Embed Size (px)
Citation preview

Johnsson et al – Hypothetical and factual willingness
1
Hypothetical and factual willingness to
participate in biobank research
Johnsson, Linus1 (LJ), MD, PhD student
Helgesson, Gert2 (GH), Associate Professor
Rafnar, Thorunn3 (TR), PhD, Chief Operating Officer
Halldorsdottir, Ingibjorg3 (IH), BS, Director
Chia, Kee-Seng4 (CKS), Professor
Eriksson, Stefan1 (SE), PhD, Senior Researcher
Hansson, Mats G.1 (MGH), Professor
1Centre for Research Ethics and Bioethics
Uppsala University
Box 564
SE-751 22 Uppsala
Phone: +46 18 471 62 22
Fax: +46 18 471 66 75
2Stockholm Centre for Healthcare Ethics
LIME, Karolinska Institutet
Berzelius väg 3

Johnsson et al – Hypothetical and factual willingness
2
SE-171 77 Stockholm
Phone: +46 8 524 837 67
Fax: +46 8 345 128
3UVS
Snorrabraut 60
105 Reykjavik, Iceland
Phone: +354 570 19 00
Fax: +354 570 19 03
4Centre for Molecular Epidemiology
Yong Loo Lin School of Medicine
National University of Singapore
MD3, 16 Medical Drive
Singapore 117597
Phone: +65 6516 49 71
Fax: +65 6779 14 89
Correspondence to: Linus Johnsson, [email protected]
Word count (including abstract but excluding references): 1730

Johnsson et al – Hypothetical and factual willingness
3
Abstract
In the debate on biobank regulation, arguments often draw upon findings in surveys on
public attitudes. Surveys on willingness to participate in research may not always
predict actual participation rates, however. We compared hypothetical willingness as
estimated in eleven surveys conducted in Sweden, Iceland, UK, Ireland, US, and
Singapore to factual participation rates in twelve biobank studies. Studies were matched
by country and approximate time frame. Of 22 pairwise comparisons, twelve suggest
that factual willingness to participate in biobank research is greater than hypothetical,
six indicate the converse relationship, and four are inconclusive. Factual donors, in
particular when recruited in health care or otherwise face-to-face with the researcher,
are possibly motivated by factors that are less influential in a hypothetical context, such
as altruism, trust, and sense of duty. The value of surveys in assessing factual
willingness may thus be limited.
Introduction
Successful biobank research depends on people’s attitudes and trust in science.1-3
Unsurprisingly, arguments for various regulative practices often rely on survey
assessments of such attitudes.4,5 A well-known limitation of surveys, however, is that in
matters of low salience to the responders, their actions may contradict their stated
intentions.6 Factual participation in biobank research has sometimes been much greater
than predicted.7 In this study we hypothesize that this is a general tendency rather than
an isolated phenomenon.
Johnsson et al – Hypothetical and factual willingness
4
Materials and methods
By tracking references from contemporary literature on public attitudes to biobank
research we identified nine public attitude surveys from Sweden,2,8 Iceland,9 the UK,10
Ireland,11 the US,12-14 and Singapore15 addressing willingness to participate in biobank
research or to store samples for future research. As sample donors are often recruited in
health care, we also included two British surveys conducted on patients.16,17 Surveys
carried out on previous research subjects or subpopulations could not be expected to be
representative of the general population and were thus excluded.
Several published biobank studies carried out in the UK,18,19 US,20-24 Iceland,25
and Singapore26,27 had data on factual participation rates. In Sweden, we obtained
participation data from a biobank maintained by the department of Endocrine Oncology,
Uppsala University Hospital. The Trinity Biobank in Dublin provided us with Irish
recruitment data. All included studies used opt-in for enrollment.
We endeavored to match each survey to one or several biobank research
projects carried out in the same country in approximately the same time frame. Due to
the small number of studies we accepted a five year gap (mid-enrollment).
Statistical analysis
Survey estimates of hypothetical willingness were compared to factual participation
rates using the Chi-squared test with continuity correction and α=0.05. Some studies did
not report raw numbers; in these cases, ranges of possible numerators and denominators
were reverse-engineered from percentages and n-values. Those ratios least likely to
reject the null hypothesis were selected for analysis. In cases where subjects were
recruited to a real-world study from a population of previous responders, we used the

Johnsson et al – Hypothetical and factual willingness
5
cumulative participation rate for comparisons in order to eliminate selection bias. P-
values less than 0.0001 are reported as <0.0001; others are presented as exact values.
Results
The willingness of Swedes to donate samples for genetic research and long-term storage
was estimated to 78% in 2002 (table 1).2 According to another survey from 2003, 94%
would agree or consider agreeing to storage of traceable samples for future research if
allowed to choose between various models of consent ranging from renewed consent for
each purpose to blanket consent.8 Of 307 unique patients admitted to the department of
Endocrine Oncology in Uppsala in July–December 2003, 233 correctly filled out at least
one consent/refusal form. Of the latter, 98% consented to research and open-ended
storage, which is more than predicted by the surveys.
According to an Icelandic public survey (ELSAGEN) conducted in 2002, 65%
thought they would be very or rather likely to participate in genetic research in the
future.9 Factual recruitment rates in the Icelandic Cancer Project (ICP) during 2001–
2002 were higher: 88% of eligible patients and 82% of controls agreed to open-ended
storage of samples for use in other cancer research projects, including genetic and
commercial research.25
In 2002, the willingness to join the UK Biobank was estimated to 34%.10 Such
participation implies consent to open-ended storage and genetic research. A survey on
British dental patients in 2003 found that 82% would donate excess tissue to cancer
research if asked.17 In 2005, 96% of postoperative patients in a teaching hospital
thought they would not object to their tissue being used in research.16 Participation in a
biobank study from 1998–2002 was higher than predicted by any of the three surveys,

Johnsson et al – Hypothetical and factual willingness
6
with 99% of surgical patients donating leftover tissue to commercial biomedical
research.18 In the UK Biobank pilot phase in 2006, invitations were sent by mail to a
random sample of the population in the vicinity of an assessment centre. Of those
contacted in February-April, 10% agreed,19 which is lower than predicted by the
reviewed surveys.
In 2004, 74% of the Irish claimed to be willing to donate excess tissue for non-
genetic research and storage for future research.11 In the same year Trinity Biobank
recruited subjects by posting buccal swab kits to a random sample of the population
(Joe McPartlin, personal communication). The participants gave broad consent for use
of their samples, including genetic research and open-ended anonymized storage. The
participation rate was 17%, which is far less than estimated by the survey.
Of participants in the 1998 American Healthstyles Survey, 43% thought
themselves willing to donate samples for genetic research and storage for future
research; 53% would consent to genetic research but not to storage.13 Another American
survey from 2005 found that of those respondents that could be segmented into
categories depending on their attitudes to genetic research, 46% were either
“supportive” or “altruistic”.12 A third survey conducted in 2007-2008 estimated the
willingness of Americans to participate in a cohort study involving genetic research to
60%.14 We matched these studies to five American biobank studies. Of Americans
eligible for the 1999 NHANES survey, 60% (84% of respondents) donated samples to
be stored for future academic biomedical research, including genetic research.23 In
another study conducted in 1999–2000, a random sample of the population were
interviewed by phone about their smoking behavior and asked to mail buccal swabs for
genetic analysis. Participation among interviewees was 26%.20 A large-scale

Johnsson et al – Hypothetical and factual willingness
7
population-based biobank had a 44% enrollment rate in 2002–2004.21 In a study on
colorectal cancer patients in 2001–2004, 63% donated samples to genetic research.24 In
2003–2004, samples collected from NHANES respondents were no longer used for
genetic research or stored for future research; under these conditions, 71% of eligible
Americans (98% of respondents) donated samples.22 Of the resulting ten comparisons,
five indicate that actual participation was higher than predicted, two suggest the
converse relationship, and three show no difference.
An interview study on the general population in Singapore in 2002 estimated
the willingness to donate blood for genetic research and storage for future research to
40%.15 In the Singapore Prospective Study Program (SP2), the recruitment rate in
2004–2007 was 64%. Participants were recruited from the 199226 and 199827 Singapore
National Health Surveys; adjusting for the 68% response rate of these surveys yields a
cumulative response rate of 43%, which is comparable to the survey estimate.
Discussion
Of 22 pairwise comparisons, twelve suggest that factual willingness to participate in
biobank research is greater than surveys predict, six indicate the converse relationship,
and four show no difference (figure 1). Due to the small number of studies included, we
could not control for some potentially influential confounders, nor is it possible to
analyze them statistically. We will, however, give a rough indication of the extent to
which they may have affected our results.
Some studies suggest that fewer people are willing to donate material for
research and open-ended storage than for research alone.2,13,15,17 Involvement of
commercial interests has been identified as another deterring factor in some

Johnsson et al – Hypothetical and factual willingness
8
contexts.3,4,28,29 However, these two factors explain nothing of our findings (table 2).
Some people may associate genetic research with eugenics or discrimination3,29
or think of it as “tampering with nature.”11,28 It is at least possible that genetic research
could have been a deterring factor in seven cases, though other factors may partly
explain these differences.
Patients may be more inclined to participate in research than the general
public,11 possibly from a sense of duty to reciprocate30 or because they find themselves
part of a social agreement,16 community, or alliance.31 Potential research subjects may
find it easier to trust researchers whom they meet face-to-face, and so may be more
likely to agree to participate. These two factors together may have influenced the
outcomes of twelve comparisons. They may not always be crucial, however: In the
Icelandic Cancer Project, controls were recruited by phone and mail, but participation in
this group was almost as high as among patients, with whom the researcher had face-to-
face contact at some point.25
The above factors do not, in isolation or jointly, explain all of our results. We
argue that this residue can be explained by reference to fundamental differences
between hypothetical and factual choice. Psychologists have found that the more highly
embedded an attitude, the more strongly it is related to behavioral intentions.32 If a
survey fails to engage the subject, it may reflect mere opinions rather than stable
attitudes.6 In contrast, finding that one’s choice really matters could awaken a fuller
range of emotional rationality.
Our study has some important limitations. Some biobank studies relied on
invitees to respond to mailed invitations (UK Biobank and Trinity Biobank), possibly
yielding dropout that does not reflect unwillingness to participate as such. As we have

Johnsson et al – Hypothetical and factual willingness
9
expressed participation rates as percentages of all invitees, actual willingness may have
been underestimated in these cases. Willingness to participate in research may also be
context-sensitive in ways that escape the above categorization; for instance, people’s
views regarding a specific biobank do not necessarily reflect their attitudes toward
biobank research as a whole.
Public surveys are expected to provide accurate estimates of people’s attitudes
and to be representative of the population. Those that we reviewed in this study
predicted behavior poorly, which could be due to either individual flaws or a general
tendency to reflect attitudes other than those that are operative in actual decisions to
participate in research. Both possible sources of error must be held in mind when
surveys assessing willingness to participate in research are used in policy making.
Acknowledgements
This study was conducted as part of the AutoCure and CCPRB projects of the EU Sixth
Framework Programme. The authors of this study have been independent from the
funders in both conception and execution of the study.
Conflict of interest
The authors declare no conflict of interest.
Ethics approval
Ethics approval was not required for this study.

Johnsson et al – Hypothetical and factual willingness
10
Author contributions
LJ, GH, SE and MGH designed the study. LJ, TR, IH, and CKS collected the data. LJ
analyzed the data and wrote the paper. All authors contributed to revision of critical
intellectual content and approved the publication of the final version of this article.
Keywords
Biobanks
Tissue banks
DNA banks
Sample collections
Sample repositories
Genetic databases
Public attitudes
Trust
Public surveys
References
1. Hansson MG: Ethics and biobanks. Br J Cancer 2008. 2. Kettis-Lindblad A, Ring L, Viberth E, Hansson MG: Genetic research and
donation of tissue samples to biobanks. What do potential sample donors in the Swedish general public think? Eur J Public Health 2006; 16: 433-440.
3. Levitt M, Weldon S: A well placed trust?: Public perceptions of the
governance of DNA databases. Crit Public Health 2005; 15: 311-321.

Johnsson et al – Hypothetical and factual willingness
11
4. Caulfield T: Biobanks and Blanket Consent: The Proper Place of the
Public Good and Public Perception Rationales. King's Law Journal 2007; 18: 209-226. 5. Wendler D: One-time general consent for research on biological samples.
BMJ 2006; 332: 544-547. 6. Pardo R, Midden C, Miller JD: Attitudes toward biotechnology in the
European Union. J Biotechnol 2002; 98: 9-24. 7. Johnsson L, Hansson MG, Eriksson S, Helgesson G: Patients' refusal to
consent to storage and use of samples in Swedish biobanks: cross sectional study. BMJ 2008; 337: a345.
8. Nilstun T, Hermeren G: Human tissue samples and ethics--attitudes of the
general public in Sweden to biobank research. Med Health Care Philos 2006; 9: 81-86. 9. Guðmundsdóttir ML, Nordal S: Iceland; in: Häyry M, Chadwick R,
Árnason V, Árnason G (eds): The Ethics and Governance of Human Genetic Databases: European Perspectives. Cambridge: Cambridge University Press, 2007.
10. Hapgood R, McCabe C, Shickle D. Public preferences for participation in
a large DNA cohort study: a discrete choice experiment: Sheffield Health Economics Group Discussion Paper Series. Sheffield, The University of Sheffield, School of Health and Related Research, 2004.
11. Cousins G, McGee H, Ring L et al. Public perceptions of biomedical
research: a survey of the general population in Ireland. Dublin, Health Research Board, 2005.
12. Pulley JM, Brace MM, Bernard GR, Masys DR: Attitudes and perceptions
of patients towards methods of establishing a DNA biobank. Cell Tissue Bank 2008; 9: 55-65.
13. Wang SS, Fridinger F, Sheedy KM, Khoury MJ: Public attitudes regarding
the donation and storage of blood specimens for genetic research. Community Genet 2001; 4: 18-26.
14. Kaufman D, Murphy J, Scott J, Hudson K: Subjects matter: a survey of
public opinions about a large genetic cohort study. Genet Med 2008; 10: 831-839. 15. Wong ML, Chia KS, Yam WM, Teodoro GR, Lau KW: Willingness to
donate blood samples for genetic research: a survey from a community in Singapore. Clin Genet 2004; 65: 45-51.
16. Bryant RJ, Harrison RF, Start RD et al: Ownership and uses of human
tissue: what are the opinions of surgical in-patients? J Clin Pathol 2008; 61: 322-326.

Johnsson et al – Hypothetical and factual willingness
12
17. Goodson ML, Vernon BG: A study of public opinion on the use of tissue samples from living subjects for clinical research. J Clin Pathol 2004; 57: 135-138.
18. Jack AL, Womack C: Why surgical patients do not donate tissue for
commercial research: review of records. BMJ 2003; 327: 262. 19. UK Biobank. Report of the integrated pilot phase, 2006. 20. Kozlowski LT, Vogler GP, Vandenbergh DJ, Strasser AA, O'Connor RJ,
Yost BA: Using a telephone survey to acquire genetic and behavioral data related to cigarette smoking in "made-anonymous" and "registry" samples. Am J Epidemiol 2002; 156: 68-77.
21. McCarty CA, Wilke RA, Giampietro PF, Wesbrook SD, Caldwell MD:
Marshfield Clinic Personalized Medicine Research Project (PMRP): design, methods and recruitment for a large population-based biobank. Personalized Med 2005; 2: 49-79.
22. McQuillan GM, Pan Q, Porter KS: Consent for genetic research in a
general population: an update on the National Health and Nutrition Examination Survey experience. Genet Med 2006; 8: 354-360.
23. McQuillan GM, Porter KS, Agelli M, Kington R: Consent for genetic
research in a general population: the NHANES experience. Genet Med 2003; 5: 35-42. 24. Ford BM, Evans JS, Stoffel EM, Balmana J, Regan MM, Syngal S:
Factors associated with enrollment in cancer genetics research. Cancer Epidemiol Biomarkers Prev 2006; 15: 1355-1359.
25. Rafnar T, Thorlacius S, Steingrimsson E et al: The Icelandic Cancer
Project--a population-wide approach to studying cancer. Nat Rev Cancer 2004; 4: 488-492.
26. Tan CE, Emmanuel SC, Tan BY, Jacob E: Prevalence of diabetes and
ethnic differences in cardiovascular risk factors. The 1992 Singapore National Health Survey. Diabetes Care 1999; 22: 241-247.
27. Cutter J, Tan BY, Chew SK: Levels of cardiovascular disease risk factors
in Singapore following a national intervention programme. Bull World Health Organ 2001; 79: 908-915.
28. Human Genetics Commission. Public attitudes to human genetic
information. London, Human Genetics Commission, 2001. 29. Wong ML, Chia KS, Wee S et al: Concerns over participation in genetic
research among Malay-Muslims, Chinese and Indians in Singapore: a focus group study. Community Genet 2004; 7: 44-54.
30. Hoeyer K, Lynoe N: Motivating donors to genetic research?

Johnsson et al – Hypothetical and factual willingness
13
Anthropological reasons to rethink the role of informed consent. Med Health Care Philos 2006; 9: 13-23.
31. Dixon-Woods M, Wilson D, Jackson C, Cavers D, Pritchard-Jones K:
Human Tissue and ‘the Public’: The Case of Childhood Cancer Tumour Banking. BioSocieties 2008; 3: 57-80.
32. Ajzen I: Nature and operation of attitudes. Annu Rev Psychol 2001; 52:
27-58.

Johnsson et al – Hypothetical and factual willingness
14
Titles and legends to figures
Figure 1: Willingness to participate in biobank research. In 12 of 22 pairwise
comparisons, factual willingness to participate in biobank research was higher than
estimated in the corresponding surveys. Six comparisons yielded the opposite result. In
two of these (IE and US2), the biobank studies recruited participants by asking them to
supply buccal swabs by mail. In three others (GB4, GB5, and GB6) the first stage of
recruitment to the biobank study in question (UK Biobank) relied on potential subjects
to respond to a mailed invitation, which could explain part of the dropout. Significant
differences (p<0.05) are marked with an asterisk. Each comparison has an index that
identifies the study country (SE = Sweden, IS = Iceland, GB = Great Britain, IE =
Ireland, US = United States, SG = Singapore). For details on the studies in each pair,
see table 1.

Johnsson et al – Hypothetical and factual willingness
15
Tables

Johnsson et al – Hypothetical and factual willingness
16
Index* StudyStudy year Rate
Rate in % (95% CI) Study
Study year Rate
Rate in % (95% CI) p
SE1 Kettis-Lindblad 2006
2002 2 220 / 2 830
78 (77 to 80)
Uppsala 2003 228 / 233
98 (96 to 100)
<0.0001
SE2 Nilstun 2006 2003 853 / 904
94 (93 to 96)
Uppsala 2003 228 / 233
98 (96 to 100)
0.042
IS1 Gudmundsdottir 2007
2002 598 / 915
65 (62 to 68)
Rafnar 2004 (patients)
2001-2002
3 352 / 3 817
88 (87 to 89)
<0.0001
IS2 Gudmundsdottir 2007
2002 598 / 915
65 (62 to 68)
Rafnar 2004 (controls)
2001-2002
1 435 / 1 743
82 (81 to 84)
<0.0001
GB1 Hapgood 2004 2002 441 / 1 283
34 (32 to 37)
Jack 2003 1998-2002
3 102 / 3 140
99 (98 to 99)
<0.0001
GB2 Goodson 2004 2003 82 / 100
82 (74 to 90)
Jack 2003 1998-2002
3 102 / 3 140
99 (98 to 99)
<0.0001
GB3 Bryant 2008 2005 184 / 191
96 (94 to 99)
Jack 2003 1998-2002
3 102 / 3 140
99 (98 to 99)
0.011
GB4 Hapgood 2004 2002 441 / 1 283
34 (32 to 37)
UK Biobank 2006 2 860 / 28 812
10 (10 to 10)
<0.0001
GB5 Goodson 2004 2003 82 / 100
82 (74 to 90)
UK Biobank 2006 2 860 / 28 812
10 (10 to 10)
<0.0001
GB6 Bryant 2008 2005 184 / 191
96 (94 to 99)
UK Biobank 2006 2 860 / 28 812
10 (10 to 10)
<0.0001
IE Cousins 2005 2004 1 703 / 2 294
74 (72 to 76)
Trinity Biobank
2004 1 267 / 7 500
17 (16 to 18)
<0.0001
US1 Wang 2001 (storage)
1998 1 122 / 2 621
43 (41 to 45)
McQuillan 2003
1999 1 635 / 2 721
60 (58 to 62)
<0.0001
US2 Wang 2001 (storage)
1998 1 122 / 2 621
43 (41 to 45)
Kozlowski 2002
1999-2000
870 / 3 383
26 (24 to 27)
<0.0001
US3 Wang 2001 (storage)
1998 1 122 / 2 621
43 (41 to 45)
McCarty 2005
2002-2004
17 463 / 39
44 (44 to 44)
0.25
US4 Wang 2001 (no storage)
1998 1 391 / 2 621
53 (51 to 55)
Ford 2006 2001-2004
696 / 1 111
63 (60 to 65)
<0.0001
US5 Pulley 2008 2005 362 / 795
46 (42 to 49)
McCarty 2005
2002-2004
17 463 / 39
44 (44 to 44)
0.40
US6 Pulley 2008 2005 362 / 795
46 (42 to 49)
McQuillan 2006
2003-2004
4 960 / 6 971
71 (70 to 72)
<0.0001
US7 Pulley 2008 2005 362 / 795
46 (42 to 49)
Ford 2006 2001-2004
696 / 1 111
63 (60 to 65)
<0.0001
US8 Kaufman 2008 2007-2008
2 818 / 4 659
60 (59 to 62)
McCarty 2005
2002-2004
17 463 / 39
44 (44 to 44)
<0.0001
US9 Kaufman 2008 2007-2008
2 818 / 4 659
60 (59 to 62)
McQuillan 2006
2003-2004
4 960 / 6 971
71 (70 to 72)
<0.0001
US10 Kaufman 2008 2007-2008
2 818 / 4 659
60 (59 to 62)
Ford 2006 2001-2004
696 / 1 111
63 (60 to 65)
0.20
SG Wong 2004 2002 217 / 548
40 (36 to 44)
SP2 2004-2007
4 044 / 9 329
43 (42 to 44)
0.093
Attitude survey Biobank study
Table 1: Pairwise comparison of surveys and biobank studies. Surveys were matched to biobank studies by country and approximate time frame. Some studies that were comparable to several others appear more than once in the table. Where a survey made multiple assessments of willingness based on different scenarios, we used the one that best matched the setting of the corresponding biobank study. The 46% found by Pulley refers to the proportion of respondents described as "supportive" or "altruistic"; counting also "passively supportive" individuals, the proportion is 79%, which is higher than the corresponding factual participation rates (p<0.0001).* SE = Sweden, IS = Iceland, GB = Great Britain, IE = Ireland, US = United States, SG = Singapore
Johnsson et al – Hypothetical and factual willingness
17
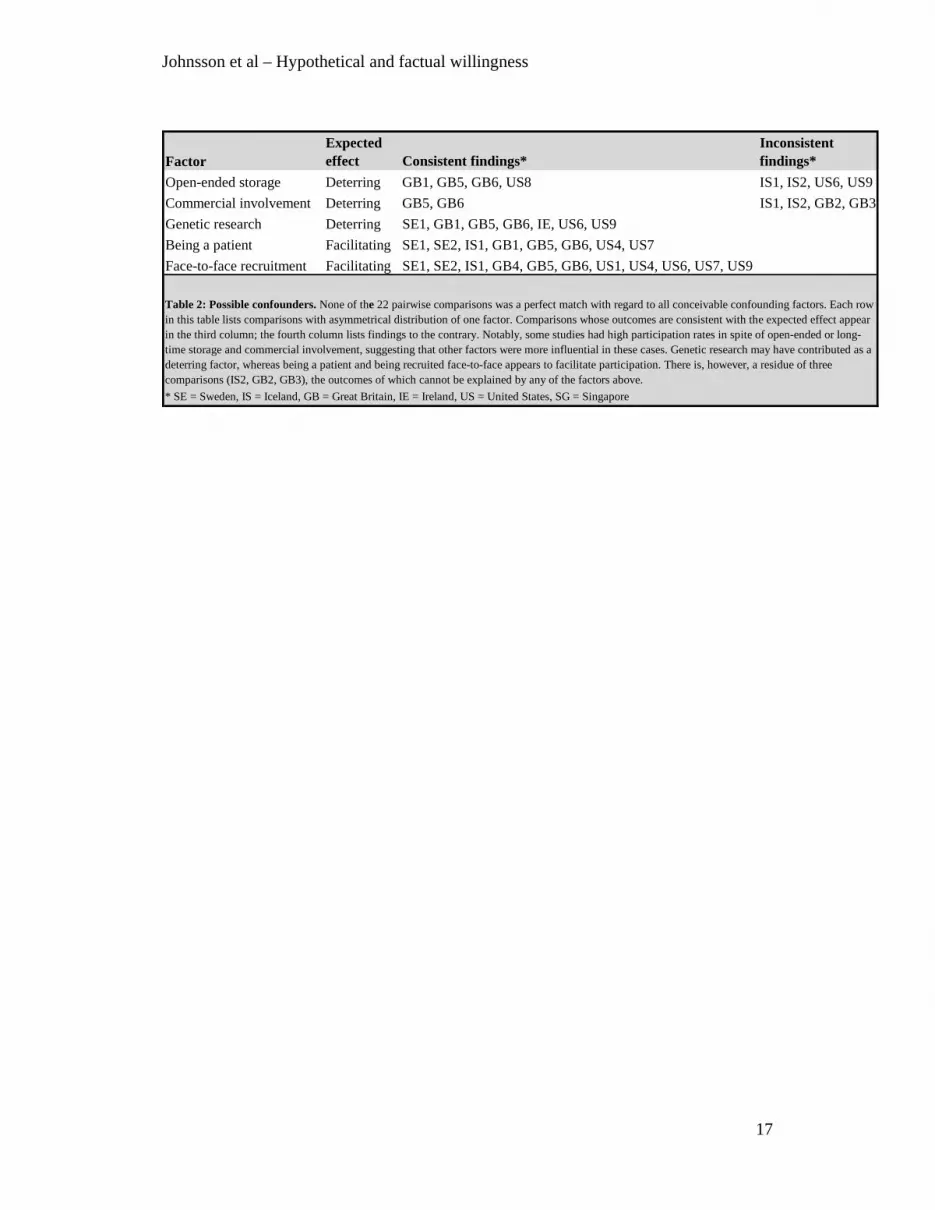
FactorExpected effect Consistent findings*
Inconsistent findings*
Open-ended storage Deterring GB1, GB5, GB6, US8 IS1, IS2, US6, US9Commercial involvement Deterring GB5, GB6 IS1, IS2, GB2, GB3Genetic research Deterring SE1, GB1, GB5, GB6, IE, US6, US9Being a patient Facilitating SE1, SE2, IS1, GB1, GB5, GB6, US4, US7Face-to-face recruitment Facilitating SE1, SE2, IS1, GB4, GB5, GB6, US1, US4, US6, US7, US9
Table 2: Possible confounders. None of the 22 pairwise comparisons was a perfect match with regard to all conceivable confounding factors. Each row in this table lists comparisons with asymmetrical distribution of one factor. Comparisons whose outcomes are consistent with the expected effect appear in the third column; the fourth column lists findings to the contrary. Notably, some studies had high participation rates in spite of open-ended or long-time storage and commercial involvement, suggesting that other factors were more influential in these cases. Genetic research may have contributed as a deterring factor, whereas being a patient and being recruited face-to-face appears to facilitate participation. There is, however, a residue of three comparisons (IS2, GB2, GB3), the outcomes of which cannot be explained by any of the factors above.* SE = Sweden, IS = Iceland, GB = Great Britain, IE = Ireland, US = United States, SG = Singapore

Johnsson et al – Hypothetical and factual willingness
18


