Embed Size (px)
Citation preview
DOCUMENTOS DE ECONOMÍA Y FINANZAS INTERNACIONALES
Working Papers on International
Economics and Finance
DEFI 11-09 November 2011
Hysteresis and Import Penetration with
Decreasing Sunk Costs
Henry Aray
Asociación Española de Economía y Finanzas Internacionales
www.aeefi.com ISSN: 1696-6376
Hysteresis and Import Penetration withDecreasing Sunk Costs
Henry Aray∗
University of Granada
July 8, 2011
Abstract
This article proposes an extension of Dixit (1989, Quart. J. Econ.),
assuming that potential exporting firms benefit from the experience of
firms already settled in the foreign market which allows the sunk cost
to diminish. In general, the numerical results show that hysteresis is
lower as expected. More interestingly, hysteresis is decreasing with the
number of firms. As regards the Dixit case, decreasing sunk cost has a
greater impact on entering than on exiting. Finally, the combination
of expected depreciation/appreciation rate and sunk cost has striking
implications on the import share.
Key words: Real Options, Exchange Rate, Sunk Cost.
JEL Classification: F14, F31, L16.∗Corresponding author: Universidad de Granada. Facultad de Ciencias Económicas
y Empresariales. Dpto. de Teoría e Historia Económica. Campus de la Cartuja S/N,18011 Granada, España. e-mail: [email protected]. Phone: +34958241000 ext. 20140. Fax:+3495849995.
1
1 Introduction
Dixit (1989) proposes a very interesting model of entry in an foreign market
under exchange rate uncertainty. The model considers the option of Japanese
firms exporting to a competitive market in the US. Real option theory is used
to determine the trigger exchange rates that produce the entry and exit of
firms. Firms sequentially enter the US market, with firms whose marginal
costs are lower being the first in entering. Undertaking the exporting project
implies incurring a sunk cost, which is assumed to be constant for all firms.
Recently, Benkler (2006) established a relationship between the fixed costs
of entry into a new market and the degree of familiarity with this market,
such that the fixed cost of entry is lower as long as the entrants (potential)
are more familiar with the idiosyncrasies of the new markets.
Why can potential entrants get account with new markets? The answer
could be given by the literature on urbanization and localization economies
which claims that positive externalities can be generated due to the proximity
among firms. Desmet and Fafchamps (2005 ) distinguish between localization
economies, which derive from being located close to other firms in the
same industry; and urbanization economies, associated with closeness to
overall economic activity. Interactions among firms allow the exchange of
useful information among their trading partners about the functioning of
foreign markets, administrative rules, etc. Hence, export barriers could be
2
reduced if the firms exchange information about the target market. The
exchange of information among firms could be made easier by the spacial
concentration of firms. Head et al. (1995) and Aitken et al. (1997) show
that the spacial concentration of exporting firms helps other local firms in the
internationalization process. The argument is that proximity among firms
could increase the transmission of knowledge on the exportation practice and
thus facilitate the flows of information about the target country. Becchetti
and Rossi (2000) find strong evidence for the positive impact of industrial
district on the probability of exporting and the export intensity of small-
and medium-sized Italian firms. Similar results were found by Castillo and
Requena (2007) for Spain and Koening (2009) for France.
Following the above literature, our assumption is that more information
about the foreign market from both the demand and supply side allow
the sunk cost to decrease, thus fostering early penetration in the target
market. We consider that when there are more exporters in an industry,
more information is available for potential exporters. Therefore, we propose
a slight extension of Dixit (1989) allowing sunk cost to decrease with the
number of exporting firms already settled in the foreign market.
With respect to the Dixit case, our numerical results show that decreasing
sunk costs have a greater impact on the option of activating than on the
option of abandoning. For any given exchange rate, the lower the sunk cost,
the narrower the range of number of firms in equilibrium in the industry.
3
With regard to this question, one of the main contributions of this article
is that unlike the Dixit case where hysteresis increases as long as new firms
enter, in industries where the marginal contribution to the reduction of the
sunk cost of the new adding firm is constant or increasing, the hysteresis
decreases with the number of firms. However, in industries with decreasing
marginal contribution to the reduction of the sunk cost of the new adding
firm, mixed results are found. For the first third of entering firms, the
hysteresis decreases, but increases for the following firms. Finally, regarding
market share, our results suggest that countries whose exchange rate suffers
from exchange rate depreciation in the long term, the positive growth of the
exchange rate hides the positive effects of decreasing sunk costs. In contrast,
countries whose exchange rate suffers from exchange rate appreciation in the
long term, the negative growth of the exchange rate can be dampened by the
positive effects of decreasing sunk costs.
The article is organized as follows. A summary of the Dixit model
is presented in section 2. Section 3 provides the numerical results, while
conclusions are drawn in section 4.
2 The Dixit’s Model
Dixit’s model considers that all the uncertainty comes from the exchange
rate, R, defined as the number of Japanese currency units (Yen) necessary
to buy one unit of US currency (Dollar). R is assumed to follow a geometric
4
Brownian motion as
dR
R= µdt+ σdz
where dz is an increment of a standard Wiener process, is uncorrelated
across time and at any one instant satisfies E(dz) = 0, E(dz2) = dt, where
E denotes the expectations operator. The parameter µ is the expected
depreciation rate and σ is a measure of exchange rate volatility.
Dixit (1989) considers N Japanese firms that are potential suppliers of
imports to the US. The firms are risk neutral and have rational expectations,
that is, they maximize the expected present value of profits in yen. When in
the US market, they act as price-takers. Each must incur a sunk capital cost
of k dollars to enter this market. This cannot be recouped if the firm should
decide to quit at a later date. Moreover, the firm may have to pay a further
l dollars to shut down. If it should decide to reenter at a still later date, it
must spend k.
Each active firm sells one unit of output per unit of time in the market
and acts as a price-taker. The variable cost of supplying the unit of output
to the foreign market for the firm n is wn yen.
The equilibrium of the industry evolves as if to maximize the expected
present discounted value of the overall surplus of this industry measured in
yen, V (R).
The problem is solved as a sequence of option pricing problems such as
5
E [dVn (R)]
dt+RU (n)−W (n) = ρVn (R) (1)
Where U (n) is the utility of the industry when there are n firms and
W (n) is the variable cost of the first n firms
U (n) =nX
j=1
pj
W (n) =nX
j=1
wj
Where pj is the marginal contribution of firm j to utility and wj the
variable cost of firm j.
Equation (1) states that the capital gains plus the dividend flow must
equal the normal return. The general solution to the equation is
Vn (R) = A (n)R−α +B (n)Rβ +RU (n)
ρ− µ− W (n)
ρ
where −α < 0 and β > 1, and A (n) and B (n) are constants to be
determined. The boundary conditions for the endpoints n = 0 and N ,
A (0) = 0 and B (N) = 0 are imposed. The interpretation of the conditions
are as follows: when there are no established firms, the shutdown option
takes a value of zero, and when there is the maximum possible number of
firms, the option to add more is worthless.
Let In be the exchange rate at which it only becomes optimal to introduce
the nth firm. When previously there were (n − 1), the value-matching and
smooth pasting conditions are
6
Vn−1 (In) = Vn (In)− kIn
V 0n−1 (In) = V 0
n (In)− k
Similarly, let Dn be the exchange rate at which it only becomes optimal
that a firm abandons. When there are n firms, the value-matching and
smooth pasting conditions are
Vn (Dn) = Vn−1 (Dn)− lDn
V 0n (Dn) = V 0
n−1 (Dn)− l
Considering that
an = A (n)−A (n− 1)
bn = B (n− 1)−B (n)
A (n) =nX
j=1
aj
B (n) =NX
j=n+1
bj
The four-equation system to be solved for an,bn, In andDn can be written
as
7
anI−αn − bnI
βn +
Inpnρ− µ
− wn
ρ− kIn = 0
−αanI−α−1n − βbnIβ−1n +
pnρ− µ
− k = 0 (2)
anD−αn − bnD
βn +
Dnpnρ− µ
− wn
ρ+ lDn = 0
−αanD−α−1n − βbnD
β−1n +
pnρ− µ
+ l = 0
3 Numerical Results
To solve the system of equations (2), Dixit’s baseline case considers the
following parametrization: k = 2, ρ = 0.025, l = 0, N = 100. Foreign
demand and foreign supply are given by
Qd = 360− 160p
QS = 110 + 40p
Therefore, the net import demand function is
q = 250− 200p
which finally gives the net import inverse demand function
pn = 1.25−n
200
8
wn = 0.85 +n
500
Let sunk cost decrease with the number of firms settled in the foreign
market. Decreasing sunk cost could be related to more transparent industries
which could not only foster earlier penetration, but also incur a lower sunk
cost. Therefore, we specify K(n) by nesting Dixit’s constant sunk cost
(k = 2) for the first potential exporting firm, with K 0(n) < 0.
In order to provide a general solution we consider three cases
K1(n) = k − n− 1N − 1
K2(n) =k
nα, a > 0
K3(n) =¡k2 − γ (n− 1)
¢1/2, γ > 0
where K 001 (n) = 0, which implies that the marginal contribution of the nth
firm to the reduction of the sunk cost is constant and equal to − (1/N − 1).
K 002 (n) > 0. Hence K2(n) is a convex function and the marginal contribution
of the nth firm to the reduction of the sunk cost is decreasing with n and
equal to −αkn−α−1. K 003 (n) < 0 and K3(n) is a concave function and the
marginal contribution of the nth firm to the reduction of the sunk cost is
increasing with n and equal to −γ2(k2 − γ (n− 1))−1/2.
We consider a 50 percent reduction in the sunk cost from the first
entrant to the last entrant. Therefore, when no foreign (Japanese) firm
9
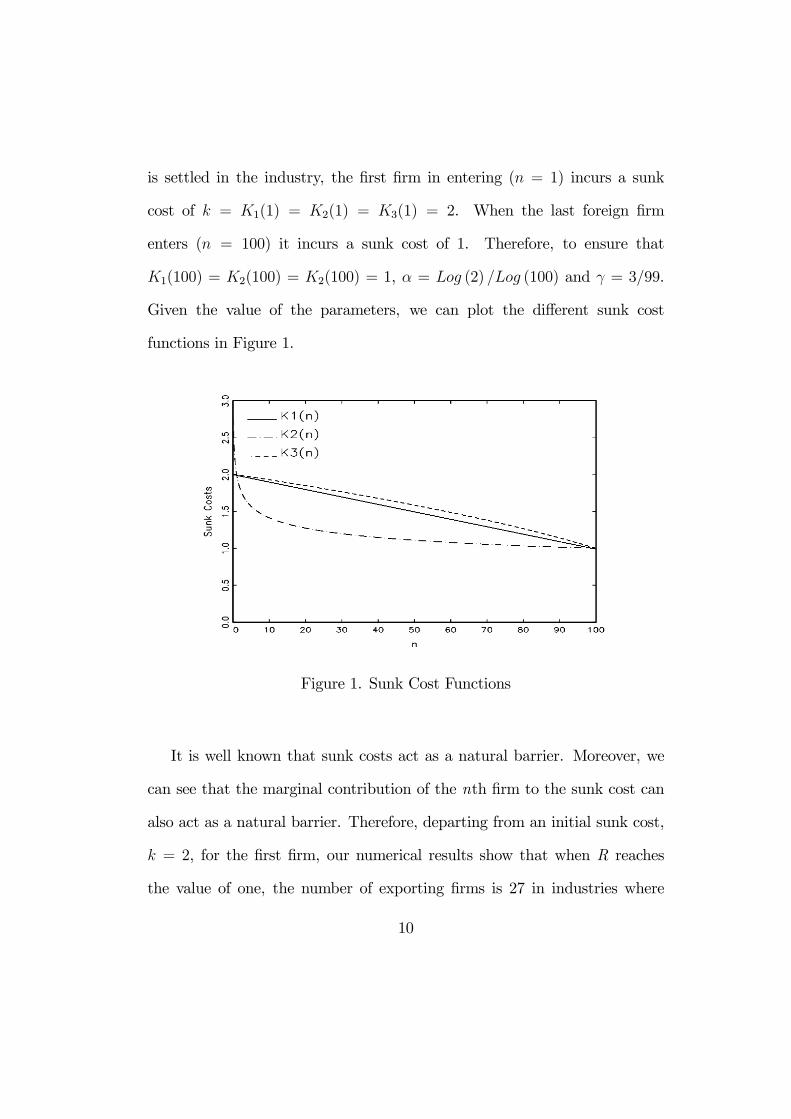
is settled in the industry, the first firm in entering (n = 1) incurs a sunk
cost of k = K1(1) = K2(1) = K3(1) = 2. When the last foreign firm
enters (n = 100) it incurs a sunk cost of 1. Therefore, to ensure that
K1(100) = K2(100) = K2(100) = 1, α = Log (2) /Log (100) and γ = 3/99.
Given the value of the parameters, we can plot the different sunk cost
functions in Figure 1.
Figure 1. Sunk Cost Functions
It is well known that sunk costs act as a natural barrier. Moreover, we
can see that the marginal contribution of the nth firm to the sunk cost can
also act as a natural barrier. Therefore, departing from an initial sunk cost,
k = 2, for the first firm, our numerical results show that when R reaches
the value of one, the number of exporting firms is 27 in industries where
10
the marginal contribution of the nth firm to the sunk cost is decreasing
(K2 (n)). However, if the marginal contribution of the nth firm to the sunk
cost is constant or increasing, the number of exporting firm is 21; and if
there is no marginal contribution (Dixit’s case), the number is 20. This
result can shed light on policy implications. If information exchange is the
via through which sunk cost can be reduced, and higher information gains
come from previously entering firms, as in the case of K2 (n), the role of the
government in the earlier stages of penetration in a market could be crucial in
providing information on the target market through official institutions and
promoting the exchange of information among firms by fostering localization
and urbanization economies. When R reaches the value of 1.76, regardless
of the sunk cost function specified, all the firms have entered. However, with
K2 (n), all the firms except the first and the last have entered before and
have incurred lower sunk costs.
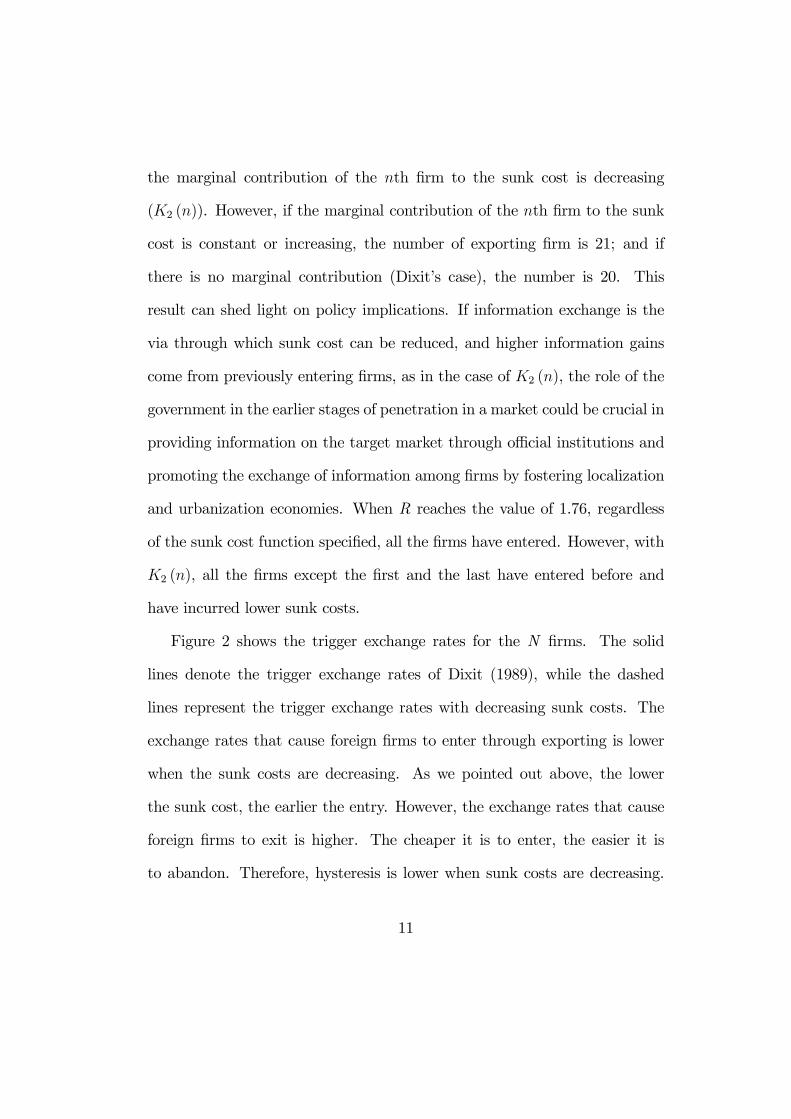
Figure 2 shows the trigger exchange rates for the N firms. The solid
lines denote the trigger exchange rates of Dixit (1989), while the dashed
lines represent the trigger exchange rates with decreasing sunk costs. The
exchange rates that cause foreign firms to enter through exporting is lower
when the sunk costs are decreasing. As we pointed out above, the lower
the sunk cost, the earlier the entry. However, the exchange rates that cause
foreign firms to exit is higher. The cheaper it is to enter, the easier it is
to abandon. Therefore, hysteresis is lower when sunk costs are decreasing.
11
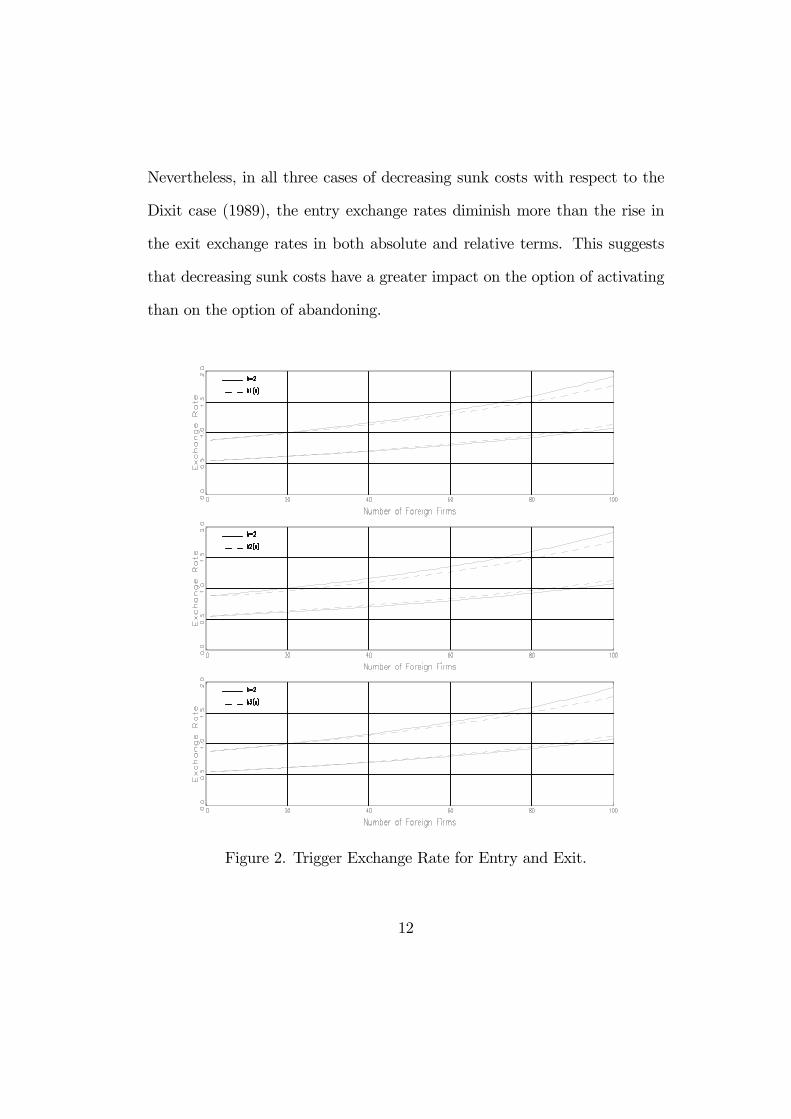
Nevertheless, in all three cases of decreasing sunk costs with respect to the
Dixit case (1989), the entry exchange rates diminish more than the rise in
the exit exchange rates in both absolute and relative terms. This suggests
that decreasing sunk costs have a greater impact on the option of activating
than on the option of abandoning.
Figure 2. Trigger Exchange Rate for Entry and Exit.
12
When half of the firms have already settled in the industry (n = 50), the
exchange rate that induces one firm to enter is 68 percent higher than the rate
that induces one firm to exit with constant sunk cost. With lineal decreasing
sunk cost it is 59 percent higher, with convex decreasing sunk cost it is 52
percent, and with concave decreasing sunk cost it is 61 percent. Equilibrium
with 50 firms in the case of k = 2 is compatible with any exchange rate in the
interval (0.75, 1.25); with K1(50), (0.76,1.21); with K2(50), (0.78, 1.18) and
with K3(50), (0.76, 1.22). Therefore, the lower the sunk cost, the narrower
the inaction bands, that is, the lower the hysteresis. Looking at this another
way, an exchange rate equal to 1 is compatible with any number of firms in
intervals: (20,90) with k = 2, (21,85) with K1(n) and K3(n), and (27,84)
with K2(n). The lower the sunk costs, the narrower the range of the number
firms in equilibrium.
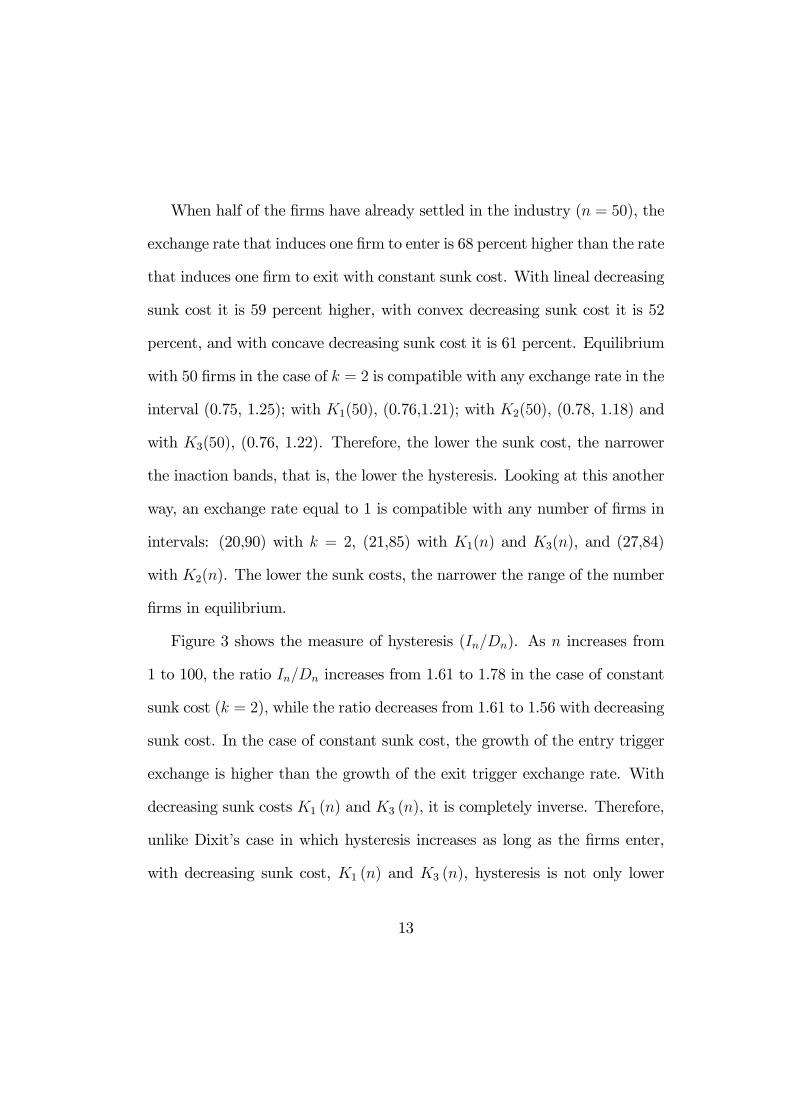
Figure 3 shows the measure of hysteresis (In/Dn). As n increases from
1 to 100, the ratio In/Dn increases from 1.61 to 1.78 in the case of constant
sunk cost (k = 2), while the ratio decreases from 1.61 to 1.56 with decreasing
sunk cost. In the case of constant sunk cost, the growth of the entry trigger
exchange is higher than the growth of the exit trigger exchange rate. With
decreasing sunk costs K1 (n) and K3 (n), it is completely inverse. Therefore,
unlike Dixit’s case in which hysteresis increases as long as the firms enter,
with decreasing sunk cost, K1 (n) and K3 (n), hysteresis is not only lower
13
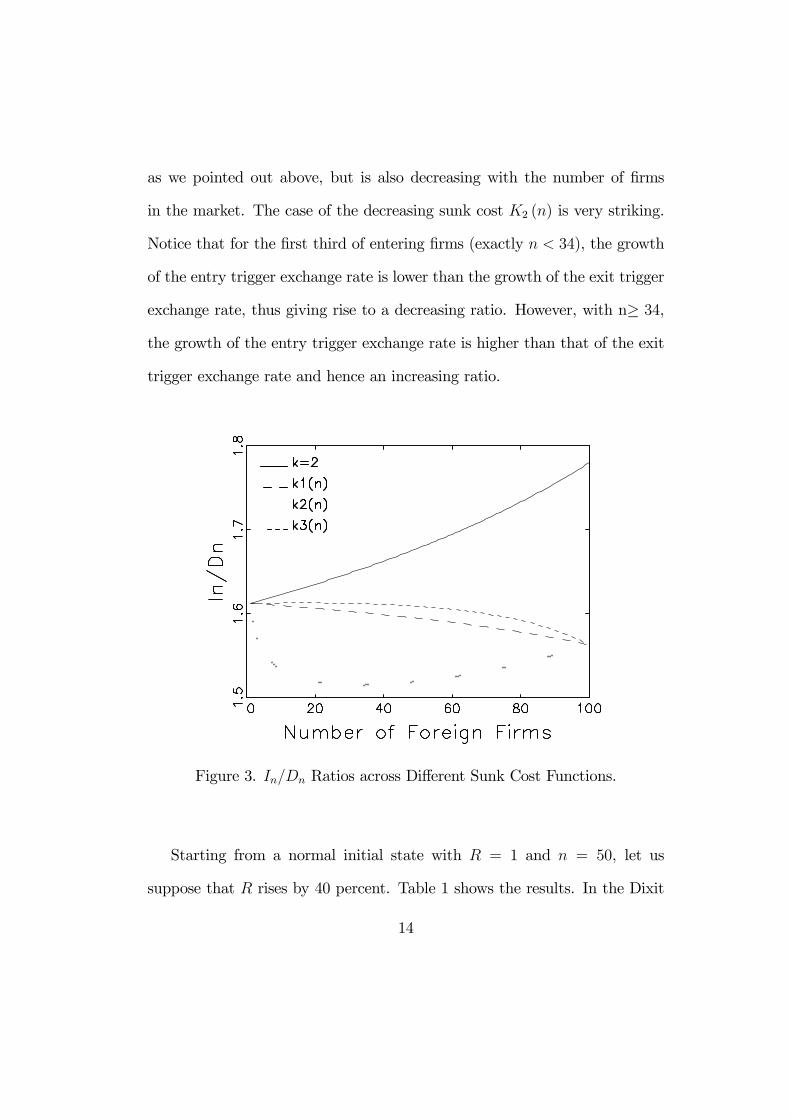
as we pointed out above, but is also decreasing with the number of firms
in the market. The case of the decreasing sunk cost K2 (n) is very striking.
Notice that for the first third of entering firms (exactly n < 34), the growth
of the entry trigger exchange rate is lower than the growth of the exit trigger
exchange rate, thus giving rise to a decreasing ratio. However, with n≥ 34,
the growth of the entry trigger exchange rate is higher than that of the exit
trigger exchange rate and hence an increasing ratio.
Figure 3. In/Dn Ratios across Different Sunk Cost Functions.
Starting from a normal initial state with R = 1 and n = 50, let us
suppose that R rises by 40 percent. Table 1 shows the results. In the Dixit
14
case, n rises to 64, that is, the importation share increases from the normal
level of 25 percent to 30.3 percent. With decreasing sunk cost, n rises more
and so the import share. Nevertheless, it is quite a small effect of a very
large overvaluation. In the most sensitive case, K2 (n), n rises to 72 and
the import share increases to 33.1 percent and 32.1 percent for K1 (n) and
K3 (n), respectively.
Let us also examine the response of the system to changes in the
parameters around the central values after a 40 percent overvaluation. The
first line of the Table 1 summarizes the results for the central case stated
above. In the first variation, k doubles from 2 to 4, while wn is offsetting to
keep the normal full cost at the median equal to 1. With regard to the central
case, the number of firms is reduced to 57 in the constant sunk case, that
is, seven firms exit. In the case of the decreasing sunk cost, the number of
exiting firms is also lower. Specifically, four firms exit with K1 (n), five firms
exit withK3 (n) and only three firms exit withK2 (n). In the second variation
(σ halved) a large variation occurs in the number of entering firms: 10 in
the case of constant sunk cost, 11 with K1 (n) and K3 (n) and 9 with K2 (n).
However, it is striking that the variations across different sunk cost functions
are not so remarkable. Nevertheless, when wage is constant (wn horizontal)
and the range price is halved, a large variation is found with respect to the
central case and between the constant sunk cost and decreasing sunk cost.
In all three cases, the variation in the entering firms with decreasing sunk
15
cost almost double the case of the constant sunk cost.
It is especially interesting to note the variation that produces changes in
µ. Notice that the import share is very sensitive to a variation of ±2%
in µ and more sensitive when µ = −0.02 and when the sunk costs are
higher. In the case of the constant sunk cost (the highest sunk cost), the
import share is reduced by 5.7 points, while the reduction is 5.1 with K3 (n)
(the second highest sunk cost), 4.8 with K1 (n) and 3.5 with K2 (n). When
µ = 0.02, the variation in the import share shows a 4.8 point increase with
k, 3.6 with K1 (n) and K3 (n) and 2.9 with K2 (n). Therefore, considering
an expected depreciation/appreciation rate of the same magnitude of the
exchange rate, we find that the import share is more sensitive to exchange
rate appreciations than to exchange rate depreciations. Moreover, under
exchange rate appreciations, the larger the sunk cost, the larger the reduction
in the import share. Under exchange rate depreciation, the larger the sunk
cost, the larger the increase in the import share. Therefore, the larger the
sunk cost, the larger the variation in import share due to exchange rate
movements. Incidentally, it can be observed that higher positive values of
µ reduce the differences across industry shares with a different sunk cost
structure. This result suggests that in countries whose exchange rate suffers
from exchange rate depreciation in the long term, the positive growth of the
exchange rate hides the positive effects of decreasing sunk costs. Notice in
Table 1 that with any sunk cost structure, with µ = 0.02 and the central
16
values of the parameters, the import share is about 35-36 percent. However,
in countries whose exchange rate suffers from exchange rate appreciation in
the long term, the negative growth of the exchange rate can be dampened
by the positive effects of decreasing sunk costs.
Table 2 merely deserves comments. It shows that the exchange rate to
start exiting and to restore n = 50 is higher with decreasing sunk costs.
Therefore, import penetration is more "easy-come-easy-go" with decreasing
sunk costs and even more so when these costs are lower.
4 Conclusion
In this article we have extended the Dixit model (QJE, 1989) to allow for a
decrease in the sunk cost of entering a foreign market by exporting as long
as the domestic firms establish in the target market. The numerical results
show that, as regards the Dixit case, decreasing sunk costs have a greater
impact on the option of activating than on the option of abandoning. For
any given exchange rate, the lower the sunk cost, the narrower the range of
number of firms in equilibrium in the industry. Moreover, hysteresis is lower
with decreasing sunk cost as expected. The contribution of the article to
this question is that unlike the Dixit case where hysteresis increases as long
as new firms enter the market, hysteresis decreases with number of firms in
industries where the marginal contribution to the reduction of the sunk cost
of the new adding firm is constant or increasing. However, in industries with
17
decreasing marginal contribution to the reduction of the sunk cost of the
new adding firm, mixed results are found. For the first entering firms, the
hysteresis decreases, while it increases for the rest of the firms. Given an
expected depreciation/appreciation rate of the same magnitude in absolute
value, import share is more sensitive under an appreciation environment.
Moreover, the larger the sunk cost, the larger the variation in import share
due to exchange rate movements. Finally, our results suggest that in countries
whose exchange rate suffers from exchange rate depreciation in the long term,
the positive growth of the exchange rate will hide the positive effects of
decreasing sunk costs. In contrast, in countries whose exchange rate suffers
from exchange rate appreciation in the long term, the negative growth of the
exchange rate can be dampened by the positive effects of decreasing sunk
costs.
18
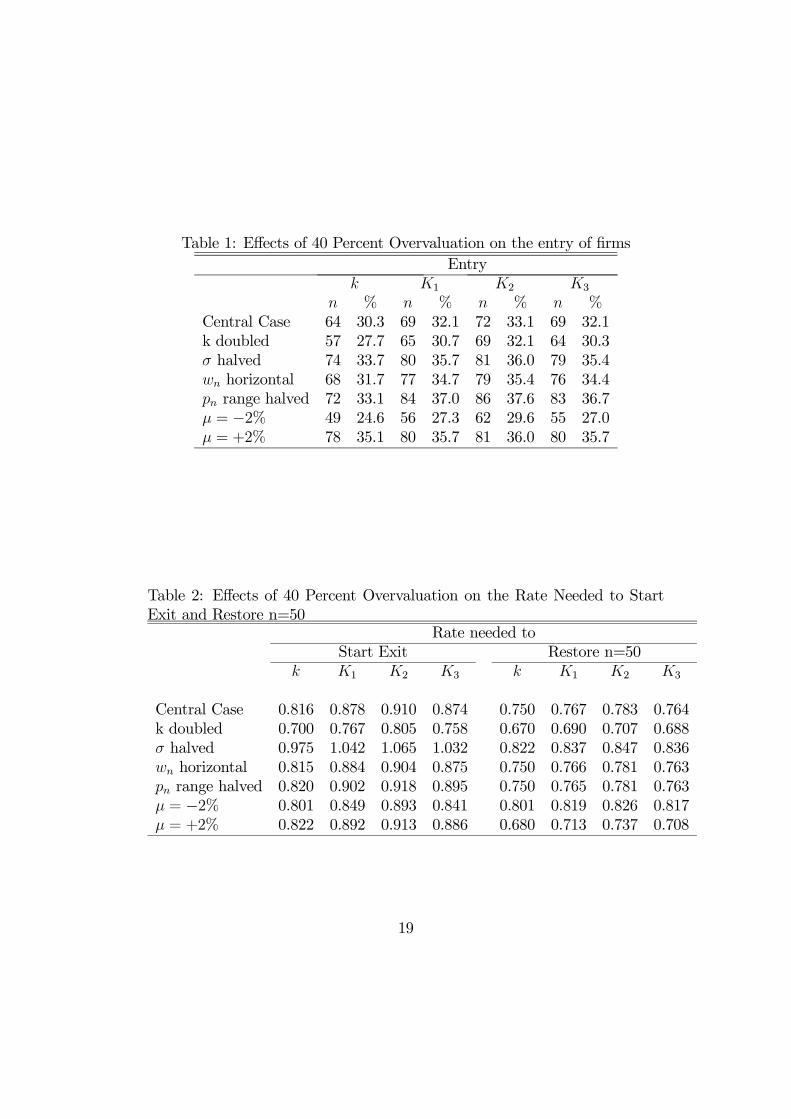
Table 1: Effects of 40 Percent Overvaluation on the entry of firmsEntry
k K1 K2 K3
n % n % n % n %Central Case 64 30.3 69 32.1 72 33.1 69 32.1k doubled 57 27.7 65 30.7 69 32.1 64 30.3σ halved 74 33.7 80 35.7 81 36.0 79 35.4wn horizontal 68 31.7 77 34.7 79 35.4 76 34.4pn range halved 72 33.1 84 37.0 86 37.6 83 36.7µ = −2% 49 24.6 56 27.3 62 29.6 55 27.0µ = +2% 78 35.1 80 35.7 81 36.0 80 35.7
Table 2: Effects of 40 Percent Overvaluation on the Rate Needed to StartExit and Restore n=50
Rate needed toStart Exit Restore n=50
k K1 K2 K3 k K1 K2 K3
Central Case 0.816 0.878 0.910 0.874 0.750 0.767 0.783 0.764k doubled 0.700 0.767 0.805 0.758 0.670 0.690 0.707 0.688σ halved 0.975 1.042 1.065 1.032 0.822 0.837 0.847 0.836wn horizontal 0.815 0.884 0.904 0.875 0.750 0.766 0.781 0.763pn range halved 0.820 0.902 0.918 0.895 0.750 0.765 0.781 0.763µ = −2% 0.801 0.849 0.893 0.841 0.801 0.819 0.826 0.817µ = +2% 0.822 0.892 0.913 0.886 0.680 0.713 0.737 0.708
19
References
[1] Aitken, B., Hanson, G. H. and Harrison, A. E. 1997. Spillovers, foreign
investment, and export behavior, Journal of International Economics
43(1-2), 103-132.
[2] Becchetti, L. and Rossi, S. 2000. The Positive Effect of Industrial
District on the Export Performance of Italian Firms, Review of Industrial
Organization 16(1), 53-68.
[3] Benkler, Y., 2006. The Wealth of Networks: How Social Production
Transforms Markets, New Haven: Yale University Press.
[4] Castillo, J. and F. Requena. 2007. Information Spillovers and the Choice
of Export Destination: A Multinomial Logit Analysis of Spanish Young
SMEs, Small Business Economics 28(1), 69-86.
[5] Desmet, K. and Fafchamps, M. 2005. Changes in the Spatial Concentra-
tion of Employment Across US Counties: A Sectoral Analysis 1972-2000,
Journal of Economic Geography 5(3), 261-84.
[6] Dixit, A. 1989. Hysteresis, Import Penetration, and Exchange Rate Pass-
Through. The Quarterly Journal of Economics 104 (2), 205-228.
[7] Head, K., Ries, J. and Swenson, D.,1995. Agglomeration Benefits and
Location Choice: Evidence from Manufacturing Investments, Journal of
International Economics 38 (3-4), 223-247.
20
[8] Koening, P. 2009. Agglomeration and the export decisions of French firms,
Journal of Urban Economics 66 (3), 186-195.
21