Embed Size (px)
Citation preview

POSTER PRESENTATIONS
COMMUNICATIONS POSTER
POSTER PRÄSENTATIONEN


IDENTIFICATION OF THREE EGYPTIAN SUGAR BEETGENOTYPES AND DETECTION OF DNA SIMILARITY
M.A. EL-MANHALY*, M.S.SALEH*, NABAWYA S.A. GHURA*,M.M.M.AHMED**, B.A.ALI**
* Sugar Crops Res. Inst., Agric. Res. Centre, Giza, Egypt** Nucleic Acid Res. Dept. genetic Engineering & Biotechnology Res. Inst. (GEBRI),
Mubarak City for Scientific Res. & Technology Applications, Alexandria, Egypt.
ABSTRACT
Three Egyptian sugar beet genotypes Eg.6, Eg.26, and Eg.27 raised throughbreeding program after the success of seed production in Egypt, were evaluatedconcerning the main two characteristics root yield and sugar yield. Theevaluation was executed through three years of experimental work 2000/2001,2001/2002, and 2002/2003 in El Noubaria, Egypt. The experiments included 20genotypes of sugar beet, 10 Egyptian genotypes and 10 imported varieties.
Data showed that those three Egyptian sugar beet genotypes presented higherroot yield and higher sugar yield than some imported commercial sugar beetvarieties cultivated in Egypt. In addition to that, high degree of similarity wasnoticed within each genotype in vegetative characteristics in Noubaria and ingenerative characteristics in the Northern Western Coast.
In 2002 – 2003, potential use of random amplified polymeric DNA (RAPD) andrestriction fragment length polymorphism (RFLP) for 18 Sr DNA gene wereapplied in this study to detect genetic similarity and polymorphisms between andwithin the three Egyptian sugar beet genotypes Eg.6,Eg. 26 and Eg. 27.
Nineteen primers a single, short aligonucleiotides (ten and twenty mer). Theresults showed that, the similarity within the three genotypes (Eg.6,Eg.26 andEg.27) were 96,6% , 96,8% and 98,6 respectively.
INTRODUCTION
Sugar beet is the second sugar crop in Egypt next to sugar cane. Sugar beetproduces about 25% of the Egyptian sugar and it is cultivated in about 140000feddan (about 60000 hectar).
It’s cultivation completely depends on seed importation from abroad, becausethe natural conditions of environment in Egypt are not suitable for flowering andseed production.
Proceedings of the 67th IIRB Congress, February 2004, Brussels (B) 169
GENETICS AND BREEDING – GÉNÉTIQUE ET SÉLECTION
GENETIK UND ZÜCHTUNG

Sugar beet is a biennial crop, produces roots and leaves in the first season andflowers and seeds in the second season.
To have flowering and seed setting, roots (mother beet and / or stockings)should be subjected to vernalization under 5-8oc and above 90% humidity forabout 5-6 months.
Since years, attempts have been done by using artificial vernalization by storingthe roots in cold rooms have those conditions of low temperature and highhumidity. High success in getting sugar beet flowering and seed setting hasbeen met by many Egyptian scientists (El Gharbawy, et al., 1977, Younan 1984,El Manhaly, et al., 1987 , El Talkhawy 1992, Ghura 1995, Saleh 1999 and ElSheikh 2003).
Successful of sugar beet flowering and seed setting under Egyptian conditionshas been reported by the American sugar beet breeder Larry Campbell in June1994 during his evaluation mission in Egypt. He reported that, sugar beetflowering is biologically possible in Egypt and plants from seeds are as good asthose from European seeds even better concerning bolting resistance.
Different breeding materials of sugar beet imported from abroad (mainly fromU.S.A.) were subjected for flowering and producing viable seeds by El Manhalyand his colleges in breeding and genetic research department, Sabahia Agric.Res. St., Alexandria, Sugar Crops Research institut, Agric. Res. Centre, Egypt.All materials obtained and used in breeding program were diploid (2n=18chromosome). The materials included diploid multigerm lines, diploidmonogram lines and CMS and their O-type lines. Open pollination crossing andbi-parental crossing programs were applied. During more than 14 years ofcontinuous work, more than thousand sugar beet genotypes have been raised.It has been planned to evaluate some of those obtained genotypes every yearin different planting dates in some of the commercial sugar beet areas, such asKafr El Sheikh, Noubaria and El Fayome in the Middle of Egypt.
Considerable variations have been found among the evaluated genotypes.Series of selection have been carried out mainly for root yield, sugar content andbolting resistance. After 6 generations of selection it could be raised 10 Egyptiangenotypes with root yield, sugar content and bolting resistance higher than someof the imported varieties El Manhaly, et al., (2000) evaluated thirty two Egyptiansugar beet genotypes and found many of them had good root weight and free ofbolting. El Sheikh (2003) evaluated some Egyptian sugar beet genotypescompared with imported varieties and found three of the Egyptian genotypesalmost free of bolting and surpassed the imported varieties in sugar content andpurity percentage.
The variation among sugar beet breeding material or varieties have beenreported by many authors (El Manhaly, et al., 1987 in Egypt, Doney, et al., 1988in U.S.A., Ghura, 1989 in Egypt, and Abo El Ghait 1993 in Egypt).
170 Proceedings of the 67th IIRB Congress, February 2004, Brussels (B)
POSTER PRESENTATIONS - COMMUNICATIONS POSTER - POSTER PRÄSENTATIONEN

Through selection to release highly recommended genotypes, very high degreeof similarity in the desired commercial traits within each genotype is highlydesired. On the other hand the detection of DNA similarity in theserecommended genotypes should be also highly considered.
DNA markers (RAPDs) and quantitative genetic techniques were used tocharacterize genetic heterogeneity within and among populations fromthroughout the natural range of the species, Bekessy et al; (2003).
Genetic diversity in a crop species is fundamental to its improvement. Geneticvariability is considered the reservoir that plant breeders fall upon in therecontinuous strive to develop improved varieties and hybrids. Interest in geneticdiversity within elite germblasm is one of the main goals persuade by manyscientists. Beside the morphological and biochemical markers, molecularmarkers such as RAPD, RFLP , AFLP and microsatalite amplification productsare extremely useful in determining genetic diversity, as well as evolutionary andtaxonomic relations. The DNA fingerprints as revealed by RAPD have beenfound to be useful in a number of approaches. For example, the determinationof intraspecific relationships between plants DNA Technology is a method formolecular identification and differentiation of different varieties. It has become animperative tool for genetic resources conservation, protection of intellectualproperty rights, and genetically improving economical important geneticresources.
In the last few years, genetic maps of a variety of plant species have beenconstructed including both isozymes and restriction fragment lengthpolymorphisms (RFLPs) (Graner, et al., 1991). While isozymes markers areavailable in limited number, RFLP markers reveal an almost unlimited number ofplymorphisms. (Botstein, et al., 1980). Nevertheless, the analysis of RFLPmarkers is time-consuming, laborious and the utilization of radioactive isotopescould not be replaced satisfactorily by non- radioactive labeling, preventing thespread of marker-assisted selection in applied plant breeding .
Molecular Markers, including RAPDs, are routinely used to evaluate geneticdiversity in germplasm collection (Karp, et al., 1998). RAPD technique was alsoused in genus beta for assessment of genetic relationship (Reamon – Buttner,et al., 1996, Shen et al., 1996, Shen et al., 1998). The recently developedtechniques, based on the polymerase chain reaction (PCR), offer a new tool forconstruction of linkage maps. The arbitrarily primed PCR (AP-PCR)(Welsh andMcCleland 1990) as well the random amplified polymorphic DNA (RAPD)technique ( Williams, et al., 1990) utilizes arbitrary primers for the amplificationof template DNA. The ((RAPD) technique utilizes decamer primer arbitrarysequence with GC content < 50%. As time consuming and expensive synthesisof special primers can be avoided. A set of commercially available primers canbe used for different species (Klein – Lankhorst, et al., 1991). The use ofarbitrary primers for evolution studies and linkage analysis has been foundeffective in several plant species (Carlson, et al., 1991 and Halward, et al.,1992). Taberner, et al., (1997) studied the genetic variability of sugar beet crop
Proceedings of the 67th IIRB Congress, February 2004, Brussels (B) 171
GENETICS AND BREEDING – GÉNÉTIQUE ET SÉLECTION
GENETIK UND ZÜCHTUNG

by RAPD analysis of 122 individuals using eight primers. The high resolutionprovided by random amplified polymorphic DNA (RAPDs), in combination withefficient genetic distance estimators, allowed a very detailed description of theecology and evolution of the populations.
The objective of this study was To Clarify The Similarity In The Field and toevaluate the genetic similarities within and between three genotypes of sugarbeet by the use of RAPD and RFLP for 18S r RNA Molecular markers.
MATERIALS AND METHODS
Twenty multigern sugar beet genotypes were used in this research work. Theyincluded ten imported from different seed companies in Europe and all of themare polyploid (anisoploid) and ten produced in Egypt and all of them are diploid.The ten Egyptian genotypes have been as a result of selection from 32 Egyptiangenotypes often their filed Evaluation in 1997/1998 and 1998/ 1999.
The imported genotypes (varieties cultivated commercially in Egypt) wereraspoly, oscarpoly , gloria , kawemira, top , H.poly 1, beta poly , pleno , demapoly and farida. The Egyptian genotypes were: C-11, Gifera N8, Gifera Ng, Eg.6,Eg23, Eg.26, Eg.27, El Kaser, and om ElRakham .
Seeds of the twenty genotypes were sown in 21st, 18th and 13th of October 2000,2001 and 2002 respectively and harvesting was done in 18th, 15th and 8th of may2001, 2002, 2003 respectively. The experiment in each year included four replicates and each of them hadtwenty plots, each of them 21m2(1/200 fed.). Complete randomized block designwas used in these experiments. The normal agriculture treatments of sugar beet in Egypt such as soilpreparation for sowing, irrigation, howling, fertilization, plant protection againstweeds , insects and disease were applied for this work.
At harvest in every year, sugar beet root yield, sugar content for each plot wasrecorded and sugar yield as a result of root yield x sugar percentage wasestimated. The results were converted to ton/fed. to facilitate the discussions.Data collected was subjected to statistical analysis including compining analysis.Analysis of variance was appled according to Steel and Torrte (1980) . Resultsobtained were tbulated.
After the harvesting of 2002 season, selection was done among the ten Egyptiangenotypes for roots with good shape and good weight . The selected roots werestored in cold room at 6c° and 90% humidity from may until the end of December2002 for vernalisation. Thereafter , the roots were outstored and re-planted inthe Northern Western Coast in ten isolated locations with more than 5km asdistance between each two of them , for flowering and seed production .
172 Proceedings of the 67th IIRB Congress, February 2004, Brussels (B)
POSTER PRESENTATIONS - COMMUNICATIONS POSTER - POSTER PRÄSENTATIONEN

The data collected for each genotypes in the generative season was date offlowering , percentage and duration and seed setting and ripening. To facilitatethe statistical analysis, the number of days from replanting the vernalized rootsto the stage of the flowering or seed setting or ripening were used in thiscalculation. Seeds were harvested in July 2003 and weight of seeds was recorded for eachgenotype and for each plant. During this season visual observations concerningsimilarity and homogeneity in each stage were recorded for each of the tengenotypes.
More attention has been given to three Egyptian genotypes Eg.6, Eg.26 andEg.27 as more premising ones in previous years and therefore statisticalanalysis for some characteristics in the generative season were concentratedfor those genotypes. Fifteen plants were randomly chosen for such studies .
In the vegetative season of 2002/2003. 35 plants from each of these threegenotypes were also randomly chosen for study root weight , root length , rootdiameter, T.s.s%, leaf number , leaf weight, leaf blade length and width and leafpetiol length for individual plants. That was to study the similarity within each ofthese genotypes for help in release them.
In addition to that, research work was carried out in the laboratory of the NucleicAcid Res. Dep. Genetic Engineering & Biotechnology Res. Inst., Mubarak city forscientific.Res. & Techn. Application, Alexandria, Egypt. The aim was to identifythe three Egyptian genotypes Eg.6, Eg.26 and Eg.27 and detection of DNAsimilarity. The following research work was applied:
1- EXTRACTION OF DNA
DNA was extracted from fresh materials (four individual plants and bulk of50plants from each family ) according to modified mini-prep CTAB method ofHarris (1995). About 0.5g leaf tissue beets was put into mortar in liquid nitrogenbefore ground to a fine powder using disposable plastic grinders. The powderwas than mixed to homogenous slurry with 100 ml- extraction buffer (100 mMTris – HC1 pH 8.0, 20 mM Na 2EDTA, 1.4 M Nacl, 2% W/v CTAB, 0.2% v/v 2-mercaptoethanol ) while continuing grinding Additional 900ml of the extractionbuffer was subsequently added before the tube was incubated at 65oC for 30min. The sample was then cooled to ambient temperature and washed byadding 200 ml of wet shloroform (Chloroform: octan - 1-01 = 24:1) The mixturewas gently mixed and centrifuged at 13000 rpm for 2 min. The aqueous layerwas removed and subjected to second washing process, by adding 500 ml ofwet chloroform. The DNA was precipitated from the aqueous layer by adding 600ml ice-cold propan – 2-o1 at room temperature for 10-15 min. After centrifugationat 13000 rpm for 2 min, the DNA pellet was washed with 1 of wash buffer (76%ethanol, 10 mM ammonium acetate) and stands at room temperature for 20 min,before subjected to another centrifugation. The supernatant was dissolved in100ml TE buffer (10mM Tris – HCL pH 7.6; 1 mM EDTA) and stored at a 4C°untilused .
Proceedings of the 67th IIRB Congress, February 2004, Brussels (B) 173
GENETICS AND BREEDING – GÉNÉTIQUE ET SÉLECTION
GENETIK UND ZÜCHTUNG

2- RAPD – PCR
The polymerase chain reaction mixture (25ml ) consisted of 0.064 U of Taq DNApolymerase (Fanzyme), 25 pmol dNTPs, and 25 pmol of primer, 2.5 ML. 10x TaqDNA polymerase buffer and 40 ng of genomic DNA. The final reaction mixturewas placed in a DNA thermal cycle (Perkin Elmer 9700 ). The PCR programmeincluded an initial denaturation step at 94°C for 2 mins followed by 45 cycles with94°C for 30 seconds for DNA denaturation, annealing as mentioned with eachprimer , extension at 72°C for 30 seconds and final extension at 72°C for 10minutes were carried out. The samples were cooled at 4°C. the amplified DNAfragments were separated on 2.5% agarose gel and stained with ethidiumbromide. X 174 DNA marker (pb 1353, 1078, 872, …., 72) Used in this study.The amplified pattern was visualized on a UV transilluminator and photographed.
Random Amplified Polymorphic DNA(RAPD) was carried out using the followingrandom primers.
Table (1): The sequences of the primers used and their annealing temperature.
Primer Sequence 5`- 3` Annealing Tm/Sec
1 CAG GCC CTT CCA GCA CCC AC 60/302 GAA ACC GGT GGT GAT GGC AG3 GGA CTG GAG TGT GAT CGC AG 63/304 GGA CTG GAG TGG TGA CGC AG 60/305 GGT GAC GGG GTA ACG CC 55/306 AGG CCC CTG T 32/307 ATG CCC CTG T8 AAA GCT GCG G9 ACC GCC GAAG10 AGC CAG CGA A 45/3011 ATG ACG TTG A12 CTG AGG AGT G13 GGG CTA GGG T14 GGC ACT GAG G15 CGC TGT CGC C16 AGT CCT CGC C17 TGG TGG ACC A18 ACC GGG AAC G19 AGC AGGTGG A
174 Proceedings of the 67th IIRB Congress, February 2004, Brussels (B)
POSTER PRESENTATIONS - COMMUNICATIONS POSTER - POSTER PRÄSENTATIONEN

3- AMPLIFICATION OF 18S R RNA GENE
Amplification of 18S rRNA gene (Kuske et. al. 1998) was carried out using towspecific primers the sequences of the primers were .
Table (2): The sequences of the primers (18S rDNA gene) used and theirannealing temperatures.
Primer Sequence 5`- 3` Annealing Tm/Sec
Forward GCA AGT CTG GTG CCA GCC 55°c /1 min Reverse CTT CCG TCA ATT CCT TTA AG
The polymerase chain reaction mixture (25ml) consisted of 0.64 U of Taq DNApolymerase (Fanzyme). 25 pmol dNTPs and 25 pmol of random primer, 2.5ML.10x Taq DNA polymerase buffer and 40 ng of genomic DNA. The final reactionmixture was placed in a DNA thermal cycle (Perkin Elmer 9700). The PCRprogramme included an initial denaturation step at 94°C for 2 min followed by 30cycles with 94°C for 1 min for DNA denaturation , 55°c for 1 min annealing,extension at 72°C for 1 min and final extension at 72°C for 10 minutes werecarried out. The samples were cooled at 4°C. the amplified DNA fragments wereseparated on 2.0% agarose gel and stained with ethidium bromide. Theamplified pattern was visualized on a UV transilluminator and photographed.
4-RFLP FOR 18S RRNA GENE
PCR Products resulted from 18S rRNA gene amplification were digested withvarious restriction endonucleases of 10U enzyme/mg of DNA products,incubator 18 hour. The DNA fragments were separated on 2.5% agrose gel andstained with ethiduim bromide ø x 174 DNA marker (pb 1353, 1078, 872,72)used in this study. The Fragments pattern was visualized on a UVtransilluminator and photographed.
RESULTS AND DISCUSSIONS
A- FIELD EXPERIMENTS
Table (3) Presents the analysis of variance of root yield and sugar yield of 20sugar beet genotypes in three years of experimental work. The 20 genotypesincluded 10 imported varieties and 10 genotypes produced locally in Egypt.
High significant differences in root yield and sugar yield were obtained betweenthe twenty genotypes, between the ten Egyptian genotypes and between theimported varieties. High significant differences in root yield were obtainedbetween the imported and the Egyptian genotypes, while the sugar yield differedsignificantly. The interaction between genotypes and years had high significanteffect on root yield and sugars yield.
Proceedings of the 67th IIRB Congress, February 2004, Brussels (B) 175
GENETICS AND BREEDING – GÉNÉTIQUE ET SÉLECTION
GENETIK UND ZÜCHTUNG

Similar results were obtained by Hanna, et al., (1988) in Egypt, Ghura (1989) inEgypt, Abd Aal and Dawwam (1991) in Egypt, Abo El Ghait (1993) in Egypt andGhandorah and Refay (1994), in Saudi Arabia.
Table (4) Presents the means of root yield (t /fed ) and gross sugar yield ( t/fed)for tenty sugar beet genotypes of three years in Nubaria, Egypt. Some of the tenEgyptian genotypes had better root yield and sugar yield than some of theimported varieties. The Egyptian genotype Eg.27 yielded the highest root yield30.61 t/fed. And sugar yield 5.02 t/fed. The second genotype was the importedvariety which yielded roots of 29.38 t/fed. And sugar 4.66 t/fed.
The imported variety Oscarpoly gave 28.60 tons of root / fed. And 4.49 tons ofsugar / fed. The two Egyptian genotypes Eg.6 and Eg.26 gave root yield of 28.62t/fed. And 28.5 t/fed. And sugar yield of 5.1 t/fed. And 4.76 t/fed. Respectively.There is no significant differences between them and the highest commercialvariety Oscar paly.
Table (3): Analysis of variance for genotypes x year interactions for of rootyield and gross sugar yield in sugar beet.
Mean of squares
Source of variation D.f. Root yield Gross sugar yield
Replicates over year 11 3.39 1.55Genotypes 19 90.499** 5.22**Eg. Genotypes 9 113.73** 4.77**Imported varietes 9 58.96** 2.22**Eg. genotypes V.S., 1 165.19** 3.22*Imported var.Years 2 18.97 N.s. 0.49 N.s.Genotypes x years 38 44.41** 1.80**Polled Error 171 9.27 0.728
Df : Degrees of freedom. * : Significant at 0.05 level of probability. ** : Significant at 0.01 level of probability. N.s : Not significant.
176 Proceedings of the 67th IIRB Congress, February 2004, Brussels (B)
POSTER PRESENTATIONS - COMMUNICATIONS POSTER - POSTER PRÄSENTATIONEN

Table (4 ) Means of root yield (t/fed) and gross sugar yield (t/fad) for twenty sugar beetgenotypes for three years at.
Genotypes Root yield (ton/fed) Gross sugar (ton/fed)
1 C – 11 25.80 4.042 Gifera N8 24.94 3.943 Gifera N9 23.96 3.684 Eg. 6 28.62 5.105 Eg. 7 23.81 3.796 Eg 23 21.69 3.467 Eg 26 28.5 4.768 Eg 27 30.61 5.029 El-KASR 21.48 3.4710 Om-El-Rakham 23.35 3.7111 Ras poly 25.90 4.2412 Oscar poly 28.60 4.4913 Gloria 25.63 4.4114 Kawemina 26.22 4.3515 Top 27.44 4.4616 H. poly 28.17 4.5617 Beta poly 21.34 3.1718 Pleno 29.38 4.6619 Dema poly 26.57 4.2620 Farida 26.30 4.64
L.S.D. at 5% level 4.22 1.18
To similar results each of El Manhaly, et al., (1987), El Manhaly, et al., (2000 )and El Sheikh (2003).
It could be concluded that some of the Egyptian sugar beet genotypes,especially the three ones Eg.6, Eg. 26 and Eg.27 cauld be considered as highlypromising genotype, could be gradually used in commercial sugar beetcultivation in Egypt.
Table (5) presents the analysis of variance of nine important characteristics inthe vegetative season 2002/2003 for the three Egyptian sugar beet genotypesEg.6, Eg.26 and Eg.27.
Significant differences were only obtained in leaf weight within the plants of Eg.6and in root length within the plants of Eg.26. no any other significant differencewas obtained for any other trait within the plants of any of the three genotypes.This means that, very high degree of similarity for almost all the vegetativecharacteristics within each of the genotypes Eg.6, Eg,26 and Eg.27.
Table (6) presents the analysis of variance of flowering stages and some seedcharacteristics of the plants within each of the three genotypes Eg.6, Eg.26 andEg.27 in the generative season 2003 in the Northern western coast, Egypt.
Proceedings of the 67th IIRB Congress, February 2004, Brussels (B) 177
GENETICS AND BREEDING – GÉNÉTIQUE ET SÉLECTION
GENETIK UND ZÜCHTUNG

In the plants of the Eg.6 one case of significant difference appeared in the dateof initiation stage. In the Eg.26 two cases of significant differences occurred inthe dates of initiation and in the duration of flowering. In the Eg.27 two cases ofsignificant differences were obtained in rosette stage and in flowering stage.With the exception of these cases of significant differences, no other significantdifference was noticed for any of the other traits within any of the threegenotypes.
Table ( 5 ): Analysis of variance for nine important vegetative characteristics forindividual plants of three Egyptian genotypes in 2002/2003 seas.
178 Proceedings of the 67th IIRB Congress, February 2004, Brussels (B)
POSTER PRESENTATIONS - COMMUNICATIONS POSTER - POSTER PRÄSENTATIONEN
Mean of squares for Eg 6Source
ofvariation
Df Rootweight
Rootlength
Rootdiameter
T.S.S%
LeafNumber
Leafweight
Leaf Bladelength
LeafBladewidth
Leafpetiollength
Blocks 2 95.9 32.9 22.9 2.3 16.5 34..6 12.0 5.6 30.9
Plant 34 339.9 41.4 12.1 2.8 45.4 13..4 * 9.6 6.8 15.9
Error 68 398.9 63.8 11.1 2.1 37.8 50.8 9.5 7.6 18.2
Mean of squares for Eg 26Blocks 2 133.9 61.5 23.5 2.3 22.9 87.5 13.79 2.8 20.5
Plant 34 399.6 150.5* 10.4 2.9 63.8 14.5 6.8 4.1 19.0
Error 68 732.2 58.1 16.8 2.8 78.8 11.6 15.9 5.3 16.3
Mean of squares for Eg 27Blocks 2 274.0 56.0 72.7 2.3 87.1 18.5 6.9 2.1 16.7
Plant 34 765.6 65.0 85.5 3.3 60.3 61.0 11.1 2.8 16.6
Error 68 877.4 97.0 94.0 2.8 51.8 76.0 15.6 4.1 15.0
Df : degrees of freedom. * : significant at 0.05 level of probability.
Table (6 ): Analysis of variance of flowering stages and some seed characteristics ofplants of three Egyptian genotypes in the season of Jan.- July 2003
Mean of squares for (Eg 6)Source ofvariation
Df Rosette Initiation Flowing During of
floweringSeed
setting
Ripening Seed
harvestingWeight ofseed plant
100 seedweight
Blocks 2 41.83 42.89 260.62 30.33 158.33 11.76 63.43 7.1 01.51
Plant 14 98.8 59.88* 123.56 8.42 19.86 3.60 4.83 67.22 2.71
Error 28 74.21 21.34 149.0 13.0 14.33 10.15 5.1 108.94 3.26
Mean of squares for Eg 26Blocks 2 25.33 78.62 201.19 86.0 32.1 128.69 9.19 22.46 3.17
Plant 14 24.16 83.22* 62.27 20.32* 68.1 29.11 3.21 26.55 1.66
Error 28 36.61 48.51 61.41 11.41 99.38 46.23 6.14 47.97 1.29
Mean of squares for Eg 27Blocks 2 7.83 14.91 9.19 5.91 29.91 31.86 6.86 61.52 1.45
Plant 14 8.38* 4.6 9.71* 13.64 26.1 14.97 8.41 106.38 1.18
Error 28 5.17 4.96 4.96 16.4 22.31 20.94 6.72 69.92 1.65
Df : degrees of freedom. * : significant at 0.05 level of probability.
From the results presented in both tables 5 and 6, it could be clarified that withineach of the three Egyptian genotypes Eg.6, Eg.26 and Eg.27, the sugar beetplants are genetically homogenous. It could be concluded that each of thesegenotypes would be stable among years of cultivation and would be highlypromised for commercial cultivation .

B- BIOTECHNOLOGY LAB. EXPERIMENTS
RAPD assays were performed using random primers. Amplification of genomicDNA using the twenty primers yielded. Banding patterns for representatives ofthe various groups and individuals are for band. Amplified successfully on thegenomic DNA from samples of three genotypes sugar beets (Fig. 1.2.3 and 4)and Table (7 and 8)showed the genetic similarity estimated as band sharing (BS)for each primer within and between three genotypes (6.26 and 27). Thecomparison within three genotypes beets the bands sharing average valueswere (96.6. 96.8 and 98.6% respectively ). But between three families the bandsharing values were (93.0, 90.0 and 87.7) respectively. The results showed thehigh genetic similarity within all genotypes than between genotypes. Restrictionfragment length polymorphism (RFLP) for 18S rDNA gene was showed nodetect genetic variation between and within the three genotypes (Fig. 5). These high numeric similarities suggest a common lineage, although this couldnot be confirmed from the available passport data. These data indicate that highgenetic similarity or very little genetic variation exists within these genotypes.The within genotypes accessions had a high genetic similarity averaging rangewere (96.6 to 98.6) in (Table 7). While between genotypes accessions had a lowgenetic similarity or high genetic variation averaging range were (87.7 to 93.8)in (Table 8). Overestimation of genetic similarity using RAPD markers cannot bediscounted. However, in this study great care was taken to standardize reactionconditions, score only bands reproducible over the duplicate extractions, andreplicate amplifications within extractions.
Table (7): The similarity percentage within genotypes using different random
GenotypesPrimers Eg.6 Eg.26 Eg.27
1 100.0 - 100.02 66.7 100 71.43 62.5 83.3 71.44 - - -5 100.0 - -6 100.0 - 100.07 100.0 - 100.08 100.0 - -9 100.0 - -10 - - -11 100.0 100.0 100.012 100.0 100.0 100.013 100.0 100.0 100.014 100.0 100.0 100.015 100.0 100.0 100.016 100.0 100.0 100.017 100.0 100.0 100.018 100.0 100.0 100.019 100.0 100.0 100.020 100.0 100.0 100.0
Proceedings of the 67th IIRB Congress, February 2004, Brussels (B) 179
GENETICS AND BREEDING – GÉNÉTIQUE ET SÉLECTION
GENETIK UND ZÜCHTUNG

Table (8): The similarity percentage between genotypes using different andom primers.
GenotypesPrimers Eg. 6 x Eg. 27 Eg. 6 x Eg. 26 Eg. 27 x Eg. 26
1 100.0 100.0 100.02 80.0 85.7 66.73 100.0 00.0 00.04 28.6 57.1 40.05 72.7 81.8 60.06 100.0 100.0 100.07 100.0 100.0 100.08 100.0 100.0 100.09 100.0 100.0 100.010 - - -11 100.0 100.0 100.012 100.0 100.0 100.013 100.0 100.0 100.014 100.0 100.0 100.015 100.0 100.0 100.016 100.0 100.0 100.017 100.0 100.0 100.018 100.0 100.0 100.019 100.0 100.0 100.020 100.0 100.0 100.0
Therefore , to increase the range of genetic variation the RAPD analysisreported here confirms observations made using traditional phenotypicevaluation. It also demonstrates the usefulness of molecular data in the withinand between three genotypes of sugar beets. The identification of cultivars orbreeding lines is very important in all horticultural and agricultural species inorder to protect the rights of plant breeders. In sugar beet , cultivars areidentified in flowering trials and breeders, rights are presented by cultivarcharacteristics including flower, leaf and growth morphology (Uphoff and Wricke1992 and Bekessy, et. al., 2003)
The basis of PCR fingerprinting is the amplification of polymorphic DNA throughthe specific selection of primer annealing sites. Either , constant primer sitesbridge a single variable distribution in the DNA. Differences in the distancebetween primer-binding sites of existence of these sites leads to synthesis ofamplified DNA fragment. RAPD short arbitrary sequences of nucleotides can beused to amplify random fragments of DNA. This technique produces a largenumber of fragments, many of which are individual – specific, (Williams, et al.,1990; Williams, et al., 1993 and Bekessy, et al., 2003).
If inheritance is verified, RAPD patterns can be also applied for populationgenetics done by Williams, et al., 1990 and Williams, et al., 1993. However, thereis a possibility of dominance of RAPD markers that may hide genetic variationand smaller fragments that usually not visualized. They can be ill suited for the
180 Proceedings of the 67th IIRB Congress, February 2004, Brussels (B)
POSTER PRESENTATIONS - COMMUNICATIONS POSTER - POSTER PRÄSENTATIONEN

characterization of breeding systems or the calculation of genetic parameters, orphylogenetic inferences, (Shen, et al., 1998 and Cutsem et al., 2003).
CONCLUSION
In conclusion it may emphasized that most as the RAPD primers amplifiedsuccessfully genomic DNA of the Genotypes under study of beets. The resultsshowed the high genetic similarity within all genotypes than between genotypes.Restriction fragment length pholymorphism (RELP) for 18S rDNA gene wasshowed no detect genetic variation between and within the three genotypes.This similarity in DNA fingerprint provides a rapid and effective method ofdetecting the genetic variation of different genotypes which DNA fingerprintinghas potential maker – assisted selection during beet breeding programs. Thistechnique can also identify DNA markers linked to quantitative trait loci (QTL).
Proceedings of the 67th IIRB Congress, February 2004, Brussels (B) 181
GENETICS AND BREEDING – GÉNÉTIQUE ET SÉLECTION
GENETIK UND ZÜCHTUNG

182 Proceedings of the 67th IIRB Congress, February 2004, Brussels (B)
POSTER PRESENTATIONS - COMMUNICATIONS POSTER - POSTER PRÄSENTATIONEN
M 1 2 3 4 5 M 1 2 3 4 5
Primer (2 ) Primer (18)
872
234
603
281
Figure (2): RAPD amplification products generated from five-sample within genotype26 by random: The six lanes of each primer are: M is DNA marker - Lane 1 is Sample 1, Lane 2 is Sample 2, lane 3is Sample 3, Lane 4 is Sample 4 and Lane 5 is Sample 5 Bulk.
M 1 2 3 4 5
Primer (3 )
M 1 2 3 4 5 M 1 2 3 4 5
Primer (6 ) Primer ( 7 )
603
281
603
281
310
603
Figure (1) : RAPD amplification products generated from five-sample within genotype 6by random: The six lanes of each primer are: M is DNA marker - Lane 1 is Sample 1, Lane 2 is Sample 2, lane 3 is Sample3, Lane 4 is Sample 4 and Lane 5 is Sample 5 Bulk.

Proceedings of the 67th IIRB Congress, February 2004, Brussels (B) 183
GENETICS AND BREEDING – GÉNÉTIQUE ET SÉLECTION
GENETIK UND ZÜCHTUNG
M 1 2 3 4 5 M 1 2 3 4 5
Primer (2) Primer (3)
603
234
603
271
Figure (3): RAPD amplification products generated from five-sample within genotypeEg 27 by random: The six lanes of each primer are: M is DNA marker - Lane 1 is Sample 1, Lane 2 is Sample 2, lane 3 is Sample3, Lane 4 is Sample 4 and Lane 5 is Sample 5 Bulk.
M 1 2 3 1 2 3 1 2 3 M 1 2 3 4 5 6
Primers (6, 7 and 14) Primers (8 and 9)
M12 3 1 2 3 1
Primers (1,2,5,3 and 4)
603
281
1353
281
1078
194
1078
281
Figure (4): RAPD amplification products generated of three samples bulk betweengenotypes Eg 6, 26 and 27 by random: The six lanes of each primer are: M is DNA marker - Lane 1 is Eg 6, Lane 2 is Eg 26 and lane 3 is Eg 27,
184 Proceedings of the 67th IIRB Congress, February 2004, Brussels (B)
POSTER PRESENTATIONS - COMMUNICATIONS POSTER - POSTER PRÄSENTATIONEN
18S r DNA gene
M 6 26 27 6 26 27 M M 6 26 27 M
Bam HI Hinf I Hind III
M 6 26 27
MboII
603 bp
603
271
603
310
118
Figure (5): A. PCR amplification products generated by 18S r DNA gene primers. B. RFLPpatterns of 18S r DNA gene digested with restriction enzymes Bam HI, Hinf IHind III and MboII. Lane M: DNA marker, Lane 6: genotype 6, Lane 26:genotype 6, Lane 27 genotype 27.

REFERENCES
1- Abd El–Aal ,S.M and H.A. Dawwam (1991).Evaluation of some importedsugar beet varieties in Minufiya. Governorate, J.Agric Res.16(1): 137- 149.
2- Abo El – Ghait, R. (1993). Evaluation of some sugar beet varieties underdifferent environmental conditions M.Sc., thesis. Fac. Of Agric. El – MinufiyaUniv., Egypt. Crop Sci., 28(2): 247-250.
3- Bekessy S.A., Richaed A. Ennosb, Mark A. Burgmana, Adrian C. Newtonc,peter K. Adesd (2003) Neutral DNA markers fail to detect genetic divergencein an ecologically important trait. Biological conservation 110: 267-275.
4- Botstein, D., Whte, R.L., Skolnick, M.H. and Davis, R.W. (1980) Constructionof a genetic linkage map in man using restriction fragment lengthpolymorphisms. Am. J. Hum. Gent. 32: 314-331.
5- Carlison JE, Tulsieram LK, Glaubitz JC, Luk VWK, Kauffeldt C and RutledgeR (1991). Segregating of random amplified DNA markers in F1 progeny ofconifers. Theor. Appl. Genet. 83, 194-200.
6- Cutsem V.P., Jardin D> P., Boutte, C. and Beauwens (2003) Distinctionbetween cultivated and wild chicory gene pools using AFLP markers Theor.Appl. Genet. 107:713-718.
7- Doney, D.L.; R.E. Wyse and J.C. Theurer (1988). Selection for sucrose yieldin stressed sugar beet seedlings.
8- El-Gharabawy, A.A. and S.E. EL-Kalla (1977). Evaluation of sugar beet seedproduction in Egypt. Agric. Res. Rev. Cairo, 55: 71-76.
9- El – Manhaly, M.A.; N.Z Younan and M.A. Farage (1997). Sugar beetflowering and seed production in Egypt. Com. In Sci. Dev. Res., 19:45-61.
10- El – Manhaly.M.A, Nabawya S. A.Ghura and M.S.Saleh (2000). Selection forbolting resistance in some beet genotypes in Egypt., Alex. Sci: Exch., vol.2/no 4.pp. 333-346.
11- El-Sheikh, s.R(2003): Studies on sugar beet breeding under Egyptianconditions, Ph.D Thesis , Fac of Agric. Univ. of El Azhar, Cairo, Egypt.
12- El Talkhawy, N.M. (1992): studies on the flowering in some sugar beetvarieties . Ph.D. Thesis , Alexandria Univ.
13- Ghura, Nabawya S. A. (1989). Studies on sugar beet M.Sc., Thesis. Fac.Agric., Alex. Univ., Egypt.
14- Ghura, Nabawya S. A. N. Saleh (1995); studies on sugar beet Ph. D. thesis,Alexandria Univ.
15- Graner, A., Jahoon , A., Schondelmaier, J., Siedler, H., Pillen , K., Fischbeck,G., Wenzel , G. and Herrman, R.G.(1991). Construction of an RFLP map ofBarley. Theor. Appl . Genet. 83.: 250-256.
Proceedings of the 67th IIRB Congress, February 2004, Brussels (B) 185
GENETICS AND BREEDING – GÉNÉTIQUE ET SÉLECTION
GENETIK UND ZÜCHTUNG

16- Halward T, Stalker T, Larue E, and Kochert G (1992). Use of single – primerDNA amplifications in genetic studies of peanut (Aracbis bypogaea L.) PlantMol. Biol. 18.315-325.
17- Hanna, A.s.; A.T. El-Kassaby; A.N. Attie and M.A. Badawi (1988). Studies onthe interrelationships among planting dates, hill spacing, varieties andnitrogen fertilization in sugar beet (Beta vulgaris, L.). Jour. Agric. Sci.,Mansoura Uni., 13 (2): 598-605.
18- Karp, A., Isaac, P.G and Ingram , D.S. (1998) Molecular tools for screeningbiodiversity, Chapman & Hall , London.
19- Klein–Lankhorst RM,VermuntA, Weide R, Liharska T and Zabel P(1991).Isolation of molecular markers for tomato(L.esculentum)usingrandom amplified polymorphic DNA(RAPD).Theor. Appl. Genet. 81.661-667.
20- Reamon – Buttner, S.M., Wricke, G. and Frese, L. (1996). Interspecificrelationship and genetic diversity in wild beets in section Corllinae genusBata: Isozyme and RAPD analses. Genet. Resour. Crop. Evol., 43:261-274.
21- Shen, Y., Newbury, H.J. and Ford-Lioyd, B.V. (1996). The taxonomiccharactcrisation of annual Beta germplasm in a genetic resources collectionusing molecular makers. Euphytica, 91: 205 – 212.
22- Shen , Y., Ford-Lloyd, B.V. and Newbury, H.J(1998) “Genetic relationshipswithin the genus Beta determinded using both PCR- based marker and DNAsequencing techniques’ , Heredity, Vol. 80 , Pt. 5, pp. 624-32.
23- Steel, R. G. D., and Torrie, J. H. (1980). Principals and procedures ofstatistics. 2nd. Ed McGraw Hill Book Co., New York, USA.
24- Taberner A, Dopazo J and Castnera P (1997). Genetic characterization ofpopulations of a de novo arisen sugar beet pest , Aubeonymusmariaefranciscae (Coleoptera, Cureulionidae), by RAPD analysis. J Mol .Evol 45(1): 24-31.
25- Uphoff, H. and Wricke, G (1992) Random amplified polymorphic DNA(RAPD) markers in sugar beet (Beta vulgaris L.): mapping the genes fornematode resistance and hypocotyls colour. Plant Breeding 109, 168-171.
26- Welsh, J . & McCleeland, M. (1990): fingerprinting genome – using PCR witharbitrary primers. Nucleic Acid Research 18: 7213-7218.
27- Williams, J.G.K., Kublik, A.R., Livak, K.J., Rafalski, J.A. and Tingey ,S.V(1990). “DNA polymorphism amplified by arbitrary primers are useful asgenetic markers”. Nucleic Acid Research, Vol. 18, pp.6531-6535.
28- Williams, J.G.K., Hanafey, MK, Rafalski JA and Tingey SV(1993): Geneticanalysis using random amplified polymorphic DNA markers MethodsEnzymol., 218:704-740.
29- Younan, N. zaki , (1984): Genetical studies on sugar beet,Ph.D.thesis , facof Agric. Univ. of Alexandria, Egypt .
186 Proceedings of the 67th IIRB Congress, February 2004, Brussels (B)
POSTER PRESENTATIONS - COMMUNICATIONS POSTER - POSTER PRÄSENTATIONEN

SUGARBEET CULTIVAR AND BIOLOGICAL CONTROL
D. GROGAN1, L. MARK2, P. SWEENEY2, P. HIGGINS2, J. MORRISSEY2
AND F.O’GARA2
1 Seed Dept., Irish Sugar Ltd., Mallow, Co. Cork.2 Biomerit Research Centre, Microbiology Dept., University College, Cork.
ABSTRACT
An investigation of Irish ‘suppressive’ soils has resulted in the selection of thegram-negative bacteria; Pseudomonas fluorescens strain F113, which wasshown to control the common soil phytopathogen Pythium ultimum. Thecolonisation ability of F113 on inoculated seed, and the impact of F113 onresident soil microbial populations has been established. Field trials have shownthat seed inoculated with F113 (utilising a modified pellet) has had plantpopulations and white sugar yields comparable to fungicide treated seed over anumber of years. It is known that plants select for different microbialcommunities in the rhizosphere soil, probably mediated by signal moleculesexuded from the roots. As part of an EU Fifth Framework project, known as‘ECO-SAFE’, it was decided to investigate whether sugarbeet cultivar had anyinfluence on the activity of F113 as a biological control agent. Preliminary resultshave indicated that cultivar does condition resident microbial communities, withdifferent cultivars selecting for genotypically and phenotypically distinctpseudomonad populations. Further analysis has indicated differences in theorganic fraction composition of root exudates from these cultivars. One cultivardemonstrated a distinctive response to inoculation with F113. This apparentcultivar/inoculant interaction has implications for the potential use as seedinoculants of biological control agents and other microbial plant growthpromoting agents.
ABRÉGÉ
Une étude des sols "répressifs" irlandais a donné lieu à la sélection de labactérie de grain négative: Pseudomonas fluorescens souche F113, dont il a étédémontré qu'elle contrôle le phytopathogène Pythium ultimum commun du sol.La capacité de colonisation de la F113 sur les semences inoculées, et l'impactde la F113 sur les peuplements microbiens de sol résidents a été déterminée.Des essais sur le terrain ont indiqué que les semences inoculées avec la F113(à l'aide d'un granulé modifié) ont eu des peuplements et des récoltes debetterave sucrière blanche comparables à des semences traitées avec unfongicide pendant un certain nombre d'années. On sait que les plantessélectionnent différentes communautés microbiennes dans la rhizosphère, sousl'influence probable de molécules signal s'exsudant des racines. Dans le cadre
Proceedings of the 67th IIRB Congress, February 2004, Brussels (B) 187
GENETICS AND BREEDING – GÉNÉTIQUE ET SÉLECTION
GENETIK UND ZÜCHTUNG

d'un cinquième projet cadre de l'UE, qui porte le nom de ECO-SAFE, il a étédécidé d'étudier si le cultivar de la betterave sucrière avait une influence surl'activité de la F113 en tant qu'agent de contrôle biologique. Des résultatspréliminaires ont indiqué que le cultivar conditionne en effet les communautésmicrobiennes résidentes, avec différents cultivars sélectionnant des populationspseudomonad génotypiquement et phénotypiquement distinctes. Des analysesplus approfondies ont indiqué des différences dans la composition fractionnaireorganique des exsudations des racines de ces cultivars. Un cultivar a démontréune réponse caractéristique à l'inoculation à la F113. Cette interactioncultivar/inoculum apparente a des implications pour l'utilisation potentielled'agents de contrôle biologiques et d'autres agents microbiens favorisant lacroissance des plantes comme inoculants de semence
KURZFASSUNG
Eine Untersuchung irischer “suppressiver” Böden ergab die Selektion von gramnegativen Bakterien Pseudomonas flourescens, Stamm F113, die das gemeinePhytopathogen Pythium ultimum einschränken können. DieBesiedlungsfähigkeit von mit F113 geimpftem Saatgut und der Einfluss von F113auf mikrobielle Bodenpopulationen wurde nachgewiesen. Feldversuche übereine Reihe von Jahren hinweg zeigen, dass mit F113 geimpftes Saatgut mitfungizidbehandeltem Saatgut vergleichbare Bestandsdichten undWeisszuckererträge bringt. Es ist bekannt, dass Pflanzen spezifische mikrobielleGemeinschaften in der Rhizosphäre selektieren, was wahrscheinlich durchSignalmoleküle in den Wurzelausscheidungen vermittelt wird. Als Teil eines EURahmenprojekts, bekannt als “ECO-SAFE”, wurde entschieden den Einfluss derZuckerrübensorte auf die Tätigkeit von F113 als biologischesBekampfungsmittel zu untersuchen. Vorläufige Ergebnisse deuten darauf hin,dass die Sorte die ansässigen mikrobielle Gemeinschaft bestimmt, wobeiunterschiedliche Sorten auf genotypisch und phänotypisch bestimmtePseudomonasstämme hin selektieren. Weitere Analysen deuten aufUnterschiede in der organischen Zusammensetzung derWurzelausscheidungen verschiedener Sorten hin. Eine Sorte reagierte ganzcharacteristisch auf die Impfung mit F113. Die Beziehung zwischen Sorte undImpfstoff hat Auswirkungen auf die mögliche Nutzung von Saatgutimpfstoffen alsBiologische Bekämpfungsmittel und als mikrobielle Pflanzenwachstumsförderer.
INTRODUCTION
Environmental concerns over the use of agri-chemicals have stimulated interestin the use of biological control agents (BCAs) for more sustainable plant diseasecontrol. Soil-borne, non-pathogenic bacteria with the ability to antagonise fungalphytopathogens may be a realistic alternative to chemical fungicides currentlyused on sugarbeet seed. The rare, but well-known, phenomenon of‘suppressive’ soil is a soil in which phytopathogenic fungi are unable to persist,or are present but fail to induce severe symptoms on susceptible crops (WALSH,U.F., et al., 2001). An investigation of Irish ‘suppressive’ soils has resulted in the
188 Proceedings of the 67th IIRB Congress, February 2004, Brussels (B)
POSTER PRESENTATIONS - COMMUNICATIONS POSTER - POSTER PRÄSENTATIONEN
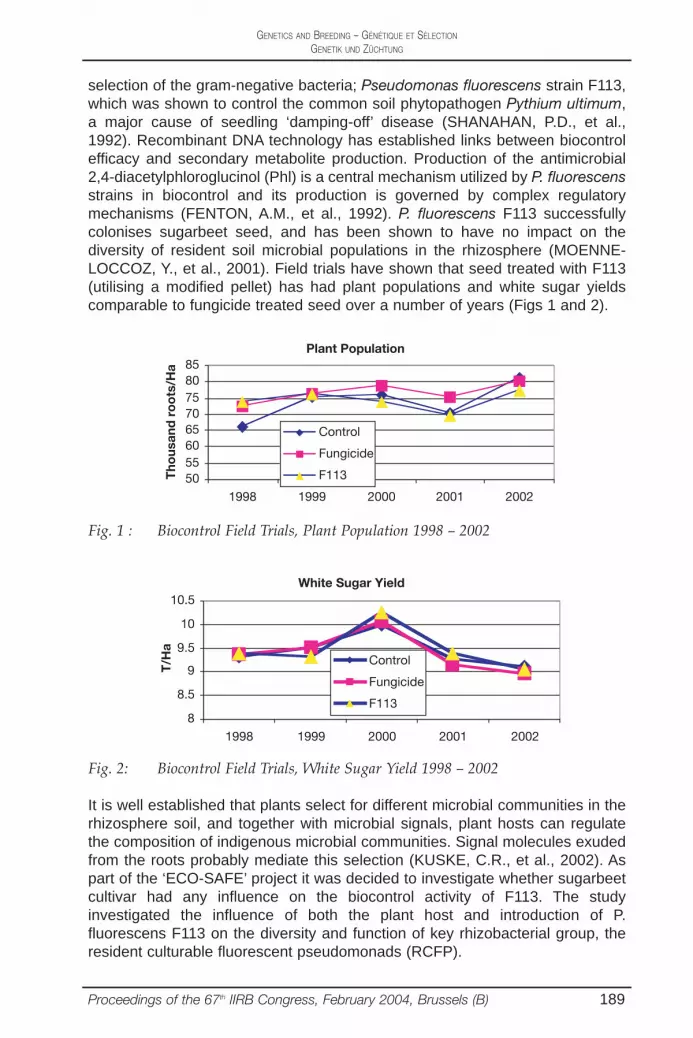
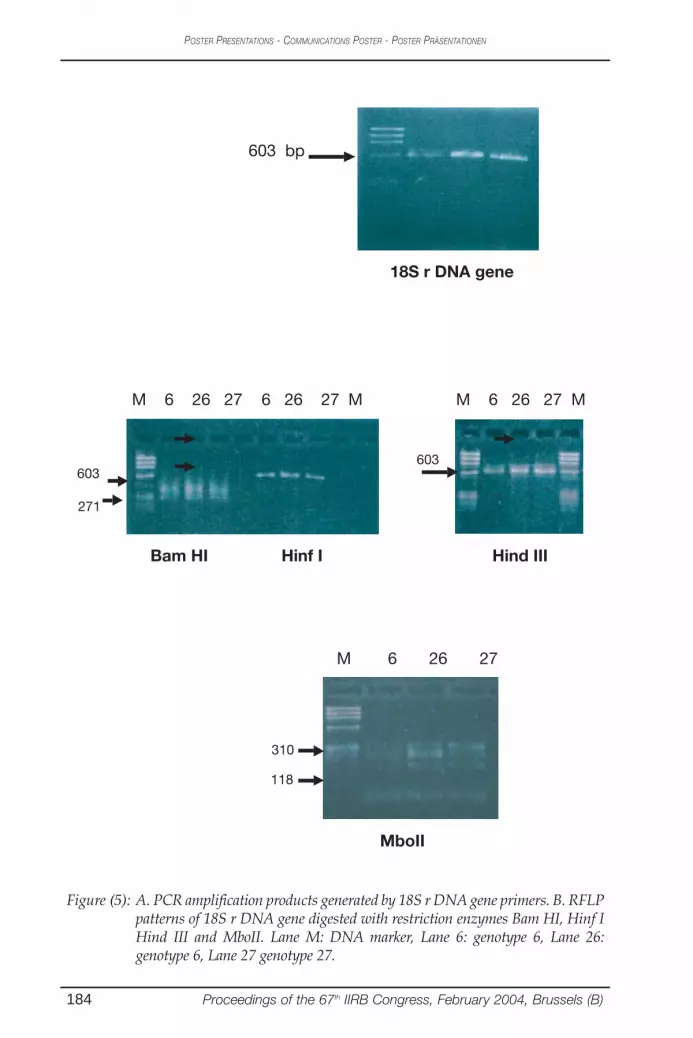
selection of the gram-negative bacteria; Pseudomonas fluorescens strain F113,which was shown to control the common soil phytopathogen Pythium ultimum,a major cause of seedling ‘damping-off’ disease (SHANAHAN, P.D., et al.,1992). Recombinant DNA technology has established links between biocontrolefficacy and secondary metabolite production. Production of the antimicrobial2,4-diacetylphloroglucinol (Phl) is a central mechanism utilized by P. fluorescensstrains in biocontrol and its production is governed by complex regulatorymechanisms (FENTON, A.M., et al., 1992). P. fluorescens F113 successfullycolonises sugarbeet seed, and has been shown to have no impact on thediversity of resident soil microbial populations in the rhizosphere (MOENNE-LOCCOZ, Y., et al., 2001). Field trials have shown that seed treated with F113(utilising a modified pellet) has had plant populations and white sugar yieldscomparable to fungicide treated seed over a number of years (Figs 1 and 2).
Proceedings of the 67th IIRB Congress, February 2004, Brussels (B) 189
GENETICS AND BREEDING – GÉNÉTIQUE ET SÉLECTION
GENETIK UND ZÜCHTUNG
Plant Population
5055606570758085
1998 1999 2000 2001 2002
Control
Fungicide
F113Tho
usan
d r
oo
ts/H
a
Fig. 1 : Biocontrol Field Trials, Plant Population 1998 – 2002
White Sugar Yield
8
8.5
9
9.5
10
10.5
1998 1999 2000 2001 2002
T/H
a
Control
Fungicide
F113
Fig. 2: Biocontrol Field Trials, White Sugar Yield 1998 – 2002
It is well established that plants select for different microbial communities in therhizosphere soil, and together with microbial signals, plant hosts can regulatethe composition of indigenous microbial communities. Signal molecules exudedfrom the roots probably mediate this selection (KUSKE, C.R., et al., 2002). Aspart of the ‘ECO-SAFE’ project it was decided to investigate whether sugarbeetcultivar had any influence on the biocontrol activity of F113. The studyinvestigated the influence of both the plant host and introduction of P.fluorescens F113 on the diversity and function of key rhizobacterial group, theresident culturable fluorescent pseudomonads (RCFP).

MATERIALS AND METHODS
Two diploid cultivars, Celt (Syngenta) and Roberta (KWS), were inoculated withwild-type P. fluorescens strain F113 during pelleting with a modified 50:50 EBBlend:Vermiculite mix. Both untreated controls and fungicide controls wereincluded in replicated field trials at four locations adjacent to National SugarbeetVariety trials during 2000 & 2001. Plants were sampled 12 weeks after sowing,and resident culturable fluorescent pseudomonads were isolated from therhizospheres using standard methods (MOENNE-LOCCOZ, Y., et al., 2001).
RESULTS
Analysis of RCFP populations indicated that different sugarbeet cultivars supportvarying population sizes in the rhizosphere (Fig. 3).
190 Proceedings of the 67th IIRB Congress, February 2004, Brussels (B)
POSTER PRESENTATIONS - COMMUNICATIONS POSTER - POSTER PRÄSENTATIONEN
Pseudomonad Pseudomonad Population Population SizeSize
dcdbcd
bcabbcd
aba
0
2
4
6
8
Bulk Soil Celt Roberta Manhattan Atlantas Madlene Ocean Ariana
Lo
g c
fuL
og
cfu
/g d
ry s
oi
g d
ry s
oi
Fig. 3: Population size of the RCFP in the rhizosphere of different sugarbeetcultivars.
Whole protein cell fingerprinting confirmed that RCFP populations from Robertaand Celt were genetically diverse with a high degree of strain diversity (Fig. 4).Preliminary results indicate that they also have different carbon utilisationprofiles.
i
Different diversitybased on whole protein cell fingerprint profiling
Celt and bulk soil isolates
Roberta isolates
Celt and bulk soilisolates
Fig. 4: Genetic diversity of RCFP.

Preliminary HPLC analysis has indicated differences in the organic carbonfraction composition of Celt and Roberta root exudates (Fig. 5).
Proceedings of the 67th IIRB Congress, February 2004, Brussels (B) 191
GENETICS AND BREEDING – GÉNÉTIQUE ET SÉLECTION
GENETIK UND ZÜCHTUNG
HPLC profile of plant exudates
mAURoberta
Celt
Control
mAU
Time (minutes)
Fig. 5: Preliminary chemical analysis of total organic carbon in root exudates.
RCFP isolated from the majority of sugarbeet cultivars are resistant to theantifungal metabolite 2,4-diacetylphloroglucinol (Phl, Fig 6). However, onecultivar (Celt) selected for a Phl-sensitive RCFP population.
% RCFP isolates tolerant to Phl at conc. of 300ug/ml
0
20
40
60
80
100
120
Bulk soil Roberta Ariana Madlene Manhattan Ocean Atlantis Celt
Fig. 6: Resistance of RCFP to Phl.
Preliminary evidence suggests that when the Phl producing strain F113 was intro-duced, the RCFP population from Celt exhibited increased resistance to Phl (Fig 7).
Ability of RCFP field isolates to grow in presence of 300ug/ml of Phl
0
20
40
60
80
100
120
Bulk soil Roberta Roberta + F113 Celt Celt + F113
% T
oler
ance
Fig. 7: Addition of biocontrol agent P. fluorescens F113.

CONCLUSION
This preliminary evidence of apparent cultivar/inoculant interaction hasimplications for the potential use of biological control agents and other microbialplant growth promoting agents applied as seed inoculants. It is likely thatmicrobial inoculants, whether wild-type or improved by recombinant DNAtechnology, may need to be cultivar specific, or alternatively, would need thewidest possible cultivar host range to successfully replace current practise.Research has continued during 2003 to further investigate the role of host plantsignals in plant-microbial interactions and the implications for yield and diseaseresistance.
REFERENCES
1. WALSH, U.F., MORRISSEY, J.P., & O’GARA, F.: Pseudomonas forbiocontrol of phytopathogens: from functional genomics to commercialexploitation. Current Opinion in Biotechnology, 12, 289-295, 2001.
2. SHANAHAN, P.D., O'SULLIVAN, J., SIMPSON, P., GLENNON, J.D., &O'GARA, F.: Isolation of 2,4-diacetylphloroglucinol from a fluorescentpseudomonad and investigation of physiological parameters influencing itsproduction. Appl. Environ. Microbiol., 58, 353-358, 1992.
3. FENTON, A.M., STEPHENS, P.M., CROWLEY, J., O'CALLAGHAN, M. &O'GARA, F.: Exploitation of gene(s) involved in 2,4-diacetylphloroglucinolbiosynthesis to confer a new biocontrol capability to a Pseudomonas strain.Appl. Environ. Microbiol., 58, 3873-3878, 1992.
4. MOENNE-LOCCOZ, Y., TICHY, H.V., O'DONNELL, A., SIMON, R., &O'GARA, F.: Impact of 2,4-diacetylphloroglucinol-producing biocontrol strainPseudomonas fluorescens F113 on intraspecific diversity of residentculturable fluorescent pseudomonads associated with the roots of field-grown sugar beet seedlings. Appl Environ Microbiol., 67(8), 3418-25, 2001.
5. KUSKE, C.R., TICKNOR, L.O., MILLER, M.E., DUNBAR, J.M., DAVIS, J.A.,BARNS, S.M. & BELNAP, J.: Comparison of soil bacterial communities inrhizospheres of three plant species and the interspaces in an arid grassland.Appl Environ Microbiol., 68(4), 1854-63, 2002.
192 Proceedings of the 67th IIRB Congress, February 2004, Brussels (B)
POSTER PRESENTATIONS - COMMUNICATIONS POSTER - POSTER PRÄSENTATIONEN

STUDY OF GENETIC DIVERSITY IN SUGAR BEETINBRED LINES BY PROTEIN MARKERS TECHNIQUE
T.P. FEDULOVA, S.N. MITIN, A.V. KORNIENKO
All-Russian Research Institute of Sugar Beet and Sugar (VNIISS), Ramon,Voronezh Region, Russia – 396030
ABSTRACT
When a breeder develops starting material using inbreeding and different sibcrossings, a great number of lines, which need an adequate genetic estimationbefore their further use, are accumulated. In most cases, sugar beet varieties,lines and hybrids are identified using morphological characteristics. But todifferentiate samples of close origin as well as to reveal hidden genetic variabilityand to control inbred lines uniformity is not always a success here. Use ofprotein markers proves to be more efficient (Lesnevich L.A., 1993).
ETUDE DE LA DIVERSITE GENETIQUE DES LIGNEES AUTOFERTILESEN BETTERAVE SUCRIERE PAR LA TECHNIQUE DE MARQUEURS
DE PROTEINES
ABRÉGÉ
Lorsque un sélectionneur obtient du matériel génétique par autofertilisation etdifférents croisements de variétés, il accumule un nombre important de lignées,qui doivent être génétiquement appréhendées avant de pouvoir être utilisées.Dans la plupart des cas, les variétés de betterave sucrière , les lignées ethybrides sont identifiés en se référant aux caractéristiques morphologiques. Onn’arrive pas toujours à différencier les échantillons d’origine proche et de révélerla variabilité génétique cachée ou de contrôler l’uniformité des lignéesautofertiles. L’utilisation de marqueurs de protéines s’avère plus efficace danscette recherche. (Lesnevich L.A., 1993).
Proceedings of the 67th IIRB Congress, February 2004, Brussels (B) 193
GENETICS AND BREEDING – GÉNÉTIQUE ET SÉLECTION
GENETIK UND ZÜCHTUNG

UNTERSUCHUNG DER GENETISCHEN DIVERSITÄT BEI AUTOFERTILENZUCKERRÜBENLINIEN MIT HILFE VON PROTEINMARKERN
KURZFASSUNG
Wenn Züchter neues Material durch Inzucht und verschiedene Kreuzeungenzüchtet, wird eine große Anzahl Linien die eine adequate genetische Beurteilungvor ihrer Verwendung benötigen, angehäuft. In den meisten Fällen werdenZuckerrübensorten, Linien und Hybriden durch morphologische Merkmalebestimmt. Zur Differenzierung von Linien mit nah verwandten Quellen oder auchum verborgene genetische Variabilität hervorzuheben und die Gleichförmigkeitvon Inzuchtlinien zu bestimmen ist diese Methode nicht immer von Erfolggekrönt. Die Verwendung von Protein-Markern stellte sich hier als effizienterheraus (Lesnevich L.A., 1993)
194 Proceedings of the 67th IIRB Congress, February 2004, Brussels (B)
POSTER PRESENTATIONS - COMMUNICATIONS POSTER - POSTER PRÄSENTATIONEN

RELATIONSHIP BETWEEN DOUBLE OVULE (TWIN)RATE BEFORE ANTHESIS AND AFTER RIPENING IN
MONOGERM SELF-FERTILIZED SUGAR BEET
N. OGATA AND H. TAKAHASHI
National Agricultural Research Center for Hokkaido Region, Shinsei MemuroKasaigun Hokkaido 082-0071, Japan.
ABSTRACT
Double ovule (twin or poly ovules) fruits that include two or more true seeds(ovules) in a monogerm fruit are an undesirable character for monogerm sugarbeet (Beta vulgaris L.). Double ovule rates are known to be controlled byquantitative genetic traits, and individual selection is effective for improvingthese types of traits. However, it is also known that double ovule rates of ripeningfruit have shown some differences among seed lots of one cultivar. The purposeof this study is to compare the percentage of double ovule fruits before anthesiswith that after ripening. Materials used were 6 selected groups as high rate ofdouble ovules from “NK-183mm-O”, and “NK-195mm-O” as the very low rate.Stecklings of these materials were grown in pots in the greenhouse for seedproduction. Before anthesis, the number of ovules in buds, taken from eachplant, was checked anatomically. After ripening by paper bag isolation, fruitswere harvested from those groups individually, and checked for the number ofovules by x-ray method. Results show large differences between the breedinggroups for double ovule rates before anthesis and after ripening. The averagedouble ovule rates of each group before anthesis were from about 2 to 4 timeshigher than after fruit ripening. The coefficients of variation for ripening fruitswere higher than that before anthesis. However between double ovule ratesbefore anthesis and after ripening, there was highly positive correlation that wasstatistically significant. Thus the formation of double ovule fruit is considered tobe controlled genetically before anthesis, but finally determined by the sameconditions during ovule development after pollination. It suggests that pollenquality, amount and timing of pollination are important for double ovuleformation.
Proceedings of the 67th IIRB Congress, February 2004, Brussels (B) 195
GENETICS AND BREEDING – GÉNÉTIQUE ET SÉLECTION
GENETIK UND ZÜCHTUNG
CORRELATION ENTRE LE TAUX D'OVULES JUMELLES AVANTL'ANTHESE ET APRES LA MATURATION EN BETTERAVE
SUCRIERE MONOGERME AUTO-FERTILISEE
ABRÉGÉ
Les fruits à double ovules (jumeaux ou poly-ovules) qui présentent deux ouplusieurs graines (ovules) dans les betteraves porte-graines monogermesprésentent un caractère indésirable pour la betterave Beta vulgaris L.. Lesdoubles ovules sont reconnus comme étant des traits génétiques et la sélectionindividuelle représente une solution pour leur amélioration. Il est par ailleursreconnu que les fruits à doubles ovules de porte-graines en maturation varientselon le lot de graines ou le cultivar. L’objectif de cette étude est de comparer lepourcentage de fruits à double ovules avant l’anthèse de ceux après maturation.Six groupes sélectionnés ont été choisis comme matériel de comparaison, „NK-183mm-O“ avec une présence importante de doubles ovules et „NK-195mm-O“avec une présence moindre. Ces planchons ont été plantés dans des pots enserre pour la production de graines. Le nombre d’ovules a été relevéanatomiquement pour chaque germe de chaque plante. Après maturation, lesgraines des différents groupes ont été récoltées individuellement etradiographiées pour en connaître le nombre d’ovules. Les résultats montrent qu’ilexiste de grandes différences dans l’apparition des doubles ovules dans lesgroupes aussi bien avant l’anthèse qu’après maturation. Pour tous les groupes,la présence du double ovule avant l’anthèse était de deux à quatre fois plusélevée qu’après maturation. Les coéfficients de variations pour les porte-grainesmûrs étaient plus importants que pour ceux avant anthèse. Une corrélationpositive importante a pu être établie pour la présence de doubles ovules avantAnthesis et après maturation, statistiquement significative. Il apparaît que l’onpeut contrôler génétiquement l’apparition des doubles ovules avant l’anthèse,mais qu’ils sont influencés ensuite par des facteurs précis durant leur germinationaprès pollinisation. Il a été établi en outre que la qualité du pollen ainsi que sonnombre de même que le moment de la pollinisation jouent un grand rôle dans laformation de doubles ovules.
RELATION ZWISCHEN DER RATE DOPPELTER KEIMZELLEN VORDER ANTHESE UND NACH DER REIFE IN MONOGERMEN,
SELBSTFERTILEN ZUCKERRÜBEN
KURZFASSUNG
Früchte mit doppelten Keimzellen die zwei oder mehrere Samen beinhalten(Ovula) sind in monogermen Samenträgern unerwünschte Karaktere fürZuckerrüben (Beta Vulgaris L.) Die Häufigkeit doppelter Keimzellen ist alsquantitativer genetischer Karakter bekannt und Einzelpflanzenselektion ist eineeffektive Lösung für dessen Verbesserung. Es ist jedoch auch bekannt, dass dieHäufigkeit doppelter Keimzellen von reifenden Samenträgern je nachSaatgutpartie oder Kultivar variiert. Ziel dieser Studie ist es den Prozentsatz von
196 Proceedings of the 67th IIRB Congress, February 2004, Brussels (B)
POSTER PRESENTATIONS - COMMUNICATIONS POSTER - POSTER PRÄSENTATIONEN

Früchten mit doppelten Keimzellen vor Anthese mit dem nach der Reife zuvergleichen. Als Material wurden 6 ausgewählte Gruppen von „NK-183mm-O“ mithoher Häufigkeit doppelter Keimzellen, und von „NK-195mm-O“ mit niedrigerHäufigkeit verwendet. Diese Stecklinge wurden im Gewächshaus in Töpfen fürdie Saatgutproduktion angebaut. Vor der Anthese wurde die Anzahl Keimzellenin allen Knospen aller Pflanzen anatomisch überprüft. Nach der Reife wurden dieSamen der verschiedenen Gruppen individuell abgeerntet und durchRöntgenstrahlen auf die Anzahl Keimzellen überprüft. Die Resultate zeigten,dass grosse Unterschiede bei der Häufigkeit der doppelten Keimzellen bei denGruppen vor Anthese und nach Reife bestanden. Bei allen Gruppen war dieHäufigkeit der doppelten Keimzellen vor Anthese etwa zwei- bis viermal höher alsnach der Reife. Die Variationskoeffizienten für reife Samenträger waren höher alsbei jenen vor Anthese. Die Häufigkeit doppelter Keimzellen vor Anthese und nachReife ergab jedoch eine hohe positive Korrelation mit statistischer Signifikanz.Daraus erbigt sich das die Ausbildung doppelter Keimzellen vor der Anthesegenetisch kontrolliert wird, jedoch im weiteren Verlauf durch bestimmteBedingungen während der Keimzellenentwicklung nach der bestäubungbeeinflusst wird. Es wird weiterhin angenommen dab die Pollenqualität und–menge sowie der Zeitpunkt der Bestäubung einen hohen Einfluss auf dieAusbildung doppelter Keimzellen haben.
INTRODUCTION
Double ovule (twin or poly ovules) is fruit that include two or more true seeds(ovules) in a monogerm fruit (Nemazi and Nielson 1967). This double ovule fruitis an undesirable character for monogerm sugar beet (Beta vulgaris L.), becauseit forces the thinning work on the farmer for both direct sowing and transplantingcultivation. However, since the double ovule fruit looks the same as the truemonogerm fruit, it is difficult to eliminate the double ovule fruit in the process ofseed cleaning. Double ovule rates have been known to be controlled byquantitative genetic traits, and individual selection is effective for improving thesetypes of traits (Ogata and Tanaka 2002). And the fruit located on higher branchesof a plant have higher rates of double ovules than lower ones (Ogata et al. 2003).However, it has been known that there are some differences for double ovulerates of ripening fruits among the seed lots of one cultivar or line. So it appearsthat there is a possibility of changing the double ovule rates after pollination byvarying the conditions of seed production. The purpose of this study is to comparethe percentage of double ovule fruits before anthesis with that after ripening.
MATERIALS AND METHOD
Materials used as high rate of double ovules were 6 selected lines from “NK-183mm-O”, and “NK-195mm-O” was used as very low rate. For the seedproduction, materials were sown in pots in the greenhouse on 29th Jan. 2002.Those plants were vernalized artificially at 5Åé with 16 hours day length from25th Apr. to 23rd Jul. After the vernalization, plants developed the seed stalk and
Proceedings of the 67th IIRB Congress, February 2004, Brussels (B) 197
GENETICS AND BREEDING – GÉNÉTIQUE ET SÉLECTION
GENETIK UND ZÜCHTUNG

buds. Before anthesis, all buds of the main stem and branches were taken from6 plants of each breeding material, and the number of ovules included in thesebuds was checked anatomically under the microscope. 10 plants of eachmaterial were harvested individually from 1st Nov. after ripening by paper bagisolation. All fruits were checked for the number of ovules by x-ray method(Ogata and Tanaka 1996). The double ovule rates both in buds and fruits wereestimated by percentage to total number of buds and fruits investigatedrespectively. Also, the amount of pollen from 4 plants of each material wasestimated every 3 days during the anthesis period by setting a glass slide trapin the paper bag. The amount of pollen on each slide was estimated by an indexfrom 0 (no pollen) to 5 (many).
RESULTS AND DISCUSSION
There were large differences between the materials for double ovules ratesbefore anthesis and after ripening (Table 1). Before anthesis, the double ovulerates were from 5.2% to 68.1%, the average of materials was 45.5%. Afterripening showed 0.7% to 19.4%, the average was 10.3%. So the average doubleovule rate of each material before anthesis was higher by about 3.2 to 7.4 timesthan that after ripening. The coefficients of variation (C.V.) for ripening fruits ofeach line were clearly higher than that before anthesis.
Table 1. Double ovule rates before anthesis and after ripening. in self fertile O-typesof sugar beet.
198 Proceedings of the 67th IIRB Congress, February 2004, Brussels (B)
POSTER PRESENTATIONS - COMMUNICATIONS POSTER - POSTER PRÄSENTATIONEN
Ratio(%) Lines Average(%):A C.V.(%) Average(%):B C.V.(%) B/A?100
NK195mm -O 5.2 c 43.1 0.7 c 105.7 13.5 NK183mm -O-45 36.9 b 25.0 7.8 b 32.4 21.1 NK183mm -O-65 61.6 a 18.5 19.4 a 41.2 31.5 NK183mm -O-81 68.1 a 12.8 18.6 a 46.5 27.3 NK183mm -O-83 59.9 a 4.9 9.1 b 70.6 15.2 NK183mm -O-87 40.1 b 21.0 7.2 b 97.3 18.0 NK183mm -O-102 46.4 b 23.7 9.1 b 44.8 19.6 Mean 45.5 21.3 10.3 62.7 22.6
Before Anthesis After Ripening
Different letters mean statistically significant at 5% level by Duncan using the arc sign transformed data of percentage.
C.V. means coefficient of variation for each line (Standard deviation/Averagex100).
However between double ovule rates before anthesis and after ripening therewas a highly positive correlation, R2=0.832 which was statistically significant(Fig. 1). Furthermore all materials except for NK183mm-O-83 situated almost onthe regression curve y=0.0038X2+0.0274X. NK183mm-O-83 showed a ratherlow rate of double ovules after ripening in spite of high rate before anthesis. Theresults of pollen amount are shown in table 2. There were statistically significant

differences between the lines for both pollen indexes, especially for accumulatedpollen index. NK183mm-O-83 showed the smallest indexes of all material forboth accumulated and day average indexes.
Fig. 1 Relationships between double ovules rates before anthesis and after ripeningin monogerm sugar beets.
Proceedings of the 67th IIRB Congress, February 2004, Brussels (B) 199
GENETICS AND BREEDING – GÉNÉTIQUE ET SÉLECTION
GENETIK UND ZÜCHTUNG
Lines NK195mm -O 26.3 a 0.68 a NK183mm -O-45 25.3 a 0.71 a NK183mm -O-65 18.5 ab 0.56 a NK183mm -O-81 26.0 a 0.73 a NK183mm -O-83 12.9 b 0.42 a NK183mm -O-87 22.9 a 0.65 a NK183mm -O-102 25.0 a 0.81 a Mean 22.5 0.65
Different letters mean statistically significant at 5% level by Duncan.
Accumulated Pollen Index
Day Average for Pollen Index
Pollen index was estimated in every 3 days during flowering periods by 0 (no pollen) to 5 (many pollen).
y = 0.0038x2 + 0.0274x
R2
= 0.8324**
0
10
20
30
0 10 20 30 40 50 60 70 80
Double ovules rates before anthesis (%)
Do
uble
ovu
les
rate
s af
ter
rip
enin
g (%
)
O-types (n=7)
83
8165
195
45
87
102
Numerals side of dots means the name of each O-type.
** means significant level at 1%.
Table 2 Pollen index for each self fertile O-type of sugar beet.

From these results of double ovule rates in buds, the formation of double ovule fruitis considered to be controlled genetically before anthesis. It appeared thatmaterials could be divided into 3 groups with genetic differences for the ability toproduce double ovules. The 1st group was the lower one includes only NK195mm-O, the 2nd group which was the middle one includes NK183mm-O-45, NK183mm-O-87 and NK183mm-O-102, and the 3rd and highest group was NK183mm-O-65,NK183mm-O-81 and NK183mm-O-83. However it suggests that many of thedouble ovules in buds could not develop into double ovules in fruits, but developedonly one ovule in a fruit which leads to monogerm fruits. Also only about 20% ofdouble ovules in buds could develop into double ovule fruit in all materials. Thus itseems that the formation of double ovule fruits were strongly affected by someovule development conditions after pollination. This investigation suggests thatpollen quality, amount and timing of pollination are important for double ovuleformation. It also seems that although NK183mm-O-83 was included in the 3rdgroup, this line could not produce a large amount of pollen and had short flowerduration, therefore the rates of double ovule in fruits became lower than other linesin the 3rd group. This investigation suggests that an excellent pollinator thatcontinues to produce ample healthy pollen, when grown with a flowering CMS inhybrid seed production, could lead to relatively higher double ovule rates than thecase of normal pollinators. It also suggests that good growing conditions for pollenproduction would lead to the same results.
REFERENCES
1. NEMAZI, J. & NIELSON, K.: Occurrence of double ovules in sugar beet, J.Amer. Soc. Sugar Beet Techn., 14, 389-394, 1967.
2. OGATA, N. & TANAKA, M.: Inheritance of monogerm traits of sugar beetfruits 3. soft X-ray observations of double ovule fruits, Proc. Japan. Soc.Sugar Beet Techn., 38, 24-31, 1996.
3. OGATA, N. & TANAKA, M.: Genetic variation and effects of individualselection for double ovules and bigerm fruits of monogerm sugar beet,Breeding research, 4(4),201-208, 2002.
4. OGATA, N., TAKAHASHI, H. & TANAKA, M.: Distribution of double –ovulefruits in each indivudual sugar beet, Japan. Journal of Crop Sci., 72(1), 68-75, 2003.
200 Proceedings of the 67th IIRB Congress, February 2004, Brussels (B)
POSTER PRESENTATIONS - COMMUNICATIONS POSTER - POSTER PRÄSENTATIONEN

EXPLORATION OF BETA VULGARIS, SSP. CICLA (L)KOCH IN KAGOSHIMA PREFECTURE (SOUTHMOST
OF MAINLAND JAPAN) FOR BREEDING NEWGENETIC RESOURCES OF SUGAR BEET
HIROYUKI TAKAHASHI AND OGATA NAOKI
National Agricultural Research Center for Hokkaido Region (NARCH), ShinseiMemuro Kasaigun Hokkaido 082-0071, Japan.
ABSTRACT
In Japan, sugar beet (Beta vulgaris L.) is cultivated only in Hokkaido, situatedbetween latitude 42°N and 45°N. Since in Hokkaido the temperature andhumidity during the summer are higher than other cultivation area in samelatitude, it causes some diseases epidemic outbreaks, such as Cercospora leafspot and Aphanomyces root rot. To improve resistance of sugar beet to thesediseases, wild Beta species and subspecies are very important for breeding newgene resources. In 2002, an exploration for collecting local cultivars of Betavulgaris, ssp. cicla (Swiss chard) was undertaken at Kagoshima prefecture(southernmost of mainland Japan, between latitude 28°N and 32°N) in whereSwiss chard is popular as local leafy vegetable. In this exploration, 38 cultivarsseeds were collected, and many of them were observed in detached island,Amami-Oshima (latitude 28°N) and Koshiki-jima (latitude 32°N). Characteristicsof collected cultivars were as follows; the collected cultivars except for 4 cultivarswere annual life form by the field test at Hokkaido. Especially, most of cultivarscollected in Amami-Oshima were begun bolting at 50 days after sowing, itsuggested that these easily bolting character was resulted from regeneratingunder the condition of high mean air temperature (21°C) in Amami-Oshima. Allcultivars were classified in multigerm. And for polyploidy by the flow-cytometryanalyze, 33 cultivars were detected as diploid same as sugar beet (2X=18), but5 cultivars collected in Nan-Satsu area (southwest in mainland of Kagoshimaprefecture) were detected as tetraploid. In some locations, leaf diseasesymptom similar with Cercospora leaf spot of sugar beet was observed in manySwiss chard cultivars, but some cultivars showed resistance to this diseasesymptom. From these results, some Swiss chard cultivars were expected asnew gene resources with disease resistance for improving sugar beet, althoughtheir annual life forms and easily bolting characters must be removed.
Proceedings of the 67th IIRB Congress, February 2004, Brussels (B) 201
GENETICS AND BREEDING – GÉNÉTIQUE ET SÉLECTION
GENETIK UND ZÜCHTUNG

INVESTIGATIONS SUR BETA VULGARIS, SSP. CICLA (L)DANS LA PREFECTURE DE KAGOSHIMA (SUD-OUEST
DU JAPON) POUR LA SELECTION DE NOUVELLES RESSOURCESGENETIQUES DE LA BETTERAVE SUCRIERE
ABRÉGÉ
Au Japon, la betterave sucrière (Beta vulgaris L.) n’est cultivée qu’à Hokkaido,située entre 42° et 45° de latitude nord. Hokkaido subi de fortes températures etune grande humidité en été, nettement plus que dans d’autres pays de mêmelatitude. Cela entraîne des épidémies de maladies comme notamment lacercosporiose et la pourriture noire de la racine. Des variétés et sous-variétéssauvages de Beta ont été introduites pour améliorer la résistance des betteravessucrières à ces maladies et créer de nouvelles ressources génétiques. En 2002,une expédition dans la préfecture Kagoshima (extrême sud de l’île principale duJapon, latitude 28° à 30° nord) a été entreprise pour récolter des cultivars deBeta vulgaris, ssp. cicla (bette à carde) où cette plante est très largementconsommée comme légume feuille. Durant cette expédition, 38 graines decultivar ont été récoltées et plusieurs ont été observées sur l’île de Amami-Oshima (latitude 27° nord) et celle de Koshiki-jima (latitude 32° nord). Lescultivars recueillis présentaient les caractéristiques suivantes : tous sauf 4cultivars présentaient une forme annuelle selon les tests effectués à Hokkaido.La plupart des cultivars et notamment ceux récoltés à Amami-Oshima sontmontés en graines à 50 jours. Cette caractéristique de montée à grainesprécoce résultant de la température élevée de l’air à Amami-Oshima (21°C).Tous les cultivars ont été classifiés comme multi-germes. Pour les polyploïdes,33 cultivars se sont avérés diploïdes comme la betterave sucrière (2X=18),mais 5 cultivars, récoltés dans la région de Nan-Satsu (sud-ouest de lapréfecture de Kagoshima), se sont avérés tetraploïde par analyse cytométrique.Dans certaines localités, des symptômes similaires à ceux de la cercosporiosede la betterave sucrière ont été observés sur de nombreux cultivars, maiscertains cultivars se sont montrés résistants à cette maladie. Les résultats ontdémontré que la caractéristique de montée à graines précoce doit être éliminéedes cultivars de bette à carde afin de pouvoir l’utiliser pour améliorer la betteravesucrière. Toutefois, certains cultivars présentant une résistance à la maladiesont à considérer comme de nouvelles ressources génétiques.
PROSPEKTION VON BETA VULGARIS SSP. CICLA (L) KOCH INDER PREFEKTUR KAGOSHIMA (SÜDWESTEN JAPANS) ZUR
ZÜCHTUNG NEUER GENETISCHER RESSOURCEN VONZUCKERRÜBEN
KURZFASSUNG
In Japan wird die Zuckerrübe (Beta Vulgaris L.) nur auf Hokkaido, das zwischendem 42.° und 45.° nördlichen Breitengrad liegt, angebaut. Da in Hokkaido dieTemperatur und Feuchtigkeit während des Sommers höher liegt als in
202 Proceedings of the 67th IIRB Congress, February 2004, Brussels (B)
POSTER PRESENTATIONS - COMMUNICATIONS POSTER - POSTER PRÄSENTATIONEN

vergleichbaren Anbaugebieten des gleichen Breitengrades, werdenKrankheitsausbrüche wie Cercospora Blattfleckenkrankheit und AphanomycesWurzelfäule beobachtet. Zur Verbesserung der Resistenz der Zuckerrübengegenüber diesen Krankheiten sind wilde Beta Arten und Unterarten vongrösster Bedeutung für die Selektion neuer genetischer Ressourcen. 2002wurde eine Expedition in der Kagoshima Prefektur (südlicher Punkt derjapanischen Hauptinseln, zwischen dem 28.° und 30.° nördlichen Breitengrad)zur Einsammlung lokaler Kultivare von Beta vulgaris, ssp. cicla (Mangold),unternommen. In dieser Gegend gilt Mangold als populäres lokales Gemüse.Bei diesen Expeditionen wurden 38 Kultivare gesammelt und viele von ihnenwurden auf den abgelegenen Inseln Amami-Oshima (27.° nördlicherReitengrad) und Koshiki-jima (32.° nördlicher Reitengrad) wieder gefunden. DieEigenschaften der gesammelten Kultivare waren wie folgt: alle ausser 4Kultivare stellten sich als jährliche Formen bei einem Feldversuch in Hokkaidoheraus. Insbesondere die meisten Kultivare die in Amami-Oshima gesammeltwurden begannen nach 50 Tagen nach der Aussaat zu schossen. Man nimmtan, dass diese schnell schossenden Kultivare durch die durchschnittlich hoheLufttemperatur (21°C) in Amami-Oshima entstanden sind. Alle Kultivare wurdenals multigerm eingestuft. Bezüglich der Polyploïdy, wurden 33 Kultivare alsdiploïd, gleich der Zuckerrübe, eingestuft (2X=18), jedoch 5 Kultivare die in Nan-Satsu gesammelt worden waren (Süd-Westen der Kagoshima Prefektur)wurden durch Flusscytometrie als tetraploïd eingestuft. Auf einigen Standortenwurden Krankheitssymptome die der Cercospora Blattfleckenkrankheit inZuckerrüben ähnen, auf manchen Kultivaren beobachtet. Einige Kultivare warenresistent gegenüber dieser Krankheit. Aus diesen Resultaten ergibt sich, dasszunächst der Schosserkarakter entfernt werden muss bevor die MangoldKultivare für die Verbesserung der Zuckerrübe verwendet werden können.Einige der Kultivare sind jedoch als genetische Ressource fürKrankheitsresistenz von Bedeutung.
INTRODUCTION
Sugar beet (Beta vulgaris L. saccharifera) is one of main crops cultivated widelyas sugar materials in the Northern Hemisphere, and in Japan sugar beet iscultivated only in Hokkaido. As the sugar beet is relatively young crop and alsoalmost all cultivars were developed from only one single cultivated population,the ‘White Silesian’ type, the genetic base of this crop was supposed to be verynarrow (van Geyt et. al., 1990, Frese et. al., 2001). Accordingly, wild species andsubspecies were used in sugar beet breeding to improve seed traits or diseaseresistance (Munerati, 1932; Tjebbes, 1933; Doney & Whitney, 1990). In therecent years, the reason such as competition with import sugar and reduction forthe impact of extensive agrochemical use to environment, improving diseaseresistances of sugar beet is very important objects for the sugar beet breeders.The Swiss chard (Beta vulgaris ssp. cicla) is the subspecies of sugar beet. SinceSwiss chard has high adaptability to hot area, it is mainly cultivated on thewestern part of Japan and uses for local leafy vegetable in summer. But, thecultivated area of Swiss chard is decreasing gradually by the reason of aging of
Proceedings of the 67th IIRB Congress, February 2004, Brussels (B) 203
GENETICS AND BREEDING – GÉNÉTIQUE ET SÉLECTION
GENETIK UND ZÜCHTUNG

farmers, and also cultivation scale is small as for only private use. So it wouldbe apprehensive about disappearance of Swiss chard local cultivars from Japan.Then, for the purpose of conserving the local varieties and utilizing them forsugar beet breeding, in 2002 NARCH explored on Kagoshima Prefecture, wheresituated in southmost of mainland Japan (between 28°N and 32°N) and manyfarmers still cultivate Swiss chard.
METHOD
This Exploration was conducted from May 19th to May 25th in 2002 on 3 areasin Kagoshima prefecture, those were Kagoshima mainland, Amami Oshima andKoshiki-Jima (Fig. 1). Cultivation methods and plant characters of Swiss chardswere investigated at the each site from the farmer. When exploring, the plantgrowing stages of Swiss chards were from flowering stage to seed matured
204 Proceedings of the 67th IIRB Congress, February 2004, Brussels (B)
POSTER PRESENTATIONS - COMMUNICATIONS POSTER - POSTER PRÄSENTATIONEN
Hokkaido
pref.
Kagoshima
pref.
Setouchi (6)
Kasari (5)
Tatsugo (1)Yamato (2)
Sato (1)Kamikoshiki (3)
Kajima (3)
Shimokoshiki (2)
Kawanabe (3)
Nejime (2)Kaimon (2)
Kagoshima (2) Kokubu (2)
Kushira (2)Chiran (2)
Kagoshima Mainland
Amami-Oshima
Koshiki-Jima Japan
Fig. 1 Exploration maps and collection sites ofSwiss chard in Kagoshima prefecture.The number of cultivars collected werenoted in the parenthesis at each site.

stage in Kagoshima prefecture, and then seeds could be harvested from seedmatured stage plants. The collected cultivars were investigated on germity(monogerm or multigerm) of seed ball by morphological observation, andhypocotyl color, plant type, leaf shape, bolting stem color and life cycle (annualor biennial) were investigated at the field test in NARCH (Memuro in Hokkaido)in 2003. In addition, their polyploidy were analyzed by flow-cytometer with asmall piece of leaf.
RESULTS AND CONCLUSION
In this exploration, total 38 local cultivars of Swiss chard were collected, asfollows, 15 cultivars in Kagoshima mainland, 14 one in Amami-Oshima and 9one in Koshiki-Jima (Fig. 1). Seed germity of all collected cultivar was multigerm.In Kagoshima prefecture, general sowing dates were September, and harvestedleaves until June in next year, and harvested seed in June or July. In there Swisschards were cooked as boiled green leaves or stewing leaves and petiole withpork. Hereafter, other characters of collected cultivars were shown for the eachexploration area (Fig. 1 and Table 1).
Kagoshima mainland; growing stage was just flowering time when exploring.Almost all cultivars were diploid, but all 5 cultivars collected at Kawanabe andKaimon (southwest in Kagoshima mainland called Nan-Satsu area) weretetraploid. Hypocotyl and bolting stem color were mostly red, especially stemcolor of “FK-02-20” and “FK-02-22” collected at Kagoshima and Chiran wereclearly deep red, and moreover their branches and petioles were also deep red.Plant type and leaf shape, there were not clear commonness as in wholeKagoshima mainland, but locality of characters could be observed in each site.Life forms tested in Hokkaido were annual except for 2 cultivars collected atKaimon and 1 cultivar at Kagoshima.
Amami-Oshima; growing stage was seed maturing time when exploring. Allcultivars were diploid. Hypocotyl and bolting stem color for all cultivars weregreen. Plant types were procumbent except for “FK-02-16” collected at Setouchithat was only prostrate. Life forms of all cultivars were annual tested inHokkaido. This commonness was resulted from the location of Amami-Oshima,that is, detached 380km south from Kagoshima mainland. And more, mostcultivars collected in Amami-Oshima began bolting about 50 days after sowingin Hokkaido although other cultivars collected in Kagoshima mainland andKoshiki-Jima required 60 days or over for bolting. This easily bolting characterwas considered that it was resulted from regenerating under the condition ofhigh mean air temperature (21°C) in Amami-Oshima. In general cropping periodin Hokkaido is from May to October, and mean air temperature in during thisperiod is 15°C. That is the same temperature as in January of Amami-Oshima.Koshiki-Jima; growing stage was flowering time when exploring. All cultivarswere diploid. Hypocotyl colors, plant types and leaf shapes were almost sameas each other. However for the cultivars collected at Kajima, hypocotyl colors of“FK-02-30” and ”FK-02-31” were segregated to red and green. Bolting stem
Proceedings of the 67th IIRB Congress, February 2004, Brussels (B) 205
GENETICS AND BREEDING – GÉNÉTIQUE ET SÉLECTION
GENETIK UND ZÜCHTUNG

color was mostly green in many cultivars but 3 cultivars were red. Life formswere annual tested in Hokkaido except for “FK-02-36” collected at Sato.
Table 1 Characters of Swiss chard collected in Kagoshima prefecture
206 Proceedings of the 67th IIRB Congress, February 2004, Brussels (B)
POSTER PRESENTATIONS - COMMUNICATIONS POSTER - POSTER PRÄSENTATIONEN
Exp. Site Poly- Hypocotyl Plant Leaf Stem Life
area name ploidy color type shape color form
Kawanabe FK-02-1 4X Red Erect Lanceolate Node Red Annual
FK-02-2 4X Red Prostrate Lanceolate Node Red Annual
FK-02-3 4X R&G Erect Heart Green Annual
Kaimon FK-02-4 4X Red Prostrate Heart Red Biennial
FK-02-5 4X Red Erect Heart Red Biennial
Kagoshima FK-02-20 2X Red Prostrate Heart Red Annual
FK-02-21 2X Red Prostrate Lanceolate Node Red Biennial
Chiran FK-02-22 2X Red Procumbent Wide Red Annual
FK-02-23 2X Green Procumbent Lanceolate Green Annual
Kusira FK-02-24 2X Red Erect Lanceolate Node Red Annual
FK-02-25 2X Red Erect Lanceolate Node Red Annual
Nejime FK-02-26 - - - - -
FK-02-27 2X Red Procumbent Wide Node Red Annual
Kokubu FK-02-28 2X Red Prostrate Wide Green Annual
FK-02-29 2X Red Procumbent Lanceolate Green Annual
Kasari FK-02-6 2X Green Procumbent Heart Green Annual
FK-02-7 2X Green Procumbent Heart Green Annual
FK-02-8 2X Green Procumbent Heart Green Annual
FK-02-9 2X Green Procumbent Lanceolate Green Annual
FK-02-10 2X Green Procumbent Lanceolate Green Annual
Setouchi FK-02-11 2X Green Procumbent Lanceolate Green Annual
FK-02-12 2X Green Procumbent Heart Green Annual
FK-02-13 2X Green Procumbent Lanceolate Green Annual
FK-02-14 2X Green Procumbent Heart Green Annual
FK-02-15 2X Green Procumbent Lanceolate Green Annual
FK-02-16 2X Green Prostrate Heart Green Annual
Tatsugo FK-02-17 2X Green Procumbent Lanceolate Green Annual
Yamato FK-02-18 2X Green Procumbent Lanceolate Green Annual
FK-02-19 2X Green Procumbent Lanceolate Green Annual
Kajima FK-02-30 2X R&G Procumbent Lanceolate Green Annual
FK-02-31 2X R&G Procumbent Lanceolate Green Annual
FK-02-32 2X Green Procumbent Lanceolate Green Annual
Kamikoshik FK-02-33 2X Red Procumbent Lanceolate Green Annual
FK-02-34 2X Red Erect Lanceolate Red Annual
FK-02-35 2X Red Procumbent Lanceolate Green Annual
Sato FK-02-36 2X Red Procumbent Lanceolate Red Biennial
Shimokosh FK-02-37 2X Red Procumbent Heart Green Annual
FK-02-38 2X Red Procumbent Lanceolate Node Red Annual
1) "R&G" means hypocotyl color segregated in red and green.
2) "Node Red" means stem color is green, but only node part is red.
3) All the cultivars are "multigerm".
Am
ami-O
shim
aK
oshi
ki-J
ima
Cultivar
Kag
oshi
ma
mai
nlan
d
1) 2)

When exploring, leaf disease symptom similar with sugar beet Cercospora leafspot was observed in many cultivars at each site, however some cultivarsshowed resistance to this disease symptom. It suggests that there is possibilityto utilize these resistant cultivars for improving sugar beet as new Cercosporaleaf spot resistant resources, although some problems such as annual life formin Hokkaido were remained. Moreover the age of farmers who cultivated Swisschard has been very advanced, so in the near future these local cultivars ofSwiss chard would be extinct, therefore immediately it must be needed detailexploring again.
REFERENCES
1. VAN GEYT, J.P.C., LANGE, W., OLEO, M., & DE BOCK, TH.S.M.: NatureVariation within the Genus Beta and Its Possible Use for Breeding SugarBeet. A review. Euphytica, 49, 57-56, 1990
2. TJEBBES, K.: The Wild Beets of the North Sea Region. Botaniska Notiser,14, 305-315, 1933
3. MUNERATI, O.: Sull’ Incrocio della Barbabietola Coltivata con la BetaSelvaggia della Costa Adriatica. L’Industria Saccarifera Italiana, 25, 303-304,1932
4. DONEY, D.L. & WHITNEY, E.D.: Genetic Enhancement in Beta for DiseaseResistance Using Wild Relatives: a Strong Case for the Value of GeneticConservation. Economic Botany, 44(4), 445-451, 1990
5. FRESE, L., DESPREZ, B. & ZIEGLER, D.: Potential of Genetic Resourcesand Breeding Strategies for Basebrodening in Beta. Broadening the GeneticBase of Crop Production, 17, 295-309, 2001
Proceedings of the 67th IIRB Congress, February 2004, Brussels (B) 207
GENETICS AND BREEDING – GÉNÉTIQUE ET SÉLECTION
GENETIK UND ZÜCHTUNG


DEVELOPMENT OF DNA MICROARRAYS FORTHE IDENTIFICATION OF NEW MOLECULAR
MARKERS TO BE EXPLOITED IN SUGAR BEETBREEDING
MANOUELA KAPSETAKIa, MILENA VYTOVAa, AIKATERINI PETRAKIc,OLGA KOUTITAd, GEORGE DIALINASb, NICKOLAS J. PANOPOULOSa,c,
GEORGE N. SKARACISd AND DIMITRIS KAFETZOPOULOSa
a Institute of Molecular Biology and Biotechnology, Foundation for Research andTechnology - Hellas, P.O. Box 1527, GR 71110, Heraklion, Greece
b Department of Biology University of Athens,GR 157 01, Kouponia, Panepistimioupoli, Athens
c Department of Biology, University of Crete, P.O. Box 2208,GR 71 409, Heraklion, Greece
d Hellenic Sugar Industry S.A. GR 57400, Sindos - Thessaloniki, Greece
ABSTRACT
The identification of candidate molecular markers and genes for molecularbreeding has mainly been based on molecular features that derive from variousallele, gene or chromosome structures and significantly correlate to certainphenotypic characteristics. Gene expression analysis, using DNA microarrays,already has proved a powerful tool for unravelling new gene functions, forperceiving molecular pathways and visualizing characteristic features (molecularportraits) for complex biological systems. In order to identify and validate newtools for breeding sugar beet, especially suitable for selecting importantmultigenic traits, we have developed DNA microarays for profiling variousgermplasms and for correlating certain phenotypical characteristic with specificgene expression signatures. The DNA microarrays for sugar beet expressionprofiling can combine several available resources, such as clones from root andleaf cDNA libraries, selected gene fragments cloned by PCR, and specificoligonucleotides 60-70 bp long. In this study, the design and fabrication of theDNA microarray are presented, methods for the isolation, preparation anddesign of the various probes are described and the differences between theexpression profiles of various tissues, varieties and growth conditions aredemonstrated.
INTRODUCTION
The sugar beet crop has enjoyed a remarkable genetic improvement over time,mainly through conventional breeding methodology. In recent years, molecular
Proceedings of the 67th IIRB Congress, February 2004, Brussels (B) 209
GENETICS AND BREEDING – GÉNÉTIQUE ET SÉLECTION
GENETIK UND ZÜCHTUNG

breeding approaches have become a very important additional technology that isexpected to significantly contribute in meeting present and future challenges fora quantitatively and qualitatively better sugar beet crop to be produced in theframework of an agriculture characterized by sustainability, high precision andadaptability to the ever changing agroclimatic conditions and market demands.Molecular markers linked to several agronomically important traits have alreadybeen identified and marker-assisted selection is being employed to improve theefficiency of breeding programs (for review see Scholten & Lange, 2000; Kraft,2001; Skaracis, 2004). These markers have so far almost exclusively been basedon genomic DNA polymorphisms (i.e. RFLPs, RAPDs, AFLPs, SSRs, SNPs etc.).
DNA microarrays for gene expression profiling are emerging as potentially verypowerful tools towards the same purpose. They can comprise a fast andgenome-wide screening method for the identification of genes that configuredistinct expression profiles in different genotypes thus allowing for theassociation of gene expression to phenotypic properties of each genotype.Eventually, these expression profiles can be used as molecular markers for amore efficient selection of desirable traits. Additionally, the analysis of geneexpression can lead to the recognition of new gene clusters that may constituteexpression signatures for multigenic traits, such as resistance to biotic andabiotic stresses and various yield related characters.
The purpose of this study was the fabrication of a pilot sugar beet cDNAmicroarray and its preliminary use in unravelling possible gene expressionprofile differences between plant tissues, genotypes and growing conditions.
MATERIALS AND METHODS
Plant material: cDNA libraries were constructed using mRNA extracted from a)root tissue of a rhizomania resistant plant growing in a diseased field, b) leaftissue of a high sucrose content - Cercospora leaf spot resistant plant grownunder medium infection intensity and c) leaf tissue of a plant from a locally growncommercial cultivar. Plant material used for examining gene expression profilescame from a dual resistant genotype grown in the field (to reveal tissue specificgene expression) and a very similar genotype grown in the green house (tostudy differences possibly due to growing conditions).
RNA extraction: RNA was extracted from leaves or root of sugar beet using amodified version of the procedure described by Chomczynski and Sacchi(1987). The RNA isolated was subsequently layered on a CsTFA cushion(Amersham Pharmacia Biotech) and further purified from residual DNAcontamination by sedimentation with ultracentrifugation. The total RNA obtainedwas used for polyA+ mRNA isolation with oligo(dT) chromatography.
Library construction: The sugar beet cDNA libraries were constructed usingeither the pBluescriptII XR cDNA Library Construction Kit or the ZAP-cDNAGigapack III Gold Cloning Kit (Stratagene). The libraries were stored at –80oC.
210 Proceedings of the 67th IIRB Congress, February 2004, Brussels (B)
POSTER PRESENTATIONS - COMMUNICATIONS POSTER - POSTER PRÄSENTATIONEN

Amplification of the cDNA clones: Bacterial cultures were diluted 1:10 withddH2O in 96-format, incubated at 100oC for 10 min and centrifuged for 5 min at1300g. 1-5µl was used for each PCR reaction. PCR was performed in 100_lreaction mix, in 96 well plates, using primers designed on the vector sequenceflanking the cDNA sequence (Fwd primer: 5’ctgcaaggcgattaagttgggtaac-3’, Revprimer: 5’gtgagcggataacaatttcacacaggaaaacagc3’). Cycling conditions includedone cycle at 95oC for 5 min followed by 35 cycles at 95oC for 30sec, 65oC for45sec and 72oC for 3 min and a last cycle at 72oC for 5 min (Bowtell &Sambrook, 2002). Amplified products were purified with Nucleofast (Macherey-Nagel) and samples were lyophilized and resuspended in 50%DMSO, in aconcentration appropriate for printing of the microarray slides (200ng/µl).
Printing of microarrays: cDNA samples were printed in triplets (spot size:120µm, spot spacing: 325µm), on glass Gold Seal Microslides (FISHER) coatedwith poly-L-Lysine according to DeRisi Lab (Bowtell & Sambrook, 2002; Blalock,2003). The Arrayer used was SpotArray 24 (Packard BioSciences).
Nucleic acid labeling: Approximately 2µg of intact polyA+ mRNA isolated fromeither leaf or root sugar beet tissues was combined with in vitro transcribedcontrol RNA mix and labeled with Alexa fluor 546 or 647 respectively using theULYSIS kit (Molecular Probes). Labeled probes were purified with Autoseq-50sepharose columns (Amersham Pharmacia Biotech), supplemented with 1µlcarrier DNA (sheared salmon sperm DNA, 10mg/ml), vacuum dried andresuspended in EMBL hybridization mix 6xSSC, 0.5%SDS, 5xDenhardt’s and50% deionized Formamide, in a final volume of 15µl.
Hybridization: Microarray slides were prehybridized in 6xSSC, 0.5%SDS and1%BSA for 1 hour and hybridized in 15 µl EMBL hybridization buffer (describedabove) under glass coverslip at 42oC, for 16-20 hrs (Bowtell & Sambrook, 2002;Blalock, 2003). Fluorescent images of hybridized microarrays were obtained byusing a ScanArray 5000 MicroArray Analysis System (GSi Lumonics) andanalyzed with ImaGene v5.5 (BioDiscovery). The results were analyzed withMicrosoft Excel.
RESULTS
The pilot approach successfully followed for the fabrication of a sugar beet DNAmicroarray is outlined in fig. 1 and 2.
Tissue specific cDNA libraries were arrayed in 96 format and the clones wereindividually numbered. 1400 clones coming from leaf as well as from root wereamplified by PCR and run on agarose gels in order to sort the PCR products thatqualified for printing (fig. 3). 608 PCR products were selected and prepared forprinting including a number of positive and negative controls. After printing, theslides were stained with SYBR green II to visualize the spots printed on the glassslides (fig. 4).
Proceedings of the 67th IIRB Congress, February 2004, Brussels (B) 211
GENETICS AND BREEDING – GÉNÉTIQUE ET SÉLECTION
GENETIK UND ZÜCHTUNG

212 Proceedings of the 67th IIRB Congress, February 2004, Brussels (B)
POSTER PRESENTATIONS - COMMUNICATIONS POSTER - POSTER PRÄSENTATIONEN
SequencingSequencing
TargetPreparation
TargetPreparation
MS
HC
MA, PL
PC, IA
Data AnalysisStorage
Data AnalysisStorage
PC, DI
Library construction
Library construction
CPBR, TCLibrary
arrayLibrary
array
Data BankData Bank
Design ofOligos
Design ofOligos
OligoSynthesis
OligoSynthesis
OS
SAProbe
preparationProbe
preparation
TC, BR, Seq
Array construction
Array construction
HybridisationHybridisation
Array Scanning
Array Scanning
ImageAnalysis Image
Analysis
Material Flow Information Flow
HARDWARE:BR: Biorobot ,CP: Colony Picker ,FR: Fluorescence Reader ,HC: HybridizationMA: Micro Arrayer , MS: Micro Array Scanner , OS: OligonucleotideSynthesizer , PL: PlateLoader , TC: Thermal Cycler , Seq : Sequencer .
SOFTWARE: SA: Sequence Analysis ,IA: Image Analysis , DI: Data Intergration
SequencingSequencing
TargetPreparation
TargetPreparation
MS
HC
MA, PL
PC, IA
Data AnalysisStorage
Data AnalysisStorage
PC, DI
Library construction
Library construction
CPBR, TCLibrary
arrayLibrary
array
Data BankData Bank
Design ofOligos
Design ofOligos
OligoSynthesis
OligoSynthesis
OS
SAProbe
preparationProbe
preparation
TC, BR, Seq
Array construction
Array construction
HybridisationHybridisation
Array Scanning
Array Scanning
ImageAnalysis Image
Analysis
Material Flow Information Flow
HARDWARE:BR: Biorobot ,CP: Colony Picker,FR: Fluorescence Reader,HC: HybridizationMA: Micro Arrayer , MS: Micro Array Scanner, OS: OligonucleotideSynthesizer , PL: PlateLoader , TC: Thermal Cycler , Seq : Sequencer .
SOFTWARE: SA: Sequence Analysis ,IA: Image Analysis , DI: Data Intergration
Figure 1. Microarray project flow chart
Microarray Biochip Technology by Mark Schena, BioTechniques Books.
Figure 2. Flow chart of two color microarray experiments

Proceedings of the 67th IIRB Congress, February 2004, Brussels (B) 213
GENETICS AND BREEDING – GÉNÉTIQUE ET SÉLECTION
GENETIK UND ZÜCHTUNG
Figure 3. Amplification of cDNA clones.Sugar beet cDNA clones were amplified by PCR and analyzed on agarosegels. The picture revealed some PCR products inappropriate for furtheranalysis either due to their low yield or due to multiple band amplification.Those samples were not included in the microarrays. See arrows for someexamples. M: DNA molecular weight standard.
Figure 4. SYBR Green II stainingThis fluorescent labeling indicates the presence of DNA in the spots andreveals the spot size and morphology. However, this method cannot be usedfor quantification of the DNA deposited on each spot.

In order to compare the expression profiles of leaf and root tissues, mRNA wasisolated from these two tissues of a field grown variety and labeled with twodifferent fluorescent dyes, alexa 546 and alexa 647. In another experiment, acomparison was made for the expression profiles of two almost identicalgenotypes grown under two different conditions i.e. field (FG) and greenhouse(GH). For the latter comparison, mRNA was isolated from leaf tissues. All sets ofsamples have been treated similarly in terms of labeling as well as in any furtherstep of the procedure and in every case the two samples of each pair werepurified, mixed and used together for the hybridization of a microarray slide. Afterthe appropriate washes the slide was scanned with a confocal laser scanner inorder to produce two images (one for every label) illustrating the fluorescenthybridized spots. The images produced were analyzed with an automated imageanalysis program that corrects the background, recognizes the spots and marksthem.
The images were transformed to present the two fluorescent dyes with twodifferent pseudocolors, red and green, and then they were combined to producea false color overlay image. The color emerging for a single spot variesaccording to the relative expression level of the gene that it represents. Yellowspots illustrate genes equally expressed and red or green spots illustrate genesdifferentially expressed (fig. 5, 6).
The final output of the image analysis process was a list of numbers describingthe intensity of fluorescence of each spot, for two channels A and B. The datawere represented on a graphical display, which facilitates their rapidassessment. A scatter plot of the two channel intensities is the most commongraphical display of a cDNA microarray experiment. The points close to thediagonal indicate that these genes display similar levels of expression, betweenthe samples tested. The points away from the diagonal indicate differentiallyexpressed genes. Normalization and evaluation of data was carried out withrespect to RNA spike in controls added externally at defined amounts and withthe use of statistical analysis program.
Genes that were identified as differentially expressed in each of the pairedsamples examined, were then easily retracted from the frozen stock library inorder to confirm the observed difference using Northern blot analysis.Subsequently, the confirmed genes were identified by sequence analysis.
Interestingly, the sequence analysis of clone IJ15 (shown on graphical display –fig.7 and on Northern blot – fig. 8), differentially expressed only under fieldgrowing conditions, revealed 60% identity to glp3 cDNA of Pisum sativum whichencodes for germin-like protein 3, an extracellular matrix protein known to beinvolved in development, stress response and defense against pathogens in theplants. This germin-like protein was found associated to enhanced sugar beetgermination and consequently field emergence (De Los Reyes and McGrath,2003).
214 Proceedings of the 67th IIRB Congress, February 2004, Brussels (B)
POSTER PRESENTATIONS - COMMUNICATIONS POSTER - POSTER PRÄSENTATIONEN

Proceedings of the 67th IIRB Congress, February 2004, Brussels (B) 215
GENETICS AND BREEDING – GÉNÉTIQUE ET SÉLECTION
GENETIK UND ZÜCHTUNG
Figure 5. False colour overlay images / Root vs Leaf.Experiment comparing the expression profiles of the root and the leaf of a fieldgrown sugar beet variety. Red spots represent cDNAs expressed in the rootwhile green spots represent cDNAs expressed in the leaf. Yellow spotsrepresent cDNAs expressed in both tissues. With this experiment genes withtissue specific expression can be identified.
Figure 6. False colour overlay images / FG vs GH.Microarray experiment comparing the expression profiles under field(stressed) and greenhouse (non-stressed) conditions. Green spots representcDNAs expressed in greenhouse (GH) and red spots represent cDNAsexpressed in the field (FG). Yellow and orange spots represent cDNAsexpressed in both conditions.

216 Proceedings of the 67th IIRB Congress, February 2004, Brussels (B)
POSTER PRESENTATIONS - COMMUNICATIONS POSTER - POSTER PRÄSENTATIONEN
Fluorescence intensity in channel B
10
100
1000
10000
100000
10 100 1000 10000 100000
Fluo
resc
ence
inte
nsity
in c
hann
el A
10
100
1000
10000
100000
100 1000 10000 100000
Figure 7. Graphical display of analysis of clone IJ15.Data obtained from the image analysis of the sugar beet microarray FG vsGH scatter plot: the plot of the two channel intensities in logarithmic scale.The points away from the diagonal represent differentially expressed genes.The “cloud” of data represents the distribution of spot intensities. The spotindicated with the red arrow represents the cDNA clone 1J15. For this spotfluorescence intensity in channel A (fluorescence used for labeling of the FGsample) was 20-fold higher than fluorescence intensity in channel B(fluorescence used for labeling of the GH sample).
Figure 8. Northern BlotTotal RNA extracted from plants under both growing conditions was run onformaldehyde denaturing agarose gel and transferred on nylon membrane.cDNAs corresponding to either red or green spots were labeled and used forNorthern analysis in order to reconfirm the microarray results. Clone 1J15,identified as a red spot, is expressed only in field grown material. The Betavulgaris housekeeping gene V-type ATPase (large subunit) was is used as acontrol.
GH
tot
al R
NA
FG
to
tal R
NA
Beta vulgaris V-type H+ATPase
Clone 1J15

GENERAL REMARKS
The DNA microarray technology is a very powerful, holistic approach of geneexpression and gene function analysis. It requires high numbers of high qualityinput material in order to ensure results with high degree of precision, solidityand biological significance. It employs high fidelity automation of serialprocesses, advanced technology for image analysis and computer-basedmethods of statistical analysis of the massive-scale data produced. As laborious,complex and expensive as this multifarious technology may seem, with this workwe wish to propose that it is nevertheless possible to make it accessible toeveryone interested in taking advantage of its potential.
The construction of microarrays is a process that involves a series of preparationsteps that require careful design. For this purpose, there are a number ofdecisions that need to be taken and a number of quality control assays thatneed to be developed. The sequence and the amount of probe deposited ineach spot are critical for the quality of the spots generated on a microarray slide.The availability of advanced techniques for large-scale sequencing and forchemical synthesis of oligonucleotides can help overcome possible errorsoccurring from the overgrowth of contaminating sequences produced with theamplification of cDNA clones with PCR. This makes oligonucleotide libraries formicroarrays more and more popular. Adequate quantity of DNA deposited in thespots, the integrity of mRNA during isolation and a sophisticated method forcorrecting and normalizing the output data of image analysis are some examplesof the major issues that need to be controlled carefully.
This technology has already produced significant results in many different areasof application. In the area of sugar beet genetic improvement it is expected thatthe expression profiles from various varieties, tissues and growth conditions willbring to light new genes and gene functions in the species. The characteristicpatterns of gene expression in every case will allow for the establishment ofexpression signatures for the selection of desired traits. Furthermore, theexpression profiles will assist in elucidating networks of complex molecularpathways that underlie plant’s resistance mechanisms against biotic and abioticstresses.
REFERENCES
• BLALOCK, E. Beginner’s Guide to Microarrays. Kluwer Academic Publishers.2003.
• BOWTELL, D. and SAMBROOK, J. DNA Microarrays. A Molecular cloningmanual. CSHL PRESS.2002.
• CHOMCZYNSKI, P. and SACCHI, N. Single-Step Method of RNA Isolation byAcid Guanidium Thiocyanate-Phenol-Chloroform Extraction. AnalyticalBiochemistry 162: 156-159, 1987.
Proceedings of the 67th IIRB Congress, February 2004, Brussels (B) 217
GENETICS AND BREEDING – GÉNÉTIQUE ET SÉLECTION
GENETIK UND ZÜCHTUNG

• DE LOS REYES, B. and MCGRATH, M. Cultivar-specific seedling vigor andexpression of a putative oxalate oxidase germin-like protein in sugar beet(Beta vulgaris L.). Theoretical and Applied Genetics 107(1): 54 – 61, 2003.
• KRAFT, T. Molecular markers-where are we today? Proc. of the 64th IIRBCongress: 159-166, 2001.
• SCHOLTEN, O. and W. LANGE. Breeding for resistance to rhizomania insugar beet: A review. Euphytica 112: 219-231, 2000.
• SKARACIS, G.N. Molecular breeding of sugar beet. In: Genetics andBreeding of Sugar Beet, Biancardi, E., Cambell, L., Skaracis, G.N. and DeBiaggi, M. (Eds.) Science Publishers, Inc. (in press), 2004.
218 Proceedings of the 67th IIRB Congress, February 2004, Brussels (B)
POSTER PRESENTATIONS - COMMUNICATIONS POSTER - POSTER PRÄSENTATIONEN

GERMINATION TEST OF SUGAR BEET SEED
G. GYLLENSPETZ1, U. MEYER1, G. APOSTOLIDES1, M. BLOMBERG2,B. DESPREZ1, J.A. ESTEBAN BASELGA1, J. FAUCHÈRE1, P. JANSEN1,
K. JUNGWIRTH1, P. HALMER1, M. JØRSBOE1, E. LADEWIG1,2,J. LÉCHAPPÉ1, E. SLIWINSKA1, M. TITS1, B. DE VERGNES1
1 Members of the Study Group Seed Quality and Testing2 Institute of Sugar Beet Research, Göttingen, Germany
ABSTRACT
For sugar beet seed germination tests are ruled out by ISTA (International SeedTesting Association). Despite the application of these rules differing resultsbetween laboratories may occur, especially if lower temperatures are in use. Inorder to minimize possible deviation a more detailed description of thegermination test was developed over several years by collaboration of 11laboratories in 9 European countries.
BESTIMMUNG DER KEIMFÄHIGKEIT BEIZUCKERRÜBENSAATGUT
KURZFASSUNG
Die Bestimmung der Keimfähigkeit für Saatgut bei Zuckerrüben wird nach denRegeln der ISTA (International Seed Testing Association) durchgeführt. Trotz derAnwendung dieser Regeln kann es, insbesondere bei Anwendung niedrigerTemperaturen, zwischen Laboren zu abweichenden Ergebnissen kommen. Umdiese möglichen Abweichungen gering zu halten wurde in Zusammenarbeit mit11 Laboren in 9 europäischen Ländern über mehrere Jahre eine gegenüberISTA detailliertere Methodenbeschreibung erarbeitet.
TEST DE GERMINATION DES GRAINES DE BETTERAVESUCRIERE
ABRÉGÉ
Les tests de germination des graines de betteraves sucrières sont réglementéspar l’ISTA (Association Internationale de Tests de Germination). Malgrél’application de ces réglementations, il existe des différences entre leslaboratoires. Afin de minimiser ces déviations, une description plus détaillée dutest de germination a été élaborée sur plusieurs années en collaboration avec11 laboratoires dans 9 pays d’Europe.
Proceedings of the 67th IIRB Congress, February 2004, Brussels (B) 219
GENETICS AND BREEDING – GÉNÉTIQUE ET SÉLECTION
GENETIK UND ZÜCHTUNG

INTRODUCTION
For sugar beet seed germination tests are ruled out by ISTA (International SeedTesting Association). Despite the application of these rules differing resultsbetween laboratories may occur, especially if lower temperatures are in use. Inorder to minimize possible deviation a more detailed description of thegermination test was developed over several years by collaboration of 11laboratories in 9 European countries. This article presents a completedescription of the methodology of germination test for sugar beet.
METHODOLOGY
Type of seed to be tested:
n Pelleted seeds
Equipment:
n Plastic germination seed boxes. Different boxes can be used:• Length 19 (± 2 cm)• Wide 14 (± 2 cm)• Height 4 (± 1 cm)
n Pleated paper and covering paper, white or grey• Schleicher & Schuell GmbH
Hahnestr. 337586 DasselTel.: 49-05561/7910Fax: 49-05561/791533
• Pleated paper, white Art-Nr. 10344672• Pleated paper, grey Art-Nr. 10345572• Covering paper, white Art-Nr. 10334365
n Climate chamber or incubator
220 Proceedings of the 67th IIRB Congress, February 2004, Brussels (B)
POSTER PRESENTATIONS - COMMUNICATIONS POSTER - POSTER PRÄSENTATIONEN

Procedure:
1. 4 replicates of 100 seeds should be used. These 400 seeds must be takenat random from the sample.
2. Each replicate should be placed in a drypleated paper. This can be done with thepaper inside or outside the box. Two seedsare placed in each pleat on opposite sides ofthe pleat. The seeds are placed at least 2-3cm from the edge of the filter paper. Theseeds should be placed at the bottom of thepleat in a zigzag manner.
3. The covering filter paper should be placed inthe germination box in such a way that thelength of the covering paper is equal at bothends of the box. The pleated paper is thenplaced on top of the open covering paper.
4. After placing the pleated paper in the box thecovering paper is folded over the top of thepleat before watering.
5. 40 ml +-1ml of water at 20°C ± 2°C should be used.
6. The water must be poured carefully over the top of the covering paper. Thepaper must absorb all water before closing the box.
7. When the four replicates have been completed they placed in a darkgermination chamber or incubator, which is calibrated to 20°C ± 1,0°C. As arecommendation the temperature should be as close as possible to 20°C. Asecond investigation shall be done 2003 on 15°C and 20°C.
Proceedings of the 67th IIRB Congress, February 2004, Brussels (B) 221
GENETICS AND BREEDING – GÉNÉTIQUE ET SÉLECTION
GENETIK UND ZÜCHTUNG

Counting:
4 day count:
After 96 hours ± 1 hour the first germination count is made.
1. This count must be done with the filter paper inside the germination box.
2. A mark is made on the pleated paper againsteither the germinated or ungerminated seeds.
3. A seed shall be counted as germinated if thereis a starting of germination seen root tipvisible. Note if there is brownness orblackness on the root, starting from the seednearest the cortex (primary infection). Theseedling is not counted as germinated even ifthere is a germ.
4. If a clear abnormal germ (see 7 days count) this germ is not counted asgerminated. The final decision will be taken at 7 days count if germinated orabnormal.
7 day count:
After 7 days a final germination count is made.
1. The same rule for measuring the germination is used as in the 4-day count.
2. The non-germinated seeds in the final counting are examined as follows:
222 Proceedings of the 67th IIRB Congress, February 2004, Brussels (B)
POSTER PRESENTATIONS - COMMUNICATIONS POSTER - POSTER PRÄSENTATIONEN

Normal germs
Abnormal germs
Proceedings of the 67th IIRB Congress, February 2004, Brussels (B) 223
GENETICS AND BREEDING – GÉNÉTIQUE ET SÉLECTION
GENETIK UND ZÜCHTUNG
Broken germs not caused by the counting method (left)Missing roots (middle)Leaves emerging first (right)
Curly (left)Too small leaves and roots (middle)Glassy (right)
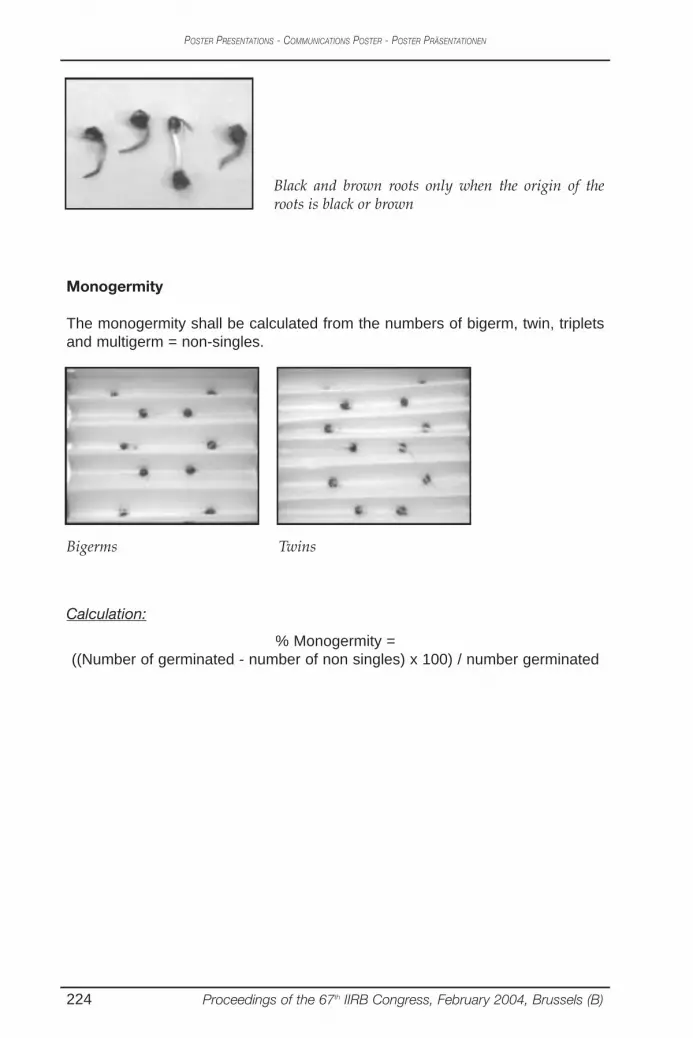
Monogermity
The monogermity shall be calculated from the numbers of bigerm, twin, tripletsand multigerm = non-singles.
224 Proceedings of the 67th IIRB Congress, February 2004, Brussels (B)
POSTER PRESENTATIONS - COMMUNICATIONS POSTER - POSTER PRÄSENTATIONEN
Black and brown roots only when the origin of theroots is black or brown
Bigerms Twins
Calculation:
% Monogermity = ((Number of germinated - number of non singles) x 100) / number germinated

COMPARISON OF METHODS TO MEASURETHE SPHERICITY OF SEED
P. HALMER1), M. BLOMBERG2), J. FAUCHÈRE1), G. GYLLENSPETZ1),E. LADEWIG2), J. LÉCHAPPÉ1), U. MEYER1), M. TITS1),
B. DE VERGNES1)
1) Members of the Image Analysis Study Subgroup 2) Institute of Sugar Beet Research, Göttingen, Germany
ABSTRACT
We report a study carried out to compare the sphericity index values calculatedon pelleted seed samples using three different measurement principles: [1] acommercially-available image analysis method (3D) that captures views ofindividual seeds falling under gravity; [2] two different (2D) image analysismethod systems that captures images of individual seeds lying flat on a flatsurface; [3] size screening of a population of seeds using round-hole and slot-hole sieve screens. To calculate the sphericity index (value = 1 for perfectsphericity): in [1] and [2] ratios of minimum and maximum diameters determinedby computer algorithms were used to calculate a sphericity index for individualseeds; in [3] a ratio is calculated between the median seed-size valuesdetermined by the two series of screens. Pelleted seed with three basic differentgeometric ellipsoid shapes were used, made from seed of brassica, lettuce andtomato; the 3 shapes were mixed in different proportions to produce six‘unknown’ samples for comparative analysis. Results showed close conformance between the sphericity values obtained bythe three laboratories equipped with the same 3D system. Results from the 2Dsystems produced higher means sphericity index values than the 3D system,and also differed from each other. The size screening analysis in generalproduced sphericity values intermediate between the 3D and the two 2Dsystems. These results can be partly explained by the different geometricaspects of the seed measured by the three systems.
METHODENVERGLEICH ZUR ERFASSUNG DER RUNDHEIT VONSAATGUT
KURZFASSUNG
Der Beitrag vergleicht den Rundheits-Index von pelletierten Saatgutproben mitdrei unterschiedlichen Messprinzipien. Methode [1] war ein kommerziellverfügbares Bild-Analyse System (3D), welches Aufnahmen vom fallendenSaatkorn machte. Bei Methode [2] wurden zwei verschiedene Bild-Analyse-
Proceedings of the 67th IIRB Congress, February 2004, Brussels (B) 225
GENETICS AND BREEDING – GÉNÉTIQUE ET SÉLECTION
GENETIK UND ZÜCHTUNG

Methoden (2D) genutzt, um Aufnahmen von einem einzigen Saatkorn, welchesflach auf einer ebenen Oberfläche liegt, zu machen. Die dritte Methode [3] war diekonventionelle Siebung einer Saatgutpartie mit Rundloch- und Langlochsieben.Der Rundheitsindex wurde bei Methode [1] und [2] mit Hilfe einesComputeralgorithmus errechnet. Dabei wurde der Quotient des minimalen undmaximalen Durchmessers des Saatgutes gebildet (ein Wert von eins entsprichtvollkommener Rundheit). Beim Verfahren [3] wurde der Quotient aus der mittlerenSaatkorngröße mittels Rundloch- und Langlochsiebung gebildet. Es wurdepilliertes Saatgut mit drei verschiedenen geometrischen Grundformen verwendet:Raps, Salat und Tomate. Das Saatgut wurde für eine vergleichende Analyse zusechs Proben mit unterschiedlichen Mischungsverhältnissen unterteilt. Die Untersuchungen ergaben eine enge Übereinstimmung der Ergebnissezwischen den drei 3D-Systemen. Die 2D-Systeme ergaben höhere Rundheits-Index Mittelwerte als das 3D-System und waren untereinander nicht so gutvergleichbar. Die konventionelle Siebtechnik ergab Werte, die zwischen der 3D-und der 2D-Technik lagen. Die variierenden Ergebnisse der drei Systemekönnen teilweise mit der unterschiedlichen geometrischen Form des Saatguteserklärt werden.
COMPARAISON DE METHODES DE MESURE DE LA SPHERICITEDE LA GRAINE
ABRÉGÉ
Nous présentons les résultats d’une étude portant sur la comparaison desvaleurs index de sphéricité, calculées sur des échantillons de graines enrobéesà l’aide de trois principes de mesure : [1] une méthode d’analyse par l’imagedisponible dans le commerce (3D) et qui permet d’accéder à des vues degraines individuelles qui tombent par gravité; [2] deux méthodes différentesd’analyse par l’image (2D) qui captent des images de graines individuelles à plat; [3] le criblage d’une population de graines en utilisant des tamis à maillesrondes et mailles allongées. Pour calculer l’index de sphéricité (valeur = 1 poursphéricité parfaite): avec la méthode [1] et [2] on a utilisé des rapports dediamètres minimum et maximum déterminés par algorithmes ordinateurs pourcalculer l’index de sphéricité pour des graines individuelles; en [3] un rapport estcalculé entre les valeurs de grandeurs moyennes comme déterminées par lesdeux séries de tamis. Les graines enrobées de forme ellipsoïde géométrique ontété utilisées, comportant des graines de chou, de laitue et tomate; les 3 formesont été mélangées dans des proportions diverses afin de produire sixéchantillons ‘inconnus’ pour analyse comparative. Les résultats ont établi une conformité très proche entre les valeurs de sphéricitéobtenues par les trois laboratoires équipés avec le même système 3D. Lesrésultats des systèmes 2D ont produit des valeurs index de sphéricité plusélevées que le système 3D system, et également différentes entre-elles.L’analyse par criblage a généralement produit des valeurs de sphéricitéintermédiaires à celles de 3D et des deux systèmes 2D. Ces résultats peuvents’expliquer par les aspects géométriques différents des graines mesurées parles trois systèmes.
226 Proceedings of the 67th IIRB Congress, February 2004, Brussels (B)
POSTER PRESENTATIONS - COMMUNICATIONS POSTER - POSTER PRÄSENTATIONEN

INTRODUCTION
This study compares the sphericity index values calculated on pelleted seedsamples using three different measurement principles and to identify causalfactors affecting results from alternative laboratory seed image analysissystems.
An earlier study (TITS, M. & LEVEQUE, E., 2001) produced good results withthe comparability between 3D systems, but there existed a discrepancy to 2Dsystems and conventional size-screening. A comparison between photometricmethods and conventional size-screening was carried out by a subgroup in amethodological trial.
Sphericity index is the ratio between the smallest apparent diameter to thelargest apparent; the value is one for perfect sphericity. The mean sphericityindex value was considered to be the threshold value for concern in sugar beetin some French seed drills.
MATERIAL AND METHODS
Three different measurement principles were used: [1] an image analysismethod (3D) that captures views of individual seeds falling under gravity; [2] twodifferent (2D) image analysis systems that capture images of individual seedslying on a flat surface; [3] size screening of a population of seeds using round-hole and slot-hole sieve screens.
The sphericity index was calculated using the ratios of minimum and maximumdiameters determined by computer algorithms in [1] and [2], and the ratiobetween the median population seed-size values determined by the two seriesof screens in [3].
Pelleted seed with three basic different geometric ellipsoid shapes were madefrom seed of brassica, lettuce and tomato. Brassica has a round shape, whereaslettuce and tomato have flattershapes. The three shapeswere mixed in differentproportions to produce six‘unknown’ samples forcomparative analysis, all withcalculated mean sphericityindexes around 0.8 accordingto the 3D system.
Proceedings of the 67th IIRB Congress, February 2004, Brussels (B) 227
GENETICS AND BREEDING – GÉNÉTIQUE ET SÉLECTION
GENETIK UND ZÜCHTUNG
Fig.1: Delta Technologies “pseudo3D” system. Three camerascapture views of individual seedfalling under gravity.
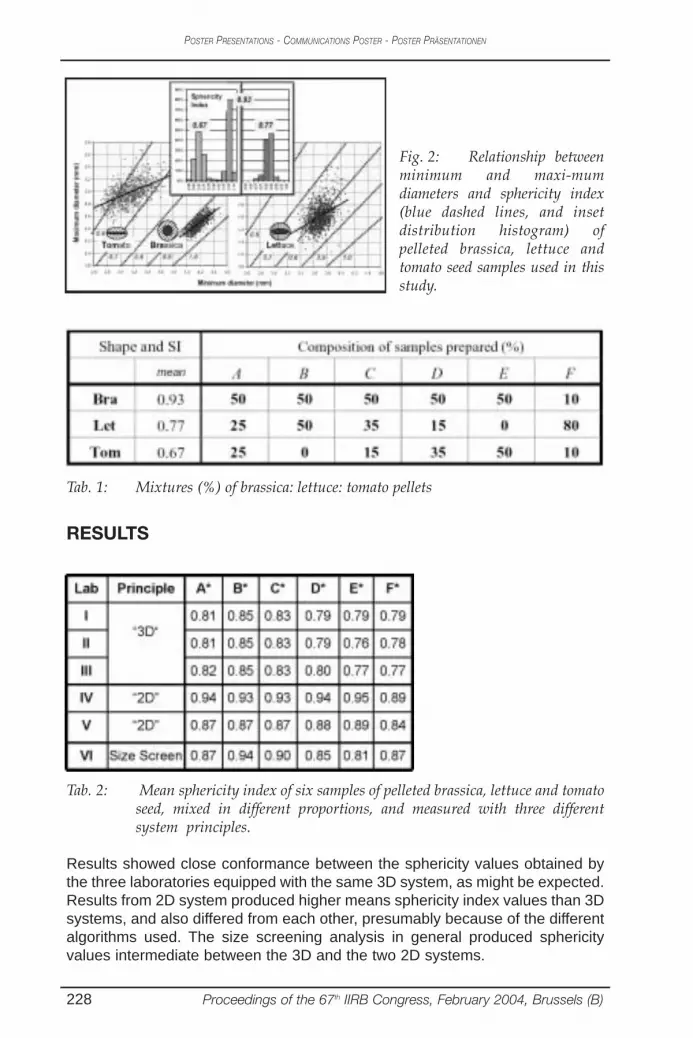
Tab. 1: Mixtures (%) of brassica: lettuce: tomato pellets
RESULTS
228 Proceedings of the 67th IIRB Congress, February 2004, Brussels (B)
POSTER PRESENTATIONS - COMMUNICATIONS POSTER - POSTER PRÄSENTATIONEN
Fig. 2: Relationship betweenminimum and maxi-mumdiameters and sphericity index(blue dashed lines, and insetdistribution histogram) ofpelleted brassica, lettuce andtomato seed samples used in thisstudy.
Tab. 2: Mean sphericity index of six samples of pelleted brassica, lettuce and tomatoseed, mixed in different proportions, and measured with three differentsystem principles.
Results showed close conformance between the sphericity values obtained bythe three laboratories equipped with the same 3D system, as might be expected.Results from 2D system produced higher means sphericity index values than 3Dsystems, and also differed from each other, presumably because of the differentalgorithms used. The size screening analysis in general produced sphericityvalues intermediate between the 3D and the two 2D systems.

Fig. 3: “3D” sphericity distribution sample A (left); “2D” sphericity distributionsample A (right)
CONCLUSION
These results can be partly explained by the different geometric aspects of theseed measured by the three systems. Each system measures the ratio betweena different combination of the three ellipsoid 'diameters' (i.e., the smallest,intermediate and largest axes). In the 2D system, seeds lie flat and do not 'show'their smallest dimension, unlike falling seeds in the 3D system which show boththe smallest and largest dimension. Screening methods do not 'detect' thelargest diameter of a seed: only the smallest and intermediate diameters.
The question remaining to be addressed in further research is: which SI valuesare most meaningful for seed handling performance through which drills?"
REFERENCES
1. TITS, M. & LEVEQUE, E.: Caracteristiques physiques de lots de graines, in :Proceedings of the 64th IIRB Congress, Bruges, 293-302, 2001.
ACKNOWLEDGEMENTS
We thank Martin Williams (Germain’s Technology Group – GTG) for pelleting theseed samples, and Bob Osborne (GTG), Jean Francois Legarde (Syngenta),and Maria Rosaria Mannino and Didier Demilly (GEVES-SNES) for help withpreliminary data analysis.
Proceedings of the 67th IIRB Congress, February 2004, Brussels (B) 229
GENETICS AND BREEDING – GÉNÉTIQUE ET SÉLECTION
GENETIK UND ZÜCHTUNG
Sphericity Index
0.0 0.2 0.4 0.6 0.8 1.0
0
10
20
30
40
50D
istr
ibut
ion
(in %
)
Sphericity Index
0.0 0.2 0.4 0.6 0.8 1.0
0
10
20
30
40
50