Embed Size (px)
Citation preview

The Engineering Meetings Board has approved this paper for publication. It has successfully completed SAE’s peer review process under the supervision of the session organizer. This process requires a minimum of three (3) reviews by industry experts. All rights reserved. No part of this publication may be reproduced, stored in a retrieval system, or transmitted, in any form or by any means, electronic, mechanical, photocopying, recording, or otherwise, without the prior written permission of SAE. ISSN 0148-7191 Positions and opinions advanced in this paper are those of the author(s) and not necessarily those of SAE. The author is solely responsible for the content of the paper. SAE Customer Service: Tel: 877-606-7323 (inside USA and Canada) Tel: 724-776-4970 (outside USA) Fax: 724-776-0790 Email: [email protected] SAE Web Address: http://www.sae.org
Printed in USA
2009-01-1184
Impact of Biodiesel Emission Products from a Multi-Cylinder Direct Injection Diesel Engine on Particulate Filter Performance
Amy Peterson, Po-I Lee and Ming-Chia Lai Wayne State University
Ming-Cheng Wu and Craig DiMaggio Delphi Corporation
Copyright © 2009 SAE International
ABSTRACT
As diesel emission regulations continue to increase, the use of exhaust aftertreatment systems containing, for example the diesel oxidation catalyst (DOC) and diesel particulate filter (DPF) will become necessary in order to meet these stringent emission requirements. The addition of a DOC and DPF in conjunction with utilizing biodiesel fuels requires extensive research to study the implications that biodiesel blends have on emissions as well as to examine the effect on aftertreatment devices.
The proceeding work discusses results from a 2006 VM Motori four-cylinder 2.8L direct injection diesel engine coupled with a diesel oxidation catalyst and catalyzed diesel particulate filter. Tests were done using ultra low sulfur diesel fuel blended with 20% choice white grease biodiesel fuel to evaluate the effects of biodiesel emission products on the performance and effectiveness of the aftertreatment devices and the effect of low temperature combustion modes.
INTRODUCTION
In light of the stringent diesel emission regulations in the European and US markets, the addition of aftertreatment emission systems is essential to meet EPA requirements. In addition, the rapidly increasing cost for fossil fuels as well as the pursuit of environmental conservation has brought about an interest in a renewable and clean burning fuel, specifically biodiesel. Neat biodiesel is a renewable energy source with
properties similar to that of diesel fuel, making its implementation in diesel engines appealing.
Biodiesel is a renewable fuel consisting of the mono-alkyl ester, or long chain fatty acid, derived from vegetable oils, animal fats, or waste oils [1]. In addition, all production biodiesel is tested and must conform to ASTM D6751 standards. Those not meeting these standards are technically not biodiesel, thereby protecting the quality and integrity of each batch of biodiesel produced and distributed for consumer use. Biodiesel or “neat” biodiesel refers to the pure fuel before it is mixed with diesel fuel. Biodiesel blends are denoted as BXX where XX refers to the percentage by volume of biodiesel added to the diesel fuel. It is completely soluble in petroleum based diesel fuel with the majority of blending up to 20 percent.
Early reported research of biodiesel blends on engine emissions indicates a reduction of CO, PM, and THC with a slight increase in NOx [2, 3]. However, the impact of NOx is more controversial with current studies reporting NOx emissions to be similar and possibly lower than that of ULSD emissions based on the engine strategy used [4-6].
Previous studies on biodiesel have found on average a 20% reduction of PM emissions with the use of B20 [7]. Analysis of the soot produced using B20 indicates a lower brake-even temperature [8], as well as increased reactivity and amorphous soot structure formation [9]. This effect on B20 soot is of interest with the lower PM
*9-2009-01-1084*
emission regulations and the possibility of enhanced performance of diesel particulate filters.
Studies published by Williams and coworkers [10] report a lower balance point temperature and faster regeneration rate with B20 and a catalyzed DPF for the heavy-duty application. Similar findings were reported by Tatur et. al [11] although focus is on the light duty application and an active regeneration strategy is used.
The addition of a diesel particulate filter for the light duty application in conjunction with biodiesel fuels warrants further research. This paper will focus on the performance of aftertreatment systems using a light duty diesel engine and analyze the impact of B20 on loading, regeneration rate, fuel oil dilution, and the low temperature combustion regime.
EXPERIMENTAL SETUP
The engine used in this experiment is a 2006 model year 2.8L 120kW VM Motori DI diesel engine accompanied by a diesel oxidation catalyst (DOC) and catalyzed diesel particulate filter (DPF) aftertreatment emission system. The engine utilizes a variable geometry turbocharger, common rail, and cooled high pressure EGR calibrated to meet current emission standards. The basic engine specifications are shown in table 1.
Table 1. Engine Specifications
Cylinders 4
Displacement (L) 2.8
Rated Power (kW) 120 @ 3800 rpm
Rated Torque (Nm) 400 @ 1800 rpm
Bore x Stroke (mm) 94 x 100
Compression Ratio 17.5:1
Fuel System Common Rail
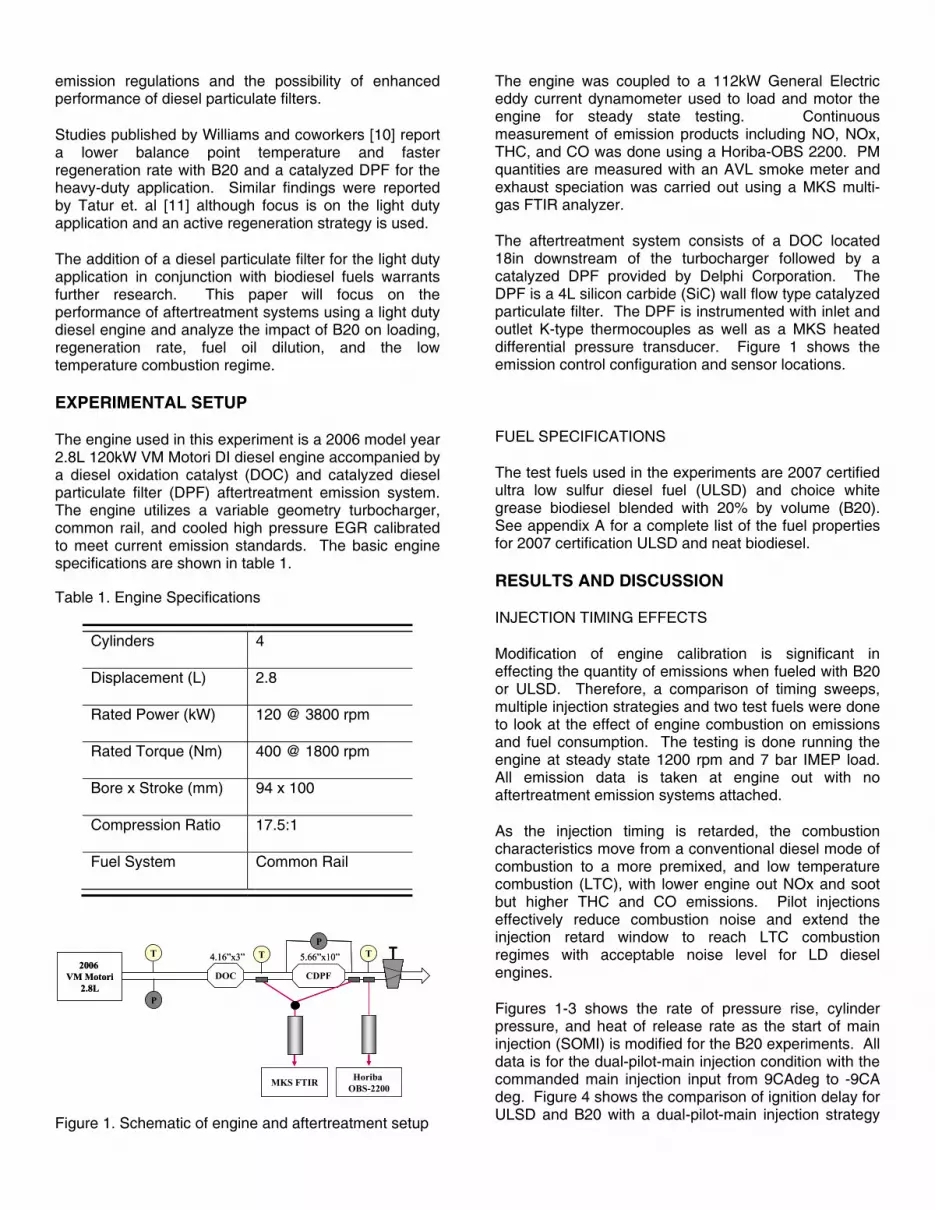
Figure 1. Schematic of engine and aftertreatment setup
The engine was coupled to a 112kW General Electric eddy current dynamometer used to load and motor the engine for steady state testing. Continuous measurement of emission products including NO, NOx, THC, and CO was done using a Horiba-OBS 2200. PM quantities are measured with an AVL smoke meter and exhaust speciation was carried out using a MKS multi-gas FTIR analyzer.
The aftertreatment system consists of a DOC located 18in downstream of the turbocharger followed by a catalyzed DPF provided by Delphi Corporation. The DPF is a 4L silicon carbide (SiC) wall flow type catalyzed particulate filter. The DPF is instrumented with inlet and outlet K-type thermocouples as well as a MKS heated differential pressure transducer. Figure 1 shows the emission control configuration and sensor locations.
FUEL SPECIFICATIONS
The test fuels used in the experiments are 2007 certified ultra low sulfur diesel fuel (ULSD) and choice white grease biodiesel blended with 20% by volume (B20). See appendix A for a complete list of the fuel properties for 2007 certification ULSD and neat biodiesel.
RESULTS AND DISCUSSION
INJECTION TIMING EFFECTS
Modification of engine calibration is significant in effecting the quantity of emissions when fueled with B20 or ULSD. Therefore, a comparison of timing sweeps, multiple injection strategies and two test fuels were done to look at the effect of engine combustion on emissions and fuel consumption. The testing is done running the engine at steady state 1200 rpm and 7 bar IMEP load. All emission data is taken at engine out with no aftertreatment emission systems attached.
As the injection timing is retarded, the combustion characteristics move from a conventional diesel mode of combustion to a more premixed, and low temperature combustion (LTC), with lower engine out NOx and soot but higher THC and CO emissions. Pilot injections effectively reduce combustion noise and extend the injection retard window to reach LTC combustion regimes with acceptable noise level for LD diesel engines.
Figures 1-3 shows the rate of pressure rise, cylinder pressure, and heat of release rate as the start of main injection (SOMI) is modified for the B20 experiments. All data is for the dual-pilot-main injection condition with the commanded main injection input from 9CAdeg to -9CA deg. Figure 4 shows the comparison of ignition delay for ULSD and B20 with a dual-pilot-main injection strategy
2006 VM Motori
2.8L
T
P
T
CDPF
T
DOC
MKS FTIR Horiba OBS-2200
P5.66”x10”4.16”x3”
2006 VM Motori
2.8L
T
P
T
CDPF
T
DOC
MKS FTIR Horiba OBS-2200
P5.66”x10”4.16”x3”

and commanded SOMI. The ignition delay is defined as the duration period between the start of fuel injection (SOMI) and the start of combustion (SOC). SOC is defined as the change in slope from negative to positive of the heat release analysis [12].
Figure 2. Rate of pressure rise for B20 experiments, dual-pilot-main injection sweep
Figure 3. Cylinder pressure rise for B20 experiments dual-pilot-main injection sweep
Figure 4. Heat release rate for B20 experiments dual-pilot-main injection sweep
Figure 5. Ignition delay for B20 and ULSD experiments for dual-pilot-main injection sweep
Fuel consumption
Analysis of the brake specific fuel consumption indicates an overall increase as the timing is retarded for all of the injection strategies used. Adding one pilot to the main injection develops a more premixed combustion, showing a decrease in overall fuel consumption.
On average, a 3% increase in fuel consumption was reported when using B20. This is consistent with the lower heating value of biodiesel. However, the injection strategy of one pilot and a main injection shows the best fuel economy, but dual-pilots have the best fuel economy and latest injection timing.
Figure 6. Comparison of timing and injection strategy on BSFC.
THC
The quantity of THC increases as the timing is retarded for both B20 and ULSD due to incomplete combustion and lower in-cylinder temperatures because of the late injection timing. However, comparing the different injection strategies, B20 produces 30% lower HC with one injection strategy as the timing is retarded, but the difference is negligible when one and two pilots are added. The less volatile components of biodiesel in the fuel accounts for the increase in THC for the main only
-4
-2
0
2
4
6
8
10
-40 -30 -20 -10 0 10 20 30 40
Crank Angle DegreeRat
e of
Pre
ssur
e R
ise
(bar
/CA
) SOMI 9CASOMI 3CASOMI 0CASOMI -3CASOMI -9CA
0
20
40
60
80
100
120
-60 -50 -40 -30 -20 -10 0 10 20 30 40 50 60Crank Angle Degree
Cyl
inde
r Pre
ssur
e (b
ar)
SOMI 9 CASOMI 3 CASOMI 0 CASOMI -3 CASOMI -9 CA
-20
0
20
40
60
80
100
-40 -30 -20 -10 0 10 20 30 40
Crank Angle Degree
Hea
t Rel
ease
Rat
e (J
/deg
)
SOMI 9CASOMI 3CASOMI 0CASOMI -3CASOMI -9CA
0.2
0.4
0.6
0.8
1
1.2
-10 -8 -6 -4 -2 0 2 4 6 8 10Crank Angle Degree
Igni
tion
Del
ay (m
s
ULSD
B20
150
160
170
180
190
200
210
220
230
240
-15 -10 -5 0 5 10 15
Main Timing (CAdeg)
BSF
C (g
/kW
hr)
ULSD Main ULSD Pilot-Main ULSD Dual-Pilot-Main
B20 Main B20 Pilot-Main B20 Dual-Pilot-Main

injection; however, pilot injection effects, the ignition delay, and the premixed burn fraction along with the oxygen content of the biodiesel seem to even out the volatility effects of the biodiesel fuel components. Furthermore, comparison of THC quantity independent of fuel indicates that as the number of pilot injections are increased, less HC are produced due to combustion phasing, higher temperature and better mixing.
Figure 7: Comparison of timing and injection strategy on THC.
CO
The trend of CO emissions is similar to that of the THC emissions. As the timing is retarded CO emissions increase independent of the injection strategy. However, increasing the number of pilots reduce up to 80% in CO emissions compared to a single injection event. The production of CO is very dependent on the injection timing. Severely retarding the timing with multiple injections for B20 produces slightly more CO than ULSD, but as the timing is advanced the differences are negligible.
Figure 8: Comparison of timing and injection strategy on CO.
NOx
One strategy of operating in the LTC regime is that NOx production will reduce as the timing is retarded. This is seen uniformly in figure 9, independent of fuel. An interesting thing to note is that the addition of one pilot lowers the NOx values for both fuels. However the addition of a second pilot increases the NOx values. Comparing the fuel effects, the difference in NOx emissions produced with B20 are insignificant for both the main-only and pilot-main injection strategies. However the addition of a second pilot indicates a 17% increase in the NOx values possibly due to significant increase in premixed burn fraction.
Figure 9: Comparison on timing and injection strategy on NOx.
PM
An important characteristic of DPF loading and regeneration is the effect of PM production. Not only is the fuel type important to characterize, but also the combustion regime used. Tests were done to evaluate the amount of soot generated utilizing different injection strategies as well as the fuel effect on these strategies.
As shown in figure 10, comparing the effect of advancing and retarding the timing on FSN number shows a reduction in the FSN number as the timing is retarded, a strategy of the LTC regime. This trend is seen independent of the fuel used. However, as you compare the FSN numbers fueled with biodiesel, B20 produces a lower FSN number than ULSD for the pilot injection cases. The reduction in FSN is most significant for two pilot injections.
Comparing the different injection strategies, utilizing only a main injection gives the lowest overall FSN. However at engine operating point utilizing only one or two injections gives approximately the same quantity of soot.
0
500
1000
1500
2000
2500
3000
3500
4000
4500
-10 -8 -6 -4 -2 0 2 4 6 8 10 12
Injection Timing (CAdeg)
TH
C (p
pm)
ULSD Main ULSD Pilot-Main ULSD Dual-Pilot-Main
B20 Main B20 Pilot-Main B20 Dual-Pilot-Main
0
500
1000
1500
2000
-10 -8 -6 -4 -2 0 2 4 6 8 10 12
Injection Timing (CAdeg)
CO
(ppm
)
ULSD Main ULSD Pilot-Main ULSD Dual-Pilot-Main
B20 Main B20 Pilot-Main B20 Dual-Pilot-Main
0
50
100
150
200
250
-10 -8 -6 -4 -2 0 2 4 6 8 10 12
Main Injection Timing (CAdeg)N
Ox
ppm
ULSD Main ULSD Pilot-Main ULSD Dual-Pilot-Main
B20 Main B20 Pilot-Main B20 Dual-Pilot-Main
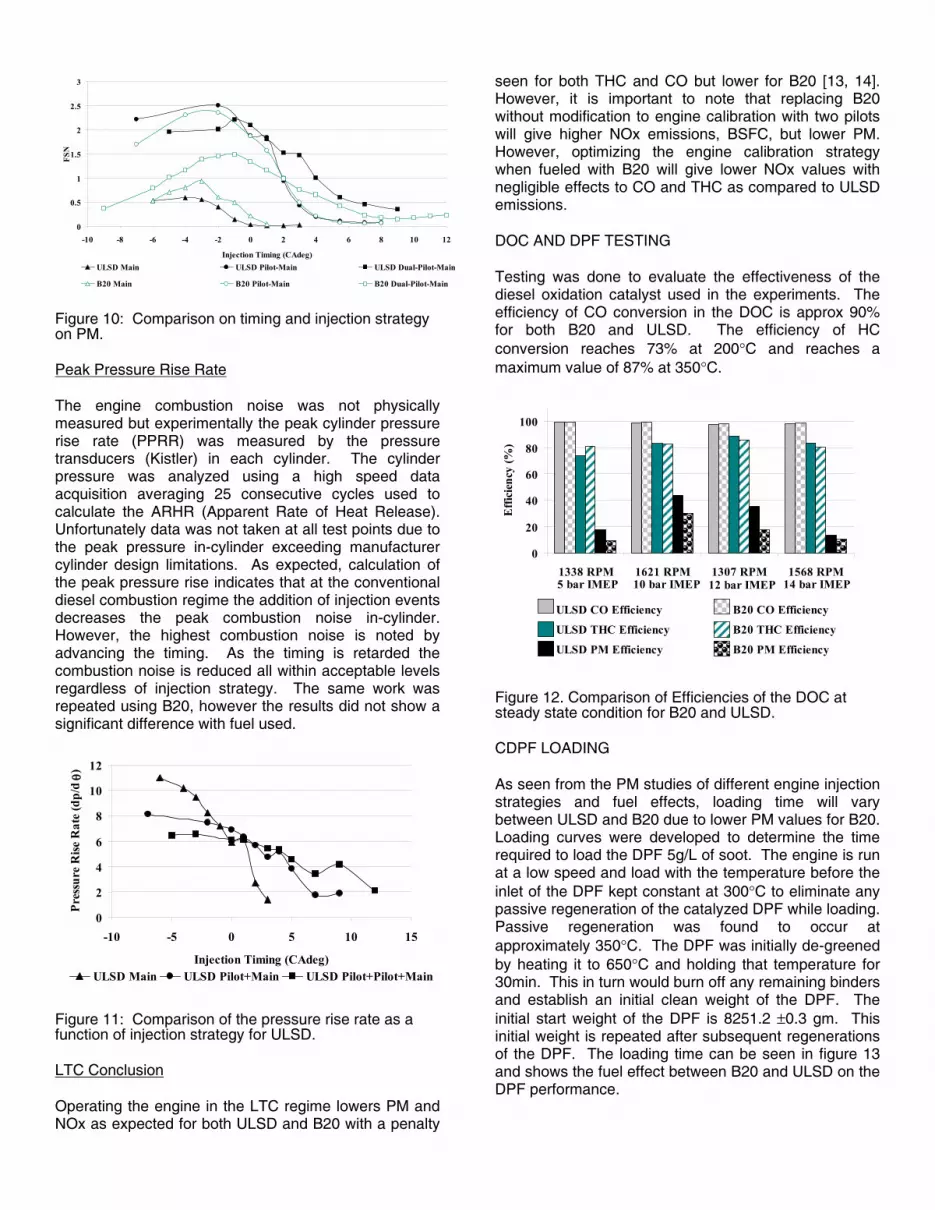
Figure 10: Comparison on timing and injection strategy on PM.
Peak Pressure Rise Rate
The engine combustion noise was not physically measured but experimentally the peak cylinder pressure rise rate (PPRR) was measured by the pressure transducers (Kistler) in each cylinder. The cylinder pressure was analyzed using a high speed data acquisition averaging 25 consecutive cycles used to calculate the ARHR (Apparent Rate of Heat Release). Unfortunately data was not taken at all test points due to the peak pressure in-cylinder exceeding manufacturer cylinder design limitations. As expected, calculation of the peak pressure rise indicates that at the conventional diesel combustion regime the addition of injection events decreases the peak combustion noise in-cylinder. However, the highest combustion noise is noted by advancing the timing. As the timing is retarded the combustion noise is reduced all within acceptable levels regardless of injection strategy. The same work was repeated using B20, however the results did not show a significant difference with fuel used.
Figure 11: Comparison of the pressure rise rate as a function of injection strategy for ULSD.
LTC Conclusion
Operating the engine in the LTC regime lowers PM and NOx as expected for both ULSD and B20 with a penalty
seen for both THC and CO but lower for B20 [13, 14]. However, it is important to note that replacing B20 without modification to engine calibration with two pilots will give higher NOx emissions, BSFC, but lower PM. However, optimizing the engine calibration strategy when fueled with B20 will give lower NOx values with negligible effects to CO and THC as compared to ULSD emissions.
DOC AND DPF TESTING
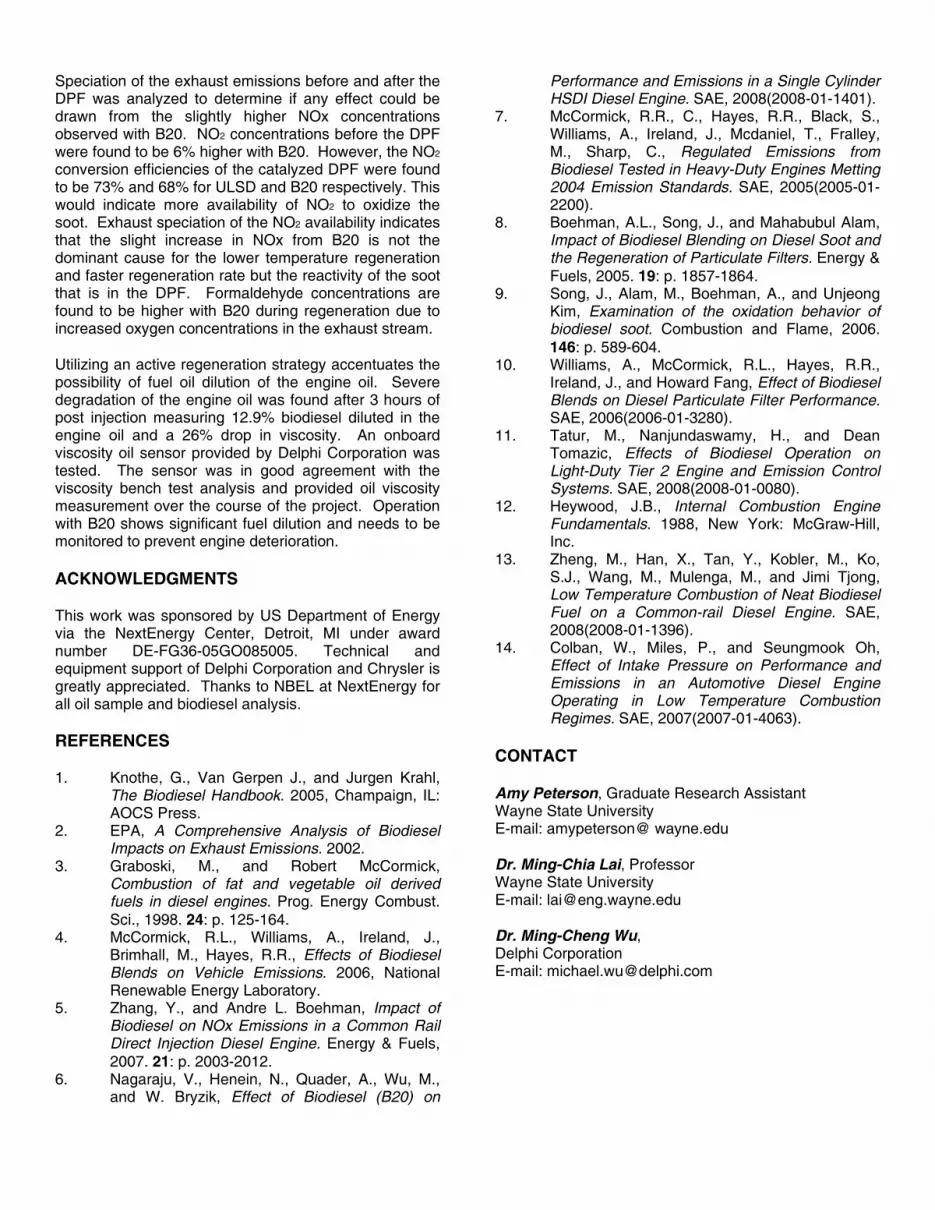
Testing was done to evaluate the effectiveness of the diesel oxidation catalyst used in the experiments. The efficiency of CO conversion in the DOC is approx 90% for both B20 and ULSD. The efficiency of HC conversion reaches 73% at 200 C and reaches a maximum value of 87% at 350 C.
Figure 12. Comparison of Efficiencies of the DOC at steady state condition for B20 and ULSD.
CDPF LOADING
As seen from the PM studies of different engine injection strategies and fuel effects, loading time will vary between ULSD and B20 due to lower PM values for B20. Loading curves were developed to determine the time required to load the DPF 5g/L of soot. The engine is run at a low speed and load with the temperature before the inlet of the DPF kept constant at 300 C to eliminate any passive regeneration of the catalyzed DPF while loading. Passive regeneration was found to occur at approximately 350 C. The DPF was initially de-greened by heating it to 650 C and holding that temperature for 30min. This in turn would burn off any remaining binders and establish an initial clean weight of the DPF. The initial start weight of the DPF is 8251.2 0.3 gm. This initial weight is repeated after subsequent regenerations of the DPF. The loading time can be seen in figure 13 and shows the fuel effect between B20 and ULSD on the DPF performance.
0
0.5
1
1.5
2
2.5
3
-10 -8 -6 -4 -2 0 2 4 6 8 10 12
Injection Timing (CAdeg)
FSN
ULSD Main ULSD Pilot-Main ULSD Dual-Pilot-Main
B20 Main B20 Pilot-Main B20 Dual-Pilot-Main
0
2
4
6
8
10
12
-10 -5 0 5 10 15
Injection Timing (CAdeg)
Pres
sure
Rise
Rat
e (d
p/d
)
ULSD Main ULSD Pilot+Main ULSD Pilot+Pilot+Main
0
20
40
60
80
100
1338 RPM 1621 RPM 1307 RPM 1568 RPM
Effi
cien
cy (%
)
ULSD CO Efficiency B20 CO Efficiency
ULSD THC Efficiency B20 THC Efficiency
ULSD PM Efficiency B20 PM Efficiency
5 bar IMEP 10 bar IMEP 12 bar IMEP 14 bar IMEP

Figure 13. Loading curve developed for each test fuel.
The DPF was quickly removed while hot and immediately weighed. This procedure was reported by [10] as the DPF starts to immediately gain moisture weight. Care was taken to measure the DPF at approximately 400 C each time to eliminate any additional water gain.
DPF REGENERATION RATE
Regeneration is the process of elevating the exhaust temperature flowing through the DPF to burn the soot trapped within the core of the filter. This process restores the DPF allowing exhaust gas to flow through the device and preserving performance and efficiency of the engine. Regeneration types and strategies vary depending on the engine used and control capabilities.
For this work an active regeneration scheme is utilized by the initiation of an added post injection late in the cycle to the ECU calibration. The late post injection provides the hydrocarbons needed to initiate hydrocarbon combustion when it reacts with the diesel oxidation catalyst. The heat generated increases the temperature within the desired range before it enters the DPF.
Before any work could be done to regenerate the DPF, extensive knowledge of the exothermic reaction occurring in the DOC needed to be determined for each of the fuels used. Post injection quantities, EGR values as well as speed and load were modified to carefully control the temperature before it entered the DPF. Strategies were developed to produce repeatable temperatures before the DPF so that the fuel effect could be determined for the regeneration rate and the temperature at which regeneration begins.
Determining the Temperature Regeneration Begins
In all of the tests conducted, the DPF is preloaded with 5g/L of soot with the engine running at a steady state condition. An active regeneration strategy is employed to determine the lowest ignition temperature of the soot when loaded using ULSD. The same testing procedure is repeated for B20. The engine is maintained at a low speed and load, post injection quantity is started at 2mm3/cyc and gradually increased as the temperature of the DPF reaches steady state. The quantity of injection is until the pressure drop across the DPF begins to drop indicating the start of regeneration. The regeneration event continues until the pressure drop becomes constant, indicating the DPF is clean.
Figure 14. Temperature that regeneration begins for ULSD and B20 as a function of the differential pressure slope.
Figure 14 shows the variation of temperature in the start of regeneration is dependent upon the test fuel used. This starting temperature is determined by measuring the pressure drop across the DPF. The temperature at which the slope changes from positive to negative indicates the temperature at which the soot ignites and the start of the DPF regeneration is determined. The temperature at which regeneration begins for B20 is found to be about 33 C lower than that of ULSD soot which began to regenerate at about 559 C.
Effect of Fuel on the Regeneration Rate
To further understand the effect that B20 will have on the performance of the aftertreatment system, the rate at which regeneration occurs is analyzed. The same engine setup is used with a DOC followed by a catalyzed DPF. The DPF is preloaded to 5g/L of soot at a medium load and speed to simulate 25% recommended DPF loading and regeneration conditions. For the case shown in figure 15 the DPF is regenerated at a low speed and load and the post injection is initiated. Post injection continues until the DP measurement becomes steady. The temperature was held constant at 600 C for both B20 and ULSD to eliminate any temperature effect and to evaluate the difference of regeneration rate behavior between the two fuels.
8245
8250
8255
8260
8265
8270
8275
8280
0 30 60 90
Time (min)
Wei
ght (
gm) B20
ULSD
-0.12
-0.08
-0.04
0
0.04
0.08
450 470 490 510 530 550 570
DPF Inlet Temperature (C)
DPF
Diff
eren
tial P
ress
ure
Slop
e
B20_01 B20_02 ULSD_01 ULSD_02

Figure 15. Regeneration Rate results for B20 and ULSD.
Holding the regeneration at this lower temperature shows the soot loaded with B20 has a faster regeneration rate compared to the soot loaded with ULSD. This data is similar to data reported in previous studies [10], [11]. Explanations of the faster regeneration rate have been accredited to the soot of the B20 being more reactive due to higher oxygen content and amorphous soot structure [8], [10].
SPECIATION ANALYSIS FOR DPF REGENERATION
During regeneration, a catalyzed DPF uses the conversion of NO into the aggressive soot oxidant NO2. The potential of a small increase in NOx emissions when B20 is used could be a factor for the faster regeneration rate and lower regeneration temperature required when compared to soot loaded with ULSD. Therefore, analysis of the exhaust speciation before and after the catalyzed DPF could be useful in understanding this result during DPF regeneration.
Tests were conducted to measure the NO, NO2, and NOx emissions before and after the catalyzed DPF during a regeneration event. All speciation data was taken using an MKS-2030 high speed FTIR multi-gas analyzer.
Figure 16-17 highlights the differences in NOx, NO, and NO2 concentration before the catalyzed DPF for both B20 and ULSD. The NOx concentration before the DPF with B20 is 38% higher than the ULSD at this regeneration operating point. Similar values are seen for NO. This slight increase could be an explanation of the lower temperature required to start regeneration loaded with soot produced by B20. Therefore examination of the NO2 concentrations is of interest. Figure 13 shows the peak of NO2 to be slightly higher with B20 than ULSD. As the temperature increases to 550C the NO conversion becomes thermodynamically limited indicating regeneration by the presence of O2 rather than NO2.
Figure 16. The variation of NOx and NO before the DPF during regeneration for B20 and ULSD.
Figure 17. Speciation of the NO2 before the DPF during regeneration for B20 and ULSD.
Figure 18 is the speciation analysis after the DPF of the NO2 production across the DPF for both B20 and ULSD. As the temperature increases during the regeneration event, the NO2 out of the DPF with B20 peaks at 154 ppm, 16% lower than the NO2 concentration with ULSD. This confirms studies indicating that the reactivity of the soot, not the increased availability of NO2 increases the regeneration rate and decreased temperature needed to initiate regeneration.
0.01.02.03.04.05.06.07.08.09.0
10.0
2 3 4 5 6 7 8 9 10Time (min)
DP
(kPa
)
B20ULSD
0
50
100
150
200
250
300
350
400
450
0.00 1.00 2.00 3.00 4.00 5.00
Time (min)
Con
cent
ratio
n (p
pm
0
100
200
300
400
500
600
700
800
Tem
p B
efor
e D
PF (C
)
B20 NO B20 NOx ULSD NO
ULSD NOx Temp Before DPF
0
10
20
30
40
50
60
0.00 1.00 2.00 3.00 4.00 5.00
Time (min)
Con
cent
ratio
n (p
pm
0
100
200
300
400
500
600
700
800
Tem
p B
efor
e D
PF (C
)
B20 NO2 ULSD NO2 Temp Before DPF

Figure 18. NO2 Speciation after the DPF during regeneration for B20 and ULSD.
Additional Species Analysis
Comparison of the exhaust species before and after the DPF when fueled with B20 and ULSD is also done using the FTIR. The following figures show the methane, ethane, formaldehyde, and ethylene present in the exhaust stream before and after the DPF during the active regeneration event. The figures depict the transient response of the species during the first 8 minutes of regeneration. The first 30 seconds of data is the exhaust at a steady state condition. The first peak shown in figure 19 is a result of the initialization of the post injection strategy. The temperature before the DPF rapidly increases as a result of the exothermic reaction of the hydrocarbons on the DOC catalyst which corresponds to the initial peak of the methane, the formaldehyde, and the ethane concentrations. Comparison of the two fuels used shows that the formaldehyde for B20 is higher than that of ULSD. This is possibly due to the additional oxygen found in B20. ULSD also has a ‘delayed’ formation of formaldehyde compared to B20. This is attributed to the decreased oxygen concentration in the exhaust stream with ULSD compared to B20.
Figure 19. Speciation of the exhaust before the DPF for B20 and ULSD.
Figure 20 shows the exhaust speciation after the DPF. As seen from the graph, the catalyzed DPF is very proficient at eliminating the ethane, ethylene, and formaldehyde to trace levels after 8 minutes of operation. However, methane which shows the same trend for both ULSD and B20 is higher for the B20 fuel.
Figure 20. Speciation of exhaust after the DPF for B20 and ULSD.
ENGINE OIL DILUTION
An engine equipped with an actively regenerated DPF, can lead to fuel dilution of the engine oil. The dilution of fuel in engine oil is a function of the engine operating strategy and properties of the fuel used. Biodiesel, in particular, is made of fatty methyl esters, which have different physical attributes compared to ULSD: higher surface tension, higher viscosity and lubricity, and lower volatility. The mechanism for oil dilution, regardless of fuel used, is driven by the low volatility components in the fuel. These low volatile components require longer vaporizing after injection, which may lead to deposition on the cylinder walls during combustion. As the piston moves down during the power stroke, these deposits can be pushed down into the crankcase. Fuel dilution of motor oil can be detrimental to an engine and its components. Viscosity, in particular, is an important factor in the quality of engine oil. As the viscosity decreases metal to metal contact can occur causing catastrophic failure of bearings and the wearing of the pistons and rings.
The engine oil viscosity was measured with a prototype oil sensor provided by Delphi Corporation. The oil condition sensor is designed to measure both viscosity and soot of engine oil in situ. The engine oil pan has been modified to accommodate the sensor. The sensor is engaged once the temperature of the engine oil reaches 77 C and the viscosity measurement automatically begins. The sensor proceeds through the algorithm outputting the value of the viscosity registered at 70 oC.
0
100
200
300400
500
600
700
0.00 1.00 2.00 3.00 4.00 5.00 6.00 7.00
Time (min)
Con
cent
ratio
n (p
pm
0
100
200
300400
500
600
700
Tem
p af
ter
DPF
(C)
B20 NO2 ULSD NO2 B20 Temp ULSD Temp
0
100
200
300
400
500
600
0 1 2 3 4 5 6 7 8Time (min)
Tem
p be
fore
DPF
(C)
-5
0
5
10
15
20
25
30
Spec
ies C
once
ntra
ton
(ppm
) Temp bCDPF (C)B20 FormaldehydeULSD FormaldehydeB20 EthyleneULSD EthyleneB20 EthaneULSD EthaneB20 MethaneULSD Methane
-1
0
1
2
3
4
5
6
7
0 1 2 3 4 5 6 7 8Time (min)
Spec
ies C
once
ntra
tion
(ppm
)
-5
0
5
10
15
20
25
30
Met
hane
Con
cent
ratio
n (p
pm)
B20 FormaldehydeULSD FormaldehydeB20 EthyleneULSD EthyleneB20 EthaneULSD EthaneB20 MethaneULSD Methane

Figure 21 shows the viscosity measurement using the Delphi on-board oil sensor. Two tests runs are shown in the figure where each run indicates fresh engine oil at about 26.6 cSt. The first test run shows the degradation of the engine oil under normal operating conditions. The post injection strategy is used on the second to last data point with the final viscosity measurement showing severe engine oil dilution: 10%-15% fuel dilution within 3-4hrs of post injection. The data is repeated for the second run. No soot was observed due to the short hours of engine operation.
Figure 21. Delphi oil sensor measurement of engine oil viscosity during regeneration with B20.
Figure 22 shows the viscosity measurement from the Delphi sensor using B20 with multiple post injection events. For this test, the engine oil is changed and a baseline viscosity measurement is taken. Multiple post injection events are done with the viscosity measured immediately following. The engine is then run at normal operating conditions with the viscosity measurement taken immediately following. The decrease in engine oil viscosity can be seen in figure 22 immediately following the post injection event. An increase in the engine oil viscosity is also seen after normal engine operating conditions. This is attributed to the evaporation of B20 and flow back to the combustion chamber.
Figure 23 highlights the comparison measuring the viscosity of ULSD and B20 with multiple post injection events. Overall, initiation of a post injection strategy shows severe engine oil dilution over time for both ULSD and B20.
Figure 22. Measurement of the viscosity during multiple regeneration events with B20.
Figure 23. Comparison of ULSD and B20 effect on viscosity during multiple regeneration events.
CONCLUSION
Results show that operating the engine in the LTC regime will produce lower PM and NOx with a slight penalty in fuel consumption. Timing sweep data indicates the effect of replacing ULSD with B20 on emissions. Due to the low volatile components of B20, optimization of injection timing is critical in engine out emissions reduction.
Implementation of aftertreatment systems are significantly affected with the use of B20 fuel. Data has shown that the temperature at which regeneration occurs is reduced by 33 C compared to soot loaded with ULSD. The quantity of PM is also lower with B20 increasing the loading time by 21%. This gives an advantage over ULSD by increasing the amount of time it takes to load the DPF, thereby reducing the number of regenerations required and increasing the overall life expectancy of a DPF.
10
15
20
25
30
35
0 20 40 60
Cumulative Hours of Engine Run
Visc
osity
(cen
tisto
ke) Fresh oil viscosity
Start post inj
1st run
2nd run
Start post inj
10 vol % dilution
15 vol % dilution
10
15
20
25
30
35
0 20 40 60
Cumulative Hours of Engine Run
Visc
osity
(cen
tisto
ke) Fresh oil viscosity
Start post inj
1st run
2nd run
Start post inj
10 vol % dilution
15 vol % dilution
10
15
20
25
30
35
0 5 10 15 20 25
Cumulative Engine Run Time (hours)
Vis
cosi
ty (c
St)
B20 in Engine Oil
Started Post Cylinder Fuel Injection
Stopped Post Cylinder Fuel Injection
Fresh Oil Viscosity
10
15
20
25
30
35
0 5 10 15 20 25
Cumulative Engine Run Time (hours)
Vis
cosi
ty (c
St)
B20 in Engine Oil
Started Post Cylinder Fuel Injection
Stopped Post Cylinder Fuel Injection
Fresh Oil Viscosity
10
15
20
25
30
35
0 5 10 15 20 25
Engine Run Time (hours)
Vis
cosi
ty (c
St)
B20 in Engine Oil ULSD in Engine Oil
Start post cyl inj
Stop post cyl inj
Fresh oil viscosity
10
15
20
25
30
35
0 5 10 15 20 25
Engine Run Time (hours)
Vis
cosi
ty (c
St)
B20 in Engine Oil ULSD in Engine Oil
Start post cyl inj
Stop post cyl inj
Fresh oil viscosity
Speciation of the exhaust emissions before and after the DPF was analyzed to determine if any effect could be drawn from the slightly higher NOx concentrations observed with B20. NO2 concentrations before the DPF were found to be 6% higher with B20. However, the NO2 conversion efficiencies of the catalyzed DPF were found to be 73% and 68% for ULSD and B20 respectively. This would indicate more availability of NO2 to oxidize the soot. Exhaust speciation of the NO2 availability indicates that the slight increase in NOx from B20 is not the dominant cause for the lower temperature regeneration and faster regeneration rate but the reactivity of the soot that is in the DPF. Formaldehyde concentrations are found to be higher with B20 during regeneration due to increased oxygen concentrations in the exhaust stream.
Utilizing an active regeneration strategy accentuates the possibility of fuel oil dilution of the engine oil. Severe degradation of the engine oil was found after 3 hours of post injection measuring 12.9% biodiesel diluted in the engine oil and a 26% drop in viscosity. An onboard viscosity oil sensor provided by Delphi Corporation was tested. The sensor was in good agreement with the viscosity bench test analysis and provided oil viscosity measurement over the course of the project. Operation with B20 shows significant fuel dilution and needs to be monitored to prevent engine deterioration.
ACKNOWLEDGMENTS
This work was sponsored by US Department of Energy via the NextEnergy Center, Detroit, MI under award number DE-FG36-05GO085005. Technical and equipment support of Delphi Corporation and Chrysler is greatly appreciated. Thanks to NBEL at NextEnergy for all oil sample and biodiesel analysis. REFERENCES
1. Knothe, G., Van Gerpen J., and Jurgen Krahl, The Biodiesel Handbook. 2005, Champaign, IL: AOCS Press.
2. EPA, A Comprehensive Analysis of Biodiesel Impacts on Exhaust Emissions. 2002.
3. Graboski, M., and Robert McCormick, Combustion of fat and vegetable oil derived fuels in diesel engines. Prog. Energy Combust. Sci., 1998. 24: p. 125-164.
4. McCormick, R.L., Williams, A., Ireland, J., Brimhall, M., Hayes, R.R., Effects of Biodiesel Blends on Vehicle Emissions. 2006, National Renewable Energy Laboratory.
5. Zhang, Y., and Andre L. Boehman, Impact of Biodiesel on NOx Emissions in a Common Rail Direct Injection Diesel Engine. Energy & Fuels, 2007. 21: p. 2003-2012.
6. Nagaraju, V., Henein, N., Quader, A., Wu, M., and W. Bryzik, Effect of Biodiesel (B20) on
Performance and Emissions in a Single Cylinder HSDI Diesel Engine. SAE, 2008(2008-01-1401).
7. McCormick, R.R., C., Hayes, R.R., Black, S., Williams, A., Ireland, J., Mcdaniel, T., Fralley, M., Sharp, C., Regulated Emissions from Biodiesel Tested in Heavy-Duty Engines Metting 2004 Emission Standards. SAE, 2005(2005-01-2200).
8. Boehman, A.L., Song, J., and Mahabubul Alam, Impact of Biodiesel Blending on Diesel Soot and the Regeneration of Particulate Filters. Energy & Fuels, 2005. 19: p. 1857-1864.
9. Song, J., Alam, M., Boehman, A., and Unjeong Kim, Examination of the oxidation behavior of biodiesel soot. Combustion and Flame, 2006. 146: p. 589-604.
10. Williams, A., McCormick, R.L., Hayes, R.R., Ireland, J., and Howard Fang, Effect of Biodiesel Blends on Diesel Particulate Filter Performance. SAE, 2006(2006-01-3280).
11. Tatur, M., Nanjundaswamy, H., and Dean Tomazic, Effects of Biodiesel Operation on Light-Duty Tier 2 Engine and Emission Control Systems. SAE, 2008(2008-01-0080).
12. Heywood, J.B., Internal Combustion Engine Fundamentals. 1988, New York: McGraw-Hill, Inc.
13. Zheng, M., Han, X., Tan, Y., Kobler, M., Ko, S.J., Wang, M., Mulenga, M., and Jimi Tjong, Low Temperature Combustion of Neat Biodiesel Fuel on a Common-rail Diesel Engine. SAE, 2008(2008-01-1396).
14. Colban, W., Miles, P., and Seungmook Oh, Effect of Intake Pressure on Performance and Emissions in an Automotive Diesel Engine Operating in Low Temperature Combustion Regimes. SAE, 2007(2007-01-4063).
CONTACT
Amy Peterson, Graduate Research Assistant Wayne State University E-mail: amypeterson@ wayne.edu Dr. Ming-Chia Lai, Professor Wayne State University E-mail: [email protected] Dr. Ming-Cheng Wu, Delphi Corporation E-mail: [email protected]

DEFINITIONS, ACRONYMS, ABBREVIATIONS
ASTM: American Society for Testing and Materials
bTDC: Before Top Dead Center
B20: 20% Biodiesel, 80% ULSD
DPF: Diesel Particulate Filter
DOC: Diesel Oxidation Catalyst
ECU: Engine Control Unit
EPA: Environmental Protection Agency
EGR: Exhaust Gas Recirculation
FSN: Filter Smoke Number
FTIR: Fourier Transform Infrared
LTC: Low Temperature Combustion
NOx: Oxides of Nitrogen
NO: Nitric Oxide
NO2: Nitrogen Dioxide
PM: Particulate Matter
SOMI: Start of Main Injection
THC: Total Hydrocarbons
ULSD: Ultra-Low Sulfur Diesel
APPENDIX A
FAME composition (wt) %
FA CWG
C14:0 1.86%
C16:0 22.56%
C16:1 2.97%
C18:0 12.82%
C18:1 41.23%
C18:2 16.91%
C18:3 1.65%
Table 3 Choice White Grease-derived fatty acid methyl ester composition (B100). Data provided by National Biodiesel Laboratory.
PROPERTY TESTING METHOD
2007 Cert
ULSD B-100
Flash Point (ºC) ASTM D93 153 164
Viscosity 400C (mm2/sec)
ASTM D445 2.7 4.7
Sulfur ASTM D5453 8ppm 0.0011%
mass
Cetane Number ASTM D613 42 58.4
Cloud point (ºC) D 2500 -2 9
Pour point (ºC) D 97 -11 -
Density (kg/m3) 0.8475 0.8721
LHV (J/g) 43956.5 42988.6
Table 4. Properties of ULSD and B20.