Embed Size (px)
Citation preview

|University of Dhaka
Page 1
Impact of Foreign Remittance on Landholding and
Land Relations in Rural Bangladesh: A Case Study
from Jirtoly, Village in the District of Noakhali.
Muhammad Aminur Rahman
Department of Development Studies
University of Dhaka
Honors Thesis
Date: 10/02/2013
Submitted by: R

|University of Dhaka
Page 2
Section One
Declaration of Researcher-
I certify that this research does not incorporate without acknowledgement any material
previously submitted for a degree or diploma in any university; and that to the best of
my knowledge and belief it does not contain any material previously published or
written by another person except where due reference is made in the text.
…………………………………………..
Signature
Declaration of Supervisor:
I believe that this research is properly presented, conforms to the best specifications
of thesis presentation in the university and is prima facie worthy of examination.
………………………………………….
Signature

|University of Dhaka
Page 3
To my beloved parents and elder brother Atiqur Rahman without them I
cannot simply imagine myself.

|University of Dhaka
Page 4
Content
Title Page
No.
Section
One
Declaration 2
Contents 4
List of Map 6
List of Table 6
List of Figure 7
Acknowledgement 8
Abstract 9
Abbreviation 11
Section
Two
Chapter One
Introduction
Background 12
Justification 13
Objective of the study 15
Research Questions 16
Research Hypothesis 16
Chapter Two Analytical Framework
Formal Definition of the Concepts 17
Research Methodology 18
Source of Data 18
Sample Size 18
Sampling Technique 18

|University of Dhaka
Page 5
Possible Technical / Practical
Problem
19
Chapter Three Review of Literature
Theoretical Issues of Migration 20
Some Theories of Migration
Network Theory 21
Segmented Labor Market Theory 21
World System Theory 22
Factors of Labor Migration in
General
22
Remittance and its Impacts 23
Section
Three
Chapter Four Migration and Remittance: at a
Glance in Bangladesh
29
Bangladesh Agriculture at a
Glance
32
Profile of Study Area: At a Glance
33
Determinants of Emigration from
Study Area
35
Section
Four
Chapter Five Findings and Data Analysis
General Findings
1. Profile of the Households 36
2. Types of Structure of the
Household 36
3. Number of Migrants in the
Households, their Age and
Education
37
4. Activity Distribution of the
Migrants 38
Case Study One 40

|University of Dhaka
Page 6
5. Media of Managing VISA and
Sources of the Mobilization of
Money
42
6. Monthly Remittance Received
and Their Uses 43
7. Investment of Remittance
money
44
Chapter Six Impact on Land Holding
1. Types of Land ownership
and Amount of Land 46
2. Prices of Land Market 48
Case Study Two 48
Impact on Land Relation
1. Cultivation of Land 51
2. Situation of Share
Cropping 53
Chapter Seven Conclusion 56
Section
Five
Appendix Table and Figure of Findings 58
Questionnaire 63
Reference 74

|University of Dhaka
Page 7
List of Map
Name of Map Page No.
Map 1. Village Jirtoly 34
Map 2. Begumgonj Upazila 62
Picture 1 48
Picture 2 50
List of Tables:
Table
No.
Name of Table Page No.
4.1 Remittance Earned from 1976-2010 32
4.2 Land Distribution in Different Sectors of
Bangladesh 33
5.1 Types of Structure of the Residential House 37
5.2 Level of Education of the Migrants 38
5.3 Types of Training Received by the Migrants 40
5.4 Types of Activities of the Migrants in Host Countries 40
5.5 Duration of Migration, Average Earning and Cost
of Migration.
42
5.6 Medium of Migration
42
5.7 Sector-wise Investment of Remitted Money 45
5.6 Contribution of Agriculture in Household’s Income. 55
6 Members of Household (%) 59

|University of Dhaka
Page 8
List of Figures:
Figure
No.
Name of Figure Page No.
4.1 Year-wise Overseas Employment of Bangladeshis
from 1976 to 2010.
29
4.2 District-Wise Overseas Employment (Major Districts)
from 2005-2010
30
4.3 Country-wise Overseas Employment (Major Countries)
from 1976-2010
30
4.4 Year-wise Remittance Earned from 1976-2010 in
Million US$
31
5.1 Age-distribution of the Migrants. 37
5.2 Number of Years as Migrant 38
5.3 Monthly Earnings of the Migrants Abroad 39
5.4 Money Spent for Migration over the Year 43
5.5 Sources of Finance for Migration 43
5.6 Monthly Remittance Received by the Households (%) 44
6.1&6.2 Changes of Land ownership (Permanent) before and
after Migration
46
6.3&6.4 Land Ownership (Mortgaged in) before and after
Migration
47
6.5 Plan of Households to Build New homestead in
Agricultural Land
49
6.6 Percentage of Households Shifting Residence 47
6.7 Percentage of Land cultivation by Operation 51
6.8 Current Status of Land 51
6.9 Reasons of non-operation of agricultural land 52

|University of Dhaka
Page 9
6.10 Percentage of Hired Labor Outside of Locality 52
6.11 Types of Agricultural Labor 49
6.12 Supervision of Farming Activities 50
6.13 Households Involved in Share Cropping 60
6.14 Occupation of Migrants before Migration 60
|University of Dhaka
Page 10
Acknowledgement
With simple thanks, all gratitude cannot be expressed to my honorable and dear
teacher, a renowned economist of the country, Dr Mahbub Ullah, who supervised me
throughout my research despite his tight time schedule. His guideline, suggestions and
inspiration made my research easier. Thanks to him for giving me opportunity to gain
such precious knowledge which could never be learned in any other ways. Special
thanks to my fellow colleagues, Abdul Hamid, Sonam Saha, Tasfi Salsabil and
Hasnaine Molla who cordially helped me during my study. Thanks to Imran Hossain
Bhuiyan and Juwel Ahmed Sarker for helping me to develop the questionnaire. Thanks
to my friends Mahmudul Hasan, Hasan Morshed and Eusuf Ali for their help in my
field work. Special thanks to Md. Zayed Ibne Abul Fazal who cordially helped me in
editing my research paper. Thanks and gratitude to my beloved parents who always
inspire me to go ahead in any situation. Finally, thanks to local agricultural officer
Jasim Uddin for helping me to collect information on land prices, area and cultivation
of land. Above all, thanks to those respondents who generously helped me, though it
was not much pleasant for them.

|University of Dhaka
Page 11
Abstract:
Remittance is the money which is sent by the migrants (temporary and permanent
both) to their home country. Now, more than 7 million people of Bangladeshi migrants
are sending remittance. During 1990s the remittance inflow in rural area, especially in
southern and eastern part of Bangladesh increased rapidly due to massive migration of
working age people. Now-a-days, remittance is regarded as the major source of foreign
currency earnings followed by the RMG sector in Bangladesh. But the net contribution
of remittance is the highest. Remittance has various impacts on the socio-economic
fabric. It has three types of impact on an economy— macro level, micro level and
meso-level impacts. At the macro level, it contributes to financing country’s trade
across the border. In micro level, it has various types of impacts on migrant households
such as regards earnings, education, health, land ownership and land relation
(production) etc. Besides, at meso-level, it has impacts like inequality in income, land
ownership, cost of agricultural production and labor crisis during on-season cultivation
etc. in the locality. Here, studied tried to explore the micro-level impacts of remittance
in the rural area. In this study, focus is concentrated on the change in land holding and
land relation which has occurred due to remittance injection in rural area during last
decades (2000-2010). No formal theory has been used in this study. Field study has
been conducted by using structured and semi-structured questionnaire. SPSS tools
have been used to analyze the outcomes of the field study. Qualitative and quantitative
methods have been used in describing and analyzing those outcomes. Two case studies
have been presented to focus on the negative impacts of remittance and massive
migration of working age people, particularly, male members of the households. The
village Jirtoly has been chosen for the field study in the district of Noakhali. Because
here, the major portion of working age people are staying abroad. As a consequence,
remittance is the key earnings for most of the households. Moreover, agricultural land
is scarce here. So most migrant households are attracted to invest on land property due
to high rate of gains in land price. Growing tendency of building new houses on
agricultural land is decreasing the availability of cultivable land. In addition, massive
migration has created pressure on the supply of farm labor. Here, cultivation has now
become highly dependent on hired labor from the outside of locality. This study has
been conducted mostly to find out whether remittance has any impact on temporary
(mortgage) and permanent land ownership pattern. The study engaged to find out
whether any change has occurred in land relation due to the injection of remittance.
The key findings of the study are— Land ownership has changed in rural area through
selling out land or mortgaging for mobilizing money in the process of migration.
Source of agricultural labor in migrant prone area has changed. In addition, it would
be seen that some households have given up farming due to lack of working age people
in the household, scarcity of hired labor and higher cost of production. The study found
that share cropping has increased. In addition, it has been seen that major portion of
land is now in the ownership of migrant households. Outcomes of the study are true
and applicable for those regions which are similar with the study area in terms of

|University of Dhaka
Page 12
migration intensity and land-man ratio etc. Finally, the study has explored the
dynamics of land holding and production relation because of remittance inflow. This
study has also explored some general impacts of remittance. Some negative impacts
of migration and remittance in specific cases have been given to show the drawbacks
of migration and remittance.
|University of Dhaka
Page 13
Abbreviation:
ADB: Asian Development Bank
APO: Asian Productivity Organization
BAIRA: Bangladesh Association of International Recruiting Agency
BBS: Bangladesh Bureau of Statistics
BIDS: Bangladesh Institute of Development Studies
CPD: Centre for Policy Dialogue
FAO: Food and Agricultural Organization
HYV: High Yielding Variety
IMF: International Monetary Fund
IOM: International Organization for Migration
KSA: Kingdom of Saudi Arabia
MES: Manufacturing Execution System
MoA: Ministry of Agriculture
NAP: New Agriculture Policy
NAEP: New Agriculture and Environment Policy
UN: United Nations
UNDP: United Nations Development Program
USA: United States of America
UAE: United Arab Emirate
EU: European Union
SME: Small and Medium Enterprises
BRRI: Bangladesh Rice Research Institute.

|University of Dhaka
Page 14
Section Two
Chapter One
1. Background:
Migration is the movement of people from one place to another for taking up
permanent or semi-permanent jobs and other purposes across or within a political
boundary. Temporary migration is the seasonal movement of people for jobs in the
agricultural sector or other sectors in a particular season of a year. Migration has been
occurring throughout the human history. It occurs at a large variety of scales:
intercontinental (between continents), intra-continental (between countries within a
given continent), and regional (among different adjoining countries) and within a
country. Amongst these, the pattern of rural to urban migration is very significant—
the movement of people within different parts of a country in search of better
opportunities. This occurs for various reasons. Two key factors of such migration
are—
1. Push Factors: the factors that drive people to leave a place for certain
difficulties such as food shortages, war, flood, unemployment, crime etc.
2. Pull Factors: the reasons that attract people to migrate for better opportunities
such as greater job opportunity, nicer climate, better food supply, freedom, etc.
These factors may occur alone or collectively in the process of migration. For example,
we can imagine a region which has gone through a natural disaster recently, has large
unemployment, restricted freedom, less academic chances and warlike situation. These
environmental, political, economic or cultural factors selectively or as a group may
affect the process of migration.
Every year many people migrate from one country to another for various reasons or
purposes. Despite the unwillingness of countries to loosen immigration policy, a large
number of people living outside their country of origin rose from 120 million in 1990
to about 214 million in 2011, as the United Nations (UN) estimates. According to the
2010 UN Human Development Report, these migrants accounted for
approximately 3.1 percent of the world population (as of 2010).
From pre-historic time, people have migrated from one region to another in seeking
better shelter or easier availability of food. Like others this is not a new phenomenon
for Indian subcontinent. It had a fine trade-link with other parts of the world from the
ancient times. To others, the subcontinent was a rich place for doing business. For this,
British, Dutch, Portuguese and so on came here. Though migration from Bangladesh
can be traced back to ancient periods, it occurred in a bigger scale after 1976. During
1980s, a large amount of Bangladeshis migrated abroad and this trend still continues
today. But, recently the rate of migration has slowed down because of constraints in
host countries like KSA, Kuwait, and Oman etc.

|University of Dhaka
Page 15
Migration brings great opportunity for remittance earning for the country. Still now,
the contribution of this sector is the largest single component of our foreign currency
earnings. It helps to reduce the gap in balance of payments1. In last two and half years,
one million and sixty seven thousand Bangladeshis found their job abroad. (Prothom
Alo, Monday, August 1, 2011). Now, 7.5 million Bangladeshis are working in
different countries, which consist of 12.7 percent labor of the total labor force. Total
remittance sent by migrant workers was UD$10 billion in 2010, which consists 11
percent of total GDP. (Daily Star, Thursday, March 31, 2011). 11). Migrant people
contribute in host country’s economy as well as their home countries. Any economy,
which is capable of using the whole potential labor forces, can develop rapidly. Labor
forces only serve their country directly, if they got job at home. But in case of
Bangladesh, more than 5% of the potential labor force is unemployed and 28.7% is
under-employed (MES, 2009). This situation bound the people to seek for job outside.
As a result, unskilled (a large number of), semi-skilled and skilled (a few) Bangladeshi
had to migrate.
Remittance inflow has impacts mostly on the socio-economic fabric of rural
Bangladesh. Migrants’ household now got opportunities to expand their choices in
health care, education, food etc. The impact of remittance on land is also noticeable in
countryside. It influenced the local land ownership scenario. It increased credit
availability to both associated and non-associated households. Due to growing
earnings of migrant households, they are now in control of neighboring land market.
In one hand, remittance plays vital role in foreign currency earnings; on the other,
massive migration from rural area brings the anxiety of labor supply crisis in
agriculture sector. Farming in rural area has become dependent on hired labor. Due to
this, some of the migrant families have already given up self-cultivation. Remittance
also creates inequality among rural households in terms of income and asset holdings.
Land scarcity with huge remittance injection is responsible for raising land prices
uninterruptedly during last decade. These scenarios are more apparent in the southern
part of Bangladesh because here, especially from Chittagong, Noakhali, and Comilla
districts, there are a large number of migrants. This study was conducted in village
Jirtoly, a village of Noakhali district. The findings from this study may be factual for
those villages which are similar to the Village Jirtoly in many terms such as migration,
geographic standing, population, destination of migration etc. The reasons for
choosing this village as the study subject are—
1 The Balance of Payments (BOP) is the method countries use to monitor all international
monetary transactions at a specific period of time. All trades conducted by both the private
and public sectors are accounted for in the BOP in order to determine how much money is
going in and out of a country. If a country has received money, this is known as a credit, and,
if a country has paid or given money, the transaction is counted as a debit. Theoretically, the
BOP should be zero, meaning that assets (credits) and liabilities (debits) should balance,
source: http://www.investopedia.com/articles/03/060403. Last visited 17/12/2011.

|University of Dhaka
Page 16
It is a migration prone area.
Most of the households are dependent on remittance.
On average, at least one member each of these households is staying abroad.
Migrant households hold most of the lands, which were hold by non-
migrants’ before.
Land price increased rapidly in this region due to remittance-led demand.
In peak season, labor crisis in agriculture becomes acute.
Production cost rose rapidly here in comparison to other regions of
Bangladesh.
Cultivation reduced to only crop in a year due to labor crisis.
Agricultural production is hugely dependent on hired labor.
Here, it is a common tendency for most of the remittance earning households
to buy land.
Its socio-economic situation is similar to the other villages of southern parts
of the country.
Researcher himself belongs to this village also.
2. Justification of the Study:
Remittance has multiple effects in rural areas of Bangladesh. It influences household
income, education, health, purchasing capacity of food and other necessary goods. Its
impact on landholding system is also noticeable in rural area. Remittance brings
opportunity for migrant households to buy new or regain sold and mortgaged land. In
rural areas, tendency of purchasing land by migrant households brings unequal
competition with non-migrant households in land market. Due to high competition,
hyperinflation occurs to land prices and day by day it is sky-rocketing. As a result,
land is getting concentrated in the hands of a people. This reality of changing land
ownership situation is almost unexplored.
Due to migration and remittance inflow, land relation has been affected. Massive
migration of work force (both internal and external migration) from agrarian economy2
created labor shortage (Lewis’ Two Sector model of economy3). Because of this
shortage, land owners now have to cultivate either by hired labor or through share
2Agrarian economy a culture or community in which agriculture is
the primary means of subsistence; an economy that relies heavily on agricultural production;
http://dictionary.reference.com/browse/agrarian+society.
3 Arthur Lewis (January 23, 1915), “Economic Development with Unlimited Supplies of Labour”
(Manchester School) He is renowned in economics for his two sector model of economic
development, Industrial sector and traditional/ agricultural sector. According to him, marginal
productivity of agricultural sector is near to zero. So, for development surplus labor from traditional
sector have to be switch out to industrial sector.
http://www.nobelprize.org/nobel_prizes/economics/laureates/1979/lewis-autobio.html.

|University of Dhaka
Page 17
cropping. Sometimes they shut down cultivation with the burden of higher production
cost. The shortage of labor supply also creates impact on agricultural production. As a
result, food demand may rise and supply may fall creating a serious concern. However,
a lot of academic work has been done on ‘migrants’ and ‘remittance’ during 1980s and
1990s by many researchers including Raisul A. Mahmud in collaboration with
Bangladesh Institute of Development Studies (BIDS). Recently, Professor Tasneem
Siddiqui has also done substantia work on migration and remittance when she was a
fellow of International Organization of Migration (IOM) and Bangladesh Association
of International Recruiting Agencies (BAIRA). Agriculture is a popular study domain
for academicians. A lot of works has been done on peasant economy and agrarian
society. In Bangladesh, the well-known contributors to rural agriculture sector study
are Mahbub Hassain, Hosen Zillur Rahman, Mahbub Ullah and Atiur Rahman. They
substantially contributed in agricultural research with exploring the dynamics of rural
economy of Bangladesh. But a few works are found addreesing the relation between
remittance and land. This study carries out the impacts of remittance on the rural social
and economic activities. This study has found that major volume of remittance is being
used in consumption and medical treatments and the bulk investment of remitted money
goes in purchasing land. It is required to take proper policy and strategy for switching
out remittance money in more productive sectors. This study is important as it intended
to explore some unexplored impacts of remittance in rural economy such as inequality
in terms of land holding, income, and wealth. It is also important because it shows the
negetive impact of using remittance on agricultural land.
Objectives of the Study:
When a person from agrarian households decides to go abroad, he has to mobilize
substantial amount of money. For this most of them either sell out their land or
mortgage for a particular period of time. As a result, before going abroad, one type of
land holding change occurs. Again after a successful migration, some of them want to
get back their land or invest in purchasing agricultural land. For this reason, another
type of land ownership changes occur. On the other hand, due to migration in the
working age, land relation changes because of labor deployment changes, supervision
and use of land. However, this study has been conducted mostly to find out— the
changes of land ownerships in the rural area of Bangladesh during the last decade.
Special focus has been given on land holding size, reasons of change in land
ownership, and influence of remittance on these changes. This study has also been
conducted to find land relation in terms of land cultivation and labor deployment.
Following questions are posed to find the answers— is land cultivated by land owners
or cultivated by others? Do the households give up self-cultivation due to remittance
inflow and labor shortage? If all these happened, we may try to unfold the chain of
link between migration and consequent changes in land relation.

|University of Dhaka
Page 18
Research Questions:
This study has been done to find the answers to the following questions—
Do remittance changes landholding in rural Bangladesh?
Do remittances have any impact on land relation?
How do they impinge upon overall production relation?
Research Hypothesis:
External source of remittance has impact on landholding and land relation in rural
Bangladesh.

|University of Dhaka
Page 19
Chapter Two
Analytical Framework
Formal Definition of the Concepts:
Foreign- “According to the legal encyclopedia, foreign means, which belong to, or
operate in accordance with, another nation, territory, state, or jurisdiction, as in the
case of nonresident trustees, corporations, or persons” (Legal encyclopedia, cited in
Saleem W .M & Aslam .R.).
Remittance is- “The process of sending money to remove an obligation. This is most
often done through an electronic network, wire transfer or mail. The term also refers
to the amount of money being sent to remove the obligation” (Cultural Literacy, 2002,
cited in Saleem W .M & Aslam .R.).
Or, Remittances are “the portion of international migrant worker’s earnings, sent back
from the country of employment to the country of origin”. (IOM, 2002)
Landholding: it denotes “an area of land that someone owns or rent” Cambridge
Advanced Learner’s Dictionary, (Third Edition).
Or, “a piece of land that somebody owns rents; the fact of owning or renting land”.
Oxford advanced learner’s dictionary. (Seventh Edition, p.861).
Land Relation-Here, Land relation or Agrarian Relations is Production relations
in agriculture. Since land is the primary means of production in agriculture, the form
of land property is the basis of agrarian relations. The nature of agrarian relations is
determined by the nature of landownership and land tenure. Agrarian relations change
as conditions of landownership and land tenure change. (The Great Soviet
Encyclopedia, 3rd Edition (1970-1979), © 2010 The Gale Group, Last visited,
16/12/2011).
In other words, Land relation means agrarian relation or production relation among
owners, agricultural workers and land. It focuses on whether land is cultivated by land
owners or others. This relation can be of different types: such as, landowners
themselves engage in production activity directly by using household labor; or by hired
labor or owners do not engage in production directly but they rent out their land, such
as in share cropping or cash leasing for a particular time.
Rural Area is-“The area of or relating to farming; agricultural. Areas are referred to
as the countryside in modern usage. Rural areas can have an agricultural character,
though many rural areas are characterized by an economy based on logging, mining,
petroleum and natural gas exploration, or tourisms”. (Waqar M. Saleem &Raana A.).

|University of Dhaka
Page 20
Research Methodology:
To perform this study, both quantitative and qualitative study method have been used
through structured and semi-structured questionnaire. A well defined structured
questionnaire has been used to collect required quantitative information. The reasons
of using structured questionnaire is-
To understand the changes occurring elaborately such as land holding size, labor uses
etc. requires both qualitative and quantitative description. In support of qualitative
description, semi-structured questionnaire has been chosen. To acquire supplementary
information out of quantitative value semi-structured questionnaire is more suitable.
As a result, semi-structured questionnaire has been used in the research. To estimate
the quantitative value, SPSS and Microsoft excel has been used.
Sources of Data:
a) Primary data- They have been collected from the selected area with well-defined
structured and semi-structured questionnaire. Questionnaire has been framed with the
consultation of the supervisor. Detailed information has been gathered by using
questionnaire as much as possible. To collect further information, help from key
informants was sought e.g. Banker, Union Parishad Chairman, and A/C Land of
respected Upazila and so on. Some case studies or in-depth interview have been
conducted with both migrant household members and non-migrants for better
understanding of the situation.
b) Secondary Data- They have been gathered from various literature, national and
international journals, magazines, news papers and from different online sources such
as BBS website, Bangladesh Bank website, Ministry of Expatriates Welfare’s website,
Ministry of Agriculture’s website and Ministry of Land etc.
Sample Size:
The sample size of the present survey consists of 75 from a total 350 households of
the village North Jirtoly. Among total respondents, 65 per cent were female and 35 per
cent were male. Only migrant households are included in the survey. It was conducted
by the researcher himself.
Sampling Technique:
Sample size is selected by using random sampling method. Random sampling is a
sampling method in which all members of a group (population or universe) have an
equal and independent chance of being selected. Households have been selected
randomly to capture diverse phenomena. Above all this method has been adopted to
escape from biasness to particular group or household. Those households have been

|University of Dhaka
Page 21
included whose members are currently staying abroad or have just returned from
abroad.
Possible Technical / Practical Problem:
In doing field work, several problems had to be handled. For example, some people
refused to give information. Sometimes they denied allowing entrance into their
houses, when male members were not present. Difficulties were faced in gathering
information from wealthy households. Often, they tried to evade responding to the
questions. Some people also hid information as they thought them to be personal and
confidential. Wealthy households of the village were afraid of income tax. Some
people tried to provide cooked information. As most of respondents were female, in
some cases they failed to give accurate information, particularly about land holdings
and monthly income. In addition, there was hurry due to time limit. So, cross checking
of information was not possible. Financial limitation also affected the study. In most
of the time, government officials at Upazila were not possible to contact. Due to lack
of adequate knowledge about amount of agricultural land and homestead, precise
information in some respects could not be gathered. For this reason, information
gathered from the respondents was checked with field level agriculture officer and
other adjacent land owners. It must be mentioned here that, as son of the locality I got
advantage also. Majority of the households gave me information spontaneously; most
of them talked to me friendly.
As an ancient means of livelihood, agriculture always has been a favorite area of
research to academicians. In comparison, remittance is a new field of research; its
academic history is not very old. It drew attention at broader space after the Second
World War because of market liberalization and easier movement of human beings
across the world. With Structural Adjustment program, many countries turned to open
market from restrictive economic policies. As a consequence of massive migration, in
response to the needs and welfare of migrants, International Organization for
Migration (IOM) was created by the United Nations (UN). Many countries opened
separate wings to look after the interests and welfare of the migrants. As an important
sector of the national economy of various countries, migration and remittance came to
draw special attention of governments as well as academicians.

|University of Dhaka
Page 22
Chapter Three
Literature Review
Remittance is inevitably related to migration. So before analyzing the impacts of
remittance on rural area, it is better to have a look on the theoretical issues of migration.
Theoretical Issues of Migration
Migration literature unfolds two fundamental views on the migration-development
relationship: neoclassical (or equilibrium) and structural (or dependency) theory. The
neoclassical practice focuses on the equilibrium models which treat migration as a
voluntary-economic rational choice of mankind. Individuals seek to enhance their
economic conditions by responding to offered higher wages away from home. This
mobility ensures the optimal distribution and hence, efficient allocation of population.
If individuals have adequate information, rational and economic mentality, often move
to areas where they can sell their labor at higher price. Such mobility serves to restore
the balance between unequally distributed resources across space in a manner that
presumably benefits both destination and sending places (through remittances), and
the migrants themselves (Todaro, 1969, 1976; Massey, 1993, 1994 cited in Manohar
P. S. and Zaman H., 2009). The neoclassical position has been criticized because it
does not find sufficient empirical support and does not recognize the structural factors
which originate and control migration- “non-automatic reducibility of self interest to
the interest of the community and the fundamental role of the state” (Battistella, 1992:
116, cited in Manohar P. S. and Zaman H., 2009). The structural theory shifts its focus
from individual action to national and international political and economic forces, from
the micro-level to macro-social processes. Migration is viewed as a module of the
process of capital accumulation, generation and instrumental device for strengthening
the economy to the detriment of developing economies. The long-term result does not
restore equilibrium between uneven economies but reaffirmation of dependence of
“periphery” societies on “core” societies. The decision to migrate is, therefore, far
from a free, rational choice of profit maximization: it is instead a forced decision from
lack of alternatives at the local level (Portes and Walton, 1981; Massey, 1993, 1994,
1999, cited in Manohar P. S. and Zaman H., 2009). The structural approach not only
recognizes the fundamental importance of economic factors as the cause of
international labor migration, but also addresses the increasing landlessness and lack
of educational, cultural and institutional services in labor exporting countries. Potential
migrants view overseas employment either as a source of subsistence earnings, socio-
economic mobility, or personal fulfillment. Empirical analysis on the effects of
emigration has produced a plethora of literature.
A cursory overview of relevant migration literature reveals various models of
migration-development analysis. Tapinos (1982) (cited in Kubursi A. 2007) suggests
that the effects of emigration on labor-exporting countries can be analyzed at three

|University of Dhaka
Page 23
levels: the impact of the departure of workers on employment, production and wages;
the transfer of funds and its effects on the living standard of family members, the
resultant income distribution, and productive accumulation and growth; and the effects
of return migration on the stock of human capital (from Adepoju, 1991: 53, cited in
Kubursi A. 2007). Papademetriou and Martin (1991), (cited in Kubursi A. 2007) have
proposed a model for the study of effects of labor emigration in the name of “three
Rs”. These are linked to recruitment, remittances, and return. The “three Rs” occur at
different levels. First, recruitment affects those who emigrate, thus making an impact
on employment and production. Second, remittances affect the living standards of
migrant households and thus the growth of communities. Third, returning migrants
affect the quantity and quality of the workforce. Many scholars have followed this
model to evaluate the developmental effects of emigration over a sending region. One
important variable missing in these models is the economic cost of migration. This is
important when, e.g. in Bangladeshi context, contract workers depend primarily on
families and other traditional sources for raising the sunk cost. This entails in a heavy
impact on the subsistence economy and thus influences the nature and extent of
developmental effects at micro level. Along with “three Rs”, the economic cost of
labor migration is also addressed in this study.
Theories of Migration 1. Network Theory
Kinship, friendship and shared community origins are hypothesized to be liable to
increase migration flows because they reduce the psychic and risk costs of
immigration. These network connections constitute a valuable social capital that
migrants can draw upon to gain access to foreign employment, and better wages and
working conditions (Boyd, 1989, cited in Uddin F. M. A., & H. T. J. 2006). There is a
rich literature on the immigrant multiplier effects4 where family members secure the
entrance of others. In the study area, it is found that most of the migrants go abroad
through family members or relatives. Networking actively worked in the studied area
also.
2. Segmented Labor Market Theory
Both neoclassical migration theory and new economic theory conceptualize migration
decisions as the outcome of rational economic calculations by individuals or families
as a response to the objective market forces or constraints. Segmented labor market
theory of migration takes, however, a different perspective, where immigration
responds to demand driven forces within structural imbalances of advanced economies
(Piore 1979, cited in Uddin F. M. A., & H. T. J. 2006). Capitalism raises segmented
4In general economy, the multiplier attempts to quantify the additional effects of a policy
beyond those that are immediately
measurable. http://www.investopedia.com/search/default.aspx?q=multiplier%20effects#ixzz
1gof0PftQ

|University of Dhaka
Page 24
labor markets where primary market which generates high payment and secure jobs
coexists with a secondary market (i.e. typically generating insecure, low paying jobs,
and hazardous and unpleasant working conditions). Immigrants become desirable and
are sought for jobs in the secondary market where residents turn away from certain
occupations. In this respect, segmented labor markets theory is complementary to both
the neoclassical theory and new economic theory of immigration.
3. World Systems Theory
An international division of labor has emerged in the wake of globalization and the
extension of capitalism into distant regions (Uddin F. M. A., & H. T. J. 2006). Labor-
intensive production is a characteristic of developing countries and capital-intensive
production is now concentrated in a few cities in advanced countries. When groups of
people lose their secure patterns of living and working, become a large pool of
potential migrants. Unskilled workers saw their wages fall as the demand for their
skills dimmed, while skilled workers experienced major wage increases as the demand
for their skills escalated. Globalization according to the world system creates large
pool of highly mobile labor in developing countries while simultaneously creating the
linkages and connections to advanced countries’ labor markets (Rumbaut 1991, cited
in Uddin F. M. A., & H. T. J. 2006). Available evidence suggests that industrialization
and agricultural development as indicators of capitalist market development are
instrumental in inducing migratory flows according to the world systems theory,
particularly when they occur under unfavorable demographic and economic
conditions, and where the communities affected are connected to the larger world
markets and centers (Ricketts 1987, cited in Uddin F. M. A., & H. T. J. 2006).
Factors in Labor Migration in General
In recent years, the issue of foreign labor force has become serious economic, political,
and social matter. Rich and industrialized countries are magnets in labor migration. In
response to declining populations, increasing labor shortages and relative high wages,
ever-larger numbers of foreign workers are entering and often times illegally engaging
in unskilled work under poor and even dangerous working conditions (Manohar P. S.
and Zaman H., 2009). Many of these countries strictly prohibit the entry of foreigners
at unauthorized work while open doors more widely for skilled and specialized
workers. Resistance to movement of people is thus driven by economic and political
policies designed to enhance local labor quality by attracting a selected group of
workers, while erecting barriers to others. The combination of slow demographic
growth, earlier retirement age, and a dwindling pool of high school and college
graduates in effect guarantees that many industrialized nations will face labor
shortages at various points during economic cycles, thereby creating the demand to
supplement their human resources (Johnston 1991, cited in Manohar P. S. and Zaman
H., 2009).

|University of Dhaka
Page 25
Remittance and its Impacts:
Remittance is playing a vital role in Bangladesh economy. Since 1970s its importance
in foreign currency earnings has been on the rise. The remittance sent by migrants has
considerable impact on country’s export and import. Because of its importance, several
macro and micro level studies have conducted to search better way of utilizing
remittance and finding out new destination for migrants. These studies enriched the
literature on remittances. In most of the cases, studies found out the reasons, results,
consequences of migration and remittance. Some studies have focused on socio-
economic impact of remittance in rural as well as urban areas of Bangladesh. Here, the
spirit of the study is mostly related to the impact of remittance in land holding or
ownership and land relation especially in terms of production relation. Though there
is abundant studies on migration and remittance and their impact on different segments
of economy and society, there are little studies about its impacts on land and land
related activities (Cotula L. 2004). New studies on it may reduce the knowledge gap on the
relation between remittance and agricultural land.
There is an important impact of remittance and migration of working age people over
rural socio-economy. Some researchers have slightly focused on this issue, among them
Mahmood (1991) shows that ownership of land prior to migration is an important determinant
of migration (Mahmood, 1991 cited in Murshid K.A.S et al. IOM, 2002). The consensus in
the literature about the relationship between migration and rural development remains
thin (Bonsu M. A. & Burger K. 2008). Bonsu M. A. & Burger K. (2008) ,say, in
focusing on remittance and agriculture, the evidence suggests that migration does not
usually lead to radical transformation of rural agriculture but it occupies a central part
in the maintenance of rural people’s livelihood (De Haan, cited in Bonsu M. A. &
Burger K. 2008). Croll and Ping (1997) (cited in M. A. & Burger K. 2008) shows from
a series of field study centered on Chinese village that high rates of out migration are
caused by land scarcity, rising cost of agriculture and a strong desire of villagers to
leave agriculture, and these in some cases lead to shortage of labor. Bigsten (1996)
(cited in M. A. & Burger K. 2008) argues that high wages (pull factor) are more
important than land scarcity (push factor) in explaining migration decision. Bonsu and
Burger (2008) note about negative impact of migration, that while migrants are away,
household have less labor to allocate to local economic activities. They further say, if
a migrants household’s marginal product on the firm is positive, crop production will
fall when the household sends out a migrant (Bonsu M. A. & Burger K. 2008). Taylor
et al. (2003) (cited in Bonsu M. A. & Burger K. 2008) notes that the adverse effects of
loss of labor may be high since migrants tend to be younger and better educated than
the average rural laborer. Rozelle et al. (1999) reports a significant and negative effect
on household cropping income, but Taylor et al. (2003) using the household farm
survey data collected by Rozelle in another paper found that although loss of labor to
migration has a negative effect on household cropping income, the overall effect of
migration on crop yields is positive. The loss in yield due to the reduction in available labor
may be compensated for by remittances from the migrants (Taylor et al. 2003; Rozelle et al.

|University of Dhaka
Page 26
1999, cited in Bonsu M. A. & Burger K. 2008) which are used to purchase additional inputs
or substitutes for labor in cropping.
Asian Development Bank (ADB) estimated that from 1976 to June 2009 about 6.5
million workers went abroad from Bangladesh and remitted a cumulative $62.3 billion.
On the basis of destination, they categorized migration in three phases. During FY
1976-FY1990, migration has been characterized by mostly unskilled workers going to
the Middle Eastern countries predominantly to work in construction following the oil
price boom in the early-1990s. About 0.8 million workers or about 52,000 workers per
year went abroad and remitted $6.5 billion or nearly $0.44 million per year then.
During FY 1991-FY2000, Bangladeshi workers went in large numbers to the newly
industrialized South East Asian countries, e.g. Malaysia, Republic of Korea and
Singapore when they experienced a phase of rapid industrial and infrastructural
expansion requiring cheap and unskilled workers. This new trend, combined with the
continued outflow of workers to the Middle East, nearly quadrupled the size of annual
migration to more than 200,000. Remittance increased nearly three-fold to around $1.3
billion per year. Finally, during FY2001-FY2009, with the opening of new markets for
Bangladeshi workers in the East European countries and Italy, the annual migration
received a further boost and doubled to about 405,00 workers per year. Remittance
inflows increased four times to nearly $4.8 billion annually. (Asian Development
Bank, March 2010).
Literature found on remittance, shows that Purchase of land was the single most
important sector to which overseas remittance was put. (Mahmood, 1986; 1991 cited
in Murshid K.A.S et al. IOM, 2002). Siddiqui T. & Abrar R. C., (2003) also support this
finding. From the pattern of use of remittance one finds that for some families
remittance is the major source of income to maintain subsistence. (Siddiqui T. & Abrar
R. C., 2003).Construction and repair of house account for 15-40 and 10-30 percent of
total remittances received respectively. Average level of expenditure on house
building is the highest in Dhaka city, followed by Comilla, Sylhet and Noakhali
(Murshid K.A.S et al. IOM, 2002). Murshid K.A.S et al. (2002) say that rural migrant’s
households spend most of their remittance money on consumption, interest payment
and festivals than non-migrant family. Habibullah (1980), found that non-receivers of
remittance invested more in business than the remittance receivers in both rural and
urban areas (Habibullah 1980, cited in Murshid K.A.S et al. IOM, 2002). This denotes
that remittance money is used in less productive or non-productive sectors. In the
Bangladeshi context, according to Siddiqui and Abrar (2003), land is seen the safest
and a very profitable investment, in all kinds of land such as arable, homestead and
commercial land and so on. Mortgage in and mortgage out of land has also increased
due to migration and remittance inflow. Siddiqui and Abrar (2003) find that a
substantial amount of remittance is used to finance migration of other family members.
They estimates that 9.21 percent of remittance is used in purchasing luxurious goods
including cassette player, radio, television, computer etc. (Siddiqui T. & Abrar R.
C.,2003). Cotula (2004) notes that a significant amount of remittance money is used

|University of Dhaka
Page 27
in building a new house or repairing the existing one. In Turkey, the 1970 “Abadan
Survey” found that 49 percent of remittances were spent on housing (quoted in Russel,
1986, cited in Cotula L. 2004). Similar results were reported for Pakistan (Gilani et al,
1981 cited in Cotula L. 2004). In Ghana, Kabki et al (2003) found that the majority of
the migrants interviewed were investing in a house for their family, and that most of
those who had not done so yet hoped to do it in the future (Cotula L. 2004). In the
Todgha oasis valley, Southern Morocco, remittances enable families to move out of
the traditional village and build new houses (de Haas, 2003, cited in Cotula L. 2004).
A study from eleven Mexican villages found that between 71 percent and 89 percent
of migrant households had expanded or repaired their house or built a new one (Basok,
2003, cited in Cotula L. 2004)).
Many empirical studies show that the major mode of land acquisition is inheritance.
The others form of transferring land ownership are purchases and various kinds of
gifts. Through purchase, land ownership has mostly been changed. (Andre C. &
Platteau P. J, march 1997).
Mahbub Ullah, a village economy researcher of Bangladesh, slightly touched on
migration and its impacts on land ownership transformation and land relation in his
book, Land Livelihood and Change in Rural Bangladesh (1996). Chapter three of this
book is about “Economic Structure, Income Distribution and Landlessness in
Bangladesh”. Here, he shows that rural household’s income is significantly correlated
with land property (Ullah M. 1996). He notes, over the years land-man ratio has
declined. The Poorest have lost their land but interestingly improved their income. The
middle income group lost both land property and income and the upper income group
has gained both land property and income. (Ullah M. 1996). Land ownership is also
changing through leasing out and leasing in (Ullah M., 1996,)
He says migration from Bangladesh is not new phenomenon. According to him—
Long distance migration for seeking jobs and economic prosperity is not new phenomenon for
Bangladesh. (Ullah M.,1996, p.53).
He says that the lack of employment opportunity at home led people to migration.
(Ullah M. 1996). To draw attention on the positive outcome of migration he notes—
Out migration of labor has brought an opportunity for Bangladesh government to reduce
unemployment problems, shortage of foreign exchange and investable surplus. (Ullah M.,
1996, p. 53).
Further he mentioned that—
The socioeconomic impact of international migration can be discerned from the socio-
economic background of the people undertaking such migration (Ullah M. 1996, p.54).
He says that the opportunities of developing the economies of Middle East are helping
some rural households of Bangladesh to stabilize or expand their economic base in

|University of Dhaka
Page 28
land. (Ullah M.,1996). He found that a large number of migrants belong to middle and
higher landowning category. These migrants are likely to be having higher educational
status. He says various socio-economic survey results have shown that a strong
correlation exits between the level of educational attainment and the level of land
ownership. (Ullah M.,1996). Mentioning on land relation, he says—
Migration of working member of the households has transformed family-worker based farms
into hired-labor based farms. In some cases, it has resulted in the growth of lease contracts
which creates demand for labor in other households. (Ullah M., 1996, p.55).
Another person who also worked on remittance and its impact land related activities
is Lorenzo Cotula. He discussed about it in his famous writing, “Explaining the
Linkages between Remittances and Access to Land: a Conceptual Framework”. Here, he says, focusing on the positive impact of migration and remittance, remittance can
not only contribute to household’s livelihood it also can foster longer-term
development through investment in education, land and small business. It also can be
helpful in social development projects, such as schools, health centers etc. (Cotula L.
2004).
To draw attention to the challenges occurred due to migration and remittance inflow,
Cotula says few challenges have to be faced by the rural economy. The absence of a
significant portion of the adult population may create labor shortage. This labor
shortage may make the local economy highly dependent on remittance and
sustainability in longer term. Further, he says, migration may increase inequality, as
households receiving remittances are able to buy land and other key resources, set up
new businesses and improve their children’s education, conversely, households not
receiving remittance may see them unable to compete with remittance receiving
households because of poorer income. He also says that inflows of remittances may
intensify competition and even conflict in buying scarce valuable resources especially
in land. Finally, Cotula says, in urban and peri-urban areas, substantial remittance
inflows and lack of effective local planning may lead to unregulated urban expansion
into previously agricultural lands without adequate service provision. (Cotula L.
2004).
By drawing evidence from West Africa, he notes that, land is of crucial importance to
economies and societies, providing the basis for a major share of GDP and
employment in most countries, and constituting the main source of livelihood for a
large portion of the population of Africa. In many areas, however, valuable land is
becoming increasingly scarce, partly as a result of demographic growth. Competition
has therefore become stronger, and better resourced and connected groups are
positioning themselves to gain control over land. New players - often urban elites such
as civil servants, traders and politicians - are entering the land arena, and formal or
informal land transfers are mushrooming (Ouedraogo, 2003, cite in Cotula L. 2004)).
He says that as an important source of hard currency, international remittances may
contribute to these changes in land relations by enabling migrant households to
improve their access to land through purchases, rentals, loans, customary institutions
and a variety of other arrangements.
|University of Dhaka
Page 29
To focus on the linkage between remittance and land Cotula says, within the highly
diversified livelihood strategies of rural households, land constitutes a key asset. He
says,
“The linkages between remittances and access to land are extremely complex and likely to
vary considerably from place to place, depending on local socio-cultural factors, on the local
economic and ecological context, and so on. They can take many different forms, from land
purchases funded through remittances to a variety of other land access mechanisms (rentals,
administrative allocations, loans, etc). (Cotula L. 2004)”.
They raise a range of issues, such as effects on land use patterns, on land competition
and disputes, and on land access for non-migrant households. The land-related effects
of remittances may take decades to materialize; for instance, de Haas (2003) (cited in
Lorenzo Cotula L. 2004) found that many migrants only started to invest in land after
more than two decades of absence.
Further he says-
“Studies from across the world show that purchases of agricultural land constitute a frequent
form of remittance use. Land purchases may be formal transfers of land ownership, or
informal transactions where the seller is not the legitimate owner (e.g. as land may be owned
by the state) or has no land title to prove his land rights. In Bangladesh, Mahamood (1992)
(cited in Cotula L.2004) found that some 15 percent of the remittances sent by migrants in the
Middle East went in land purchases, in housing 19 percent). (Cotula L. 2004)”.
In the Indian state of Kerala, Zachariah et al (2001) (cited in Cotula L., 2004) found
that a larger proportion of migrant households had bought land than non-migrant
households during the five years preceding their survey. In rural Egypt, Adams (1991,
quoted in Adams 1996, cited in Cotula L., 2004) “found that 73 percent of total per
capita expenditures on investment by external migrants went into the purchase of
agricultural and building land.
Cotula (2004) further says- “while migration and development policies have evolved in a
largely parallel way, in the literature a longstanding debate on the relationship between
migration and development has opposed “optimists” and “pessimists” (de Haas, 2003 cited
in Cotula L. 2004).. “Optimists” emphasize the benefits arising from remittances, which for
many countries are a precious source of foreign exchange as well as a major component of
household income. (Lorenzo C. 2004). Returned migrants bring back knowledge, ideas, skills
and experience (Ammassari, 2003 cited in Cotula L. 2004).
On the other hand, “pessimists” - particularly noticeable in the 1970s - stress the problems
created by substantial out-migration. First, migration may entail the loss of scarce skilled
labor (“brain drain”). Moreover, in agriculture-based economies where a significant portion
of the adult population is away, labor shortages may make the local economy highly dependent
on remittances, raising concerns for its sustainability in the longer term. Secondly, moreover,
migration may further deepen inequality, as households receiving remittances are able to buy
land and other key resources, set up new businesses and improve their children’s education,

|University of Dhaka
Page 30
while households not benefiting from this source of income may see their access to such
resources and livelihood strategies reduced. (Cotula L. 2004)”.
In preceding Cotula (2004) says:
“A claim that is sometimes made is that out-migration and the ensuing labor loss may result
in a reduction of land under cultivation (Rubenstein, 1992, quoted in de Haas, 2003, cited in
Cotula L. 2004). However, in some cases remittances may help tackle this issue, by enabling
households to recruit hired labor to cultivate the fields. Migrants usually entrusted land
cultivation to other household members (women in particular), to sharecroppers or to hired
laborers. This improved wage levels and sharecropping conditions. (ibid, 2004)”.
From above discussion we realize that, most of the people migrate due to lack of
employment opportunity in home country. Some of them migrate for the desire of
better living. It also has shown that migration has impacts on land ownership and
cultivation pattern. Most of the literature says that land is seen as the safest sector of
using remittance money. Some of them say that in rural area, most of the remittance is
used for consumption and building new houses or repairing home but it depends on
the level of earnings of migrants household. At last, but not the least, most of the
literature shows that remittance has become important source of earnings for migrant
households in the rural area of Bangladesh. Missing part is that, none of these
literatures has focused rigorously on remittance and land property. Furthermore,
another missing point is— none of literature has focused on rising land prices, due to
cash availability through remittance. Due to building new home on cultivable land,
availability of agricultural land is declining and this phenomenon has not been
addressed. In Bangladesh perspectives, most of the studies were done in 19980s and
1990s. But new phenomenon has arisen due to greater remittance infusion. In recent
decade (2000-2010) remittance inflow has increased substantially. As a result, its
diverse impact on rural areas especially in land and land related activities is more vivid
than before. Finally, none of these literatures has made exclusive focus on the impact
of remittance on land holdings and relation. So, a dependable study has to be done for
exploring the recent trend of migration as well as impact of remittance on land holding
and relation in the backdrop of land scarcity. Here, it should be mentioned that
utilization and investment of valuable remittance can ensure welfare of both migrant
households and above all, for the nation by switching substantial amount of remittance
from non-productive sector to productive sector.

|University of Dhaka
Page 31
Section Three
Chapter Four
1. Migration and Remittance in Bangladesh: at a Glance
People started massive migration from Bangladesh since 1976. Now, 7.5 million
Bangladeshis are staying abroad (figure 4.1). Remittance sent by them totals
461,713.56 crore taka (Table, 4.1) till November, 2010.
Figure: 4.1: Year-wise Overseas Employment of Bangladeshis from 1976 to 2010.
Source: Bangladesh Bank, up to Nov’2010.
It is noticeable from figure (4.2), that till 2008 the trend of migration from Bangladesh
was more or less consistently upward. Since 2009 it started going downward, because
of imposition of restriction on migration from Bangladesh by some Middle East
countries such as Saudi Arabia and Kuwait. Specially, restriction by Saudi Arabia on
emigration from Bangladesh is significantly responsible in this case, because around
37 per cent of Bangladeshis’ destination is there. Other causes may be, recent
economic recession all over the world as some countries curtailed employment of
overseas workers due to financial crisis. Negative propaganda about Bangladeshi
workers in print and electronic media is another cause of falling migration rate. Illegal
activities, in reality, by some Bangladeshis in host countries are also liable for it. As a
consequence, many migrants have lost their job and had to return home. However,
among total out-migrants, most of them have emigrated from Comilla District,
followed by Chittagong, Brahmanbaria, Tangail, and Dhaka districts. Present study
area occupies the sixth position (figure, 4.2).

|University of Dhaka
Page 32
Figure:4.2: District-wise Employment (Major Districts) from 2005 to 2010.
Source: Bangladesh Bank, up to Nov’2010.
At present, largest share of the Bangladeshi migrants stay in Kingdom of Saudi Arabia
(KSA, 37 per cent) followed by United Arab Emirates, UAE (26 per cent) and Kuwait
(19 per cent).
Figure: 4.3: Country-wise Overseas Employment (Major Countries) from 1976
to 2010.
Source: Bangladesh Bank, up to Nov’2010.
Some migrants stay in Europe, Africa, and U.S.A. Most of the migrants are involved
in lower category job such as taxi driving, construction, day labor, cleaner etc. Some
of them do professional job such as, doctor, nurse and white color jobs as official, but
in percentage terms, this is insignificant. According to Siddiqi, in 2008, 32 per cent
skilled workers, 16 per cent semi-skilled, 52 per cent unskilled migrants, but no
professional migrated from Bangladesh and total migrants were 87,5055 in number

|University of Dhaka
Page 33
(Siddiqi, 2009). Though migration has slowed down to KSA, Bangladesh is still
receiving the highest amount of remittance from KSA, around 30 per cent. United
States of America (USA) is the second largest remittance sending country; around 17
per cent remittance comes from there. UAE placed at number three, Bangladesh
receives around 16 per cent remittance from UAE (Siddiqi, 2009). From figure (4.4)
it is noticeable that remittance flow showed upward trend and its contribution to
foreign currency earnings had been going upward, though during last few years, it
showed slightly downward trend. To prevent downward trend, new markets have to be
found out. To maintain balance or competitiveness, Bangladesh should emphasize on
the creation of more skilled and professional migrants now.
Figure: 4.4: Year-Wise Remittance Earned from 1976 to 2010 in million US$.
Source: Bangladesh Bank up to Nov’2010.
Skilled and professional migrant’s income, in aggregation, is much higher than
unskilled labor. So, if unskilled labor migration decreases, the gap should be filled by
sending more skilled and professional workers. Finally, in response to decreasing
migration rate it is needed to find new markets. But it did not happen as expected.

|University of Dhaka
Page 34
Table: 4.1: Remittance Earned: 1976 - 2010.
Source: Bangladesh Bank, up to Nov’2010.
2. Bangladesh Agriculture at a Glance:
Agriculture is a very significant sector for Bangladesh economy. Contribution of
agriculture in national GDP is 18 per cent (BBS: 2011). Its contribution reduced
because contribution of the industrial sector and service sector contribution increased.
Now service sector’s contribution is 52 per cent and industrial sector contribution is
32 per cent respectively (BBS: 2011). Average land holding size is decreasing due
various reasons such building new homestead, demographic change etc. However,
table (4.2) shows a short picture of Bangladesh agriculture. There are three typical
types of farm holdings in Bangladesh: owner farms, owner cum tenant farms and
tenant farms. The land distribution pattern (by types of tenure) remains more or less
stable with a somewhat relative decrease in owner-cum-tenant farmers as well as the

|University of Dhaka
Page 35
area they operated in 2005. An insignificant percentage of tenant farms (1.39 percent
in 1983/84 and 3.48 percent in 1996) are also observed being operated in an
insignificant percentage of land (0.55 percent in 1983/84 and 1.90 percent in 1996).
This was however slightly higher for owners (1.06 acre) than that for owner-cum-
tenant holdings (1.02 acre) in 2005.
Table 4.2: Percentage Distribution of Farm Holdings and Area (by Type of
Tenure) in Bangladesh
1983-84 1996 2005
Type
s of
tenur
e
% of
farm
holdin
gs
% of
area
Avera
ge
size
(acre)
% of
farm
holdin
gs
% of
area
Avera
ge
size
(acre)
% of
farm
holdin
gs
% of
area
Avera
ge
size
(acre)
Owne
r
62.78 58.76 2.13 61.66 58.51 1.61 69.76 73.32 1.06
Owne
r-
cum-
tenan
ts
35.83 40.69 2.58 34.86 39.59 1.90 23.73 24.08 1.02
Tena
nts
1.39 0.55 0.89 3.48 1.90 0.88 6.51 2.60 0.40
All 100.0
0
(1019
6)
100.0
0
(2317
0)
2.27 100.0
0
(1179
7)
100.0
0
(2020
8)
1.71 100.0
0
(1453
6)
100.0
0
(2362
0)
1.01
Source: Agriculture Census Survey, 2005, BBS
The proportion of area under tenancy is observed to increase from 17 percent of the
operated area in 1983/84 to about 22 per cent in 1996 (Table 1). This change may
occur due to the rapid rural-urban migration along with the increase of absentee land
owners and the abandonment of some farms in favor of taking up rural non-farm
occupations. The extent of share tenancy in rural Bangladesh has declined, giving way
to fixed rent tenancy and medium term leasing arrangements. These institutional
changes are assumed to enable tenants to derive some of the benefits of additional
investment as agriculture inputs.

|University of Dhaka
Page 36
3. Profile of Study area: At a Glance:
This study has been conducted mainly in Jirtoly Union under Begumgonj Upazila in
Noakhali district. The village area is 25 square km. It is one of the most densely
populated villages of the country. Its total approximate population is 45000. Average
population density is about 1800 per square km, where national density is 964 per
square km, and in Noakhali this density is 853 (national population census, 2011, BBS
web site, last visited 09/11/2011). In study area, most of the household earnings are
dependent on remittance. Due to remittance inflow this village seems comparatively
one of the developed villages in this country. Almost every household has electric
connection. Modern technology such as connection of satellite TV channel, internet
service etc. is also available here. Here, most of the village roads are Pacca5. Transport
system is also well developed. This village stands near a national high way (Noakhali
to Laksmipur) and two big Bazaars called Chomuhoni, (one of largest economic
centers of the country) and Chandragonj are near to this village.
Map 1: Village Jirtoly
Jirtoly Most of the houses in the village are Tinshed6 and semi pacca7. Recently, tinshed
houses are replaced by pacca building. Literacy rate is above 90%. It has 14 sub-
5 Pacca is Bengali word; it means the structure which is built by concrete such as cement,
bricks, and stone etc. 6 Tineshed is another Bengali word, it denotes to that structure which built by using Tin. 7 Semi-pacca denotes to that structure or home which is ground’s part is built by concrete
and upper part is built by tin.

|University of Dhaka
Page 37
villages and six wards. Total area is divided in 14 Mouzas8, it has 5 Bazaars, which
function two times every week. It has four big Dighis9, which plays an important role
in agricultural irrigation. It has more or less 43 separate agricultural tracts10, which are
cultivated once in a year. Main productive crop is paddy which is cultivated during
BORO season from November to April/May. The village is highly dependent on other
regions for rice, vegetable etc. It has two high schools and 5 government primary
schools.(Source: Personal interview with Union Chairman).
Determinants of Emigration from Study Area:
The environmental and economic background of Jirtoly tempts villagers look for
alternatives. Not only because of lands remaining under water for around 7 months a
year, but also due to shrinking of land holdings under population pressure. The Jirtoly
experience shows a low landownership situation. On average, households of returnees
in the sample had less than one acre of land before and after migration. Acreage is
much lower than a rural household requires for its subsistence level of income. The
situation has aggravated due to one season crop agriculture. Villagers produce only
one-season paddy per year and production is strictly limited due to environmental
constraints. Flood is another factor that frequently affects. But the effects of it on
decision of migration have not been researched in general, in the context of Jirtoly,
and Bangladesh as a whole. It is a major issue. Villagers cannot rely on local
agriculture to fulfill their needs and are forced to look elsewhere. Thus, recurring
floods, poor land-owner relationship, water logging, and single crop production are
structural forces that have shaped the patterns of contract migration from Jirtoly. Some
other determinants are networking among relatives who live abroad. From this study
it has seen most of the migrants migrated with assistance of their relatives. Some
migrants go with the fame of successful migration history. Households which have
migrant members, most of them are economically well off. Their social status is also
higher. Poverty is not a big problem but has little effects over migration.
However, considering above reality, let’s see what types of changes in terms of
development and non-development, those occurred during last decades. To see the
changes, consider the events sequentially. A migrant takes several times to influence
over so called changes. In most of the cases it requires time for the migrant families to
be stable both economically and socially. After a successful migration, migrant
household attempt to buy new lands, assets, build new homes etc. During field study
this is found that the majority of migrants who migrated before 2000 and stayed longer
8 Mouza is bengali terminology which denotes to the division of land zone in Bangladesh. 9 Locally called Dighi, it means a large pond. 10 Beel is agricultural land which goes under water in rainy season. Sometimes due to low
land or heavy rain, cultivation of land becomes impossible.

|University of Dhaka
Page 38
time did very well. Now, they are investing in purchasing new land, ornaments,
furniture, building new resident and so on.
Section Four
Chapter Five
Findings and Data Analysis:
General Findings:
Before analyzing the relationship between remittance and land ownership & land
relation, it is expedient to describe some relevant findings about migrants’ households
of the study area. The following picture has emerged from the survey of migrants’
households.
1. Profile of the Households:
Among surveyed households the modal group consisted of 5 members (20 per cent)
followed by 4 members (17.3 per cent), 6 members (17.3 per cent), 7 members (13.3
percent), 8 members (6.7 percent), 9 members (10. 7 percent) and 10 and above (10.7
percent). Average size of households is 6.21. Households consisting 4 or 5 members
are nuclear families. The households consisting 7 or more members are either joint or
extended families. Households with larger size, say 7 or above have been observed to
be economically well-off compared to other households as more than one of their
members have availed the opportunity of migration through their blood ties with the
first migrant of the household. On other hand, as they have surplus labor to continue
self- cultivation in agriculture, they can combine remittance income with higher
income from agriculture. They can use this advantage to invest in productive sector.
According to some respondents, migrant members belonging to their family are doing
business in host country. If more than two members of a household are migrants that
household is assured of earning an income which leaves a lot of savings. By using this
saving, some of them start joint-venture business abroad or invest their pulled savings
in different sectors (e.g. purchasing new land, transports, building construction for
renting and business etc.) in the home country.
In terms of education, most of the respondents are still up to primary level (28 per cent)
and some respondents have no formal education yet (26.7 per cent). Ages of this
category are above 40 years. They are older generation of the village. Newly married
women ages are in between 30-40 years. Their education level is either under
secondary (16 per cent) or below higher-secondary (14.7 per cent). This study indicates
that a major portion of girls of the village got married before completing their
education. It also denotes that child marriage is still vibrant in rural area.
2. Types of Structure of the Household:

|University of Dhaka
Page 39
Recently, in most of the cases, pacca buildings are replacing semi-pacca building. It
is commonly seen that, large portion of the households containing migrant members
are intended to build pacca building. The households, which member are staying
abroad for a long time e.g.10-15 years and doing good job such as driving, hotel
servants, official job, business, in most of the cases, their resident’s structure is pacca.
From table (5.1), it is seen that tinshed household’s structure is still dominating in
village. If new trend of constructing Pacca residents continues, pacca building will be
major portion within a few years. This table shows the village Jirtoly is materially well
off. Let’s see, what about migrant numbers of the households.
Table: 5.1: Types of Structure of the Residential House
Types Frequency Percent Valid Percent Cumulative
Percent
Pacca 18 24.0 24.0 24.0
Semi-
pacca
16 21.3 21.3 45.3
Tinshed 39 52.0 52.0 97.3
Bamboo 1 1.3 1.3 98.7
Others 1 1.3 1.3 100.0
Total 75 100.0 100.0
Source: Field Survey.
3. Number of Migrants in the Households, their Age and
Education:
In the study area 61 per cent of the households have only one migrant. The households
which contain more than two migrant members, their economic condition are better
than those which have only one migrant (Table5.1). Majority of the migrants ages
range in between 31-40 years. The migrants around 51-60 years are only 8 per cent.
Whose ages are around 21-30 years consist 28 per cent. The people belong to the ages
range 21-30, they are from the newly migrated portion of the village. Large portion of
this group are the migrants UAE or Oman, because only these two countries of Middle
East are still recruiting workers from Bangladesh.

|University of Dhaka
Page 40
Figure: 5.1: Age-distribution of the Migrants.
Average Age of Migrants
(%)
6.00 / 8.0%
18.00 / 24.0%
30.00 / 40.0%
21.00 / 28.0%
51-60 years
41-50 years
31-40 years
20-30 years
Source: Field Survey.
Most the of migrants’ Educational level is under secondary (32 per cent), followed by
secondary 21 per cent and primary 20 percent respectively. The migrants, who passed
H.S.C, consist 16 per cent. It is found that the migrants who passed S.S.C and H.S.C,
their monthly income are comparatively higher than those who are non-educated or up
to primary educated. (Table, 5.2).
Table: 5.2: Level of Education of the Migrants
Frequen
cy
Percent Valid
Percent
Cumulative
Percent
Up to
Primary
15 20.0 20.0 20.0
Under
Secondary
24 32.0 32.0 52.0
Secondary 16 21.3 21.3 73.3
Under higher
Secondary
1 1.3 1.3 74.7
Higher
Secondary
12 16.0 16.0 90.7
Tertiary
(Degree)
4 5.3 5.3 96.0
No
education
3 4.0 4.0 100.0

|University of Dhaka
Page 41
Total 75 100.0 100.0
Source: Field Survey.
4. Activity Distribution of the Migrants:
It is commonly seen in the study area that the highest numbers of people have migrated
in 2006 followed by 1997, 1996, 2004 and 2007 respectively. It is seen from the figure
that the migration from this village is not stable. The lowest number of migrants went
in 2008 whereas the highest number of migrant left Bangladesh in this year. It is also
noticeable that migration from this region has decreased in 2008, 2010 and 2011
respectively (figure, 5.2). This trend more or less was consistent during 2000 to 2007.
Figure: 5.2: Number of Years as Migrant Year of migration
Year of migration
2011.000
2009.000
2008.000
2007.000
2006.000
2005.000
2004.000
2003.000
2002.000
2001.000
2000.000
1999.000
1998.000
1997.000
1996.000
1995.000
1994.000
1992.000
1991.000
1990.000
Freq
uenc
y
10
8
6
4
2
01
3
1
6
8
3
6
4
5
3
6
1
7
3
55
1
4
1
2
Source: Field Survey.
Migration has decreased because of imposing restriction on migrating of Bangladeshis
to KSA and Kuwait. Still most of the migrants live in KSA and Kuwait. As result,
imposing restriction on migration from Bangladesh to these countries has impacted on
migration from this village. However, large number of the migrants of the study area
work in construction sector (15 per cent) followed by business 13 per cent, business-
servants 12 per cent and daily labor 11 per cent respectively. Those who are doing
business or work as business servants, majority of them are KSA migrants and their
monthly income comparatively better than others. Migrants who are daily labor or
working as construction workers, most of them comes from UAE, Bahrain, Oman,
Malaysia etc. These people’s households’ economic situation is comparatively inferior
in the village.

|University of Dhaka
Page 42
Figure: 5.3: Monthly Earnings of the Migrants Abroad Monthly income of Migrant
5.3%
2.7%
17.3%
24.0% 25.3%
22.7%
2.7%
51- above
41-50 thousands
31-40 thousands
26-30 thousands 21-25 thousands
16-20 thousands
10-15 thousands
Source: Field Survey.
In addition, the migrants who come from Europe, Singapore, and South Africa, they
are earning a handsome amount of money. Their monthly income ranges from 50
thousands to above. Majority of them came from well off households. Those who are
migrants of KSA, their monthly average earnings fluctuate from 25 thousands to 35
thousands. The Migrants who have come from UAE and other Middle East countries,
their monthly earnings fluctuate from 15 thousands to 25 thousands (See figure, 5.3).
It is found that some migrants who have taken training before migration and got job in
relevant field; their monthly income also comparatively higher than others except
business man and business servants. (See table, 5.3). Some migrants of the study area
have taken informal training for higher earnings in host country but unfortunately a
large portion of them are not doing job in relevant field. From observation it is found that 57 per cent of migrants took training before migration (See appendix figure: 7.5).
Most of them took technical training on electrics, workshop, and computer, fridge and
air condition (see table 5.3 and 5.4).
Table: 5.3: Types of Training Received by the Migrants
Source: Field Survey.
Types of Training Frequency Percentage
Computer 3 4.0
Tailoring 8 10.7
Driving 7 9.3
Workshop Mechanic 6 8.0
Electric 9 12.0

|University of Dhaka
Page 43
Table: 5.4: Types of Activities of the Migrants in Host Countries
Types of Activities Frequency Percent
Daily labor 8 10.7
Workshop 4 5.3
Electrician 1 1.3
Business 10 13.3
Cleaner 5 6.7
Driving 6 8.0
Construction 11 14.7
Mechanic 4 5.3
Tailor 5 6.7
Business Servant 9 12.0
Hotel 7 9.3
Others 4 5.3
Total 75 100.0
Source: Field Survey.
Case Study One:
During field work an interesting case has been found which can open new insight for
further study. A household was interviewed which head is Monohor Ali (65). This
household is consisted above 15 members. Monohor Ali’s has eight sons and five
daughters. All daughters are married but no sons did married yet. His four sons are
staying abroad. They are doing business in Kuwait. His elder son went abroad in 1992.
Fridge and A/C 1 1.3
Painting 4 5.3
Pipe fitting 3 4.0
No training 34 45.3
Total 75 100.0

|University of Dhaka
Page 44
He managed VISA from recruiting Agency. After a successful migration he brought
another three brothers of him in Kuwait. The migrants came later joined with him in
business. Their monthly earnings now above 3 lack taka. In recent years they have
become one of the wealthy households in the village. But the history prior to migration
was not pleasant. According to Monohor Ali, “One day I was unable to feed my
children as their necessity, I was a Rickshaw puller and share cropper. My poor income
was not sufficient to feed them”. Tear was floating in his eyes. He said, “I passed a
long time in hunger and starvation but now I am wealthy, I donate in different social
functions and activities. Now I have a lot investment in transports and business. I have
brought 4 acres land and another 9 acres land I have mortgaged in. I have brought some
stores in Town. Now I have no dearth. My other four sons just are waiting to go
abroad”. When he was asked about younger four son’s education who are staying at
home. He replied “they are not interested in achieving higher education”, they argued
that “there are no benefits becoming higher educated, because it is hopeless to desire
to get job by becoming higher educated. Non-educated persons are earning better than
educated persons”. Again he was asked how he mobilized required money for
migration when his elder son Mobarak went abroad. He said “I sold my last piece of
land and borrowed money from neighbors in terms of interest”. He spontaneously said
“I got married my three daughters after migration. Now I am constructing a pacca
building which is three floored and has 16 rooms”. His household’s situation rapidly
improved when his SSC passed third son went abroad. This is successful history of
migration. But there are some sad histories in the Village. Folloing one can be an
example of bad experience of the migration.
Eusuf Ali (48) went abroad in 1998. Before migration he was day labor. He failed to
make a good history of success. He is a migrant of UAE. He is only one migrant in the
village whose family is living in a resident built by Bamboo. He mobilized all money
for migration from lending. In the meantime he fell in severe disease after migration.
Several years he had to survive hand to mouth in abroad. His family is still struggling
to get rid of from lending. His monthly earnins is only 15000 taka. This poor amount
of money is not alone enough to feed family members, let alone repayment of loan. He
has no cultivable land or working age son who can contributes in family earnings. He
has three marriageable daughters. Total members of family are eight. He has two little
sons. He said, “I don’t know when the darkness of my life will go away, when I will
get married my daughters, how I will get rid of my loans, Allah helps me”. Recently
he returned home for three month leave, he wished that he will do better this time
because after returning to host country he will join in a new job. (Source: Researcher’s
own interview with Respondent).
Table (5.5) reveals some traits of migration. In the table (5.5) it has been shown that
the persons who have been staying abroad for a long time as migrants, their monthly
average income (36000 thousands taka) are comparatively higher than other migrants.
Their migration cost also lower than other migrants (84000 thousands taka). It is seen
that the migration cost incessantly increased over the years. It is also shown that

|University of Dhaka
Page 45
income level in recent years has not increased; comparing to increased migration cost.
The amount of Migration cost increased 98 per cent from 1991-94 to 1995-96. It is
again noticeable from the table in recent years migration cost also started going higher
(38% from 2003-06 to 2007-08).
Table 5.5: Duration of Migration, Average Earning and Cost of Migration.
uration as migrants Average Monthly Earnings Average Cost
Migration
Frequency Earnings in tk. In taka Percentage
change
16-19 Years (1991-
1994)
9 36000 84000
12-15 Years (1995-
1998)
19 30000 165000 96%
8-11 Years (1999-
2002)
27 28500 210000 27%
4-7 Years (2003-
2006)
31 30000 218000 4%
0-3 Years (2007-
2010)
17 28000 350000 38%
Total (1991-2010) 103 25100 205400 41.25%
Source: Field Survey.
5. Media of Managing VISA and Sources of the Mobilization of
Money:
From Table (5.6), it is seen that, most of the migrants have managed VISA for
migration through relatives outside of households (37.3 per cent) followed by
Recruiting Agency (30 per cent) and Household members respectively (Table, 5.4).

|University of Dhaka
Page 46
Table: 5.6: Medium of Migration
Frequency Percent
Through Recruiting agency 23 30.7
Through Household
Member
14 18.7
Relatives other than
household members
28 37.3
Friends 8 10.7
Others 2 2.7
Total 75 100.0
Source: Field Survey.
Those who migrated before 2000, the average cost of migration for them was 1lack
to 1.2 lack taka. It varies from country to country; Migration to KSA, South Africa,
USA and European countries requires comparatively more cost than migration to
other countries of the world (figure 5.5).
Figure: 5.4: Money Spent for Migration Over the Year
How much Money has Required for Migration
Thousand Taka
13.3%
8.0%
13.3%
24.0%
28.0%
13.3%
below 1 lac
3 lac-above
2.51 lac-3 lac
2.1 lac-2.5 lac
1.51 lac- 2 lac
1 lac-1.5
Source: Field Survey.
Migrants have mobilized large amount of money from mortgaging out land followed
by remitted money, selling out land and both mortgaging out and selling out land. It is
interesting to see that people do not want sell land for migration without searching all
alternatives. In most of the cases they prefer mortgaging out land in hoping that they
will return their land after successful migration. Those who sold out land, most of their
land holding size is above 2 acres. Small land holding households do not want to sell
out land. Without selling out land they either borrow or take loan from formal and
informal money lenders from locality or outside of locality. They try to string into land

|University of Dhaka
Page 47
at the last moment. It is seen that a substantial amount of money come from own
savings, from observation it is seen that they are either come from Wealthy households
or were in service or job holder before migration. (figure, 5.5).
Figure: 5.5: Sources of Finance for Migration: How did he/she mobilize required money for migration?
12.0%
13.3%
6.7%
16.0%
9.3%
14.7%
6.7%
21.3%
borrowing
own savings
wife's family
remitted money
local money lender.
selling out land
mortgage+sell land.
mortgage out land.
Source: Field Survey
6. Monthly Remittance Received and their Uses:
Average monthly received money of households from migrants varies not only from
country to country but also on the basis of occupation and number of migrants of the
household as well as member of households. However, from the figure (5.7) it is seen
that the most of the households receive 11-15 thousands taka per month. Those
households which receive below 10 thousands taka, their family size either small or
one household’s member is migrants. Most of the respondents said that, their migrants’
members only send required money for monthly consumption.
Figure: 5.7: Monthly Remittance Received by the Households (%):
Average money received by Household.
(per month)
On an average, how much remittance do receive from migrant per month
31-above
21-30 thousands
16-20 thousands
11-15 thousands
6-10 thousands
1-5 thousands
Freq
uenc
y
30
20
10
0 3
8
14
24
21
5
Source: Field Survey.
Surplus money is saved by their migrants’ members either for repayment of debt or
investment. Almost 100 per cent respondents said that their most of the remitted money
is used for food consumption. It varies from 40 per cent to 70 percent based on family
size. Next important field of consumption is non-food consumption such as for

|University of Dhaka
Page 48
medicine, doctor cost; mobile cost, etc. (see Appendix, figure: 7.7). In compare to
national expenditure scenario of migrants (table: 5.5) it seems, in variation of some
respect, findings almost same. It is interesting to see that expenditure for education is
not more than 10 per cent for most of the households, where it is said that remitted
money induces for increasing expenditure on education. It might be the fact behind
showing reluctant to education that in most of the cases, school going people does not
get incentives for taking education. During field work it is frequently heard from young
generation, they are waiting just for migration; they said becoming formal educated
will not repute their fate. If they gained degree, they will not find job in Bangladesh.
It is interesting to hear that, some of them consider spending time for education as
wasting of time. However, those migrants who migrated by borrowing, they have to
spend a substantial amount of money for interest payment. During field work, any
formal money lenders have not been found. Women plays key role in lending money
informally. Women do it invisibly, because it is seen as stigma and bad practice in the
village. However, some remitted money is used for home construction, purchasing
luxury goods such as gold, ornament, fridge, mobile etc. (appendix figure, 7.4, 7.5, 7.6
etc.).
7. Investment of Remittance money:
Table (5.6) shows that most of migrants’ households have no investment (41 per cent)
in any sectors which can bring hard money. Those households who have investment,
they have invested mostly in Bank savings and buying new land. Interestingly, the
migrant household who can afford to buy land, she prefers to buy land in road sides or
that of proper area, so that, in future, she can build new home and use that home as
source of income by renting. Only 1.3 per cent of households have invested in
mortgaging in land. That means remittance has little impact on changing land
ownership in terms of mortgaging in and mortgaging out land in the studied area. But
migration has impact substantially. A substantial amount of money is also invested in
migration of other household members. From the table (5.6) it is seen that 41 per cent
of households have no investment. They may come from that group of households
which have only one migrant member or new migrant who still spending most of the
money in debt payment or their income is very poor because of doing poor category
work such as day labor, cleaner and son on in host country

|University of Dhaka
Page 49
Table: 5.7: Sector-wise Investment of Remitted Money
Frequency Valid Percent
In business 7 9.3 9.3
In buying new land 12 16.0 16.0
In bank savings 18 24.0 24.0
In mortgaging in land 1 1.3 1.3
In migration of other
household members
6 8.0 8.0
no investment 31 41.3 41.3
Total 75 100.0 100.0
Source: Field Survey.
However, most of the literature related to remittance and its impact on socio-economic
fabric of society found that there is strong positive as well as negative relation between
remittance and land holding & land relation. Positive impact is in the sense that after
a successful migration, remittance brings opportunity for some households to purchase
new farm or agricultural land. Negative impact is in the sense that before migration,
some household sale their beloved land to mobilize money. As result, land ownership
changes for the first time during migration. If for any reason, migration journey
become failure, that households might not got back their land.

|University of Dhaka
Page 50
Chapter Six
Impact on Land Holding:
In Bangladesh, majority of migrants are generated from the rural areas and poor
communities. Remittances allow the poor people to increase the expenditure on both
durable and non-durable goods. Whenever people go abroad, the major portion of their
migration costs come from the sale or mortgage out of their agricultural land. The
critical reasoning of utilization of remittances in Bangladesh shows that, 11.24 percent
of total remittances are used for purchasing of agriculture land. In utilizing the money
coming as remittance, priority is given to release the mortgaged land or to buy
agricultural land.
1. Types of Land ownership and Amount of Land:
It has found from the study area that, most of the households are not willing to sell out
their land for migration. Those who have land above 1.5 acres prefer to mortgage out
land rather than selling out it. It has been seen that, people want to string into land till
the last moment. Without any critical necessity, they don’t even mortgage out land let
alone to sale out it. Before going to mortgage out or sell out land, they seek money
from local money lenders, from relative, from friends; as many sources as they can. If
they fail then they interfere into the land.
Figure: 6.1 &6.2: Changes of Land ownership (Permanent) before and after
Migration Ownership before migration (permanent)
Ownership before migration (permanent)
no land
3.1-above
2.1-2.5 acre
1.6-2 acre
1.1-1.5 acre
0.5-1 acre
below 0.5 acre
Fre
qu
en
cy
30
20
10
0
24
45
2
1111
18
Current ownership of land ( permanent)
Current ownership of land ( permanent)
no land
3.1-above
2.6-3 acre
2.1-2.5 acre
1.6-2 acre
1.1-1.5 acre
0.5-1 acre
below 0.5 acre
Fre
qu
en
cy
30
20
10
0
17
433
1010
27
Source: Field Survey.

|University of Dhaka
Page 51
The households which have no land, they mobilize maximum portion of money for
migration from local money lenders in response of interest rate. Interest rate, for most
of the cases, remains in between 5 to 10 percent (appendix, table: 7.5). As a result,
they have to spend a substantial amount of their earnings in paying interest. They need
several years to pay out the debt completely and to become economically stable. From
figure (6.1&6.2), it is seen that, the land ownership of migrants’ household has
changed in rural area. Before migration, 24 per cent of households were no land, but
after migration it reduced to 17 per cent. It also noticeable from the figure that, the
number of households which land ownership is below one acre, their percentage has
increased. It was 18 per cent before migration and reached to 27 per cent after
migration. It means those household which had no land before migration they have
purchased some land after successful migration. Land ownership range in between 2.1
acres to 3 acres has reduced comparatively before and after migration. It reduced from
5 per cent to 1 percent. It is noticeable that households which have land above 3 acres
they are only 4 per cent and they are more or less stable before and after migration. In
the village, this portion of households is wealthy and can mobilize money from their
own savings and remittance without selling land. Furthermore, it is found from figure
(6.3&6.4) that land ownership change in terms of mortgage in not significantly found
in study area. Among 75 households 73 per cent of houses were no land in terms of
mortgage in before migration and it reduced to 64 per cent after migration, that means
household invest some money in mortgaging in land bur this type of land ownership
do not sustain for a longer time. It changes very frequently; as a result you will not
find any significant change for an extended time rather a particular time. So,
generalized prediction is not possible in terms of changing land ownership in mortgage
in or out.

|University of Dhaka
Page 52
Figure 6.3&6.4: Land ownership (mortgaged in) before and After Migration Ownership before migration (mortgaged)
Ownership before migration (mortgaged)
no land3.1-abovebelow 0.5 acre
Fre
qu
en
cy
80
60
40
20
0
73
Current ownership of land (mortgaged)
Current ownership of land (mortgaged)
no land
3.1-above
1.1-1.5 acre
0.5-1 acre
below 0,5 acreF
req
ue
ncy
70
60
50
40
30
20
10
0
64
4
Source: Field Survey.
2. Prices of Land Market:
It is observed that the land prices have increased very rapidly in study area. Because
of variation in years of migration land prices seem different. Land prices are seen 1 to
5 thousands is 26 per cent during 1990-1995. Prices rose to 6 to 10 thousands during
1996-2000 and it reached to 11 to 15 thousands in 2001 to 2005. During 2006, 2007,
2008, 2009 and 2010 land prices increased very rapidly. It reached to 21 thousands to
above 30 thousands. Prices increased 69 percent in 2010 in respect of 2001. In 2010
land prices were found 31 to 35 thousands taka per decimal. Land prices vary
according its standing and ecological importance. Land prices increase for various
reasons such as poor land-man relationship, high competition in land market etc. But,
recently, remittance is playing vital role in increasing land. Due to poor land-man
relationship and increased migrants households’ income, there has risen more demand
for land than supply. As a consequence, heavy competition indulges in increasing land
prices. The land which is closed to road or in proper places or besides any one resident,
it prices were above forty thousand per acre in 2010 according to its importance to
buyer.

|University of Dhaka
Page 53
Case Study Two
Optimistic about positive impact of migration claim that migration of households
members and their sent remittance brings greater opportunity for migrants households
in terms of health facility, education, luxury good etc. after a successful journey. But it
is unfortunate to say that in the study area this impact was found almost absent in study
area. In addition, in rural area it is seen that most of the migrants’ households which
were no land before migration, they have purchased land for building new resident.
Most of the young people of the study area, particularly male people, seem very much
reluctant to education. Furthermore, some negative impacts of migration and remittance
will be found if intensive study carried out in study area, such as moral degradation of
young members of households. Availability of satellite, mobile phone and lack of
proper take care and monitoring them plays vital role for moral degradation. Divorce
rate has increased in rural area due to extra marital love and misbelieve between
husband and wife. Anarchic situation in the households also impact on behavior and
psychology of younger members of household.
Agricultural Land is Decreasing Rapidly in Rural Area
Picture 1: Agricultural land is being elevated through earth filling to build new
homestead.
In the study area, agricultural lands are turning into new homestead in an alarming rate
(picture 1). Maximum migrant households purchase new land to build new homestead.
Those who have built new home in agricultural land contain a member who stays
abroad. Those who are living in older one, among them 61 per cent said they will build
new home in agricultural land. Already 36 per cent is living in home which is built in
agricultural land (figure 6.5). So, this is highly treat to agricultural land and as well as

|University of Dhaka
Page 54
an alarm for higher authority to become conscious on implementing rules and regulation
related to building new settlement in agricultural land. It is seen in the study area that a
lot of new home has been built in agricultural land and some houses are in under
construction.
Figure 6.5: Plan of Households to Build New homestead in Agricultural Land
38.7%
61.3%
No
Yes
Source: Field Survey.
Local agricultural officer Abbas Uddin informed that at least 25 new homestead has
been built in fresh agricultural land in the village during last ten years. He said that,
there were 25 acres land in Uttar Pather11, almost 10 acres has already turned into new
homestead. Further he informed that another Beel named Boli Pather12 was consisted
with 75 acres of agricultural land. Now, Almost 20 acres of this land zone have already
turned into new homestead. To verify the estimated statistics, local settlement officer at
Upazila level was asked to give update information about how many new homes have
been built in 158 no. jirtoly mouza13 and 173 no. Mohabbatpur mouza, they failed to
give update information. It was asked to Mr. Abbas Uddin that, What types affect
occurred in agriculture due to building a new home in fresh agricultural land? He said
that, it not only reduced agricultural production, but also, reduced fertility of land. He
said, when a new home is built, it need extra soil to fill the land. The soil is lift out from
others agricultural land, through this way surface soil goes out from agricultural land to
homestead. As a result, fertility of land degrades.
Due dissimilarity of land, the productivity of upper land compare to lower land
decreases in one hand because farmers cannot irrigate on the land properly and apply
fertilizer. Lower land absorbs the fertility of upper land. On the other hand, Farmers
cannot cultivate land within a same time because of water stagnant in lower land.
Through this way productivity of land decreases gradually. Land fertility is decreasing
through another way. Many bricks field have been established in response to fill the
demand of rising pacca building. These brick fields are absorbing valuable soil from
11 Local language, it indicates to that land which is situated northern part of the residential
area.
12 Boli pathar, is land area, which was named from some name BOLI (brave). 13 Mouza is a Bengali word which means a specific land zone.

|University of Dhaka
Page 55
agricultural land. When new resident is built in new homestead it put pressure on the
land which is surrounded it (picture 2). Sometimes new resident needs new pond, which
grasp some agricultural land. Owner of the land cannot cultivate the land properly due
to homestead wastage in their land. The shadow of trees of the household’s reduces
productivity of land also. Not only has it, households’ domestic animals sometimes
damaged the crop of the land. So, multiple negative impacts occurred on agricultural
land due to building new homestead in agricultural land.
Figure: 6.6: Percentage of Households Shifting Residence Has household changed location of living?
64.0%
36.0%
No
Yes
Source: Field Survey.
Abbas Uddin told that, if an effective rules and regulation do not put forward
immediately to prevent building new homestead on agricultural land, within a few years
maximum agricultural land will be turned into homestead. This scenario really pathetic
in study area. It almost has seen true from personal observation for every similar
Pather14 in Begumgonj Upazila. Some people unreasonably are building new homes in
agricultural land. They could build new residential home in older one; some of them do
it to show higher status in society. So, government should aware to protect agricultural
land. Existing rules and regulation about new settlement should be strictly imposed or
new rules should be incorporated if needed. Awareness programs should be arranged to
inspire people to build home in existing non-agricultural land. Following pictures
represent the reality of agricultural land.
Picture 2: New home occupying agricultural land.
14 Pathar is a local terminology denoting large stretch of cultivable land.

|University of Dhaka
Page 56
Impact on Land Relation:
Analysis of the impact of foreign remittance on agrarian or production relation is very
difficult. It changes frequently according time and space as well as along with
geographic situation changes. So, no general conclusion is possible in analyzing the
relation between remittance and land. However, following results have been found in
the study area during field work.
Cultivation of Land:
Agricultural land is comparatively scarce in study area than any other parts of the
country. Land-man relation or proportion of land in terms of households is less than
one acre. Most of the land is in ownership of few people. However, in terms of land
cultivation in the study area, 33 per cent of migrants’ households do not cultivate their
owned land and 16 percent has no land. Though 50 percent of households have said
that they cultivate their land, it does not represent the real fact (Figure 6.12).
Figure 6.7: Percentage of Land cultivation by Operation Do you cultivate your land?
33.3%
50.7%
16.0%
No
Yes
Source:
Field Survey.
Some households do not cultivate their total land; a portion of land is cultivated by
others as share cropping. Those households which do not cultivate their land, 30
percent of their land is in sharecropping and 13 percent of the land is in mortgaged out.
Only 1.3 per cent households has land both in mortgaged out and in share cropping in
the study area. It is noticeable that 54 per cent of households are in “others”. It
represents that household which has no land in share cropping, mortgaged out or in
both. ‘Others’ also includes those households, who have no land and who cultivate
their total land (figure 6.8).

|University of Dhaka
Page 57
Figure 6.8: Current Status of Land Current status of land if does not cultivad by own
54.7%
1.3%
13.3%
30.7%
others
share cropping+mortg
Mortgagedout
in share cropping
Source: Field Survey.
Among selected households those who do not cultivate their land, 11.8 per cent of
them said that they do not cultivate their land because of lack of working age people
in households and 14.1 per cent said that they do not cultivate because of uncertainty
in availability of daily labors. Only 2.4 per cent said, they do not cultivate their land
due to lack of care taker.
Figure: 6.9: Reasons of non-operation of agricultural land
I f l a nd d o e s no t c u l t i va t e d b y o w n t he n w hy ?
6 2 . 4 %
2 . 4 %
7 . 1 %
2 . 4 %
1 4 . 1 %
1 1 . 8 %
n o t a p p l i c a b l e
p r o d u c t i o n c o s t i s h
l a c k o f c a r e t a k e r
l a c k o f D a i l y l a b o r
l a c k o f wo r k i n g a g e
Source: Field Survey.
Those households which cultivate land in the absence of male members, in those
households’ female members lead agricultural farming and they are actively involved
in the whole process. They manage the activities of cultivation in absence of male
members of household. Figure (6.9) represents the picture more precisely. In study
area most of the respondents were female; among them above 60 per cent said that
they are care taker of the whole process of cultivation especially in expenditure of
agricultural farming. It is noticeable 7.1 per cent said that they do not cultivate their
land because of higher cultivation cost. The gain from agriculture is lower than the
cost required for cultivation. They said that production cost has increased due to
dependency in hired labor, irrigation, fertilizer. Diesel and electricity prices are
increasing day by day which has also multiple effects on production.

|University of Dhaka
Page 58
Figure 6.10: Percentage of Hired Labor Outside of Locality Amount of labor supply ( hired, outside of locality)
34.7%
22.7% 21.3%
5.3%
6.7%
4.0%
Missing
61%80% 51%-60%
41%-50%
31%-40%
Amount of labor supply ( hired, outside of locality)
34.7%
22.7% 21.3%
5.3%
6.7%
4.0%
Missing
61%80% 51%-60%
41%-50%
31%-40%
Source: Field Survey.
Figure (6.10) represents that most of the households are dependent on hired labor that
comes out of own locality (61%-80%). It means that land cultivation in study area is
highly dependent on hired labor. Moreover, 17.3 percent of households are completely
dependent on hired labor for cultivation. Only 5.3 percent do cultivation by using only
their own household’s labor. In addition, 44 per cent respondents said that their
agricultural farming is done by using both hired labor (from locality and outside of
locality) and household’s labor. It has to be noted that, the contribution of households’
labor vary in between 10 per cent to 15 per cent in most of the cases, only in a few
cases it exceed, if household land holding size is very few, but working age members
of households are abundant.
Figure 6.11: Types of Agricultural Labor
What is the source of Agricultural labor?
33.3%
44.0%
17.3%
5.3%
not applicable
Hired & family membe
Hired
Family member
What is the source of Agricultural labor?
33.3%
44.0%
17.3%
5.3%
not applicable
Hired & family membe
Hired
Family member
Source: Field Survey.
It varies if households’ land ownership is 0.5 acre to less than 1 acre. They try to
cultivate their land by exploiting more labor forces from own household and their
productivity of land also higher than the households that cultivate land by hired labor.
Wealthy households whose agricultural land is higher than 1 acre, they are dependent
on more hired labor in compare to amount of land ownership.

|University of Dhaka
Page 59
Figure 6.12: Supervision of Farming Activities Who is the care taker of the agricultural farming.
5.3%
1.3%
4.0%
68.0%
21.3%
Son (migrant)
Father (migrant)
wife (respondent)
own (respondent)
Source: Field Survey.
Situation of Share Cropping:
In study area it is found that most of the households (both migrants and non-migrants)
want to involve in agricultural farming. They want to maintain relation to land by any
means. They consider it as the safest source of food supply. It is found, those who has
no land, they try to involve in production through sharecropping. Among respondents,
36 per cent are involved in share cropping. Some of the households have no land, some
have few, but they involved in share cropping for getting more crops. Though the
figure (6.13) discloses that 64 per cent of households do not involved in share
cropping, some of them are seeking land for sharecropping but due to scarcity of land
there are high competition for getting land as sharecropping. Moreover, land owners
prefer to give their land in share cropping to relatives or favored one. Land cultivation
in share cropping is increasing. To find this change a time series study can be carried
out. From figure (6.14), it is noticeable that 16 per cent of migrants were involved in
agricultural farming before migration. It does not represent the real picture of reality,
in rural area of Bangladesh, working age people involved in multiple works.
6.13: Households Involved in Share Cropping Is household involved in Share cropping
64.0%
36.0%
No
Yes
Source: Field Survey.
Those who were daily labor (13 per cent), or job holders (29 per cent) or studied (18
per cent) or did business (14 per cent), most of them were also involved in agricultural

|University of Dhaka
Page 60
farming. That means net withdrawal of agricultural labor due to migration is higher
than the figure represents.
Figure 6.14: Occupation of Migrants before Migration What did migrant do before migration?1.3%
1.3%
13.3%
18.7%
29.3%
14.7%
16.0%
5.3%Driving
Daily labor
Study
Job
Business
Agricultural Farming
Source: Field Survey.
Table 6: Contribution of Agriculture in Household’s Income.
Frequency Contribution (%)
59 13%
No Contribution 16 21%
Total 75
From the table (6) it is seen that 59 of the households has income contribution from
agriculture. Here, income from agriculture denotes to the income from cultivable land,
cattle raising, homestead cultivation etc. Agriculture contributes 13 per cent in
households’ income. Among total households 16 of them said they are completely
dependent on remittance earnings. They are 21 per cent among the respondents.
Finally, it was asked to farmers that which type seeds they prefer to cultivate in their
land. Almost 100 percent respondents said, they prefer cultivating High Yielding
Variety (HYV) than domestic seeds because the productivity of HYV is higher than
traditional seeds. They said that, they cultivated traditional seeds few years ago. But
in recent years, traditional seeds cultivation has thrown away from cultivation. Now
most of the land is cultivated by HYV seeds. Though the productivity of HYV is higher
than the traditional seeds but there has a great debate about its compatibility and
sustainability. People cannot collect mother seeds from HYV, every year they have to
purchase new seeds from market. Experts said that frequent cultivation of same seeds
on same land, reduces fertility of land. HYV seeds need more irrigation and chemical
fertilizer for greater production. In addition, HYV plants are more vulnerable for
harmful insecticides attack. As a result, more chemical has to use in land. Through this
process, land fertility decrease. In addition, the most alarming matter is that our
agricultural farming has become dependent for seeds. If any incidence occurs in seeds
supply then what would happen to our agricultural production, it is the time to think.
Without modifying traditional seeds, dependency for farming seeds on others outside
|University of Dhaka
Page 61
of the country cannot be reduced. Diversified crop cultivation has to be introduced. It
is good for us that our cultivation pattern has been transforming to various productions
which were mostly concentrated on only rice cultivation.

|University of Dhaka
Page 62
Chapter Seven
Conclusion:
Though there is a huge debate among experts regarding the sustainability of migration
in terms of economic and social development, the importance of out migration cannot
be denied at present situation of Bangladesh. As a labor abundant country, a huge
working age people is unemployed or under employed in Bangladesh. So, opportunity
of migration is seen as boon for Bangladesh economy for finding job space for lots of
working age people. Contribution of remittance money sent by migrants in national
GDP is going higher and higher and this trend will continue next few years. According
to World Bank, the current global economic downturn has slowed the growth of new
migrants going abroad but the flow of remittances to Bangladesh remains remarkably
resilient (World Bank 2009) and there is a clear expectation that remittances will
remain important for Bangladeshis in the years ahead.
This study tried to find out the size of migrants’ households and their socio-economic
condition in general. Some general information has been taken to see households’
status rigorously. Most of the households’ home are tinshed structured. Recently,
capable households’ prefer to spend money in building pacca resident rather than
spending on Tinshed or semi-pacca building. It is found that some migrants gained
training in one sector but serving in other sectors. If they got job in relevant sector of
their training, they could earn more money than present earnings. In study area, most
of the migrants managed VISA trough relatives. Some of them managed it from
recruiting agency. Managing Migration VISA from recruiting agency need higher cost
compared to other sectors such as from relatives, from family members and friends.
Cost of migration was comparatively lower before 2000 but it increased considerably
in post-2000 period. To mobilize required money for migration, majority of migrants
mortgaged out land rather than sold out. So, land ownership has changed for most of
the cases temporarily. Most of the migrants come from Middle East and majority of
them are unskilled. Average earnings of migrants vary in between 20 thousands to 25
thousands on the basis of host country, living period and occupation etc. The migrants
who are living in host country for a long time; their monthly income is comparatively
higher than the migrants’ who are living for shorter time. In consequences, their
households’ economic condition is also comparatively well off for most of the cases
in rural area. In the study area, migrants’ households spend most of their earnings on
food consumption and medicine respectively. A substantial amount of earnings are
also spent in debt payment. Most of the households have no other source of income
without earnings from remittance. This portion of households’ is more vulnerable in
terms economic crisis if any unexpected incidence occurs to their migrant member.
In terms of land ownership, majority of the households have more or less permanent
land ownership, but most of the land still in hand of few households. The holding size

|University of Dhaka
Page 63
of land for rich households is above 4 acre or higher. They are comparatively in better
positions to increase their land ownership. They got more chance as well to increase
their holdings if member of their household stays abroad and do well. Rich households
have various types of income sources except remittance e.g. from agriculture, job,
business and so on. In terms of production relation, it is found that most of the
households want to maintain agricultural farming by any means. They leave cultivation
when there is no way for cultivation. Some of them cultivate land as supplementary of
household’s food supply.
Share cropping is increasing in rural area. Large farm holders are leaving farming in
alarming rate because of uncertainty and unavailability of agricultural labor in study
area. The absence of male members of the migrants’ households is also liable for
increasing sharecropping. Cash rent and lease out of land are completely absent in
study area. Agriculture economist said that sharecropping reduces efficient use of
agricultural land due to lack of intensive cultivation of farm land by sharecropper.
Sharecropper get less incentives to give extra labor and inputs for production, because
they know giving extra labor will bring half return for them. At present, due to scarcity
of agricultural land for sharecropping, it seems it does not reduce the production in
study area. Share cropper also try to produce more crops in fear of losing cropping
opportunity in next year, but when land for sharecropping will be more than
sharecroppers willing to cultivate then production might fell down. Where agricultural
land is abundant and sharecropping is higher, in that regions production level might
fall down because lack of intensive cultivation by share croppers. In economics it is
called efficiency loss. Because of massive cultivation of HYV seeds in majority of
land in response to rising demand of food supply, agricultural sector has become
dependent on exported seeds. It indicates that our agricultural sector has become
almost vulnerable in terms of supply of seeds.

|University of Dhaka
Page 64
Section Five
Appendix:
Table and Figure of Findings
Table: 7.1: Members of Household Frequency Percent Valid Percent
Valid 2 member 1 1.3 1.3
3 member 2 2.7 2.7
4 member 13 17.3 17.3
5 member 15 20.0 20.0
6 member 13 17.3 17.3
7 member 10 13.3 13.3
8 member 5 6.7 6.7
9 member 8 10.7 10.7
10 and above member 8 10.7 10.7
Total 75 100.0 100.0
Source: Field Survey.
Figure: 7.1: Education Level of Household Head.
Education Level of Household head
(%)
26.7%
8.0%
6.7%
14.7%
16.0%
28.0%
no education
Tertiary
Higher secondary
Secondary
Under secondary
Primary
Source: Field Survey.

|University of Dhaka
Page 65
Figure: 7.2: Types of Structure of the Residential House. Types of Structure of the residential house
1.33 / 1.3%
1.33 / 1.3%
52.00 / 52.0%
21.33 / 21.3%
24.00 / 24.0%
Others
Bamboo
Tinshed
Semi pacca
Pacca
Source: Field Survey.
Table: 7.2: Number of Migrants of the household
Frequency Percent Valid Percent
1 member 46 61.3 61.3
2 member 19 25.3 25.3
3 member 6 8.0 8.0
4 member 1 1.3 1.3
no migrant at
present
3 4.0 4.0
Total 75 100.0 100.0
Source: Researcher’s own Calculation.
Figure: 7.3: Numbers of Migrants of the Household. Number of Migrants of the household
3.00 / 4.0%
1.00 / 1.3%
6.00 / 8.0%
19.00 / 25.3%
46.00 / 61.3%
no migrant (Present)
4 member
3 member
2 member
1 member
Source: Field Survey

|University of Dhaka
Page 66
Table: 7.3: Age Distribution of Migrants.
Frequency Percent Valid Percent
Valid 20-30
years
21 28.0 28.0
31-40
years
30 40.0 40.0
41-50
years
18 24.0 24.0
51-60
years
6 8.0 8.0
Total 75 100.0 100.0
Source: Field Survey
Figure: 7.4: Education level of Migrants
Education level of Migrant
3.00 / 4.0%
4.00 / 5.3%
12.00 / 16.0%
1.00 / 1.3%
16.00 / 21.3% 24.00 / 32.0%
15.00 / 20.0%
no education
tertiary
higher secondary
under higher seconda
secondary under secondary
primary
Source: Field Survey.
Figure: 7.5: Types of Training.
Types of Training
45.3%
4.0%
5.3%
1.3%
12.0%
8.0%
9.3%
10.7%
4.0%
No training
pipe fitting
painting
fridge and A/C
Electric
Workshop
Driving
Tailoring
computer
Source: Field Survey.

|University of Dhaka
Page 67
Figure, 7.6: Media of Migration VISA. How did he/ she Manage VISA for Migration
2.7%
10.7%
37.3%
18.7%
30.7%
Others
Through Friends
From relatives
Through Household Me
Through Recruiting a
Source: Field Survey.
Figure: 7.7: Percentage of Expenditure (Non-food). Percentage of expenditure ( Non-food)
1.3%
1.3%
9.3%
8.0%
49.3%
16.0%
13.3%
1.3%
no cost
46%-50%
26%-30%
21%-25%
16%-20%
11%-15%
5%-10%
below 5%
Source: Field Survey.
Figure: 7.8: Percentage of Expenditure (Debt Payment) Percentage of expenditure ( Debt payment)
no cost
31%-35%
26%-30%
16%-20%
11%-15%
5%-10%
below 5%
Source: Field Survey.

|University of Dhaka
Page 68
Table: 7.4: Percentage of expenditure (Education).
Frequency Percent Valid Percent
Valid below 5% 28 37.3 37.3
5%-10% 21 28.0 28.0
11%-15% 4 5.3 5.3
16%-20% 3 4.0 4.0
21%-25% 1 1.3 1.3
26%-30% 3 4.0 4.0
no cost 15 20.0 20.0
Total 75 100.0 100.0
Source: Field Survey.
Figure: 7.9: Sectors of Remittance Investment. In which sector remittance money is mostly invested?
In which sector remittance money is mostly invested?
no investment
In migration of othe
In mortgaging in lan
In bank savings
In buying new land
In business
Perce
nt
50
40
30
20
10
0
Source: Field Survey.
Figure: 7.10: Percentage of Household income (Agriculture). Percentage of contribution (agriculture)
90.7%
5.3%
4.0%
none
10%-20%
below 10%
Source: Field Survey.

|University of Dhaka
Page 69
Figure: 7.11. Does household has other source of income
69.3%
30.7%
no
yes
Source: Field Survey.
Table: 7.5: Rates of interest of debt
Frequency Percent Valid Percent
5%-10% 27 36.0 81.8
11%-15% 6 8.0 18.2
Total 33 44.0 100.0
Missing System 42 56.0
Total 75 100.0
Source: Field Survey.
Map: 3 Begumgonj Upazila
Begumgonj Upazila.

|University of Dhaka
Page 70
Questionnaire
Date: …………………..
Serial No: ………………
Research Topic
Impact of Foreign Remittance on Landholding and Land Relations
in Rural Bangladesh: A Case Study from Village Jirtoly in the
District of Noakhali.
[N. B. The data collected here will be used only for present study and all kinds of
confidentialities of information will be kept.]
Name of Surveyor:…………………………………………………….
Address: ……………………………………………………………………………………
Personal Information ( Respondent)
Name of Household Head: ….………………………… Mob: ………………………….
Father/Husband:……………………………………………………………………………
Village: …………………………………… Bari: ………………………….......................
Upazilla:…………………………………………………………………………………….
Zilla:…………………………………………………………………………………………
Religion:…………………………………………………………………………………….

|University of Dhaka
Page 71
Household’s General Information:
1.1. Members of Household:
Name Relation
with
Household
head
Age Education
Level
Occupation Sex
Male Femal
e
Code:
Members of household 2 Member=1, 3 Members=2, 4 Members=3,
5 Members=4, 4= 6 Members=5, 7
Members=6, 8 Members=7, 9 Members=8,
10 & Above=9.
Sex
Male=1 Female=2
Occupation Agricultural labor=1, Daily labor=2,
Service=3, Business=4, Student=5,
Housewife=6, Returned migrant=7, Job=8,
Others=9.
Education Primary=1, Under secondary=2,
Secondary=3, Under higher secondary=4,
Higher secondary=5, Tertiary=6, No
Education=7.
Age 1-10 Years=1, 11-20 Years=2, 21-
30Years=3, 31-40 Years=4, 41- 50=5
51-Above=6
1.2. Type of structure of the residential house.
Answer: Pacca/ Semi Pacca/ Tinshed/ Bamboo/ Thatch/Others
Code: Pacca=1, Semi pacca=2, Tinshed=3, Bamboo=4, Thatch=5, Others=6
1.3. Have the residential house built after Migration
Answer: Yes/ No
1.4. When the residential house was built?
Answer: …………………………………
1.5. How many members of your
household stay abroad?
Answer: 1/2/3/4/5/
Code: Yes=1, No=2
1=1 Member, 2=2 Members, 3=3 Members,
4=4 Members, 5=5 Members, 6=6 Members.

|University of Dhaka
Page 72
1.6. General information about migrant member of the household.
Code:
Age 20-30 years=1, 31-40 years=2, 41-50 years=3
51-60 years=4, 60-above=5.
Relationship with
household head
1=Husband, 2=Son, 3=Father, 4=Brother, 5=Own, 6=Others.
Education Primary=1, Under secondary=2,Secondary=3, Under Higher
Secondary=4,Higher Secondary=5
Tertiary=6, No Education=7.
Occupation Daily labor=1, Business=2, Cleaner=3, Driving=4,
Construction=5, Mechanic=6, Tailoring=7, Business
Servant=8, Hotel=9, Electric=10, Workshop=11,
Others=12.
Name of the host country KSA=1, UAE=2, Bahrain=3, Kuwait=4, Oman=5,
Malaysia=6, Katter=7, Singapore=8, U.S.A=9, Europe=10,
Others=11.
1.7. How did he/she manage visa for migration?
Answer:
Media of migration Code
a. Through recruiting agency A=1
b. Through household member B=2
c. Buying VISA from relatives C=3
d. Through friends D=4
Name Age Relationship
with household
head
Educational
level
Occupation Name of
Host
Country
Year of
Migration

|University of Dhaka
Page 73
e. Others (please mention) F=5
1.8. How much cost has required for migration?
Answer: ……………………………………………………… (Thousands taka)
Code:
1.9. Why did he/she migrate?
Answer:
1. Lack of job opportunity in home
country.
2. For higher earnings.
3. Hoping for a better living.
4. Scarcity of agricultural land for farming.
5. Lack of required degree for finding job.
6. For internal conflict
7. Others (please mention) ……………………………………………………………
1.10. Did migrant(s) take any training before migration?
Answer: Yes/No
1.11. If, yes then the types of training.
Name of Migrants Types of
training
Monthly income (thousands taka)
Code: Types of Training-
Computer=1, Tailoring=2, Driving=3, Workshop=4, Electric=5, Fridge & A/C=6,
Painting=7, Pipe Fitting=8, Others=9.
Code: Monthly Income (Thousand)-
Below 1 lac=1, 1-1.5 lac=2, 1.51-2 lac=3, 2.1-2.5 lac=4, 2.51 lac-3 lac=5, 3.1-Above=6
Code: A=1, b=2, c=3, d=4, e=5, f=6, g=7
Code: Yes=1, No=2

|University of Dhaka
Page 74
10-15=1, 16-20=2, 21-25=3, 26-30=4, 31-35=5, 36-40=6, 41-45=7, 46-50=8, 51-Above=9
1.12. On an average, how much remittance do you receive from migrant(s) per month?
Answer :………………………………………( thousands taka).
Code: Monthly Received Money (thousand)-
1-5=1, 6-10=2, 11-15=3, 16-20=4, 21-25=5, 26-30=6, 30-Above=7
1.13. Has household has any borrowing in purpose of Migration?
Answer: Yes/ No
1.14. If yes, then how much Money?
Answer: ……………………………………… ( thousand taka).
Code: Amount of borrowing (thousand).
Below 50=1, 51-1 lackh=2, 1.1 lac-1.5 lackh=3, 1.6 lac-2 lackh=4, 2.1 lack-2.5
lackh=5, 2.6-3 lackh=6, 3.1-4 lackh=7, 4 lackh- Above=8.
1.15. Has household overcome from borrowing?
Answer: Yes/ No
1.16. If no, then how much Money?
Answer: ……………………………………………......
Code: Amount of borrowing:
Below 50=1, 51-1 lac=2, 1.1 lac-1.5 lac=3, 1.6 lac-2 lac=4, 2.1 lac-2.5 lac=5, 2.6-3
lac=6, 3.1-4 lac=7, 4 lac- Above=8.
1.17. How did he/she mobilize required maximum money for migration?
Answer:
Source of Migration
money
Amount Current status Terms and conditions When
Paid/go
t back
Not
paid/
not got
back
Applicab
le
Not
applicable
Code: Yes=1, No=2
Code: Yes=1, No=2

|University of Dhaka
Page 75
a.By borrowing
b. By mortgaging out
land
c. Selling out land
d.From local money
lenders
e. From remitted
money
f. From wife’s family
g.From own savings
h.Borrowing from
relatives.
I.From Selling assets
J.Others
Code:
Source of Migration money a=1, b=2, c=3, d=4, e=5, f=6, g=7, h=8, i=9, j=10
Amount of Money Below 50=1, 51-1 lac=2, 1.1 lac-1.5 lac=3, 1.6 lac-2 lac=4, 2.1 lac
2.1lac=5, 2.6-3 lac=6, 3.1-4 lac=7, 4 lac- Above=8.
Current status Paid=1, Not paid=2, Partial paid=3.
Terms & condition: Applicable=1, Not Applicable=2.
Rate of Interest: 5%-10%=1, 11%-15%=2, 16%-20%=3.
1.19. What is the relation with the providers of finance?
Answer:
1. Family members (blood
related)
2. Relatives
3. Friends
4. Nabors
5. None
Code: a=1, b=2, c=3, d=4, e=5.
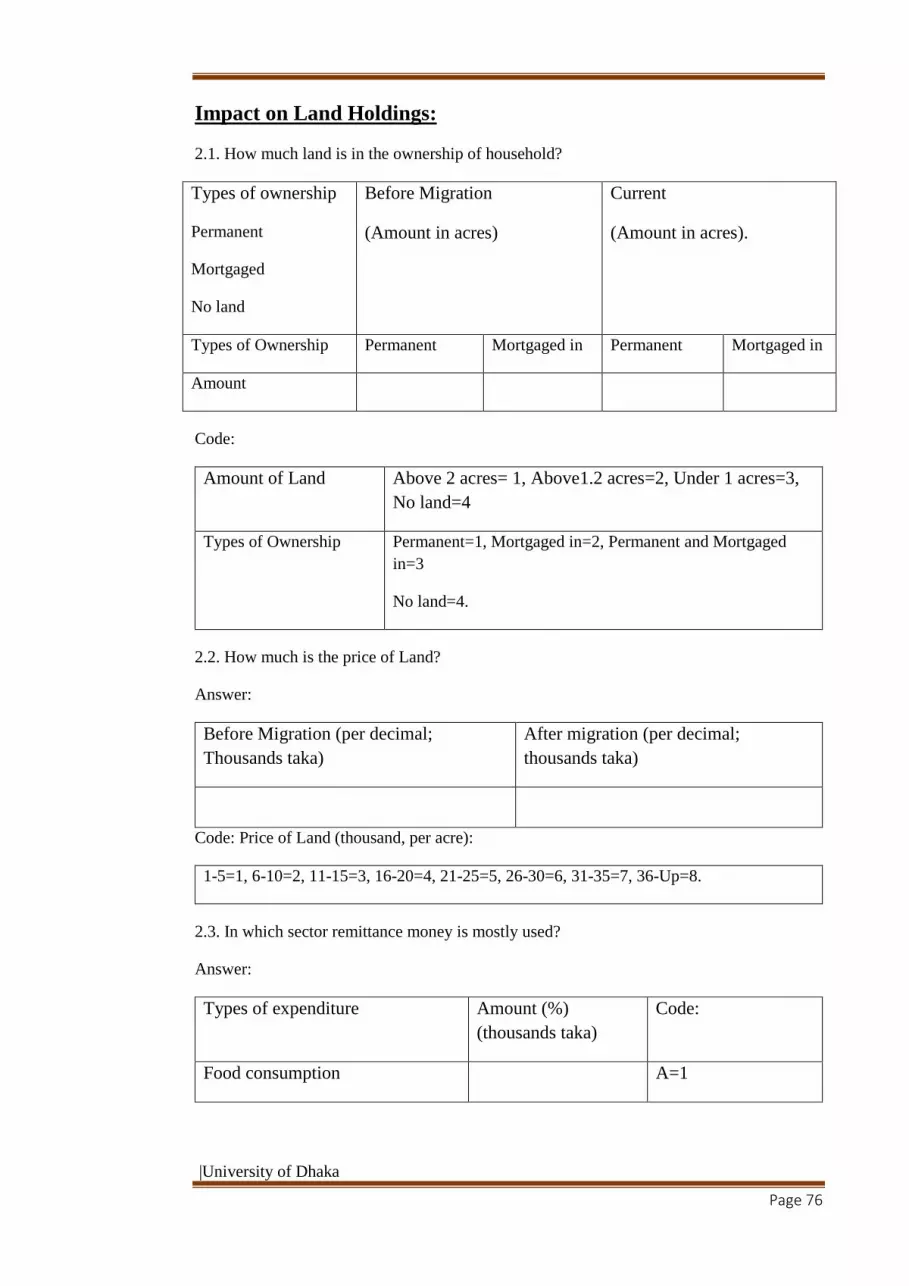
|University of Dhaka
Page 76
Impact on Land Holdings:
2.1. How much land is in the ownership of household?
Types of ownership
Permanent
Mortgaged
No land
Before Migration
(Amount in acres)
Current
(Amount in acres).
Types of Ownership Permanent Mortgaged in Permanent Mortgaged in
Amount
Code:
Amount of Land Above 2 acres= 1, Above1.2 acres=2, Under 1 acres=3,
No land=4
Types of Ownership Permanent=1, Mortgaged in=2, Permanent and Mortgaged
in=3
No land=4.
2.2. How much is the price of Land?
Answer:
Before Migration (per decimal;
Thousands taka)
After migration (per decimal;
thousands taka)
Code: Price of Land (thousand, per acre):
1-5=1, 6-10=2, 11-15=3, 16-20=4, 21-25=5, 26-30=6, 31-35=7, 36-Up=8.
2.3. In which sector remittance money is mostly used?
Answer:
Types of expenditure Amount (%)
(thousands taka)
Code:
Food consumption A=1

|University of Dhaka
Page 77
Non food consumption (clothing,
mobile cost, doctor, donation etc.)
B=2
Education C=3
Luxury goods D=4
In debt payment E=5
In marriage of daughter/son
Home construction/repair F=6
Others G=7
Code: Percentage of Expenditure:
Below 5=1, 5-10=2, 11-15=3, 16-20=4, 21-25=5, 26-30=6, 31-35=7, 36-40=8, 41-45=9,
46-50=10, 51-55=11, 56-60=12, 61-70=13, 71-Above=14, No Expenditure=15.
2.4. Has household changed location of Living?
Answer: Yes/ No
2.5. If yes, then where?
Answer:
1. In agricultural land
2. Non-agricultural land
3. Not applicable.
2.6. When did resident build?
Answer:
1. Before migration
2. After migration
2.7. Has household planned for building home in new agricultural land?
Answer: Yes/ No.
2.8. In which sectors remittance money is
mostly invested.
Answer:
Types Amount (%) Code
Code: a=1, b=2.
Code: a=1, b=2, c=3
Code: a=1, b=2.
Code: Yes=1, No=2.

|University of Dhaka
Page 78
In business A=1
In Buying new land B=2
In bank savings C=3
In mortgaging in land D=4
In lending E=5
In migration of other family
members.
F=6
Others G=7
No investment H=8
Code: Percentage of investment:
Below 5=1, 5-10=2, 11-15=3, 16-20=4, 21-25=5, 26-30=6, 31-35=7, 36-40=8, 41-45=9,
46-50=10, 51-55=11, 56-60=12, 61-70=13, 71-Above=14, No Expenditure=15.
Impact on Land Relation:
3.1. Who cultivate your land?
Answer:
1. By own
2. By others
3.2. If cultivated by own, then which amount of land?
Answer:
Types Amount (acres) Code
Total A=1
Partial By own B.1=2
B.2=3 By others
3.3. Is household involved in Share Cropping?
Answer: Yes/ No
3.4. What is the source of agriculture labor?
Code: a=1, b=2,
Yes=1, No=2

|University of Dhaka
Page 79
Answer:
Types of labor Amount (%) Code
Household member A=1
Hired (Locality and out of locality) B=2
Hired & Household member C=3
Code: Percentage of labor supply:
Below 10=1, 10-20=2, 21-30=3, 31-40=4, 41-50=5, 51-60=6, 61-70=7, 71-80=8, 81-
100=9.
3.5 Who look after the process of cultivation?
Answer:
Types of person Code
Own (respondent) A=1
Wife (respondent) B=2
Husband C=3
Father ( migrant) D=4
Mother (migrant) E=5
Permanent house servant F=6
Son (migrant) G=7
Others H=8
3.6 What did migrant do before migration?
Answer:
Types works Code
Agricultural farming A=1
Business B=2
Job C=3

|University of Dhaka
Page 80
Study D=4
Daily labor E=5
Driving F=6
Others G=7
3.7. If land does not cultivated by own then why?
Answer:
Types of reason Code
Lack of working age people A=1
Lack of day labor B=2
Lack of care taker C=3
Cost of cultivation is higher than gains D=4
Others E=5
3.8. If land does not cultivated by own then what is the current status of land?
Answer:
Status of land Amount of land
(acres)
Taka/crops (per
acres, in percent)
Code
Share cropping 1/2, 1/3, 1/4 A=1
Mortgaged out B=2
Cash rent C=3
Lease out D=5
Others D=6
3.9. Does household share cost with share cropper?
Answer: Yes/ No
3.10. If yes, then how?
Answer:
How Amount (%) Code
Code: Yes=1, No=2.

|University of Dhaka
Page 81
Total Partial
Provide cash money A=1
Provide seeds B=2
Provide fertilizer C=3
Share cost of Irrigation D=4
Others E=5
3.11. How many times do land cultivate?
Answer: 1/2/3
3.12. Which types of seeds do you cultivate in your land?
Answer: 1. HYV, 2. Traditional 3. Both.
3.13. Does household has other source of
income?
Answer: Yes/ No.
3.14. If yes, then what types of income?
Answer:
Sources of income Amount (%) (thousands taka) Code:
Agriculture A=1
Business B=2
Job C=3
Pension D=4
Others E=5
Code: (%) of contribution:
Below 10=1, 10-20=2, 21-30=3, 31-40=4, 41-50=5, 51-60=6, 61-70=7, 71-80=8, 81-100=9.
Code: Once=1, Twice=2
Code: HYV=1, Traditional=2, Both=3
Code: Yes=1, No=2.

|University of Dhaka
Page 82
Interviewed Persons:
1. Shamsul Alam Lablu
Chairman, 3 no. Jirtoly.
2. Abbas Uddin
Local Agriculture Officer
Begumgonj, Noakhali.


