Embed Size (px)
Citation preview


Version: 1st version
Main Authors: Harini Nagendra (P5), Paola Mairota, Rocco Labadessa and Vincenzo Leronni (P8), Carmela Marangi, Fasma Diele, Dino Torri, Valeria Tomaselli (P1), Emilio Padoa-Schioppa (P10)
Project ref. number 263435
Project title BIO_SOS: Biodiversity Multisource Monitoring System: from Space to Species
Deliverable title Framework for understanding human impacts on habitat, land cover and landscape fragmentation
Deliverable number D6.9
Deliverable version Version 1
Previous version(s)
Contractual date of delivery
31 March 2013
Actual date of delivery 17 May 2013
Deliverable filename BIO_SOS_6.9 _V1.doc
Nature of deliverable R
Dissemination level PU = Public
Number of pages 50
Workpackage WP6 Task 6.4

Partner responsible Partner 5 (ATREE)
Author(s) Harini Nagendra (P5), Paola Mairota, Rocco Labadessa and Vincenzo Leronni (P8), Carmela Marangi, Fasma Diele, Dino Torri, Valeria Tomaselli (P1), Emilio Padoa-Schioppa (P10)
Editor Harini Nagendra (P5)
EC Project Officer Florence Beroud
Abstract Deliverable D6.9 is the output of WP6-Task 6.5 activity, focusing on the development of a theoretical framework to understand how human impacts, both positive and negative, influence changes in habitat, land cover change, and landscape fragmentation and connectivity. The deliverable builds on Tasks 6.1, 6.2, 6.3 and 6.4 with inputs from the leads of these tasks, based on the insights delivered from specific site-based analyses, providing a multi-faceted view of pressure and its impacts from different theoretical perspectives. The deliverable addresses five separate but connected themes. The first two themes (Section 3 and Section 4) address the theoretical frameworks that explain the mechanisms by which human pressures manifest their impact on land cover change; and the mechanisms by which human pressures manifest their impact on habitats. The next theme (Section 5) moves from developing an understanding of how human pressure manifests itself on habitat change, to developing an understanding of the impact of human-induced changes in habitat cover on biodiversity using one specific framework of island biogeography, which has some implications for protected area management of isolated natural and semi-natural habitat patches. The fourth theme (Section 6) is focused on demonstrating the usefulness of habitat classification taxonomies (specifically the GHC classification scheme adopted by BIO_SOS) for recording changes in habitats as a response to human pressure. The fifth theme (Section 7) focuses on theoretical frameworks that can help to link human pressure-induced habitat fragmentation with changes in biodiversity. These discussions demonstrate the need for more integrated theoretical frameworks to address the complex issue of human pressures, and how these translate into changes on

land cover, habitat cover and fragmentation, and ultimately on biodiversity. A diversity of theoretical frameworks currently exist and have been used at different levels of analysis, as some of the examples cited here demonstrate. Yet a more comprehensive, coupled social-ecological framework that is hierarchical and applies across multiple levels is required to further elucidate the link between human pressure (process), and ecological impact (pattern).
Keywords Local pressures, threat analysis, monitoring impact

D6.9: Developing a framework for understanding human impacts on positive and negative changes in habitat, land cover and landscape fragmentation
BIO_SOS FP7-SPACE-2010-1 GA 263435 Page 5 of 50
Signatures
Written by Responsibility- Company Date Signature
Harini Nagendra Editor (P5) 15-05-2013
Verified by
Carmela Marangi Project Management Team
(P1)
Approved by
Palma Blonda Coordinator (P1) 17-07-2013
Fifamè Koudogbo QAP 16-07-2015

D6.9: Developing a framework for understanding human impacts on positive and negative changes in habitat, land cover and landscape fragmentation
BIO_SOS FP7-SPACE-2010-1 GA 263435 Page 6 of 50
Table of Contents
1. Executive summary .......................................................................................................................... 7
2. Introduction ....................................................................................................................................... 9
3. Mechanisms by which human pressures manifest their impact on land cover ................................. 10
4. Mechanisms by which human pressures manifest their impact on habitats ..................................... 13
4.1 Human pressures and the impact of urbanization ................................................................. 13
4.2 Human pressures as manifested through water and sediment supply .................................. 17
5. Impact of human-induced changes in habitat cover on biodiversity ................................................. 18
6. The use of habitat classification systems for recording habitat modifications .................................. 20
6.1 A case study: IT4 site ........................................................................................................... 20
7. Impact of human-induced habitat fragmentation on biodiversity ...................................................... 28
7.1 Habitat fragmentation and its impact on biodiversity – taxa-specific studies in Alta Murgia ... 28
7.2 Habitat fragmentation and its effect on biodiversity – meta-population models applied to the wolf-wild boar pair in Alta Murgia ........................................................................................................ 38
8. Conclusions and recommendations ................................................................................................ 43
9. References ..................................................................................................................................... 44
10. Appendices ................................................................................................................................. 50
10.1 Appendix 1. Acronyms used ................................................................................................. 50

D6.8 Methodology to identify and quantify local pressures
BIO_SOS FP7-SPACE-2010-1 GA 263435 Page 7 of 50
1. Executive summary
Deliverable D6.9 is the output of WP6-Task 6.5 activity, with this strictly related to the activity of WP5-Task 5.4, on change detection and the activity of both Task 6.2 and Task 6.7 in WP6. The objective of the BIO_SOS project, and main focus of Task 6.5, within which D6.9 is embedded, is the development of a theoretical framework, based on the findings across multiple sites, to understand how human impacts, both positive and negative, influence changes in habitat, land cover change, and landscape fragmentation and connectivity. A special concern is devoted to Mediterranean areas, where three of the five study sites of the project are located. The deliverable builds on Tasks 6.1, 6.2, 6.3 and 6.4 with inputs from the leads of these tasks, based on the insights delivered from specific site-based analyses, providing a multi-faceted view of pressure and its impacts from different theoretical perspectives.
The deliverable consists of five sections. The first section (Section 3) focuses on the mechanisms by which human pressures manifest their impact on land cover change. Beginning from an initial dominant focus on population increase as a major explanatory factor for land cover change, theoretical explanatory frameworks have become increasingly more sophisticated, including an adequate consideration of land change as a coupled human and natural system with socio-economic, institutional, biophysical, demographic and ecological drivers of change. A number of studies have been conducted on different types of land cover change, focusing for e.g. on deforestation, reforestation, agricultural change and urbanization. Many recent studies stress that analytical separation of human drivers into factors acting independently is not viable, as many factors act in synergy. Further, complex feedback loops connect the processes of human impact to the patterns of ecological outcomes leading to multivariate and/or nonlinear relationships that have the capacity to generate unanticipated outcomes for managers dealing with human impacts on protected areas, for e.g. when conservation policies intended to limit human pressure lead to increased impacts. Thus, there is a need for more integrated theoretical frameworks that adequately encompass a consideration of social and ecological pressures on land cover change.
The second section (Section 4) moves deeper, from studies of the drivers of land cover change, to examining the mechanisms by which human pressures manifest their impact on habitats. This section considers two aspects of human pressure that are especially relevant to BIO_SOS, namely, urbanization (which has manifest impact on all BIO_SOS sites) and its impact on habitat transformation (Section 4.1); and human pressures that drive changes in water and sediment supply, which are an especial focus of Task 6.3, D6.5 (Section 4.2). Urbanization is very important in the European Union (EU), where about 75% of the European population lives in urban areas. In Italy, two main forces impacted by urbanization have driven habitat transformation over the past 50 years - land abandonment in mountain areas due to movement to cities, which leads to regrowth in rural areas; and the growth of urban footprints that lead to impacts such as the loss of agricultural soils in Italy. The issue of urbanization and its impact on habitats is illustrated here with respect to studies in Milan, which have implications for all of Italy, and for many parts of the EU as well. A brief section discusses the need for a better theoretical understanding of the manner in which human pressure influences hydrology, water and sediment supply, through case scenario analyses using spatially distributed models such as LANDPLANER that have been developed in Task 6.3 within WP 6.
The third section (Section 5) discusses the impact of human-induced changes in habitat cover on biodiversity, based on the theoretical framework of island biogeography as illustrated through a case study in the islands of western Mediterranean Sea and Macaronesia. The study indicated that human drivers have the potential to strongly modify bio-geographical patterns, displacing island biodiversity from the equilibrium points expected by theory on the basis of geographical features. This is an important theoretical insight that can be critical for habitat modelling for conservation management, as many natural and semi-natural habitat patches in protected areas, especially those surrounded by extremely human-dominated or altered habitats, function as islands and the theory of island biogeography can be relevant for conservation management in such locations (as in several of the BIO_SOS sites).
D6.8 Methodology to identify and quantify local pressures
BIO_SOS FP7-SPACE-2010-1 GA 263435 Page 8 of 50
The fourth section (Section 6) describes the use of habitat classification systems for recording habitat modifications, using the example of the IT4 BIO_SOS site that is subject to a range of human pressures, showing the usefulness of the General Habitat Category classification scheme adopted by BIO_SOS, for recording changes in habitats as a response to human pressure. The fifth section (Section 7) moves to consider an area of focus for the WP within which this Task and Deliverable are embedded (WP6), namely the issue of human pressure-induced habitat fragmentation and the manner in which this induces changes in biodiversity. The first section (Section 7.1) focuses on assessments of change using studies of specific taxa (herbaceous plants, grasshoppers, butterflies and birds) in the site IT3. A step-wise comprehensive analysis is demonstrated, considering and integrating aspects of drivers, determinism, role of the matrix and multispecies responses with reference to the focal habitat of interest. In this, the use of species assemblages (here, taxa) provides a better focus on their relations with pattern, providing grounds for inferential studies on how human impacts affect biodiversity via the analysis of landscape change. This is particularly useful from both the management point of view as it allows for a considerate amount of generalization across species, and within the context of the BIO_SOS project, as only spatial explicit consequences of human activities can be revealed directly by means of Earth Observation (EO) technologies.
The second section (Section 7.2) describes insights gained from mathematical meta-population modelling of a predator-prey population pair using the same site IT3 as an example. The main issue from a theoretical perspective is how to conceptualize the role of human pressure in influencing the risk of local extinction for predator populations such as the wolf, in an area whose extension and vegetation type is not suited for hosting a viable and stable population of predators. This section discusses how meta-population dynamics can provide a suitable theoretical framework (and methodological approach) for assessing the role of human pressure on landscape fragmentation, and ultimately, on biodiversity.

D6.8 Methodology to identify and quantify local pressures
BIO_SOS FP7-SPACE-2010-1 GA 263435 Page 9 of 50
2. Introduction
WP6 within the BIO_SOS project focuses on modelling at the habitat and landscape level, pressures scenario analysis and development of modules for conversion of land cover into habitat maps, as well as development of modules for pressure indicator production and trends evaluation. Thus, a focus on the conceptualization, assessment and monitoring of human pressure and its impacts, both positive and negative, on conservation outcomes within and outside protected areas forms a major focus of this WP. Within this, Task 6.5 focuses directly on pressure from human impacts such as poaching, hunting, logging, urbanization, agriculture, mining, and road construction.
One deliverable has previously been submitted within this Task. D6.8 focused on providing an operational contribution to the implementation of “threat analysis” (Salafsky et al., 2003, 2008), which is required as an input for scenario building and evaluation. A review of existing terminologies and frameworks for assessment of locally recognizable pressures and their impact on habitats was conducted; along with reviews of experiences from conservation assessments conducted using these terminologies and frameworks. Based on this, we assessed the strengths and weaknesses of different approaches. Our goal was to develop a methodology that can be used to extract information from EO data on changes in the extent and intensity of pressures over time, and we developed a framework for this based on the assessments of impacts of pressures, building on the approach developed by Salafsky et al., and widely used. This framework was used to describe pressure-induced impacts in BIO_SOS sites, followed by a literature analysis, based on which methods for mapping changes in pressure-related impacts were proposed. The framework was subsequently utilized further in WP6 within Task 6.6, D6.11 to develop definitions for bio indicators and rules to monitor changes in indicator values over time.
This deliverable, the second within Task 6.5, provides a theoretical assessment of the nature in which human impacts influence land cover change, habitat change and habitat fragmentation. D6.9 builds on work conducted in WP2, Task 2.2, where for each site, an analysis of pressures and threats was carried out within the framework of Convention on Biological Diversity (CBD) and Streamlining European 2010 Biodiversity (SEBI) indicators with focus on three main headline indicators covering: (i) habitats of European interest in the context of a broad habitat assessment; (ii) abundance and distribution of selected plant species; and (iii) fragmentation of natural and semi-natural areas; in D2.2 from WP2 (Task 2.2), which concerns the identification of pressures and threats for each site, and D2.1 from WP2 (Task 2.1), which focuses on biodiversity indicator selection, with the main aim being to provide a method for direct and indirect measurement of pressures/threats and evaluation of impacts on habitats. It also builds on Tasks 6.1, 6.2, 6.3 and 6.4 with inputs from the leads of these tasks, based on the insights delivered from specific site-based analyses, providing a multi-faceted view of pressure and its impacts from different theoretical perspectives.

D6.8 Methodology to identify and quantify local pressures
BIO_SOS FP7-SPACE-2010-1 GA 263435 Page 10 of 50
3. Mechanisms by which human pressures manifest their impact on land cover
Human pressure on the earth’s surface has had large scale impacts in the past centuries, leading to claims that we have now entered the era of the Anthropocene (Crutzen, 2002). Of these, human induced changes in land cover are amongst the most significant, causing impacts on global climate that are comparable with the impacts driven by combustion of fossil fuels (IPCC, 2007). A number of studies have been conducted over the past ~20 years to develop a better theoretical understanding of the human drivers of land use/land cover change (LULCC), strongly (though not completely) influenced by two important global international programs investigation the human dimensions of global environmental change – the Land-Use and Land-Cover Change (LUCC) Project, which was active from 1994 to 2005 (http://www.igbp.net/researchprojects/pastprojects/landuseandcoverchange.4.1b8ae20512db692f2a680009062.html), and a subsequent initiative from the LUCC community i.e. the Global Land Project, which was activated in 2006 and continues to perform major synthetic, integrative research at an international scale (http://www.globallandproject.org/home/background.php). A number of integrative research efforts have investigated the human drivers of LULCC during these two decades, producing a number of frameworks aimed at developing a better understanding of the positive and negative role played by human agents in transforming land cover in different parts of the world.
Much initial research on human pressure has focused on increases in population, laying the blame for deforestation for e.g. on shifting cultivation and commercial logging as major proximate drivers (Myers, 1993; Rudel, 2002). Population growth is thus frequently identified as a primary underlying cause that drives deforestation in the developing tropics (Allen and Barnes, 1985; Mather and Needle, 2000). The IPAT framework, where I (environmental impact) is the product of P (population), A (affluence), and T (technology), has long been considered as a comprehensive equation that identifies all major drivers of environmental change (Ehrlich and Ehrlich, 1990; Meyer & Turner, 1992) in a theoretically elegant, usefully simplistic manner. Yet there is much evidence that this equation does not satisfactorily apply at regional and local scales of analysis, where a number of other variables apart from population and wealth – including biophysical, ecological, and social variables – become important (Keyes and McConnell, 2005).
A review by Kaimowitz and Angelsen (1998) examined 150 published studies to evaluate the examining factors affecting deforestation. They sought to assess the relative importance of economic, demographic, and biophysical causes of deforestation. In general, they found that deforestation was more likely to occur in dryer, flatter regions with high-fertility soil where expansion of cropped areas and pasture lands was a key motivator (Ibid., 89–90). However the evidence regarding population pressure was more controversial. Many national studies did find that population density and the percentage of forested land in a country are negatively correlated. Yet of the 40 or so studies in their review that focused on national-level data, many were of poor quality, and there were limited degrees of freedom from problems of cross-national studies where the number of “independent” variables must be kept relatively small, as well as problems of confusion between correlation and causality. The correlation with population thus tended to disappear when additional variables are incorporated in a model.
In a highly influential review of 152 subnational case studies of tropical deforestation taken from publications in scientific journals, Geist and Lambin (2001) found that PAT variables are significant causal factors in less than half (42%) of all cases. Even in these cases, the PAT variables do not act alone. Except in 3% of the cases, the PAT variables were found associated with institutional and/or cultural factors that were crucial co-explanatory drivers of change. As they state, “Our findings reveal that prior studies have given too much emphasis to population growth and shifting cultivation as primary causes of deforestation” (Ibid., 143–144). Indeed, their meta-analysis clearly demonstrates that institutional innovations can act to set negative feedback loops in motion, decreasing and even reversing forest degradation and clearing (Geist and Lambin, 2003). This has been supported by findings from recent studies in many countries across the world (Schweik et al., 2003; Bray et al., 2004; Nagendra and Southworth, 2010). Thus the subnational studies reported
D6.8 Methodology to identify and quantify local pressures
BIO_SOS FP7-SPACE-2010-1 GA 263435 Page 11 of 50
by Geist and Lambin (2001) also lead to a serious questioning of this earlier presumed cause of deforestation.
Keys and McConnell (2005) conducted a large-scale comparative analysis of the drivers of agricultural change in Latin America, Sub-Saharan Africa, and South and Southeast Asia, based on a set of 91 case studies. They find that the main proximate human influences were changes in agricultural practices, specifically the adoption of new field crop types, tree planting and horticulture. The main associated underlying drivers were demographic (population increase), but also markets and changing property regimes. Analytical separation of human drivers into factors acting independently was not possible, as most factors acted in synergy, for instance increasing urbanization leading to changing preferences for specific crops. This study, as the Geist and Lambin (2001, 2003) studies, also points to the important role of this institutions, property rights and governance regimes in influencing land cover change (Nagendra and Ostrom, 2007). Thus, the role of protected areas – a very important aspect of BIO_SOS – is especially critical in influencing the type and extent of human pressure and its outcomes on land cover, in different parts of the world.
Rudel et al. (2009) further highlighted the complexity of theoretical frameworks required to study land cover change, examining 227 studies of deforestation to conclude that the anthropogenic drivers of deforestation have changed between the 1960s and 1980s, and the 1980s to current date. From the 1960s to the 1980s, they attribute much of deforestation in Southeast Asia and Latin America to small-scale farmers, with state assistance. After the 1980s, globalization and urbanization started to play a more influential role, with ranchers, farmers and loggers in distant rainforests such as Brazil and Indonesia beginning to cut down forests stimulated by consumer demand in distant markets, thus weakening the relationship between local population growth and deforestation, and introducing the influence of tele-connections which are more difficult to model, predict and respond to.
Seto et al. (2011) corroborated these insights through a recent study of urbanization. These authors conducted a very large meta-analysis of 326 studies on urbanization, finding that overall urbanization is becoming more expansive instead of compact. Regional differences are apparent, with urbanization in China for example being influenced by annual growth in GDP per capita, but this influence seeming less apparent in India and Africa where demographic influences are stronger. In most high income countries such as in Europe, urbanization had slowed and further expansion was strongly related to growth in GDP. Yet there was significant variation in urban expansion rates that could not be captured by these aspects of economic or demographic growth, suggesting that our theoretical understanding of the human drivers of land cover change related to urbanization need to be more fully developed, and could be related to factors that are difficult to quantify and observe systematically, such as international capital flows, or urban land use policy.
Few studies focus on Europe, with most synthetic research in tropical and sub-tropical parts of the world. A recent study by Hill et al. (2008) assesses the drivers of land cover change in the Iberian peninsula, finding a large and widespread increase in vegetation density due to the abandonment of rural areas. Counter-intuitively, a decrease in human pressure in these areas leads to increased ecological impoverishment through an increased risk of fire, and an impact on the hydrological cycle due to a greater demand for water. Differences in the land use applied to different land cover types (e.g. grassland that is natural vs grassland that is grazed or cut) also has an impact on ecology (Verburg et al., 2009). In such cases again, some human pressure e.g. with low intensity but extensive grazing, can prevent vegetation succession towards shrub or forest, conserving endangered semi-natural grasslands (Quetier et al., 2005).
A further complexity is introduced by the fact that human drivers of land cover change do not act independent of ecology – rather, pressure acts to influence land cover within a coupled human and natural system (Liu et al., 2007), through complex feedback loops. For example, forest clearing in the Biligiri Rangaswamy Tiger Reserve (BRT), one of the BIO_SOS sites in India, takes place because of conversion to agriculture due to human requirements for land. However, the process of cultivation to agriculture – an anthropogenic change – can further lead to soil degradation – an ecological change - which sets up a positive feedback loop encouraging further anthropogenic conversions of more forest land into agriculture over time. Thus it is important to understand the

D6.8 Methodology to identify and quantify local pressures
BIO_SOS FP7-SPACE-2010-1 GA 263435 Page 12 of 50
coupled nature of these complex feedback loops that connect the processes of human impact to the patterns of ecological outcomes – the so-called pattern to process link (Nagendra and Southworth, 2003). Such complex relationships are often multivariate and/or nonlinear, leading to unexpected outcomes for policies, e.g. when exotic species introduced for an intended purpose become invasive (Sass et al., 2006), or when conservation policies intended to limit human pressure lead to increased impacts (Liu et al., 2007).
In conclusion, beginning from an initial dominant focus on population increase as a major explanatory factor for land cover change, theoretical explanatory frameworks have become increasingly more sophisticated, including an adequate consideration of land change as a coupled human and natural system with socio-economic, institutional, biophysical, demographic and ecological drivers of change. A number of studies have been conducted on different types of land cover change, focusing for e.g. on deforestation, reforestation, agricultural change and urbanization. Many recent studies stress that analytical separation of human drivers into factors acting independently is not viable, as many factors act in synergy. Further, complex feedback loops connect the processes of human impact to the patterns of ecological outcomes leading to multivariate and/or nonlinear relationships that have the capacity to generate unanticipated outcomes for managers dealing with human impacts on protected areas, for e.g. when conservation policies intended to limit human pressure lead to increased impacts. Thus, there is a need for more integrated theoretical frameworks that adequately encompass a consideration of social and ecological pressures on land cover change.

D6.8 Methodology to identify and quantify local pressures
BIO_SOS FP7-SPACE-2010-1 GA 263435 Page 13 of 50
4. Mechanisms by which human pressures manifest their impact on habitats
4.1 Human pressures and the impact of urbanization
Human activities are now recognized as the main driving force on earth’s ecology. Beginning with industrial revolution a new geological epoch called the Anthropocene appears to be now in force (Crutzen, 2002). Human activities have significantly altered climate and biogeochemical cycles (IPCC 2007). Crutzen (2002) suggests that we are in a new geological era, the ‘Anthropocene’, in which humans are major drivers of global scale processes, from atmospheric changes to biotic extinctions. Humans now rival natural geological and ecological processes in determining biodiversity at the global scale, and present-day species distributions cannot be exhaustively analysed without considering human impact (Nogués-Bravo et al., 2008).
In 2008 two American ecologists, Erle Ellis and Navin Ramankutty, modified the concept of biomes (Ellis & Ramankutty, 2008). They observed that in biome maps, climate is the main driving force which explains the distribution of biomes. This means that we have a map of potential vegetation, very far from real vegetation. They take into account the concept of Anthropocene and draw a new map of anthropic biomes. The result is that only 25% of earth surface can be considered wild or not modified by human activities (Vitousek et al., 1997; Sanderson et al., 2002; Foley et al., 2005). Their anthropogenic map of biomes appears much more complex, and anthropogenic biomes are defined as heterogeneous landscape mosaics (Fig.1) that better describe the earth.
Anthropogenic biomes have been identified using global data of population (urban and rural populations), land use, and percentage of vegetation cover. The result is explained in table 1: with 6 groups, and 21 different biomes. Of these, 4 groups (dense settlements, villages, croplands and rangelands) harbor about 90% of Net Primary Productivity.
Group Biome Area (km2);
Area [%]
Population
(inh./ km2)
NPP
(g/m2)
Dense settlements
11 Urban 596798 0,46 3172 500
12 Dense settlements 858973 0,66 807 590
Villages
21 Rice villages 743561 0,57 774 550
22 Irrigate villages 1039661 0,79 500 380
23 Cropped and pastoral vllages 637172 0,49 300 180
24 Pastoral villages 824577 0,63 256 500
25 Rainfed villages 2309580 1,76 243 440
26 Rainfed mosaic villages
2156985 1,65 230 750
Croplands

D6.8 Methodology to identify and quantify local pressures
BIO_SOS FP7-SPACE-2010-1 GA 263435 Page 14 of 50
31 Residential irrigated cropland
2392752 1,83 114 520
32 Residential rainfed mosaic
16705271 12,76 36 640
33 Populated irrigated cropland 728377 0,56 9 500
34 Populated rainfed cropland
6446369 4,92 6 490
35 Remote cropland 986932 0,75 1 380
Rangelands
41 Residential rangelands
7311093 5,59 32 300
42 Populated rangelands
11522131 8,80 4 230
43 Remote rangelands 20908741 15,97 0 140
Forested
51 Populated forests 11229535 8,58 3 680
52 Remote forests 14094783 10,77 0 530
Wildlands
61 Wild forests 8204751 6,27 0 440
62 Sparse tree 9724677 7,43 0 120
63 Barren 11476659 8,77 0 10
Table 1 – Data on Anthropogenic biomes (from Ellis & Ramakutty, 2008)
The work of Ellis and Ramankutty (2008) helps to understand the main transformation of habitats, in particular in Europe, China and India. It also highlights the role of urbanization, which is a major transformer in the European Union.
The socio-economic development that has occurred in the European Union countries in the last few decades has increased the urbanization process – a combination of densification and outward spread of people and built areas (Forman, 2008). About 75% of the European population lives in urban areas. The future of European cities is a matter of great concern, because more than a quarter of the European Union's territory is now directly affected by urban land use and, by 2020, about 80% of Europeans will be living in urban areas. This means that demands on land around cities are becoming increasingly acute (EEA 2006a, 2006b).
At local scale, in Italy two main forces drive habitat transformation into the past ’50 years (Falcucci et al., 2007). The first one is land abandonment in mountain areas (Figure 1a). With human movement to towns and floodplain areas crops and rangelands were abandoned and forests regrowth.

D6.8 Methodology to identify and quantify local pressures
BIO_SOS FP7-SPACE-2010-1 GA 263435 Page 15 of 50
The other main transformation (Figure 1b), that today appear the main risk for natural and semi natural habitats is the trend of urbanization. As shown in Figure 2 the loss of agricultural soil in Italy is much higher than in other western countries.
Cities are among the most altered ecosystems on the planet (Collins et al., 2000). They are composed of various ecosystems controlled by human activities, but interact also with surrounding natural and semi-natural ecosystems. Urban populations can quickly increase in time as a consequence of births and immigration exceeding deaths and emigration. Today, we witness rapid, visible and conflicting changes in land use which are shaping landscapes within cities and around them. Cities are ecosystems influenced by economic, social and cultural dynamics of human activities, and are heterotrophic systems that essentially depend on ecosystem goods and services, that is, matter and energy built up by natural and semi-natural ecosystems, that are predominant in surrounding natural and agricultural territories.
Figure 1 – Land transformation in Italy
Natural systems that surround cities provide multiple goods and services: streams and rivers near cities offer a water supply, including drinking water, wastewater treatment, supporting diverse natural plant communities and enhancing aesthetics; groundwater flows create underground reservoirs that support wells and agriculture. On the other hand, a city, as an open system, creates impacts on surrounding ecosystems including: soil erosion and degradation of natural resources such as atmospheric pollution produced by traffic; chemical discharges in unpolluted water and increasing demands on water; heat production (city as urban heat island) and noise; invasive alien species invasion; habitat destruction; over-exploitation of fisheries; soil compaction and erosion; habitat fragmentation and damage, biodiversity erosion and threat. The present urbanization process is creating pronounced impacts on the natural systems that by now man has left in small spaces around cities.
Forman introduced the concept of urban region in 2008, to better identify the suitable spatial scale for encompassing the smaller scales at which resource degradation and erosion processes caused by urban expansion are a threat. The urban region represents the area of active interactions between cities as municipalities and the surrounding territory (Forman, 2008). Inside it ecological conditions really matter (Sukopp et al., 1995; McDonnell et al., 1997; Pickett, 2006; Grimm et al., 2003; Musacchio and Wu, 2004; Kowarik and Korner, 2005), because environmental and recreational resources require a broader spatial prospective for the urban planner. In Figures 2 and 3 we see, as an example the expansion of the urban region of Milan from 2000 to 2008 (see Padoa-Schioppa et al., 2010 for a detailed explanation about the elaboration of the map). In six years the built area has intensified in the municipalities within the urban region, while there is an evident expansion towards the North-East of the Milan urban region. The results show that in 2002 the Milan metropolitan area accounted for 10% of total area of Lombardy; in 2008 it had increased to 13%, with a 31% increase in six years (about 5% per year). A more detailed analysis showed, in the first case, five ranges of the percentage of urban classification: greater densification is

D6.8 Methodology to identify and quantify local pressures
BIO_SOS FP7-SPACE-2010-1 GA 263435 Page 16 of 50
observed around the urban centre of Milan (the Milan metro-area), particularly in the north-west towards the province of Varese, Como and north-east into the province of Bergamo. The average density of the nucleus, i.e. the area affected by the urban region of Milan, increased by 7% in 2008 as compared to 2002. The comparison of the two representations of population density (number of inhabitants/km sq.) of municipalities that fall respectively in the two urban regions showed that there was an increase in the density of built areas around the metropolitan area of Milan and in areas close to the fringe of two urban regions.
Figure 2 - The urban region of Milan in 2002 evaluated by the density of settlements. From Padoa-Schioppa et al., 2010.
Figure 3 - The urban region of Milan in 2008 evaluated by the density of settlements. From Padoa-Schioppa et al., 2010.

D6.8 Methodology to identify and quantify local pressures
BIO_SOS FP7-SPACE-2010-1 GA 263435 Page 17 of 50
4.2 Human pressures as manifested through water and sediment supply
Habitat integrity and maintenance requires the continued supply of water and sediment within limits which depends on the ecological requirement. Arid and semiarid environments often need to harvest runoff from surrounding areas to increase their water availability. The same occurs in humid environments when aquatic ecosystems are concerned (water supply to lakes and ponds). Sediments may be beneficial until they do not silt protected lakes and ponds. Usually erosion is a pressure agent because of its negative effects on soil and on soil seed banks. Yet even erosion can be beneficial under some circumstances (e.g. pioneering plants to protect, such as Artemisia caerulescens L. var. cretacea, endemic to eroded areas in central Italy).
Modification of the fluxes of water and sediment in the landscape that lead to different concentrations, variations in vegetation cover or land management are all factors that can drive changes in local runoff harvest, sediment supply, etc. Of these, human structures that create major impacts in terms of driving changes in water and sediment fluxes are linear structures such as roads (including foot paths), and cultivated field boundaries. Modification of land use in the hydrological basin of a spot of interest (e.g. a pond), even if located outside a protected area of interest, can have significant effect on the protected spot due to interconnected hydrologies. Thus for e.g. changing a corn field into a walnut tree plantation outside a protected Natura 2000 site will reduce runoff production, reducing downslope runoff harvesting potential.
Achieving a better theoretical understanding of the manner in which human pressure influences hydrology, water and sediment supply can help in conservation planning in areas within and surrounding protected areas. In this context, case scenario analyses using spatially distributed models such as the LANDPLANER developed in this WP (Task 6.3), can help assessing effects and countermeasures where and when necessary. If changes are required to be detected by periodic monitoring, their effects on the protected ecosystems can be simulated with models such as LANDPLANER, in order to evaluate their probable short, middle and long term effects evaluated.

D6.8 Methodology to identify and quantify local pressures
BIO_SOS FP7-SPACE-2010-1 GA 263435 Page 18 of 50
5. Impact of human-induced changes in habitat cover on biodiversity
Habitat alteration and biological invasions are major causes of the current biodiversity crisis: human activities are thus directly responsible for most present-day extinctions, changes in community assemblies and modifications in the geographical ranges of species (Sala et al., 2000).
One example that can show (although indirectly) the relationship between habitat transformation, human pressures and biodiversity crisis comes from utilizing the theoretical framework of island biogeography (Ficetola & Padoa-Schioppa, 2009). The theory of island biogeography predicts species richness based on geographical factors that influence the extinction–colonization balance, such as area and isolation. However, human influence is the major cause of present biotic changes, and may therefore modify bio-geographical patterns by increasing extinctions and colonisations. The aim of a study conducted was to evaluate the effect of human activities on the species richness of reptiles on islands. They carried out the study in the island of western Mediterranean Sea and Macaronesia. These authors used a large data set (n= 212 islands) compiled from the literature, building spatial regression models to compare the effect of geographical (area, isolation, topography) and human (population, airports) factors on native and alien species. They also used piecewise regression to evaluate whether human activities cause deviation of the species–area relationship from the linear (on log–log axes) pattern, and path analysis to reveal the relationships among multiple potential predictors.
Figure 4 (from Ficetola & Padoa-Schioppa, 2009) - Path diagrams, representing three models (of the relationships between island area, human population, presence of airports and richness of native reptiles. (a) Full model, assuming that island size affects species richness directly and through its relationship with human impact. (b) Both island size and human activities affect species richness,
but there is no co-action among them. (c) Island size directly affects species richness, while human activities do not have an effect. The model in (a) performed significantly better than the alternative
models. The numerical values are the path coefficients.
The richness of both native and alien species was best explained by models combining geographical and human factors. The richness of native species was negatively related to human influence, while that of alien species was positively related, with the overall balance being negative. In models that did not take into account human factors, the relationship between island area and species richness was not linear. Large islands hosted fewer native species than expected from a

D6.8 Methodology to identify and quantify local pressures
BIO_SOS FP7-SPACE-2010-1 GA 263435 Page 19 of 50
linear (on log–log axes) species–area relationship, because they were more strongly affected by human influence than were small islands. Path analysis showed that island size has a direct positive effect on reptile richness. However, area also had a positive relationship with human impact, which in turn mediated a negative effect on richness.
Thus in conclusion, anthropogenic factors can strongly modify the bio-geographical pattern of islands, probably because they are major drivers of present-day extinctions and colonisations. Such human drivers can displace island biodiversity from the equilibrium points expected by theory on the basis of geographical features. This is an important theoretical insight that can be critical for habitat modelling for conservation management.

D6.8 Methodology to identify and quantify local pressures
BIO_SOS FP7-SPACE-2010-1 GA 263435 Page 20 of 50
6. The use of habitat classification systems for recording habitat modifications
A crucial issue in any process for habitat monitoring is the detection of changes, in terms of both habitat conversion and habitat modification. Habitat classification schemes such as EUNIS and Annex I, although widely used in habitat mapping, are also quite ineffective in detecting habitat modifications. General Habitat Categories (GHCs) have been specifically designed for detecting and mapping changes (Bunce et al., 2008). GHCs seem to be particularly feasible in detecting habitat changes, especially in describing within class changes related to specific class modifications.
The GHCs are based on Life Forms (Raunkiaer, 1934). This system includes natural habitats (Life Forms-LF Habitats) and artificial habitats (Non-Life Form Habitats) such as urban, crops and sparsely vegetated.
In the GHCs Handbook (Bunce et al., 2011) a key (decision tree) is given for the detection of the six super categories: Urban (URB), Cultivated (CUL), Sparsely Vegetated (SPV), Tree (TRS) and Shrubs, Herbaceous wetland (HER) and other Herbaceous (OTHER HER). For each of the LF habitat types, information can be expanded by adding more details about the specific life form (e.g. HER-HEL, HER-EHY, HER-SHY) , height (e.g. TRS-LPH, TRS-MPH, TRS-TPH, etc.), phenology (e.g. TRS-MPH/EVR, TRS-MPH/DEC, etc.) and leaf type (e.g. TRS-MPH/EVR/CON, TRS-MPH/EVR/NLE, etc.). The GHCs are formed of individual LFs or NLFs and all possible combinations within each of the super categories, for a total amount of about 140 GHCs (Bunce et al., 2011). Further detailed information on environment, site, management and species composition are provided by specific indicators and qualifiers.
Information on height, life form and phenology, in addition to more details deriving from vegetation structure (that is, the possible combinations between specific GHCs according to specific percentage rules) makes possible the detection of changes also in terms of modification within a specific habitat type.
For long term habitat monitoring and change detection the coupling of habitat taxonomies such as EUNIS with GHCs is highly recommended. In fact, if EUNIS classification system can be recommended for habitat classification (hierarchical and comprehensive pan-European habitat classification system (natural to artificial habitats), directly linked to the Natura 2000 classification scheme), it was not primarily designed for integrated monitoring purposes (Lengyel et al., 2008; Tomaselli et al., 2013). GHCs are a very flexible tool for detecting habitat quality and habitat changes, both in terms of habitat conversion and modification (Bunce et al., 2008, 2011).
6.1 A case study: IT4 site
Le Cesine (IT4) falls in the EU Natura 2000 (N2K) as SCI (IT9150032) and SPA (IT9150014). IT4 is one of the oldest protected areas in Puglia region, having been declared Ramsar site in 1977 and State Natural Reserve in 1980. It’s also an Important Bird Area (IBA 146 and 146M).
It is a coastal site, mainly composed by a complex of coastal lagoons (priority habitat 1150 “Coastal lagoons”) according to Directive 92/43 EEC, Annex I, where an intricate ecological pattern occurs. Several helophytic stands merge with stripes of halophilous and dry therophytic vegetation, contributing to create very peculiar vegetation mosaics. Despite the limited extent, this area is characterized by a high diversity in habitats and vegetation types (Tomaselli et al., 2011). Among the vegetation of brackish marshes, Cladium mariscus communities (priority habitat 7210 “Calcareous fens with Cladium mariscus and species of the Caricion davallianae”), Phragmites australis communities (EUNIS A2.53C) and Bolboschoenus martimus var. compactus communities (EUNIS A2.53D) are the most widespread. In the peripheral part of the brackish marshes dense populations Juncus maritumus and Spartina versicolor (habitat 1410 “Mediterranean salt meadows (Juncetalia maritimi)”) form discontinuous belts at the edges with the sandbar; on salty soils, fragments of halophytic shrubs (habitat 1420 “Mediterranean and thermo-Atlantic halophilous scrubs (Sarcocornetiea fruticosi)”) are settled. In the inner part of the brackish marshes, subject to

D6.8 Methodology to identify and quantify local pressures
BIO_SOS FP7-SPACE-2010-1 GA 263435 Page 21 of 50
long flooding periods and with very salty soils in summer (dry period), an annual halophytic vegetation appears (habitat 1310 “Salicornia and other annuals colonizing mud and sand”).
Along the sandy shore, a typical series of dunes vegetation sets up (habitat types: 1210 “Annual vegetation of drift lines”; 2110 “Embryonic shifting dunes”; 2120 “Shifting dunes along the shoreline with Ammophila arenaria (white dunes)”; 2230 “Fixed coastal dunes with herbaceous vegetation (grey dunes)”). Juniperus macrocarpa subsp. macrocarpa communities (priority habitat 2250 “Coastal dunes with Juniperus spp.”) form discontinuous thickets.
The woody vegetation is composed of Pinus halepensis plantations (EUNIS G3.F1) and Mediterranean maquis and garrigues (EUNIS F5.514; F6.2C).
In the inland, small and fragmented patches of therophytic vegetation of temporary ponds (priority habitat 3170 “Mediterranean temporary ponds”) are “nested” in a matrix of agricultural areas (mainly olive groves) surrounding the coastal wetland.
The complete list of natural and semi-natural habitat types for the IT4 site is reported in Table 2. Habitat types are labelled according to the Annex I (92/43 EEC directive), EUNIS (in order to include all natural and semi-natural types, also those not covered by the Annex I (Tomaselli et al., 2013)) and GHCs (General Habitat Categories (Bunce et al., 2008), the ideal framework for detecting changes in habitat structure over time). Corine Land Cover (CLC) labels have been use to provide a more general and widely known framework.

D6.8 Methodology to identify and quantify local pressures
BIO_SOS FP7-SPACE-2010-1 GA 263435 Page 22 of 50
CLC Lev. III CLC description Annex I EUNIS GHC Lev. II/III
2.3.1 Pastures X E1.6 HER-THE
3.1.2 Coniferous forest X G3.F1 CUL-WOC
3.2.4. Transitional woodland shrub X F5.51 TRS-MPH/DEC
3.2.3 Sclerophyllous vegetation
2250* B1.63 (B1.631) TRS-MPH/CON/EVR
X F5.51 (F5.514) TRS-MPH/EVR
X F6.2C TRS-DCH/EVR; TRS-LPH/EVR
3.3.1 Beaches, dunes, and sand
plains
1210 B2.13 HER-LHE/THE
2110 B1.31 HER-LHE/CHE
2120 B1.32 HER-LHE/CHE
2230 B1.48 HER-LHE/THE
4.1.1 Inland marshes 3170* C3.42 (C3.421) THE+GEO+THE/GEO
4.2.1 Salt marshes
1310 A2.55 HER-THE+SPV/TER
1410 A2.52 (A2.522) HER W-SHY/EHY+EHY/HEL
1420 A2.52 (A2.526) TRS-SCH/NLE
7210* D5.24 HER W-SHY/EHY+EHYHEL
X A2.53C HER W-EHYHEL
A2.53D HER W-SHY/EHY+EHYHEL
5.1.1 Water courses X C2 HER W-SHY/EHY+EHYHEL
5.2.1 Coastal lagoons 1150 X03 Habitat complex
AQU+TER+SHY+EHY+CHE+LHE/CHE
Table 2 - The complete list of natural and semi-natural habitat types for the IT4 site.
D6.8 Methodology to identify and quantify local pressures
BIO_SOS FP7-SPACE-2010-1 GA 263435 Page 23 of 50
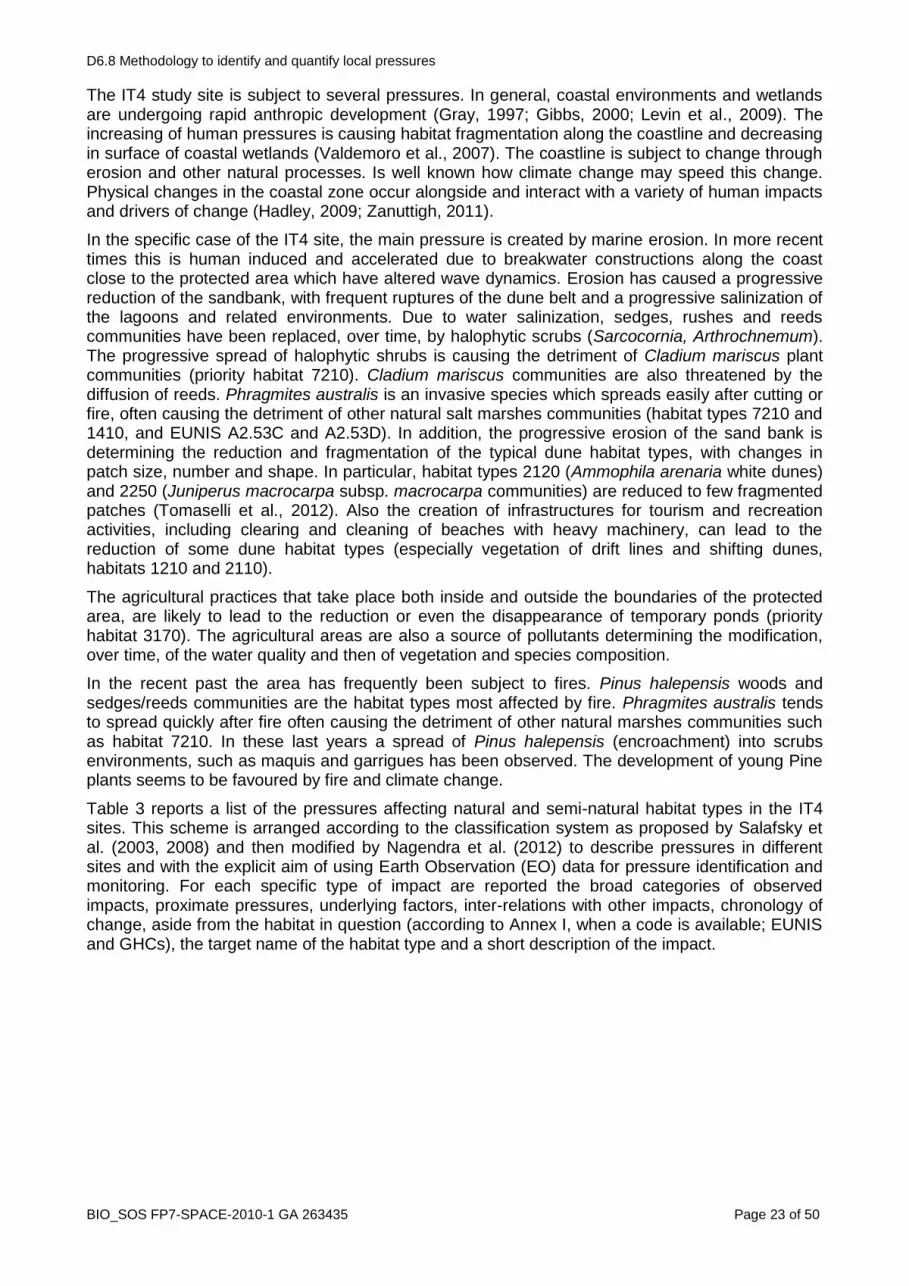
The IT4 study site is subject to several pressures. In general, coastal environments and wetlands are undergoing rapid anthropic development (Gray, 1997; Gibbs, 2000; Levin et al., 2009). The increasing of human pressures is causing habitat fragmentation along the coastline and decreasing in surface of coastal wetlands (Valdemoro et al., 2007). The coastline is subject to change through erosion and other natural processes. Is well known how climate change may speed this change. Physical changes in the coastal zone occur alongside and interact with a variety of human impacts and drivers of change (Hadley, 2009; Zanuttigh, 2011).
In the specific case of the IT4 site, the main pressure is created by marine erosion. In more recent times this is human induced and accelerated due to breakwater constructions along the coast close to the protected area which have altered wave dynamics. Erosion has caused a progressive reduction of the sandbank, with frequent ruptures of the dune belt and a progressive salinization of the lagoons and related environments. Due to water salinization, sedges, rushes and reeds communities have been replaced, over time, by halophytic scrubs (Sarcocornia, Arthrochnemum). The progressive spread of halophytic shrubs is causing the detriment of Cladium mariscus plant communities (priority habitat 7210). Cladium mariscus communities are also threatened by the diffusion of reeds. Phragmites australis is an invasive species which spreads easily after cutting or fire, often causing the detriment of other natural salt marshes communities (habitat types 7210 and 1410, and EUNIS A2.53C and A2.53D). In addition, the progressive erosion of the sand bank is determining the reduction and fragmentation of the typical dune habitat types, with changes in patch size, number and shape. In particular, habitat types 2120 (Ammophila arenaria white dunes) and 2250 (Juniperus macrocarpa subsp. macrocarpa communities) are reduced to few fragmented patches (Tomaselli et al., 2012). Also the creation of infrastructures for tourism and recreation activities, including clearing and cleaning of beaches with heavy machinery, can lead to the reduction of some dune habitat types (especially vegetation of drift lines and shifting dunes, habitats 1210 and 2110).
The agricultural practices that take place both inside and outside the boundaries of the protected area, are likely to lead to the reduction or even the disappearance of temporary ponds (priority habitat 3170). The agricultural areas are also a source of pollutants determining the modification, over time, of the water quality and then of vegetation and species composition.
In the recent past the area has frequently been subject to fires. Pinus halepensis woods and sedges/reeds communities are the habitat types most affected by fire. Phragmites australis tends to spread quickly after fire often causing the detriment of other natural marshes communities such as habitat 7210. In these last years a spread of Pinus halepensis (encroachment) into scrubs environments, such as maquis and garrigues has been observed. The development of young Pine plants seems to be favoured by fire and climate change.
Table 3 reports a list of the pressures affecting natural and semi-natural habitat types in the IT4 sites. This scheme is arranged according to the classification system as proposed by Salafsky et al. (2003, 2008) and then modified by Nagendra et al. (2012) to describe pressures in different sites and with the explicit aim of using Earth Observation (EO) data for pressure identification and monitoring. For each specific type of impact are reported the broad categories of observed impacts, proximate pressures, underlying factors, inter-relations with other impacts, chronology of change, aside from the habitat in question (according to Annex I, when a code is available; EUNIS and GHCs), the target name of the habitat type and a short description of the impact.

D6.8 Methodology to identify and quantify local pressures
BIO_SOS FP7-SPACE-2010-1 GA 263435 Page 24 of 50
Habitat target
name
Specific type of
impact Broad impact category
Short description of the
impact
Proximate
pressure
Underlying
factors
Inter-relations
with other
impacts
Chronology of
change Habitat in question
Mediterranean
maquis and relevant mosaics
Native shrubs (maquis) to Pine
woods (Pine
encroachment)
Land cover/habitat
conversion
In these last years a spread of Pinus spp. into scrubs
environments (maquis and garrigues) has been
observed. Young Pine
plants development seems
to be favoured by fire and
climate change.
Forest (Pine)
encroachment
Changes in fire
regime, climate change
Fire regime past-present-
future
GHC: TRS-MPH/EVR; TRS-
LPH/EVR; TRS DCH/EVR (EUNIS F5.51 (F5.514) and F6.2C)
Mediterranean maquis and
relevant mosaics
Native shrubs
(maquis) to Pine
woods (Pine plantations)
Land cover/habitat
conversion
This impact refers to the
past, when extensive Pine
reforestation have been planted
Woods (Pine)
plantations
Agriculture policies
(incentives)
Pine
encroachment Past
GHC: TRS-MPH/EVR; TRS-LPH/EVR; TRS DCH/EVR (EUNIS
F5.51 (F5.514) and F6.2C)
Pine plantations Fire regime Disruption/Modification
of ecological regimes
Pine forests (old plantations) are threatened
by arsons. The Pine forest
cover decreases over time
Anthropogenic
and natural fires
Socio-economic
conflicts and climate change
Change in species
composition
Past-present-
future GHC: CUL-WOC (EUNIS G3.F1)
Dune vegetation
Decrease in area
and patch size;
habitat fragmentation
Changes in spatial
connectivity
Coastal erosion is determining the
fragmentation of coastal
dune habitat types, with changes in patch size,
number and shape.
Coastal erosion
Economic activities (e.g.
building
construction along rivers and water
courses)
past-present-
future
GHC: HER-THE (Annex I 1210);
HER-LHE/CHE (Annex 1 2110 and
2120); HER-LHE/THE (Annex I 2230)
Dune vegetation
Change in species
composition;
change in
dominance and
evenness values
Disruption of plant and
animal community
structure
Clearing and cleaning of
beaches with heavy
machinery
Change in
management
regimes
Tourism intensification,
infrastructure
development
Habitat loss and
fragmentation
Past, present,
future
GHC: HER-THE (Annex I 1210); HER-LHE/CHE (Annex 1 2110 and
2120); HER-LHE/THE (Annex I
2230)

D6.8 Methodology to identify and quantify local pressures
BIO_SOS FP7-SPACE-2010-1 GA 263435 Page 25 of 50
Dune vegetation Beaches to urban Land cover/habitat
conversion
Creation of infrastructures
for tourism and recreation activities can lead to
reduction of dune habitat
types
Building for
recreation
infrastructure and tourist facilities
Tourism
intensification,
infrastructure development
Habitat loss and
fragmentation
Past, present,
future
GHC: HER-THE (Annex I 1210);
HER-LHE/CHE (Annex 1 2110 and
2120); HER-LHE/THE (Annex I 2230)
Salt marshes
Conversion of salt
marshes communities to
reed beds
Land cover/habitat conversion
Phragmites australis
is an invasive species which spreads easily after
cutting
or fire often causing the
detriment of other natural
salt marshes communities
Fire or cutting Agricultural
practices present-future
GHC: THE+SPV/TER (Annex I
1310); EHY-HEL (Annex I 1410;
TRS-SCH/NLE (Annex I 1420)
Brackish marshes Water salinization Land cover/habitat
modification
Frequent ruptures of
coastal dunes are determining the
salinization of waters of
lagoons and related environments
Coastal erosion
and rupture of coastal dunes
Economic
activities (e.g. building
construction along
rivers and water courses)
Conversion of
sedges, reeds and
rushes communities to
Sarcocornia and
other alophytic scrubs
communities
past-present-
future
GHC: SHY/EHY+EHY/HEL (Annex I
7210 and EUNIS A2.53D); EHY/HEL (EUNIS A2.53C)
Brackish marshes
Conversion of
sedges, reeds and rushes
communities to
Sarcocornia and other alophytic
scrubs
communities
Land cover/habitat
conversion
Due to water salinization,
sedges, rushes and reeds communities are replaced,
over time, by alophytic
shrub communities
Water salinization Economic
activities Water salinization
past-present-
future
GHC: SHY/EHY+EHY/HEL (Annex I 7210 and EUNIS A2.53D); EHY/HEL
(EUNIS A2.53C)
Coastal lagoons Water pollution Land cover/habitat
modification
The surrounding agricultural areas are a
source of pollutants for the
lagoon waters, determining the
modification, over time, of
vegetation and species
composition
Agricultural runoff
Agricultural
practices
intensification
past-present-
future
GHC:
AQU+TER+SHY+EHY+CHE+LHE/
CHE (Annex I 1150)

D6.8 Methodology to identify and quantify local pressures
BIO_SOS FP7-SPACE-2010-1 GA 263435 Page 26 of 50
Temporary ponds
Conversion of
temporary ponds
to agricultural areas
Land cover/habitat
conversion
In IT4 temporary ponds
are small isolated patches nested in a matrix of
agricultural surface.
Expansion of agricultural practices can cause the
reduction/disappearance of
these small natural areas
Agriculture
intensification
Agricultural policies and
incentives
past-present-
future
GHC: THE+GEO+THE/GEO (Annex
I 3170)
Table 3 - List of the pressures affecting natural and semi-natural habitat types in the IT4 sites. This scheme is arranged according to the classification system as proposed by Salafsky et al. (2003, 2008) and then modified by Nagendra et al. (2012) to describe pressures in different sites and with the
explicit aim of using EO data for pressure identification and monitoring.

D6.8 Methodology to identify and quantify local pressures
BIO_SOS FP7-SPACE-2010-1 GA 263435 Page 27 of 50
Some examples of recording habitat modification by using the GHCs system are provided by observations carried out in the IT4 site. A relevant case is represented by the target of woody evergreen vegetation (Mediterranean maquis with Myrtus communis and Pistacia lentiscus and garrigues with Erika forskalii; habitat types: EUNIS F5.51 (F5.514) and F6.2C, respectively). During the first half of the last century, large part of these environments had been subject of forest plantations (Pinus halepensis). These coniferous plantations developed well and, at present, they cover a significant part of the surface of the protected area. In recent years, the area has been subject to frequent fires, also affecting woody vegetation and coniferous plantations. This, together with the climate change, seems to have favored the seed germination and the development of young pines in the woody evergreen vegetation environments. In terms of habitat type, sensu Annex I or EUNIS, neither habitat change (habitat conversion) is involved, nor can habitat modification be recorded. But, if using the GHCs classifications, a structural modification can be caught. Pinus young plants grow up very quickly and can reach height of more than 2 mt in few years. Mediterranean maquis and garrigues are mostly represented by the following GHCs: TRS-MPH/EVR; TRS-LPH/EVR implying height ranges between 0.3-0.6 and 0.6-2.0 mt. A change in height can be identified by a modification of the GHC (in some cases: LPH/EVR to MPH/EVR or MPH/EVR to TPH/EVR). If the Pinus density becomes quite relevant (with percentage more than 40%, according to the percentage rules for determining the GHC, Bunce et al. 2011) the GHC modification can involve also life type and phenology (e.g. LPH/EVR to MPH/EVR/CON).
Another case is the modification of water quality and regime, with diffusion of Phragmites australis, which spreads easily especially after cutting or fire often causing the detriment of other natural salt marshes communities. The habitat conversion is represented by changing habitat type and code (Annex I or EUNIS), but in early stage of habitat modification (modification of the water regime, still does not implying significant floristic changes) can be recorded by GHCs: EHY to HEL or SHY/EHY to EHY/HEL.

D6.8 Methodology to identify and quantify local pressures
BIO_SOS FP7-SPACE-2010-1 GA 263435 Page 28 of 50
7. Impact of human-induced habitat fragmentation on biodiversity
This section describes two studies conducted in the BIO_SOS Natura 2000 site in Alta Murgia, Italy, providing us with theoretical insights into the impact of human-induced changes in habitat fragmentation on biodiversity from two perspectives. The first one looks at the impact of fragmentation on overall measures of biodiversity such as species richness and diversity indices versus the impact on specific functional taxa. The second study assesses a little-considered but very important aspect of species distribution that is critical for wild carnivores (in this case taking a theoretical example of wolves) i.e. the impact of habitat fragmentation on the maintenance or disturbance of meta-populations that require the existence of a number of habitat patches connected by corridors for their persistence. These two studies help us to develop a broader understanding of the nature of human-induced impacts on biodiversity that can provide important lessons for conservation in other Mediterranean landscapes.
7.1 Habitat fragmentation and its impact on biodiversity – taxa-specific studies in Alta Murgia
Landscape change is inherent in natural systems and, particularly in human dominated ones, is one of the factors which have complex influence on species distribution, interrelations and aggregation patterns thus being crucial within the context of biodiversity conservation. In their effective and overarching synthesis Lindenmayer and Fisher (2006) provide a strong contribution to the analysis of how human impacts influence landscape changes, habitat, fragmentation and connectivity and of their ecological consequences. They propose to reconcile the two complementary perspectives to landscape modifications, the human and the individual species perspectives. The human perspective is mainly based on pattern-oriented approaches, while the individual species perspective focusses on process-oriented approaches.
In this view spatially explicit alterations brought about by human activities are seen in the light of their relationships with aggregated measures of species occurrence as it is recognized that landscape change is associated with both changes to landscape pattern (composition and configuration) and number of ecological processes (e.g. species responses, hydrological effects).
Pattern oriented approaches, such as those based on the patch-corridor-matrix model (Forman, 1995) and the variegated model (McIntyre and Hobbs, 1999), allow for the quantification of the main alteration in land cover and habitat structure (composition and configuration), at the landscape level, and of the structural deterioration of native vegetation and habitat quality at a locally scaled level. Even though aggregated measures of species assemblages (e.g., species richness and species diversity) may lead over-simplification of ecologial processes, the use of groups of species provides a better focus on their relations with pattern.
This rationale provides grounds for inferential studies on how human impacts affect biodiversity via the analysis of landscape change. This is particularly useful from both the management point of view as it allows for a considerate amount of generalization across species, and within the context of the BIO_SOS project, as only spatial explicit consequences of human activities can be revealed directly by means of EO technologies.
The main landscape modifications are associated to native vegetation or habitat fragmentation and to the alteration of the ecological role of the matrix.
The process of habitat fragmentation consists of four spatial effects occurring simultaneosly or in succession, yet at distinct pace: a) reduction in habitat amount, (b) increase in number of habitat patches, (c) decrease in sizes of habitat patches, and (d) increase in isolation of patches (Fahrig, 2003). Fragmentation also implies changes in the internal properties (quality) habitat, mainly due to edge effect and patch isolation.
The ecological role of the landscape matrix is recognised by theoretical, empirical and applied studies (e.g., Ehrenfeld and Toth, 1997; Race and Fonseca, 1996; Bedford, 1996; Bell et al., 1997; Wiens, 1999; Jedicke 2001; Fischer et al 2008; Didham 2010, and cited literature). It is defined by the extent to which resources and facilities supplied to organisms by native vegetation or habitats are also available in the

D6.8 Methodology to identify and quantify local pressures
BIO_SOS FP7-SPACE-2010-1 GA 263435 Page 29 of 50
surrounding matrix (Lindenmayer and Fisher, 2006), that is the extent to which the matrix facilitates or hampers survival, movements and genetic fluxes among habitat patches. As such it is central to the conceptualisation and modelling of movement-based functional connectivity (e.g., Schippers et al., 1996; Adriaensen et al., 2003; McRae et al., 2003; Ray, 2005).
Agricultural development, economic activity, urbanization and increasing mobility associated with human dominated landscapes are considered the main drivers of fragmentation worldwide. Moreover, landscape modifications do not occur at random within a landscape, but are driven by the productive potential of the physical environment (Lindenmayer and Fisher, 2006). Finally organisms and their assemblages show complex and even time-mediated responses to landscape change due to the multifaceted nature of this process as well as to different relaxation times and extinction debts exhibited by short and long-living organisms (Lindenmayer and Fisher, 2006; Krauss et al., 2010).
Thus in order to understand the impact of landscape change on biodiversity a step-wise comprehensive analysis should to be carried out considering and integrating all these aspects (drivers, determinism, role of the matrix, multispecies responses) with reference to the native vegetation or the focal habitat (land cover/land use class) of interest. An analysis of this kind is attempted here by means of the integration of the results of the various activities carried out within the framework of BIO_SOS (WP6, task 6.2) with reference to one of the test sites of the BIO SOS project, the Natura 2000 (N2K) “Murgia Alta” IT9120007 SCI/SPA and to its focal habitat (semi-natural grasslands) of conservation interest, reports of which can be found in several deliverables (D6.2, D6.3, D6.4 and in Mairota et al., 2012).
Assessing the relative importance of spatially explicit drivers of native vegetation or habitat change (step 1, D6.4-Part1) can be helped by historical analyses intended at the evaluation of the degree and the rate of changes at the “regional” scale. For this purpose the “fragmentation geometries“ procedure described in EEA and FOEN, 2011 proved to be useful to quantify and visualize fragmentation. “Fragmentation geometries” are defined as particular combinations of fragmenting elements in the landscape, both linear and areal, either natural or anthropogenic. The procedure is intended to be applicable at any scale, provided that a set of scale and problem specific fragmentation geometries are defined (EEA and FOEN, 2011). In the examined case the main cause of landscape change and habitat fragmentation was identified in the conversion of grasslands into cereal croplands which has occurred at an accelerated pace and at a higher order of magnitude in the first time interval examined (1990 and 1999), thus confirming the findings of many studies relevant to grasslands worldwide (e.g. Sala et al., 2000; WallisDeVries et al., 2002; Hoekstra et al., 2005).
A preliminary evaluation of the landscape’s spatial (configuration) and non-spatial (composition) properties, according to the patch-corridor-matrix model, was carried out (step 2, D6.3, D6.4-Part1 and Mairota et al. 2012) on 30 1km x 1km sample local landscapes extracted from the regional landscape (as in e.g., McGarigal and McComb, 1995; Wu and David, 2002), which bore no direct link to the behavioral attributes of any species and consisted in the application of quantitative techniques referring to traditional landscape pattern analysis (LPA), for the computation of landscape pattern indices (LPIs). These were statistically treated as in McGarigal and McComb (1995) a) to disentangle the effect of habitat loss on habitat configuration which is imperative when trying to understand the response of organisms to fragmentation (McGarigal and McComb, 1995; Fahrig, 2003; Lindenmayer and Fisher, 2006; Didham et al., 2011); b) to extract a set of non-redundant, landscape and scale specific LPIs suitable to be summarised, by means of principal component analysis (PCA), into few latent components representing fragmentation gradients for the focal class. This has allowed for the ranking of the 30 local landscapes also in relation to the quality of the matrix (homogeneous vs. heterogeneous); from poorly fragmented (NF) to moderately fragmented and fragmented in a homogeneous or heterogeneous matrix (MF_hom, MF_het, F_hom, F_het) (D.3, Mairota et al., 2012).
Such a ranking has provided the expert judgemental base for the stratification of samples needed for field surveys (step 3, D6.4-Part2) aimed at the retrieval of both information on vegetation structure (percentage cover and height) and of biodiversity surrogates. These consisted in the traditional measures of species assemblages (species richness and species diversity) as well as in those relevant to functional groups (e.g., life forms, chorology, habitat specificialization, role within focal vegetation

D6.8 Methodology to identify and quantify local pressures
BIO_SOS FP7-SPACE-2010-1 GA 263435 Page 30 of 50
syntaxon) for three taxonomic groups (herb plants, grasshoppers and butterflies) associated to grasslands.
A further step (presented here) consists in the qualitative:
1. Validation of the ranking of step 2 against the variegated landscape model by means of both the landscape level (habitat amount and isolation and matrix quality) and patch level attributes (patch average size, shape and edge contrast) relevant to the main aspects of fragmentation and which are reputed capable to exert combined effects on species (Didham et al., 2011);
2. Verification of the non-random nature of landscape change by means of physical attibutes (i.e. percent slope);
3. Exploration of the influence of the nature of the matrix vs fragmentation on both habitat quality and species distribution.
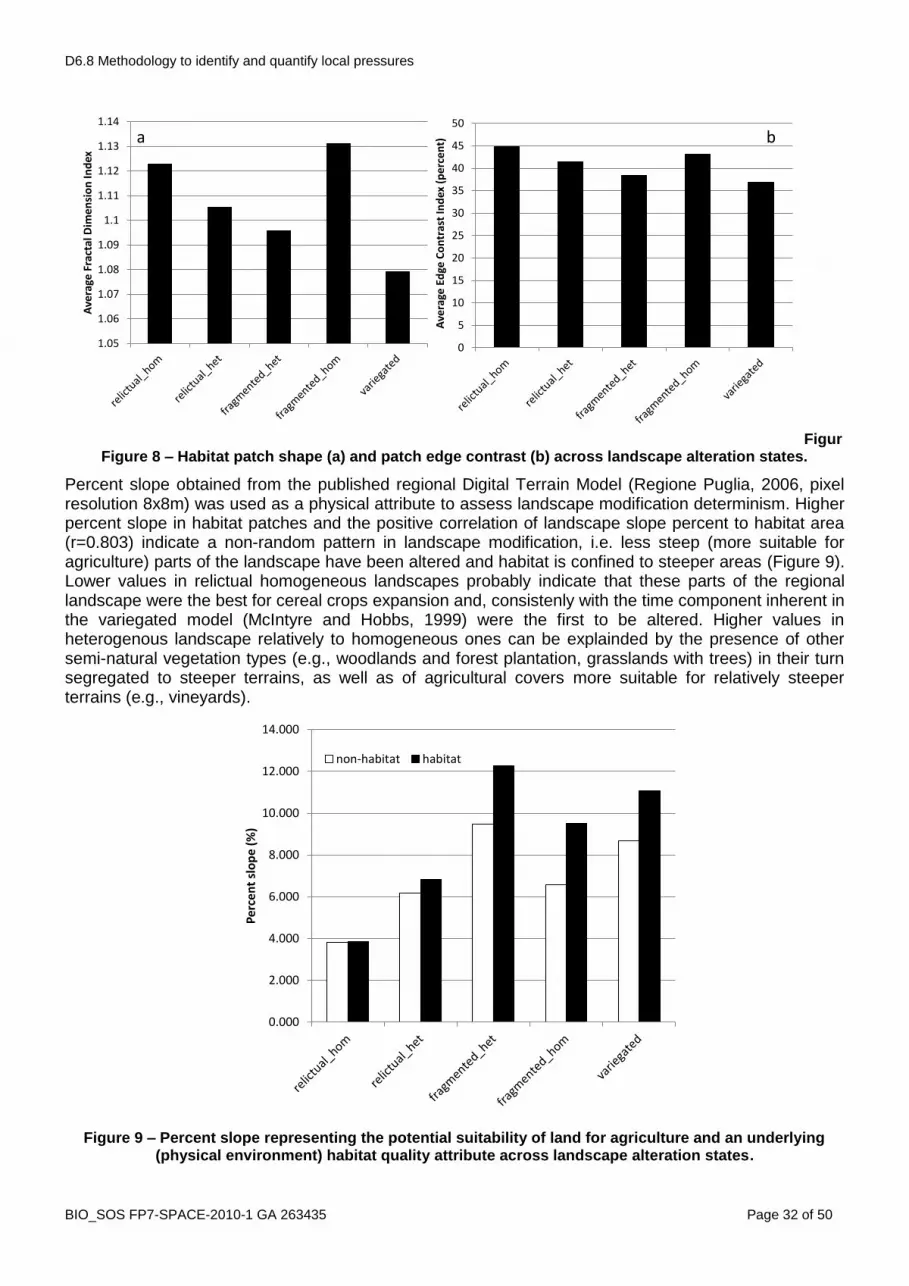
The variegated landscape model (McIntyre and Hobbs, 1999) provides a more continuous classification of landscape condition in the initial phases along the continuum of human landscape modification than the patch-corridor-matrix model and is considered complementary to it (Lindenmayer and Fisher, 2006). “Intact“ landscapes contain >90% of the original vegetation cover, “varigated“ lansdcapes 60-90%, “fragmented” 10-60, relictual 10%. The classification used for the ranking in step 2 resulted consistent with the variegated model with F, MF and NF landscapes being equivalent respectively to relictual, fragmented and variegated, and with F_hom as most altered ones (Figure 5). Intact landscapes are absent in this case, confirming a long lasting human influence. This gradient is also confirmed by the trends exhibited by both habitat patch average size and habitat patches isolation degree (Figure 6). The assumptions made on the quality of the matrix also result verified (Figure 7) confirming that in this kind of landscapes habitat modification (loss and fragmentation) can occur both in an heterogeneous and in an homogeneous context. The quality of the matrix (a landscape level attribute), in addition, exerts a direct effect on two patch level attributes (i.e. patch shape and edge contrast) (Figure 8), thus indirectly contributing to the resulting effects on species determined by these two patch level attributes (see Didham et al., 2011). In the analysed case this can be explained considering that relictual patches in homogeneous landscapes tend to exhibit less compact and more convoluted shapes as in most cases croplands are carved out ephemeral stream valleys and that cereal crops are the most contrasting land cover with respect to grasslands (D6.3).
0
10
20
30
40
50
60
70
80
90
100
Ha
bit
at
am
ou
nt
(pe
rce
nt)
Figure 5 – Landscape alteration states (following McIntyre and Hobbs, 2006). in IT3 defined in terms of habitat amount percent (landscape level attribute).

D6.8 Methodology to identify and quantify local pressures
BIO_SOS FP7-SPACE-2010-1 GA 263435 Page 31 of 50
0
50
100
150
200
250
Ave
racg
eh
abia
tp
atch
are
a (h
ecta
rs)
a
0
5
10
15
20
25
30
35
40
45
50
Shar
e in
“is
let”
(p
eec
en
t)
b
Figure 6 – Habitat patch average size (a) and habitat patches isolation degree (b) across landscape alteration states.
0
0.2
0.4
0.6
0.8
1
1.2
1.4
1.6
Lan
dsc
ape
het
ero
gen
eity
(SH
DI)
Figure 7 – Matrix quality and patch shape across landscape alteration states.
D6.8 Methodology to identify and quantify local pressures
BIO_SOS FP7-SPACE-2010-1 GA 263435 Page 32 of 50
1.05
1.06
1.07
1.08
1.09
1.1
1.11
1.12
1.13
1.14
Ave
rage
Fra
ctal
Dim
ensi
on
Ind
ex
0
5
10
15
20
25
30
35
40
45
50
Ave
rage
Ed
ge C
on
tras
t In
dex
(p
erc
en
t)a b
FigurFigure 8 – Habitat patch shape (a) and patch edge contrast (b) across landscape alteration states.
Percent slope obtained from the published regional Digital Terrain Model (Regione Puglia, 2006, pixel resolution 8x8m) was used as a physical attribute to assess landscape modification determinism. Higher percent slope in habitat patches and the positive correlation of landscape slope percent to habitat area (r=0.803) indicate a non-random pattern in landscape modification, i.e. less steep (more suitable for agriculture) parts of the landscape have been altered and habitat is confined to steeper areas (Figure 9). Lower values in relictual homogeneous landscapes probably indicate that these parts of the regional landscape were the best for cereal crops expansion and, consistenly with the time component inherent in the variegated model (McIntyre and Hobbs, 1999) were the first to be altered. Higher values in heterogenous landscape relatively to homogeneous ones can be explainded by the presence of other semi-natural vegetation types (e.g., woodlands and forest plantation, grasslands with trees) in their turn segregated to steeper terrains, as well as of agricultural covers more suitable for relatively steeper terrains (e.g., vineyards).
0.000
2.000
4.000
6.000
8.000
10.000
12.000
14.000
Per
cen
t sl
op
e (%
)
non-habitat habitat
Figure 9 – Percent slope representing the potential suitability of land for agriculture and an underlying (physical environment) habitat quality attribute across landscape alteration states.
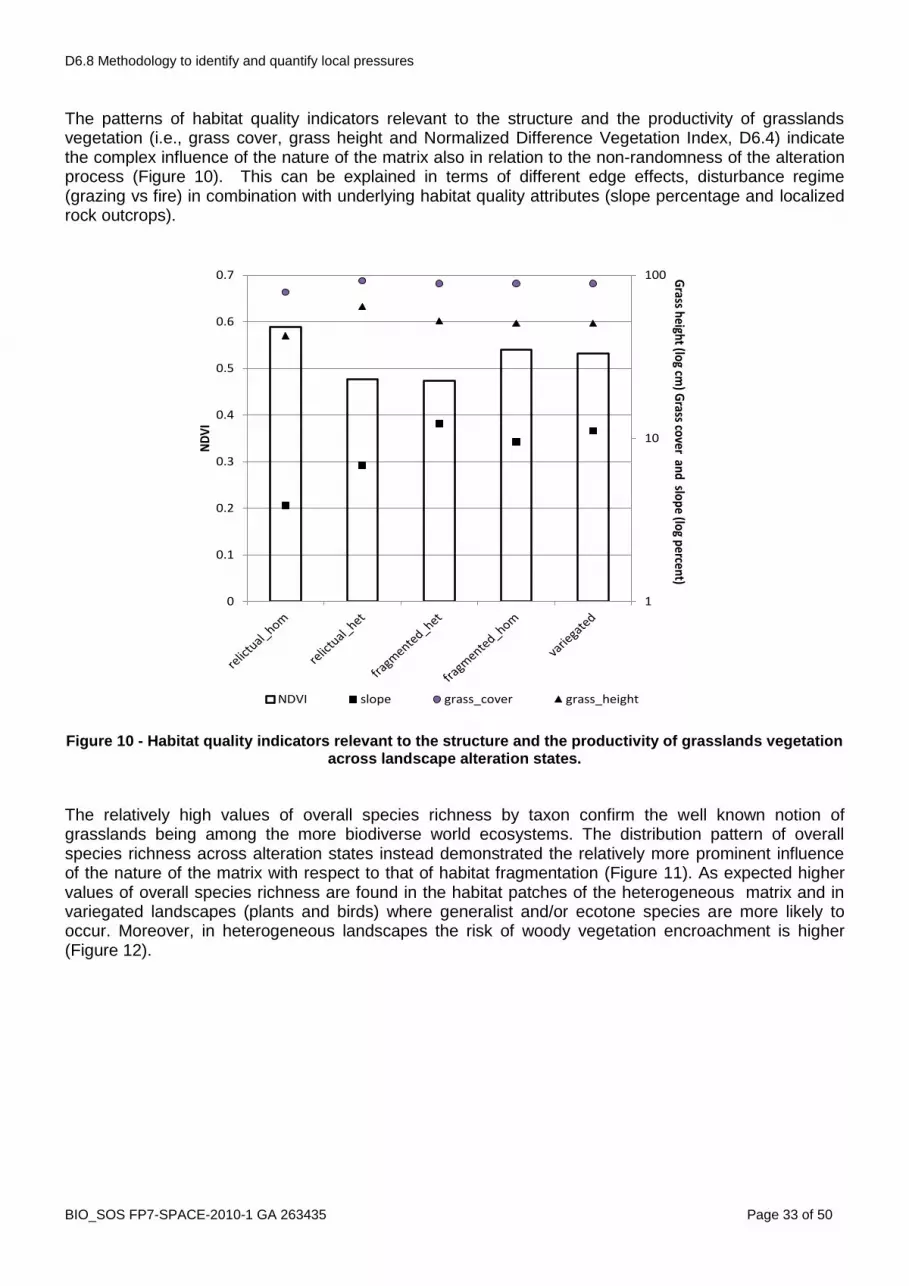
D6.8 Methodology to identify and quantify local pressures
BIO_SOS FP7-SPACE-2010-1 GA 263435 Page 33 of 50
The patterns of habitat quality indicators relevant to the structure and the productivity of grasslands vegetation (i.e., grass cover, grass height and Normalized Difference Vegetation Index, D6.4) indicate the complex influence of the nature of the matrix also in relation to the non-randomness of the alteration process (Figure 10). This can be explained in terms of different edge effects, disturbance regime (grazing vs fire) in combination with underlying habitat quality attributes (slope percentage and localized rock outcrops).
1
10
100
0
0.1
0.2
0.3
0.4
0.5
0.6
0.7 Grass height (log cm
) Grass cover and slope (log percent)
ND
VI
NDVI slope grass_cover grass_height
Figure 10 - Habitat quality indicators relevant to the structure and the productivity of grasslands vegetation across landscape alteration states.
The relatively high values of overall species richness by taxon confirm the well known notion of grasslands being among the more biodiverse world ecosystems. The distribution pattern of overall species richness across alteration states instead demonstrated the relatively more prominent influence of the nature of the matrix with respect to that of habitat fragmentation (Figure 11). As expected higher values of overall species richness are found in the habitat patches of the heterogeneous matrix and in variegated landscapes (plants and birds) where generalist and/or ecotone species are more likely to occur. Moreover, in heterogeneous landscapes the risk of woody vegetation encroachment is higher (Figure 12).

D6.8 Methodology to identify and quantify local pressures
BIO_SOS FP7-SPACE-2010-1 GA 263435 Page 34 of 50
0
10
20
30
40
50
60
70
80
90
Her
b s
pec
ies
rich
nes
s (S
)
0
1
2
3
4
5
6
7
8
9
Bir
d s
pec
ies
rich
nes
s (S
)
0
2
4
6
8
10
12
14
Ort
ho
pte
ra s
pec
ies
rich
nes
s (S
)
0
5
10
15
20
25
Lep
ido
pte
ra s
pec
ies
rich
nes
s (S
)
a b
c d
Figure 11 – Distribution patterns of species richness across landscape alteration states. Herbaceous plants (a), birds (b), grasshoppers (c), butterflies (d).

D6.8 Methodology to identify and quantify local pressures
BIO_SOS FP7-SPACE-2010-1 GA 263435 Page 35 of 50
0
0.5
1
1.5
2
2.5
3
Tree
cove
r (p
erc
en
t)
Figure 12 - Tree cover percent across landscape alteration states.
Vegetation composition, besides being regarded as an indicator of the response of plant organisms to landscape/habitat characteristics, provides information on habitat quality as it affects the distribution pattern of species of other trophic levels. When richness in habitat characteristic herbaceous species is examined in connection to landscape alteration states, it seems that this attribute is not so much affected by the nature of the matrix as much as by the degree of fragmentation (Figure 13).
0
2
4
6
8
10
12
Hab
itat
ch
arac
teri
stic
sp
eci
es
(S)
Figure 13 – Habitat characteristic herbaceous species richness across landscape alteration states.

D6.8 Methodology to identify and quantify local pressures
BIO_SOS FP7-SPACE-2010-1 GA 263435 Page 36 of 50
The increased degree of alteration (relictual landscapes), particularly associated to reduced habitat amount, reduced patch size and increased isolation, seem to affect the life form (Bei-Bienko, 1950; Pravdin, 1978) diversity within the orthoptera community (Figure 14). The influence of the matrix in terms of increased edge effect seems more evident in both relictual and fragmented habitats where the community tends to be dominated by chortobionta. These group select the mid herb layer and is mainly comprised of generalist or ecotone species. The different community composition of the variegated landscape could be explained in terms of more heterogenous habitat quality conditions between patches belonging to the same landscape.
0
0.5
1
1.5
2
2.5
3
3.5
4
Spec
ies
rich
nes
s (S
) Li
fe f
orm
div
ersi
ty (
H)
S_Thamnobionta S_Chortobionta S_Geobionta H_LF_SOrthoptera
Figure 14 – Orthoptera life form diversity and life forms species richness across landscape alteration states.
Lepidoptera grasslands communities (Figure 15) tend to be formed by non-habitat specialist species and the contribution of habitat specialists is more evident in moderately altered landscapes. In relictual landscapes, besides the effects of both habitat loss and patch size contraction, the relatively reduced grasslands specialist component of both lepidoptera and herb species richness (Figure 15) might be related to the co-extinction hypotesis formulated by Krauss et al. (2010), in connection with the longer duration of landscape modification.

D6.8 Methodology to identify and quantify local pressures
BIO_SOS FP7-SPACE-2010-1 GA 263435 Page 37 of 50
0
5
10
15
20
25
relictual_hom relictual_het fragmented_het fragmented_hom variegated
Spe
cie
s ri
chn
ess
(S)
S_grasslandLep S_Lepidoptera S_grasslandPlants
Figure 15 – Lepidoptera overall, functional groups (Lepidoptera and herbaceous grassland specialists) species richness across landscape alteration states.
In both less altered and altered homogeneous landscapes dominated by open land covers bird assemblages tend to be less rich, yet these are richer in specialist species (Figure 16).
0
1
2
3
4
5
6
7
8
9
Bir
ds
spec
ies
rich
nes
s(S
)
S_grassBirds S_rareBirds S_Birds
Figure 16 - Bird overall, functional groups and rare species richness across landscape alteration states.

D6.8 Methodology to identify and quantify local pressures
BIO_SOS FP7-SPACE-2010-1 GA 263435 Page 38 of 50
The results of the integrated analysis presented are consistent with the mainstream literature on the impacts of human induced landscape change on biodiversity (see Lindenmayer and Fisher, 2006 and literature cited). The concurrent role of many components associated to landscape change and fragmentation determining complex and non linear effects has emerged with regard to different biodiversity indicator taxa. These confirm the challenges associated with habitat modelling based on bivariate regression techniques and the need for empirical attempts to quantitatively disentangling the “interdependence of habitat effects” on species related processes (Didham et al., 2011), which however are extremely data demanding.
In terms of a theoretical perspective, this analysis provides evidence that good habitat conservation status is not necessarly represented by high values of the aggregated measures of community composition traditionally used as biodiversity surrogates (i.e., species richness and diversity indices), while functional groups seem more appropriate to supplying synoptic information on these aspects of community and habitat structure.
7.2 Habitat fragmentation and its effect on biodiversity – meta-population models applied to the wolf-wild boar pair in Alta Murgia
A special concern of BIO_SOS is devoted to Mediterranean areas, where three of the five study sites of the project are located. The intense human migration and the impact of many millennia of civilizations in the Mediterranean have given rise to significant human impacts on the landscape, such that entire landscapes have been repeatedly redesigned through the centuries. This has had a major impact on native forests which underwent destruction and replacement to simpler habitats with clearing of woodlands to make room for agriculture and pastoral activities. A high degree of fragmentation, due to habitat loss as well as an increased complexity of the habitat patch configuration, presents a widespread threat to the landscapes in such areas.
Most of the effort spent in the project on conservation issues, deals with endangered species which currently populate the Natura 2000 study sites, or may potentially establish viable populations, provided the necessary conditions are maintained or restored by planning feasible positive conservation actions. However, the case of the small sample of wolves which recently showed up in the Alta Murgia site presents an interesting and different theoretical perspective with which to conceptualize and analyse the role of human pressure on habitat fragmentation, and consequently on wolf meta-population distributions.
Wolves, as for e.g. coyotes and dingoes, are considered keystone species, as their impact on their embedding ecosystems is disproportionally large with respect to their abundance (Paine, 1995). Soulé et al. (2003) describe the ecological effectiveness of the role of top predators for communities and ecosystems. Their extinction can cause a cascade of secondary extinctions. For that reason they are a focus of interest in a number of large-scale projects such as the North America Wildlands Network (http://www.twp.org/) aiming at building large reconnected areas of land at continental scale to ensure the viability and sustainability of big wild animal populations (Soulé et al., 1999). In several European countries wolves are protected by national laws that try to conserve and increment the number of such predators. The legal status of wolves in the European Union countries is directly specified in the Habitats Directive (92/43/EEC). By default wolf populations are listed under Annexes II and IV. Annex II requires the establishment of Natura 2000 sites for the species while annex IV requires strict protection, prohibiting any destruction or damage to the population (Kaczensky et al., 2013). Guidelines for good
conservation practice, methodologies and vision are constantly provided and updated by European initiatives like LCIE, the Large Carnivore Initiative, which has had the official status of a Specialist Group within the Species Survival Commission (SSC) of the International Union for the Conservation of Nature (IUCN). LCIE aims at favouring policies and actions “to maintain and restore, in coexistence with people, viable populations of large carnivores as an integral part of ecosystems and landscapes across Europe”.
The species they focus on are the ones that once were abundant in forest areas of the European continent (namely, brown boar, wolf, wolverine, Eurasian lynx, Iberian lynx, and golden jackal). The threats, the obstacles and the challenges that pave the way to an effective conservation strategy are well

D6.8 Methodology to identify and quantify local pressures
BIO_SOS FP7-SPACE-2010-1 GA 263435 Page 39 of 50
resumed in what the LCIE write regarding LCIE vision: “because these species roam over huge areas, our network of national parks and other protected areas are not enough on their own. For large carnivores to have a long term future we have to allow them to spread and reoccupy many of their former habitats - this means reintegrating them into the landscapes where we humans live, and work, and play.”
The main issue from a theoretical perspective is how to conceptualize the role of human pressure in influencing the risk of local extinction for predator populations such as the wolf, in an area whose extension and vegetation type is not suited for hosting a viable and stable population of predators. The lack of suitable data on the presence and distribution of wolves in the Alta Murgia site make it difficult to conduct statistically sound local distribution modelling. However, meta-population dynamics can provide a suitable theoretical framework and methodological approach for assessing the role of human pressure on landscape fragmentation, and ultimately, on biodiversity using the wolf as a proxy to evaluate the prediction and prevention of extinction events.
Meta-population dynamics, i.e. the dynamics of a "`population of populations" (Levins, 1969), represent an effective tool for investigating the dispersal of species population in fragmented habitat, especially when competition or predator-prey systems are present. The ecological effects of human activities induce different changes in natural habitats. Habitat fragmentation is one of the classical consequences of human population growth: indeed, given human population activities and urban sprawl, habitats are often fragmented into patches connected via migration corridors set in non-habitat portions of the landscape (Fahrig, 2003). For cyclic predator-prey population dynamics, as it is the case of wolf-wild boar pair on which we focus our attention, experimental and theoretical results suggest that the subdivision of the same amount of habitat into smaller pieces may also provide positive effects on their stability (Huffaker 1958; Baggio et al., 2011); however the increasing reduction of the size of migration corridors abates the number of the individuals that are able to migrate from a patch to another and species are confined in more and more isolated patches. When increasing fragmentation produces patches too small to sustain local populations, the worst consequence of the reduction of the size of migration corridor is the extinction of the species. This motives us to consider the effects of such reduction on the permanence or the extinction of cyclic populations living in a fragmented habitat, such as the wolf - wild boar pair which populates the italian Alta Murgia Natura 2000 site.
The wolf with its endemic Italian subspecies, canis lupus italicus, had almost disappeared from the Italian territory and in 1970, the number of individuals had dropped down to less than 100 (Boitani, 2003; Falcucci, 2007). In the last 40 years there has been an inversion of the trend, because human activities had favoured flatter accessible locations, leaving large hilly and mountain areas abandoned, with the consequent recovery and expansion of forests in hilly locations. This process is in a way uncorrelated to planned conservation policies. The present distribution of wolf in Italy as well as throughout Europe is displayed in Figure 17.
As can be appreciated by from the figure, the wolf population is almost absent in coastal and nearby areas. Their presence in Alta Murgia site is not a stable one and it is possibly correlated to the recent introduction of wild boar (Sus scrofa) in the area.

D6.8 Methodology to identify and quantify local pressures
BIO_SOS FP7-SPACE-2010-1 GA 263435 Page 40 of 50
Figure 17 - Distribution of the wolf in Europe 2006-2011. Dark cells: permanent occurrence, Grey cells: sporadic occurrence. Red borders mark countries for which information was available (www.lcie.org)
The social organization of wolves is that of a group living in packs, normally with only two reproductive animals. Wolf packs are territorial, but as for all the large carnivores, wolves live in low densities and have very large home ranges. Presently, it is not known if the area of the Alta Murgia BIO_SOS site can host a whole pack. Nevertheless national legal obligations bind the managing authorities to set up conservation policies even for such a limited number of individuals. The challenge for the regional authorities is to plan actions capable to maintain the small “population” of wolves while limiting at the same time the presence of wild boars, due to their large and negative impact on agricultural practices.
In deliverable D6.5 we described the mathematical models and the numerical simulations of the predator-prey dynamics in a simplified context. Such studies are preliminary to a qualitative analysis of the real life processes we are concerned with.
Mathematical models describing cyclic populations dynamics in patchy landscapes are generally spatially implicit (see Jansen, 2001), meaning that they have no spatial dimension and all patches are accessible via dimensionless corridors. As a consequence, the models are described by means of

D6.8 Methodology to identify and quantify local pressures
BIO_SOS FP7-SPACE-2010-1 GA 263435 Page 41 of 50
ordinary differential equations coupled through diffusion coefficients that model the migration of species from a patch to another. Lotka-Volterra (LV) systems (Okubo and Levin 2001) as well as its modifications like Rosenzweig-MacArtur (RM) (Rosenzweig and MacArthur 1963), May (May, 1974) and Variable Territory (VT) (Turchin and Batzli, 2001) are the most widely used differential equations considered in this context.
However, in recent years, the consideration of spatial processes in ecological systems has been growing and spatially explicit modelling has revealed to be more effective for the ecological understanding of such kind of phenomena (Conroy et al., 1995; Dunning et al., 1996; South, 1999; Turner at al., 1995).
An interesting example of such approach is represented by a numerical study conducted by Strohm and Tyson (2001). Therein, the authors investigate the effects of habitat fragmentation through spatially explicit models i.e. models which take into account the spatial dimension. In that paper the authors define as `bad' patches those parts of the habitat where migration of predator and prey occurs, and prey population cannot grow. The predator and prey migration is modelled through transport terms acting only in the `bad' patches which are included in two coupled diffusive PDE equations that describe the population dynamics in the whole domain Ω (see the illustrative example in Figure 18). Consequently, the authors depart from a meta-population dynamics approach where the domain Ω is considered as fragmented in more smaller domains Ωi (that correspond to the `good patches' of the previous approach) and migration corridors are set in non-habitat portions of the landscape i.e. outside the domains Ωi. In this case two coupled reaction-diffusion equations describe the dynamics in each domain Ωi and they are linked by migration diffusion terms occurring only at corridor entrance positions (see Figure II.2). In this framework, some numerical results based on a two-dimensional spatially extended predator-prey model can be found in Garvie and Golinski (2010).
Figure 18 - An illustration of a generic five `good patches' two-dimensional single-population spatially explicit model; migration occurs in the habitat’s bad patch inside the domain Ω towards good patches (for
details see Strohm and Tyson, 2001).
Unfortunately, the integration of the spatial dimension is difficult and expensive - both practically, to parameterise spatially-explicit models (Urban and Keitt, 2001), and numerically, to provide accurate solutions (Garvie and Golinski, 2010). Furthermore, it leads sometimes to qualitatively similar predictions found by alternative approaches as, for example, the graph theory which has minimal data requirements and efficient algorithms (Baggio et al., 2011, Urban and Keitt, 2001). As concerns cyclic population dynamics, by reducing spatially explicit models into spatially implicit equivalent ones it is possible to capture the main features of the spatially explicit models and use standard mathematical tools to study

D6.8 Methodology to identify and quantify local pressures
BIO_SOS FP7-SPACE-2010-1 GA 263435 Page 42 of 50
the solution behaviour (Strohm and Tyson, 2012). A comparison of four classical models found in the literature in terms of patch sizes and corridor entrance size variations shows that, for given values of the parameters, different dynamics may arise: this suggests that the correct choice of the model as well as the estimation of its parameters will be crucial for a realistic modelling study of predator-prey pairs.
By following a meta-population approach similar to the one provided in (Garvie and Golinski, 2010), in deliverable D6.5 we firstly numerically investigated the answer of the spatially explicit reaction-diffusion RM model to the variation of corridor entrance size; the results have then been compared with the ones provided by a new reduced implicit model where the spatial dependence is taken into account via relationships which link growth and death rates of prey and predators with the sizes of each patch and of the corridor entrances. This way, the new spatially implicit model inherits the relevant information of spatial explicit models from which they have been deduced. In so doing, we were motivated by similar results in Strohm and Tyson (2012), where they show that a spatially explicit model can be reduced to a simplified implicit one which preserving the same qualitative behaviour, but with a lower computational cost. Computational cost is a major obstacle for increasing the complexity of the scenario to be simulated.
Thus, we conclude that the implicit model, described by ordinary differential equations, seems to provide an effective tool for a theoretical investigation of the effects of fragmentation (i.e. the reduction of patches and migration corridor entrance sizes) on wolf meta-populations. This may provide an effective tool for a further theoretical analysis able to provide some predictive biological information related to outcomes driven by human impacts on landscape fragmentation, which is the main focus of this deliverable.

D6.8 Methodology to identify and quantify local pressures
BIO_SOS FP7-SPACE-2010-1 GA 263435 Page 43 of 50
8. Conclusions and recommendations
Deliverable D6.9 addresses the requirement for theoretical frameworks to understand how human impacts, both positive and negative, influence changes in habitat, land cover change, and landscape fragmentation and connectivity. The deliverable addresses five separate but connected themes. The first two themes (Section 3 and Section 4) address the theoretical frameworks that explain the mechanisms by which human pressures manifest their impact on land cover change; and the mechanisms by which human pressures manifest their impact on habitats. The next theme (Section 5) moves from developing an understanding of how human pressure manifests itself on habitat change, to developing an understanding of the impact of human-induced changes in habitat cover on biodiversity using one specific framework of island biogeography, which has some implications for protected area management of isolated natural and semi-natural habitat patches. The fourth theme (Section 6) is focused on demonstrating the usefulness of habitat classification taxonomies (specifically the GHC classification scheme adopted by BIO_SOS) for recording changes in habitats as a response to human pressure. The fifth theme (Section 7) focuses on theoretical frameworks that can help to link human pressure-induced habitat fragmentation with changes in biodiversity. The first part (Section 7.1) demonstrates a step-wise comprehensive analysis that integrates aspects of drivers, determinism and role of the matrix to assess multispecies (taxa) responses, while the second part (Section 7.2) describes insights gained from mathematical meta-population modelling of a predator-prey population pair using the same site IT3 as an example. These discussions demonstrate the need for more integrated theoretical frameworks to address the complex issue of human pressures, and how these translate into changes on land cover, habitat cover and fragmentation, and ultimately on biodiversity. A diversity of theoretical frameworks currently exist and have been used at different levels of analysis, as some of the examples cited here demonstrate. Yet a more comprehensive, coupled social-ecological framework that is hierarchical and applies across multiple levels is required to further elucidate the link between human pressure (process), and ecological impact (pattern).

D6.8 Methodology to identify and quantify local pressures
BIO_SOS FP7-SPACE-2010-1 GA 263435 Page 44 of 50
9. References
Adriaensen, F., Chardon, J.P., De Blust, G., Swinnen, E., Villalba, S., Gulinck, H., Matthysen, E., 2003 The application of “least-cost” modelling as a functional landscape model. Landscape and Urban Planning 64:233–247
Allen, J.C., Barnes, D.F., 1985. The causes of deforestation in developing countries. Annals of the Association of American Geographers 75: 163–184.
Baggio, J.A., Salau, K., Janssen, M.A., Schoon, M.L., Bodin O., 2011.Landscape connectivity and predator-prey population dynamics. Landscape Ecology 26: 33-45.
Bedford B.L., 1996. The need to define hydrologic equivalence at the landscape scale for freshwater wetland mitigation. Ecological Applications 5: 57-69.
Bei-Bienko, G.Y., 1950. Orthoptera and Dermaptera. In: Fauna of USSR, III: The Steppe, pp. 379-424.
Bell, S.S., Fonseca, M.S., Mooten, L.B., 1997. Linking restoration and landscape ecology. Restoration Ecology 5: 318-323.
Boitani, L., 2003. Wolf conservation and recovery. In Mech D.L. and Boitani L. (eds). Wolves: Behavior, Ecology and Conservation. The University of Chicago Press, Chicago, USA, pp. 317-340.
Bray, D.B., Ellis, E.A., Armijo-Canto, A., Beck, C.T., 2004. The institutional drivers of sustainable landscapes: A case study of the ‘Mayan Zone’ in Quintana Roo, Mexico. Land Use Policy 21: 333–346.
Bunce, R.G.H., Metzger, M.J., Jongman, R.H.G., Brandt, J., de Blust, G., Elena-Rossello, R., Groom, G.B., Halada, L., Hofer, G., Howard, D.C., Kovàrˇ, P., Mücher, C.A., Padoa-Schioppa, E., Paelinx, D., Palo, A., Perez-Soba, M., Ramos, I.L., Roche, P., Skanes, H., Wrbka, T., 2008. A standardized procedure for surveillance and monitoring European habitats and provision of spatial data. Landscape Ecology 23: 11–25.
Bunce, R.G.H., Bogers, M.M.B., Roche, P., Walczak, M., Geijzendorffer, I.R., Jongman, R.H.G., 2011. Manual for habitat surveillance and monitoring and vegetation in temperate, Mediterranean and desert biomes.Alterra-EBONE_Handbook_v20110131. http://www.ebone.wur.nl/NR/rdonlyres/DADAAB1E-F07C-4AA3-8621-20548A9B7DE6/135332/report2154.pdf
Conroy, M.J., Cohen, Y., James, F.C., Matsinos, Y.G., Maurer, B.A., 1995. Parameter-estimation, reliability, and model improvement for spatially explicit models of animal populations. Ecological Applications 5: 17–19.
Collins, J.P., Kinzig, A., Grimm, N.B., Fagan, W.F., Hope, D., Wu, J., 2000. A new urban ecology. American Scientist 88: 416-425.
Cosner, C., 1996. Variability, vagueness and comparison methods for ecological models. Bulletin of Mathematical Biology 58: 207–246.
Crutzen P.J., 2002. Geology of mankind. Nature 415: 23.
Didham, R.K., 2010. Ecological consequences of habitat fragmentation. Encyclopedia of Life Sciences. – Wiley.
Didham, R.K., Kapos, V., Ewers, R.M., 2011. Rethinking the conceptual foundations of habitat fragmentation research. Oikos 121: 161–170
Dunning, J.B., Stewart, D.J., Danielson, B.J., Noon, B.R., Root, T.L., Lamberson, R.H., Stevens, E.E., 1995. Spatially explicit population models - current forms and future uses, Ecological Applications 5: 3–11.
EEA, 2006a. Land accounts for Europe 1990-2000. EEA Report No 11/2006.
EEA, 2006b. Urban sprawl in Europe. The ignored challenge. EEA Report No 10/2006.

D6.8 Methodology to identify and quantify local pressures
BIO_SOS FP7-SPACE-2010-1 GA 263435 Page 45 of 50
Ehrenfeld, J.G., Toth, L.A., 1997. Restoration ecology and the ecosystem perspective. Restoration Ecology 5: 307-317.
Ehrlich, P.R., Ehrlich, A.H., 1990. The Population Explosion. New York: Simon and Schuster.
Ellis, E.C., Ramankutty N., 2008. Putting people in the map: anthropogenic biomes of the world. Frontiers in Ecology and the Environment 6: 439-447.
European Environment Agency (EEA) and Federal Office for the Environment (FOEN), 2011. Landscape fragmentation in Europe. Report No 2/2011. Publications Office of the European Union, Luxembourg.
McGarigal, K., McComb, W.C., 1995. Relationships between landscape structure and breeding birds in the Oregon Coast Range. Ecological Monographs 65: 235-260.
Fahrig L., 2003. Effects of habitat fragmentation on biodiversity. Annual Review of Ecology, Evolution and Systematics 34: 487-515
Falcucci A., 2007. Conservation of large carnivores in a human dominated landscape: habitat models and potential distribution. PhD Dissertation, University of Idaho, available at http://www.carnivoreconservation.org/files/thesis/falcucci_2007_phd.pdf.
Falcucci, A., Maiorano, L., Boitani, L., 2007. Changes in land-use/ land-cover patterns in Italy and their implications for biodiversity conservation. Landscape Ecology 22: 617–631.
Ficetola, G.F., Padoa-Schioppa, E., 2009. Human activities alter biogeographical patterns of reptiles on Mediterranean islands. Global Ecology and Biogeography 18: 214-222.
Fischer, J., Lindenmayer, D.B., Montague-Drake, R., 2008. The role of landscape texture in conservation biogeography: a case study on birds in south-eastern Australia. Diversity and Distributions 14: 38–46.
Foley J.A., DeFries, R., Asner, G.P., Barford, C., Bonan, G., Carpenter, S.R., Chapin, F.S., Co, M.T., Daily, G.C., Gibbs, H.K., Helkowski, J.H., Holloway, T., Howard, E.A., Kucharik, C.J., Monfreda, C., Patz, J.A., Prentice, I.C., Ramankutty, N., Snyder, P.K., 2005. Global consequences of land use. Science 309: 570-74.
Forman, R.T.T. (1995). Land Mosaics: The Ecology of Landscape and Regions. Cambridge University Press, Cambridge
Forman, R.T.T., 2008. Urban Regions: Ecology and Planning Beyond The City. Cambridge University Press.
Garvie M.R., Golinski M., 2010. Meta-population dynamics for spatially extended predator-prey interactions. Ecological Complexity 7: 55–59.
Geist, H.J., Lambin, E.F., 2001. What drives tropical deforestation? A meta-analysis of proximate and underlying causes of deforestation based on sub-national case study evidence. LUCC Report Series, no. 4. Louvain-la-Neuve: LUCC International Project Office, University of Louvain.
Geist, H.J., Lambin, E.F., 2003. Regional differences in tropical deforestation. Environment 45: 22–36.
Gibbs J.P., 2000. Wetlands loss and biodiversity conservation. Conservation Biology 14: 314-317
Gray J.S., 1997. Marine biodiversity: patterns, threats and conservation needs. Biodiversity and Conservation 6:153–175
Grimm, N.B., Baker, L.J., Hope, D., 2003. An ecosystem approach to understanding cities: familiar foundations and uncharted frontiers. In A.R. Berkowitz and K.S. Hollweg (eds.), Understanding Urban Ecosystems: A New Frontier for Science and Education. New York: Springer, 95-114.
Hadley D., 2009. Land use and the coastal zone. Land Use Policy 26: 198–203.
Hill, J., Stellmes, M., Udelhoven, T., Röder, A., Sommer, S., 2008. Mediterranean desertification and land degradation: mapping related land use change syndromes based on satellite observations. Global and Planetary Change 64: 146-157.

D6.8 Methodology to identify and quantify local pressures
BIO_SOS FP7-SPACE-2010-1 GA 263435 Page 46 of 50
Huffaker, C.B., 1958. Experimental studies on predation: dispersion factors and predator-prey oscillation, Hilgardia 27: 343–383.
Jadicke, E., 2001. Biodiversität, Geodiversität, Ökodiversität. Kriterien zur Analyse der Landschaftsstruktur – ein konzeptioneller Diskussionbeitrag. Naturschutz und Landschaftsplannung 33: 59-68.
Jansen, V.A.A., 2001. The dynamics of two diffusively coupled predator-prey populations. Theoretical Population Biology 59: 119–131.
Kaczensky P., Chapron G., von Arx M., Huber D., Andrén H., Linnell, J. (Eds), 2013. Status, management and distribution of large carnivores – bear, lynx, wolf & wolverine – in Europe. LCIE,
http://www1.nina.no/lcie_new/pdf/635017910121675037_Task2-LIFE%20and%20LC_final.pdf.
Keys, E., McConnell, W.J., 2005. Global change and the intensification of agriculture in the tropics. Global Environmental Change 15: 320-337.
Kinzig, A., Leemans, R., Lodge, D.M., Mooney, H.A., Oesterheld, M., Poff, N.L., Sykes, M.T., Walker, B.H., Walker, M., Wall, D.H., 2000. Biodiversity – global biodiversity scenarios for the year 2100. Science 287: 1770–1774.
Kowarik, I., Korner, S. (Eds), 2005. Wild Urban Woodlands: New Perspective for Urban Forestry. New York: Springer.
Krauss, J., Bommarco, R., Guardiola, M., Heikkinen, R.K., Helm, A., Kuussaari, M., Lindborg, M., Öckinger, E., Pärtel, M., Pino, J., Pöyry, J., Raatikainen, K.M., Sang, A., Stefanescu, C., Teder, T., Zobel, M., Steffan-Dewenter, I., 2010. Habitat fragmentation causes immediate and time delayed biodiversity loss at different trophic levels Ecology Letters 13: 597–605
Lengyel, S., Kobler, S., Kutnar, L., Framstad, E., Henry, P.Y., Babij, V., Gruber, B., Schmeller, D., Henle, K., 2008. A review and a framework for the integration of biodiversity monitoring at the habitat level. Biodiversity and Conservation 17: 3341-3356.
Levin, N., Elron, E., Gasith, A, 2009. Decline of wetland ecosystems in the coastal plain of Israel during the 20th century: implications for wetland conservation and management. Landscape and Urban Planning 92: 220–232
Levins, R., 1969. Some demographic and genetic consequences of environmental heterogeneity for biological control. Bulletin of the Entomological Society of America 15: 237–240.
Lindenmayer, D.B., Fisher, J., 2006. Habitat Fragmentation and Landscape Change. Island Press, Washington Covelo London, p. 328.
Liu, J., Dietz, T., Carpenter, S.R., Alberti, M., Folke, C., Moran, E., Pell, A.N., et al., 2007. Complexity of coupled human and natural systems. Science 317: 1513-1516.
Mairota, P., Kosmidou V., Nagendra H. 2011a. Preliminary report on landscape pattern analysis – State of the art. BIO_SOS Biodiversity Multisource Monitoring System: from Space TO Species (BIO_SOS) Deliverable D6.2.
Mairota, P., Boccaccio, L., Labadessa, R., Leronni, V., Tomaselli, V., Tarantino, C., Cafarelli, B., 2011b. Pre-evaluation and rank sampling. BIO_SOS Biodiversity Multisource Monitoring System: from Space TO Species (BIO_SOS) Deliverable D6.3.
Mairota, P., Cafarelli, B., Labadessa, R., Leronni, V., Blonda, P., Lovergine, F., Pasquariello, G., Honrado, J., Lucas, R., Charnock, B., Bailey, M., Nagendra, H., Niphadkar, M., Kosmidou, V., 2012. Landscape pattern analysis PART II. BIO_SOS Biodiversity Multisource Monitoring System: from Space TO Species (BIO_SOS) Deliverable D6.4.
Mairota, P., Cafarelli, B., Boccaccio, L., Leronni, V., Labadessa, R., Kosmidou, V., Nagendra, H., 2012. Using landscape structure to develop quantitative baselines for protected area monitoring. Ecological Indicators DOI: 10.1016/j.ecolind.2012.08.017.

D6.8 Methodology to identify and quantify local pressures
BIO_SOS FP7-SPACE-2010-1 GA 263435 Page 47 of 50
Mather, A.S, Needle, C.L., 2000. The relationships of population and forest trends. Geographical Journal 166: 2–13.
May, R., 1974. Stability and complexity in model ecosystems, Princeton University Press, Princeton.
McDonnell, M.J., Pickett, S.T.A., Groffman, P., Bohlen, P., Pouyat, R.V., Zipperer, W.C., Parmelee, R.W., Carreiro, M.M., Medley, K., 1997. Ecosystem processes along an urban-to-rural gradient. Urban Ecosystems 1: 21-36.
McIntyre, S., Hobbs, R., 1999. A framework for conceptualizing human effects on landscapes and its relvance to management and research models. Conservation Biology 13: 1282-1292.
McRae, B.H., Dickson, B.G., Keitt, T.H., Shah, V.B., 2008. Using circuit theory to model connectivity in ecology and conservation. Ecology 10: 2712-272
Meyer, W.B., Turner, B.L.II, 1992. Human population growth and global landuse/land-cover change. Annual Review of Ecology and Systematics 23: 39–61.
Minor, E.S., Urban, D.L., 2007. Graph theory as a proxy for spatially explicit population models in conservation planning. Ecological Applications 17: 1771–1782.
Musacchio, L.R., Wu, J., 2004. Collaborative landscape-scale ecological research: emerging trends in urban and regional ecology. Urban Ecosystems 7: 175-178.
Myers, N., 1993. Tropical forests: the main deforestation fronts. Environmental Conservation 20: 9–16.
Nagendra, H., Mairota, P., Blonda, P., Marangi, C., Torri, D., Lucas, R., Dimopoulos, P., Honrado, J., Niphadkar, M., Mücher, C.A., Tomaselli, V., 2012. Developing a methodology to identify locally recognizable pressures and quantify their impact on habitats. BIO_SOS Biodiversity Multisource Monitoring System: from Space TO Species (BIO_SOS) Deliverable D6.10.
Nagendra, H., Southworth, J., 2010. Reforesting Landscapes: Linking Pattern and Process. Springer, Dordrecht, The Netherlands.
Nagendra, H., Ostrom, E., 2007. Institutions, collective action and forest degradation: Learning from studies in Nepal. In The Sage Handbook of Environment and Society, eds. J. Pretty, A. Ball, T. Benton, J. Guivant, D. R. Lee, D. Orr, M. J. Pfeffer and H. Ward, Sage Publications, London, pp 578-589.
Nogués-Bravo, D., Araújo, M.B., Romdal, T., Rahbek, C., 2008. Scale effects and human impact on the elevational species richness gradients. Nature 453: 216–219.
Okubo, A., Levin, S.A., 2001. Diffusion and Ecological Problems: Modern Perspectives. Springer, New York.
Padoa-Schioppa, E., Diana, E., Digiovinazzo, P., Ficetola, G.F., Bottoni, L., 2010. Where’s the boundary? Defining the urban region of Milano. IALE-UK Conference proceedings.
Paine, R.T., 1995. A conversation on refining the concept of keystone species. Conservation Biology 9: 962–964.
Pickett, S.T.A., 2006. Advising urban ecology studies: frameworks, concepts, and results from the Baltimore Ecosystem Study. Austral Ecology 31: 114-25.
Quetier, F., Marty, P., Lepart, J., 2005. Farmers’ management strategies and land use in an agropastoral landscape: roquefort cheese production rules as a driver of change. Agricultural Systems 84: 171–193.
Race, M.S., Fonseca, M.S., 1996. Fixing compensatory mitigation. What will it take? Ecological Applications 5: 94-101.
Raunkiaer C., 1934. The Life Forms of Plants and Statistical Plant Geography: being the collected papers of C. Raunkiaer, Oxford University Press, Oxford. Reprinted 1978 (ed. by Frank N. Egerton), Ayer Co Publications.
Ray, N., 2005. PathMatrix: a GIS tool to compute effective distances among samples. Molecular Ecology Notes 5: 177-180.
D6.8 Methodology to identify and quantify local pressures
BIO_SOS FP7-SPACE-2010-1 GA 263435 Page 48 of 50
Rosenzweig, M., MacArthur, R., 1963. Graphical representation and stability conditions of predator-prey interactions. The American Naturalist 97: 209–223.
Rudel, T.K., 2002. A tropical forest transition? Agricultural change, out-migration, and secondary forests in the Ecuadorian Amazon. Annals of the Association of American Geographers 92: 87–102.
Rudel, T.K., DeFries, R., Asner, G.P., Laurance, W.F., 2009. Changing drivers of deforestation and new opportunities for conservation. Conservation Biology 23: 1396-1405.
Sala, O.E., Chapin, F.S., Armesto, J.J., Berlow, E., Bloomfield, J., Dirzo, R., Huber-Sanwald, E., Huenneke, L.F., Jackson, R.B., Kinzing, A., Leemans, R., Lodge, D.M., Mooney, H.A., Oesterheld, M., Poff, N.L., Sykes, M.T., Walker, B.H., Walker, M., Wall, D.H., 2000. Global biodiversity scenarios for the year 2011. Science 287: 1770-1774.
Salafsky, N., Salzer, D., Ervin, J., Boucher, T., Ostlie W., 2003. Conventions for defining, naming, measuring, combining, and mapping threats in conservation: an initial proposal for a standard system. Conservation Measures Partnership, Washington, D.C.
Salafsky, N., Salzer, D., Stattersfield, A.J., Hilton-Taylor, C., Neugarten, R., Butchart, S.H.M., Collen, B., Cox, N., Master, L.L., O’Connor, S., Wilkie, D., 2008. A standard lexicon for biodiversity: unified classifications of threats and actions. Conservation Biology 22: 897– 911.
Sanderson E.W., Jaiteh, M., Levy, M.A., Redford, K.H., Wannebo, A.V., Woolmer, G., 2002. The human footprint and the last of the wild. BioScience 52: 891-904.
Sass, G.G., Kitchell, J.F., Carpenter, S.R., Hrabik, T.R., Marburg, A.E., Turner, M.G., 2006. Fish community and food web responses to a whole-lake removal of coarse woody habitat. Fisheries 31: 321-330.
Schippers, P., Verboom, J. Knaapen, J.P., Van Apeldoorn, R.C., 1996. Dispersal and habitat connectivity in complex heterogeneous landscapes: an analysis with a GIS-based random walk model. Ecography 19: 97-106.
Schweik, C.M., Nagendra, H., Sinha, D.R., 2003. Using satellite imagery to locate innovative forest management practices in Nepal. Ambio 32: 312–319.
Seto, K.C., Fragkias, M., Güneralp, B., Reilly, M.K., 2011. A meta-analysis of global urban land expansion. PloS ONE 6: e23777.
Soulé, M., Terborgh, J., 1999. Continental Conservation: Scientific Foundations of Regional Reserve Networks. Washington: Island Press.
Soulé, M.E., Estes, J.A., Berger, J., Martinez del Rio, C., 2003. Ecological effectiveness: conservation goals for interactive species. Conservation Biology 17: 1238-1250.
South, A., 1999. Dispersal in spatially explicit populations models. Conservation Biology 13: 1039–1046.
Strohm, S., Tyson, R., 2009. The effect of habitat fragmentation on cyclic population dynamics: a numerical study. Bulletin of Mathematical Biology 71: 1323–1348.
Strohm S., Tyson R., 2012. The effect of habitat fragmentation on cyclic population dynamics: a reduction to ordinary differential equations. Theoretical Ecology 5: 495-596.
Sukopp, H., Numata, M., Huber, A., 1995. Urban Ecology as the Basis of Urban Planning. The Hague, Netherlands: SPB Academic Publishing.
Tomaselli, V., Di Pietro, R., Sciandrello, S., 2011. Plant communities structure and composition in three coastal wetlands in southern Apulia (Italy). Biologia 66: 1027-1043.
Tomaselli, V., Tenerelli, P., Sciandrello, S., 2012. Mapping and quantifying habitat fragmentation in small coastal areas: a case study of three protected wetlands in Apulia (Italy). Environmental Monitoring and Assessment 184: 693-713.
Tomaselli, V., Dimopoulos, P., Marangi, C., Kallimanis, A.S., Adamo, M., Tarantino, C., Panitsa, M., Terzi, M., Veronico, G., Lovergine, F., Nagendra, H., Lucas, R., Mairota, P., Mücher, C.A., Blonda, P.,

D6.8 Methodology to identify and quantify local pressures
BIO_SOS FP7-SPACE-2010-1 GA 263435 Page 49 of 50
2013. Translating land cover/land use classifications to habitat taxonomies for landscape monitoring: a Mediterranean assessment. Landscape Ecology DOI 10.1007/s10980-013-9863-3.
Turchin P., Batzli G., 2001. Availability of food and the population dynamics of arvicoline rodents. Ecology 82: 1521–1534.
Turner, M.G., Arthaud, G.J., Engstrom, R.T., Hejl, S.J., Liu, J.G., Loeb, S., McKelvey, K., 1995. Usefulness of spatially explicit population models in land management. Ecological Applications 5: 12–16.
Urban, D., Keitt, T., 2001. Landscape connectivity: a graph-theoretic perpective. Ecology 82: 1205–1218.
Valdemoro, H.I., Sanchez-Arcilla, A., Jiménez, J.A., 2007. Coastal dynamics and wetlands stability. The Ebro delta case. Hydrobiology 577:17–29.
Verburg, P.H., Van De Steeg, J., Veldkamp, A., Willemen, L., 2009. From land cover change to land function dynamics: a major challenge to improve land characterization. Journal of Environmental Management 90: 1327-1335.
Vitousek, P.M., Mooney, H.A., Lubchenco, J., Melillo, J.M., 1997. Human domination of earth’s ecosystems. Science 277: 494-499.
Wiens, J.A., 1999. Landscape Ecology: Scaling from Mechanism to Management. In: Perspectives in Ecology, Backhuys Publishers, Leiden, pp 13-24.
Wu, J. G., David, J. L., 2002. A spatially explicit hierarchical approach to modeling complex ecological systems: theory and applications. Ecological Modelling 153: 7 – 26.
Zanuttigh, B., 2011. Coastal flood protection: What perspective in a changing climate? The THESEUS approach. Environmental Science and Policy 14: 845 – 863.

D6.8 Methodology to identify and quantify local pressures
BIO_SOS FP7-SPACE-2010-1 GA 263435 Page 50 of 50
10. Appendices
10.1 Appendix 1. Acronyms used
Biligiri Rangaswamy Tiger Reserve (BRT)
Convention on Biological Diversity (CBD)
Corine Land Cover (CLC)
Earth Observation (EO)
General Habitat Categories
International Union for the Conservation of Nature
Land Use/Land Cover Change (LULCC)
Land-Use and Land-Cover Change Project (LUCC)
Landscape Pattern Analysis (LPA)
Landscape Pattern Index (LPI)
LCIE, the Large Carnivore Initiative
Lotka-Volterra (LV)
Principal Component Analysis (PCA)
Rosenzweig-MacArtur (RM)
Streamlining European 2010 Biodiversity (SEBI)
Variable Territory (VT)


