Embed Size (px)
Citation preview
Influence of the NAO on the northwestern Mediterranean wave climate
Bartomeu Cañellas 1, alejandro orfila 1, fernando méndez 2, alBerto Álvarez 1 and joaquín tintoré 1
1 imedea (CsiC- uiB), 07190 esporles, illes Balears, spain. 2 environmental Hydraulic institute, iH Cantabria, universidad de Cantabria, 39005 santander, spain.
summarY: this study examines teleconnections between the north atlantic oscillation (nao) and the wave climate of the northwestern mediterranean sea (nWm), defined by the monthly mean significant wave height (sWH) and the 95th percentile significant wave height (95th percentile sWH), in the period ranging from 1958 to 2001. the data analyzed comes from the multidecadal hindcast over europe carried out during the HiPoCas project. in order to avoid fictitious cross-corre-lations, data were prewhitened by fitting a p-order autoregressive model. to split the temporal and spatial variability, an eof encoding technique was applied to residuals before searching for teleconnections. We found the northwestern mediterranean wave climate to be influenced by the north atlantic oscillation (nao) with an instantaneous response. When the nao is in its positive phase, positive anomalies in the sWH and the 95th percentile sWH appear in the area between the Balearic islands, the Gulf of lions and the Catalonian coast.
Keywords: teleconnections, wave climate, nao, eof, mediterranean sea, variability.
resumen: Influencia de la nao en el clima marítimo del Mediterráneo noroccidental. – el presente trabajo es-tudia las teleconexiones entre la oscilación del atlántico norte (nao) y el clima marítimo en el mediterráneo noroccidental, definido por la media mensual de la altura significante (sWH) y la media mensual de la altura significante correspondiente al percentil 95 (percentil 95 sWH), en el período comprendido entre 1958 y 2001. los datos analizados corresponden al retroanálisis de 44 años de datos atmosféricos, dentro del marco del proyecto HiPoCas. estos datos han sido codificados en forma de eofs para obtener la variabilidad espacio-temporal asociada a la nao. los datos utilizados han sido previamente blanqueados para evitar correlaciones ficticias entre las series, mediante el ajuste a un modelo autorregresivo de orden p. los resultados muestran como el clima marítimo del mediterráneo noroccidental está influenciado a escala mensual por las distintas fases de la nao. Cuando la nao está en su fase positiva, podemos observar anomalías positivas en la altura significante media mensual, así como en la altura de ola correspondiente al percentil 95, estas anomalías aparecen en la zona comprendida entre las islas Baleares, el Golfo de león y la costa catalana.
Palabras clave: teleconexiones, clima marítimo, nao, eof, variabilidad, mar mediterráneo.
Scientia Marina 74(1)march 2010, 55-64, Barcelona (spain)
issn: 0214-8358doi: 10.3989/scimar.2010.74n1055
introduCtion
teleconnections are interactions between widely separated parts of the ocean and the atmosphere oc-curring at different time scales. these interactions lead to recurring and persistent modes of low-fre-quency variability in large-scale patterns of atmos-pheric pressure and ocean circulation anomalies
(vignudelli et al., 1999; orfila et al., 2005). these anomalies in the large-scale circulation are manifest-ed in surface waves and drive some of the variability of the wave climate, which has consequences for the operation and safety of shipping, offshore activi-ties, and coastal development, among other things (Kushnir et al., 1997). therefore, it is important to search for and recognize teleconnections in order to
56 • B. Cañellas et al.
sCi. mar., 74(1), march 2010, 55-64. issn 0214-8358 doi: 10.3989/scimar.2010.74n1055
predict and characterize the wave climate variability over time.
a fraction of the interannual variability in the climate in europe is associated with a single pattern of pressure anomalies in the north eastern atlantic area, known as the north atlantic oscillation (nao) (Hurrell, 1995). the nao has long been identified as a major factor in climate variability and oceanic variability in many areas of the northern hemisphere (e.g. rogers, 1997; rodwell et al., 1999; vignudelli et al., 1999; Hurrell et al., 2001; lionello and sanna, 2005; lionello and Galati, 2008). it can be described as an irregular oscillatory transfer of mass between two main centres of action, the icelandic low and the azores High, that modify the paths of the storms crossing the north atlantic from the east coast of america to europe (Woolf et al., 2002).
Wave climate analysis requires a large amount of data to ensure statistical significance (Cañellas et al., 2007). traditionally, these data have been collected using scalar and directional wave buoys moored at specific locations, which provide high temporal resolution records. in the last decade, satel-lites have been used to overcome the spatial lack of data (Krogstad and Barstow, 1999) but the problem of having a large amount of spatial and temporal wave records is still unresolved. queffeulou (2005, 2007) used altimeter data to analyze the wave height variability over the mediterranean sea. However, al-timeter data have a shortcoming: they are temporally inhomogeneous and has a coarse spatial resolution in areas like the western mediterranean, marked by a complex orography. alternatively, wave generation models are another option to avoid the usual lack of data in ocean and atmospheric studies. models are initialized with real conditions and the deviation due to the nonlinearity of the governing equations is cor-rected by data assimilation. numerical models can now be implemented in very fine grids. although, hindcasted model data usually underestimate the actual sea wave height (sWH) when compared with buoy observations, satellite data and simulations forced by higher resolution wind fields, they provide a reliable representation of the real space and time variability (lionello and sanna, 2005). therefore, these hindcast models have become a powerful tool not only for engineering and predicting scales but for carrying out climate studies involving large tem-poral periods.
the mediterranean sea is well known to be one of the most active cyclogenetic areas in the world.
the orography of the surrounding area with the Pyrenees in the western part and the alps in the north-eastern part are natural barriers controlling the generation and track patterns of cyclones over the western mediterranean area. in this area, the climate is mainly conditioned by severe atmospheric forcing during the winter season, when the polar front jet is more likely to influence mediterranean cyclogen-esis and weather (trigo et al., 2002a). most of the strong winds observed in the mediterranean belong to the category of local winds and are originated as down slope flows by air-flow/mountain interaction, or are due to channelling effects (Buzzi et al., 2005). the northwestern mediterranean area is forced by northerly and north-westerly winds during most of the year, while less intense cyclogenetic activity is observed during the rest of the year (trigo et al., 2002b; Cañellas et al., 2007).
this study explores the influence of the monthly nao index as a general descriptor of the pressure field variability in north atlantic areas, on the monthly average sWH fields in the northwestern mediterranean sea, and the 95th percentile signifi-cant wave height, in the period from 1958 to 2001.
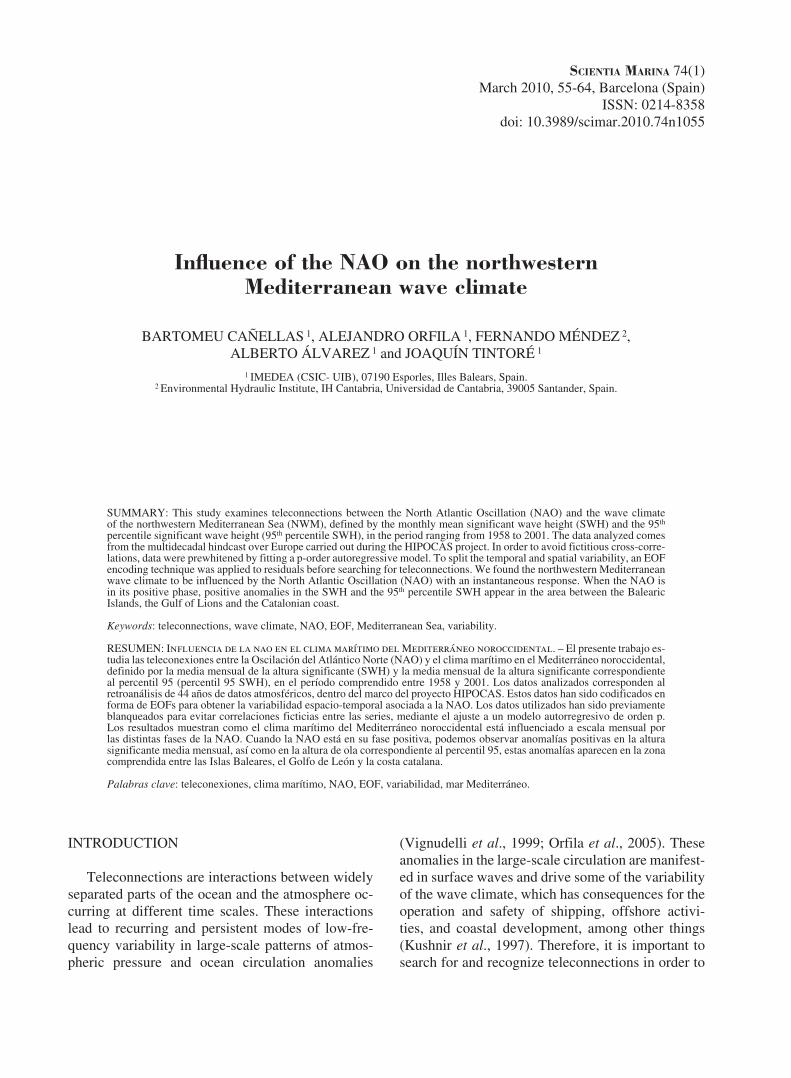
44 years of hourly wave data with 0.125º spa-tial resolution obtained from the HiPoCas project (ratsimandresy et al., 2008) in the northwestern mediterranean sea (fig. 1) were analyzed. the un-derlying assumption is that the wave climate for the northwestern mediterranean area is influenced by large-scale atmospheric patterns of variability, like the nao phenomenon, originated in the adjacent atlantic ocean. the article is structured as follows: section 2 describes the data and methodology em-ployed in the study. results obtained from the eof analysis are shown in section 3. section 4 discusses and concludes the work.
materials and metHods
Wave data is part of the HiPoCas Project (Hind-cast of dynamic Processes of the ocean and Coastal areas of europe) (soares et al., 2008). this database consists in a high resolution (spatial and temporal), long-term hindcasted dataset that covers the period from 1958 to 2001 on an hourly basis. it provides 44 years of wave data over a homogeneous grid. the HiPoCas dataset was produced by means of dy-namical downscaling from the nCeP/nCar global reanalysis (Kalnay et al., 1996) using the regional
nao influenCe on mediterranean Wave Climate • 57
sCi. mar., 74(1), march 2010, 55-64. issn 0214-8358 doi: 10.3989/scimar.2010.74n1055
atmospheric model remo (jacob and Podzun, 1997). Hourly wind fields from remo were used as the forcing for the third generation wave model Wam (see sotillo et al., 2006, for more details). in the present paper, we use 2021 HiPoCas nodes in an area between 40ºn-44ºn and 0º-6ºe (fig. 1), with a spatial resolution of 1/8º.
in the western mediterranean sea, sWH data from the HiPoCas database were extensively cali-brated using altimeter and buoy data. the calibration was achieved through the eof decomposition of the spatial modes and their temporal amplitudes, which were then transformed using a non-linear parameter-ization to fit the satellite and buoy data adequately (for more details please see, Cavaleri et al., 2005; tomas et al., 2008).
monthly nao index data were provided by the Climate analysis section, nCar (Hurrell, 1995). the nao index used in this study has been calcu-lated as the difference in the normalized pressure be-tween Ponta delgada in the azores and stykkishol-mur in reykjavik (iceland). the wave parameters chosen for the correlation with the nao index are the monthly mean significant wave height (sWH) and the 95th percentile of the sWH.
the monthly mean and standard deviation for the sWH were obtained by fitting hourly time se-ries to a log-normal probability distribution of the entire HiPoCas database (jaspers, 1956). there is no theoretical basis for selecting the initial unknown
probability distribution function to represent the observed data. some other probability distributions are also valid for this purpose: the most common is the bi-parametric Weibull distribution and the log-normal distribution. these two distributions are good enough to describe the mean behaviour of the sWH time series. However, we did not use the whole record to compute the mean and standard deviation to avoid a possible “contamination” in the sWH statistics due to the influence of extremal maxima/minima. then, fitted data correspond only to the sWH between the 5 and 95th percentiles of the cumulative distribution function in order to exclude sWH that correspond to the extremal range of prob-ability. as a result, the mean and standard deviation for each month at each node were obtained from this probability distribution. moreover, the 95th percen-tile sWH (which corresponds to those wave heights that are only surpassed during 5% of each year) was obtained using the same theoretical probability func-tion. With this parameter, only the highest sWH are retained, and are a good indicator for the most ex-treme long term sWH episodes.
once hourly data are aggregated into the monthly statistical parameters, data are encoded with em-pirical orthogonal functions (eofs) to identify the preferred modes of variability (Preisendorfer, 1988). eof decomposition of the temporal vari-ance describes these spatial patterns with the highest contribution to time variability. However, if the eof decomposition of the spatial variance is carried out, spatial patterns with the strongest spatial gradients will be obtained (Álvarez, 2003). in this study, we have focused on spatial variance eof modes since we are interested in the possible influence of the nao on the variability of the spatial patterns of the wave climate. time series from the temporal ampli-tudes associated with these eofs are used to cross correlate with the monthly nao index.
Cross-correlation functions strongly depend on the structure of the original time series through auto-correlation, which implies that nonzero values of the cross-correlation function do not necessarily repre-sent a relationship between two time series if they are auto-correlated (Katz, 1988). in order to avoid possible artificial cross correlations, a prewhitening of each time series was carried out. Prewhitening fits a p-order autoregressive model (ar (p)) of the form
x(t) = a1x(t – 1) + … + apx(t–p)+Φ(t) (1)
Fig. 1. – Geographic location of the study area.
58 • B. Cañellas et al.
sCi. mar., 74(1), march 2010, 55-64. issn 0214-8358 doi: 10.3989/scimar.2010.74n1055
to the original time series, which is sufficient to reduce the residuals {Φ(t)} to white noise. the or-der of the autoregressive is selected by the akaike information Criterion (akaike, 1974). the akaike information Criterion (aiC) determines the model order “p” by minimizing a theoretical information function given by,
AIC(p) = Nln(σ2x(p))+2p (2)
where n is the number of samples and σ2x is the es-
timated variance of the white driving noise and the term 2p in equation (2) is a ‘‘penalty’’ for the use of extra ar coefficients that do not substantially re-duce the prediction error (Konyaev, 1990). once the value of the filter order “p” is obtained by minimiz-ing equation (2) the residuals obtained after fitting the ar (p) process in eq. (1) are not autocorrelated time series.
results
Spatial Variance EOF modes for monthly mean SWH
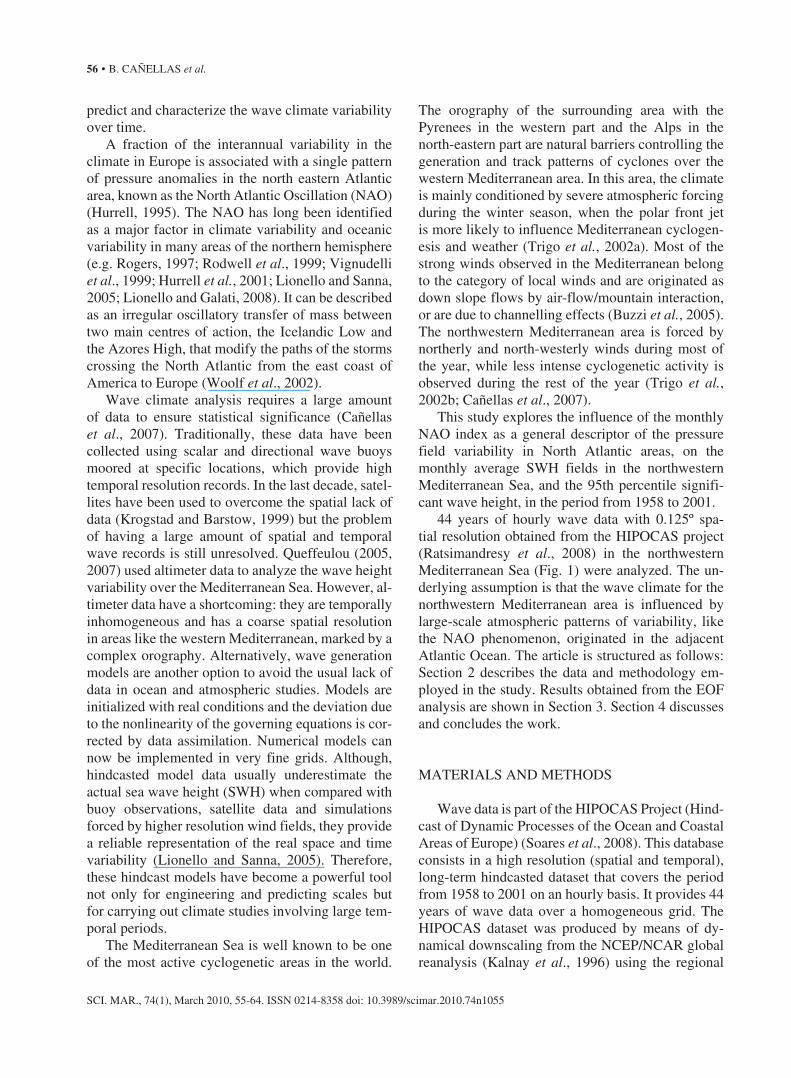
the first two eofs account for 91.03% of the total variance (fig. 2) and are related to the spatial patterns with the highest contribution to the spatial variance of the significant wave height fields.
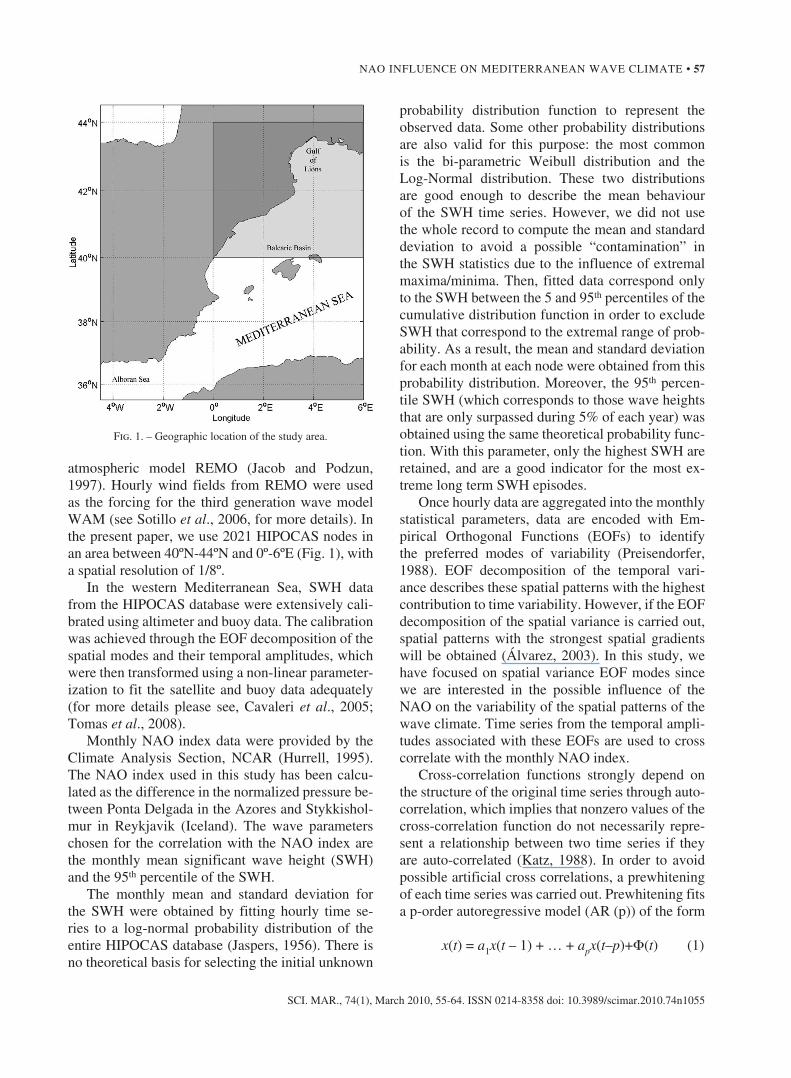
for the first eof, which accounts for 82.79% of the total variance (fig. 3a), the resulting eof de-composition shows a strong spatial gradient in the west-east direction, with a maximum anomaly lo-cated on the east boundary. Conversely, the second spatial eof mode, which accounts for 8.25% of the total variance, (fig. 3B), shows no spatial gradients. this pattern displays an isostatic response of the whole area, modulated throughout the year by the temporal amplitude time series.
the order applied for the prewhitening attending the aiC is p = 2 for the nao index and 12 for the temporal amplitudes of both eofs. the spatial mean time series, computed for each of the 528 months (not prewhitened), is shown in figure 4a. maximum values are reached during the autumn-winter months. for the monthly mean sWH, the autocorrelation function (not shown) is negatively autocorrelated at time lag τ = 6, which indicates strong seasonality.
for the first eof, the temporal amplitude presents an annual cycle that is highly influenced
by seasonality (fig. 4B, C): the autumn-winter months have the highest positive amplitudes (fig. 4B), while spring-summer months have less intense significant wave height fields in the whole area analyzed.
1 2 3 4 5 60
0.1
0.2
0.3
0.4
0.5
0.6
0.7
0.8
0.9
1
eigenvalue number
var
ianc
e e
xpla
ined
Fig. 2. – variance explained by the first six eofs for the monthly sWH. the grey dotted line corresponds to the 0.95 cumulative ex-plained variance. only eofs with explained variance above this line
were selected for the analysis.
Fig. 3. – a, first spatial variance eof mode for the monthly mean sWH; B, second spatial variance eof mode for the monthly mean
sWH.
a
B
nao influenCe on mediterranean Wave Climate • 59
sCi. mar., 74(1), march 2010, 55-64. issn 0214-8358 doi: 10.3989/scimar.2010.74n1055
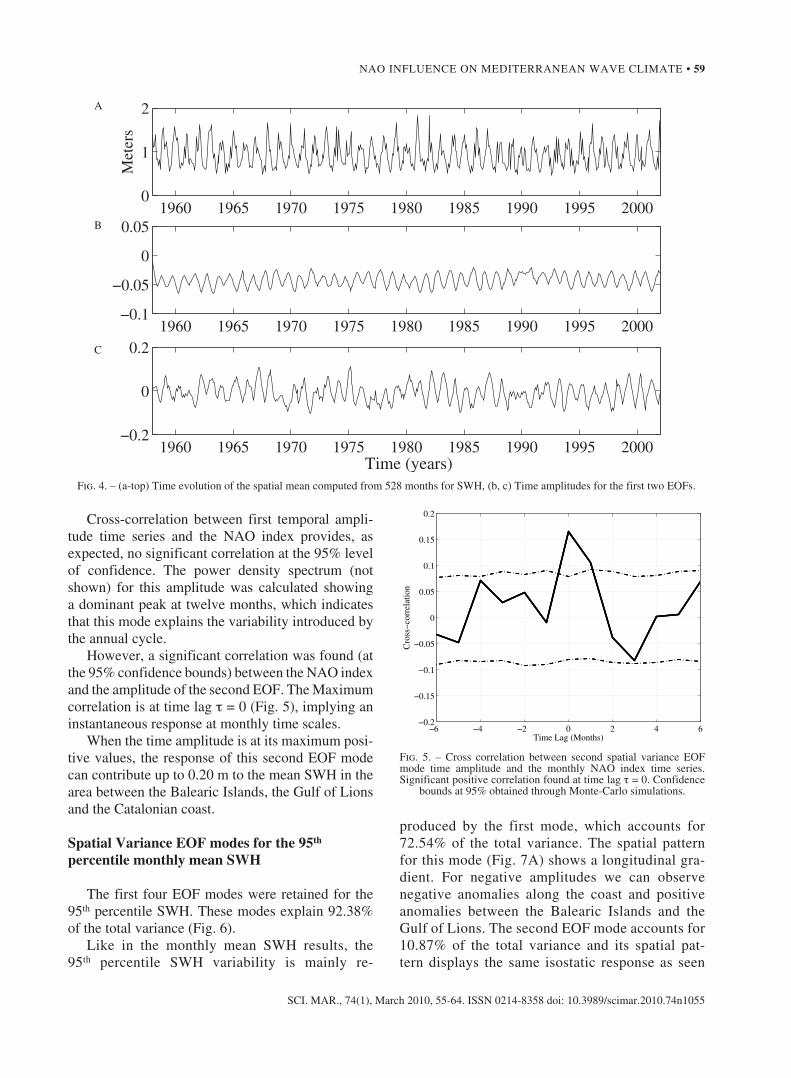
Cross-correlation between first temporal ampli-tude time series and the nao index provides, as expected, no significant correlation at the 95% level of confidence. the power density spectrum (not shown) for this amplitude was calculated showing a dominant peak at twelve months, which indicates that this mode explains the variability introduced by the annual cycle.
However, a significant correlation was found (at the 95% confidence bounds) between the nao index and the amplitude of the second eof. the maximum correlation is at time lag τ = 0 (fig. 5), implying an instantaneous response at monthly time scales.
When the time amplitude is at its maximum posi-tive values, the response of this second eof mode can contribute up to 0.20 m to the mean sWH in the area between the Balearic islands, the Gulf of lions and the Catalonian coast.
Spatial Variance EOF modes for the 95th percentile monthly mean SWH
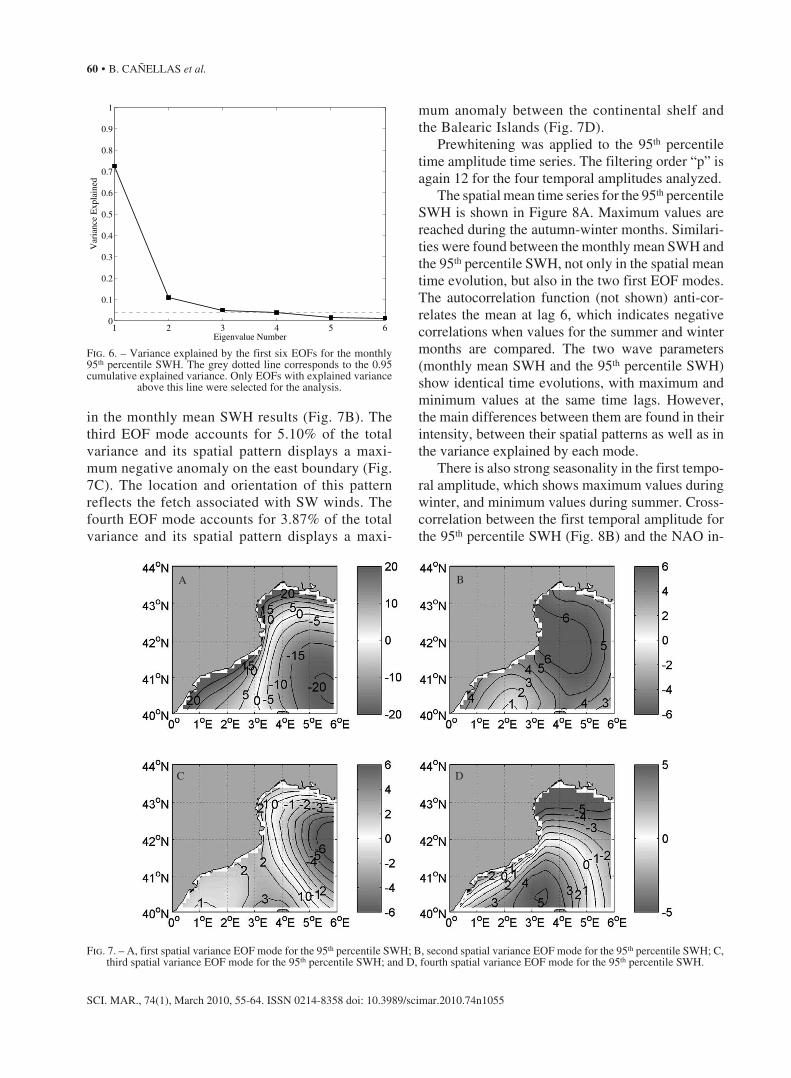
the first four eof modes were retained for the 95th percentile sWH. these modes explain 92.38% of the total variance (fig. 6).
like in the monthly mean sWH results, the 95th percentile sWH variability is mainly re-
produced by the first mode, which accounts for 72.54% of the total variance. the spatial pattern for this mode (fig. 7a) shows a longitudinal gra-dient. for negative amplitudes we can observe negative anomalies along the coast and positive anomalies between the Balearic islands and the Gulf of lions. the second eof mode accounts for 10.87% of the total variance and its spatial pat-tern displays the same isostatic response as seen
1960 1965 1970 1975 1980 1985 1990 1995 20000
1
2M
eter
s
1960 1965 1970 1975 1980 1985 1990 1995 2000−0.2
0
0.2
Time (years)
1960 1965 1970 1975 1980 1985 1990 1995 2000−0.1
−0.05
0
0.05
Fig. 4. – (a-top) time evolution of the spatial mean computed from 528 months for sWH, (b, c) time amplitudes for the first two eofs.
−6 −4 −2 0 2 4 6−0.2
−0.15
−0.1
−0.05
0
0.05
0.1
0.15
0.2
time lag (months)
Cro
ss−
corr
elat
ion
Fig. 5. – Cross correlation between second spatial variance eof mode time amplitude and the monthly nao index time series. significant positive correlation found at time lag τ = 0. Confidence
bounds at 95% obtained through monte-Carlo simulations.
a
B
C
60 • B. Cañellas et al.
sCi. mar., 74(1), march 2010, 55-64. issn 0214-8358 doi: 10.3989/scimar.2010.74n1055
in the monthly mean sWH results (fig. 7B). the third eof mode accounts for 5.10% of the total variance and its spatial pattern displays a maxi-mum negative anomaly on the east boundary (fig. 7C). the location and orientation of this pattern reflects the fetch associated with sW winds. the fourth eof mode accounts for 3.87% of the total variance and its spatial pattern displays a maxi-
mum anomaly between the continental shelf and the Balearic islands (fig. 7d).
Prewhitening was applied to the 95th percentile time amplitude time series. the filtering order “p” is again 12 for the four temporal amplitudes analyzed.
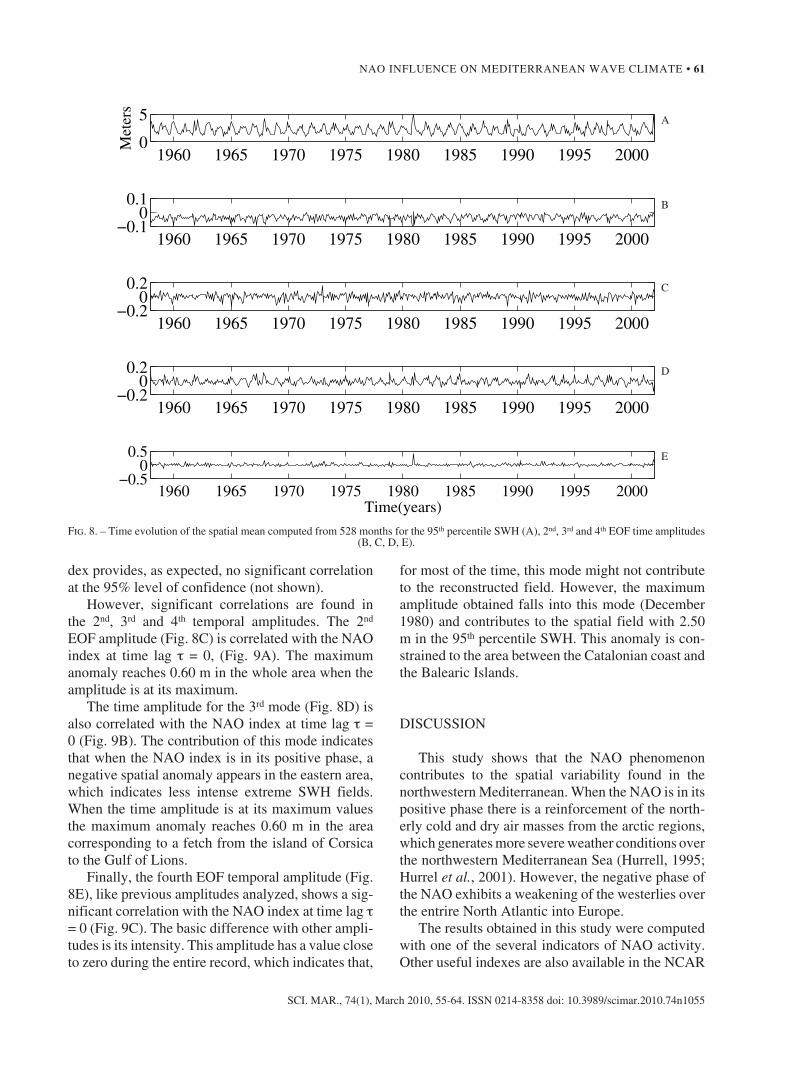
the spatial mean time series for the 95th percentile sWH is shown in figure 8a. maximum values are reached during the autumn-winter months. similari-ties were found between the monthly mean sWH and the 95th percentile sWH, not only in the spatial mean time evolution, but also in the two first eof modes. the autocorrelation function (not shown) anti-cor-relates the mean at lag 6, which indicates negative correlations when values for the summer and winter months are compared. the two wave parameters (monthly mean sWH and the 95th percentile sWH) show identical time evolutions, with maximum and minimum values at the same time lags. However, the main differences between them are found in their intensity, between their spatial patterns as well as in the variance explained by each mode.
there is also strong seasonality in the first tempo-ral amplitude, which shows maximum values during winter, and minimum values during summer. Cross-correlation between the first temporal amplitude for the 95th percentile sWH (fig. 8B) and the nao in-
1 2 3 4 5 60
0.1
0.2
0.3
0.4
0.5
0.6
0.7
0.8
0.9
1
eigenvalue number
var
ianc
e e
xpla
ined
Fig. 6. – variance explained by the first six eofs for the monthly 95th percentile sWH. the grey dotted line corresponds to the 0.95 cumulative explained variance. only eofs with explained variance
above this line were selected for the analysis.
Fig. 7. – a, first spatial variance eof mode for the 95th percentile sWH; B, second spatial variance eof mode for the 95th percentile sWH; C, third spatial variance eof mode for the 95th percentile sWH; and d, fourth spatial variance eof mode for the 95th percentile sWH.
a B
C d
nao influenCe on mediterranean Wave Climate • 61
sCi. mar., 74(1), march 2010, 55-64. issn 0214-8358 doi: 10.3989/scimar.2010.74n1055
dex provides, as expected, no significant correlation at the 95% level of confidence (not shown).
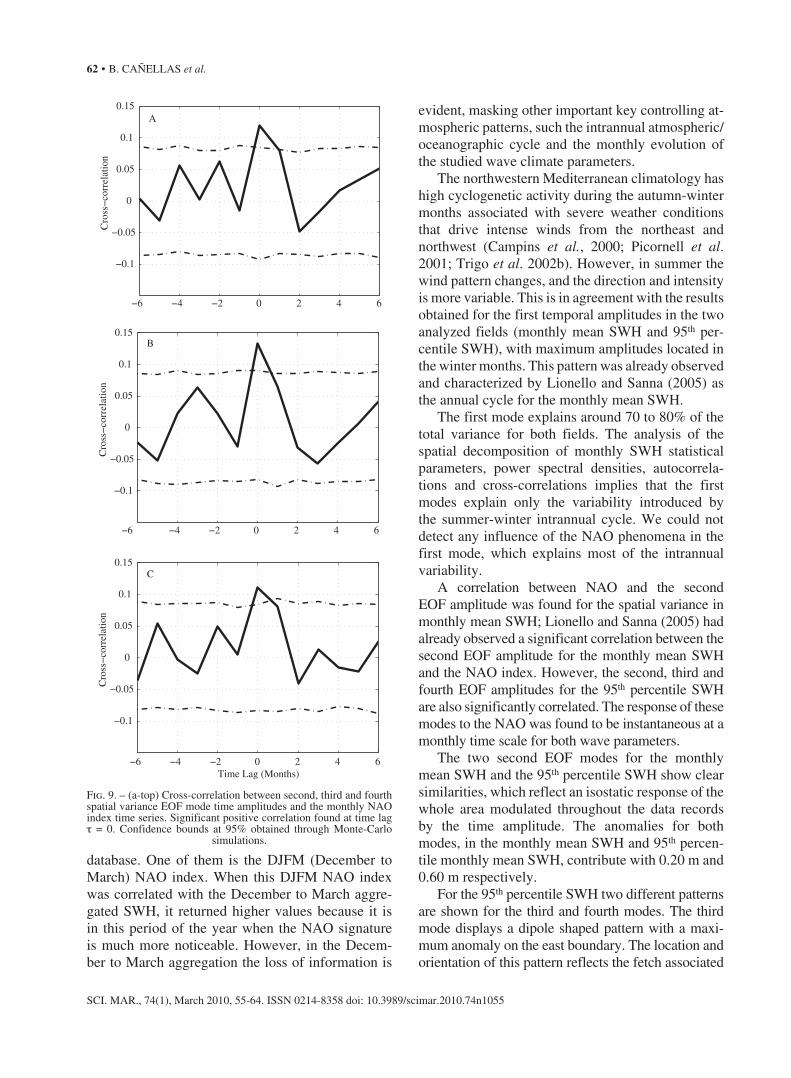
However, significant correlations are found in the 2nd, 3rd and 4th temporal amplitudes. the 2nd eof amplitude (fig. 8C) is correlated with the nao index at time lag τ = 0, (fig. 9a). the maximum anomaly reaches 0.60 m in the whole area when the amplitude is at its maximum.
the time amplitude for the 3rd mode (fig. 8d) is also correlated with the nao index at time lag τ = 0 (fig. 9B). the contribution of this mode indicates that when the nao index is in its positive phase, a negative spatial anomaly appears in the eastern area, which indicates less intense extreme sWH fields. When the time amplitude is at its maximum values the maximum anomaly reaches 0.60 m in the area corresponding to a fetch from the island of Corsica to the Gulf of lions.
finally, the fourth eof temporal amplitude (fig. 8e), like previous amplitudes analyzed, shows a sig-nificant correlation with the nao index at time lag τ = 0 (fig. 9C). the basic difference with other ampli-tudes is its intensity. this amplitude has a value close to zero during the entire record, which indicates that,
for most of the time, this mode might not contribute to the reconstructed field. However, the maximum amplitude obtained falls into this mode (december 1980) and contributes to the spatial field with 2.50 m in the 95th percentile sWH. this anomaly is con-strained to the area between the Catalonian coast and the Balearic islands.
disCussion
this study shows that the nao phenomenon contributes to the spatial variability found in the northwestern mediterranean. When the nao is in its positive phase there is a reinforcement of the north-erly cold and dry air masses from the arctic regions, which generates more severe weather conditions over the northwestern mediterranean sea (Hurrell, 1995; Hurrel et al., 2001). However, the negative phase of the nao exhibits a weakening of the westerlies over the entrire north atlantic into europe.
the results obtained in this study were computed with one of the several indicators of nao activity. other useful indexes are also available in the nCar
1960 1965 1970 1975 1980 1985 1990 1995 2000−0.5
00.5
time(years)
1960 1965 1970 1975 1980 1985 1990 1995 2000−0.2
00.2
1960 1965 1970 1975 1980 1985 1990 1995 2000−0.2
00.2
1960 1965 1970 1975 1980 1985 1990 1995 2000−0.1
00.1
1960 1965 1970 1975 1980 1985 1990 1995 20000
5m
eter
s
Fig. 8. – time evolution of the spatial mean computed from 528 months for the 95th percentile sWH (a), 2nd, 3rd and 4th eof time amplitudes (B, C, d, e).
a
B
C
d
e
62 • B. Cañellas et al.
sCi. mar., 74(1), march 2010, 55-64. issn 0214-8358 doi: 10.3989/scimar.2010.74n1055
database. one of them is the djfm (december to march) nao index. When this djfm nao index was correlated with the december to march aggre-gated sWH, it returned higher values because it is in this period of the year when the nao signature is much more noticeable. However, in the decem-ber to march aggregation the loss of information is
evident, masking other important key controlling at-mospheric patterns, such the intrannual atmospheric/oceanographic cycle and the monthly evolution of the studied wave climate parameters.
the northwestern mediterranean climatology has high cyclogenetic activity during the autumn-winter months associated with severe weather conditions that drive intense winds from the northeast and northwest (Campins et al., 2000; Picornell et al. 2001; trigo et al. 2002b). However, in summer the wind pattern changes, and the direction and intensity is more variable. this is in agreement with the results obtained for the first temporal amplitudes in the two analyzed fields (monthly mean sWH and 95th per-centile sWH), with maximum amplitudes located in the winter months. this pattern was already observed and characterized by lionello and sanna (2005) as the annual cycle for the monthly mean sWH.
the first mode explains around 70 to 80% of the total variance for both fields. the analysis of the spatial decomposition of monthly sWH statistical parameters, power spectral densities, autocorrela-tions and cross-correlations implies that the first modes explain only the variability introduced by the summer-winter intrannual cycle. We could not detect any influence of the nao phenomena in the first mode, which explains most of the intrannual variability.
a correlation between nao and the second eof amplitude was found for the spatial variance in monthly mean sWH; lionello and sanna (2005) had already observed a significant correlation between the second eof amplitude for the monthly mean sWH and the nao index. However, the second, third and fourth eof amplitudes for the 95th percentile sWH are also significantly correlated. the response of these modes to the nao was found to be instantaneous at a monthly time scale for both wave parameters.
the two second eof modes for the monthly mean sWH and the 95th percentile sWH show clear similarities, which reflect an isostatic response of the whole area modulated throughout the data records by the time amplitude. the anomalies for both modes, in the monthly mean sWH and 95th percen-tile monthly mean sWH, contribute with 0.20 m and 0.60 m respectively.
for the 95th percentile sWH two different patterns are shown for the third and fourth modes. the third mode displays a dipole shaped pattern with a maxi-mum anomaly on the east boundary. the location and orientation of this pattern reflects the fetch associated
−6 −4 −2 0 2 4 6
−0.1
−0.05
0
0.05
0.1
A0.15
Time Lag (Months)
Cro
ss−
corr
elat
ion
−6 −4 −2 0 2 4 6
−0.1
−0.05
0
0.05
0.1
0.15
Cro
ss−
corr
elat
ion
−6 −4 −2 0 2 4 6
−0.1
−0.05
0
0.05
0.1
0.15
Cro
ss−
corr
elat
ion
B
C
Fig. 9. – (a-top) Cross-correlation between second, third and fourth spatial variance eof mode time amplitudes and the monthly nao index time series. significant positive correlation found at time lag τ = 0. Confidence bounds at 95% obtained through monte-Carlo
simulations.

nao influenCe on mediterranean Wave Climate • 63
sCi. mar., 74(1), march 2010, 55-64. issn 0214-8358 doi: 10.3989/scimar.2010.74n1055
with the intense south-west winds originating in the island of Corsica and propagated to the Gulf of li-ons, which are most common during the wintertime (fig. 10a). this negative anomaly in the eastern area during the positive phase of the nao reduces the monthly mean sWH values by up to 0.60 m. the fourth eof for the 95th percentile sWH mode also displays a dipole shaped pattern with maximum val-ues for the anomaly between the spanish continental shelf and the Balearic islands. the location and orien-tation of this pattern reflects the fetch associated with the intense winds from the north-east, which are often associated with the most severe sea storms recorded in the western mediterranean. these storms usually cause coastal damage and large economic loss in loca-tions like mallorca and valencia.
in december 1980 (as well as november 2001, not shown) a severe storm was recorded in the area between Catalonia and the Balearic islands, see for instance the amplitude in the 4th eof for the 95th sWH percentile (see fig. 8e). in this event, wind waves originated in the vicinity of the Gulf of Genoa with a south-west propagation direction (fig. 10B). the observed fetch has the same spatial pattern as the fourth eof mode. this mode suggests that the variability corresponding to these extreme events is reflected in this spatial pattern.
the correlation of long term wave climate pa-rameters with the nao phenomena indicates that some of the variability of wave height is associated with the nao in the northwestern mediterranean sea. However, a strong seasonal signal was found
Fig. 10. – a, snapshot from the HiPoCas database (12/01/2001), which shows the sWH field associated with the south-west winds generated near the island of Corsica and propagated towards the Gulf of lions. B, snapshot from the HiPoCas database (12/28/1980), which shows the fetch associated with the severe north-east winds, generated in the Gulf of Genoa and propagated towards the Catalonian coast, valencia
coast and the Balearic islands.
a
B
64 • B. Cañellas et al.
sCi. mar., 74(1), march 2010, 55-64. issn 0214-8358 doi: 10.3989/scimar.2010.74n1055
in both parameters, monthly mean sWH and the 95th percentile monthly mean sWH, as suggested by previous studies of the cyclogenetic activity of the mediterranean this fact has already been noted by lionello and sanna (2005).
the two analyzed parameters provided good re-sults for the analysis; however, we found that the 95th percentile sWH provides more dynamic information (patterns of variability in higher order eofs) than the monthly mean sWH.
aCKnoWledGments
the authors would like to thank Puertos del estado (ministerio de fomento) for the use of the HiPoCas database. the authors appreciate the financial sup-port from the Govern Balear Project (uGizC). a. orfila and j. tintore appreciate the financial support from the miCin Project Ctm2006-12072/mar. Comments on the manuscript from two anonymous referees are greatly acknowledged.
referenCes
Álvarez, a. – 2003. Performance of satellite-Based ocean forecast-ing (soft) systems: a study in the adriatic sea. J. Atmos. Ocean. Technol. 20(5): 717-729, doi: 10.1175/1520-0426.
akaike, H. – 1974. a new look at the statistical model identifica-tion. IEEE Trans. Automat. Contr., 19: 716-723.
Campins, j., a. Genoves, a. jansa, , j.a. Guijarro and C. ramis. – 2000. a Catalogue and a Classification of surface Cyclones for the Western mediterranean. Int. J. Climatol., 20: 969-984.
Cañellas, B., a. orfila, f.j. mendez, m. menendez, l. Gomez-Pujol and j. tintoré. – 2007. application of a Pot model to estimate the extreme significant wave height levels around the Balearic sea (Western mediterranean). J. Coast. Res., 50: 329-333.
Cavaleri, l. and m. sclavo. – 2006. the calibration of wind and wave model data in the mediterranean sea. Coastal Eng., 53(7): 613-627.
Hurrell, j.W. – 1995. decadal trends in the north atlantic oscil-lation: regional temperatures and Precipitation. Science, 269(5224): 676-679, doi: 10.1126/science.269.5224.676.
Hurrell, j.W., Y. Kushnir and m. visbeck. – 2001. the north atlan-tic oscillation. Science, volume 291 (5504): 603-605).
jacob, d. and r. Podzun. – 1997. sensitivity studies with the re-gional climate model remo, Meteorol. Atmos. Phys., 63 (1-2), doi: 119-129,10.1007/Bf01025368.
jaspers, n.H. – 1956. statistical distribution patterns of ocean waves and of wave induced stresses and motions with engineering ap-plications, Trans. Soc. Nav. Archit. Mar. Eng., 64: 375-432.
Kalnay, e., m. Kanamitsu, r. Kistler, W. Collins, d. deaven, l. Gandin, m. iredell, s. saha, G. White, j. Woollen, Y. zhu, a. leetmaa, r. reynolds, m. Chelliah, W. ebisuzaki, W. Higgins, j. janowiak, K. mo, C. ropelewski, j. Wang, r. jenne and d. joseph. – 1996. the nCeP/nCar 40-years reanalysis Project, Bull. Am. Meteorol. Soc., 77: 437-471.
Katz, r.W. – 1988. use of cross correlations in the search for tel-econnections. J. Climate, 8: 241-253.
Konyaev, K.v. – 1990. spectral analysis of physical oceanographic data. in: Russian Translation Series. (vol. 81). a.a. Balkema, rotterdam.
Kushnir, Y., v.j. Cardone, j.G. Greenwood and m.a. Cane. – 1997. the recent increase in north atlantic Wave Heights, J. Climate, 10(8): 2107-2113, doi:10.1175/1520-0442.
Krogstad, H.e. and s. Barstow. – 1999. satellite wave measure-ments for coastal applications. Coastal Eng., 37: 283-307, doi:10.1016/s0378-3839(99)00030-7
lionello, P. and a. sanna. – 2005. mediterranean wave climate variability and its links with nao and indian monsoon. Clim. Dyn., 25(6): 611-623, doi:10.1007/s00382-005-0025-4.
lionello, P and m.B. Galati. – 2008. links of the significant wave height distribution in the mediterranean sea with the northern Hemisphere teleconnection pattern. Adv. Geosci., 17: 13-18.
linonello, P., s. Cogo, m.B. Galati and a. sanna. – 2008. the mediterranean surface wave climate inferred from future sce-nario simulations, Global Planet. Change, 63(2-3): 152-162, doi:10.1016/j.gloplacha.2008.03.004.
orfila, a., a. alvarez, j. tintore, a. jordi and G. Basterretxea. – 2005. Climate teleconnections at monthly time scales in the ligurian sea inferred from satellite data. Progr. Oceanogr., 66(2-4): 157-170, doi:10.1016/j.physletb.2003.10.071.
Picornell, m.a., a. jansa, a. Genoves and j. Campins. – 2001. automated database from the Hirlam(inm)-0.5º analyses in the Western mediterranean. Int. J. Climatol., 21: 335-354, doi:10.10002/joc.621.
Preisendorfer, r.W. – 1988. Principal component analysis in mete-orology and oceanography. elsevier science Publishing Com-pany, new York.
queffeulou, P. – 2005. Wave height variability over the mediterra-nean sea, using altimeter data. Proceedings of the 5th Interna-tional Symposium on Ocean Wave Measurements and Analysis (madrid, spain), Paper 21, Cd-rom.
queffeulou, P. and a. Bentamy. – 2007. analysis of wave height variability using altimeter neasurements: application to the mediterranean sea. J. Atmos. Ocean. Tech., 24(12): 2078-2092, doi:10.1175/2007jteCH0507.1.
ratsimandresy, a.W., m.G. sotillo, j.C. Carretero albiach, e. Ál-varez fanjul and H. Hajji. – 2008. a 44-year high resolution ocean and atmospheric hindcast for the mediterranean Basin developed within the HiPoCas Project. Coastal Eng., 55: 827-842, doi:10.1016/j.coastaleng.2008.02.025.
rodwell, m.j., d.P. rowell and C.K. folland. – 1999. oceanic forc-ing of the wintertime north atlantic oscillation and european climate. Nature, 398: 320-323.
rogers, j.C. – 1997. north atlantic storm track variability and its association to the north atlantic oscillation and climate variability of northern europe, J. Climate, 10: 1635-1647, doi: 10.1175/1520-0442(1997)010<1635:nastva>2.0.Co;2.
soares, C.G. – 2008. Hindcast of dynamic processes of the ocean and coastal areas of europe. Coastal Eng., 55: 825-826, doi:10.1016/j.coastaleng.2008.02.007.
sotillo, m.G., r. aznar and f. valero. – 2006. mediterranean offshore extreme wind analysis from the 44-year HiPoCas database: different approaches towards the estimation of return periods and levels of extreme values. Adv. Geosci., 7: 275-278.
tomas, a., f.j. mendez and i.j. losada. – 2008. a method for spa-tial calibration of wave hindcast data bases. Cont. Shelf Res., 28(3): 391-398.
trigo, r.m., t.j. osborn and j.m. Corte-real. – 2002a. the north atlantic oscillation influence on europe: climate impacts and associated physical mechanisms, Climate Res., 20(1): 9-17, doi: 10.3354/cr020009.
trigo, i.f., G.r. Bigg and t.d. davies. – 2002b. Climatology of cyclogenesis mechanisms in the mediterranean. Mon. Weather Rew., 130(3): 549-569.
vignudelli, s., G. P. Gasparini, m. astraldi and m. schiano. – 1999. a possible influence of the north atlantic oscillation on the circulation of the Western mediterranean sea. Geophys. Res. Lett., 26(5): 623-626.
Woolf, d. K., P.G. Challenor and P.d. Cotton. – 2002. the vari-ability and predictability of north atlantic wave climate, J. Geophys. Res., 107(C10): 9.1-9.14.
scient. ed.: j. font.received september 2, 2008. accepted march 3, 2009.Published online november 19, 2009.


