Embed Size (px)
Citation preview
INITIATING COVERAGE
BOB Capital Markets Ltd is a wholly owned subsidiary of Bank of Baroda
Important disclosures, including any required research certifications, are provided at the end of this report.
BUY
TP: Rs 330 | 23% VRL LOGISTICS | Logistics | 28 November 2019
Robust model, formidable moats – initiate with BUY
We initiate coverage on VRL Logistics (VRLL) with BUY and a Mar’21 TP of
Rs 330, set at 22x FY22E P/E. Despite a prolonged growth slowdown, VRLL’s
competitive moats are intact – viz. a wide network, vast scale of operations,
and cost and capital efficiency. An asset-heavy operating model also adds heft
to the LTL business. Though we are cautious on near-term prospects and build
in a 6% topline CAGR over FY19-FY22, we expect VRLL to outperform the
industry once the economic cycle turns, by virtue of its superior business model.
Sayan Das Sharma [email protected]
Ticker/Price VRLL IN/Rs 269
Market cap US$ 339.9mn
Shares o/s 90mn
3M ADV US$ 0.3mn
52wk high/low Rs 316/Rs 222
Promoter/FPI/DII 68%/6%/20%
Source: NSE
STOCK PERFORMANCE
Source: NSE
Moats intact despite external headwinds: A series of systemic growth
impediments (weak industrial activity, demonetisation, disruptive start-ups)
have capped VRLL’s growth at a 6% CAGR over FY15-FY19. Despite these
challenges, we believe the moats that underpin VRLL’s apex position in the LTL
industry remain sound – (1) expanding network (47 hubs, 929 locations),
(2) vast scale of operations, (3) healthy operating cost structure (in-house
design, low-cost sourcing of fuel, tyres & spare parts), and (4) efficient working
capital management (working capital of 13 days in FY19).
Asset-heavy model bodes well in cyclical upturn: VRLL’s asset-heavy model
(4,470+ owned trucks) is well suited for LTL operations, as also evidenced by the
high asset intensity of top US LTL players. The company has substantially
outperformed peers in the previous economic upcycle – clocking an 18% topline
CAGR vs. 5% for TRPC (freight) over FY07-FY14. Strong moats and a superior
business model should help VRLL outpace peers in the next upcycle as well.
Initiate with BUY: We estimate a moderate 6% topline CAGR over FY19-FY22
given adverse macro conditions, though earnings are forecast to log a 14% CAGR
due to a lower tax rate. Initiate with BUY and a Mar’21 TP of Rs 330, set at 22x
FY22E EPS – in line with the average multiple of the past one year.
KEY FINANCIALS
Y/E 31 Mar FY18A FY19A FY20E FY21E FY22E
Total revenue (Rs mn) 19,223 21,095 21,580 23,424 25,196
EBITDA (Rs mn) 2,342 2,440 3,261 3,580 3,851
Adj. net profit (Rs mn) 926 919 1,103 1,191 1,352
Adj. EPS (Rs) 10.2 10.2 12.2 13.2 15.0
Adj. EPS growth (%) 32.7 (0.7) 20.0 8.0 13.5
Adj. ROAE (%) 16.3 14.8 16.5 16.5 17.3
Adj. P/E (x) 26.2 26.4 22.0 20.4 17.9
EV/EBITDA (x) 11.3 10.5 7.8 7.1 6.5
Source: Company, BOBCAPS Research
210260310360410460
Nov
-16
Feb-
17May-1
7Aug
-17
Nov
-17
Feb-
18May-18
Aug
-18
Nov
-18
Feb-
19May-19
Aug
-19
Nov
-19
(Rs) VRLL
VRL LOGISTICS
EQUITY RESEARCH 2 28 November 2019
Investment rationale
Competitive moats intact despite slowdown
A series of growth impediments – weak industrial activity, demonetisation, GST,
disruptive start-ups – have capped VRLL’s topline growth at a 6% CAGR over
FY15-FY19. Despite these challenges, the company’s goods transport business
(GT: ~80% of revenue, 7% CAGR) has outperformed most other surface
transporters. Its GT business model remains one of the strongest in the Indian
logistics space, in our view. An unparalleled hub-and-spoke network, wide asset
portfolio, and cost and capital efficiency serve as sturdy moats, aiding best-in-
class performance for VRLL on key metrics.
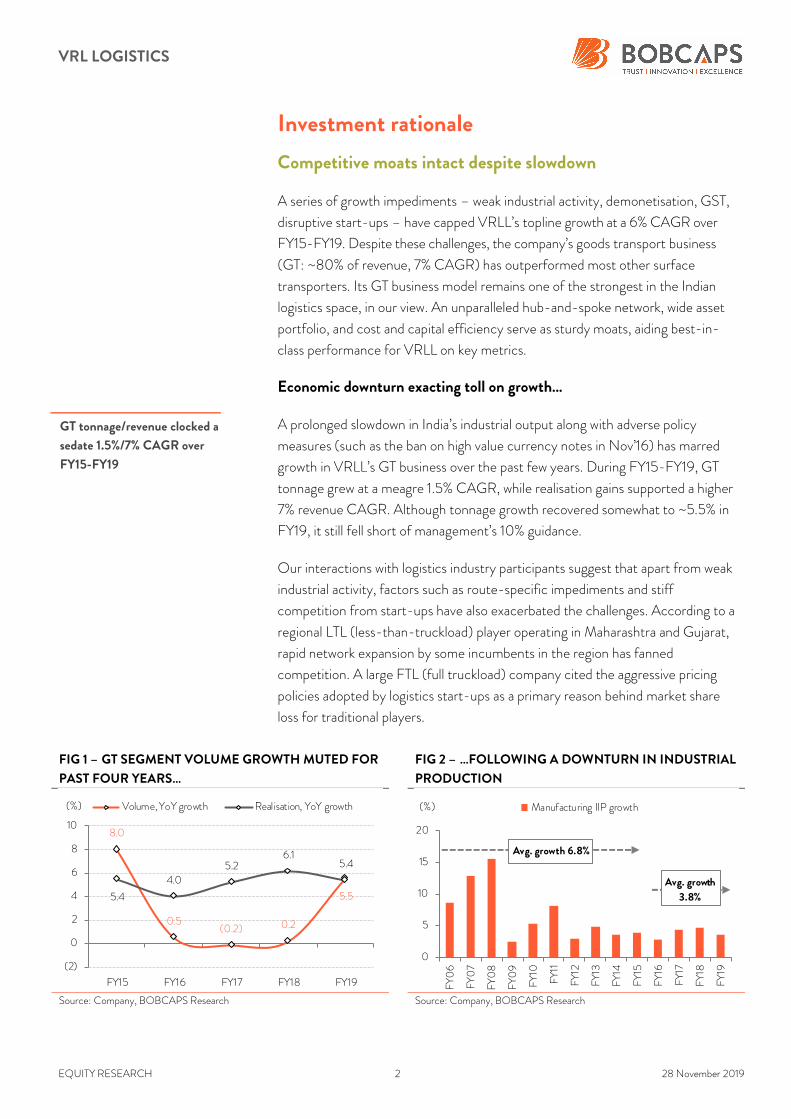
Economic downturn exacting toll on growth…
A prolonged slowdown in India’s industrial output along with adverse policy
measures (such as the ban on high value currency notes in Nov’16) has marred
growth in VRLL’s GT business over the past few years. During FY15-FY19, GT
tonnage grew at a meagre 1.5% CAGR, while realisation gains supported a higher
7% revenue CAGR. Although tonnage growth recovered somewhat to ~5.5% in
FY19, it still fell short of management’s 10% guidance.
Our interactions with logistics industry participants suggest that apart from weak
industrial activity, factors such as route-specific impediments and stiff
competition from start-ups have also exacerbated the challenges. According to a
regional LTL (less-than-truckload) player operating in Maharashtra and Gujarat,
rapid network expansion by some incumbents in the region has fanned
competition. A large FTL (full truckload) company cited the aggressive pricing
policies adopted by logistics start-ups as a primary reason behind market share
loss for traditional players.
FIG 1 – GT SEGMENT VOLUME GROWTH MUTED FOR
PAST FOUR YEARS…
FIG 2 – …FOLLOWING A DOWNTURN IN INDUSTRIAL
PRODUCTION
Source: Company, BOBCAPS Research Source: Company, BOBCAPS Research
8.0
0.5(0.2) 0.2
5.55.4
4.05.2
6.15.4
(2)
0
2
4
6
8
10
FY15 FY16 FY17 FY18 FY19
(%) Volume, YoY growth Realisation, YoY growth
0
5
10
15
20
FY06
FY07
FY08
FY09
FY10
FY11
FY12
FY13
FY14
FY15
FY16
FY17
FY18
FY19
(%) Manufacturing IIP growth
Avg. growth
3.8%
Avg. growth 6.8%
GT tonnage/revenue clocked a
sedate 1.5%/7% CAGR over
FY15-FY19
VRL LOGISTICS
EQUITY RESEARCH 3 28 November 2019
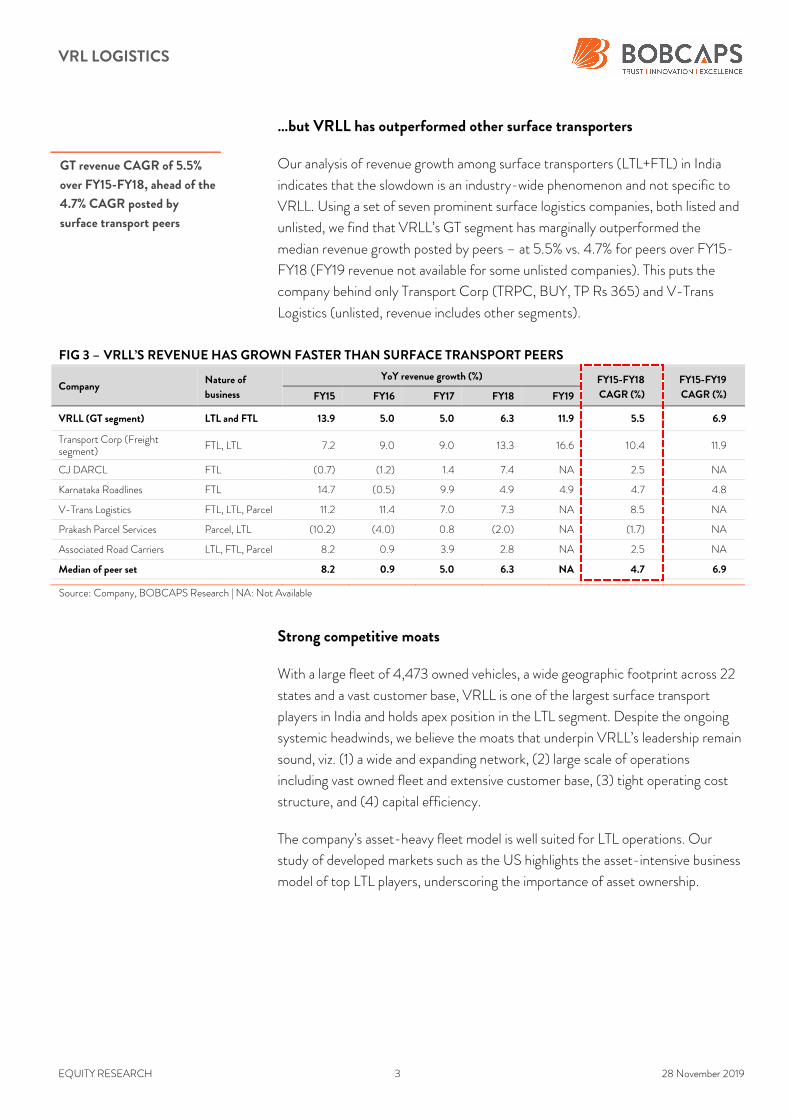
…but VRLL has outperformed other surface transporters
Our analysis of revenue growth among surface transporters (LTL+FTL) in India
indicates that the slowdown is an industry-wide phenomenon and not specific to
VRLL. Using a set of seven prominent surface logistics companies, both listed and
unlisted, we find that VRLL’s GT segment has marginally outperformed the
median revenue growth posted by peers – at 5.5% vs. 4.7% for peers over FY15-
FY18 (FY19 revenue not available for some unlisted companies). This puts the
company behind only Transport Corp (TRPC, BUY, TP Rs 365) and V-Trans
Logistics (unlisted, revenue includes other segments).
FIG 3 – VRLL’S REVENUE HAS GROWN FASTER THAN SURFACE TRANSPORT PEERS
Company Nature of
business
YoY revenue growth (%) FY15-FY18
CAGR (%)
FY15-FY19
CAGR (%) FY15 FY16 FY17 FY18 FY19
VRLL (GT segment) LTL and FTL 13.9 5.0 5.0 6.3 11.9 5.5 6.9
Transport Corp (Freight segment)
FTL, LTL 7.2 9.0 9.0 13.3 16.6 10.4 11.9
CJ DARCL FTL (0.7) (1.2) 1.4 7.4 NA 2.5 NA
Karnataka Roadlines FTL 14.7 (0.5) 9.9 4.9 4.9 4.7 4.8
V-Trans Logistics FTL, LTL, Parcel 11.2 11.4 7.0 7.3 NA 8.5 NA
Prakash Parcel Services Parcel, LTL (10.2) (4.0) 0.8 (2.0) NA (1.7) NA
Associated Road Carriers LTL, FTL, Parcel 8.2 0.9 3.9 2.8 NA 2.5 NA
Median of peer set 8.2 0.9 5.0 6.3 NA 4.7 6.9
Source: Company, BOBCAPS Research | NA: Not Available
Strong competitive moats
With a large fleet of 4,473 owned vehicles, a wide geographic footprint across 22
states and a vast customer base, VRLL is one of the largest surface transport
players in India and holds apex position in the LTL segment. Despite the ongoing
systemic headwinds, we believe the moats that underpin VRLL’s leadership remain
sound, viz. (1) a wide and expanding network, (2) large scale of operations
including vast owned fleet and extensive customer base, (3) tight operating cost
structure, and (4) capital efficiency.
The company’s asset-heavy fleet model is well suited for LTL operations. Our
study of developed markets such as the US highlights the asset-intensive business
model of top LTL players, underscoring the importance of asset ownership.
GT revenue CAGR of 5.5%
over FY15-FY18, ahead of the
4.7% CAGR posted by
surface transport peers
VRL LOGISTICS
EQUITY RESEARCH 4 28 November 2019
#1 Unmatched network strength, efficient hub-and-spoke model
VRLL has one of the widest goods transport networks among surface transporters
in India, comprising 700+ branches, 183 agencies and 47 hubs – these cover 929
locations across 22 states and 5 union territories (as of Sep’19). The company’s
vast reach ensures last-mile delivery even in remote locations across the country.
In comparison, TRPC – the second largest publicly listed road transporter – has
only 25 hubs, though its branch network is similar at 700, and V-Trans has ~20
hubs and ~600 branches.
VRLL has traditionally had a strong network in the southern and western parts of
the country, at 57% and 23% of company-wide agencies and branches
respectively as of Sep’19. It is also gradually fortifying its presence in the northern
region – the branch and agency count in these states has risen to 124 in Q2FY20
vs. 109 in FY17, while total location coverage is largely unchanged. An extensive
geographic reach coupled with reliable services has helped VRLL emerge as the
preferred LTL partner for corporates and SMEs.
FIG 4 – STRONG NETWORK IN SOUTHERN AND WESTERN REGIONS (No.) FY17 FY18 FY19 H1FY20
Region Agency Branch Hub Agency Branch Hub Agency Branch Hub Agency Branch Hub
South 147 414 28 130 432 27 109 443 28 97 430 27
West 67 131 9 61 146 9 55 152 9 55 158 10
North 35 74 6 34 88 6 27 91 4 26 98 4
East & Central 6 57 4 6 63 5 5 56 5 5 60 6
Total 255 676 47 231 729 47 196 742 46 183 746 47
Source: Company, BOBCAPS Research
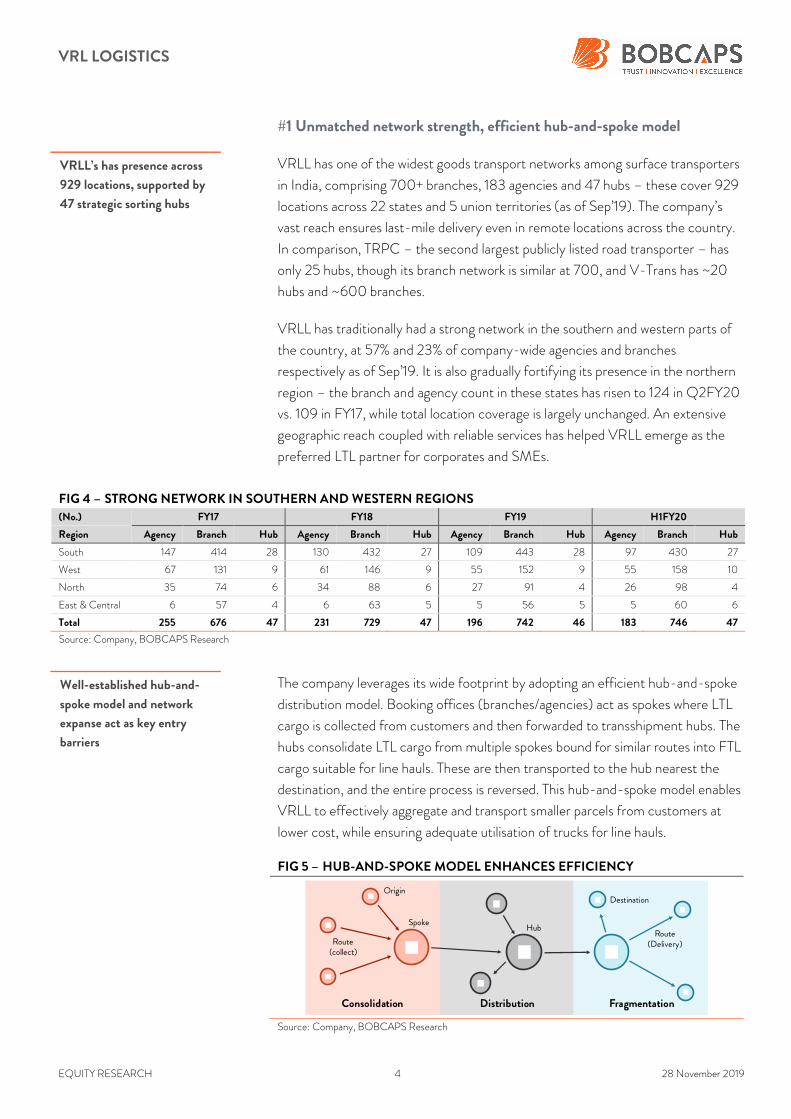
The company leverages its wide footprint by adopting an efficient hub-and-spoke
distribution model. Booking offices (branches/agencies) act as spokes where LTL
cargo is collected from customers and then forwarded to transshipment hubs. The
hubs consolidate LTL cargo from multiple spokes bound for similar routes into FTL
cargo suitable for line hauls. These are then transported to the hub nearest the
destination, and the entire process is reversed. This hub-and-spoke model enables
VRLL to effectively aggregate and transport smaller parcels from customers at
lower cost, while ensuring adequate utilisation of trucks for line hauls.
FIG 5 – HUB-AND-SPOKE MODEL ENHANCES EFFICIENCY
Source: Company, BOBCAPS Research
Origin
Spoke
Consolidation Distribution Fragmentation
Route(collect)
Hub
Destination
Route(Delivery)
VRLL’s has presence across
929 locations, supported by
47 strategic sorting hubs
Well-established hub-and-
spoke model and network
expanse act as key entry
barriers
VRL LOGISTICS
EQUITY RESEARCH 5 28 November 2019
VRLL’s newly commissioned transshipment hub at Surat is garnering good
business and should boost revenue from FY20 onwards. The 240,000sq ft
facility began operations in Aug’19. As per management, Surat volumes have risen
~20% and daily trips have increased multifold after commissioning of the hub.
Though VRLL was already operating in the region through its branches, mainly on
the Surat to South India route, this new centre provides higher operational
flexibility and enables the company to service other parts of the country from
Surat. Management expects the hub to generate revenue of Rs 0.4bn-0.5bn in
FY20 (2.5-3% of FY20 GT revenue), gradually scaling up to Rs 1bn by FY21 (~5%
of FY21 revenue).
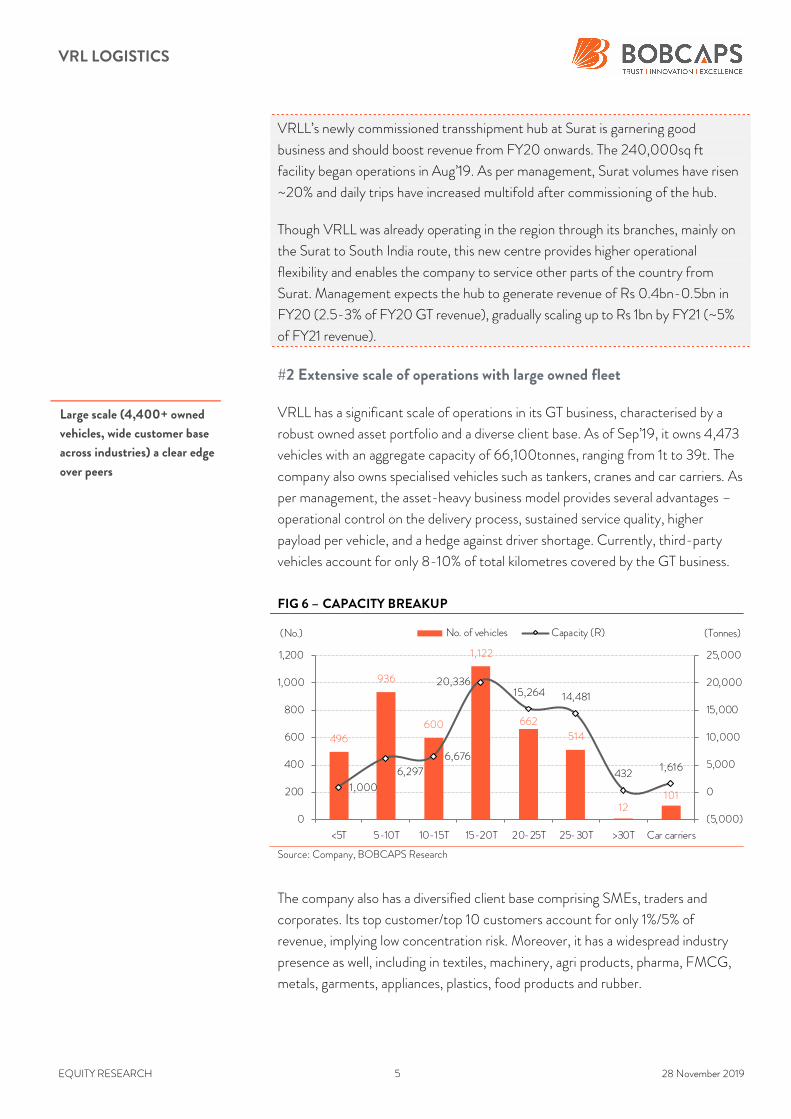
#2 Extensive scale of operations with large owned fleet
VRLL has a significant scale of operations in its GT business, characterised by a
robust owned asset portfolio and a diverse client base. As of Sep’19, it owns 4,473
vehicles with an aggregate capacity of 66,100tonnes, ranging from 1t to 39t. The
company also owns specialised vehicles such as tankers, cranes and car carriers. As
per management, the asset-heavy business model provides several advantages –
operational control on the delivery process, sustained service quality, higher
payload per vehicle, and a hedge against driver shortage. Currently, third-party
vehicles account for only 8-10% of total kilometres covered by the GT business.
FIG 6 – CAPACITY BREAKUP
Source: Company, BOBCAPS Research
The company also has a diversified client base comprising SMEs, traders and
corporates. Its top customer/top 10 customers account for only 1%/5% of
revenue, implying low concentration risk. Moreover, it has a widespread industry
presence as well, including in textiles, machinery, agri products, pharma, FMCG,
metals, garments, appliances, plastics, food products and rubber.
496
936
600
1,122
662
514
12101
1,000
6,297
6,676
20,33615,264 14,481
4321,616
(5,000)
0
5,000
10,000
15,000
20,000
25,000
0
200
400
600
800
1,000
1,200
<5T 5-10T 10-15T 15-20T 20-25T 25-30T >30T Car carriers
(Tonnes)(No.) No. of vehicles Capacity (R)
Large scale (4,400+ owned
vehicles, wide customer base
across industries) a clear edge
over peers
VRL LOGISTICS
EQUITY RESEARCH 6 28 November 2019
XPO’s strategic shift underpins the importance of asset in LTL model
In our Mar’19 sector initiation report, Transformation underway, we highlighted
our general preference for asset-light business models in the logistics space.
Though we retain this preference in most verticals (such as FTL and third-party
logistics or 3PL), our analysis of the US market indicates that high asset intensity
could have several advantages in the LTL business.
A case in point is the evolution of XPO Logistics’ LTL strategy since 2015. XPO is
a leading logistics player globally with a presence across freight forwarding and
brokerage, contract logistics, last mile, FTL, LTL, and expedited delivery. The
company traditionally followed an asset-light model across segments, including
FTL and LTL. In 2015, it gravitated to a more asset-heavy model only for its LTL
segment through two transformational acquisitions:
(1) Norbert Dentressangle of France, a logistics conglomerate, which followed a
asset heavy structure in the LTL business with 7,700 owned trucks and
3,200 trucks contracted through owner-operators; and
(2) Con-Way, the second largest LTL carrier in the US. North American
capacity of the combined entity (XPO + Con-Way) catapulted to 11,000
owned tractors, 33,000 owned trailers, and 6,000 contracted trucks.
XPO’s strategic shift was driven by the fact that a large contingent of its
customers preferred working with LTL operators that owned at least some assets,
as it gave them higher visibility of truck availability, especially in an economic
upcycle where capacity becomes limited. Its management also highlighted that
without assets, an LTL operator is unlikely to garner a major share of customer
transportation spend. XPO’s LTL strategy shift underpins the importance of assets
in the business.
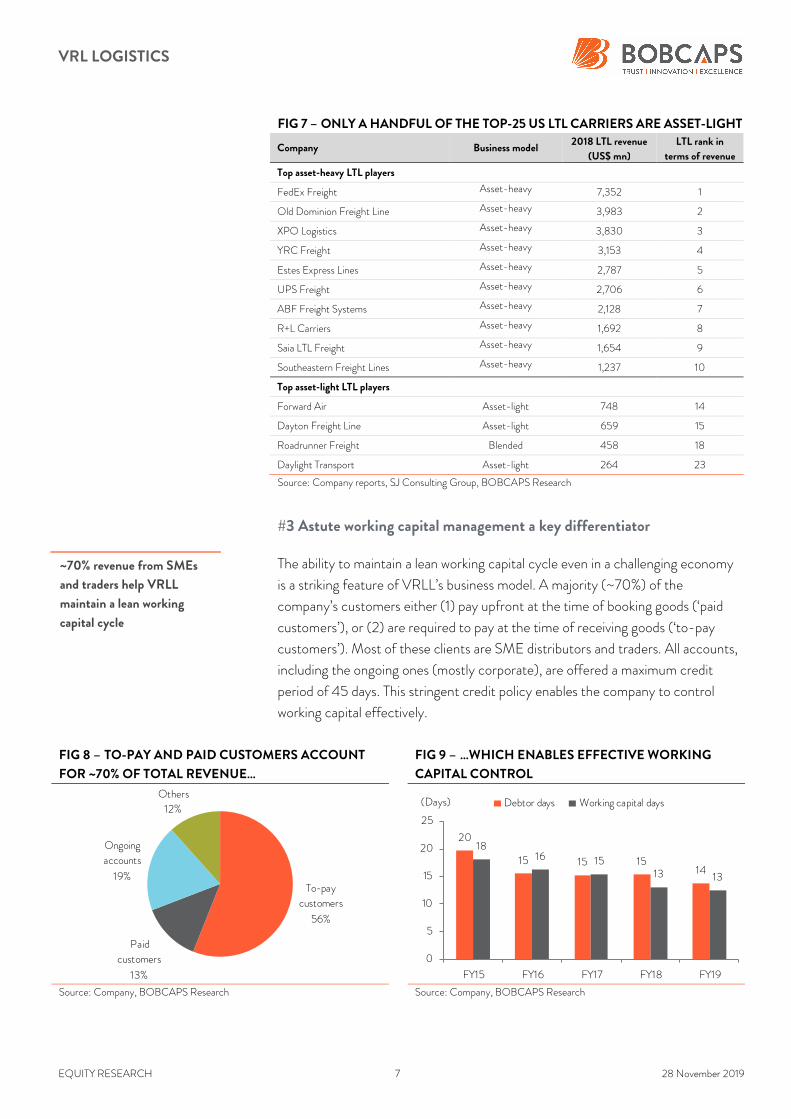
Our research also indicates that barring a few exceptions – notably, C.H.
Robinson (US$ 0.5bn LTL revenue in 2018) – most LTL carriers in developed
markets follow a similar asset-intensive model. Figure 7 highlights that most of the
top LTL players in the US own assets.
VRL LOGISTICS
EQUITY RESEARCH 7 28 November 2019
FIG 7 – ONLY A HANDFUL OF THE TOP-25 US LTL CARRIERS ARE ASSET-LIGHT
Company Business model 2018 LTL revenue
(US$ mn)
LTL rank in
terms of revenue
Top asset-heavy LTL players
FedEx Freight Asset-heavy 7,352 1
Old Dominion Freight Line Asset-heavy 3,983 2
XPO Logistics Asset-heavy 3,830 3
YRC Freight Asset-heavy 3,153 4
Estes Express Lines Asset-heavy 2,787 5
UPS Freight Asset-heavy 2,706 6
ABF Freight Systems Asset-heavy 2,128 7
R+L Carriers Asset-heavy 1,692 8
Saia LTL Freight Asset-heavy 1,654 9
Southeastern Freight Lines Asset-heavy 1,237 10
Top asset-light LTL players
Forward Air Asset-light 748 14
Dayton Freight Line Asset-light 659 15
Roadrunner Freight Blended 458 18
Daylight Transport Asset-light 264 23
Source: Company reports, SJ Consulting Group, BOBCAPS Research
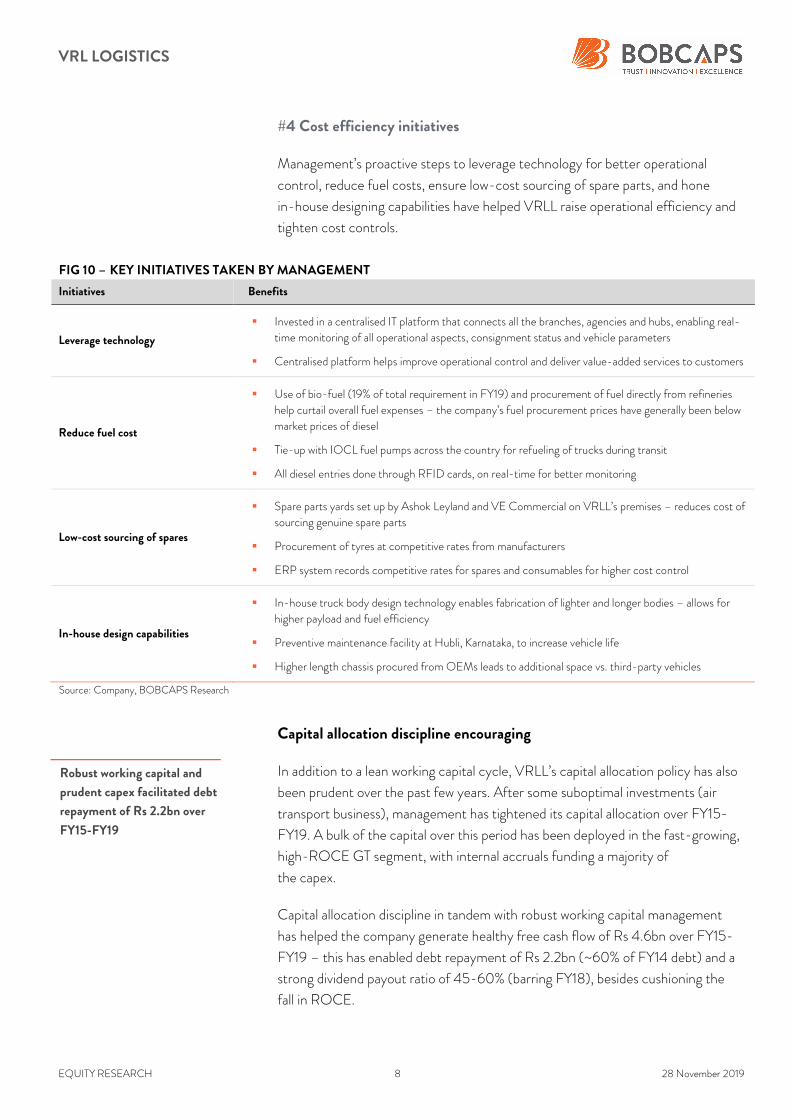
#3 Astute working capital management a key differentiator
The ability to maintain a lean working capital cycle even in a challenging economy
is a striking feature of VRLL’s business model. A majority (~70%) of the
company’s customers either (1) pay upfront at the time of booking goods (‘paid
customers’), or (2) are required to pay at the time of receiving goods (‘to-pay
customers’). Most of these clients are SME distributors and traders. All accounts,
including the ongoing ones (mostly corporate), are offered a maximum credit
period of 45 days. This stringent credit policy enables the company to control
working capital effectively.
FIG 8 – TO-PAY AND PAID CUSTOMERS ACCOUNT
FOR ~70% OF TOTAL REVENUE… FIG 9 – …WHICH ENABLES EFFECTIVE WORKING
CAPITAL CONTROL
Source: Company, BOBCAPS Research Source: Company, BOBCAPS Research
To-pay
customers
56%
Paid
customers
13%
Ongoing
accounts
19%
Others
12%
20
15 15 1514
1816 15
13 13
0
5
10
15
20
25
FY15 FY16 FY17 FY18 FY19
(Days) Debtor days Working capital days
~70% revenue from SMEs
and traders help VRLL
maintain a lean working
capital cycle
VRL LOGISTICS
EQUITY RESEARCH 8 28 November 2019
#4 Cost efficiency initiatives
Management’s proactive steps to leverage technology for better operational
control, reduce fuel costs, ensure low-cost sourcing of spare parts, and hone
in-house designing capabilities have helped VRLL raise operational efficiency and
tighten cost controls.
FIG 10 – KEY INITIATIVES TAKEN BY MANAGEMENT
Initiatives Benefits
Leverage technology
Invested in a centralised IT platform that connects all the branches, agencies and hubs, enabling real-time monitoring of all operational aspects, consignment status and vehicle parameters
Centralised platform helps improve operational control and deliver value-added services to customers
Reduce fuel cost
Use of bio-fuel (19% of total requirement in FY19) and procurement of fuel directly from refineries help curtail overall fuel expenses – the company’s fuel procurement prices have generally been below market prices of diesel
Tie-up with IOCL fuel pumps across the country for refueling of trucks during transit
All diesel entries done through RFID cards, on real-time for better monitoring
Low-cost sourcing of spares
Spare parts yards set up by Ashok Leyland and VE Commercial on VRLL’s premises – reduces cost of sourcing genuine spare parts
Procurement of tyres at competitive rates from manufacturers
ERP system records competitive rates for spares and consumables for higher cost control
In-house design capabilities
In-house truck body design technology enables fabrication of lighter and longer bodies – allows for higher payload and fuel efficiency
Preventive maintenance facility at Hubli, Karnataka, to increase vehicle life
Higher length chassis procured from OEMs leads to additional space vs. third-party vehicles
Source: Company, BOBCAPS Research
Capital allocation discipline encouraging
In addition to a lean working capital cycle, VRLL’s capital allocation policy has also
been prudent over the past few years. After some suboptimal investments (air
transport business), management has tightened its capital allocation over FY15-
FY19. A bulk of the capital over this period has been deployed in the fast-growing,
high-ROCE GT segment, with internal accruals funding a majority of
the capex.
Capital allocation discipline in tandem with robust working capital management
has helped the company generate healthy free cash flow of Rs 4.6bn over FY15-
FY19 – this has enabled debt repayment of Rs 2.2bn (~60% of FY14 debt) and a
strong dividend payout ratio of 45-60% (barring FY18), besides cushioning the
fall in ROCE.
Robust working capital and
prudent capex facilitated debt
repayment of Rs 2.2bn over
FY15-FY19
VRL LOGISTICS
EQUITY RESEARCH 9 28 November 2019
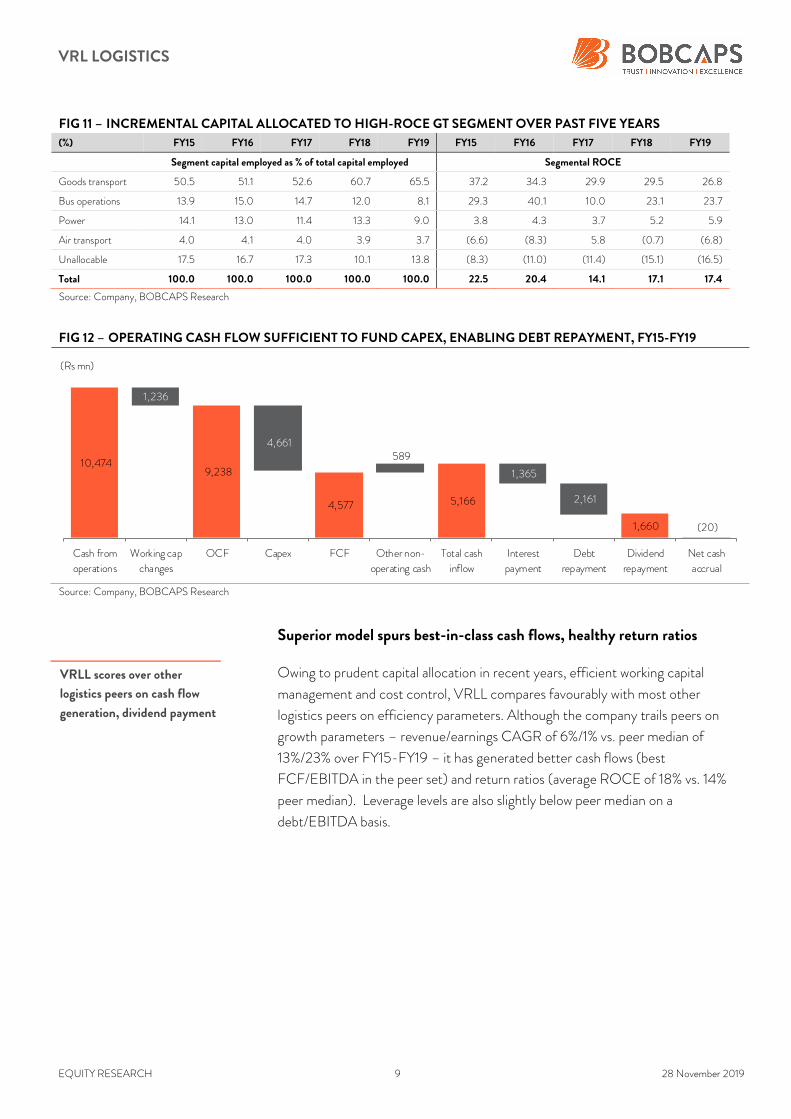
FIG 11 – INCREMENTAL CAPITAL ALLOCATED TO HIGH-ROCE GT SEGMENT OVER PAST FIVE YEARS
(%) FY15 FY16 FY17 FY18 FY19 FY15 FY16 FY17 FY18 FY19
Segment capital employed as % of total capital employed Segmental ROCE
Goods transport 50.5 51.1 52.6 60.7 65.5 37.2 34.3 29.9 29.5 26.8
Bus operations 13.9 15.0 14.7 12.0 8.1 29.3 40.1 10.0 23.1 23.7
Power 14.1 13.0 11.4 13.3 9.0 3.8 4.3 3.7 5.2 5.9
Air transport 4.0 4.1 4.0 3.9 3.7 (6.6) (8.3) 5.8 (0.7) (6.8)
Unallocable 17.5 16.7 17.3 10.1 13.8 (8.3) (11.0) (11.4) (15.1) (16.5)
Total 100.0 100.0 100.0 100.0 100.0 22.5 20.4 14.1 17.1 17.4
Source: Company, BOBCAPS Research
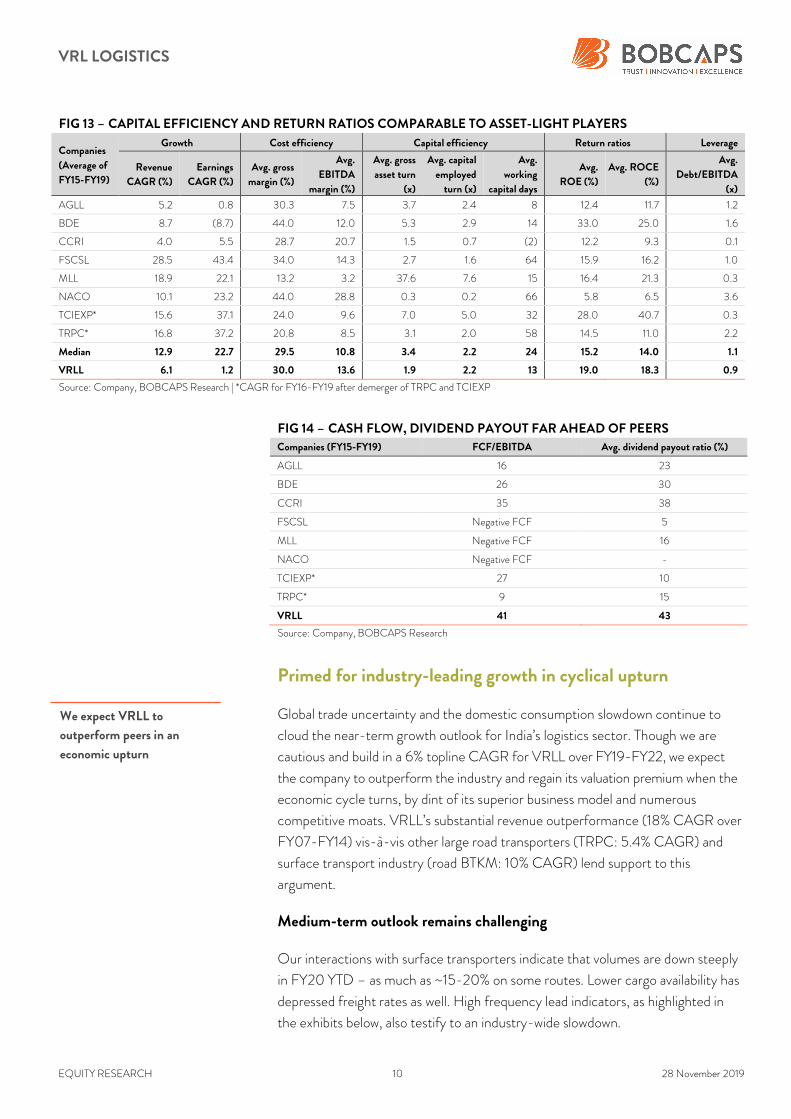
FIG 12 – OPERATING CASH FLOW SUFFICIENT TO FUND CAPEX, ENABLING DEBT REPAYMENT, FY15-FY19
Source: Company, BOBCAPS Research
Superior model spurs best-in-class cash flows, healthy return ratios
Owing to prudent capital allocation in recent years, efficient working capital
management and cost control, VRLL compares favourably with most other
logistics peers on efficiency parameters. Although the company trails peers on
growth parameters – revenue/earnings CAGR of 6%/1% vs. peer median of
13%/23% over FY15-FY19 – it has generated better cash flows (best
FCF/EBITDA in the peer set) and return ratios (average ROCE of 18% vs. 14%
peer median). Leverage levels are also slightly below peer median on a
debt/EBITDA basis.
10,474 9,238
4,661
4,577 5,166
1,660 (20)
1,236
589
1,365
2,161
Cash from
operations
Working cap
changes
OCF Capex FCF Other non-
operating cash
Total cash
inflow
Interest
payment
Debt
repayment
Dividend
repayment
Net cash
accrual
(Rs mn)
VRLL scores over other
logistics peers on cash flow
generation, dividend payment
VRL LOGISTICS
EQUITY RESEARCH 10 28 November 2019
FIG 13 – CAPITAL EFFICIENCY AND RETURN RATIOS COMPARABLE TO ASSET-LIGHT PLAYERS
Companies
(Average of
FY15-FY19)
Growth Cost efficiency Capital efficiency Return ratios Leverage
Revenue
CAGR (%)
Earnings
CAGR (%)
Avg. gross
margin (%)
Avg.
EBITDA
margin (%)
Avg. gross
asset turn
(x)
Avg. capital
employed
turn (x)
Avg.
working
capital days
Avg.
ROE (%)
Avg. ROCE
(%)
Avg.
Debt/EBITDA
(x)
AGLL 5.2 0.8 30.3 7.5 3.7 2.4 8 12.4 11.7 1.2
BDE 8.7 (8.7) 44.0 12.0 5.3 2.9 14 33.0 25.0 1.6
CCRI 4.0 5.5 28.7 20.7 1.5 0.7 (2) 12.2 9.3 0.1
FSCSL 28.5 43.4 34.0 14.3 2.7 1.6 64 15.9 16.2 1.0
MLL 18.9 22.1 13.2 3.2 37.6 7.6 15 16.4 21.3 0.3
NACO 10.1 23.2 44.0 28.8 0.3 0.2 66 5.8 6.5 3.6
TCIEXP* 15.6 37.1 24.0 9.6 7.0 5.0 32 28.0 40.7 0.3
TRPC* 16.8 37.2 20.8 8.5 3.1 2.0 58 14.5 11.0 2.2
Median 12.9 22.7 29.5 10.8 3.4 2.2 24 15.2 14.0 1.1
VRLL 6.1 1.2 30.0 13.6 1.9 2.2 13 19.0 18.3 0.9
Source: Company, BOBCAPS Research | *CAGR for FY16-FY19 after demerger of TRPC and TCIEXP
FIG 14 – CASH FLOW, DIVIDEND PAYOUT FAR AHEAD OF PEERS Companies (FY15-FY19) FCF/EBITDA Avg. dividend payout ratio (%)
AGLL 16 23
BDE 26 30
CCRI 35 38
FSCSL Negative FCF 5
MLL Negative FCF 16
NACO Negative FCF -
TCIEXP* 27 10
TRPC* 9 15
VRLL 41 43
Source: Company, BOBCAPS Research
Primed for industry-leading growth in cyclical upturn
Global trade uncertainty and the domestic consumption slowdown continue to
cloud the near-term growth outlook for India’s logistics sector. Though we are
cautious and build in a 6% topline CAGR for VRLL over FY19-FY22, we expect
the company to outperform the industry and regain its valuation premium when the
economic cycle turns, by dint of its superior business model and numerous
competitive moats. VRLL’s substantial revenue outperformance (18% CAGR over
FY07-FY14) vis-à-vis other large road transporters (TRPC: 5.4% CAGR) and
surface transport industry (road BTKM: 10% CAGR) lend support to this
argument.
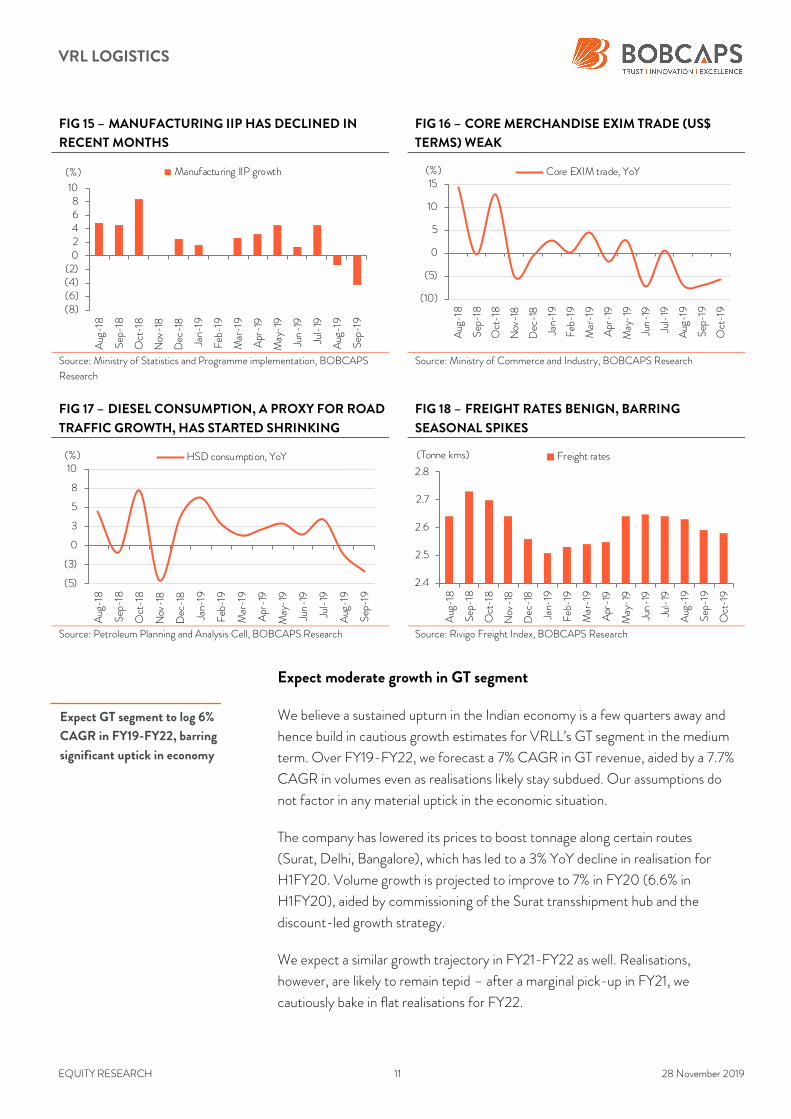
Medium-term outlook remains challenging
Our interactions with surface transporters indicate that volumes are down steeply
in FY20 YTD – as much as ~15-20% on some routes. Lower cargo availability has
depressed freight rates as well. High frequency lead indicators, as highlighted in
the exhibits below, also testify to an industry-wide slowdown.
We expect VRLL to
outperform peers in an
economic upturn
VRL LOGISTICS
EQUITY RESEARCH 11 28 November 2019
FIG 15 – MANUFACTURING IIP HAS DECLINED IN
RECENT MONTHS FIG 16 – CORE MERCHANDISE EXIM TRADE (US$
TERMS) WEAK
Source: Ministry of Statistics and Programme implementation, BOBCAPS
Research Source: Ministry of Commerce and Industry, BOBCAPS Research
FIG 17 – DIESEL CONSUMPTION, A PROXY FOR ROAD
TRAFFIC GROWTH, HAS STARTED SHRINKING
FIG 18 – FREIGHT RATES BENIGN, BARRING
SEASONAL SPIKES
Source: Petroleum Planning and Analysis Cell, BOBCAPS Research Source: Rivigo Freight Index, BOBCAPS Research
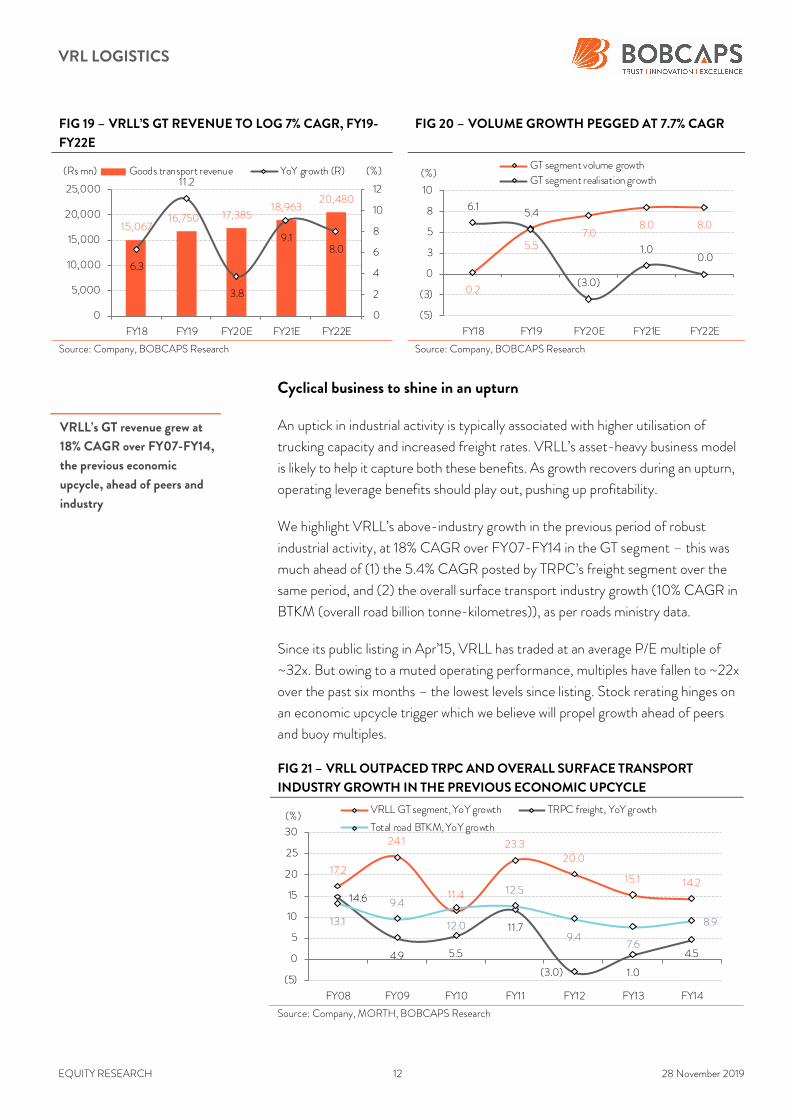
Expect moderate growth in GT segment
We believe a sustained upturn in the Indian economy is a few quarters away and
hence build in cautious growth estimates for VRLL’s GT segment in the medium
term. Over FY19-FY22, we forecast a 7% CAGR in GT revenue, aided by a 7.7%
CAGR in volumes even as realisations likely stay subdued. Our assumptions do
not factor in any material uptick in the economic situation.
The company has lowered its prices to boost tonnage along certain routes
(Surat, Delhi, Bangalore), which has led to a 3% YoY decline in realisation for
H1FY20. Volume growth is projected to improve to 7% in FY20 (6.6% in
H1FY20), aided by commissioning of the Surat transshipment hub and the
discount-led growth strategy.
We expect a similar growth trajectory in FY21-FY22 as well. Realisations,
however, are likely to remain tepid – after a marginal pick-up in FY21, we
cautiously bake in flat realisations for FY22.
(8)(6)(4)(2)0246810
Aug
-18
Sep
-18
Oct-18
Nov
-18
Dec
-18
Jan-
19
Feb
-19
Mar-1
9
Apr-19
May
-19
Jun-19
Jul-19
Aug
-19
Sep
-19
(%) Manufacturing IIP growth
(10)
(5)
0
5
10
15
Aug
-18
Sep
-18
Oct-18
Nov
-18
Dec
-18
Jan-
19
Feb
-19
Mar-19
Apr-19
May
-19
Jun-19
Jul-19
Aug
-19
Sep
-19
Oct-1
9
(%) Core EXIM trade, YoY
(5)
(3)
0
3
5
8
10
Aug
-18
Sep
-18
Oct-18
Nov
-18
Dec
-18
Jan-
19
Feb
-19
Mar-19
Apr-19
May-19
Jun-19
Jul-19
Aug
-19
Sep
-19
(%) HSD consumption, YoY
2.4
2.5
2.6
2.7
2.8
Aug
-18
Sep
-18
Oct-18
Nov
-18
Dec
-18
Jan-
19
Feb
-19
Mar-19
Apr-19
May-19
Jun-19
Jul-19
Aug
-19
Sep
-19
Oct-19
(Tonne kms) Freight rates
Expect GT segment to log 6%
CAGR in FY19-FY22, barring
significant uptick in economy
VRL LOGISTICS
EQUITY RESEARCH 12 28 November 2019
FIG 19 – VRLL’S GT REVENUE TO LOG 7% CAGR, FY19-
FY22E FIG 20 – VOLUME GROWTH PEGGED AT 7.7% CAGR
Source: Company, BOBCAPS Research Source: Company, BOBCAPS Research
Cyclical business to shine in an upturn
An uptick in industrial activity is typically associated with higher utilisation of
trucking capacity and increased freight rates. VRLL’s asset-heavy business model
is likely to help it capture both these benefits. As growth recovers during an upturn,
operating leverage benefits should play out, pushing up profitability.
We highlight VRLL’s above-industry growth in the previous period of robust
industrial activity, at 18% CAGR over FY07-FY14 in the GT segment – this was
much ahead of (1) the 5.4% CAGR posted by TRPC’s freight segment over the
same period, and (2) the overall surface transport industry growth (10% CAGR in
BTKM (overall road billion tonne-kilometres)), as per roads ministry data.
Since its public listing in Apr’15, VRLL has traded at an average P/E multiple of
~32x. But owing to a muted operating performance, multiples have fallen to ~22x
over the past six months – the lowest levels since listing. Stock rerating hinges on
an economic upcycle trigger which we believe will propel growth ahead of peers
and buoy multiples.
FIG 21 – VRLL OUTPACED TRPC AND OVERALL SURFACE TRANSPORT
INDUSTRY GROWTH IN THE PREVIOUS ECONOMIC UPCYCLE
Source: Company, MORTH, BOBCAPS Research
15,06716,750 17,385
18,96320,480
6.3
11.2
3.8
9.18.0
0
2
4
6
8
10
12
0
5,000
10,000
15,000
20,000
25,000
FY18 FY19 FY20E FY21E FY22E
(%)(Rs mn) Goods transport revenue YoY growth (R)
0.2
5.57.0
8.0 8.0
6.15.4
(3.0)
1.00.0
(5)
(3)
0
3
5
8
10
FY18 FY19 FY20E FY21E FY22E
(%)GT segment volume growth
GT segment realisation growth
17.2
24.1
11.4
23.320.0
15.1 14.2
14.6
4.9 5.5
11.7
(3.0) 1.0
4.5
13.1
9.4
12.0
12.5
9.47.6
8.9
(5)
0
5
10
15
20
25
30
FY08 FY09 FY10 FY11 FY12 FY13 FY14
(%)VRLL GT segment, YoY growth TRPC freight, YoY growth
Total road BTKM, YoY growth
VRLL’s GT revenue grew at
18% CAGR over FY07-FY14,
the previous economic
upcycle, ahead of peers and
industry
VRL LOGISTICS
EQUITY RESEARCH 13 28 November 2019
GST, E-way bill implementation to benefit organized LTL players
We expect organised LTL players to gain market share from unorganised players
post stricter implementation of the E-way bill as compliance requirement for the
latter is likely to increase. Gradual alignment of manufacturers’ supply chain
process post GST would also benefit organised LTL players by providing more
opportunities for cargo consolidation. We expect VRLL to benefit from this trend.
Relatively insulated from DFC impact but start-ups a risk
In this section, we analyse the impact of future industry developments – DFC
commissioning, vehicle scrappage norms, and intensifying competition from start-
ups – on VRLL’s long-term prospects. Though the DFC will drive a shift in traffic
from road to rail, we believe LTL players (including VRLL) will be relatively more
shielded from the threat than FTL incumbents. Scrappage norms too are unlikely
to have much impact going by the company’s fleet composition. However, we see
potential risks to growth emanating from disruptive LTL start-ups.
Relatively insulated from freight corridor threat
Expected by end-2021, commissioning of the DFC should bring in multifold
benefits for container train operators (CTO), including (1) faster speeds of ~75
kmph vs. ~25kmph currently, (2) higher load carrying (~13,000t vs. 5,000t) and
hence increased double stacking, and (3) higher station spacing (~40km vs. ~7km).
This will enable the Indian Railways (IR) to provide transit time guarantees, reduce
turnaround time, and improve per-tonne-kilometre economics versus road.
Consequently, we expect some freight traffic to shift towards rail from road.
Industry estimates peg IR’s incremental freight capacity to grow by 1.1bn tonnes
post DFC, nearly doubling the existing level.
That said, we expect LTL companies to be less affected as (1) LTL cargo typically
comprises lightweight, redistribution freight as against bulk and container cargo
transported by rail, (2) the hub-and-spoke model is critical to seamlessly carry
out LTL operations, and (3) the focus is on domestic cargo, whereas the DFC is
likely to cater to EXIM cargo first. Moreover, VRLL derives ~40% of its revenue
from the southern region which does not fall within the western and eastern rail
corridors.
LTL players are more
insulated from DFC threat
due to higher entry barriers
VRL LOGISTICS
EQUITY RESEARCH 14 28 November 2019
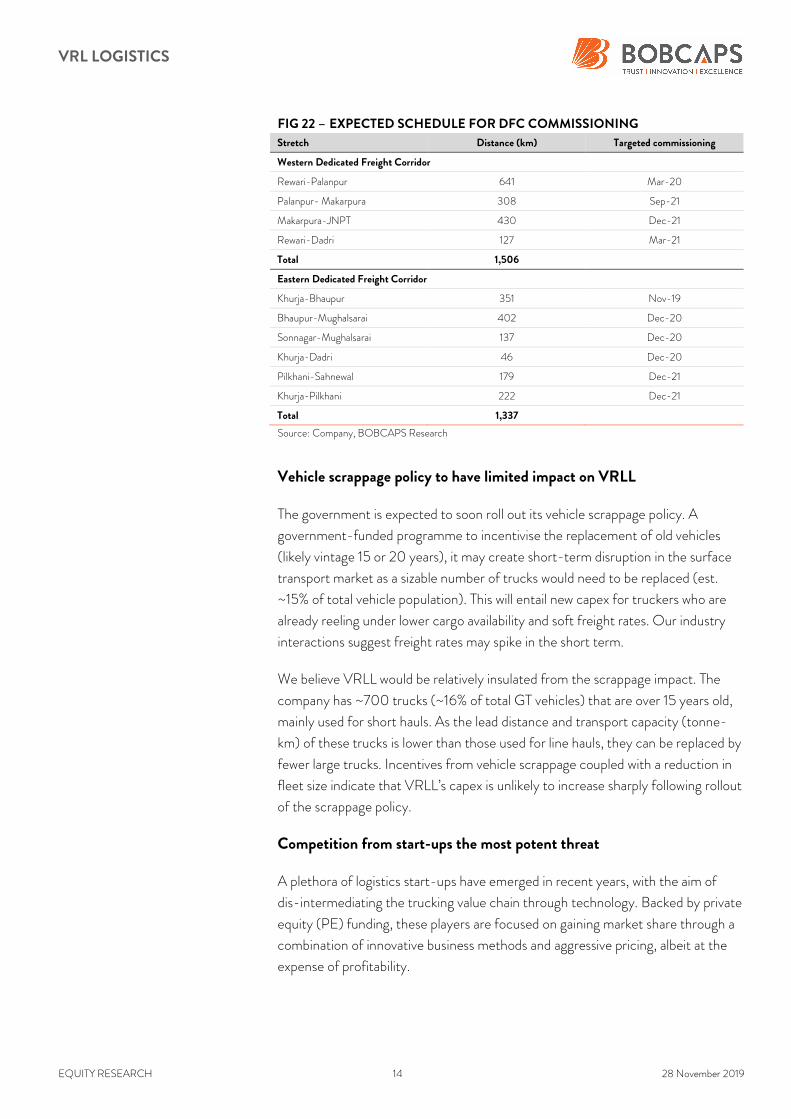
FIG 22 – EXPECTED SCHEDULE FOR DFC COMMISSIONING
Stretch Distance (km) Targeted commissioning
Western Dedicated Freight Corridor
Rewari-Palanpur 641 Mar-20
Palanpur- Makarpura 308 Sep-21
Makarpura-JNPT 430 Dec-21
Rewari-Dadri 127 Mar-21
Total 1,506
Eastern Dedicated Freight Corridor
Khurja-Bhaupur 351 Nov-19
Bhaupur-Mughalsarai 402 Dec-20
Sonnagar-Mughalsarai 137 Dec-20
Khurja-Dadri 46 Dec-20
Pilkhani-Sahnewal 179 Dec-21
Khurja-Pilkhani 222 Dec-21
Total 1,337
Source: Company, BOBCAPS Research
Vehicle scrappage policy to have limited impact on VRLL
The government is expected to soon roll out its vehicle scrappage policy. A
government-funded programme to incentivise the replacement of old vehicles
(likely vintage 15 or 20 years), it may create short-term disruption in the surface
transport market as a sizable number of trucks would need to be replaced (est.
~15% of total vehicle population). This will entail new capex for truckers who are
already reeling under lower cargo availability and soft freight rates. Our industry
interactions suggest freight rates may spike in the short term.
We believe VRLL would be relatively insulated from the scrappage impact. The
company has ~700 trucks (~16% of total GT vehicles) that are over 15 years old,
mainly used for short hauls. As the lead distance and transport capacity (tonne-
km) of these trucks is lower than those used for line hauls, they can be replaced by
fewer large trucks. Incentives from vehicle scrappage coupled with a reduction in
fleet size indicate that VRLL’s capex is unlikely to increase sharply following rollout
of the scrappage policy.
Competition from start-ups the most potent threat
A plethora of logistics start-ups have emerged in recent years, with the aim of
dis-intermediating the trucking value chain through technology. Backed by private
equity (PE) funding, these players are focused on gaining market share through a
combination of innovative business methods and aggressive pricing, albeit at the
expense of profitability.
VRL LOGISTICS
EQUITY RESEARCH 15 28 November 2019
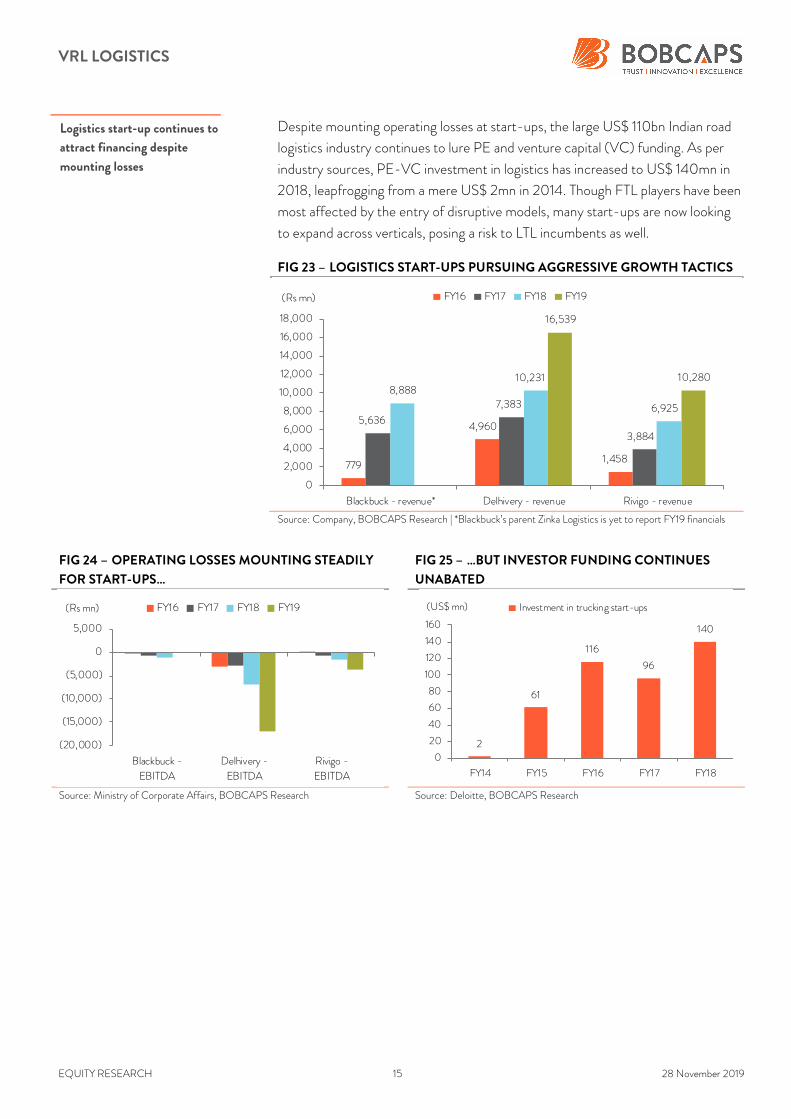
Despite mounting operating losses at start-ups, the large US$ 110bn Indian road
logistics industry continues to lure PE and venture capital (VC) funding. As per
industry sources, PE-VC investment in logistics has increased to US$ 140mn in
2018, leapfrogging from a mere US$ 2mn in 2014. Though FTL players have been
most affected by the entry of disruptive models, many start-ups are now looking
to expand across verticals, posing a risk to LTL incumbents as well.
FIG 23 – LOGISTICS START-UPS PURSUING AGGRESSIVE GROWTH TACTICS
Source: Company, BOBCAPS Research | *Blackbuck’s parent Zinka Logistics is yet to report FY19 financials
FIG 24 – OPERATING LOSSES MOUNTING STEADILY
FOR START-UPS…
FIG 25 – …BUT INVESTOR FUNDING CONTINUES
UNABATED
Source: Ministry of Corporate Affairs, BOBCAPS Research Source: Deloitte, BOBCAPS Research
779
4,960
1,458
5,636
7,383
3,884
8,888 10,231
6,925
16,539
10,280
0
2,000
4,000
6,000
8,000
10,000
12,000
14,000
16,000
18,000
Blackbuck - revenue* Delhivery - revenue Rivigo - revenue
(Rs mn) FY16 FY17 FY18 FY19
(20,000)
(15,000)
(10,000)
(5,000)
0
5,000
Blackbuck -
EBITDA
Delhivery -
EBITDA
Rivigo -
EBITDA
(Rs mn) FY16 FY17 FY18 FY19
2
61
116
96
140
0
20
40
60
80
100
120
140
160
FY14 FY15 FY16 FY17 FY18
(US$ mn) Investment in trucking start-ups
Logistics start-up continues to
attract financing despite
mounting losses
VRL LOGISTICS
EQUITY RESEARCH 16 28 November 2019
Rivigo bolstering LTL presence
Traditionally focused on FTL, some start-ups have begun entering the LTL space
as well and their progress remains a key monitorable. As per industry sources,
premier logistics start-up Rivigo is eyeing the LTL/part truck-load segment as its
next growth engine and has aggressively expanded its presence in this space in
FY19. Its LTL business covers 15.6k pin-codes across India in FY19 (5.7k in FY18),
has 3mn sq ft of storage area (~1mn in FY18), and has added ~100 branches to
take its branch and processing centre network to ~225.
Another prominent start-up, Delhivery is exploring suitable acquisition targets
to bolster its presence in the B2B category, diversifying beyond its core
e-commerce category. As VRLL generates a majority of its revenue from the LTL
(~80% of revenue) and B2B (~100% of revenue) segments, this may pose a
threat to the company’s future prospects.
VRL LOGISTICS
EQUITY RESEARCH 17 28 November 2019
Financial review
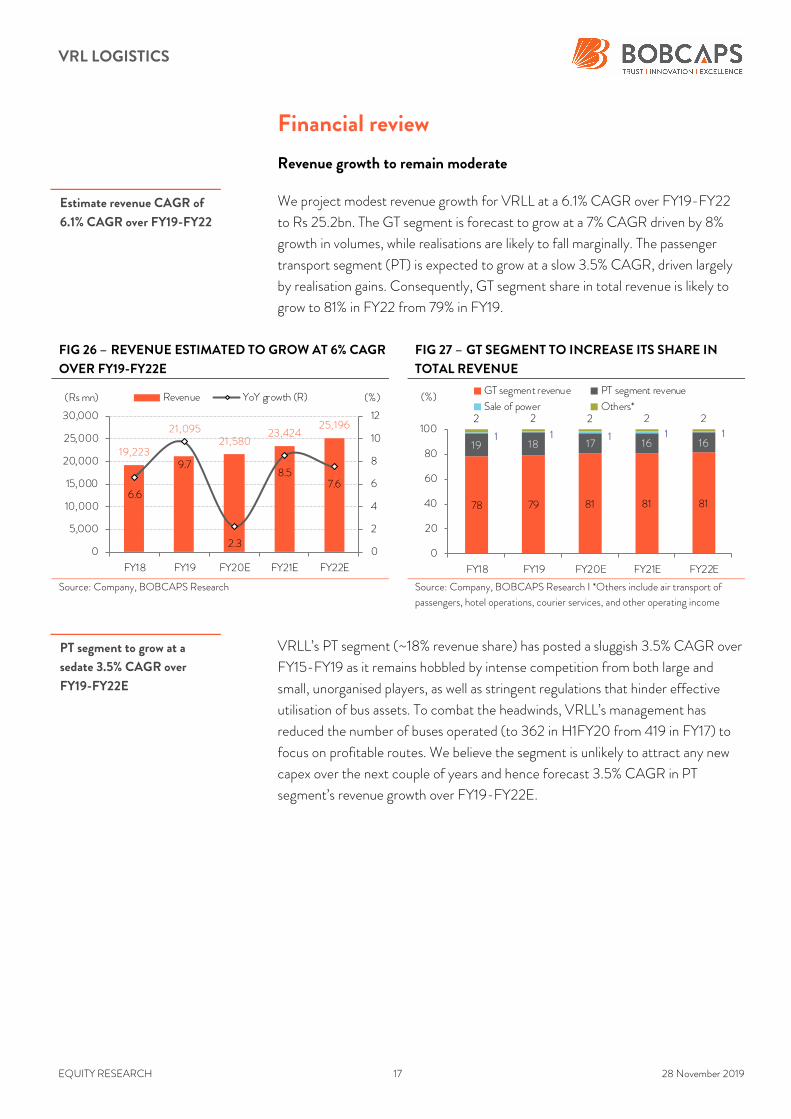
Revenue growth to remain moderate
We project modest revenue growth for VRLL at a 6.1% CAGR over FY19-FY22
to Rs 25.2bn. The GT segment is forecast to grow at a 7% CAGR driven by 8%
growth in volumes, while realisations are likely to fall marginally. The passenger
transport segment (PT) is expected to grow at a slow 3.5% CAGR, driven largely
by realisation gains. Consequently, GT segment share in total revenue is likely to
grow to 81% in FY22 from 79% in FY19.
FIG 26 – REVENUE ESTIMATED TO GROW AT 6% CAGR
OVER FY19-FY22E FIG 27 – GT SEGMENT TO INCREASE ITS SHARE IN
TOTAL REVENUE
Source: Company, BOBCAPS Research Source: Company, BOBCAPS Research I *Others include air transport of
passengers, hotel operations, courier services, and other operating income
VRLL’s PT segment (~18% revenue share) has posted a sluggish 3.5% CAGR over
FY15-FY19 as it remains hobbled by intense competition from both large and
small, unorganised players, as well as stringent regulations that hinder effective
utilisation of bus assets. To combat the headwinds, VRLL’s management has
reduced the number of buses operated (to 362 in H1FY20 from 419 in FY17) to
focus on profitable routes. We believe the segment is unlikely to attract any new
capex over the next couple of years and hence forecast 3.5% CAGR in PT
segment’s revenue growth over FY19-FY22E.
19,223
21,09521,580
23,42425,196
6.6
9.7
2.3
8.57.6
0
2
4
6
8
10
12
0
5,000
10,000
15,000
20,000
25,000
30,000
FY18 FY19 FY20E FY21E FY22E
(%)(Rs mn) Revenue YoY growth (R)
78 79 81 81 81
19 18 17 16 161 1 1 1 1
2 2 2 2 2
0
20
40
60
80
100
FY18 FY19 FY20E FY21E FY22E
(%)GT segment revenue PT segment revenue
Sale of power Others*
Estimate revenue CAGR of
6.1% CAGR over FY19-FY22
PT segment to grow at a
sedate 3.5% CAGR over
FY19-FY22E
VRL LOGISTICS
EQUITY RESEARCH 18 28 November 2019
FIG 28 – RT SEGMENT’S REALISATION TO GROW AT
DECENT PACE, PASSENGER GROWTH TO BE MUTED FIG 29 – PT REVENUE TO LOG A 3.5% CAGR OVER
FY19-FY22E
Source: Company, BOBCAPS Research Source: Company, BOBCAPS Research
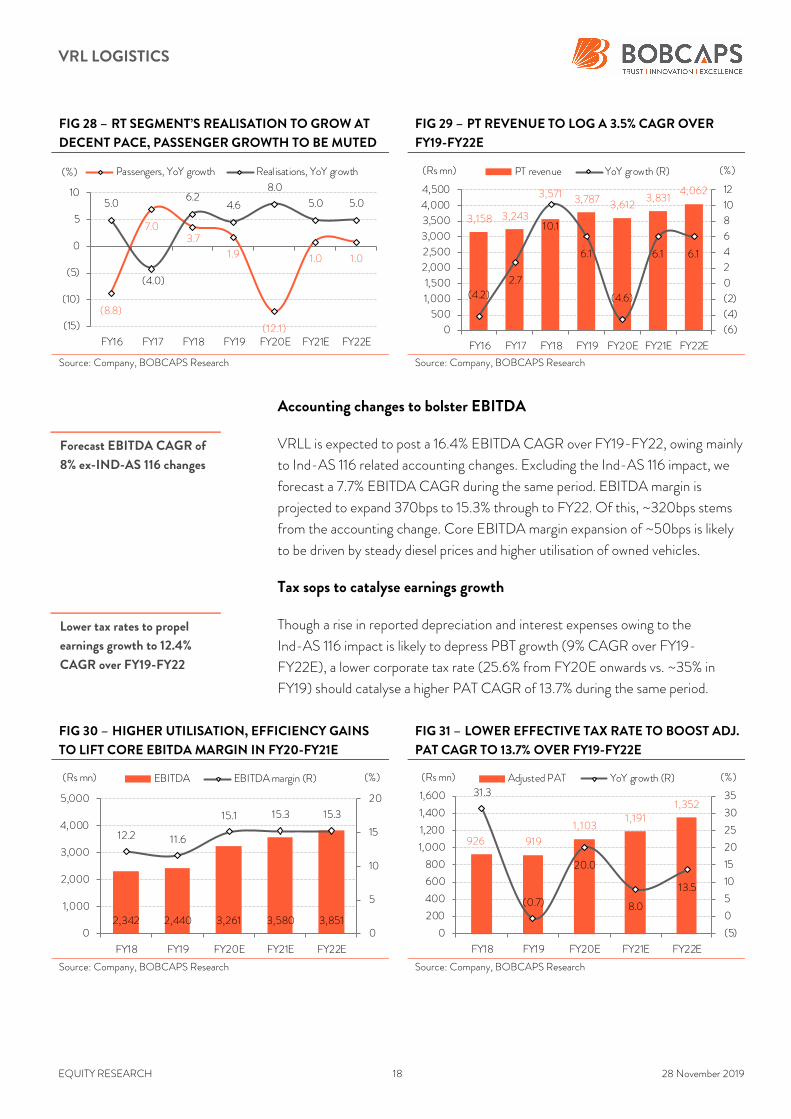
Accounting changes to bolster EBITDA
VRLL is expected to post a 16.4% EBITDA CAGR over FY19-FY22, owing mainly
to Ind-AS 116 related accounting changes. Excluding the Ind-AS 116 impact, we
forecast a 7.7% EBITDA CAGR during the same period. EBITDA margin is
projected to expand 370bps to 15.3% through to FY22. Of this, ~320bps stems
from the accounting change. Core EBITDA margin expansion of ~50bps is likely
to be driven by steady diesel prices and higher utilisation of owned vehicles.
Tax sops to catalyse earnings growth
Though a rise in reported depreciation and interest expenses owing to the
Ind-AS 116 impact is likely to depress PBT growth (9% CAGR over FY19-
FY22E), a lower corporate tax rate (25.6% from FY20E onwards vs. ~35% in
FY19) should catalyse a higher PAT CAGR of 13.7% during the same period.
FIG 30 – HIGHER UTILISATION, EFFICIENCY GAINS
TO LIFT CORE EBITDA MARGIN IN FY20-FY21E FIG 31 – LOWER EFFECTIVE TAX RATE TO BOOST ADJ.
PAT CAGR TO 13.7% OVER FY19-FY22E
Source: Company, BOBCAPS Research Source: Company, BOBCAPS Research
(8.8)
7.03.7
1.9
(12.1)
1.0 1.0
5.0
(4.0)
6.24.6
8.0
5.0 5.0
(15)
(10)
(5)
0
5
10
FY16 FY17 FY18 FY19 FY20E FY21E FY22E
(%) Passengers, YoY growth Real isations, YoY growth
3,158 3,243
3,571 3,787 3,6123,831
4,062
(4.2)
2.7
10.1
6.1
(4.6)
6.1 6.1
(6)
(4)
(2)
0
2
4
6
8
10
12
0
500
1,000
1,500
2,000
2,500
3,000
3,500
4,000
4,500
FY16 FY17 FY18 FY19 FY20E FY21E FY22E
(%)(Rs mn) PT revenue YoY growth (R)
2,342 2,440 3,261 3,580 3,851
12.2 11.6
15.1 15.3 15.3
0
5
10
15
20
0
1,000
2,000
3,000
4,000
5,000
FY18 FY19 FY20E FY21E FY22E
(%)(Rs mn) EBITDA EBITDA margin (R)
926 919
1,1031,191
1,35231.3
(0.7)
20.0
8.0
13.5
(5)
0
5
10
15
20
25
30
35
0
200
400
600
800
1,000
1,200
1,400
1,600
FY18 FY19 FY20E FY21E FY22E
(%)(Rs mn) Adjusted PAT YoY growth (R)
Forecast EBITDA CAGR of
8% ex-IND-AS 116 changes
Lower tax rates to propel
earnings growth to 12.4%
CAGR over FY19-FY22
VRL LOGISTICS
EQUITY RESEARCH 19 28 November 2019
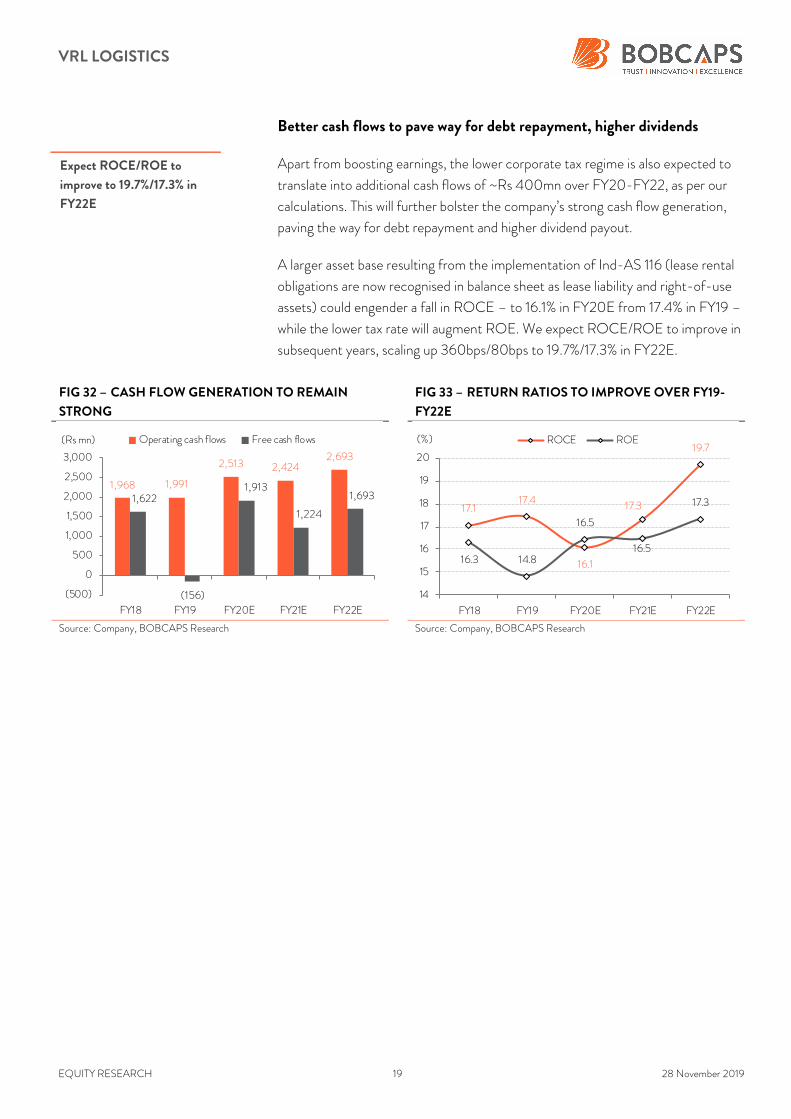
Better cash flows to pave way for debt repayment, higher dividends
Apart from boosting earnings, the lower corporate tax regime is also expected to
translate into additional cash flows of ~Rs 400mn over FY20-FY22, as per our
calculations. This will further bolster the company’s strong cash flow generation,
paving the way for debt repayment and higher dividend payout.
A larger asset base resulting from the implementation of Ind-AS 116 (lease rental
obligations are now recognised in balance sheet as lease liability and right-of-use
assets) could engender a fall in ROCE – to 16.1% in FY20E from 17.4% in FY19 –
while the lower tax rate will augment ROE. We expect ROCE/ROE to improve in
subsequent years, scaling up 360bps/80bps to 19.7%/17.3% in FY22E.
FIG 32 – CASH FLOW GENERATION TO REMAIN
STRONG
FIG 33 – RETURN RATIOS TO IMPROVE OVER FY19-
FY22E
Source: Company, BOBCAPS Research Source: Company, BOBCAPS Research
1,968 1,991
2,513 2,4242,693
1,622
(156)
1,913
1,224
1,693
(500)
0
500
1,000
1,500
2,000
2,500
3,000
FY18 FY19 FY20E FY21E FY22E
(Rs mn) Operating cash flows Free cash flows
17.117.4
16.1
17.3
19.7
16.3 14.8
16.5
16.5
17.3
14
15
16
17
18
19
20
FY18 FY19 FY20E FY21E FY22E
(%) ROCE ROE
Expect ROCE/ROE to
improve to 19.7%/17.3% in
FY22E
VRL LOGISTICS
EQUITY RESEARCH 20 28 November 2019
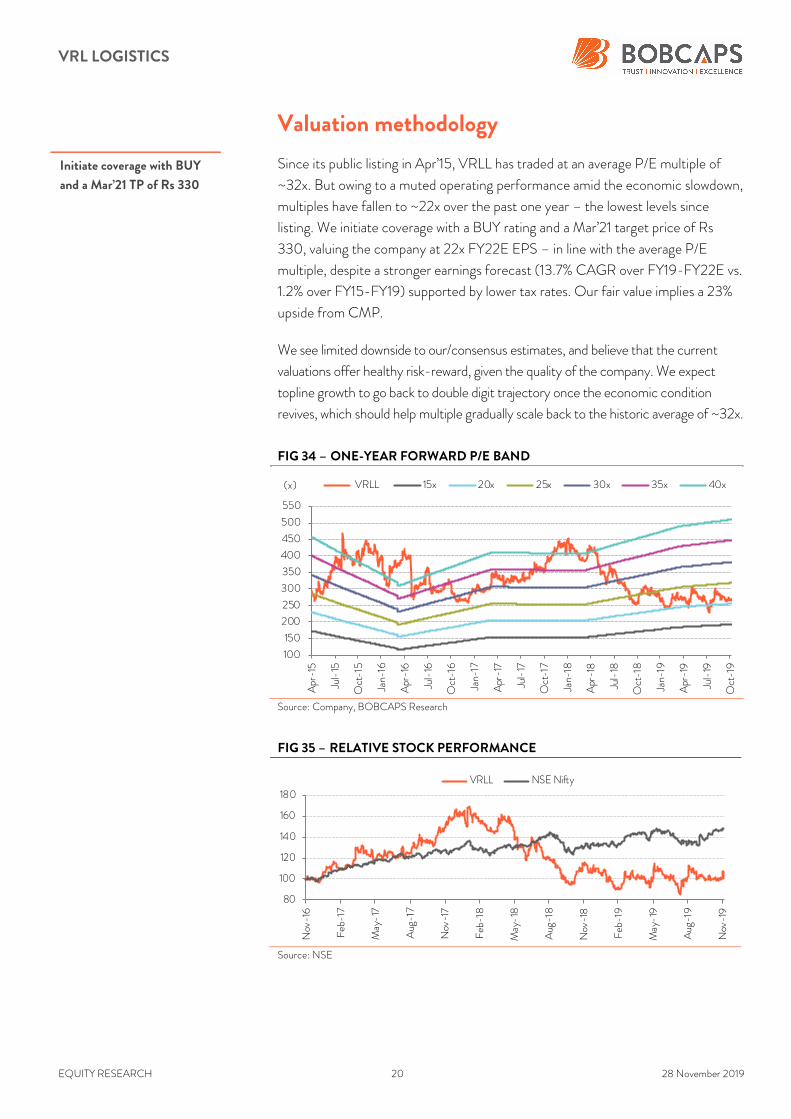
Valuation methodology
Since its public listing in Apr’15, VRLL has traded at an average P/E multiple of
~32x. But owing to a muted operating performance amid the economic slowdown,
multiples have fallen to ~22x over the past one year – the lowest levels since
listing. We initiate coverage with a BUY rating and a Mar’21 target price of Rs
330, valuing the company at 22x FY22E EPS – in line with the average P/E
multiple, despite a stronger earnings forecast (13.7% CAGR over FY19-FY22E vs.
1.2% over FY15-FY19) supported by lower tax rates. Our fair value implies a 23%
upside from CMP.
We see limited downside to our/consensus estimates, and believe that the current
valuations offer healthy risk-reward, given the quality of the company. We expect
topline growth to go back to double digit trajectory once the economic condition
revives, which should help multiple gradually scale back to the historic average of ~32x.
FIG 34 – ONE-YEAR FORWARD P/E BAND
Source: Company, BOBCAPS Research
FIG 35 – RELATIVE STOCK PERFORMANCE
Source: NSE
100
150
200
250
300
350
400
450
500
550
Apr
-15
Jul-15
Oct-1
5
Jan-
16
Apr-16
Jul-16
Oct-16
Jan-
17
Apr-17
Jul-17
Oct-17
Jan-
18
Apr-18
Jul-18
Oct-18
Jan-
19
Apr-19
Jul-19
Oct-19
VRLL 15x 20x 25x 30x 35x 40x(x)
80
100
120
140
160
180
Nov
-16
Feb
-17
May-17
Aug
-17
Nov
-17
Feb
-18
May-18
Aug
-18
Nov
-18
Feb
-19
May
-19
Aug
-19
Nov
-19
VRLL NSE Nifty
Initiate coverage with BUY
and a Mar’21 TP of Rs 330
VRL LOGISTICS
EQUITY RESEARCH 21 28 November 2019
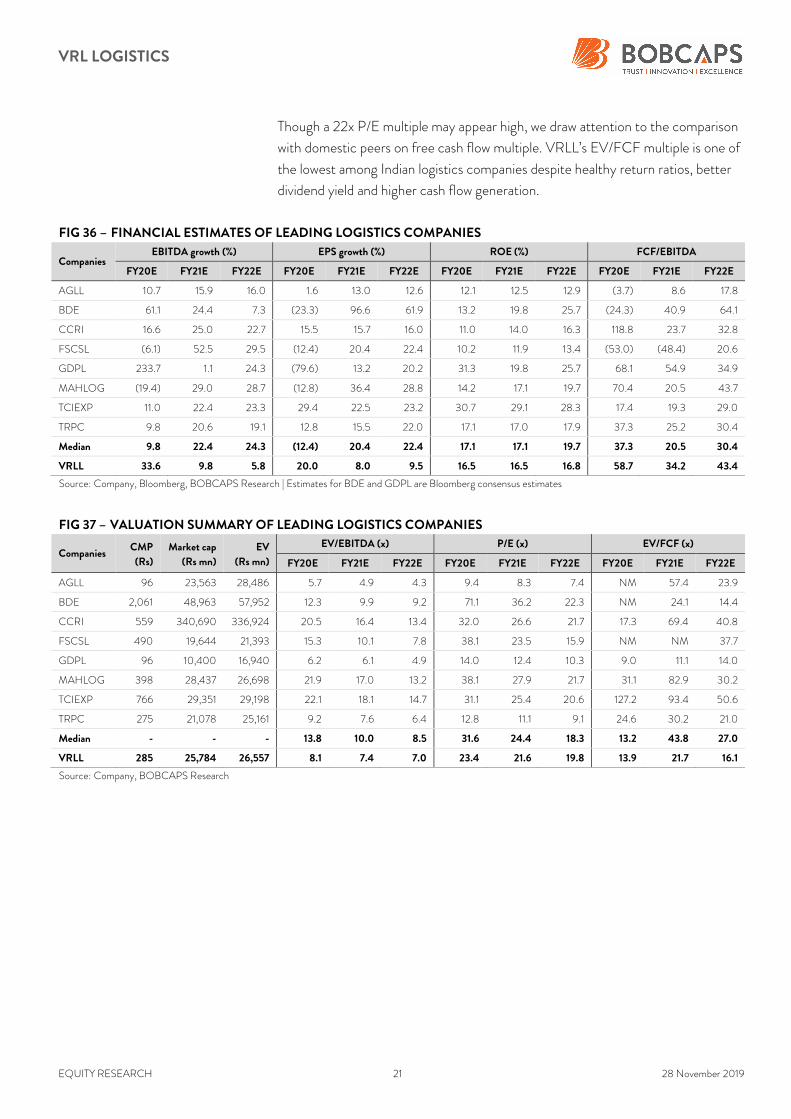
Though a 22x P/E multiple may appear high, we draw attention to the comparison
with domestic peers on free cash flow multiple. VRLL’s EV/FCF multiple is one of
the lowest among Indian logistics companies despite healthy return ratios, better
dividend yield and higher cash flow generation.
FIG 36 – FINANCIAL ESTIMATES OF LEADING LOGISTICS COMPANIES
Companies EBITDA growth (%) EPS growth (%) ROE (%) FCF/EBITDA
FY20E FY21E FY22E FY20E FY21E FY22E FY20E FY21E FY22E FY20E FY21E FY22E
AGLL 10.7 15.9 16.0 1.6 13.0 12.6 12.1 12.5 12.9 (3.7) 8.6 17.8
BDE 61.1 24.4 7.3 (23.3) 96.6 61.9 13.2 19.8 25.7 (24.3) 40.9 64.1
CCRI 16.6 25.0 22.7 15.5 15.7 16.0 11.0 14.0 16.3 118.8 23.7 32.8
FSCSL (6.1) 52.5 29.5 (12.4) 20.4 22.4 10.2 11.9 13.4 (53.0) (48.4) 20.6
GDPL 233.7 1.1 24.3 (79.6) 13.2 20.2 31.3 19.8 25.7 68.1 54.9 34.9
MAHLOG (19.4) 29.0 28.7 (12.8) 36.4 28.8 14.2 17.1 19.7 70.4 20.5 43.7
TCIEXP 11.0 22.4 23.3 29.4 22.5 23.2 30.7 29.1 28.3 17.4 19.3 29.0
TRPC 9.8 20.6 19.1 12.8 15.5 22.0 17.1 17.0 17.9 37.3 25.2 30.4
Median 9.8 22.4 24.3 (12.4) 20.4 22.4 17.1 17.1 19.7 37.3 20.5 30.4
VRLL 33.6 9.8 5.8 20.0 8.0 9.5 16.5 16.5 16.8 58.7 34.2 43.4
Source: Company, Bloomberg, BOBCAPS Research | Estimates for BDE and GDPL are Bloomberg consensus estimates
FIG 37 – VALUATION SUMMARY OF LEADING LOGISTICS COMPANIES
Companies CMP
(Rs)
Market cap
(Rs mn)
EV
(Rs mn)
EV/EBITDA (x) P/E (x) EV/FCF (x)
FY20E FY21E FY22E FY20E FY21E FY22E FY20E FY21E FY22E
AGLL 96 23,563 28,486 5.7 4.9 4.3 9.4 8.3 7.4 NM 57.4 23.9
BDE 2,061 48,963 57,952 12.3 9.9 9.2 71.1 36.2 22.3 NM 24.1 14.4
CCRI 559 340,690 336,924 20.5 16.4 13.4 32.0 26.6 21.7 17.3 69.4 40.8
FSCSL 490 19,644 21,393 15.3 10.1 7.8 38.1 23.5 15.9 NM NM 37.7
GDPL 96 10,400 16,940 6.2 6.1 4.9 14.0 12.4 10.3 9.0 11.1 14.0
MAHLOG 398 28,437 26,698 21.9 17.0 13.2 38.1 27.9 21.7 31.1 82.9 30.2
TCIEXP 766 29,351 29,198 22.1 18.1 14.7 31.1 25.4 20.6 127.2 93.4 50.6
TRPC 275 21,078 25,161 9.2 7.6 6.4 12.8 11.1 9.1 24.6 30.2 21.0
Median - - - 13.8 10.0 8.5 31.6 24.4 18.3 13.2 43.8 27.0
VRLL 285 25,784 26,557 8.1 7.4 7.0 23.4 21.6 19.8 13.9 21.7 16.1
Source: Company, BOBCAPS Research
VRL LOGISTICS
EQUITY RESEARCH 22 28 November 2019
Key risks
Key downside risks to our thesis are:
Sharp increase in diesel prices: Any sharp rise in diesel prices can deplete the
company’s operating margin owing to the lag in passing on cost increases
to customers.
Prolonged manufacturing slowdown: VRLL’s GT segment growth is reliant on
industrial manufacturing activity. If the manufacturing activity remains weak
for a prolonged period of time, if may continue to impact the company’s
growth prospects.
Large capex plan: We assume that VRLL will maintain the capital allocation
discipline exhibited over the past few years and distribute a majority of its
profit as dividends. However, the unveiling of any large capex plan may cap
free cash flow generation and therefore dividend payout.
VRL LOGISTICS
EQUITY RESEARCH 23 28 November 2019
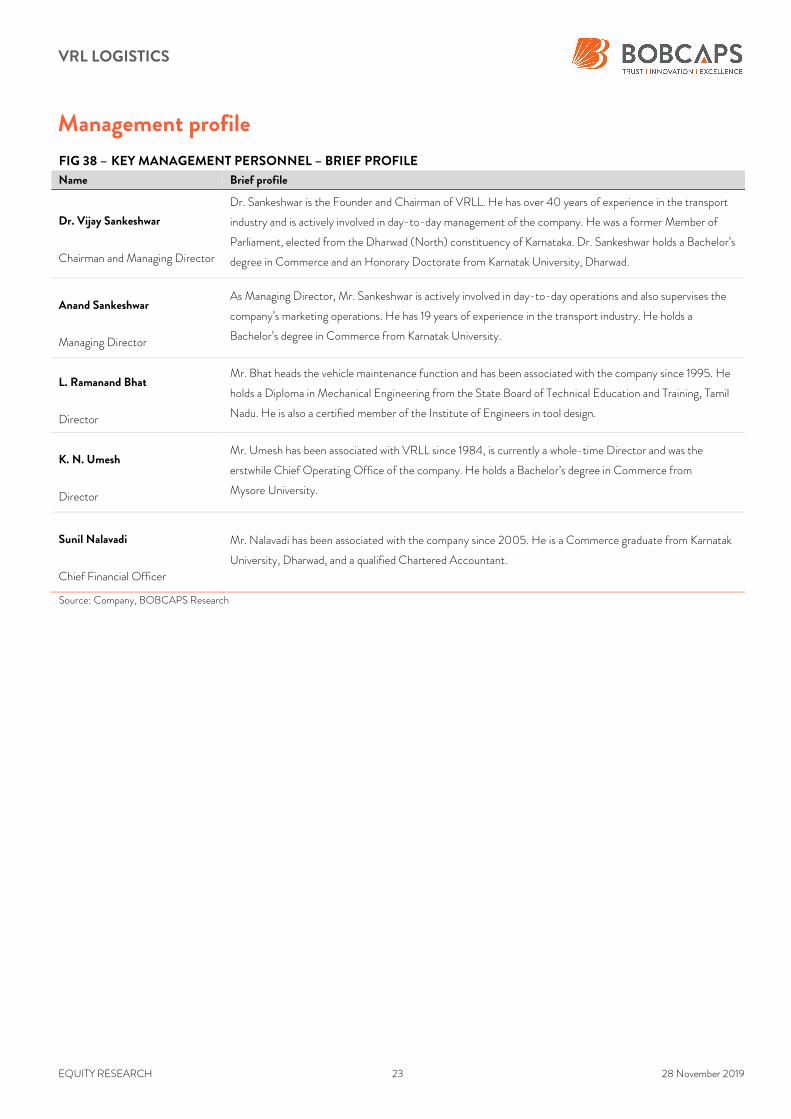
Management profile
FIG 38 – KEY MANAGEMENT PERSONNEL – BRIEF PROFILE
Name Brief profile
Dr. Vijay Sankeshwar
Chairman and Managing Director
Dr. Sankeshwar is the Founder and Chairman of VRLL. He has over 40 years of experience in the transport
industry and is actively involved in day-to-day management of the company. He was a former Member of
Parliament, elected from the Dharwad (North) constituency of Karnataka. Dr. Sankeshwar holds a Bachelor’s
degree in Commerce and an Honorary Doctorate from Karnatak University, Dharwad.
Anand Sankeshwar
Managing Director
As Managing Director, Mr. Sankeshwar is actively involved in day-to-day operations and also supervises the
company’s marketing operations. He has 19 years of experience in the transport industry. He holds a
Bachelor’s degree in Commerce from Karnatak University.
L. Ramanand Bhat
Director
Mr. Bhat heads the vehicle maintenance function and has been associated with the company since 1995. He
holds a Diploma in Mechanical Engineering from the State Board of Technical Education and Training, Tamil
Nadu. He is also a certified member of the Institute of Engineers in tool design.
K. N. Umesh
Director
Mr. Umesh has been associated with VRLL since 1984, is currently a whole-time Director and was the
erstwhile Chief Operating Office of the company. He holds a Bachelor’s degree in Commerce from
Mysore University.
Sunil Nalavadi
Chief Financial Officer
Mr. Nalavadi has been associated with the company since 2005. He is a Commerce graduate from Karnatak
University, Dharwad, and a qualified Chartered Accountant.
Source: Company, BOBCAPS Research
VRL LOGISTICS
EQUITY RESEARCH 24 28 November 2019
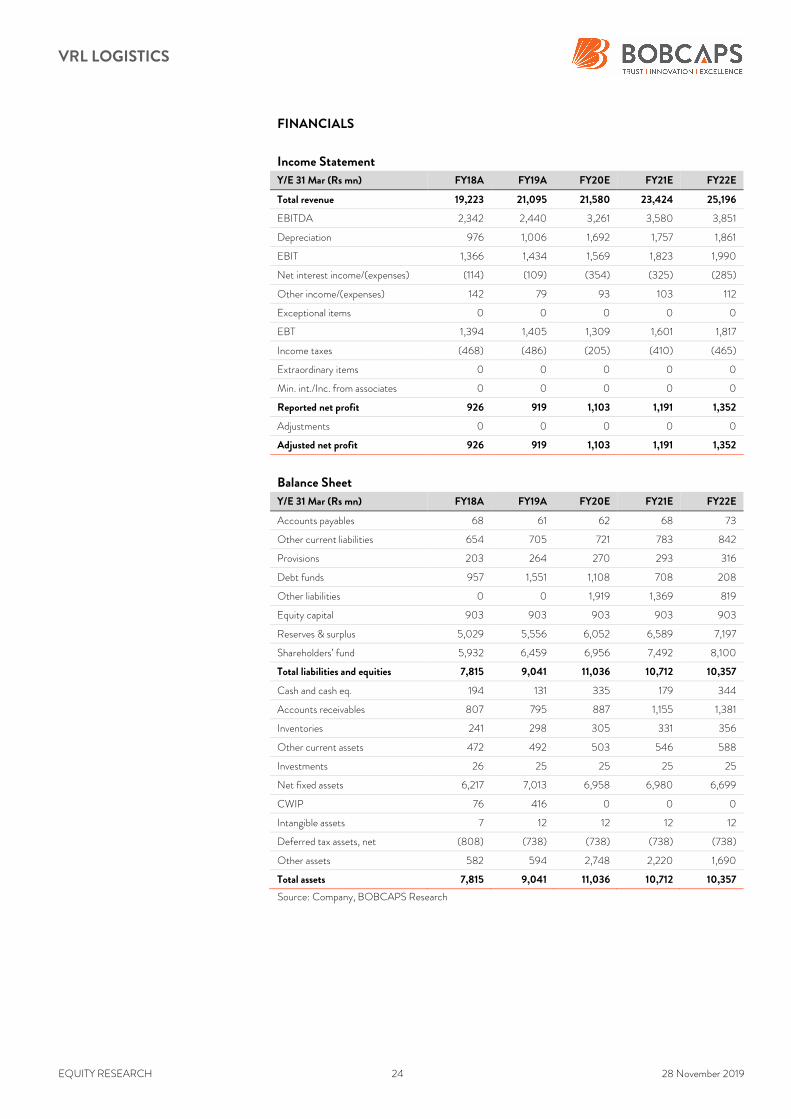
FINANCIALS
Income Statement
Y/E 31 Mar (Rs mn) FY18A FY19A FY20E FY21E FY22E
Total revenue 19,223 21,095 21,580 23,424 25,196
EBITDA 2,342 2,440 3,261 3,580 3,851
Depreciation 976 1,006 1,692 1,757 1,861
EBIT 1,366 1,434 1,569 1,823 1,990
Net interest income/(expenses) (114) (109) (354) (325) (285)
Other income/(expenses) 142 79 93 103 112
Exceptional items 0 0 0 0 0
EBT 1,394 1,405 1,309 1,601 1,817
Income taxes (468) (486) (205) (410) (465)
Extraordinary items 0 0 0 0 0
Min. int./Inc. from associates 0 0 0 0 0
Reported net profit 926 919 1,103 1,191 1,352
Adjustments 0 0 0 0 0
Adjusted net profit 926 919 1,103 1,191 1,352
Balance Sheet
Y/E 31 Mar (Rs mn) FY18A FY19A FY20E FY21E FY22E
Accounts payables 68 61 62 68 73
Other current liabilities 654 705 721 783 842
Provisions 203 264 270 293 316
Debt funds 957 1,551 1,108 708 208
Other liabilities 0 0 1,919 1,369 819
Equity capital 903 903 903 903 903
Reserves & surplus 5,029 5,556 6,052 6,589 7,197
Shareholders’ fund 5,932 6,459 6,956 7,492 8,100
Total liabilities and equities 7,815 9,041 11,036 10,712 10,357
Cash and cash eq. 194 131 335 179 344
Accounts receivables 807 795 887 1,155 1,381
Inventories 241 298 305 331 356
Other current assets 472 492 503 546 588
Investments 26 25 25 25 25
Net fixed assets 6,217 7,013 6,958 6,980 6,699
CWIP 76 416 0 0 0
Intangible assets 7 12 12 12 12
Deferred tax assets, net (808) (738) (738) (738) (738)
Other assets 582 594 2,748 2,220 1,690
Total assets 7,815 9,041 11,036 10,712 10,357
Source: Company, BOBCAPS Research
VRL LOGISTICS
EQUITY RESEARCH 25 28 November 2019
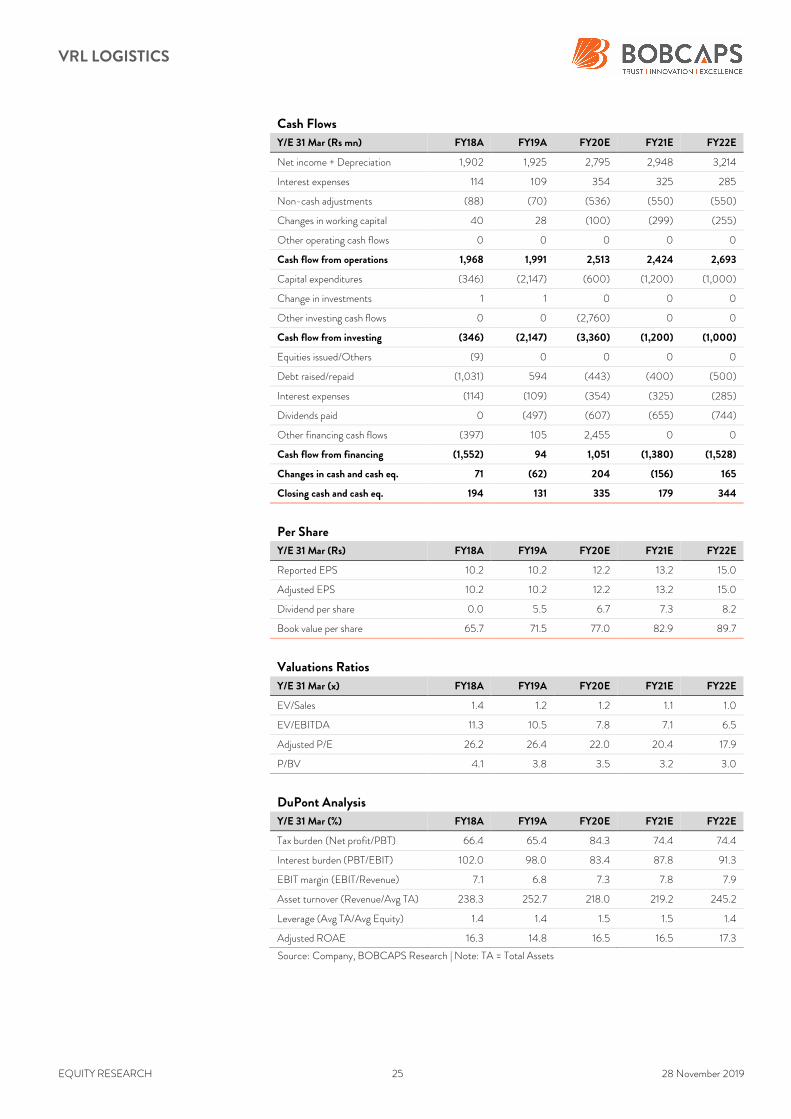
Cash Flows
Y/E 31 Mar (Rs mn) FY18A FY19A FY20E FY21E FY22E
Net income + Depreciation 1,902 1,925 2,795 2,948 3,214
Interest expenses 114 109 354 325 285
Non-cash adjustments (88) (70) (536) (550) (550)
Changes in working capital 40 28 (100) (299) (255)
Other operating cash flows 0 0 0 0 0
Cash flow from operations 1,968 1,991 2,513 2,424 2,693
Capital expenditures (346) (2,147) (600) (1,200) (1,000)
Change in investments 1 1 0 0 0
Other investing cash flows 0 0 (2,760) 0 0
Cash flow from investing (346) (2,147) (3,360) (1,200) (1,000)
Equities issued/Others (9) 0 0 0 0
Debt raised/repaid (1,031) 594 (443) (400) (500)
Interest expenses (114) (109) (354) (325) (285)
Dividends paid 0 (497) (607) (655) (744)
Other financing cash flows (397) 105 2,455 0 0
Cash flow from financing (1,552) 94 1,051 (1,380) (1,528)
Changes in cash and cash eq. 71 (62) 204 (156) 165
Closing cash and cash eq. 194 131 335 179 344
Per Share
Y/E 31 Mar (Rs) FY18A FY19A FY20E FY21E FY22E
Reported EPS 10.2 10.2 12.2 13.2 15.0
Adjusted EPS 10.2 10.2 12.2 13.2 15.0
Dividend per share 0.0 5.5 6.7 7.3 8.2
Book value per share 65.7 71.5 77.0 82.9 89.7
Valuations Ratios
Y/E 31 Mar (x) FY18A FY19A FY20E FY21E FY22E
EV/Sales 1.4 1.2 1.2 1.1 1.0
EV/EBITDA 11.3 10.5 7.8 7.1 6.5
Adjusted P/E 26.2 26.4 22.0 20.4 17.9
P/BV 4.1 3.8 3.5 3.2 3.0
DuPont Analysis
Y/E 31 Mar (%) FY18A FY19A FY20E FY21E FY22E
Tax burden (Net profit/PBT) 66.4 65.4 84.3 74.4 74.4
Interest burden (PBT/EBIT) 102.0 98.0 83.4 87.8 91.3
EBIT margin (EBIT/Revenue) 7.1 6.8 7.3 7.8 7.9
Asset turnover (Revenue/Avg TA) 238.3 252.7 218.0 219.2 245.2
Leverage (Avg TA/Avg Equity) 1.4 1.4 1.5 1.5 1.4
Adjusted ROAE 16.3 14.8 16.5 16.5 17.3
Source: Company, BOBCAPS Research | Note: TA = Total Assets
VRL LOGISTICS
EQUITY RESEARCH 26 28 November 2019
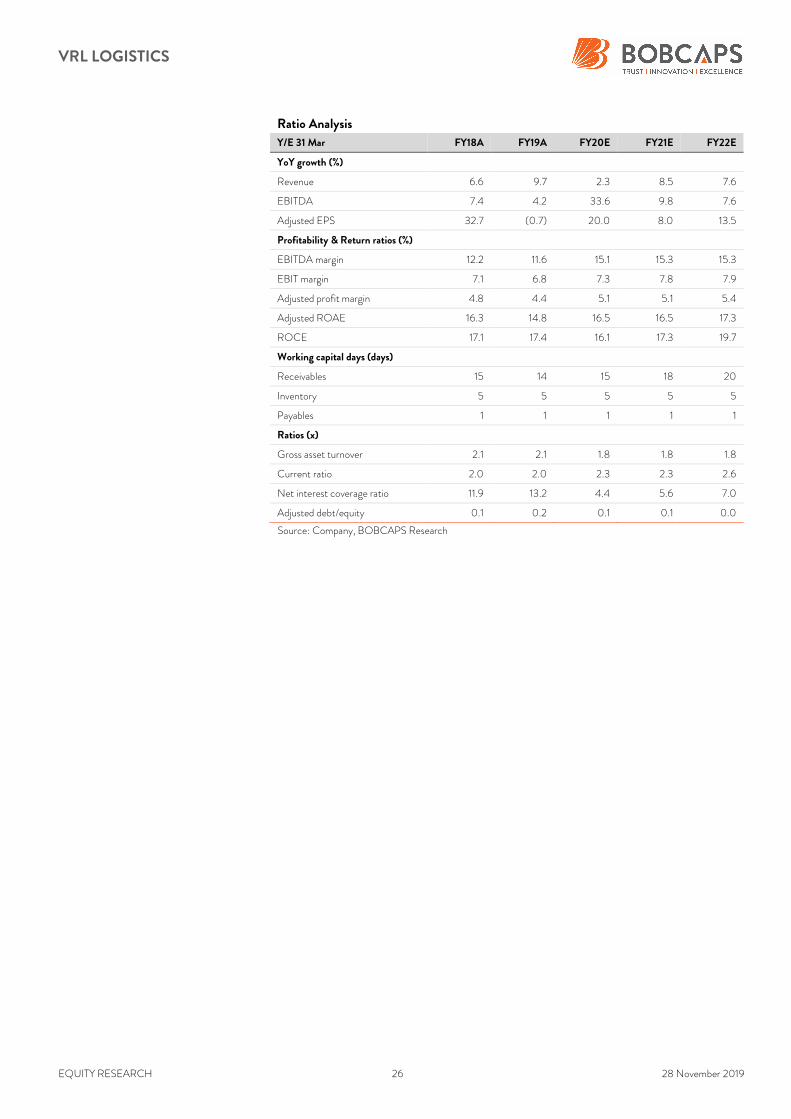
Ratio Analysis
Y/E 31 Mar FY18A FY19A FY20E FY21E FY22E
YoY growth (%)
Revenue 6.6 9.7 2.3 8.5 7.6
EBITDA 7.4 4.2 33.6 9.8 7.6
Adjusted EPS 32.7 (0.7) 20.0 8.0 13.5
Profitability & Return ratios (%)
EBITDA margin 12.2 11.6 15.1 15.3 15.3
EBIT margin 7.1 6.8 7.3 7.8 7.9
Adjusted profit margin 4.8 4.4 5.1 5.1 5.4
Adjusted ROAE 16.3 14.8 16.5 16.5 17.3
ROCE 17.1 17.4 16.1 17.3 19.7
Working capital days (days)
Receivables 15 14 15 18 20
Inventory 5 5 5 5 5
Payables 1 1 1 1 1
Ratios (x)
Gross asset turnover 2.1 2.1 1.8 1.8 1.8
Current ratio 2.0 2.0 2.3 2.3 2.6
Net interest coverage ratio 11.9 13.2 4.4 5.6 7.0
Adjusted debt/equity 0.1 0.2 0.1 0.1 0.0
Source: Company, BOBCAPS Research
VRL LOGISTICS
EQUITY RESEARCH 27 28 November 2019
Disclaimer
Recommendations and Absolute returns (%) over 12 months
BUY – Expected return >+15%
ADD – Expected return from >+5% to +15%
REDUCE – Expected return from -5% to +5%
SELL – Expected return <-5%
Note: Recommendation structure changed with effect from 1 January 2018 (Hold rating discontinued and replaced by Add / Reduce)
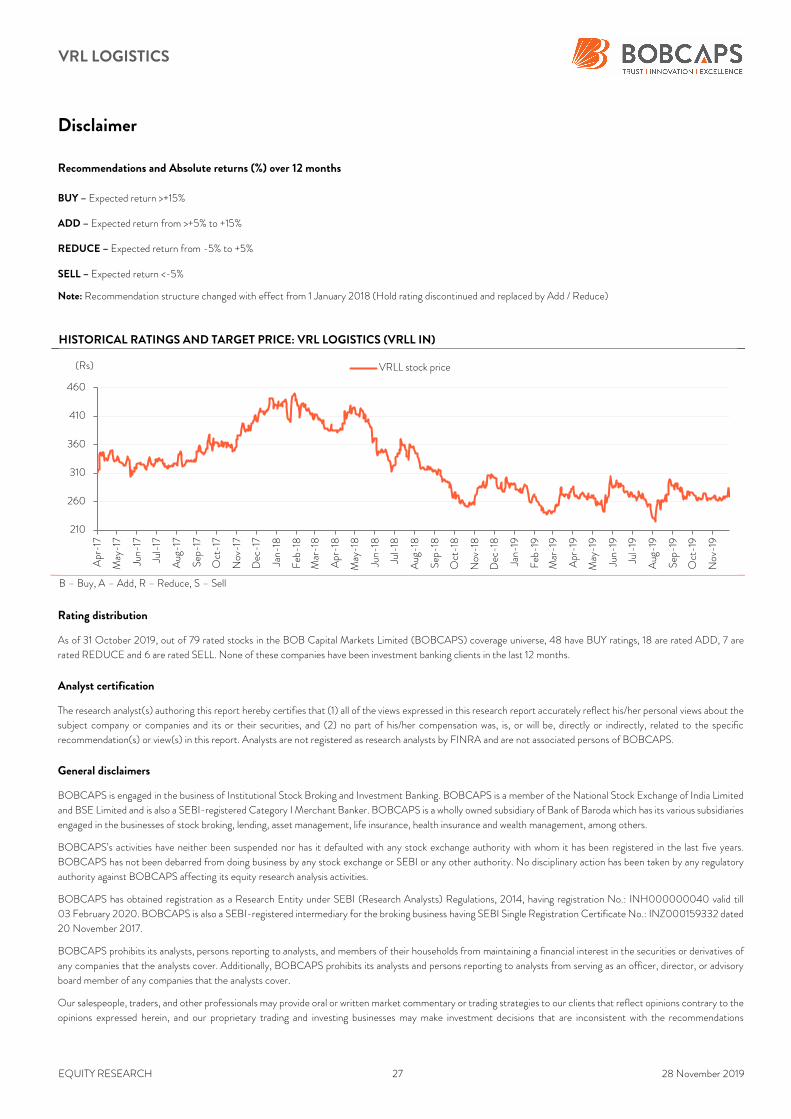
HISTORICAL RATINGS AND TARGET PRICE: VRL LOGISTICS (VRLL IN)
B – Buy, A – Add, R – Reduce, S – Sell
Rating distribution
As of 31 October 2019, out of 79 rated stocks in the BOB Capital Markets Limited (BOBCAPS) coverage universe, 48 have BUY ratings, 18 are rated ADD, 7 are
rated REDUCE and 6 are rated SELL. None of these companies have been investment banking clients in the last 12 months.
Analyst certification
The research analyst(s) authoring this report hereby certifies that (1) all of the views expressed in this research report accurately reflect his/her personal views about the
subject company or companies and its or their securities, and (2) no part of his/her compensation was, is, or will be, directly or indirectly, related to the specific
recommendation(s) or view(s) in this report. Analysts are not registered as research analysts by FINRA and are not associated persons of BOBCAPS.
General disclaimers
BOBCAPS is engaged in the business of Institutional Stock Broking and Investment Banking. BOBCAPS is a member of the National Stock Exchange of India Limited
and BSE Limited and is also a SEBI-registered Category I Merchant Banker. BOBCAPS is a wholly owned subsidiary of Bank of Baroda which has its various subsidiaries
engaged in the businesses of stock broking, lending, asset management, life insurance, health insurance and wealth management, among others.
BOBCAPS’s activities have neither been suspended nor has it defaulted with any stock exchange authority with whom it has been registered in the last five years.
BOBCAPS has not been debarred from doing business by any stock exchange or SEBI or any other authority. No disciplinary action has been taken by any regulatory
authority against BOBCAPS affecting its equity research analysis activities.
BOBCAPS has obtained registration as a Research Entity under SEBI (Research Analysts) Regulations, 2014, having registration No.: INH000000040 valid till
03 February 2020. BOBCAPS is also a SEBI-registered intermediary for the broking business having SEBI Single Registration Certificate No.: INZ000159332 dated
20 November 2017.
BOBCAPS prohibits its analysts, persons reporting to analysts, and members of their households from maintaining a financial interest in the securities or derivatives of
any companies that the analysts cover. Additionally, BOBCAPS prohibits its analysts and persons reporting to analysts from serving as an officer, director, or advisory
board member of any companies that the analysts cover.
Our salespeople, traders, and other professionals may provide oral or written market commentary or trading strategies to our clients that reflect opinions contrary to the
opinions expressed herein, and our proprietary trading and investing businesses may make investment decisions that are inconsistent with the recommendations
210
260
310
360
410
460
Apr-17
May
-17
Jun-
17
Jul-17
Aug
-17
Sep
-17
Oct-17
Nov
-17
Dec
-17
Jan-
18
Feb
-18
Mar-18
Apr-18
May
-18
Jun-
18
Jul-18
Aug
-18
Sep
-18
Oct-18
Nov
-18
Dec
-18
Jan-
19
Feb
-19
Mar-19
Apr-19
May
-19
Jun-
19
Jul-19
Aug
-19
Sep
-19
Oct-19
Nov
-19
(Rs) VRLL stock price
VRL LOGISTICS
EQUITY RESEARCH 28 28 November 2019
expressed herein. In reviewing these materials, you should be aware that any or all of the foregoing, among other things, may give rise to real or potential conflicts of
interest. Additionally, other important information regarding our relationships with the company or companies that are the subject of this material is provided herein.
This material should not be construed as an offer to sell or the solicitation of an offer to buy any security in any jurisdiction where such an offer or solicitation would be
illegal. We are not soliciting any action based on this material. It is for the general information of BOBCAPS’s clients. It does not constitute a personal recommendation
or take into account the particular investment objectives, financial situations, or needs of individual clients. Before acting on any advice or recommendation in this
material, clients should consider whether it is suitable for their particular circumstances and, if necessary, seek professional advice.
The price and value of the investments referred to in this material and the income from them may go down as well as up, and investors may realize losses on any
investments. Past performance is not a guide for future performance, future returns are not guaranteed and a loss of original capital may occur. BOBCAPS does not
provide tax advice to its clients, and all investors are strongly advised to consult with their tax advisers regarding any potential investment in certain transactions —
including those involving futures, options, and other derivatives as well as non-investment-grade securities —that give rise to substantial risk and are not suitable for all
investors. The material is based on information that we consider reliable, but we do not represent that it is accurate or complete, and it should not be relied on as such.
Opinions expressed are our current opinions as of the date appearing on this material only. We endeavour to update on a reasonable basis the information discussed in
this material, but regulatory, compliance, or other reasons may prevent us from doing so.
We and our affiliates, officers, directors, and employees, including persons involved in the preparation or issuance of this material, may from time to time have “long” or
“short” positions in, act as principal in, and buy or sell the securities or derivatives thereof of companies mentioned herein and may from time to time add to or dispose
of any such securities (or investment). We and our affiliates may act as market makers or assume an underwriting commitment in the securities of companies discussed
in this document (or in related investments), may sell them to or buy them from customers on a principal basis, and may also perform or seek to perform investment
banking or advisory services for or relating to these companies and may also be represented in the supervisory board or any other committee of these companies.
For the purpose of calculating whether BOBCAPS and its affiliates hold, beneficially own, or control, including the right to vote for directors, one per cent or more of
the equity shares of the subject company, the holdings of the issuer of the research report is also included.
BOBCAPS and its non-US affiliates may, to the extent permissible under applicable laws, have acted on or used this research to the extent that it relates to non-US
issuers, prior to or immediately following its publication. Foreign currency denominated securities are subject to fluctuations in exchange rates that could have an adverse
effect on the value or price of or income derived from the investment. In addition, investors in securities such as ADRs, the value of which are influenced by foreign
currencies, effectively assume currency risk. In addition, options involve risks and are not suitable for all investors. Please ensure that you have read and understood the
Risk disclosure document before entering into any derivative transactions.
In the US, this material is only for Qualified Institutional Buyers as defined under rule 144(a) of the Securities Act, 1933. No part of this document may be distributed
in Canada or used by private customers in the United Kingdom.
No part of this material may be (1) copied, photocopied, or duplicated in any form by any means or (2) redistributed without BOBCAPS’s prior written consent.
Company-specific disclosures under SEBI (Research Analysts) Regulations, 2014
The research analyst(s) or his/her relatives do not have any material conflict of interest at the time of publication of this research report.
BOBCAPS or its research analyst(s) or his/her relatives do not have any financial interest in the subject company. BOBCAPS or its research analyst(s) or his/her
relatives do not have actual/beneficial ownership of one per cent or more securities in the subject company at the end of the month immediately preceding the date of
publication of this report.
The research analyst(s) has not received any compensation from the subject company in the past 12 months. Compensation of the research analyst(s) is not based on
any specific merchant banking, investment banking or brokerage service transactions.
BOBCAPS or its research analyst(s) is not engaged in any market making activities for the subject company.
The research analyst(s) has not served as an officer, director or employee of the subject company.
BOBCAPS or its associates may have material conflict of interest at the time of publication of this research report.
BOBCAPS’s associates may have financial interest in the subject company. BOBCAPS’s associates may hold actual / beneficial ownership of one per cent or more
securities in the subject company at the end of the month immediately preceding the date of publication of this report.
BOBCAPS or its associates may have managed or co-managed a public offering of securities for the subject company or may have been mandated by the subject
company for any other assignment in the past 12 months.
BOBCAPS may have received compensation from the subject company in the past 12 months. BOBCAPS may from time to time solicit or perform investment banking
services for the subject company. BOBCAPS or its associates may have received compensation from the subject company in the past 12 months for services in respect
of managing or co-managing public offerings, corporate finance, investment banking or merchant banking, brokerage services or other advisory services in a merger or
specific transaction. BOBCAPS or its associates may have received compensation for products or services other than investment banking or merchant banking or
brokerage services from the subject company in the past 12 months.


