Embed Size (px)
Citation preview
INSTITUTIONAL SOURCES TRANSFORMING CRISES INTO
A SPRINGBOARD FOR INNOVATIONS
CHEW YEN CHENG MICHELE
(MSc, NUS; BSc (Hons), UCL)
A THESIS SUBMITTED
FOR THE DEGREE OF DOCTOR OF PHILOSOPHY DIVISION OF ENGINEERING & TECHNOLOGY MANAGEMENT
FACULTY OF ENGINEERING NATIONAL UNIVERSITY OF SINGAPORE
2011
brought to you by COREView metadata, citation and similar papers at core.ac.uk
provided by ScholarBank@NUS

INSTITUTIONAL SOURCES TRANSFORMING CRISES INTO
A SPRINGBOARD FOR INNOVATIONS
Acknowledgements
I am very grateful to the patient guidance of Prof ChihiroWatanabe. His invaluable experience
and expertise in a broad range of topics has made this possible because not many supervisors
have the mix of policy and academic experience, especially in the area of technology policy,
patents and technology management. And not many were willing to undertake supervision of a
topic such as water as many are not familiar with the technology.
I would also like to thank Prof Hang Chang Chieh for his foresight of accepting such a PhD topic
to be undertaken within the department.
I would also like to thank the officers from PUB who had provided me with data and agreed to
my many hours of interview.
Table of Contents
SUMMARY I LIST OF TABLES ....................................................................................................................................... II LIST OF FIGURES .................................................................................................................................... III CHAPTER I 1 INTRODUCTION ........................................................................................................................................ 1
1.1 INTRODUCTION...................................................................................................................................... 2 1.2 BACKGROUND ....................................................................................................................................... 4
1.2.1 Water – A Global Issue ............................................................................................. 4 1.2.2 Singapore’s NEWater Journey .................................................................................. 4
1.3 THEORETICAL BACKGROUND ................................................................................................................ 8 1.4 LITERATURE REVIEW ............................................................................................................................ 9 1.5 RESEARCH QUESTION ......................................................................................................................... 12
CHAPTER II 14 FOUR-PHASED DEVELOPMENT ......................................................................................................... 14
2.1 INTRODUCTION.................................................................................................................................... 15 2.2 DATA CONSTRUCTION ......................................................................................................................... 15
2.2.1 NEWater Dependency ............................................................................................. 16 2.2.2 Trend in Learning .................................................................................................... 18 2.2.3 Elasticity of NEWater Substitution ......................................................................... 20 2.2.4 Accumulation of Knowledge Stock ......................................................................... 23
2.3 RESULTS ............................................................................................................................................. 27 2.3.1 Stock & Functionality ............................................................................................. 27 2.3.2 Four Phases of NEWater Development Trajectory ................................................. 40 2.3.3 Institutional Approaches .......................................................................................... 53
2.4 DISCUSSION ........................................................................................................................................ 65 CHAPTER III 71 CONCLUSION 71
3.1 SUMMARY OF FINDINGS ...................................................................................................................... 72 3.2 LIMITATION ........................................................................................................................................ 73 3.3 FUTURE WORK .................................................................................................................................... 74
REFERENCES 76 APPENDIX 87
i
SUMMARY
This PhD research attempts an in-depth analysis on Singapore’s strategy in transforming its
vulnerability in water into a springboard for new innovations. Using NEWater as the innovative
solution to achieving the nation’s vision of being self-sufficient in water, the transformation
process of achieving growth and sustainability is mapped out. The initial stage of growth was
dependent on imported capabilities (comprising technologies and human capabilities). As local
firms collaborated with overseas partners in projects, learning occurred. The learning was
absorbed and assimilated, leading to the development of indigenous capabilities (technologies and
human capabilities). These indigenous capabilities developed were later exported by local
companies via projects secured in overseas markets. This internationalization activity triggered
further innovation among the leaders (innovators) and the followers (imitators). The dynamic
relationship between the innovation and institutional factors is the essence of the co-evolutionary
acclimatization stage, the final stage of the growth framework.
ii
LIST OF TABLES
Table 1.1 NEWater factories in Singapore ...................................................................................... 7 Table 2.1 Trend in NEWater Dependency in Singapore (2003-2011) – 103 m3/d, % ................... 16 Table 2.2 Estimated trajectory for NEWater dependency in Singapore (2003-2011) ................... 17 Table 2.3 Diffusion parameters in knowledge stock of Singapore’s NEWater development trajectories (2003-2009) ................................................................................................................ 32 Table 2.4 Quarterly trends in knowledge stock of the two waves of Singapore’s NEWater development (2003-2009) ............................................................................................................. 33 Table 2.5 Learning-based knowledge coefficient and Technology-based knowledge coefficient 37 Table 2.6 Country of origin for suppliers of products and services for Singapore’s NEWater factories ......................................................................................................................................... 41 Table 2.7 Leading Japanese suppliers# of advanced membranes to Singapore NEWater factories ....................................................................................................................................................... 42 Table 2.8 Export destination of Kristal™ membranes manufactured by Hyflux Limited ............ 45 Table 2.9 Designed capacities of water plants constructed by Hyflux Limited ............................ 45 Table 2.10 Nature of international projects contracted by Keppel Integrated Engineering .......... 47 Table 2.11 Export of indigenous capabilities by Sembcorp Industries# ........................................ 49 Table 2.12 Corporate R&D centers established by global water players in Singapore ................. 56 Table 2.13 Public sector R&D centers established in Singapore .................................................. 56 Table 2.14 Water projects awarded under DBOO model .............................................................. 64 Table 2.15 Dependency on technology-driven water in Singapore ............................................... 67
iii
LIST OF FIGURES
Figure 1.1. Closing the water loop. ................................................................................................. 6 Figure 2.1. Trend in NEWater dependency in Singapore (2003-2011): actual and estimated (%). ....................................................................................................................................................... 17 Figure 2.2. Level and timing of inflection in a diffusion trajectory in the Bass Model. ............... 26 Figure 2.3. Trend in learning coefficient (2003-2009). ................................................................. 28 Figure 2.4. Trend in NEWater and Conventional Water ratio (2003-2009). ................................. 29 Figure 2.5. Trend in the correlation between prices and volume of NEWater and Conventional Water (2003-2009). ...................................................................................... 30 Figure 2.6. Trend in knowledge stock of two waves in Singapore’s NEWater development (2003-2009). ............................................................................................................................................. 34 Figure 2.7. Trends in the ratios of two waves in knowledge stock of Singapore’s NEWater development (2003-2009). ............................................................................................................ 35 Figure 2.8. Correlation between the ratio of the two waves in knowledge stock in Singapore’s NEWater development (2003-2009). ............................................................................................ 35 Figure 2.9. Scheme of knowledge stock in Singapore’s NEWater development (2003-2009). .... 36 Figure 2.10. Trends in the technology-based knowledge coefficient and learning-based knowledge coefficient of Singapore’s NEWater development (2003-2009). ............................... 37 Figure 2.11. Inflection points of the two waves of knowledge stock of Singapore’s NEWater (2003Q1- 2015Q4). ....................................................................................................................... 39 Figure 2.12. Four-phased NEWater transformation process. ........................................................ 40 Figure 2.13. Value chain in the water business. ............................................................................ 57 Figure 2.14. A vibrant water ecosystem in Singapore involving more than 70 companies. ......... 58 Figure 2.15. The Design-Build-Own-Operate model. ................................................................... 61 Figure 2.16. The Design-Bid-Build model. ................................................................................... 62 Figure 2.17. The Design and Build model..................................................................................... 63 Figure 2.18. Strong partnership established in the DTSS Changi Water Reclamation Plant. ....... 64 Figure 2.19. Strong partnership established in the Marina Barrage Project. ................................. 65 Figure 2.20. Innovator-Imitator relationship. ................................................................................ 67 Figure 2.21. Sustaining global economic competitiveness via new functionality development. .. 68
iv
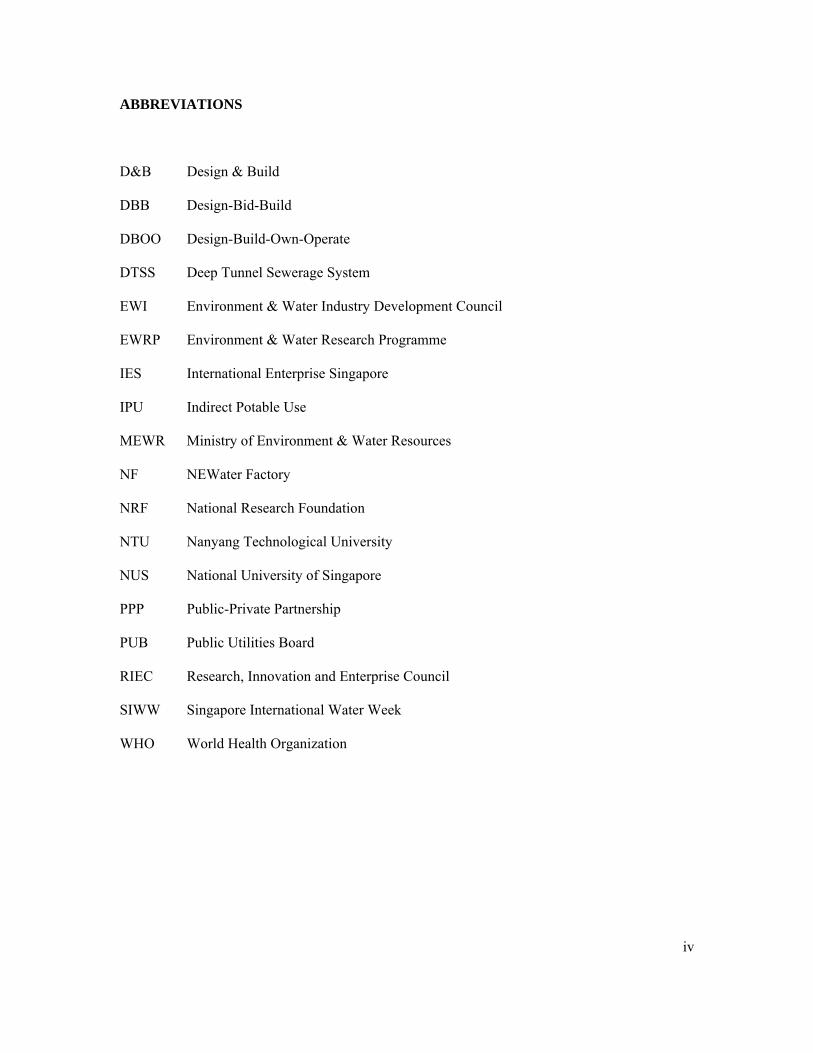
ABBREVIATIONS
D&B Design & Build
DBB Design-Bid-Build
DBOO Design-Build-Own-Operate
DTSS Deep Tunnel Sewerage System
EWI Environment & Water Industry Development Council
EWRP Environment & Water Research Programme
IES International Enterprise Singapore
IPU Indirect Potable Use
MEWR Ministry of Environment & Water Resources
NF NEWater Factory
NRF National Research Foundation
NTU Nanyang Technological University
NUS National University of Singapore
PPP Public-Private Partnership
PUB Public Utilities Board
RIEC Research, Innovation and Enterprise Council
SIWW Singapore International Water Week
WHO World Health Organization

1
CHAPTER I
INTRODUCTION
2
CHAPTER I INTRODUCTION
1.1 Introduction
The research idea is to propose a model for transforming a national vulnerability into an
economic growth pillar. To achieve this objective, national vulnerabilities that had been
transformed into an economic competitive strength were shortlisted. Japan’s labour shortage
vulnerability in the 1960s, which lead to the development of the nation’s automation industry, in
particular, the robotics industry, is one example. Another example is the energy crisis in Japan
that occurred during the 1970s. The vulnerability of insufficient energy supply as a consequence
of dependence on imported crude oil spurred innovations in systems efficiency for greater
efficient use of energy by energy-intensive industries (mainly the manufacturing industry). These
vulnerabilities have been studied and mathematical models have been proposed. The
mathematical models suggest the evolution of economies from the Industrialization Era to the
Knowledge-based Era. Thus, the proposed models take into account new theoretical concepts that
have evolved along the way and have improved predictive capabilities as scenario planning is an
important aspect for businesses and nations. The emphasis of the research is focused on which
variables to measure and how the statistical significance and predictability of the variables.
Literature neither document the transformation process nor does it document the application of
various mathematical models in the analysis of a real-life transformation.
This research focuses on a vulnerability that affects nations globally. That is the vulnerability of
water as water is probably the only natural resource to have an impact of all aspects of human
civilization. To name a few, these include agriculture, industrial development, health and culture.
3
According to Goal 7 of the World Health Organization Millennium Development Goals1 on
environmental sustainability, it is targeted to half the proportion of people without sustainable
access to safe drinking water and sanitation by 2015. This is a challenge because as global
population is soaring. It is estimated that by 2050, 70% of the world’s population will be living in
cities. Water is an issue that affects small and large cities, as well as developed and developing
cities. Singapore, a small city has experienced the transformation from a developing to a
developed city and has also successfully transformed its vulnerability in water into an opportunity
for economic competitiveness. Thus, it is selected as the focus of this research to study the
transformation process in light of the institutional innovations enabling the transformation.
Following Chapter I, which provides the motivation and theoretical background, Chapter II
identifies the phases necessary for the transformation and the institutional factors that facilitated
the transition between the phases, supported by empirical data. A summary of the findings and
the conclusion is presented in Chapter III.
This PhD research makes significant contribution to existing literature on economic growth
because it operationalizes the co-evolutionary theory and identifies the phrases that are required
for the transformation of a national vulnerability into an economic strength. This PhD research
also makes significant contribution to existing research in terms of the technoeconomics analysis
approach in the sense that it uses the co-evolutionary as a platform that pools together several
economics aspects to analyze the transformation of an innovation.
1 World Health Organization, Millennium Development Goals, available online http://www.who.int/topics/millennium_development_goals/mdg7/en/index.html
4
1.2 Background
1.2.1 Water – A Global Issue
Urbanization is the trend of the twenty-first century. Already half of the world’s population is
urban. It is estimated that given the average annual global growth at 1.5%, by 2050, the urban
population is estimated to reach 61.8%2. Economic growth increases the purchasing power of the
urban population and increases the demand for goods and services. Water is one such good and
service in which the demand will increase because water is vital for direct human well-being and
to sustain various water-dependent ecosystems services (part of industrial development).
Competition for water between the various sectors of an economy (typically, agriculture,
manufacturing/industry and domestic) will intensify. Although water is a recyclable natural
resource, it is imperative to provide exemplars of cities that are prudent in water demand and
resource use. This is one of the motivations for selecting Singapore’s water vulnerability as the
focus of this thesis. In the 1960s, ensuring sufficient water supply was a great challenge. Today,
Singapore is able to successfully manage the nation’s water supply and demand requirements. By
operationalizing Singapore’s transformation, policy makers who intent to embark on such
transformations can use the model as a reference and adapt it according to the status institutional
conditions and economic development status of their nation.
1.2.2 Singapore’s NEWater Journey
Singapore, a small island state of only 700 square kilometers became an independent state in
1965. In the early post-independence period, Singapore faced severe environmental challenges
that threatened its survival. Among these challenges were the spread of vector-borne diseases and
the threat of not having sufficient water for its people. The main source of water supply then was
2 UN-HABITAT report 2010 “State of the World Cities 2010/11: Bridging the Urban Divide”, available online http://www.unhabitat.org/content.asp?cid=8051&catid=7&typeid=46&subMenuId=0
5
water imported from Malaysia, supplemented with water from local catchments, i.e., reservoirs.
The Singapore Government recognized that the supply from imported sources and local
catchments will not be able to ensure a stable and sustainable water supply for the country’s
growing economy and population (Long, 2002). In 1971, a Water Planning Unit was set up in the
Prime Minister’s Office to study the scope and feasibility of new conventional sources, such as
unprotected catchments and unconventional sources, such as water reuse and desalination. The
Singapore Water Reclamation Study (NEWater Study) was initiated in 1998 as a joint initiative
between the Public Utilities Board (PUB) and the Ministry of the Environment and Water
Resources (MEWR). The primary objective of the joint initiative was to determine the suitability
of using NEWater as a source of raw water to supplement Singapore's water supply. NEWater
can be mixed and blended with reservoir water and then undergo conventional water treatment to
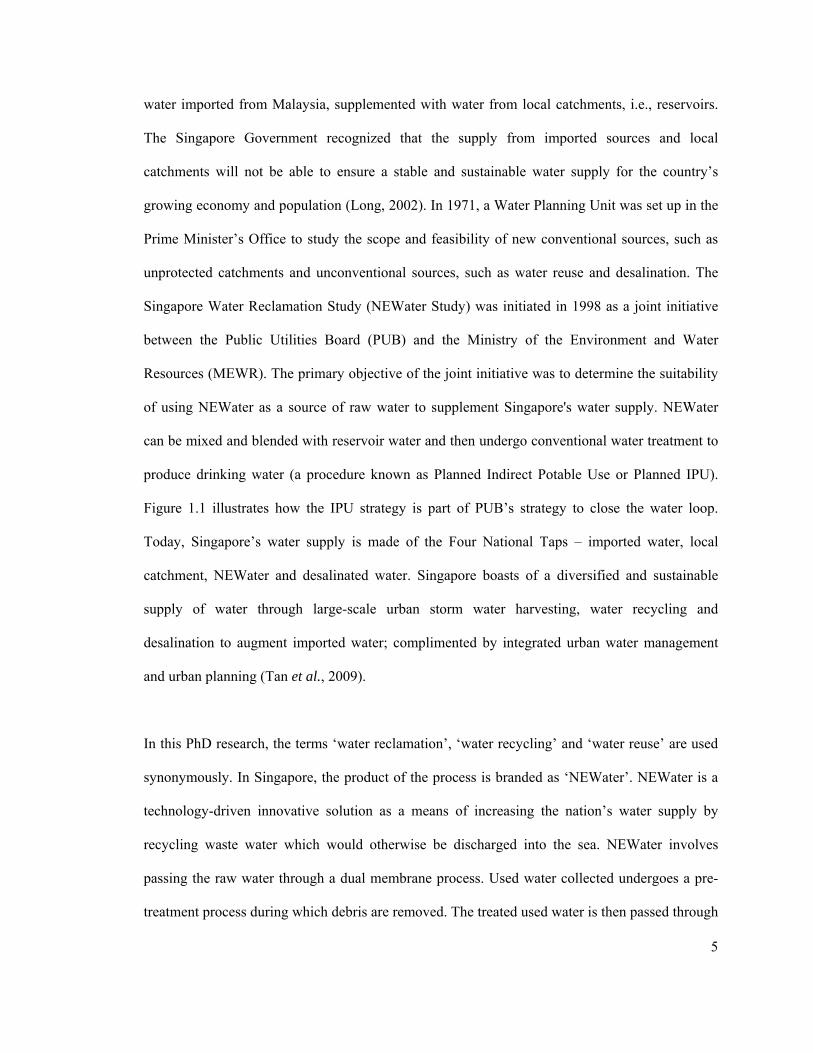
produce drinking water (a procedure known as Planned Indirect Potable Use or Planned IPU).
Figure 1.1 illustrates how the IPU strategy is part of PUB’s strategy to close the water loop.
Today, Singapore’s water supply is made of the Four National Taps – imported water, local
catchment, NEWater and desalinated water. Singapore boasts of a diversified and sustainable
supply of water through large-scale urban storm water harvesting, water recycling and
desalination to augment imported water; complimented by integrated urban water management
and urban planning (Tan et al., 2009).
In this PhD research, the terms ‘water reclamation’, ‘water recycling’ and ‘water reuse’ are used
synonymously. In Singapore, the product of the process is branded as ‘NEWater’. NEWater is a
technology-driven innovative solution as a means of increasing the nation’s water supply by
recycling waste water which would otherwise be discharged into the sea. NEWater involves
passing the raw water through a dual membrane process. Used water collected undergoes a pre-
treatment process during which debris are removed. The treated used water is then passed through
6
the first stage known as microfiltration. During this stage, suspended solids, colloidal particles,
disease-causing bacteria, some viruses and protozoan cysts are removed. The filtered water then
goes through the second stage known as reverse osmosis. At this stage, bacteria, viruses, heavy
metals, nitrate, chloride, sulphate, disinfection by-products, aromatic hydrocarbons, pesticides are
removed. The final stage involves ultraviolet disinfection to ensure that all organisms are
inactivated. Typically, alkaline chemicals are added to the water to restore the pH balance of the
water. NEWater passed more than 65,000 scientific tests and surpassed the requirements for
portable use by the World Health Organization (WHO).
Figure 1.1. Closing the water loop.
As of June 2011, there are five NEWater factories in operation in Singapore. Table 1.1 details the
year of commission, the designed production capacity and the procurement model of each of the
NEWater factories. NEWater is supplied primarily to wafer fabrication, electronic and power
Stormwater Management
Collection of Rainfall in Drains &
Reservoirs
RAIN SEA Treatment of Wastewater
Collection of Wastewater in
Sewers
Reclamation of Used Water
Supply of Water to the Population &
Industries
Desalination
Treatment of Raw to Potable
Water
Direct Non-Potable Use
Direct Non- Potable Use
7
generation industries for process use; and to commercial and institutional buildings for air
conditioning cooling purposes. The demand for NEWater for such non-portable industrial
purposes has grown 15-fold from 4mgd3 in 2003 to 60mgd in 2011. It is estimated that the
demand by non-domestic sector (as a percentage of the total national demand) will continue to
increase from 55% in 2010 to 70% in 2060. Thus, the PUB has put in long-term plans for
NEWater to meet 50% of the nation’s total water demand by 2060, an additional 20% from the
current 30%.
Table 1.1 NEWater factories in Singapore Name Plant Capacity Year Commissioned Procurement Model Bedok 18mgd Jan 2003 DBB Kranji 17mgd Jan 2003 DBB Seletar 5mgd Feb 2004 D&B Ulu Pandan 32mgd Mar 2007 DBOO Changi 50mgd May 2010 DBOO DBB – Design-Bid-Build D&B – Design & Build DBOO – Design-Build-Own-Operate
Inspired by the success of NEWater, the research agenda of this research was to identify the
phases of development required for the successful transformation process. After the identification
of each phase, the institutional factors that facilitated the transition between the phases were
determined. As such this PhD research is a multidisciplinary research drawing on economics,
policy and the management of technology.
3 mgd: million gallons per day
8
1.3 Theoretical Background
This PhD research attempts to study the transformation process through the lens of the
evolutionary theory (Nelson, 2004). A background to economic growth theory is provided
followed by a discussion of the relevance of the evolutionary theory to this PhD research.
The neoclassical growth theory (Solow, 1956) is the centerpiece of economic growth theory. In
this model, the engine of growth, as depicted by labour productivity (Total Factor Productivity
(TFP)) grows continually and exogenously. In response, the capital stock (assumed homogenous
over time) is continually increased allowing for a continual expansion in the level of output and
consumption. Productivity changes that are assumed exogenous in the model are, in fact, the
result of conscious decisions on the part of economic agents. In the current knowledge-based
economy, the change is due to innovation. However, the model does not explain why access to
these innovations should be different, nor is it noted that these innovations themselves are
economic decisions – they have costs and benefits, and are made by optimizing, private agents.
This basic weakness in the Solow model was the driving force behind the development of the
endogenous growth theory. The literature on endogenous growth has concentrated on replacing
this assumed exogenous productivity growth by an endogenous process. The models developed
range from perfectly competitive, convex models to models featuring a range of market failures
(e.g., external effects, imperfectly competitive behavior by firms, etc.). The productivity of labour
is thought to arise from the invention of techniques consciously developed to create the
technological improvement (Shell, 1967, and 1973). Although the theory takes into account
innovation as an endogenous process, it assumes that the technologies are time stationary. In
reality, R&D is consistently advancing technologies. A positive feature of the endogenous growth
models is that it places emphasis on knowledge (human capital), and its production and
dissemination. However, the model is static, this implies that learning and human capital is also
9
static in time and at a certain level. In reality, R&D is constantly evolving and the ability to learn
and the human capital built is also constantly changing.
This PhD research studies an innovation that is technology-driven and knowledge-intensive
taking place in a knowledge-based economy. The capacity to commercialize the outputs of the
research requires learning and assimilation. Learning and assimilation do not take place
spontaneously. A suitable environment, known as the eco-system has to be created to nurture it.
At the macro-level (Geels, 2005), it involves government policies that facilitate the building of an
eco-system that encourages and sustains learning and assimilation. Therefore, given the
limitations of the endogenous growth theory, and the characteristics of this research topic, the
evolutionary theory was adopted for this PhD research. The evolutionary theory is able to address
the rich mix of institutions (Watanabe et al., 2006) involved in the economic activity. It
recognizes that firms, households and markets are not the only institutions involved. It also
recognizes the role played by the government is not simply a response to market failure but may
be one of stimulating a vibrant eco-system that is crucial to the building up of indigenous
capabilities. Finally, the theory incorporates the concept of co-evolution, which is an important
observation in this research.
1.4 Literature Review
In this PhD research, the focus is on the co-evolutionary transformation process of a vulnerability
into an economic strength. This process is similar to the catching-up or leapfrogging process
studied by many scholars globally. Literature related to catching-up or leapfrogging is plentiful
and can be grouped into two categories. Research in one category concentrates on the
transformation at the firm / industry level. Lee & Lim (2001) described three transformation
patterns – stage-skipping, path-creating and path-following from a study of six industries in
10
Korea – the D-RAM, automobile, mobile phone, consumer electronics, personal computer and
machine tool industry. Popular industries that have been studied include the automobile industry
(Yang et al., 2006) and the mobile phone / telecommunication services industry (Chen et al.,
2007). Other industries that have also been studied in-depth are the water supply and sanitation
industry (Geels, 2005), and the wind energy industry (Kristinsson & Rao, 2008). Hobday (1995)
conducted a comprehensive study of electronic firms in the four dragons of East Asia (South
Korea, Taiwan, Hong Kong and Singapore) with the emphasis to explore how local East Asian
overcame the barriers to enter the market. Choung et al. (2000) studied the transformation of
Korean semiconductor firms and identified that a clear indication of the type of technology
capability and the direction (depth and scope) of capability accumulation are necessary for a
successful transformation for the companies studied. Furtado and Freitas (2000) conducted an in-
depth study on the learning process that enabled a successful transformation in Petrobras, a
Brazilian state-owned oil and gas company. The study is interesting as the oil and gas industry is
often considered a ‘sunset’ industry with little innovation and thus little learning needs to take
place. For Petrobras, depending on the technological systems / projects (subsea multiphase flow
pumping system, subsea separation system or electrical submersible pumps in subsea wells),
different degrees of learning was required. Another interesting feature of this study is the method
utilized in tracing the learning. Conventional studies trace learning via the learning curve concept
or variation of it, whereas this study traces learning via the type of agreement – industry project
agreements or technological co-orporation agreements.
Research in the other category concentrates on the transformation with regards to a nation.
Fukuda & Watanabe (2008), through their study on the national innovation systems in Japan and
the United States, suggested four principles on which co-evolutionary transformation of a nation
is established: 1) sustainable development through substitution, 2) self-propagation through co-
11
evolution, 3) organizational inertia and inspired learning from competitors, and 4) heterogeneous
synergy. Yao et al. (2009) through the use of principal component analysis illustrated how ICT
(information and communication technology) triggered co-evolution that lead to sustainable
development in Brazil, Russia, India and China. From the studies conducted on the channels for
transformation – learning (Kristinsson & Rao, 2008), universities and public research
organization (Mazzoleni & Nelson, 2007), technology transfer (Dechezlepretre et al., 2008) and
institutions (Kobos et al., 2006; Nelson, 2008), it can be concluded that institutions play an
important role in the transformation process. A comparison of the innovation policies for Taiwan
and Ireland revealed different approaches undertaken by the government to facilitate the
transformation process (Lin et al., 2010). The Taiwanese government was found to adopt a more
active top-down approach that involved substantial government research funding and resources to
develop target industries while the Irish government adopted a bottom-up approach focusing on
creating an innovative environment and encouraging firm-level research and development.
Another recent study by Gallagher & Shafaeddin (2010) investigated the role of government
policies in the transformation of China and Mexico. The authors identified three phases in the
transformation process in Mexico’s technological capabilities. The first phase was identified as
the ‘ISI period’. This period was a period of intensive protection of local technological
capabilities. Industrialization and manufacturing productivity increased to fulfill domestic market
demands. The second phase was the ‘Transition period’. The economy was in crisis and demand
contracted. There was large devaluation and trade balance deficit. To transit out of this phase,
there was the opening up of the Mexican economy, the first stage of liberalization. The final
phase was the ‘New regulatory framework and NAFTA’ phase. Trade and financial reform and
public deficit control were implemented, and export increased. Further to this, the authors
detailed the transformation in the terms of production capacity, competitiveness and sectoral
linkages and that of technological capabilities. By mapping the transformation process to the
12
government policies implemented by the Mexican government, the authors were able to illustrate
that strong government support by the Chinese government and effective government policies
aimed at industrial learning catalyzed the development of indigenous firms in China. As a result,
China outperforms Mexico.
The co-evolutionary transformation process in literature is often analyzed by the parties involved.
Utilizing the definition suggested by Yang et al. (2006), co-evolution refers to the successive
changes among two or more ecological interdependent but unique parties so that their
evolutionary trajectories intertwine overtime, adapting to each other. Co-evolution among two
parties can take the form of 1) co-evolution between technology and users (Coombs et al., 2001;
Lundvall, 1988; Clark, 1985; Leonard-Barton, 1988; Oudshoorn & Pinch, 2003); 2) co-evolution
between technology and culture (Du et al., 1997; Van Dijck, 1998); and 3) co-evolution of
science and technology (Kline & Rosenberg, 1986; Layton, 1971, 1976).
Co-evolution among three parties can take the form of 1) co-evolution between science,
technology and the market (Callon et al., 1992; Stankiewicz, 1992); and 2) co-evolution between
technology, industry structure and policy institutions (Nelson, 1994; Van de Ven & Garud, 1994;
Rosenkopf & Tushman, 1994; Leydesdorff & Etzkowitz, 1998; Leydesdorff, 2000). Thus, this
PhD research acknowledges that different forms of co-evolution can and may exist concurrently.
Thus it is not the intention to identify a particular category of co-evolution and deduce that it is
‘the’ co-evolution significantly influencing the transformation.
1.5 Research Question
From the literature survey conducted, it is revealed that there is currently no study conducted on
the water industry through the lens of a co-evolutionary transformation process at the nation level.
Although studies have documented successful transformation processes, mainly in the electronics,
13
semiconductor and mobile phone industries, these industries are unlike the water industry, as in,
the product is a good-to-have versus water that is a necessity for survival. All the papers reviewed,
except for the study conducted by Gallagher & Shafaeddin (2010), did not illustrate the
transformation process as a evolutionary process, describing a step-wise transition over time. The
phases identified in Gallagher & Shafaeddin (2010) were restricted to technological capabilities
and production capacity. Thus, this research aims to map out the process of transforming a
national vulnerability into a pillar for economic growth by focusing on NEWater in Singapore.
The research question seeks to identify the growth development trajectory required for
transforming a national vulnerability into a strength for economic growth. The question asked is
whether a step-wise growth development trajectory is required for the transformation. If so, what
are the trajectories? In addressing this main research question, institutional innovations positively
associated with the growth development are identified.
The methodology used in the existing literature to measure economic growth is centered on the
economics. The approach taken in this PhD research is an innovative application of economics,
technoeconomics and in-depth qualitative case studies to support the quantitative analysis. In
conventional economics analysis, learning and elasticity of substitution were studied in silos.
Learning, considered a human issue, is related to the management field while elasticity of
substitution is a pure economics topic. In this PhD research, the effects of learning and elasticity
of substitution are studied in combination. In addition, the Bi-bass model is used to decompose
the total knowledge stock accumulated and in combination with the concept of functionality
development to illustrate economic sustainability. The various technoeconomics concepts are
pooled together and studied using the co-evolutionary platform.
14
CHAPTER II
FOUR-PHASED DEVELOPMENT
15
Chapter II FOUR-PHASED DEVELOPMENT
2.1 Introduction
The section uses technoeconomics to analyze empirical data collected on NEWater to map out the
various phases required for the transformation of Singapore’s vulnerability in water into an
economic strength for the nation. To accomplish this mapping, the following will be established
in the specific order indicated. Firstly, Singapore’s dependence on NEWater as a source of supply
will be established to support the study on the NEWater industry in Singapore. Secondly, learning
from spillover technology and assimilation of the learning is established to illustrate the build up
of indigenous capabilities by local firms. This is essential because the knowledge base is a good
gauge of the development of the industry in terms of economic activities. The greater the
internationalization opportunities, the greater the level of economic growth. Finally, the ability to
sustain the economic activity is illustrated by the concept of functionality development.
2.2 Data Construction
Actual production figures for NEWater are not publicly available and the relative short history of
NEWater means about six yearly data points to work with. Thus, one of the challenges of this
PhD research, besides obtaining the data, is the construction of data for analysis. The following
describes the systematic manner in which the data is constructed through investigating 1) the
dependency on NEWater, followed by 2) the trend in learning as a result of the dependency on
NEWater, 3) the elasticity of NEWater as a substitute for convention water, 4) the accumulation
of knowledge stock, and 5) functionality development.
16
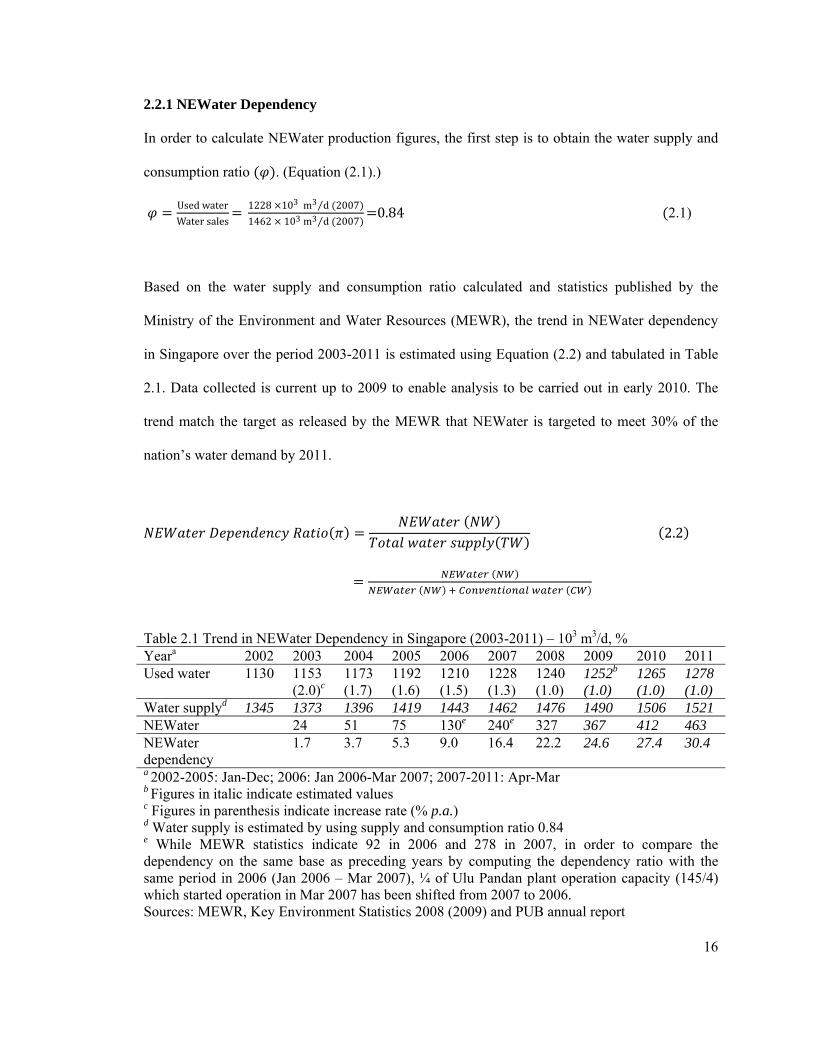
2.2.1 NEWater Dependency
In order to calculate NEWater production figures, the first step is to obtain the water supply and
consumption ratio . (Equation (2.1).)
Used water
Water sales
1228 103 m3 d⁄ 2007
1462 103 m3 d ⁄ 20070.84 2.1)
Based on the water supply and consumption ratio calculated and statistics published by the
Ministry of the Environment and Water Resources (MEWR), the trend in NEWater dependency
in Singapore over the period 2003-2011 is estimated using Equation (2.2) and tabulated in Table
2.1. Data collected is current up to 2009 to enable analysis to be carried out in early 2010. The
trend match the target as released by the MEWR that NEWater is targeted to meet 30% of the
nation’s water demand by 2011.
2.2
Table 2.1 Trend in NEWater Dependency in Singapore (2003-2011) – 103 m3/d, % Yeara 2002 2003 2004 2005 2006 2007 2008 2009 2010 2011 Used water 1130 1153 1173 1192 1210 1228 1240 1252b 1265 1278 (2.0)c (1.7) (1.6) (1.5) (1.3) (1.0) (1.0) (1.0) (1.0) Water supplyd 1345 1373 1396 1419 1443 1462 1476 1490 1506 1521 NEWater 24 51 75 130e 240e 327 367 412 463 NEWater dependency
1.7 3.7 5.3 9.0 16.4 22.2 24.6 27.4 30.4
a 2002-2005: Jan-Dec; 2006: Jan 2006-Mar 2007; 2007-2011: Apr-Mar b Figures in italic indicate estimated values c Figures in parenthesis indicate increase rate (% p.a.) d Water supply is estimated by using supply and consumption ratio 0.84 e While MEWR statistics indicate 92 in 2006 and 278 in 2007, in order to compare the dependency on the same base as preceding years by computing the dependency ratio with the same period in 2006 (Jan 2006 – Mar 2007), ¼ of Ulu Pandan plant operation capacity (145/4) which started operation in Mar 2007 has been shifted from 2007 to 2006. Sources: MEWR, Key Environment Statistics 2008 (2009) and PUB annual report
17
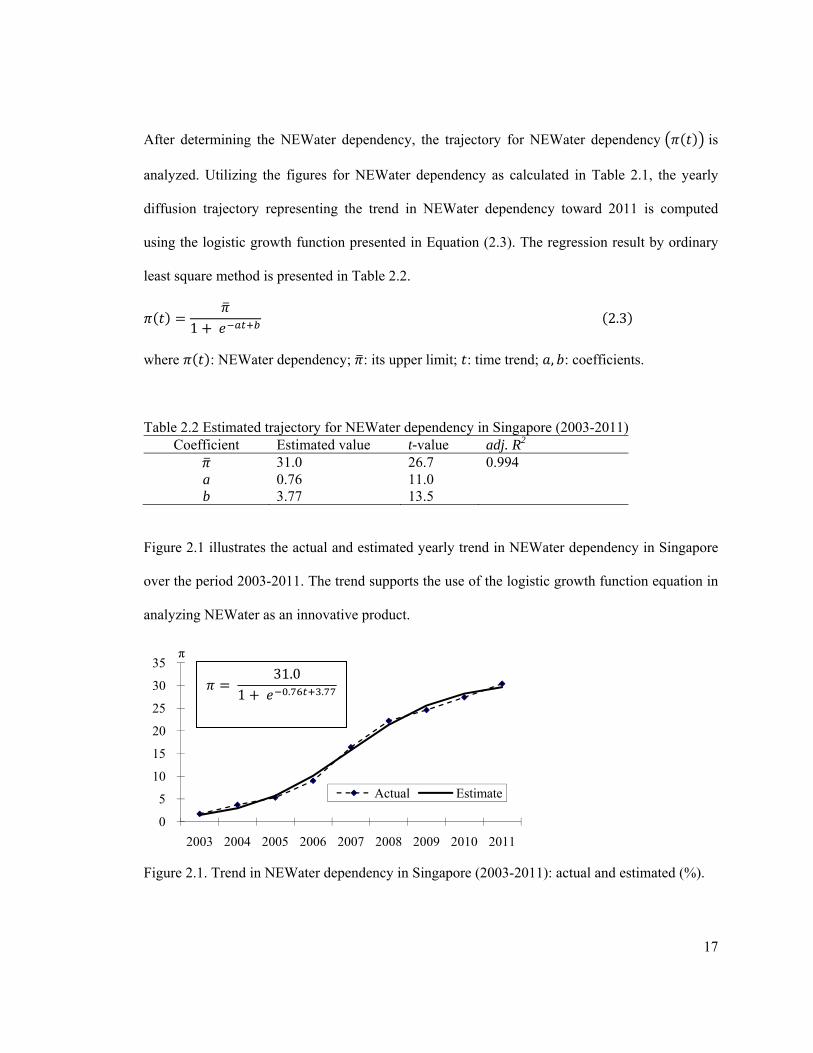
After determining the NEWater dependency, the trajectory for NEWater dependency is
analyzed. Utilizing the figures for NEWater dependency as calculated in Table 2.1, the yearly
diffusion trajectory representing the trend in NEWater dependency toward 2011 is computed
using the logistic growth function presented in Equation (2.3). The regression result by ordinary
least square method is presented in Table 2.2.
1 2.3
where : NEWater dependency; : its upper limit; : time trend; , : coefficients.
Table 2.2 Estimated trajectory for NEWater dependency in Singapore (2003-2011)
Coefficient Estimated value t-value adj. R2 31.0 26.7 0.994
a 0.76 11.0 b 3.77 13.5
Figure 2.1 illustrates the actual and estimated yearly trend in NEWater dependency in Singapore
over the period 2003-2011. The trend supports the use of the logistic growth function equation in
analyzing NEWater as an innovative product.
Figure 2.1. Trend in NEWater dependency in Singapore (2003-2011): actual and estimated (%).
0
5
10
15
20
25
30
35
2003 2004 2005 2006 2007 2008 2009 2010 2011
π
Actual Estimate
31.0
1 . .
18
In order to proceed with further analysis with sufficient number of data sets, the figures for the
quarterly trend and quarterly total used water are incorporated into the estimated function.
The quarterly trajectory , and the quarterly NEWater production capacity
(consumption based) over the period 2003-2009 are estimated using Equation (2.4) and the results
are tabulated in Appendix A-1.
31.0
1 . . 2.4
where : quarterly trend in used water (supply based); : quarterly time trend.
2.2.2 Trend in Learning
Having established an increase in the cumulative production of NEWater, the next step builds on
the learning curve concept to illustrate learning taking place. The learning curve depicted by
Σ , where is the fixed price of a product, ΣY is the cumulative production, is a
coefficient, is the learning coefficient; illustrates the correlation between cumulative production
and price and that the learning coefficient incorporates the effects of learning. With the quarterly
production figures of NEWater and the trend in the fixed price of NEWater , (deflated
by Manufacturing Product Price Index for manufactured goods) calculated, it is possible to study
the effects of learning in NEWater by estimating the dynamic learning coefficient using
Equation (2.5).
2.5
where A: coefficient; ∑ : cumulative stock of NEWater production; : dynamic learning
coefficient; : time trend. See Appendix A-1.
19
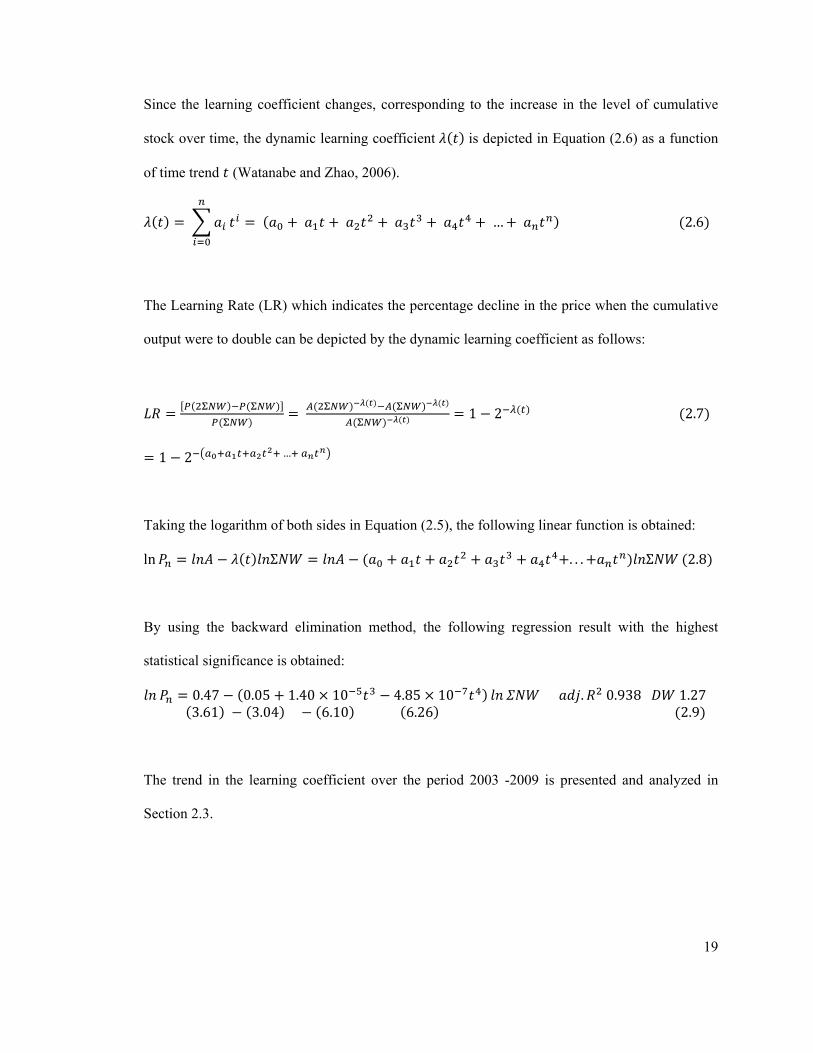
Since the learning coefficient changes, corresponding to the increase in the level of cumulative
stock over time, the dynamic learning coefficient is depicted in Equation (2.6) as a function
of time trend (Watanabe and Zhao, 2006).
… 2.6
The Learning Rate (LR) which indicates the percentage decline in the price when the cumulative
output were to double can be depicted by the dynamic learning coefficient as follows:
1 2 2.7
1 2 …
Taking the logarithm of both sides in Equation (2.5), the following linear function is obtained:
ln Σ . . . Σ 2.8
By using the backward elimination method, the following regression result with the highest
statistical significance is obtained:
0.47 0.05 1.40 10 4.85 10 . 0.938 1.27 3.61 3.04 6.10 6.26 2.9
The trend in the learning coefficient over the period 2003 -2009 is presented and analyzed in
Section 2.3.
20
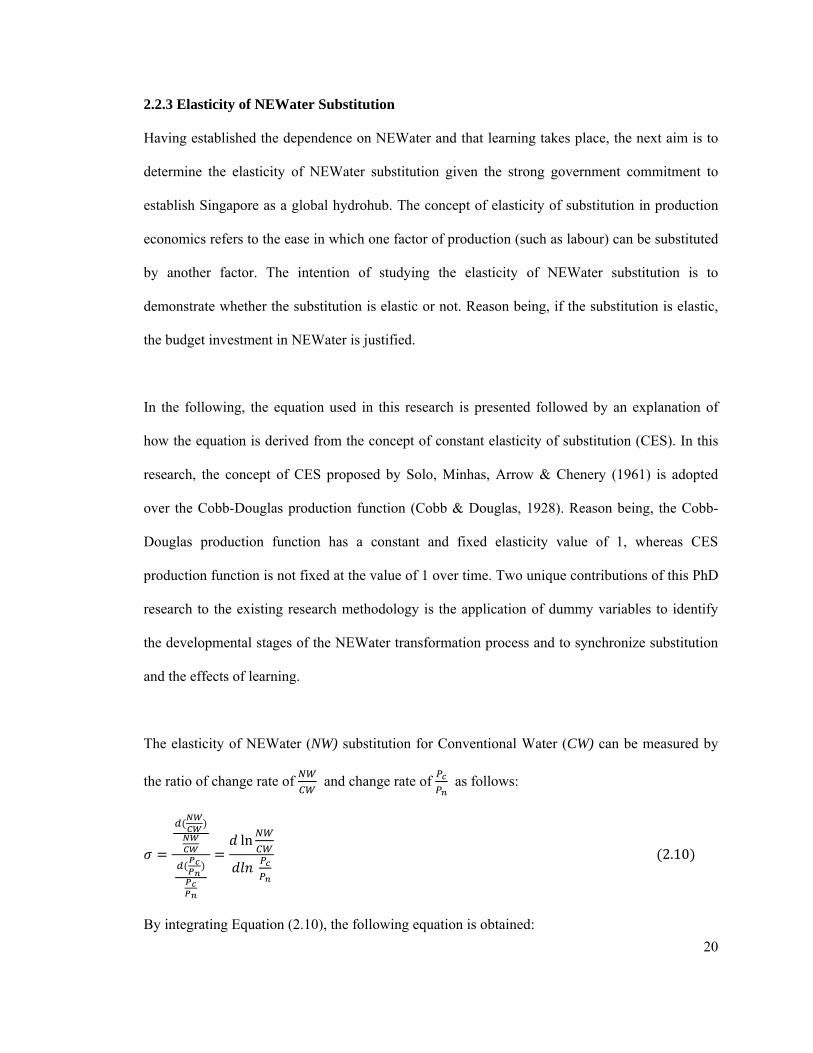
2.2.3 Elasticity of NEWater Substitution
Having established the dependence on NEWater and that learning takes place, the next aim is to
determine the elasticity of NEWater substitution given the strong government commitment to
establish Singapore as a global hydrohub. The concept of elasticity of substitution in production
economics refers to the ease in which one factor of production (such as labour) can be substituted
by another factor. The intention of studying the elasticity of NEWater substitution is to
demonstrate whether the substitution is elastic or not. Reason being, if the substitution is elastic,
the budget investment in NEWater is justified.
In the following, the equation used in this research is presented followed by an explanation of
how the equation is derived from the concept of constant elasticity of substitution (CES). In this
research, the concept of CES proposed by Solo, Minhas, Arrow & Chenery (1961) is adopted
over the Cobb-Douglas production function (Cobb & Douglas, 1928). Reason being, the Cobb-
Douglas production function has a constant and fixed elasticity value of 1, whereas CES
production function is not fixed at the value of 1 over time. Two unique contributions of this PhD
research to the existing research methodology is the application of dummy variables to identify
the developmental stages of the NEWater transformation process and to synchronize substitution
and the effects of learning.
The elasticity of NEWater (NW) substitution for Conventional Water (CW) can be measured by
the ratio of change rate of and change rate of as follows:
ln
2.10
By integrating Equation (2.10), the following equation is obtained:
21
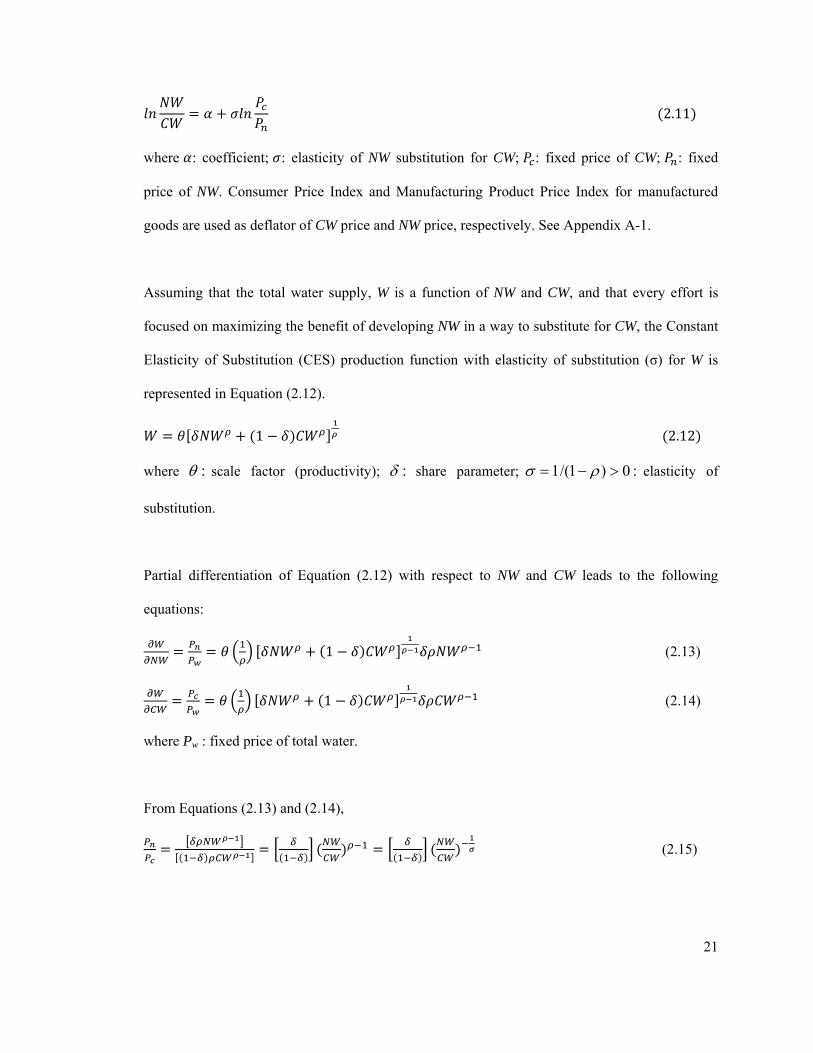
2.11
where : coefficient; : elasticity of NW substitution for CW; : fixed price of CW; : fixed
price of NW. Consumer Price Index and Manufacturing Product Price Index for manufactured
goods are used as deflator of CW price and NW price, respectively. See Appendix A-1.
Assuming that the total water supply, W is a function of NW and CW, and that every effort is
focused on maximizing the benefit of developing NW in a way to substitute for CW, the Constant
Elasticity of Substitution (CES) production function with elasticity of substitution (σ) for W is
represented in Equation (2.12).
1 2.12
where : scale factor (productivity); : share parameter; :0)1/(1 elasticity of
substitution.
Partial differentiation of Equation (2.12) with respect to NW and CW leads to the following
equations:
1 (2.13)
1 (2.14)
where Pw : fixed price of total water.
From Equations (2.13) and (2.14),
(2.15)
22
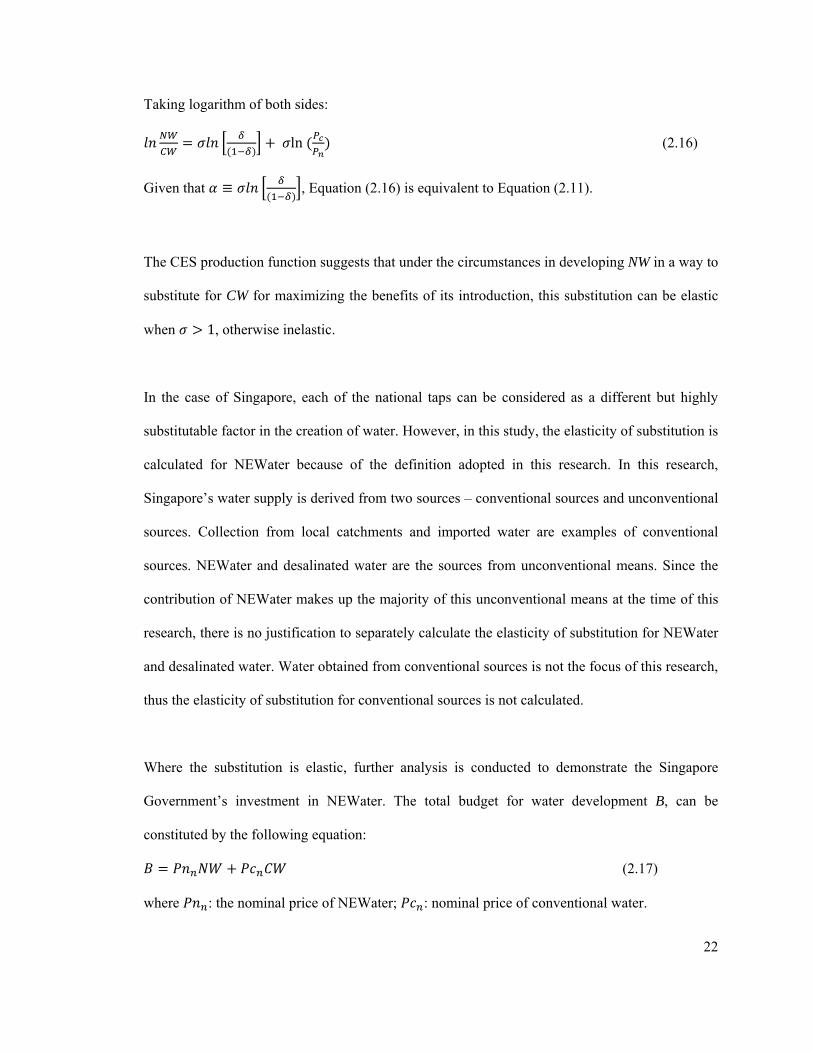
Taking logarithm of both sides:
ln (2.16)
Given that , Equation (2.16) is equivalent to Equation (2.11).
The CES production function suggests that under the circumstances in developing NW in a way to
substitute for CW for maximizing the benefits of its introduction, this substitution can be elastic
when 1, otherwise inelastic.
In the case of Singapore, each of the national taps can be considered as a different but highly
substitutable factor in the creation of water. However, in this study, the elasticity of substitution is
calculated for NEWater because of the definition adopted in this research. In this research,
Singapore’s water supply is derived from two sources – conventional sources and unconventional
sources. Collection from local catchments and imported water are examples of conventional
sources. NEWater and desalinated water are the sources from unconventional means. Since the
contribution of NEWater makes up the majority of this unconventional means at the time of this
research, there is no justification to separately calculate the elasticity of substitution for NEWater
and desalinated water. Water obtained from conventional sources is not the focus of this research,
thus the elasticity of substitution for conventional sources is not calculated.
Where the substitution is elastic, further analysis is conducted to demonstrate the Singapore
Government’s investment in NEWater. The total budget for water development B, can be
constituted by the following equation:
(2.17)
where : the nominal price of NEWater; : nominal price of conventional water.
23
The ratio of the share of the budget for NEWater can be depicted as follows:
(2.18)
Taking the logarithm and using Equation (2.16),
1
. 1 (2.19)
Equation (2.19) suggests that when the elasticity of substitution is elastic 1 , an increase in
relative price justifies an increase in the share of NEWater expenditure. The results are
presented and discussed in Section 2.3.
2.2.4 Accumulation of Knowledge Stock
This sub-section builds on the concept of learning and substitution that has been established in the
preceding sub-sections. As learning takes place, there is an accumulation in the total knowledge
stock. The Bass model is applied to study the trend in the total knowledge stock accumulated. The
Bass model (Bass, 1969) depicts the diffusion trajectory of the levels of innovative goods and
services as a dynamic game between innovator (p) and imitator (q). The Bi-Bass model, which
incorporates two Bass models with different phases of trajectories, is then applied to decompose
the total knowledge stock so as to study the trend of the different knowledge stocks and the
dynamic relationship between the innovator and the imitator (Watanabe et al., 2011). The
relationship between the innovator and imitator reflects the process in which the imitator
‘substitutes’ for the innovator. Subsequent to studying the dynamic relationship, functionality
24
development emergence, maturity and stagnation are identified. Functionality development is
generally defined as the ability to dramatically improve the performance of production processes,
goods and services by means of innovation (Watanabe et al., 2005). The ability to improve is
measured by the diffusion trajectory of the innovation, as depicted by the logistic growth model
introduced by Verhulst (1845). The model introduced by Verhuslt (1845) demonstrates a sigmoid
growth, that is, diffusion continues but eventually terminates. The termination level corresponds
to the upper ceiling of the logistic growth model. Functionality development can thus be
measured by the ratio of the upper ceiling to the level of diffusion. A high level of functionality
development reflects innovation taking place. Thus, a method of accessing the sustainability of
innovations is to observe the level of functionality development. The longer the ability to prolong
the functionality development, the more ‘sustainable’ the innovation (Watanabe et al., 2009a;
Watanabe et al., 2009b). See Appendix A-2.
The following is the detailed data construction. To construct the data required to analyze the
knowledge stock, the quarterly trend in NEWater supply estimated using Equation 2.4 is used.
The total knowledge stock of NEWater corresponds to the cumulative stock of NEWater
production. Appendix A-1 contains the data used for the analysis. The following details the
derivation of the equations from the Bi-Bass and the concept of functionality development.
From the Bi-bass model, knowledge stock can be calculated using Equation (2.20).
1
1 2.20
where N: upper ceiling of the trajectory (carrying capacity); p: innovator; q: imitator.
25
Since the knowledge stock corresponds to the cumulative stock of NEWater production,
knowledge stock of NEWater can be represented as in Equation (2.21).
Σ (2.21)
By decomposing NEWater trajectory into 2 waves, and , and applying the Bi-Bass model,
that allows the study of different trajectories, NEWater knowledge stock (Y) in Equation (2.21)
can be depicted by Equation (2.22).
1
1
1
1
1
1 2.22
where , , and , , indicate upper ceiling of the trajectory (carrying capacity),
innovator and imitator in the first and second wave, respectively.
After identifying the trends in the different trajectories, the next step is to associate the trend with
the types of knowledge that is typical of the water industry. For the purpose of this research, the
knowledge types are categorized into two broad categories: Technology-based knowledge stock
(TKS) and Learning-based knowledge stock (LKS). Further to this categorization, regression
analysis of Equation (2.23) is conducted to illustrate the following: 1) the development of TKS in
light of imported technology and indigenously developed technology from the first wave to the
second wave, and 2) the contribution of LKS to the total knowledge stock as a result from the
shift from the first wave to the second wave.
1.2 2.23
26
where : scale factor; : coefficient of slope dummy variable representing learning for and
obsolescence for , respectively; : coefficient of constant dummy variable; : time trend; and :
dummy variable.
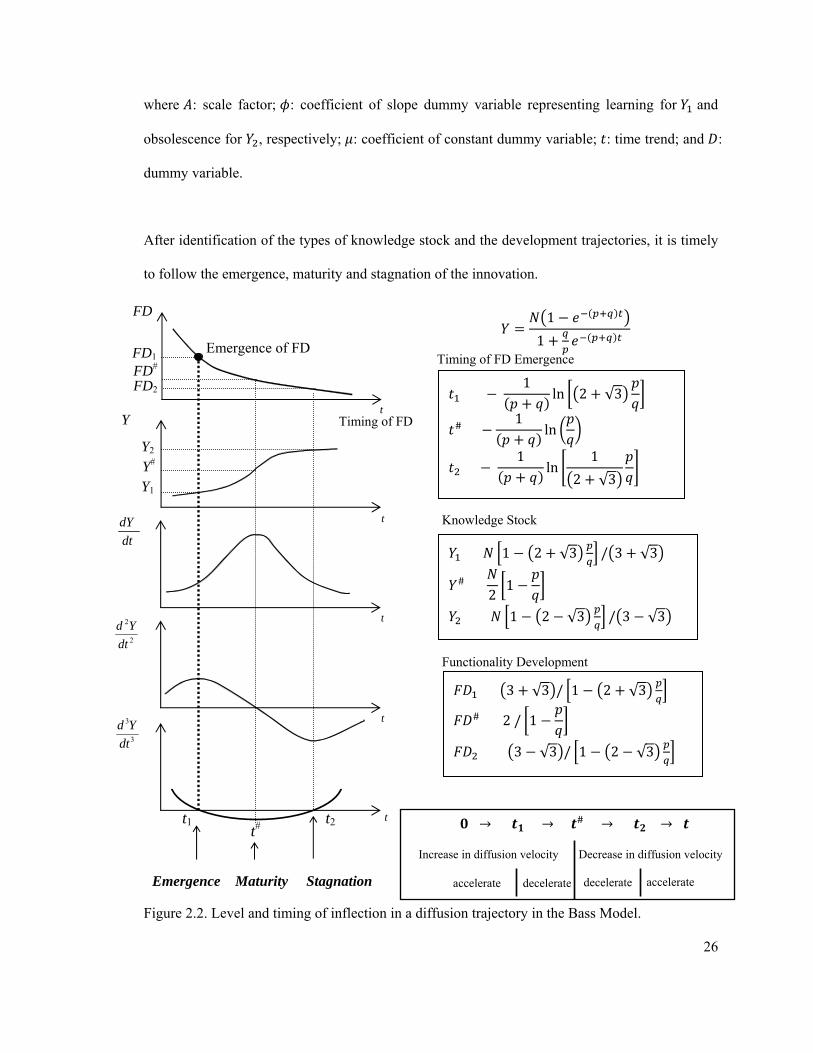
After identification of the types of knowledge stock and the development trajectories, it is timely
to follow the emergence, maturity and stagnation of the innovation.
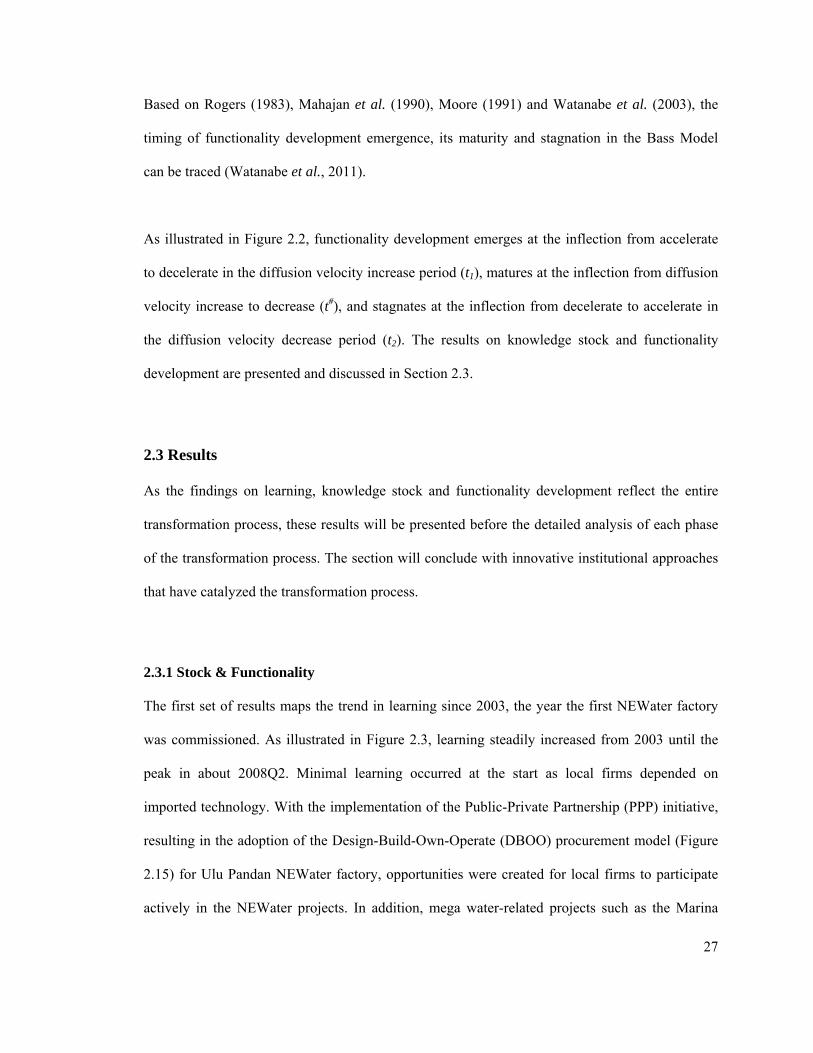
Figure 2.2. Level and timing of inflection in a diffusion trajectory in the Bass Model.
1
1
Emergence Maturity Stagnation
t1 t2
3
3
dt
Yd
t
t
t
t
FD
t
dt
dY
2
2
dt
Yd
Emergence of FD
Timing of FD Y
t#
Y2
Y1 Y#
FD2
FD1 FD#
1ln 2 √3
# 1
ln
1ln
1
2 √3
# 2
1
1 2 √3 / 3 √3
1 2 √3 / 3 √3
# 2 / 1
3 √3 / 1 2 √3
3 √3 / 1 2 √3
Timing of FD Emergence
Knowledge Stock
Functionality Development
#
Increase in diffusion velocity Decrease in diffusion velocity
accelerate decelerate decelerate accelerate
27
Based on Rogers (1983), Mahajan et al. (1990), Moore (1991) and Watanabe et al. (2003), the
timing of functionality development emergence, its maturity and stagnation in the Bass Model
can be traced (Watanabe et al., 2011).
As illustrated in Figure 2.2, functionality development emerges at the inflection from accelerate
to decelerate in the diffusion velocity increase period (t1), matures at the inflection from diffusion
velocity increase to decrease (t#), and stagnates at the inflection from decelerate to accelerate in
the diffusion velocity decrease period (t2). The results on knowledge stock and functionality
development are presented and discussed in Section 2.3.
2.3 Results
As the findings on learning, knowledge stock and functionality development reflect the entire
transformation process, these results will be presented before the detailed analysis of each phase
of the transformation process. The section will conclude with innovative institutional approaches
that have catalyzed the transformation process.
2.3.1 Stock & Functionality
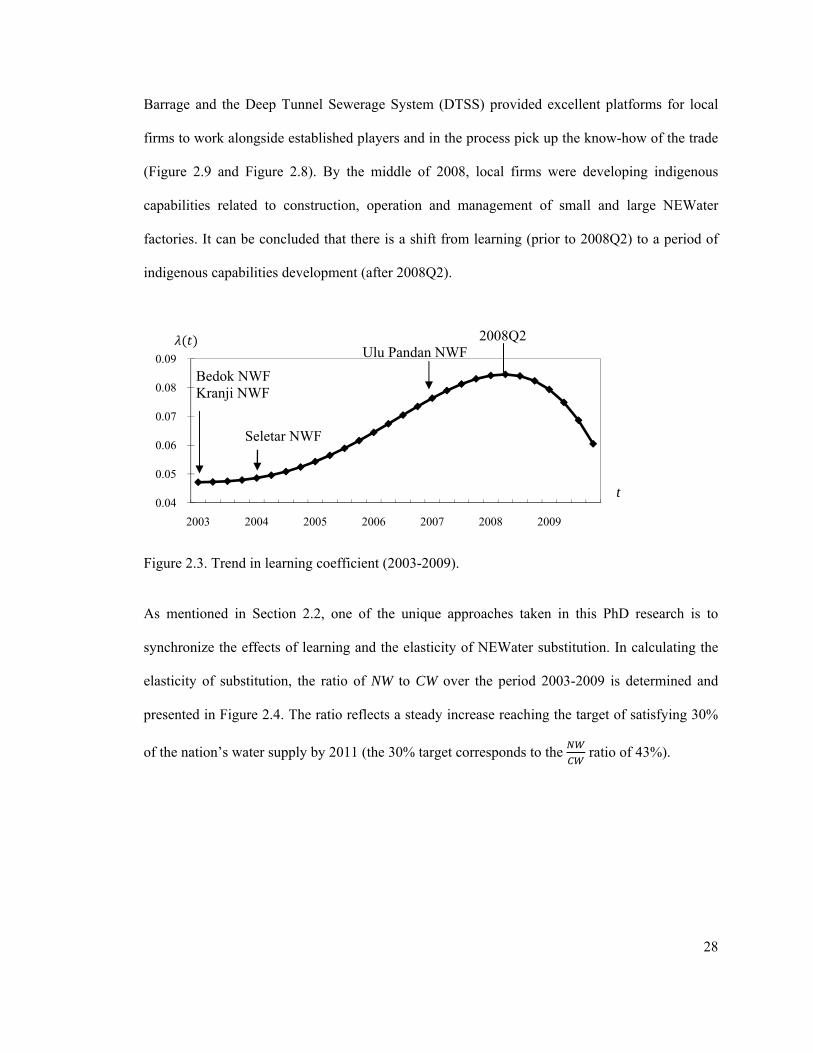
The first set of results maps the trend in learning since 2003, the year the first NEWater factory
was commissioned. As illustrated in Figure 2.3, learning steadily increased from 2003 until the
peak in about 2008Q2. Minimal learning occurred at the start as local firms depended on
imported technology. With the implementation of the Public-Private Partnership (PPP) initiative,
resulting in the adoption of the Design-Build-Own-Operate (DBOO) procurement model (Figure
2.15) for Ulu Pandan NEWater factory, opportunities were created for local firms to participate
actively in the NEWater projects. In addition, mega water-related projects such as the Marina
28
Barrage and the Deep Tunnel Sewerage System (DTSS) provided excellent platforms for local
firms to work alongside established players and in the process pick up the know-how of the trade
(Figure 2.9 and Figure 2.8). By the middle of 2008, local firms were developing indigenous
capabilities related to construction, operation and management of small and large NEWater
factories. It can be concluded that there is a shift from learning (prior to 2008Q2) to a period of
indigenous capabilities development (after 2008Q2).
Figure 2.3. Trend in learning coefficient (2003-2009).
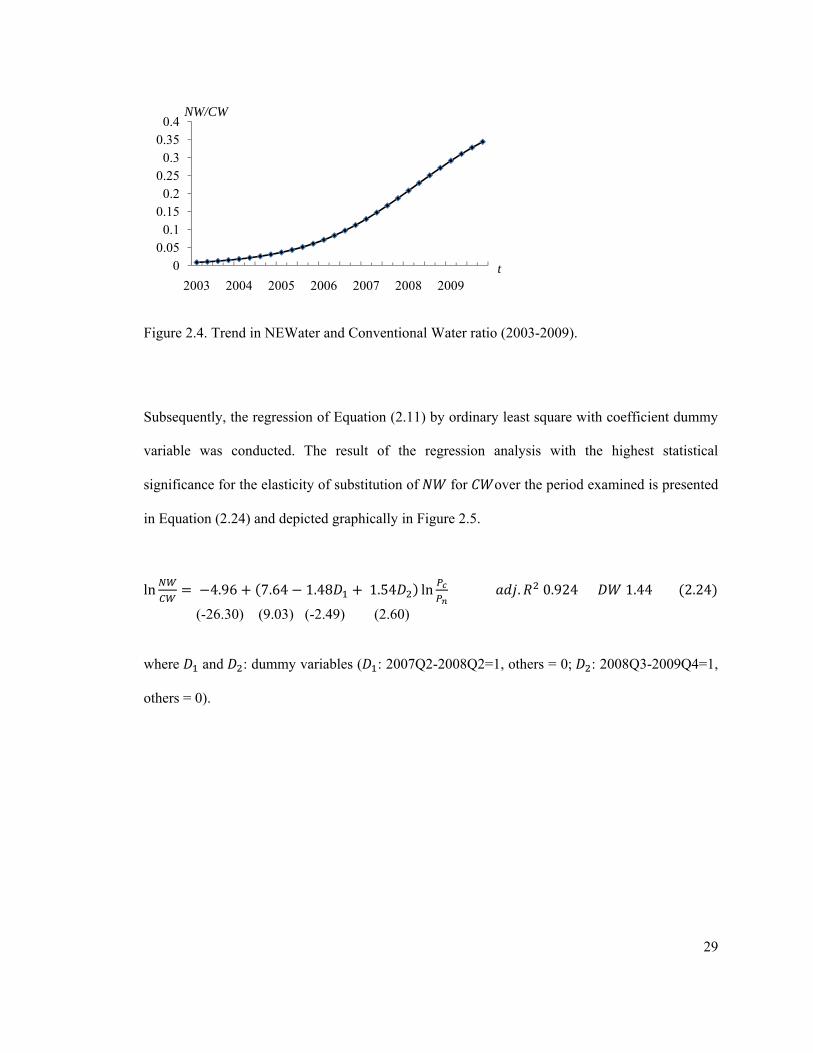
As mentioned in Section 2.2, one of the unique approaches taken in this PhD research is to
synchronize the effects of learning and the elasticity of NEWater substitution. In calculating the
elasticity of substitution, the ratio of NW to CW over the period 2003-2009 is determined and
presented in Figure 2.4. The ratio reflects a steady increase reaching the target of satisfying 30%
of the nation’s water supply by 2011 (the 30% target corresponds to the ratio of 43%).
0.04
0.05
0.06
0.07
0.08
0.09
2003 2004 2005 2006 2007 2008 2009
t
2008Q2
Bedok NWF Kranji NWF
Seletar NWF
Ulu Pandan NWF
29
Figure 2.4. Trend in NEWater and Conventional Water ratio (2003-2009).
Subsequently, the regression of Equation (2.11) by ordinary least square with coefficient dummy
variable was conducted. The result of the regression analysis with the highest statistical
significance for the elasticity of substitution of for over the period examined is presented
in Equation (2.24) and depicted graphically in Figure 2.5.
ln 4.96 7.64 1.48 1.54 ln . 0.924 1.44 2.24
where and : dummy variables ( : 2007Q2-2008Q2=1, others = 0; : 2008Q3-2009Q4=1,
others = 0).
00.05
0.10.15
0.20.25
0.30.35
0.4
2003 2004 2005 2006 2007 2008 2009
NW/CW
t
(-26.30) (9.03) (-2.49) (2.60)
30
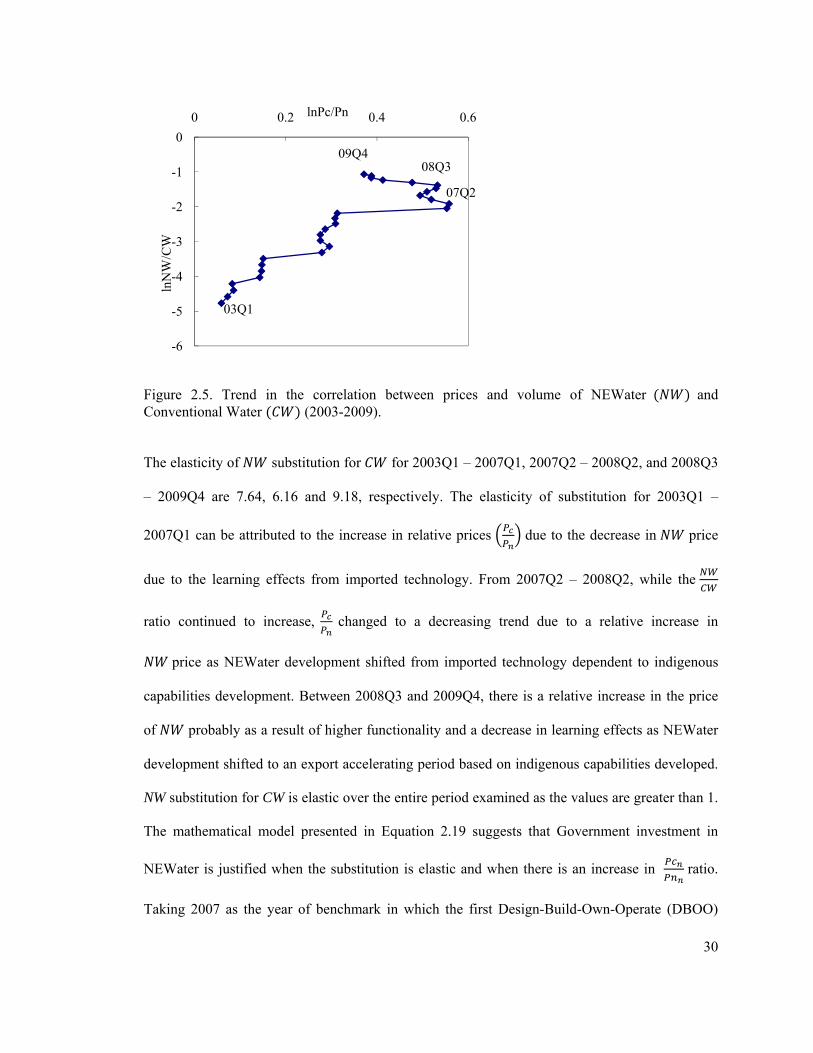
Figure 2.5. Trend in the correlation between prices and volume of NEWater and Conventional Water (2003-2009).
The elasticity of substitution for for 2003Q1 – 2007Q1, 2007Q2 – 2008Q2, and 2008Q3
– 2009Q4 are 7.64, 6.16 and 9.18, respectively. The elasticity of substitution for 2003Q1 –
2007Q1 can be attributed to the increase in relative prices due to the decrease in price
due to the learning effects from imported technology. From 2007Q2 – 2008Q2, while the
ratio continued to increase, changed to a decreasing trend due to a relative increase in
price as NEWater development shifted from imported technology dependent to indigenous
capabilities development. Between 2008Q3 and 2009Q4, there is a relative increase in the price
of probably as a result of higher functionality and a decrease in learning effects as NEWater
development shifted to an export accelerating period based on indigenous capabilities developed.
NW substitution for CW is elastic over the entire period examined as the values are greater than 1.
The mathematical model presented in Equation 2.19 suggests that Government investment in
NEWater is justified when the substitution is elastic and when there is an increase in ratio.
Taking 2007 as the year of benchmark in which the first Design-Build-Own-Operate (DBOO)
-6
-5
-4
-3
-2
-1
0
0 0.2 0.4 0.6
lnN
W/C
W
lnPc/Pn
07Q2
08Q309Q4
03Q1
31
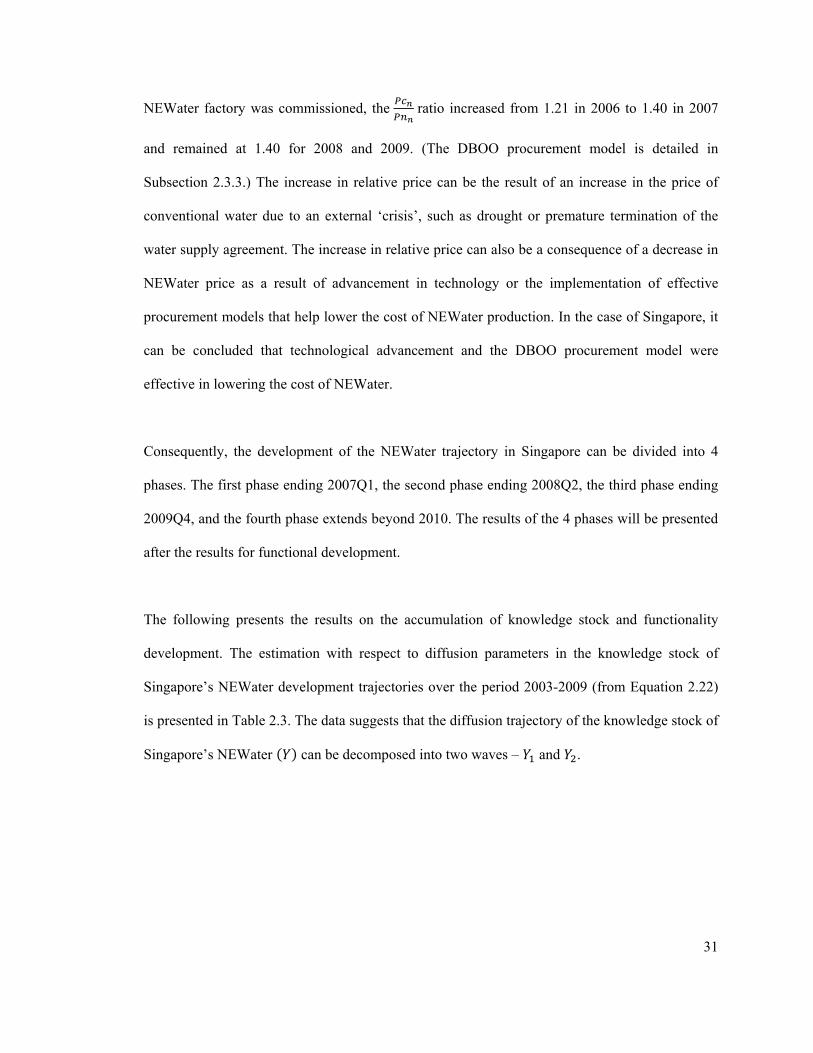
NEWater factory was commissioned, the ratio increased from 1.21 in 2006 to 1.40 in 2007
and remained at 1.40 for 2008 and 2009. (The DBOO procurement model is detailed in
Subsection 2.3.3.) The increase in relative price can be the result of an increase in the price of
conventional water due to an external ‘crisis’, such as drought or premature termination of the
water supply agreement. The increase in relative price can also be a consequence of a decrease in
NEWater price as a result of advancement in technology or the implementation of effective
procurement models that help lower the cost of NEWater production. In the case of Singapore, it
can be concluded that technological advancement and the DBOO procurement model were
effective in lowering the cost of NEWater.
Consequently, the development of the NEWater trajectory in Singapore can be divided into 4
phases. The first phase ending 2007Q1, the second phase ending 2008Q2, the third phase ending
2009Q4, and the fourth phase extends beyond 2010. The results of the 4 phases will be presented
after the results for functional development.
The following presents the results on the accumulation of knowledge stock and functionality
development. The estimation with respect to diffusion parameters in the knowledge stock of
Singapore’s NEWater development trajectories over the period 2003-2009 (from Equation 2.22)
is presented in Table 2.3. The data suggests that the diffusion trajectory of the knowledge stock of
Singapore’s NEWater can be decomposed into two waves – and .
32
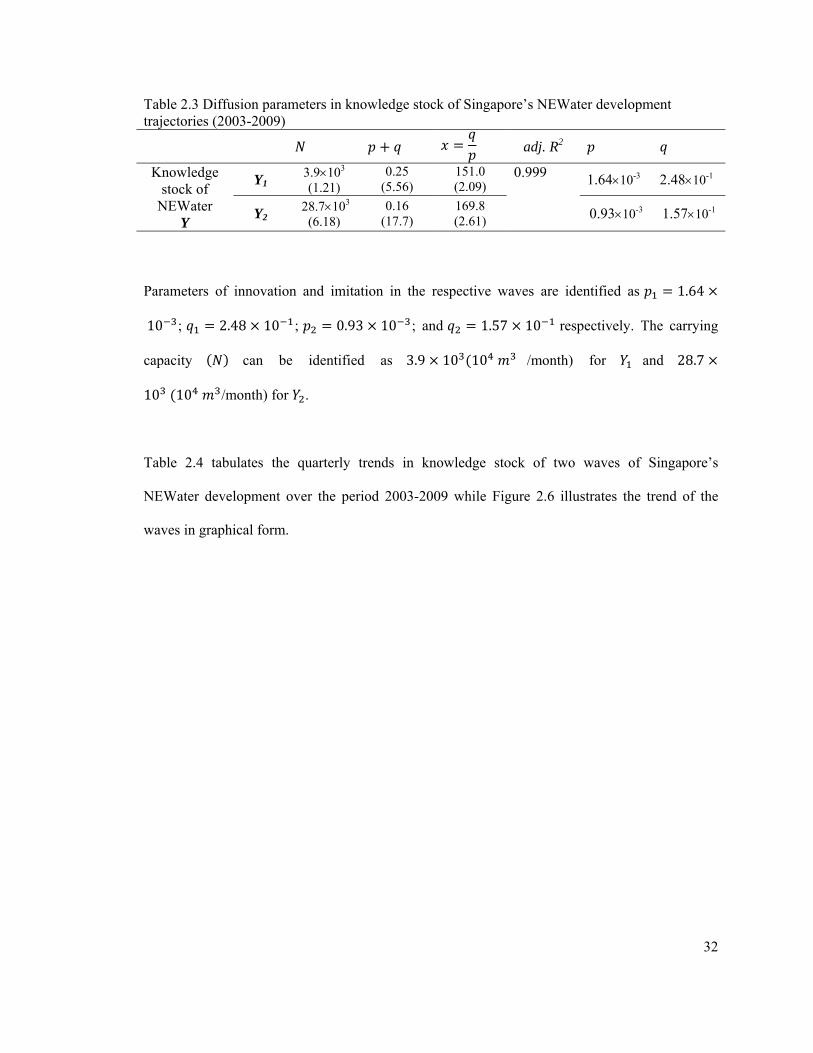
Table 2.3 Diffusion parameters in knowledge stock of Singapore’s NEWater development trajectories (2003-2009)
adj. R2
Knowledge stock of
NEWater Y
Y1 3.9103 (1.21)
0.25 (5.56)
151.0 (2.09)
0.999 1.6410-3 2.4810-1
Y2 28.7103 (6.18)
0.16 (17.7)
169.8 (2.61) 0.9310-3 1.5710-1
Parameters of innovation and imitation in the respective waves are identified as 1.64
10 ; 2.48 10 ; 0.93 10 ; and 1.57 10 respectively. The carrying
capacity can be identified as 3.9 10 10 /month) for and 28.7
10 10 /month) for .
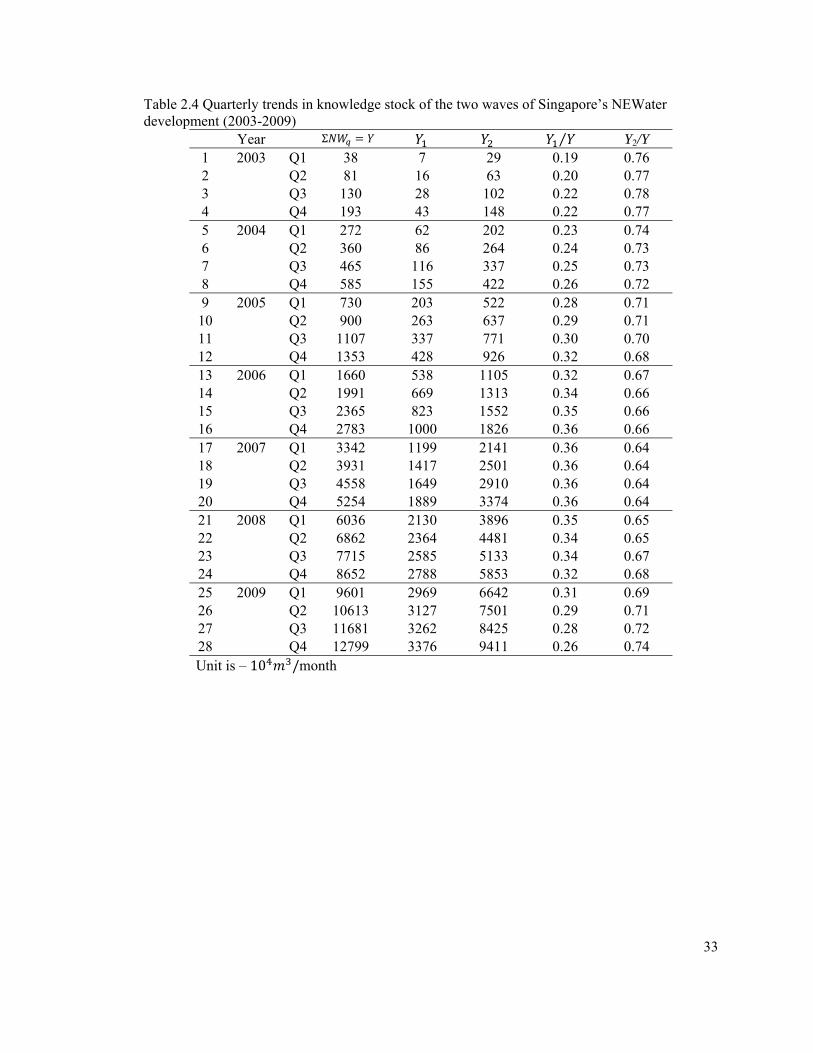
Table 2.4 tabulates the quarterly trends in knowledge stock of two waves of Singapore’s
NEWater development over the period 2003-2009 while Figure 2.6 illustrates the trend of the
waves in graphical form.
33
Table 2.4 Quarterly trends in knowledge stock of the two waves of Singapore’s NEWater development (2003-2009)
Year Σ ⁄ Y2/Y 1 2003 Q1 38 7 29 0.19 0.76 2 Q2 81 16 63 0.20 0.77 3 Q3 130 28 102 0.22 0.78 4 Q4 193 43 148 0.22 0.77 5 2004 Q1 272 62 202 0.23 0.74 6 Q2 360 86 264 0.24 0.73 7 Q3 465 116 337 0.25 0.73 8 Q4 585 155 422 0.26 0.72 9 2005 Q1 730 203 522 0.28 0.71
10 Q2 900 263 637 0.29 0.71 11 Q3 1107 337 771 0.30 0.70 12 Q4 1353 428 926 0.32 0.68 13 2006 Q1 1660 538 1105 0.32 0.67 14 Q2 1991 669 1313 0.34 0.66 15 Q3 2365 823 1552 0.35 0.66 16 Q4 2783 1000 1826 0.36 0.66 17 2007 Q1 3342 1199 2141 0.36 0.64 18 Q2 3931 1417 2501 0.36 0.64 19 Q3 4558 1649 2910 0.36 0.64 20 Q4 5254 1889 3374 0.36 0.64 21 2008 Q1 6036 2130 3896 0.35 0.65 22 Q2 6862 2364 4481 0.34 0.65 23 Q3 7715 2585 5133 0.34 0.67 24 Q4 8652 2788 5853 0.32 0.68 25 2009 Q1 9601 2969 6642 0.31 0.69 26 Q2 10613 3127 7501 0.29 0.71 27 Q3 11681 3262 8425 0.28 0.72 28 Q4 12799 3376 9411 0.26 0.74 Unit is – 10 /month
34
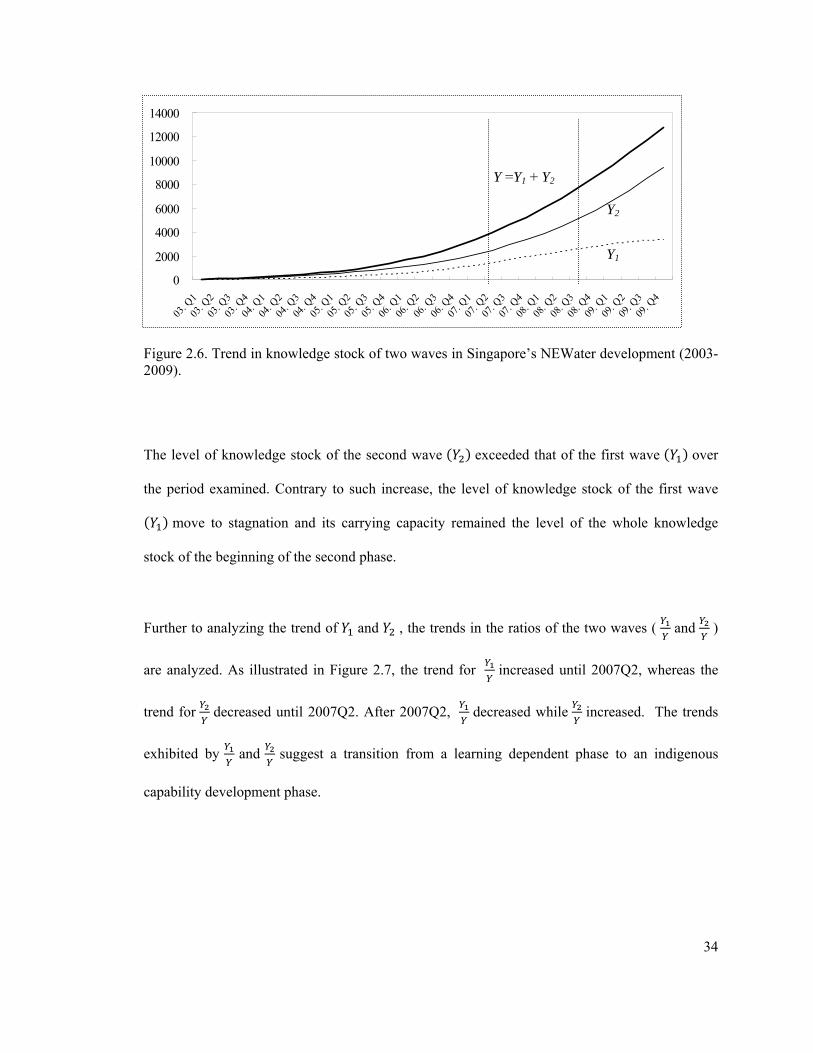
Figure 2.6. Trend in knowledge stock of two waves in Singapore’s NEWater development (2003-2009).
The level of knowledge stock of the second wave exceeded that of the first wave over
the period examined. Contrary to such increase, the level of knowledge stock of the first wave
move to stagnation and its carrying capacity remained the level of the whole knowledge
stock of the beginning of the second phase.
Further to analyzing the trend of and , the trends in the ratios of the two waves ( and )
are analyzed. As illustrated in Figure 2.7, the trend for increased until 2007Q2, whereas the
trend for decreased until 2007Q2. After 2007Q2, decreased while increased. The trends
exhibited by and suggest a transition from a learning dependent phase to an indigenous
capability development phase.
0
2000
4000
6000
8000
10000
12000
14000
03. Q
1
03. Q
2
03. Q
3
03. Q
4
04. Q
1
04. Q
2
04. Q
3
04. Q
4
05. Q
1
05. Q
2
05. Q
3
05. Q
4
06. Q
1
06. Q
2
06. Q
3
06. Q
4
07. Q
1
07. Q
2
07. Q
3
07. Q
4
08. Q
1
08. Q
2
08. Q
3
08. Q
4
09. Q
1
09. Q
2
09. Q
3
09. Q
4
Y =Y1 + Y2
Y1
Y2
35
Figure 2.7. Trends in the ratios of two waves in knowledge stock of Singapore’s NEWater development (2003-2009).
By studying the correlation between and (Figure 2.8), it can be concluded that substitutes
for starting from 2007Q2.
Figure 2.8. Correlation between the ratio of the two waves in knowledge stock in Singapore’s NEWater development (2003-2009).
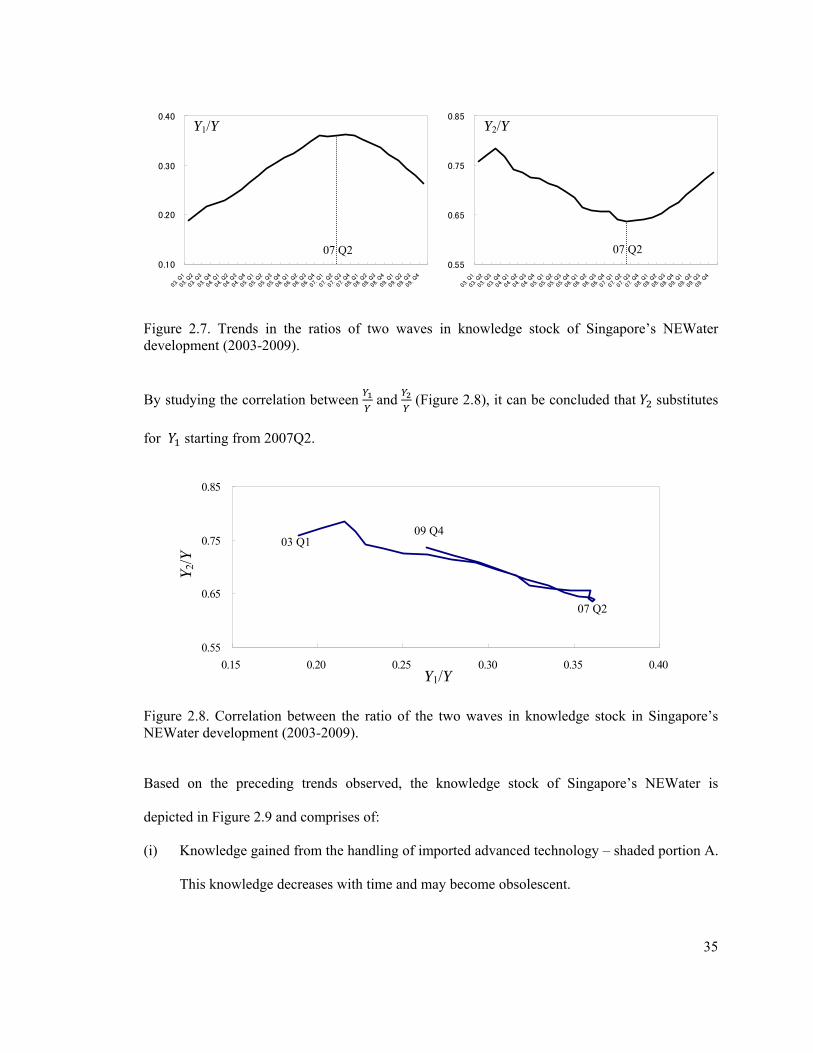
Based on the preceding trends observed, the knowledge stock of Singapore’s NEWater is
depicted in Figure 2.9 and comprises of:
(i) Knowledge gained from the handling of imported advanced technology – shaded portion A.
This knowledge decreases with time and may become obsolescent.
0.55
0.65
0.75
0.85
0.15 0.20 0.25 0.30 0.35 0.40Y1/Y
Y2/
Y
07 Q2
03 Q1 09 Q4
0.55
0.65
0.75
0.85
03. Q
1
03. Q
2
03. Q
3
03. Q
4
04. Q
1
04. Q
2
04. Q
3
04. Q
4
05. Q
1
05. Q
2
05. Q
3
05. Q
4
06. Q
1
06. Q
2
06. Q
3
06. Q
4
07. Q
1
07. Q
2
07. Q
3
07. Q
4
08. Q
1
08. Q
2
08. Q
3
08. Q
4
09. Q
1
09. Q
2
09. Q
3
09. Q
4
0.10
0.20
0.30
0.40
03. Q
1
03. Q
2
03. Q
3
03. Q
4
04. Q
1
04. Q
2
04. Q
3
04. Q
4
05. Q
1
05. Q
2
05. Q
3
05. Q
4
06. Q
1
06. Q
2
06. Q
3
06. Q
4
07. Q
1
07. Q
2
07. Q
3
07. Q
4
08. Q
1
08. Q
2
08. Q
3
08. Q
4
09. Q
1
09. Q
2
09. Q
3
09. Q
4
Y1/Y Y2/Y
07 Q2 07 Q2
36
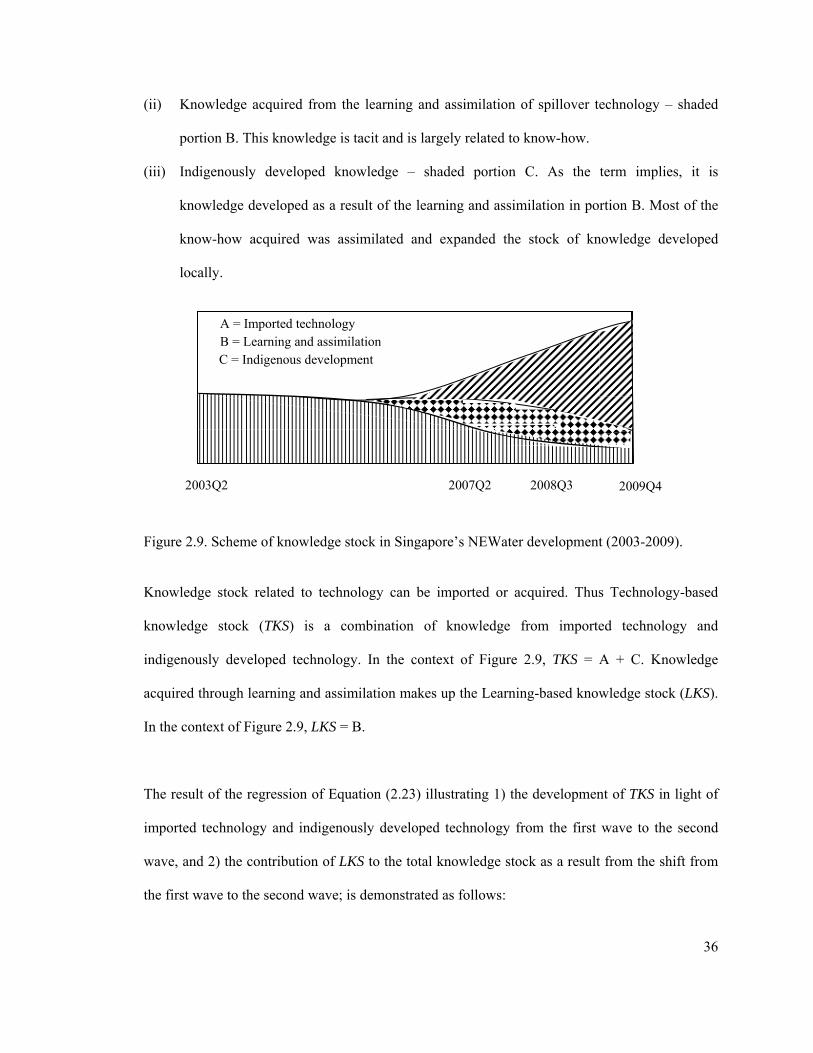
(ii) Knowledge acquired from the learning and assimilation of spillover technology – shaded
portion B. This knowledge is tacit and is largely related to know-how.
(iii) Indigenously developed knowledge – shaded portion C. As the term implies, it is
knowledge developed as a result of the learning and assimilation in portion B. Most of the
know-how acquired was assimilated and expanded the stock of knowledge developed
locally.
Figure 2.9. Scheme of knowledge stock in Singapore’s NEWater development (2003-2009).
Knowledge stock related to technology can be imported or acquired. Thus Technology-based
knowledge stock (TKS) is a combination of knowledge from imported technology and
indigenously developed technology. In the context of Figure 2.9, TKS = A + C. Knowledge
acquired through learning and assimilation makes up the Learning-based knowledge stock (LKS).
In the context of Figure 2.9, LKS = B.
The result of the regression of Equation (2.23) illustrating 1) the development of TKS in light of
imported technology and indigenously developed technology from the first wave to the second
wave, and 2) the contribution of LKS to the total knowledge stock as a result from the shift from
the first wave to the second wave; is demonstrated as follows:
AB
C
2003Q2 2007Q2 2008Q3 2009Q4
A = Imported technology B = Learning and assimilation C = Indigenous development
37
ln 0.39 0.04 0.03 1 1.28 . 0.981 2.25
6.54 31.00 12.49 20.97
ln 0.75 0.01 0.02 1 0.51 . 0.960 (2.26)
26.46 19.67 12.52 17.80 where : quarterly time trend; : dummy variable (2003Q1-2007Q1 = 1, 2007Q2-2009Q4 = 0)
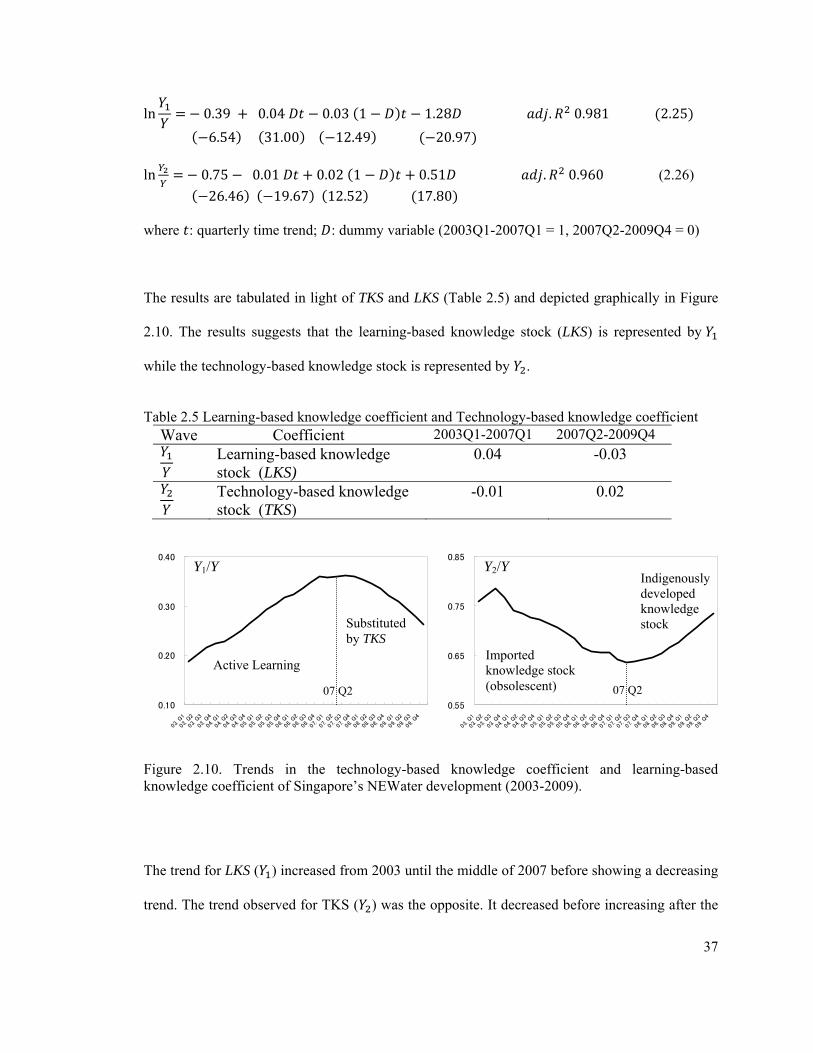
The results are tabulated in light of TKS and LKS (Table 2.5) and depicted graphically in Figure
2.10. The results suggests that the learning-based knowledge stock (LKS) is represented by
while the technology-based knowledge stock is represented by .
Table 2.5 Learning-based knowledge coefficient and Technology-based knowledge coefficient
Wave Coefficient 2003Q1-2007Q1 2007Q2-2009Q4
Learning-based knowledge stock (LKS)
0.04 -0.03
Technology-based knowledge stock (TKS)
-0.01 0.02
Figure 2.10. Trends in the technology-based knowledge coefficient and learning-based knowledge coefficient of Singapore’s NEWater development (2003-2009).
The trend for LKS ( ) increased from 2003 until the middle of 2007 before showing a decreasing
trend. The trend observed for TKS ( ) was the opposite. It decreased before increasing after the
0.55
0.65
0.75
0.85
03. Q
1
03. Q
2
03. Q
3
03. Q
4
04. Q
1
04. Q
2
04. Q
3
04. Q
4
05. Q
1
05. Q
2
05. Q
3
05. Q
4
06. Q
1
06. Q
2
06. Q
3
06. Q
4
07. Q
1
07. Q
2
07. Q
3
07. Q
4
08. Q
1
08. Q
2
08. Q
3
08. Q
4
09. Q
1
09. Q
2
09. Q
3
09. Q
4
0.10
0.20
0.30
0.40
03. Q
1
03. Q
2
03. Q
3
03. Q
4
04. Q
1
04. Q
2
04. Q
3
04. Q
4
05. Q
1
05. Q
2
05. Q
3
05. Q
4
06. Q
1
06. Q
2
06. Q
3
06. Q
4
07. Q
1
07. Q
2
07. Q
3
07. Q
4
08. Q
1
08. Q
2
08. Q
3
08. Q
4
09. Q
1
09. Q
2
09. Q
3
09. Q
4
Y1/Y Y2/Y
07 Q2 07 Q2
Active Learning
Substituted by TKS
Imported knowledge stock (obsolescent)
Indigenously developed knowledge stock
38
first half of 2007. Despite the opposing trends, the total knowledge stock increased over the entire
period analyzed (Figure 2.6). Initial increase in learning-based knowledge stock (LKS) is
probably due to the accumulation of knowledge by local companies from the construction of the
first 3 NEWater factories. This LKS was slowly transformed into indigenous developed
technology-based knowledge stock (TKS) when opportunities were created via the Design-Build-
Own-Operate scheme for local companies to contribute actively in projects. The award for the
Ulu Pandan NEWater factory under the Design-Build-Own-Operate scheme was one such
opportunity and which resulted in an increase in the technology-based knowledge stock. The
trend for TKS decreased until 2007Q2 as imported technology either became obsolete or became
assimilated through learning. The trend began to pick up due to technology developed
indigenously. This increase gave rise to the overall increase in the total knowledge stock
illustrated in Figure 2.6.
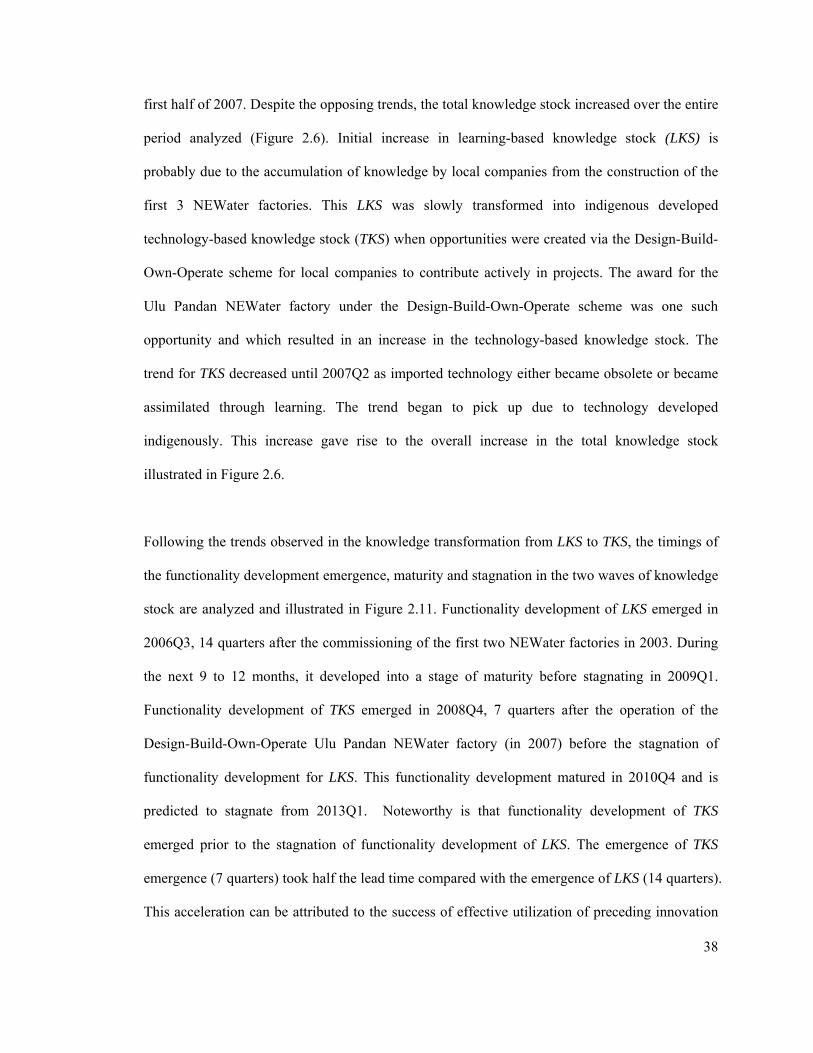
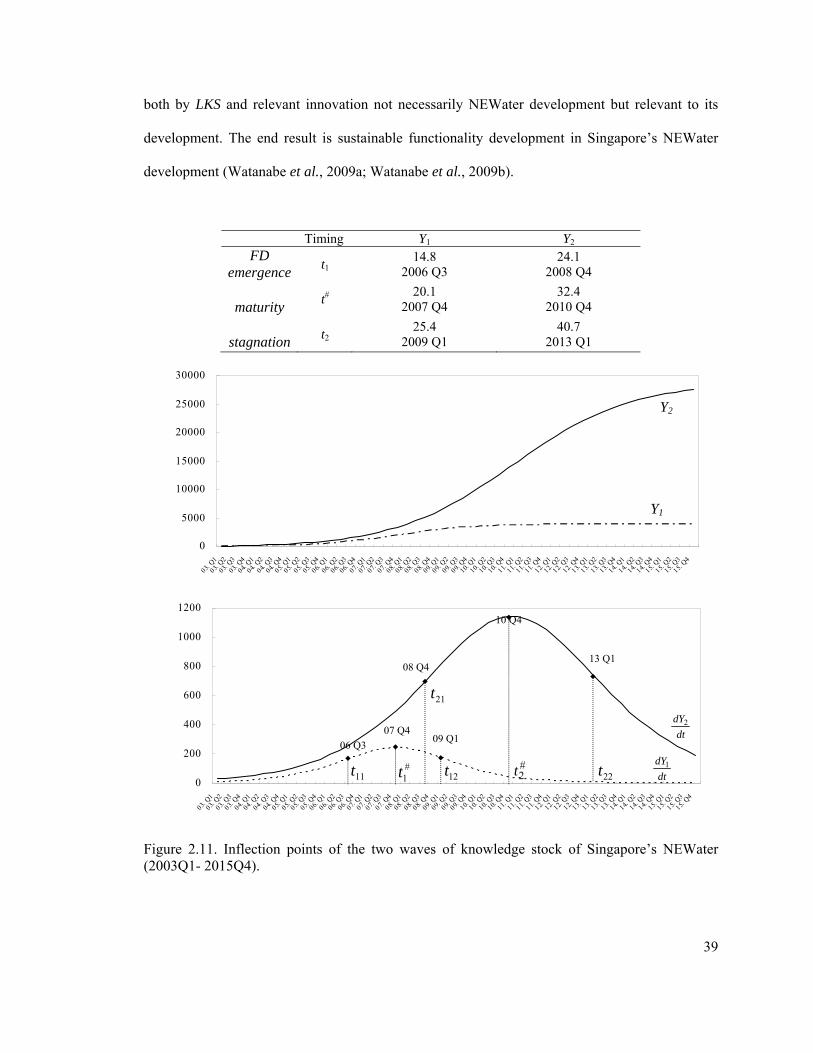
Following the trends observed in the knowledge transformation from LKS to TKS, the timings of
the functionality development emergence, maturity and stagnation in the two waves of knowledge
stock are analyzed and illustrated in Figure 2.11. Functionality development of LKS emerged in
2006Q3, 14 quarters after the commissioning of the first two NEWater factories in 2003. During
the next 9 to 12 months, it developed into a stage of maturity before stagnating in 2009Q1.
Functionality development of TKS emerged in 2008Q4, 7 quarters after the operation of the
Design-Build-Own-Operate Ulu Pandan NEWater factory (in 2007) before the stagnation of
functionality development for LKS. This functionality development matured in 2010Q4 and is
predicted to stagnate from 2013Q1. Noteworthy is that functionality development of TKS
emerged prior to the stagnation of functionality development of LKS. The emergence of TKS
emergence (7 quarters) took half the lead time compared with the emergence of LKS (14 quarters).
This acceleration can be attributed to the success of effective utilization of preceding innovation
39
both by LKS and relevant innovation not necessarily NEWater development but relevant to its
development. The end result is sustainable functionality development in Singapore’s NEWater
development (Watanabe et al., 2009a; Watanabe et al., 2009b).
Timing Y1 Y2 FD
emergence t1
14.8 2006 Q3
24.1 2008 Q4
maturity
t# 20.1
2007 Q4 32.4
2010 Q4
stagnation
t2 25.4
2009 Q1 40.7
2013 Q1
Figure 2.11. Inflection points of the two waves of knowledge stock of Singapore’s NEWater (2003Q1- 2015Q4).
0
5000
10000
15000
20000
25000
30000
03. Q1
03. Q2
03. Q3
03. Q4
04. Q1
04. Q2
04. Q3
04. Q4
05. Q1
05. Q2
05. Q3
05. Q4
06. Q1
06. Q2
06. Q3
06. Q4
07. Q1
07. Q2
07. Q3
07. Q4
08. Q1
08. Q2
08. Q3
08. Q4
09. Q1
09. Q2
09. Q3
09. Q4
10. Q1
10. Q2
10. Q3
10. Q4
11. Q1
11. Q2
11. Q3
11. Q4
12. Q1
12. Q2
12. Q3
12. Q4
13. Q1
13. Q2
13. Q3
13. Q4
14. Q1
14. Q2
14. Q3
14. Q4
15. Q1
15. Q2
15. Q3
15. Q4
Y1
Y2
0
200
400
600
800
1000
1200
03. Q1
03. Q2
03. Q3
03. Q4
04. Q1
04. Q2
04. Q3
04. Q4
05. Q1
05. Q2
05. Q3
05. Q4
06. Q1
06. Q2
06. Q3
06. Q4
07. Q1
07. Q2
07. Q3
07. Q4
08. Q1
08. Q2
08. Q3
08. Q4
09. Q1
09. Q2
09. Q3
09. Q4
10. Q1
10. Q2
10. Q3
10. Q4
11. Q1
11. Q2
11. Q3
11. Q4
12. Q1
12. Q2
12. Q3
12. Q4
13. Q1
13. Q2
13. Q3
13. Q4
14. Q1
14. Q2
14. Q3
14. Q4
15. Q1
15. Q2
15. Q3
15. Q4
dt
dY1
dt
dY2
21t
#2t
#1t 22t11t 12t
06 Q3
07 Q409 Q1
08 Q4
10 Q4
13 Q1
40
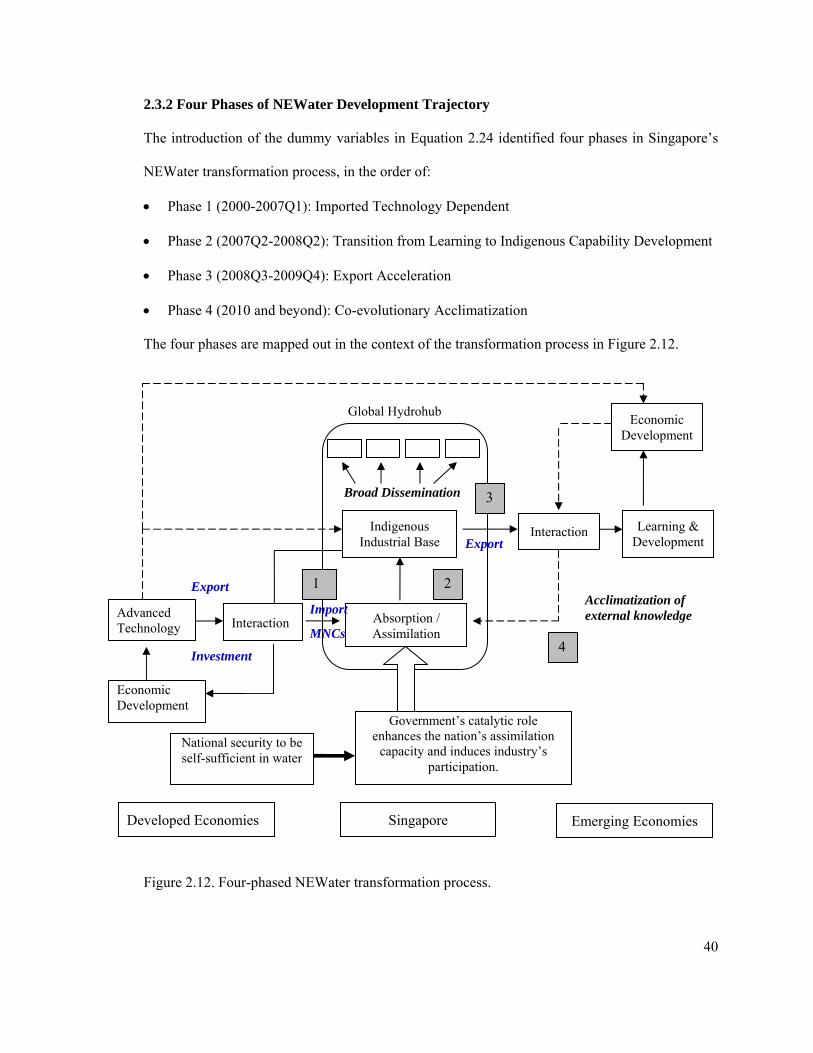
2.3.2 Four Phases of NEWater Development Trajectory
The introduction of the dummy variables in Equation 2.24 identified four phases in Singapore’s
NEWater transformation process, in the order of:
Phase 1 (2000-2007Q1): Imported Technology Dependent
Phase 2 (2007Q2-2008Q2): Transition from Learning to Indigenous Capability Development
Phase 3 (2008Q3-2009Q4): Export Acceleration
Phase 4 (2010 and beyond): Co-evolutionary Acclimatization
The four phases are mapped out in the context of the transformation process in Figure 2.12.
Figure 2.12. Four-phased NEWater transformation process.
Economic Development
Learning & Development
Interaction Indigenous Industrial Base
Broad Dissemination
Global Hydrohub
Export
Interaction Absorption / Assimilation
Advanced Technology
Economic Development
Acclimatization of external knowledge Import
MNCs
Export
Investment
National security to be self-sufficient in water
Government’s catalytic role enhances the nation’s assimilation
capacity and induces industry’s participation.
1 2
3
4
Developed Economies Singapore Emerging Economies
41
The following details each phase of the transformation process.
Phase 1 (2000-2007Q1): Imported Technology Dependent
This is gestation phase which began probably as early as the late 1990s when pilot tests and
research studies conducted overseas suggested that the development of membrane technologies
had become reliable and cost efficient to operate and maintain. This was when the PUB
announced the decision to adopt the use of membranes for water treatment. In 1999, the NEWater
Demonstration Project was undertaken to study the feasibility of recycling water using
membranes. This lead to the commissioning of the Bedok NEWater Demonstration Plant in 2000.
This demonstration plant was dependent on imported technology. The advanced reverse osmosis
membranes were imported from Nitto Denko, an established membrane supplier in Japan. The
ultrafiltration/microfiltration membranes were imported primarily from US Filters (now known as
Memcor) in the United States. The encouraging data (such as the quality of drinking water as
explained in Section 1.2.2) from the Demonstration Plant lead to the commissioning of three
advanced NEWater factories – the Bedok NEWater factory, the Kranji NEWater Factory and the
Seletar NEWater Factory.
Table 2.6 Country of origin for suppliers of products and services for Singapore’s NEWater factories Product / Service Korea Japan US Europe Canada France Netherlands Microfiltration/Ultrafiltration * * * Reverse Osmosis * * Ultraviolet Disinfection * * * Engineering-related Services * * *
Data collected on the main components and services required for an operational NEWater factory
suggests heavy dependence on technology and capabilities imported from established companies
overseas (Table 2.6). Established Japanese firms such as Nitto Denko, Asahi Kasei and Toray are
the main suppliers of reverse osmosis membranes (Table 2.7). The technologies related to
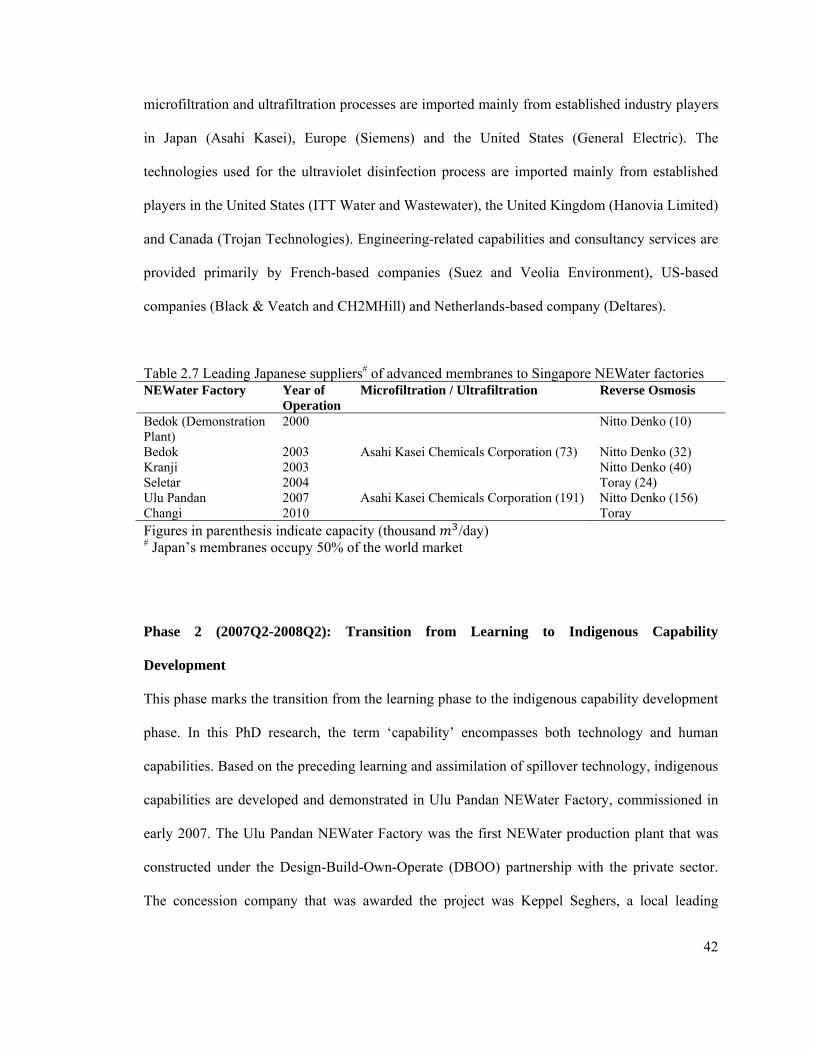
42
microfiltration and ultrafiltration processes are imported mainly from established industry players
in Japan (Asahi Kasei), Europe (Siemens) and the United States (General Electric). The
technologies used for the ultraviolet disinfection process are imported mainly from established
players in the United States (ITT Water and Wastewater), the United Kingdom (Hanovia Limited)
and Canada (Trojan Technologies). Engineering-related capabilities and consultancy services are
provided primarily by French-based companies (Suez and Veolia Environment), US-based
companies (Black & Veatch and CH2MHill) and Netherlands-based company (Deltares).
Table 2.7 Leading Japanese suppliers# of advanced membranes to Singapore NEWater factories NEWater Factory Year of
Operation Microfiltration / Ultrafiltration Reverse Osmosis
Bedok (Demonstration Plant)
2000 Nitto Denko (10)
Bedok 2003 Asahi Kasei Chemicals Corporation (73) Nitto Denko (32) Kranji 2003 Nitto Denko (40) Seletar 2004 Toray (24) Ulu Pandan 2007 Asahi Kasei Chemicals Corporation (191) Nitto Denko (156) Changi 2010 Toray Figures in parenthesis indicate capacity (thousand /day) # Japan’s membranes occupy 50% of the world market
Phase 2 (2007Q2-2008Q2): Transition from Learning to Indigenous Capability
Development
This phase marks the transition from the learning phase to the indigenous capability development
phase. In this PhD research, the term ‘capability’ encompasses both technology and human
capabilities. Based on the preceding learning and assimilation of spillover technology, indigenous
capabilities are developed and demonstrated in Ulu Pandan NEWater Factory, commissioned in
early 2007. The Ulu Pandan NEWater Factory was the first NEWater production plant that was
constructed under the Design-Build-Own-Operate (DBOO) partnership with the private sector.
The concession company that was awarded the project was Keppel Seghers, a local leading
43
provider of comprehensive environmental solutions for both water and solid waste treatment.
Under the terms of the agreement, Keppel Seghers is to deliver a plant with a capacity to treat
32mgd (148,000m3/day) of used water and to deliver NEWater at S$0.30 per m3 for the first year.
The duration of the agreement is for 20 years starting 2007 and ending 2027.
A noteworthy point of Ulu Pandan NEWater Factory is the innovations implemented in the
NEWater factory. One of the innovations was a new process design that allowed higher stacks of
8 and 9 membrane modules in the first and second filtration stages respectively instead of 5 in the
existing plants. Another innovation was the construction of the reverse osmosis units on top of the
concrete water tanks to maximize the utilization of the land area. Yet another evidence of
indigenous capabilities being developed was the innovative substitution of microfiltration for
ultrafiltration before the reverse osmosis filtration process. The microfiltration membranes used
were pressure hollow fibre membranes made of polyvinylidene difluoride (PVDF) manufactured
by Asahi in place of the ultrafiltration membranes used in the earlier plants (supplied by Zenon
Environmental Inc., now part of GE and Siemens). These innovations are the result of the private
sector’s approach of a comprehensive systems approach to designing and constructing a water
treatment plant at a competitive cost and yet taking into account local constraints.
Phase 3 (2008Q3-2009Q4): Export Acceleration
Following the development of indigenous capabilities and the success of DBOO projects,
companies began to internationalize their businesses by securing projects abroad. This is an
indirect way of measuring the export of indigenous capabilities accumulated throughout the first
two phases.
44
The following details the export acceleration phase experienced by three prominent local
companies, presented in alphabetical order, starting with Hyflux Limited; followed by Keppel
Integrated Engineering and Sembcorp Industries.
Hyflux Limited
Hyflux Limited was the main provider of microfiltration membranes for the Seletar NEWater
factory. Its subsidiary, SingSpring (Pte) Ltd was the concession company for Singapore’s first
desalination plant, the Tuas Desalination Plant. The Tuas Desalination Plant was a DBOO project
awarded under the PPP initiative. After building and developing indigenous capabilities as a
microfiltration membrane manufacturer and as a main contractor and systems integrator for large-
scale water treatment plants, the company accelerated the export of its indigenous capabilities to
countries such as Algeria, Dubai and China (Table 2.8 and Table 2.9). One of the prominent deals
secured overseas was the US$468 million4 contract to design, build and operate a seawater
desalination plant in western Algeria. The contract was significant to Hyflux because it was
chosen by Algeria Energy Company despite numerous bidders. One of the reasons may be that
Hyflux is recognized for its capability in designing, building and operating seawater desalination
plants. This indigenous capability can be traced back to the DBOO contract it won for
Singapore’s first seawater desalination plant. This supports the success of the institutional
innovation of DBOO in promoting learning and assimilation of capabilities and thereafter
building of indigenous capabilities by local firms. Discussion of DBOO is presented in
Subsection 2.3.3.
Further to the deal in Algeria, Hyflux is currently building the Tianjin Dagang Desalination Plant,
China’s largest membrane-based seawater desalination plant with a designed capacity of 100,000
4 Milieu (March 2009) http://app.mewr.gov.sg/data/imgCont/943/2009_03.pdf. Last accessed on 12 Feb 2011.
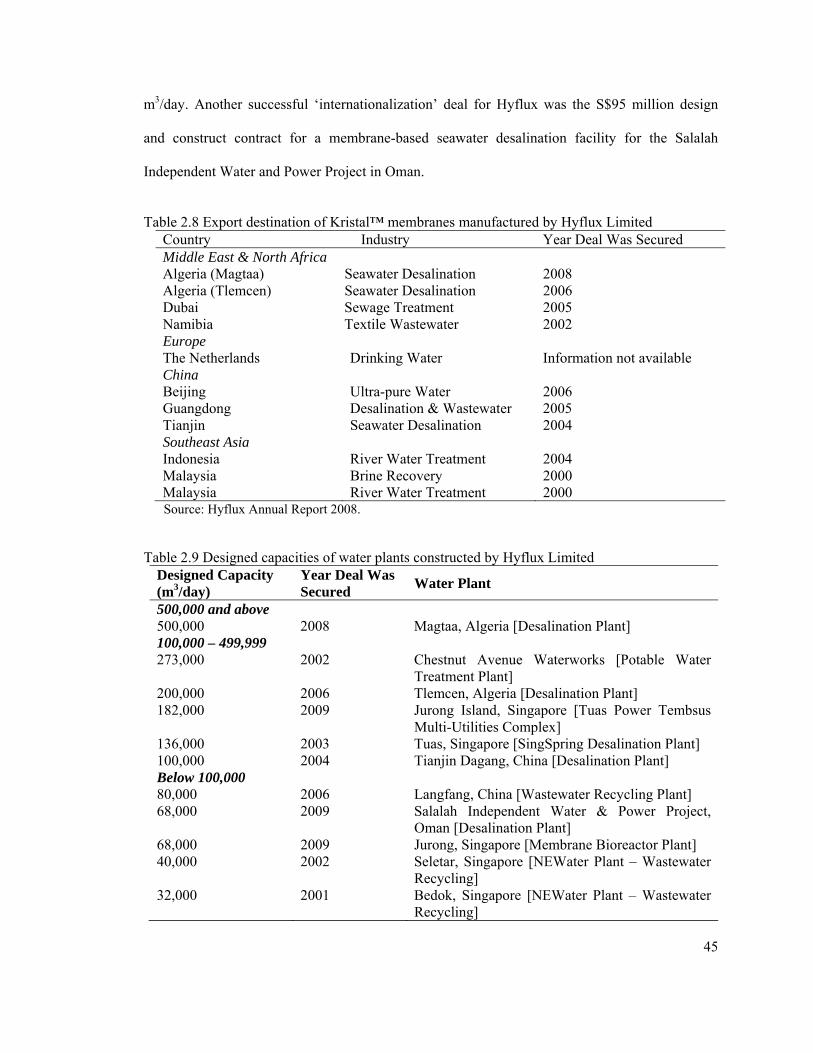
45
m3/day. Another successful ‘internationalization’ deal for Hyflux was the S$95 million design
and construct contract for a membrane-based seawater desalination facility for the Salalah
Independent Water and Power Project in Oman.
Table 2.8 Export destination of Kristal™ membranes manufactured by Hyflux Limited
Country Industry Year Deal Was Secured Middle East & North Africa Algeria (Magtaa) Seawater Desalination 2008 Algeria (Tlemcen) Seawater Desalination 2006 Dubai Sewage Treatment 2005 Namibia Textile Wastewater 2002 Europe The Netherlands Drinking Water Information not available China Beijing Ultra-pure Water 2006 Guangdong Desalination & Wastewater 2005 Tianjin Seawater Desalination 2004 Southeast Asia Indonesia River Water Treatment 2004 Malaysia Brine Recovery 2000 Malaysia River Water Treatment 2000
Source: Hyflux Annual Report 2008.
Table 2.9 Designed capacities of water plants constructed by Hyflux Limited
Designed Capacity (m3/day)
Year Deal Was Secured
Water Plant
500,000 and above 500,000 2008 Magtaa, Algeria [Desalination Plant] 100,000 – 499,999 273,000 2002 Chestnut Avenue Waterworks [Potable Water
Treatment Plant] 200,000 2006 Tlemcen, Algeria [Desalination Plant] 182,000 2009 Jurong Island, Singapore [Tuas Power Tembsus
Multi-Utilities Complex] 136,000 2003 Tuas, Singapore [SingSpring Desalination Plant] 100,000 2004 Tianjin Dagang, China [Desalination Plant] Below 100,000 80,000 2006 Langfang, China [Wastewater Recycling Plant] 68,000 2009 Salalah Independent Water & Power Project,
Oman [Desalination Plant] 68,000 2009 Jurong, Singapore [Membrane Bioreactor Plant] 40,000 2002 Seletar, Singapore [NEWater Plant – Wastewater
Recycling] 32,000 2001 Bedok, Singapore [NEWater Plant – Wastewater
Recycling]
46
Hyflux responded positively to the EWI’s creation of Centers of Excellence strategy (detailed in
Section 2.4) by establishing the Hyflux Global R&D Center in Singapore to conduct cutting-edge
R&D on membranes. In addition, to be at the forefront of research, Hyflux recruited scientists and
seconded outstanding faculty members from academic institutions. This created opportunities for
researchers to work on innovations with commercialize application or to solve problems
encountered in projects that the company was undertaking, be it locally or abroad.
Keppel Integrated Engineering (KIE)
KIE was the main contractor for Ulu Pandan NEWater factory. KIE’s export acceleration phase
was attributed to the NEWater and Waste-to-Energy projects secured from the Singapore
Government in 2004 and 2005 respectively, which in turn was supported by the the acquisition of
Keppel Seghers Technology (formerly Seghers Better Technology) in 2002. The acquisition was
important as it served to establish the technology foundation for the group on which the KIE’s
core competence in delivering environmental solutions is built on.5 KIE currently has a strong
portfolio of proprietary technologies. After the Ulu Pandan NEWater factory was commissioned
in 2007, KIE expanded its global presence and exported its indigenous capabilities to Algeria,
Qatar, Sweden and the United Kingdom (Table 2.10).
With the large numbers of overseas projects secured, the company was also prudent in
maintaining its strong portfolio of proprietary technologies, so that it could continue to export
innovative and sustainable environmental solutions. The Keppel Technology Advisory Panel
established the Keppel Environmental Technology Centre (KETC) in 2007 as a center of
excellence to 1) spearhead innovation in leading-edge environmental technology R&D; 2)
5 Keppel Corporation Annual Report 2008.
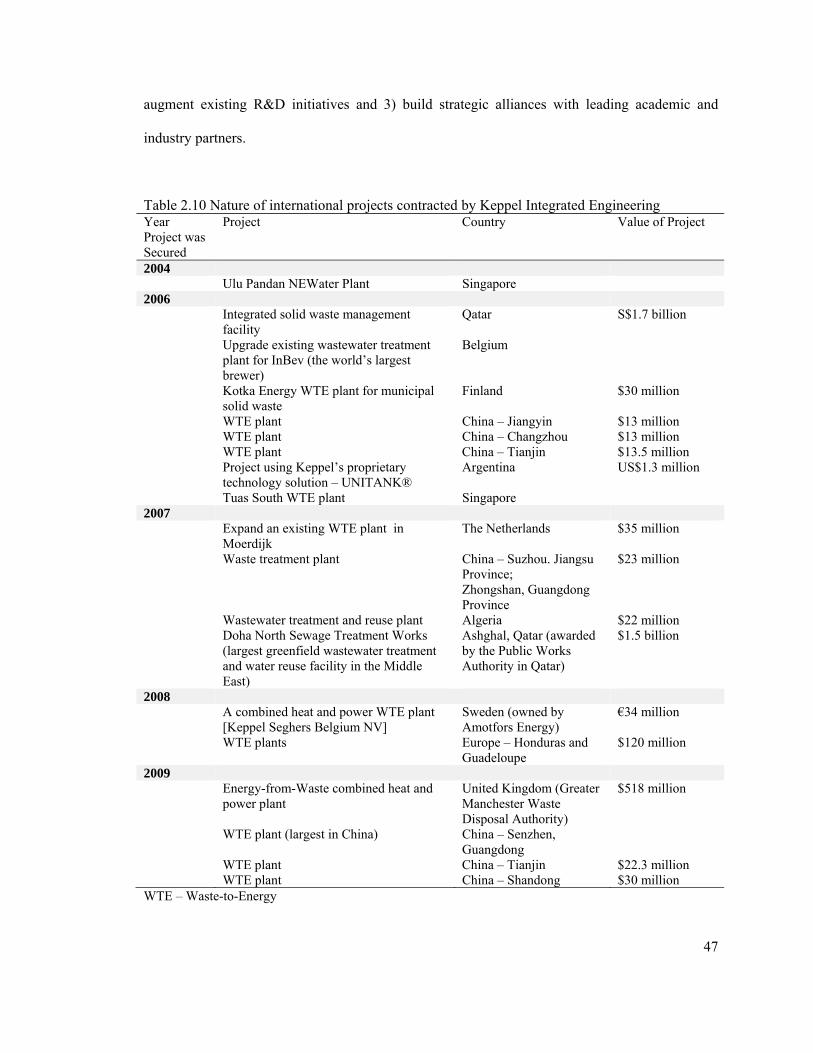
47
augment existing R&D initiatives and 3) build strategic alliances with leading academic and
industry partners.
Table 2.10 Nature of international projects contracted by Keppel Integrated Engineering Year Project was Secured
Project Country Value of Project
2004 Ulu Pandan NEWater Plant Singapore 2006 Integrated solid waste management
facility Qatar S$1.7 billion
Upgrade existing wastewater treatment plant for InBev (the world’s largest brewer)
Belgium
Kotka Energy WTE plant for municipal solid waste
Finland $30 million
WTE plant China – Jiangyin $13 million WTE plant China – Changzhou $13 million WTE plant China – Tianjin $13.5 million Project using Keppel’s proprietary
technology solution – UNITANK® Argentina US$1.3 million
Tuas South WTE plant Singapore 2007 Expand an existing WTE plant in
Moerdijk The Netherlands $35 million
Waste treatment plant China – Suzhou. Jiangsu Province; Zhongshan, Guangdong Province
$23 million
Wastewater treatment and reuse plant Algeria $22 million Doha North Sewage Treatment Works
(largest greenfield wastewater treatment and water reuse facility in the Middle East)
Ashghal, Qatar (awarded by the Public Works Authority in Qatar)
$1.5 billion
2008 A combined heat and power WTE plant
[Keppel Seghers Belgium NV] Sweden (owned by Amotfors Energy)
€34 million
WTE plants Europe – Honduras and Guadeloupe
$120 million
2009 Energy-from-Waste combined heat and
power plant United Kingdom (Greater Manchester Waste Disposal Authority)
$518 million
WTE plant (largest in China) China – Senzhen, Guangdong
WTE plant China – Tianjin $22.3 million WTE plant China – Shandong $30 million WTE – Waste-to-Energy
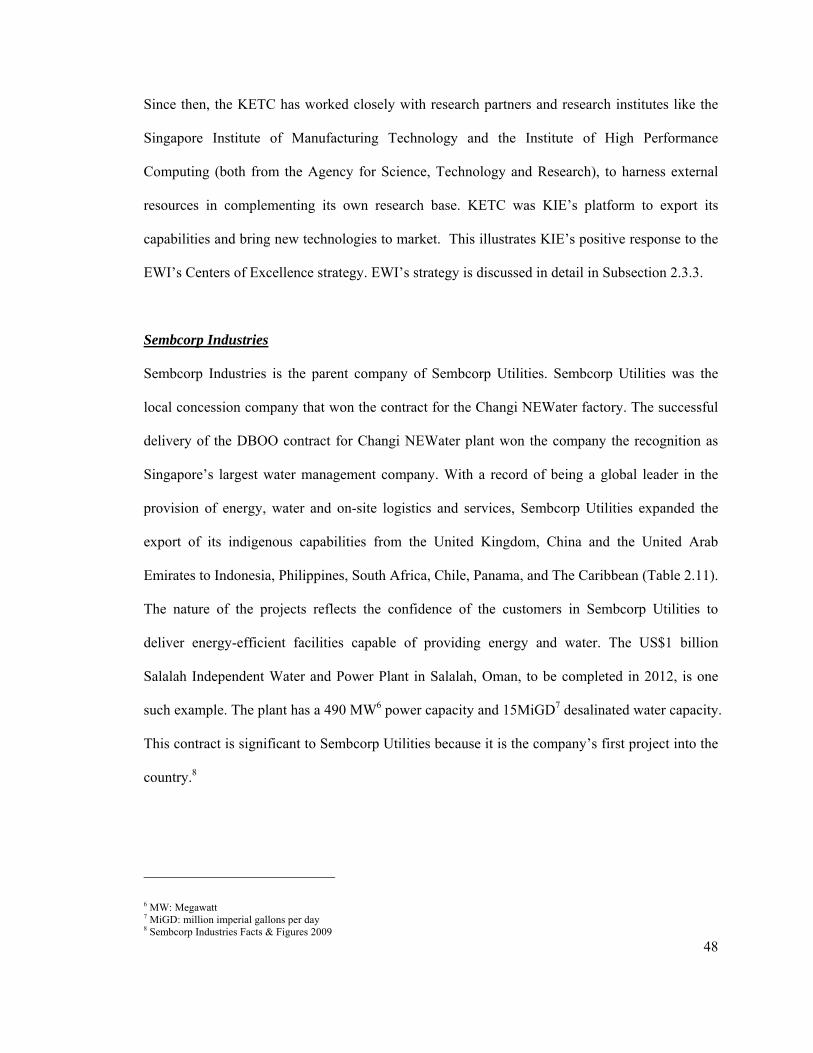
48
Since then, the KETC has worked closely with research partners and research institutes like the
Singapore Institute of Manufacturing Technology and the Institute of High Performance
Computing (both from the Agency for Science, Technology and Research), to harness external
resources in complementing its own research base. KETC was KIE’s platform to export its
capabilities and bring new technologies to market. This illustrates KIE’s positive response to the
EWI’s Centers of Excellence strategy. EWI’s strategy is discussed in detail in Subsection 2.3.3.
Sembcorp Industries
Sembcorp Industries is the parent company of Sembcorp Utilities. Sembcorp Utilities was the
local concession company that won the contract for the Changi NEWater factory. The successful
delivery of the DBOO contract for Changi NEWater plant won the company the recognition as
Singapore’s largest water management company. With a record of being a global leader in the
provision of energy, water and on-site logistics and services, Sembcorp Utilities expanded the
export of its indigenous capabilities from the United Kingdom, China and the United Arab
Emirates to Indonesia, Philippines, South Africa, Chile, Panama, and The Caribbean (Table 2.11).
The nature of the projects reflects the confidence of the customers in Sembcorp Utilities to
deliver energy-efficient facilities capable of providing energy and water. The US$1 billion
Salalah Independent Water and Power Plant in Salalah, Oman, to be completed in 2012, is one
such example. The plant has a 490 MW6 power capacity and 15MiGD7 desalinated water capacity.
This contract is significant to Sembcorp Utilities because it is the company’s first project into the
country.8
6 MW: Megawatt 7 MiGD: million imperial gallons per day 8 Sembcorp Industries Facts & Figures 2009
49
Table 2.11 Export of indigenous capabilities by Sembcorp Industries# Capacity of Treatment Facility
Year Facility will be Operational
Country of Treatment Facility Number of Projects in the Country
2,000,000 – 3,000,000 m3/day 2003 United Kingdom (Teesside) 1 2005 China (Nanjing; Shanghai) 2 3,000,000 – 4,000,000 m3/day 2006 United Arab Emirates (Fujairah) 1 2006 China (Zhangjiagang) 1 2008 China (Shenyang) 1 2009 Singapore (Changi) 1 2009 China (Tianjin) 1 5,000,000 – 6,000,000 m3/day 2010 China (Yancheng; Zhumadian; Fuzhou;
Qitaihe; Yanjiao; Xinmin) 6
Indonesia (Batam; Talang Kelapa) 2 Philippines (Subic Bay) 1 South Africa (Nelspruit; Ballito) 2 United Kingdom (Bournemouth) 1 Chile (Santiago; Colina; Lampa;
Antofagasta; La Negra) 5
Panama (Lake Gatun) 1 The Caribbean (Antigua; Bonaire;
Curacao) 3
2011 China (Qinzhou) 1 2012 Oman (Salalah) 1 # Sembcorp Industries was the developer, owner and operator
Phase 4 (2010 and beyond): Co-evolutionary Acclimatization9
As illustrated in Phase 1 to Phase 3, by 2010, successful innovations have been created and
exported as a result of the indigenous capabilities built. These successful innovations
disseminated spur further innovations that in turn generate new innovations which become
embedded in the whole eco-system. Research collaborations spur innovation in a virtuous cycle
manner. Take for example the research collaboration between Optiqua Technologies, a subsidiary
of Dutch optical sensor company Optisense, and PUB, to develop Optiqua’s real-time sensor
technology. Research in real-time sensing is very crucial to the monitoring of water quality.
9 The concept of ‘co-evolutionary acclimatization’ refers to successive changes among two or more ecological interdependent but unique parties so that their evolutionary trajectories intertwine overtime, adapting to each other.
50
Desired characteristics of real-time sensors include the ability to detect contaminants present at
minute levels, the ability to detect new contaminants and IT capability to support real-time
sensing and data transmission. This is a good example in which innovation in sensors can spur
innovations in IT systems or innovations in nanomaterials. Research in this area has global
implications as developed countries are vulnerable to new contaminants while developing
countries lack resources to monitor the quality of water fit for drinking. Another example is the
collaboration between ITT Corporation and PUB to conduct joint research and technology testing
to further develop energy-efficient water and wastewater treatment solutions. Research to address
water-energy nexus is important as the price of crude oil (the primary energy source) continues to
escalate. Innovative solutions in systems design may in turn induce innovations in membranes
and vice versa.
Another successful co-evolutionary acclimatization phenomenon is observed in the MEMSTILL
project undertaken by local company, Keppel Integrated Engineering. MEMSTILL® is a novel
and low-cost desalination technology developed by a consortium which includes the Netherlands
Organization for Applied Scientific Research and Keppel Seghers Belgium N.V., a wholly owned
subsidiary of Keppel Integrated Engineering Ltd. The first bench scale test and first pilot plant
test were conducted in Singapore. The second pilot testing was conducted in the Netherlands with
improved materials and configurations to achieve ten times better results. The third pilot testing
was also conducted in the Netherlands with the consortium deciding on a large demonstration
plant planned in Singapore to further develop and commercialize the technology. The new design
has been tested in Belgium and Spain.
Co-evolutionary acclimatization is also observed in the area of membrane bioreactors. Toray has
a pilot plant located within the Ulu Pandan Water Reclamation Plant in Singapore, while Asahi
51
has its pilot plant located at Utrecht Water Reclamation Plant in The Netherlands. For both plants,
local firm, Keppel Seghers, designed, constructed, commissioned and operated the two membrane
bioreactor pilot plants to test the technology that treats wastewater into industrial water quality in
a single step. This advancement in R&D work was a major attractive factor for Mitsubishi Rayon
to start up a pilot plant at Bedok Water Reclamation Plant in Singapore. This illustrates that co-
evolutionary acclimatization is not bound by geographic boundaries.
Yet another example of co-evolution between innovation and institutional systems in the
Singapore NEWater industry is reflected in the local water solutions company Hyflux Limited.
Initially established as a membrane trading company, Hyflux has evolved into an integrated water
solutions company. The company was quick to realize the constraints in solely being a membrane
supplier / manufacturer as water-related projects tend to involve both EPC and O&M aspects.
Hyflux leveraged on the opportunities as a component supplier / manufacturer in water projects
and learned from the established players. The learning was assimilated and indigenous
capabilities were accumulated over time. With the indigenous capabilities and the timely
implementation of the DBOO scheme, Hyflux won the bid as the main concession company for
Singapore’s first desalination plant constructed under the DBOO scheme in 2005. A firm belief in
the potential of membrane technology, Hyflux decided to leverage on its core competence in
understanding the market needs of their customers in the Asia Pacific region by investing in
membrane R&D. The proposal to establish the Membrane R&D Center to conduct R&D on
membranes was supported by the government as the ‘Environment & Water Technologies’ was
identified as one of Singapore’s three key economic growth pillars identified by the study
conducted by the National Research Foundation10. The establishment of such a R&D center
10 In August 2004, the Ministerial Committee on Research and Development (MCRD), chaired by then Deputy Prime Minister, Dr Tony Tan, was formed to review Singapore’s R&D’s strategies and direction. The Committee recommended that Singapore needed to
52
signifies the government’s commitment to transform Singapore into a global hydrohub through
the establishment of a vibrant water eco-system. This center was the pioneer of centers of
excellence. Participating in EWI’s trade missions to Asia Pacific and the Middle East region
facilitated Hyflux’s penetration into China, India and the Middle East. With a strategic
intellectual property plan and through government’s support schemes from International
Enterprise Singapore11, Hyflux set up manufacturing facilities in China. With a good track record
and proprietary technology, participating in SIWW saw an increase in the number of overseas
contracts won. With the experience to innovate to meet the stringent requirements of each project
(local and overseas), Hyflux has plans, over the next 5 years, to develop a Hyflux Innovation
Center and Hyflux Production Hub in Singapore. The company has also secured contracts in 2010
to construct a membrane bioreactor plant and a desalination plant on Jurong island. It is evident
from the above that co-evolutionary acclimatization is successful. Macroeconomic data supports
this co-evolutionary acclimatization phenomenon observed. Indigenous Gross National Income
(GNI) figures for Singapore12 grew by S$71,865 million from S$110,671.3 million in 1999 to
S$182,536 million in 2009. Given that GNI is equivalent to GNP (Gross National Product), and
thus it is the result of the value-added generated by Singaporeans in Singapore (GSS) and value-
added generated by Singaporean in Foreign country (GSF).
refocus its research and innovation agenda to keep up with international developments. Singapore had to transform itself into an innovation-driven economy that competes on knowledge and talent. The Committee also outlined a national R&D framework to implement its strategic thrusts. The Research, Innovation and Enterprise Council (RIEC), chaired by the Prime Minister, Mr Lee Hsien Loong was set up to lead the national drive to promote knowledge creation, innovation and enterprise. The RIEC was formed within the National Research Foundation (NRF), a department formed within the Prime Minister’s Office on 1 January 2006. An initial amount of S$5 billion was set aside for the period between 2006 and 2010 to promote the three key strategic growth areas identified by the NRF Board. The Environmental & Water Technologies was one of the three key economic growth pillars for the Singapore economy. The other two strategic growth areas being the Biomedical Sciences and the Interactive & Digital Media. 11 International Enterprise Singapore (IE Singapore) is one of the sister agencies under the Ministry of Trade and Industry. 12 Yearbook of Statistics Singapore 2010, Singapore Department of Statistics
53
2.3.3 Institutional Approaches
The following details institutional factors (Nelson, 2008) such as the innovative approaches of the
Singapore Government in catalyzing the transformation process. The intention is to identify and
illustrate the success of the institutional innovations through qualitative detailed examples as the
results of the innovations may yield intangible benefits that may not be accurately reflected via
statistically analysis. It is not the aim of this PhD research to quantify the success. The discussion
on institutional innovations, which may take the form of government initiatives, will be
conducted over the entire transformation process as it recognizes that government initiatives often
span over a number of years and the results may not be immediately observable.
The open tender method adopted by the Public Utilities Board13 (PUB) is an innovative way of
increasing the pool of subcontractors which increases the opportunities for interaction and
learning. In most projects, the contract is awarded to a main contractor. The main contractor then
sources for subcontractors with complementary skills and expertise to jointly design an efficient
system. The subcontractors are made up of providers of engineering-related services and
components (pumps, pipes, membranes). The open tender method provides the main contractor
with options of subcontractors and at the same time does not compromise on quality because only
companies that are able to prove that their products / services meet the requirements specified and
met the stringent due diligence requirements as laid out by PUB will be among the list of
approved subcontractors. This indirectly forces local companies to assimilate and develop
indigenous high quality capabilities quickly that are comparable to or better than the reputable
companies so that they can remain competitive in the industry.
13 The PUB is one of the two statutory boards under the Ministry of the Environment and Water Resources). The National Environment Agency (NEA) being the other.
54
Another government initiative was the setting up of the Environment and Water Industry
Development Council (EWI) in May 2006 under the Ministry of the Environment and Water
Resources to spearhead the development of the environment and water industry in Singapore. Its
vision is to develop Singapore into a ‘global hydrohub’ for business, investment, research and
technology through its three-pronged strategy, focusing on Technology Development, Cluster
Development and Internationalization.
The Technology Development strategy aims to build up the R&D and technology base for the
environment and water sector, and, at the same time, develop the necessary manpower to meet the
needs of the sector. A S$100 million Environment & Water Research Programme (EWRP) was
launched in 2006. The March 2009 issue of Milieu reported that since then, four Request-for-
Proposals (RFPs) have been completed, with some S$30 million in research grants awarded to
more than 30 research projects. The RFPs are open to research institutions and companies to
submit proposals for funding. New knowledge created by the private sector and existing
knowledge of the private sector contributed towards Singapore’s pool of knowledge stock. These
companies bring with them expertise in areas that they are strong in. Viewing water treatment as
a system, the areas of research are diverse and cover the various parts of the system. Examples
include membrane fouling, biomimetic membranes and rapid pathogen detection.
Another strategy by the Technology Development group was to promote Singapore as a global
test-bed. PUB facilities were made available for test-bedding of all new technologies related to
water. The aim was to be the hub for the private sector to test their technologies here before
implementation in or selling the technologies to other parts of Asia. The market may not be
Singapore but Singapore is geographically located with fast access to many parts of Asia and the
infrastructure for such activities is available. An example of a successful project is the Singapore-
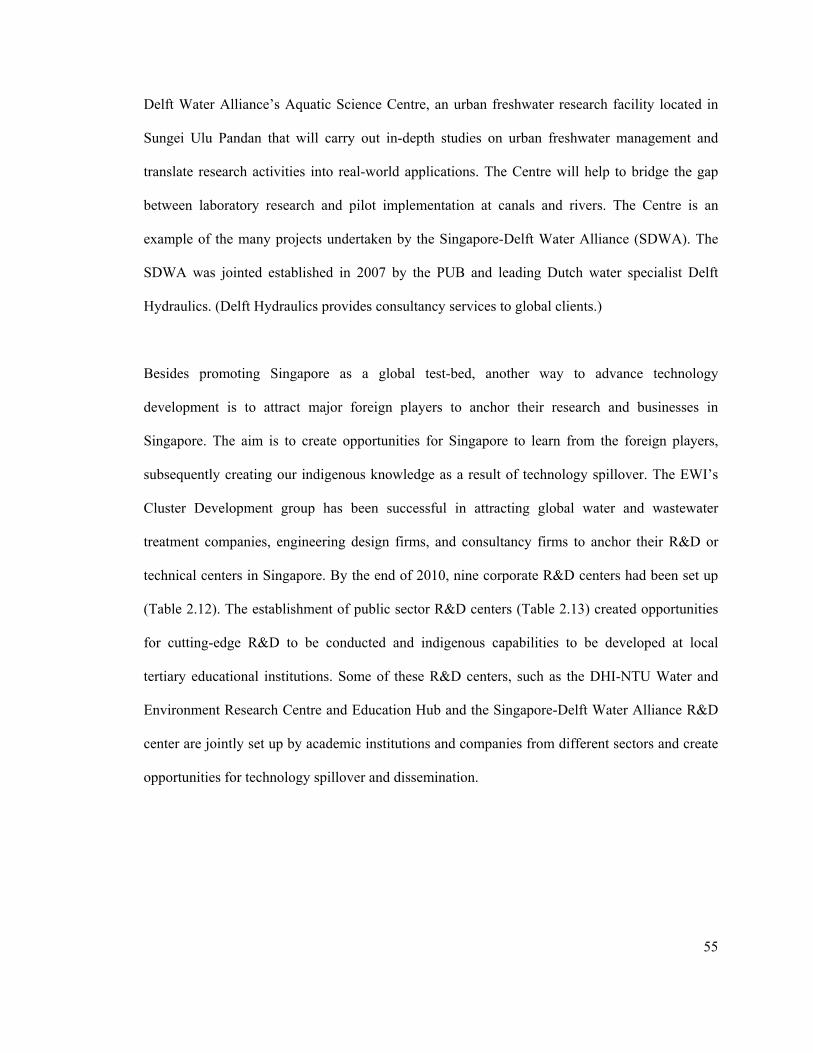
55
Delft Water Alliance’s Aquatic Science Centre, an urban freshwater research facility located in
Sungei Ulu Pandan that will carry out in-depth studies on urban freshwater management and
translate research activities into real-world applications. The Centre will help to bridge the gap
between laboratory research and pilot implementation at canals and rivers. The Centre is an
example of the many projects undertaken by the Singapore-Delft Water Alliance (SDWA). The
SDWA was jointed established in 2007 by the PUB and leading Dutch water specialist Delft
Hydraulics. (Delft Hydraulics provides consultancy services to global clients.)
Besides promoting Singapore as a global test-bed, another way to advance technology
development is to attract major foreign players to anchor their research and businesses in
Singapore. The aim is to create opportunities for Singapore to learn from the foreign players,
subsequently creating our indigenous knowledge as a result of technology spillover. The EWI’s
Cluster Development group has been successful in attracting global water and wastewater
treatment companies, engineering design firms, and consultancy firms to anchor their R&D or
technical centers in Singapore. By the end of 2010, nine corporate R&D centers had been set up
(Table 2.12). The establishment of public sector R&D centers (Table 2.13) created opportunities
for cutting-edge R&D to be conducted and indigenous capabilities to be developed at local
tertiary educational institutions. Some of these R&D centers, such as the DHI-NTU Water and
Environment Research Centre and Education Hub and the Singapore-Delft Water Alliance R&D
center are jointly set up by academic institutions and companies from different sectors and create
opportunities for technology spillover and dissemination.
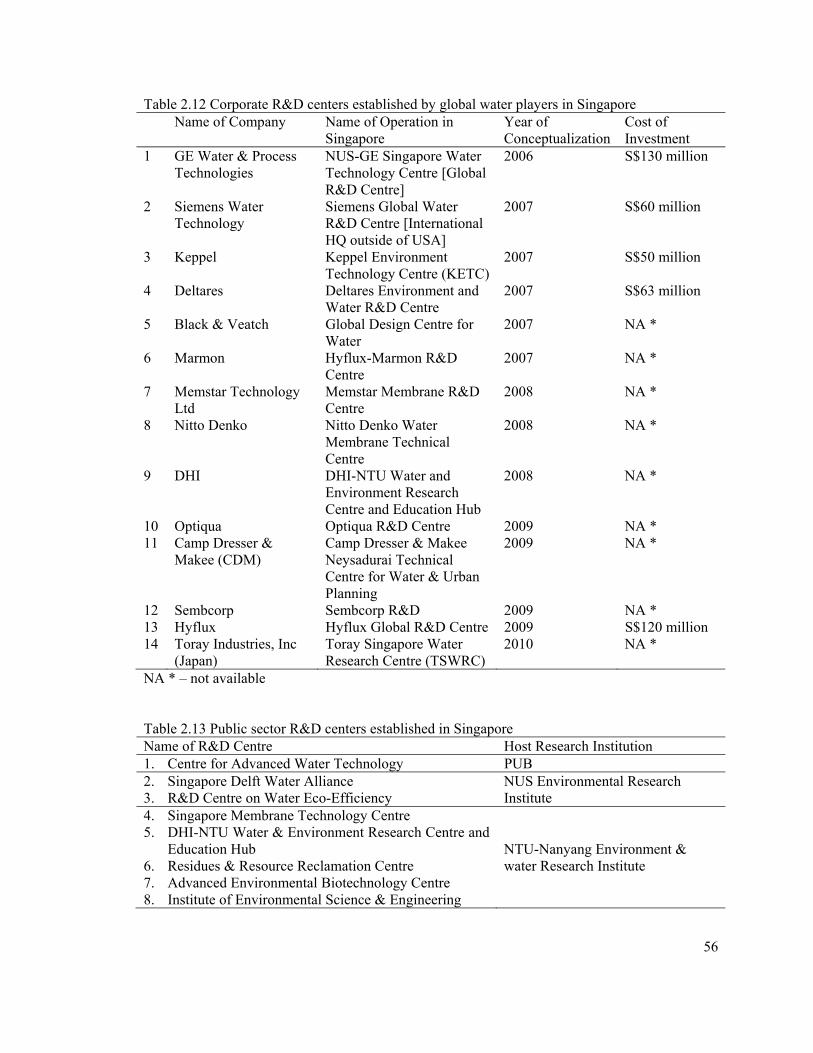
56
Table 2.12 Corporate R&D centers established by global water players in Singapore Name of Company Name of Operation in
Singapore Year of Conceptualization
Cost of Investment
1 GE Water & Process Technologies
NUS-GE Singapore Water Technology Centre [Global R&D Centre]
2006 S$130 million
2 Siemens Water Technology
Siemens Global Water R&D Centre [International HQ outside of USA]
2007 S$60 million
3 Keppel Keppel Environment Technology Centre (KETC)
2007 S$50 million
4 Deltares Deltares Environment and Water R&D Centre
2007 S$63 million
5 Black & Veatch Global Design Centre for Water
2007 NA *
6 Marmon Hyflux-Marmon R&D Centre
2007 NA *
7 Memstar Technology Ltd
Memstar Membrane R&D Centre
2008 NA *
8 Nitto Denko Nitto Denko Water Membrane Technical Centre
2008 NA *
9 DHI DHI-NTU Water and Environment Research Centre and Education Hub
2008 NA *
10 Optiqua Optiqua R&D Centre 2009 NA * 11 Camp Dresser &
Makee (CDM) Camp Dresser & Makee Neysadurai Technical Centre for Water & Urban Planning
2009 NA *
12 Sembcorp Sembcorp R&D 2009 NA * 13 Hyflux Hyflux Global R&D Centre 2009 S$120 million 14 Toray Industries, Inc
(Japan) Toray Singapore Water Research Centre (TSWRC)
2010 NA *
NA * – not available
Table 2.13 Public sector R&D centers established in Singapore Name of R&D Centre Host Research Institution 1. Centre for Advanced Water Technology PUB 2. Singapore Delft Water Alliance 3. R&D Centre on Water Eco-Efficiency
NUS Environmental Research Institute
4. Singapore Membrane Technology Centre 5. DHI-NTU Water & Environment Research Centre and
Education Hub 6. Residues & Resource Reclamation Centre 7. Advanced Environmental Biotechnology Centre 8. Institute of Environmental Science & Engineering
NTU-Nanyang Environment & water Research Institute
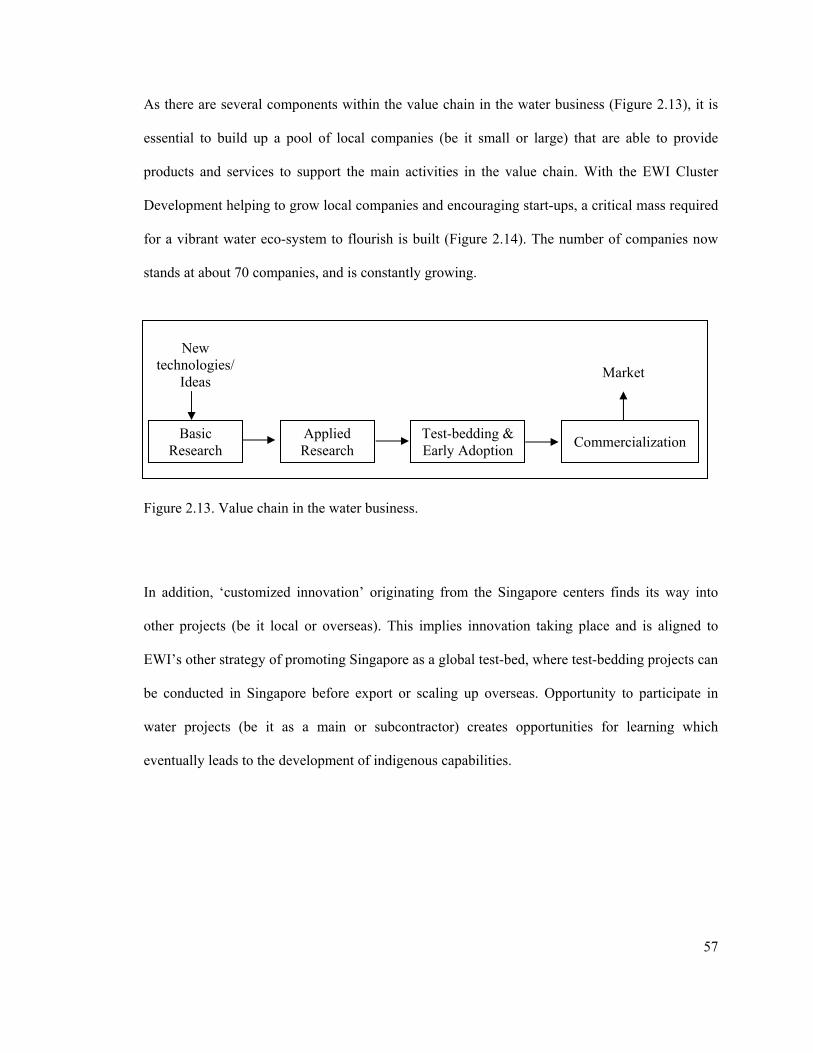
57
As there are several components within the value chain in the water business (Figure 2.13), it is
essential to build up a pool of local companies (be it small or large) that are able to provide
products and services to support the main activities in the value chain. With the EWI Cluster
Development helping to grow local companies and encouraging start-ups, a critical mass required
for a vibrant water eco-system to flourish is built (Figure 2.14). The number of companies now
stands at about 70 companies, and is constantly growing.
Figure 2.13. Value chain in the water business.
In addition, ‘customized innovation’ originating from the Singapore centers finds its way into
other projects (be it local or overseas). This implies innovation taking place and is aligned to
EWI’s other strategy of promoting Singapore as a global test-bed, where test-bedding projects can
be conducted in Singapore before export or scaling up overseas. Opportunity to participate in
water projects (be it as a main or subcontractor) creates opportunities for learning which
eventually leads to the development of indigenous capabilities.
Basic Research
Applied Research
Test-bedding & Early Adoption
Commercialization
New technologies/
Ideas Market
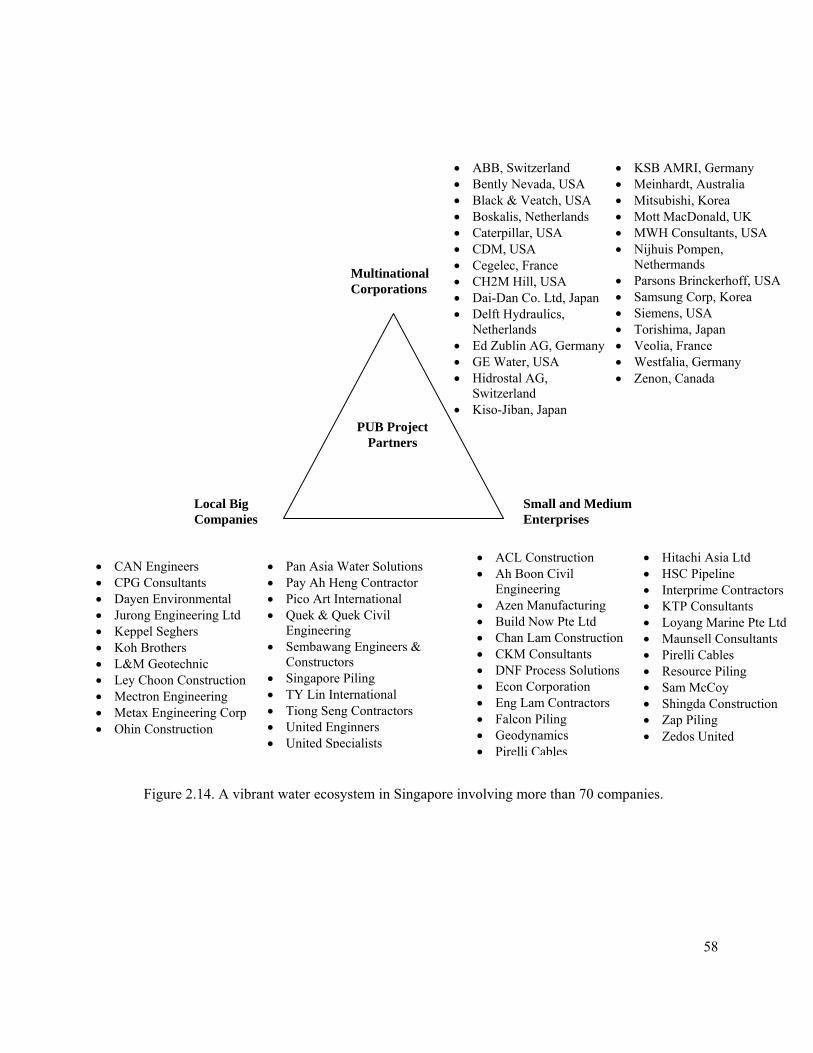
58
Figure 2.14. A vibrant water ecosystem in Singapore involving more than 70 companies.
PUB Project Partners
Multinational Corporations
Local Big Companies
Small and Medium Enterprises
CAN Engineers CPG Consultants Dayen Environmental Jurong Engineering Ltd Keppel Seghers Koh Brothers L&M Geotechnic Ley Choon Construction Mectron Engineering Metax Engineering Corp Ohin Construction
Pan Asia Water Solutions Pay Ah Heng Contractor Pico Art International Quek & Quek Civil
Engineering Sembawang Engineers &
Constructors Singapore Piling TY Lin International Tiong Seng Contractors United Enginners United Specialists
ABB, Switzerland Bently Nevada, USA Black & Veatch, USA Boskalis, Netherlands Caterpillar, USA CDM, USA Cegelec, France CH2M Hill, USA Dai-Dan Co. Ltd, Japan Delft Hydraulics,
Netherlands Ed Zublin AG, Germany GE Water, USA Hidrostal AG,
Switzerland Kiso-Jiban, Japan
KSB AMRI, Germany Meinhardt, Australia Mitsubishi, Korea Mott MacDonald, UK MWH Consultants, USA Nijhuis Pompen,
Nethermands Parsons Brinckerhoff, USA Samsung Corp, Korea Siemens, USA Torishima, Japan Veolia, France Westfalia, Germany Zenon, Canada
ACL Construction Ah Boon Civil
Engineering Azen Manufacturing Build Now Pte Ltd Chan Lam Construction CKM Consultants DNF Process Solutions Econ Corporation Eng Lam Contractors Falcon Piling Geodynamics Pirelli Cables
Hitachi Asia Ltd HSC Pipeline Interprime Contractors KTP Consultants Loyang Marine Pte Ltd Maunsell Consultants Pirelli Cables Resource Piling Sam McCoy Shingda Construction Zap Piling Zedos United
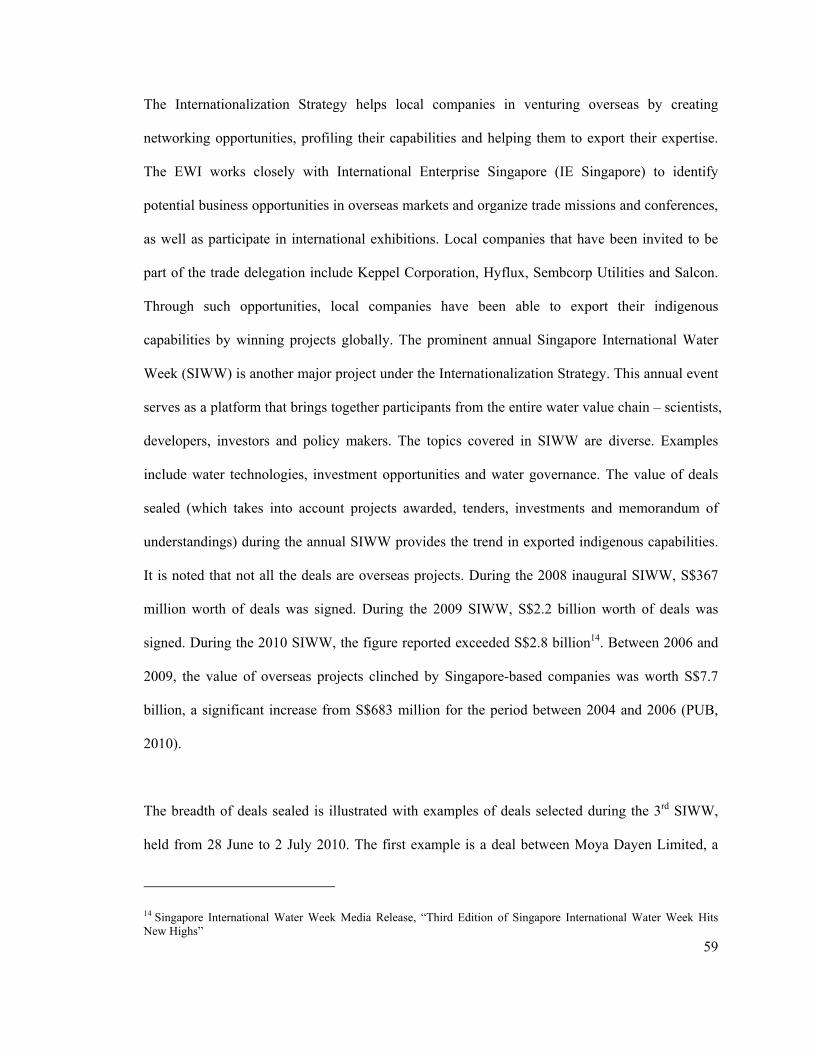
59
The Internationalization Strategy helps local companies in venturing overseas by creating
networking opportunities, profiling their capabilities and helping them to export their expertise.
The EWI works closely with International Enterprise Singapore (IE Singapore) to identify
potential business opportunities in overseas markets and organize trade missions and conferences,
as well as participate in international exhibitions. Local companies that have been invited to be
part of the trade delegation include Keppel Corporation, Hyflux, Sembcorp Utilities and Salcon.
Through such opportunities, local companies have been able to export their indigenous
capabilities by winning projects globally. The prominent annual Singapore International Water
Week (SIWW) is another major project under the Internationalization Strategy. This annual event
serves as a platform that brings together participants from the entire water value chain – scientists,
developers, investors and policy makers. The topics covered in SIWW are diverse. Examples
include water technologies, investment opportunities and water governance. The value of deals
sealed (which takes into account projects awarded, tenders, investments and memorandum of
understandings) during the annual SIWW provides the trend in exported indigenous capabilities.
It is noted that not all the deals are overseas projects. During the 2008 inaugural SIWW, S$367
million worth of deals was signed. During the 2009 SIWW, S$2.2 billion worth of deals was
signed. During the 2010 SIWW, the figure reported exceeded S$2.8 billion14. Between 2006 and
2009, the value of overseas projects clinched by Singapore-based companies was worth S$7.7
billion, a significant increase from S$683 million for the period between 2004 and 2006 (PUB,
2010).
The breadth of deals sealed is illustrated with examples of deals selected during the 3rd SIWW,
held from 28 June to 2 July 2010. The first example is a deal between Moya Dayen Limited, a
14 Singapore International Water Week Media Release, “Third Edition of Singapore International Water Week Hits New Highs”
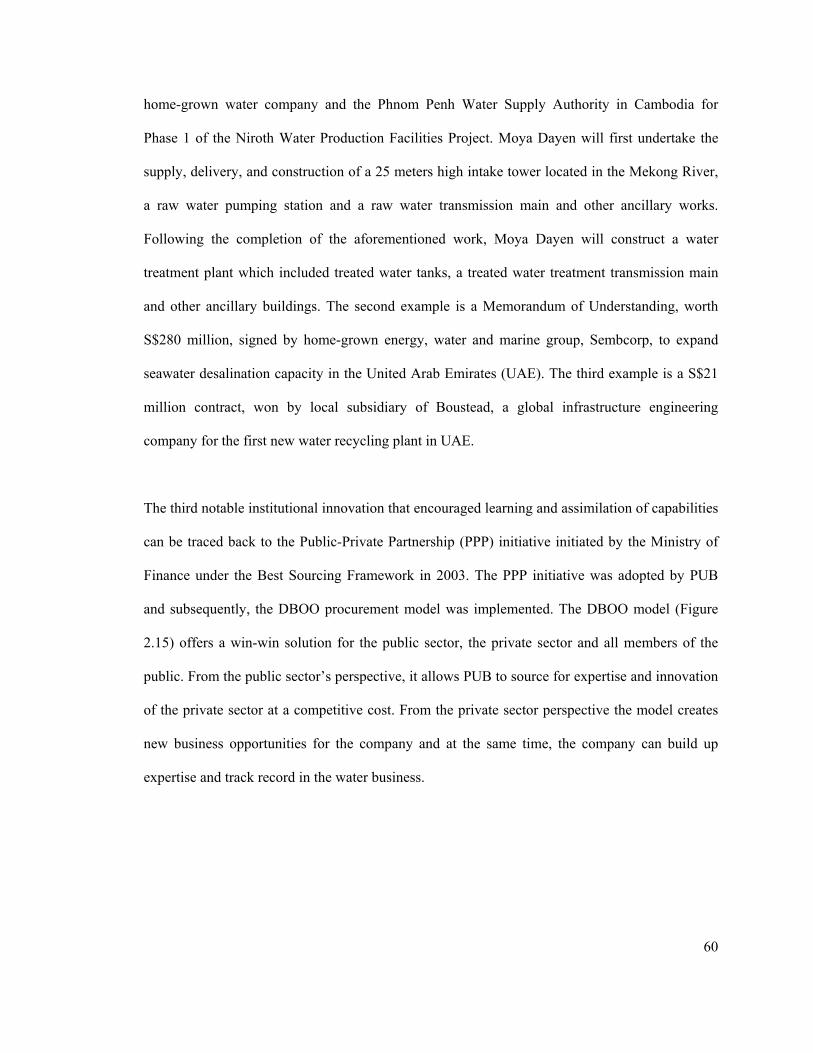
60
home-grown water company and the Phnom Penh Water Supply Authority in Cambodia for
Phase 1 of the Niroth Water Production Facilities Project. Moya Dayen will first undertake the
supply, delivery, and construction of a 25 meters high intake tower located in the Mekong River,
a raw water pumping station and a raw water transmission main and other ancillary works.
Following the completion of the aforementioned work, Moya Dayen will construct a water
treatment plant which included treated water tanks, a treated water treatment transmission main
and other ancillary buildings. The second example is a Memorandum of Understanding, worth
S$280 million, signed by home-grown energy, water and marine group, Sembcorp, to expand
seawater desalination capacity in the United Arab Emirates (UAE). The third example is a S$21
million contract, won by local subsidiary of Boustead, a global infrastructure engineering
company for the first new water recycling plant in UAE.
The third notable institutional innovation that encouraged learning and assimilation of capabilities
can be traced back to the Public-Private Partnership (PPP) initiative initiated by the Ministry of
Finance under the Best Sourcing Framework in 2003. The PPP initiative was adopted by PUB
and subsequently, the DBOO procurement model was implemented. The DBOO model (Figure
2.15) offers a win-win solution for the public sector, the private sector and all members of the
public. From the public sector’s perspective, it allows PUB to source for expertise and innovation
of the private sector at a competitive cost. From the private sector perspective the model creates
new business opportunities for the company and at the same time, the company can build up
expertise and track record in the water business.
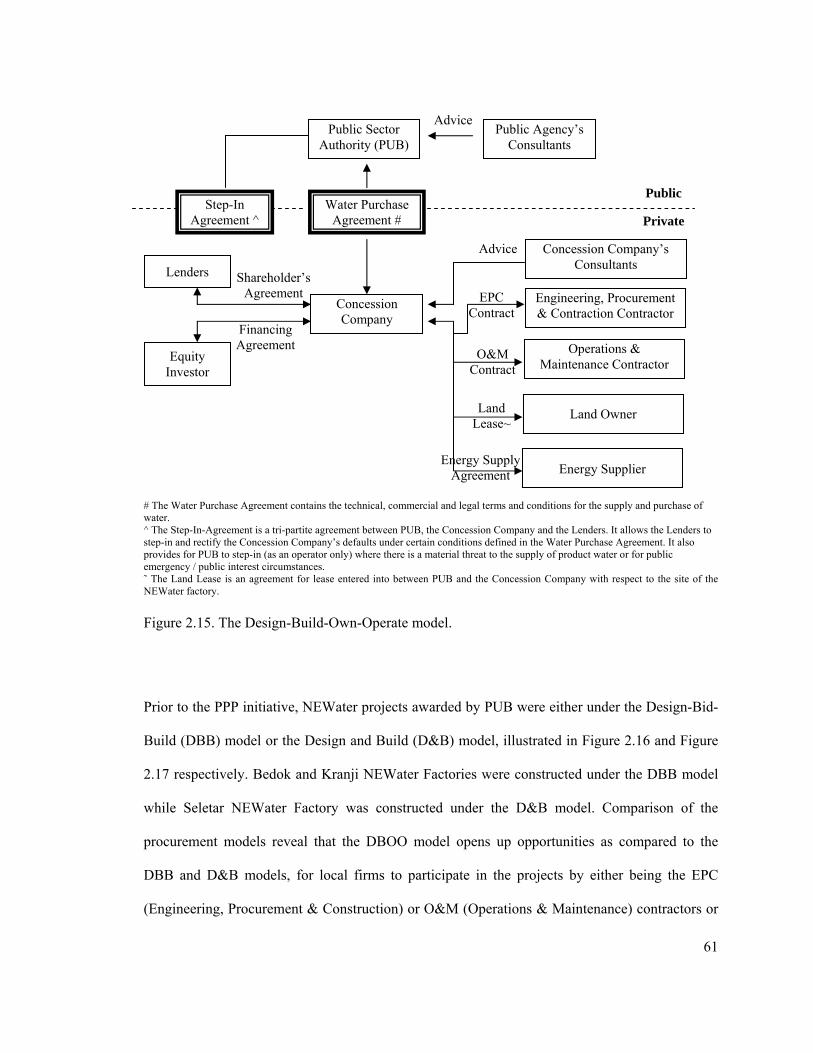
61
# The Water Purchase Agreement contains the technical, commercial and legal terms and conditions for the supply and purchase of water. ^ The Step-In-Agreement is a tri-partite agreement between PUB, the Concession Company and the Lenders. It allows the Lenders to step-in and rectify the Concession Company’s defaults under certain conditions defined in the Water Purchase Agreement. It also provides for PUB to step-in (as an operator only) where there is a material threat to the supply of product water or for public emergency / public interest circumstances. ˜ The Land Lease is an agreement for lease entered into between PUB and the Concession Company with respect to the site of the NEWater factory.
Figure 2.15. The Design-Build-Own-Operate model.
Prior to the PPP initiative, NEWater projects awarded by PUB were either under the Design-Bid-
Build (DBB) model or the Design and Build (D&B) model, illustrated in Figure 2.16 and Figure
2.17 respectively. Bedok and Kranji NEWater Factories were constructed under the DBB model
while Seletar NEWater Factory was constructed under the D&B model. Comparison of the
procurement models reveal that the DBOO model opens up opportunities as compared to the
DBB and D&B models, for local firms to participate in the projects by either being the EPC
(Engineering, Procurement & Construction) or O&M (Operations & Maintenance) contractors or
Public Sector Authority (PUB)
Public Agency’s Consultants
Advice
Step-In Agreement ^
Water Purchase Agreement #
Concession Company
Lenders
Equity Investor
Shareholder’s Agreement
Financing Agreement
Concession Company’s Consultants
Advice
Engineering, Procurement & Contraction Contractor
Operations & Maintenance Contractor
Land Owner
Energy Supplier
EPC Contract
O&M Contract
Land Lease~
Energy Supply Agreement
Public
Private
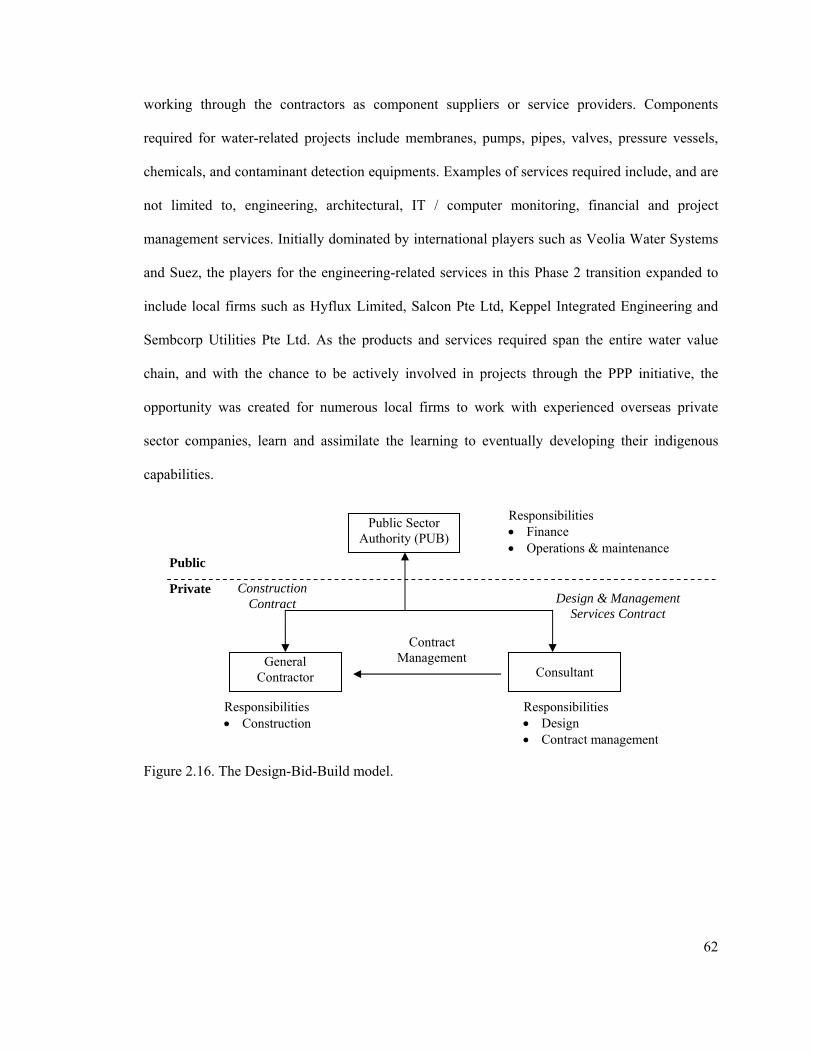
62
working through the contractors as component suppliers or service providers. Components
required for water-related projects include membranes, pumps, pipes, valves, pressure vessels,
chemicals, and contaminant detection equipments. Examples of services required include, and are
not limited to, engineering, architectural, IT / computer monitoring, financial and project
management services. Initially dominated by international players such as Veolia Water Systems
and Suez, the players for the engineering-related services in this Phase 2 transition expanded to
include local firms such as Hyflux Limited, Salcon Pte Ltd, Keppel Integrated Engineering and
Sembcorp Utilities Pte Ltd. As the products and services required span the entire water value
chain, and with the chance to be actively involved in projects through the PPP initiative, the
opportunity was created for numerous local firms to work with experienced overseas private
sector companies, learn and assimilate the learning to eventually developing their indigenous
capabilities.
Figure 2.16. The Design-Bid-Build model.
Public Sector Authority (PUB)
General Contractor Consultant
Construction Contract
Responsibilities Finance Operations & maintenance
Design & Management Services Contract
Contract Management
Responsibilities Construction
Responsibilities Design Contract management
Public
Private
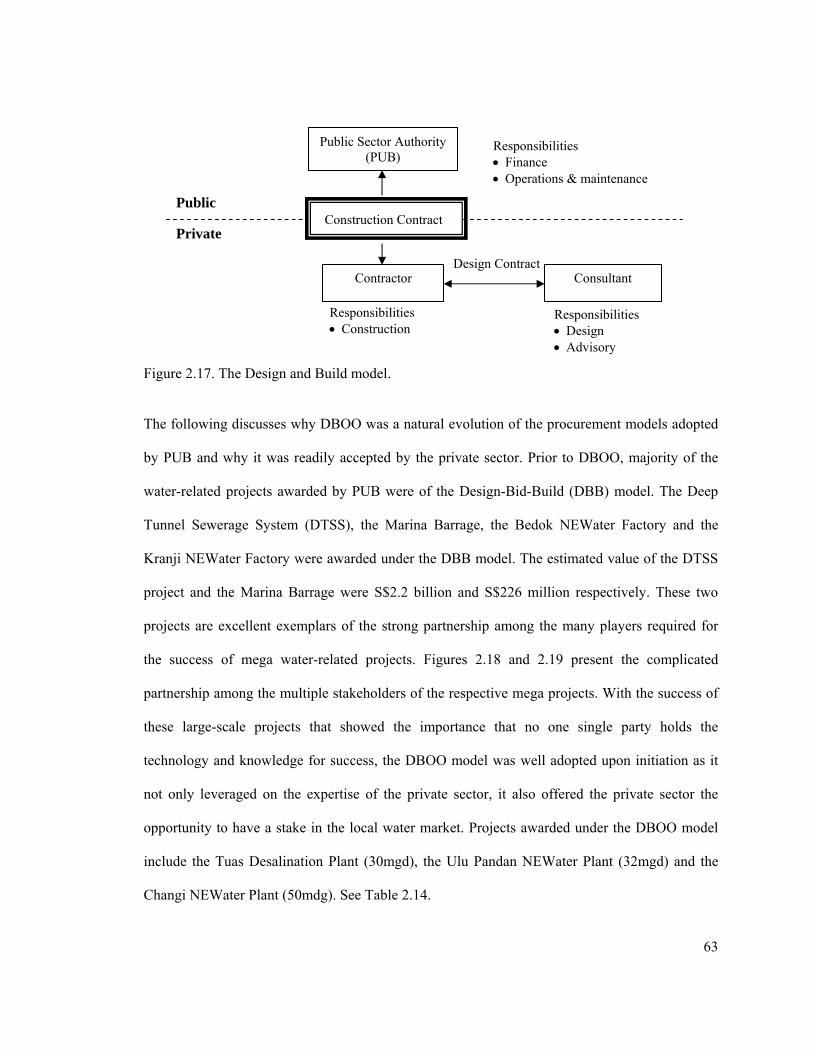
63
Figure 2.17. The Design and Build model.
The following discusses why DBOO was a natural evolution of the procurement models adopted
by PUB and why it was readily accepted by the private sector. Prior to DBOO, majority of the
water-related projects awarded by PUB were of the Design-Bid-Build (DBB) model. The Deep
Tunnel Sewerage System (DTSS), the Marina Barrage, the Bedok NEWater Factory and the
Kranji NEWater Factory were awarded under the DBB model. The estimated value of the DTSS
project and the Marina Barrage were S$2.2 billion and S$226 million respectively. These two
projects are excellent exemplars of the strong partnership among the many players required for
the success of mega water-related projects. Figures 2.18 and 2.19 present the complicated
partnership among the multiple stakeholders of the respective mega projects. With the success of
these large-scale projects that showed the importance that no one single party holds the
technology and knowledge for success, the DBOO model was well adopted upon initiation as it
not only leveraged on the expertise of the private sector, it also offered the private sector the
opportunity to have a stake in the local water market. Projects awarded under the DBOO model
include the Tuas Desalination Plant (30mgd), the Ulu Pandan NEWater Plant (32mgd) and the
Changi NEWater Plant (50mdg). See Table 2.14.
Responsibilities Design Advisory
Public Sector Authority (PUB)
Responsibilities Construction
Responsibilities Finance Operations & maintenance
Contractor
Construction Contract Public
Private
Consultant Design Contract
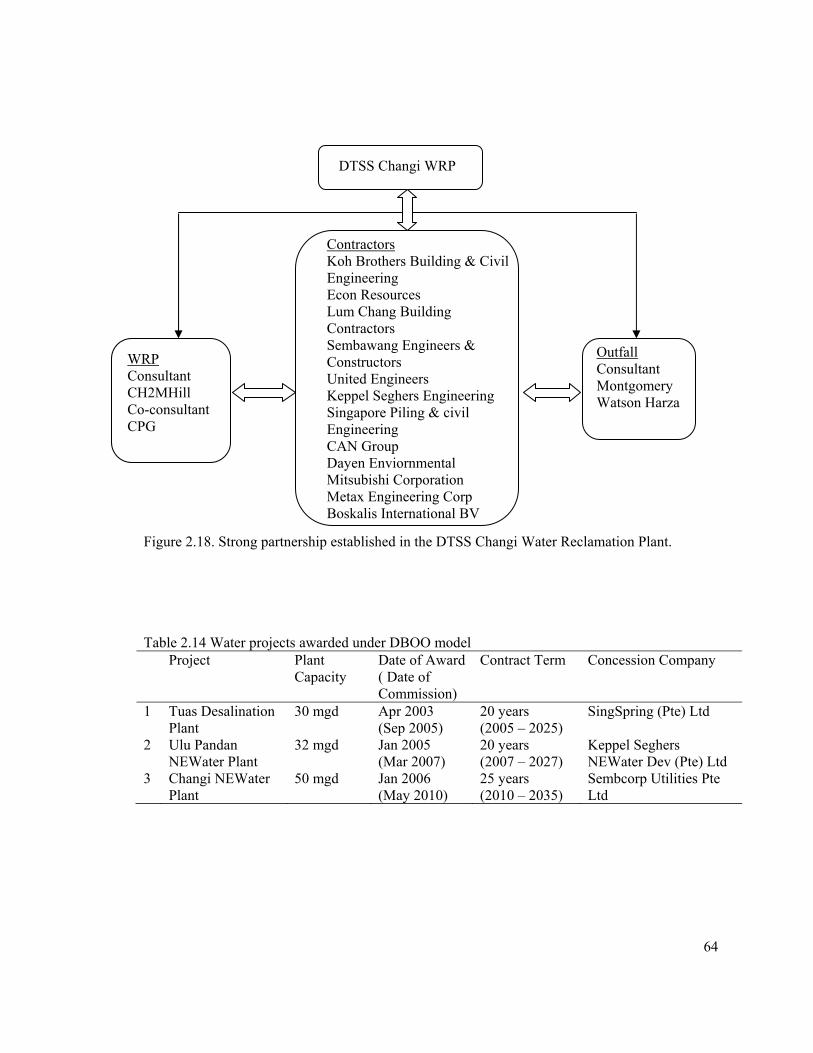
64
Figure 2.18. Strong partnership established in the DTSS Changi Water Reclamation Plant.
Table 2.14 Water projects awarded under DBOO model Project Plant
Capacity Date of Award ( Date of Commission)
Contract Term Concession Company
1 Tuas Desalination Plant
30 mgd Apr 2003 (Sep 2005)
20 years (2005 – 2025)
SingSpring (Pte) Ltd
2 Ulu Pandan NEWater Plant
32 mgd Jan 2005 (Mar 2007)
20 years (2007 – 2027)
Keppel Seghers NEWater Dev (Pte) Ltd
3 Changi NEWater Plant
50 mgd Jan 2006 (May 2010)
25 years (2010 – 2035)
Sembcorp Utilities Pte Ltd
Contractors Koh Brothers Building & Civil Engineering Econ Resources Lum Chang Building Contractors Sembawang Engineers & Constructors United Engineers Keppel Seghers Engineering Singapore Piling & civil Engineering CAN Group Dayen Enviornmental Mitsubishi Corporation Metax Engineering Corp Boskalis International BV
DTSS Changi WRP
WRP Consultant CH2MHill Co-consultant CPG
Outfall Consultant Montgomery Watson Harza
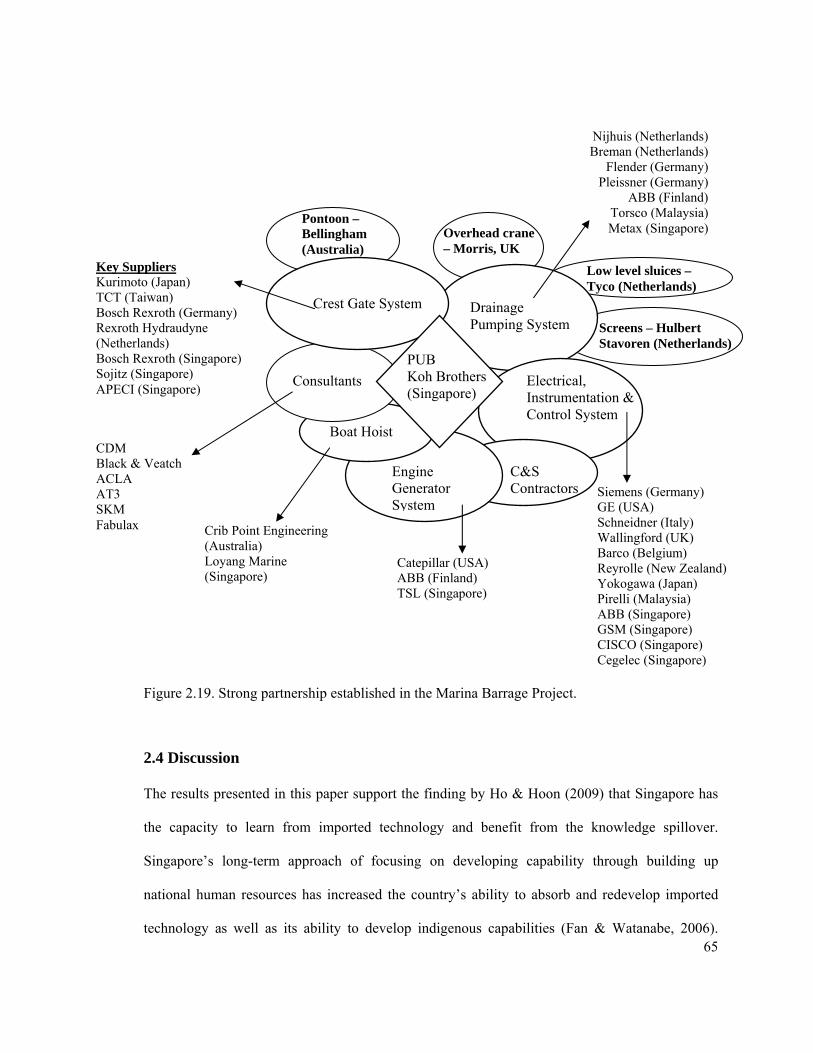
65
Figure 2.19. Strong partnership established in the Marina Barrage Project.
2.4 Discussion
The results presented in this paper support the finding by Ho & Hoon (2009) that Singapore has
the capacity to learn from imported technology and benefit from the knowledge spillover.
Singapore’s long-term approach of focusing on developing capability through building up
national human resources has increased the country’s ability to absorb and redevelop imported
technology as well as its ability to develop indigenous capabilities (Fan & Watanabe, 2006).
Siemens (Germany) GE (USA) Schneidner (Italy) Wallingford (UK) Barco (Belgium) Reyrolle (New Zealand) Yokogawa (Japan) Pirelli (Malaysia) ABB (Singapore) GSM (Singapore) CISCO (Singapore) Cegelec (Singapore)
Key Suppliers Kurimoto (Japan) TCT (Taiwan) Bosch Rexroth (Germany) Rexroth Hydraudyne (Netherlands) Bosch Rexroth (Singapore) Sojitz (Singapore) APECI (Singapore)
Crest Gate System
Consultants
Boat Hoist
Engine Generator System
C&S Contractors
Electrical, Instrumentation & Control System
Drainage Pumping System
CDM Black & Veatch ACLA AT3 SKM Fabulax Crib Point Engineering
(Australia) Loyang Marine (Singapore)
Catepillar (USA) ABB (Finland) TSL (Singapore)
Nijhuis (Netherlands) Breman (Netherlands)
Flender (Germany) Pleissner (Germany)
ABB (Finland) Torsco (Malaysia) Metax (Singapore)
Pontoon – Bellingham (Australia)
Overhead crane – Morris, UK
Low level sluices – Tyco (Netherlands)
Screens – Hulbert Stavoren (Netherlands)
PUB Koh Brothers (Singapore)
66
While the study by Ho & Hoon (2009) identified specific channels of technological diffusion
(better educational quality, import of capital goods and foreign direct investment inflows from the
G5 countries to Singapore as the important channels of technological diffusion), this PhD
identified the specific government policies that facilitated the diffusion. In the case of NEWater
in Singapore, similar to renewable energy in the United States (Kobos et al., 2006), institutional
policies play an important role in facilitating a successful transformation.
The opportunity for local companies to participate as sub-contractors in projects increased the
level of learning-based knowledge stock as learning had to occur in order to become suppliers of
the relevant parts, materials, equipments or services. This was also observed by Huang & Liu
(2008) in their study on the adoption of stationary fuel cell technology. The substitution of the
technology-based knowledge stock for learning-based knowledge stock builds on the future work
suggested by Ho & Hoon (2009) and illustrates the dynamic process of creative destruction of
innovation. In addition, Sharp (1991) found that out-of-date technology delays the transformation
process. The results from this research demonstrate that the out-of-date technology is substituted
with up-to-date technology relevant to the project and thus the ability of the nation to remain
competitive in the global context. The findings on functionality development together with the
analysis on the knowledge stock second the ‘learning economy’ concept (Lundvall & Johnson,
1994) that knowledge becomes obsolete more rapidly than before and therefore it is imperative
that learning must occur continuously so that new functionalities are developed.
The positive elasticity value of NEWater substitution for convention water confirms that the
national investment in NEWater is justified. The vision to be self-sufficient in water by 2061
(Table 2.15) is achievable. The co-evolutionary acclimatization phenomenon observed is
evidence that the institutional approaches have been successful in constructing co-evolution
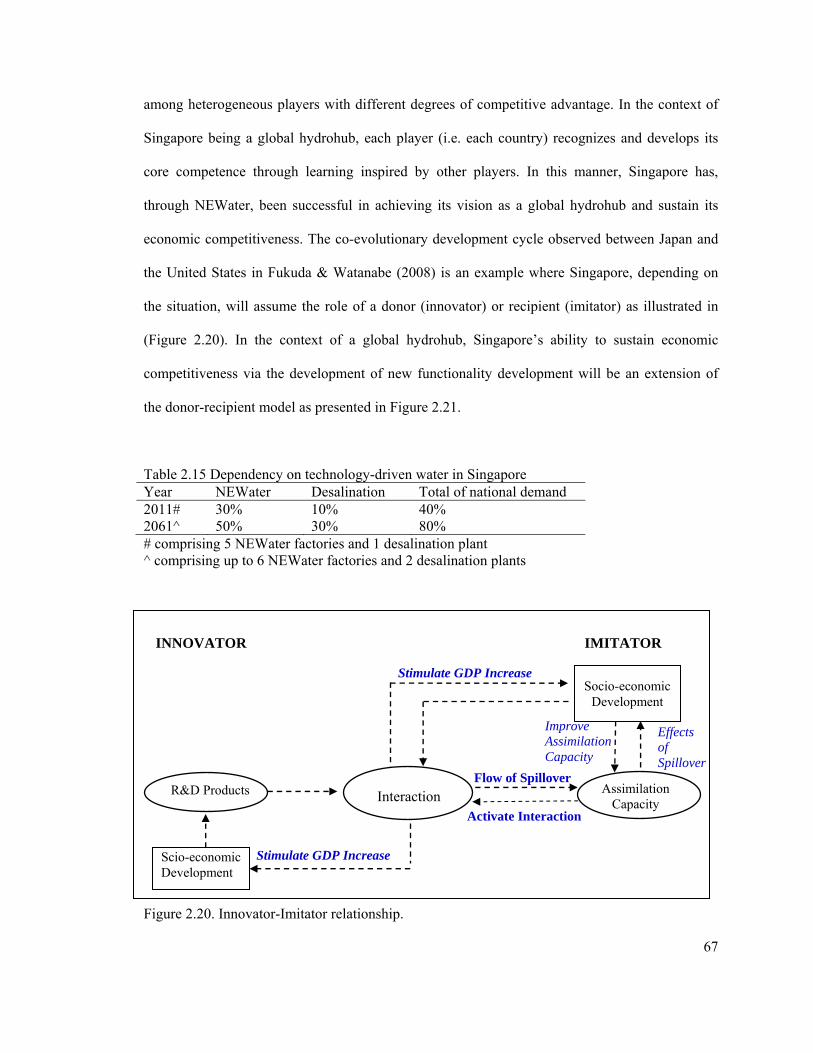
67
among heterogeneous players with different degrees of competitive advantage. In the context of
Singapore being a global hydrohub, each player (i.e. each country) recognizes and develops its
core competence through learning inspired by other players. In this manner, Singapore has,
through NEWater, been successful in achieving its vision as a global hydrohub and sustain its
economic competitiveness. The co-evolutionary development cycle observed between Japan and
the United States in Fukuda & Watanabe (2008) is an example where Singapore, depending on
the situation, will assume the role of a donor (innovator) or recipient (imitator) as illustrated in
(Figure 2.20). In the context of a global hydrohub, Singapore’s ability to sustain economic
competitiveness via the development of new functionality development will be an extension of
the donor-recipient model as presented in Figure 2.21.
Table 2.15 Dependency on technology-driven water in Singapore Year NEWater Desalination Total of national demand 2011# 30% 10% 40% 2061^ 50% 30% 80% # comprising 5 NEWater factories and 1 desalination plant ^ comprising up to 6 NEWater factories and 2 desalination plants
Figure 2.20. Innovator-Imitator relationship.
Socio-economic Development
Assimilation Capacity Interaction
Activate Interaction
Scio-economic Development
Stimulate GDP Increase
Flow of Spillover
Stimulate GDP Increase
Improve Assimilation Capacity
Effects of Spillover
R&D Products
INNOVATOR IMITATOR
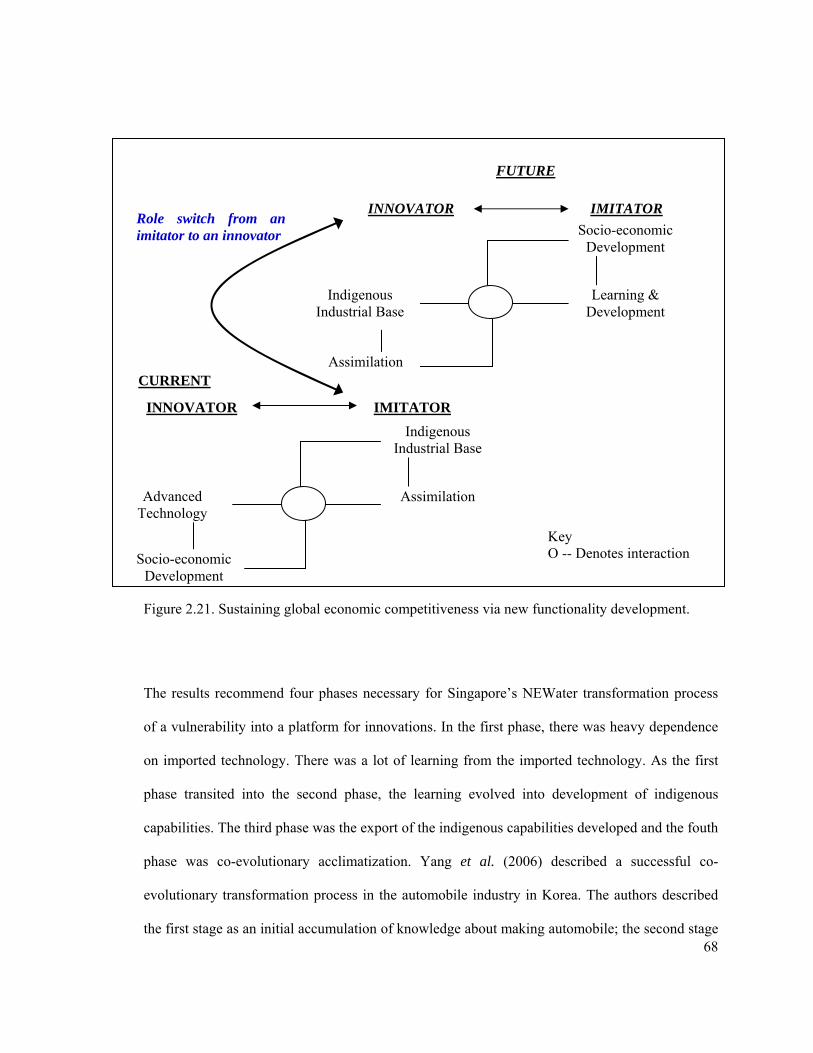
68
Figure 2.21. Sustaining global economic competitiveness via new functionality development.
The results recommend four phases necessary for Singapore’s NEWater transformation process
of a vulnerability into a platform for innovations. In the first phase, there was heavy dependence
on imported technology. There was a lot of learning from the imported technology. As the first
phase transited into the second phase, the learning evolved into development of indigenous
capabilities. The third phase was the export of the indigenous capabilities developed and the fouth
phase was co-evolutionary acclimatization. Yang et al. (2006) described a successful co-
evolutionary transformation process in the automobile industry in Korea. The authors described
the first stage as an initial accumulation of knowledge about making automobile; the second stage
INNOVATOR
INNOVATOR IMITATOR
CURRENT
Indigenous Industrial Base
Assimilation Advanced Technology
Socio-economic Development
FUTURE
IMITATOR
Socio-economic Development
Learning & Development
Indigenous Industrial Base
Assimilation
Role switch from an imitator to an innovator
Key O -- Denotes interaction
69
was assembling; the third stage was manufacturing; and the fourth stage was creation using own
technology. The Korean automobile trajectory is similar to the Singapore NEWater trajectory in
the sense that accumulation of knowledge and development of indigenous technology are
important to the development. However, in the case of the Korean automobile industry, the
development was limited to economic development within Korea, whereas the development in
Singapore’s NEWater industry goes international.
One of the unique contributions of this PhD research to existing research methodology is the
combination of the effects of learning and the elasticity of substitution to study the transformation
process over time. Although the findings of this PhD research support the findings of the study by
Yang et al. (2006) that learning and dynamic government initiatives are key factors required for
the economic growth, it goes further to suggest that a successful transformation must proceed in a
particular order. The order of the phases being, firstly, to be dependent on imported technology.
This progresses into a phase where there is a transition from learning to indigenous capability
development. The third phase being exporting the indigenous capabilities developed. The final
phase being co-evolutionary acclimatization. Comparison of the government policies that
facilitated the transition in the Korean automobile industry and that of Singapore’s NEWater
industry revealed that in the case of Singapore, the policies were initiated with the aim of creating
a vibrant eco-system and the vision of establishing Singapore as a global hydrohub from the
beginning. Commitment from the government was strong. Similar to Japan’s strategy to promote
industrial development, Singapore’s approach of developing indigenous capabilities was a long-
term one with the intention to build up national human capabilities that in turn will increase
Singapore’s ability to absorb and redevelop imported foreign capabilities as well as to develop
indigenous capabilities (Fan and Watanabe, 2006).
70
One of the institutional innovations that contributed significantly to the transformation process is
the DBOO scheme under the umbrella of the PPP initiative. PPP has been implemented and
studied in many projects, especially those funded by non-profit organizations, such as the Asian
Development Bank. The finding from this PhD research adds to the growing list of positive
experiences of PPP. Chen et al. (2011) reported positive contribution of PPP to the integrated
urban water management in Singapore. Bel et al. (2010) reported that PPP in the solid waste and
water services sector in the US and UK not only reduced cost but more importantly, was a crucial
component in building up an industry. In the water sector in China, PPP projects have been
successful (Lee, 2010). However, not all PPP initiatives result in positive experiences. In France,
for example, PPP was introduced in 1989. Unfortunately, undesirable behaviors of the private
sector, such as interest-seeking practices resulted in the decision to revert to municipal operations.
This illustrates the flexibility of the 4-phase development trajectory proposed in this PhD research,
as the framework does not impose that PPP be the institutional innovation implemented for the
transformation process to succeed. Rather, it will be up to the government (and thus, the
important role that the government plays) to put in place the appropriate policies and initiatives
taking into account the economic conditions of the nation and the needs of the nation.

71
CHAPTER III
CONCLUSION
72
CHAPTER III CONCLUSION
3.1 Summary of Findings
Singapore’s NEWater transformation trajectory involves 4 phases in the specific order of 1)
dependent on imported technology, 2) transition from learning to indigenous capability
development, 3) export acceleration and 4) co-evolutionary acclimatization.
In Phase 1, learning from the imported capabilities was the main activity. By building on the
learning curve concept, the trend in learning suggests that learning steadily increased until its
peak around 2008Q2. The results from the accumulation of knowledge stock also support this
trend. The Learning-based knowledge stock (LBS) accumulated between 2003 and 2007Q2 was
through active learning and assimilation of imported capabilities. Thereafter, the focus changed to
accumulation of indigenous capabilities. The substitution of Technology-based knowledge (TKS)
for Learning-based knowledge stock (LBS) illustrated the transition from learning to indigenous
capability development, characterized as Phase 2 of the transformation process. As illustrated in
the trend for Technology-based knowledge stock (TKS), knowledge acquired from imported
technology declined until 2007Q2 but picked up thereafter due to the accumulation of indigenous
knowledge. The indigenous capabilities developed enabled local companies to win contracts
overseas and this was the dominant activity observed in Phase 3, the export acceleration phase.
An interesting phenomenon, known as co-evolutionary acclimatization was observed soon after.
The private sector and the government Indigenous capabilities exported spurred further
innovation which created more business opportunities and R&D in Singapore.
73
Innovative institutional approaches by the Singapore Government catalyzed the transformation
process. Noteworthy are the DBOO procurement model and the EWI. The DBOO procurement
model was crucial is creating opportunities for local companies to work with and learn from
experienced counterparts. The learning formed the foundation for the development of indigenous
capabilities. The indigenous capabilities enable globalization and co-evolutionary acclimatization.
The EWI, with a comprehensive 3-pronged strategy of technology development, cluster
development, and internationalization, was paramount in the formation of a vibrant water eco-
system necessary for the transformation into a global hydrohub.
The success of the Singapore NEWater transformation is attributed to the supportive institutional
factors which is discussed within the framework of co-evolutionary development theory.
3.2 Limitation
Statistically, one of the major constrains while undertaking this research is the lack of data to
perform empirical analysis. The numbers for NEWater were based on estimated quarterly trend.
The average of the Manufacturing Price Index for Manufacturing Goods was used in the
calculations. A more accurate reflection would be to use the export and import figures for
membranes. The co-evolutionary acclimatization phase, which started in 2010, is in its infancy.
Thus, the findings are limited to the current information available. Visits to the emerging
(recipient / imitator) economies, supplemented with interviews would hold the current findings.
In terms of the analysis on institutional innovations, this PhD research limits the institutional
analysis to Singapore’s government policies on the water industry as there are challenges in
undertaking institutional analysis across countries and industries. Below are some of the
challenges summarized from a review by Araral (2010). Firstly, institution refers to many
74
different types of entities which include organizations and rules that structure patterns of
interaction within and across organizations. Secondly, institutions are invisible to the extent that
they can be formal or informal shared patterns of understanding. Thirdly, inputs are required from
diverse disciplines (markets, hierarchies, firms, national governments, international regimes) are
required. Such inputs may be confidential. Fourthly, multiple languages used across disciplines
impedes the comparison and application of diverse theories and models.
As with other exploratory studies, one of the limitations of this research is the ability to
generalize this model to other industries. Vulnerabilities faced by other nations include that
related to the aging population, climate change, energy and medi-care. This model also
recognizes that the paths and patterns of transformation will differ among nations. Singapore is a
small island state with a stable government in control. Accordingly, efforts to implement, monitor
and control the policies within a confined small island state will be different from that in
developing countries that may comprise of many states or islands, each governed differently
depending on the party in power. This will be particularly relevant to addressing the issues related
to climate change. For example, to comply with the emission levels defined in the Kyoto Protocol,
future work can investigate ‘alternative fuels’ such as biofuels and ‘green technologies’. Such
work in emerging economies has hardly emerged due to economic and political priorities. In
certain cases, it is an issue of accessibility in terms of accessibility into the country and
accessibility to data to work on.
3.3 Future Work
This research focused on the water industry in Singapore. Future work focusing on different
industries can refine the transformation process and broaden the present understanding of such a
transformation process. For example, with the emergence of the importance of the service
75
industry to the Singapore economy, future work focusing on the service industry will bring to
light the necessary policies for the service industry to contribute to the nation’s economic
competitiveness. On the technology-driven front, this framework can be applied to study
Singapore’s efforts in building indigenous capabilities in the biomedical sciences. Having
invested heavily in the biomedical sciences, the result from this future work will assist policy
makers in shaping the future Science & Technology policy for Singapore. The findings will also
justify the government’s investment in the industry and the value-add of the industry to the
nation’s economic competitiveness.
As the water-energy nexus will impact decisions of businesses and policy makers, future work is
suggested for investigating the synergy between NEWater and desalination. Qualitative and
quantitative data is insufficient for a comprehensive investigation to be conducted at the point of
writing this thesis but preliminary analysis does reveal that the synergy is created from the fusion
of the indigenous strengths from desalination and the learning from NEWater.

76
REFERENCES
77
REFERENCES
Araral, E., 2010. Improving Effectiveness and Efficiency in the Water Sector: Institutions,
Infrastructure and Indicators. Water Policy, 12, Supplement 1, 1-7.
Arrow, K.J., 1962. The Economic Implication of Learning by Doing. Review of Economic Studies,
29, 155-173.
Arrow, K.J., Chenery, H.B., Minhas, B.S. & Solow, R.M., 1961. Capital-labor Substitution and
Economic Efficiency. Review of Economics and Statistics, 43(3), 225-250.
Bass, F.M., 1969. A New Product Growth Model for Consumer Durables. Management Science,
15(5), 215-227.
Bel, G., Fageda, X., & Warner, M.E., 2010. Is Private Production of Public Services Cheaper
Than Public Productivity? A Meta-regression Analysis of Solid Waste and Water Services.
Journal of Policy Analysis and Management, 29(3), 553-577.
Callon, M., Laredo, P., & Rabeharisoa, V., 1992. The Management and Evaluation of
Technological Programs and the Dynamics of Techno-economic Networks: The Case of the
AFME. Research Policy, 21, 215-236.
78
Chen, D.C., Maksimovic, C., & Voulvoulis, N., 2011. Institutional Capacity and Policy Options
for Integrated Urban Water Management: A Singapore Case Study. Water Policy, 13, 53-68.
Chen, C., & Watanabe, C., & Griffy-Brown, C., 2007. The Co-evolution Process of
Technological Innovation – An Empirical Study of Mobile Phone Vendors and
Telecommunication Service Operators in Japan. Technology in Society, 29, 1-22.
Choung, J-Y., Hwang, J-H., & Choi, J-H., 2000. Transition of Latecomer Firms from Technology
Users to Technology Generators: Korean Semiconductor Firms. World Development, 28(5), 969-
982.
Clark, K.B., 1985. The Interaction of Design Hierarchies and Market Concepts in Technological
Evolution. Research Policy, 4, 235-251.
Coombs, R., Green, K., Richards, A., & Walsh, V., 2001. Technology and The Market: Demand,
Users and Innovation. Cheltenham, UK, Edward Elgar.
Dechezlepretre, A., Glachant, M., & Meniere, Y., 2008. The Clean Development Mechanism and
the International Diffusion of Technologies: An Empirical Study. Energy Policy, 36, 1273-1283.
Du, G.P., Hall, S., Janes, L., MacKay, H., & Negus, K., 1997. Doing Cultural Studies: The Story
of the Sony Walkman. London: Sage Publications.
Fan, P. & Watanabe, C., 2006. Promoting Industrial Development Through Technology Policy:
Lessons from Japan and China. Technology in Society, 28, 303-320.
79
Fukuda, K., & Watanabe, C., 2008. Japanese and US Perspectives on the National Innovation
Ecosystem. Technology in Society, 30, 49-63.
Furtado, A.T., & Freitas, A.G. de., 2000. The Catch-up Strategy of Petrobras Through
Cooperative R&D. Journal of Technology Transfer, 25, 23-36.
Gallagher, K.P., & Shafarddin, M., 2010. Policies for Industrial Learning in China and Mexico.
Technology in Society, 32, 81-99.
Geels, F., 2005. Co-evolution of Technology and Society: The Transition in Water Supply and
Personal Hygiene in the Netherlands (1850-1930) – A Case Study in Multi-level Perspective.
Technology in Society, 27, 363-397.
Ho, K.W., & Hoon, T.H., 2009. Growth Accounting for a Technology Follower in a World of
Ideas: The Case of Singapore. Journal of Asian Economics, 20, 156-173.
Hobday, M., 1995. East Asian Latecomer Firms: Learning the Technology of Electronics. World
Development, 23(7), 1171-1193.
Huang, A.Y-J., & Liu, R-H., 2008. Learning for Supply as a Motive to be the Early Adopter of a
New Energy Technology: A Study on the Adoption of Stationary Fuel Cells. Energy Policy, 36,
2143-2153.
80
Kline, S.J., & Rosenberg, N., 1986. An Overview of Innovation. In: Landau, R. Rosenberg N.,
(eds). The Positive Sum Strategy: Harnessing Technology for Economic Growth. Washington,
DC: National Academy Press, 275-305.
Kobos, P.H., Erickson, J.D., & Drennen, T.E., 2006. Technological Learning and Renewable
Energy Costs: Implications for US Renewable Energy Policy. Energy Policy, 1645-1658.
Kondo, R., Watanabe, C., & Moriyama, K., 2007. A Resonant Development Trajectory for IT
Development: Lessons from Japan’s i-mode. International Journal of Advances in Management
Research, 4(2), 7-27.
Kristinsson, K. & Rao, R., 2008. Interactive Learning or Technology Transfer as a Way of Catch-
up? Analysing the Wind Energy Industry in Denmark and India. Industry and Innovation, 15(3),
197-320.
Layton, E., 1971. Mirror-image Twins: The Communities of Science and Technology in 19th
Century America. Technology and Culture, 12(4), 562-580.
Layton, E., 1976. American Ideologies of Science and Engineering. Technology and Culture,
17(4), 688-701.
Lee, K., & Lim, C., 2001. Technological Regimes, Catching-up and Leapfrogging: Findings from
the Korean Industries. Research Policy, 30(3), 459-483.
81
Lee, S.H., 2010. Development of Public Private Partnership (PPP) Projects in the Chinese Water
Sector. Water Resource Management, 24, 1925-1945.
Leonard-Narton, D., 1988. Implementation as Mutual Adaptation of Technology and
Organization. Research Policy, 17, 251-267.
Leydesdorff, L., 2000. The Triple Helix: An Evolutionary Model of Innovations. Research Policy,
29, 243-255.
Leydesdorff, L., & Etzkowitz, H., 1998. The Triple Helix as a Model for Innovation Studies.
Science and Public Policy, 25(3), 195-203.
Lin, G.T.R., Shen, Y-C, & Chou, J., 2010. National Innovation Policy and Performance:
Comparing the Small Island Countries of Taiwan and Ireland. Technology in Society, 32, 161-172.
Lobina, E., & Hall, D., 2007. Experience with Private Sector Participation in Grenoble, France,
and Lessons on Strengthening Public Water Operations. Utilities Policy, 15, 93-109.
Long. J.S.R., 2002. On the Threshold of Self-sufficiency: Toward the Desecuritization of the
Water Issue in Singapore-Malaysia Relations, in: C. G. Kwa (Ed.) Beyond Vulnerability? Water
in Singapore-Malaysia Relations, p. 109, Institute of Defence and Strategic Studies, Singapore.
Lundvall, B.A., 1988. Innovation As An Interactive Process: From User-producer Interaction to
the National System of Innovation. In Dosi, G., Freeman, C., Nelson, R., Silverberg, G., Soete, L.,
(eds.) Technical Change and Economic Theory. London, Pinter, 349-369.
82
Lundvall, B.A., & Johnson, B., 1994. The Learning Economy. Journal of Industry Studies, 1(2),
23-42.
Mahajan, V., Muller, E., & Srivastara, R.K., 1990. Determination of Adopter Categories by Using
Innovation Diffusion Models. Journal of Marketing Research, 27(1), 37-50.
Mazzoleni, R., & Nelson, R.R., 2007. Public Research Institutions and Economic Catch-up.
Research Policy, 36(10), 1512-1528.
Moore, G.A., 1991. Crossing the Chasm: Marketing and Selling Technology Products to
Mainstream Customers, Harper Business Essentials, New York, Harper Collins.
Nelson, R.R., 1994. The Co-evolution of Technology, Industrial Structure, and Supporting
Institutions. Industrial and Corporation Change, 3(1), 47-63.
Nelson, R.R., 2004. Economic Development from the Perspective of Evolutionary Economic
Theory. Essay available online http://dcsh.xoc.uam.mx/eii/globelicswp/wpg0702.pdf.
Nelson, R.R., 2008. What Enables Rapid Economic Progress: What are the Needed Institutions?
Research Policy, 37, 1-11.
Oudshoorn, N., & Pinch, T., 2003. How Users Matter: The Co-construction of Users and
Technology. Cambridge, Massachusetts, MIT Press.
83
Public Utilities Board, 2009. Milieu, Public Utilities Board.
Public Utilities Board, 2010. Singapore: A Global Hydrohub, Public Utilities Board, presentation
for the Singapore International Water Week 2010, Pre-event Media Briefing, 16 June.
Rogers, E. M., 1983. Diffusion of Innovations (3rd edn), The Free Press, New York.
Rosenkopf, L., & Tushman, M., 1994. The Co-evolution of Technology and Organization. In:
Baum, J.A., Singh, J.V., (eds). Evolutionary Dynamics of Organizations. New York, Oxford:
Oxford University Press, 403-424.
Sharp, M., 1991. Technology – A Special Case for Catch-Up. Technology in Society, 13, 189-205.
Shell, K., 1967. “A Model of Inventive Activity and Capital Accumulation,” in: Shell, K., ed.,
Essays on the Theory of Optimal Economic Growth, MIT Press, Cambridge.
Shell, K., 1973. “Inventive Activity, Industrial Organization and Economic Activity,” in Mirrlees,
J. and Stern, N., eds., Models of Economic Growth, Macmillian & Co., London, U.K.
Solow, R.M., 1956. A Contribution to the Theory of Economic Growth. The Quarterly Journal of
Economics, 70(1), 65-94.
Stankiewicz, R., 1992. Technology as an Autonomous Socio-cognitive System. In: Grupp, H.,
(ed). Dynamics of Science-based Innovation. Berlin: Springer, 19-44.
84
Tan, Y.S., Lee, T.J., & Tan, K., 2009. Clean, Green and Blue, Singapore, Institute of Southeast
Asian Studies.
Van de Ven, A.H., & Garud, R., 1994. The Co-evolution of Technical and Institutional Events in
the Development of an innovation. In: Baum, J.A., Singh, J.V., (eds). Evolutionary Dynamics of
Organizations. New York, Oxford: Oxford University Press, 425-443.
Van, D.J., 1998. Imagenation: Popular Images of Genetics. New York: New York University
Press.
Verhulst, P.F., 1845. Recherches Mathematiques sur la loi d’Accroissement de la Population.
Nouveaux Mémoires de l’Académie Royale des Sci. et Belles-Lettres de Bruxelles, 18, 3-38.
Watanabe, C., Asgari, B. & Nagamatsu, A., 2003. Virtuous Cycle between R&D, Functionality
Development and Assimilation Capacity for Competitive Strategy in Japan’s High-technology
Industry. Technovation, 23(11), 879-900.
Watanabe, C., Hur, J.Y. & Matsumoto, K., 2005. Technological Diversification and Firms’
Techno-economic Structure: An Assessment of Canon’s Sustainable Growth Tracjectory.
Technological Forecasting and Social Change, 72(1), 11-27.
Watanabe, C. Hur, J.Y. & Lei, S.Y., 2006. Converging Trend of Innovation Efforts in High-
technology Firms under Paradigm Shift: A Case of Japan’s Electrical Machinery. OMEGA, 34(2),
178-188.
85
Watanabe, C., & Zhao, W., 2006. Co-evolutionary Dynamism of Innovation and Institution, in
Yoda, N., Pariser, R. & Chon M.C. (eds)., Chemical Business and Economics, The Chemical
Society of Japan, Tokyo, 106-121.
Watanabe, C., Lei, S., & Ouchi, N., 2009a. Fusing Indigenous Technology Development and
Market Learning for Higher Functionality Development: An Empirical Analysis of the Growth
Trajectory of Canon Printers. Technovation, 29(2), 265-283.
Watanabe, C., Moriyama, K., & Shin, J.H., 2009b. Functionality Development Dynamism in a
Diffusion Trajectory: A Case of Japan’s Mobile Phones Development. Technological Forecasting
& Social Change, 76:6, 737-753.
Watanabe, C., Shin, J.H., Hekkinen, J., Zhao, W., & Griffy-Brown, C., 2011. New Functionality
Development Through Follower Substitution for a Leader in Open Innovation. Technological
Forecasting & Social Change, 78(1), 116-131.
Yang, Joon-Mo., Kim, Tae-Wan, & Han, Hyun-Ok., 2006. Understanding the Economic
Development of Korea from A Co-evolutionary Perspective. Journal of Asian Economics, 17,
601-621.
Yao, X., Watanabe, C., & Ying, L., 2009. Institutional Structure of Sustainable Development in
BRICs: Focusing on ICT utilization. Technology in Society, 31, 9-28.

86
Zhao, W., & Watanabe, C., 2008. A Comparison of Institutional Systems Affecting Software
Advancement in China and India: The Role of outsourcing from Japan and the United States.
Technology in Society, 30, 429-436.

87
APPENDIX
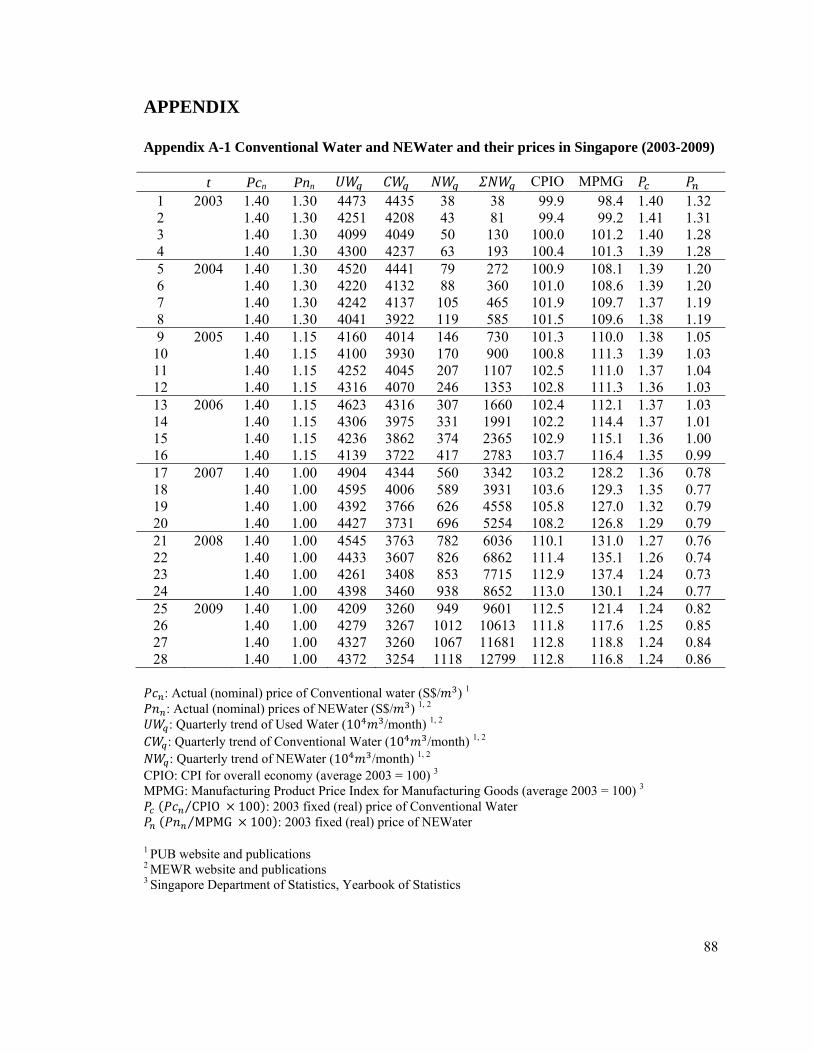
88
APPENDIX
Appendix A-1 Conventional Water and NEWater and their prices in Singapore (2003-2009) t Pcn Pnn CPIO MPMG
1 2003 1.40 1.30 4473 4435 38 38 99.9 98.4 1.40 1.32 2 1.40 1.30 4251 4208 43 81 99.4 99.2 1.41 1.31 3 1.40 1.30 4099 4049 50 130 100.0 101.2 1.40 1.28 4 1.40 1.30 4300 4237 63 193 100.4 101.3 1.39 1.28 5 2004 1.40 1.30 4520 4441 79 272 100.9 108.1 1.39 1.20 6 1.40 1.30 4220 4132 88 360 101.0 108.6 1.39 1.20 7 1.40 1.30 4242 4137 105 465 101.9 109.7 1.37 1.19 8 1.40 1.30 4041 3922 119 585 101.5 109.6 1.38 1.19 9 2005 1.40 1.15 4160 4014 146 730 101.3 110.0 1.38 1.05
10 1.40 1.15 4100 3930 170 900 100.8 111.3 1.39 1.03 11 1.40 1.15 4252 4045 207 1107 102.5 111.0 1.37 1.04 12 1.40 1.15 4316 4070 246 1353 102.8 111.3 1.36 1.03 13 2006 1.40 1.15 4623 4316 307 1660 102.4 112.1 1.37 1.03 14 1.40 1.15 4306 3975 331 1991 102.2 114.4 1.37 1.01 15 1.40 1.15 4236 3862 374 2365 102.9 115.1 1.36 1.00 16 1.40 1.15 4139 3722 417 2783 103.7 116.4 1.35 0.99 17 2007 1.40 1.00 4904 4344 560 3342 103.2 128.2 1.36 0.78 18 1.40 1.00 4595 4006 589 3931 103.6 129.3 1.35 0.77 19 1.40 1.00 4392 3766 626 4558 105.8 127.0 1.32 0.79 20 1.40 1.00 4427 3731 696 5254 108.2 126.8 1.29 0.79 21 2008 1.40 1.00 4545 3763 782 6036 110.1 131.0 1.27 0.76 22 1.40 1.00 4433 3607 826 6862 111.4 135.1 1.26 0.74 23 1.40 1.00 4261 3408 853 7715 112.9 137.4 1.24 0.73 24 1.40 1.00 4398 3460 938 8652 113.0 130.1 1.24 0.77 25 2009 1.40 1.00 4209 3260 949 9601 112.5 121.4 1.24 0.82 26 1.40 1.00 4279 3267 1012 10613 111.8 117.6 1.25 0.85 27 1.40 1.00 4327 3260 1067 11681 112.8 118.8 1.24 0.84 28 1.40 1.00 4372 3254 1118 12799 112.8 116.8 1.24 0.86
: Actual (nominal) price of Conventional water (S$/ ) 1 : Actual (nominal) prices of NEWater (S$/ ) 1, 2 : Quarterly trend of Used Water (10 /month) 1, 2 : Quarterly trend of Conventional Water (10 /month) 1, 2 : Quarterly trend of NEWater (10 /month) 1, 2
CPIO: CPI for overall economy (average 2003 = 100) 3 MPMG: Manufacturing Product Price Index for Manufacturing Goods (average 2003 = 100) 3
CPIO⁄ 100 : 2003 fixed (real) price of Conventional Water MPMG⁄ 100 : 2003 fixed (real) price of NEWater
1 PUB website and publications 2 MEWR website and publications 3 Singapore Department of Statistics, Yearbook of Statistics
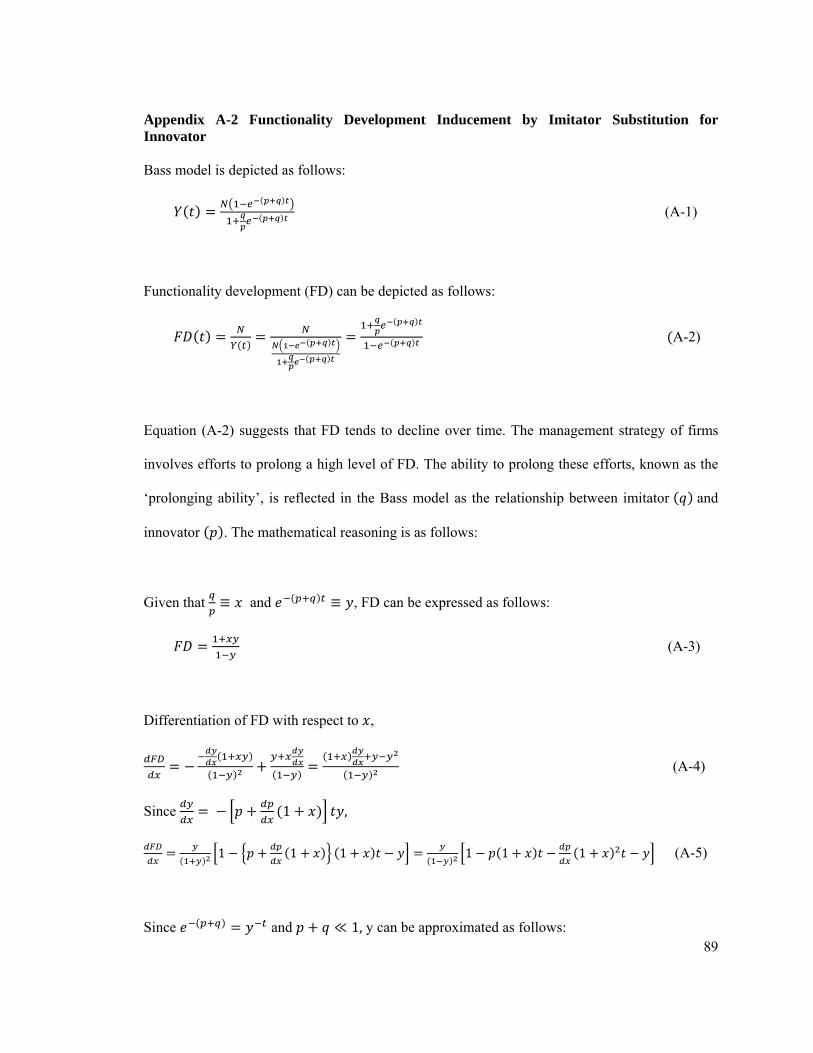
89
Appendix A-2 Functionality Development Inducement by Imitator Substitution for Innovator Bass model is depicted as follows:
(A-1)
Functionality development (FD) can be depicted as follows:
A-2)
Equation (A-2) suggests that FD tends to decline over time. The management strategy of firms
involves efforts to prolong a high level of FD. The ability to prolong these efforts, known as the
‘prolonging ability’, is reflected in the Bass model as the relationship between imitator and
innovator . The mathematical reasoning is as follows:
Given that and , FD can be expressed as follows:
(A-3)
Differentiation of FD with respect to ,
(A-4)
Since 1 ,
1 1 1 1 1 1 (A-5)
Since and 1, y can be approximated as follows:
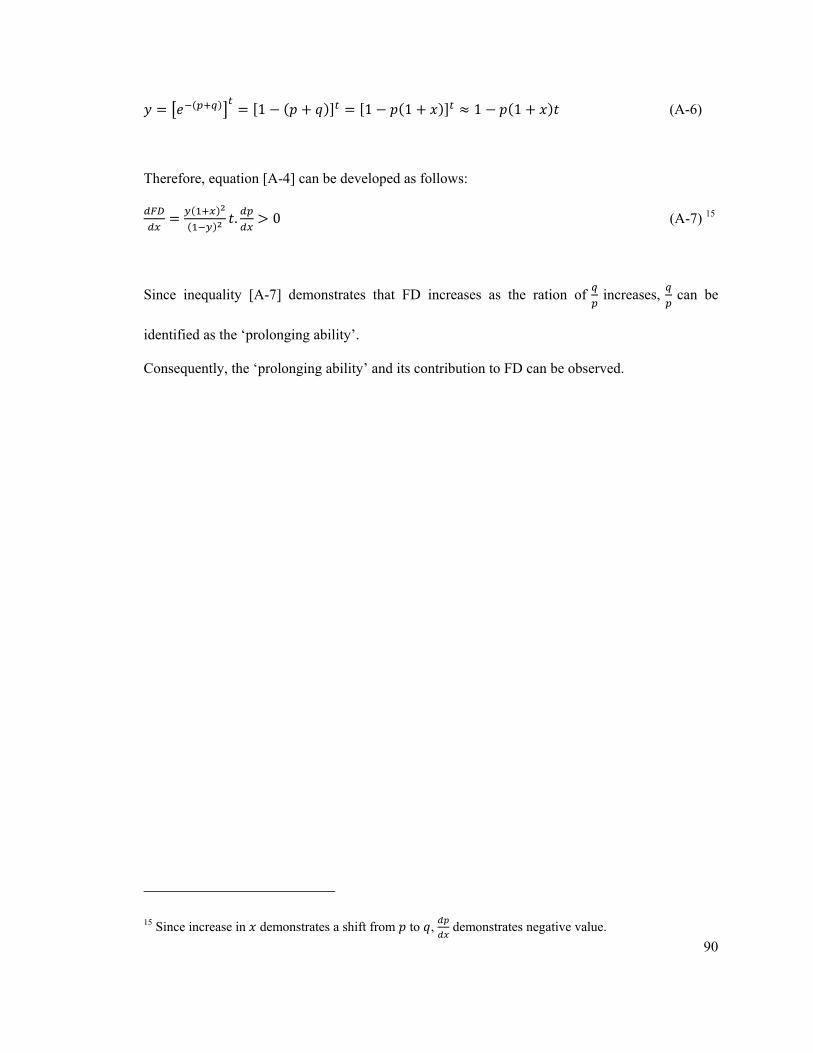
90
1 1 1 1 1 (A-6)
Therefore, equation [A-4] can be developed as follows:
. 0 (A-7) 15
Since inequality [A-7] demonstrates that FD increases as the ration of increases, can be
identified as the ‘prolonging ability’.
Consequently, the ‘prolonging ability’ and its contribution to FD can be observed.
15 Since increase in demonstrates a shift from to , demonstrates negative value.


