Embed Size (px)
Citation preview
Integrated Campaign for Aerosols, gases andRadiation Budget (ICARB): An overview
K Krishna Moorthy1, S K Satheesh2, S Suresh Babu1 and C B S Dutt3
1Space Physics Laboratory, Vikram Sarabhai Space Centre, Trivandrum 695 022, India.2Centre for Atmospheric and Oceanic Sciences, Indian Institute of Science, Bangalore 560 012, India.
3Indian Space Research Organisation Head Quarters, New BEL Road, Bangalore 560 094, India.
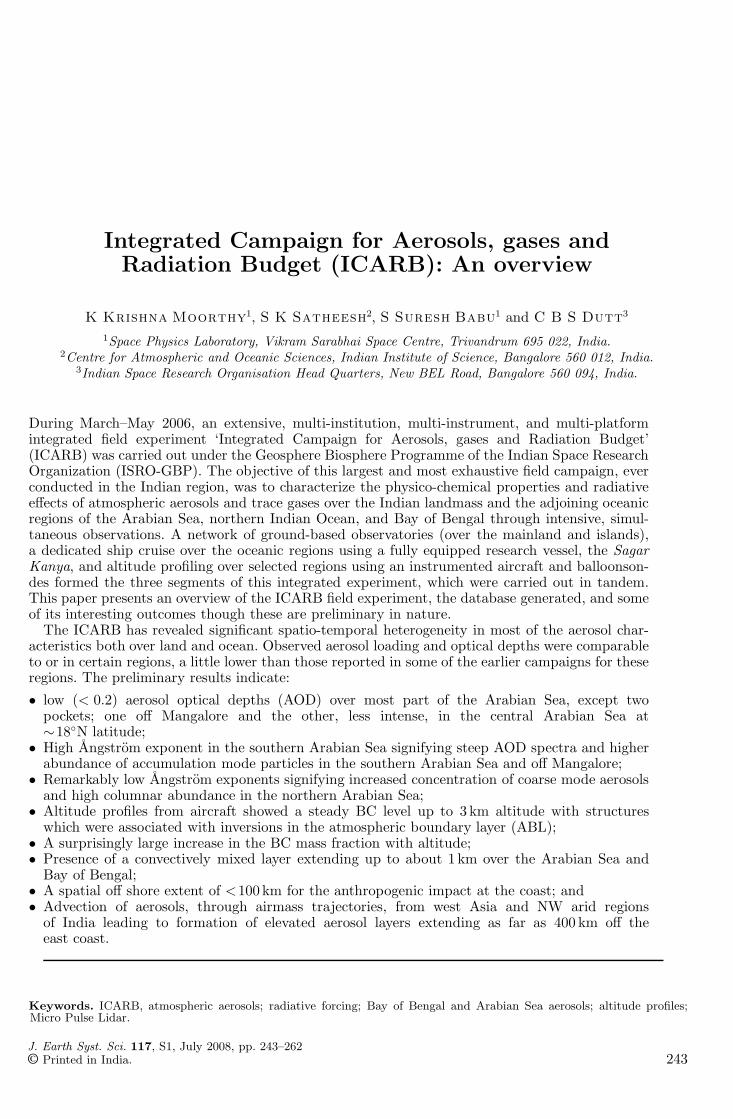
During March–May 2006, an extensive, multi-institution, multi-instrument, and multi-platformintegrated field experiment ‘Integrated Campaign for Aerosols, gases and Radiation Budget’(ICARB) was carried out under the Geosphere Biosphere Programme of the Indian Space ResearchOrganization (ISRO-GBP). The objective of this largest and most exhaustive field campaign, everconducted in the Indian region, was to characterize the physico-chemical properties and radiativeeffects of atmospheric aerosols and trace gases over the Indian landmass and the adjoining oceanicregions of the Arabian Sea, northern Indian Ocean, and Bay of Bengal through intensive, simul-taneous observations. A network of ground-based observatories (over the mainland and islands),a dedicated ship cruise over the oceanic regions using a fully equipped research vessel, the SagarKanya, and altitude profiling over selected regions using an instrumented aircraft and balloonson-des formed the three segments of this integrated experiment, which were carried out in tandem.This paper presents an overview of the ICARB field experiment, the database generated, and someof its interesting outcomes though these are preliminary in nature.
The ICARB has revealed significant spatio-temporal heterogeneity in most of the aerosol char-acteristics both over land and ocean. Observed aerosol loading and optical depths were comparableto or in certain regions, a little lower than those reported in some of the earlier campaigns for theseregions. The preliminary results indicate:
• low (< 0.2) aerosol optical depths (AOD) over most part of the Arabian Sea, except twopockets; one off Mangalore and the other, less intense, in the central Arabian Sea at∼18◦N latitude;
• High Angstrom exponent in the southern Arabian Sea signifying steep AOD spectra and higherabundance of accumulation mode particles in the southern Arabian Sea and off Mangalore;
• Remarkably low Angstrom exponents signifying increased concentration of coarse mode aerosolsand high columnar abundance in the northern Arabian Sea;
• Altitude profiles from aircraft showed a steady BC level up to 3 km altitude with structureswhich were associated with inversions in the atmospheric boundary layer (ABL);
• A surprisingly large increase in the BC mass fraction with altitude;• Presence of a convectively mixed layer extending up to about 1 km over the Arabian Sea and
Bay of Bengal;• A spatial off shore extent of <100 km for the anthropogenic impact at the coast; and• Advection of aerosols, through airmass trajectories, from west Asia and NW arid regions
of India leading to formation of elevated aerosol layers extending as far as 400 km off theeast coast.
Keywords. ICARB, atmospheric aerosols; radiative forcing; Bay of Bengal and Arabian Sea aerosols; altitude profiles;Micro Pulse Lidar.
J. Earth Syst. Sci. 117, S1, July 2008, pp. 243–262© Printed in India. 243
244 K Krishna Moorthy et al
1. Introduction
Atmospheric aerosols play an important role in theEarth’s energy budget and contribute to climatechange. They affect the climate directly by scat-tering and absorbing radiation (McCormick andLudwig 1967; Charlson et al 1992) and indirectlyby acting as cloud condensation nuclei and therebyaffecting cloud properties (Twomey 1977). How-ever, radiative forcing and the resulting climateimpact due to atmospheric aerosols remain largelyuncertain primarily due to inadequate data rep-resenting the spatio-temporal heterogeneity of theaerosol properties and in the understanding ofaerosol cloud interactions (IPCC 2007). The uncer-tainty in the aerosol direct climate forcing is esti-mated to be in the range of −0.1 to −0.9W m−2
(with a mean value of −0.5W m−2), while itis much higher for the indirect forcing (varyingfrom −0.3 to −1.8W m−2) with a mean value of−0.7W m−2. Reduction of these uncertainties callsfor a co-ordinated research strategy that will suc-cessfully integrate data from multiple platformssuch as ground-based network, ship, aircraft, bal-loon, and satellite, as well as numerical modelingand data assimilation (Penner et al 1994; Kaufmanet al 2002; Diner et al 2004; Yu et al 2006). Thisis particularly needed for the Asian region, with allits natural diversities, high density of population,diverse living habits, and the growing industriali-zation and urbanization.
Over the past decade, more than a dozenintense field experiments have been conducted tocharacterize physical, chemical, and optical prop-erties, and the radiative effects of aerosols ina variety of aerosol regimes around the world.These include BASE-A over Brazil (Kaufman et al1992), SAFARI-92 over the southern Atlantic andsouthern Africa (Lindesay et al 1996), TRACE-Aover the southern Atlantic (Fishman et al 1996),SCAR-A over North America (Remer et al 1997),SCAR-B over Brazil (Kaufman et al 1998), ACE-1over the Southern Oceans (Bates et al 1998),TARFOX over the northwestern Atlantic (Russellet al 1999), ACE-2 over the northern Atlantic(Raes et al 2000), Aerosols99 over the Atlantic(Bates et al 2001), INDOEX over the IndianOcean (Ramanathan et al 2001), SAFARI-2000over South Africa and the south Atlantic (Kinget al 2003), PRIDE over Puerto Rico (Reid et al2003), TRACE-P over east Asia and the north-western Pacific (Jacob et al 2003), ACE-Asiaover east Asia and the northwest Pacific (Huebertet al 2003), MINOS over the Mediterranean region(Lelieveld et al 2002), CLAMS over the east coastof U.S. (Smith et al 2005) and NEAQS overthe north Atlantic (Quinn and Bates 2005). Dur-ing each of these comprehensive missions, aerosols
were studied in great detail, using combinationsof in situ and remote sensing observations ofphysical and chemical properties from differentplatforms. In addition, long term aerosol moni-toring network such as AERONET of NASA(Holben et al 1998), sunphotometer networkin east Asia (SKYNET, http://atmos.cr.chiba-u.ac.jp/aerosol/skynet), multifilter shadowbandradiometer (MFRSR) network in north America(Alaxandrov et al 2002), Micropulse Lidar Net-work (MPLNET) of NASA (Welton et al 2001),and European Aerosol Research Lidar Network(Matthias et al 2004) were pursued, essentially tounderstand the complex physical and optical pro-perties of atmospheric aerosols.
Despite the large diversities in aerosol char-acteristics over India, a concerted effort leadingto development of region-specific and season-specific aerosol models remains to be achieved.The Geosphere Biosphere Programme of the IndianSpace Research Organization (ISRO–GBP) how-ever, has been addressing this problem in a focusedmanner using a chain of ground-based observato-ries over the mainland and islands in the ArabianSea (AS) and Bay of Bengal (BoB) (now calledthe ARFI network, ARFI standing for AerosolRadiative Forcing over India), supplemented withpilot campaigns (for e.g., Moorthy et al 2005a, b;Ganguly et al 2005; Vinoj et al 2004; Tripathi et al2005; Pant et al 2006; Babu et al 2002, 2004).Based on the inferences drawn from such efforts,an integrated campaign, the first of its kind overthis region, was conceived and executed duringthe March–May period of 2006. This campaign,ICARB (Integrated Campaign for Aerosols, gases,and Radiation Budget), is also the first of a seriesof such campaigns planned under ISRO-GBP. Briefdescriptions of the campaign concept and detailsof its execution are given in the following sectionswith some preliminary results.
2. Scientific objectives andmeasurements
The ICARB essentially addressed the followingissues:
• What is the nature of the spatio-temporal het-erogeneities of the aerosol environment overIndia and the adjoining oceans? Where arethe hotspots (natural/anthropogenic) and sinks?How does the spatial distribution change withtime?
• What is the nature of the vertical distribution ofaerosol properties over the coastal regions whichinterface between the more polluted continentalregions and the less polluted oceanic regions?
ICARB – An overview 245
How strong are the elevated aerosol layers atdifferent regions?
• What are the influences of long-range transportand regional meteorology on the spatial distri-bution of aerosols and gases? How strong arethe impacts of advection from different sourceregions in India, south China, east Asia, etc.,over the BoB and India, west Asia, and Africaover the Arabian Sea? How does the changein the prevailing circulation pattern modify theregional distribution?
• What is the net impact of aerosols on regionalradiative forcing and how does this forcingchange with the above processes?
• What are the impacts of mesoscale processes likethe land/sea-breeze activity on the surface con-centrations and altitude profiles of aerosols alongthe coastal regions? What is the spatial variationof marine atmospheric boundary layer (MABL)over the BoB and Arabian Sea and whatare its implications to vertical and horizontalexchanges?
In order to address the above questions, the fol-lowing parameters pertaining to aerosols and gaseswere measured or estimated using collocated mea-surements during ICARB:
• Spectral Aerosol Optical Depth, AOD (over theland network, onboard the ship and from Mini-coy and Port Blair islands).
• Mass concentration and size distribution of com-posite aerosols over the land and ocean.
• Bulk aerosol sampling from coastal, inland andoceanic environments for identifying and distin-guishing major chemical species as well as toassess the source strength of different geogra-phical regions using the chemical composition asfingerprints.
• Mass concentrations of aerosol black carbon overselected land stations, islands, and onboard thecruise and aircraft.
• Balloon and SODAR measurements of boundarylayer parameters to understand the vertical mix-ing in the marine atmospheric boundary layerover the oceans.
• GPS-sonde measurements of the altitude profilesof ozone over the oceanic regions.
• Altitude profiles of aerosol extinction usingmicro-pulse lidar (MPL) onboard the aircraftsupplemented with similar measurements fromthe adjoining coastal mainland in conjunctionwith the cruise measurements.
• Aircraft measurements of vertical profiles ofimportant aerosol species and trace gases overthe study area and horizontal gradients to under-stand the spatial dispersion of these species andto model them.
3. Period of the campaign
The campaign, spanning for about two months,was conducted in the window March to May 2006.The main rationales in selecting the campaignwindow were:
• Availability of uninterrupted sunshine over theentire region (India and adjoining continents aswell as over the oceanic region) for most of thetime.
• The period forms part of the long, Asian dry sea-son, with very little precipitation and hence theaerosols have long atmospheric residence timeeven in the lower troposphere.
• The period also favours a significant amountof long-range “trans-boundary transport” ofaerosols and trace gases from central India,east and southeast Asia to the BoB and westAsia and east Africa, as well as India to theArabian Sea (Moorthy et al 2003, 2005a).
4. The structure of ICARB
The campaign was structured following an‘integrated-segmented’ approach. It consisted ofthree observation-intense segments; viz., the landsegment, the ocean segment, and the air segment.Each segment was planned to be self-contained andcomplete, the data from all these will be synthe-sized to characterize the spatio-temporal features,which would then be used for regional radiativeforcing.
4.1 The land segment
The land segment comprised fixed aerosol obser-vatories, making continuous time series measure-ments of several aerosol parameters following acommon protocol. These observatories are spreadover the Indian mainland as shown by the circlesencircling the star symbols in figure 1, as well astwo island observatories, Minicoy (MCY) in theAS and Port Blair (PBR) in the BoB. Here theobservations are carried out on a continuous basis.In all, there were 18 stations operating in the net-work. The stations and the measurements fromthese are listed in table 1.
4.2 The ocean segment
The ocean segment of ICARB was designed soas to obtain a snapshot of various parameters ofaerosols and gases (that are important in estimat-ing the radiative forcing), using collocated instru-ments, operating as far as possible, under thesame environmental conditions, covering the vast
246 K Krishna Moorthy et al
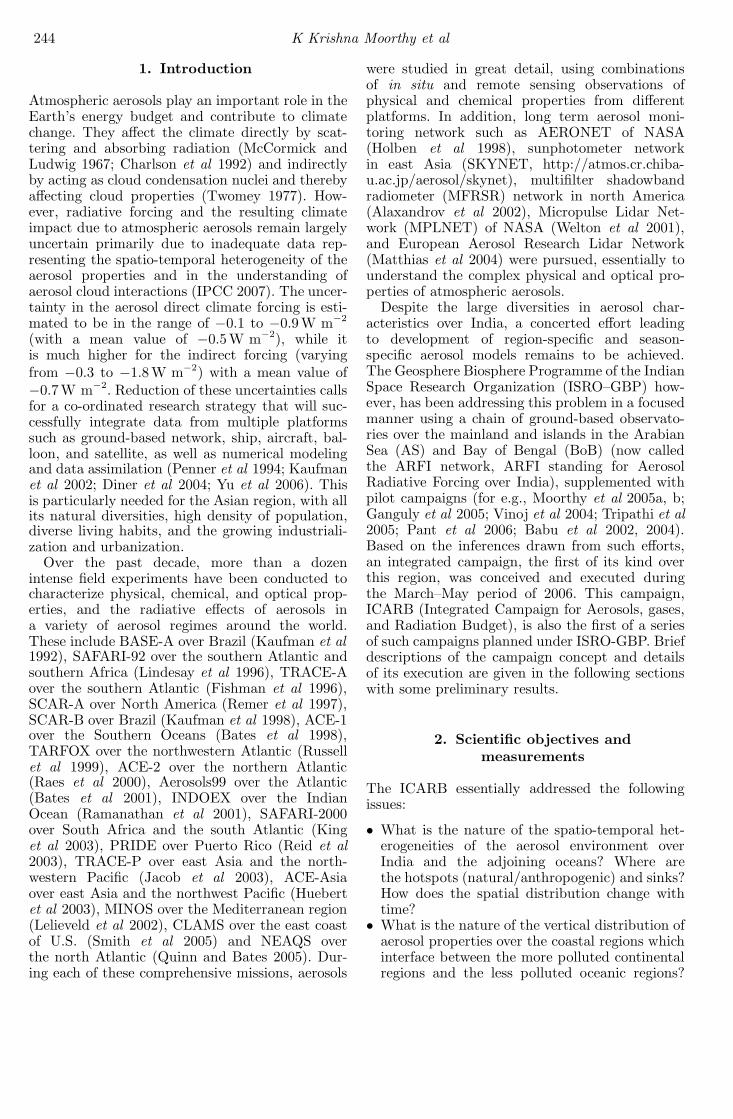
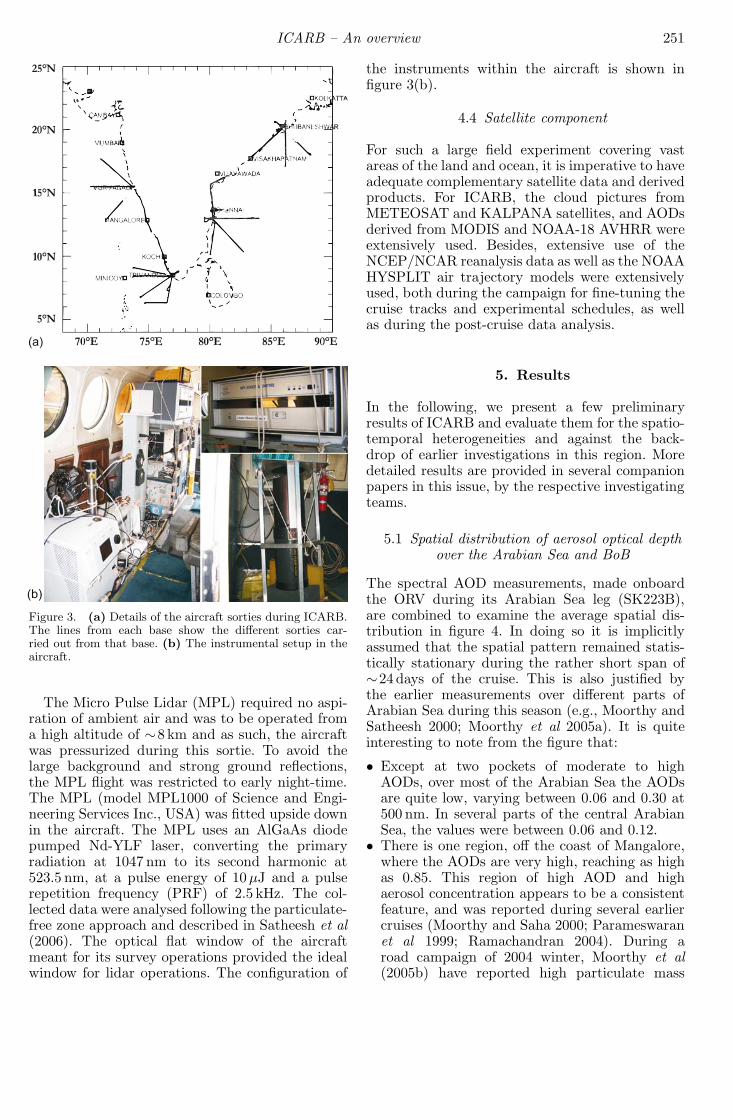
Figure 1. Schematic representation of the operational phase of ICARB during March–May 2006. The continuous linesshow the cruise track of SK223 (in the ocean segment). The points on the lines indicate the ship’s location at 05:30 UTCfor the date identified below it; the number stands for the day and the alphabet for the month, M for March, A for April,and My for May. The bases from where the aircraft sorties were made are identified with a symbol of the aircraft. The otherpoints represent the fixed stations of the land segment, from where aerosol and gas measurements were made.
oceanic regions of the BoB, northern Indian Ocean(IO), and the AS, during a climatologically dis-tinct season when the prevailing conditions do notchange drastically. As such, measurements of allthe relevant parameters were carried out onboardthe oceanographic research vessel (ORV ) SagarKanya, of the Department of Ocean Development,the cruise# SK223, which was dedicated to theICARB, to cover the entire oceanic regions ofinterest in as short a time-span as possible. Thiswould provide a statistically stationary (in tem-poral scale) spatial mosaic of all the parameterswith a reasonable spatial resolution needed forinputting to the current General Circulation Mod-els (GCM) for climate impact assessment. More-over, the climatological winds over these regionsand their relevance to transport aerosols to dif-ferent oceanic regions, and the extent of cloudi-ness were also considered. The cruise had two mainlegs; SK223A covering the BoB and northern IOregions, and 223B covering the Arabian Sea. Therewas a short cruise for a period of one week, pre-ceding SK223A, which was considered as a dryrun, and during this some of the aerosol instru-ments were set up, fine tuned and calibrated. Sev-eral measurements were also initiated in this phase.Details are given in table 2, while the tracks areshown in figure 1 by the lines over the oceanicregions. Overall the ship sailed for 56 days dur-ing ICARB, covering a track length of >25,000 km
surveying the atmosphere over an oceanic area>4million km2. Important urban conglomerationsand ports on the mainland, en route the cruise,are marked in figure 1, so that the rationale ofthe track would be easily understood. During itscourse, the cruise collected atmospheric data fromcoastal regions adjacent to major urban centressuch as Goa, Mangalore, Kochi, Chennai, Nellore,Vijayawada, Visakhapatnam, Bhubaneswar/Puri,Kolkata, Chittagong, Ranagoon, Port Blair,Colombo (and southern Sri Lanka), Trivandrum,Lakshadweep, Mumbai, Kutch, Kandla and theeastern coasts of Oman, Yemen and Muscat andput these data in juxtaposition with those from farand pristine oceanic environments of the BoB andArabian Sea.
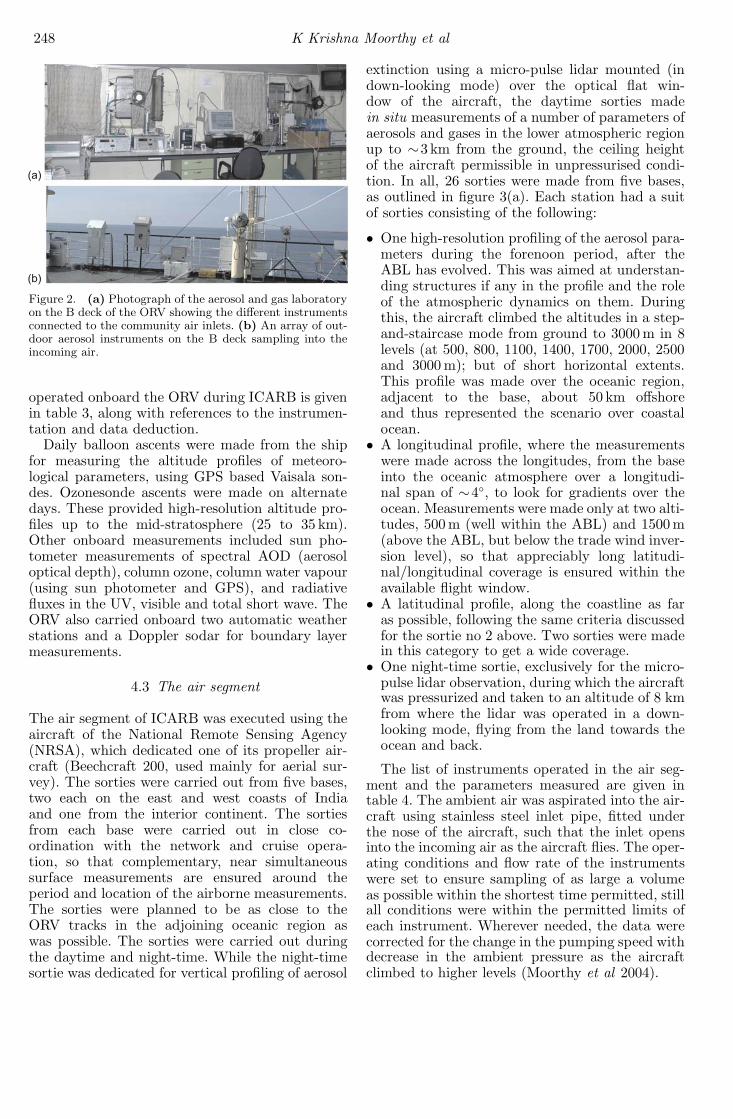
In the ocean segment collocated measurementsof more than 20 parameters of aerosols andtrace gases, data on the state of the atmosphere(including the marine atmospheric boundary layer,MABL), and vertical profiles of meteorologicalparameters and concentration of ozone, were madeusing about 40 different instruments by a teamfrom 26 national laboratories, academic institu-tions, and universities, onboard the ORV. Foraerosols and gas measurements, two dedicated lab-oratories were set up in the top (B and C) decksof the ORV, with community air inlets providingthe air samples needed for all the indoor measur-ing instruments (figure 2, top). All the outdoor
ICARB – An overview 247
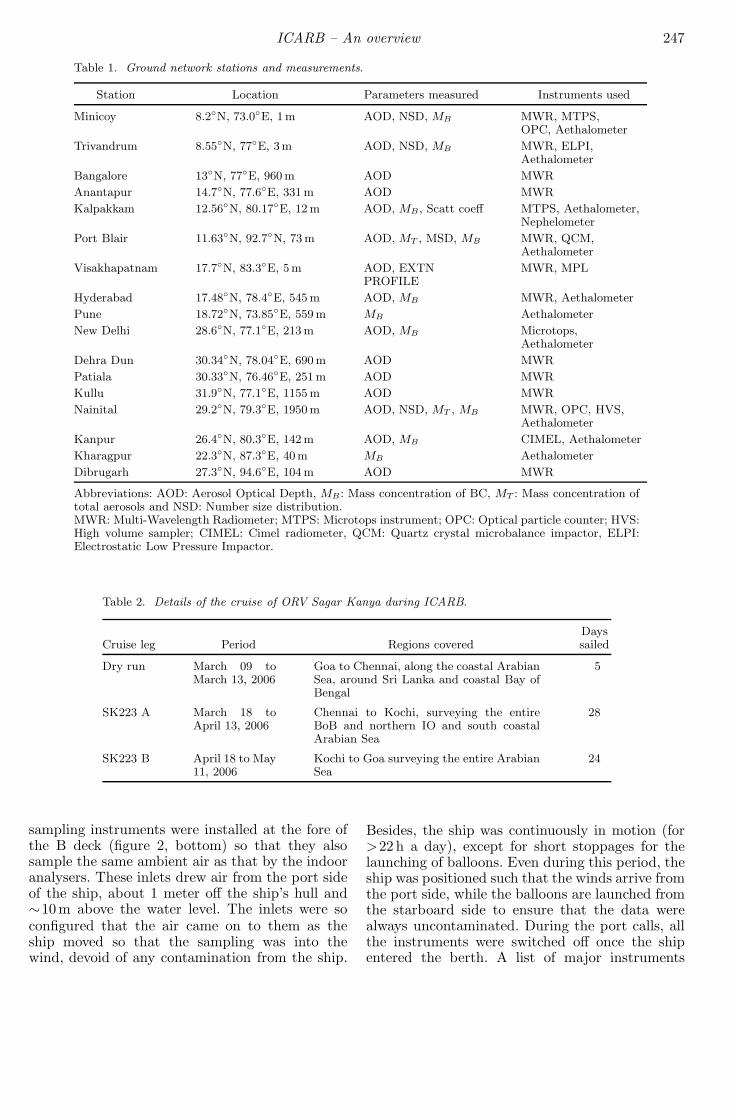
Table 1. Ground network stations and measurements.
Station Location Parameters measured Instruments used
Minicoy 8.2◦N, 73.0◦E, 1m AOD, NSD, MB MWR, MTPS,OPC, Aethalometer
Trivandrum 8.55◦N, 77◦E, 3m AOD, NSD, MB MWR, ELPI,Aethalometer
Bangalore 13◦N, 77◦E, 960 m AOD MWR
Anantapur 14.7◦N, 77.6◦E, 331 m AOD MWR
Kalpakkam 12.56◦N, 80.17◦E, 12 m AOD, MB , Scatt coeff MTPS, Aethalometer,Nephelometer
Port Blair 11.63◦N, 92.7◦N, 73 m AOD, MT , MSD, MB MWR, QCM,Aethalometer
Visakhapatnam 17.7◦N, 83.3◦E, 5m AOD, EXTN MWR, MPLPROFILE
Hyderabad 17.48◦N, 78.4◦E, 545 m AOD, MB MWR, Aethalometer
Pune 18.72◦N, 73.85◦E, 559 m MB Aethalometer
New Delhi 28.6◦N, 77.1◦E, 213 m AOD, MB Microtops,Aethalometer
Dehra Dun 30.34◦N, 78.04◦E, 690 m AOD MWR
Patiala 30.33◦N, 76.46◦E, 251 m AOD MWR
Kullu 31.9◦N, 77.1◦E, 1155 m AOD MWR
Nainital 29.2◦N, 79.3◦E, 1950 m AOD, NSD, MT , MB MWR, OPC, HVS,Aethalometer
Kanpur 26.4◦N, 80.3◦E, 142 m AOD, MB CIMEL, Aethalometer
Kharagpur 22.3◦N, 87.3◦E, 40m MB Aethalometer
Dibrugarh 27.3◦N, 94.6◦E, 104 m AOD MWR
Abbreviations: AOD: Aerosol Optical Depth, MB : Mass concentration of BC, MT : Mass concentration oftotal aerosols and NSD: Number size distribution.MWR: Multi-Wavelength Radiometer; MTPS: Microtops instrument; OPC: Optical particle counter; HVS:High volume sampler; CIMEL: Cimel radiometer, QCM: Quartz crystal microbalance impactor, ELPI:Electrostatic Low Pressure Impactor.
Table 2. Details of the cruise of ORV Sagar Kanya during ICARB.
DaysCruise leg Period Regions covered sailed
Dry run March 09 toMarch 13, 2006
Goa to Chennai, along the coastal ArabianSea, around Sri Lanka and coastal Bay ofBengal
5
SK223 A March 18 toApril 13, 2006
Chennai to Kochi, surveying the entireBoB and northern IO and south coastalArabian Sea
28
SK223 B April 18 to May11, 2006
Kochi to Goa surveying the entire ArabianSea
24
sampling instruments were installed at the fore ofthe B deck (figure 2, bottom) so that they alsosample the same ambient air as that by the indooranalysers. These inlets drew air from the port sideof the ship, about 1 meter off the ship’s hull and∼10m above the water level. The inlets were soconfigured that the air came on to them as theship moved so that the sampling was into thewind, devoid of any contamination from the ship.
Besides, the ship was continuously in motion (for>22 h a day), except for short stoppages for thelaunching of balloons. Even during this period, theship was positioned such that the winds arrive fromthe port side, while the balloons are launched fromthe starboard side to ensure that the data werealways uncontaminated. During the port calls, allthe instruments were switched off once the shipentered the berth. A list of major instruments
248 K Krishna Moorthy et al
Figure 2. (a) Photograph of the aerosol and gas laboratoryon the B deck of the ORV showing the different instrumentsconnected to the community air inlets. (b) An array of out-door aerosol instruments on the B deck sampling into theincoming air.
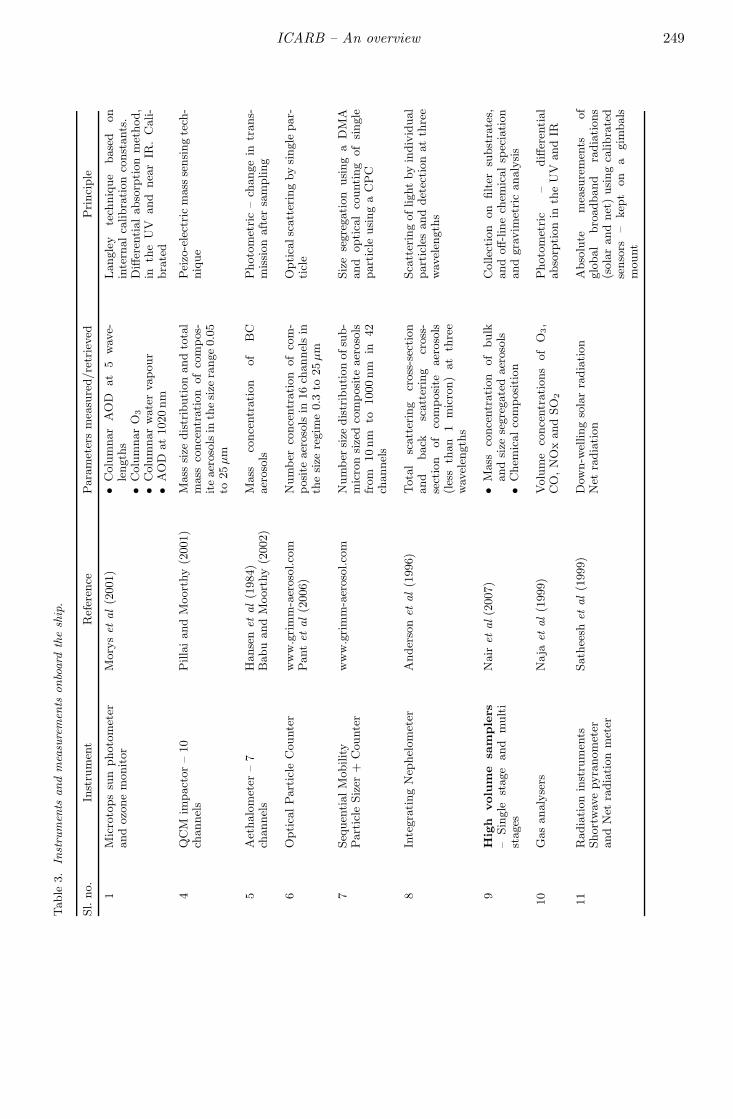
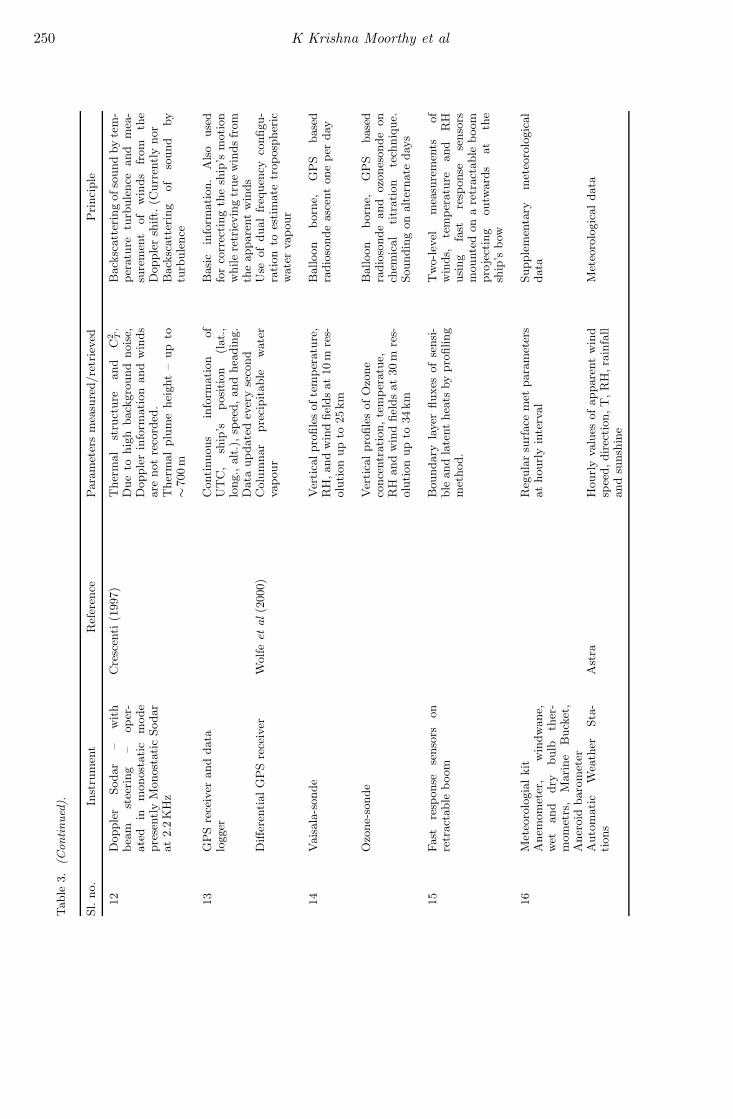
operated onboard the ORV during ICARB is givenin table 3, along with references to the instrumen-tation and data deduction.
Daily balloon ascents were made from the shipfor measuring the altitude profiles of meteoro-logical parameters, using GPS based Vaisala son-des. Ozonesonde ascents were made on alternatedays. These provided high-resolution altitude pro-files up to the mid-stratosphere (25 to 35 km).Other onboard measurements included sun pho-tometer measurements of spectral AOD (aerosoloptical depth), column ozone, column water vapour(using sun photometer and GPS), and radiativefluxes in the UV, visible and total short wave. TheORV also carried onboard two automatic weatherstations and a Doppler sodar for boundary layermeasurements.
4.3 The air segment
The air segment of ICARB was executed using theaircraft of the National Remote Sensing Agency(NRSA), which dedicated one of its propeller air-craft (Beechcraft 200, used mainly for aerial sur-vey). The sorties were carried out from five bases,two each on the east and west coasts of Indiaand one from the interior continent. The sortiesfrom each base were carried out in close co-ordination with the network and cruise opera-tion, so that complementary, near simultaneoussurface measurements are ensured around theperiod and location of the airborne measurements.The sorties were planned to be as close to theORV tracks in the adjoining oceanic region aswas possible. The sorties were carried out duringthe daytime and night-time. While the night-timesortie was dedicated for vertical profiling of aerosol
extinction using a micro-pulse lidar mounted (indown-looking mode) over the optical flat win-dow of the aircraft, the daytime sorties madein situ measurements of a number of parameters ofaerosols and gases in the lower atmospheric regionup to ∼3 km from the ground, the ceiling heightof the aircraft permissible in unpressurised condi-tion. In all, 26 sorties were made from five bases,as outlined in figure 3(a). Each station had a suitof sorties consisting of the following:
• One high-resolution profiling of the aerosol para-meters during the forenoon period, after theABL has evolved. This was aimed at understan-ding structures if any in the profile and the roleof the atmospheric dynamics on them. Duringthis, the aircraft climbed the altitudes in a step-and-staircase mode from ground to 3000 m in 8levels (at 500, 800, 1100, 1400, 1700, 2000, 2500and 3000 m); but of short horizontal extents.This profile was made over the oceanic region,adjacent to the base, about 50 km offshoreand thus represented the scenario over coastalocean.
• A longitudinal profile, where the measurementswere made across the longitudes, from the baseinto the oceanic atmosphere over a longitudi-nal span of ∼4◦, to look for gradients over theocean. Measurements were made only at two alti-tudes, 500 m (well within the ABL) and 1500 m(above the ABL, but below the trade wind inver-sion level), so that appreciably long latitudi-nal/longitudinal coverage is ensured within theavailable flight window.
• A latitudinal profile, along the coastline as faras possible, following the same criteria discussedfor the sortie no 2 above. Two sorties were madein this category to get a wide coverage.
• One night-time sortie, exclusively for the micro-pulse lidar observation, during which the aircraftwas pressurized and taken to an altitude of 8 kmfrom where the lidar was operated in a down-looking mode, flying from the land towards theocean and back.
The list of instruments operated in the air seg-ment and the parameters measured are given intable 4. The ambient air was aspirated into the air-craft using stainless steel inlet pipe, fitted underthe nose of the aircraft, such that the inlet opensinto the incoming air as the aircraft flies. The oper-ating conditions and flow rate of the instrumentswere set to ensure sampling of as large a volumeas possible within the shortest time permitted, stillall conditions were within the permitted limits ofeach instrument. Wherever needed, the data werecorrected for the change in the pumping speed withdecrease in the ambient pressure as the aircraftclimbed to higher levels (Moorthy et al 2004).
ICARB – An overview 249Table
3.
Inst
rum
ents
and
mea
sure
men
tsonbo
ard
the
ship
.
Sl.
no.
Inst
rum
ent
Ref
eren
cePara
met
ers
mea
sure
d/re
trie
ved
Pri
nci
ple
1M
icro
tops
sun
photo
met
erand
ozo
ne
monit
or
Mory
set
al
(2001)
•C
olu
mnar
AO
Dat
5w
ave-
length
s•
Colu
mnar
O3
•C
olu
mnar
wate
rva
pour
•A
OD
at
1020
nm
Langle
yte
chniq
ue
base
don
inte
rnalca
libra
tion
const
ants
.D
iffer
enti
al
abso
rpti
on
met
hod,
inth
eU
Vand
nea
rIR
.C
ali-
bra
ted
4Q
CM
impact
or
–10
channel
sP
illa
iand
Moort
hy
(2001)
Mass
size
distr
ibuti
on
and
tota
lm
ass
conce
ntr
ati
on
of
com
pos-
ite
aer
oso
lsin
the
size
range
0.0
5to
25
µm
Pei
zo-e
lect
ric
mass
sensi
ng
tech
-niq
ue
5A
ethalo
met
er–
7ch
annel
sH
anse
net
al
(1984)
Babu
and
Moort
hy
(2002)
Mass
conce
ntr
ati
on
of
BC
aer
oso
lsP
hoto
met
ric
–ch
ange
intr
ans-
mission
aft
ersa
mpling
6O
pti
calPart
icle
Counte
rw
ww
.grim
m-a
eroso
l.co
mPant
etal
(2006)
Num
ber
conce
ntr
ation
of
com
-posite
aer
oso
lsin
16
channel
sin
the
size
regim
e0.3
to25
µm
Opti
calsc
att
erin
gby
single
par-
ticl
e
7Seq
uen
tialM
obility
Part
icle
Siz
er+
Counte
rw
ww
.gri
mm
-aer
oso
l.co
mN
um
ber
size
distr
ibuti
on
ofsu
b-
mic
ron
size
dco
mposi
teaer
oso
lsfr
om
10
nm
to1000
nm
in42
channel
s
Siz
ese
gre
gati
on
usi
ng
aD
MA
and
opti
cal
counti
ng
of
single
part
icle
using
aC
PC
8In
tegra
ting
Nep
hel
om
eter
Ander
son
etal
(1996)
Tota
lsc
att
erin
gcr
oss
-sec
tion
and
back
scatt
erin
gcr
oss
-se
ctio
nof
com
posi
teaer
oso
ls(l
ess
than
1m
icro
n)
at
thre
ew
avel
ength
s
Sca
tter
ing
oflight
by
indiv
idual
part
icle
sand
det
ecti
on
at
thre
ew
avel
ength
s
9H
igh
volu
me
sam
ple
rs–
Sin
gle
stage
and
mult
ist
ages
Nair
etal(2
007)
•M
ass
conce
ntr
ati
on
of
bulk
and
size
segre
gate
daer
oso
ls•
Chem
icalco
mposi
tion
Collec
tion
on
filt
ersu
bst
rate
s,and
off-lin
ech
emic
al
spec
iati
on
and
gra
vim
etri
canaly
sis
10
Gas
analy
sers
Naja
etal
(1999)
Volu
me
conce
ntr
ati
ons
of
O3,
CO
,N
Ox
and
SO
2
Photo
met
ric
–diff
eren
tial
abso
rpti
on
inth
eU
Vand
IR
11
Radia
tion
inst
rum
ents
Short
wav
epyra
nom
eter
and
Net
radia
tion
met
er
Sath
eesh
etal
(1999)
Dow
n-w
elling
sola
rra
dia
tion
Net
radia
tion
Abso
lute
mea
sure
men
tsof
glo
bal
bro
adband
radia
tions
(sola
rand
net
)using
calibra
ted
senso
rs–
kep
ton
agim
bals
mount
250 K Krishna Moorthy et alTable
3.
(Continued
).
Sl.
no.
Inst
rum
ent
Ref
eren
cePara
met
ers
mea
sure
d/re
trie
ved
Pri
nci
ple
12
Dopple
rSodar
–w
ith
bea
mst
eering
–oper
-ate
din
monost
ati
cm
ode
pre
sently
Monost
atic
Sodar
at
2.2
KH
z
Cre
scen
ti(1
997)
Ther
mal
stru
cture
and
C2 T.
Due
tohig
hback
gro
und
noise,
Dopple
rin
form
ati
on
and
win
ds
are
not
reco
rded
.
Back
scatt
erin
gofso
und
by
tem
-per
atu
retu
rbule
nce
and
mea
-su
rem
ent
of
win
ds
from
the
Dopple
rsh
ift.
(Curr
entl
ynor
Ther
mal
plu
me
hei
ght
–up
to∼
700
mB
ack
scatt
erin
gof
sound
by
turb
ule
nce
13
GP
Sre
ceiv
erand
data
logger
Conti
nuous
info
rmati
on
of
UT
C,
ship
’spositi
on
(lat.
,lo
ng.,
alt
.),sp
eed,and
hea
din
g.
Data
update
dev
ery
seco
nd
Basic
info
rmati
on.
Also
use
dfo
rco
rrec
ting
the
ship
’sm
oti
on
while
retr
ievin
gtr
ue
win
dsfr
om
the
appare
nt
win
ds
Diff
eren
tialG
PS
rece
iver
Wolfe
etal(2
000)
Colu
mnar
pre
cipit
able
wate
rva
pour
Use
of
dual
freq
uen
cyco
nfigu-
ration
toes
tim
ate
troposp
her
icw
ate
rva
pour
14
Vais
ala
-sonde
Ver
tica
lpro
file
softe
mper
atu
re,
RH
,and
win
dfiel
ds
at
10
mre
s-olu
tion
up
to25
km
Balloon
born
e,G
PS
base
dra
dio
sonde
asc
ent
one
per
day
Ozo
ne-
sonde
Ver
tica
lpro
file
sofO
zone
conce
ntr
ati
on,te
mper
atu
e,R
Hand
win
dfiel
ds
at
30
mre
s-olu
tion
up
to34
km
Balloon
born
e,G
PS
base
dra
dio
sonde
and
ozo
nes
onde
on
chem
ical
titr
ation
tech
niq
ue.
Soundin
gon
alt
ernate
day
s
15
Fast
resp
onse
senso
rson
retr
act
able
boom
Boundary
layer
fluxes
of
sensi-
ble
and
late
nt
hea
tsby
pro
filing
met
hod.
Tw
o-lev
elm
easu
rem
ents
of
win
ds,
tem
per
atu
reand
RH
using
fast
resp
onse
senso
rsm
ounte
don
are
tract
able
boom
pro
ject
ing
outw
ard
sat
the
ship
’sbow
16
Met
eoro
logia
lkit
Anem
om
eter
,w
indw
ane,
wet
and
dry
bulb
ther
-m
om
etrs
,M
ari
ne
Buck
et,
Aner
oid
baro
met
er
Reg
ula
rsu
rface
met
para
met
ers
at
hourl
yin
terv
al
Supple
men
tary
met
eoro
logic
al
data
Auto
matic
Wea
ther
Sta
-ti
ons
Ast
raH
ourl
yva
lues
of
appare
nt
win
dsp
eed,direc
tion,T
,R
H,ra
infa
lland
sunsh
ine
Met
eoro
logic
aldata
ICARB – An overview 251
Figure 3. (a) Details of the aircraft sorties during ICARB.The lines from each base show the different sorties car-ried out from that base. (b) The instrumental setup in theaircraft.
The Micro Pulse Lidar (MPL) required no aspi-ration of ambient air and was to be operated froma high altitude of ∼8 km and as such, the aircraftwas pressurized during this sortie. To avoid thelarge background and strong ground reflections,the MPL flight was restricted to early night-time.The MPL (model MPL1000 of Science and Engi-neering Services Inc., USA) was fitted upside downin the aircraft. The MPL uses an AlGaAs diodepumped Nd-YLF laser, converting the primaryradiation at 1047 nm to its second harmonic at523.5 nm, at a pulse energy of 10μJ and a pulserepetition frequency (PRF) of 2.5 kHz. The col-lected data were analysed following the particulate-free zone approach and described in Satheesh et al(2006). The optical flat window of the aircraftmeant for its survey operations provided the idealwindow for lidar operations. The configuration of
the instruments within the aircraft is shown infigure 3(b).
4.4 Satellite component
For such a large field experiment covering vastareas of the land and ocean, it is imperative to haveadequate complementary satellite data and derivedproducts. For ICARB, the cloud pictures fromMETEOSAT and KALPANA satellites, and AODsderived from MODIS and NOAA-18 AVHRR wereextensively used. Besides, extensive use of theNCEP/NCAR reanalysis data as well as the NOAAHYSPLIT air trajectory models were extensivelyused, both during the campaign for fine-tuning thecruise tracks and experimental schedules, as wellas during the post-cruise data analysis.
5. Results
In the following, we present a few preliminaryresults of ICARB and evaluate them for the spatio-temporal heterogeneities and against the back-drop of earlier investigations in this region. Moredetailed results are provided in several companionpapers in this issue, by the respective investigatingteams.
5.1 Spatial distribution of aerosol optical depthover the Arabian Sea and BoB
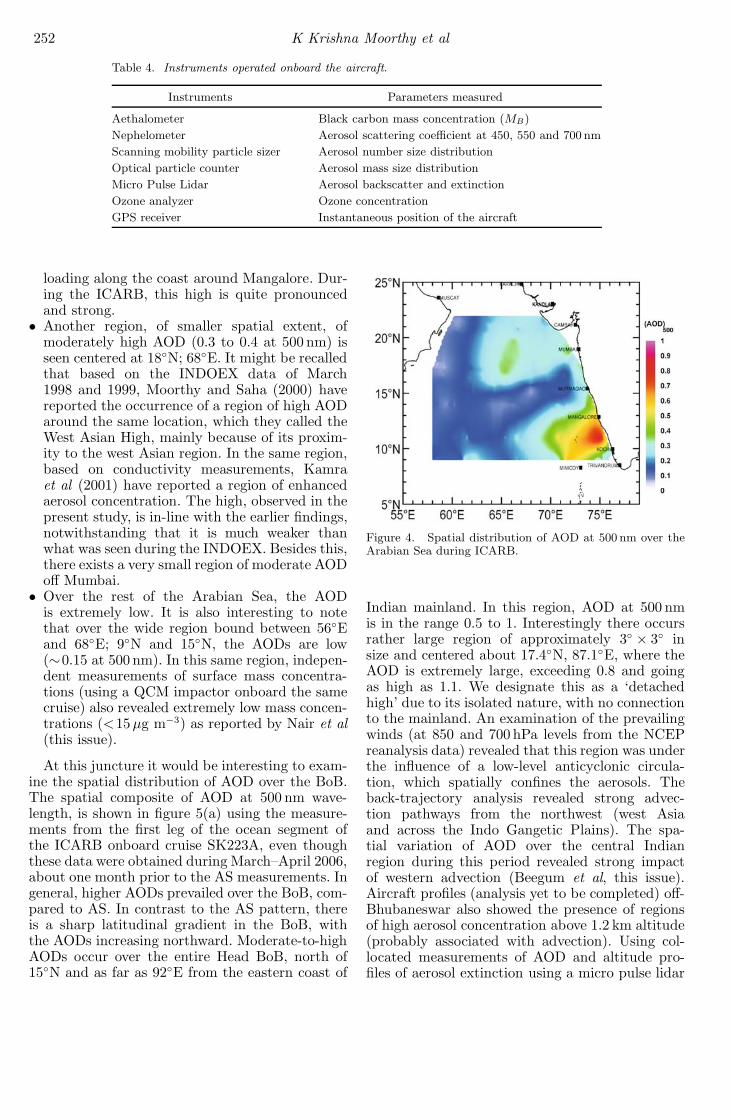
The spectral AOD measurements, made onboardthe ORV during its Arabian Sea leg (SK223B),are combined to examine the average spatial dis-tribution in figure 4. In doing so it is implicitlyassumed that the spatial pattern remained statis-tically stationary during the rather short span of∼24 days of the cruise. This is also justified bythe earlier measurements over different parts ofArabian Sea during this season (e.g., Moorthy andSatheesh 2000; Moorthy et al 2005a). It is quiteinteresting to note from the figure that:
• Except at two pockets of moderate to highAODs, over most of the Arabian Sea the AODsare quite low, varying between 0.06 and 0.30 at500 nm. In several parts of the central ArabianSea, the values were between 0.06 and 0.12.
• There is one region, off the coast of Mangalore,where the AODs are very high, reaching as highas 0.85. This region of high AOD and highaerosol concentration appears to be a consistentfeature, and was reported during several earliercruises (Moorthy and Saha 2000; Parameswaranet al 1999; Ramachandran 2004). During aroad campaign of 2004 winter, Moorthy et al(2005b) have reported high particulate mass
252 K Krishna Moorthy et al
Table 4. Instruments operated onboard the aircraft.
Instruments Parameters measured
Aethalometer Black carbon mass concentration (MB)
Nephelometer Aerosol scattering coefficient at 450, 550 and 700 nm
Scanning mobility particle sizer Aerosol number size distribution
Optical particle counter Aerosol mass size distribution
Micro Pulse Lidar Aerosol backscatter and extinction
Ozone analyzer Ozone concentration
GPS receiver Instantaneous position of the aircraft
loading along the coast around Mangalore. Dur-ing the ICARB, this high is quite pronouncedand strong.
• Another region, of smaller spatial extent, ofmoderately high AOD (0.3 to 0.4 at 500 nm) isseen centered at 18◦N; 68◦E. It might be recalledthat based on the INDOEX data of March1998 and 1999, Moorthy and Saha (2000) havereported the occurrence of a region of high AODaround the same location, which they called theWest Asian High, mainly because of its proxim-ity to the west Asian region. In the same region,based on conductivity measurements, Kamraet al (2001) have reported a region of enhancedaerosol concentration. The high, observed in thepresent study, is in-line with the earlier findings,notwithstanding that it is much weaker thanwhat was seen during the INDOEX. Besides this,there exists a very small region of moderate AODoff Mumbai.
• Over the rest of the Arabian Sea, the AODis extremely low. It is also interesting to notethat over the wide region bound between 56◦Eand 68◦E; 9◦N and 15◦N, the AODs are low(∼0.15 at 500 nm). In this same region, indepen-dent measurements of surface mass concentra-tions (using a QCM impactor onboard the samecruise) also revealed extremely low mass concen-trations (<15μg m−3) as reported by Nair et al(this issue).
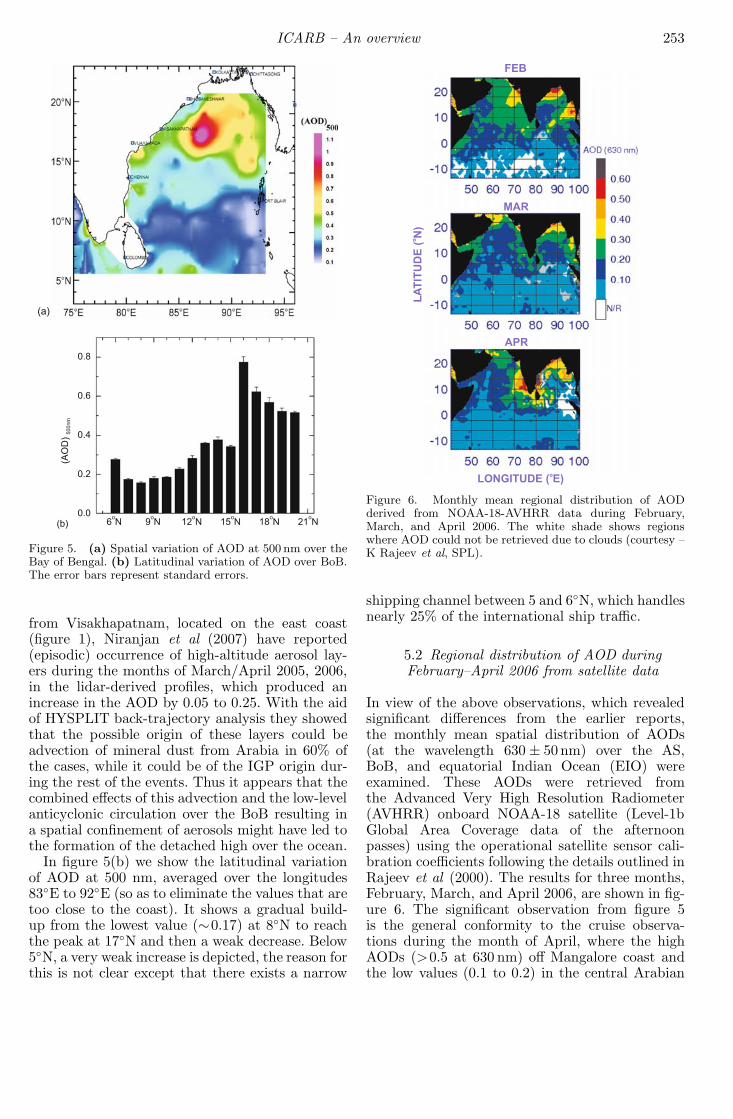
At this juncture it would be interesting to exam-ine the spatial distribution of AOD over the BoB.The spatial composite of AOD at 500 nm wave-length, is shown in figure 5(a) using the measure-ments from the first leg of the ocean segment ofthe ICARB onboard cruise SK223A, even thoughthese data were obtained during March–April 2006,about one month prior to the AS measurements. Ingeneral, higher AODs prevailed over the BoB, com-pared to AS. In contrast to the AS pattern, thereis a sharp latitudinal gradient in the BoB, withthe AODs increasing northward. Moderate-to-highAODs occur over the entire Head BoB, north of15◦N and as far as 92◦E from the eastern coast of
Figure 4. Spatial distribution of AOD at 500 nm over theArabian Sea during ICARB.
Indian mainland. In this region, AOD at 500 nmis in the range 0.5 to 1. Interestingly there occursrather large region of approximately 3◦ × 3◦ insize and centered about 17.4◦N, 87.1◦E, where theAOD is extremely large, exceeding 0.8 and goingas high as 1.1. We designate this as a ‘detachedhigh’ due to its isolated nature, with no connectionto the mainland. An examination of the prevailingwinds (at 850 and 700 hPa levels from the NCEPreanalysis data) revealed that this region was underthe influence of a low-level anticyclonic circula-tion, which spatially confines the aerosols. Theback-trajectory analysis revealed strong advec-tion pathways from the northwest (west Asiaand across the Indo Gangetic Plains). The spa-tial variation of AOD over the central Indianregion during this period revealed strong impactof western advection (Beegum et al, this issue).Aircraft profiles (analysis yet to be completed) off-Bhubaneswar also showed the presence of regionsof high aerosol concentration above 1.2 km altitude(probably associated with advection). Using col-located measurements of AOD and altitude pro-files of aerosol extinction using a micro pulse lidar
ICARB – An overview 253
Figure 5. (a) Spatial variation of AOD at 500 nm over theBay of Bengal. (b) Latitudinal variation of AOD over BoB.The error bars represent standard errors.
from Visakhapatnam, located on the east coast(figure 1), Niranjan et al (2007) have reported(episodic) occurrence of high-altitude aerosol lay-ers during the months of March/April 2005, 2006,in the lidar-derived profiles, which produced anincrease in the AOD by 0.05 to 0.25. With the aidof HYSPLIT back-trajectory analysis they showedthat the possible origin of these layers could beadvection of mineral dust from Arabia in 60% ofthe cases, while it could be of the IGP origin dur-ing the rest of the events. Thus it appears that thecombined effects of this advection and the low-levelanticyclonic circulation over the BoB resulting ina spatial confinement of aerosols might have led tothe formation of the detached high over the ocean.
In figure 5(b) we show the latitudinal variationof AOD at 500 nm, averaged over the longitudes83◦E to 92◦E (so as to eliminate the values that aretoo close to the coast). It shows a gradual build-up from the lowest value (∼0.17) at 8◦N to reachthe peak at 17◦N and then a weak decrease. Below5◦N, a very weak increase is depicted, the reason forthis is not clear except that there exists a narrow
Figure 6. Monthly mean regional distribution of AODderived from NOAA-18-AVHRR data during February,March, and April 2006. The white shade shows regionswhere AOD could not be retrieved due to clouds (courtesy –K Rajeev et al, SPL).
shipping channel between 5 and 6◦N, which handlesnearly 25% of the international ship traffic.
5.2 Regional distribution of AOD duringFebruary–April 2006 from satellite data
In view of the above observations, which revealedsignificant differences from the earlier reports,the monthly mean spatial distribution of AODs(at the wavelength 630 ± 50 nm) over the AS,BoB, and equatorial Indian Ocean (EIO) wereexamined. These AODs were retrieved fromthe Advanced Very High Resolution Radiometer(AVHRR) onboard NOAA-18 satellite (Level-1bGlobal Area Coverage data of the afternoonpasses) using the operational satellite sensor cali-bration coefficients following the details outlined inRajeev et al (2000). The results for three months,February, March, and April 2006, are shown in fig-ure 6. The significant observation from figure 5is the general conformity to the cruise observa-tions during the month of April, where the highAODs (>0.5 at 630 nm) off Mangalore coast andthe low values (0.1 to 0.2) in the central Arabian
254 K Krishna Moorthy et al
Sea (bound between 55◦E to 65◦E; and equator to15◦N) are clearly seen in the bottom panel. Look-ing back to the temporal evolution of AOD, theupper panels of the same figure show that:
• In February, two distinct regions of high AODvalues are observed over BoB, one in the northand the other in the east off the Myanmar coast.Over most parts of the Arabian Sea, AOD isbetween 0.2 and 0.3 with relatively smaller spa-tial variation.
• The AODs significantly decrease from Februaryto March, over the entire Arabian Sea and BoB.Over the Arabian Sea, except very near the con-tinent, AOD is generally less than 0.2 in Marchand very low values are encountered particularlyover the central and eastern parts.
Comparing these observations with the meanregional distribution of AOD obtained from7 years’ data over this region (Nair et al 2005),the major difference is that while the AOD distri-bution shows an increase over the eastern ArabianSea from February to March in the mean pattern,it shows a decrease in the year 2006.
5.3 Spatial variation of Angstrom parametersover the Arabian Sea during ICARB
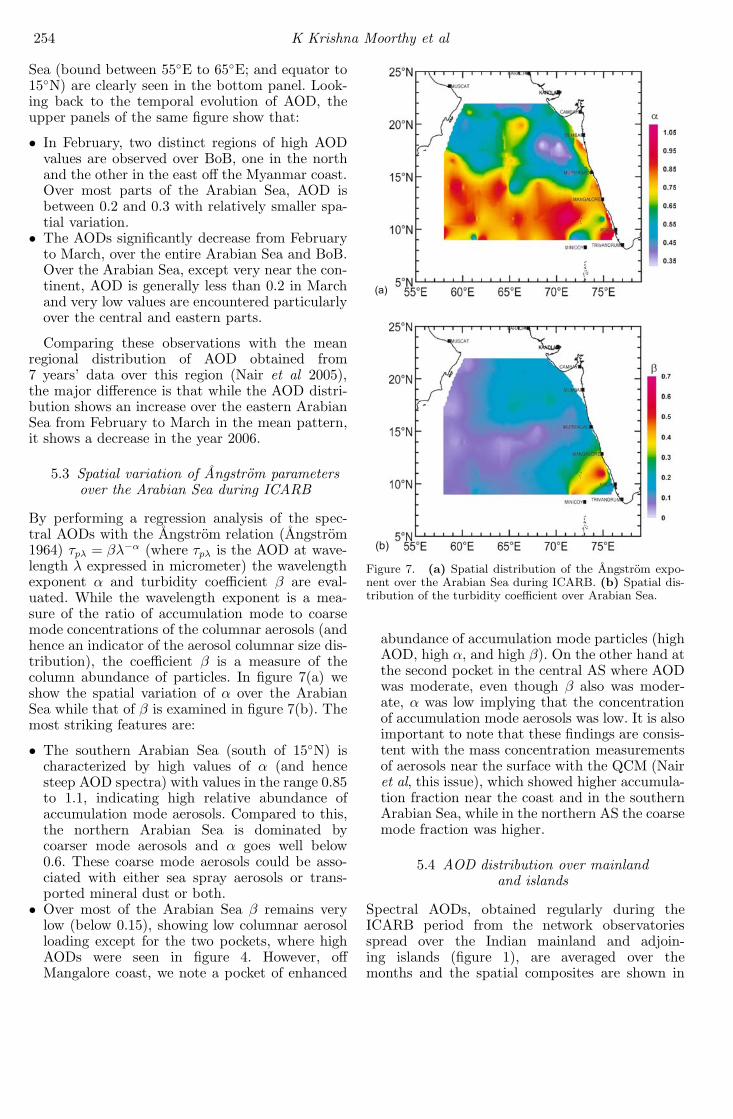
By performing a regression analysis of the spec-tral AODs with the Angstrom relation (Angstrom1964) τpλ = βλ−α (where τpλ is the AOD at wave-length λ expressed in micrometer) the wavelengthexponent α and turbidity coefficient β are eval-uated. While the wavelength exponent is a mea-sure of the ratio of accumulation mode to coarsemode concentrations of the columnar aerosols (andhence an indicator of the aerosol columnar size dis-tribution), the coefficient β is a measure of thecolumn abundance of particles. In figure 7(a) weshow the spatial variation of α over the ArabianSea while that of β is examined in figure 7(b). Themost striking features are:
• The southern Arabian Sea (south of 15◦N) ischaracterized by high values of α (and hencesteep AOD spectra) with values in the range 0.85to 1.1, indicating high relative abundance ofaccumulation mode aerosols. Compared to this,the northern Arabian Sea is dominated bycoarser mode aerosols and α goes well below0.6. These coarse mode aerosols could be asso-ciated with either sea spray aerosols or trans-ported mineral dust or both.
• Over most of the Arabian Sea β remains verylow (below 0.15), showing low columnar aerosolloading except for the two pockets, where highAODs were seen in figure 4. However, offMangalore coast, we note a pocket of enhanced
Figure 7. (a) Spatial distribution of the Angstrom expo-nent over the Arabian Sea during ICARB. (b) Spatial dis-tribution of the turbidity coefficient over Arabian Sea.
abundance of accumulation mode particles (highAOD, high α, and high β). On the other hand atthe second pocket in the central AS where AODwas moderate, even though β also was moder-ate, α was low implying that the concentrationof accumulation mode aerosols was low. It is alsoimportant to note that these findings are consis-tent with the mass concentration measurementsof aerosols near the surface with the QCM (Nairet al, this issue), which showed higher accumula-tion fraction near the coast and in the southernArabian Sea, while in the northern AS the coarsemode fraction was higher.
5.4 AOD distribution over mainlandand islands
Spectral AODs, obtained regularly during theICARB period from the network observatoriesspread over the Indian mainland and adjoin-ing islands (figure 1), are averaged over themonths and the spatial composites are shown in
ICARB – An overview 255
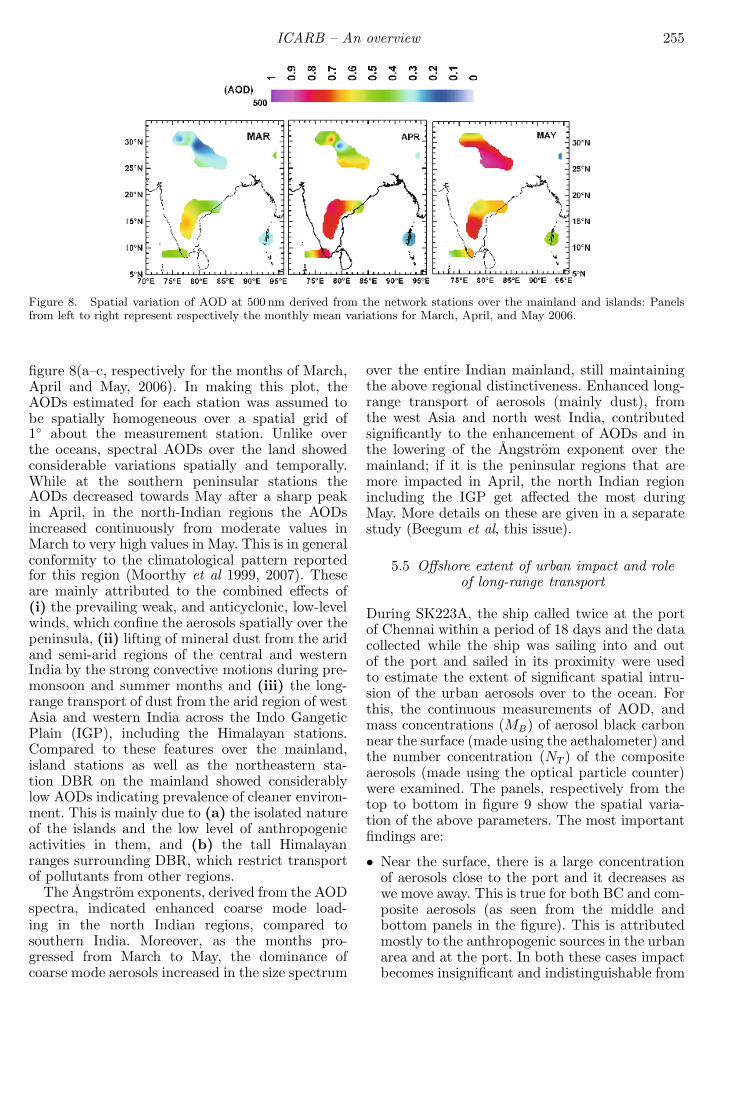
Figure 8. Spatial variation of AOD at 500 nm derived from the network stations over the mainland and islands: Panelsfrom left to right represent respectively the monthly mean variations for March, April, and May 2006.
figure 8(a–c, respectively for the months of March,April and May, 2006). In making this plot, theAODs estimated for each station was assumed tobe spatially homogeneous over a spatial grid of1◦ about the measurement station. Unlike overthe oceans, spectral AODs over the land showedconsiderable variations spatially and temporally.While at the southern peninsular stations theAODs decreased towards May after a sharp peakin April, in the north-Indian regions the AODsincreased continuously from moderate values inMarch to very high values in May. This is in generalconformity to the climatological pattern reportedfor this region (Moorthy et al 1999, 2007). Theseare mainly attributed to the combined effects of(i) the prevailing weak, and anticyclonic, low-levelwinds, which confine the aerosols spatially over thepeninsula, (ii) lifting of mineral dust from the aridand semi-arid regions of the central and westernIndia by the strong convective motions during pre-monsoon and summer months and (iii) the long-range transport of dust from the arid region of westAsia and western India across the Indo GangeticPlain (IGP), including the Himalayan stations.Compared to these features over the mainland,island stations as well as the northeastern sta-tion DBR on the mainland showed considerablylow AODs indicating prevalence of cleaner environ-ment. This is mainly due to (a) the isolated natureof the islands and the low level of anthropogenicactivities in them, and (b) the tall Himalayanranges surrounding DBR, which restrict transportof pollutants from other regions.
The Angstrom exponents, derived from the AODspectra, indicated enhanced coarse mode load-ing in the north Indian regions, compared tosouthern India. Moreover, as the months pro-gressed from March to May, the dominance ofcoarse mode aerosols increased in the size spectrum
over the entire Indian mainland, still maintainingthe above regional distinctiveness. Enhanced long-range transport of aerosols (mainly dust), fromthe west Asia and north west India, contributedsignificantly to the enhancement of AODs and inthe lowering of the Angstrom exponent over themainland; if it is the peninsular regions that aremore impacted in April, the north Indian regionincluding the IGP get affected the most duringMay. More details on these are given in a separatestudy (Beegum et al, this issue).
5.5 Offshore extent of urban impact and roleof long-range transport
During SK223A, the ship called twice at the portof Chennai within a period of 18 days and the datacollected while the ship was sailing into and outof the port and sailed in its proximity were usedto estimate the extent of significant spatial intru-sion of the urban aerosols over to the ocean. Forthis, the continuous measurements of AOD, andmass concentrations (MB) of aerosol black carbonnear the surface (made using the aethalometer) andthe number concentration (NT ) of the compositeaerosols (made using the optical particle counter)were examined. The panels, respectively from thetop to bottom in figure 9 show the spatial varia-tion of the above parameters. The most importantfindings are:
• Near the surface, there is a large concentrationof aerosols close to the port and it decreases aswe move away. This is true for both BC and com-posite aerosols (as seen from the middle andbottom panels in the figure). This is attributedmostly to the anthropogenic sources in the urbanarea and at the port. In both these cases impactbecomes insignificant and indistinguishable from
256 K Krishna Moorthy et al
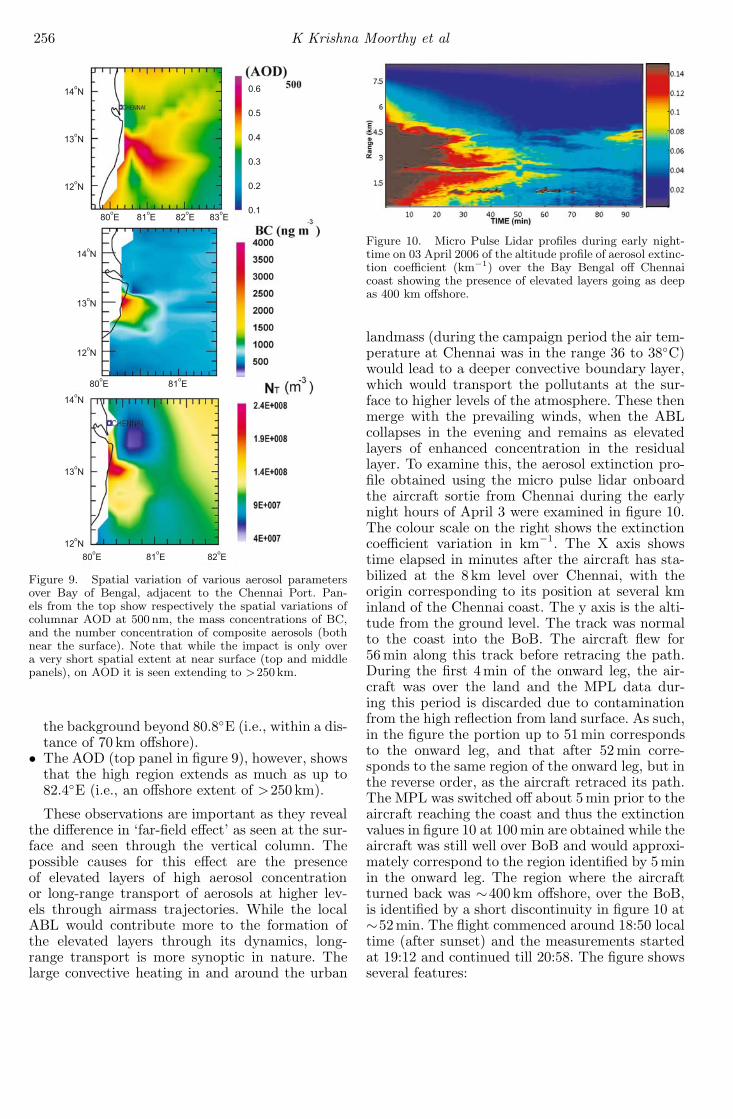
Figure 9. Spatial variation of various aerosol parametersover Bay of Bengal, adjacent to the Chennai Port. Pan-els from the top show respectively the spatial variations ofcolumnar AOD at 500 nm, the mass concentrations of BC,and the number concentration of composite aerosols (bothnear the surface). Note that while the impact is only overa very short spatial extent at near surface (top and middlepanels), on AOD it is seen extending to >250 km.
the background beyond 80.8◦E (i.e., within a dis-tance of 70 km offshore).
• The AOD (top panel in figure 9), however, showsthat the high region extends as much as up to82.4◦E (i.e., an offshore extent of >250 km).
These observations are important as they revealthe difference in ‘far-field effect’ as seen at the sur-face and seen through the vertical column. Thepossible causes for this effect are the presenceof elevated layers of high aerosol concentrationor long-range transport of aerosols at higher lev-els through airmass trajectories. While the localABL would contribute more to the formation ofthe elevated layers through its dynamics, long-range transport is more synoptic in nature. Thelarge convective heating in and around the urban
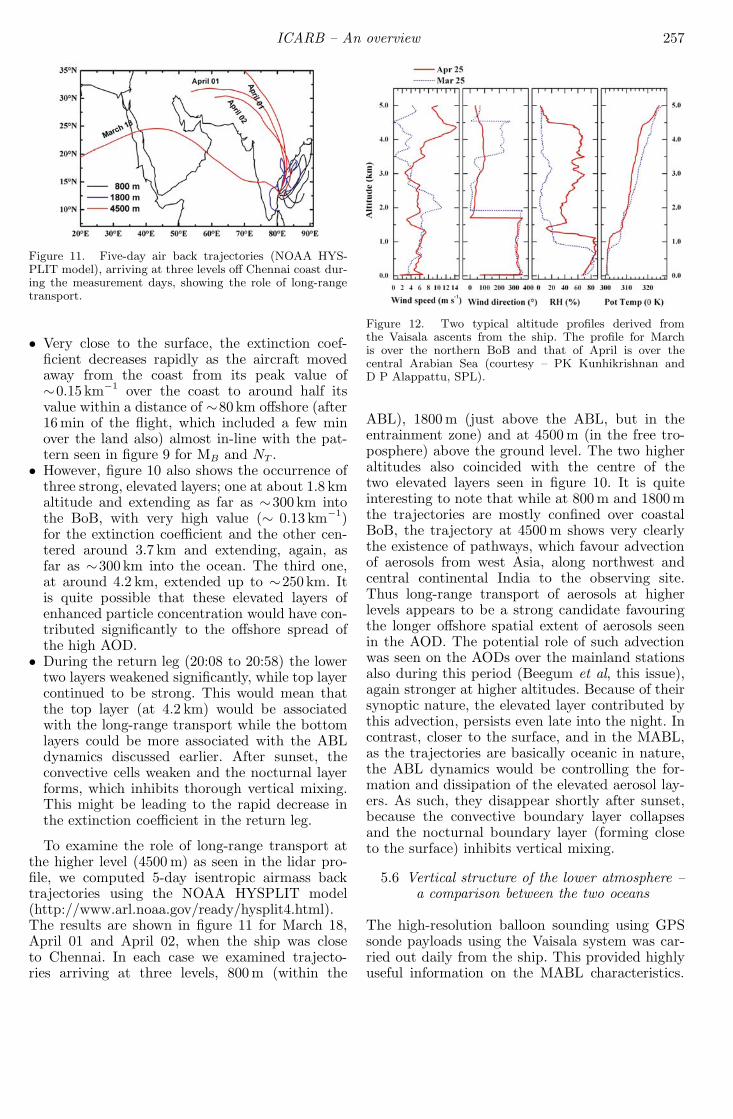
Figure 10. Micro Pulse Lidar profiles during early night-time on 03 April 2006 of the altitude profile of aerosol extinc-tion coefficient (km−1) over the Bay Bengal off Chennaicoast showing the presence of elevated layers going as deepas 400 km offshore.
landmass (during the campaign period the air tem-perature at Chennai was in the range 36 to 38◦C)would lead to a deeper convective boundary layer,which would transport the pollutants at the sur-face to higher levels of the atmosphere. These thenmerge with the prevailing winds, when the ABLcollapses in the evening and remains as elevatedlayers of enhanced concentration in the residuallayer. To examine this, the aerosol extinction pro-file obtained using the micro pulse lidar onboardthe aircraft sortie from Chennai during the earlynight hours of April 3 were examined in figure 10.The colour scale on the right shows the extinctioncoefficient variation in km−1. The X axis showstime elapsed in minutes after the aircraft has sta-bilized at the 8 km level over Chennai, with theorigin corresponding to its position at several kminland of the Chennai coast. The y axis is the alti-tude from the ground level. The track was normalto the coast into the BoB. The aircraft flew for56 min along this track before retracing the path.During the first 4min of the onward leg, the air-craft was over the land and the MPL data dur-ing this period is discarded due to contaminationfrom the high reflection from land surface. As such,in the figure the portion up to 51 min correspondsto the onward leg, and that after 52 min corre-sponds to the same region of the onward leg, but inthe reverse order, as the aircraft retraced its path.The MPL was switched off about 5 min prior to theaircraft reaching the coast and thus the extinctionvalues in figure 10 at 100 min are obtained while theaircraft was still well over BoB and would approxi-mately correspond to the region identified by 5 minin the onward leg. The region where the aircraftturned back was ∼400 km offshore, over the BoB,is identified by a short discontinuity in figure 10 at∼52min. The flight commenced around 18:50 localtime (after sunset) and the measurements startedat 19:12 and continued till 20:58. The figure showsseveral features:
ICARB – An overview 257
Figure 11. Five-day air back trajectories (NOAA HYS-PLIT model), arriving at three levels off Chennai coast dur-ing the measurement days, showing the role of long-rangetransport.
• Very close to the surface, the extinction coef-ficient decreases rapidly as the aircraft movedaway from the coast from its peak value of∼0.15 km−1 over the coast to around half itsvalue within a distance of ∼80 km offshore (after16 min of the flight, which included a few minover the land also) almost in-line with the pat-tern seen in figure 9 for MB and NT .
• However, figure 10 also shows the occurrence ofthree strong, elevated layers; one at about 1.8 kmaltitude and extending as far as ∼300 km intothe BoB, with very high value (∼ 0.13 km−1)for the extinction coefficient and the other cen-tered around 3.7 km and extending, again, asfar as ∼300 km into the ocean. The third one,at around 4.2 km, extended up to ∼250 km. Itis quite possible that these elevated layers ofenhanced particle concentration would have con-tributed significantly to the offshore spread ofthe high AOD.
• During the return leg (20:08 to 20:58) the lowertwo layers weakened significantly, while top layercontinued to be strong. This would mean thatthe top layer (at 4.2 km) would be associatedwith the long-range transport while the bottomlayers could be more associated with the ABLdynamics discussed earlier. After sunset, theconvective cells weaken and the nocturnal layerforms, which inhibits thorough vertical mixing.This might be leading to the rapid decrease inthe extinction coefficient in the return leg.
To examine the role of long-range transport atthe higher level (4500 m) as seen in the lidar pro-file, we computed 5-day isentropic airmass backtrajectories using the NOAA HYSPLIT model(http://www.arl.noaa.gov/ready/hysplit4.html).The results are shown in figure 11 for March 18,April 01 and April 02, when the ship was closeto Chennai. In each case we examined trajecto-ries arriving at three levels, 800 m (within the
Figure 12. Two typical altitude profiles derived fromthe Vaisala ascents from the ship. The profile for Marchis over the northern BoB and that of April is over thecentral Arabian Sea (courtesy – PK Kunhikrishnan andD P Alappattu, SPL).
ABL), 1800 m (just above the ABL, but in theentrainment zone) and at 4500 m (in the free tro-posphere) above the ground level. The two higheraltitudes also coincided with the centre of thetwo elevated layers seen in figure 10. It is quiteinteresting to note that while at 800 m and 1800 mthe trajectories are mostly confined over coastalBoB, the trajectory at 4500 m shows very clearlythe existence of pathways, which favour advectionof aerosols from west Asia, along northwest andcentral continental India to the observing site.Thus long-range transport of aerosols at higherlevels appears to be a strong candidate favouringthe longer offshore spatial extent of aerosols seenin the AOD. The potential role of such advectionwas seen on the AODs over the mainland stationsalso during this period (Beegum et al, this issue),again stronger at higher altitudes. Because of theirsynoptic nature, the elevated layer contributed bythis advection, persists even late into the night. Incontrast, closer to the surface, and in the MABL,as the trajectories are basically oceanic in nature,the ABL dynamics would be controlling the for-mation and dissipation of the elevated aerosol lay-ers. As such, they disappear shortly after sunset,because the convective boundary layer collapsesand the nocturnal boundary layer (forming closeto the surface) inhibits vertical mixing.
5.6 Vertical structure of the lower atmosphere –a comparison between the two oceans
The high-resolution balloon sounding using GPSsonde payloads using the Vaisala system was car-ried out daily from the ship. This provided highlyuseful information on the MABL characteristics.
258 K Krishna Moorthy et al
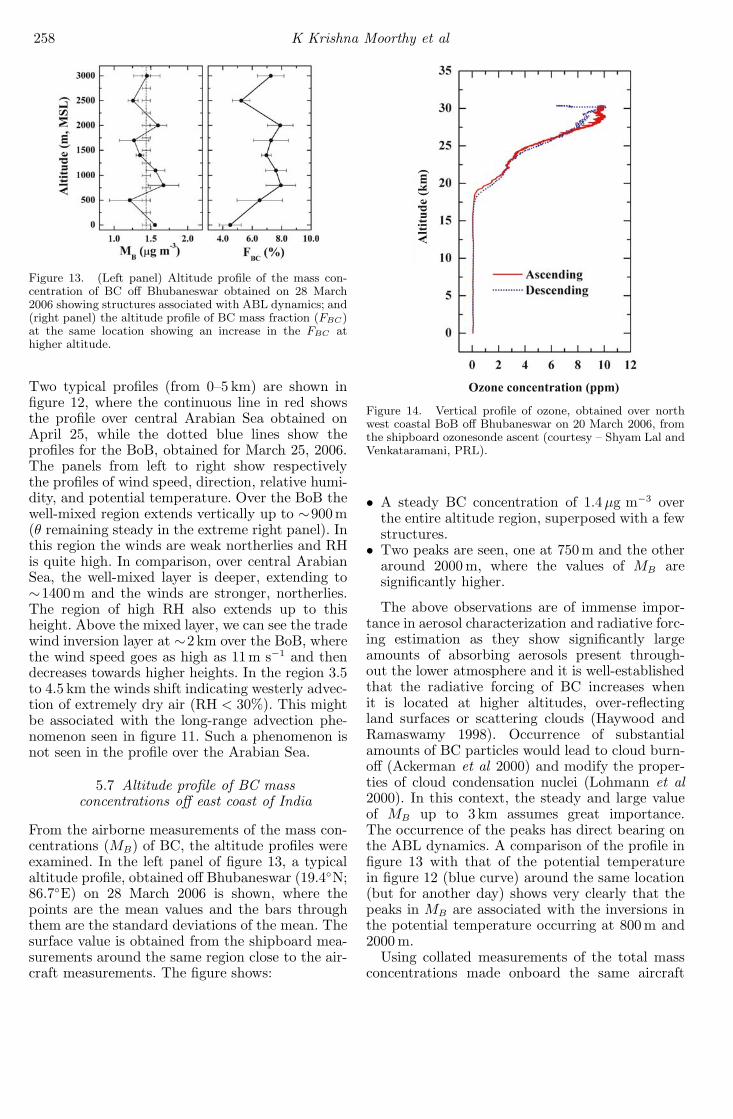
Figure 13. (Left panel) Altitude profile of the mass con-centration of BC off Bhubaneswar obtained on 28 March2006 showing structures associated with ABL dynamics; and(right panel) the altitude profile of BC mass fraction (FBC)at the same location showing an increase in the FBC athigher altitude.
Two typical profiles (from 0–5 km) are shown infigure 12, where the continuous line in red showsthe profile over central Arabian Sea obtained onApril 25, while the dotted blue lines show theprofiles for the BoB, obtained for March 25, 2006.The panels from left to right show respectivelythe profiles of wind speed, direction, relative humi-dity, and potential temperature. Over the BoB thewell-mixed region extends vertically up to ∼900m(θ remaining steady in the extreme right panel). Inthis region the winds are weak northerlies and RHis quite high. In comparison, over central ArabianSea, the well-mixed layer is deeper, extending to∼1400m and the winds are stronger, northerlies.The region of high RH also extends up to thisheight. Above the mixed layer, we can see the tradewind inversion layer at ∼2 km over the BoB, wherethe wind speed goes as high as 11m s−1 and thendecreases towards higher heights. In the region 3.5to 4.5 km the winds shift indicating westerly advec-tion of extremely dry air (RH < 30%). This mightbe associated with the long-range advection phe-nomenon seen in figure 11. Such a phenomenon isnot seen in the profile over the Arabian Sea.
5.7 Altitude profile of BC massconcentrations off east coast of India
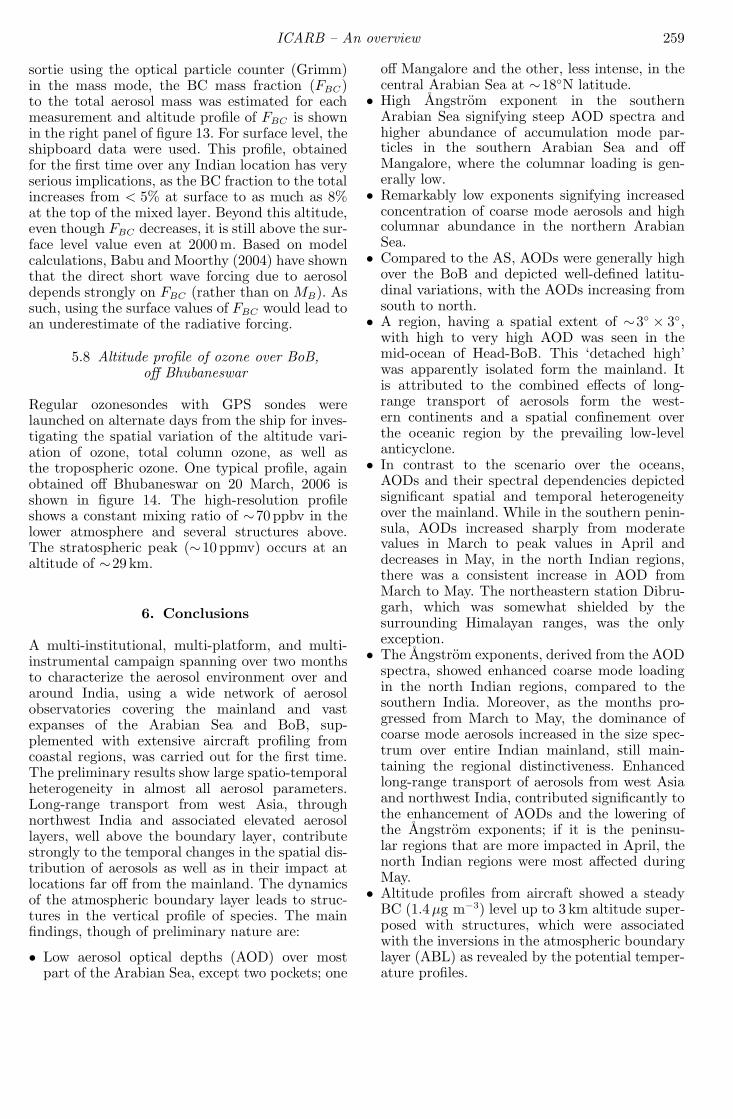
From the airborne measurements of the mass con-centrations (MB) of BC, the altitude profiles wereexamined. In the left panel of figure 13, a typicalaltitude profile, obtained off Bhubaneswar (19.4◦N;86.7◦E) on 28 March 2006 is shown, where thepoints are the mean values and the bars throughthem are the standard deviations of the mean. Thesurface value is obtained from the shipboard mea-surements around the same region close to the air-craft measurements. The figure shows:
Figure 14. Vertical profile of ozone, obtained over northwest coastal BoB off Bhubaneswar on 20 March 2006, fromthe shipboard ozonesonde ascent (courtesy – Shyam Lal andVenkataramani, PRL).
• A steady BC concentration of 1.4μg m−3 overthe entire altitude region, superposed with a fewstructures.
• Two peaks are seen, one at 750 m and the otheraround 2000 m, where the values of MB aresignificantly higher.
The above observations are of immense impor-tance in aerosol characterization and radiative forc-ing estimation as they show significantly largeamounts of absorbing aerosols present through-out the lower atmosphere and it is well-establishedthat the radiative forcing of BC increases whenit is located at higher altitudes, over-reflectingland surfaces or scattering clouds (Haywood andRamaswamy 1998). Occurrence of substantialamounts of BC particles would lead to cloud burn-off (Ackerman et al 2000) and modify the proper-ties of cloud condensation nuclei (Lohmann et al2000). In this context, the steady and large valueof MB up to 3 km assumes great importance.The occurrence of the peaks has direct bearing onthe ABL dynamics. A comparison of the profile infigure 13 with that of the potential temperaturein figure 12 (blue curve) around the same location(but for another day) shows very clearly that thepeaks in MB are associated with the inversions inthe potential temperature occurring at 800 m and2000 m.
Using collated measurements of the total massconcentrations made onboard the same aircraft
ICARB – An overview 259
sortie using the optical particle counter (Grimm)in the mass mode, the BC mass fraction (FBC)to the total aerosol mass was estimated for eachmeasurement and altitude profile of FBC is shownin the right panel of figure 13. For surface level, theshipboard data were used. This profile, obtainedfor the first time over any Indian location has veryserious implications, as the BC fraction to the totalincreases from < 5% at surface to as much as 8%at the top of the mixed layer. Beyond this altitude,even though FBC decreases, it is still above the sur-face level value even at 2000 m. Based on modelcalculations, Babu and Moorthy (2004) have shownthat the direct short wave forcing due to aerosoldepends strongly on FBC (rather than on MB). Assuch, using the surface values of FBC would lead toan underestimate of the radiative forcing.
5.8 Altitude profile of ozone over BoB,off Bhubaneswar
Regular ozonesondes with GPS sondes werelaunched on alternate days from the ship for inves-tigating the spatial variation of the altitude vari-ation of ozone, total column ozone, as well asthe tropospheric ozone. One typical profile, againobtained off Bhubaneswar on 20 March, 2006 isshown in figure 14. The high-resolution profileshows a constant mixing ratio of ∼70 ppbv in thelower atmosphere and several structures above.The stratospheric peak (∼10 ppmv) occurs at analtitude of ∼29 km.
6. Conclusions
A multi-institutional, multi-platform, and multi-instrumental campaign spanning over two monthsto characterize the aerosol environment over andaround India, using a wide network of aerosolobservatories covering the mainland and vastexpanses of the Arabian Sea and BoB, sup-plemented with extensive aircraft profiling fromcoastal regions, was carried out for the first time.The preliminary results show large spatio-temporalheterogeneity in almost all aerosol parameters.Long-range transport from west Asia, throughnorthwest India and associated elevated aerosollayers, well above the boundary layer, contributestrongly to the temporal changes in the spatial dis-tribution of aerosols as well as in their impact atlocations far off from the mainland. The dynamicsof the atmospheric boundary layer leads to struc-tures in the vertical profile of species. The mainfindings, though of preliminary nature are:
• Low aerosol optical depths (AOD) over mostpart of the Arabian Sea, except two pockets; one
off Mangalore and the other, less intense, in thecentral Arabian Sea at ∼18◦N latitude.
• High Angstrom exponent in the southernArabian Sea signifying steep AOD spectra andhigher abundance of accumulation mode par-ticles in the southern Arabian Sea and offMangalore, where the columnar loading is gen-erally low.
• Remarkably low exponents signifying increasedconcentration of coarse mode aerosols and highcolumnar abundance in the northern ArabianSea.
• Compared to the AS, AODs were generally highover the BoB and depicted well-defined latitu-dinal variations, with the AODs increasing fromsouth to north.
• A region, having a spatial extent of ∼3◦ × 3◦,with high to very high AOD was seen in themid-ocean of Head-BoB. This ‘detached high’was apparently isolated form the mainland. Itis attributed to the combined effects of long-range transport of aerosols form the west-ern continents and a spatial confinement overthe oceanic region by the prevailing low-levelanticyclone.
• In contrast to the scenario over the oceans,AODs and their spectral dependencies depictedsignificant spatial and temporal heterogeneityover the mainland. While in the southern penin-sula, AODs increased sharply from moderatevalues in March to peak values in April anddecreases in May, in the north Indian regions,there was a consistent increase in AOD fromMarch to May. The northeastern station Dibru-garh, which was somewhat shielded by thesurrounding Himalayan ranges, was the onlyexception.
• The Angstrom exponents, derived from the AODspectra, showed enhanced coarse mode loadingin the north Indian regions, compared to thesouthern India. Moreover, as the months pro-gressed from March to May, the dominance ofcoarse mode aerosols increased in the size spec-trum over entire Indian mainland, still main-taining the regional distinctiveness. Enhancedlong-range transport of aerosols from west Asiaand northwest India, contributed significantly tothe enhancement of AODs and the lowering ofthe Angstrom exponents; if it is the peninsu-lar regions that are more impacted in April, thenorth Indian regions were most affected duringMay.
• Altitude profiles from aircraft showed a steadyBC (1.4μg m−3) level up to 3 km altitude super-posed with structures, which were associatedwith the inversions in the atmospheric boundarylayer (ABL) as revealed by the potential temper-ature profiles.
260 K Krishna Moorthy et al
• A remarkable increase with altitude of the BCmass fraction, implying higher abundance of BCand increased forcing.
• Presence of convectively mixed layer extendingup to about 1 km over the Arabian Sea and Bayof Bengal.
• The offshore extent of anthropogenic impactat the port and urban centres are limited to< 100 km at the surface level.
• Long-range transport of aerosols, through air-mass trajectories, from west Asia and NW aridregions of India leading to formation of elevatedaerosol layers extending as far as 400 km off theeast coast.
Acknowledgements
The ICARB was a national endeavour. Morethan 100 scientists from 26 institutions includingnational laboratories, academic institutions, anduniversities, contributed to its success and we arethankful to each one of them. Though it would bedifficult to list them by name, the research out-puts from these investigators appear as scientificpapers in the same issue. We are grateful to theDirector, NRSA and its aircraft team headed byDr. K Kalyanaraman, and V Raghu Venkatara-man for the total co-operation and the immensehelp. Excellent support and facilities were pro-vided by the National Centre for Antarctic andOcean Studies, which provided the research vesselfor a period of two months dedicated for this cam-paign and we are extremely thankful to Dr. RasikRavindra, and Dr. M Sudhakar and his team.The ICARB campaign was an outcome of theuntiring efforts of the Geosphere Biosphere Pro-gramme of the Indian Space Research Organiza-tion and we are thankful to Dr. V Jayaraman,Prof. R Sridharan, and Dr. K Parameswaran forall the encouragement and support. The techni-cal support provided by Mr. P Pradeep Kumarand Mr. P Pramod in installing the instrumentsonboard the ship and making measurements isacknowledged. The support provided by the IndiaMeteorological Department in making the regularmeteorological measurements as well as balloonascents from the ship was creditable.
References
Ackerman A S, Toon O B, Stevens D E, Heymsfield A J,Ramanathan V and Welton E J 2000 Reduction of tropi-cal cloudiness by soot; Science 288 1042–1047.
Alexandrov M D, Lacis A A, Carlson B E and Cairns B 2002Remote sensing of atmospheric aerosols and trace gasesby means of multifilter rotating shadowband radiometer.Part II: Climatological applications; J. Atmos. Sci. 59544–566.
Anderson T L et al 1996 Performance characteristicsof a high sensitivity, three-wavelength, total scatter/backscatter nephelometer; J. Atmos. Oceanic Technol. 13967–985.
Angstrom A 1964 The parameters of atmospheric turbidity;Tellus 16 64–75.
Babu S S and Moorthy K K 2002 Aerosol black carbon overa tropical coastal station in India; Geophys. Res Lett.29(23) 2098, 13-1 to 13-4, doi: 10.1029/2002GL015662.
Babu S S, Satheesh S K and Moorthy K K 2002 Aerosolradiative forcing due to enhanced black carbon atan urban site in India; Geophys. Res. Lett. 29(18)10.1029/2002GL015179.
Babu S S, Moorthy K K and Satheesh S K 2004 Aerosolblack carbon over Arabian Sea during inter monsoonand summer monsoon seasons; Geophys. Res. Lett. 31(6)L06104, 10.1029/2003GL018716.
Bates T S, Huebert B J, Gras J L, Griffiths F Band Durkee P A 1998 International Global AtmosphericChemistry (IGAC) project’s first aerosol experiment(ACE 1): Overview; J. Geophys. Res. 103 16,297–16,318.
Bates T S et al 2001 Regional physical and chemical proper-ties of the marine boundary layer aerosol across theAtlantic during Aerosols99: An overview; J. Geophys.Res. 106 20,767–20,782.
Beegum S N, Moorthy K K, Nair V S, Babu S S,Satheesh S K, Vinoj V, Ramakrishna Reddy R, RamaGopal K, Badarinath K V S, Niranjan K, Santosh KumarPandey, Behera M, Jeyaram A, Bhuyan P K, Gogoi M M,Sacchidanand Singh, Pant P, Dumka U C, Yogesh Kant,Kuniyal J C and Darshan Singh 2008 Characteristicsof Spectral Aerosol Optical Depths over India duringICARB; J. Earth Sys. Sci. (this issue).
Charlson R J, Schwartz S E, Hales J M, Cess R D,Coakley J A, Hansen J E and Hofmann D J 1992 Cli-mate forcing by anthropogenic aerosols; Science 255423–430.
Crescenti G H 1997 A lookback on two decades of Dopplersodar comparison studies; Bull. Amer. Meteor. Soc. 78651–673.
Diner D J, Ackerman T P, Anderson T L et al2004 Progressive Aerosol Retrievel and AssimilationGlobal Observing Network (PARAGON): An integratedapproach for characterizing aerosol climatic and environ-mental interactions; Bull. Amer. Meteor. Soc. 85(10)1491–1501.
Fishman J et al 1996 NASA GTE TRACE A experiment(September–October 2002): Overview; J. Geophys. Res.101 23,865–23,880.
Ganguly D, Gadhavi H, Jayaraman A, Rajesh T Aand Misra A 2005 Single scattering albedo of aerosolsover the central India: Implications for the regionalaerosol radiative forcing; Geophys. Res. Lett. 32 LI8803,doi:10.1029/2005GL023903.
Hansen A D A, Rosen H and Novakov T 1984 Aethalo-meter – An instrument for the real-time measurement ofoptical absorption by aerosol particles; Sci. Total Envi-ron. 36 191–196.
Haywood J M and Ramaswamy V 1998 Global sensitivitystudies of the direct radiative forcing due to anthro-pogenic sulfate and black carbon aerosols; J. Geophys.Res. 103 6043–6058.
Holben B N, Eck T F, Slutsker I, Tanre D, Buis J P,Setzer A, Vermote E, Reagan J A, Kaufman Y J,Nakajima T, Lavenu F, Jankowiak I and Smirnov A 1998AERONET – A federated instrument network and dataarchive for aerosol characterization; Rem. Sens. Environ.66 1–16.
Huebert B J, Bates T, Russell P B, Shi G, Kim Y J,Kawamura K, Carmichael G and Nakajima T 2003
ICARB – An overview 261
An overview of ACE-Asia: Strategies for quantify-ing the relationships between Asian aerosols and theirclimatic impacts; J. Geophys. Res. 108 doi:10.1029/2003JD003550.
IPCC 2007 Climate Change 2007: The Physical Sci-ence Basis. Contribution of Working Group I to theFourth Assessment Report of the IntergovernmentalPanel on Climate Change; Cambridge University Press:Cambridge, United Kingdom and New York.
Jacob D J, Crawford J H, Kleb M M et al 2003 The transportand chemical evolution of over the Pacific (TRACE-P)aircraft mission: design, execution, and first results;J. Geophys. Res. 108 9000, doi:10.1029/2002JD003276.
Kamra A K, Murugavel P, Pawar S D andGopalakrishnan V 2001 Background aerosolconcentration derived from the atmospheric electricconductivity measurements made over the Indian oceanduring INDOEX; J. Geophys. Res. 106 28,463–28,651.
Kaufman Y J, Hobbs P V, Kirchhoff V W J H, Artaxo P,Remer L A, Holben B N, King M D, Ward D E,Prins E M, Longo K M, Mattos L F, Nobre C A,Spinhirne J D, Ji Q, Thompson A M, Gleason J F,Christopher S A and Tsay S C 1998 Smoke, Clouds, andRadiation – Brazil (SCAR−B) experiment; J. Geophys.Res. 103 31,783–31,808.
Kaufman Y J, Setzer A and Ward D et al 1992 Bio-mass burning Airborne and Spaceborne Experimentin the Amazonas (BASE-A); J. Geophys. Res. 9714,581–14,599.
Kaufman Y J, Tanre D and Boucher O 2002 A satel-lite view of aerosols in the climate system; Nature 419215–223.
King M D, Platnick S, Moeller C C, Revercomb H E andChu D A 2003 Remote sensing of smoke, land, and cloudsfrom the NASA ER-2 during SAFARI2000; J. Geophys.Res. 108(D13) 8502, doi:10.1029/2002JD003207.
Lelieveld J, Berresheim H and Borrmann S et al 2002 Globalair pollution crossroads over the Mediterranean; Science298 794–799.
Lindesay J A, Andreae M O and Goldammer J G et al 1996International Geosphere Biosphere Programme/Inter-national global Atmospheric Chemistry SAFARI-92 fieldexperiment: Background and overview; J. Geophys. Res.101 23,521–23,530.
Lohmann U, Feichter J, Penner J and Leatch R 2000Indirect effect of sulfate and carbonaceous aerosols:A mechanistic treatment; J. Geophys. Res. 10512,193–12,206.
Matthias V and Coauthors 2004 Aerosol lidar intercompari-son in the framework of EARLINET, Part I: Instruments;Appl. Opt. 43 961–976.
McCormick R A and Ludwig J H 1967 Climate modi-fication by atmospheric aerosols; Science 156 (3780),1358–1359.
Moorthy K K, Babu S S and Satheesh S K 2003 Aerosolspectral optical depths over the Bay of Bengal: Roleof transport; Geophys. Res. Lett. 30(5) doi:10.1029/2002GL016520.
Moorthy K K, Babu S S and Satheesh S K 2005aAerosol characteristics and Radiative Impacts over theArabian Sea during the Intermonsoon Season: Resultsfrom ARMEX Field Campaign; J. Atmos. Sci. 62192–206.
Moorthy K K et al 2005b Wintertime spatial characteristicsof boundary layer aerosols over peninsular India; J. Geo-phys. Res. 110 D08207, doi:10.1029/2004JD005520.
Moorthy K K, Babu S S and Satheesh S K 2007 Tem-poral heterogeneity in aerosol characteristics and theresulting radiative impact at a tropical coastal station-I:
Microphysical and Optical properties; Ann. Geophys. 252293–2308.
Moorthy K K, Babu S S, Sunilkumar S V, Gupta P Kand Gera B S 2004 Altitude profiles of aerosol BC,derived from aircraft measurements over an inlandurban location in India; Geophys. Res. Lett. 31 L22103,doi:10.1029/2004gl021336.
Moorthy K K, Niranjan K, Narasimhamurthy B,Agashe V V and Murthy B V K 1999 Aerosol Climato-logy over India, 1. ISRO GBP MWR Network and Data-base, Scientific Report; ISRO GBP, SR 03 99, IndianSpace Research Organisation, India.
Moorthy K K and Saha A 2000 Aerosol study dur-ing INDOEX: Observation of enhanced aerosol activityover the mid Arabian Sea during the northern winter;J. Atmos. Sol. Terr. Phys. 62 65–72.
Moorthy K K and Satheesh S K 2000 Characteristics ofaerosols over a remote island, Minicoy in the ArabianSea: Optical properties and retrieved size characteristics;Quart. J. Roy. Meteor. Soc. 126 81–109.
Morys M, Mims III F M, Hagerup S, Anderson S E,Baker A, Kia J and Walkup T 2001 Design, calibrationand performance of Microtops II handheld ozone monitorand sunphotometer; J. Geophys. Res. 106 14,573–14,582.
Nair V S, Moorthy K K, Alappattu D P,Kunhikrishnan P K, George S, Nair P, Babu S S,Abish B, Satheesh S K, Tripathi S N, Niranjan K,Madhavan B L, Srikanth V, Dutt C B S, Badrinath K V Sand Ramakrishna Reddy R 2007 Wintertime aerosolcharacteristics over the Indo-Gangetic Plain (IGP):Impacts of local boundary layer processes and long-range transport; J. Geophys. Res. 112 D13205, doi:10.1029/2006JD008099.
Nair V S, Moorthy K K, Babu S S, Narasimhulu K,Reddy L S S, Reddy R R, Rama Gopal K, Sreekanth V,Madhavan B L and Niranjan K 2008 Size segre-gated aerosol mass concentration measurements over theArabian Sea during ICARB; J. Earth. Sys. Sci. (thisissue).
Nair S K, Parameswaran K and Rajeev K 2005 Seven-yearssatellite observations of the mean structure and variabili-ties in the regional aerosol distribution over the oceanicareas around the Indian subcontinent; Ann. Geophys. 232011–2030.
Naja et al 1999 Variabilities in O3, NO, CO and CH4
over the Indian Ocean during winter; Curr. Sci. 76931–937.
Niranjan K, Sreekanth V, Madhavan B L and Moorthy K K2007 Aerosol physical properties and Radiative forcing atthe outflow region from the Indo-Gangetic Plains duringtypical clear and hazy periods of wintertime; Geophys.Res. Lett. 34 L19805, doi: 10.1029/2007GL031224.
Pant P, Hegde P, Dumka U C, Sagar R, Satheesh S K,Moorthy K K, Saha A and Srivastava M K 2006Aerosol Characteristics at a High Altitude Locationin Central Himalayas: Optical Properties and Radia-tive Forcing; J. Geophys. Res. 111(D17) D17206,10.1029/2005JD006768.
Parameswaran K, Nair P R, Rajan R and Ramana M V1999 Aerosol loading in coastal and marine environmentsin the Indian Ocean region during winter season; Curr.Sci. 76 947–955.
Penner J E, Charlson R J, Hales J M, Laulainen N S,Leifer R, Novakov T, Ogren J, Radke L F, Schwartz S Eand Travis L 1994 Quantifying and minimizing uncer-tainty of climate forcing by anthropogenic aerosols; Bull.Am. Meteorol. Soc. 75 375–400.
Pillai P S and Moorthy K K 2001 Aerosol mass-size distri-butions at a tropical coastal environment: Response to
262 K Krishna Moorthy et al
mesoscale and synoptic scale processes; Atmos. Environ.35 4099–4122.
Quinn P K and Bates T S 2005 Regional aerosol prop-erties: Comparisons of boundary layer measurementsfrom ACE 1, ACE 2, Aerosols99, INDOEX, ACE Asia,TARFOX, and NEAQS; J. Geophys. Res. 110 D14202,doi: 10.1029/2004JD004755.
Raes F, Bates T, McGovern F M and van Liederkerte M2000 The second Aerosol Characterization Experiment(ACE-2): General overview and main results; Tellus 52B111–126.
Rajeev K, Ramanathan V and Meywerk J 2000 Regionalaerosol distribution and its long-range transport over theIndian Ocean; J. Geophys. Res. 105 2029–2043.
Ramachandran S 2004 Spectral aerosol optical characteris-tics during the north east monsoon over the Arabian Seaand the tropical Indian Ocean: Aerosol optical depthsand their variabilities; J. Geophys. Res. 109 D19207,doi:10.1029/2003JD004476.
Ramanathan V et al 2001 Indian Ocean Experiment: Anintegrated analysis of the climate and the great Indo-Asian haze; J. Geophys. Res. 106 28,371–28,398.
Remer L A, Gasso S, Hegg D A, Kaufman Y J andHolben B N 1997 Urban/industrial aerosol: Ground-based Sun/sky radiometer and airborne in situ measure-ments; J. Geophys. Res. 102 16,849–16,859.
Russell P B, Hobbs P V and Stowe L L 1999 Aerosolproperties and radiative effects in the United StatesEast Coast haze plume: An overview of TroposphericAerosol Radiative Forcing Observational Experiment(TARFOX); J. Geophys. Res. 104 2213–2222.
Satheesh S K, Ramanathan V, Jones X L, Lobert J M,Podogorny I A, Prospero J M, Holben B N and Leob N G1999 A Model for the natural and anthropogenic aerosolsfor the tropical Indian Ocean derived from IndianOcean Experiment data; J. Geophys. Res. 104(D22)27421–27440.
Satheesh S K, Vinoj V and Moorthy K K 2006 Verticaldistribution of aerosols over a continetal urban sitein India; Geophys. Res. Lett. 33 L20816, doi:10.1029/2006/GL027729.
Smith Jr W L, Charlock T P, Kahn R, Martins J V,Remer L A, Hobbs P V, Redemann J and Rutledge C K2005 EOS Terra Aerosol and Radiative Flux Validation:An Overview of the Chesapeake Lighthouse and Air-craft Measurements for Satellites (CLAMS) Experiment;J. Atmos. Sci. 62(4) 903–918.
Tripathi S N, Dey S, Tare V and Satheesh S K 2005 Aerosolblack carbon radiative forcing at an industrial city innorthern India; Geophys. Res. Lett. 32 doi:10.1029/2005/GL022515.
Twomey S 1977 Atmospheric aerosols; Elsevier,Amsterdam–Oxford–New York.
Vinoj V, Babu S S, Satheesh S K, Moorthy K K andKaufman Y J 2004 Radiative forcing by aerosols over theBay of Bengal region derived from ship borne, island-based and satellite (Moderate-Resolution Imaging Spec-troradiometer) observations; J. Geophys. Res. 109(D5)D05203, doi: 10.1029/2003JD004329.
Vinoj V and Satheesh S K 2003 Measurements ofaerosol optical depth over Arabian Sea during summermonsoon season; Geophys. Res. Lett. 30 doi:10.1029/2002GL0166.
Wolfe D E and Gutman S I 2000 Developing on operational,surface based, GPS water vapour observing system forNOAA: network design and results; J. Atmos. Oceanic.Technol. 17 426–440.
Yu H, Kaufman Y J, Chin M, Feingold G, Remer L A,Anderson T L, Balkanski Y, Bellouin N, Boucher O,Christopher S, DeCola P, Kahn R, Koch D, Loeb N,Reddy M S, Schulz M, Takemura T and Zhou M 2006A review of measurement-based assessments of theaerosol direct radiative effect and forcing; Atmos. Chem.Phys. 6 613–666.
MS received 2 August 2007; revised 24 September 2007; accepted 11 October 2007


