Embed Size (px)
Citation preview
#9501Intellectual Property Protection, Market Orientation and Location of
Overseas R&D Activities by Multinational Enterprises
Nagesh KumarMarch 1995
Discussion Paper Series
United Nations University, Institute for New Technologies, Keizer Karelplein 19, 6211 TC Maastricht, The NetherlandsTel: (31) (43) 350 6300, Fax: (31) (43) 350 6399, e-mail: [email protected], URL: http://www.intech.unu.edu
2
1. INTRODUCTION
The internationalization of R&D activity of multinational enterprises (MNEs) which was first noticed in
the early 1970s (US Tariff Commission, 1973), has since attracted a lot of attention in the literature.
MNEs from most home countries reveal a tendency to internationalize an increasing proportion of their
R&D. The R&D activities of MNE affiliates now account for a considerable proportion of national
R&D expenditure in a number of host countries. Dunning (1994) noted that the share of MNE
affiliates in national R&D expenditure exceeded 15 per cent in Australia, Belgium, Canada, the UK,
Germany, South Korea and Singapore in the 1980s. In the US, 15.4 per cent of all R&D in industry
was conducted by foreign affiliates in 1990, compared to 6.4 per cent in 1980 (OECD, 1993). In view
of considerable spillovers of R&D activity, its internationalization is seen to be contributing to
technological capability in host countries. The geographical distribution of the overseas R&D activity
of MNEs, however, has been highly uneven across countries. The existing literature has focused on
analyzing the determinants of interindustry or interfirm variation in the propensity to internationalize
R&D. Relatively little attention has been paid to an analysis of factors that determine the location of
overseas R&D by MNEs.
The international distribution of R&D activity of MNEs can be expected to be uneven depending upon,
among other things, the extent and nature of foreign direct investment (FDI) received by the country
and the resources and environment prevailing in the country for conducting technological activities.
The treatment of intellectual property, among other policy instruments, may also have an important
bearing on a country's ability to attract R&D investments from MNEs.
This paper develops an analytical framework for explaining the location of overseas R&D investments
made by MNEs. This framework is then used to analyze the determinants of location of R&D
investments by US MNEs on the basis of the Benchmark Survey data on US Direct Investment
Abroad in 1977, 1982 and 1989. The analysis focuses on the potential role played by such factors as
the extent, technology intensity and market orientation of US FDI in the host country, technological
resources and infrastructure available, and their trade, investment and intellectual property regimes.
The structure of the paper is as follows. The following section reviews the trends in internationalization
of R&D and technological activities of MNEs from US and Japan. It also summarises earlier findings
on trends and patterns in overseas R&D activity of MNEs from other countries. Section 3 reviews the
existing literature on determinants of overseas R&D. Section 4 reviews major motivations of setting up
3
R&D abroad in the light of the literature and formulates hypotheses for explaining its location. Section
5 presents empirical findings respectively for the full sample, the subsamples according to the level of
development of the country, and industry level tests conducted for verifying the role of intellectual
property protection on the location of R&D. The final section concludes the paper with a few
observations on the policy implications of the findings.
2. TRENDS IN INTERNATIONALIZATION OF R&D ACTIVITY
Patel and Pavitt (1991) have analyzed the importance of overseas R&D in generation of technology by
the 686 largest manufacturing corporations by examining the origin of the patents obtained by them in
the US. They find that technological activities of large corporations were largely concentrated in home
countries and not yet globalized considerably. They note a significant variation in the importance of
overseas innovation across MNEs from different home countries ranging between a marginal 0.6 per
cent for Japanese corporations to 82 per cent for Dutch corporations. The US corporations obtained
3.2 per cent of their patents on the basis of research abroad and German MNEs, 6.9 per cent. Cantwell
(1992) further analyzed the same data on US patenting by the world's leading firms and noted variation
across industry groups in the propensity of patenting from overseas R&D, in addition to those across
home countries. Food MNEs were found to be the most internationalized in R&D, followed by
pharmaceutical and non-metallic mineral products. Let us now review the patterns of
internationalization of R&D for MNEs from the US, Japan and other major home countries.
The US Corporations
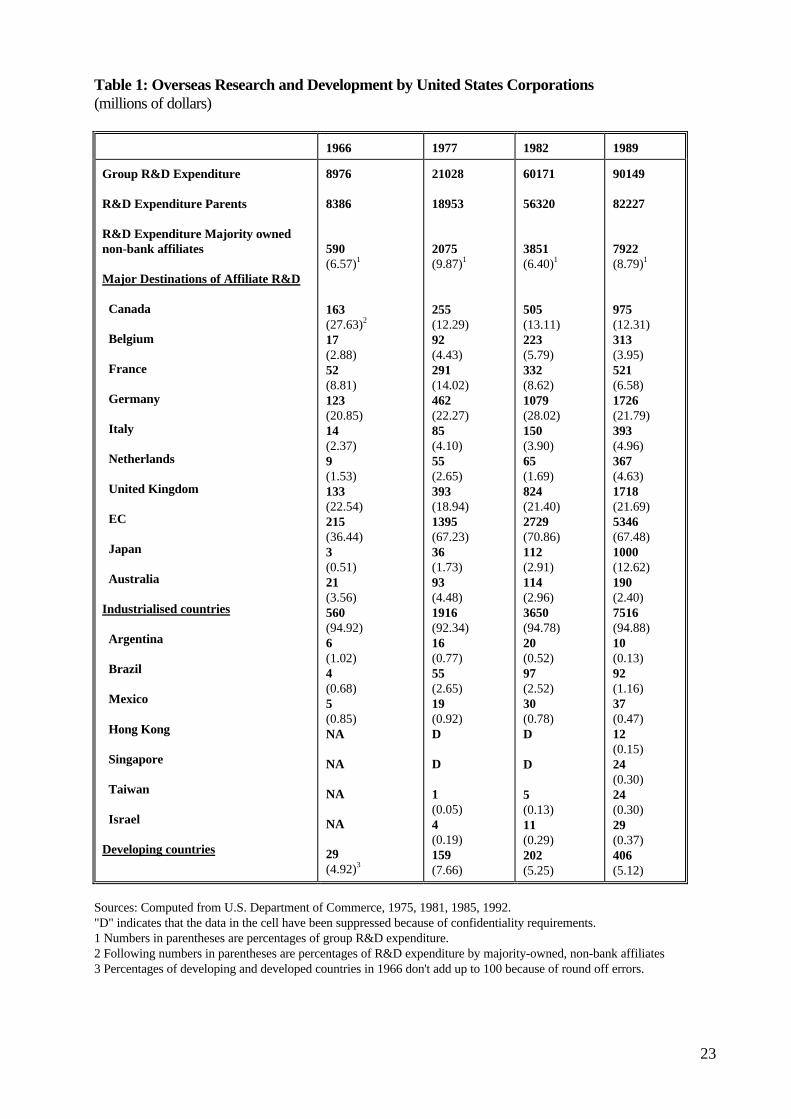
The trends in R&D activity within US corporations, as brought out by the four successive Benchmark
surveys, have been summarised in Table 1. The expenditure on overseas R&D increased rapidly
between 1966 and 1977, which brought its share up from 6.57 to 9.87 per cent in total group
expenditures. The early enthusiasm for location of R&D activity abroad waned, however, in the period
between 1977 and 1982. The concentration of R&D activity in the home country increased bringing
the share of overseas affiliates in R&D down to 6.4 per cent in 1982. In the 1980s again, overseas
R&D was attached increasing importance by US corporations bringing its share up to nearly 9 per cent
in 1989.
In 1989, the majority owned affiliates of US corporations spent nearly US$ 8 billion on R&D in their
host countries. The country wise distribution of this activity is highly uneven and is concentrated in a
handful of industrialised countries. Developing countries as a group account for about 5 per cent of
4
total overseas R&D by US affiliates. Developing countries had increased their share in overseas R&D
in the period between 1966 and 1977 when overseas R&D as a phenomenon expanded rapidly to 7.66
from under 5 per cent. Subsequently, their share declined to slightly over 5 per cent and does not reveal
any increasing trend in the more recent period. Within each group a handful of countries account for a
disproportionately large share of overseas R&D. Among the industrialised countries, Canada, Germany
and the UK account for nearly 56 per cent of overseas R&D in 1989. Japan has increasingly become an
important location for R&D by US corporations, with its share rising from 0.5 per cent in 1966 to
12.62 per cent in 1989. Among developing countries, Brazil, Mexico, Israel, Taiwan are major
locations of R&D by US corporations.
The Japanese Corporations
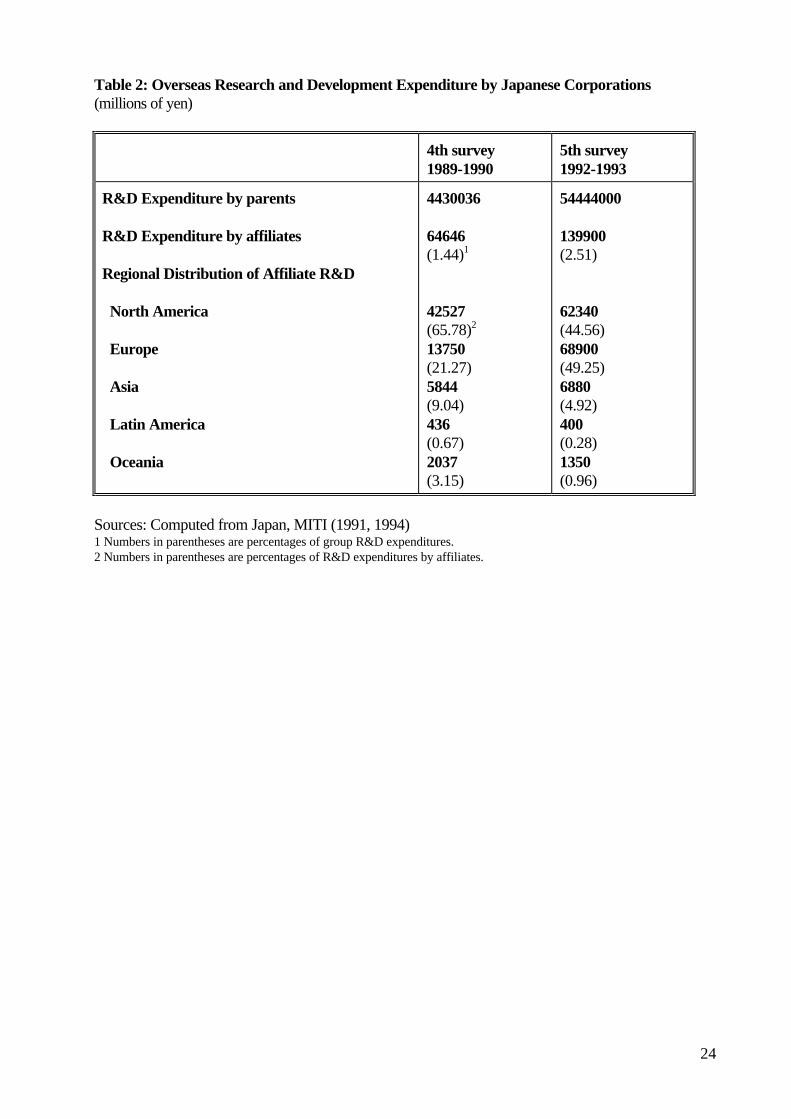
Table 2 summarises the distribution of R&D activity in the Japanese corporations, as revealed by the
two recent benchmark surveys of their overseas activities conducted by MITI. The R&D activity in the
case of Japanese enterprises is even more heavily concentrated at the parent than their US
counterparts, as also observed by Patel and Pavitt (1991) on the basis of origin of patents. But the
trends show an increasing internationalization over time. The share of overseas R&D in total group
expenditure has nearly doubled from 1.46 percent in the fiscal year 1989/90 to 2.57 in 1992/93. But the
bulk of the overseas R&D activity is concentrated in industrialised countries with North America
(largely the US) accounting for nearly 66 per cent of expenditure in 1989/90 and 44.56 per cent in
1992/3. The European (largely the EC) continent has suddenly become a favoured location for R&D
by Japanese corporations in the recent period. The total R&D expenditure by Japanese affiliates
increased by five times between 1989/90 and 1992/93, bringing their share in total overseas
expenditure up from 21.27 to 49.25 per cent. The concentration of Japanese FDI in the EC countries
over the late 1980s and early 1990s in the wake of Single European Market plan (Kumar, 1994a) seem
to have been accompanied by a similar concentration of R&D investments to support their
manufacturing investments. The increasing concentration of R&D expenditure in the EC countries has
meant that the share of R&D expenditures of Japanese affiliates in developing countries in has come
down over the past three years. In the case of Latin America and Oceanic countries, even the absolute
expenditure has also declined between the two survey periods.
Other Corporations
Zejan (1990) examined the R&D activities of Swedish MNEs on the basis of the 1978 Survey of
Swedish investments abroad compiled by IUI. The survey covered 118 MNEs, 43 of which undertook
R&D abroad. Overseas R&D accounted for 10 per cent of total expenditure on R&D in 1978 by
5
Swedish industry. The overseas R&D of Swedish companies was largely concentrated in the EC
countries, which accounted for 58.5 per cent and the US accounted for another 19.5 per cent.
Hakanson and Nobel (1993, a,b) have analyzed the foreign R&D for a sample of 20 Swedish MNEs in
1987. These MNEs operated 170 foreign R&D units accounting for some 25 per cent of their total
R&D expenditure. Zander (1994) found a rising trend in the share of US patents originating abroad
obtained by Swedish companies over the 1890 to 1990. In the period 1986-90 about 30 per cent of
patents originated in foreign countries. However, the bulk of overseas patents emerged in industrialised
countries, with the U.S. and Germany accounting for 65.4 per cent of all overseas patents obtained
between 1986-90 (and nearly 70 per cent during 1981-85).
Wortmann (1990) has examined the overseas R&D of 23 German MNEs. The sample German MNEs
employed nearly 18 per cent of their R&D personnel abroad. The growth of foreign R&D employment
had been faster than that in the home country. About half of total foreign R&D employment of German
companies was concentrated in Europe and most of the other half in North America. The chemical and
pharmaceutical industry showed a very high R&D intensity abroad largely due to requirements for
clinical testing as a condition of approval in many markets. The electrical industry also revealed a
relatively high propensity to do R&D abroad.
Cantwell and Kotecha (1994) have analyzed the internationalization of the technological activity of
French corporations using US patents taken by leading enterprises. They find that the share of patents
originating overseas for French corporations has been lower compared to their European counterparts.
But it has also shown an increasing tendency, having risen from 8.19 per cent during 1969-72 to 15.87
per cent during 1987-90.
6
3. DETERMINANTS OF OVERSEAS R&D: THE LITERATURE
Lall (1979), Hewitt (1980), Hirschey and Caves (1981), and Pearce (1989) have analyzed the
determinants of interindustry variation in the propensity of US MNEs to do overseas R&D using
Benchmark Survey data (1966 in all the cases except for Pearce, who uses the 1982 survey). Overseas
R&D had a significant positive relationship with the extent of multinationality of industry. The R&D
intensity of industry also had a positive relationship with overseas R&D. It was explained in terms of a
higher pressure to locate R&D abroad on cost saving reasons in more R&D intensive industries. The
tendency of industry to use licensing as a means of exploiting their knowledge abroad was positively
related to the extent of overseas R&D. Lall also found some difference in the performance of
multinationality and R&D intensity variables across process and engineering industry subsamples. In
addition, Hirschey and Caves found the scale economies in R&D (captured by a proxy of efficient scale
of production units) discouraging overseas R&D. The tendency to centralize production for foreign
markets at a few overseas locations (captured by affiliate exports to other than the US) favoured
overseas R&D. The R&D expenditure per employee as a measure of relative cost of doing R&D in the
US was also positively related with the overseas R&D. The industries producing durable goods were
undertaking more overseas R&D because of the need to adapt their products to local conditions. In
addition, Hewitt found affiliate exports to US parents to have a positive influence on overseas R&D.
A number of firm level studies have analyzed the phenomenon of overseas R&D, as well. Mansfield,
Teece and Romeo (1979), in a study covering a sample of 55 US and middle Atlantic firms, found the
proportion of overseas R&D to be positively related to the proportion of subsidiary sales (as in the
industry level studies), negatively related to exports, and positively related to firm size (in view of
economies of scale involved in R&D). Drug industry firms revealed a higher propensity to locate R&D
abroad than other firms in order 'to avoid FDA regulations' in the US. Pearce (1989) analyzed the
determinants of overseas R&D performed by 122 leading MNEs in 1982. The overseas production
ratio had a positive relationship with overseas R&D, and exports a negative, as expected. The
relationship between overseas R&D and firm size was found to be an inverted-U shaped. Natural
resource based industries (viz. building materials, and paper and wood products) showed a lower
tendency to perform R&D overseas than other industries.
Zejan (1990) found R&D intensity of affiliates positively related with that of parent in a cross section
tobit model explaining the R&D intensity of foreign affiliates of Swedish MNEs. The host country
characteristics (viz. size of the market and per capita income as a proxy of level of development in the
7
host country and scientific resources available) were both found to have a positive and significant
influence on affiliate R&D. The affiliates exporting to markets other than Sweden revealed a greater
tendency to do R&D. Hakanson (1992) analyzed the determinants of distribution of foreign R&D
employment by 20 Swedish companies across 21 countries. The relative levels of foreign R&D across
sample companies were positively related with the extent of foreign employment and international
acquisitions of firmsas expected. The overall R&D employment by Swedish firms in a country was
found to be positively related with the size of the market, as measured by manufacturing employment.
Predictably, the R&D intensity of a country had a positive influence on R&D motivated to exploit
R&D resources of foreign countries. The size of market and the US dummy favoured local market-
oriented R&D. The size of market also favoured political and local production supporting R&D. The
six founding members of EC have attracted politically motivated and local production supporting
R&D. The index of psychic distance from Sweden was negatively related with all types of foreign
R&D except for the research resource oriented R&D.
Pearce and Singh (1992) analyzed the determinants of overseas subsidiary patent ratio ( share of US
patents attributable to the R&D units outside the home country) in 1981/83 for 432 leading firms. The
prominent explanatory variable was overseas production ratio with the predicted positive and
significant influence. Firm size and export ratio came up with mixed results often with poor levels of
statistical significance across subsamples. They also did not observe a systematic influence of country
or industry characteristics other than the firm level factors. Continental European firms revealed a
greater, and Japanese firms a lower, tendency to innovate abroad than their US counterparts holding
other things constant in tune with other literature.
Another strand of the literature has looked at the impact of the presence of MNEs on local R&D
activity in host countries. In a study covering 43 Indian manufacturing industries by Kumar (1991), the
MNE affiliates appeared to be spending a significantly lower proportion of their sales on R&D than
their local counterparts in univariate tests. But the statistical significance of these differences vanished
in a multivariate context and apparently was on account of extraneous factors. Veugelers and Vanden
Houte (1990) found a negative effect of the presence of MNEs on the innovative efforts of domestic
firms in Belgian manufacturing, especially if their products were less differentiated.
The existing literature, therefore, has brought out the factors explaining internationalization of R&D
activity. The internationalization of production, R&D intensity of industry and economies of scale in
R&D emerge as major factors explaining internationalization of R&D across industries. The intensity
8
of overseas production and firm size explain the extent of overseas R&D across firms. The limited
attention that has been paid to an analysis of locational factors brings out the importance of size of the
host country market and its level of development. A more detailed analysis of factors that make a
country more attractive as a potential location for R&D investments by MNEs remains to be made.
4. EXPLAINING THE LOCATION OF OVERSEAS R&D: THEORY AND HYPOTHESES
MNE decision making with respect to the location of R&D is determined by the balancing of factors
that encourage concentration at headquarters and those that favour location abroad. The economies of
scale in innovative activities (which are often considerable), agglomeration economies, and the risk of
dissipation of trade secrets tend to encourage concentration of R&D. A number of factors; such as the
need for product or process adaptations for specific markets, cost rationalizations and appropriation of
knowledge spillovers from technological activities of rival firms; may encourage overseas R&D.
The overseas R&D of firms may be motivated by one or more of the following three broad reasons.
The first and foremost reason is to support their foreign production by adaptations necessary for
specific markets. Some of these adaptations are best undertaken closer to the markets for which they
are meant; for instance, adaptations of consumer goods to the local cultural environment. The location
of this type of R&D investment will be influenced by the market orientation of foreign affiliates and the
size of local markets. The second motivation for overseas R&D could be to rationalise it according to
cost considerations. Availability of abundant trained R&D personnel or other resources required for
technological activities at relatively lower cost than in the home country may prompt MNEs to locate a
part of their R&D activity to such locations to reduce their global R&D costs. It may also include
rationalization of development of certain products and processes at an overseas R&D unit in view of
economies of scope or scale. The location of this type of R&D would be explained by the relative
abundance and cost of technological resources. Astra's major biotechnology research centre set up in
India in the late 1980s, for instance, has been primarily designed to tap abundant trained manpower
available at low cost. Finally, MNEs also locate R&D in other countries advanced in their own fields to
benefit from the knowledge spillovers or to simply keep track of the activities of their competitors. The
examples of this type of R&D include investment in R&D or in high technology start up enterprises in
biotechnologies and microelectronics in the US by European and Japanese enterprises, the US chemical
enterprises investing in R&D in Germany, and European and US companies investing in semiconductor
development in Japan. Dunning (1988) argued that US MNEs were likely to invest heavily abroad in
R&D in the sectors where they were confronted with major international rivals whose home countries
9
were sources of innovative activity. These R&D investments would be directed toward the most
technologically advanced countries in the world.
4.1 Hypotheses
The location of the R&D activities of a corporation which has decided to internationalize its R&D
could be influenced by several factors. In what follows a few major factors determining the location of
R&D by MNEs, especially those from the US, are identified with predictions on their likely role. These
factors include the scale and type of foreign direct investment in the country, availability of resources
and conditions conducive for innovative activities in potential host countries in terms of their structural
characteristics and the policy environment. The empirical verification of the predictions is made in the
following section.
Scale and Nature of Local Production
a) Scale of Direct Investment in the Host Countries
The industry and firm level studies, as reviewed above, have generally reported a significant linear
relationship between overseas R&D and overseas production ratio. The extent of R&D performed by
MNEs in a host country may also be related to the extent of their market penetration in it. This is
because the extent of penetration of FDI in an economy reflects the relative attractiveness of the host
economy for doing business in terms of policy environment and availability of infrastructure. It can be
expected that countries that are attractive for US FDI are also relatively more attractive locations for
doing R&D. Therefore, a positive relationship is predicted between overseas R&D and the extent of
US MNE participation (USSALES) in an economy.
b) Market Size
In view of economies of scale involved in research, the size of the host country market may exercise an
important influence on the decision to set up an R&D unit to assist local production. Regional R&D
units are often set up closer to the major markets for the firms. Hence, affiliates operating in countries
with larger markets should have better chance of hosting a R&D unit, holding other factors constant.
Market size has been found by Zejan (1990) and Hakanson (1992) to be an important determinant of
location of R&D for Swedish corporations. The market size (MSIZE), as captured by the national
income of a country, is thus expected to add to the attractiveness of a country as a location for
overseas R&D.
10
c) Technology Intensity of Local Operations
More technology intensive affiliates generally need more technological inputs than others. Hence,
countries hosting technology intensive affiliates are more likely also to be hosting R&D establishments
of MNEs, other things held constant. Technology intensity of affiliates (TECHINT) is proxied by the
significance of technology payments by affiliates.
d) Market Orientation of Local Production
The market orientation of affiliates may have implications for the relative need for doing local R&D.
An affiliate serving entirely the local market may have different demand for technological inputs than
one having a global product mandate from the parent. Production for local markets may require
adaptations and hence need for local R&D. An affiliate exporting to the US parent may be producing
to the given designs and may not require significant R&D inputs. The capability for adaptations may
also be required to support the affiliates exporting to regional or (non-US) global markets. Hirschey
and Caves (1981) found the exporting to non-US markets to be an important influence on overseas
R&D in industry level studies. Therefore, the affiliate R&D intensity in a country is expected to be
positively related with the proportion of local (host country) sales (LOCASAL) and that of non-US
exports (NUSEXP) but not with exports to US (USEXP).
Host Country Resources
e) Technological Resources and Infrastructure
A considerable proportion of overseas R&D activity of MNEs is geared toward internalizing
knowledge spillovers from ongoing research in a host country and toward benefiting from the
technological infrastructure and resources available there. A high concentration of overseas R&D in a
few technologically advanced countries lends support to this expectation. If that were so, countries
with greater technological effort will have greater likelihood of attracting R&D activity of foreign
MNEs, other things held constant. The technological resources and infrastructure of countries will be
captured with the help of three measures reflecting the scale and environment conducive for
technological activities namely, the share of national resources devoted to R&D activity (RDGNP),
proportion of residents in patent grants (RESPAT), and a measure of attainment of higher education
(HED). The latter captures the availability of R&D personnel.
f) Supply of Low Cost Personnel
A considerable proportion of overseas R&D could be motivated by the push for cost reduction and
hence rationalized to locations having a low cost supply of S&T personnel. Hence, other things being
11
same, countries with a low cost supply of R&D personnel are likely to attract more overseas R&D
activity of MNEs than others. In the absence of data on wage costs of R&D personnel in different
sample countries, we employ two variables to capture the possible effect of this factor; the average
wages rates (WAGE), and R&D expenditure per R&D worker by affiliates of US MNEs (RDEXEMP)
in different countries. Both of these measures have obvious limitations in capturing the effect of the
factor under discussion. These limitations have to be kept in mind while interpreting the findings.
g) Communications Infrastructure
R&D activity requires a constant interaction with different production and research units within a
corporation at different locations. Hence, availability of adequate communication infrastructure may be
a minimum requirement for a country to be able to attract investment in R&D by MNEs. The
relationship between availability of communication infrastructure and the extent of overseas R&D
activity, however, need not be linear and continuous, but only a necessary condition. Nevertheless, an
indicator of telecommunication infrastructure in the country (PHONES) would be included among the
potential factors explaining the location of overseas R&D.
Policy Environment in the Host Country
h) Intellectual Property Protection
There has been a considerable controversy on the role of intellectual property protection in influencing
the FDI inflows to a country in the literature (see e.g., Frischtak, 1989; Ferrantino, 1993; Mansfield,
1994). The issue of intellectual property protection links more directly with R&D activity. MNEs may
be apprehensive to locate their key R&D centres in countries with weak intellectual property regimes.
Therefore, the relative strength of intellectual property protection available in a country may be a factor
in determining the overseas R&D activity by MNEs. If, on the other hand, overseas R&D is directed to
local adaptations and providing other support to local production of MNE, and not directed to new
product development, intellectual property regimes may not be of much consequence for its location.
Therefore, the effect of intellectual property protection on location of R&D may depend on the type of
R&D that is conducted.
The empirical examination of its role is complicated by the fact that the level of intellectual property
protection offered by different countries varies across different products. Therefore, unless the R&D
activity of foreign affiliates in the country is broken down according to products or industries and
nature of R&D activity, a rigorous examination of its role can not be made. The data for this level of
disaggregation, however, is not reported. We attempt a two step process wherein the importance of
12
intellectual property protection in determining R&D by US affiliates is first examined at the country
level using an index of overall strength of patent protection (IPP). This index measures the strength of
patent protection on a six point scale constructed by Rapp and Rozek (1990) based upon conformity of
each nation's patent laws to the minimum standards proposed by the US Chamber of Commerce. Being
based on subjective assessment of individuals, such an index has its own limitations. The inferences
drawn on the basis of it should be treated with caution and be taken as indicative rather than definitive.
Since the nature of overseas R&D conducted by MNEs in technologically advanced nations and
developing countries could be different, the role of IPP is examined for subsamples of countries as
well.
The second step involves a verification of the role of IPP in location of R&D for two process industry
groups, viz. processed foods and chemicals (also covering pharmaceutical). A number of countries do
not provide for product patents in one or both of these industries. The information on whether or not
patent protection on products is provided is used to examine their role in determining R&D location.
i) Trade Policies
The role of trade policy regime of host countries in influencing the R&D intensity of MNEs is also less
straight forward. An economy protecting intermediate products and capital goods may create greater
demand for technological inputs by increasing the need for indigenization. On the other hand, a
restrictive trade regime may discourage MNEs from undertaking R&D activity in the economy because
of perceived difficulties in importing equipment, personnel, components and other inputs for R&D and
other handicaps of a restrictive atmosphere. Hence, TRBARR, a variable capturing both tariff and non-
tariff barriers on intermediate and capital goods is included among potential explanatory variables
without a prediction of the direction of impact.
j) Host Country Performance Requirements
The role of different restrictions imposed by the host governments on the conduct of foreign affiliates,
more generally called Trade Related Investment Measures (TRIMs), has been debated in recent years
in connection with the recently concluded multilateral trade negotiations (see Guisinger et al., 1985).
One set of performance requirements that may have a bearing on R&D intensity of foreign affiliates is
the requirement to transfer technology (TTREQ) to the host country.
13
5. EMPIRICAL ANALYSIS
In light of the above predictions, the R&D intensity of majority owned US affiliates (AFRDSjt) in jth
country in tth time is expected to be a function of the following variables.
AFRDSjt = AFRDSjt (USSALESjt, MSIZEjt, TECHINTjt, LOCASALjt, NUSEXPjt, USEXPjt,
RDGNPjt, RESPATjt, HEDjt, WAGEjt, RDCOSTjt, PHONESjt, IPPjt, TRBARRjt, TTREQjt, ujt)
where u represents unspecified and random influences.
j = 1..........nth country;
t = 1977, 1982, 1989.
An empirical test of these predictions is conducted with the help of the Benchmark Survey data on
Direct Investments Abroad conducted by the US Department of Commerce. These surveys provide
information on expenditure on R&D by majority owned affiliates of US enterprises in different host
countries in the industrialised and developing countries. The country coverage in the Surveys extend to
54 countries which are significant hosts of US FDI. The R&D information on a considerable number of
countries, however, is suppressed either for confidentiality or other reasons. The data from the 1977,
1982 and 1989 benchmark surveys are pooled to allow examination of overtime trends in addition to
increasing the degrees of freedom available. Annex 1 provides more details of the data set and
measurements and sources of variables. The effect of time dimension will be detected by including
dummy variables for 1977 and 1989 and using 1982 as a benchmark.
A number of our variables have high collinearities among themselves (especially the alternative
measurements of technology resources factor). That implies that all the variables can not be tried
together. Hence a number of alternative combinations are tried and reported. As is clear from the
variable measurements given in Annex 1, all the variables have been normalized except for MSIZE.
MSIZE is transformed into natural logarithms to suppress the scale of variation. Nevertheless,
heteroscedasticity could be a problem in a sample comprising a heterogeneous mix of countries such as
this. In the situations where the precise form of heteroscedasticity is unknown as is generally the case,
use of neither ordinary least squares nor of generalised least squares is appropriate (Greene, 1993).
However, it is possible to correct the covariance matrix for the ordinary least squares using White's
consistent estimator. Greene provides a ready procedure for OLS estimation with revised covariance
matrix in his LIMDEP econometric software (see Greene, 1991). We use this procedure for correcting
for the potential heteroscedasticity in the present exercise. First the results for the overall sample are
14
presented. Later findings pertaining to the subsamples of industrialised and developing countries are
discussed which reveal a considerable variation in the performance of variables.
5.1. Full Sample
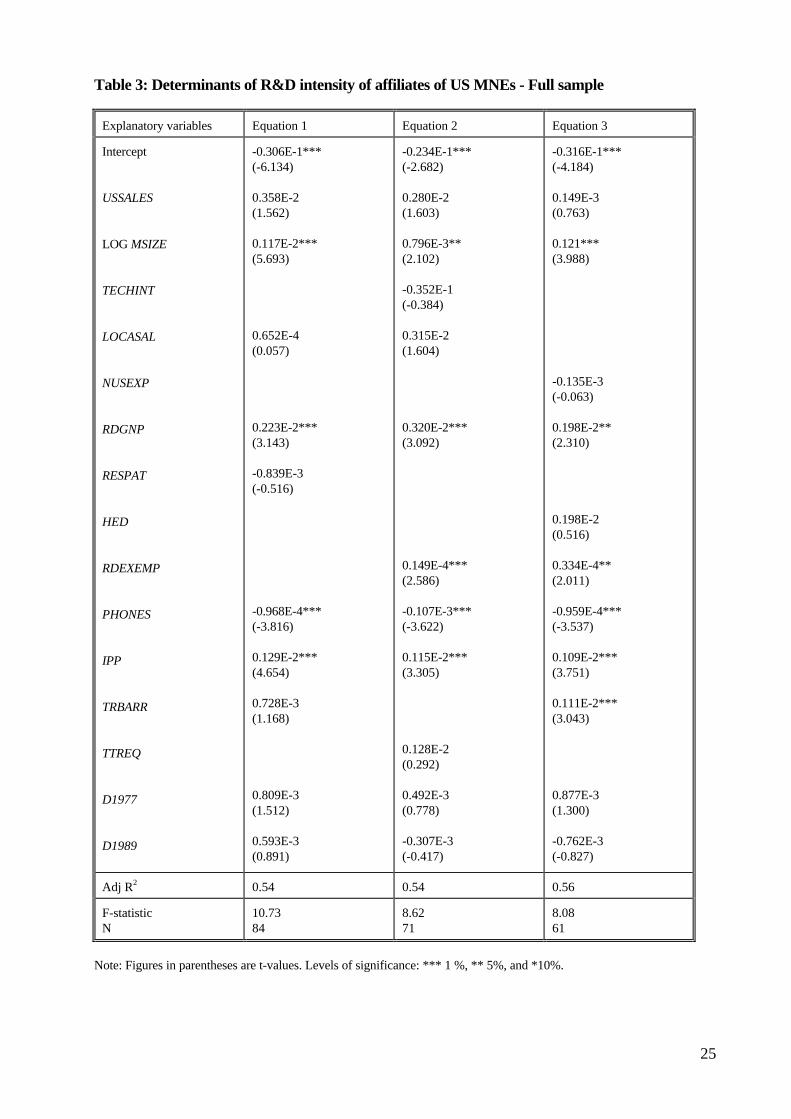
Table 3 presents the estimated equations for the full sample. The US penetration in the host country
market as captured by USSALES has a predicted positive sign throughout but generally falls short of
acceptable levels of statistical significance in terms of t-test. It would appear from this that a higher
degree of penetration of US investments in the country does not necessarily make it a more attractive
location for R&D.
MSIZE turns out to be a significant determinant of affiliate R&D with a predicted positive sign. MNE
affiliates operating in countries with larger markets are more likely to have their operations supported
by local R&D, other things held constant.
Technology intensity of local production captured by TECHINT has a negative coefficient that is not
significantly different from zero in statistical terms. It appears that the decision pertaining to R&D
location, being a part of global decision making of the organization, is taken independently of the
technological requirements of a particular affiliate or operation. Being a host to technology intensive
manufacture does not seem to ensure a proportionately greater attraction as an R&D location.
The market orientation of US FDI in the country was expected to have some influence on the R&D
activity of affiliates. The proportion of local sales (LOCASAL) has an expected positive sign and just
misses a 10 per cent level of statistical significance. The intensity in exports to third countries
(NUSEXP) has a negative sign and very poor t-values. The intensity of exports to the US (USEXP) to
comes up with a similar result (not included in the reported equations. It appears that export oriented
affiliates produce largely to the designs supplied to them by parent. Hence, R&D facilities for
supporting them are not necessary. The affiliates producing for local market are more likely to have a
R&D laboratory to support them in product and sometimes process adaptations according to local
conditions or specifications, holding other things constant.
RDGNP, one of the variables tried to capture aspects of technological resources and infrastructure
available in the country, is generally significant with a positive sign at 1 per cent level in most
combinations. It tends to support the prediction that a considerable proportion of overseas R&D of
MNEs is motivated to benefit from technological environment and resources in other countries. Hence,
15
countries with more developed technological resources are more likely to attract overseas R&D of
MNEs, other things held constant. The others viz. RESPAT and HED do not achieve statistical
significance.
Among the two variables employed to capture the cost of personnel, WAGE which measures average
industrial wages prevailing in the country, performs very poorly in terms of t-values and was dropped
from the reported equations. It had an obvious limitation as an indicator of relative levels of
remuneration of R&D employees. The other variable RDEXEMP, measuring R&D expenditure per
R&D employee comes up with a positive and significant coefficient. This would tend to imply that
internationalization of R&D in general is not driven by cost saving considerations. Given the limitations
of measurement, however, one is wary of drawing that inference. This variable measures research costs
and salaries per R&D employee. It in not possible to infer from the performance of this variable
anything meaningful about the role of wage rates of R&D personnel in explaining location unless
nonwage R&D costs are held constant across observations. That is obviously not the case as research
costs are affected from industry composition, the nature of R&D, as well as the location. Therefore,
further work is necessary before a judgement could be made on the role of availability of cheap trained
manpower on location of R&D by MNEs.
PHONES is consistently significant with a negative sign which appears to be counterintuitive. Although
a linear functional relationship is not expected between telecommunication infrastructure and location
of R&D it being a necessary and not a sufficient condition, its negative sign is quite surprising.
PHONES appears to be picking up other influences. In any case, given the high and quite comparable
levels of telecommunication infrastructure in the industrialised countries, it may be a relevant factor
only in the case of developing countries. Hence, a comment on its performance is reserved till its
performance in subsamples has been observed.
Among the policy factors, IPP comes up with a positive and significant coefficient consistently. It
would appear to suggest that a strong intellectual property regime is an important condition for
attracting R&D activity of MNEs. The role of IPP is subject to further tests in the following
subsections and hence is reserved for a comment later.
TRBARR is with a positive coefficient and achieves statistical significant in some combinations such as
equation 3. It tends to suggest that protection of intermediate and capital goods industries may attract
more R&D investments than others keeping other things same. The possible explanation for this
16
outcome is that barriers on imports of capital and intermediate goods encourage MNE affiliates to
undertake product and process adaptations locally by making imported alternatives more expensive.
TTREQ has a positive sign but is not statistically significant. The performance requirements for transfer
of technology do not, therefore, appear to be important in influencing the pattern of R&D location.
The time dummies are generally insignificant; 1977 with a positive sign and 1989 with a negative sign.
It tends to signify a decline in internationalization of R&D by US MNEs since 1977 as was noted in
section 2 above.
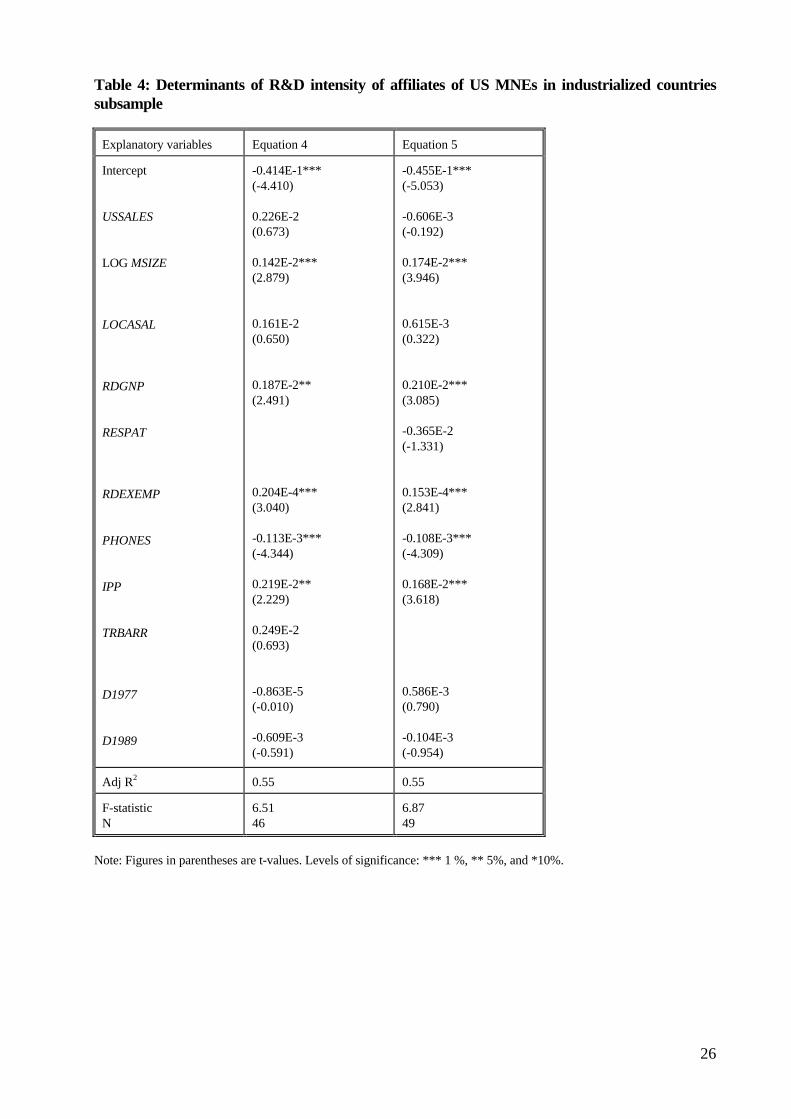
5.2. Level of Development and Overseas R&D
In the second stage of analysis, subsamples of industrialised and developing countries were separated
and same model was estimated for subsamples. The results for industrialised countries subsample
summarised in Table 4 echo the full sample findings. Hence, we do not repeat their explanations. The
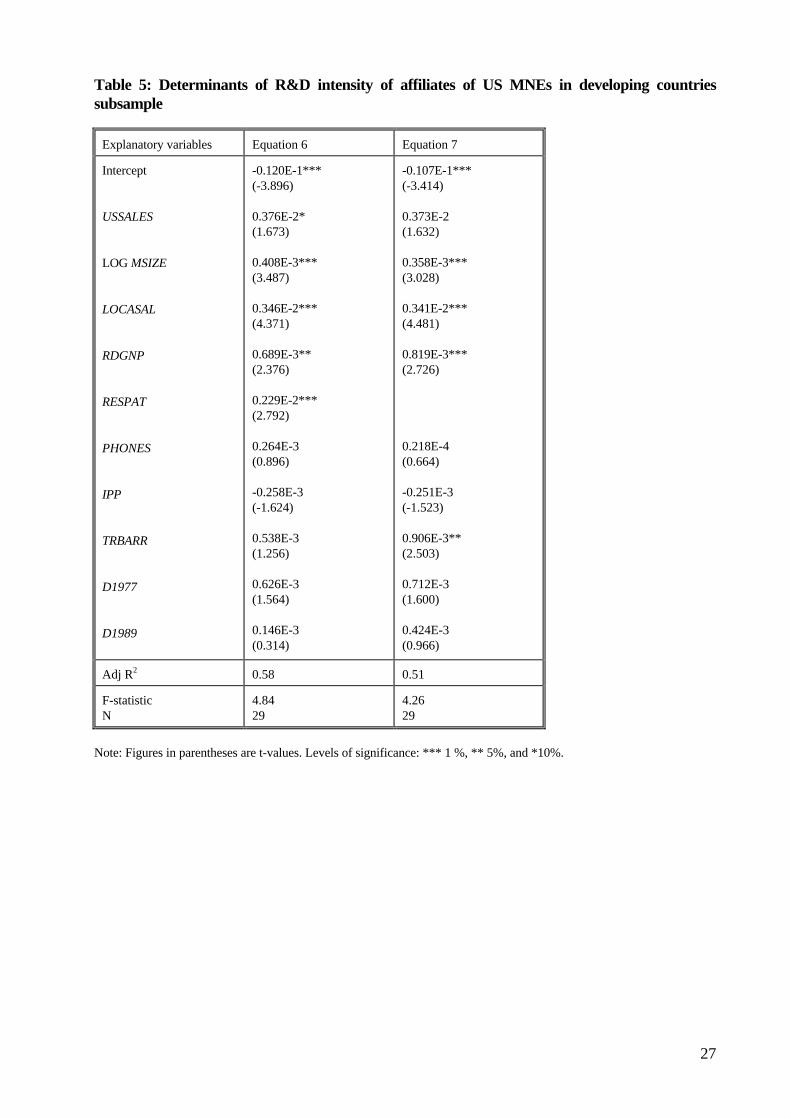
relationships for the developing country subsample reported in Table 5 look quite different from those
of full or industrialised country samples in a number of respects and hence warrant comment.
The scale of US FDI in developing countries represented by USSALES has a positive coefficient as
earlier but manages to cross the threshold of t-value for a 10 per cent level of statistical significance.
Therefore, developing countries with a higher extent of US FDI have a slightly better chance of
receiving R&D investments in affiliates, other things remaining the same. MSIZE retains its positive
and highly significant coefficient indicating the importance of market size for R&D activity presumably
because of economies of scale involved in R&D irrespective of level of development. LOCASAL
imparts a strong positive influence on affiliate R&D for this sample unlike the previous two. Affiliate
exports intensity whether or not to US has a converse relationship (not reported in the Table). It
appears that affiliate R&D in developing countries whenever undertaken is geared towards adaptations
for the local markets. Developing countries are unlikely to be used as location for technology
development for global markets.
RDGNP is positive and significant as earlier, suggesting that other things being same, developing
countries with higher scale of technological activity have a greater chance of being chosen as bases for
R&D activity by MNEs. RESPAT which was never significantly different from zero in earlier samples,
turns up with a strong positive coefficient. The share of residents in total patent granted in a country
that this variable represents is a measure of national technological capability. Therefore, this
relationship suggests that developing countries with higher technological capability are more likely to
17
be chosen as bases for R&D of MNEs. This finding tends to reinforce the expectation that a potential
motive of internationalization of R&D of MNEs is to internalize the spillovers of national R&D
systems in the host countries. PHONES comes up with a predicted positive sign unlike the previous
samples. The statistical significance is marred by its high collinearity with IPP. Though it has poor t-
values in the equations reported in the table, it does achieve a 10 per cent level of statistical significance
in some combinations not reported here. Unlike their industrialised counterparts, developing countries
differ greatly among themselves in terms of the availability of telecommunication infrastructure. Other
things being same, countries equipped with reasonable levels of such infrastructure appear more likely
choices for R&D investments by MNEs.
IPP unlike in the previous samples has a negative sign in the present sample and just misses a 10 per
cent level of significance. It is an interesting result and suggests that among developing countries, level
of intellectual property protection does not appear to be a prerequisite for R&D investments by MNEs.
If at all, a strong regime may discourage MNEs to do R&D in the country! One possible explanation of
this result could be that MNEs do some local R&D in countries with weak patent regimes to safeguard
their intellectual property by registration of adaptations as local innovations. The developing countries
with weak patent regimes are generally those with significant imitative capabilities. While intellectual
property protection is generally weak, local innovations which may often be marginal adaptations of
foreign innovations, are better protected than the foreign innovations as a part of the national policies
to encourage local technological capability. In the countries with strong patent regimes such response
on the part of MNEs would not be necessary.
An alternative and perhaps more plausible explanation could be provided by the divergence in the
performance of IPP in developing and industrialised country subsamples. A strong positive influence in
the case of industrialised countries and an insignificant negative influence for developing countries may
in fact be reflecting the different nature of R&D activity performed by MNE affiliates in the two groups
of countries. It is possible that overseas R&D located in industrially and technologically advanced
countries is of more creative type or product or process development oriented and may be more
responsive to availability of adequate intellectual property protection. The examples of this type could
include the development of Ford Mondeo in Europe for production and sales worldwide by Ford's
Belgian subsidiary, or biotechnology research by German chemical and pharmaceutical MNEs in the
US to benefit from spillovers from other R&D in the field in the country (Wortman, 1990). On the
other hand R&D based in developing countries may be geared more to adaptations for the local or
regional markets. These adaptations may not be affected much by the availability or otherwise of patent
18
protection. Note in this context that LOCASAL as a determinant of overseas R&D is significant only
for the developing country subsample and not for industrialised countries. That may indicate that R&D
performed in developing countries is more local production oriented than that conducted in
industrialised countries and hence is not sensitive to the level of intellectual property protection.
However, one may not read too much from these results in view of the limitations of measurement.
TRBARR, like earlier, comes up with a positive and significant influence on affiliate R&D intensity. It is
consistent with the explanation of LOCASAL. In developing countries the bulk of the R&D activity is
geared towards adaptations for the local market. The requirement for such adaptations may be
particularly higher in economies with high trade barriers because of imported alternatives being more
expensive. The year dummies are with positive sign but are not significantly different from zero.
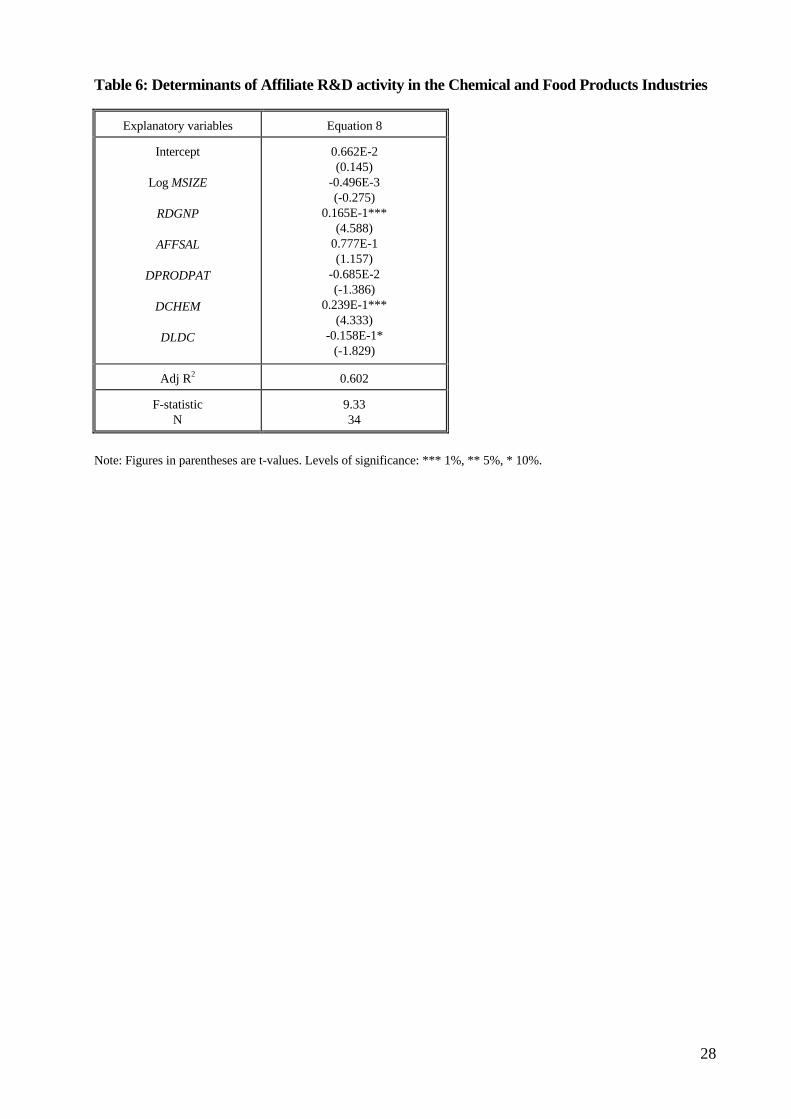
5.3. Product Patents and Overseas R&D in Food and Chemical Industries
A further test of the role of the intellectual property regime in influencing the location of overseas R&D
activity of MNEs is conducted for chemical and food products industries. The Benchmark Surveys do
not provide the break up of affiliate R&D expenditure in different host countries by the industries of
affiliate. However, the R&D employment in the affiliates is given for 7 broad manufacturing groups.
Thus it is possible to construct the share of R&D employment as a proportion of total employment of
affiliates in respective industries in different host countries. Processed foods and chemical (covering
pharmaceutical) industries are picked up from the broad industries available. The level of patent
protection varies across countries for food and chemical industries as a number of countries with soft
intellectual property regimes do no provide product patents in these industries. The observations are
pooled across the two industries for the 1989 Benchmark Survey. It is not possible to extend this
analysis to cover earlier years because of unavailability of certain variables. The exact model estimated
is as follows:
AFRDEMPij = AFRDEMPij (MSIZEj, RDGNPj, AFFSALij, DPRODPATij, DCHEMij,
DLDCj , uij)
where AFRDEMPij is share of R&D employees in total employment of affiliate in ith
industry and jth country;
AFFSALij is share of total affiliate sales in jth country accounted for by ith
industry;
DPRODPATij is dummy for availability of product patents for products of ith
industry in jth country;
DCHEMij is a dummy variable for chemical industry observations;
19
DLDCj is a dummy variable for developing country.
uij represents unspecified and random influences.
i = chemical or food industry.
j = 1......n host countries.
The estimated version of the above equation is presented in Table 6. The technological resources and
infrastructure variable RDGNP continues to be significant with positive sign. MSIZE representing
market size in terms of overall national income is not significantly different from zero. Perhaps the
national income does not capture the size of the market for the respective industries as the composition
of industrial value added indeed varies widely across nations. The importance of the industry for US
operations in the country captured by AFSALij has a positive sign but does not achieve statistical
significance. It suggests that the importance of the ith industry for operations of US affiliates in a
particular country is not related to its importance as R&D location. This observation corroborates the
inference drawn earlier about MNEs being more selective about R&D locations than for production
locations.
DPRODPATij turns up with a negative coefficient which is not significantly different from zero. This
outcome in a sample comprising both industrialised and developing countries for intellectual property
protection sensitive chemical and food industries is interesting. It suggest that the level of patent
protection has no significant influence on decision making of MNEs regarding location of their
overseas R&D in chemical and food industries. This finding considerably weakens the argument that a
strong patent regime is a prerequisite for innovation and thus for attracting R&D activity of MNEs. It
appears that the other factors such as availability of R&D infrastructure and environment are more
important in influencing the decision making of MNEs with respect of R&D location than the
intellectual property regime. The lack of product patents does not seem to be a particularly significant
constraint for MNEs to set up an R&D laboratory in a particular country. In any case MNEs may
register patents in their home countries or elsewhere as they would do in any case. There are examples
of R&D facilities set up by affiliates of chemical, pharmaceutical and food MNEs such as Ciba,
Hoechst, ICI, Unilever, Cadbury, and Astra in India which does not provide product patents in their
branches of manufacture. Furthermore, findings reported in earlier sections suggested that the bulk of
the overseas R&D especially in developing countries is directed to support local production and is
presumably of adaptive type. If that is the case, the availability of product patents may not matter much
for influencing the location of overseas R&D.
20
The strong positive coefficient of DCHEM signifies that chemical industry affiliates are more R&D
intensive than their food industry counterparts. In general chemical industry is more research intensive
than the food industry. This result suggests that chemical industry MNEs also undertake more overseas
R&D than their food industry counterparts. Mansfield et al. (1979) had noted a higher propensity of
drug firms to locate R&D abroad to avoid FDA regulations. DLDC has a significant negative
coefficient indicating that a much less proportion of overseas R&D is performed in developing
countries even after holding other factors constant.
21
6. CONCLUDING REMARKS
This paper has examined the determinants of location of overseas R&D activity by US MNEs in an
analytical framework developed to take into account the influences of the nature and extent of FDI and
host country resources and policy regimes. The major empirical findings of the analysis are
recapitulated here. A larger penetration of FDI in a country, in general, does not appear to improve its
attractiveness as a potential host for R&D investment by MNEs. Among the developing countries,
however, FDI penetration appears to improve their chances to attract R&D investments, other things
held constant. The countries hosting high technology productive investments of MNEs are also not
necessarily important hosts of their R&D investments. The countries with larger domestic markets are
more likely to receive R&D investments from MNEs holding other things constant. The affiliates
producing for export markets, whether to the home country or to other countries, appear to produce
according to given designs and drawings and are unlikely to undertake local R&D. Affiliates producing
for the local markets, especially in developing countries, on the other hand, are more likely to have a
R&D laboratory supporting them. The need for adaptations for specific local markets appears to be a
major motivation for overseas R&D, especially in developing countries.
The technological resources and infrastructure available in the country exercise a strong influence on
the probability of attracting R&D investments from MNEs. In addition, in developing countries the
local technological capability also plays an important role in attracting MNE investments in R&D. It
would appear from this finding that another major motivation of overseas R&D investments is to utilize
technological resources available in different countries and to internalize the spillovers from R&D done
by national firms. The barriers on import of capital and intermediate goods especially in developing
countries creates greater demand for technological inputs by subsidiaries by making imported
alternatives relatively more expensive and hence increases probability of undertaking local R&D for
adaptations.
The overall strength of intellectual property regime of the country favourably affects the probability of
attracting R&D investments of MNEs only in full and industrialised country samples. For developing
countries, strength of intellectual property protection does not appear to be a condition for R&D
investments. It appears that the type of R&D that is undertaken in developing countries is not sensitive
to the relative strength of patent protection offered by them. The R&D based in industrialised countries
may be more creative or new development oriented, hence demanding stronger intellectual property
regimes. These inferences should, however, be read with caution and treated as tentative in view of
22
limitations of measurement. A more direct test for food and chemical industries covering both
industrialised and developing countries did not bring out a significant role of intellectual property
protection in influencing the location of R&D by MNEs. Apparently, there are types of R&D
operations which may be quite sensitive to the strength of property rights. But there are others which
are not so much affected by the availability of product patents or strong patent regimes. MNEs, in any
case, are better placed than national firms to obviate constraints placed by weak intellectual property
regimes of their host governments on their technological activities by registering the patents in their
home countries. How else could one explain the setting up of biotechnology research centres by
pharmaceutical MNEs such as Astra in such countries having no product patents for pharmaceutical
products as India?
MNEs from different home countries have revealed different propensities to internationalize their R&D
activity as seen in Section 2. US MNEs have a lower tendency to internationalize their R&D than
European MNEs and higher tendency than Japanese MNEs, for instance. While there are no a priori
reasons to expect a different performance of the above variables in explaining the location of overseas
R&D by MNEs from other countries, there may be a few additional factors operating in specific cases.
Let us now conclude the paper with a few remarks on the policy implications for developing countries
aspiring to host R&D investments of MNEs. The R&D investments of MNEs are highly dependent
upon the country's ability to provide necessary technological resources and local technological
capability. These conditions have to be created before R&D investments from MNEs can take place.
Seen this way, MNEs tend to widen the gap between technologically richer and technologically poorer
nations by concentrating their R&D investments in the countries already ahead in this respect. The
intellectual property protection regime as such may not affect the flow of investments in R&D
significantly but may affect the nature or direction of R&D activity conducted. The liberalization of
either FDI or trade regime may not be of much consequence as far as inflows of R&D investments
from MNEs are concerned. Finally, in so far as market size is an important determinant of location of
R&D, membership in a regional trading block may increase a country's attractiveness as a host to R&D
investments by extending the effective market size beyond national territories.
23
Table 1: Overseas Research and Development by United States Corporations(millions of dollars)
1966 1977 1982 1989
Group R&D Expenditure
R&D Expenditure Parents
R&D Expenditure Majority ownednon-bank affiliates
Major Destinations of Affiliate R&D
Canada
Belgium
France
Germany
Italy
Netherlands
United Kingdom
EC
Japan
Australia
Industrialised countries
Argentina
Brazil
Mexico
Hong Kong
Singapore
Taiwan
Israel
Developing countries
8976
8386
590(6.57)1
163(27.63)2
17(2.88)52(8.81)123(20.85)14(2.37)9(1.53)133(22.54)215(36.44)3(0.51)21(3.56)560(94.92)6(1.02)4(0.68)5(0.85)NA
NA
NA
NA
29(4.92)3
21028
18953
2075(9.87)1
255(12.29)92(4.43)291(14.02)462(22.27)85(4.10)55(2.65)393(18.94)1395(67.23)36(1.73)93(4.48)1916(92.34)16(0.77)55(2.65)19(0.92)D
D
1(0.05)4(0.19)159(7.66)
60171
56320
3851(6.40)1
505(13.11)223(5.79)332(8.62)1079(28.02)150(3.90)65(1.69)824(21.40)2729(70.86)112(2.91)114(2.96)3650(94.78)20(0.52)97(2.52)30(0.78)D
D
5(0.13)11(0.29)202(5.25)
90149
82227
7922(8.79)1
975(12.31)313(3.95)521(6.58)1726(21.79)393(4.96)367(4.63)1718(21.69)5346(67.48)1000(12.62)190(2.40)7516(94.88)10(0.13)92(1.16)37(0.47)12(0.15)24(0.30)24(0.30)29(0.37)406(5.12)
Sources: Computed from U.S. Department of Commerce, 1975, 1981, 1985, 1992."D" indicates that the data in the cell have been suppressed because of confidentiality requirements.1 Numbers in parentheses are percentages of group R&D expenditure.2 Following numbers in parentheses are percentages of R&D expenditure by majority-owned, non-bank affiliates3 Percentages of developing and developed countries in 1966 don't add up to 100 because of round off errors.
24
Table 2: Overseas Research and Development Expenditure by Japanese Corporations(millions of yen)
4th survey1989-1990
5th survey1992-1993
R&D Expenditure by parents
R&D Expenditure by affiliates
Regional Distribution of Affiliate R&D
North America
Europe
Asia
Latin America
Oceania
4430036
64646(1.44)1
42527(65.78)2
13750(21.27)5844(9.04)436(0.67)2037(3.15)
54444000
139900(2.51)
62340(44.56)68900(49.25)6880(4.92)400(0.28)1350(0.96)
Sources: Computed from Japan, MITI (1991, 1994)1 Numbers in parentheses are percentages of group R&D expenditures.2 Numbers in parentheses are percentages of R&D expenditures by affiliates.
25
Table 3: Determinants of R&D intensity of affiliates of US MNEs - Full sample
Explanatory variables Equation 1 Equation 2 Equation 3
Intercept
USSALES
LOG MSIZE
TECHINT
LOCASAL
NUSEXP
RDGNP
RESPAT
HED
RDEXEMP
PHONES
IPP
TRBARR
TTREQ
D1977
D1989
-0.306E-1***(-6.134)
0.358E-2(1.562)
0.117E-2***(5.693)
0.652E-4(0.057)
0.223E-2***(3.143)
-0.839E-3(-0.516)
-0.968E-4***(-3.816)
0.129E-2***(4.654)
0.728E-3(1.168)
0.809E-3(1.512)
0.593E-3(0.891)
-0.234E-1***(-2.682)
0.280E-2(1.603)
0.796E-3**(2.102)
-0.352E-1(-0.384)
0.315E-2(1.604)
0.320E-2***(3.092)
0.149E-4***(2.586)
-0.107E-3***(-3.622)
0.115E-2***(3.305)
0.128E-2(0.292)
0.492E-3(0.778)
-0.307E-3(-0.417)
-0.316E-1***(-4.184)
0.149E-3(0.763)
0.121***(3.988)
-0.135E-3(-0.063)
0.198E-2**(2.310)
0.198E-2(0.516)
0.334E-4**(2.011)
-0.959E-4***(-3.537)
0.109E-2***(3.751)
0.111E-2***(3.043)
0.877E-3(1.300)
-0.762E-3(-0.827)
Adj R2 0.54 0.54 0.56
F-statisticN
10.7384
8.6271
8.0861
Note: Figures in parentheses are t-values. Levels of significance: *** 1 %, ** 5%, and *10%.
26
Table 4: Determinants of R&D intensity of affiliates of US MNEs in industrialized countriessubsample
Explanatory variables Equation 4 Equation 5
Intercept
USSALES
LOG MSIZE
LOCASAL
RDGNP
RESPAT
RDEXEMP
PHONES
IPP
TRBARR
D1977
D1989
-0.414E-1***(-4.410)
0.226E-2(0.673)
0.142E-2***(2.879)
0.161E-2(0.650)
0.187E-2**(2.491)
0.204E-4***(3.040)
-0.113E-3***(-4.344)
0.219E-2**(2.229)
0.249E-2(0.693)
-0.863E-5(-0.010)
-0.609E-3(-0.591)
-0.455E-1***(-5.053)
-0.606E-3(-0.192)
0.174E-2***(3.946)
0.615E-3(0.322)
0.210E-2***(3.085)
-0.365E-2(-1.331)
0.153E-4***(2.841)
-0.108E-3***(-4.309)
0.168E-2***(3.618)
0.586E-3(0.790)
-0.104E-3(-0.954)
Adj R2 0.55 0.55
F-statisticN
6.5146
6.8749
Note: Figures in parentheses are t-values. Levels of significance: *** 1 %, ** 5%, and *10%.
27
Table 5: Determinants of R&D intensity of affiliates of US MNEs in developing countriessubsample
Explanatory variables Equation 6 Equation 7
Intercept
USSALES
LOG MSIZE
LOCASAL
RDGNP
RESPAT
PHONES
IPP
TRBARR
D1977
D1989
-0.120E-1***(-3.896)
0.376E-2*(1.673)
0.408E-3***(3.487)
0.346E-2***(4.371)
0.689E-3**(2.376)
0.229E-2***(2.792)
0.264E-3(0.896)
-0.258E-3(-1.624)
0.538E-3(1.256)
0.626E-3(1.564)
0.146E-3(0.314)
-0.107E-1***(-3.414)
0.373E-2(1.632)
0.358E-3***(3.028)
0.341E-2***(4.481)
0.819E-3***(2.726)
0.218E-4(0.664)
-0.251E-3(-1.523)
0.906E-3**(2.503)
0.712E-3(1.600)
0.424E-3(0.966)
Adj R2 0.58 0.51
F-statisticN
4.8429
4.2629
Note: Figures in parentheses are t-values. Levels of significance: *** 1 %, ** 5%, and *10%.
28
Table 6: Determinants of Affiliate R&D activity in the Chemical and Food Products Industries
Explanatory variables Equation 8
Intercept
Log MSIZE
RDGNP
AFFSAL
DPRODPAT
DCHEM
DLDC
0.662E-2(0.145)
-0.496E-3(-0.275)
0.165E-1***(4.588)
0.777E-1(1.157)
-0.685E-2(-1.386)
0.239E-1***(4.333)
-0.158E-1*(-1.829)
Adj R2 0.602
F-statisticN
9.3334
Note: Figures in parentheses are t-values. Levels of significance: *** 1%, ** 5%, * 10%.
29
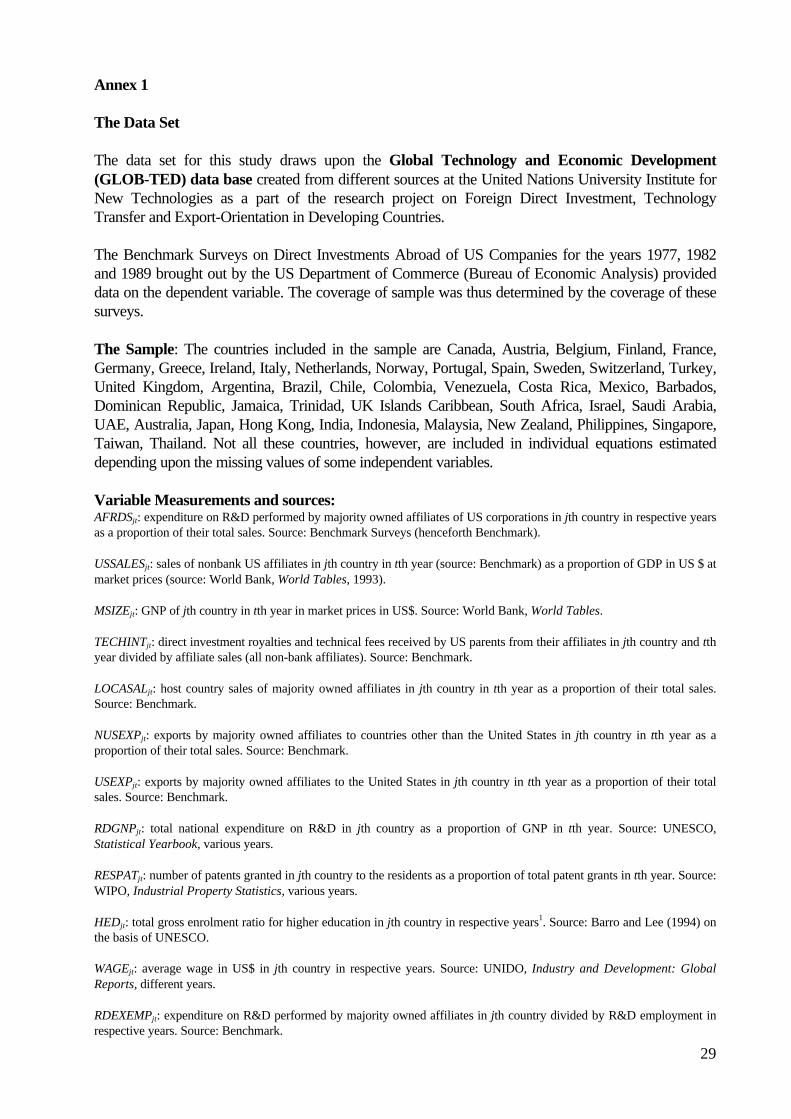
Annex 1
The Data Set
The data set for this study draws upon the Global Technology and Economic Development(GLOB-TED) data base created from different sources at the United Nations University Institute forNew Technologies as a part of the research project on Foreign Direct Investment, TechnologyTransfer and Export-Orientation in Developing Countries.
The Benchmark Surveys on Direct Investments Abroad of US Companies for the years 1977, 1982and 1989 brought out by the US Department of Commerce (Bureau of Economic Analysis) provideddata on the dependent variable. The coverage of sample was thus determined by the coverage of thesesurveys.
The Sample: The countries included in the sample are Canada, Austria, Belgium, Finland, France,Germany, Greece, Ireland, Italy, Netherlands, Norway, Portugal, Spain, Sweden, Switzerland, Turkey,United Kingdom, Argentina, Brazil, Chile, Colombia, Venezuela, Costa Rica, Mexico, Barbados,Dominican Republic, Jamaica, Trinidad, UK Islands Caribbean, South Africa, Israel, Saudi Arabia,UAE, Australia, Japan, Hong Kong, India, Indonesia, Malaysia, New Zealand, Philippines, Singapore,Taiwan, Thailand. Not all these countries, however, are included in individual equations estimateddepending upon the missing values of some independent variables.
Variable Measurements and sources:AFRDSjt: expenditure on R&D performed by majority owned affiliates of US corporations in jth country in respective yearsas a proportion of their total sales. Source: Benchmark Surveys (henceforth Benchmark).
USSALESjt: sales of nonbank US affiliates in jth country in tth year (source: Benchmark) as a proportion of GDP in US $ atmarket prices (source: World Bank, World Tables, 1993).
MSIZEjt: GNP of jth country in tth year in market prices in US$. Source: World Bank, World Tables.
TECHINTjt: direct investment royalties and technical fees received by US parents from their affiliates in jth country and tthyear divided by affiliate sales (all non-bank affiliates). Source: Benchmark.
LOCASALjt: host country sales of majority owned affiliates in jth country in tth year as a proportion of their total sales.Source: Benchmark.
NUSEXPjt: exports by majority owned affiliates to countries other than the United States in jth country in tth year as aproportion of their total sales. Source: Benchmark.
USEXPjt: exports by majority owned affiliates to the United States in jth country in tth year as a proportion of their totalsales. Source: Benchmark.
RDGNPjt: total national expenditure on R&D in jth country as a proportion of GNP in tth year. Source: UNESCO,Statistical Yearbook, various years.
RESPATjt: number of patents granted in jth country to the residents as a proportion of total patent grants in tth year. Source:WIPO, Industrial Property Statistics, various years.
HEDjt: total gross enrolment ratio for higher education in jth country in respective years1. Source: Barro and Lee (1994) onthe basis of UNESCO.
WAGEjt: average wage in US$ in jth country in respective years. Source: UNIDO, Industry and Development: GlobalReports, different years.
RDEXEMPjt: expenditure on R&D performed by majority owned affiliates in jth country divided by R&D employment inrespective years. Source: Benchmark.
30
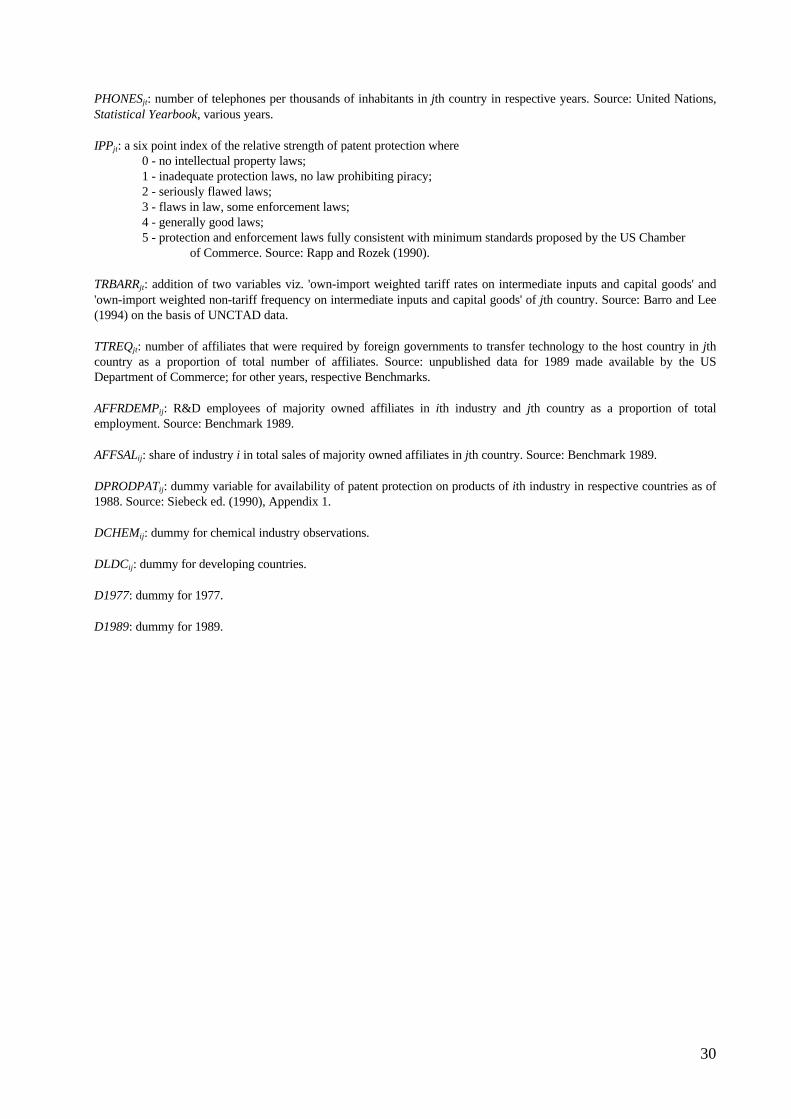
PHONESjt: number of telephones per thousands of inhabitants in jth country in respective years. Source: United Nations,Statistical Yearbook, various years.
IPPjt: a six point index of the relative strength of patent protection where0 - no intellectual property laws; 1 - inadequate protection laws, no law prohibiting piracy;2 - seriously flawed laws;3 - flaws in law, some enforcement laws;4 - generally good laws;5 - protection and enforcement laws fully consistent with minimum standards proposed by the US Chamber
of Commerce. Source: Rapp and Rozek (1990).
TRBARRjt: addition of two variables viz. 'own-import weighted tariff rates on intermediate inputs and capital goods' and'own-import weighted non-tariff frequency on intermediate inputs and capital goods' of jth country. Source: Barro and Lee(1994) on the basis of UNCTAD data.
TTREQjt: number of affiliates that were required by foreign governments to transfer technology to the host country in jthcountry as a proportion of total number of affiliates. Source: unpublished data for 1989 made available by the USDepartment of Commerce; for other years, respective Benchmarks.
AFFRDEMPij: R&D employees of majority owned affiliates in ith industry and jth country as a proportion of totalemployment. Source: Benchmark 1989.
AFFSALij: share of industry i in total sales of majority owned affiliates in jth country. Source: Benchmark 1989.
DPRODPATij: dummy variable for availability of patent protection on products of ith industry in respective countries as of1988. Source: Siebeck ed. (1990), Appendix 1.
DCHEMij: dummy for chemical industry observations.
DLDCij: dummy for developing countries.
D1977: dummy for 1977.
D1989: dummy for 1989.
31
References
Barro, Robert J. and Jong-Wha Lee. 1994. Data Set for a Panel of 138 countries, Cambridge, Mass.:Harvard University.
Cantwell, John. 1992. 'The Internationalisation of Technological Activity and its Implications forCompetitiveness'. In Grandstrand, O., L. Håkanson & S. Sjölander (Eds.). Technology Managementand International Business: Internationalization of R & D and technology. Chichester: John Wiley.
Cantwell, John and U. Kotecha. 1993. The Internationalisation of Technological Activity: the FrenchEvidence in a Comparative Setting. Discussion Papers in International Investment & Business StudiesNo. 179, Reading, England: University of Reading.
Dunning, John H. 1988. Multinationals, Technology and Competitiveness. London: Unwin.
Dunning, John H. 1994. 'Multinational Enterprises and the Globalization of Innovatory Capacity'.Research Policy, 23: 67-88.
Dunning, John. and R. Narula. 1994. The R&D Activities of Foreign Firms in the U.S., DiscussionPapers in International Investment & Business Studies, No. 189. University of Reading.
Ferrantino, Michael J. 1993. 'The Effect of Intellectual Property Rights on International Trade andInvestment', Weltwirschaftliches Archiv, 129, 300-331.
Frischtak, Claudio R. 1989. The Protection of Intellectual Property Rights and Industrial TechnologyDevelopment in Brazil, Industry and Energy Working Papers 13, Washington, DC: The World Bank.
Greene, William H. 1991. LIMDEP Version 6.0: User's Manual and Reference Guide, Bellport, NY:Econometric Software Inc.
Greene, William H. 1993. Econometric Analysis (Second Edition), New York: Macmillan.
Guisinger, Stephen E. et al. 1985. Investment Incentives and Performance Requirements: Patterns ofInternational Trade, Production and Investment, New York: Praeger.
Håkanson, Lars. 1992. 'Locational Determinants of Foreign R&D in Swedish Multinationals'. InGrandstrand, O., L. Håkanson & S. Sjölander (Eds.). Technology Management and InternationalBusiness: Internationalization of R & D and technology. Chichester: John Wiley.
Håkanson, Lars and R. Nobel. 1993a. 'Foreign Research and Development in Swedish Multinationals'.Research Policy, 22: 373-396.
Håkanson, Lars and R. Nobel. 1993b. 'Determinants of Foreign R&D in Swedish Multinationals'.Research Policy, 24, 22: 397-411
Hirschey, Robert C. and Richard E. Caves. 1981. 'Research and Transfer of Technology ByMultinational Enterprises', Oxford Bulletin of Economics and Statistics, 43(2), 115-130.
Hewitt, Gary. 1980. 'Research and Development Performed Abroad by U.S. ManufacturingMultinationals". Kyklos, Vol. 33: 308-327.
32
Japan, MITI, 1991, Fourth Basic Survey on Overseas Business Activities (in Japanese) Tokyo:Ministry of International Trade and Industry.
Japan, MITI, 1994, Fifth Basic Survey on Overseas Business Activities (in Japanese) Tokyo: Ministryof International Trade and Industry.
Kumar, Nagesh. 1991. 'Mode of rivalry and comparative behaviour of multinational and localenterprises: The case of Indian manufacturing', Journal of Development Economics, 35, 381-392.
Kumar, Nagesh. 1994a. 'Regional Trading Blocs, Industrial Reorganization and Foreign DirectInvestments: The Case of the Single European Market', World Competition, 18(2), 35-55.
Kumar, Nagesh. 1994b. 'Determinants of Export Orientation of Foreign Production by U.S.Multinationals: An Inter-country Analysis', Journal of International Business Studies, 25(1), 141-156.
Lall, Sanjaya. 1979. 'The International Allocation of Research Activity by US Multinationals', OxfordBulletin of Economics and Statistics, 41, 313-331.
Lipsey, Robert, E., M. Blomström and I.B. Kravis. 1990. R&D by Multinational Firms and HostCountry Exports. Reprint Series, No. 34, Stockholm School of Economics.
Mansfield, Edwin, D. Teece and A. Romeo. 1979. 'Overseas Research and Development by US-basedFirms', Economica, 46, 187-196.
Mansfield, Edwin. 1994. Intellectual Property Protection, Foreign Direct Investment, and TechnologyTransfer. Discussion Paper 19, Washington DC: International Finance Corporation.
OECD. 1993. The Impact of Foreign Investment on Domestic Economies of OECD Countries,DSTI/EAS/IND(93)3, Paris: OECD.
Patel, Pari and K. Pavitt. 1991. 'Large Firms in the Production of the World's Technology: AnImportant Case of "Non-Globalisation"'. Journal of International Business Studies, 22(1), 1-22.
Pearce, Robert D. 1989. The Internationalisation of Research and Development by MultinationalEnterprises. London: MacMillan.
Pearce, Robert D. and S. Singh. 1992. Globalizing Research and Development. London: MacMillan.
Ramstetter, Eric D. 1992. 'The Macroeconomic Effects of Inward Direct Investment in Taiwan: AMultifirm Econometric Analysis', in Mitsuru Toida and Daisuke Hiratsuka, eds., Projections for AsianIndustrializing Region I, Tokyo: Institute of Developing Economies, pp. 53-154.
Rapp, Richard T. and R.P. Rozek. 1990. Benefits and Costs of Intellectual Property Protection inDeveloping Countries, Working Paper #3, White Plains, NY: National Economic Research Associates,Inc.
Siebeck, Wolfgang. ed. 1990. Strengthening Protection of Intellectual Property in DevelopingCountries: A survey of the literature, World Bank Discussion Papers 112, Washington,DC: the WorldBank.
33
U.S. Department of Commerce (Bureau of Economic Analysis) 1975. U.S.Direct Investment Abroad,1966: Final Data. Washington DC: Government Printing Office.
U.S. Department of Commerce (Bureau of Economic Analysis) 1981. U.S.Direct Investment Abroad,1977. Washington DC: Government Printing Office.
U.S. Department of Commerce (Bureau of Economic Analysis) 1985. U.S.Direct Investment Abroad:1982 Benchmark Survey Data. Washington DC: Government Printing Office.
U.S. Department of Commerce (Bureau of Economic Analysis) 1992. U.S.Direct Investment Abroad:1989 Benchmark Survey, Final Results. Washington DC: Government Printing Office.
U.S. Tariff Commission. 1973. Implications of Multinational Firms for World Trade and Investmentand for U.S. Trade and Labour, Washington,DC: US Congress.
Veugelers, Reinhilde and P. Vanden Houte. 1990. 'Domestic R&D in the Presence of MultinationalEnterprise'. International Journal of Industrial Organization, 8: 1-15.
Wortmann, Michael. 1990. 'Multinationals and the Internalization of R&D: New Developments inGerman Companies'. Research Policy, 19: 175-183.
Zander, Ivo. 1994. The Tortoise Evolution of the Multinational Corporation - Foreign TechnologicalActivity in Swedish Multinational Firms, 1890-1990. Doctoral Dissertation, Stockholm: StockholmSchool of Economics, Institute of International Business.
Zejan, Mario C. 1990. "R&D Activities in Affiliates of Swedish Multinational Enterprises'.Scandinavian Journal of Economics, 92(3): 487-500.

![Imperfect international competition, multinational enterprises and manufactured exports from developing countries [microform]](https://img.pdfslide.net/doc/110x75/6355ef61328574b6730c331a/imperfect-international-competition-multinational-enterprises-and-manufactured.jpg)


