Embed Size (px)
Citation preview

Interactive
Rapid Noninvasive
Meiyappan Solaiyappan Tim Poston National University of Singapore
Pheng Ann Heng Chinese University of Hong Kong
Elliot R. McVeigh Michael A. Guttman Elias A. Zerhouni Johns Hopkins Univers--y School of Medicine
New imaging and
computerized visualization
technology may let doctors
replace today’s multiple costly
heart exams with one
procedure, making it easier
and more economical to
diagnose heart disease.
0018-9162/96/$5 00 0 1996 IEEE
ew interactive computerized visualization technology promises to give doctors easier, quicker, and less expensive ways to deter- mine whether and to what extent patients have heart disease.
This is of great interest to doctors and patients, as heart disease is one of the most prevalent and costly health-care problems in the United States.
This new visualization technology, combined with new image acquisi- tion methods, may allow doctors to take the results of one noninvasive cardiac examination and produce a variety of 3D displays that can be eas- ily manipulated to reveal problems not accessible now without multiple costly assessments. This means one magnetic resonance imaging (MRI) examination could someday replace the battery of tests many patients now must undergo based on touch, sound, and such technologies as elec- trical potential, X rays, ultrasound, and gamma rays.
Each examination involves specialists, specialized equipment, and con- siderable expense. And, patients frequently must undergo many or all of these tests because physicians need a complete heart workup before they can perform bypass or angioplasty surgery, two of the common ways to treat heart disease. In fact, doctors performed over 400,000 bypass surg- eries and almost 400,000 angioplasties in the United States in 1993 alone.
In recent years, MRI technology has shown tremendous promise for providing comprehensive cardiac exams. Vascular morphology and coro- nary blood flow can be revealed with flow measurements and MR angiog- raphy, in which doctors use X rays to view blood vessels injected with an opaque substance. Tissue blood supply can be examined by monitoring the signal change of the heart tissue during the injection process. Tissue functional capabilities can be determined by measuring the strain on the middle muscular layer of the heart wall with MRI tagging techniques. All this means that MRI technique is ahead of the capability of computerized visualization tools to analyze and display the resulting data.
The visualization developments we will now discuss make both raw MRI data and derived information, such as heart wall contraction rate estimates, direlctly accessible to doctors.
TAGGED MIR AND STRAIN ESTIMATES The function of the heart is to move blood, so the organ’s malfunctions
involve the way it moves. A 3D snapshot does not provide sufficient infor- mation to evaluate even simple motion-based performance measures, such as the fraction of blood volume ejected with each beat.
A cine-loop, which is a set of closely sequenced 3D images and data readings, of thle heart that show the heart wall shape at each moment of the beat does answer such overall questions. However, it does not reveal how smaller parts of the heart muscle move. This is important, because heart problems usually occur in a segment of muscle that may, for exam- ple, be unable to contract completely because the inflow of arterial blood has been obstructed. Since the heart compensates in complex ways for
January 1996

such problems, they are not easily detected from overall heart performance data.
The solution lies in “tagged” magnetic resonance images, a method developed in the late 1 9 8 0 ~ . ~ , ~ In this method, a pattern of noninvasive markers is placed in the tissue of the heart wall’s middle muscular layer. The mark- ers are deliberate tissue spin polarization changes caused by the MRI machine.5 The motion of the marker pattern can be tracked over the heart cycle with a temporal sequence of images taken during multiple heartbeats at the same point in the cycle.
The tagged images can be used in two complementary ways. They can be displayed directly, as discussed later. Or a computed description of the heart motion can be exmcted to compute the strain, the change of the heart wall’s shape at each point and moment, and display it by color coding8
Figure 1 shows sequential stills of heart contraction cine- loops, visualized in different ways. The bottom row shows the left ventricle of a dog’s heart in which arterial blood inflow has been deliberately blocked. Areas in red are the muscles that contract properly during each phase of the cycle. The areas in blue show vividly the part of the heart that is not contracting properly.
The process of determining the heart wall’s geometry, from which these contraction estimates are derived, is not easy to do quickly or completely automatically. We now estimate the heart wall’s contours in each “slice” of the heart through which an image has been taken. This is done by a “snake” technique that minimizes a combination of curve-bending energy and a potential which is lowest at wall-like points of the image.8 However, we have to edit the results manually before they can be used for the strain estimation program.
Since the user can best recognize errors in the context of the neighboring slices, the imaging computer interface can be used to edit the 3 D images, rather than each slice in a 2D display. This considerably reduces the time involved in estimating the strain.
We are working to reduce the time further by improving the tools that adjust curves and by making corrections progress from one of the 2D images that comprise the total 3D visualization to the rest. If a strain estimation routine draws the heart wall contour on the wrong side of a muscle group, moving the image of the wall in just one image would pull the contours in all images to just about the right posi- tions. These can be adjusted further by snake techniques.
However, physicians cannot obtain the strain estimate while the MRI is taking place. If physicians were able to obtain findings this way, they could continue an MRI exam if they needed more information and complete the process in one patient visit. Now, doctors can onlylook at raw MRI data and draw some conclusions during a test. If more information is needed, more analysis must be done, and sometimes, more testing must take place.
DYNAMIC VOLUME RENDERING Watching tissue markers move is revealing. For example,
as chemically induced stress on the heart increases, a region of muscle may stop contributing to the contraction process. The tags in that area suddenlybecome quiescent. This is far more conspicuous than the resulting change in the motion of the heart wall shape and is very informative. It is partic-
ularly clear if, instead of displaying rectangular data slices in a rectangular box, we remove surrounding noise and smcture from the image by displaying a volume of inter- est adapted to the ventricle shape.
Classical computer graphics have concentrated on spec- ifymg and rendering surfaces. The 3D data from such sys- tems as computerized tomography (CT) or MRI do not fit this model. Such algorithms as Marching Cubes can extract polygonal surfaces bounding particular ranges, but considerable information is discarded in this process. In addition, the threshold chosen can introduce artifacts, such as the apparent narrowing of an artery, and parts of the same image may have their own ideal thresholds9
Also, the number of polygons used to create an image often makes it impossible to interact in real time with that image, such as by rotating the view. The mesh reduction schemes that can improve this often take 20 to 80 minutes and can last longer, which is impractical for medical image exploratory work.
The alternative, which is faster, is to volume-render the entire data set by passing rays from front to back and blending the values encountered. Blending can mean using the values to fix opacities, finding the maximum intensity along the ray, or using a weighted average of the values encountered.
Graphics hardware usually provides a fourth color com- ponent, alpha, alongside red, green, and blue, to contain opacityvalues. Each voxel in, for example, a 256 x 256 x 256 block of data needs to be accessed. Software using the data then must interpolate between them for a smooth result. Until recently, this computationally intensive process has been even slower than drawing the half-mil- lion triangles of a typical skull or brain surface image. However, the new approach of 3D texture mappinglo has led to much faster hardware solutions.
3D textures In Silicon Graphics’ Reality Engine and Indigo Impact,
the graphics architecture uses 3 D textures to load a 3D image data set into the graphics hardware. An interpo- lated image on any plane is extracted quickly and dis- played in any 3D position. Volume rendering can then be achieved by generating planar slices of image data paral- lel to the projection plane and blending them across the entire volume to yield the final image, as in Figure 2.
Although the basic 3 D texture technique greatly improves volume-rendering speed, it does not always yield real-time performance directly, particularly for stereo ren- dering. Stereo greatly improves the image’s value, since so much vlsual noise can be filtered out by the human capacity to concentrate perception at a particular depth. However, stereo doubles the graphics load by requiring separate computations for each eye.
Graphics hardware limits the numbdr of component 2D images that can be loaded at one time in the texture mem- ory for 3D rendering. We have developed strategies to split a large volume into smaller blocks while maintaining a trade-off with the performance penalty that may result from texture memory swapping. Rendering such a fragmented volume requires additional care to avoid artifacts that may otherwise appear at the boundaries of the fragments. These strategies are kept transparent to the user during render-
Computer

Figure 1. Sequential stills of heart contraction cine-loops visualized in various ways. Top: A healthy human le f t ventricle, volume-rendered in a cubical volume of interest. Second row: The same data with a volume of interest between nested ellipsoids. In animation, the tag motion s8hows clearly and informatively. Third row: Adaptively extracted polygonal surfaces for the inner and outer ventricle walls, color-coded with strain estimates. Fourth row: The same surfaces embedded in volumi~-rendered images, clipped in oblique planes that t he physician can angle for maximum insight. Bottom row: A dog‘s l e f t ventricle into which the arterial blood flow has been blocked. The strain- coded surface is displayed with three orthogonal data slices, with blue shading for subnormal contraction. (The animations from which these stills were drawn may be seen on the World Wide Web.’ An earlier version is in video?)
ing and can easily be tailored to take advantage of future hardware enhancements that will handle large-image data.
When the image is rotating fast, it can be simplified by using fewer planes in the rendering for a higher frame rate and a sense of smooth motion. Such inconspicuous sim- plification “on the fly” is unavailable in surface rendering.
DEFINING THE SLICES. We load the scanned image vol- ume I , a 3D grid of scalar intensities, as a one-component 3D texture, and assign color and alpha opacity values through a lookup table definition. This requires less mem- ory than loading red, green, blue, and alpha separately. Interactive change of the lookup table gives a rough visual segmentation of the volume. But for MRI data, we also need schemes such as ellipsoidal rendering, which we will
Figure 2. A tarso volume (center) surrounded by stills from a cardiac cycle cine-loop of a volume of interest around the heart. (The animation is on the World Wide Web.’)
January 1996
discuss. Image slices normal to the view direction are alpha-blended, from farthest to nearest. This nonassocia- tive blending rule is a poor model for the transmission of light through a translucent medium but is well supported in hardware.
To produce the image slices we need, we must intersect I with N planes orthogonal to the vector pointing to the viewer. In world coordinates, this vector is z = (O,O,l), with the usual graphics convention that the z-axis points out of the screen. If the image is placed in the space of the world coordinates by a 4 x 4 matrixM, let R be M’s upper left 3 x 3 matrix, an orthogonal matrix, up to a scalar fac- tor that does not alter what follows. The vector, in image data coordinates that map to 8, is thus simply v = R-lz, which up to a scalar is the third row or column ofR, accord- ing to the convention that matrices act from the right or left. Graphics languages vary in this, but in any such lan- guage, the matrix R is always available to be read. The three- to six-sided polygonal intersection of each plane with the data cuboid defines the coordinates for extract- ing the reformatted image from the 3D texture.
The required planes are of the formP, = {x I v x = c } , where c selects the plane. If the corners x,, . . . , x, of the data set have v - x, = c,, set c,, = m a , = ,, , , {c,} and c,,
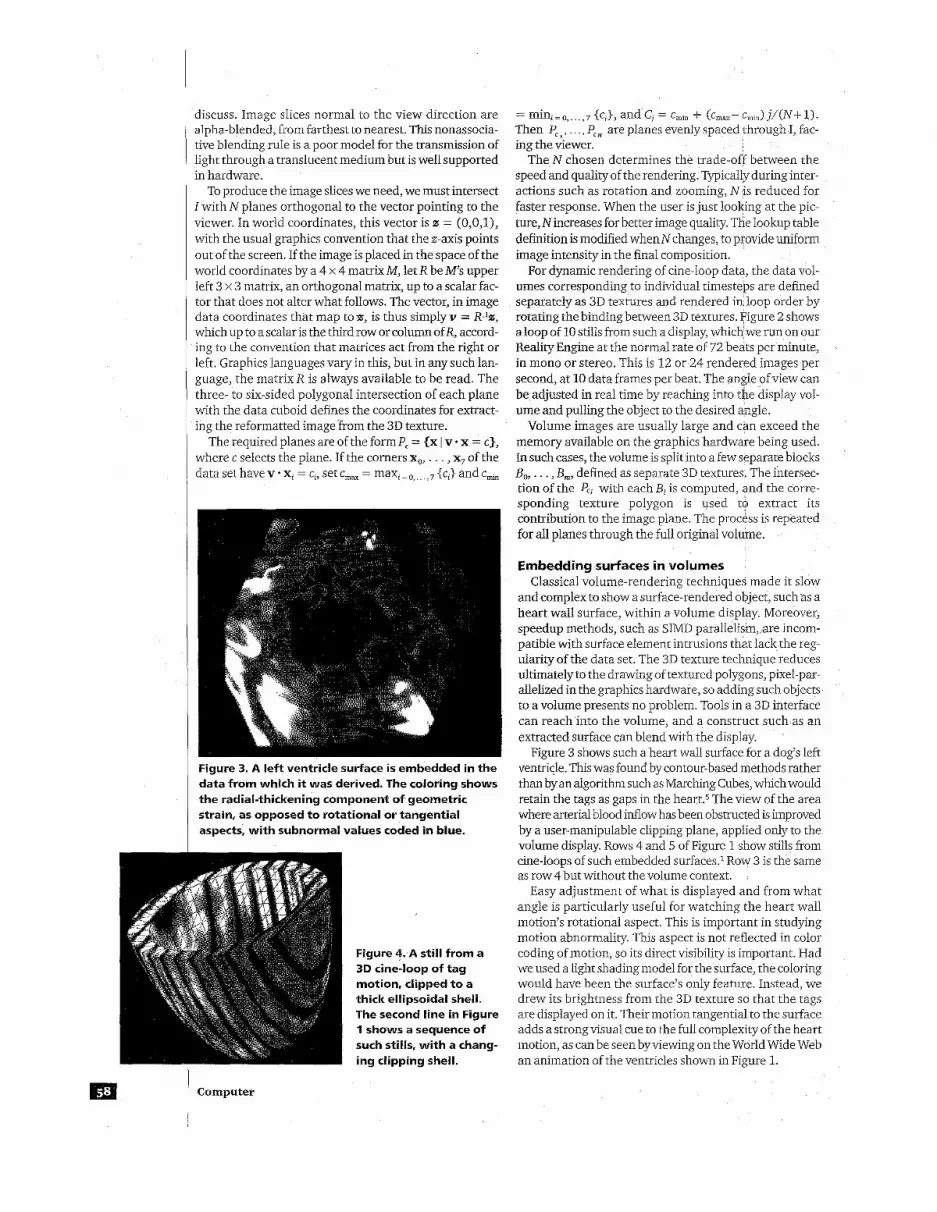
Figure 3. A left ventricle surface is embedded in the data from which it was derived. The coloring shows the radial-thickening component of geometric strain, as opposed to rotational or tangential aspects, with subnormal values coded in blue.
Figure 4. A still from a 3D cine-loop of tag motion, clipped to a thick ellipsoidal shell. The second line in Figure 1 shows a sequence of such stills, with a chang- ing clipping shell.
Computer
- - mint=,, ., {c3, and C, = c,,, + (cmax- c,,,>j/(N+l). Then P,, , , P,, are planes evenly spaced through I, fac- ing the viewer.
The N chosen determines the trade-off between the speed and quality of the rendering. Typically during inter- actions such as rotation and zooming, N is reduced for faster response. When the user is just looking at the pic- ture, N increases for better image quality. The lookup table definition is modified whenNchanges, to provide uniform image intensity in the final composition.
For dynamic rendering of cine-loop data, the data vol- umes corresponding to individual timesteps are defined separately as 3 D textures and rendered in loop order by rotating the binding between 3D textures. Figure 2 shows a loop of 10 stills from such a display, which we run on our Reality Engine at the normal rate of 72 beats per minute, in mono or stereo. This is 12 or 24 rendered images per second, at 10 data frames per beat. The angle of view can be adjusted in real time by reaching into the display vol- ume and pulling the object to the desired angle.
Volume images are usually large and can exceed the memory available on the graphics hardware being used. In such cases, the volume is split into a few separate blocks Bo, . . . , B,, defined as separate 3D textures. The intersec- tion of the Pc, with each B, is computed, and the corre- sponding texture polygon is used to extract its contribution to the image plane. The process is repeated for all planes through the full original volume.
Embedding surfaces in volumes Classical volume-rendering techniques made it slow
and complex to show a surface-rendered object, such as a heart wall surface, within a volume display. Moreover, speedup methods, such as SIMD parallelism,,are incom- patible with surface element intrusions that lack the reg- ularity of the data set. The 3D texture technique reduces ultimately to the drawing of textured polygons, pixel-par- allelized in the graphics hardware, so adding such objects to a volume presents no problem. Tools in a 3D interface can reach into the volume, and a construct such as an extracted surface can blend with the display.
Figure 3 shows such a heart wall surface for a dog’s left ventricle. This was found by contour-based methods rather than by an algorithm such as Marching Cubes, which would retain the tags as gaps in the heart.5 The view of the area where arterial blood inflow has been obstructed is improved by a user-manipulable clipping plane, applied only to the volume display. Rows 4 and 5 of Figure 1 show stills from cine-loops of such embedded surfaces.l Row 3 is the same as row 4 but rhrlthout the volume context.
Easy adjustment of what is displayed and from what angle is particularly useful for watching the heart wall motion’s rotational aspect. This is important in studying motion abnormality. This aspect is not reflected in color coding of motion, so its direct visibility is important. Had we used a light shading model for the surface, the coloring would have been the surface’s only feature. Instead, we drew its brightness from the 3D texture so that the tags are displayed on it. Their motion tangential to the surface adds a strong visual cue to the full complexity of the heart motion, as can be seen byviewing on the World Wide Web an animation of the ventricles shown in Figure 1.

ELLIPSOIDAL RENDERING Looking at parts of a volume
If one controls the voxel opacity values, different voxel populations can be viewed with different emphases in the final rendered image. One can make certain tissues com- pletely transparent by assigning the corresponding alpha values to zero. This often provides a way of showing spe- cific components of the image without separating them as data structures. In cardiac MRI, this does not fully solve the segmentation problem. Noise, motion, and other forms of variability often mean that the desired segment is not simply those voxels with values between v, and v,. In particular, segmentation into connected components can- not be done on a voxel-by-voxel basis. There are many algorithmic approaches to segmentation, but most are time-consuming, and few are fully automatic.
However, along with the user’s freedom to resize or select different cuboid volumes of interest, color and trans- parency management lets one view a specific feature of interest in detail not obscured by its surroundings. The reach-in 3D interface described next simplifies the neces- sary user input involved in editing the choice of display volume, which can be selected from a toolkit of shapes. In such an interface, selection is a quick task for the user, in contrast to that of correcting a full heart wall estimation.
Determining the exact shape of the wall of a moving left ventricle from MRI data at typical resolution is not yet fully automatic and cannot be done in a few minutes. The mus- cle is easily distinguished from blood, but inner wall boundaries are confused because of the presence of pap- illary muscles. However, a hollow ellipsoid fitted to the ventricle, as seen in Figure 4, can reveal the moving tag lines or dots very clearly. Without the tags, this clipping would make the image nearly useless by suppressing the movement of the heart surface. The tags make visible the movement within the heart wall.
The user can adjust the ellipsoid’s placement and pro- portions. While watching the motion, the user can use an interface to slice into the image and reveal its cross sec- tions. This allows an in-depth study of the heart’s motion, with displays generated fast enough to be seen during the MRI exam, rather than in later study.
Controlling the displayed volume The classical volume-rendering approach to limiting the
region of visibility is to specify a condition to be tested for each voxel. For instance, by testing whether its coordinates (x,y, z ) satisfy
@(x,y, z ) =Ax2 + Bxy + Cy2 + Dyz + Ez2 + F z x + Gx + Hy +Iz + JI 0 (1)
we create an ellipsoid if the quadratic part of @ is positive definite. Similarly, data-dependent tests could be built into the rendering routine.
In a 3D texture environment, the results of the test can be precomputed as a matte volume M, stored in a separate 3D texture. Multiplying slices ofM and of the image Iinto a frame buffer produces image slices in which voxels out- side the matte are invisible. This established method is well supported by the Reality Engine hardware and is highly flexible. However, it has substantial overhead in
moving image and matte slices between buffers. Therefore, we have developed faster approaches.
To avoid the expense of using an intermediate image- processing buffer, we use a special buffer supported by the SGI graphics hardware. This lets us control the writing of each pixel into the display buffer by a threshold compari- son of the numeric value stored, for that location, in a dis- play-associated stencil buffer. We use this to store a single bit, recording .whether that pixel is within the matte vol- ume. This provides a fast yes-or-no rendering test for each later operation at that location.
In cases where the algebra is tractable, one can specify the intersection directly and use it as a polygon within which to map the 3D texture image I , with faster results. For instance, suppose the z-component v, of the normal v to P,, is not zero. Else, permute coordinates in what follows. Using (x,y) as coordinates on P,,, and substitut- ing z = (c, - v, x - v, y)/v,, the function @ in Equation 1 becomes
F(x,y) = ax, -t bxy + cy2 + dx + ey +f (2)
on Pc,, for easilyfound a, . . . ,f. With the nonorthogonal change of coordinates
u-b:y 2cd-be 2ae - bd x(u,v)=-- - ~ , y(u,v)=v - ~
2a b2- 4ac b2- 4ac ( 3 )
F takes the form
(4)
for an easily found constant K. If K > 0 the intersection {F=O} is nonempty, and we can parameterize it by
/ i - - - \
(u,v) = [ G S c o s o , 4ac - b2
(5)
and use Equation 3 to draw it in P,,. Similar methods using hyperbolic functions apply to unclosed quadrics.
Such analysis becomes more laborious for more com- plex geometriies, so it is often wise to leave intersection- finding to the stencil hardware while exploring what shapes are most useful in visualization. When a geometry has been chosen, analysis can speed its use.
We have also developed a third approach, placing land- scape descriptions of the front and back of the clipping surface into z-buffers. Front and backare so describable in arbitrary view directions only for a convex object, and most organs are not convex. However, many have land- scape front and back from at least one direction. Refinements ito handle more complex cases are under development.
MRA IN TANGENT PLANES MR angiography to visualize the coronary arteries is
made difficult by the tortuous path of these vessels. However, the fact that the coronaryvessels lie on the sur- face of the ventricle can be exploited to efficiently cover
January 1996

Figure 5. Mult ip le tangent planes of the heart have been mutual ly clipped (top), yielding a polyhedral image of the heart (bottom). Left: Images with M R textures. Right: L i t and shaded images.
Figure 6. Tangent planes of M R angiography data around the heart have been mutual ly clipped and visually unwrapped into a f la t map of part of the surface.
work volume r ', - - - _
Figure 7. A schematic (left) and a photograph (right) show the Wirtual Workbench 3D environment. In the r ight image, looking from over the notch in the mirror shelf, one sees a virtual ly displayed tool, with its handle where one feels the real sensor, Users reach into the workbench with a sensor tool, see a virtual copy of the tool in the apparent place they feel #t, and move it just l ike a real tool.
the length of the vessel with few imaging planes. Instead of prescribing a conventional stack of MRI slices through a region containing the a r t e r i e~ ,~ we can prescribe image planes that are tangent to the surface of the ventricle and intersect the path of the vessel. This prescription can be accomplished by using a few long-axis scout views of the heart. Displaying these tangent planes with the appro- priate clipping is equivalent to peeling off part of the
breath, can generate the image^.^ Essentially the same scheme can be used to display the
whole surface of the heart. The top of Figure 5 shows 40 imaging planes at left with the acquired data. Below each version, they are clipped by one another and enlarged. The resulting polyhedral heart, seen as a single flat image, has problems like those of a photograph of a globe and would be better ifvisuallyunwrapped or projected. But as an eas-
Computer
I
Figure 8. In a typical Virtual Workbench application, t he user edits curves in a 3D sett ing by reaching in and pulling control points with a virtual tool.
ily manipulated object in a stereo environment, it vividly displays the heart's blood supply system.

Figures 5 and 6 were first drawn by using the graphics hardware to clip every plane P along its intersection with all other planes Q. This was done by effectively clipping the outward side of Q in P into a 2D stencil buffer used to mask P. We now use a more efficient approach, allied to the simplex method of linear programming, to calculate directly the clipping polygon for each P. Research contin- ues on the selection of planes and MR parameters.
3D INTERFACE Doctors have sometimes tried an interface showing 3D-
rendered images on the monitor only to abandon this prac- tice and return to a classical display of slices. It is not easy to position an object, on the other side of the screen, that has six degrees of freedom with a tool that has two degrees of freedom, such as a mouse. This is just one of the tasks that compete for attention with the medical task at hand. Placement and control should be nearly automatic and rely on eye-hand coordination. Without such coordina- tion, even simple location tasks become harder.
The Virtual Workbench The Virtual Workbench, shown in Figures 7a and 7b,11
is an interface allowing easy 3D image manipulation in delicate tasks, such as brain surgery planning or editing heart wall contour or artery curve estimates. The user reaches into the space where a mirrored stereo display shows images of the data and the manipulation tool. The tool appears at the same location that the hand feels the actual sensor handle. The software provides a toolkit for sketching a curve, grabbing, rotating, moving, slicing, and editing an image, and so on.
The movement of a slice plane, like those in Figures 1 and 3, is controlled by the blade of the virtual knife that is seen where the user feels the sensor handle and that is adjusted in real time. Adjusting a cuboid or ellipsoidal vol- ume of interest becomes a simple matter of using the tool tip to move a corner or a tip. In Figure 8, the tool is correcting a computer-estimated heart wall contour, with the vital 3D context of the neighboring contours available to the user.12
We are exploiting this more natural interface and the faster rendering discussed above to develop a general 3D data-editing tool so that interaction becomes real-time and undemanding.
As a control scheme for 3D data structures, this inter- face also shows promise for directing the acquisition of MR data. We hope to couple it with MRI equipment so that the user can specify an image collection plane by control- ling a virtual plane in the interface work volume, rather than through intersections with 2D slices, as must be done now. An image collection box that works well for a volume of interest in previously collected image data could be specified in the same manner.
This would reduce the time spent during an MRI exam on exploration and control-setting, which currently occupy as much as half of the procedure. It would allow more of the exam to be devoted to data collection and greatly decrease the total time and cost involved.
MODERN GRAPHICS HARDWARE IS FAST ENOUGH to make vol- ume data from any imaging method directly and interac- tively accessible to the physician, while combining it with
diagnostic computer constructs. The demands of such a display at interactive speeds mean that software opti- mization needls as much attention as the visualization tools. The continuing “arms race” between sensor output volume and graphics-processing speed will maintain this requirement.
We have described tools for visualization at interactive speeds. These tools use 3D texture volume rendering alone and in combination with an extracted surface for strain visualization, clipped to polyhedral or curvilinear volumes under easy user control. This interface can be extended to specify the geometry of data collection, of particular inter- est for innovative protocols. For example, the interface can simplify select mg planes in the tangential MR angiogra- phy scheme, adapted to following arteries around the heart’s middle muscle layer, that avoids the turbulence artifacts seen in planes that meet ventricular blood.
Effective visualization techniques and recent advances in MR physics make it possible that a single assessment session with a single imaging method may provide a com- prehensive cardiac workup. This would replace the mul- tiple studies, with multiple teams of experts, that currently must be performed at greater cost. I
References ~
1. The animatison from which the heart contraction stills were taken can be seen on the World Wide Web at http://ciemed. iss.nus.sg/research/heart/motion.html or at http://www. mri.jhu.edu,/visualization/motion.html.
2. S. Meiyappan and P.A. Heng, “Dynamic Volume Rendering of a Beating Heart” (video), in Video Proc. ACMAEEE 1994 Symp. on Volume Visualization, IEEE CS Press, Los Alamitos, Calif., Order No. PR07067,1995.
3. R.R. Edelman et al., “Coronary Arteries: Breath-hold MR Angiography,” Radiology, Vol. 181, 1991, pp. 641-643.
4. E.A. Zerhouiii et al., “Human Heart: Tagging with MRImag- ing-a Method for Noninvasive Assessment of Myocardial Motion,”Radiology, Vol. 169, No. 1,1988, pp. 59-63.
5. M. Guttman, J.L. Prince, and E.R. McVeigh, “Tag and Con- tour Detection in Tagged MR Images of the Left Ventricle,” IEEE Trans. Medical Imaging, Vol. 13, No. 1,1994, pp. 74-88.
6. E.R. McVeigh,“Functional Cardiac MRI: Motion Tracking Techniques,” to be published in Magnetic Resonance Imaging.
7. E.R. McVeigh et al., “Visualization andhalysis of Functional Cardiac MRI Data,” Proc. Medical Imaging 94: Physiology and Functionfrom MultidimensionaZImages, SPIE-International Society for Optical Engineering, Bellevue, WashJ994, pp.
8. C.C. Moore et al., “Calculation of Three-Dimensional Left Ventricular Strains from Biplanar Tagged MR Images,” J. MagneticResonanceImaging,Vol. 2, No. 2,1994, pp. 165.175.
9. E.J. Halpern and R.J. Wechsler, “CT Angiography of the Renal Artery: Can Shaded Surface Display be Used to Grade Severity ofRenalArteryStenosis?,”Radiology,Vol. 193 (P), 1994, p. 128.
10. K. Perlin and E.M. Hoffert, “Hypertexture,” Computer Graph- ics, Vol. 23, :L989, pp. 253-262.
11. T. Poston and L. Serra, “The Virtual Workbench: Dextrous VR,”Proc. VI.~T94-VirtualRealitySofhYare and Technology, World Scientific, Singapore, 1994, pp. 111.122.
12. L. Serraet al,, “Virtual Space EditingofTagged MRIHeart Data,” Proc. CVRMed 95-Firstlnt‘l. Con$ on Computer Vision, Virtual Reality andRobotics in Medicine, Springer-Verlag, Berlin, 1995.
109-117.
January 1996

Meiyappan Solaiyappan is an associate research staff member at the Institute of Systems Science, National Uni- versity of Singapore, and works in its joint cardiac analysis program with the Johns Hopkins University. His specialty is designing visualization techniques for dynamic imaging applications. He received a bachelor’s degree in engineering in 1984from the College of Engineering ofAnna University in Madras, India.
T i m Poston is an applications geometer at the Institute of Systems Science, National University of Singapore. His inter- ests include the application ofgeometry to medical anatomy and 30 interface design, and the inherent nonlineanties of visual understanding. He received a PhD in mathematics in 1972from the University of Warwick in England. He is a member of the American Mathematical Society.
PhengAnn Hengis an assistantprofessor of computer sci- ence at Chinese University ofHongKong. His research inter- ests include interactive scientific visualization, virtual reality applications, and 30 medical imaging. He received a BS in computer science in 1985from the National University of Singapore, and an MS in computer science in 198z an MA in applied mathematics in 1988, and a PhD in computer sci- ence in 1992, allfrom Indiana University.
Elliott R. McVeigh is an associate professor of biomedical engineering and radiology at the Johns Hopkins University
School ofMedicine. He has been involved with MRlresearch since 1983 and has been working on the physics and data analysis offunctional cardiac MRlsince 1988. He received a PhD in physics in 1984 and a PhD in medical biophysics in 1988fiom the University of Toronto.
Michael A. Guttman zs an instructor at the Johns Hop- kins Unzversity School of Medicine’s Department of Radiol- ogy. His research interests include medical instrumentation and imaging, and minimally invasive diagnosis and treat- ment. He received a BS in electrical engineering in 1985 and an MS in biomedical engineering in 1991 from the Johns Hopkins University.
E l k A . Zerhouni zsprofessor of radiology and MRlDivi- szon director at Johns Hopkins University His primary research contributrons include development and validation of quantztative densitometric methods for CT, development of hzgh-resoluhon CTmethods for structural and physiologic lung imaging, and the use of MR signal intensity analyszs to monitor tumor response to therapy. He has also implemented and validated MR hssue tagging
Readers can contact Solaiyappan, Poston, and Heng at the institute of Systems Science, National Universiq of Singapore, e-mail {meiyap, tim, pheng}@iss.nus.sg. They can contactzer- houni, McVeigh, and Guttrnan at Johns Hopkins Universiq; e-mail {zerhouni, emcveigh, mguttman} @mri.jhu.edu.
PAPERS TW-MMDBMS’96
I996 International Workshop on Multimedia Data Base Management Systems August 14- 16, 1996, Minnowbrook Conference Center, Blue Mountain Lake, NY
Sponsored by the New York Center for Advanced Technology in Computer Applications and Software Engineering (CASE) Incooperation with IEEE Computer Society, IEEE Technical Committee on Mulbmedia Computing, ACM SIG Multimedia*,
ACM SIGMOD*, and the Data Management Specialty Group of the MITRE Corp.
Obiectives: IW-MMDBMS’96 is an mternational technical forum for active researchers and pracbtioners who are involved m var- ious aspects of multmedia database management issues The workshop wdl emphasis issues relevant to designmg, developmg, and utdizmg multrmedia database management systems The paper presentations, panel, and workmg group discussions will address the followmg issues as they relate to multmedia database management - Multvnedia Database Modelmg - Decomposi- tion/Organlzation Techmques - Storage Smctures and Techniques - Distnbuted Multimedia DBMS - Data Transmission - Meta Data Management - Performance Evaluahon - Multunedia Network Protocols and Infrastructures - Access Secunty Issues - Mulb. media Database Applications - Multmedia Data Synchronlzation - Query Language Designs, Specificabon, and Optrmization - OS Issues - QoS DehveryPresentabon Issues - Retneval Techmques and Algonthms - Access Methods, Browsing, and Indexmg Techniques - 00 Paradigms - System, Schema, and Fucntional Architectures - Image Processing, etc General Chair Vice General Chair Prosam Chairs Program Co-chairs P. Bruce Berra Ench Neuhold Gngsley C Nwosu (AT&T Bell Labs) Patslck Bobbie (FL A&M) CASE, Syracuse Univ. GMD-PSI Bhavani Thuraismgham (MITRE) Cynl Orji (Flonda Int’l U ) Program Committee: M Adiba (IMAG-LGI), L Anyanwu (Montclrur St U), A Asthma (AT&T Bell Labs ), J Buford (U Mass Lowell), B Furht (Flonda Atlantic U ), A Ghafoor Purdue U.), S Ghandehanzadeh (USC), E Golsham (Anzona St U.), W Grosky (Wayne St U.), Le Gmenwald (U. Oklahoma), A. Hsu (Siemens Corp. Res.), R. Jam (UC-San Diego), K Jeffay (U NC), W. Klas (GMD-IPSI), C h u n g (VictonaU Tech ), T D C Little (Boston U ), K. Lyons (IBM), R Mehrotra (U Missoun), B &den (AT&T Bell Labs ), D Petkowc (IBM), P. Venkat Rangan (UC-San Diego), 0 R L Sheng (Hong Kong US&T), W Sterhg (AT&T GIS), R Yavatkar (U. Kentucky), P. Yu (IBM), H-J. Zhang (HP Labs)
Information for Authors: Submit 4 copies of each paper not exceedmg 25 double-spaced pages. A few selected papers will apea m special issues of the Journal of MuEmediu Tools and Applicdns, and the IEEE Musmedia Magazine. Submit papers to Dr. Kingsley C. NWOSU, AT&T Bell Labs., 67 Whippany Rd., RM 2C-256, Whippany, NJ 07981-0903. Phone(201)386-4211, Fax:(201)386-6235, emad:[email protected] att com


