Embed Size (px)
Citation preview
TABLE OF CONTENTS
GROWTH THROUGH DIVERSIFICATION
COMPANY INFORMATION Mission, Vision ........................................................... Core Values ................................................................Key Performance Indicators 2018-19 .........................Code of Conduct .......................................................Corporate Strategy .....................................................Our Footprint ...............................................................Our Journey ................................................................Company Profile .........................................................Business Categories ...................................................Our Customers ...........................................................Awards & Recognitions ..............................................
CORPORATE GOVERNANCE Corporate Information ................................................Bankers ......................................................................Board of Directors ......................................................Key Business Executives ...........................................Organizational Structure ............................................Information System & Control ...................................Listing on Pakistan Stock Exchange (PSX) ................Stakeholder Engagement ..........................................Group Structure & Associate Companies .................Statement of Compliance ..........................................
DIRECTORS' REPORT & FINANCIAL ANALYSIS Chairman's Review ....................................................Directors' Report ........................................................Directors' Report (Urdu) ..............................................Annexures to Directors' Report ..................................Financial Analysis ....................................................... Key Financial Ratios ................................................... Graphical Representation of Ratios ...............................
Dupont Chart ............................................................Dupont Analysis ........................................................Last Six Years Statement of Financial Position ...............Horizontal Analysis on Statement of Financial Position ...Vertical Analysis on Statement of Financial Position .......Commentary on Analysis of Statement of Financial Position ...................................................................Last Six Years Statement of Profit or Loss .....................Horizontal Analysis on Statement of Profit or Loss .........Vertical Analysis on Statement of Profit or Loss .............
0405060809101214152223
26272830333435363839
444657586162636465666768
69707071
71727272727374757676778588
929394
100101102103104106161162163164170171172173174176
232234235236
240247249
Interloop Limited, known across the globe for its manufacturing excellence in Hosiery products and service delivery, is expanding its Hosiery business and diversifying into Apparel manufacturing including, Denim, Seamless Active wear and Knitwear, positioning itself as a multi-category multi-country partner with a growth mindset, providing end to end solutions to its customers and creating value for its stakeholders.
Commentary on Analysis of Statement of Profit or Loss ..Last Six Years Statement of Cash Flow .........................Horizontal Analysis on Statement of Cash Flow .............Vertical Analysis on Statement of Cash Flow .................Commentary on Analysis of Statement of Cash Flow .....Statement of Cash Flow Using Direct Method ...............Statement of Value Addition ........................................Economic Value Added .............................................
Sustainability ..............................................................Alignment with UNPD SDGs .......................................People ....................................................................Planet .....................................................................Prosperity ................................................................
FINANCIAL STATEMENTSIndependent Review Report to the Members ............Unconsolidated Financial Statements .......................
Auditor's Report to the Members .................................Unconsolidated Statement of Financial Position ............Unconsolidated Statement of Profit or Loss ..................Unconsolidated Statement of Comprehensive Income ...Unconsolidated Statement of Changes in Equity ...........Unconsolidated Statement of Cash Flow ......................Notes to the Unconsolidated Financial Statements .........
Consolidated Financial Statements ...........................Directors' Consolidated Report ...................................Directors' Consolidated Report (Urdu) ..........................Auditors Report to the Members .................................. Consolidated Statement of Financial Position ................Consolidated Statement of Profit or Loss .......................Consolidated Statement of Comprehensive Income .......Consolidated Statement of Changes in Equity ...............Consolidated Statement of Cash Flow .........................Notes to the Consolidated Financial Statements ............
SHAREHOLDER INFORMATIONPattern of Shareholding .............................................Pattern of Non-Voting Shareholding ..........................Information for Shareholders .....................................Notice of AGM ............................................................Explanatory Statement under 134 (3) Companies Act, 2017 ....................................................................Notice of AGM (Urdu) ................................................Forms of Proxy in Urdu & English .............................
1
2018
- 1
9A
nnua
l Rep
ort
COMPANY INFORMATION
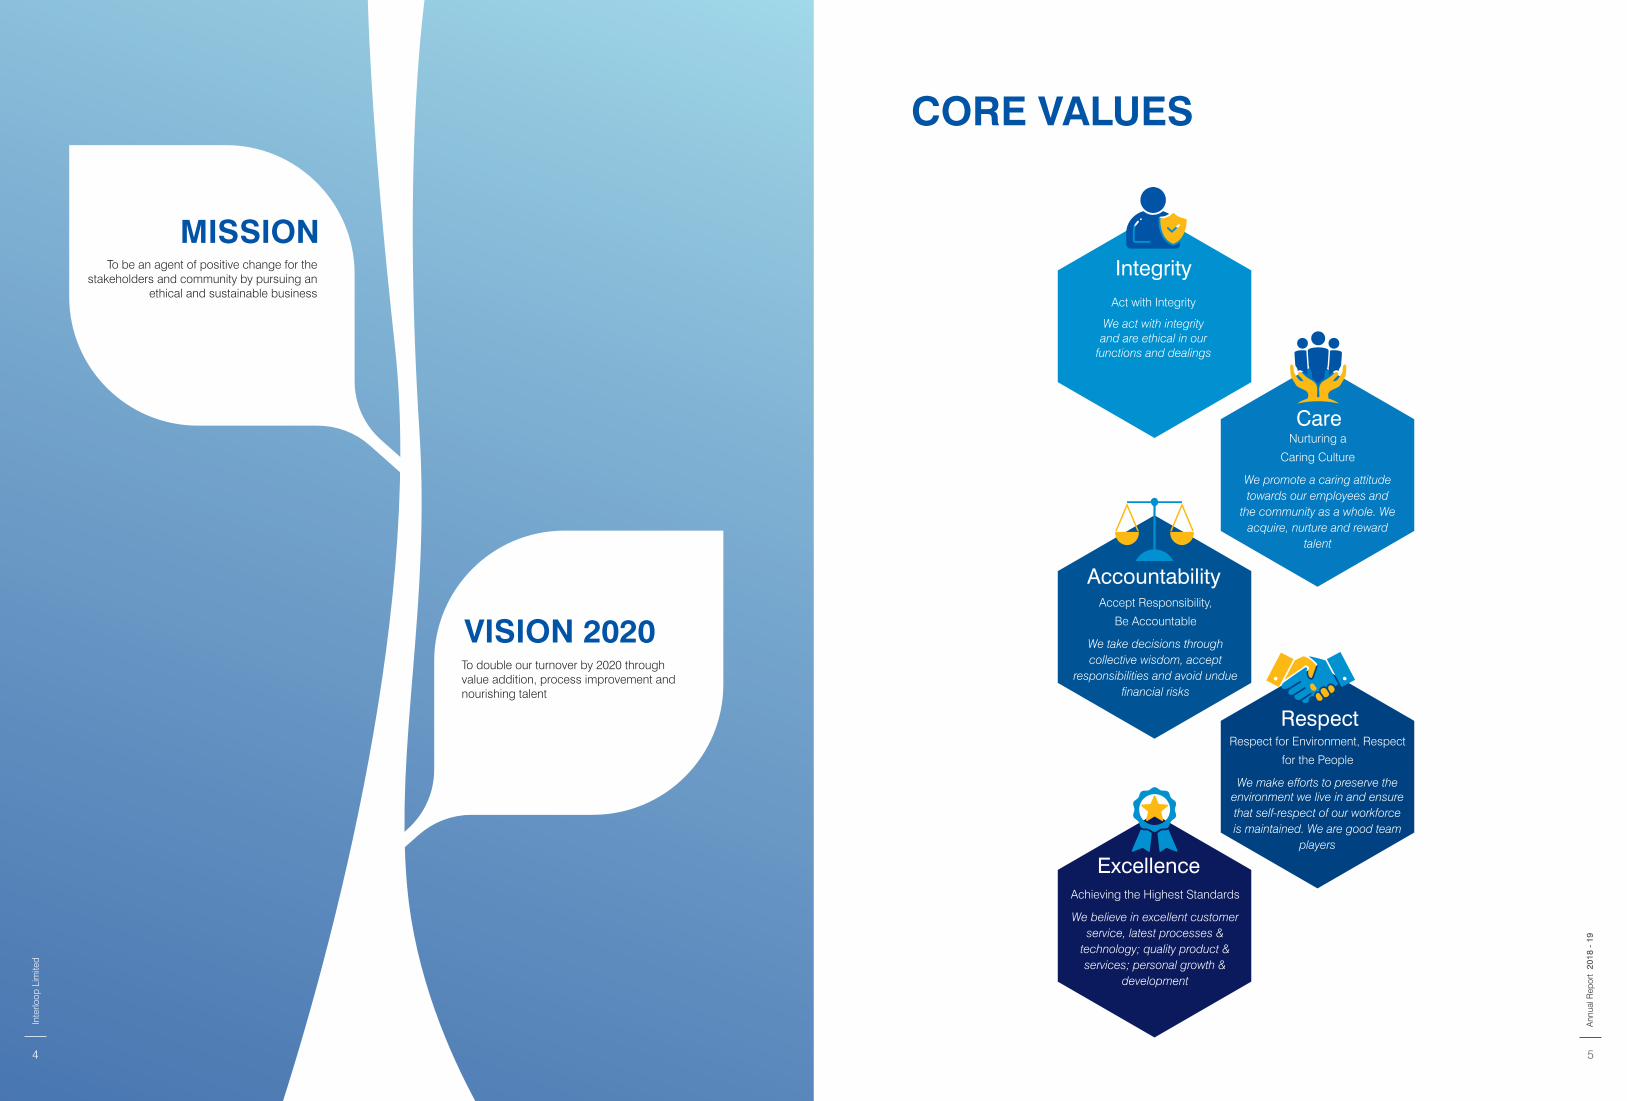
VISION 2020To double our turnover by 2020 through value addition, process improvement and nourishing talent
To be an agent of positive change for the stakeholders and community by pursuing an
ethical and sustainable business
MISSION
CORE VALUES
CareNurturing a
Caring Culture
We promote a caring attitude towards our employees and
the community as a whole. We acquire, nurture and reward
talent
IntegrityAct with Integrity
We act with integrity and are ethical in our
functions and dealings
ExcellenceAchieving the Highest Standards
We believe in excellent customer service, latest processes &
technology; quality product & services; personal growth &
development
RespectRespect for Environment, Respect
for the People
We make efforts to preserve the environment we live in and ensure that self-respect of our workforce is maintained. We are good team
players
AccountabilityAccept Responsibility,
Be Accountable
We take decisions through collective wisdom, accept
responsibilities and avoid undue financial risks
5
2018
- 1
9A
nnua
l Rep
ort
Inte
rloop
Lim
ited
4
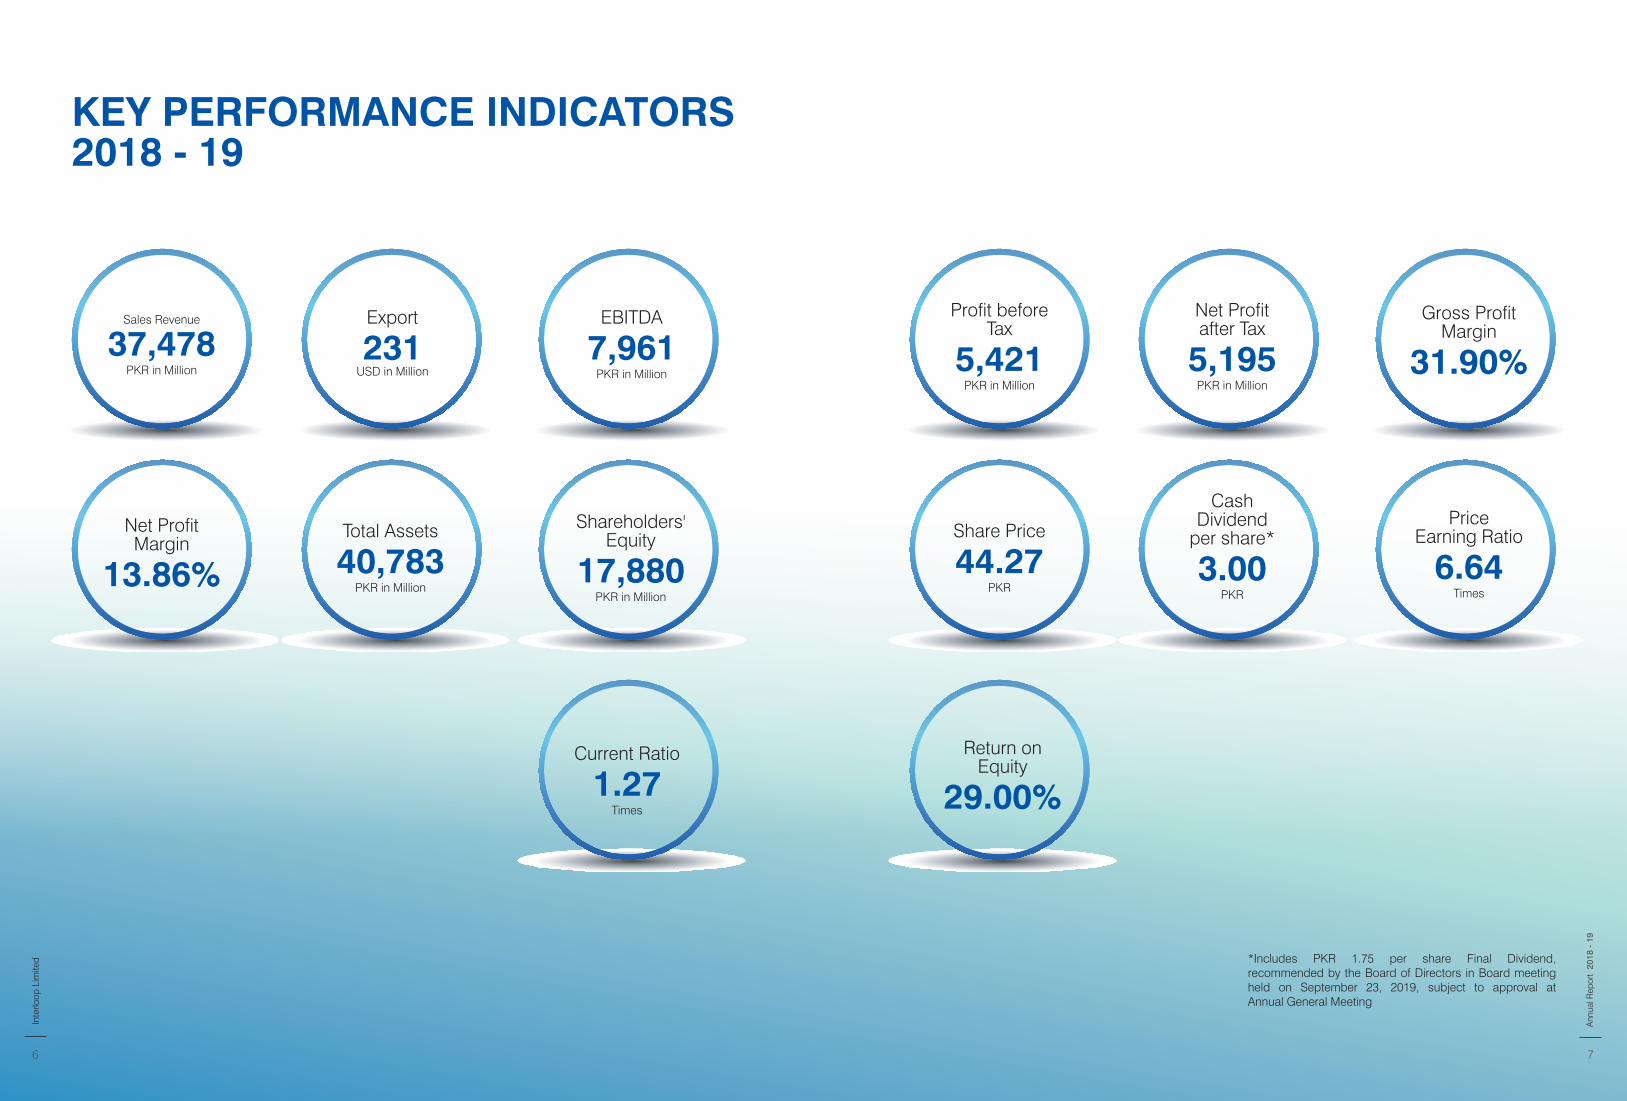
KEY PERFORMANCE INDICATORS2018 - 19
Sales Revenue
37,478 PKR in Million
Net Profitafter Tax
5,195 PKR in Million
Profit beforeTax
5,421 PKR in Million
Export
231USD in Million
Total Assets
40,783PKR in Million
PriceEarning Ratio
6.64 Times
Share Price
44.27 PKR
Gross ProfitMargin
31.90%EBITDA
7,961 PKR in Million
Shareholders'Equity
17,880 PKR in Million
CashDividend
per share*
3.00 PKR
Return onEquity
29.00%
Net ProfitMargin
13.86%
Current Ratio
1.27Times
*Includes PKR 1.75 per share Final Dividend, recommended by the Board of Directors in Board meeting held on September 23, 2019, subject to approval at Annual General Meeting
Inte
rloop
Lim
ited
6 7
2018
- 1
9A
nnua
l Rep
ort
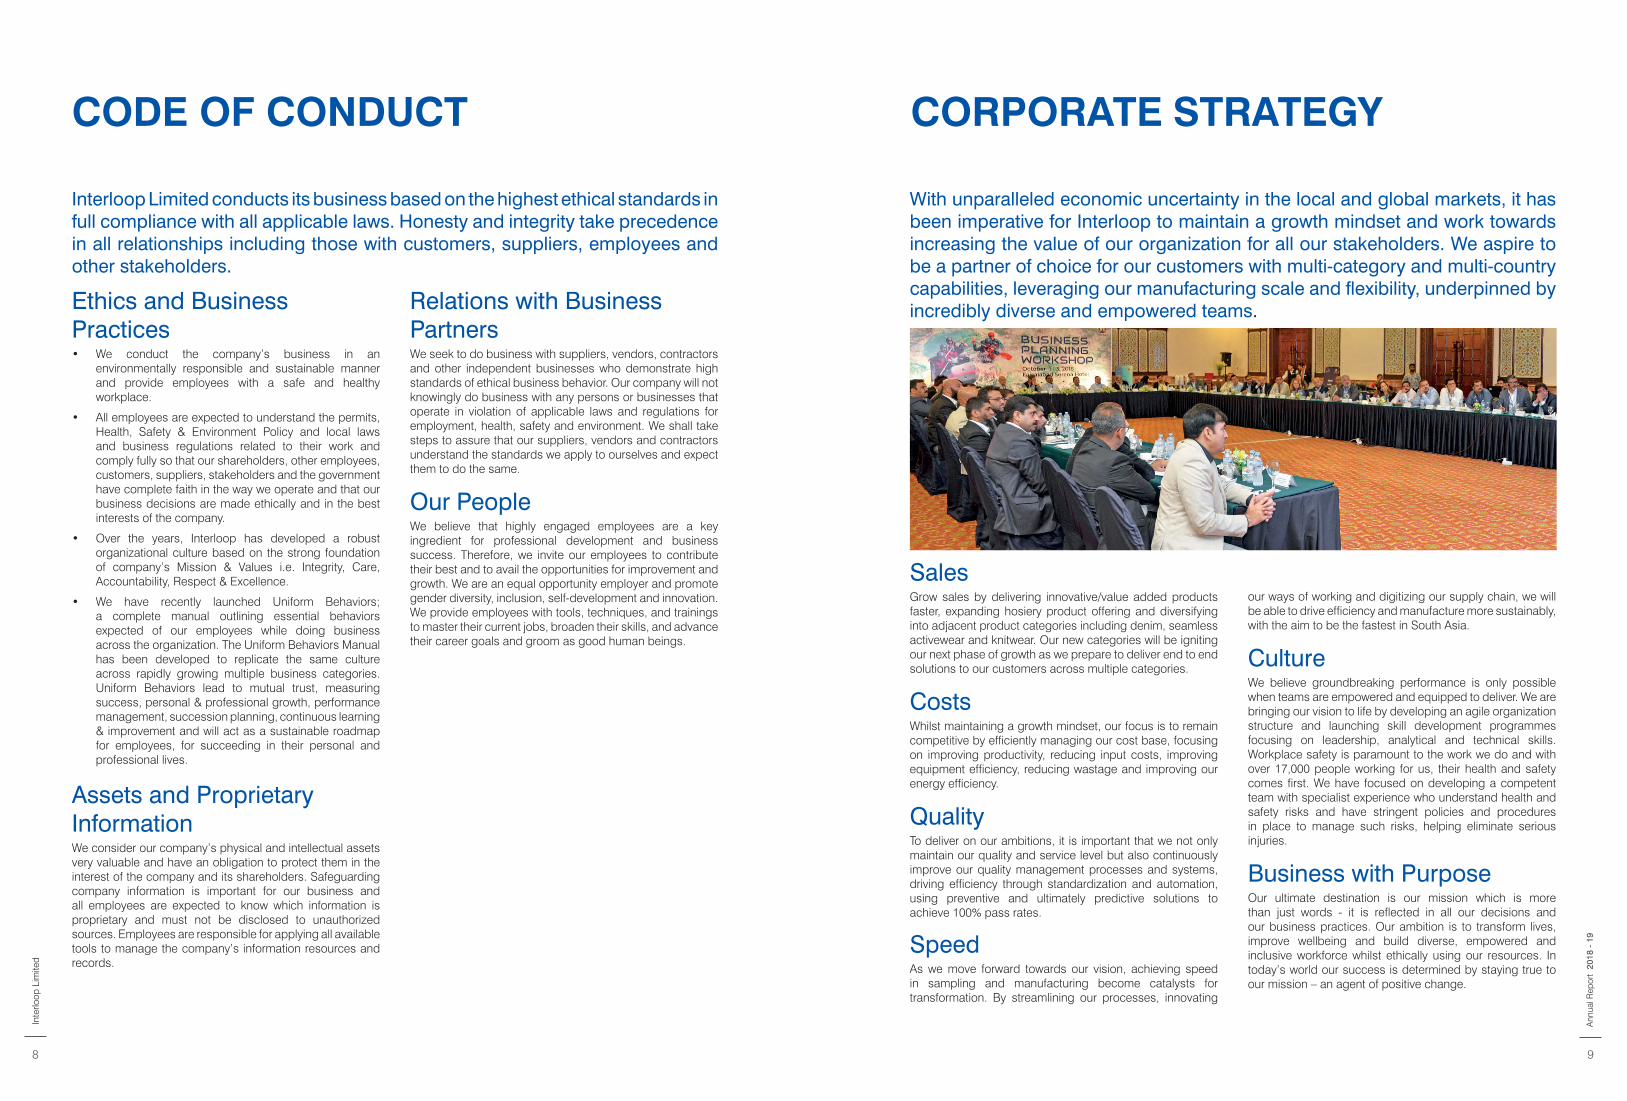
CODE OF CONDUCT
Interloop Limited conducts its business based on the highest ethical standards in full compliance with all applicable laws. Honesty and integrity take precedence in all relationships including those with customers, suppliers, employees and other stakeholders.
Sales Grow sales by delivering innovative/value added products faster, expanding hosiery product offering and diversifying into adjacent product categories including denim, seamless activewear and knitwear. Our new categories will be igniting our next phase of growth as we prepare to deliver end to end solutions to our customers across multiple categories.
CostsWhilst maintaining a growth mindset, our focus is to remain competitive by efficiently managing our cost base, focusing on improving productivity, reducing input costs, improving equipment efficiency, reducing wastage and improving our energy efficiency.
QualityTo deliver on our ambitions, it is important that we not only maintain our quality and service level but also continuously improve our quality management processes and systems, driving efficiency through standardization and automation, using preventive and ultimately predictive solutions to achieve 100% pass rates.
SpeedAs we move forward towards our vision, achieving speed in sampling and manufacturing become catalysts for transformation. By streamlining our processes, innovating
With unparalleled economic uncertainty in the local and global markets, it has been imperative for Interloop to maintain a growth mindset and work towards increasing the value of our organization for all our stakeholders. We aspire to be a partner of choice for our customers with multi-category and multi-country capabilities, leveraging our manufacturing scale and flexibility, underpinned by incredibly diverse and empowered teams.
CORPORATE STRATEGY
Ethics and Business Practices• We conduct the company’s business in an
environmentally responsible and sustainable manner and provide employees with a safe and healthy workplace.
• All employees are expected to understand the permits, Health, Safety & Environment Policy and local laws and business regulations related to their work and comply fully so that our shareholders, other employees, customers, suppliers, stakeholders and the government have complete faith in the way we operate and that our business decisions are made ethically and in the best interests of the company.
• Over the years, Interloop has developed a robust organizational culture based on the strong foundation of company’s Mission & Values i.e. Integrity, Care, Accountability, Respect & Excellence.
• We have recently launched Uniform Behaviors; a complete manual outlining essential behaviors expected of our employees while doing business across the organization. The Uniform Behaviors Manual has been developed to replicate the same culture across rapidly growing multiple business categories. Uniform Behaviors lead to mutual trust, measuring success, personal & professional growth, performance management, succession planning, continuous learning & improvement and will act as a sustainable roadmap for employees, for succeeding in their personal and professional lives.
Assets and Proprietary InformationWe consider our company’s physical and intellectual assets very valuable and have an obligation to protect them in the interest of the company and its shareholders. Safeguarding company information is important for our business and all employees are expected to know which information is proprietary and must not be disclosed to unauthorized sources. Employees are responsible for applying all available tools to manage the company’s information resources and records.
Relations with BusinessPartnersWe seek to do business with suppliers, vendors, contractors and other independent businesses who demonstrate high standards of ethical business behavior. Our company will not knowingly do business with any persons or businesses that operate in violation of applicable laws and regulations for employment, health, safety and environment. We shall take steps to assure that our suppliers, vendors and contractors understand the standards we apply to ourselves and expect them to do the same.
Our PeopleWe believe that highly engaged employees are a key ingredient for professional development and business success. Therefore, we invite our employees to contribute their best and to avail the opportunities for improvement and growth. We are an equal opportunity employer and promote gender diversity, inclusion, self-development and innovation. We provide employees with tools, techniques, and trainings to master their current jobs, broaden their skills, and advance their career goals and groom as good human beings.
our ways of working and digitizing our supply chain, we will be able to drive efficiency and manufacture more sustainably, with the aim to be the fastest in South Asia.
CultureWe believe groundbreaking performance is only possible when teams are empowered and equipped to deliver. We are bringing our vision to life by developing an agile organization structure and launching skill development programmes focusing on leadership, analytical and technical skills. Workplace safety is paramount to the work we do and with over 17,000 people working for us, their health and safety comes first. We have focused on developing a competent team with specialist experience who understand health and safety risks and have stringent policies and procedures in place to manage such risks, helping eliminate serious injuries.
Business with PurposeOur ultimate destination is our mission which is more than just words - it is reflected in all our decisions and our business practices. Our ambition is to transform lives, improve wellbeing and build diverse, empowered and inclusive workforce whilst ethically using our resources. In today’s world our success is determined by staying true to our mission – an agent of positive change.
Inte
rloop
Lim
ited
8 9
2018
- 1
9A
nnua
l Rep
ort
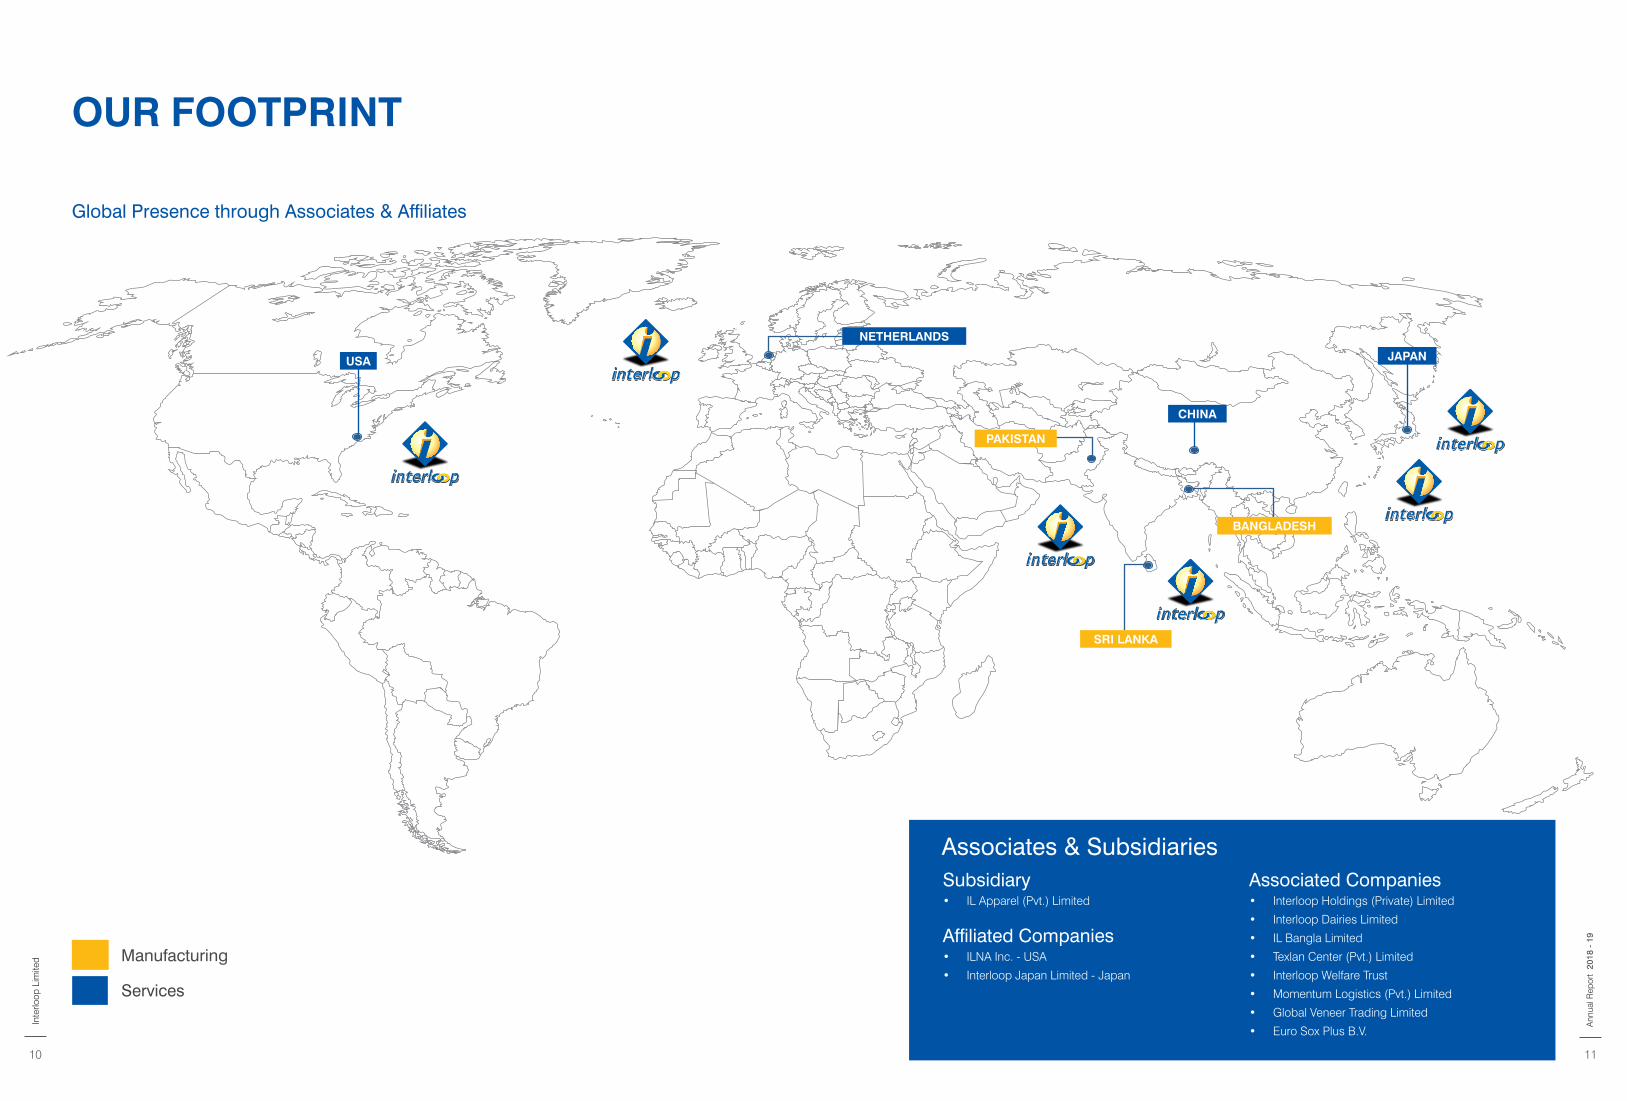
OUR FOOTPRINT
Manufacturing
Services
Global Presence through Associates & Affiliates
Subsidiary• IL Apparel (Pvt.) Limited
Affiliated Companies• ILNA Inc. - USA
• Interloop Japan Limited - Japan
Associated Companies• Interloop Holdings (Private) Limited
• Interloop Dairies Limited
• IL Bangla Limited
• Texlan Center (Pvt.) Limited
• Interloop Welfare Trust
• Momentum Logistics (Pvt.) Limited
• Global Veneer Trading Limited
• Euro Sox Plus B.V.
Associates & Subsidiaries
USA
PAKISTAN
SRI LANKA
JAPAN
CHINA
BANGLADESH
NETHERLANDS
Inte
rloop
Lim
ited
10 11
2018
- 1
9A
nnua
l Rep
ort
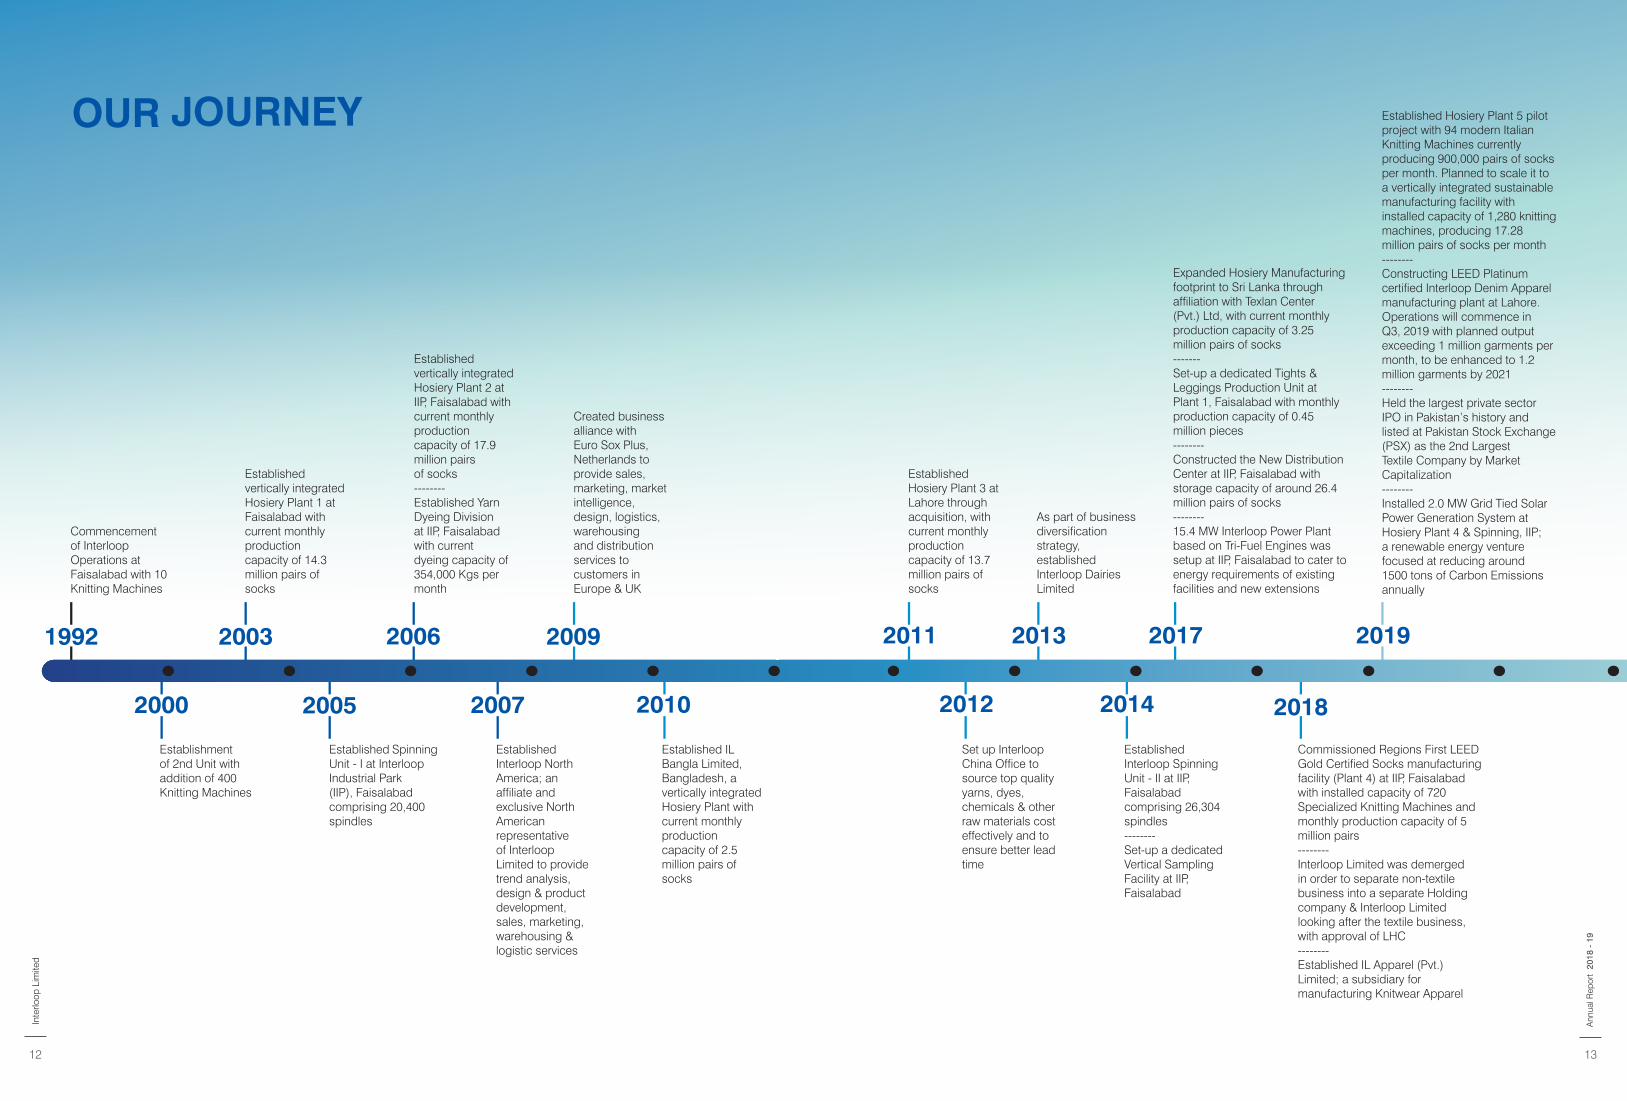
Establishment of 2nd Unit with addition of 400 Knitting Machines
Established Spinning Unit - I at Interloop Industrial Park (IIP), Faisalabad comprising 20,400 spindles
Commencement of Interloop Operations at Faisalabad with 10 Knitting Machines
Established vertically integrated Hosiery Plant 1 at Faisalabad with current monthly production capacity of 14.3 million pairs of socks
Established vertically integrated Hosiery Plant 2 at IIP, Faisalabad with current monthly production capacity of 17.9 million pairsof socks --------Established Yarn Dyeing Division at IIP, Faisalabad with current dyeing capacity of 354,000 Kgs per month
Created business alliance with Euro Sox Plus, Netherlands to provide sales, marketing, market intelligence, design, logistics, warehousing and distribution services to customers in Europe & UK
Established Hosiery Plant 3 at Lahore through acquisition, with current monthly production capacity of 13.7 million pairs of socks
As part of business diversification strategy, established Interloop Dairies Limited
Expanded Hosiery Manufacturing footprint to Sri Lanka through affiliation with Texlan Center (Pvt.) Ltd, with current monthly production capacity of 3.25 million pairs of socks------- Set-up a dedicated Tights & Leggings Production Unit at Plant 1, Faisalabad with monthly production capacity of 0.45 million pieces--------Constructed the New Distribution Center at IIP, Faisalabad with storage capacity of around 26.4 million pairs of socks --------15.4 MW Interloop Power Plant based on Tri-Fuel Engines was setup at IIP, Faisalabad to cater to energy requirements of existing facilities and new extensions
Established Hosiery Plant 5 pilot project with 94 modern Italian Knitting Machines currently producing 900,000 pairs of socks per month. Planned to scale it to a vertically integrated sustainable manufacturing facility with installed capacity of 1,280 knitting machines, producing 17.28 million pairs of socks per month--------Constructing LEED Platinum certified Interloop Denim Apparel manufacturing plant at Lahore. Operations will commence in Q3, 2019 with planned output exceeding 1 million garments per month, to be enhanced to 1.2 million garments by 2021--------Held the largest private sector IPO in Pakistan’s history and listed at Pakistan Stock Exchange (PSX) as the 2nd Largest Textile Company by Market Capitalization--------Installed 2.0 MW Grid Tied Solar Power Generation System at Hosiery Plant 4 & Spinning, IIP; a renewable energy venture focused at reducing around 1500 tons of Carbon Emissions annually
Commissioned Regions First LEED Gold Certified Socks manufacturing facility (Plant 4) at IIP, Faisalabad with installed capacity of 720 Specialized Knitting Machines and monthly production capacity of 5 million pairs--------Interloop Limited was demerged in order to separate non-textile business into a separate Holding company & Interloop Limited looking after the textile business, with approval of LHC--------Established IL Apparel (Pvt.) Limited; a subsidiary for manufacturing Knitwear Apparel
Established Interloop North America; an affiliate and exclusive North American representative of Interloop Limited to provide trend analysis, design & product development, sales, marketing, warehousing & logistic services
Established IL Bangla Limited, Bangladesh, a vertically integrated Hosiery Plant with current monthly production capacity of 2.5 million pairs of socks
Set up Interloop China Office to source top quality yarns, dyes, chemicals & other raw materials cost effectively and to ensure better lead time
EstablishedInterloop Spinning Unit - II at IIP, Faisalabad comprising 26,304 spindles --------Set-up a dedicated Vertical Sampling Facility at IIP, Faisalabad
OUR JOURNEY
1992 2009 2017 20192003 20112006 2013
2000 2010 20182005 20122007 2014
Inte
rloop
Lim
ited
12 13
2018
- 1
9A
nnua
l Rep
ort
COMPANY PROFILE BUSINESS CATEGORIES
700Million
Pairs of Socks & Tights
annually
HOSIERY
26Million
Kgs Yarns, 5 Million Kgs Dyeing capacity
with 0.9 Million Kgs Air Covering annually
YARNS
12Million
Garments planned capacity
annually by 2021
DENIM
6.50Million
pieces planned capacity
annually by 2021
SEAMLESS ACTIVEWEAR
65Million
pieces planned capacity
annually by 2021
KNITWEAR
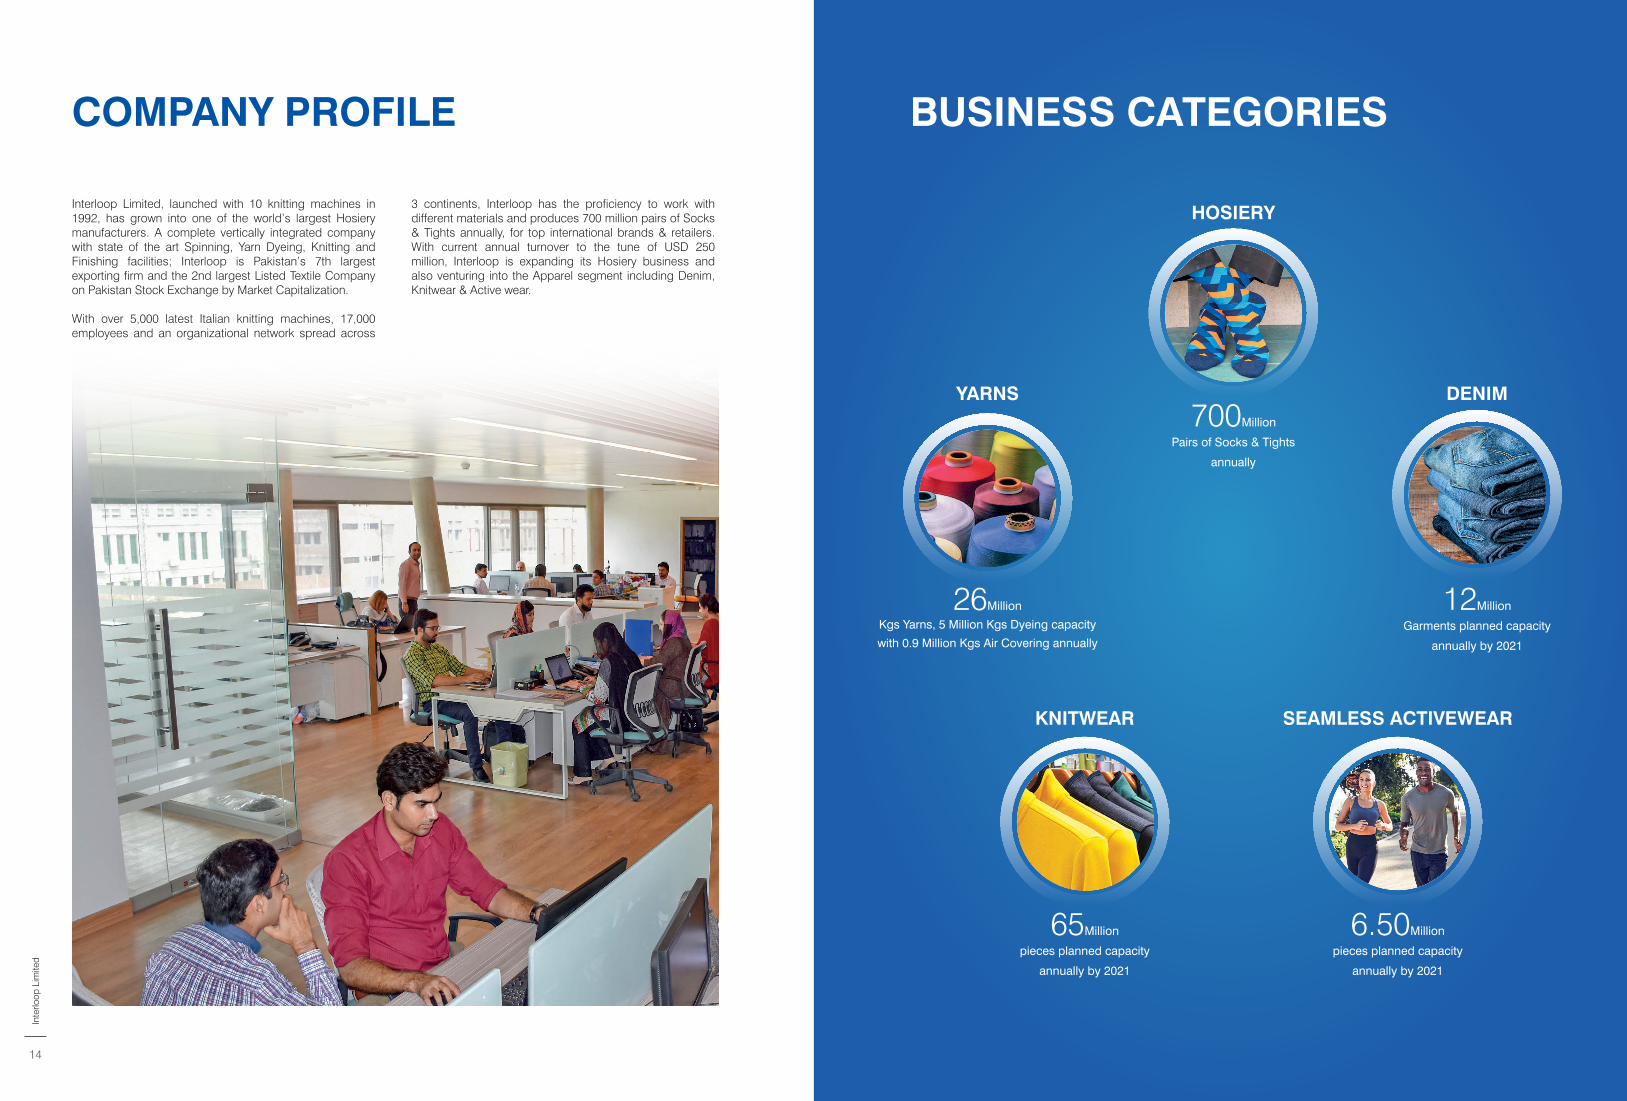
Interloop Limited, launched with 10 knitting machines in 1992, has grown into one of the world’s largest Hosiery manufacturers. A complete vertically integrated company with state of the art Spinning, Yarn Dyeing, Knitting and Finishing facilities; Interloop is Pakistan’s 7th largest exporting firm and the 2nd largest Listed Textile Company on Pakistan Stock Exchange by Market Capitalization.
With over 5,000 latest Italian knitting machines, 17,000 employees and an organizational network spread across
3 continents, Interloop has the proficiency to work with different materials and produces 700 million pairs of Socks & Tights annually, for top international brands & retailers. With current annual turnover to the tune of USD 250 million, Interloop is expanding its Hosiery business and also venturing into the Apparel segment including Denim, Knitwear & Active wear.
Inte
rloop
Lim
ited
14
Product DevelopmentA dedicated Vertical Sampling Facility (VSF) at Interloop Industrial Park, Faisalabad comprising a Yarn Library, dedicated Yarn Dyeing Machines, 100 Knitting Machines and Linking to Finishing capabilities develops premium quality products for customers. The Product Development Lab houses a complete range of latest colour development machines. We also offer a Product Development facility through our associate company in Sri Lanka.
Quality AssuranceThe Quality Department looks after Quality Assurance, Quality Control, Quality Testing Labs & QMS. The Quality Policy refers the way our teams follow the working processes to produce quality products and deliver excellent services to our valued customers. QD has five product & raw material testing labs; a central development lab at VSF for testing of new developments and four production labs for product testing. Three labs are ISO/IEC 17025:2005 accredited from PNAC (Pakistan National Accreditation Council). The central development lab is also ISO/IEC 17043 accredited which makes Interloop the First Textile Company in Pakistan to provide Local Proficiency Testing (PT).
Research & Innovation A dedicated Research & Innovation (R&I) Centre at the Global Headquarters - Pakistan, is a self-sufficient facility with hi-tech knitting, processing and finishing operations, a modern lab, and is looked after by an extremely competent team. A Global Innovation Forum having representation from our worldwide teams and R&I Centre, works as the heart of entire innovation process. From raw concepts to testing and commercialization, multiple commercial concepts have been launched including innovative knitting constructions, processing treatments, specialty yarns and finishing operations. Three Patents have already been granted to Interloop and patents for two products are in the application process.
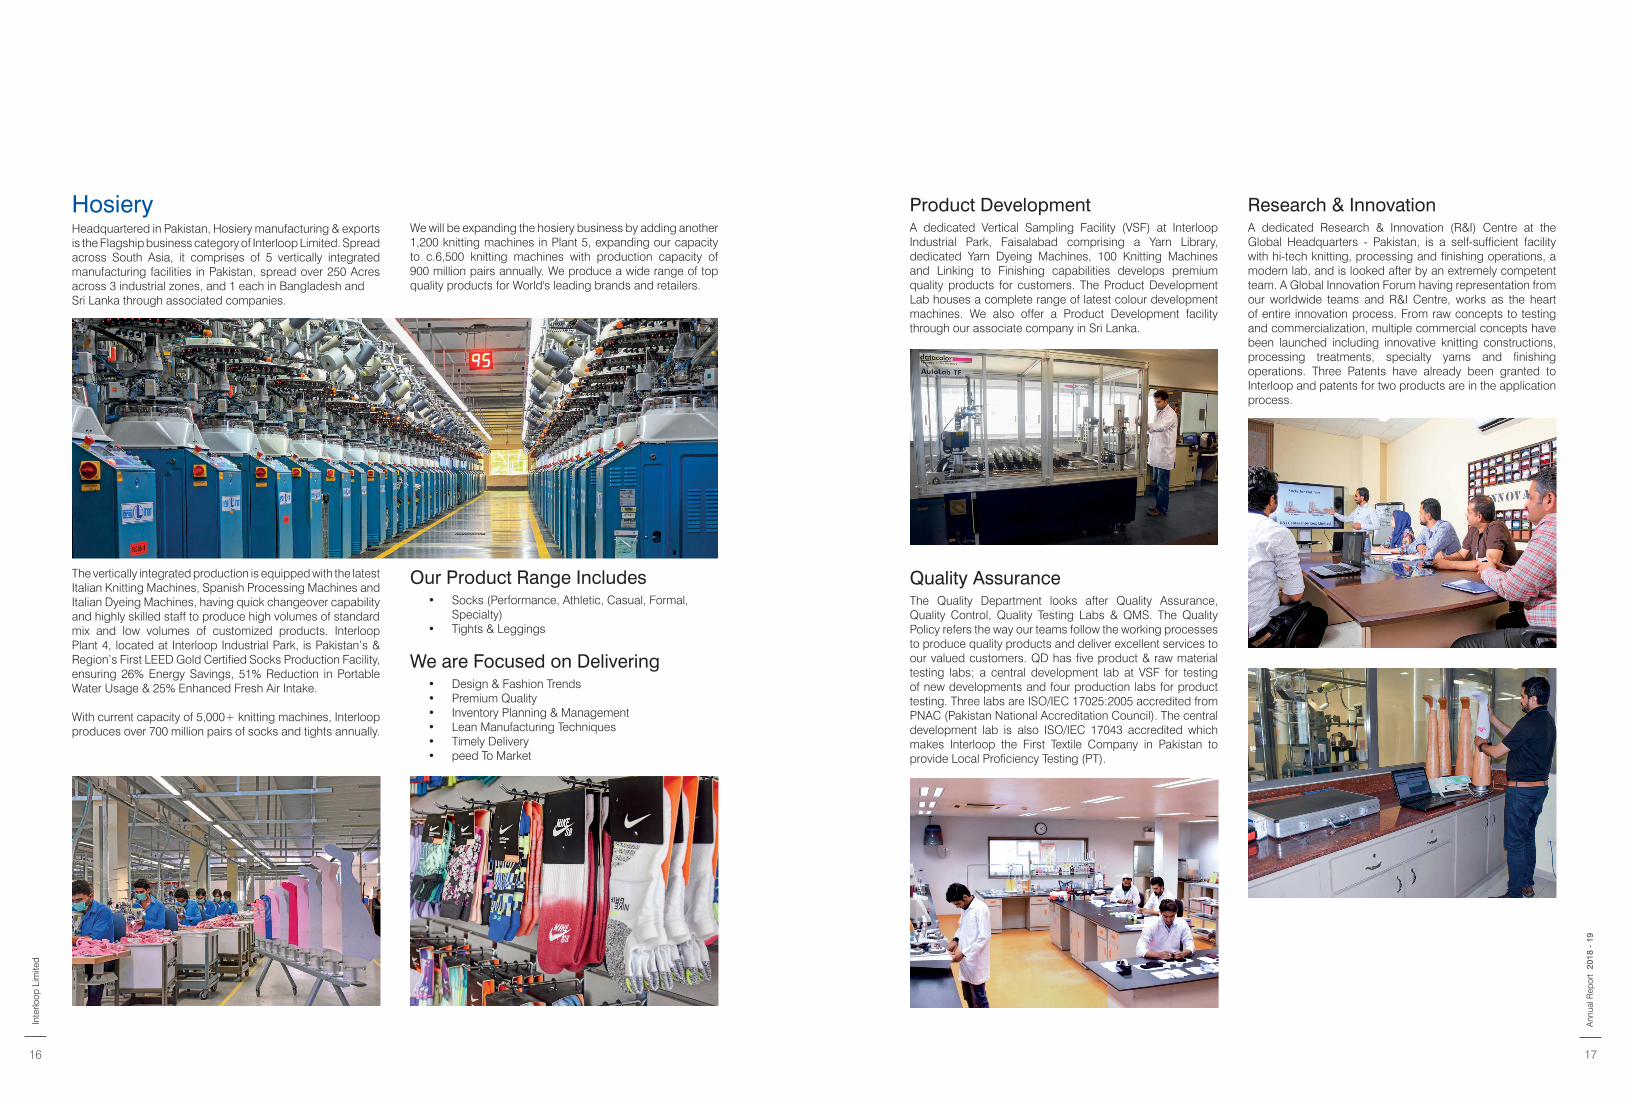
HosieryHeadquartered in Pakistan, Hosiery manufacturing & exports is the Flagship business category of Interloop Limited. Spread across South Asia, it comprises of 5 vertically integrated manufacturing facilities in Pakistan, spread over 250 Acres across 3 industrial zones, and 1 each in Bangladesh and Sri Lanka through associated companies.
The vertically integrated production is equipped with the latest Italian Knitting Machines, Spanish Processing Machines and Italian Dyeing Machines, having quick changeover capability and highly skilled staff to produce high volumes of standardmix and low volumes of customized products. Interloop Plant 4, located at Interloop Industrial Park, is Pakistan’s & Region’s First LEED Gold Certified Socks Production Facility, ensuring 26% Energy Savings, 51% Reduction in Portable Water Usage & 25% Enhanced Fresh Air Intake.
With current capacity of 5,000+ knitting machines, Interloop produces over 700 million pairs of socks and tights annually.
We will be expanding the hosiery business by adding another 1,200 knitting machines in Plant 5, expanding our capacity to c.6,500 knitting machines with production capacity of 900 million pairs annually. We produce a wide range of top quality products for World's leading brands and retailers.
Our Product Range Includes• Socks (Performance, Athletic, Casual, Formal,
Specialty)• Tights & Leggings
We are Focused on Delivering• Design & Fashion Trends• Premium Quality• Inventory Planning & Management• Lean Manufacturing Techniques• Timely Delivery• peed To Market
Inte
rloop
Lim
ited
16 17
2018
- 1
9A
nnua
l Rep
ort
As part of business diversification, Interloop is entering into the Denim Apparel Segment and has envisioned a production facility with minimal environmental impact, prioritized worker well-being and which will maintain high standards of operational and cost efficiency, ensuring that Interloop continues to serve its customers, effectively.
The production facility will be LEED Platinum Certified and will be the most technologically advanced and sustainable denim apparel production facility in this part of the world, underpinning Interloop’s Mission.
With current capacity of 125,000 pcs per month at the Denim Development Center, the plant is going into production in Q3, 2019 with planned capacity of 500,000 pcs per month, to be enhanced to 1 million pcs per month in 2020. The plant has been designed in line with Lean concepts, will promote gender diversity and is expected to achieve 50:50 male to female ratio.
The scope of operations includes Cut & Sew, Laundry and Packing & Accessories. Automated precision machinery has been installed to improve productivity. Overhead hanging systems have been put in place to ensure a Lean manufacturing system. Eco-friendly technologies are being used to replace aggressive processing agents and reduce
water consumption. Latest machinery including Laser machines have been commissioned to replace manual processes for minimizing impact on workers and improving quality. Built-in quality measures have been put in place to minimize defects and rework.
The implementation of new and eco-friendly technologies will have favorable impacts both on our people and our planet and will enhance worker safety, boost productivity and minimize risk of work-related accidents or long term illness.
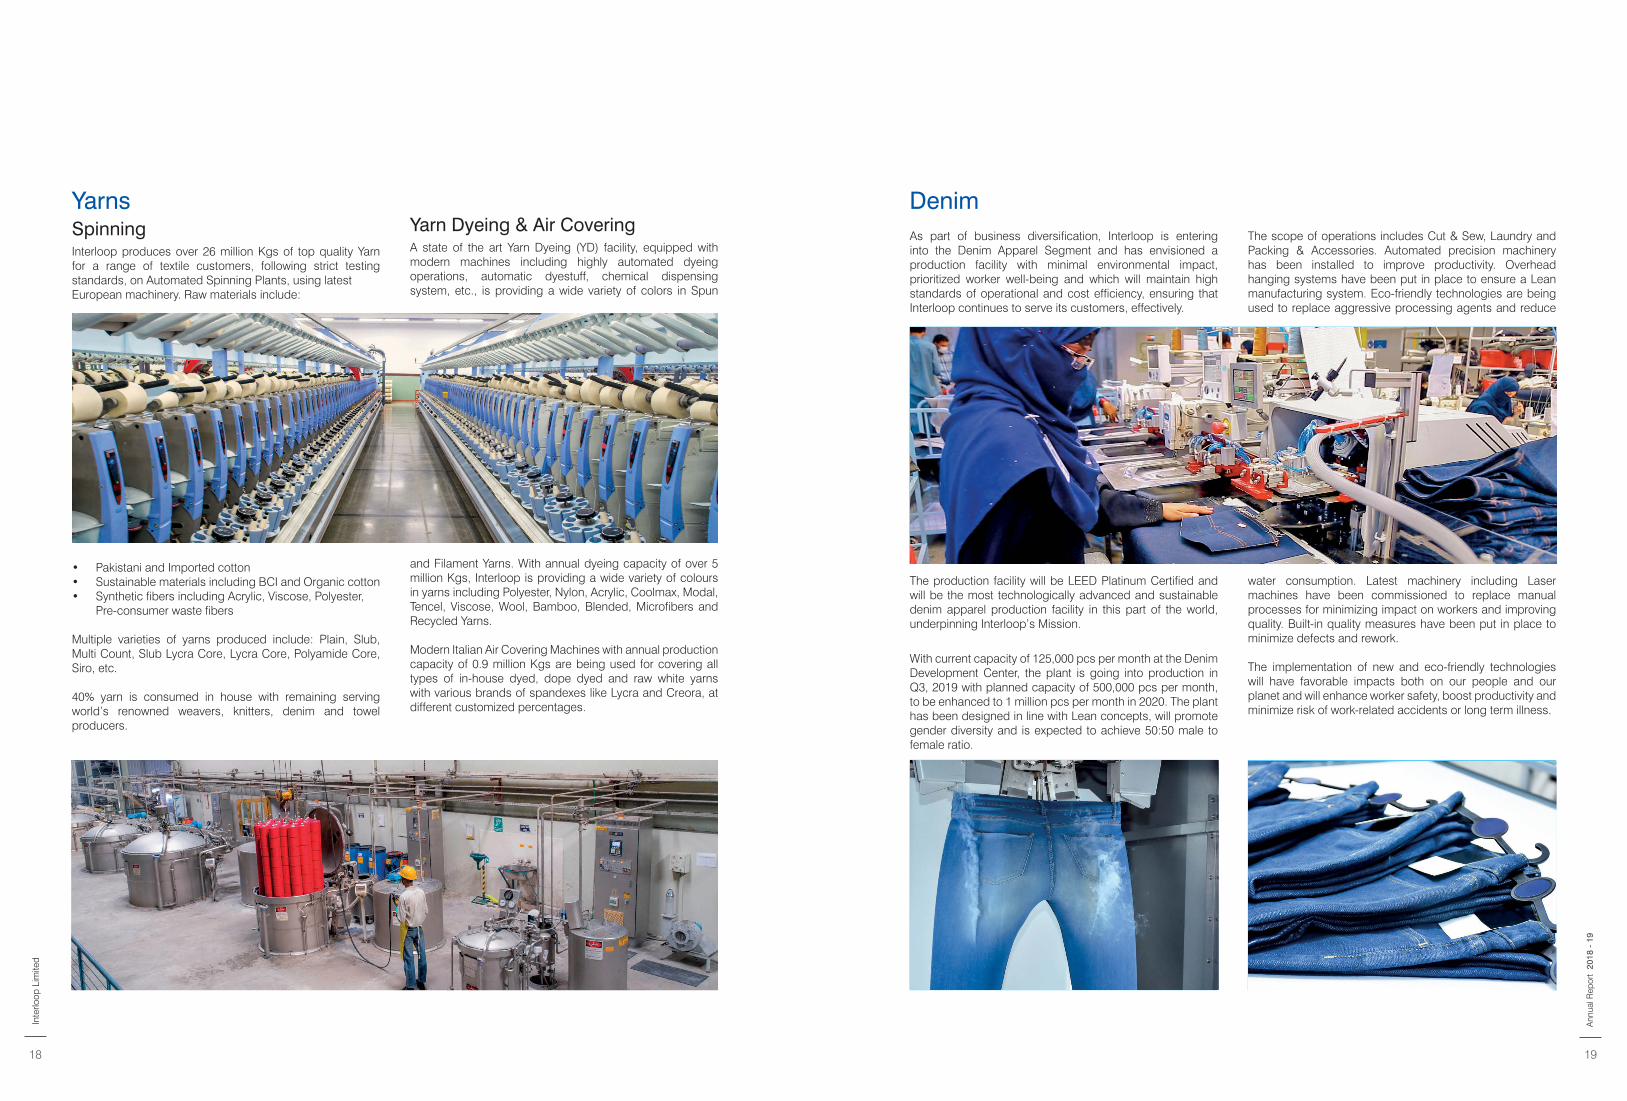
SpinningInterloop produces over 26 million Kgs of top quality Yarn for a range of textile customers, following strict testing standards, on Automated Spinning Plants, using latest European machinery. Raw materials include:
• Pakistani and Imported cotton • Sustainable materials including BCI and Organic cotton• Synthetic fibers including Acrylic, Viscose, Polyester, Pre-consumer waste fibers
Multiple varieties of yarns produced include: Plain, Slub, Multi Count, Slub Lycra Core, Lycra Core, Polyamide Core, Siro, etc.
40% yarn is consumed in house with remaining serving world’s renowned weavers, knitters, denim and towel producers.
Yarn Dyeing & Air CoveringA state of the art Yarn Dyeing (YD) facility, equipped with modern machines including highly automated dyeing operations, automatic dyestuff, chemical dispensing system, etc., is providing a wide variety of colors in Spun
and Filament Yarns. With annual dyeing capacity of over 5 million Kgs, Interloop is providing a wide variety of colours in yarns including Polyester, Nylon, Acrylic, Coolmax, Modal, Tencel, Viscose, Wool, Bamboo, Blended, Microfibers and Recycled Yarns.
Modern Italian Air Covering Machines with annual production capacity of 0.9 million Kgs are being used for covering all types of in-house dyed, dope dyed and raw white yarns with various brands of spandexes like Lycra and Creora, at different customized percentages.
Yarns Denim
Inte
rloop
Lim
ited
18 19
2018
- 1
9A
nnua
l Rep
ort
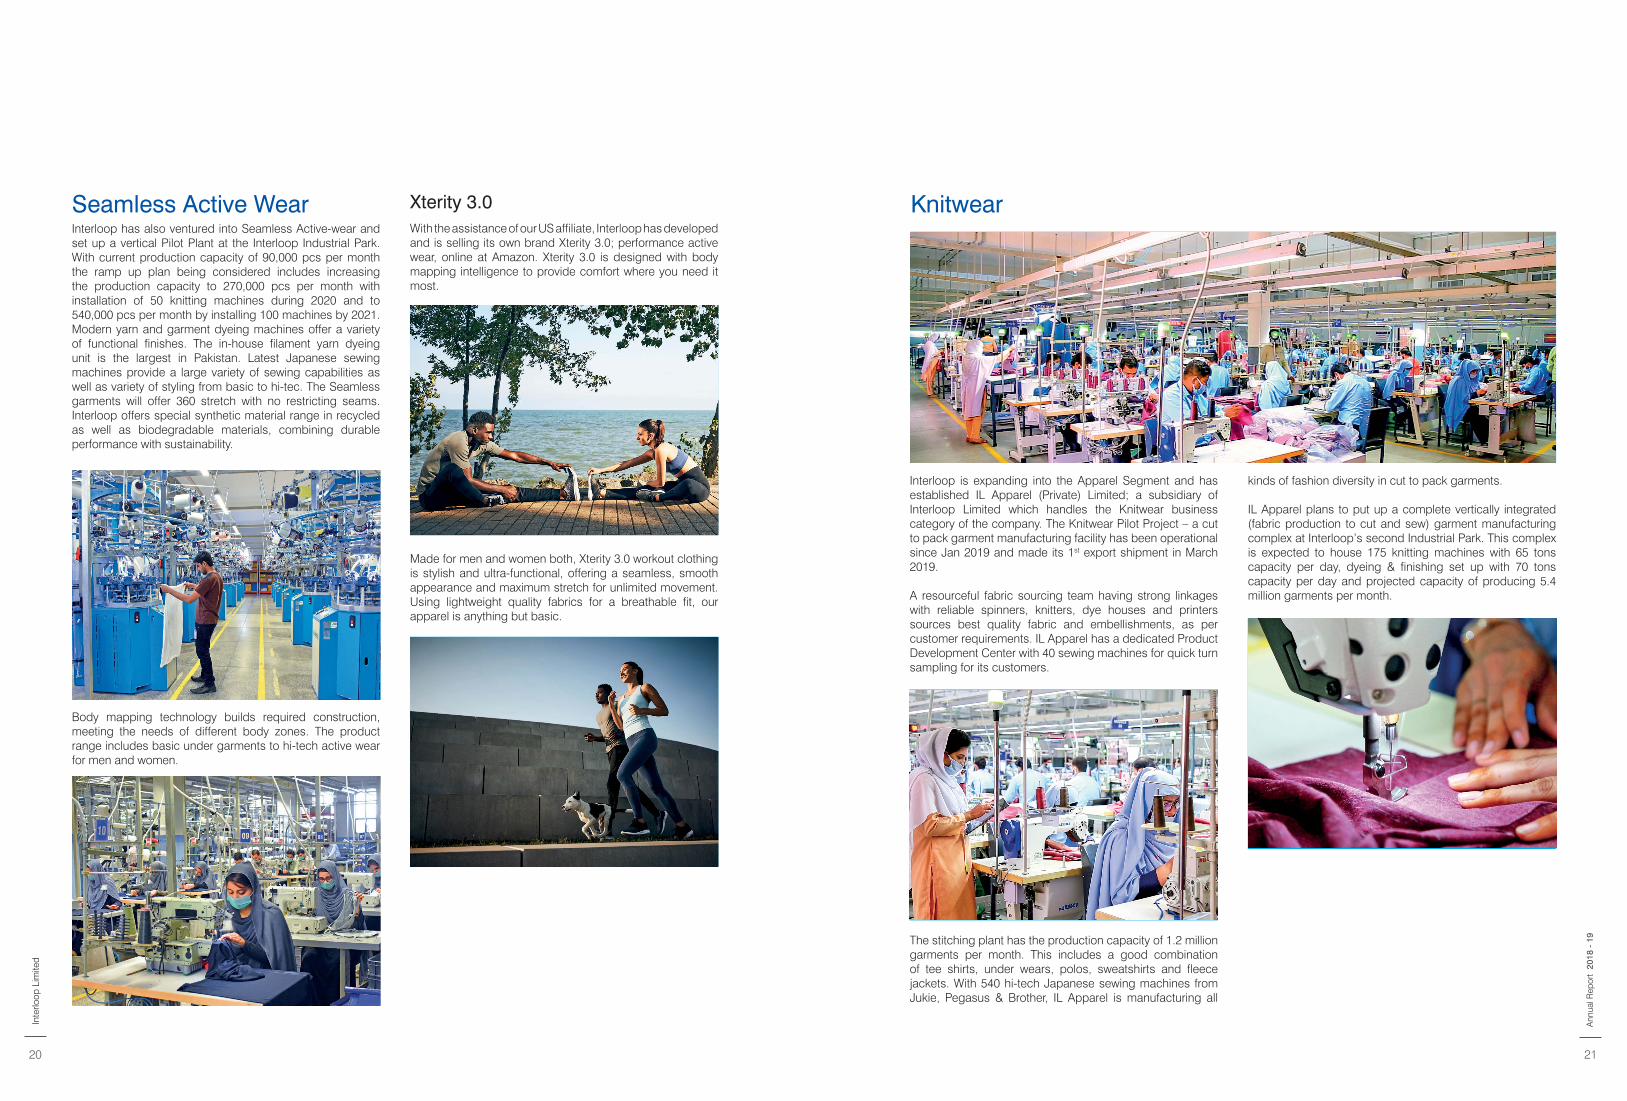
Seamless Active WearInterloop has also ventured into Seamless Active-wear and set up a vertical Pilot Plant at the Interloop Industrial Park. With current production capacity of 90,000 pcs per month the ramp up plan being considered includes increasing the production capacity to 270,000 pcs per month with installation of 50 knitting machines during 2020 and to 540,000 pcs per month by installing 100 machines by 2021. Modern yarn and garment dyeing machines offer a variety of functional finishes. The in-house filament yarn dyeing unit is the largest in Pakistan. Latest Japanese sewing machines provide a large variety of sewing capabilities as well as variety of styling from basic to hi-tec. The Seamless garments will offer 360 stretch with no restricting seams. Interloop offers special synthetic material range in recycled as well as biodegradable materials, combining durable performance with sustainability.
Body mapping technology builds required construction, meeting the needs of different body zones. The product range includes basic under garments to hi-tech active wear for men and women.
Xterity 3.0With the assistance of our US affiliate, Interloop has developed and is selling its own brand Xterity 3.0; performance active wear, online at Amazon. Xterity 3.0 is designed with body mapping intelligence to provide comfort where you need it most.
Made for men and women both, Xterity 3.0 workout clothing is stylish and ultra-functional, offering a seamless, smooth appearance and maximum stretch for unlimited movement. Using lightweight quality fabrics for a breathable fit, our apparel is anything but basic.
Interloop is expanding into the Apparel Segment and has established IL Apparel (Private) Limited; a subsidiary of Interloop Limited which handles the Knitwear business category of the company. The Knitwear Pilot Project – a cut to pack garment manufacturing facility has been operational since Jan 2019 and made its 1st export shipment in March 2019.
A resourceful fabric sourcing team having strong linkages with reliable spinners, knitters, dye houses and printers sources best quality fabric and embellishments, as per customer requirements. IL Apparel has a dedicated Product Development Center with 40 sewing machines for quick turn sampling for its customers.
The stitching plant has the production capacity of 1.2 million garments per month. This includes a good combination of tee shirts, under wears, polos, sweatshirts and fleece jackets. With 540 hi-tech Japanese sewing machines from Jukie, Pegasus & Brother, IL Apparel is manufacturing all
kinds of fashion diversity in cut to pack garments.
IL Apparel plans to put up a complete vertically integrated (fabric production to cut and sew) garment manufacturing complex at Interloop’s second Industrial Park. This complex is expected to house 175 knitting machines with 65 tons capacity per day, dyeing & finishing set up with 70 tons capacity per day and projected capacity of producing 5.4 million garments per month.
Knitwear
Inte
rloop
Lim
ited
20 21
2018
- 1
9A
nnua
l Rep
ort
OUR CUSTOMERS
Some of our top clients include: Interloop has been recognised all over the globe for instituting sustainable practices for its people, operations and the community
AWARDS & RECOGNITION
Interloop was conferred the 14th EFP - OSH
Diamond Award 2018 in recognition of its best
practices in safety, health & environment
In recognition of Interloop’s efforts
towards Triple Bottom Line Sustainability,
Interloop was among the 7 companies from around
the world, endowed with the ‘Sustainability
Innovation Award 2015’, by Business School
Lousanne, Switzerland.
Target Corporation recognized Interloop Limited with the
2017 ‘Partnership Award’ for Responsible Sourcing and Community Development
Interloop was among the 2 out of 34 suppliers from 6 countries to receive PUMA Sustainability
Award 2018 for outstanding performance in Social
Compliance & Environmental Sustainability
In 2016 & 2017 Interloop was conferred adidas Performance Award for its PEOPLE
category based on Employee Welfare Initiatives & CSR
In 2018, adidas awarded Interloop for Zero Waste Water discharge at its LEED
Gold Certified facility, 120KW solar energy generation being enhanced to 2MW by Q3,
2019, significantly reducing the use of plastic & commitment to plant 73,000 trees by 2020
H&M conferred the Sustainability Award
on Interloop Limited in 2016 for its People and Environment focused
Initiatives
Interloop won the Global Supplier ‘Best in Quality’
Award from C&A for 2016-17 for complying
with the quality performance criteria though out the year
OUR CUSTOMERS
Some of our top clients include:
23
2018
- 1
9A
nnua
l Rep
ort
CORPORATE GOVERNANCE
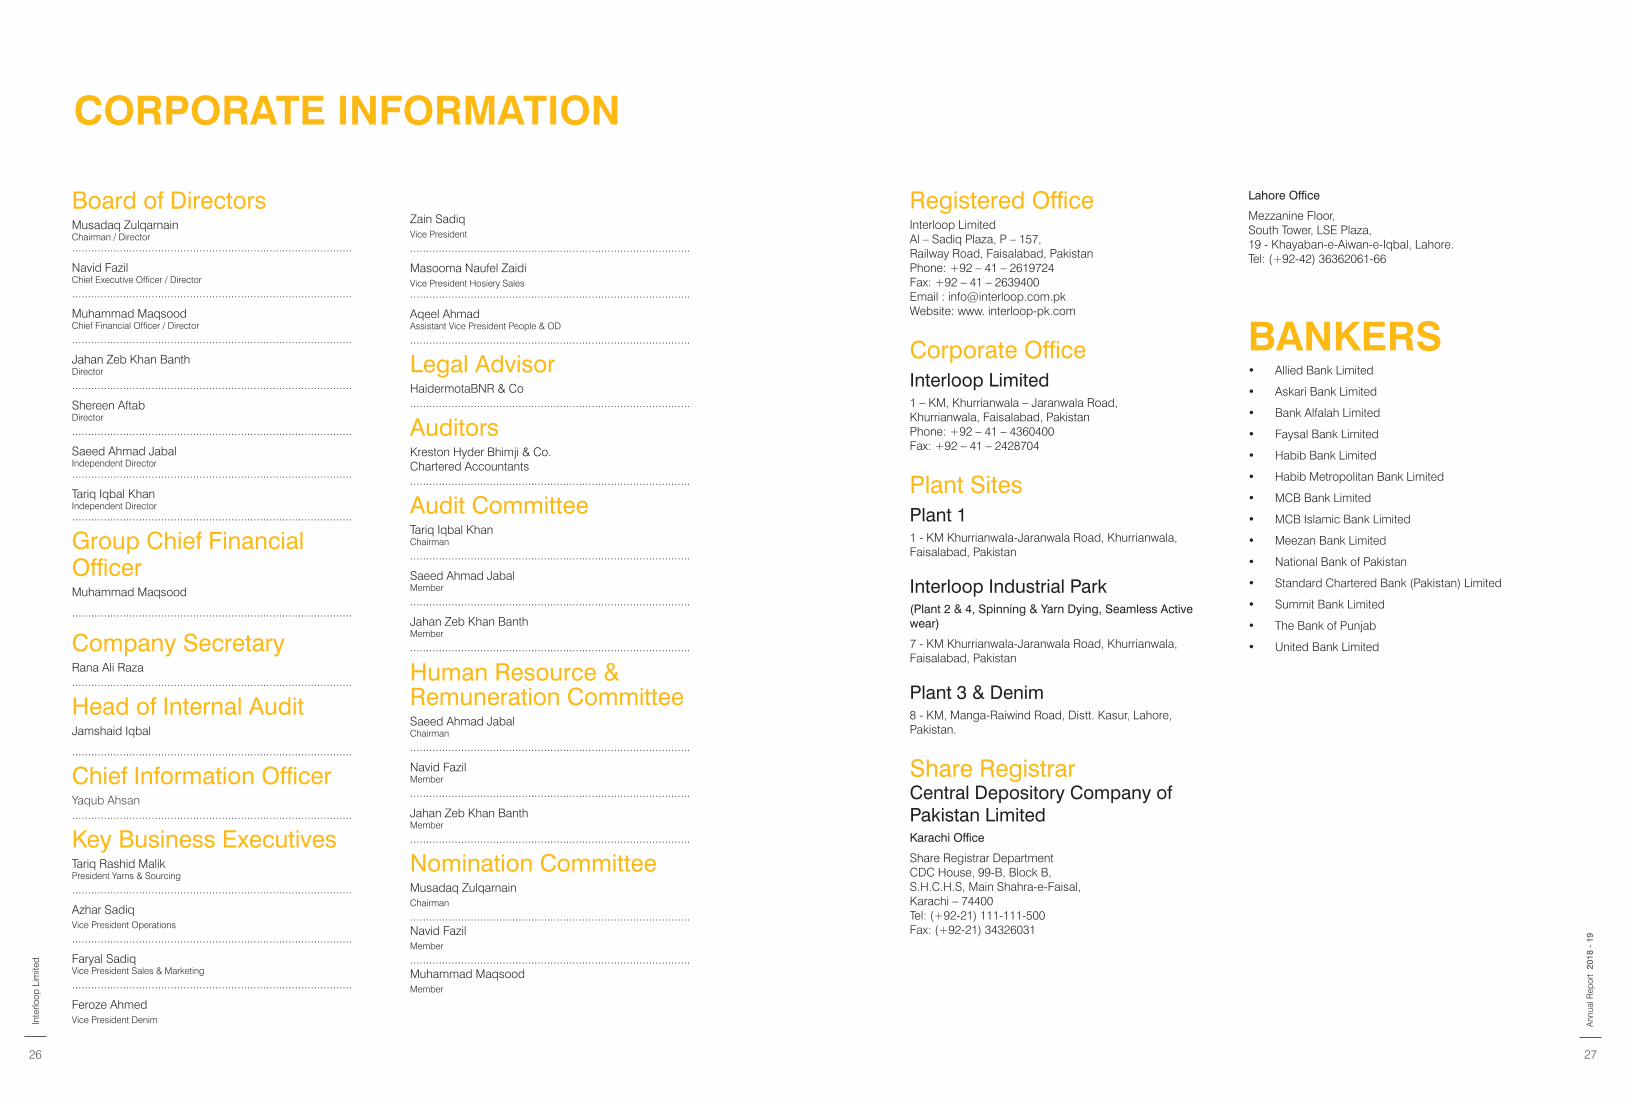
Board of DirectorsMusadaq Zulqarnain Chairman / Director........................................................................................
Navid Fazil Chief Executive Officer / Director
........................................................................................
Muhammad Maqsood Chief Financial Officer / Director
........................................................................................
Jahan Zeb Khan Banth Director
........................................................................................
Shereen Aftab Director
........................................................................................
Saeed Ahmad Jabal Independent Director........................................................................................
Tariq Iqbal Khan Independent Director........................................................................................
Group Chief Financial OfficerMuhammad Maqsood
........................................................................................
Company SecretaryRana Ali Raza........................................................................................
Head of Internal AuditJamshaid Iqbal
........................................................................................
Chief Information OfficerYaqub Ahsan........................................................................................
Key Business ExecutivesTariq Rashid Malik President Yarns & Sourcing
........................................................................................
Azhar SadiqVice President Operations ........................................................................................
Faryal SadiqVice President Sales & Marketing
........................................................................................
Feroze Ahmed Vice President Denim
Zain SadiqVice President
........................................................................................
Masooma Naufel ZaidiVice President Hosiery Sales ........................................................................................
Aqeel AhmadAssistant Vice President People & OD
........................................................................................
Legal AdvisorHaidermotaBNR & Co........................................................................................
AuditorsKreston Hyder Bhimji & Co.Chartered Accountants........................................................................................
Audit CommitteeTariq Iqbal Khan Chairman
........................................................................................
Saeed Ahmad Jabal Member
........................................................................................
Jahan Zeb Khan Banth Member
........................................................................................
Human Resource & Remuneration Committee
Saeed Ahmad Jabal Chairman
........................................................................................
Navid Fazil Member
........................................................................................
Jahan Zeb Khan Banth Member
........................................................................................
Nomination CommitteeMusadaq Zulqarnain Chairman
........................................................................................Navid Fazil Member
........................................................................................Muhammad Maqsood Member
CORPORATE INFORMATION
Registered OfficeInterloop LimitedAl – Sadiq Plaza, P – 157,Railway Road, Faisalabad, PakistanPhone: +92 – 41 – 2619724Fax: +92 – 41 – 2639400Email : [email protected]: www. interloop-pk.com
Corporate OfficeInterloop Limited1 – KM, Khurrianwala – Jaranwala Road,Khurrianwala, Faisalabad, PakistanPhone: +92 – 41 – 4360400Fax: +92 – 41 – 2428704
Plant SitesPlant 11 - KM Khurrianwala-Jaranwala Road, Khurrianwala,Faisalabad, Pakistan
Interloop Industrial Park (Plant 2 & 4, Spinning & Yarn Dying, Seamless Active wear)
7 - KM Khurrianwala-Jaranwala Road, Khurrianwala, Faisalabad, Pakistan
Plant 3 & Denim8 - KM, Manga-Raiwind Road, Distt. Kasur, Lahore, Pakistan.
Share RegistrarCentral Depository Company of Pakistan LimitedKarachi Office
Share Registrar DepartmentCDC House, 99-B, Block B,S.H.C.H.S, Main Shahra-e-Faisal,Karachi – 74400Tel: (+92-21) 111-111-500Fax: (+92-21) 34326031
Lahore Office
Mezzanine Floor,South Tower, LSE Plaza,19 - Khayaban-e-Aiwan-e-Iqbal, Lahore.Tel: (+92-42) 36362061-66
• Allied Bank Limited
• Askari Bank Limited
• Bank Alfalah Limited
• Faysal Bank Limited
• Habib Bank Limited
• Habib Metropolitan Bank Limited
• MCB Bank Limited
• MCB Islamic Bank Limited
• Meezan Bank Limited
• National Bank of Pakistan
• Standard Chartered Bank (Pakistan) Limited
• Summit Bank Limited
• The Bank of Punjab
• United Bank Limited
BANKERS
Inte
rloop
Lim
ited
26 27
2018
- 1
9A
nnua
l Rep
ort
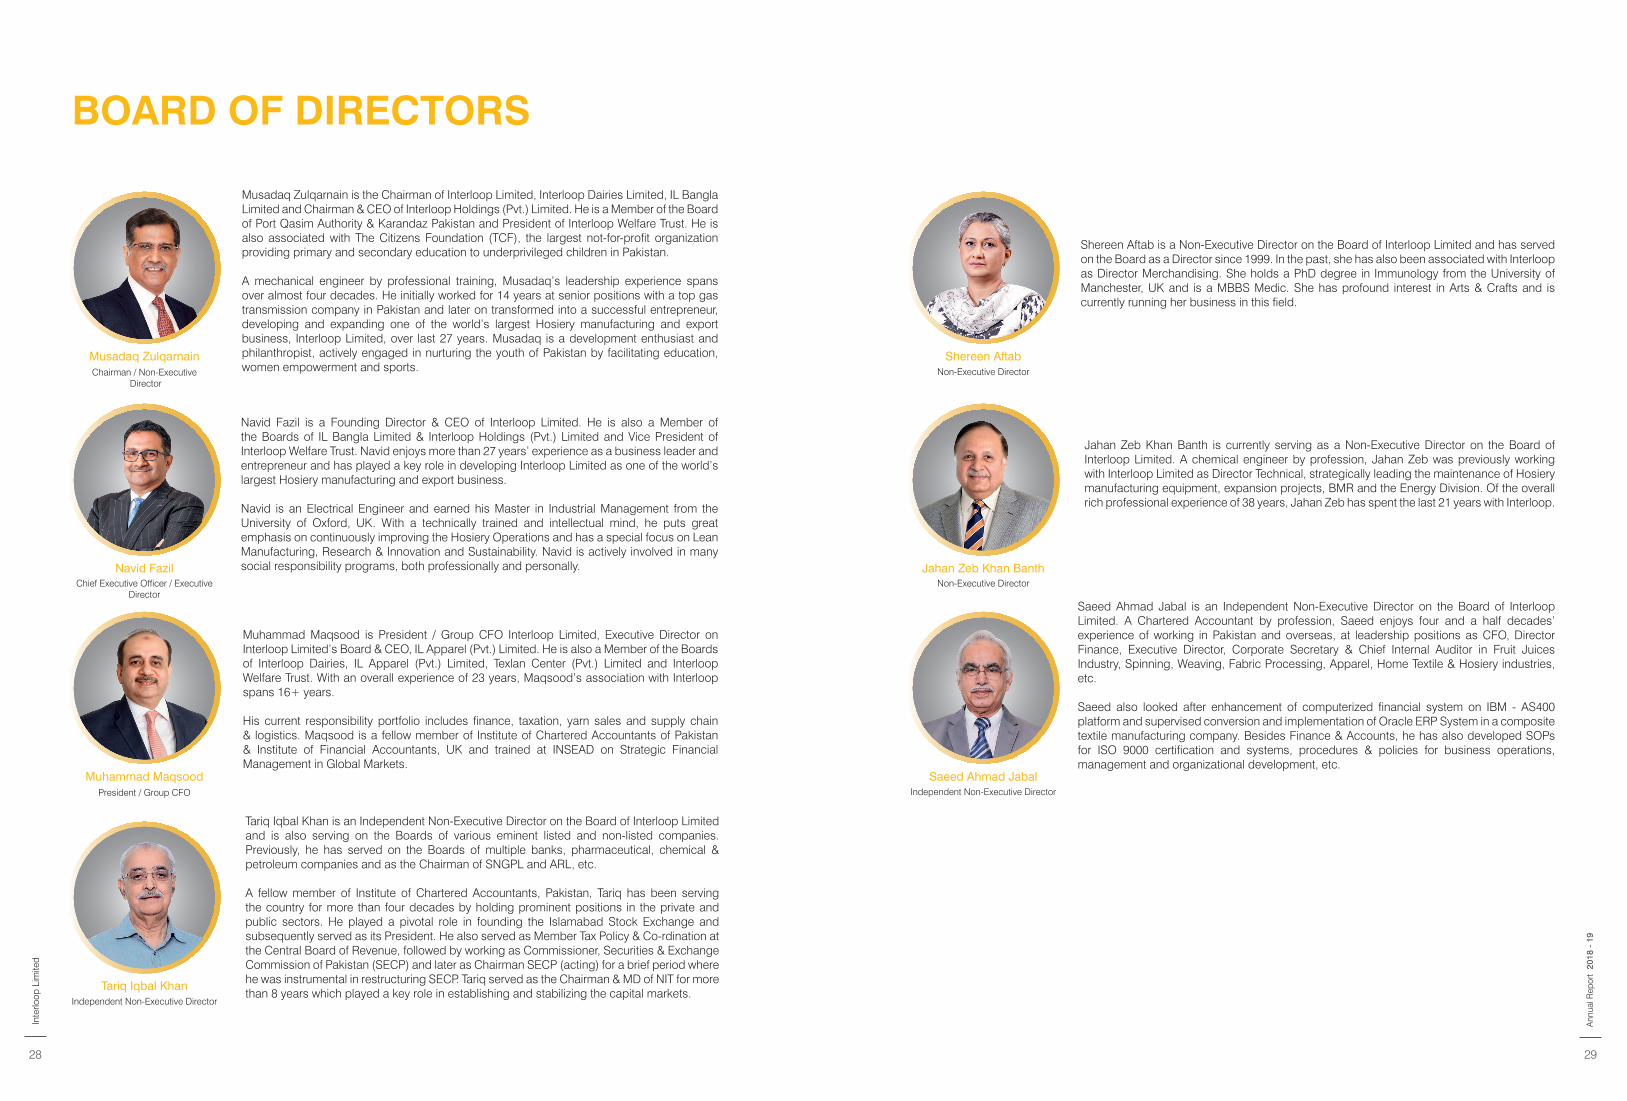
BOARD OF DIRECTORS
Musadaq Zulqarnain is the Chairman of Interloop Limited, Interloop Dairies Limited, IL Bangla Limited and Chairman & CEO of Interloop Holdings (Pvt.) Limited. He is a Member of the Board of Port Qasim Authority & Karandaz Pakistan and President of Interloop Welfare Trust. He is also associated with The Citizens Foundation (TCF), the largest not-for-profit organization providing primary and secondary education to underprivileged children in Pakistan.
A mechanical engineer by professional training, Musadaq’s leadership experience spans over almost four decades. He initially worked for 14 years at senior positions with a top gas transmission company in Pakistan and later on transformed into a successful entrepreneur, developing and expanding one of the world’s largest Hosiery manufacturing and export business, Interloop Limited, over last 27 years. Musadaq is a development enthusiast and philanthropist, actively engaged in nurturing the youth of Pakistan by facilitating education, women empowerment and sports.
Musadaq ZulqarnainChairman / Non-Executive
Director
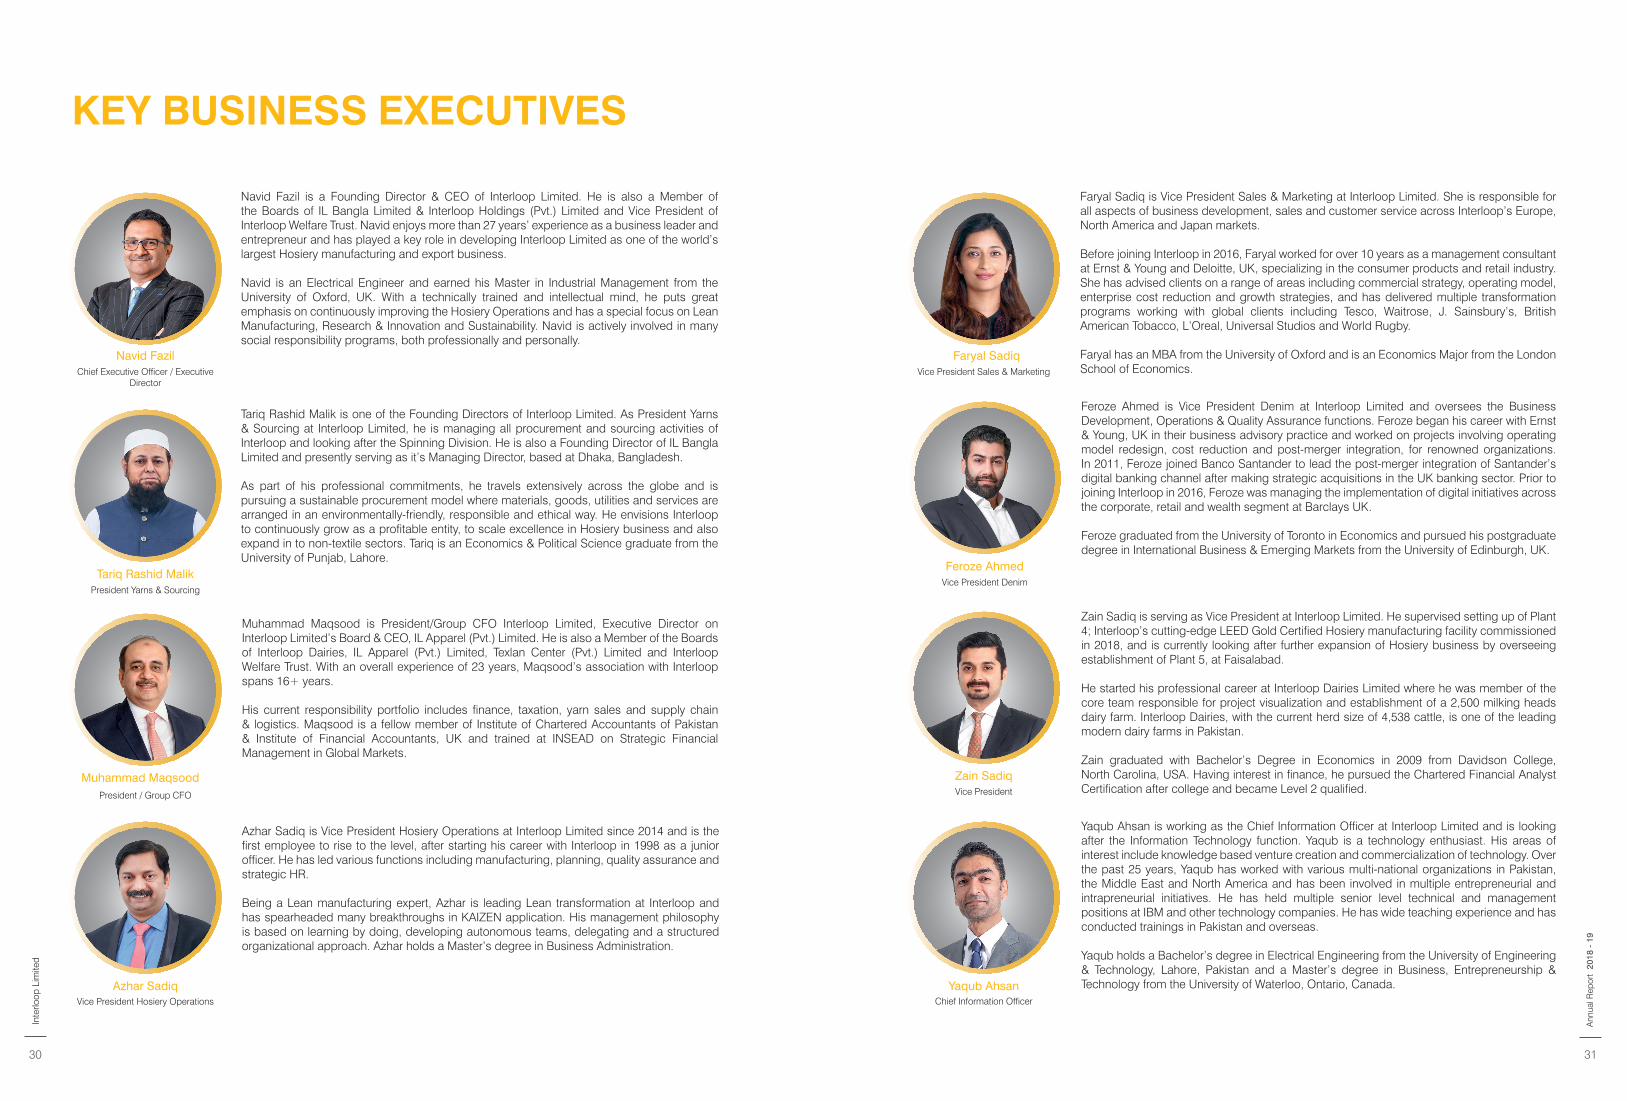
Navid Fazil is a Founding Director & CEO of Interloop Limited. He is also a Member of the Boards of IL Bangla Limited & Interloop Holdings (Pvt.) Limited and Vice President of Interloop Welfare Trust. Navid enjoys more than 27 years’ experience as a business leader and entrepreneur and has played a key role in developing Interloop Limited as one of the world’s largest Hosiery manufacturing and export business.
Navid is an Electrical Engineer and earned his Master in Industrial Management from the University of Oxford, UK. With a technically trained and intellectual mind, he puts great emphasis on continuously improving the Hosiery Operations and has a special focus on Lean Manufacturing, Research & Innovation and Sustainability. Navid is actively involved in many social responsibility programs, both professionally and personally.Navid Fazil
Chief Executive Officer / Executive Director
Muhammad Maqsood is President / Group CFO Interloop Limited, Executive Director on Interloop Limited’s Board & CEO, IL Apparel (Pvt.) Limited. He is also a Member of the Boards of Interloop Dairies, IL Apparel (Pvt.) Limited, Texlan Center (Pvt.) Limited and Interloop Welfare Trust. With an overall experience of 23 years, Maqsood’s association with Interloop spans 16+ years.
His current responsibility portfolio includes finance, taxation, yarn sales and supply chain & logistics. Maqsood is a fellow member of Institute of Chartered Accountants of Pakistan & Institute of Financial Accountants, UK and trained at INSEAD on Strategic Financial Management in Global Markets.
Muhammad MaqsoodPresident / Group CFO
Tariq Iqbal Khan is an Independent Non-Executive Director on the Board of Interloop Limited and is also serving on the Boards of various eminent listed and non-listed companies. Previously, he has served on the Boards of multiple banks, pharmaceutical, chemical & petroleum companies and as the Chairman of SNGPL and ARL, etc.
A fellow member of Institute of Chartered Accountants, Pakistan, Tariq has been serving the country for more than four decades by holding prominent positions in the private and public sectors. He played a pivotal role in founding the Islamabad Stock Exchange and subsequently served as its President. He also served as Member Tax Policy & Co-rdination at the Central Board of Revenue, followed by working as Commissioner, Securities & Exchange Commission of Pakistan (SECP) and later as Chairman SECP (acting) for a brief period where he was instrumental in restructuring SECP. Tariq served as the Chairman & MD of NIT for more than 8 years which played a key role in establishing and stabilizing the capital markets.
Tariq Iqbal KhanIndependent Non-Executive Director
Shereen Aftab is a Non-Executive Director on the Board of Interloop Limited and has served on the Board as a Director since 1999. In the past, she has also been associated with Interloop as Director Merchandising. She holds a PhD degree in Immunology from the University of Manchester, UK and is a MBBS Medic. She has profound interest in Arts & Crafts and is currently running her business in this field.
Shereen AftabNon-Executive Director
Jahan Zeb Khan Banth is currently serving as a Non-Executive Director on the Board of Interloop Limited. A chemical engineer by profession, Jahan Zeb was previously working with Interloop Limited as Director Technical, strategically leading the maintenance of Hosiery manufacturing equipment, expansion projects, BMR and the Energy Division. Of the overall rich professional experience of 38 years, Jahan Zeb has spent the last 21 years with Interloop.
Jahan Zeb Khan BanthNon-Executive Director
Saeed Ahmad Jabal is an Independent Non-Executive Director on the Board of Interloop Limited. A Chartered Accountant by profession, Saeed enjoys four and a half decades’ experience of working in Pakistan and overseas, at leadership positions as CFO, Director Finance, Executive Director, Corporate Secretary & Chief Internal Auditor in Fruit Juices Industry, Spinning, Weaving, Fabric Processing, Apparel, Home Textile & Hosiery industries, etc.
Saeed also looked after enhancement of computerized financial system on IBM - AS400 platform and supervised conversion and implementation of Oracle ERP System in a composite textile manufacturing company. Besides Finance & Accounts, he has also developed SOPs for ISO 9000 certification and systems, procedures & policies for business operations, management and organizational development, etc.
Saeed Ahmad JabalIndependent Non-Executive Director
Inte
rloop
Lim
ited
28 29
2018
- 1
9A
nnua
l Rep
ort
KEY BUSINESS EXECUTIVES
Faryal Sadiq is Vice President Sales & Marketing at Interloop Limited. She is responsible for all aspects of business development, sales and customer service across Interloop’s Europe, North America and Japan markets.
Before joining Interloop in 2016, Faryal worked for over 10 years as a management consultant at Ernst & Young and Deloitte, UK, specializing in the consumer products and retail industry. She has advised clients on a range of areas including commercial strategy, operating model, enterprise cost reduction and growth strategies, and has delivered multiple transformation programs working with global clients including Tesco, Waitrose, J. Sainsbury’s, British American Tobacco, L’Oreal, Universal Studios and World Rugby.
Faryal has an MBA from the University of Oxford and is an Economics Major from the London School of Economics.
Feroze Ahmed is Vice President Denim at Interloop Limited and oversees the Business Development, Operations & Quality Assurance functions. Feroze began his career with Ernst & Young, UK in their business advisory practice and worked on projects involving operating model redesign, cost reduction and post-merger integration, for renowned organizations. In 2011, Feroze joined Banco Santander to lead the post-merger integration of Santander’s digital banking channel after making strategic acquisitions in the UK banking sector. Prior to joining Interloop in 2016, Feroze was managing the implementation of digital initiatives across the corporate, retail and wealth segment at Barclays UK.
Feroze graduated from the University of Toronto in Economics and pursued his postgraduate degree in International Business & Emerging Markets from the University of Edinburgh, UK.
Zain Sadiq is serving as Vice President at Interloop Limited. He supervised setting up of Plant 4; Interloop’s cutting-edge LEED Gold Certified Hosiery manufacturing facility commissioned in 2018, and is currently looking after further expansion of Hosiery business by overseeing establishment of Plant 5, at Faisalabad.
He started his professional career at Interloop Dairies Limited where he was member of the core team responsible for project visualization and establishment of a 2,500 milking heads dairy farm. Interloop Dairies, with the current herd size of 4,538 cattle, is one of the leading modern dairy farms in Pakistan.
Zain graduated with Bachelor’s Degree in Economics in 2009 from Davidson College, North Carolina, USA. Having interest in finance, he pursued the Chartered Financial Analyst Certification after college and became Level 2 qualified.
Yaqub Ahsan is working as the Chief Information Officer at Interloop Limited and is looking after the Information Technology function. Yaqub is a technology enthusiast. His areas of interest include knowledge based venture creation and commercialization of technology. Over the past 25 years, Yaqub has worked with various multi-national organizations in Pakistan, the Middle East and North America and has been involved in multiple entrepreneurial and intrapreneurial initiatives. He has held multiple senior level technical and management positions at IBM and other technology companies. He has wide teaching experience and has conducted trainings in Pakistan and overseas.
Yaqub holds a Bachelor’s degree in Electrical Engineering from the University of Engineering & Technology, Lahore, Pakistan and a Master’s degree in Business, Entrepreneurship & Technology from the University of Waterloo, Ontario, Canada.Yaqub Ahsan
Chief Information Officer
Zain SadiqVice President
Feroze AhmedVice President Denim
Faryal SadiqVice President Sales & Marketing
Navid Fazil is a Founding Director & CEO of Interloop Limited. He is also a Member of the Boards of IL Bangla Limited & Interloop Holdings (Pvt.) Limited and Vice President of Interloop Welfare Trust. Navid enjoys more than 27 years’ experience as a business leader and entrepreneur and has played a key role in developing Interloop Limited as one of the world’s largest Hosiery manufacturing and export business.
Navid is an Electrical Engineer and earned his Master in Industrial Management from the University of Oxford, UK. With a technically trained and intellectual mind, he puts great emphasis on continuously improving the Hosiery Operations and has a special focus on Lean Manufacturing, Research & Innovation and Sustainability. Navid is actively involved in many social responsibility programs, both professionally and personally.
Tariq Rashid Malik is one of the Founding Directors of Interloop Limited. As President Yarns & Sourcing at Interloop Limited, he is managing all procurement and sourcing activities of Interloop and looking after the Spinning Division. He is also a Founding Director of IL Bangla Limited and presently serving as it’s Managing Director, based at Dhaka, Bangladesh.
As part of his professional commitments, he travels extensively across the globe and is pursuing a sustainable procurement model where materials, goods, utilities and services are arranged in an environmentally-friendly, responsible and ethical way. He envisions Interloop to continuously grow as a profitable entity, to scale excellence in Hosiery business and also expand in to non-textile sectors. Tariq is an Economics & Political Science graduate from the University of Punjab, Lahore.
Muhammad Maqsood is President/Group CFO Interloop Limited, Executive Director on Interloop Limited’s Board & CEO, IL Apparel (Pvt.) Limited. He is also a Member of the Boards of Interloop Dairies, IL Apparel (Pvt.) Limited, Texlan Center (Pvt.) Limited and Interloop Welfare Trust. With an overall experience of 23 years, Maqsood’s association with Interloop spans 16+ years.
His current responsibility portfolio includes finance, taxation, yarn sales and supply chain & logistics. Maqsood is a fellow member of Institute of Chartered Accountants of Pakistan & Institute of Financial Accountants, UK and trained at INSEAD on Strategic Financial Management in Global Markets.
Azhar Sadiq is Vice President Hosiery Operations at Interloop Limited since 2014 and is the first employee to rise to the level, after starting his career with Interloop in 1998 as a junior officer. He has led various functions including manufacturing, planning, quality assurance and strategic HR.
Being a Lean manufacturing expert, Azhar is leading Lean transformation at Interloop and has spearheaded many breakthroughs in KAIZEN application. His management philosophy is based on learning by doing, developing autonomous teams, delegating and a structured organizational approach. Azhar holds a Master’s degree in Business Administration.
Azhar SadiqVice President Hosiery Operations
Muhammad MaqsoodPresident / Group CFO
Tariq Rashid MalikPresident Yarns & Sourcing
Navid FazilChief Executive Officer / Executive
Director
Inte
rloop
Lim
ited
30 31
2018
- 1
9A
nnua
l Rep
ort
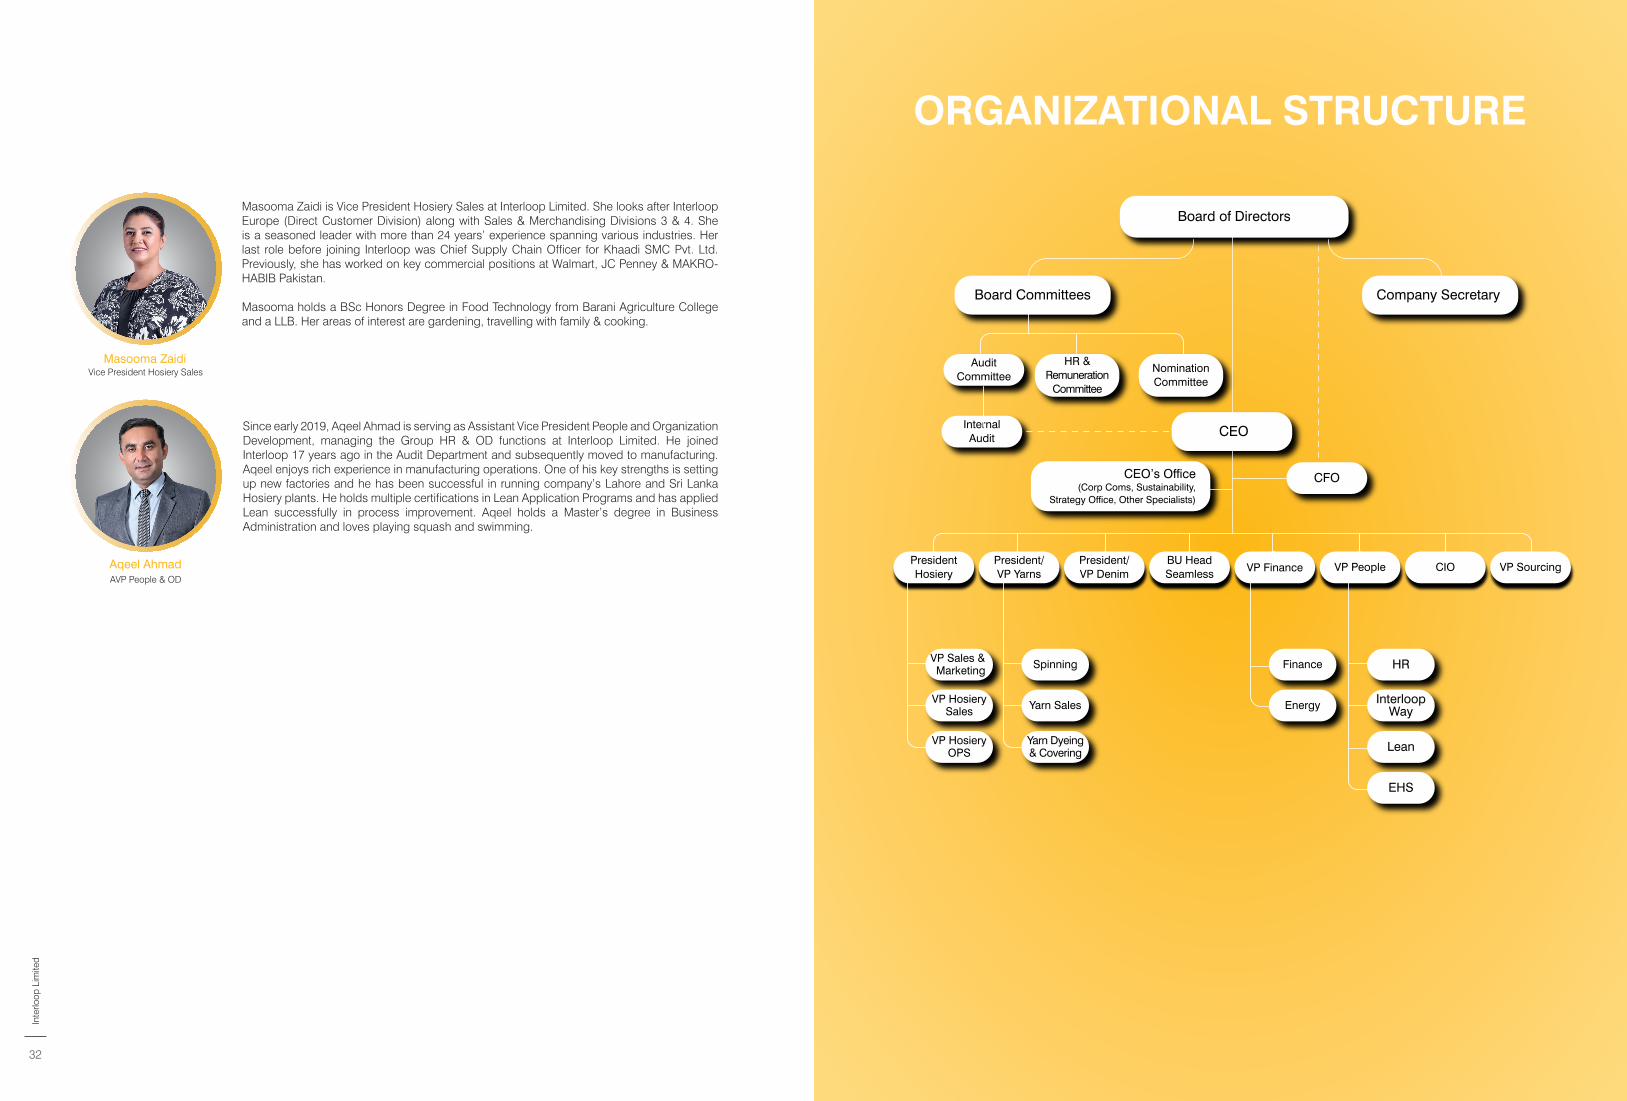
Masooma Zaidi is Vice President Hosiery Sales at Interloop Limited. She looks after Interloop Europe (Direct Customer Division) along with Sales & Merchandising Divisions 3 & 4. She is a seasoned leader with more than 24 years’ experience spanning various industries. Her last role before joining Interloop was Chief Supply Chain Officer for Khaadi SMC Pvt. Ltd. Previously, she has worked on key commercial positions at Walmart, JC Penney & MAKRO-HABIB Pakistan.
Masooma holds a BSc Honors Degree in Food Technology from Barani Agriculture College and a LLB. Her areas of interest are gardening, travelling with family & cooking.
Since early 2019, Aqeel Ahmad is serving as Assistant Vice President People and Organization Development, managing the Group HR & OD functions at Interloop Limited. He joined Interloop 17 years ago in the Audit Department and subsequently moved to manufacturing. Aqeel enjoys rich experience in manufacturing operations. One of his key strengths is setting up new factories and he has been successful in running company’s Lahore and Sri Lanka Hosiery plants. He holds multiple certifications in Lean Application Programs and has applied Lean successfully in process improvement. Aqeel holds a Master’s degree in Business Administration and loves playing squash and swimming.
Masooma ZaidiVice President Hosiery Sales
Board of Directors
Company Secretary Board Committees
PresidentHosiery
President/VP Yarns
President/VP Denim
AuditCommittee
InternalAudit
HR &Remuneration
Committee
NominationCommittee
BU HeadSeamless
VP HosierySales
VP Sales & Marketing
VP HosieryOPS
VP Finance VP People CIO
CFO
VP Sourcing
Yarn Dyeing& Covering
Yarn Sales
Spinning
Lean
EHS
InterloopWay
HRFinance
Energy
CEO’s Office (Corp Coms, Sustainability,
Strategy Office, Other Specialists)
CEO
Aqeel AhmadAVP People & OD
ORGANIZATIONAL STRUCTURE
Inte
rloop
Lim
ited
32
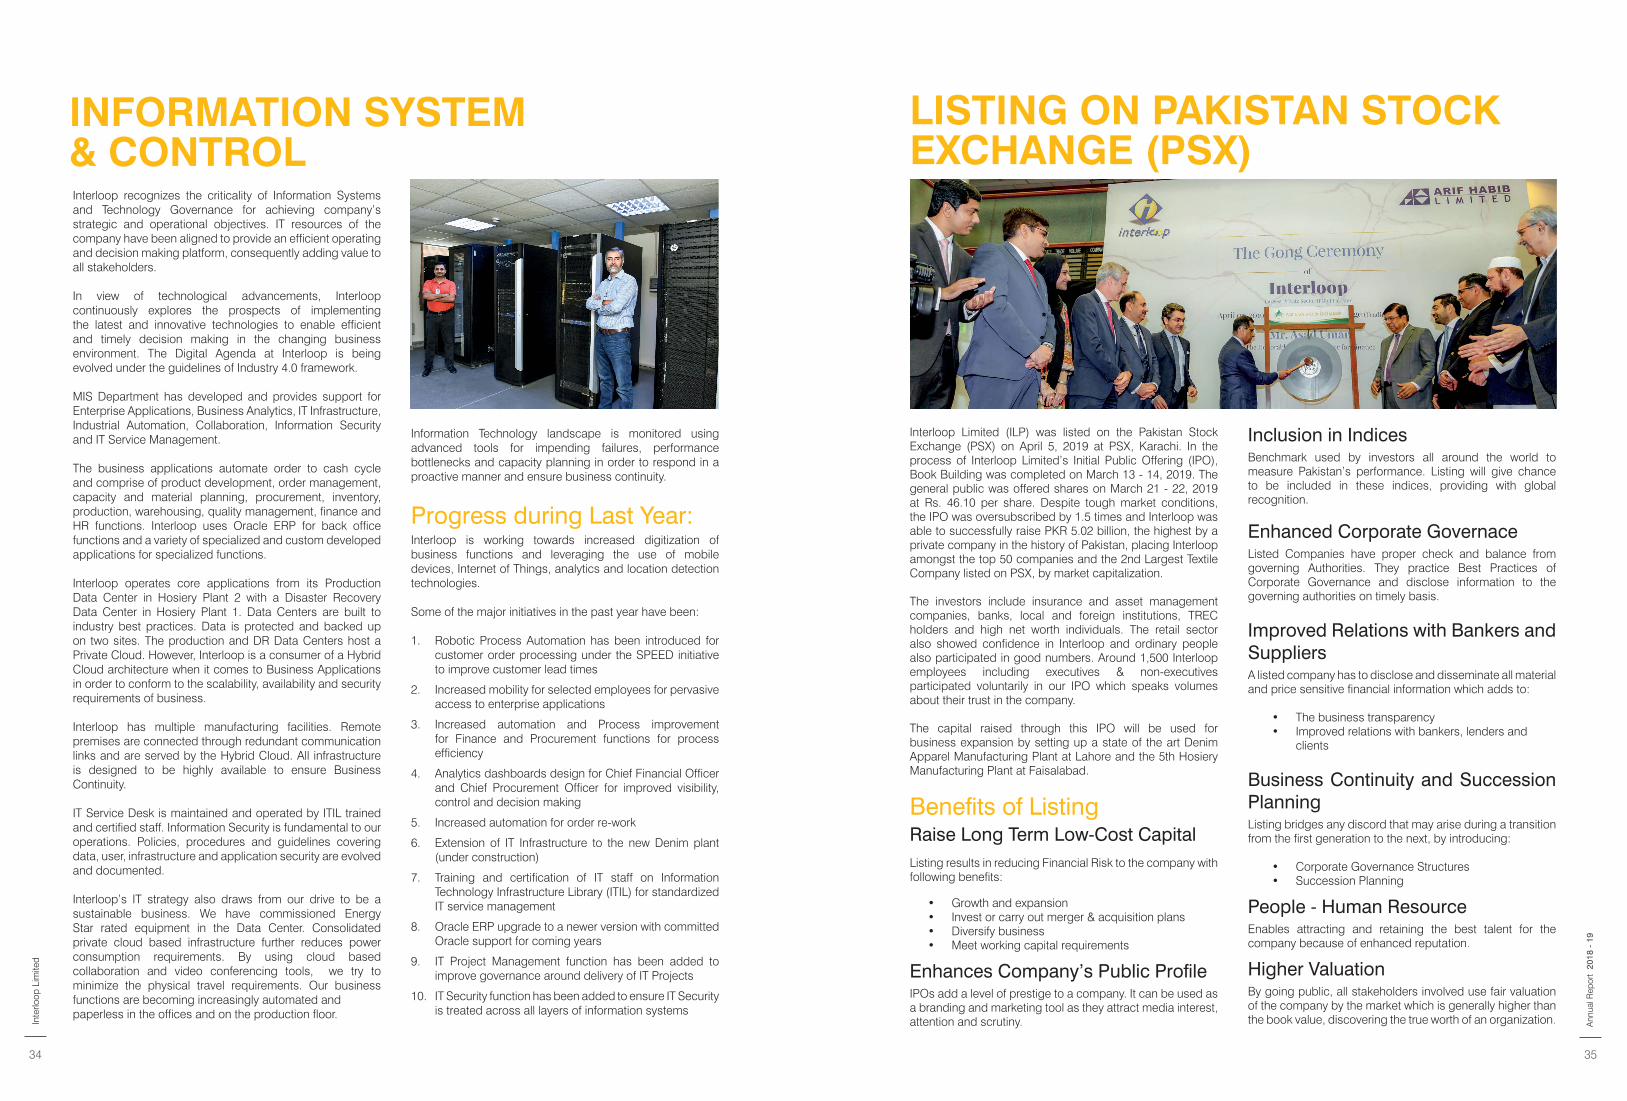
Interloop recognizes the criticality of Information Systems and Technology Governance for achieving company’s strategic and operational objectives. IT resources of the company have been aligned to provide an efficient operating and decision making platform, consequently adding value to all stakeholders.
In view of technological advancements, Interloop continuously explores the prospects of implementing the latest and innovative technologies to enable efficient and timely decision making in the changing business environment. The Digital Agenda at Interloop is being evolved under the guidelines of Industry 4.0 framework.
MIS Department has developed and provides support for Enterprise Applications, Business Analytics, IT Infrastructure, Industrial Automation, Collaboration, Information Security and IT Service Management.
The business applications automate order to cash cycle and comprise of product development, order management, capacity and material planning, procurement, inventory, production, warehousing, quality management, finance and HR functions. Interloop uses Oracle ERP for back office functions and a variety of specialized and custom developed applications for specialized functions.
Interloop operates core applications from its Production Data Center in Hosiery Plant 2 with a Disaster Recovery Data Center in Hosiery Plant 1. Data Centers are built to industry best practices. Data is protected and backed up on two sites. The production and DR Data Centers host a Private Cloud. However, Interloop is a consumer of a Hybrid Cloud architecture when it comes to Business Applications in order to conform to the scalability, availability and security requirements of business.
Interloop has multiple manufacturing facilities. Remote premises are connected through redundant communication links and are served by the Hybrid Cloud. All infrastructure is designed to be highly available to ensure Business Continuity.
IT Service Desk is maintained and operated by ITIL trained and certified staff. Information Security is fundamental to our operations. Policies, procedures and guidelines covering data, user, infrastructure and application security are evolved and documented.
Interloop’s IT strategy also draws from our drive to be a sustainable business. We have commissioned Energy Star rated equipment in the Data Center. Consolidated private cloud based infrastructure further reduces power consumption requirements. By using cloud based collaboration and video conferencing tools, we try to minimize the physical travel requirements. Our business functions are becoming increasingly automated and paperless in the offices and on the production floor.
Information Technology landscape is monitored using advanced tools for impending failures, performance bottlenecks and capacity planning in order to respond in a proactive manner and ensure business continuity.
Progress during Last Year:Interloop is working towards increased digitization of business functions and leveraging the use of mobile devices, Internet of Things, analytics and location detection technologies.
Some of the major initiatives in the past year have been:
1. Robotic Process Automation has been introduced for customer order processing under the SPEED initiative to improve customer lead times
2. Increased mobility for selected employees for pervasive access to enterprise applications
3. Increased automation and Process improvement for Finance and Procurement functions for process efficiency
4. Analytics dashboards design for Chief Financial Officer and Chief Procurement Officer for improved visibility, control and decision making
5. Increased automation for order re-work
6. Extension of IT Infrastructure to the new Denim plant (under construction)
7. Training and certification of IT staff on Information Technology Infrastructure Library (ITIL) for standardized IT service management
8. Oracle ERP upgrade to a newer version with committed Oracle support for coming years
9. IT Project Management function has been added to improve governance around delivery of IT Projects
10. IT Security function has been added to ensure IT Security is treated across all layers of information systems
INFORMATION SYSTEM & CONTROL
LISTING ON PAKISTAN STOCK EXCHANGE (PSX)
Interloop Limited (ILP) was listed on the Pakistan Stock Exchange (PSX) on April 5, 2019 at PSX, Karachi. In the process of Interloop Limited’s Initial Public Offering (IPO), Book Building was completed on March 13 - 14, 2019. The general public was offered shares on March 21 - 22, 2019 at Rs. 46.10 per share. Despite tough market conditions, the IPO was oversubscribed by 1.5 times and Interloop was able to successfully raise PKR 5.02 billion, the highest by a private company in the history of Pakistan, placing Interloop amongst the top 50 companies and the 2nd Largest Textile Company listed on PSX, by market capitalization.
The investors include insurance and asset management companies, banks, local and foreign institutions, TREC holders and high net worth individuals. The retail sector also showed confidence in Interloop and ordinary people also participated in good numbers. Around 1,500 Interloop employees including executives & non-executives participated voluntarily in our IPO which speaks volumes about their trust in the company.
The capital raised through this IPO will be used for business expansion by setting up a state of the art Denim Apparel Manufacturing Plant at Lahore and the 5th Hosiery Manufacturing Plant at Faisalabad.
Benefits of ListingRaise Long Term Low-Cost CapitalListing results in reducing Financial Risk to the company with following benefits:
• Growth and expansion• Invest or carry out merger & acquisition plans• Diversify business• Meet working capital requirements
Enhances Company’s Public ProfileIPOs add a level of prestige to a company. It can be used as a branding and marketing tool as they attract media interest, attention and scrutiny.
Inclusion in IndicesBenchmark used by investors all around the world to measure Pakistan’s performance. Listing will give chance to be included in these indices, providing with global recognition.
Enhanced Corporate GovernaceListed Companies have proper check and balance from governing Authorities. They practice Best Practices of Corporate Governance and disclose information to the governing authorities on timely basis.
Improved Relations with Bankers and SuppliersA listed company has to disclose and disseminate all material and price sensitive financial information which adds to:
• The business transparency • Improved relations with bankers, lenders and
clients
Business Continuity and Succession PlanningListing bridges any discord that may arise during a transition from the first generation to the next, by introducing:
• Corporate Governance Structures • Succession Planning
People - Human ResourceEnables attracting and retaining the best talent for the company because of enhanced reputation.
Higher ValuationBy going public, all stakeholders involved use fair valuation of the company by the market which is generally higher than the book value, discovering the true worth of an organization.In
terlo
op L
imite
d
34 35
2018
- 1
9A
nnua
l Rep
ort
STAKEHOLDER ENGAGEMENT
Shareholders / Institutional InvestorsInterloop acknowledges and honors the trust our investors and shareholders have placed in us. Safeguarding their interest is our prime responsibility. Our investors and shareholders’ interest revolves around good returns, profitability, growth and regulatory compliances. We respond to their expectations through improvement in business mechanics, effective governance and corporate reporting framework. Annual General Meetings and statutory reporting are the most effective means of our engagement with our investors & shareholders. Support of shareholders and investors is critical in achieving the company objectives.
Investors’ Grievance PolicyThe Company has a Investors’ Grievance Policy in place. Any complaints or observations received either directly by the Corporate Affairs Department or during General Meetings are addressed by the Company Secretary. The Shareholders are given the information as desired by them and as per the law. All written complaints are responded in writing.
Minority ShareholdersThe management of the company believes, encourages and ensures the equitable treatment of all shareholders including minority shareholders. Company ficilitates all share holders to attend, speak and vote at the General Meetings and appoint another member as his/her proxy in his/her absence. The notices of General Meetings are circulated by the company within the regulatory timeframes to the registered addresses of the shareholders (including minority shareholders) as well as published in Urdu and English newspapers.
Investor Relations SectionTo keep transparency in the relationship between the company and its shareholders, the website of Interloop Limited (interloop-pk.com) contains all major financial information needed for investors’ decision making in a separate tab.
Banks and otherLendersWe value our relationship with our financial partners and lenders who are engaged with the company on an on-going basis in relation to negotiation of rates, lending purposes, short term financing, deposits and investments. Banks are also consulted on issues linked with letters of credit and payments to suppliers, along with other disbursements of operational nature. Periodic briefings, quarterly financial
reporting, Head Office and Plants’ visits are the important means for our engagement with this category of stakeholders.
Suppliers and VendorsOur sustainable growth is also attributable to engaging reputed and dependable suppliers & vendors as business partners for supply of raw material, industrial inputs, equipment and machinery. We believe in strategic relationships and have developed strong connections with top local and international vendors in the industry. Our Procurement & Supplies team stays in continuous contact with suppliers and vendors through meetings and correspondences to resolve all issues for on time deliveries, any concerns about terms and conditions and timely payments.
CustomersDeveloping and sustaining long term relationships with our customers forms the key to our business success. Their expectations are focused on product quality, pricing and service delivery. While our Operations teams focus on producing top quality products according to customer specifications, our Sales and Merchandising teams remain in close contact with this stakeholder segment to resolve issues, if any, on a priority basis. We continue to engage with our customers through meetings, plant visits and other communications. We derive success from our scale of production, flexibility of order sizes processing, variety and quality of products and customer servicing.
RegulatorsOur commitment to compliance with laws and regulations is evident from our Corporate and Legal team‘s continued efforts for efficient and effective legal and regulatory conformity. The engagement includes submission of periodic reports, communicating through letters and emails and responding to enquiries and meetings as and when required. Active engagement with regulators improves level of compliance.
Our PeopleInterloop’s commitment to its People, a dedicated and competent workforce, is at the core of its human resource strategy. We provide a nurturing and caring environment to our people where they give peak performance. We invest heavily in their professional and personal trainings. We have introduced family friendly policies and world-
class daycare centers for working mothers. Besides monetary compensation, Interloop provides long-term employment benefits, scholarships for employees’ children, health benefits, sports facilities for physical fitness, free transportation, subsidized meals and organizes multiple social events for employees. Along with regular meetings, communication takes place through emails, company notices, intranet and online media.
Local Community & General PublicInterloop’s Mission and reason for existence is to bring about a positive change in the community. To pursue this cause, Interloop has invested heavily in the community. Its main areas of focus include Education, Sports, Literary Activities, Health Care and Disaster Relief. The company has long term KPIs and every year a CSR spending target is fixed and implemented through an organized system. The management encourages hiring workforce including women from local vicinities and considers engaging less privileged and special persons. The company’s social and environmental initiatives are aligned with Sustainable Development Goals of United Nations Development Programme.
MediaDifferent communication mediums are used to apprise the general public about new developments, hiring, various activities and social & environmental initiatives of Interloop Limited. This creates effective awareness about the company and a positive corporate brand image.
Inte
rloop
Lim
ited
36 37
2018
- 1
9A
nnua
l Rep
ort
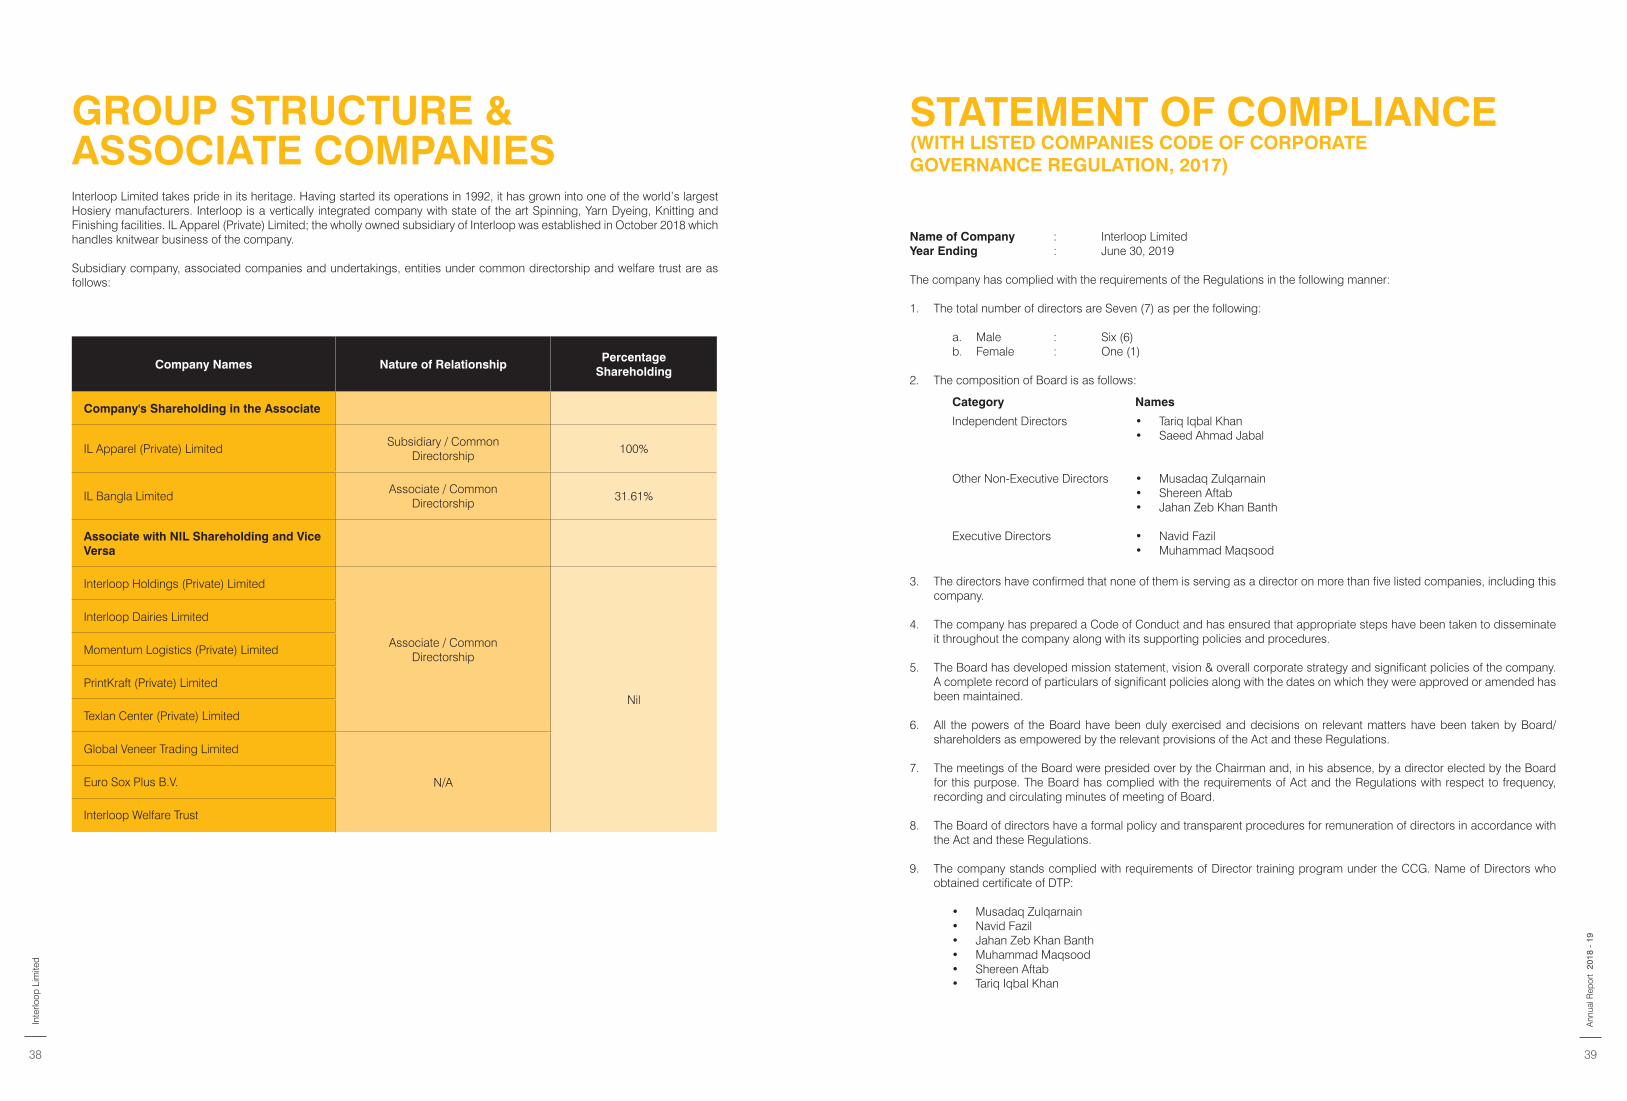
GROUP STRUCTURE & ASSOCIATE COMPANIESInterloop Limited takes pride in its heritage. Having started its operations in 1992, it has grown into one of the world’s largest Hosiery manufacturers. Interloop is a vertically integrated company with state of the art Spinning, Yarn Dyeing, Knitting and Finishing facilities. IL Apparel (Private) Limited; the wholly owned subsidiary of Interloop was established in October 2018 which handles knitwear business of the company.
Subsidiary company, associated companies and undertakings, entities under common directorship and welfare trust are as follows:
STATEMENT OF COMPLIANCE
Name of Company : Interloop Limited Year Ending : June 30, 2019
The company has complied with the requirements of the Regulations in the following manner:
1. The total number of directors are Seven (7) as per the following:
a. Male : Six (6)b. Female : One (1)
2. The composition of Board is as follows:
3. The directors have confirmed that none of them is serving as a director on more than five listed companies, including this company.
4. The company has prepared a Code of Conduct and has ensured that appropriate steps have been taken to disseminate it throughout the company along with its supporting policies and procedures.
5. The Board has developed mission statement, vision & overall corporate strategy and significant policies of the company. A complete record of particulars of significant policies along with the dates on which they were approved or amended has been maintained.
6. All the powers of the Board have been duly exercised and decisions on relevant matters have been taken by Board/ shareholders as empowered by the relevant provisions of the Act and these Regulations.
7. The meetings of the Board were presided over by the Chairman and, in his absence, by a director elected by the Board for this purpose. The Board has complied with the requirements of Act and the Regulations with respect to frequency, recording and circulating minutes of meeting of Board.
8. The Board of directors have a formal policy and transparent procedures for remuneration of directors in accordance with the Act and these Regulations.
9. The company stands complied with requirements of Director training program under the CCG. Name of Directors who obtained certificate of DTP:
• Musadaq Zulqarnain • Navid Fazil• Jahan Zeb Khan Banth• Muhammad Maqsood• Shereen Aftab• Tariq Iqbal Khan
Independent Directors
Other Non-Executive Directors
Executive Directors
• Tariq Iqbal Khan• Saeed Ahmad Jabal
• Musadaq Zulqarnain• Shereen Aftab• Jahan Zeb Khan Banth
• Navid Fazil• Muhammad Maqsood
Category Names
Company Names Nature of RelationshipPercentage
Shareholding
Company's Shareholding in the Associate
IL Apparel (Private) Limited Subsidiary / Common
Directorship100%
IL Bangla Limited Associate / Common
Directorship31.61%
Associate with NIL Shareholding and Vice Versa
Interloop Holdings (Private) Limited
Associate / CommonDirectorship
Nil
Interloop Dairies Limited
Momentum Logistics (Private) Limited
PrintKraft (Private) Limited
Texlan Center (Private) Limited
Global Veneer Trading Limited
N/AEuro Sox Plus B.V.
Interloop Welfare Trust
(WITH LISTED COMPANIES CODE OF CORPORATE GOVERNANCE REGULATION, 2017)
Inte
rloop
Lim
ited
38 39
2018
- 1
9A
nnua
l Rep
ort
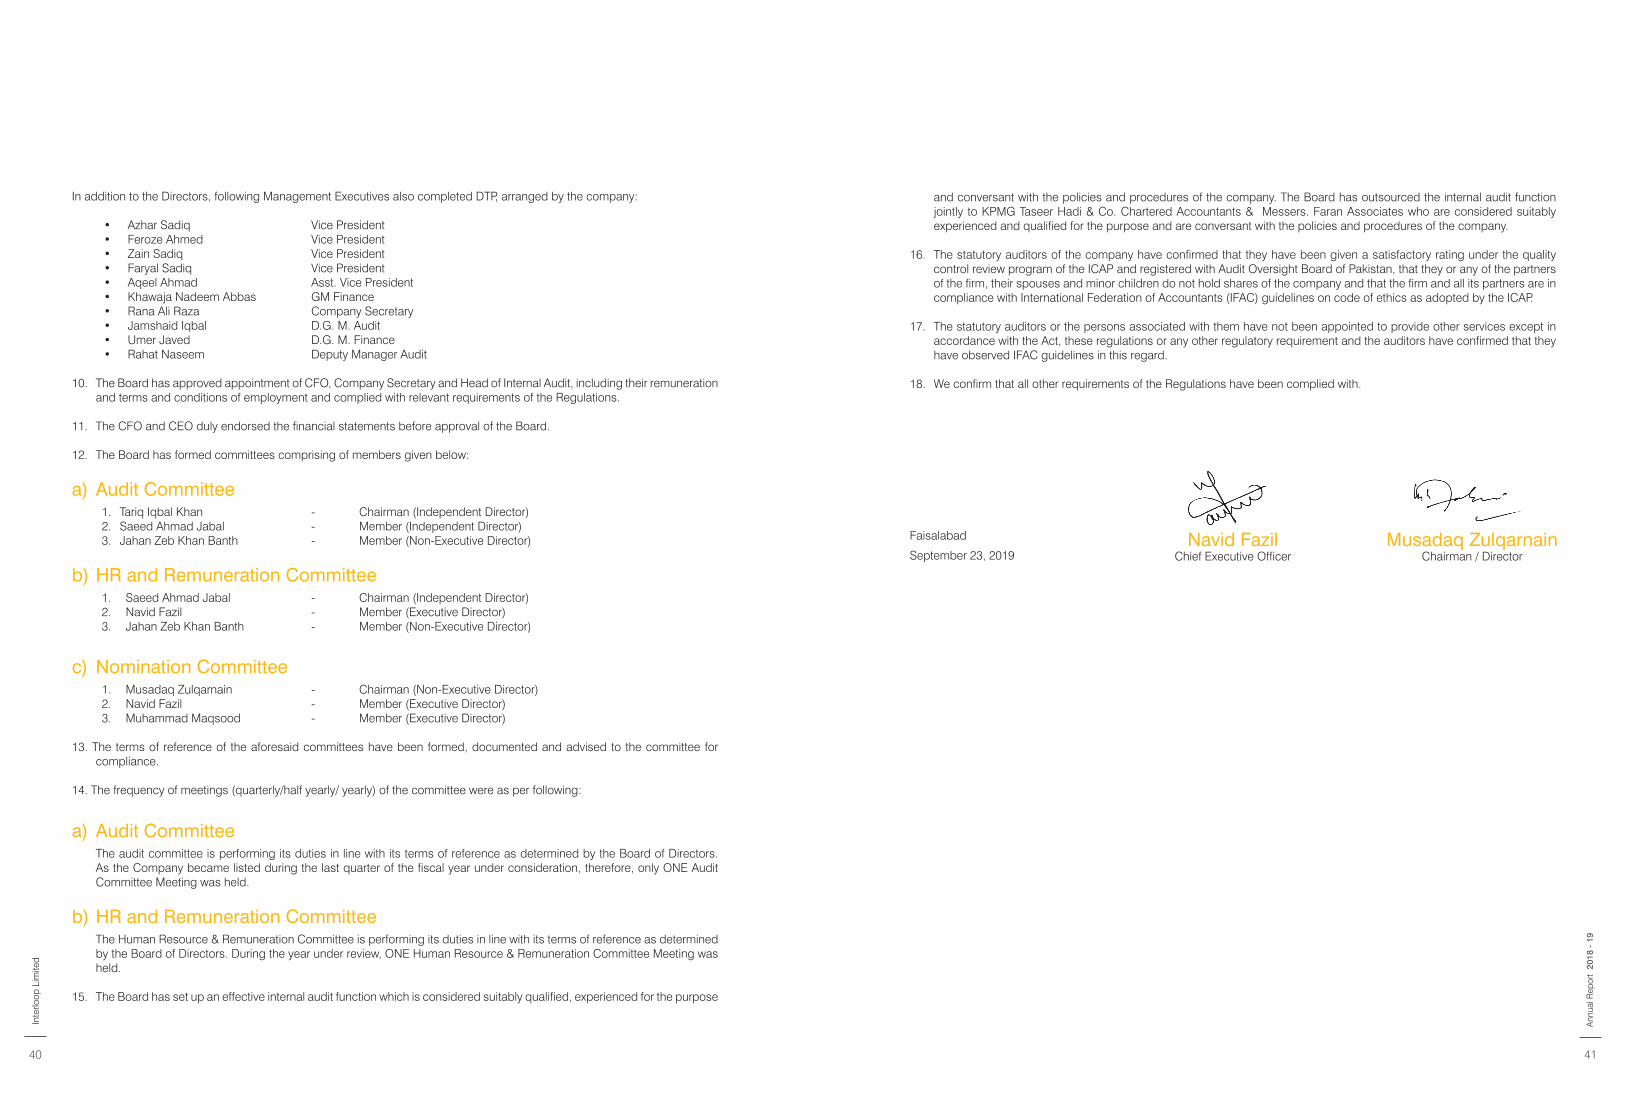
In addition to the Directors, following Management Executives also completed DTP, arranged by the company:
• Azhar Sadiq Vice President• Feroze Ahmed Vice President• Zain Sadiq Vice President• Faryal Sadiq Vice President• Aqeel Ahmad Asst. Vice President• Khawaja Nadeem Abbas GM Finance• Rana Ali Raza Company Secretary • Jamshaid Iqbal D.G. M. Audit• Umer Javed D.G. M. Finance• Rahat Naseem Deputy Manager Audit
10. The Board has approved appointment of CFO, Company Secretary and Head of Internal Audit, including their remuneration and terms and conditions of employment and complied with relevant requirements of the Regulations.
11. The CFO and CEO duly endorsed the financial statements before approval of the Board.
12. The Board has formed committees comprising of members given below:
a) Audit Committee1. Tariq Iqbal Khan - Chairman (Independent Director) 2. Saeed Ahmad Jabal - Member (Independent Director) 3. Jahan Zeb Khan Banth - Member (Non-Executive Director)
b) HR and Remuneration Committee1. Saeed Ahmad Jabal - Chairman (Independent Director)2. Navid Fazil - Member (Executive Director) 3. Jahan Zeb Khan Banth - Member (Non-Executive Director)
c) Nomination Committee1. Musadaq Zulqarnain - Chairman (Non-Executive Director)2. Navid Fazil - Member (Executive Director) 3. Muhammad Maqsood - Member (Executive Director)
13. The terms of reference of the aforesaid committees have been formed, documented and advised to the committee for compliance.
14. The frequency of meetings (quarterly/half yearly/ yearly) of the committee were as per following:
a) Audit CommitteeThe audit committee is performing its duties in line with its terms of reference as determined by the Board of Directors. As the Company became listed during the last quarter of the fiscal year under consideration, therefore, only ONE Audit Committee Meeting was held.
b) HR and Remuneration CommitteeThe Human Resource & Remuneration Committee is performing its duties in line with its terms of reference as determined by the Board of Directors. During the year under review, ONE Human Resource & Remuneration Committee Meeting was held.
15. The Board has set up an effective internal audit function which is considered suitably qualified, experienced for the purpose
and conversant with the policies and procedures of the company. The Board has outsourced the internal audit function jointly to KPMG Taseer Hadi & Co. Chartered Accountants & Messers. Faran Associates who are considered suitably experienced and qualified for the purpose and are conversant with the policies and procedures of the company.
16. The statutory auditors of the company have confirmed that they have been given a satisfactory rating under the quality control review program of the ICAP and registered with Audit Oversight Board of Pakistan, that they or any of the partners of the firm, their spouses and minor children do not hold shares of the company and that the firm and all its partners are in compliance with International Federation of Accountants (IFAC) guidelines on code of ethics as adopted by the ICAP.
17. The statutory auditors or the persons associated with them have not been appointed to provide other services except in accordance with the Act, these regulations or any other regulatory requirement and the auditors have confirmed that they have observed IFAC guidelines in this regard.
18. We confirm that all other requirements of the Regulations have been complied with.
Faisalabad
September 23, 2019Navid Fazil
Chief Executive OfficerMusadaq Zulqarnain
Chairman / Director
Inte
rloop
Lim
ited
40 41
2018
- 1
9A
nnua
l Rep
ort
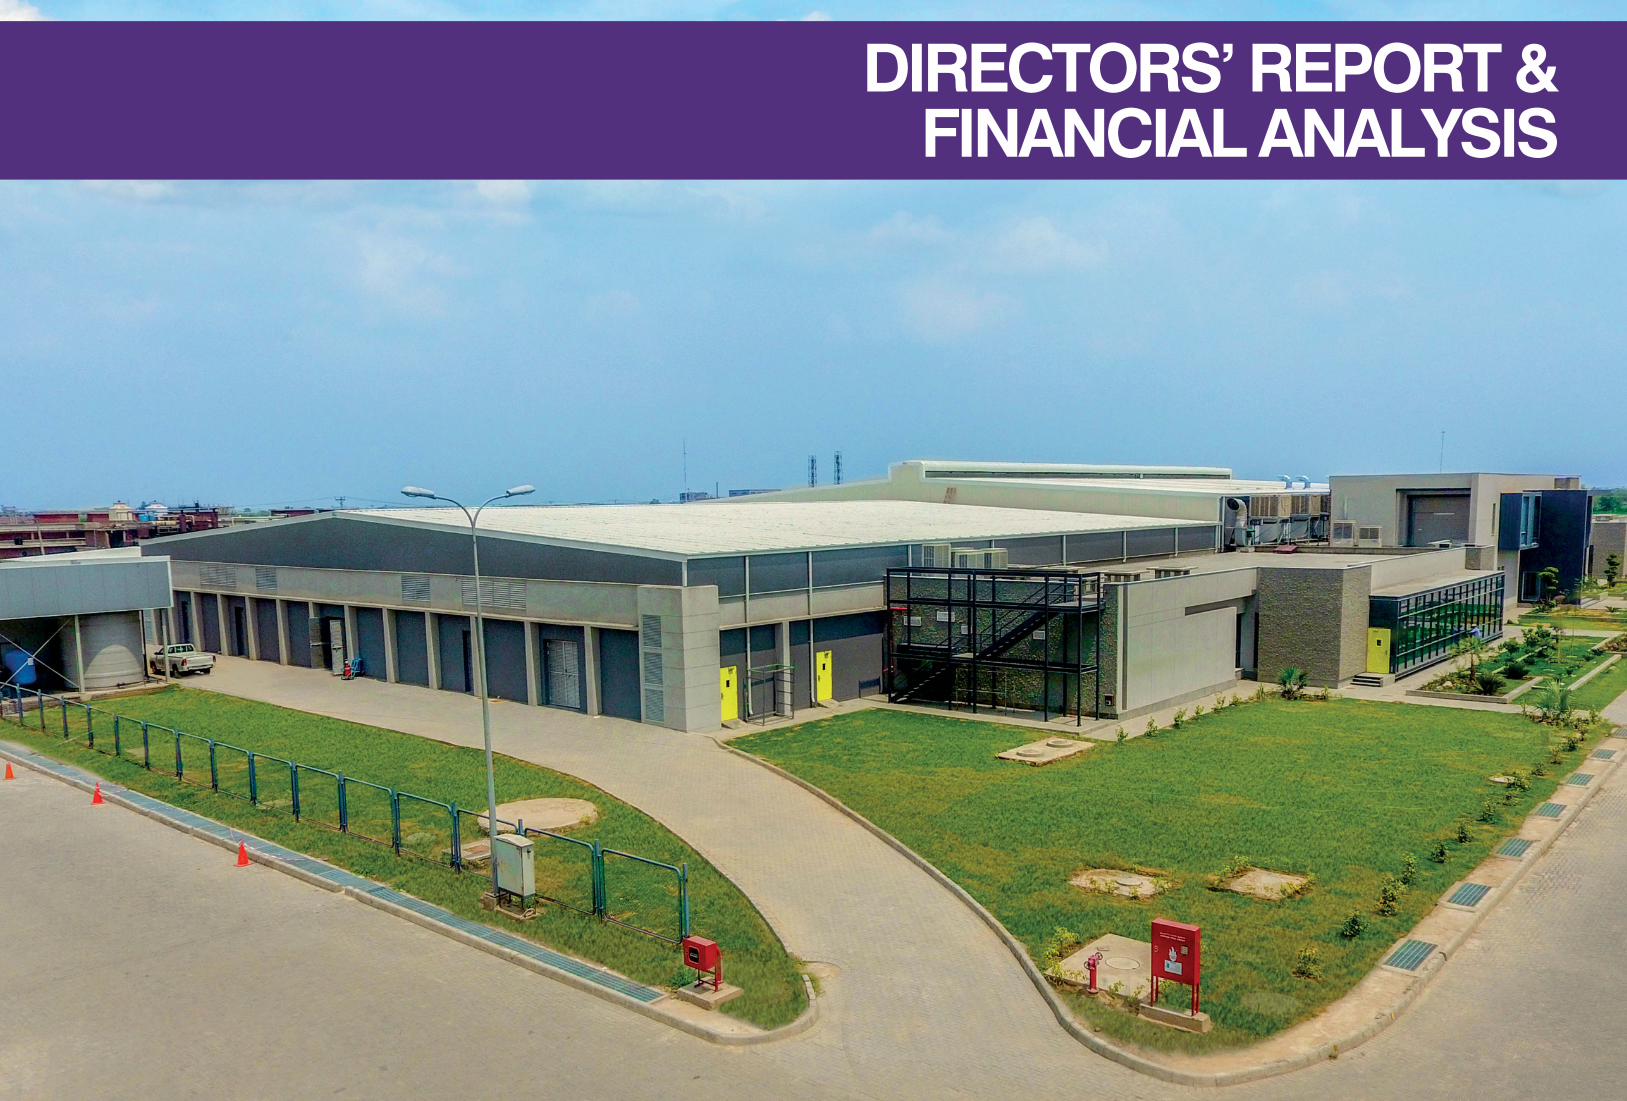
DIRECTORS’ REPORT & FINANCIAL ANALYSIS
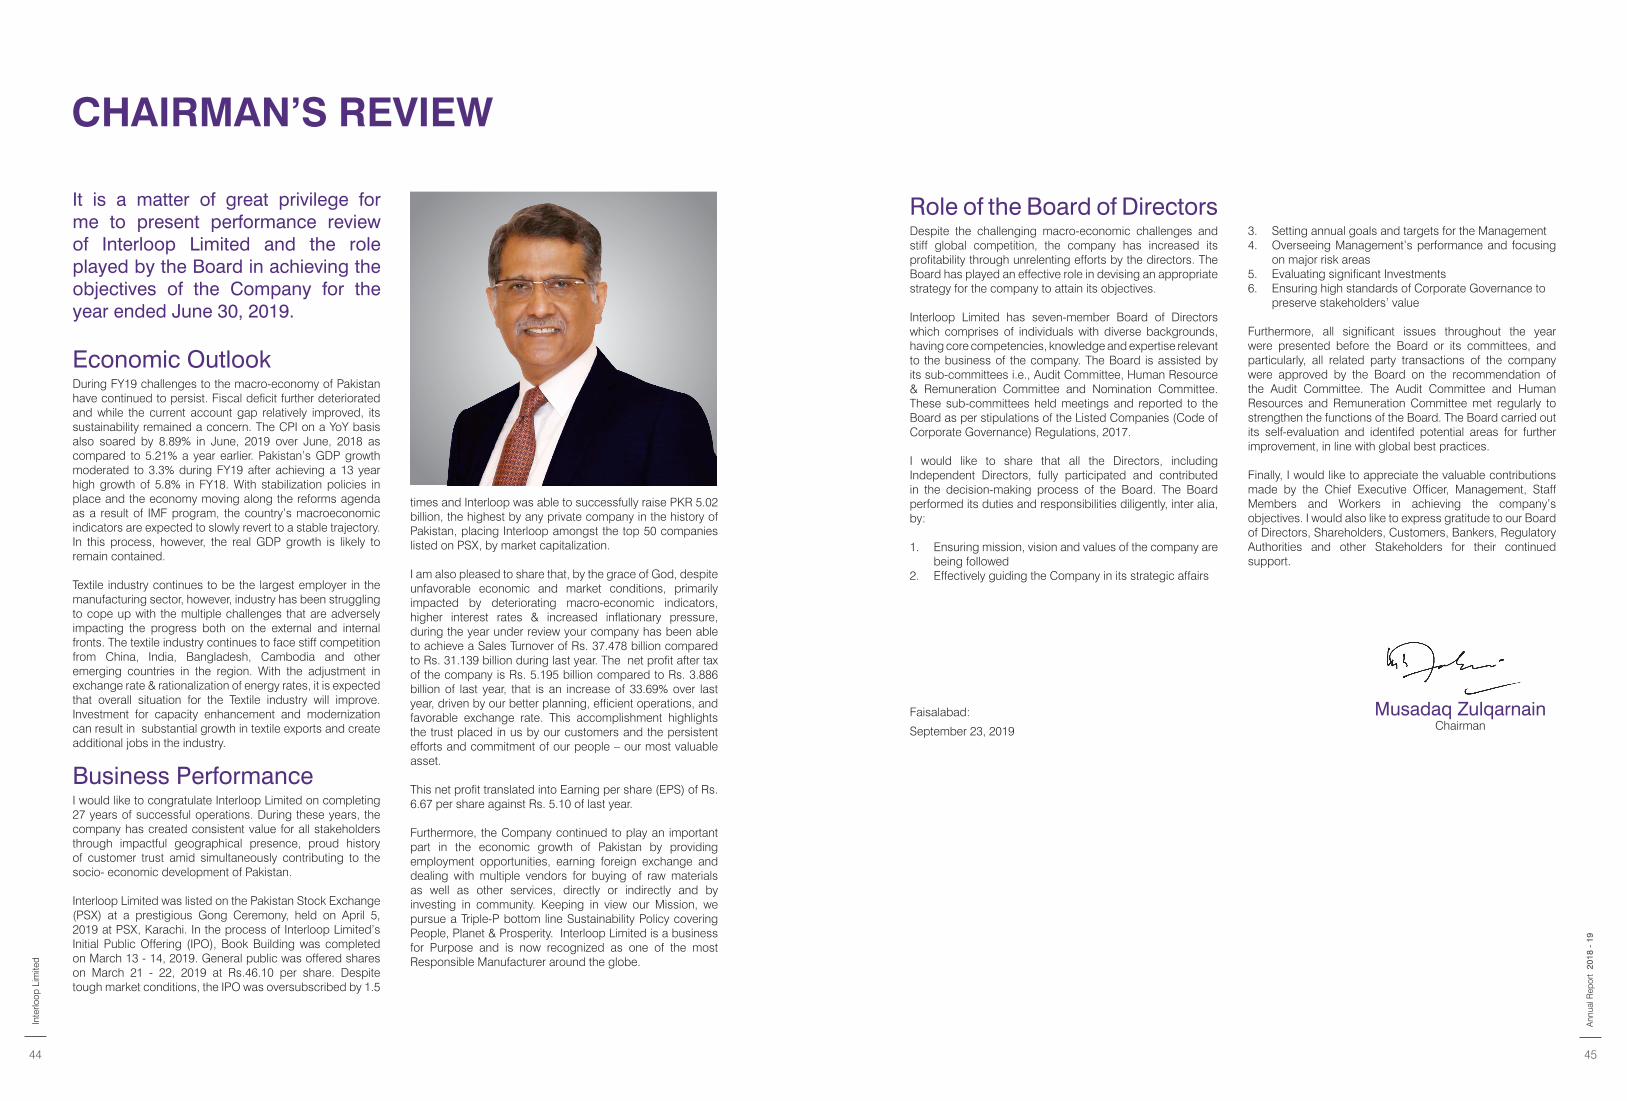
CHAIRMAN’S REVIEW
It is a matter of great privilege for me to present performance review of Interloop Limited and the role played by the Board in achieving the objectives of the Company for the year ended June 30, 2019.
Economic OutlookDuring FY19 challenges to the macro-economy of Pakistan have continued to persist. Fiscal deficit further deteriorated and while the current account gap relatively improved, its sustainability remained a concern. The CPI on a YoY basis also soared by 8.89% in June, 2019 over June, 2018 as compared to 5.21% a year earlier. Pakistan’s GDP growth moderated to 3.3% during FY19 after achieving a 13 year high growth of 5.8% in FY18. With stabilization policies in place and the economy moving along the reforms agenda as a result of IMF program, the country’s macroeconomic indicators are expected to slowly revert to a stable trajectory. In this process, however, the real GDP growth is likely to remain contained.
Textile industry continues to be the largest employer in the manufacturing sector, however, industry has been struggling to cope up with the multiple challenges that are adversely impacting the progress both on the external and internal fronts. The textile industry continues to face stiff competition from China, India, Bangladesh, Cambodia and other emerging countries in the region. With the adjustment in exchange rate & rationalization of energy rates, it is expected that overall situation for the Textile industry will improve. Investment for capacity enhancement and modernization can result in substantial growth in textile exports and create additional jobs in the industry.
Business PerformanceI would like to congratulate Interloop Limited on completing 27 years of successful operations. During these years, the company has created consistent value for all stakeholders through impactful geographical presence, proud history of customer trust amid simultaneously contributing to the socio- economic development of Pakistan.
Interloop Limited was listed on the Pakistan Stock Exchange (PSX) at a prestigious Gong Ceremony, held on April 5, 2019 at PSX, Karachi. In the process of Interloop Limited’s Initial Public Offering (IPO), Book Building was completed on March 13 - 14, 2019. General public was offered shares on March 21 - 22, 2019 at Rs.46.10 per share. Despite tough market conditions, the IPO was oversubscribed by 1.5
times and Interloop was able to successfully raise PKR 5.02 billion, the highest by any private company in the history of Pakistan, placing Interloop amongst the top 50 companies listed on PSX, by market capitalization. I am also pleased to share that, by the grace of God, despite unfavorable economic and market conditions, primarily impacted by deteriorating macro-economic indicators, higher interest rates & increased inflationary pressure, during the year under review your company has been able to achieve a Sales Turnover of Rs. 37.478 billion compared to Rs. 31.139 billion during last year. The net profit after tax of the company is Rs. 5.195 billion compared to Rs. 3.886 billion of last year, that is an increase of 33.69% over last year, driven by our better planning, efficient operations, and favorable exchange rate. This accomplishment highlights the trust placed in us by our customers and the persistent efforts and commitment of our people – our most valuable asset.
This net profit translated into Earning per share (EPS) of Rs. 6.67 per share against Rs. 5.10 of last year.
Furthermore, the Company continued to play an important part in the economic growth of Pakistan by providing employment opportunities, earning foreign exchange and dealing with multiple vendors for buying of raw materials as well as other services, directly or indirectly and by investing in community. Keeping in view our Mission, we pursue a Triple-P bottom line Sustainability Policy covering People, Planet & Prosperity. Interloop Limited is a business for Purpose and is now recognized as one of the most Responsible Manufacturer around the globe.
Role of the Board of DirectorsDespite the challenging macro-economic challenges and stiff global competition, the company has increased its profitability through unrelenting efforts by the directors. The Board has played an effective role in devising an appropriate strategy for the company to attain its objectives.
Interloop Limited has seven-member Board of Directors which comprises of individuals with diverse backgrounds, having core competencies, knowledge and expertise relevant to the business of the company. The Board is assisted by its sub-committees i.e., Audit Committee, Human Resource & Remuneration Committee and Nomination Committee. These sub-committees held meetings and reported to the Board as per stipulations of the Listed Companies (Code of Corporate Governance) Regulations, 2017.
I would like to share that all the Directors, including Independent Directors, fully participated and contributed in the decision-making process of the Board. The Board performed its duties and responsibilities diligently, inter alia, by:
1. Ensuring mission, vision and values of the company are being followed
2. Effectively guiding the Company in its strategic affairs
3. Setting annual goals and targets for the Management4. Overseeing Management’s performance and focusing
on major risk areas5. Evaluating significant Investments6. Ensuring high standards of Corporate Governance to
preserve stakeholders’ value
Furthermore, all significant issues throughout the year were presented before the Board or its committees, and particularly, all related party transactions of the company were approved by the Board on the recommendation of the Audit Committee. The Audit Committee and Human Resources and Remuneration Committee met regularly to strengthen the functions of the Board. The Board carried out its self-evaluation and identifed potential areas for further improvement, in line with global best practices.
Finally, I would like to appreciate the valuable contributions made by the Chief Executive Officer, Management, Staff Members and Workers in achieving the company’s objectives. I would also like to express gratitude to our Board of Directors, Shareholders, Customers, Bankers, Regulatory Authorities and other Stakeholders for their continued support.
Musadaq ZulqarnainChairman
Faisalabad:
September 23, 2019
Inte
rloop
Lim
ited
44 45
2018
- 1
9A
nnua
l Rep
ort
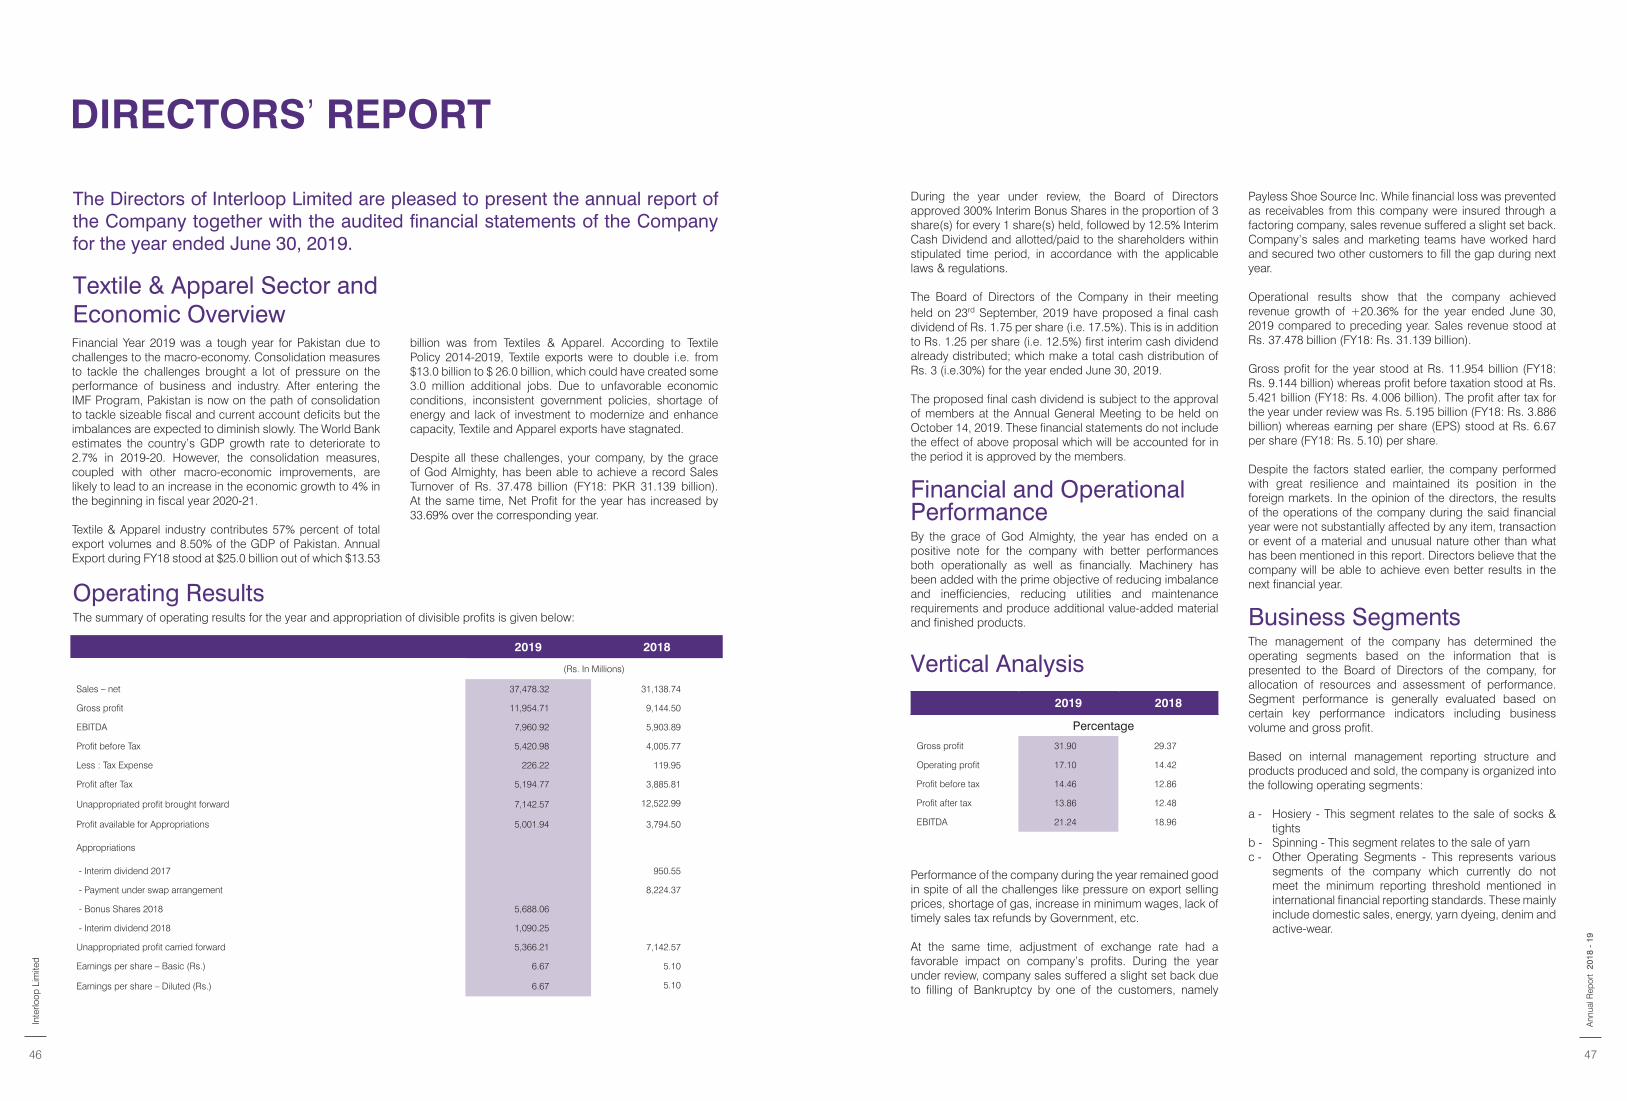
DIRECTORS’ REPORT
The Directors of Interloop Limited are pleased to present the annual report of the Company together with the audited financial statements of the Company for the year ended June 30, 2019.
2019 2018
(Rs. In Millions)
Sales – net 37,478.32 31,138.74
Gross profit 11,954.71 9,144.50
EBITDA 7,960.92 5,903.89
Profit before Tax 5,420.98 4,005.77
Less : Tax Expense 226.22 119.95
Profit after Tax 5,194.77 3,885.81
Unappropriated profit brought forward 7,142.57 12,522.99
Profit available for Appropriations 5,001.94 3,794.50
Appropriations
- Interim dividend 2017 950.55
- Payment under swap arrangement 8,224.37
- Bonus Shares 2018 5,688.06
- Interim dividend 2018 1,090.25
Unappropriated profit carried forward 5,366.21 7,142.57
Earnings per share – Basic (Rs.) 6.67 5.10
Earnings per share – Diluted (Rs.) 6.67 5.10
Operating Results The summary of operating results for the year and appropriation of divisible profits is given below:
Financial Year 2019 was a tough year for Pakistan due to challenges to the macro-economy. Consolidation measures to tackle the challenges brought a lot of pressure on the performance of business and industry. After entering the IMF Program, Pakistan is now on the path of consolidation to tackle sizeable fiscal and current account deficits but the imbalances are expected to diminish slowly. The World Bank estimates the country’s GDP growth rate to deteriorate to 2.7% in 2019-20. However, the consolidation measures, coupled with other macro-economic improvements, are likely to lead to an increase in the economic growth to 4% in the beginning in fiscal year 2020-21.
Textile & Apparel industry contributes 57% percent of total export volumes and 8.50% of the GDP of Pakistan. Annual Export during FY18 stood at $25.0 billion out of which $13.53
billion was from Textiles & Apparel. According to Textile Policy 2014-2019, Textile exports were to double i.e. from $13.0 billion to $ 26.0 billion, which could have created some 3.0 million additional jobs. Due to unfavorable economic conditions, inconsistent government policies, shortage of energy and lack of investment to modernize and enhance capacity, Textile and Apparel exports have stagnated.
Despite all these challenges, your company, by the grace of God Almighty, has been able to achieve a record Sales Turnover of Rs. 37.478 billion (FY18: PKR 31.139 billion). At the same time, Net Profit for the year has increased by 33.69% over the corresponding year.
Textile & Apparel Sector and Economic Overview
During the year under review, the Board of Directors approved 300% Interim Bonus Shares in the proportion of 3 share(s) for every 1 share(s) held, followed by 12.5% Interim Cash Dividend and allotted/paid to the shareholders within stipulated time period, in accordance with the applicable laws & regulations.
The Board of Directors of the Company in their meeting held on 23rd September, 2019 have proposed a final cash dividend of Rs. 1.75 per share (i.e. 17.5%). This is in addition to Rs. 1.25 per share (i.e. 12.5%) first interim cash dividend already distributed; which make a total cash distribution of Rs. 3 (i.e.30%) for the year ended June 30, 2019.
The proposed final cash dividend is subject to the approval of members at the Annual General Meeting to be held on October 14, 2019. These financial statements do not include the effect of above proposal which will be accounted for in the period it is approved by the members.
Financial and Operational PerformanceBy the grace of God Almighty, the year has ended on a positive note for the company with better performances both operationally as well as financially. Machinery has been added with the prime objective of reducing imbalance and inefficiencies, reducing utilities and maintenance requirements and produce additional value-added material and finished products.
Vertical Analysis
Performance of the company during the year remained good in spite of all the challenges like pressure on export selling prices, shortage of gas, increase in minimum wages, lack of timely sales tax refunds by Government, etc.
At the same time, adjustment of exchange rate had a favorable impact on company’s profits. During the year under review, company sales suffered a slight set back due to filling of Bankruptcy by one of the customers, namely
Payless Shoe Source Inc. While financial loss was prevented as receivables from this company were insured through a factoring company, sales revenue suffered a slight set back. Company’s sales and marketing teams have worked hard and secured two other customers to fill the gap during next year.
Operational results show that the company achieved revenue growth of +20.36% for the year ended June 30, 2019 compared to preceding year. Sales revenue stood at Rs. 37.478 billion (FY18: Rs. 31.139 billion).
Gross profit for the year stood at Rs. 11.954 billion (FY18: Rs. 9.144 billion) whereas profit before taxation stood at Rs. 5.421 billion (FY18: Rs. 4.006 billion). The profit after tax for the year under review was Rs. 5.195 billion (FY18: Rs. 3.886 billion) whereas earning per share (EPS) stood at Rs. 6.67 per share (FY18: Rs. 5.10) per share.
Despite the factors stated earlier, the company performed with great resilience and maintained its position in the foreign markets. In the opinion of the directors, the results of the operations of the company during the said financial year were not substantially affected by any item, transaction or event of a material and unusual nature other than what has been mentioned in this report. Directors believe that the company will be able to achieve even better results in the next financial year.
Business SegmentsThe management of the company has determined the operating segments based on the information that is presented to the Board of Directors of the company, for allocation of resources and assessment of performance. Segment performance is generally evaluated based on certain key performance indicators including business volume and gross profit.
Based on internal management reporting structure and products produced and sold, the company is organized into the following operating segments:
a - Hosiery - This segment relates to the sale of socks & tights
b - Spinning - This segment relates to the sale of yarnc - Other Operating Segments - This represents various
segments of the company which currently do not meet the minimum reporting threshold mentioned in international financial reporting standards. These mainly include domestic sales, energy, yarn dyeing, denim and active-wear.
2019 2018
Percentage
Gross profit 31.90 29.37
Operating profit 17.10 14.42
Profit before tax 14.46 12.86
Profit after tax 13.86 12.48
EBITDA 21.24 18.96
Inte
rloop
Lim
ited
46 47
2018
- 1
9A
nnua
l Rep
ort
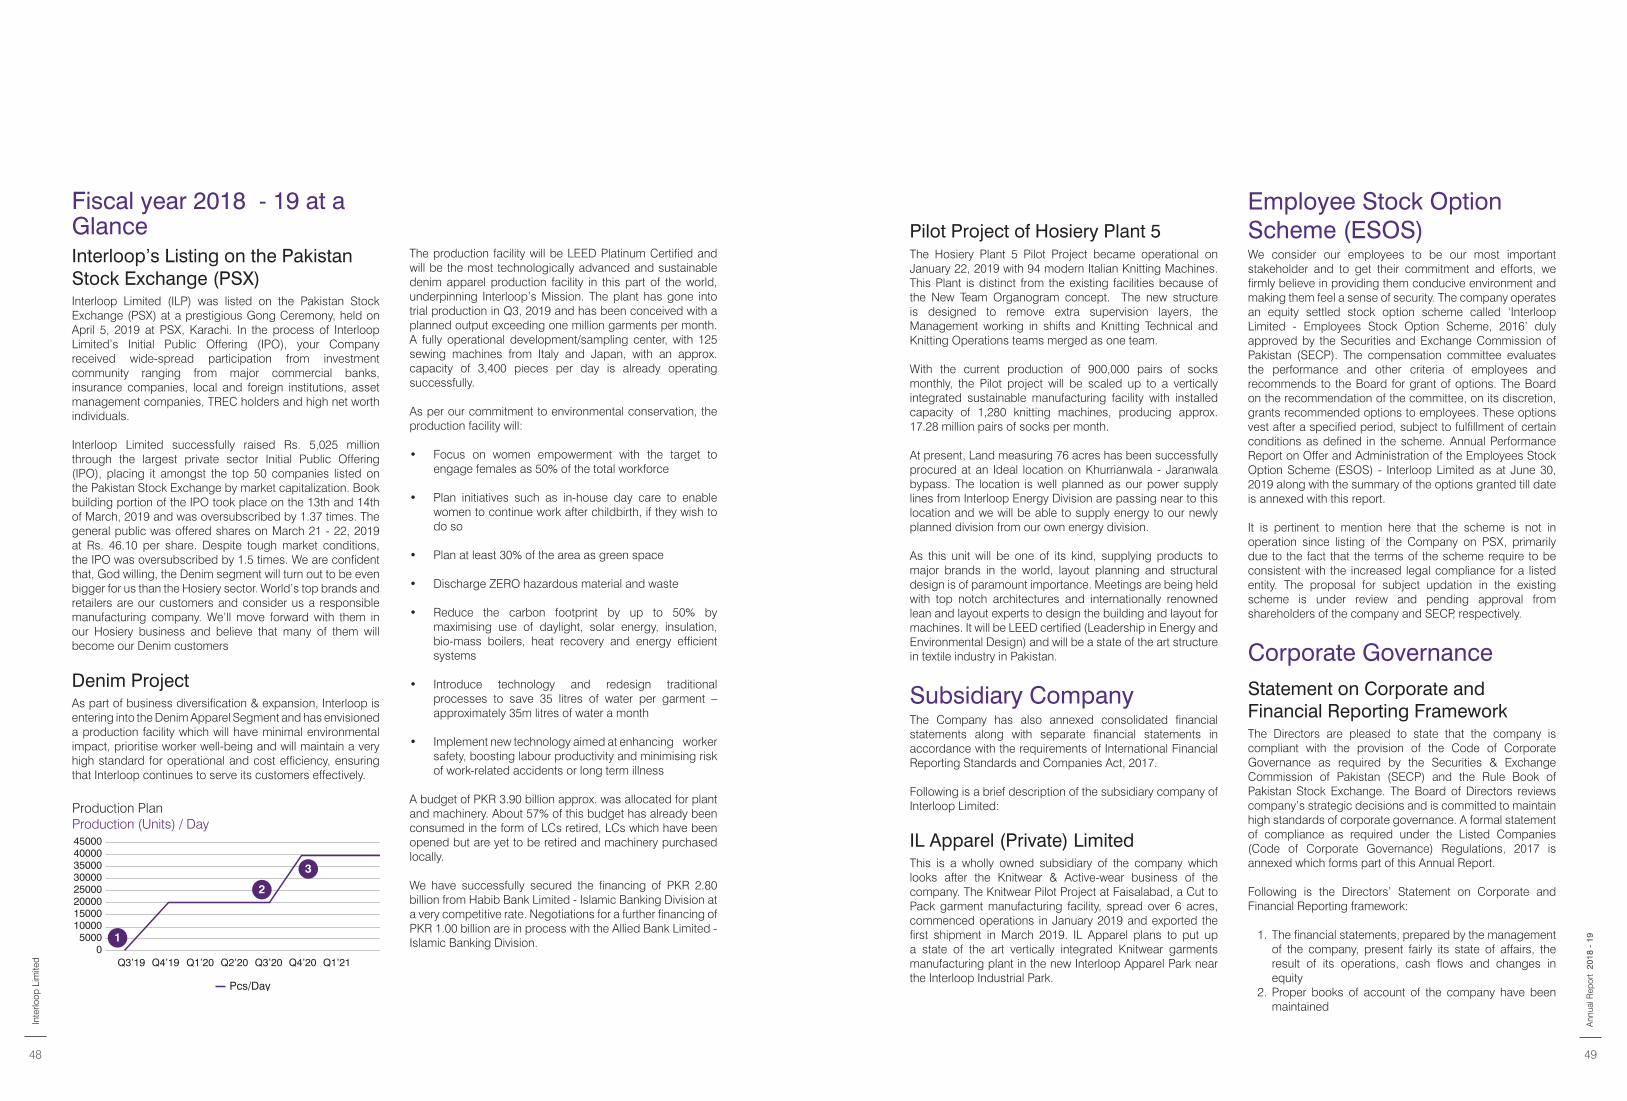
Fiscal year 2018 - 19 at a GlanceInterloop’s Listing on the Pakistan Stock Exchange (PSX)Interloop Limited (ILP) was listed on the Pakistan Stock Exchange (PSX) at a prestigious Gong Ceremony, held on April 5, 2019 at PSX, Karachi. In the process of Interloop Limited’s Initial Public Offering (IPO), your Company received wide-spread participation from investment community ranging from major commercial banks, insurance companies, local and foreign institutions, asset management companies, TREC holders and high net worth individuals.
Interloop Limited successfully raised Rs. 5,025 million through the largest private sector Initial Public Offering (IPO), placing it amongst the top 50 companies listed on the Pakistan Stock Exchange by market capitalization. Book building portion of the IPO took place on the 13th and 14th of March, 2019 and was oversubscribed by 1.37 times. The general public was offered shares on March 21 - 22, 2019 at Rs. 46.10 per share. Despite tough market conditions, the IPO was oversubscribed by 1.5 times. We are confident that, God willing, the Denim segment will turn out to be even bigger for us than the Hosiery sector. World’s top brands and retailers are our customers and consider us a responsible manufacturing company. We’ll move forward with them in our Hosiery business and believe that many of them will become our Denim customers
Denim ProjectAs part of business diversification & expansion, Interloop is entering into the Denim Apparel Segment and has envisioned a production facility which will have minimal environmental impact, prioritise worker well-being and will maintain a very high standard for operational and cost efficiency, ensuring that Interloop continues to serve its customers effectively.
The production facility will be LEED Platinum Certified and will be the most technologically advanced and sustainable denim apparel production facility in this part of the world, underpinning Interloop’s Mission. The plant has gone into trial production in Q3, 2019 and has been conceived with a planned output exceeding one million garments per month. A fully operational development/sampling center, with 125 sewing machines from Italy and Japan, with an approx. capacity of 3,400 pieces per day is already operating successfully.
As per our commitment to environmental conservation, the production facility will:
• Focus on women empowerment with the target to engage females as 50% of the total workforce
• Plan initiatives such as in-house day care to enable women to continue work after childbirth, if they wish to do so
• Plan at least 30% of the area as green space
• Discharge ZERO hazardous material and waste
• Reduce the carbon footprint by up to 50% by maximising use of daylight, solar energy, insulation, bio-mass boilers, heat recovery and energy efficient systems
• Introduce technology and redesign traditional processes to save 35 litres of water per garment – approximately 35m litres of water a month
• Implement new technology aimed at enhancing worker safety, boosting labour productivity and minimising risk of work-related accidents or long term illness
A budget of PKR 3.90 billion approx. was allocated for plant and machinery. About 57% of this budget has already been consumed in the form of LCs retired, LCs which have been opened but are yet to be retired and machinery purchased locally.
We have successfully secured the financing of PKR 2.80 billion from Habib Bank Limited - Islamic Banking Division at a very competitive rate. Negotiations for a further financing of PKR 1.00 billion are in process with the Allied Bank Limited - Islamic Banking Division.
4500040000350003000025000200001500010000
50000
Q3’19 Q4’19 Q1’20 Q2’20 Q3’20 Q4’20 Q1’21
Pcs/Day
1
2
3
Production PlanProduction (Units) / Day
Pilot Project of Hosiery Plant 5The Hosiery Plant 5 Pilot Project became operational on January 22, 2019 with 94 modern Italian Knitting Machines. This Plant is distinct from the existing facilities because of the New Team Organogram concept. The new structure is designed to remove extra supervision layers, the Management working in shifts and Knitting Technical and Knitting Operations teams merged as one team. With the current production of 900,000 pairs of socks monthly, the Pilot project will be scaled up to a vertically integrated sustainable manufacturing facility with installed capacity of 1,280 knitting machines, producing approx. 17.28 million pairs of socks per month. At present, Land measuring 76 acres has been successfully procured at an Ideal location on Khurrianwala - Jaranwala bypass. The location is well planned as our power supply lines from Interloop Energy Division are passing near to this location and we will be able to supply energy to our newly planned division from our own energy division. As this unit will be one of its kind, supplying products to major brands in the world, layout planning and structural design is of paramount importance. Meetings are being held with top notch architectures and internationally renowned lean and layout experts to design the building and layout for machines. It will be LEED certified (Leadership in Energy and Environmental Design) and will be a state of the art structure in textile industry in Pakistan.
Subsidiary CompanyThe Company has also annexed consolidated financial statements along with separate financial statements in accordance with the requirements of International Financial Reporting Standards and Companies Act, 2017.
Following is a brief description of the subsidiary company of Interloop Limited:
IL Apparel (Private) LimitedThis is a wholly owned subsidiary of the company which looks after the Knitwear & Active-wear business of the company. The Knitwear Pilot Project at Faisalabad, a Cut to Pack garment manufacturing facility, spread over 6 acres, commenced operations in January 2019 and exported the first shipment in March 2019. IL Apparel plans to put up a state of the art vertically integrated Knitwear garments manufacturing plant in the new Interloop Apparel Park near the Interloop Industrial Park.
Employee Stock Option Scheme (ESOS)We consider our employees to be our most important stakeholder and to get their commitment and efforts, we firmly believe in providing them conducive environment and making them feel a sense of security. The company operates an equity settled stock option scheme called ‘Interloop Limited - Employees Stock Option Scheme, 2016’ duly approved by the Securities and Exchange Commission of Pakistan (SECP). The compensation committee evaluates the performance and other criteria of employees and recommends to the Board for grant of options. The Board on the recommendation of the committee, on its discretion, grants recommended options to employees. These options vest after a specified period, subject to fulfillment of certain conditions as defined in the scheme. Annual Performance Report on Offer and Administration of the Employees Stock Option Scheme (ESOS) - Interloop Limited as at June 30, 2019 along with the summary of the options granted till date is annexed with this report.
It is pertinent to mention here that the scheme is not in operation since listing of the Company on PSX, primarily due to the fact that the terms of the scheme require to be consistent with the increased legal compliance for a listed entity. The proposal for subject updation in the existing scheme is under review and pending approval from shareholders of the company and SECP, respectively.
Corporate GovernanceStatement on Corporate and Financial Reporting FrameworkThe Directors are pleased to state that the company is compliant with the provision of the Code of Corporate Governance as required by the Securities & Exchange Commission of Pakistan (SECP) and the Rule Book of Pakistan Stock Exchange. The Board of Directors reviews company’s strategic decisions and is committed to maintain high standards of corporate governance. A formal statement of compliance as required under the Listed Companies (Code of Corporate Governance) Regulations, 2017 is annexed which forms part of this Annual Report.
Following is the Directors’ Statement on Corporate and Financial Reporting framework:
1. The financial statements, prepared by the management of the company, present fairly its state of affairs, the result of its operations, cash flows and changes in equity
2. Proper books of account of the company have been maintained
Inte
rloop
Lim
ited
48 49
2018
- 1
9A
nnua
l Rep
ort
3. Appropriate accounting policies have been consistently applied in preparation of the financial statements and accounting estimates are based on reasonable and prudent judgment
4. International Financial Reporting Standards, as applicable in Pakistan, have been followed in preparation of financial statements and any departure there from has been adequately disclosed
5. A mission statement, vision and overall corporate strategy for the company is prepared, adopted and reviewed as and when deemed appropriate by the Board
6. The system of internal control is sound in design and has been effectively implemented and monitored
7. There are no significant doubts upon the company’s ability to continue as a going concern
8. There has been no material departure from the best practices of corporate governance as detailed in the listing regulations
Composition of Board of DirectorsInterloop Limited has seven member (6 Male & 1 Female) Board of Directors which comprises of individuals with diverse backgrounds having core competencies, knowledge and expertise relevant to the business of the company. The Board is assisted by its sub-committees i.e., Audit Committee, Human Resource and Remuneration Committee and Nomination Committee. These sub-committees held meetings and reported to the Board as per stipulations of the Listed Companies (Code of Corporate Governance) Regulations, 2017. The diverse mix of gender, knowledge, expertise and skill sets of the members enhances the effectiveness of our Board. Our Board composition represents the interests of all categories of shareholders and it consists of :
» Independent Directors 2 » Other Non-Executive Directors 3 » Executive Directors 2
In order to adopt and adhere to the best practices of the Code of Corporate Governance regulations, the company, prior to filing of listing application with the PSX, appointed Tariq Iqbal Khan and Saeed Ahmad Jabal as Independent Directors of the company, followed by appointment of Jahan Zeb Khan Banth as Non-Executive Director in place of the casual vacancy created by the outgoing Director of the company.
Furthermore, during the period under consideration, Navid Fazil was appointed as the Chief Executive Officer of the company w.e.f. September 8, 2018 to fill up the casual vacancy caused by resignation of Musadaq Zulqarnain.
Meetings of the Board of Directors & CommitteesSince Interloop Limited became listed on the Pakistan Stock Exchange on April 5, 2019, the information on the meetings of the Board of Directors of the company is being shared from date of formal listing. Two meetings of Board of Directors and one meeting each of Audit Committee and HR & Remuneration Committee were held respectively during the year after listing on PSX. Attendance by the directors/members is as follows:
Board of Directors: » Musadaq Zulqarnain (Chairman) 2 » Navid Fazil (Chief Executive Officer) 2 » Jahan Zeb Khan Banth 2 » Muhammad Maqsood 2 » Shereen Aftab 0 » Saeed Ahmad Jabal 2 » Tariq Iqbal Khan 2
Audit Committee:
» Tariq Iqbal Khan (Chairman) 1 » Saeed Ahmad Jabal 1 » Jahan Zeb Khan Banth 1
HR & Remuneration Committee: » Saeed Ahmad Jabal (Chairman) 1 » Navid Fazil 1 » Jahan Zeb Khan Banth 1
Related Party Transaction and Transfer PricingIt is the policy of the company to ensure that all transactions entered with related parties must be at arm’s length. The company has fully complied with best practices on Transfer Pricing as contained in the Listing Regulations of Pakistan Stock Exchange while executing all transactions with related party.
Adequacy of Internal Financial ControlsThe company has established an effective and efficient system of internal financial controls to safeguard the assets of the company, prevent and detect fraud and ensure compliance with all statutory and legal requirements. The internal control structure is regularly reviewed and monitored by the Internal Audit function, duly established
by the Board. Audit Committee reviews the internal control system on quarterly basis, in accordance with its terms of reference.
Pattern of ShareholdingTwo statements of the pattern of shareholding as at June 30, 2019, for Ordinary Shares, & Non-Voting Ordinary Shares respectively, which are required to be disclosed under the reporting framework, are annexed to this report.
Directors’ RemunerationThe remuneration of the Board members is approved by the Board itself. However, in accordance with the code of corporate governance, it is ensured that no Director takes part in deciding his own remuneration. The company does not pay remuneration to non-executive directors except fee for attending the meetings.
External Auditors The present auditors M/s. Kreston Hyder Bhimji & Company, Chartered Accountants, are retiring and being eligible, offer themselves for re-appointment. The Board of Directors proposes the re-appointment of M/s. Kreston Hyder Bhimji & Company, Chartered Accountants, as the auditors until the next Annual General Meeting.
Health, Safety & Environment Health, Safety & Environment is our core value. We take pride in our practices and will ensure that we run safe operations and are not a source of environmental degradation. The health and safety of our employees, the safety of our assets, the security of our operations and healthy environment always remain among the top priorities of the company. Safety is an all-encompassing priority for the company, from the Board down to the business units.
Corporate Social Responsibility The company is committed towards fulfilling its Corporate Social Responsibility (CSR) and actively takes part in social work programs. During the year under review, as part of our CSR program, substantial contribution was made in the education, health, culture and sports sectors.
Material Changes There have been no material changes since June 30, 2019 to date of the report and the company has not entered into any commitment during this period which would have an adverse impact on the financial position of the company.
Description of Principal Risks & UncertaintiesWe expect no principal risks & uncertainties as at the closing period of June 30, 2019.
Business Risks, Challenges And Future OutlookWhile observing the rise in immense global competition in textiles, including speed to market requirements by retailers and brands, the company has to keep an eye on the shift in sourcing patterns. This can be effectively mitigated through efficiency improvements & interventions in supply chain thus reducing lead times.
With the present economic conditions that are expected to prevail for foreseeable period, the company aims to develop and implement measures that will enable the company to minimize the adverse effects. We feel, in today’s highly competitive global environment, the textile sector in Pakistan needs to upgrade its supply chain, improve productivity, and maximize value-addition to be able to survive in the global market.
Consolidated Financial Statement Consolidated financial statements for the period ended June 30, 2019 of the company and its subsidiary IL Apparel (Private) Limited are annexed.
AcknowledgmentThe Directors would like to thank all stakeholders of the company including, customers, shareholders, vendors, government agencies, bankers & all other business associates for their continued support during the year. We place on record our appreciation for the contributions made by the employees at all level.
For & on behalf of the Board of Directors
Faisalabad: September 23, 2019
Navid FazilChief Executive Officer
Jahan Zeb Khan BanthDirector
Inte
rloop
Lim
ited
50 51
2018
- 1
9A
nnua
l Rep
ort
Inte
rloop
Lim
ited
52 53
2018
- 1
9A
nnua
l Rep
ort
Inte
rloop
Lim
ited
54 55
2018
- 1
9A
nnua
l Rep
ort
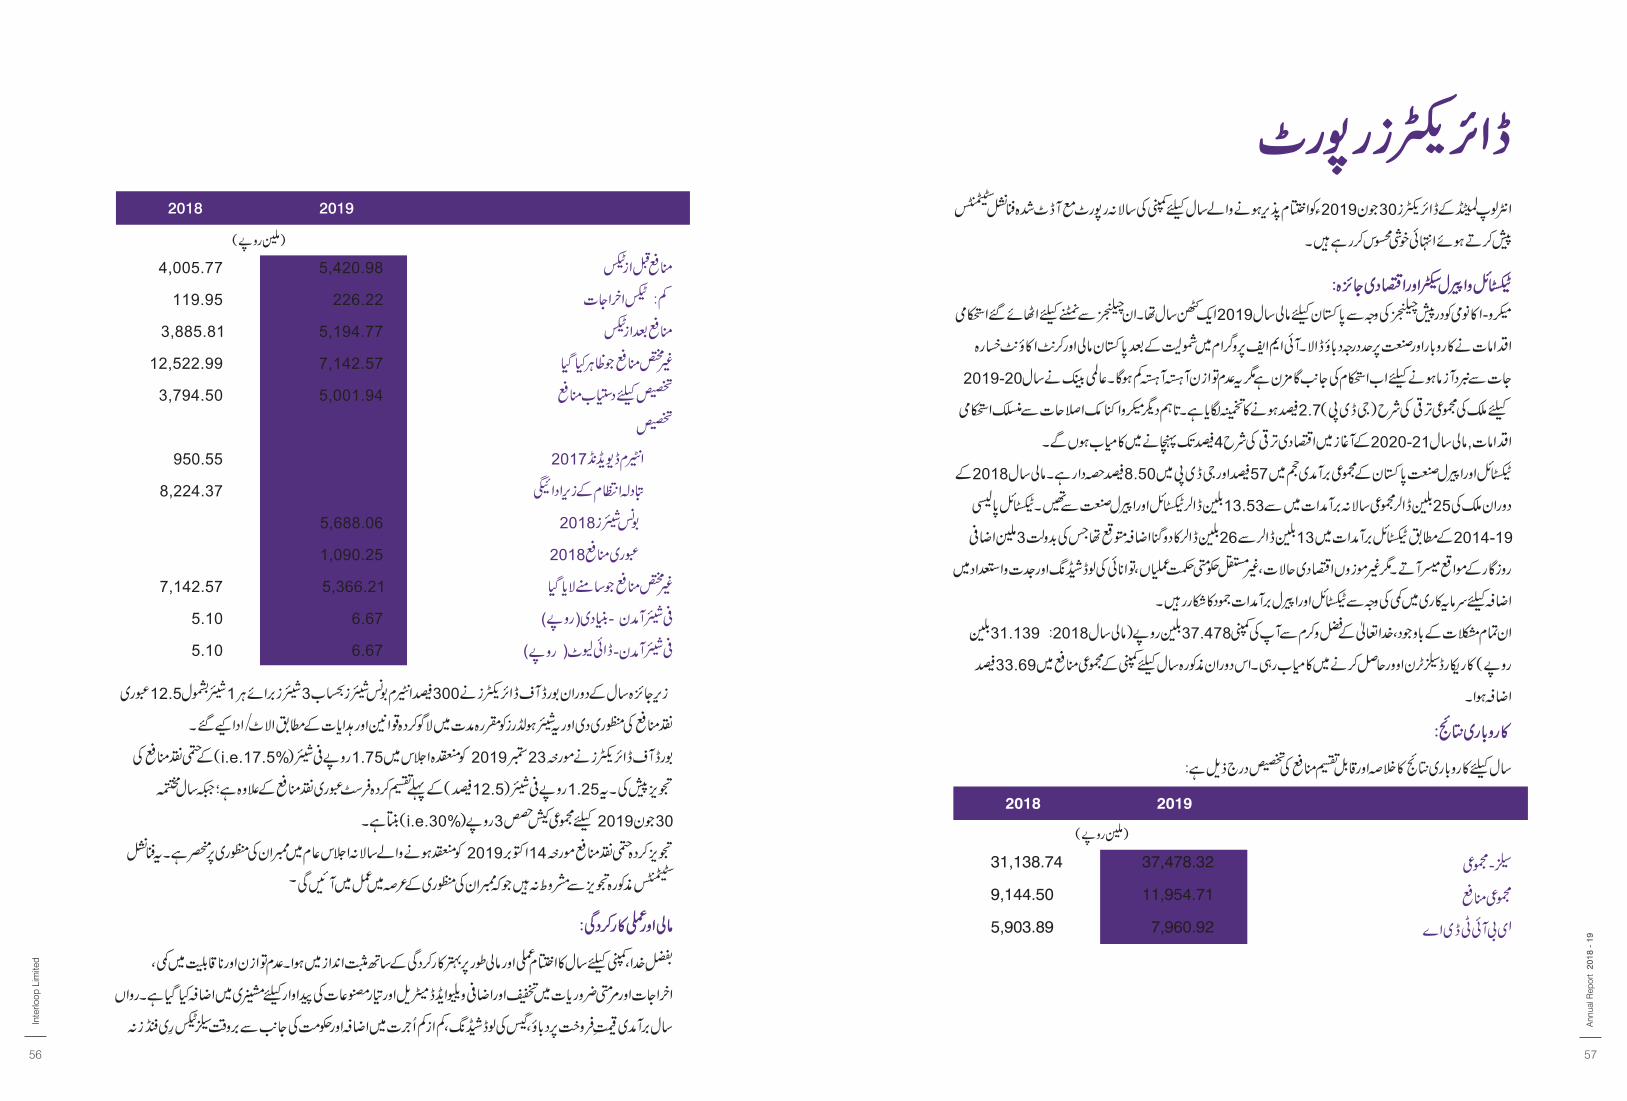
2018 2019
37,478.32
11,954.71
7,960.92
31,138.74
9,144.50
5,903.89
2018 2019
Inte
rloop
Lim
ited
56 57
2018
- 1
9A
nnua
l Rep
ort
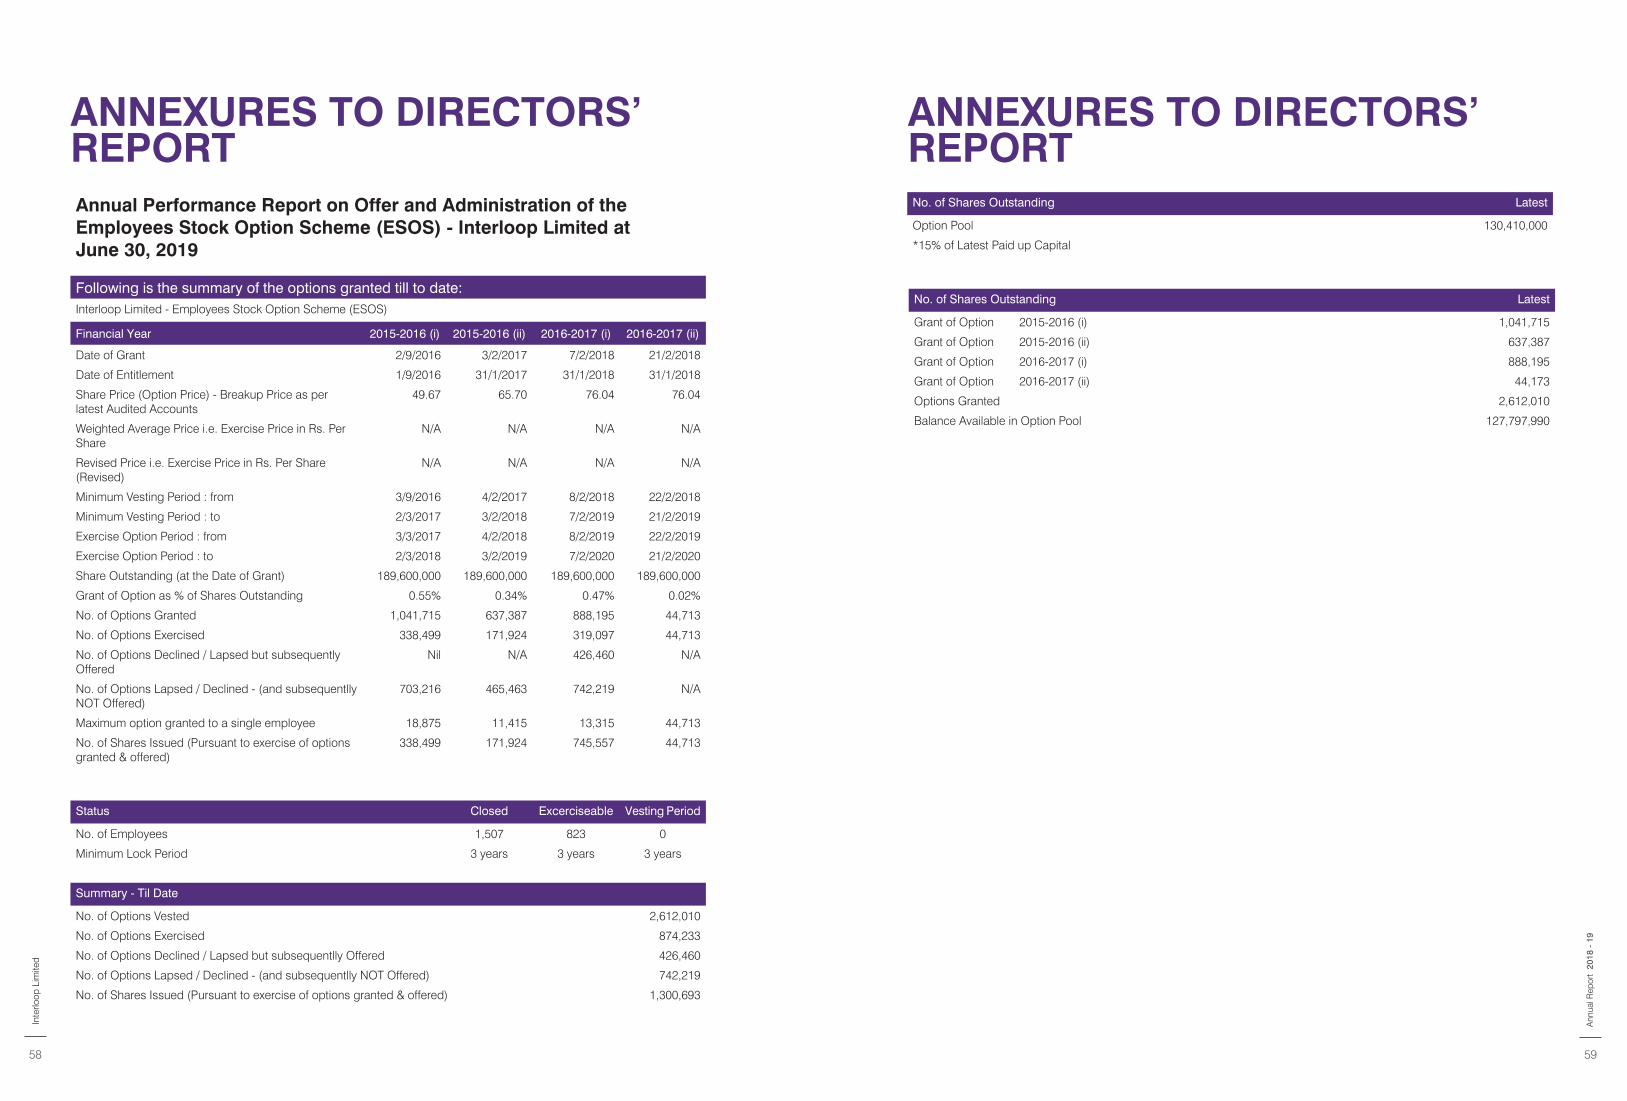
ANNEXURES TO DIRECTORS’ REPORT Annual Performance Report on Offer and Administration of the Employees Stock Option Scheme (ESOS) - Interloop Limited at June 30, 2019
Following is the summary of the options granted till to date:Interloop Limited - Employees Stock Option Scheme (ESOS)
Financial Year 2015-2016 (i) 2015-2016 (ii) 2016-2017 (i) 2016-2017 (ii)
Date of Grant 2/9/2016 3/2/2017 7/2/2018 21/2/2018
Date of Entitlement 1/9/2016 31/1/2017 31/1/2018 31/1/2018
Share Price (Option Price) - Breakup Price as per latest Audited Accounts
49.67 65.70 76.04 76.04
Weighted Average Price i.e. Exercise Price in Rs. Per Share
N/A N/A N/A N/A
Revised Price i.e. Exercise Price in Rs. Per Share (Revised)
N/A N/A N/A N/A
Minimum Vesting Period : from 3/9/2016 4/2/2017 8/2/2018 22/2/2018
Minimum Vesting Period : to 2/3/2017 3/2/2018 7/2/2019 21/2/2019
Exercise Option Period : from 3/3/2017 4/2/2018 8/2/2019 22/2/2019
Exercise Option Period : to 2/3/2018 3/2/2019 7/2/2020 21/2/2020
Share Outstanding (at the Date of Grant) 189,600,000 189,600,000 189,600,000 189,600,000
Grant of Option as % of Shares Outstanding 0.55% 0.34% 0.47% 0.02%
No. of Options Granted 1,041,715 637,387 888,195 44,713
No. of Options Exercised 338,499 171,924 319,097 44,713
No. of Options Declined / Lapsed but subsequently Offered
Nil N/A 426,460 N/A
No. of Options Lapsed / Declined - (and subsequentlly NOT Offered)
703,216 465,463 742,219 N/A
Maximum option granted to a single employee 18,875 11,415 13,315 44,713
No. of Shares Issued (Pursuant to exercise of options granted & offered)
338,499 171,924 745,557 44,713
Status Closed Excerciseable Vesting Period
No. of Employees 1,507 823 0
Minimum Lock Period 3 years 3 years 3 years
Summary - Til Date
No. of Options Vested 2,612,010
No. of Options Exercised 874,233
No. of Options Declined / Lapsed but subsequentlly Offered 426,460
No. of Options Lapsed / Declined - (and subsequentlly NOT Offered) 742,219
No. of Shares Issued (Pursuant to exercise of options granted & offered) 1,300,693
ANNEXURES TO DIRECTORS’ REPORT No. of Shares Outstanding Latest
Option Pool 130,410,000
*15% of Latest Paid up Capital
No. of Shares Outstanding Latest
Grant of Option 2015-2016 (i) 1,041,715
Grant of Option 2015-2016 (ii) 637,387
Grant of Option 2016-2017 (i) 888,195
Grant of Option 2016-2017 (ii) 44,173
Options Granted 2,612,010
Balance Available in Option Pool 127,797,990
Inte
rloop
Lim
ited
58 59
2018
- 1
9A
nnua
l Rep
ort

FINANCIAL ANALYSIS
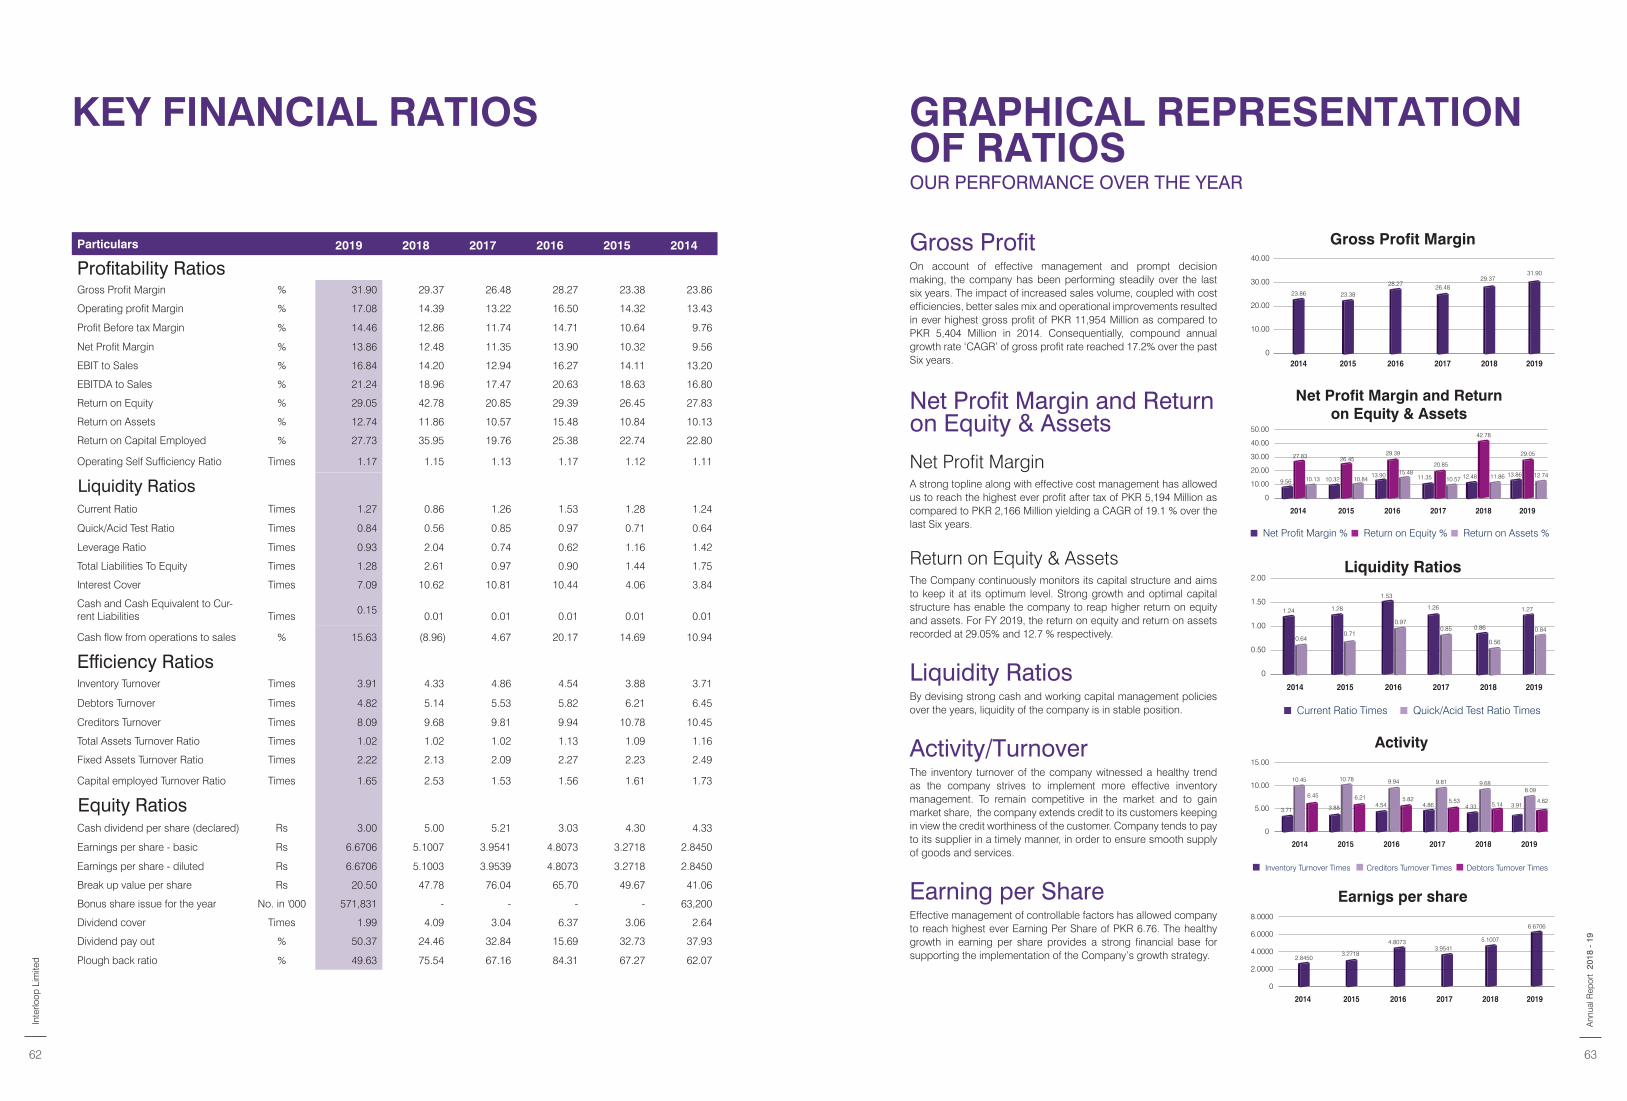
KEY FINANCIAL RATIOS
Particulars 2019 2018 2017 2016 2015 2014
Profitability RatiosGross Profit Margin % 31.90 29.37 26.48 28.27 23.38 23.86
Operating profit Margin % 17.08 14.39 13.22 16.50 14.32 13.43
Profit Before tax Margin % 14.46 12.86 11.74 14.71 10.64 9.76
Net Profit Margin % 13.86 12.48 11.35 13.90 10.32 9.56
EBIT to Sales % 16.84 14.20 12.94 16.27 14.11 13.20
EBITDA to Sales % 21.24 18.96 17.47 20.63 18.63 16.80
Return on Equity % 29.05 42.78 20.85 29.39 26.45 27.83
Return on Assets % 12.74 11.86 10.57 15.48 10.84 10.13
Return on Capital Employed % 27.73 35.95 19.76 25.38 22.74 22.80
Operating Self Sufficiency Ratio Times 1.17 1.15 1.13 1.17 1.12 1.11
Liquidity RatiosCurrent Ratio Times 1.27 0.86 1.26 1.53 1.28 1.24
Quick/Acid Test Ratio Times 0.84 0.56 0.85 0.97 0.71 0.64
Leverage Ratio Times 0.93 2.04 0.74 0.62 1.16 1.42
Total Liabilities To Equity Times 1.28 2.61 0.97 0.90 1.44 1.75
Interest Cover Times 7.09 10.62 10.81 10.44 4.06 3.84
Cash and Cash Equivalent to Cur-rent Liabilities Times
0.15 0.01 0.01 0.01 0.01 0.01
Cash flow from operations to sales % 15.63 (8.96) 4.67 20.17 14.69 10.94
Efficiency RatiosInventory Turnover Times 3.91 4.33 4.86 4.54 3.88 3.71
Debtors Turnover Times 4.82 5.14 5.53 5.82 6.21 6.45
Creditors Turnover Times 8.09 9.68 9.81 9.94 10.78 10.45
Total Assets Turnover Ratio Times 1.02 1.02 1.02 1.13 1.09 1.16
Fixed Assets Turnover Ratio Times 2.22 2.13 2.09 2.27 2.23 2.49
Capital employed Turnover Ratio Times 1.65 2.53 1.53 1.56 1.61 1.73
Equity RatiosCash dividend per share (declared) Rs 3.00 5.00 5.21 3.03 4.30 4.33
Earnings per share - basic Rs 6.6706 5.1007 3.9541 4.8073 3.2718 2.8450
Earnings per share - diluted Rs 6.6706 5.1003 3.9539 4.8073 3.2718 2.8450
Break up value per share Rs 20.50 47.78 76.04 65.70 49.67 41.06
Bonus share issue for the year No. in '000 571,831 - - - - 63,200
Dividend cover Times 1.99 4.09 3.04 6.37 3.06 2.64
Dividend pay out % 50.37 24.46 32.84 15.69 32.73 37.93
Plough back ratio % 49.63 75.54 67.16 84.31 67.27 62.07
GRAPHICAL REPRESENTATIONOF RATIOSOUR PERFORMANCE OVER THE YEAR
Gross ProfitOn account of effective management and prompt decision making, the company has been performing steadily over the last six years. The impact of increased sales volume, coupled with cost efficiencies, better sales mix and operational improvements resulted in ever highest gross profit of PKR 11,954 Million as compared to PKR 5,404 Million in 2014. Consequentially, compound annual growth rate ‘CAGR’ of gross profit rate reached 17.2% over the past Six years.
Net Profit Margin and Returnon Equity & Assets
Net Profit MarginA strong topline along with effective cost management has allowed us to reach the highest ever profit after tax of PKR 5,194 Million as compared to PKR 2,166 Million yielding a CAGR of 19.1 % over the last Six years.
Return on Equity & AssetsThe Company continuously monitors its capital structure and aims to keep it at its optimum level. Strong growth and optimal capital structure has enable the company to reap higher return on equity and assets. For FY 2019, the return on equity and return on assets recorded at 29.05% and 12.7 % respectively.
Liquidity Ratios
By devising strong cash and working capital management policies over the years, liquidity of the company is in stable position.
Activity/Turnover The inventory turnover of the company witnessed a healthy trend as the company strives to implement more effective inventory management. To remain competitive in the market and to gain market share, the company extends credit to its customers keeping in view the credit worthiness of the customer. Company tends to pay to its supplier in a timely manner, in order to ensure smooth supply of goods and services.
Earning per Share
Effective management of controllable factors has allowed company to reach highest ever Earning Per Share of PKR 6.76. The healthy growth in earning per share provides a strong financial base for supporting the implementation of the Company’s growth strategy.
Gross Profit Margin40.00
30.00
20.00
10.00
0201920182017201620152014
23.86 23.38
28.27 26.4829.37
31.90
Net Profit Margin and Returnon Equity & Assets
201920182017201620152014
Net Profit Margin % Return on Equity % Return on Assets %
50.00
40.00
30.00
20.00
10.00
0
27.83 26.45 29.39
20.85
42.78
29.05
10.13 10.84 15.48
10.57 11.86 12.74 9.56 10.32
13.90 11.35 12.48 13.86
Liquidity Ratios
Current Ratio Times Quick/Acid Test Ratio Times
201920182017201620152014
1.24 1.28
1.53
1.26
0.86
1.27
2.00
1.50
1.00
0.50
0
0.64 0.71
0.97 0.85
0.56
0.84
Activity
201920182017201620152014
15.00
10.00
5.00
0
Inventory Turnover Times Creditors Turnover Times Debtors Turnover Times
5.14 6.45 6.21 5.82 5.53 4.82
10.45 10.78 9.94 9.81 9.68 8.09
3.71 3.88 4.54 4.86 4.33 3.91
Earnigs per share
201920182017201620152014
8.0000
6.0000
4.0000
2.0000
0
2.8450 3.2718
4.8073 3.9541
5.1007
6.6706
Inte
rloop
Lim
ited
62 63
2018
- 1
9A
nnua
l Rep
ort
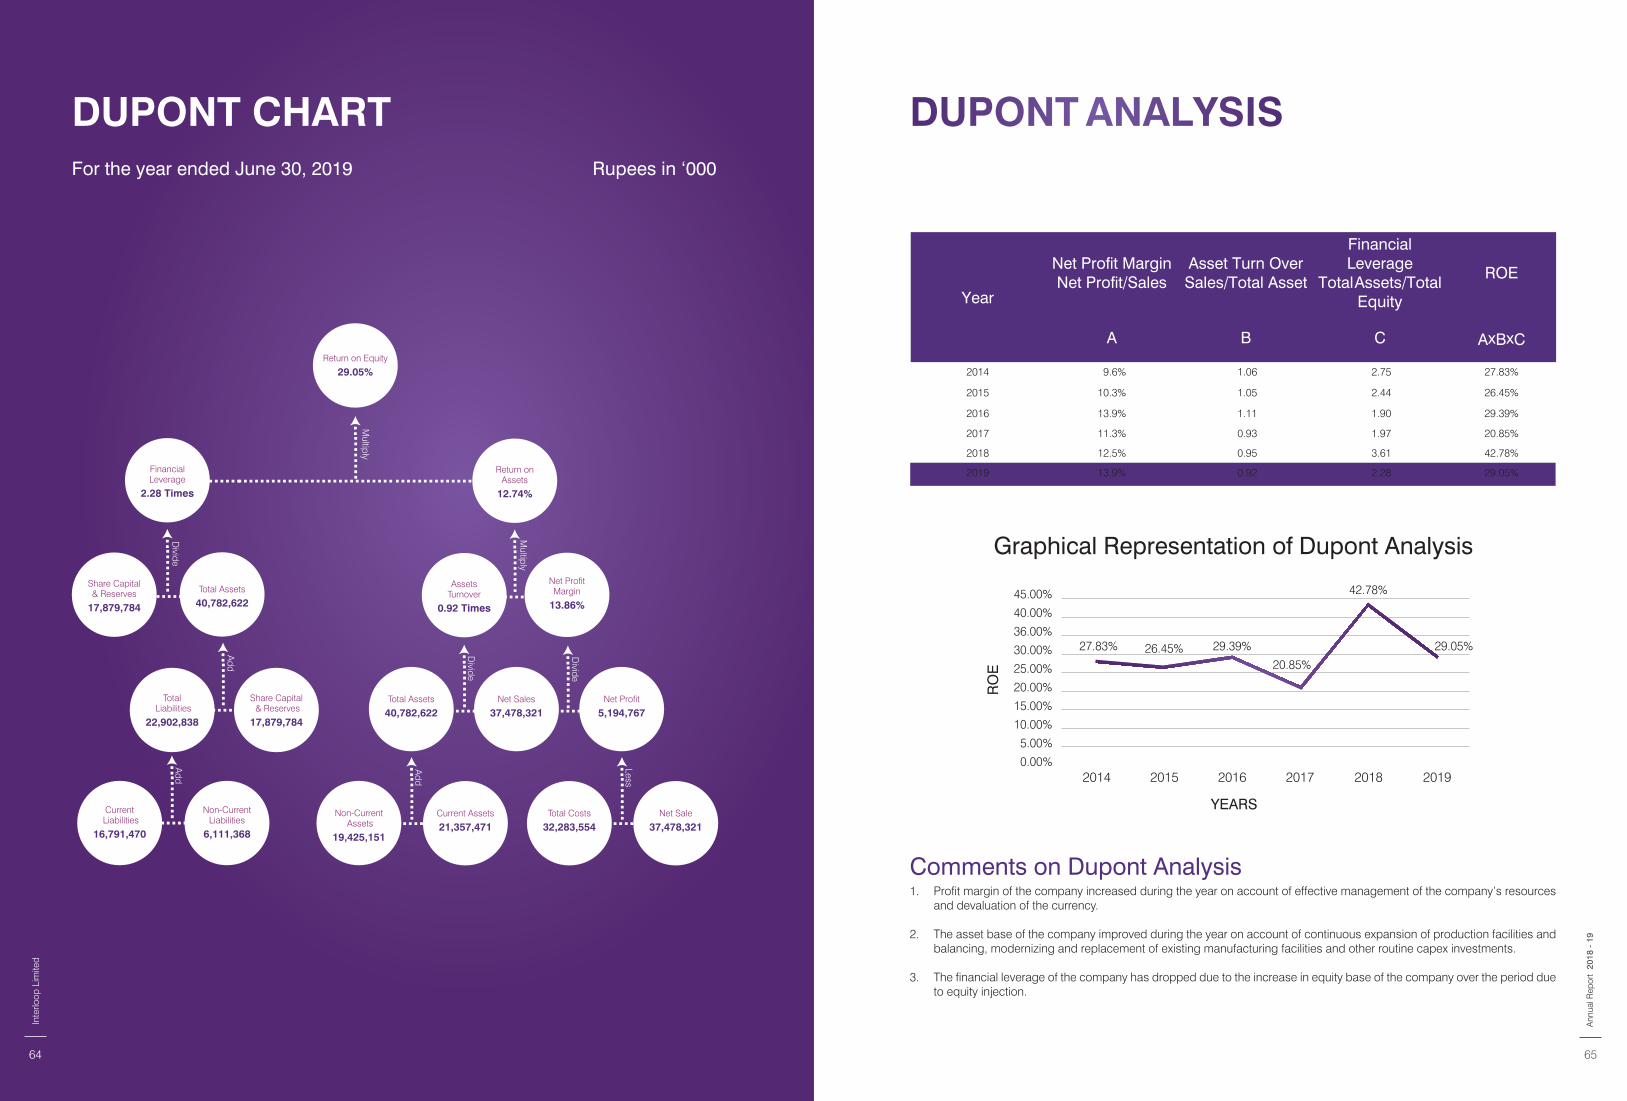
DUPONT CHART For the year ended June 30, 2019 Rupees in ‘000
Return on Equity
29.05%
Return onAssets
12.74%
Net ProfitMargin
13.86%
Total Assets
40,782,622Net Sales
37,478,321Net Profit
5,194,767
Current Liabilities
16,791,470
Non-Current Liabilities
6,111,368
Net Sale
37,478,321Total Costs
32,283,554Current Assets
21,357,471Non-Current
Assets
19,425,151
Financial Leverage
2.28 Times
Share Capital & Reserves
17,879,784
Total Assets
40,782,622
AssetsTurnover
0.92 Times
Total Liabilities
22,902,838
Share Capital & Reserves
17,879,784
Multiply
Divide
Divide
Multiply
Divide
Less
Add
Add
Add
DUPONT ANALYSIS
Year
Net Profit MarginNet Profit/Sales
Asset Turn OverSales/Total Asset
Financial Leverage
Total Assets/Total Equity
ROE
A B C AxBxC
2014 9.6% 1.06 2.75 27.83%
2015 10.3% 1.05 2.44 26.45%
2016 13.9% 1.11 1.90 29.39%
2017 11.3% 0.93 1.97 20.85%
2018 12.5% 0.95 3.61 42.78%
2019 13.9% 0.92 2.28 29.05%
Comments on Dupont Analysis
1. Profit margin of the company increased during the year on account of effective management of the company’s resources and devaluation of the currency.
2. The asset base of the company improved during the year on account of continuous expansion of production facilities and
balancing, modernizing and replacement of existing manufacturing facilities and other routine capex investments.
3. The financial leverage of the company has dropped due to the increase in equity base of the company over the period due to equity injection.
45.00%40.00%36.00%30.00%25.00%20.00%15.00%10.00%
5.00%0.00%
2014 2015 2016 2017 2018 2019
27.83% 26.45% 29.39%
20.85%
42.78%
29.05%
YEARS
RO
E
Graphical Representation of Dupont Analysis
65
2018
- 1
9A
nnua
l Rep
ort
Inte
rloop
Lim
ited
64
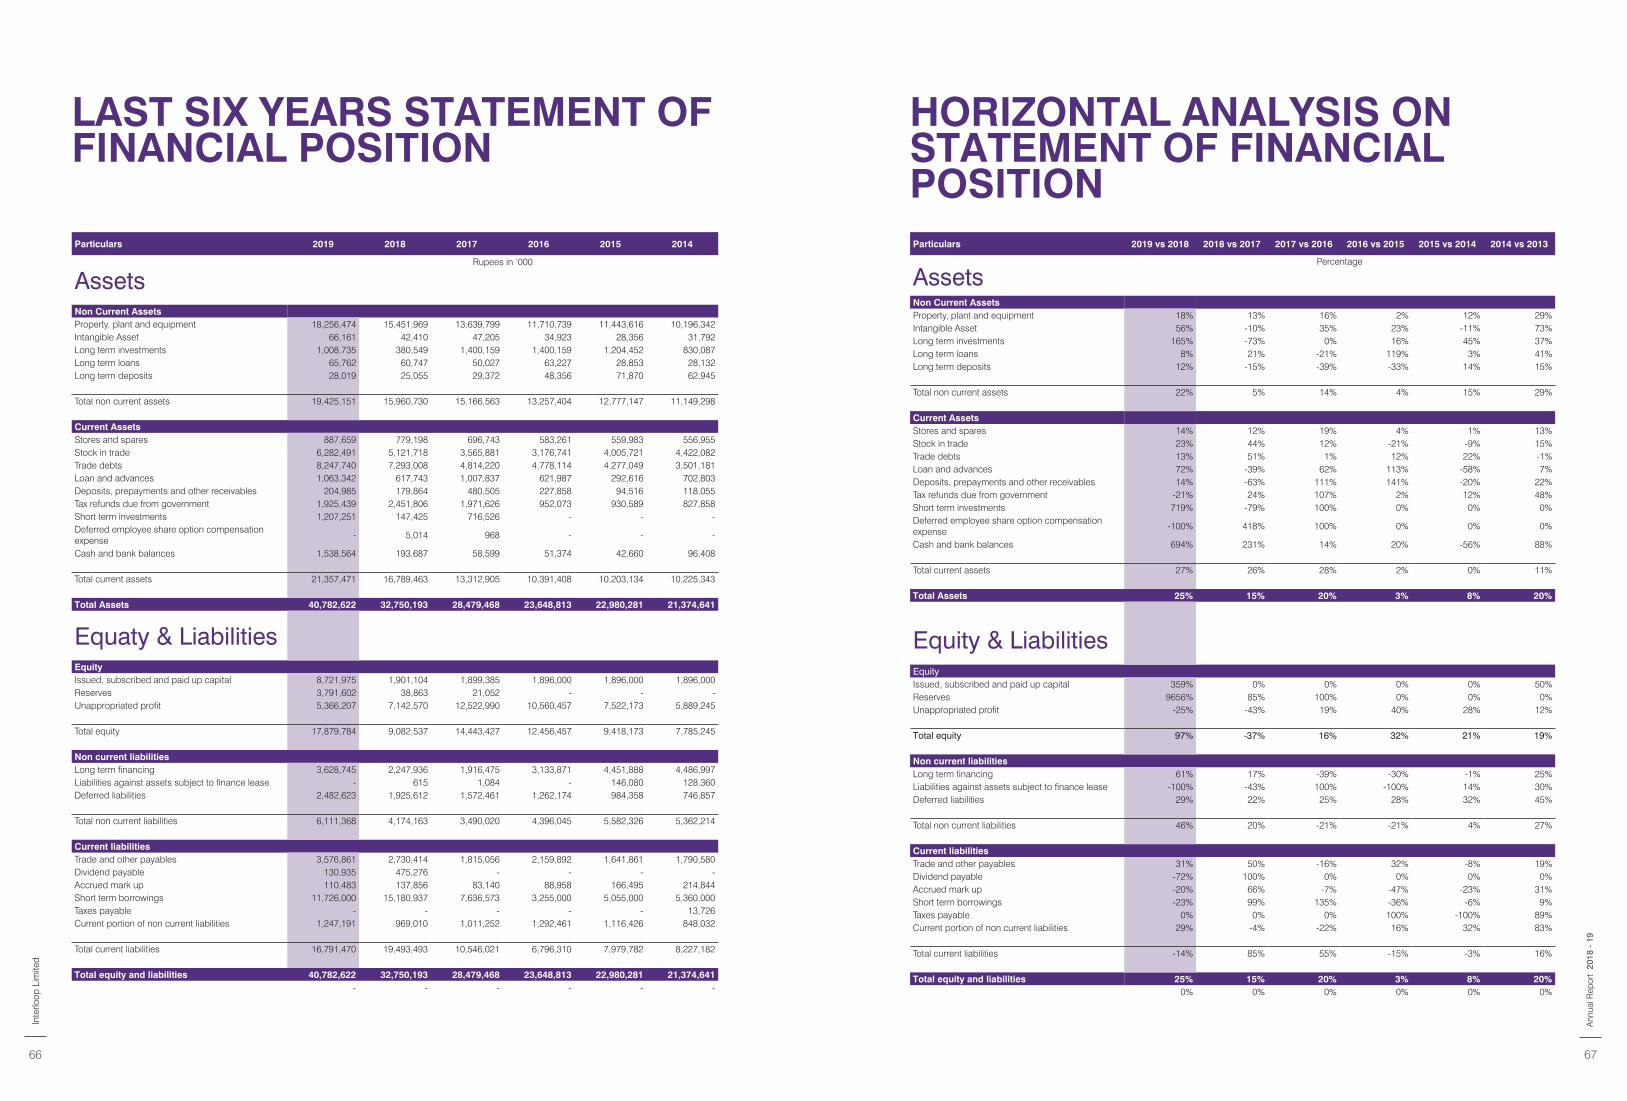
LAST SIX YEARS STATEMENT OF FINANCIAL POSITION
HORIZONTAL ANALYSIS ON STATEMENT OF FINANCIAL POSITION
Particulars 2019 2018 2017 2016 2015 2014
Rupees in ‘000
AssetsNon Current AssetsProperty, plant and equipment 18,256,474 15,451,969 13,639,799 11,710,739 11,443,616 10,196,342 Intangible Asset 66,161 42,410 47,205 34,923 28,356 31,792 Long term investments 1,008,735 380,549 1,400,159 1,400,159 1,204,452 830,087 Long term loans 65,762 60,747 50,027 63,227 28,853 28,132 Long term deposits 28,019 25,055 29,372 48,356 71,870 62,945
Total non current assets 19,425,151 15,960,730 15,166,563 13,257,404 12,777,147 11,149,298
Current AssetsStores and spares 887,659 779,198 696,743 583,261 559,983 556,955 Stock in trade 6,282,491 5,121,718 3,565,881 3,176,741 4,005,721 4,422,082 Trade debts 8,247,740 7,293,008 4,814,220 4,778,114 4,277,049 3,501,181 Loan and advances 1,063,342 617,743 1,007,837 621,987 292,616 702,803 Deposits, prepayments and other receivables 204,985 179,864 480,505 227,858 94,516 118,055 Tax refunds due from government 1,925,439 2,451,806 1,971,626 952,073 930,589 827,858 Short term investments 1,207,251 147,425 716,526 - - - Deferred employee share option compensation expense
- 5,014 968 - - -
Cash and bank balances 1,538,564 193,687 58,599 51,374 42,660 96,408
Total current assets 21,357,471 16,789,463 13,312,905 10,391,408 10,203,134 10,225,343
Total Assets 40,782,622 32,750,193 28,479,468 23,648,813 22,980,281 21,374,641
Equaty & LiabilitiesEquityIssued, subscribed and paid up capital 8,721,975 1,901,104 1,899,385 1,896,000 1,896,000 1,896,000 Reserves 3,791,602 38,863 21,052 - - - Unappropriated profit 5,366,207 7,142,570 12,522,990 10,560,457 7,522,173 5,889,245
Total equity 17,879,784 9,082,537 14,443,427 12,456,457 9,418,173 7,785,245
Non current liabilitiesLong term financing 3,628,745 2,247,936 1,916,475 3,133,871 4,451,888 4,486,997 Liabilities against assets subject to finance lease - 615 1,084 - 146,080 128,360 Deferred liabilities 2,482,623 1,925,612 1,572,461 1,262,174 984,358 746,857
Total non current liabilities 6,111,368 4,174,163 3,490,020 4,396,045 5,582,326 5,362,214
Current liabilitiesTrade and other payables 3,576,861 2,730,414 1,815,056 2,159,892 1,641,861 1,790,580 Dividend payable 130,935 475,276 - - - - Accrued mark up 110,483 137,856 83,140 88,958 166,495 214,844 Short term borrowings 11,726,000 15,180,937 7,636,573 3,255,000 5,055,000 5,360,000 Taxes payable - - - - - 13,726 Current portion of non current liabilities 1,247,191 969,010 1,011,252 1,292,461 1,116,426 848,032
Total current liabilities 16,791,470 19,493,493 10,546,021 6,796,310 7,979,782 8,227,182
Total equity and liabilities 40,782,622 32,750,193 28,479,468 23,648,813 22,980,281 21,374,641 - - - - - -
Particulars 2019 vs 2018 2018 vs 2017 2017 vs 2016 2016 vs 2015 2015 vs 2014 2014 vs 2013
Percentage
AssetsNon Current AssetsProperty, plant and equipment 18% 13% 16% 2% 12% 29%Intangible Asset 56% -10% 35% 23% -11% 73%Long term investments 165% -73% 0% 16% 45% 37%Long term loans 8% 21% -21% 119% 3% 41%Long term deposits 12% -15% -39% -33% 14% 15%
Total non current assets 22% 5% 14% 4% 15% 29%
Current AssetsStores and spares 14% 12% 19% 4% 1% 13%Stock in trade 23% 44% 12% -21% -9% 15%Trade debts 13% 51% 1% 12% 22% -1%Loan and advances 72% -39% 62% 113% -58% 7%Deposits, prepayments and other receivables 14% -63% 111% 141% -20% 22%Tax refunds due from government -21% 24% 107% 2% 12% 48%Short term investments 719% -79% 100% 0% 0% 0%Deferred employee share option compensation expense
-100% 418% 100% 0% 0% 0%
Cash and bank balances 694% 231% 14% 20% -56% 88%
Total current assets 27% 26% 28% 2% 0% 11%
Total Assets 25% 15% 20% 3% 8% 20%
Equity & LiabilitiesEquityIssued, subscribed and paid up capital 359% 0% 0% 0% 0% 50%Reserves 9656% 85% 100% 0% 0% 0%Unappropriated profit -25% -43% 19% 40% 28% 12%
Total equity 97% -37% 16% 32% 21% 19%
Non current liabilitiesLong term financing 61% 17% -39% -30% -1% 25%Liabilities against assets subject to finance lease -100% -43% 100% -100% 14% 30%Deferred liabilities 29% 22% 25% 28% 32% 45%
Total non current liabilities 46% 20% -21% -21% 4% 27%
Current liabilitiesTrade and other payables 31% 50% -16% 32% -8% 19%Dividend payable -72% 100% 0% 0% 0% 0%Accrued mark up -20% 66% -7% -47% -23% 31%Short term borrowings -23% 99% 135% -36% -6% 9%Taxes payable 0% 0% 0% 100% -100% 89%Current portion of non current liabilities 29% -4% -22% 16% 32% 83%
Total current liabilities -14% 85% 55% -15% -3% 16%
Total equity and liabilities 25% 15% 20% 3% 8% 20% 0% 0% 0% 0% 0% 0%
Inte
rloop
Lim
ited
66 67
2018
- 1
9A
nnua
l Rep
ort
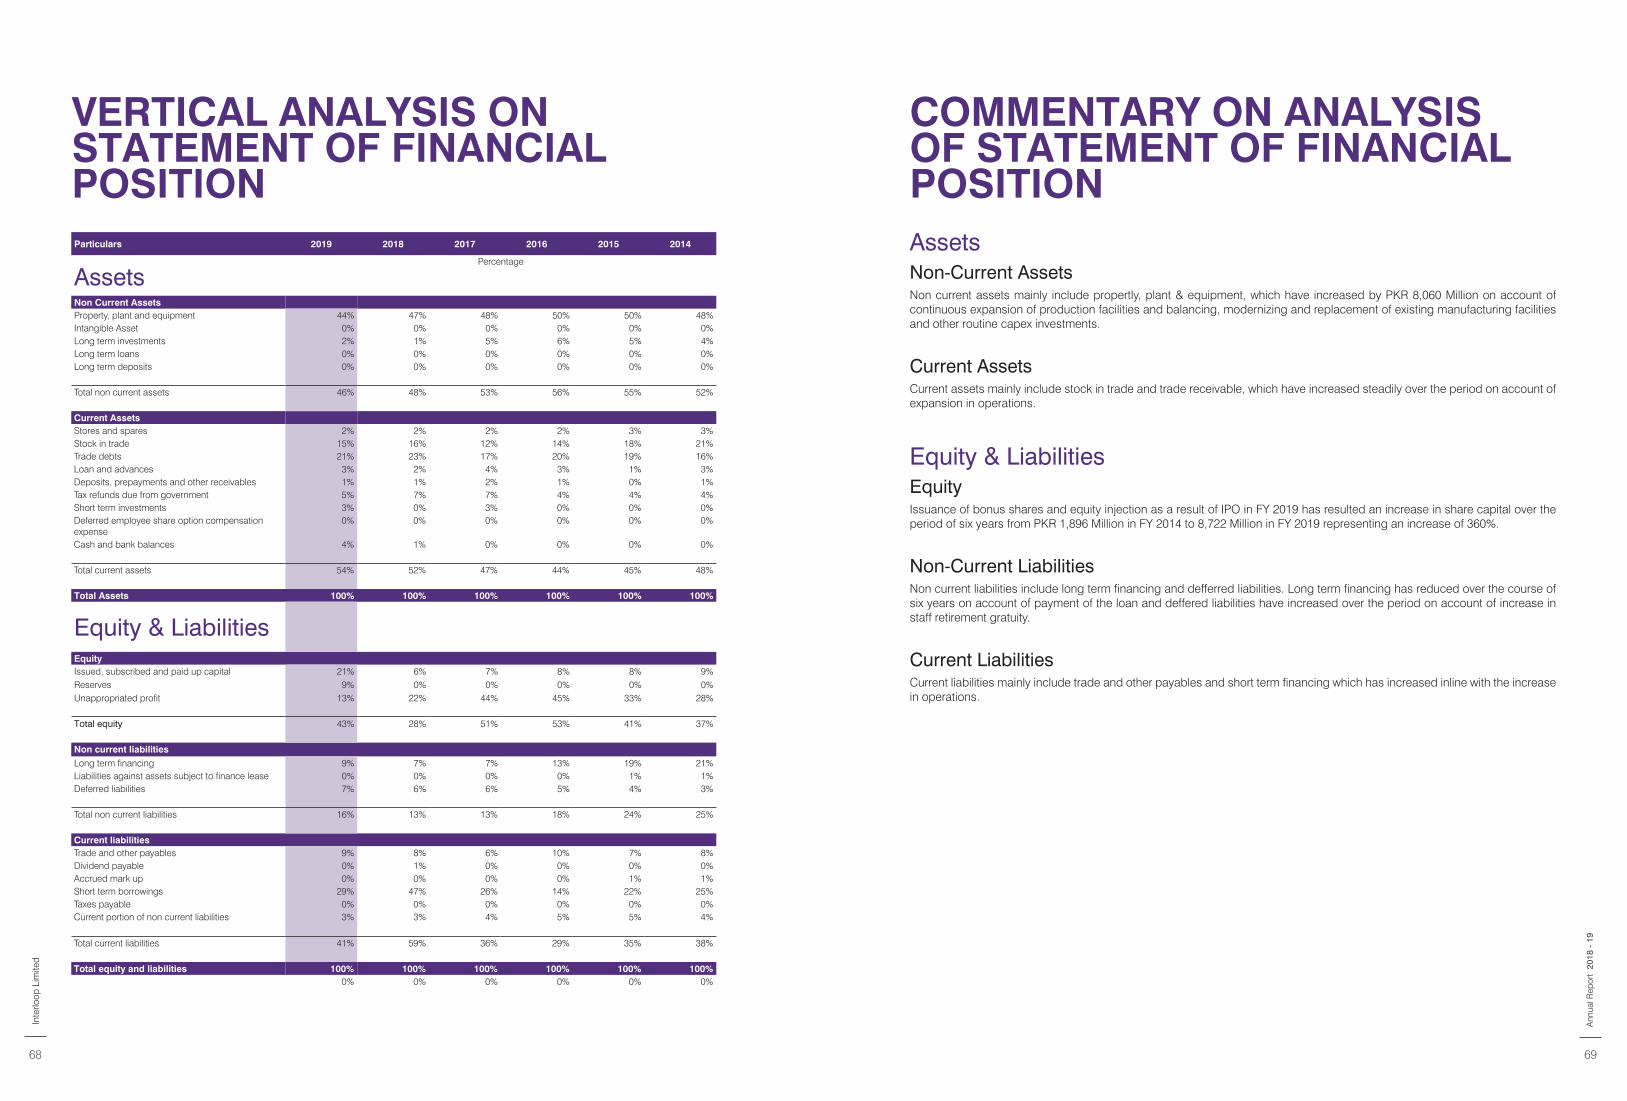
Assets Non-Current AssetsNon current assets mainly include propertly, plant & equipment, which have increased by PKR 8,060 Million on account of continuous expansion of production facilities and balancing, modernizing and replacement of existing manufacturing facilities and other routine capex investments.
Current Assets Current assets mainly include stock in trade and trade receivable, which have increased steadily over the period on account of expansion in operations.
Equity & LiabilitiesEquityIssuance of bonus shares and equity injection as a result of IPO in FY 2019 has resulted an increase in share capital over the period of six years from PKR 1,896 Million in FY 2014 to 8,722 Million in FY 2019 representing an increase of 360%.
Non-Current LiabilitiesNon current liabilities include long term financing and defferred liabilities. Long term financing has reduced over the course of six years on account of payment of the loan and deffered liabilities have increased over the period on account of increase in staff retirement gratuity.
Current Liabilities Current liabilities mainly include trade and other payables and short term financing which has increased inline with the increase in operations.
COMMENTARY ON ANALYSIS OF STATEMENT OF FINANCIAL POSITION
VERTICAL ANALYSIS ON STATEMENT OF FINANCIAL POSITIONParticulars 2019 2018 2017 2016 2015 2014
Percentage
AssetsNon Current AssetsProperty, plant and equipment 44% 47% 48% 50% 50% 48%Intangible Asset 0% 0% 0% 0% 0% 0%Long term investments 2% 1% 5% 6% 5% 4%Long term loans 0% 0% 0% 0% 0% 0%Long term deposits 0% 0% 0% 0% 0% 0%
Total non current assets 46% 48% 53% 56% 55% 52%48% 53% 56% 55% 52%
Current AssetsStores and spares 2% 2% 2% 2% 3% 3%Stock in trade 15% 16% 12% 14% 18% 21%Trade debts 21% 23% 17% 20% 19% 16%Loan and advances 3% 2% 4% 3% 1% 3%Deposits, prepayments and other receivables 1% 1% 2% 1% 0% 1%Tax refunds due from government 5% 7% 7% 4% 4% 4%Short term investments 3% 0% 3% 0% 0% 0%Deferred employee share option compensation expense
0% 0% 0% 0% 0% 0%
Cash and bank balances 4% 1% 0% 0% 0% 0%
Total current assets 54% 52% 47% 44% 45% 48%52% 47% 44% 45% 48%
Total Assets 100% 100% 100% 100% 100% 100%
Equity & LiabilitiesEquityIssued, subscribed and paid up capital 21% 6% 7% 8% 8% 9%Reserves 9% 0% 0% 0% 0% 0%Unappropriated profit 13% 22% 44% 45% 33% 28%
Total equity 43% 28% 51% 53% 41% 37%
Non current liabilitiesLong term financing 9% 7% 7% 13% 19% 21%Liabilities against assets subject to finance lease 0% 0% 0% 0% 1% 1%Deferred liabilities 7% 6% 6% 5% 4% 3%
Total non current liabilities 16% 13% 13% 18% 24% 25%
Current liabilitiesTrade and other payables 9% 8% 6% 10% 7% 8%Dividend payable 0% 1% 0% 0% 0% 0%Accrued mark up 0% 0% 0% 0% 1% 1%Short term borrowings 29% 47% 26% 14% 22% 25%Taxes payable 0% 0% 0% 0% 0% 0%Current portion of non current liabilities 3% 3% 4% 5% 5% 4%
Total current liabilities 41% 59% 36% 29% 35% 38%
Total equity and liabilities 100% 100% 100% 100% 100% 100% 0% 0% 0% 0% 0% 0%
Inte
rloop
Lim
ited
68 69
2018
- 1
9A
nnua
l Rep
ort
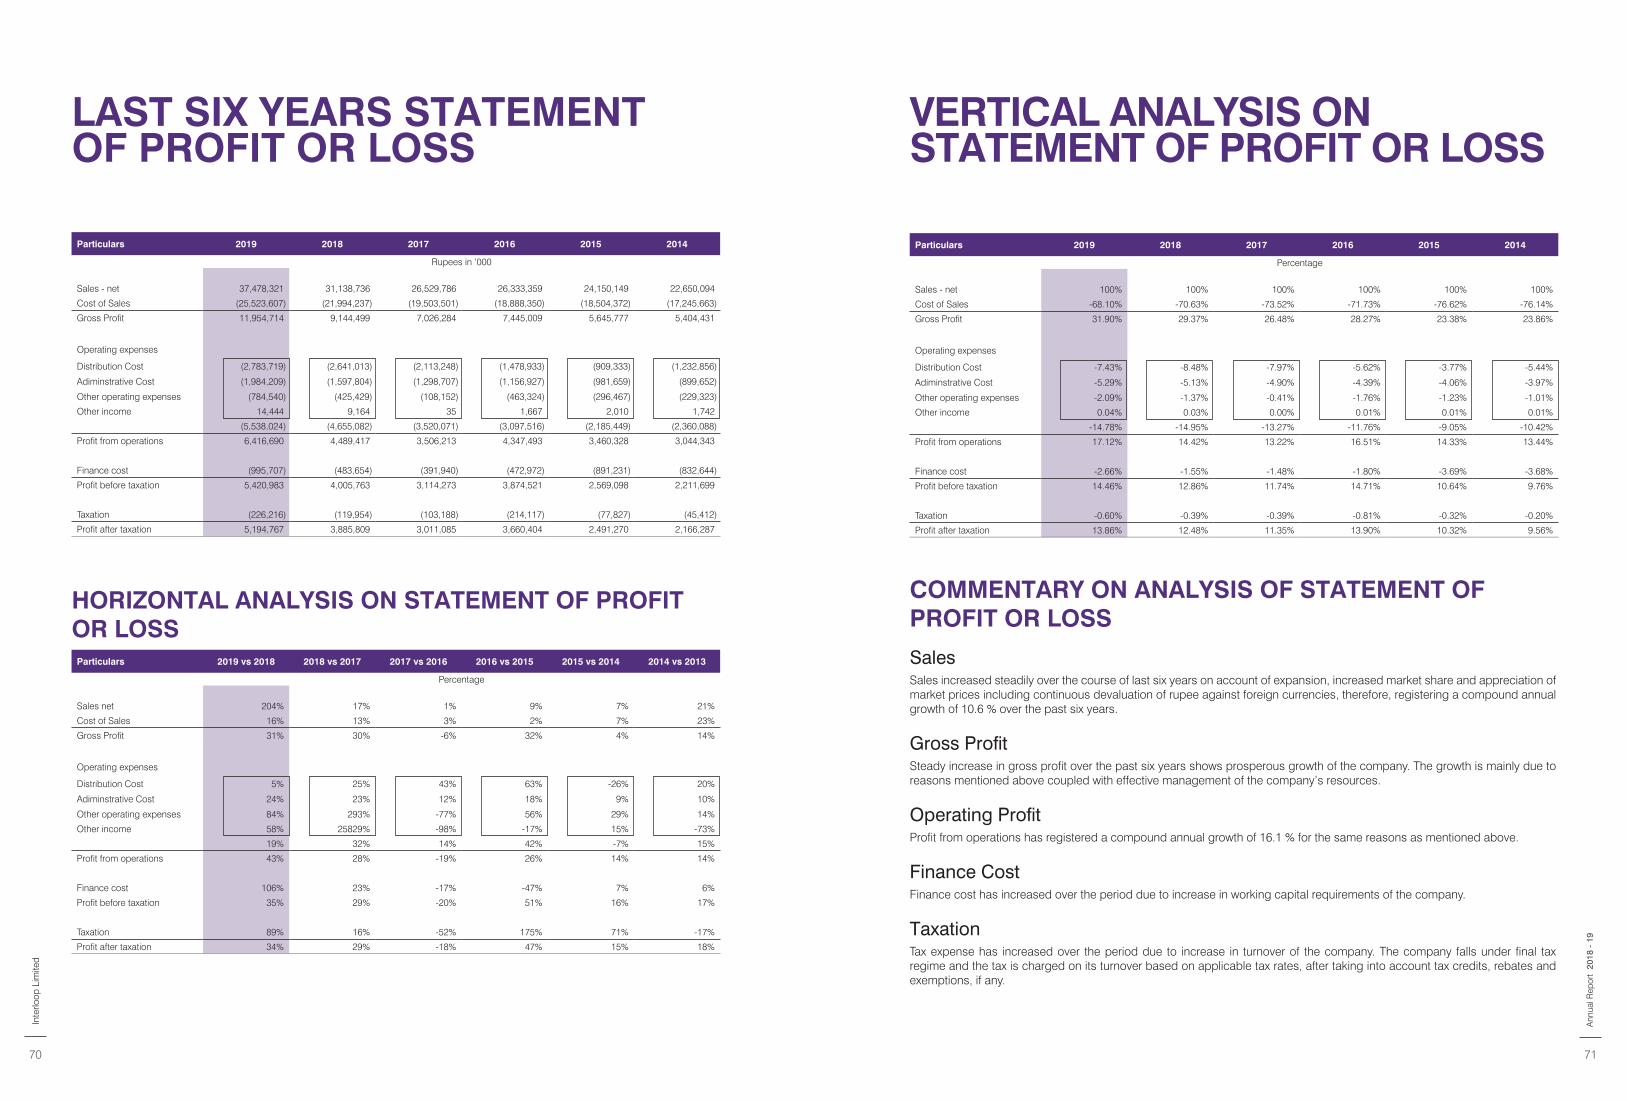
LAST SIX YEARS STATEMENT OF PROFIT OR LOSS
VERTICAL ANALYSIS ON STATEMENT OF PROFIT OR LOSS
HORIZONTAL ANALYSIS ON STATEMENT OF PROFIT OR LOSS
COMMENTARY ON ANALYSIS OF STATEMENT OF PROFIT OR LOSS
SalesSales increased steadily over the course of last six years on account of expansion, increased market share and appreciation of market prices including continuous devaluation of rupee against foreign currencies, therefore, registering a compound annual growth of 10.6 % over the past six years.
Gross Profit Steady increase in gross profit over the past six years shows prosperous growth of the company. The growth is mainly due to reasons mentioned above coupled with effective management of the company’s resources.
Operating ProfitProfit from operations has registered a compound annual growth of 16.1 % for the same reasons as mentioned above.
Finance CostFinance cost has increased over the period due to increase in working capital requirements of the company.
TaxationTax expense has increased over the period due to increase in turnover of the company. The company falls under final tax regime and the tax is charged on its turnover based on applicable tax rates, after taking into account tax credits, rebates and exemptions, if any.
Particulars 2019 2018 2017 2016 2015 2014
Rupees in ‘000
Sales - net 37,478,321 31,138,736 26,529,786 26,333,359 24,150,149 22,650,094
Cost of Sales (25,523,607) (21,994,237) (19,503,501) (18,888,350) (18,504,372) (17,245,663)
Gross Profit 11,954,714 9,144,499 7,026,284 7,445,009 5,645,777 5,404,431
Operating expenses
Distribution Cost (2,783,719) (2,641,013) (2,113,248) (1,478,933) (909,333) (1,232,856)
Adiminstrative Cost (1,984,209) (1,597,804) (1,298,707) (1,156,927) (981,659) (899,652)
Other operating expenses (784,540) (425,429) (108,152) (463,324) (296,467) (229,323)
Other income 14,444 9,164 35 1,667 2,010 1,742
(5,538,024) (4,655,082) (3,520,071) (3,097,516) (2,185,449) (2,360,088)
Profit from operations 6,416,690 4,489,417 3,506,213 4,347,493 3,460,328 3,044,343
Finance cost (995,707) (483,654) (391,940) (472,972) (891,231) (832,644)
Profit before taxation 5,420,983 4,005,763 3,114,273 3,874,521 2,569,098 2,211,699
Taxation (226,216) (119,954) (103,188) (214,117) (77,827) (45,412)
Profit after taxation 5,194,767 3,885,809 3,011,085 3,660,404 2,491,270 2,166,287
Particulars 2019 2018 2017 2016 2015 2014
Percentage
Sales - net 100% 100% 100% 100% 100% 100%
Cost of Sales -68.10% -70.63% -73.52% -71.73% -76.62% -76.14%
Gross Profit 31.90% 29.37% 26.48% 28.27% 23.38% 23.86%
Operating expenses
Distribution Cost -7.43% -8.48% -7.97% -5.62% -3.77% -5.44%
Adiminstrative Cost -5.29% -5.13% -4.90% -4.39% -4.06% -3.97%
Other operating expenses -2.09% -1.37% -0.41% -1.76% -1.23% -1.01%
Other income 0.04% 0.03% 0.00% 0.01% 0.01% 0.01%
-14.78% -14.95% -13.27% -11.76% -9.05% -10.42%
Profit from operations 17.12% 14.42% 13.22% 16.51% 14.33% 13.44%
Finance cost -2.66% -1.55% -1.48% -1.80% -3.69% -3.68%
Profit before taxation 14.46% 12.86% 11.74% 14.71% 10.64% 9.76%
Taxation -0.60% -0.39% -0.39% -0.81% -0.32% -0.20%
Profit after taxation 13.86% 12.48% 11.35% 13.90% 10.32% 9.56%
Particulars 2019 vs 2018 2018 vs 2017 2017 vs 2016 2016 vs 2015 2015 vs 2014 2014 vs 2013
Percentage
Sales net 204% 17% 1% 9% 7% 21%
Cost of Sales 16% 13% 3% 2% 7% 23%
Gross Profit 31% 30% -6% 32% 4% 14%
Operating expenses
Distribution Cost 5% 25% 43% 63% -26% 20%
Adiminstrative Cost 24% 23% 12% 18% 9% 10%
Other operating expenses 84% 293% -77% 56% 29% 14%
Other income 58% 25829% -98% -17% 15% -73%
19% 32% 14% 42% -7% 15%
Profit from operations 43% 28% -19% 26% 14% 14%
Finance cost 106% 23% -17% -47% 7% 6%
Profit before taxation 35% 29% -20% 51% 16% 17%
Taxation 89% 16% -52% 175% 71% -17%
Profit after taxation 34% 29% -18% 47% 15% 18%
Inte
rloop
Lim
ited
70 71
2018
- 1
9A
nnua
l Rep
ort
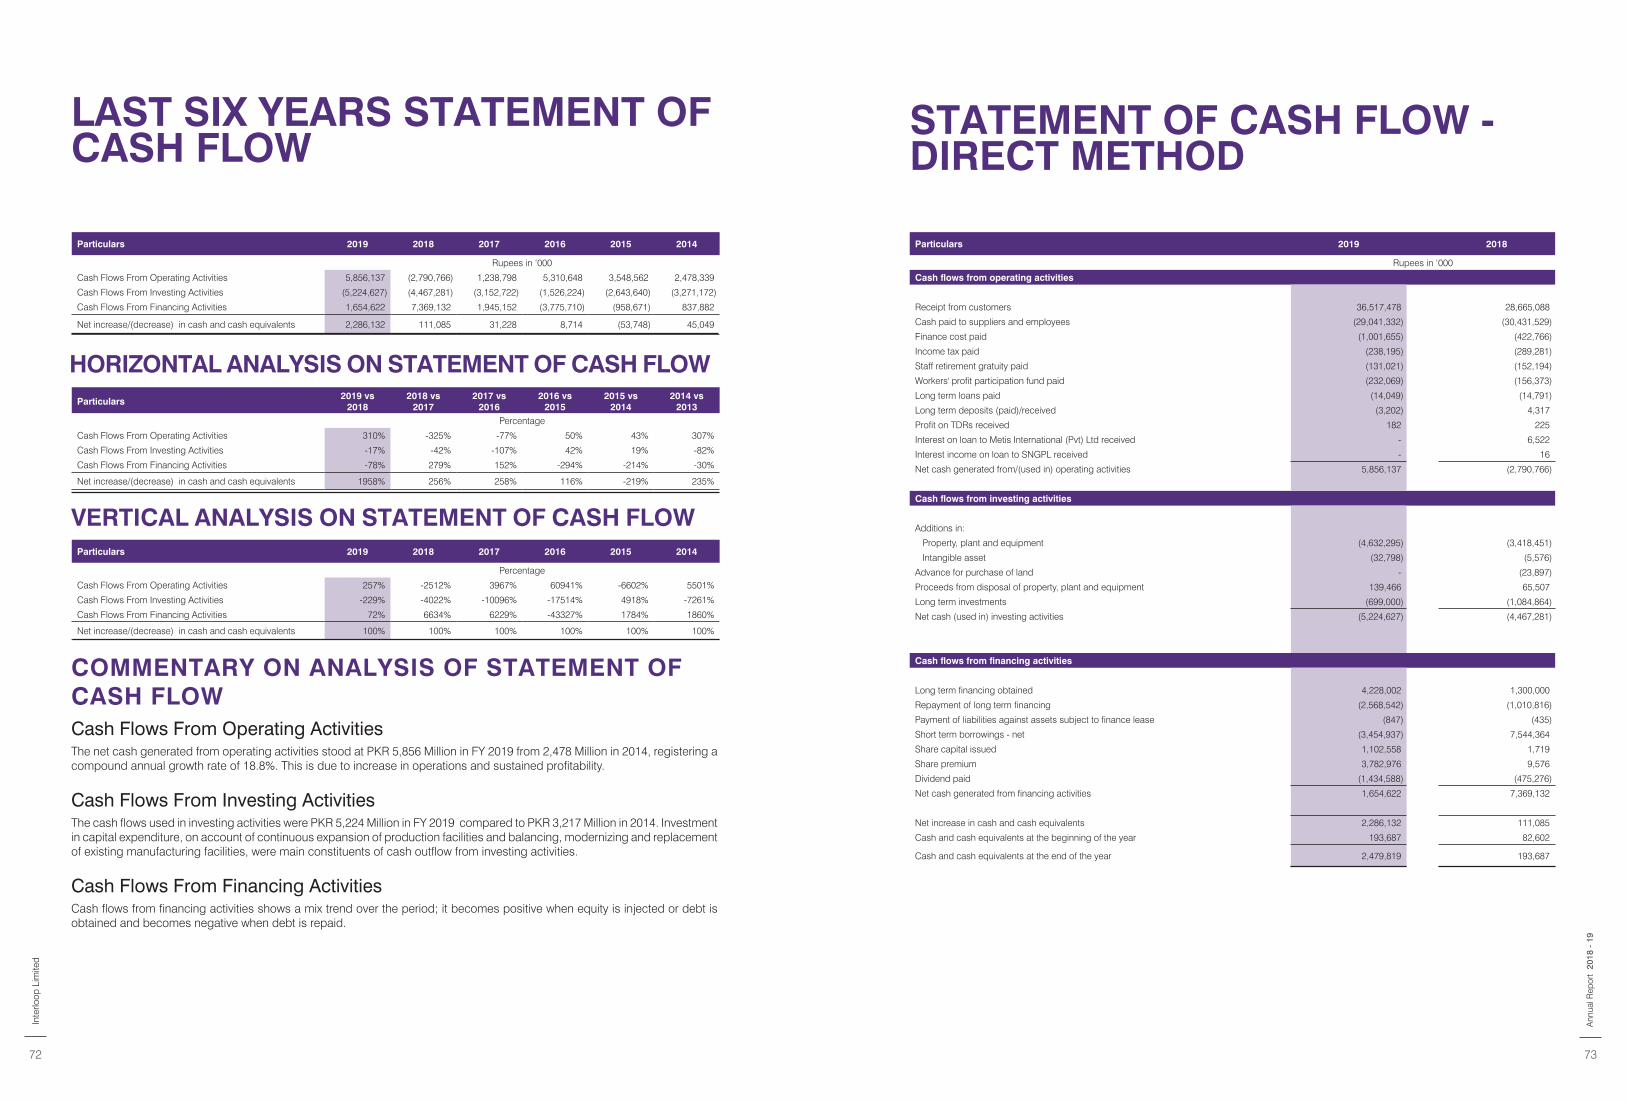
LAST SIX YEARS STATEMENT OF CASH FLOW
STATEMENT OF CASH FLOW -DIRECT METHOD
HORIZONTAL ANALYSIS ON STATEMENT OF CASH FLOW
VERTICAL ANALYSIS ON STATEMENT OF CASH FLOW
COMMENTARY ON ANALYSIS OF STATEMENT OF CASH FLOWCash Flows From Operating ActivitiesThe net cash generated from operating activities stood at PKR 5,856 Million in FY 2019 from 2,478 Million in 2014, registering a compound annual growth rate of 18.8%. This is due to increase in operations and sustained profitability.
Cash Flows From Investing Activities The cash flows used in investing activities were PKR 5,224 Million in FY 2019 compared to PKR 3,217 Million in 2014. Investment in capital expenditure, on account of continuous expansion of production facilities and balancing, modernizing and replacement of existing manufacturing facilities, were main constituents of cash outflow from investing activities.
Cash Flows From Financing ActivitiesCash flows from financing activities shows a mix trend over the period; it becomes positive when equity is injected or debt is obtained and becomes negative when debt is repaid.
Particulars 2019 2018 2017 2016 2015 2014
Rupees in ‘000
Cash Flows From Operating Activities 5,856,137 (2,790,766) 1,238,798 5,310,648 3,548,562 2,478,339
Cash Flows From Investing Activities (5,224,627) (4,467,281) (3,152,722) (1,526,224) (2,643,640) (3,271,172)
Cash Flows From Financing Activities 1,654,622 7,369,132 1,945,152 (3,775,710) (958,671) 837,882
Net increase/(decrease) in cash and cash equivalents 2,286,132 111,085 31,228 8,714 (53,748) 45,049
Particulars2019 vs
20182018 vs
20172017 vs
20162016 vs
20152015 vs
20142014 vs
2013Percentage
Cash Flows From Operating Activities 310% -325% -77% 50% 43% 307%
Cash Flows From Investing Activities -17% -42% -107% 42% 19% -82%
Cash Flows From Financing Activities -78% 279% 152% -294% -214% -30%
Net increase/(decrease) in cash and cash equivalents 1958% 256% 258% 116% -219% 235%
Particulars 2019 2018 2017 2016 2015 2014
Percentage
Cash Flows From Operating Activities 257% -2512% 3967% 60941% -6602% 5501%
Cash Flows From Investing Activities -229% -4022% -10096% -17514% 4918% -7261%
Cash Flows From Financing Activities 72% 6634% 6229% -43327% 1784% 1860%
Net increase/(decrease) in cash and cash equivalents 100% 100% 100% 100% 100% 100%
Particulars 2019 2018
Rupees in ‘000
Cash flows from operating activities
Receipt from customers 36,517,478 28,665,088
Cash paid to suppliers and employees (29,041,332) (30,431,529)
Finance cost paid (1,001,655) (422,766)
Income tax paid (238,195) (289,281)
Staff retirement gratuity paid (131,021) (152,194)
Workers' profit participation fund paid (232,069) (156,373)
Long term loans paid (14,049) (14,791)
Long term deposits (paid)/received (3,202) 4,317
Profit on TDRs received 182 225
Interest on loan to Metis International (Pvt) Ltd received - 6,522
Interest income on loan to SNGPL received - 16
Net cash generated from/(used in) operating activities 5,856,137 (2,790,766)
Cash flows from investing activities
Additions in:
Property, plant and equipment (4,632,295) (3,418,451)
Intangible asset (32,798) (5,576)
Advance for purchase of land - (23,897)
Proceeds from disposal of property, plant and equipment 139,466 65,507
Long term investments (699,000) (1,084,864)
Net cash (used in) investing activities (5,224,627) (4,467,281)
Cash flows from financing activities
Long term financing obtained 4,228,002 1,300,000
Repayment of long term financing (2,568,542) (1,010,816)
Payment of liabilities against assets subject to finance lease (847) (435)
Short term borrowings - net (3,454,937) 7,544,364
Share capital issued 1,102,558 1,719
Share premium 3,782,976 9,576
Dividend paid (1,434,588) (475,276)
Net cash generated from financing activities 1,654,622 7,369,132
Net increase in cash and cash equivalents 2,286,132 111,085
Cash and cash equivalents at the beginning of the year 193,687 82,602
Cash and cash equivalents at the end of the year 2,479,819 193,687
Inte
rloop
Lim
ited
72 73
2018
- 1
9A
nnua
l Rep
ort
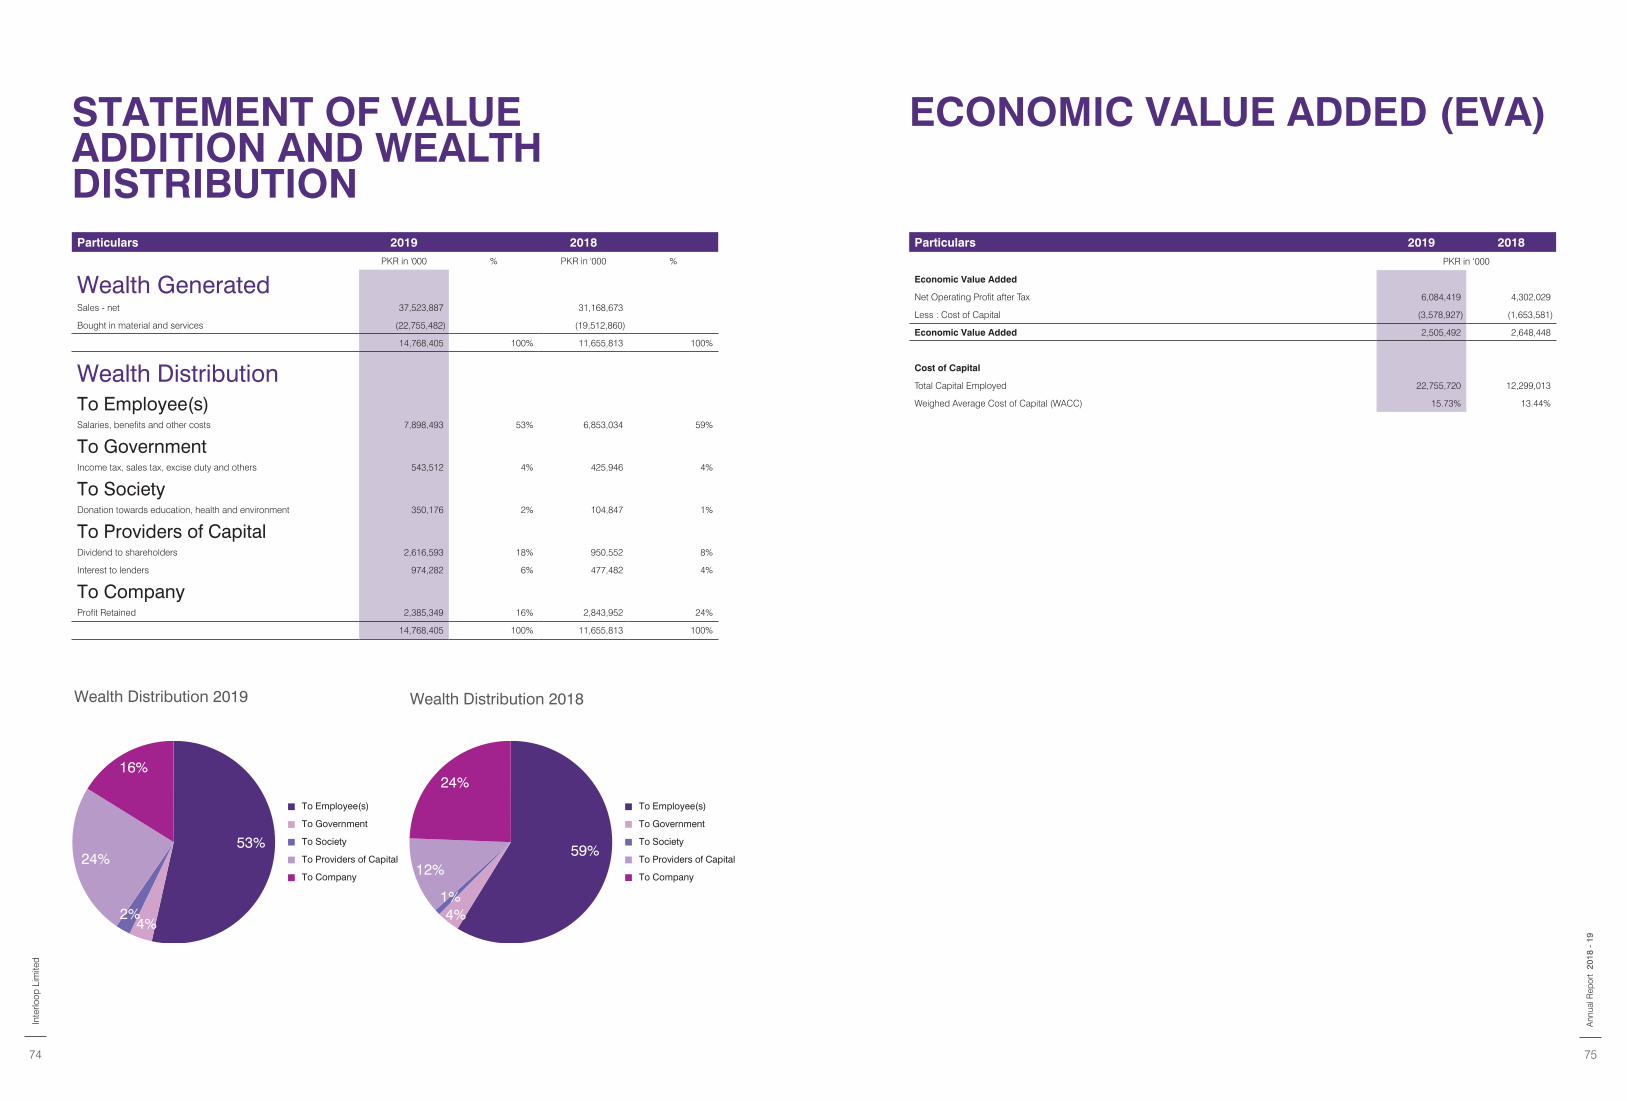
STATEMENT OF VALUE ADDITION AND WEALTH DISTRIBUTION
ECONOMIC VALUE ADDED (EVA)
Wealth Distribution 2019 Wealth Distribution 2018
Particulars 2019 2018PKR in '000 % PKR in '000 %
Wealth GeneratedSales - net 37,523,887 31,168,673
Bought in material and services (22,755,482) (19,512,860)
14,768,405 100% 11,655,813 100%
Wealth DistributionTo Employee(s)Salaries, benefits and other costs 7,898,493 53% 6,853,034 59%
To GovernmentIncome tax, sales tax, excise duty and others 543,512 4% 425,946 4%
To SocietyDonation towards education, health and environment 350,176 2% 104,847 1%
To Providers of CapitalDividend to shareholders 2,616,593 18% 950,552 8%
Interest to lenders 974,282 6% 477,482 4%
To CompanyProfit Retained 2,385,349 16% 2,843,952 24%
14,768,405 100% 11,655,813 100%
Particulars 2019 2018
PKR in ‘000
Economic Value Added
Net Operating Profit after Tax 6,084,419 4,302,029
Less : Cost of Capital (3,578,927) (1,653,581)
Economic Value Added 2,505,492 2,648,448
Cost of Capital
Total Capital Employed 22,755,720 12,299,013
Weighed Average Cost of Capital (WACC) 15.73% 13.44%
53%
4%2%
24%
16%
To Employee(s)
To Government
To Society
To Providers of Capital
To Company
59%
4%1%
12%
24%To Employee(s)
To Government
To Society
To Providers of Capital
To Company
Inte
rloop
Lim
ited
74 75
2018
- 1
9A
nnua
l Rep
ort
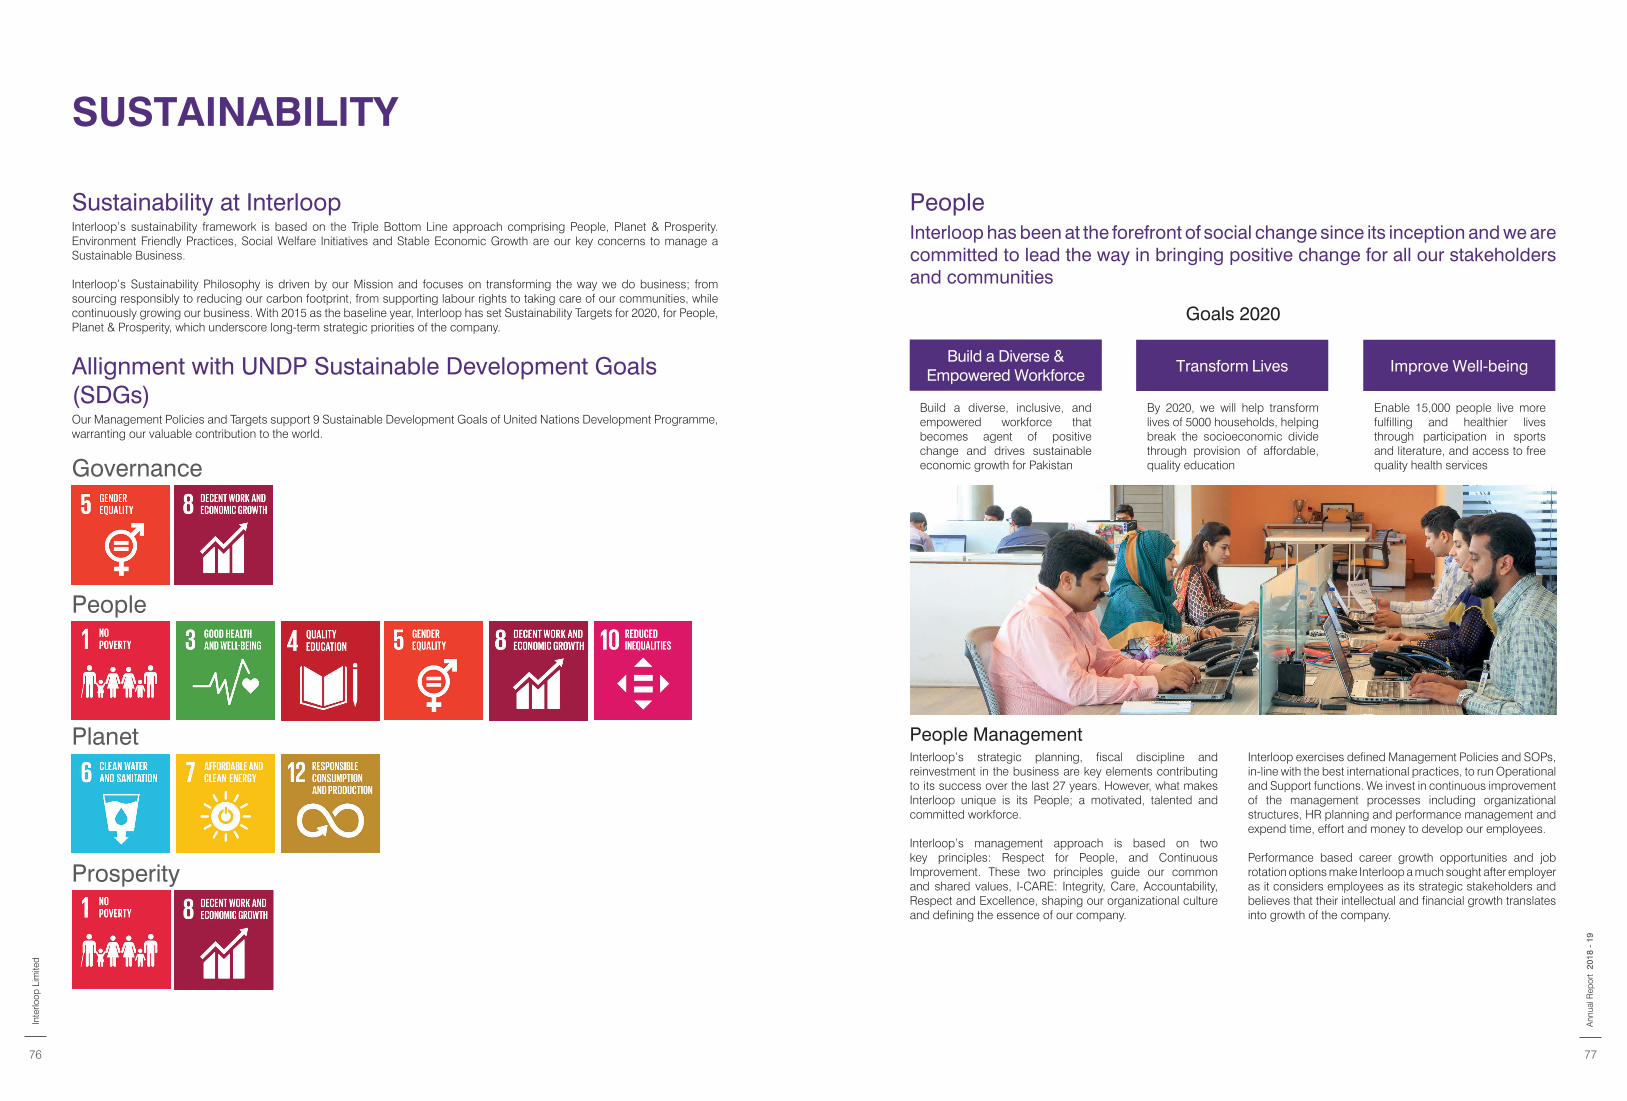
SUSTAINABILITY
Sustainability at InterloopInterloop’s sustainability framework is based on the Triple Bottom Line approach comprising People, Planet & Prosperity. Environment Friendly Practices, Social Welfare Initiatives and Stable Economic Growth are our key concerns to manage a Sustainable Business.
Interloop’s Sustainability Philosophy is driven by our Mission and focuses on transforming the way we do business; from sourcing responsibly to reducing our carbon footprint, from supporting labour rights to taking care of our communities, while continuously growing our business. With 2015 as the baseline year, Interloop has set Sustainability Targets for 2020, for People, Planet & Prosperity, which underscore long-term strategic priorities of the company.
Allignment with UNDP Sustainable Development Goals (SDGs)Our Management Policies and Targets support 9 Sustainable Development Goals of United Nations Development Programme, warranting our valuable contribution to the world.
Governance
People
Planet
Prosperity
PeopleInterloop has been at the forefront of social change since its inception and we are committed to lead the way in bringing positive change for all our stakeholders and communities
Goals 2020
Build a Diverse & Empowered Workforce
Build a diverse, inclusive, and empowered workforce that becomes agent of positive change and drives sustainable economic growth for Pakistan
Transform Lives
By 2020, we will help transform lives of 5000 households, helping break the socioeconomic divide through provision of affordable, quality education
Improve Well-being
Enable 15,000 people live more fulfilling and healthier lives through participation in sports and literature, and access to free quality health services
People ManagementInterloop’s strategic planning, fiscal discipline and reinvestment in the business are key elements contributing to its success over the last 27 years. However, what makes Interloop unique is its People; a motivated, talented and committed workforce.
Interloop’s management approach is based on two key principles: Respect for People, and Continuous Improvement. These two principles guide our common and shared values, I-CARE: Integrity, Care, Accountability, Respect and Excellence, shaping our organizational culture and defining the essence of our company.
Interloop exercises defined Management Policies and SOPs, in-line with the best international practices, to run Operational and Support functions. We invest in continuous improvement of the management processes including organizational structures, HR planning and performance management and expend time, effort and money to develop our employees.
Performance based career growth opportunities and job rotation options make Interloop a much sought after employer as it considers employees as its strategic stakeholders and believes that their intellectual and financial growth translates into growth of the company.
Inte
rloop
Lim
ited
76 77
2018
- 1
9A
nnua
l Rep
ort
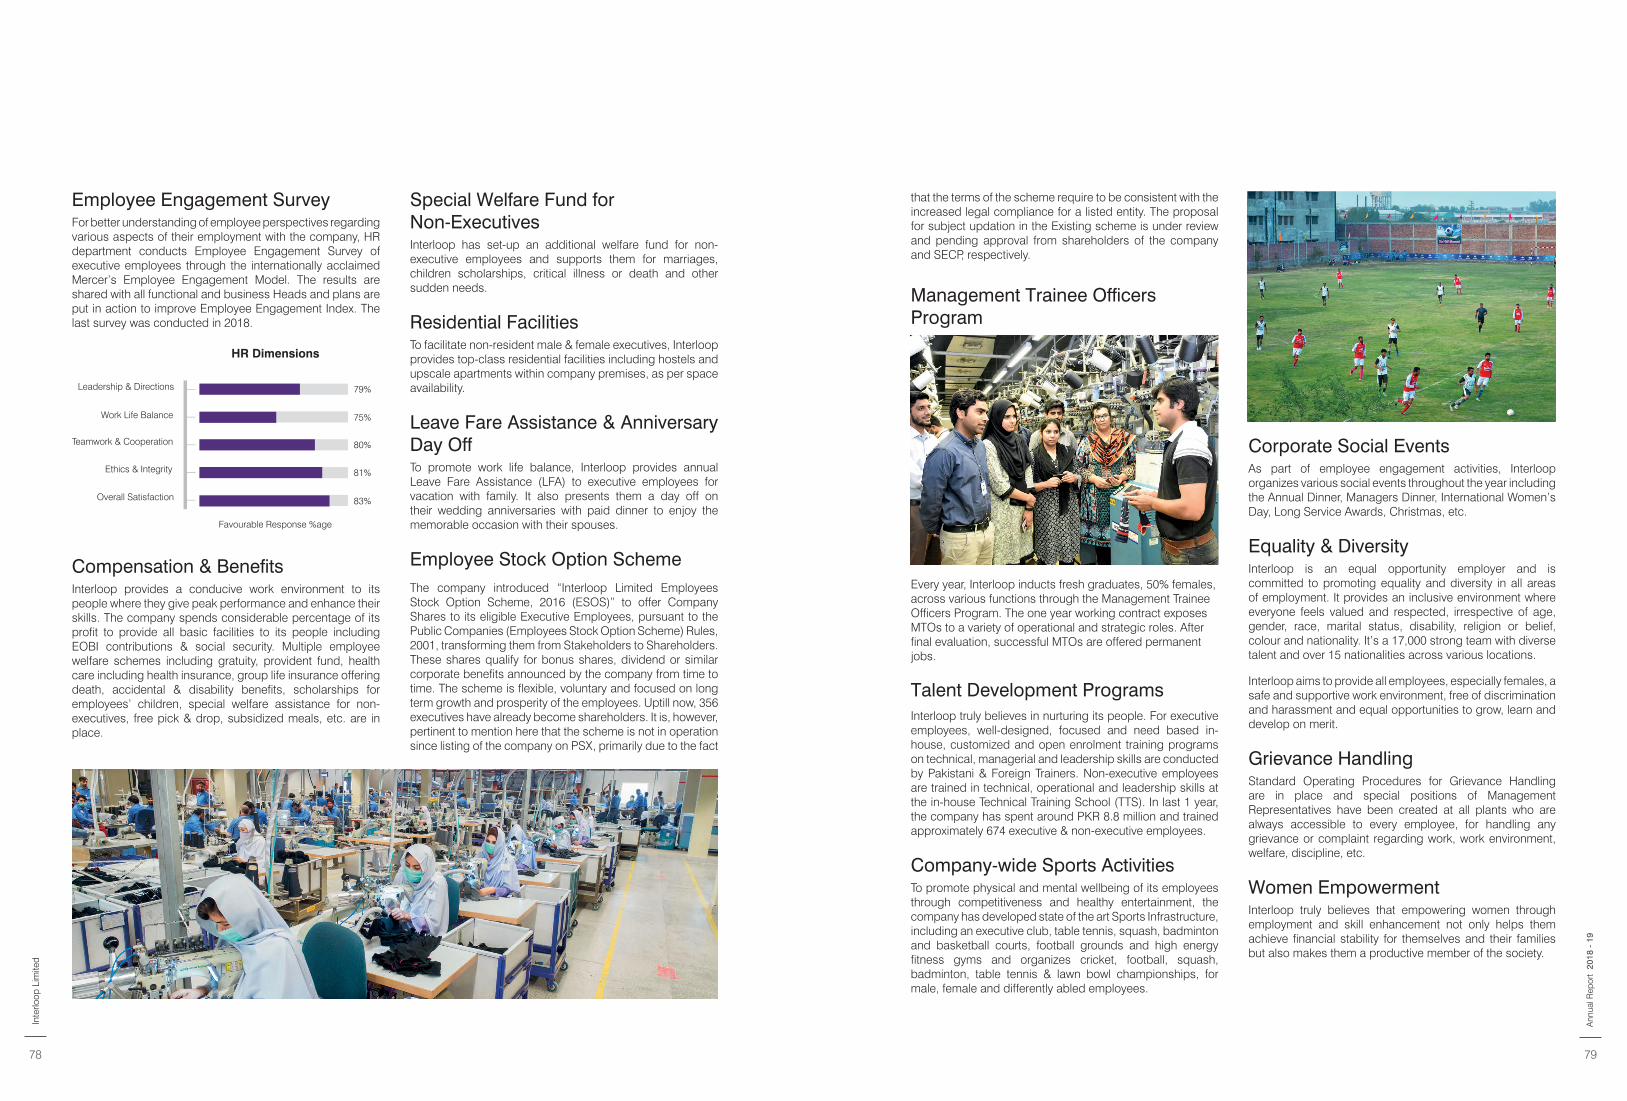
Employee Engagement SurveyFor better understanding of employee perspectives regarding various aspects of their employment with the company, HR department conducts Employee Engagement Survey of executive employees through the internationally acclaimed Mercer’s Employee Engagement Model. The results are shared with all functional and business Heads and plans are put in action to improve Employee Engagement Index. The last survey was conducted in 2018.
Compensation & BenefitsInterloop provides a conducive work environment to its people where they give peak performance and enhance their skills. The company spends considerable percentage of its profit to provide all basic facilities to its people including EOBI contributions & social security. Multiple employee welfare schemes including gratuity, provident fund, health care including health insurance, group life insurance offering death, accidental & disability benefits, scholarships for employees’ children, special welfare assistance for non-executives, free pick & drop, subsidized meals, etc. are in place.
Special Welfare Fund for Non-ExecutivesInterloop has set-up an additional welfare fund for non-executive employees and supports them for marriages, children scholarships, critical illness or death and other sudden needs.
Residential FacilitiesTo facilitate non-resident male & female executives, Interloop provides top-class residential facilities including hostels and upscale apartments within company premises, as per space availability.
Leave Fare Assistance & Anniversary Day OffTo promote work life balance, Interloop provides annual Leave Fare Assistance (LFA) to executive employees for vacation with family. It also presents them a day off on their wedding anniversaries with paid dinner to enjoy the memorable occasion with their spouses.
Employee Stock Option SchemeThe company introduced “Interloop Limited Employees Stock Option Scheme, 2016 (ESOS)” to offer Company Shares to its eligible Executive Employees, pursuant to the Public Companies (Employees Stock Option Scheme) Rules, 2001, transforming them from Stakeholders to Shareholders. These shares qualify for bonus shares, dividend or similar corporate benefits announced by the company from time to time. The scheme is flexible, voluntary and focused on long term growth and prosperity of the employees. Uptill now, 356 executives have already become shareholders. It is, however, pertinent to mention here that the scheme is not in operation since listing of the company on PSX, primarily due to the fact
HR Dimensions
Favourable Response %age
Leadership & Directions
Work Life Balance
Teamwork & Cooperation
Ethics & Integrity
Overall Satisfaction
79%
75%
80%
81%
83%
that the terms of the scheme require to be consistent with the increased legal compliance for a listed entity. The proposal for subject updation in the Existing scheme is under review and pending approval from shareholders of the company and SECP, respectively.
Management Trainee Officers Program
Every year, Interloop inducts fresh graduates, 50% females, across various functions through the Management Trainee Officers Program. The one year working contract exposes MTOs to a variety of operational and strategic roles. After final evaluation, successful MTOs are offered permanent jobs.
Talent Development ProgramsInterloop truly believes in nurturing its people. For executive employees, well-designed, focused and need based in-house, customized and open enrolment training programs on technical, managerial and leadership skills are conducted by Pakistani & Foreign Trainers. Non-executive employees are trained in technical, operational and leadership skills at the in-house Technical Training School (TTS). In last 1 year, the company has spent around PKR 8.8 million and trained approximately 674 executive & non-executive employees.
Company-wide Sports ActivitiesTo promote physical and mental wellbeing of its employees through competitiveness and healthy entertainment, the company has developed state of the art Sports Infrastructure, including an executive club, table tennis, squash, badminton and basketball courts, football grounds and high energy fitness gyms and organizes cricket, football, squash, badminton, table tennis & lawn bowl championships, for male, female and differently abled employees.
Corporate Social EventsAs part of employee engagement activities, Interloop organizes various social events throughout the year including the Annual Dinner, Managers Dinner, International Women’s Day, Long Service Awards, Christmas, etc.
Equality & DiversityInterloop is an equal opportunity employer and is committed to promoting equality and diversity in all areas of employment. It provides an inclusive environment where everyone feels valued and respected, irrespective of age, gender, race, marital status, disability, religion or belief, colour and nationality. It’s a 17,000 strong team with diverse talent and over 15 nationalities across various locations.
Interloop aims to provide all employees, especially females, a safe and supportive work environment, free of discrimination and harassment and equal opportunities to grow, learn and develop on merit.
Grievance HandlingStandard Operating Procedures for Grievance Handling are in place and special positions of Management Representatives have been created at all plants who are always accessible to every employee, for handling any grievance or complaint regarding work, work environment, welfare, discipline, etc.
Women EmpowermentInterloop truly believes that empowering women through employment and skill enhancement not only helps them achieve financial stability for themselves and their families but also makes them a productive member of the society.
Inte
rloop
Lim
ited
78 79
2018
- 1
9A
nnua
l Rep
ort
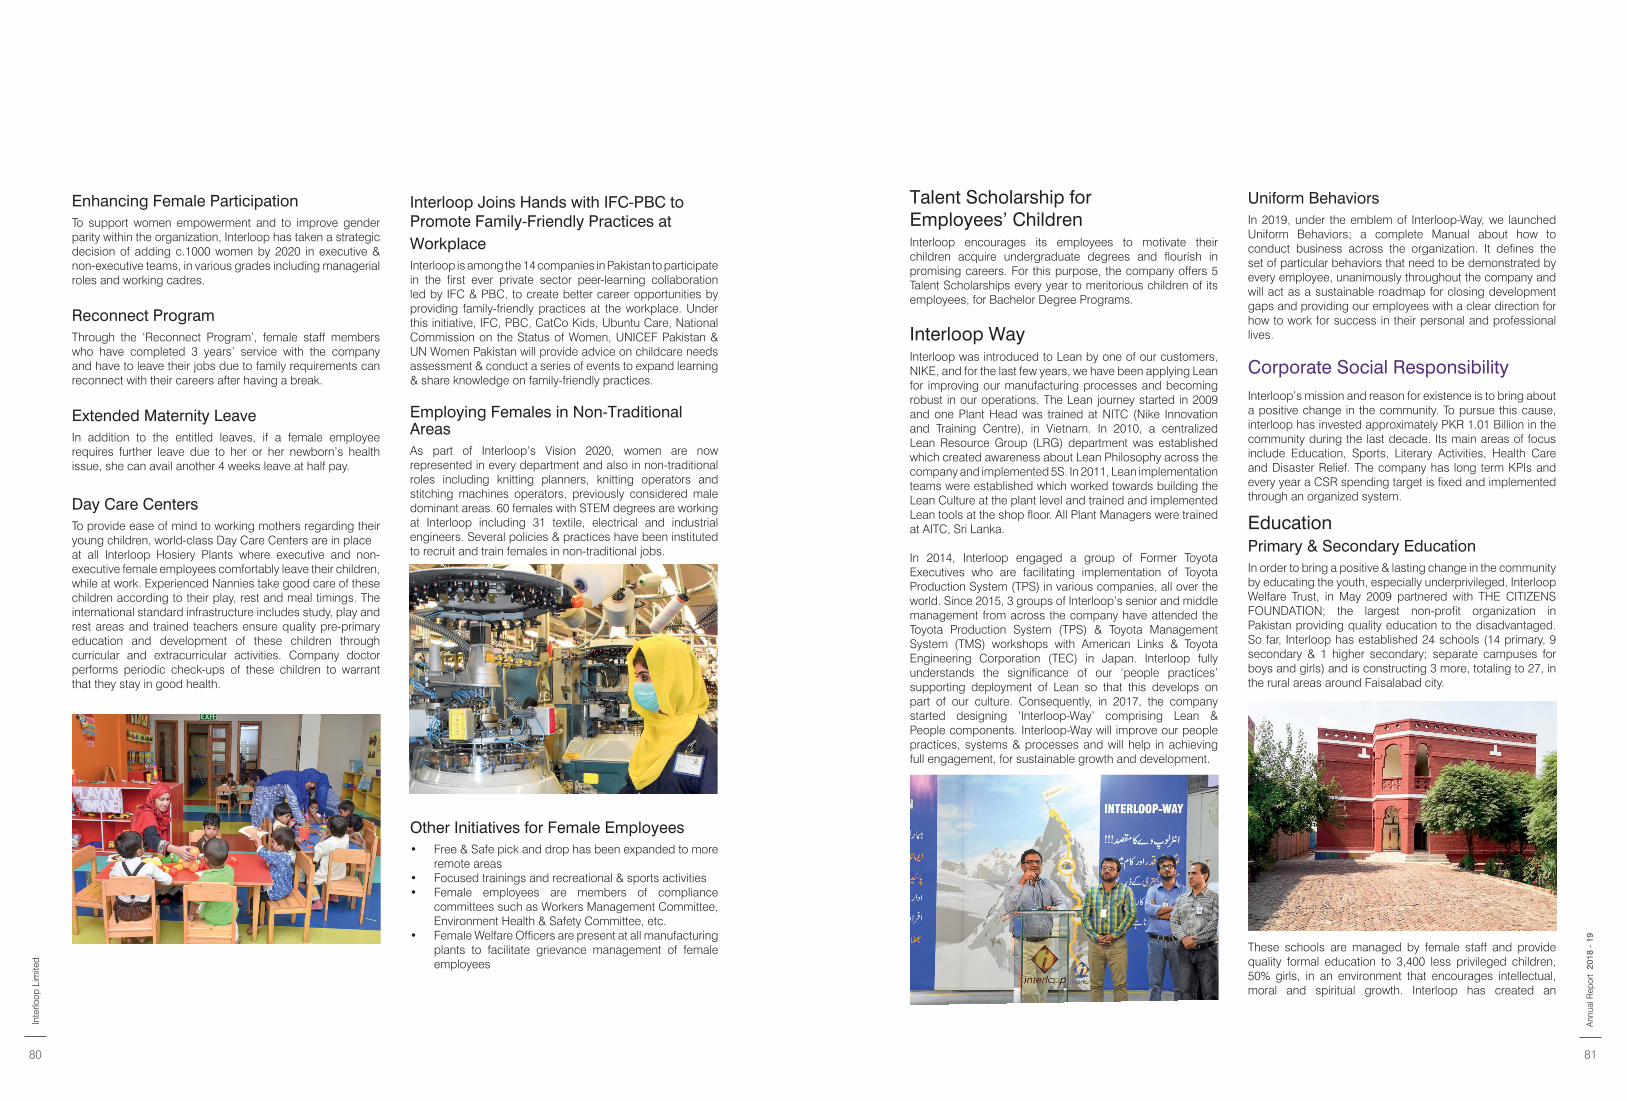
Enhancing Female ParticipationTo support women empowerment and to improve gender parity within the organization, Interloop has taken a strategic decision of adding c.1000 women by 2020 in executive & non-executive teams, in various grades including managerial roles and working cadres.
Reconnect Program Through the ‘Reconnect Program’, female staff members who have completed 3 years’ service with the company and have to leave their jobs due to family requirements can reconnect with their careers after having a break.
Extended Maternity LeaveIn addition to the entitled leaves, if a female employee requires further leave due to her or her newborn’s health issue, she can avail another 4 weeks leave at half pay.
Day Care CentersTo provide ease of mind to working mothers regarding their young children, world-class Day Care Centers are in place at all Interloop Hosiery Plants where executive and non-executive female employees comfortably leave their children, while at work. Experienced Nannies take good care of these children according to their play, rest and meal timings. The international standard infrastructure includes study, play and rest areas and trained teachers ensure quality pre-primary education and development of these children through curricular and extracurricular activities. Company doctor performs periodic check-ups of these children to warrant that they stay in good health.
Interloop Joins Hands with IFC-PBC to Promote Family-Friendly Practices at WorkplaceInterloop is among the 14 companies in Pakistan to participate in the first ever private sector peer-learning collaboration led by IFC & PBC, to create better career opportunities by providing family-friendly practices at the workplace. Under this initiative, IFC, PBC, CatCo Kids, Ubuntu Care, National Commission on the Status of Women, UNICEF Pakistan & UN Women Pakistan will provide advice on childcare needs assessment & conduct a series of events to expand learning & share knowledge on family-friendly practices.
Employing Females in Non-Traditional AreasAs part of Interloop’s Vision 2020, women are now represented in every department and also in non-traditional roles including knitting planners, knitting operators and stitching machines operators, previously considered male dominant areas. 60 females with STEM degrees are working at Interloop including 31 textile, electrical and industrial engineers. Several policies & practices have been instituted to recruit and train females in non-traditional jobs.
Other Initiatives for Female Employees• Free & Safe pick and drop has been expanded to more
remote areas• Focused trainings and recreational & sports activities• Female employees are members of compliance
committees such as Workers Management Committee, Environment Health & Safety Committee, etc.
• Female Welfare Officers are present at all manufacturing plants to facilitate grievance management of female employees
Talent Scholarship for Employees’ ChildrenInterloop encourages its employees to motivate their children acquire undergraduate degrees and flourish in promising careers. For this purpose, the company offers 5 Talent Scholarships every year to meritorious children of its employees, for Bachelor Degree Programs.
Interloop WayInterloop was introduced to Lean by one of our customers, NIKE, and for the last few years, we have been applying Lean for improving our manufacturing processes and becoming robust in our operations. The Lean journey started in 2009 and one Plant Head was trained at NITC (Nike Innovation and Training Centre), in Vietnam. In 2010, a centralized Lean Resource Group (LRG) department was established which created awareness about Lean Philosophy across the company and implemented 5S. In 2011, Lean implementation teams were established which worked towards building the Lean Culture at the plant level and trained and implemented Lean tools at the shop floor. All Plant Managers were trained at AITC, Sri Lanka. In 2014, Interloop engaged a group of Former Toyota Executives who are facilitating implementation of Toyota Production System (TPS) in various companies, all over the world. Since 2015, 3 groups of Interloop’s senior and middle management from across the company have attended the Toyota Production System (TPS) & Toyota Management System (TMS) workshops with American Links & Toyota Engineering Corporation (TEC) in Japan. Interloop fully understands the significance of our ‘people practices’ supporting deployment of Lean so that this develops on part of our culture. Consequently, in 2017, the company started designing ‘Interloop-Way’ comprising Lean & People components. Interloop-Way will improve our people practices, systems & processes and will help in achieving full engagement, for sustainable growth and development.
Uniform BehaviorsIn 2019, under the emblem of Interloop-Way, we launched Uniform Behaviors; a complete Manual about how to conduct business across the organization. It defines the set of particular behaviors that need to be demonstrated by every employee, unanimously throughout the company and will act as a sustainable roadmap for closing development gaps and providing our employees with a clear direction for how to work for success in their personal and professional lives.
Corporate Social ResponsibilityInterloop’s mission and reason for existence is to bring about a positive change in the community. To pursue this cause, interloop has invested approximately PKR 1.01 Billion in the community during the last decade. Its main areas of focus include Education, Sports, Literary Activities, Health Care and Disaster Relief. The company has long term KPIs and every year a CSR spending target is fixed and implemented through an organized system.
EducationPrimary & Secondary EducationIn order to bring a positive & lasting change in the community by educating the youth, especially underprivileged, Interloop Welfare Trust, in May 2009 partnered with THE CITIZENS FOUNDATION; the largest non-profit organization in Pakistan providing quality education to the disadvantaged. So far, Interloop has established 24 schools (14 primary, 9 secondary & 1 higher secondary; separate campuses for boys and girls) and is constructing 3 more, totaling to 27, in the rural areas around Faisalabad city.
These schools are managed by female staff and provide quality formal education to 3,400 less privileged children, 50% girls, in an environment that encourages intellectual, moral and spiritual growth. Interloop has created an
Inte
rloop
Lim
ited
80 81
2018
- 1
9A
nnua
l Rep
ort
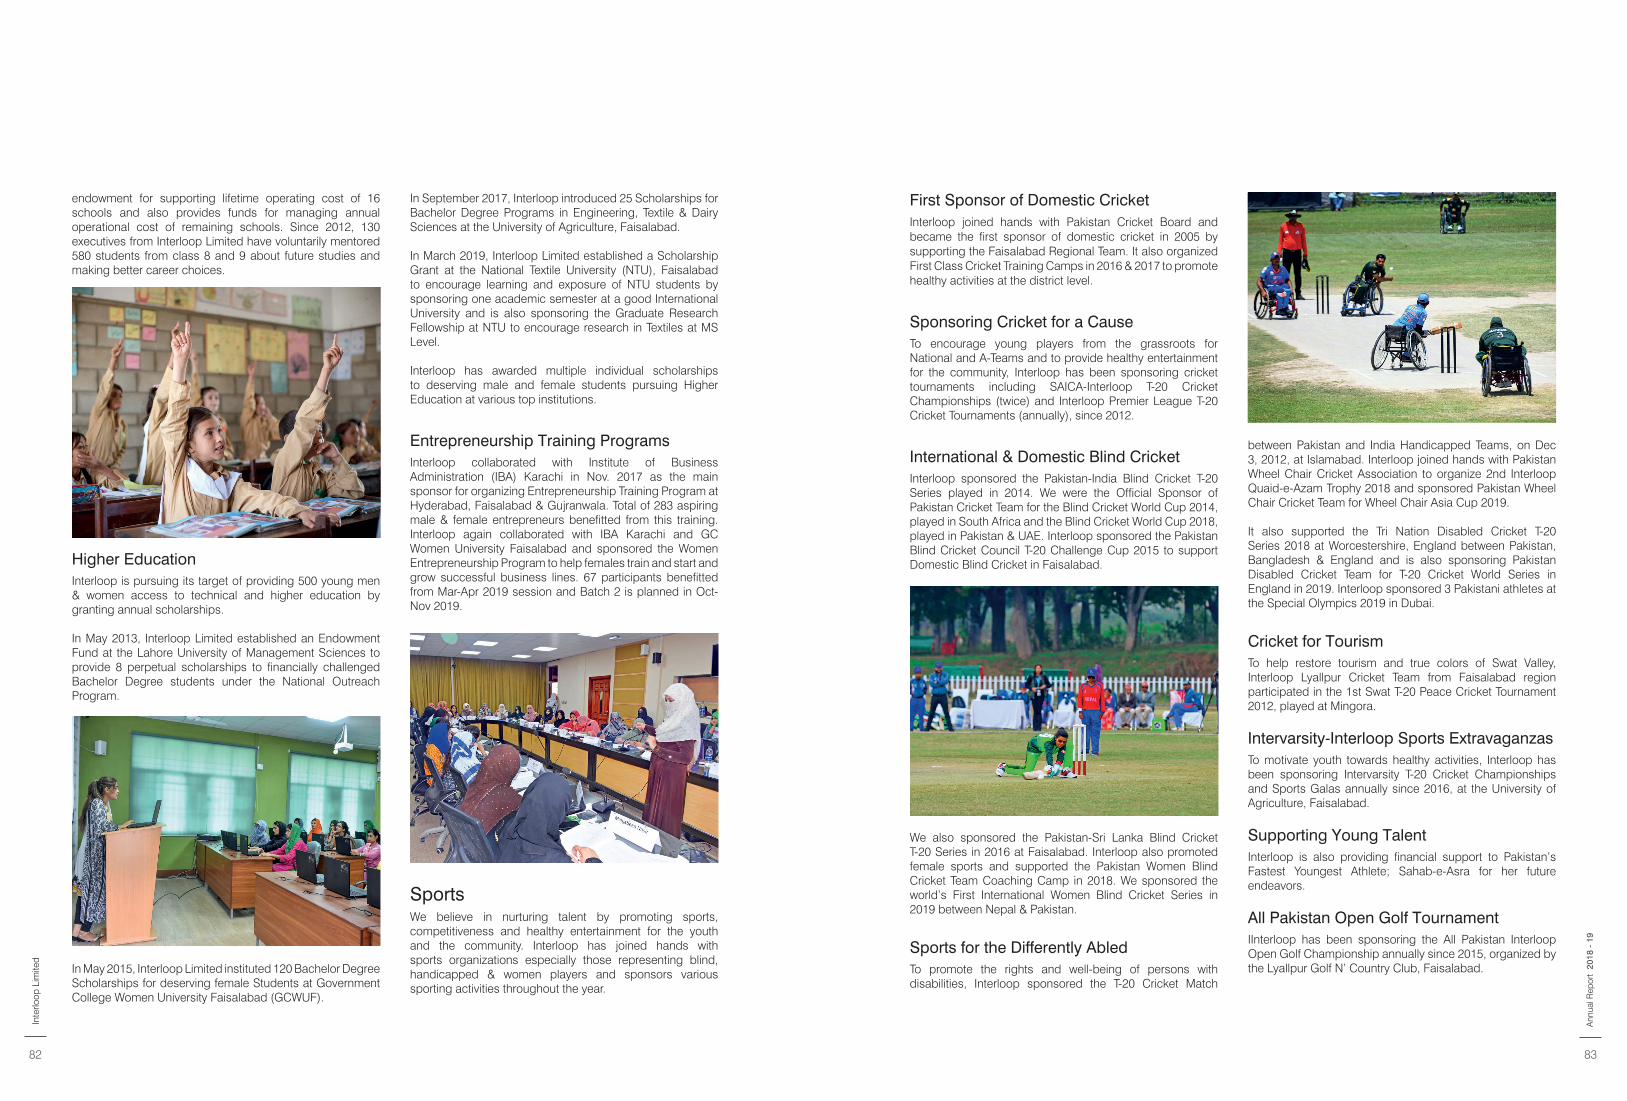
endowment for supporting lifetime operating cost of 16 schools and also provides funds for managing annual operational cost of remaining schools. Since 2012, 130 executives from Interloop Limited have voluntarily mentored 580 students from class 8 and 9 about future studies and making better career choices.
Higher EducationInterloop is pursuing its target of providing 500 young men & women access to technical and higher education by granting annual scholarships.
In May 2013, Interloop Limited established an Endowment Fund at the Lahore University of Management Sciences to provide 8 perpetual scholarships to financially challenged Bachelor Degree students under the National Outreach Program.
In May 2015, Interloop Limited instituted 120 Bachelor Degree Scholarships for deserving female Students at Government College Women University Faisalabad (GCWUF).
In September 2017, Interloop introduced 25 Scholarships for Bachelor Degree Programs in Engineering, Textile & Dairy Sciences at the University of Agriculture, Faisalabad.
In March 2019, Interloop Limited established a Scholarship Grant at the National Textile University (NTU), Faisalabad to encourage learning and exposure of NTU students by sponsoring one academic semester at a good International University and is also sponsoring the Graduate Research Fellowship at NTU to encourage research in Textiles at MS Level.
Interloop has awarded multiple individual scholarships to deserving male and female students pursuing Higher Education at various top institutions.
Entrepreneurship Training ProgramsInterloop collaborated with Institute of Business Administration (IBA) Karachi in Nov. 2017 as the main sponsor for organizing Entrepreneurship Training Program at Hyderabad, Faisalabad & Gujranwala. Total of 283 aspiring male & female entrepreneurs benefitted from this training.Interloop again collaborated with IBA Karachi and GC Women University Faisalabad and sponsored the Women Entrepreneurship Program to help females train and start and grow successful business lines. 67 participants benefitted from Mar-Apr 2019 session and Batch 2 is planned in Oct-Nov 2019.
SportsWe believe in nurturing talent by promoting sports, competitiveness and healthy entertainment for the youth and the community. Interloop has joined hands with sports organizations especially those representing blind, handicapped & women players and sponsors various sporting activities throughout the year.
First Sponsor of Domestic CricketInterloop joined hands with Pakistan Cricket Board and became the first sponsor of domestic cricket in 2005 by supporting the Faisalabad Regional Team. It also organized First Class Cricket Training Camps in 2016 & 2017 to promote healthy activities at the district level.
Sponsoring Cricket for a CauseTo encourage young players from the grassroots for National and A-Teams and to provide healthy entertainment for the community, Interloop has been sponsoring cricket tournaments including SAICA-Interloop T-20 Cricket Championships (twice) and Interloop Premier League T-20 Cricket Tournaments (annually), since 2012.
International & Domestic Blind CricketInterloop sponsored the Pakistan-India Blind Cricket T-20 Series played in 2014. We were the Official Sponsor of Pakistan Cricket Team for the Blind Cricket World Cup 2014, played in South Africa and the Blind Cricket World Cup 2018, played in Pakistan & UAE. Interloop sponsored the Pakistan Blind Cricket Council T-20 Challenge Cup 2015 to support Domestic Blind Cricket in Faisalabad.
We also sponsored the Pakistan-Sri Lanka Blind Cricket T-20 Series in 2016 at Faisalabad. Interloop also promoted female sports and supported the Pakistan Women Blind Cricket Team Coaching Camp in 2018. We sponsored the world’s First International Women Blind Cricket Series in 2019 between Nepal & Pakistan.
Sports for the Differently AbledTo promote the rights and well-being of persons with disabilities, Interloop sponsored the T-20 Cricket Match
between Pakistan and India Handicapped Teams, on Dec 3, 2012, at Islamabad. Interloop joined hands with Pakistan Wheel Chair Cricket Association to organize 2nd Interloop Quaid-e-Azam Trophy 2018 and sponsored Pakistan Wheel Chair Cricket Team for Wheel Chair Asia Cup 2019.
It also supported the Tri Nation Disabled Cricket T-20 Series 2018 at Worcestershire, England between Pakistan, Bangladesh & England and is also sponsoring Pakistan Disabled Cricket Team for T-20 Cricket World Series in England in 2019. Interloop sponsored 3 Pakistani athletes at the Special Olympics 2019 in Dubai.
Cricket for TourismTo help restore tourism and true colors of Swat Valley, Interloop Lyallpur Cricket Team from Faisalabad region participated in the 1st Swat T-20 Peace Cricket Tournament 2012, played at Mingora.
Intervarsity-Interloop Sports ExtravaganzasTo motivate youth towards healthy activities, Interloop has been sponsoring Intervarsity T-20 Cricket Championships and Sports Galas annually since 2016, at the University of Agriculture, Faisalabad.
Supporting Young TalentInterloop is also providing financial support to Pakistan’s Fastest Youngest Athlete; Sahab-e-Asra for her future endeavors.
All Pakistan Open Golf TournamentIInterloop has been sponsoring the All Pakistan Interloop Open Golf Championship annually since 2015, organized by the Lyallpur Golf N’ Country Club, Faisalabad.
Inte
rloop
Lim
ited
82 83
2018
- 1
9A
nnua
l Rep
ort
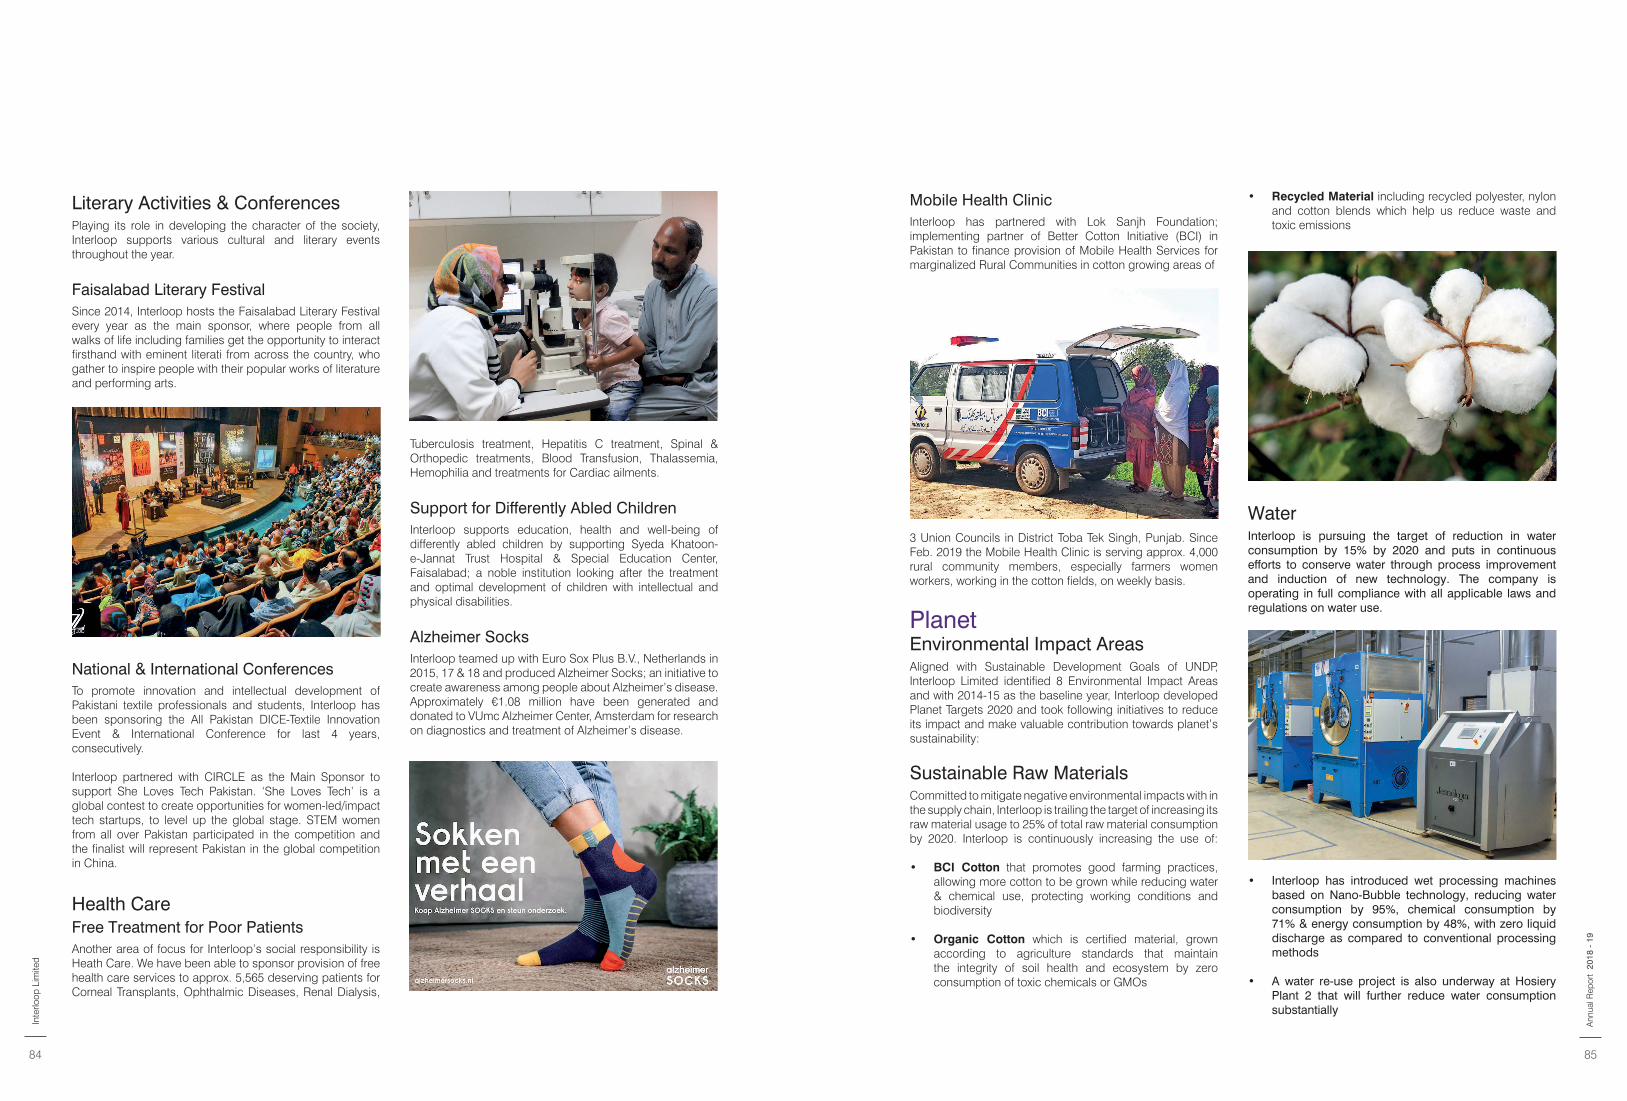
Literary Activities & Conferences Playing its role in developing the character of the society, Interloop supports various cultural and literary events throughout the year.
Faisalabad Literary FestivalSince 2014, Interloop hosts the Faisalabad Literary Festival every year as the main sponsor, where people from all walks of life including families get the opportunity to interact firsthand with eminent literati from across the country, who gather to inspire people with their popular works of literature and performing arts.
National & International ConferencesTo promote innovation and intellectual development of Pakistani textile professionals and students, Interloop has been sponsoring the All Pakistan DICE-Textile Innovation Event & International Conference for last 4 years, consecutively.
Interloop partnered with CIRCLE as the Main Sponsor to support She Loves Tech Pakistan. ‘She Loves Tech’ is a global contest to create opportunities for women-led/impact tech startups, to level up the global stage. STEM women from all over Pakistan participated in the competition and the finalist will represent Pakistan in the global competition in China.
Health CareFree Treatment for Poor PatientsAnother area of focus for Interloop’s social responsibility is Heath Care. We have been able to sponsor provision of free health care services to approx. 5,565 deserving patients for Corneal Transplants, Ophthalmic Diseases, Renal Dialysis,
Tuberculosis treatment, Hepatitis C treatment, Spinal & Orthopedic treatments, Blood Transfusion, Thalassemia, Hemophilia and treatments for Cardiac ailments.
Support for Differently Abled ChildrenInterloop supports education, health and well-being of differently abled children by supporting Syeda Khatoon-e-Jannat Trust Hospital & Special Education Center, Faisalabad; a noble institution looking after the treatment and optimal development of children with intellectual and physical disabilities.
Alzheimer SocksInterloop teamed up with Euro Sox Plus B.V., Netherlands in 2015, 17 & 18 and produced Alzheimer Socks; an initiative to create awareness among people about Alzheimer’s disease. Approximately €1.08 million have been generated and donated to VUmc Alzheimer Center, Amsterdam for research on diagnostics and treatment of Alzheimer’s disease.
• Recycled Material including recycled polyester, nylon and cotton blends which help us reduce waste and toxic emissions
WaterInterloop is pursuing the target of reduction in water consumption by 15% by 2020 and puts in continuous efforts to conserve water through process improvement and induction of new technology. The company is operating in full compliance with all applicable laws and regulations on water use.
• Interloop has introduced wet processing machines based on Nano-Bubble technology, reducing water consumption by 95%, chemical consumption by 71% & energy consumption by 48%, with zero liquid discharge as compared to conventional processing methods
• A water re-use project is also underway at Hosiery Plant 2 that will further reduce water consumption substantially
Mobile Health ClinicInterloop has partnered with Lok Sanjh Foundation; implementing partner of Better Cotton Initiative (BCI) in Pakistan to finance provision of Mobile Health Services for marginalized Rural Communities in cotton growing areas of
3 Union Councils in District Toba Tek Singh, Punjab. Since Feb. 2019 the Mobile Health Clinic is serving approx. 4,000 rural community members, especially farmers women workers, working in the cotton fields, on weekly basis.
PlanetEnvironmental Impact AreasAligned with Sustainable Development Goals of UNDP, Interloop Limited identified 8 Environmental Impact Areas and with 2014-15 as the baseline year, Interloop developed Planet Targets 2020 and took following initiatives to reduce its impact and make valuable contribution towards planet’s sustainability:
Sustainable Raw MaterialsCommitted to mitigate negative environmental impacts with in the supply chain, Interloop is trailing the target of increasing its raw material usage to 25% of total raw material consumption by 2020. Interloop is continuously increasing the use of:
• BCI Cotton that promotes good farming practices, allowing more cotton to be grown while reducing water & chemical use, protecting working conditions and biodiversity
• Organic Cotton which is certified material, grown according to agriculture standards that maintain the integrity of soil health and ecosystem by zero consumption of toxic chemicals or GMOs
Inte
rloop
Lim
ited
84 85
2018
- 1
9A
nnua
l Rep
ort
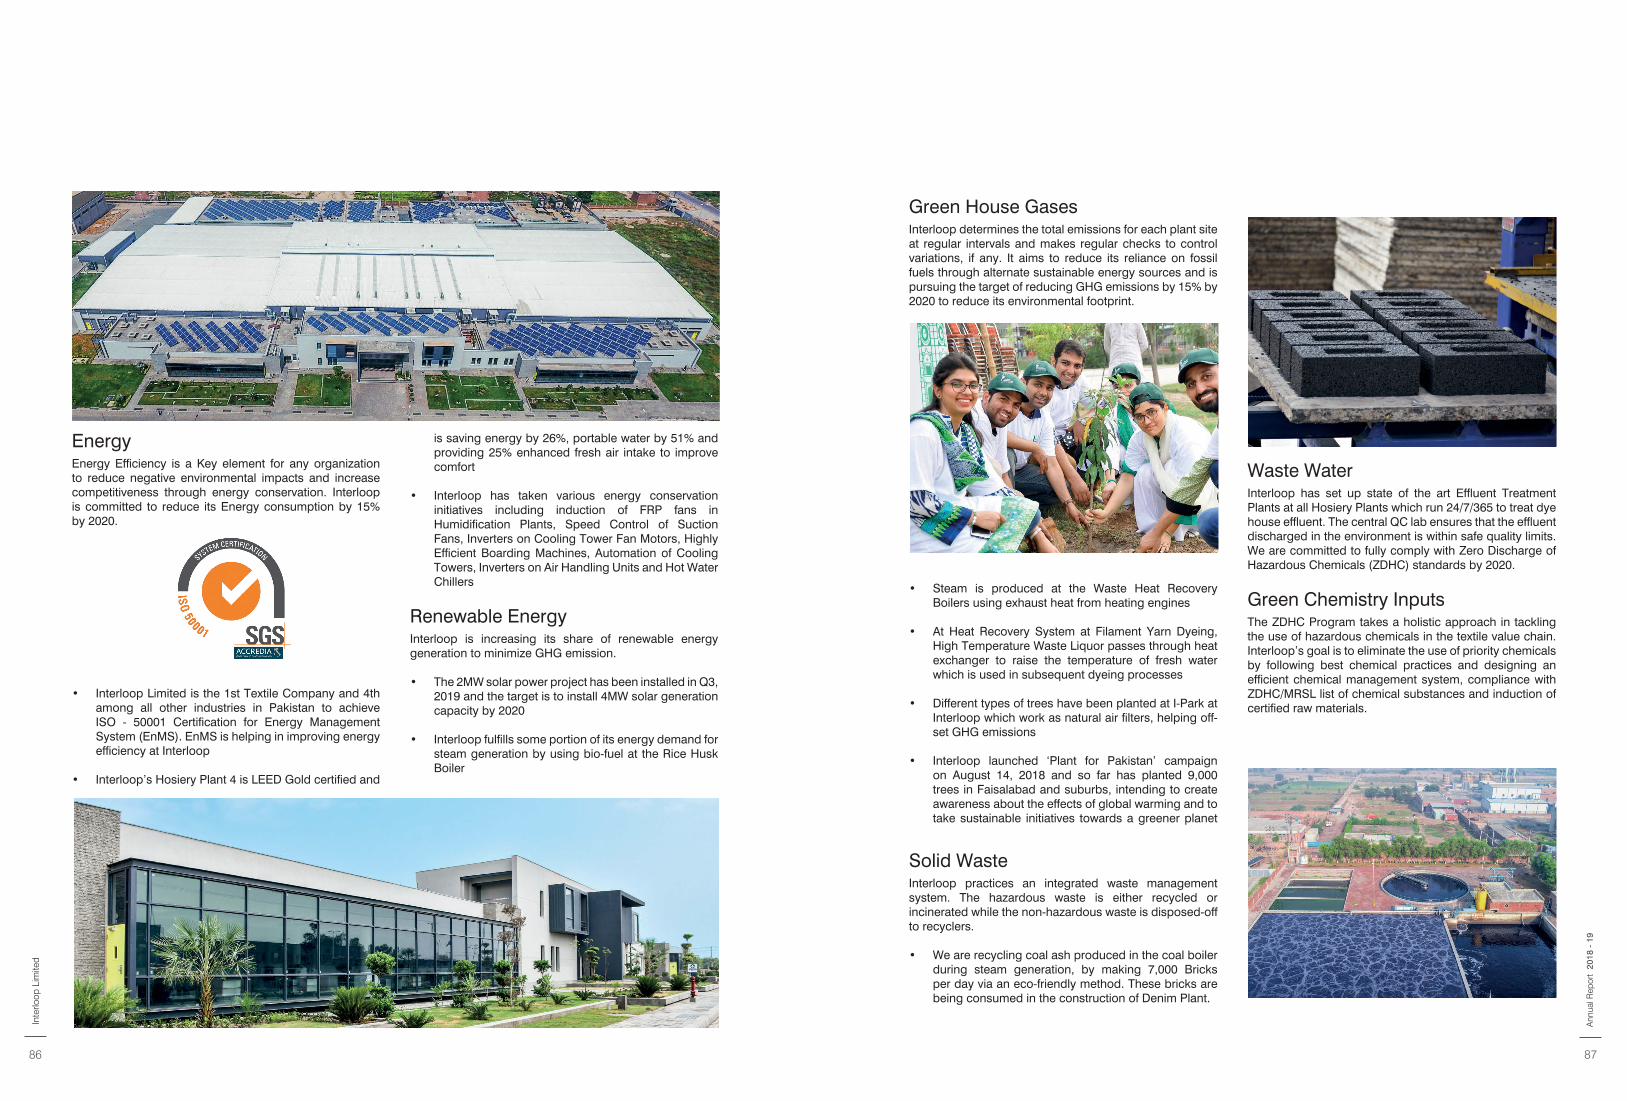
EnergyEnergy Efficiency is a Key element for any organization to reduce negative environmental impacts and increase competitiveness through energy conservation. Interloop is committed to reduce its Energy consumption by 15% by 2020.
• Interloop Limited is the 1st Textile Company and 4th among all other industries in Pakistan to achieve ISO - 50001 Certification for Energy Management System (EnMS). EnMS is helping in improving energy efficiency at Interloop
• Interloop’s Hosiery Plant 4 is LEED Gold certified and
is saving energy by 26%, portable water by 51% and providing 25% enhanced fresh air intake to improve comfort
• Interloop has taken various energy conservation initiatives including induction of FRP fans in Humidification Plants, Speed Control of Suction Fans, Inverters on Cooling Tower Fan Motors, Highly Efficient Boarding Machines, Automation of Cooling Towers, Inverters on Air Handling Units and Hot Water Chillers
Renewable EnergyInterloop is increasing its share of renewable energy generation to minimize GHG emission.
• The 2MW solar power project has been installed in Q3, 2019 and the target is to install 4MW solar generation capacity by 2020
• Interloop fulfills some portion of its energy demand for steam generation by using bio-fuel at the Rice Husk Boiler
Green House Gases Interloop determines the total emissions for each plant site at regular intervals and makes regular checks to control variations, if any. It aims to reduce its reliance on fossil fuels through alternate sustainable energy sources and is pursuing the target of reducing GHG emissions by 15% by 2020 to reduce its environmental footprint.
• Steam is produced at the Waste Heat Recovery Boilers using exhaust heat from heating engines
• At Heat Recovery System at Filament Yarn Dyeing, High Temperature Waste Liquor passes through heat exchanger to raise the temperature of fresh water which is used in subsequent dyeing processes
• Different types of trees have been planted at I-Park at Interloop which work as natural air filters, helping off-set GHG emissions
• Interloop launched ‘Plant for Pakistan’ campaign on August 14, 2018 and so far has planted 9,000 trees in Faisalabad and suburbs, intending to create awareness about the effects of global warming and to take sustainable initiatives towards a greener planet
Solid WasteInterloop practices an integrated waste management system. The hazardous waste is either recycled or incinerated while the non-hazardous waste is disposed-off to recyclers.
• We are recycling coal ash produced in the coal boiler during steam generation, by making 7,000 Bricks per day via an eco-friendly method. These bricks are being consumed in the construction of Denim Plant.
Waste Water Interloop has set up state of the art Effluent Treatment Plants at all Hosiery Plants which run 24/7/365 to treat dye house effluent. The central QC lab ensures that the effluent discharged in the environment is within safe quality limits. We are committed to fully comply with Zero Discharge of Hazardous Chemicals (ZDHC) standards by 2020.
Green Chemistry InputsThe ZDHC Program takes a holistic approach in tackling the use of hazardous chemicals in the textile value chain. Interloop’s goal is to eliminate the use of priority chemicals by following best chemical practices and designing an efficient chemical management system, compliance with ZDHC/MRSL list of chemical substances and induction of certified raw materials.
Inte
rloop
Lim
ited
86 87
2018
- 1
9A
nnua
l Rep
ort
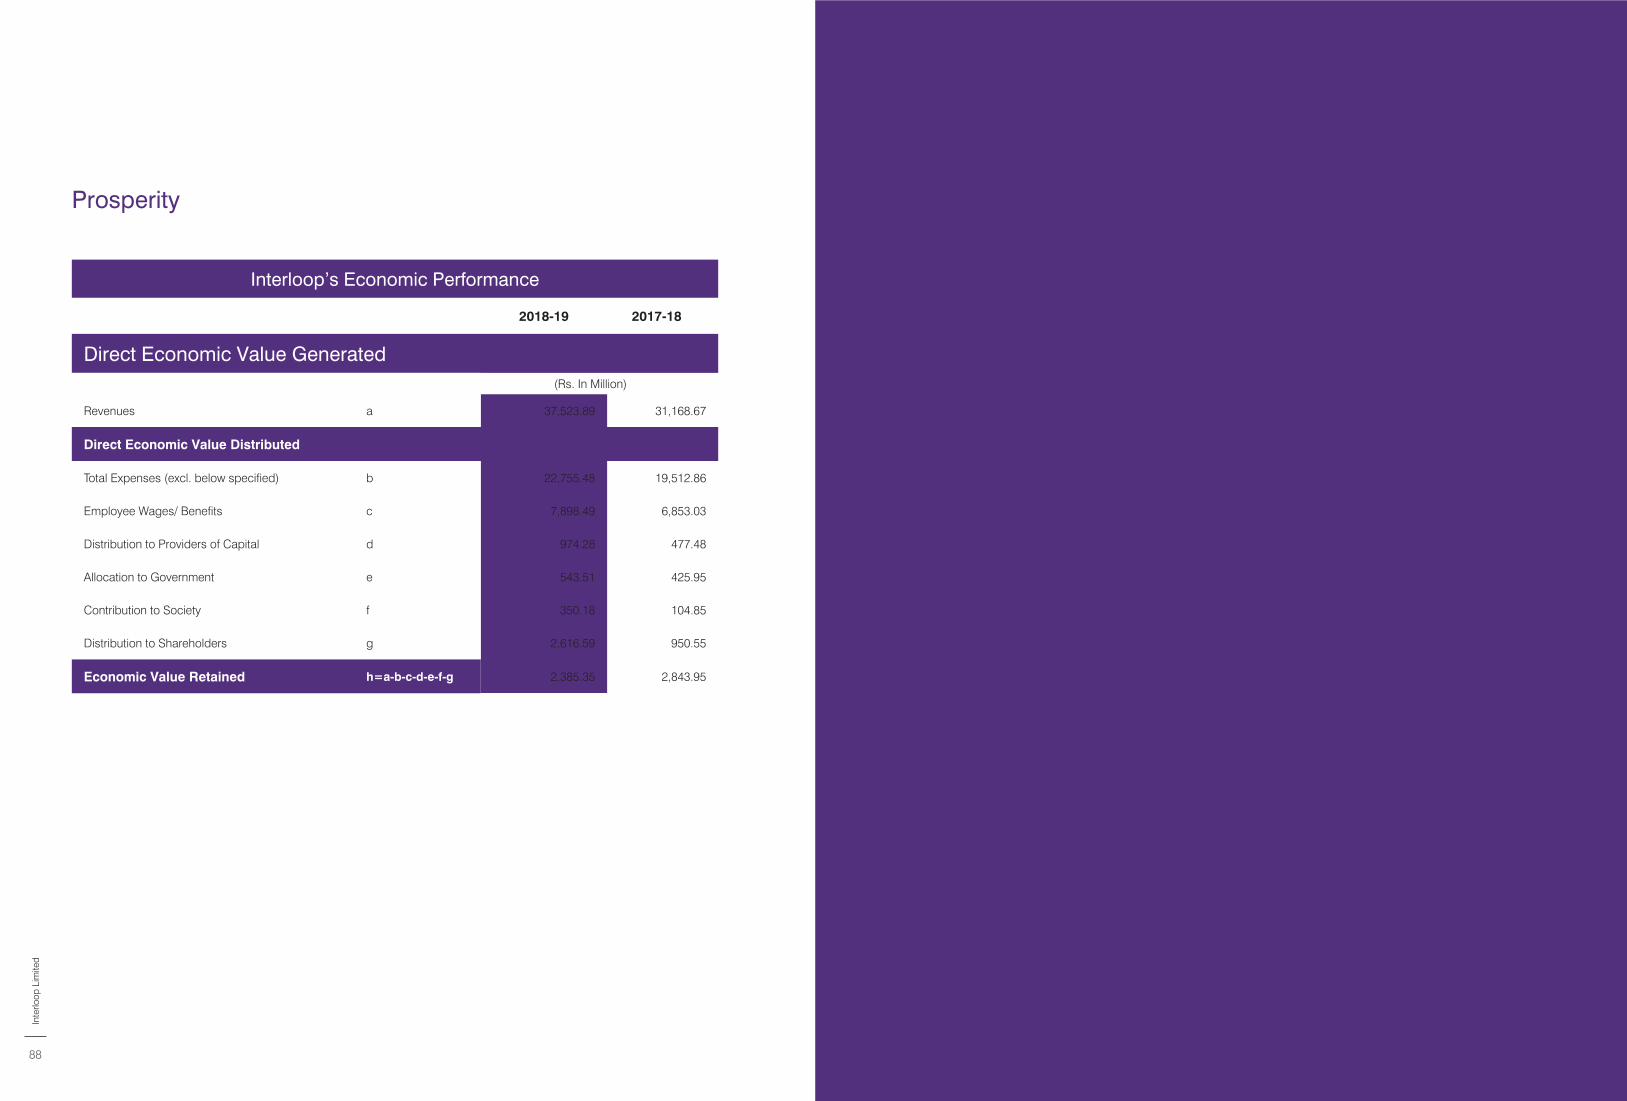
Interloop’s Economic Performance
2018-19 2017-18
Direct Economic Value Generated(Rs. In Million)
Revenues a 37,523.89 31,168.67
Direct Economic Value Distributed
Total Expenses (excl. below specified) b 22,755.48 19,512.86
Employee Wages/ Benefits c 7,898.49 6,853.03
Distribution to Providers of Capital d 974.28 477.48
Allocation to Government e 543.51 425.95
Contribution to Society f 350.18 104.85
Distribution to Shareholders g 2,616.59 950.55
Economic Value Retained h=a-b-c-d-e-f-g 2,385.35 2,843.95
Prosperity
Inte
rloop
Lim
ited
88
FINANCIAL STATEMENTS
INDEPENDENT REVIEW REPORT TO THE MEMBERSReview Report on the Statement of Compliance Contained In Listed Companies (Code of Corporate Governance) Regulations, 2017.We have reviewed the enclosed statement of compliance with Listed Companies (Code of Corporate Governance) Regulation, 2017 (the Regulations) prepared by the Board of Directors of Interloop Limited (The Company) for the year ended June 30, 2019, in accordance with the requirements of regulation 40 of the Regulations.
The responsibility for compliance with the Regulations is that of the Board of Directors of the Company. Our Responsibility is to review whether the statement of compliance reflects the status of the Company’s compliance with the provisions of the Regulations and report if it does not and to highlight any non-compliance with the requirements of the Regulations. A review is limited primarily to inquiries of the company’s personnel and review of various documents prepared by the Company to comply with the Regulations.
As a part of our audit of the financial statements we are required to obtain an understanding of the accounting and internal control system sufficient to plan the audit and develop an effective audit approach. We are not required to consider whether the Board of Directors’ Statement on internal control covers all risks and controls or to form an opinion on the effectiveness of such internal controls, the Company’s corporate governance procedures and risks.
The Regulation require the Company to place before the Audit Committee, and upon recommendations of the Audit Committee place before the Board of Directors for their review and approval, its related party transactions and also ensure compliance with the requirements of section 208 of the Companies Act, 2017. We are only required and have ensured compliance of this requirement to the extent of the approval the related party transactions by the Board of Directors upon recommendation of the Audit Committee. We have not carried out procedures to assess and determine the Company’s process for identification of related parties and that whether the related party transactions were undertaken at arm’s length price or not.
Based on our review, nothing has come to our attention which causes us to believe that the statement of compliance does not appropriately reflect the Company’s compliance, in all material respects, with the requirements contained in the Regulations as applicable to the Company for the year ended June 30, 2019.
FaisalabadSeptember 23, 2019
Kreston Hyder Bhimji & Co.Chartered Accounants
INTERLOOP LIMITED
UNCONSOLIDATED FINANCIAL
STATEMENTS FOR THE YEAR ENDED JUNE 30, 2019
Inte
rloop
Lim
ited
92
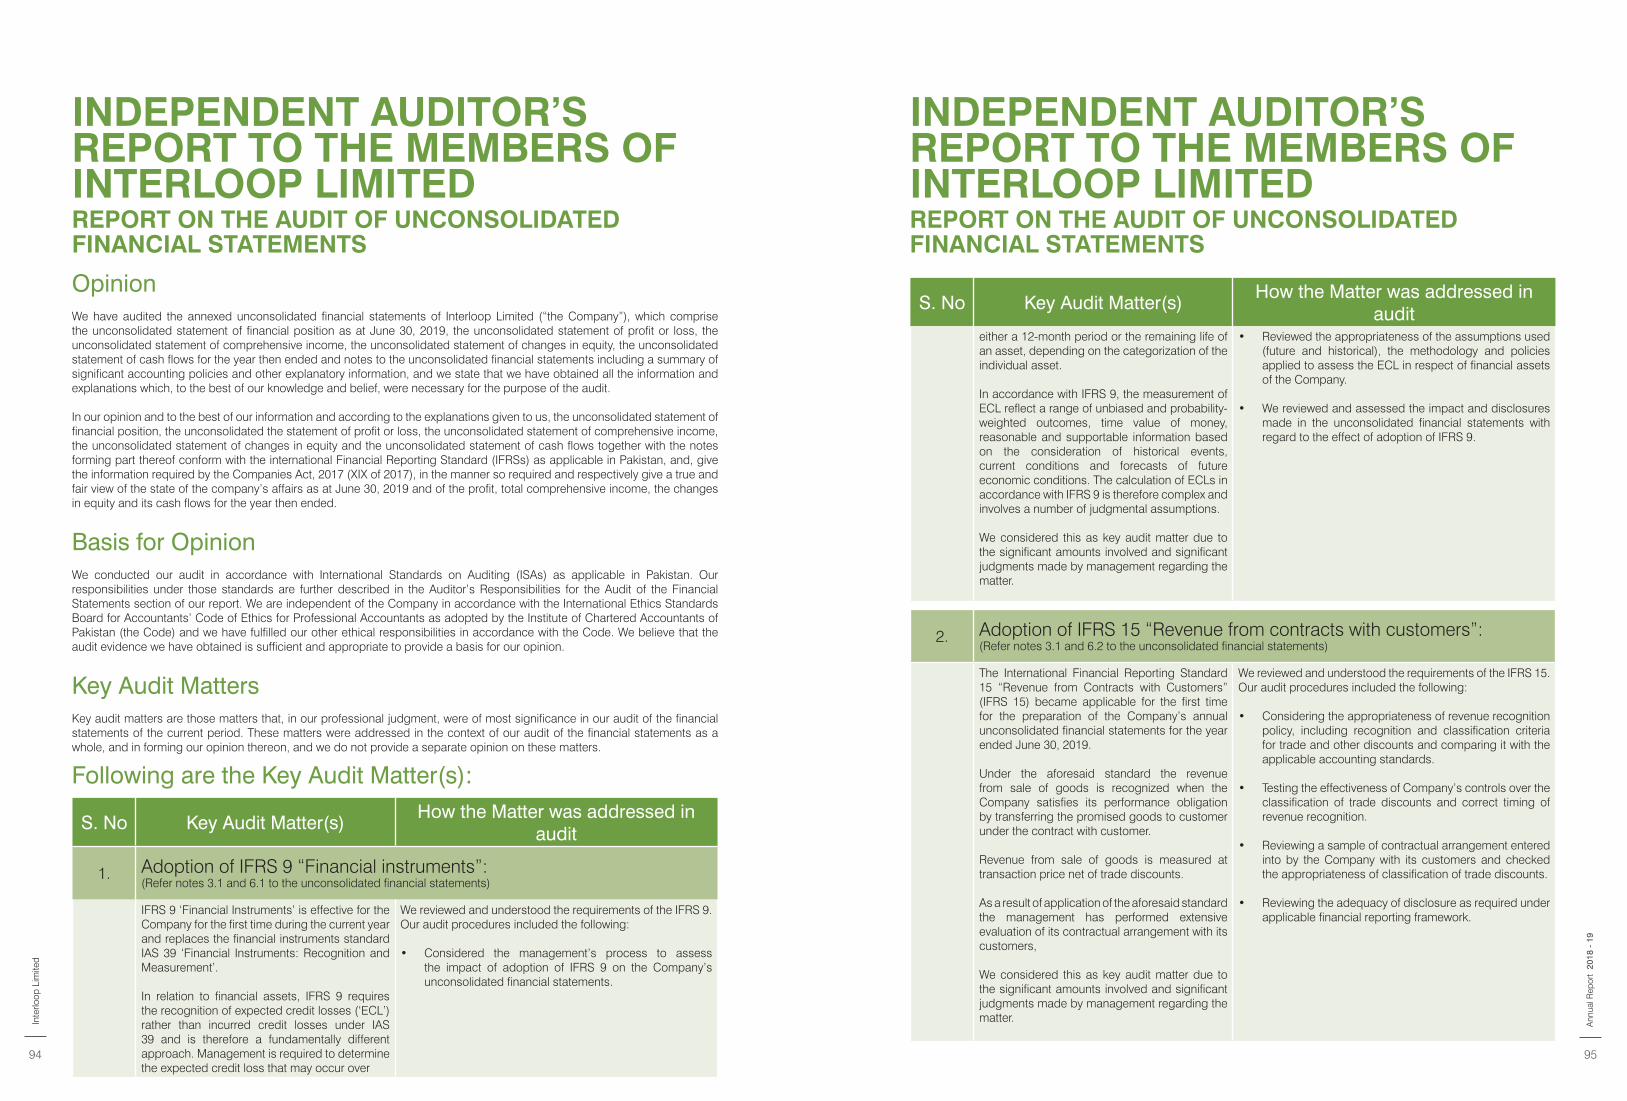
S. No Key Audit Matter(s)How the Matter was addressed in
audit
1. Adoption of IFRS 9 “Financial instruments”: (Refer notes 3.1 and 6.1 to the unconsolidated financial statements)
IFRS 9 ‘Financial Instruments’ is effective for the Company for the first time during the current year and replaces the financial instruments standard IAS 39 ‘Financial Instruments: Recognition and Measurement’.
In relation to financial assets, IFRS 9 requires the recognition of expected credit losses (‘ECL’) rather than incurred credit losses under IAS 39 and is therefore a fundamentally different approach. Management is required to determine the expected credit loss that may occur over
We reviewed and understood the requirements of the IFRS 9. Our audit procedures included the following:
• Considered the management’s process to assess the impact of adoption of IFRS 9 on the Company’s unconsolidated financial statements.
Following are the Key Audit Matter(s):
INDEPENDENT AUDITOR’S REPORT TO THE MEMBERS OF INTERLOOP LIMITED REPORT ON THE AUDIT OF UNCONSOLIDATED FINANCIAL STATEMENTS
OpinionWe have audited the annexed unconsolidated financial statements of Interloop Limited (“the Company”), which comprise the unconsolidated statement of financial position as at June 30, 2019, the unconsolidated statement of profit or loss, the unconsolidated statement of comprehensive income, the unconsolidated statement of changes in equity, the unconsolidated statement of cash flows for the year then ended and notes to the unconsolidated financial statements including a summary of significant accounting policies and other explanatory information, and we state that we have obtained all the information and explanations which, to the best of our knowledge and belief, were necessary for the purpose of the audit.
In our opinion and to the best of our information and according to the explanations given to us, the unconsolidated statement of financial position, the unconsolidated the statement of profit or loss, the unconsolidated statement of comprehensive income, the unconsolidated statement of changes in equity and the unconsolidated statement of cash flows together with the notes forming part thereof conform with the international Financial Reporting Standard (IFRSs) as applicable in Pakistan, and, give the information required by the Companies Act, 2017 (XIX of 2017), in the manner so required and respectively give a true and fair view of the state of the company’s affairs as at June 30, 2019 and of the profit, total comprehensive income, the changes in equity and its cash flows for the year then ended.
Basis for OpinionWe conducted our audit in accordance with International Standards on Auditing (ISAs) as applicable in Pakistan. Our responsibilities under those standards are further described in the Auditor’s Responsibilities for the Audit of the Financial Statements section of our report. We are independent of the Company in accordance with the International Ethics Standards Board for Accountants’ Code of Ethics for Professional Accountants as adopted by the Institute of Chartered Accountants of Pakistan (the Code) and we have fulfilled our other ethical responsibilities in accordance with the Code. We believe that the audit evidence we have obtained is sufficient and appropriate to provide a basis for our opinion.
Key Audit MattersKey audit matters are those matters that, in our professional judgment, were of most significance in our audit of the financial statements of the current period. These matters were addressed in the context of our audit of the financial statements as a whole, and in forming our opinion thereon, and we do not provide a separate opinion on these matters.
S. No Key Audit Matter(s)How the Matter was addressed in
auditeither a 12-month period or the remaining life of an asset, depending on the categorization of the individual asset.
In accordance with IFRS 9, the measurement of ECL reflect a range of unbiased and probability-weighted outcomes, time value of money, reasonable and supportable information based on the consideration of historical events, current conditions and forecasts of future economic conditions. The calculation of ECLs in accordance with IFRS 9 is therefore complex and involves a number of judgmental assumptions.
We considered this as key audit matter due to the significant amounts involved and significant judgments made by management regarding the matter.
• Reviewed the appropriateness of the assumptions used (future and historical), the methodology and policies applied to assess the ECL in respect of financial assets of the Company.
• We reviewed and assessed the impact and disclosures made in the unconsolidated financial statements with regard to the effect of adoption of IFRS 9.
INDEPENDENT AUDITOR’S REPORT TO THE MEMBERS OF INTERLOOP LIMITED REPORT ON THE AUDIT OF UNCONSOLIDATED FINANCIAL STATEMENTS
2. Adoption of IFRS 15 “Revenue from contracts with customers”:(Refer notes 3.1 and 6.2 to the unconsolidated financial statements)
The International Financial Reporting Standard 15 “Revenue from Contracts with Customers” (IFRS 15) became applicable for the first time for the preparation of the Company’s annual unconsolidated financial statements for the year ended June 30, 2019.
Under the aforesaid standard the revenue from sale of goods is recognized when the Company satisfies its performance obligation by transferring the promised goods to customer under the contract with customer.
Revenue from sale of goods is measured at transaction price net of trade discounts.
As a result of application of the aforesaid standard the management has performed extensive evaluation of its contractual arrangement with its customers,
We considered this as key audit matter due to the significant amounts involved and significant judgments made by management regarding the matter.
We reviewed and understood the requirements of the IFRS 15. Our audit procedures included the following:
• Considering the appropriateness of revenue recognition policy, including recognition and classification criteria for trade and other discounts and comparing it with the applicable accounting standards.
• Testing the effectiveness of Company’s controls over the classification of trade discounts and correct timing of revenue recognition.
• Reviewing a sample of contractual arrangement entered into by the Company with its customers and checked the appropriateness of classification of trade discounts.
• Reviewing the adequacy of disclosure as required under applicable financial reporting framework.
Inte
rloop
Lim
ited
94 95
2018
- 1
9A
nnua
l Rep
ort
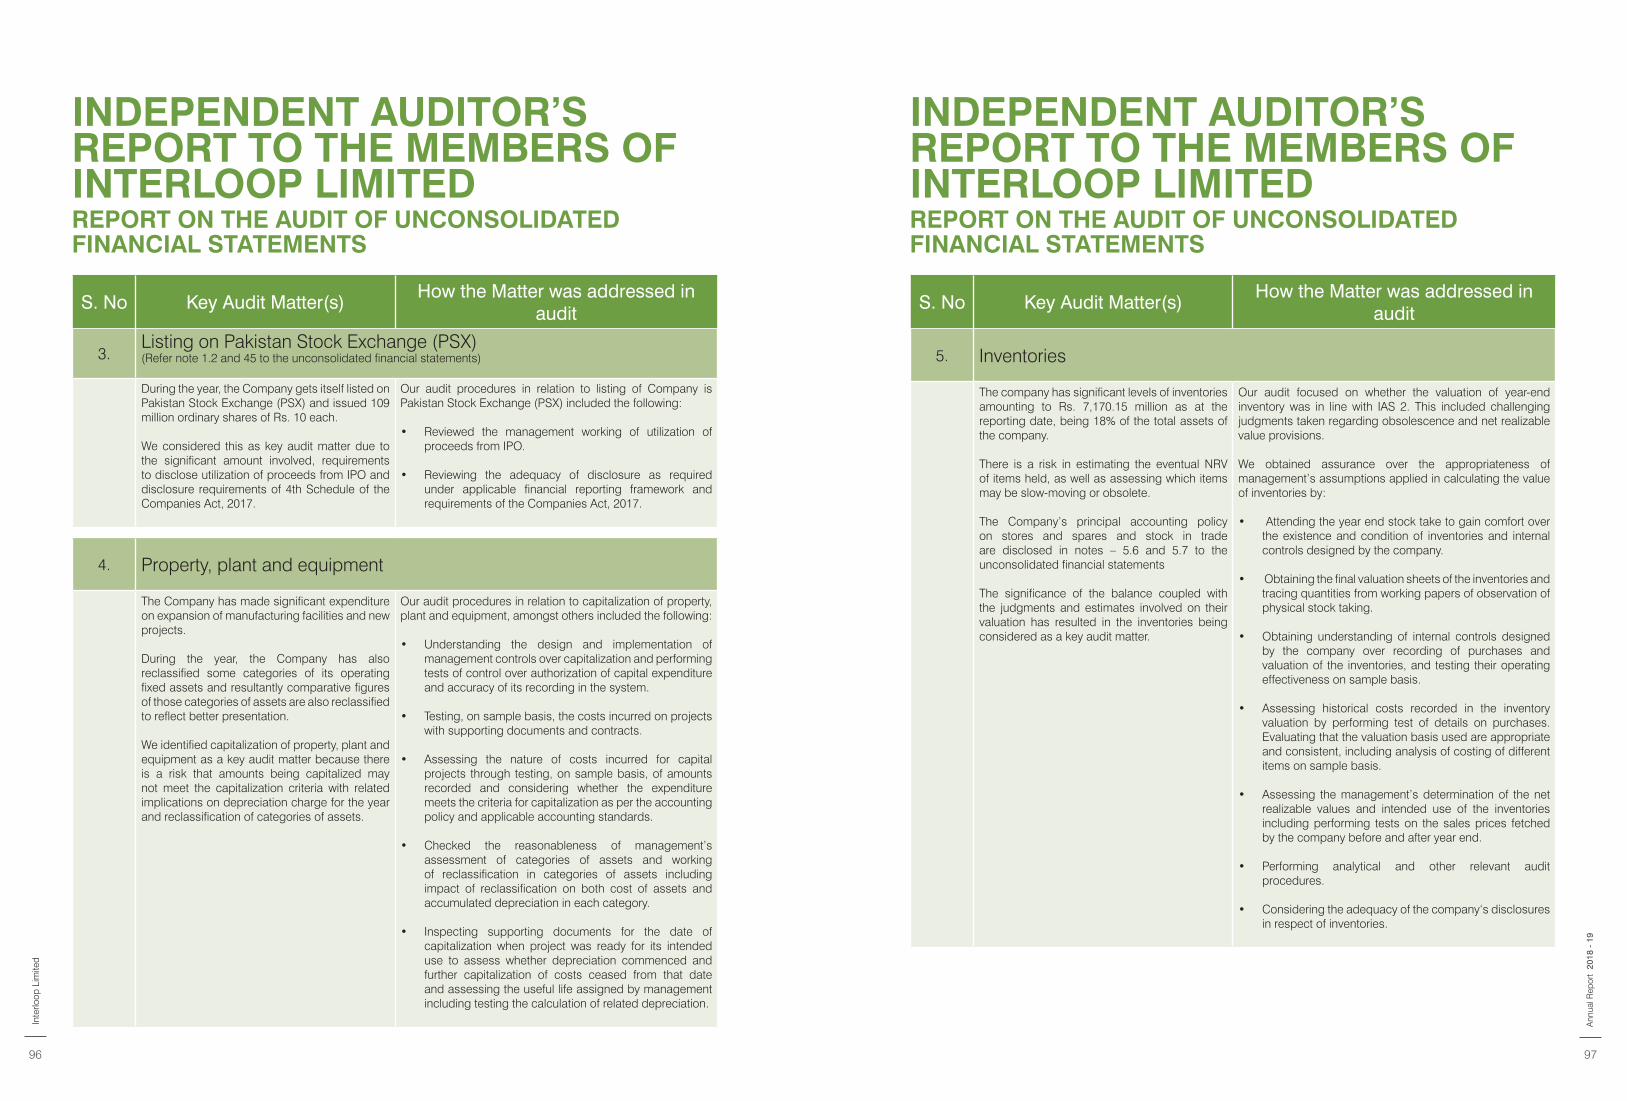
4. Property, plant and equipment
The Company has made significant expenditure on expansion of manufacturing facilities and new projects.
During the year, the Company has also reclassified some categories of its operating fixed assets and resultantly comparative figures of those categories of assets are also reclassified to reflect better presentation. We identified capitalization of property, plant and equipment as a key audit matter because there is a risk that amounts being capitalized may not meet the capitalization criteria with related implications on depreciation charge for the year and reclassification of categories of assets.
Our audit procedures in relation to capitalization of property, plant and equipment, amongst others included the following:
• Understanding the design and implementation of management controls over capitalization and performing tests of control over authorization of capital expenditure and accuracy of its recording in the system.
• Testing, on sample basis, the costs incurred on projects with supporting documents and contracts.
• Assessing the nature of costs incurred for capital projects through testing, on sample basis, of amounts recorded and considering whether the expenditure meets the criteria for capitalization as per the accounting policy and applicable accounting standards.
• Checked the reasonableness of management’s assessment of categories of assets and working of reclassification in categories of assets including impact of reclassification on both cost of assets and accumulated depreciation in each category.
• Inspecting supporting documents for the date of capitalization when project was ready for its intended use to assess whether depreciation commenced and further capitalization of costs ceased from that date and assessing the useful life assigned by management including testing the calculation of related depreciation.
S. No Key Audit Matter(s)How the Matter was addressed in
audit
3.Listing on Pakistan Stock Exchange (PSX)(Refer note 1.2 and 45 to the unconsolidated financial statements)
During the year, the Company gets itself listed on Pakistan Stock Exchange (PSX) and issued 109 million ordinary shares of Rs. 10 each.
We considered this as key audit matter due to the significant amount involved, requirements to disclose utilization of proceeds from IPO and disclosure requirements of 4th Schedule of the Companies Act, 2017.
Our audit procedures in relation to listing of Company is Pakistan Stock Exchange (PSX) included the following:
• Reviewed the management working of utilization of proceeds from IPO.
• Reviewing the adequacy of disclosure as required under applicable financial reporting framework and requirements of the Companies Act, 2017.
INDEPENDENT AUDITOR’S REPORT TO THE MEMBERS OF INTERLOOP LIMITED REPORT ON THE AUDIT OF UNCONSOLIDATED FINANCIAL STATEMENTS
S. No Key Audit Matter(s)How the Matter was addressed in
audit
5. Inventories
The company has significant levels of inventories amounting to Rs. 7,170.15 million as at the reporting date, being 18% of the total assets of the company.
There is a risk in estimating the eventual NRV of items held, as well as assessing which items may be slow-moving or obsolete.
The Company’s principal accounting policy on stores and spares and stock in trade are disclosed in notes – 5.6 and 5.7 to the unconsolidated financial statements
The significance of the balance coupled with the judgments and estimates involved on their valuation has resulted in the inventories being considered as a key audit matter.
Our audit focused on whether the valuation of year-end inventory was in line with IAS 2. This included challenging judgments taken regarding obsolescence and net realizable value provisions.
We obtained assurance over the appropriateness of management’s assumptions applied in calculating the value of inventories by:
• Attending the year end stock take to gain comfort over the existence and condition of inventories and internal controls designed by the company.
• Obtaining the final valuation sheets of the inventories and tracing quantities from working papers of observation of physical stock taking.
• Obtaining understanding of internal controls designed by the company over recording of purchases and valuation of the inventories, and testing their operating effectiveness on sample basis.
• Assessing historical costs recorded in the inventory valuation by performing test of details on purchases. Evaluating that the valuation basis used are appropriate and consistent, including analysis of costing of different items on sample basis.
• Assessing the management’s determination of the net realizable values and intended use of the inventories including performing tests on the sales prices fetched by the company before and after year end.
• Performing analytical and other relevant audit procedures.
• Considering the adequacy of the company‘s disclosures in respect of inventories.
INDEPENDENT AUDITOR’S REPORT TO THE MEMBERS OF INTERLOOP LIMITED REPORT ON THE AUDIT OF UNCONSOLIDATED FINANCIAL STATEMENTS
Inte
rloop
Lim
ited
96 97
2018
- 1
9A
nnua
l Rep
ort
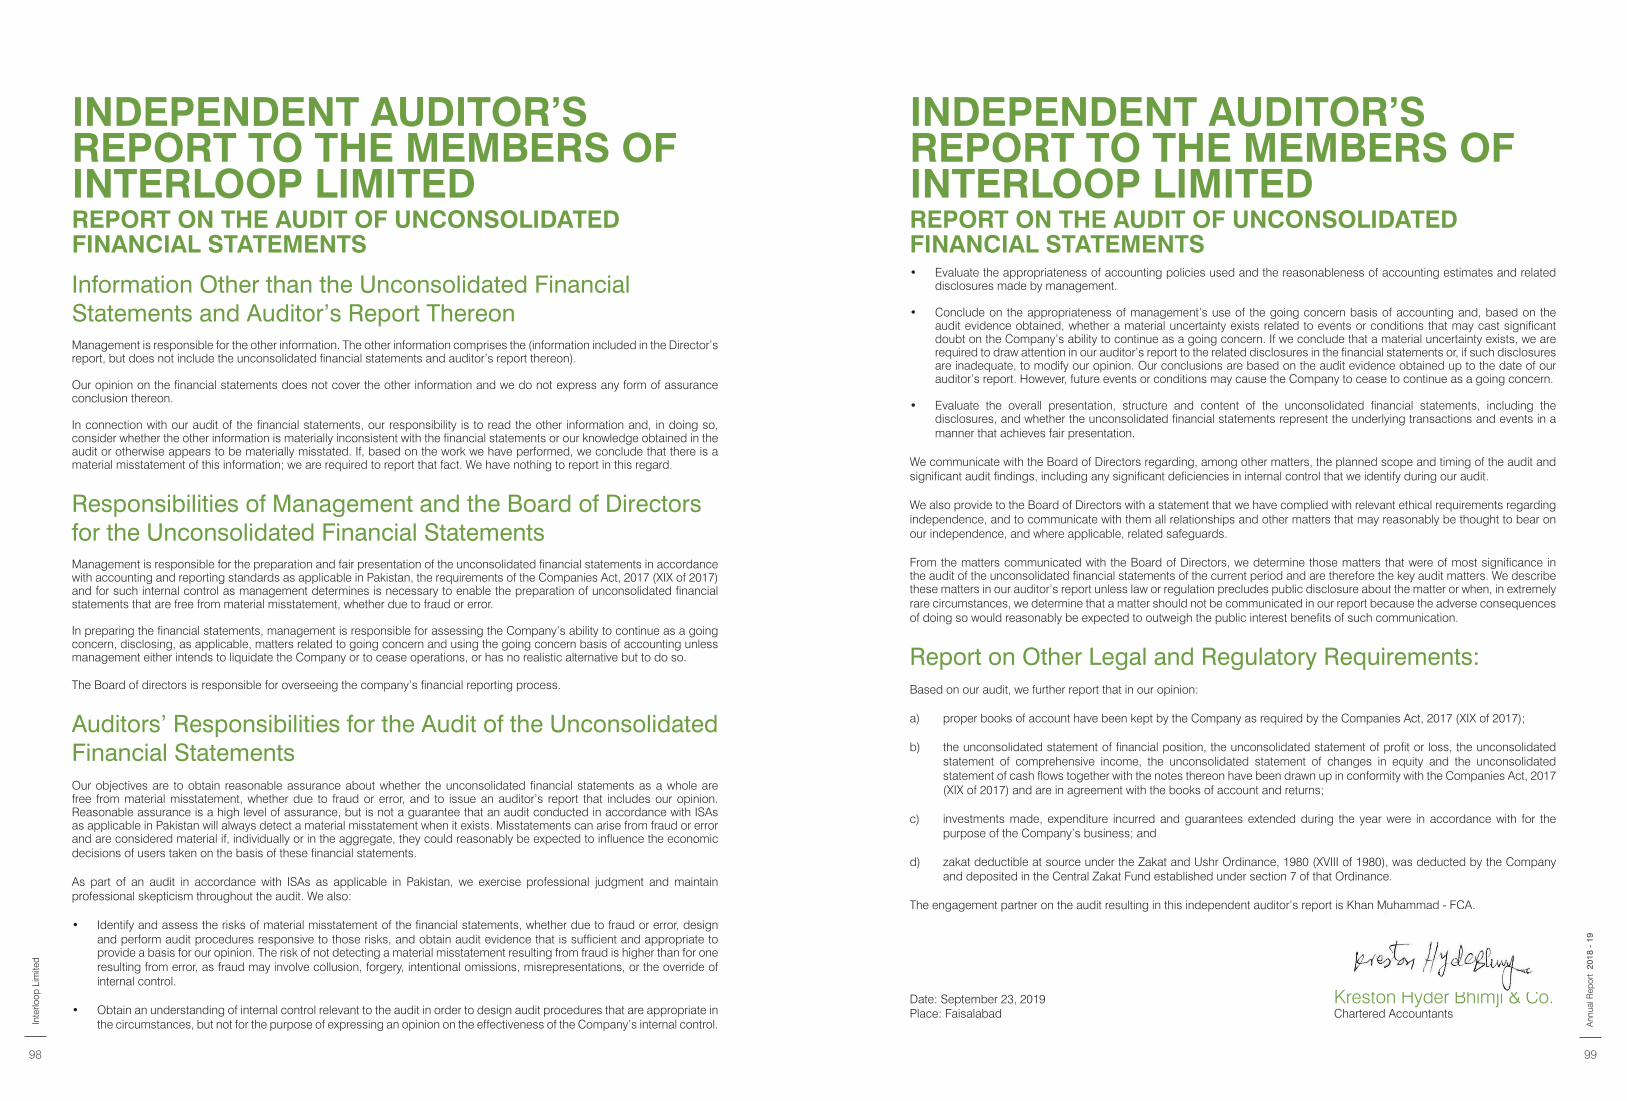
INDEPENDENT AUDITOR’S REPORT TO THE MEMBERS OF INTERLOOP LIMITED REPORT ON THE AUDIT OF UNCONSOLIDATED FINANCIAL STATEMENTS
Information Other than the Unconsolidated Financial Statements and Auditor’s Report ThereonManagement is responsible for the other information. The other information comprises the (information included in the Director’s report, but does not include the unconsolidated financial statements and auditor’s report thereon).
Our opinion on the financial statements does not cover the other information and we do not express any form of assurance conclusion thereon.
In connection with our audit of the financial statements, our responsibility is to read the other information and, in doing so, consider whether the other information is materially inconsistent with the financial statements or our knowledge obtained in the audit or otherwise appears to be materially misstated. If, based on the work we have performed, we conclude that there is a material misstatement of this information; we are required to report that fact. We have nothing to report in this regard.
Responsibilities of Management and the Board of Directors for the Unconsolidated Financial StatementsManagement is responsible for the preparation and fair presentation of the unconsolidated financial statements in accordance with accounting and reporting standards as applicable in Pakistan, the requirements of the Companies Act, 2017 (XIX of 2017) and for such internal control as management determines is necessary to enable the preparation of unconsolidated financial statements that are free from material misstatement, whether due to fraud or error.
In preparing the financial statements, management is responsible for assessing the Company’s ability to continue as a going concern, disclosing, as applicable, matters related to going concern and using the going concern basis of accounting unless management either intends to liquidate the Company or to cease operations, or has no realistic alternative but to do so. The Board of directors is responsible for overseeing the company’s financial reporting process.
Auditors’ Responsibilities for the Audit of the Unconsolidated Financial Statements
Our objectives are to obtain reasonable assurance about whether the unconsolidated financial statements as a whole are free from material misstatement, whether due to fraud or error, and to issue an auditor’s report that includes our opinion. Reasonable assurance is a high level of assurance, but is not a guarantee that an audit conducted in accordance with ISAs as applicable in Pakistan will always detect a material misstatement when it exists. Misstatements can arise from fraud or error and are considered material if, individually or in the aggregate, they could reasonably be expected to influence the economic decisions of users taken on the basis of these financial statements.
As part of an audit in accordance with ISAs as applicable in Pakistan, we exercise professional judgment and maintain professional skepticism throughout the audit. We also:
• Identify and assess the risks of material misstatement of the financial statements, whether due to fraud or error, design and perform audit procedures responsive to those risks, and obtain audit evidence that is sufficient and appropriate to provide a basis for our opinion. The risk of not detecting a material misstatement resulting from fraud is higher than for one resulting from error, as fraud may involve collusion, forgery, intentional omissions, misrepresentations, or the override of internal control.
• Obtain an understanding of internal control relevant to the audit in order to design audit procedures that are appropriate in the circumstances, but not for the purpose of expressing an opinion on the effectiveness of the Company’s internal control.
• Evaluate the appropriateness of accounting policies used and the reasonableness of accounting estimates and related disclosures made by management.
• Conclude on the appropriateness of management’s use of the going concern basis of accounting and, based on the audit evidence obtained, whether a material uncertainty exists related to events or conditions that may cast significant doubt on the Company’s ability to continue as a going concern. If we conclude that a material uncertainty exists, we are required to draw attention in our auditor’s report to the related disclosures in the financial statements or, if such disclosures are inadequate, to modify our opinion. Our conclusions are based on the audit evidence obtained up to the date of our auditor’s report. However, future events or conditions may cause the Company to cease to continue as a going concern.
• Evaluate the overall presentation, structure and content of the unconsolidated financial statements, including the disclosures, and whether the unconsolidated financial statements represent the underlying transactions and events in a manner that achieves fair presentation.
We communicate with the Board of Directors regarding, among other matters, the planned scope and timing of the audit and significant audit findings, including any significant deficiencies in internal control that we identify during our audit.
We also provide to the Board of Directors with a statement that we have complied with relevant ethical requirements regarding independence, and to communicate with them all relationships and other matters that may reasonably be thought to bear on our independence, and where applicable, related safeguards.
From the matters communicated with the Board of Directors, we determine those matters that were of most significance in the audit of the unconsolidated financial statements of the current period and are therefore the key audit matters. We describe these matters in our auditor’s report unless law or regulation precludes public disclosure about the matter or when, in extremely rare circumstances, we determine that a matter should not be communicated in our report because the adverse consequences of doing so would reasonably be expected to outweigh the public interest benefits of such communication.
Report on Other Legal and Regulatory Requirements:Based on our audit, we further report that in our opinion:
a) proper books of account have been kept by the Company as required by the Companies Act, 2017 (XIX of 2017);
b) the unconsolidated statement of financial position, the unconsolidated statement of profit or loss, the unconsolidated statement of comprehensive income, the unconsolidated statement of changes in equity and the unconsolidated statement of cash flows together with the notes thereon have been drawn up in conformity with the Companies Act, 2017 (XIX of 2017) and are in agreement with the books of account and returns;
c) investments made, expenditure incurred and guarantees extended during the year were in accordance with for the purpose of the Company’s business; and
d) zakat deductible at source under the Zakat and Ushr Ordinance, 1980 (XVIII of 1980), was deducted by the Company and deposited in the Central Zakat Fund established under section 7 of that Ordinance.
The engagement partner on the audit resulting in this independent auditor’s report is Khan Muhammad - FCA.
Date: September 23, 2019 Kreston Hyder Bhimji & Co.Place: Faisalabad Chartered Accountants
INDEPENDENT AUDITOR’S REPORT TO THE MEMBERS OF INTERLOOP LIMITED REPORT ON THE AUDIT OF UNCONSOLIDATED FINANCIAL STATEMENTS
Inte
rloop
Lim
ited
98 99
2018
- 1
9A
nnua
l Rep
ort
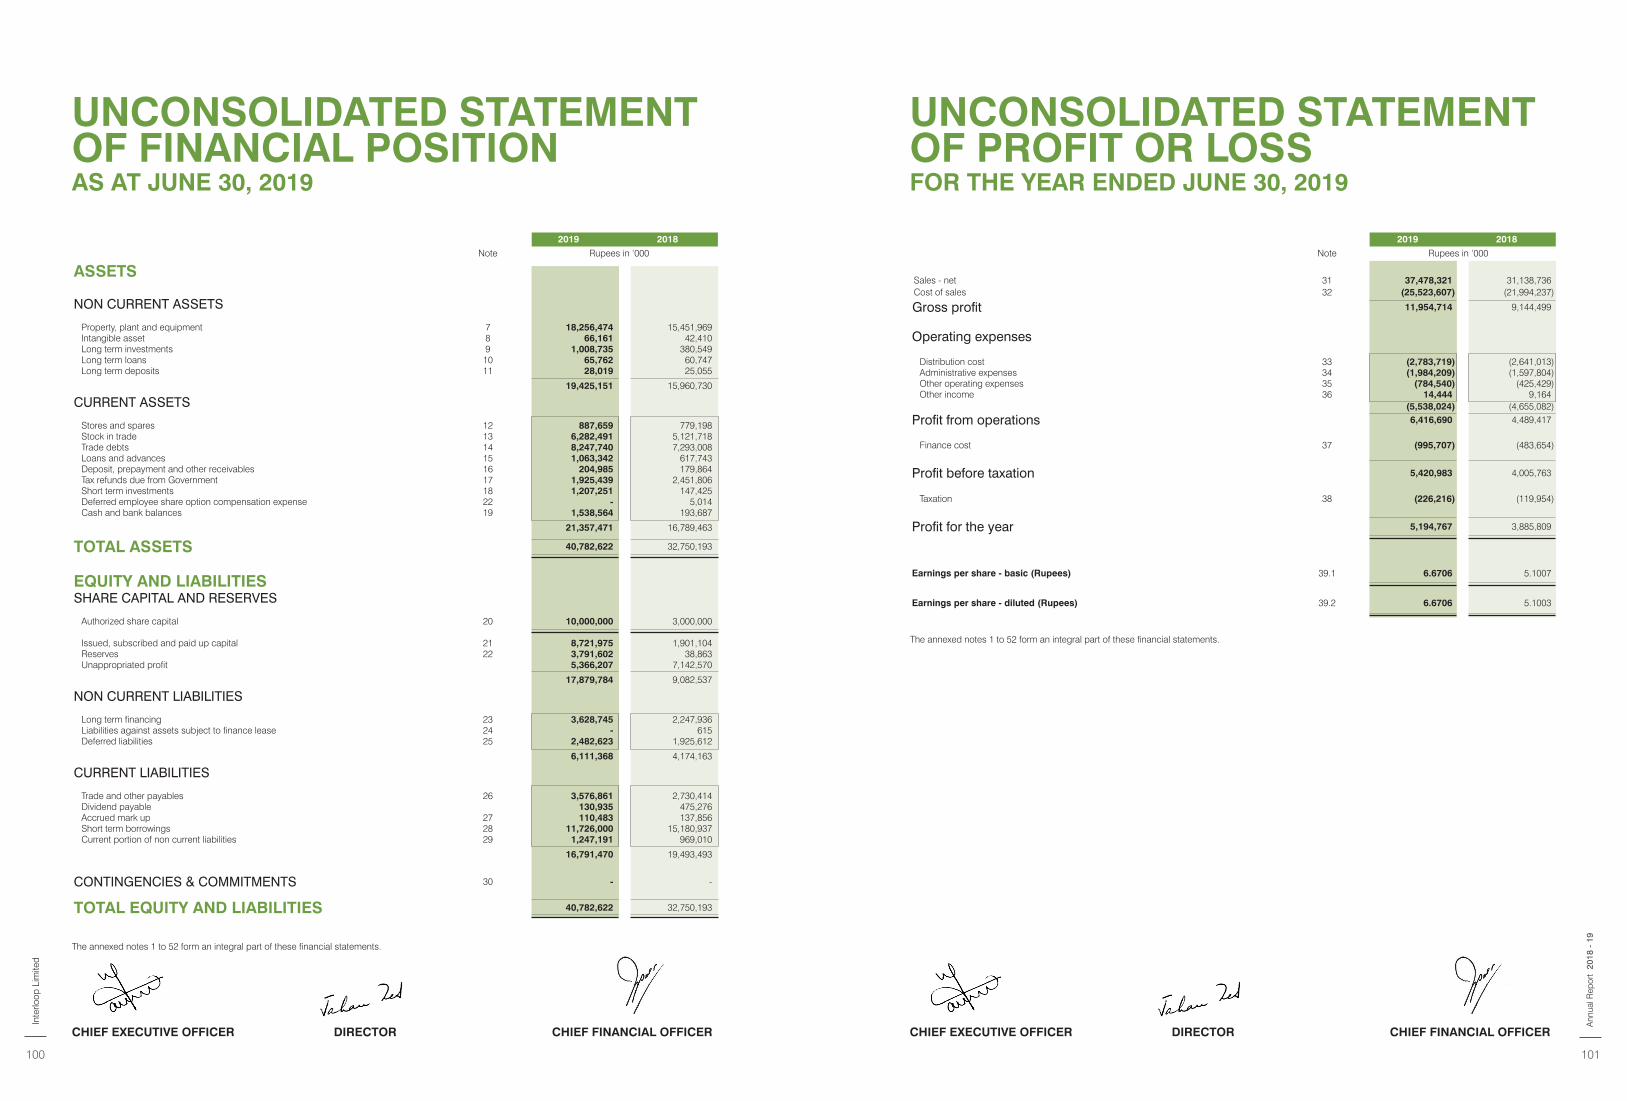
2019 2018
Note Rupees in ‘000
ASSETS
NON CURRENT ASSETS
Property, plant and equipment 7 18,256,474 15,451,969 Intangible asset 8 66,161 42,410 Long term investments 9 1,008,735 380,549 Long term loans 10 65,762 60,747 Long term deposits 11 28,019 25,055
19,425,151 15,960,730
CURRENT ASSETS
Stores and spares 12 887,659 779,198 Stock in trade 13 6,282,491 5,121,718 Trade debts 14 8,247,740 7,293,008 Loans and advances 15 1,063,342 617,743 Deposit, prepayment and other receivables 16 204,985 179,864 Tax refunds due from Government 17 1,925,439 2,451,806 Short term investments 18 1,207,251 147,425 Deferred employee share option compensation expense 22 - 5,014 Cash and bank balances 19 1,538,564 193,687
21,357,471 16,789,463
TOTAL ASSETS 40,782,622 32,750,193
EQUITY AND LIABILITIESSHARE CAPITAL AND RESERVES
Authorized share capital 20 10,000,000 3,000,000
Issued, subscribed and paid up capital 21 8,721,975 1,901,104 Reserves 22 3,791,602 38,863 Unappropriated profit 5,366,207 7,142,570
17,879,784 9,082,537
NON CURRENT LIABILITIES
Long term financing 23 3,628,745 2,247,936 Liabilities against assets subject to finance lease 24 - 615 Deferred liabilities 25 2,482,623 1,925,612
6,111,368 4,174,163
CURRENT LIABILITIES
Trade and other payables 26 3,576,861 2,730,414 Dividend payable 130,935 475,276 Accrued mark up 27 110,483 137,856 Short term borrowings 28 11,726,000 15,180,937 Current portion of non current liabilities 29 1,247,191 969,010
16,791,470 19,493,493
CONTINGENCIES & COMMITMENTS 30 - -
TOTAL EQUITY AND LIABILITIES 40,782,622 32,750,193
The annexed notes 1 to 52 form an integral part of these financial statements.
UNCONSOLIDATED STATEMENT OF FINANCIAL POSITIONAS AT JUNE 30, 2019
UNCONSOLIDATED STATEMENT OF PROFIT OR LOSSFOR THE YEAR ENDED JUNE 30, 2019
2019 2018
Note Rupees in ‘000
Sales - net 31 37,478,321 31,138,736 Cost of sales 32 (25,523,607) (21,994,237)
Gross profit 11,954,714 9,144,499
Operating expenses
Distribution cost 33 (2,783,719) (2,641,013)Administrative expenses 34 (1,984,209) (1,597,804)Other operating expenses 35 (784,540) (425,429)Other income 36 14,444 9,164
(5,538,024) (4,655,082)
Profit from operations 6,416,690 4,489,417
Finance cost 37 (995,707) (483,654)
Profit before taxation 5,420,983 4,005,763
Taxation 38 (226,216) (119,954)
Profit for the year 5,194,767 3,885,809
Earnings per share - basic (Rupees) 39.1 6.6706 5.1007
Earnings per share - diluted (Rupees) 39.2 6.6706 5.1003
The annexed notes 1 to 52 form an integral part of these financial statements.
CHIEF EXECUTIVE OFFICER DIRECTOR CHIEF FINANCIAL OFFICERCHIEF EXECUTIVE OFFICER DIRECTOR CHIEF FINANCIAL OFFICER
Inte
rloop
Lim
ited
100 101
2018
- 1
9A
nnua
l Rep
ort
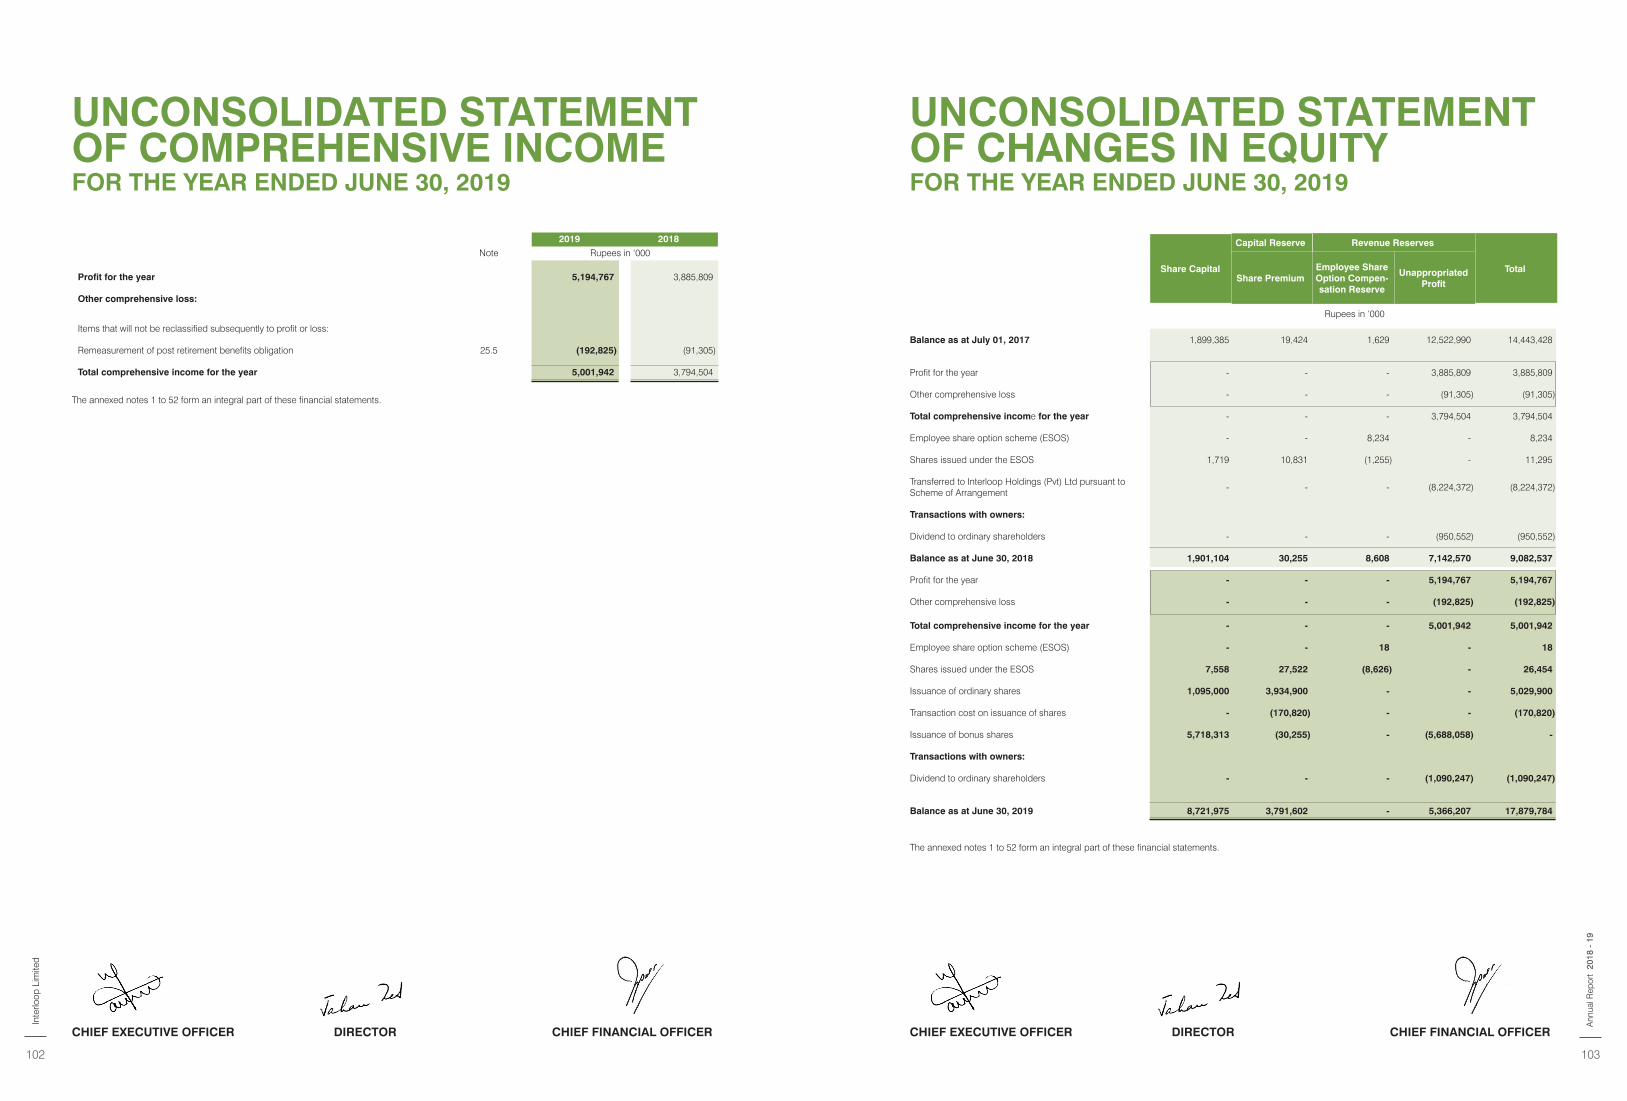
The annexed notes 1 to 52 form an integral part of these financial statements.
2019 2018
Note Rupees in ‘000
Profit for the year 5,194,767 3,885,809
Other comprehensive loss:
Items that will not be reclassified subsequently to profit or loss:
Remeasurement of post retirement benefits obligation 25.5 (192,825) (91,305)
Total comprehensive income for the year 5,001,942 3,794,504
UNCONSOLIDATED STATEMENT OF COMPREHENSIVE INCOME FOR THE YEAR ENDED JUNE 30, 2019
Share Capital
Capital Reserve Revenue Reserves
TotalShare Premium
Employee Share Option Compen-sation Reserve
Unappropriated Profit
Rupees in ‘000
Balance as at July 01, 2017 1,899,385 19,424 1,629 12,522,990 14,443,428
Profit for the year - - - 3,885,809 3,885,809
Other comprehensive loss - - - (91,305) (91,305)
Total comprehensive income for the year - - - 3,794,504 3,794,504
Employee share option scheme (ESOS) - - 8,234 - 8,234
Shares issued under the ESOS 1,719 10,831 (1,255) - 11,295
Transferred to Interloop Holdings (Pvt) Ltd pursuant to Scheme of Arrangement
- - - (8,224,372) (8,224,372)
Transactions with owners:
Dividend to ordinary shareholders - - - (950,552) (950,552)
Balance as at June 30, 2018 1,901,104 30,255 8,608 7,142,570 9,082,537
Profit for the year - - - 5,194,767 5,194,767
Other comprehensive loss - - - (192,825) (192,825)
Total comprehensive income for the year - - - 5,001,942 5,001,942
Employee share option scheme (ESOS) - - 18 - 18
Shares issued under the ESOS 7,558 27,522 (8,626) - 26,454
Issuance of ordinary shares 1,095,000 3,934,900 - - 5,029,900
Transaction cost on issuance of shares - (170,820) - - (170,820)
Issuance of bonus shares 5,718,313 (30,255) - (5,688,058) -
Transactions with owners:
Dividend to ordinary shareholders - - - (1,090,247) (1,090,247)
Balance as at June 30, 2019 8,721,975 3,791,602 - 5,366,207 17,879,784
The annexed notes 1 to 52 form an integral part of these financial statements.
UNCONSOLIDATED STATEMENT OF CHANGES IN EQUITY FOR THE YEAR ENDED JUNE 30, 2019
CHIEF EXECUTIVE OFFICER DIRECTOR CHIEF FINANCIAL OFFICERCHIEF EXECUTIVE OFFICER DIRECTOR CHIEF FINANCIAL OFFICER
Inte
rloop
Lim
ited
102 103
2018
- 1
9A
nnua
l Rep
ort
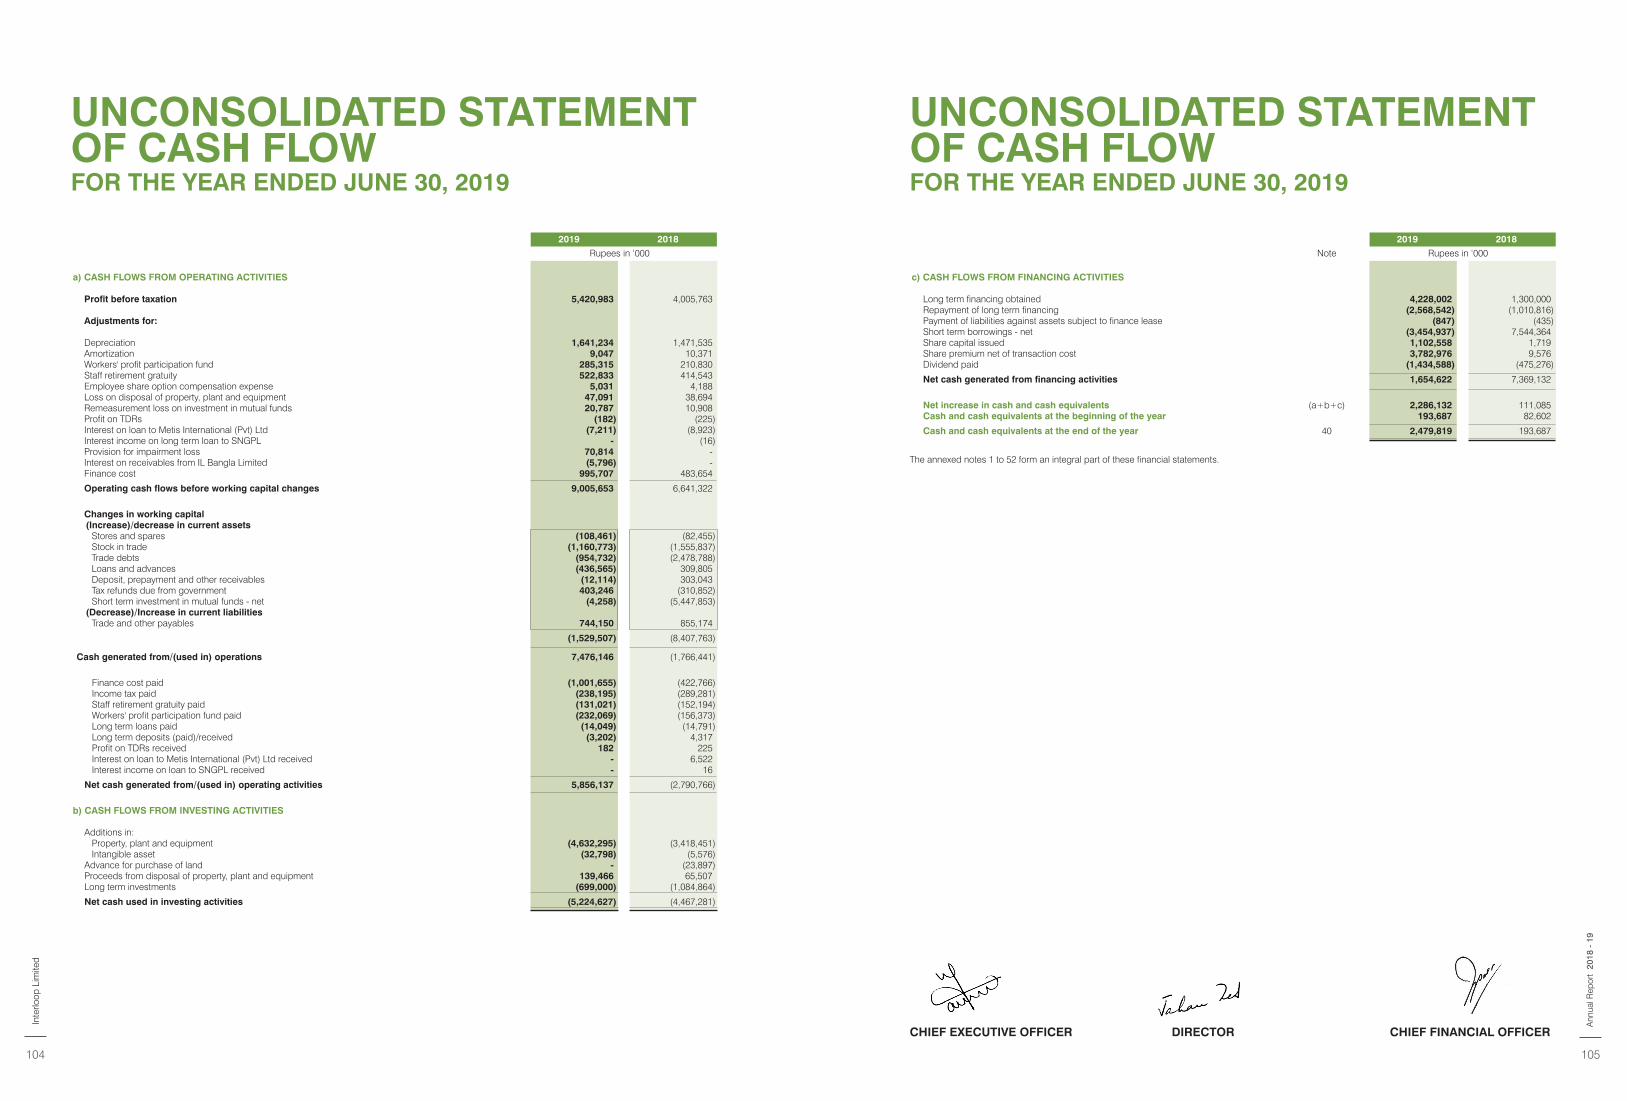
UNCONSOLIDATED STATEMENT OF CASH FLOW FOR THE YEAR ENDED JUNE 30, 2019
2019 2018
Rupees in ‘000
a) CASH FLOWS FROM OPERATING ACTIVITIES
Profit before taxation 5,420,983 4,005,763
Adjustments for:
Depreciation 1,641,234 1,471,535 Amortization 9,047 10,371 Workers' profit participation fund 285,315 210,830 Staff retirement gratuity 522,833 414,543 Employee share option compensation expense 5,031 4,188 Loss on disposal of property, plant and equipment 47,091 38,694 Remeasurement loss on investment in mutual funds 20,787 10,908 Profit on TDRs (182) (225)Interest on loan to Metis International (Pvt) Ltd (7,211) (8,923)Interest income on long term loan to SNGPL - (16)Provision for impairment loss 70,814 - Interest on receivables from IL Bangla Limited (5,796) - Finance cost 995,707 483,654
Operating cash flows before working capital changes 9,005,653 6,641,322
Changes in working capital (Increase)/decrease in current assets
Stores and spares (108,461) (82,455)Stock in trade (1,160,773) (1,555,837)Trade debts (954,732) (2,478,788)Loans and advances (436,565) 309,805 Deposit, prepayment and other receivables (12,114) 303,043 Tax refunds due from government 403,246 (310,852)Short term investment in mutual funds - net (4,258) (5,447,853)
(Decrease)/Increase in current liabilitiesTrade and other payables 744,150 855,174
(1,529,507) (8,407,763)
Cash generated from/(used in) operations 7,476,146 (1,766,441)
Finance cost paid (1,001,655) (422,766)Income tax paid (238,195) (289,281)Staff retirement gratuity paid (131,021) (152,194)Workers' profit participation fund paid (232,069) (156,373)Long term loans paid (14,049) (14,791)Long term deposits (paid)/received (3,202) 4,317 Profit on TDRs received 182 225 Interest on loan to Metis International (Pvt) Ltd received - 6,522 Interest income on loan to SNGPL received - 16
Net cash generated from/(used in) operating activities 5,856,137 (2,790,766)
b) CASH FLOWS FROM INVESTING ACTIVITIES
Additions in: Property, plant and equipment (4,632,295) (3,418,451) Intangible asset (32,798) (5,576)Advance for purchase of land - (23,897)Proceeds from disposal of property, plant and equipment 139,466 65,507 Long term investments (699,000) (1,084,864)
Net cash used in investing activities (5,224,627) (4,467,281)
The annexed notes 1 to 52 form an integral part of these financial statements.
2019 2018
Note Rupees in ‘000
c) CASH FLOWS FROM FINANCING ACTIVITIES
Long term financing obtained 4,228,002 1,300,000 Repayment of long term financing (2,568,542) (1,010,816)Payment of liabilities against assets subject to finance lease (847) (435)Short term borrowings - net (3,454,937) 7,544,364 Share capital issued 1,102,558 1,719 Share premium net of transaction cost 3,782,976 9,576 Dividend paid (1,434,588) (475,276)
Net cash generated from financing activities 1,654,622 7,369,132
Net increase in cash and cash equivalents (a+b+c) 2,286,132 111,085 Cash and cash equivalents at the beginning of the year 193,687 82,602
Cash and cash equivalents at the end of the year 40 2,479,819 193,687
UNCONSOLIDATED STATEMENT OF CASH FLOW FOR THE YEAR ENDED JUNE 30, 2019
CHIEF EXECUTIVE OFFICER DIRECTOR CHIEF FINANCIAL OFFICER
Inte
rloop
Lim
ited
104 105
2018
- 1
9A
nnua
l Rep
ort
1. LEGAL STATUS AND OPERATIONS
1.1 Interloop Limited (the Company) was incorporated in Pakistan on 25th April, 1992 as a private limited company and subsequently it was converted into public limited company on 18th July, 2008. The Company was listed on Pakistan Stock Exchange on 5th April, 2019. The Company is engaged in the business of manufacturing and selling of socks, leggies, denim and yarn, providing yarn dyeing services and to generate electricity for its own use.
The geographical locations and addresses of the Company’s business units, including production facilities are as under:
- Registered office: Al-Sadiq Plaza, P-157, Railway Road, Faisalabad. - Corporate office & Plant 1: 1-KM, Khurrianwala – Jaranwala Road, Khurrianwala, Faisalabad-Pakistan. - Plant 2, Plant 4 & Spinning: 7-KM, Khurrianwala – Jaranwala Road, Khurrianwala, Faisalabad-Pakistan. - Plant 5: 6-KM, Khurrianwala – Jaranwala Road, Khurrianwala, Faisalabad-Pakistan. - Plant 3 & Denim: 8-KM, Manga- Raiwind Road, Raiwind, Dist. Kasur, Lahore-Pakistan.
1.2 The Board of Directors of the Company decided to initiate the proceedings for enlisting of the Company on the Pakistan Stock Exchange Limited to finance hosiery division - V and denim projects. Hence, the Company issued the prospectus for Initial Public Offer (IPO) of 109 million ordinary shares of Rupees 10 each at a floor price of Rupees 45 per share including share premium of Rupees 35 per share as on 05 March 2019. Details regarding utilization of IPO proceeds for denim project and plant expansion have been fully explained in the prospectus. Before the date of the reporting period, 81.750 million ordinary shares were offered and successfully subscribed through book building process by Institutional Investors and High Net Worth Individuals (HNWI) at a strike price of Rupees 46.10 per share while the remaining 27.250 million ordinary shares were offered to general public for subscription at strike price of Rupees 46.10 per share. Ordinary shares offered to general public were fully subscribed and shares have been duly allotted to all shareholders. As on 05 April 2019, Pakistan Stock Exchange Limited has approved the Company’s application for formal listing and quotation of the shares on Pakistan Stock Exchange.
2. BASIS OF PREPARATION
2.1 Statement of compliance
These unconsolidated financial statements have been prepared in accordance with the accounting and reporting standards as applicable in Pakistan. The accounting and reporting standards applicable in Pakistan comprise of:
- International Financial Reporting Standards (IFRS Standards) issued by the International Accounting Standards Board (IASB) as notified under the Companies Act, 2017; and
- Provisions of and directives issued under the Companies Act, 2017.
Where the provisions of and directives issued under the Companies Act, 2017 differ from the IFRS Standards, the provisions of and directives issued under the Companies Act, 2017 have been followed.
2.2 Basis of measurement
These unconsolidated financial statements have been prepared under the historical cost convention except as otherwise stated in respective policy notes.
2.3 Functional and presentation currency
These unconsolidated financial statements are presented in Pakistani Rupee which is also the Company’s functional currency.
3. NEW AND REVISED STANDARDS, INTERPRETATIONS AND PRONOUNCEMENTS
3.1 Standards, interpretations and amendments to approved accounting standards which became effective during the year
- Amendment to IAS 40 ‘Investment Property’:
Transfers of investment property clarifies that an entity shall transfer a property to, or from, investment property when, and only when there is a change in use. A change in use occurs when the property meets, or ceases to meet, the definition of investment property and there is evidence of the change in use. In isolation, a change in management’s intentions for the use of a property does not provide evidence of a change in use. The amendment does not have any impact on Company’s financial statements.
- Amendments to IFRS 2 ‘Share-based Payment’ - Clarifying how to account for certain types of share-based payments:
The amendments are intended to eliminate diversity in practice in three main areas: - The effects of vesting conditions on the measurement of a cash-settled share-based payment transaction; - The classification of a share-based payment transaction with net settlement features for withholding tax
obligations; - The accounting where a modification to the terms and conditions of a share-based payment transaction
changes its classification from cash-settled to equity-settled. The amendment does not have a significant impact on these unconsolidated financial statements.
- Amendment to IFRS 4 ‘Insurance Contract’- Applying IFRS 9 ‘Financial Instruments’ with IFRS 4:
The amendment address issue arising from the different effective dates of IFRS 9 and the forthcoming new insurance contract standard IFRS 17 ‘Insurance Contracts’. The amendments introduce two alternative options for entities issuing contracts within the scope of IFRS 4, notably a temporary exemption and an overlay approach. The temporary exemption enables eligible entities to defer the implementation date of IFRS 9. The overlay approach allows an entity applying IFRS 9 from July 01, 2018 onwards to remove from profit or loss the effects of some of the accounting mismatches that may occur from applying IFRS 9 before IFRS 17 is applied. The amendment does not have any impact on the Company’s financial statements.
NOTES TO THE UNCONSOLIDATED FINANCIAL STATEMENTSFOR THE YEAR ENDED JUNE 30, 2019
NOTES TO THE UNCONSOLIDATED FINANCIAL STATEMENTSFOR THE YEAR ENDED JUNE 30, 2019
Inte
rloop
Lim
ited
106 107
2018
- 1
9A
nnua
l Rep
ort
- IFRS 9 ‘Financial instruments’:
IFRS 9 is a replacement for IAS 39 ‘Financial Instruments’ and covers three distinct areas. Phase 1 contains new requirements for the classification and measurement of financial assets and liabilities. Phase 2 relates to the impairment of financial assets and requires the calculation of impairment on an expected loss basis rather than the current incurred loss basis. Phase 3 relates to less stringent requirements for general hedge accounting. Impact of adoption of IFRS 9 is disclosed in Note. 6.1 of the unconsolidated financial statements.
- IFRS 15, ‘Revenue from Contracts with Customers’:
This standard deals with revenue recognition and establishes principles for reporting useful information to users of financial statements about the nature, amount, timing and uncertainty of revenue and cash flows arising from an entity’s contracts with customers. Revenue is recognized when a customer obtains control of a good or service and thus has the ability to direct the use and obtain the benefits from the good or service. The standard replaces IAS 18 ‘Revenue’, IAS 11 ‘Construction contracts’ and IFRIC 13, ‘Customer Loyalty Programmes’. Impact of adoption of IFRS 15 is disclosed in Note. 6.2 of the unconsolidated financial statements.
- IFRIC 22, ‘Foreign currency transactions and advance consideration’:
IFRIC 22 clarifies which date should be used for translation when a foreign currency transaction involves payment or receipt in advance of the item it relates to. The related item is translated using the exchange rate on the date the advance foreign currency is received or paid and the prepayment or deferred income is recognized. The date of the transaction for the purpose of determining the exchange rate to use on initial recognition of the related asset, expense or income (or part of it) would remain the date on which receipt of payment from advance consideration was recognized. If there are multiple payments or receipts in advance, the entity shall determine a date of the transaction for each payment or receipt of advance consideration. The interpretation does not have a significant impact on these unconsolidated financial statements.
- Annual improvements to IFRS standards 2014-2016 cycle [Amendments to IAS 28 ‘Investments in Associates and Joint Ventures’]:
Amendments to IAS 28 clarifies that a venture capital organization and other similar entities may elect to measure investments in associates and joint ventures at fair value through profit or loss, for each associate or joint venture separately at the time of initial recognition of investment. Furthermore, similar election is available to non-investment entity that has an interest in an associate or joint venture that is an investment entity, when applying the equity method, to retain the fair value measurement applied by that investment entity associate or joint venture to the investment entity associate’s or joint venture’s interests in subsidiaries. This election is made separately for each investment entity associate or joint venture. The amendments do not have any impact on these unconsolidated financial statements.
The other amendments to published standards and interpretations that are mandatory for the financial year are considered not to be relevant or to have any significant impact on the Company’s financial reporting and operations and are therefore not disclosed in these unconsolidated financial statements.
3.2 Standards, interpretations and amendments to approved accounting standards that are issued but not yet effective and have not been early adopted by the Company
- Amendment to IAS 19 ‘Employee Benefits, - Plan Amendment, Curtailment or Settlement’ (effective for annual period beginning on or after January 01, 2019):
The amendments to IAS 19 specify that an entity must;
(i) determine current service cost for the remainder of the period after the plan amendment, curtailment or settlement using the actuarial assumptions used to remeasure the net defined benefit liability (asset) reflecting the benefits offered under the plan and the plan assets after that event and determine net interest for the remainder of the period after the plan amendment, curtailment or settlement using:
(a) the net defined benefit liability (asset) reflecting the benefits offered under the plan and the plan assets after that event; and
(b) the discount rate used to remeasure that net defined benefit liability (asset).
(ii) determine any past service cost, or a gain or loss on settlement, without considering the effect of the asset ceiling. This amount is to be recognized in profit or loss. An entity then determine the effect of the asset ceiling after the plan amendment, curtailment or settlement. Any change in that effect, excluding amounts included in net interest, is recognized in other comprehensive income.
The Company is yet to assess the full impact of the amendment.
- Amendment to IAS 28 ‘Investments in Associates and Joint Ventures’ - Long term investment in Associates and Joint Ventures (effective for annual period beginning on or after January 01, 2019):
The amendment will affect companies that finance such entities with preference shares or with loans for which repayment is not expected in the foreseeable future (referred to as long-term interests or ‘LTI’). The amendment and accompanying example state that LTI are in the scope of both IFRS 9 and IAS 28 and explain the annual sequence in which both standards are to be applied. The amendment is not likely to have an impact on the Company’s financial statements.
- Amendment to IFRS 9 ‘Financial Instrument’- prepayment Features with Negative Compensation and modifications of financial liabilities (effective for annual period beginning on or after January 01, 2019):
The amendment allow debt instruments with negative compensation prepayment features to be measured at amortized cost or fair value through other comprehensive income. The amendment also clarified that gains and losses arising on modifications of financial liabilities that do not result in derecognition should be recognized in profit or loss.
- IFRS 16, ‘Leases’ (effective for periods beginning on or after January 01, 2019):
IFRS 16 introduces a single lessee accounting model and requires a lessee to recognize assets and liabilities for
NOTES TO THE UNCONSOLIDATED FINANCIAL STATEMENTSFOR THE YEAR ENDED JUNE 30, 2019
NOTES TO THE UNCONSOLIDATED FINANCIAL STATEMENTSFOR THE YEAR ENDED JUNE 30, 2019
Inte
rloop
Lim
ited
108 109
2018
- 1
9A
nnua
l Rep
ort
all leases with a term of more than 12 months, unless the underlying asset is of low value. A lessee is required to recognize a right-of-use asset representing its right to use the underlying leased asset and a lease liability representing its obligation to make lease payments. The full impact of the future adoption is currently under review.
- IFRIC 23 ‘Uncertainty over Income Tax Treatments’ (effective for annual periods beginning on or after January 01, 2019):
IFRIC 23 clarifies how the recognition and measurement requirements of IAS 12 ‘Income taxes’, are applied where there is uncertainty over income tax treatments. An uncertain tax treatment is any tax treatment applied by an entity where there is uncertainty over whether that treatment will be accepted by the tax authority. For example, a decision to claim a deduction for a specific expense or not to include a specific item of income in a tax return is an uncertain tax treatment if its acceptability is uncertain under tax law. IFRIC 23 applies to all aspects of income tax accounting where there is an uncertainty regarding the treatment of an item, including taxable profit or loss, the tax bases of assets and liabilities, tax losses and credits and tax rates. The interpretation is not expected to have significant impact on the Company’s financial statements.
- Amendments to IAS 1, ‘Presentation of financial statements’, and IAS 8, ‘Accounting policies, changes in accounting estimates and errors’ (effective for the Company’s annual period beginning on January 1, 2019):
These amendments and consequential amendments to other IFRSs:
(i) use a consistent definition of materiality throughout IFRSs and the Conceptual Framework for Financial Reporting;
(ii) clarify the explanation of the definition of material; and(iii) incorporate some of the guidance in IAS 1 about immaterial information.
These amendments are not expected to have a significant impact on the Company’s future financial statements.
- Amendment to IFRS 3 ‘Business Combinations’ – Definition of a Business (effective for business combinations for which the acquisition date is on or after the beginning of annual period beginning on or after 1 January 2020):
The IASB has issued amendments aiming to resolve the difficulties that arise when an entity determines whether it has acquired a business or a group of assets. The amendments clarify that to be considered a business, an acquired set of activities and assets must include, at a minimum, an input and a substantive process that together significantly contribute to the ability to create outputs. The amendments include an election to use a concentration test. The standard is effective for transactions in the future and therefore would not have an impact on past financial statements.
- Annual Improvements to IFRS Standards 2015–2017 Cycle. The new cycle of improvements addresses improvements to following approved accounting standards (effective for annual period beginning on or after January 1, 2019):
- IFRS 3 Business Combinations and IFRS 11 Joint Arrangements. The amendment aims to clarify the accounting treatment when a company increases its interest in a joint operation that meets the definition of a business. A company remeasures its previously held interest in a joint operation when it obtains control of the business. A company does not remeasure its previously held interest in a joint operation when it obtains joint control of the business.
- IAS 12 Income Taxes. The amendment clarify that all income tax consequences of dividends (including payments on financial instruments classified as equity) are recognized consistently with the transaction that generates the distributable profits.
- IAS 23 Borrowing Costs. The amendment clarify that a company treats as part of general borrowings any borrowing originally made to develop an asset when the asset is ready for its intended use or sale.
Further, the following new standards have been issued by the International Accounting Standards Board (IASB), which are yet to be notified by the Securities and Exchange Commission of Pakistan (SECP), for the purposes of their applicability in Pakistan:
IFRS - 1 ‘First time adoption of International Financial Reporting Standards’. IFRS - 14 ‘Regulatory Deferral Accounts’. IFRS - 17 ‘Insurance Contracts’.
4. CRITICAL ACCOUNTING ESTIMATES AND JUDGMENTS
The preparation of financial statements in conformity with the approved accounting standards require management to make judgments, estimates and assumptions that affect the application of accounting policies and the reported amounts of assets and liabilities, income and expenses. The estimates and associated assumptions are based on historical experience and various other factors that are believed to be reasonable under the circumstances, the results of which form the basis of making the judgments about carrying values of assets and liabilities that are not readily apparent from other sources. Actual results may differ from these estimates.
The estimates and underlying assumptions are reviewed on an ongoing basis. Revisions to accounting estimates are recognized in the period in which the estimates are revised if the revision affects only that period, or in the period of the revision and future periods. Judgments made by management in application of the approved accounting standards that have significant effect on the unconsolidated financial statements and estimates with a significant risk of material adjustments in the next year are discussed in respective policy notes. The areas where various assumptions and estimates are significant to the Company’s financial statements or where judgment was exercised in application of accounting policies are as follows:
• Estimate of useful life of operating fixed assets - note 5.1
NOTES TO THE UNCONSOLIDATED FINANCIAL STATEMENTSFOR THE YEAR ENDED JUNE 30, 2019
NOTES TO THE UNCONSOLIDATED FINANCIAL STATEMENTSFOR THE YEAR ENDED JUNE 30, 2019
Inte
rloop
Lim
ited
110 111
2018
- 1
9A
nnua
l Rep
ort
• Impairment of non-financial assets - note 5.5• Stores and spares - note 5.6• Stock-in-trade - note 5.7• Staff retirement benefits - note 5.10• Provisions - note 5.13• Contingencies - note 5.14• Taxation - note 5.15
5. SUMMARY OF SIGNIFICANT ACCOUNTING POLICIES
5.1 Operating fixed assets and depreciation
Operating fixed assets, except freehold land which is stated at cost, are stated at cost less accumulated depreciation and any identified accumulated impairment loss. Cost comprises acquisition and other directly attributable costs.
Depreciation is calculated at the rates stated in note 7.1 applying reducing balance method. The useful life and residual value of major components of operating fixed assets are reviewed annually to determine that expectations are not significantly different from the previous estimates. Adjustment in depreciation rate for current and future periods is made if expectations are significantly different from the previous estimates. Depreciation is charged from the month when an asset becomes available for use, whereas no depreciation is charged in the month of its disposal. Gain and loss on disposal of fixed assets is included in statement of profit or loss.
Expenditure, which enhances or extends the performance of operating fixed assets beyond its original specification and its useful life, is recognized as a capital expenditure and is added to the cost of the operating fixed assets. These are depreciated on reducing balance method at the rate mentioned in the relevant note.
5.2 Capital work in progress
Capital work in progress is stated at cost less any identified impairment loss and represents direct cost of material, labour, applicable overheads and borrowing costs on qualifying assets. Transfers are made to relevant property, plant and equipment category as and when assets are available for its intended use.
5.3 Leases
Operating leases
Leases where a significant portion of the risks and rewards of ownership are retained by the lessor are classified as operating leases. Payments made under operating leases (net of any incentives received from the lessor) are charged to the income statement on a straight-line basis over the period of lease.
Finance leases
Leases in terms of which the Company has substantially all the risks and rewards of ownership are classified as
finance leases. Assets subject to finance lease are stated at the lower of present value of minimum lease payments under the lease agreements and the fair value of the assets, less accumulated depreciation and any identified impairment loss.
The related rental obligations, net of finance costs are classified as current and long term liability depending upon the timing of the payment.
Each lease payment is allocated between the liability and finance cost so as to achieve a constant rate on the balance outstanding. The interest element of the rental is charged to statement of profit or loss over the lease term.
Assets acquired under a finance lease are depreciated over the estimated useful life of the asset on a reducing balance method at the rates given in note 7.1. Depreciation of leased assets is charged to statement of profit or loss.
Residual value and the useful life of an asset are reviewed at least at each financial year-end.
Depreciation on additions to leased assets is charged from the month in which an asset is acquired, while no depreciation is charged for the month in which the asset is disposed off.
5.4 Intangible asset - Computer software
Intangible assets are stated at cost less accumulated amortization and any identified accumulated impairment loss. These are amortized using the reducing balance method at the rates given in note 8. Amortization on additions is charged from the month in which an intangible asset is acquired, while no amortization is charged for the month in which intangible asset is disposed off.
Costs associated with maintaining computer software program are recognized as an expense as and when incurred. Costs that are directly attributable to identifiable software and have probable economic benefits exceeding one year, are recognized as an intangible asset at the time of initial recognition. Direct costs include the purchase cost of software and related overhead costs.
Expenditure, which enhances or extends the performance of computer software beyond its original specification and useful life, is recognized as a capital expenditure and added to the cost of the software. These are amortized on reducing balance method at the rate mentioned in the relevant note.
5.5 Impairment of non-financial assets
The carrying amounts of the Company’s non-financial assets, other than stock in trade and stores and spares, are reviewed at each reporting date to determine whether there is any indication of impairment. If any such indication exists then the asset’s recoverable amount is estimated. For goodwill and intangible assets that have indefinite lives or that are not yet available for use, recoverable amount is estimated at each reporting date.
An impairment loss is recognized if the carrying amount of an asset or its cash-generating unit exceeds its recoverable amount. A cash-generating unit is the smallest identifiable asset group that generates cash flows that largely are independent from other assets and groups.
NOTES TO THE UNCONSOLIDATED FINANCIAL STATEMENTSFOR THE YEAR ENDED JUNE 30, 2019
NOTES TO THE UNCONSOLIDATED FINANCIAL STATEMENTSFOR THE YEAR ENDED JUNE 30, 2019
Inte
rloop
Lim
ited
112 113
2018
- 1
9A
nnua
l Rep
ort
Impairment losses are recognized in profit or loss. Impairment losses recognized in respect of cash-generating units are allocated first to reduce the carrying amount of any goodwill allocated to the units and then to reduce the carrying amount of the other assets of the unit on a pro-rata basis. Impairment losses on goodwill shall not be reversed.
An impairment loss is reversed if there has been a change in the estimates used to determine the recoverable amount. An impairment loss is reversed only to the extent that the asset’s carrying amount does not exceed the carrying amount that would have been determined, net of depreciation or amortization, if no impairment loss had been recognized. Prior impairments of non-financial assets are reviewed for possible reversal at each reporting date.
5.6 Stores and spares
Stores and spares are carried at moving average cost. Provision is made for slow moving and obsolete store items when so identified. Stores and spares held for capital expenditure are included in capital work in progress.
5.7 Stock-in-trade
These are stated at the lower of cost and net realizable value (NRV). The methods used for the calculation of cost are as follows:
Raw material - At factory Moving average cost - In transit Invoice value plus direct charges in respect thereof. Work in process and finished goods Prime cost including a proportion of production overheads. Wastes are valued at net realizable value.
Stock-in-trade is regularly reviewed by the management and any obsolete items are brought down to their net realizable value. Net realizable value signifies the selling price in the ordinary course of business less costs necessary to be incurred to affect such sale.
5.8 Cash and cash equivalents
Cash and cash equivalents comprise of cash in hand, cheques in hand/cheques overdrawn, balances with banks and include short term highly liquid investments with original maturities of three months or less. The cash and cash equivalents are readily convertible to known amount of cash and are subject to insignificant risk of change in value.
5.9 Non-current assets held for sale
Non-current assets (or disposal groups) are classified as assets held for sale when their carrying amount is to be recovered principally through a sale transaction rather than continuing use and a sale is considered highly probable. They are stated at the lower of carrying amount and fair value less costs to sell. Impairment losses on initial classification as held for sale and subsequent gains or losses on re-measurements are recognized in the statement of profit or loss.
Once classified as held-for-sale, intangible assets and property, plant and equipment, are no longer amortized or depreciated.
5.10 Staff retirement benefits
(a) Defined Benefit Plan
The Company operates an unfunded gratuity scheme for all employees according to the terms of employment, subject to a minimum qualifying period of service. Annual provision is made on the basis of actuarial valuation to cover obligations under the scheme for all employees eligible to gratuity benefits.
The cost of providing benefits is determined using the projected unit credit method, with actuarial valuation being carried out at each balance sheet date. Remeasurement of net defined benefit liability, which comprise of actuarial gains and losses i.e. experience adjustments and the effects of changes in actuarial assumptions, are recognized immediately in other comprehensive income. The Company determines net interest expense/(income) on the defined benefit obligation for the period by applying the discount rate used to measure the defined benefit obligation at the beginning of the annual period to then-net defined benefit, taking into account any change in the net defined benefit obligation during the period as a result of contributions and benefit payments. Net interest expense and other expenses e.g. current service cost, related to defined benefit plans are recognized in statement of profit or loss.
(b) Defined Contribution Plan
There is a contributory provident fund for executive staff of the Company for which contributions are charged to profit or loss as and when incurred.
The Company makes monthly contribution to the fund at the rate of 7.5% whereas employees of the Company make monthly contributions to the fund at the rates ranging from 7.5% to 12.5% of basic salary. The assets of the fund are held separately under the control of trustees.
(c) Employees’ Share Option Scheme (ESOS)
The Company operates an equity settled stock option scheme to be called ‘Interloop Limited - Employees Stock Option Scheme, 2016’. The compensation committee (“committee”) of the Board of directors (“Board”) evaluates the performance and other criteria of employees and recommends to the Board for grant of options. The Board on the recommendation of the committee, on its discretion, grants recommended options to employees. These options vest after a specified period subject to fulfillment of certain conditions as defined in the scheme. Upon vesting, employees are eligible to apply and secure allotment of Company’s shares at a pre-determined price on the date of grant of options.
The fair value of the share option is measured at grant date as difference of fair value of share and exercise price and is recognized as an employee compensation expense, with a corresponding increase in equity, on the straight line basis over the vesting period. The amount recognized as an expense is adjusted to reflect the number of
NOTES TO THE UNCONSOLIDATED FINANCIAL STATEMENTSFOR THE YEAR ENDED JUNE 30, 2019
NOTES TO THE UNCONSOLIDATED FINANCIAL STATEMENTSFOR THE YEAR ENDED JUNE 30, 2019
Inte
rloop
Lim
ited
114 115
2018
- 1
9A
nnua
l Rep
ort
awards for which the related service and non-market performance conditions are expected to be met, such that the amount ultimately recognized is based on the number of awards that meet the related service and non- market performance conditions at the vesting date.
When share options are exercised, the proceeds received, net of any transaction costs, are credited to share capital (nominal value) and share premium.
5.11 Trade and other payables
Trade and other payables are initially recognized at fair value and subsequently at amortized cost using effective interest rate method. Exchange gains and losses arising on translation in respect of liabilities in foreign currency are added to the carrying amount of the respective liabilities.
5.12 Ijarah
Ijarah payments under an Ijarah are recognized as an expense in the statement of profit or loss on a straight-line basis over the Ijarah term.
5.13 Provisions
Provisions are recognized in the balance sheet when the Company has a present legal or constructive obligation as a result of past events and it is probable that an outflow of resources will be required to settle the obligation and a reliable estimate of the amount can be made.
Provisions are reviewed at each balance sheet date and are adjusted to reflect the current best estimate. If it is no longer probable that an outflow of resources embodying economic benefits will be required to settle the obligation, the provisions are reversed.
5.14 Contingencies
The assessment of the contingencies inherently involves the exercise of significant judgment as the outcome of the future events cannot be predicted with certainty. The company, based on the availability of the latest information, estimates the value of contingent assets and liabilities which may differ on the occurrence / non-occurrence of the uncertain future events.
5.15 Taxation
Current
The charge for current taxation is based on taxable income at current rates of taxation after taking into account tax credits, rebates and exemptions available, if any. However, for income covered under Final Taxation Regime (FTR), taxation is based on the applicable tax rates under such Regime after taking into account tax credits, rebates and exemptions, if any.
Deferred
Deferred tax is accounted for using the balance sheet liability method in respect of temporary differences arising from differences between the carrying amount of assets and liabilities in the unconsolidated financial statements and the corresponding tax basis used in the computation of taxable income. Deferred tax is calculated by using the tax rates enacted at the balance sheet date. In this regard, the effect on deferred taxation of the portion of income subjected to Final Tax Regime is adjusted in accordance with the requirements of Accounting Technical Release – 27 of the Institute of Chartered Accountants of Pakistan, if considered material.
Deferred tax liability is recognized for all taxable temporary differences and deferred tax asset is recognized for all deductible temporary differences and carry forward of unused tax losses and unused tax credits, if any, to the extent that it is probable that future taxable profit will be available against which these can be utilized.
Deferred tax assets are reduced to the extent that it is no longer probable that the related tax benefit will be realized. Significant management judgment is required to determine the amount of deferred tax assets that can be recognized, based upon the likely timing and level of future taxable profits together with future tax planning strategies.
5.16 Foreign currency translation
All monetary assets and liabilities in foreign currencies are translated into rupees at exchange rates prevailing at the balance sheet date. Transactions in foreign currencies are translated into rupees at exchange rates prevailing at the date of transaction. Non-monetary assets and liabilities that are measured in terms of historical cost in a foreign currency are translated into rupees at exchange rates prevailing at the date of transaction. Non-monetary assets and liabilities denominated in foreign currency that are stated at fair value are translated into rupees at exchange rates prevailing at the date when fair values are determined. Exchange gains and losses are included in the statement of profit or loss immediately.
5.17 Borrowing costs
Borrowing costs directly attributable to the acquisition, construction or production of qualifying assets, which are assets that necessarily take a substantial period of time to get ready for their intended use or sale, are added to the cost of those assets, until such time when the assets are substantially ready for their intended use or sale. All other borrowing costs are charged to statement of profit or loss in the period of as and when incurred.
5.18 Government grants
Government grants are recognized when there is reasonable assurance that entity will comply with the conditions attached to it and grant will be received.
5.19 Earnings per share
The Company presents basic and diluted earnings per share (EPS) for its ordinary shares. Basic EPS is calculated by dividing the profit by weighted average number of shares outstanding during the period. Diluted EPS is calculated by adjusting for the effects of all dilutive potential ordinary shares.
NOTES TO THE UNCONSOLIDATED FINANCIAL STATEMENTSFOR THE YEAR ENDED JUNE 30, 2019
NOTES TO THE UNCONSOLIDATED FINANCIAL STATEMENTSFOR THE YEAR ENDED JUNE 30, 2019
Inte
rloop
Lim
ited
116 117
2018
- 1
9A
nnua
l Rep
ort
5.20 Share capital
Ordinary shares are classified as equity and recognized at their face value.
5.21 Dividend
Dividend distribution to the Company’s shareholders is recognized as a liability in the Company’s unconsolidated financial statements in the period in which dividends are approved.
5.22 Segment reporting
Segment reporting is based on the operating (business) segments of the Company. An operating segment is a component of the Company that engages in business activities from which it may earn revenues and incur expenses, including revenues and expenses that relate to the transactions with any of the Company’s other components. An operating segment’s operating results are reviewed regularly by the chief operating decision maker (‘CODM’) to make decisions about resources to be allocated to the segment and assess its performance, and for which discrete financial information is available. The CODM, who is responsible for allocating resources and assessing performance of the operating segments, has been identified as the Board of Directors of the Company that makes the strategic decisions.
Segment results that are reported to the CODM include items directly attributable to a segment as well as those that can be allocated on a reasonable basis. Those incomes, expenses, assets, liabilities and other balances which cannot be allocated to a particular segment on a reasonable basis are reported as unallocated.
Transaction among the business segments are recorded at cost. Inter segment sales and purchases are eliminated from the total.
5.23 Investment in subsidiary and associate
Investments in subsidiary and associate are recognized at cost less impairment loss, if any. At each balance sheet date, the recoverable amounts are estimated to determine the extent of impairment losses, if any, and carrying amounts of investments are adjusted accordingly. Impairment losses are recognized as expense. Where impairment losses subsequently reverse, the carrying amounts of the investments are increased to the revised recoverable amounts but limited to the extent of initial cost of investments. A reversal of impairment loss is recognized in the statement of profit or loss.
The profits and losses of subsidiary and associated entities are carried forward in their financial statements and not dealt within these financial statements except to the extent of dividend declared by the subsidiary and associate. Gains and losses on disposal of investments are included in other income.
5.24 Related party transactions
All transactions with related parties are carried out at agreed terms and conditions and on arm’s length basis.
6. CHANGES IN ACCOUNTING POLICIES DUE TO APPLICABILITY OF CERTAIN INTERNATIONAL FINANCIAL REPORTING STANDARDS (IFRS)
6.1 IFRS 9, ‘Financial Instruments’
A financial instrument is any contract that gives rise to a financial asset of one entity and a financial liability or equity instrument of another entity.
6.1.1 Financial assets
The standard introduced new classification and measurement models for financial assets. A financial asset shall be measured at amortized cost if it is held in order to collect contractual cash flows which arise on specified dates and that are ‘solely payment of principal and interest (SPPI)’ on the principal amount outstanding. A debt investment shall be measured at fair value through other comprehensive income if it is held in order to collect contractual cash flows which arise on specified dates that are solely principal and interest and as well as selling the asset on the basis of its fair value. All other financial assets are classified and measured at fair value through profit or loss unless the Company makes an irrevocable election on initial recognition to present gains and losses on equity instruments in other comprehensive income. Despite these requirements, a financial asset may be irrevocably designated as measured at fair value through profit or loss to reduce the effect of, or eliminate, an accounting mismatch.
Key changes in accounting policies resulting from application of IFRS 9
A. Classification and measurement of financial instruments
Investments and other financial assets
Classification:
The Company classifies its financial assets in the following measurement categories:- those to be measured subsequently at fair value (either through other comprehensive income, or through
profit or loss), and- those to be measured at amortized cost
The classification depends on the Company’s business model for managing the financial assets and the contractual terms of the cash flows. In order for a financial asset to be classified and measured at amortized cost or fair value through OCI, it needs to give rise to cash flows that are ‘solely payments of principal and interest (SPPI)’ on the principal amount outstanding. This assessment is referred to as the SPPI test and is performed at an instrument level. The Company’s business model for managing financial assets refers to how it manages its financial assets in order to generate cash flows.
For assets measured at fair value, gains and losses will either be recorded in profit or loss or other comprehensive income. For investments in debt instruments, this will depend on the business model in which the investment is held. For investments in equity instruments, this will depend on whether the Company has made an irrevocable election at the time of initial recognition to account for the equity investment at fair value through other comprehensive income. The Company reclassifies debt investments when and only when its business model for managing those assets changes.
NOTES TO THE UNCONSOLIDATED FINANCIAL STATEMENTSFOR THE YEAR ENDED JUNE 30, 2019
NOTES TO THE UNCONSOLIDATED FINANCIAL STATEMENTSFOR THE YEAR ENDED JUNE 30, 2019
Inte
rloop
Lim
ited
118 119
2018
- 1
9A
nnua
l Rep
ort
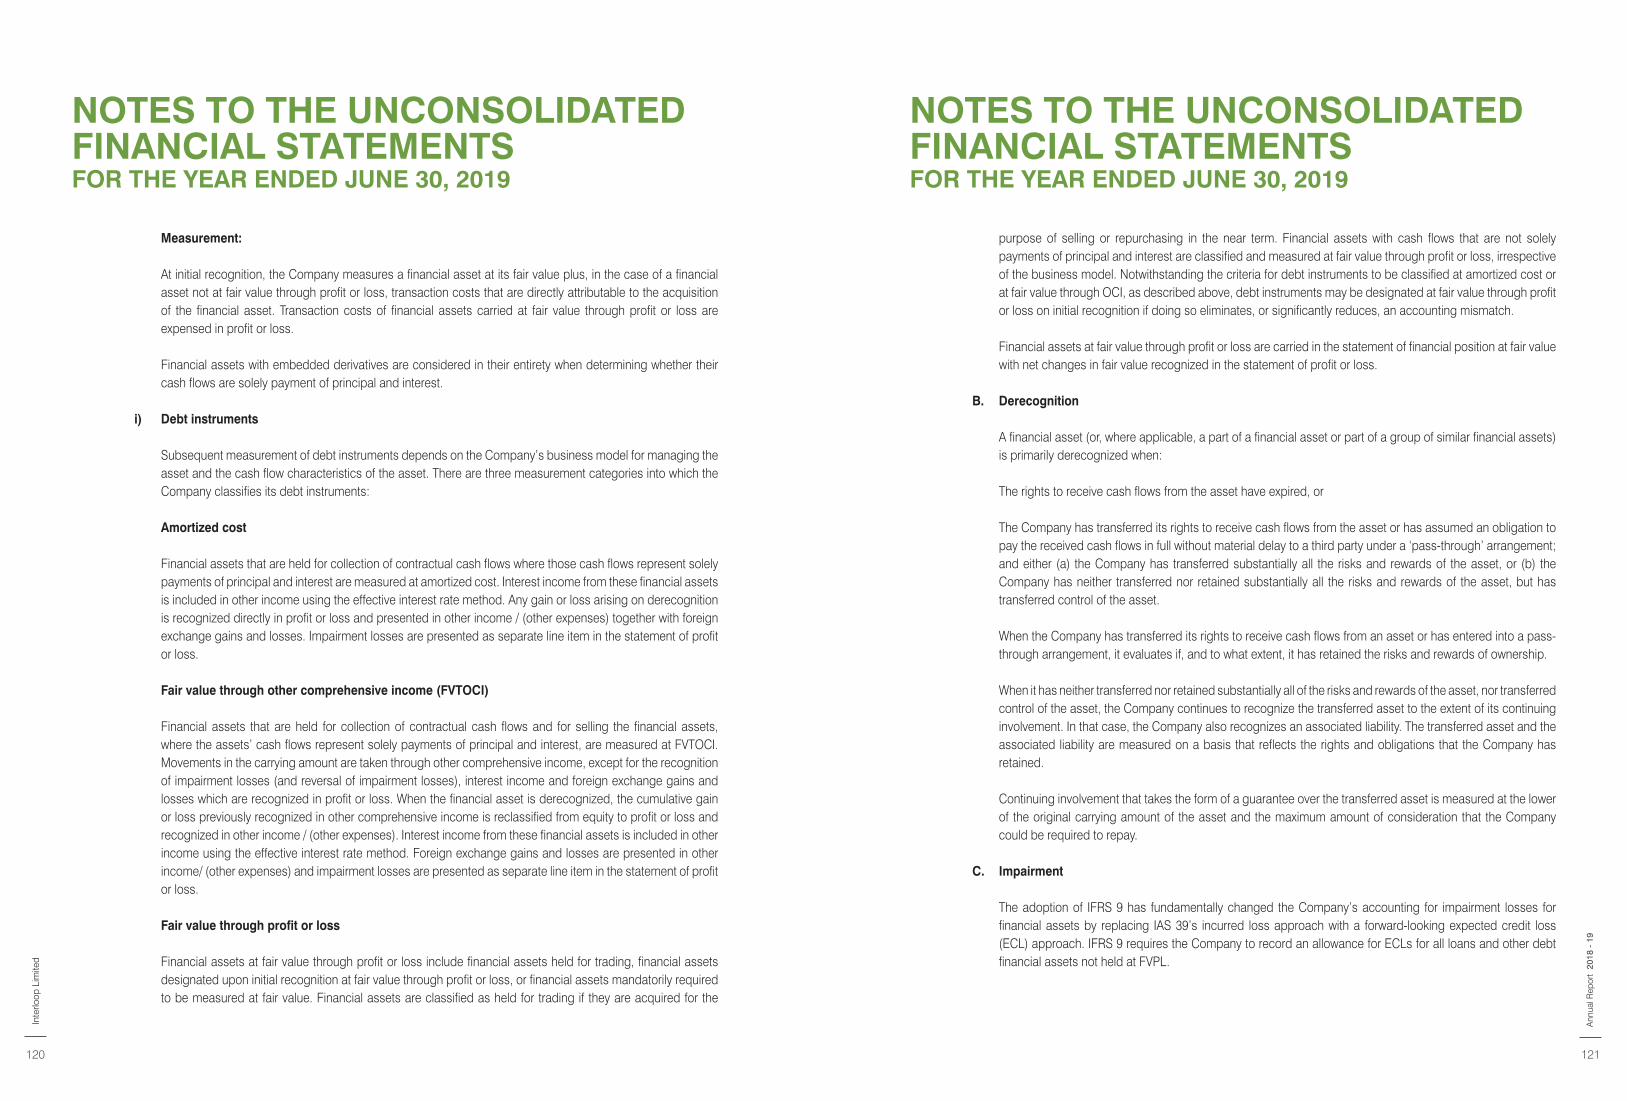
Measurement:
At initial recognition, the Company measures a financial asset at its fair value plus, in the case of a financial asset not at fair value through profit or loss, transaction costs that are directly attributable to the acquisition of the financial asset. Transaction costs of financial assets carried at fair value through profit or loss are expensed in profit or loss.
Financial assets with embedded derivatives are considered in their entirety when determining whether their cash flows are solely payment of principal and interest.
i) Debt instruments
Subsequent measurement of debt instruments depends on the Company’s business model for managing the asset and the cash flow characteristics of the asset. There are three measurement categories into which the Company classifies its debt instruments:
Amortized cost
Financial assets that are held for collection of contractual cash flows where those cash flows represent solely payments of principal and interest are measured at amortized cost. Interest income from these financial assets is included in other income using the effective interest rate method. Any gain or loss arising on derecognition is recognized directly in profit or loss and presented in other income / (other expenses) together with foreign exchange gains and losses. Impairment losses are presented as separate line item in the statement of profit or loss.
Fair value through other comprehensive income (FVTOCI)
Financial assets that are held for collection of contractual cash flows and for selling the financial assets, where the assets’ cash flows represent solely payments of principal and interest, are measured at FVTOCI. Movements in the carrying amount are taken through other comprehensive income, except for the recognition of impairment losses (and reversal of impairment losses), interest income and foreign exchange gains and losses which are recognized in profit or loss. When the financial asset is derecognized, the cumulative gain or loss previously recognized in other comprehensive income is reclassified from equity to profit or loss and recognized in other income / (other expenses). Interest income from these financial assets is included in other income using the effective interest rate method. Foreign exchange gains and losses are presented in other income/ (other expenses) and impairment losses are presented as separate line item in the statement of profit or loss.
Fair value through profit or loss
Financial assets at fair value through profit or loss include financial assets held for trading, financial assets designated upon initial recognition at fair value through profit or loss, or financial assets mandatorily required to be measured at fair value. Financial assets are classified as held for trading if they are acquired for the
purpose of selling or repurchasing in the near term. Financial assets with cash flows that are not solely payments of principal and interest are classified and measured at fair value through profit or loss, irrespective of the business model. Notwithstanding the criteria for debt instruments to be classified at amortized cost or at fair value through OCI, as described above, debt instruments may be designated at fair value through profit or loss on initial recognition if doing so eliminates, or significantly reduces, an accounting mismatch.
Financial assets at fair value through profit or loss are carried in the statement of financial position at fair value with net changes in fair value recognized in the statement of profit or loss.
B. Derecognition
A financial asset (or, where applicable, a part of a financial asset or part of a group of similar financial assets) is primarily derecognized when:
The rights to receive cash flows from the asset have expired, or
The Company has transferred its rights to receive cash flows from the asset or has assumed an obligation to pay the received cash flows in full without material delay to a third party under a ‘pass-through’ arrangement; and either (a) the Company has transferred substantially all the risks and rewards of the asset, or (b) the Company has neither transferred nor retained substantially all the risks and rewards of the asset, but has transferred control of the asset.
When the Company has transferred its rights to receive cash flows from an asset or has entered into a pass-through arrangement, it evaluates if, and to what extent, it has retained the risks and rewards of ownership.
When it has neither transferred nor retained substantially all of the risks and rewards of the asset, nor transferred control of the asset, the Company continues to recognize the transferred asset to the extent of its continuing involvement. In that case, the Company also recognizes an associated liability. The transferred asset and the associated liability are measured on a basis that reflects the rights and obligations that the Company has retained.
Continuing involvement that takes the form of a guarantee over the transferred asset is measured at the lower of the original carrying amount of the asset and the maximum amount of consideration that the Company could be required to repay.
C. Impairment
The adoption of IFRS 9 has fundamentally changed the Company’s accounting for impairment losses for financial assets by replacing IAS 39’s incurred loss approach with a forward-looking expected credit loss (ECL) approach. IFRS 9 requires the Company to record an allowance for ECLs for all loans and other debt financial assets not held at FVPL.
NOTES TO THE UNCONSOLIDATED FINANCIAL STATEMENTSFOR THE YEAR ENDED JUNE 30, 2019
NOTES TO THE UNCONSOLIDATED FINANCIAL STATEMENTSFOR THE YEAR ENDED JUNE 30, 2019
Inte
rloop
Lim
ited
120 121
2018
- 1
9A
nnua
l Rep
ort
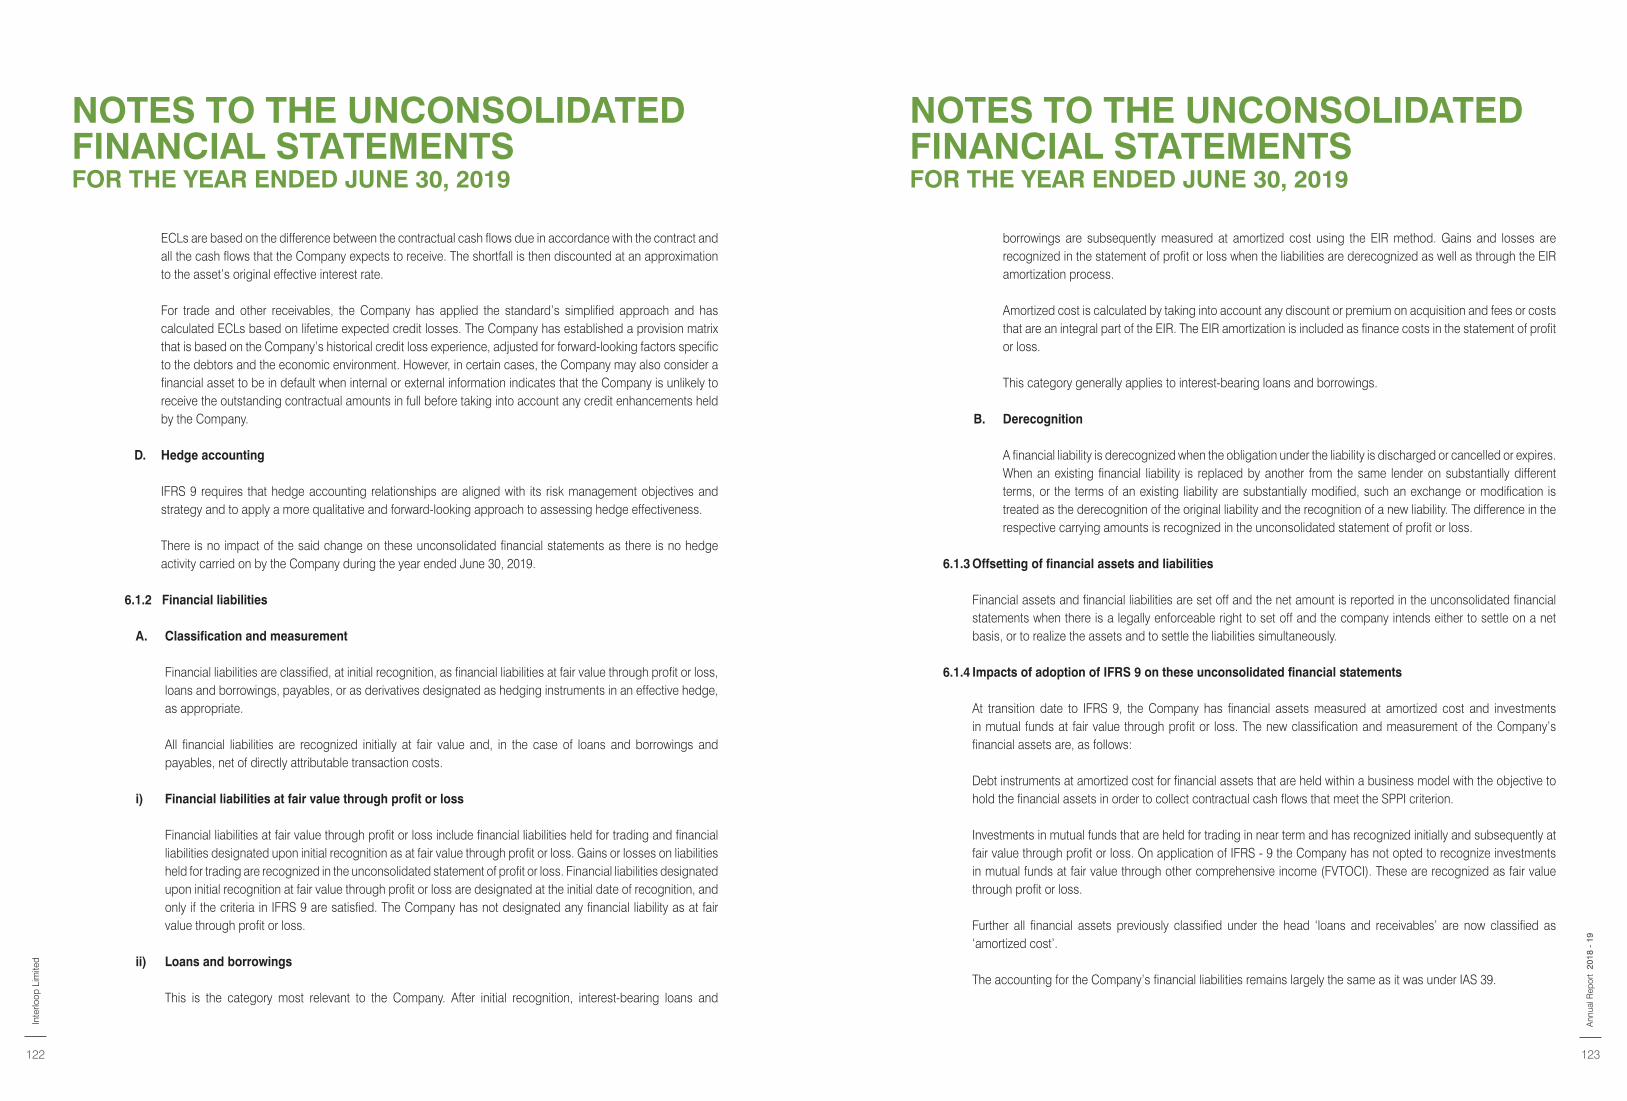
ECLs are based on the difference between the contractual cash flows due in accordance with the contract and all the cash flows that the Company expects to receive. The shortfall is then discounted at an approximation to the asset’s original effective interest rate.
For trade and other receivables, the Company has applied the standard’s simplified approach and has calculated ECLs based on lifetime expected credit losses. The Company has established a provision matrix that is based on the Company’s historical credit loss experience, adjusted for forward-looking factors specific to the debtors and the economic environment. However, in certain cases, the Company may also consider a financial asset to be in default when internal or external information indicates that the Company is unlikely to receive the outstanding contractual amounts in full before taking into account any credit enhancements held by the Company.
D. Hedge accounting
IFRS 9 requires that hedge accounting relationships are aligned with its risk management objectives and strategy and to apply a more qualitative and forward-looking approach to assessing hedge effectiveness.
There is no impact of the said change on these unconsolidated financial statements as there is no hedge activity carried on by the Company during the year ended June 30, 2019.
6.1.2 Financial liabilities
A. Classification and measurement
Financial liabilities are classified, at initial recognition, as financial liabilities at fair value through profit or loss, loans and borrowings, payables, or as derivatives designated as hedging instruments in an effective hedge, as appropriate.
All financial liabilities are recognized initially at fair value and, in the case of loans and borrowings and payables, net of directly attributable transaction costs.
i) Financial liabilities at fair value through profit or loss
Financial liabilities at fair value through profit or loss include financial liabilities held for trading and financial liabilities designated upon initial recognition as at fair value through profit or loss. Gains or losses on liabilities held for trading are recognized in the unconsolidated statement of profit or loss. Financial liabilities designated upon initial recognition at fair value through profit or loss are designated at the initial date of recognition, and only if the criteria in IFRS 9 are satisfied. The Company has not designated any financial liability as at fair value through profit or loss.
ii) Loans and borrowings
This is the category most relevant to the Company. After initial recognition, interest-bearing loans and
borrowings are subsequently measured at amortized cost using the EIR method. Gains and losses are recognized in the statement of profit or loss when the liabilities are derecognized as well as through the EIR amortization process.
Amortized cost is calculated by taking into account any discount or premium on acquisition and fees or costs that are an integral part of the EIR. The EIR amortization is included as finance costs in the statement of profit or loss.
This category generally applies to interest-bearing loans and borrowings.
B. Derecognition
A financial liability is derecognized when the obligation under the liability is discharged or cancelled or expires. When an existing financial liability is replaced by another from the same lender on substantially different terms, or the terms of an existing liability are substantially modified, such an exchange or modification is treated as the derecognition of the original liability and the recognition of a new liability. The difference in the respective carrying amounts is recognized in the unconsolidated statement of profit or loss.
6.1.3 Offsetting of financial assets and liabilities
Financial assets and financial liabilities are set off and the net amount is reported in the unconsolidated financial statements when there is a legally enforceable right to set off and the company intends either to settle on a net basis, or to realize the assets and to settle the liabilities simultaneously.
6.1.4 Impacts of adoption of IFRS 9 on these unconsolidated financial statements
At transition date to IFRS 9, the Company has financial assets measured at amortized cost and investments in mutual funds at fair value through profit or loss. The new classification and measurement of the Company’s financial assets are, as follows:
Debt instruments at amortized cost for financial assets that are held within a business model with the objective to hold the financial assets in order to collect contractual cash flows that meet the SPPI criterion.
Investments in mutual funds that are held for trading in near term and has recognized initially and subsequently at fair value through profit or loss. On application of IFRS - 9 the Company has not opted to recognize investments in mutual funds at fair value through other comprehensive income (FVTOCI). These are recognized as fair value through profit or loss.
Further all financial assets previously classified under the head ‘loans and receivables’ are now classified as ‘amortized cost’.
The accounting for the Company’s financial liabilities remains largely the same as it was under IAS 39.
NOTES TO THE UNCONSOLIDATED FINANCIAL STATEMENTSFOR THE YEAR ENDED JUNE 30, 2019
NOTES TO THE UNCONSOLIDATED FINANCIAL STATEMENTSFOR THE YEAR ENDED JUNE 30, 2019
Inte
rloop
Lim
ited
122 123
2018
- 1
9A
nnua
l Rep
ort
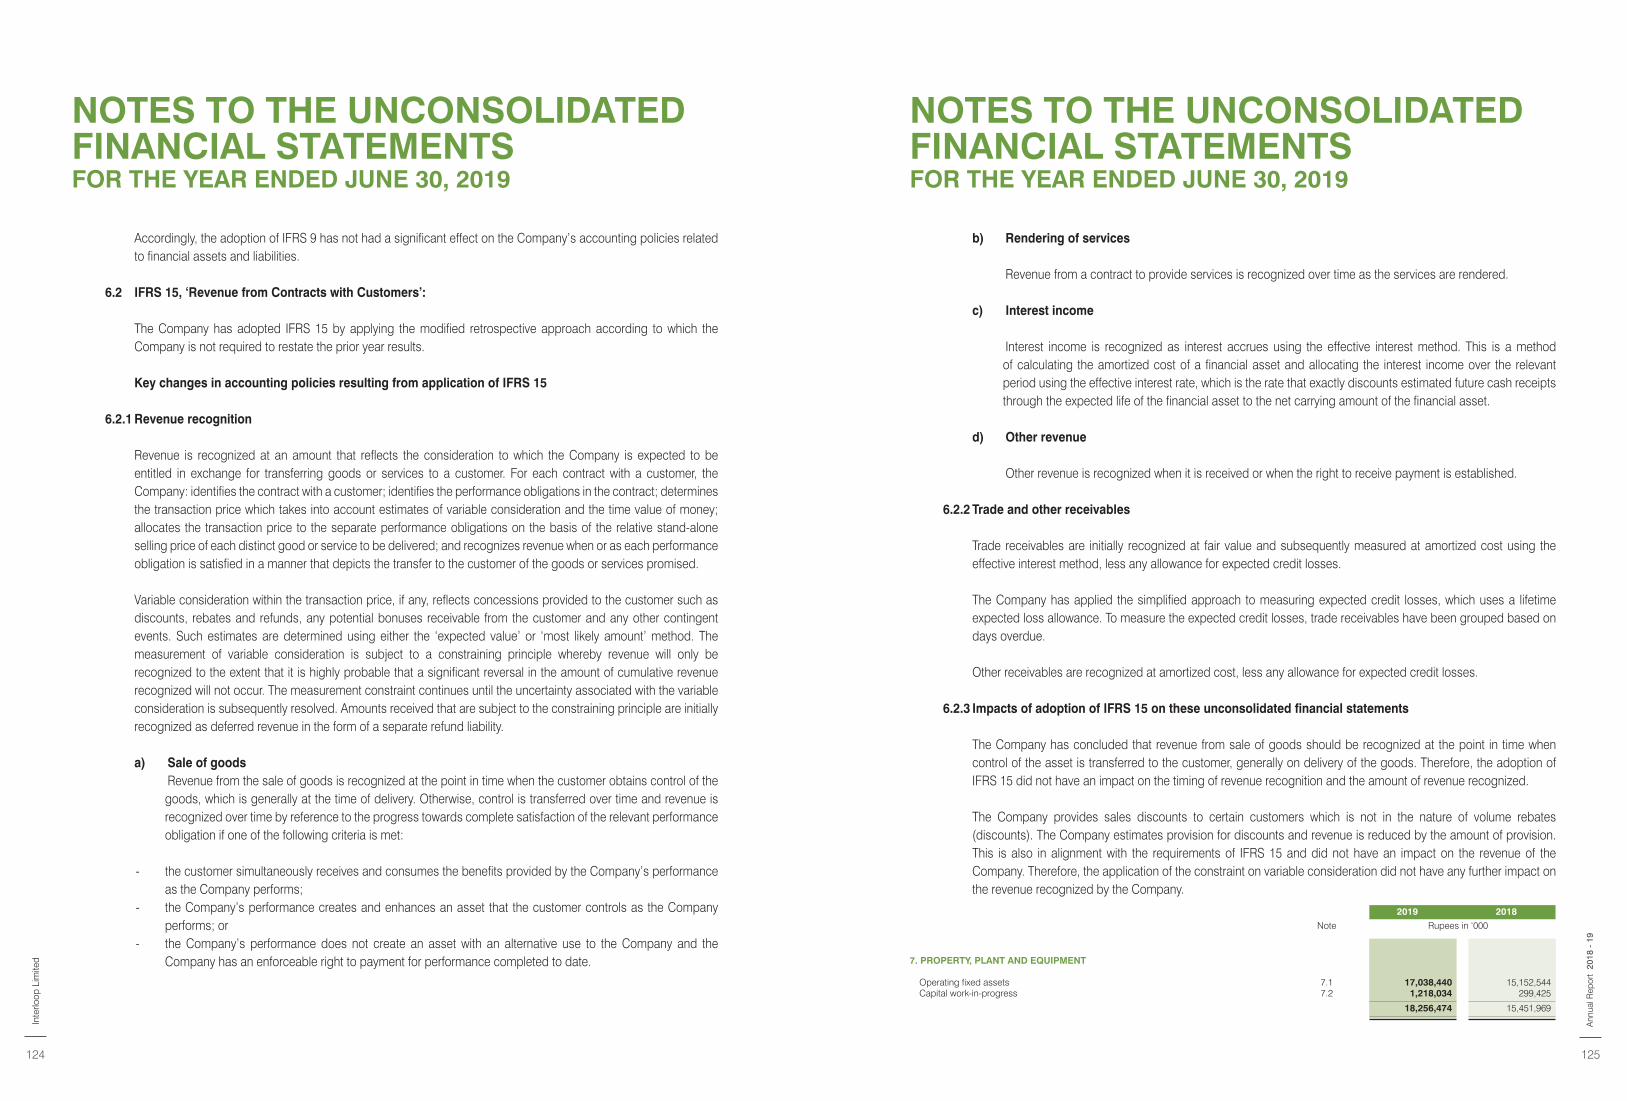
Accordingly, the adoption of IFRS 9 has not had a significant effect on the Company’s accounting policies related to financial assets and liabilities.
6.2 IFRS 15, ‘Revenue from Contracts with Customers’:
The Company has adopted IFRS 15 by applying the modified retrospective approach according to which the Company is not required to restate the prior year results.
Key changes in accounting policies resulting from application of IFRS 15
6.2.1 Revenue recognition
Revenue is recognized at an amount that reflects the consideration to which the Company is expected to be entitled in exchange for transferring goods or services to a customer. For each contract with a customer, the Company: identifies the contract with a customer; identifies the performance obligations in the contract; determines the transaction price which takes into account estimates of variable consideration and the time value of money; allocates the transaction price to the separate performance obligations on the basis of the relative stand-alone selling price of each distinct good or service to be delivered; and recognizes revenue when or as each performance obligation is satisfied in a manner that depicts the transfer to the customer of the goods or services promised.
Variable consideration within the transaction price, if any, reflects concessions provided to the customer such as discounts, rebates and refunds, any potential bonuses receivable from the customer and any other contingent events. Such estimates are determined using either the ‘expected value’ or ‘most likely amount’ method. The measurement of variable consideration is subject to a constraining principle whereby revenue will only be recognized to the extent that it is highly probable that a significant reversal in the amount of cumulative revenue recognized will not occur. The measurement constraint continues until the uncertainty associated with the variable consideration is subsequently resolved. Amounts received that are subject to the constraining principle are initially recognized as deferred revenue in the form of a separate refund liability.
a) Sale of goods Revenue from the sale of goods is recognized at the point in time when the customer obtains control of the
goods, which is generally at the time of delivery. Otherwise, control is transferred over time and revenue is recognized over time by reference to the progress towards complete satisfaction of the relevant performance obligation if one of the following criteria is met:
- the customer simultaneously receives and consumes the benefits provided by the Company’s performance as the Company performs;
- the Company’s performance creates and enhances an asset that the customer controls as the Company performs; or
- the Company’s performance does not create an asset with an alternative use to the Company and the Company has an enforceable right to payment for performance completed to date.
2019 2018
Note Rupees in ‘000
7. PROPERTY, PLANT AND EQUIPMENT
Operating fixed assets 7.1 17,038,440 15,152,544 Capital work-in-progress 7.2 1,218,034 299,425
18,256,474 15,451,969
b) Rendering of services
Revenue from a contract to provide services is recognized over time as the services are rendered.
c) Interest income
Interest income is recognized as interest accrues using the effective interest method. This is a method of calculating the amortized cost of a financial asset and allocating the interest income over the relevant period using the effective interest rate, which is the rate that exactly discounts estimated future cash receipts through the expected life of the financial asset to the net carrying amount of the financial asset.
d) Other revenue
Other revenue is recognized when it is received or when the right to receive payment is established.
6.2.2 Trade and other receivables
Trade receivables are initially recognized at fair value and subsequently measured at amortized cost using the effective interest method, less any allowance for expected credit losses.
The Company has applied the simplified approach to measuring expected credit losses, which uses a lifetime expected loss allowance. To measure the expected credit losses, trade receivables have been grouped based on days overdue.
Other receivables are recognized at amortized cost, less any allowance for expected credit losses.
6.2.3 Impacts of adoption of IFRS 15 on these unconsolidated financial statements
The Company has concluded that revenue from sale of goods should be recognized at the point in time when control of the asset is transferred to the customer, generally on delivery of the goods. Therefore, the adoption of IFRS 15 did not have an impact on the timing of revenue recognition and the amount of revenue recognized.
The Company provides sales discounts to certain customers which is not in the nature of volume rebates (discounts). The Company estimates provision for discounts and revenue is reduced by the amount of provision. This is also in alignment with the requirements of IFRS 15 and did not have an impact on the revenue of the Company. Therefore, the application of the constraint on variable consideration did not have any further impact on the revenue recognized by the Company.
NOTES TO THE UNCONSOLIDATED FINANCIAL STATEMENTSFOR THE YEAR ENDED JUNE 30, 2019
NOTES TO THE UNCONSOLIDATED FINANCIAL STATEMENTSFOR THE YEAR ENDED JUNE 30, 2019
Inte
rloop
Lim
ited
124 125
2018
- 1
9A
nnua
l Rep
ort
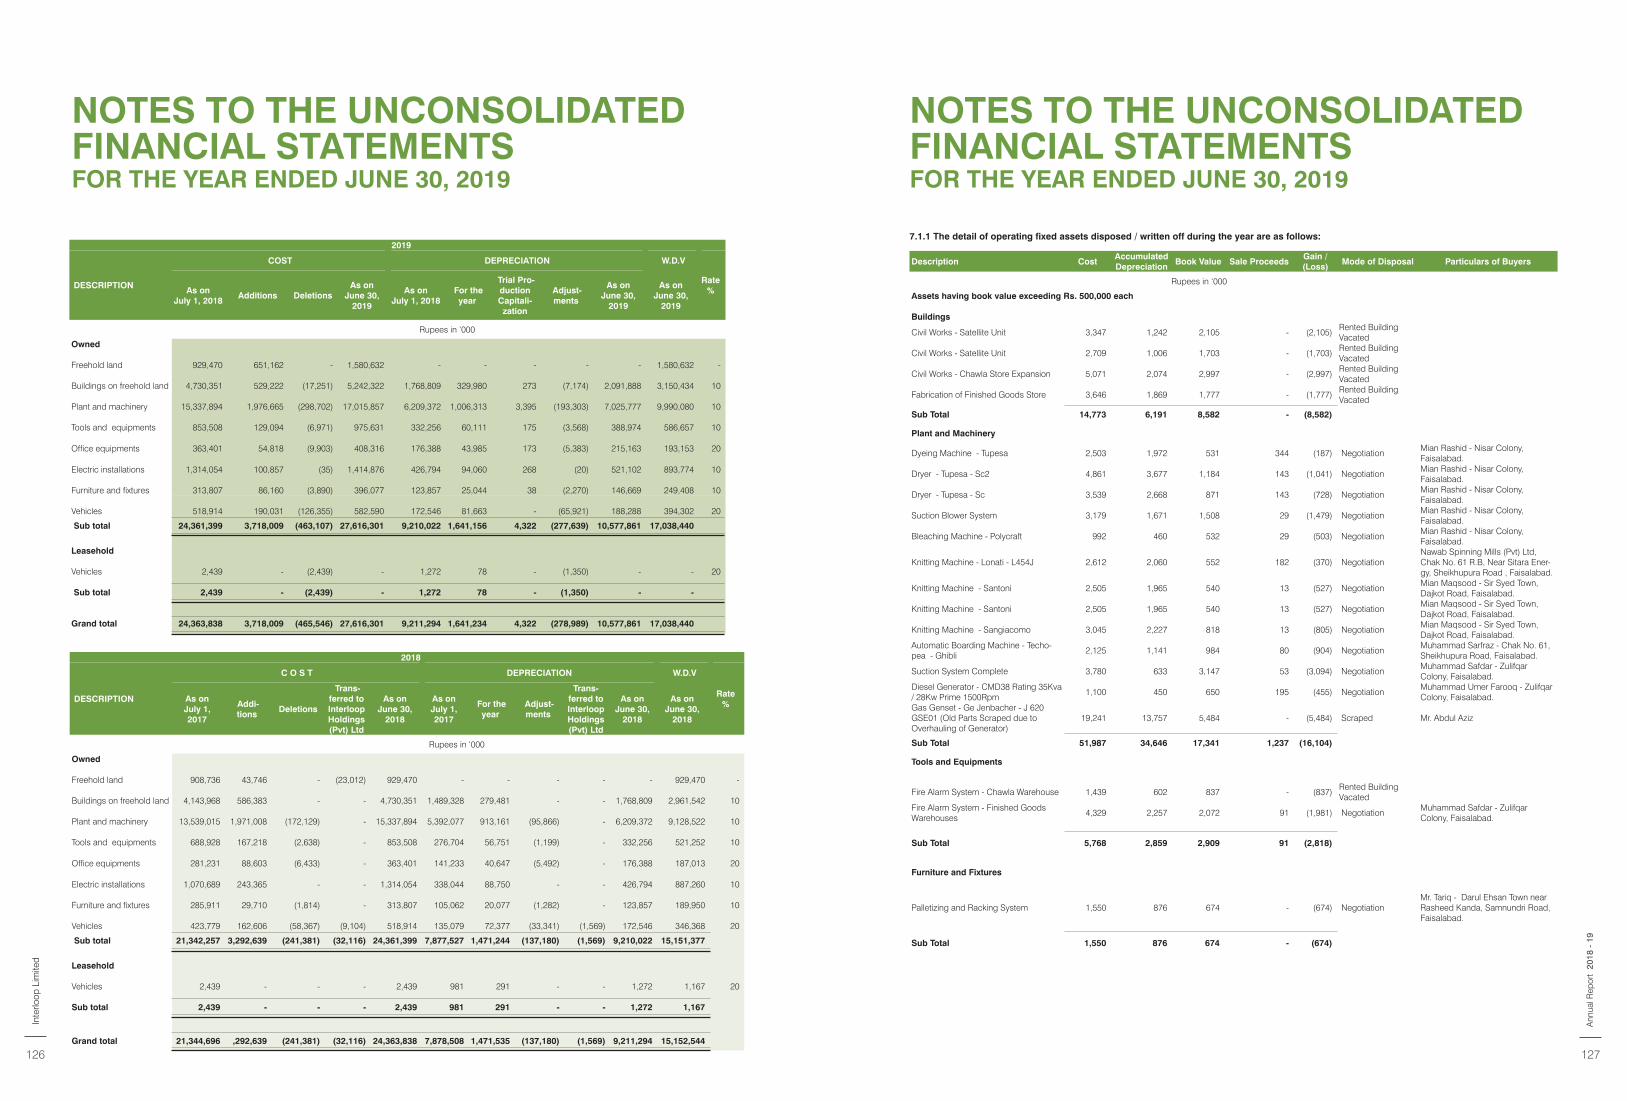
2018
DESCRIPTION
C O S T DEPRECIATION W.D.V
Rate %
As on July 1, 2017
Addi-tions
Deletions
Trans-ferred to Interloop Holdings (Pvt) Ltd
As on June 30,
2018
As on July 1, 2017
For the year
Adjust-ments
Trans-ferred to Interloop Holdings (Pvt) Ltd
As on June 30,
2018
As on June 30,
2018
Rupees in ‘000
Owned
Freehold land 908,736 43,746 - (23,012) 929,470 - - - - - 929,470 -
Buildings on freehold land 4,143,968 586,383 - - 4,730,351 1,489,328 279,481 - - 1,768,809 2,961,542 10
Plant and machinery 13,539,015 1,971,008 (172,129) - 15,337,894 5,392,077 913,161 (95,866) - 6,209,372 9,128,522 10
Tools and equipments 688,928 167,218 (2,638) - 853,508 276,704 56,751 (1,199) - 332,256 521,252 10
Office equipments 281,231 88,603 (6,433) - 363,401 141,233 40,647 (5,492) - 176,388 187,013 20
Electric installations 1,070,689 243,365 - - 1,314,054 338,044 88,750 - - 426,794 887,260 10
Furniture and fixtures 285,911 29,710 (1,814) - 313,807 105,062 20,077 (1,282) - 123,857 189,950 10
Vehicles 423,779 162,606 (58,367) (9,104) 518,914 135,079 72,377 (33,341) (1,569) 172,546 346,368 20
Sub total 21,342,257 3,292,639 (241,381) (32,116) 24,361,399 7,877,527 1,471,244 (137,180) (1,569) 9,210,022 15,151,377
Leasehold
Vehicles 2,439 - - - 2,439 981 291 - - 1,272 1,167 20
Sub total 2,439 - - - 2,439 981 291 - - 1,272 1,167
Grand total 21,344,696 ,292,639 (241,381) (32,116) 24,363,838 7,878,508 1,471,535 (137,180) (1,569) 9,211,294 15,152,544
2019
DESCRIPTION
COST DEPRECIATION W.D.V
Rate % As on
July 1, 2018 Additions Deletions
As on June 30,
2019
As on July 1, 2018
For the year
Trial Pro-duction Capitali-zation
Adjust-ments
As on June 30,
2019
As on June 30,
2019
Rupees in ‘000
Owned
Freehold land 929,470 651,162 - 1,580,632 - - - - - 1,580,632 -
Buildings on freehold land 4,730,351 529,222 (17,251) 5,242,322 1,768,809 329,980 273 (7,174) 2,091,888 3,150,434 10
Plant and machinery 15,337,894 1,976,665 (298,702) 17,015,857 6,209,372 1,006,313 3,395 (193,303) 7,025,777 9,990,080 10
Tools and equipments 853,508 129,094 (6,971) 975,631 332,256 60,111 175 (3,568) 388,974 586,657 10
Office equipments 363,401 54,818 (9,903) 408,316 176,388 43,985 173 (5,383) 215,163 193,153 20
Electric installations 1,314,054 100,857 (35) 1,414,876 426,794 94,060 268 (20) 521,102 893,774 10
Furniture and fixtures 313,807 86,160 (3,890) 396,077 123,857 25,044 38 (2,270) 146,669 249,408 10
Vehicles 518,914 190,031 (126,355) 582,590 172,546 81,663 - (65,921) 188,288 394,302 20
Sub total 24,361,399 3,718,009 (463,107) 27,616,301 9,210,022 1,641,156 4,322 (277,639) 10,577,861 17,038,440
Leasehold
Vehicles 2,439 - (2,439) - 1,272 78 - (1,350) - - 20
Sub total 2,439 - (2,439) - 1,272 78 - (1,350) - -
Grand total 24,363,838 3,718,009 (465,546) 27,616,301 9,211,294 1,641,234 4,322 (278,989) 10,577,861 17,038,440
7.1.1 The detail of operating fixed assets disposed / written off during the year are as follows:
Description CostAccumulated Depreciation
Book Value Sale ProceedsGain / (Loss)
Mode of Disposal Particulars of Buyers
Rupees in ‘000
Assets having book value exceeding Rs. 500,000 each
Buildings
Civil Works - Satellite Unit 3,347 1,242 2,105 - (2,105)Rented Building Vacated
Civil Works - Satellite Unit 2,709 1,006 1,703 - (1,703)Rented Building Vacated
Civil Works - Chawla Store Expansion 5,071 2,074 2,997 - (2,997)Rented Building Vacated
Fabrication of Finished Goods Store 3,646 1,869 1,777 - (1,777)Rented Building Vacated
Sub Total 14,773 6,191 8,582 - (8,582)
Plant and Machinery
Dyeing Machine - Tupesa 2,503 1,972 531 344 (187) Negotiation Mian Rashid - Nisar Colony, Faisalabad.
Dryer - Tupesa - Sc2 4,861 3,677 1,184 143 (1,041) Negotiation Mian Rashid - Nisar Colony, Faisalabad.
Dryer - Tupesa - Sc 3,539 2,668 871 143 (728) Negotiation Mian Rashid - Nisar Colony, Faisalabad.
Suction Blower System 3,179 1,671 1,508 29 (1,479) Negotiation Mian Rashid - Nisar Colony, Faisalabad.
Bleaching Machine - Polycraft 992 460 532 29 (503) Negotiation Mian Rashid - Nisar Colony, Faisalabad.
Knitting Machine - Lonati - L454J 2,612 2,060 552 182 (370) Negotiation Nawab Spinning Mills (Pvt) Ltd, Chak No. 61 R.B, Near Sitara Ener-gy, Sheikhupura Road , Faisalabad.
Knitting Machine - Santoni 2,505 1,965 540 13 (527) Negotiation Mian Maqsood - Sir Syed Town, Dajkot Road, Faisalabad.
Knitting Machine - Santoni 2,505 1,965 540 13 (527) Negotiation Mian Maqsood - Sir Syed Town, Dajkot Road, Faisalabad.
Knitting Machine - Sangiacomo 3,045 2,227 818 13 (805) Negotiation Mian Maqsood - Sir Syed Town, Dajkot Road, Faisalabad.
Automatic Boarding Machine - Techo-pea - Ghibli
2,125 1,141 984 80 (904) Negotiation Muhammad Sarfraz - Chak No. 61, Sheikhupura Road, Faisalabad.
Suction System Complete 3,780 633 3,147 53 (3,094) Negotiation Muhammad Safdar - Zulifqar Colony, Faisalabad.
Diesel Generator - CMD38 Rating 35Kva / 28Kw Prime 1500Rpm
1,100 450 650 195 (455) Negotiation Muhammad Umer Farooq - Zulifqar Colony, Faisalabad.
Gas Genset - Ge Jenbacher - J 620 GSE01 (Old Parts Scraped due to Overhauling of Generator)
19,241 13,757 5,484 - (5,484) Scraped Mr. Abdul Aziz
Sub Total 51,987 34,646 17,341 1,237 (16,104)
Tools and Equipments
Fire Alarm System - Chawla Warehouse 1,439 602 837 - (837)Rented Building Vacated
Fire Alarm System - Finished Goods Warehouses
4,329 2,257 2,072 91 (1,981) Negotiation Muhammad Safdar - Zulifqar Colony, Faisalabad.
Sub Total 5,768 2,859 2,909 91 (2,818)
Furniture and Fixtures
Palletizing and Racking System 1,550 876 674 - (674) Negotiation Mr. Tariq - Darul Ehsan Town near Rasheed Kanda, Samnundri Road, Faisalabad.
Sub Total 1,550 876 674 - (674)
NOTES TO THE UNCONSOLIDATED FINANCIAL STATEMENTSFOR THE YEAR ENDED JUNE 30, 2019
NOTES TO THE UNCONSOLIDATED FINANCIAL STATEMENTSFOR THE YEAR ENDED JUNE 30, 2019
Inte
rloop
Lim
ited
126 127
2018
- 1
9A
nnua
l Rep
ort
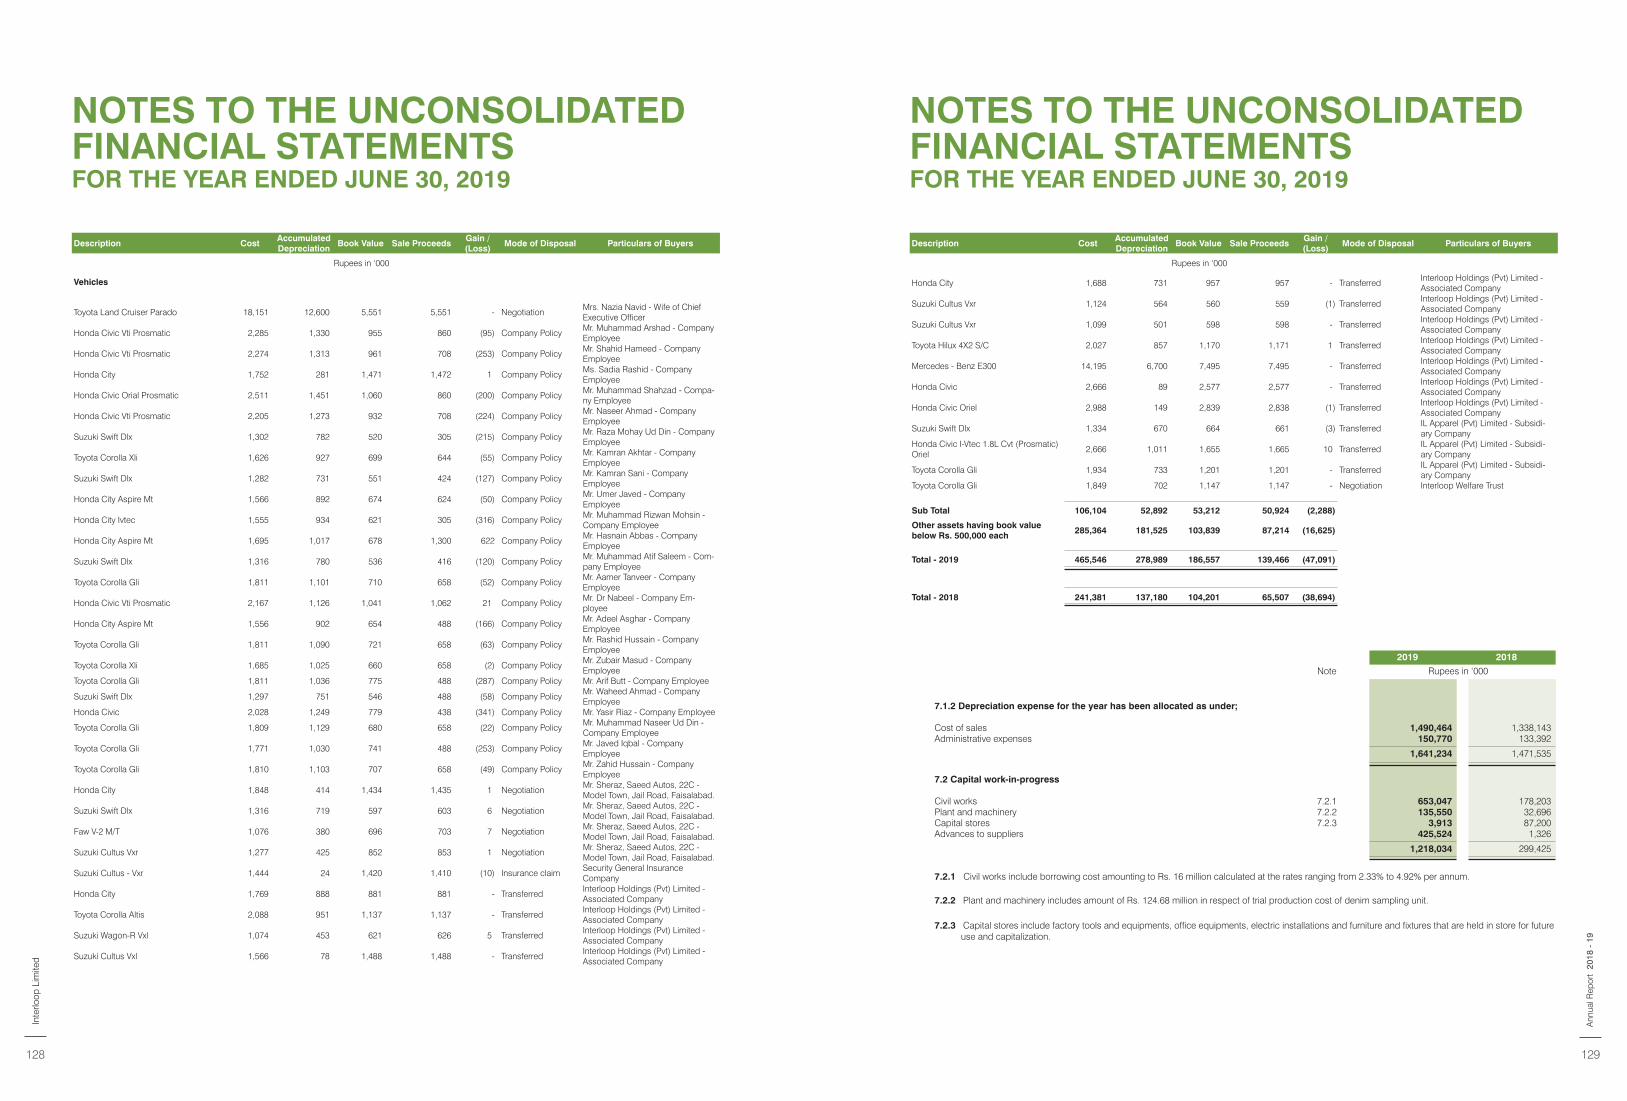
Description CostAccumulated Depreciation
Book Value Sale ProceedsGain / (Loss)
Mode of Disposal Particulars of Buyers
Rupees in ‘000
Vehicles
Toyota Land Cruiser Parado 18,151 12,600 5,551 5,551 - NegotiationMrs. Nazia Navid - Wife of Chief Executive Officer
Honda Civic Vti Prosmatic 2,285 1,330 955 860 (95) Company PolicyMr. Muhammad Arshad - Company Employee
Honda Civic Vti Prosmatic 2,274 1,313 961 708 (253) Company PolicyMr. Shahid Hameed - Company Employee
Honda City 1,752 281 1,471 1,472 1 Company PolicyMs. Sadia Rashid - Company Employee
Honda Civic Orial Prosmatic 2,511 1,451 1,060 860 (200) Company PolicyMr. Muhammad Shahzad - Compa-ny Employee
Honda Civic Vti Prosmatic 2,205 1,273 932 708 (224) Company PolicyMr. Naseer Ahmad - Company Employee
Suzuki Swift Dlx 1,302 782 520 305 (215) Company PolicyMr. Raza Mohay Ud Din - Company Employee
Toyota Corolla Xli 1,626 927 699 644 (55) Company PolicyMr. Kamran Akhtar - Company Employee
Suzuki Swift Dlx 1,282 731 551 424 (127) Company PolicyMr. Kamran Sani - Company Employee
Honda City Aspire Mt 1,566 892 674 624 (50) Company PolicyMr. Umer Javed - Company Employee
Honda City Ivtec 1,555 934 621 305 (316) Company PolicyMr. Muhammad Rizwan Mohsin - Company Employee
Honda City Aspire Mt 1,695 1,017 678 1,300 622 Company PolicyMr. Hasnain Abbas - Company Employee
Suzuki Swift Dlx 1,316 780 536 416 (120) Company PolicyMr. Muhammad Atif Saleem - Com-pany Employee
Toyota Corolla Gli 1,811 1,101 710 658 (52) Company PolicyMr. Aamer Tanveer - Company Employee
Honda Civic Vti Prosmatic 2,167 1,126 1,041 1,062 21 Company PolicyMr. Dr Nabeel - Company Em-ployee
Honda City Aspire Mt 1,556 902 654 488 (166) Company PolicyMr. Adeel Asghar - Company Employee
Toyota Corolla Gli 1,811 1,090 721 658 (63) Company PolicyMr. Rashid Hussain - Company Employee
Toyota Corolla Xli 1,685 1,025 660 658 (2) Company PolicyMr. Zubair Masud - Company Employee
Toyota Corolla Gli 1,811 1,036 775 488 (287) Company Policy Mr. Arif Butt - Company Employee
Suzuki Swift Dlx 1,297 751 546 488 (58) Company PolicyMr. Waheed Ahmad - Company Employee
Honda Civic 2,028 1,249 779 438 (341) Company Policy Mr. Yasir Riaz - Company Employee
Toyota Corolla Gli 1,809 1,129 680 658 (22) Company PolicyMr. Muhammad Naseer Ud Din - Company Employee
Toyota Corolla Gli 1,771 1,030 741 488 (253) Company PolicyMr. Javed Iqbal - Company Employee
Toyota Corolla Gli 1,810 1,103 707 658 (49) Company PolicyMr. Zahid Hussain - Company Employee
Honda City 1,848 414 1,434 1,435 1 NegotiationMr. Sheraz, Saeed Autos, 22C - Model Town, Jail Road, Faisalabad.
Suzuki Swift Dlx 1,316 719 597 603 6 NegotiationMr. Sheraz, Saeed Autos, 22C - Model Town, Jail Road, Faisalabad.
Faw V-2 M/T 1,076 380 696 703 7 NegotiationMr. Sheraz, Saeed Autos, 22C - Model Town, Jail Road, Faisalabad.
Suzuki Cultus Vxr 1,277 425 852 853 1 NegotiationMr. Sheraz, Saeed Autos, 22C - Model Town, Jail Road, Faisalabad.
Suzuki Cultus - Vxr 1,444 24 1,420 1,410 (10) Insurance claimSecurity General Insurance Company
Honda City 1,769 888 881 881 - TransferredInterloop Holdings (Pvt) Limited - Associated Company
Toyota Corolla Altis 2,088 951 1,137 1,137 - TransferredInterloop Holdings (Pvt) Limited - Associated Company
Suzuki Wagon-R Vxl 1,074 453 621 626 5 TransferredInterloop Holdings (Pvt) Limited - Associated Company
Suzuki Cultus Vxl 1,566 78 1,488 1,488 - TransferredInterloop Holdings (Pvt) Limited - Associated Company
2019 2018
Note Rupees in ‘000
7.1.2 Depreciation expense for the year has been allocated as under;
Cost of sales 1,490,464 1,338,143 Administrative expenses 150,770 133,392
1,641,234 1,471,535
7.2 Capital work-in-progress
Civil works 7.2.1 653,047 178,203 Plant and machinery 7.2.2 135,550 32,696 Capital stores 7.2.3 3,913 87,200 Advances to suppliers 425,524 1,326
1,218,034 299,425
7.2.1 Civil works include borrowing cost amounting to Rs. 16 million calculated at the rates ranging from 2.33% to 4.92% per annum.
7.2.2 Plant and machinery includes amount of Rs. 124.68 million in respect of trial production cost of denim sampling unit.
7.2.3 Capital stores include factory tools and equipments, office equipments, electric installations and furniture and fixtures that are held in store for future use and capitalization.
Description CostAccumulated Depreciation
Book Value Sale ProceedsGain / (Loss)
Mode of Disposal Particulars of Buyers
Rupees in ‘000
Honda City 1,688 731 957 957 - TransferredInterloop Holdings (Pvt) Limited - Associated Company
Suzuki Cultus Vxr 1,124 564 560 559 (1) TransferredInterloop Holdings (Pvt) Limited - Associated Company
Suzuki Cultus Vxr 1,099 501 598 598 - TransferredInterloop Holdings (Pvt) Limited - Associated Company
Toyota Hilux 4X2 S/C 2,027 857 1,170 1,171 1 TransferredInterloop Holdings (Pvt) Limited - Associated Company
Mercedes - Benz E300 14,195 6,700 7,495 7,495 - TransferredInterloop Holdings (Pvt) Limited - Associated Company
Honda Civic 2,666 89 2,577 2,577 - TransferredInterloop Holdings (Pvt) Limited - Associated Company
Honda Civic Oriel 2,988 149 2,839 2,838 (1) TransferredInterloop Holdings (Pvt) Limited - Associated Company
Suzuki Swift Dlx 1,334 670 664 661 (3) TransferredIL Apparel (Pvt) Limited - Subsidi-ary Company
Honda Civic I-Vtec 1.8L Cvt (Prosmatic) Oriel
2,666 1,011 1,655 1,665 10 TransferredIL Apparel (Pvt) Limited - Subsidi-ary Company
Toyota Corolla Gli 1,934 733 1,201 1,201 - TransferredIL Apparel (Pvt) Limited - Subsidi-ary Company
Toyota Corolla Gli 1,849 702 1,147 1,147 - Negotiation Interloop Welfare Trust
Sub Total 106,104 52,892 53,212 50,924 (2,288)
Other assets having book value below Rs. 500,000 each
285,364 181,525 103,839 87,214 (16,625)
Total - 2019 465,546 278,989 186,557 139,466 (47,091)
Total - 2018 241,381 137,180 104,201 65,507 (38,694)
NOTES TO THE UNCONSOLIDATED FINANCIAL STATEMENTSFOR THE YEAR ENDED JUNE 30, 2019
NOTES TO THE UNCONSOLIDATED FINANCIAL STATEMENTSFOR THE YEAR ENDED JUNE 30, 2019
Inte
rloop
Lim
ited
128 129
2018
- 1
9A
nnua
l Rep
ort
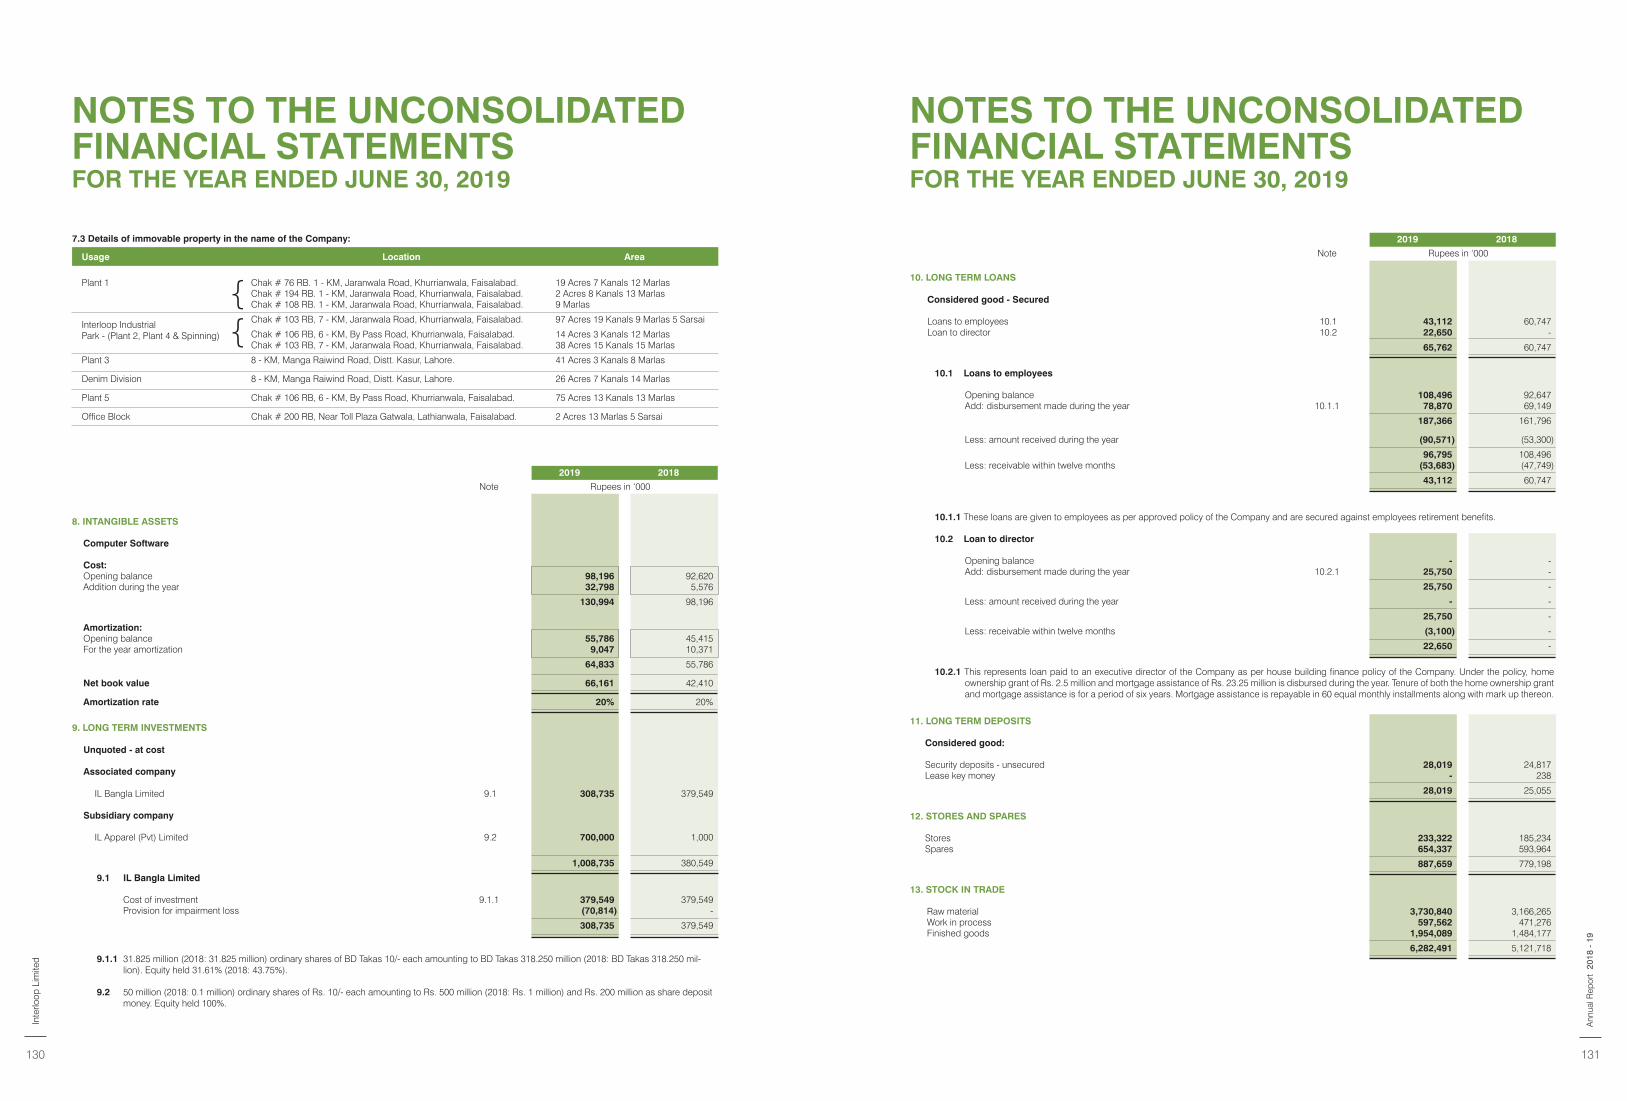
7.3 Details of immovable property in the name of the Company:
Usage Location Area
Plant 1 Chak # 76 RB. 1 - KM, Jaranwala Road, Khurrianwala, Faisalabad. 19 Acres 7 Kanals 12 MarlasChak # 194 RB. 1 - KM, Jaranwala Road, Khurrianwala, Faisalabad. 2 Acres 8 Kanals 13 MarlasChak # 108 RB. 1 - KM, Jaranwala Road, Khurrianwala, Faisalabad. 9 Marlas
Interloop Industrial Park - (Plant 2, Plant 4 & Spinning)
Chak # 103 RB, 7 - KM, Jaranwala Road, Khurrianwala, Faisalabad. 97 Acres 19 Kanals 9 Marlas 5 Sarsai
Chak # 106 RB, 6 - KM, By Pass Road, Khurrianwala, Faisalabad. 14 Acres 3 Kanals 12 MarlasChak # 103 RB, 7 - KM, Jaranwala Road, Khurrianwala, Faisalabad. 38 Acres 15 Kanals 15 Marlas
Plant 3 8 - KM, Manga Raiwind Road, Distt. Kasur, Lahore. 41 Acres 3 Kanals 8 Marlas
Denim Division 8 - KM, Manga Raiwind Road, Distt. Kasur, Lahore. 26 Acres 7 Kanals 14 Marlas
Plant 5 Chak # 106 RB, 6 - KM, By Pass Road, Khurrianwala, Faisalabad. 75 Acres 13 Kanals 13 Marlas
Office Block Chak # 200 RB, Near Toll Plaza Gatwala, Lathianwala, Faisalabad. 2 Acres 13 Marlas 5 Sarsai
2019 2018
Note Rupees in ‘000
8. INTANGIBLE ASSETS
Computer Software
Cost:Opening balance 98,196 92,620 Addition during the year 32,798 5,576
130,994 98,196
Amortization:Opening balance 55,786 45,415 For the year amortization 9,047 10,371
64,833 55,786
Net book value 66,161 42,410
Amortization rate 20% 20%
9. LONG TERM INVESTMENTS
Unquoted - at cost
Associated company
IL Bangla Limited 9.1 308,735 379,549
Subsidiary company
IL Apparel (Pvt) Limited 9.2 700,000 1,000
1,008,735 380,549
9.1 IL Bangla Limited
Cost of investment 9.1.1 379,549 379,549 Provision for impairment loss (70,814) -
308,735 379,549
9.1.1 31.825 million (2018: 31.825 million) ordinary shares of BD Takas 10/- each amounting to BD Takas 318.250 million (2018: BD Takas 318.250 mil-lion). Equity held 31.61% (2018: 43.75%).
9.2 50 million (2018: 0.1 million) ordinary shares of Rs. 10/- each amounting to Rs. 500 million (2018: Rs. 1 million) and Rs. 200 million as share deposit money. Equity held 100%.
{{
2019 2018
Note Rupees in ‘000
10. LONG TERM LOANS
Considered good - Secured
Loans to employees 10.1 43,112 60,747 Loan to director 10.2 22,650 -
65,762 60,747
10.1 Loans to employees
Opening balance 108,496 92,647 Add: disbursement made during the year 10.1.1 78,870 69,149
187,366 161,796
Less: amount received during the year (90,571) (53,300)
96,795 108,496 Less: receivable within twelve months (53,683) (47,749)
43,112 60,747
10.1.1 These loans are given to employees as per approved policy of the Company and are secured against employees retirement benefits.
10.2 Loan to director
Opening balance - - Add: disbursement made during the year 10.2.1 25,750 -
25,750 -
Less: amount received during the year - -
25,750 -
Less: receivable within twelve months (3,100) -
22,650 -
10.2.1 This represents loan paid to an executive director of the Company as per house building finance policy of the Company. Under the policy, home ownership grant of Rs. 2.5 million and mortgage assistance of Rs. 23.25 million is disbursed during the year. Tenure of both the home ownership grant and mortgage assistance is for a period of six years. Mortgage assistance is repayable in 60 equal monthly installments along with mark up thereon.
11. LONG TERM DEPOSITS
Considered good:
Security deposits - unsecured 28,019 24,817 Lease key money - 238
28,019 25,055
12. STORES AND SPARES
Stores 233,322 185,234 Spares 654,337 593,964
887,659 779,198
13. STOCK IN TRADE
Raw material 3,730,840 3,166,265 Work in process 597,562 471,276 Finished goods 1,954,089 1,484,177
6,282,491 5,121,718
NOTES TO THE UNCONSOLIDATED FINANCIAL STATEMENTSFOR THE YEAR ENDED JUNE 30, 2019
NOTES TO THE UNCONSOLIDATED FINANCIAL STATEMENTSFOR THE YEAR ENDED JUNE 30, 2019
Inte
rloop
Lim
ited
130 131
2018
- 1
9A
nnua
l Rep
ort
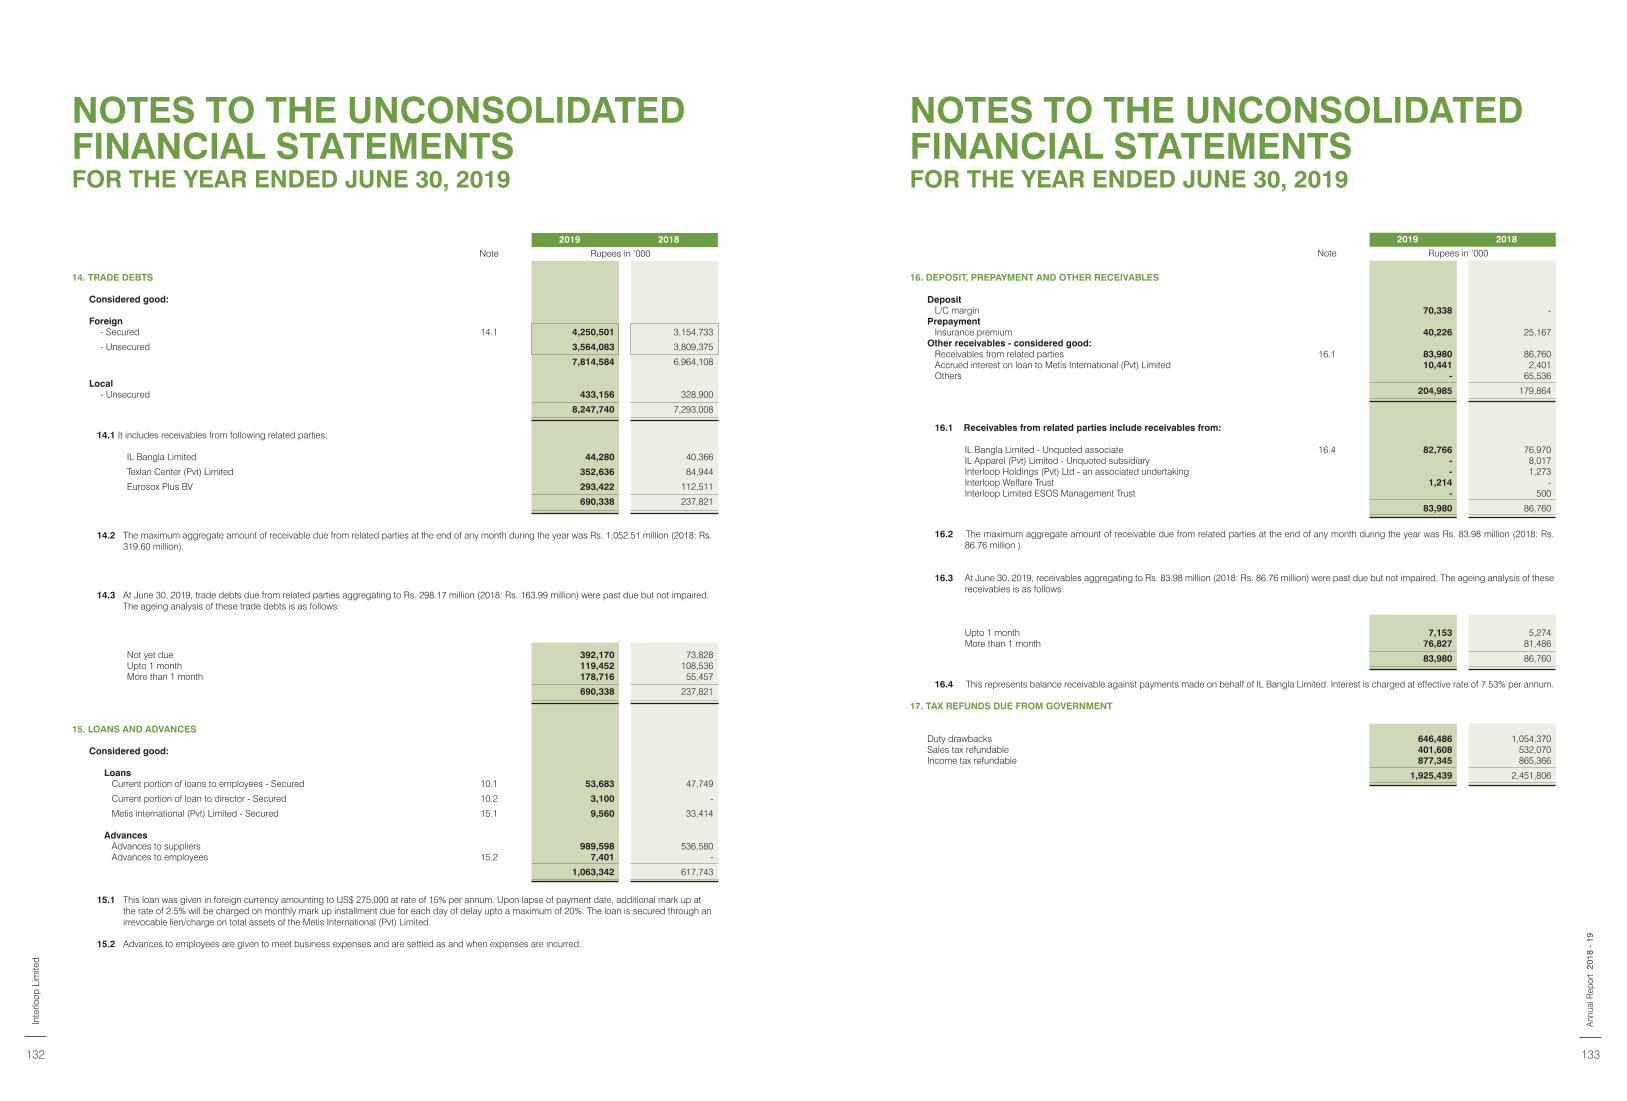
15. LOANS AND ADVANCES
Considered good:
LoansCurrent portion of loans to employees - Secured 10.1 53,683 47,749
Current portion of loan to director - Secured 10.2 3,100 -
Metis international (Pvt) Limited - Secured 15.1 9,560 33,414
AdvancesAdvances to suppliers 989,598 536,580 Advances to employees 15.2 7,401 -
1,063,342 617,743
15.1 This loan was given in foreign currency amounting to US$ 275,000 at rate of 15% per annum. Upon lapse of payment date, additional mark up at the rate of 2.5% will be charged on monthly mark up installment due for each day of delay upto a maximum of 20%. The loan is secured through an irrevocable lien/charge on total assets of the Metis International (Pvt) Limited.
15.2 Advances to employees are given to meet business expenses and are settled as and when expenses are incurred.
2019 2018
Note Rupees in ‘000
14. TRADE DEBTS
Considered good:
Foreign- Secured 14.1 4,250,501 3,154,733
- Unsecured 3,564,083 3,809,375
7,814,584 6,964,108
Local- Unsecured 433,156 328,900
8,247,740 7,293,008
14.1 It includes receivables from following related parties;
IL Bangla Limited 44,280 40,366
Texlan Center (Pvt) Limited 352,636 84,944
Eurosox Plus BV 293,422 112,511
690,338 237,821
14.2 The maximum aggregate amount of receivable due from related parties at the end of any month during the year was Rs. 1,052.51 million (2018: Rs. 319.60 million).
14.3 At June 30, 2019, trade debts due from related parties aggregating to Rs. 298.17 million (2018: Rs. 163.99 million) were past due but not impaired. The ageing analysis of these trade debts is as follows:
Not yet due 392,170 73,828 Upto 1 month 119,452 108,536 More than 1 month 178,716 55,457
690,338 237,821
2019 2018
Note Rupees in ‘000
16. DEPOSIT, PREPAYMENT AND OTHER RECEIVABLES
DepositL/C margin 70,338 -
PrepaymentInsurance premium 40,226 25,167
Other receivables - considered good:Receivables from related parties 16.1 83,980 86,760 Accrued interest on loan to Metis International (Pvt) Limited 10,441 2,401 Others - 65,536
204,985 179,864
16.1 Receivables from related parties include receivables from:
IL Bangla Limited - Unquoted associate 16.4 82,766 76,970 IL Apparel (Pvt) Limited - Unquoted subsidiary - 8,017 Interloop Holdings (Pvt) Ltd - an associated undertaking - 1,273 Interloop Welfare Trust 1,214 - Interloop Limited ESOS Management Trust - 500
83,980 86,760
16.2 The maximum aggregate amount of receivable due from related parties at the end of any month during the year was Rs. 83.98 million (2018: Rs. 86.76 million ).
16.3 At June 30, 2019, receivables aggregating to Rs. 83.98 million (2018: Rs. 86.76 million) were past due but not impaired. The ageing analysis of these receivables is as follows:
Upto 1 month 7,153 5,274 More than 1 month 76,827 81,486
83,980 86,760
16.4 This represents balance receivable against payments made on behalf of IL Bangla Limited. Interest is charged at effective rate of 7.53% per annum.
17. TAX REFUNDS DUE FROM GOVERNMENT
Duty drawbacks 646,486 1,054,370 Sales tax refundable 401,608 532,070 Income tax refundable 877,345 865,366
1,925,439 2,451,806
NOTES TO THE UNCONSOLIDATED FINANCIAL STATEMENTSFOR THE YEAR ENDED JUNE 30, 2019
NOTES TO THE UNCONSOLIDATED FINANCIAL STATEMENTSFOR THE YEAR ENDED JUNE 30, 2019
Inte
rloop
Lim
ited
132 133
2018
- 1
9A
nnua
l Rep
ort
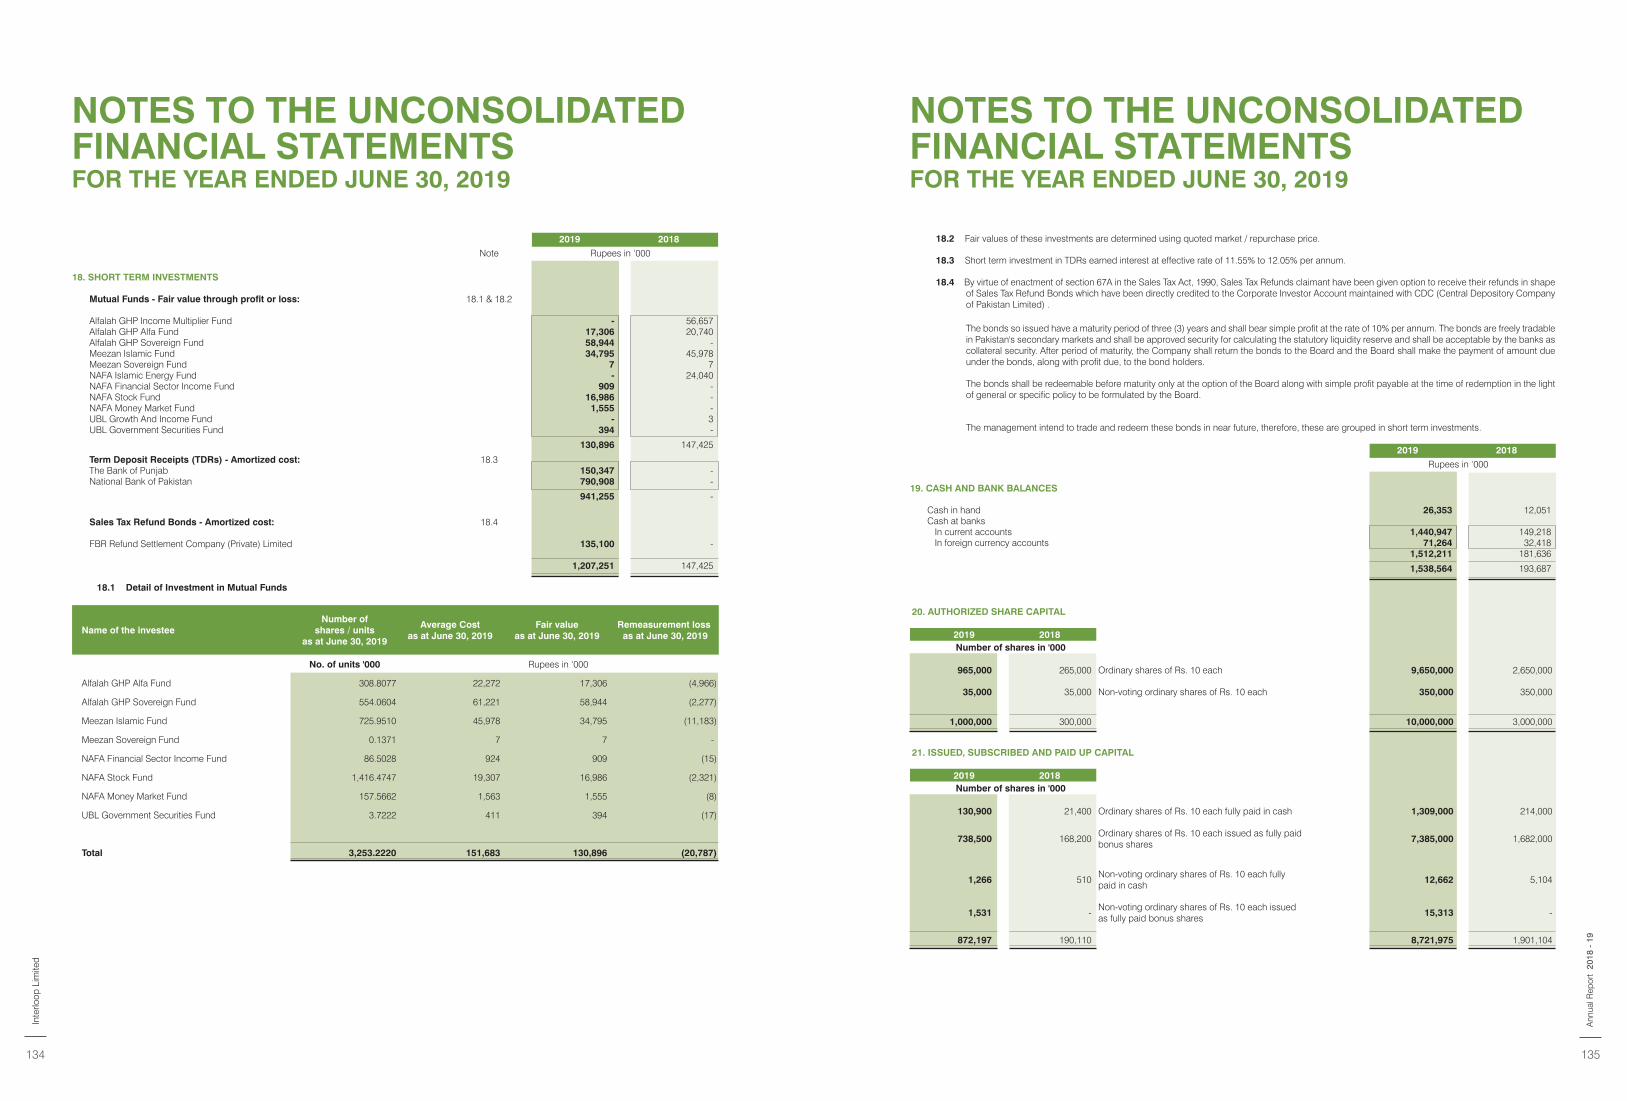
Name of the investeeNumber of
shares / units as at June 30, 2019
Average Cost as at June 30, 2019
Fair value as at June 30, 2019
Remeasurement loss as at June 30, 2019
No. of units '000 Rupees in ‘000
Alfalah GHP Alfa Fund 308.8077 22,272 17,306 (4,966)
Alfalah GHP Sovereign Fund 554.0604 61,221 58,944 (2,277)
Meezan Islamic Fund 725.9510 45,978 34,795 (11,183)
Meezan Sovereign Fund 0.1371 7 7 -
NAFA Financial Sector Income Fund 86.5028 924 909 (15)
NAFA Stock Fund 1,416.4747 19,307 16,986 (2,321)
NAFA Money Market Fund 157.5662 1,563 1,555 (8)
UBL Government Securities Fund 3.7222 411 394 (17)
Total 3,253.2220 151,683 130,896 (20,787)
2019 2018
Note Rupees in ‘000
18. SHORT TERM INVESTMENTS
Mutual Funds - Fair value through profit or loss: 18.1 & 18.2
Alfalah GHP Income Multiplier Fund - 56,657 Alfalah GHP Alfa Fund 17,306 20,740 Alfalah GHP Sovereign Fund 58,944 - Meezan Islamic Fund 34,795 45,978 Meezan Sovereign Fund 7 7 NAFA Islamic Energy Fund - 24,040 NAFA Financial Sector Income Fund 909 - NAFA Stock Fund 16,986 - NAFA Money Market Fund 1,555 - UBL Growth And Income Fund - 3 UBL Government Securities Fund 394 -
130,896 147,425
Term Deposit Receipts (TDRs) - Amortized cost: 18.3The Bank of Punjab 150,347 - National Bank of Pakistan 790,908 -
941,255 -
Sales Tax Refund Bonds - Amortized cost: 18.4
FBR Refund Settlement Company (Private) Limited 135,100 -
1,207,251 147,425
18.1 Detail of Investment in Mutual Funds
2019 2018
Rupees in ‘000
19. CASH AND BANK BALANCES
Cash in hand 26,353 12,051 Cash at banks
In current accounts 1,440,947 149,218 In foreign currency accounts 71,264 32,418
1,512,211 181,636
1,538,564 193,687
20. AUTHORIZED SHARE CAPITAL
2019 2018Number of shares in '000
965,000 265,000 Ordinary shares of Rs. 10 each 9,650,000 2,650,000
35,000 35,000 Non-voting ordinary shares of Rs. 10 each 350,000 350,000
1,000,000 300,000 10,000,000 3,000,000
21. ISSUED, SUBSCRIBED AND PAID UP CAPITAL
2019 2018Number of shares in '000
130,900 21,400 Ordinary shares of Rs. 10 each fully paid in cash 1,309,000 214,000
738,500 168,200 Ordinary shares of Rs. 10 each issued as fully paid bonus shares
7,385,000 1,682,000
1,266 510 Non-voting ordinary shares of Rs. 10 each fully paid in cash
12,662 5,104
1,531 - Non-voting ordinary shares of Rs. 10 each issued as fully paid bonus shares
15,313 -
872,197 190,110 8,721,975 1,901,104
18.2 Fair values of these investments are determined using quoted market / repurchase price.
18.3 Short term investment in TDRs earned interest at effective rate of 11.55% to 12.05% per annum.
18.4 By virtue of enactment of section 67A in the Sales Tax Act, 1990, Sales Tax Refunds claimant have been given option to receive their refunds in shape of Sales Tax Refund Bonds which have been directly credited to the Corporate Investor Account maintained with CDC (Central Depository Company of Pakistan Limited) .
The bonds so issued have a maturity period of three (3) years and shall bear simple profit at the rate of 10% per annum. The bonds are freely tradable in Pakistan's secondary markets and shall be approved security for calculating the statutory liquidity reserve and shall be acceptable by the banks as collateral security. After period of maturity, the Company shall return the bonds to the Board and the Board shall make the payment of amount due under the bonds, along with profit due, to the bond holders.
The bonds shall be redeemable before maturity only at the option of the Board along with simple profit payable at the time of redemption in the light of general or specific policy to be formulated by the Board.
The management intend to trade and redeem these bonds in near future, therefore, these are grouped in short term investments.
NOTES TO THE UNCONSOLIDATED FINANCIAL STATEMENTSFOR THE YEAR ENDED JUNE 30, 2019
NOTES TO THE UNCONSOLIDATED FINANCIAL STATEMENTSFOR THE YEAR ENDED JUNE 30, 2019
Inte
rloop
Lim
ited
134 135
2018
- 1
9A
nnua
l Rep
ort
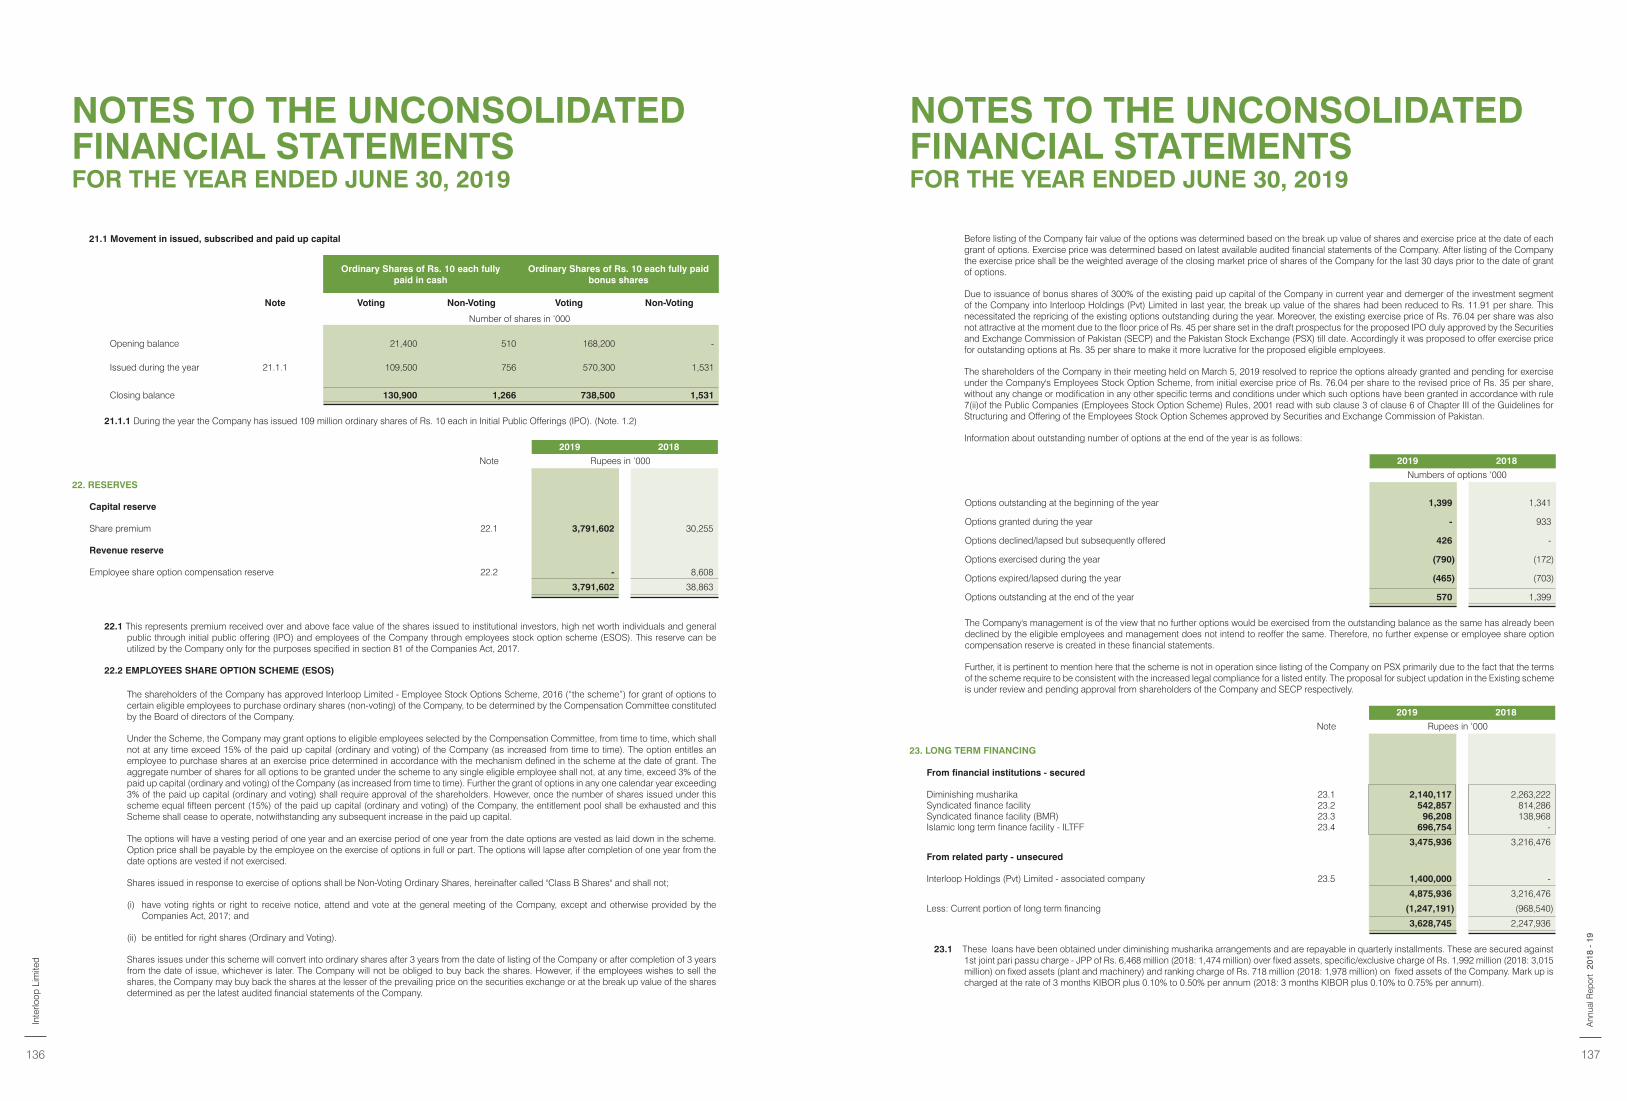
2019 2018
Note Rupees in ‘000
22. RESERVES
Capital reserve
Share premium 22.1 3,791,602 30,255
Revenue reserve
Employee share option compensation reserve 22.2 - 8,608
3,791,602 38,863
21.1 Movement in issued, subscribed and paid up capital
Ordinary Shares of Rs. 10 each fully paid in cash
Ordinary Shares of Rs. 10 each fully paid bonus shares
Note Voting Non-Voting Voting Non-Voting
Number of shares in ‘000
Opening balance 21,400 510 168,200 -
Issued during the year 21.1.1 109,500 756 570,300 1,531
Closing balance 130,900 1,266 738,500 1,531
21.1.1 During the year the Company has issued 109 million ordinary shares of Rs. 10 each in Initial Public Offerings (IPO). (Note. 1.2)
22.1 This represents premium received over and above face value of the shares issued to institutional investors, high net worth individuals and general public through initial public offering (IPO) and employees of the Company through employees stock option scheme (ESOS). This reserve can be utilized by the Company only for the purposes specified in section 81 of the Companies Act, 2017.
22.2 EMPLOYEES SHARE OPTION SCHEME (ESOS)
The shareholders of the Company has approved Interloop Limited - Employee Stock Options Scheme, 2016 (“the scheme”) for grant of options to certain eligible employees to purchase ordinary shares (non-voting) of the Company, to be determined by the Compensation Committee constituted by the Board of directors of the Company.
Under the Scheme, the Company may grant options to eligible employees selected by the Compensation Committee, from time to time, which shall not at any time exceed 15% of the paid up capital (ordinary and voting) of the Company (as increased from time to time). The option entitles an employee to purchase shares at an exercise price determined in accordance with the mechanism defined in the scheme at the date of grant. The aggregate number of shares for all options to be granted under the scheme to any single eligible employee shall not, at any time, exceed 3% of the paid up capital (ordinary and voting) of the Company (as increased from time to time). Further the grant of options in any one calendar year exceeding 3% of the paid up capital (ordinary and voting) shall require approval of the shareholders. However, once the number of shares issued under this scheme equal fifteen percent (15%) of the paid up capital (ordinary and voting) of the Company, the entitlement pool shall be exhausted and this Scheme shall cease to operate, notwithstanding any subsequent increase in the paid up capital.
The options will have a vesting period of one year and an exercise period of one year from the date options are vested as laid down in the scheme. Option price shall be payable by the employee on the exercise of options in full or part. The options will lapse after completion of one year from the date options are vested if not exercised.
Shares issued in response to exercise of options shall be Non-Voting Ordinary Shares, hereinafter called "Class B Shares" and shall not;
(i) have voting rights or right to receive notice, attend and vote at the general meeting of the Company, except and otherwise provided by the Companies Act, 2017; and
(ii) be entitled for right shares (Ordinary and Voting).
Shares issues under this scheme will convert into ordinary shares after 3 years from the date of listing of the Company or after completion of 3 years from the date of issue, whichever is later. The Company will not be obliged to buy back the shares. However, if the employees wishes to sell the shares, the Company may buy back the shares at the lesser of the prevailing price on the securities exchange or at the break up value of the shares determined as per the latest audited financial statements of the Company.
2019 2018
Numbers of options ‘000
Options outstanding at the beginning of the year 1,399 1,341
Options granted during the year - 933
Options declined/lapsed but subsequently offered 426 -
Options exercised during the year (790) (172)
Options expired/lapsed during the year (465) (703)
Options outstanding at the end of the year 570 1,399
The Company's management is of the view that no further options would be exercised from the outstanding balance as the same has already been declined by the eligible employees and management does not intend to reoffer the same. Therefore, no further expense or employee share option compensation reserve is created in these financial statements.
Further, it is pertinent to mention here that the scheme is not in operation since listing of the Company on PSX primarily due to the fact that the terms of the scheme require to be consistent with the increased legal compliance for a listed entity. The proposal for subject updation in the Existing scheme is under review and pending approval from shareholders of the Company and SECP respectively.
2019 2018
Note Rupees in ‘000
23. LONG TERM FINANCING
From financial institutions - secured
Diminishing musharika 23.1 2,140,117 2,263,222 Syndicated finance facility 23.2 542,857 814,286 Syndicated finance facility (BMR) 23.3 96,208 138,968 Islamic long term finance facility - ILTFF 23.4 696,754 -
3,475,936 3,216,476
From related party - unsecured
Interloop Holdings (Pvt) Limited - associated company 23.5 1,400,000 -
4,875,936 3,216,476
Less: Current portion of long term financing (1,247,191) (968,540)
3,628,745 2,247,936
23.1 These loans have been obtained under diminishing musharika arrangements and are repayable in quarterly installments. These are secured against 1st joint pari passu charge - JPP of Rs. 6,468 million (2018: 1,474 million) over fixed assets, specific/exclusive charge of Rs. 1,992 million (2018: 3,015 million) on fixed assets (plant and machinery) and ranking charge of Rs. 718 million (2018: 1,978 million) on fixed assets of the Company. Mark up is charged at the rate of 3 months KIBOR plus 0.10% to 0.50% per annum (2018: 3 months KIBOR plus 0.10% to 0.75% per annum).
Before listing of the Company fair value of the options was determined based on the break up value of shares and exercise price at the date of each grant of options. Exercise price was determined based on latest available audited financial statements of the Company. After listing of the Company the exercise price shall be the weighted average of the closing market price of shares of the Company for the last 30 days prior to the date of grant of options.
Due to issuance of bonus shares of 300% of the existing paid up capital of the Company in current year and demerger of the investment segment of the Company into Interloop Holdings (Pvt) Limited in last year, the break up value of the shares had been reduced to Rs. 11.91 per share. This necessitated the repricing of the existing options outstanding during the year. Moreover, the existing exercise price of Rs. 76.04 per share was also not attractive at the moment due to the floor price of Rs. 45 per share set in the draft prospectus for the proposed IPO duly approved by the Securities and Exchange Commission of Pakistan (SECP) and the Pakistan Stock Exchange (PSX) till date. Accordingly it was proposed to offer exercise price for outstanding options at Rs. 35 per share to make it more lucrative for the proposed eligible employees.
The shareholders of the Company in their meeting held on March 5, 2019 resolved to reprice the options already granted and pending for exercise under the Company's Employees Stock Option Scheme, from initial exercise price of Rs. 76.04 per share to the revised price of Rs. 35 per share, without any change or modification in any other specific terms and conditions under which such options have been granted in accordance with rule 7(ii)of the Public Companies (Employees Stock Option Scheme) Rules, 2001 read with sub clause 3 of clause 6 of Chapter III of the Guidelines for Structuring and Offering of the Employees Stock Option Schemes approved by Securities and Exchange Commission of Pakistan.
Information about outstanding number of options at the end of the year is as follows:
NOTES TO THE UNCONSOLIDATED FINANCIAL STATEMENTSFOR THE YEAR ENDED JUNE 30, 2019
NOTES TO THE UNCONSOLIDATED FINANCIAL STATEMENTSFOR THE YEAR ENDED JUNE 30, 2019
Inte
rloop
Lim
ited
136 137
2018
- 1
9A
nnua
l Rep
ort
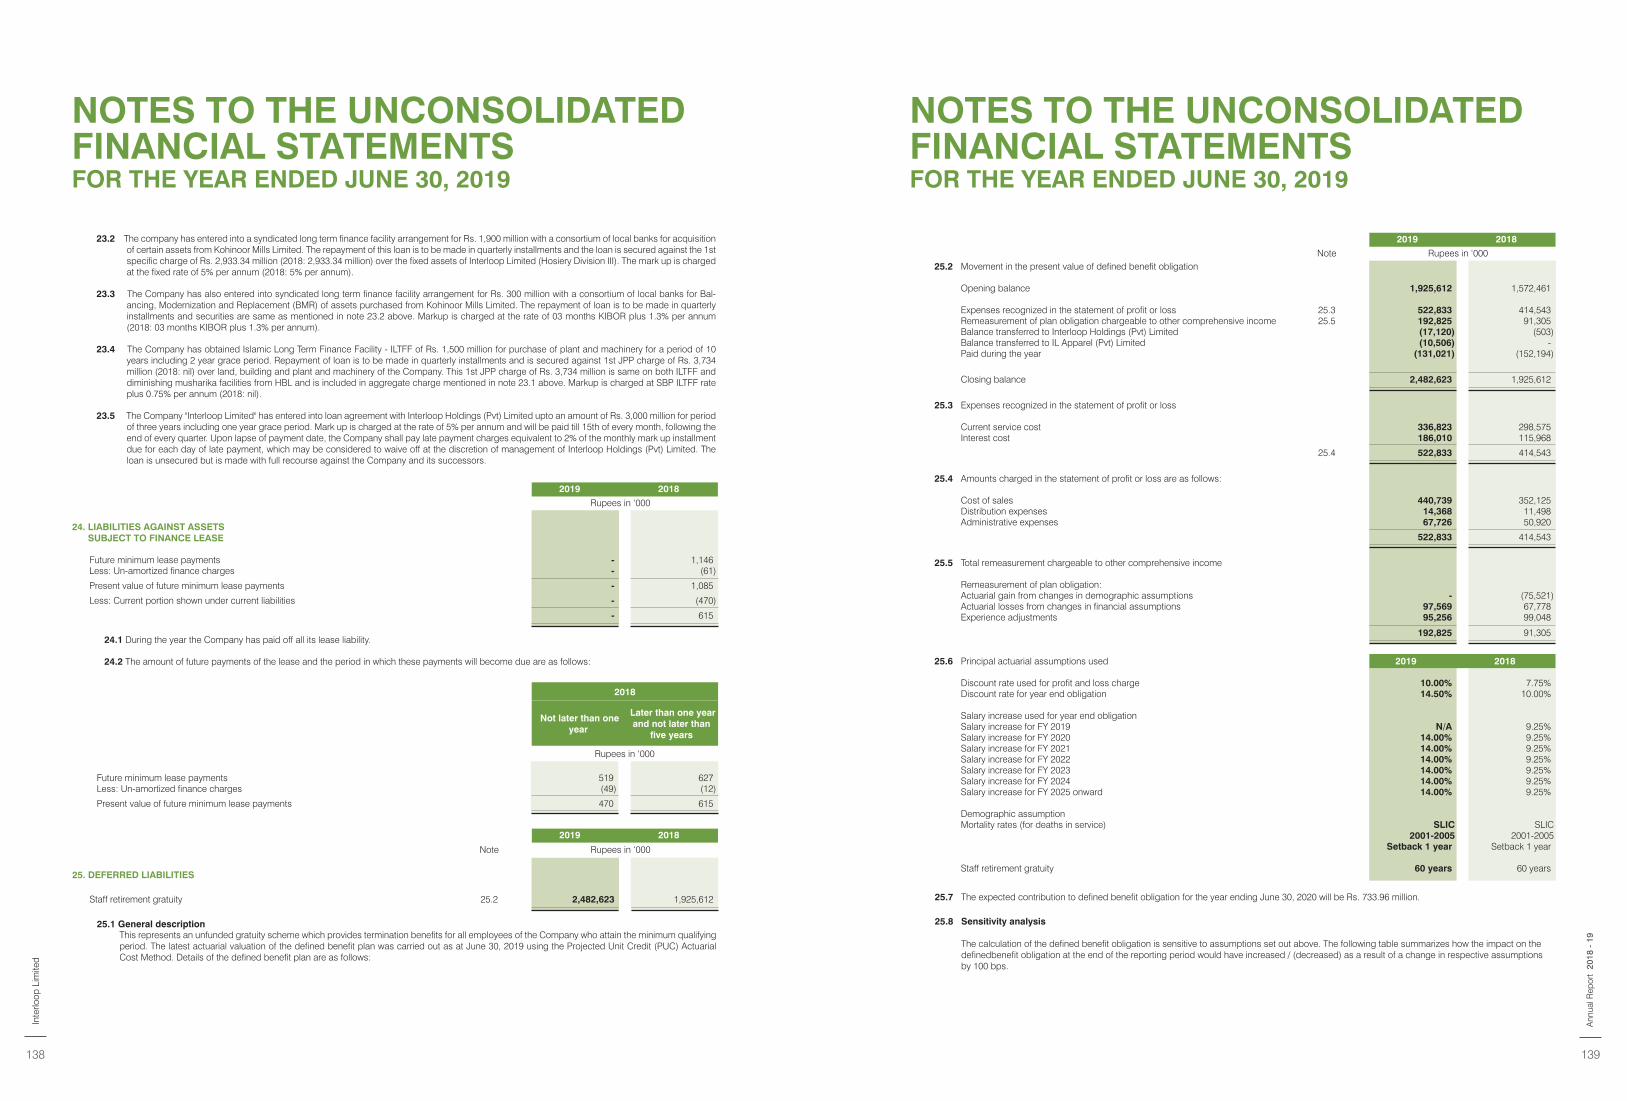
2019 2018
Rupees in ‘000
24. LIABILITIES AGAINST ASSETS SUBJECT TO FINANCE LEASE
Future minimum lease payments - 1,146 Less: Un-amortized finance charges - (61)
Present value of future minimum lease payments - 1,085
Less: Current portion shown under current liabilities - (470)
- 615
2018
Not later than one year
Later than one year and not later than
five years
Rupees in ‘000
Future minimum lease payments 519 627 Less: Un-amortized finance charges (49) (12)
Present value of future minimum lease payments 470 615
24.1 During the year the Company has paid off all its lease liability.
24.2 The amount of future payments of the lease and the period in which these payments will become due are as follows:
23.2 The company has entered into a syndicated long term finance facility arrangement for Rs. 1,900 million with a consortium of local banks for acquisition of certain assets from Kohinoor Mills Limited. The repayment of this loan is to be made in quarterly installments and the loan is secured against the 1st specific charge of Rs. 2,933.34 million (2018: 2,933.34 million) over the fixed assets of Interloop Limited (Hosiery Division III). The mark up is charged at the fixed rate of 5% per annum (2018: 5% per annum).
23.3 The Company has also entered into syndicated long term finance facility arrangement for Rs. 300 million with a consortium of local banks for Bal-ancing, Modernization and Replacement (BMR) of assets purchased from Kohinoor Mills Limited. The repayment of loan is to be made in quarterly installments and securities are same as mentioned in note 23.2 above. Markup is charged at the rate of 03 months KIBOR plus 1.3% per annum (2018: 03 months KIBOR plus 1.3% per annum).
23.4 The Company has obtained Islamic Long Term Finance Facility - ILTFF of Rs. 1,500 million for purchase of plant and machinery for a period of 10 years including 2 year grace period. Repayment of loan is to be made in quarterly installments and is secured against 1st JPP charge of Rs. 3,734 million (2018: nil) over land, building and plant and machinery of the Company. This 1st JPP charge of Rs. 3,734 million is same on both ILTFF and diminishing musharika facilities from HBL and is included in aggregate charge mentioned in note 23.1 above. Markup is charged at SBP ILTFF rate plus 0.75% per annum (2018: nil).
23.5 The Company "Interloop Limited" has entered into loan agreement with Interloop Holdings (Pvt) Limited upto an amount of Rs. 3,000 million for period of three years including one year grace period. Mark up is charged at the rate of 5% per annum and will be paid till 15th of every month, following the end of every quarter. Upon lapse of payment date, the Company shall pay late payment charges equivalent to 2% of the monthly mark up installment due for each day of late payment, which may be considered to waive off at the discretion of management of Interloop Holdings (Pvt) Limited. The loan is unsecured but is made with full recourse against the Company and its successors.
2019 2018
Note Rupees in ‘000
25. DEFERRED LIABILITIES
Staff retirement gratuity 25.2 2,482,623 1,925,612
25.1 General descriptionThis represents an unfunded gratuity scheme which provides termination benefits for all employees of the Company who attain the minimum qualifying period. The latest actuarial valuation of the defined benefit plan was carried out as at June 30, 2019 using the Projected Unit Credit (PUC) Actuarial Cost Method. Details of the defined benefit plan are as follows:
25.7 The expected contribution to defined benefit obligation for the year ending June 30, 2020 will be Rs. 733.96 million.
25.8 Sensitivity analysis
The calculation of the defined benefit obligation is sensitive to assumptions set out above. The following table summarizes how the impact on the definedbenefit obligation at the end of the reporting period would have increased / (decreased) as a result of a change in respective assumptions by 100 bps.
2019 2018
Note Rupees in ‘00025.2 Movement in the present value of defined benefit obligation
Opening balance 1,925,612 1,572,461
Expenses recognized in the statement of profit or loss 25.3 522,833 414,543 Remeasurement of plan obligation chargeable to other comprehensive income 25.5 192,825 91,305 Balance transferred to Interloop Holdings (Pvt) Limited (17,120) (503)Balance transferred to IL Apparel (Pvt) Limited (10,506) - Paid during the year (131,021) (152,194)
Closing balance 2,482,623 1,925,612
25.3 Expenses recognized in the statement of profit or loss
Current service cost 336,823 298,575 Interest cost 186,010 115,968
25.4 522,833 414,543
25.4 Amounts charged in the statement of profit or loss are as follows:
Cost of sales 440,739 352,125 Distribution expenses 14,368 11,498 Administrative expenses 67,726 50,920
522,833 414,543
25.5 Total remeasurement chargeable to other comprehensive income
Remeasurement of plan obligation:Actuarial gain from changes in demographic assumptions - (75,521)Actuarial losses from changes in financial assumptions 97,569 67,778 Experience adjustments 95,256 99,048
192,825 91,305
25.6 Principal actuarial assumptions used 2019 2018
Discount rate used for profit and loss charge 10.00% 7.75%Discount rate for year end obligation 14.50% 10.00%
Salary increase used for year end obligationSalary increase for FY 2019 N/A 9.25%Salary increase for FY 2020 14.00% 9.25%Salary increase for FY 2021 14.00% 9.25%Salary increase for FY 2022 14.00% 9.25%Salary increase for FY 2023 14.00% 9.25%Salary increase for FY 2024 14.00% 9.25%Salary increase for FY 2025 onward 14.00% 9.25%
Demographic assumptionMortality rates (for deaths in service) SLIC SLIC
2001-2005 2001-2005Setback 1 year Setback 1 year
Staff retirement gratuity 60 years 60 years
NOTES TO THE UNCONSOLIDATED FINANCIAL STATEMENTSFOR THE YEAR ENDED JUNE 30, 2019
NOTES TO THE UNCONSOLIDATED FINANCIAL STATEMENTSFOR THE YEAR ENDED JUNE 30, 2019
Inte
rloop
Lim
ited
138 139
2018
- 1
9A
nnua
l Rep
ort
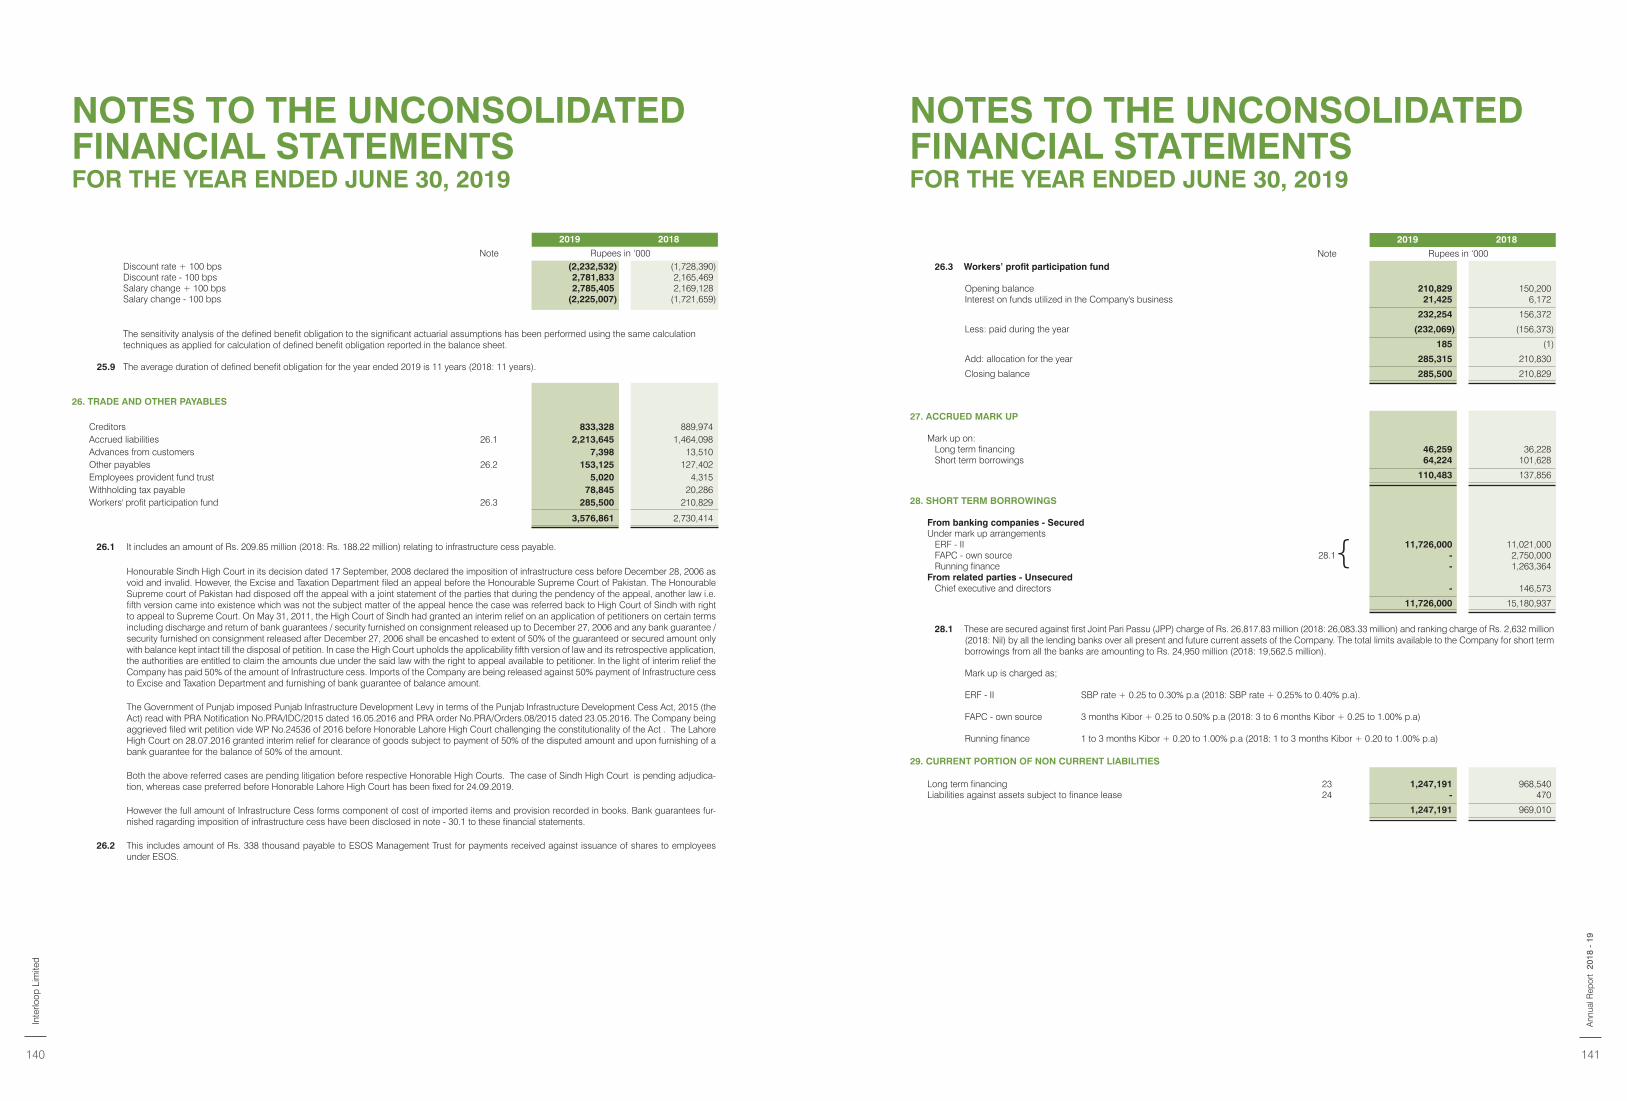
{
2019 2018
Note Rupees in ‘000Discount rate + 100 bps (2,232,532) (1,728,390)Discount rate - 100 bps 2,781,833 2,165,469 Salary change + 100 bps 2,785,405 2,169,128 Salary change - 100 bps (2,225,007) (1,721,659)
The sensitivity analysis of the defined benefit obligation to the significant actuarial assumptions has been performed using the same calculation techniques as applied for calculation of defined benefit obligation reported in the balance sheet.
25.9 The average duration of defined benefit obligation for the year ended 2019 is 11 years (2018: 11 years).
26. TRADE AND OTHER PAYABLES
Creditors 833,328 889,974 Accrued liabilities 26.1 2,213,645 1,464,098 Advances from customers 7,398 13,510 Other payables 26.2 153,125 127,402 Employees provident fund trust 5,020 4,315 Withholding tax payable 78,845 20,286 Workers' profit participation fund 26.3 285,500 210,829
3,576,861 2,730,414
26.1 It includes an amount of Rs. 209.85 million (2018: Rs. 188.22 million) relating to infrastructure cess payable.
Honourable Sindh High Court in its decision dated 17 September, 2008 declared the imposition of infrastructure cess before December 28, 2006 as void and invalid. However, the Excise and Taxation Department filed an appeal before the Honourable Supreme Court of Pakistan. The Honourable Supreme court of Pakistan had disposed off the appeal with a joint statement of the parties that during the pendency of the appeal, another law i.e. fifth version came into existence which was not the subject matter of the appeal hence the case was referred back to High Court of Sindh with right to appeal to Supreme Court. On May 31, 2011, the High Court of Sindh had granted an interim relief on an application of petitioners on certain terms including discharge and return of bank guarantees / security furnished on consignment released up to December 27, 2006 and any bank guarantee / security furnished on consignment released after December 27, 2006 shall be encashed to extent of 50% of the guaranteed or secured amount only with balance kept intact till the disposal of petition. In case the High Court upholds the applicability fifth version of law and its retrospective application, the authorities are entitled to claim the amounts due under the said law with the right to appeal available to petitioner. In the light of interim relief the Company has paid 50% of the amount of Infrastructure cess. Imports of the Company are being released against 50% payment of Infrastructure cess to Excise and Taxation Department and furnishing of bank guarantee of balance amount.
The Government of Punjab imposed Punjab Infrastructure Development Levy in terms of the Punjab Infrastructure Development Cess Act, 2015 (the Act) read with PRA Notification No.PRA/IDC/2015 dated 16.05.2016 and PRA order No.PRA/Orders.08/2015 dated 23.05.2016. The Company being aggrieved filed writ petition vide WP No.24536 of 2016 before Honorable Lahore High Court challenging the constitutionality of the Act . The Lahore High Court on 28.07.2016 granted interim relief for clearance of goods subject to payment of 50% of the disputed amount and upon furnishing of a bank guarantee for the balance of 50% of the amount.
Both the above referred cases are pending litigation before respective Honorable High Courts. The case of Sindh High Court is pending adjudica-tion, whereas case preferred before Honorable Lahore High Court has been fixed for 24.09.2019.
However the full amount of Infrastructure Cess forms component of cost of imported items and provision recorded in books. Bank guarantees fur-nished ragarding imposition of infrastructure cess have been disclosed in note - 30.1 to these financial statements.
26.2 This includes amount of Rs. 338 thousand payable to ESOS Management Trust for payments received against issuance of shares to employees under ESOS.
27. ACCRUED MARK UP
Mark up on:Long term financing 46,259 36,228 Short term borrowings 64,224 101,628
110,483 137,856
28. SHORT TERM BORROWINGS
From banking companies - SecuredUnder mark up arrangements
ERF - II28.1
11,726,000 11,021,000 FAPC - own source - 2,750,000 Running finance - 1,263,364
From related parties - UnsecuredChief executive and directors - 146,573
11,726,000 15,180,937
28.1 These are secured against first Joint Pari Passu (JPP) charge of Rs. 26,817.83 million (2018: 26,083.33 million) and ranking charge of Rs. 2,632 million (2018: Nil) by all the lending banks over all present and future current assets of the Company. The total limits available to the Company for short term borrowings from all the banks are amounting to Rs. 24,950 million (2018: 19,562.5 million).
Mark up is charged as;
ERF - II SBP rate + 0.25 to 0.30% p.a (2018: SBP rate + 0.25% to 0.40% p.a).
FAPC - own source 3 months Kibor + 0.25 to 0.50% p.a (2018: 3 to 6 months Kibor + 0.25 to 1.00% p.a)
Running finance 1 to 3 months Kibor + 0.20 to 1.00% p.a (2018: 1 to 3 months Kibor + 0.20 to 1.00% p.a)
29. CURRENT PORTION OF NON CURRENT LIABILITIES
Long term financing 23 1,247,191 968,540 Liabilities against assets subject to finance lease 24 - 470
1,247,191 969,010
2019 2018
Note Rupees in ‘00026.3 Workers’ profit participation fund
Opening balance 210,829 150,200 Interest on funds utilized in the Company's business 21,425 6,172
232,254 156,372
Less: paid during the year (232,069) (156,373)
185 (1)
Add: allocation for the year 285,315 210,830
Closing balance 285,500 210,829
NOTES TO THE UNCONSOLIDATED FINANCIAL STATEMENTSFOR THE YEAR ENDED JUNE 30, 2019
NOTES TO THE UNCONSOLIDATED FINANCIAL STATEMENTSFOR THE YEAR ENDED JUNE 30, 2019
Inte
rloop
Lim
ited
140 141
2018
- 1
9A
nnua
l Rep
ort
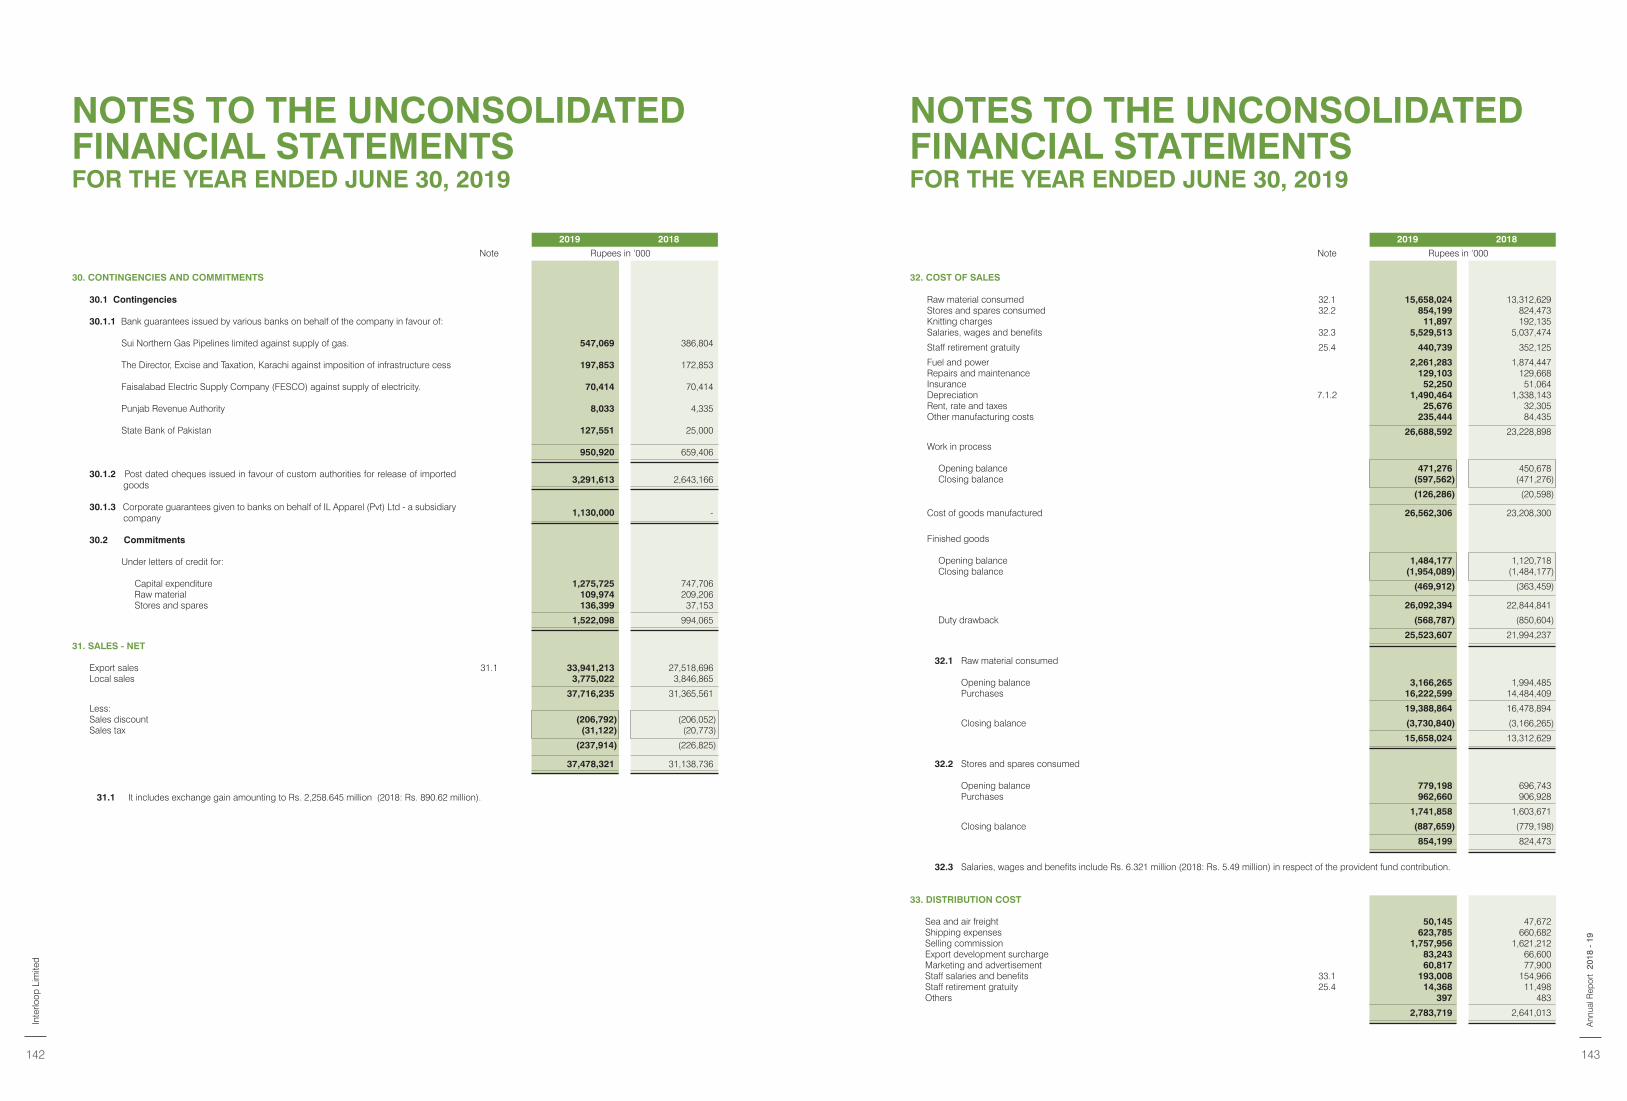
2019 2018
Note Rupees in ‘000
30. CONTINGENCIES AND COMMITMENTS
30.1 Contingencies
30.1.1 Bank guarantees issued by various banks on behalf of the company in favour of:
Sui Northern Gas Pipelines limited against supply of gas. 547,069 386,804
The Director, Excise and Taxation, Karachi against imposition of infrastructure cess 197,853 172,853
Faisalabad Electric Supply Company (FESCO) against supply of electricity. 70,414 70,414
Punjab Revenue Authority 8,033 4,335
State Bank of Pakistan 127,551 25,000
950,920 659,406
30.1.2 Post dated cheques issued in favour of custom authorities for release of imported goods
3,291,613 2,643,166
30.1.3 Corporate guarantees given to banks on behalf of IL Apparel (Pvt) Ltd - a subsidiary company
1,130,000 -
30.2 Commitments
Under letters of credit for:
Capital expenditure 1,275,725 747,706 Raw material 109,974 209,206 Stores and spares 136,399 37,153
1,522,098 994,065
31. SALES - NET
Export sales 31.1 33,941,213 27,518,696 Local sales 3,775,022 3,846,865
37,716,235 31,365,561
Less:Sales discount (206,792) (206,052)Sales tax (31,122) (20,773)
(237,914) (226,825)
37,478,321 31,138,736
31.1 It includes exchange gain amounting to Rs. 2,258.645 million (2018: Rs. 890.62 million).
2019 2018
Note Rupees in ‘000
32. COST OF SALES
Raw material consumed 32.1 15,658,024 13,312,629 Stores and spares consumed 32.2 854,199 824,473 Knitting charges 11,897 192,135 Salaries, wages and benefits 32.3 5,529,513 5,037,474
Staff retirement gratuity 25.4 440,739 352,125
Fuel and power 2,261,283 1,874,447 Repairs and maintenance 129,103 129,668 Insurance 52,250 51,064 Depreciation 7.1.2 1,490,464 1,338,143 Rent, rate and taxes 25,676 32,305 Other manufacturing costs 235,444 84,435
26,688,592 23,228,898
Work in process
Opening balance 471,276 450,678 Closing balance (597,562) (471,276)
(126,286) (20,598)
Cost of goods manufactured 26,562,306 23,208,300
Finished goods
Opening balance 1,484,177 1,120,718 Closing balance (1,954,089) (1,484,177)
(469,912) (363,459)
26,092,394 22,844,841
Duty drawback (568,787) (850,604)
25,523,607 21,994,237
32.1 Raw material consumed
Opening balance 3,166,265 1,994,485 Purchases 16,222,599 14,484,409
19,388,864 16,478,894
Closing balance (3,730,840) (3,166,265)
15,658,024 13,312,629
32.2 Stores and spares consumed
Opening balance 779,198 696,743 Purchases 962,660 906,928
1,741,858 1,603,671
Closing balance (887,659) (779,198)
854,199 824,473
32.3 Salaries, wages and benefits include Rs. 6.321 million (2018: Rs. 5.49 million) in respect of the provident fund contribution.
33. DISTRIBUTION COST
Sea and air freight 50,145 47,672 Shipping expenses 623,785 660,682 Selling commission 1,757,956 1,621,212 Export development surcharge 83,243 66,600 Marketing and advertisement 60,817 77,900 Staff salaries and benefits 33.1 193,008 154,966 Staff retirement gratuity 25.4 14,368 11,498 Others 397 483
2,783,719 2,641,013
NOTES TO THE UNCONSOLIDATED FINANCIAL STATEMENTSFOR THE YEAR ENDED JUNE 30, 2019
NOTES TO THE UNCONSOLIDATED FINANCIAL STATEMENTSFOR THE YEAR ENDED JUNE 30, 2019
Inte
rloop
Lim
ited
142 143
2018
- 1
9A
nnua
l Rep
ort
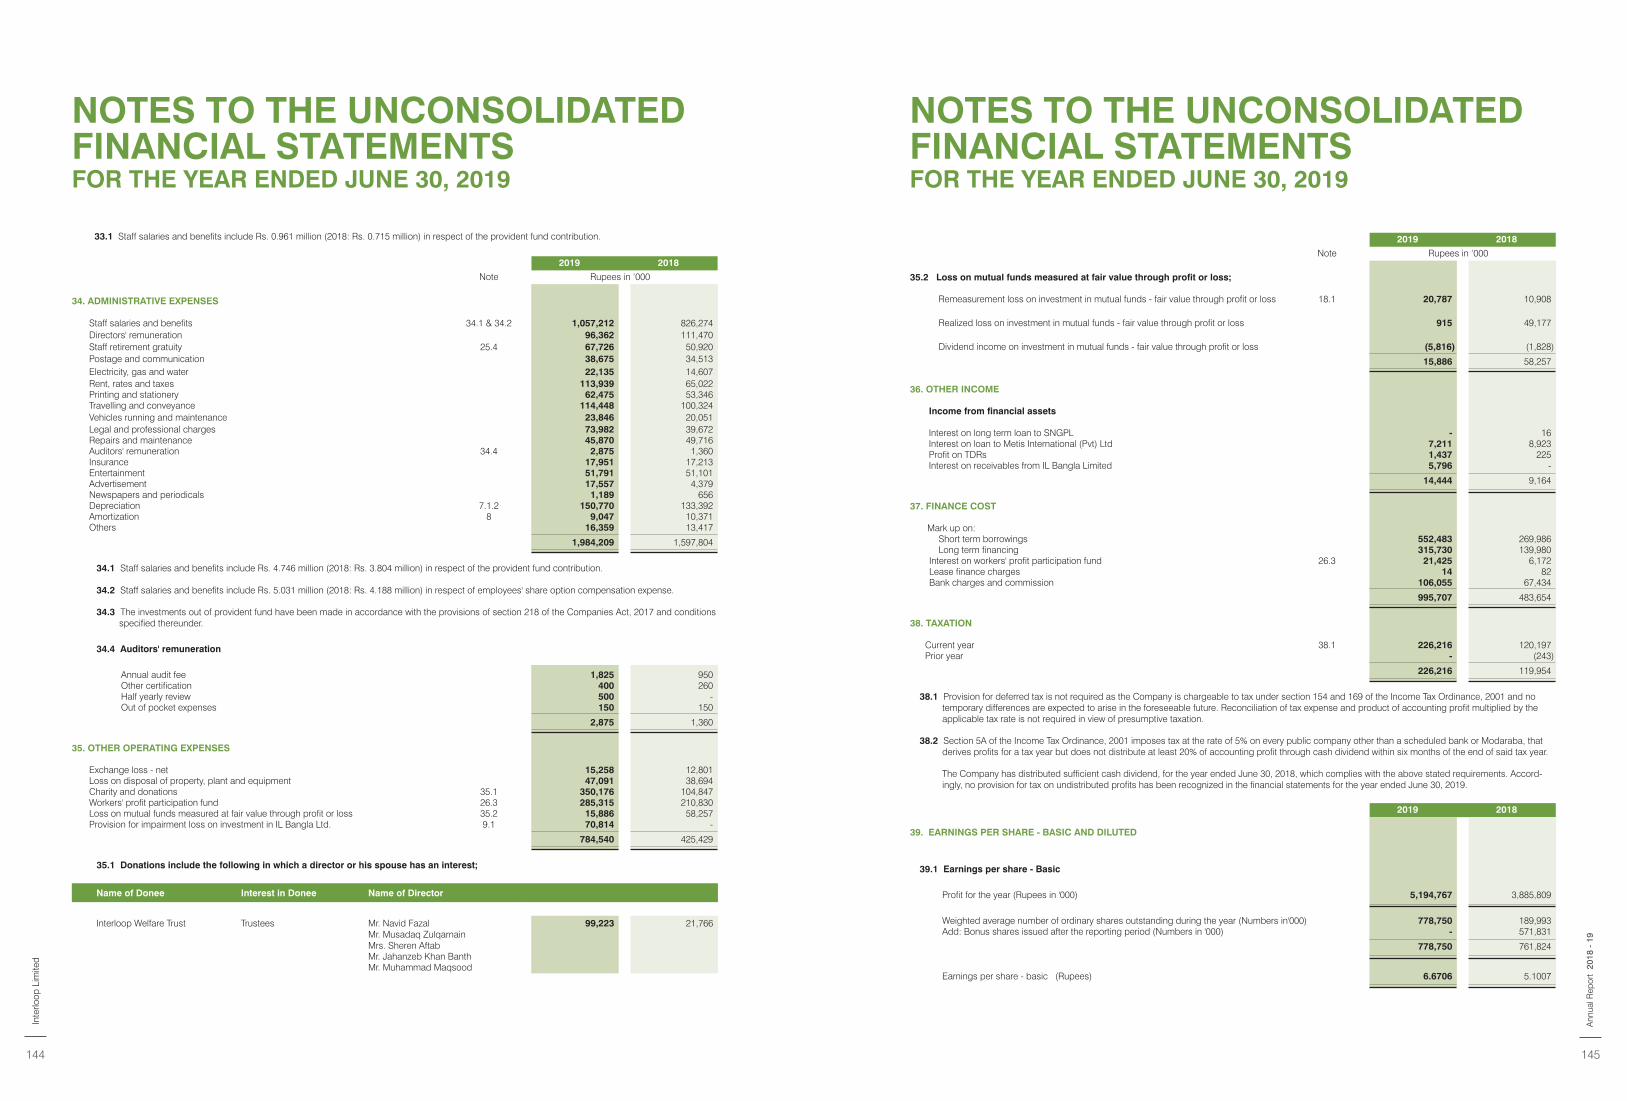
33.1 Staff salaries and benefits include Rs. 0.961 million (2018: Rs. 0.715 million) in respect of the provident fund contribution.
2019 2018
Note Rupees in ‘000
34. ADMINISTRATIVE EXPENSES
Staff salaries and benefits 34.1 & 34.2 1,057,212 826,274 Directors' remuneration 96,362 111,470 Staff retirement gratuity 25.4 67,726 50,920 Postage and communication 38,675 34,513 Electricity, gas and water 22,135 14,607 Rent, rates and taxes 113,939 65,022 Printing and stationery 62,475 53,346 Travelling and conveyance 114,448 100,324 Vehicles running and maintenance 23,846 20,051 Legal and professional charges 73,982 39,672 Repairs and maintenance 45,870 49,716 Auditors' remuneration 34.4 2,875 1,360 Insurance 17,951 17,213 Entertainment 51,791 51,101 Advertisement 17,557 4,379 Newspapers and periodicals 1,189 656 Depreciation 7.1.2 150,770 133,392 Amortization 8 9,047 10,371 Others 16,359 13,417
1,984,209 1,597,804
34.1 Staff salaries and benefits include Rs. 4.746 million (2018: Rs. 3.804 million) in respect of the provident fund contribution.
34.2 Staff salaries and benefits include Rs. 5.031 million (2018: Rs. 4.188 million) in respect of employees' share option compensation expense.
34.3 The investments out of provident fund have been made in accordance with the provisions of section 218 of the Companies Act, 2017 and conditions specified thereunder.
34.4 Auditors' remuneration
Annual audit fee 1,825 950 Other certification 400 260 Half yearly review 500 - Out of pocket expenses 150 150
2,875 1,360
35. OTHER OPERATING EXPENSES
Exchange loss - net 15,258 12,801 Loss on disposal of property, plant and equipment 47,091 38,694 Charity and donations 35.1 350,176 104,847 Workers' profit participation fund 26.3 285,315 210,830 Loss on mutual funds measured at fair value through profit or loss 35.2 15,886 58,257 Provision for impairment loss on investment in IL Bangla Ltd. 9.1 70,814 -
784,540 425,429
35.1 Donations include the following in which a director or his spouse has an interest;
Name of Donee Interest in Donee Name of Director
Interloop Welfare Trust Trustees Mr. Navid Fazal 99,223 21,766 Mr. Musadaq ZulqarnainMrs. Sheren AftabMr. Jahanzeb Khan BanthMr. Muhammad Maqsood
2019 2018
Note Rupees in ‘000
35.2 Loss on mutual funds measured at fair value through profit or loss;
Remeasurement loss on investment in mutual funds - fair value through profit or loss 18.1 20,787 10,908
Realized loss on investment in mutual funds - fair value through profit or loss 915 49,177
Dividend income on investment in mutual funds - fair value through profit or loss (5,816) (1,828)
15,886 58,257
36. OTHER INCOME
Income from financial assets
Interest on long term loan to SNGPL - 16 Interest on loan to Metis International (Pvt) Ltd 7,211 8,923 Profit on TDRs 1,437 225 Interest on receivables from IL Bangla Limited 5,796 -
14,444 9,164
37. FINANCE COST
Mark up on:Short term borrowings 552,483 269,986 Long term financing 315,730 139,980
Interest on workers' profit participation fund 26.3 21,425 6,172 Lease finance charges 14 82 Bank charges and commission 106,055 67,434
995,707 483,654
38. TAXATION
Current year 38.1 226,216 120,197 Prior year - (243)
226,216 119,954
38.1 Provision for deferred tax is not required as the Company is chargeable to tax under section 154 and 169 of the Income Tax Ordinance, 2001 and no temporary differences are expected to arise in the foreseeable future. Reconciliation of tax expense and product of accounting profit multiplied by the applicable tax rate is not required in view of presumptive taxation.
38.2 Section 5A of the Income Tax Ordinance, 2001 imposes tax at the rate of 5% on every public company other than a scheduled bank or Modaraba, that derives profits for a tax year but does not distribute at least 20% of accounting profit through cash dividend within six months of the end of said tax year.
The Company has distributed sufficient cash dividend, for the year ended June 30, 2018, which complies with the above stated requirements. Accord-ingly, no provision for tax on undistributed profits has been recognized in the financial statements for the year ended June 30, 2019.
2019 2018
39. EARNINGS PER SHARE - BASIC AND DILUTED
39.1 Earnings per share - Basic
Profit for the year (Rupees in '000) 5,194,767 3,885,809
Weighted average number of ordinary shares outstanding during the year (Numbers in'000) 778,750 189,993 Add: Bonus shares issued after the reporting period (Numbers in '000) - 571,831
778,750 761,824
Earnings per share - basic (Rupees) 6.6706 5.1007
NOTES TO THE UNCONSOLIDATED FINANCIAL STATEMENTSFOR THE YEAR ENDED JUNE 30, 2019
NOTES TO THE UNCONSOLIDATED FINANCIAL STATEMENTSFOR THE YEAR ENDED JUNE 30, 2019
Inte
rloop
Lim
ited
144 145
2018
- 1
9A
nnua
l Rep
ort
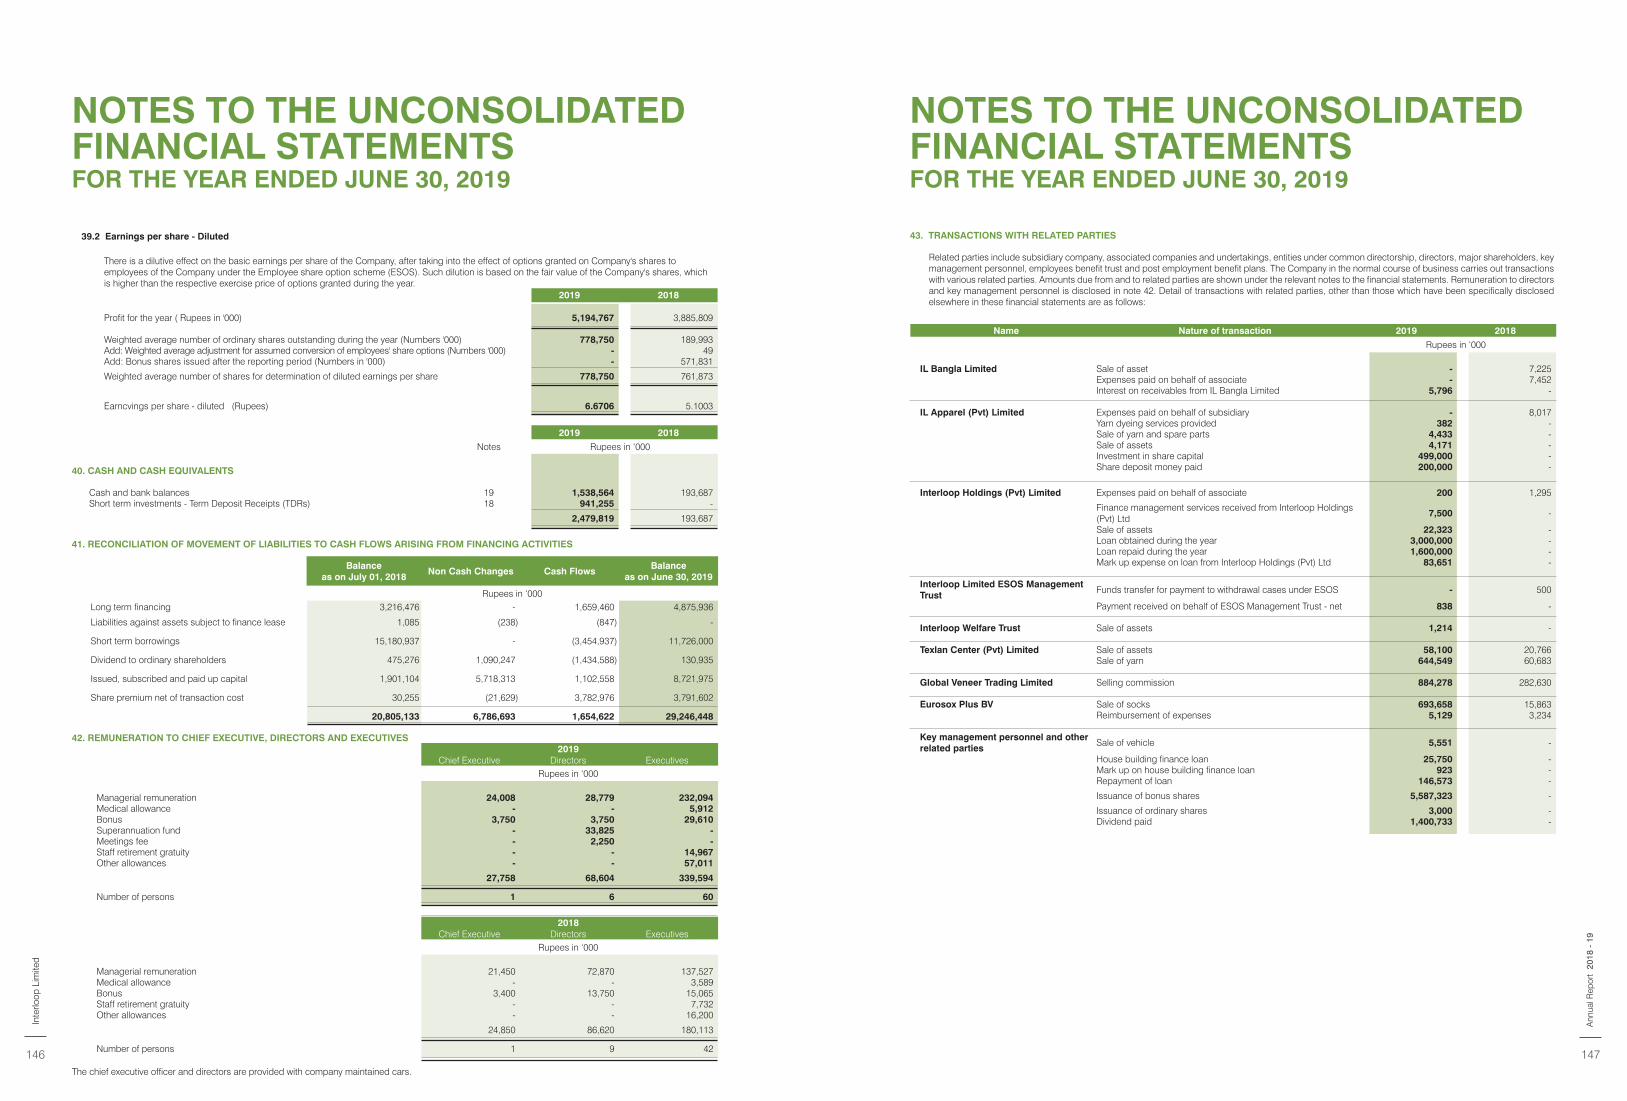
43. TRANSACTIONS WITH RELATED PARTIES
Related parties include subsidiary company, associated companies and undertakings, entities under common directorship, directors, major shareholders, key management personnel, employees benefit trust and post employment benefit plans. The Company in the normal course of business carries out transactions with various related parties. Amounts due from and to related parties are shown under the relevant notes to the financial statements. Remuneration to directors and key management personnel is disclosed in note 42. Detail of transactions with related parties, other than those which have been specifically disclosed elsewhere in these financial statements are as follows:
39.2 Earnings per share - Diluted
There is a dilutive effect on the basic earnings per share of the Company, after taking into the effect of options granted on Company's shares to employees of the Company under the Employee share option scheme (ESOS). Such dilution is based on the fair value of the Company's shares, which is higher than the respective exercise price of options granted during the year.
2019 2018
Profit for the year ( Rupees in '000) 5,194,767 3,885,809
Weighted average number of ordinary shares outstanding during the year (Numbers '000) 778,750 189,993 Add: Weighted average adjustment for assumed conversion of employees' share options (Numbers '000) - 49 Add: Bonus shares issued after the reporting period (Numbers in '000) - 571,831
Weighted average number of shares for determination of diluted earnings per share 778,750 761,873
Earncvings per share - diluted (Rupees) 6.6706 5.1003
2019 2018
Notes Rupees in ‘000
40. CASH AND CASH EQUIVALENTS
Cash and bank balances 19 1,538,564 193,687 Short term investments - Term Deposit Receipts (TDRs) 18 941,255 -
2,479,819 193,687
41. RECONCILIATION OF MOVEMENT OF LIABILITIES TO CASH FLOWS ARISING FROM FINANCING ACTIVITIES
Balance as on July 01, 2018
Non Cash Changes Cash FlowsBalance
as on June 30, 2019
Rupees in ‘000Long term financing 3,216,476 - 1,659,460 4,875,936
Liabilities against assets subject to finance lease 1,085 (238) (847) -
Short term borrowings 15,180,937 - (3,454,937) 11,726,000
Dividend to ordinary shareholders 475,276 1,090,247 (1,434,588) 130,935
Issued, subscribed and paid up capital 1,901,104 5,718,313 1,102,558 8,721,975
Share premium net of transaction cost 30,255 (21,629) 3,782,976 3,791,602
20,805,133 6,786,693 1,654,622 29,246,448
42. REMUNERATION TO CHIEF EXECUTIVE, DIRECTORS AND EXECUTIVES2019
Chief Executive Directors ExecutivesRupees in ‘000
Managerial remuneration 24,008 28,779 232,094 Medical allowance - - 5,912 Bonus 3,750 3,750 29,610 Superannuation fund - 33,825 - Meetings fee - 2,250 - Staff retirement gratuity - - 14,967 Other allowances - - 57,011
27,758 68,604 339,594
Number of persons 1 6 60
2018Chief Executive Directors Executives
Rupees in ‘000
Managerial remuneration 21,450 72,870 137,527 Medical allowance - - 3,589 Bonus 3,400 13,750 15,065 Staff retirement gratuity - - 7,732 Other allowances - - 16,200
24,850 86,620 180,113
Number of persons 1 9 42
The chief executive officer and directors are provided with company maintained cars.
Name Nature of transaction 2019 2018
Rupees in ‘000
IL Bangla Limited Sale of asset - 7,225 Expenses paid on behalf of associate - 7,452 Interest on receivables from IL Bangla Limited 5,796 -
IL Apparel (Pvt) Limited Expenses paid on behalf of subsidiary - 8,017 Yarn dyeing services provided 382 - Sale of yarn and spare parts 4,433 - Sale of assets 4,171 - Investment in share capital 499,000 - Share deposit money paid 200,000 -
Interloop Holdings (Pvt) Limited Expenses paid on behalf of associate 200 1,295
Finance management services received from Interloop Holdings (Pvt) Ltd
7,500 -
Sale of assets 22,323 - Loan obtained during the year 3,000,000 - Loan repaid during the year 1,600,000 - Mark up expense on loan from Interloop Holdings (Pvt) Ltd 83,651 -
Interloop Limited ESOS Management Trust
Funds transfer for payment to withdrawal cases under ESOS - 500
Payment received on behalf of ESOS Management Trust - net 838 -
Interloop Welfare Trust Sale of assets 1,214 -
Texlan Center (Pvt) Limited Sale of assets 58,100 20,766 Sale of yarn 644,549 60,683
Global Veneer Trading Limited Selling commission 884,278 282,630
Eurosox Plus BV Sale of socks 693,658 15,863 Reimbursement of expenses 5,129 3,234
Key management personnel and other related parties
Sale of vehicle 5,551 -
House building finance loan 25,750 - Mark up on house building finance loan 923 - Repayment of loan 146,573 -
Issuance of bonus shares 5,587,323 -
Issuance of ordinary shares 3,000 - Dividend paid 1,400,733 -
NOTES TO THE UNCONSOLIDATED FINANCIAL STATEMENTSFOR THE YEAR ENDED JUNE 30, 2019
NOTES TO THE UNCONSOLIDATED FINANCIAL STATEMENTSFOR THE YEAR ENDED JUNE 30, 2019
Inte
rloop
Lim
ited
146 147
2018
- 1
9A
nnua
l Rep
ort
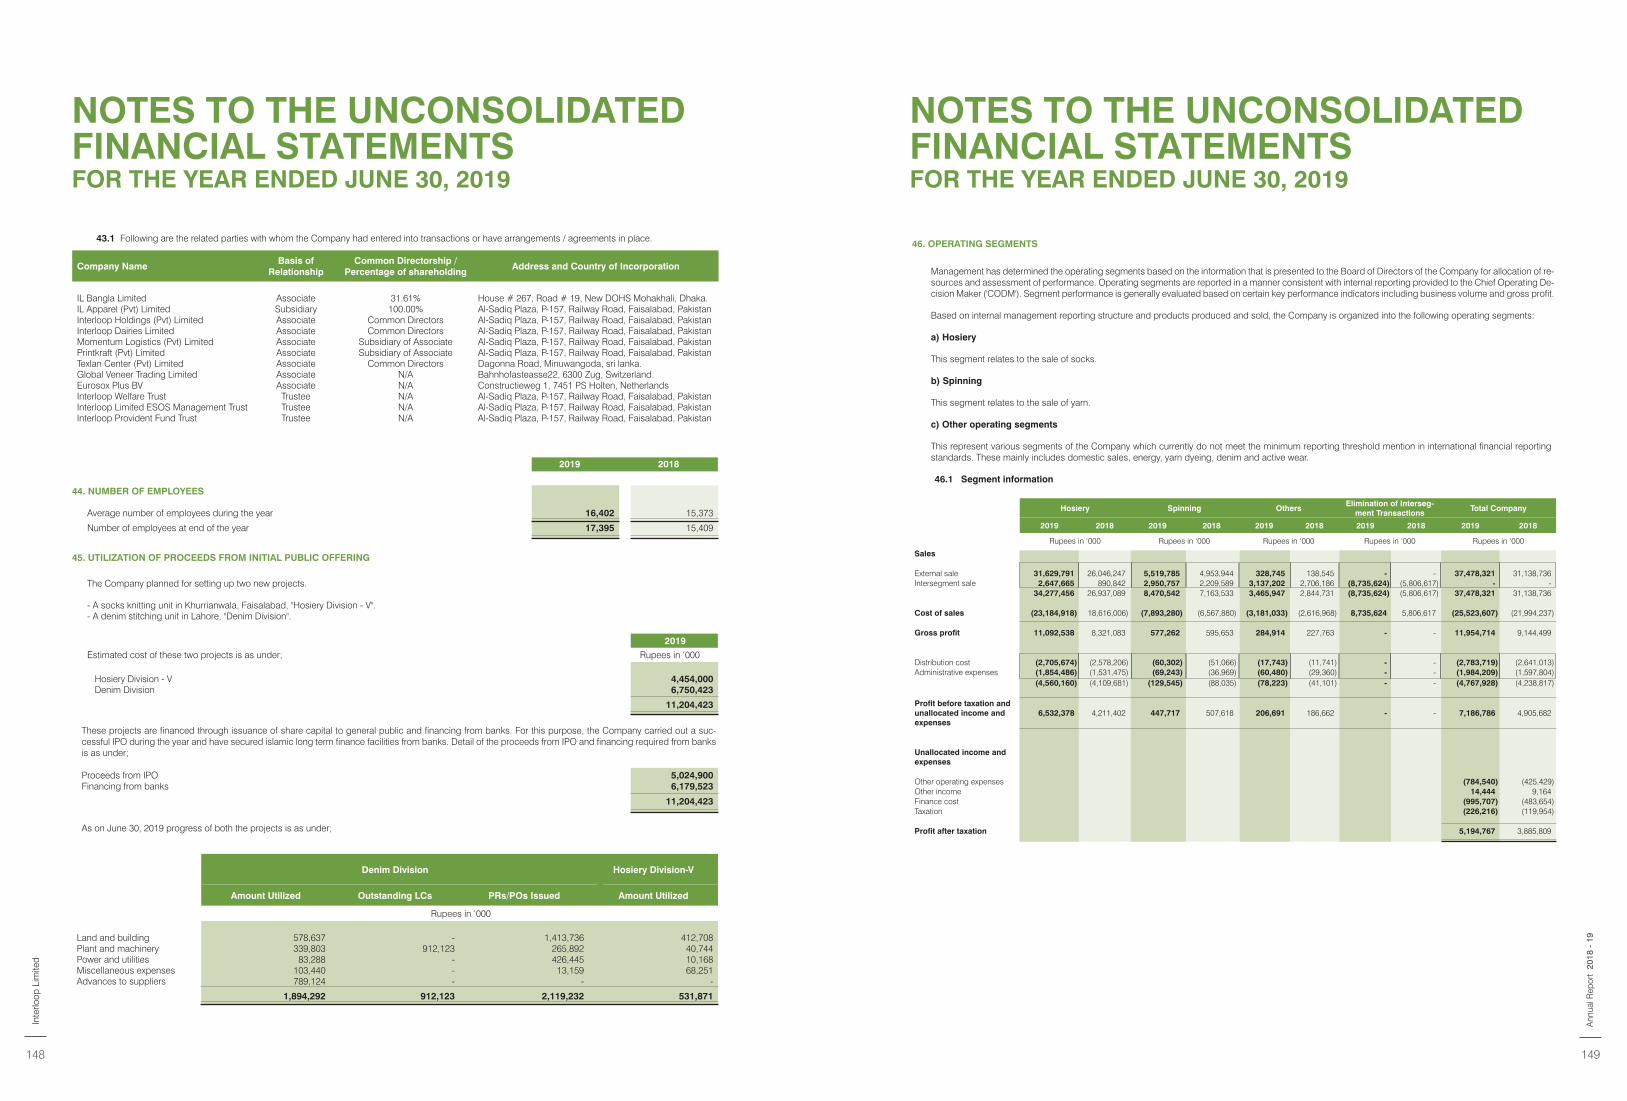
Company NameBasis of
RelationshipCommon Directorship /
Percentage of shareholdingAddress and Country of Incorporation
IL Bangla Limited Associate 31.61% House # 267, Road # 19, New DOHS Mohakhali, Dhaka. IL Apparel (Pvt) Limited Subsidiary 100.00% Al-Sadiq Plaza, P-157, Railway Road, Faisalabad, PakistanInterloop Holdings (Pvt) Limited Associate Common Directors Al-Sadiq Plaza, P-157, Railway Road, Faisalabad, PakistanInterloop Dairies Limited Associate Common Directors Al-Sadiq Plaza, P-157, Railway Road, Faisalabad, PakistanMomentum Logistics (Pvt) Limited Associate Subsidiary of Associate Al-Sadiq Plaza, P-157, Railway Road, Faisalabad, PakistanPrintkraft (Pvt) Limited Associate Subsidiary of Associate Al-Sadiq Plaza, P-157, Railway Road, Faisalabad, PakistanTexlan Center (Pvt) Limited Associate Common Directors Dagonna Road, Minuwangoda, sri lanka.Global Veneer Trading Limited Associate N/A Bahnhofasteasse22, 6300 Zug, Switzerland.Eurosox Plus BV Associate N/A Constructieweg 1, 7451 PS Holten, NetherlandsInterloop Welfare Trust Trustee N/A Al-Sadiq Plaza, P-157, Railway Road, Faisalabad, PakistanInterloop Limited ESOS Management Trust Trustee N/A Al-Sadiq Plaza, P-157, Railway Road, Faisalabad, PakistanInterloop Provident Fund Trust Trustee N/A Al-Sadiq Plaza, P-157, Railway Road, Faisalabad, Pakistan
2019 2018
44. NUMBER OF EMPLOYEES
Average number of employees during the year 16,402 15,373
Number of employees at end of the year 17,395 15,409
45. UTILIZATION OF PROCEEDS FROM INITIAL PUBLIC OFFERING
The Company planned for setting up two new projects.
- A socks knitting unit in Khurrianwala, Faisalabad, "Hosiery Division - V".- A denim stitching unit in Lahore, "Denim Division".
2019
Estimated cost of these two projects is as under; Rupees in ‘000
Hosiery Division - V 4,454,000 Denim Division 6,750,423
11,204,423
These projects are financed through issuance of share capital to general public and financing from banks. For this purpose, the Company carried out a suc-cessful IPO during the year and have secured islamic long term finance facilities from banks. Detail of the proceeds from IPO and financing required from banks is as under;
Proceeds from IPO 5,024,900 Financing from banks 6,179,523
11,204,423
As on June 30, 2019 progress of both the projects is as under;
43.1 Following are the related parties with whom the Company had entered into transactions or have arrangements / agreements in place.
Denim Division Hosiery Division-V
Amount Utilized Outstanding LCs PRs/POs Issued Amount Utilized
Rupees in ‘000
Land and building 578,637 - 1,413,736 412,708 Plant and machinery 339,803 912,123 265,892 40,744 Power and utilities 83,288 - 426,445 10,168 Miscellaneous expenses 103,440 - 13,159 68,251 Advances to suppliers 789,124 - - -
1,894,292 912,123 2,119,232 531,871
46. OPERATING SEGMENTS
Management has determined the operating segments based on the information that is presented to the Board of Directors of the Company for allocation of re-sources and assessment of performance. Operating segments are reported in a manner consistent with internal reporting provided to the Chief Operating De-cision Maker ('CODM'). Segment performance is generally evaluated based on certain key performance indicators including business volume and gross profit.
Based on internal management reporting structure and products produced and sold, the Company is organized into the following operating segments:
a) Hosiery
This segment relates to the sale of socks.
b) Spinning
This segment relates to the sale of yarn.
c) Other operating segments
This represent various segments of the Company which currently do not meet the minimum reporting threshold mention in international financial reporting standards. These mainly includes domestic sales, energy, yarn dyeing, denim and active wear.
46.1 Segment information
Hosiery Spinning OthersElimination of Interseg-
ment TransactionsTotal Company
2019 2018 2019 2018 2019 2018 2019 2018 2019 2018
Rupees in ‘000 Rupees in ‘000 Rupees in ‘000 Rupees in ‘000 Rupees in ‘000
Sales
External sale 31,629,791 26,046,247 5,519,785 4,953,944 328,745 138,545 - - 37,478,321 31,138,736 Intersegment sale 2,647,665 890,842 2,950,757 2,209,589 3,137,202 2,706,186 (8,735,624) (5,806,617) - -
34,277,456 26,937,089 8,470,542 7,163,533 3,465,947 2,844,731 (8,735,624) (5,806,617) 37,478,321 31,138,736
Cost of sales (23,184,918) 18,616,006) (7,893,280) (6,567,880) (3,181,033) (2,616,968) 8,735,624 5,806,617 (25,523,607) (21,994,237)
Gross profit 11,092,538 8,321,083 577,262 595,653 284,914 227,763 - - 11,954,714 9,144,499
Distribution cost (2,705,674) (2,578,206) (60,302) (51,066) (17,743) (11,741) - - (2,783,719) (2,641,013)Administrative expenses (1,854,486) (1,531,475) (69,243) (36,969) (60,480) (29,360) - - (1,984,209) (1,597,804)
(4,560,160) (4,109,681) (129,545) (88,035) (78,223) (41,101) - - (4,767,928) (4,238,817)
Profit before taxation and unallocated income and expenses
6,532,378 4,211,402 447,717 507,618 206,691 186,662 - - 7,186,786 4,905,682
Unallocated income and expenses
Other operating expenses (784,540) (425,429)Other income 14,444 9,164 Finance cost (995,707) (483,654)Taxation (226,216) (119,954)
Profit after taxation 5,194,767 3,885,809
NOTES TO THE UNCONSOLIDATED FINANCIAL STATEMENTSFOR THE YEAR ENDED JUNE 30, 2019
NOTES TO THE UNCONSOLIDATED FINANCIAL STATEMENTSFOR THE YEAR ENDED JUNE 30, 2019
Inte
rloop
Lim
ited
148 149
2018
- 1
9A
nnua
l Rep
ort
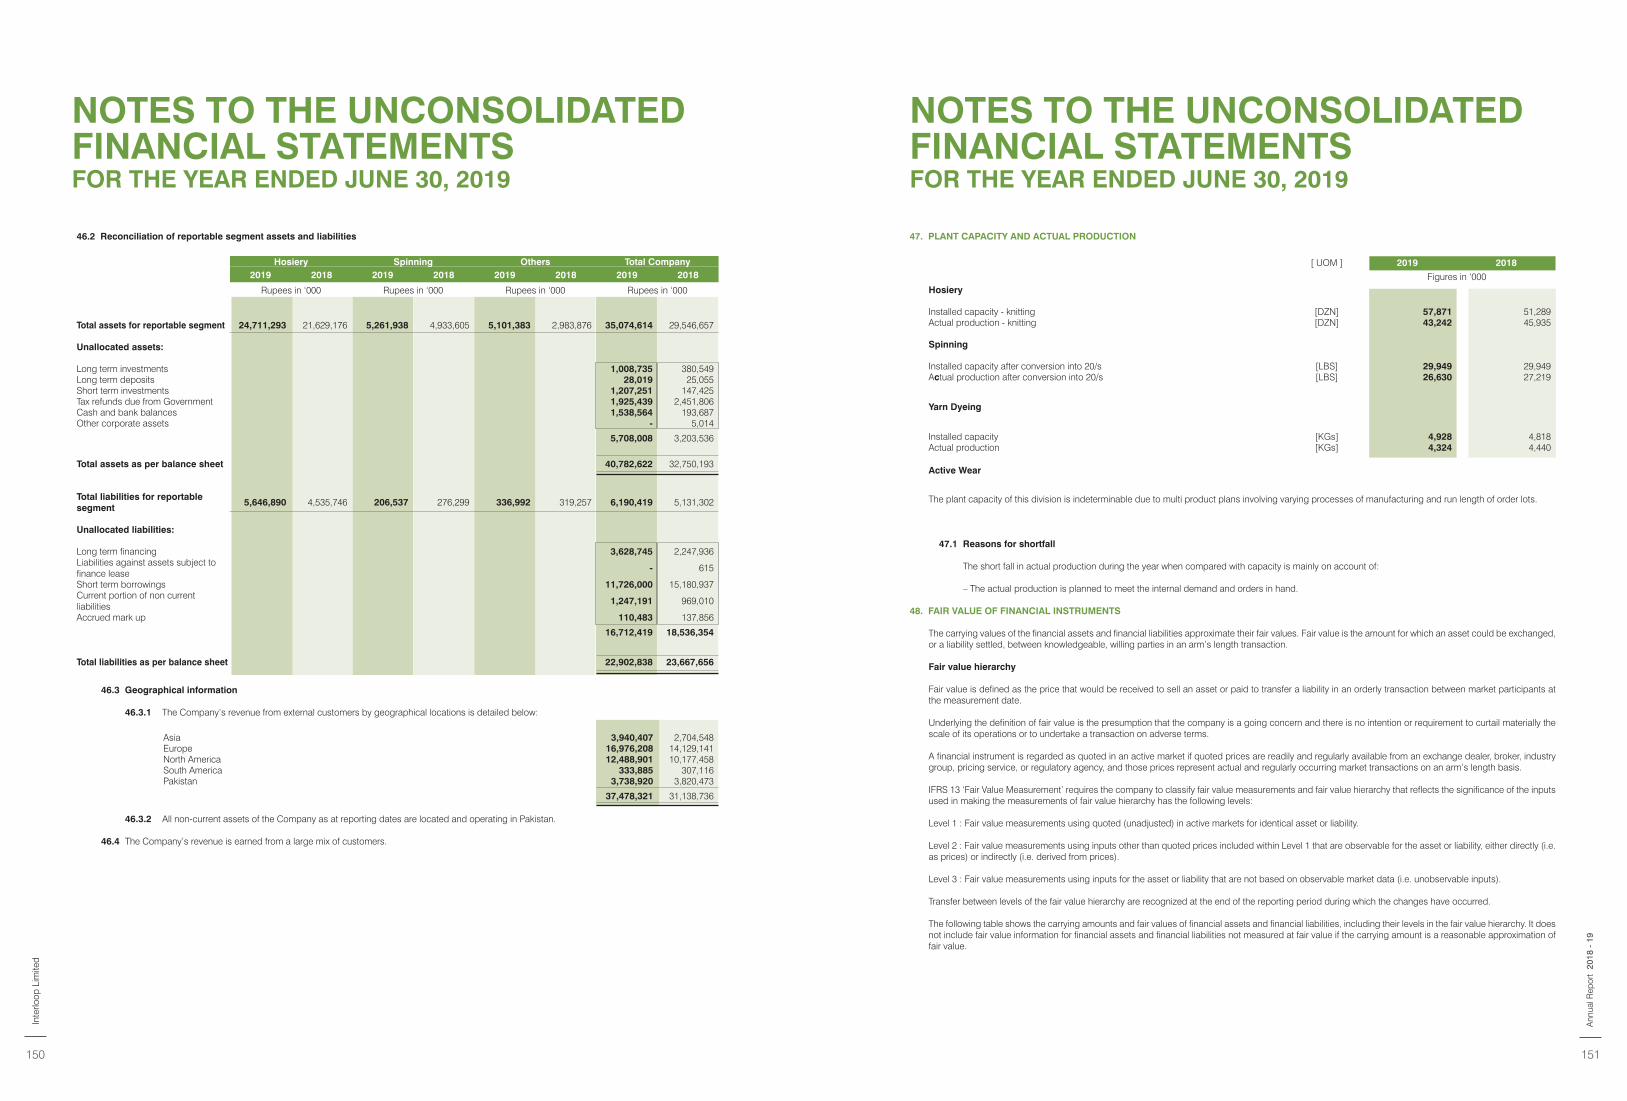
46.2 Reconciliation of reportable segment assets and liabilities
Hosiery Spinning Others Total Company2019 2018 2019 2018 2019 2018 2019 2018
Rupees in ‘000 Rupees in ‘000 Rupees in ‘000 Rupees in ‘000
Total assets for reportable segment 24,711,293 21,629,176 5,261,938 4,933,605 5,101,383 2,983,876 35,074,614 29,546,657
Unallocated assets:
Long term investments 1,008,735 380,549 Long term deposits 28,019 25,055 Short term investments 1,207,251 147,425 Tax refunds due from Government 1,925,439 2,451,806 Cash and bank balances 1,538,564 193,687 Other corporate assets - 5,014
5,708,008 3,203,536
Total assets as per balance sheet 40,782,622 32,750,193
Total liabilities for reportable segment
5,646,890 4,535,746 206,537 276,299 336,992 319,257 6,190,419 5,131,302
Unallocated liabilities:
Long term financing 3,628,745 2,247,936 Liabilities against assets subject to finance lease
- 615
Short term borrowings 11,726,000 15,180,937 Current portion of non current liabilities
1,247,191 969,010
Accrued mark up 110,483 137,856
16,712,419 18,536,354
Total liabilities as per balance sheet 22,902,838 23,667,656
46.3 Geographical information
46.3.1 The Company’s revenue from external customers by geographical locations is detailed below:
Asia 3,940,407 2,704,548 Europe 16,976,208 14,129,141 North America 12,488,901 10,177,458 South America 333,885 307,116 Pakistan 3,738,920 3,820,473
37,478,321 31,138,736
46.3.2 All non-current assets of the Company as at reporting dates are located and operating in Pakistan.
46.4 The Company’s revenue is earned from a large mix of customers.
47. PLANT CAPACITY AND ACTUAL PRODUCTION
[ UOM ] 2019 2018
Figures in ‘000Hosiery
Installed capacity - knitting [DZN] 57,871 51,289 Actual production - knitting [DZN] 43,242 45,935
Spinning
Installed capacity after conversion into 20/s [LBS] 29,949 29,949 Actual production after conversion into 20/s [LBS] 26,630 27,219
Yarn Dyeing
Installed capacity [KGs] 4,928 4,818 Actual production [KGs] 4,324 4,440
Active Wear
The plant capacity of this division is indeterminable due to multi product plans involving varying processes of manufacturing and run length of order lots.
47.1 Reasons for shortfall The short fall in actual production during the year when compared with capacity is mainly on account of: – The actual production is planned to meet the internal demand and orders in hand.
48. FAIR VALUE OF FINANCIAL INSTRUMENTS
The carrying values of the financial assets and financial liabilities approximate their fair values. Fair value is the amount for which an asset could be exchanged, or a liability settled, between knowledgeable, willing parties in an arm’s length transaction. Fair value hierarchy Fair value is defined as the price that would be received to sell an asset or paid to transfer a liability in an orderly transaction between market participants at the measurement date. Underlying the definition of fair value is the presumption that the company is a going concern and there is no intention or requirement to curtail materially the scale of its operations or to undertake a transaction on adverse terms.
A financial instrument is regarded as quoted in an active market if quoted prices are readily and regularly available from an exchange dealer, broker, industry group, pricing service, or regulatory agency, and those prices represent actual and regularly occurring market transactions on an arm’s length basis.
IFRS 13 ‘Fair Value Measurement’ requires the company to classify fair value measurements and fair value hierarchy that reflects the significance of the inputs used in making the measurements of fair value hierarchy has the following levels:
Level 1 : Fair value measurements using quoted (unadjusted) in active markets for identical asset or liability. Level 2 : Fair value measurements using inputs other than quoted prices included within Level 1 that are observable for the asset or liability, either directly (i.e. as prices) or indirectly (i.e. derived from prices). Level 3 : Fair value measurements using inputs for the asset or liability that are not based on observable market data (i.e. unobservable inputs).
Transfer between levels of the fair value hierarchy are recognized at the end of the reporting period during which the changes have occurred.
The following table shows the carrying amounts and fair values of financial assets and financial liabilities, including their levels in the fair value hierarchy. It does not include fair value information for financial assets and financial liabilities not measured at fair value if the carrying amount is a reasonable approximation of fair value.
NOTES TO THE UNCONSOLIDATED FINANCIAL STATEMENTSFOR THE YEAR ENDED JUNE 30, 2019
NOTES TO THE UNCONSOLIDATED FINANCIAL STATEMENTSFOR THE YEAR ENDED JUNE 30, 2019
Inte
rloop
Lim
ited
150 151
2018
- 1
9A
nnua
l Rep
ort
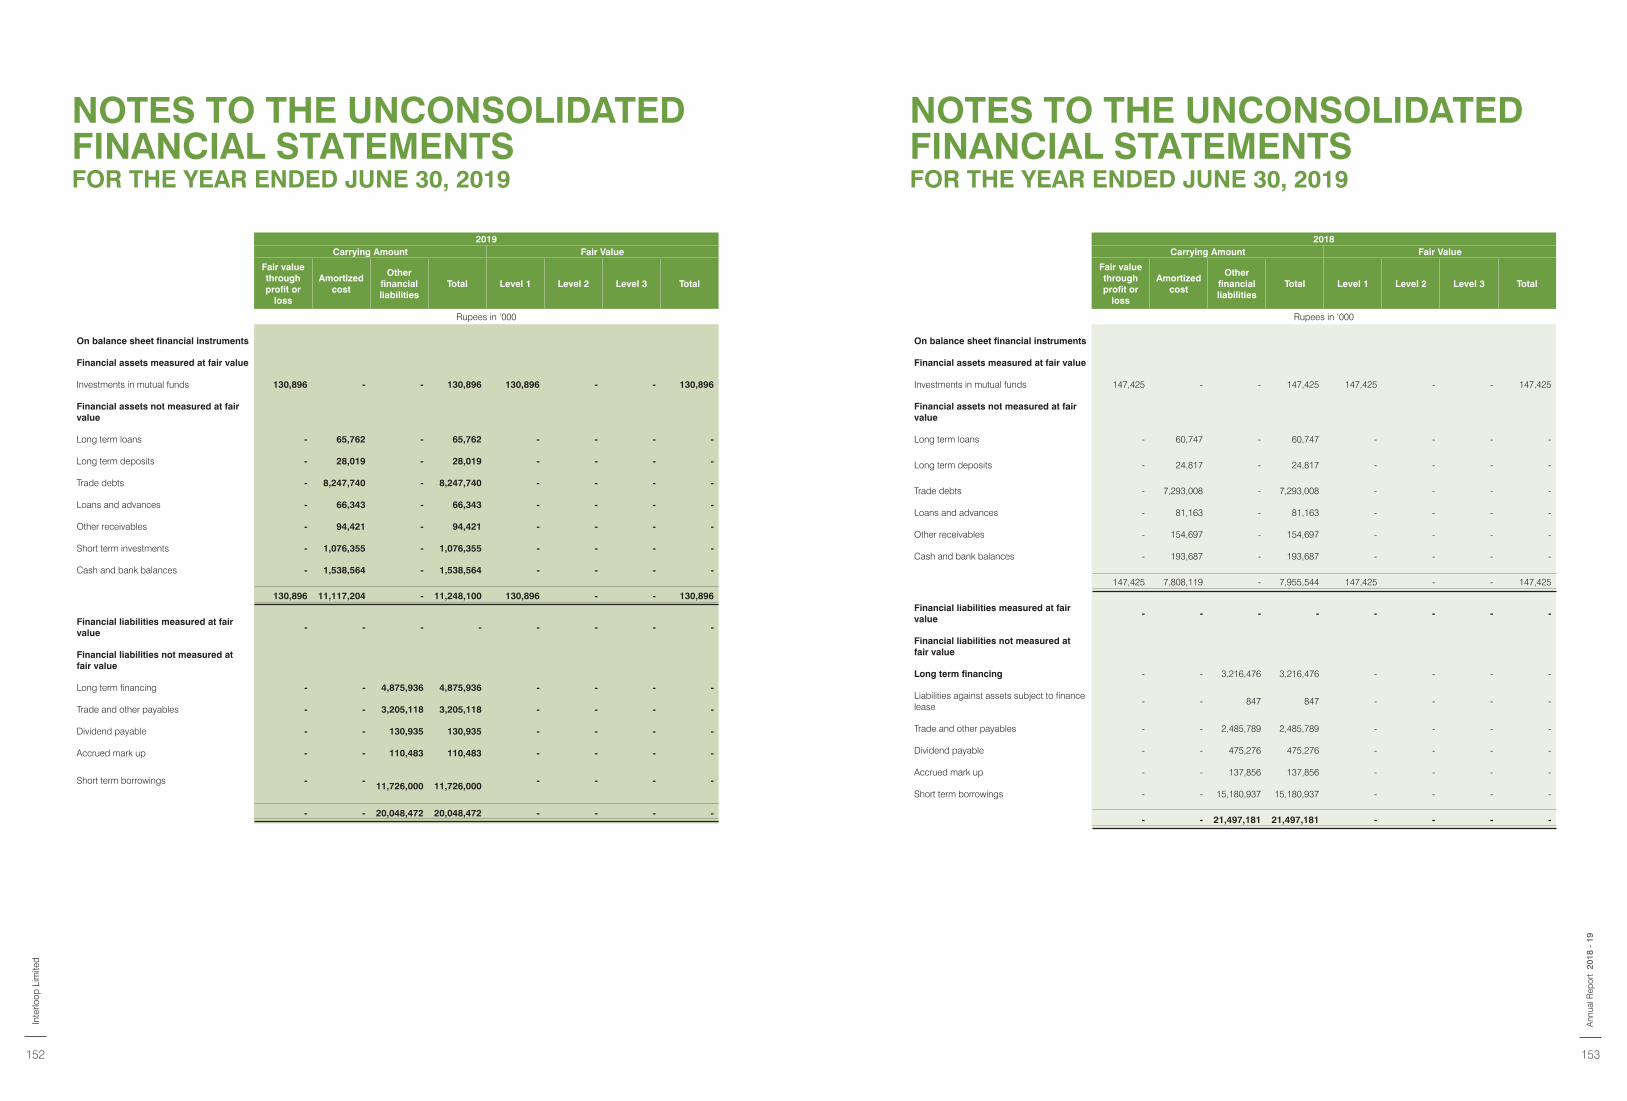
2019Carrying Amount Fair Value
Fair value through profit or
loss
Amortized cost
Other financial liabilities
Total Level 1 Level 2 Level 3 Total
Rupees in ‘000
On balance sheet financial instruments
Financial assets measured at fair value
Investments in mutual funds 130,896 - - 130,896 130,896 - - 130,896
Financial assets not measured at fair value
Long term loans - 65,762 - 65,762 - - - -
Long term deposits - 28,019 - 28,019 - - - -
Trade debts - 8,247,740 - 8,247,740 - - - -
Loans and advances - 66,343 - 66,343 - - - -
Other receivables - 94,421 - 94,421 - - - -
Short term investments - 1,076,355 - 1,076,355 - - - -
Cash and bank balances - 1,538,564 - 1,538,564 - - - -
130,896 11,117,204 - 11,248,100 130,896 - - 130,896
Financial liabilities measured at fair value
- - - - - - - -
Financial liabilities not measured at fair value
Long term financing - - 4,875,936 4,875,936 - - - -
Trade and other payables - - 3,205,118 3,205,118 - - - -
Dividend payable - - 130,935 130,935 - - - -
Accrued mark up - - 110,483 110,483 - - - -
Short term borrowings - -
11,726,000
11,726,000 - - - -
- - 20,048,472 20,048,472 - - - -
2018Carrying Amount Fair Value
Fair value through profit or
loss
Amortized cost
Other financial liabilities
Total Level 1 Level 2 Level 3 Total
Rupees in ‘000
On balance sheet financial instruments
Financial assets measured at fair value
Investments in mutual funds 147,425 - - 147,425 147,425 - - 147,425
Financial assets not measured at fair value
Long term loans - 60,747 - 60,747 - - - -
Long term deposits - 24,817 - 24,817 - - - -
Trade debts - 7,293,008 - 7,293,008 - - - -
Loans and advances - 81,163 - 81,163 - - - -
Other receivables - 154,697 - 154,697 - - - -
Cash and bank balances - 193,687 - 193,687 - - - -
147,425 7,808,119 - 7,955,544 147,425 - - 147,425
Financial liabilities measured at fair value
- - - - - - - -
Financial liabilities not measured at fair value
Long term financing - - 3,216,476 3,216,476 - - - -
Liabilities against assets subject to finance lease
- - 847 847 - - - -
Trade and other payables - - 2,485,789 2,485,789 - - - -
Dividend payable - - 475,276 475,276 - - - -
Accrued mark up - - 137,856 137,856 - - - -
Short term borrowings - - 15,180,937 15,180,937 - - - -
- - 21,497,181 21,497,181 - - - -
NOTES TO THE UNCONSOLIDATED FINANCIAL STATEMENTSFOR THE YEAR ENDED JUNE 30, 2019
NOTES TO THE UNCONSOLIDATED FINANCIAL STATEMENTSFOR THE YEAR ENDED JUNE 30, 2019
Inte
rloop
Lim
ited
152 153
2018
- 1
9A
nnua
l Rep
ort
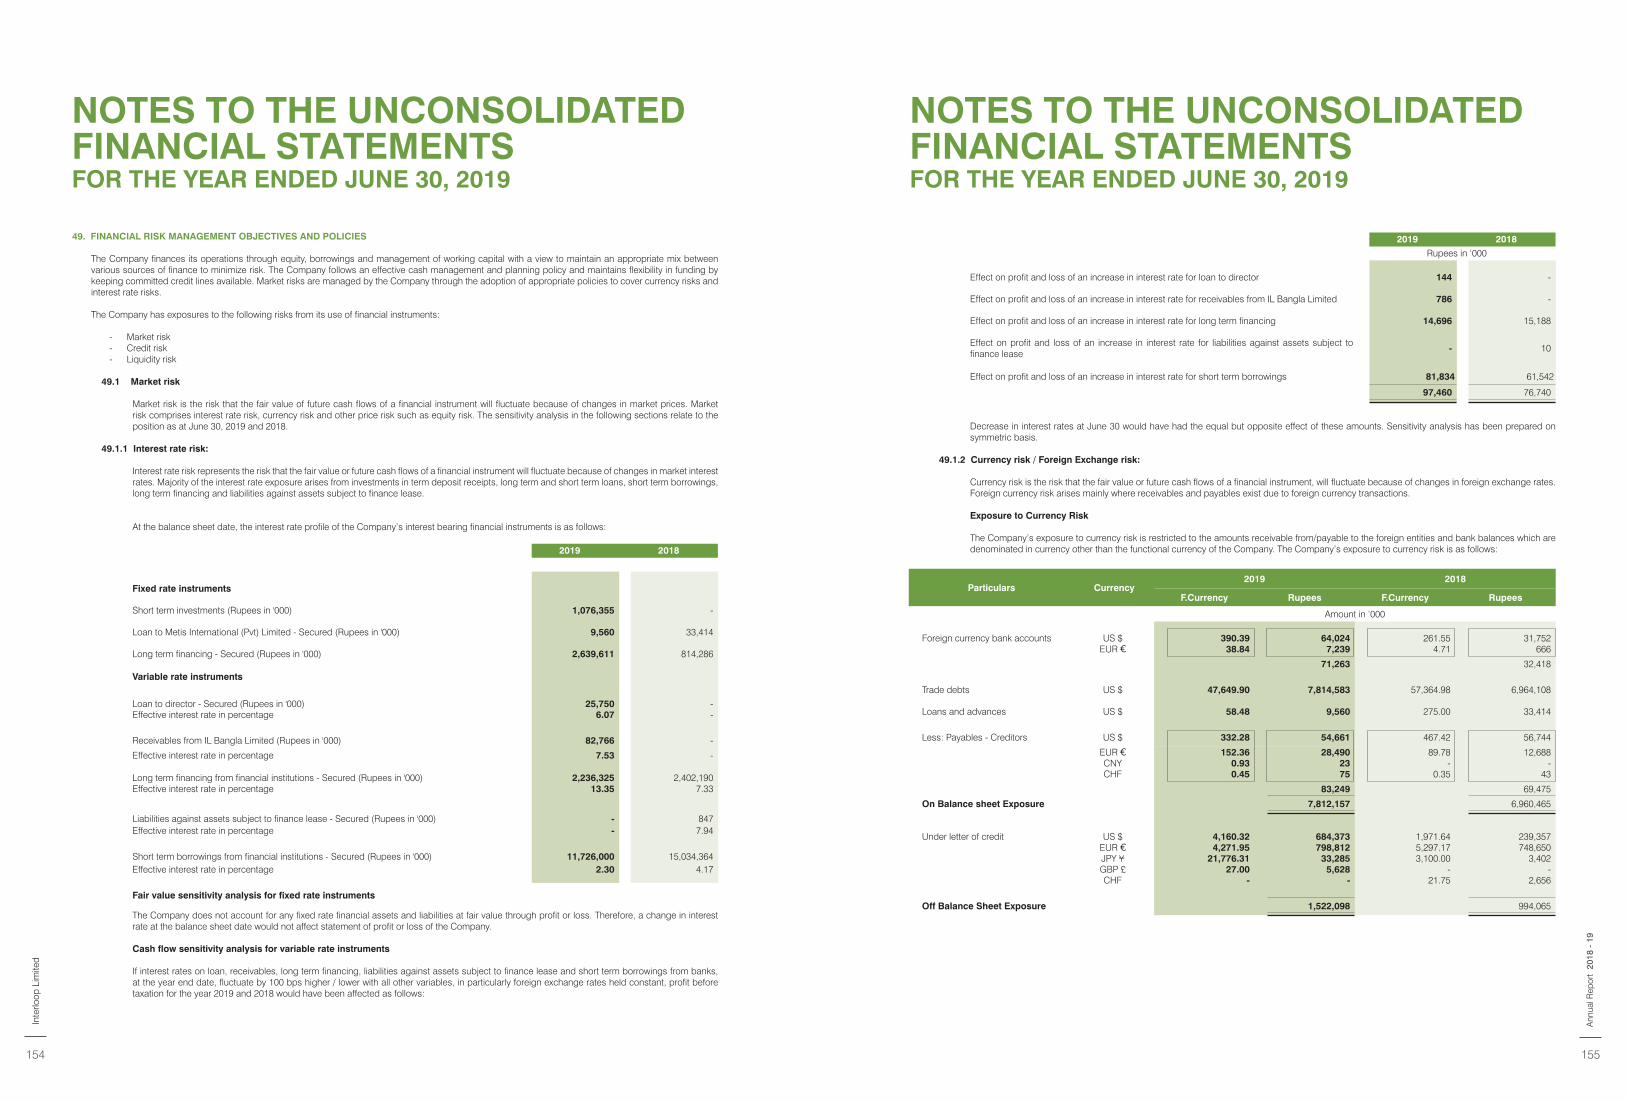
49. FINANCIAL RISK MANAGEMENT OBJECTIVES AND POLICIES
The Company finances its operations through equity, borrowings and management of working capital with a view to maintain an appropriate mix between various sources of finance to minimize risk. The Company follows an effective cash management and planning policy and maintains flexibility in funding by keeping committed credit lines available. Market risks are managed by the Company through the adoption of appropriate policies to cover currency risks and interest rate risks.
The Company has exposures to the following risks from its use of financial instruments:
- Market risk - Credit risk - Liquidity risk
49.1 Market risk
Market risk is the risk that the fair value of future cash flows of a financial instrument will fluctuate because of changes in market prices. Market risk comprises interest rate risk, currency risk and other price risk such as equity risk. The sensitivity analysis in the following sections relate to the position as at June 30, 2019 and 2018.
49.1.1 Interest rate risk:
Interest rate risk represents the risk that the fair value or future cash flows of a financial instrument will fluctuate because of changes in market interest rates. Majority of the interest rate exposure arises from investments in term deposit receipts, long term and short term loans, short term borrowings, long term financing and liabilities against assets subject to finance lease.
At the balance sheet date, the interest rate profile of the Company’s interest bearing financial instruments is as follows:
2019 2018
Fixed rate instruments
Short term investments (Rupees in '000) 1,076,355 -
Loan to Metis International (Pvt) Limited - Secured (Rupees in '000) 9,560 33,414
Long term financing - Secured (Rupees in '000) 2,639,611 814,286
Variable rate instruments
Loan to director - Secured (Rupees in '000) 25,750 - Effective interest rate in percentage 6.07 -
Receivables from IL Bangla Limited (Rupees in '000) 82,766 -
Effective interest rate in percentage 7.53 -
Long term financing from financial institutions - Secured (Rupees in '000) 2,236,325 2,402,190 Effective interest rate in percentage 13.35 7.33
Liabilities against assets subject to finance lease - Secured (Rupees in '000) - 847 Effective interest rate in percentage - 7.94
Short term borrowings from financial institutions - Secured (Rupees in '000) 11,726,000 15,034,364 Effective interest rate in percentage 2.30 4.17
Fair value sensitivity analysis for fixed rate instruments
The Company does not account for any fixed rate financial assets and liabilities at fair value through profit or loss. Therefore, a change in interest rate at the balance sheet date would not affect statement of profit or loss of the Company.
Cash flow sensitivity analysis for variable rate instruments
If interest rates on loan, receivables, long term financing, liabilities against assets subject to finance lease and short term borrowings from banks, at the year end date, fluctuate by 100 bps higher / lower with all other variables, in particularly foreign exchange rates held constant, profit before taxation for the year 2019 and 2018 would have been affected as follows:
2019 2018
Rupees in ‘000
Effect on profit and loss of an increase in interest rate for loan to director 144 -
Effect on profit and loss of an increase in interest rate for receivables from IL Bangla Limited 786 -
Effect on profit and loss of an increase in interest rate for long term financing 14,696 15,188
Effect on profit and loss of an increase in interest rate for liabilities against assets subject to finance lease
- 10
Effect on profit and loss of an increase in interest rate for short term borrowings 81,834 61,542
97,460 76,740
Decrease in interest rates at June 30 would have had the equal but opposite effect of these amounts. Sensitivity analysis has been prepared on symmetric basis.
49.1.2 Currency risk / Foreign Exchange risk:
Currency risk is the risk that the fair value or future cash flows of a financial instrument, will fluctuate because of changes in foreign exchange rates. Foreign currency risk arises mainly where receivables and payables exist due to foreign currency transactions.
Exposure to Currency Risk The Company’s exposure to currency risk is restricted to the amounts receivable from/payable to the foreign entities and bank balances which are denominated in currency other than the functional currency of the Company. The Company’s exposure to currency risk is as follows:
Particulars Currency2019 2018
F.Currency Rupees F.Currency Rupees
Amount in ‘000
Foreign currency bank accounts US $ 390.39 64,024 261.55 31,752 EUR 38.84 7,239 4.71 666
71,263 32,418
Trade debts US $ 47,649.90 7,814,583 57,364.98 6,964,108
Loans and advances US $ 58.48 9,560 275.00 33,414
Less: Payables - Creditors US $ 332.28 54,661 467.42 56,744
EUR 152.36 28,490 89.78 12,688 CNY 0.93 23 - - CHF 0.45 75 0.35 43
83,249 69,475
On Balance sheet Exposure 7,812,157 6,960,465
Under letter of credit US $ 4,160.32 684,373 1,971.64 239,357 EUR 4,271.95 798,812 5,297.17 748,650 JPY ¥ 21,776.31 33,285 3,100.00 3,402 GBP £ 27.00 5,628 - - CHF - - 21.75 2,656
Off Balance Sheet Exposure 1,522,098 994,065
NOTES TO THE UNCONSOLIDATED FINANCIAL STATEMENTSFOR THE YEAR ENDED JUNE 30, 2019
NOTES TO THE UNCONSOLIDATED FINANCIAL STATEMENTSFOR THE YEAR ENDED JUNE 30, 2019
Inte
rloop
Lim
ited
154 155
2018
- 1
9A
nnua
l Rep
ort
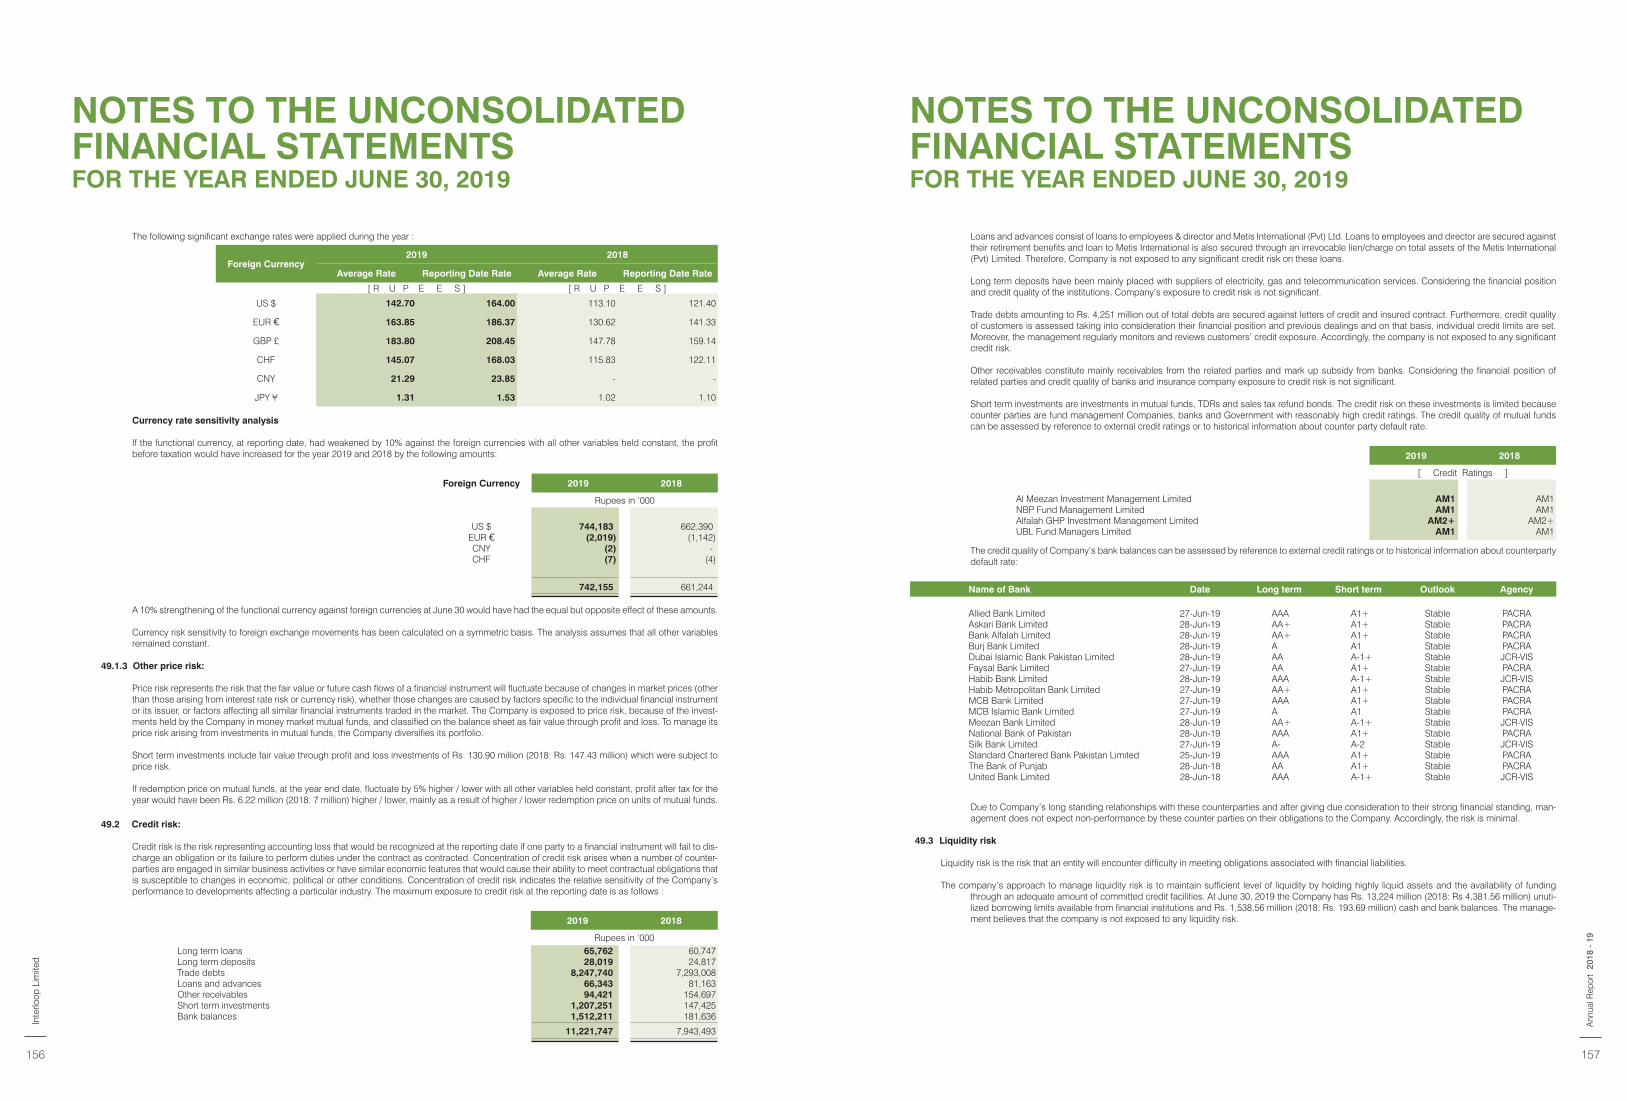
The following significant exchange rates were applied during the year :
Foreign Currency2019 2018
Average Rate Reporting Date Rate Average Rate Reporting Date Rate
[ R U P E E S ] [ R U P E E S ]
US $ 142.70 164.00 113.10 121.40
EUR 163.85 186.37 130.62 141.33
GBP £ 183.80 208.45 147.78 159.14
CHF 145.07 168.03 115.83 122.11
CNY 21.29 23.85 - -
JPY ¥ 1.31 1.53 1.02 1.10
Currency rate sensitivity analysis If the functional currency, at reporting date, had weakened by 10% against the foreign currencies with all other variables held constant, the profit before taxation would have increased for the year 2019 and 2018 by the following amounts:
Foreign Currency 2019 2018
Rupees in ‘000
US $ 744,183 662,390 EUR (2,019) (1,142)CNY (2) - CHF (7) (4)
742,155 661,244 A 10% strengthening of the functional currency against foreign currencies at June 30 would have had the equal but opposite effect of these amounts.
Currency risk sensitivity to foreign exchange movements has been calculated on a symmetric basis. The analysis assumes that all other variables remained constant.
49.1.3 Other price risk:
Price risk represents the risk that the fair value or future cash flows of a financial instrument will fluctuate because of changes in market prices (other than those arising from interest rate risk or currency risk), whether those changes are caused by factors specific to the individual financial instrument or its issuer, or factors affecting all similar financial instruments traded in the market. The Company is exposed to price risk, because of the invest-ments held by the Company in money market mutual funds, and classified on the balance sheet as fair value through profit and loss. To manage its price risk arising from investments in mutual funds, the Company diversifies its portfolio.
Short term investments include fair value through profit and loss investments of Rs. 130.90 million (2018: Rs. 147.43 million) which were subject to price risk.
If redemption price on mutual funds, at the year end date, fluctuate by 5% higher / lower with all other variables held constant, profit after tax for the year would have been Rs. 6.22 million (2018: 7 million) higher / lower, mainly as a result of higher / lower redemption price on units of mutual funds.
Loans and advances consist of loans to employees & director and Metis International (Pvt) Ltd. Loans to employees and director are secured against their retirement benefits and loan to Metis International is also secured through an irrevocable lien/charge on total assets of the Metis International (Pvt) Limited. Therefore, Company is not exposed to any significant credit risk on these loans.
Long term deposits have been mainly placed with suppliers of electricity, gas and telecommunication services. Considering the financial position and credit quality of the institutions, Company’s exposure to credit risk is not significant.
Trade debts amounting to Rs. 4,251 million out of total debts are secured against letters of credit and insured contract. Furthermore, credit quality of customers is assessed taking into consideration their financial position and previous dealings and on that basis, individual credit limits are set. Moreover, the management regularly monitors and reviews customers’ credit exposure. Accordingly, the company is not exposed to any significant credit risk. Other receivables constitute mainly receivables from the related parties and mark up subsidy from banks. Considering the financial position of related parties and credit quality of banks and insurance company exposure to credit risk is not significant.
Short term investments are investments in mutual funds, TDRs and sales tax refund bonds. The credit risk on these investments is limited because counter parties are fund management Companies, banks and Government with reasonably high credit ratings. The credit quality of mutual funds can be assessed by reference to external credit ratings or to historical information about counter party default rate.
2019 2018
[ Credit Ratings ]
Al Meezan Investment Management Limited AM1 AM1 NBP Fund Management Limited AM1 AM1 Alfalah GHP Investment Management Limited AM2+ AM2+ UBL Fund Managers Limited AM1 AM1
The credit quality of Company’s bank balances can be assessed by reference to external credit ratings or to historical information about counterparty default rate:
Name of Bank Date Long term Short term Outlook Agency
Allied Bank Limited 27-Jun-19 AAA A1+ Stable PACRAAskari Bank Limited 28-Jun-19 AA+ A1+ Stable PACRABank Alfalah Limited 28-Jun-19 AA+ A1+ Stable PACRABurj Bank Limited 28-Jun-19 A A1 Stable PACRADubai Islamic Bank Pakistan Limited 28-Jun-19 AA A-1+ Stable JCR-VISFaysal Bank Limited 27-Jun-19 AA A1+ Stable PACRAHabib Bank Limited 28-Jun-19 AAA A-1+ Stable JCR-VISHabib Metropolitan Bank Limited 27-Jun-19 AA+ A1+ Stable PACRAMCB Bank Limited 27-Jun-19 AAA A1+ Stable PACRAMCB Islamic Bank Limited 27-Jun-19 A A1 Stable PACRAMeezan Bank Limited 28-Jun-19 AA+ A-1+ Stable JCR-VISNational Bank of Pakistan 28-Jun-19 AAA A1+ Stable PACRASilk Bank Limited 27-Jun-19 A- A-2 Stable JCR-VISStandard Chartered Bank Pakistan Limited 25-Jun-19 AAA A1+ Stable PACRAThe Bank of Punjab 28-Jun-18 AA A1+ Stable PACRAUnited Bank Limited 28-Jun-18 AAA A-1+ Stable JCR-VIS
Due to Company’s long standing relationships with these counterparties and after giving due consideration to their strong financial standing, man-agement does not expect non-performance by these counter parties on their obligations to the Company. Accordingly, the risk is minimal.
49.3 Liquidity risk
Liquidity risk is the risk that an entity will encounter difficulty in meeting obligations associated with financial liabilities.
The company’s approach to manage liquidity risk is to maintain sufficient level of liquidity by holding highly liquid assets and the availability of funding through an adequate amount of committed credit facilities. At June 30, 2019 the Company has Rs. 13,224 million (2018: Rs 4,381.56 million) unuti-lized borrowing limits available from financial institutions and Rs. 1,538.56 million (2018: Rs. 193.69 million) cash and bank balances. The manage-ment believes that the company is not exposed to any liquidity risk.
49.2 Credit risk:
Credit risk is the risk representing accounting loss that would be recognized at the reporting date if one party to a financial instrument will fail to dis-charge an obligation or its failure to perform duties under the contract as contracted. Concentration of credit risk arises when a number of counter-parties are engaged in similar business activities or have similar economic features that would cause their ability to meet contractual obligations that is susceptible to changes in economic, political or other conditions. Concentration of credit risk indicates the relative sensitivity of the Company’s performance to developments affecting a particular industry. The maximum exposure to credit risk at the reporting date is as follows :
2019 2018
Rupees in ‘000Long term loans 65,762 60,747 Long term deposits 28,019 24,817 Trade debts 8,247,740 7,293,008 Loans and advances 66,343 81,163 Other receivables 94,421 154,697 Short term investments 1,207,251 147,425 Bank balances 1,512,211 181,636
11,221,747 7,943,493
NOTES TO THE UNCONSOLIDATED FINANCIAL STATEMENTSFOR THE YEAR ENDED JUNE 30, 2019
NOTES TO THE UNCONSOLIDATED FINANCIAL STATEMENTSFOR THE YEAR ENDED JUNE 30, 2019
Inte
rloop
Lim
ited
156 157
2018
- 1
9A
nnua
l Rep
ort
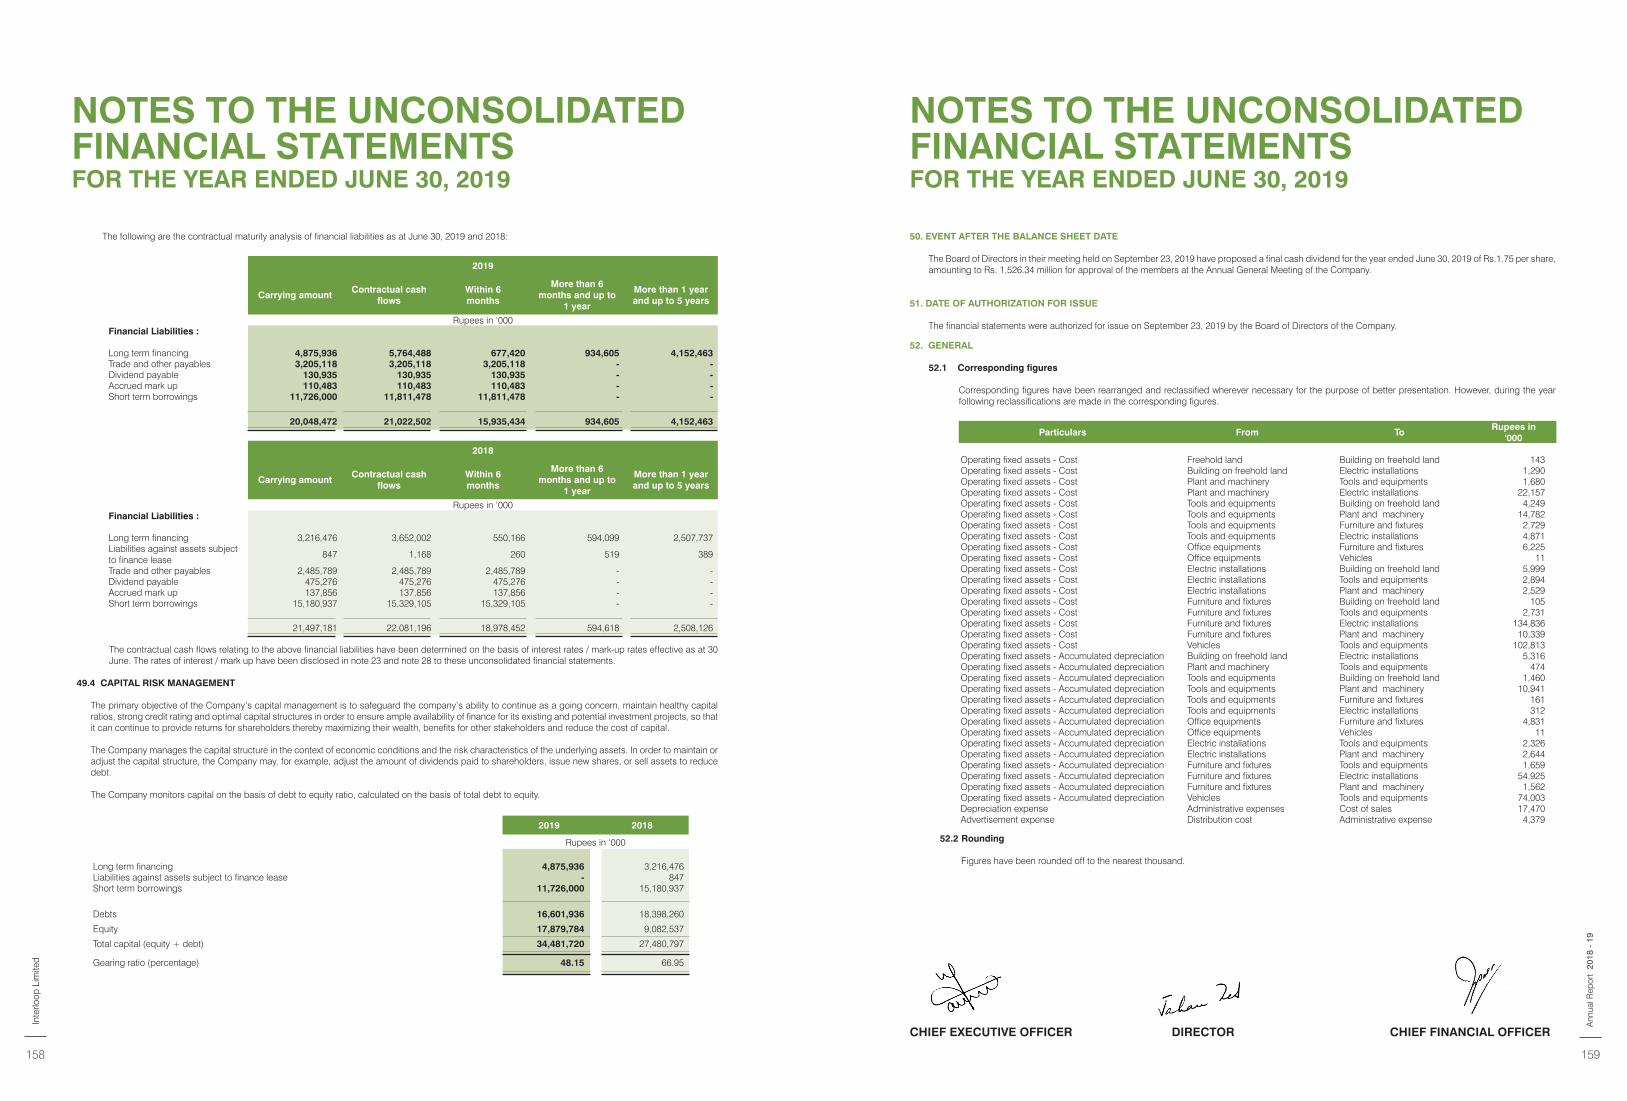
50. EVENT AFTER THE BALANCE SHEET DATE
The Board of Directors in their meeting held on September 23, 2019 have proposed a final cash dividend for the year ended June 30, 2019 of Rs.1.75 per share, amounting to Rs. 1,526.34 million for approval of the members at the Annual General Meeting of the Company.
51. DATE OF AUTHORIZATION FOR ISSUE
The financial statements were authorized for issue on September 23, 2019 by the Board of Directors of the Company.
2019 2018
Rupees in ‘000
Long term financing 4,875,936 3,216,476 Liabilities against assets subject to finance lease - 847 Short term borrowings 11,726,000 15,180,937
Debts 16,601,936 18,398,260
Equity 17,879,784 9,082,537
Total capital (equity + debt) 34,481,720 27,480,797
Gearing ratio (percentage) 48.15 66.95
52. GENERAL
52.1 Corresponding figures
Corresponding figures have been rearranged and reclassified wherever necessary for the purpose of better presentation. However, during the year following reclassifications are made in the corresponding figures.
Particulars From To Rupees in
'000
Operating fixed assets - Cost Freehold land Building on freehold land 143 Operating fixed assets - Cost Building on freehold land Electric installations 1,290 Operating fixed assets - Cost Plant and machinery Tools and equipments 1,680 Operating fixed assets - Cost Plant and machinery Electric installations 22,157 Operating fixed assets - Cost Tools and equipments Building on freehold land 4,249 Operating fixed assets - Cost Tools and equipments Plant and machinery 14,782 Operating fixed assets - Cost Tools and equipments Furniture and fixtures 2,729 Operating fixed assets - Cost Tools and equipments Electric installations 4,871 Operating fixed assets - Cost Office equipments Furniture and fixtures 6,225 Operating fixed assets - Cost Office equipments Vehicles 11 Operating fixed assets - Cost Electric installations Building on freehold land 5,999 Operating fixed assets - Cost Electric installations Tools and equipments 2,894 Operating fixed assets - Cost Electric installations Plant and machinery 2,529 Operating fixed assets - Cost Furniture and fixtures Building on freehold land 105 Operating fixed assets - Cost Furniture and fixtures Tools and equipments 2,731 Operating fixed assets - Cost Furniture and fixtures Electric installations 134,836 Operating fixed assets - Cost Furniture and fixtures Plant and machinery 10,339 Operating fixed assets - Cost Vehicles Tools and equipments 102,813 Operating fixed assets - Accumulated depreciation Building on freehold land Electric installations 5,316 Operating fixed assets - Accumulated depreciation Plant and machinery Tools and equipments 474 Operating fixed assets - Accumulated depreciation Tools and equipments Building on freehold land 1,460 Operating fixed assets - Accumulated depreciation Tools and equipments Plant and machinery 10,941 Operating fixed assets - Accumulated depreciation Tools and equipments Furniture and fixtures 161 Operating fixed assets - Accumulated depreciation Tools and equipments Electric installations 312 Operating fixed assets - Accumulated depreciation Office equipments Furniture and fixtures 4,831 Operating fixed assets - Accumulated depreciation Office equipments Vehicles 11 Operating fixed assets - Accumulated depreciation Electric installations Tools and equipments 2,326 Operating fixed assets - Accumulated depreciation Electric installations Plant and machinery 2,644 Operating fixed assets - Accumulated depreciation Furniture and fixtures Tools and equipments 1,659 Operating fixed assets - Accumulated depreciation Furniture and fixtures Electric installations 54,925 Operating fixed assets - Accumulated depreciation Furniture and fixtures Plant and machinery 1,562 Operating fixed assets - Accumulated depreciation Vehicles Tools and equipments 74,003 Depreciation expense Administrative expenses Cost of sales 17,470 Advertisement expense Distribution cost Administrative expense 4,379
52.2 Rounding Figures have been rounded off to the nearest thousand.
The following are the contractual maturity analysis of financial liabilities as at June 30, 2019 and 2018:
2019
Carrying amountContractual cash
flowsWithin 6 months
More than 6 months and up to
1 year
More than 1 year and up to 5 years
Rupees in ‘000Financial Liabilities :
Long term financing 4,875,936 5,764,488 677,420 934,605 4,152,463 Trade and other payables 3,205,118 3,205,118 3,205,118 - - Dividend payable 130,935 130,935 130,935 - - Accrued mark up 110,483 110,483 110,483 - - Short term borrowings 11,726,000 11,811,478 11,811,478 - -
20,048,472 21,022,502 15,935,434 934,605 4,152,463
2018
Carrying amountContractual cash
flowsWithin 6 months
More than 6 months and up to
1 year
More than 1 year and up to 5 years
Rupees in ‘000Financial Liabilities :
Long term financing 3,216,476 3,652,002 550,166 594,099 2,507,737 Liabilities against assets subject to finance lease
847 1,168 260 519 389
Trade and other payables 2,485,789 2,485,789 2,485,789 - - Dividend payable 475,276 475,276 475,276 - - Accrued mark up 137,856 137,856 137,856 - - Short term borrowings 15,180,937 15,329,105 15,329,105 - -
21,497,181 22,081,196 18,978,452 594,618 2,508,126
The contractual cash flows relating to the above financial liabilities have been determined on the basis of interest rates / mark-up rates effective as at 30 June. The rates of interest / mark up have been disclosed in note 23 and note 28 to these unconsolidated financial statements.
49.4 CAPITAL RISK MANAGEMENT
The primary objective of the Company’s capital management is to safeguard the company’s ability to continue as a going concern, maintain healthy capital ratios, strong credit rating and optimal capital structures in order to ensure ample availability of finance for its existing and potential investment projects, so that it can continue to provide returns for shareholders thereby maximizing their wealth, benefits for other stakeholders and reduce the cost of capital.
The Company manages the capital structure in the context of economic conditions and the risk characteristics of the underlying assets. In order to maintain or adjust the capital structure, the Company may, for example, adjust the amount of dividends paid to shareholders, issue new shares, or sell assets to reduce debt.
The Company monitors capital on the basis of debt to equity ratio, calculated on the basis of total debt to equity.
CHIEF EXECUTIVE OFFICER DIRECTOR CHIEF FINANCIAL OFFICER
NOTES TO THE UNCONSOLIDATED FINANCIAL STATEMENTSFOR THE YEAR ENDED JUNE 30, 2019
NOTES TO THE UNCONSOLIDATED FINANCIAL STATEMENTSFOR THE YEAR ENDED JUNE 30, 2019
Inte
rloop
Lim
ited
158 159
2018
- 1
9A
nnua
l Rep
ort

INTERLOOP LIMITED
CONSOLIDATED FINANCIAL
STATEMENTS FOR THE YEAR ENDED JUNE 30, 2019
DIRECTORS’ CONSOLIDATED REPORT
The Directors are pleased to present the consolidated audited results of Interloop Limited (“the holding company”) and its subsidiary i.e., M/s IL Apparel (Private) Limited, for the year ended June 30, 2019. The Holding Company has annexed its consolidated financial statements along with its separate financial statements in accordance with the requirement of International Financial Reporting Standards and as required under section 228 of the Companies Act, 2017.
The textile sector in Pakistan face a tougher playing field in the region when compared with the textile sector in other countries. The “cost of doing business” in the country is relatively higher on region-wide basis. Despite seeing one of the most aggressive monetary tightening policies in Asia since 2018, the Country’s inflation rose to a five year high of 8.8% on year-on-year basis in April 2019 as compared to 9.4% in the previous month and 3.7% during corresponding month of last year. Similarly, despite over 30 percent rupee devaluation, country’s overall textile sector exports declined 1.42 percent to $13.329 billion in the year ended June 30, 2019. Knitwear grew 7.0 percent to $2.89 billion during the year 2018/2019 as compared with $2.711 billion in the preceding year. Likewise, the export of readymade garments exhibited 3.0 percent growth to $2.65 billion in the year as against $2.577 billion in the preceding year.
However, by the grace of God Almighty, during the financial year ended June 30, 2019, the Group earned a net profit after tax of PKR 5,061 million, compared to net profit of PKR 3,735 million earned during the preceding financial year. The operational and financial performance of group is portraying improvements inspite of cut-throat competition and high operating costs. The current order book of the parent company is healthy and it has confirmed orders up to December 2019 to run the plant(s) at reasonably good capacity. The Apparel business is performing well along with a newly added division of denim in the current year. The management is confident that the parent company as well as its subsidiary will be able to build on their performance, going forward. The Group is striving to be one of the leading players in the global businesses and planning to expand its footprint in Pakistan as well. The Group is expected to achieve higher production, sales volume and, by the grace of God, will achieve even better financial results during the ensuing year.
The Directors’ Report giving a detailed analysis of the performance of the Interloop Limited and its subsidiary i.e., M/s IL Apparel (Private) Limited, for the year ended June 30, 2019, has also been presented separately.
ON BEHALF OF THE BOARD
Musadaq ZulqarnainDirector / Chairman
FaisalabadSeptember 23, 2019
Navid FazilChief Executive Officer
Inte
rloop
Lim
ited
162 163
2018
- 1
9A
nnua
l Rep
ort
S. No Key Audit Matter(s)How the Matter was addressed in
audit
1. Adoption of IFRS 9 “Financial instruments”: (Refer notes 3.1 and 7.1 to the consolidated financial statements)
IFRS 9 ‘Financial Instruments’ is effective for the Company for the first time during the current year and replaces the financial instruments standard IAS 39 ‘Financial Instruments: Recognition and Measurement’.
In relation to financial assets, IFRS 9 requires the recognition of expected credit losses (‘ECL’) rather than incurred credit losses under IAS
We reviewed and understood the requirements of the IFRS 9. Our audit procedures included the following:
• Considered the management’s process to assess the impact of adoption of IFRS 9 on the Company’s consolidated financial statements.
• Reviewed the appropriateness of the assumptions used (future and historical), the methodology and policies applied to assess the ECL in respect of consolidated financial assets of the Company.
Following are the Key Audit Matter(s):
INDEPENDENT AUDITOR’S REPORT TO THE MEMBERS OF INTERLOOP LIMITED REPORT ON THE AUDIT OF CONSOLIDATED FINANCIAL STATEMENTS
OpinionWe have audited the annexed consolidated financial statements of Interloop Limited and its subsidiary (the Group), which comprise the consolidated statement of financial position as at June 30, 2019, and the consolidated statement of profit or loss, the consolidated statement of comprehensive income, the consolidated statement of changes in equity and the consolidated statement of cash flows for the year then ended, and notes to the consolidated financial statements, including a summary of significant accounting policies.
In our opinion, the annexed consolidated financial statements give a true and fair view of the consolidated financial position of the Group as at June 30, 2019 and its consolidated financial performance and its consolidated cash flows for the year then ended in accordance with the approved accounting standards as applicable in Pakistan.
Basis for OpinionWe conducted our audit in accordance with International Standards on Auditing (ISAs) as applicable in Pakistan. Our responsibilities under those standards are further described in the Auditor’s Responsibilities for the Audit of the Consolidated Financial Statements section of our report. We are independent of the Group in accordance with the International Ethics Standards Board for Accountants’ Code of Ethics for Professional Accountants as adopted by the Institute of Chartered Accountants of Pakistan (the Code), and we have fulfilled our other ethical responsibilities in accordance with the Code. We believe that the audit evidence we have obtained is sufficient and appropriate to provide a basis for our opinion.
Key Audit MattersKey audit matters are those matters that, in our professional judgment, were of most significance in our audit of the financial statements of the current period. These matters were addressed in the context of our audit of the financial statements as a whole, and in forming our opinion thereon, and we do not provide a separate opinion on these matters.
INDEPENDENT AUDITOR’S REPORT TO THE MEMBERS OF INTERLOOP LIMITED REPORT ON THE AUDIT OF CONSOLIDATED FINANCIAL STATEMENTS
S. No Key Audit Matter(s)How the Matter was addressed in
audit39 and is therefore a fundamentally different approach. Management is required to determine the expected credit loss that may occur over either a 12-month period or the remaining life of an asset, depending on the categorization of the individual asset.
In accordance with IFRS 9, the measurement of ECL reflect a range of unbiased and probability-weighted outcomes, time value of money, reasonable and supportable information based on the consideration of historical events, current conditions and forecasts of future economic conditions. The calculation of ECLs in accordance with IFRS 9 is therefore complex and involves a number of judgmental assumptions.
We considered this as key audit matter due to the significant amounts involved and significant judgments made by management regarding the matter.
• We reviewed and assessed the impact and disclosures made in the consolidated financial statements with regard to the effect of adoption of IFRS 9.
2. Adoption of IFRS 15 “Revenue from contracts with customers”:(Refer notes 3.1 and 7.2 to the consolidated financial statements)
The International Financial Reporting Standard 15 “Revenue from Contracts with Customers” (IFRS 15) became applicable for the first time for the preparation of the Company’s annual consolidated financial statements for the year ended June 30, 2019.
Under the aforesaid standard the revenue from sale of goods is recognized when the Company satisfies its performance obligation by transferring the promised goods to customer under the contract with customer.
Revenue from sale of goods is measured at transaction price net of trade discounts.
As a result of application of the aforesaid standard the management has performed extensive evaluation of its contractual arrangement with its customers,
We reviewed and understood the requirements of the IFRS 15. Our audit procedures included the following:
• Considering the appropriateness of revenue recognition policy, including recognition and classification criteria for trade and other discounts and comparing it with the applicable accounting standards.
• Testing the effectiveness of Company’s controls over the classification of trade discounts and correct timing of revenue recognition.
• Reviewing a sample of contractual arrangement entered into by the Company with its customers and checked the appropriateness of classification of trade discounts.
• Reviewing the adequacy of disclosure as required under applicable financial reporting framework.
.
Inte
rloop
Lim
ited
164 165
2018
- 1
9A
nnua
l Rep
ort
4. Property, plant and equipment
The Company has made significant expenditure on expansion of manufacturing facilities and new projects.
During the year, the Company has also reclassified some categories of its operating fixed assets and resultantly comparative figures of those categories of assets are also reclassified to reflect better presentation. We identified capitalization of property, plant and equipment as a key audit matter because there is a risk that amounts being capitalized may not meet the capitalization criteria with related implications on depreciation charge for the year and reclassification of categories of assets.
Our audit procedures in relation to capitalization of property, plant and equipment, amongst others included the following:
• Understanding the design and implementation of management controls over capitalization and performing tests of control over authorization of capital expenditure and accuracy of its recording in the system.
• Testing, on sample basis, the costs incurred on projects with supporting documents and contracts.
• Assessing the nature of costs incurred for capital projects through testing, on sample basis, of amounts recorded and considering whether the expenditure meets the criteria for capitalization as per the accounting policy and applicable accounting standards.
• Checked the reasonableness of management’s assessment of categories of assets and working of reclassification in categories of assets including impact of reclassification on both cost of assets and accumulated depreciation in each category.
S. No Key Audit Matter(s)How the Matter was addressed in
auditWe considered this as key audit matter due to the significant amounts involved and significant judgments made by management regarding the matter.
.
3.Listing on Pakistan Stock Exchange (PSX)(Refer note 1.1.2 and 47 to the consolidated financial statements)
During the year, the Company gets itself listed on Pakistan Stock Exchange (PSX) and issued 109 million ordinary shares of Rs. 10 each.
We considered this as key audit matter due to the significant amount involved, requirements to disclose utilization of proceeds from IPO and disclosure requirements of 4th Schedule of the Companies Act, 2017.
Our audit procedures in relation to listing of Company is Pakistan Stock Exchange (PSX) included the following:
• Reviewed the management working of utilization of proceeds from IPO.
• Reviewing the adequacy of disclosure as required under applicable financial reporting framework and requirements of the Companies Act, 2017.
S. No Key Audit Matter(s)How the Matter was addressed in
audit• Inspecting supporting documents for the date of
capitalization when project was ready for its intended use to assess whether depreciation commenced and further capitalization of costs ceased from that date and assessing the useful life assigned by management including testing the calculation of related depreciation.
5. Inventories
The company has significant levels of inventories amounting to Rs. 7,188.38 million as at the reporting date, being 18% of the total assets of the company.
There is a risk in estimating the eventual NRV of items held, as well as assessing which items may be slow-moving or obsolete.
The Company’s principal accounting policy on stores and spares and stock in trade are disclosed in notes – 6.6 and 6.7 to the financial statements
The significance of the balance coupled with the judgments and estimates involved on their valuation has resulted in the inventories being considered as a key audit matter.
Our audit focused on whether the valuation of year-end inventory was in line with IAS 2. This included challenging judgments taken regarding obsolescence and net realizable value provisions. We obtained assurance over the appropriateness of management’s assumptions applied in calculating the value of inventories by:
• Attending the year end stock take to gain comfort over the existence and condition of inventories and internal controls designed by the company.
• Obtaining the final valuation sheets of the inventories and tracing quantities from working papers of observation of physical stock taking.
• Obtaining understanding of internal controls designed by the company over recording of purchases and valuation of the inventories, and testing their operating effectiveness on sample basis.
• Assessing historical costs recorded in the inventory valuation by performing test of details on purchases. Evaluating that the valuation basis used are appropriate and consistent, including analysis of costing of different items on sample basis.
• Assessing the management’s determination of the net realizable values and intended use of the inventories including performing tests on the sales prices fetched by the company before and after year end.
• Performing analytical and other relevant audit procedures.
• Considering the adequacy of the company‘s disclosures in respect of inventories.
INDEPENDENT AUDITOR’S REPORT TO THE MEMBERS OF INTERLOOP LIMITED REPORT ON THE AUDIT OF CONSOLIDATED FINANCIAL STATEMENTS
INDEPENDENT AUDITOR’S REPORT TO THE MEMBERS OF INTERLOOP LIMITED REPORT ON THE AUDIT OF CONSOLIDATED FINANCIAL STATEMENTS
Inte
rloop
Lim
ited
166 167
2018
- 1
9A
nnua
l Rep
ort
Information Other than the Consolidated Financial Statements and Auditor’s Report Thereon Management is responsible for the other information. The other information comprises the information included in the annual report, but does not include the consolidated financial statements and our auditor’s report thereon.
Our opinion on the consolidated financial statements does not cover the other information and we do not express any form of assurance conclusion thereon.
In connection with our audit of the consolidated financial statements, our responsibility is to read the other information and, in doing so, consider whether the other information is materially inconsistent with the consolidated financial statements or our knowledge obtained in the audit or otherwise appears to be materially misstated.
If, based on the work we have performed, we conclude that there is a material misstatement of this other information; we are required to report that fact. We have nothing to report in this regard.
Responsibilities of Management and the Board of Directors for the Consolidated Financial Statements Management is responsible for the preparation and fair presentation of the Consolidated financial statements in accordance with approved accounting standards as applicable in Pakistan and the requirements of Companies Act, 2017 and for such internal control as management determines is necessary to enable the preparation of consolidated financial statements that are free from material misstatement, whether due to fraud or error.
In preparing the consolidated financial statements, management is responsible for assessing the Group’s ability to continue as a going concern, disclosing, as applicable, matters related to going concern and using the going concern basis of accounting unless management either intends to liquidate the Group or to cease operations, or has no realistic alternative but to do so.
The Board of Directors is responsible for overseeing the Group’s financial reporting process.
Auditor’s Responsibilities for the Audit of the Consolidated Financial Statements Our objectives are to obtain reasonable assurance about whether the consolidated financial statements as a whole are free from material misstatement, whether due to fraud or error, and to issue an auditor’s report that includes our opinion. Reasonable assurance is a high level of assurance, but is not a guarantee that an audit conducted in accordance with ISAs as applicable in Pakistan will always detect a material misstatement when it exists. Misstatements can arise from fraud or error and are considered material if, individually or in the aggregate, they could reasonably be expected to influence the economic decisions of users taken on the basis of these consolidated financial statements.
As part of an audit in accordance with ISAs as applicable in Pakistan, we exercise professional judgment and maintain professional skepticism throughout the audit. We also:
• Identify and assess the risks of material misstatement of the consolidated financial statements, whether due to fraud or error, design and perform audit procedures responsive to those risks, and obtain audit evidence that is sufficient
and appropriate to provide a basis for our opinion. The risk of not detecting a material misstatement resulting from fraud is higher than for one resulting from error, as fraud may involve collusion, forgery, intentional omissions, misrepresentations, or the override of internal control.
• Obtain an understanding of internal control relevant to the audit in order to design audit procedures that are appropriate in the circumstances, but not for the purpose of expressing an opinion on the effectiveness of the Group’s internal control.
• Evaluate the appropriateness of accounting policies used and the reasonableness of accounting estimates and related disclosures made by management.
• Conclude on the appropriateness of management’s use of the going concern basis of accounting and based on the audit evidence obtained, whether a material uncertainty exists related to events or conditions that may cast significant doubt on the Group’s ability to continue as a going concern. If we conclude that a material uncertainty exists, we are required to draw attention in our auditor’s report to the related disclosures in the consolidated financial statements or, if such disclosures are inadequate, to modify our opinion. Our conclusions are based on the audit evidence obtained up to the date of our auditor’s report. However, future events or conditions may cause the Group to cease to continue as a going concern.
• Evaluate the overall presentation, structure and content of the consolidated financial statements, including the disclosures, and whether the consolidated financial statements represent the underlying transactions and events in a manner that achieves fair presentation.
• Obtain sufficient appropriate audit evidence regarding the financial information of the entities or business activities within the Group to express an opinion on the consolidated financial statements. We are responsible for the direction, supervision and performance of the Group audit. We remain solely responsible for our audit opinion.
We communicate with the board of directors regarding, among other matters, the planned scope and timing of the audit and significant audit findings, including any significant deficiencies in internal control that we identify during our audit.
We also provide to the Board of Directors with a statement that we have complied with relevant ethical requirements regarding independence, and to communicate with them all relationships and other matters that may reasonably be thought to bear on our independence, and where applicable, related safeguards.
From the matters communicated with the Board of Directors, we determine those matters that were of most significance in the audit of the financial statements of the current period and are therefore the key audit matters. We describe these matters in our auditor’s report unless law or regulation precludes public disclosure about the matter or when, in extremely rare circumstances, we determine that a matter should not be communicated in our report because the adverse consequences of doing so would reasonably be expected to outweigh the public interest benefits of such communication.
The engagement partner on the audit resulting in this independent auditor’s report is Khan Muhammad - FCA.
Date: September 23, 2019 Kreston Hyder Bhimji & Co.Place: Faisalabad Chartered Accountants
INDEPENDENT AUDITOR’S REPORT TO THE MEMBERS OF INTERLOOP LIMITED REPORT ON THE AUDIT OF CONSOLIDATED FINANCIAL STATEMENTS
INDEPENDENT AUDITOR’S REPORT TO THE MEMBERS OF INTERLOOP LIMITED REPORT ON THE AUDIT OF CONSOLIDATED FINANCIAL STATEMENTS
Inte
rloop
Lim
ited
168 169
2018
- 1
9A
nnua
l Rep
ort
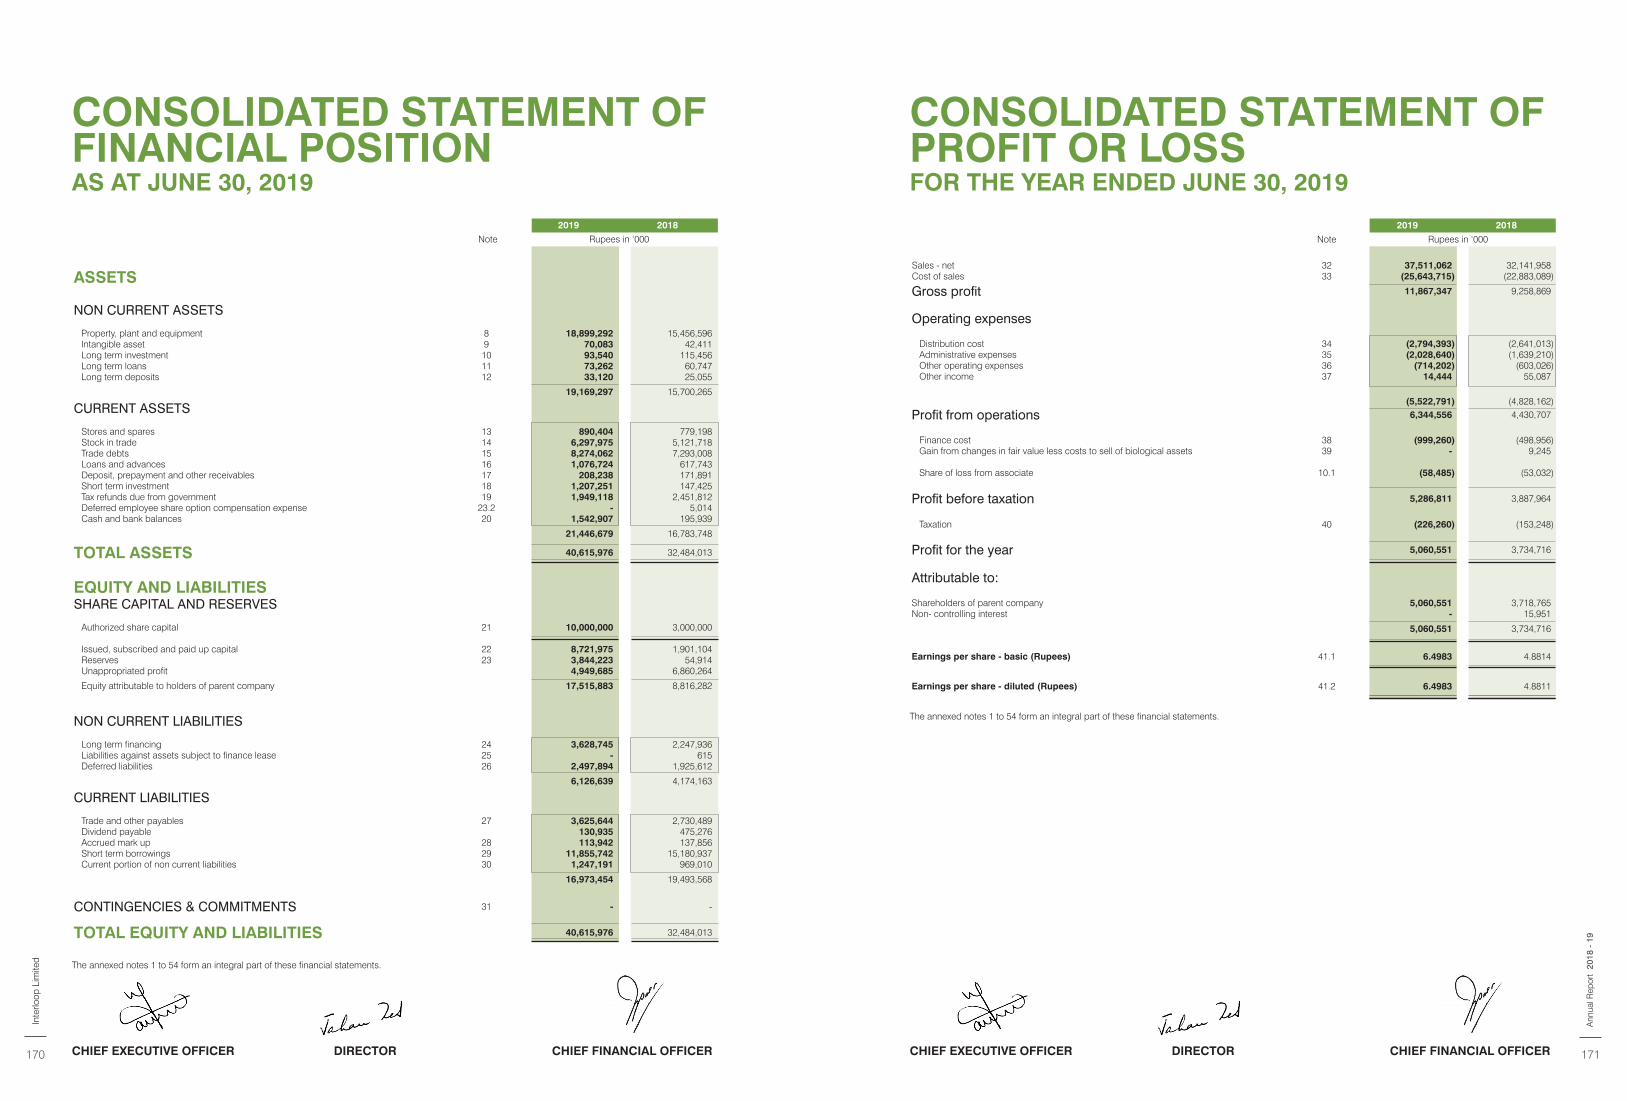
2019 2018
Note Rupees in ‘000
ASSETS
NON CURRENT ASSETS
Property, plant and equipment 8 18,899,292 15,456,596 Intangible asset 9 70,083 42,411 Long term investment 10 93,540 115,456 Long term loans 11 73,262 60,747 Long term deposits 12 33,120 25,055
19,169,297 15,700,265
CURRENT ASSETS
Stores and spares 13 890,404 779,198 Stock in trade 14 6,297,975 5,121,718 Trade debts 15 8,274,062 7,293,008 Loans and advances 16 1,076,724 617,743 Deposit, prepayment and other receivables 17 208,238 171,891 Short term investment 18 1,207,251 147,425 Tax refunds due from government 19 1,949,118 2,451,812 Deferred employee share option compensation expense 23.2 - 5,014 Cash and bank balances 20 1,542,907 195,939
21,446,679 16,783,748
TOTAL ASSETS 40,615,976 32,484,013
EQUITY AND LIABILITIESSHARE CAPITAL AND RESERVES
Authorized share capital 21 10,000,000 3,000,000
Issued, subscribed and paid up capital 22 8,721,975 1,901,104 Reserves 23 3,844,223 54,914 Unappropriated profit 4,949,685 6,860,264
Equity attributable to holders of parent company 17,515,883 8,816,282
NON CURRENT LIABILITIES
Long term financing 24 3,628,745 2,247,936 Liabilities against assets subject to finance lease 25 - 615 Deferred liabilities 26 2,497,894 1,925,612
6,126,639 4,174,163
CURRENT LIABILITIES
Trade and other payables 27 3,625,644 2,730,489 Dividend payable 130,935 475,276 Accrued mark up 28 113,942 137,856 Short term borrowings 29 11,855,742 15,180,937 Current portion of non current liabilities 30 1,247,191 969,010
16,973,454 19,493,568
CONTINGENCIES & COMMITMENTS 31 - -
TOTAL EQUITY AND LIABILITIES 40,615,976 32,484,013
The annexed notes 1 to 54 form an integral part of these financial statements.
CONSOLIDATED STATEMENT OF FINANCIAL POSITIONAS AT JUNE 30, 2019
2019 2018
Note Rupees in ‘000
Sales - net 32 37,511,062 32,141,958 Cost of sales 33 (25,643,715) (22,883,089)
Gross profit 11,867,347 9,258,869
Operating expenses
Distribution cost 34 (2,794,393) (2,641,013)Administrative expenses 35 (2,028,640) (1,639,210)Other operating expenses 36 (714,202) (603,026)Other income 37 14,444 55,087
(5,522,791) (4,828,162)
Profit from operations 6,344,556 4,430,707
Finance cost 38 (999,260) (498,956)Gain from changes in fair value less costs to sell of biological assets 39 - 9,245
Share of loss from associate 10.1 (58,485) (53,032)
Profit before taxation 5,286,811 3,887,964
Taxation 40 (226,260) (153,248)
Profit for the year 5,060,551 3,734,716
Attributable to:
Shareholders of parent company 5,060,551 3,718,765 Non- controlling interest - 15,951
5,060,551 3,734,716
Earnings per share - basic (Rupees) 41.1 6.4983 4.8814
Earnings per share - diluted (Rupees) 41.2 6.4983 4.8811
The annexed notes 1 to 54 form an integral part of these financial statements.
CONSOLIDATED STATEMENT OF PROFIT OR LOSSFOR THE YEAR ENDED JUNE 30, 2019
CHIEF EXECUTIVE OFFICER DIRECTOR CHIEF FINANCIAL OFFICER CHIEF EXECUTIVE OFFICER DIRECTOR CHIEF FINANCIAL OFFICER
Inte
rloop
Lim
ited
170 171
2018
- 1
9A
nnua
l Rep
ort
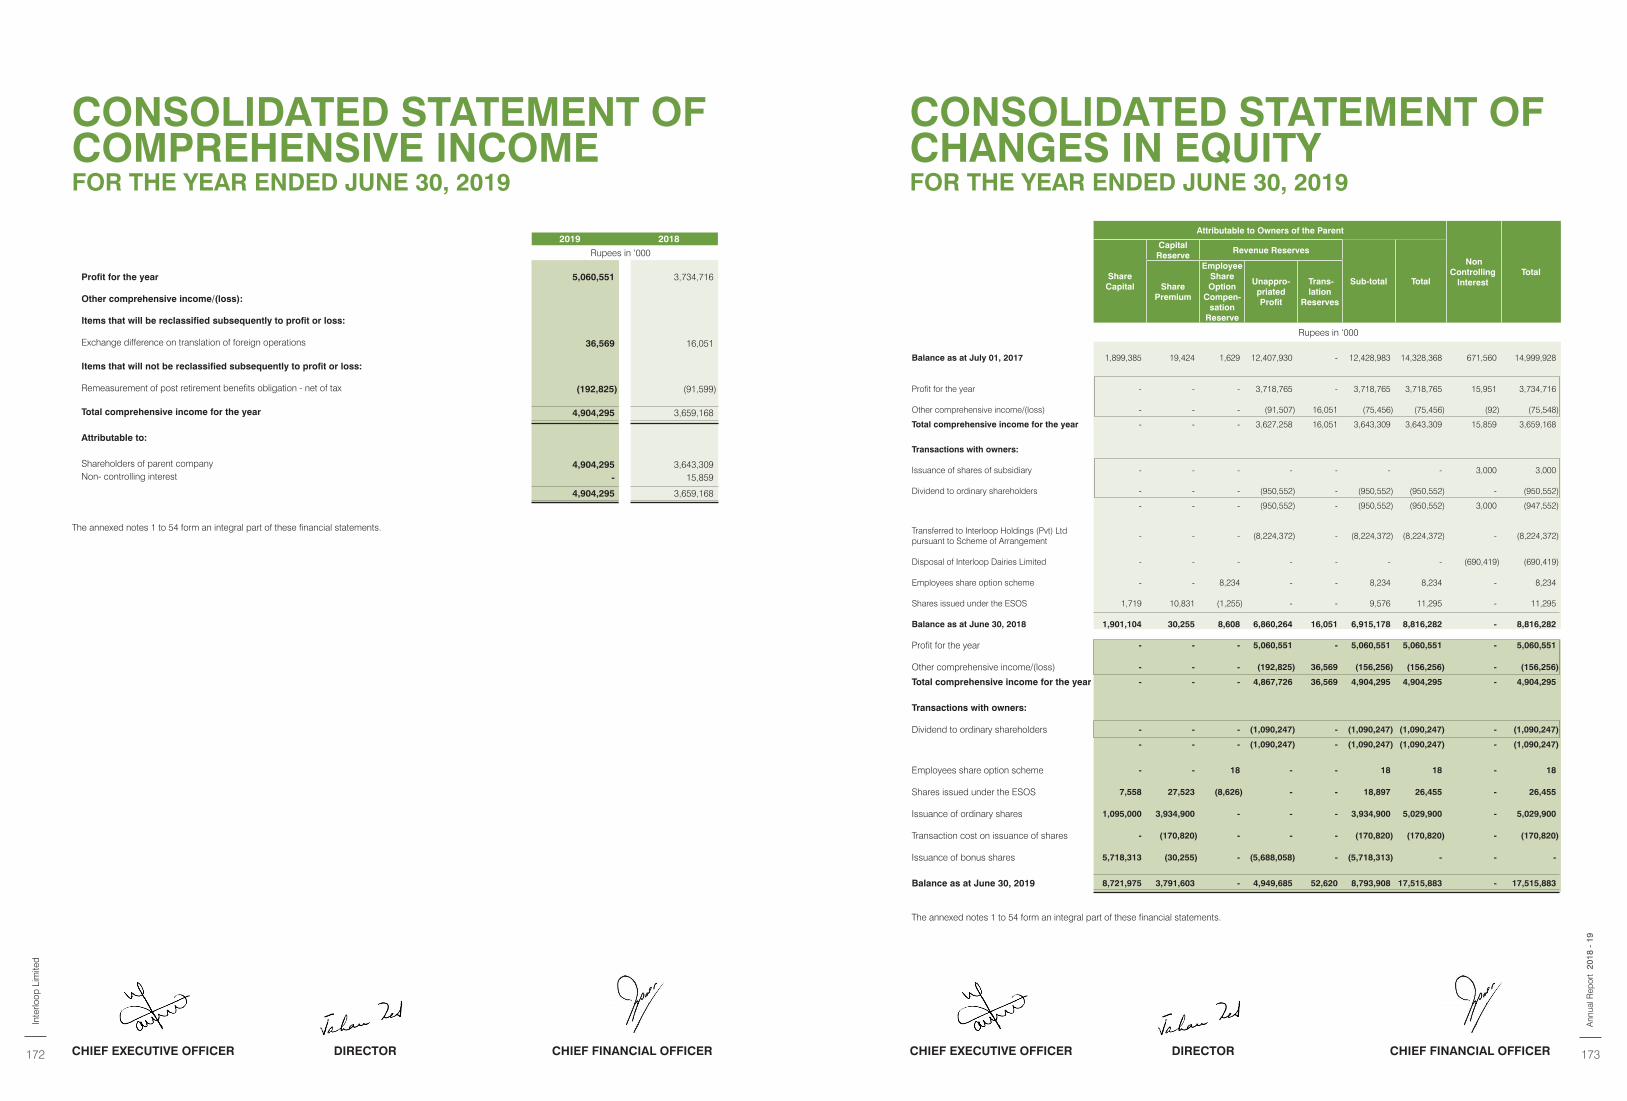
2019 2018
Rupees in ‘000
Profit for the year 5,060,551 3,734,716
Other comprehensive income/(loss):
Items that will be reclassified subsequently to profit or loss:
Exchange difference on translation of foreign operations 36,569 16,051
Items that will not be reclassified subsequently to profit or loss:
Remeasurement of post retirement benefits obligation - net of tax (192,825) (91,599)
Total comprehensive income for the year 4,904,295 3,659,168
Attributable to:
Shareholders of parent company 4,904,295 3,643,309 Non- controlling interest - 15,859
4,904,295 3,659,168
The annexed notes 1 to 54 form an integral part of these financial statements.
CONSOLIDATED STATEMENT OF COMPREHENSIVE INCOMEFOR THE YEAR ENDED JUNE 30, 2019
Attributable to Owners of the Parent
Non Controlling
Interest TotalShare
Capital
Capital Reserve
Revenue Reserves
Sub-total TotalShare
Premium
Employee Share Option
Compen-sation
Reserve
Unappro-priated Profit
Trans-lation
Reserves
Rupees in ‘000
Balance as at July 01, 2017 1,899,385 19,424 1,629 12,407,930 - 12,428,983 14,328,368 671,560 14,999,928
Profit for the year - - - 3,718,765 - 3,718,765 3,718,765 15,951 3,734,716
Other comprehensive income/(loss) - - - (91,507) 16,051 (75,456) (75,456) (92) (75,548)
Total comprehensive income for the year - - - 3,627,258 16,051 3,643,309 3,643,309 15,859 3,659,168
Transactions with owners:
Issuance of shares of subsidiary - - - - - - - 3,000 3,000
Dividend to ordinary shareholders - - - (950,552) - (950,552) (950,552) - (950,552)
- - - (950,552) - (950,552) (950,552) 3,000 (947,552)
Transferred to Interloop Holdings (Pvt) Ltd pursuant to Scheme of Arrangement
- - - (8,224,372) - (8,224,372) (8,224,372) - (8,224,372)
Disposal of Interloop Dairies Limited - - - - - - - (690,419) (690,419)
Employees share option scheme - - 8,234 - - 8,234 8,234 - 8,234
Shares issued under the ESOS 1,719 10,831 (1,255) - - 9,576 11,295 - 11,295
Balance as at June 30, 2018 1,901,104 30,255 8,608 6,860,264 16,051 6,915,178 8,816,282 - 8,816,282
Profit for the year - - - 5,060,551 - 5,060,551 5,060,551 - 5,060,551
Other comprehensive income/(loss) - - - (192,825) 36,569 (156,256) (156,256) - (156,256)
Total comprehensive income for the year - - - 4,867,726 36,569 4,904,295 4,904,295 - 4,904,295
Transactions with owners:
Dividend to ordinary shareholders - - - (1,090,247) - (1,090,247) (1,090,247) - (1,090,247)
- - - (1,090,247) - (1,090,247) (1,090,247) - (1,090,247)
Employees share option scheme - - 18 - - 18 18 - 18
Shares issued under the ESOS 7,558 27,523 (8,626) - - 18,897 26,455 - 26,455
Issuance of ordinary shares 1,095,000 3,934,900 - - - 3,934,900 5,029,900 - 5,029,900
Transaction cost on issuance of shares - (170,820) - - - (170,820) (170,820) - (170,820)
Issuance of bonus shares 5,718,313 (30,255) - (5,688,058) - (5,718,313) - - -
Balance as at June 30, 2019 8,721,975 3,791,603 - 4,949,685 52,620 8,793,908 17,515,883 - 17,515,883
The annexed notes 1 to 54 form an integral part of these financial statements.
CONSOLIDATED STATEMENT OF CHANGES IN EQUITYFOR THE YEAR ENDED JUNE 30, 2019
CHIEF EXECUTIVE OFFICER DIRECTOR CHIEF FINANCIAL OFFICER CHIEF EXECUTIVE OFFICER DIRECTOR CHIEF FINANCIAL OFFICER
Inte
rloop
Lim
ited
172 173
2018
- 1
9A
nnua
l Rep
ort
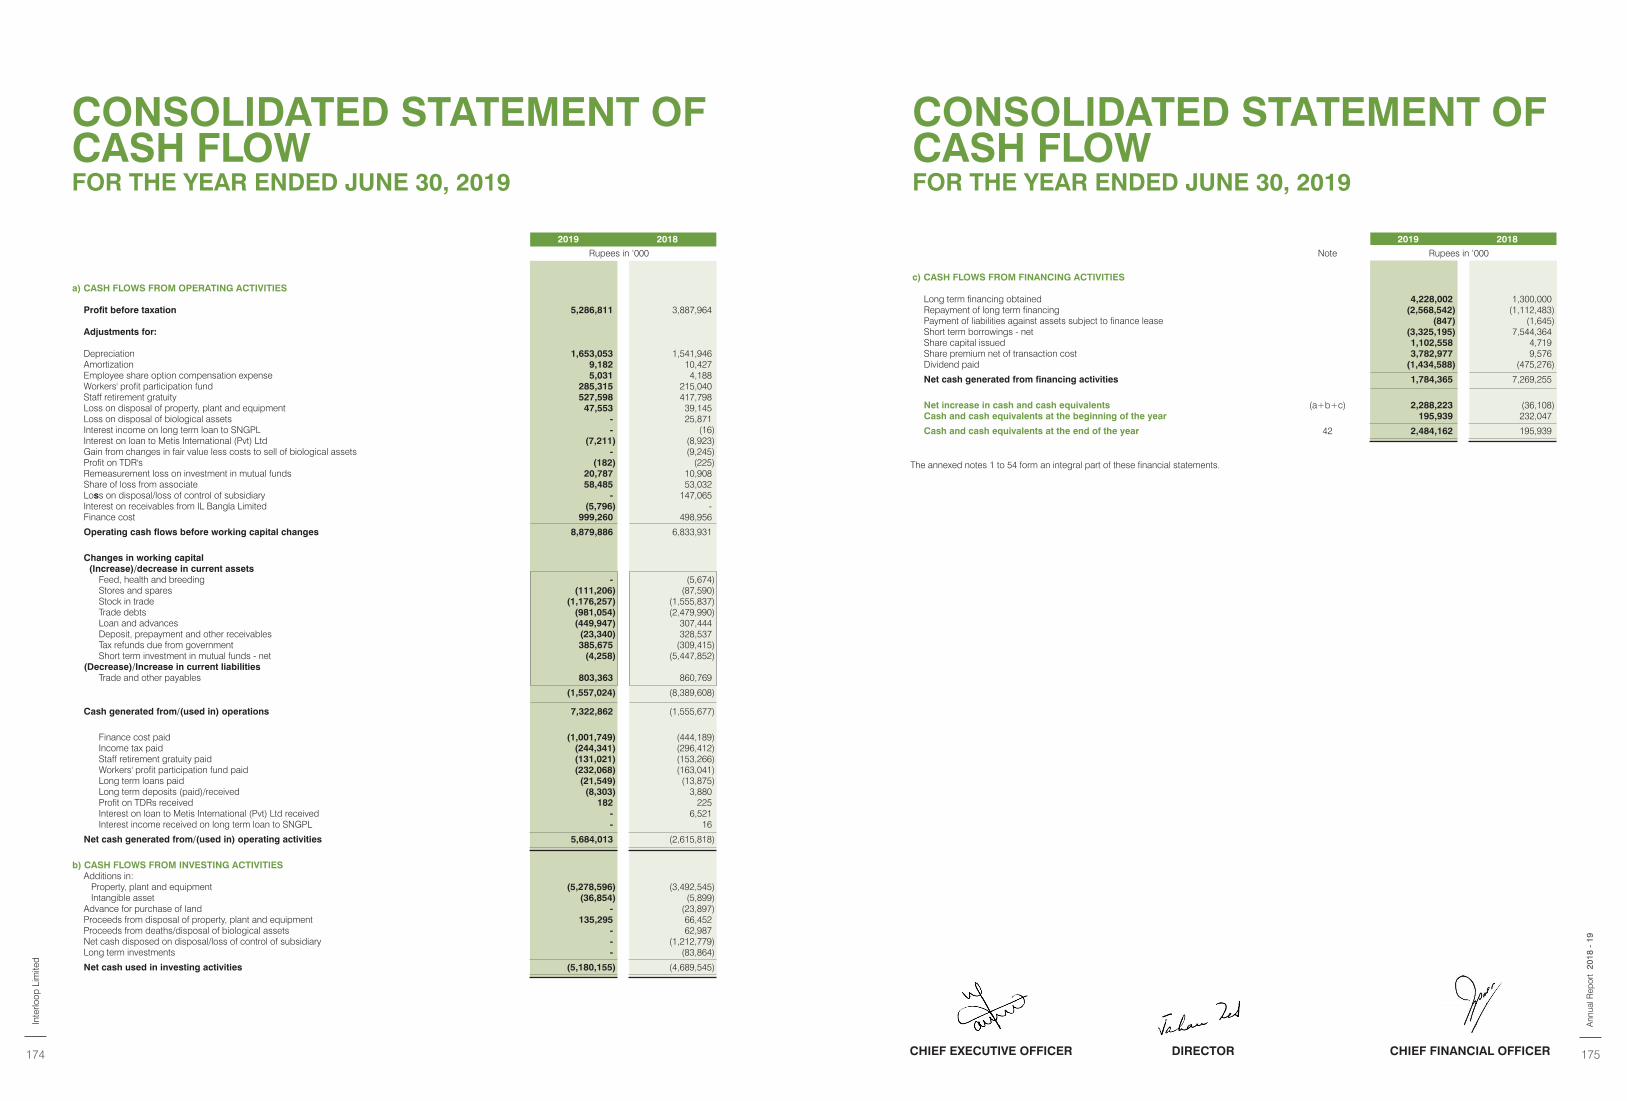
CONSOLIDATED STATEMENT OF CASH FLOWFOR THE YEAR ENDED JUNE 30, 2019
2019 2018
Rupees in ‘000
a) CASH FLOWS FROM OPERATING ACTIVITIES
Profit before taxation 5,286,811 3,887,964
Adjustments for:
Depreciation 1,653,053 1,541,946 Amortization 9,182 10,427 Employee share option compensation expense 5,031 4,188 Workers' profit participation fund 285,315 215,040 Staff retirement gratuity 527,598 417,798 Loss on disposal of property, plant and equipment 47,553 39,145 Loss on disposal of biological assets - 25,871 Interest income on long term loan to SNGPL - (16)Interest on loan to Metis International (Pvt) Ltd (7,211) (8,923)Gain from changes in fair value less costs to sell of biological assets - (9,245)Profit on TDR's (182) (225)Remeasurement loss on investment in mutual funds 20,787 10,908 Share of loss from associate 58,485 53,032 Loss on disposal/loss of control of subsidiary - 147,065 Interest on receivables from IL Bangla Limited (5,796) - Finance cost 999,260 498,956
Operating cash flows before working capital changes 8,879,886 6,833,931
Changes in working capital (Increase)/decrease in current assets
Feed, health and breeding - (5,674)Stores and spares (111,206) (87,590)Stock in trade (1,176,257) (1,555,837)Trade debts (981,054) (2,479,990)Loan and advances (449,947) 307,444 Deposit, prepayment and other receivables (23,340) 328,537 Tax refunds due from government 385,675 (309,415)Short term investment in mutual funds - net (4,258) (5,447,852)
(Decrease)/Increase in current liabilitiesTrade and other payables 803,363 860,769
(1,557,024) (8,389,608)
Cash generated from/(used in) operations 7,322,862 (1,555,677)
Finance cost paid (1,001,749) (444,189)Income tax paid (244,341) (296,412)Staff retirement gratuity paid (131,021) (153,266)Workers' profit participation fund paid (232,068) (163,041)Long term loans paid (21,549) (13,875)Long term deposits (paid)/received (8,303) 3,880 Profit on TDRs received 182 225 Interest on loan to Metis International (Pvt) Ltd received - 6,521 Interest income received on long term loan to SNGPL - 16
Net cash generated from/(used in) operating activities 5,684,013 (2,615,818)
b) CASH FLOWS FROM INVESTING ACTIVITIESAdditions in: Property, plant and equipment (5,278,596) (3,492,545) Intangible asset (36,854) (5,899)Advance for purchase of land - (23,897)Proceeds from disposal of property, plant and equipment 135,295 66,452 Proceeds from deaths/disposal of biological assets - 62,987 Net cash disposed on disposal/loss of control of subsidiary - (1,212,779)Long term investments - (83,864)
Net cash used in investing activities (5,180,155) (4,689,545)
2019 2018
Note Rupees in ‘000
c) CASH FLOWS FROM FINANCING ACTIVITIES
Long term financing obtained 4,228,002 1,300,000 Repayment of long term financing (2,568,542) (1,112,483)Payment of liabilities against assets subject to finance lease (847) (1,645)Short term borrowings - net (3,325,195) 7,544,364 Share capital issued 1,102,558 4,719 Share premium net of transaction cost 3,782,977 9,576 Dividend paid (1,434,588) (475,276)
Net cash generated from financing activities 1,784,365 7,269,255
Net increase in cash and cash equivalents (a+b+c) 2,288,223 (36,108)Cash and cash equivalents at the beginning of the year 195,939 232,047
Cash and cash equivalents at the end of the year 42 2,484,162 195,939
The annexed notes 1 to 54 form an integral part of these financial statements.
CONSOLIDATED STATEMENT OF CASH FLOWFOR THE YEAR ENDED JUNE 30, 2019
CHIEF EXECUTIVE OFFICER DIRECTOR CHIEF FINANCIAL OFFICER
Inte
rloop
Lim
ited
174 175
2018
- 1
9A
nnua
l Rep
ort
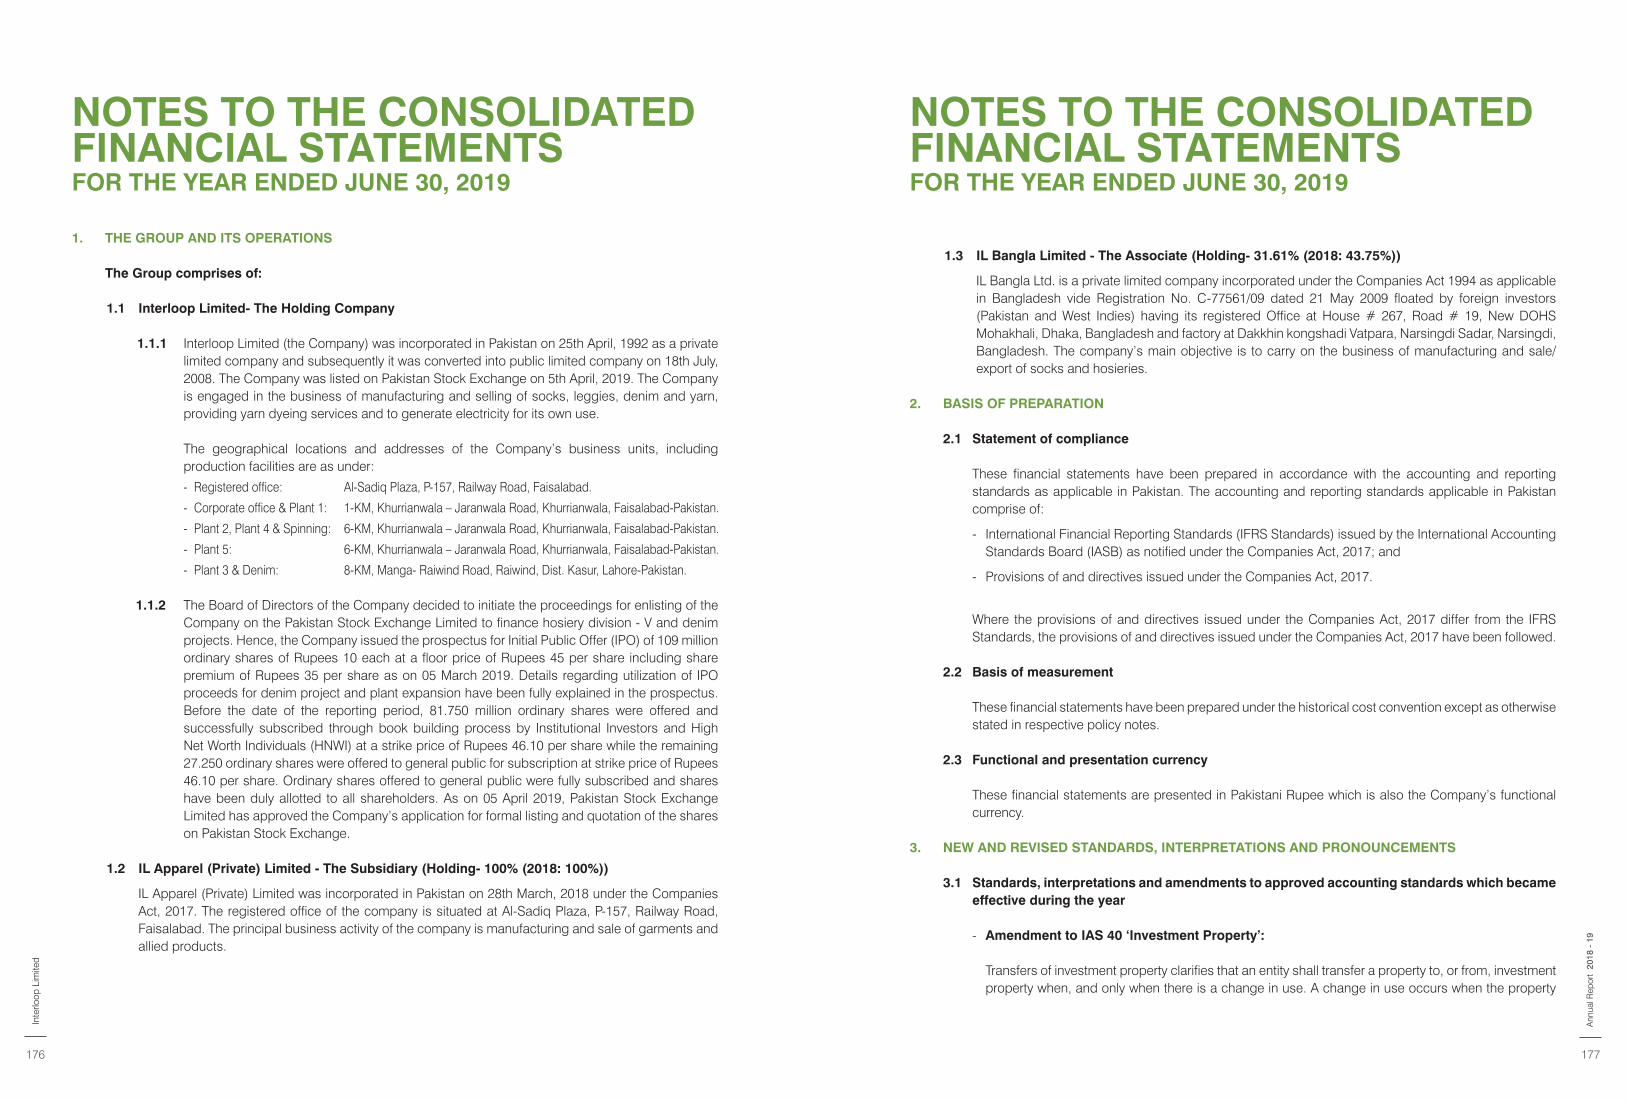
NOTES TO THE CONSOLIDATED FINANCIAL STATEMENTSFOR THE YEAR ENDED JUNE 30, 2019
NOTES TO THE CONSOLIDATED FINANCIAL STATEMENTSFOR THE YEAR ENDED JUNE 30, 2019
1. THE GROUP AND ITS OPERATIONS
The Group comprises of:
1.1 Interloop Limited- The Holding Company
1.1.1 Interloop Limited (the Company) was incorporated in Pakistan on 25th April, 1992 as a private limited company and subsequently it was converted into public limited company on 18th July, 2008. The Company was listed on Pakistan Stock Exchange on 5th April, 2019. The Company is engaged in the business of manufacturing and selling of socks, leggies, denim and yarn, providing yarn dyeing services and to generate electricity for its own use.
The geographical locations and addresses of the Company’s business units, including production facilities are as under:
- Registered office: Al-Sadiq Plaza, P-157, Railway Road, Faisalabad.
- Corporate office & Plant 1: 1-KM, Khurrianwala – Jaranwala Road, Khurrianwala, Faisalabad-Pakistan.
- Plant 2, Plant 4 & Spinning: 6-KM, Khurrianwala – Jaranwala Road, Khurrianwala, Faisalabad-Pakistan.
- Plant 5: 6-KM, Khurrianwala – Jaranwala Road, Khurrianwala, Faisalabad-Pakistan.
- Plant 3 & Denim: 8-KM, Manga- Raiwind Road, Raiwind, Dist. Kasur, Lahore-Pakistan.
1.1.2 The Board of Directors of the Company decided to initiate the proceedings for enlisting of the Company on the Pakistan Stock Exchange Limited to finance hosiery division - V and denim projects. Hence, the Company issued the prospectus for Initial Public Offer (IPO) of 109 million ordinary shares of Rupees 10 each at a floor price of Rupees 45 per share including share premium of Rupees 35 per share as on 05 March 2019. Details regarding utilization of IPO proceeds for denim project and plant expansion have been fully explained in the prospectus. Before the date of the reporting period, 81.750 million ordinary shares were offered and successfully subscribed through book building process by Institutional Investors and High Net Worth Individuals (HNWI) at a strike price of Rupees 46.10 per share while the remaining 27.250 ordinary shares were offered to general public for subscription at strike price of Rupees 46.10 per share. Ordinary shares offered to general public were fully subscribed and shares have been duly allotted to all shareholders. As on 05 April 2019, Pakistan Stock Exchange Limited has approved the Company’s application for formal listing and quotation of the shares on Pakistan Stock Exchange.
1.2 IL Apparel (Private) Limited - The Subsidiary (Holding- 100% (2018: 100%))
IL Apparel (Private) Limited was incorporated in Pakistan on 28th March, 2018 under the Companies Act, 2017. The registered office of the company is situated at Al-Sadiq Plaza, P-157, Railway Road, Faisalabad. The principal business activity of the company is manufacturing and sale of garments and allied products.
1.3 IL Bangla Limited - The Associate (Holding- 31.61% (2018: 43.75%))
IL Bangla Ltd. is a private limited company incorporated under the Companies Act 1994 as applicable in Bangladesh vide Registration No. C-77561/09 dated 21 May 2009 floated by foreign investors (Pakistan and West Indies) having its registered Office at House # 267, Road # 19, New DOHS Mohakhali, Dhaka, Bangladesh and factory at Dakkhin kongshadi Vatpara, Narsingdi Sadar, Narsingdi, Bangladesh. The company’s main objective is to carry on the business of manufacturing and sale/export of socks and hosieries.
2. BASIS OF PREPARATION
2.1 Statement of compliance
These financial statements have been prepared in accordance with the accounting and reporting standards as applicable in Pakistan. The accounting and reporting standards applicable in Pakistan comprise of:
- International Financial Reporting Standards (IFRS Standards) issued by the International Accounting Standards Board (IASB) as notified under the Companies Act, 2017; and
- Provisions of and directives issued under the Companies Act, 2017.
Where the provisions of and directives issued under the Companies Act, 2017 differ from the IFRS Standards, the provisions of and directives issued under the Companies Act, 2017 have been followed.
2.2 Basis of measurement
These financial statements have been prepared under the historical cost convention except as otherwise stated in respective policy notes.
2.3 Functional and presentation currency
These financial statements are presented in Pakistani Rupee which is also the Company’s functional currency.
3. NEW AND REVISED STANDARDS, INTERPRETATIONS AND PRONOUNCEMENTS
3.1 Standards, interpretations and amendments to approved accounting standards which became effective during the year
- Amendment to IAS 40 ‘Investment Property’:
Transfers of investment property clarifies that an entity shall transfer a property to, or from, investment property when, and only when there is a change in use. A change in use occurs when the property
Inte
rloop
Lim
ited
176 177
2018
- 1
9A
nnua
l Rep
ort
NOTES TO THE CONSOLIDATED FINANCIAL STATEMENTSFOR THE YEAR ENDED JUNE 30, 2019
NOTES TO THE CONSOLIDATED FINANCIAL STATEMENTSFOR THE YEAR ENDED JUNE 30, 2019
meets, or ceases to meet, the definition of investment property and there is evidence of the change in use. In isolation, a change in management’s intentions for the use of a property does not provide evidence of a change in use. The amendment does not have any impact on Company’s financial statements.
- Amendments to IFRS 2 ‘Share-based Payment’ - Clarifying how to account for certain types of share-based payments:
The amendments are intended to eliminate diversity in practice in three main areas:- The effects of vesting conditions on the measurement of a cash-settled share-based payment
transaction;- The classification of a share-based payment transaction with net settlement features for withholding
tax obligations;- The accounting where a modification to the terms and conditions of a share-based payment
transaction changes its classification from cash-settled to equity-settled.
The amendment does not have a significant impact on these consolidated financial statements.
- Amendment to IFRS 4 ‘Insurance Contract’- Applying IFRS 9 ‘Financial Instruments’ with IFRS 4:
The amendment address issue arising from the different effective dates of IFRS 9 and the forthcoming new insurance contract standard IFRS 17 ‘Insurance Contracts’. The amendments introduce two alternative options for entities issuing contracts within the scope of IFRS 4, notably a temporary exemption and an overlay approach. The temporary exemption enables eligible entities to defer the implementation date of IFRS 9. The overlay approach allows an entity applying IFRS 9 from July 01, 2018 onwards to remove from profit or loss the effects of some of the accounting mismatches that may occur from applying IFRS 9 before IFRS 17 is applied. The amendment does not have any impact on the Company’s financial statements.
- IFRS 9 ‘Financial instruments’:
IFRS 9 is a replacement for IAS 39 ‘Financial Instruments’ and covers three distinct areas. Phase 1 contains new requirements for the classification and measurement of financial assets and liabilities. Phase 2 relates to the impairment of financial assets and requires the calculation of impairment on an expected loss basis rather than the current incurred loss basis. Phase 3 relates to less stringent requirements for general hedge accounting. Impact of adoption of IFRS 9 is disclosed in Note. 7.1 of the financial statements.
- IFRS 15, ‘Revenue from Contracts with Customers’:
This standard deals with revenue recognition and establishes principles for reporting useful information to users of financial statements about the nature, amount, timing and uncertainty of revenue and cash flows arising from an entity’s contracts with customers. Revenue is recognized when a customer obtains control of a good or service and thus has the ability to direct the use and obtain the benefits from the good or service. The standard replaces IAS 18 ‘Revenue’, IAS 11 ‘Construction contracts’
and IFRIC 13, ‘Customer Loyalty Programmes’. Impact of adoption of IFRS 15 is disclosed in Note. 7.2 of the financial statements.
- IFRIC 22, ‘Foreign currency transactions and advance consideration’:
IFRIC 22 clarifies which date should be used for translation when a foreign currency transaction involves payment or receipt in advance of the item it relates to. The related item is translated using the exchange rate on the date the advance foreign currency is received or paid and the prepayment or deferred income is recognized. The date of the transaction for the purpose of determining the exchange rate to use on initial recognition of the related asset, expense or income (or part of it) would remain the date on which receipt of payment from advance consideration was recognized. If there are multiple payments or receipts in advance, the entity shall determine a date of the transaction for each payment or receipt of advance consideration. The interpretation does not have a significant impact on the these financial statements.
- Annual improvements to IFRS standards 2014-2016 cycle [Amendments to IAS 28 ‘Investments in Associates and Joint Ventures’]:
Amendments to IAS 28 clarifies that a venture capital organization and other similar entities may elect to Amendments to IAS 28 clarifies that a venture capital organization and other similar entities may elect to measure investments in associates and joint ventures at fair value through profit or loss, for each associate or joint venture separately at the time of initial recognition of investment. Furthermore, similar election is available to non-investment entity that has an interest in an associate or joint venture that is an investment entity, when applying the equity method, to retain the fair value measurement applied by that investment entity associate or joint venture to the investment entity associate’s or joint venture’s interests in subsidiaries. This election is made separately for each investment entity associate or joint venture. The amendments do not have any impact on these financial statements.
The other amendments to published standards and interpretations that are mandatory for the financial year are considered not to be relevant or to have any significant impact on the Company’s financial reporting and operations and are therefore not disclosed in these financial statements.
3.2 Standards, interpretations and amendments to approved accounting standards that are issued but not yet effective and have not been early adopted by the Company
- Amendment to IAS 19 ‘Employee Benefits, - Plan Amendment, Curtailment or Settlement’ (effective for annual period beginning on or after January 01, 2019):
The amendments to IAS 19 specify that an entity must;
(i) determine current service cost for the remainder of the period after the plan amendment, curtailment or settlement using the actuarial assumptions used to remeasure the net defined benefit liability (asset) reflecting the benefits offered under the plan and the plan assets after that event and determine net interest for the remainder of the period after the plan amendment, curtailment or settlement using:
Inte
rloop
Lim
ited
178 179
2018
- 1
9A
nnua
l Rep
ort
NOTES TO THE CONSOLIDATED FINANCIAL STATEMENTSFOR THE YEAR ENDED JUNE 30, 2019
NOTES TO THE CONSOLIDATED FINANCIAL STATEMENTSFOR THE YEAR ENDED JUNE 30, 2019
(a) the net defined benefit liability (asset) reflecting the benefits offered under the plan and the plan assets after that event; and
(b) the discount rate used to remeasure that net defined benefit liability (asset); and
(ii) determine any past service cost, or a gain or loss on settlement, without considering the effect of the asset ceiling. This amount is to be recognized in profit or loss. An entity then determine the effect of the asset ceiling after the plan amendment, curtailment or settlement. Any change in that effect, excluding amounts included in net interest, is recognized in other comprehensive income.
The Company is yet to assess the full impact of the amendment.
- Amendment to IAS 28 ‘Investments in Associates and Joint Ventures’ - Long term investment in Associates and Joint Ventures (effective for annual period beginning on or after January 01, 2019):
The amendment will affect companies that finance such entities with preference shares or with loans for which repayment is not expected in the foreseeable future (referred to as long-term interests or ‘LTI’). The amendment and accompanying example state that LTI are in the scope of both IFRS 9 and IAS 28 and explain the annual sequence in which both standards are to be applied. The amendment is not likely to have an impact on the Company’s financial statements.
- Amendment to IFRS 9 ‘Financial Instrument’- prepayment Features with Negative Compensation and modifications of financial liabilities (effective for annual period beginning on or after January 01, 2019):
The amendment allow debt instruments with negative compensation prepayment features to be measured at amortized cost or fair value through other comprehensive income. The amendment also clarified that gains and losses arising on modifications of financial liabilities that do not result in derecognition should be recognized in profit or loss.
- IFRS 16, ‘Leases’ (effective for periods beginning on or after January 01, 2019):
IFRS 16 introduces a single lessee accounting model and requires a lessee to recognize assets and liabilities for all leases with a term of more than 12 months, unless the underlying asset is of low value. A lessee is required to recognize a right-of-use asset representing its right to use the underlying leased asset and a lease liability representing its obligation to make lease payments. The full impact of the future adoption is currently under review.
- IFRIC 23 ‘Uncertainty over Income Tax Treatments’ (effective for annual periods beginning on or after January 01, 2019):
IFRIC 23 clarifies how the recognition and measurement requirements of IAS 12 ‘Income taxes’, are
applied where there is uncertainty over income tax treatments. An uncertain tax treatment is any tax treatment applied by an entity where there is uncertainty over whether that treatment will be accepted by the tax authority. For example, a decision to claim a deduction for a specific expense or not to include a specific item of income in a tax return is an uncertain tax treatment if its acceptability is uncertain under tax law. IFRIC 23 applies to all aspects of income tax accounting where there is an uncertainty regarding the treatment of an item, including taxable profit or loss, the tax bases of assets and liabilities, tax losses and credits and tax rates. The interpretation is not expected to have significant impact on the Company’s financial statements.
- Amendments to IAS 1, ‘Presentation of financial statements’, and IAS 8, ‘Accounting policies, changes in accounting estimates and errors’ (effective for the Company’s annual period beginning on January 1, 2019):
These amendments and consequential amendments to other IFRSs:
(i) use a consistent definition of materiality throughout IFRSs and the Conceptual Framework for Financial Reporting;
(ii) clarify the explanation of the definition of material; and
(iii) incorporate some of the guidance in IAS 1 about immaterial information.
These amendments are not expected to have a significant impact on the Company’s future financial statements.
- Amendment to IFRS 3 ‘Business Combinations’ – Definition of a Business (effective for business combinations for which the acquisition date is on or after the beginning of annual period beginning on or after 1 January 2020):
The IASB has issued amendments aiming to resolve the difficulties that arise when an entity determines whether it has acquired a business or a group of assets. The amendments clarify that to be considered a business, an acquired set of activities and assets must include, at a minimum, an input and a substantive process that together significantly contribute to the ability to create outputs. The amendments include an election to use a concentration test. The standard is effective for transactions in the future and therefore would not have an impact on past financial statements.
- Annual Improvements to IFRS Standards 2015–2017 Cycle. The new cycle of improvements addresses improvements to following approved accounting standards (effective for annual period beginning on or after January 1, 2019):
- IFRS 3 Business Combinations and IFRS 11 Joint Arrangements. The amendment aims to clarify the accounting treatment when a company increases its interest in a joint operation that meets the definition of a business. A company remeasures its previously held interest in a joint operation when it obtains control of the business. A company does not remeasure its previously held interest in a joint operation when it obtains joint control of the business.
Inte
rloop
Lim
ited
180 181
2018
- 1
9A
nnua
l Rep
ort
NOTES TO THE CONSOLIDATED FINANCIAL STATEMENTSFOR THE YEAR ENDED JUNE 30, 2019
NOTES TO THE CONSOLIDATED FINANCIAL STATEMENTSFOR THE YEAR ENDED JUNE 30, 2019
- IAS 12 Income Taxes. The amendment clarify that all income tax consequences of dividends (including payments on financial instruments classified as equity) are recognized consistently with the transaction that generates the distributable profits.
- IAS 23 Borrowing Costs. The amendment clarify that a company treats as part of general borrowings any borrowing originally made to develop an asset when the asset is ready for its intended use or sale.
Further, the following new standards have been issued by the International Accounting Standards Board (IASB), which are yet to be notified by the Securities and Exchange Commission of Pakistan (SECP), for the purposes of their applicability in Pakistan:
IFRS - 1 ‘First time adoption of International Financial Reporting Standards’. IFRS - 14 ‘Regulatory Deferral Accounts’. IFRS - 17 ‘Insurance Contracts’.
4. CRITICAL ACCOUNTING ESTIMATES AND JUDGMENTS The preparation of financial statements in conformity with the approved accounting standards require
management to make judgments, estimates and assumptions that affect the application of accounting policies and the reported amounts of assets and liabilities, income and expenses. The estimates and associated assumptions are based on historical experience and various other factors that are believed to be reasonable under the circumstances, the results of which form the basis of making the judgments about carrying values of assets and liabilities that are not readily apparent from other sources. Actual results may differ from these estimates.
The estimates and underlying assumptions are reviewed on an ongoing basis. Revisions to accounting estimates are recognised in the period in which the estimates are revised if the revision affects only that period, or in the period of the revision and future periods. Judgments made by management in application of the approved accounting standards that have significant effect on the financial statements and estimates with a significant risk of material adjustments in the next year are discussed in respective policy notes. The areas where various assumptions and estimates are significant to the Company’s financial statements or where judgment was exercised in application of accounting policies are as follows:
• Estimate of useful life of operating fixed assets - note 6.1• Impairment of non financial assets - note 6.5• Stores and spares - note 6.6• Stock-in-trade - note 6.7• Staff retirement benefits - note 6.10• Provisions - note 6.13• Contingencies - note 6.14• Taxation - note 6.15
5. BASIS OF CONSOLIDATION
Subsidiary
Subsidiary is an entity over which the Group has control. The Group controls an entity when the Group is exposed to, or has rights to, variable returns from its involvement with the entity and has the ability to affect those returns through its power to direct the activities of the entity. Subsidiary is fully consolidated from the date on which control is transferred to the Group and is deconsolidated from the date that control ceases.
The assets and liabilities of Subsidiary Company have been consolidated on a line by line basis and carrying value of investments held by the Holding Company is eliminated against Holding Company’s share in paid up capital of the Subsidiary Company.
Intragroup balances and transactions have been eliminated. Non-controlling interests are that part of net results of the operations and of net assets of Subsidiary Company
attributable to interest which are not owned by the Holding Company. Non-controlling interests are presented as separate item in the consolidated financial statements.
Associate
Associates is an entity in which the Group has significant influence, but not control, over the financial and operating policies. Interests in associate is accounted for using the equity method. They are initially recognized at cost, which includes transaction costs. Subsequent to initial recognition, the consolidated financial statements include the Group’s share of the profit or loss and other comprehensive income of equity accounted investee, until the date on which significant influence ceases.
Unrealized gains arising from transactions with equity accounted investee are eliminated against the investment to the extent of the Group companies’ interest in the investee. Unrealized losses are eliminated in the same way as unrealized gains, but only to the extent that there is no evidence of im airment.
6. SUMMARY OF SIGNIFICANT ACCOUNTING POLICIES
6.1 Operating fixed assets and depreciation
Operating fixed assets, except freehold land which is stated at cost, are stated at cost less accumulated depreciation and any identified accumulated impairment loss.
Depreciation is charged to statement of profit or loss, unless it is included in the carrying amount of another asset, at the rates stated in note 8.1 applying reducing balance method. The useful life and residual value of major components of fixed assets are reviewed annually to determine that expectations are not significantly different from the previous estimates. Adjustment in depreciation rate for current and future periods is made if expectations are significantly different from the previous estimates. Depreciation is charged from the month when an asset becomes available for use, whereas no depreciation is charged in the month of its disposal. Gain/loss on disposal of fixed assets is included in statement of profit or loss.
Expenditure, which enhances or extends the performance of operating fixed assets beyond its original specification and its useful life, is recognized as a capital expenditure and is added to the cost of the
Inte
rloop
Lim
ited
182 183
2018
- 1
9A
nnua
l Rep
ort
NOTES TO THE CONSOLIDATED FINANCIAL STATEMENTSFOR THE YEAR ENDED JUNE 30, 2019
NOTES TO THE CONSOLIDATED FINANCIAL STATEMENTSFOR THE YEAR ENDED JUNE 30, 2019
operating fixed assets. These are depreciated on reducing balance method at the rate mentioned in the relevant note.
6.2 Capital work in progress
Capital work in progress is stated at cost less any identified impairment loss and represents direct cost of material, labour, applicable overheads and borrowing costs on qualifying assets. Transfers are made to relevant property, plant and equipment category as and when assets are available for its intended use.
6.3 Leases
Operating leases
Leases where a significant portion of the risks and rewards of ownership are retained by the lessor are classified as operating leases. Payments made under operating leases (net of any incentives received from the lessor) are charged to the income statement on a straight-line basis over the period of lease.
Finance leases
Leases in terms of which the Company has substantially all the risks and rewards of ownership are classified as finance leases. Assets subject to finance lease are stated at the lower of present value of minimum lease payments under the lease agreements and the fair value of the assets, less accumulated depreciation and any identified impairment loss.
The related rental obligations, net of finance costs are classified as current and long term liability depending upon the timing of the payment.
Each lease payment is allocated between the liability and finance cost so as to achieve a constant rate on the balance outstanding. The interest element of the rental is charged to statement of profit or loss over the lease term.
Assets acquired under a finance lease are depreciated over the estimated useful life of the asset on a reducing balance method at the rates given in note 8.1. Depreciation of leased assets is charged to statement of profit or loss.
Residual value and the useful life of an asset are reviewed at least at each financial year-end.
Depreciation on additions to leased assets is charged from the month in which an asset is acquired, while no depreciation is charged for the month in which the asset is disposed off.
6.4 Intangible asset - Computer software
Intangible assets are stated at cost less accumulated amortization and any identified accumulated
impairment loss. These are amortized using the reducing balance method at the rates given in note 9. Amortization on additions is charged from the month in which an intangible asset is acquired, while no amortization is charged for the month in which intangible asset is disposed off.
Costs associated with maintaining computer software programme are recognized as an expense as and when incurred. Costs that are directly attributable to identifiable software and have probable economic benefits exceeding one year, are recognized as an intangible asset at the time of initial recognition. Direct costs include the purchase cost of software and related overhead costs.
Expenditure, which enhances or extends the performance of computer software beyond its original specification and useful life, is recognized as a capital expenditure and added to the cost of the software. These are amortised on straight line method at the rate mentioned in the relevant note.
6.5 Impairment of non-financial assets
Non financial assets
The carrying amounts of the Company’s non-financial assets, other than stock in trade and stores and spares, are reviewed at each reporting date to determine whether there is any indication of impairment. If any such indication exists then the asset’s recoverable amount is estimated. For goodwill and intangible assets that have indefinite lives or that are not yet available for use, recoverable amount is estimated at each reporting date.
An impairment loss is recognised if the carrying amount of an asset or its cash-generating unit exceeds its recoverable amount. A cash-generating unit is the smallest identifiable asset group that generates cash flows that largely are independent from other assets and groups.
Impairment losses are recognised in profit and loss. Impairment losses recognised in respect of cash-generating units are allocated first to reduce the carrying amount of any goodwill allocated to the units and then to reduce the carrying amount of the other assets of the unit on a pro-rata basis. Impairment losses on goodwill shall not be reversed.
An impairment loss is reversed if there has been a change in the estimates used to determine the recoverable amount. An impairment loss is reversed only to the extent that the asset’s carrying amount does not exceed the carrying amount that would have been determined, net of depreciation or amortisation, if no impairment loss had been recognised. Prior impairments of non-financial assets (other than goodwill) are reviewed for possible reversal at each reporting date.
6.6 Stores and spares
Stores and spares are carried at moving average cost. Provision is made for slow moving and obsolete store items when so identified. Stores and spares held for capital expenditure are included in capital work in progress.
Inte
rloop
Lim
ited
184 185
2018
- 1
9A
nnua
l Rep
ort
NOTES TO THE CONSOLIDATED FINANCIAL STATEMENTSFOR THE YEAR ENDED JUNE 30, 2019
NOTES TO THE CONSOLIDATED FINANCIAL STATEMENTSFOR THE YEAR ENDED JUNE 30, 2019
6.7 Stock-in-trade
These are stated at the lower of cost and net realizable value (NRV). The methods used for the calculation of cost are as follows:
Raw material - At factory Moving average cost - In transit Invoice value plus direct charges in respect thereof. Work in process and finished goods Prime cost including a proportion of production overheads. Wastes are valued at net realizable value.
Stock-in-trade is regularly reviewed by the management and any obsolete items are brought down to their net realizable value. Net realizable value signifies the selling price in the ordinary course of business less costs necessary to be incurred to affect such sale.
6.8 Cash and cash equivalents
Cash and cash equivalents comprise of cash in hand, cheques in hand/cheques overdrawn, balances with banks and include short term highly liquid investments. The cash and cash equivalents are readily convertible to known amount of cash and are subject to insignificant risk of change in value.
6.9 Non-current assets held for sale
Non-current assets (or disposal groups) are classified as assets held for sale when their carrying amount is to be recovered principally through a sale transaction rather than continuing use and a sale is considered highly probable. They are stated at the lower of carrying amount and fair value less costs to sell. Impairment losses on initial classification as held for sale and subsequent gains or losses on re-measurements are recognized in the statement of profit or loss.
Once classified as held-for-sale, intangible assets and property, plant and equipment, are no longer amortised or depreciated.
6.10 Staff retirement benefits
(a) Defined Benefit Plan
The Company operates an unfunded gratuity scheme for all employees according to the terms of employment, subject to a minimum qualifying period of service. Annual provision is made on the basis of actuarial valuation to cover obligations under the scheme for all employees eligible to gratuity benefits.
The cost of providing benefits is determined using the projected unit credit method, with actuarial valuation being carried out at each balance sheet date. Remeasurement of net defined benefit liability, which comprise of actuarial gains and losses i.e. experience adjustments and the effects of changes in actuarial assumptions, are recognised immediately in other comprehensive income. The Company determines net interest expense/(income) on the defined benefit obligation for the period by applying
the discount rate used to measure the defined benefit obligation at the beginning of the annual period to then-net defined benefit, taking into account any change in the net defined benefit obligation during the period as a result of contributions and benefit payments. Net interest expense and other expenses e.g. current service cost, related to defined benefit plans are recognised in profit and loss.
(b) Defined Contribution Plan
There is a contributory provident fund for executive staff of the Company for which contributions are charged to profit and loss as and when incurred.
The Company makes monthly contribution to the fund at the rate of 7.5% whereas employees of the Company make monthly contributions to the fund at the rates ranging form 7.5% to 12.5% of basic salary. The assets of the fund are held separately under the control of trustees.
(c) Employees’ Share Option Scheme (ESOS)
The Company operates an equity settled stock option scheme to be called ‘Interloop Limited - Employees Stock Option Scheme, 2016’. The compensation committee (“committee”) of the Board of directors (“Board”) evaluates the performance and other criteria of employees and recommends to the Board for grant of options. The Board on the recommendation of the committee, on its discretion, grants recommended options to employees. These options vest after a specified period subject to fulfillment of certain conditions as defined in the scheme. Upon vesting, employees are eligible to apply and secure allotment of Company’s shares at a pre-determined price on the date of grant of options.
The fair value of the grant of share options is measured at grant date and difference of fair value and exercise price is recognized as an employee compensation expense, with a corresponding increase in equity, on the straight line basis over the vesting period. The amount recognized as an expense is adjusted to reflect the number of awards for which the related service and non-market performance conditions are expected to be met, such that the amount ultimately recognized is based on the number of awards that meet the related service and non- market performance conditions at the vesting date.
When share options are exercised, the proceeds received, net of any transaction costs, are credited to share capital (nominal value) and share premium.
6.11 Trade and other payables
Trade and other payables are initially recognized at fair value and subsequently at amortized cost using effective interest rate method. Exchange gains and losses arising on translation in respect of liabilities in foreign currency are added to the carrying amount of the respective liabilities.
6.12 Ijarah
Ijarah payments under an Ijarah are recognized as an expense in the statement of profit or loss on a
Inte
rloop
Lim
ited
186 187
2018
- 1
9A
nnua
l Rep
ort
NOTES TO THE CONSOLIDATED FINANCIAL STATEMENTSFOR THE YEAR ENDED JUNE 30, 2019
NOTES TO THE CONSOLIDATED FINANCIAL STATEMENTSFOR THE YEAR ENDED JUNE 30, 2019
straight-line basis over the Ijarah term.
6.13 Provisions
Provisions are recognized in the balance sheet when the Company has a present legal or constructive obligation as a result of past events and it is probable that an outflow of resources will be required to settle the obligation and a reliable estimate of the amount can be made.
Provisions are reviewed at each balance sheet date and are adjusted to reflect the current best estimate. If it is no longer probable that an outflow of resources embodying economic benefits will be required to settle the obligation, the provisions are reversed.
6.14 Contingencies
The assessment of the contingencies inherently involves the exercise of significant judgment as the outcome of the future events cannot be predicted with certainty. The company, based on the availability of the latest information, estimates the value of contingent assets and liabilities which may differ on the occurrence / non-occurrence of the uncertain future events.
6.15 Taxation
Current
The charge for current taxation is based on taxable income at current rates of taxation after taking into account tax credits, rebates and exemptions available, if any. However income covered under Final Taxation Regime (FTR), taxation is based on the applicable tax rates under such Regime after taking into account tax credits, rebates and exemptions, if any.
Deferred
Deferred tax is accounted for using the balance sheet liability method in respect of temporary differences arising from differences between the carrying amount of assets and liabilities in the financial statements and the corresponding tax basis used in the computation of taxable income. Deferred tax is calculated by using the tax rates enacted at the balance sheet date. In this regard, the effect on deferred taxation of the portion of income subjected to Final Tax Regime is adjusted in accordance with the requirements of Accounting Technical Release – 27 of the Institute of Chartered Accountants of Pakistan, if considered material.
Deferred tax liability is recognized for all taxable temporary differences and deferred tax asset is recognized for all deductible temporary differences and carry forward of unused tax losses and unused tax credits, if any, to the extent that it is probable that future taxable profit will be available against which these can be utilized.
Deferred tax assets are reduced to the extent that it is no longer probable that the related tax benefit will be realized. Significant management judgment is required to determine the amount of deferred tax
assets that can be recognized, based upon the likely timing and level of future taxable profits together with future tax planning strategies.
6.16 Foreign currency translation
All monetary assets and liabilities in foreign currencies are translated into rupees at exchange rates prevailing at the balance sheet date. Transactions in foreign currencies are translated into rupees at exchange rates prevailing at the date of transaction. Non-monetary assets and liabilities that are measured in terms of historical cost in a foreign currency are translated into rupees at exchange rates prevailing at the date of transaction. Non-monetary assets and liabilities denominated in foreign currency that are stated at fair value are translated into rupees at exchange rates prevailing at the date when fair values are determined. Exchange gains and losses are included in the statement of profit or loss immediately.
6.17 Government grants
Government grants are recognised when there is reasonable assurance that entity will comply with the conditions attached to it and grant will be received.
6.18 Borrowing costs
Borrowing costs directly attributable to the acquisition, construction or production of qualifying assets, which are assets that necessarily take a substantial period of time to get ready for their intended use or sale, are added to the cost of those assets, until such time when the assets are substantially ready for their intended use or sale. All other borrowing costs are charged to statement of profit or loss as and when incurred.
6.19 Earnings per share
The Company presents basic and diluted earnings per share (EPS) for its ordinary shares. Basic EPS is calculated by dividing the profit by weighted average number of shares outstanding during the period. Diluted EPS is calculated by adjusting for the effects of all dilutive potential ordinary shares.
6.20 Share capital
Ordinary shares are classified as equity and recognised at their face value.
6.21 Dividend
Dividend distribution to the Company’s shareholders is recognised as a liability in the Company’s financial statements in the period in which dividends are approved.
6.22 Segment reporting
Segment reporting is based on the operating (business) segments of the Company. An operating
Inte
rloop
Lim
ited
188 189
2018
- 1
9A
nnua
l Rep
ort
NOTES TO THE CONSOLIDATED FINANCIAL STATEMENTSFOR THE YEAR ENDED JUNE 30, 2019
NOTES TO THE CONSOLIDATED FINANCIAL STATEMENTSFOR THE YEAR ENDED JUNE 30, 2019
segment is a component of the Company that engages in business activities from which it may earn revenues and incur expenses, including revenues and expenses that relate to the transactions with any of the Company’s other components. An operating segment’s operating results are reviewed regularly by the chief operating decision maker (‘CODM’) to make decisions about resources to be allocated to the segment and assess its performance, and for which discrete financial information is available. The CODM, who is responsible for allocating resources and assessing performance of the operating segments, has been identified as the Board of Directors of the Company that makes the strategic decisions.
Segment results that are reported to the CODM include items directly attributable to a segment as well as those that can be allocated on a reasonable basis. Those incomes, expenses, assets, liabilities and other balances which cannot be allocated to a particular segment on a reasonable basis are reported as unallocated.
Transaction among the business segments are recorded at cost. Inter segment sales and purchases
are eliminated from the total.
6.23 Related party transactions
All transactions with related parties are carried out at agreed terms and conditions and on arm’s length basis.
7. CHANGES IN ACCOUNTING POLICIES DUE TO APPLICABILITY OF CERTAIN INTERNATIONAL FINANCIAL REPORTING STANDARDS (IFRS)
7.1 IFRS 9, ‘Financial Instruments’
A financial instrument is any contract that gives rise to a financial asset of one entity and a financial liability or equity instrument of another entity.
7.1.1 Financial assets
The standard introduced new classification and measurement models for financial assets. A financial asset shall be measured at amortized cost if it is held in order to collect contractual cash flows which arise on specified dates and that are ‘solely payment of principal and interest (SPPI)’ on the principal amount outstanding. A debt investment shall be measured at fair value through other comprehensive income if it is held in order to collect contractual cash flows which arise on specified dates that are solely principal and interest and as well as selling the asset on the basis of its fair value. All other financial assets are classified and measured at fair value through profit or loss unless the Company makes an irrevocable election on initial recognition to present gains and losses on equity instruments in other comprehensive income. Despite these requirements, a financial asset may be irrevocably designated as measured at fair value through profit or loss to reduce the effect of, or eliminate, an accounting mismatch.
Key changes in accounting policies resulting from application of IFRS 9
A. Classification and measurement of financial instrumentsa) Investments and other financial assets
Classification:
The Company classifies its financial assets in the following measurement categories:
- those to be measured subsequently at fair value (either through other comprehensive income, or through profit or loss), and
- those to be measured at amortized cost
The classification depends on the Company’s business model for managing the financial assets and the contractual terms of the cash flows. In order for a financial asset to be classified and measured at amortized cost or fair value through OCI, it needs to give rise to cash flows that are ‘solely payments of principal and interest (SPPI)’ on the principal amount outstanding. This assessment is referred to as the SPPI test and is performed at an instrument level. The Company’s business model for managing financial assets refers to how it manages its financial assets in order to generate cash flows.
For assets measured at fair value, gains and losses will either be recorded in profit or loss or other comprehensive income. For investments in debt instruments, this will depend on the business model in which the investment is held. For investments in equity instruments, this will depend on whether the Company has made an irrevocable election at the time of initial recognition to account for the equity investment at fair value through other comprehensive income. The Company reclassifies debt investments when and only when its business model for managing those assets changes.
Measurement:
At initial recognition, the Company measures a financial asset at its fair value plus, in the case of a financial asset not at fair value through profit or loss, transaction costs that are directly attributable to the acquisition of the financial asset. Transaction costs of financial assets carried at fair value through profit or loss are expensed in profit or loss.
Financial assets with embedded derivatives are considered in their entirety when determining whether their cash flows are solely payment of principal and interest.
i) Debt instruments
Subsequent measurement of debt instruments depends on the Company’s business model for managing the asset and the cash flow characteristics of the asset. There are three measurement categories into which the Company classifies its debt instruments:
Inte
rloop
Lim
ited
190 191
2018
- 1
9A
nnua
l Rep
ort
NOTES TO THE CONSOLIDATED FINANCIAL STATEMENTSFOR THE YEAR ENDED JUNE 30, 2019
NOTES TO THE CONSOLIDATED FINANCIAL STATEMENTSFOR THE YEAR ENDED JUNE 30, 2019
Amortized cost
Financial assets that are held for collection of contractual cash flows where those cash flows represent solely payments of principal and interest are measured at amortized cost. Interest income from these financial assets is included in other income using the effective interest rate method. Any gain or loss arising on derecognition is recognized directly in profit or loss and presented in other income / (other expenses) together with foreign exchange gains and losses. Impairment losses are presented as separate line item in the statement of profit or loss.
Fair value through other comprehensive income (FVTOCI)
Financial assets that are held for collection of contractual cash flows and for selling the financial assets, where the assets’ cash flows represent solely payments of principal and interest, are measured at FVTOCI. Movements in the carrying amount are taken through other comprehensive income, except for the recognition of impairment losses (and reversal of impairment losses), interest income and foreign exchange gains and losses which are recognized in profit or loss. When the financial asset is derecognized, the cumulative gain or loss previously recognized in other comprehensive income is reclassified from equity to profit or loss and recognized in other income / (other expenses). Interest income from these financial assets is included in other income using the effective interest rate method. Foreign exchange gains and losses are presented in other income/ (other expenses) and impairment losses are presented as separate line item in the statement of profit or loss.
Fair value through profit or loss
Financial assets at fair value through profit or loss include financial assets held for trading, financial assets designated upon initial recognition at fair value through profit or loss, or financial assets mandatorily required to be measured at fair value. Financial assets are classified as held for trading if they are acquired for the purpose of selling or repurchasing in the near term. Financial assets with cash flows that are not solely payments of principal and interest are classified and measured at fair value through profit or loss, irrespective of the business model. Not with standing the criteria for debt instruments to be classified at amortized cost or at fair value through OCI, as described above, debt instruments may be designated at fair value through profit or loss on initial recognition if doing so eliminates, or significantly reduces, an accounting mismatch.
Financial assets at fair value through profit or loss are carried in the statement of financial position at fair value with net changes in fair value recognized in the statement of profit or loss.
B. Derecognition
A financial asset (or, where applicable, a part of a financial asset or part of a group of similar financial assets) is primarily derecognized when:
The rights to receive cash flows from the asset have expired, or
The Company has transferred its rights to receive cash flows from the asset or has assumed an obligation to pay the received cash flows in full without material delay to a third party under a ‘pass-through’ arrangement; and either (a) the Company has transferred substantially all the risks and rewards of the asset, or (b) the Company has neither transferred nor retained substantially all the risks and rewards of the asset, but has transferred control of the asset.
When the Company has transferred its rights to receive cash flows from an asset or has entered into a pass-through arrangement, it evaluates if, and to what extent, it has retained the risks and rewards of ownership.
When it has neither transferred nor retained substantially all of the risks and rewards of the asset, nor transferred control of the asset, the Company continues to recognize the transferred asset to the extent of its continuing involvement. In that case, the Company also recognizes an associated liability. The transferred asset and the associated liability are measured on a basis that reflects the rights and obligations that the Company has retained.
Continuing involvement that takes the form of a guarantee over the transferred asset is measured at the lower of the original carrying amount of the asset and the maximum amount of consideration that the Company could be required to repay.
C. Impairment
The adoption of IFRS 9 has fundamentally changed the Company’s accounting for impairment losses for financial assets by replacing IAS 39’s incurred loss approach with a forward-looking expected credit loss (ECL) approach. IFRS 9 requires the Company to record an allowance for ECLs for all loans and other debt financial assets not held at FVPL.
ECLs are based on the difference between the contractual cash flows due in accordance with the contract and all the cash flows that the Company expects to receive. The shortfall is then discounted at an approximation to the asset’s original effective interest rate.
For trade and other receivables, the Company has applied the standard’s simplified approach and has calculated ECLs based on lifetime expected credit losses. The Company has established a provision matrix that is based on the Company’s historical credit loss experience, adjusted for forward-looking factors specific to the debtors and the economic environment. However, in certain cases, the Company may also consider a financial asset to be in default when internal or external information indicates that the Company is unlikely to receive the outstanding contractual amounts in full before taking into account any credit enhancements held by the Company.
D. Hedge accounting
IFRS 9 requires that hedge accounting relationships are aligned with its risk management objectives and strategy and to apply a more qualitative and forward-looking approach to assessing hedge effectiveness.
Inte
rloop
Lim
ited
192 193
2018
- 1
9A
nnua
l Rep
ort
NOTES TO THE CONSOLIDATED FINANCIAL STATEMENTSFOR THE YEAR ENDED JUNE 30, 2019
NOTES TO THE CONSOLIDATED FINANCIAL STATEMENTSFOR THE YEAR ENDED JUNE 30, 2019
There is no impact of the said change on these consolidated financial statements as there is no hedge activity carried on by the Company during the year ended June 30, 2019.
7.1.2 Financial liabilities
A. Classification and measurement
Financial liabilities are classified, at initial recognition, as financial liabilities at fair value through profit or loss, loans and borrowings, payables, or as derivatives designated as hedging instruments in an effective hedge, as appropriate.
All financial liabilities are recognized initially at fair value and, in the case of loans and borrowings and payables, net of directly attributable transaction costs.
i) Financial liabilities at fair value through profit or loss
Financial liabilities at fair value through profit or loss include financial liabilities held for trading and financial liabilities designated upon initial recognition as at fair value through profit or loss. Gains or losses on liabilities held for trading are recognized in the consolidated statement of profit or loss. Financial liabilities designated upon initial recognition at fair value through profit or loss are designated at the initial date of recognition, and only if the criteria in IFRS 9 are satisfied. The Company has not designated any financial liability as at fair value through profit or loss.
ii) Loans and borrowings
This is the category most relevant to the Company. After initial recognition, interest-bearing loans and borrowings are subsequently measured at amortized cost using the EIR (effective interest rate) method. Gains and losses are recognized in the statement of profit or loss when the liabilities are derecognized as well as through the EIR amortisation process.
Amortized cost is calculated by taking into account any discount or premium on acquisition and fees or costs that are an integral part of the EIR. The EIR amortisation is included as finance costs in the statement of profit or loss.
This category generally applies to interest-bearing loans and borrowings.
B. Derecognition
A financial liability is derecognized when the obligation under the liability is discharged or cancelled or expires. When an existing financial liability is replaced by another from the same lender on substantially different terms, or the terms of an existing liability are substantially modified, such an exchange or modification is treated as the derecognition of the original liability and the recognition
of a new liability. The difference in the respective carrying amounts is recognized in the consolidated statement of profit or loss.
7.1.3 Offsetting of financial assets and liabilities
Financial assets and financial liabilities are set off and the net amount is reported in the financial statements when there is a legally enforceable right to set off and the company intends either to settle on a net basis, or to realize the assets and to settle the liabilities simultaneously.
7.1.4 Impacts of adoption of IFRS 9 on these consolidated financial statements
At transition date to IFRS 9, the Company has financial assets measured at amortized cost and investments in mutual funds at fair value through profit or loss. The new classification and measurement of the Company’s financial assets are, as follows:
Debt instruments at amortized cost for financial assets that are held within a business model with the objective to hold the financial assets in order to collect contractual cash flows that meet the SPPI criterion.
Investments in mutual funds that are held for trading in near term and has recognized initially and subsequently at fair value through profit or loss. On application of IFRS - 9 the Company has not opted to recognize investments in mutual funds at fair value through other comprehensive income (FVTOCI). These are recognized as fair value through profit or loss.
Further all financial assets previously classified under the head ‘loans and receivables’ are now classified as ‘amortised cost’.
The accounting for the Company’s financial liabilities remains largely the same as it was under IAS 39.
Accordingly, the adoption of IFRS 9 has not had a significant effect on the Company’s accounting policies related to financial assets and liabilities.
7.2 IFRS 15, ‘Revenue from Contracts with Customers’:
The Company has adopted IFRS 15 by applying the modified retrospective approach according to which the Company is not required to restate the prior year results.
Key changes in accounting policies resulting from application of IFRS 15
7.2.1 Revenue recognition
Revenue is recognized at an amount that reflects the consideration to which the Company is expected
Inte
rloop
Lim
ited
194 195
2018
- 1
9A
nnua
l Rep
ort
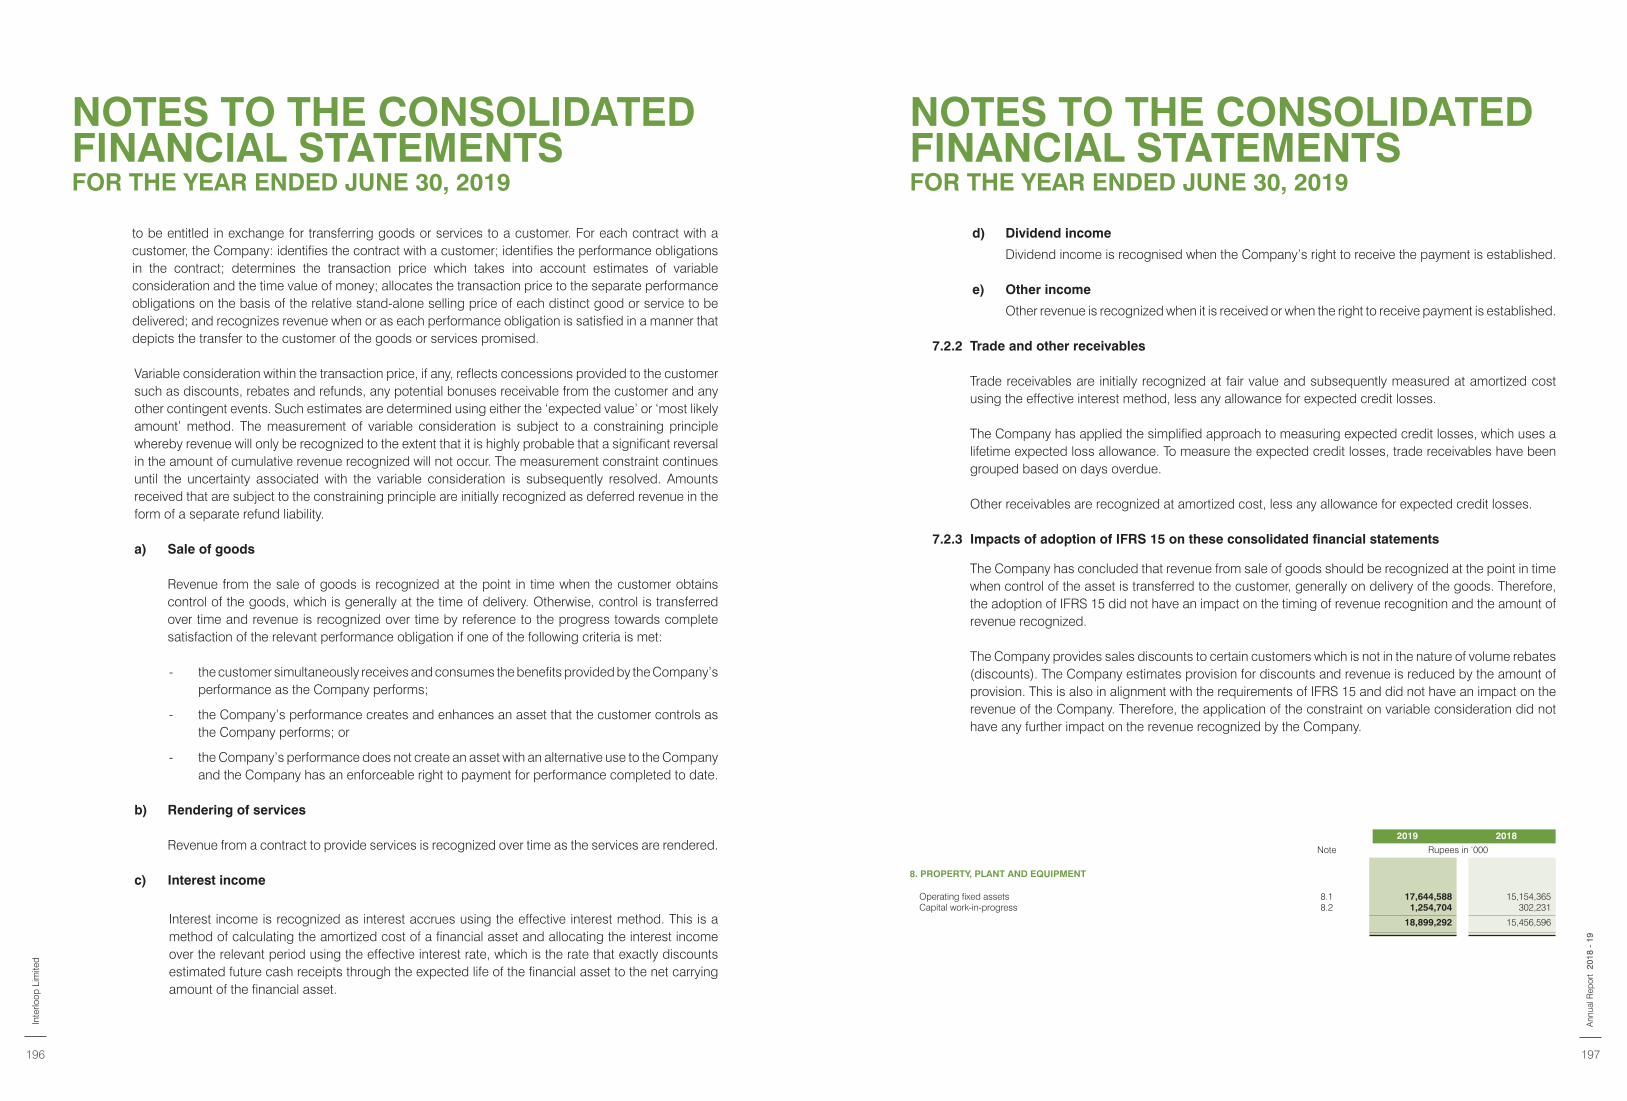
NOTES TO THE CONSOLIDATED FINANCIAL STATEMENTSFOR THE YEAR ENDED JUNE 30, 2019
NOTES TO THE CONSOLIDATED FINANCIAL STATEMENTSFOR THE YEAR ENDED JUNE 30, 2019
to be entitled in exchange for transferring goods or services to a customer. For each contract with a customer, the Company: identifies the contract with a customer; identifies the performance obligations in the contract; determines the transaction price which takes into account estimates of variable consideration and the time value of money; allocates the transaction price to the separate performance obligations on the basis of the relative stand-alone selling price of each distinct good or service to be delivered; and recognizes revenue when or as each performance obligation is satisfied in a manner that depicts the transfer to the customer of the goods or services promised.
Variable consideration within the transaction price, if any, reflects concessions provided to the customer such as discounts, rebates and refunds, any potential bonuses receivable from the customer and any other contingent events. Such estimates are determined using either the ‘expected value’ or ‘most likely amount’ method. The measurement of variable consideration is subject to a constraining principle whereby revenue will only be recognized to the extent that it is highly probable that a significant reversal in the amount of cumulative revenue recognized will not occur. The measurement constraint continues until the uncertainty associated with the variable consideration is subsequently resolved. Amounts received that are subject to the constraining principle are initially recognized as deferred revenue in the form of a separate refund liability.
a) Sale of goods
Revenue from the sale of goods is recognized at the point in time when the customer obtains control of the goods, which is generally at the time of delivery. Otherwise, control is transferred over time and revenue is recognized over time by reference to the progress towards complete satisfaction of the relevant performance obligation if one of the following criteria is met:
- the customer simultaneously receives and consumes the benefits provided by the Company’s performance as the Company performs;
- the Company’s performance creates and enhances an asset that the customer controls as the Company performs; or
- the Company’s performance does not create an asset with an alternative use to the Company and the Company has an enforceable right to payment for performance completed to date.
b) Rendering of services
Revenue from a contract to provide services is recognized over time as the services are rendered.
c) Interest income
Interest income is recognized as interest accrues using the effective interest method. This is a method of calculating the amortized cost of a financial asset and allocating the interest income over the relevant period using the effective interest rate, which is the rate that exactly discounts estimated future cash receipts through the expected life of the financial asset to the net carrying amount of the financial asset.
2019 2018
Note Rupees in ‘000
8. PROPERTY, PLANT AND EQUIPMENT
Operating fixed assets 8.1 17,644,588 15,154,365 Capital work-in-progress 8.2 1,254,704 302,231
18,899,292 15,456,596
d) Dividend income
Dividend income is recognised when the Company’s right to receive the payment is established.
e) Other income
Other revenue is recognized when it is received or when the right to receive payment is established.
7.2.2 Trade and other receivables
Trade receivables are initially recognized at fair value and subsequently measured at amortized cost using the effective interest method, less any allowance for expected credit losses.
The Company has applied the simplified approach to measuring expected credit losses, which uses a lifetime expected loss allowance. To measure the expected credit losses, trade receivables have been grouped based on days overdue.
Other receivables are recognized at amortized cost, less any allowance for expected credit losses.
7.2.3 Impacts of adoption of IFRS 15 on these consolidated financial statements
The Company has concluded that revenue from sale of goods should be recognized at the point in time when control of the asset is transferred to the customer, generally on delivery of the goods. Therefore, the adoption of IFRS 15 did not have an impact on the timing of revenue recognition and the amount of revenue recognized.
The Company provides sales discounts to certain customers which is not in the nature of volume rebates (discounts). The Company estimates provision for discounts and revenue is reduced by the amount of provision. This is also in alignment with the requirements of IFRS 15 and did not have an impact on the revenue of the Company. Therefore, the application of the constraint on variable consideration did not have any further impact on the revenue recognized by the Company.
Inte
rloop
Lim
ited
196 197
2018
- 1
9A
nnua
l Rep
ort
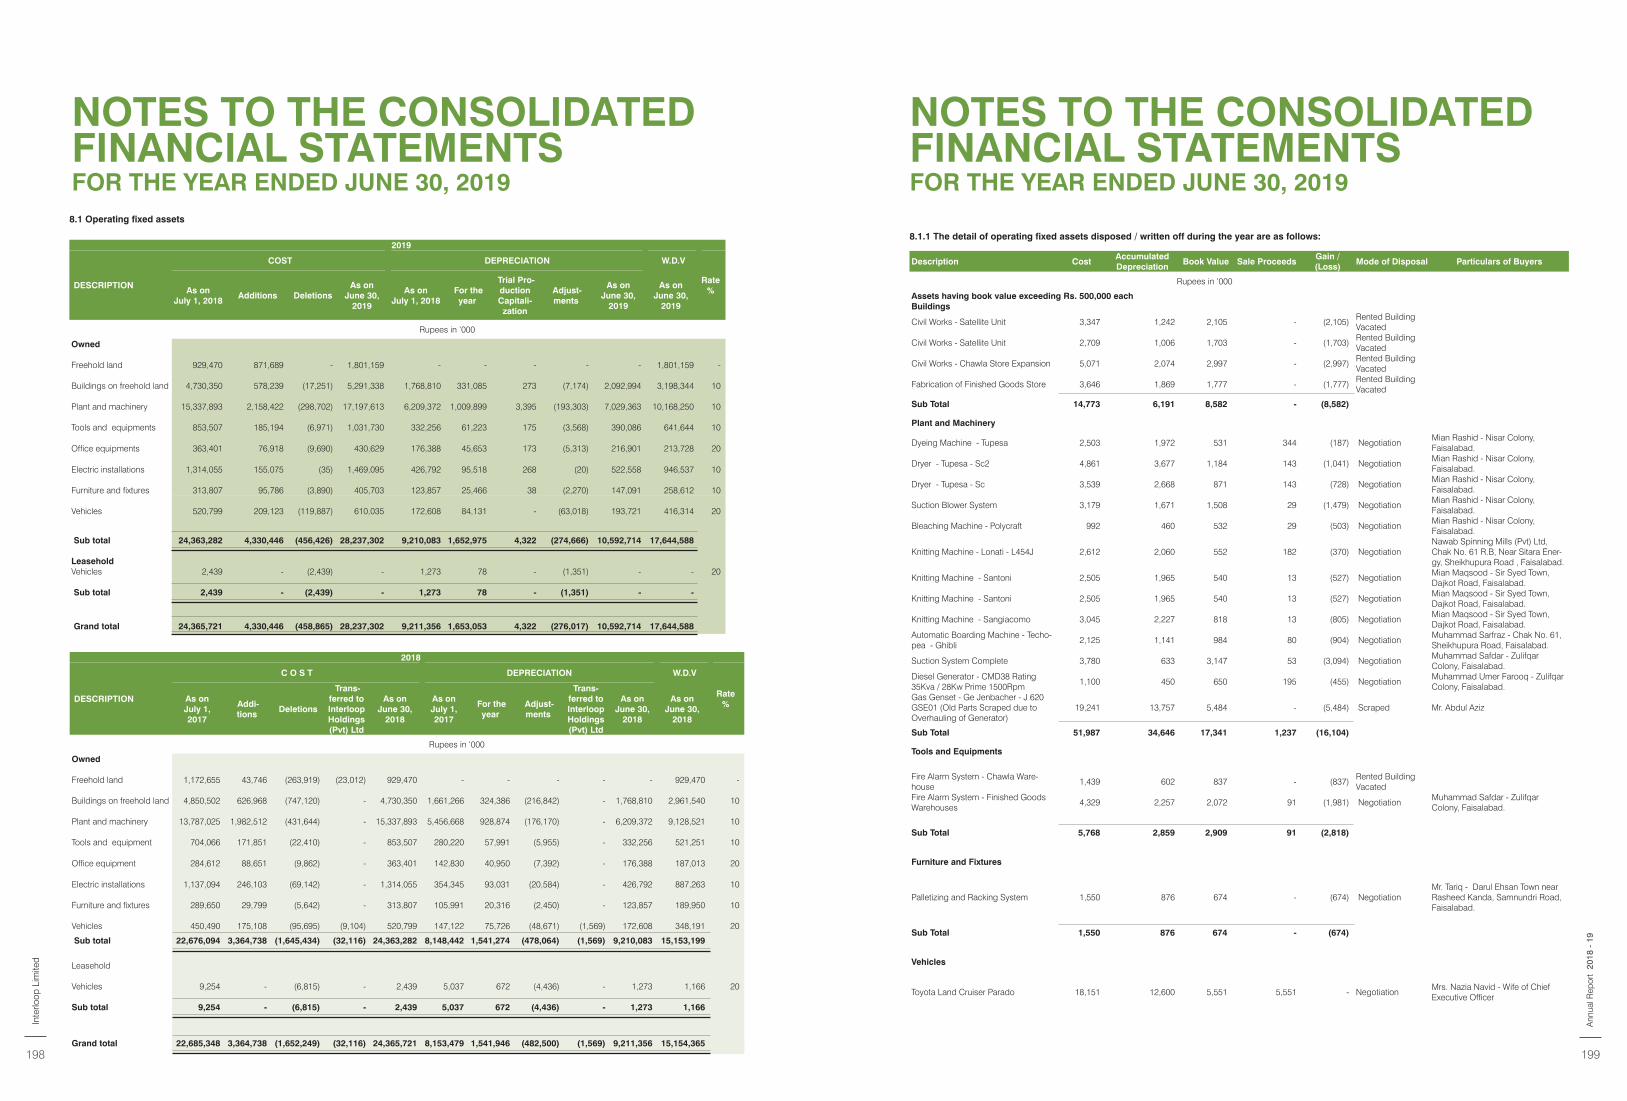
NOTES TO THE CONSOLIDATED FINANCIAL STATEMENTSFOR THE YEAR ENDED JUNE 30, 2019
NOTES TO THE CONSOLIDATED FINANCIAL STATEMENTSFOR THE YEAR ENDED JUNE 30, 2019
2018
DESCRIPTION
C O S T DEPRECIATION W.D.V
Rate %
As on July 1, 2017
Addi-tions
Deletions
Trans-ferred to Interloop Holdings (Pvt) Ltd
As on June 30,
2018
As on July 1, 2017
For the year
Adjust-ments
Trans-ferred to Interloop Holdings (Pvt) Ltd
As on June 30,
2018
As on June 30,
2018
Rupees in ‘000
Owned
Freehold land 1,172,655 43,746 (263,919) (23,012) 929,470 - - - - - 929,470 -
Buildings on freehold land 4,850,502 626,968 (747,120) - 4,730,350 1,661,266 324,386 (216,842) - 1,768,810 2,961,540 10
Plant and machinery 13,787,025 1,982,512 (431,644) - 15,337,893 5,456,668 928,874 (176,170) - 6,209,372 9,128,521 10
Tools and equipment 704,066 171,851 (22,410) - 853,507 280,220 57,991 (5,955) - 332,256 521,251 10
Office equipment 284,612 88,651 (9,862) - 363,401 142,830 40,950 (7,392) - 176,388 187,013 20
Electric installations 1,137,094 246,103 (69,142) - 1,314,055 354,345 93,031 (20,584) - 426,792 887,263 10
Furniture and fixtures 289,650 29,799 (5,642) - 313,807 105,991 20,316 (2,450) - 123,857 189,950 10
Vehicles 450,490 175,108 (95,695) (9,104) 520,799 147,122 75,726 (48,671) (1,569) 172,608 348,191 20
Sub total 22,676,094 3,364,738 (1,645,434) (32,116) 24,363,282 8,148,442 1,541,274 (478,064) (1,569) 9,210,083 15,153,199
Leasehold
Vehicles 9,254 - (6,815) - 2,439 5,037 672 (4,436) - 1,273 1,166 20
Sub total 9,254 - (6,815) - 2,439 5,037 672 (4,436) - 1,273 1,166
Grand total 22,685,348 3,364,738 (1,652,249) (32,116) 24,365,721 8,153,479 1,541,946 (482,500) (1,569) 9,211,356 15,154,365
2019
DESCRIPTION
COST DEPRECIATION W.D.V
Rate % As on
July 1, 2018 Additions Deletions
As on June 30,
2019
As on July 1, 2018
For the year
Trial Pro-duction Capitali-zation
Adjust-ments
As on June 30,
2019
As on June 30,
2019
Rupees in ‘000
Owned
Freehold land 929,470 871,689 - 1,801,159 - - - - - 1,801,159 -
Buildings on freehold land 4,730,350 578,239 (17,251) 5,291,338 1,768,810 331,085 273 (7,174) 2,092,994 3,198,344 10
Plant and machinery 15,337,893 2,158,422 (298,702) 17,197,613 6,209,372 1,009,899 3,395 (193,303) 7,029,363 10,168,250 10
Tools and equipments 853,507 185,194 (6,971) 1,031,730 332,256 61,223 175 (3,568) 390,086 641,644 10
Office equipments 363,401 76,918 (9,690) 430,629 176,388 45,653 173 (5,313) 216,901 213,728 20
Electric installations 1,314,055 155,075 (35) 1,469,095 426,792 95,518 268 (20) 522,558 946,537 10
Furniture and fixtures 313,807 95,786 (3,890) 405,703 123,857 25,466 38 (2,270) 147,091 258,612 10
Vehicles 520,799 209,123 (119,887) 610,035 172,608 84,131 - (63,018) 193,721 416,314 20
Sub total 24,363,282 4,330,446 (456,426) 28,237,302 9,210,083 1,652,975 4,322 (274,666) 10,592,714 17,644,588
Leasehold Vehicles 2,439 - (2,439) - 1,273 78 - (1,351) - - 20
Sub total 2,439 - (2,439) - 1,273 78 - (1,351) - -
Grand total 24,365,721 4,330,446 (458,865) 28,237,302 9,211,356 1,653,053 4,322 (276,017) 10,592,714 17,644,588
8.1 Operating fixed assets
8.1.1 The detail of operating fixed assets disposed / written off during the year are as follows:
Description CostAccumulated Depreciation
Book Value Sale ProceedsGain / (Loss)
Mode of Disposal Particulars of Buyers
Rupees in ‘000
Assets having book value exceeding Rs. 500,000 eachBuildings
Civil Works - Satellite Unit 3,347 1,242 2,105 - (2,105)Rented Building Vacated
Civil Works - Satellite Unit 2,709 1,006 1,703 - (1,703)Rented Building Vacated
Civil Works - Chawla Store Expansion 5,071 2,074 2,997 - (2,997)Rented Building Vacated
Fabrication of Finished Goods Store 3,646 1,869 1,777 - (1,777)Rented Building Vacated
Sub Total 14,773 6,191 8,582 - (8,582)
Plant and Machinery
Dyeing Machine - Tupesa 2,503 1,972 531 344 (187) Negotiation Mian Rashid - Nisar Colony, Faisalabad.
Dryer - Tupesa - Sc2 4,861 3,677 1,184 143 (1,041) Negotiation Mian Rashid - Nisar Colony, Faisalabad.
Dryer - Tupesa - Sc 3,539 2,668 871 143 (728) Negotiation Mian Rashid - Nisar Colony, Faisalabad.
Suction Blower System 3,179 1,671 1,508 29 (1,479) Negotiation Mian Rashid - Nisar Colony, Faisalabad.
Bleaching Machine - Polycraft 992 460 532 29 (503) Negotiation Mian Rashid - Nisar Colony, Faisalabad.
Knitting Machine - Lonati - L454J 2,612 2,060 552 182 (370) Negotiation Nawab Spinning Mills (Pvt) Ltd, Chak No. 61 R.B, Near Sitara Ener-gy, Sheikhupura Road , Faisalabad.
Knitting Machine - Santoni 2,505 1,965 540 13 (527) Negotiation Mian Maqsood - Sir Syed Town, Dajkot Road, Faisalabad.
Knitting Machine - Santoni 2,505 1,965 540 13 (527) Negotiation Mian Maqsood - Sir Syed Town, Dajkot Road, Faisalabad.
Knitting Machine - Sangiacomo 3,045 2,227 818 13 (805) Negotiation Mian Maqsood - Sir Syed Town, Dajkot Road, Faisalabad.
Automatic Boarding Machine - Techo-pea - Ghibli
2,125 1,141 984 80 (904) Negotiation Muhammad Sarfraz - Chak No. 61, Sheikhupura Road, Faisalabad.
Suction System Complete 3,780 633 3,147 53 (3,094) Negotiation Muhammad Safdar - Zulifqar Colony, Faisalabad.
Diesel Generator - CMD38 Rating 35Kva / 28Kw Prime 1500Rpm
1,100 450 650 195 (455) Negotiation Muhammad Umer Farooq - Zulifqar Colony, Faisalabad.
Gas Genset - Ge Jenbacher - J 620 GSE01 (Old Parts Scraped due to Overhauling of Generator)
19,241 13,757 5,484 - (5,484) Scraped Mr. Abdul Aziz
Sub Total 51,987 34,646 17,341 1,237 (16,104)
Tools and Equipments
Fire Alarm System - Chawla Ware-house
1,439 602 837 - (837)Rented Building Vacated
Fire Alarm System - Finished Goods Warehouses
4,329 2,257 2,072 91 (1,981) Negotiation Muhammad Safdar - Zulifqar Colony, Faisalabad.
Sub Total 5,768 2,859 2,909 91 (2,818)
Furniture and Fixtures
Palletizing and Racking System 1,550 876 674 - (674) Negotiation Mr. Tariq - Darul Ehsan Town near Rasheed Kanda, Samnundri Road, Faisalabad.
Sub Total 1,550 876 674 - (674)
Vehicles
Toyota Land Cruiser Parado 18,151 12,600 5,551 5,551 - NegotiationMrs. Nazia Navid - Wife of Chief Executive Officer
Inte
rloop
Lim
ited
198 199
2018
- 1
9A
nnua
l Rep
ort
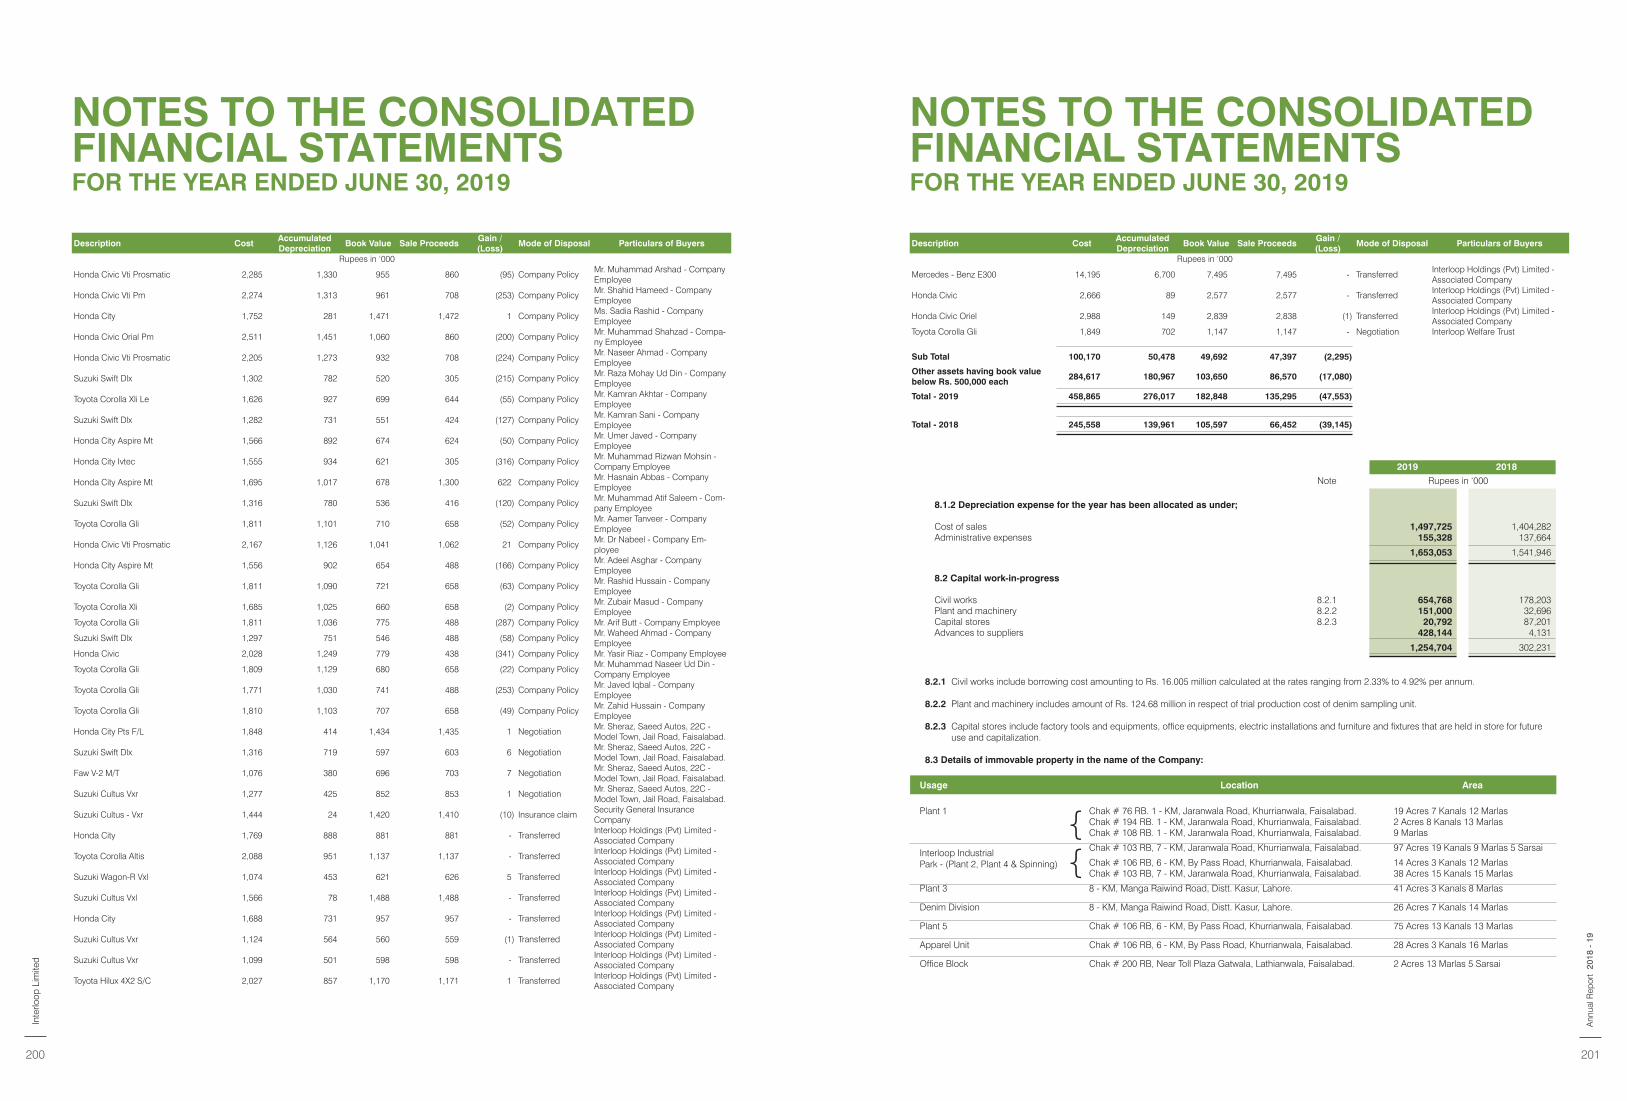
NOTES TO THE CONSOLIDATED FINANCIAL STATEMENTSFOR THE YEAR ENDED JUNE 30, 2019
NOTES TO THE CONSOLIDATED FINANCIAL STATEMENTSFOR THE YEAR ENDED JUNE 30, 2019
Description CostAccumulated Depreciation
Book Value Sale ProceedsGain / (Loss)
Mode of Disposal Particulars of Buyers
Rupees in ‘000
Honda Civic Vti Prosmatic 2,285 1,330 955 860 (95) Company PolicyMr. Muhammad Arshad - Company Employee
Honda Civic Vti Pm 2,274 1,313 961 708 (253) Company PolicyMr. Shahid Hameed - Company Employee
Honda City 1,752 281 1,471 1,472 1 Company PolicyMs. Sadia Rashid - Company Employee
Honda Civic Orial Pm 2,511 1,451 1,060 860 (200) Company PolicyMr. Muhammad Shahzad - Compa-ny Employee
Honda Civic Vti Prosmatic 2,205 1,273 932 708 (224) Company PolicyMr. Naseer Ahmad - Company Employee
Suzuki Swift Dlx 1,302 782 520 305 (215) Company PolicyMr. Raza Mohay Ud Din - Company Employee
Toyota Corolla Xli Le 1,626 927 699 644 (55) Company PolicyMr. Kamran Akhtar - Company Employee
Suzuki Swift Dlx 1,282 731 551 424 (127) Company PolicyMr. Kamran Sani - Company Employee
Honda City Aspire Mt 1,566 892 674 624 (50) Company PolicyMr. Umer Javed - Company Employee
Honda City Ivtec 1,555 934 621 305 (316) Company PolicyMr. Muhammad Rizwan Mohsin - Company Employee
Honda City Aspire Mt 1,695 1,017 678 1,300 622 Company PolicyMr. Hasnain Abbas - Company Employee
Suzuki Swift Dlx 1,316 780 536 416 (120) Company PolicyMr. Muhammad Atif Saleem - Com-pany Employee
Toyota Corolla Gli 1,811 1,101 710 658 (52) Company PolicyMr. Aamer Tanveer - Company Employee
Honda Civic Vti Prosmatic 2,167 1,126 1,041 1,062 21 Company PolicyMr. Dr Nabeel - Company Em-ployee
Honda City Aspire Mt 1,556 902 654 488 (166) Company PolicyMr. Adeel Asghar - Company Employee
Toyota Corolla Gli 1,811 1,090 721 658 (63) Company PolicyMr. Rashid Hussain - Company Employee
Toyota Corolla Xli 1,685 1,025 660 658 (2) Company PolicyMr. Zubair Masud - Company Employee
Toyota Corolla Gli 1,811 1,036 775 488 (287) Company Policy Mr. Arif Butt - Company Employee
Suzuki Swift Dlx 1,297 751 546 488 (58) Company PolicyMr. Waheed Ahmad - Company Employee
Honda Civic 2,028 1,249 779 438 (341) Company Policy Mr. Yasir Riaz - Company Employee
Toyota Corolla Gli 1,809 1,129 680 658 (22) Company PolicyMr. Muhammad Naseer Ud Din - Company Employee
Toyota Corolla Gli 1,771 1,030 741 488 (253) Company PolicyMr. Javed Iqbal - Company Employee
Toyota Corolla Gli 1,810 1,103 707 658 (49) Company PolicyMr. Zahid Hussain - Company Employee
Honda City Pts F/L 1,848 414 1,434 1,435 1 NegotiationMr. Sheraz, Saeed Autos, 22C - Model Town, Jail Road, Faisalabad.
Suzuki Swift Dlx 1,316 719 597 603 6 NegotiationMr. Sheraz, Saeed Autos, 22C - Model Town, Jail Road, Faisalabad.
Faw V-2 M/T 1,076 380 696 703 7 NegotiationMr. Sheraz, Saeed Autos, 22C - Model Town, Jail Road, Faisalabad.
Suzuki Cultus Vxr 1,277 425 852 853 1 NegotiationMr. Sheraz, Saeed Autos, 22C - Model Town, Jail Road, Faisalabad.
Suzuki Cultus - Vxr 1,444 24 1,420 1,410 (10) Insurance claimSecurity General Insurance Company
Honda City 1,769 888 881 881 - TransferredInterloop Holdings (Pvt) Limited - Associated Company
Toyota Corolla Altis 2,088 951 1,137 1,137 - TransferredInterloop Holdings (Pvt) Limited - Associated Company
Suzuki Wagon-R Vxl 1,074 453 621 626 5 TransferredInterloop Holdings (Pvt) Limited - Associated Company
Suzuki Cultus Vxl 1,566 78 1,488 1,488 - TransferredInterloop Holdings (Pvt) Limited - Associated Company
Honda City 1,688 731 957 957 - TransferredInterloop Holdings (Pvt) Limited - Associated Company
Suzuki Cultus Vxr 1,124 564 560 559 (1) TransferredInterloop Holdings (Pvt) Limited - Associated Company
Suzuki Cultus Vxr 1,099 501 598 598 - TransferredInterloop Holdings (Pvt) Limited - Associated Company
Toyota Hilux 4X2 S/C 2,027 857 1,170 1,171 1 TransferredInterloop Holdings (Pvt) Limited - Associated Company
2019 2018
Note Rupees in ‘000
8.1.2 Depreciation expense for the year has been allocated as under;
Cost of sales 1,497,725 1,404,282 Administrative expenses 155,328 137,664
1,653,053 1,541,946
8.2 Capital work-in-progress
Civil works 8.2.1 654,768 178,203 Plant and machinery 8.2.2 151,000 32,696 Capital stores 8.2.3 20,792 87,201 Advances to suppliers 428,144 4,131
1,254,704 302,231
8.2.1 Civil works include borrowing cost amounting to Rs. 16.005 million calculated at the rates ranging from 2.33% to 4.92% per annum.
8.2.2 Plant and machinery includes amount of Rs. 124.68 million in respect of trial production cost of denim sampling unit.
8.2.3 Capital stores include factory tools and equipments, office equipments, electric installations and furniture and fixtures that are held in store for future use and capitalization.
8.3 Details of immovable property in the name of the Company:
Description CostAccumulated Depreciation
Book Value Sale ProceedsGain / (Loss)
Mode of Disposal Particulars of Buyers
Rupees in ‘000
Mercedes - Benz E300 14,195 6,700 7,495 7,495 - TransferredInterloop Holdings (Pvt) Limited - Associated Company
Honda Civic 2,666 89 2,577 2,577 - TransferredInterloop Holdings (Pvt) Limited - Associated Company
Honda Civic Oriel 2,988 149 2,839 2,838 (1) TransferredInterloop Holdings (Pvt) Limited - Associated Company
Toyota Corolla Gli 1,849 702 1,147 1,147 - Negotiation Interloop Welfare Trust
Sub Total 100,170 50,478 49,692 47,397 (2,295)
Other assets having book value below Rs. 500,000 each
284,617 180,967 103,650 86,570 (17,080)
Total - 2019 458,865 276,017 182,848 135,295 (47,553)
Total - 2018 245,558 139,961 105,597 66,452 (39,145)
Usage Location Area
Plant 1 Chak # 76 RB. 1 - KM, Jaranwala Road, Khurrianwala, Faisalabad. 19 Acres 7 Kanals 12 MarlasChak # 194 RB. 1 - KM, Jaranwala Road, Khurrianwala, Faisalabad. 2 Acres 8 Kanals 13 MarlasChak # 108 RB. 1 - KM, Jaranwala Road, Khurrianwala, Faisalabad. 9 Marlas
Interloop Industrial Park - (Plant 2, Plant 4 & Spinning)
Chak # 103 RB, 7 - KM, Jaranwala Road, Khurrianwala, Faisalabad. 97 Acres 19 Kanals 9 Marlas 5 Sarsai
Chak # 106 RB, 6 - KM, By Pass Road, Khurrianwala, Faisalabad. 14 Acres 3 Kanals 12 MarlasChak # 103 RB, 7 - KM, Jaranwala Road, Khurrianwala, Faisalabad. 38 Acres 15 Kanals 15 Marlas
Plant 3 8 - KM, Manga Raiwind Road, Distt. Kasur, Lahore. 41 Acres 3 Kanals 8 Marlas
Denim Division 8 - KM, Manga Raiwind Road, Distt. Kasur, Lahore. 26 Acres 7 Kanals 14 Marlas
Plant 5 Chak # 106 RB, 6 - KM, By Pass Road, Khurrianwala, Faisalabad. 75 Acres 13 Kanals 13 Marlas
Apparel Unit Chak # 106 RB, 6 - KM, By Pass Road, Khurrianwala, Faisalabad. 28 Acres 3 Kanals 16 Marlas
Office Block Chak # 200 RB, Near Toll Plaza Gatwala, Lathianwala, Faisalabad. 2 Acres 13 Marlas 5 Sarsai
{{
Inte
rloop
Lim
ited
200 201
2018
- 1
9A
nnua
l Rep
ort
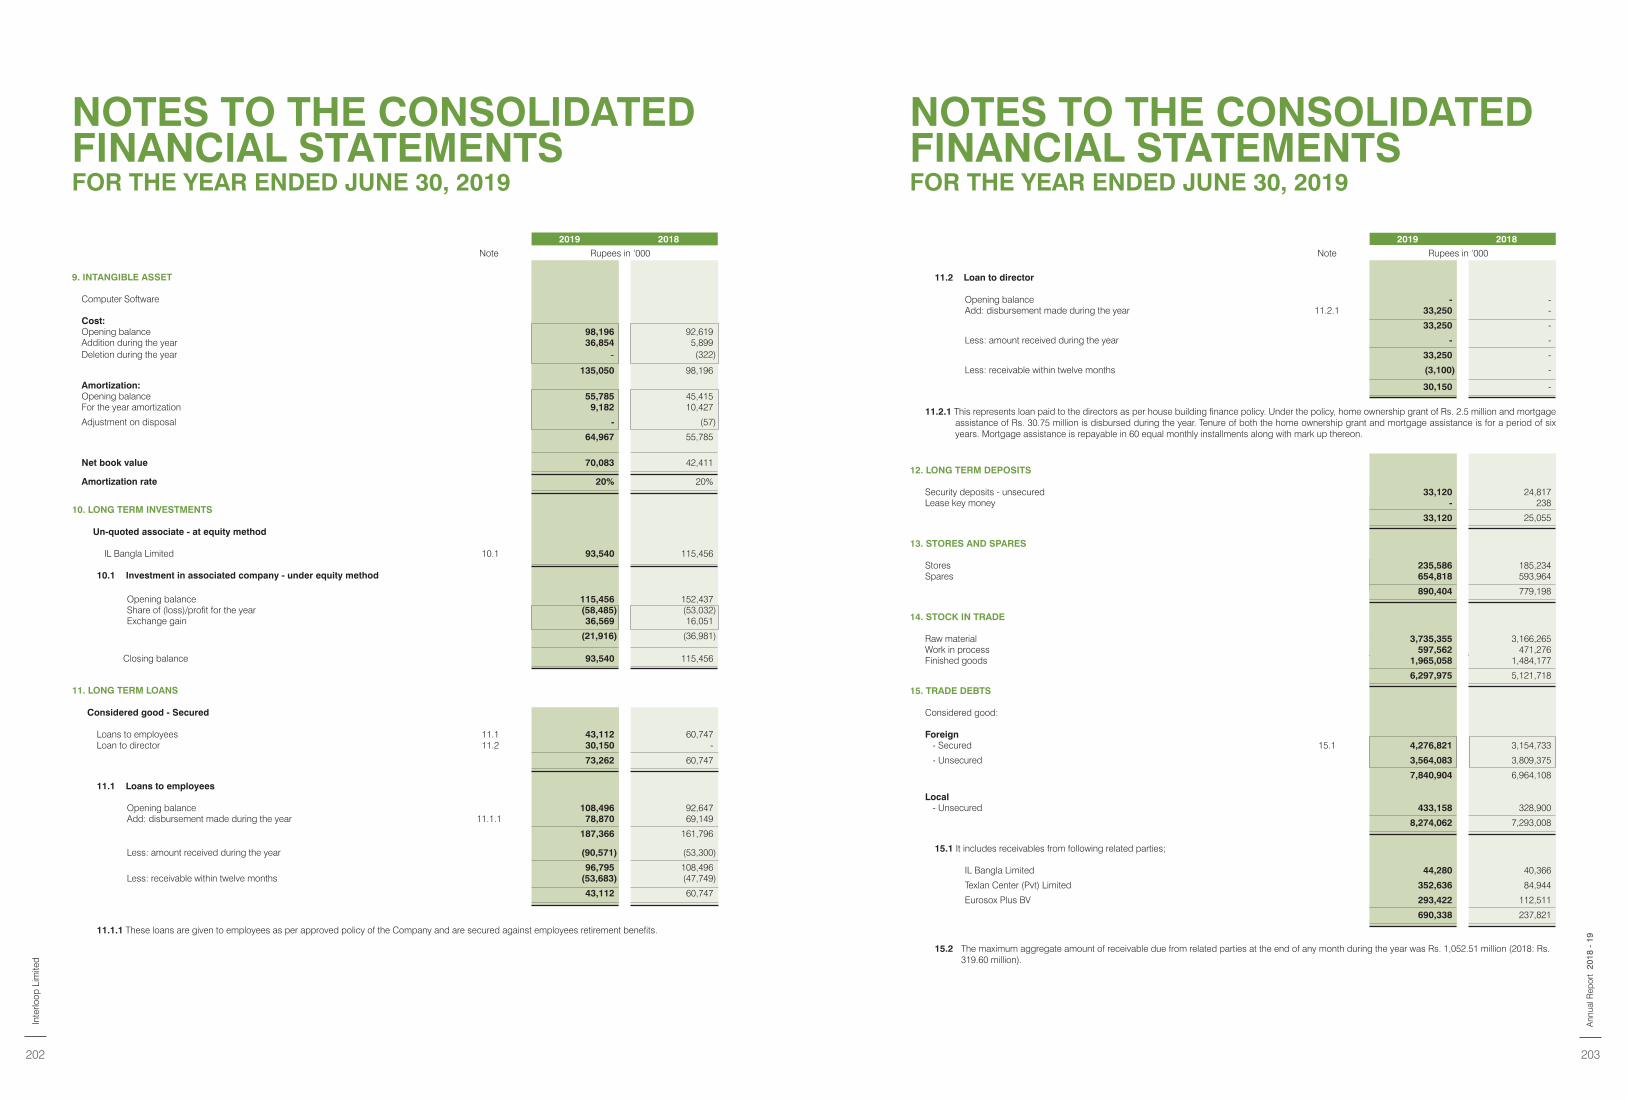
NOTES TO THE CONSOLIDATED FINANCIAL STATEMENTSFOR THE YEAR ENDED JUNE 30, 2019
NOTES TO THE CONSOLIDATED FINANCIAL STATEMENTSFOR THE YEAR ENDED JUNE 30, 2019
10. LONG TERM INVESTMENTS
Un-quoted associate - at equity method
IL Bangla Limited 10.1 93,540 115,456
10.1 Investment in associated company - under equity method
Opening balance 115,456 152,437 Share of (loss)/profit for the year (58,485) (53,032)Exchange gain 36,569 16,051
(21,916) (36,981)
Closing balance 93,540 115,456
2019 2018
Note Rupees in ‘000
9. INTANGIBLE ASSET
Computer Software
Cost:Opening balance 98,196 92,619 Addition during the year 36,854 5,899 Deletion during the year - (322)
135,050 98,196
Amortization:Opening balance 55,785 45,415 For the year amortization 9,182 10,427
Adjustment on disposal - (57)
64,967 55,785
Net book value 70,083 42,411
Amortization rate 20% 20%12. LONG TERM DEPOSITS
Security deposits - unsecured 33,120 24,817 Lease key money - 238
33,120 25,055
13. STORES AND SPARES
Stores 235,586 185,234 Spares 654,818 593,964
890,404 779,198
14. STOCK IN TRADE
Raw material 3,735,355 3,166,265 Work in process 597,562 471,276 Finished goods 1,965,058 1,484,177
6,297,975 5,121,718
2019 2018
Note Rupees in ‘000
11.2 Loan to director
Opening balance - - Add: disbursement made during the year 11.2.1 33,250 -
33,250 -
Less: amount received during the year - -
33,250 -
Less: receivable within twelve months (3,100) -
30,150 -
11.2.1 This represents loan paid to the directors as per house building finance policy. Under the policy, home ownership grant of Rs. 2.5 million and mortgage assistance of Rs. 30.75 million is disbursed during the year. Tenure of both the home ownership grant and mortgage assistance is for a period of six years. Mortgage assistance is repayable in 60 equal monthly installments along with mark up thereon.
11. LONG TERM LOANS
Considered good - Secured
Loans to employees 11.1 43,112 60,747 Loan to director 11.2 30,150 -
73,262 60,747
11.1 Loans to employees
Opening balance 108,496 92,647 Add: disbursement made during the year 11.1.1 78,870 69,149
187,366 161,796
Less: amount received during the year (90,571) (53,300)
96,795 108,496 Less: receivable within twelve months (53,683) (47,749)
43,112 60,747
11.1.1 These loans are given to employees as per approved policy of the Company and are secured against employees retirement benefits.
15. TRADE DEBTS
Considered good:
Foreign- Secured 15.1 4,276,821 3,154,733
- Unsecured 3,564,083 3,809,375
7,840,904 6,964,108
Local- Unsecured 433,158 328,900
8,274,062 7,293,008
15.1 It includes receivables from following related parties;
IL Bangla Limited 44,280 40,366
Texlan Center (Pvt) Limited 352,636 84,944
Eurosox Plus BV 293,422 112,511
690,338 237,821
15.2 The maximum aggregate amount of receivable due from related parties at the end of any month during the year was Rs. 1,052.51 million (2018: Rs. 319.60 million).
Inte
rloop
Lim
ited
202 203
2018
- 1
9A
nnua
l Rep
ort
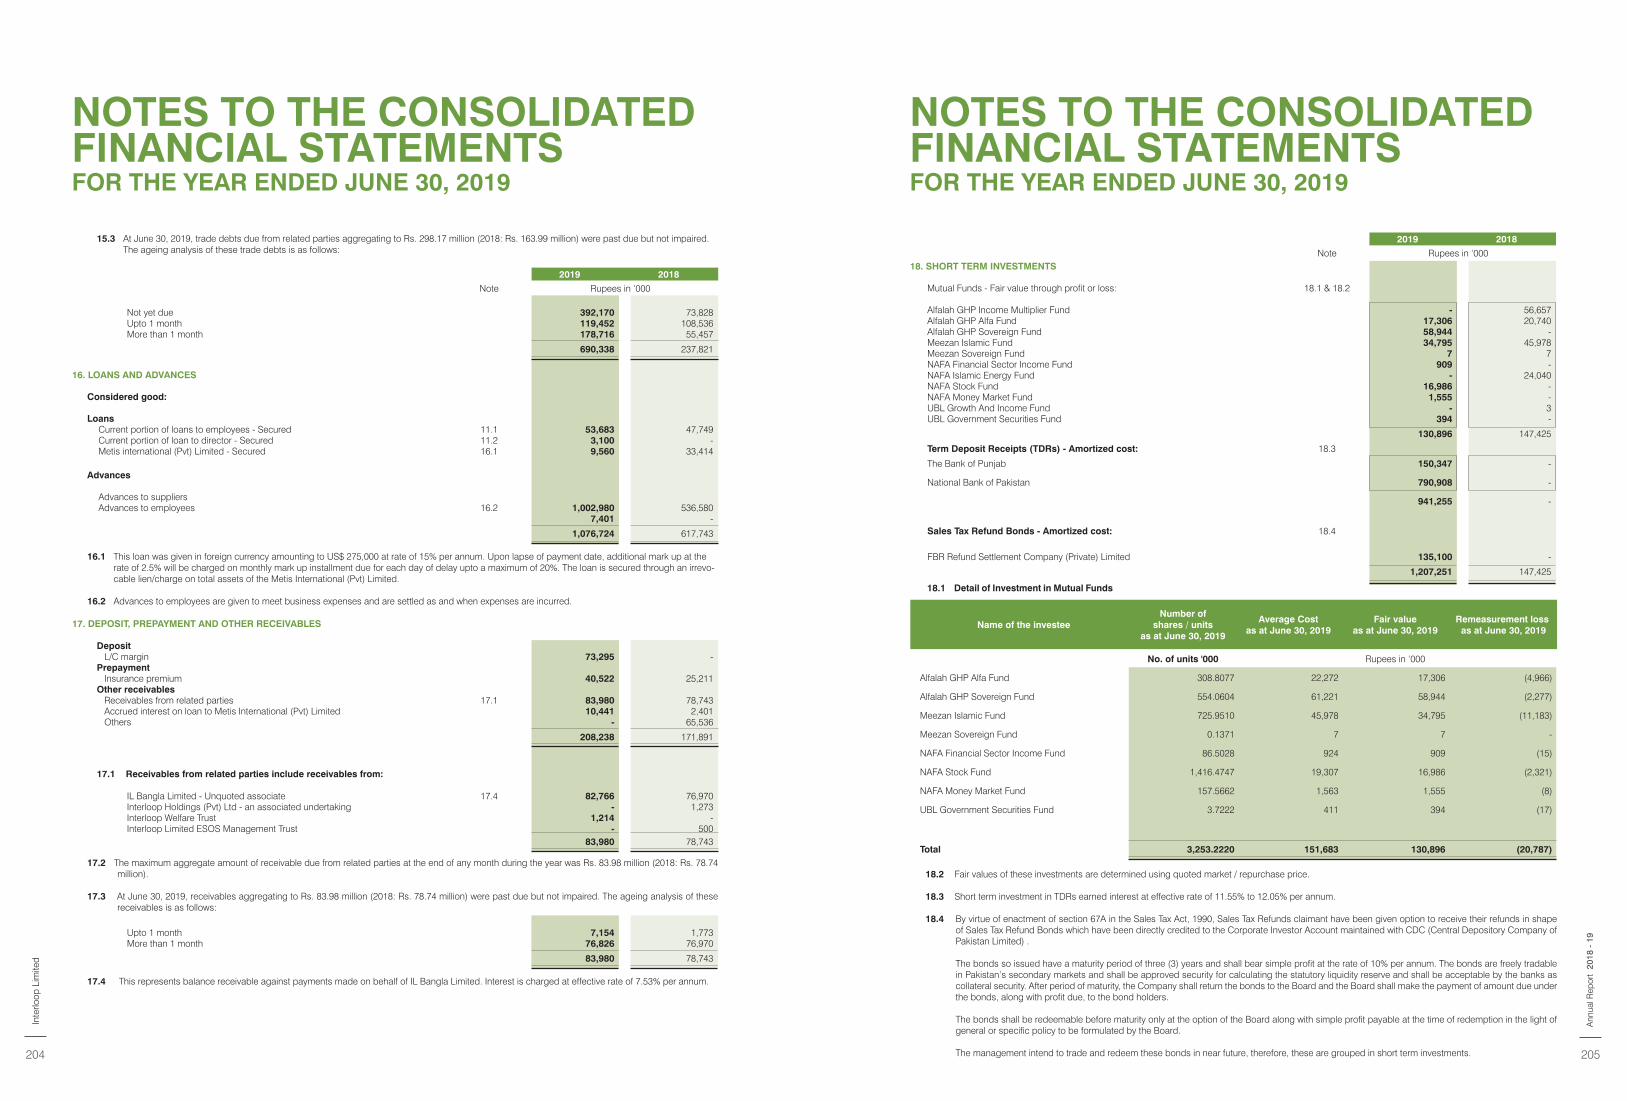
NOTES TO THE CONSOLIDATED FINANCIAL STATEMENTSFOR THE YEAR ENDED JUNE 30, 2019
NOTES TO THE CONSOLIDATED FINANCIAL STATEMENTSFOR THE YEAR ENDED JUNE 30, 2019
15.3 At June 30, 2019, trade debts due from related parties aggregating to Rs. 298.17 million (2018: Rs. 163.99 million) were past due but not impaired. The ageing analysis of these trade debts is as follows:
2019 2018
Note Rupees in ‘000
Not yet due 392,170 73,828 Upto 1 month 119,452 108,536 More than 1 month 178,716 55,457
690,338 237,821
16. LOANS AND ADVANCES
Considered good:
LoansCurrent portion of loans to employees - Secured 11.1 53,683 47,749 Current portion of loan to director - Secured 11.2 3,100 - Metis international (Pvt) Limited - Secured 16.1 9,560 33,414
Advances
Advances to suppliersAdvances to employees 16.2 1,002,980 536,580
7,401 -
1,076,724 617,743
16.1 This loan was given in foreign currency amounting to US$ 275,000 at rate of 15% per annum. Upon lapse of payment date, additional mark up at the rate of 2.5% will be charged on monthly mark up installment due for each day of delay upto a maximum of 20%. The loan is secured through an irrevo-cable lien/charge on total assets of the Metis International (Pvt) Limited.
16.2 Advances to employees are given to meet business expenses and are settled as and when expenses are incurred.
2019 2018
Note Rupees in ‘00018. SHORT TERM INVESTMENTS
Mutual Funds - Fair value through profit or loss: 18.1 & 18.2
Alfalah GHP Income Multiplier Fund - 56,657 Alfalah GHP Alfa Fund 17,306 20,740 Alfalah GHP Sovereign Fund 58,944 - Meezan Islamic Fund 34,795 45,978 Meezan Sovereign Fund 7 7 NAFA Financial Sector Income Fund 909 - NAFA Islamic Energy Fund - 24,040 NAFA Stock Fund 16,986 - NAFA Money Market Fund 1,555 - UBL Growth And Income Fund - 3 UBL Government Securities Fund 394 -
130,896 147,425
Term Deposit Receipts (TDRs) - Amortized cost: 18.3
The Bank of Punjab 150,347 -
National Bank of Pakistan 790,908 -
941,255 -
Sales Tax Refund Bonds - Amortized cost: 18.4
FBR Refund Settlement Company (Private) Limited 135,100 -
1,207,251 147,425
17. DEPOSIT, PREPAYMENT AND OTHER RECEIVABLES
DepositL/C margin 73,295 -
PrepaymentInsurance premium 40,522 25,211
Other receivables Receivables from related parties 17.1 83,980 78,743 Accrued interest on loan to Metis International (Pvt) Limited 10,441 2,401 Others - 65,536
208,238 171,891
17.1 Receivables from related parties include receivables from:
IL Bangla Limited - Unquoted associate 17.4 82,766 76,970 Interloop Holdings (Pvt) Ltd - an associated undertaking - 1,273 Interloop Welfare Trust 1,214 - Interloop Limited ESOS Management Trust - 500
83,980 78,743
17.2 The maximum aggregate amount of receivable due from related parties at the end of any month during the year was Rs. 83.98 million (2018: Rs. 78.74 million).
17.3 At June 30, 2019, receivables aggregating to Rs. 83.98 million (2018: Rs. 78.74 million) were past due but not impaired. The ageing analysis of these receivables is as follows:
Upto 1 month 7,154 1,773 More than 1 month 76,826 76,970
83,980 78,743
17.4 This represents balance receivable against payments made on behalf of IL Bangla Limited. Interest is charged at effective rate of 7.53% per annum.
Name of the investeeNumber of
shares / units as at June 30, 2019
Average Cost as at June 30, 2019
Fair value as at June 30, 2019
Remeasurement loss as at June 30, 2019
No. of units '000 Rupees in ‘000
Alfalah GHP Alfa Fund 308.8077 22,272 17,306 (4,966)
Alfalah GHP Sovereign Fund 554.0604 61,221 58,944 (2,277)
Meezan Islamic Fund 725.9510 45,978 34,795 (11,183)
Meezan Sovereign Fund 0.1371 7 7 -
NAFA Financial Sector Income Fund 86.5028 924 909 (15)
NAFA Stock Fund 1,416.4747 19,307 16,986 (2,321)
NAFA Money Market Fund 157.5662 1,563 1,555 (8)
UBL Government Securities Fund 3.7222 411 394 (17)
Total 3,253.2220 151,683 130,896 (20,787)
18.2 Fair values of these investments are determined using quoted market / repurchase price.
18.3 Short term investment in TDRs earned interest at effective rate of 11.55% to 12.05% per annum.
18.4 By virtue of enactment of section 67A in the Sales Tax Act, 1990, Sales Tax Refunds claimant have been given option to receive their refunds in shape of Sales Tax Refund Bonds which have been directly credited to the Corporate Investor Account maintained with CDC (Central Depository Company of Pakistan Limited) .
The bonds so issued have a maturity period of three (3) years and shall bear simple profit at the rate of 10% per annum. The bonds are freely tradable in Pakistan’s secondary markets and shall be approved security for calculating the statutory liquidity reserve and shall be acceptable by the banks as collateral security. After period of maturity, the Company shall return the bonds to the Board and the Board shall make the payment of amount due under the bonds, along with profit due, to the bond holders.
The bonds shall be redeemable before maturity only at the option of the Board along with simple profit payable at the time of redemption in the light of general or specific policy to be formulated by the Board.
The management intend to trade and redeem these bonds in near future, therefore, these are grouped in short term investments.
18.1 Detail of Investment in Mutual Funds
Inte
rloop
Lim
ited
204 205
2018
- 1
9A
nnua
l Rep
ort
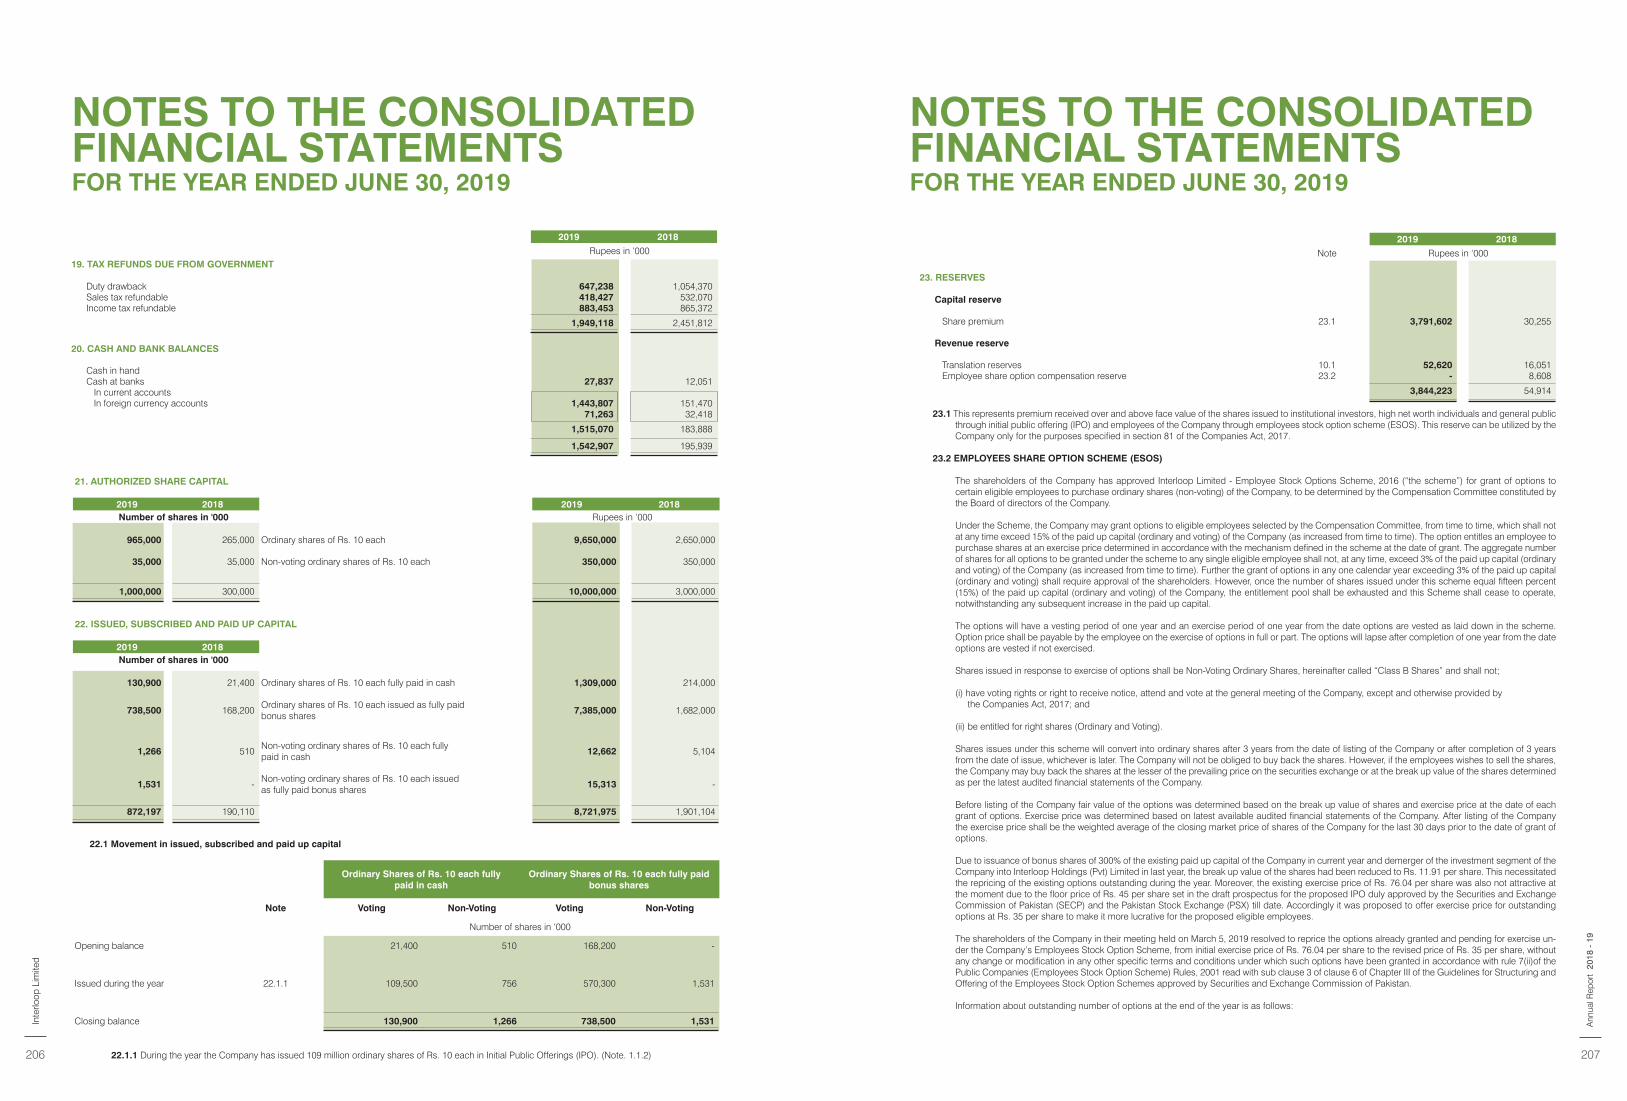
NOTES TO THE CONSOLIDATED FINANCIAL STATEMENTSFOR THE YEAR ENDED JUNE 30, 2019
NOTES TO THE CONSOLIDATED FINANCIAL STATEMENTSFOR THE YEAR ENDED JUNE 30, 2019
2019 2018
Rupees in ‘00019. TAX REFUNDS DUE FROM GOVERNMENT
Duty drawback 647,238 1,054,370 Sales tax refundable 418,427 532,070 Income tax refundable 883,453 865,372
1,949,118 2,451,812
20. CASH AND BANK BALANCES
Cash in handCash at banks 27,837 12,051
In current accountsIn foreign currency accounts 1,443,807 151,470
71,263 32,418
1,515,070 183,888
1,542,907 195,939
21. AUTHORIZED SHARE CAPITAL
2019 2018 2019 2018Number of shares in '000 Rupees in ‘000
965,000 265,000 Ordinary shares of Rs. 10 each 9,650,000 2,650,000
35,000 35,000 Non-voting ordinary shares of Rs. 10 each 350,000 350,000
1,000,000 300,000 10,000,000 3,000,000
22. ISSUED, SUBSCRIBED AND PAID UP CAPITAL
2019 2018Number of shares in '000
130,900 21,400 Ordinary shares of Rs. 10 each fully paid in cash 1,309,000 214,000
738,500 168,200 Ordinary shares of Rs. 10 each issued as fully paid bonus shares
7,385,000 1,682,000
1,266 510 Non-voting ordinary shares of Rs. 10 each fully paid in cash
12,662 5,104
1,531 - Non-voting ordinary shares of Rs. 10 each issued as fully paid bonus shares
15,313 -
872,197 190,110 8,721,975 1,901,104
22.1 Movement in issued, subscribed and paid up capital
Ordinary Shares of Rs. 10 each fully paid in cash
Ordinary Shares of Rs. 10 each fully paid bonus shares
Note Voting Non-Voting Voting Non-Voting
Number of shares in ‘000
Opening balance 21,400 510 168,200 -
Issued during the year 22.1.1 109,500 756 570,300 1,531
Closing balance 130,900 1,266 738,500 1,531
22.1.1 During the year the Company has issued 109 million ordinary shares of Rs. 10 each in Initial Public Offerings (IPO). (Note. 1.1.2)
2019 2018
Note Rupees in ‘000
23. RESERVES
Capital reserve
Share premium 23.1 3,791,602 30,255
Revenue reserve
Translation reserves 10.1 52,620 16,051 Employee share option compensation reserve 23.2 - 8,608
3,844,223 54,914
23.1 This represents premium received over and above face value of the shares issued to institutional investors, high net worth individuals and general public through initial public offering (IPO) and employees of the Company through employees stock option scheme (ESOS). This reserve can be utilized by the Company only for the purposes specified in section 81 of the Companies Act, 2017.
23.2 EMPLOYEES SHARE OPTION SCHEME (ESOS)
The shareholders of the Company has approved Interloop Limited - Employee Stock Options Scheme, 2016 (“the scheme”) for grant of options to certain eligible employees to purchase ordinary shares (non-voting) of the Company, to be determined by the Compensation Committee constituted by the Board of directors of the Company.
Under the Scheme, the Company may grant options to eligible employees selected by the Compensation Committee, from time to time, which shall not at any time exceed 15% of the paid up capital (ordinary and voting) of the Company (as increased from time to time). The option entitles an employee to purchase shares at an exercise price determined in accordance with the mechanism defined in the scheme at the date of grant. The aggregate number of shares for all options to be granted under the scheme to any single eligible employee shall not, at any time, exceed 3% of the paid up capital (ordinary and voting) of the Company (as increased from time to time). Further the grant of options in any one calendar year exceeding 3% of the paid up capital (ordinary and voting) shall require approval of the shareholders. However, once the number of shares issued under this scheme equal fifteen percent (15%) of the paid up capital (ordinary and voting) of the Company, the entitlement pool shall be exhausted and this Scheme shall cease to operate, notwithstanding any subsequent increase in the paid up capital.
The options will have a vesting period of one year and an exercise period of one year from the date options are vested as laid down in the scheme. Option price shall be payable by the employee on the exercise of options in full or part. The options will lapse after completion of one year from the date options are vested if not exercised.
Shares issued in response to exercise of options shall be Non-Voting Ordinary Shares, hereinafter called “Class B Shares” and shall not;
(i) have voting rights or right to receive notice, attend and vote at the general meeting of the Company, except and otherwise provided by the Companies Act, 2017; and
(ii) be entitled for right shares (Ordinary and Voting).
Shares issues under this scheme will convert into ordinary shares after 3 years from the date of listing of the Company or after completion of 3 years from the date of issue, whichever is later. The Company will not be obliged to buy back the shares. However, if the employees wishes to sell the shares, the Company may buy back the shares at the lesser of the prevailing price on the securities exchange or at the break up value of the shares determined as per the latest audited financial statements of the Company.
Before listing of the Company fair value of the options was determined based on the break up value of shares and exercise price at the date of each grant of options. Exercise price was determined based on latest available audited financial statements of the Company. After listing of the Company the exercise price shall be the weighted average of the closing market price of shares of the Company for the last 30 days prior to the date of grant of options.
Due to issuance of bonus shares of 300% of the existing paid up capital of the Company in current year and demerger of the investment segment of the Company into Interloop Holdings (Pvt) Limited in last year, the break up value of the shares had been reduced to Rs. 11.91 per share. This necessitated the repricing of the existing options outstanding during the year. Moreover, the existing exercise price of Rs. 76.04 per share was also not attractive at the moment due to the floor price of Rs. 45 per share set in the draft prospectus for the proposed IPO duly approved by the Securities and Exchange Commission of Pakistan (SECP) and the Pakistan Stock Exchange (PSX) till date. Accordingly it was proposed to offer exercise price for outstanding options at Rs. 35 per share to make it more lucrative for the proposed eligible employees.
The shareholders of the Company in their meeting held on March 5, 2019 resolved to reprice the options already granted and pending for exercise un-der the Company’s Employees Stock Option Scheme, from initial exercise price of Rs. 76.04 per share to the revised price of Rs. 35 per share, without any change or modification in any other specific terms and conditions under which such options have been granted in accordance with rule 7(ii)of the Public Companies (Employees Stock Option Scheme) Rules, 2001 read with sub clause 3 of clause 6 of Chapter III of the Guidelines for Structuring and Offering of the Employees Stock Option Schemes approved by Securities and Exchange Commission of Pakistan.
Information about outstanding number of options at the end of the year is as follows:
Inte
rloop
Lim
ited
206 207
2018
- 1
9A
nnua
l Rep
ort
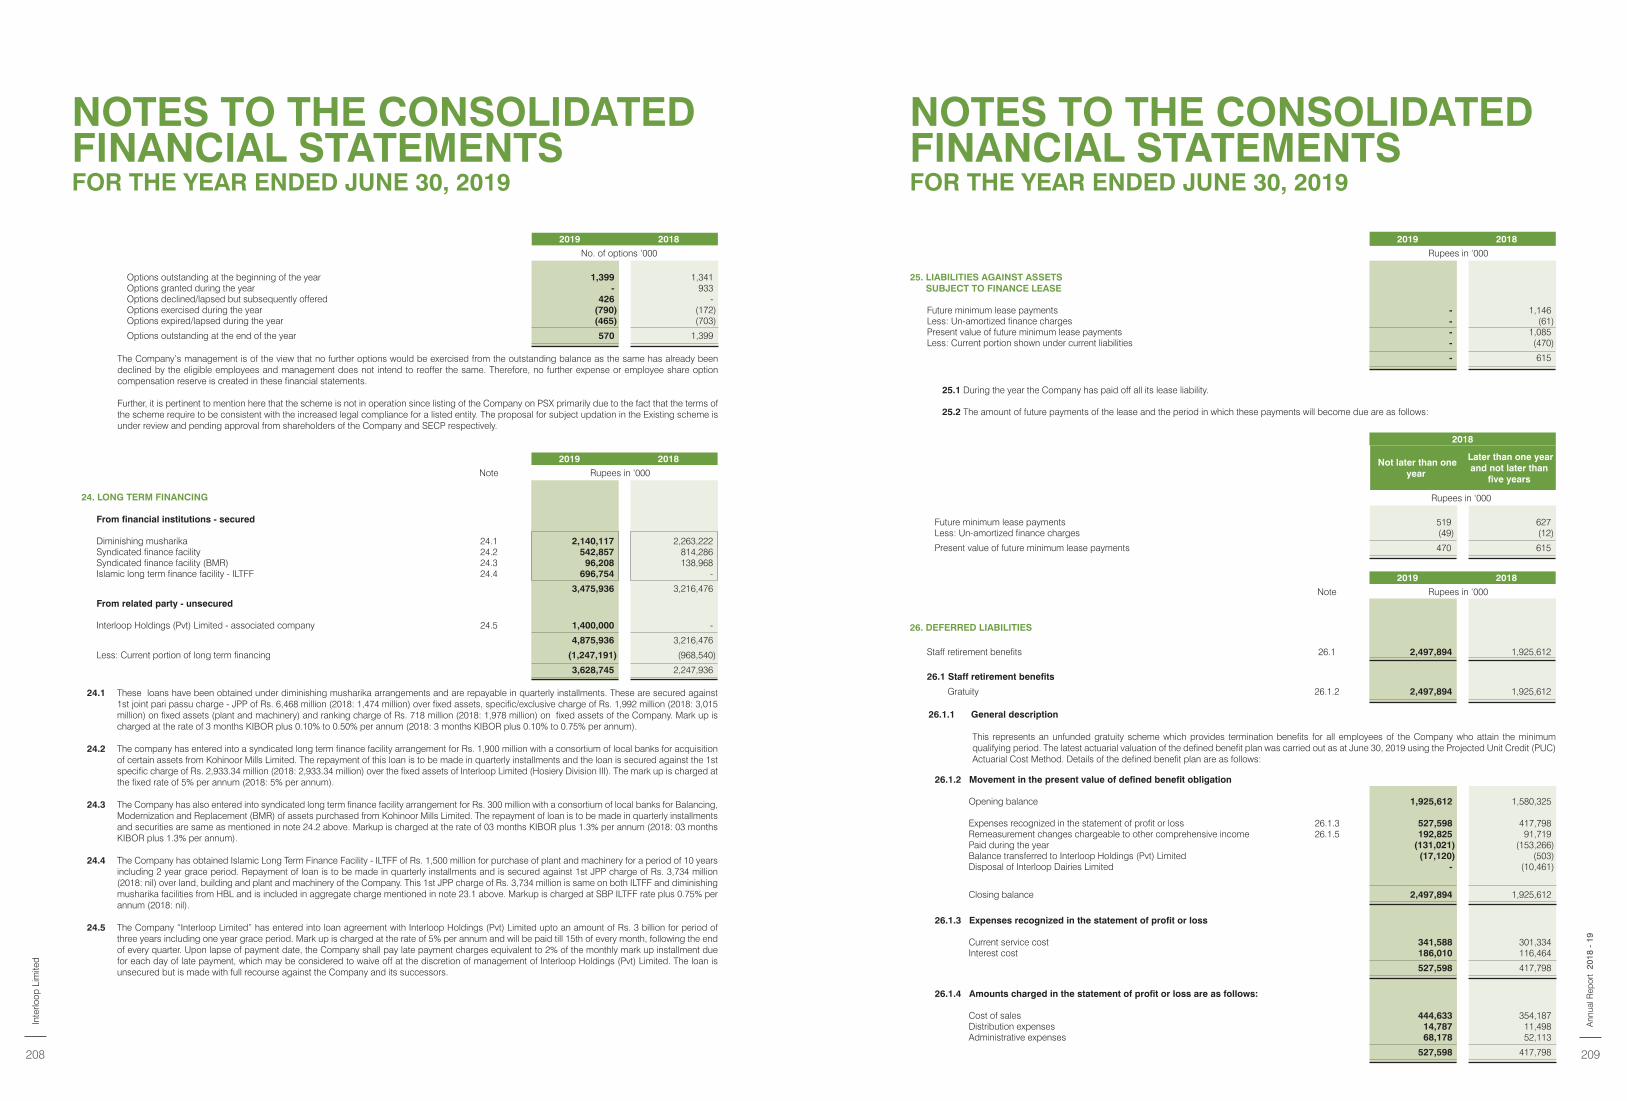
NOTES TO THE CONSOLIDATED FINANCIAL STATEMENTSFOR THE YEAR ENDED JUNE 30, 2019
NOTES TO THE CONSOLIDATED FINANCIAL STATEMENTSFOR THE YEAR ENDED JUNE 30, 2019
2019 2018
No. of options ‘000
Options outstanding at the beginning of the year 1,399 1,341 Options granted during the year - 933 Options declined/lapsed but subsequently offered 426 - Options exercised during the year (790) (172)Options expired/lapsed during the year (465) (703)
Options outstanding at the end of the year 570 1,399
The Company’s management is of the view that no further options would be exercised from the outstanding balance as the same has already been declined by the eligible employees and management does not intend to reoffer the same. Therefore, no further expense or employee share option compensation reserve is created in these financial statements.
Further, it is pertinent to mention here that the scheme is not in operation since listing of the Company on PSX primarily due to the fact that the terms of the scheme require to be consistent with the increased legal compliance for a listed entity. The proposal for subject updation in the Existing scheme is under review and pending approval from shareholders of the Company and SECP respectively.
2019 2018
Note Rupees in ‘000
24. LONG TERM FINANCING
From financial institutions - secured
Diminishing musharika 24.1 2,140,117 2,263,222 Syndicated finance facility 24.2 542,857 814,286 Syndicated finance facility (BMR) 24.3 96,208 138,968 Islamic long term finance facility - ILTFF 24.4 696,754 -
3,475,936 3,216,476
From related party - unsecured
Interloop Holdings (Pvt) Limited - associated company 24.5 1,400,000 -
4,875,936 3,216,476
Less: Current portion of long term financing (1,247,191) (968,540)
3,628,745 2,247,936
24.1 These loans have been obtained under diminishing musharika arrangements and are repayable in quarterly installments. These are secured against 1st joint pari passu charge - JPP of Rs. 6,468 million (2018: 1,474 million) over fixed assets, specific/exclusive charge of Rs. 1,992 million (2018: 3,015 million) on fixed assets (plant and machinery) and ranking charge of Rs. 718 million (2018: 1,978 million) on fixed assets of the Company. Mark up is charged at the rate of 3 months KIBOR plus 0.10% to 0.50% per annum (2018: 3 months KIBOR plus 0.10% to 0.75% per annum).
24.2 The company has entered into a syndicated long term finance facility arrangement for Rs. 1,900 million with a consortium of local banks for acquisition of certain assets from Kohinoor Mills Limited. The repayment of this loan is to be made in quarterly installments and the loan is secured against the 1st specific charge of Rs. 2,933.34 million (2018: 2,933.34 million) over the fixed assets of Interloop Limited (Hosiery Division III). The mark up is charged at the fixed rate of 5% per annum (2018: 5% per annum).
24.3 The Company has also entered into syndicated long term finance facility arrangement for Rs. 300 million with a consortium of local banks for Balancing, Modernization and Replacement (BMR) of assets purchased from Kohinoor Mills Limited. The repayment of loan is to be made in quarterly installments and securities are same as mentioned in note 24.2 above. Markup is charged at the rate of 03 months KIBOR plus 1.3% per annum (2018: 03 months KIBOR plus 1.3% per annum).
24.4 The Company has obtained Islamic Long Term Finance Facility - ILTFF of Rs. 1,500 million for purchase of plant and machinery for a period of 10 years including 2 year grace period. Repayment of loan is to be made in quarterly installments and is secured against 1st JPP charge of Rs. 3,734 million (2018: nil) over land, building and plant and machinery of the Company. This 1st JPP charge of Rs. 3,734 million is same on both ILTFF and diminishing musharika facilities from HBL and is included in aggregate charge mentioned in note 23.1 above. Markup is charged at SBP ILTFF rate plus 0.75% per annum (2018: nil).
24.5 The Company “Interloop Limited” has entered into loan agreement with Interloop Holdings (Pvt) Limited upto an amount of Rs. 3 billion for period of three years including one year grace period. Mark up is charged at the rate of 5% per annum and will be paid till 15th of every month, following the end of every quarter. Upon lapse of payment date, the Company shall pay late payment charges equivalent to 2% of the monthly mark up installment due for each day of late payment, which may be considered to waive off at the discretion of management of Interloop Holdings (Pvt) Limited. The loan is unsecured but is made with full recourse against the Company and its successors.
2019 2018
Rupees in ‘000
25. LIABILITIES AGAINST ASSETS SUBJECT TO FINANCE LEASE
Future minimum lease payments - 1,146 Less: Un-amortized finance charges - (61)Present value of future minimum lease payments - 1,085 Less: Current portion shown under current liabilities - (470)
- 615
2018
Not later than one year
Later than one year and not later than
five years
Rupees in ‘000
Future minimum lease payments 519 627 Less: Un-amortized finance charges (49) (12)
Present value of future minimum lease payments 470 615
25.1 During the year the Company has paid off all its lease liability.
25.2 The amount of future payments of the lease and the period in which these payments will become due are as follows:
2019 2018
Note Rupees in ‘000
26. DEFERRED LIABILITIES
Staff retirement benefits 26.1 2,497,894 1,925,612
26.1 Staff retirement benefits
Gratuity 26.1.2 2,497,894 1,925,612
26.1.1 General description
This represents an unfunded gratuity scheme which provides termination benefits for all employees of the Company who attain the minimum qualifying period. The latest actuarial valuation of the defined benefit plan was carried out as at June 30, 2019 using the Projected Unit Credit (PUC) Actuarial Cost Method. Details of the defined benefit plan are as follows:
26.1.2 Movement in the present value of defined benefit obligation
Opening balance 1,925,612 1,580,325
Expenses recognized in the statement of profit or loss 26.1.3 527,598 417,798 Remeasurement changes chargeable to other comprehensive income 26.1.5 192,825 91,719 Paid during the year (131,021) (153,266)Balance transferred to Interloop Holdings (Pvt) Limited (17,120) (503)Disposal of Interloop Dairies Limited - (10,461)
Closing balance 2,497,894 1,925,612
26.1.3 Expenses recognized in the statement of profit or loss
Current service cost 341,588 301,334 Interest cost 186,010 116,464
527,598 417,798
26.1.4 Amounts charged in the statement of profit or loss are as follows:
Cost of sales 444,633 354,187 Distribution expenses 14,787 11,498 Administrative expenses 68,178 52,113
527,598 417,798
Inte
rloop
Lim
ited
208 209
2018
- 1
9A
nnua
l Rep
ort
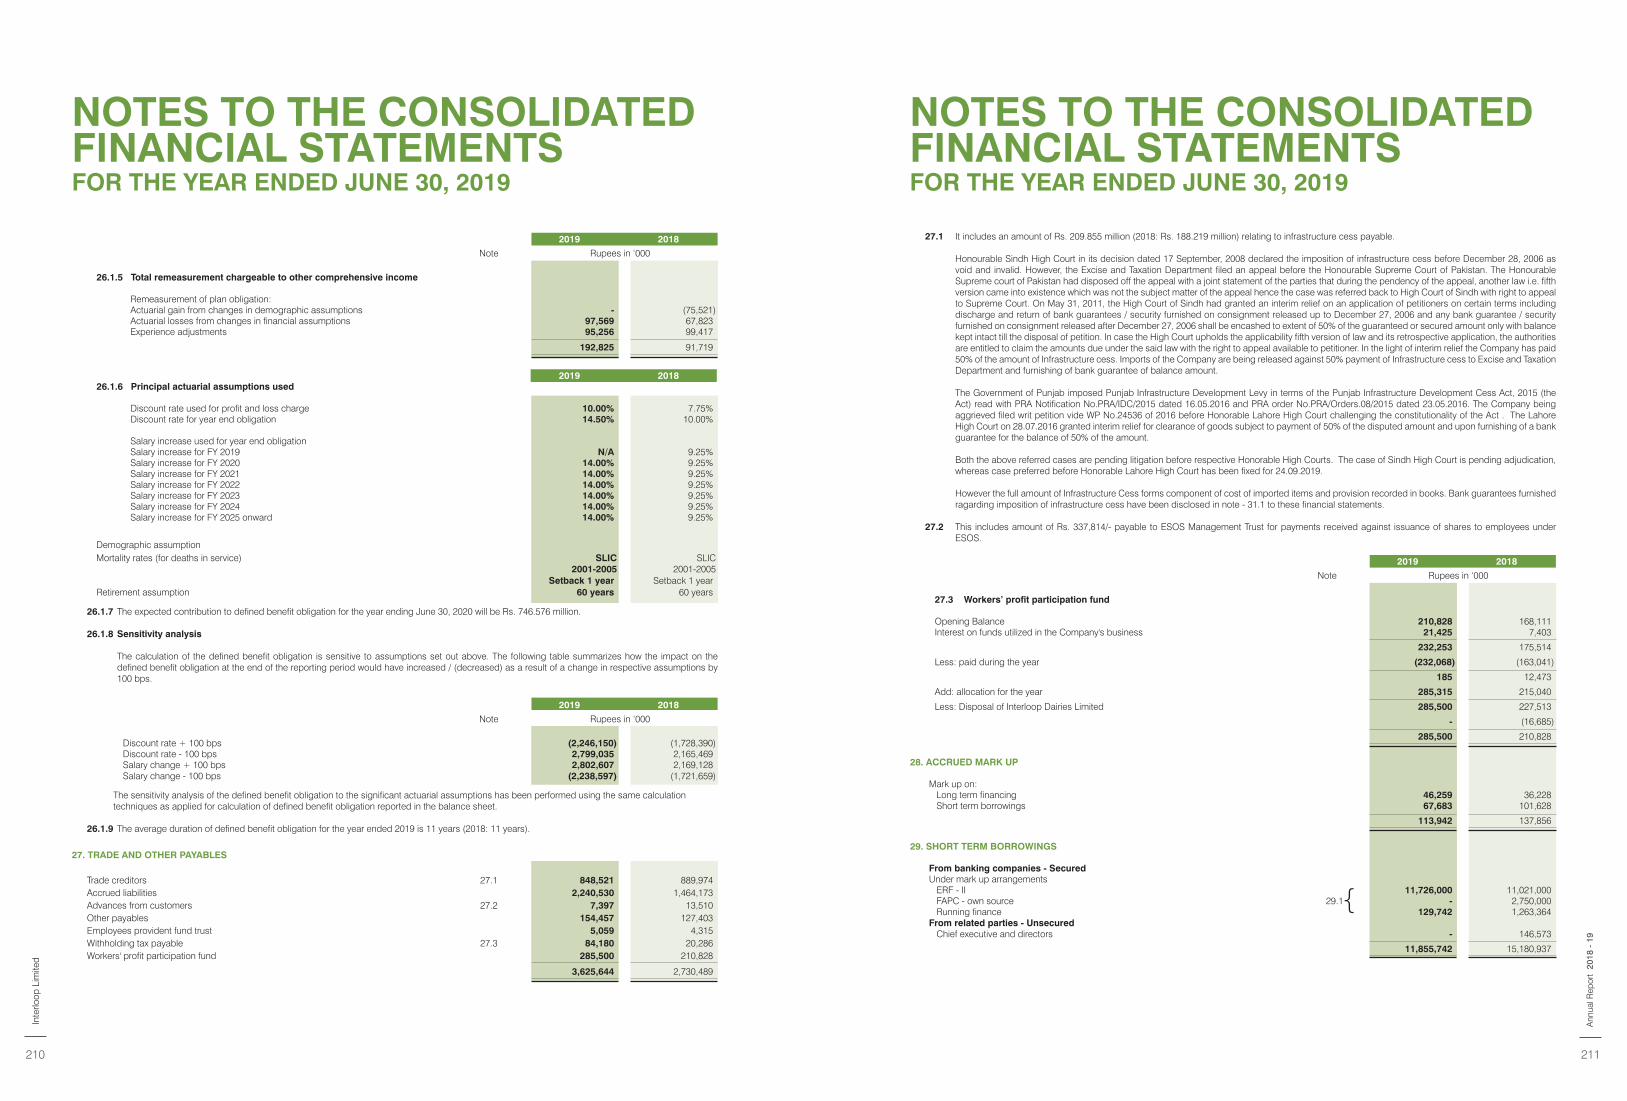
NOTES TO THE CONSOLIDATED FINANCIAL STATEMENTSFOR THE YEAR ENDED JUNE 30, 2019
NOTES TO THE CONSOLIDATED FINANCIAL STATEMENTSFOR THE YEAR ENDED JUNE 30, 2019
27.1 It includes an amount of Rs. 209.855 million (2018: Rs. 188.219 million) relating to infrastructure cess payable.
Honourable Sindh High Court in its decision dated 17 September, 2008 declared the imposition of infrastructure cess before December 28, 2006 as void and invalid. However, the Excise and Taxation Department filed an appeal before the Honourable Supreme Court of Pakistan. The Honourable Supreme court of Pakistan had disposed off the appeal with a joint statement of the parties that during the pendency of the appeal, another law i.e. fifth version came into existence which was not the subject matter of the appeal hence the case was referred back to High Court of Sindh with right to appeal to Supreme Court. On May 31, 2011, the High Court of Sindh had granted an interim relief on an application of petitioners on certain terms including discharge and return of bank guarantees / security furnished on consignment released up to December 27, 2006 and any bank guarantee / security furnished on consignment released after December 27, 2006 shall be encashed to extent of 50% of the guaranteed or secured amount only with balance kept intact till the disposal of petition. In case the High Court upholds the applicability fifth version of law and its retrospective application, the authorities are entitled to claim the amounts due under the said law with the right to appeal available to petitioner. In the light of interim relief the Company has paid 50% of the amount of Infrastructure cess. Imports of the Company are being released against 50% payment of Infrastructure cess to Excise and Taxation Department and furnishing of bank guarantee of balance amount.
The Government of Punjab imposed Punjab Infrastructure Development Levy in terms of the Punjab Infrastructure Development Cess Act, 2015 (the Act) read with PRA Notification No.PRA/IDC/2015 dated 16.05.2016 and PRA order No.PRA/Orders.08/2015 dated 23.05.2016. The Company being aggrieved filed writ petition vide WP No.24536 of 2016 before Honorable Lahore High Court challenging the constitutionality of the Act . The Lahore High Court on 28.07.2016 granted interim relief for clearance of goods subject to payment of 50% of the disputed amount and upon furnishing of a bank guarantee for the balance of 50% of the amount.
Both the above referred cases are pending litigation before respective Honorable High Courts. The case of Sindh High Court is pending adjudication, whereas case preferred before Honorable Lahore High Court has been fixed for 24.09.2019.
However the full amount of Infrastructure Cess forms component of cost of imported items and provision recorded in books. Bank guarantees furnished ragarding imposition of infrastructure cess have been disclosed in note - 31.1 to these financial statements.
27.2 This includes amount of Rs. 337,814/- payable to ESOS Management Trust for payments received against issuance of shares to employees under ESOS.
2019 2018
Note Rupees in ‘000
26.1.5 Total remeasurement chargeable to other comprehensive income
Remeasurement of plan obligation:Actuarial gain from changes in demographic assumptions - (75,521)Actuarial losses from changes in financial assumptions 97,569 67,823 Experience adjustments 95,256 99,417
192,825 91,719
2019 201826.1.6 Principal actuarial assumptions used
Discount rate used for profit and loss charge 10.00% 7.75%Discount rate for year end obligation 14.50% 10.00%
Salary increase used for year end obligationSalary increase for FY 2019 N/A 9.25%Salary increase for FY 2020 14.00% 9.25%Salary increase for FY 2021 14.00% 9.25%Salary increase for FY 2022 14.00% 9.25%Salary increase for FY 2023 14.00% 9.25%Salary increase for FY 2024 14.00% 9.25%Salary increase for FY 2025 onward 14.00% 9.25%
Demographic assumptionMortality rates (for deaths in service) SLIC SLIC
2001-2005 2001-2005Setback 1 year Setback 1 year
Retirement assumption 60 years 60 years
26.1.7 The expected contribution to defined benefit obligation for the year ending June 30, 2020 will be Rs. 746.576 million.
26.1.8 Sensitivity analysis
The calculation of the defined benefit obligation is sensitive to assumptions set out above. The following table summarizes how the impact on the defined benefit obligation at the end of the reporting period would have increased / (decreased) as a result of a change in respective assumptions by 100 bps.
2019 2018
Note Rupees in ‘000
Discount rate + 100 bps (2,246,150) (1,728,390)Discount rate - 100 bps 2,799,035 2,165,469 Salary change + 100 bps 2,802,607 2,169,128 Salary change - 100 bps (2,238,597) (1,721,659)
The sensitivity analysis of the defined benefit obligation to the significant actuarial assumptions has been performed using the same calculation techniques as applied for calculation of defined benefit obligation reported in the balance sheet.
26.1.9 The average duration of defined benefit obligation for the year ended 2019 is 11 years (2018: 11 years).
27. TRADE AND OTHER PAYABLES
Trade creditors 27.1 848,521 889,974 Accrued liabilities 2,240,530 1,464,173 Advances from customers 27.2 7,397 13,510 Other payables 154,457 127,403 Employees provident fund trust 5,059 4,315 Withholding tax payable 27.3 84,180 20,286 Workers' profit participation fund 285,500 210,828
3,625,644 2,730,489
2019 2018
Note Rupees in ‘000
27.3 Workers’ profit participation fund
Opening Balance 210,828 168,111 Interest on funds utilized in the Company's business 21,425 7,403
232,253 175,514
Less: paid during the year (232,068) (163,041)
185 12,473
Add: allocation for the year 285,315 215,040
Less: Disposal of Interloop Dairies Limited 285,500 227,513
- (16,685)
285,500 210,828
28. ACCRUED MARK UP
Mark up on:Long term financing 46,259 36,228 Short term borrowings 67,683 101,628
113,942 137,856
29. SHORT TERM BORROWINGS
From banking companies - SecuredUnder mark up arrangements
ERF - II 11,726,000 11,021,000 FAPC - own source 29.1 - 2,750,000 Running finance 129,742 1,263,364
From related parties - UnsecuredChief executive and directors - 146,573
11,855,742 15,180,937
Inte
rloop
Lim
ited
210 211
2018
- 1
9A
nnua
l Rep
ort
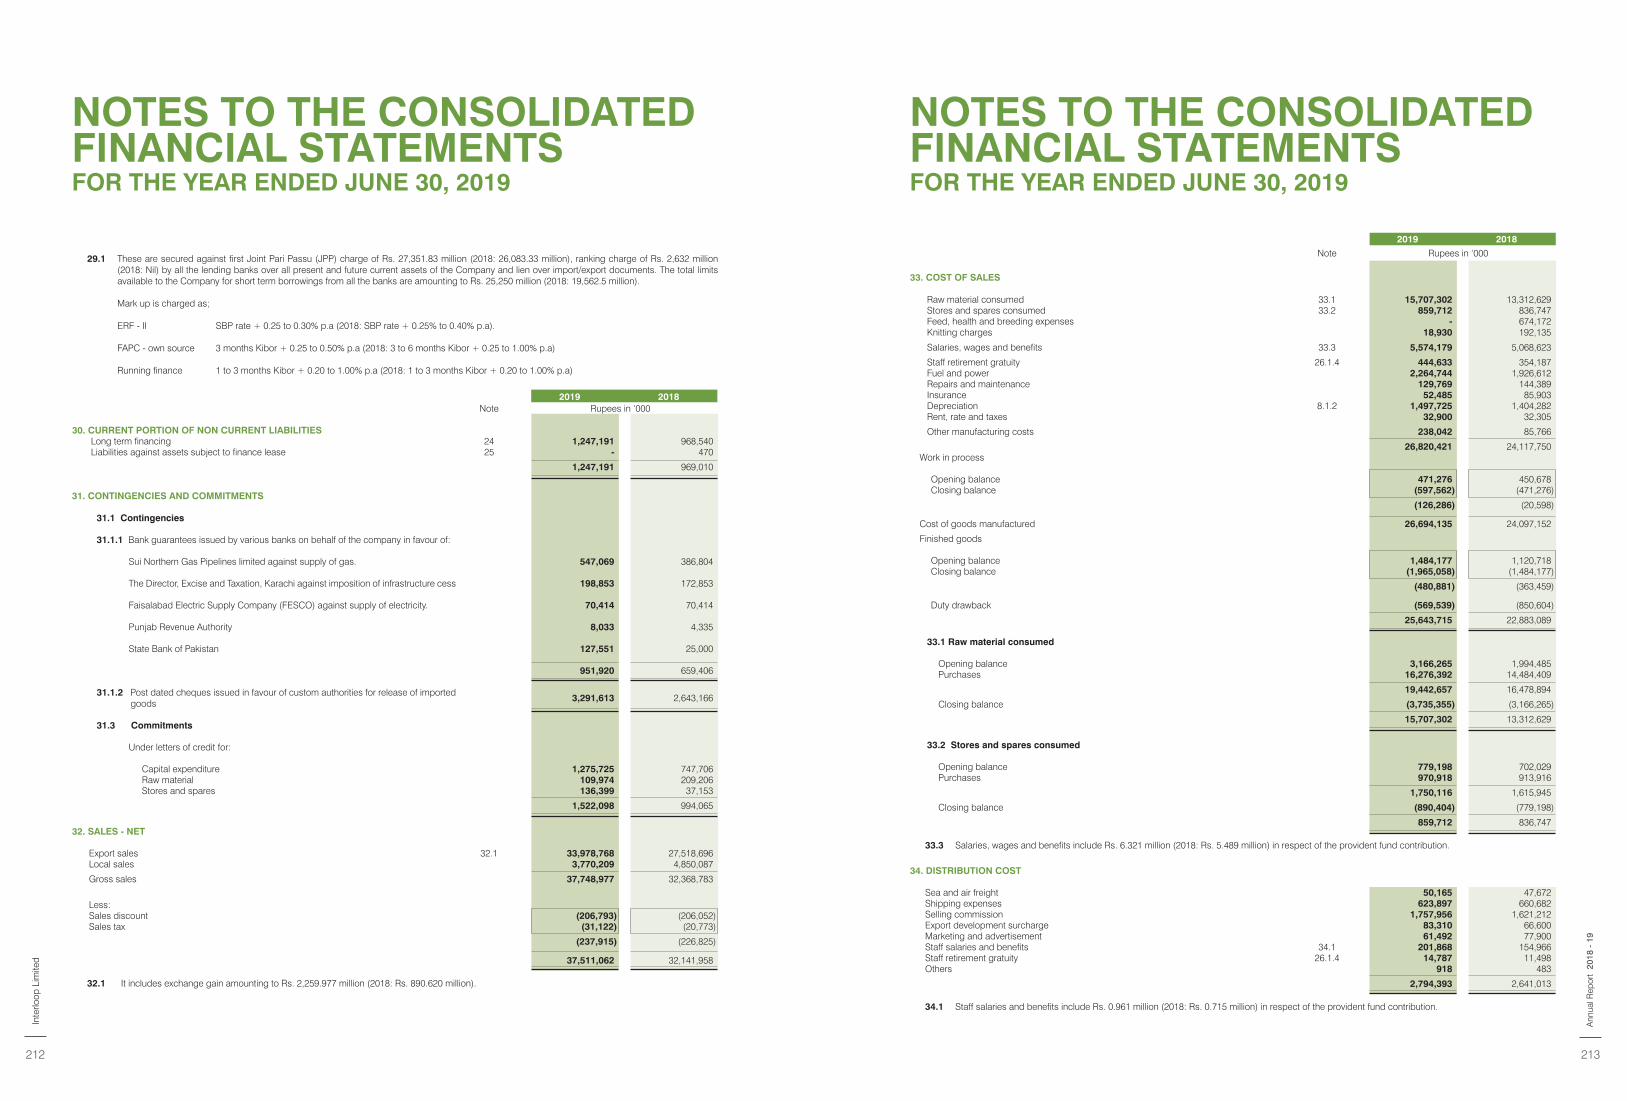
NOTES TO THE CONSOLIDATED FINANCIAL STATEMENTSFOR THE YEAR ENDED JUNE 30, 2019
NOTES TO THE CONSOLIDATED FINANCIAL STATEMENTSFOR THE YEAR ENDED JUNE 30, 2019
29.1 These are secured against first Joint Pari Passu (JPP) charge of Rs. 27,351.83 million (2018: 26,083.33 million), ranking charge of Rs. 2,632 million (2018: Nil) by all the lending banks over all present and future current assets of the Company and lien over import/export documents. The total limits available to the Company for short term borrowings from all the banks are amounting to Rs. 25,250 million (2018: 19,562.5 million).
Mark up is charged as;
ERF - II SBP rate + 0.25 to 0.30% p.a (2018: SBP rate + 0.25% to 0.40% p.a).
FAPC - own source 3 months Kibor + 0.25 to 0.50% p.a (2018: 3 to 6 months Kibor + 0.25 to 1.00% p.a)
Running finance 1 to 3 months Kibor + 0.20 to 1.00% p.a (2018: 1 to 3 months Kibor + 0.20 to 1.00% p.a)
2019 2018Note Rupees in ‘000
30. CURRENT PORTION OF NON CURRENT LIABILITIESLong term financing 24 1,247,191 968,540 Liabilities against assets subject to finance lease 25 - 470
1,247,191 969,010
31. CONTINGENCIES AND COMMITMENTS
31.1 Contingencies
31.1.1 Bank guarantees issued by various banks on behalf of the company in favour of:
Sui Northern Gas Pipelines limited against supply of gas. 547,069 386,804
The Director, Excise and Taxation, Karachi against imposition of infrastructure cess 198,853 172,853
Faisalabad Electric Supply Company (FESCO) against supply of electricity. 70,414 70,414
Punjab Revenue Authority 8,033 4,335
State Bank of Pakistan 127,551 25,000
951,920 659,406
31.1.2 Post dated cheques issued in favour of custom authorities for release of imported goods
3,291,613 2,643,166
31.3 Commitments
Under letters of credit for:
Capital expenditure 1,275,725 747,706 Raw material 109,974 209,206 Stores and spares 136,399 37,153
1,522,098 994,065
32. SALES - NET
Export sales 32.1 33,978,768 27,518,696 Local sales 3,770,209 4,850,087
Gross sales 37,748,977 32,368,783
Less:Sales discount (206,793) (206,052)Sales tax (31,122) (20,773)
(237,915) (226,825)
37,511,062 32,141,958
32.1 It includes exchange gain amounting to Rs. 2,259.977 million (2018: Rs. 890.620 million).
2019 2018
Note Rupees in ‘000
33. COST OF SALES
Raw material consumed 33.1 15,707,302 13,312,629 Stores and spares consumed 33.2 859,712 836,747 Feed, health and breeding expenses - 674,172 Knitting charges 18,930 192,135
Salaries, wages and benefits 33.3 5,574,179 5,068,623
Staff retirement gratuity 26.1.4 444,633 354,187 Fuel and power 2,264,744 1,926,612 Repairs and maintenance 129,769 144,389 Insurance 52,485 85,903 Depreciation 8.1.2 1,497,725 1,404,282 Rent, rate and taxes 32,900 32,305
Other manufacturing costs 238,042 85,766
26,820,421 24,117,750 Work in process
Opening balance 471,276 450,678 Closing balance (597,562) (471,276)
(126,286) (20,598)
Cost of goods manufactured 26,694,135 24,097,152
Finished goods
Opening balance 1,484,177 1,120,718 Closing balance (1,965,058) (1,484,177)
(480,881) (363,459)
Duty drawback (569,539) (850,604)
25,643,715 22,883,089
33.1 Raw material consumed
Opening balance 3,166,265 1,994,485 Purchases 16,276,392 14,484,409
19,442,657 16,478,894
Closing balance (3,735,355) (3,166,265)
15,707,302 13,312,629
33.2 Stores and spares consumed
Opening balance 779,198 702,029 Purchases 970,918 913,916
1,750,116 1,615,945
Closing balance (890,404) (779,198)
859,712 836,747
33.3 Salaries, wages and benefits include Rs. 6.321 million (2018: Rs. 5.489 million) in respect of the provident fund contribution.
34. DISTRIBUTION COST
Sea and air freight 50,165 47,672 Shipping expenses 623,897 660,682 Selling commission 1,757,956 1,621,212 Export development surcharge 83,310 66,600 Marketing and advertisement 61,492 77,900 Staff salaries and benefits 34.1 201,868 154,966 Staff retirement gratuity 26.1.4 14,787 11,498 Others 918 483
2,794,393 2,641,013
34.1 Staff salaries and benefits include Rs. 0.961 million (2018: Rs. 0.715 million) in respect of the provident fund contribution.
Inte
rloop
Lim
ited
212 213
2018
- 1
9A
nnua
l Rep
ort
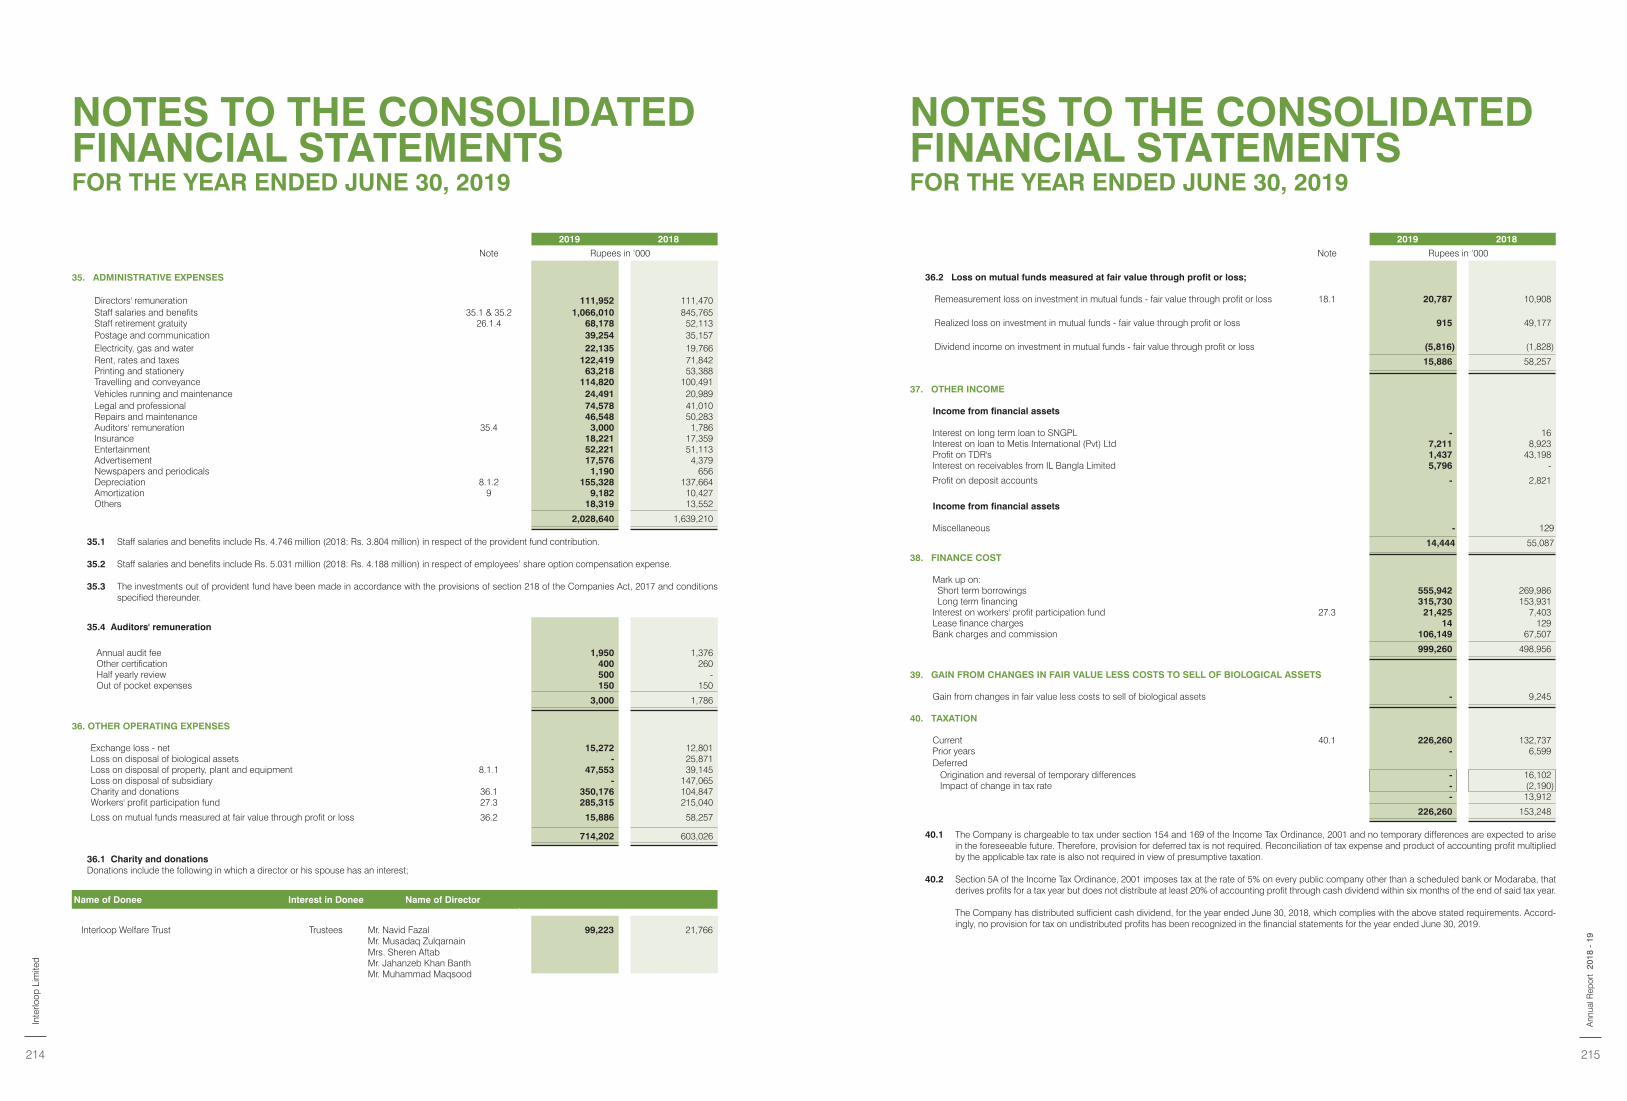
NOTES TO THE CONSOLIDATED FINANCIAL STATEMENTSFOR THE YEAR ENDED JUNE 30, 2019
NOTES TO THE CONSOLIDATED FINANCIAL STATEMENTSFOR THE YEAR ENDED JUNE 30, 2019
2019 2018
Note Rupees in ‘000
35. ADMINISTRATIVE EXPENSES
Directors' remuneration 111,952 111,470 Staff salaries and benefits 35.1 & 35.2 1,066,010 845,765 Staff retirement gratuity 26.1.4 68,178 52,113 Postage and communication 39,254 35,157 Electricity, gas and water 22,135 19,766 Rent, rates and taxes 122,419 71,842 Printing and stationery 63,218 53,388 Travelling and conveyance 114,820 100,491 Vehicles running and maintenance 24,491 20,989 Legal and professional 74,578 41,010 Repairs and maintenance 46,548 50,283 Auditors' remuneration 35.4 3,000 1,786 Insurance 18,221 17,359 Entertainment 52,221 51,113 Advertisement 17,576 4,379 Newspapers and periodicals 1,190 656 Depreciation 8.1.2 155,328 137,664 Amortization 9 9,182 10,427 Others 18,319 13,552
2,028,640 1,639,210
35.1 Staff salaries and benefits include Rs. 4.746 million (2018: Rs. 3.804 million) in respect of the provident fund contribution.
35.2 Staff salaries and benefits include Rs. 5.031 million (2018: Rs. 4.188 million) in respect of employees’ share option compensation expense.
35.3 The investments out of provident fund have been made in accordance with the provisions of section 218 of the Companies Act, 2017 and conditions specified thereunder.
35.4 Auditors' remuneration
Annual audit fee 1,950 1,376 Other certification 400 260 Half yearly review 500 - Out of pocket expenses 150 150
3,000 1,786
36. OTHER OPERATING EXPENSES
Exchange loss - net 15,272 12,801 Loss on disposal of biological assets - 25,871 Loss on disposal of property, plant and equipment 8.1.1 47,553 39,145 Loss on disposal of subsidiary - 147,065 Charity and donations 36.1 350,176 104,847 Workers' profit participation fund 27.3 285,315 215,040
Loss on mutual funds measured at fair value through profit or loss 36.2 15,886 58,257
714,202 603,026
36.1 Charity and donationsDonations include the following in which a director or his spouse has an interest;
Name of Donee Interest in Donee Name of Director
Interloop Welfare Trust Trustees Mr. Navid Fazal 99,223 21,766 Mr. Musadaq ZulqarnainMrs. Sheren AftabMr. Jahanzeb Khan BanthMr. Muhammad Maqsood
2019 2018
Note Rupees in ‘000
36.2 Loss on mutual funds measured at fair value through profit or loss;
Remeasurement loss on investment in mutual funds - fair value through profit or loss 18.1 20,787 10,908
Realized loss on investment in mutual funds - fair value through profit or loss 915 49,177
Dividend income on investment in mutual funds - fair value through profit or loss (5,816) (1,828)
15,886 58,257
37. OTHER INCOME
Income from financial assets
Interest on long term loan to SNGPL - 16 Interest on loan to Metis International (Pvt) Ltd 7,211 8,923 Profit on TDR's 1,437 43,198 Interest on receivables from IL Bangla Limited 5,796 -
Profit on deposit accounts - 2,821
Income from financial assets
Miscellaneous - 129
14,444 55,087
38. FINANCE COST
Mark up on: Short term borrowings 555,942 269,986 Long term financing 315,730 153,931 Interest on workers' profit participation fund 27.3 21,425 7,403 Lease finance charges 14 129 Bank charges and commission 106,149 67,507
999,260 498,956
39. GAIN FROM CHANGES IN FAIR VALUE LESS COSTS TO SELL OF BIOLOGICAL ASSETS
Gain from changes in fair value less costs to sell of biological assets - 9,245
40. TAXATION
Current 40.1 226,260 132,737 Prior years - 6,599 Deferred Origination and reversal of temporary differences - 16,102 Impact of change in tax rate - (2,190)
- 13,912
226,260 153,248
40.1 The Company is chargeable to tax under section 154 and 169 of the Income Tax Ordinance, 2001 and no temporary differences are expected to arise in the foreseeable future. Therefore, provision for deferred tax is not required. Reconciliation of tax expense and product of accounting profit multiplied by the applicable tax rate is also not required in view of presumptive taxation.
40.2 Section 5A of the Income Tax Ordinance, 2001 imposes tax at the rate of 5% on every public company other than a scheduled bank or Modaraba, that derives profits for a tax year but does not distribute at least 20% of accounting profit through cash dividend within six months of the end of said tax year.
The Company has distributed sufficient cash dividend, for the year ended June 30, 2018, which complies with the above stated requirements. Accord-ingly, no provision for tax on undistributed profits has been recognized in the financial statements for the year ended June 30, 2019.
Inte
rloop
Lim
ited
214 215
2018
- 1
9A
nnua
l Rep
ort
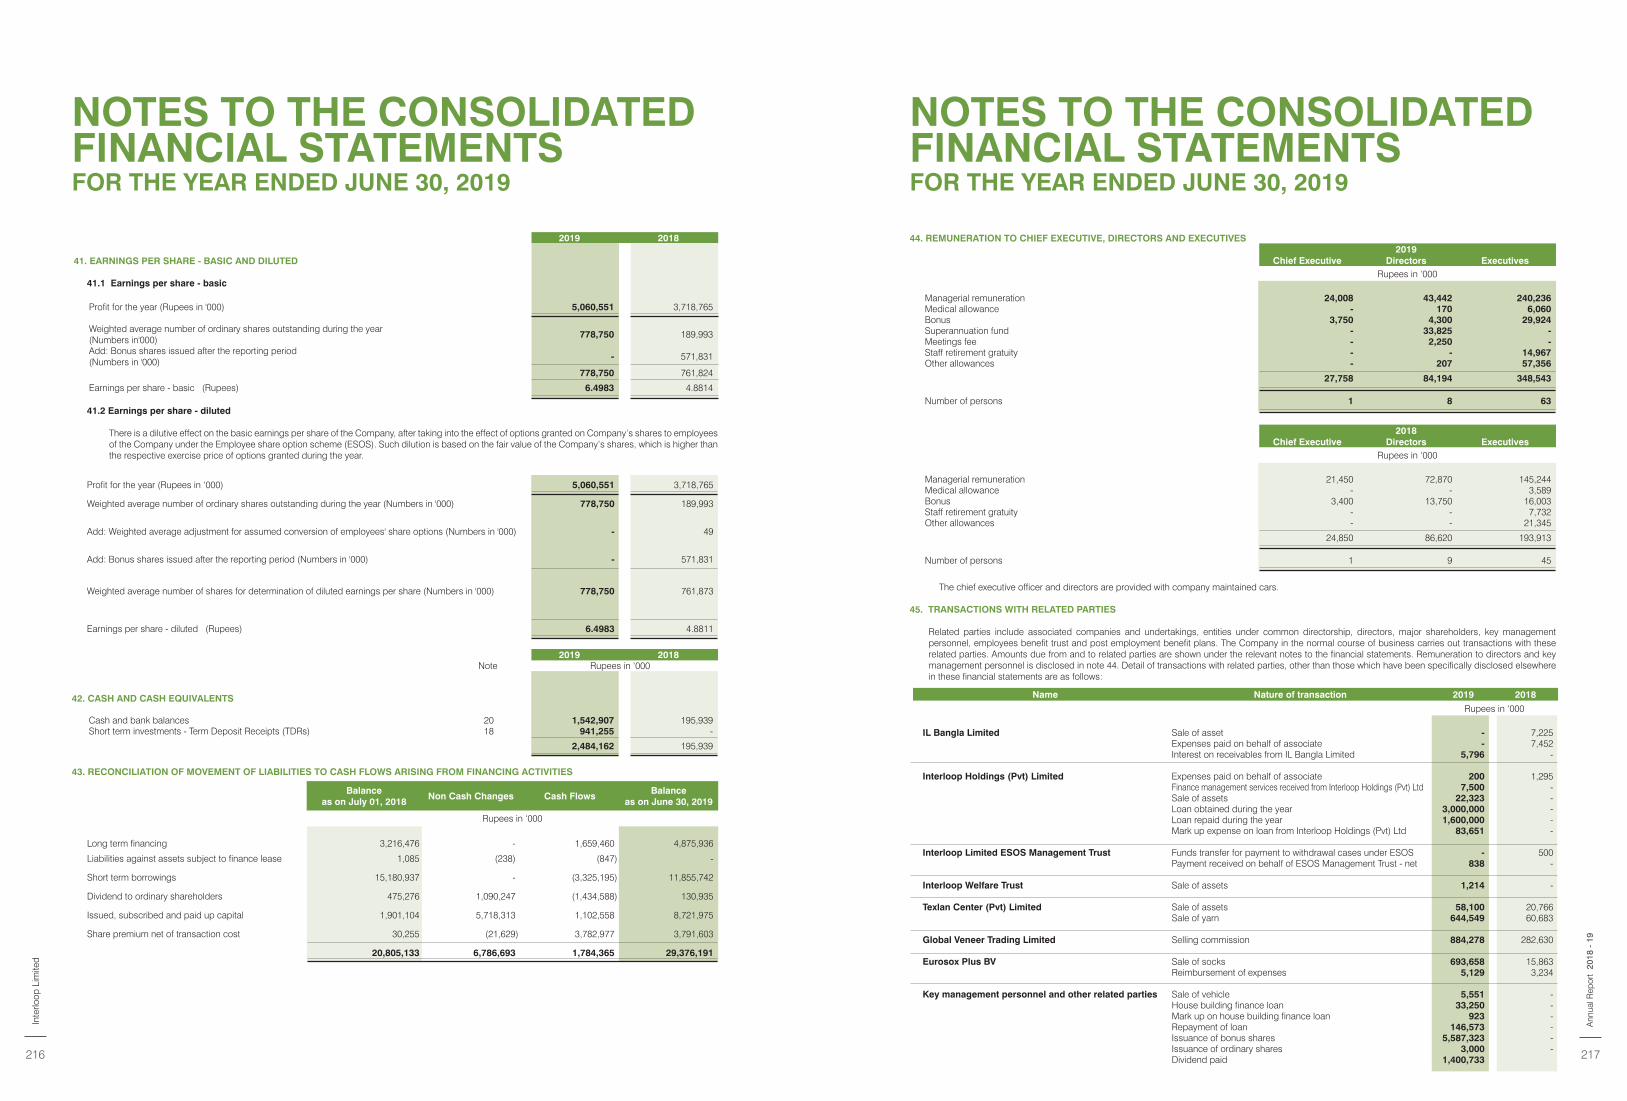
NOTES TO THE CONSOLIDATED FINANCIAL STATEMENTSFOR THE YEAR ENDED JUNE 30, 2019
NOTES TO THE CONSOLIDATED FINANCIAL STATEMENTSFOR THE YEAR ENDED JUNE 30, 2019
2019 2018
41. EARNINGS PER SHARE - BASIC AND DILUTED
41.1 Earnings per share - basic
Profit for the year (Rupees in '000) 5,060,551 3,718,765
Weighted average number of ordinary shares outstanding during the year (Numbers in'000)
778,750 189,993
Add: Bonus shares issued after the reporting period (Numbers in '000)
- 571,831
778,750 761,824
Earnings per share - basic (Rupees) 6.4983 4.8814
41.2 Earnings per share - diluted
There is a dilutive effect on the basic earnings per share of the Company, after taking into the effect of options granted on Company’s shares to employees of the Company under the Employee share option scheme (ESOS). Such dilution is based on the fair value of the Company’s shares, which is higher than the respective exercise price of options granted during the year.
Profit for the year (Rupees in ‘000) 5,060,551 3,718,765
Weighted average number of ordinary shares outstanding during the year (Numbers in '000) 778,750 189,993
Add: Weighted average adjustment for assumed conversion of employees' share options (Numbers in '000) - 49
Add: Bonus shares issued after the reporting period (Numbers in '000) - 571,831
Weighted average number of shares for determination of diluted earnings per share (Numbers in '000) 778,750 761,873
Earnings per share - diluted (Rupees) 6.4983 4.8811
2019 2018Note Rupees in ‘000
42. CASH AND CASH EQUIVALENTS
Cash and bank balances 20 1,542,907 195,939 Short term investments - Term Deposit Receipts (TDRs) 18 941,255 -
2,484,162 195,939
43. RECONCILIATION OF MOVEMENT OF LIABILITIES TO CASH FLOWS ARISING FROM FINANCING ACTIVITIES
Balance as on July 01, 2018
Non Cash Changes Cash FlowsBalance
as on June 30, 2019
Rupees in ‘000
Long term financing 3,216,476 - 1,659,460 4,875,936
Liabilities against assets subject to finance lease 1,085 (238) (847) -
Short term borrowings 15,180,937 - (3,325,195) 11,855,742
Dividend to ordinary shareholders 475,276 1,090,247 (1,434,588) 130,935
Issued, subscribed and paid up capital 1,901,104 5,718,313 1,102,558 8,721,975
Share premium net of transaction cost 30,255 (21,629) 3,782,977 3,791,603
20,805,133 6,786,693 1,784,365 29,376,191
44. REMUNERATION TO CHIEF EXECUTIVE, DIRECTORS AND EXECUTIVES2019
Chief Executive Directors Executives Rupees in ‘000
Managerial remuneration 24,008 43,442 240,236 Medical allowance - 170 6,060 Bonus 3,750 4,300 29,924 Superannuation fund - 33,825 - Meetings fee - 2,250 - Staff retirement gratuity - - 14,967 Other allowances - 207 57,356
27,758 84,194 348,543
Number of persons 1 8 63
2018Chief Executive Directors Executives
Rupees in ‘000
Managerial remuneration 21,450 72,870 145,244 Medical allowance - - 3,589 Bonus 3,400 13,750 16,003 Staff retirement gratuity - - 7,732 Other allowances - - 21,345
24,850 86,620 193,913
Number of persons 1 9 45
The chief executive officer and directors are provided with company maintained cars.
45. TRANSACTIONS WITH RELATED PARTIES
Related parties include associated companies and undertakings, entities under common directorship, directors, major shareholders, key management personnel, employees benefit trust and post employment benefit plans. The Company in the normal course of business carries out transactions with these related parties. Amounts due from and to related parties are shown under the relevant notes to the financial statements. Remuneration to directors and key management personnel is disclosed in note 44. Detail of transactions with related parties, other than those which have been specifically disclosed elsewhere in these financial statements are as follows:
Name Nature of transaction 2019 2018
Rupees in ‘000
IL Bangla Limited Sale of asset - 7,225 Expenses paid on behalf of associate - 7,452 Interest on receivables from IL Bangla Limited 5,796 -
Interloop Holdings (Pvt) Limited Expenses paid on behalf of associate 200 1,295 Finance management services received from Interloop Holdings (Pvt) Ltd 7,500 - Sale of assets 22,323 - Loan obtained during the year 3,000,000 - Loan repaid during the year 1,600,000 - Mark up expense on loan from Interloop Holdings (Pvt) Ltd 83,651 -
Interloop Limited ESOS Management Trust Funds transfer for payment to withdrawal cases under ESOS - 500 Payment received on behalf of ESOS Management Trust - net 838 -
Interloop Welfare Trust Sale of assets 1,214 -
Texlan Center (Pvt) Limited Sale of assets 58,100 20,766 Sale of yarn 644,549 60,683
Global Veneer Trading Limited Selling commission 884,278 282,630
Eurosox Plus BV Sale of socks 693,658 15,863 Reimbursement of expenses 5,129 3,234
Key management personnel and other related parties Sale of vehicle 5,551 - House building finance loan 33,250 - Mark up on house building finance loan 923 - Repayment of loan 146,573 - Issuance of bonus shares 5,587,323 - Issuance of ordinary shares 3,000 - Dividend paid 1,400,733
Inte
rloop
Lim
ited
216 217
2018
- 1
9A
nnua
l Rep
ort
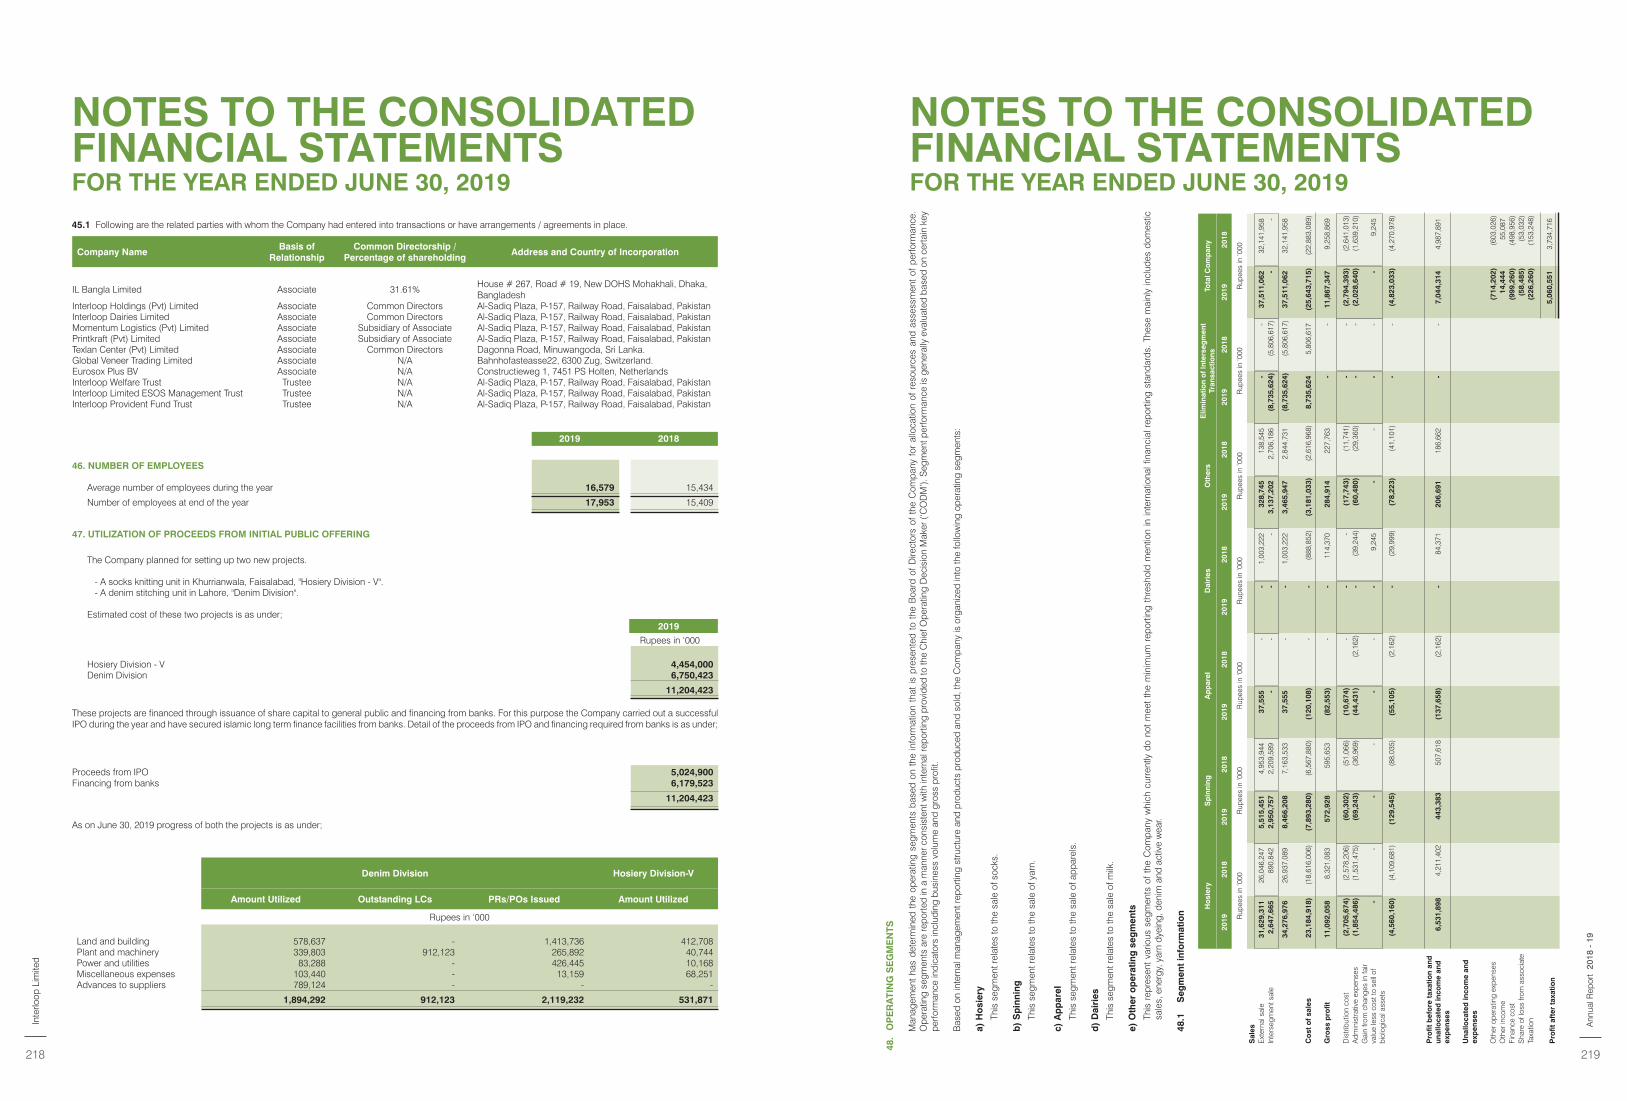
NOTES TO THE CONSOLIDATED FINANCIAL STATEMENTSFOR THE YEAR ENDED JUNE 30, 2019
NOTES TO THE CONSOLIDATED FINANCIAL STATEMENTSFOR THE YEAR ENDED JUNE 30, 2019
Company NameBasis of
RelationshipCommon Directorship /
Percentage of shareholdingAddress and Country of Incorporation
IL Bangla Limited Associate 31.61%House # 267, Road # 19, New DOHS Mohakhali, Dhaka, Bangladesh
Interloop Holdings (Pvt) Limited Associate Common Directors Al-Sadiq Plaza, P-157, Railway Road, Faisalabad, PakistanInterloop Dairies Limited Associate Common Directors Al-Sadiq Plaza, P-157, Railway Road, Faisalabad, PakistanMomentum Logistics (Pvt) Limited Associate Subsidiary of Associate Al-Sadiq Plaza, P-157, Railway Road, Faisalabad, PakistanPrintkraft (Pvt) Limited Associate Subsidiary of Associate Al-Sadiq Plaza, P-157, Railway Road, Faisalabad, PakistanTexlan Center (Pvt) Limited Associate Common Directors Dagonna Road, Minuwangoda, Sri Lanka.Global Veneer Trading Limited Associate N/A Bahnhofasteasse22, 6300 Zug, Switzerland.Eurosox Plus BV Associate N/A Constructieweg 1, 7451 PS Holten, NetherlandsInterloop Welfare Trust Trustee N/A Al-Sadiq Plaza, P-157, Railway Road, Faisalabad, PakistanInterloop Limited ESOS Management Trust Trustee N/A Al-Sadiq Plaza, P-157, Railway Road, Faisalabad, PakistanInterloop Provident Fund Trust Trustee N/A Al-Sadiq Plaza, P-157, Railway Road, Faisalabad, Pakistan
Denim Division Hosiery Division-V
Amount Utilized Outstanding LCs PRs/POs Issued Amount Utilized
Rupees in ‘000
Land and building 578,637 - 1,413,736 412,708 Plant and machinery 339,803 912,123 265,892 40,744 Power and utilities 83,288 - 426,445 10,168 Miscellaneous expenses 103,440 - 13,159 68,251 Advances to suppliers 789,124 - - -
1,894,292 912,123 2,119,232 531,871
2019 2018
46. NUMBER OF EMPLOYEES
Average number of employees during the year 16,579 15,434
Number of employees at end of the year 17,953 15,409
47. UTILIZATION OF PROCEEDS FROM INITIAL PUBLIC OFFERING
The Company planned for setting up two new projects.
- A socks knitting unit in Khurrianwala, Faisalabad, "Hosiery Division - V".- A denim stitching unit in Lahore, "Denim Division".
Estimated cost of these two projects is as under;2019
Rupees in ‘000
Hosiery Division - V 4,454,000 Denim Division 6,750,423
11,204,423
These projects are financed through issuance of share capital to general public and financing from banks. For this purpose the Company carried out a successful IPO during the year and have secured islamic long term finance facilities from banks. Detail of the proceeds from IPO and financing required from banks is as under;
Proceeds from IPO 5,024,900 Financing from banks 6,179,523
11,204,423
As on June 30, 2019 progress of both the projects is as under;
45.1 Following are the related parties with whom the Company had entered into transactions or have arrangements / agreements in place.
48.
OP
ER
ATI
NG
SE
GM
EN
TS
Man
agem
ent
has
dete
rmin
ed t
he o
pera
ting
segm
ents
bas
ed o
n th
e in
form
atio
n th
at is
pre
sent
ed t
o th
e B
oard
of
Dire
ctor
s of
the
Com
pany
for
allo
catio
n of
res
ourc
es a
nd a
sses
smen
t of
per
form
ance
. O
pera
ting
segm
ents
are
repo
rted
in a
man
ner c
onsi
sten
t with
inte
rnal
repo
rting
pro
vide
d to
the
Chi
ef O
pera
ting
Dec
isio
n M
aker
(‘C
OD
M’).
Seg
men
t per
form
ance
is g
ener
ally
eva
luat
ed b
ased
on
certa
in k
ey
perfo
rman
ce in
dica
tors
incl
udin
g bu
sine
ss v
olum
e an
d gr
oss
prof
it.
Bas
ed o
n in
tern
al m
anag
emen
t rep
ortin
g st
ruct
ure
and
prod
ucts
pro
duce
d an
d so
ld, t
he C
ompa
ny is
org
aniz
ed in
to th
e fo
llow
ing
oper
atin
g se
gmen
ts:
a) H
osi
ery
This
seg
men
t rel
ates
to th
e sa
le o
f soc
ks.
b)
Sp
inni
ng
This
seg
men
t rel
ates
to th
e sa
le o
f yar
n.
c) A
pp
arel
This
seg
men
t rel
ates
to th
e sa
le o
f app
arel
s.
d)
Dai
ries
This
seg
men
t rel
ates
to th
e sa
le o
f milk
.
e) O
ther
op
erat
ing
seg
men
ts
This
rep
rese
nt v
ario
us s
egm
ents
of
the
Com
pany
whi
ch c
urre
ntly
do
not
mee
t th
e m
inim
um r
epor
ting
thre
shol
d m
entio
n in
inte
rnat
iona
l fin
anci
al r
epor
ting
stan
dard
s. T
hese
mai
nly
incl
udes
dom
estic
sa
les,
ene
rgy,
yar
n dy
eing
, den
im a
nd a
ctiv
e w
ear.
48.1
S
egm
ent
info
rmat
ion
Ho
sier
yS
pin
ning
Ap
par
elD
airi
esO
ther
sE
limin
atio
n o
f Int
erse
gm
ent
Tran
sact
ions
Tota
l Co
mp
any
2019
2018
2019
2018
2019
2018
2019
2018
2019
2018
2019
2018
2019
2018
Rup
ees
in ‘0
00R
upee
s in
‘000
Rup
ees
in ‘0
00R
upee
s in
‘000
Rup
ees
in ‘0
00R
upee
s in
‘000
Rup
ees
in ‘0
00
Sal
esE
xter
nal s
ale
31,
629,
311
26,
046,
247
5,5
15,4
51
4,9
53,9
44
37,
555
- -
1
,003
,222
3
28,7
45
138
,545
-
-
37,
511,
062
32,
141,
958
Inte
rseg
men
t sal
e 2
,647
,665
8
90,8
42
2,9
50,7
57
2,2
09,5
89
-
- -
-
3,1
37,2
02
2,7
06,1
86
(8,
735,
624)
(5,8
06,6
17)
-
-
34,
276,
976
26,
937,
089
8,4
66,2
08
7,1
63,5
33
37,
555
- -
1
,003
,222
3
,465
,947
2
,844
,731
(
8,73
5,62
4) (5
,806
,617
) 3
7,51
1,06
2 3
2,14
1,95
8
Co
st o
f sa
les
23,
184,
918)
(18,
616,
006)
(7,
893,
280)
(6,5
67,8
80)
(12
0,10
8) -
-
(888
,852
) (
3,18
1,03
3) (2
,616
,968
) 8
,735
,624
5
,806
,617
(
25,6
43,7
15)
(22,
883,
089)
Gro
ss p
rofit
11,
092,
058
8,3
21,0
83
572
,928
5
95,6
53
(82
,553
) -
-
114
,370
2
84,9
14
227
,763
-
-
11,
867,
347
9,2
58,8
69
Dis
tribu
tion
cost
(2,
705,
674)
(2,5
78,2
06)
(60
,302
) (5
1,06
6) (
10,6
74)
- -
-
(17
,743
) (1
1,74
1) -
-
(2,
794,
393)
(2,6
41,0
13)
Adm
inis
trativ
e ex
pens
es (
1,85
4,48
6) (1
,531
,475
) (
69,2
43)
(36,
969)
(44
,431
) (2
,162
) -
(3
9,24
4) (
60,4
80)
(29,
360)
-
- (
2,02
8,64
0) (1
,639
,210
)G
ain
from
cha
nges
in fa
ir va
lue
less
cos
t to
sell
of
biol
ogic
al a
sset
s -
-
-
- -
-
-
9,2
45
-
- -
-
-
9,2
45
(4,
560,
160)
(4,1
09,6
81)
(12
9,54
5) (8
8,03
5) (
55,1
05)
(2,1
62)
-
(29,
999)
(78
,223
) (4
1,10
1) -
-
(4,
823,
033)
(4,2
70,9
78)
Pro
fit b
efo
re t
axat
ion
and
un
allo
cate
d in
com
e an
d
exp
ense
s 6
,531
,898
4
,211
,402
4
43,3
83
507
,618
(
137,
658)
(2,1
62)
-
84,
371
206
,691
1
86,6
62
-
- 7
,044
,314
4
,987
,891
Una
lloca
ted
inco
me
and
ex
pen
ses
Oth
er o
pera
ting
expe
nses
(71
4,20
2) (6
03,0
26)
Oth
er in
com
e 1
4,44
4 5
5,08
7 Fi
nanc
e co
st (
999,
260)
(498
,956
)S
hare
of l
oss
from
ass
ocia
te (
58,4
85)
(53,
032)
Taxa
tion
(22
6,26
0) (1
53,2
48)
Pro
fit a
fter
tax
atio
n 5
,060
,551
3
,734
,716
Inte
rloop
Lim
ited
218 219
2018
- 1
9A
nnua
l Rep
ort
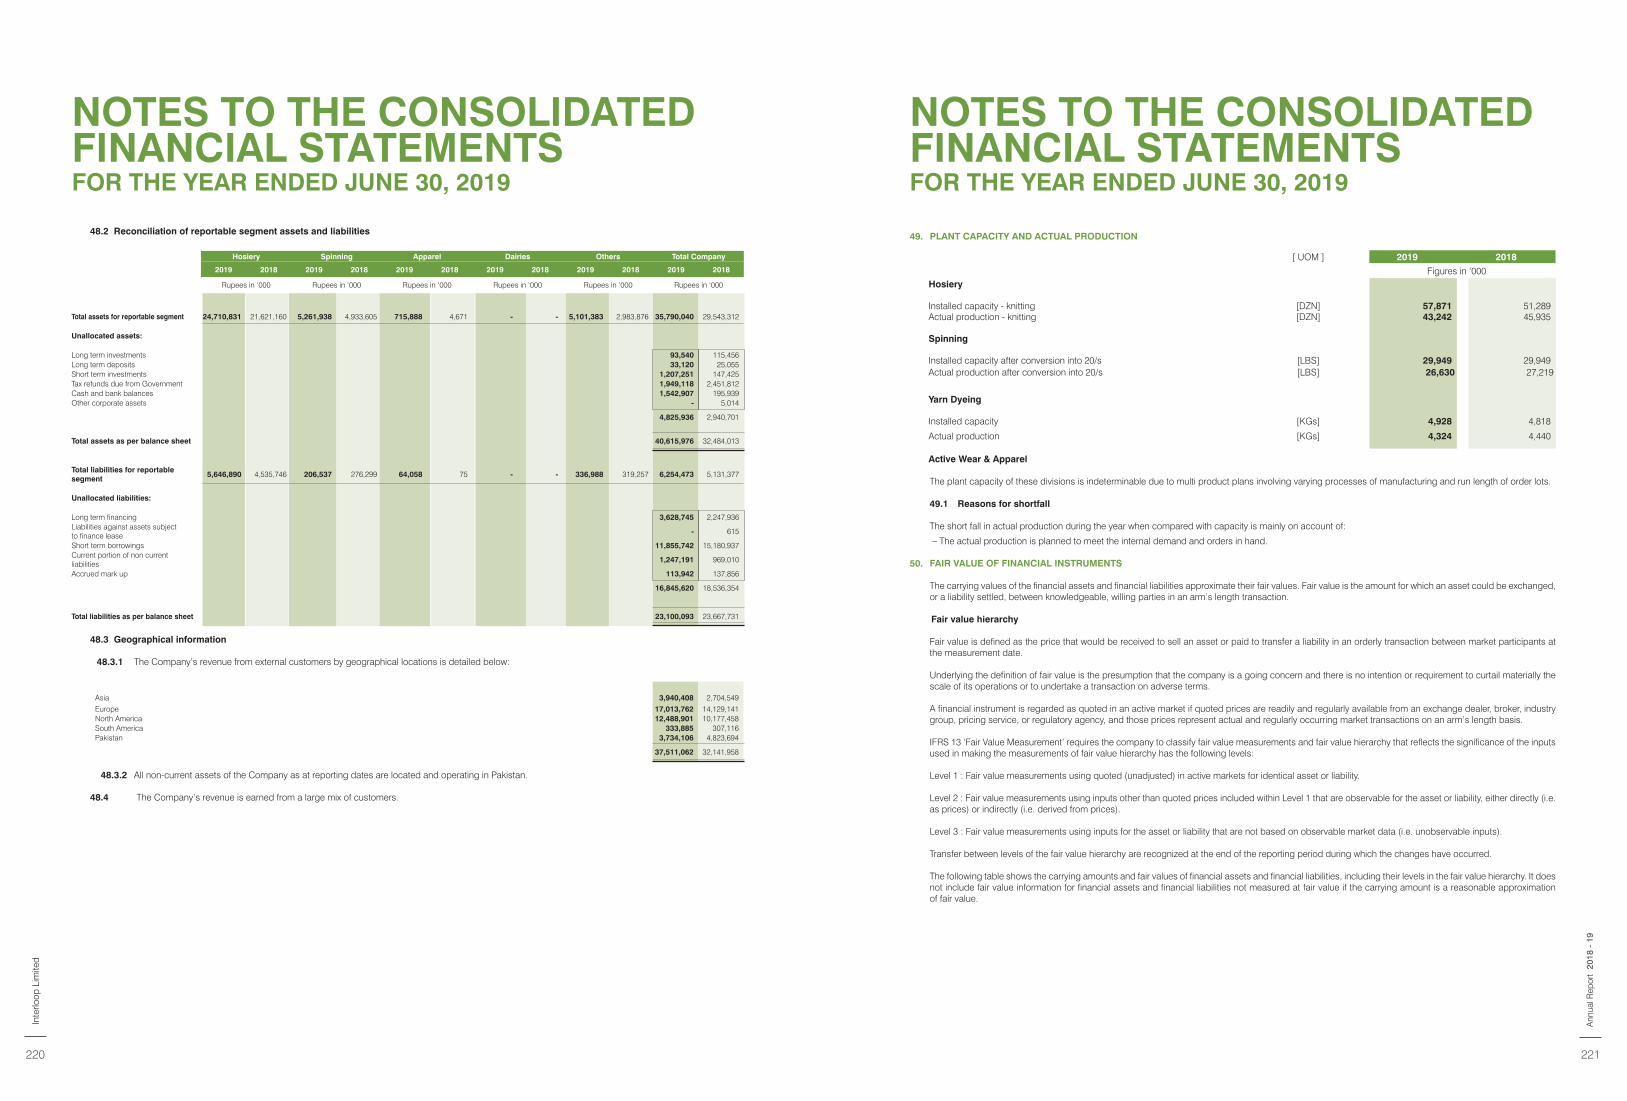
NOTES TO THE CONSOLIDATED FINANCIAL STATEMENTSFOR THE YEAR ENDED JUNE 30, 2019
NOTES TO THE CONSOLIDATED FINANCIAL STATEMENTSFOR THE YEAR ENDED JUNE 30, 2019
48.2 Reconciliation of reportable segment assets and liabilities
Hosiery Spinning Apparel Dairies Others Total Company
2019 2018 2019 2018 2019 2018 2019 2018 2019 2018 2019 2018
Rupees in ‘000 Rupees in ‘000 Rupees in ‘000 Rupees in ‘000 Rupees in ‘000 Rupees in ‘000
Total assets for reportable segment 24,710,831 21,621,160 5,261,938 4,933,605 715,888 4,671 - - 5,101,383 2,983,876 35,790,040 29,543,312
Unallocated assets:
Long term investments 93,540 115,456 Long term deposits 33,120 25,055 Short term investments 1,207,251 147,425 Tax refunds due from Government 1,949,118 2,451,812 Cash and bank balances 1,542,907 195,939 Other corporate assets - 5,014
4,825,936 2,940,701
Total assets as per balance sheet 40,615,976 32,484,013
Total liabilities for reportable segment
5,646,890 4,535,746 206,537 276,299 64,058 75 - - 336,988 319,257 6,254,473 5,131,377
Unallocated liabilities:
Long term financing 3,628,745 2,247,936 Liabilities against assets subjectto finance lease
- 615
Short term borrowings 11,855,742 15,180,937 Current portion of non current liabilities
1,247,191 969,010
Accrued mark up 113,942 137,856
16,845,620 18,536,354
Total liabilities as per balance sheet 23,100,093 23,667,731
48.3 Geographical information
48.3.1 The Company’s revenue from external customers by geographical locations is detailed below:
Asia 3,940,408 2,704,549 Europe 17,013,762 14,129,141 North America 12,488,901 10,177,458 South America 333,885 307,116 Pakistan 3,734,106 4,823,694
37,511,062 32,141,958
48.3.2 All non-current assets of the Company as at reporting dates are located and operating in Pakistan.
48.4 The Company’s revenue is earned from a large mix of customers.
49. PLANT CAPACITY AND ACTUAL PRODUCTION
[ UOM ] 2019 2018
Figures in ‘000Hosiery
Installed capacity - knitting [DZN] 57,871 51,289 Actual production - knitting [DZN] 43,242 45,935
Spinning
Installed capacity after conversion into 20/s [LBS] 29,949 29,949 Actual production after conversion into 20/s [LBS] 26,630 27,219
Yarn Dyeing
Installed capacity [KGs] 4,928 4,818
Actual production [KGs] 4,324 4,440
Active Wear & Apparel
The plant capacity of these divisions is indeterminable due to multi product plans involving varying processes of manufacturing and run length of order lots.
49.1 Reasons for shortfall
The short fall in actual production during the year when compared with capacity is mainly on account of:
– The actual production is planned to meet the internal demand and orders in hand.
50. FAIR VALUE OF FINANCIAL INSTRUMENTS
The carrying values of the financial assets and financial liabilities approximate their fair values. Fair value is the amount for which an asset could be exchanged, or a liability settled, between knowledgeable, willing parties in an arm’s length transaction.
Fair value hierarchy
Fair value is defined as the price that would be received to sell an asset or paid to transfer a liability in an orderly transaction between market participants at the measurement date.
Underlying the definition of fair value is the presumption that the company is a going concern and there is no intention or requirement to curtail materially the scale of its operations or to undertake a transaction on adverse terms.
A financial instrument is regarded as quoted in an active market if quoted prices are readily and regularly available from an exchange dealer, broker, industry group, pricing service, or regulatory agency, and those prices represent actual and regularly occurring market transactions on an arm’s length basis.
IFRS 13 ‘Fair Value Measurement’ requires the company to classify fair value measurements and fair value hierarchy that reflects the significance of the inputs used in making the measurements of fair value hierarchy has the following levels:
Level 1 : Fair value measurements using quoted (unadjusted) in active markets for identical asset or liability.
Level 2 : Fair value measurements using inputs other than quoted prices included within Level 1 that are observable for the asset or liability, either directly (i.e. as prices) or indirectly (i.e. derived from prices).
Level 3 : Fair value measurements using inputs for the asset or liability that are not based on observable market data (i.e. unobservable inputs).
Transfer between levels of the fair value hierarchy are recognized at the end of the reporting period during which the changes have occurred.
The following table shows the carrying amounts and fair values of financial assets and financial liabilities, including their levels in the fair value hierarchy. It does not include fair value information for financial assets and financial liabilities not measured at fair value if the carrying amount is a reasonable approximation of fair value.
Inte
rloop
Lim
ited
220 221
2018
- 1
9A
nnua
l Rep
ort
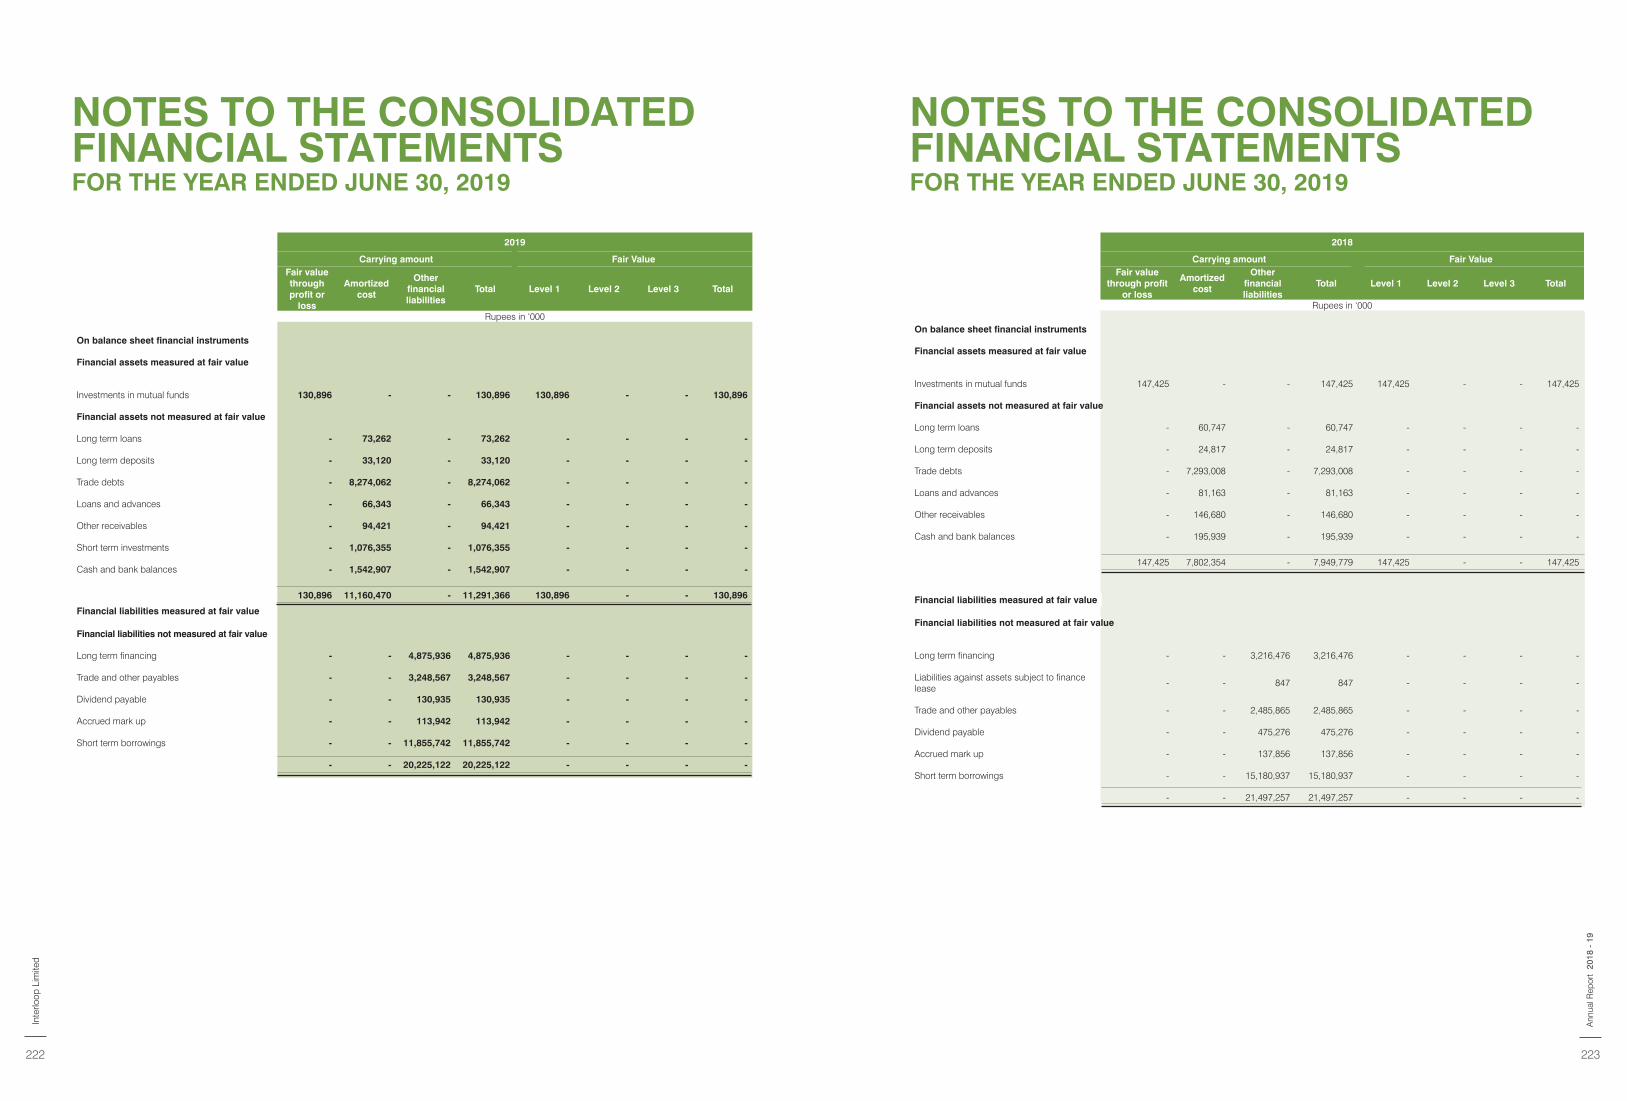
NOTES TO THE CONSOLIDATED FINANCIAL STATEMENTSFOR THE YEAR ENDED JUNE 30, 2019
NOTES TO THE CONSOLIDATED FINANCIAL STATEMENTSFOR THE YEAR ENDED JUNE 30, 2019
2019
Carrying amount Fair ValueFair value through profit or
loss
Amortized cost
Other financial liabilities
Total Level 1 Level 2 Level 3 Total
Rupees in ‘000
On balance sheet financial instruments
Financial assets measured at fair value
Investments in mutual funds 130,896 - - 130,896 130,896 - - 130,896
Financial assets not measured at fair value
Long term loans - 73,262 - 73,262 - - - -
Long term deposits - 33,120 - 33,120 - - - -
Trade debts - 8,274,062 - 8,274,062 - - - -
Loans and advances - 66,343 - 66,343 - - - -
Other receivables - 94,421 - 94,421 - - - -
Short term investments - 1,076,355 - 1,076,355 - - - -
Cash and bank balances - 1,542,907 - 1,542,907 - - - -
130,896 11,160,470 - 11,291,366 130,896 - - 130,896
Financial liabilities measured at fair value
Financial liabilities not measured at fair value
Long term financing - - 4,875,936 4,875,936 - - - -
Trade and other payables - - 3,248,567 3,248,567 - - - -
Dividend payable - - 130,935 130,935 - - - -
Accrued mark up - - 113,942 113,942 - - - -
Short term borrowings - - 11,855,742 11,855,742 - - - -
- - 20,225,122 20,225,122 - - - -
2018
Carrying amount Fair ValueFair value
through profit or loss
Amortized cost
Other financial liabilities
Total Level 1 Level 2 Level 3 Total
Rupees in ‘000
On balance sheet financial instruments
Financial assets measured at fair value
Investments in mutual funds 147,425 - - 147,425 147,425 - - 147,425
Financial assets not measured at fair value
Long term loans - 60,747 - 60,747 - - - -
Long term deposits - 24,817 - 24,817 - - - -
Trade debts - 7,293,008 - 7,293,008 - - - -
Loans and advances - 81,163 - 81,163 - - - -
Other receivables - 146,680 - 146,680 - - - -
Cash and bank balances - 195,939 - 195,939 - - - -
147,425 7,802,354 - 7,949,779 147,425 - - 147,425
Financial liabilities measured at fair value
Financial liabilities not measured at fair value
Long term financing - - 3,216,476 3,216,476 - - - -
Liabilities against assets subject to finance lease
- - 847 847 - - - -
Trade and other payables - - 2,485,865 2,485,865 - - - -
Dividend payable - - 475,276 475,276 - - - -
Accrued mark up - - 137,856 137,856 - - - -
Short term borrowings - - 15,180,937 15,180,937 - - - -
- - 21,497,257 21,497,257 - - - -
Inte
rloop
Lim
ited
222 223
2018
- 1
9A
nnua
l Rep
ort
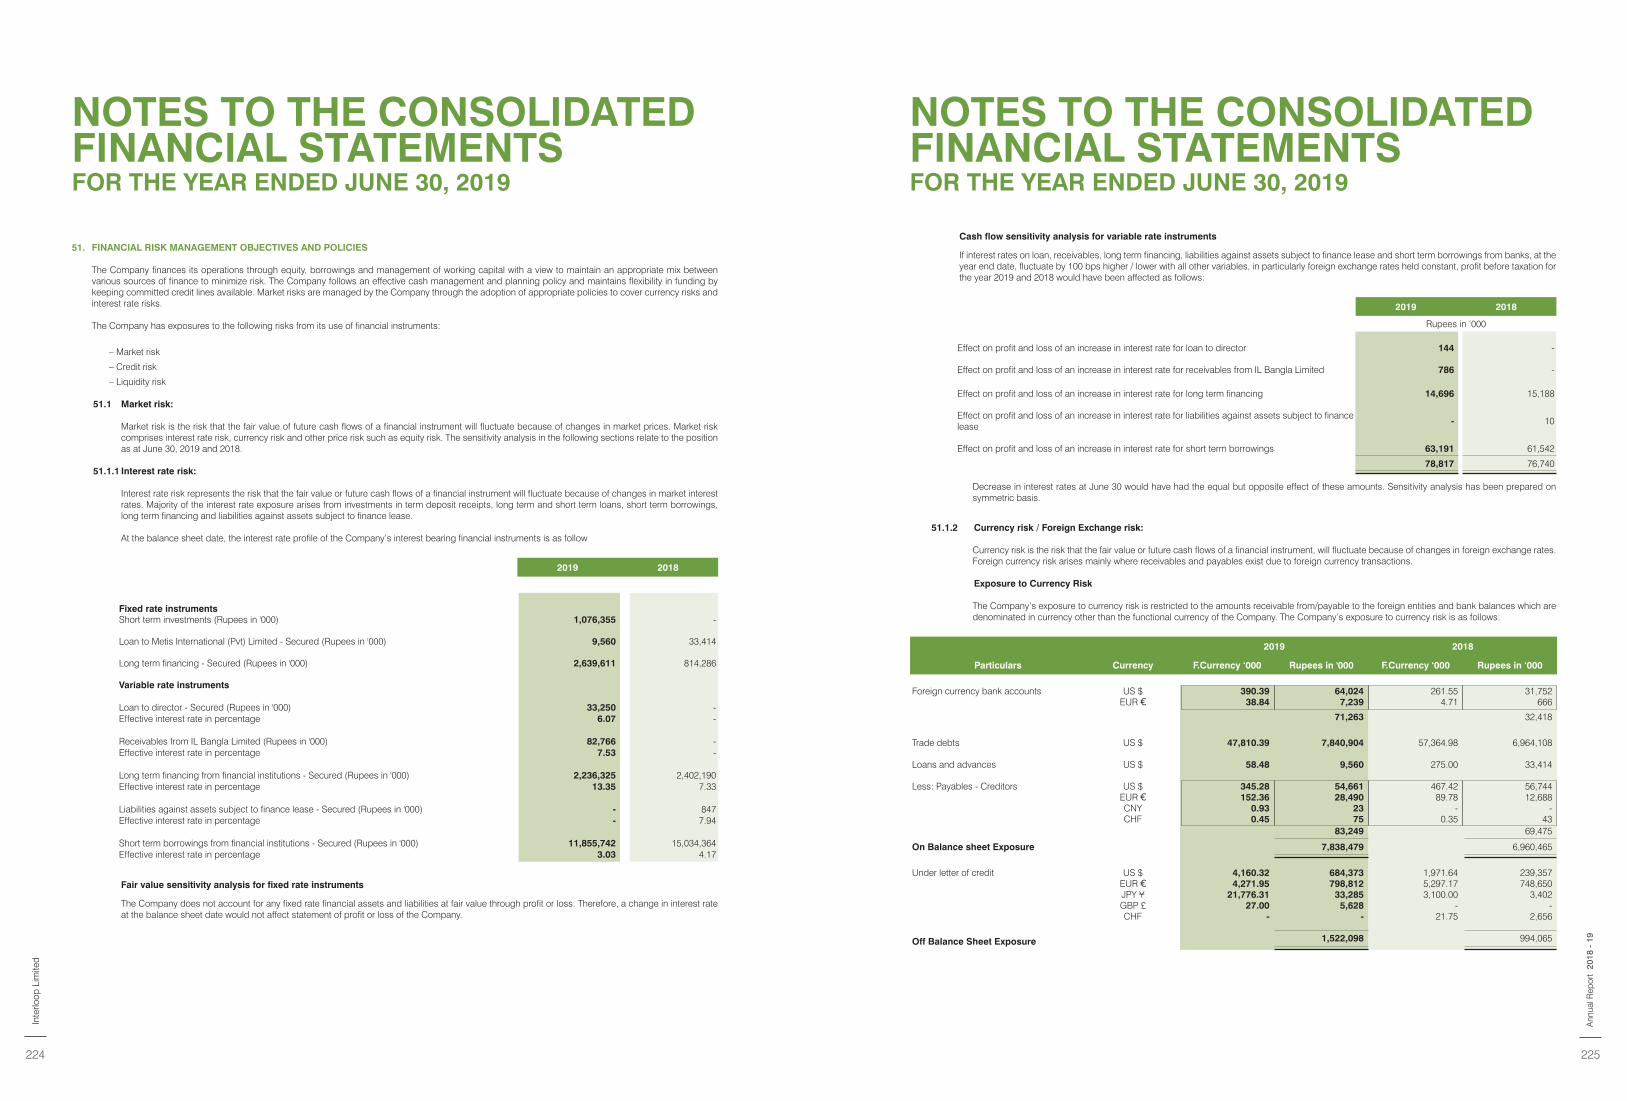
NOTES TO THE CONSOLIDATED FINANCIAL STATEMENTSFOR THE YEAR ENDED JUNE 30, 2019
NOTES TO THE CONSOLIDATED FINANCIAL STATEMENTSFOR THE YEAR ENDED JUNE 30, 2019
51. FINANCIAL RISK MANAGEMENT OBJECTIVES AND POLICIES
The Company finances its operations through equity, borrowings and management of working capital with a view to maintain an appropriate mix between various sources of finance to minimize risk. The Company follows an effective cash management and planning policy and maintains flexibility in funding by keeping committed credit lines available. Market risks are managed by the Company through the adoption of appropriate policies to cover currency risks and interest rate risks.
The Company has exposures to the following risks from its use of financial instruments:
– Market risk
– Credit risk
– Liquidity risk
51.1 Market risk:
Market risk is the risk that the fair value of future cash flows of a financial instrument will fluctuate because of changes in market prices. Market risk comprises interest rate risk, currency risk and other price risk such as equity risk. The sensitivity analysis in the following sections relate to the position as at June 30, 2019 and 2018.
51.1.1 Interest rate risk:
Interest rate risk represents the risk that the fair value or future cash flows of a financial instrument will fluctuate because of changes in market interest rates. Majority of the interest rate exposure arises from investments in term deposit receipts, long term and short term loans, short term borrowings, long term financing and liabilities against assets subject to finance lease.
At the balance sheet date, the interest rate profile of the Company’s interest bearing financial instruments is as follow
2019 2018
Fixed rate instrumentsShort term investments (Rupees in '000) 1,076,355 -
Loan to Metis International (Pvt) Limited - Secured (Rupees in '000) 9,560 33,414
Long term financing - Secured (Rupees in '000) 2,639,611 814,286
Variable rate instruments
Loan to director - Secured (Rupees in '000) 33,250 - Effective interest rate in percentage 6.07 -
Receivables from IL Bangla Limited (Rupees in '000) 82,766 - Effective interest rate in percentage 7.53 -
Long term financing from financial institutions - Secured (Rupees in '000) 2,236,325 2,402,190 Effective interest rate in percentage 13.35 7.33
Liabilities against assets subject to finance lease - Secured (Rupees in '000) - 847 Effective interest rate in percentage - 7.94
Short term borrowings from financial institutions - Secured (Rupees in '000) 11,855,742 15,034,364 Effective interest rate in percentage 3.03 4.17
Fair value sensitivity analysis for fixed rate instruments
The Company does not account for any fixed rate financial assets and liabilities at fair value through profit or loss. Therefore, a change in interest rate at the balance sheet date would not affect statement of profit or loss of the Company.
Cash flow sensitivity analysis for variable rate instruments
If interest rates on loan, receivables, long term financing, liabilities against assets subject to finance lease and short term borrowings from banks, at the year end date, fluctuate by 100 bps higher / lower with all other variables, in particularly foreign exchange rates held constant, profit before taxation for the year 2019 and 2018 would have been affected as follows:
2019 2018
Rupees in ‘000
Effect on profit and loss of an increase in interest rate for loan to director 144 -
Effect on profit and loss of an increase in interest rate for receivables from IL Bangla Limited 786 -
Effect on profit and loss of an increase in interest rate for long term financing 14,696 15,188
Effect on profit and loss of an increase in interest rate for liabilities against assets subject to finance lease
- 10
Effect on profit and loss of an increase in interest rate for short term borrowings 63,191 61,542
78,817 76,740
Decrease in interest rates at June 30 would have had the equal but opposite effect of these amounts. Sensitivity analysis has been prepared on symmetric basis.
51.1.2 Currency risk / Foreign Exchange risk:
Currency risk is the risk that the fair value or future cash flows of a financial instrument, will fluctuate because of changes in foreign exchange rates. Foreign currency risk arises mainly where receivables and payables exist due to foreign currency transactions.
Exposure to Currency Risk
The Company’s exposure to currency risk is restricted to the amounts receivable from/payable to the foreign entities and bank balances which are denominated in currency other than the functional currency of the Company. The Company’s exposure to currency risk is as follows:
2019 2018
Particulars Currency F.Currency ‘000 Rupees in '000 F.Currency ‘000 Rupees in ‘000
Foreign currency bank accounts US $ 390.39 64,024 261.55 31,752 EUR 38.84 7,239 4.71 666
71,263 32,418
Trade debts US $ 47,810.39 7,840,904 57,364.98 6,964,108
Loans and advances US $ 58.48 9,560 275.00 33,414
Less: Payables - Creditors US $ 345.28 54,661 467.42 56,744 EUR 152.36 28,490 89.78 12,688 CNY 0.93 23 - - CHF 0.45 75 0.35 43
83,249 69,475
On Balance sheet Exposure 7,838,479 6,960,465
Under letter of credit US $ 4,160.32 684,373 1,971.64 239,357 EUR 4,271.95 798,812 5,297.17 748,650 JPY ¥ 21,776.31 33,285 3,100.00 3,402 GBP £ 27.00 5,628 - - CHF - - 21.75 2,656
Off Balance Sheet Exposure 1,522,098 994,065
Inte
rloop
Lim
ited
224 225
2018
- 1
9A
nnua
l Rep
ort
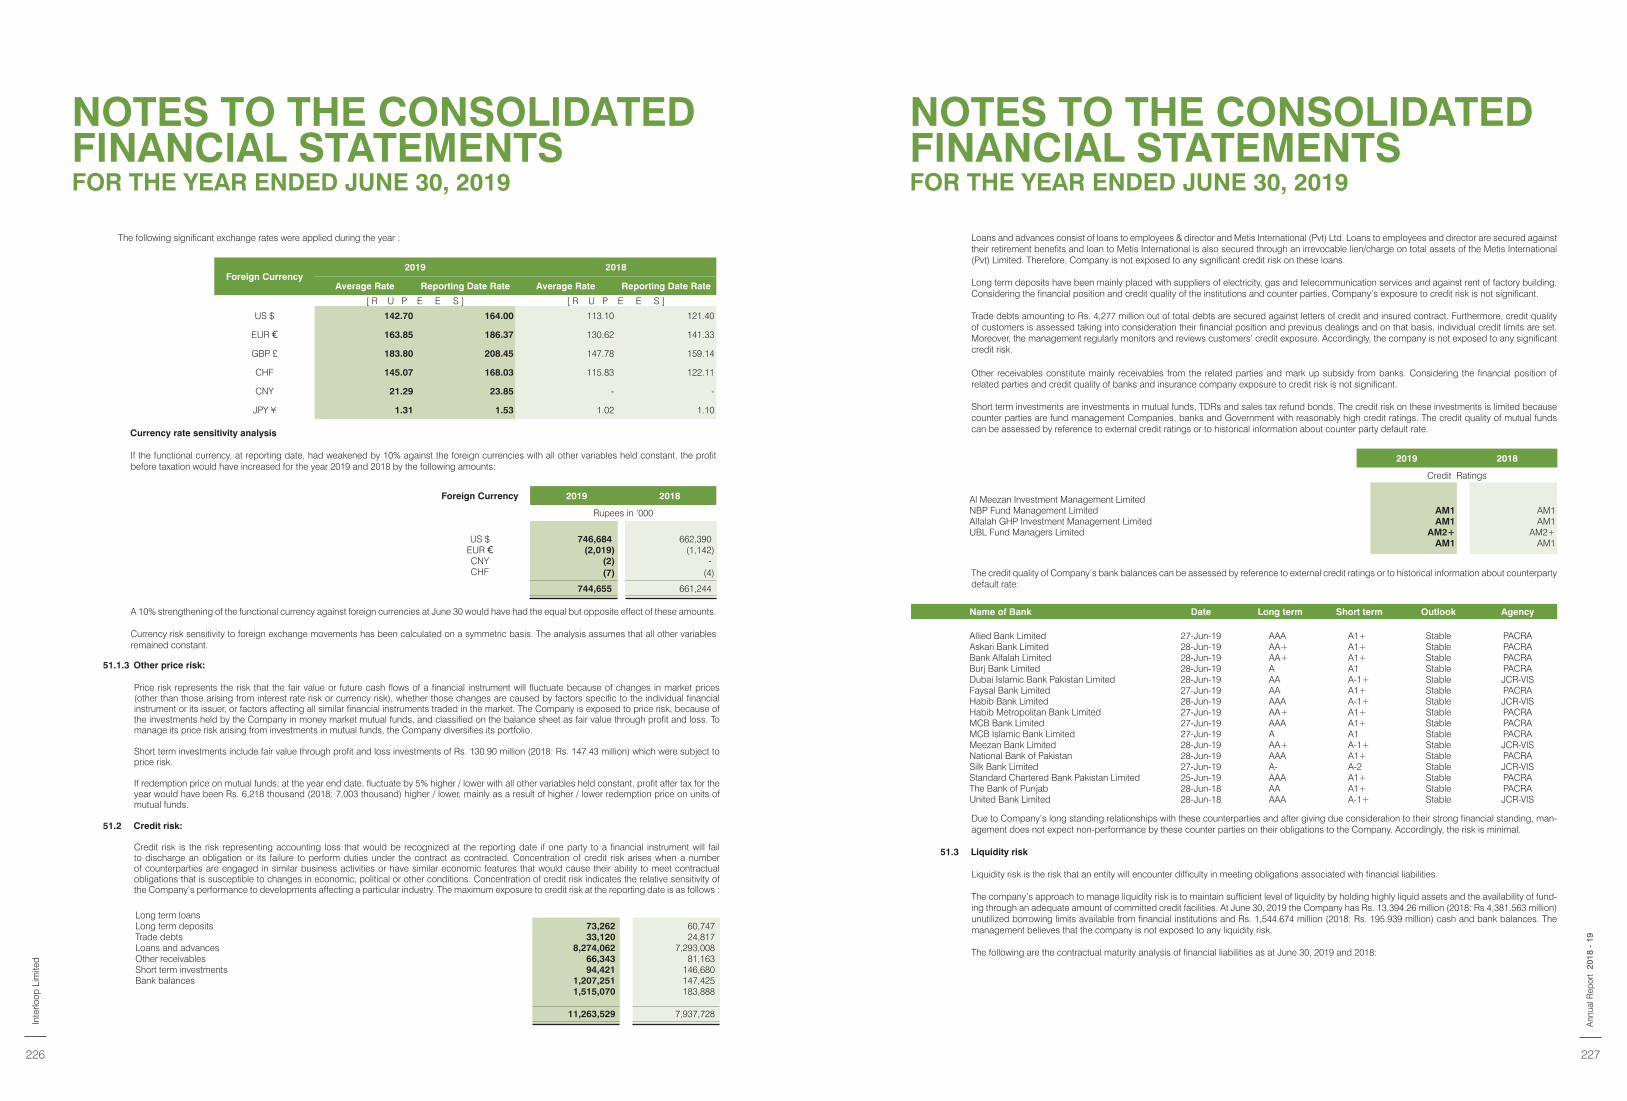
NOTES TO THE CONSOLIDATED FINANCIAL STATEMENTSFOR THE YEAR ENDED JUNE 30, 2019
NOTES TO THE CONSOLIDATED FINANCIAL STATEMENTSFOR THE YEAR ENDED JUNE 30, 2019
The following significant exchange rates were applied during the year :
Foreign Currency2019 2018
Average Rate Reporting Date Rate Average Rate Reporting Date Rate
[ R U P E E S ] [ R U P E E S ]
US $ 142.70 164.00 113.10 121.40
EUR 163.85 186.37 130.62 141.33
GBP £ 183.80 208.45 147.78 159.14
CHF 145.07 168.03 115.83 122.11
CNY 21.29 23.85 - -
JPY ¥ 1.31 1.53 1.02 1.10
Currency rate sensitivity analysis
If the functional currency, at reporting date, had weakened by 10% against the foreign currencies with all other variables held constant, the profit before taxation would have increased for the year 2019 and 2018 by the following amounts:
Foreign Currency 2019 2018
Rupees in ‘000
US $ 746,684 662,390 EUR (2,019) (1,142)CNY (2) - CHF (7) (4)
744,655 661,244
A 10% strengthening of the functional currency against foreign currencies at June 30 would have had the equal but opposite effect of these amounts.
Currency risk sensitivity to foreign exchange movements has been calculated on a symmetric basis. The analysis assumes that all other variables remained constant.
51.1.3 Other price risk:
Price risk represents the risk that the fair value or future cash flows of a financial instrument will fluctuate because of changes in market prices (other than those arising from interest rate risk or currency risk), whether those changes are caused by factors specific to the individual financial instrument or its issuer, or factors affecting all similar financial instruments traded in the market. The Company is exposed to price risk, because of the investments held by the Company in money market mutual funds, and classified on the balance sheet as fair value through profit and loss. To manage its price risk arising from investments in mutual funds, the Company diversifies its portfolio.
Short term investments include fair value through profit and loss investments of Rs. 130.90 million (2018: Rs. 147.43 million) which were subject to price risk.
If redemption price on mutual funds, at the year end date, fluctuate by 5% higher / lower with all other variables held constant, profit after tax for the year would have been Rs. 6,218 thousand (2018: 7,003 thousand) higher / lower, mainly as a result of higher / lower redemption price on units of mutual funds.
51.2 Credit risk:
Credit risk is the risk representing accounting loss that would be recognized at the reporting date if one party to a financial instrument will fail to discharge an obligation or its failure to perform duties under the contract as contracted. Concentration of credit risk arises when a number of counterparties are engaged in similar business activities or have similar economic features that would cause their ability to meet contractual obligations that is susceptible to changes in economic, political or other conditions. Concentration of credit risk indicates the relative sensitivity of the Company’s performance to developments affecting a particular industry. The maximum exposure to credit risk at the reporting date is as follows :
Long term loansLong term deposits 73,262 60,747 Trade debts 33,120 24,817 Loans and advances 8,274,062 7,293,008 Other receivables 66,343 81,163 Short term investments 94,421 146,680 Bank balances 1,207,251 147,425
1,515,070 183,888
11,263,529 7,937,728
Loans and advances consist of loans to employees & director and Metis International (Pvt) Ltd. Loans to employees and director are secured against their retirement benefits and loan to Metis International is also secured through an irrevocable lien/charge on total assets of the Metis International (Pvt) Limited. Therefore, Company is not exposed to any significant credit risk on these loans.
Long term deposits have been mainly placed with suppliers of electricity, gas and telecommunication services and against rent of factory building. Considering the financial position and credit quality of the institutions and counter parties, Company’s exposure to credit risk is not significant.
Trade debts amounting to Rs. 4,277 million out of total debts are secured against letters of credit and insured contract. Furthermore, credit quality of customers is assessed taking into consideration their financial position and previous dealings and on that basis, individual credit limits are set. Moreover, the management regularly monitors and reviews customers’ credit exposure. Accordingly, the company is not exposed to any significant credit risk.
Other receivables constitute mainly receivables from the related parties and mark up subsidy from banks. Considering the financial position of related parties and credit quality of banks and insurance company exposure to credit risk is not significant.
Short term investments are investments in mutual funds, TDRs and sales tax refund bonds. The credit risk on these investments is limited because counter parties are fund management Companies, banks and Government with reasonably high credit ratings. The credit quality of mutual funds can be assessed by reference to external credit ratings or to historical information about counter party default rate.
2019 2018
Credit Ratings
Al Meezan Investment Management LimitedNBP Fund Management Limited AM1 AM1 Alfalah GHP Investment Management Limited AM1 AM1 UBL Fund Managers Limited AM2+ AM2+
AM1 AM1
The credit quality of Company’s bank balances can be assessed by reference to external credit ratings or to historical information about counterparty default rate:
Name of Bank Date Long term Short term Outlook Agency
Allied Bank Limited 27-Jun-19 AAA A1+ Stable PACRAAskari Bank Limited 28-Jun-19 AA+ A1+ Stable PACRABank Alfalah Limited 28-Jun-19 AA+ A1+ Stable PACRABurj Bank Limited 28-Jun-19 A A1 Stable PACRADubai Islamic Bank Pakistan Limited 28-Jun-19 AA A-1+ Stable JCR-VISFaysal Bank Limited 27-Jun-19 AA A1+ Stable PACRAHabib Bank Limited 28-Jun-19 AAA A-1+ Stable JCR-VISHabib Metropolitan Bank Limited 27-Jun-19 AA+ A1+ Stable PACRAMCB Bank Limited 27-Jun-19 AAA A1+ Stable PACRAMCB Islamic Bank Limited 27-Jun-19 A A1 Stable PACRAMeezan Bank Limited 28-Jun-19 AA+ A-1+ Stable JCR-VISNational Bank of Pakistan 28-Jun-19 AAA A1+ Stable PACRASilk Bank Limited 27-Jun-19 A- A-2 Stable JCR-VISStandard Chartered Bank Pakistan Limited 25-Jun-19 AAA A1+ Stable PACRAThe Bank of Punjab 28-Jun-18 AA A1+ Stable PACRAUnited Bank Limited 28-Jun-18 AAA A-1+ Stable JCR-VIS
Due to Company’s long standing relationships with these counterparties and after giving due consideration to their strong financial standing, man-agement does not expect non-performance by these counter parties on their obligations to the Company. Accordingly, the risk is minimal.
51.3 Liquidity risk
Liquidity risk is the risk that an entity will encounter difficulty in meeting obligations associated with financial liabilities.
The company’s approach to manage liquidity risk is to maintain sufficient level of liquidity by holding highly liquid assets and the availability of fund-ing through an adequate amount of committed credit facilities. At June 30, 2019 the Company has Rs. 13,394.26 million (2018: Rs 4,381.563 million) unutilized borrowing limits available from financial institutions and Rs. 1,544.674 million (2018: Rs. 195.939 million) cash and bank balances. The management believes that the company is not exposed to any liquidity risk.
The following are the contractual maturity analysis of financial liabilities as at June 30, 2019 and 2018:
Inte
rloop
Lim
ited
226 227
2018
- 1
9A
nnua
l Rep
ort
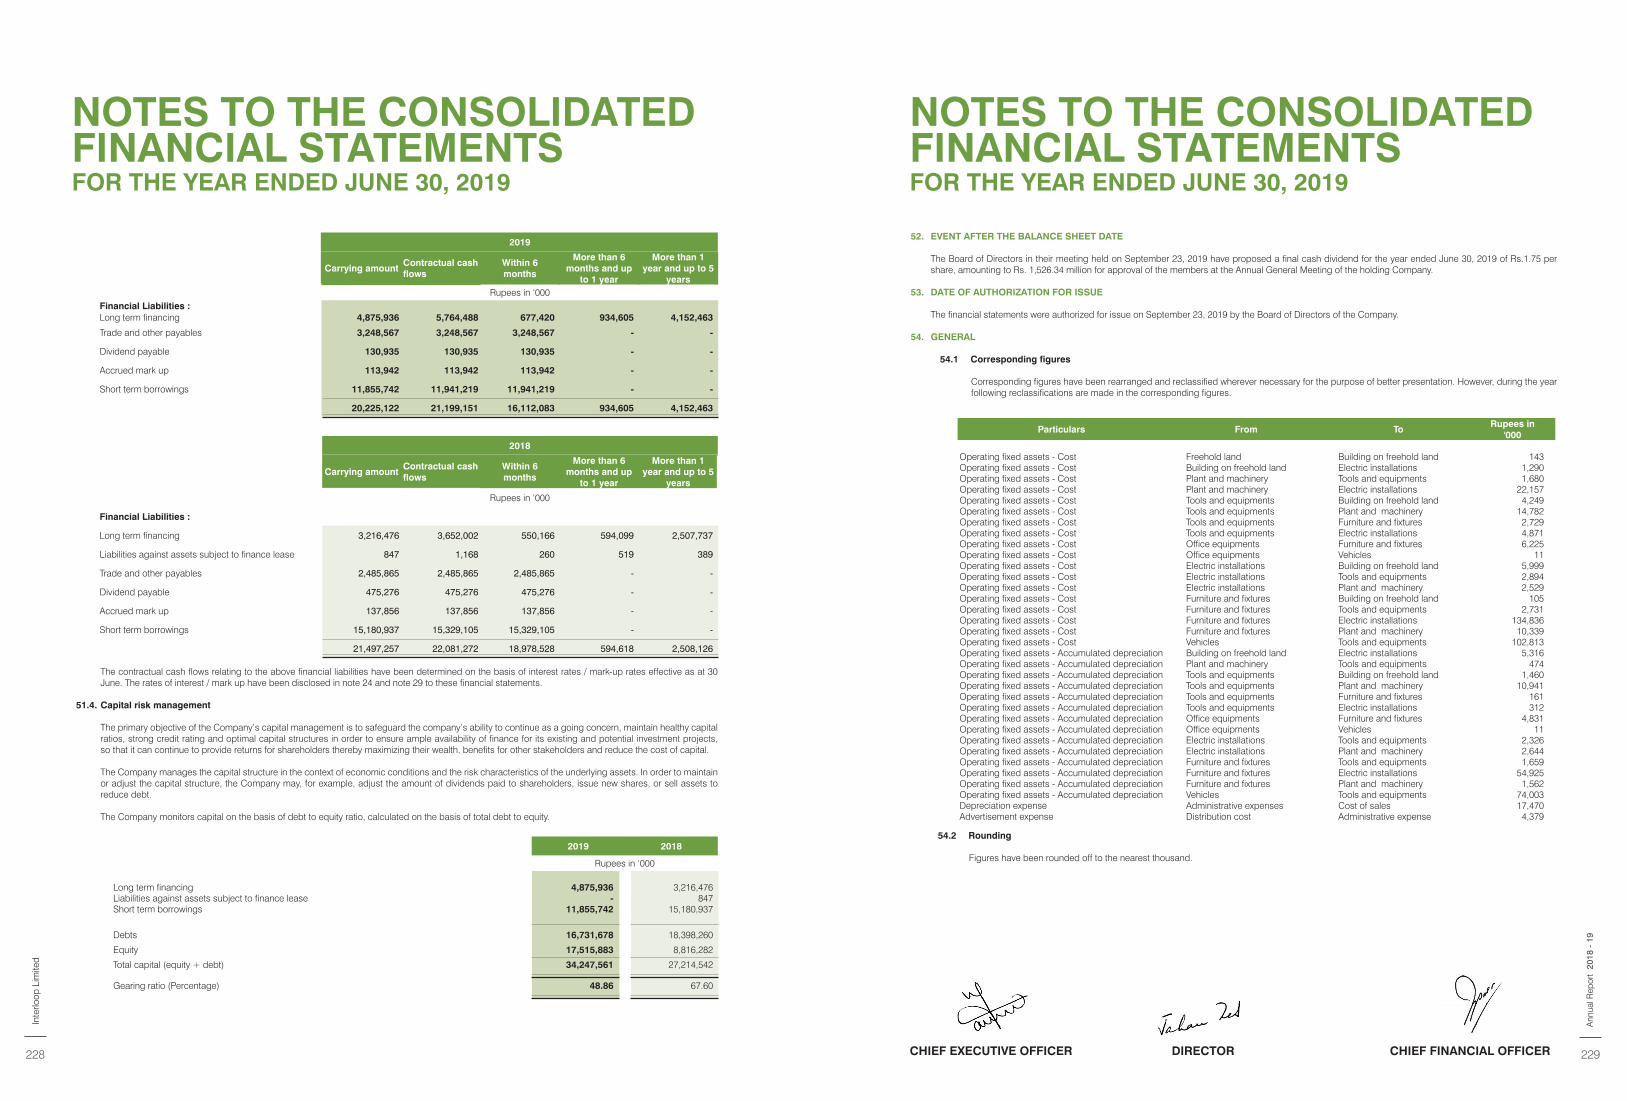
NOTES TO THE CONSOLIDATED FINANCIAL STATEMENTSFOR THE YEAR ENDED JUNE 30, 2019
NOTES TO THE CONSOLIDATED FINANCIAL STATEMENTSFOR THE YEAR ENDED JUNE 30, 2019
2019
Carrying amountContractual cash flows
Within 6 months
More than 6 months and up
to 1 year
More than 1 year and up to 5
yearsRupees in ‘000
Financial Liabilities :Long term financing 4,875,936 5,764,488 677,420 934,605 4,152,463
Trade and other payables 3,248,567 3,248,567 3,248,567 - -
Dividend payable 130,935 130,935 130,935 - -
Accrued mark up 113,942 113,942 113,942 - -
Short term borrowings 11,855,742 11,941,219 11,941,219 - -
20,225,122 21,199,151 16,112,083 934,605 4,152,463
2018
Carrying amountContractual cash flows
Within 6 months
More than 6 months and up
to 1 year
More than 1 year and up to 5
years
Rupees in ‘000
Financial Liabilities :
Long term financing 3,216,476 3,652,002 550,166 594,099 2,507,737
Liabilities against assets subject to finance lease 847 1,168 260 519 389
Trade and other payables 2,485,865 2,485,865 2,485,865 - -
Dividend payable 475,276 475,276 475,276 - -
Accrued mark up 137,856 137,856 137,856 - -
Short term borrowings 15,180,937 15,329,105 15,329,105 - -
21,497,257 22,081,272 18,978,528 594,618 2,508,126
The contractual cash flows relating to the above financial liabilities have been determined on the basis of interest rates / mark-up rates effective as at 30 June. The rates of interest / mark up have been disclosed in note 24 and note 29 to these financial statements.
51.4. Capital risk management
The primary objective of the Company’s capital management is to safeguard the company’s ability to continue as a going concern, maintain healthy capital ratios, strong credit rating and optimal capital structures in order to ensure ample availability of finance for its existing and potential investment projects, so that it can continue to provide returns for shareholders thereby maximizing their wealth, benefits for other stakeholders and reduce the cost of capital.
The Company manages the capital structure in the context of economic conditions and the risk characteristics of the underlying assets. In order to maintain or adjust the capital structure, the Company may, for example, adjust the amount of dividends paid to shareholders, issue new shares, or sell assets to reduce debt.
The Company monitors capital on the basis of debt to equity ratio, calculated on the basis of total debt to equity.
2019 2018
Rupees in ‘000
Long term financing 4,875,936 3,216,476 Liabilities against assets subject to finance lease - 847 Short term borrowings 11,855,742 15,180,937
Debts 16,731,678 18,398,260
Equity 17,515,883 8,816,282
Total capital (equity + debt) 34,247,561 27,214,542
Gearing ratio (Percentage) 48.86 67.60
Particulars From To Rupees in
'000
Operating fixed assets - Cost Freehold land Building on freehold land 143 Operating fixed assets - Cost Building on freehold land Electric installations 1,290 Operating fixed assets - Cost Plant and machinery Tools and equipments 1,680 Operating fixed assets - Cost Plant and machinery Electric installations 22,157 Operating fixed assets - Cost Tools and equipments Building on freehold land 4,249 Operating fixed assets - Cost Tools and equipments Plant and machinery 14,782 Operating fixed assets - Cost Tools and equipments Furniture and fixtures 2,729 Operating fixed assets - Cost Tools and equipments Electric installations 4,871 Operating fixed assets - Cost Office equipments Furniture and fixtures 6,225 Operating fixed assets - Cost Office equipments Vehicles 11 Operating fixed assets - Cost Electric installations Building on freehold land 5,999 Operating fixed assets - Cost Electric installations Tools and equipments 2,894 Operating fixed assets - Cost Electric installations Plant and machinery 2,529 Operating fixed assets - Cost Furniture and fixtures Building on freehold land 105 Operating fixed assets - Cost Furniture and fixtures Tools and equipments 2,731 Operating fixed assets - Cost Furniture and fixtures Electric installations 134,836 Operating fixed assets - Cost Furniture and fixtures Plant and machinery 10,339 Operating fixed assets - Cost Vehicles Tools and equipments 102,813 Operating fixed assets - Accumulated depreciation Building on freehold land Electric installations 5,316 Operating fixed assets - Accumulated depreciation Plant and machinery Tools and equipments 474 Operating fixed assets - Accumulated depreciation Tools and equipments Building on freehold land 1,460 Operating fixed assets - Accumulated depreciation Tools and equipments Plant and machinery 10,941 Operating fixed assets - Accumulated depreciation Tools and equipments Furniture and fixtures 161 Operating fixed assets - Accumulated depreciation Tools and equipments Electric installations 312 Operating fixed assets - Accumulated depreciation Office equipments Furniture and fixtures 4,831 Operating fixed assets - Accumulated depreciation Office equipments Vehicles 11 Operating fixed assets - Accumulated depreciation Electric installations Tools and equipments 2,326 Operating fixed assets - Accumulated depreciation Electric installations Plant and machinery 2,644 Operating fixed assets - Accumulated depreciation Furniture and fixtures Tools and equipments 1,659 Operating fixed assets - Accumulated depreciation Furniture and fixtures Electric installations 54,925 Operating fixed assets - Accumulated depreciation Furniture and fixtures Plant and machinery 1,562 Operating fixed assets - Accumulated depreciation Vehicles Tools and equipments 74,003 Depreciation expense Administrative expenses Cost of sales 17,470 Advertisement expense Distribution cost Administrative expense 4,379
54.2 Rounding
Figures have been rounded off to the nearest thousand.
52. EVENT AFTER THE BALANCE SHEET DATE
The Board of Directors in their meeting held on September 23, 2019 have proposed a final cash dividend for the year ended June 30, 2019 of Rs.1.75 per share, amounting to Rs. 1,526.34 million for approval of the members at the Annual General Meeting of the holding Company.
53. DATE OF AUTHORIZATION FOR ISSUE
The financial statements were authorized for issue on September 23, 2019 by the Board of Directors of the Company.
54. GENERAL
54.1 Corresponding figures
Corresponding figures have been rearranged and reclassified wherever necessary for the purpose of better presentation. However, during the year following reclassifications are made in the corresponding figures.
CHIEF EXECUTIVE OFFICER DIRECTOR CHIEF FINANCIAL OFFICER
Inte
rloop
Lim
ited
228 229
2018
- 1
9A
nnua
l Rep
ort

SHAREHOLDERINFORMATION
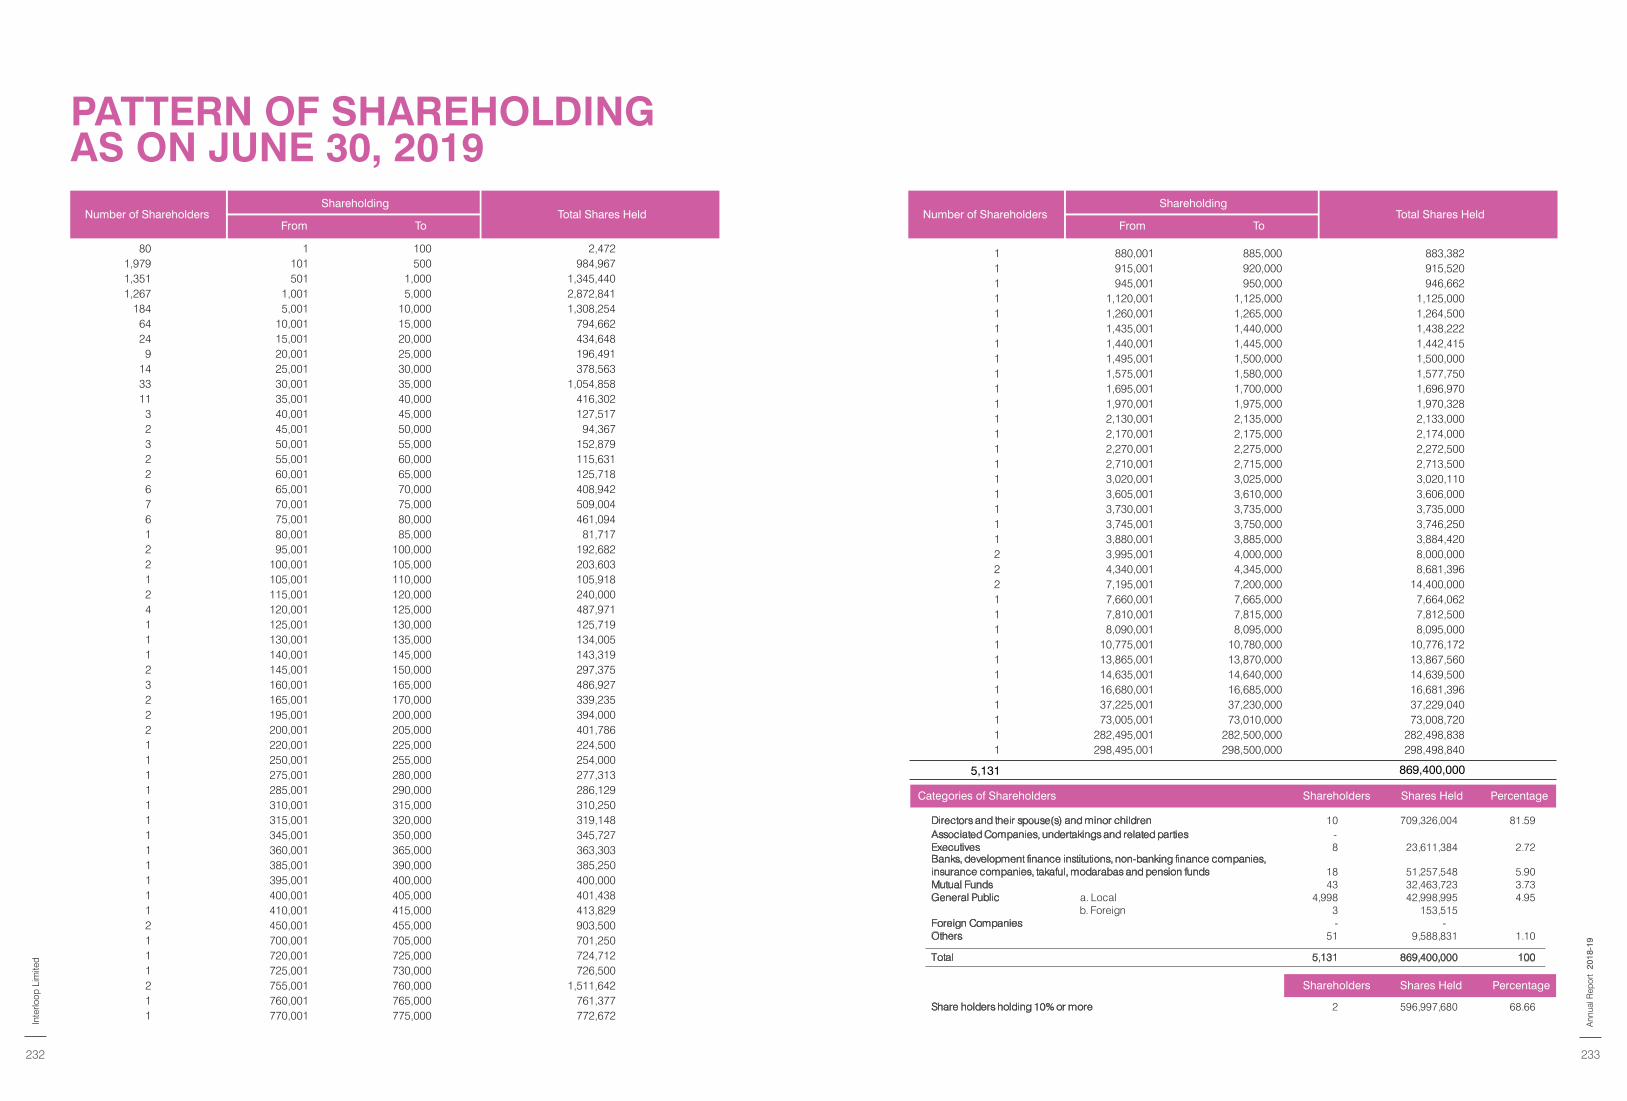
1 880,001 885,000 883,3821 915,001 920,000 915,5201 945,001 950,000 946,6621 1,120,001 1,125,000 1,125,0001 1,260,001 1,265,000 1,264,5001 1,435,001 1,440,000 1,438,2221 1,440,001 1,445,000 1,442,4151 1,495,001 1,500,000 1,500,0001 1,575,001 1,580,000 1,577,7501 1,695,001 1,700,000 1,696,9701 1,970,001 1,975,000 1,970,3281 2,130,001 2,135,000 2,133,0001 2,170,001 2,175,000 2,174,0001 2,270,001 2,275,000 2,272,5001 2,710,001 2,715,000 2,713,5001 3,020,001 3,025,000 3,020,1101 3,605,001 3,610,000 3,606,0001 3,730,001 3,735,000 3,735,0001 3,745,001 3,750,000 3,746,2501 3,880,001 3,885,000 3,884,4202 3,995,001 4,000,000 8,000,0002 4,340,001 4,345,000 8,681,3962 7,195,001 7,200,000 14,400,0001 7,660,001 7,665,000 7,664,0621 7,810,001 7,815,000 7,812,5001 8,090,001 8,095,000 8,095,0001 10,775,001 10,780,000 10,776,1721 13,865,001 13,870,000 13,867,5601 14,635,001 14,640,000 14,639,5001 16,680,001 16,685,000 16,681,3961 37,225,001 37,230,000 37,229,0401 73,005,001 73,010,000 73,008,7201 282,495,001 282,500,000 282,498,8381 298,495,001 298,500,000 298,498,840
PATTERN OF SHAREHOLDINGAS ON JUNE 30, 2019
Number of ShareholdersShareholding
From ToTotal Shares Held Number of Shareholders
Shareholding
From ToTotal Shares Held
80 1 100 2,4721,979 101 500 984,9671,351 501 1,000 1,345,4401,267 1,001 5,000 2,872,841
184 5,001 10,000 1,308,25464 10,001 15,000 794,66224 15,001 20,000 434,648
9 20,001 25,000 196,49114 25,001 30,000 378,56333 30,001 35,000 1,054,85811 35,001 40,000 416,302
3 40,001 45,000 127,5172 45,001 50,000 94,3673 50,001 55,000 152,8792 55,001 60,000 115,6312 60,001 65,000 125,7186 65,001 70,000 408,9427 70,001 75,000 509,0046 75,001 80,000 461,0941 80,001 85,000 81,7172 95,001 100,000 192,6822 100,001 105,000 203,6031 105,001 110,000 105,9182 115,001 120,000 240,0004 120,001 125,000 487,9711 125,001 130,000 125,7191 130,001 135,000 134,0051 140,001 145,000 143,3192 145,001 150,000 297,3753 160,001 165,000 486,9272 165,001 170,000 339,2352 195,001 200,000 394,0002 200,001 205,000 401,7861 220,001 225,000 224,5001 250,001 255,000 254,0001 275,001 280,000 277,3131 285,001 290,000 286,1291 310,001 315,000 310,2501 315,001 320,000 319,1481 345,001 350,000 345,7271 360,001 365,000 363,3031 385,001 390,000 385,2501 395,001 400,000 400,0001 400,001 405,000 401,4381 410,001 415,000 413,8292 450,001 455,000 903,5001 700,001 705,000 701,2501 720,001 725,000 724,7121 725,001 730,000 726,5002 755,001 760,000 1,511,6421 760,001 765,000 761,3771 770,001 775,000 772,672
5,131 869,400,000
Directors and their spouse(s) and minor children 10 709,326,004 81.59Associated Companies, undertakings and related parties - Executives 8 23,611,384 2.72Banks, development finance institutions, non-banking finance companies, insurance companies, takaful, modarabas and pension funds 18 51,257,548 5.90Mutual Funds 43 32,463,723 3.73General Public a. Local 4,998 42,998,995 4.95
b. Foreign 3 153,515Foreign Companies - - Others 51 9,588,831 1.10
Total 5,131 869,400,000 100
Share holders holding 10% or more 2 596,997,680 68.66
Categories of Shareholders Shareholders Shares Held Percentage
Shareholders Shares Held Percentage
Ann
ual R
epor
t 20
18-1
9
Inte
rloop
Lim
ited
232 233
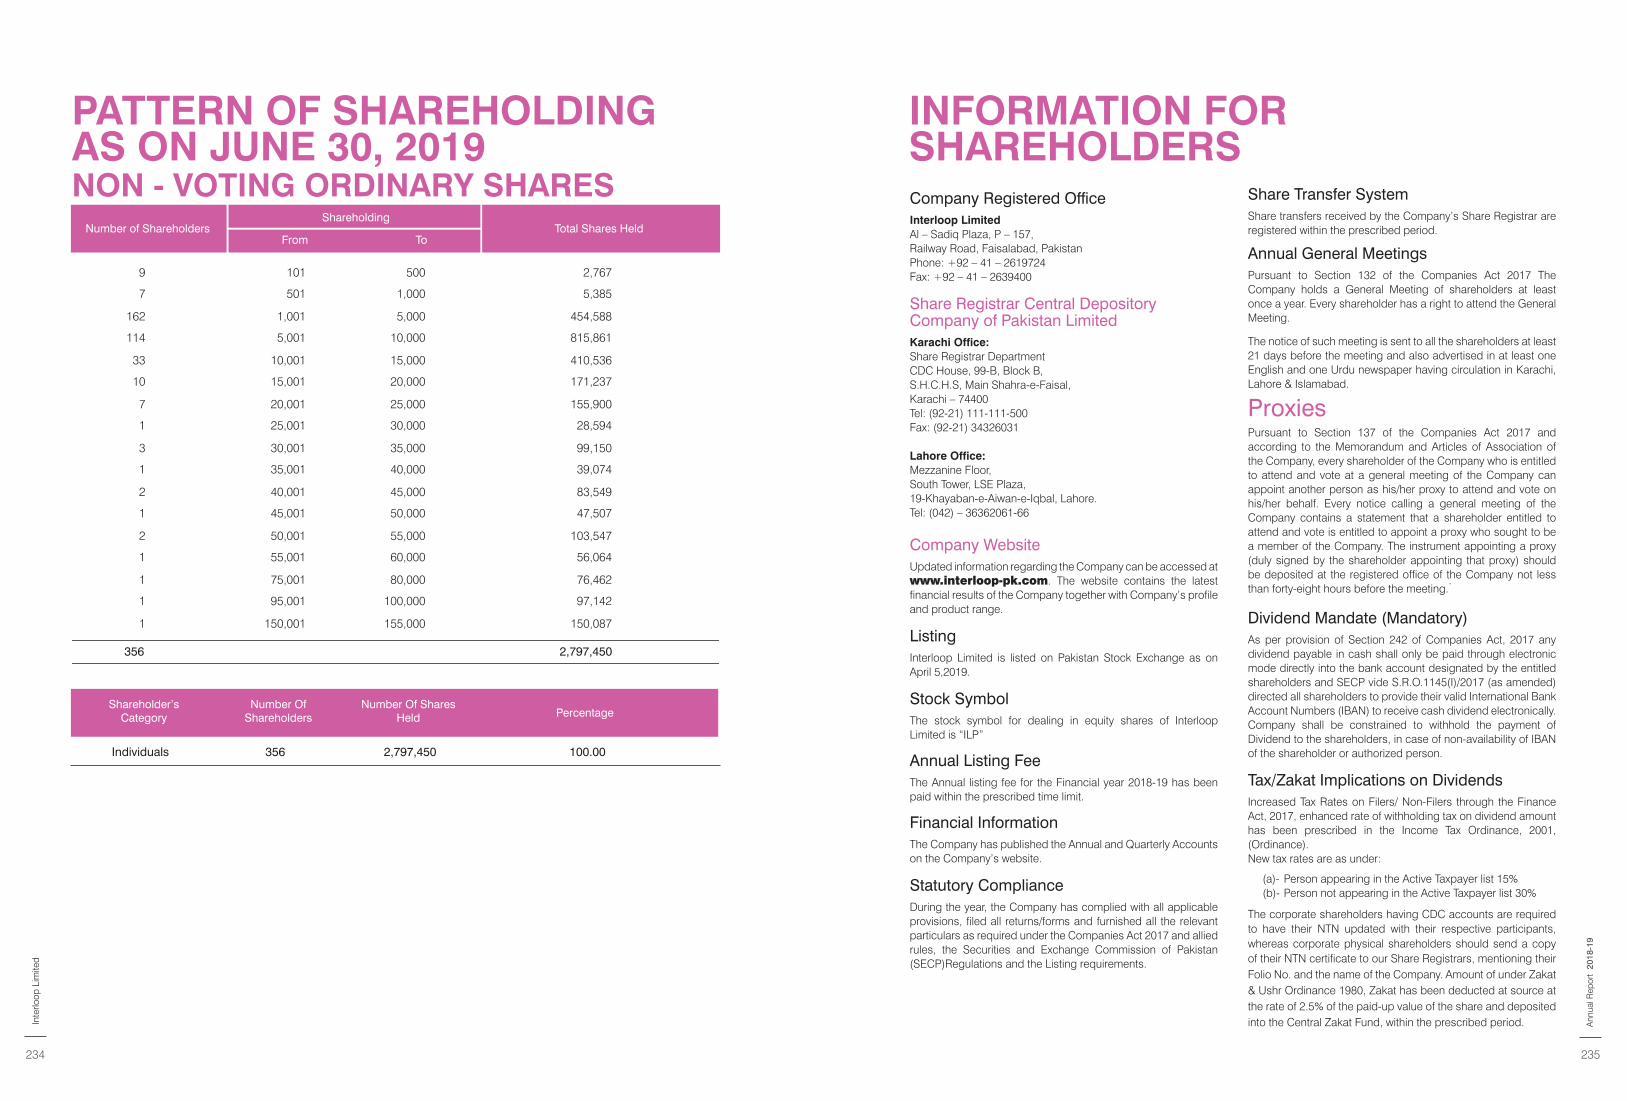
ToShareholdings From Total Number of Shares HeldNumber of Shareholders
101 2,7675009
501 5,3851,0007
1,001 454,5885,000162
5,001 815,86110,000114
10,001 410,53615,00033
15,001 171,23720,00010
20,001 155,90025,0007
25,001 28,59430,0001
30,001 99,15035,0003
35,001 39,07440,0001
40,001 83,54945,0002
45,001 47,50750,0001
50,001 103,54755,0002
55,001 56,06460,0001
75,001 76,46280,0001
95,001 97,142100,0001
150,001 150,087155,0001
2,797,450356
356 100.002,797,450Individuals
Company Registered OfficeInterloop LimitedAl – Sadiq Plaza, P – 157,Railway Road, Faisalabad, PakistanPhone: +92 – 41 – 2619724Fax: +92 – 41 – 2639400
Share Registrar Central Depository Company of Pakistan LimitedKarachi Office:Share Registrar DepartmentCDC House, 99-B, Block B,S.H.C.H.S, Main Shahra-e-Faisal, Karachi – 74400Tel: (92-21) 111-111-500Fax: (92-21) 34326031
Lahore Office:Mezzanine Floor,South Tower, LSE Plaza,19-Khayaban-e-Aiwan-e-Iqbal, Lahore.Tel: (042) – 36362061-66
Company WebsiteUpdated information regarding the Company can be accessed at www.interloop-pk.com. The website contains the latest financial results of the Company together with Company’s profile and product range.
ListingInterloop Limited is listed on Pakistan Stock Exchange as on April 5,2019.
Stock SymbolThe stock symbol for dealing in equity shares of Interloop Limited is “ILP”
Annual Listing FeeThe Annual listing fee for the Financial year 2018-19 has been paid within the prescribed time limit.
Financial InformationThe Company has published the Annual and Quarterly Accounts on the Company’s website.
Statutory ComplianceDuring the year, the Company has complied with all applicable provisions, filed all returns/forms and furnished all the relevant particulars as required under the Companies Act 2017 and allied rules, the Securities and Exchange Commission of Pakistan (SECP)Regulations and the Listing requirements.
Share Transfer SystemShare transfers received by the Company’s Share Registrar are registered within the prescribed period.
Annual General MeetingsPursuant to Section 132 of the Companies Act 2017 The Company holds a General Meeting of shareholders at least once a year. Every shareholder has a right to attend the General Meeting.
The notice of such meeting is sent to all the shareholders at least 21 days before the meeting and also advertised in at least one English and one Urdu newspaper having circulation in Karachi, Lahore & Islamabad.
ProxiesPursuant to Section 137 of the Companies Act 2017 and according to the Memorandum and Articles of Association of the Company, every shareholder of the Company who is entitled to attend and vote at a general meeting of the Company can appoint another person as his/her proxy to attend and vote on his/her behalf. Every notice calling a general meeting of the Company contains a statement that a shareholder entitled to attend and vote is entitled to appoint a proxy who sought to be a member of the Company. The instrument appointing a proxy (duly signed by the shareholder appointing that proxy) should be deposited at the registered office of the Company not less than forty-eight hours before the meeting.
.
Dividend Mandate (Mandatory)As per provision of Section 242 of Companies Act, 2017 any dividend payable in cash shall only be paid through electronic mode directly into the bank account designated by the entitled shareholders and SECP vide S.R.O.1145(I)/2017 (as amended) directed all shareholders to provide their valid International Bank Account Numbers (IBAN) to receive cash dividend electronically. Company shall be constrained to withhold the payment of Dividend to the shareholders, in case of non-availability of IBAN of the shareholder or authorized person.
Tax/Zakat Implications on DividendsIncreased Tax Rates on Filers/ Non-Filers through the Finance Act, 2017, enhanced rate of withholding tax on dividend amount has been prescribed in the Income Tax Ordinance, 2001, (Ordinance).New tax rates are as under:
(a)- Person appearing in the Active Taxpayer list 15%(b)- Person not appearing in the Active Taxpayer list 30%
The corporate shareholders having CDC accounts are required to have their NTN updated with their respective participants, whereas corporate physical shareholders should send a copy of their NTN certificate to our Share Registrars, mentioning their Folio No. and the name of the Company. Amount of under Zakat & Ushr Ordinance 1980, Zakat has been deducted at source at the rate of 2.5% of the paid-up value of the share and deposited into the Central Zakat Fund, within the prescribed period.
INFORMATION FORSHAREHOLDERS
PATTERN OF SHAREHOLDINGAS ON JUNE 30, 2019NON - VOTING ORDINARY SHARES
Number of ShareholdersShareholding
From ToTotal Shares Held
Shareholder’s Category
Number Of Shareholders
Number Of Shares Held Percentage
Ann
ual R
epor
t 20
18-1
9
Inte
rloop
Lim
ited
234 235
attached with the proxy form. Representatives of corporate members should bring the usual documents required for such purpose.
CDC Account Holders will also have to follow the under mentioned guidelines as laid down in Circular 1 dated January 26, 2000 issued by the Securities and Exchange Commission of Pakistan (SECP):
a) For Attending AGM• In case of individuals, the account holder or sub-
account holder and / or the person whose securities are in group account and their registration details are uploaded as per the regulations, shall authenticate identity by showing his / her original Computerized National Identity Card (CNIC) or original passport at the time of attending the Meeting.
• Members registered on CDC are also requested to bring their particulars, I.D. numbers and account numbers in CDS.
• In case of corporate entity, the Board of Directors’ resolution / power of attorney with specimen signature of the nominee shall be produced (unless it has been provided earlier) at the time of the meeting.
b) For Appointing Proxy• In case of individuals, the account holder or sub-
account holder and / or the person whose securities are in group account and their registration detail is uploaded as per the regulations, shall submit the proxy form as per the above requirement.
• The proxy form shall be witnessed by the person whose name, address and CNIC number shall be mentioned on the form.
• Attested copies of CNIC of the beneficial owners and the proxy shall be furnished with the proxy form.
• The proxy shall produce his / her original CNIC or original passport at the time of meeting.
• In case of corporate entity, the Board of Directors’ resolution / power of attorney with specimen signature shall be submitted (unless it has been provided earlier) along with proxy form to the Company.
iv. Notify The Changes in Addresses
of ShareholdersThe shareholders of the Company are requested to notify changes in their mailing addresses (if any), to our share registrar/transfer agent.
v. CNIC / NTN number on Electronic Dividend (Mandatory) a As per SRO 831 (1) / 2012 dated July 05, 2012 and
other relevant rules the electronic Dividend should also bear the CNIC Number of the registered shareholder or the authorized person, except in case of minor[s] and corporate shareholder[s].
b As per Regulation no. 4 & 6 of SRO 1145 (1)/2017 dated November 2017, the Company shall be constrained to withhold the payment of Dividend to the shareholders, in case of non-availability of identification number (CNIC or National Tax Number) of the shareholder or authorized person.
c Accordingly, the shareholders, who have not yet submitted copy of their valid CNIC or NTN are once again requested to immediately submit the same to the Share Registrar.
vi. Transmission of Audited Financial Statements / Notices Through Email
Members are hereby informed that pursuant to SECP SRO 787(1)/2014 dated September 8, 2014, and under section 223(6) of the Companies Act 2017, circulation of Audited Financial Statements and Notice of Annual General Meeting has been allowed in electronic format through email.
In compliance with the above requirements, members who wish to receive the Annual Report 2019 in electronic form may file an application as per the form provided on the Company’s website in compliance with the subject SRO. The members who have provided consent to receive Annual Report 2019 can subsequently request any other media including hard copy which shall be provided free of cost within seven days.
vii. Transmission of Annual Financial Statements Through CD/DVD/USB
Members are hereby informed that pursuant to SECP SRO 787(1)/2014 dated September 8, 2014, and under section 223(6) of the Companies Act 2017, circulation of Audited Financial Statements and Notice of Annual General Meeting
NOTICE OF 27TH ANNUAL GENERAL MEETINGNotice is hereby given that the 27th Annual General Meeting of the members of Interloop Limited (“Company”) is scheduled to be held on Monday, October 14th, 2019 at 10:00 a.m. at Serena Hotel, Club Road, Civil Lines, Faisalabad, to transact the following business:
Ordinary Business1 To confirm the minutes of the Extra Ordinary General
Meeting held on March 5, 2019.
2 To receive, consider and adopt audited accounts of the Company for the year ended June 30, 2019 together with the Chairman’s Review Report, Directors’ and Auditors’ Report thereon.
3 To approve Final Cash Dividend @ 17.5% [i.e. Rs. 1.75/share for the year ended June 30, 2019 as recommended by the Board of Directors.
4 To appoint auditors for the year ending June 30, 2020 and fix their remuneration. The retiring Auditors M/s Kreston Hyder Bhimji & Company, Chartered Accountants, being eligible have offered themselves for reappointment.
Special Business5 To consider and if thought fit, to pass with or without
modification(s), the following resolution as special resolution, as circulated to the members of the Company along with the notice of this AGM and initialed by the Company Secretary for the purpose of identification, in substitution of and to the exclusion of the existing Articles of Association of the Company.
The text of this special resolution is as under:
“Resolved Thatthe existing Articles of Association of the Company be and are hereby altered and be replaced with a new set of Articles of Association of the Company.”
“Resolved Further Thatany changes, as may be required by the Securities and Exchange Commission of Pakistan (SECP), in the new set of Articles shall be treated as approved and adopted by the shareholders and the same shall have effect from the date of passing of this special resolution.”
“Resolved Further That The Chief Executive Officer or the Company Secretary be and are hereby authorized singly to fulfill all legal, corporate and
procedural formalities and to do all necessary acts, deeds and things in connection therewith and ancillary thereto as may be required or expedient to give effect to the spirit and intent of the above resolution and filings with SECP along with all requisite documents, affidavits, statements etc. for recording of the alterations of Articles of Association .”
Other Business6 To transact any other business with the permission of
the Chair.
BY ORDER OF THE BOARD
(Rana Ali Raza) Faisalabad:Company Secretary Date: September 23, 2019
Notesi. Closure of Share Transfer BooksThe Share Transfer Books of the Company shall remain closed from 07th October 2019 to 14th October 2019 (both days inclusive). Transfer received in order at our Share Registrar/Transfer agent, CDC Share Registrar Services Limited (CDCSRSL), CDC House, 99-B, S.M.C.H. Society, Main Shahrah-e-Faisal, Karachi 74400, at the close of business on Friday, October 04th, 2019 will be considered in time for the purpose of above entitlement to the transferees.
ii. Participation in Annual General
MeetingA member entitled to attend, speak and vote at this Annual General Meeting shall be entitled to appoint another member, as a proxy to attend and vote on his / her behalf. The instrument appointing Proxy must be received at the Registered Office or Share Registrar of the Company not less than 48 hours before the time of the meeting. For the convenience of the members a Proxy Application Form is dispatched with the Notice of the Meeting.
iii. Further Guidelines for CDC
Account HoldersAny Individual Beneficial Owner of CDC, entitled to vote at this Meeting, must bring his / her original Computerized National Identity Card (CNIC) to prove identity, and in case of proxy, a copy of shareholder’s attested CNIC must be
Ann
ual R
epor
t 20
18-1
9
Inte
rloop
Lim
ited
236 237
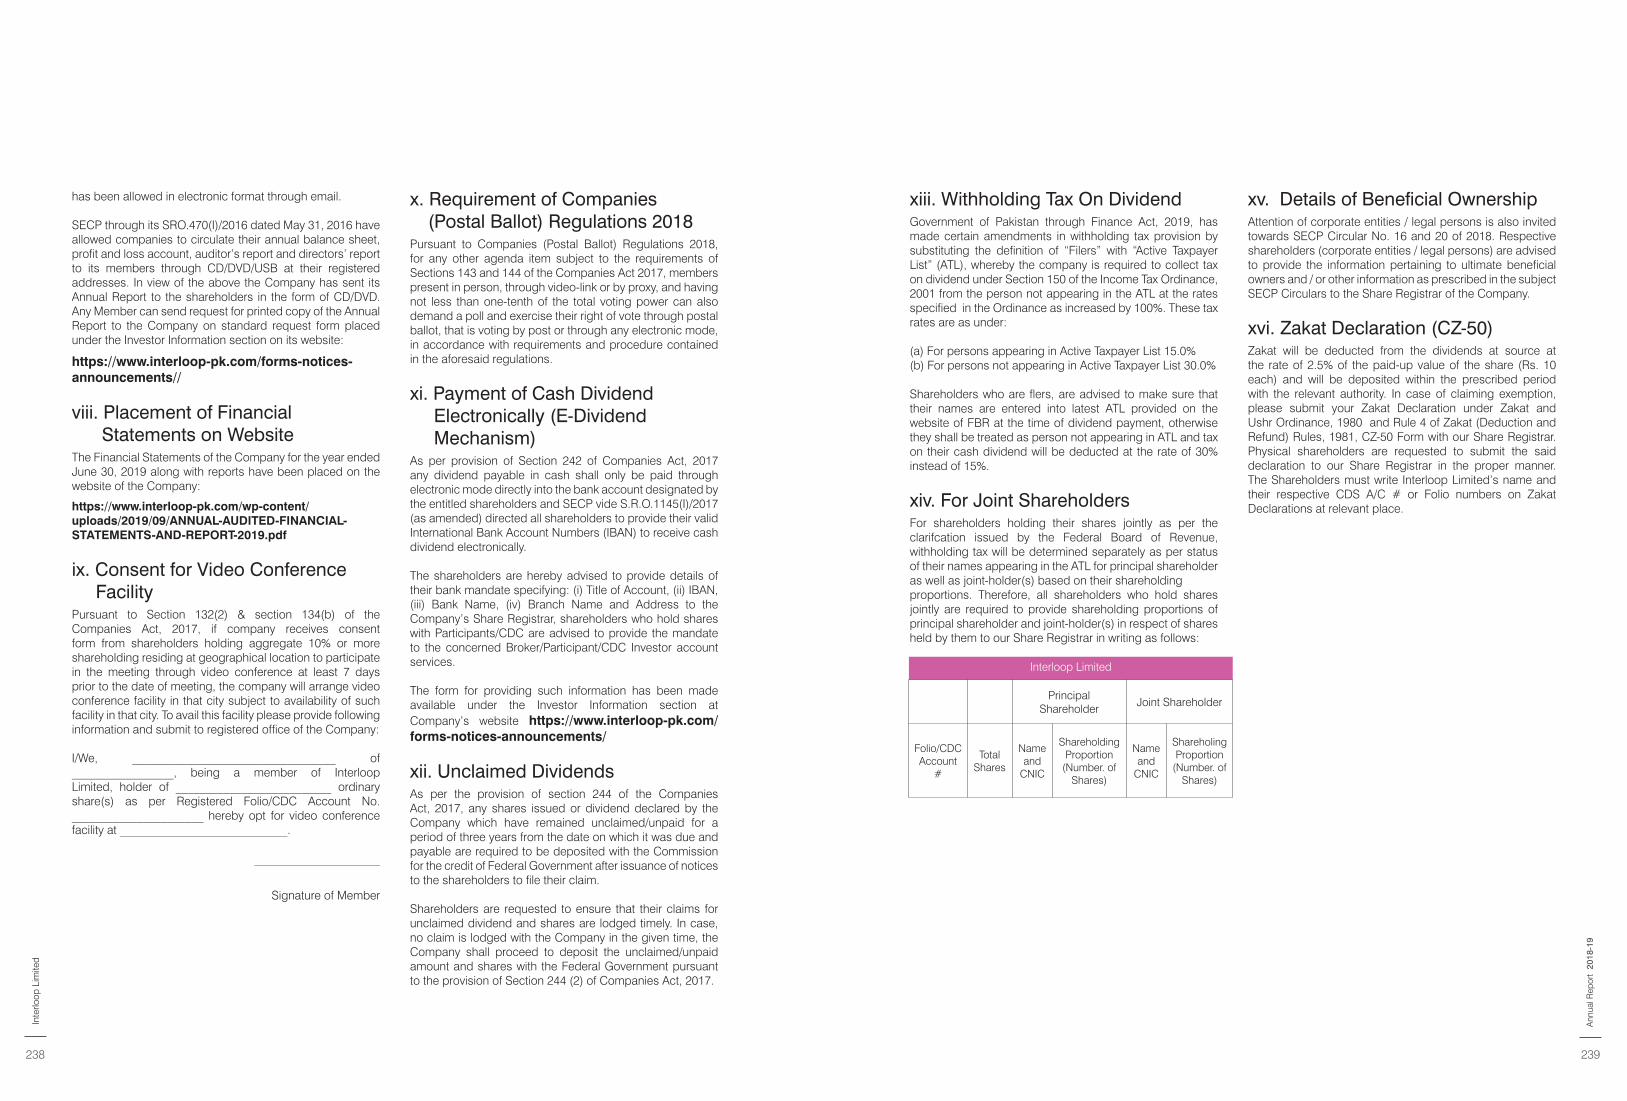
has been allowed in electronic format through email.
SECP through its SRO.470(I)/2016 dated May 31, 2016 have allowed companies to circulate their annual balance sheet, profit and loss account, auditor’s report and directors’ report to its members through CD/DVD/USB at their registered addresses. In view of the above the Company has sent its Annual Report to the shareholders in the form of CD/DVD. Any Member can send request for printed copy of the Annual Report to the Company on standard request form placed under the Investor Information section on its website:
https://www.interloop-pk.com/forms-notices-announcements//
viii. Placement of Financial Statements on Website
The Financial Statements of the Company for the year ended June 30, 2019 along with reports have been placed on the website of the Company:
https://www.interloop-pk.com/wp-content/uploads/2019/09/ANNUAL-AUDITED-FINANCIAL-STATEMENTS-AND-REPORT-2019.pdf
ix. Consent for Video Conference Facility
Pursuant to Section 132(2) & section 134(b) of the Companies Act, 2017, if company receives consent form from shareholders holding aggregate 10% or more shareholding residing at geographical location to participate in the meeting through video conference at least 7 days prior to the date of meeting, the company will arrange video conference facility in that city subject to availability of such facility in that city. To avail this facility please provide following information and submit to registered office of the Company:
I/We, __________________________________ of _________________, being a member of Interloop Limited, holder of __________________________ ordinary share(s) as per Registered Folio/CDC Account No. ______________________ hereby opt for video conference facility at ____________________________.
_____________________
Signature of Member
x. Requirement of Companies (Postal Ballot) Regulations 2018
Pursuant to Companies (Postal Ballot) Regulations 2018, for any other agenda item subject to the requirements of Sections 143 and 144 of the Companies Act 2017, members present in person, through video-link or by proxy, and having not less than one-tenth of the total voting power can also demand a poll and exercise their right of vote through postal ballot, that is voting by post or through any electronic mode, in accordance with requirements and procedure contained in the aforesaid regulations.
xi. Payment of Cash Dividend Electronically (E-Dividend Mechanism)
As per provision of Section 242 of Companies Act, 2017 any dividend payable in cash shall only be paid through electronic mode directly into the bank account designated by the entitled shareholders and SECP vide S.R.O.1145(I)/2017 (as amended) directed all shareholders to provide their valid International Bank Account Numbers (IBAN) to receive cash dividend electronically.
The shareholders are hereby advised to provide details of their bank mandate specifying: (i) Title of Account, (ii) IBAN, (iii) Bank Name, (iv) Branch Name and Address to the Company’s Share Registrar, shareholders who hold shares with Participants/CDC are advised to provide the mandate to the concerned Broker/Participant/CDC Investor account services.
The form for providing such information has been made available under the Investor Information section at Company’s website https://www.interloop-pk.com/forms-notices-announcements/
xii. Unclaimed DividendsAs per the provision of section 244 of the Companies Act, 2017, any shares issued or dividend declared by the Company which have remained unclaimed/unpaid for a period of three years from the date on which it was due and payable are required to be deposited with the Commission for the credit of Federal Government after issuance of notices to the shareholders to file their claim.
Shareholders are requested to ensure that their claims for unclaimed dividend and shares are lodged timely. In case, no claim is lodged with the Company in the given time, the Company shall proceed to deposit the unclaimed/unpaid amount and shares with the Federal Government pursuant to the provision of Section 244 (2) of Companies Act, 2017.
xiii. Withholding Tax On DividendGovernment of Pakistan through Finance Act, 2019, has made certain amendments in withholding tax provision by substituting the definition of “Filers” with “Active Taxpayer List” (ATL), whereby the company is required to collect tax on dividend under Section 150 of the Income Tax Ordinance, 2001 from the person not appearing in the ATL at the rates specified in the Ordinance as increased by 100%. These tax rates are as under:
(a) For persons appearing in Active Taxpayer List 15.0%(b) For persons not appearing in Active Taxpayer List 30.0%
Shareholders who are flers, are advised to make sure that their names are entered into latest ATL provided on the website of FBR at the time of dividend payment, otherwise they shall be treated as person not appearing in ATL and tax on their cash dividend will be deducted at the rate of 30% instead of 15%.
xiv. For Joint ShareholdersFor shareholders holding their shares jointly as per the clarifcation issued by the Federal Board of Revenue, withholding tax will be determined separately as per status of their names appearing in the ATL for principal shareholder as well as joint-holder(s) based on their shareholding proportions. Therefore, all shareholders who hold shares jointly are required to provide shareholding proportions of principal shareholder and joint-holder(s) in respect of shares held by them to our Share Registrar in writing as follows:
xv. Details of Beneficial OwnershipAttention of corporate entities / legal persons is also invited towards SECP Circular No. 16 and 20 of 2018. Respective shareholders (corporate entities / legal persons) are advised to provide the information pertaining to ultimate beneficial owners and / or other information as prescribed in the subject SECP Circulars to the Share Registrar of the Company.
xvi. Zakat Declaration (CZ-50)Zakat will be deducted from the dividends at source at the rate of 2.5% of the paid-up value of the share (Rs. 10 each) and will be deposited within the prescribed period with the relevant authority. In case of claiming exemption, please submit your Zakat Declaration under Zakat and Ushr Ordinance, 1980 and Rule 4 of Zakat (Deduction and Refund) Rules, 1981, CZ-50 Form with our Share Registrar. Physical shareholders are requested to submit the said declaration to our Share Registrar in the proper manner. The Shareholders must write Interloop Limited’s name and their respective CDS A/C # or Folio numbers on Zakat Declarations at relevant place.
Interloop Limited
Principal Shareholder
Joint Shareholder
Folio/CDC Account
#
Total Shares
Name and
CNIC
Shareholding Proportion
(Number. of Shares)
Name and
CNIC
Shareholing Proportion
(Number. of Shares)
Ann
ual R
epor
t 20
18-1
9
Inte
rloop
Lim
ited
238 239
STATEMENT UNDER SECTION134 (3) of the Companies Act, 2017
This statement sets out the material facts pertaining to the special business, being Items on the notice, intended to be transacted at the annual general meeting of the Company to be held on October 14, 2019.
Explanation on Item # 5The Companies Act, 2017 has replaced the Companies Ordinance, 1984 and it is desirable to amend the Articles of Association of the Company to reflect the provisions and sections of the new Companies Act, 2017. Also, the Company has now become listed and it requires to add few additional clauses relevant in the context of a listed entity. As the amendments have been numerous, it is proposed to adopt the revised revision as a whole in substitution of the existing Articles of Association.
The Board of Directors of the Company in their meeting held on September 23, 2019, has recommended alteration in the
existing Articles of the Company and its replacement with a new set of Articles of Association, to bring it in line with the provisions of the Companies Act, 2017 and other applicable regulations.
A copy of new set of Articles of Association is being circulated to members with the notice of Annual General Meeting.
The new set of Articles of Association have been kept at the Registered Office of the Company and may be inspected by members on working days during usual business hours from Monday to Friday (9.00 a.m. - 5.00 p.m.) from the date of issuance/publication of this notice till the date of general meeting.
The Directors of the Company have no direct or indirect interest in the special resolution proposing alterations in the Articles of Association, except to the extent of their shareholding in the Company.
Ann
ual R
epor
t 20
18-1
9
Inte
rloop
Lim
ited
240 241
Ann
ual R
epor
t 20
18-1
9
Inte
rloop
Lim
ited
242 243
https://www.interloop-pk.com/wp-content/uploads/2019/09/ANNUAL-AUDITED-FINANCIAL-STATEMENTS-AND-REPORT-2019.pdf
Ann
ual R
epor
t 20
18-1
9
Inte
rloop
Lim
ited
244 245
Ann
ual R
epor
t 20
18-1
9
Inte
rloop
Lim
ited
246 247
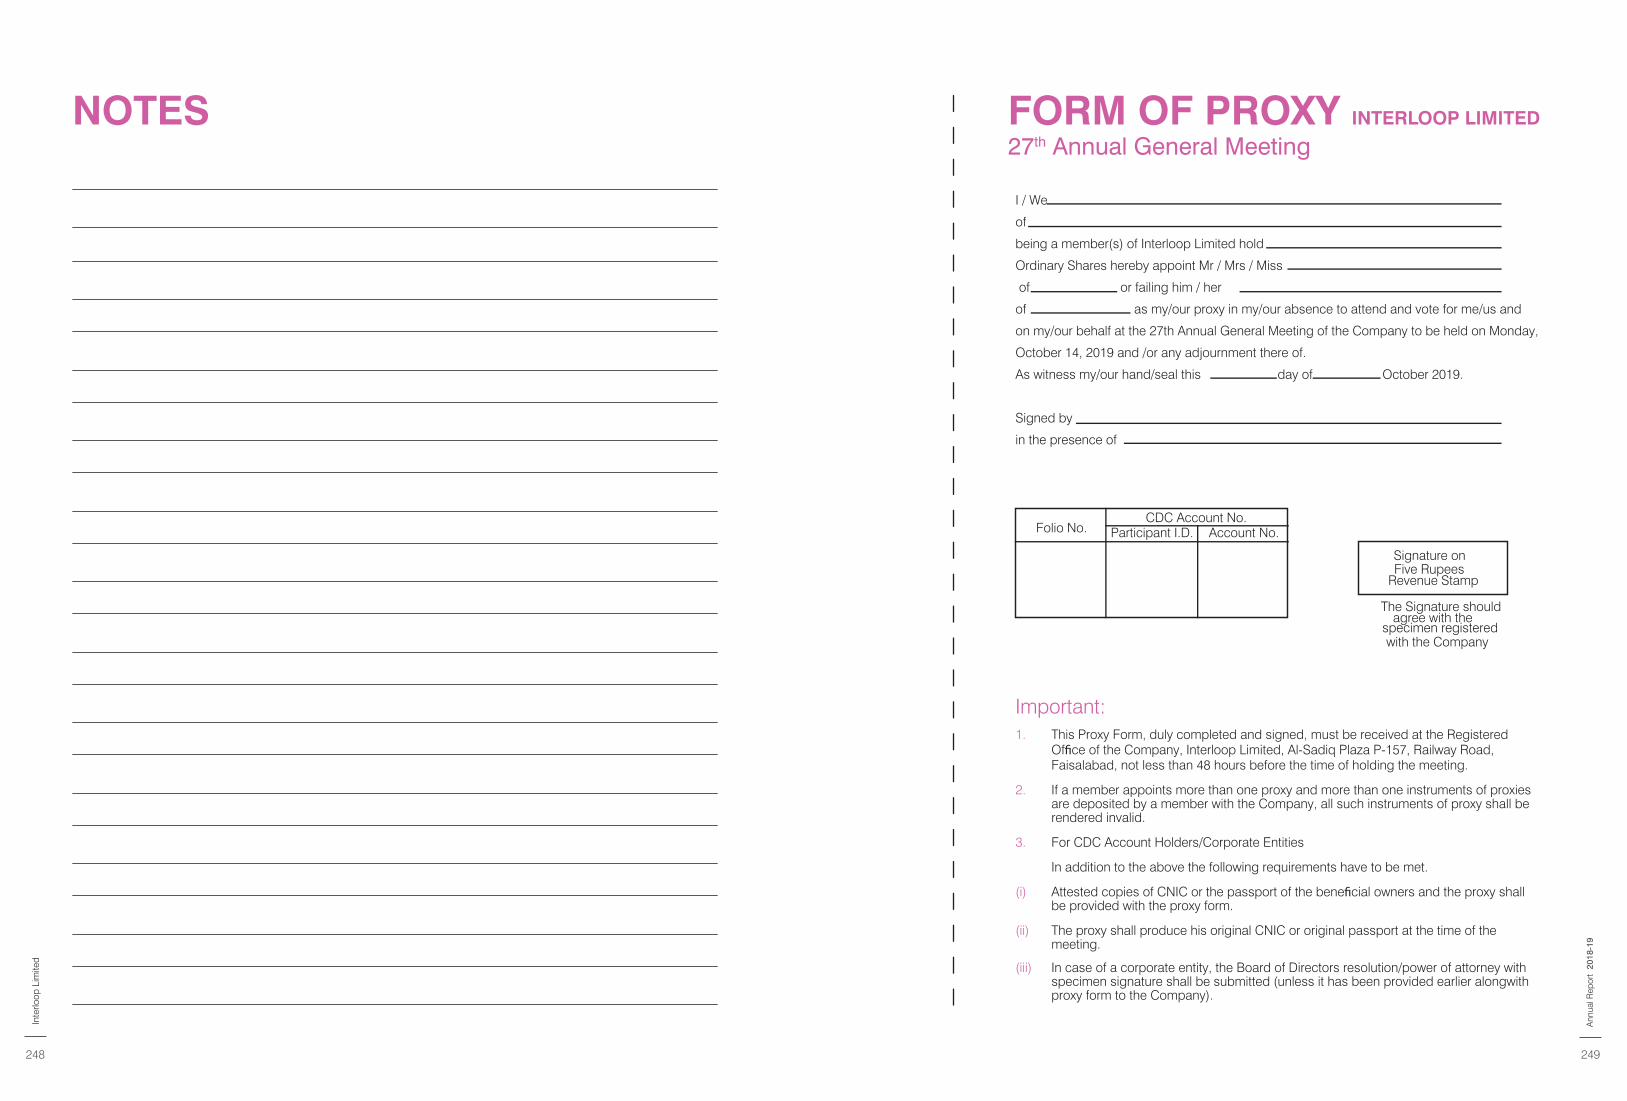
Folio No.
CDC Account No. Participant I.D. Account No.
I / We
of
being a member(s) of Interloop Limited hold
Ordinary Shares hereby appoint Mr / Mrs / Miss
of or failing him / her
of as my/our proxy in my/our absence to attend and vote for me/us and
on my/our behalf at the 27th Annual General Meeting of the Company to be held on Monday,
October 14, 2019 and /or any adjournment there of.
As witness my/our hand/seal this day of October 2019.
Signed by
in the presence of
Signature onFive Rupees
Revenue Stamp
The Signature shouldagree with the
specimen registeredwith the Company
Important:1. This Proxy Form, duly completed and signed, must be received at the Registered
Office of the Company, Interloop Limited, Al-Sadiq Plaza P-157, Railway Road, Faisalabad, not less than 48 hours before the time of holding the meeting.
2. If a member appoints more than one proxy and more than one instruments of proxies are deposited by a member with the Company, all such instruments of proxy shall be rendered invalid.
3. For CDC Account Holders/Corporate Entities
In addition to the above the following requirements have to be met.
(i) Attested copies of CNIC or the passport of the beneficial owners and the proxy shall be provided with the proxy form.
(ii) The proxy shall produce his original CNIC or original passport at the time of the meeting.
(iii) In case of a corporate entity, the Board of Directors resolution/power of attorney with specimen signature shall be submitted (unless it has been provided earlier alongwith proxy form to the Company).
FORM OF PROXY INTERLOOP LIMITED
27th Annual General MeetingNOTES
Ann
ual R
epor
t 20
18-1
9
Inte
rloop
Lim
ited
248 249
27
1427
P-157
2019
2019
Inte
rloop
Lim
ited
250


![( I]YDIA) LIMITED - Stellant Securities India Limited](https://img.pdfslide.net/doc/110x75/63273b4b5c2c3bbfa80412e2/-iydia-limited-stellant-securities-india-limited.jpg)


