Embed Size (px)
Citation preview


Managerial Finance
Prepared For Muhammad Enamul Haque
Assistant Professor
United International University
Prepared By Group: 2
Syeda Shotorupa Zafar ID: 111101192
Mahar Afrose Khan ID: 111101182
Taslima Akter Piu ID: 111101203
Shahmin Jahan Shoma ID: 111101221
Mashrora Rahman ID: 111093045
Tazin Mahmud ID:
Date of Submission: August 14, 2012
United International University

Letter of transmittal
August 14, 2012
Muhammad Enamul Haque
Course Instructor
United International University
Subject: Request to accept our report on “Ratio Analysis of Square Textile Limited (2007-2011)
Dear Sir,
With respect and honor submission, we want to inform you that, we are submitting a report on
“Financial Analysis of Square Textile Limited (2007-2011)” All the works presented here is
done with utmost sincerely and honesty. We have tried our best to make this report
comprehensive and informative.
For our report a irst we collect financial Statement from Square Textile Limited. From the
Statement we get some data, by which we do ratio analysis & our graphs & present the whole
financial condition of Square Textile Limited from 2007-2011.
Sincerely,
Mahar Afrose Khan

Acknowledgment letter
No work is possible to be completed by one individual. In every step of this study, Invaluable
help and suggestions from many individuals and institutional experts supported us to do this
report.
The whole report was based on the “Financial Analysis of Square Textile Limited from 2007 to
2011”. .First of all, we like to thank our honorable course Instructor Muhammad Enamul Haque
for guiding us to prepare the report from starting point to finishing end. We would like to convey
our special thanks to the officials of Square Textile Limited.
At last we would like to remember the almighty Allah for blessing us with the strength, ability
and patience to do this task.

1.1 Introduction………………… Page: 1-5
1.2 Origin of the Report…………………………………..Page: 3
1.3 .Objective of the Report………………………………Page: 3
1.4 .Scope……………………………………………………………Page: 4
1.5 .Limitation…………………………………………………….Page: 4
1.6 Methodology………………………………………………..Page: 3
1.7 Profile of Sqaure Textile Limited in Bangladesh………………..Page: 4
2. Theories of Ratio Analysis……………….Page: 7-9
3. Ratio Analysis in Details…………………Page: 10-27
4. Comparison of Ratio Analysis………..Page: 28-31
3. Conclusion……………….Page: 32-33
Table of Contents

1
Executive Summary
According to the requirements of the BBA program, we chose to prepare financial report on
“Square Textile Limited in Bangladesh.” The report is based on the financial Statement of
Square Textile Limited. Anyone can easily understand the financial condition of Square Textile
Limited from 2007 to 2011 from here. At first, we are doing the ratio analysis for both 2007 to
2011 where we find out the liquidity ratio (Square’s ability to meet short-term obligations),
leverage ratio (the amount of equity in comparison to debt or the amount of earnings in
comparison to debt), coverage ratio (the ability to meet its interest payments and thus avoid
bankruptcy), activity ratio (effectively the firm is using its assets) & profitability ratio (the profit
was earned which is relative to sales, total assets and net worth). From the ratio analysis we can
find out the financial situation of Square textile Limited of 2007 to 2011 & we compare among
these five years to find out which one is the best year & which one is the worst year.

2
CHAPTER 1
Introduction

3
1.1 Origin of Report:
This term paper has been prepared as a part of the Financial Management course of Unitred
International University. The report titled, “Ratio Analysis of Square Textile Limited” is being
assigned by our course instructor. We have collected all the required information from the annual
report of Square for the year 2007, 2008, 2009 2010 & 2011. We have tried our best to combine
and relate the information with the concept of the report, but due to time limitation and restricted
access to information there still remains some limitations.
1.2 Main Objectives:
Our main objective is to learn about the financial condition of the company Square Textile
Limited
1.3 Specific objectives:
Our specific objectives are-
To learn about the financial ratios of Square Textile Limited.
To know about the financial condition of this industry
1.4 Methodology:
We have used mainly secondary data sources for this report. The data has been collected from
the annual report of Square Textile Limited which are available in the company website. Thus,
the following sources of information have been used:
The company’ websites
The company’ circulars

4
1.5 Scope:
We have been assigned to make a report on Ratio Analysis Square Textile Limited, but as Square
Textile is very large & is continuing its work for a long time, it is impossible to work on the
whole financial condition. We have chosen only 2007 to 20101 financial reports for making our
report.
1.6 Limitation:
Our report covers the overall Ratio Analysis of Square Textile Limited from the year 2007 to
2011. However, we faced some limitations in preparing this report. They are-
Inadequacy of information as all information is not present in the online.
Time limitations
Lack of reliable sources
Restricted access
1.7 Square Textile Limited (Company Overview) :
Square Textiles Ltd. started its journey by establishing the first unit in 1997. One year later the
second unit was established. Square Textile is a subsidiary company of Square Group .The
Company was incorporated as a public limited company in the year of 1994. The operation was
started in 1997.It was enlisted in Dhaka Stock Exchange & Chittagong Stock Exchange in 2002.
Within a very short time of span the company achieved some significance success. Square
Textile receives Oeko-Tex standard100 and ISO-9002 certificates in the year 2000. Authorized
capital of the company is tk. 1000 million. It’s paid- up capital is tk. 251.90 million. 1,223
employees are working in this organization. The business lines of Square Textiles Limited are
manufacturing and marketing of yarn. The factory is located in Saradaganj, Kashimpur,
Gazipur, Bangladesh. Its office is located at Uttara in Dhaka

5
Mission Statement:
The mission statement of Square Textiles Limited is “Our mission is realization of vision through
maximum production of goods and services strictly on ethical and moral standards at minimum
costs to the society ensuring optimum benefits to the shareholders and other stakeholders.”
This mission is envisioned by the concept of business which ensures well being of the investors,
stakeholders, employees and members of the society which will create new wealth in the form
of goods and services.
Strategic goals & Objectives:
The company sets the following objectives for it to achieve:
• To strive hard to optimize profit through conduction of transparent business operations within
the legal and social framework with malice to none and justice for all
• To create more jobs with minimum investments
• To be competitive in the internal as well as external markets
• To maximize export earning with minimum imported in-puts
• To reduce the income gap between top and bottom categories of employees

6

7
CHAPTER 2
Theories of Ratio
Analysis
8
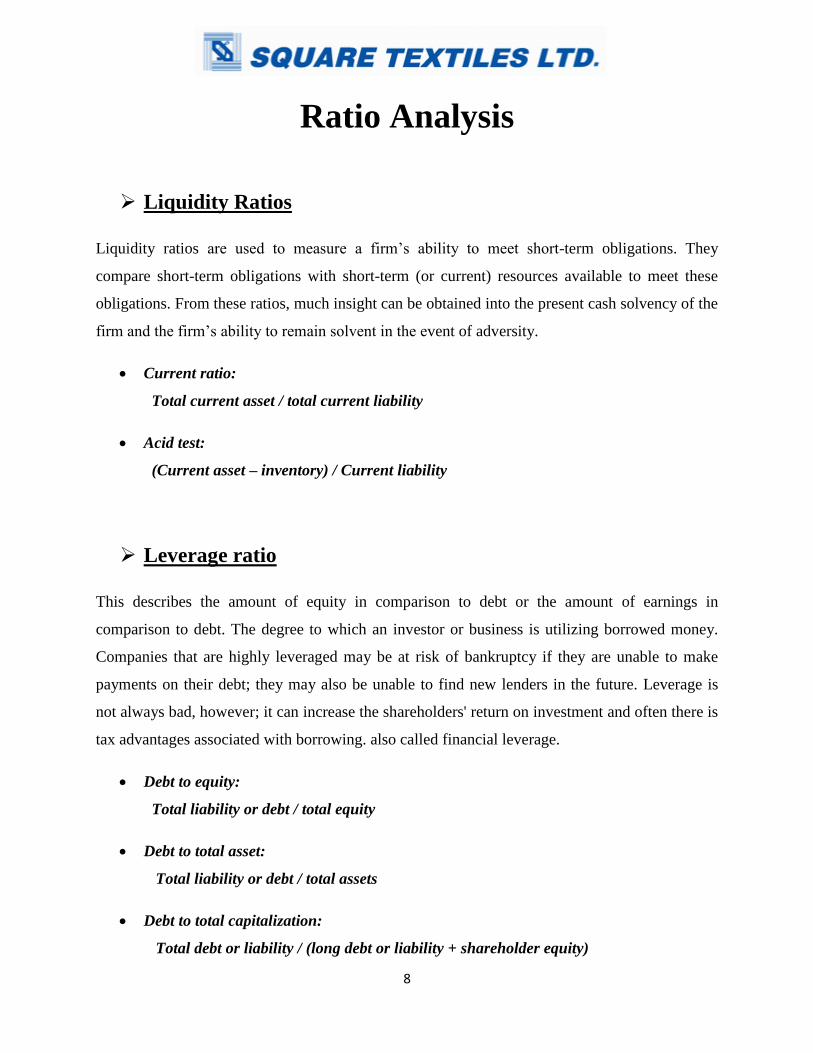
Ratio Analysis
Liquidity Ratios
Liquidity ratios are used to measure a firm’s ability to meet short-term obligations. They
compare short-term obligations with short-term (or current) resources available to meet these
obligations. From these ratios, much insight can be obtained into the present cash solvency of the
firm and the firm’s ability to remain solvent in the event of adversity.
Current ratio:
Total current asset / total current liability
Acid test:
(Current asset – inventory) / Current liability
Leverage ratio
This describes the amount of equity in comparison to debt or the amount of earnings in
comparison to debt. The degree to which an investor or business is utilizing borrowed money.
Companies that are highly leveraged may be at risk of bankruptcy if they are unable to make
payments on their debt; they may also be unable to find new lenders in the future. Leverage is
not always bad, however; it can increase the shareholders' return on investment and often there is
tax advantages associated with borrowing. also called financial leverage.
Debt to equity:
Total liability or debt / total equity
Debt to total asset:
Total liability or debt / total assets
Debt to total capitalization:
Total debt or liability / (long debt or liability + shareholder equity)

9
Coverage ratio
This ratio serves as one measure of the firm’s ability to meet its interest payments and thus avoid
bankruptcy. In general, the higher the ratio, the greater the likelihood that the company could
cover its interest payments without difficulty. It also sheds some light on the firm’s capacity to
take on new debt.
Interest Coverage Ratio :
Earnings before interest and taxes / interest expense
Activity ratio
Activity ratios, also known as efficiency or turnover ratios, measure how effectively the firm is
using its assets. We will focus our attention primarily on how effectively the firm is managing
two specific asset groups – receivables and inventories – and its total assets in general.
Receivable turnover
Net credit sales / account receivables
Receivable turnover in days
360days / receivable turnover
Payable turnover
Credit purchase / account payable
Payable turnover in days
360 days / account payables
Inventory turnover
Cost of goods sold / inventory
Inventory turnover in day
360days / inventory turnover

10
Assent turnover
Net sales / average total asset
Profitability ratio
Profitability ratios measure how well a company is performing by analyzing how profit was
earned relative to sales, total assets and net worth Profitability ratios are of two types – those
showing profitability in relation to sales and those showing profitability in relation to investment.
Together, these ratios indicate the firm’s overall effectiveness of operation.
Gross profit margin
(Net sales – cost of goods sold) / net sales or gross profit / net sales)
Net profit margin
Net income / net sales
Return assets
Net income / average total asset
Return on equity
Net income/ average shareholder equity

11
CHAPTER 3
Ratio Analysis of Square
Textile Limited
(2007-2011)

12
3.2 BALANCE SFEET OF SQUARE PHARMACEUTICAL LIMITED ( 2007 to 2011)
2007 2008 2009 2010 2011
Net Assets:
Assets at Cost
Less Depreciation
1078559049 1475847250 1378552606 1286399483 1402876722
Investment-Long
Term(At Cost)
95000000 95000000 105000000 160783760 160783760
Share Money
Deposit
400000000 800000000 800000000 875619239 857619239
Fixed Assets 1573559049 2370847250 2283552606 2304802482 2421279721
Current Assets:
Stocks 577163363 1267785890 942568134 1623278528 1236014474
Trade Debtor 819360445 1689670282 1683329048 1666731087 2008696513
Short Term Loan 561880590 224332805 431848649 656447428 695694698
Advance,Deposits
and Prepayments
95085340 210569262 120651506 289172239 542235494
Cash & Bank
Balances
32326157 44691475 46332373 65503243 321816224
Current Assets 2085815895 3437049714 3224729710 4301132525 4804457403
Less:current
liabilities:
Short Term Bank
Loan
537743415 777528585 573802358 998924770 486705024
Short Term Loan 176143717 301562429 552993073 787887594 569592985
Sundry Creditors 624970405 1322409529 870756515 733985411 1385606603
Other Current
Liabilities
106212860 149339005 170321074 192438380 291387314
Provision for
Income Tax
113862118 171393544 108728783 210154935 319598085
Less:current
liabilities
1558932515 2722233092 2276601803 2923391090 3052890011
Net Current
Assets
526883380 714816622 948127907 1377741435 1751567392
Less:Deferred Tax
Liabilities
79959968 121017768 112276486 111305232 111305232
2020482461 2964646104 3119404027 `3571238685 4061541881
Financed By:
Shares Holders
Equity:
2020482461 2964646104 3119404027 3571238685 4061541881
Share Capital 394333700 588200440 705804530 811716610 974059932
General Reserve
and Surplus
1626148761 2376445664 2413563497 2759522075 3087481949
2020482461 2964646104 3119404027 3571238685 4061541881

13
3.3 INCOME STATEMENT OF SQUARE PHARMACEUTICALS (2007 to 2011)
2007 2008 2009 2010 2011
Sales 2541542767 3052235640 3882244010 4445402112 5247748947
Cost of goods
sold
(1958696404) (2589019736) (3348870289) (3558642850) (4176991364)
Gross Profit 582846363 463215904 533373721 886759262 1070757583
Operating
expenses
(61767371) (85777018) (109832354) (113189908) (157385096)
Finance cost (106026180) (109701045) (121730159) (94609920 (162981165)
Operating
Income
415052812 267737841 301811208 678959434 750391322
Other Income 16626533 23722979 25554510 31023629 15710732
Net Income
Before
W.P.P& W.F
431679345 291460820 327365718 709983063 766102054
Allocation for
W.P.P & W.F
(20556159) (13879087) (15588844) (33808717) (36481050)
Net Income
Before Tax
411123186 277581733 311776874 676174346 729621004
Provision For
Income Tax
(58676050) (41051825) (51142872) (111405203) (109443150)
Net Income
For The
Year
352447136 236529908 260634002 564769143 620177854
Earning per
share
7.45 3.35 3.69 5.80 6.37

14
3.4 Ratio Analysis of Financial Statements
Square Textile
Liquidity Ratios
Current ratio:
current assent current liability current ratio
2007 2085815895 1558932515 1.337977029
2008 3437049714 2722233092 1.262584649
2009 3224729710 2276601803 1.41646629
2010 4301132525 2923391090 1.471281944
2011 4804457403 3052890011 1.573740746
Description:

15
Acid test:
current assent inventory current liability acid test
2007 2085815895 577163363 1558932515 0.967747172
2008 3437049714 1267785890 2722233092 0.796869243
2009 3224729710 942568134 2276601803 1.002442137
2010 4301132525 1623278528 2923391090 0.916009495
2011 4804457403 1236014474 3052890011 1.168873728
Description:

16
Leverage ratio
Debt to equity:
total debt total equity Debt to equity
2007 1558932515 2020482461 0.771564488
2008 2722233092 2964646104 0.918232058
2009 2276601803 3119404027 0.729819473
2010 2923391090 3571238685 0.818593028
2011 3052890011 4061541881 0.751657893
Description:

17
Debt to total asset:
total debt total assets Debt to total asset
2007 1558932515 3659374944 0.4260106
2008 2722233092 5807896964 0.46871236
2009 2276601803 5508282316 0.413305214
2010 1607691112 6605935007 0.243370713
2011 1571079577 7225737124 0.217428278
Description:

18
Coverage ratio
Interest Coverage Ratio :
Description:
EBIT interest expense Interest Coverage Ratio
2007 411123186 106026180 3.877562938
2008 277581733 109701045 2.530347209
2009 311776874 121730159 2.561213068
2010 676174346 94609920 7.14697091
2011 729621004 162981165 4.476719773

19
Activity ratio
Receivable turnover

20
Receivable turnover in days

21
Payable turnover

22
Payable turnover in days

23
Inventory turnover
Description:
Cost of goods sold inventory Inventory turnover
2007 1958696404 577163363 3.393660321
2008 2589019736 1267785890 2.042158504
2009 3348870289 942568134 3.552921182
2010 3558642850 1623278528 2.192256467
2011 4176991364 1236014474 3.379403277

24
Inventory turnover in day
360days Inventory turnover Inventory turnover in day
2007 360 3.393660321 106.0801512
2008 360 2.042158504 176.2840638
2009 360 3.55291182 101.3253405
2010 360 2.192256467 164.2143633
2011 360 3.379403277 106.5276827

25
Profitability ratio
Gross profit margin
Net sales cost of goods sold net sales
Gross profit
margin
2007 2541542767 1958696404 2541542767 0.229327781
2008 3052235640 2589019736 3052235640 0.151762825
2009 3882244010 3348870289 3882244010 0.137387995
2010 1438410562 1214595646 1438410562 0.155598771
2011 4063481565 3705847220 4063481565 0.088011804
Description:

26
Net profit margin
Net income net sales Net profit margin
2007 352447136 2541542767 0.138674486
2008 236529908 3052235640 0.077493987
2009 260634002 3882244010 0.067134884
2010 564769143 1438410562 0.392634174
2011 620177854 4063481565 0.152622288
Description:

27
Return of assets

28
Return on equity

29
CHAPTER 4
Findings
(2007 to2011)

30
We do ratio analysis of Square Textile Limited in Bangladesh of 2007 to 2011. After the analysis
we find out the situation of Liquidity Ratio, Leverage Ratio, Coverage Ratio, and Activity Ratio
& Profitability Ratio. The highest & lowest conditions of the ratio are given below:
Name of the Ratio
Highest Amount
Year Lowest Amount Year
Liquidity Ratios
Current ratio:
1.573740746 2011 1.262584649 2008
Acid test:
1.168873728 2011 0.796869243 2008
Leverage ratio
Debt to equity:
0.918232058 2008 0.729819473 2009
Debt to total asset:
0.413305214 2009 0.4260106 2007
Coverage ratio
Interest
CoverageRatio 4.476719773 2011 7.14697091 2010
Activity ratio:
Receivable turnover
Receivable turnover
in days
Payable turnover

31
From the chart we can find out that Square had the highest capacity to meet short-term
obligations in 2011 & the lowest capacity to meet short-term obligations in 2008.
From the leverage ratio we can find out the degree to which an investor or business is utilizing
borrowed money. Here we can see, the debt to equity is highest in 2008 & lowest in 2009 & debt
to asset is highest in 2009 & lowest in 2007. That means Square borrowed lots of money in 2008
& borrowed lots of assets in 2009.So both 2009 & 2010 were the risky year. Because, company
may unable to make payments on their debt; they may also be unable to find new lenders in the
future.
Next coverage ratio serves as one measure of the firm’s ability to meet its interest payments and
thus avoid bankruptcy. The highest coverage ratio was in 2011 & lowest was 2010. That means
2011 is a great year to meet its interest payments.
Payable turnover in
days
Inventory turnover
3.552921182 2009 2.042158504 2008
Inventory turnover in
days
176.2840638 2008 101.3253405 2009
Profitability ratio
Gross profit margin
229327781 2007 088011804 2008
Net profit margin
0.152622288 2011 0.067134884 2009
Return of assets
Return on equity

32
Next come activity ratios. It is also known as efficiency or turnover ratios, measure how
effectively the firm is using its assets. We find out that the uppermost Receivable turnover
occurred in……& lowest is…….. That means……..Besides the uppermost Payable turnover
occurred in…… & lowest……..That means………………. Moreover, the highest Inventory
turnover occurred in 2009 & lowest in 2008
Next we can see the Profitability ratio. Square earn maximum gross profit in 2007 & minimum
in 2008. Besides, highest net profit earned in 2011 & lowest net profit eared in 2009. & Square
return their asset greatest in……………& smallest in…………..Moreover, Square return their
equity utmost in……………& least in…………..
After doing the Ratio Analysis we can say that among 2007 to 2011 ……………… is the best
year. Because …………………………. .& ……………………… is the worst year
because………………………………. &……., ……… & ………………. is considered as
average year because they are neither so best financial year nor so worse. So, the stay in the
middle state.
33
CHAPTER 5
Conclusion
34
Squar Textile is a growing industry now and its companies are involved with broad financial
activities. By comparing each year of the company with its past records may not give the correct
image of the organization, the comparison should also be made with the industrial average. In the
Square Tetile Limited, the financial data of Square are being analyzed both with the help of past
records and by comparing the data with industrial average. Here the financial condition of
Square Tetile Limited is in the most favorable in 20000000000000…. (year) because it shows
positive result than other years. In 200 the financial analysis condition of Square Textile with
the past records are quite favorable but after the comparison with the industry average it seems
there are a number of scopes for improvement. But that’s not all. Square Textile is very popular
in Bangladesh & still it covers a very strong position in the market.