Embed Size (px)
Citation preview
International Union of Crystallography http://www.iucr.org/iucr-top/comm/cpd/
NEWSLETTER No. 20, Summer 1998 http://www.iucr.org/iucr-top/comm/cpd/Newsletters/
EXTENDED SOFTWARE/METHODS DEVELOPMENT ISSUE
d Benson Kariuki,
achlan Cranswick, "Guest Editor'
rn Arnt-Andreas, "EPDIC6 Fundamental Parameter A
nces in the Rietveld-Analysis
rCell as teaching tool"
rogram for laboratory X- uantitative analysis and
as, "AXES - a software
Daniel Chateigner, "Practical expe the Berkeley texture package" p10
ic Algorithms for molecular optimization problems" p32-33
Synthesizing Line Profiles"
David Cox and Peter & Thierry Roisnel, "FullProf.98 indows 95/NT Applications for
"3rd Canadian Powder
in crystallography" Analysis" p16-17
Syb Gorter & Dean Diffraction Programs" p18
tter p40 S. I? Sen Gmta "ISPD'98 : Powder Diffraction" p18 sion on Powder
Diffraction Newsletter p40
1
CPD CHAIRMAN'S MESSAGE
Bob Cernik Daresbury Laboratory, Warrington, Cheshire, WA4 4AD, UK E-mail: R.J. [email protected]
This is a busy time for the commission, the CPD is planning to increase its level of interaction and co-operation with other IUCr commissions, it will shortly endorse a set of guidelines on Rietveld refinement and will extend its coverage of powder diffraction into more applied areas. The field has moved on significantly in terms of software development. Groups from all over the world have been developing new ways to extract the maximum amount of information from powder profiles for structure solution and refinement. Maximum entropy, genetic algorithms, optimised direct methods and Monte Carlo techniques have all made recent advances and the fundamental parameters approach shows promise for Rietveld analysis. It is very difficult to know which of these approaches will be more fruitful so I asked Lachlan Cranswick if he would be prepared to solicit submissions of current powder structure solution and refinement developments on behalf of the CPD. I was expecting a small but significant response, what he obtained, as you can see, was an overwhelming response. That left a dilemma, publish shortened or the whole versions or the articles? I decided that in the interests of fairness we should publish all the information we received. This is not intended to be a comprehensive catalogue but it does show just how much work is being put into structure solution at present. We do not have all approaches represented, genetic algorithms and optimised direct methods are not discussed in detail. However Lachlan has assembled
a great deal of information and I would like to thank him very much for his initiative. Our publication of this material does not endorse one approach over any other, it is intended to keep you informed about developments. We are fortunate that an increase in circulation and promised advertising revenue enables us to send out this extended issue without spending too much CPD funding. We would welcome informal submissions at any time from groups developing software and methods of potential interest to the powder diffraction community.
The next issue of the newsletter will be edited by professor Siba Sen Gupta, I would be grateful if you would send any information regarding events, developments or other activities directly to him. The next issue will cover powder diffraction in India and Asia and will contain details of the powder diffraction school in Calcutta this autumn.
GUEST EDITOR'S COMMENTS
As Hugo Mändar and Toivo Vajakas state most succinctly in their AXES article, "progress in powder X-ray diffraction has always been in high correlation with progress in developing of new algorithms, methods and computer programs for diffraction data processing". It is in this spirit that various biases of this editor have become apparent in inviting contributions to update the community of the status of several software packages, opinions; and techniques that allow the intelligent use of software. With an extra eye to the future, two contributions from non crystallographers were also requested on the subject of algorithms. In this case "memetic algorithms", and the possibilities of "evolving new algorithms". I hope these articles are not considered too off topic; as one obvious future of powder diffraction is the improved extraction of every drop of information from the diffraction pattern to solve more complex problems. Mathematical algorithms are a fundamental key for putting "nature to the question" by finer degrees via powder diffraction based methods.
"Exciting times" and "powder diffraction" are presently equivalent concepts, especially those who program and develop algorithms; of which the benefits flow to all who use powder diffraction. The aura of powder diffraction becoming a mature technique in same vein as routine single crystal "expert systems" is apparent. This is the time of cheap desktop computing power; various commercial and freeware computer programming kits; emerging massively parallel computers; the Internet for obtaining and distributing code, programs and ideas at the near speed of light. It is quite popular to discuss and compare how powder diffraction and crystallography was performed 5, l0,20 and 40 years ago. These often lively and entertaining discussions bring to my mind a favourite portion of Henry Charles Lea's history of jurisprudence; of which a small extract follows.
"Wise in our generation, we laugh at the inconsistencies of our forefathers, which, rightly considered as portions of the great cycle of human progress, are rather to be respected as trophies of the silent victory, won by almost imperceptible gradations ........... It is by such indirect means that individuals, each relying on his own right hand, have been gradually led to endure regular forms of government, and to cherish the abstract idea of justice as indispensable between man and man. Viewed in this light, the ancient forms of procedure lose their ludicrous aspect, and we contemplate their whimsical admixture of force, faith, and reason, as we might the first rnde engine of Watt, or the "Clermont," which painfully labored in the waters of the Hudson - clumsy and rough it is true, yet venerable as the origin and prognostic of future triumphs." (From the introduction to The Wager of Battle; Superstition and Force, Essays on the Wager of Law, The Wager of Battle, The Ordeal, Torture. (1892), Page 103-104. Henry Charles Lea, University of Pennsylvania)
While past procedures in powder diffraction helped determine our present, it is the prognostic of "future triumphs" based in the here and now that is worth pondering. On this high note of editorial hyperbole, now would be a good time to take complete responsibility and apologise for any errors and mistakes that leaked into this issue of the newsletter. Sincere thanks goes to the contributors who made the time to contribute their articles and opinions. Appreciation must also go to Philips (http://www.analytical.philips.com/) and Siefert (http://www.roentgenseifert.com/) for their support of the CPD newsletter through their advertisements. It is folly to forget that "Diffraction does not live by software alone!"
Lachlan M. D. Cranswick (Editor, CPD Newsletter No. 20)
Secretary, CCP14 (Collaborative Computational Project for Single Crystal and Powder Diffraction)
Daresbury Laboratory, Warrington, WA4 4AD, UK E-mail: [email protected]
WWW: http://www.ccp14.ac.uWpeopleflachlan/
2
Fundamental Parameters Workshop - EPDIC 6, August 1998
The Bruker-AXS GmbH cordially invites you to the following workshop, which will be held as a satellite meeting accompanying the 6th EPDIC conference in Budapest:
"A New Fundamental Parameters Approach in Profile Analysis of Powder Data"
Line profile shapes are a convolution of (i) the emission profile, (ii) an instrument component and (iii) specimen aberrations. This approach to line profile analysis is well known latest since the pioneering work of Klug &Alexander in 1974. Nevertheless, until today current profile fit routines still apply empirical models to the peaks which do not distinguish between these contributions and are often inadequate in modeling observed peak shapes in X-ray data.
A common problem is the description of peak asymmetry which is mainly a result of axial divergence effects. In addition, the extraction of sample effects, such as crystal size/strain broadening relies on the (time consuming) measurement of a large crystal size, strain free 'standard' sample under the same instrumental conditions as the 'unknown' sample.
The problem with an empirical/standard approach is that a large number of refinable parameters are required to accurately describe line profiles over the whole 2Theta range. This parametrization as well as the insufficient description of instrumental contributions (such as asymmetry) performed by recent profile fit routines result either in inadequate fits or in erroneous interpretation of the specimen contributions.
The new fundamental parameters approach presented in this workshop uses a convolution based method to synthesize line profiles. Instrumental and specimen aberrations are convoluted with the emission profile to form the final line profile. Peak position, shape and asymmetry are described by the instrument and sample contributions resulting in accurate estimates of Bragg angle and profile shape. Sample related effects, such as specimen absorption, crystallite size and strain broadening, are entered as refinable values. The physical parameters of the diffractometer, such as the receiving slit length, horizontal divergence, and the primary and secondary Soller slit angles, are measurable quantities and are not usually refined but can be if required. This theoretical modeling of line profiles provides information on diffractometer misalignment and/or geometric irregularities. Significantly the fundamental parameters approach reduces the number of refined parameters and thus decreases parameter correlation in general.
Computationally demanding numerical convolutions, indicative of the fundamental parameters approach, have in the past made it an unlikely approach for routine line profile or Rietveld analysis (e.g. Howard & Snyder, 1989), but this has been overcome with the inclusion of a number of fast algorithms and by using a direct convolution- interpolation procedure. Efficiencies in the refinement procedure together with extremely fast algorithms has resulted in an approach that is at least three to ten times faster than conventional profile fit programs - even for non-convolution based fit routines.
The procedures presented at the workshop are expected to overcome the recent, empirical profile fitting methods.
The topics to he discussed are: 1. Possibilities and limit; of recent profile analysis techniques 2. Fundamental parameter approach vs. conventional fitting techniques
a) Principles & core mathematics b) Generation of line profiles c) Emission profile, instrument characterisation, sample contributions
3. STANDARDLESS real structure analysis (crystallite size, microstrain,
4. Instrument characterisation (axial divergence, horizontal divergence or
5. Use of any parameter couplings and of any constraints (linear and
6. "How many peaks are there?" 7. Instrument alignment aspects 8. Software
absorption, ...)
flat specimen, slit dimensions, ...)
non-linear)
Preliminary date: Monday, 24. August, 16:30 - 18:30. The final schedule will be provided in the 2nd announcement and at the EPDIC registration desc.
Workshop language is ENGLISH. Participation is free.
For further information please contact:
Dr. Arnt Kern Bruker-AXS GmbH Oestliche Rheinbrueckenstr. 50 D-76181 Karlsruhe Fax: ++49-721-595-6693 EMail: [email protected]
Xnd code: from X-ray laboratory data to incommensurately modulated phases. Rietveld modelling of complex materials.
J.-F. Berar (*) and G. Baldinozzi (+)
(*) Laboratoire de Cristallographie, CNRS BP 166 F 38042 Grenoble Cedex, France. [email protected] (+) Laboratoire de Chimie Physique du Solide, CNRS ECP F 92995 Chatenay-Malabry Cedex, France. [email protected]
Introduction The Rietveld program xnd [ 1] was first written in the late 80's to take full profit of data collected with high resolution laboratory diffractometers. At that time, to reduce significantly the data collection time, only the significant regions of the pattern were recorded. Moreover, due to the goniometer encoding, scanning was not performed with fixed steps and/or fixed counting times. Xnd was therefore designed according to these requirements.
A careful look to the data, often recorded with a simple filter or a graphite monochromator, showed that the radiation impinging on the sample was not perfectly monochromatised: small amounts of parasitic emission lines (and even W-LM lines related to the filament evaporation) can pollute the diffraction pattern.
In order to analyse these data, xnd was not limited to the popular two wavelength choice. Moreover, real materials studied in chemistry laboratories, often present the coexistence of parasitic phases. Multiple phase handling was therefore introduced in the refinement code. These choices have led to a series of consequences for the line shape modelling. As a matter of fact, each wavelength and each phase have a priori specific profile functions: within the linear system approximation, these profiles can be described by the convolution of the functions related to the experimental geometry and to the intrinsic profile line shape [2]. Nevertheless, for this rigorous approach, time
3
consuming calculations have to he performed. The Voigt (or its approximation by a pseudo-Voigt [3]) function turns out to be an efficient compromise between accurate line shape modelling and calculation time for most problems [4, 5, 6]. Within this approximation, the line shape parameters can be described in terms of simple Lorentzian and Gaussian contributions. Moreover, the meaning of these parameters can he straightforwardly related to a proper physical or instrumental origin [2].
Following the same leit motiv, preferred orientation effects were taken into account using a limited polynomial expansion on the spherical harmonic basis. These functions were also used to model the sample anisotropic broadening due to crystallite size or strain effects.
Some other features were also added to the program: refinable background by linear interpolation coefficients or splines, rigid body constraints and restraints on bond lengths, absorption and anomalous scattering corrections, x-ray and neutron joint refinements [7] ...
In the following, two peculiar features of xnd are discussed in a more detailed way.
Simultaneous refinement of multiple data sets The increasing brightness of radiation sources has allowed the use of diffraction experiments to perform real time monitoring of phase transitions, chemical reactions and in situ studies of reaction kinetics. These experiments were generally analysed by refining independently a large number of data sets, the result of the refinement of a given data set being the ,starting point for the following one. This way of operating has two main counterbacks:
it does not take into account that the parameters describing a givendata set are not uncorrelated to the ones of the neighbouring data sets.
the recording statistic of an individual data set in a real time monitoring experiment is rather poor.
Therefore, it is reasonable to try to refine simultaneously all the available data defining a limited number of global parameters but allowing them to vary according to a proper external variable (time, temperature, external electric or magnetic field, ...) The parameter dependence is expressed within a limited polynomial development approximating the real behaviour of the parameter. A rather obvious example of application could he the investigation of the thermal evolution of the lattice parameters:
This approach has some evident benefits as, for most of the parameters, a first order expansion (N=l) is often enough to describe the evolution. In that case the total number of refined parameters is divided by nearly 2/N_patterns .
Therefore, small continuous variations of a parameter can be significantly analy sed handling all the experiments simultaneously and more reliable esds for these parameters can be obtained even in the case of individual data sets having a rather poor statistical quality.
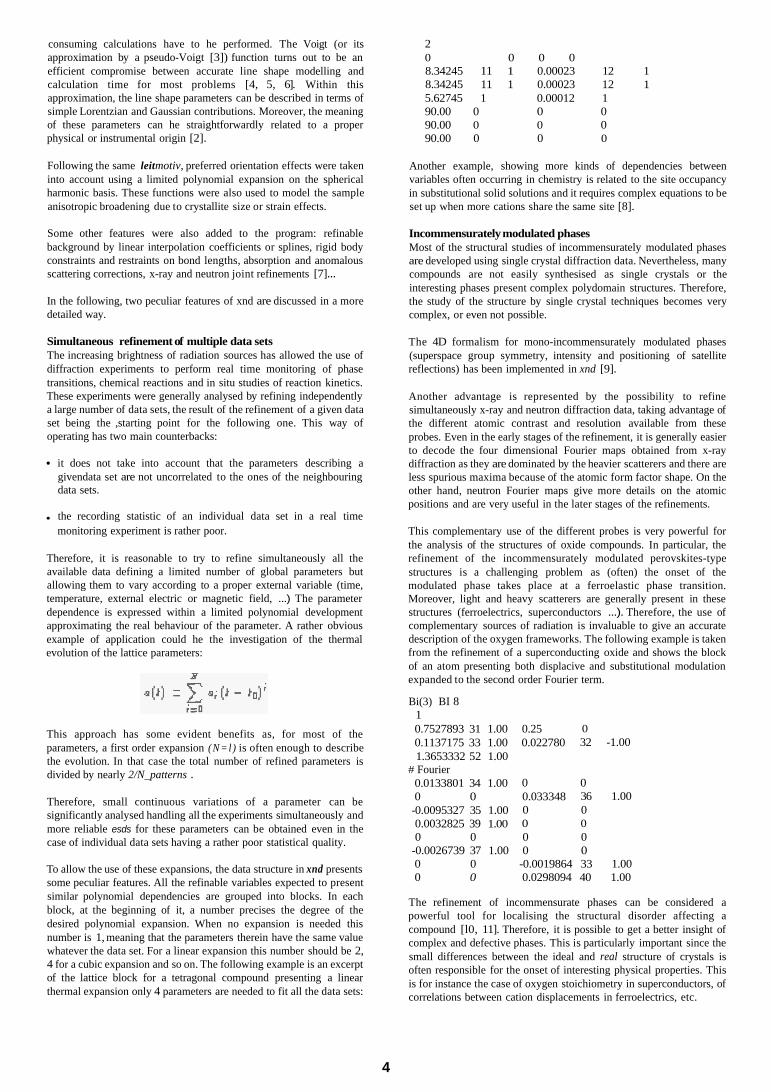
To allow the use of these expansions, the data structure in xnd presents some peculiar features. All the refinable variables expected to present similar polynomial dependencies are grouped into blocks. In each block, at the beginning of it, a number precises the degree of the desired polynomial expansion. When no expansion is needed this number is 1, meaning that the parameters therein have the same value whatever the data set. For a linear expansion this number should be 2, 4 for a cubic expansion and so on. The following example is an excerpt of the lattice block for a tetragonal compound presenting a linear thermal expansion only 4 parameters are needed to fit all the data sets:
2 0 0 0 0 8.34245 11 1 0.00023 12 8.34245 11 1 0.00023 12 5.62745 1 0.00012 1 90.00 0 0 0 90.00 0 0 0 90.00 0 0 0
1 1
Another example, showing more kinds of dependencies between variables often occurring in chemistry is related to the site occupancy in substitutional solid solutions and it requires complex equations to be set up when more cations share the same site [8].
Incommensurately modulated phases Most of the structural studies of incommensurately modulated phases are developed using single crystal diffraction data. Nevertheless, many compounds are not easily synthesised as single crystals or the interesting phases present complex polydomain structures. Therefore, the study of the structure by single crystal techniques becomes very complex, or even not possible.
The 4D formalism for mono-incommensurately modulated phases (superspace group symmetry, intensity and positioning of satellite reflections) has been implemented in xnd [9].
Another advantage is represented by the possibility to refine simultaneously x-ray and neutron diffraction data, taking advantage of the different atomic contrast and resolution available from these probes. Even in the early stages of the refinement, it is generally easier to decode the four dimensional Fourier maps obtained from x-ray diffraction as they are dominated by the heavier scatterers and there are less spurious maxima because of the atomic form factor shape. On the other hand, neutron Fourier maps give more details on the atomic positions and are very useful in the later stages of the refinements.
This complementary use of the different probes is very powerful for the analysis of the structures of oxide compounds. In particular, the refinement of the incommensurately modulated perovskites-type structures is a challenging problem as (often) the onset of the modulated phase takes place at a ferroelastic phase transition. Moreover, light and heavy scatterers are generally present in these structures (ferroelectrics, superconductors ...). Therefore, the use of complementary sources of radiation is invaluable to give an accurate description of the oxygen frameworks. The following example is taken from the refinement of a superconducting oxide and shows the block of an atom presenting both displacive and substitutional modulation expanded to the second order Fourier term.
Bi(3) BI 8 1 0.7527893 31 1.00 0.1137175 33 1.00 1.3653332 52 1.00
0.0133801 34 1.00 0 0
-0.0095327 35 1.00 0.0032825 39 1.00 0 0
-0.0026739 37 1.00 0 0 0 0
# Fourier
0.25 0.022780
0 0.033348 0 0 0 0
-0.0019864 0.0298094
0 32 -1.00
0 36 1.00 0 0 0 0 33 1.00 40 1.00
The refinement of incommensurate phases can be considered a powerful tool for localising the structural disorder affecting a compound [l0, 11]. Therefore, it is possible to get a better insight of complex and defective phases. This is particularly important since the small differences between the ideal and real structure of crystals is often responsible for the onset of interesting physical properties. This is for instance the case of oxygen stoichiometry in superconductors, of correlations between cation displacements in ferroelectrics, etc.
4
loD0
n Y
‘3 24 Y 3 27 3 3 I4
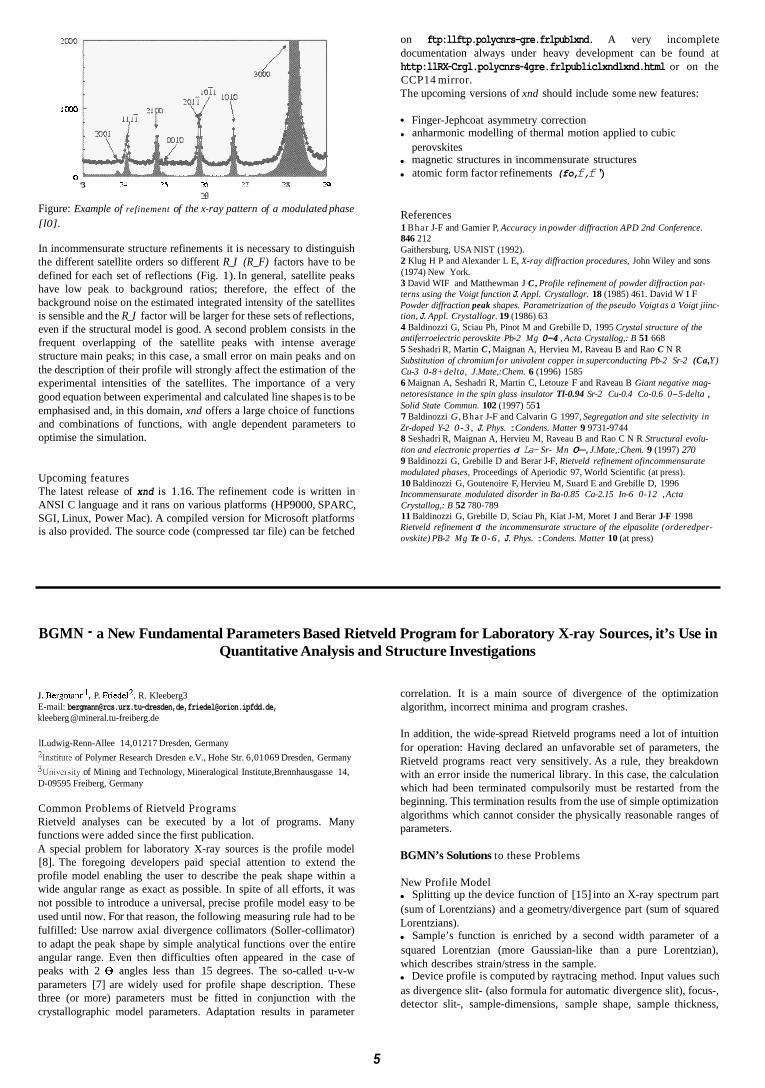
Figure: Example of refinement of the x-ray pattern of a modulated phase [l0].
In incommensurate structure refinements it is necessary to distinguish the different satellite orders so different R_I (R_F) factors have to be defined for each set of reflections (Fig. 1). In general, satellite peaks have low peak to background ratios; therefore, the effect of the background noise on the estimated integrated intensity of the satellites is sensible and the R_I factor will be larger for these sets of reflections, even if the structural model is good. A second problem consists in the frequent overlapping of the satellite peaks with intense average structure main peaks; in this case, a small error on main peaks and on the description of their profile will strongly affect the estimation of the experimental intensities of the satellites. The importance of a very good equation between experimental and calculated line shapes is to be emphasised and, in this domain, xnd offers a large choice of functions and combinations of functions, with angle dependent parameters to optimise the simulation.
Upcoming features The latest release of xnd is 1.16. The refinement code is written in ANSI C language and it rans on various platforms (HP9000, SPARC, SGI, Linux, Power Mac). A compiled version for Microsoft platforms is also provided. The source code (compressed tar file) can be fetched
on ftp:llftp.polycnrs-gre.frlpub1xnd. A very incomplete documentation always under heavy development can be found at http:llRX-Crgl.polycnrs-4gre.frlpubliclxndlxnd.html or on the CCP14 mirror. The upcoming versions of xnd should include some new features:
Finger-Jephcoat asymmetry correction anharmonic modelling of thermal motion applied to cubic perovskites magnetic structures in incommensurate structures atomic form factor refinements (fo, f, f‘ )
References 1 Bhar J-F and Gamier P, Accuracy in powder diffraction APD 2nd Conference. 846 212 Gaithersburg, USA NIST (1992). 2 Klug H P and Alexander L E, X-ray diffraction procedures, John Wiley and sons (1974) New York. 3 David WIF and Matthewman J C , Profile refinement of powder diffraction pat- terns using the Voigt function J. Appl. Crystallogr. 18 (1985) 461. David W I F Powder diffraction peak shapes. Parametrization of the pseudo Voigt as a Voigt jiinc- tion, J. Appl. Crystallogr. 19 (1986) 63 4 Baldinozzi G, Sciau Ph, Pinot M and Grebille D, 1995 Crystal structure of the antiferroelectric perovskite Pb-2 Mg 0-4 , Acta Crystallog,: B 51 668 5 Seshadri R, Martin C , Maignan A, Hervieu M, Raveau B and Rao C N R Substitution of chromium for univalent copper in superconducting Pb-2 Sr-2 (Ca, Y) Cu-3 0-8+delta, J.Mate,:Chem. 6 (1996) 1585 6 Maignan A, Seshadri R, Martin C, Letouze F and Raveau B Giant negative mag- netoresistance in the spin glass insulator Tl-0.94 Sr-2 Cu-0.4 Co-0.6 0-5-delta , Solid State Commun. 102 (1997) 55 1 7 Baldinozzi G, Bhar J-F and Calvarin G 1997, Segregation and site selectivity in Zr-doped Y-2 0-3, J. Phys. : Condens. Matter 9 9731-9744 8 Seshadri R, Maignan A, Hervieu M, Raveau B and Rao C N R Structural evolu- tion and electronic properties of La- Sr- Mn 0- , J.Mate,:Chem. 9 (1997) 270 9 Baldinozzi G, Grebille D and Berar J-F, Rietveld refinement ofincommensurate modulated phases, Proceedings of Aperiodic 97, World Scientific (at press). 10 Baldinozzi G, Goutenoire F, Hervieu M, Suard E and Grebille D, 1996 Incommensurate modulated disorder in Ba-0.85 Ca-2.15 In-6 0-12 , Acta Crystallog,: B 52 780-789 11 Baldinozzi G, Grebille D, Sciau Ph, Kiat J-M, Moret J and Berar J-F 1998 Rietveld refinement of the incommensurate structure of the elpasolite (orderedper- ovskite) PB-2 Mg Te 0-6, J. Phys. : Condens. Matter 10 (at press)
BGMN - a New Fundamental Parameters Based Rietveld Program for Laboratory X-ray Sources, it’s Use in Quantitative Analysis and Structure Investigations
J. Bergmannl, P. Friede12, R. Kleeberg3 E-mail: [email protected],de,[email protected], kleeberg @mineral.tu-freiberg.de
lLudwig-Renn-Allee 14,01217 Dresden, Germany 21nstitute of Polymer Research Dresden e.V., Hohe Str. 6,01069 Dresden, Germany 3University of Mining and Technology, Mineralogical Institute,Brennhausgasse 14, D-09595 Freiberg, Germany
Common Problems of Rietveld Programs Rietveld analyses can be executed by a lot of programs. Many functions were added since the first publication. A special problem for laboratory X-ray sources is the profile model [8]. The foregoing developers paid special attention to extend the profile model enabling the user to describe the peak shape within a wide angular range as exact as possible. In spite of all efforts, it was not possible to introduce a universal, precise profile model easy to be used until now. For that reason, the following measuring rule had to be fulfilled: Use narrow axial divergence collimators (Soller-collimator) to adapt the peak shape by simple analytical functions over the entire angular range. Even then difficulties often appeared in the case of peaks with 2 0 angles less than 15 degrees. The so-called u-v-w parameters [7] are widely used for profile shape description. These three (or more) parameters must be fitted in conjunction with the crystallographic model parameters. Adaptation results in parameter
5
correlation. It is a main source of divergence of the optimization algorithm, incorrect minima and program crashes.
In addition, the wide-spread Rietveld programs need a lot of intuition for operation: Having declared an unfavorable set of parameters, the Rietveld programs react very sensitively. As a rule, they breakdown with an error inside the numerical library. In this case, the calculation which had been terminated compulsorily must be restarted from the beginning. This termination results from the use of simple optimization algorithms which cannot consider the physically reasonable ranges of parameters.
BGMN’s Solutions to these Problems
New Profile Model Splitting up the device function of [15] into an X-ray spectrum part
(sum of Lorentzians) and a geometry/divergence part (sum of squared Lorentzians).
Sample’s function is enriched by a second width parameter of a squared Lorentzian (more Gaussian-like than a pure Lorentzian), which describes strain/stress in the sample.
Device profile is computed by raytracing method. Input values such as divergence slit- (also formula for automatic divergence slit), focus-, detector slit-, sample-dimensions, sample shape, sample thickness,
estimated linear attenuation coefficient, focus misalignement etc. can be used to simulate the possible paths of X-rays at given angles.
This “device peaks” are automatic fitted to a predefined residual (e.g. 0.7 %) by a sum of Lorentzians. Their parameters are interpolated over the whole angular range. These are used in calculation of device profile part for each experimental peak to describe.
When running the optimization algorithm, all profile parameters depending on the device are constant. Correlation amongst profile and structure parameters is eliminated.
See: http://www.mineral.tu-freiberg.de/mineralogie~gmn/index,html
New Refinement Algorithm for Reliable Convergence The nonlinear least square algorithm is designed basing on a practical book by [23]. Within the central, linear part of the algorithm, a simple solution of the equation system above the Hesse matrix is replaced by the RG-CD algorithm (Restricted Gradient-Conjugated Direction) described in [22]. In its complete version, the algorithm supplies any in-equation constraints for linear combinations of parameters. Lower and upper parameter limits can be optionally defined by means of the simplified version used in BGMN [24].
New Features of BGMN
Description and Correction of Preferred Orientation To overcome the well-known problems caused by the March function [9], Järvinen has used spherical harmonics firstly [16]. We use a modified version of spherical harmonics until 10th order which can also be applied for samples of sophisticated orientation distributions. Parameter correlation and incorrect results can be avoided by defining the suitable order of the spherical harmonics resp. by the automatic reducing of the order depending on the measured intensity.
Real Structure Functions The influence of different real structures on the scattering functions of polycrystals has been studied in detail by [18]. In the case of dislocations, he made the conclusion of gaussian peaks. Its width (squared variance) should be proportional to dislocation density as well as to length of scattering vector.
Basing on [5], [20] has checked BGMN’s model for valid crystallite size distribution. Equivalent to [5], he found the following formula:
withpv= volume percentage of columns having a length D; in parallel to scattering vector. bl = width parameter (half FWHM) of the simple Lorentzian part of the size broadening. b2 = width (standard deviation (T) of the quadratic Lorentzian part of the size broadening.
According to this we assume a Lorentz width bl independent from the length of the scattering vector and a squared Lorentzian width b2 5 bl. Both influences are greatly discussed in real structure literature, so the default formulae for peak widths considers both. Of course, one may assume other formulae.
Molecular crystals (rigid bodies) New functions describing that lattice positions are placed by molecules instead of atoms were introduced. In cases of molecules, rotational parameters appear in addition to the translational ones. Based on the extended functions for molecules, we can define modifications of valence angles, torsion around bondings as well as stretching/compressing within molecules.
Free programmability If the functions integrated are not sufficient to solve the special problem, define new parameters and dependencies by means of the formula interpreter inside the program. This way, it is easy to describe parameter couplings which are not part of the standard program capacity (e.g. between different atomic positions).
Error analysis Beside of the well-known R values, BGMN calculates random error for all parameters and arbitrary functions of them. Therefore, one can declare arbitrary functions as so-called GOAL‘S. For every GOAL, value and ESD are calculated.
Quantitative Phase Analysis Because of the excellent stability of the algorithm, BGMN enables routine quantitative phase analysis without the time-consuming work of programming “refinement strategies” or “analytical tasks” for new sample groups. Some special methods to use the BGMN features in QPA are:
Use of Parameter Limits for zero point correction (to avoid correlation with lattice parameters) for cell parameters (to avoid meaningless results for minor phases, to define phases in substitutional series) for occupation factors (to avoid correlation with PO correction model) for peak width (to avoid “background-modeling” by a lot of broad lines of a minor phase)
Use of Anisotropic Parameters anisotropic line broadening model applicable e.g. for phyllosilicates complex models (spherical harmonics of different order) for preferred orientation correction BGMN uses statistical tests to reduce the complexity of model in the case of lacking intensity. After running the foregoing refinement of the isotropic parameters. the program checks the calculated phase intensity. If it is to low (below a limit to define global in the configuration or individual in the structure file), BGMN reduces the order of the spherical harmonics PO model. This may be done down to isotropy, also for peak broadening. So, BGMN can start from the same structure model if the phase is a main component or a minor phase.
Use of Disordering Models formula interpreter can be used to formulate disordering models into the structure description like individual broadening and shifting parameters of selected groups of hkl, e.g. with k# 3n examples of this approach are published at EPDIC-5 [4].
Use in Serial Analysis write in the batch file only the command lines
bgmn controlfilel bgmn controlfile2
and so on, and the refinement will done in fully automatic manner.
The control file contains only the name of device profile file, measurement file, structure files and output files. Predefining of background is not necessary. We analyzed series up to 50 samples, containing up to 12 phases and refining up to 152 parameters without any problems. Examples of analysis can be visited at
http://www.mineral.tu-freiberg.de/mineralogie~gm~applications.html
Example of Routine Phase Analysis An example of routine analysis will be presented here. The sample is a commercial slate, used in reconstruction of historical buildings. It was prepared by stepwise grinding and sieving smaller 20 pn and packing into standard front-loading sample holder. Special problems are the strong PO and the Mg-Fe-substitution in chlorite minerals. The refinement starts without any background separation. The cell parameters of all phases present had to be refined. Substitution of Mg- Fe at 3 positions in chlorite, Ca-Fe and Mg-Fe substitution in ankerite and the K+ occupation factor in muscovite were also refined. Anisotropic line broadening models for muscovite and chlorite were used. Isotropic crystallite size broadening model was introduced for all other phases, for ankerite additional microstrain broadening was
6
assumed. The program had to refine 75 parameters at all. A PentiumII 200MHz processor needed 5 minutes 6 seconds to fit 2467 measuring values and 915 peaks without any user interaction. The complex PO starting models of albite, microcline and ankerite have been reduced automatic to isotropy. The iron substitution in ankerite was calculated to the predefined limits. The quantitative results are given in table 1.
Atom type
c p
Ti (om> I &j (kcal*mol-’)
300 4 1 I
I r n i w
1.60
100
0
0.12
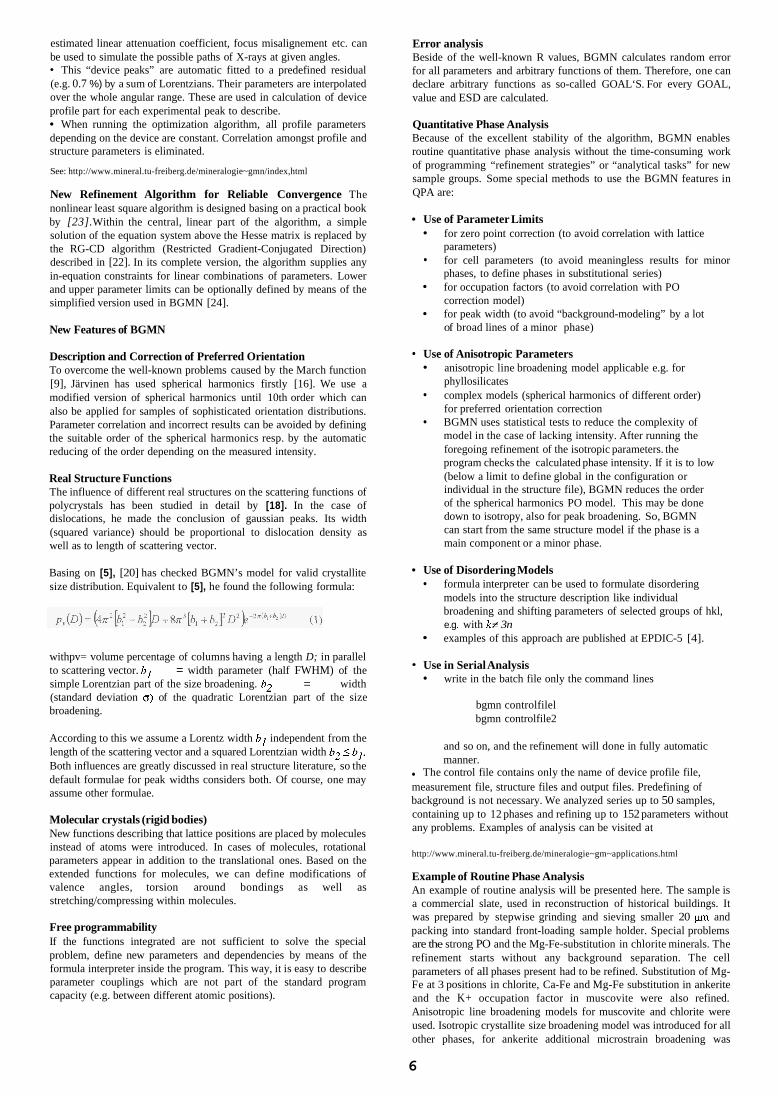
Figure 1: Rwp=13.81%, Rexp=9.85%, Durbin-Watson d=l.22
Rietveld refinement plot of slate sample. Co-Ka radiation,
0.165
Quartz 30.11 ite IIb 1 15.60
0.15 0.160
Table 1: Results of slate quantitative analysis
Note that the ankerite concentration calculated is near the detection limit but may be significant. The calculated individual PO correction factors of 001 chlorite and muscovite reflections are about 2.5. This is common value for layer silicates in front loading technique.
Structure Refinement of Organic Solids Using the integrated formula interpreter, solid state structure refinement of organics is very easy to do by a four step procedure. Especially for polymers structure proposals are performed with reliability factors below 10% ([9],[10],[11],[12]). Here we present an overview about (IPA-HQ)n results [9].
Structureless Approximation The first step, the structureless approximation, results in unit cell parameters and information about symmetry operators.
0.20
Symmetryelement 1 Q, uniqueaxis b I unique axis c mthout 1 3 13% I 3.44%
Atomic identifier 052-Clnext
C45-052-CI next
fE rev.& ra,cq. resp. S,,, 1.44*106 kcai mol-1nm-2 0.132 nm 1.44* lo6 kcal mol-’deg-2 115 deg
Table 2: Test of symmetry operators for (IPA-HQ)n
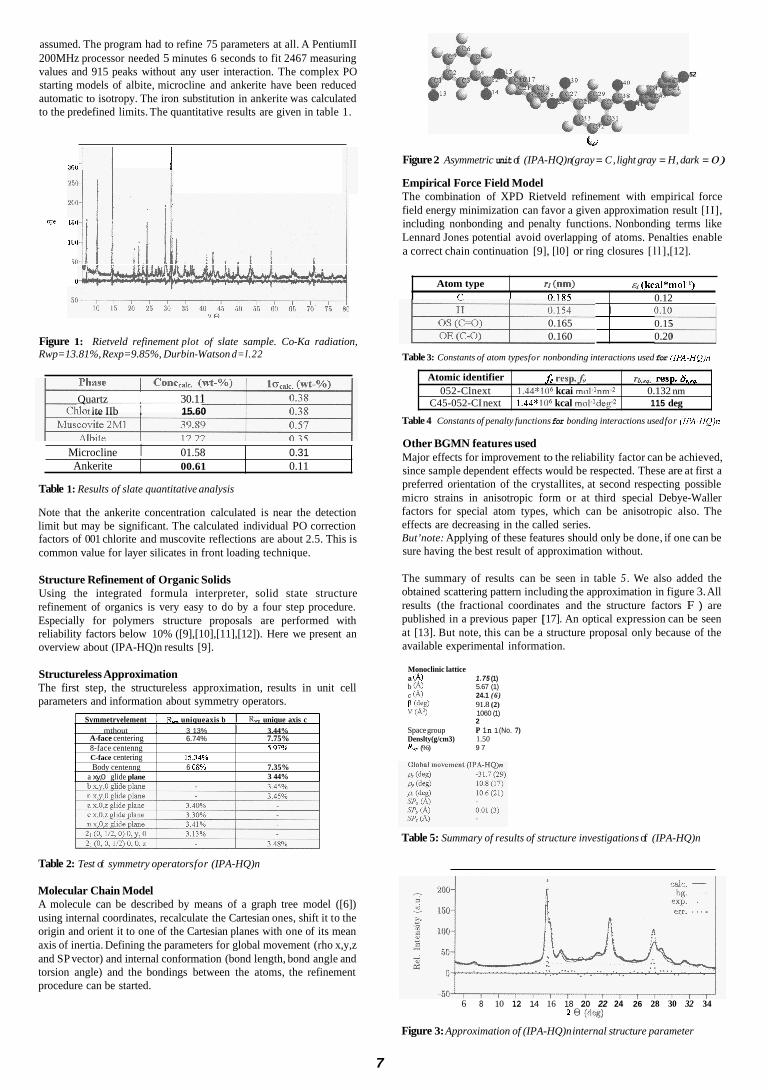
Molecular Chain Model A molecule can be described by means of a graph tree model ([6]) using internal coordinates, recalculate the Cartesian ones, shift it to the origin and orient it to one of the Cartesian planes with one of its mean axis of inertia. Defining the parameters for global movement (rho x,y,z and SP vector) and internal conformation (bond length, bond angle and torsion angle) and the bondings between the atoms, the refinement procedure can be started.
Microcline I 01.58
52
0.31
G
Ankerite
Figure 2 Asymmetric unit of (IPA-HQ)n (gray = C, light gray = H, dark = 0)
Empirical Force Field Model The combination of XPD Rietveld refinement with empirical force field energy minimization can favor a given approximation result [I I], including nonbonding and penalty functions. Nonbonding terms like Lennard Jones potential avoid overlapping of atoms. Penalties enable a correct chain continuation [9], [l0] or ring closures [ l l ] ,[12].
00.61 0.11
A-face centering 8-face centenng C-face centering Body centenng
a xy,0 glide plane
6.74% 7.75% 5.97%
15.34% 6 08% 7.35%
3 44%
I
Table 3: Constants of atom types for nonbonding interactions used for (IPA-HQ)n
Table 4 Constants of penalty functions for bonding interactions used for (IPA-HQ)n
Other BGMN features used Major effects for improvement to the reliability factor can be achieved, since sample dependent effects would be respected. These are at first a preferred orientation of the crystallites, at second respecting possible micro strains in anisotropic form or at third special Debye-Waller factors for special atom types, which can be anisotropic also. The effects are decreasing in the called series. But’note: Applying of these features should only be done, if one can be sure having the best result of approximation without.
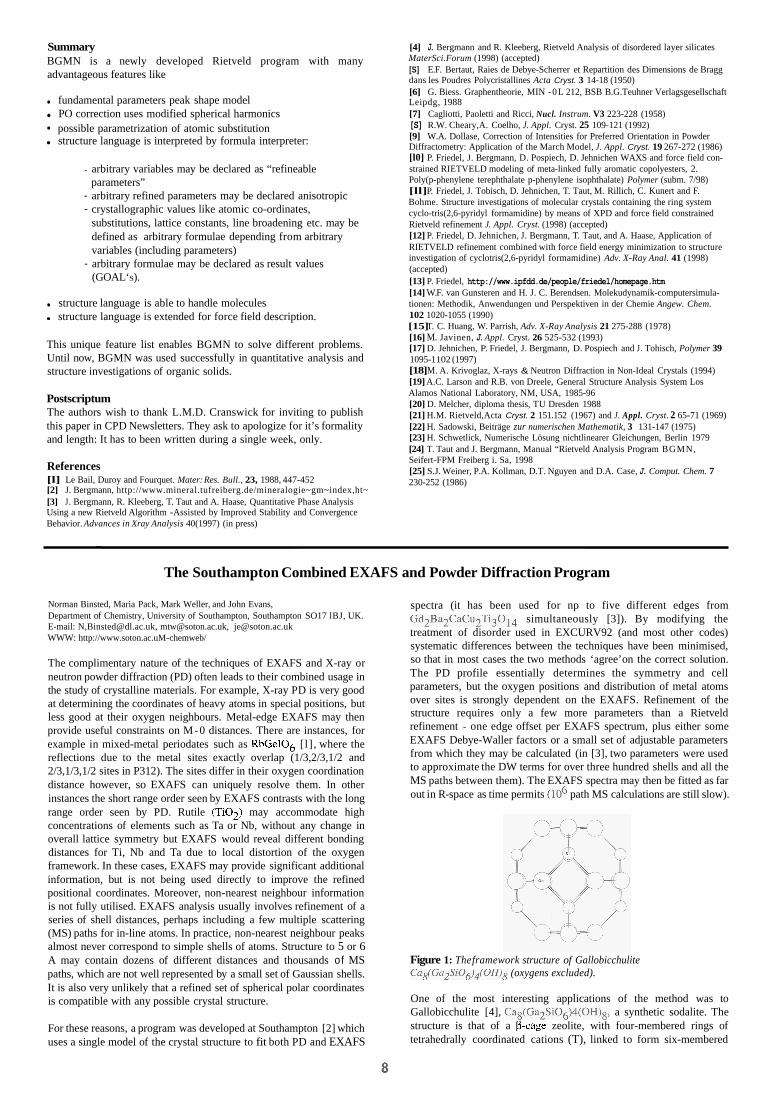
The summary of results can be seen in table 5 . We also added the obtained scattering pattern including the approximation in figure 3. All results (the fractional coordinates and the structure factors F ) are published in a previous paper [ 17]. An optical expression can be seen at [13]. But note, this can be a structure proposal only because of the available experimental information.
Monoclinic lattice
b (4 5.67 (1) c (4 24.1 (6 ) P (W 91.8 (2) v (A31 1060 (1)
Space group Denslty(g/cm3) 1.50 R, (%) 9 7
a (4 1.75 (1)
2 P 1 n 1 (No. 7)
Table 5: Summary of results of structure investigations of (IPA-HQ)n
6 8 10 12 14 16 18 20 22 24 26 28 30 32 34 2 8 (dw)
Figure 3: Approximation of (IPA-HQ)n internal structure parameter
7
Summary BGMN is a newly developed Rietveld program with many advantageous features like
fundamental parameters peak shape model PO correction uses modified spherical harmonics possible parametrization of atomic substitution structure language is interpreted by formula interpreter:
- arbitrary variables may be declared as “refineable
- arbitrary refined parameters may be declared anisotropic - crystallographic values like atomic co-ordinates,
parameters”
substitutions, lattice constants, line broadening etc. may be defined as arbitrary formulae depending from arbitrary variables (including parameters)
(GOAL‘S). - arbitrary formulae may be declared as result values
structure language is able to handle molecules structure language is extended for force field description.
This unique feature list enables BGMN to solve different problems. Until now, BGMN was used successfully in quantitative analysis and structure investigations of organic solids.
Postscriptum The authors wish to thank L.M.D. Cranswick for inviting to publish this paper in CPD Newsletters. They ask to apologize for it’s formality and length: It has to been written during a single week, only.
References [l] Le Bail, Duroy and Fourquet. Mater: Res. Bull., 23, 1988, 447-452 [2] J. Bergmann, http://www.mineral.tufreiberg.de/mineralogie~gm~index,ht~ [3] J. Bergmann, R. Kleeberg, T. Taut and A. Haase, Quantitative Phase Analysis Using a new Rietveld Algorithm -Assisted by Improved Stability and Convergence Behavior. Advances in Xray Analysis 40(1997) (in press)
[4] J. Bergmann and R. Kleeberg, Rietveld Analysis of disordered layer silicates MaterSci.Forum (1998) (accepted) [S] E.F. Bertaut, Raies de Debye-Scherrer et Repartition des Dimensions de Bragg dans les Poudres Polycristallines Acta Cryst. 3 14-18 (1950) [6] G. Biess. Graphentheorie, MIN - 0 L 212, BSB B.G.Teuhner Verlagsgesellschaft Leipdg, 1988 [7] Cagliotti, Paoletti and Ricci, Nucl. Instrum. V3 223-228 (1958) [S] R.W. Cheary,A. Coelho, J. Appl. Cryst. 25 109-121 (1992) [9] W.A. Dollase, Correction of Intensities for Preferred Orientation in Powder Diffractometry: Application of the March Model, J. Appl. Cryst. 19 267-272 (1986) [l0] P. Friedel, J. Bergmann, D. Pospiech, D. Jehnichen WAXS and force field con- strained RIETVELD modeling of meta-linked fully aromatic copolyesters, 2. Poly(p-phenylene terephthalate p-phenylene isophthalate) Polymer (subm. 7/98) [ll] P. Friedel, J. Tobisch, D. Jehnichen, T. Taut, M. Rillich, C. Kunert and F. Bohme. Structure investigations of molecular crystals containing the ring system cyclo-tris(2,6-pyridyl formamidine) by means of XPD and force field constrained Rietveld refinement J. Appl. Cryst. (1998) (accepted) [12] P. Friedel, D. Jehnichen, J. Bergmann, T. Taut, and A. Haase, Application of RIETVELD refinement combined with force field energy minimization to structure investigation of cyclotris(2,6-pyridyl formamidine) Adv. X-Ray Anal. 41 (1998) (accepted) [13] P. Friedel, http://www.ipfdd.de/people/friedel/homepage.htm [14] W.F. van Gunsteren and H. J. C. Berendsen. Molekudynamik-computersimula- tionen: Methodik, Anwendungen und Perspektiven in der Chemie Angew. Chem. 102 1020-1055 (1990) [15] T. C. Huang, W. Parrish, Adv. X-Ray Analysis 21 275-288 (1978) [16] M. Javinen, J. Appl. Cryst. 26 525-532 (1993) [17] D. Jehnichen, P. Friedel, J. Bergmann, D. Pospiech and J. Tohisch, Polymer 39
[18] M. A. Krivoglaz, X-rays & Neutron Diffraction in Non-Ideal Crystals (1994) [19] A.C. Larson and R.B. von Dreele, General Structure Analysis System Los Alamos National Laboratory, NM, USA, 1985-96 [20] D. Melcher, diploma thesis, TU Dresden 1988 [21] H.M. Rietveld,Acta Cryst. 2 151.152 (1967) and J. Appl. Cryst. 2 65-71 (1969) [22] H. Sadowski, Beiträge zur numerischen Mathematik, 3 131-147 (1975) [23] H. Schwetlick, Numerische Lösung nichtlinearer Gleichungen, Berlin 1979 [24] T. Taut and J. Bergmann, Manual “Rietveld Analysis Program BGMN, Seifert-FPM Freiberg i. Sa, 1998 [25] S.J. Weiner, P.A. Kollman, D.T. Nguyen and D.A. Case, J. Comput. Chem. 7 230-252 (1986)
1095-1 102 (1997)
- ~~~~~~~~
The Southampton Combined EXAFS and Powder Diffraction Program
Norman Binsted, Maria Pack, Mark Weller, and John Evans, Department of Chemistry, University of Southampton, Southampton SO17 lBJ, UK. E-mail: N,[email protected], [email protected], [email protected] WWW: http://www.soton.ac.uM-chemweb/
The complimentary nature of the techniques of EXAFS and X-ray or neutron powder diffraction (PD) often leads to their combined usage in the study of crystalline materials. For example, X-ray PD is very good at determining the coordinates of heavy atoms in special positions, but less good at their oxygen neighbours. Metal-edge EXAFS may then provide useful constraints on M-0 distances. There are instances, for example in mixed-metal periodates such as RbGeIOg [l] , where the reflections due to the metal sites exactly overlap (1/3,2/3,1/2 and 2/3,1/3,1/2 sites in P312). The sites differ in their oxygen coordination distance however, so EXAFS can uniquely resolve them. In other instances the short range order seen by EXAFS contrasts with the long range order seen by PD. Rutile (Ti02) may accommodate high concentrations of elements such as Ta or Nb, without any change in overall lattice symmetry but EXAFS would reveal different bonding distances for Ti, Nb and Ta due to local distortion of the oxygen framework. In these cases, EXAFS may provide significant additional information, but is not being used directly to improve the refined positional coordinates. Moreover, non-nearest neighbour information is not fully utilised. EXAFS analysis usually involves refinement of a series of shell distances, perhaps including a few multiple scattering (MS) paths for in-line atoms. In practice, non-nearest neighbour peaks almost never correspond to simple shells of atoms. Structure to 5 or 6 A may contain dozens of different distances and thousands of MS paths, which are not well represented by a small set of Gaussian shells. It is also very unlikely that a refined set of spherical polar coordinates is compatible with any possible crystal structure.
For these reasons, a program was developed at Southampton [2] which uses a single model of the crystal structure to fit both PD and EXAFS
spectra (it has been used for np to five different edges from Gd2Ba2CaCu2Ti3OI4 simultaneously [3]). By modifying the treatment of disorder used in EXCURV92 (and most other codes) systematic differences between the techniques have been minimised, so that in most cases the two methods ‘agree’ on the correct solution. The PD profile essentially determines the symmetry and cell parameters, but the oxygen positions and distribution of metal atoms over sites is strongly dependent on the EXAFS. Refinement of the structure requires only a few more parameters than a Rietveld refinement - one edge offset per EXAFS spectrum, plus either some EXAFS Debye-Waller factors or a small set of adjustable parameters from which they may be calculated (in [3], two parameters were used to approximate the DW terms for over three hundred shells and all the MS paths between them). The EXAFS spectra may then be fitted as far out in R-space as time permits (lo6 path MS calculations are still slow).
Figure 1: The framework structure of Gallobicchulite Cag(GU2SiO~)4(0H)8 (oxygens excluded).
One of the most interesting applications of the method was to Gallobicchulite [4], Cag(Ga2SiOg)4(0H)8, a synthetic sodalite. The structure is that of a P-cage zeolite, with four-membered rings of tetrahedrally coordinated cations (T), linked to form six-membered
rings normal to the (111) directions of the cubic cell, and with intrachannel Ca and OH on cube diagonals (fig.1).
In this material NMR and EXAFS data [5] suggested a high degree of ordering in terms of (Si,Ga) occupancy of sites and Ga-0 bond lengths consistent with distinct gallium sites. The powder diffraction data, however, indicated a structure disordered on a large scale, with a single T-0 distance.
1 9 0 0 -
k i d ' , A
1 0 50 S O 1 3 0
28.
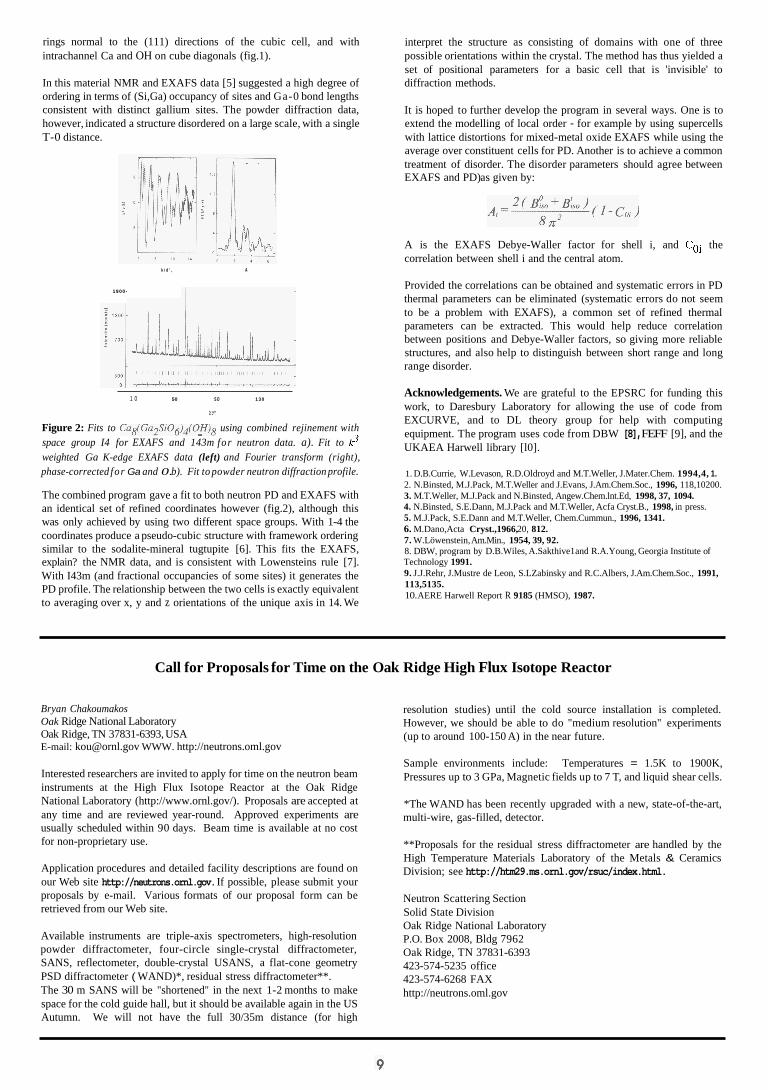
Figure 2: Fits to Ca~(Ga2Si06)4(0-H)~ using combined rejinement with space group I4 for EXAFS and 143m for neutron data. a). Fit to k3 weighted Ga K-edge EXAFS data (left) and Fourier transform (right), phase-corrected for Ga and 0. b). Fit to powder neutron diffraction profile.
The combined program gave a fit to both neutron PD and EXAFS with an identical set of refined coordinates however (fig.2), although this was only achieved by using two different space groups. With 1-4 the coordinates produce a pseudo-cubic structure with framework ordering similar to the sodalite-mineral tugtupite [6]. This fits the EXAFS, explain? the NMR data, and is consistent with Lowensteins rule [7]. With I43m (and fractional occupancies of some sites) it generates the PD profile. The relationship between the two cells is exactly equivalent to averaging over x, y and z orientations of the unique axis in 14. We
interpret the structure as consisting of domains with one of three possible orientations within the crystal. The method has thus yielded a set of positional parameters for a basic cell that is 'invisible' to diffraction methods.
It is hoped to further develop the program in several ways. One is to extend the modelling of local order - for example by using supercells with lattice distortions for mixed-metal oxide EXAFS while using the average over constituent cells for PD. Another is to achieve a common treatment of disorder. The disorder parameters should agree between EXAFS and PD) as given by:
A is the EXAFS Debye-Waller factor for shell i, and Coi the correlation between shell i and the central atom.
Provided the correlations can be obtained and systematic errors in PD thermal parameters can be eliminated (systematic errors do not seem to be a problem with EXAFS), a common set of refined thermal parameters can be extracted. This would help reduce correlation between positions and Debye-Waller factors, so giving more reliable structures, and also help to distinguish between short range and long range disorder.
Acknowledgements. We are grateful to the EPSRC for funding this work, to Daresbury Laboratory for allowing the use of code from EXCURVE, and to DL theory group for help with computing equipment. The program uses code from DBW [8], FEFF [9], and the UKAEA Harwell library [l0].
1. D.B.Currie, W.Levason, R.D.Oldroyd and M.T.Weller, J.Mater.Chem. 1994,4, 1. 2. N.Binsted, M.J.Pack, M.T.Weller and J.Evans, J.Am.Chem.Soc., 1996, 118,10200. 3. M.T.Weller, M.J.Pack and N.Binsted, Angew.Chem.lnt.Ed, 1998, 37, 1094. 4. N.Binsted, S.E.Dann, M.J.Pack and M.T.Weller, Acfa Cryst.B., 1998, in press. 5. M.J.Pack, S.E.Dann and M.T.Weller, Chem.Cummun., 1996, 1341. 6. M.Dano,Acta Cryst.,1966, 20, 812. 7. W.Löwenstein, Am.Min., 1954, 39, 92. 8. DBW, program by D.B.Wiles, A.Sakthive1 and R.A.Young, Georgia Institute of Technology 1991. 9. J.J.Rehr, J.Mustre de Leon, S.LZabinsky and R.C.Albers, J.Am.Chem.Soc., 1991, 113,5135. 10. AERE Harwell Report R 9185 (HMSO), 1987.
Call for Proposals for Time on the Oak Ridge High Flux Isotope Reactor
Bryan Chakoumakos Oak Ridge National Laboratory Oak Ridge, TN 37831-6393, USA E-mail: [email protected] WWW. http://neutrons.oml.gov
Interested researchers are invited to apply for time on the neutron beam instruments at the High Flux Isotope Reactor at the Oak Ridge National Laboratory (http://www.ornl.gov/). Proposals are accepted at any time and are reviewed year-round. Approved experiments are usually scheduled within 90 days. Beam time is available at no cost for non-proprietary use.
Application procedures and detailed facility descriptions are found on our Web site http://neutrons.ornl.gov. If possible, please submit your proposals by e-mail. Various formats of our proposal form can be retrieved from our Web site.
Available instruments are triple-axis spectrometers, high-resolution powder diffractometer, four-circle single-crystal diffractometer, SANS, reflectometer, double-crystal USANS, a flat-cone geometry PSD diffractometer ( WAND)*, residual stress diffractometer**. The 30 m SANS will be "shortened" in the next 1-2 months to make space for the cold guide hall, but it should be available again in the US Autumn. We will not have the full 30/35m distance (for high
resolution studies) until the cold source installation is completed. However, we should be able to do "medium resolution" experiments (up to around 100-150 A) in the near future.
Sample environments include: Temperatures = 1.5K to 1900K, Pressures up to 3 GPa, Magnetic fields up to 7 T, and liquid shear cells.
*The WAND has been recently upgraded with a new, state-of-the-art, multi-wire, gas-filled, detector.
**Proposals for the residual stress diffractometer are handled by the High Temperature Materials Laboratory of the Metals & Ceramics Division; see http://htm29.ms.ornl.gov/rsuc/index.html.
Neutron Scattering Section Solid State Division Oak Ridge National Laboratory P.O. Box 2008, Bldg 7962 Oak Ridge, TN 37831-6393 423-574-5235 office
http://neutrons.oml.gov 423-574-6268 FAX
Practical experience of BEARTEX, the Berkeley texture package
Daniel Chateigner Lab. Physique de l'Etat CondensE, 72085 Univ. du Maine - Le Mans, France E-mail: [email protected] WWW: http://www.univ-lemans.fr/-dchat//danielc/daniel.htm
Abstract The Berkeley Texture Package (Beartex) is demonstrated for its most usual applications in the field of texture analysis. It is shown how a regular texture analysis can be routinely conducted with this package, in the case of neutron or X-ray data, using several examples concerning different materials and elaboration processes, on thin films and bulks. It is demonstrated on several examples how texture can correlate physical properties quantitatively, and how it helps understanding anisotropic measurements.
1. Introduction Quantitative texture analysis (QTA) has now been developed for some 50 years. From the early works thoroughly documented in many books [Bunge, 1982 and 1982a; Wenk, 1985; Matthies et al., 19871, to the up to date methodologies for the data treatments and using new generation tools, a tremendous amount of work as been achieved.
Used in the former time by geologists, then metallurgists. QTA became essential in a lot of different fields in science, with the parallel development of more and more anisotropic materials, due to its capability to describe the correlation between physical properties and crystallite orientations. However, as materials are obtained by sophisticated processes (natural or not) giving rise to multiple phases of different crystalline symmetry with various texture strengths, crystalline ratios, particle sizes and strain states, QTA is becoming a complex characterisation procedure.
Among all possibilities to calculate the main texture quantities, we choose for this paper to illustrate a routine texture analyses using the Berkeley Texture Package (Beartex, Wenk et al., 1998), taking several examples of materials, and in order to give people a rough approach of what QTA means. People more interested than what is presented here are invited to consult other formalisms, methodologies and packages.
A general definition of QTA would be out of concerns in this paper and is enough detailed using examples in the paper by Wenk et a1 (1998). The reader interested in getting familiar with the terms that are used here find examples at http://www.univ- lemans.fr/-dchat/beartex/beartex.htm. The study presented on this site demonstrates the capability of texture analysis to describe hetero- epitaxial relationships [Chateigner et Erler, 19971 using classical X- rays. Peoples using neutron diffraction (and position sensitive detector) and interested in QTA on multiphase samples with low crystal symmetries may find it in the paper of Chateigner & al., 19971. We prefer for this example paper to focuss on the correlations between QTA and anisotropic physical properties. For this we chose three examples of materials science, anionic conductors (BiCoVOx), high performance permanent magnets (Sm-Co family) and high temperature superconductors (YBCO and BSCCO family)."
2. Anionic conductivity in BiCoVOx ceramics [Muller et al., 19961 Solid electrolytes exhibiting good ionic conductivity by 02- ions are used in oxygen sensors, oxygen pumps, or fuel cells. Their main features are (i) a high oxide ion conductivity over a wide range of temperatures and oxygen partial pressures, and (ii) a low fabrication cost of tubes and membranes with large surface and low thickness. Therefore, the polycrystalline ceramics represent an important economical and technological challenge.
Among compounds showing such properties, the compound discovered in 1985 [1,2] and formulated Bi4V2011 is of interest. Its structure is close to the Aurivillius phase Bi2MoO6. This compound may be viewed as an intergrowth, along the c axis, of alternating (Bi202)2+ sheets and (M004)~- perovskite layers. The complete substitution of Mo6+ ions by V5+ cations induces the creation of oxygen vacancies to conserve the total electroneutrality. In previous works [3,4], it has been demonstrated that these vacancies are located
in the plane of octahedra (V05 ,5O0,5), conferring a two-dimensional behaviour of the conductivity.
The aim of this work was to show the relation between the texture and the conductivity of the Bi4(V0,85Co0,15)2011-6 compound. The uniaxial pressure-induced and the magnetic field-induced orientations were studied.
To create orientations in the polycrystalline samples, two processes based on the application of a uniaxial pressure (about 2 kbar) and/or a magnetic field (7T) were used on powders. Then we measured the (006) pole figures and normalised them by direct integration in order to check c axis orientations strengths. The ionic conductivity measurements were carried out by impedance spectroscopy on single crystals and on oriented polycrystalline ceramics.
The texture of one plate-shaped single crystal was firstly investigated. In single crystals, the orientation density reaches high values somehow limited by the experimental resolution. For example, a maximal density near 4000 m.r.d. was estimated using the (006) pole figure. The (006) distribution density measured on the 2 kbar uniaxially pressed sample (P2), has shown a low orientation with a maximal density equal to 14.8 m.r.d.. Using a pressure of 12.5 kbar, the resulting (006) pole density was slightly larger, with 22 m.r.d.. When a magnetic field of 7 T was combined with the 2 kbar pressure (H7P2), the maximum (006) pole density reached 33 m.r.d.. Following these results, both pressure and magnetic field align the grains with their c axes parallel to the applied force or magnetic field direction, the strongest orientation being obtained with a combined process.
Table 1 : Summary of the orientation pole densities PO06 and anisotropic conductivity of single crystal (SC), a 2 kbar uniaxially pressed powder (P2) and a sample oriented by combining axial pressure and a 7T magnetic jield (H7P2).
Taking into account the platelet shape of the single crystals, the conductivity measurements were performed parallel (a//) and perpendicular (al) to the (a,b) plane. The conductivity a// and al measured on a single crystal can be considered as the upper and lower limits which can be attained on a perfect three-dimensionally oriented material. In contrast, on free powders, the absence of preferred orientation averages out the parallel and perpendicular conduction effects. Oriented powders have an intermediate conductivity behaviour. The sample characteristics and the values of the maximum (006) orientation densities are summarised in the table 1. The conductivity values o// and al are given at 870 K: the values obtained on the sample H7P2 are close to the values measured on the single crystal. The difference between a// and ol is around 7O.1Oe3 S.cm" for the single c stal, 50.109 S.cm-' for the sample H7P2, and around 20.10-
H7P2 than for the sample P2, and shows the effect of the magnetic field on the macroscopic conductivity anisotropy, in relation to the degree of texture.
S.cm- 7 for the sample P2. This difference is greater for the sample
2 2 . Anisotropic magnetic properties in textured SmC0.5 bulks [Legrand et al., 1997/ Solidification in a magnetic field (Bt) of the intermetallic compounds SmCo5 and Sm2Co17 produces oriented polycrystals. The resulting high degree of orientation validates a model which explains the physical orientation mechanism which occurs during the solidification process.
10
Due to the association of a rare earth and a transition metal, the ferromagnetic phases SmCo5 (1:s) and Sm2Co17 (217) are exhibiting high saturation magnetisation (Jsl:5 = 0.95 T and J~2:17 = 1.4 T at room temperature), high Curie temperature (Tc1:5 = 710°C and Tc2: 17 = 917"C), with a large uniaxial magnetocrystalline anisotropy along the crystallographic c-axis. The crystal structure of the SmCo5 phase is hexagonal (CaCus-type). The structure of the Sm2Co17 phase can be generated from that of SmCo5 by an ordered substitution of Co dumb-bells into some of the Sm sites. Consequently, these two phases are crystallographically coherent and particularly both have their c- axis as the easiest-magnetisation direction [Kumar, 1988]. Sm-Co type permanent magnets are based on these two ferromagnetic phases.
The produced samples are magnetically characterised by magnetisation measurements carried out in a fluxmeter.
Two experiments have been done (Samples 1 and 2). In each case, the material was heated up to the fusion by HF induction in an alumina crucible, then solidified within a few minutes in a vertical thermal gradient. Sample 1 was solidified without magnetic field, while a magnetic field Bt = 2.5 T was applied for Sample 2. The SEM analyses show that the samples consist of two phases SmCo5 and Sm2Co17 (Figure 1).
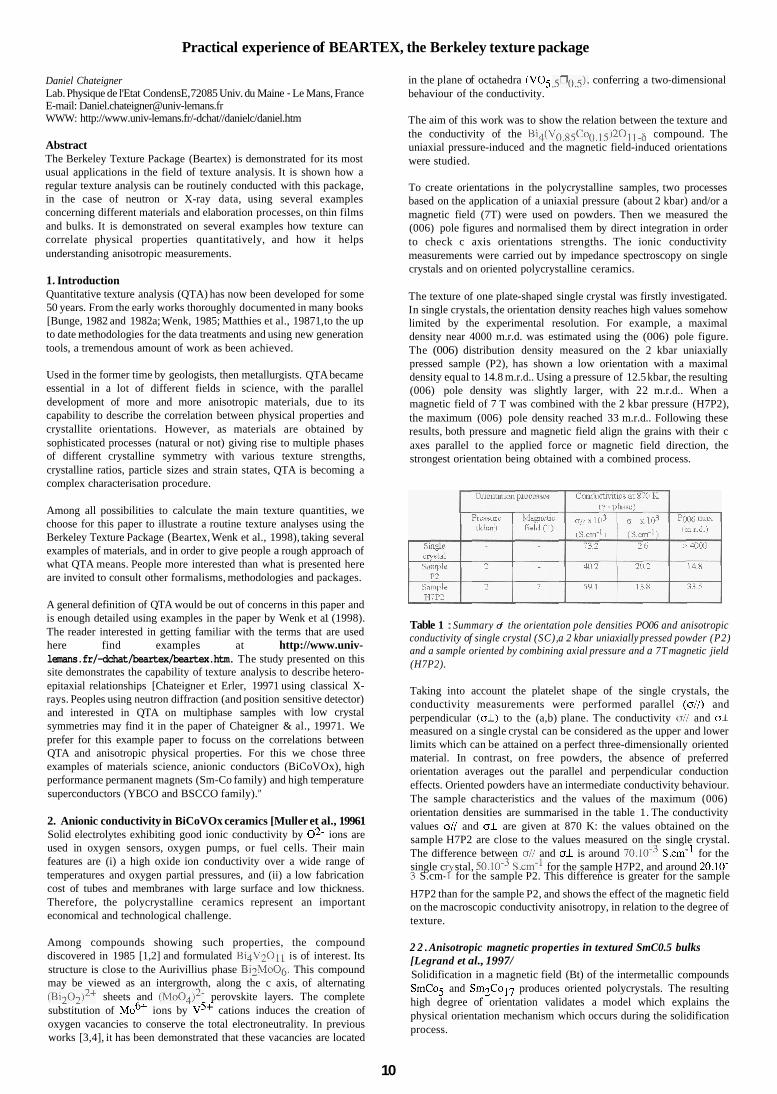
Figure 1: SEM micrography of Sample 2: a morphological texture parallel to Bt is formed by the Sm2Co17 phase (dark grey) in the SmCo5 matrix (light grey). The black areas correspond to holes and cracks in the materials.
The 2:17 phase is aligned parallel to the vertical direction in the 1:5 matrix. This morphological texture has not been observed on Sample 1 and is attributed to the combination of the vertical thermal gradient and the applied magnetic field. The magnetisation measurements performed on the whole samples, in two perpendicular directions (vertical and radial) are presented on Figure 1. Sample 2 exhibits easy- magnetisation and hard-magnetisation directions parallel and perpendicular to Bt respectively. This is the volumic signature of a crystallographic orientation, the c-axes of the grains lying preferentially along the vertical direction. On the contrary, Sample 1 is rather isotropic and does not reveal the c-axes orientation. It is interesting to note that Sample 2 is both morphologically and crystallographically textured
1.2
h - J c v '3
0.8 c I
0 0.5 1 1.5 2 2.5 3
poH (Tesla)
Figure 2: Magnetisation curves of the samples solidified in a vertical magneticjield Bt = 2.5T (Sample 2, bold lines) or in zero-jield (Sample I , fine lines). The full and the dotted curve correspond to vertical and radial measurements respectively.
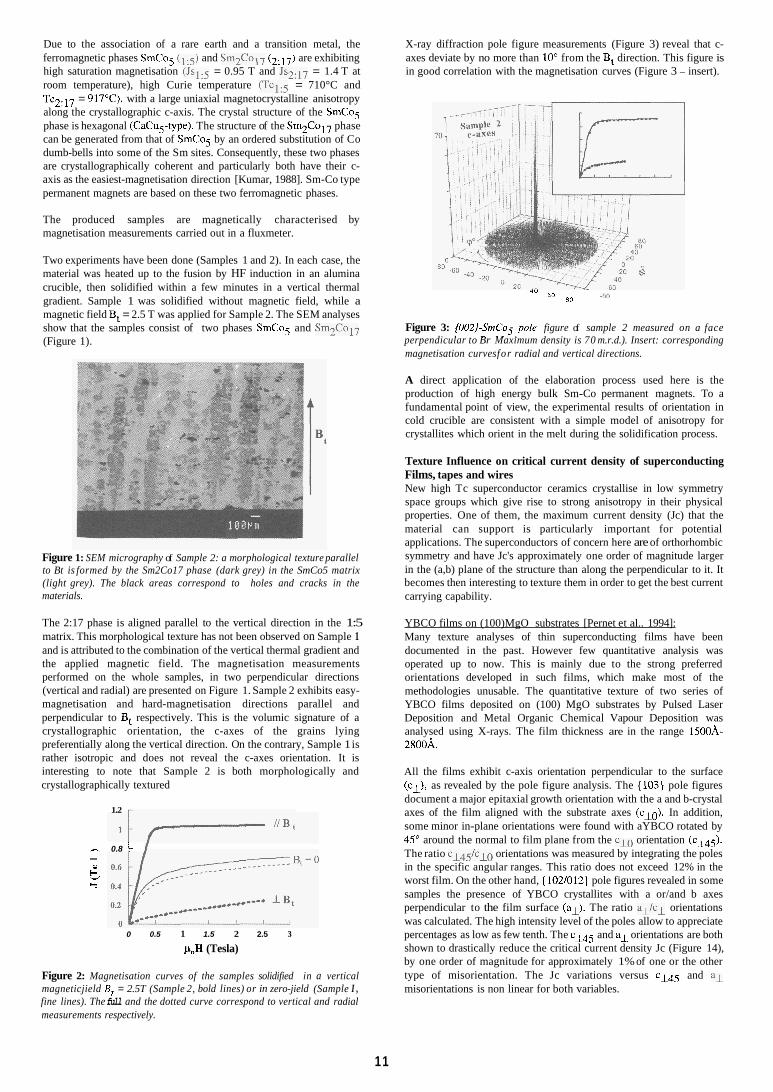
X-ray diffraction pole figure measurements (Figure 3) reveal that c- axes deviate by no more than 10" from the B, direction. This figure is in good correlation with the magnetisation curves (Figure 3 - insert).
80 -On 00
4"
Figure 3: {002/-SmCo5,pole figure of sample 2 measured on a face perpendicular to Br Maximum density is 70 m.r.d.). Insert: corresponding magnetisation curves for radial and vertical directions.
A direct application of the elaboration process used here is the production of high energy bulk Sm-Co permanent magnets. To a fundamental point of view, the experimental results of orientation in cold crucible are consistent with a simple model of anisotropy for crystallites which orient in the melt during the solidification process.
Texture Influence on critical current density of superconducting Films, tapes and wires New high Tc superconductor ceramics crystallise in low symmetry space groups which give rise to strong anisotropy in their physical properties. One of them, the maximum current density (Jc) that the material can support is particularly important for potential applications. The superconductors of concern here are of orthorhombic symmetry and have Jc's approximately one order of magnitude larger in the (a,b) plane of the structure than along the perpendicular to it. It becomes then interesting to texture them in order to get the best current carrying capability.
YBCO films on (100)MgO substrates [Pernet et al.. 1994]: Many texture analyses of thin superconducting films have been documented in the past. However few quantitative analysis was operated up to now. This is mainly due to the strong preferred orientations developed in such films, which make most of the methodologies unusable. The quantitative texture of two series of YBCO films deposited on (100) MgO substrates by Pulsed Laser Deposition and Metal Organic Chemical Vapour Deposition was analysed using X-rays. The film thickness are in the range 150OA- 2800A.
All the films exhibit c-axis orientation perpendicular to the surface (cl), as revealed by the pole figure analysis. The { 103} pole figures document a major epitaxial growth orientation with the a and b-crystal axes of the film aligned with the substrate axes ( l o ) . In addition, some minor in-plane orientations were found with aYBCO rotated by 45" around the normal to film plane from the c l 0 orientation (c145). The ratio C ~ ~ ~ / C L O orientations was measured by integrating the poles in the specific angular ranges. This ratio does not exceed 12% in the worst film. On the other hand, { 102/012} pole figures revealed in some samples the presence of YBCO crystallites with a or/and b axes perpendicular to the film surface (al). The ratio al/cl orientations was calculated. The high intensity level of the poles allow to appreciate percentages as low as few tenth. The c l 4 5 and al orientations are both shown to drastically reduce the critical current density Jc (Figure 14), by one order of magnitude for approximately 1% of one or the other type of misorientation. The Jc variations versus c145 and a 1 misorientations is non linear for both variables.
11
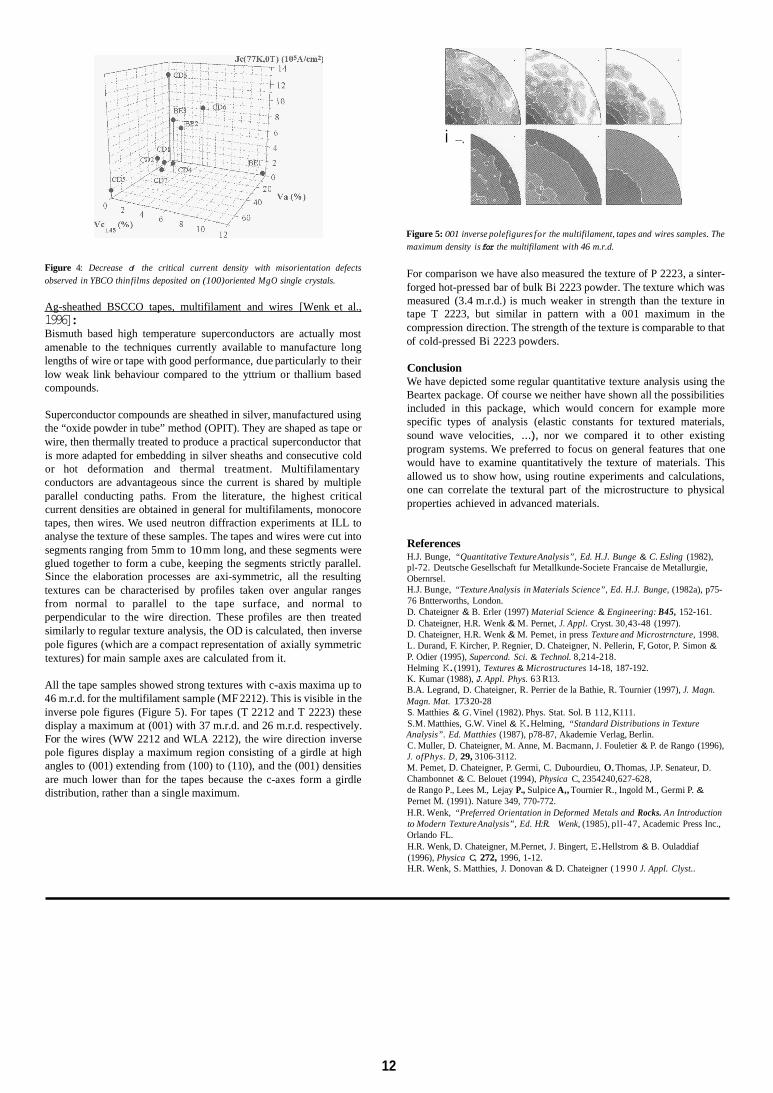
Figure 4: Decrease of the critical current density with misorientation defects observed in YBCO thin films deposited on (100) oriented MgO single crystals.
Ag-sheathed BSCCO tapes, multifilament and wires [Wenk et al., 1996]: Bismuth based high temperature superconductors are actually most amenable to the techniques currently available to manufacture long lengths of wire or tape with good performance, due particularly to their low weak link behaviour compared to the yttrium or thallium based compounds.
Superconductor compounds are sheathed in silver, manufactured using the “oxide powder in tube” method (OPIT). They are shaped as tape or wire, then thermally treated to produce a practical superconductor that is more adapted for embedding in silver sheaths and consecutive cold or hot deformation and thermal treatment. Multifilamentary conductors are advantageous since the current is shared by multiple parallel conducting paths. From the literature, the highest critical current densities are obtained in general for multifilaments, monocore tapes, then wires. We used neutron diffraction experiments at ILL to analyse the texture of these samples. The tapes and wires were cut into segments ranging from 5mm to 10 mm long, and these segments were glued together to form a cube, keeping the segments strictly parallel. Since the elaboration processes are axi-symmetric, all the resulting textures can be characterised by profiles taken over angular ranges from normal to parallel to the tape surface, and normal to perpendicular to the wire direction. These profiles are then treated similarly to regular texture analysis, the OD is calculated, then inverse pole figures (which are a compact representation of axially symmetric textures) for main sample axes are calculated from it.
All the tape samples showed strong textures with c-axis maxima up to 46 m.r.d. for the multifilament sample (MF 2212). This is visible in the inverse pole figures (Figure 5). For tapes (T 2212 and T 2223) these display a maximum at (001) with 37 m.r.d. and 26 m.r.d. respectively. For the wires (WW 2212 and WLA 2212), the wire direction inverse pole figures display a maximum region consisting of a girdle at high angles to (001) extending from (100) to (110), and the (001) densities are much lower than for the tapes because the c-axes form a girdle distribution, rather than a single maximum.
i --,
Figure 5: 001 inverse polefigures for the multifilament, tapes and wires samples. The maximum density is for the multifilament with 46 m.r.d.
For comparison we have also measured the texture of P 2223, a sinter- forged hot-pressed bar of bulk Bi 2223 powder. The texture which was measured (3.4 m.r.d.) is much weaker in strength than the texture in tape T 2223, but similar in pattern with a 001 maximum in the compression direction. The strength of the texture is comparable to that of cold-pressed Bi 2223 powders.
Conclusion We have depicted some regular quantitative texture analysis using the Beartex package. Of course we neither have shown all the possibilities included in this package, which would concern for example more specific types of analysis (elastic constants for textured materials, sound wave velocities, ...), nor we compared it to other existing program systems. We preferred to focus on general features that one would have to examine quantitatively the texture of materials. This allowed us to show how, using routine experiments and calculations, one can correlate the textural part of the microstructure to physical properties achieved in advanced materials.
References H.J. Bunge, “Quantitative Texture Analysis”, Ed. H.J. Bunge & C. Esling (1982), pl-72. Deutsche Gesellschaft fur Metallkunde-Societe Francaise de Metallurgie, Obernrsel. H.J. Bunge, “Texture Analysis in Materials Science”, Ed. H.J. Bunge, (1982a), p75- 76 Bntterworths, London. D. Chateigner & B. Erler (1997) Material Science & Engineering: B45, 152-161. D. Chateigner, H.R. Wenk & M. Pernet, J. Appl. Cryst. 30,43-48 (1997). D. Chateigner, H.R. Wenk & M. Pemet, in press Texture and Microstrncture, 1998. L. Durand, F. Kircher, P. Regnier, D. Chateigner, N. Pellerin, F, Gotor, P. Simon & P. Odier (1995), Supercond. Sci. & Technol. 8,214-218. Helming K. (1991), Textures & Microstructures 14-18, 187-192. K. Kumar (1988), J. Appl. Phys. 63 R13. B.A. Legrand, D. Chateigner, R. Perrier de la Bathie, R. Tournier (1997), J. Magn. Magn. Mat. 173 20-28 S. Matthies & G. Vinel (1982). Phys. Stat. Sol. B 112, K111. S.M. Matthies, G.W. Vinel & K. Helming, “Standard Distributions in Texture Analysis”. Ed. Matthies (1987), p78-87, Akademie Verlag, Berlin. C. Muller, D. Chateigner, M. Anne, M. Bacmann, J. Fouletier & P. de Rango (1996), J. ofPhys. D, 29, 3106-3112. M. Pemet, D. Chateigner, P. Germi, C. Dubourdieu, 0. Thomas, J.P. Senateur, D. Chambonnet & C. Belouet (1994), Physica C, 2354240,627-628, de Rango P., Lees M., Lejay P., Sulpice A,, Tournier R., Ingold M., Germi P. & Pernet M. (1991). Nature 349, 770-772. H.R. Wenk, “Preferred Orientation in Deformed Metals and Rocks. An Introduction to Modern Texture Analysis”, Ed. H:R. Wenk, (1985), pll-47, Academic Press Inc., Orlando FL. H.R. Wenk, D. Chateigner, M.Pernet, J. Bingert, E. Hellstrom & B. Ouladdiaf (1996), Physica C, 272, 1996, 1-12. H.R. Wenk, S. Matthies, J. Donovan & D. Chateigner ( 1 9 9 0 J. Appl. Clyst..
12

A Fundamental Parameters Convolution Based Approach to Synthesizing Line Profiles
By A.A. Coelho', A.A. Kern2, and R.W. C h e w 3 E-mail: [email protected], [email protected], cheary @phys.uts.edu.au 1,2 Bruker Analytical X-Ray Systems GmbH, D-76187 Karlsruhe, Germany
University of Technology, Sydney, Broadway, New South Wales, Australia 2007
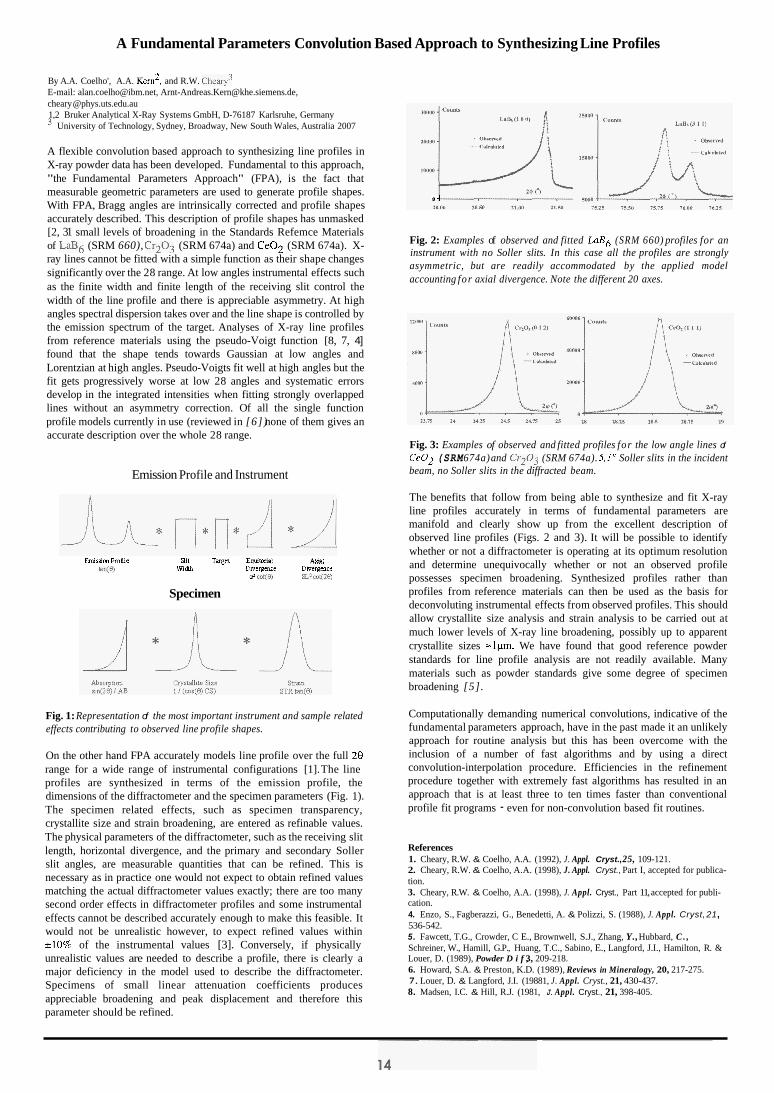
A flexible convolution based approach to synthesizing line profiles in X-ray powder data has been developed. Fundamental to this approach, "the Fundamental Parameters Approach" (FPA), is the fact that measurable geometric parameters are used to generate profile shapes. With FPA, Bragg angles are intrinsically corrected and profile shapes accurately described. This description of profile shapes has unmasked [2, 31 small levels of broadening in the Standards Refemce Materials of L a 6 (SRM 660), Cr203 (SRM 674a) and CeO2 (SRM 674a). X- ray lines cannot be fitted with a simple function as their shape changes significantly over the 28 range. At low angles instrumental effects such as the finite width and finite length of the receiving slit control the width of the line profile and there is appreciable asymmetry. At high angles spectral dispersion takes over and the line shape is controlled by the emission spectrum of the target. Analyses of X-ray line profiles from reference materials using the pseudo-Voigt function [8, 7, 4] found that the shape tends towards Gaussian at low angles and Lorentzian at high angles. Pseudo-Voigts fit well at high angles but the fit gets progressively worse at low 28 angles and systematic errors develop in the integrated intensities when fitting strongly overlapped lines without an asymmetry correction. Of all the single function profile models currently in use (reviewed in [6]) none of them gives an accurate description over the whole 28 range.
Emission Profile and Instrument
Ermrson Profile Sit Target Equtonal Axla1 w1 mh Divergmcc Divergence
d coy@ SL'cal(2B)
Specimen
Fig. 1: Representation of the most important instrument and sample related effects contributing to observed line profile shapes.
On the other hand FPA accurately models line profile over the full 28 range for a wide range of instrumental configurations [1]. The line profiles are synthesized in terms of the emission profile, the dimensions of the diffractometer and the specimen parameters (Fig. 1). The specimen related effects, such as specimen transparency, crystallite size and strain broadening, are entered as refinable values. The physical parameters of the diffractometer, such as the receiving slit length, horizontal divergence, and the primary and secondary Soller slit angles, are measurable quantities that can be refined. This is necessary as in practice one would not expect to obtain refined values matching the actual diffractometer values exactly; there are too many second order effects in diffractometer profiles and some instrumental effects cannot be described accurately enough to make this feasible. It would not be unrealistic however, to expect refined values within 210% of the instrumental values [3]. Conversely, if physically unrealistic values are needed to describe a profile, there is clearly a major deficiency in the model used to describe the diffractometer. Specimens of small linear attenuation coefficients produces appreciable broadening and peak displacement and therefore this parameter should be refined.
04
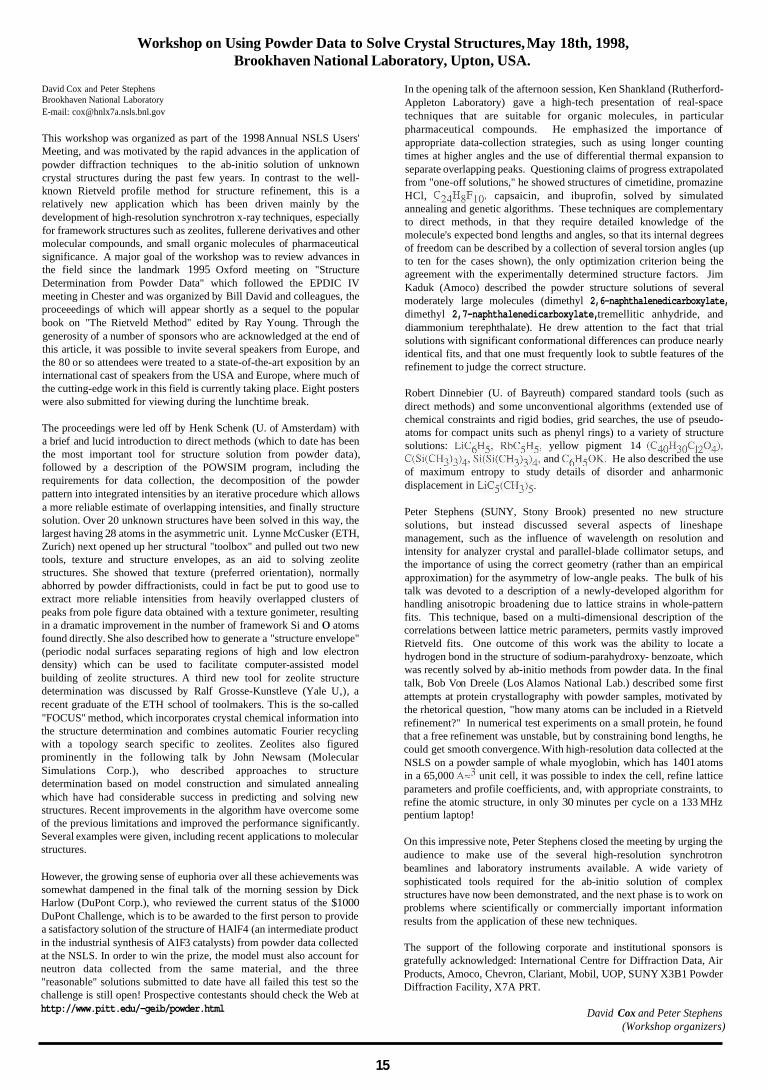
Fig. 2: Examples of observed and fitted LaB6 (SRM 660) profiles for an instrument with no Soller slits. In this case all the profiles are strongly asymmetric, but are readily accommodated by the applied model accounting for axial divergence. Note the different 20 axes.
Fig. 3: Examples of observed and fitted profiles for the low angle lines of CeO2 (SRM 674a) and Cr203 (SRM 674a). 5,1" Soller slits in the incident beam, no Soller slits in the diffracted beam.
The benefits that follow from being able to synthesize and fit X-ray line profiles accurately in terms of fundamental parameters are manifold and clearly show up from the excellent description of observed line profiles (Figs. 2 and 3). It will be possible to identify whether or not a diffractometer is operating at its optimum resolution and determine unequivocally whether or not an observed profile possesses specimen broadening. Synthesized profiles rather than profiles from reference materials can then be used as the basis for deconvoluting instrumental effects from observed profiles. This should allow crystallite size analysis and strain analysis to be carried out at much lower levels of X-ray line broadening, possibly up to apparent crystallite sizes = 1 p . We have found that good reference powder standards for line profile analysis are not readily available. Many materials such as powder standards give some degree of specimen broadening [5].
Computationally demanding numerical convolutions, indicative of the fundamental parameters approach, have in the past made it an unlikely approach for routine analysis but this has been overcome with the inclusion of a number of fast algorithms and by using a direct convolution-interpolation procedure. Efficiencies in the refinement procedure together with extremely fast algorithms has resulted in an approach that is at least three to ten times faster than conventional profile fit programs - even for non-convolution based fit routines.
References 1. Cheary, R.W. & Coelho, A.A. (1992), J. Appl. Cryst., 25, 109-121. 2. Cheary, R.W. & Coelho, A.A. (1998), J. Appl. Cryst., Part I, accepted for publica- tion. 3. Cheary, R.W. & Coelho, A.A. (1998), J. Appl. Cryst., Part 11, accepted for publi- cation. 4. Enzo, S., Fagberazzi, G., Benedetti, A. & Polizzi, S. (1988), J. Appl. Cryst, 21, 536-542. 5. Fawcett, T.G., Crowder, C E., Brownwell, S.J., Zhang, Y., Hubbard, C . , Schreiner, W., Hamill, G.P., Huang, T.C., Sabino, E., Langford, J.I., Hamilton, R. & Louer, D. (1989), Powder D i f , 3, 209-218. 6. Howard, S.A. & Preston, K.D. (1989), Reviews in Mineralogy, 20, 217-275. 7. Louer, D. & Langford, J.I. (19881, J. Appl. Cryst., 21, 430-437. 8. Madsen, I.C. & Hill, R.J. (1981, J. Appl. Cryst., 21, 398-405.
Workshop on Using Powder Data to Solve Crystal Structures, May 18th, 1998, Brookhaven National Laboratory, Upton, USA.
David Cox and Peter Stephens Brookhaven National Laboratory E-mail: [email protected]
This workshop was organized as part of the 1998 Annual NSLS Users' Meeting, and was motivated by the rapid advances in the application of powder diffraction techniques to the ab-initio solution of unknown crystal structures during the past few years. In contrast to the well- known Rietveld profile method for structure refinement, this is a relatively new application which has been driven mainly by the development of high-resolution synchrotron x-ray techniques, especially for framework structures such as zeolites, fullerene derivatives and other molecular compounds, and small organic molecules of pharmaceutical significance. A major goal of the workshop was to review advances in the field since the landmark 1995 Oxford meeting on "Structure Determination from Powder Data" which followed the EPDIC IV meeting in Chester and was organized by Bill David and colleagues, the proceeedings of which will appear shortly as a sequel to the popular book on "The Rietveld Method" edited by Ray Young. Through the generosity of a number of sponsors who are acknowledged at the end of this article, it was possible to invite several speakers from Europe, and the 80 or so attendees were treated to a state-of-the-art exposition by an international cast of speakers from the USA and Europe, where much of the cutting-edge work in this field is currently taking place. Eight posters were also submitted for viewing during the lunchtime break.
The proceedings were led off by Henk Schenk (U. of Amsterdam) with a brief and lucid introduction to direct methods (which to date has been the most important tool for structure solution from powder data), followed by a description of the POWSIM program, including the requirements for data collection, the decomposition of the powder pattern into integrated intensities by an iterative procedure which allows a more reliable estimate of overlapping intensities, and finally structure solution. Over 20 unknown structures have been solved in this way, the largest having 28 atoms in the asymmetric unit. Lynne McCusker (ETH, Zurich) next opened up her structural "toolbox" and pulled out two new tools, texture and structure envelopes, as an aid to solving zeolite structures. She showed that texture (preferred orientation), normally abhorred by powder diffractionists, could in fact be put to good use to extract more reliable intensities from heavily overlapped clusters of peaks from pole figure data obtained with a texture gonimeter, resulting in a dramatic improvement in the number of framework Si and 0 atoms found directly. She also described how to generate a "structure envelope" (periodic nodal surfaces separating regions of high and low electron density) which can be used to facilitate computer-assisted model building of zeolite structures. A third new tool for zeolite structure determination was discussed by Ralf Grosse-Kunstleve (Yale U,), a recent graduate of the ETH school of toolmakers. This is the so-called "FOCUS" method, which incorporates crystal chemical information into the structure determination and combines automatic Fourier recycling with a topology search specific to zeolites. Zeolites also figured prominently in the following talk by John Newsam (Molecular Simulations Corp.), who described approaches to structure determination based on model construction and simulated annealing which have had considerable success in predicting and solving new structures. Recent improvements in the algorithm have overcome some of the previous limitations and improved the performance significantly. Several examples were given, including recent applications to molecular structures.
However, the growing sense of euphoria over all these achievements was somewhat dampened in the final talk of the morning session by Dick Harlow (DuPont Corp.), who reviewed the current status of the $1000 DuPont Challenge, which is to be awarded to the first person to provide a satisfactory solution of the structure of HAlF4 (an intermediate product in the industrial synthesis of A1F3 catalysts) from powder data collected at the NSLS. In order to win the prize, the model must also account for neutron data collected from the same material, and the three "reasonable" solutions submitted to date have all failed this test so the challenge is still open! Prospective contestants should check the Web at http://www.pitt.edu/-geib/powder.html
In the opening talk of the afternoon session, Ken Shankland (Rutherford- Appleton Laboratory) gave a high-tech presentation of real-space techniques that are suitable for organic molecules, in particular pharmaceutical compounds. He emphasized the importance of appropriate data-collection strategies, such as using longer counting times at higher angles and the use of differential thermal expansion to separate overlapping peaks. Questioning claims of progress extrapolated from "one-off solutions," he showed structures of cimetidine, promazine HCl, C24HgF10, capsaicin, and ibuprofin, solved by simulated annealing and genetic algorithms. These techniques are complementary to direct methods, in that they require detailed knowledge of the molecule's expected bond lengths and angles, so that its internal degrees of freedom can be described by a collection of several torsion angles (up to ten for the cases shown), the only optimization criterion being the agreement with the experimentally determined structure factors. Jim Kaduk (Amoco) described the powder structure solutions of several moderately large molecules (dimethyl 2,6-naphthalenedicarboxylate, dimethyl 2,7-naphthalenedicarboxylate, tremellitic anhydride, and diammonium terephthalate). He drew attention to the fact that trial solutions with significant conformational differences can produce nearly identical fits, and that one must frequently look to subtle features of the refinement to judge the correct structure.
Robert Dinnebier (U. of Bayreuth) compared standard tools (such as direct methods) and some unconventional algorithms (extended use of chemical constraints and rigid bodies, grid searches, the use of pseudo- atoms for compact units such as phenyl rings) to a variety of structure solutions: LiCgHs,. RbC5H5, yellow pigment 14 ( C ~ O H ~ O C ~ ~ O ~ ) , C(Si(CH3)3)4, Si(Si(CH3)3)4, and CgH50K. He also described the use of maximum entropy to study details of disorder and anharmonic displacement in L ~ C S ( C H ~ ) ~ .
Peter Stephens (SUNY, Stony Brook) presented no new structure solutions, but instead discussed several aspects of lineshape management, such as the influence of wavelength on resolution and intensity for analyzer crystal and parallel-blade collimator setups, and the importance of using the correct geometry (rather than an empirical approximation) for the asymmetry of low-angle peaks. The bulk of his talk was devoted to a description of a newly-developed algorithm for handling anisotropic broadening due to lattice strains in whole-pattern fits. This technique, based on a multi-dimensional description of the correlations between lattice metric parameters, permits vastly improved Rietveld fits. One outcome of this work was the ability to locate a hydrogen bond in the structure of sodium-parahydroxy- benzoate, which was recently solved by ab-initio methods from powder data. In the final talk, Bob Von Dreele (Los Alamos National Lab.) described some first attempts at protein crystallography with powder samples, motivated by the rhetorical question, "how many atoms can be included in a Rietveld refinement?" In numerical test experiments on a small protein, he found that a free refinement was unstable, but by constraining bond lengths, he could get smooth convergence. With high-resolution data collected at the NSLS on a powder sample of whale myoglobin, which has 1401 atoms in a 65,000 A=3 unit cell, it was possible to index the cell, refine lattice parameters and profile coefficients, and, with appropriate constraints, to refine the atomic structure, in only 30 minutes per cycle on a 133 MHz pentium laptop!
On this impressive note, Peter Stephens closed the meeting by urging the audience to make use of the several high-resolution synchrotron beamlines and laboratory instruments available. A wide variety of sophisticated tools required for the ab-initio solution of complex structures have now been demonstrated, and the next phase is to work on problems where scientifically or commercially important information results from the application of these new techniques.
The support of the following corporate and institutional sponsors is gratefully acknowledged: International Centre for Diffraction Data, Air Products, Amoco, Chevron, Clariant, Mobil, UOP, SUNY X3B1 Powder Diffraction Facility, X7A PRT.
David Cox and Peter Stephens (Workshop organizers)
15
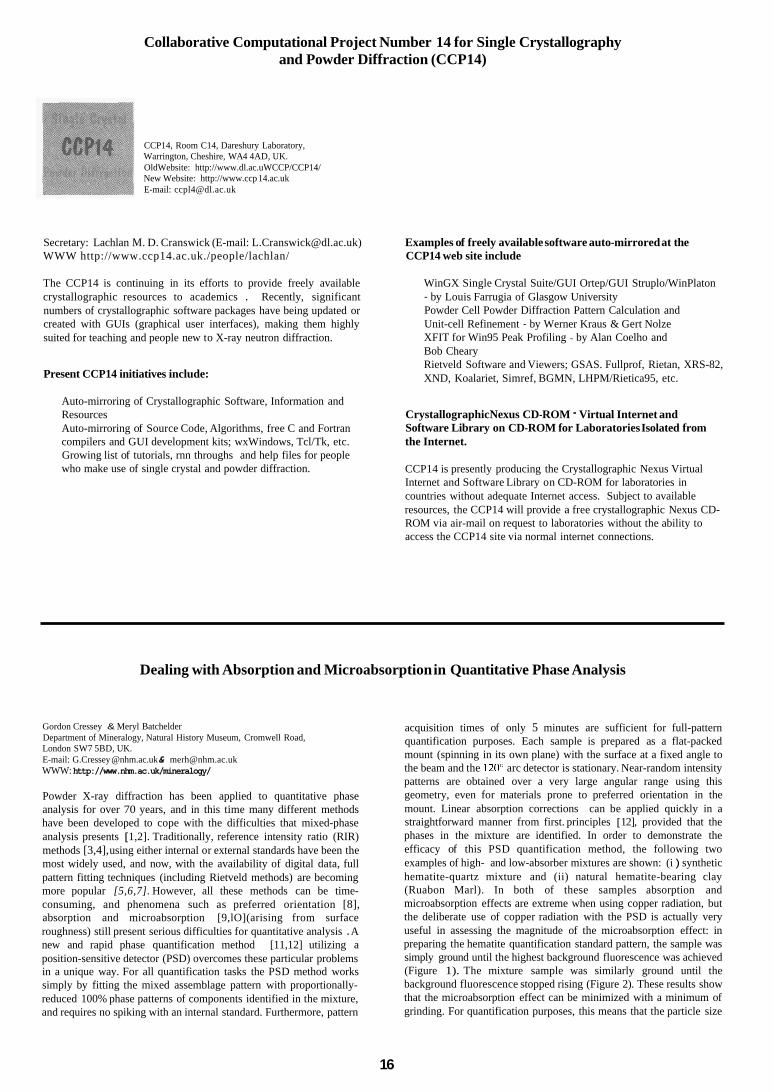
Collaborative Computational Project Number 14 for Single Crystallography and Powder Diffraction (CCP14)
CCP14, Room C14, Dareshury Laboratory, Warrington, Cheshire, WA4 4AD, UK. OldWebsite: http://www.dl.ac.uWCCP/CCP14/ New Website: http://www.ccp 14.ac.uk E-mail: [email protected]
Secretary: Lachlan M. D. Cranswick (E-mail: [email protected]) WWW http://www.ccp14.ac.uk./people/lachlan/
The CCP14 is continuing in its efforts to provide freely available crystallographic resources to academics . Recently, significant numbers of crystallographic software packages have being updated or created with GUIs (graphical user interfaces), making them highly suited for teaching and people new to X-ray neutron diffraction.
Present CCP14 initiatives include:
Auto-mirroring of Crystallographic Software, Information and Resources Auto-mirroring of Source Code, Algorithms, free C and Fortran compilers and GUI development kits; wxWindows, Tcl/Tk, etc. Growing list of tutorials, rnn throughs and help files for people who make use of single crystal and powder diffraction.
Examples of freely available software auto-mirrored at the CCP14 web site include
WinGX Single Crystal Suite/GUI Ortep/GUI Struplo/WinPlaton - by Louis Farrugia of Glasgow University Powder Cell Powder Diffraction Pattern Calculation and Unit-cell Refinement - by Werner Kraus & Gert Nolze XFIT for Win95 Peak Profiling - by Alan Coelho and Bob Cheary Rietveld Software and Viewers; GSAS. Fullprof, Rietan, XRS-82, XND, Koalariet, Simref, BGMN, LHPM/Rietica95, etc.
Crystallographic Nexus CD-ROM - Virtual Internet and Software Library on CD-ROM for Laboratories Isolated from the Internet.
CCP14 is presently producing the Crystallographic Nexus Virtual Internet and Software Library on CD-ROM for laboratories in countries without adequate Internet access. Subject to available resources, the CCP14 will provide a free crystallographic Nexus CD- ROM via air-mail on request to laboratories without the ability to access the CCP14 site via normal internet connections.
Dealing with Absorption and Microabsorption in Quantitative Phase Analysis
Gordon Cressey & Meryl Batchelder Department of Mineralogy, Natural History Museum, Cromwell Road, London SW7 5BD, UK. E-mail: G.Cressey @nhm.ac.uk & [email protected] WWW: http://www.nhm.ac.uk/mineralogy/
Powder X-ray diffraction has been applied to quantitative phase analysis for over 70 years, and in this time many different methods have been developed to cope with the difficulties that mixed-phase analysis presents [ 1,2]. Traditionally, reference intensity ratio (RIR) methods [3,4], using either internal or external standards have been the most widely used, and now, with the availability of digital data, full pattern fitting techniques (including Rietveld methods) are becoming more popular [5,6,7]. However, all these methods can be time- consuming, and phenomena such as preferred orientation [8], absorption and microabsorption [9,lO](arising from surface roughness) still present serious difficulties for quantitative analysis . A new and rapid phase quantification method [11,12] utilizing a position-sensitive detector (PSD) overcomes these particular problems in a unique way. For all quantification tasks the PSD method works simply by fitting the mixed assemblage pattern with proportionally- reduced 100% phase patterns of components identified in the mixture, and requires no spiking with an internal standard. Furthermore, pattern
acquisition times of only 5 minutes are sufficient for full-pattern quantification purposes. Each sample is prepared as a flat-packed mount (spinning in its own plane) with the surface at a fixed angle to the beam and the 120" arc detector is stationary. Near-random intensity patterns are obtained over a very large angular range using this geometry, even for materials prone to preferred orientation in the mount. Linear absorption corrections can be applied quickly in a straightforward manner from first. principles [ 12], provided that the phases in the mixture are identified. In order to demonstrate the efficacy of this PSD quantification method, the following two examples of high- and low-absorber mixtures are shown: (i ) synthetic hematite-quartz mixture and (ii) natural hematite-bearing clay (Ruabon Marl). In both of these samples absorption and microabsorption effects are extreme when using copper radiation, but the deliberate use of copper radiation with the PSD is actually very useful in assessing the magnitude of the microabsorption effect: in preparing the hematite quantification standard pattern, the sample was simply ground until the highest background fluorescence was achieved (Figure 1). The mixture sample was similarly ground until the background fluorescence stopped rising (Figure 2). These results show that the microabsorption effect can be minimized with a minimum of grinding. For quantification purposes, this means that the particle size
16
and surface smoothness of each sample is replicated, and the microabsorption effect in the mixture is directly proportional to the microabsorption of the standard phase(s). Therefore, the microabsorption effect cancels out when proportioning the standard pattern to fit the mixed assemblage pattern. Results of phase quantification using this approach [12] are demonstrated for the hematite-quartz mixture (Figure 3) and the natural Ruabon Marl (Figure 4).
0
10 20 30 40 50 60 70 80 90 100 110 120
W C % J
Figure 1. For coarse powder (D), whole pattern intensity is lost because of microabsorption: the intensity of both the Bragg peaks and fluorescence background (the undulating signal detected by the PSD) are lowered. Grinding to a powder of about 10 micron grain size minimizes the microabsorption effect, but further grinding to 5 microns has little further effect.
40W}
? - A s R I niFWT TF t /h - .7E19Cm06Oz 1 0 . 3 9 . rematte q t tFFEC- 3' S-SFACE i? .GnhESSOh M Cq'3ABSCRCT Oh
D 'FRACT O h A k 7 F..3RECLEhCF .S I GCOOPER RAD 41C'.
A <37 micron sieve fraction, ground to 4 0 microns
B c37 micron sieve fraction
C Difference pattern (5 - A)
Figure 2. If the constituent grains are large, then the Bragg peaks and fluorescence background from the high-absorber phase (hematite peaks starred) appear too low and will lead to an error in quantification. Grinding to 4 0 microns ensures that microabsorption is minimized (top pattern).
RTZ + HEMATITE mutu 01% Qr 10 "01% Hemat
5000 ~
4000 ~
c ' 3000-
2000 ~
z (countsx c 43)
1000 -
0 -
, I I , , , I , , , ,
10 20 30 40 50 60 70 80 90 100 110 120
W c K J
absorption
Quartz Si02 Hematite Fe,O,
Figure 3. Quantification of a mixture of Quartz + 10% Hematite (by volume). Microabsorption was first minimized by grinding each sample to <10 microns. The correction for absorption (from linear absorption coefficients and densities) is based solely on the fit (apparent volume) measurements and assumes no knowledge of actual volumes [ 12 ].
Figure 4. Phase Quantification of the Ruabon Marl, a natural hematite- bearing clay. Microabsorption from the hematite standard was minimized as outlined in Figure 1, and corrections for absorption applied as in [ 12 ].
References [l] Klug HP &Alexander LE. X-ray difraction Procedures (Wiley, New York,) 2nd ed. (1974) [2] Snyder RL & Bish DL. Quantitative Analysis. Reviews in Mineralogy (Min. Soc. America, Washington, DC), 20 (1989) 101-144. [3] Chung FH. JAppl Cryst 7 (1974) 519-525. [41 Chung FH. JAppl Cryst 7 (1974) 526-531. [51 Smith DK, Johnson GG Jr, Scheible A, Wims AM, Johnson JL, Ullmann G. Powder Diff 2 (1987) 73-77. [61 Hill RJ, Howard CJ. JAppl Cryst 20 (1987) 467-474. [71 Bish DL, Howard SA. JAppl Cryst 21 (1988) 86-91. [8] Brindley GW. 1980. In: Brindley GW, Brown G, editors. Crystal structures of clay minerals and their X-ray identification. London: Mineralogical Soc. p 41 1-438 (1980). [9] Wilchinsky ZW. Acta Cryst 4 (1951)l-9. [l0] Herman H, Ermrich M. Acta Cryst A43 (1987) 401-405. [ll] Cressey G, Schofield PF. Powder Diff IIl (1996) 35-39. [12] Batchelder M & Cressey G. Clays & Clay Minerals 46 (1998) 183-194.
17
World Directory of Powder Diffraction Programs Release 1998 Syb Gorter and Deane K. Smith
The World Directory of Powder Diffraction Programs is a continuing project with the goal to identify and catalogue all the programs available for powder diffraction analysis. It is a joint project of Syb Gorter of the Program Exchange Bank in the Netherlands and Deane K. Smith of the USA and is sponsored by the Commission on Powder Diffraction of the International Union of Crystallography. The main collection point is Daresbury, Great Britain. This collection point can be reached at the following address.
ftp://ftv.dl.ac.uk/wdvvl
This site contains programs categorized into 22 areas of activity and 6 subgroups. The directory structure is designed such that one has to choose first the platform. The next level contains subdirectories named after the Table numbers in the printed catalogue.
The table numbers cover the following categories:
Table0 1. TableO2. TableO3a. Table03 b. Table03c. TableO3d. Table04. TableO5. Table06. Table07. Table08. Table09. TablelO. Tablel 1. Tablel2a.
Crystallographic databases Analysis packages Diffractometer Control File manipulation Peak Finding Film reading d-Generation Graphical d-1 display Phase identification Automatic Indexing Refinement/indexing Refinement/error analysis Metric analysis Pattern Generation Small groups profile fitting
(no unit cell restraint)
Tablel2b. Tablel 3. Tablel4. Table 15. Tablel 6. Tablel 7. Table 18. Tablel 9. Table20. Table21. Table22.
Full pattern profile fitting Deconvolution Crystallinity/strain/texture Rietveld - structure refinement Quantitative analysis Structure Determination (powder) Structure display Small-angle Scattering Miscellaneous programs Epitaxy Teaching
All programs are available as zip files and can be unzipped on different platforms using the unzip software available in the first level UNZIP directory.
Further detailed descriptions on the web for all programs is under construction. A printed version published in 1995 by the Program Exchange Bank is still available (Current price US$ 50, postage and handling included). Contact Syb Gorter ([email protected]) for a copy.
A discount of US$15 is available for payment in cash. Send orders to: Drs. Ing. S. Gorter 43 van Lennepdreef, NL-2353 NJ Leiderdorp, the Netherlands E-Mail address: [email protected] Fax: (31) 71 582 0827 Phone: (31) 71 527 4415, during business hours or (31) 71 589 1388 Manager of the Program Exchange Bank, the Central Distribution Site for Powder Diffraction Software Maintainer of the World Directory of Powder Diffraction Software
ISPD'98 : An International School on Powder Diffraction Prof. S. P. Sen Gupta
I.A.C.S., Jadavpur, Calcutta-700 032.
ISPD'98 : An International School on Powder Diffraction (ISPD'98), sponsored by IUCr and Co-sponsored by ICDD (USA), CSIR, INSA, DST, DAE (India), will be organized at the prestigious institute of Calcutta namely, Indian Association for the Cultivation of Science (IACS) for the first-time in this sub-continent. The School, ISPD'98, will be inaugurated by Prof. Ted Baker, President, IUCr and will be attended by Dr. R. Chidambaram, Vice-president, IUCr, Bob Cernik (Chairman, CPD) Lynne McCusker, Tellgreu, Izumi, John Fabir an other eminent speakers. Strong responses have been received and it is expected that about 200 participants will be attending the School. The School will have talks and 'hands-on' tutorials on all aspects of Powder Diffraction including Rietveld method, surface structures etc. Technical talks will be delivered by representatives from Philips, Siemens. IUCr funding will be available for young scientists. The Registration fee (which is a total package) is US $150 (Young participants) and US $ 200 (regular participant). The School will be held from October 7-10, 1998 during festival time at Calcutta.
These interested may contact
Prof. S. P. Sen Gupta, Secretary, ISPD'98, IACS, Calcutta 700 032, India Fax : +91-033-4732805 E-mail: [email protected] or [email protected]; WWW via: http://gandalf.otago.ac.nz:8OO/~eavers/ASC~asca9S.htm
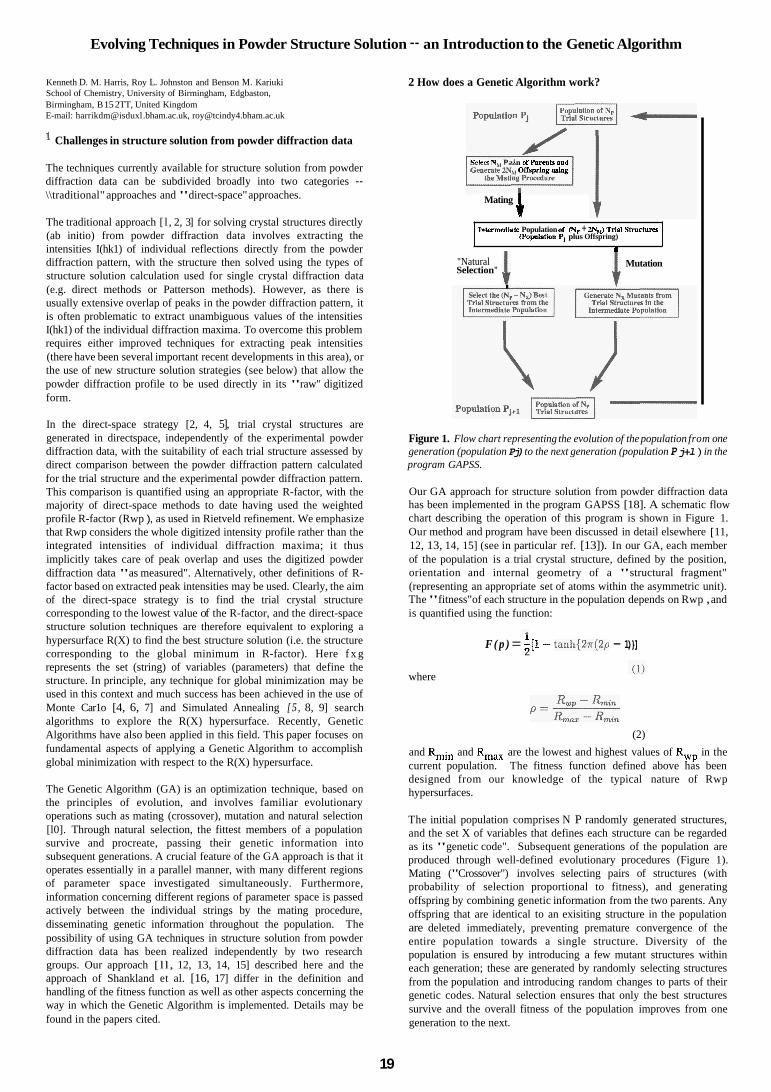
Evolving Techniques in Powder Structure Solution -- an Introduction to the Genetic Algorithm
Kenneth D. M. Harris, Roy L. Johnston and Benson M. Kariuki School of Chemistry, University of Birmingham, Edgbaston, Birmingham, B 15 2TT, United Kingdom E-mail: harrikdm@isduxl .bham.ac.uk, [email protected]
Challenges in structure solution from powder diffraction data
The techniques currently available for structure solution from powder diffraction data can be subdivided broadly into two categories -- \\traditional" approaches and "direct-space" approaches.
The traditional approach [ l , 2, 3] for solving crystal structures directly (ab initio) from powder diffraction data involves extracting the intensities I(hk1) of individual reflections directly from the powder diffraction pattern, with the structure then solved using the types of structure solution calculation used for single crystal diffraction data (e.g. direct methods or Patterson methods). However, as there is usually extensive overlap of peaks in the powder diffraction pattern, it is often problematic to extract unambiguous values of the intensities I(hk1) of the individual diffraction maxima. To overcome this problem requires either improved techniques for extracting peak intensities (there have been several important recent developments in this area), or the use of new structure solution strategies (see below) that allow the powder diffraction profile to be used directly in its "raw" digitized form.
In the direct-space strategy [2, 4, 5], trial crystal structures are generated in directspace, independently of the experimental powder diffraction data, with the suitability of each trial structure assessed by direct comparison between the powder diffraction pattern calculated for the trial structure and the experimental powder diffraction pattern. This comparison is quantified using an appropriate R-factor, with the majority of direct-space methods to date having used the weighted profile R-factor (Rwp ), as used in Rietveld refinement. We emphasize that Rwp considers the whole digitized intensity profile rather than the integrated intensities of individual diffraction maxima; it thus implicitly takes care of peak overlap and uses the digitized powder diffraction data "as measured". Alternatively, other definitions of R- factor based on extracted peak intensities may be used. Clearly, the aim of the direct-space strategy is to find the trial crystal structure corresponding to the lowest value of the R-factor, and the direct-space structure solution techniques are therefore equivalent to exploring a hypersurface R(X) to find the best structure solution (i.e. the structure corresponding to the global minimum in R-factor). Here f x g represents the set (string) of variables (parameters) that define the structure. In principle, any technique for global minimization may be used in this context and much success has been achieved in the use of Monte Car1o [4, 6, 7] and Simulated Annealing [5, 8, 9] search algorithms to explore the R(X) hypersurface. Recently, Genetic Algorithms have also been applied in this field. This paper focuses on fundamental aspects of applying a Genetic Algorithm to accomplish global minimization with respect to the R(X) hypersurface.
The Genetic Algorithm (GA) is an optimization technique, based on the principles of evolution, and involves familiar evolutionary operations such as mating (crossover), mutation and natural selection [l0]. Through natural selection, the fittest members of a population survive and procreate, passing their genetic information into subsequent generations. A crucial feature of the GA approach is that it operates essentially in a parallel manner, with many different regions of parameter space investigated simultaneously. Furthermore, information concerning different regions of parameter space is passed actively between the individual strings by the mating procedure, disseminating genetic information throughout the population. The possibility of using GA techniques in structure solution from powder diffraction data has been realized independently by two research groups. Our approach [ll, 12, 13, 14, 15] described here and the approach of Shankland et al. [16, 17] differ in the definition and handling of the fitness function as well as other aspects concerning the way in which the Genetic Algorithm is implemented. Details may be found in the papers cited.
2 How does a Genetic Algorithm work?
Sekd N Pain of Parents and ~enera122~ , , Ofiprtng usbg
j , Mating
Intermediate Population of (Np + 2N,J M a 1 Stmctum (Population PJ plus Offspring)
I
"Natural Selection"
Mutation I I
Figure 1. Flow chart representing the evolution of the population from one generation (population Pj) to the next generation (population P j+l ) in the program GAPSS.
Our GA approach for structure solution from powder diffraction data has been implemented in the program GAPSS [18]. A schematic flow chart describing the operation of this program is shown in Figure 1. Our method and program have been discussed in detail elsewhere [ 11, 12, 13, 14, 15] (see in particular ref. [13]). In our GA, each member of the population is a trial crystal structure, defined by the position, orientation and internal geometry of a "structural fragment" (representing an appropriate set of atoms within the asymmetric unit). The "fitness" of each structure in the population depends on Rwp , and is quantified using the function:
F ( p ) = 1[1- tanh{27r(2p - 1)}] 2
where
(2) and Rmin and Rmax are the lowest and highest values of Rwp in the current population. The fitness function defined above has been designed from our knowledge of the typical nature of Rwp hypersurfaces.
The initial population comprises N P randomly generated structures, and the set X of variables that defines each structure can be regarded as its "genetic code". Subsequent generations of the population are produced through well-defined evolutionary procedures (Figure 1). Mating ("Crossover") involves selecting pairs of structures (with probability of selection proportional to fitness), and generating offspring by combining genetic information from the two parents. Any offspring that are identical to an exisiting structure in the population are deleted immediately, preventing premature convergence of the entire population towards a single structure. Diversity of the population is ensured by introducing a few mutant structures within each generation; these are generated by randomly selecting structures from the population and introducing random changes to parts of their genetic codes. Natural selection ensures that only the best structures survive and the overall fitness of the population improves from one generation to the next.
19
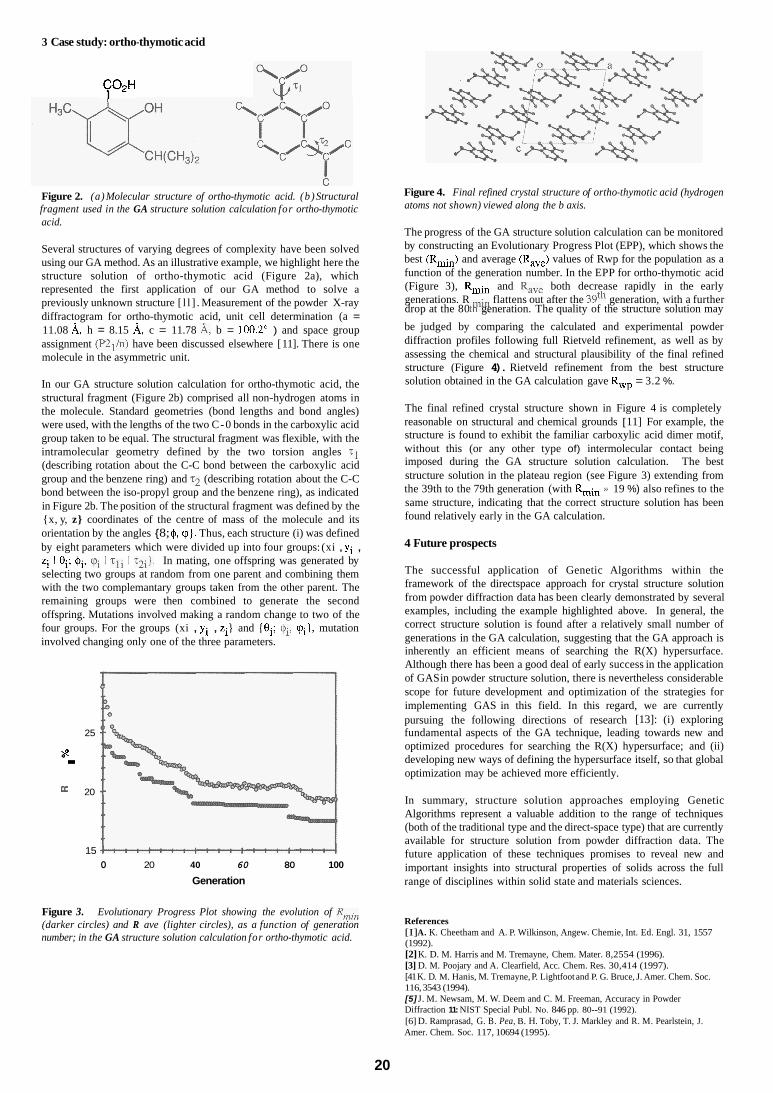
3 Case study: ortho-thymotic acid
C02H I
Figure 2. (a) Molecular structure of ortho-thymotic acid. (b ) Structural fragment used in the GA structure solution calculation for ortho-thymotic acid.
Several structures of varying degrees of complexity have been solved using our GA method. As an illustrative example, we highlight here the structure solution of ortho-thymotic acid (Figure 2a), which represented the first application of our GA method to solve a previously unknown structure [ l l ] . Measurement of the powder X-ray diffractogram for ortho-thymotic acid, unit cell determination (a = 11.08 A, h = 8.15 A, c = 11.78 A, b = 100.2' ) and space group assignment (P21/n) have been discussed elsewhere [1 1]. There is one molecule in the asymmetric unit.
In our GA structure solution calculation for ortho-thymotic acid, the structural fragment (Figure 2b) comprised all non-hydrogen atoms in the molecule. Standard geometries (bond lengths and bond angles) were used, with the lengths of the two C-0 bonds in the carboxylic acid group taken to be equal. The structural fragment was flexible, with the intramolecular geometry defined by the two torsion angles "1 (describing rotation about the C-C bond between the carboxylic acid group and the benzene ring) and ~2 (describing rotation about the C-C bond between the iso-propyl group and the benzene ring), as indicated in Figure 2b. The position of the structural fragment was defined by the {x, y, z} coordinates of the centre of mass of the molecule and its orientation by the angles { 8; $, c p ) . Thus, each structure (i) was defined by eight parameters which were divided up into four groups: (xi , yi , zi I 8i; $i, 'pi I TI^ I ~ 2 i ) . In mating, one offspring was generated by selecting two groups at random from one parent and combining them with the two complemantary groups taken from the other parent. The remaining groups were then combined to generate the second offspring. Mutations involved making a random change to two of the four groups. For the groups (xi , yi , zi} and (8i; $, cpi], mutation involved changing only one of the three parameters.
25
8 . = 20
15 0 20 40 60 80 100
Generation
Figure 3. Evolutionary Progress Plot showing the evolution of Rnzin (darker circles) and R ave (lighter circles), as a function of generation number; in the GA structure solution calculation for ortho-thymotic acid.
Figure 4. Final refined crystal structure of ortho-thymotic acid (hydrogen atoms not shown) viewed along the b axis.
The progress of the GA structure solution calculation can be monitored by constructing an Evolutionary Progress Plot (EPP), which shows the best (Rmin) and average (Rave) values of Rwp for the population as a function of the generation number. In the EPP for ortho-thymotic acid (Figure 3), Rmin and Rave both decrease rapidly in the early generations. R flattens out after the 39th generation, with a further
be judged by comparing the calculated and experimental powder diffraction profiles following full Rietveld refinement, as well as by assessing the chemical and structural plausibility of the final refined structure (Figure 4). Rietveld refinement from the best structure solution obtained in the GA calculation gave Rwp = 3.2 %.
The final refined crystal structure shown in Figure 4 is completely reasonable on structural and chemical grounds [ 11] For example, the structure is found to exhibit the familiar carboxylic acid dimer motif, without this (or any other type of) intermolecular contact being imposed during the GA structure solution calculation. The best structure solution in the plateau region (see Figure 3) extending from the 39th to the 79th generation (with Rmin D 19 %) also refines to the same structure, indicating that the correct structure solution has been found relatively early in the GA calculation.
drop at the 80 tPin generation. The quality of the structure solution may
4 Future prospects
The successful application of Genetic Algorithms within the framework of the directspace approach for crystal structure solution from powder diffraction data has been clearly demonstrated by several examples, including the example highlighted above. In general, the correct structure solution is found after a relatively small number of generations in the GA calculation, suggesting that the GA approach is inherently an efficient means of searching the R(X) hypersurface. Although there has been a good deal of early success in the application of GAS in powder structure solution, there is nevertheless considerable scope for future development and optimization of the strategies for implementing GAS in this field. In this regard, we are currently pursuing the following directions of research [13]: (i) exploring fundamental aspects of the GA technique, leading towards new and optimized procedures for searching the R(X) hypersurface; and (ii) developing new ways of defining the hypersurface itself, so that global optimization may be achieved more efficiently.
In summary, structure solution approaches employing Genetic Algorithms represent a valuable addition to the range of techniques (both of the traditional type and the direct-space type) that are currently available for structure solution from powder diffraction data. The future application of these techniques promises to reveal new and important insights into structural properties of solids across the full range of disciplines within solid state and materials sciences.
References [I] A. K. Cheetham and A. P. Wilkinson, Angew. Chemie, Int. Ed. Engl. 31, 1557 (1992). [2] K. D. M. Harris and M. Tremayne, Chem. Mater. 8,2554 (1996). [3] D. M. Poojary and A. Clearfield, Acc. Chem. Res. 30,414 (1997). [41 K. D. M. Hanis, M. Tremayne, P. Lightfoot and P. G. Bruce, J. Amer. Chem. Soc. 116, 3543 (1994). [5] J. M. Newsam, M. W. Deem and C. M. Freeman, Accuracy in Powder Diffraction 11: NIST Special Publ. No. 846 pp. 80--91 (1992). [6] D. Ramprasad, G. B. Pea, B. H. Toby, T. J. Markley and R. M. Pearlstein, J. Amer. Chem. Soc. 117, 10694 (1995).
20
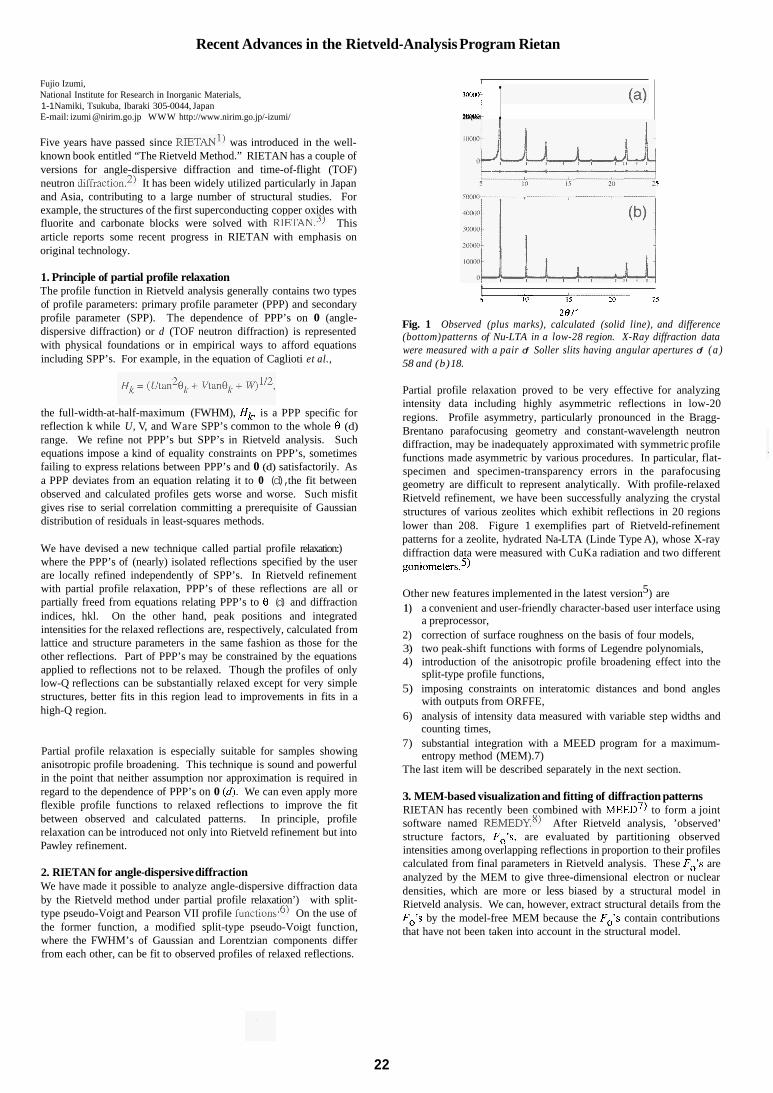
Recent Advances in the Rietveld-Analysis Program Rietan
Fujio Izumi, National Institute for Research in Inorganic Materials, 1-1 Namiki, Tsukuba, Ibaraki 305-0044, Japan E-mail: izumi @nirim.go.jp WWW http://www.nirim.go.jp/-izumi/
Five years have passed since RTETANl) was introduced in the well- known book entitled “The Rietveld Method.” RIETAN has a couple of versions for angle-dispersive diffraction and time-of-flight (TOF) neutron diffraction.2) It has been widely utilized particularly in Japan and Asia, contributing to a large number of structural studies. For example, the structures of the first superconducting copper oxides with fluorite and carbonate blocks were solved with RIETAN.3) This article reports some recent progress in RIETAN with emphasis on original technology.
1. Principle of partial profile relaxation The profile function in Rietveld analysis generally contains two types of profile parameters: primary profile parameter (PPP) and secondary profile parameter (SPP). The dependence of PPP’s on 0 (angle- dispersive diffraction) or d (TOF neutron diffraction) is represented with physical foundations or in empirical ways to afford equations including SPP’s. For example, in the equation of Caglioti et al.,
the full-width-at-half-maximum (FWHM), H b is a PPP specific for reflection k while U, V, and Ware SPP’s common to the whole 0 (d) range. We refine not PPP’s but SPP’s in Rietveld analysis. Such equations impose a kind of equality constraints on PPP’s, sometimes failing to express relations between PPP’s and 0 (d) satisfactorily. As a PPP deviates from an equation relating it to 0 (d), the fit between observed and calculated profiles gets worse and worse. Such misfit gives rise to serial correlation committing a prerequisite of Gaussian distribution of residuals in least-squares methods.
We have devised a new technique called partial profile relaxation:) where the PPP’s of (nearly) isolated reflections specified by the user are locally refined independently of SPP’s. In Rietveld refinement with partial profile relaxation, PPP’s of these reflections are all or partially freed from equations relating PPP’s to 0 (d) and diffraction indices, hkl. On the other hand, peak positions and integrated intensities for the relaxed reflections are, respectively, calculated from lattice and structure parameters in the same fashion as those for the other reflections. Part of PPP’s may be constrained by the equations applied to reflections not to be relaxed. Though the profiles of only low-Q reflections can be substantially relaxed except for very simple structures, better fits in this region lead to improvements in fits in a high-Q region.
Partial profile relaxation is especially suitable for samples showing anisotropic profile broadening. This technique is sound and powerful in the point that neither assumption nor approximation is required in regard to the dependence of PPP’s on 0 (4. We can even apply more flexible profile functions to relaxed reflections to improve the fit between observed and calculated patterns. In principle, profile relaxation can be introduced not only into Rietveld refinement but into Pawley refinement.
2. RIETAN for angle-dispersive diffraction We have made it possible to analyze angle-dispersive diffraction data by the Rietveld method under partial profile relaxation’) with split- type pseudo-Voigt and Pearson VII profile functions.6) On the use of the former function, a modified split-type pseudo-Voigt function, where the FWHM’s of Gaussian and Lorentzian components differ from each other, can be fit to observed profiles of relaxed reflections.
I
2D(xxI ’-i I 5
t --L- I /
5 I f f 15 20 2.5
26 /” Fig. 1 Observed (plus marks), calculated (solid line), and difference (bottom) patterns of Nu-LTA in a low-28 region. X-Ray diffraction data were measured with a pair of Soller slits having angular apertures of (a ) 58 and (b) 18.
Partial profile relaxation proved to be very effective for analyzing intensity data including highly asymmetric reflections in low-20 regions. Profile asymmetry, particularly pronounced in the Bragg- Brentano parafocusing geometry and constant-wavelength neutron diffraction, may be inadequately approximated with symmetric profile functions made asymmetric by various procedures. In particular, flat- specimen and specimen-transparency errors in the parafocusing geometry are difficult to represent analytically. With profile-relaxed Rietveld refinement, we have been successfully analyzing the crystal structures of various zeolites which exhibit reflections in 20 regions lower than 208. Figure 1 exemplifies part of Rietveld-refinement patterns for a zeolite, hydrated Na-LTA (Linde Type A), whose X-ray diffraction data were measured with CuKa radiation and two different goniometers.5)
Other new features implemented in the latest version5) are 1) a convenient and user-friendly character-based user interface using
a preprocessor, 2) correction of surface roughness on the basis of four models, 3) two peak-shift functions with forms of Legendre polynomials, 4) introduction of the anisotropic profile broadening effect into the
split-type profile functions, 5) imposing constraints on interatomic distances and bond angles
with outputs from ORFFE, 6) analysis of intensity data measured with variable step widths and
counting times, 7) substantial integration with a MEED program for a maximum-
entropy method (MEM).7) The last item will be described separately in the next section.
3. MEM-based visualization and fitting of diffraction patterns RIETAN has recently been combined with MEED7) to form a joint software named REMEDY.8) After Rietveld analysis, ’observed’ structure factors, Fa's, are evaluated by partitioning observed intensities among overlapping reflections in proportion to their profiles calculated from final parameters in Rietveld analysis. These Fo’s are analyzed by the MEM to give three-dimensional electron or nuclear densities, which are more or less biased by a structural model in Rietveld analysis. We can, however, extract structural details from the Fo’s by the model-free MEM because the Fo’s contain contributions that have not been taken into account in the structural model.
22
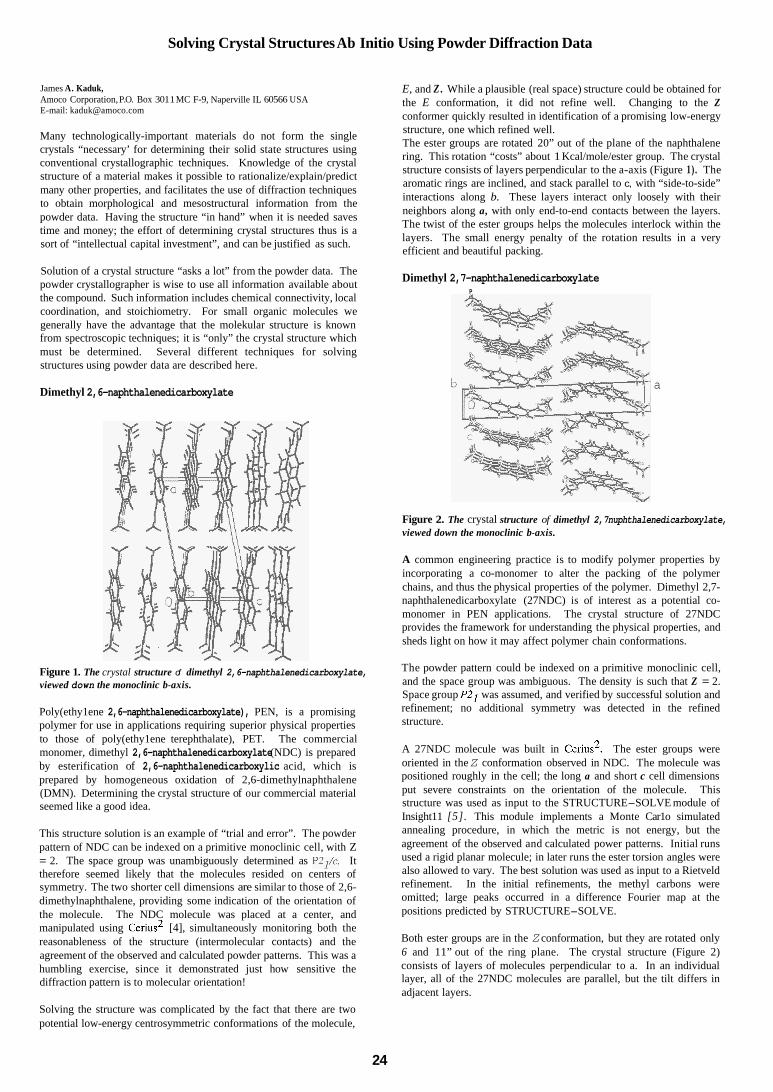
Solving Crystal Structures Ab Initio Using Powder Diffraction Data
James A. Kaduk, Amoco Corporation, P.O. Box 301 1 MC F-9, Naperville IL 60566 USA E-mail: [email protected]
Many technologically-important materials do not form the single crystals “necessary’ for determining their solid state structures using conventional crystallographic techniques. Knowledge of the crystal structure of a material makes it possible to rationalize/explain/predict many other properties, and facilitates the use of diffraction techniques to obtain morphological and mesostructural information from the powder data. Having the structure “in hand” when it is needed saves time and money; the effort of determining crystal structures thus is a sort of “intellectual capital investment”, and can be justified as such.
Solution of a crystal structure “asks a lot” from the powder data. The powder crystallographer is wise to use all information available about the compound. Such information includes chemical connectivity, local coordination, and stoichiometry. For small organic molecules we generally have the advantage that the molekular structure is known from spectroscopic techniques; it is “only” the crystal structure which must be determined. Several different techniques for solving structures using powder data are described here.
Dimethyl 2,6-naphthalenedicarboxylate
Figure 1. The crystal structure of dimethyl 2,6-naphthalenedicarboxylate, viewed down the monoclinic b-axis.
Poly(ethy1ene 2,6-naphthalenedicarboxylate), PEN, is a promising polymer for use in applications requiring superior physical properties to those of poly(ethy1ene terephthalate), PET. The commercial monomer, dimethyl 2,6-naphthalenedicarboxylate (NDC) is prepared by esterification of 2,6-naphthalenedicarboxylic acid, which is prepared by homogeneous oxidation of 2,6-dimethylnaphthalene (DMN). Determining the crystal structure of our commercial material seemed like a good idea.
This structure solution is an example of “trial and error”. The powder pattern of NDC can be indexed on a primitive monoclinic cell, with Z = 2. The space group was unambiguously determined as P21/c. It therefore seemed likely that the molecules resided on centers of symmetry. The two shorter cell dimensions are similar to those of 2,6- dimethylnaphthalene, providing some indication of the orientation of the molecule. The NDC molecule was placed at a center, and manipulated using Cerius2 [4], simultaneously monitoring both the reasonableness of the structure (intermolecular contacts) and the agreement of the observed and calculated powder patterns. This was a humbling exercise, since it demonstrated just how sensitive the diffraction pattern is to molecular orientation!
Solving the structure was complicated by the fact that there are two potential low-energy centrosymmetric conformations of the molecule,
E, and Z . While a plausible (real space) structure could be obtained for the E conformation, it did not refine well. Changing to the Z conformer quickly resulted in identification of a promising low-energy structure, one which refined well. The ester groups are rotated 20” out of the plane of the naphthalene ring. This rotation “costs” about 1 Kcal/mole/ester group. The crystal structure consists of layers perpendicular to the a-axis (Figure 1) . The aromatic rings are inclined, and stack parallel to c, with “side-to-side” interactions along b. These layers interact only loosely with their neighbors along a, with only end-to-end contacts between the layers. The twist of the ester groups helps the molecules interlock within the layers. The small energy penalty of the rotation results in a very efficient and beautiful packing.
Dimethyl 2,7-naphthalenedicarboxylate P
a
Figure 2. The crystal structure of dimethyl 2,7nuphthalenedicarboxylate, viewed down the monoclinic b-axis.
A common engineering practice is to modify polymer properties by incorporating a co-monomer to alter the packing of the polymer chains, and thus the physical properties of the polymer. Dimethyl 2,7- naphthalenedicarboxylate (27NDC) is of interest as a potential co- monomer in PEN applications. The crystal structure of 27NDC provides the framework for understanding the physical properties, and sheds light on how it may affect polymer chain conformations.
The powder pattern could be indexed on a primitive monoclinic cell, and the space group was ambiguous. The density is such that Z = 2. Space group P21 was assumed, and verified by successful solution and refinement; no additional symmetry was detected in the refined structure.
A 27NDC molecule was built in Cerius2. The ester groups were oriented in the Z conformation observed in NDC. The molecule was positioned roughly in the cell; the long a and short c cell dimensions put severe constraints on the orientation of the molecule. This structure was used as input to the STRUCTURE-SOLVE module of Insight11 [5]. This module implements a Monte Car1o simulated annealing procedure, in which the metric is not energy, but the agreement of the observed and calculated power patterns. Initial runs used a rigid planar molecule; in later runs the ester torsion angles were also allowed to vary. The best solution was used as input to a Rietveld refinement. In the initial refinements, the methyl carbons were omitted; large peaks occurred in a difference Fourier map at the positions predicted by STRUCTURE-SOLVE.
Both ester groups are in the Z conformation, but they are rotated only 6 and 11” out of the ring plane. The crystal structure (Figure 2) consists of layers of molecules perpendicular to a. In an individual layer, all of the 27NDC molecules are parallel, but the tilt differs in adjacent layers.
24
-.-- -..--. . . . . . . . . . . . . . .
,. , . . . . .. . , :I.. ".*'..
A for automatic
quantitative phase analysis
+ Windows graphical user interface + + + + + + +
Full power of BGMN@ algorithm Calculation and separation of instrumental function Constraints for all parameters definable Automatic background determination during refineme Spherical harmonics model for correction of preferred orientation Calculation of amorphous content with internal standard Extendible phase database with structure information
Bogen s t rasse 4 1 D-22926 Ah rens bu rg http:// www. roentgenseifert.com eMail: [email protected].: +49(0)4102 8074, Far: +49(0)4102 807-189
26
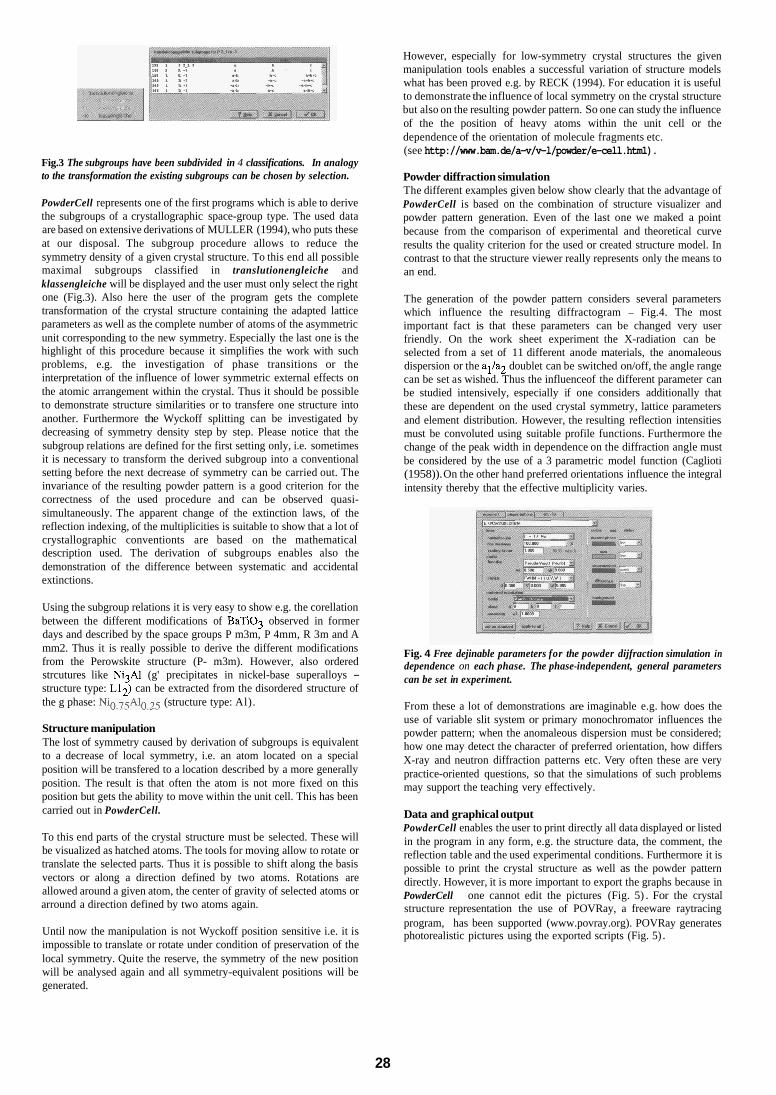
Fig.3 The subgroups have been subdivided in 4 classifications. In analogy to the transformation the existing subgroups can be chosen by selection.
PowderCell represents one of the first programs which is able to derive the subgroups of a crystallographic space-group type. The used data are based on extensive derivations of MULLER (1994), who puts these at our disposal. The subgroup procedure allows to reduce the symmetry density of a given crystal structure. To this end all possible maximal subgroups classified in translutionengleiche and klassengleiche will be displayed and the user must only select the right one (Fig.3). Also here the user of the program gets the complete transformation of the crystal structure containing the adapted lattice parameters as well as the complete number of atoms of the asymmetric unit corresponding to the new symmetry. Especially the last one is the highlight of this procedure because it simplifies the work with such problems, e.g. the investigation of phase transitions or the interpretation of the influence of lower symmetric external effects on the atomic arrangement within the crystal. Thus it should be possible to demonstrate structure similarities or to transfere one structure into another. Furthermore the Wyckoff splitting can be investigated by decreasing of symmetry density step by step. Please notice that the subgroup relations are defined for the first setting only, i.e. sometimes it is necessary to transform the derived subgroup into a conventional setting before the next decrease of symmetry can be carried out. The invariance of the resulting powder pattern is a good criterion for the correctness of the used procedure and can be observed quasi- simultaneously. The apparent change of the extinction laws, of the reflection indexing, of the multiplicities is suitable to show that a lot of crystallographic conventionts are based on the mathematical description used. The derivation of subgroups enables also the demonstration of the difference between systematic and accidental extinctions.
Using the subgroup relations it is very easy to show e.g. the corellation between the different modifications of BaTiOg observed in former days and described by the space groups P m3m, P 4mm, R 3m and A mm2. Thus it is really possible to derive the different modifications from the Perowskite structure (P- m3m). However, also ordered strcutures like Ni3AI (g' precipitates in nickel-base superalloys - structure type: L12) can be extracted from the disordered structure of the g phase: Ni0.75A10.25 (structure type: Al).
Structure manipulation The lost of symmetry caused by derivation of subgroups is equivalent to a decrease of local symmetry, i.e. an atom located on a special position will be transfered to a location described by a more generally position. The result is that often the atom is not more fixed on this position but gets the ability to move within the unit cell. This has been carried out in PowderCell.
To this end parts of the crystal structure must be selected. These will be visualized as hatched atoms. The tools for moving allow to rotate or translate the selected parts. Thus it is possible to shift along the basis vectors or along a direction defined by two atoms. Rotations are allowed around a given atom, the center of gravity of selected atoms or arround a direction defined by two atoms again.
Until now the manipulation is not Wyckoff position sensitive i.e. it is impossible to translate or rotate under condition of preservation of the local symmetry. Quite the reserve, the symmetry of the new position will be analysed again and all symmetry-equivalent positions will be generated.
However, especially for low-symmetry crystal structures the given manipulation tools enables a successful variation of structure models what has been proved e.g. by RECK (1994). For education it is useful to demonstrate the influence of local symmetry on the crystal structure but also on the resulting powder pattern. So one can study the influence of the the position of heavy atoms within the unit cell or the dependence of the orientation of molecule fragments etc. (see http://www.bam.de/a-v/v-l/powder/e-cell.htm1).
Powder diffraction simulation The different examples given below show clearly that the advantage of PowderCell is based on the combination of structure visualizer and powder pattern generation. Even of the last one we maked a point because from the comparison of experimental and theoretical curve results the quality criterion for the used or created structure model. In contrast to that the structure viewer really represents only the means to an end.
The generation of the powder pattern considers several parameters which influence the resulting diffractogram - Fig.4. The most important fact is that these parameters can be changed very user friendly. On the work sheet experiment the X-radiation can be selected from a set of 11 different anode materials, the anomaleous dispersion or the al/a2 doublet can be switched on/off, the angle range can be set as wished. Thus the influenceof the different parameter can be studied intensively, especially if one considers additionally that these are dependent on the used crystal symmetry, lattice parameters and element distribution. However, the resulting reflection intensities must be convoluted using suitable profile functions. Furthermore the change of the peak width in dependence on the diffraction angle must be considered by the use of a 3 parametric model function (Caglioti (1958)). On the other hand preferred orientations influence the integral intensity thereby that the effective multiplicity varies.
Fig. 4 Free dejinable parameters for the powder dijfraction simulation in dependence on each phase. The phase-independent, general parameters can be set in experiment.
From these a lot of demonstrations are imaginable e.g. how does the use of variable slit system or primary monochromator influences the powder pattern; when the anomaleous dispersion must be considered; how one may detect the character of preferred orientation, how differs X-ray and neutron diffraction patterns etc. Very often these are very practice-oriented questions, so that the simulations of such problems may support the teaching very effectively.
Data and graphical output PowderCell enables the user to print directly all data displayed or listed in the program in any form, e.g. the structure data, the comment, the reflection table and the used experimental conditions. Furthermore it is possible to print the crystal structure as well as the powder pattern directly. However, it is more important to export the graphs because in PowderCell one cannot edit the pictures (Fig. 5). For the crystal structure representation the use of POVRay, a freeware raytracing program, has been supported (www.povray.org). POVRay generates photorealistic pictures using the exported scripts (Fig. 5).
28
CSD/ICSD databanks. Arguments in this sense are found in the multiplication of methods allowing to locate molecules or known fragments. All crystal systems were the subject of SDPD, the monoclinic and orthorhombic systems being the more generally studied with respectively 42.4 and 30.1%. Instruments selected were traditionally either neutron reactors (65), synchrotron radiation sources (64) or in-laboratory conventional X-ray diffractometers with (94) or without (143) incident beam monochromator. In fact these numbers do no reflect the possible joint use of 2 or 3 of these instruments. Neutrons were used scarcely alone (22), many neutron cases correspond to studies of liquid-solid state phase transitions at low temperature (Fitch and Cockcroft). That the most complex structures will soon be solved from synchrotron data is evidence. We should first agree on what is a complex structure and define complexity criteria. Anyway, conventional X-rays have not really been outperformed yet by synchrotron radiation in quantity (237 and 64 applications, respectively) nor in quality (no real gap in complexity is observed, although it should be).
Some times ago, it was stated that we were unable to determine structures as large as those we could refine by the Rietveld method. The new paradox is that we can locate now molecules in much bigger cells than we could refine without constraints. Due to resistance to change, habits listed in the SDPD-Database have chances to give us the tendencies for the years to come. Few softwares dominate each step of the SDPD whole process, they will probably extend their domination unless more efficient ones appear. Not all softwares are in the public domain so that some methods are the exclusivity of developers or teams repeating structure determinations by their own way. SDPD will not expand faster before a larger distribution of these new softwares.
If your works is lacking in the database, please send the references ([email protected]).
1. W.H. Zachariasen, Actu Ctystallogr: 1 (1948) 265-268 2. http://fluo.univ-lernans.fr:8001/iniref.html
Line Profile Analysis and the Rietveld Method: crossing paths?
Matteo Leoni* and J. Ian Langford'
38050 Mesiano (TN), Italy &School of Physics & Astronomy, University of Birmingham, Birmingham B1S 2TT, UK E-mail: [email protected] & [email protected]
Is a combination of the Rietveld Method (RM) and Line Profile Analysis (LPA) possible? Or, in other words, is it possible to obtain meaningful microstructural information from pattern refinement? Opinions in the scientific community are divided, but the answer is probably "Yes, provided we are aware of what we are doing", with the additional proviso that, at least for the time being, sample imperfections are not too complicated. However, in all cases the physical meaning and validity of a solution have to be carefully checked against one's experience and intuition and, if practicable, information from other techniques. While the traditional Rietveld recipe for pattern generation and refinement is mostly unequivocal, the correspondence between an observed broadened peak and a set of physically sound microstructural parameters is not: a given line-profile shape can be compatible with different broadening models.
*Dipartimento di Ingegneria dei Materiali, Universita di Trento,
The question of profile shape is of course central to obtaining precise and meaningful results from the structure refinement, but empirical shape and shape-trend functions have mostly been used since the original work of Rietveld. From the technical point of view it is quite easy to embed in the refinement procedure a routine for the generation of profile shapes based on microstructural parameters. More-or-less independently, some authors (Scardi and Lutterotti, Delhez and Mittemeijer, Cheary and Coelho, von Dreele, Bergmann, for example) have gone some way towards accomplishing this in recent years by using different approaches and models, but rarely has a convincing analysis of the validity of the results been carried out. Clearly both the RM and LPA are defined mathematically over a wide range of parameters, but, owing to the phenomenological nature of the models which often underlie the mathematical analysis, and also to various approximations, the results can be of limited physical significance. This in turn means they must be taken cum grano salis, unless a validation a priori carried out with traditional methods is undertaken. For example, extremely high values for crystallite size or microstrain derived from Rietveld refinement have been reported in the literature. These cannot be justified by any model since the criteria on which the models are based have not been met.
It must be stressed that LPA is limited in its application and has not yet been developed as a global tool. It merely gives an explanation for line- profile shapes in somewhat restricted cases. There are various models, applied singly or simultaneously, which are only valid when certain sources of broadening are present, such as crystallite size, stacking
faults, dislocations, microstrain or composition gradients, etc.. A definitive microstructural refinement tool, able to handle all of these has not yet been established, though some proposed procedures perhaps represent a move in the right direction; those derived from integral breadth methods (English and Dutch schools) and single-peak Fourier approaches (Italian school) seem the most reasonable to be included in Rietveld codes. Due to their nature, and since they can account for anisotropic broadening, they can permit a direct comparison to be made with traditional profile analysis techniques, such the Warren-Averbach method. However, even in this case, validity is restricted by the limitations of the underlying theories, i.e. limited crystallite size and non-specific microstrain, both presenting simple distributions. Improvements in the field may well be reported in the future, but the best solution is likely to be a comparative one.
A few words should be added on purely quantitative aspects, related to the instrumental contribution to the profile shape. Recent additions to the literature show the possibility, in limited cases, of calculating the instrumental profile shape for a given geometry; actual measurements are, in fact, conducted on suitable standard materials that are not guaranteed to be defect-free (even the NBS line-profile standard has been proven to be slightly defective). On the other hand, since it is impossible to be certain that calculations take into account all instrumental effects, quantitative values have to be considered good estimates within the reliability of the instrumental profile. (This is valid also for traditional LPA.) Even this field is still open and a definitive solution is still awaited.
In conclusion, the state-of-the-art allows for a microstructural refinement in the Rietveld method, but clearly the nature of any structural imperfections present in the sample must be ascertained by 'traditional' methods beforehand; characterization of microstructure is more than simply reporting values of 'size' and 'strain'. Also, prior to attaching any physical significance to the results, a check on the range of validity of the model employed and, whenever possible, a cross- check of the results, should be carried out. However, even when the results are not physically meaningful, a profile shape model which adequately accounts for anisotropic sample broadening can enhance the quality of pattern fitting and hence the quality of the refined structural data.
Since the literature on the subject is vast and growing continuously, a dedicated Website, intended to expand with further contributions from the scientific community, is being set-up by the authors under the URL http://bragg .ing.unitn.it/sizestrain/ Mirroring and further notes will be available on the CCP14 Website http://www.ccpl4.ac.uk
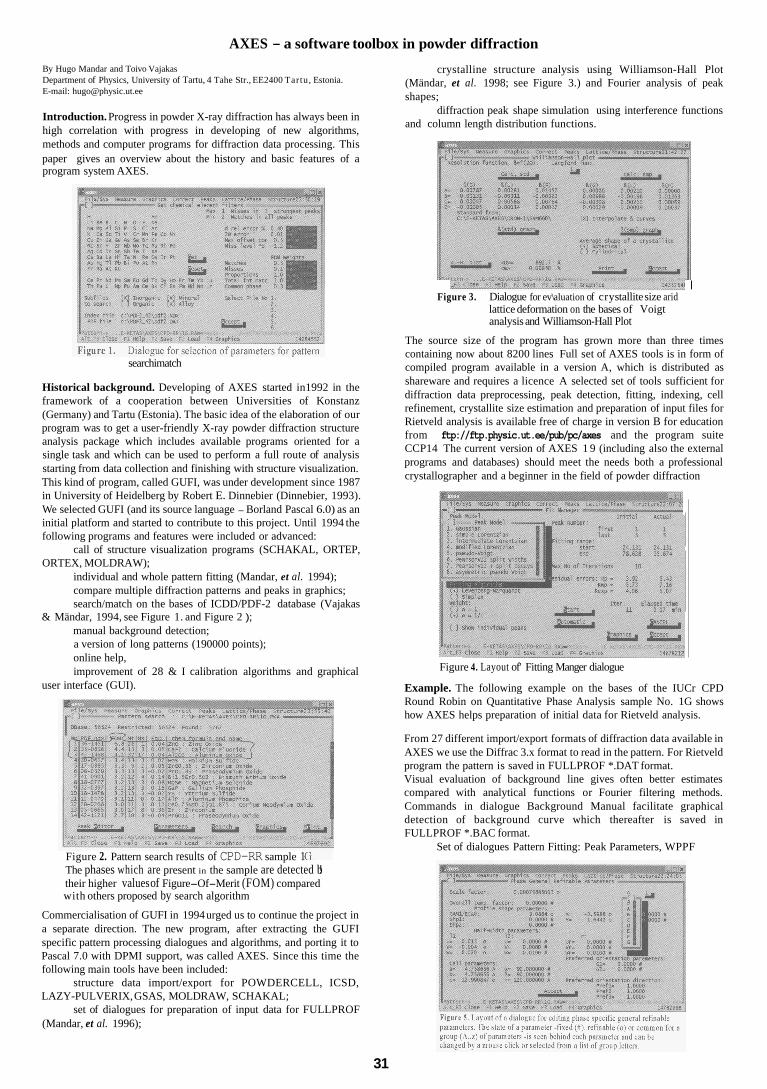
AXES - a software toolbox in powder diffraction
By Hugo Mandar and Toivo Vajakas Department of Physics, University of Tartu, 4 Tahe Str., EE2400 Tartu, Estonia. E-mail: [email protected]
Introduction. Progress in powder X-ray diffraction has always been in high correlation with progress in developing of new algorithms, methods and computer programs for diffraction data processing. This paper gives an overview about the history and basic features of a program system AXES.
searchimatch
Historical background. Developing of AXES started in1992 in the framework of a cooperation between Universities of Konstanz (Germany) and Tartu (Estonia). The basic idea of the elaboration of our program was to get a user-friendly X-ray powder diffraction structure analysis package which includes available programs oriented for a single task and which can be used to perform a full route of analysis starting from data collection and finishing with structure visualization. This kind of program, called GUFI, was under development since 1987 in University of Heidelberg by Robert E. Dinnebier (Dinnebier, 1993). We selected GUFI (and its source language - Borland Pascal 6.0) as an initial platform and started to contribute to this project. Until 1994 the following programs and features were included or advanced:
call of structure visualization programs (SCHAKAL, ORTEP, ORTEX, MOLDRAW);
individual and whole pattern fitting (Mandar, et al. 1994); compare multiple diffraction patterns and peaks in graphics; search/match on the bases of ICDD/PDF-2 database (Vajakas
manual background detection; a version of long patterns (190000 points); online help, improvement of 28 & I calibration algorithms and graphical
& Mändar, 1994, see Figure 1. and Figure 2 );
user interface (GUI).
Figure 2. Pattern search results of CPD-RR sample 1 The phases which are present in the sample are detected b! their higher values of Figure-Of-Merit (FOM) compared with others proposed by search algorithm
Commercialisation of GUFI in 1994 urged us to continue the project in a separate direction. The new program, after extracting the GUFI specific pattern processing dialogues and algorithms, and porting it to Pascal 7.0 with DPMI support, was called AXES. Since this time the following main tools have been included:
structure data import/export for POWDERCELL, ICSD,
set of dialogues for preparation of input data for FULLPROF LAZY-PULVERIX, GSAS, MOLDRAW, SCHAKAL;
(Mandar, et al. 1996);
crystalline structure analysis using Williamson-Hall Plot (Mändar, et al. 1998; see Figure 3.) and Fourier analysis of peak shapes;
diffraction peak shape simulation using interference functions and column length distribution functions.
I Figure 3. Dialogue for ev\ aluation of cry stallite size arid
lattice deformation on the bases of Voigt analysis and Williamson-Hall Plot
The source size of the program has grown more than three times containing now about 8200 lines Full set of AXES tools is in form of compiled program available in a version A, which is distributed as shareware and requires a licence A selected set of tools sufficient for diffraction data preprocessing, peak detection, fitting, indexing, cell refinement, crystallite size estimation and preparation of input files for Rietveld analysis is available free of charge in version B for education from ftp://ftp.physic.ut.ee/pub/pc/axes and the program suite CCP14 The current version of AXES 1 9 (including also the external programs and databases) should meet the needs both a professional crystallographer and a beginner in the field of powder diffraction
Figure 4. Layout of' Fitting Manger dialogue
Example. The following example on the bases of the IUCr CPD Round Robin on Quantitative Phase Analysis sample No. 1G shows how AXES helps preparation of initial data for Rietveld analysis.
From 27 different import/export formats of diffraction data available in AXES we use the Diffrac 3.x format to read in the pattern. For Rietveld program the pattern is saved in FULLPROF *.DAT format. Visual evaluation of background line gives often better estimates compared with analytical functions or Fourier filtering methods. Commands in dialogue Background Manual facilitate graphical detection of background curve which thereafter is saved in FULLPROF *.BAC format.
Set of dialogues Pattern Fitting: Peak Parameters, WPPF
31
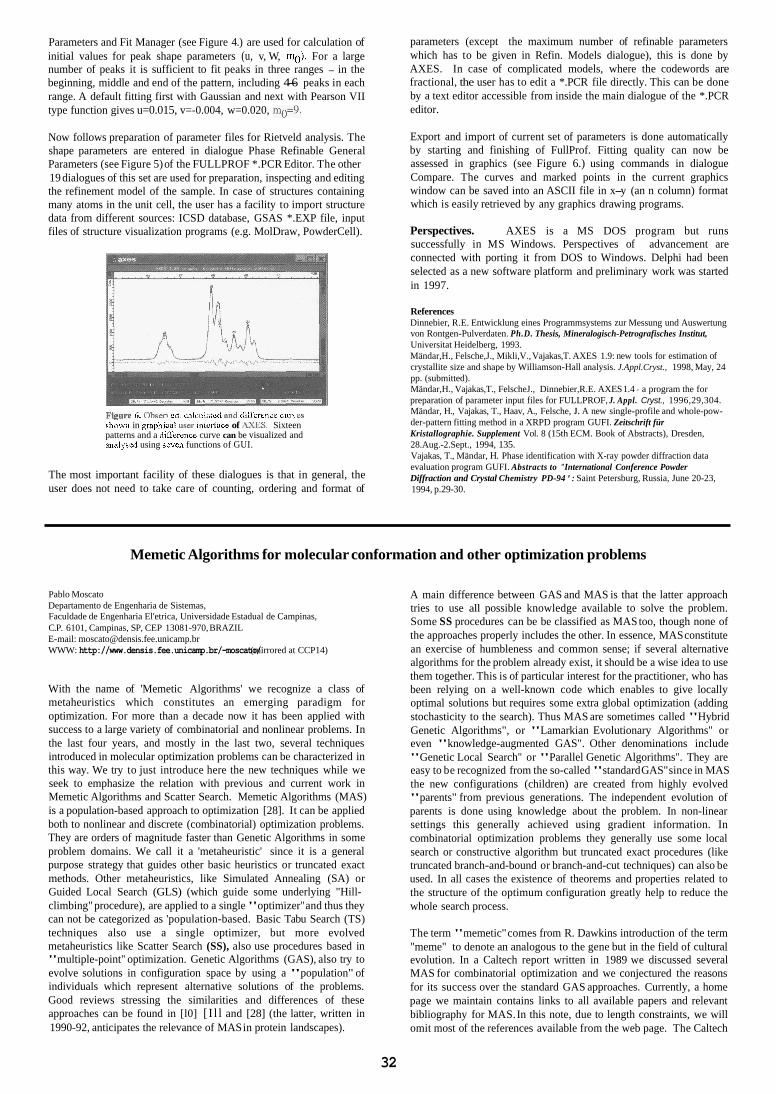
Parameters and Fit Manager (see Figure 4.) are used for calculation of initial values for peak shape parameters (u, v, W, mo). For a large number of peaks it is sufficient to fit peaks in three ranges - in the beginning, middle and end of the pattern, including 4-6 peaks in each range. A default fitting first with Gaussian and next with Pearson VII type function gives u=0.015, v=-0.004, w=0.020, m0=9.
Now follows preparation of parameter files for Rietveld analysis. The shape parameters are entered in dialogue Phase Refinable General Parameters (see Figure 5) of the FULLPROF *.PCR Editor. The other 19 dialogues of this set are used for preparation, inspecting and editing the refinement model of the sample. In case of structures containing many atoms in the unit cell, the user has a facility to import structure data from different sources: ICSD database, GSAS *.EXP file, input files of structure visualization programs (e.g. MolDraw, PowderCell).
F i ~ i i l ~ 5. !Nxei-~ ed. dculn ted a d iirilcrcncc c i m e5
shoun in gfiiphical use11 interface of XLTS. Sixteen patterns and a din'erence curve can be visualized and anelysed using seven functions of GUI.
The most important facility of these dialogues is that in general, the user does not need to take care of counting, ordering and format of
parameters (except the maximum number of refinable parameters which has to be given in Refin. Models dialogue), this is done by AXES. In case of complicated models, where the codewords are fractional, the user has to edit a *.PCR file directly. This can be done by a text editor accessible from inside the main dialogue of the *.PCR editor.
Export and import of current set of parameters is done automatically by starting and finishing of FullProf. Fitting quality can now be assessed in graphics (see Figure 6.) using commands in dialogue Compare. The curves and marked points in the current graphics window can be saved into an ASCII file in x-y (an n column) format which is easily retrieved by any graphics drawing programs.
Perspectives. AXES is a MS DOS program but runs successfully in MS Windows. Perspectives of advancement are connected with porting it from DOS to Windows. Delphi had been selected as a new software platform and preliminary work was started in 1997.
References Dinnebier, R.E. Entwicklung eines Programmsystems zur Messung und Auswertung von Rontgen-Pulverdaten. Ph.D. Thesis, Mineralogisch-Petrografisches Institut, Universitat Heidelberg, 1993. Mändar,H., Felsche,J., Mikli,V., Vajakas,T. AXES 1.9: new tools for estimation of crystallite size and shape by Williamson-Hall analysis. J.Appl.Cryst., 1998, May, 24 pp. (submitted). Mändar,H., Vajakas,T., FelscheJ., Dinnebier,R.E. AXES 1.4 - a program the for preparation of parameter input files for FULLPROF, J. Appl. Cryst., 1996,29,304. Mändar, H., Vajakas, T., Haav, A., Felsche, J. A new single-profile and whole-pow- der-pattern fitting method in a XRPD program GUFI. Zeitschrift für Kristallographie. Supplement Vol. 8 (15th ECM. Book of Abstracts), Dresden, 28.Aug.-2.Sept., 1994, 135. Vajakas, T., Mändar, H. Phase identification with X-ray powder diffraction data evaluation program GUFI. Abstracts to "International Conference Powder Diffraction and Crystal Chemistry PD-94': Saint Petersburg, Russia, June 20-23, 1994, p.29-30.
Memetic Algorithms for molecular conformation and other optimization problems
Pablo Moscato Departamento de Engenharia de Sistemas, Faculdade de Engenharia El'etrica, Universidade Estadual de Campinas, C.P. 6101, Campinas, SP, CEP 13081-970, BRAZIL E-mail: [email protected] WWW: http://www.densis.fee.unicamp.br/-moscato/ (mirrored at CCP14)
With the name of 'Memetic Algorithms' we recognize a class of metaheuristics which constitutes an emerging paradigm for optimization. For more than a decade now it has been applied with success to a large variety of combinatorial and nonlinear problems. In the last four years, and mostly in the last two, several techniques introduced in molecular optimization problems can be characterized in this way. We try to just introduce here the new techniques while we seek to emphasize the relation with previous and current work in Memetic Algorithms and Scatter Search. Memetic Algorithms (MAS) is a population-based approach to optimization [28]. It can be applied both to nonlinear and discrete (combinatorial) optimization problems. They are orders of magnitude faster than Genetic Algorithms in some problem domains. We call it a 'metaheuristic' since it is a general purpose strategy that guides other basic heuristics or truncated exact methods. Other metaheuristics, like Simulated Annealing (SA) or Guided Local Search (GLS) (which guide some underlying "Hill- climbing" procedure), are applied to a single "optimizer" and thus they can not be categorized as 'population-based. Basic Tabu Search (TS) techniques also use a single optimizer, but more evolved metaheuristics like Scatter Search (SS), also use procedures based in "multiple-point" optimization. Genetic Algorithms (GAS), also try to evolve solutions in configuration space by using a "population" of individuals which represent alternative solutions of the problems. Good reviews stressing the similarities and differences of these approaches can be found in [l0] [ I l l and [28] (the latter, written in 1990-92, anticipates the relevance of MAS in protein landscapes).
A main difference between GAS and MAS is that the latter approach tries to use all possible knowledge available to solve the problem. Some SS procedures can be be classified as MAS too, though none of the approaches properly includes the other. In essence, MAS constitute an exercise of humbleness and common sense; if several alternative algorithms for the problem already exist, it should be a wise idea to use them together. This is of particular interest for the practitioner, who has been relying on a well-known code which enables to give locally optimal solutions but requires some extra global optimization (adding stochasticity to the search). Thus MAS are sometimes called "Hybrid Genetic Algorithms", or "Lamarkian Evolutionary Algorithms" or even "knowledge-augmented GAS". Other denominations include "Genetic Local Search" or "Parallel Genetic Algorithms". They are easy to be recognized from the so-called "standard GAS" since in MAS the new configurations (children) are created from highly evolved "parents" from previous generations. The independent evolution of parents is done using knowledge about the problem. In non-linear settings this generally achieved using gradient information. In combinatorial optimization problems they generally use some local search or constructive algorithm but truncated exact procedures (like truncated branch-and-bound or branch-and-cut techniques) can also be used. In all cases the existence of theorems and properties related to the structure of the optimum configuration greatly help to reduce the whole search process.
The term "memetic" comes from R. Dawkins introduction of the term "meme" to denote an analogous to the gene but in the field of cultural evolution. In a Caltech report written in 1989 we discussed several MAS for combinatorial optimization and we conjectured the reasons for its success over the standard GAS approaches. Currently, a home page we maintain contains links to all available papers and relevant bibliography for MAS. In this note, due to length constraints, we will omit most of the references available from the web page. The Caltech
32
report that gave its name to the, at that time incipient, field discussed a hybrid of GAS and SA developed with M.G. Norman in 1988. Currently, several papers are applying hybrids of GAS with SA or other methods to a variety of molecular optimization problems [39] [34] [33]
all of them, the authors of these papers refer to their metaheuristic as "genetic", probably being unaware about the existence of other MAS. For instance, Fu et al. in [9] say that GAS "combined with conjugated gradient or molecular dynamics has been demonstrated to be efficient for the ground-state configuration search in materials research, e.g. fullerene formation, in this paper, based on the generalized tight- binding molecular dynamics, we apply the GA to study the surface reconstruction of Silicon (001) for the first time". Hybrid population approaches like this can hardly be catalogues as being 'genetic', but this denomination has appeared in previous work by Deaven and Ho [5] which got extra recognition due to an article by J. Maddox in Nature [24]. Other applications include cluster physics. Niesse and Mayne in [29] said: "In a recent paper, Gregurick, Alexander, and Hartke [S. K. Gregurick, M. H. Alexander, and B. Hartke, J. Chem. Phys. 104, 2684 (1996)] proposed a global geometry optimization technique using a modified Genetic Algorithm approach for clusters. They refer to their technique as a deterministic/stochastic genetic algorithm (DS-GA). In this technique, the stochastic part is a traditional GA, with the manipulations being carried out on binary- coded internal coordinates (atom-atom distances). The deterministic aspect of their method is the inclusion of a coarse gradient descent calculation on each geometry. This step avoids spending a large amount of computer time searching parts of the configuration space which correspond to high-energy geometries. Their tests of the technique show it is vastly more efficient than searches without this local minimization". Other papers in the area of cluster physics include [30] [16] [31] [37] [I5] [6]. Other evolutionary approaches to avariety of molecular problems can be found in: [36] [32] [8] [26] [25] [14] [13]. Their use for design problems is particularly appealing, see: [18] [38] [2]. They have also found a way into protein design [7] [20], probably due to their landscape structure [28].
[22] [1] [49][37] [I8] [21] [12] [I9] [do] [3] [27] [8] [23] P51. In
References [1] M.J. Bayley, G. Jones, P. Willett, and M.P. Williamson. Genfold: A genetic algorithm for folding protein structures using NMR restraints. Protein Science, 7(2):491--499, Feb. 1998. [2] D.E. Clark and D.R. Westhead. Evolutionary algorithms in computer-aided molecular design. Journal of Computer-aided Molecular Design, 10(4):337--358, Aug. 1996. [3] T. Dandekar and P. Argos. Identifying the tertiary fold of small proteins with different topologies from sequence and secondary structure using the genetic algorithm and extended criteria specific for strand regions. Journal of Molecular Biology, 256(3):645--660, Mar. 1, 1996. [4] P.A. de Souza, R. Garg, and V.K. Garg. Automation of the analysis of Mossbauer spectra. Hyperfine Interactions, 112( 1--4):275--278, 1998. [5] D.M. Deaven and K.O. Ho. Molecular-geometry optimization with a genetic algorithm. Physical Review Letters, 75(2):288--291, Jul 10, 1995. [6] D.M. Deaven, N. Tit, J.R. Morris, and K.M. Ho. Structural optimization of Lennard-Jones clusters by a genetic algorithm. Chemical Physics Letters, 2S6( 1.- 2):195--200, Jun. 21, 1996. 1 See: http://www.densis.fee.unicamp.br/-moscatolmemetic horne.htm1 [7] J.R. Desjarlais and T.M. Handel. New strategies in protein design. Current Opinion in Biotechnology, 6(4):460--466, Aug. 1995. [8] R. Doll and M.A. VanHove. Global optimization in LEED structure determination using genetic algorithms. Surface Science, 355( 1-3):L393--L398, Jun. 1, 1996. [9] R.T. Fu, K. Esfarjani, Y. Hashi, J. Wu, X. Sun, andY. Kawazoe. Surface reconstruction of Si (001) by genetic algorithm and simulated annealing method. Science Reports of The Research Institutes Tohoku University Series A-Physics Chemistry And Metallurgy, 44(1):77--81, Mar. 1997. [l0] F. Glover. Genetic algorithms and scatter search - unsuspected potentials. Statistics And Computing, 4((2)):131--140, Jun. 1994. [1 1] F. Glover. Scatter search and star-paths - beyond the genetic metaphor. OR Spektrum, 17((2-3)):125--137, Sep. 1995. [12] J.R. Gunn. Sampling protein conformations using segment libraries and a genetic algorithm. Journal of Chemical Physics, 106(10):4270--4281, Mar. 8, 1997. [ 13] B. Hartke. Global geometry optimization of clusters using genetic algorithms. Journal of Physical Chemistry, 97(39):9973--9976, Sep. 30, 1993.
[14] R. Hirsch and C.C. Mullergoymann. Fitting of diffusion-coefficients in a 3- compartment sustained-release drug formulation using a genetic algorithm. International Journal of Pharmaceutics, 120(2):229--234, Jun. 30, 1995. [15] K.M. H0,A.A. Shvartsburg, B.C. Pan, Z.Y. Lu, C.Z. Wang, J.G. Wacker, J.L. Fye, and M.F. Jarrold. Structures of medium-sized silicon clusters. Nature, 392(6676):582--585, Apr. 9, 1998. [16] S. Hobday and R. Smith. Optimisation of carbon cluster geometry using a genetic algorithm. Journal of The Chemical Society-Faraday Transactions, 93(22):3919--3926, Nov. 21, 1997. [17] G. Jones, P. Willett, R.C. Glen, A.R. Leach, and R. Taylor. Development and validation of a genetic algorithm for flexible docking. Journal of Molecular Biology, 267(3):727--748, Apr. 4, 1997. [I8] B.M. Kariuki, H. Serrano-Gonzalez, R.L. Johnston, and K.D.M. Harris. The application of a genetic algorithm for solving crystal structures from powder diffraction data. Chemical Physics Letters, 280(3-4):189--195, Dec. 5, 1997. [ 19] E. Landree, C. Collazo-Davila, and L.D. Marks. Multi-solution genetic algorithm approach to surface structure determination using direct methods. Acta Crystallographica Section B - Structural Science, 53:916--922, Dec. 1, 1997. [20] G.A. Lazar, J.R. Desjarlais, and T.M. Handel. De novo design of the hydrophobic core of ubiqnitin. Protein Science, 6(6):1167--1178, Jun. 1997. [21] L.P. Li, T.A. Darden, S.J. Freedman, B.C. Furie, B. Furie, J.D. Baleja, H. Smith, R.G. Hiskey, and L.G. Pedersen. Refinement of the NMR solution structure of the gamma-carboxyglntamic acid domain of coagulation factor IX using molecular dynamics simulation with initial Ca2+ positions determined by a genetic algorithm. Biochemistry, 36(8):2132--2138, Feh. 25, 1997. [22] D.M. Lorber and B.K. Shoichet. Flexible ligand docking using conformational ensembles. Protein Science, 7(4):938--950, Apr. 1998. [23] A.L. MacKay. Generalized crystallography. THEOCHEM-Journal of Molecular Structure, 336(2--3):293--303, Jun. 30, 1995. [24] J. Maddox. Genetics helping molecular-dynamics. Nature, 376(6537):209--209, Jul. 20, 1995. [25] A.C.W. May and M.S. Johnson. Protein-structure comparisons using a combination of a genetic algorithm, dynamic-programming and least- squares minimization. Protein Engineering, 7(4):475--485, Apr. 1994. [26] J.C. Meza, R.S. Judson, T.R. Fanlkner, and A.M. Treasurywala. A comparison of a direct search method and a genetic algorithm for conformational searching. Journal of Computational Chemistry, 17(9):1142--1151, Jnl. 15, 1996. [27] S.T. Miller, J.M. Hogle, and D.J. Filman. A genetic algorithm for the ab initio phasing of icosahedral viruses. Acta Crystallographica Section D - Biological Crystallography, 52:235--251, Mar. 1996. [28] P. Moscato. An introduction to population approaches for optimization and hierarchical objective functions: The role of tabu search. Annals of Operations Research, 41(1-4):85--121, 1993. [29] J.A. Niesse and H.R. Mayne. Global geometry optimization of atomic clusters using a modified genetic algorithm in space-fixed coordinates. Journal of Chemical Physics, 105(11):4700--4706, Sep. 15, 1996. [30] N. Pucello, M. Rosati, G. DAgostino, F. Pisacane, V. Rosato, and M. Celino. Search of molecular ground state via genetic algorithm: Implementation on a hybrid SIMD-MIMD platform. International Journal of Modem Physics C, 8(2):239--252, Apr. 1997. [31] W.J. Pullan. Structure prediction of benzene clusters using a genetic algorithm. Journal of Chemical Information and Computer Sciences, 37(6):1189--1193, Nov.- Dec. 1997. [32] M.L. Raymer, P.C. Sanschagrin, W.F. Punch, S. Venkataraman, E.D. Goodman, and L.A. Kuhn. Predicting conserved water-mediated and polar ligand interactions in proteins using a k-nearest-neighbors genetic algorithm. Journal of Molecular Biology, 265(4):445--464, Jan. 31, 1997. [33] K. Shankland, W.I.F. David, and T. Csoka. Crystal structure determination from powder diffraction data by the application of a genetic algorithm. Zeitschrift Fur Kristallographie, 212(8):550--552, 1997. [34] K. Shankland, W.I.F. David, T. Csoka, and L. McBride. Structure solution of ibuprofen from powder diffraction data by the application of a genetic algorithm combined with prior conformational analysis. International Journal of Pharmaceutics, 165(1):117--126, Apr. 20, 1998. [35] K.Y. Tarn and R.G. Compton. GAMATCH - a genetic algorithm-based program for indexing crystal faces. Journal of Applied Crystallography, 28:640--645, Oct. 1, 1995. [36] A.H.C. vanKampen, C.S. Strom, and L.M.C Buydens. Lethalization, penalty and repair functions for constraint handling in the genetic algorithm methodology. Chemomehics And Intelligent Laboratory Systems, 34( 1):55--68, Aug. 1996. [37] R.P. White, J.A. Niesse, and H.R. Mayne. A study of genetic algorithm approaches to global geometry optimization of aromatic hydrocarbon rnicroclusters. Journal of Chemical Physics, 108(5):2208--2218, Feb. 1, 1998. [38] P. Willett. Genetic algorithms in molecular recognition and design. Trends in Biotechnology, 13(12):516--521, Dec. 1995. [39] C.R. Zacharias, M.R. Lemes, and A.D. Pino. Combining genetic algorithm and simulated annealing: a molecular geometry optimization study. THEOCHEM- Journal of Molecular Structure, 430(29--39), Apr. 14, 1998. [40] M. Zwick, B. Lovell, and J. Marsh. Global optimization studies on the 1-d phase problem. International Journal of General Systems, 25(1):47--59, 1996.
33
Computer programming and mathematical modeling using evolutionary computation
Roland Olson, Qstfold College, 0s Alle 11, N-1757 Halden, Norway E-mail: [email protected], WWW: http://www-ia.hiof.no/-rolandol
The production of computer software and mathematical models is one of the cornerstones of modem society, both as an independent industry and as an integrated part of general industrial and research activity. Products as diverse as washing machines, mobile phones, spectrographs, combustion engines and web-browsers are controlled by software with rapidly increasing complexity, correctness problems and cost of development. The reason for this trend, which sometimes is referred to as the software crisis, is that programming is a highly creative activity that often is a form of art rather than science or well- planned engineering.
The development of accurate mathematical models in the natural sciences usually builds on a larger scientific foundation than programming, but is still often an empirical science where intuition is more important than pure deduction. There are very many applications where adequate mathematical models are lacking even though substantial measurement data are available. Some of these applications, for example determining the three-dimensional structure of a protein from data obtained using X-ray diffraction, are both important and still not well developed. For instance, the three- dimensional structures of the estrogen receptors alpha and beta remained undetermined until last year even though these structures are essential for the effective design of drugs against common diseases such as osteoporosis and breast cancer.
The field of evolutionary computation (EC) contains techniques both for automatic programming and automatic modeling where a computer independently produces programs or models using some form of simulated evolution.
The most well known techniques in evolutionary computation are evolutionsstrategie (ES), evolutionary programming (EP), genetic algorithms (GA) and genetic programming (GP). The first three deal almost exclusively with mathematical modeling but the fourth has to a small extent also been applied to automatic programming even though the focus is on modeling also for GP. There are numerous other EC techniques, many of which should not be viewed as an offspring from one of the four above and also many hybrids between EC techniques and standard combinatorial optimization methods such as the simplex method, simulated annealing and tabu search .
I have just returned from a stimulating week at the 1998 IEEE World Congress on Computational Intelligence, which included the International Conference on Evolutionary Computation, and found that the field is more diverse than ever and that navigation in this jungle of alternative methods is difficult even for someone who has been active in EC for more than a decade. It is important to have in mind that no matter what inductive mathematical modeling problem you are interested in , there are at least a half dozen rather different methods to choose from and that not one of them is likely to be the “best” method for your problem but only provide you with a starting point for your own method development.
Let me now turn to automatic programming using simulated evolution which is more difficult than automatic modeling but also more general and potentially more rewarding. During the last 6 years, my main professional occupation has been to develop ADATE (Automatic Design of Algorithms through Evolution), that currently can produce general programs of moderate complexity from first principles which means that as much code as possible is produced through artificial evolution and that the system is fed a minimum of knowledge before the evolution begins. One can say that the system starts out as a “baby machine” or a “blank sheet” and typically does not even know elementary algorithms such as how to add natural numbers. However, it can learn for example addition, multiplication, sorting, string processing and other moderately complex algorithms in a few days of evolution simulation.
The editor of this newsletter asked me to speculate a little about the future of the ADATE system and other similar techniques that are yet to be invented and so I certainly will. However, please keep in mind that my crystal ball may not be particularly reliable even though it is better polished and maintained than any other I have seen so far.. .
The key issue in the success of the ADATE system is scalability which means that neither specification difficulty nor simulation time increase unreasonably much as the synthesized programs become more and more complex.
The problem of writing specifications is similar to the problem of writing pedagogical textbooks for schools, be it a university or an elementary school, but a “textbook” for “individuals” produced by the ADATE system must start at a lower level than even textbooks for elementary school. It is relatively easy to write such ADATE “textbooks” for mathematical and logical problems, but more difficult when considering human skills that are more or less directly programmed in our genes, for example pattern recognition, motor control and language. Note that the problems of writing effective algorithms for the latter problems are largely unsolved using traditional methods and that EC may be the best way of creating such algorithms.
There is often a fundamental difference between directly writing a program for a given class of problems and writing a textbook teaching how the problems may be solved. For example, we cannot write programs that effectively deal with the complexities and intricacies of human language but we can indeed develop ADATE textbooks for all the important facets of human language. Note that full mastery of such textbooks requires generalizing ability and levels of cognition that are so far unseen in any existing algorithms.
Actually, there is no clear theoretical obstacle that would prevent the ADATE system from producing programs with such cognitive capabilities. The main obstacles are practical, in particular the time required to simulate the evolution of complex programs.
In natural evolution, nature has employed extremely massive parallelism and a computational effort that we have just begun to comprehend. ADATE is governed by laws of evolution that are likely to be more optimized and well-designed than the seemingly primitive laws of Darwinian evolution. Therefore, an evolution simulation leading to human levels of cognition can conceivably be carried out using ADATE with a computational effort many orders of magnitude smaller than that of natural evolution.
My research priority over the next years is to determine and enhance the scalability of the ADATE system, for example obtaining relationships between the complexity of synthesized programs and the corresponding simulation time. Hopefully, these relationships will be clear enough to allow extrapolation to orders of magnitude higher complexities, which may tell us how powerful computers we need to produce algorithms highly skilled in human language, logic, mathematics and general science. Maybe the world’s leading powder crystallographer in 30 years is an algorithm generated through simulated evolution on a parallel computer with ten million Merced-9 CPUS?
The 1997 prototype for the ADATE system is available at http://www-ia.hiof.no/-rolandoladate-intro.htm1
It is certainly not yet ready for powder crystallography or anything like it.
34
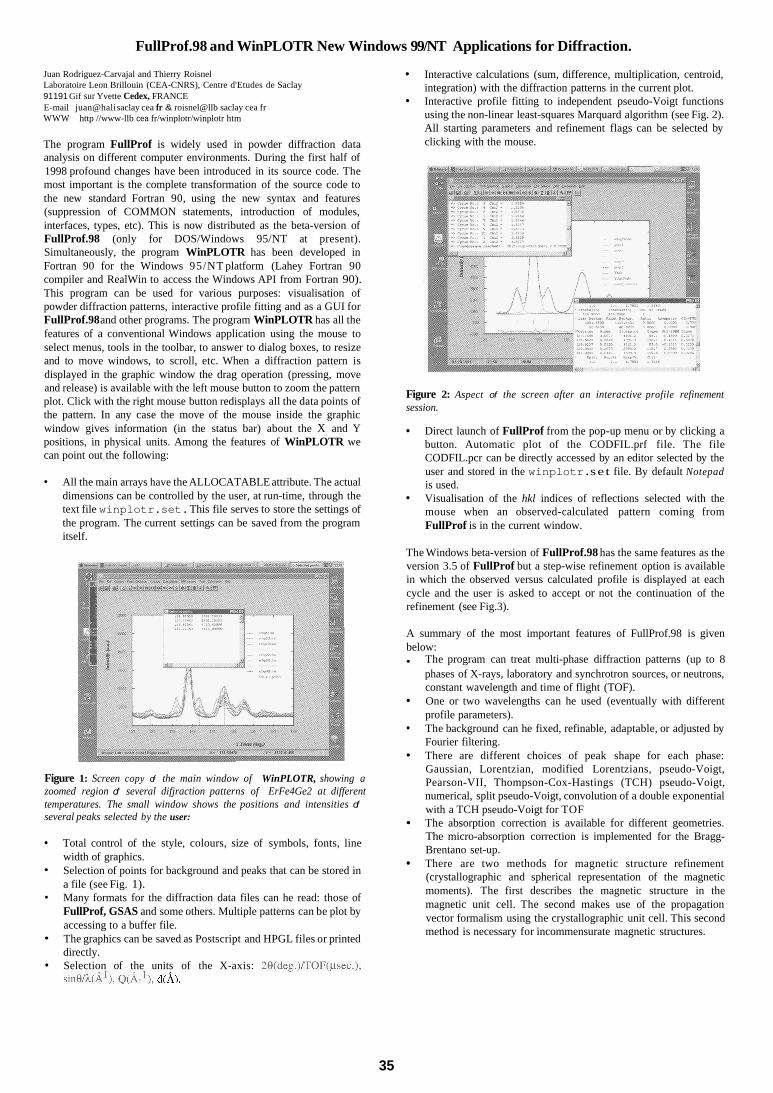
FullProf.98 and WinPLOTR New Windows 99/NT Applications for Diffraction.
Juan Rodriguez-Carvajal and Thierry Roisnel Laboratoire Leon Brillouin (CEA-CNRS), Centre d'Etudes de Saclay 91 191 Gif sur Yvette Cedex, FRANCE E-mail juan@hali saclay cea fr & roisnel@llb saclay cea fr WWW http //www-llb cea fr/winplotr/winplotr htm
The program FullProf is widely used in powder diffraction data analysis on different computer environments. During the first half of 1998 profound changes have been introduced in its source code. The most important is the complete transformation of the source code to the new standard Fortran 90, using the new syntax and features (suppression of COMMON statements, introduction of modules, interfaces, types, etc). This is now distributed as the beta-version of FullProf.98 (only for DOS/Windows 95/NT at present). Simultaneously, the program WinPLOTR has been developed in Fortran 90 for the Windows 95/NT platform (Lahey Fortran 90 compiler and RealWin to access the Windows API from Fortran 90). This program can be used for various purposes: visualisation of powder diffraction patterns, interactive profile fitting and as a GUI for FullProf.98 and other programs. The program WinPLOTR has all the features of a conventional Windows application using the mouse to select menus, tools in the toolbar, to answer to dialog boxes, to resize
Interactive calculations (sum, difference, multiplication, centroid, integration) with the diffraction patterns in the current plot. Interactive profile fitting to independent pseudo-Voigt functions using the non-linear least-squares Marquard algorithm (see Fig. 2). All starting parameters and refinement flags can be selected by clicking with the mouse.
and to move windows, to scroll, etc. When a diffraction pattern is displayed in the graphic window the drag operation (pressing, move and release) is available with the left mouse button to zoom the pattern plot. Click with the right mouse button redisplays all the data points of the pattern. In any case the move of the mouse inside the graphic window gives information (in the status bar) about the X and Y positions, in physical units. Among the features of WinPLOTR we can point out the following:
All the main arrays have the ALLOCATABLE attribute. The actual dimensions can be controlled by the user, at run-time, through the text file winplotr. set. This file serves to store the settings of the program. The current settings can be saved from the program itself.
Figure 1: Screen copy of the main window of WinPLOTR, showing a zoomed region of several difjraction patterns of ErFe4Ge2 at different temperatures. The small window shows the positions and intensities of several peaks selected by the user:
Total control of the style, colours, size of symbols, fonts, line width of graphics. Selection of points for background and peaks that can be stored in a file (see Fig. 1). Many formats for the diffraction data files can he read: those of FullProf, GSAS and some others. Multiple patterns can be plot by accessing to a buffer file. The graphics can be saved as Postscript and HPGL files or printed directly. Selection of the units of the X-axis: 28(deg.)/TOF(~sec.), sine/h(A'), Q(A-'), d@).
Figure 2: Aspect of the screen after an interactive profile refinement session.
Direct launch of FullProf from the pop-up menu or by clicking a button. Automatic plot of the CODFIL.prf file. The file CODFIL.pcr can be directly accessed by an editor selected by the user and stored in the winplotr. set file. By default Notepad is used. Visualisation of the hkl indices of reflections selected with the mouse when an observed-calculated pattern coming from FullProf is in the current window.
The Windows beta-version of FullProf.98 has the same features as the version 3.5 of FullProf but a step-wise refinement option is available in which the observed versus calculated profile is displayed at each cycle and the user is asked to accept or not the continuation of the refinement (see Fig.3).
A summary of the most important features of FullProf.98 is given below:
The program can treat multi-phase diffraction patterns (up to 8 phases of X-rays, laboratory and synchrotron sources, or neutrons, constant wavelength and time of flight (TOF). One or two wavelengths can he used (eventually with different profile parameters). The background can he fixed, refinable, adaptable, or adjusted by Fourier filtering. There are different choices of peak shape for each phase: Gaussian, Lorentzian, modified Lorentzians, pseudo-Voigt, Pearson-VII, Thompson-Cox-Hastings (TCH) pseudo-Voigt, numerical, split pseudo-Voigt, convolution of a double exponential with a TCH pseudo-Voigt for TOF The absorption correction is available for different geometries. The micro-absorption correction is implemented for the Bragg- Brentano set-up. There are two methods for magnetic structure refinement (crystallographic and spherical representation of the magnetic moments). The first describes the magnetic structure in the magnetic unit cell. The second makes use of the propagation vector formalism using the crystallographic unit cell. This second method is necessary for incommensurate magnetic structures.
35
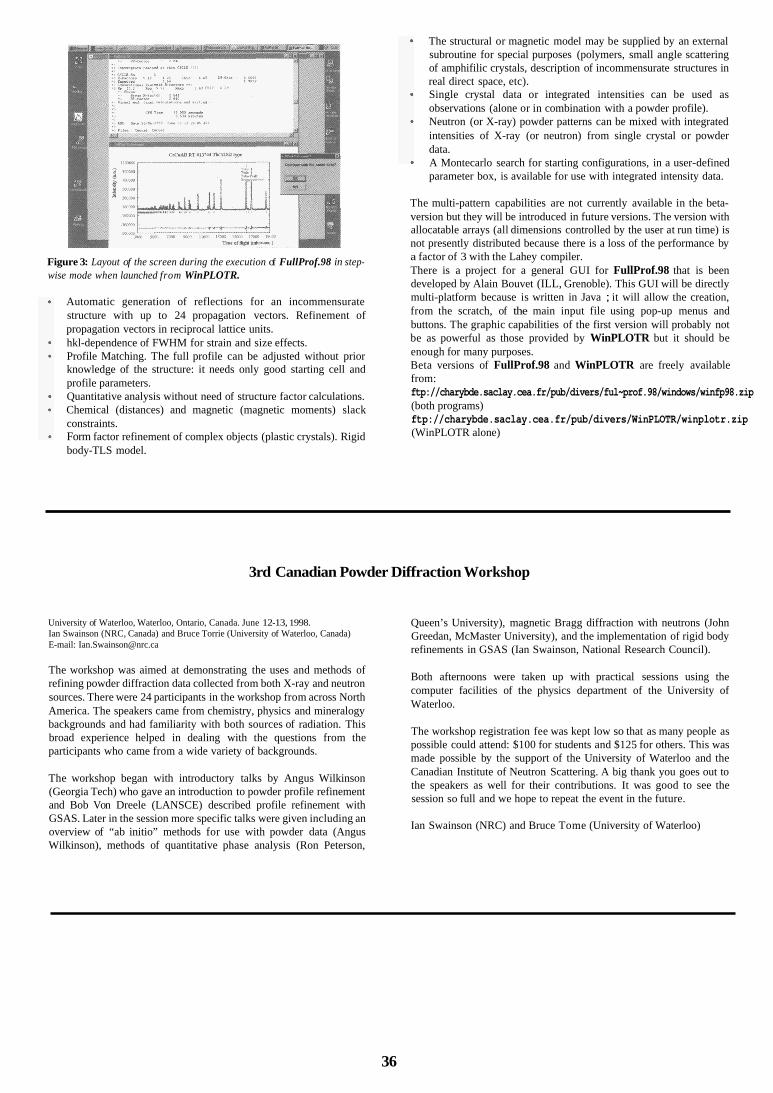
Figure 3: Layout of the screen during the execution of FullProf.98 in step- wise mode when launched from WinPLOTR.
Automatic generation of reflections for an incommensurate structure with up to 24 propagation vectors. Refinement of propagation vectors in reciprocal lattice units. hkl-dependence of FWHM for strain and size effects. Profile Matching. The full profile can be adjusted without prior knowledge of the structure: it needs only good starting cell and profile parameters. Quantitative analysis without need of structure factor calculations. Chemical (distances) and magnetic (magnetic moments) slack constraints. Form factor refinement of complex objects (plastic crystals). Rigid body-TLS model.
The structural or magnetic model may be supplied by an external subroutine for special purposes (polymers, small angle scattering of amphifilic crystals, description of incommensurate structures in real direct space, etc). Single crystal data or integrated intensities can be used as observations (alone or in combination with a powder profile). Neutron (or X-ray) powder patterns can be mixed with integrated intensities of X-ray (or neutron) from single crystal or powder data. A Montecarlo search for starting configurations, in a user-defined parameter box, is available for use with integrated intensity data.
The multi-pattern capabilities are not currently available in the beta- version but they will be introduced in future versions. The version with allocatable arrays (all dimensions controlled by the user at run time) is not presently distributed because there is a loss of the performance by a factor of 3 with the Lahey compiler. There is a project for a general GUI for FullProf.98 that is been developed by Alain Bouvet (ILL, Grenoble). This GUI will be directly multi-platform because is written in Java ; it will allow the creation, from the scratch, of the main input file using pop-up menus and buttons. The graphic capabilities of the first version will probably not be as powerful as those provided by WinPLOTR but it should be enough for many purposes. Beta versions of FullProf.98 and WinPLOTR are freely available from: ftp://charybde.saclay.cea.fr/pub/divers/ful~prof.98/windows/winfp98.zip (both programs) ftp://charybde.saclay.cea.fr/pub/divers/WinPLOTR/winplotr.zip (WinPLOTR alone)
3rd Canadian Powder Diffraction Workshop
University of Waterloo, Waterloo, Ontario, Canada. June 12-13, 1998. Ian Swainson (NRC, Canada) and Bruce Torrie (University of Waterloo, Canada) E-mail: [email protected]
The workshop was aimed at demonstrating the uses and methods of refining powder diffraction data collected from both X-ray and neutron sources. There were 24 participants in the workshop from across North America. The speakers came from chemistry, physics and mineralogy backgrounds and had familiarity with both sources of radiation. This broad experience helped in dealing with the questions from the participants who came from a wide variety of backgrounds.
The workshop began with introductory talks by Angus Wilkinson (Georgia Tech) who gave an introduction to powder profile refinement and Bob Von Dreele (LANSCE) described profile refinement with GSAS. Later in the session more specific talks were given including an overview of “ab initio” methods for use with powder data (Angus Wilkinson), methods of quantitative phase analysis (Ron Peterson,
Queen’s University), magnetic Bragg diffraction with neutrons (John Greedan, McMaster University), and the implementation of rigid body refinements in GSAS (Ian Swainson, National Research Council).
Both afternoons were taken up with practical sessions using the computer facilities of the physics department of the University of Waterloo.
The workshop registration fee was kept low so that as many people as possible could attend: $100 for students and $125 for others. This was made possible by the support of the University of Waterloo and the Canadian Institute of Neutron Scattering. A big thank you goes out to the speakers as well for their contributions. It was good to see the session so full and we hope to repeat the event in the future.
Ian Swainson (NRC) and Bruce Tome (University of Waterloo)
36
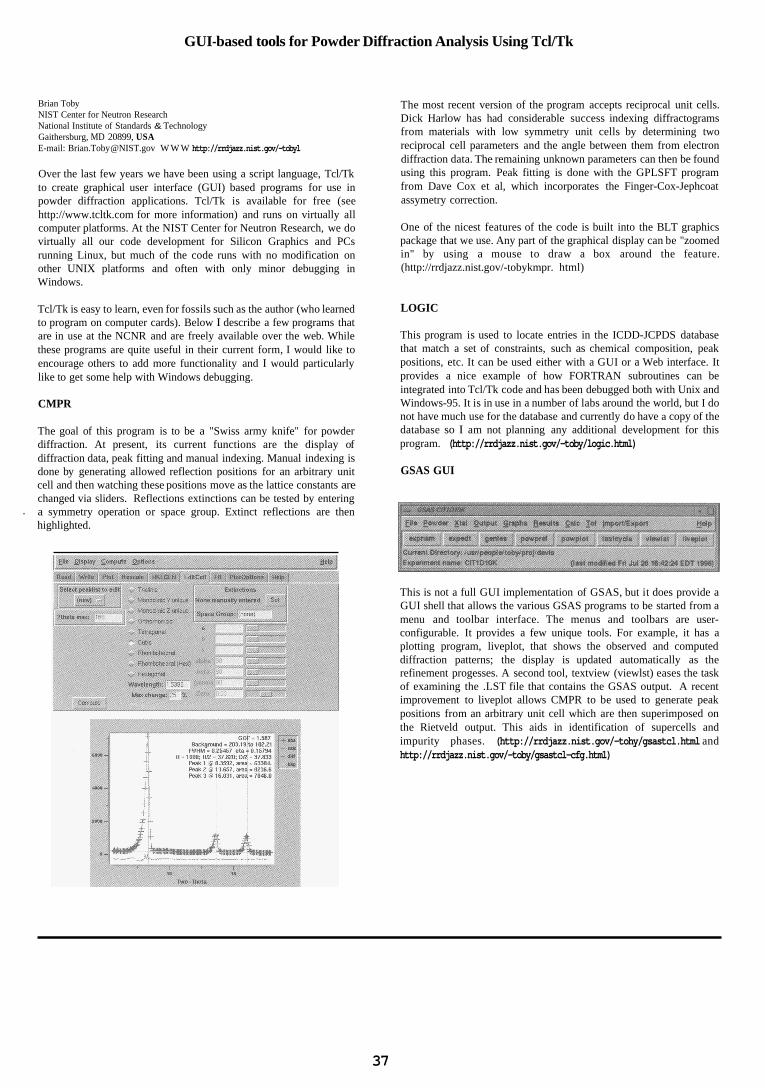
GUI-based tools for Powder Diffraction Analysis Using Tcl/Tk
Brian Toby NIST Center for Neutron Research National Institute of Standards & Technology Gaithersburg, MD 20899, USA E-mail: Brian.Toby @NIST.gov W W W http://rrdjazz.nist.gov/-tobyl
Over the last few years we have been using a script language, Tcl/Tk to create graphical user interface (GUI) based programs for use in powder diffraction applications. Tcl/Tk is available for free (see http://www.tcltk.com for more information) and runs on virtually all computer platforms. At the NIST Center for Neutron Research, we do virtually all our code development for Silicon Graphics and PCs running Linux, but much of the code runs with no modification on other UNIX platforms and often with only minor debugging in Windows.
Tcl/Tk is easy to learn, even for fossils such as the author (who learned to program on computer cards). Below I describe a few programs that are in use at the NCNR and are freely available over the web. While these programs are quite useful in their current form, I would like to encourage others to add more functionality and I would particularly like to get some help with Windows debugging.
CMPR
The goal of this program is to be a "Swiss army knife" for powder diffraction. At present, its current functions are the display of diffraction data, peak fitting and manual indexing. Manual indexing is done by generating allowed reflection positions for an arbitrary unit cell and then watching these positions move as the lattice constants are changed via sliders. Reflections extinctions can be tested by entering a symmetry operation or space group. Extinct reflections are then
*
. highlighted.
The most recent version of the program accepts reciprocal unit cells. Dick Harlow has had considerable success indexing diffractograms from materials with low symmetry unit cells by determining two reciprocal cell parameters and the angle between them from electron diffraction data. The remaining unknown parameters can then be found using this program. Peak fitting is done with the GPLSFT program from Dave Cox et al, which incorporates the Finger-Cox-Jephcoat assymetry correction.
One of the nicest features of the code is built into the BLT graphics package that we use. Any part of the graphical display can be "zoomed in" by using a mouse to draw a box around the feature. (http://rrdjazz.nist.gov/-tobykmpr. html)
LOGIC
This program is used to locate entries in the ICDD-JCPDS database that match a set of constraints, such as chemical composition, peak positions, etc. It can be used either with a GUI or a Web interface. It provides a nice example of how FORTRAN subroutines can be integrated into Tcl/Tk code and has been debugged both with Unix and Windows-95. It is in use in a number of labs around the world, but I do not have much use for the database and currently do have a copy of the database so I am not planning any additional development for this program. (http://rrdjazz.nist.gov/-toby/logic.html)
GSAS GUI
This is not a full GUI implementation of GSAS, but it does provide a GUI shell that allows the various GSAS programs to be started from a menu and toolbar interface. The menus and toolbars are user- configurable. It provides a few unique tools. For example, it has a plotting program, liveplot, that shows the observed and computed diffraction patterns; the display is updated automatically as the refinement progesses. A second tool, textview (viewlst) eases the task of examining the .LST file that contains the GSAS output. A recent improvement to liveplot allows CMPR to be used to generate peak positions from an arbitrary unit cell which are then superimposed on the Rietveld output. This aids in identification of supercells and impurity phases. (http://rrdjazz.nist.gov/-tohy/gsastcl.html and http://rrdjazz.nist.gov/-toby/gsastcl-cfg.htm1)
37
Aspects on using Java in crystallography
Steffen Weber NIRIM, Namiki 1-1, Tsukuba, Ibaraki 305, Japan E-mail: [email protected] W W W http://www.nirim.go.jp/-weberl
Introduction
Java is a relatively new programming language and it is still under development. Since the number of people working in the field of crystallography, who are interested to learn more about Java is growing I would like to point out some of Java's features that are of interest to crystallographers and leave it to the reader to access other sources on matters of Java language specifications etc. As a continuously growing language Java offers almost anything you might need to develop high- performance applications. The parts of Java that serve as standard libraries of ready-to-use methods are called Application Programming Interfaces (API). Among the newer developments are APIs for serial/parallel port communication, 2D/3D graphics, advanced image processing, speech recognition etc. Java's perhaps biggest advantages are its cross-platform portability, the easiness by which Graphical User Interfaces (GUI) can be created and multi-threading, which allows a program to perform multiple tasks independent from each other. Java is an interpreted language. The Java compiler generates so-called bytecode which is recognized by the file extension *.class. A Java interpreter will then convert this bytecode into machine dependent binary executable code. This interpreter, also referred to as Java Virtual machine (JVM), is available for many operating systems (OS), such as MS-Windows95/NT, Unix, Linux and the Mac os. Everything needed for developing and running Java programs can be downloaded for free from the Internet in form of the Java Development Kit (JDKTM) [I]. The JDK, however, does not include an Integrated Development Environment (IDE), which is usually available for other programming languages. However, such IDEs for Java can be obtained as commercial third-party products especially for MS-Windows9YNT. One of the first Visual IDEs, which is actually written in Java and therefore runs on any os with a JVM is Xelfi from Xelfi Technologies [2]. It has the look and feel known from Delphi's IDE. Among the non- visual development tools for MS-Windows95/NT ED4W from SoftAsItGets [3] is perhaps the best. Visual IDEs allow you to build your GUI by dragging components from a palette and dropping them in the design area. The frame work code is generated automatically and one only has to fill in the actual code. Note that some of the Java development tools available allow only the creation of applets, sometimes even without the possibility to actually write a single line of code. If you are interested in developing applets and applications you should choose an IDE, which offers both or just stick to the JDK and use your preferred text editor for coding. When writing Java programs it is a good practice to first create the whole GUI with menus, buttons etc. and write the actual code after that. The Java beginner should try to translate a functional program written in another language into Java. This can be done quite easily due to language similarities as in the case of C/C++. In such a translation note that arrays in Java start with index zero, unlike one as in Turbo Pascal for example. The absence of pointers in Java is another bonus, since one does not have to worry about memory allocations. It just be mentioned here that one of the newer concepts in Java's component architecture are JavaBeans, which are reusable components that are required by Visual IDEs. By writing your code as beans you may extend the palettes of components available for the creation of other programs. An example for a JavaBean is the Molecule Viewer bean from JavaSoft, which can also be seen in applet form on many websites.
1. Java applications versus applets
It would be wrong to think that Java is just a language for writing nice applets to enhance the attractiveness of web pages. Applets have severe limitations that a developer has to be aware of, since it might influence one's programming style. For example applets can neither read from nor write to the local hard disk. Therefore an applet cannot read input files in the usual sense or create temporary files for later use in the programs execution. Data files can be accessed as URL documents, which is quite another thing. Furthermore one cannot print directly from within an applet or save output graphics. Therefore hardcopies of
the applet's output cannot be easily obtained (apart from using screen capture utilities). Applets are useful for educational and demonstration purposes and make good programming exercises while learning Java. Several examples of crystallographic applets can be found on the authors homepage [4]. Apart from applets, which are embedded in a webpage and require a webbrowser or the JDK's appletviewer there are the stand-alone Java applications which can be run like any other software. Applications are what crystallographers are really interested in. Note that depending on its purpose and extent a Java program can be written in such a way that it can run both as an application or an applet. Java applications can use the full palette of the available APIs. Until the present version of the JDK (JDK1.1.6) the GUI of a Java program may have a slightly different look on different operating systems, because the corresponding os dependent window managers are being accessed. With the next JDK1.2 the developer may choose to use Java's new Abstract Windowing Toolkit (AWT) extension named Swing. A GUI created using Swing would look the same independent from the underlying os.
2. Calculation intensive programs
In case of computationally based programs, such as least squares refinement programs, Java may turn out to be too slow. One also might need to interface with some specialized hardware or drivers or one simply might want to reuse already available codes and libraries. In such cases one may use a combination of Java code and C code. C code is faster, and one does not have to recode already available code, apart from some modification for exchanging data types. FORTRAN programs can be converted to C code using some FORTRAN-to-C translator utility.
2.1 Linking native code
When linking C code to your Java program using the Java Native Interface (JNI) cross- platform portability is decreased, since a platform dependent C-compiler has to be used if one wants to transfer the program to another os. This will create some dynamic loadable library (DLL). On the Windows platform this is a *.dll file and under Unix a *.so file. This library file is loaded when a Java program containing native methods is started. One then has the possibility to exchange data between the Java side and the native side. From within the C code also system calls to other external programs can be done easily. One therefore can write a Java program where the only function of the Java side is to serve as a GUI while all computations are actually done using native code.
3. Graphics intensive programs
One of the strongest sides of Java is its graphics handling capabilities. Even with the standard APIs extensive graphics and image processing can be achieved (without specific 2D/3D APIs). With the new APIs in the forthcoming JDK1.2 those features will even leap to a much higher level.
3.1 Creating and saving images, image processing
Graphics are displayed in Java's canvas component, which also includes mouse tracking possibilities. Thus the mouse can be used for example to shift, rotate and zoom images or to index Bragg reflexions in a diffraction pattern simulation. One can either just draw onto the the canvas and/or display images that are either loaded as GIF or JPEG files or calculated pixel by pixel. The latter is of particular importance, since no input graphics is needed. One may just declare a one- dimensional array of size [image-width*image-height], each array component standing for an integer value that contains the alpha and RGB information (alpha=transparency, red, green, blue). One may then calculate/manipulate each pixel at will and then use the MemoryImageSource() class to actually create the image to be displayed. One may also make copies of an image to apply special filters (brightness, contrast etc.), the source code of which can be found in many books or on the Internet. The author used this method among others to read 10 Mbyte large binary files representing Imaging Plate
38
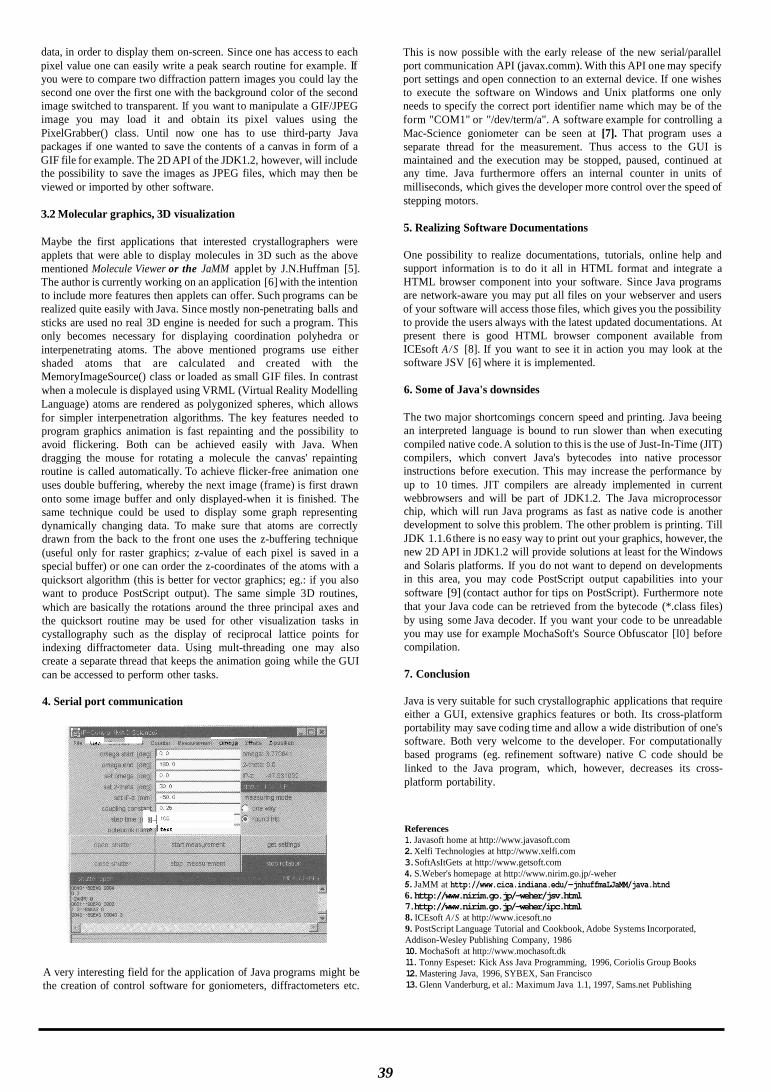
data, in order to display them on-screen. Since one has access to each pixel value one can easily write a peak search routine for example. If you were to compare two diffraction pattern images you could lay the second one over the first one with the background color of the second image switched to transparent. If you want to manipulate a GIF/JPEG image you may load it and obtain its pixel values using the PixelGrabber() class. Until now one has to use third-party Java packages if one wanted to save the contents of a canvas in form of a GIF file for example. The 2D API of the JDK1.2, however, will include the possibility to save the images as JPEG files, which may then be viewed or imported by other software.
3.2 Molecular graphics, 3D visualization
Maybe the first applications that interested crystallographers were applets that were able to display molecules in 3D such as the above mentioned Molecule Viewer or the JaMM applet by J.N.Huffman [5]. The author is currently working on an application [6] with the intention to include more features then applets can offer. Such programs can be realized quite easily with Java. Since mostly non-penetrating balls and sticks are used no real 3D engine is needed for such a program. This only becomes necessary for displaying coordination polyhedra or interpenetrating atoms. The above mentioned programs use either shaded atoms that are calculated and created with the MemoryImageSource() class or loaded as small GIF files. In contrast when a molecule is displayed using VRML (Virtual Reality Modelling Language) atoms are rendered as polygonized spheres, which allows for simpler interpenetration algorithms. The key features needed to program graphics animation is fast repainting and the possibility to avoid flickering. Both can be achieved easily with Java. When dragging the mouse for rotating a molecule the canvas' repainting routine is called automatically. To achieve flicker-free animation one uses double buffering, whereby the next image (frame) is first drawn onto some image buffer and only displayed-when it is finished. The same technique could be used to display some graph representing dynamically changing data. To make sure that atoms are correctly drawn from the back to the front one uses the z-buffering technique (useful only for raster graphics; z-value of each pixel is saved in a special buffer) or one can order the z-coordinates of the atoms with a quicksort algorithm (this is better for vector graphics; eg.: if you also want to produce PostScript output). The same simple 3D routines, which are basically the rotations around the three principal axes and the quicksort routine may be used for other visualization tasks in cystallography such as the display of reciprocal lattice points for indexing diffractometer data. Using mult-threading one may also create a separate thread that keeps the animation going while the GUI can be accessed to perform other tasks.
4. Serial port communication
\ 1ci J i T C a - -
,j I loo
P I tert
A very interesting field for the application of Java programs might be the creation of control software for goniometers, diffractometers etc.
This is now possible with the early release of the new serial/parallel port communication API (javax.comm). With this API one may specify port settings and open connection to an external device. If one wishes to execute the software on Windows and Unix platforms one only needs to specify the correct port identifier name which may be of the form "COM1" or "/dev/term/a". A software example for controlling a Mac-Science goniometer can be seen at [7]. That program uses a separate thread for the measurement. Thus access to the GUI is maintained and the execution may be stopped, paused, continued at any time. Java furthermore offers an internal counter in units of milliseconds, which gives the developer more control over the speed of stepping motors.
5. Realizing Software Documentations
One possibility to realize documentations, tutorials, online help and support information is to do it all in HTML format and integrate a HTML browser component into your software. Since Java programs are network-aware you may put all files on your webserver and users of your software will access those files, which gives you the possibility to provide the users always with the latest updated documentations. At present there is good HTML browser component available from ICEsoft A / S [8]. If you want to see it in action you may look at the software JSV [6] where it is implemented.
6. Some of Java's downsides
The two major shortcomings concern speed and printing. Java beeing an interpreted language is bound to run slower than when executing compiled native code. A solution to this is the use of Just-In-Time (JIT) compilers, which convert Java's bytecodes into native processor instructions before execution. This may increase the performance by up to 10 times. JIT compilers are already implemented in current webbrowsers and will be part of JDK1.2. The Java microprocessor chip, which will run Java programs as fast as native code is another development to solve this problem. The other problem is printing. Till JDK 1.1.6 there is no easy way to print out your graphics, however, the new 2D API in JDK1.2 will provide solutions at least for the Windows and Solaris platforms. If you do not want to depend on developments in this area, you may code PostScript output capabilities into your software [9] (contact author for tips on PostScript). Furthermore note that your Java code can be retrieved from the bytecode (*.class files) by using some Java decoder. If you want your code to be unreadable you may use for example MochaSoft's Source Obfuscator [l0] before compilation.
7. Conclusion
Java is very suitable for such crystallographic applications that require either a GUI, extensive graphics features or both. Its cross-platform portability may save coding time and allow a wide distribution of one's software. Both very welcome to the developer. For computationally based programs (eg. refinement software) native C code should be linked to the Java program, which, however, decreases its cross- platform portability.
References 1. Javasoft home at http://www.javasoft.com 2. Xelfi Technologies at http://www.xelfi.com 3. SoftAsItGets at http://www.getsoft.com 4. S.Weber's homepage at http://www.nirim.go.jp/-weher 5. JaMM at http://www.cica.indiana.edu/-jnhuffmaLJaMM/java.htnd 6. http://www.nirim.go.jp/-weher/jsv.html 7. http://www.nirim.go.jp/-weher/ipc.html 8. ICEsoft A / S at http://www.icesoft.no 9. PostScript Language Tutorial and Cookbook, Adobe Systems Incorporated, Addison-Wesley Publishing Company, 1986 10. MochaSoft at http://www.mochasoft.dk 11. Tonny Espeset: Kick Ass Java Programming, 1996, Coriolis Group Books 12. Mastering Java, 1996, SYBEX, San Francisco 13. Glenn Vanderburg, et al.: Maximum Java 1.1, 1997, Sams.net Publishing
39
What's On
7-10 Octobel; 1998 ISPD'98: An International School on Powder Diffraction, Indian Association for the Cultivation of Science Contact: Prof. S. P. Sen Gupta I.A.C.S., Jadavpur, Calcutta-700 032, India Fax : +91-033-4732805 E-mail: [email protected] or [email protected]; WWW via: http://gandalf.otago.ac.nz:800/rwea~ers/ASCA/asca98.htm
13-15 Octobel; 1998 3rd Conference of the Asian Crystallographic Association (AsCA'98) Hotel Equatorial Bangi, Selangor, Malaysia. Contact: Prof. A. Hamid Othman Jabatan Kimia, University Kebangsaan, Malaysia 43600 Bangi Malaysia Fax: +6-03-8258828 E-mail: [email protected] Int. Org. Com. Chairman: Prof. Shin-Lin Chang (slchang @phys.nthu.edu.tw) Int. Prog. Corn. Chairman: Prof. T. Yamanaka ([email protected]) WWW: http:/lgandalf.otago.ac.nz:8OO/rweavers/ASC~asca98.htm
8-12 Feburary 1999 Australian X-ray Analytical Association (AXAA99) - Analytical X-rays for Industry and Science Melbourne, Victoria, Australia Contact: Dr Mick Gould 13 Jeffrey St, Mt Waverley, 3149, Victoria, Australia
Tel: +(613) 9887-8003; E-mail: [email protected] WWW: http://www.latrobe.edu.au/wwwlaxad
Fax: +(613) 9887-8773;
4-13 August 1999 18th Congress and General Assembly of the International Union of Crystallography, Glasgow, Scotland, UK Contact: Dr. C. Gilmore, Department of Chemistry, University of Glasgow, Glasgow G12 8QQ, UK Fax: +44 (41) 330 4888; E-mail: [email protected] WWW: http://www.chem.gla.ac.uMiucr99/
CALL FOR CONTRIBUTIONS TO THE NEXT CPD NEWSLETTER
The next issue of the CPD Newsletter will be edited by S. P. Sen Gupta to appear in late
1998. He would greatly appreciate contributions from readers on matters of interest to the
powder diffraction community, e.g. meeting reports, future meetings, developments in
instruments, techniques and computer programs and news of general interest. Please send
articles and suggestions directly to him (address is Prof. S. P. Sen Gupta, I.A.C.S.,
Jadavpur, Calcutta, 700 032, India; Fax : +91-033-4732805; E-mail: [email protected])
HOW TO RECEIVE THE IUCR CPD NEWSLETTER
If you would like to be added to the mailing list for Newsletters of the IUCr Commission
on Powder Diffraction or you have changed your address, please contact
Prof. R.J. Cernik,
Daresbury Laboratory, Daresbury, Warrington, WA4 4AD, UK;
Fax: +44 (1925) 603 124
E-mail: R. J.Cernik @ dl.ac.uk
40


