Embed Size (px)
Citation preview
M I C R O B I O L O G Y D. J. Flournoy, PhD, MT(ASCP)SM
Interpreting the Sputum Gram Stain Report
In 1884 Hans Christian Joachim Gram, a Danish physician, developed the Gram stain.1 This differential stain facilitates observation and subsequent characterization of bacteria according to their shape, size, group, and staining reaction. The Gram stain is the most important and widely used stain in the fields of clinical microbiology, infectious diseases, and infection control.
Gram stains and cultures of sputum specimens are performed to detect potential respiratory pathogens. Gram stain results are available much sooner than culture results, and help physicians choose empiric therapy for patients with clinical signs of acute bacterial pneumonia.2
However, the usefulness of the sputum Gram stain is controversial because the results are not always reliable, culture results can be ambiguous, and pathogens do not always grow as expected.3-8
Determining potential respiratory pathogens from a Gram stain report prior to availability of culture results can be difficult. Problems can arise if Gram stains are misread or misinterpreted, specimens do not accurately reflect materials from the lower respiratory tract, the Gram stain report does not reflect subsequent culture results, or the Gram stain or culture do not reflect the actual cause of the illness.
This study focuses only on the relationship of Gram stain to culture. Investigators have noted relationships between Gram stains and cultures of Streptococcus pneumoniae,6'10 Haemophilus influenzae,6'11,12 and Moraxella catarrhalis.1*'14
However, few, if any, studies address how physicians should interpret sputum Gram stain results in general (ie, for all isolates cultured routinely). In this study, statistical relationships (sensitivity, specificity, positive and negative predictive values, and positive likelihood ratio) between some common Gram stain morphotypes and culture results were used to devise guidelines for interpreting the Gram stain report.
i A retrospective review of patient records was performed to determine the statistical relationship between sputum Gram stain and culture results in adult men at a Veterans Affairs Medical Center in the Midwest. Gram stain results from 1996 were statistically compared with culture results for 2,105 sputum specimens. Positive predictive values for common Gram stain morphotypes and their corresponding organisms varied from 7.1% to 90.6%. In some instances, the absence of a particular Gram stain morphotype (eg, gram-negative diplococci) was more predictive of the absence of an organism in culture (eg, Moraxella catarrhalisj than its presence. Also, Gram stain reports noting the presence of gram-negative bacilli were not predictive of cultures with gram-negative bacilli potential respiratory pathogens (positive predictive values 32.4%-54.9%). In conclusion, Gram stain results often were not accurate predictors of sputum culture results. One way to improve agreement between Gram stain and culture results is to develop Gram stain interpretation guidelines based on statistical relationships between stain and culture.
Materials and Methods The study was performed in a 389-bed, tertiary-care, general medical and surgical teaching institution primarily serving male veterans in Oklahoma and north central Texas. The study period was 1996, during which 7,405 inpatients and 263,489 outpatients were seen at the hospital and 2,105 sputum cultures and Gram stains were performed.
Sputum Culture and Gram Stain A routine bacterial sputum culture included a Gram stain.15 The Gram stain report noted sputum quality, and presence of neutrophils and bacterial morphotypes (eg, gram-positive cocci in pairs and clusters) semiquantitated. A positive Gram stain result indicated specific bacterial
From the Veterans Affairs Medical Center, and Department of Pathology, University of Oklahoma Health Sciences Center, Oklahoma City.
Reprint requests to Dr Flournoy, VAMC (113),921 NE 13th St, Oklahoma City, OK 73104-5007.
i e o I
(A
DECEMBER 1998 VOLUME 29. NUMBER 12 LABORATORY MEDICINE 7 0 3
Downloaded from https://academic.oup.com/labmed/article-abstract/29/12/763/2503918by gueston 28 May 2018
Dow
nloaded from https://academ
ic.oup.com/labm
ed/article/29/12/763/2503918 by guest on 16 January 2022
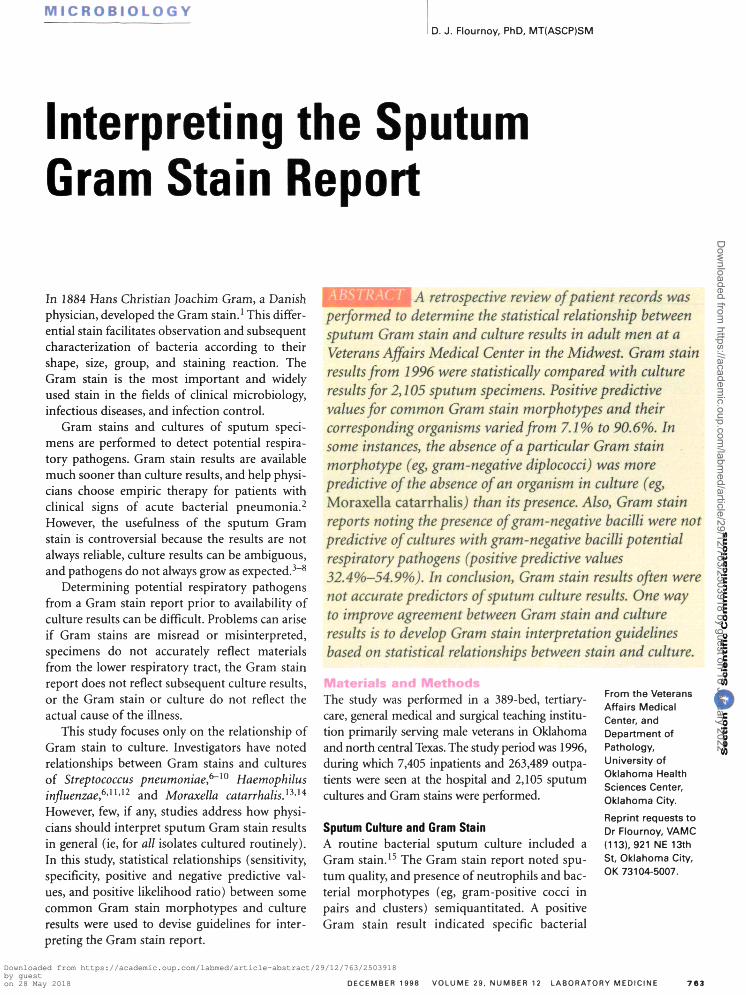
Fig 1. Positive sputum specimen showing moderate number of gram-positive cocci in pairs (Gram stain, original magnification x1,000).
Table 1. Criteria for Grading the Quality of Sputum Specimens
Squamous Specimen Grade Epithelial Cells/lpf Neutrophils/lpf
Good
Fair
Poor
Inadequate
Lpf indicates low power applicable.
0-10
11-19
>19
>19
field (10x ocular with 10x
NA (usually >25)
NA (usually >25)
>10
<10
objective); NA, not
morphotypes or mixed oral flora (Fig 1); a negative result indicated the absence of microorganisms (ie, no organisms seen).
The Gram stain was usually read within several hours after the specimen was received in the laboratory, and the culture was initially read the following morning. Specimens were cultured in 100-mm-diameter plates containing 5% sheep blood, chocolate, and MacConkey agars, and incubated in 5% carbon dioxide at 35°C for 24 hours after inoculation. Some plates were then held longer, depending on microbial flora present and the need to identify and semiquantitate isolates and perform antimicrobial susceptibility tests.
As shown in Table 1, sputum specimens were graded "good" if they had 10 or fewer squamous epithelial cells per low-power field (100 X total magnification), "fair" with 11 to 19 squamous epithelial cells, and "poor" with more than 19 squamous epithelial cells and more than 10 WBC per low-power field, based on previously described criteria.16,17 Low-power magnification was used to detect and quantitate squamous epithelial cells and WBC (Figs 2 & 3); however, microorganisms were observed under oil immersion (1,000 X total magnification). Approximately 10 to 20 low-power fields were scanned
Fig 2. "Fair" sputum specimen —11 to 19 squamous epithelial cells per low power field (Gram stain, original magnification X100).
Fig 3. "Good" sputum specimen—0 to 10 squamous epithelial cells per low power field (Gram stain, original magnification X100).
7 6 4 LABORATORY MEDICINE VOLUME 29, NUMBER 12 DECEMBER 1998
Downloaded from https://academic.oup.com/labmed/article-abstract/29/12/763/2503918by gueston 28 May 2018
Dow
nloaded from https://academ
ic.oup.com/labm
ed/article/29/12/763/2503918 by guest on 16 January 2022
before determining the specimen's grade. Because the established grading system potentially underestimates contamination from common oral flora, the poorer grade was assigned if a borderline result was obtained.
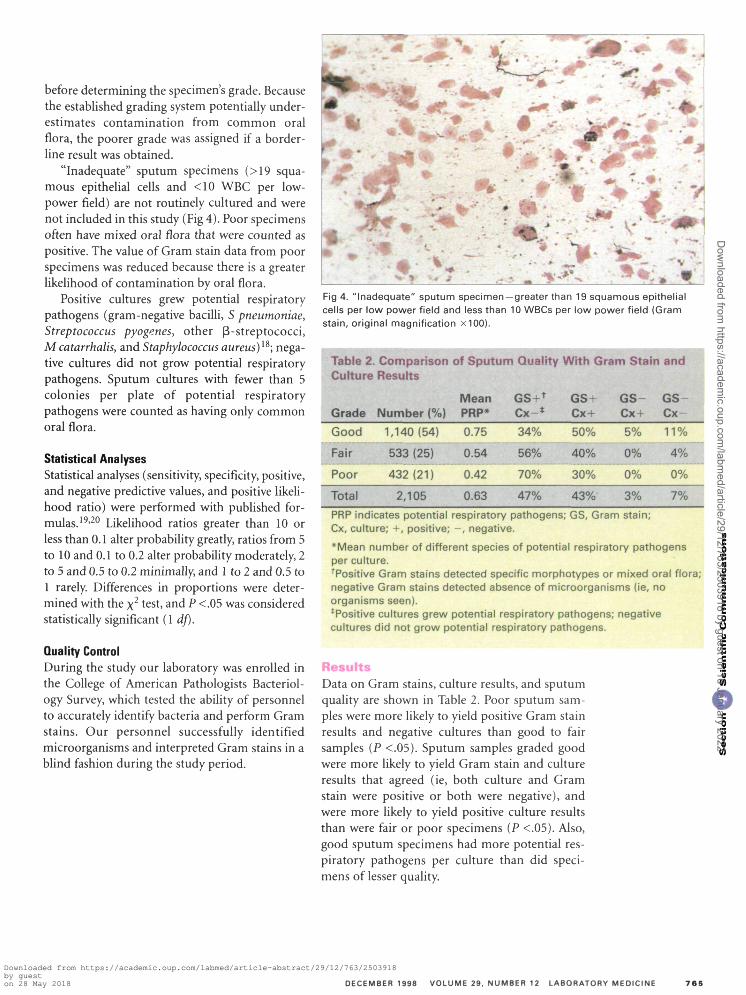
"Inadequate" sputum specimens (>19 squamous epithelial cells and <10 WBC per low-power field) are not routinely cultured and were not included in this study (Fig 4). Poor specimens often have mixed oral flora that were counted as positive. The value of Gram stain data from poor specimens was reduced because there is a greater likelihood of contamination by oral flora.
Positive cultures grew potential respiratory pathogens (gram-negative bacilli, S pneumoniae, Streptococcus pyogenes, other 0-streptococci, M catarrhalis, and Staphylococcus aureus)1^; negative cultures did not grow potential respiratory pathogens. Sputum cultures with fewer than 5 colonies per plate of potential respiratory pathogens were counted as having only common oral flora.
Statistical Analyses Statistical analyses (sensitivity, specificity, positive, and negative predictive values, and positive likelihood ratio) were performed with published formulas.19'20 Likelihood ratios greater than 10 or less than 0.1 alter probability greatly, ratios from 5 to 10 and 0.1 to 0.2 alter probability moderately, 2 to 5 and 0.5 to 0.2 minimally, and 1 to 2 and 0.5 to 1 rarely. Differences in proportions were determined with the x2 test, and P <.05 was considered statistically significant (1 df).
Quality Control During the study our laboratory was enrolled in the College of American Pathologists Bacteriology Survey, which tested the ability of personnel to accurately identify bacteria and perform Gram stains. Our personnel successfully identified microorganisms and interpreted Gram stains in a blind fashion during the study period.
Fig 4. "Inadequate" sputum specimen —greater than 19 squamous epithelial cells per low power field and less than 10 WBCs per low power field (Gram stain, original magnification x100).
Table 2. Comparison of Sputum Quality With Gram Stain and Culture Results
Grade
Good
Fair
Poor
Total
Number (%)
1,140(54)
533 (25)
432(21)
2,105
Mean PRP*
0.75
0.54
0.42
0.63
GS+t
Cx- *
34%
56%
70%
47%
GS+ Cx +
50%
40%
30%
43%
GS-Cx+
5%
0%
0%
3%
GS Cx-
11%
4%
0%
7%
PRP indicates potential respiratory pathogens; GS, Gram stain; Cx, culture; +, positive; - , negative.
*Mean number of different species of potential respiratory pathogens per culture. Positive Gram stains detected specific morphotypes or mixed oral flora; negative Gram stains detected absence of microorganisms (ie, no organisms seen). ^Positive cultures grew potential respiratory pathogens; negative cultures did not grow potential respiratory pathogens.
Results Data on Gram stains, culture results, and sputum quality are shown in Table 2. Poor sputum samples were more likely to yield positive Gram stain results and negative cultures than good to fair samples (P <.05). Sputum samples graded good were more likely to yield Gram stain and culture results that agreed (ie, both culture and Gram stain were positive or both were negative), and were more likely to yield positive culture results than were fair or poor specimens (P <.05). Also, good sputum specimens had more potential respiratory pathogens per culture than did specimens of lesser quality.
c 3 E E o 0 u E c 0
i
DECEMBER 1998 VOLUME 29. NUMBER 12 LABORATORY MEDICINE 7 6 5
Downloaded from https://academic.oup.com/labmed/article-abstract/29/12/763/2503918by gueston 28 May 2018
Dow
nloaded from https://academ
ic.oup.com/labm
ed/article/29/12/763/2503918 by guest on 16 January 2022
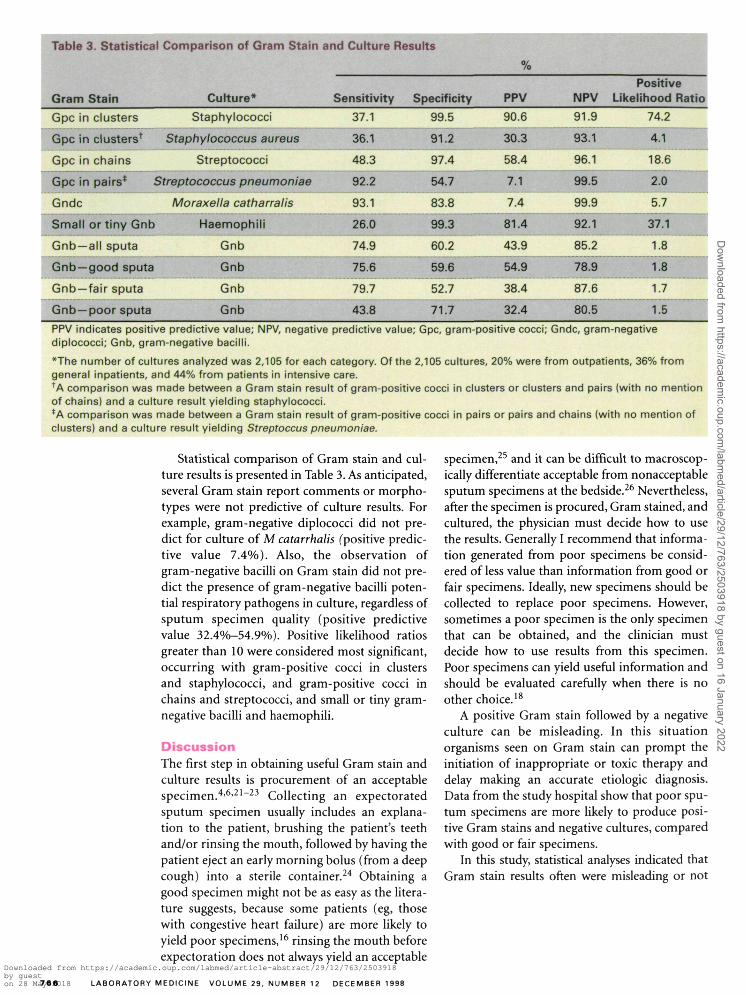
Table 3. Statistical Comparison of Gram Stain and Culture Results
Gram Stain
Gpc in clusters
Gpc in clusterst
Gpc in chains
Culture*
Staphylococci
Staphylococcus aureus
Streptococci
Gpc in pairs* Streptococcus pneumoniae
Gndc
Small or tiny Gnb
Gnb —all sputa
Gnb —good sputa
Gnb—fair sputa
Gnb —poor sputa
Moraxella catharralis
Haemophili
Gnb
Gnb
Gnb
Gnb
Sensitivity
37.1
36.1
48.3
92.2
93.1
26.0
74.9
75.6
79.7
43.8
Specificity
99.5
91.2
97.4
54.7
83.8
99.3
60.2
59.6
52.7
71.7
PPV
90.6
30.3
58.4
7.1
7.4
81.4
43.9
54.9
38.4
32.4
NPV
91.9
93.1
96.1
99.5
99.9
92.1
85.2
78.9
87.6
80.5
Positive Likelihood Ratio
74.2
4.1
18.6
2.0
5.7
37.1
1.8
1.8
1.7
1.5
PPV indicates positive predictive value; NPV, negative predictive value; Gpc, gram-positive cocci; Gndc, gram-negative diplococci; Gnb, gram-negative bacilli.
*The number of cultures analyzed was 2,105 for each category. Of the 2,105 cultures, 20% were from outpatients, 36% from general inpatients, and 44% from patients in intensive care. *A comparison was made between a Gram stain result of gram-positive cocci in clusters or clusters and pairs (with no mention of chains) and a culture result yielding staphylococci. *A comparison was made between a Gram stain result of gram-positive cocci in pairs or pairs and chains (with no mention of clusters) and a culture result yielding Streptoccus pneumoniae.
Statistical comparison of Gram stain and culture results is presented in Table 3. As anticipated, several Gram stain report comments or morpho-types were not predictive of culture results. For example, gram-negative diplococci did not predict for culture of M catarrhalis (positive predictive value 7.4%). Also, the observation of gram-negative bacilli on Gram stain did not predict the presence of gram-negative bacilli potential respiratory pathogens in culture, regardless of sputum specimen quality (positive predictive value 32.4%-54.9%). Positive likelihood ratios greater than 10 were considered most significant, occurring with gram-positive cocci in clusters and staphylococci, and gram-positive cocci in chains and streptococci, and small or tiny gram-negative bacilli and haemophili.
Discussion The first step in obtaining useful Gram stain and culture results is procurement of an acceptable specimen.4'6'21_23 Collecting an expectorated sputum specimen usually includes an explanation to the patient, brushing the patient's teeth and/or rinsing the mouth, followed by having the patient eject an early morning bolus (from a deep cough) into a sterile container.24 Obtaining a good specimen might not be as easy as the literature suggests, because some patients (eg, those with congestive heart failure) are more likely to yield poor specimens,16 rinsing the mouth before expectoration does not always yield an acceptable
specimen,25 and it can be difficult to macroscop-ically differentiate acceptable from nonacceptable sputum specimens at the bedside.26 Nevertheless, after the specimen is procured, Gram stained, and cultured, the physician must decide how to use the results. Generally I recommend that information generated from poor specimens be considered of less value than information from good or fair specimens. Ideally, new specimens should be collected to replace poor specimens. However, sometimes a poor specimen is the only specimen that can be obtained, and the clinician must decide how to use results from this specimen. Poor specimens can yield useful information and should be evaluated carefully when there is no other choice.18
A positive Gram stain followed by a negative culture can be misleading. In this situation organisms seen on Gram stain can prompt the initiation of inappropriate or toxic therapy and delay making an accurate etiologic diagnosis. Data from the study hospital show that poor sputum specimens are more likely to produce positive Gram stains and negative cultures, compared with good or fair specimens.
In this study, statistical analyses indicated that Gram stain results often were misleading or not
7 6 6 LABORATORY MEDICINE VOLUME 29. NUMBER 12 DECEMBER 1998
Downloaded from https://academic.oup.com/labmed/article-abstract/29/12/763/2503918by gueston 28 May 2018
Dow
nloaded from https://academ
ic.oup.com/labm
ed/article/29/12/763/2503918 by guest on 16 January 2022
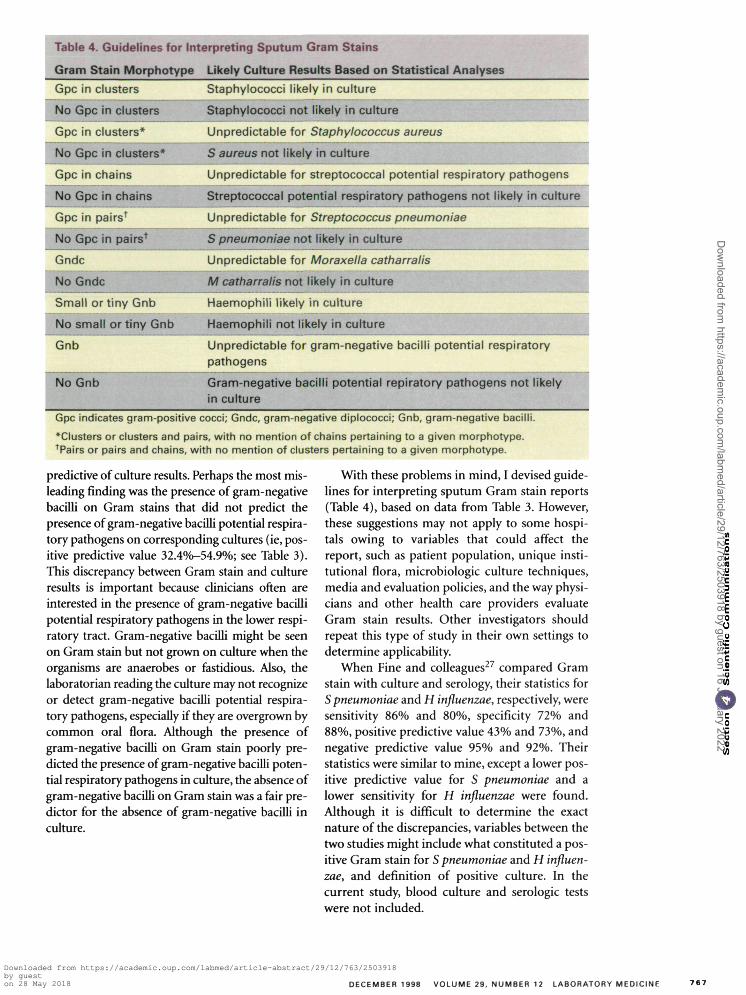
Table 4. Guidelines for Interpreting Sputum Gram Stains
Gram Stain Morphotype Likely Culture Results Based on Statistical Analyses
Gpc in clusters
No Gpc in clusters
Gpc in clusters*
No Gpc in clusters*
Gpc in chains
No Gpc in chains
Gpc in pairst
No Gpc in pairs1
Gndc
No Gndc
Small or tiny Gnb
No small or tiny Gnb
Gnb
No Gnb
Staphylococci likely in culture
Staphylococci not likely in culture
Unpredictable for Staphylococcus aureus
S aureus not likely in culture
Unpredictable for streptococcal potential respiratory pathogens
Streptococcal potential respiratory pathogens not likely in culture
Unpredictable for Streptococcus pneumoniae
S pneumoniae not likely in culture
Unpredictable for Moraxella catharralis
M catharralis not likely in culture
Haemophili likely in culture
Haemophili not likely in culture
Unpredictable for gram-negative bacilli potential respiratory pathogens
Gram-negative bacilli potential repiratory pathogens not likely in culture
Gpc indicates gram-positive cocci; Gndc, gram-negative diplococci; Gnb, gram-negative bacilli.
'Clusters or clusters and pairs, with no mention of chains pertaining to a given morphotype. tPairs or pairs and chains, with no mention of clusters pertaining to a given morphotype.
predictive of culture results. Perhaps the most misleading finding was the presence of gram-negative bacilli on Gram stains that did not predict the presence of gram-negative bacilli potential respiratory pathogens on corresponding cultures (ie, positive predictive value 32.4%-54.9%; see Table 3). This discrepancy between Gram stain and culture results is important because clinicians often are interested in the presence of gram-negative bacilli potential respiratory pathogens in the lower respiratory tract. Gram-negative bacilli might be seen on Gram stain but not grown on culture when the organisms are anaerobes or fastidious. Also, the laboratorian reading the culture may not recognize or detect gram-negative bacilli potential respiratory pathogens, especially if they are overgrown by common oral flora. Although the presence of gram-negative bacilli on Gram stain poorly predicted the presence of gram-negative bacilli potential respiratory pathogens in culture, the absence of gram-negative bacilli on Gram stain was a fair predictor for the absence of gram-negative bacilli in culture.
With these problems in mind, I devised guidelines for interpreting sputum Gram stain reports (Table 4), based on data from Table 3. However, these suggestions may not apply to some hospitals owing to variables that could affect the report, such as patient population, unique institutional flora, microbiologic culture techniques, media and evaluation policies, and the way physicians and other health care providers evaluate Gram stain results. Other investigators should repeat this type of study in their own settings to determine applicability.
When Fine and colleagues27 compared Gram stain with culture and serology, their statistics for S pneumoniae and H influenzae, respectively, were sensitivity 86% and 80%, specificity 72% and 88%, positive predictive value 43% and 73%, and negative predictive value 95% and 92%. Their statistics were similar to mine, except a lower positive predictive value for S pneumoniae and a lower sensitivity for H influenzae were found. Although it is difficult to determine the exact nature of the discrepancies, variables between the two studies might include what constituted a positive Gram stain for S pneumoniae and H influenzae, and definition of positive culture. In the current study, blood culture and serologic tests were not included.
DECEMBER 1998 VOLUME 29. NUMBER 1 2 LABORATORY MEDICINE
Downloaded from https://academic.oup.com/labmed/article-abstract/29/12/763/2503918by gueston 28 May 2018
Dow
nloaded from https://academ
ic.oup.com/labm
ed/article/29/12/763/2503918 by guest on 16 January 2022
In 1996 Reed and colleagues28 performed a meta-analysis to evaluate the sensitivity and specificity of the sputum Gram stain in community-acquired pneumococcal pneumonia. Sensitivity ranged from 15% to 100%, and specificity from 11% to 100%. They suggested that practitioners using the Gram stain be taught that a positive test requires on average more than 10 organisms resembling pneumococcus per oil immersion field in purulent sputum. However, all S pneumoniae organisms may not be lancet shaped; some might be observed as gram-positive cocci in pairs, chains, or even clusters. In 1975 Lorian and Atkinson29 noted that pneumococci can look like bacilli, and staphylococci like diplo-cocci, when exposed to antimicrobial agents. Therefore morphologic features can vary with the local "environment." This morphologic variation is a good example of how difficult it can be to compare Gram stain studies, all with different definitions of what constitutes a positive Gram stain and culture.
Conclusion The relationship of Gram stain to culture needs to be examined for each specimen type (eg, sputum, urine, wound, blood). Studies need to examine whether guidelines (see Table 4) improve the ability of physicians to make etiologic diagnoses. However, for now, if physicians can more accurately interpret sputum Gram stain results, they might be able to better choose empiric therapy and therefore reduce morbidity and mortality, especially in seriously ill patients.®
References l.Gram C. Ueber die isolierte Farbung der Schizomyceten
in Schmitt-und Trockenpraparaten. Fortschr Med. 1884;2:333-336.
2.Chapin K. Clinical microscopy. In: Murray PR, Baron EJ, Pfaller MA, et al, eds. Manual of Clinical Microbiology, 6th ed. Washington, DC: American Society for Microbiology; 1995:33-51.
3. Gleckman R, DeVita J, Hibert D, et al. Sputum Gram stain assessment in community-acquired bacteremic pneumonia. / Clin Microbiol. 1988;26:846-849.
4. Lentino JR, Lucks DA. Nonvalue of sputum culture in the management of lower respiratory tract infections. / Clin Microbiol. 1987;25:758-762.
5. Thorsteinsson SB, Musher DM, Fagan T. The diagnostic value of sputum culture in acute pneumonia. JAMA. 1975;233:894-895.
6. Musher DM. Gram stain and culture of sputum to diagnose bacterial pneumonia. / Infect Dis. 1985; 152:1096.
7. Barrett-Connor E. The nonvalue of sputum culture in the diagnosis of pneumococcal pneumonia. Am Rev Respir Dis. 1971;103:845-848.
8. Drew WL. Value of sputum culture in diagnosis of pneumococcal pneumonia. / Clin Microbiol 1977;6:62-65.
9. Rein MF, Gwaltney JM Jr, O'Brien WM, et al. Accuracy of Gram's stain in identifying pneumococci in sputum. JAMA. 1978;239:2671-2673.
lO.Perlino CA. Laboratory diagnosis of pneumonia due to Streptococcus pneumoniae. J Infect Dis. 1984;150:139-144.
11. Klein DW, Beasley PA, Ilstrup DM, et al. Can microscopic screening be used to determine the suitability of sputum for culture of Haemophilus species? Am J Clin Pathol. 1986; 86:771-773.
12. Levin DC, Schwarz MI, Matthay RA, et al. Bacteremic Hemophilus influenzae pneumonia in adults. Am J Med. 1977; 62:219-224.
13. Pollard JA, Wallace RJ Jr, Nash DR, et al. Incidence of Branhamella catarrhalis in the sputum of patients with chronic lung disease. Drugs. 1986;31(Suppl 3):103-108.
14. Ainsworth SM, Nagy SB, Morgan LA, et al. Interpretation of Gram-stained sputa containing Moraxella (Branhamella) catarrhalis. J Clin Microbiol. 1990;28:2559-2560.
15. Snyder B. Pitfalls in the Gram stain. Lab Med. 1970;1:41^M.
16. Murray PR, Washington JA. Microscopic and bacterio-logic analysis of expectorated sputum. Mayo Clinic Proc. 1975;50:339-344.
17. Flournoy DJ, Belknap DC. Patient factors associated with poor sputa. Clin Lab Sci. 1995;8:245-248.
18. Flournoy DJ, Huycke MM. Value of poor sputum specimens for routine bacterial culture. Clin Lab Sci. 1994;7:358-361.
19. Browner WS, Newman TB, Cummings SR. Designing a new study: III. Diagnostic tests. In Hulley SB, Cummings SR, eds. Designing Clinical Research: An Epidemiological Approach. Baltimore, Md: Williams 8c Wilkins; 1988:87-97.
20. Jaeschke R, Guyatt GH, Sackett DL. User's guides to the medical literature: how to use an article about a diagnostic test. JAMA. 1994;271:703-707.
21. Geckler RW, Gremillion DH, McAllister CK, et al. Microscopic and bacteriological comparison of paired sputa and transtracheal aspirates. / Clin Microbiol. 1977;6:396-399.
22. Heineman HS, Chawla JK, Lofton WM. Misinformation from sputum culture without microscopic examination. / Clin Microbiol. 1977;6:518-527.
23. Heineman HS, Radano RR. Acceptability and cost savings of selective sputum microbiology in a community teaching hospital. / Clin Microbiol. 1979;10:567-573.
24. Niejadlik DC. Sputum. In: Henry JB, Nelson DA, Tomar RH, et al. Clinical Diagnosis and Management by Laboratory Methods, 18th ed. Philadelphia, Pa: Saunders; 1991:504-518.
25. Flournoy DJ, Adkins LJ, Laughlin KJ. Value of oral hygiene before expectoration of sputum for routine bacterial culture. Chest. 1994; 105:1923.
26. Flournoy DJ, Davidson LJ. Sputum quality: can you tell by looking? Am J Infect Control. 1993;21:64-69.
27. Fine MJ, OrlofT JJ, Rihs JD, et al. Evaluation of housestaff physicians' preparation and interpretation of sputum Gram stains for community-acquired pneumonia. / Gen Intern Med. 1991;6:189-198.
28. Reed WW, Byrd GS, Gates RH Jr, et al. Sputum Gram's stain in community-acquired pneumococcal pneumonia: a meta-analysis. West J Med. 19%; 165:197-204.
29. Lorian V, Atkinson B. Abnormal forms of bacteria produced by antibiotics. Am J Clin Pathol 1975;64:678-688.
7 6 8 LABORATORY MEDICINE VOLUME 29. NUMBER 12 DECEMBER 1998
Downloaded from https://academic.oup.com/labmed/article-abstract/29/12/763/2503918by gueston 28 May 2018
Dow
nloaded from https://academ
ic.oup.com/labm
ed/article/29/12/763/2503918 by guest on 16 January 2022


![M.A. [GEOGRAPHY] NEHRU GRAM BHARATI](https://img.pdfslide.net/doc/110x75/631336d7b1e0e0053b0e511a/ma-geography-nehru-gram-bharati.jpg)