Embed Size (px)
Citation preview

F A C U L T Y O F H E A L T H S C I E N C E S
U N I V E R S I T Y O F C O P E N H A G E N
Ph.D thesisNina Gros Pedersen
Intrauterine growth restrictionin first half of pregnancy
Academic advisor: Ann Tabor, professorKaren R Wøjdemann, Ph.D

Intrauterine growth restriction in first half of pregnancy
1
ContentsPreface and aims of the Ph.D thesis.........................................................................................3
List of abbreviations ................................................................................................................... 4
Introduction...................................................................................................................................5
Background ....................................................................................................................................5
Assessing Intra Uterine Growth Restriction .....................................................................5
Fetal growth............................................................................................................................5
Diagnosis of Intra Uterine Growth Restriction.................................................................. 6
Definitions of Intra Uterine Growth Restriction ................................................................7
Customized fetal growth charts ...........................................................................................7
Determining gestational age................................................................................................ 8
Longitudinal measurements of growth .............................................................................. 8
Conditional centiles.............................................................................................................. 9
Consequences of Intra Uterine Growth Restriction....................................................... 9
Mortality ................................................................................................................................ 9
Short term morbidity........................................................................................................... 10
Long term morbidity ........................................................................................................... 10
Prematurity and growth restriction .................................................................................... 11
Growth restriction and adult disease.................................................................................. 11
Causes of Intra Uterine Growth Restriction.................................................................... 12
Trophoblast invasion ........................................................................................................... 13
Doppler ultrasound measurements .................................................................................. 15
Uterine artery Doppler ultrasound .................................................................................... 16
Unselected population ........................................................................................................ 17
High risk population............................................................................................................ 18
Severe preeclampsia / Intra Uterine Growth Restriction ................................................ 19
Stillbirth ................................................................................................................................ 19
Interpretation ....................................................................................................................... 19
Umbilical artery Doppler ultrasound .............................................................................. 20
High risk population............................................................................................................ 21
Low risk population.............................................................................................................22
Placental growth regulating hormones............................................................................22
Growth Hormone gene........................................................................................................23

Intrauterine growth restriction in first half of pregnancy
2
Human Placental Lactogen.................................................................................................23
Placental Growth Hormone ............................................................................................... 24
Insulin Growth Factor I and II........................................................................................... 26
Insulin Growth Factor Binding Proteins............................................................................27
Interventions for Intra Uterine Growth Restriction .................................................... 28
Oxygen therapy, bed rest, exercise and social support ................................................... 28
Calcium, fishoil, antioxidant supplements and antiplatelet agents .............................. 28
Food supplementation and infection................................................................................ 29
Own studies: ............................................................................................................................... 30
Papers I and II .......................................................................................................................... 30
Paper III .....................................................................................................................................35
Paper IV .................................................................................................................................... 38
Conclusions and clinical implications .................................................................................... 41
Fetal growth in first half of the pregnancy and the risk of adverse outcome ......... 41
Conditional and Date centiles: Fetuses with growth rates below 2.5th
centile ............. 42
Conditional and Date centiles: Association to low birth weight and perinatal
mortality .............................................................................................................................. 42
Growth hormones and growth rate in first half of pregnancy ....................................43
Fetal growth in first half of pregnancy as a predictor of adverse outcome ............ 44
Future research .......................................................................................................................... 45
Summary ...................................................................................................................................... 47
Dansk resume ............................................................................................................................. 50
Reference List ..............................................................................................................................53
Appendix...........................................................................................................................................

Intrauterine growth restriction in first half of pregnancy
3
Preface and aims of the Ph.D thesis
The present Ph.D thesis is based on work carried out during my employment as a Ph.D
student at the Department of Fetal Medicine and Ultrasound, Rigshospitalet, Denmark in
the period 2005-10. The work was supervised by Ann Tabor, Dr Med, professor,
Department of Fetal Medicine and Ultrasound, Rigshospitalet, Denmark and Karen R
Wøjdemann, Ph.D, Department of Obstetrics and Gynecology, Roskilde Sygehus,
Denmark.
The Ph.D thesis is based on the following original papers
I. Fetal growth between the first and second trimester and the risk of adverse
pregnancy outcome. NG Pedersen, KR Wøjdemann, T Scheike and A. Tabor.
Ultrasound Obstet Gynecol 2008;32:147-154
II. Early fetal size and growth as predictors of adverse outcome. NG Pedersen, F
Figueras, KR Wøjdemann, A Tabor and J Gardosi. Obstet Gynecol 2008;112:765-771
III. Maternal serum levels of placental Growth Hormone in early pregnancy, but not
of human Placental Lactogen, and Insulin Growth Factor-I are positively associated
with fetal growth in first trimester of human pregnancy. NG Pedersen, A Juul, M
Christiansen, KR Wøjdemann and A Tabor, submitted
IV. First trimester growth restriction and uterine arteries blood flow as predictors of
adverse pregnancy outcome. NG Pedersen, L Sperling, KR Wøjdemann, S Olesen
Larsen and A Tabor, in manuscript
The manuscripts are referred to in roman numerals (I-IV) in the text
The aims of the Ph.D thesis were:
1. To evaluate the association between fetal growth and size in first half of pregnancy
and subsequent adverse outcome
2. To analyze the association between growth factors in maternal blood and fetal
growth rate in first half of pregnancy
3. To investigate if fetuses with first trimester growth restriction have poorer
perfusion of the placenta, measured by ultrasound Doppler of the uterine and
umbilical arteries compared to a control group, and to investigate if first trimester
growth restriction in combination with poor flow in the uterine and umbilical
arteries can be used to predict poor outcome.

Intrauterine growth restriction in first half of pregnancy
4
List of abbreviations
A. Arteria
Aa. Arteriae
ADAM 12 A disintegrin and metalloprotease 12
AGA Appropriate for gestational age
BPD Biparietal diameter
CRL Crown rump length
CTG Cardiotocography
EFW Estimated fetal weight
GH Growth hormone
hPL Human placental lactogen
IGF Insulin growth factor
IGFBP Insulin growth factor binding protein
IUGR Intra uterine growth restriction
PGH Placental growth hormone
PI Pulsatility index
PAPP-A Pregnancy associated plasma protein - A
RI Resistance index
SD Standard deviation
SGA Small for gestational age

Intrauterine growth restriction in first half of pregnancy
5
Introduction
Fetal growth is of key importance in many aspect of perinatology. Impaired growth is
associated with increased neonatal morbidity and mortality, and much of routine prenatal
care focuses on detecting fetuses at increased risk of growth restriction and targeting
intensive monitoring and interventions.
In this Ph.D thesis the focus is on fetal growth in early pregnancy. We wished to elucidate
if there was an association between impaired growth in first half of pregnancy and
subsequent poor outcome. Furthermore we wished to analyze the associations between
fetal growth in first half of pregnancy and known growth factors, and finally to investigate
if the results from the first two studies could be used to improve the prediction of poor
outcome prospectively.
In the background section of the Ph.D thesis present knowledge on: Assessment of
intrauterine growth restriction (IUGR); Consequences of IUGR; Causes of IUGR; Doppler
ultrasound measurements; Placental growth regulating hormones and Interventions for
IUGR are presented. These are selected topics that are of relevance to the design and
results of our studies. The background section is followed by a presentation and discussion
of our own results.
BackgroundAssessing Intra Uterine Growth Restriction
Fetal growth
The regulation of fetal growth differs from postnatal growth regulation. Postnatal growth
is largely determined by the genetic make-up of the individual, while nutrition plays a
smaller role. Fetal growth is largely determined by the availability of nutrients to the fetus,
while it is generally thought that the genome plays a limited role1. The importance of the
maternal phenotype has been shown in cross-breeding experiments and embryo transplant
experiments in animals2 3
. In humans, in a study of pregnancies involving ovum donations,
it was found that the only factors contributing to birth weight were gestational age and the
recipient mother´s weight. The weight of the donor mother was not related to birth weight
4. These studies thus indicate that fetal growth is constrained by nutrition, and the uterine
environment is a major determinant of fetal growth.
In half-sibling studies, the influence of the mother on birth weight has been demonstrated.
There is a stronger correlation between the birth weights of half-siblings, who share the
same mother than half-siblings who share only a father5. It has been estimated that 62%

Intrauterine growth restriction in first half of pregnancy
6
of the variation of human birth weight results from the intrauterine environment,
compared with 20% and 18% from maternal and paternal genes6.
Normal fetal growth involves an increase in cell number during first and second trimester
followed by an increase in cell size, which becomes dominant in third trimester7. Thus it
is especially in late gestation that the ability of the uteroplacental unit to deliver oxygen
and nutrients becomes important for fetal growth.
Diagnosis of Intra Uterine Growth Restriction
Estimation of fetal growth during pregnancy can be made in many different ways. An
estimation of fetal weight is helpful in predicting fetal survival and making management
decisions in the low birth weight group, and in managing the delivery of the large baby,
where complications may occur8. The oldest of the clinical methods used to diagnose
IUGR is abdominal palpation, using the Leopold manoeuvres’9. The diagnostic
performance of abdominal palpation is of limited value; the sensitivities reported are
between 30% and 50%10 11
. Today the most widely used screening tool for IUGR is
symphysis – fundal height tape measurements, which seems to be somewhat better at
detecting IUGR than abdominal palpation; sensitivities range from 56% to 86%12
.
When a more accurate estimation of fetal weight is necessary ultrasonically estimated fetal
weight (EFW) is used. The parameters most often used to estimate fetal weights
ultrasonically are: biparietal diameters (BPD), head circumference, mean abdominal
diameter, abdominal circumference and femur. The measurements have been combined in
several regression equations or volumetric formulae to evaluate which combination most
accurately estimates fetal weight and predicts fetal compromise. According to a Cochrane
review from 20058
where EFW was compared with birth weight, the formula by Hadlock et
al13 14
gave approximately a mean deviation between EFW and birth weight of 10%.
In all growth retarded fetuses the abdominal circumference is the first biometric
measurement to change and it is also the most sensitive single measurement for predicting
IUGR. An abdominal measurement within the normal range almost reliably excludes IUGR
15. Another early radiographic sign of IUGR is decreased amniotic fluid volume; about 85%
of IUGR infants have oligohydramnios16
EFW, abdominal circumference and amniotic fluid levels are useful for the detection of
cases with IUGR, but less useful for the management of IUGR and have to be used in
association with other techniques of antenatal surveillance such as CTG (Cardiotocogrpah),
biophysical profile and Doppler ultrasound to make decisions about for instance the timing
of delivery17
.
Intrauterine growth restriction in first half of pregnancy
7
Definitions of Intra Uterine Growth Restriction
There are numerous definitions for impaired growth of the baby in pregnancy. Impaired
fetal growth is a disturbance of normal growth resulting in a baby that does not grow to its
potential. It can be difficult accurately to differentiate between the constitutionally small
baby and one with impaired growth, when compared with its potential. A baby may be of
normal birth weight but still significantly lighter than its genetic growth potential18
. SGA
(Small for Gestational Age) defines a child that hasn’t reached a specific weight at a given
gestational age, and IUGR defines a child that hasn’t reached its genetic growth potential19
.
However, it is not all literature that distinguishes between SGA and IUGR, and the
classifications are not consistently used according to the classifications above20-22
.
The current WHO criterion for low birth weight is a weight less than 2,500 g or below the
10th
percentile for gestational age23
and the classification “very low birth weight” is
commonly used for weights below the 3rd
percentile for gestational age. McIntire DD et al
found that for term infants morbidity and mortality were significantly higher among
infants, who were at or below the 3rd
percentile of weight for their gestational age24
, but
other groups define alternative thresholds as the best diagnostic cut-off for increased
neonatal mortality and morbidity25;26
, and at present there is no general agreement on the
most appropriate threshold .
In Denmark IUGR during pregnancy is most often classified as EFW that is 22% or more
smaller than the ultrasonically estimated mean for gestational age27
. This classification is
equal to an EFW below the 2.3 percentile for gestational age, and to the classification made
by Marsal et al in Sweden (IUGR= EFW that is below ultrasonically estimated mean weight
for gestational age – 2 SD)28
.
Historically, IUGR has been categorized as symmetric or asymmetric. Symmetric IUGR
refers to fetuses with equally poor growth velocity of the head, the abdomen and the long
bones. Asymmetric IUGR refers to infants whose head and long bones are spared compared
with their abdomen and viscera29
. The ponderal index, which compares birth weight with
length (birth weight (g) / birth length (cm)3)×100, is sometimes used as an assesment of
the thinness or obesity of the neonate30
. Infants with symmetric growth restriction have a
normal ponderal index, whereas those with asymmetric growth restriction have a reduced
ponderal index.
Customized fetal growth charts
Customized fetal growth charts are growth charts that are individually adjusted /
“customized” for physiological factors known to affect birth weight and growth: fetal sex,
gestational age, maternal height, maternal weight in early pregnancy, ethnicity and parity.

Intrauterine growth restriction in first half of pregnancy
8
The customized growth charts have in several studies demonstrated that they are more
accurate in predicting individual birth weight31;32
and are more closely associated with
stillbirths, neonatal deaths or low Apgar scores (<4) than the unadjusted population
percentile33
, probably due to improved identification of IUGR.
Determining gestational age
Since the majority of ultrasound measurements used to define IUGR depends on
gestational age a precise estimate of gestational age is a prerequisite when screening and
diagnosing IUGR. Traditionally gestational age has been determined from the first day of
the last menstrual period and then adding 280-283 days to predict the day of delivery34
.
The conditions for Naegels’s rule are: that the pregnant woman remembers the first day in
her last period; her cycle must have been regular at least for three months with an interval
of 28±4 days; she must have had at least 3 spontaneous periods before the last menstrual
period; and no bleeding in first trimester34 35
. The conditions are only met in 30-80% of the
pregnancies36-39
, and many women have delayed ovulation in some cycles, which causes a
tendency to overestimate the length of gestation39-42
.
Ultrasound dating has in several studies been shown to be more accurate than menstrual
dating43;43-48
. Ultrasound dating of pregnancy is usually based on CRL (Crown Rump
Length) or BPD49;50
. In most studies the use of CRL in first trimester has been shown to
be more accurate than BPD in second trimester for date setting36;38;51
, and in Demark where
about 90% of the pregnant women are scanned in first trimester52
there is a consensus to
use the gestational age determined by CRL in first trimester if possible53
.
Longitudinal measurements of growth
In clinical practice it is commonplace for fetal size to be estimated more than once during
pregnancy, so routine data are often longitudinal. However, when diagnosing potential
IUGR conventionally cross sectional standards for size are used, even though it seems more
logical to use longitudinal standards for growth, when having two or more measurements.
Cross sectional standards for size give information only on size, whereas longitudinal data
may be used to produce rates of growth (changes over time in size). Since fetal growth is a
dynamic process longitudinal standards for growth could improve the prediction and the
differentiation between SGA and IUGR. It would allow early identification of the baby who
begins pregnancy on a certain size percentile within the normal range and then
experiences impaired growth. The few studies that have used longitudinal measurements of
growth, and then related them to adverse outcome show convincing results that low rates
of growth can be used as a sign for fetal demise54-56
.

Intrauterine growth restriction in first half of pregnancy
9
Conditional centiles
One of the reasons that longitudinal standards for growth aren’t commonly used in the
clinic is most likely that correct statistical analysis of longitudinal fetal data is somewhat
complicated. Below is a short description of conditional centiles, which is an
acknowledged statistical method, used to estimate growth longitudinally. Conditional
centiles uses individual predictions for the expected normal range of a measurement
(conditional centiles) at the second time of measurement on the basis of the first
measurement. Each second-time measurement is thus assigned a centile, which is
conditional to the previous measurement in the same child. Conditional centiles takes into
account the normal phenomenon of regression to the mean; underweight children tend to
catch up towards median weight, while relatively heavy infants catch down57
.
Consequences of Intra Uterine Growth Restriction
Mortality
The perinatal mortality rate is higher at each gestational age in SGA-children compared
with normal weight children.
Figure 1 Risk of neonatal death at the 10th percentile relative to the 45th to 55th percentiles across gestational agefor single live births, 1996-2000.
A study from 2006 with more than 18.000.000 singleton births included showed that at 26
weeks of gestation, infants born with birth weight at the 10th
percentile or below
experienced a 3-fold risk of dying within the first 28 days of life relative to children born
with birth weights between the 45th
-55th
percentile, at 40 weeks the ratio was 1.1358
. Figure
1 with the use of data from reference58
. Other studies that use lower threshold for the

Intrauterine growth restriction in first half of pregnancy
10
definition of IUGR have reported 5-10 fold increase in the rate of death among both term
and preterm IUGR children24;59-61
.
Short term morbidity
SGA-children are at delivery compromised due to longterm placental insufficiency and
chronich intrauterine hypoxia, this renders them more vulnerable after birth. Some of the
most common problems in neonatal period are described below.
Infants born at term with birth weight below 3rd
percentile for gestational age have twice
the incidence of low Apgar scores and umbilical pH 724
. This leads to higher rates of
hypoxic brain injuries and seizures; one study with more than 200,000 infants included
demonstrated that birth weight below the 10th
percentile for gestational age conferred a 5-
fold increased risk of perinatal strokes for infants born at term62
.
Because of decreased liver glycogen and fat stores growth restricted infants are more
vulnerable to hypothermia and hypoglycaemia63
, and due to a relatively hypoxic
intrauterine environment growth restricted infant have higher risk of polycythemia64
.
Although polycythemic infants often remain asymptomatic polycythemia can in some cases
be associated with hyperbilirubinemia, hypoglycemia and necrotizing enterocolitis65
.
The incidence of sepsis is increased in growth restricted children24;66
possibly caused by a
compromised immune system. Growth restriction has previously been reported to
correlate with neutropenia in infants of hypertensive mothers67
. Furthermore growth
restricted infants are prone to coagulation abnormalities, which include a reduction in
vitamin K-dependent coagulation factors68
and decreased platelet count69
. It has been
proposed that the coagulation abnormalities are caused by antenatal hypoxia affecting the
liver and hence vitamin K-dependent coagulation70
.
An intolerance of protein intake in the first postnatal weeks has been reported when
infants that are SGA are compared with infants that are appropriate for gestational age71
.
It has been suggested that intrauterine growth restriction alters a number of metabolic and
physiologic variables in the fetus that probably affect the hepatocyte function and protein
tolerance72
.
Long term morbidity
Several studies have found an association between low birth weight for gestational age and
an increased risk of cerebral palsy73-75
. Data from 10 European countries totalling 45,703
singleton children born between 1976 and 1990 found that babies born at 32-42 weeks of
gestation with a birth weight below the 10th
centile were four to ten times more likely to
have cerebral palsy than children with birth weight between the 25th
and 75th
centile76
.

Intrauterine growth restriction in first half of pregnancy
11
Further more subtle neurologic findings, including alternation of tone during infancy,
increased activity and clumsiness in later childhood have been identified frequently in
children who had been growth restricted77;78
.
The specific risk attributable to intrauterine growth restriction on neurodevelopmental
outcome is difficult to isolate, confounding factors such as prematurity, maternal disease
and socioeconomic factors may often obscure the picture and alter the interpretation of the
specific risk of intrauterine growth restriction. Although some studies report no effect of
SGA status on cognitive outcome79;80
most studies find that on average the overall
intellectual performance of SGA children is lower but still within the reference range
compared to the performance of children with a normal birth weight,81;82
.
90% of babies who are born SGA for any reason will catch up in height with their peers by 2
years of age, but about 10% will continue to be two standard deviations below the average
height for their age, and these children are also leaner than their peers and have a lower
food intake compared with healthy controls83;84
.
Prematurity and growth restriction
Growth restriction is associated with an increased risk of spontaneous and iatrogenic
preterm deliveries59;85
. It was previously a commonly held clinical assumption that
growth-restricted fetuses are stressed by the unfavourable environment in utero, and as a
result it was claimed that these infants have accelerated maturation and are less likely to
suffer from prematurity complications when compared with appropriately grown infants86
.
However, more recent studies show an increased risk of complications related to
prematurity in SGA infants compared with Appropriate for Gestational Age (AGA) infants
including: respiratory distress syndrome70;87
, chronic lung disease22;60;61;88
, retinopathy of
prematurity89
and necrotizing enterocolitis70;90;91
, so it seems that when born preterm the
growth restricted child is vulnerable not only to the complications of growth restriction but
also to those of prematurity.
Growth restriction and adult disease
Birth weight is inversely related to the mortality rate of cardiovascular disease92 93
, and it
has been shown that infants born IUGR have an increased incidence of type 2 diabetes94
,
increased insulin resistance95
, cardiovascular disease96;97
and a set of metabolic
abnormalities known as sydrome X98
in adulthood. These finding has led to the hypothesis
that impaired fetal nutrition has long-term adverse impact on adult health by permanently
altering or programming the physiology and metabolism of the developing organism92 93
.
It has been hypothesized that fetal malnutrition and changes in the Insulin Growth Factor

Intrauterine growth restriction in first half of pregnancy
(IGF) axis may permanently imprint the organism for further pathology. In support of the
theory, there is some evidence from animal studies that long-term programming of the IGF
axis can occur as a result of fetal events99
. Furthermore IGFs and Insulin Growth Factor
Binding Proteins (IGFBP) are nutritionally regulated in the fetus, and there are
abnormalities in the Growth Hormone (GH) - IGF axis both in growth retarded
fetuses/neonates and in many of the adult diseases that are associated with low birth
weight, including cardiovascular disease, diabetes and osteoporosis100
.
Causes of Intra Uterine Growth Restriction
Several conditions are associated with restricted growth, and growth restricted infants
represent a highly heterogeneous group in terms of etiology and severity. Growth
restriction may be the only sign of the disease, or it may come with severe abnormalities in
different organ systems. The causes of growth restriction can be divided into: extrinsic,
maternal, placental and fetal, see Figure 2. In this thesis I will concentrate on the placental
causes of growth restriction, with special focus on trophoblast invasion and the secretion of
growth regulating hormones.
Figure 2.
F
C
M
I
M
C
O
MATERNAL FACTORS
Hypertension
Preeclampsia
Chronic diseases
Inherited thrombophilia
FETAL GROWTH RES
Most common conditions and causes associated
ETAL FACTORS
hromosomal trisomy
endelian single gene disorders
nborn errors of metabolism
ultiple pregnancy
ongenital structural abnormalities
ther syndromes
PLACENTAL FACTORS
Plancental mosaicism
Abnormal placentation
Uterine abnormality
Placental infarcts
Placenta praevia
12
TRICTION
with fetal growth restriction
EXTRINSIC FATCTORS
Smoking
Alcohol
Drug abuse
Infections

Intrauterine growth restriction in first half of pregnancy
Trophoblast invasion
During human pregnancy the fetus and placenta form a functional unit, with placenta
playing a key role in fetal growth. The relationship between the development of the
placenta and fetus is illustrated by the correlation between placental and fetal weight
throughout pregnancy101
. SGA neonates have significantly reduced placental weights
compared with appropriately grown neonates of the same birth weight102
. The main
structural and functional units of the human placenta are the chorionic villi. The structure
is explained in Figure 3.
Figure 3 Structure of first trimester placental villi: Villous mesenchycytotrophoblasts, which in turn are covered by a multinucleated synfeto-placental blood vessels can be seen.
Within the developed placenta there is a cavity (intervi
network of chorionic villi, which float in circulating ma
facilitate exchanges between the maternal and fetal cir
surface is 11 m2 103
. The main cells inside the chorionic
cytotrophoblasts lies the mesenchymal core, which con
various cells including fibroblasts104
. When the blastoc
the cytotrophoblasts proliferate and differentiate into v
The villous phenotype differentiates by aggregation to
multinucleated epithelium that acts as nutrient and ga
endocrine unit of the placenta106
. The extravillous phe
ability to aggressively invade maternal tissue107;108
. Ple
adapted from109
.
Mesenchymal core
Cytotropnoblasts
Syncytiotrophoblasts
Intervillous space
13
mal core surrounded by a continuous layer ofcytiotrophoblast. In the mesenchymal core
llous space) that possesses a vast
ternal blood. A large surface to
culation is created; at term the
villi are cytotrophoblasts. Below the
tains placental capillaries and
yt invades the endometrial tissue
illous or extravillous phenotypes105
.
syncytiotrophoblast, a
s exchange barrier104
, and is the
notype differentiate and acquire the
ase see Figure 4 for details. Figure
Feto-placental blood vessel

Intrauterine growth restriction in first half of pregnancy
14
Figure 4 Anatomy of the maternal-fetal interface (A) Placental chorionic villi stem from the chorionic plate andlie within the intervillous space. The point of attachment between anchoring villi and the underlying tissue isreferred to as the basal plate (box B). (B) enlargement of the area in box B. Undifferentiated cytotrophoblastprogenitors in the anchoring villi give rise to invasive cytotrophoblasts that invade the uterine interstitium andthe maternal endothelium.
Some of the extravillous cells embed in the maternal stroma either individually or in small
clusters with decidual, myometrial and immune cells. A group of the extravillous cells
express surface antigens that resemble maternal endothelial cells, which enable them to
migrate up the spiral arteries110
. During the endovascular invasion the cytotrophoblasts
plug the spiral arteries, which temporarily reduces maternal flow and oxygen supply110
.
Subsequently the fetal cells replace the maternal endothelium and portions of the smooth
muscle wall109;111
, and the spiral arteries are transformed into larger low-resistance vessels
capable of transporting the increased maternal blood flow to the placenta at low
pressure112;113
. Normally this process encompasses the proportion of the uterine arterioles
that span the decidua and the inner third of the myometrium114
. The decidual part of the
spiral arteries is invaded between week 8 and 12 of gestation115
, the myometrium around
mid-pregnancy116
.
Succesfull trophoblast invasion is required to sustain fetal growth, and absence of
trophoblast induced changes in decidual or myometrial segments of the spiral arteries is a
feature of some pregnancies complicated by growth restriction117
. In women with
preeclampsia, a group susceptible to IUGR, this deep invasion of the myometrial vessels
together with the associated vascular change is seriously impaired118
.
How this deficiency of trophoblast invasion translates into preeclampsia with endothelial
dysfunction, hypertension and possible multiorgan deficiency of the mother is not
understood. It is hypothesized that the response may result from defective trophoblast

Intrauterine growth restriction in first half of pregnancy
differentiation, impaired decidualization, extreme hyperinflammatory response or still
undefined maternal tissue processes119
.
Increased blood flow is essential to meet metabolic demand from the growing uterus as
well as the placenta and fetus. Total maternal blood volume120
and cardiac output increase
by approximately 40% during pregnancy103
, and the total uteroplacental blood flow
represents 25% of cardiac output112
. Uteroplacental blood flow has been shown to be
reduced by 50% in women with preeclampsia121
, and often there is a decrease in the
number and surface of terminal villi in IUGR, representing a malfunction of vascularization
in these pregnancies122
.
Doppler ultrasound measurements
Doppler measurements use the Doppler effect to assess the velocity and whether structures
are moving towards or away from the probe. By calculating the frequency shift of a
particular volume its speed and direction can be determined and visualized. The result
when examining vessels is a specification of the direction and velocity of the bloodstream
depicted as a velocity waveform. The curve reflects the speed of the erythrocytes and the
color-intensity reflects the number of erythrocytes in the vessel at a given velocity. The
shape of the velocity waveform depends on: heart action, blood velocity, vessel wall
compliance and both proximal and distal resistance to flow.
Figure 5 Doppler indices. (S)
Max
imu
mfr
eq
ue
ncy
shif
tcm
/se
c
Mean
pea
S
S/D ratio
D
k systolic frequency shift (D) end diastolic frequency sh
Time
RI = (S-D)/S
PI = (S-D)/mean
15
ift.

Intrauterine growth restriction in first half of pregnancy
The vascular resistance peripheral to the site of measurement mainly affects the diastolic
part of the velocity waveform. Thus the dominant influence on the waveforms recorded
from a.umbilicalis (arteria umbilicalis) and aa.uterinae (arteriae uterinae) is exerted by
vascular resistance in the placenta. As fetal hypoxia in many instances is caused by
placental pathology analysing the waveforms can serve as a diagnostic test123
. A number of
formulas and indices have been evolved to characterize the waveforms mathematically.
Some make use of only two points on the curve e.g. the systolic to diastolic ratio (S/D ratio)
or the resistance index (RI). The most commonly used measurement is the pulsatility
index (PI) that includes the average velocity over the heart cycle in the calculation, and is
superior to the other two indices for practical purposes124
. For details of the different
indices, please see Figure 5.
The persistence of an early diastolic notch (beyond 24 weeks’ gestation) in the uterine
arteries represents another sign of high impedance to flow125
. In normal pregnancies
impedance to flow decreases in a. umbilicalis and aa. uterinae with advancing gestation126
,
therefore reference curves for flows are adjusted for gestational age.
Uterine artery Doppler ultrasound
In the uterine arteries the Doppler signals are sampled 1 cm cranial to the crossing point
with the external iliac artery. The investigation should be performed on both sides, and
preferably be done in the absence of maternal breathing. Increased resistance in the
uterine arteries can be defined as: 1) flow index (PI or RI) above 95th percentile 2) PI
above a certain cut–off 3) the absence or presence of notch. See Figure 6 for details. The
indices are often calculated as an average of the bilateral measurements. Very lateral
insertion of the placenta may affect the flow; if placental site is taken into consideration it
marginally improves the predictive ability of uterine artery Doppler127
.
Figure 6 (A) Normal flow velocity wavefowaveform from the uterine artery at 24 wediastole there is a notch and in late diasto
Failure of trophoblastic invasion h
insufficiency, and several Doppler
BA
rm from the uterine artery at 24 weeeks of gestation in a pregnancy withle there is decreased flow.
as been found to be associat
studies both in first and seco
A
16
ks of gestation. (B) Flow velocityimpaired placentation. In early
ed with uteroplacental
nd trimester have

Intrauterine growth restriction in first half of pregnancy
17
Estimates for predicting preeclampsia and IUGR in an unselected population
Second trimester
Pos. LR (95% CI) Neg. LR (95% CI) No of studies Pos. LR (95% CI) Neg. LR (95% CI) No of studies
Preeclampsia Cnossen et al Papageorghiou et al*
PI 4.5 (1.7-7.3) 0.6 (0.5-0.82) 7 5.9 (5.3-6.5) 0.6 (0.5-0.6) 12
Bilateral notch 6.5 (4.3-8.7) 0.6 (0.4-0.8) 17
Unilateral notch 4.6 (1.3-7.9) 0.7 (0.5-0.9) 6
PI og notch (bi/unilateral) 7.5 (5.4-10.2) 0.6 (0.5-0.7) 1
IUGR (<10 percentil)
PI 3.4 (1.7-5.1) 0.9 (0.8-0.9) 3 3.7 (3.3-4.0) 0.8 (0.8-0.8) 13
Bilateral notch 2.8 (1.7-3.9) 0.8 (0.8-0.9) 11
Unilateral notch 2.4 (2.0-2.9) 0.9 (0.9-0.9) 2
PI og notch (bi/unilateral) 9.1 (5.0-16.7) 0.9 (0.9-0.9) 1
First trimester
Pos. LR (95% CI) Neg. LR (95% CI) No of studies Pos. LR (95% CI) Neg. LR (95% CI) No of studies
Preeclampsia Cnossen et al Papageorghiou et al*
PI 5.4 (4.1-6.7) 0.8 (0.7-0.8) 3 5.4 (4.2-6.7) 0.5 (0.4-0.6) 2
Bilateral notch 3.0 (2.4-3.3) 0.1 (0.1-0.4) 1
IUGR (<10 percentil)
PI* 2.7 (1.9 - 3.8) 0.9 (0.9-1.0) 1 2.2 (1.8-2.8) 0.9 (0.8-0.9) 2
Bilateral notch 1.3 (0.6-2.0) 0.6 (0.3-1.0) 3> 16 weeks gestation
< 16 weeks gestation
* Papageorghiou et al pooled different impedance measurments (S/D ratio, RI and PI) to define abnormal doppler results
demonstrated an association between increased impedance to flow in uterine arteries and
subsequent development of preeclampsia, IUGR and fetal death128-135. Studies investigating
the predictive accuracy of uterine artery Doppler for adverse outcome have revealed
considerably varied results. The varied results may be the consequence of differences in
Doppler technique for sampling and the definition of abnormal flow velocity waveform,
differences in the populations examined, the gestational age at which women were studied,
and different criteria for the diagnosis of preeclampsia and intrauterine IUGR.
Unselected population
The two most recent meta analyses that describe the diagnostic accuracy of uterine artery
Doppler for preeclampsia and IUGR were published in 2004 by Papageorghiou et al.
(20,000 pregnancies included in total)136
, and in 2008 by Cnossen et al. (79,000
pregnancies included in total)137
. The following likelihood ratios are reported in Table 1.
Second trimester
Cnossen et al.137
report that in second trimester the positive likelihood ratio for
preeclampsia in an unselected population is between 4.5 and 7.5, and the positive likehood
ratio for IUGR is between 2.4 and 9.1, depending on which Doppler measurements are
used. Papageorghiou et al.136
have pooled the different measurements for increased
impedance and report a positive likelihood ratio of 5.9 for pre-eclampsia and of 3.7 for
IUGR, which roughly seems to be the average of the different likelihood ratios reported by
Cnossen et al.

Intrauterine growth restriction in first half of pregnancy
18
Estimates for predicting preeclampsia and IUGR in high risk populations
Second trimester
Pos. LR (95% CI) Neg. LR (95% CI) Pos. LR (95% CI) Neg. LR (95% CI)
Preeclampsia Cnossen et al No of studies Chien et al* No of studies
PI 1.8 (0.2-3.4) 0.8 (0.5-1.0) 4 2.8 (2.3-3.4) 0.8 (0.7-0.9) 11
Bilateral notch 3.4 (1.1-5-7) 0.7 (0.5-1.0) 8
Unilateral notch 20.2 (7.5-29.5) 0.2 (0.0-0.6) 1 20.2 (7.3-56.3) 0.2 (0.03-1.0) 1
PI og notch (bi/unilateral) 21.0 (5.5-80.5) 0.5 (0.2-0.8) 1
IUGR (<10 percentil)
PI 2.3 (1.0-3.6) 0.6 (0.1-1.0) 2 2.7(2.1-3.4) 0.7 (0.6-0.9) 9
Bilateral notch 3.8 (0.7-7.0) 0.8 (0.5-1.0) 4
Unilateral notch 3.0 (1.7-4.3) 0.5 (0.4-0.9) 2 2.4 (0.6-8.6) 0.9(0.7-1.1) 1
RI og notch (bi/unilateral) 4.3 (0.6-8.1) 0.6 (0.5-0.7) 4> 16 weeks gestation
* Chien et al pooled different impedance measurments (S/D ratio, RI and PI) to define abnormal doppler results
First trimester
In first trimester the positive likelihood ratio for preeclampsia is between 3.0 and 5.4
depending on the measurement used, and the positive likelihood ratio for IUGR is between
1.3 and 2.7136;137
. In conclusion and based on the limited number of studies, it seems that
uterine artery Doppler performed in first trimester has little diagnostic accuracy in
predicting preeclampsia and IUGR in an unselected population, and the diagnostic
accuracy of uterine artery Doppler performed in second trimester is superior to that
performed in first trimester.
High risk population
The diagnostic accuracy of uterine artery Doppler has also been estimated in high risk
populations such as women with a previous history of preeclampsia, IUGR, vascular
complications, poor pregnancy outcome, unfavourable biochemical profile or women with
a known disease such as diabetes mellitus, essential hypertension, systemic lupus
erythematosus etc.
Table 2 depicts the likelihood ratios from two systematic reviews for high risk populations
published by Cnossen et al in 2008 (performed as a subgroup analysis of 79,000 high and
low risk pregnancies included in total)137
and by Chien et al in 2000 (13,000 pregnancies
included in total)138
.
In high-risk populations a positive test result predicts preeclampsia with a positive
likelihood ratio between 1.8 and 21.0, depending on which of the Doppler measurements
are used. IUGR is predicted with a positive likelihood ratio between 2.3 and 2.7137;138
. The
limited sample size of only one study and subsequent uncertainty most likely explain the
very high positive likelihood ratio around 20 for predicting preeclampsia, when either the
Doppler measurements unilateral notch or PI and notch are used.137;138
.

Intrauterine growth restriction in first half of pregnancy
19
Severe preeclampsia / Intra Uterine Growth Restriction
Several studies report that uterine artery Doppler is better at predicting severe rather than
mild disease. Steel et al.139
have reported that the sensitivity of uterine artery Doppler for
preeclampsia was 63%, whereas for gestational hypertension was 29%. Papargheorgiou et
al135
report that the sensitivity for preeclampsia with IUGR was 69%, while for
preeclampsia without IUGR it was 24%, and the sensitivity for IUGR defined by the 5th
centile was 19% whereas it was 16% for the 10th
centile.
The severity of preeclampsia and IUGR can also be estimated by looking at the gestational
age at which delivery is undertaken. Three studies134;135;140
, that all take the gestational age
at delivery into account, report that the overall sensitivity of uterine artery Doppler for
predicting preeclampsia is between 41-45%, whereas the sensitivity for preeclampsia for
those pregnancies, which required delivery before week 35, is between 81-90% .
Stillbirth
Two meta analyses136;138
have evaluated the diagnostic accuracy of uterine artery Doppler in
second trimester for perinatal death. The positive likelihood ratios reported for a: low risk,
unspecified risk and high risk population respectively were 1.8(95%CI 1.2-2.9); 2.4 (95%
CI1.54-3.44) and 4.0(95%CI 2.4-6.6); the negative likelihood ratios were 0.9(95%CI 0.8-1.1);
0.8(95%CI 0.68-0.93) and 0.6(95%CI 0.4-0.9). Both meta analyses were based on four
studies only, which of course entails some uncertainty for the reported likelihood ratios.
A study from 2007 with 30,519 women, who had uterine artery Doppler performed between
week 22 and 24 of pregnancy, showed that abnormal uterine artery Doppler is strongly
associated with a high risk of stillbirth early in pregnancy. Abnormal uterine artery
Doppler was a better predictor of the risk of stillbirth due to placental causes than
unexplained stillbirths. Since stillbirths due to placental dysfunction tend to occur at
earlier gestations the association between abnormal uterine artery Doppler and stillbirth
was strongest for stillbirths occurring at extreme preterm gestations141
.
Interpretation
Preeclampsia, IUGR and perinatal death all have a relatively low prevalence. As a thumb
rule a clinically useful test thus requires a high positive likelihood ratio (>10.0) and a low
negative likelihood ratio (<0.10). Moderate prediction can be achieved with likelihood
ratios of 5-10 and 0.1-0.2 whereas likelihood ratios of 1-5 and 0.2-1 generate only minimal
prediction142
. In light of these categories and the likelihood ratios reported in the studies
described above, it seems that uterine artery Doppler either performed in first or second
trimester has moderate predictive value for preeclampsia and minimal predictive value for

Intrauterine growth restriction in first half of pregnancy
20
IUGR and perinatal death. It is possible that uterine artery Doppler has a better predictive
value in not yet specified high risk groups or in statistic models that in combination with
other risk factors estimate the patient-specific risk for adverse pregnancy outcome.
Umbilical artery Doppler ultrasound
The umbilical arteries direct 33% of the fetal ventricular output to the placenta at 20 weeks
of gestation143
, and the assessment of umbilical bloodflow provides information on blood
perfusion of the fetoplacental unit. The normal Doppler velocity waveforms in a.
umbilicalis have a pattern compatible with the fetoplacental circulation as a low resistance
system, displaying forward flow of blood throughout the cardiac cycle. In compromised
pregnancies an absence of flow during diastole is observed, and in severely compromised
pregnancies a reversal of flow, directed from the placenta to the fetus, can be observed.
A significant difference in resistance exist along the length of the umbilical cord, the closer
to the fetus the higher the resistance, by convention / if possible the Doppler signals should
be sampled from the midportion of the cord. Furthermore in order to avoid artefacts the
Doppler gate should be placed within the walls of the selected vessel (avoiding inclusion of
both arteries or the vein), attention should be paid to aliasing, the Doppler insonation
angle should be as close to 0 as possible, and the fetus should not be breathing or
moving123
. Abnormal Doppler velocimetry in the umbilical artery is usually quantified by
an increased PI and /or absent or even reversed end diastolic velocities. In the
Scandinavian countries a scoring system with four different Blood flow classes is often used
to classify the blood flow144
.
Blood flow classes
0 = normal umbilical artery blood flow velocity waveforms
1 = PI between 2 and 3 SD above the mean
2 = PI > +3 SD and forward flow in diastole
3 = absent end-diastolic flow or reversed flow
Figure 7 displays the changes seen in the umbilical artery waveform in a normal pregnancy
and in pregnancies with fetal growth restriction.

Intrauterine growth restriction in first half of pregnancy
Normal pregnancy
Figure 7 Changes in Umbilical Dopplerrestriction
At 20 weeks gestation the umbil
145. The loss of resistance in the
substantial increase in vascularis
villi, which leads to an increase i
vasculature in the placenta has n
constricting effect146
and nitric
of the vasculature is not yet com
High risk populationA meta analysis of randomized c
artery Doppler waveform analys
significantly decreases perinatal
included, involving nearly 7000
especially if the pregnancy was c
growth, was associated with a re
inductions of labour (OR 0.8, 95
Absent end diastolic velocity
Reduced end diastolic velocity
21
waveforms in healthy pregnancies and in pregnancies with fetal growth
ical blood flow is 35ml/min, at 40 weeks it is 240 ml/min
umbilical artery throughout the pregnancy is the result of a
ation in the placenta and maturation of the tertiary stem
n the cross-sectional area for vascular outflow145
. The
o neural regulation, endothelin and prostanoid have a
oxide a dilating effect147
, but the exact humoral regulation
pletely understood.
ontrolled trials suggests that incorporation of umbilical
is into management protocols for high risk pregnancies
mortality. In a Cochrane review from 1996 11 studies were
women. The use of umbilical artery Doppler ultrasound,
omplicated with hypertension or presumed impaired fetal
duction in perinatal deaths (OR 0.7, 95% CI 0.7-0.9), fewer
% CI 0.7-0.9) and fewer admissions to hospital (OR 0.6,
Reversed end diastolic velocity
Intrauterine growth restriction in first half of pregnancy
22
95% CI 0.4-0.7). In total the use of umbilical artery Doppler ultrasound in high risk
pregnancies was associated with a 29% reduction in overall perinatal mortality148
.
Low risk population
Two meta analyses149;150
both conclude that in unselected or low risk populations umbilical
artery Doppler does not result in increased antenatal, obstetric and neonatal interventions,
and no overall difference was detected for short term clinical outcomes including perinatal
mortality.
Placental growth regulating hormones
During pregnancy the placenta is an important endocrine organ that produces numerous
hormones. The placenta secretes hormones into the circulation of the mother with the
purpose of modifying maternal metabolism in ways that will benefit the fetus, and the
maternal response to the hormones evolves to conserve resources in the interest of
maternal fitness. GH and Prolactin are two ancient, structurally related molecules with
important regulatory function for human reproduction and growth.
Serum GH increases during fasting and hypoglycaemia and among the known effects of GH
are increased lipolysis, increased hepatic output of glucose and increased peripheral
resistance to insulin151;152
. GH mediates its effect either directly or via IGF-I or II that are
both secreted from the liver and regulated by GH153
.
During childhood and adolescence GH is closely linked to longitudinal growth, but during
pregnancy the production of GH is gradually suppressed, and hormones produced in the
placenta replace many of its functions. Prolactin has a much broader spectrum of activities
than GH and these are classified as reproduction, metabolism, osmoregulation,
immunoregulation and behaviour154
.
During pregnancy the placenta secretes a ligand of maternal GH receptors: placental
Growth Hormone (PGH) and a ligand of maternal prolactin receptors: human Placental
Lactogen (hPL). PGH and hPL can both be detected in the maternal circulation at 6 weeks’
gestation and increase with advancing gestation155;156
, peak values are reached at week 34-
37156-158 159
. In the third trimester serum hPL is present in mg/l whereas PGH is found in
g/l. PGH gradually replaces the maternal pituitary GH, which disappears from maternal
serum in the second half of pregnancy. In contrast to pituitary GH PGH is secreted
tonically and is not regulated by GH releasing hormone160 161
. Until recently the general
opinion was that PGH does not cross the placenta into the fetal circulation, and therefore
the effect of PGH on fetal growth is considered to be mediated via its effect on maternal

Intrauterine growth restriction in first half of pregnancy
23
IGF-I161
. However a recent study has demonstrated that PGH can be detected in cord
blood, and it may therefore have a direct effect on fetal growth162
. Both the maternal and
fetal circulation contain hPL163;164
.
Growth Hormone gene
GH, PGH and hPL are members of a superfamily of protein hormones that are important in
the regulation of growth and development. In humans the GH-related genes are clustered
on chromosome 17165-167
. These include GH1 whose expression is restricted to the anterior
pituitary and encodes human GH (hGH) plus four genes expressed in the placental
syncytiotrophoblast (GH2, CSHL1, CSH1, CSH2). GH2 encodes PGH, and CSH1 and CSH2
encode hPL166
, whether the CSHL gene is expressed or if it is a pseudogene is not clarified.
All of the genes consist of five exons and four introns, and they show a high degree of
similarity (91%-99% conserved sequences)166;168
. Each gene encodes for a mature protein of
approximately 200 amino acids preceded by a signal peptide of about 25 amino acids169
.
The hormones have different affinities for GH Receptors and Prolactin receptors: GH binds
to both GH receptors and Prolactin receptors, PGH differs from GH by 13 of its constituent
191 amino acids; this reduces sevenfold its affinity for binding to prolactin receptors, but
has no effect on its affinity for GH receptors170
. hPL has high affinity prolactin receptors
but very weak affinity for GH receptors171;172
.
Human Placental Lactogen
Little is known of hPL’s physiological role in pregnancy. One study found a link between
fetal growth velocities in second half of pregnancy and changes in hPL in maternal serum
173, and it has been hypothesized that hPL along with PGH is released from the
syncytiotrophoblast into the maternal circulation to stimulate IGF-I production174
. It has
been demonstrated that hPL is unable to promote the growth of human fetal fibroblast and
myoblasts in the presence of an IGF-I antibody175
. However, other studies that have
investigated the relationship between PGH, hPL and IGF-I in human pregnancies, find that
regardless of gestational age IGF-I values are correlated with corresponding PGH but not
with hPL values. This suggests that PGH and not hPL is the primary regulator of maternal
IGF-I secretion157;158
.
It has also been hypothesised that hPL along with PGH contributes to the development of
maternal insulin resistance in second half of pregnancy. In second half of pregnancy
maternal utilization of glucose falls, despite increases in insulin production and secretion.
The insulin resistance promotes lipolysis and fasting ketonaemia as well as post-prandial
hyperglycaemia, sparing energy for the fetus. The increase of nutrients to the fetus

Intrauterine growth restriction in first half of pregnancy
24
stimulates a rise in fetal insulin, which promotes fetal growth. The development of insulin
resistance in second half of pregnancy matches sharp increases in the maternal
concentrations of hPL and PGH176
, and both hormones reduce insulin sensitivity in
adipocytes and skeletal muscle cells in in vitro experiments177-179
.
The majority of studies does not show significant changes in hPL concentrations following
glucose administration or insulin-induced hypoglycemia in pregnant women180;181
, and in
vitro findings in term placentae have demonstrated no effect of high or low glucose
concentrations on the production of hPL182
. However, longterm fasting (72-90 hours prior
to therapeutic abortion) has in two studies been shown to significantly increase maternal
hPL concentrations with 30-40%183;184
, so controversies exist upon the interactions between
and hPL, insulin-sensitivity and glucose in pregnancy.
In the literature cases of hPL gene deletion have been described. Among 11 offspring of
pregnancies in which no hPL could be detected in maternal plasma five had birth weights
equal to or less than 2600g185-189
. One of the cases, was a severely growth retarded, but
otherwise normal boy (birth weight of 1.270g at 35 weeks), who developed transient
neonatal hypoglycaemia. The maternal levels of IGF-I were very low and besides the
deletion of the hPL-A and hPL-B genes a deletion of the GH-V gene was observed185
.
However, two other cases of combined hPL and GH-V gene deletions were described as
having normal fetal growth190-192
. The observations from the first severely growth retarded
case suggest that the hPL, PGH and most likely other somatogenic and lactogenic
hormones act together and supplement each other in the regulation of fetal development
and growth. This inter-dependency and the ability to supplement each other is most likely
also one of the explanations to why not all children with gene deletions in hPL and GH V
genes becomes growth retarded, and why so many of the results on the IGF-axis differ and
are difficult to interpret.
Besides regulating maternal metabolism and thereby fetal growth hPL is thought to
contribute to human reproductive behavior in other ways as well. In concert with sex
steroids it stimulates DNA synthesis in human mammary epithelial cells and growth of the
ductal epitehlium. It promotes maternal hyperphagia most likely via prolactin receptors in
the hypothalamus193
, and administration of hPL to virgin rats promotes maternal
caretaking and nesting behavior194
.
Placental Growth Hormone
PGH is one of the key regulators of IGF I during pregnancy, studies of large numbers of
normal and pathological pregnancies by different groups have revealed that IGF I values in
maternal plasma correlate with corresponding PGH values158;195;196
. The correlation is

Intrauterine growth restriction in first half of pregnancy
25
supported by a study of pregnancies in women with acromegaly197
. In these cases, in spite
of high levels of pituitary GH and high basal IGF-I concentrations maternal IGF-I levels
increased gradually during pregnancy, following the pattern of PGH secretion.
The regulation of PGH secretion is very dissimilar from the regulation of pituitary GH.
During pregnancy GH releasing hormone analogues have no effect upon PGH secretion
and the levels of GH releasing hormone are stable compared to non-pregnant levels198
. In
vitro low glucose concentrations in the culture media lead to an increased liberation of
PGH from cultured placental explants182
. In vivo PGH concentrations decrease during oral
glucose tolerance test in women with gestational diabetes199
. Based on these results it has
been suggested that the syncytiotrophoblast, which is in direct contact with maternal
blood, and expressing the major glucose transporter (Glut 1) responds to rapid variations in
maternal blood glucose levels by modifying PGH secretion. Because the main fetal energy
source is glucose (80%), defective placental PGH secretion may play a role in fetal
malnutrition161
.
In transgenic mice, that over express the PGH gene, fasting insulin concentrations are four
to sevenfold higher than in control mice, and insulin sensitivity is markedly reduced152;200
.
Furthermore the over expression of PGH stimulates an 84% increases in body weight, a
56% increase in IGF I concentrations, and a 15% reduction of body fat152;200
. These
observations suggest that PGH is a major determinant of maternal insulin resistance and
stimulates the rise in maternal IGF-I concentrations in pregnancy158
.
In vitro PGH binds to intact fat cells and produces insulin-like and lipolytic responses in rat
adipose tissue in a similar way to pituitary GH151
. In vivo several studies have reported that
maternal BMI is inversely correlated to serum levels of PGH at various stages of pregnancy
156;201 202;203. During pregnancy maternal fat is accumulated with maximum increase in fat
deposits from midgestation until week 30. From week 30 and onwards fat accumulation
diminishes or even reverses, and lipolytic activity increases204;205
. The high level of PGH in
week 30 and onwards along with its lipolytic effects151
suggest PGH as a likely candidate for
these effects on maternal adipose tissue. Fetal growth during late pregnancy is dependent
on maternal substrate supply and PGH is one example of the hormonal mechanism from
placental origin, which allows adaptation of the maternal organism to this catabolic phase.
In addition to PGH’s systemic effects in the maternal organism, GH receptors in placental
tissue suggest that PGH also has autocrine or paracrine mechanisms in the placenta; in a
recent study PGH has been shown to affect the invasiveness of extravillous cytotrophoblast
206.
In conclusion the permanent secretion of PGH by villous syncytiotrophoblasts into the
maternal circulation is most likely one of the factors that alters maternal metabolism
during pregnancy. The syncytiotrophoblast replace pituitary GH with its own product,

Intrauterine growth restriction in first half of pregnancy
26
PGH and thereby seems to take control of part of the maternal metabolism during
pregnancy. In the maternal liver and other organs PGH stimulates gluconeogenesis,
lipolysis and anabolism thereby increasing nutrient availability for the fetoplacental unit206
Insulin Growth Factor I and II
The IGFs are mitogenic polypetides that stimulate cellular proliferation and differentiation
207. They have the ability to influence the transport of glucose and aminoacids across the
placenta208
and are significantly influenced by fetal nutrition and insulin levels209;210
. Fetal
insulin promotes growth of the fetus, acting as a signal of nutrient availability211
. Insulin
deficiency results in a reduction in fetal growth, as the fetal tissues decrease their uptake
and utilization of nutrients212
. IGF-I is a basic peptide that shares more than 50% homology
to insulin, and act as a potent insulin sensitizer by virtue of its supression of GH secretion
as well as through direct actions on peripheral tissues213
. In the non-pregnant woman the
IGFs are secreted by the liver and regulated by GH, but during pregnancy PGH gradually
replace the maternal pituitary GH, and takes over the control of IGF secretion158;195;196
.
During pregnancy IGF I and II are produced by the placenta214
, and serum concentrations
are higher in pregnant women than in non pregnant women215
, with concentrations rising
throughout the pregnancy216
.
Gene deletion experiments provide the most convincing evidence for a vital role of the fetal
IGF system in regulating fetal growth210;217
. Homozygote IGF-I knockout mice carry fetuses
that are 60% of the size of their wild-type littermates217
, whereas inactivation of the IGF-I
receptor results in the most severe growth retardation (45% of normal birth weight)
because of the loss of both IGF-I and IGF-II action210
. Mutation in the promoter of the
IGF–II gene in mice results in morphological changes and reduced growth of the placentas,
and this translates into a reduction of fetal size218
. Children born with gene deletions
support the role for IGF-I in normal human fetal growth. One neonate, with a
homozyogous partial deletion of the gene encoding IGF-I, resulting in IGF-I deficiency, had
severe IUGR and postnatal growth failure219
. Furthermore a polymorphism in the
promoter region of the gene encoding IGF-I, which results in low serum IGF-I
concentrations is associated with birth weights that are 215g lower than those of individuals
who are homozygous for the wild-type allele220
, and IGF-I in umbilical cord blood have
been shown to correlate with birth weights221
.

Intrauterine growth restriction in first half of pregnancy
27
Insulin Growth Factor Binding Proteins
The bioavailability of the IGFs is affected by the tissue expression and circulating
concentrations of the IGFBPs (Insulin Growth Factors Binding Proteins). At least six
different IGFBPs have been identified in fetal plasma and tissues209;222
.
These carrier proteins prolong IGF half-life; regulate IGF transport between intra and
extracellular space; limit the bioavailability of IGF via limiting free IGF’s; and modulate
cellular proliferation and death via IGFBP receptors independent of IGFs223
. Under most
circumstances IGFBP´s inhibit IGF’s action224
, however under specific condition some of
the IGFBPs are able to enhance IGF’s action225
. Disorders of fetal growth may also be the
consequence of abnormal IGFBP. IGFBP-1 and IGFBP-3 are produced in large quantities by
the maternal-fetal interface. Increased levels of IGFBP-1 are thought to reflect fetal
hypoinsulinemia, its level can be seen as an indicator of fetal malnutrition and it inhibits
the mitogenic effects of the IGF´s223 226
. In humans birth weight is negatively correlated
with IGFBP-1 concentrations227-229
. This is supported by observations in transgenic mice,
that over express IGFBP-1; in these animals there was no change in the levels of IGF-I, yet
fetal growth restriction was observed, thereby demonstrating that elevated levels of IGFBP-
1 are sufficient to cause alterations in fetal growth226
. The role of IGFBP-3 still remains
unclear; levels of IGFBP-3 and IGF-I have been seen to correlate positively with birth
weight in a numbers of studies230;231 232 233
, however, elevated levels of IGFBP-3 have also
been reported in SGA infants234
, similarly in offspring of mice over-expressing the human
IGFBP-3 a significant reduction in birth weight was reported235
.
Proteolysis of IGFBPs is an additional mechanism to regulate the levels of IGF during
pregnancy, and the IGFBP proteases very likely have a crucial role in determining tissue
availability of the IGF´s. Pregnancy associated plasma protein-A (PAPP-A)and ADAM12 (A
disintegrin and metalloprotease) are both placenta-derived proteins that are identified as
proteases for IGFBP 4 and 3 respectively236
. Low maternal serum levels of PAPP-A in early
pregnancy is known to increase the risk for IUGR237
. Gene knockout mice studies have
shown that disruption of the PAPP-A gene results in 40% reduction of fetal growth238
. A
large multicenter study showed that there was a greater proportion of infants with birth
weight below 2.500g if the maternal PAPP-A concentration was in the lowest 5%, all results
that support the hypothesis that PAPP-A is an important growth factor in the first
trimester, where it may increase the availability of free IGF-s by degrading their binding
proteins239
.
As illustrated by the over 29.000 publications on PubMed on the IGF axis, the system is
complex and intricate, exemplifying the multiple functions of the axis. In this very short

Intrauterine growth restriction in first half of pregnancy
28
review I have tried to describe some of the most important pathways for maternal
metabolism and fetal growth, however, many of the functions still remain to be explored.
Hopefully future discoveries will reveal many of the multifaceted mechanisms in the
system, and as our knowledge becomes more sophisticated and our understanding better
we may find that idiopathic cases of IUGR are caused by alterations in the IGF-axis.
Interventions for Intra Uterine Growth Restriction
Several randomized trials that aim to reduce the risk factors associated with low birth
weight have been published, but only very few of the trials have been effectfull on lowering
the number of children born with a low birth weight240
.
Oxygen therapy, bed rest, exercise and social support
Cochrane meta-analyses that investigate the effects of oxygen therapy, bed rest, exercise
and social support for women with suspected impaired fetal growth conclude that at
present no effect on birth weight can be documented from any of these interventions241-244
.
For oxygen therapy, bed rest and exercise the number of trials and sample sizes are
according to the authors too small for any final conclusion to be drawn, and results from
further trials should be awaited. For social support the meta analysis was based on
eighteen trials, involving 12,658 women, and the final conclusion was that pregnant women
need the support of caring family members, friends, and health professionals, while
programs, which offer additional support during pregnancy are unlikely to be powerful
enough to prevent the pregnancy from resulting in a low birth weight or preterm birth, but
they may reduce the number of caesarean birth244
.
Calcium, fishoil, antioxidant supplements and antiplatelet agents
Interventions, which in theory could delay or reverse inadequate trophoblast invasion such
as: calcium, fishoil, antioxidant supplements and antiplatelet agents have been tried in
different trials. Calcium245
, fishoil246
and antioxidant supplements247
showed no effect on
the risk of having a child with a low birth weight in Cochrane reviews. Two meta analyses
both including more than 12,000 high-risk pregnancies showed an effect of prophylactic
Acetylic Acid treatment. Acetylic Acid treatment showed in the first meta analysis from
1993 a reduction in the subsequent risk of IUGR, especially if the prophylaxis was started
before 17 weeks of pregnancy248
, and in the second meta analysis from 2003; treatment
with Acetylic Acid reduced the subsequent risk of preeclampsia, spontaneous preterm
birth, perinatal death and gave a mean birth weight increase of 215g249
. However, authors

Intrauterine growth restriction in first half of pregnancy
29
of other studies have come to the opposite conclusions250
, so the effect of Acetylic acid is
still disputed.
Food supplementation and infection
The majority of evidence on food supplementation and treatment of infection come from
trials conducted in developing countries or in poor communities; the relevance for women
in developed countries is less clear. In developing societies prevention of infections such as
HIV and malaria and food supplementation to undernourished women does increase birth
weight251;252
. However, when food supplementation or prophylactic prescription of
antibiotics is tried on obstetrical high-risk, but not necessarily undernourished or infected,
pregnant women in developed societies, no effect is observed on birth weight253-255
.
The lack of success for the different interventions does not necessarily mean that they are
completely ineffective. Fish oil and antioxidant supplements, does not reduce the risk of
having a child with a low birth weight, but the groups treated with fish oil and antioxidants
did have a higher mean birth weight compared to the placebo group246;247
. When social
intervention programs are explicitly designed to women, who in tests score high on
objective measurements of stress and low on objective measurements of support, the
programs leads to lower rates of tobacco, drug and alcohol use and a successive reduction
in the number of children born SGA256-265
, and when programs, that teach pregnant
women to identify and stay away from activities that provoke uterine contractions, are
specifically applied to women, who find their work physically challenging, the number of
children born SGA is reduced260;261;266-269
. Thus for an intervention to be effective it is
important not to target a whole unspecified population of high-risk pregnancies, as a large
proportion of these women probably do not have a need for the specific intervention.
Effective interventions can be seen in populations where individual specific needs are
carefully identified and then approached.

Intrauterine growth restriction in first half of pregnancy
30
Own studies:Papers I and II
Our findings regarding the first aim of the Ph.D thesis “To evaluate the association
between fetal growth and size in first half of pregnancy and subsequent adverse outcome”
are described in paper I and II, which will be summarized below.
Fetal growth between the first and second trimester and the risk of adverse
pregnancy outcome
Introduction
The most common definition of IUGR is an EFW at a single point in time below the 10th
centile for gestational age. In clinical practice however, it is commonplace for fetal size to
be estimated more than once during pregnancy, so routine data are often longitudinal.
When several measurements are made it is possible to estimate the rate of change over
specified time intervals or within-subject changes. Compared with a single measurement of
fetal size at one point during gestation sonographic measurement of fetal growth rates has
been shown to be a more accurate method of identifying fetuses at risk of neonatal
morbidity and mortality56
. Longitudinal studies on growth are often based on small
numbers of fetuses and concentrate on growth rate between the second and third
trimesters56;270;271
. To our knowledge prior to our publication there was no previous studies
on adverse pregnancy outcome and early fetal growth rate i.e. growth rate between the first
and second trimesters. The aim of this paper was to relate growth rate between the first
and second trimesters to the risk of perinatal death, IUGR, macrosomia, preterm/post-term
delivery and pre-eclampsia.
Methods
Data were retrieved from the Copenhagen First Trimester Study for Down syndrome and
malformations conducted 1998-2001. Sonographic BPD measurements at 11-14 and 17-21
weeks of gestation were analyzed for 8215 singleton pregnancies. Growth rate was defined
as millimeters of growth per day between the two measurements. To facilitate
comparisons of growth rate between ultrasound examinations performed at different
gestational weeks, growth rate was standardized according to the gestational age at the
time of the scans. A Z-score was thus calculated for each fetus by subtracting the mean
growth rate for all fetuses that were scanned the same two weeks, and dividing by the SD of
the growth rate for this group. The individual Z-scores were transformed into centiles.

Intrauterine growth restriction in first half of pregnancy
31
We obtained odds ratios (OR) for dichotomized adverse outcomes by comparing fetuses
with growth rate below the 2.5th
and above the 97.5th
centiles with a defined normal group
of fetuses with growth rates between 2.5th
and 97.5th
centiles, and comparing fetuses with
growth rates below the 10th
and above the 90th
centiles with a defined normal group of
fetuses with growth rates between the 10th
and the 90th
centiles.
Results
The mean growth rate for BPD varied as a function of gestational age at the time of the
scans: the lower the gestational age at the time of the first or second scan, the higher the
growth rate.
Growth rates below the 2.5th
centile were associated with IUGR: fetuses with growth rates
below the 2.5th
centile had an OR of 2.64 (95% CI, 1.51–4.62) for birth weights below the
mean – 2 SD28
. High growth rates were associated with an increased risk for macrosomia:
fetuses with growth rates above the 90th
and 97.5th
centiles had ORs of 2.53 (95% CI, 1.78–
3.60) and 2.83 (95% CI, 1.58–5.06), respectively, for birth weights above the mean + 2 SD28
.
When adjusted for gestational age at delivery, parity, mother’s height, mother’s weight,
mother being a smoker and fetal gender, growth rates below the 2.5th
centile meant a 105g
reduction in birth weight. In a similar model growth, rates below the 10th
centile meant a
63g reduction in birth weight. The combination of all factors included in the model
explained 45% of the variation in birth weight.
There was an association between very low growth rates and perinatal mortality. Fetuses
with growth rates below the 2.5th
centile were at increased risk of perinatal mortality, with
an OR of 4.79 (95% CI, 1.43–15.99). All three cases of perinatal death with growth rates
below the 2.5th
centile were stillborn before the 25th
week of gestation. Fetuses with growth
rates below the 10th
centile had a non-significant OR of 1.21 (95% CI, 0.36–4.08) for
perinatal mortality.
There was an association between high growth rates and preterm delivery. Fetuses with
growth rates above the 97.5th
centile had a significant OR of 2.30 (95% CI, 1.15–4.59) for
spontaneous delivery in weeks 34–36, while the OR of 3.27 (95% CI, 0.99–10.73) for
spontaneous delivery in weeks 22–33 approached significance. Growth rate showed no
association with pre-eclampsia.
Discussion
The central finding of our study was the significant relationship between BPD growth rate
between the first and second trimesters and adverse pregnancy outcome. Low growth rates
were associated with increased ORs for perinatal mortality and IUGR, and high growth
rates were associated with increased ORs for macrosomia and preterm delivery. These

Intrauterine growth restriction in first half of pregnancy
32
findings underline the importance of focusing on early growth, potentially to prevent
irreparable damage later in pregnancy. Traditional thinking is that early growth is
principally controlled genetically and occurs at a constant exponential rate with little
biological variation272
; IUGR has been assumed to occur mainly in the later half of
pregnancy. Our study refutes this showing that fetal growth rate between the first and
second trimesters does vary between fetuses and is associated with perinatal death and
birth weight.
Early fetal size and growth as predictors of adverse outcome
Introduction
Slow fetal growth is usually inferred retrospectively from the weight reached at birth,
which can be adjusted or customized for maternal factors to distinguish between
constitutional and pathological smallness. Cases thus determined to be SGA have been
found to be strongly linked to perinatal mortality33
. Recently it has been suggested that a
low first-trimester measurement of CRL in pregnancies dated by last menstrual period is
also linked with adverse outcome such as prematurity and fetal growth restriction273
. One
explanation for this observation could be that these pregnancies are misdated; a prolonged
menstruation-conception interval has been shown to be associated with adverse
outcome271;274;275
. However CRL in the first trimester also has been found to be associated
with subsequent length of gestation and birth weight in pregnancies achieved with assisted
reproductive techniques276
.
We set out to study and compare the effects of diminished early pregnancy size and
growth, as assessed from measurements in the first and second trimesters, on subsequent
pregnancy outcome including small for gestational age-birthweight and perinatal death.
Data was analyzed using conditional centiles and customized fetal growth charts.
Conditional centiles is an acknowledged statistical method, used to estimate growth
longitudinally57
, and customized fetal growth charts are growth charts that are individually
adjusted / “customized” for physiological factors known to affect birth weight and growth.
Methods
Data were retrieved from the Copenhagen First Trimester Study for Down Sydrome and
malformations conducted 1998-2001277
. Of the 13,621 women who were invited to
participate, a total of 8,215 women with singleton pregnancies agreed and had records
stored from two ultrasound examination, at 11-14 weeks and 17-21 weeks, respectively. Of
these 8215 pregnancies, 30 ended in miscarriage, 219 were excluded because of congenital

Intrauterine growth restriction in first half of pregnancy
33
anomalies, and 130 were lost to follow-up. A further 194 cases were excluded because of
one or more items of missing data, including fetal sex, parity, birthweight, gestational age
at delivery, maternal height, maternal booking weight. This left 7642 pregnancies for
analysis.
CRL were regressed against gestational age in days, calculated from the last menstrual
period, and fetal size was then assessed by gestation-specific z-scores278;279
. A small first
trimester CRL was defined as less than the 10th
centile. BPD were regressed against
gestational age in days, calculated from the first CRL, and fetal size was then assessed by
gestation-specific z-scores278;279
. Small first and second trimester BPD was defined as less
than the 10th
centile.
Early fetal growth rate was determined from the increment between the first and second
trimester BPD measurements, using conditional centiles57
. This method uses individual
predictions for the expected normal BPD range (‘conditional centiles’) during the second
trimester, on the basis of the first trimester BPD measurement. Each second trimester BPD
measurement value was thus assigned a centile which was conditional to the previous
measurement in the same pregnancy. A fetus with a conditional BPD centile below the 10th
centile was considered to have second trimester growth restriction.
To establish the normal growth velocity for BPD between first and second trimester, a
subset of all pregnancies with normal outcome was defined (n=6164), which were i) non-
smoking during pregnancy; ii) live birth iii) birthweight > 2500 g; and, iv) gestational age at
delivery 37 or more weeks, dated by first trimester CRL measurement. From this ‘normal’
subset, a sample of 300 cases was randomly selected by means of a computerized
algorithm. A linear model provided the best fit for the paired data, and the growth curve
for each fetus was described as:
Log (BDP(mm))=α + βt + γgender
where α, β and γ were the parameters characterizing the individual fetus, t the gestational
age in days determined by CRL and gender (female=0; male=1). The parameters were
calculated assuming a random effect model280
The main pregnancy outcomes assessed were prematurity, smallness for gestational age
and stillbirth. Birthweight was assessed by customised percentiles, which are individually
adjusted for maternal characteristics (booking weight, height, parity, ethnic origin)281
using coefficients derived from a Scandinavian population33
.
Results
Slow growth of the BPD <10th
and <2.5th
conditional centiles between first and second
trimesters occurred in 10.4% and 3.6% of the population, respectively. BPD growth <2.5th

Intrauterine growth restriction in first half of pregnancy
34
centile was strongly associated with increased risk of perinatal death (OR 7.3, CI 2.4 – 22.2).
All deaths occurred before 34 weeks gestation, where the association was also significant at
the 10th
conditional centile cut-off for early fetal growth (OR 16.0, CI 2.9-88.7). Small BPDs,
dated by CRL did not have an increased risk of perinatal deaths. However there was a mild
increase in smallness for gestational age at birth (weight <10th
customised centile) if the
BPD was <10th
centile in the first trimester (OR 1.4, CI 1.1 – 1.7) and in the second trimester
(OR 1.3, CI 1.1 – 1.5).
We found no link between small first trimester CRL and subsequent preterm delivery,
small for gestational age, birthweight or perinatal death
Discussion
In this study we assessed the link between fetal growth in early pregnancy and subsequent
adverse pregnancy outcome, using sequential ultrasound measurements of BPD in the first
and second trimester. Previous publications on growth in early pregnancy have looked at
early fetal size in relation last menstrual period271;273;275;276;282
or early fetal size in relation to
the day of conception when assisted reproductive technology was used276
. By using two
sequential ultrasound measurements of the BPD our method becomes independent of
gestational age error or other confounders, and it appears that slow BPD growth is able
identify a subgroup of slow growing babies whom are at increased risk of perinatal death
before 34 weeks.

Intrauterine growth restriction in first half of pregnancy
35
Paper III
Our findings regarding the second aim of the Ph.D thesis “To analyze the association
between growth factors in maternal blood and fetal growth rate in first half of pregnancy”
are described in paper III, which will be summarized below.
Maternal serum levels of placental Growth Hormone in early pregnancy, but not of
human Placental Lactogen, and Insulin Growth Factor-I are positively associated
with fetal growth in first trimester of human pregnancy
Introduction
Recent studies have shown that fetal growth in first half of pregnancy does vary between
fetuses272
and that decreased early fetal growth rate is associated with perinatal death, low
birth weight and preterm delivery54;55;273;283
. The regulation of fetal growth in the early half
of pregnancy has not been clarified. In postnatal life GH plays an important role, but the
role of GH in fetal growth remains uncertain.
The GH gene cluster contains a single gene expressed in the anterior pituitary that encodes
pituitary Growth Hormone (pGH) plus four genes expressed in the placenta that encodes
pGH, Placental GH (PGH) and hPL284
. PGH is a ligand of maternal GH receptors, and hPL
is a ligand of maternal prolactin receptors. hPL and PGH can be detected in the maternal
circulation at 6 weeks’ gestation and their concentrations increase with advancing
gestation; several studies have suggested a role for hPL and PGH in the control of fetal
growth156;176;285
. In second half of pregnancy it is known that the concentrations of PGH and
IGF-I in maternal serum are positively correlated156
, and in pregnancies with IUGR
maternal IGF-I serum levels are found to be significantly lower than the serum levels found
in normal pregnancies195
.
We wished to investigate if maternal levels of hPL, PGH and IGF-I were correlated to
growth rate in early pregnancy; speculating that high levels of hPL, PGH and IGF-I would
stimulate growth and lower levels would be associated with slower growth rates. No
previous studies have examined the correlation between fetal growth rate and maternal
hormones in the first half of pregnancy.
Methods
Data was retrieved from the Copenhagen First Trimester Study for Down´s syndrome and
malformations conducted 1998-2001. Of the 13,621 women who were invited to participate,
3,680 either refused or had an early miscarriage, leaving 9,941 (73%) women who had a first
trimester ultrasound examination, including 9710 singleton pregnancies. A total of 8,215 of

Intrauterine growth restriction in first half of pregnancy
36
these 9,710 (85%) singleton pregnancies had a record of two ultrasound examinations, at 11-
14 weeks and 17-21 weeks, respectively. Blood samples were drawn from an antecubital
vein, on the same day as the first trimester ultrasound in gestational week 11-14.
Pregnant women were categorized by fetal growth into three groups (low, intermediate and
high fetal growth rates). We defined growth rate as millimetres of growth in BPD per day
between the two sonographic measurements. As the growth from week to 11 to 21 isn’t
linear286
growth rate was standardized according to the gestational age measured in weeks
at the time of the scans. A Z-score was thus calculated for each fetus by subtracting the
mean growth rate for all fetuses that were scanned the same two weeks and dividing by the
SD of the growth rate for this group. The individual Z-scores were transformed into
centiles, and all fetuses with growth rate below the 2.5th
centile (low growth rate, n=203)
and above the 97.5th
centile (high growth rate, n=203) were identified. As a reference group
all fetuses with growth rates from the 50th
to the 51st
centile were identified (intermediate
growth rate, n=212).
The maternal blood serum concentration of hPL, PGH and IGF-I was determined in the
three different growth rate groups. Simple linear and multiple linear regression analysis,
including adjustment for known and potential confounders were used to compare serum
levels between the groups.
Results
Simple linear regression showed a differences in serum level of log10 (PGH) between the
high and intermediate growth rate groups (Table 3, p=0.037). When adjusted for maternal
weight and CRL multiple linear regression analysis confirmed this difference. Fetuses with
high growth rates thus had a higher maternal serum level of log10 (PGH) than those with
intermediate growth rate equal to B=0.05 (95%CI: 0.01-0.09). The increase in log10 (PGH)
may be translated to a relative increase of PGH of 12% (95%CI: 2%-20%) by taking the
antilog10 of B and its CI. Fetuses with low growth rates also had higher level of PGH
compared to those with intermediate growth rate, but this did not reach statistical
significance. When the serum levels in the multiple linear regression analyses were further
adjusted for the sex of the fetus and the parity of the mother, no independent effect of sex
and parity was observed for log10(PGH); the p-value, B and its CI remained robust (p =
0.009, B=0.06(95%CI: 0.01-0.10)).
No differences in hPL and IGF-I levels between the three different growth rate groups were
found after simple and multiple linear regression analysis.

Intrauterine growth restriction in first half of pregnancy
37
Discussion
In our large prospective cohort of pregnant women we observed higher maternal serum
levels of PGH in week 11-14 in women carrying fetuses with high growth rates until week 17-
20 compared to women carrying fetuses who grew at average growth rates. This result
persisted when also adjusting for CRL, maternal weight, parity and fetal sex. This
association has not previously been demonstrated.
It has been hypothesised that PGH acts to augment the supply of fatty acids and glucose to
the placenta151;152
, which would be in agreement with our present results; a high maternal
serum level of PGH would increase substrate supply to the fetus and thus promote fetal
growth. We observed a trend towards higher maternal serum levels of PGH in the low
growth rate group when compared to the intermediate group, which may seem surprising.
We have previously shown that pregnant women, who were smoking during pregnancy,
had higher PGH levels compared to non-smokers which could suggest a compensatory
mechanism by which the fetus is protected201
. In line with these findings, it has been
suggested that high maternal plasma levels of PGH in pre-eclamptic women may be a
compensatory mechanism to preserve fetal growth. In the study by Mittal et al162
patients
with preeclampsia that delivered a SGA-neonate had lower maternal serum concentrations
of PGH than patients with preeclampsia alone. Thus in line with these findings we suggest
that the trend towards higher maternal PGH levels is a compensatory mechanism to
preserve fetal growth.
In conclusion we demonstrated that maternal serum levels of PGH, but not of hPL and
total IGF-I were associated with fetal growth in early human pregnancy in a prospective
cohort of healthy pregnant women. Future studies are needed to evaluate the potential
clinical use of PGH for monitoring early fetal growth.

Intrauterine growth restriction in first half of pregnancy
38
Paper IV
Our findings regarding the third aim of the Ph.D thesis “To investigate if fetuses with first
trimester growth restriction have poorer perfusion of the placenta, measured by ultrasound
Doppler of the uterine and umbilical arteries compared to a control group, and to
investigate if first trimester growth restriction in combination with poor flow in the uterine
and umbilical arteries can be used to predict poor outcome.” are described in paper IV,
which will be summarized below.
First trimester growth restriction and uterine arteries blood flow as predictors of
adverse pregnancy outcome
Introduction
Several studies have now demonstrated that fetal growth in first half of pregnancy does
vary between fetuses, and different measurements for impaired growth in first half of
pregnancy, such as smaller than expected CRL and decreased early fetal growth rates are
associated with perinatal death, low birth weight and preterm delivery54;55;273;276;283;287
. This
implies that important information on growth restriction in early pregnancy in many cases
is lost, when the gestational age for a fetus where CRL is smaller than expected, is simply
altered.
Pre-eclampsia, fetal growth restriction, placental abruption and some cases of fetal death
often result from impaired placentation in early gestation288
. In the past 30 years Doppler
ultrasonographic studies of the uteroplacental circulation have shown that high impedance
to flow in the umbilical and uterine arteries is associated with subsequent adverse neonatal
outcome129-135;289-292
In this prospective study we wished to investigate if fetuses with a smaller than expected
CRL have poorer perfusion of the placenta, measured by ultrasound Doppler of the uterine
and umbilical arteries compared to a control group, and to investigate if a smaller than
expected CRL in combination with poor flow in the uterine arterie can be used to predict
poor outcome
Methods
Women with singleton pregnancies, where the gestational age estimated by CRL at the first
trimester scan was seven days or more smaller than the gestational age estimated by last
menstrual period were identified and invited to the study. A control group of women with
singleton pregnancies, where the gestational age was either equal to or one day larger were
identified and invited to the study. Inclusion criterions were: pregnancy should be

Intrauterine growth restriction in first half of pregnancy
39
spontaneously conceived; at least three spontaneous periods before last menstrual period;
maximum seven weeks discrepancy in gestational age when determined by CRL and last
menstrual period; planning to give birth at either one of the two participating hospitals;
live fetus at the time of the anomaly scan; able to understand Danish.
The study entailed the routine scans, which are Down Syndrome screening in gestational
week 11-14 and an anomaly scan in gestational week 18-21. In addition to the routine scans
the participants were offered a growth scan in gestational week 23-24, where a
questionnaire was answered. At the anomaly scan and growth scan umbilical and uterine
artery Doppler flows were measured. Following delivery the maternal and neonatal records
were reviewed for pre-defined perinatal outcomes.
Statistics: A group of “normal outcome pregnancies” was defined to include liveborn
infants, delivered week 37 – 41, without intrauterine growth restriction, and with no pre-
eclampsia. From the normal outcome group we determined the 5 and 95 % fractiles for the
various indicators for adverse outcome. Logistic regression was used to evaluate the
impact on the risk of adverse outcome of values below the 5 % fractile or above the 95 %
fractile. Differences in proportions were evaluated using chi-square tests and differences in
average values by using u-tests.
Results
The inclusion criterions were met by 357 cases and 451 controls, of these 182 cases and 230
controls were included in the study.
There was a significantly lower percentage of pregnant women in the case group with a
regular menstrual cycle compared to the control group (54% vs. 80 %, p<0.001), and a
smaller proportion of the case group had continued education after mandatory schooling
(73% vs. 85%, p=0.003). Otherwise there were no significant differences between the two
groups in maternal characteristics.
There was a significantly higher proportion of fetuses born with a birth weight below 2500g
in the case group compared to the control group (7.4% vs. 3.1%, p=0.048), otherwise no
significant differences in outcome was observed between the two groups.
At the scan performed week 18-21 the case and control group showed no significant
differences in growth characteristics such as: head circumference, abdominal
circumference and femur length, or in placental blood flow characteristics such as: number
of cases with mean uterine artery PI above 95th
percentile, number of cases with bilateral or
unilateral notch in the uterine arteries, number of cases with umbilical artery PI above 95th
percentile.
The growth and placental blood flow characteristics were repeated at the scan week 23-24,
and again no significant differences were observed between the two groups.

Intrauterine growth restriction in first half of pregnancy
40
In our logistic regression model only birth weight below 2500g showed a significant
association to the case group. Having a CRL seven days or more smaller than expected
increased the risk of having a child with a birth weight below 2500g with an odds ratio of
3.29.
Discussion
In this study we found no association between smaller than expected CRL as a measure of
first trimester growth restriction and placental perfusion measured by ultrasound Doppler
of the uterine and umbilical arteries in second trimester. The number of cases and controls
with high PI or bilateral/unilateral notch in the uterine arteries or high PI in the umbilical
arteries showed no significant differences between the case and control group at the scans
performed week 18-21 and week 23-24.
Only birth weight below 2500g showed a significant association to the case group in our
logistic regression model. Having a CRL seven days or more smaller than expected
increased the risk of having a child with a birth weight below 2500g with an odds ratio of
3.3. In line with these findings fetuses with a gestational age determined by CRL seven days
or more smaller than expected had about double the risk of being born with a birth weight
below 2500g.
In conclusion we confirmed the association between first trimester growth restriction and
higher risk of delivering a low birth weight infant. We were not able to demonstrate a link
between poor placental perfusion and first trimester growth restriction, and therefore do
not recommend implementation of uterine or umbilical artery flow measurements
specifically for fetuses with at smaller than expected CRL. However, we do recognize that
a smaller than expected CRL is a risk factor for giving birth to a low birth weight neonate,
and simple re-dating of pregnancies with a smaller than expected CRL, especially if the
woman has a regular menstrual cycle and is certain of the first day in her last period, can
conceal early growth restriction. On these grounds we do recommend for pregnancies with
a smaller than expected CRL that extra attention is paid to the ultrasound measurements
obtained at the anomaly scan, and should these measurements be at the low end of the
normal range scale a follow-up scan to check fetal growth should be offered to the
pregnant woman.

Intrauterine growth restriction in first half of pregnancy
41
Conclusions and clinical implicationsFetal growth in first half of the pregnancy and the risk ofadverse outcome
We have demonstrated a link between growth rate in first half of pregnancy and an
increased risk of perinatal mortality and low birth weight. Prior to our studies low
measurements of CRL and BPD in pregnancies dated by last menstrual period had been
associated to adverse outcome such as prematurity and fetal growth restriction. However,
this link could be explained by the fact that these pregnancies were misdated or had a long
prolonged menstruation-conception interval. By looking at growth rate instead of fetal size
in relation to last menstrual period, we overcame the problem of delayed ovulation and still
observed an association.
The use of longitudinal fetal measurements is somewhat complicated, and many factors
compromise the clinical value of the measurements. First there is the accuracy of the
measurements; a sonographic measurement will always contain some degree of
measurement error. The way growth rate was defined in paper I entailed that the group of
fetuses with high growth rates were the fetuses that had the lowest BPD at the first scan
and the highest BPD at the second scan; and vice versa for group of fetuses with low
growth rate. This definition of growth rate implies that some of the fetuses categorized as
having either very high or very low growth rate were most likely categorized as such with
some degree of inaccuracy due to the statistical principle of:”regression toward the mean”,
which states that if a pair of independent measurements are made from the same
distribution, samples far from the mean of the first measurement will tend to be closer to
the mean on the second one. The phenomenon occurs because each sample is affected by
random variance. In paper II we tried to overcome the problem of “regression toward the
mean” with the use of conditional centiles.
In Paper I we demonstrated that the mean growth rate for BPD varied as a function of
gestational age at the time of the scans: the lower the gestational age at the time of the first
or second scan the higher the growth rate, please see Figure 1 and 2 in Paper I for details.
To compensate for the variation in growth rate as a function of gestational age at the time
of ultrasound examination in Paper I we calculated Z-scores specific to the pair of
gestational ages at which each fetus was scanned. The conditional centiles used in Paper II
do not compensate for the variation in growth rates the same way. Thus Papers I and II
represent two different statistical approaches of standardizing longitudinal measurements
of growth in first half of pregnancy. Below we have tried to compare the two approaches to
evaluate whether they classify the same fetuses as having low growth rates, and we look at
the ability of the two approaches to predict low birth weight and perinatal mortality. As

Intrauterine growth restriction in first half of pregnancy
42
Date centiles Conditional centiles
Growth rate <2.5 percentile OR (95% CI) P Value OR (95% CI) P Value
Birth weight < mean - 2 Std Dev* 2.64 (1.51-4.62) 0.002 1.93 (1.13-3.31) 0.015
Birth weight < 2.5 customized percentile† 1.94 (1.07-3.53) 0.040 1.77 (1.05-2.98) 0.030
Perinatal mortality 4.79 (1.43-15.99) 0.031 4.12 (1.62-13.73) 0.002
the centiles used in Paper I adjust for the gestational age at the time of the scans they are
referred to as date centiles.
Conditional and Date centiles: Fetuses with growth rates below 2.5th
centile
Figure 8 illustrates the number of cases with growth rates below 2.5th centile that are classified in accordance and
not in accordance by date and customized centiles respectively.
As illustrated by Figure 8, 87 fetuses were classified as having growth rates below the 2.5th
centile by both date and conditional centiles. This represents 43% of the fetuses classified
with growth rates below the 2.5th
centile by date centiles and 30% of the fetuses, classified
with growth rates below the 2.5th
centile by conditional centiles. Thus the two different
statistical approaches seem to differ in more than 50% when defining the group of fetuses
with a very low growth rate. Given the large discrepancy between date and conditional
centiles in defining the group of fetuses that have growth rates below the 2.5th
centile, it is
possible that a statistical model that combines the two and takes into account the variation
in growth according to gestational age, the size of the fetus at the first scan, and the
phenomenon of regression to the mean would give an even better estimation of fetuses at
risk.
Conditional and Date centiles: Association to low birth weight and perinatal
mortality
Table 3 depicts the odds ratios for low birth weight and perinatal mortality from week 20
until a week after birth for date and conditional centiles below the 2.5th
percentile.
Table 3 P values are for the comparison of between groups by a two-tailed Pearson Chi square or Fischers exacttest if expected count less than 5. * Marsal K et al28. †Gardosi J et al293.
N=116
57%
N=200
70%
N=87
43% 30%
Date centiles <2.5 Conditional centiles <2.5
Intrauterine growth restriction in first half of pregnancy
43
In Table 3 the odds ratios for low birth weight and perinatal mortality seem comparable for
date and conditional centiles. Having a growth rate below the 2.5th
centile by either date or
conditional centiles produces an odds ratio between 1.77 and 2.64, depending on the
definitions of low birth weight. Odds ratios below 2 are usually considered to have
minimal clinical value, as the number of pregnancies falsely classified as being at risk is too
high compared to those actually at risk. Therefore date and conditional centiles seem to
have limited value in predicting low birth weight in the daily clinic.
Perinatal death is in Table 3 defined as stillbirth after 20 weeks of gestation plus neonatal
death through one week of life. In Table 3 conditional and date centiles below 2.5th
centile
seem equally capable of predicting perinatal mortality from week 20 until one week after
term. In Paper II perinatal mortality was defined as stillbirth after 24 weeks of gestation
plus neonatal death through 28 days of life, and in this Paper we report an odds ratio of
16(95% CI 2.9-88.7) for perinatal death before 34 weeks for fetuses with growth less than
the 10th
conditional centile. In Paper I the odds ratio for perinatal death (defined as
stillbirth after 20 weeks of gestation plus neonatal death though one week of life) is
1.21(95% CI 0.36-4.08) for fetuses with growth less than the 10th
date centile. It thus seems
that the use of conditional centiles can give us the possibility of defining a subgroup of
pregnancies with an increased risk of early fetal death that is high enough for it to have
potential clinical value. Early indications of an increased risk would allow more intensive
fetal assessment and surveillance and informed considerations on when to advise early
delivery to avoid fetal demise.
Clinical use of longitudinal measurements will require statistical processing before the
information can be of any practical use for the clinician; this could be done in already
existing computer software for ultrasound, such as ASTRAIA. The measurements could be
taken as part of the routine scans conducted in weeks 11-14 and 17-21 in many countries.
However, new studies and perhaps other statistical approaches are needed to confirm their
clinical value.
Growth hormones and growth rate in first half of pregnancy
We demonstrated that maternal serum levels of PGH, but not of hPL and total IGF-I were
associated with fetal growth in early human pregnancy. Higher maternal serum levels of
PGH were observed in women carrying fetuses with high growth rates compared to women
carrying fetuses, who grew at average growth rates, and there was a trend towards higher
maternal serum levels of PGH in the low growth rate group when compared to the
intermediate group, which we suggest is a compensatory mechanism to preserve fetal
growth. The association between PGH and early fetal growth has not previously been

Intrauterine growth restriction in first half of pregnancy
44
demonstrated, and the trend towards preservation of growth in the low growth rate group
confirms the results of other studies.
As access to the fetal compartment entails risk for the fetus involved, the vast majority of
studies on fetal growth factors, including ours, are based on maternal levels of growth
factors, not fetal levels. During pregnancy the mother and the fetus are in a physiological
conflict; in case of sparse resources the hormone system of the mother is programmed to
preserve her health, and the hormone system of the fetus is programmed to continue fetal
growth, even at the cost of the mother’s health. This conflict is reflected in diverse growth
factors and different levels of the growth factors in the maternal and fetal compartment.
Today only maternal levels of Pregnancy associated plasma protein A (PAPP-A) from the
IGF-system are used to predict IUGR, and its clinical value is limited. There is a vast
clinical potential in predicting growth restriction with the help of growth factors from the
IGF-system. However before this can become a clinical reality it is necessary with a better
understanding of the intricate relations between the fetal and maternal compartments, and
an understanding of the complex interactions between the growth factors in the IGF-
system. Many of the growth factors may rise or fall to compensate for poor function in
other parts of the system. In addition IUGR is a multifactorial condition, and the
heterogeneity of the group and diversity of causes leading to growth restriction makes it
even more difficult to pin-point one growth factor that could be used as a clinical marker
for growth restriction. Most likely different patterns of more than one growth factor will
give the best prediction of growth restriction and high-risk pregnancies in the future.
Fetal growth in first half of pregnancy as a prospectivepredictor of adverse outcome
We were not able to demonstrate a link between poor placental perfusion and first
trimester growth restriction, and therefore do not recommend measurements of uterine or
umbilical artery flow at the routine scans or at an extra scan week 23/24 specifically for
fetuses with a smaller than expected CRL.
The original intention of the last study was to investigate if growth rate in first half of
pregnancy in combination with biochemical markers associated with growth could predict
adverse outcome prospectively. However, as we were setting up the study we realised that
longitudinal measurements of growth were difficult to use in a clinical setting. The
measurements require a statistical processing and interpretation before they can be used,
and this was impossible to combine with the day-to-day recruitment for a clinical trial.
In the cohort of 8215 pregnant women used for subproject I and II there were 6027 women
with a known menstrual cycle length and of these, when adjusted for cycle length, 6% had
a gestational age estimated by ultrasound (based on CRL) that was 7-21 days smaller than

Intrauterine growth restriction in first half of pregnancy
45
expected(non-published data)
. The OR for IUGR defined as birth weight below mean – 2 SD was
1.94 (95%CI 1.14-3.30)(non-published data)
for this group compared to 2.64 (95%CI 1.51-4.62) for
fetuses with a growth rate below 2.5th
date centile (Paper I) while the OR was 1.2 (95%CI
0.97-1.48) for birth weight below the 10th
customized centile for fetuses with BPD growth
less than the 10th
conditional centile ( Paper II). As we wished to focus on IUGR in the
prospective study, we judged that a smaller than expected CRL could be used as surrogate
for longitudinal measurements in the study.
When originally planning the studies we had expected a stronger association between
maternal growth factors and early fetal growth rate, but when the results from paper III
became available we decided that the association between maternal growth factors and
early fetal growth were too weak to be used in a prospective study for the prediction of
poor outcome.
We were not able to demonstrate an association between poor placental flow and first
trimester growth restriction, but our study did confirm the association between low birth
weight and first trimester growth restriction. Based on this observation we recommend for
pregnancies with a smaller than expected CRL and ultrasound measurements at the lower
end of the normal range scale in second trimester, that a follow-up scan to check fetal
growth is offered.
Future research
The great challenge in the future is to determine different markers or risk factors during
pregnancy that can identify a high-risk group and provide prevention or treatment of
adverse outcome for this selected group. It seems logical that both the detection and
possible treatment shall take place in the beginning of the pregnancy, before irreparable
damage has occurred; this underlines the importance of focusing on first trimester in
future research. We are today aware of many risk factors for adverse pregnancy outcome,
however, the use of these risk factors in an efficient, and for the pregnant woman
beneficial, way seems one of the challenges of future research. In this Ph.D thesis the focus
is on: growth rate; conditional centiles; smaller than expected CRL; customized fetal
growth charts; biochemical markers for fetal growth; umbilical and uterine artery flow, all
factors that our study along with other studies suggest can be used to improve the
prediction of adverse outcome. Except for abnormal flow in the umbilical artery, none of
the risk factors focused on in this thesis has the capacity on its own to predict poor
outcome. However, if the risk factors are combined they might prove to have significant
clinical value. The transformation of the several known risk factors to a practical clinical
tool is something that perinatal care could benefit immensely from in the future.

Intrauterine growth restriction in first half of pregnancy
46
Successful transformation will require a strong collaboration between, statisticians,
software-programmers and doctors, which is not always easy, but improved prediction of
high-risk pregnancies would allow clinicians to give more accurate fetal assessment and
better focus resources, which most likely would lead to a decline in perinatal morbidity and
mortality.

Intrauterine growth restriction in first half of pregnancy
47
SummaryThe thesis consists of three subprojects:
First subproject
The first subproject aimed to analyze the association between growth in first half of
pregnancy and the risk of adverse outcome in a cohort of 8215 pregnant women. Data was
obtained from the Copenhagen First Trimester Study conducted in 1998-2001. Two papers
were published.
The objective of the first paper was to relate growth rate of the biparietal diameter (BPD)
between the first and second trimesters to the risk of perinatal death, intrauterine growth
restriction, macrosomia, preterm/post-term delivery and preeclampsia. We analyzed
sonographic BPD measurements at 11–14 and 17–21 weeks, and defined growth rate as
millimetres of growth per day between the two measurements. Growth rate was
dichotomized into growth rates < 2.5th
and > 97.5th
vs. 2.5th
–97.5th
centiles. Odds ratios
and 95% confidence intervals for adverse outcome were calculated. We found a significant
relationship between the growth rate of BPD from the first to the second trimester and
adverse pregnancy outcome. Low growth rates were associated with increased odds ratios
for perinatal death and intrauterine growth restriction, while high growth rates were
associated with increased odds ratios for macrosomia and preterm delivery.
The second paper was written in collaboration with Dr. Francesc Figueras and Professor
Jason Gardosi from West Midlands Perinatal Institute, Birmingham, UK. In this
collaboration data was analyzed using conditional centiles and customized fetal growth
charts. Conditional centiles are an acknowledged statistical method, used to estimate
growth longitudinally, and customized fetal growth charts are growth charts that are
individually adjusted / “customized” for physiological factors known to affect birth weight
and growth. The objective of the second paper was to determine the association between
fetal size and growth between the first and second trimesters and subsequent adverse
pregnancy outcome using conditional centiles and customized fetal growth charts for
statistical analyzes. The cohort was the same as in the first paper: 8215 pregnant women
that had fetal size estimated by ultrasound at 11-14 weeks (CRL and BPD) and again at 17-21
weeks (BPD). With the use of conditional centiles and customized fetal growth charts we
found a strong association between early fetal growth rate and perinatal death before 34
weeks (OR 16.0, CI 2.9-88.7).
Second subproject
The second subproject was done in collaboration with Professor Anders Juul, Department
of Growth and Reproduction, Rigshospitalet and Dr Michael Christiansen, Department of

Intrauterine growth restriction in first half of pregnancy
48
Clinical Biochemistry, Statens Serum Institute. In this project we wished to analyze the
association between growth factors in maternal blood and fetal growth rate in first half of
pregnancy. We investigated if maternal levels of human Placental Lactogen (hPL),
Placental Growth Hormone (PGH) and Insulin Growth Factor I (IGF-I) are associated with
growth rate of the biparietal diameter (BPD) between week 11-14 and week 17-21. Again
data from 8215 singleton pregnancies from the Copenhagen First Trimester Study were
analyzed, and growth rate was defined the same way as in our first paper. Fetuses with
growth rate of the BPD below the 2.5th
centile (low growth rate) and fetuses with growth
rate above the 97.5th
centile (high growth rate) were identified. As a reference group a
similar number of fetuses with growth rate around the median were identified
(intermediate growth rate). The maternal blood serum concentration of hPL, PGH and
IGF-I was determined in the three different growth rate groups. We found that when
adjusted for maternal weight and crown rump length (CRL), maternal PGH levels were 12%
higher in women carrying fetuses with high first trimester growth rates compared to
controls. Thus, PGH may be involved in fetal growth regulation already in early human
pregnancy.
Third subproject
The third subproject is a prospective study conducted in collaboration with Dr Lene
Sperling, Department of Obstetrics and Gynaecology, Herlev Hospital. In this study we
looked at fetuses with a discrepancy in gestational age determined by crown rump length
(CRL) and last menstrual period, and used a “smaller than expected CRL” as an indicator of
first trimester growth restriction.
We wished to investigate if fetuses with a smaller than expected CRL have impaired
perfusion of the placenta, measured by ultrasound Doppler of the uterine and umbilical
arteries compared to a control group, and to investigate if a smaller than expected CRL in
combination with abnormal flow in the uterine and umbilical arteries can be used to
predict adverse neonatal outcome.
We included 182 singleton pregnancies with a gestational age set by CRL that was seven
days or more smaller than the gestational age set by last menstrual period and 230 controls
with a gestational age set by CRL that was equal to the gestational age set by last menstrual
period. The study entailed the routine scans (nuchal translucency scan in first trimester
and anomaly scan in second trimester), a growth scan in gestational week 23-24 and a
questionnaire. At the anomaly scan and growth scan umbilical and uterine artery Doppler
flows were measured.

Intrauterine growth restriction in first half of pregnancy
49
We were not able to demonstrate a link between poor placental perfusion and first
trimester growth restriction, and therefore, based on the result from this study, do not
recommend measurements of uterine or umbilical artery flow specifically for fetuses with
at smaller than expected CRL.

Intrauterine growth restriction in first half of pregnancy
50
Dansk resumeAfhandlingen består af tre delprojekter
Første delprojekt
Formålet var at analysere associationen mellem føtal vækst i første halvdel af graviditeten
og risikoen for dårligt graviditetsudkomme i en kohorte på 8215 gravide kvinder. Data kom
fra ”Copenhagen First Trimester Study 1998-2001”. To artikler er publiceceret i første
delprojekt.
Formålet med den første artikel var at relatere vækstrate af biparietal diameteren (BPD)
mellem første og andet trimester af graviditeten til risikoen for perinatal død, intrauterin
væksthæmning, macrosomi, præterm/postterm fødsel og præeclampsi. Vi anvendte
ultralydsmål af BPD målt i uge 11-14 og 17-21 af graviditeten. Føtal vækstrate definerede vi
som millimeter vækst pr. dag mellem de to målinger. Materialet blev dichotomiseret i
grupper med vækstrate < 2.5th
vs. 2.5th
–97.5th
percentil samt > 97.5th
vs. 2.5th
–97.5th
percentil og odds ratio og 95% confidence interval for dårligt graviditets udkomme blev
beregnet.
Vi fandt signifikante sammenhæng mellem BPD-vækstraten fra første til andet trimester
og risikoen for dårligt graviditets udkomme. Lav vækstrate var associeret med en øget odds
ratio for perinatal død og intrauterin væksthæmning og høj væksrate var associeret med
øget odds ratio for macrosomi og præterm fødsel.
Den anden artikel blev skrevet i samarbejde med Dr. Francesc Figueras og Professor Jason
Gardosi fra West Midlands Perinatal Institute, Birmingham, UK. I dette samarbejde
analyserede vi data ved brug af ”conditional centiles” og ”customized fetal growth charts”.
”Conditional centiles” er en anerkendt statistisk metode, der anvendes til at estimere vækst
målt longitudinelt og ”customized fetal growth charts” er vækstdiagrammer som er
individuelt justeret/”customized” for fysiologiske faktorer, som påvirker fødselsvægten og
væksten. Formålet med artikel nummer to var at beskrive associationen mellem føtal
størrelse og vækst mellem første og andet trimester og efterfølgende graviditetsudkomme
ved anvendelsen af ”conditional centiles” og ”customized fetal growth charts” til de
statistiske analyser.
Kohorten var den same som i den første artikel: 8215 gravide kvinder, som havde fået
foretaget ultralydsmålinger i uge 11-14 (CRL, BPD) og igen i uge 17-21 ( BPD). Ved
anvendelsen af ”conditional centiles” og ”customized fetal growth charts” fandt vi en stærk
association mellem vækst i den tidlige gravidtet og perinatal død før uge 34 (OR 16.0, CI
2.9-88.7).

Intrauterine growth restriction in first half of pregnancy
51
Andet delprojekt
Andet delprojekt blev skrevet i samarbejde med Professor Anders Juul, klinik for vækst og
reproduktion, Rigshospitalet og overlæge Michael Christiansen, klinisk biokemisk afdeling,
Statens Serum Institut. I dette projekt ønskede vi at analysere associationen mellem
vækstfaktorer i maternelt blod og fosterets vækstrate mellem første og andet trimester. Vi
undersøgte om maternelle serum niveauer af human Placental Lactogen (hPL), Placental
Growth Hormone (PGH) og Insuline Growth Factor I (IGF-I) er associerede med
vækstraten af biparietal diametern mellem uge 11-14 og uge 17-21. Vi anvendte den samme
kohorte fra “ Copenhagen First Trimester Study” som i første delprojekt, ligesom
væksraten blev defineret på samme måde som i den første artikel. Fostre med BPD-
vækstrate under 2.5 percentilen (lav vækstrate) og fostre med vækstrate over 97.5
percentilen (høj vækstrate) blev identificeret. Et tilsvarende antal fostre med vækstrate
omkring medianen (intermediær vækstrate) blev anvendt som referencegruppe.
Maternelle serum koncentrationer af hPL, PGH og IGF-I blev målt i de tre forskellige
vækstrate grupper. Vi fandt at efter justering for crown rump length (CRL) og maternel
vægt er det maternelle serum niveau for PGH 12% højere hos gravide med fostre, der har en
høj vækstrate sammenlignet med den intermediære kontrol gruppe og konkluderede derfor
at PGH er involveret i føtal vækstregulering allerede tidligt i graviditeten.
Tredie delprojekt
Det tredie delprojekt er et prospektivt studie udført i samarbejde med overlæge Lene
Sperling, Obstetrisk/Gynækologisk afdeling, Herlev Hospital. I dette studie fokuserede vi
på fostre, hvor der var en forskel i gestationsalderen fastsat ved crown rump length (CRL)
og gestationsalderen fastsat ved sidste menstruation. Vi anvendte ”mindre end forventet
CRL” som en indikator for første trimester vækstretardering.
Vi ønskede at undersøge om disse små fostre har dårligere perfusion af plancenta målt ved
ultralyd Doppler i aa. Uterinae og a. Umbilicalis sammenlignet med en kontrol gruppe,
samt at undersøge om dårligt flow i aa. Uterinae og a. Umbilicalis kan anvendes til at
forudsige dårligt neonatal udkomme.
Vi inkluderede 182 singleton graviditeter, hvor gestationsalderen estimeret ved CRL i første
trimester var syv dage eller mere mindre end gestationsalderen estimeret ved sidste
menstruation og 230 kontroller hvor gestationsalderen estimeret ved CRL og sidste
menstruation var den samme. Studiet omfattede rutine skanningerne
(nakkefoldsskanningen i første trimester og anomaliskanningen i andet trimester) samt en
tilvækstskanning i uge 23-24 og et spørgeskema. Ved gennemskanningen og

Intrauterine growth restriction in first half of pregnancy
52
tilvækstskanningen blev blodgennemstrømningen i aa.uterinae og a.umbilicalis målt med
ultralyd Doppler.
Vi fandt ikke en association mellem dårlig perfusion af placenta og første trimester
vækstretardering, og kan på baggrund af dettes studie derfor ikke anbefale uterin eller
umbilical arterie flow målinger specielt til fostre med en mindre end forventet CRL.

Intrauterine growth restriction in first half of pregnancy
53
Reference List
(1) Gluckman PD. The role of pituitary hormones, growth factors and insulin in the regulation of fetal
growth. Oxf Rev Reprod Biol 1986; 8:1-60.
(2) Walton A HJ. The maternal effects of on growth and conformation in Shire horrse-Shetland pony
crosses. Proc R Soc Lond Ser 1938; B125:311-335.
(3) Gluckman PD. Endocrine and nutritional regulation of prenatal growth. Acta Paediatr Suppl 1997;
423:153-157.
(4) Barker DJ, Gluckman PD, Godfrey KM, Harding JE, Owens JA, Robinson JS. Fetal nutrition and
cardiovascular disease in adult life. Lancet 1993; 341(8850):938-941.
(5) Godfrey K, Robinson S, Barker DJ, Osmond C, Cox V. Maternal nutrition in early and late pregnancy
in relation to placental and fetal growth. BMJ 1996; 312(7028):410-414.
(6) Penrose LS. Data on the genetics of birth weight. Ann Eugen 1952; 16(4):378-381.
(7) Brar HS, Rutherford SE. Classification of intrauterine growth retardation. Semin Perinatol 1988;
12(1):2-10.
(8) Dudley NJ. A systematic review of the ultrasound estimation of fetal weight. Ultrasound Obstet
Gynecol 2005; 25(1):80-89.
(9) Loeffler FE. Clinical foetal weight prediction. J Obstet Gynaecol Br Commonw 1967; 74(5):675-677.
(10) Hall MH, Chng PK, MacGillivray I. Is routine antenatal care worth while? Lancet 1980; 2(8185):78-80.
(11) Rosenberg K, Grant JM, Hepburn M. Antenatal detection of growth retardation: actual practice in a
large maternity hospital. Br J Obstet Gynaecol 1982; 89(1):12-15.
(12) Belizan JM, Villar J, Nardin JC, Malamud J, De Vicurna LS. Diagnosis of intrauterine growth
retardation by a simple clinical method: measurement of uterine height. Am J Obstet Gynecol 1978;
131(6):643-646.
(13) Hadlock FP, Harrist RB, Sharman RS, Deter RL, Park SK. Estimation of fetal weight with the use of
head, body, and femur measurements--a prospective study. Am J Obstet Gynecol 1985; 151(3):333-337.
(14) Hadlock FP, Harrist RB, Carpenter RJ, Deter RL, Park SK. Sonographic estimation of fetal weight. The
value of femur length in addition to head and abdomen measurements. Radiology 1984; 150(2):535-
540.
(15) Warsof SL, Cooper DJ, Little D, Campbell S. Routine ultrasound screening for antenatal detection of
intrauterine growth retardation. Obstet Gynecol 1986; 67(1):33-39.
(16) Queenan JT. Management of high risk pregnancy. 3d ed. ed. Boston: Blackwell Scientific; 1994.
(17) Bobrow CS, Soothill PW. Fetal growth velocity: a cautionary tale. Lancet 1999; 353(9163):1460.
(18) Baschat AA. Fetal growth disorders. High risk pregnancy management and options. Philadelphia:
Saunders; 2006.

Intrauterine growth restriction in first half of pregnancy
54
(19) RCOG Guideline 31.2002. The investigation and management of the small-for-gestational-age fetus.
2002.
Ref Type: Report
(20) Gilbert WM, Danielsen B. Pregnancy outcomes associated with intrauterine growth restriction. Am J
Obstet Gynecol 2003; 188(6):1596-1599.
(21) Garite TJ, Clark R, Thorp JA. Intrauterine growth restriction increases morbidity and mortality
among premature neonates. Am J Obstet Gynecol 2004; 191(2):481-487.
(22) Aucott SW, Donohue PK, Northington FJ. Increased morbidity in severe early intrauterine growth
restriction. J Perinatol 2004; 24(7):435-440.
(23) WHO internet publications. http:, www.who.int/publications/en/. 2010.
Ref Type: Internet Communication
(24) McIntire DD, Bloom SL, Casey BM, Leveno KJ. Birth weight in relation to morbidity and mortality
among newborn infants. N Engl J Med 1999; 340(16):1234-1238.
(25) Seeds JW. Impaired fetal growth: definition and clinical diagnosis. Obstet Gynecol 1984; 64(3):303-
310.
(26) Patterson RM, Pouliot MR. Neonatal morphometrics and perinatal outcome: who is growth retarded?
Am J Obstet Gynecol 1987; 157(3):691-693.
(27) Sandbjerg guideline. IUGR guideline. http://www.dsog.dk/sandbjerg/ 2010.
Ref Type: Internet Communication
(28) Marsal K, Persson PH, Larsen T, Lilja H, Selbing A, Sultan B. Intrauterine growth curves based on
ultrasonically estimated foetal weights. Acta Paediatr 1996; 85(7):843-848.
(29) Vandenbosche RC, Kirchner JT. Intrauterine growth retardation. Am Fam Physician 1998; 58(6):1384.
(30) Myers SA, Ferguson R. A population study of the relationship between fetal death and altered fetal
growth. Obstet Gynecol 1989; 74(3 Pt 1):325-331.
(31) Gardosi J. The application of individualised fetal growth curves. J Perinat Med 1998; 26(4):333-338.
(32) Gardosi J. Customized fetal growth standards: rationale and clinical application. Semin Perinatol
2004; 28(1):33-40.
(33) Clausson B, Gardosi J, Francis A, Cnattingius S. Perinatal outcome in SGA births defined by
customised versus population-based birthweight standards. BJOG 2001; 108(8):830-834.
(34) Naegele FC. Lehrbuc der Geburtshülfe für Hebammen. Heidelberg: 1836.
(35) Geirsson RT. Ultrasound instead of last menstrual period as the basis of gestational age assignment.
Ultrasound Obstet Gynecol 1991; 1(3):212-219.
(36) Taipale P, Hiilesmaa V. Predicting delivery date by ultrasound and last menstrual period in early
gestation. Obstet Gynecol 2001; 97(2):189-194.
(37) Kramer MS, McLean FH, Boyd ME, Usher RH. The validity of gestational age estimation by menstrual
dating in term, preterm, and postterm gestations. JAMA 1988; 260(22):3306-3308.
(38) Verburg BO, Steegers EA, De RM, Snijders RJ, Smith E, Hofman A et al. New charts for ultrasound
dating of pregnancy and assessment of fetal growth: longitudinal data from a population-based
cohort study. Ultrasound Obstet Gynecol 2008; 31(4):388-396.

Intrauterine growth restriction in first half of pregnancy
55
(39) Geirsson RT, Busby-Earle RM. Certain dates may not provide a reliable estimate of gestational age. Br
J Obstet Gynaecol 1991; 98(1):108-109.
(40) Saito M, Yazawa K, Hashiguchi A, Kumasaka T, Nishi N, Kato K. Time of ovulation and prolonged
pregnancy. Am J Obstet Gynecol 1972; 112(1):31-38.
(41) Walker EM, Lewis M, Cooper W, Marnie M, Howie PW. Occult biochemical pregnancy: fact or
fiction? Br J Obstet Gynaecol 1988; 95(7):659-663.
(42) Guerrero R, Florez PE. The duration of pregnancy. Lancet 1969; 2(7614):268-269.
(43) Mongelli M, Wilcox M, Gardosi J. Estimating the date of confinement: ultrasonographic biometry
versus certain menstrual dates. Am J Obstet Gynecol 1996; 174(1 Pt 1):278-281.
(44) Mul T, Mongelli M, Gardosi J. A comparative analysis of second-trimester ultrasound dating formulae
in pregnancies conceived with artificial reproductive techniques. Ultrasound Obstet Gynecol 1996;
8(6):397-402.
(45) Persson PH, Kullander S. Long-term experience of general ultrasound screening in pregnancy. Am J
Obstet Gynecol 1983; 146(8):942-947.
(46) Campbell S, Warsof SL, Little D, Cooper DJ. Routine ultrasound screening for the prediction of
gestational age. Obstet Gynecol 1985; 65(5):613-620.
(47) Waldenstrom U, Axelsson O, Nilsson S. A comparison of the ability of a sonographically measured
biparietal diameter and the last menstrual period to predict the spontaneous onset of labor. Obstet
Gynecol 1990; 76(3 Pt 1):336-338.
(48) Tunon K, Eik-Nes SH, Grottum P. A comparison between ultrasound and a reliable last menstrual
period as predictors of the day of delivery in 15,000 examinations. Ultrasound Obstet Gynecol 1996;
8(3):178-185.
(49) Altman DG, Chitty LS. New charts for ultrasound dating of pregnancy. Ultrasound Obstet Gynecol
1997; 10(3):174-191.
(50) Robinson HP, Fleming JE. A critical evaluation of sonar "crown-rump length" measurements. Br J
Obstet Gynaecol 1975; 82(9):702-710.
(51) Tunon K, Eik-Nes SH, Grottum P, Von D, V, Kahn JA. Gestational age in pregnancies conceived after
in vitro fertilization: a comparison between age assessed from oocyte retrieval, crown-rump length
and biparietal diameter. Ultrasound Obstet Gynecol 2000; 15(1):41-46.
(52) Ekelund CK, Jorgensen FS, Petersen OB, Sundberg K, Tabor A. Impact of a new national screening
policy for Down's syndrome in Denmark: population based cohort study. BMJ 2008; 337:a2547.
(53) Sandbjerg guideline. Terminsfastsættelse. http://www.dsog.dk/sandbjerg/ 2009.
Ref Type: Internet Communication
(54) Pedersen NG, Figueras F, Wojdemann KR, Tabor A, Gardosi J. Early fetal size and growth as
predictors of adverse outcome. Obstet Gynecol 2008; 112(4):765-771.
(55) Pedersen NG, Wojdemann KR, Scheike T, Tabor A. Fetal growth between the first and second
trimesters and the risk of adverse pregnancy outcome. Ultrasound Obstet Gynecol 2008; 32(2):147-
154.
(56) Smith-Bindman R, Chu PW, Ecker JL, Feldstein VA, Filly RA, Bacchetti P. US evaluation of fetal
growth: prediction of neonatal outcomes. Radiology 2002; 223(1):153-161.

Intrauterine growth restriction in first half of pregnancy
56
(57) Royston P. Calculation of unconditional and conditional reference intervals for foetal size and growth
from longitudinal measurements. Stat Med 1995; 14(13):1417-1436.
(58) Boulet SL, Alexander GR, Salihu HM, Kirby RS, Carlo WA. Fetal growth risk curves: defining levels of
fetal growth restriction by neonatal death risk. Am J Obstet Gynecol 2006; 195(6):1571-1577.
(59) Lackman F, Capewell V, Richardson B, daSilva O, Gagnon R. The risks of spontaneous preterm
delivery and perinatal mortality in relation to size at birth according to fetal versus neonatal growth
standards. Am J Obstet Gynecol 2001; 184(5):946-953.
(60) Regev RH, Lusky A, Dolfin T, Litmanovitz I, Arnon S, Reichman B. Excess mortality and morbidity
among small-for-gestational-age premature infants: a population-based study. J Pediatr 2003;
143(2):186-191.
(61) Bartels DB, Kreienbrock L, Dammann O, Wenzlaff P, Poets CF. Population based study on the
outcome of small for gestational age newborns. Arch Dis Child Fetal Neonatal Ed 2005; 90(1):F53-F59.
(62) Wu YW, March WM, Croen LA, Grether JK, Escobar GJ, Newman TB. Perinatal stroke in children
with motor impairment: a population-based study. Pediatrics 2004; 114(3):612-619.
(63) Doctor BA, O'Riordan MA, Kirchner HL, Shah D, Hack M. Perinatal correlates and neonatal
outcomes of small for gestational age infants born at term gestation. Am J Obstet Gynecol 2001;
185(3):652-659.
(64) Kramer MS, Olivier M, McLean FH, Willis DM, Usher RH. Impact of intrauterine growth retardation
and body proportionality on fetal and neonatal outcome. Pediatrics 1990; 86(5):707-713.
(65) Snijders RJ, Abbas A, Melby O, Ireland RM, Nicolaides KH. Fetal plasma erythropoietin
concentration in severe growth retardation. Am J Obstet Gynecol 1993; 168(2):615-619.
(66) Simchen MJ, Beiner ME, Strauss-Liviathan N, Dulitzky M, Kuint J, Mashiach S et al. Neonatal
outcome in growth-restricted versus appropriately grown preterm infants. Am J Perinatol 2000;
17(4):187-192.
(67) Koenig JM, Christensen RD. Incidence, neutrophil kinetics, and natural history of neonatal
neutropenia associated with maternal hypertension. N Engl J Med 1989; 321(9):557-562.
(68) Pietersma-de Bruyn AL, van der Straaten PJ, van Haard PM, Kuijpers JC, Hamulyak K, Ruys JH.
Vitamin K1 levels and K1-dependent coagulation factors II and X in preterm and small-for-date
neonates. Eur J Pediatr 1990; 149(9):640-644.
(69) Hackett GA, Campbell S, Gamsu H, Cohen-Overbeek T, Pearce JM. Doppler studies in the growth
retarded fetus and prediction of neonatal necrotising enterocolitis, haemorrhage, and neonatal
morbidity. Br Med J (Clin Res Ed) 1987; 294(6563):13-16.
(70) Bernstein IM, Horbar JD, Badger GJ, Ohlsson A, Golan A. Morbidity and mortality among very-low-
birth-weight neonates with intrauterine growth restriction. The Vermont Oxford Network. Am J
Obstet Gynecol 2000; 182(1 Pt 1):198-206.
(71) Boehm G, Senger H, Braun W, Beyreiss K, Raiha NC. Metabolic differences between AGA- and SGA-
infants of very low birthweight. I. Relationship to intrauterine growth retardation. Acta Paediatr
Scand 1988; 77(1):19-23.
(72) Baserga MC, Sola A. Intrauterine growth restriction impacts tolerance to total parenteral nutrition in
extremely low birth weight infants. J Perinatol 2004; 24(8):476-481.
(73) Topp M, Langhoff-Roos J, Uldall P, Kristensen J. Intrauterine growth and gestational age in preterm
infants with cerebral palsy. Early Hum Dev 1996; 44(1):27-36.

Intrauterine growth restriction in first half of pregnancy
57
(74) Blair E, Stanley F. Intrauterine growth and spastic cerebral palsy. I. Association with birth weight for
gestational age. Am J Obstet Gynecol 1990; 162(1):229-237.
(75) Ellenberg JH, Nelson KB. Birth weight and gestational age in children with cerebral palsy or seizure
disorders. Am J Dis Child 1979; 133(10):1044-1048.
(76) SCPE Collaborative Group. Surveillance of Cerebral Palsy (SCPE) Collaborative Group Surveillance of
Cerebral Palsy in Europe: a collaboration of cerebral palsy surveys and registers. Dev Med Child
Neurol 2000; 42:816e-824.
(77) Walther FJ. Growth and development of term disproportionate small-for-gestational age infants at
the age of 7 years. Early Hum Dev 1988; 18(1):1-11.
(78) Ounsted M, Moar VA, Scott A. Neurological development of small-for-gestational age babies during
the first year of life. Early Hum Dev 1988; 16(2-3):163-172.
(79) Hawdon JM, Hey E, Kolvin I, Fundudis T. Born too small--is outcome still affected? Dev Med Child
Neurol 1990; 32(11):943-953.
(80) Martyn CN, Gale CR, Sayer AA, Fall C. Growth in utero and cognitive function in adult life: follow up
study of people born between 1920 and 1943. BMJ 1996; 312(7043):1393-1396.
(81) Paz I, Gale R, Laor A, Danon YL, Stevenson DK, Seidman DS. The cognitive outcome of full-term
small for gestational age infants at late adolescence. Obstet Gynecol 1995; 85(3):452-456.
(82) Paz I, Laor A, Gale R, Harlap S, Stevenson DK, Seidman DS. Term infants with fetal growth
restriction are not at increased risk for low intelligence scores at age 17 years. J Pediatr 2001; 138(1):87-
91.
(83) Hokken-Koelega AC, De Ridder MA, Lemmen RJ, Den HH, De Muinck Keizer-Schrama SM, Drop SL.
Children born small for gestational age: do they catch up? Pediatr Res 1995; 38(2):267-271.
(84) Karlberg J, bertsson-Wikland K. Growth in full-term small-for-gestational-age infants: from birth to
final height. Pediatr Res 1995; 38(5):733-739.
(85) Ott WJ. Intrauterine growth retardation and preterm delivery. Am J Obstet Gynecol 1993; 168(6 Pt
1):1710-1715.
(86) Cunningham FG M-DPGN. Fetal growth restriction. Williams Obstetrics 20th ed ed. Stamford, CT:
Appleton & Lange; 1997.
(87) Tyson JE, Kennedy K, Broyles S, Rosenfeld CR. The small for gestational age infant: accelerated or
delayed pulmonary maturation? Increased or decreased survival? Pediatrics 1995; 95(4):534-538.
(88) Yinon Y, Mazkereth R, Rosentzweig N, Jarus-Hakak A, Schiff E, Simchen MJ. Growth restriction as a
determinant of outcome in preterm discordant twins. Obstet Gynecol 2005; 105(1):80-84.
(89) Gortner L, Wauer RR, Stock GJ, Reiter HL, Reiss I, Jorch G et al. Neonatal outcome in small for
gestational age infants: do they really better? J Perinat Med 1999; 27(6):484-489.
(90) Malcolm G, Ellwood D, Devonald K, Beilby R, Henderson-Smart D. Absent or reversed end diastolic
flow velocity in the umbilical artery and necrotising enterocolitis. Arch Dis Child 1991; 66(7 Spec
No):805-807.
(91) Newell SJ. Enteral feeding of the micropremie. Clin Perinatol 2000; 27(1):221-34, viii.
(92) Barker DJ, Osmond C, Golding J, Kuh D, Wadsworth ME. Growth in utero, blood pressure in
childhood and adult life, and mortality from cardiovascular disease. BMJ 1989; 298(6673):564-567.

Intrauterine growth restriction in first half of pregnancy
58
(93) Lucas A. Programming by early nutrition in man. In: Bock GR Whelan J, editor. The Childhood
Environment and Adult Disease, CIBA Foundation Symposium 156. Chichester, West Sussex, Uk:
Wiley; 1991. 38-55.
(94) Hales CN, Barker DJ. Type 2 (non-insulin-dependent) diabetes mellitus: the thrifty phenotype
hypothesis. Diabetologia 1992; 35(7):595-601.
(95) Ozanne SE, Hales CN. Early programming of glucose-insulin metabolism. Trends Endocrinol Metab
2002; 13(9):368-373.
(96) Maison P, Balkau B, Simon D, Chanson P, Rosselin G, Eschwege E. Growth hormone as a risk for
premature mortality in healthy subjects: data from the Paris prospective study. BMJ 1998;
316(7138):1132-1133.
(97) Vaessen N, Heutink P, Janssen JA, Witteman JC, Testers L, Hofman A et al. A polymorphism in the
gene for IGF-I: functional properties and risk for type 2 diabetes and myocardial infarction. Diabetes
2001; 50(3):637-642.
(98) Barker DJ, Hales CN, Fall CH, Osmond C, Phipps K, Clark PM. Type 2 (non-insulin-dependent)
diabetes mellitus, hypertension and hyperlipidaemia (syndrome X): relation to reduced fetal growth.
Diabetologia 1993; 36(1):62-67.
(99) Harel Z, Tannenbaum GS. Long-term alterations in growth hormone and insulin secretion after
temporary dietary protein restriction in early life in the rat. Pediatr Res 1995; 38(5):747-753.
(100) Holt RI. Fetal programming of the growth hormone-insulin-like growth factor axis. Trends
Endocrinol Metab 2002; 13(9):392-397.
(101) Sands J, Dobbing J. Continuing growth and development of the third-trimester human placenta.
Placenta 1985; 6(1):13-21.
(102) Heinonen S, Taipale P, Saarikoski S. Weights of placentae from small-for-gestational age infants
revisited. Placenta 2001; 22(5):399-404.
(103) Atherne W. Morphometry. In: Gruenwald P, editor. The placenta and its maternal supply line.
Baltimore: University Park Press; 1975. 80-97.
(104) Kingdom J, Huppertz B, Seaward G, Kaufmann P. Development of the placental villous tree and its
consequences for fetal growth. Eur J Obstet Gynecol Reprod Biol 2000; 92(1):35-43.
(105) Irving JA, Lysiak JJ, Graham CH, Hearn S, Han VK, Lala PK. Characteristics of trophoblast cells
migrating from first trimester chorionic villus explants and propagated in culture. Placenta 1995;
16(5):413-433.
(106) Benirschke KP. Hypertensive disorders, Pathology of the human placenta. 2nd ed ed. New York:
Springer-Verlag; 2010.
(107) Fisher SJ, Cui TY, Zhang L, Hartman L, Grahl K, Zhang GY et al. Adhesive and degradative properties
of human placental cytotrophoblast cells in vitro. J Cell Biol 1989; 109(2):891-902.
(108) Librach CL, Werb Z, Fitzgerald ML, Chiu K, Corwin NM, Esteves RA et al. 92-kD type IV collagenase
mediates invasion of human cytotrophoblasts. J Cell Biol 1991; 113(2):437-449.
(109) Hunkapiller NM, Fisher SJ. Chapter 12. Placental remodeling of the uterine vasculature. Methods
Enzymol 2008; 445:281-302.
(110) Rockwell LC, Vargas E, Moore LG. Human physiological adaptation to pregnancy: inter- and
intraspecific perspectives. Am J Hum Biol 2003; 15(3):330-341.

Intrauterine growth restriction in first half of pregnancy
59
(111) Moll W, Kunzel W. The blood pressure in arteries entering the placentae of guinea pigs, rats, rabbits,
and sheep. Pflugers Arch 1973; 338(2):125-131.
(112) Kliman HJ. Uteroplacental blood flow. The story of decidualization, menstruation, and trophoblast
invasion. Am J Pathol 2000; 157(6):1759-1768.
(113) Carbillon L, Challier JC, Alouini S, Uzan M, Uzan S. Uteroplacental circulation development: Doppler
assessment and clinical importance. Placenta 2001; 22(10):795-799.
(114) Zhou Y, Fisher SJ, Janatpour M, Genbacev O, Dejana E, Wheelock M et al. Human cytotrophoblasts
adopt a vascular phenotype as they differentiate. A strategy for successful endovascular invasion? J
Clin Invest 1997; 99(9):2139-2151.
(115) Pijnenborg R, Vercruysse L, Hanssens M. Fetal-maternal conflict, trophoblast invasion, preeclampsia,
and the red queen. Hypertens Pregnancy 2008; 27(2):183-196.
(116) Osol G, Mandala M. Maternal uterine vascular remodeling during pregnancy. Physiology (Bethesda )
2009; 24:58-71.
(117) Brosens I, Dixon HG, Robertson WB. Fetal growth retardation and the arteries of the placental bed.
Br J Obstet Gynaecol 1977; 84(9):656-663.
(118) Brosens IA, Robertson WB, Dixon HG. The role of the spiral arteries in the pathogenesis of
preeclampsia. Obstet Gynecol Annu 1972; 1:177-191.
(119) Redman CW, Sacks GP, Sargent IL. Preeclampsia: an excessive maternal inflammatory response to
pregnancy. Am J Obstet Gynecol 1999; 180(2 Pt 1):499-506.
(120) Ueland K. Maternal cardiovascular dynamics. VII. Intrapartum blood volume changes. Am J Obstet
Gynecol 1976; 126(6):671-677.
(121) Lunell NO, Nylund LE, Lewander R, Sarby B. Uteroplacental blood flow in pre-eclampsia
measurements with indium-113m and a computer-linked gamma camera. Clin Exp Hypertens B 1982;
1(1):105-117.
(122) Zygmunt M, Herr F, Munstedt K, Lang U, Liang OD. Angiogenesis and vasculogenesis in pregnancy.
Eur J Obstet Gynecol Reprod Biol 2003; 110 Suppl 1:S10-S18.
(123) Tabor A UN. Føtalmedicinsk og gynækologisk ultralydskanning. 1st ed. København: Gads Forlag;
2008.
(124) Urban G, Vergani P, Ghidini A, Tortoli P, Ricci S, Patrizio P et al. State of the art: non-invasive
ultrasound assessment of the uteroplacental circulation. Semin Perinatol 2007; 31(4):232-239.
(125) Hafner E, Schuchter K, Metzenbauer M, Philipp K. Uterine artery Doppler perfusion in the first and
second pregnancies. Ultrasound Obstet Gynecol 2000; 16(7):625-629.
(126) Campbell S, az-Recasens J, Griffin DR, Cohen-Overbeek TE, Pearce JM, Willson K et al. New doppler
technique for assessing uteroplacental blood flow. Lancet 1983; 1(8326 Pt 1):675-677.
(127) Munster K, Schmidt L, Helm P. Length and variation in the menstrual cycle--a cross-sectional study
from a Danish county. Br J Obstet Gynaecol 1992; 99(5):422-429.
(128) Jurkovic D, Jauniaux E, Kurjak A, Hustin J, Campbell S, Nicolaides KH. Transvaginal color Doppler
assessment of the uteroplacental circulation in early pregnancy. Obstet Gynecol 1991; 77(3):365-369.

Intrauterine growth restriction in first half of pregnancy
60
(129) van den Elzen HJ, Cohen-Overbeek TE, Grobbee DE, Quartero RW, Wladimiroff JW. Early uterine
artery Doppler velocimetry and the outcome of pregnancy in women aged 35 years and older.
Ultrasound Obstet Gynecol 1995; 5(5):328-333.
(130) Harrington K, Fayyad A, Thakur V, Aquilina J. The value of uterine artery Doppler in the prediction
of uteroplacental complications in multiparous women. Ultrasound Obstet Gynecol 2004; 23(1):50-55.
(131) Martin AM, Bindra R, Curcio P, Cicero S, Nicolaides KH. Screening for pre-eclampsia and fetal
growth restriction by uterine artery Doppler at 11-14 weeks of gestation. Ultrasound Obstet Gynecol
2001; 18(6):583-586.
(132) Gomez O, Martinez JM, Figueras F, Del RM, Borobio V, Puerto B et al. Uterine artery Doppler at 11-14
weeks of gestation to screen for hypertensive disorders and associated complications in an unselected
population. Ultrasound Obstet Gynecol 2005; 26(5):490-494.
(133) Campbell S. First-trimester screening for pre-eclampsia. Ultrasound Obstet Gynecol 2005; 26(5):487-
489.
(134) Albaiges G, Missfelder-Lobos H, Lees C, Parra M, Nicolaides KH. One-stage screening for pregnancy
complications by color Doppler assessment of the uterine arteries at 23 weeks' gestation. Obstet
Gynecol 2000; 96(4):559-564.
(135) Papageorghiou AT, Yu CK, Bindra R, Pandis G, Nicolaides KH. Multicenter screening for pre-
eclampsia and fetal growth restriction by transvaginal uterine artery Doppler at 23 weeks of
gestation. Ultrasound Obstet Gynecol 2001; 18(5):441-449.
(136) Papageorghiou AT, Yu CK, Nicolaides KH. The role of uterine artery Doppler in predicting adverse
pregnancy outcome. Best Pract Res Clin Obstet Gynaecol 2004; 18(3):383-396.
(137) Cnossen JS, Morris RK, ter RG, Mol BW, van der Post JA, Coomarasamy A et al. Use of uterine artery
Doppler ultrasonography to predict pre-eclampsia and intrauterine growth restriction: a systematic
review and bivariable meta-analysis. CMAJ 2008; 178(6):701-711.
(138) Chien PF, Arnott N, Gordon A, Owen P, Khan KS. How useful is uterine artery Doppler flow
velocimetry in the prediction of pre-eclampsia, intrauterine growth retardation and perinatal death?
An overview. BJOG 2000; 107(2):196-208.
(139) Steel SA, Pearce JM, McParland P, Chamberlain GV. Early Doppler ultrasound screening in prediction
of hypertensive disorders of pregnancy. Lancet 1990; 335(8705):1548-1551.
(140) Harrington K, Cooper D, Lees C, Hecher K, Campbell S. Doppler ultrasound of the uterine arteries:
the importance of bilateral notching in the prediction of pre-eclampsia, placental abruption or
delivery of a small-for-gestational-age baby. Ultrasound Obstet Gynecol 1996; 7(3):182-188.
(141) Smith GC, Yu CK, Papageorghiou AT, Cacho AM, Nicolaides KH. Maternal uterine artery Doppler
flow velocimetry and the risk of stillbirth. Obstet Gynecol 2007; 109(1):144-151.
(142) Deeks JJ, Altman DG. Diagnostic tests 4: likelihood ratios. BMJ 2004; 329(7458):168-169.
(143) Rudolph AM HMTKBCRN. Studies on the circulation of the previable human fetus. Pediatr Res 1971;
5:452-465.
(144) Gudmundsson S, Korszun P, Olofsson P, Dubiel M. New score indicating placental vascular
resistance. Acta Obstet Gynecol Scand 2003; 82(9):807-812.
(145) Kiserud T, Acharya G. The fetal circulation. Prenat Diagn 2004; 24(13):1049-1059.

Intrauterine growth restriction in first half of pregnancy
61
(146) Poston L, McCarthy AL, Ritter JM. Control of vascular resistance in the maternal and feto-placental
arterial beds. Pharmacol Ther 1995; 65(2):215-239.
(147) Sand AE, Andersson E, Fried G. Effects of nitric oxide donors and inhibitors of nitric oxide signalling
on endothelin- and serotonin-induced contractions in human placental arteries. Acta Physiol Scand
2002; 174(3):217-223.
(148) Alfirevic Z, Neilson JP. Doppler ultrasonography in high-risk pregnancies: systematic review with
meta-analysis. Am J Obstet Gynecol 1995; 172(5):1379-1387.
(149) Goffinet F, Paris-Llado J, Nisand I, Breart G. Umbilical artery Doppler velocimetry in unselected and
low risk pregnancies: a review of randomised controlled trials. Br J Obstet Gynaecol 1997; 104(4):425-
430.
(150) Bricker L, Neilson JP. Routine doppler ultrasound in pregnancy. Cochrane Database Syst Rev
2000;(2):CD001450.
(151) Goodman HM, Tai LR, Ray J, Cooke NE, Liebhaber SA. Human growth hormone variant produces
insulin-like and lipolytic responses in rat adipose tissue. Endocrinology 1991; 129(4):1779-1783.
(152) Barbour LA, Shao J, Qiao L, Pulawa LK, Jensen DR, Bartke A et al. Human placental growth hormone
causes severe insulin resistance in transgenic mice. Am J Obstet Gynecol 2002; 186(3):512-517.
(153) Veldhuis JD, Bidlingmaier M, Anderson SM, Evans WS, Wu Z, Strasburger CJ. Impact of experimental
blockade of peripheral growth hormone (GH) receptors on the kinetics of endogenous and
exogenous GH removal in healthy women and men. J Clin Endocrinol Metab 2002; 87(12):5737-5745.
(154) Goffin V, Binart N, Touraine P, Kelly PA. Prolactin: the new biology of an old hormone. Annu Rev
Physiol 2002; 64:47-67.
(155) Fuglsang J, Skjaerbaek C, Espelund U, Frystyk J, Fisker S, Flyvbjerg A et al. Ghrelin and its
relationship to growth hormones during normal pregnancy. Clin Endocrinol (Oxf) 2005; 62(5):554-
559.
(156) Chellakooty M, Vangsgaard K, Larsen T, Scheike T, Falck-Larsen J, Legarth J et al. A longitudinal
study of intrauterine growth and the placental growth hormone (GH)-insulin-like growth factor I
axis in maternal circulation: association between placental GH and fetal growth. J Clin Endocrinol
Metab 2004; 89(1):384-391.
(157) Caufriez A, Frankenne F, Englert Y, Golstein J, Cantraine F, Hennen G et al. Placental growth
hormone as a potential regulator of maternal IGF-I during human pregnancy. Am J Physiol 1990;
258(6 Pt 1):E1014-E1019.
(158) Caufriez A, Frankenne F, Hennen G, Copinschi G. Regulation of maternal IGF-I by placental GH in
normal and abnormal human pregnancies. Am J Physiol 1993; 265(4 Pt 1):E572-E577.
(159) Alsat E, Mirlesse V, Fondacci C, Dodeur M, Evain-Brion D. Parathyroid hormone increases epidermal
growth factor receptors in cultured human trophoblastic cells from early and term placenta. J Clin
Endocrinol Metab 1991; 73(2):288-295.
(160) Fuglsang J, Ovesen P. Aspects of placental growth hormone physiology. Growth Horm IGF Res 2006;
16(2):67-85.
(161) Lacroix MC, Guibourdenche J, Frendo JL, Muller F, Evain-Brion D. Human placental growth
hormone--a review. Placenta 2002; 23 Suppl A:S87-S94.

Intrauterine growth restriction in first half of pregnancy
62
(162) Mittal P, Espinoza J, Hassan S, Kusanovic JP, Edwin SS, Nien JK et al. Placental growth hormone is
increased in the maternal and fetal serum of patients with preeclampsia. J Matern Fetal Neonatal
Med 2007; 20(9):651-659.
(163) Linnemann K, Malek A, Sager R, Blum WF, Schneider H, Fusch C. Leptin production and release in
the dually in vitro perfused human placenta. J Clin Endocrinol Metab 2000; 85(11):4298-4301.
(164) Hill DJ, Freemark M, Strain AJ, Handwerger S, Milner RD. Placental lactogen and growth hormone
receptors in human fetal tissues: relationship to fetal plasma human placental lactogen
concentrations and fetal growth. J Clin Endocrinol Metab 1988; 66(6):1283-1290.
(165) Hirt H, Kimelman J, Birnbaum MJ, Chen EY, Seeburg PH, Eberhardt NL et al. The human growth
hormone gene locus: structure, evolution, and allelic variations. DNA 1987; 6(1):59-70.
(166) Chen EY, Liao YC, Smith DH, Barrera-Saldana HA, Gelinas RE, Seeburg PH. The human growth
hormone locus: nucleotide sequence, biology, and evolution. Genomics 1989; 4(4):479-497.
(167) Barsh GS, Seeburg PH, Gelinas RE. The human growth hormone gene family: structure and evolution
of the chromosomal locus. Nucleic Acids Res 1983; 11(12):3939-3958.
(168) Miller WL, Eberhardt NL. Structure and evolution of the growth hormone gene family. Endocr Rev
1983; 4(2):97-130.
(169) Barrera-Saldana HA, Seeburg PH, Saunders GF. Two structurally different genes produce the same
secreted human placental lactogen hormone. J Biol Chem 1983; 258(6):3787-3793.
(170) Pavlakis GN, Hizuka N, Gorden P, Seeburg P, Hamer DH. Expression of two human growth hormone
genes in monkey cells infected by simian virus 40 recombinants. Proc Natl Acad Sci U S A 1981;
78(12):7398-7402.
(171) Lowman HB, Cunningham BC, Wells JA. Mutational analysis and protein engineering of receptor-
binding determinants in human placental lactogen. J Biol Chem 1991; 266(17):10982-10988.
(172) Solomon G, Reicher S, Gussakovsky EE, Jomain JB, Gertler A. Large-scale preparation and in vitro
characterization of biologically active human placental (20 and 22K) and pituitary (20K) growth
hormones: placental growth hormones have no lactogenic activity in humans. Growth Horm IGF Res
2006; 16(5-6):297-307.
(173) Sorensen S, von TD, Schioler V, Greisen G, Petersen S, Larsen T. Serial measurements of serum
human placental lactogen (hPL) and serial ultrasound examinations in the evaluation of fetal growth.
Early Hum Dev 2000; 60(1):25-34.
(174) Gude NM, Roberts CT, Kalionis B, King RG. Growth and function of the normal human placenta.
Thromb Res 2004; 114(5-6):397-407.
(175) Hill DJ, Crace CJ, Strain AJ, Milner RD. Regulation of amino acid uptake and deoxyribonucleic acid
synthesis in isolated human fetal fibroblasts and myoblasts: effect of human placental lactogen,
somatomedin-C, multiplication-stimulating activity, and insulin. J Clin Endocrinol Metab 1986;
62(4):753-760.
(176) Freemark M. Ontogenesis of prolactin receptors in the human fetus: roles in fetal development.
Biochem Soc Trans 2001; 29(Pt 2):38-41.
(177) Ryan EA, Enns L. Role of gestational hormones in the induction of insulin resistance. J Clin
Endocrinol Metab 1988; 67(2):341-347.

Intrauterine growth restriction in first half of pregnancy
63
(178) Leturque A, Hauguel S, Sutter Dub MT, Maulard P, Girard J. Effects of placental lactogen and
progesterone on insulin stimulated glucose metabolism in rat muscles in vitro. Diabete Metab 1989;
15(4):176-181.
(179) Kalkhoff RK, Richardson BL, Beck P. Relative effects of pregnancy, human placental lactogen and
prednisolone on carbohydrate tolerance in normal and subclinical diabetic subjects. Diabetes 1969;
18(3):153-163.
(180) Artenisio AC, Volpe A, Ragonese F, Maccarrone G, Forte F, Consolo F. Behaviour of HPL and GH
plasmatic rate in pregnant women at different times of their pregnancy during dynamic tests. Horm
Metab Res 1980; 12(5):205-208.
(181) Bjorklund AO, Adamson UK, Carlstrom KA, Hennen G, Igout A, Lins PE et al. Placental hormones
during induced hypoglycaemia in pregnant women with insulin-dependent diabetes mellitus:
evidence of an active role for placenta in hormonal counter-regulation. Br J Obstet Gynaecol 1998;
105(6):649-655.
(182) Patel N, Alsat E, Igout A, Baron F, Hennen G, Porquet D et al. Glucose inhibits human placental GH
secretion, in vitro. J Clin Endocrinol Metab 1995; 80(5):1743-1746.
(183) Tyson JE, Austin K, Farinholt J, Fiedler J. Endocrine-metabolic response to acute starvation in human
gestation. Am J Obstet Gynecol 1976; 125(8):1073-1084.
(184) Kim YJ, Felig P. Plasma chorionic somatomammotropin levels during starvation in midpregnancy. J
Clin Endocrinol Metab 1971; 32(6):864-867.
(185) Rygaard K, Revol A, Esquivel-Escobedo D, Beck BL, Barrera-Saldana HA. Absence of human placental
lactogen and placental growth hormone (HGH-V) during pregnancy: PCR analysis of the deletion.
Hum Genet 1998; 102(1):87-92.
(186) Borody IB, Carlton MA. Isolated defect in human placental lactogen synthesis in a normal pregnancy.
Case report. Br J Obstet Gynaecol 1981; 88(4):447-449.
(187) Sideri M, De VG, Guidobono F, Borgese N, Sereni LP, Nicolini U et al. Immunologically undetectable
human placental lactogen in a normal pregnancy. Case report. Br J Obstet Gynaecol 1983; 90(8):771-
773.
(188) Wohlk P, Nexo E, Jorgensen EH, Chemnitz J, Nielsen PV, Parks JS. [Low or absent serum placental
lactogen hormone in 2 normal pregnancies]. Ugeskr Laeger 1984; 146(10):727-729.
(189) Trapp M, De WR, Holzgreve W, Stals HJ, Bohnet HG. [A pregnancy without detectable human
placental lactogen (hPL)]. Zentralbl Gynakol 1987; 109(2):130-133.
(190) Nielsen PV, Pedersen H, Kampmann EM. Absence of human placental lactogen in an otherwise
uneventful pregnancy. Am J Obstet Gynecol 1979; 135(3):322-326.
(191) Wurzel JM, Parks JS, Herd JE, Nielsen PV. A gene deletion is responsible for absence of human
chorionic somatomammotropin. DNA 1982; 1(3):251-257.
(192) Simon P, Decoster C, Brocas H, Schwers J, Vassart G. Absence of human chorionic
somatomammotropin during pregnancy associated with two types of gene deletion. Hum Genet 1986;
74(3):235-238.
(193) Strader AD, Buntin JD. Changes in agouti-related peptide during the ring dove breeding cycle in
relation to prolactin and parental hyperphagia. J Neuroendocrinol 2003; 15(11):1046-1053.
(194) Handwerger S, Freemark M. The roles of placental growth hormone and placental lactogen in the
regulation of human fetal growth and development. J Pediatr Endocrinol Metab 2000; 13(4):343-356.

Intrauterine growth restriction in first half of pregnancy
64
(195) McIntyre HD, Serek R, Crane DI, Veveris-Lowe T, Parry A, Johnson S et al. Placental growth hormone
(GH), GH-binding protein, and insulin-like growth factor axis in normal, growth-retarded, and
diabetic pregnancies: correlations with fetal growth. J Clin Endocrinol Metab 2000; 85(3):1143-1150.
(196) Mirlesse V, Frankenne F, Alsat E, Poncelet M, Hennen G, Evain-Brion D. Placental growth hormone
levels in normal pregnancy and in pregnancies with intrauterine growth retardation. Pediatr Res
1993; 34(4):439-442.
(197) Beckers A, Stevenaert A, Foidart JM, Hennen G, Frankenne F. Placental and pituitary growth
hormone secretion during pregnancy in acromegalic women. J Clin Endocrinol Metab 1990; 71(3):725-
731.
(198) Mazlan M, Spence-Jones C, Chard T, Landon J, McLean C. Circulating levels of GH-releasing
hormone and GH during human pregnancy. J Endocrinol 1990; 125(1):161-167.
(199) Alsat E, Guibourdenche J, Luton D, Frankenne F, Evain-Brion D. Human placental growth hormone.
Am J Obstet Gynecol 1997; 177(6):1526-1534.
(200) Barbour LA, Shao J, Qiao L, Leitner W, Anderson M, Friedman JE et al. Human placental growth
hormone increases expression of the p85 regulatory unit of phosphatidylinositol 3-kinase and triggers
severe insulin resistance in skeletal muscle. Endocrinology 2004; 145(3):1144-1150.
(201) Chellakooty M, Skibsted L, Skouby SO, Andersson AM, Petersen JH, Main KM et al. Longitudinal
study of serum placental GH in 455 normal pregnancies: correlation to gestational age, fetal gender,
and weight. J Clin Endocrinol Metab 2002; 87(6):2734-2739.
(202) Wu Z, Bidlingmaier M, Friess SC, Kirk SE, Buchinger P, Schiessl B et al. A new nonisotopic, highly
sensitive assay for the measurement of human placental growth hormone: development and clinical
implications. J Clin Endocrinol Metab 2003; 88(2):804-811.
(203) Verhaeghe J, Pintiaux A, Van HE, Hennen G, Foidart JM, Igout A. Placental GH, IGF-I, IGF-binding
protein-1, and leptin during a glucose challenge test in pregnant women: relation with maternal body
weight, glucose tolerance, and birth weight. J Clin Endocrinol Metab 2002; 87(6):2875-2882.
(204) Villar J, Cogswell M, Kestler E, Castillo P, Menendez R, Repke JT. Effect of fat and fat-free mass
deposition during pregnancy on birth weight. Am J Obstet Gynecol 1992; 167(5):1344-1352.
(205) Herrera E. Lipid metabolism in pregnancy and its consequences in the fetus and newborn. Endocrine
2002; 19(1):43-55.
(206) Lacroix MC, Guibourdenche J, Fournier T, Laurendeau I, Igout A, Goffin V et al. Stimulation of
human trophoblast invasion by placental growth hormone. Endocrinology 2005; 146(5):2434-2444.
(207) Tricoli JV, Rall LB, Scott J, Bell GI, Shows TB. Localization of insulin-like growth factor genes to
human chromosomes 11 and 12. Nature 1984; 310(5980):784-786.
(208) Kniss DA, Shubert PJ, Zimmerman PD, Landon MB, Gabbe SG. Insulinlike growth factors. Their
regulation of glucose and amino acid transport in placental trophoblasts isolated from first-trimester
chorionic villi. J Reprod Med 1994; 39(4):249-256.
(209) Allan GJ, Flint DJ, Patel K. Insulin-like growth factor axis during embryonic development.
Reproduction 2001; 122(1):31-39.
(210) Baker J, Liu JP, Robertson EJ, Efstratiadis A. Role of insulin-like growth factors in embryonic and
postnatal growth. Cell 1993; 75(1):73-82.
(211) Fowden AL, Forhead AJ. Endocrine mechanisms of intrauterine programming. Reproduction 2004;
127(5):515-526.

Intrauterine growth restriction in first half of pregnancy
65
(212) Fowden AL. Insulin deficiency: effects on fetal growth and development. J Paediatr Child Health 1993;
29(1):6-11.
(213) Cohen P. Overview of the IGF-I system. Horm Res 2006; 65 Suppl 1:3-8.
(214) Fant M, Munro H, Moses AC. An autocrine/paracrine role for insulin-like growth factors in the
regulation of human placental growth. J Clin Endocrinol Metab 1986; 63(2):499-505.
(215) Gargosky SE, Owens PC, Walton PE, Owens JA, Robinson JS, Wallace JC et al. Most of the circulating
insulin-like growth factors-I and -II are present in the 150 kDa complex during human pregnancy. J
Endocrinol 1991; 131(3):491-497.
(216) Hernandez-Valencia M, Zarate A, Ochoa R, Fonseca ME, Amato D, De Jesus OM. Insulin-like growth
factor I, epidermal growth factor and transforming growth factor beta expression and their
association with intrauterine fetal growth retardation, such as development during human
pregnancy. Diabetes Obes Metab 2001; 3(6):457-462.
(217) Liu JP, Baker J, Perkins AS, Robertson EJ, Efstratiadis A. Mice carrying null mutations of the genes
encoding insulin-like growth factor I (Igf-1) and type 1 IGF receptor (Igf1r). Cell 1993; 75(1):59-72.
(218) Constancia M, Hemberger M, Hughes J, Dean W, Ferguson-Smith A, Fundele R et al. Placental-
specific IGF-II is a major modulator of placental and fetal growth. Nature 2002; 417(6892):945-948.
(219) Woods KA, Camacho-Hubner C, Savage MO, Clark AJ. Intrauterine growth retardation and postnatal
growth failure associated with deletion of the insulin-like growth factor I gene. N Engl J Med 1996;
335(18):1363-1367.
(220) Vaessen N, Janssen JA, Heutink P, Hofman A, Lamberts SW, Oostra BA et al. Association between
genetic variation in the gene for insulin-like growth factor-I and low birthweight. Lancet 2002;
359(9311):1036-1037.
(221) Gluckman PD, Butler JH, Comline R, Fowden A. The effects of pancreatectomy on the plasma
concentrations of insulin-like growth factors 1 and 2 in the sheep fetus. J Dev Physiol 1987; 9(1):79-88.
(222) Jones JI, Clemmons DR. Insulin-like growth factors and their binding proteins: biological actions.
Endocr Rev 1995; 16(1):3-34.
(223) Monzavi R, Cohen P. IGFs and IGFBPs: role in health and disease. Best Pract Res Clin Endocrinol
Metab 2002; 16(3):433-447.
(224) Yakar S, Liu JL, Stannard B, Butler A, Accili D, Sauer B et al. Normal growth and development in the
absence of hepatic insulin-like growth factor I. Proc Natl Acad Sci U S A 1999; 96(13):7324-7329.
(225) Wetterau LA, Moore MG, Lee KW, Shim ML, Cohen P. Novel aspects of the insulin-like growth factor
binding proteins. Mol Genet Metab 1999; 68(2):161-181.
(226) Watson CS, Bialek P, Anzo M, Khosravi J, Yee SP, Han VK. Elevated circulating insulin-like growth
factor binding protein-1 is sufficient to cause fetal growth restriction. Endocrinology 2006; 147(3):1175-
1186.
(227) Wang HS, Lim J, English J, Irvine L, Chard T. The concentration of insulin-like growth factor-I and
insulin-like growth factor-binding protein-1 in human umbilical cord serum at delivery: relation to
fetal weight. J Endocrinol 1991; 129(3):459-464.
(228) Leger J, Oury JF, Noel M, Baron S, Benali K, Blot P et al. Growth factors and intrauterine growth
retardation. I. Serum growth hormone, insulin-like growth factor (IGF)-I, IGF-II, and IGF binding
protein 3 levels in normally grown and growth-retarded human fetuses during the second half of
gestation. Pediatr Res 1996; 40(1):94-100.

Intrauterine growth restriction in first half of pregnancy
66
(229) Verhaeghe J, Billen J, Giudice LC. Insulin-like growth factor-binding protein-1 in umbilical artery and
vein of term fetuses with signs suggestive of distress during labor. J Endocrinol 2001; 170(3):585-590.
(230) Osorio M, Torres J, Moya F, Pezzullo J, Salafia C, Baxter R et al. Insulin-like growth factors (IGFs) and
IGF binding proteins-1, -2, and -3 in newborn serum: relationships to fetoplacental growth at term.
Early Hum Dev 1996; 46(1-2):15-26.
(231) Giudice LC, de ZF, Gargosky SE, Dsupin BA, de las FL, Crystal RA et al. Insulin-like growth factors
and their binding proteins in the term and preterm human fetus and neonate with normal and
extremes of intrauterine growth. J Clin Endocrinol Metab 1995; 80(5):1548-1555.
(232) Yang SW, Yu JS. Relationship of insulin-like growth factor-I, insulin-like growth factor binding
protein-3, insulin, growth hormone in cord blood and maternal factors with birth height and
birthweight. Pediatr Int 2000; 42(1):31-36.
(233) Klauwer D, Blum WF, Hanitsch S, Rascher W, Lee PD, Kiess W. IGF-I, IGF-II, free IGF-I and IGFBP-1,
-2 and -3 levels in venous cord blood: relationship to birthweight, length and gestational age in
healthy newborns. Acta Paediatr 1997; 86(8):826-833.
(234) Holmes R, Montemagno R, Jones J, Preece M, Rodeck C, Soothill P. Fetal and maternal plasma
insulin-like growth factors and binding proteins in pregnancies with appropriate or retarded fetal
growth. Early Hum Dev 1997; 49(1):7-17.
(235) Modric T, Silha JV, Shi Z, Gui Y, Suwanichkul A, Durham SK et al. Phenotypic manifestations of
insulin-like growth factor-binding protein-3 overexpression in transgenic mice. Endocrinology 2001;
142(5):1958-1967.
(236) Cowans NJ, Spencer K. First-trimester ADAM12 and PAPP-A as markers for intrauterine fetal growth
restriction through their roles in the insulin-like growth factor system. Prenat Diagn 2007; 27(3):264-
271.
(237) Smith GC, Stenhouse EJ, Crossley JA, Aitken DA, Cameron AD, Connor JM. Early pregnancy levels of
pregnancy-associated plasma protein a and the risk of intrauterine growth restriction, premature
birth, preeclampsia, and stillbirth. J Clin Endocrinol Metab 2002; 87(4):1762-1767.
(238) Conover CA, Bale LK, Overgaard MT, Johnstone EW, Laursen UH, Fuchtbauer EM et al.
Metalloproteinase pregnancy-associated plasma protein A is a critical growth regulatory factor
during fetal development. Development 2004; 131(5):1187-1194.
(239) Smith GC, Stenhouse EJ, Crossley JA, Aitken DA, Cameron AD, Connor JM. Early-pregnancy origins
of low birth weight. Nature 2002; 417(6892):916.
(240) Stevens-Simon C, Orleans M. Low-birthweight prevention programs: the enigma of failure. Birth
1999; 26(3):184-191.
(241) Say L, Gulmezoglu AM, Hofmeyr GJ. Maternal oxygen administration for suspected impaired fetal
growth. Cochrane Database Syst Rev 2003;(1):CD000137.
(242) Gulmezoglu AM, Hofmeyr GJ. Bed rest in hospital for suspected impaired fetal growth. Cochrane
Database Syst Rev 2000;(2):CD000034.
(243) Kramer MS, McDonald SW. Aerobic exercise for women during pregnancy. Cochrane Database Syst
Rev 2006; 3:CD000180.
(244) Hodnett ED, Fredericks S. Support during pregnancy for women at increased risk of low birthweight
babies. Cochrane Database Syst Rev 2003;(3):CD000198.

Intrauterine growth restriction in first half of pregnancy
67
(245) Hofmeyr GJ, Atallah AN, Duley L. Calcium supplementation during pregnancy for preventing
hypertensive disorders and related problems. Cochrane Database Syst Rev 2006; 3:CD001059.
(246) Makrides M, Duley L, Olsen SF. Marine oil, and other prostaglandin precursor, supplementation for
pregnancy uncomplicated by pre-eclampsia or intrauterine growth restriction. Cochrane Database
Syst Rev 2006; 3:CD003402.
(247) Rumbold A, Duley L, Crowther CA, Haslam RR. Antioxidants for preventing pre-eclampsia. Cochrane
Database Syst Rev 2008;(1):CD004227.
(248) Leitich H, Egarter C, Husslein P, Kaider A, Schemper M. A meta-analysis of low dose aspirin for the
prevention of intrauterine growth retardation. Br J Obstet Gynaecol 1997; 104(4):450-459.
(249) Coomarasamy A, Honest H, Papaioannou S, Gee H, Khan KS. Aspirin for prevention of preeclampsia
in women with historical risk factors: a systematic review. Obstet Gynecol 2003; 101(6):1319-1332.
(250) Ural S, Nagey DA. Preventing intrauterine growth retardation with aspirin: does it work? Birth 1998;
25(1):54-55.
(251) Villar J, Rivera J. Nutritional supplementation during two consecutive pregnancies and the interim
lactation period: effect on birth weight. Pediatrics 1988; 81(1):51-57.
(252) Ceesay SM, Prentice AM, Cole TJ, Foord F, Weaver LT, Poskitt EM et al. Effects on birth weight and
perinatal mortality of maternal dietary supplements in rural Gambia: 5 year randomised controlled
trial. BMJ 1997; 315(7111):786-790.
(253) Belizan JM, Barros F, Langer A, Farnot U, Victora C, Villar J. Impact of health education during
pregnancy on behavior and utilization of health resources. Latin American Network for Perinatal and
Reproductive Research. Am J Obstet Gynecol 1995; 173(3 Pt 1):894-899.
(254) Goldenberg RL, Andrews WW. Intrauterine infection and why preterm prevention programs have
failed. Am J Public Health 1996; 86(6):781-783.
(255) Hauth JC, Goldenberg RL, Andrews WW, DuBard MB, Copper RL. Reduced incidence of preterm
delivery with metronidazole and erythromycin in women with bacterial vaginosis. N Engl J Med 1995;
333(26):1732-1736.
(256) Mamelle N, Segueilla M, Munoz F, Berland M. Prevention of preterm birth in patients with
symptoms of preterm labor--the benefits of psychologic support. Am J Obstet Gynecol 1997;
177(4):947-952.
(257) Nordentoft M, Lou HC, Hansen D, Nim J, Pryds O, Rubin P et al. Intrauterine growth retardation and
premature delivery: the influence of maternal smoking and psychosocial factors. Am J Public Health
1996; 86(3):347-354.
(258) Rothberg AD, Lits B. Psychosocial support for maternal stress during pregnancy: effect on birth
weight. Am J Obstet Gynecol 1991; 165(2):403-407.
(259) Istvan J. Stress, anxiety, and birth outcomes: a critical review of the evidence. Psychol Bull 1986;
100(3):331-348.
(260) Homer CJ, James SA, Siegel E. Work-related psychosocial stress and risk of preterm, low birthweight
delivery. Am J Public Health 1990; 80(2):173-177.
(261) Mamelle N, Laumon B, Lazar P. Prematurity and occupational activity during pregnancy. Am J
Epidemiol 1984; 119(3):309-322.

Intrauterine growth restriction in first half of pregnancy
68
(262) Zuckerman B, Amaro H, Bauchner H, Cabral H. Depressive symptoms during pregnancy: relationship
to poor health behaviors. Am J Obstet Gynecol 1989; 160(5 Pt 1):1107-1111.
(263) McAnarney ER, Stevens-Simon C. Maternal psychological stress/depression and low birth weight. Is
there a relationship? Am J Dis Child 1990; 144(7):789-792.
(264) Brown SS EL. The Best Intentions: Unintended Pregnancy and the Well-Being of Children and
Families. Washington DC: National Academy Press; 1995.
(265) Cooper RL GRDAeaatNIoCHaHDM-FMUN. The preterme prediction study: Maternal stress is
associated with spontaneous preterm birth at less than thirty-five weeks' gestation. Am J Obstet
Gynecol 1996; 175:1286-1292.
(266) Alexander GR, Weiss J, Hulsey TC, Papiernik E. Preterm birth prevention: an evaluation of programs
in the United States. Birth 1991; 18(3):160-169.
(267) Teitelman AM, Welch LS, Hellenbrand KG, Bracken MB. Effect of maternal work activity on preterm
birth and low birth weight. Am J Epidemiol 1990; 131(1):104-113.
(268) Brett KM, Strogatz DS, Savitz DA. Employment, job strain, and preterm delivery among women in
North Carolina. Am J Public Health 1997; 87(2):199-204.
(269) Fox ME, Harris RE, Brekken AL. The active-duty military pregnancy: a new high-risk category. Am J
Obstet Gynecol 1977; 129(6):705-707.
(270) de Jong CL, Francis A, van Geijn HP, Gardosi J. Fetal growth rate and adverse perinatal events.
Ultrasound Obstet Gynecol 1999; 13(2):86-89.
(271) Larsen T, Nguyen TH, Greisen G, Engholm G, Moller H. Does a discrepancy between gestational age
determined by biparietal diameter and last menstrual period sometimes signify early intrauterine
growth retardation? BJOG 2000; 107(2):238-244.
(272) Deter RL, Buster JE, Casson PR, Carson SA. Individual growth patterns in the first trimester: evidence
for difference in embryonic and fetal growth rates. Ultrasound Obstet Gynecol 1999; 13(2):90-98.
(273) Smith GC, Smith MF, McNay MB, Fleming JE. First-trimester growth and the risk of low birth weight.
N Engl J Med 1998; 339(25):1817-1822.
(274) Gardosi J, Francis A. Early pregnancy predictors of preterm birth: the role of a prolonged
menstruation-conception interval. BJOG 2000; 107(2):228-237.
(275) Nakling J, Backe B. Adverse obstetric outcome in fetuses that are smaller than expected at second
trimester routine ultrasound examination. Acta Obstet Gynecol Scand 2002; 81(9):846-851.
(276) Bukowski R, Smith GC, Malone FD, Ball RH, Nyberg DA, Comstock CH et al. Fetal growth in early
pregnancy and risk of delivering low birth weight infant: prospective cohort study. BMJ 2007;836-
840.
(277) Wojdemann KR, Shalmi AC, Christiansen M, Larsen SO, Sundberg K, Brocks V et al. Improved first-
trimester Down syndrome screening performance by lowering the false-positive rate: a prospective
study of 9941 low-risk women. Ultrasound Obstet Gynecol 2005; 25(3):227-233.
(278) Royston P, Wright EM. How to construct 'normal ranges' for fetal variables. Ultrasound Obstet
Gynecol 1998; 11(1):30-38.
(279) Royston P. A pocket-calculator algorithm for the Shapiro-Francia test for non-normality: an
application to medicine. Stat Med 1993; 12(2):181-184.

Intrauterine growth restriction in first half of pregnancy
69
(280) Goldstein H. Multilevel statistical models. 2nd ed. London: University of London; 1995.
(281) Gardosi J, Mongelli M, Wilcox M, Chang A. An adjustable fetal weight standard. Ultrasound Obstet
Gynecol 1995; 6(3):168-174.
(282) Thorsell M, Kaijser M, Almstrom H, Andolf E. Expected day of delivery from ultrasound dating versus
last menstrual period--obstetric outcome when dates mismatch. BJOG 2008; 115(5):585-589.
(283) Kallen K. Increased risk of perinatal/neonatal death in infants who were smaller than expected at
ultrasound fetometry in early pregnancy. Ultrasound Obstet Gynecol 2004; 24(1):30-34.
(284) Haig D. Placental growth hormone-related proteins and prolactin-related proteins. Placenta 2008; 29
Suppl A:S36-S41.
(285) Fleenor D, Oden J, Kelly PA, Mohan S, Alliouachene S, Pende M et al. Roles of the lactogens and
somatogens in perinatal and postnatal metabolism and growth: studies of a novel mouse model
combining lactogen resistance and growth hormone deficiency. Endocrinology 2005; 146(1):103-112.
(286) Milani S, Bossi A, Bertino E, di Battista E, Coscia A, Aicardi G et al. Differences in size at birth are
determined by differences in growth velocity during early prenatal life. Pediatr Res 2005; 57(2):205-
210.
(287) Mook-Kanamori DO, Steegers EA, Eilers PH, Raat H, Hofman A, Jaddoe VW. Risk factors and
outcomes associated with first-trimester fetal growth restriction. JAMA 2010; 303(6):527-534.
(288) Khong TY, De WF, Robertson WB, Brosens I. Inadequate maternal vascular response to placentation
in pregnancies complicated by pre-eclampsia and by small-for-gestational age infants. Br J Obstet
Gynaecol 1986; 93(10):1049-1059.
(289) Trudinger BJ, Cook CM, Giles WB, Ng S, Fong E, Connelly A et al. Fetal umbilical artery velocity
waveforms and subsequent neonatal outcome. Br J Obstet Gynaecol 1991; 98(4):378-384.
(290) Burke G, Stuart B, Crowley P, Scanaill SN, Drumm J. Is intrauterine growth retardation with normal
umbilical artery blood flow a benign condition? BMJ 1990; 300(6731):1044-1045.
(291) Soothill PW, Ajayi RA, Campbell S, Nicolaides KH. Prediction of morbidity in small and normally
grown fetuses by fetal heart rate variability, biophysical profile score and umbilical artery Doppler
studies. Br J Obstet Gynaecol 1993; 100(8):742-745.
(292) Gaziano EP, Knox H, Ferrera B, Brandt DG, Calvin SE, Knox GE. Is it time to reassess the risk for the
growth-retarded fetus with normal Doppler velocimetry of the umbilical artery? Am J Obstet Gynecol
1994; 170(6):1734-1741.
(293) Gardosi J, Chang A, Kalyan B, Sahota D, Symonds EM. Customised antenatal growth charts. Lancet
1992; 339(8788):283-287.

Appendix
Paper I
Fetal growth between the first and second trimester and the risk of adverse pregnancy outcome. NG Pedersen,
KR Wøjdemann, T Scheike and A. Tabor. Ultrasound Obstet Gynecol 2008;32:147-154
Paper II
Early fetal size and growth as predictors of adverse outcome. NG Pedersen, F Figueras, KR Wøjdemann, A
Tabor and J Gardosi. Obstet and Gynecol 2008;112:765-771
Paper III
Maternal serum levels of placental Growth Hormone in early pregnancy, but not of human Placental Lactogen,
and Insulin Growth Factor-I are positively associated with fetal growth in first trimester of human pregnancy.
NG Pedersen, A juul, M Christiansen, KR Wøjdemann and A Tabor, submitted
Paper IV
First trimester growth restriction and uterine arteries blood flow as predictor of adverse pregnancy outcome.
NG Pedersen, L Sperling, KR Wøjdemann, S Olesen Larsen, A Tabor, in manuscript
Questionnaire used in subproject 3
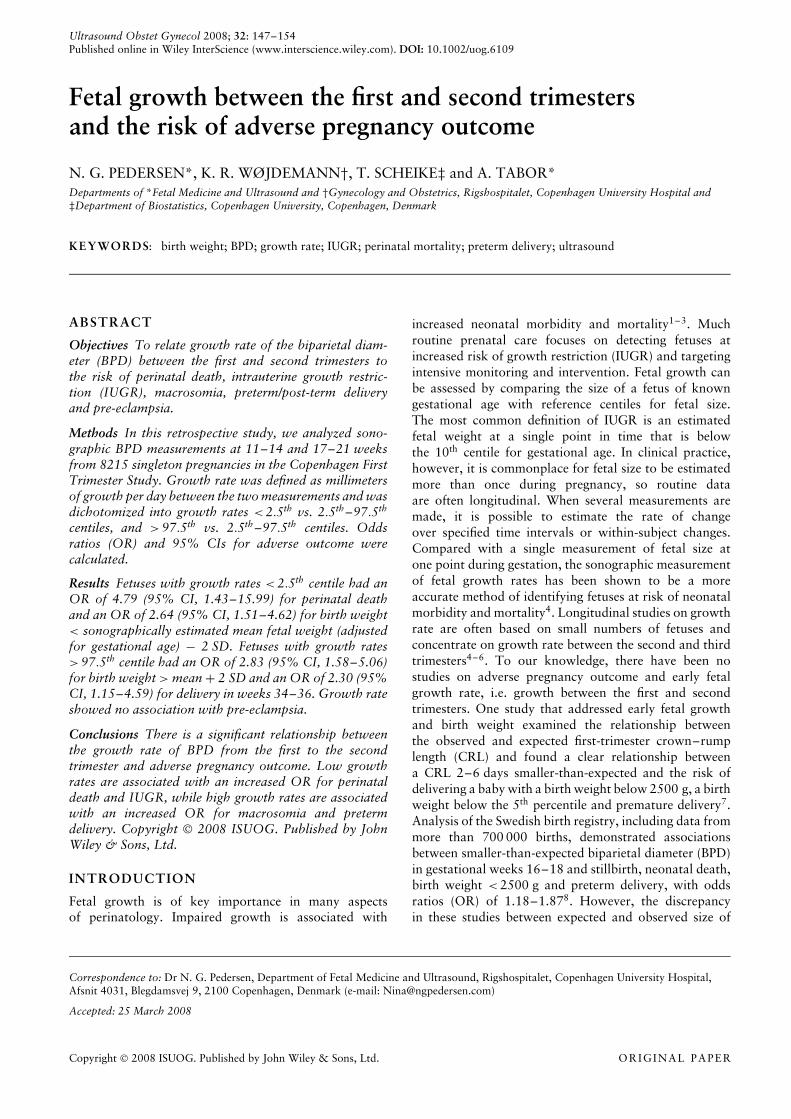
Ultrasound Obstet Gynecol 2008; 32: 147–154Published online in Wiley InterScience (www.interscience.wiley.com). DOI: 10.1002/uog.6109
Fetal growth between the first and second trimestersand the risk of adverse pregnancy outcome
N. G. PEDERSEN*, K. R. WØJDEMANN†, T. SCHEIKE‡ and A. TABOR*Departments of *Fetal Medicine and Ultrasound and †Gynecology and Obstetrics, Rigshospitalet, Copenhagen University Hospital and‡Department of Biostatistics, Copenhagen University, Copenhagen, Denmark
KEYWORDS: birth weight; BPD; growth rate; IUGR; perinatal mortality; preterm delivery; ultrasound
ABSTRACT
Objectives To relate growth rate of the biparietal diam-eter (BPD) between the first and second trimesters tothe risk of perinatal death, intrauterine growth restric-tion (IUGR), macrosomia, preterm/post-term deliveryand pre-eclampsia.
Methods In this retrospective study, we analyzed sono-graphic BPD measurements at 11–14 and 17–21 weeksfrom 8215 singleton pregnancies in the Copenhagen FirstTrimester Study. Growth rate was defined as millimetersof growth per day between the two measurements and wasdichotomized into growth rates < 2.5th vs. 2.5th –97.5th
centiles, and > 97.5th vs. 2.5th –97.5th centiles. Oddsratios (OR) and 95% CIs for adverse outcome werecalculated.
Results Fetuses with growth rates < 2.5th centile had anOR of 4.79 (95% CI, 1.43–15.99) for perinatal deathand an OR of 2.64 (95% CI, 1.51–4.62) for birth weight< sonographically estimated mean fetal weight (adjustedfor gestational age) − 2 SD. Fetuses with growth rates> 97.5th centile had an OR of 2.83 (95% CI, 1.58–5.06)for birth weight > mean + 2 SD and an OR of 2.30 (95%CI, 1.15–4.59) for delivery in weeks 34–36. Growth rateshowed no association with pre-eclampsia.
Conclusions There is a significant relationship betweenthe growth rate of BPD from the first to the secondtrimester and adverse pregnancy outcome. Low growthrates are associated with an increased OR for perinataldeath and IUGR, while high growth rates are associatedwith an increased OR for macrosomia and pretermdelivery. Copyright 2008 ISUOG. Published by JohnWiley & Sons, Ltd.
INTRODUCTION
Fetal growth is of key importance in many aspectsof perinatology. Impaired growth is associated with
increased neonatal morbidity and mortality1–3. Muchroutine prenatal care focuses on detecting fetuses atincreased risk of growth restriction (IUGR) and targetingintensive monitoring and intervention. Fetal growth canbe assessed by comparing the size of a fetus of knowngestational age with reference centiles for fetal size.The most common definition of IUGR is an estimatedfetal weight at a single point in time that is belowthe 10th centile for gestational age. In clinical practice,however, it is commonplace for fetal size to be estimatedmore than once during pregnancy, so routine dataare often longitudinal. When several measurements aremade, it is possible to estimate the rate of changeover specified time intervals or within-subject changes.Compared with a single measurement of fetal size atone point during gestation, the sonographic measurementof fetal growth rates has been shown to be a moreaccurate method of identifying fetuses at risk of neonatalmorbidity and mortality4. Longitudinal studies on growthrate are often based on small numbers of fetuses andconcentrate on growth rate between the second and thirdtrimesters4–6. To our knowledge, there have been nostudies on adverse pregnancy outcome and early fetalgrowth rate, i.e. growth between the first and secondtrimesters. One study that addressed early fetal growthand birth weight examined the relationship betweenthe observed and expected first-trimester crown–rumplength (CRL) and found a clear relationship betweena CRL 2–6 days smaller-than-expected and the risk ofdelivering a baby with a birth weight below 2500 g, a birthweight below the 5th percentile and premature delivery7.Analysis of the Swedish birth registry, including data frommore than 700 000 births, demonstrated associationsbetween smaller-than-expected biparietal diameter (BPD)in gestational weeks 16–18 and stillbirth, neonatal death,birth weight < 2500 g and preterm delivery, with oddsratios (OR) of 1.18–1.878. However, the discrepancyin these studies between expected and observed size of
Correspondence to: Dr N. G. Pedersen, Department of Fetal Medicine and Ultrasound, Rigshospitalet, Copenhagen University Hospital,Afsnit 4031, Blegdamsvej 9, 2100 Copenhagen, Denmark (e-mail: [email protected])
Accepted: 25 March 2008
Copyright 2008 ISUOG. Published by John Wiley & Sons, Ltd. ORIGINAL PAPER

148 Pedersen et al.
the fetus depends to some extent on the uncertaintysurrounding the exact dating of ovulation and conception,which obscures the possibility of detecting early growthrestriction. This was addressed recently in a cohort of976 women with known date of conception as a result ofassisted reproduction, in whom it was confirmed that asmaller-than-expected CRL increased the risk of pretermbirth and of delivering a small-for-gestational-age infant9.
We speculated that measurement of early growth ratebetween gestational weeks 11–14 and weeks 17–21would produce a more precise estimation of associatedrisks later in pregnancy and at delivery. The aim of thisstudy was to relate growth rate between the first and sec-ond trimesters to the risk of perinatal death, IUGR, macro-somia, preterm/post-term delivery and pre-eclampsia.
METHODS
For this retrospective study, data were retrieved fromthe prospective Copenhagen First Trimester Study forDown Syndrome and malformations, conducted from1998 to 200110. A total of 13 621 women, referred tothe three obstetric departments in Copenhagen UniversityHospital, were invited to participate in the CopenhagenFirst Trimester Study. Participation entailed the choiceof an ultrasound examination and/or a blood sample ingestational weeks 11–14. Additionally, at all three depart-ments, routine antenatal care included the offer of oneanomaly scan performed at around 18–20 weeks’ gesta-tion. Data, including indications and diagnoses, from allscans performed during the pregnancies were recorded inViewPoint Fetal Database
TM(ViewPoint GmbH, Webling,
Germany). Outcome data were gathered from each new-born’s clinical records after delivery, using predefinedcriteria. Of the 13 621 women initially invited to theCopenhagen First Trimester Study, 8215 women with sin-gleton pregnancies underwent a first-trimester ultrasoundexamination in weeks 11–14 and a second-trimester ultra-sound examination in weeks 17–21. Written informedconsent was obtained from the participants and the sci-entific ethics committee of the cities of Copenhagen andFrederiksberg (No. (KF) 01-288/97) and the Data Protec-tion Agency approved the study protocol. The ultrasoundexaminations were performed by 13 sonographers ordoctors experienced in obstetric ultrasound and certi-fied by The Fetal Medicine Foundation in London, UK.The ultrasound examinations in weeks 11–14 were allperformed using a Logic 700 MR scanner (General Elec-tric, Milwaukee, WI, USA). Those in weeks 17–21 wereperformed using one of the following machines: AcusonAspen Advanced, Sonoline SI 400 or Sonoline Sienna(Siemens AG, Erlangen, Germany). Gestational age wasdetermined by CRL11. BPD measurements were obtainedin an axial plane at the level of the thalami, the thirdventricle and the cavum septi pellucidi, from the outerborder to the inner border of the skull.
We defined growth rate as millimeters of growth in BPDper day between the two sonographic measurements. Tofacilitate comparisons of growth rate between ultrasound
examinations performed at different gestational weeks,growth rate was standardized according to the gestationalage at the time of the scans. A Z-score was thus calcu-lated for each fetus by subtracting the mean growth ratefor all fetuses that were scanned the same 2 weeks, anddividing by the SD of the growth rate for this group:Z-score = (observed growth rate − group mean growthrate) / (group growth rate SD). The individual Z-scoreswere transformed into centiles, and fetuses with growthrates below the 2.5th or 10th centiles, or above the 90th or97.5th centiles, were identified.
We determined the ability of growth rates below the2.5th and 10th centiles (low growth rate) and that ofgrowth rates above the 90th and 97.5th centiles (highgrowth rate) to identify pregnancies with increased risk ofperinatal death, IUGR, macrosomia, preterm/post-termdelivery and pre-eclampsia. We expected that extremegrowth rates would have a high risk for adverse outcomeand therefore categorized growth rate as low, intermediateand high. Perinatal death was defined as: death of an infantunder 1 week in age or stillbirth at 20 weeks or moreof gestation; outcome was dichotomized into perinataldeath vs. live birth. IUGR was defined as birth weightbelow 2500 g; birth weight below 2500 g at 37 weeksof gestation or later; birth weight smaller than the meansonographically estimated fetal weight for gestational ageminus two SD (mean − 2 SD)12. Each of the definitionsof IUGR was dichotomized into IUGR vs. no IUGR.Macrosomia was defined as: birth weight above 4500 g;birth weight above 4500 g at 37 weeks of gestation orlater; birth weight greater than the mean sonographicallyestimated fetal weight for gestational age plus 2 SD(mean + 2 SD). Each of the definitions of macrosomiawas dichotomized into macrosomia vs. no macrosomia.Different definitions of IUGR and macrosomia were usedto allow comparisons with other studies. Very prematuredelivery was defined as spontaneous live birth at weeks22–33, premature delivery as spontaneous live birth atweeks 34–36, term delivery as spontaneous live birthat weeks 37–41, and post-term delivery as spontaneouslive birth after 41 weeks of gestation. Gestational ageat delivery was dichotomized into very premature,premature or post-term vs. term. Pre-eclampsia wasdefined according to the guidelines of the InternationalSociety for Study of Hypertension in Pregnancy13: tworecordings of diastolic blood pressure > 90 mmHg atleast 4 h apart in previously normotensive women, andproteinuria of 300 mg or more within 24 h / two readingsof at least ++ on dipstick analysis of midstream orcatheter urine specimens if no 24-h collection wasavailable. Pre-eclampsia was dichotomized into pre-eclampsia vs. pregnancies with no pre-eclampsia.
We obtained ORs for the dichotomized adverseoutcomes by comparing fetuses with growth rates belowthe 2.5th and above the 97.5th centiles with a definednormal group of fetuses with growth rates between the2.5th and 97.5th centiles, and comparing fetuses withgrowth rates below the 10th and above the 90th centileswith a defined normal group of fetuses with growth
Copyright 2008 ISUOG. Published by John Wiley & Sons, Ltd. Ultrasound Obstet Gynecol 2008; 32: 147–154.
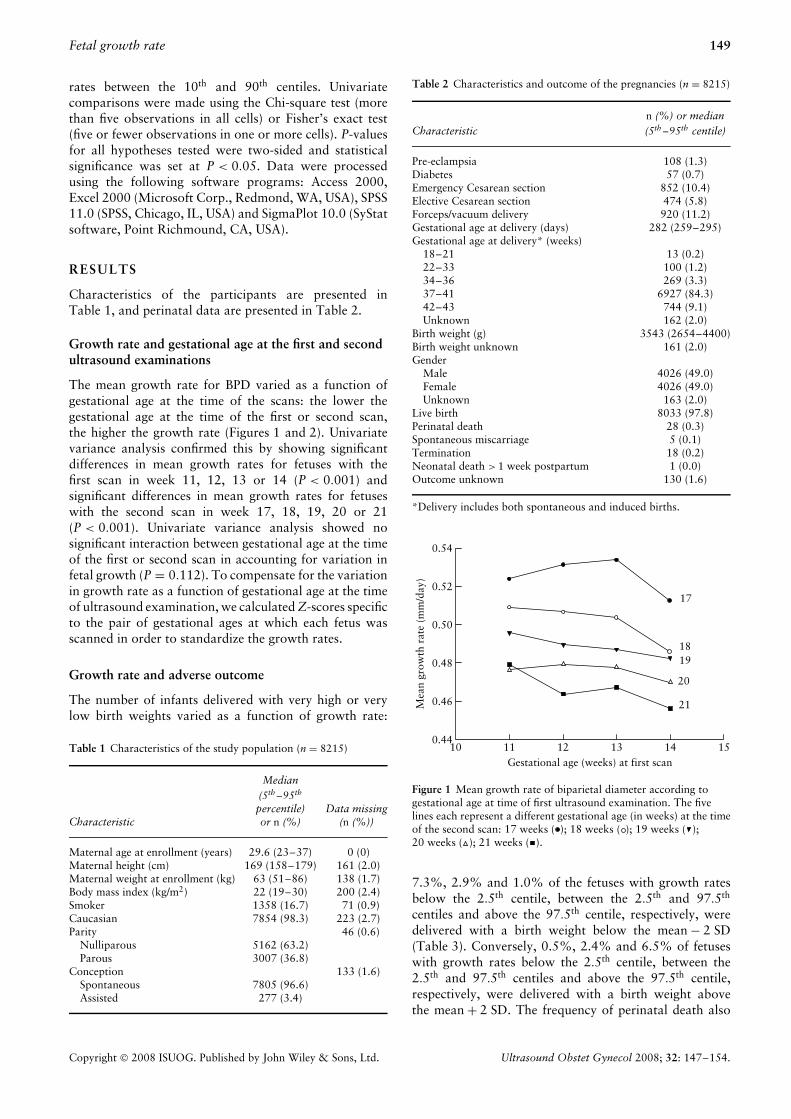
Fetal growth rate 149
rates between the 10th and 90th centiles. Univariatecomparisons were made using the Chi-square test (morethan five observations in all cells) or Fisher’s exact test(five or fewer observations in one or more cells). P-valuesfor all hypotheses tested were two-sided and statisticalsignificance was set at P < 0.05. Data were processedusing the following software programs: Access 2000,Excel 2000 (Microsoft Corp., Redmond, WA, USA), SPSS11.0 (SPSS, Chicago, IL, USA) and SigmaPlot 10.0 (SyStatsoftware, Point Richmound, CA, USA).
RESULTS
Characteristics of the participants are presented inTable 1, and perinatal data are presented in Table 2.
Growth rate and gestational age at the first and secondultrasound examinations
The mean growth rate for BPD varied as a function ofgestational age at the time of the scans: the lower thegestational age at the time of the first or second scan,the higher the growth rate (Figures 1 and 2). Univariatevariance analysis confirmed this by showing significantdifferences in mean growth rates for fetuses with thefirst scan in week 11, 12, 13 or 14 (P < 0.001) andsignificant differences in mean growth rates for fetuseswith the second scan in week 17, 18, 19, 20 or 21(P < 0.001). Univariate variance analysis showed nosignificant interaction between gestational age at the timeof the first or second scan in accounting for variation infetal growth (P = 0.112). To compensate for the variationin growth rate as a function of gestational age at the timeof ultrasound examination, we calculated Z-scores specificto the pair of gestational ages at which each fetus wasscanned in order to standardize the growth rates.
Growth rate and adverse outcome
The number of infants delivered with very high or verylow birth weights varied as a function of growth rate:
Table 1 Characteristics of the study population (n = 8215)
Characteristic
Median(5th –95th
percentile)or n (%)
Data missing(n (%))
Maternal age at enrollment (years) 29.6 (23–37) 0 (0)Maternal height (cm) 169 (158–179) 161 (2.0)Maternal weight at enrollment (kg) 63 (51–86) 138 (1.7)Body mass index (kg/m2) 22 (19–30) 200 (2.4)Smoker 1358 (16.7) 71 (0.9)Caucasian 7854 (98.3) 223 (2.7)Parity 46 (0.6)
Nulliparous 5162 (63.2)Parous 3007 (36.8)
Conception 133 (1.6)Spontaneous 7805 (96.6)Assisted 277 (3.4)
Table 2 Characteristics and outcome of the pregnancies (n = 8215)
Characteristicn (%) or median(5th –95th centile)
Pre-eclampsia 108 (1.3)Diabetes 57 (0.7)Emergency Cesarean section 852 (10.4)Elective Cesarean section 474 (5.8)Forceps/vacuum delivery 920 (11.2)Gestational age at delivery (days) 282 (259–295)Gestational age at delivery* (weeks)
18–21 13 (0.2)22–33 100 (1.2)34–36 269 (3.3)37–41 6927 (84.3)42–43 744 (9.1)Unknown 162 (2.0)
Birth weight (g) 3543 (2654–4400)Birth weight unknown 161 (2.0)Gender
Male 4026 (49.0)Female 4026 (49.0)Unknown 163 (2.0)
Live birth 8033 (97.8)Perinatal death 28 (0.3)Spontaneous miscarriage 5 (0.1)Termination 18 (0.2)Neonatal death > 1 week postpartum 1 (0.0)Outcome unknown 130 (1.6)
*Delivery includes both spontaneous and induced births.
0.54
0.52
0.50
0.48
Mea
n gr
owth
rat
e (m
m/d
ay)
0.46
0.4410 11 12
Gestational age (weeks) at first scan13 14
21
20
1918
17
15
Figure 1 Mean growth rate of biparietal diameter according togestational age at time of first ultrasound examination. The fivelines each represent a different gestational age (in weeks) at the timeof the second scan: 17 weeks ( ); 18 weeks ( ); 19 weeks ( );20 weeks ( ); 21 weeks ( ).
7.3%, 2.9% and 1.0% of the fetuses with growth ratesbelow the 2.5th centile, between the 2.5th and 97.5th
centiles and above the 97.5th centile, respectively, weredelivered with a birth weight below the mean − 2 SD(Table 3). Conversely, 0.5%, 2.4% and 6.5% of fetuseswith growth rates below the 2.5th centile, between the2.5th and 97.5th centiles and above the 97.5th centile,respectively, were delivered with a birth weight abovethe mean + 2 SD. The frequency of perinatal death also
Copyright 2008 ISUOG. Published by John Wiley & Sons, Ltd. Ultrasound Obstet Gynecol 2008; 32: 147–154.

150 Pedersen et al.
Table 3 Distribution of adverse outcomes
(n) % with a growth rate that was:
Adverse outcome < 2.5th centile < 10th centile2.5th –97.5th
centile 10th –90th centile > 90th centile > 97.5th centile
IUGRBirth weight < 2500 g (11/193) 5.70 (29/801) 3.62 (243/7660) 3.17 (212/6480) 3.27 (19/773) 2.46 (6/201) 2.99Birth weight < 2500 g at > 37 weeks* (4/183) 2.19 (10/765) 1.31 (75/7290) 1.03 (68/6169) 1.10 (1/726) 0.14 (0/187) 0.00Birth weight < mean − 2 SD† (14/193) 7.25 (33/800) 4.13 (220/7635) 2.88 (191/6460) 2.96 (12/769) 1.56 (2/201) 1.00
MacrosomiaBirth weight > 4500 g (0/193) 0.00 (20/801) 2.50 (278/7660) 3.63 (228/6480) 3.52 (43/773) 5.56 (13/201) 6.47Birth weight > 4500 g at > 37 weeks* (0/183) 0.00 (19/765) 2.48 (276/7290) 3.79 (228/6169) 3.69 (42/726) 5.78 (13/187) 6.95Birth weight > mean + 2 SD† (1/193) 0.52 (10/800) 1.25 (182/7635) 2.38 (144/6460) 2.23 (42/769) 5.46 (13/201) 6.47
Perinatal death (3/194) 1.55 (3/802) 0.37 (25/7644) 0.33 (20/6468) 0.31 (5/769) 0.65 (0/201) 0.00Spontaneous delivery‡ at:
22–33 weeks (1/138) 0.72 (4/582) 0.69 (37/5520) 0.67 (32/4690) 0.68 (5/525) 0.95 (3/139) 2.1634–36 weeks (3/140) 2.14 (16/594) 2.69 (158/5641) 2.80 (133/4791) 2.78 (21/541) 3.88 (9/145) 6.2142–43 weeks (10/147) 6.08 (33/611) 5.40 (338/5821) 5.81 (300/4958) 6.05 (21/541) 3.88 (6/142) 4.23
Pre-eclampsia (2/203) 0.99 (12/823) 1.46 (104/7808) 1.33 (86/6607) 1.30 (10/785) 1.27 (2/204) 0.98
*Excluding fetuses delivered at or before 37 weeks. †Birth weight below the sonographically estimated (US) mean for gestational age (GA)minus two SD; birth weight greater than US mean for GA plus two SD (Marsal et al.12). ‡For gestational age at delivery the denominator isdefined as the pre- or post-term group plus the term group. IUGR, intrauterine growth restriction.
0.54
0.52
0.50
0.48
Mea
n gr
owth
rat
e (m
m/d
ay)
0.46
0.4416 17 18
Gestational age (weeks) at second scan2019 21
1412
13
11
22
Figure 2 Mean growth rate of biparietal diameter according togestational age at time of second ultrasound examination. The fourlines each represent a different gestational age (in weeks) at the timeof the first scan: 11 weeks ( ); 12 weeks ( ); 13 weeks ( );14 weeks ( ).
varied as a function of growth rate: 1.6%, 0.3% and0.0% of fetuses with growth rates below the 2.5th centile,between the 2.5th and 97.5th centiles and above the97.5th centile, respectively, died perinatally. There wasa tendency for spontaneous delivery to vary as a functionof growth rate: 2.1%, 2.8% and 6.2% of fetuses withgrowth rate below the 2.5th centile, between the 2.5th and97.5th centiles and above the 97.5th centile, respectively,were delivered at weeks 34–36, whereas 6.1%, 5.8%and 4.2% of the fetuses with growth rate below the2.5th centile, between the 2.5th and 97.5th centiles andabove the 97.5th centile, respectively, were delivered atweeks 42–43. There was no systematic variation betweengrowth rate and the number of pregnancies diagnosedwith pre-eclampsia.
Growth rate and birth weight
Growth rates below the 2.5th centile were associated withIUGR (Table 4): fetuses with growth rates below the 2.5th
centile had an OR of 2.64 (95% CI, 1.51–4.62) for birthweights below the mean − 2 SD. High growth rates wereassociated with an increased risk for macrosomia: fetuseswith growth rates above the 90th and 97.5th centileshad ORs of 2.53 (95% CI, 1.78–3.60) and 2.83 (95%CI, 1.58–5.06), respectively, for birth weights above themean + 2 SD.
When adjusted for gestational age at delivery, parity,mother’s height, mother’s weight, mother being a smokerand fetal gender, growth rates below the 2.5th centilemeant a 105-g reduction in birth weight (Table 5). In asimilar model, growth rates below the 10th centile meanta 63-g reduction in birth weight. The combination ofall factors included in the model explained 45% of thevariation in birth weight.
Birth weight adjusted for gestational age at deliveryvaried as a linear function of growth rate adjusted forgestational age at the time of the first and second scans(R2 = 0.010, P < 0.001) (Figure 3). Growth rate for BPDbetween the first and second trimesters alone was able toexplain 1% of the variation in birth weight. Higher orderpolynomial models did not improve the fit.
Growth rate and perinatal mortality
There was an association between very low growth ratesand perinatal mortality (Table 6). Fetuses with growthrates below the 2.5th centile were at increased riskof perinatal mortality, with an OR of 4.79 (95% CI,1.43–15.99). All three cases of perinatal death withgrowth rates below the 2.5th centile were stillborn beforethe 25th week of gestation. Fetuses with growth rates
Copyright 2008 ISUOG. Published by John Wiley & Sons, Ltd. Ultrasound Obstet Gynecol 2008; 32: 147–154.

Fetal growth rate 151
Table 4 Odds ratios (OR) for intrauterine growth restriction (IUGR) and macrosomia for fetuses with growth rates < 2.5th and 10th centiles,and growth rates > 90th and 97.5th centiles
Growth rate < 2.5th centile Growth rate < 10th centile
Adverse outcome OR (95% CI) P OR (95% CI) P
IUGRBirth weight < 2500 g 1.85 (0.99–3.44) 0.050 1.11 (0.75–1.65) 0.603Birth weight < 2500 g at > 37 weeks 2.15 (0.78–5.94) 0.128 1.19 (0.62–2.32) 0.612Birth weight < mean − 2 SD* 2.64 (1.51–4.62) 0.002† 1.41 (0.97–2.06) 0.071
Growth rate > 90th centile Growth rate > 97.5th centile
OR (95% CI) P OR (95% CI) P
MacrosomiaBirth weight > 4500 g 1.62 (1.56–2.26) 0.005† 1.83 (1.03–3.26) 0.035†Birth weight > 4500 g at > 37 weeks 1.60 (1.14–2.25) 0.006† 1.90 (1.07–3.38) 0.027†Birth weight > mean + 2 SD* 2.53 (1.78–3.60) < 0.0001† 2.83 (1.58–5.06) < 0.0001†
Reference groups for IUGR and macrosomia were fetuses without IUGR and macrosomia, respectively. *Marsal et al.12: mean − 2 SD,sonographically estimated fetal weight smaller than mean for gestational age minus 2 SD; mean + 2 SD, sonographically estimated fetalweight greater than mean for gestational age plus 2 SD. †Significant P-value.
Table 5 Linear regression: change in birth weight (B, in g) according to growth rate < 2.5th centile, gestational age at delivery, fetal genderand maternal characteristics
95% CI for B
B lowest highest t P
Constant 3317.69 3262.74 3372.64 118.01 0.001Growth rate < 2.5th centile −105.39 −165.06 −45.72 −4.01 0.001Gestational age at delivery (days from 280) 26.12 25.39 26.82 71.63 0.001Parous 131.56 112.38 150.73 13.56 0.001Male fetal gender 136.03 117.58 154.48 14.18 < 0.0001Smoking during pregnancy −74.09 −86.49 −61.69 −11.71 < 0.0001Maternal height (cm from 169) 9.36 7.81 10.91 11.80 < 0.0001Maternal weight (kg from 65) 5.17 4.31 6.03 11.80 < 0.0001
R2 = 0.452 (adjusted R2 = 0.452), P < 0.001.
Table 6 Odds ratios (OR) for perinatal mortality, week of delivery and pre-eclampsia for fetuses with growth rates < 2.5th and 10th centiles,and growth rates > 90th and 97.5th centiles
Growth rate< 2.5th centile
Growth rate< 10th centile
Growth rate> 90th centile
Growth rate> 97.5th centile
Adverse outcome OR (95% CI) P OR (95% CI) P OR (95% CI) P OR (95% CI) P
Perinatal mortality 4.79 (1.43–15.99) 0.031* 1.21 (0.36–4.08) 0.735 2.11 (0.79–5.64) 0.179 0.00 1.000Spontaneous delivery at:
22–33 weeks 1.08 (0.15–7.94) 0.610 1.01 (0.36–2.86) 1.000 1.40 (0.54–3.61) 0.415 3.27 (0.99–10.73) 0.07434–36 weeks 0.76 (0.24–2.41) 1.000 0.97 (0.57–1.64) 0.908 1.41 (0.89–2.26) 0.146 2.30 (1.15–4.59) 0.037*42–43 weeks 1.18 (0.62–2.27) 0.611 0.89 (0.61–1.28) 0.523 0.63 (0.39–0.99) 0.041* 0.72 (0.31–1.63) 0.425
Pre-eclampsia 0.74 (0.18–3.01) 0.737 1.12 (0.61–2.06) 0.711 0.98 (0.51–1.89) 0.948 0.73 (0.18–2.99) 0.664
Reference groups for perinatal mortality, preterm/post-term delivery and pre-eclampsia were live birth, delivery at weeks 37–41 andpregnancies without complications, respectively. *Significant P-value.
Copyright 2008 ISUOG. Published by John Wiley & Sons, Ltd. Ultrasound Obstet Gynecol 2008; 32: 147–154.

152 Pedersen et al.
4
2
0
Z-s
core
: bir
th w
eigh
t ad
just
ed f
orge
stat
iona
l age
at
deliv
ery
−2
−4−4 −2 0
Z-score: growth rate adjusted forgestational age at first and second scans
2 4
Figure 3 Scatterplot of birth weight adjusted for gestational age atdelivery according to growth rate for biparietal diameter adjustedfor gestational age at the time of the first and second scans. Thelinear regression line is indicated: R2 = 0.010, P < 0.001,y = 0.099x.
below the 10th centile had a non-significant OR of 1.21(95% CI, 0.36–4.08) for perinatal mortality. Fetuses withgrowth rates above 90th centile were not at increased riskof perinatal mortality and no fetus with a growth rateabove the 97.5th centile died.
Growth rate and gestational age at delivery
There was an association between high growth rates andpreterm delivery (Table 6). Fetuses with growth ratesabove the 97.5th centile had a significant OR of 2.30(95% CI, 1.15–4.59) for spontaneous delivery in weeks34–36, while the OR of 3.27 (95% CI, 0.99–10.73)for spontaneous delivery in weeks 22–33 approachedsignificance.
DISCUSSION
The central finding of our study was the significantrelationship between BPD growth rate between the firstand second trimesters and adverse pregnancy outcome.Low growth rates were associated with increased ORsfor perinatal mortality and IUGR, and high growth rateswere associated with increased ORs for macrosomia andpreterm delivery. These findings underline the importanceof focusing on early growth, potentially to preventirreparable damage later in pregnancy. Traditionalthinking is that early growth is principally controlledgenetically and occurs at a constant exponential rate withlittle biological variation14; IUGR has been assumed tooccur mainly in the latter half of pregnancy. Our studyrefutes this, showing that fetal growth rate between thefirst and second trimesters does vary between fetuses and isassociated with perinatal death and low birth weight. Thisimplies that a suboptimal environment in the beginningof pregnancy limits fetal growth for the remainder of thepregnancy.
Studies have demonstrated that smaller-than-expectedultrasound measurements in the first half of pregnancyare associated with low birth weight7,15,16. It has beensuggested that this association is due to delayed ovulationrather than an association with early fetal growth.Our study demonstrated, in a healthy cohort of 8215pregnancies, that BPD growth rate between the firstand second trimesters is indeed associated with birthweight. By looking at growth rate instead of fetal sizein relation to last menstrual period, we overcame thepotential problem of delayed ovulation, and still observedan association. Bukowski et al.9 overcame the problem ofdelayed ovulation by studying pregnancies with knowndates of conception because of assisted reproduction,and they too observed an association between early fetalgrowth and birth weight. The association between lowbirth weight and growth in early pregnancy is now wellestablished, and is most likely to represent the early onsetof IUGR.
The study that investigated the relationship betweenbirth weight and smaller-than-expected embryo/fetus atfirst-trimester ultrasound reported an OR of 1.7 forbirth weights below 2500g and an OR of 2.8 for birthweights below the 5th centile for gestational age, ifthe embryo/fetus was 2–6 days smaller than expected7.The studies that looked at the relationship betweenbirth weight and smaller-than-expected fetuses at second-trimester ultrasound examination reported ORs around1.5 for birth weight below 2500g or birth weight belowthe mean − 2 SD, if the fetus was at least 7 days smallerthan expected8,15,16. We found an OR of 1.9 for birthweight below 2500g, and an OR of 2.6 for birth weightbelow the mean − 2 SD for fetuses with growth ratesbelow the 2.5th centile. The growth rate of the BPDbetween the first and second trimesters thus seems to bea better predictor for IUGR than is a single measurementof BPD in the second trimester, and a single measurementtaken in the first trimester seems to be a better predictorfor IUGR than is a single measurement taken in the secondtrimester7,9.
Growth rate from the second to the third trimestershows a very strong correlation to birth weight4, withfetuses with growth rates below the 10th centile betweensecond and third trimesters having an OR of 16.9 for birthweight below 2500 g and an OR of 36.1 for birth weightless than the 5th centile for gestational age. Although it isno surprise that fetal growth later in pregnancy can predictneonatal birth weight, little research has been conductedto evaluate the association between fetal growth rate fromthe second to the third trimester and the association withadverse pregnancy outcome4,17–19.
We found that fetuses with growth rates below the2.5th centile had an OR of 4.79 for perinatal death.Studies that describe the association between smaller-than-expected BPD in the second trimester and perinataldeath found ORs in the region of 2–3 for perinataldeath8,15,16. Accordingly, longitudinal measurements ofgrowth between the first and second trimesters seem more
Copyright 2008 ISUOG. Published by John Wiley & Sons, Ltd. Ultrasound Obstet Gynecol 2008; 32: 147–154.

Fetal growth rate 153
sensitive for perinatal death than does a single second-trimester measurement of BPD. A recently published studywith data from 30 755 pregnancies reported that a uterineartery pulsatility index in the top decile at 22–24 weeks ofgestation was strongly associated with the subsequent riskof stillbirth. The association was stronger for stillbirth dueto placental causes than it was for unexplained stillbirths;furthermore, stillbirth due to placental causes occurredat earlier gestations than did unexplained stillbirths, withmedians of 30 and 38 weeks of gestation, respectively20.In our study, the three cases of perinatal death withgrowth rates below the 2.5th centile were all stillbornbefore the 25th week of gestation. It could be speculatedthat both the low growth rate and the early stillbirthwere caused by very poor placentation. Future studiescombining Doppler flow velocimetry with growth ratemeasurement could help to elucidate this.
We expected that low growth rate would be relatedto preterm birth, and high growth rate would be relatedto post-term birth. This would be in accordance with theknown link between IUGR and preterm birth and previousstudies that have reported associations between smaller-than-expected CRL/BPD and preterm birth or larger-than-expected CRL/BPD and post-term birth7,8,15,21. However,we observed the opposite: the higher the growth rate,the higher the risk for spontaneous preterm delivery,and the lower the growth rate, the higher the risk forspontaneous post-term delivery. The association betweenhigh growth rates and preterm delivery could be causedby early stretching of the myometrium as a result ofthe high fetal growth rate22. It is well known thatthe risk of preterm labor is higher in pregnancies withincreased intrauterine volume, such as in multifetalpregnancies23 and singleton pregnancies diagnosed withmacrosomia24 or polyhydramnios25. Fetuses with growthrates greater than the 97.5th centile had an OR of2.30 for spontaneous delivery week 34–36 and thesame group of fetuses had an OR of 2.83 for birthweight above the mean + 2 SD, suggesting an associationbetween preterm birth and macrosomia. While in thisstudy we focused on spontaneous delivery, other studiesrelating pre- and post-term birth to discrepancy ingestational age determined by last menstrual period and byultrasound7–9,15 did not distinguish between spontaneousand induced delivery; this could be one explanationfor the different results. Furthermore, gestational ageat delivery is difficult to interpret in a populationwith deviant sizes of CRL or BPD; if the gestationalage is determined sonographically, erroneous adjustmentaccording to fetal size could seriously bias the associationbetween smaller-than-expected fetuses and preterm birthand the association between larger-than-expected fetusesand post-term birth. Like birth weight, traditionallyparturition has been thought to be controlled byevents occurring in late pregnancy26. However, there isincreasing evidence supporting the possibility that thetiming of delivery is also determined predominantly earlyin gestation: low maternal pregnancy-associated plasmaprotein-A (PAPP-A) levels as early as weeks 8–14 are
associated with preterm birth27, while maternal plasmacorticotropin-releasing hormone (CRH) concentration inweeks 16–20 can identify groups of women who aredestined to experience normal term, preterm or post-term delivery28. In addition, there seems to be a geneticpredisposition to spontaneous preterm birth29.
We expected that low growth rate and pre-eclampsiawould both be a consequence of poor placentation, andtherefore low growth rate in early pregnancy couldbe a predictor for the subsequent development of pre-eclampsia. However, this study did not demonstratesuch an association. The prevalence of pre-eclampsiawas 1.3%, which is lower than the 3–5% prevalencenormally reported30. Our low prevalence probablyreflects a fairly healthy pregnant population with alow incidence of predisposing factors such as diabetes,extremes of reproductive age, hypertension and obesity31;furthermore, 98% of the population was Caucasian, anethnic group known to have a low risk of pre-eclampsia.
Growth rate varied as a function of the gestationalage at the time of the first and second ultrasoundexaminations. Variation in growth rate according togestational age in early pregnancy is in agreement with theresults of Milani et al.32; in a longitudinal growth studyincluding 130 healthy singletons followed from week12 to delivery with a minimum of five measurementsof head circumference, 5–10 weeks apart, growth ratewas described as parabolic, increasing until 17 weeks ofgestation, and then decreasing until delivery32.
In this study growth rate was adjusted only forgestational age. More complex models, additionallyincluding biochemical markers, uterine artery pulsatilityindex and adjustment for fetal gender and parentalcharacteristics, will most likely identify at-risk pregnanciesmore accurately. Such a model is outside the scope of ourstudy, but would probably be a valuable clinical tool,enabling resources to be focused more accurately on thepregnancies at highest risk.
In conclusion, we found a significant relationshipbetween the growth rate of BPD between the first andsecond trimesters and adverse pregnancy outcome. Lowgrowth rates were associated with increased ORs forperinatal mortality and IUGR and high growth rateswere associated with increased ORs for macrosomia andpreterm delivery. These findings underline the importanceof focusing on the first trimester instead of later pregnancywhen irreparable damage may already have occurred.
REFERENCES
1. Kramer MS, Olivier M, McLean FH, Willis DM, Usher RH.Impact of intrauterine growth retardation and body propor-tionality on fetal and neonatal outcome. Pediatrics 1990; 86:707–713.
2. McIntire DD, Bloom SL, Casey BM, Leveno KJ. Birth weight inrelation to morbidity and mortality among newborn infants.N Engl J Med 1999; 340: 1234–1238.
3. Bernstein IM, Horbar JD, Badger GJ, Ohlsson A, Golan A.Morbidity and mortality among very-low-birth-weight neonateswith intrauterine growth restriction. The Vermont OxfordNetwork. Am J Obstet Gynecol 2000; 182: 198–206.
Copyright 2008 ISUOG. Published by John Wiley & Sons, Ltd. Ultrasound Obstet Gynecol 2008; 32: 147–154.

154 Pedersen et al.
4. Smith-Bindman R, Chu PW, Ecker JL, Feldstein VA, Filly RA,Bacchetti P. US evaluation of fetal growth: prediction ofneonatal outcomes. Radiology 2002; 223: 153–161.
5. de Jong CL, Francis A, van Geijn HP, Gardosi J. Fetal growthrate and adverse perinatal events. Ultrasound Obstet Gynecol1999; 13: 86–89.
6. Larsen T, Nguyen TH, Greisen G, Engholm G, Moller H. Doesa discrepancy between gestational age determined by biparietaldiameter and last menstrual period sometimes signify earlyintrauterine growth retardation? BJOG 2000; 107: 238–244.
7. Smith GC, Smith MF, McNay MB, Fleming JE. First-trimestergrowth and the risk of low birth weight. N Engl J Med 1998;339: 1817–1822.
8. Kallen K. Increased risk of perinatal/neonatal death in infantswho were smaller than expected at ultrasound fetometry in earlypregnancy. Ultrasound Obstet Gynecol 2004; 24: 30–34.
9. Bukowski R, Smith GC, Malone FD, Ball RH, Nyberg DA,Comstock CH, Hankins GD, Berkowitz RL, Gross SJ,Dugoff L, Craigo SD, Timor-Tritsch IE, Carr SR, Wolfe HM,D’Alton ME. Fetal growth in early pregnancy and risk ofdelivering low birth weight infant: prospective cohort study.BMJ 2007; 334: 836–840.
10. Wojdemann KR, Christiansen M, Sundberg K, Larsen SO,Shalmi A, Tabor A. Quality assessment in prospective nuchaltranslucency screening for Down syndrome. Ultrasound ObstetGynecol 2001; 18: 641–644.
11. Robinson HP, Fleming JE. A critical evaluation of sonar‘‘crown-rump length’’ measurements. Br J Obstet Gynaecol1975; 82: 702–710.
12. Marsal K, Persson PH, Larsen T, Lilja H, Selbing A, Sultan B.Intrauterine growth curves based on ultrasonically estimatedfoetal weights. Acta Paediatr 1996; 85: 843–848.
13. Brown MA, Lindheimer MD, de Swiet M, Van Assche A,Moutquin JM. The classification and diagnosis of thehypertensive disorders of pregnancy: statement from theInternational Society for the Study of Hypertension in pregnancy(ISSHP). Hypertens Pregnancy 2001; 20: IX–XIV.
14. Deter RL, Buster JE, Casson PR, Carson SA. Individual growthpatterns in the first trimester: evidence for difference inembryonic and fetal growth rates. Ultrasound Obstet Gynecol1999; 13: 90–98.
15. Nakling J, Backe B. Adverse obstetric outcome in fetusesthat are smaller than expected at second trimester routineultrasound examination. Acta Obstet Gynecol Scand 2002;81: 846–851.
16. Nguyen T, Larsen T, Engholm G, Moller H. A discrepancybetween gestational age estimated by last menstrual periodand biparietal diameter may indicate an increased risk offetal death and adverse pregnancy outcome. BJOG 2000; 107:1122–1129.
17. Larsen T, Greisen G, Petersen S. Intrauterine growth correlation
to postnatal growth – influence of risk factors and complicationsin pregnancy. Early Hum Dev 1997; 47: 157–165.
18. Hata T, Kuno A, Akiyama M, Yanagihara T, Manabe A,Miyazaki K. Detection of small-for-gestational-age infantswith poor perinatal outcomes using individualized growthassessment. Gynecol Obstet Invest 1999; 47: 162–165.
19. Danielian PJ, Allman AC, Steer PJ. Is obstetric and neonataloutcome worse in fetuses who fail to reach their own growthpotential? Br J Obstet Gynaecol 1992; 99: 452–454.
20. Smith GC, Yu CK, Papageorghiou AT, Cacho AM, NicolaidesKH. Maternal uterine artery Doppler flow velocimetry and therisk of stillbirth. Obstet Gynecol 2007; 109: 144–151.
21. Gardosi J, Vanner T, Francis A. Gestational age and inductionof labour for prolonged pregnancy. Br J Obstet Gynaecol 1997;104: 792–797.
22. Oldenhof AD, Shynlova OP, Liu M, Langille BL, Lye SJ.Mitogen-activated protein kinases mediate stretch-induced c-fosmRNA expression in myometrial smooth muscle cells. Am JPhysiol Cell Physiol 2002; 283: C1530–C1539.
23. Gardner MO, Goldenberg RL, Cliver SP, Tucker JM, NelsonKG, Copper RL. The origin and outcome of preterm twinpregnancies. Obstet Gynecol 1995; 85: 553–557.
24. Lackman F, Capewell V, Richardson B, da Silva O, Gagnon R.The risks of spontaneous preterm delivery and perinatalmortality in relation to size at birth according to fetal versusneonatal growth standards. Am J Obstet Gynecol 2001; 184:946–953.
25. Hill LM, Breckle R, Thomas ML, Fries JK. Polyhydramnios:ultrasonically detected prevalence and neonatal outcome.Obstet Gynecol 1987; 69: 21–25.
26. Cunningham CF, Macdonald PC, Grant NF, Leveno KJ,Gilstrap LC. Partuition. In Williams Obstetrics (19th edn), Cun-ningham CF, Macdonald PC, Grant NF, Leveno KJ, GilstrapLC (eds.) Prentice Hall International: London, 1993; 297–361.
27. Smith GC, Stenhouse EJ, Crossley JA, Aitken DA, CameronAD, Connor JM. Early-pregnancy origins of low birth weight.Nature 2002; 417: 916.
28. McLean M, Bisits A, Davies J, Woods R, Lowry P, Smith R. Aplacental clock controlling the length of human pregnancy. NatMed 1995; 1: 460–463.
29. Varner MW, Esplin MS. Current understanding of geneticfactors in preterm birth. BJOG 2005; 112 (Suppl 1): 28–31.
30. Roberts JM, Cooper DW. Pathogenesis and genetics of pre-eclampsia. Lancet 2001; 357: 53–56.
31. Stone CD, Diallo O, Shyken J, Leet T. The combined effect ofmaternal smoking and obesity on the risk of preeclampsia.J Perinat Med 2007; 35: 28–31.
32. Milani S, Bossi A, Bertino E, di Battista E, Coscia A, Aicardi G,Fabris C, Benso L. Differences in size at birth are determined bydifferences in growth velocity during early prenatal life. PediatrRes 2005; 57: 205–210.
Copyright 2008 ISUOG. Published by John Wiley & Sons, Ltd. Ultrasound Obstet Gynecol 2008; 32: 147–154.

Early Fetal Size and Growth as Predictors ofAdverse OutcomeNina Gros Pedersen, MD, Francesc Figueras, MD, PhD, Karen R. Wøjdemann, MD, PhD,Ann Tabor, MD, Prof, and Jason Gardosi, MD, Prof
OBJECTIVE: To evaluate the association between fetalsize and growth between the first and second trimestersand subsequent adverse pregnancy outcome.
METHODS: A cohort was created of 7,642 singletonpregnancies cared for in three obstetric units associatedwith Copenhagen University. Data were obtained fromultrasound measurements at 11–14 weeks (crown-rumplength, biparietal diameter) and 17–21 weeks (biparietaldiameter). Fetal size was assessed by gestation-specific zscores, and fetal growth between the first and secondtrimester was calculated individually using conditionalcentiles. The main outcome measures were preterm deliv-ery, smallness for gestational age, and perinatal death.
RESULTS: Slow growth of the biparietal diameter lessthan the 10th and less than the 2.5th conditional centilesbetween first and second trimesters occurred in 10.4%and 3.6% of the population, respectively. Biparietal di-ameter growth less than the 10th centile was associatedwith perinatal death before 34 weeks (risk 0.5% com-pared with 0.04%, odds ratio [OR] 16.0, confidenceinterval [CI] 2.9–88.7). Biparietal diameter growth lessthan the 2.5th centile was the best predictor of perinataldeath at any gestation, with a positive likelihood ratio of4.7 and an OR of 7.3 (CI 2.4–22.2). In contrast, thebiparietal diameter, dated by crown-rump length, did nothave an increased risk of perinatal death; however, therewas a mildly increased risk of small for gestational agebirth weight (less than the 10th customized centile) if thebiparietal diameter was below the 10th centile in the firsttrimester (risk 17% compared with 12%, OR 1.5, CI1.2–1.8) or in the second trimester (risk 15.8% comparedwith 12.4%, OR 1.3, CI 1.1–1.5).
CONCLUSION: Slow growth of the fetal biparietal diam-eter between the first and second trimesters of preg-nancy is a strong predictor of perinatal death before 34weeks.(Obstet Gynecol 2008;112:765–71)
LEVEL OF EVIDENCE: II
Fetal growth restriction is associated with adverseperinatal outcome,1 cerebral palsy,2 and adverse
effects in adult life.3 Recognition of intrauterinegrowth problems allows referral for investigationssuch as ultrasonography and Doppler to assess fetalwellbeing,4 and such tests have been shown to reduceperinatal mortality.5
Slow fetal growth is usually inferred retrospec-tively from the weight reached at birth, which can beadjusted or customized for maternal factors to distin-guish between constitutional and pathological small-ness. Cases thus determined to be small for gesta-tional age (SGA) have been found to be stronglylinked to perinatal mortality.6 Longitudinal studieshave shown that most of the constitutional variation inbirth weight starts in the third trimester of pregnancy.7
More recently, it has been suggested that a lowfirst-trimester measurement of crown-rump length(CRL) in pregnancies dated by last menstrual periodis also linked with adverse outcome such as prematu-rity and fetal growth restriction.8 One explanation forthis observation could be that these pregnancies aremisdated; a prolonged menstruation–conception in-terval has been shown to be associated with adverseoutcome.9–11 However, low CRL in the first trimesteralso has been found to be associated with subsequentlength of gestation and birth weight in pregnanciesachieved with assisted reproductive techniques.12
In everyday practice, the actual date of concep-tion is not likely to be known, and thus measurementof the first scan is needed to establish the gestationalage rather than the size for gestation of the embryo or
From the Department of Fetal Medicine and Ultrasound, Copenhagen UniversityHospital, Copenhagen, Denmark; the West Midlands Perinatal Institute,Birmingham, United Kingdom; and the Hospital Clinic, Barcelona, Spain.
Corresponding author: Prof. Jason Gardosi, West Midlands Perinatal Institute,Aston Cross, Birmingham B6 5RQ, UK; e-mail: [email protected].
Financial DisclosureThe authors have no potential conflicts of interest to disclose.
© 2008 by The American College of Obstetricians and Gynecologists. Publishedby Lippincott Williams & Wilkins.ISSN: 0029-7844/08
VOL. 112, NO. 4, OCTOBER 2008 OBSTETRICS & GYNECOLOGY 765

fetus. We set out to study and compare the effects ofdiminished early pregnancy size and growth, as as-sessed from measurements in the first and secondtrimesters, on subsequent pregnancy outcome, includ-ing SGA birth weight and perinatal death. We hy-pothesized that at these early gestations, growthwould be a better predictor of subsequent pregnancyoutcome than size for gestation.
MATERIALS AND METHODSData for this study were retrieved from the prospec-tive Copenhagen First Trimester Study for Downsyndrome and malformations,13 conducted from 1998to 2001 at the three obstetric departments associatedwith Copenhagen University Hospital. At all threedepartments, antenatal care included the offer of ananomaly scan at gestational weeks 18–20. Participantsin the study were offered an additional ultrasoundexamination and a serum blood sample at gestationalweeks 11–14. Written informed consent was ob-tained. The study protocol for the Copenhagen FirstTrimester Study was approved by the scientific ethicscommittee of the cities of Copenhagen and Frederiks-berg (No. KF 01–288/97) and the Danish Data Pro-tection Agency.
Of the 13,621 women who were invited to par-ticipate, 3,680 either refused or had an early miscar-riage, leaving 9,941 (73%) women who had a first-trimester ultrasound examination, including 9,710singleton pregnancies. A total of 8,215 of these 9,710(85%) pregnancies had a record of two ultrasoundexaminations, one at 11–14 weeks and another at17–21 weeks. A further 30 pregnancies ended inmiscarriage, 130 were lost to follow-up, and 219 hada congenital anomaly detected during or after preg-nancy. Finally, 194 cases were excluded because ofone or more items of missing data, including (nonex-clusively) fetal sex (n�15), parity (n�44), birth weight(n�11), gestational age at delivery (n�24), maternalheight (n�134), and maternal booking weight(n�157). This resulted in a study cohort of 7,642singleton pregnancies with complete data includingrecords of first- and second-trimester ultrasound scan.
The ultrasound examinations were performedby 13 sonographers or doctors experienced inobstetric ultrasonography and certified by the FetalMedicine Foundation in London. Ultrasound scanswere performed with Logic 700 MR (General Elec-tric, Milwaukee, WI), ACUSON Aspen Advanced(Aspen Ultrasound, Oceanside, CA), or Sonoline SI400 or Sonoline Sienna (Siemens AG, Erlangen,Germany).
Gestational age was assessed at the first ultra-sound examination by measurement of fetal CRL.14
Fetal biparietal diameter (BPD) was obtained at thefirst and second ultrasound scans by measuring in theaxial plane at the level of the thalami, the thirdventricle and the cavum septum pellucidum, from theouter border to the inner border of the skull.
Fetal size in the first trimester was assessed byCRL and BPD. Normal ranges were constructedusing previously described methodology.15 Naturallogarithmic-transformed CRL measurements were re-gressed against gestational age in days, calculatedfrom the last menstrual period. Separate linear, linear-cubic, and linear-quadratic regression models werefitted to estimate the relationship between fetal vari-ables and gestational age in days. The best-fittingmodel for each variable was selected. Standard devi-ation (SD) curves as functions of gestational age werecalculated by means of a quadratic polynomial regres-sion procedure of absolute residuals of the measure-ment of interest. The z scores ([measurement-mean]/SD) were calculated for assessing model fit. Normaldistribution of the z scores was checked with theShapiro-Francia W’ test.16 A small first-trimester CRLwas defined as less than the 10th centile. The Appen-dix, available at www.greenjournal.org/cgi/content/full/112/4/765/DC1, details the model coefficientsand SD for CRL.
For BPD, normal ranges were constructed bymeans of the same methodology described above.Natural logarithmic-transformed BPD measurementswere regressed against gestational age in days, calcu-lated from the first CRL measurement. Small first-and second-trimester BPD was defined as less thanthe 10th centile. The Appendix, available at www.greenjournal.org/cgi/content/full/112/4/765/DC1,details the model coefficients and SD for BPD.
Early fetal growth rate was estimated from theincrement between the first- and second-trimesterBPD measurements using conditional centiles.17 Thismethod uses individual predictions for the expectednormal BPD range (conditional centiles) during thesecond trimester on the basis of the first-trimesterBPD measurement. Each second-trimester BPD mea-surement value was thus assigned a centile, which wasconditional to the previous measurement in the samepregnancy. A fetus with a conditional BPD centilebelow the 10th centile was considered to have second-trimester growth restriction.
To establish the normal growth velocity for BPDbetween the first and second trimesters, a subset ofpregnancies was defined (n�6,164) that excludedsmoking, hypertension, and preexisting diabetes and
766 Pedersen et al Early Fetal Growth and Perinatal Outcome OBSTETRICS & GYNECOLOGY

resulted in a normal outcome, which included 1) livebirth, 2) birth weight more than 2,500 g, and 3)gestational age at delivery of 37 or more weeks datedby first-trimester CRL measurement. From this “nor-mal” subset, a sample of 300 cases was randomlyselected by means of a computerized algorithm (SPSS13.0, SPSS, Inc., Chicago, IL). Natural logarithmictransformation of the BPD resulted in the leastskewed distribution of residuals about the generaltrend. A linear model provided the best fit for thepaired data, and the growth curve for each fetus wasdescribed as:
Log [BDP(mm)] � � � �t � � gender
where �, �, and � were the parameters character-izing the individual fetus, t was the gestational age indays (centered at 112 days), and gender was female 0,male 1. The parameters were calculated by means ofmultilevel multiple linear regression assuming a ran-dom effect model. Repeated measurements in thesame fetus comprised level 1, and those in differentfetuses comprised level 2. Individual regression linesfor each variable were calculated for each fetus, andfrom these the regression lines for the whole groupwere derived.18 Modeling software MLwiN v 2.1(Centre for Multilevel Modeling, University of Bris-tol, Bristol, UK) was used.
The Appendix, available at www.greenjournal.org/cgi/content/full/112/4/765/DC1, depicts the for-mulae used for calculating the conditional intervals.
The main pregnancy outcomes assessed wereprematurity, SGA, and perinatal mortality. Prematu-rity (less than 37 weeks of gestation) was divided intoearly preterm (less than 34 weeks) and late preterm(34–36 weeks). Length of pregnancy was calculated indays and was based on CRL measurement at the firstultrasound scan.
Birth weight was assessed by customized percen-tiles, as previously described,19 which were individu-ally adjusted for maternal characteristics (bookingweight, height, parity, ethnic origin) using coefficientsderived from a Scandinavian population6 and avail-able as software (GROW Centile Calculator 5.12.1,2007, Gestation Network, www.gestation.net). Smallfor gestational age was defined as a customized birthweight centile less than 10.
Perinatal mortality was defined as stillbirth after24 weeks of gestation plus neonatal deaths through 28days of life.
Data from scans, including measurements andother details, were recorded in the ViewPoint FetalDatabase (ViewPoint GmbH, Webling, Germany). Out-come data were gathered from the clinical records of
each pregnancy, delivery, and neonate and entered intospreadsheet format using predefined criteria. Two-by-two tables were created to assess the association betweenearly fetal growth and pregnancy outcome, from whichsensitivity, specificity, and likelihood ratios were calcu-lated. Confidence intervals (CIs) were calculated byexact binomial method. The statistical package SPSS13.0 (SPSS, Inc.) was used for analysis.
RESULTSTable 1 details the characteristics of the 7,642 preg-nancies included in the study. There were no differ-ences in maternal characteristics between cases withor without perinatal deaths, except for a higher ma-ternal age at delivery (32.3 compared with 29.8,P�.01). Using the 10th centile as the cutoff identified9.7% of fetuses as having a low first-trimester CRL,9.8% as having a low second-trimester BPD, and10.4% as having slow growth between the first andsecond trimesters (Table 1).
The effects of small CRL or BPD (less than the10thcentile) and slow BPD growth (less than the 10th condi-tional centile) are detailed in Table 2 for length ofpregnancy, SGA at birth, and perinatal death. Low CRLhad no effect on these pregnancy outcomes, includingbirth weight less than the 10th (Table 2) as well as lessthan the 5th centile limit (odds ratio [OR] 1.17, CI0.87–1.57). Small BPD did have a modest associationwith SGA birth weight in both the first (OR 1.49, CI1.23–1.80) and second (OR 1.27, CI 1.07–1.52) trimes-ters. Neither of these parameters showed a link withperinatal mortality at any gestational age category at lessthan the 10th centile (Table 2) or at less than the 5th andless than the 2.5th centile cutoff limits.
In contrast, slow BPD growth (less than the 10thconditional centile) was a strong predictor of perinataldeath before 34 weeks (OR 16.0, CI 2.9–88.7). Fourof the seven perinatal deaths occurring before 34weeks had early fetal growth restriction, whereasnone of the 11 deaths from 34 weeks on had earlyfetal growth restriction. Early perinatal deaths werealso more likely to have a birth weight centile lessthan 10: four of seven deaths at less than 34 weekswere less than the 10th customized centile and twomore were borderline (11th and 16th centiles, respec-tively), whereas four of the 11 perinatal deaths at 34weeks or more were SGA. The maternal and preg-nancy characteristics of early BPD growth less thanthe 10th and more than the 10th conditional centileare compared in Table 3.
In Table 4, the diagnostic performance for peri-natal death at any gestation is examined for a range ofcutoff limits for early fetal growth restriction. The risk
VOL. 112, NO. 4, OCTOBER 2008 Pedersen et al Early Fetal Growth and Perinatal Outcome 767

increases with the severity of growth restriction, witha conditional centile less than 2.5 having a positivelikelihood ratio of 4.7 and an OR of 7.3 (CI 2.4 – 22.2)for perinatal death.
DISCUSSIONIn this study, we assessed the link between fetalgrowth in early pregnancy and subsequent adversepregnancy outcome using sequential ultrasound mea-surements of BPD in the first and second trimesters.Previous publications on growth in early pregnancyhave looked at early fetal size in relation to lastmenstrual period 8,10–12,20 or early fetal size in relationto the day of conception when assisted reproductivetechnology was used.12 By using two sequential ultra-sound measurements of the BPD, our method be-comes independent of gestational-age error. It ap-pears that slow BPD growth is indicative of asubgroup of slow-growing fetuses that are at increasedrisk of perinatal mortality.
These findings have potentially important clinicalvalue. Early indication of an increased risk wouldallow more intensive fetal assessment and surveil-lance and informed considerations on when to adviseearly delivery to avoid fetal demise. Slow BPD growthbetween the first and second trimesters was moreprevalent in a subgroup that was slightly older, had ahigher body mass index, increased parity, was morelikely to be non-European, and had a higher preva-lence of diabetes. Although statistically significant,these differences were relatively small (Table 3) andare unlikely to explain the observed increased risk forperinatal death. When comparing the characteristicsof slow with normal BPD growth pregnancies thatresulted in perinatal death, only maternal age atdelivery reached significance (32.3 compared with29.8, P�.01). Much larger databases allowing mul-tivariate analyses would be needed to quantify therelative contributions of these factors to perinatalloss.
Table 1. Characteristics and Outcome of Included Pregnancies (N�7,642)
n % Median Range
Maternal age at entrance, y 29.6 18–51European 7,320 95.8Primipara 3,225 42.2Smoking 1,251 16.4
Missing data 60 0.8Maternal booking weight, kg 63 39–155Maternal height, cm 169 111–194Delivery
Emergency cesarean delivery 805 10.5Elective cesarean delivery 450 5.9Forceps or vacuum 869 11.4Missing 2 0.03
First scanGestational age, d* 91 77–104CRL less than 10th centile 725 9.7
Second scanGestational age, d 133 119–153BPD less than 10th centile 751 9.8
BPD growth between 1st and 2nd scanLess than 10th conditional centile 796 10.4
Gestational age at delivery, d† 282 175–304Less than 34 wk 85 1.134–36 wk 262 3.437 or more wk 7,295 95.5
Mean SD
Birth weight, g 3,539 550Less than 10th customized centile 978 12.8
Stillbirths 16 0.21Neonatal death 2
Less than 1 wk 11 wk or more 1
CRL, crown-rump length; BPD, biparietal diameter; SD, standard deviation.* Total of 7,472 cases with recorded last menstrual period.† Dated by CRL.
768 Pedersen et al Early Fetal Growth and Perinatal Outcome OBSTETRICS & GYNECOLOGY

Table 2. Association Between Perinatal Outcome and Small Crown-Rump Length, Small BiparietalDiameter, and Slow Biparietal Diameter Growth
n
First-Trimester CRLLess Than 10th Centile
OR 95% CI PYes (n�725) No (n�6,747)
GA at delivery, wkLess than 34 82 9 73 0.84 0.59–1.19 .3134 to less than 37 255 29 226 1.2 0.81–1.78 .3637 or more 7,135 687 6,448 1.15 0.57–2.31 .69
SGA cust, wkLess than 34 27 2 25 0.55 0.1–2.84 .4734 or more 923 89 834 0.99 0.78–1.25 .93Total 950 91 859 0.98 0.78–1.24 .89
Perinatal death, wkLess than 34 7 0 7 — — —34 or more 11 1 10 0.93 0.12–7.26 .94Total 18 1 17 0.55 0.07–4.11 .55
First-Trimester BPDLess Than 10th Centile
Yes (n�856) No (n�6,786)
GA at delivery, wkLess than 34 82 10 75 1.06 0.55–2.05 .8734 to less than 37 255 27 235 0.91 0.62–1.35 .6437 or more 7,135 819 6,476 1.06 0.75–1.5 .74
SGA cust, wkLess than 34 27 5 25 2 0.53–7.55 .334 or more 923 142 806 1.48* 1.21–1.8 �.001Total 950 147 831 1.49* 1.23–1.8 �.001
Perinatal death, wkLess than 34 7 2 5 3.5 0.6–21.08 .1534 or more 11 1 10 0.79 0.1–6.2 .82Total 18 3 15 1.58 0.46–5.5 .46
Second-Trimester BPDLess Than 10th Centile
Yes (n�751) No (n�6,891)
GA at delivery, wkLess than 34 85 6 79 1.08 0.74–1.56 .734 to less than 37 262 26 236 1.01 0.67–1.53 .9637 or more 7,295 719 6,576 0.69 0.31–1.6 .4
SGA cust, wkLess than 34 30 4 26 4.07 0.7–23.7 .134 or more 948 115 833 1.31* 1.06–1.62 .012Total 978 119 859 1.27* 1.07–1.52 .008
Perinatal death, wkLess than 34 7 1 6 2.43 0.24–24.33 24.3334 or more 11 1 10 0.9 0.12–7.15 .93Total 18 2 16 1.15 0.36–5 .85
BPD Growth Less Than 10thConditional Centile
Yes (n�796) No (n�6,846)
GA at delivery, wkLess than 34 85 10 75 1.15 0.6–2.21 .6834 to less than 37 262 27 235 0.99 0.67–1.46 .9537 or more 7,295 759 6,536 0.97 0.69–1.38 .9
SGA cust, wkLess than 34 30 6 24 3.19 0.82–12.36 .0834 or more 948 111 837 1.16 0.94–1.44 .12Total 978 117 861 1.2 0.97–1.48 .09
Perinatal death, wkLess than 34 7 4 3 16.0* 2.89–88.7 �.00134 or more 11 0 11 — — —Total 18 4 14 2.46 0.81–7.51 .1
CRL, crown-rump length; OR, odds ratio; CI, confidence interval; GA, gestational age; SGA cust, small for gestational age (less than the10th centile) by customized standards; BPD, biparietal diameter.
* Statistically significant.
VOL. 112, NO. 4, OCTOBER 2008 Pedersen et al Early Fetal Growth and Perinatal Outcome 769

The BPD measurements can be taken as part ofroutine clinical practice, which usually already offersscans at approximately 11–14 and 17–20 weeks.Having two sequential measurements allows the eval-uation of early growth proper, rather than size, and isindependent of gestational age. By using conditionalcentiles, we were further able to avoid the effect ofmeasurement error and regression to the mean, whichis inherent in repeat measurements and which canattenuate the relationship between growth and ad-verse outcome.
Many of these early deaths demonstrated signifi-cant smallness for gestational age. This is consistentwith reports that preterm stillborn fetuses are morelikely to be SGA than fetuses stillborn at term.21 Inmost fetal deaths before 34 weeks in this study, agrowth deficit can be demonstrated to have startedbetween the first and second trimesters.
The study also was able to examine associationsbetween fetal size in the first and second trimesters
and pregnancy outcome. We have found no linkbetween small first-trimester CRL and subsequentpreterm delivery, SGA birth weight, or perinataldeath. This is in contrast to a previously describedassociation between a small CRL and low birthweight.8 A possible explanation for those findings isthat, instead of representing slow early growth, asmaller-than-expected CRL could simply be due toan overestimate of the age of the fetus at the time ofthe scan. This can occur either because of incorrectmenstrual dates or because of delayed ovulation inthe conception cycle. A prolonged menstruation–conception interval has been shown to be linked toadverse outcome, including prematurity, fetal growthrestriction, and stillbirth.9–11
More recently, small first-trimester CRL mea-surements in a cohort of assisted-reproduction preg-nancies with certain conception dates also haveshown an association with low birth weight.12 It isuncertain whether such findings can be extrapolated
Table 4. Diagnostic Performance for Perinatal Mortality (Any Gestation) With Biparietal DiameterGrowth by Conditional Centiles, Using Various Cutoffs
Frequency(%)
A0/N0(%)
A1/N1(%)
Se(95% CI)
Sp(95% CI) �LHR �LHR
OR(95% CI)
BPD growthConditional centile
Less than 15 1,131/7,792 (14.8) 14/6,511 (0.22) 4/1,131 (0.35) 22.2 (6.4–47,7) 85.2 (84.4–86) 1.5 0.91 1.65 (0.54–5.01)Less than 10 796/7,792 (10.4) 14/6,846 (0.2) 4/796 (0.5) 22.2 (6.4–47,7) 89.6 (88.9–90.3) 2.14 0.98 2.46 (0.81–7.51)Less than 5 458/7,792 (6.0) 14/7,184 (0.19) 4/458 (0.87) 22.2 (6.4–47,7) 94 (93.5–94.6) 3.73 0.83 4.51 (1.48–13.76)Less than 2.5 272/7,792 (3.6) 15/7,370 (0.2) 3/272 (1.1) 16.7 (3.5–41.4) 96.5 (96.1–96.9) 4.72 0.86 7.32 (2.41–22.2)
A0, cases among fetuses with normal growth during early second trimester (N0); A1, cases among fetuses with early fetal growth restriction(N1); Se, sensitivity; Sp, specificity; LHR, likelihood ratio; OR, odds ratio; CI; confidence interval; BPD, biparietal diameter.
Table 3. Population Characteristics by Early Fetal Growth
BPD Growth
Less Than 10th Centile(n�796)
10th Centile or More(n�6,846) OR (95% CI) P*
Maternal age, y, mean (SD) 30.3 (4.1) 29.7 (4.2) �.001Maternal age 35 y or older 95 (11.9) 683 (10.0) 1.22 (0.97–1.54) .08BMI (kg/m2) mean (SD) 23.4 (4) 22.8 (3.8) .001BMI 30 or higher 58 (7.3) 350 (5.1) 1.46 (1.09–1.95) .01Primiparity 300 (37.7) 2,935 (42.7) 0.81 (0.69–0.94) .006Non-European ethnicity 51 (6.4) 271 (4) 1.66 (1.22–2.26) .001Smoking† 113 (15.1) 1,138 (16.7) 0.83 (0.67–1.02) .26Male fetus 407 (51.1) 3,392 (49.5) 1.07 (0.92–1.23) .4Medical condition
Diabetes 13 (1.6) 42 (0.6) 2.69 (1.44–5.03) .001Hypertension 2 (0.3) 47 (0.7) 0.36 (0.09–1.5) .15Other‡ 32 (4) 291 (4.3) 0.94 (0.65–1.37) .76
BPD, biparietal diameter; OR, odds ratio; CI, confidence interval; SD, standard deviation; BMI, body mass index.Data are n (%) unless otherwise indicated.* T-test or Pearson �2.† Sixty cases missing.‡ Includes neurologic, cardiovascular, renal, digestive, respiratory, and immunologic diseases.
770 Pedersen et al Early Fetal Growth and Perinatal Outcome OBSTETRICS & GYNECOLOGY

to spontaneously conceived pregnancies. As the au-thors of that study noted, even in pregnancies wherethe observed first-trimester size was equal to thatexpected, there was a higher rate of low birth weightand SGA.12 Furthermore, practical applicability ofthis assessment would be limited in spontaneouslyconceived pregnancies because the exact date ofconception is usually not known and a CRL measure-ment cannot be used simultaneously for establishinggestational age and assessing fetal size for gestation.
We also looked at the association between BPD sizeand adverse outcome, using CRL to establish gestationalage. In contrast to our findings for slow BPD growthbetween the first and second trimesters, no significantassociation with perinatal mortality was observed. How-ever, a small BPD in either the first or second trimesterdid show a significant, albeit modest, association withsubsequent SGA birth weight (Table 2). This finding isconsistent with previous reports of ultrasound measure-ments in both the first and second trimesters.10,11,20,22
However, the latter studies had to rely on menstrualdating, which always raises the question of whethersome of the effect on birth weight is due to misdating ofthe pregnancy. Because our data included a first-trimes-ter measurement of CRL to establish the dates accu-rately, our analysis can confirm and quantify the linkbetween a smaller-than-expected second-trimester BPDand subsequent low birth weight. Furthermore, we showthat this association can be demonstrated already late inthe first trimester.
We excluded congenital anomalies from the anal-ysis because the primary purpose of recruitment tothis study was to screen for congenital defects. Anom-alies are already known to have an association withearly SGA,23 and a smaller-than-expected BPD mea-surement ought to prompt more intensive investiga-tion to establish whether a structural or chromosomalabnormality is present.
Our study shows that, in pregnancies with nocongenital anomalies, early fetal growth restriction asindicated by serial BPD measurements is a significantindicator of increased perinatal mortality risk. Suchinformation can be derived easily from ultrasound in-vestigations already carried out routinely in mostpregnancies.
REFERENCES1. M Kady S, Gardosi J. Perinatal mortality and fetal growth restric-
tion. Best Pract Res Clin Obstet Gynaecol 2004;18:397–410.2. Jarvis S, Glinianaia SV, Torrioli MG, Platt MJ, Miceli M, Jouk PS,
et al. Cerebral palsy and intrauterine growth in single births:European collaborative study. Lancet 2003;362:1106–11.
3. Godfrey KM, Barker DJ. Fetal nutrition and adult disease. AmJ Clin Nutr 2000;71:1344S–52S.
4. Royal College of Obstetricians and Gynaecologists. The investiga-tions and management of small-for gestational-age fetus. RCOGGreen Top Guideline No. 31. London (UK): RCOG Press; 2002.
5. Alfirevic Z, Neilson JP. Doppler ultrasonography in high-riskpregnancies: systematic review with meta-analysis. Am JObstet Gynecol 1995;172:1379–87.
6. Clausson B, Gardosi J, Francis A, Cnattingius S. Perinataloutcome in SGA births defined by customised versus popula-tion-based birthweight standards. BJOG 2001;108:830–4.
7. de Jong CL, Gardosi J, Baldwin C, Francis A, Dekker GA, vanGeijn HP. Fetal weight gain in a serially scanned high-riskpopulation. Ultrasound Obstet Gynecol 1998;11:39–43.
8. Smith GC, Smith MF, McNay MB, Fleming JE. First-trimestergrowth and the risk of low birth weight. N Engl J Med1998;339:1817–22.
9. Gardosi J, Francis A. Early pregnancy predictors of pretermbirth: the role of a prolonged menstruation-conception inter-val. BJOG 2000;107:228–37.
10. Larsen T, Nguyen TH, Greisen G, Engholm G, Moller H. Does adiscrepancy between gestational age determined by biparietaldiameter and last menstrual period sometimes signify early intra-uterine growth retardation? BJOG 2000;107:238–44.
11. Nakling J, Backe B. Adverse obstetric outcome in fetuses that aresmaller than expected at second trimester routine ultrasoundexamination. Acta Obstet Gynecol Scand 2002;81:846–51.
12. Bukowski R, Smith GC, Malone FD, Ball RH, Nyberg DA,Comstock CH, et al. Fetal growth in early pregnancy and riskof delivering low birth weight infant: prospective cohort study.BMJ 2007;334:836.
13. Wojdemann KR, Shalmi AC, Christiansen M, Larsen SO,Sundberg K, Brocks V, et al. Improved first-trimester Downsyndrome screening performance by lowering the false-posi-tive rate: a prospective study of 9941 low-risk women. Ultra-sound Obstet Gynecol 2005;25:227–33.
14. Robinson HP, Fleming JE. A critical evaluation of sonar“crown-rump length” measurements. Br J Obstet Gynaecol1975;82:702–10.
15. Royston P, Wright EM. How to construct “normal ranges” forfetal variables. Ultrasound Obstet Gynecol 1998;11:30–8.
16. Royston P. A pocket-calculator algorithm for the Shapiro-Francia test for non-normality: an application to medicine. StatMed 1993;12:181–4.
17. Royston P. Calculation of unconditional and conditional ref-erence intervals for foetal size and growth from longitudinalmeasurements. Stat Med 1995;14:1417–36.
18. Goldstein H. Multilevel statistical models. 2nd ed. London(UK): University of London; 1995.
19. Gardosi J, Mongelli M, Wilcox M, Chang A. An adjustable fetalweight standard. Ultrasound Obstet Gynecol 1995;6:168–74.
20. Thorsell M, Kaijser M, Almstrom H, Andolf E. Expected dayof delivery from ultrasound dating versus last menstrualperiod–obstetric outcome when dates mismatch. BJOG 2008;115:585–9.
21. Gardosi J, Mul T, Mongelli M, Fagan D. Analysis of birth-weight and gestational age in antepartum stillbirths. Br J ObstetGynaecol 1998;105:524–30.
22. Rasmussen S, Kiserud T, Albrechtsen S. Foetal size and bodyproportion at 17–19 weeks of gestation and neonatal size,proportion, and outcome. Early Hum Dev 2006;82:683–90.
23. Nikkila A, Kallen B, Marsal K. Fetal growth and congenitalmalformations. Ultrasound Obstet Gynecol 2007;29:289–95.
VOL. 112, NO. 4, OCTOBER 2008 Pedersen et al Early Fetal Growth and Perinatal Outcome 771

Maternal serum levels of placental Growth Hormone in early pregnancy, but not of human
Placental Lactogen, and Insulin Growth Factor-I, are positively associated with fetal growth
in first trimester of human pregnancy
N. G. Pedersen*, A. Juul
†, M Christiansen
‡, K. R. Wøjdemann
§ and A. Tabor*
*Department of Fetal Medicine and Ultrasound, Rigshospitalet, Copenhagen University Hospital,
Denmark
†Department of Growth and Reproduction, Rigshospitalet, Copenhagen University Hospital,
Denmark
‡ Department of Clinical Biochemistry, Statens Serum Institute, Copenhagen, Denmark
§ Department of Obstetrics and Gynecology, Roskilde University Hospital, Roskilde, Denmark
Corresponding author:
Dr N.G. Pedersen, Department of Fetal Medicine and Ultrasound, Rigshospitalet, Copenhagen
University Hospital, Afsnit 4031, Blegdamsvej 9, 2100 Copenhagen, Denmark
E-mail: [email protected]
Tel: +45 35 45 37 22
Fax: +45 35 45 37 39
Short title: Fetal growth rate
Keywords: Growth rate, BPD, PGH, HPL, IGF-1, ultrasound

2
Abstract
Objective: To investigate if maternal levels of human Placental Lactogen (hPL), Placental Growth
Hormone (PGH) and Insulin Growth Factor-I (IGF-I) are associated with growth rate of the
biparietal diameter (BPD) in first half of pregnancy.
Methods: Data on 8215 singleton fetuses from the Copenhagen First Trimester Study with
measurements of BPD from ultrasound scans performed in week 11-14 and week 17-21 of
pregnancy were analysed. Growth rate was defined as millimetres of growth/day of BPD between
the two scans. Fetuses with growth rate below the 2.5th
centile (low growth rate, n=203) and above
the 97.5th
centile (high growth rate, n=203) were identified. As a reference group 212 fetuses with
growth rate around the median were identified (intermediate growth rate). Out of the 618 selected
cases in the three growth rate groups a total of 463 cases had a blood sample taken (equal to 5.6%
of the original sample size of 8215 pregnancies). The maternal blood serum concentration of hPL,
PGH and IGF-I was determined in the three different growth rate groups. Simple linear and
multiple linear regression analysis, including adjustment for known and potential confounders were
used to compare serum levels between the groups.
Results: Simple linear regression showed a differences in serum level of log10 (PGH) between the
high and intermediate growth rate groups (p=0.037). When adjusted for maternal weight and CRL
multiple linear regression analysis confirmed this difference. Fetuses with high growth rates had
when adjusted for CRL and maternal weight a 12% (95%CI: 2%-20%, p=0.009) higher maternal
serum level of PGH than those with intermediate growth rates. No differences in hPL and IGF-I
levels between the three different growth rate groups were found after simple and multiple linear
regression analysis.
Conclusion: Maternal PGH levels were higher in women carrying fetuses with high first trimester
growth rates compared to controls both in a simple unadjusted analysis and in analyses adjusted for

3
known and potential confounders. Thus, PGH may be involved in fetal growth regulation already in
early human pregnancy.

4
Introduction
Fetal growth in early pregnancy has traditionally been considered to be under tight genetic control
and to occur at a constant exponential rate with little biologic variation; intrauterine growth
restriction has been assumed to occur mainly in the latter half of pregnancy. Recent studies,
however, have shown that fetal growth in first half of pregnancy does vary between fetuses1 and
that decreased early fetal growth rate is associated with perinatal death, low birth weight and
preterm delivery 2-5
. The regulation of fetal growth in the early half of pregnancy has not been
clarified. In postnatal life growth hormone (GH) plays an important role, but the role of GH in fetal
growth remains uncertain.
The GH gene cluster contains a single gene expressed in the anterior pituitary (GH1) plus four
genes expressed in the placenta (SHL1, CSH1, GH2, CSH2). GH1 encodes pituitary Growth
Hormone (pGH), GH2 encodes Placental GH (PGH), while CSH1 and CSH2 encode hPL 6. PGH is
a ligand of maternal GH receptors, and hPL is a ligand of maternal prolactin receptors. hPL and
PGH can be detected in the maternal circulation at 6 weeks’ gestation and their concentrations
increase with advancing gestation; several studies have suggested a role for hPL and PGH in the
control of fetal growth 7,8,9
. Pregnancies complicated by intrauterine growth restriction (IUGR)
show reduced concentration of maternal and fetal serum hPL as well as reduced maternal serum
levels of PGH 10
. In second half of pregnancy it is known that the concentrations of PGH and IGF-I
in maternal serum are positively correlated 9, and in pregnancies with IUGR maternal IGF-I serum
levels are found to be significantly lower than the serum levels found in normal pregnancies 11
.
Until recently the general opinion was that PGH does not cross the placenta into the fetal
circulation, and the effect of PGH on fetal growth was considered to be indirectly mediated by
effects on maternal metabolism, possibly via IGF-I, hereby regulating substrate supply to the fetus.

5
However a recent study has demonstrated that PGH can be detected in cord blood and it may
therefore have direct effect on fetal growth 12
.
We wished to investigate if maternal levels of hPL, PGH and IGF-I were correlated to growth rate
in early pregnancy; speculating that high levels of hPL, PGH and IGF-I would stimulate growth and
lower levels would be associated with slower growth rates. No previous studies have examined the
correlation between fetal growth rate and maternal hormones in the first half of pregnancy.
Materials and methods
Study population
Data was retrieved from the Copenhagen First Trimester Study for Down´s syndrome and
malformations conducted 1998-2001 13
. A total of 13,621 women referred to three obstetric
departments in Copenhagen University Hospital were invited to participate. Participation entailed
the choice of an ultrasound examination and / or a blood sample in gestational week 11-14.
Additionally at all three departments, routine antenatal care included the offer of one anomaly scan
at around 18-20 week’s gestation. Of the 13,621 women who were invited to participate, 3,680
either refused or had an early miscarriage, leaving 9,941 (73%) women who had a first trimester
ultrasound examination, including 9710 singleton pregnancies. A total of 8,215 of these 9,710
(85%) singleton pregnancies had a record of two ultrasound examinations, at 11-14 weeks and 17-
21 weeks, respectively. Data, including indications and diagnoses, from all scans performed during
the pregnancies were recorded in ViewPoint Fetal Database (ViewPoint GmbH, Webling,
Germany).

6
Ultrasound
The ultrasound examinations were performed by 13 sonographers or doctors experienced in
obstetric ultrasound and certified by The Fetal Medicine Foundation in London, UK. The
ultrasound examinations in week 11-14 were all performed using a Logic 700 MR scanner (General
Electric, Milwaukee, WI, USA). Those in week 17-21 were performed using one of the following
machines: Acuson Aspen Advanced, Sonoline SI 400 or Sonoline Sienna (Siemens AG, Erlangen,
Germany). Gestational age was determined by CRL14
. BPD measurements were obtained in an
axial plane at the level of the thalami, the third ventricle and cavum septi pellucidi, from the outer
border to the inner border of the skull.
Growth rate
Pregnant women were categorized by fetal growth into three groups (low, intermediate and high
fetal growth rates). We defined growth rate as millimetres of growth in BPD per day between the
two sonographic measurements. As the growth from week to 11 to 21 isn’t linear 15
growth rate
was standardized according to the gestational age measured in weeks at the time of the scans. A Z-
score was thus calculated for each fetus by subtracting the mean growth rate for all fetuses that were
scanned the same two weeks and dividing by the SD of the growth rate for this group. Z-score =
(observed growth rate - group mean growth rate) / (group growth rate SD) 5. The individual Z-
scores were transformed into centiles, and all fetuses with growth rate below the 2.5th
centile (low
growth rate, n=203) and above the 97.5th
centile (high growth rate, n=203) were identified. As a
reference group all fetuses with growth rates from the 50th
to the 51st centile were identified
(intermediate growth rate, n=212). Out of the 618 selected cases in the three growth rate groups a
total of 463 cases had a blood sample taken (equal to 5.6% of the original sample size).

7
Blood samples
Blood samples were drawn from an antecubital vein, on the same day as the first trimester
ultrasound in gestational week 11-14, and centrifuged at 3000 rpm for 10 minutes. Serum was
stored at -20 Celsius until analyses. Maternal blood from the three different growth rate groups was
analysed. The number of women that had a blood sample taken was 143/203 (70%) from the group
with low growth rate, 166/212 (78%) from the group with intermediate growth rate and 154/203
(75%) from the group with high growth rate. The actual number of blood samples analysed for
hPL, PGH and IGF-I varied slightly from the above numbers, as the amount of serum left, was not
always sufficient to perform the analysis for all three biochemical markers. The exact number of
pregnancies in the three different growth rate groups that had maternal serum levels of hPL, PGH
and IGF-I measured is depicted in Table 3.
Hormone assays
PGH was determined by a solid-phase enzyme linked immunosorbent assay (hPGH ELISA
EL2017, Biocode Hycel, Liege Belgium). Standards were recombinant hPGH provided by the
manufacturer. Analytical sensitivity was 1.9 ng/ml. In our hands, intra-assay variation was 2.6%
(at 8.2 ng/ml) and 3.7% (at 38.1 ng/ml), respectively. Inter-assay variation was 5.7% (at 8.2 ng/ml)
and 3.3% (at 38.1 ng/ml), respectively.
HPL was determined by a modification of a commercially available solid-phase
enzymeimmunoassay (HPL ELISA EIA-1283, DRG Instruments GmbH, Marburg, Germany). The
sensitivity of the assay was increased by using standards (produced by diluting provided standards
in the 0-standard) at 0.02 mg/l, 0.04 mg/l, 0.16 mg/l, 0.32 mg/l, 0.64 mg/l, and 1.25 mg/l and
increasing the incubation time of samples from 30 minutes to 3 hours. The standard material was

8
provided and quantified by the assay manufacturer. The intra-asay variation was 8.3% (at 0.76
mg/l) and 3.2% (at 1.2 mg/l), respectively. The inter-assay variation was 14% (at 0.76 mg/l) and
7.1% (at 1.2 mg/l), respectively.
IGF-I was determined by a solid-phase enzyme-labelled chemiluminescent immunometric assay
(Immulite 2000, Diagnostic Products Corporation, LA, USA). Standards were calibrated towards
the WHO NIBSC IRR 87/518. Analytical sensitivity was 20 ng/ml. In our hands, intra-assay CV%
were 1.9% (at 51 ng/ml), 2.0% (at 239 ng/ml) and 2.1% at (472 ng/ml), respectively. Interassay
CV% were 8.9% (at 72 ng/ml), 5.9% (at 273 ng/ml), and 8.2% (at 395 ng/ml), respectively.
Statistical analyses
The serum values of hPL, PGH and IGF-I all showed a distribution that was skewed to the right and
the values were therefore log10 transformed to obtain approximate normality. Q-Q plots were used
to determine if the data were normally distributed.
To compare categorized characteristics of the study population between the three growth rate
groups univariate comparisons were made using the Chi-square test (more than five observations in
all cells) or Fisher’s exact test (five or fewer observations in one or more cells). Continuous
characteristics were compared by means of one-way ANOVA.
Linear regression analyses were used to compare mean serum levels of log10(hPL), log10( PGH) and
log10 (IGF-I) between the three different growth rate groups with the intermediate growth rate group
as a reference. Analyses adjusted for CRL and mother’s weight (kg) were also performed as both
these variables are known to affect serum levels of hPL16
, PGH 17
and IGF-I 9. Other characteristics
of the mother and fetus, that we expected could influence serum levels of hPL, PGH and IGF-I and
where a significant difference between the three growth rate groups (parity and fetal sex) was

9
found, were included in supplementary analyses. P values for all hypotheses tested were two-sided
and statistical significance was set at P < 0.05.
Data were processed using the software programs Access 2000, Excel 2000 (Microsoft Corp.,
Redmond, WA, USA), SPSS 11.0 (Chicago, IL. USA) and SigmaPlot 10.0 (SyStat software, Point
Richmound, Ca, USA).
Ethical considerations
Written informed consent was obtained from the participants, and the scientific ethics committee of
the cities of Copenhagen and Frederiksberg (No. (KF) 01-288/97) and the Data Protection Agency
approved the study protocol.
Results
Data on prenatal characteristics and pregnancy outcomes are shown in Table 1. Mean BPD at both
the first and the second scan was significantly different between the three growth rate groups. At
the first scan the higher the growth rate the lower the mean BPD (21.4 mm, 22.6 mm and 23.6 mm
for high, intermediate and low growth rate respectively, p<0.001). At the second scan the higher
the growth rate the higher the mean BPD (46.2 mm, 44.2 mm and 40.5 mm for high, intermediate
and low growth rate respectively, p<0.001). The group of fetuses with the highest growth rate was
significantly younger than fetuses from the two other growth rate groups at the time of the second
scan (131.0 days vs. 134.6 days and 134.4 days, p<0.001). The fetuses from the low growth rate
group were delivered earlier, had a lower birth weight and the lowest percentage of live births.
There was a predominance of female fetuses in the low and intermediate growth rate group
compared to the high growth rate group (57% and 56% vs. 30% in the high growth rate group,
p<0.001). The percentage of caesarean sections was highest in the group of fetuses with a high

10
growth rate. The individual fetal growth rates for the three different groups are illustrated in Figure
1.
Data on maternal characteristics are shown in Table 2. The percentage of nulliparous mothers was
significantly different between the three growth rate groups, the higher the growth rate the higher
the percentage of nulliparous women (75%, 62% and 59% for high, intermediate and low growth
rates, respectively, p=0.009). Otherwise the mothers of the fetuses were similar with regard to
characteristics that could influence the growth rate.
Maternal serum concentrations of hPL, PGH and IGF-I according to growth rate group are
illustrated in Figure 2.
Simple linear regression showed a differences in serum level of log10 (PGH) between the high and
intermediate growth rate groups (Table 3, p=0.037). When adjusted for maternal weight and CRL
multiple linear regression analysis confirmed this difference (Table 4). Fetuses with high growth
rates thus had a higher maternal serum level of log10 (PGH) than those with intermediate growth
rate equal to B=0.05 (95%CI: 0.01-0.09). The increase in log10 (PGH) may be translated to a
relative increase of PGH of 12% (95%CI: 2%-20%) by taking the antilog10 of B and its CI. Fetuses
with low growth rates also had higher level of PGH compared to those with intermediate growth
rate, but this did not reach statistical significance. When subdividing the analysis for PGH by fetal
sex simple linear regression showed a significant difference in maternal serum levels of log10 (PGH)
between the high and intermediate growth rate group for male fetuses (p=0.043, n=221). The
female fetus group was slightly smaller (n=197), and here we did not observe a difference. For
log10 (PGH) there was no interaction between fetal growth rate and sex (p=0.204).
No difference was found for the levels of log10(hPL) and log10(IGF-I) between the three different
growth rate groups with simple linear regression analysis or after adjustment for maternal weight
and CRL. For log10(hPL), log10 (PGH) and log10(IGF-I) the serum levels varied significantly as a
11
function of CRL, and for log10(hPL) and log10 (PGH) the serum levels varied significantly as a
function of maternal weight (Table 4). When the serum levels in the multiple linear regression
analyses were further adjusted for the sex of the fetus and the parity of the mother, no independent
effect of sex and parity was observed for log10(PGH); the p-value, B and its CI remained robust (p =
0.009, B=0.06(95%CI: 0.01-0.10)). For log10(hPL) and log10(IGF-I) there remained no significant
difference in serum levels between the three growth rate groups, when the serum levels in the
multiple linear regression analyses were further adjusted for the sex of the fetus and the parity of the
mother.
Discussion
In our large prospective cohort of pregnant women we observed higher maternal serum levels of
PGH in week 11-14 in women carrying fetuses with high growth rates until week 17-20 compared
to women carrying fetuses who grew at average growth rates. This result persisted when also
adjusting for CRL, maternal weight, parity and fetal sex. This association has not previously been
demonstrated. It has been hypothesised that PGH acts to augment the supply of fatty acids and
glucose to the placenta 18,19
, which would be in agreement with our present results; a high maternal
serum level of PGH would increase substrate supply to the fetus and thus promote fetal growth. We
observed a trend towards higher maternal serum levels of PGH in the low growth rate group when
compared to the intermediate group, which may seem surprising. We have previously shown that
pregnant women, who were smoking during pregnancy, had higher PGH levels compared to non-
smokers which could suggest a compensatory mechanism by which the fetus is protected 17
. In line
with these findings, it has been suggested that high maternal plasma levels of PGH in preeclamptic
women may be a compensatory mechanism to preserve fetal growth. In the study by Mittal et al.12
patients with preeclampsia that delivered a small for gestational age neonate had lower maternal
serum concentrations of PGH than patients with preeclampsia alone. Thus in line with these

12
findings we suggest that the trend towards higher maternal PGH levels is a compensatory
mechanism to preserve fetal growth.
In second half of pregnancy concentrations of PGH and IGF-I in maternal serum are positively
correlated 9, and in pregnancies complicated by IUGR maternal PGH and IGF-I levels has been
found to be significantly lower than levels in normal pregnant women 11
. The IGFs are mitogenic
polypetides that stimulate cellular proliferation and differentiation. They have the ability to
influence the transport of glucose and amino acids across the placenta 20
and are significantly
influenced by fetal nutrition and insulin levels 21,22
. We expected that the high maternal levels of
PGH would lead to corresponding high levels of IGF-I, but this was not the case. There was no
difference in the IGF-I concentration between the three different growth rate groups. During
pregnancy PGH gradually replaces the maternal pituitary GH, which disappears from maternal
serum in the second half of pregnancy. PGH can be detected in the maternal circulation at 6 weeks’
gestation and its concentration increases with advancing gestation 9,23
, peak values are reached at
week 34-37 9. It is possible that maternal IGF-I level in the early half of pregnancy is primarily
controlled by pituitary GH, because placental PGH secretion may be too modest to suppress
maternal pituitary secretion of GH in early pregnancy 10
, and hereby control maternal levels of IGF-
I. This would explain why higher level of PGH in our study did not lead to a corresponding high
level of IGF-I. Alternatively, the presence of GH binding protein (GHBP) in the circulation, may
modulate the function of pituitary GH and PGH, and thereby influence the level of PGH in a way
that is not accounted for in the present study. However, free and bound PGH have been shown to
correlate highly significantly 11
, so in all likelihood GHBP is not a major confounder in our present
study.
The physiological role of hPL in pregnancy remain controversial. It has been hypothesized that
hPL along with PGH is released from the syncytiotrophoblast into the maternal circulation to

13
stimulate IGF-I production 24
. This is supported by a study that demonstrated that hPL and PGH
are unable to promote the growth of human fetal fibroblast and myoblasts in the presence of an
IGF-I antibody 25
. However, other studies that have investigated the relationship between PGH,
hPL and IGF-I in human pregnancies find, regardless of gestational age, that IGF-I values are
correlated with corresponding PGH but not with hPL values, which suggest that PGH and not hPL
is the primary regulator of maternal IGF-I secretion 10,26
. Maternal blood levels of hPL are
correlated with the weight of the placenta 27-29
, and that of the fetus 30-32
. Low hPL levels have been
described in association with severe IUGR 28,33
. Furthermore a link between fetal growth velocities
in second half of pregnancy and changes in hPL in maternal serum has been demonstrated 34
. We
were not able to confirm such an association in the first half of pregnancy in our present study as no
association between fetal growth rate and maternal level of hPL was observed.
Strengths of our study
Our study was based on a very large cohort of representative pregnant women, who were recruited
from the same geographical area. In all women, ultrasonography was performed by certified
ultrasonographers minimizing methodological bias. In addition, all hormone measurements were
done at the same time using standardized assays from the same batch, hereby minimizing the
interassay variation.
Weaknesses of our study
Although hPL 35
, PGH 36,37
and IGF-I 38
show no circadian rhythm there is a minor variation over
24 hours and a single sample taken from an individual might therefore not be entirely representative
for the individual. Furthermore the use of ultrasound techniques, when taking measurements,
unavoidably encompasses some uncertainty, which could weaken a possible association between
growth rate and growth hormones. We found that the mean BPD between the different growth rate
groups was significantly different at the first and the second scan. At the first scan high growth rate

14
was associated with the lowest BPD, and at the second scan high growth rate was associated with
the highest BPD. Part of this could most likely be explained by the statistical principle: “regression
toward the mean” 39
which states that if a pair of independent measurements are made from the
same distribution, samples far from the mean on the first measurement will tend to be closer to the
mean on the second one. The phenomenon occurs because each sample is affected by random
variance. Another explanation could be that fetal growth theoretically occurs in spurts. This would
imply that the fetuses with the smallest BPD at the first scan were behind the other fetuses of the
same gestational age with larger BPD and therefore up until the second scan experienced a period
with higher growth rate than the rest.
The group of fetuses with the highest growth rate were significantly younger at the time of the
second scan than those with intermediate or low growth rate. Milani et al 15
followed a cohort of
130 pregnant women longitudinally from week 12 to delivery and onwards, and demonstrated that
peak velocities for growth of the head circumference were reached around week 17 of pregnancy at
the rate of approximately 12.5 mm / week, from then on the velocity declines towards term, where it
was around 4 mm / week. These results are in accordance with the low gestational age for fetuses
with high growth rates, as the second ultrasound measurement was performed from week 17 to 21.
We observed a predominance of male fetuses in the large growth rate group. The higher growth
rates of male fetuses are in accordance with the study from 2007 by Bukowski R et al.40
. In a
cohort of 28,000 fetuses they found that male fetuses at week eight to twelve of gestation on
average were 0.3 days larger than female fetuses 40
. Finally the percentage of nulliparous women
was higher in the high growth rate group, for which we have no explanation.
We were not able to demonstrate an association between total IGF-I and early fetal growth rate. In
the circulation, IGF-I is bound to specific IGF binding proteins (IGFBP-1 to -6), of which IGFBP-3
bind more than 90% 41
. The presence of IGFBP prolongs the half-life of IGF-I, prevents its
15
hypoglycaemic actions, and strongly influences its biological activity. In pregnancy, specific
IGFBP-3 proteases are induced, and they degrade IGFBP-3 hereby influencing the amount of free,
biologically active IGF-I in the circulation of pregnant women. We exclusively determined total
IGF-I in our present study, and therefore it cannot be ruled out that had we been able to unmask
some of the interactions within the complex IGF-system, then perhaps other links between fetal
growth rate and IGFs could be identified. Our findings encourage further and more extensive
examinations of the role of the IGF-axis (e.g. determination of free IGF-I) in controlling fetal
growth in early pregnancy.
In conclusion we demonstrated that maternal serum levels of PGH, but not of hPL and total IGF-I
were associated with fetal growth in early human pregnancy in a prospective cohort of 600 healthy
pregnant women. Future studies are needed to evaluate the potential clinical use of PGH for
monitoring early fetal growth.

16
References
1. Deter RL, Buster JE, Casson PR, and Carson SA. Individual growth patterns in the first
trimester: evidence for difference in embryonic and fetal growth rates. Ultrasound
Obstet.Gynecol. 1999; 13: 90-98.
2. Smith GC, Smith MF, McNay MB, and Fleming JE. First-trimester growth and the risk of low
birth weight. N.Engl.J.Med. 1998; 339: 1817-1822.
3. Kallen K. Increased risk of perinatal/neonatal death in infants who were smaller than expected
at ultrasound fetometry in early pregnancy. Ultrasound Obstet.Gynecol. 2004; 24: 30-34.
4. Pedersen NG, Figueras F, Wojdemann KR, Tabor A, and Gardosi J. Early fetal size and
growth as predictors of adverse outcome. Obstet.Gynecol. 2008; 112: 765-771.
5. Pedersen NG, Wojdemann KR, Scheike T, and Tabor A. Fetal growth between the first and
second trimesters and the risk of adverse pregnancy outcome. Ultrasound Obstet.Gynecol.
2008; 32: 147-154.
6. Haig D. Placental growth hormone-related proteins and prolactin-related proteins. Placenta
2008; 29 Suppl A: S36-S41.
7. Freemark M. Ontogenesis of prolactin receptors in the human fetus: roles in fetal
development. Biochem.Soc.Trans. 2001; 29: 38-41.
8. Fleenor D, Oden J, Kelly PA, Mohan S, Alliouachene S, Pende M, Wentz S, Kerr J, and
Freemark M. Roles of the lactogens and somatogens in perinatal and postnatal metabolism
and growth: studies of a novel mouse model combining lactogen resistance and growth
hormone deficiency. Endocrinology 2005; 146: 103-112.
9. Chellakooty M, Vangsgaard K, Larsen T, Scheike T, Falck-Larsen J, Legarth J, Andersson
AM, Main KM, Skakkebaek NE, and Juul A. A longitudinal study of intrauterine growth and
the placental growth hormone (GH)-insulin-like growth factor I axis in maternal circulation:
association between placental GH and fetal growth. J.Clin.Endocrinol.Metab. 2004; 89: 384-
391.
10. Caufriez A, Frankenne F, Hennen G, and Copinschi G. Regulation of maternal IGF-I by
placental GH in normal and abnormal human pregnancies. Am.J.Physiol. 1993; 265: E572-
E577.
11. McIntyre HD, Serek R, Crane DI, Veveris-Lowe T, Parry A, Johnson S, Leung KC, Ho KK,
Bougoussa M, Hennen G, Igout A, Chan FY, Cowley D, Cotterill A, and Barnard R. Placental
growth hormone (GH), GH-binding protein, and insulin-like growth factor axis in normal,
growth-retarded, and diabetic pregnancies: correlations with fetal growth.
J.Clin.Endocrinol.Metab 2000; 85: 1143-1150.
12. Mittal P, Espinoza J, Hassan S, Kusanovic JP, Edwin SS, Nien JK, Gotsch F, Than NG, Erez
O, Mazaki-Tovi S, and Romero R. Placental growth hormone is increased in the maternal and
fetal serum of patients with preeclampsia. J.Matern.Fetal Neonatal Med. 2007; 20: 651-659.

17
13. Wojdemann KR, Christiansen M, Sundberg K, Larsen SO, Shalmi A, and Tabor A. Quality
assessment in prospective nuchal translucency screening for Down syndrome. Ultrasound
Obstet.Gynecol. 2001; 18: 641-644.
14. Robinson HP and Fleming JE. A critical evaluation of sonar "crown-rump length"
measurements. Br.J.Obstet.Gynaecol. 1975; 82: 702-710.
15. Milani S, Bossi A, Bertino E, di Battista E, Coscia A, Aicardi G, Fabris C, and Benso L.
Differences in size at birth are determined by differences in growth velocity during early
prenatal life. Pediatr.Res. 2005; 57: 205-210.
16. Chard T. Human placental lactogen in the monitoring of high-risk pregnancy. Ric.Clin.Lab.
1982; 12: 207-220.
17. Chellakooty M, Skibsted L, Skouby SO, Andersson AM, Petersen JH, Main KM, Skakkebaek
NE, and Juul A. Longitudinal study of serum placental GH in 455 normal pregnancies:
correlation to gestational age, fetal gender, and weight. J.Clin.Endocrinol.Metab. 2002; 87:
2734-2739.
18. Barbour LA, Shao J, Qiao L, Pulawa LK, Jensen DR, Bartke A, Garrity M, Draznin B, and
Friedman JE. Human placental growth hormone causes severe insulin resistance in transgenic
mice. Am.J.Obstet.Gynecol. 2002; 186: 512-517.
19. Goodman HM, Tai LR, Ray J, Cooke NE, and Liebhaber SA. Human growth hormone variant
produces insulin-like and lipolytic responses in rat adipose tissue. Endocrinology 1991; 129:
1779-1783.
20. Kniss DA, Shubert PJ, Zimmerman PD, Landon MB, and Gabbe SG. Insulinlike growth
factors. Their regulation of glucose and amino acid transport in placental trophoblasts isolated
from first-trimester chorionic villi. J.Reprod.Med. 1994; 39: 249-256.
21. Allan GJ, Flint DJ, and Patel K. Insulin-like growth factor axis during embryonic
development. Reproduction. 2001; 122: 31-39.
22. Baker J, Liu JP, Robertson EJ, and Efstratiadis A. Role of insulin-like growth factors in
embryonic and postnatal growth. Cell. 1993; 75: 73-82.
23. Fuglsang J, Skjaerbaek C, Espelund U, Frystyk J, Fisker S, Flyvbjerg A, and Ovesen P.
Ghrelin and its relationship to growth hormones during normal pregnancy.
Clin.Endocrinol.(Oxf). 2005; 62: 554-559.
24. Gude NM, Roberts CT, Kalionis B, and King RG. Growth and function of the normal human
placenta. Thromb.Res. 2004; 114: 397-407.
25. Hill DJ, Crace CJ, Strain AJ, and Milner RD. Regulation of amino acid uptake and
deoxyribonucleic acid synthesis in isolated human fetal fibroblasts and myoblasts: effect of
human placental lactogen, somatomedin-C, multiplication-stimulating activity, and insulin.
J.Clin.Endocrinol.Metab. 1986; 62: 753-760.

18
26. Caufriez A, Frankenne F, Englert Y, Golstein J, Cantraine F, Hennen G, and Copinschi G.
Placental growth hormone as a potential regulator of maternal IGF-I during human pregnancy.
Am.J.Physiol. 1990; 258: E1014-E1019.
27. Cramer DW, Beck P, and Makowski EL. Correlation of gestational age with maternal human
chorionic somatomammotropin and maternal and fetal growth hormone plasma concentrations
during labor. Am.J.Obstet.Gynecol. 1971; 109: 649-655.
28. Lindberg BS and Nilsson BA. Human placental lactogen (HPL) levels in abnormal
pregnancies. J.Obstet.Gynaecol.Br.Commonw. 1973; 80: 1046-1053.
29. Sciarra JJ, Sherwood LM, Varma AA, and Lundberg WB. Human placental lactogen (HPL)
and placental weight. Am.J.Obstet.Gynecol. 1968; 101: 413-416.
30. Boyce A, Schwartz D, Hubert C, Cedard L, and Dreyfus J. Smoking, human placental
lactogen and birth weight. Br.J.Obstet.Gynaecol. 1975; 82: 964-967.
31. Letchworth AT, Boardman RJ, Bristow C, Landon J, and Chard T. A rapid semi-automated
method for the measurement of human chorionic somatomammotrophin. The normal range in
the third trimester and its relation to fetal weight. J.Obstet.Gynaecol.Br.Commonw. 1971; 78:
542-548.
32. Lindberg BS and Nilsson BA. Variations in maternal plasma levels of human placental
lactogen (HPL) in normal pregnancy and labour. J.Obstet.Gynaecol.Br.Commonw. 1973; 80:
619-626.
33. Hensleigh PA, Cheatum SG, and Spellacy WN. Oxytocinase and human placental lactogen for
the prediction of intrauterine growth retardation. Am.J.Obstet.Gynecol. 1977; 129: 675-678.
34. Sorensen S, von TD, Schioler V, Greisen G, Petersen S, and Larsen T. Serial measurements of
serum human placental lactogen (hPL) and serial ultrasound examinations in the evaluation of
fetal growth. Early Hum.Dev. 2000; 60: 25-34.
35. Pavlou C, Chard T, and Letchworth AT. Circulating levels of human chorionic
somatomammotrophin in late pregnancy: disappearance from the circulation after delivery,
variation during labour, and circadian variation. J.Obstet.Gynaecol.Br.Commonw. 1972; 79:
629-634.
36. Eriksson L, Frankenne F, Eden S, Hennen G, and Von SB. Growth hormone 24-h serum
profiles during pregnancy--lack of pulsatility for the secretion of the placental variant.
Br.J.Obstet.Gynaecol. 1989; 96: 949-953.
37. Eriksson L, Eden S, Frohlander N, Bengtsson BA, and Von SB. Continuous 24-hour secretion
of growth hormone during late pregnancy. A regulator of maternal metabolic adjustment?
Acta Obstet.Gynecol.Scand. 1988; 67: 543-547.
38. Juul A, Moller S, Mosfeldt-Laursen E, Rasmussen MH, Scheike T, Pedersen SA, Kastrup
KW, Yu H, Mistry J, Rasmussen S, Muller J, Henriksen J, and Skakkebaek NE. The acid-
labile subunit of human ternary insulin-like growth factor binding protein complex in serum:
hepatosplanchnic release, diurnal variation, circulating concentrations in healthy subjects, and

19
diagnostic use in patients with growth hormone deficiency. J.Clin.Endocrinol.Metab. 1998;
83: 4408-4415.
39. Bland JM and Altman DG. Some examples of regression towards the mean. BMJ. 1994; 309:
780-780.
40. Bukowski R, Smith GC, Malone FD, Ball RH, Nyberg DA, Comstock CH, Hankins GD,
Berkowitz RL, Gross SJ, Dugoff L, Craigo SD, Timor-Tritsch IE, Carr SR, Wolfe HM, and
D'Alton ME. Human sexual size dimorphism in early pregnancy. Am.J.Epidemiol. 2007; 165:
1216-1218.
41. Juul A. Serum levels of insulin-like growth factor I and its binding proteins in health and
disease. Growth Horm.IGF.Res. 2003; 13: 113-170.

Low growth rate
Gestational age (days)
60 80 100 120 140 160
BP
D (
mm
)
10
20
30
40
50
60
Figure 1
Legend to Figure 1: Growth of the BPD as a function of gestational age in fetuses with low (n=203), intermediate (n=212) and high (n=203) growth rates respectively.
Intermediate growth rate
Gestational age (days)
60 80 100 120 140 160
BP
D (
mm
)
10
20
30
40
50
60
High growth rate
Gestational age (days)
60 80 100 120 140 160
BP
D (
mm
)
10
20
30
40
50
60

Figure 2
Legend to Figure 2: Box and whiskers plots (median, 25
th centile, 75
th centile and range) of maternal serum
levels of hPL, PGH and IGF-I for fetuses with low, intermediate and high growth rates, ○ represents outliers.

low intermediate high p value*
n mean (SD)/percentage n mean (SD)/percentage n mean (SD)/percentage
203 212 203
143 70% 166 78% 154 75%
BPD first scan (mm) 143 23.6 (2.9) 166 22.6 (2.5) 154 21.4 (2.6) <0.001
BPD second scan (mm) 143 40.5 (2.7) 166 44.2 (2.3) 154 46.2 (3.0) <0.001
Gest age first scan (days) 143 90.1 (4.6) 166 90.7 (4.5) 154 90.3 (4.3) 0.508
Gest age second scan (days) 143 134.4 (6.7) 166 134.6 (4.9) 154 131.0 (6.2) 0.000
138 275.5 (27.1) 165 280.5 (15.8) 153 279.1 (13.9) 0.077
missing 5 1 1
135 3366.4 (641.3) 164 3518.6 (468.2) 153 3631.9 (583.7) <0.001
missing 8 2 1
female 77 57.0% 92 56.1% 46 30% <0.001
male 58 42.9% 72 43.9% 107 70%
missing 8 2 1
caesarean sectio 14 10.3% 12 7.3% 27 17.8% 0.013
vaginal 122 89.7% 152 92.7% 125 82.2%
missing 7 2 2
Outcome
live birth 133 95% 164 99.4'% 153 100.0% 0.002
not live birth† 7 5.0% 1 0.6% 0 0%
missing 3 1 1
*Categorized characteristics were compared using the Chi-square test (more than five observations in all cells) or Fisher’s exact test (five or fewer
observations in one or more cells). Continuous characteristics were compared by means of one-way ANOVA.
†Defined as neonatal death or termination of pregnancy from 18 weeks of gestation until 1 week post partum
Delivery
Cases
Cases with blood sample
Table 1
Prenatal characteristics and pregnancy outcomes of the included pregnancies
Sex
Gest age at delivery (days)
Birth weight (g)

Growth rate: low intermediate high
n mean (SD)/percentage missing n mean (SD)/percentage missing n mean (SD)/percentage missing
Cases with blood sample 143 166 154
Weight (kg) 142 65.3 (11.2) 1 164 64.6 (9.1) 2 154 65.8 (12.3) 0
Height (cm) 142 167.0 (6.3) 1 164 169.1 (6.2) 2 151 168.9 (6.6) 3
BMI 142 23.3 (3.9) 1 163 22.6 (2.9) 3 151 23.1 (4.0) 3
Ethnicity
Caucasian 135 100% 156 97% 151 98%
Other 0 0% 5 3% 3 2%
missing 8 5 0
Parity
nulliparous 83 59% 103 62% 115 75%
parous 58 41% 63 38% 39 25%
missing 2 0 0
yes 25 18% 21 13% 33 21%
no 117 82% 144 87% 121 79%
missing 1 1 0
yes 15 11% 14 9% 8 5%
no 119 89% 150 91% 144 95%
missing 9 2 2
spontaneous 134 96% 161 99% 149 97%
assisted 5 4% 1 1% 5 3%
missing 4 4 0
*Categorized characteristics were compared using the Chi-square test (more than five observations in all cells) or Fisher’s exact test (five or fewer
observations in one or more cells). Continuous characteristics were compared by means of one-way ANOVA.
†Medical conditions includes the following conditions: abruptio placenta (1 pregnancy), diabetes (4 pregnancies), sclerosis (1 pregnancy), epilepsia (1 pregnancy),
raised liver parameters (2 pregnancies), IUGR (2 pregnancies) preeclampsia levi gradu (4 pregnancies),
preeclampsia magno gradu (4 pregnancies) and other rare diseases (18 pregnancies).
Conception
Table 2
Maternal characteristics of the study population
Smoker
Medical condition†

Table 3
(growth rate around the median=reference), using simple linear regression analyses.
†n B t P
log10 hPL (mg/L) lowest highest
constant -0.52 -0,56 -0,49
low growth rate 133 0.02 -0,03 0,07 0.85 0,397
high growth rate 139 -0.01 -0,05 0,04 -0.28 0,781
intermediate growth rate* 156
llog10 PGH (ng/ml)
constant 0.52 0.49 0.55 35.10 <0.001
low growth rate 132 0.03 -0.01 0.08 1.47 0.142
high growth rate 139 0.05 0.00 0.09 2.10 0.037
intermediate growth rate* 156
log10 IGF-I (ng/ml)
constant 2,16 2,14 2,18 222,42 <0.001
low growth rate 127 0,00 -0,03 0,03 -0,26 0,798
high growth rate 134 -0,01 -0,04 0,02 -0,54 0,590
intermediate growth rate* 154
†The number of blood samples analysed for hPL, PGH and IGF-I varies, as the amount of serum left, wasn’t always
suffient to perform the analysis for all three biochemical markers.
Predicted change in serum concentration for hPL, PGH and IGF-I by growth rate group
95% CI
*This parameter is set to zero because it is the reference

Table 4
(estimated by CRL) and growth rate group (growth rate around the median=reference), using multiple linear regression analyses.
†n B t P
log10 hPL (mg/L) lowest highest
constant -0.52 -0.55 -0.50
low growth rate 132 0.03 -0.01 0.07 1.60 0.110
high growth rate 139 0.01 -0.03 0.05 0.56 0.570
intermediate growth rate* 153
CRL (mm from 68.5) 0.01 0.01 0.02 14.73 <0.001
maternal weight (kg from 65) 0.00 0.00 0.00 -2.78 0.006
log10 PGH (ng/ml)
constant 0.52 0.49 0.55
low growth rate 131 0.04 0.00 0.08 1.95 0.052
high growth rate 139 0.05 0.01 0.09 2.63 0.009
intermediate growth rate* 153
CRL (mm from 68.5) 0.01 0.00 0.01 6.01 <0.001
maternal weight (kg from 65) 0.00 0.00 0.00 -2.30 0.022
log10 IGF-I (ng/ml)
constant 2.16 2.14 2.18
low growth rate 126 -0.01 -0.03 0.02 -0.36 0.722
high growth rate 134 -0.01 -0.04 0.02 -0.68 0.499
intermediate growth rate* 151
CRL (mm from 68.5) -0.00 -0.00 0.00 -2.40 0.017
maternal weight (kg from 65) 0.00 -0.00 0.00 1.00 0.318
†The number of blood samples analysed for hPL, PGH and IGF-I varies, as the amount of serum left, wasn’t always suffient to perform the analysis for all three biochemical markers.
suffient to perform the analysis for all three biochemical markers. When records on CRL or maternal weight was
missing, the case was omitted from the analysis.
Predicted change in serum concentration for hPL, PGH and IGF-I by mother's weight (kg), gestational age of child
95% CI
*This parameter is set to zero because it is the reference

1
First trimester growth restriction and uterine artery bloodflow as predictors of adverse pregnancy
outcome
NG Pedersen*, L Sperling†, KR Wøjdemann§, S Olesen Larsen‡, A Tabor*
*Department of Fetal Medicine and Ultrasound, Rigshospitalet, Copenhagen University Hospital, Denmark
† Department of Obstetrics and Gynecology, Herlev University Hospital, Herlev, Denmark
‡ Department of Clinical Biochemistry and Immunology Serum Institute, Copenhagen, Denmark
§ Department of Obstetrics and Gynecology, Roskilde University Hospital, Roskilde, Denmark
Corresponding author:
Dr NG. Pedersen, Department of Fetal Medicine and Ultrasound, Rigshospitalet, Copenhagen University
Hospital, Department 4002, Blegdamsvej 9, 2100 Copenhagen, Denmark
E-mail: [email protected]
Tel: +45 35 45 37 22
Fax: +45 35 45 37 39
Short title: First trimester growth restriction
Key words: CRL, menstrual cycle, growth restriction, ultrasound

2
Abstract
Objective: To estimate the value of screening for fetal growth restriction by performing color Doppler
assessment of uterine arteries at 18-21 and 23-24 weeks for fetuses with a with a discrepancy in gestational
age determined by crown rump length (CRL) and last menstrual period crown rump length of 7 days or
more.
Methods: Women with singleton pregnancies, where the gestational age estimated by CRL at the first
trimester scan was seven days or more smaller than the gestational age estimated by last menstrual period
were identified and invited to the study, and a control group of women with singleton pregnancies, where
the gestational age was either equal to or one day larger were invited to the study. The study entailed the
routine scans, which are Down Syndrome screening in gestational week 11-14 and an anomaly scan in
gestational week 18-21. In addition to the routine scans the participants were offered a growth scan in
gestational week 23-24, where a questionnaire was answered. At the anomaly scan and growth scan
umbilical and uterine artery Doppler flows were measured.
Results: 182 cases and 230 controls were included in the study. There was a significantly higher proportion
of fetuses born with a birth weight below 2500g in the case group compared to the control group (7.4% vs.
3.1%, p=0.048), and in our logistic regression models birth weight below 2500g showed a significant
association to the case group. Having a CRL seven days or more smaller than expected increased the risk of
having a child with a birth weight below 2500g with an odds ratio of 3.29.
At the scan performed week 18-21 the case and control group showed no significant differences in
biometric ultrasound measurements or in placental blood flow characteristics. The biometric
measurements and placental blood flow characteristics were repeated at the scan week 23-24, and again
no significant differences was observed between the two groups.
Conclusion: We were not able to demonstrate a link between poor placental perfusion and first trimester
growth restriction, and therefore do not recommend implementation of uterine or umbilical artery flow
measurements specifically for fetuses with at smaller than expected CRL.

3
Introduction
There is often a discrepancy between gestational age estimated by last menstrual period and CRL.
Common practice in most Ultrasound and Obstetrical departments is to use the date set by CRL,
irrespective of the discrepancy. Several studies have now demonstrated that fetal growth in first half of
pregnancy does vary between fetuses, and different measurements for impaired growth in first half of
pregnancy, such as smaller than expected CRL and decreased early fetal growth rates are associated with
perinatal death, low birth weight and preterm delivery 1-6. This implies that important information on
growth restriction in early pregnancy in many cases is lost, when the gestational age for a fetus where CRL
is smaller than expected, is simply altered.
Pre-eclampsia, fetal growth restriction, placental abruption and some cases of fetal death are believed to
result from impaired placentation in early gestation 7. Deficient placentation is characterized by
inadequate trophoblast invasion into the maternal spiral arteries and failure to develop low-resistance
uteroplacental circulation 8. In the past 30 years Doppler ultrasonographic studies of the uteroplacental
circulation have shown that high impedance to flow is associated with subsequent pre-eclampsia, IUGR and
related complications 9.
Uterine artery volume flow rate increased by more than 3-fold during pregnancy, partly influenced by an
increased artery diameter and reduced resistance to flow 10. In women with pre-eclampsia uteroplacental
blood flow has been shown to be reduced by 50% 11 , and several Doppler studies both in first and second
trimester have demonstrated an association between increased impedance to flow in the uterine arteries
and subsequent development of pre-eclampsia, IUGR and fetal death 12-18.
The umbilical arteries direct 33% of the fetal ventricular output to the placenta at 20 weeks of gestation 19,
and the assessment of umbilical blood flow provides information on blood perfusion of the fetoplacental
unit. Doppler measurement in the umbilical artery reflects the downstream impedance and is extensively
used to identify placental compromise 20. Poor umbilical flow is associated with high risk of perinatal,
death, IUGR, preterm birth and morbidity in the newborn period 21-24.
In this prospective study we wished to investigate if fetuses with a smaller than expected CRL have poorer
perfusion of the placenta, measured by ultrasound Doppler of the uterine and umbilical arteries compared
to a control group, and to investigate if a smaller than expected CRL in combination with poor flow in the
uterine arteries can be used to predict poor outcome
Methods
This study took place at two of the obstetric departments of Copenhagen University Hospital; Herlev
Hospital and Rigshospitalet. All women attending our antenatal services are offered Down Syndrom

4
screening in gestational week 11-14 (a double test i.e. PAPP-A and βhCG and a nuchal translucency scan)
and an anomaly scan in gestational week 18-21 as part of standard antenatal care. Pregnancies where the
gestational age estimated by CRL at the first trimester scan was seven days or more smaller than the
gestational age estimated by last menstrual period were identified, and all women with a discrepancy of
seven days or more were invited to participate in the study. This group of pregnancies is referred to as the
case group. As a control group all pregnancies, where the gestational age estimated by CRL at the first
trimester scan was either equal to or one day larger than the gestational age estimated by last menstrual
period, were identified. As the numbers of pregnancies in the control group meeting these criteria were
more than that of the case group, not all women in the control group were invited. The selection of the
women in the control group was time-wise, so that the number of women in the two groups was kept
approximately equal at all times, this ensured a random selection of the women in the control group.
Inclusion criterions were: pregnancy should be spontaneously conceived; at least three spontaneous
periods before last menstrual period; maximum 7 weeks discrepancy in gestational age when determined
by CRL and last menstrual period; planning to give birth at either one of the two participating hospitals; live
fetus at the time of the anomaly scan; able to understand Danish. At Rigshopitalet we included women
that had their first trimester scan performed in the period February 2008 to February 2009, and at Herlev
Hospital we included women that had their first trimester scan performed in the period May 2008 to
December 2008.
The study entailed the routine scans, a growth scan in gestational week 23-24 and a questionnaire. At the
anomaly scan and growth scan umbilical and uterine artery Doppler flows were measured.
Left and right uterine arteries were identified with the use of color Doppler at the crossover with the
external iliac arteries. The pulse wave Doppler signals were sampled 1 cm cranial to the crossing point.
When three similar consecutive waveforms were obtained, the presence of an early diastolic notch was
noted, the pulsatility index was measured, and the mean PI of the two vessels was calculated. The Doppler
signals from the umbilical artery were sampled as close to the midportion of the cord as possible. When
three similar consecutive waveforms were obtained the pulsatility index was measured. The assessment of
the flow velocity waveform was performed only at the time of the scans. The results of the scans were
available to the patient and the treating clinician as part of standard care. While other fetal surveillance
(e.g. serial biometry for those with abnormal Doppler results etc.) was undertaken, no women received
medical interventions such as aspirin based on the results of the extra scans.
The ultrasound examinations were performed using the following machines: Alfa 10 (Aloka, Meerbusch,
Germany), Logiq 7 / 9, Voluson E8 (General Electric, Milwaukee, WI, USA). The scans were performed by 20

5
different sonographers or doctors experienced in obstetric ultrasound. Data including indications from all
scans performed during the pregnancy were recorded in ASTRAIA.
Following delivery the maternal and neonatal records were reviewed for pre-defined perinatal outcomes.
Perinatal death was defined as: death to a child under one week or a stillborn of 20 or more weeks of
gestation. Intrauterine growth restriction was defined as low birth weight (birth weight below 2500g) or
small for gestational age (birth weight two standard deviations below ultrasonically estimated mean for
gestational age) 25. Very premature was defined as spontaneous live birth week 22-33 of gestation,
premature as spontaneous live birth week 34-36; term as spontaneous live birth week 37-41; and post-
term as spontaneous live birth after 41 weeks of gestation. Pre-eclampsia was defined according to the
guidelines of International Society of Hypertension in Pregnancy. This requires two recordings of diastolic
blood pressure of more than 90mm Hg at least four hours apart in previously normotensive women, and
proteinuria of 300mg or more in 24 hours, or two readings of at least two pluses on dipstick analysis of
midstream or catheter urine specimens if no 24-hour collection is available 26.
Ethics: In accordance with guidelines from the National Health Board of Health and Danish Data Protection
Agency approval from our institutional ethics committees was given and written consent was obtained
from all the participants.
Data were processed using the following software programs: Excel 2007 (Microsoft Corp., Redmond WA,
USA), SPSS 17 (SPSS, Chicago, IL, USA), S-PLUS (4.0, MathSoft Inc, Seattle, Washington, USA).
Statistics:
A group of "normal outcome pregnancies" was defined to include liveborn infants, delivered week 37 - 41
without intrauterine growth restriction, defined as small for gestational age and with no preeclampsia, it
consisted of 338 pregnancies. From the normal outcome group we determined the 5 and 95 % fractiles
either for the observed data as such or, if there was a clear dependence on the estimated gestational age at
the time of the scan, for the deviations (residuals) from the values expected from a linear regression on the
gestational age. This was done separately for values obtained in week 18 - 21 and week 23 - 24. For PAPP-A
measured in week 11 - 14 recorded Multiple of the Medians (MoM) values were used.
Logistic regression models were used to evaluate the impact on the risk of adverse outcome of values
below the 5 % fractile or above the 95 % fractile for the various indicators. Variables entered in the logistic
regression models were: case vs. control; PAPP-A below 5th percentile vs. PAPP-A above 5th percentile
(week 11-14); bilateral or unilateral notch vs. no notch (week 18-21 and week 23-24); mean uterine artery
PI above 95th percentile vs. mean uterine artery PI below 95th percentile (week 18-21 and week 23-24);
abdominal circumference below 5th percentile vs. abdominal circumference above 5th percentile ( week 18-
21 and week 23-24); femur length below 5th percentile vs. femur length above 5th percentile week 18-21

6
and week 23-24); estimated fetal weight below 5th percentile week vs. estimated fetal weight above 5th
percentile (week 23-24). In various steps the regressions were repeated excluding variables without any
significant effect on the outcome leading to a reasonable set of explanatory variables.
Differences in proportions were evaluated using chi-square tests and differences in average values by using
u-tests. All p-values stated are two-sided, and p-values below 5 % are stated as significant.
Results
The inclusion criterions were met by 357 cases and 451 controls, of these 182 cases and 230 controls were
included in the study. 17 cases and 7 controls refused to participate, 124 cases and 198 controls were
never asked, 5 cases did not come to the growth scan in gestational week 23-24, 2 cases emigrated and 27
cases and 16 controls were not included for unknown reasons.
Characteristics of the study population are shown in Table 1. There was a significantly lower percentage of
pregnant women in the case group with a regular menstrual cycle compared to the control group (54% vs.
80 %, p<0.001), and a smaller proportion of the case group had continued education after mandatory
schooling (73% vs. 85%, p=0.003). Otherwise there were no significant differences between the two groups
in maternal characteristics.
Outcome of the study population is illustrated in Table 2. There was a significantly higher proportion of
fetuses born with a birth weight below 2500g in the case group compared to the control group (7.4% vs.
3.1%, p=0.048), otherwise no significant differences in outcome was observed between the two groups.
Although not significant the percentage of intrauterine deaths in the case group was somewhat higher than
that in the control group (1.7% vs. 0.9% p=0.786). In the case group the causes for perinatal death were 1)
Known triploidy where the parents decided to continue the pregnancy, intrauterine death was diagnosed
week 28. 2) Unknown reasons, intrauterine death was diagnosed week 20, mother had previously had two
late miscarriages also in week 20. 3) Unknown reasons, intrauterine death was diagnosed week 36. In the
control group the different causes for perinatal death were: 1) Abruptio placentae, mother was known to
have Neurofibromatosis von Recklinghausen and hypothyroid disease and the child was severely growth
restricted, intrauterine death was diagnosed week 34. 2) Unknown reasons, intrauterine death was
diagnosed week 36.
Ultrasound characteristics of the study population is illustrated in Table 3. At the scan performed week 18-
21 the case and control group showed no significant differences in growth characteristics such as: head
circumference, abdominal circumference and femur length, or in placental blood flow characteristics such
as: number of cases with mean uterine artery PI above 95th percentile, number of cases with bilateral or
unilateral notch in the uterine arteries, number of cases with umbilical artery PI above 95th percentile.
7
The growth and placental blood flow characteristics were repeated at the scan week 23-24, and again no
significant differences was observed between the two groups.
Table 4 shows the results from the logistic regression analysis. Only birth weight below 2500g showed a
significant association to the case group. Having a CRL seven days or more smaller than expected increased
the risk of having a child with a birth weight below 2500g with an odds ratio of 3.29. Doppler flow
characteristics of the uterine arteries such as bilateral or unilateral notch, and mean uterine artery PI above
95th percentile measured week 18-21 was significantly related to the risk of giving birth to a child with a
birth weight either below 2500g or diagnosed as small for gestational age, with odds ratios between 2.48
and 4.51. Abdominal circumference below 5th percentile measured week 18-21 was significantly associated
to the risk of having a child with a birth weight below 2500g, diagnosed as small for gestational age and
spontaneous birth before gestational week 34, with odds ratios between 4.01 and 16.31. Only ultrasound
measurement obtained week 23-24 showed a significant association to pre-eclampsia, measurements
obtained week 18-21 did not. The risk of pre-eclampsia was increased with an odds ratio of 6.32 if bilateral
or unilateral notches were diagnosed week 23-24, and with 2.95 if the estimated fetal weight was below
the 5th percentile in week 23-24. The adverse outcome perinatal death had too few cases for logistic
regression analysis to be performed in a meaningful way.
Discussion
In this study we found no association between smaller than expected CRL as a measure of first trimester
growth restriction and placental perfusion measured by Doppler ultrasound of the uterine and umbilical
arteries in second trimester. The number of cases and controls with high PI or bilateral/unilateral notch in
the uterine arteries or high PI in the umbilical arteries showed no significant differences between the case
and control group at the scans performed week 18-21 and week 23-24.
Only birth weight below 2500g showed a significant association to the case group in our logistic regression
model. Having a CRL seven days or more smaller than expected increased the risk of having a child with a
birth weight below 2500g with an odds ratio of 3.3. In line with these findings we confirmed that fetuses
with a gestational age determined by CRL 7 days or more smaller than expected have about double the risk
of being born with a birth weight below 2500g. The risk is in agreement with previous studies that report
odds ratios between 2 and 3 for very low birth weights, when CRL is smaller than expected1;5;6.
Besides a slightly higher percentage of fetuses with a smaller than expected CRL that were delivered week
34-36 (4% vs. 1%) our study did not exhibit a difference in the overall pattern of week of delivery between
the case and control group, and our logistic regression model did not show any association between a
smaller than expected CRL and delivery before gestational week 34. Previous studies that investigated the

8
association between smaller than expected CRL and week of delivery1;5;6 all report an increased risk for
preterm delivery with odds ratios around two. Two of the previous studies on first trimester growth
restriction and preterm birth1;6;6 are retrospective studies conducted in cohorts of 976 and 4229
pregnancies, the larger cohorts may explain why they were able to demonstrate an association.
The number of pregnancies that developed preeclampsia did not show any significant differences between
the case and the control group, and nor did we find any significant relationship between smaller than
expected CRL and preeclampsia in our logistic regression model. The findings are in line with previous
studies on preeclampsia and first trimester growth restriction, an association has never been reported
between the two1;5;6
The mortality rate for fetuses with a positive heart rate at the ultrasound scan in week 17 was in a Danish
study from 1986 reported to be 0.7% 27. The mortality rate for fetuses with a smaller than expected CRL
was 1.7% in our study. Taking into account that only pregnancies with a positive heart action at the scan in
week 18-21 were included, we find the mortality rate of 1.7% somewhat higher than expected, suggesting
an increased risk of perinatal death in the case group. Two out of the three fetuses from the case group
that suffered intrauterine demise did so before week 29 of gestation, which is in accordance with findings
from one of our previous studies; that growth restriction in first half of pregnancy is a predictor of perinatal
death taking place relatively early in pregnancy 3.
There was a lower percentage of women with a regular menstrual cycle in the case group compared to the
control group, and the length of education was also significantly lower for the case group, otherwise
maternal characteristics between the two groups did not differ. It seems unlikely that the differences in
maternal characteristics between the two groups in any way biased the associations between first
trimester growth restriction and adverse outcome.
To assess first trimester growth by difference in gestational age, when determined by last menstrual period
and CRL requires first of all that the pregnant woman remembers the first day in her last period, and for the
assessment to be as accurate as possible her cycle must have been regular with spontaneous periods the
past months before becoming pregnant. According to previous studies these conditions are only met in 30-
80% of pregnancies 28-31, which is an important weakness of the method used in our study. In addition to
that, many women have delayed ovulation in some cycles, which causes a tendency to overestimate the
length of gestation, thereby adding error to the method 31-34.
In a clinical setting it is difficult to differentiate between women with a regular and irregular cycle when
determining perinatal care. As the purpose of the study was to investigate if a smaller than expected CRL in
combination with uterine artery flow could be used in a clinical setting to predict adverse outcome, women

9
with both regular and irregular cycles were included in the study, it is possible that we would have found a
higher association to adverse outcome had we only included women, who reported a regular cycle.
In conclusion we confirm the association between first trimester growth restriction and higher risk of
delivering a low birth weight infant. We were not able to demonstrate a link between poor placental
perfusion and first trimester growth restriction, and therefore do not recommend implementation of
uterine or umbilical artery flow measurements for fetuses with at smaller than expected CRL. However,
we do recognize that a smaller than expected CRL is a risk factor for giving birth to a low birth weight
neonate, and simple re-dating of pregnancies with a smaller than expected CRL, especially if the woman
has a regular menstrual cycle and is certain of the first day in her last period, can conceal early growth
restriction. On these grounds we do recommend for pregnancies with a smaller than expected CRL that
extra attention is paid to the ultrasound measurements obtained at the anomaly scan, and should these
measurements be at the low end of the normal range scale a follow- up scan to check fetal growth should
be offered to the woman.

10
Reference List
(1) Smith GC, Smith MF, McNay MB, Fleming JE. First-trimester growth and the risk of low birth weight.N Engl J Med 1998; 339(25):1817-1822.
(2) Kallen K. Increased risk of perinatal/neonatal death in infants who were smaller than expected atultrasound fetometry in early pregnancy. Ultrasound Obstet Gynecol 2004; 24(1):30-34.
(3) Pedersen NG, Figueras F, Wojdemann KR, Tabor A, Gardosi J. Early fetal size and growth aspredictors of adverse outcome. Obstet Gynecol 2008; 112(4):765-771.
(4) Pedersen NG, Wojdemann KR, Scheike T, Tabor A. Fetal growth between the first and secondtrimesters and the risk of adverse pregnancy outcome. Ultrasound Obstet Gynecol 2008; 32(2):147-154.
(5) Mook-Kanamori DO, Steegers EA, Eilers PH, Raat H, Hofman A, Jaddoe VW. Risk factors andoutcomes associated with first-trimester fetal growth restriction. JAMA 2010; 303(6):527-534.
(6) Bukowski R, Smith GC, Malone FD, Ball RH, Nyberg DA, Comstock CH et al. Fetal growth in earlypregnancy and risk of delivering low birth weight infant: prospective cohort study. BMJ 2007;836-840.
(7) Khong TY, De WF, Robertson WB, Brosens I. Inadequate maternal vascular response to placentationin pregnancies complicated by pre-eclampsia and by small-for-gestational age infants. Br J ObstetGynaecol 1986; 93(10):1049-1059.
(8) Osol G, Mandala M. Maternal uterine vascular remodeling during pregnancy. Physiology (Bethesda) 2009; 24:58-71.
(9) Campbell S, Pearce JM, Hackett G, Cohen-Overbeek T, Hernandez C. Qualitative assessment ofuteroplacental blood flow: early screening test for high-risk pregnancies. Obstet Gynecol 1986;68(5):649-653.
(10) Thaler I, Manor D, Itskovitz J, Rottem S, Levit N, Timor-Tritsch I et al. Changes in uterine blood flowduring human pregnancy. Am J Obstet Gynecol 1990; 162(1):121-125.
(11) Lunell NO, Nylund LE, Lewander R, Sarby B. Uteroplacental blood flow in pre-eclampsiameasurements with indium-113m and a computer-linked gamma camera. Clin Exp Hypertens B1982; 1(1):105-117.
(12) van den Elzen HJ, Cohen-Overbeek TE, Grobbee DE, Quartero RW, Wladimiroff JW. Early uterineartery Doppler velocimetry and the outcome of pregnancy in women aged 35 years and older.Ultrasound Obstet Gynecol 1995; 5(5):328-333.

11
(13) Martin AM, Bindra R, Curcio P, Cicero S, Nicolaides KH. Screening for pre-eclampsia and fetalgrowth restriction by uterine artery Doppler at 11-14 weeks of gestation. Ultrasound ObstetGynecol 2001; 18(6):583-586.
(14) Gomez O, Martinez JM, Figueras F, Del RM, Borobio V, Puerto B et al. Uterine artery Doppler at 11-14 weeks of gestation to screen for hypertensive disorders and associated complications in anunselected population. Ultrasound Obstet Gynecol 2005; 26(5):490-494.
(15) Campbell S. First-trimester screening for pre-eclampsia. Ultrasound Obstet Gynecol 2005;26(5):487-489.
(16) Albaiges G, Missfelder-Lobos H, Lees C, Parra M, Nicolaides KH. One-stage screening for pregnancycomplications by color Doppler assessment of the uterine arteries at 23 weeks' gestation. ObstetGynecol 2000; 96(4):559-564.
(17) Papageorghiou AT, Yu CK, Bindra R, Pandis G, Nicolaides KH. Multicenter screening for pre-eclampsia and fetal growth restriction by transvaginal uterine artery Doppler at 23 weeks ofgestation. Ultrasound Obstet Gynecol 2001; 18(5):441-449.
(18) Harrington K, Fayyad A, Thakur V, Aquilina J. The value of uterine artery Doppler in the predictionof uteroplacental complications in multiparous women. Ultrasound Obstet Gynecol 2004; 23(1):50-55.
(19) Rudolph AM HMTKBCRN. Studies on the circulation of the previable human fetus. Pediatr Res 1971;5:452-465.
(20) Alfirevic Z, Neilson JP. Doppler ultrasonography in high-risk pregnancies: systematic review withmeta-analysis. Am J Obstet Gynecol 1995; 172(5):1379-1387.
(21) Trudinger BJ, Cook CM, Giles WB, Ng S, Fong E, Connelly A et al. Fetal umbilical artery velocitywaveforms and subsequent neonatal outcome. Br J Obstet Gynaecol 1991; 98(4):378-384.
(22) Burke G, Stuart B, Crowley P, Scanaill SN, Drumm J. Is intrauterine growth retardation with normalumbilical artery blood flow a benign condition? BMJ 1990; 300(6731):1044-1045.
(23) Soothill PW, Ajayi RA, Campbell S, Nicolaides KH. Prediction of morbidity in small and normallygrown fetuses by fetal heart rate variability, biophysical profile score and umbilical artery Dopplerstudies. Br J Obstet Gynaecol 1993; 100(8):742-745.
(24) Gaziano EP, Knox H, Ferrera B, Brandt DG, Calvin SE, Knox GE. Is it time to reassess the risk for thegrowth-retarded fetus with normal Doppler velocimetry of the umbilical artery? Am J ObstetGynecol 1994; 170(6):1734-1741.
(25) Marsal K, Persson PH, Larsen T, Lilja H, Selbing A, Sultan B. Intrauterine growth curves based onultrasonically estimated foetal weights. Acta Paediatr 1996; 85(7):843-848.
(26) Brown MA, Lindheimer MD, de SM, Van AA, Moutquin JM. The classification and diagnosis of thehypertensive disorders of pregnancy: statement from the International Society for the Study ofHypertension in Pregnancy (ISSHP). Hypertens Pregnancy 2001; 20(1):IX-XIV.

12
(27) Tabor A, Philip J, Madsen M, Bang J, Obel EB, Norgaard-Pedersen B. Randomised controlled trial ofgenetic amniocentesis in 4606 low-risk women. Lancet 1986; 1(8493):1287-1293.
(28) Taipale P, Hiilesmaa V. Predicting delivery date by ultrasound and last menstrual period in earlygestation. Obstet Gynecol 2001; 97(2):189-194.
(29) Kramer MS, McLean FH, Boyd ME, Usher RH. The validity of gestational age estimation bymenstrual dating in term, preterm, and postterm gestations. JAMA 1988; 260(22):3306-3308.
(30) Verburg BO, Steegers EA, De RM, Snijders RJ, Smith E, Hofman A et al. New charts for ultrasounddating of pregnancy and assessment of fetal growth: longitudinal data from a population-basedcohort study. Ultrasound Obstet Gynecol 2008; 31(4):388-396.
(31) Geirsson RT, Busby-Earle RM. Certain dates may not provide a reliable estimate of gestational age.Br J Obstet Gynaecol 1991; 98(1):108-109.
(32) Saito M, Yazawa K, Hashiguchi A, Kumasaka T, Nishi N, Kato K. Time of ovulation and prolongedpregnancy. Am J Obstet Gynecol 1972; 112(1):31-38.
(33) Walker EM, Lewis M, Cooper W, Marnie M, Howie PW. Occult biochemical pregnancy: fact orfiction? Br J Obstet Gynaecol 1988; 95(7):659-663.
(34) Guerrero R, Florez PE. The duration of pregnancy. Lancet 1969; 2(7614):268-269.

Table 1
Maternal characteristics of study population
Case group Control group
mean (SD) or n (%) mean (SD) or n (%) p-value unknown
Maternal age at enrollment (years) 29.8 (4.9) 30.4 (4.5) NS 1
Maternal weight at enrollment (kg) 68.7 (16.6) 67.8 (13.6) NS 1
Maternal height (cm) 166.6 (11.1) 167.9 (9.7) NS 1
Body Mass Index 24.5 (5.7) 24.6 (12.8) NS 1
Caucasians 219/226 (96.9) 170/180 (94.4) NS 6
Nulliparous 61/171 (35.7) 74/225 (32.9) NS 16
Smoker 16/181 (8.8) 18/230 (7.8) NS 1
Education after mandatory schooling 126/172 (73.3) 193/226 (85.4) 0.003 14
Regular menstrual cycle 69/128 (53.9) 127/159 (79.9) <0.001 125
Cases with maternal disease
Hyperthyroid disease 2/182 (1.10) 0/230 (0.00)
Hypothyroid disease 1/182 (0.55) 4/230 (1.74)
Diabetes 6/182 (3.30) 4/230 (1.74) NS 0
Non Significant (NS), Standard Deviation (SD), numbers (n)
The maternal characteristics were dichotomized into: caucasians vs. other ethnich origin; nuliparous vs. parous; smoker vs. non-smoker;
education after mandatory schooling vs. no education after mandatory schooling; regular menstrual cycle vs. unregular menstrual cycle
pre-eclampsia vs. no preeclampsia; diabetes vs. no diabetes. The overall distrubution for hyper, hypo and no thyroid disease
was compared between cases and controls
NS 0

Table 2
Outcome of study population
Case group Control group
mean (SD) or n (%) mean (SD) or n (%) p-value unknown
Intrauterine death 3/180 (1.7) 2/229 (0.9) NS 3
Birth weight (g) 3441.6 (626.23) 3508.52 (590.0) NS 9
Birth weigth < 2500g 13/176 (7.4) 7/227 (3.1) 0.048 9
Small for gestational age 11/176 (6.2) 6/225 (2.7) 0.077 11
Placental weight at birth (g) 682.5 (164.5) 684.6 (144.4) NS 65
Head circumference at birth (cm) 35.2 (2.6) 35.2 (2.4) NS 62
Length at birth (cm) 51.6 (3.4) 52.0 (2.8) NS 20
Female infant 99/177 (55.9) 105/227 (46.3) 0.067 8
Gestational age at delivery (weeks)§
22-33 1/122 (0.8) 2/159 (1.3)
34-36 5/122 (4.1) 2/159 (1.3)
37-41 114/122 (93.4) 149/159 (93.7)
42-43 2/122 (1.6) 6/159 (3.8)
Cases with pre-eclampsia 9/182 (4.9) 8/230 (3.5) NS 0
Non Significant (NS), Standard Deviation (SD), Numbers (n)
§ Only spontaneous delivery were included † 281 pregnancies were recorded as spontanous births, all of them had week of delivery registered
The outcome variables were dichtomized into: l ive birth vs. intrauterine death; birth weight < 2500g vs. birth weigth > 2500g;
birth weight < mean - 2SD vs. birth weight > mean - 2SD; cases with preeclampsia vs. cases without preeclampsia; female vs. male.
The overall distribution of spontaneous delivery week: 22-33, 34-36, 37-41 and 42-43 was compared between cases and controls.
NS †

Table 3
Ultrasound characteristics of study population
Scan week 11-14 Scan week 18-21 Scan week 23-24
n (%) p-value unknown mean (SD) or n (%) p-value unknown mean (SD) or n (%) p-value unknown
Numbers scanned
case 182/182 (100.0) 182/182 (100.0) 179/182 (98.4)
control 230/230 (100.0) 230/230 (100.0) 226/230 (98.3)Gestational age
case 86.9 (5.5) 136.8 (5.0) 168.0 (5.1)
control 89.0 (3.5) 138.4 (4.3) 168.1 (4.3)
PAPP-A below 5th centile§
case 9/179 (5.0)
control 13/228 (5.7)
Head circumference†
case 167.8 (10.2) 218.5 (11.5)
control 171.3 (8.5) 220.2 (9.4)
Abdominal circumference†
case 145.7 (11.2) 193.8 (13.7)
control 148.9 (10.2) 195.0 (10.7)
Femur length†
case 30.3 (2.7) 42.5 (2.9)
control 31.7 (2.3) 42.6 (2.2)
Estimated fetal weight (%)
case -4.2 (10.12)
control -3.2(8.5)
Mean uterine artery PI above 95th percentile†
case 10/160 (6.3) 14/178 (7.9)
control 11/214 (5.1) 12/226 (5.3)
Uterine arteries bilateral or unilateral notch‡
case 28/119 (23.5) 27/155 (17.4)
control 38/169 (22.5) 25/194 (12.9)
Umbilical artery PI above 95th percentile†
case 11/168 (6.5) 4/174 (2.3)
control 7/212 (3.3) 6/223 (2.6)
Abbreviations: Non Significant (NS), Standard Deviation (SD), Numbers (n)§ Gestational age was adjusted for with the use of MoM values
† If there was a clear dependence on gestational age P values were adjusted for gestational age with the use of linear regression
‡ 33 pregnancies week 18-21 and 52 pregnancies week 23-24 were omitted from this analysis as they had the record: "suggestion of notch"
NS NS
NS NS
91‡
7<0.001
NS
<0.0010 0
5
NS
NS
NS
NS
NS
NS
NS
1
1
NS
NS
NS
1532
38 8
7
11‡
7
1 8
13

Table 4
Prediction of adverse outcome
B SE OR 95% CI p-value
Birth weigth < 2500g
Case 1.19 0.59 3.29 1.06-10.26 0.036
Bilateral or unilateral notch (week 18-21) 0.91 0.58 2.48 0.77-7.96 0.120
Abdominal circumference below 5th percentile (week 18-21) 1.39 0.66 4.01 1.07-15.05 0.036
Femur length below 5th percentile (week 23-24) 1.39 0.66 4.40 1.10-17.64 0.033
Small for gestational age
Bilateral or unilateral notch (week 18-21) 1.11 0.63 3.02 0.86-10.64 0.079
Mean uterine artery PI above 95th percentile (week 18-21) 1.51 0.74 4.51 1.02-20.00 0.043
Abdominal circumference below 5th percentile (week 18-21) 1.95 0.67 7.04 1.86-26.67 0.003
Spontaneous birth before gestational week 34
Abdominal circumference below 5th percentile (week 18-21) 2.79 1.03 16.31 2.07-128.57 0.006
Pre-eclampsia
Bilateral or unilateral notch (week 23-24) 1.84 0.55 6.32 2.09-19.06 <0.001
Estimated fetal weight below 5th percentile (week 23-24) 1.08 0.72 2.95 0.70-12.59 0.134
Regression Coefficient (B), Standard Error (SE), Odds ratio (OR), Confindence Interval (CI)

SpørgeSkemaOM TIDLIGERE GRAVIDITETER & HELBRED
NAVN:CPR:FØDESTED:
1. Hvilken dato besvarer du dette spørgeskema? dato: / år:
2. Hvornår er din termin ? ( Vi ønsker datoen for den termin, du har fået fastsat ved nakkefolds skanningen) dato: / år:
3. Hvis du ikke kender din terminsdato, sæt kryds her:
4. Hvilket land er du født i:
5. Hvilket land / lande stammer dine forældre fra:
6. Hvor gammel er du? år
7. Hvor høj er du? cm
8. Hvad vejede du lige før du blev gravid ? kg
Hvis du ikke kender den vægt, du havde lige før du blev gravid, sæt kryds her 9. Hvor mange kilo havde du cirka taget på, da du i denne graviditet fik taget blodprøven, der sammen med nakkefoldsskanningen vurderer risikoen for Downs syndrom. Jeg havde taget kg på Hvis du ikke kender den vægt, du havde, da du fik taget blodprøven i denne graviditet, sæt kryds her
10. Var du op til den nuværende graviditet behandlet for barnløshed (med hormoner/IVF)? Sæt kun ét kryds JA NEJ
Læge Nina Gros Pedersen Professor, Overlæge Ann TaborKlinik for føtalmedicin og ultralydskanning Rigshospitalet
1
CRL&FLOW

DE FØLGENDE SPØRGSMÅL HANDLER OM DIN MENSTRUATION
11. Mange kvinder oplever lidt pletblødninger i trusserne før den egentlige menstruation starter, er dette tilfældet for dig ? Sæt kryds og svar ved enten JA eller NEJ neden for NEJ ◊ Hvad var datoen for første dag i din sidste menstruation ? dato: / år:
JA ◊ For dig, som har lidt pletblødninger inden den egentlige menstruation starter, er den første dag i din sidste menstruation den første af to dage i træk, hvor du har blødt begge dage, og blødningen i mindst én af dagene har været kraftigere end en pletblødning. Hvad var datoen for første dag i din sidste menstruation før du blev gravid? dato: / år:
Hvis du ikke kan huske datoen for første dag i din sidste menstruation, sæt kryds her
12. Har din cykluslængde* i de sidste tre måneder før denne graviditet været det samme antal dage? Sæt kryds og svar ved enten JA eller NEJ neden for
JA ◊ Hvor mange dage har din cykluslængde været ? dage
NEJ ◊ Den korteste cykluslængde jeg har haft inden for de sidste tre måneder var cirka dage Den længste cykluslængde jeg har haft inden for de sidste tre måneder var cirka dage
Hvis du ikke kan huske hvor mange dage din cykluslængde har været inden for de sidste tre måneder, sæt kryds her
* Hvad er en cykluslængde ? Længden af en menstruationscyklus er antallet af dage mellem første dag i en menstruation tilførste dag i næste menstruation. Har du for eksempel første dag i en menstruation den 1. august og første dag i den næstemenstruation den 30. august er cykluslængden 29 dage.
13. Passer et af de fire nedenstående udsagn på dig ? Sæt kryds ved enten JA eller NEJ neden under de fire udsagn.
1. Jeg har haft mindre end 3 menstruationer siden sidste graviditet 2. Jeg har haft mindre end 3 menstruationer siden ophør med P-piller 3. Jeg har haft mindre end 3 menstruationer siden fjernelse af spiral 4. Jeg havde P-ring, da jeg blev gravid
NEJ ◊ ingen af de fire ovenstående udsagn passer på mig
JA ◊ mindst et af de fire ovenstående udsagn passer på mig Hvis du har sat kryds ved JA, hvilket nummer har det udsagn, der passer på dig ? Udsagn nummer : 1 2 3 4 ( sæt ring om nummeret )
2CRL&FLOW

DE NÆSTE SPØRGSMÅL HANDLER OM DIN NUVÆRENDE GRAVIDITET
14. Har du haft pletblødning / blødning i din nuværende graviditet Sæt kryds og svar ved enten JA eller NEJ neden for JA ◊ gå videre til spørgsmål 15 NEJ ◊ gå videre til spørgsmål 18
15. Hvis du har blødt i din nuværende graviditet, har du så... (Sæt ét kryds, hvor det er relevant) 1. blødt før uge 12 af graviditeten 2. blødt efter uge 12 af graviditeten 3. blødt både før og efter uge 12 af graviditeten
16. Hvor mange dage har du blødt i alt ? Jeg har blødt cirka dage i alt
17. Hvor kraftig var din blødning / blødninger ? Sæt kun ét kryds 1. Der har kun været lidt pletblødning 2. Der har minimum været én blødning, der var lige så kraftig som en menstruationsblødning
DE FØLGENDE SPØRGSMÅL HANDLER OM TIDLIGERE GRAVIDITETER
18. Har du været gravid før, dette omfatter også graviditeter, som er endt med abort eller dødfødsel. Sæt kun ét kryds JA ◊ gå videre til spørgsmål 19 NEJ ◊ gå videre til spørgsmål 37
19. Hvor mange gange har du været gravid (dette omfatter også graviditeter som er endt med abort eller dødfødsel) ? Jeg har været gravid gange
20. Hvor mange levende børn har du født? Jeg har født levende børn
21. Er nogen af dine graviditeter endt med spontan abort eller dødfødsel ? Sæt kun ét kryds JA ◊ gå videre til spørgsmål 22 NEJ ◊ gå videre til spørgsmål 23
3CRL&FLOW

22. I hvilken uge af graviditeten endte graviditeten med spontan abort eller dødfødsel? Udfyld kun for de graviditeter hvor det har relevans:
1. Min første graviditet endte i abort eller dødfødsel i uge af graviditeten 2. Min anden graviditet endte i abort eller dødfødsel i uge af graviditeten 3. Min tredje graviditet endte i abort eller dødfødsel i uge af graviditeten 4. Min fjerde graviditet endte i abort eller dødfødsel i uge af graviditeten 5. Min femte graviditet endte i abort eller dødfødsel i uge af graviditeten 6. Min sjette graviditet endte i abort eller dødfødsel i uge af graviditeten
OM DIN FØRSTE FØDSEL
23. Var der nogen af følgende komplikationer ? (Sæt et kryds ved hver række) JA NEJ a. Svangerskabsforgiftning b. Forhøjet blodtryk c. For tidlig fødsel Hvis JA til punkt c, i hvilken uge af graviditeten blev barnet / børnene født: uge af graviditeten d. Andre komplikationer Hvis JA til andre komplikationer, skriv venligst hvilke
24. Fødte du tvillinger ? JA ◊ gå videre til spørgsmål 26 NEJ ◊ gå videre til spørgsmål 25
25. Hvor meget vejede barnet ? gram Hvis du ikke ved hvor meget barnet vejede, sæt kryds her
26a. Hvor meget vejede tvilling 1 ? gram Hvis du ikke ved hvor meget tvilling 1 vejede, sæt kryds her
26b. Hvor meget vejede tvilling 2 ? gram Hvis du ikke ved hvor meget tvilling 2 vejede, sæt kryds her
OM DIN ANDEN FØDSEL (Hvis du ikke har født to levende børn, gå videre til spørgsmål 37) 27. Var der nogen af følgende komplikationer ? JA NEJ a. Svangerskabsforgiftning b. Forhøjet blodtryk c. For tidlig fødsel Hvis JA til punkt c, i hvilken uge af graviditeten blev barnet / børnene født: uge af graviditeten d. Andre komplikationer Hvis JA til andre komplikationer, skriv venligst hvilke
28. Fødte du tvillinger ? JA ◊ gå videre til spørgsmål 30 NEJ ◊ gå videre til spørgsmål 29
4CRL&FLOW

5
29. Hvor meget vejede barnet ? gram Hvis du ikke ved hvor meget barnet vejede, sæt kryds her
30. Hvor meget vejede tvilling 1 ? gram Hvis du ikke ved hvor meget tvilling 1 vejede, sæt kryds her
31. Hvor meget vejede tvilling 2 ? gram Hvis du ikke ved hvor meget tvilling 2 vejede, sæt kryds her
OM DIN TREDJE FØDSEL (Hvis du ikke har født tre levende børn, gå videre til spørgsmål 37) 32. Var der nogen af følgende komplikationer ? JA NEJ a. Svangerskabsforgiftning b. Forhøjet blodtryk c. For tidlig fødsel Hvis JA til punkt c, i hvilken uge af graviditeten blev barnet / børnene født: uge af graviditeten d. Andre komplikationer Hvis JA til andre komplikationer, skriv venligst hvilke
33. Fødte du tvillinger ? JA ◊ gå videre til spørgsmål 35 NEJ ◊ gå videre til spørgsmål 34
34. Hvor meget vejede barnet ? gram Hvis du ikke ved hvor meget barnet vejede, sæt kryds her
35. Hvor meget vejede tvilling 1 ? gram Hvis du ikke ved hvor meget tvilling 1 vejede, sæt kryds her
36. Hvor meget vejede tvilling 2 ? gram Hvis du ikke ved hvor meget tvilling 2 vejede, sæt kryds her
HER KOMMER ET PAR SPØRGSMÅL OM DIN EGEN FØDSEL
37. Hvad vejede du, da du selv blev født ? gram Hvis du ikke kender din vægt, besvar venligst spørgsmål 38
38. Jeg kender ikke min nøjagtige fødselsvægt, men jeg mener, at jeg vejede: Sæt kun ét kryds Mindre end 3000 gram Mellem 3000 og 4000 gram Mellem 4000 og 4500 gram Mere end 4500 gram Ved ikke
CRL&FLOW

6
DE FØLGENDE SPØRGSMÅL HANDLER OM DIT HELBRED OG MEDICIN
39. Havde du en kronisk sygdom, da du blev gravid ? Sæt kun ét kryds JA NEJ ◊ gå videre til spørgsmål 42
40. Havde du nogen af følgende sygdomme, da du blev gravid ? Sæt evt. flere kryds a. Forhøjet blodtryk f. Nyresygdom b. Hjertesygdom g. Epilepsi c. Lungesygdom/astma h. Gigt d. Sukkersyge i. Psykisk sygdom e. Stofskiftesygdom j. Anden sygdom
41. Hvis du havde en anden sygdom, skriv hvilken
42. Har du i løbet af graviditeten taget medicin oftere end 1 gang om ugen ? Sæt kun ét kryds (Se bort fra jern, vitaminer og kalk) JA NEJ ◊ gå videre til spørgsmål 45
43. Hvilken medicin har du taget oftere end 1 gang om ugen i løbet af denne graviditet ? Sæt kryds i ét eller flere felter, hvis du har taget den pågældende medicin.
43a. Medicin mod (a-l): a. Forhøjet blodtryk b. Hjertesygdom c. Lungesygdom/astma d. Sukkersyge e. Stofskiftesygdom f. Nyresygdom g. Epilepsi h. Gigt i. Psykisk sygdom . j. Infektion (ikke blærebetændelse) k. Blærebetændelse l. Hæmoroider
43b. Anden medicin (m-q): m. Smertestillende medicin n. Beroligende medicin o. Narkotiske stoffer p. Amfetamin q. Kokain
43c. Naturmedicin (r): r. Fiskeolie
44. Skriv venligst navnet/navnene og dosis på den medicin du har taget:
CRL&FLOW

7
HER FØLGER NOGLE SPØRGSMÅL OM UDDANNELSE OG ARBEJDE
45. Hvilken almen skolegang har du? Sæt kun ét kryds a. Går stadig i skole b. 7 års skolegang eller mindre c. 8-9 års skolegang d. 10 års skolegang e. Studenter eksamen, HF eksamen (inklusiv HHX og HTX) f. Andet
46. Har du afsluttet en uddannelse efter din almene skolegang? Sæt kun ét kryds JA ◊ gå videre til spørgsmål 47 NEJ ◊ gå videre til spørgsmål 48
47. Hvilken uddannelse har du afsluttet? Sæt kun ét kryds (Hvis du har flere uddannelser, sæt da kun kryds ved den længstvarende afsluttede uddannelse.) a. Specialarbejderuddannelse b. Handelsskolernes grunduddannelse (HG) / basisår i EFG-uddannelse c. Lærlinge-, EFG- eller HG-uddannelse d. Anden faglig uddannelse e. Kort videregående uddannelse, under 3 år f. Mellemlang videregående uddannelse 3-4 år g. Lang videregående uddannelse, over 4 år
48. Jeg har ingen afsluttet uddannelse fordi: Sæt kun ét kryds (Hvis du har afluttet en uddannelse, gå da videre til spørgsmål 49) 1. Jeg aldrig har påbegyndt en uddannelse 2. Jeg stadig er under uddannelse 3. Jeg har afbrudt en uddannelse
49. Hvad er din erhvervsmæssige stilling ? Sæt kun ét kryds a. Selvstændig erhvervsdrivende (dvs. egen virksomhed eller forretning) Skriv antal underordnede/ansatte b. Funktionær/tjenestemand (offentligt ansat) Skriv antal underordnede/ansatte c. Funktionær (privat ansat) Skriv antal underordnede/ansatte d. Faglært arbejder Skriv antal underordnede/ansatte e. Specialarbejder Skriv antal underordnede/ansatte f. Arbejdsløs g. Medhjælpende ægtefælle/sambo, hjemmegående husmor h. Lærling / efg-elev i. På bistandshjælp / A-kasse j. Studerende angiv fag: k. Skoleelev l. Barsel / forældreorlov angiv stilling, når du ikke er på orlov: m. Andet
CRL&FLOW

8
50. Hvad er din stilling mere nøjagtigt? ( Skriv venligst mere nøjagtigt, fx oversygeplejerske, ikke bare ansat i sundhedsvæsenet eller lærer – ikke blot ansat på skole):
HER KOMMER NOGLE SPØRGSMÅL VEDRØRENDE RYGEVANER
51. Ryger du? Sæt kun ét kryds a. Ja, dagligt b. Ja, men der er dage, hvor jeg ikke ryger c. Nej, jeg holdt op indenfor de første 3 mdr. af graviditeten, gå videre til 54 d. Nej, jeg er holdt op før graviditeten, gå videre til spørgsmål 53 e. Nej, jeg har aldrig røget, gå videre til spørgsmål 55
52. Hvis du er ryger nu: Skriv antal ud for hvor meget, du ryger. Skriv 0, hvis du ikke ryger det pågældende. a. Cigaretter: cigaretter pr. dag b. Pibe: pibestop pr. dag c. Hash: antal gange pr. uge 53. Hvis du stoppede med at ryge før du blev gravid: Hvor mange måneder før du blev gravid stoppede du med at ryge ? måneder
54. Hvis du er stoppet med at ryge før du blev gravid - eller hvis du er stoppet med at ryge inden for de 3 første måneder af graviditeten: Skriv antal ud for hvor meget, du røg den sidste måneds tid inden du stoppede. Skriv 0, hvis du ikke ryger det pågældende. a. Cigaretter: cigaretter pr. dag b. Pibe: pibestop pr. dag c. Hash: antal gange pr. uge
CRL&FLOW

9
HER KOMMER NOGLE SPØRGSMÅL OM KOST OG DRIKKEVARER HER I GRAVIDITETEN
55. Hvilken kost spiser du her i graviditeten ? Sæt kun ét kryds a. Almindelig varieret b. Almindelig, men ikke særlig varieret c. Vegetarisk, dog fisk og fjerkræ d. Vegetarisk, dog mælk og æg e. Kun kost fra planteriget (veganisk)
56. Drikkevarer. Hvad drikker du nu på dette tidspunkt i graviditeten? Skriv et tal på hver linje for at vise, hvad du drikker (kaffe, te osv.), skriv 0, hvis du ikke drikker det pågældende a. Antal krus kaffe dagligt krus dagligt b. Antal krus te dagligt krus dagligt c. Antal liter cola om ugen liter pr. uge d. Antal almindelig øl om ugen flasker pr. uge e. Antal stærke øl om ugen flasker pr. uge f. Antal glas vin om ugen glas pr. uge g. Antal genstande spiritus om ugen genst. pr. uge
57. Slik m.v. Spiser du på dette tidspunkt i graviditeten: Sæt kun ét kryds i hver linie: JA NEJ slik chips
58. Hvor meget slik/chips spiser du nu på dette tidspunkt i graviditeten? Sæt evt. flere kryds, hvis du spiser både slik og chips
a. Slik dagligt b. Slik 1-3 gange om ugen c. Slik sjældnere end 1 gang om ugen d. Chips dagligt e. Chips 1-3 gange om ugen f. Chips sjældnere end 1 gang om ugen
Mange tak fordi du tog dig tid til at udfylde skemaet.
Venlig hilsen
Læge Nina Gros Pedersen Professor, overlæge Ann TaborKlinik for føtalmedicin og ultralydskanningRigshospitalet
CRL&FLOW


