Embed Size (px)
Citation preview
INVERTED BASE PAVEMENT STRUCTURES
A Thesis Presented to
The Academic Faculty
by
Douglas D. Cortes Avellaneda
In Partial Fulfillment of the Requirements for the Degree of
Doctor in Philosophy in the School of Civil and Environmental Engineering
Georgia Institute of Technology December 2010
PREVIEW

UMI Number: 3451229
All rights reserved
INFORMATION TO ALL USERS The quality of this reproduction is dependent upon the quality of the copy submitted.
In the unlikely event that the author did not send a complete manuscript
and there are missing pages, these will be noted. Also, if material had to be removed, a note will indicate the deletion.
UMI 3451229
Copyright 2011 by ProQuest LLC. All rights reserved. This edition of the work is protected against
unauthorized copying under Title 17, United States Code.
ProQuest LLC 789 East Eisenhower Parkway
P.O. Box 1346 Ann Arbor, MI 48106-1346
PREVIEW

INVERTED BASE PAVEMENT STRUCTURES
Approved by:
Dr. J. Carlos Santamarina, Advisor School of Civil and Environmental Engineering Georgia Institute of Technology
Dr. David Frost School of Civil and Environmental Engineering Georgia Institute of Technology
Dr. Susan Burns School of Civil and Environmental Engineering Georgia Institute of Technology
Dr. Guillermo Godsztein School of Mathematics Georgia Institute of Technology
Dr. Shane Buchanan Vulcan Materials Company
Dr. Paul Mayne School of Civil and Environmental Engineering Georgia Institute of Technology
Date Approved:
PREVIEW

A German y Maria
la semilla y la tierra
PREVIEW
iv
ACKNOWLEDGEMENTS
The culmination of this work is a testament to the love and dedication of my
parents German and Maria, the support of my siblings Lynda, Glen and Howard, and the
resilience that defines my extended family’s character. Theirs is the light that shines
through the darkest moments and the compass of my steps.
The contributions of my thesis committee have enriched this manuscript. To Dr.
Burns, Dr. Buchannan, Dr. Frost, Dr. Goldsztein, and Dr. Mayne my most sincere
appreciation. I would like to especially acknowledge the role of my advisor Dr.
Santamarina. From the time I joined his research group as an undergraduate, Carlos has
always guided me with implacable patience. I feel privileged to have spent these years
learning from such an exceptional scientist, lecturer, and human being. His mentorship
has permanently influenced my life.
Thanks to Brett, Sami and Jaime, the good friends with whom I sailed into this
journey, and my friends in the geosystems group from whom I have learned so many
valuable lessons. My gratitude to Tae-Sup, Hosung, Maria Cristina, Pierre, Veronica,
Nico, Jong-Won, Jaewon, Minsu and Ba-Te. To Andy and Mike, thanks for their
collaboration in the development of devices. Thanks also to the Colombian community at
Georgia Tech for so many wonderful moments. My appreciation to Joan, Johanna, Paola,
Lina, Palomita, Yuley, Manuel, Will, Ricardo, Jaime, Alejandro, Mario-Camilo, Lucio,
Fernando, Cesar, Seunghee, and Sheng.
Finally, I would like to humbly express my immense gratitude and love to Sara,
the ballerina whose motion harmoniously turned harsh winters into appeasing springs.
PREVIEW
v
TABLE OF CONTENTS
Page
ACKNOWLEDGEMENTS iv
LIST OF TABLES x
LIST OF FIGURES xi
SUMMARY xvii
CHAPTERS
1. INTRODUCTION 1
1.1. Motivation and Significance 1
1.2. Thesis Organization 3
2. THE LAGRANGE CASE STUDY 5
2.1. Introduction 5
2.2. Project Description 6
2.3. Laboratory and Field Material Characterization 7
2.3.1. Subgrade 7
2.3.2. Cement-Treated Base 10
2.3.3. Unbound Aggregate Base 12
2.3.4. Asphalt Concrete 13
2.4. Discussion 13
2.5. Conclusions 14
3. NEW FIELD TEST 26
3.1. Introduction 26
3.2. Review of Available Characterization Methods 27
3.2.1. Laboratory Methods 27
PREVIEW
vi
3.2.2. Field Methods 28
3.2.3. Summary of Observations 29
3.3. Determination of Stiffness-Stress Parameters – Test Design 30
3.3.1. Test Design – Physical Considerations 30
3.3.2. Sensor Installation 31
3.4. Test Results 32
3.4.1. Laboratory Prototype – Zero-Lateral-Strain P-Wave Velocity Measurements 32
3.4.2. Field P-Wave Velocity Measurements - Inverted Base Pavement Structure 33
3.5. Analysis and Discussion 35
3.5.1. Determination of Stiffness-Stress Parameters from Laboratory Measurements 36
3.5.2. Determination of Stiffness-Stress Parameters from In-Situ Measurements 36
3.6. Summary and Conclusions 38
4. UNBOUND AGGREGATE BASES: CONSTITUTIVE MODEL SELECTION AND CALIBRATION 48
4.1. Introduction 48
4.2. Resilient Modulus – A Granular Media Perspective 49
4.2.1. State of Stresses 49
4.2.2. Density 50
4.2.3. Grain Size Distribution 51
4.2.4. Moisture Content 51
4.2.5. Particle Shape 52
4.3. Available Constitutive Models 52
4.4. Model Selection 54
PREVIEW
vii
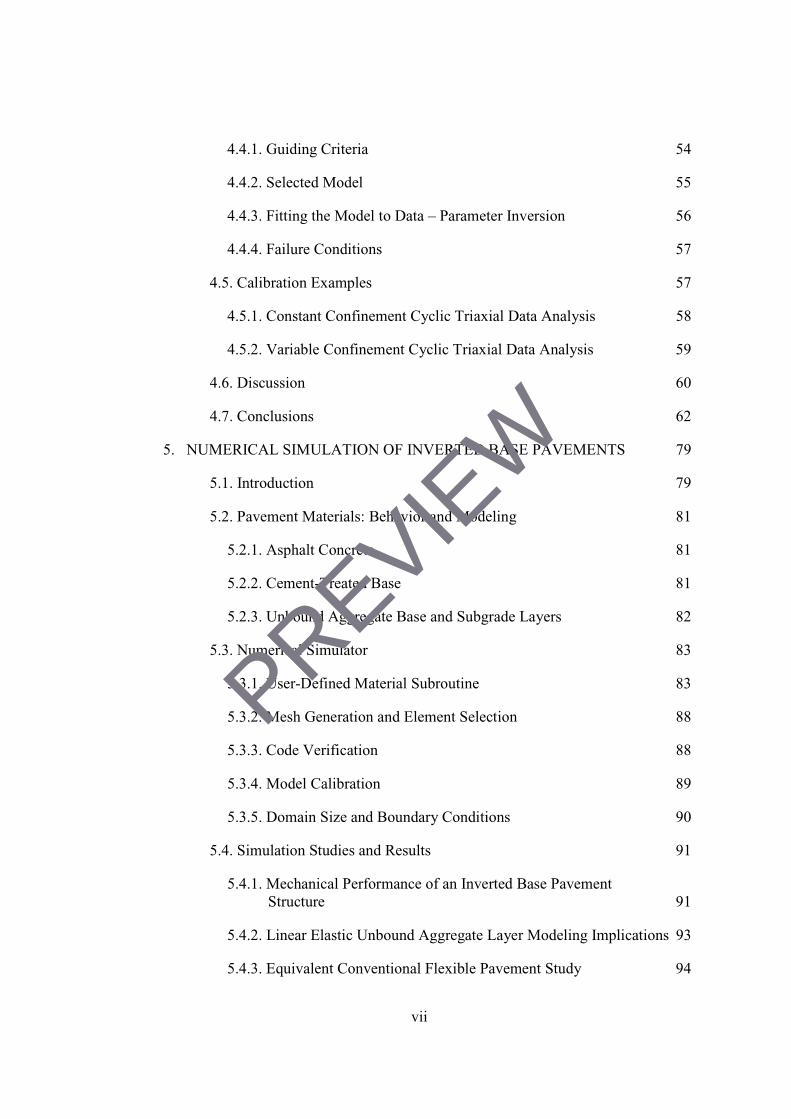
4.4.1. Guiding Criteria 54
4.4.2. Selected Model 55
4.4.3. Fitting the Model to Data – Parameter Inversion 56
4.4.4. Failure Conditions 57
4.5. Calibration Examples 57
4.5.1. Constant Confinement Cyclic Triaxial Data Analysis 58
4.5.2. Variable Confinement Cyclic Triaxial Data Analysis 59
4.6. Discussion 60
4.7. Conclusions 62
5. NUMERICAL SIMULATION OF INVERTED BASE PAVEMENTS 79
5.1. Introduction 79
5.2. Pavement Materials: Behavior and Modeling 81
5.2.1. Asphalt Concrete 81
5.2.2. Cement-Treated Base 81
5.2.3. Unbound Aggregate Base and Subgrade Layers 82
5.3. Numerical Simulator 83
5.3.1. User-Defined Material Subroutine 83
5.3.2. Mesh Generation and Element Selection 88
5.3.3. Code Verification 88
5.3.4. Model Calibration 89
5.3.5. Domain Size and Boundary Conditions 90
5.4. Simulation Studies and Results 91
5.4.1. Mechanical Performance of an Inverted Base Pavement Structure 91
5.4.2. Linear Elastic Unbound Aggregate Layer Modeling Implications 93
5.4.3. Equivalent Conventional Flexible Pavement Study 94
PREVIEW
viii
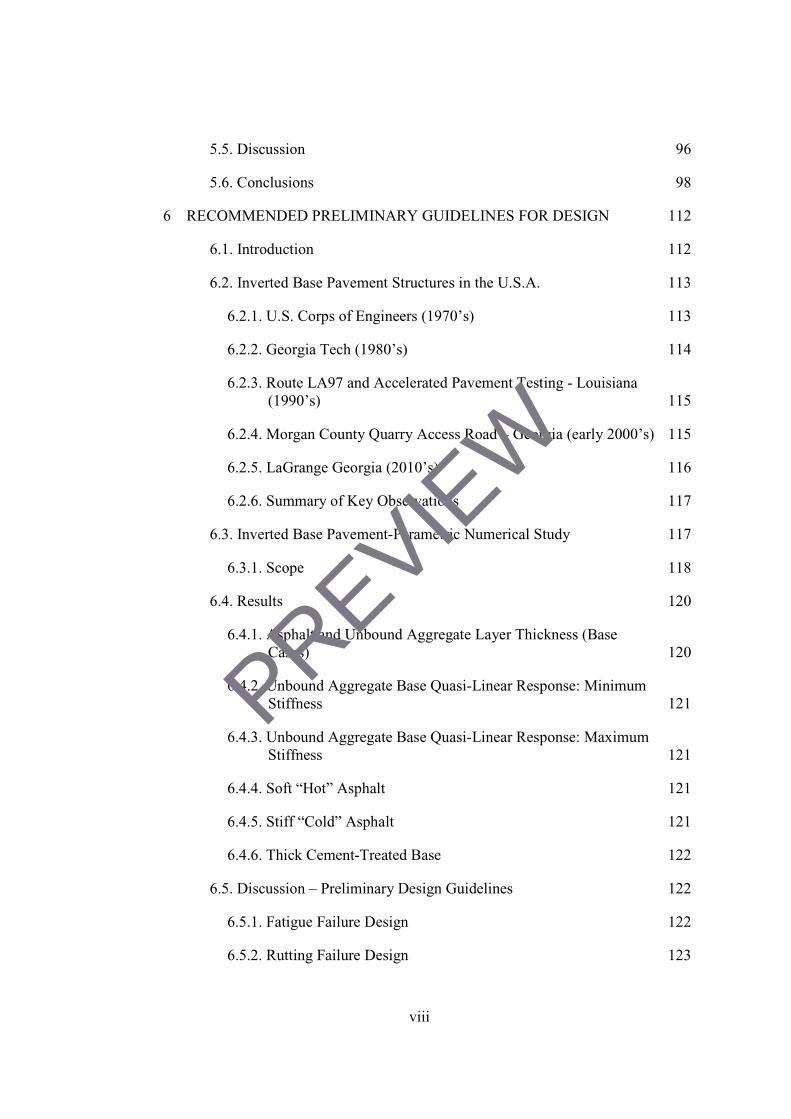
5.5. Discussion 96
5.6. Conclusions 98
6 RECOMMENDED PRELIMINARY GUIDELINES FOR DESIGN 112
6.1. Introduction 112
6.2. Inverted Base Pavement Structures in the U.S.A. 113
6.2.1. U.S. Corps of Engineers (1970’s) 113
6.2.2. Georgia Tech (1980’s) 114
6.2.3. Route LA97 and Accelerated Pavement Testing - Louisiana (1990’s) 115
6.2.4. Morgan County Quarry Access Road – Georgia (early 2000’s) 115
6.2.5. LaGrange Georgia (2010’s) 116
6.2.6. Summary of Key Observations 117
6.3. Inverted Base Pavement-Parametric Numerical Study 117
6.3.1. Scope 118
6.4. Results 120
6.4.1. Asphalt and Unbound Aggregate Layer Thickness (Base Cases) 120
6.4.2. Unbound Aggregate Base Quasi-Linear Response: Minimum Stiffness 121
6.4.3. Unbound Aggregate Base Quasi-Linear Response: Maximum Stiffness 121
6.4.4. Soft “Hot” Asphalt 121
6.4.5. Stiff “Cold” Asphalt 121
6.4.6. Thick Cement-Treated Base 122
6.5. Discussion – Preliminary Design Guidelines 122
6.5.1. Fatigue Failure Design 122
6.5.2. Rutting Failure Design 123
PREVIEW
ix
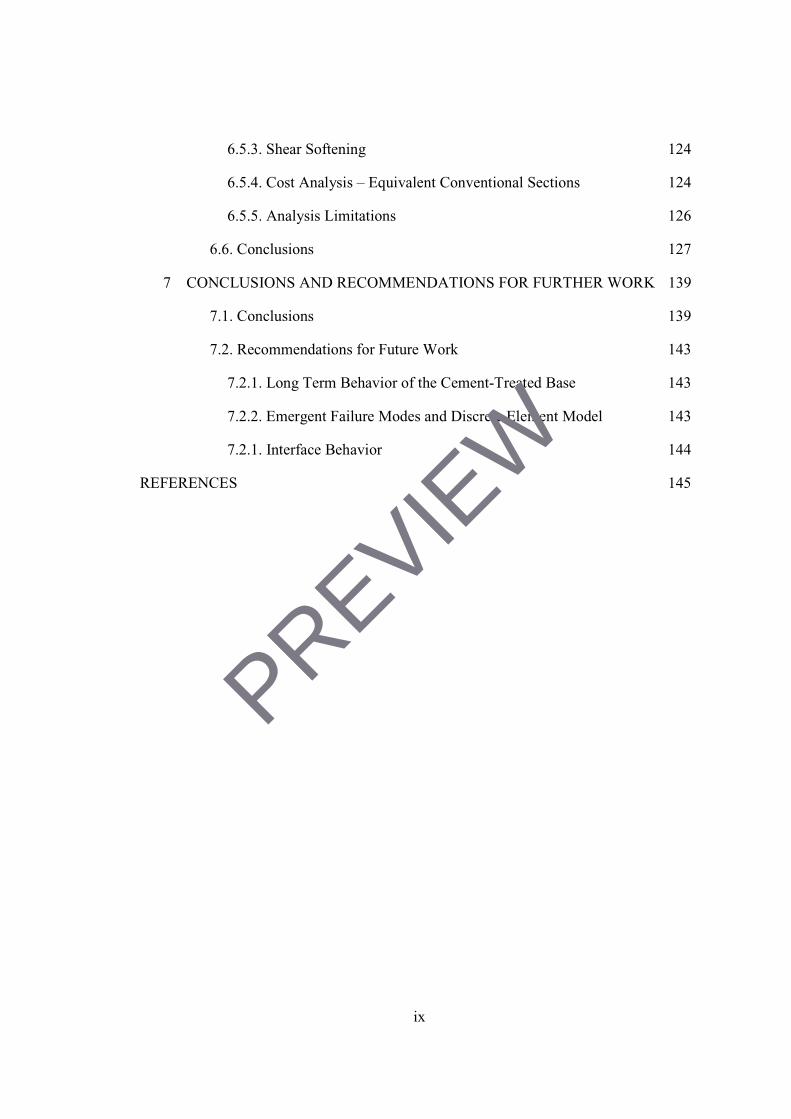
6.5.3. Shear Softening 124
6.5.4. Cost Analysis – Equivalent Conventional Sections 124
6.5.5. Analysis Limitations 126
6.6. Conclusions 127
7 CONCLUSIONS AND RECOMMENDATIONS FOR FURTHER WORK 139
7.1. Conclusions 139
7.2. Recommendations for Future Work 143
7.2.1. Long Term Behavior of the Cement-Treated Base 143
7.2.2. Emergent Failure Modes and Discrete Element Model 143
7.2.1. Interface Behavior 144
REFERENCES 145
PREVIEW
x
LIST OF TABLES
Page
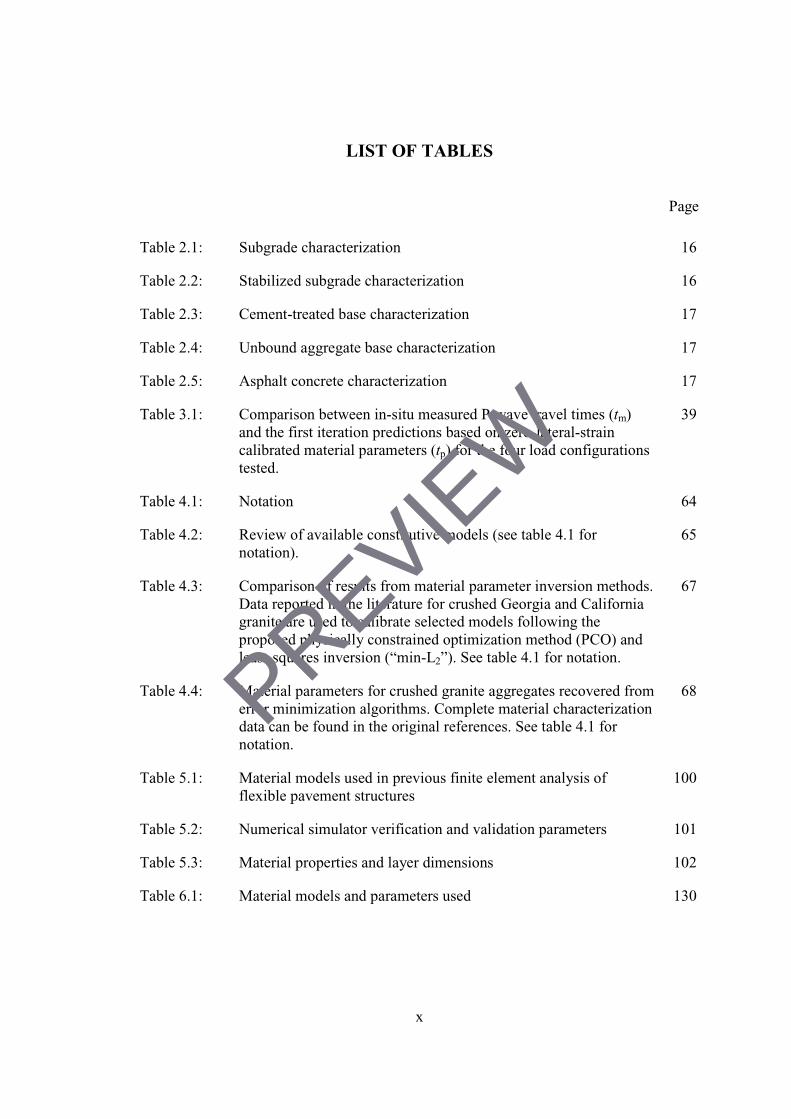
Table 2.1: Subgrade characterization 16
Table 2.2: Stabilized subgrade characterization 16
Table 2.3: Cement-treated base characterization 17
Table 2.4: Unbound aggregate base characterization 17
Table 2.5: Asphalt concrete characterization 17
Table 3.1: Comparison between in-situ measured P-wave travel times (tm) and the first iteration predictions based on zero-lateral-strain calibrated material parameters (tp) for the four load configurations tested.
39
Table 4.1: Notation 64
Table 4.2: Review of available constitutive models (see table 4.1 for notation).
65
Table 4.3: Comparison of results from material parameter inversion methods. Data reported in the literature for crushed Georgia and California granite are used to calibrate selected models following the proposed physically constrained optimization method (PCO) and least-squares inversion (“min-L2”). See table 4.1 for notation.
67
Table 4.4: Material parameters for crushed granite aggregates recovered from error minimization algorithms. Complete material characterization data can be found in the original references. See table 4.1 for notation.
68
Table 5.1: Material models used in previous finite element analysis of flexible pavement structures
100
Table 5.2: Numerical simulator verification and validation parameters 101
Table 5.3: Material properties and layer dimensions 102
Table 6.1: Material models and parameters used 130
PREVIEW
xi
LIST OF FIGURES
Page
Figure 2.1: Designed inverted and conventional base sections. The upper 0.15m of the subgrade was stabilized with unbound aggregate base material in order to satisfy the design requirements.
18
Figure 2.2: Test section original topography (dashed) overlaid by the as-built longitudinal cross section. Laboratory test samples are recovered at every station.
18
Figure 2.3: Stabilization of the subgrade upper 0.15m through addition of unbound aggregate base and re-compaction.
19
Figure 2.4: Cement-treated base construction monitoring from the time water is added to the mix to the final bituminous cover.
20
Figure 2.5: In-situ water content and liquid limit of tested soil samples. The lower plot shows the sampling locations relative to cut and fill sections.
21
Figure 2.6: Porosity data computed from density measurements. The lower figure shows sampling locations relative to cut and fill sections.
22
Figure 2.7: Surface wave test results for all layers. 22
Figure 2.8: Comparison of field and laboratory normalized resistivity data. Field data (filled circles) show an increase in resistivity starting at 100min; laboratory specimens exhibit resistivity increases as soon as 20min (hollow circles).
23
Figure 2.9: Cement-treated base integrity assessment. GDOT bridge crew cut a 6mm wide 12mm deep groove on the hardened surface which extended from the center line to the shoulder in a rectangular section. A 0.3mm diameter copper wire was buried in the groove
24
Figure 2.10: Grain size distribution of sample recovered at station 300+00, 290+00, and 300+00.
24
Figure 2.11: Particle orientation anisotropy from digital image processing of photographs taken during the forensic investigation.
25
Figure 2.12: Constrained modulus calculated from surface wave velocity data. 25
PREVIEW
xii
Figure 3.1: Graphical description of the designed sensors and relative scales that influence the selection of sensor size and positioning.
40
Figure 3.2: Borehole drilling tools (a) diamond core bit and (b) rebar-cutter. 40
Figure 3.3: Instrumented laboratory zero lateral strain test cell: (a) upper platen used as a guide for borehole drilling and sensor installation, (b) lower platen, (c) fully instrumented cell.
41
Figure 3.4: Laboratory test data results, signature cascades as a function of the applied vertical stress for horizontal and diagonal rays (a) bottom source-receiver pair BB, (b) middle source-receiver pair MM, (c) bottom-to-middle source-receiver pair BN, and (d) middle-to-bottom source receiver pair MB.
42
Figure 3.5: Laboratory test data results for waves propagating in the vertical direction VV. Signature cascade as a function of the applied vertical stress.
43
Figure 3.6: Vertical and horizontal P-wave velocities as a function of the applied vertical stress.
43
Figure 3.7: Field test loading configurations: plan view and cross section. 44
Figure 3.8: Field test data results for horizontally propagating waves between sensors buried at 0.17m (BB) from the pavement surface. Signature cascade as a function of the proximity to the loaded truck.
45
Figure 3.9: P-wave velocity as a function of the distance between the tire centerline and the mid-point between the source and receiver. The asymptotic trend captures the unloaded P-wave velocity.
45
Figure 3.10: P-wave velocity as a function of the stress in the direction of wave propagation. The entire data set collapses under a single power law trend with a 245m·s-1
α coefficient, 0.18 β exponent for a Ko coefficient of 0.38.
46
Figure 3.11: Laboratory measured and predicted constrained moduli in the vertical and horizontal directions as a function of the stress in the direction of P-wave propagation and the mean stress.
46
Figure 3.12: Advanced (a) and simplified (b) in-situ material parameter inversion
47
Figure 4.1: Fundamental concepts in granular materials that influence the resilient behavior of unbound aggregate bases.
69
PREVIEW
xiii
Figure 4.2: Effect of particle shape on the stiffness-stress material parameters under virgin loading and reloading (data from Cho et al. 2006). The alpha and beta parameters fit the model presented in equation 4.1 (also shown in the insert).
69
Figure 4.3: The simulated data corresponds to the equation of motion for an accelerating body, x= ½at2 with random noise. The second and sixth order polynomial coefficients are determined by fitting to the black points. New data are shown as hollow points. Original figure from Santamarina and Fratta (2005).
70
Figure 4.4: Cyclic triaxial at constant confinement test results for crushed granite aggregate (data from Tutumluer 1995). The axial resilient modulus Ez is plotted (a) against the peak mean stress p=(3σc+∆σv) and (b) the peak deviatoric stress q=∆σv.
71
Figure 4.5: Error surface sections obtained while fitting equation 4.2 to axial resilient modulus Ez data in tutumluer (1995). The optimum values for k1and k2 are selected by error minimization keeping k3= k4=0. The 4 plots show: (a) the error surface in three dimensions, (b) the analyzed errors in k1–k2 space (min-L2 plots at the intersection), (c) a slice of the error surface in the k2-plane, and (d) a slice of the error surface in the k1-plane.
72
Figure 4.6: Predictions based on the parameters obtained from min-L2 optimization (dashed line) and physically constrained optimization PCO (continuous) compared against the measured experimental data. The data is from tutumluer (1995) and the fitted model is presented in equation 4.2. The axial resilient modulus Ez is plotted (a) against the peak mean stress p=(3σc+∆σv) and (b) the peak deviatoric stress q=∆σv.
73
Figure 4.7: Cyclic triaxial under variable confinement. Data for crushed granite aggregate from Adu-Osei et al. (2001b). The axial Ez, radial Er, and shear G* resilient moduli are plotted (a) against the mean stress p=(σ1+2σ3) and (b) the deviatoric stress q=σ1-σ3.
73
Figure 4.8: Error surface sections obtained while fitting equation 4.2 to axial resilient modulus Ez data in Adu-Osei et al. (2001b). The optimum values for k1and k2 are selected by error minimization keeping k3= k4= 0. The 4 plots show: (a) the error surface in three dimensions, (b) the analyzed errors in k1–k2 space (min-L2 plots at the intersection), (c) a slice of the error surface in the k2-plane, and (d) a slice of the error surface in the k1-plane.
74
PREVIEW
xiv
Figure 4.9: Error surface sections obtained while fitting equation 4.2 to radial resilient modulus Er data in Adu-Osei et al. (2001b). The optimum values for k1and k2 are selected by error minimization keeping k3= k4= 0. The 4 plots show: (a) the error surface in three dimensions, (b) the analyzed errors in k1–k2 space (min-L2 plots at the intersection), (c) a slice of the error surface in the k2-plane, and (d) a slice of the error surface in the k1-plane.
75
Figure 4.10: Error surface sections obtained while fitting equation 4.2 to shear resilient modulus G* data in Adu-Osei et al. (2001b). The optimum values for k1and k2 are selected by error minimization keeping k3= k4= 0. The 4 plots show: (a) the error surface in three dimensions, (b) the analyzed errors in k1–k2 space (min-L2 plots at the intersection), (c) a slice of the error surface in the k2-plane, and (d) a slice of the error surface in the k1-plane.
76
Figure 4.11: Predictions based on the parameters obtained from min-L2 optimization (dashed line) and physically constrained optimization PCO (continuous) compared against the measured experimental data. The data is from Adu-Osei et al. (2001b) and the fitted model is presented in equation 4.2. The axial Ez, radial Er, and shear G* resilient moduli are plotted (a) against the mean stress p=(σ1+2σ3) and (b) the deviatoric stress q=σ1-σ3.
77
Figure 4.12: Comparison of axial elastic resilient modulus predictions for well graded crushed granite based on the models and parameters documented in the literature and the proposed model and parameter reduction method. (a) data reported by Tutumluer (1995) and Adu-Osei (2001b) and (b) comparison of behavior predictions made based on the reported models and material parameters (table 4.3) and the selected model (equation 4.2) and the proposed physically constrained material parameter inversion method (PCO-table 4.3). The range of traffic induced mean stresses expected for conventional flexible pavements and inverted base pavement structures are shown for reference.
78
Figure 5.1: Conventional flexible pavement (a) and (b) inverted base pavement structures.
103
Figure 5.2: Meshed pavement section using edge biased seeding techniques. This method results in a non-uniform distribution of elements along the edge with density bias in the vicinity of steep gradient areas. The insert zooms in to the edge of the wheel load.
104
PREVIEW
xv
Figure 5.3: Model validation studies: (a) isotropic linear elastic half space subjected to a circular uniform load, (b) layered isotropic linear elastic solutions from available pavement analysis software, (c) layered cross-isotropic linear elastic base solutions from GT-Pave. Results presented for KENLAYER and GT-Pave were digitized from Tutumluer (1995).
105
Figure 5.4: Non-linear elastic model validation using repeated load triaxial test results for crushed granite from Georgia (data in Tutumluer 1995).
106
Figure 5.5: Effects of model domain size and choice of boundary conditions on critical pavement design parameters for an inverted base pavement structure: maximum tensile strains in the asphalt concrete εAC and cement-treated base εCTB layers (a) and (c), and maximum vertical stress on the unbound aggregate base σUAB and subgrade σSG layers (b) and (d). Zero lateral displacement boundaries are used along the edge of the model for all layers in (a) and (c), and along the unbound aggregate base and subgrade only in (b) and (d).
107
Figure 5.6: Vertical σz, radial σr, and shear τzr stress profiles as a function of depth in the modeled inverted base pavement section along the load centerline and the wheel edge for a 550kPa uniformly distributed load over a circular area of radius 0.15m.
108
Figure 5.7: Radial profiles of (a) vertical, (b) radial, and (c) shear stresses at multiple locations within the inverted base pavement structure. Q = 550kPa, r = 0.15m, and R=10r.
109
Figure 5.8: Comparison between inverted base pavement critical design parameter predictions from linear elastic and non-linear elasto-plastic unbound aggregate base models: (a) strains at the bottom of the asphalt concrete layer, (b) strains at the bottom of the cement treated base layer, (c) vertical stresses on top of the unbound aggregate base layer, and (d) vertical stresses on top of subgrade layer. Q = 550kPa, r = 0.15m, and R=10r.
110
Figure 5.9: Mechanical response in terms of (a) tensile strains at the bottom of the asphalt concrete layer and (b) vertical stresses on the subgrade for the studied inverted base pavement and four conventional flexible pavement sections. Wheel load Q = 550kPa, contact area radius r = 0.15m, and domain size R=10r.
111
Figure 6.1: Inverted base pavement geometry
131
PREVIEW
xvi
Figure 6.2: The effect of asphalt concrete thickness tAC and unbound aggregate base thickness tUAB (asphalt and unbound aggregate layer thickness - base cases). Markers show simulated AC/UAB thickness combinations.
132
Figure 6.3: The effect of unloaded linear elastic stiffness assumption (unbound aggregate base quasi-linear response: minimum stiffness case). Markers show simulated AC/UAB thickness combinations and dashed lines show base cases results for comparison.
133
Figure 6.4: The effect of loaded linear elastic stiffness assumption (unbound aggregate base quasi-linear response: maximum stiffness case). Markers show simulated AC/UAB thickness combinations and dashed lines show base cases results for comparison.
134
Figure 6.5: The effect of lower asphalt concrete stiffness (soft “hot” asphalt case). Markers show simulated AC/UAB thickness combinations and dashed lines show base cases results for comparison.
135
Figure 6.6: The effect of higher asphalt concrete stiffness (stiff “cold” asphalt case). Markers show simulated AC/UAB thickness combinations and dashed lines show base cases results for comparison.
136
Figure 6.7: The effect of thicker cement-treated base (thick cement-treated sub-base case). Markers show simulated AC/UAB thickness combinations and dashed lines show base cases results for comparison.
137
Figure 6.8: Effect of the shear softening term on the predicted maximum tensile strains in the asphalt concrete layer.
138
Figure 6.9: Comparison of critical pavement response parameters for three typical conventional flexible pavement structures (C1, C2, and C3) and two inverted base pavement structures (IP1 and IP2).
138
PREVIEW
xvii
SUMMARY
An inverted base pavement is a new pavement structure that consists of an
unbound aggregate base between a stiff cement-treated foundation layer and a thin
asphalt cover. Unlike conventional pavements which rely on upper stiff layers to bear and
spread traffic loads, the unbound aggregate inter-layer in an inverted base pavement plays
a major role in the mechanical response of the pavement structure. Traditional empirical
pavement design methods rely on rules developed through long-term experience with
conventional flexible or rigid pavement structures. The boundaries imposed on the
unbound aggregate base in an inverted pavement structure change radically from those in
conventional pavements. Therefore, current empirically derived design methods are
unsuitable for the analysis of inverted base pavements. The present work documents a
comprehensive experimental study on a full-scale inverted pavement test section built
near LaGrange, Georgia. A detailed description of the mechanical behavior of the test
section before, during and after construction provides critically needed understanding of
the internal behavior and macro-scale performance of this pavement structure. Given the
critical role of the unbound aggregate base and its proximity to the surface, a new field
test was developed to characterize the stress-dependent stiffness of the as-built layer. A
complementary numerical study that incorporates state-of-the-art concepts in constitutive
modeling of unbound aggregates is used to analyze experimental results and to develop
preliminary guidelines for inverted base pavement design. Simulation results show that
an inverted pavement can deliver superior rutting resistance compared to a conventional
flexible pavement structure with the same fatigue life. Furthermore, results show that an
PREVIEW

xviii
inverted base pavement structure can exceed the structural capacity of conventional
flexible pavement designs for three typical road types both in rutting and fatigue while
saving up to 40% of the initial construction costs.
PREVIEW
1
CHAPTER 1
INTRODUCTION
1.1. Motivation and Significance
The U.S. public road system comprises over 4 million miles of roads and
highways (FHWA 2009). Georgia has 88000 miles of paved roads, 99% of which are
flexible pavement structures. Commissioning new roads and retrofitting existing ones are
multi-million dollar decisions. The aggregate base in both rigid and flexible pavement
structures is considered a weak layer that needs to be protected from service traffic
induced stresses by either a thick Portland cement concrete layer or a thick asphalt
concrete layer.
Inverted base pavements consist of an unbound aggregate base confined by a stiff
cement-treated foundation layer and a thin asphalt cover. The thin asphalt cover and the
proximity of the unbound aggregate layer to the surface make the granular layer a critical
structural element. Unlike conventional pavement sections which rely on the upper stiff
layers to bear and spread the traffic loads, the unbound aggregate inter-layer in an
inverted base pavement plays a major role in the mechanical response of the pavement
structure. Success stories in South Africa and test sections in the U.S.A. confirm the
viability of this alternative pavement structure (Barksdale 1984; Tutumluer 1995;
Tutumluer and Barksdale 1995; Rasoulian et al. 2000; Rasoulian et al. 2001; Terrell
2002; Terrell et al. 2003; Titi et al. 2003).
Traditional empirical pavement design methods rely on rules developed through
long-term experience. The application of empirical design methods is limited to the type
PREVIEW
2
of pavement structure, materials, construction practices, and site dependent
environmental conditions considered to develop the design procedure. The boundaries
imposed on the unbound aggregate base in an inverted pavement structure change
radically from those of either flexible or rigid pavements. Therefore, empirically derived
design methods used for conventional flexible pavement structures are unsuitable for the
analysis of inverted base pavements. In order to overcome empirical design limitations,
research efforts have focused on the development of mechanistic design techniques in
which the pavement section is treated as a structure, and its mechanical behavior is
evaluated using analytical/numerical tools from mechanics.
Mechanistic pavement analysis requires a profound understanding of the behavior
of the materials in the pavement structure. In this context, the resilient response of
unbound aggregate bases, sub-bases, and subgrade is a key input property in mechanistic-
empirical pavement design procedures, i.e., NCHRP 1-37A. Inaccuracies in the
determination of the resilient behavior contribute to erroneous predictions of overall
pavement response (Witczak 2004).
Unbound aggregates exhibit a stress dependent non-linear elastic response under
cyclic loading (Morgan 1966; Monismith et al. 1967; Hicks and Monismith 1971; Allen
and Thompson 1974; Barksdale 1984; Adu-Osei 2000; Lekarp et al. 2000). In an inverted
pavement section, the thinner asphalt concrete layer combined with the stiffer cement
treated foundation leads to the development of large stresses within the unbound
aggregate under service loading. Larger fluctuations in the state of stress exacerbate the
non-linear response of the unbound aggregate base in an inverted structure. Therefore, the
mechanical response of the unbound aggregate base, both under construction and during
PREVIEW
3
its service life, must be thoroughly characterized and clearly understood before predictive
inverted pavement design methods can emerge.
The present work documents a comprehensive experimental, analytical and
numerical study centered on a full-scale inverted pavement test section built in the state
of Georgia. A detailed description of the mechanical behavior of the test section before,
during and after construction provides critically needed information to enhance our
understanding of the internal behavior and macro-scale performance of this pavement
system. A complementary analytical and numerical study that incorporates the state-of-
the-art in constitutive modeling of unbound aggregates is used to extrapolate
experimental results and to develop preliminary guidelines for inverted base pavement
design.
1.2. Thesis Organization
The study presented in this dissertation centers on the fundamental understanding
of unbound aggregate bases in the context of inverted base pavement structures. The
information is organized as follows:
Chapter 2 documents the full-size field study of an inverted base pavement test
section constructed in LaGrange, Georgia. This is the second of its kind in the U.S.A.
and the first one to be fully tested, documented, and analyzed. Members of the
Particulate Media Research Laboratory participated in the extensive field test
program.
PREVIEW
4
Chapter 3 explores the limitations of available laboratory and field unbound
aggregate base stiffness characterization methods and presents a novel test alternative
for as-built characterization.
Chapter 4 offers a comprehensive review of unbound aggregate behavior and
available constitutive models, addresses model selection in detail, and implements a
calibration method based on robust physical principles and concepts from information
theory.
Chapter 5 documents the numerical implementation of the selected constitutive
model, explores the effect of modeling assumptions and presents the predicted
mechanical response of an inverted base pavement structure. Dr. H.S. Shin helped
implement the model in ABAQUS.
Chapter 6 summarizes a simulation study of inverted base pavement structures and
recommends preliminary guidelines for design.
Chapter 7 summarizes salient conclusions and identifies potential areas for future
research.
The chapters in the thesis are written as self-contained documents; therefore, the reader
will find some repetition particularly among the introductory sections for the different
chapters.
PREVIEW
5
CHAPTER 2
THE LAGRANGE CASE STUDY
2.1. Introduction
The need for improved road performance, optimal use of resources, superior cost
efficiency, budget constraints, and energy efficiency prompt the analysis of alternative
pavement structures. The use of inverted base pavements in the U.S.A. has been hindered
by the lack of field experiments and related research required to investigate the
mechanical response of this pavement structure under local conditions, construction
practices, and required quality control and performance. A full-scale field study was
conducted in LaGrange, Georgia, with support of the Georgia Department of
Transportation (GDOT). The laboratory and field studies conducted as part of this pilot
project advance both the current state of knowledge on the behavior of inverted base
pavement systems and the state of the practice in terms of construction processes and
quality assurance.
The investigation was designed to gather detailed information before, during and
after the construction of the inverted base pavement test section in order to gain critically
needed understanding of the internal behavior and macro-scale performance of this
pavement structure through complementary analytical and numerical studies. The results
of this investigation will help identify the potential benefits and limitations of inverted
base pavement structures, and will allow for the calibration of numerical models that can
later be used for optimal design.
PREVIEW


