Embed Size (px)
Citation preview
Investing in Sustainable Access to Communications: The Role of Telecom Energy Services Companies
B
ABOUT IFCIFC—a member of the World Bank Group—is the largest global development institution focused on the private sector in emerging markets.
We work in more than 100 countries, using our capital, expertise, and influence to create markets and opportunities in developing countries.
In fiscal year 2020, we invested more than $22 billion in private companies and financial institutions in developing countries, leveraging the
power of the private sector to end extreme poverty and boost shared prosperity. For more information, visit www.ifc.org.
DISCLAIMERThe material in this work is copyrighted. Copying and/or transmitting portions or all of this work without permission may be a violation of
applicable law. IFC encourages dissemination of its work and will normally grant permission to reproduce portions of the work promptly, and
when the reproduction is for educational and non-commercial purposes, without a fee, subject to such attributions and notices as we may
reasonably require.
IFC does not guarantee the accuracy, reliability, or completeness of the content included in this work, or for the conclusions or judgments
described herein, and accepts no responsibility or liability for any omissions or errors (including, without limitation, typographical errors and
technical errors) in the content whatsoever or for reliance thereon. The boundaries, colors, denominations, and other information shown
on any map in this work do not imply any judgement on the part of the World Bank Group concerning the legal status of any territory or the
endorsement or acceptance of such boundaries. The findings, interpretations, and conclusions expressed in this volume do not necessarily
reflect the views of the Executive Directors of the World Bank Group or the governments they represent.
The contents of this work are intended for general informational purposes only and are not intended to constitute legal, securities, or
investment advice, an opinion regarding the appropriateness of any investment, or a solicitation of any type.
IFC or its affiliates may have an investment in, provide other advice or services to, or otherwise have a financial interest in, certain of the
companies and parties (including named herein).
All other queries on rights and licenses, including subsidiary rights, should be addressed to IFC Communications, 2121 Pennsylvania Avenue
NW, Washington DC 20433. International Finance Corporation is an international organization established by Articles of Agreement among its
member countries, and a member of the World Bank Group. All names, logos and trademarks are the property of IFC and you may not use any
of such materials for any purpose without the express written consent of IFC. Additionally, “International Finance Corporation” and “IFC” are
registered trademarks of IFC and are protected under international law.
September 2021
© International Finance Corporation 2021. All rights reserved.
2121 Pennsylvania Avenue NW
Washington, DC 20433 USA
Internet: www.ifc.org
i
TABLE OF CONTENTSFOREWORD .................................................................................................................................................................. vi
ACKNOWLEDGEMENTS ............................................................................................................................................... vii
DEFINITIONS ............................................................................................................................................................... viii
EXECUTIVE SUMMARY ................................................................................................................................................. ix
1. WHAT ARE TESCOS? ..............................................................................................................................................2
1.1 Background ...............................................................................................................................................................................................................2
1.2 Introduction to TESCOs ....................................................................................................................................................................................... 4
2. WHAT IS THE OUTLOOK FOR BAD-GRID AND OFF-GRID SITES? ........................................................................11
2.1 Telecom towers growth forecast .....................................................................................................................................................................11
2.2 Forecast of bad-grid and off-grid sites growth ......................................................................................................................................... 12
2.3 Adoption of renewable energy solutions .....................................................................................................................................................16
3. WHAT IS THE GROWTH POTENTIAL FOR TESCOS? ............................................................................................25
3.1 Current TESCO market overview ................................................................................................................................................................... 25
3.2 TESCO market forecast .................................................................................................................................................................................... 27
3.3 Site forecasting methodology .........................................................................................................................................................................30
3.4 Growth strategies of TESCOs ......................................................................................................................................................................... 38
4. WHAT ARE THE DIFFERENT TYPES OF TESCOS? ................................................................................................43
4.1 Types of TESCO operators ............................................................................................................................................................................... 43
4.2 TESCO business models .....................................................................................................................................................................................49
4.3 TESCO revenue model ...................................................................................................................................................................................... 52
5. HOW CAN TESCOS BE ASSESSED AS INVESTMENT OPPORTUNITIES? ...............................................................55
5.1 Framework for assessing the overall bankability of TESCOs ............................................................................................................... 55
5.2 Framework for assessing TESCOs’ contractual risks ................................................................................................................................61
5.3 Framework for assessing TESCOs’ country specific risks ..................................................................................................................... 63
6. CONCLUSION ......................................................................................................................................................67
ii
LIST OF FIGURESFigure 0-1: Definition of TESCOs ................................................................................................................................................................................... viii
Figure 0-2: Key questions addressed in each chapter ................................................................................................................................................... x
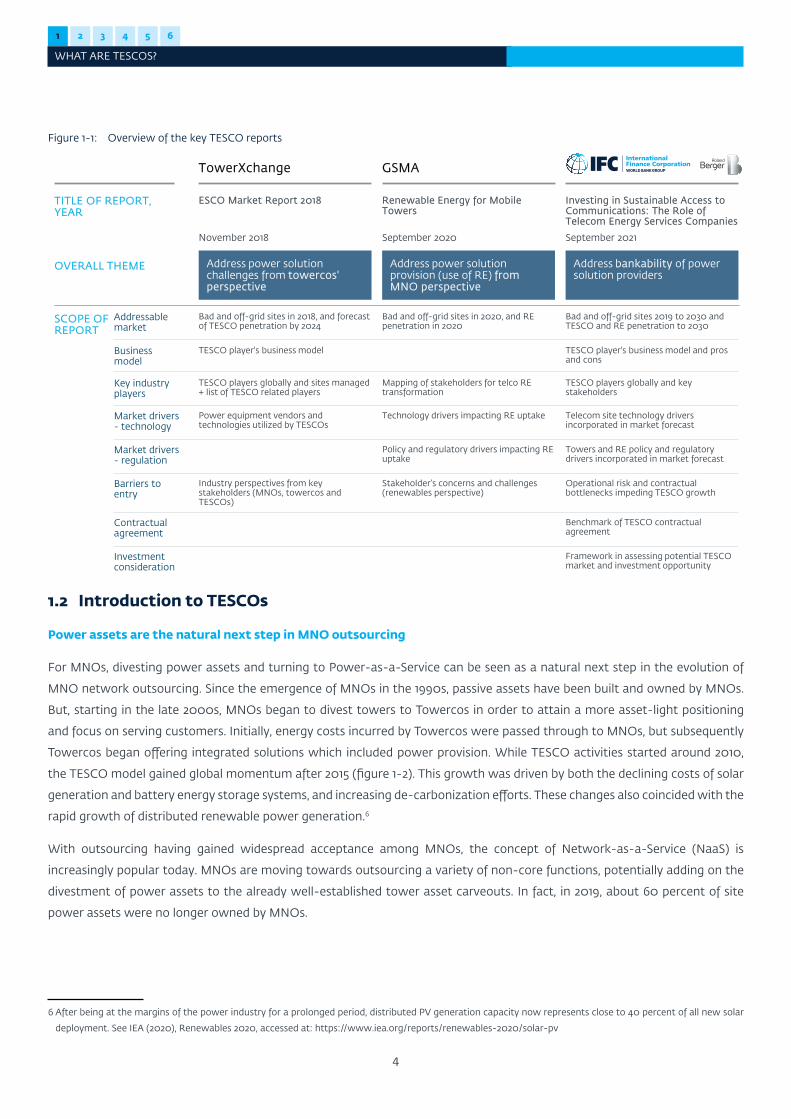
Figure 1-1: Overview of the key TESCO reports ............................................................................................................................................................ 4
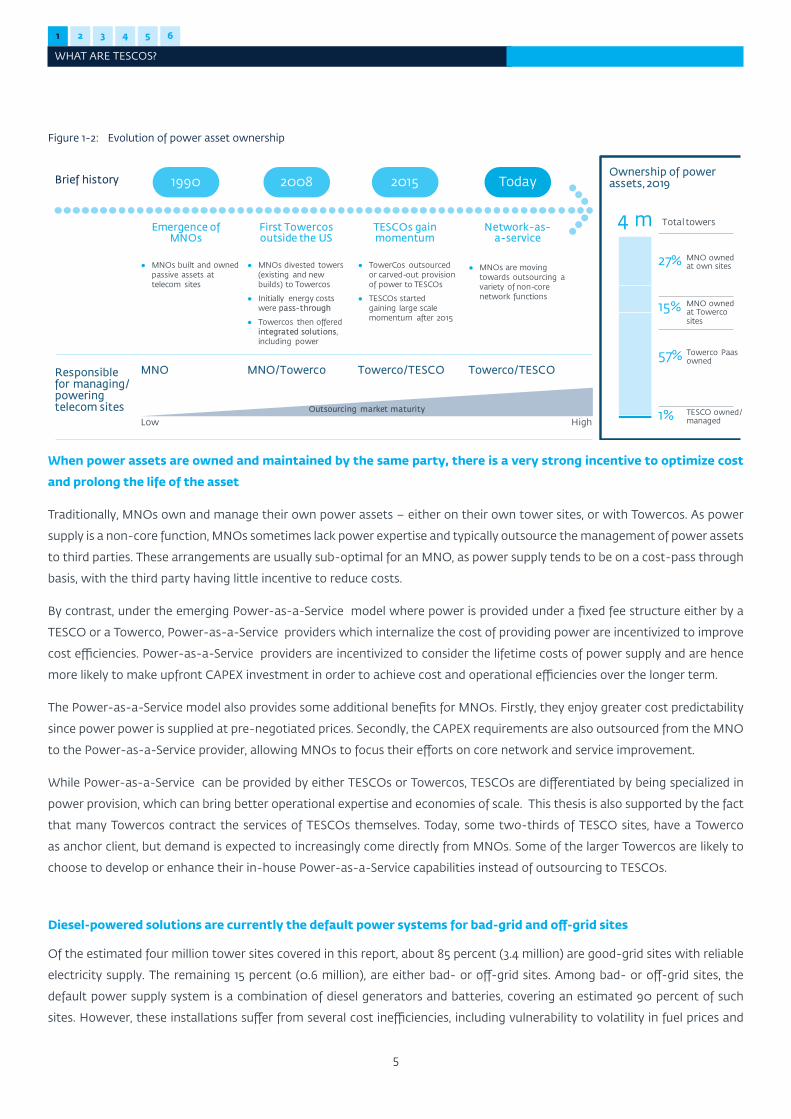
Figure 1-2: Evolution of power asset ownership ........................................................................................................................................................... 5
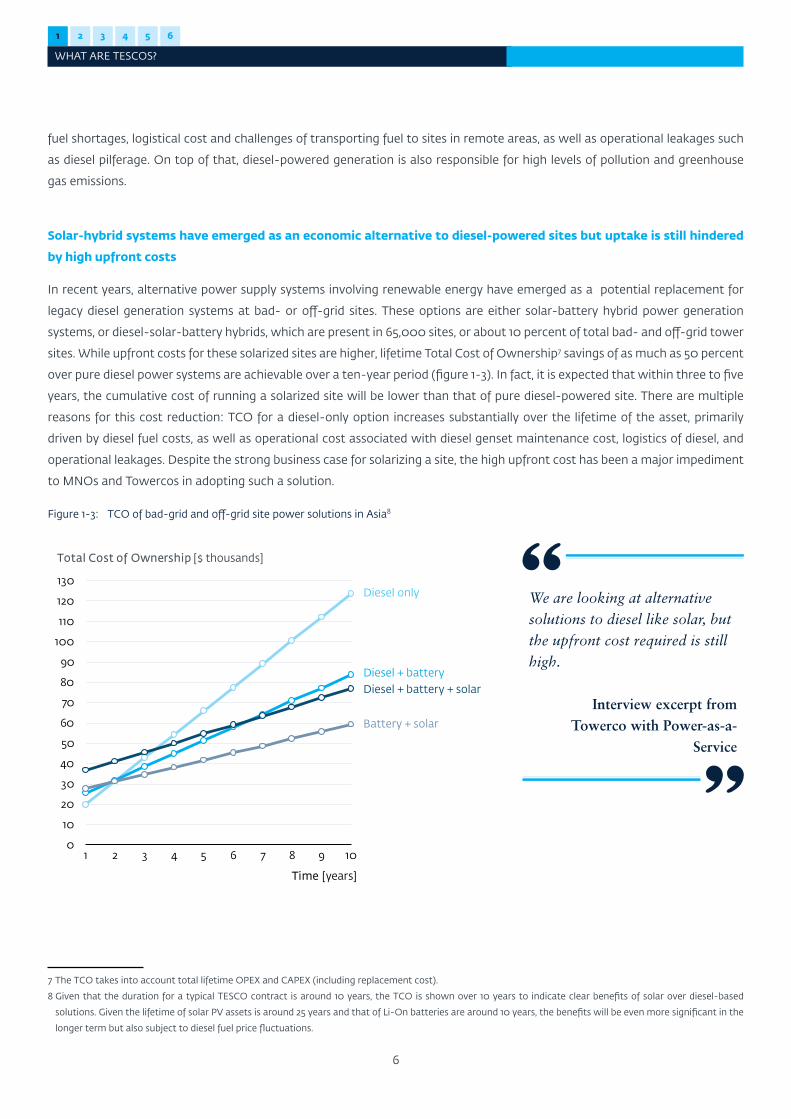
Figure 1-3: TCO of bad-grid and off-grid site power solutions in Asia .................................................................................................................... 6
Figure 1-4: Typical scope of services of a TESCO and its benefits to MNOs or Towercos and other stakeholders ............................................ 9
Figure 2-1: Forecast of number of telecom towers in the markets within the scope of this report (thousand sites) ...................................... 12
Figure 2-2: Number of bad-grid and off-grid sites, 2019–30 (thousand sites) ......................................................................................................... 13
Figure 2-3: Number of bad-grid and off-grid sites by region, 2019-30 (thousand sites) ........................................................................................ 13
Figure 2-4: Proportion of bad-grid and off-grid sites of total sites by region, 2019-30 (thousand sites).............................................................14
Figure 2-5: Gross addition and net addition of bad-grid and off-grid sites, 2019-2030 (thousand sites) ............................................................ 15
Figure 2-6: Power solutions at bad-grid and off-grid sites, 2019–30 (thousand sites) ...........................................................................................16
Figure 2-7: Key factors influencing the penetration of renewable energy solutions .............................................................................................. 17
Figure 2-8: Global horizontal irradiation ........................................................................................................................................................................18
Figure 2-9: Comparison of alternatives to diesel in power generation ....................................................................................................................20
Figure 2-10: Selected MNOs and Towercos with sustainability targets .................................................................................................................... 22
Figure 2-11: Breakdown of global RE asset ownership by region (thousand sites) ...................................................................................................23
Figure 3-1: Split of TESCO sites by region in 2019 ........................................................................................................................................................ 26
Figure 3-2: Overview of grid split by region and TESCO activity in 2019.................................................................................................................. 26
Figure 3-3: Overview of ownership of site managed by TESCOs (percent of sites) ............................................................................................... 26
Figure 3-4: TESCO sites by region (thousand sites) .................................................................................................................................................... 27
Figure 3-5: Overview of potential TESCO markets in 2030 ....................................................................................................................................... 28
Figure 3-6: Top 40 TESCO markets by 2030 (number of sites) ................................................................................................................................. 29
Figure 3-7: Forecasted addressable market for TESCO and penetration, 2030 (thousand sites) ......................................................................... 31
Figure 3-8: Countries with TESCO RfPs issued or likely to be issued ........................................................................................................................32
Figure 3-9: Considerations for MNOs in selecting power solution providers .......................................................................................................... 34
Figure 3-10: Key considerations for Towercos offering Power-as-a-Service in engaging TESCOs ........................................................................ 35
Figure 3-11: TESCO site growth by customer (thousand sites) ................................................................................................................................... 36
Figure 3-12: TESCO growth areas .................................................................................................................................................................................... 39
Figure 3-13: Investment required for TESCO sites by region in 2030 ($ millions) ......................................................................................................41
Figure 4-1: Type of TESCO players and typical scope of works in adjacent services ..............................................................................................44
Figure 4-2: Number of TESCO sites by type of TESCO business model ...................................................................................................................44
Figure 4-3: Assessment of typical TESCO pricing structure from the TESCO perspective .................................................................................... 53
Figure 5-1: Framework for assessing TESCOs’ bankability ......................................................................................................................................... 57
iii
Figure 5-2: Contractual benchmarks ............................................................................................................................................................................ 62
Figure 5-3: Key metrics for evaluating country-level risks for TESCOs in emerging markets ...............................................................................64
Figure C-1: World Bank Group institutions ................................................................................................................................................................... 71
Figure C-2: IFC’s solutions ................................................................................................................................................................................................ 72
Figure C-3: IFC’s investments in digital infrastructure projects ................................................................................................................................ 72
Figure C-4: TMT solutions to create markets and build project pipelines ..............................................................................................................73
Figure C-5: TMT global initiatives to create markets .................................................................................................................................................. 74
Figure C-6: MIGA Political Risk Insurance Solutions .................................................................................................................................................... 75
iv
LIST OF BOXESBox 1: Deep-dive into power-sharing ....................................................................................................................................................................... 36
Box 2: Scope for renewables beyond serving bad-grid and off-grid sites .................................................................................................... 39
Box 3: Deep-dive into how TESCOs optimize technology .................................................................................................................................46
Box 4: Deep-dive into Remote Monitoring Systems (RMS) ............................................................................................................................. 47
Box 5: Deep-dive into the Anchor-Business-Community (ABC) model .........................................................................................................51
Box 6: The development impact of TESCOs ............................................................................................................................................................59
v
LIST OF ABBREVIATIONS
CAPEX Capital Expenditure
EAP East Asia and the Pacific
ECA Europe and Central Asia
ESG Environmental, Social and Corporate Governance
IBRD The International Bank for Reconstruction and Development
ICSID The International Centre for Settlement of Investment Disputes
ICT Information and Communications Technology
IDA The International Development Association
IFC The International Finance Corporation
LAC Latin America and the Caribbean
MIGA Multilateral Investment Guarantee Agency
MENA Middle East and North Africa
MNO Mobile Network Operator
NaaS Network-as-a-Service
O&M Operations and Maintenance
OPEX Operational Expenditure
R&D Research and Development
RE Renewable Energy
REIT Real Estate Investment Trust
RfP Request for Proposal
RMS Remote Monitoring System
PaaS Power-as-a-Service
PPA Power Purchase Agreement
PV Photovoltaic
SA South Asia
SLA Service Level Agreement
SSA Sub-Saharan Africa
TESCO Telecom Energy Services Company
TCO Total Cost of Ownership
Towerco Tower Company
TMT Telecommunications, Media and Technology
WBG World Bank Group
vi
FOREWORD
It is my pleasure to present Investing in Sustainable Access to Communications: The Role
of Telecom Energy Services Companies.
IFC is the largest global development institution focused on the private sector in
emerging markets. For decades, we have been investing in infrastructure in order to
address development challenges. IFC brings a 50-year investment track record in the
Telecommunications, Media and Technology (TMT) sector, having committed and
mobilized more than $11 billion for over 300 projects. We seek to enable widespread
digital connectivity and to promote inclusive growth of the digital economy sector
in emerging markets.
Half of the world’s population still lacks reliable internet access. There is a growing
digital divide between those with access to reliable telecom services and those who
are cut off from these essential resources. Most of those facing access challenges
live in emerging market economies. One of the most significant barriers to the
full expansion of digital connectivity is the lack of a reliable electricity supply. This
barrier is especially acute in rural and remote areas.
Employing renewable energy solutions in remote areas will facilitate the expansion
of digital connectivity to isolated communities. As part of the World Bank Group’s
Climate Action Plan, IFC has pledged to align 100% of its new operations with the
Paris Agreement by 2025. IFC is promoting new energy-efficient business models to
connect rural communities to the internet and boost national economies.
Strengthening the digital capacity and reach of developing countries will enable
significant progress to be made towards improved quality-of-life measures and
economic stability around the world. This report focuses on the critical topic of
enabling digital connectivity in underserved areas by financing the construction of
environmentally-sustainable telecommunications towers. As a leading financier of
low-cost renewable energy projects around the world, IFC is well-equipped to help
make these innovative new business solutions a reality.
Morgan Landy
Senior Director, Global
Infrastructure
vii
ACKNOWLEDGEMENTSThe preparation of this report was led by a joint team of industry specialists in IFC’s Global TMT practice, under the
leadership of Ariana Batori (Global Lead for Broadband and TESCO Investments) and Carlo Maria Rossotto (Global Lead
for TMT Upstream) and in partnership with a team of consultants from Roland Berger. The core team also included
Ferdinand Van Ingen (Senior Industry Specialist) and Karla Diaz Clarke (Investment Officer). The team is grateful for the
valuable contributions by Georges Houngbonon (Economist), Tunc Alyanak (Senior Investment Officer and Global Lead
for Distributed Generation), Ishan Purohit (Energy Specialist), Peter Mockel (Principal Industry Specialist), Neelam Patel
(Investment Officer), Pranab Gosh (Principal Investment Officer), Doyle Gallegos (Lead Digital Development Specialist,
World Bank), Eric Dunand (Senior Digital Development Specialist, World Bank), Hoda Moustafa (Head MIGAF, MIGA),
Yann Burtin (Senior Underwriter, MIGA) and a number of other World Bank Group staff who contributed advice and
inputs.
The report was produced under the overall guidance provided by Morgan Landy (Senior Director, Global Infrastructure),
German Cufre (Manager, Global TMT) and Diep Nguyen-van Houtte (Senior Manager, Infrastructure Upstream).
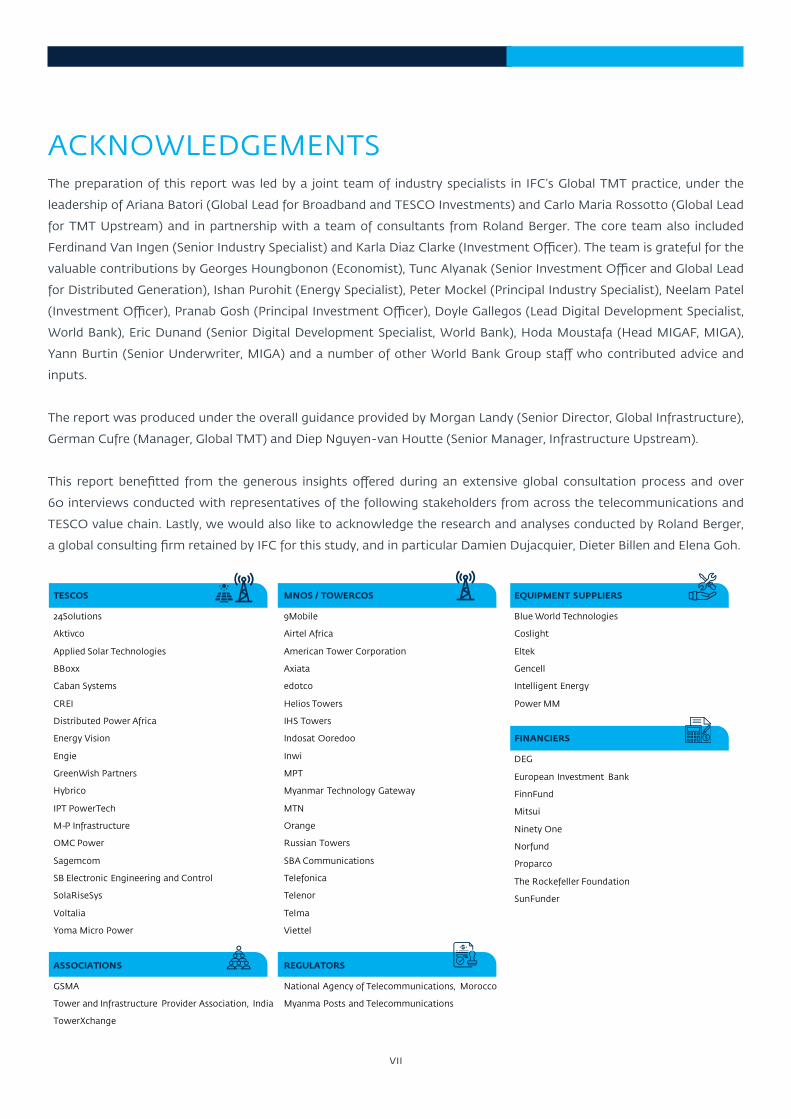
This report benefitted from the generous insights offered during an extensive global consultation process and over
60 interviews conducted with representatives of the following stakeholders from across the telecommunications and
TESCO value chain. Lastly, we would also like to acknowledge the research and analyses conducted by Roland Berger,
a global consulting firm retained by IFC for this study, and in particular Damien Dujacquier, Dieter Billen and Elena Goh.
TESCOS
24Solutions
Aktivco
Applied Solar Technologies
BBoxx
Caban Systems
CREI
Distributed Power Africa
Energy Vision
Engie
GreenWish Partners
Hybrico
IPT PowerTech
M-P Infrastructure
OMC Power
Sagemcom
SB Electronic Engineering and Control
SolaRiseSys
Voltalia
Yoma Micro Power
ASSOCIATIONS
GSMA
Tower and Infrastructure Provider Association, India
TowerXchange
MNOS / TOWERCOS
9Mobile
Airtel Africa
American Tower Corporation
Axiata
edotco
Helios Towers
IHS Towers
Indosat Ooredoo
Inwi
MPT
Myanmar Technology Gateway
MTN
Orange
Russian Towers
SBA Communications
Telefonica
Telenor
Telma
Viettel
REGULATORS
National Agency of Telecommunications, Morocco
Myanma Posts and Telecommunications
EQUIPMENT SUPPLIERS
Blue World Technologies
Coslight
Eltek
Gencell
Intelligent Energy
Power MM
FINANCIERS
DEG
European Investment Bank
FinnFund
Mitsui
Ninety One
Norfund
Proparco
The Rockefeller Foundation
SunFunder
viii
DEFINITIONSTower sites include ground-based (macro) towers and rooftop towers, but exclude small cells and social poles such as
streetlights.
A point of presence is defined as one Mobile Network Operator (MNO) hosted on a single site, regardless of the number of
antennas hosted, base station, or technologies used.
Greenfield sites refer to newly-built tower sites where the power supply is provided by TESCOs from the start of operations.
Brownfield sites refer to existing tower sites already in operation which switch to having power supplied by TESCOs.
Off-grid sites refer to sites that are not connected to the national grid.
Bad-grid sites refer to sites which are connected to the national grid, but experience an average of more than eight hours of
electricity supply outage per day.
Good-grid sites refer to sites which are connected to the national grid and experience fewer than eight hours of electricity
supply outage on average per day.
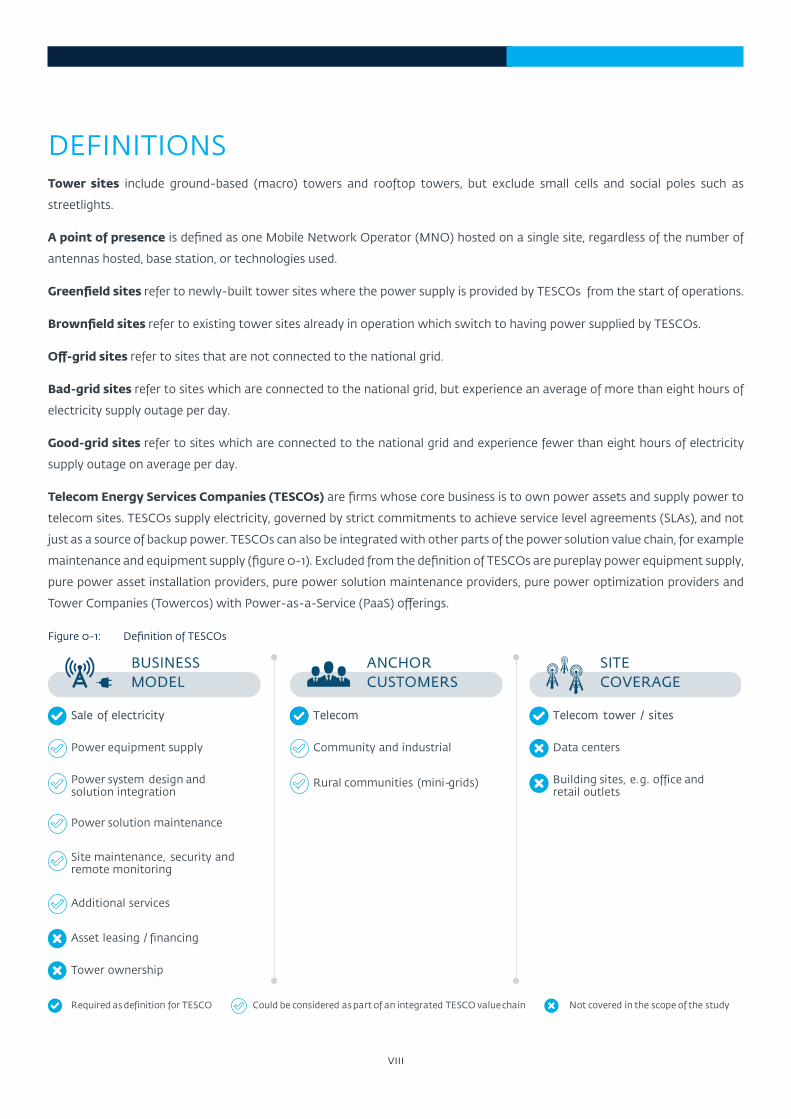
Telecom Energy Services Companies (TESCOs) are firms whose core business is to own power assets and supply power to
telecom sites. TESCOs supply electricity, governed by strict commitments to achieve service level agreements (SLAs), and not
just as a source of backup power. TESCOs can also be integrated with other parts of the power solution value chain, for example
maintenance and equipment supply (figure 0-1). Excluded from the definition of TESCOs are pureplay power equipment supply,
pure power asset installation providers, pure power solution maintenance providers, pure power optimization providers and
Tower Companies (Towercos) with Power-as-a-Service (PaaS) offerings.
Figure 0-1: Definition of TESCOs
Asset leasing / financing
Power system design and solution integration
Sale of electricity
Power solution maintenance
Community and industrial Data centers
Building sites, e.g. office and retail outlets
Power equipment supply
Telecom Telecom tower / sites
Tower ownership
Rural communities (mini-grids)
Additional services
Site maintenance, security and remote monitoring
BUSINESS MODEL
ANCHOR CUSTOMERS
SITE COVERAGE
Required as definition for TESCO Could be considered as part of an integrated TESCO value chain Not covered in the scope of the study
ix
EXECUTIVE SUMMARYBackground and objectives
The expansion of telecommunications services to unserved and underserved areas is key to reduce the digital connectivity
gap. In order to do so, it is important to explore innovative and cost-efficient technologies and business models. TESCOs offer
solutions for powering and managing telecom companies’ networks in off-grid and bad-grid areas (Chapter 1). TESCOs typically
replace diesel-powered solutions with hybrid renewable energy options. By anchoring the demand around a large telecom
client, they can also aggregate the demand of nearby villages, contributing to the rural electrification agenda, and providing a
viable model where village-level electrification programs have failed in the past. Access to reliable power remains a challenge
for telecom operators in many emerging markets. Non-existent to poor grid infrastructure at many tower locations has driven
a high dependence on diesel fuel to power such sites, increasing energy costs and carbon footprint for telecom operators.
TESCOs have emerged as solution providers to MNOs and Towercos, offering them a diverse portfolio of energy solutions and
services for sites, typically through the use of distributed renewable energy generation and battery energy storage systems.
TESCO solutions, which increasingly rely upon renewable energy, such as solar PV (Photovoltaic) systems, provide a tremendous
opportunity to reduce costs and carbon footprint, due to rapidly declining cost and increasing maturity of renewable energy
and battery energy storage systems technologies. TESCOs can play a pivotal role in expanding telecommunications coverage
by addressing the power supply challenges faced by MNOs and Towercos at tower sites with either unreliable or no grid
connectivity (bad- or off-grid sites).
Having financed the network expansion of mobile network operators, or MNOs, and Towercos over the past 30 years, IFC is
now turning its attention to TESCOs as additional solution providers for addressing these issues. IFC is seeking to contribute
to the growth and development of innovative solution providers for telecom sites located in areas with little to no access to
electricity by providing insights into the growth perspectives of the TESCO market globally (Chapters 2 and 3). TESCOs can
deliver high development impact in terms of access to mobile communications and broadband for unconnected communities
in rural areas when serving bad-grid and off-grid areas. Communities benefit from increased access to services enabled by
mobile connectivity. TESCO investments also contribute to improved environmental sustainability and combat climate change,
as they enable large-scale use of green power solutions like solar PV systems that result in significant greenhouse gas savings.
IFC proposes a market segmentation framework based on current business models (Chapter 4). The report then examines the
typical commercial arrangements and key drivers which influence the bankability of TESCOs (Chapter 5). IFC also estimates the
total amount of financing needed in order to address the pressing need for connectivity in unserved and underserved areas and
acts as a call to action to stakeholders in the industry and in the financing community to work towards bridging this important
connectivity gap. The five sections covered in this report represent the key dimensions required to assess the investment
opportunity for TESCOs. Many of these topics are the first of their kind in the industry and have been built on a foundation of
excellent collaboration with both industry associations and private companies.
x
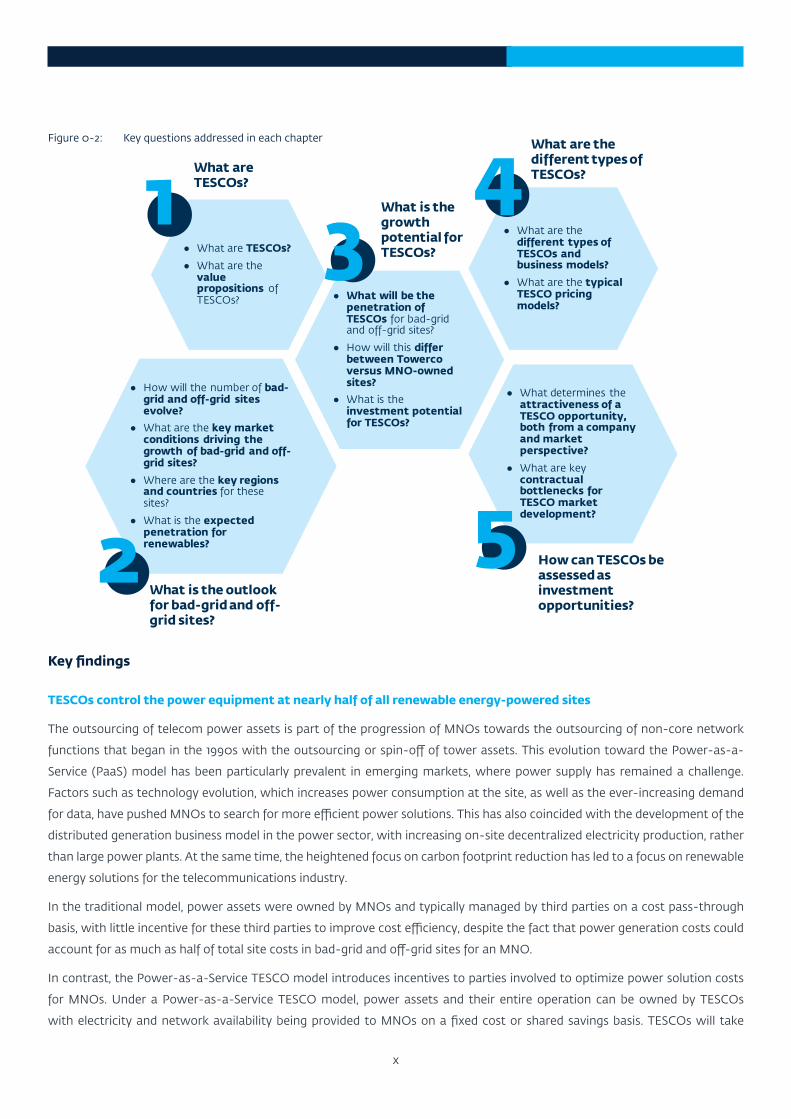
Figure 0-2: Key questions addressed in each chapter
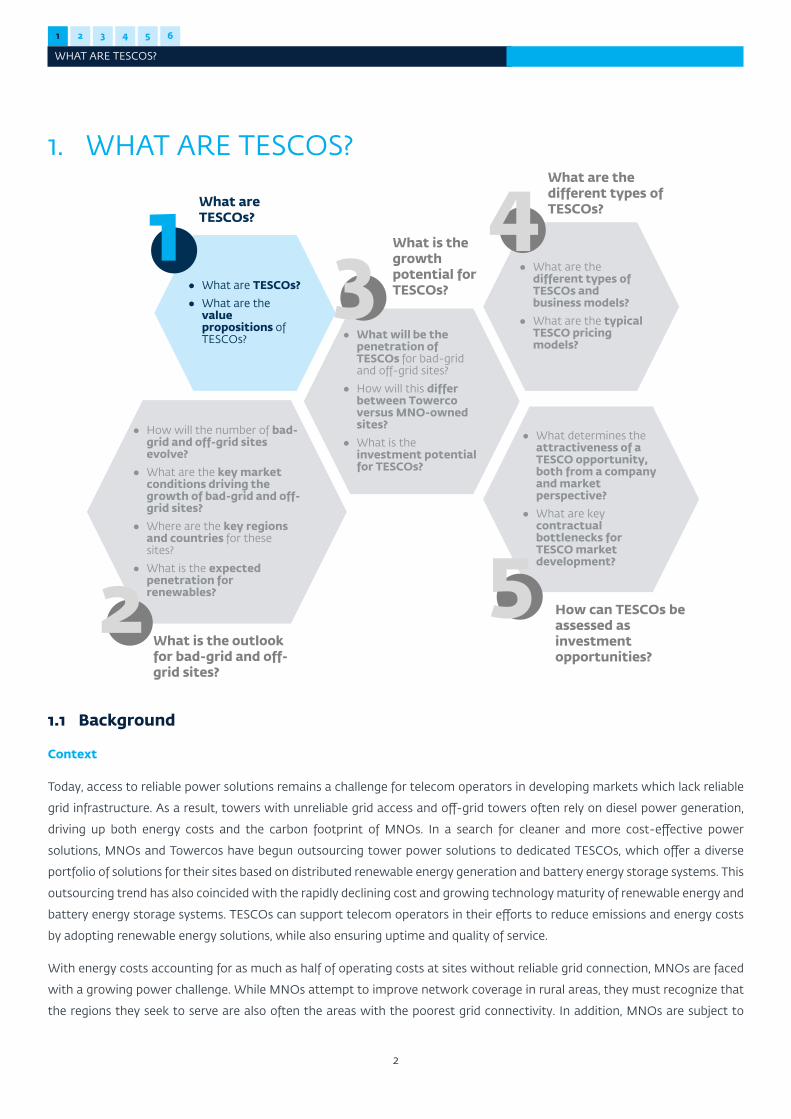
● How will the number of bad-grid and off-grid sites evolve?
● What are the key market conditions driving the growth of bad-grid and off-grid sites?
● Where are the key regions and countries for these sites?
● What is the expected penetration for renewables?
● What are the different types of TESCOs and business models?
● What are the typical TESCO pricing models?
● What will be the penetration of TESCOs for bad-grid and off-grid sites?
● How will this differ between Towercoversus MNO-owned sites?
● What is the investment potential for TESCOs?
● What determines the attractiveness of a TESCO opportunity, both from a company and market perspective?
● What are key contractual bottlenecks for TESCO market development?
● What are TESCOs?
● What are the value propositions of TESCOs?
How can TESCOs be assessed as investment opportunities?
What are TESCOs?
What is the outlook for bad-grid and off-grid sites?
What is the growth potential for TESCOs?
What are the different types of TESCOs?1
5
4
2
3
Key findings
TESCOs control the power equipment at nearly half of all renewable energy-powered sites
The outsourcing of telecom power assets is part of the progression of MNOs towards the outsourcing of non-core network
functions that began in the 1990s with the outsourcing or spin-off of tower assets. This evolution toward the Power-as-a-
Service (PaaS) model has been particularly prevalent in emerging markets, where power supply has remained a challenge.
Factors such as technology evolution, which increases power consumption at the site, as well as the ever-increasing demand
for data, have pushed MNOs to search for more efficient power solutions. This has also coincided with the development of the
distributed generation business model in the power sector, with increasing on-site decentralized electricity production, rather
than large power plants. At the same time, the heightened focus on carbon footprint reduction has led to a focus on renewable
energy solutions for the telecommunications industry.
In the traditional model, power assets were owned by MNOs and typically managed by third parties on a cost pass-through
basis, with little incentive for these third parties to improve cost efficiency, despite the fact that power generation costs could
account for as much as half of total site costs in bad-grid and off-grid sites for an MNO.
In contrast, the Power-as-a-Service TESCO model introduces incentives to parties involved to optimize power solution costs
for MNOs. Under a Power-as-a-Service TESCO model, power assets and their entire operation can be owned by TESCOs
with electricity and network availability being provided to MNOs on a fixed cost or shared savings basis. TESCOs will take
xi
on the burden of upfront Capital Expenditure (CAPEX) on behalf of the tower owner or MNO. With full control over energy
management, TESCOs approach power solutions from a Total Cost of Ownership (TCO) perspective and are hence highly
incentivized to generate cost savings for both parties and make the required upfront investments to modernize power assets.
The primary means by which TESCOs achieve cost efficiencies is by converting existing diesel-powered sites to either solar or
solar-hybrid technologies.
To meet the global sustainability challenge, MNO industry body GSMA has announced an industry-wide roadmap to achieve
carbon neutrality by 2050 in line with the Paris Agreement. In addition, many leading MNOs have gone a step further to bring
forward carbon neutrality targets to 2040. As a significant part of achieving carbon neutrality for MNOs will involve the switch
towards renewable sources of energy, TESCOS will play a major role in catalyzing this industry shift.
In the last decade, both MNOs and Towercos have embraced the Power-as-a-Service model offered by TESCOs, largely
procuring energy solutions from specialized energy experts in order to improve energy cost efficiencies, achieve better cost
predictability, guarantee service improvement and coverage and address environmental sustainability targets whilst ensuring
resiliency and future-proofing their network infrastructure. In fact, while TESCOs now control the power equipment at one
percent of the total number of tower sites globally, this represents nearly half of all renewable energy-powered sites globally.
The number of bad-grid and off-grid sites is expected to grow by 22 percent over the next 10 years and the penetration
of renewable energy solutions at such sites is expected to increase threefold
Bad-grid and off-grid sites offer TESCOs the greatest opportunities to achieve cost savings through site power solution
optimization, especially by reducing reliance on diesel. In the six regions covered in this report, the total number of bad- and
off-grid sites is expected to increase by 22 percent from 611,000 in 2019 to 745,000 in 2030. The increase is driven by rising
mobile penetration due to rising per capita incomes, network densification due to higher per capita network traffic, Universal
Service Obligations to expand rural coverage and the pace of power grid expansion lagging behind the construction of new
telecom sites.
The majority of bad-grid and off-grid sites can be found in South Asia (SA), Sub-Saharan Africa (SSA) and East Asia and the
Pacific (EAP), which account for 36 percent, 29 percent and 19 percent of global bad- and off-grid sites, respectively. The largest
increase in bad- and off-grid sites is expected in SSA, where it will increase by 89,000 from 115,000 in 2019 to 205,000 in
2030. Unsurprisingly, the proportion of these sites is highly correlated with the rate of grid access, as well as to the quality of
electricity supply where sites are connected to the grid.
The penetration of renewable energy solutions at bad-grid and off-grid sites is expected to increase from 10 percent to 27
percent by 2030. In terms of regional split, the top three regions of EAP, SSA and SA are expected to account for over 34 percent,
29 percent and 24 percent of bad- and off-grid sites with renewable power solutions by 2030 respectively.
The number of TESCO sites is expected to quadruple by 2030
Today there are 26 countries with operational TESCO sites as well as 57 countries which could be new markets for TESCOs by
2030. Of these, 10 countries are expected to account for nearly half of the TESCO market. By 2030, TESCO penetration of bad-
grid and off-grid sites could increase from 7 percent (42,000 TESCO sites) to 22 percent (166,000 TESCO sites). On a regional
level, SSA and SA lead in the number of current TESCO sites, accounting for 48 percent and 38 percent of global TESCO sites,
respectively. These two regions are also expected to comprise a majority of TESCO sites in 2030.
The estimated total TESCOs sites of 166,000 by 2030 represents a 38 percent penetration rate of the total addressable market
(436,000 sites). The estimate takes into account a minimum scale required for a commercially viable TESCO contract, as well
xii
as the usable solar resources need to support solar power generation. The estimate also considers potential competition with
Towercos offering Power-as-a-Service. The penetration rate in 2030 will still fall short of its full potential due to a variety
of reasons, including lengthy contract negotiations, resistance to new technologies, individual market complexities, and the
preference of some MNOs to maintain in-house power operations. However, growing acceptance of Power-as-a-Service and
improved market conditions could unlock potential upsides, bringing the total number of TESCO sites to 250,000 by 2030.
There are four key types of TESCO players present in the market today
TESCOs are typically integrated with Operations and Maintenance (O&M) service providers (44 percent of TESCO sites), power
producers (36 percent), power equipment manufacturers or integrators (17 percent), or pureplay TESCOs (3 percent). Value
chain integration is common for TESCOs which seek to take advantage of synergies from expertise developed from other
business segments. For example, service providers of O&M for passive infrastructure assets can leverage on existing field
technicians on-the-ground to provide O&M for power assets. Power equipment manufacturers bring to the TESCO model
their strong expertise in technical power solutions and Research and Development (R&D) capabilities, while distributed power
producers, especially those specializing in solar power generation, can bring their existing expertise in optimizing solar power
generation technology.
A TESCO attractiveness and bankability framework takes into account operator-specific considerations and
market risks
Factors to consider in determining a TESCO’s ability to secure contracts and deliver on its long-term contractual commitments
include the TESCO’s track record and on-the-ground experience in similar operating environments, operational expertise, and
technical solutions, as well as the TESCO’s access to equity and financing capital. In order to ensure bankability of contracts,
key clauses include the tenor, fee structure, committed generation and services, Service Level Agreements (SLAs) and penalties,
currency and indexation, valuation of legacy assets and termination clauses. In addition, there are also macro risks in emerging
regions, including currency risk, internal or external country conflicts, uneven power market regulation, and the safety and
security of remote sites.
The estimated investment need for the forecast growth in TESCO sites amounts to $3.9 billion by 2030
SSA is expected to require the biggest investment for new TESCO sites at $1.6 billion, followed by SA at $800 million, and Middle
East and North Africa (MENA) at $600 million, and EAP at $400 million (largely driven by Southeast Asian countries). The
financing community is called upon to support the growth of TESCOs and assist in bridging the connectivity gap in underserved
regions.
TESCOs have the potential to deliver high development impact in terms of the benefits brought about to unconnected
communities and to the regional economy, as well as their contribution to environmental sustainability
Finally, TESCOs have a key role to play in opening opportunities for the social and economic inclusion of unconnected
communities in bad-grid and off-grid rural areas. TESCOs can also support network deployment, and offer energy cost savings
that can be partially passed to end-users. In addition, TESCOs’ investment can result in increased communities’ coverage of
mobile telephony or broadband networks, including 3G or higher-speed mobile networks. Also, by employing greener power
solutions like solar PV systems, TESCO investments can result in significant greenhouse gas savings, bringing the additional
benefit of environmental sustainability.
Chapter 1
WHAT ARE TESCOS?
1 2 3 4 5 6
WHAT ARE TESCOS?
2
1. WHAT ARE TESCOS?
● How will the number of bad-grid and off-grid sites evolve?
● What are the key market conditions driving the growth of bad-grid and off-grid sites?
● Where are the key regions and countries for these sites?
● What is the expected penetration for renewables?
● What are the different types of TESCOs and business models?
● What are the typical TESCO pricing models?
● What will be the penetration of TESCOs for bad-grid and off-grid sites?
● How will this differ between Towercoversus MNO-owned sites?
● What is the investment potential for TESCOs?
● What determines the attractiveness of a TESCO opportunity, both from a company and market perspective?
● What are key contractual bottlenecks for TESCO market development?
● What are TESCOs?
● What are the value propositions of TESCOs?
How can TESCOs be assessed as investment opportunities?
What are TESCOs?
What is the outlook for bad-grid and off-grid sites?
What is the growth potential for TESCOs?
What are the different types of TESCOs?1
5
4
2
3
1.1 Background
Context
Today, access to reliable power solutions remains a challenge for telecom operators in developing markets which lack reliable
grid infrastructure. As a result, towers with unreliable grid access and off-grid towers often rely on diesel power generation,
driving up both energy costs and the carbon footprint of MNOs. In a search for cleaner and more cost-effective power
solutions, MNOs and Towercos have begun outsourcing tower power solutions to dedicated TESCOs, which offer a diverse
portfolio of solutions for their sites based on distributed renewable energy generation and battery energy storage systems. This
outsourcing trend has also coincided with the rapidly declining cost and growing technology maturity of renewable energy and
battery energy storage systems. TESCOs can support telecom operators in their efforts to reduce emissions and energy costs
by adopting renewable energy solutions, while also ensuring uptime and quality of service.
With energy costs accounting for as much as half of operating costs at sites without reliable grid connection, MNOs are faced
with a growing power challenge. While MNOs attempt to improve network coverage in rural areas, they must recognize that
the regions they seek to serve are also often the areas with the poorest grid connectivity. In addition, MNOs are subject to
1 2 3 4 5 6
WHAT ARE TESCOS?
3
increased power requirements from the deployment of newer technologies, as well as the overall mobile network sector’s
commitment to reduce emissions by 45 percent by 2030 and achieve net zero emissions by 2050. It is in this context that the
emergence of TESCOs has had the impact of catalyzing a transition towards renewable energy generation at telecom sites.
Nevertheless, the TESCO market is still in its early growth stage today, with many emerging players and varying business
models. This report, Investing in Sustainable Access to Communications: The Role of Telecom Energy Services Companies, contains the
findings of a global assessment of the current status and potential of TESCOs.
Scope of the report
This report covers the TESCO market in SSA, MENA, Latin America and the Caribbean (LAC), SA, EAP, and Europe and Central
Asia (ECA) as per IFC’s definitions. In these regions, the proportion of bad-grid and off-grid sites is expected to be higher
compared to developed economies. In all, a total of 173 countries within the six identified regions are covered in this report.1
This report also complements other authoritative studies by TowerXchange and GSMA which have already been published.
Figure 1-1 summarizes the complementarity between TowerXchange’s ESCO Market Report 2018, GSMA’s Renewable Energy
Adoption for Off-grid Sites report and this TESCO market assessment, which is done from the perspective of prospective
investors.
TowerXchange has been involved in the TESCO market since 2015, before TESCOs have achieved the growth momentum as
seen today. Recognizing the need for power solutions in grid-challenged tower environments, TowerXchange’s ESCO Market
Report 20182 and the ESCO Borderless Report 20203 provide a comprehensive view of key stakeholders such as TESCO, MNOs,
Towercos, equipment suppliers, financiers and regulators. The two reports also document recent market developments and
opportunities, and provide exclusive interviews with actors in the TESCO market.
In 2014, the GSMA Green Power for Mobile program published the Global Telecom ESCO Tower Market4 report, which identified
over one million bad-grid and off-grid sites. The report indicated that 90 percent of these sites were powered by diesel
generators, emitting over 45 million tons of carbon dioxide per year. In September 2020, the GSMA ClimateTech program
published the Renewable Energy for Mobile Towers5 report, which updated the estimates of existing renewable energy penetration
for bad- and off-grid sites in 91 low- and middle-income countries. The 2020 report also identified key issues faced by MNOs
as they pursued renewable energy solutions on such sites.
Investing in Sustainable Access to Communications: The Role of Telecom Energy Services Companies aims to analyze the opportunities
and barriers supporting or hindering the growth of TESCOs and their impact on TESCOs’ ability to attract capital. This analysis
is conducted through a market forecast for such energy services for telecom towers, focusing largely on emerging markets.
Investing in Sustainable Access to Communications provides a comprehensive view of TESCO bankability, including a detailed
review of the key market conditions, economic, technology and regulatory trends likely to impact the TESCO market and an
assessment of the relationship between the key stakeholders.
1 Refer to the Annex A for the full list of countries covered in this report.
2 TowerXchange (2018), TowerXchange’s ESCO Market Report 2018, accessed at: https://www.towerxchange.com/publication/towerxchanges-annual-telecom-
esco-market-report-2018/
3 TowerXchange (2020), ESCO Borderless Report 2020, accessed at: https://content.comms.euromoneyplc.com/esco_borderless_report_2020.html
4 GSMA (2015), Global Telecom ESCO Tower Market, accessed at: https://www.gsma.com/mobilefordevelopment/wp-content/uploads/2015/01/140617-GSMA-
report-draft-vF-KR-v7.pdf
5 GSMA (2020), Renewable Energy for Mobile Towers: Opportunities for low- and middle-income countries, accessed at: https://www.gsma.com/
mobilefordevelopment/wp-content/uploads/2020/09/Clean_Tech_Report_R_WebSingles.2.pdf
1 2 3 4 5 6
WHAT ARE TESCOS?
4
Figure 1-1: Overview of the key TESCO reports
6 After being at the margins of the power industry for a prolonged period, distributed PV generation capacity now represents close to 40 percent of all new solar
deployment. See IEA (2020), Renewables 2020, accessed at: https://www.iea.org/reports/renewables-2020/solar-pv
OVERALL THEME
TITLE OF REPORT, YEAR
SCOPE OF REPORT
Addressable market
Key industry players
Business model
Market drivers - technology
Market drivers - regulation
Barriers to entry
Contractual agreement
Investment consideration
TowerXchange GSMA
Address power solution challenges from towercos' perspective
Address power solution provision (use of RE) from MNO perspective
Address bankability of power solution providers
ESCO Market Report 2018
November 2018
Renewable Energy for Mobile Towers
September 2020
Investing in Sustainable Access to Communications: The Role of Telecom Energy Services Companies
September 2021
Bad and off-grid sites in 2018, and forecast of TESCO penetration by 2024
Bad and off-grid sites in 2020, and RE penetration in 2020
Bad and off-grid sites 2019 to 2030 and TESCO and RE penetration to 2030
TESCO players globally and sites managed + list of TESCO related players
Mapping of stakeholders for telco RE transformation
TESCO players globally and key stakeholders
TESCO player's business model TESCO player's business model and pros and cons
Telecom site technology drivers incorporated in market forecast
Technology drivers impacting RE uptake
Towers and RE policy and regulatory drivers incorporated in market forecast
Policy and regulatory drivers impacting RE uptake
Operational risk and contractual bottlenecks impeding TESCO growth
Stakeholder’s concerns and challenges (renewables perspective)
Benchmark of TESCO contractual agreement
Framework in assessing potential TESCO market and investment opportunity
Power equipment vendors and technologies utilized by TESCOs
Industry perspectives from key stakeholders (MNOs, towercos and TESCOs)
1.2 Introduction to TESCOs
Power assets are the natural next step in MNO outsourcing
For MNOs, divesting power assets and turning to Power-as-a-Service can be seen as a natural next step in the evolution of
MNO network outsourcing. Since the emergence of MNOs in the 1990s, passive assets have been built and owned by MNOs.
But, starting in the late 2000s, MNOs began to divest towers to Towercos in order to attain a more asset-light positioning
and focus on serving customers. Initially, energy costs incurred by Towercos were passed through to MNOs, but subsequently
Towercos began offering integrated solutions which included power provision. While TESCO activities started around 2010,
the TESCO model gained global momentum after 2015 (figure 1-2). This growth was driven by both the declining costs of solar
generation and battery energy storage systems, and increasing de-carbonization efforts. These changes also coincided with the
rapid growth of distributed renewable power generation.6
With outsourcing having gained widespread acceptance among MNOs, the concept of Network-as-a-Service (NaaS) is
increasingly popular today. MNOs are moving towards outsourcing a variety of non-core functions, potentially adding on the
divestment of power assets to the already well-established tower asset carveouts. In fact, in 2019, about 60 percent of site
power assets were no longer owned by MNOs.
1 2 3 4 5 6
WHAT ARE TESCOS?
5
Figure 1-2: Evolution of power asset ownership
Ownership of power assets, 2019
Emergence of MNOs
● MNOs built and owned passive assets at telecom sites
First Towercosoutside the US
● MNOs divested towers (existing and new builds) to Towercos
● Initially energy costs were pass-through
● Towercos then offered integrated solutions, including power
TESCOs gain momentum
● TowerCos outsourced or carved-out provision of power to TESCOs
● TESCOs started gaining large scale momentum after 2015
● MNOs are moving towards outsourcing a variety of non-core network functions
MNO MNO/Towerco Towerco/TESCO Towerco/TESCOResponsible for managing/ powering telecom sites Outsourcing market maturity
Low High
Network-as-a-service
Today1990 2008 2015
27%
15%
57%
1%
MNO owned at own sites
MNO owned at Towercosites
Towerco Paasowned
TESCO owned/ managed
Total towers4 m
Brief history
When power assets are owned and maintained by the same party, there is a very strong incentive to optimize cost
and prolong the life of the asset
Traditionally, MNOs own and manage their own power assets – either on their own tower sites, or with Towercos. As power
supply is a non-core function, MNOs sometimes lack power expertise and typically outsource the management of power assets
to third parties. These arrangements are usually sub-optimal for an MNO, as power supply tends to be on a cost-pass through
basis, with the third party having little incentive to reduce costs.
By contrast, under the emerging Power-as-a-Service model where power is provided under a fixed fee structure either by a
TESCO or a Towerco, Power-as-a-Service providers which internalize the cost of providing power are incentivized to improve
cost efficiencies. Power-as-a-Service providers are incentivized to consider the lifetime costs of power supply and are hence
more likely to make upfront CAPEX investment in order to achieve cost and operational efficiencies over the longer term.
The Power-as-a-Service model also provides some additional benefits for MNOs. Firstly, they enjoy greater cost predictability
since power power is supplied at pre-negotiated prices. Secondly, the CAPEX requirements are also outsourced from the MNO
to the Power-as-a-Service provider, allowing MNOs to focus their efforts on core network and service improvement.
While Power-as-a-Service can be provided by either TESCOs or Towercos, TESCOs are differentiated by being specialized in
power provision, which can bring better operational expertise and economies of scale. This thesis is also supported by the fact
that many Towercos contract the services of TESCOs themselves. Today, some two-thirds of TESCO sites, have a Towerco
as anchor client, but demand is expected to increasingly come directly from MNOs. Some of the larger Towercos are likely to
choose to develop or enhance their in-house Power-as-a-Service capabilities instead of outsourcing to TESCOs.
Diesel-powered solutions are currently the default power systems for bad-grid and off-grid sites
Of the estimated four million tower sites covered in this report, about 85 percent (3.4 million) are good-grid sites with reliable
electricity supply. The remaining 15 percent (0.6 million), are either bad- or off-grid sites. Among bad- or off-grid sites, the
default power supply system is a combination of diesel generators and batteries, covering an estimated 90 percent of such
sites. However, these installations suffer from several cost inefficiencies, including vulnerability to volatility in fuel prices and
1 2 3 4 5 6
WHAT ARE TESCOS?
6
fuel shortages, logistical cost and challenges of transporting fuel to sites in remote areas, as well as operational leakages such
as diesel pilferage. On top of that, diesel-powered generation is also responsible for high levels of pollution and greenhouse
gas emissions.
Solar-hybrid systems have emerged as an economic alternative to diesel-powered sites but uptake is still hindered
by high upfront costs
In recent years, alternative power supply systems involving renewable energy have emerged as a potential replacement for
legacy diesel generation systems at bad- or off-grid sites. These options are either solar-battery hybrid power generation
systems, or diesel-solar-battery hybrids, which are present in 65,000 sites, or about 10 percent of total bad- and off-grid tower
sites. While upfront costs for these solarized sites are higher, lifetime Total Cost of Ownership7 savings of as much as 50 percent
over pure diesel power systems are achievable over a ten-year period (figure 1-3). In fact, it is expected that within three to five
years, the cumulative cost of running a solarized site will be lower than that of pure diesel-powered site. There are multiple
reasons for this cost reduction: TCO for a diesel-only option increases substantially over the lifetime of the asset, primarily
driven by diesel fuel costs, as well as operational cost associated with diesel genset maintenance cost, logistics of diesel, and
operational leakages. Despite the strong business case for solarizing a site, the high upfront cost has been a major impediment
to MNOs and Towercos in adopting such a solution.
7 The TCO takes into account total lifetime OPEX and CAPEX (including replacement cost).
8 Given that the duration for a typical TESCO contract is around 10 years, the TCO is shown over 10 years to indicate clear benefits of solar over diesel-based
solutions. Given the lifetime of solar PV assets is around 25 years and that of Li-On batteries are around 10 years, the benefits will be even more significant in the
longer term but also subject to diesel fuel price fluctuations.
Figure 1-3: TCO of bad-grid and off-grid site power solutions in Asia8
421 5 76 8 9 100
10
120
20
70
60
90
40
80
50
100
110
3
30
130
Diesel + battery
Diesel only
Diesel + battery + solar
Time [years]
Total Cost of Ownership [$ thousands]
Battery + solar
We are looking at alternative solutions to diesel like solar, but the upfront cost required is still high.
Interview excerpt from Towerco with Power-as-a-
Service
1 2 3 4 5 6
WHAT ARE TESCOS?
7
TESCOs have attracted both MNOs and Towercos as clients
TESCOs have tapped into this opportunity, allowing both MNOs and Towercos to outsource their power solution requirements
to power experts and transferring the upfront cost of site modernization to TESCOs. TESCOs engage in long-term contracts
with their customers to provide Power-as-a-Service , typically on a monthly fixed-fee structure for about 10 years. TESCOs
deploy capital to modernize power systems at the customer’s existing telecom brownfield sites or install such solutions at
newly-built greenfield sites. The Power-as-a-Service agreement is bound by strict Service Level Agreements (SLAs) to ensure
minimum network availability that is based on the site criticality.9
The scope for TESCOs can include both brownfield and greenfield sites. In the former, TESCOs modernize and solarize typically
inefficient legacy sites, while in the latter, TESCOs can deploy new power solutions. The greenfield site options gives TESCOs
more control over the power solution design and reduces the complications of dealing with legacy assets.
Beyond power asset management, TESCOs’ scope of work typically includes additional synergistic services such as the supply
of power equipment, installation and commissioning, as well passive infrastructure maintenance, such as security or cleaning
of sites. TESCOs continue to expand their portfolio of services, adapting it to their clients’ needs. In some instances, TESCOs
offer a full range of services and position themselves as a Network-as-a-Service provider, especially in rural or remote areas.
The benefits of outsourcing to TESCOs extend beyond cost savings
Outsourcing to TESCOs can deliver a number of benefits for customers (figure 1-4). Outsourcing can result in cost savings
for MNOs and Towercos by converting power solution cost into an Operational Expenditure-only (OPEX) cost and reducing
dependence on diesel technology. This can also improve cost predictability for MNOs and Towercos through long-term fixed
pricing contracts. These cost savings can enable operators to provide affordable digital connectivity services. These outcomes
can be enhanced in the long run as TESCOs contribute to future-proofing network infrastructure by offering remote site
monitoring and upgrading outdated legacy power systems.
Beyond cost savings and cost predictability, the decision to outsource to TESCOs can also result in increased availability of
mobile connectivity for end-users. Cost savings enable MNOs to extend their services in otherwise commercially unattractive
areas. Such outcomes can also be achieved thanks to strict uptime requirements embedded in TESCO contracts.
TESCOs have the potential to deliver benefits to unconnected communities and to the regional economy
TESCOs’ attractiveness can also be assessed through their development impact. TESCOs can contribute to increased access to
mobile connectivity for unconnected communities in rural areas when serving bad-grid and off-grid areas with a low population
coverage or a nascent TESCO market segment.
Key benefits to communities include increased access to quality mobile connectivity through improved penetration rate of
mobile telephony or broadband. In remote rural areas previously considered unprofitable, TESCO investments and network
deployment can result in energy saving alternatives for mobile or tower operators, which brings opportunities for increased
communities’ coverage of mobile telephony or broadband.
9 Site criticality (importance of the site could be determined based various factors, for example, revenue per site, types of customers served) determines different
levels of SLAs, determining the type of solution used and frequency of visit by the team
1 2 3 4 5 6
WHAT ARE TESCOS?
8
In areas with low mobile connectivity, TESCO investments can generate great benefits that far outweigh costs due to the
potential that access to internet has in promoting GDP growth and employment. This impact is especially visible in low-income
countries or regions with high level of informality or unemployment. Furthermore, the commercial viability of the TESCO’s
business model can trigger replication by new entrants, offering the possibility of a market-wide propagation, which could
further increase benefits to more stakeholders.
TESCOs can contribute to environmental sustainability
In a context where telecommunications rely on fossil fuels, TESCO investments that enable large-scale use of green power
solutions like solar PV systems, offer the possibility of significant greenhouse gas savings, thus contributing to environmental
sustainability. Further, TESCO investments can also promote environmental sustainability of the market for mobile connectivity
by inducing competition, which then results in innovation in power consumption, and a wider adoption of sustainable power
solutions by mobile operators.
1 2 3 4 5 6
WHAT ARE TESCOS?
9
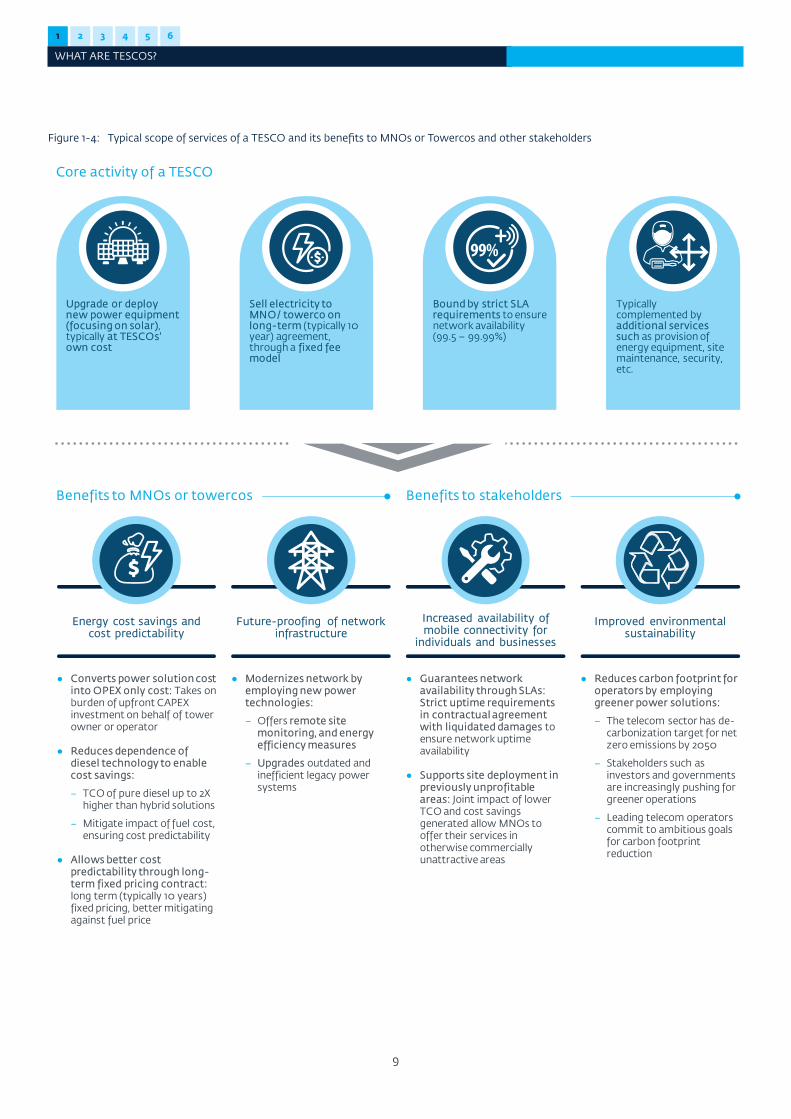
Figure 1-4: Typical scope of services of a TESCO and its benefits to MNOs or Towercos and other stakeholders
Core activity of a TESCO
Bound by strict SLA requirements to ensure network availability (99.5 – 99.99%)
Typically complemented by additional services such as provision of energy equipment, site maintenance, security, etc.
Sell electricity to MNO/ towerco on long-term (typically 10 year) agreement, through a fixed fee model
● Converts power solution cost into OPEX only cost: Takes on burden of upfront CAPEX investment on behalf of tower owner or operator
● Reduces dependence of diesel technology to enable cost savings:
– TCO of pure diesel up to 2Xhigher than hybrid solutions
– Mitigate impact of fuel cost, ensuring cost predictability
● Allows better cost predictability through long-term fixed pricing contract: long term (typically 10 years) fixed pricing, better mitigating against fuel price
Energy cost savings and cost predictability
Upgrade or deploy new power equipment (focusing on solar), typically at TESCOs' own cost
● Modernizes network by employing new power technologies:
– Offers remote site monitoring, and energy efficiency measures
– Upgrades outdated and inefficient legacy power systems
Future-proofing of network infrastructure
● Guarantees network availability through SLAs: Strict uptime requirements in contractual agreement with liquidated damages to ensure network uptime availability
● Supports site deployment in previously unprofitable areas: Joint impact of lower TCO and cost savings generated allow MNOs to offer their services in otherwise commercially unattractive areas
Increased availability of mobile connectivity for
individuals and businesses
● Reduces carbon footprint for operators by employing greener power solutions:
– The telecom sector has de-carbonization target for net zero emissions by 2050
– Stakeholders such as investors and governments are increasingly pushing for greener operations
– Leading telecom operators commit to ambitious goals for carbon footprint reduction
Improved environmental sustainability
Benefits to stakeholdersBenefits to MNOs or towercos
Chapter 2
WHAT IS THE OUTLOOK FOR BAD-GRID AND OFF-GRID SITES?
1 2 3 4 5 6
WHAT IS THE OUTLOOK FOR BAD-GRID AND OFF-GRID SITES?
11
2. WHAT IS THE OUTLOOK FOR BAD-GRID AND OFF-GRID SITES?
● How will the number of bad-grid and off-grid sites evolve?
● What are the key market conditions driving the growth of bad-grid and off-grid sites?
● Where are the key regions and countries for these sites?
● What is the expected penetration for renewables?
● What are the different types of TESCOs and business models?
● What are the typical TESCO pricing models?
● What will be the penetration of TESCOs for bad-grid and off-grid sites?
● How will this differ between Towercoversus MNO-owned sites?
● What is the investment potential for TESCOs?
● What determines the attractiveness of a TESCO opportunity, both from a company and market perspective?
● What are key contractual bottlenecks for TESCO market development?
● What are TESCOs?
● What are the value propositions of TESCOs?
How can TESCOs be assessed as investment opportunities?
What are TESCOs?
What is the outlook for bad-grid and off-grid sites?
What is the growth potential for TESCOs?
What are the different types of TESCOs?
5
4
2
31
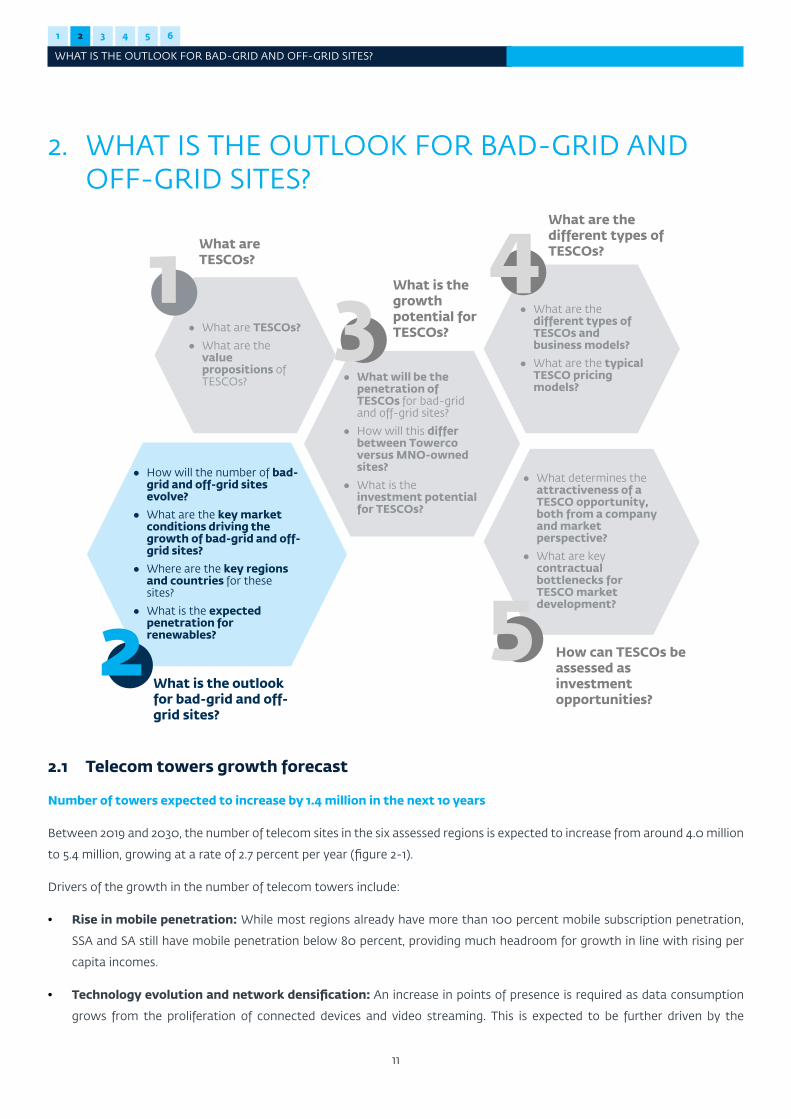
2.1 Telecom towers growth forecast
Number of towers expected to increase by 1.4 million in the next 10 years
Between 2019 and 2030, the number of telecom sites in the six assessed regions is expected to increase from around 4.0 million
to 5.4 million, growing at a rate of 2.7 percent per year (figure 2-1).
Drivers of the growth in the number of telecom towers include:
• Rise in mobile penetration: While most regions already have more than 100 percent mobile subscription penetration,
SSA and SA still have mobile penetration below 80 percent, providing much headroom for growth in line with rising per
capita incomes.
• Technology evolution and network densification: An increase in points of presence is required as data consumption
grows from the proliferation of connected devices and video streaming. This is expected to be further driven by the
1 2 3 4 5 6
WHAT IS THE OUTLOOK FOR BAD-GRID AND OFF-GRID SITES?
12
transition toward newer technologies which have a lower coverage radius. In particular, 4G network densification is likely
to have a large short-term impact in emerging markets.
• Expansion of telecom networks into rural and remote areas: Telecom operators are expected to increasingly deploy
sites in remote and lower population density areas as urban penetration reaches saturation. Most countries also include
mandatory network coverage obligations for MNOs to deploy sites in these areas.
• Rise in tenancy ratios is expected due to increased sharing of passive infrastructure and growing penetration of
independent Towercos. Tower sharing can drive the reduction in deployment costs, giving MNOs faster time to market.
MNOs are faced with increased competition and compressing margins, incentivizing CAPEX optimization. Similar dynamics
are also at play for power assets. Infrastructure sharing has also gained support from telecom regulators, with tower
sharing being mandated or encouraged in some markets.
10 The scope of this report includes SSA, MENA, LAC, SA, EAP and EAC.
Figure 2-1: Forecast of number of telecom towers in the markets within the scope of this report10 (thousand sites)
202720222019 2020 2021 2023 20262024 2025 2028 2029 2030
4,026 4,091 4,116 4,188 4,323 4,492 4,640 4,823 5,034 5,157 5,280 5,408
+1,382
2.2 Forecast of bad-grid and off-grid sites growth
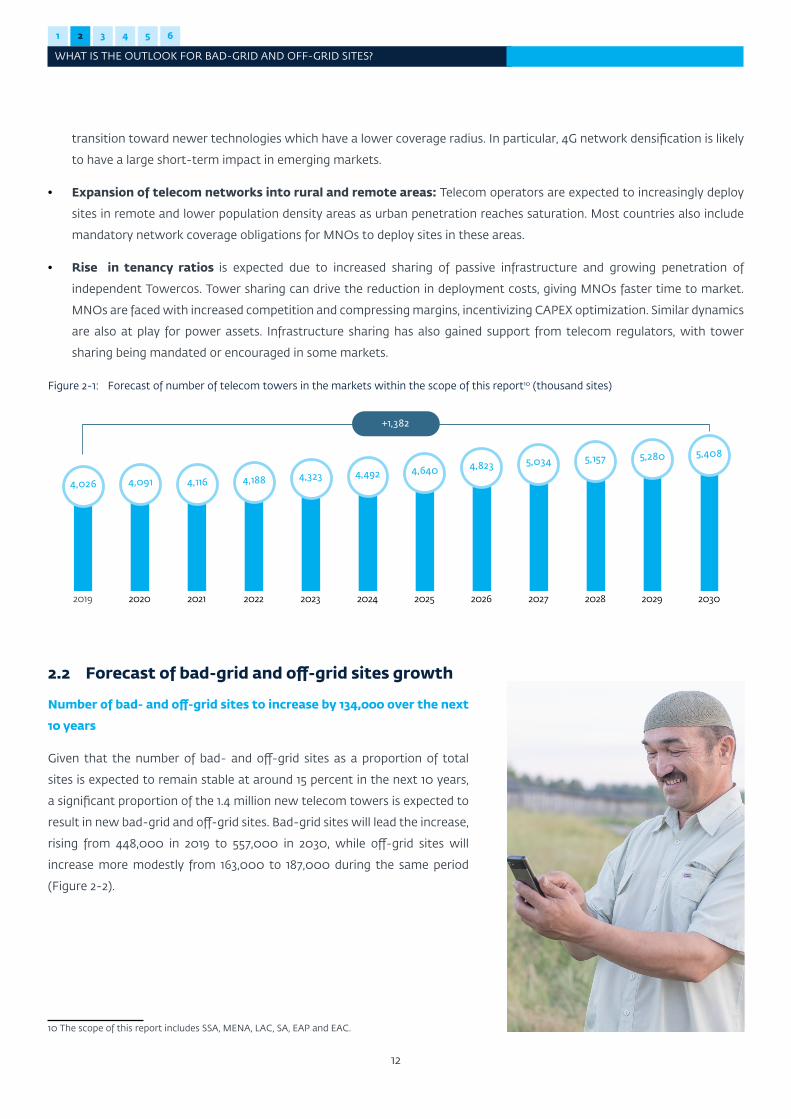
Number of bad- and off-grid sites to increase by 134,000 over the next
10 years
Given that the number of bad- and off-grid sites as a proportion of total
sites is expected to remain stable at around 15 percent in the next 10 years,
a significant proportion of the 1.4 million new telecom towers is expected to
result in new bad-grid and off-grid sites. Bad-grid sites will lead the increase,
rising from 448,000 in 2019 to 557,000 in 2030, while off-grid sites will
increase more modestly from 163,000 to 187,000 during the same period
(Figure 2-2).
1 2 3 4 5 6
WHAT IS THE OUTLOOK FOR BAD-GRID AND OFF-GRID SITES?
13
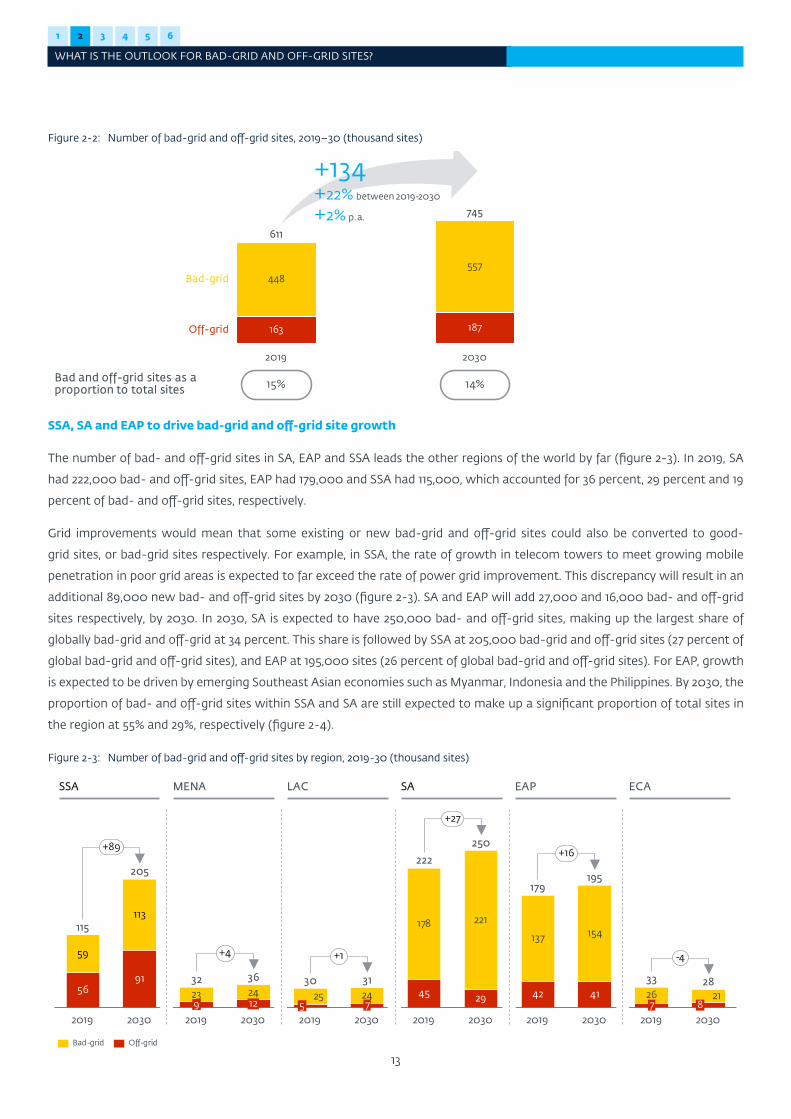
Figure 2-2: Number of bad-grid and off-grid sites, 2019–30 (thousand sites)
557448
163
Bad-grid
Off-grid 187
611
745
+134+22% between 2019-2030
+2% p.a.
2019 2030
Bad and off-grid sites as a proportion to total sites 15% 14%
SSA, SA and EAP to drive bad-grid and off-grid site growth
The number of bad- and off-grid sites in SA, EAP and SSA leads the other regions of the world by far (figure 2-3). In 2019, SA
had 222,000 bad- and off-grid sites, EAP had 179,000 and SSA had 115,000, which accounted for 36 percent, 29 percent and 19
percent of bad- and off-grid sites, respectively.
Grid improvements would mean that some existing or new bad-grid and off-grid sites could also be converted to good-
grid sites, or bad-grid sites respectively. For example, in SSA, the rate of growth in telecom towers to meet growing mobile
penetration in poor grid areas is expected to far exceed the rate of power grid improvement. This discrepancy will result in an
additional 89,000 new bad- and off-grid sites by 2030 (figure 2-3). SA and EAP will add 27,000 and 16,000 bad- and off-grid
sites respectively, by 2030. In 2030, SA is expected to have 250,000 bad- and off-grid sites, making up the largest share of
globally bad-grid and off-grid at 34 percent. This share is followed by SSA at 205,000 bad-grid and off-grid sites (27 percent of
global bad-grid and off-grid sites), and EAP at 195,000 sites (26 percent of global bad-grid and off-grid sites). For EAP, growth
is expected to be driven by emerging Southeast Asian economies such as Myanmar, Indonesia and the Philippines. By 2030, the
proportion of bad- and off-grid sites within SSA and SA are still expected to make up a significant proportion of total sites in
the region at 55% and 29%, respectively (figure 2-4).
Figure 2-3: Number of bad-grid and off-grid sites by region, 2019-30 (thousand sites)
SSA MENA LAC SA EAP ECA
2019
221
2412
20302030 2019
24
178
205
45 42
2019
297
2030
137
20192019
154
41 26
2030
21
36
8
32
59
2556 23
2030
91
5 72019
92030
113115
30 31
222
250
179195
33 28
+89
+4 +1
+27
+16
-4
Bad-grid Off-grid
1 2 3 4 5 6
WHAT IS THE OUTLOOK FOR BAD-GRID AND OFF-GRID SITES?
14
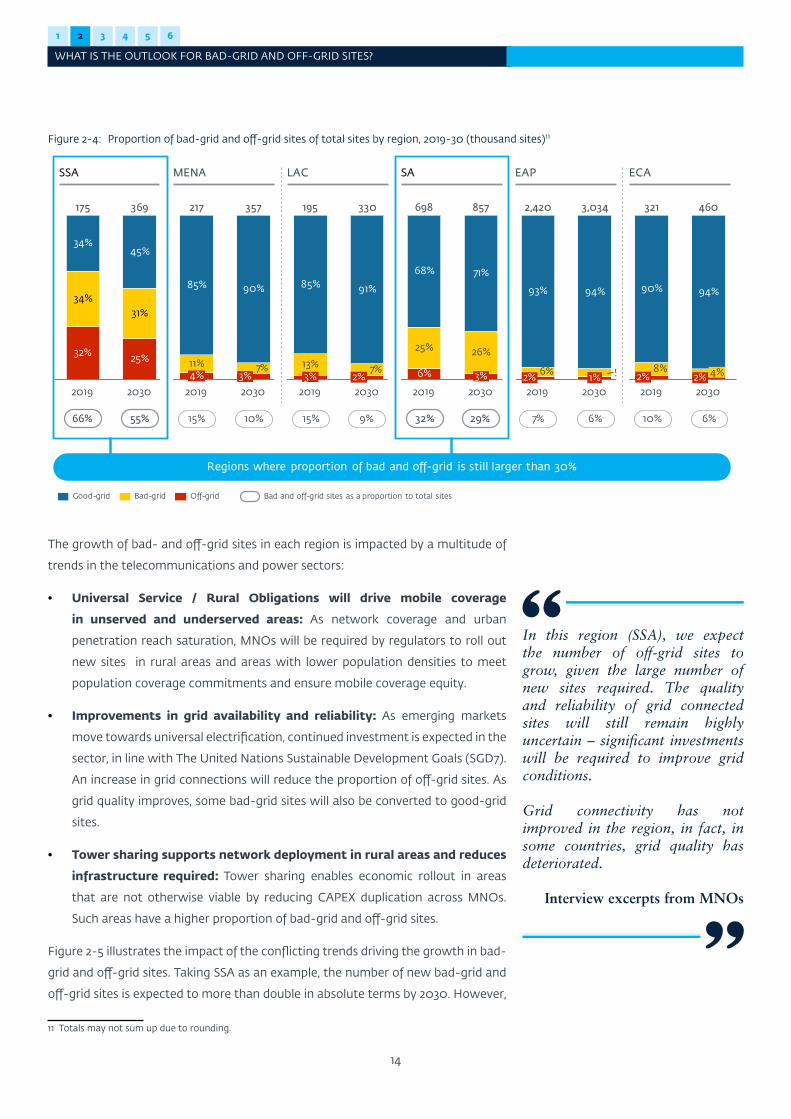
Figure 2-4: Proportion of bad-grid and off-grid sites of total sites by region, 2019-30 (thousand sites)11
11 Totals may not sum up due to rounding.
66% 55% 15% 10% 15% 9% 32% 29% 7% 6% 10% 6%
Regions where proportion of bad and off-grid is still larger than 30%
Bad and off-grid sites as a proportion to total sites
SSA MENA LAC SA EAP ECA
32% 25%6%
34%31%
11% 7% 13% 7%
25% 26%
6% 5% 8%
34%45%
85% 90% 85% 91%
68% 71%
93% 94% 90% 94%
3%2019 2030 2019
857
4% 3% 2%2030
3,034
2019 2030 20302019
3%
20302%2019
1% 2%2030 2019
4%2%
460369175 217 698357 195 330 2,420 321
Good-grid Bad-grid Off-grid
The growth of bad- and off-grid sites in each region is impacted by a multitude of
trends in the telecommunications and power sectors:
• Universal Service / Rural Obligations will drive mobile coverage
in unserved and underserved areas: As network coverage and urban
penetration reach saturation, MNOs will be required by regulators to roll out
new sites in rural areas and areas with lower population densities to meet
population coverage commitments and ensure mobile coverage equity.
• Improvements in grid availability and reliability: As emerging markets
move towards universal electrification, continued investment is expected in the
sector, in line with The United Nations Sustainable Development Goals (SGD7).
An increase in grid connections will reduce the proportion of off-grid sites. As
grid quality improves, some bad-grid sites will also be converted to good-grid
sites.
• Tower sharing supports network deployment in rural areas and reduces
infrastructure required: Tower sharing enables economic rollout in areas
that are not otherwise viable by reducing CAPEX duplication across MNOs.
Such areas have a higher proportion of bad-grid and off-grid sites.
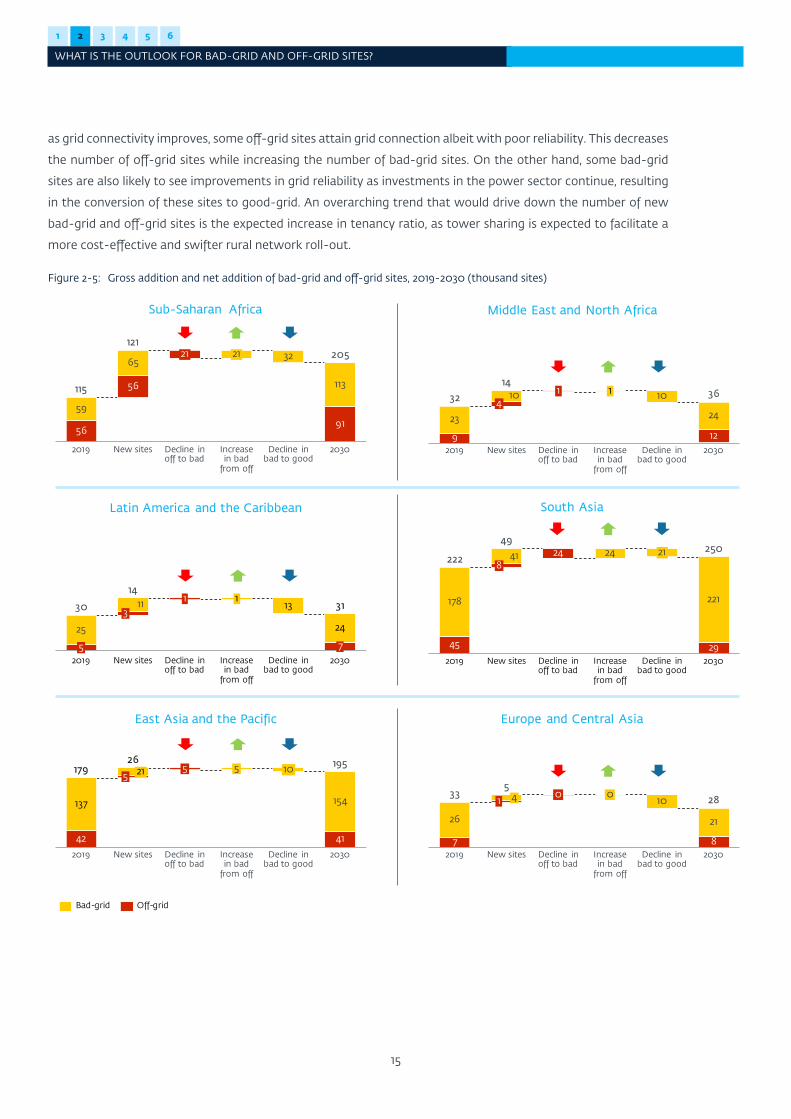
Figure 2-5 illustrates the impact of the conflicting trends driving the growth in bad-
grid and off-grid sites. Taking SSA as an example, the number of new bad-grid and
off-grid sites is expected to more than double in absolute terms by 2030. However,
In this region (SSA), we expect the number of off-grid sites to grow, given the large number of new sites required. The quality and reliability of grid connected sites will still remain highly uncertain – significant investments will be required to improve grid conditions.
Grid connectivity has not improved in the region, in fact, in some countries, grid quality has deteriorated.
Interview excerpts from MNOs
1 2 3 4 5 6
WHAT IS THE OUTLOOK FOR BAD-GRID AND OFF-GRID SITES?
15
as grid connectivity improves, some off-grid sites attain grid connection albeit with poor reliability. This decreases
the number of off-grid sites while increasing the number of bad-grid sites. On the other hand, some bad-grid
sites are also likely to see improvements in grid reliability as investments in the power sector continue, resulting
in the conversion of these sites to good-grid. An overarching trend that would drive down the number of new
bad-grid and off-grid sites is the expected increase in tenancy ratio, as tower sharing is expected to facilitate a
more cost-effective and swifter rural network roll-out.
Figure 2-5: Gross addition and net addition of bad-grid and off-grid sites, 2019-2030 (thousand sites)
3221
115
65
59
56
113
New sites2019
56
Decline in off to bad
21
Increase in bad
from off
Decline in bad to good
91
2030
121205
Sub-Saharan Africa
Latin America and the Caribbean
East Asia and the Pacific
1
Decline in off to bad
25
20195
113
New sites
1
Increase in bad
from off
13
Decline in bad to good
24
72030
30
14
31 178
41
45
2019
218
Decline in off to bad
New sites
24 24
Increase in bad
from off
Decline in bad to good
221
292030
222
49250
5 21
137
2019
1955
42
New sites Decline in off to bad
5
Increase in bad
from off
10
Decline in bad to good
154
179
41
2030
26
2019
26
7
1 4 0 0
New sites Decline in off to bad
Increase in bad
from off
10
Decline in bad to good
21
8
28
2030
335
Decline in off to bad
23
1
24
9
10
2019
4
New sites Decline in bad to good
1
Increase in bad
from off
32 10
122030
1436
Middle East and North Africa
South Asia
Europe and Central Asia
Bad-grid Off-grid
1 2 3 4 5 6
WHAT IS THE OUTLOOK FOR BAD-GRID AND OFF-GRID SITES?
16
2.3 Adoption of renewable energy solutions
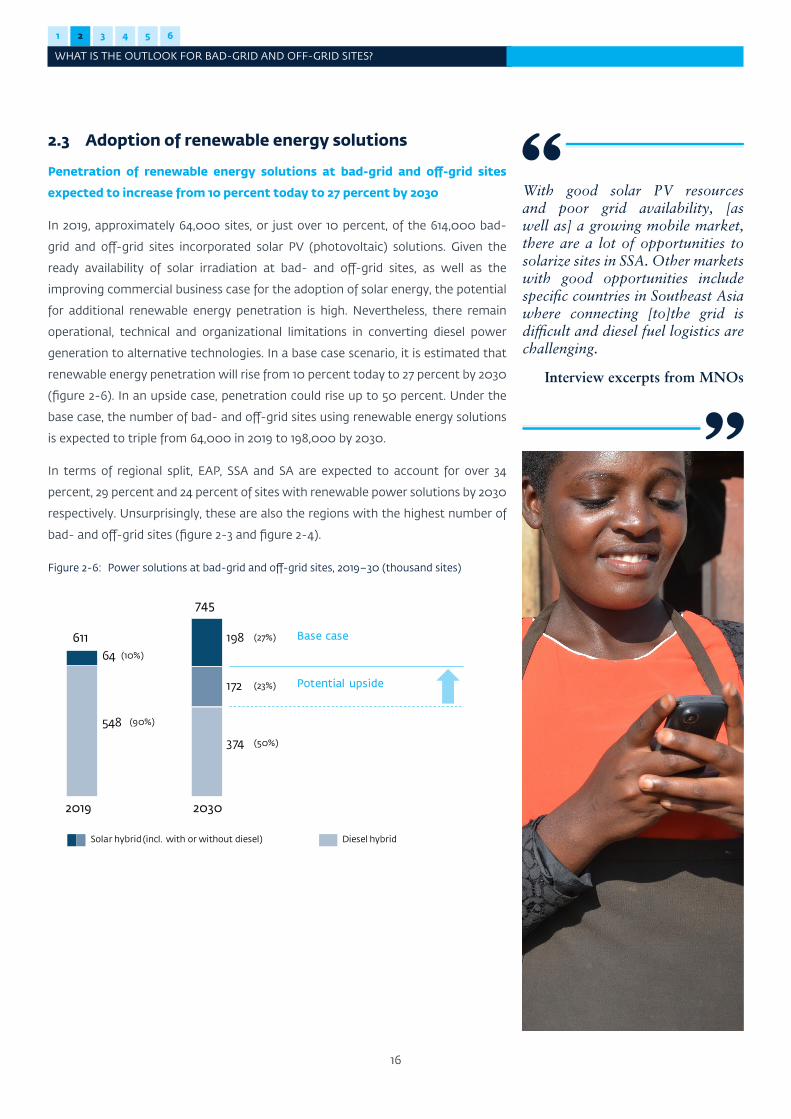
Penetration of renewable energy solutions at bad-grid and off-grid sites
expected to increase from 10 percent today to 27 percent by 2030
In 2019, approximately 64,000 sites, or just over 10 percent, of the 614,000 bad-
grid and off-grid sites incorporated solar PV (photovoltaic) solutions. Given the
ready availability of solar irradiation at bad- and off-grid sites, as well as the
improving commercial business case for the adoption of solar energy, the potential
for additional renewable energy penetration is high. Nevertheless, there remain
operational, technical and organizational limitations in converting diesel power
generation to alternative technologies. In a base case scenario, it is estimated that
renewable energy penetration will rise from 10 percent today to 27 percent by 2030
(figure 2-6). In an upside case, penetration could rise up to 50 percent. Under the
base case, the number of bad- and off-grid sites using renewable energy solutions
is expected to triple from 64,000 in 2019 to 198,000 by 2030.
In terms of regional split, EAP, SSA and SA are expected to account for over 34
percent, 29 percent and 24 percent of sites with renewable power solutions by 2030
respectively. Unsurprisingly, these are also the regions with the highest number of
bad- and off-grid sites (figure 2-3 and figure 2-4).
Figure 2-6: Power solutions at bad-grid and off-grid sites, 2019–30 (thousand sites)
Base case
Potential upside
745
20302019
611
Solar hybrid (incl. with or without diesel) Diesel hybrid
374
198
172
(27%)
(23%)
(50%)
64
548
(10%)
(90%)
With good solar PV resources and poor grid availability, [as well as] a growing mobile market, there are a lot of opportunities to solarize sites in SSA. Other markets with good opportunities include specific countries in Southeast Asia where connecting [to]the grid is difficult and diesel fuel logistics are challenging.
Interview excerpts from MNOs
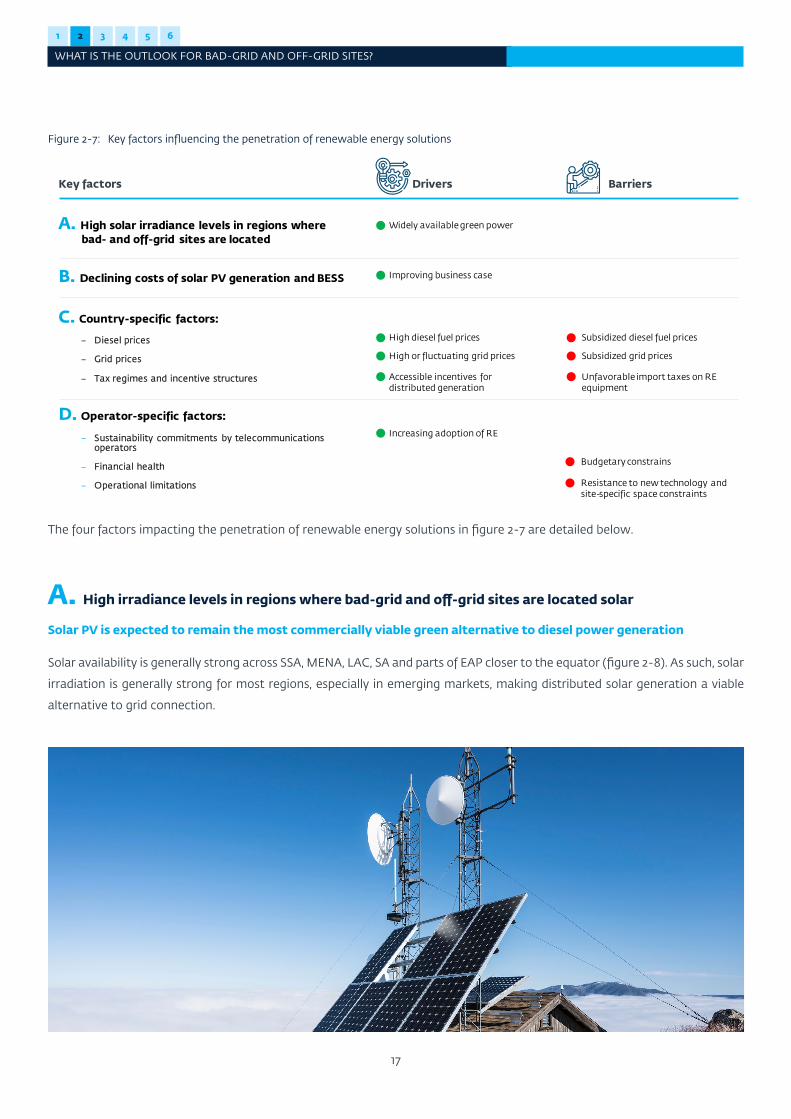
1 2 3 4 5 6
WHAT IS THE OUTLOOK FOR BAD-GRID AND OFF-GRID SITES?
17
Figure 2-7: Key factors influencing the penetration of renewable energy solutions
A. High solar irradiance levels in regions where bad- and off-grid sites are located
B. Declining costs of solar PV generation and BESS
C. Country-specific factors:
– Diesel prices
– Grid prices
– Tax regimes and incentive structures
D. Operator-specific factors:
– Sustainability commitments by telecommunications operators
– Financial health
– Operational limitations
Drivers Barriers
Widely available green power
Improving business case
High diesel fuel prices
High or fluctuating grid prices
Subsidized diesel fuel prices
Subsidized grid prices
Accessible incentives for distributed generation
Unfavorable import taxes on RE equipment
Budgetary constrains
Resistance to new technology and site-specific space constraints
Increasing adoption of RE
Key factors
The four factors impacting the penetration of renewable energy solutions in figure 2-7 are detailed below.
A. High irradiance levels in regions where bad-grid and off-grid sites are located solar
Solar PV is expected to remain the most commercially viable green alternative to diesel power generation
Solar availability is generally strong across SSA, MENA, LAC, SA and parts of EAP closer to the equator (figure 2-8). As such, solar
irradiation is generally strong for most regions, especially in emerging markets, making distributed solar generation a viable
alternative to grid connection.
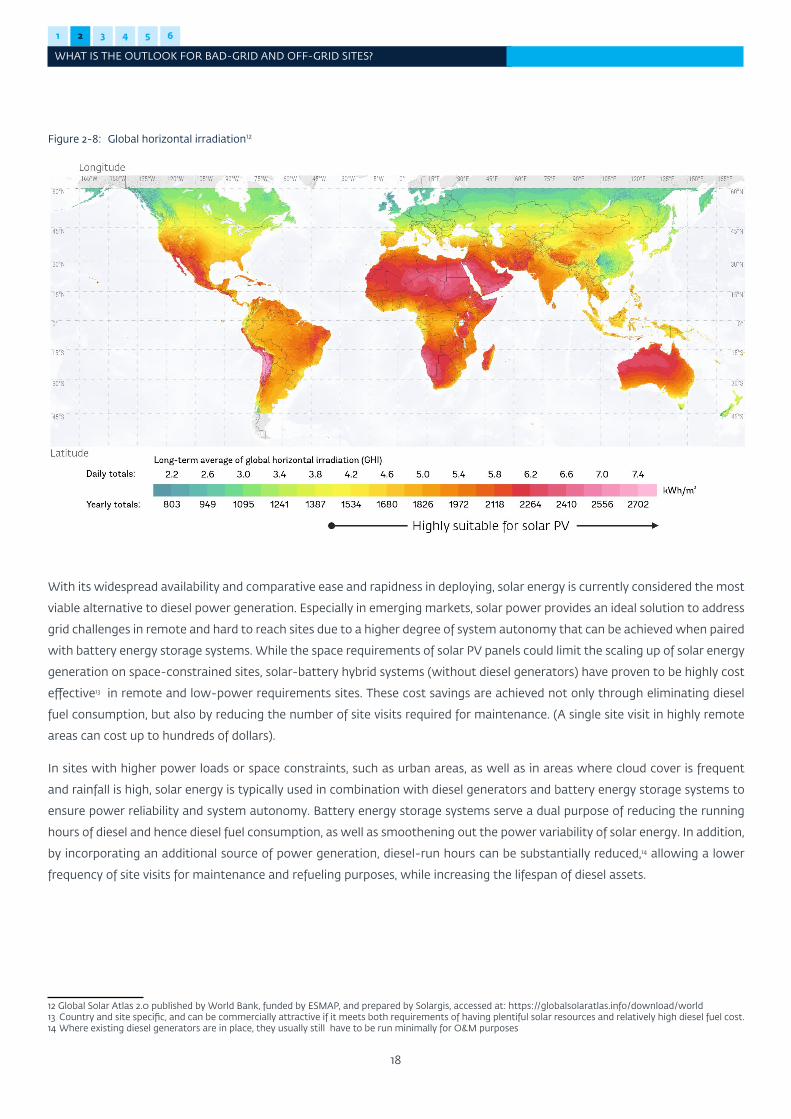
1 2 3 4 5 6
WHAT IS THE OUTLOOK FOR BAD-GRID AND OFF-GRID SITES?
18
Figure 2-8: Global horizontal irradiation12
12 Global Solar Atlas 2.0 published by World Bank, funded by ESMAP, and prepared by Solargis, accessed at: https://globalsolaratlas.info/download/world13 Country and site specific, and can be commercially attractive if it meets both requirements of having plentiful solar resources and relatively high diesel fuel cost.14 Where existing diesel generators are in place, they usually still have to be run minimally for O&M purposes
With its widespread availability and comparative ease and rapidness in deploying, solar energy is currently considered the most
viable alternative to diesel power generation. Especially in emerging markets, solar power provides an ideal solution to address
grid challenges in remote and hard to reach sites due to a higher degree of system autonomy that can be achieved when paired
with battery energy storage systems. While the space requirements of solar PV panels could limit the scaling up of solar energy
generation on space-constrained sites, solar-battery hybrid systems (without diesel generators) have proven to be highly cost
effective13 in remote and low-power requirements sites. These cost savings are achieved not only through eliminating diesel
fuel consumption, but also by reducing the number of site visits required for maintenance. (A single site visit in highly remote
areas can cost up to hundreds of dollars).
In sites with higher power loads or space constraints, such as urban areas, as well as in areas where cloud cover is frequent
and rainfall is high, solar energy is typically used in combination with diesel generators and battery energy storage systems to
ensure power reliability and system autonomy. Battery energy storage systems serve a dual purpose of reducing the running
hours of diesel and hence diesel fuel consumption, as well as smoothening out the power variability of solar energy. In addition,
by incorporating an additional source of power generation, diesel-run hours can be substantially reduced,14 allowing a lower
frequency of site visits for maintenance and refueling purposes, while increasing the lifespan of diesel assets.
1 2 3 4 5 6
WHAT IS THE OUTLOOK FOR BAD-GRID AND OFF-GRID SITES?
19
B. Declining cost of solar PV generation and battery energy storage
systems
Cost of solar energy generation has fallen rapidly due to both the lower cost of solar PV panels and improved unit efficiency
Solar energy generation has witnessed rapid cost reductions of over 80 percent in
the last 10 years. This rapid decline is due to a combination of economies of scale,
technological innovation and a high degree of competition among PV manufacturers.
Manufacturing costs of solar PV modules have declined with increasing scale and
improving technology, while manufacturing costs have fallen as production has
shifted towards lower-cost countries. Due to technological advances, each PV
module is also capable of producing a higher energy output, leading to better unit
efficiencies. Technology innovation is also bringing down the cost of inverters. This
cost decline is expected to continue with growing global adoption, as well as with
expected technological advances to further reduce equipment costs and improve
unit efficiency. Hence, solar PV is expected to remain as one of the cheapest green
technologies with proven long-term reliability for distributed generation.
Lead acid batteries remain the main storage technology used in telecom sites, but declining prices, high energy density and better cyclic life will drive
strong growth in lithium ion batteries
Currently, over 80 percent of all batteries at telecom sites are still supported by lead
acid chemistries. However, lithium ion batteries have experienced strong growth
due to steep declines in prices recently, driven by innovation in automotive batteries.
Lead acid batteries have the benefits of being relatively affordable, able to withstand
harsh conditions with minimal maintenance, and highly tolerant to overcharging.
However, they have relatively short lifespans, are slow to charge, have lower energy
densities, and are extremely prone to theft due to high second-hand value. In
contrast, lithium ion batteries offer the benefits of quick charging times and high
energy densities. Because of their low recycling value, lithium ion batteries are less
prone to theft. They also have a better cyclic life than lead acid batteries. With its
fast-charging properties, lithium ion performs well in poor grid connected locations
with frequent but short outages, such as in India. In addition, the high energy density
of lithium ion batteries makes their use highly attractive at space-constrained sites,
such as urban areas where land acquisition and costs are challenging, potentially
offsetting the higher upfront cost.
We expect the price for solar PV systems to decline even further; this will spark further interest and investments into renewable energy.
Interview excerpt from MNO
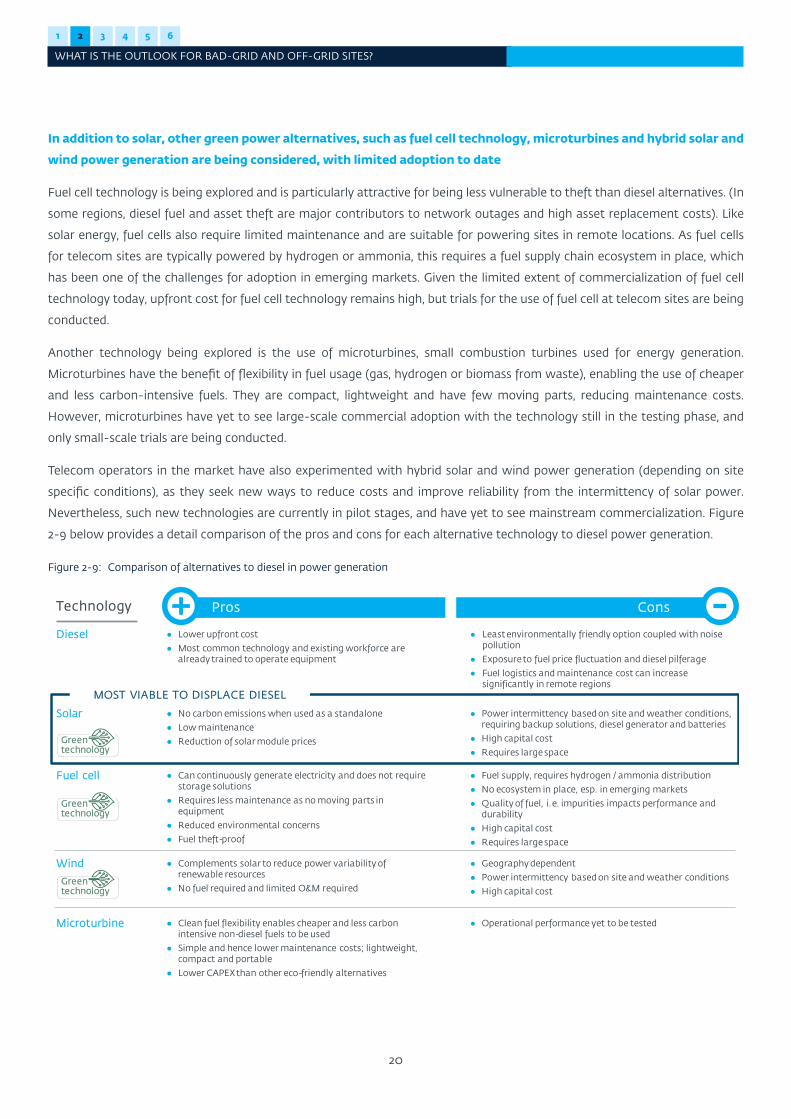
1 2 3 4 5 6
WHAT IS THE OUTLOOK FOR BAD-GRID AND OFF-GRID SITES?
20
In addition to solar, other green power alternatives, such as fuel cell technology, microturbines and hybrid solar and
wind power generation are being considered, with limited adoption to date
Fuel cell technology is being explored and is particularly attractive for being less vulnerable to theft than diesel alternatives. (In
some regions, diesel fuel and asset theft are major contributors to network outages and high asset replacement costs). Like
solar energy, fuel cells also require limited maintenance and are suitable for powering sites in remote locations. As fuel cells
for telecom sites are typically powered by hydrogen or ammonia, this requires a fuel supply chain ecosystem in place, which
has been one of the challenges for adoption in emerging markets. Given the limited extent of commercialization of fuel cell
technology today, upfront cost for fuel cell technology remains high, but trials for the use of fuel cell at telecom sites are being
conducted.
Another technology being explored is the use of microturbines, small combustion turbines used for energy generation.
Microturbines have the benefit of flexibility in fuel usage (gas, hydrogen or biomass from waste), enabling the use of cheaper
and less carbon-intensive fuels. They are compact, lightweight and have few moving parts, reducing maintenance costs.
However, microturbines have yet to see large-scale commercial adoption with the technology still in the testing phase, and
only small-scale trials are being conducted.
Telecom operators in the market have also experimented with hybrid solar and wind power generation (depending on site
specific conditions), as they seek new ways to reduce costs and improve reliability from the intermittency of solar power.
Nevertheless, such new technologies are currently in pilot stages, and have yet to see mainstream commercialization. Figure
2-9 below provides a detail comparison of the pros and cons for each alternative technology to diesel power generation.
Figure 2-9: Comparison of alternatives to diesel in power generation
Technology
Diesel
Solar
Fuel cell
Wind
Pros Cons
● Lower upfront cost● Most common technology and existing workforce are
already trained to operate equipment
● Least environmentally friendly option coupled with noise pollution
● Exposure to fuel price fluctuation and diesel pilferage● Fuel logistics and maintenance cost can increase
significantly in remote regions
● Power intermittency based on site and weather conditions, requiring backup solutions, diesel generator and batteries
● High capital cost● Requires large space
● No carbon emissions when used as a standalone● Low maintenance ● Reduction of solar module prices
● Fuel supply, requires hydrogen / ammonia distribution● No ecosystem in place, esp. in emerging markets● Quality of fuel, i.e. impurities impacts performance and
durability● High capital cost● Requires large space
● Can continuously generate electricity and does not require storage solutions
● Requires less maintenance as no moving parts in equipment
● Reduced environmental concerns● Fuel theft-proof
● Geography dependent● Power intermittency based on site and weather conditions● High capital cost
● Complements solar to reduce power variability of renewable resources
● No fuel required and limited O&M required
Microturbine ● Operational performance yet to be tested● Clean fuel flexibility enables cheaper and less carbon intensive non-diesel fuels to be used
● Simple and hence lower maintenance costs; lightweight, compact and portable
● Lower CAPEX than other eco-friendly alternatives
Green technology
MOST VIABLE TO DISPLACE DIESEL
Green technology
Green technology
1 2 3 4 5 6
WHAT IS THE OUTLOOK FOR BAD-GRID AND OFF-GRID SITES?
21
C. Country-specific factors
Despite global cost reductions in solar, country-specific and operator-
specific drivers impact the business case for solar
Country-specific drivers of the business case for solar include:
• Cost of diesel fuel: The business case for solarizing a telecom site is highly
dependent on fuel cost. For example, Mali, a land-locked country, has a
diesel fuel price of around $1.1 per liter, making the case for weaning off diesel
consumption very attractive. Diesel subsidies may dampen the business case for
solar, despite the additional operational cost for diesel, such as diesel pilferage
and logistics for diesel refueling and transportation at remote sites. Countries
with low fuel costs include Angola and Sudan, where diesel can costs less than
$0.30 per liter.
• Availability of incentives for renewable energy equipment: Certain
renewables equipment classes benefit from tax waivers, in order to support
national renewable energy targets or de-carbonization targets. For example,
countries with supportive import duties for small-scale renewables equipment
include Guinea and Mali, where distributed renewables power generation is
expected to be a key pillar of universal electricity access. However, incentives
and tax policies are subject to revisions based on national policies and agendas,
such as boosting renewable energy supply to meet targets, or in contrast,
implementing of safeguard duties to protect domestic industries.
• Grid tariffs and regulations for distributed energy generation: Subsidized
grid tariffs may hinder the development of distributed solar PV generation.
On the other hand, solar PV on bad-grid sites can mitigate against high grid
tariffs and insulate the user against fluctuating grid prices. Availability of net-
metering policies could offer distributed power generation an alternative
source of revenue in selling excess electricity back to the grid. For example, such
opportunities exist in Nicaragua, where grid prices are generally high and rules
for net energy metering are in place. In Myanmar, distributed power generation
includes selling power to communities through mini-grids to support national
electrification targets.
Taking into account full CAPEX (import duties, transportation cost, taxes) and OPEX (diesel fuel and potential subsidies, grid prices), each market has a very different business case for solarizing sites
Interview excerpt from TESCO
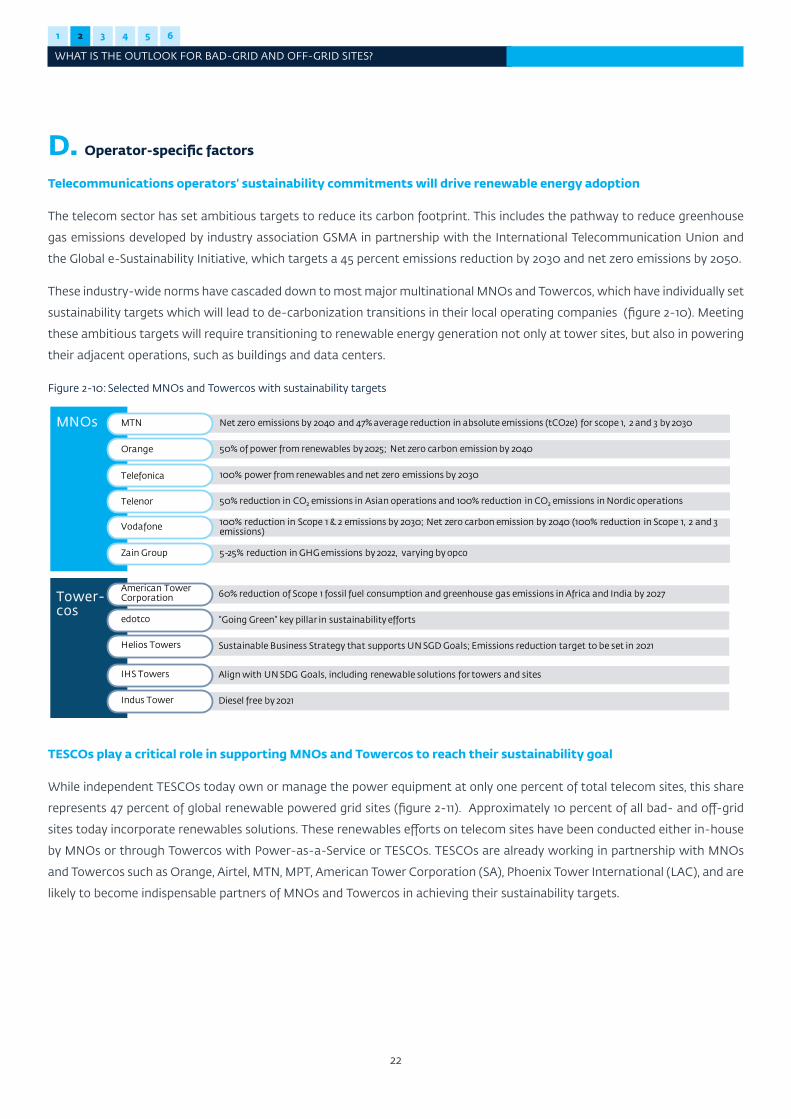
1 2 3 4 5 6
WHAT IS THE OUTLOOK FOR BAD-GRID AND OFF-GRID SITES?
22
D. Operator-specific factors
Telecommunications operators’ sustainability commitments will drive renewable energy adoption
The telecom sector has set ambitious targets to reduce its carbon footprint. This includes the pathway to reduce greenhouse
gas emissions developed by industry association GSMA in partnership with the International Telecommunication Union and
the Global e-Sustainability Initiative, which targets a 45 percent emissions reduction by 2030 and net zero emissions by 2050.
These industry-wide norms have cascaded down to most major multinational MNOs and Towercos, which have individually set
sustainability targets which will lead to de-carbonization transitions in their local operating companies (figure 2-10). Meeting
these ambitious targets will require transitioning to renewable energy generation not only at tower sites, but also in powering
their adjacent operations, such as buildings and data centers.
Figure 2-10: Selected MNOs and Towercos with sustainability targets
MNOs
Tower-cos
Net zero emissions by 2040 and 47% average reduction in absolute emissions (tCO2e) for scope 1, 2 and 3 by 2030MTN
50% of power from renewables by 2025; Net zero carbon emission by 2040 Orange
50% reduction in CO2 emissions in Asian operations and 100% reduction in CO2 emissions in Nordic operationsTelenor
100% power from renewables and net zero emissions by 2030Telefonica
5-25% reduction in GHG emissions by 2022, varying by opcoZain Group
100% reduction in Scope 1 & 2 emissions by 2030; Net zero carbon emission by 2040 (100% reduction in Scope 1, 2 and 3 emissions)Vodafone
Sustainable Business Strategy that supports UN SGD Goals; Emissions reduction target to be set in 2021Helios Towers
“Going Green” key pillar in sustainability effortsedotco
Align with UN SDG Goals, including renewable solutions for towers and sites IHS Towers
60% reduction of Scope 1 fossil fuel consumption and greenhouse gas emissions in Africa and India by 2027American Tower Corporation
Diesel free by 2021Indus Tower
TESCOs play a critical role in supporting MNOs and Towercos to reach their sustainability goal
While independent TESCOs today own or manage the power equipment at only one percent of total telecom sites, this share
represents 47 percent of global renewable powered grid sites (figure 2-11). Approximately 10 percent of all bad- and off-grid
sites today incorporate renewables solutions. These renewables efforts on telecom sites have been conducted either in-house
by MNOs or through Towercos with Power-as-a-Service or TESCOs. TESCOs are already working in partnership with MNOs
and Towercos such as Orange, Airtel, MTN, MPT, American Tower Corporation (SA), Phoenix Tower International (LAC), and are
likely to become indispensable partners of MNOs and Towercos in achieving their sustainability targets.
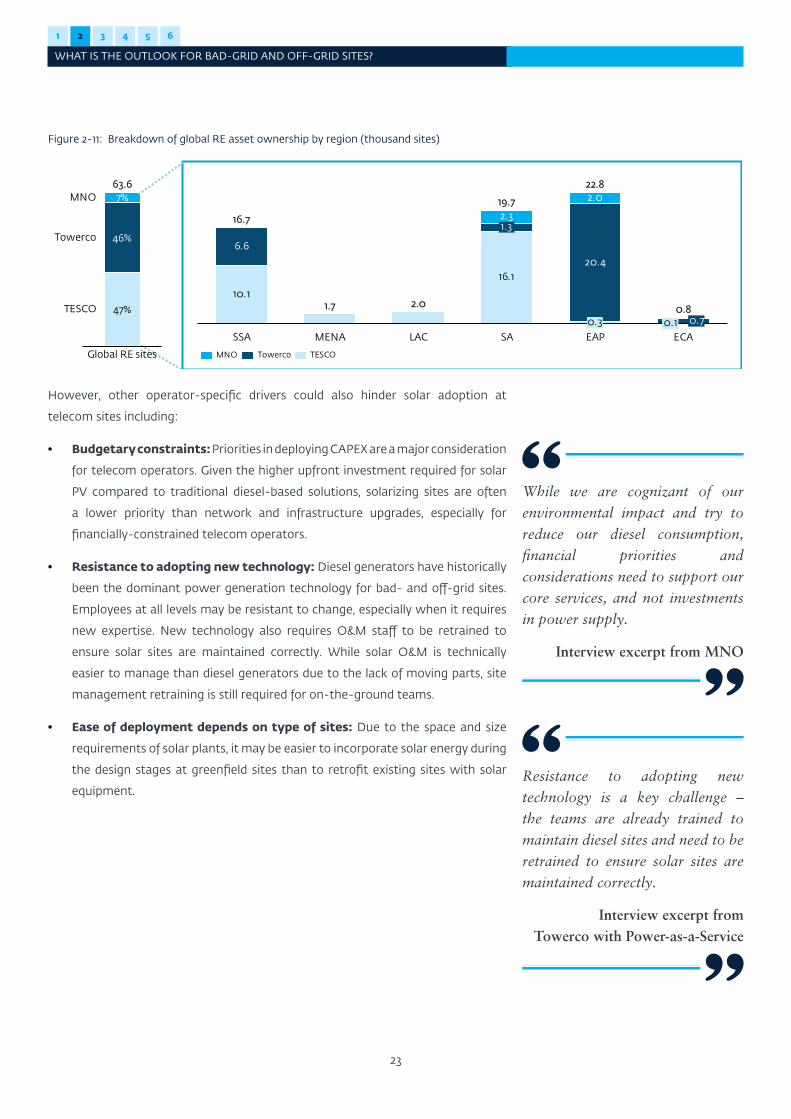
1 2 3 4 5 6
WHAT IS THE OUTLOOK FOR BAD-GRID AND OFF-GRID SITES?
23
Figure 2-11: Breakdown of global RE asset ownership by region (thousand sites)
16.1
EAPMENA
20.4
6.6
10.12.0
2.3
SSA LAC
1.3
22.8
SA
2.0
0.3 0.70.1ECA
16.7
1.7
19.7
0.847%
46%
7%63.6
MNO
Global RE sites
Towerco
TESCO
TowercoMNO TESCO
However, other operator-specific drivers could also hinder solar adoption at
telecom sites including:
• Budgetary constraints: Priorities in deploying CAPEX are a major consideration
for telecom operators. Given the higher upfront investment required for solar
PV compared to traditional diesel-based solutions, solarizing sites are often
a lower priority than network and infrastructure upgrades, especially for
financially-constrained telecom operators.
• Resistance to adopting new technology: Diesel generators have historically
been the dominant power generation technology for bad- and off-grid sites.
Employees at all levels may be resistant to change, especially when it requires
new expertise. New technology also requires O&M staff to be retrained to
ensure solar sites are maintained correctly. While solar O&M is technically
easier to manage than diesel generators due to the lack of moving parts, site
management retraining is still required for on-the-ground teams.
• Ease of deployment depends on type of sites: Due to the space and size
requirements of solar plants, it may be easier to incorporate solar energy during
the design stages at greenfield sites than to retrofit existing sites with solar
equipment.Resistance to adopting new technology is a key challenge – the teams are already trained to maintain diesel sites and need to be retrained to ensure solar sites are maintained correctly.
Interview excerpt from Towerco with Power-as-a-Service
While we are cognizant of our environmental impact and try to reduce our diesel consumption, financial priorities and considerations need to support our core services, and not investments in power supply.
Interview excerpt from MNO
Chapter 3
WHAT IS THE GROWTH POTENTIAL FOR TESCOS?
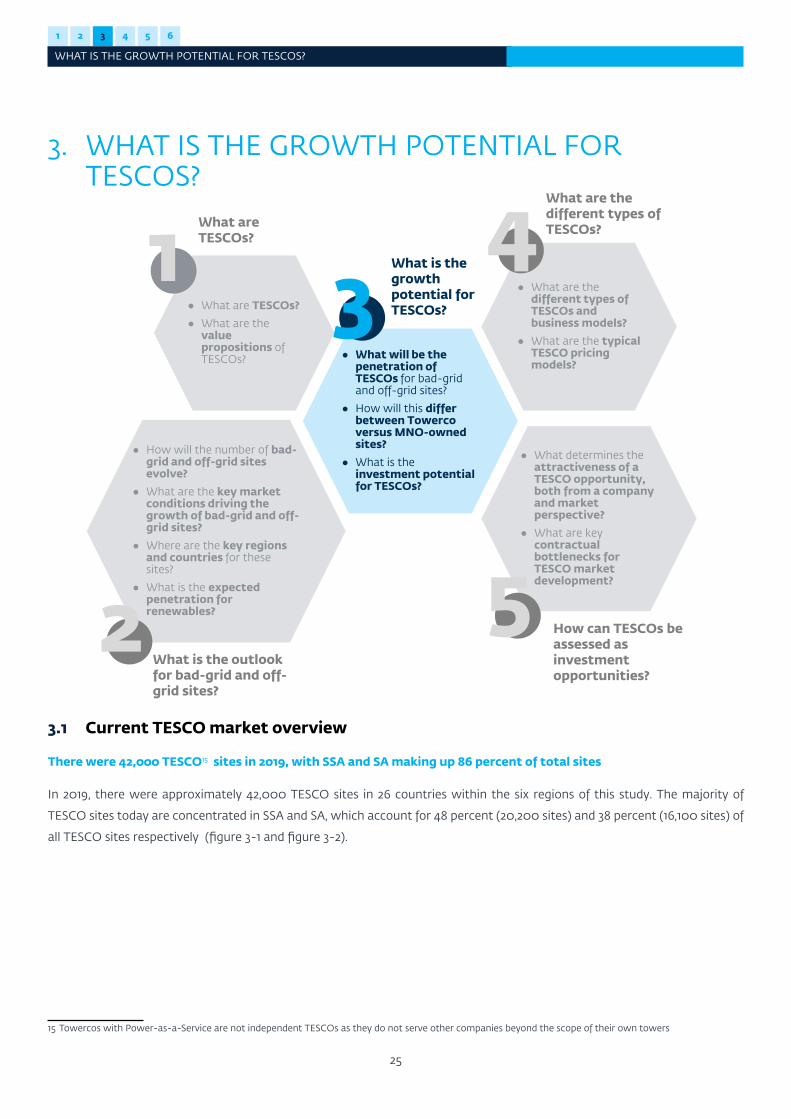
1 2 3 4 5 6
WHAT IS THE GROWTH POTENTIAL FOR TESCOS?
25
3. WHAT IS THE GROWTH POTENTIAL FOR TESCOS?
15 Towercos with Power-as-a-Service are not independent TESCOs as they do not serve other companies beyond the scope of their own towers
● What are the different types of TESCOs and business models?
● What are the typical TESCO pricing models?
● What determines the attractiveness of a TESCO opportunity, both from a company and market perspective?
● What are key contractual bottlenecks for TESCO market development?
● What are TESCOs?
● What are the value propositions of TESCOs?
How can TESCOs be assessed as investment opportunities?
What are TESCOs?
What are the different types of TESCOs?
5
41
● How will the number of bad-grid and off-grid sites evolve?
● What are the key market conditions driving the growth of bad-grid and off-grid sites?
● Where are the key regions and countries for these sites?
● What is the expected penetration for renewables?
What is the outlook for bad-grid and off-grid sites?
2
● What will be the penetration of TESCOs for bad-grid and off-grid sites?
● How will this differ between Towercoversus MNO-owned sites?
● What is the investment potential for TESCOs?
What is the growth potential for TESCOs?3
3.1 Current TESCO market overview
There were 42,000 TESCO15 sites in 2019, with SSA and SA making up 86 percent of total sites
In 2019, there were approximately 42,000 TESCO sites in 26 countries within the six regions of this study. The majority of
TESCO sites today are concentrated in SSA and SA, which account for 48 percent (20,200 sites) and 38 percent (16,100 sites) of
all TESCO sites respectively (figure 3-1 and figure 3-2).
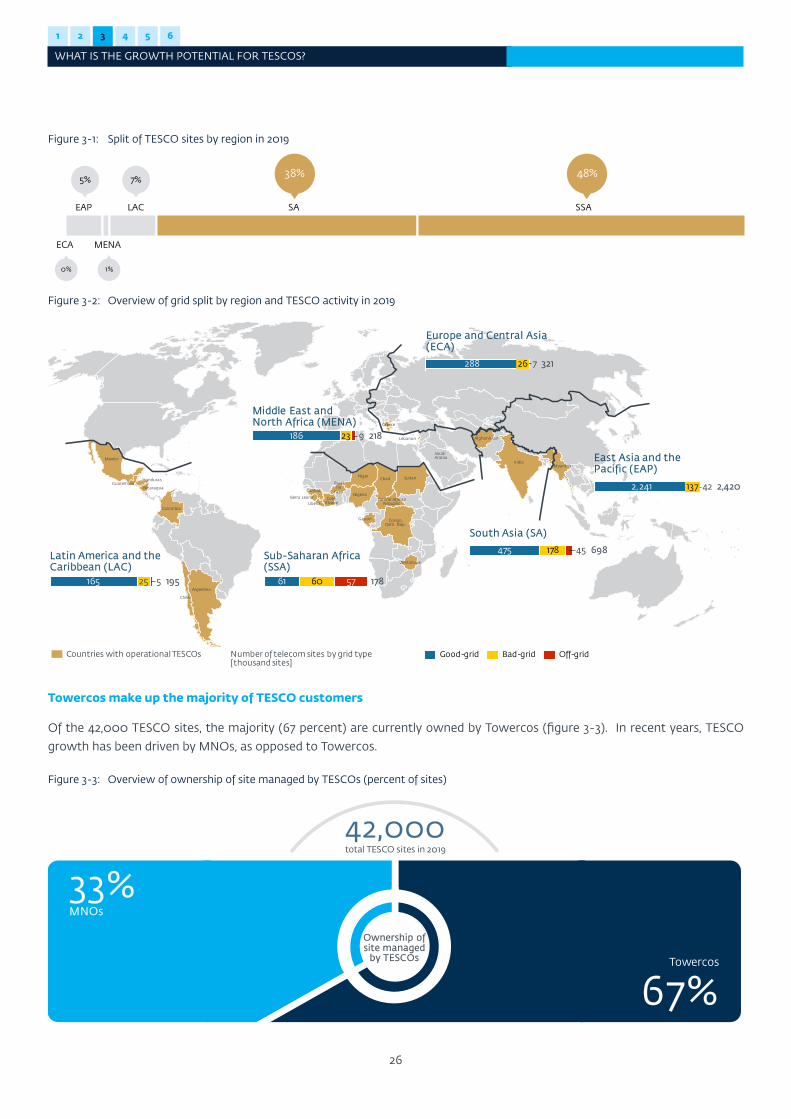
1 2 3 4 5 6
WHAT IS THE GROWTH POTENTIAL FOR TESCOS?
26
Figure 3-1: Split of TESCO sites by region in 2019
ECA
EAP
MENA
LAC SA SSA
5% 7%38% 48%
0% 1%
Figure 3-2: Overview of grid split by region and TESCO activity in 2019
32126 7288
23 9186 218
5 19525165
475 45178 698
61 60 57 178
Bad-gridGood-grid Off-gridCountries with operational TESCOs Number of telecom sites by grid type [thousand sites]
Burkina
Faso
Chad
Congo, Dem. Rep.
Cote d'Ivoire
Guinea
LiberiaSierra Leone
Sudan
Zimbabwe
Argentina
GuatemalaNicaragua
Colombia
Afghanistan
IndiaMyanmar
Europe and Central Asia (ECA)
Latin America and the Caribbean (LAC)
Middle East and North Africa (MENA)
South Asia (SA)
Sub-Saharan Africa (SSA)
East Asia and the Pacific (EAP)
422,241 137 2,420Central African
Republic
Gabon
Honduras
Mexico
Lebanon
Saudi Arabia
Greece
Niger
Nigeria
Chile
Towercos make up the majority of TESCO customers
Of the 42,000 TESCO sites, the majority (67 percent) are currently owned by Towercos (figure 3-3). In recent years, TESCO
growth has been driven by MNOs, as opposed to Towercos.
Figure 3-3: Overview of ownership of site managed by TESCOs (percent of sites)
42,000
Ownership of site managed
by TESCOs
33%
67%Towercos
MNOs
total TESCO sites in 2019
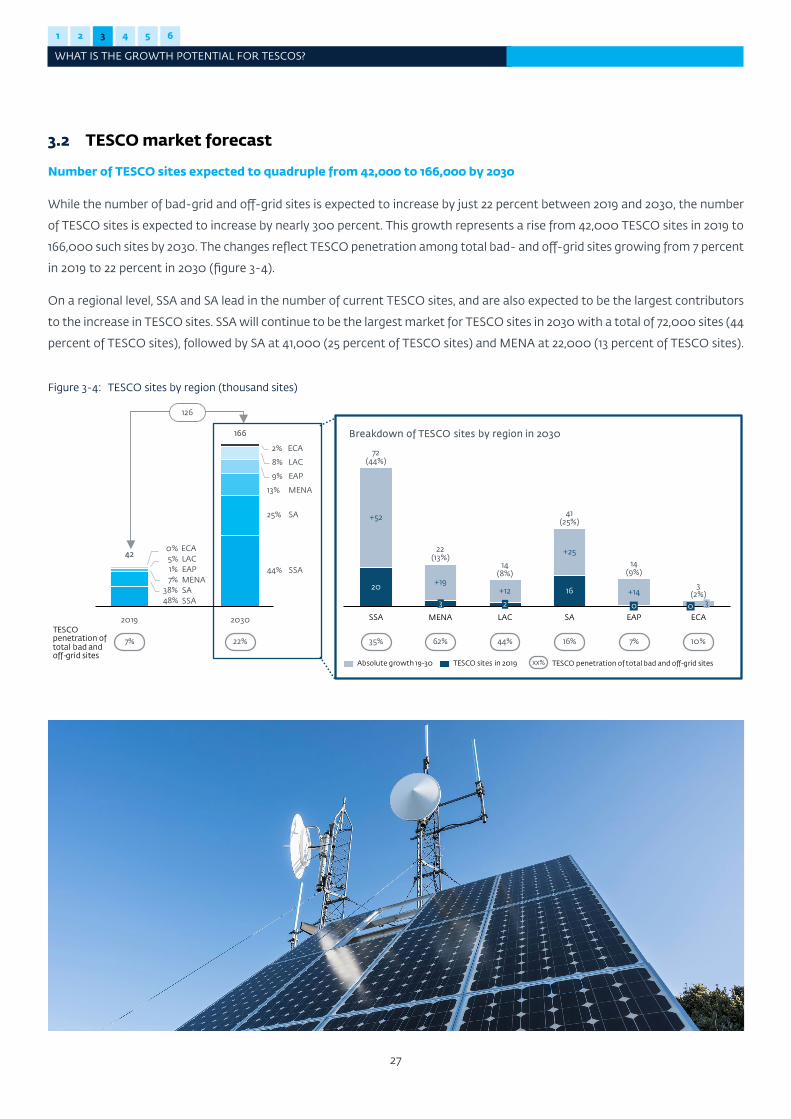
1 2 3 4 5 6
WHAT IS THE GROWTH POTENTIAL FOR TESCOS?
27
3.2 TESCO market forecast
Number of TESCO sites expected to quadruple from 42,000 to 166,000 by 2030
While the number of bad-grid and off-grid sites is expected to increase by just 22 percent between 2019 and 2030, the number
of TESCO sites is expected to increase by nearly 300 percent. This growth represents a rise from 42,000 TESCO sites in 2019 to
166,000 such sites by 2030. The changes reflect TESCO penetration among total bad- and off-grid sites growing from 7 percent
in 2019 to 22 percent in 2030 (figure 3-4).
On a regional level, SSA and SA lead in the number of current TESCO sites, and are also expected to be the largest contributors
to the increase in TESCO sites. SSA will continue to be the largest market for TESCO sites in 2030 with a total of 72,000 sites (44
percent of TESCO sites), followed by SA at 41,000 (25 percent of TESCO sites) and MENA at 22,000 (13 percent of TESCO sites).
Figure 3-4: TESCO sites by region (thousand sites)
SSA MENA
+52
20 +19+12
3 2
LAC
+25
0SA
16 +14
EAP
14(9%)
0 3
3(2%)
ECA
72(44%)
22(13%)
14(8%)
41(25%)
Absolute growth 19-30 TESCO sites in 2019
SSA
13%
1% 44%
38%
0%
MENA
48%
5%
7%
2019
2%
8%
25%
9%
2030
ECA
LAC
EAP
SA
42
166
SSA
MENA
ECALACEAP
SA
TESCO penetration of total bad and off-grid sites
7% 22%
126
35% 62% 44% 16% 7% 10%
Breakdown of TESCO sites by region in 2030
TESCO penetration of total bad and off-grid sitesxx%
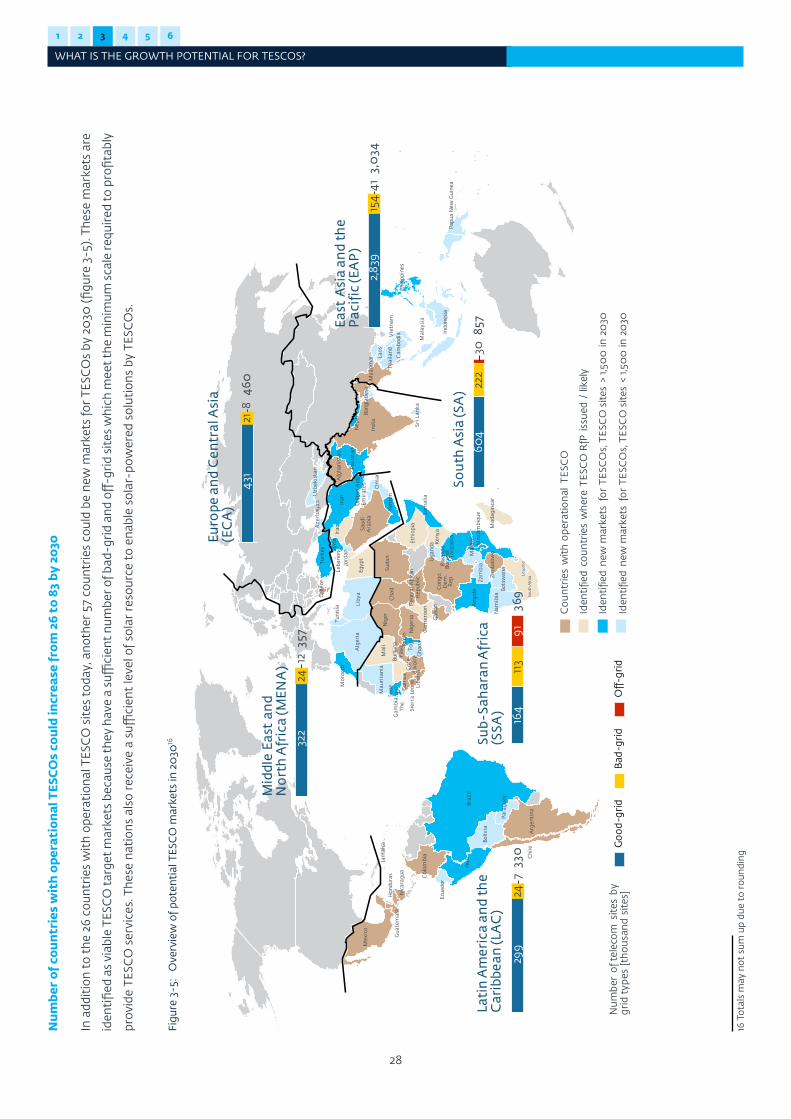
1 2 3 4 5 6
WHAT IS THE GROWTH POTENTIAL FOR TESCOS?
28
Nu
mbe
r of
cou
ntr
ies
wit
h o
pera
tion
al T
ESC
Os
cou
ld in
crea
se fr
om 2
6 to
83
by 2
030
16 T
otal
s m
ay n
ot s
um u
p du
e to
rou
ndin
g
In a
ddit
ion
to t
he 2
6 co
untr
ies
wit
h op
erat
iona
l TES
CO
sit
es t
oday
, ano
ther
57
coun
trie
s co
uld
be n
ew m
arke
ts fo
r TE
SCO
s by
20
30 (fi
gure
3-5
). Th
ese
mar
kets
are
iden
tifie
d as
via
ble
TESC
O ta
rget
mar
kets
bec
ause
they
hav
e a
suffi
cien
t num
ber o
f bad
-gri
d an
d off
-gri
d si
tes
whi
ch m
eet t
he m
inim
um s
cale
requ
ired
to p
rofit
ably
prov
ide
TESC
O s
ervi
ces.
The
se n
atio
ns a
lso
rece
ive
a su
ffici
ent
leve
l of s
olar
res
ourc
e to
ena
ble
sola
r-po
wer
ed s
olut
ions
by
TESC
Os.
Figu
re 3
-5:
Ove
rvie
w o
f pot
enti
al T
ESC
O m
arke
ts in
20
3016
821
431
460
2429
97
330
857
604
3022
2
Goo
d-g
ridBa
d-g
ridO
ff-gr
id
East
Asi
a an
d th
e P
acif
ic (E
AP
)
Euro
pe a
nd
Cen
tral
Asi
a (E
CA
)
Lati
n A
mer
ica
and
the
Car
ibbe
an (L
AC
)
Mid
dle
East
an
d N
ort
h A
fric
a (M
ENA
)
Sou
th A
sia
(SA
)
Sub-
Sah
aran
Afr
ica
(SSA
)
Ang
ola
Beni
n
Bots
wan
a
Burk
ina
Faso
Buru
ndi
Cam
eroo
n
Cha
d Con
go,
Dem
. R
ep.
Cot
e d'
Ivoi
reEt
hiop
ia
Gam
bia,
Th
e
Gha
na
Gui
nea
Keny
a
Libe
ria
Mad
agas
car
Mal
awi
Mal
iM
auri
tani
a
Moz
ambi
que
Nam
ibia
Nig
er
Nig
eria
Rw
anda
Sene
gal
Sier
ra L
eone
Som
alia
Suda
n Tanz
ania
Togo
Uga
nda
Zam
bia
Zim
babw
eBo
livia
Gua
tem
ala
Nic
arag
ua
Peru
Leba
non
Liby
a
Syri
a
Yem
en
Afg
hani
stan
Bang
lade
shIn
dia
Nep
alPa
kist
an
Cam
bodi
a
Mya
nmar
Papu
a N
ew G
uine
a
Phili
ppin
es
Cen
tral
Afri
can
Rep
ublic
Gab
on
Egyp
t
Iraq Sa
udi
Ara
bia
Mex
ico
Hon
dura
s
Gre
ece
Chi
leA
rgen
tina
Col
ombi
a
Braz
il
Ecua
dor
Jam
aica
Alg
eria
Iran
Jord
anM
oroc
co
Om
an
Tuni
sia
Uni
ted
Ara
b Em
irat
es
Sri L
anka
Indo
nesi
a
Laos
Mal
aysi
a
Thai
land
Vie
tnam
Aze
rbai
jan
Turk
eyU
zbek
ista
n
Para
guay
Num
ber
of te
leco
m s
ites
by
grid
typ
es [
thou
sand
sit
es]
Leso
tho
Sout
h Af
rica
Iden
tifie
d ne
w m
arke
ts f
or T
ESC
Os,
TES
CO
sit
es >
1,50
0 in
20
30
Iden
tifie
d co
untr
ies
whe
re T
ESC
O R
fPis
sued
/ li
kely
Cou
ntrie
s w
ith
oper
atio
nal
TESC
O
Iden
tifie
d ne
w m
arke
ts f
or T
ESC
Os,
TES
CO
site
s <
1,50
0 in
20
30
2,83
93,
034
4115
4
1235
724
322
164
113
9136
9
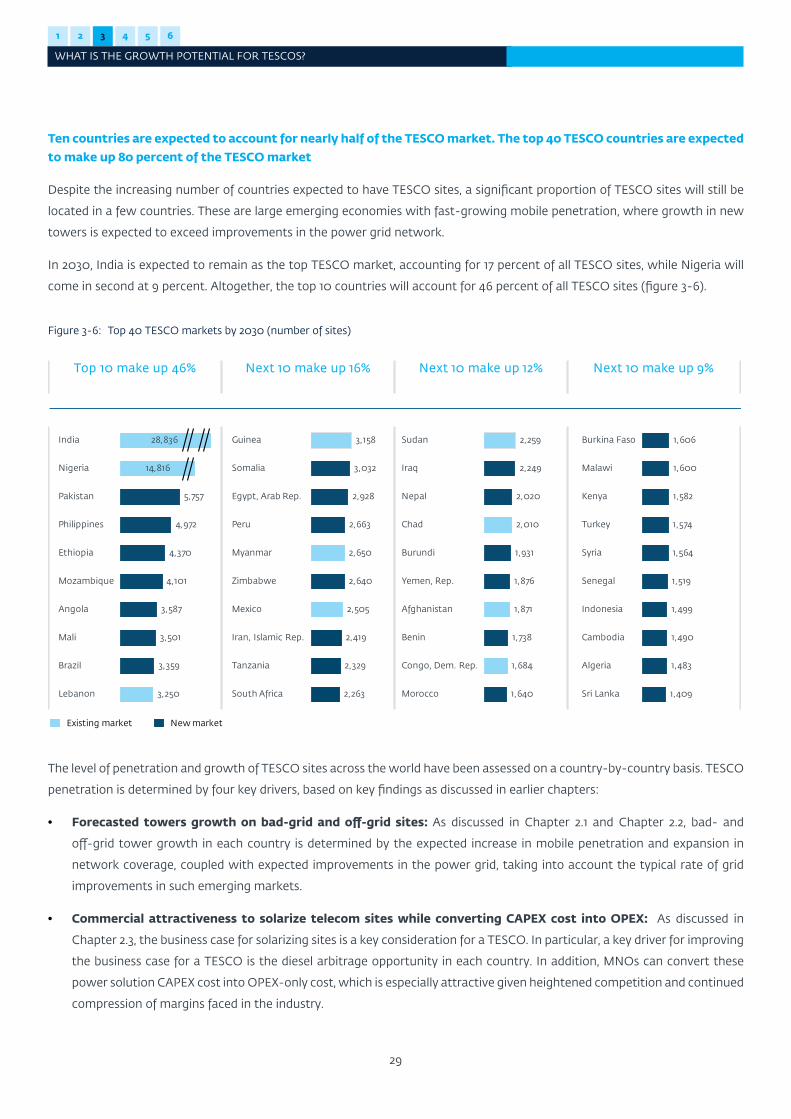
1 2 3 4 5 6
WHAT IS THE GROWTH POTENTIAL FOR TESCOS?
29
Ten countries are expected to account for nearly half of the TESCO market. The top 40 TESCO countries are expected to make up 80 percent of the TESCO market
Despite the increasing number of countries expected to have TESCO sites, a significant proportion of TESCO sites will still be
located in a few countries. These are large emerging economies with fast-growing mobile penetration, where growth in new
towers is expected to exceed improvements in the power grid network.
In 2030, India is expected to remain as the top TESCO market, accounting for 17 percent of all TESCO sites, while Nigeria will
come in second at 9 percent. Altogether, the top 10 countries will account for 46 percent of all TESCO sites (figure 3-6).
Figure 3-6: Top 40 TESCO markets by 2030 (number of sites)
Top 10 make up 46% Next 10 make up 16% Next 10 make up 12% Next 10 make up 9%
Guinea
Mexico
Myanmar
2,663
Egypt, Arab Rep.
Somalia
Iran, Islamic Rep.
Peru
Zimbabwe
Tanzania
2,419
South Africa
3,158
3,032
2,928
2,650
2,640
2,505
2,329
2,263
Chad
Nepal
Sudan
Yemen, Rep.
Iraq
2,259
Afghanistan
Burundi
Benin
Congo, Dem. Rep.
Morocco
2,249
2,020
2,010
1,931
1,876
1,871
1,738
1,684
1,640
1,490Cambodia
1,564
Burkina Faso
Turkey
1,606
Kenya
Malawi
Algeria
Syria
Senegal
Indonesia
Sri Lanka
1,600
1,582
1,574
1,519
1,499
1,483
1,409
3,359
Mozambique
28,836India
14,816Nigeria
Pakistan
Angola
Philippines
Ethiopia
Mali
Brazil
Lebanon
4,370
5,757
4,972
4,101
3,587
3,501
3,250
Existing market New market
The level of penetration and growth of TESCO sites across the world have been assessed on a country-by-country basis. TESCO
penetration is determined by four key drivers, based on key findings as discussed in earlier chapters:
• Forecasted towers growth on bad-grid and off-grid sites: As discussed in Chapter 2.1 and Chapter 2.2, bad- and
off-grid tower growth in each country is determined by the expected increase in mobile penetration and expansion in
network coverage, coupled with expected improvements in the power grid, taking into account the typical rate of grid
improvements in such emerging markets.
• Commercial attractiveness to solarize telecom sites while converting CAPEX cost into OPEX: As discussed in
Chapter 2.3, the business case for solarizing sites is a key consideration for a TESCO. In particular, a key driver for improving
the business case for a TESCO is the diesel arbitrage opportunity in each country. In addition, MNOs can convert these
power solution CAPEX cost into OPEX-only cost, which is especially attractive given heightened competition and continued
compression of margins faced in the industry.
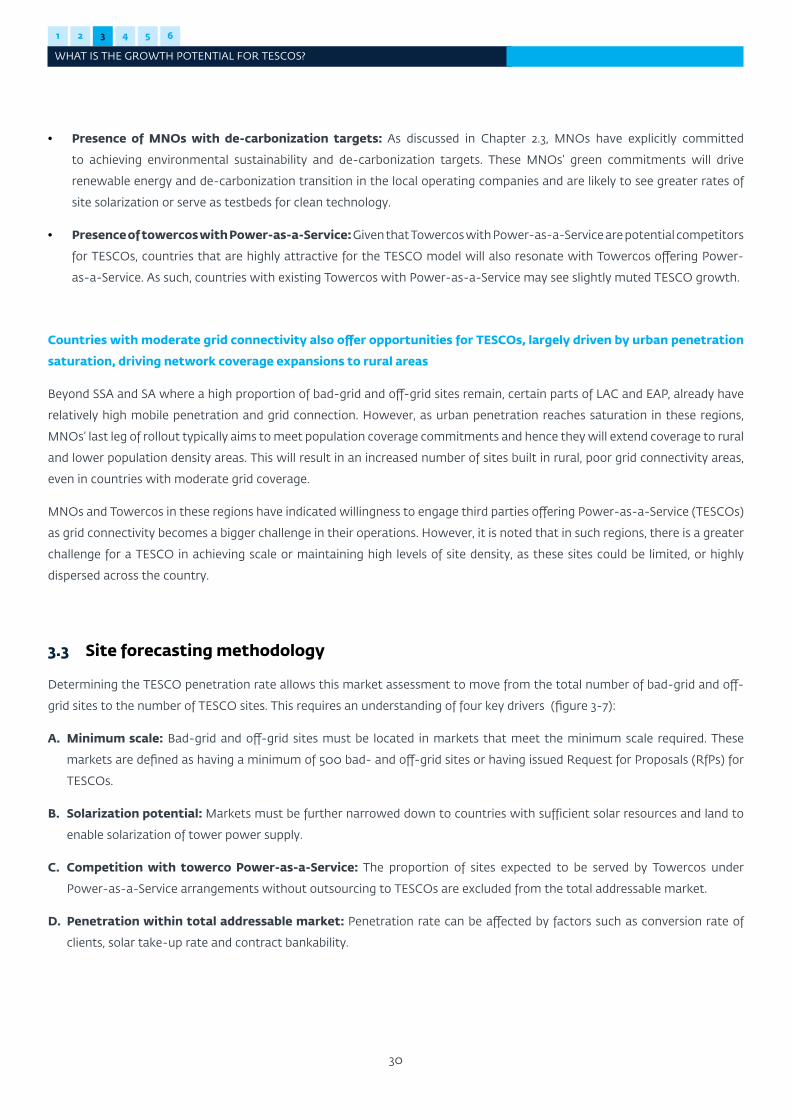
1 2 3 4 5 6
WHAT IS THE GROWTH POTENTIAL FOR TESCOS?
30
• Presence of MNOs with de-carbonization targets: As discussed in Chapter 2.3, MNOs have explicitly committed
to achieving environmental sustainability and de-carbonization targets. These MNOs’ green commitments will drive
renewable energy and de-carbonization transition in the local operating companies and are likely to see greater rates of
site solarization or serve as testbeds for clean technology.
• Presence of towercos with Power-as-a-Service: Given that Towercos with Power-as-a-Service are potential competitors
for TESCOs, countries that are highly attractive for the TESCO model will also resonate with Towercos offering Power-
as-a-Service. As such, countries with existing Towercos with Power-as-a-Service may see slightly muted TESCO growth.
Countries with moderate grid connectivity also offer opportunities for TESCOs, largely driven by urban penetration
saturation, driving network coverage expansions to rural areas
Beyond SSA and SA where a high proportion of bad-grid and off-grid sites remain, certain parts of LAC and EAP, already have
relatively high mobile penetration and grid connection. However, as urban penetration reaches saturation in these regions,
MNOs’ last leg of rollout typically aims to meet population coverage commitments and hence they will extend coverage to rural
and lower population density areas. This will result in an increased number of sites built in rural, poor grid connectivity areas,
even in countries with moderate grid coverage.
MNOs and Towercos in these regions have indicated willingness to engage third parties offering Power-as-a-Service (TESCOs)
as grid connectivity becomes a bigger challenge in their operations. However, it is noted that in such regions, there is a greater
challenge for a TESCO in achieving scale or maintaining high levels of site density, as these sites could be limited, or highly
dispersed across the country.
3.3 Site forecasting methodology
Determining the TESCO penetration rate allows this market assessment to move from the total number of bad-grid and off-
grid sites to the number of TESCO sites. This requires an understanding of four key drivers (figure 3-7):
A. Minimum scale: Bad-grid and off-grid sites must be located in markets that meet the minimum scale required. These
markets are defined as having a minimum of 500 bad- and off-grid sites or having issued Request for Proposals (RfPs) for
TESCOs.
B. Solarization potential: Markets must be further narrowed down to countries with sufficient solar resources and land to
enable solarization of tower power supply.
C. Competition with towerco Power-as-a-Service: The proportion of sites expected to be served by Towercos under
Power-as-a-Service arrangements without outsourcing to TESCOs are excluded from the total addressable market.
D. Penetration within total addressable market: Penetration rate can be affected by factors such as conversion rate of
clients, solar take-up rate and contract bankability.
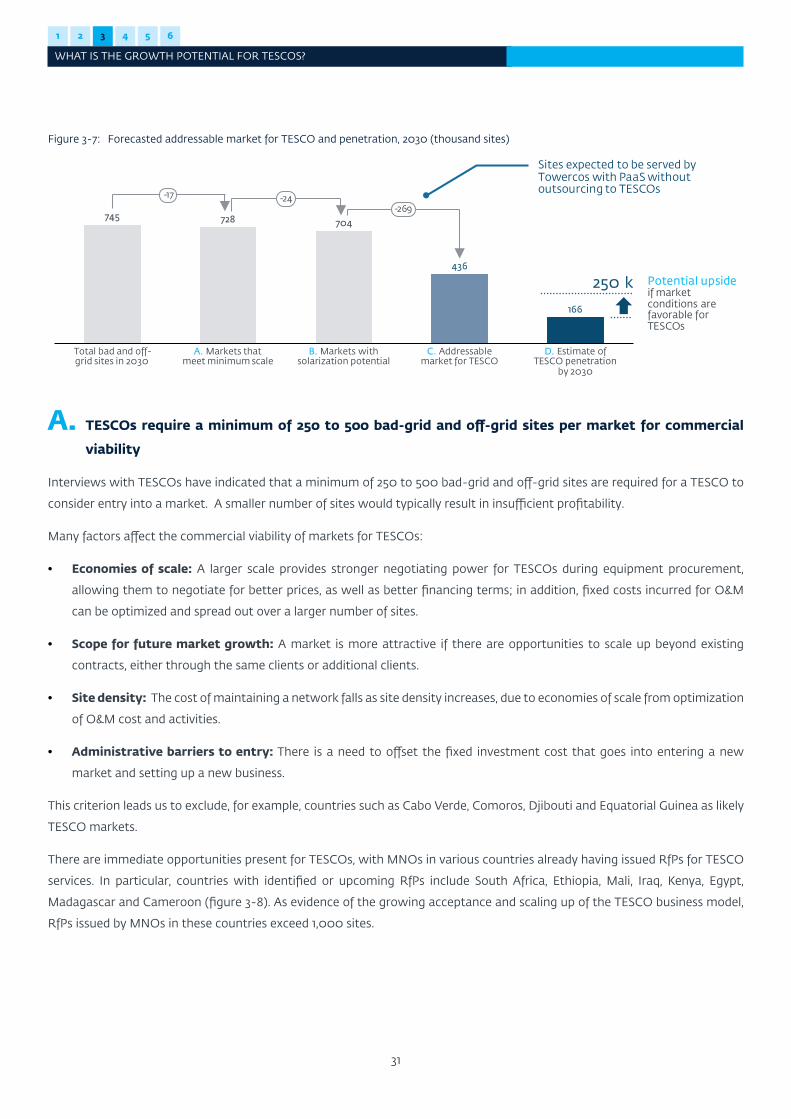
1 2 3 4 5 6
WHAT IS THE GROWTH POTENTIAL FOR TESCOS?
31
Figure 3-7: Forecasted addressable market for TESCO and penetration, 2030 (thousand sites)
Total bad and off-grid sites in 2030
C. Addressable market for TESCO
A. Markets that meet minimum scale
B. Markets with solarization potential
D. Estimate of TESCO penetration
by 2030
728745704
436
166
-17 -24-269
Potential upsideif market conditions are favorable for TESCOs
250 k
Sites expected to be served by Towercos with PaaS without outsourcing to TESCOs
A. TESCOs require a minimum of 250 to 500 bad-grid and off-grid sites per market for commercial
viability
Interviews with TESCOs have indicated that a minimum of 250 to 500 bad-grid and off-grid sites are required for a TESCO to
consider entry into a market. A smaller number of sites would typically result in insufficient profitability.
Many factors affect the commercial viability of markets for TESCOs:
• Economies of scale: A larger scale provides stronger negotiating power for TESCOs during equipment procurement,
allowing them to negotiate for better prices, as well as better financing terms; in addition, fixed costs incurred for O&M
can be optimized and spread out over a larger number of sites.
• Scope for future market growth: A market is more attractive if there are opportunities to scale up beyond existing
contracts, either through the same clients or additional clients.
• Site density: The cost of maintaining a network falls as site density increases, due to economies of scale from optimization
of O&M cost and activities.
• Administrative barriers to entry: There is a need to offset the fixed investment cost that goes into entering a new
market and setting up a new business.
This criterion leads us to exclude, for example, countries such as Cabo Verde, Comoros, Djibouti and Equatorial Guinea as likely
TESCO markets.
There are immediate opportunities present for TESCOs, with MNOs in various countries already having issued RfPs for TESCO
services. In particular, countries with identified or upcoming RfPs include South Africa, Ethiopia, Mali, Iraq, Kenya, Egypt,
Madagascar and Cameroon (figure 3-8). As evidence of the growing acceptance and scaling up of the TESCO business model,
RfPs issued by MNOs in these countries exceed 1,000 sites.
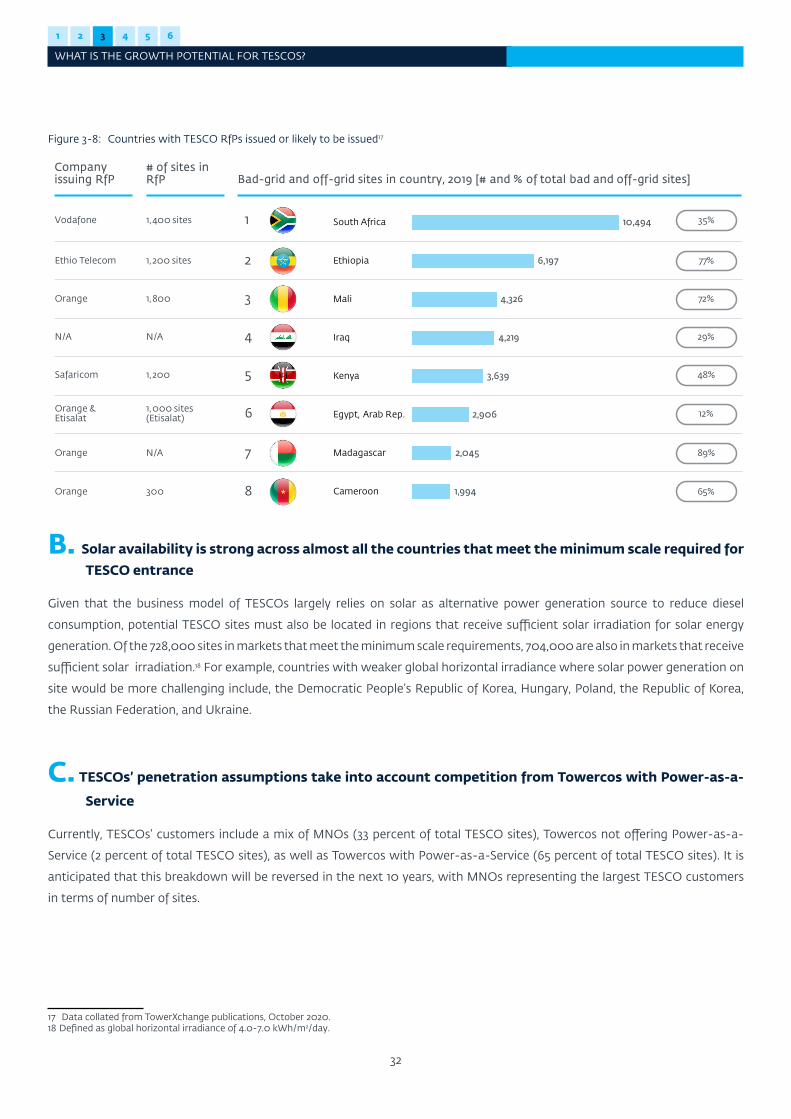
1 2 3 4 5 6
WHAT IS THE GROWTH POTENTIAL FOR TESCOS?
32
Figure 3-8: Countries with TESCO RfPs issued or likely to be issued17
17 Data collated from TowerXchange publications, October 2020.18 Defined as global horizontal irradiance of 4.0-7.0 kWh/m2/day.
Company issuing RfP Bad-grid and off-grid sites in country, 2019 [# and % of total bad and off-grid sites]
Iraq
South Africa
Egypt, Arab Rep.
Ethiopia
Madagascar
Mali
Kenya
Cameroon 1,994
10,494
6,197
4,326
4,219
3,639
2,906
2,045
35%
77%
72%
29%
48%
12%
89%
65%
# of sites in RfP
1,000 sites (Etisalat)
1,400 sites
1,800
N/A
1,200 sites
1,200
N/A
300
1
2
3
4
5
6
7
8
Orange & Etisalat
Vodafone
Orange
N/A
Ethio Telecom
Safaricom
Orange
Orange
B. Solar availability is strong across almost all the countries that meet the minimum scale required for TESCO entrance
Given that the business model of TESCOs largely relies on solar as alternative power generation source to reduce diesel
consumption, potential TESCO sites must also be located in regions that receive sufficient solar irradiation for solar energy
generation. Of the 728,000 sites in markets that meet the minimum scale requirements, 704,000 are also in markets that receive
sufficient solar irradiation.18 For example, countries with weaker global horizontal irradiance where solar power generation on
site would be more challenging include, the Democratic People’s Republic of Korea, Hungary, Poland, the Republic of Korea,
the Russian Federation, and Ukraine.
C. TESCOs’ penetration assumptions take into account competition from Towercos with Power-as-a-
Service
Currently, TESCOs’ customers include a mix of MNOs (33 percent of total TESCO sites), Towercos not offering Power-as-a-
Service (2 percent of total TESCO sites), as well as Towercos with Power-as-a-Service (65 percent of total TESCO sites). It is
anticipated that this breakdown will be reversed in the next 10 years, with MNOs representing the largest TESCO customers
in terms of number of sites.
1 2 3 4 5 6
WHAT IS THE GROWTH POTENTIAL FOR TESCOS?
33
MNOs can decide between maintaining operations in-house, outsourcing
power solutions to Towercos, or outsourcing TESCOs
A fundamental decision facing MNOs is whether to retain or divest ownership of
their tower assets. Once the towers are sold, the contractual agreements between
MNOs and Towercos could be on a: i) cost pass-through model, or ii) performance
or efficiency-based model. Where the cost of powering the sites is passed through
with the MNO being responsible for it, Towercos have little incentive to improve
operational metrics. Not divesting the towers, on the other hand, leaves the
MNOs with having to address power issues themselves and continuing to incur
associated CAPEX. A TESCO can step in as a specialized partner to relieve the MNO
of power infrastructure, engineering, procurement and O&M challenges, while
allowing the MNO to focus investments and efforts on its core service provisions
and optimize CAPEX allocation. The TESCO then assumes the CAPEX of the power
assets, typically with a contract that incentivizes them to reduce OPEX, improve
operational metrics and drive constant innovation, while helping MNOs reach their
sustainability targets. Through TESCO contracts, MNOs can also achieve mid- to
long-term predictability of energy costs. The attractiveness of this latter feature is,
however, highly dependent on the local operating environment economics, such as
tax regime, fuel cost, grid prices, and can act as an incentive or deterrent to entering
into long-term energy contracts with TESCOs.
In contrast, working with a Towerco which offers Power-as-a-Service is the
preferred route for MNOs which have divested their towers or are otherwise
looking for a simple solution. The scale and geographic presence of many Towercos
provide MNOs with increased comfort that they will deliver on their contractual
obligations. Towercos with Power-as-a-Service may also offer solutions for MNOs
looking to adopt a full Network-as-a-Service model of outsourcing both tower and
power solutions. TESCOs are themselves expanding their portfolio of services to
reach beyond pure power provision, often building on an existing portfolio of O&M
services which may present attractive propositions. This is especially the case in rural
or remote areas, where cost savings can be significant when one party manages all
the services of a telecoms site. Towercos’ appetite to tackle such areas depends on
their respective strategies and local market dynamics.
Figure 3-9 below summarizes the key considerations for an MNO for selecting a site
power solution provider, as informed by the interviews with MNOs conducted for
this study.
We have tried a do-it-ourselves approach to power management, but we are not a power solution expert – this is where a TESCO comes in.
Interview excerpt from MNO
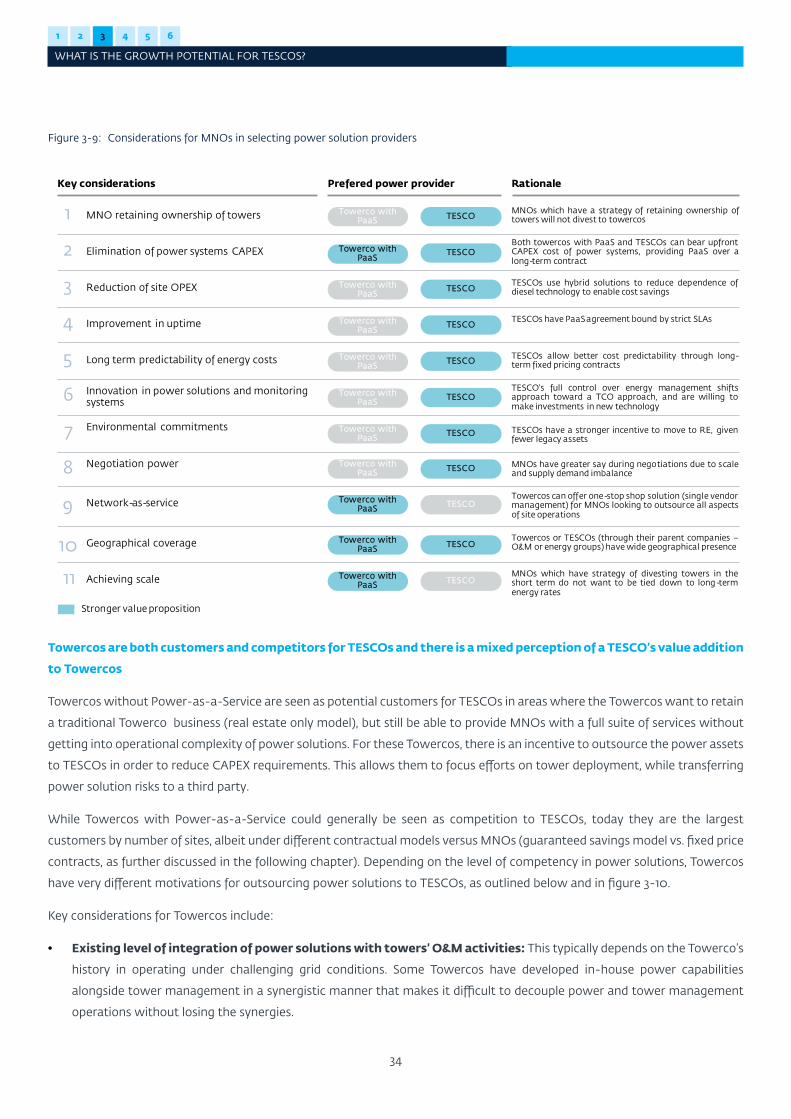
1 2 3 4 5 6
WHAT IS THE GROWTH POTENTIAL FOR TESCOS?
34
Figure 3-9: Considerations for MNOs in selecting power solution providers
Stronger value proposition
Prefered power provider Rationale
Both towercos with PaaS and TESCOs can bear upfrontCAPEX cost of power systems, providing PaaS over along-term contract
Towerco with PaaS TESCO
TESCO's full control over energy management shiftsapproach toward a TCO approach, and are willing tomake investments in new technology
Towerco with PaaS
TESCO
Towercos can offer one-stop shop solution (single vendormanagement) for MNOs looking to outsource all aspectsof site operations
Towerco with PaaS
TESCOs use hybrid solutions to reduce dependence ofdiesel technology to enable cost savings
TESCOs allow better cost predictability through long-term fixed pricing contracts
Towerco with PaaS TESCO
TESCO
TESCOTowerco with PaaS
Key considerations
MNOs which have a strategy of retaining ownership oftowers will not divest to towercosTESCOTowerco with
PaaS
TESCOTowerco with PaaS
TESCOs have PaaSagreement bound by strict SLAs
Elimination of power systems CAPEX
Innovation in power solutions and monitoring systems
Reduction of site OPEX
Network-as-service
Long term predictability of energy costs
MNO retaining ownership of towers
Improvement in uptime
1
2
4
5
6
9
3
Towerco with PaaS TESCO TESCOs have a stronger incentive to move to RE, given
fewer legacy assetsEnvironmental commitments 7
Towerco with PaaS TESCO MNOs have greater say during negotiations due to scale
and supply demand imbalanceNegotiation power8
Towerco with PaaS
Towercos or TESCOs (through their parent companies –O&M or energy groups) have wide geographical presenceTESCOGeographical coverage
Achieving scale Towerco with PaaS TESCO
MNOs which have strategy of divesting towers in theshort term do not want to be tied down to long-termenergy rates
10
11
Towercos are both customers and competitors for TESCOs and there is a mixed perception of a TESCO’s value addition
to Towercos
Towercos without Power-as-a-Service are seen as potential customers for TESCOs in areas where the Towercos want to retain
a traditional Towerco business (real estate only model), but still be able to provide MNOs with a full suite of services without
getting into operational complexity of power solutions. For these Towercos, there is an incentive to outsource the power assets
to TESCOs in order to reduce CAPEX requirements. This allows them to focus efforts on tower deployment, while transferring
power solution risks to a third party.
While Towercos with Power-as-a-Service could generally be seen as competition to TESCOs, today they are the largest
customers by number of sites, albeit under different contractual models versus MNOs (guaranteed savings model vs. fixed price
contracts, as further discussed in the following chapter). Depending on the level of competency in power solutions, Towercos
have very different motivations for outsourcing power solutions to TESCOs, as outlined below and in figure 3-10.
Key considerations for Towercos include:
• Existing level of integration of power solutions with towers’ O&M activities: This typically depends on the Towerco’s
history in operating under challenging grid conditions. Some Towercos have developed in-house power capabilities
alongside tower management in a synergistic manner that makes it difficult to decouple power and tower management
operations without losing the synergies.
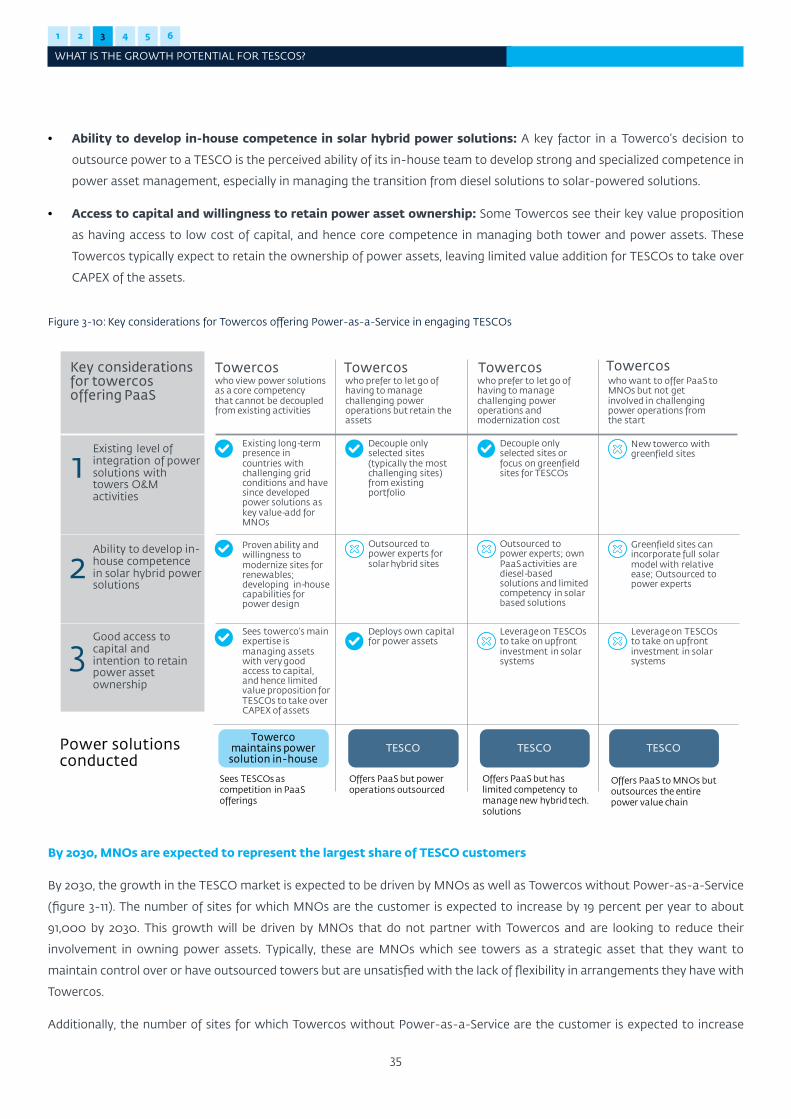
1 2 3 4 5 6
WHAT IS THE GROWTH POTENTIAL FOR TESCOS?
35
• Ability to develop in-house competence in solar hybrid power solutions: A key factor in a Towerco’s decision to
outsource power to a TESCO is the perceived ability of its in-house team to develop strong and specialized competence in
power asset management, especially in managing the transition from diesel solutions to solar-powered solutions.
• Access to capital and willingness to retain power asset ownership: Some Towercos see their key value proposition
as having access to low cost of capital, and hence core competence in managing both tower and power assets. These
Towercos typically expect to retain the ownership of power assets, leaving limited value addition for TESCOs to take over
CAPEX of the assets.
Figure 3-10: Key considerations for Towercos offering Power-as-a-Service in engaging TESCOs
1
2
Existing level of integration of power solutions with towers O&M activities
Ability to develop in-house competence in solar hybrid power solutions
3Good access to capital and intention to retain power asset ownership
Key considerations for towercosoffering PaaS
Power solutions conducted
TESCO Towerco
maintains power solution in-house
TESCO TESCO
Proven ability and willingness to modernize sites for renewables; developing in-house capabilities for power design
Existing long-term presence in countries with challenging grid conditions and have since developed power solutions as key value-add for MNOs
Outsourced to power experts; own PaaS activities are diesel-based solutions and limited competency in solar based solutions
Offers PaaS but power operations outsourced
Deploys own capital for power assets
Outsourced to power experts for solar hybrid sites
Sees towerco’s main expertise is managing assets with very good access to capital, and hence limited value proposition for TESCOs to take over CAPEX of assets
Decouple only selected sites (typically the most challenging sites) from existing portfolio
Decouple only selected sites or focus on greenfield sites for TESCOs
Offers PaaS to MNOs but outsources the entire power value chain
Offers PaaS but has limited competency to manage new hybrid tech. solutions
Towercos Towercos Towercos Towercos
Leverage on TESCOs to take on upfront investment in solar systems
Leverage on TESCOsto take on upfront investment in solar systems
Greenfield sites can incorporate full solar model with relative ease; Outsourced to power experts
New towerco with greenfield sites
who view power solutions as a core competency that cannot be decoupled from existing activities
who prefer to let go of having to manage challenging power operations but retain the assets
who prefer to let go of having to manage challenging power operations and modernization cost
who want to offer PaaS to MNOs but not get involved in challenging power operations from the start
Sees TESCOs as competition in PaaS offerings
By 2030, MNOs are expected to represent the largest share of TESCO customers
By 2030, the growth in the TESCO market is expected to be driven by MNOs as well as Towercos without Power-as-a-Service
(figure 3-11). The number of sites for which MNOs are the customer is expected to increase by 19 percent per year to about
91,000 by 2030. This growth will be driven by MNOs that do not partner with Towercos and are looking to reduce their
involvement in owning power assets. Typically, these are MNOs which see towers as a strategic asset that they want to
maintain control over or have outsourced towers but are unsatisfied with the lack of flexibility in arrangements they have with
Towercos.
Additionally, the number of sites for which Towercos without Power-as-a-Service are the customer is expected to increase
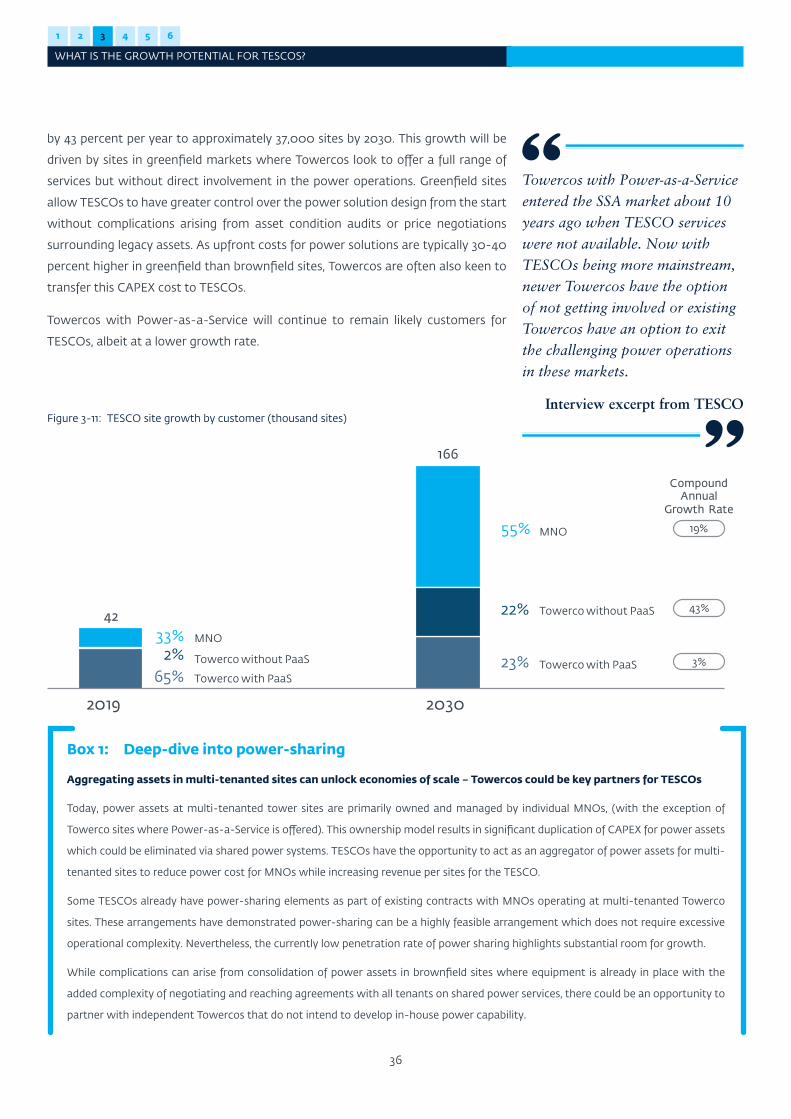
1 2 3 4 5 6
WHAT IS THE GROWTH POTENTIAL FOR TESCOS?
36
by 43 percent per year to approximately 37,000 sites by 2030. This growth will be
driven by sites in greenfield markets where Towercos look to offer a full range of
services but without direct involvement in the power operations. Greenfield sites
allow TESCOs to have greater control over the power solution design from the start
without complications arising from asset condition audits or price negotiations
surrounding legacy assets. As upfront costs for power solutions are typically 30-40
percent higher in greenfield than brownfield sites, Towercos are often also keen to
transfer this CAPEX cost to TESCOs.
Towercos with Power-as-a-Service will continue to remain likely customers for
TESCOs, albeit at a lower growth rate.
Figure 3-11: TESCO site growth by customer (thousand sites)
Towerco without PaaS
2%
2030
33%
65%23%
55%
2019
22%
MNO
42
166
Towerco with PaaS
Compound Annual
Growth Rate
19%
43%
3%Towerco without PaaS
MNO
Towerco with PaaS
Towercos with Power-as-a-Service entered the SSA market about 10 years ago when TESCO services were not available. Now with TESCOs being more mainstream, newer Towercos have the option of not getting involved or existing Towercos have an option to exit the challenging power operations in these markets.
Interview excerpt from TESCO
Box 1: Deep-dive into power-sharing
Aggregating assets in multi-tenanted sites can unlock economies of scale – Towercos could be key partners for TESCOs
Today, power assets at multi-tenanted tower sites are primarily owned and managed by individual MNOs, (with the exception of
Towerco sites where Power-as-a-Service is offered). This ownership model results in significant duplication of CAPEX for power assets
which could be eliminated via shared power systems. TESCOs have the opportunity to act as an aggregator of power assets for multi-
tenanted sites to reduce power cost for MNOs while increasing revenue per sites for the TESCO.
Some TESCOs already have power-sharing elements as part of existing contracts with MNOs operating at multi-tenanted Towerco
sites. These arrangements have demonstrated power-sharing can be a highly feasible arrangement which does not require excessive
operational complexity. Nevertheless, the currently low penetration rate of power sharing highlights substantial room for growth.
While complications can arise from consolidation of power assets in brownfield sites where equipment is already in place with the
added complexity of negotiating and reaching agreements with all tenants on shared power services, there could be an opportunity to
partner with independent Towercos that do not intend to develop in-house power capability.
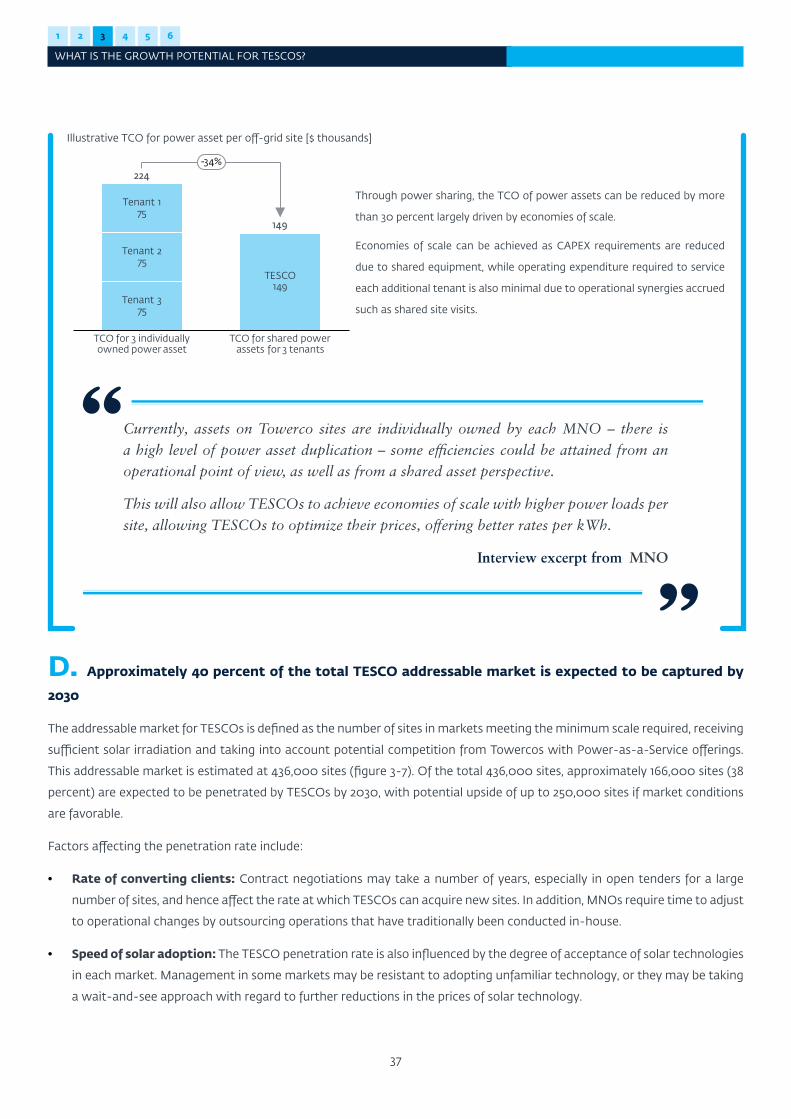
1 2 3 4 5 6
WHAT IS THE GROWTH POTENTIAL FOR TESCOS?
37
D. Approximately 40 percent of the total TESCO addressable market is expected to be captured by
2030
The addressable market for TESCOs is defined as the number of sites in markets meeting the minimum scale required, receiving
sufficient solar irradiation and taking into account potential competition from Towercos with Power-as-a-Service offerings.
This addressable market is estimated at 436,000 sites (figure 3-7). Of the total 436,000 sites, approximately 166,000 sites (38
percent) are expected to be penetrated by TESCOs by 2030, with potential upside of up to 250,000 sites if market conditions
are favorable.
Factors affecting the penetration rate include:
• Rate of converting clients: Contract negotiations may take a number of years, especially in open tenders for a large
number of sites, and hence affect the rate at which TESCOs can acquire new sites. In addition, MNOs require time to adjust
to operational changes by outsourcing operations that have traditionally been conducted in-house.
• Speed of solar adoption: The TESCO penetration rate is also influenced by the degree of acceptance of solar technologies
in each market. Management in some markets may be resistant to adopting unfamiliar technology, or they may be taking
a wait-and-see approach with regard to further reductions in the prices of solar technology.
Illustrative TCO for power asset per off-grid site [$ thousands]
TCO for 3 individually owned power asset
Tenant 275
Tenant 175
Tenant 375
TESCO149
TCO for shared power assets for 3 tenants
224
149
-34%
Through power sharing, the TCO of power assets can be reduced by more
than 30 percent largely driven by economies of scale.
Economies of scale can be achieved as CAPEX requirements are reduced
due to shared equipment, while operating expenditure required to service
each additional tenant is also minimal due to operational synergies accrued
such as shared site visits.
Currently, assets on Towerco sites are individually owned by each MNO – there is a high level of power asset duplication – some efficiencies could be attained from an operational point of view, as well as from a shared asset perspective.
This will also allow TESCOs to achieve economies of scale with higher power loads per site, allowing TESCOs to optimize their prices, offering better rates per kWh.
Interview excerpt from MNO
1 2 3 4 5 6
WHAT IS THE GROWTH POTENTIAL FOR TESCOS?
38
• Contract bankability: In a nascent TESCO market where contract
standardization is still not prevalent, the terms negotiated by the TESCO
and their clients influence the type of financing they can attract. Suboptimal
contract structures could limit TESCOs’ ability to quickly scale operations.
• Market complexity: Other factors relating to individual markets may affect the
ability of TESCOs to conduct operations and impact the speed of deployment or
contract negotiations, for example, security concerns in conflict zones.
3.4 Growth strategies of TESCOs
Scalability of the TESCO model
TESCOs can undertake a number of strategies to scale up both in existing markets
and internationally (figure 3-12).
First, there is room to grow by serving more sites in the tower portfolios of existing
clients in the same country. Operational synergies can be achieved by maximizing
the utility of on-the-ground field teams to serve as many sites as possible with
minimal idle time or travelling time between sites. This is typically conducted
through negotiating to serve dense site clusters or diversification of business loading
field staff where the same teams may conduct multiple services on nearby sites.
Second, TESCOs can target new customers on existing sites, serving multiple
tenants to reduce duplication of power assets between MNOs, while increasing
revenue per site for the TESCOs (Box 1). Given Towercos’ mandate of increasing co-
location, TESCOs partnering with Towercos have the added benefit of serving sites
that are multi-tenanted.
Third, TESCOs can acquire second anchor customers in existing countries of
operation. This type of acquisition enables economies of scale in terms of equipment
procurement, financing and site operations,depending on distribution or overlap of
sites. MNOs in countries where TESCOs are already serving their competitors risk
falling behind on cost competitiveness.
Finally, beyond in-country expansion, a key growth avenue for TESCOs is
international expansion. When bidding for overseas contracts, TESCOs would
be able to differentiate themselves from competitors by demonstrating their
substantial expertise in running TESCO operations in challenging markets.
We can have stronger negotiation power when we centralize procurement to negotiate for better pricing and flexible payment terms.
Interview excerpt from TESCO
TESCO credentials (proven ability to maintain or improve uptime) are important for operators to be convinced on our capabilities and be a long-term partner for their network
Interview excerpt from TESCO
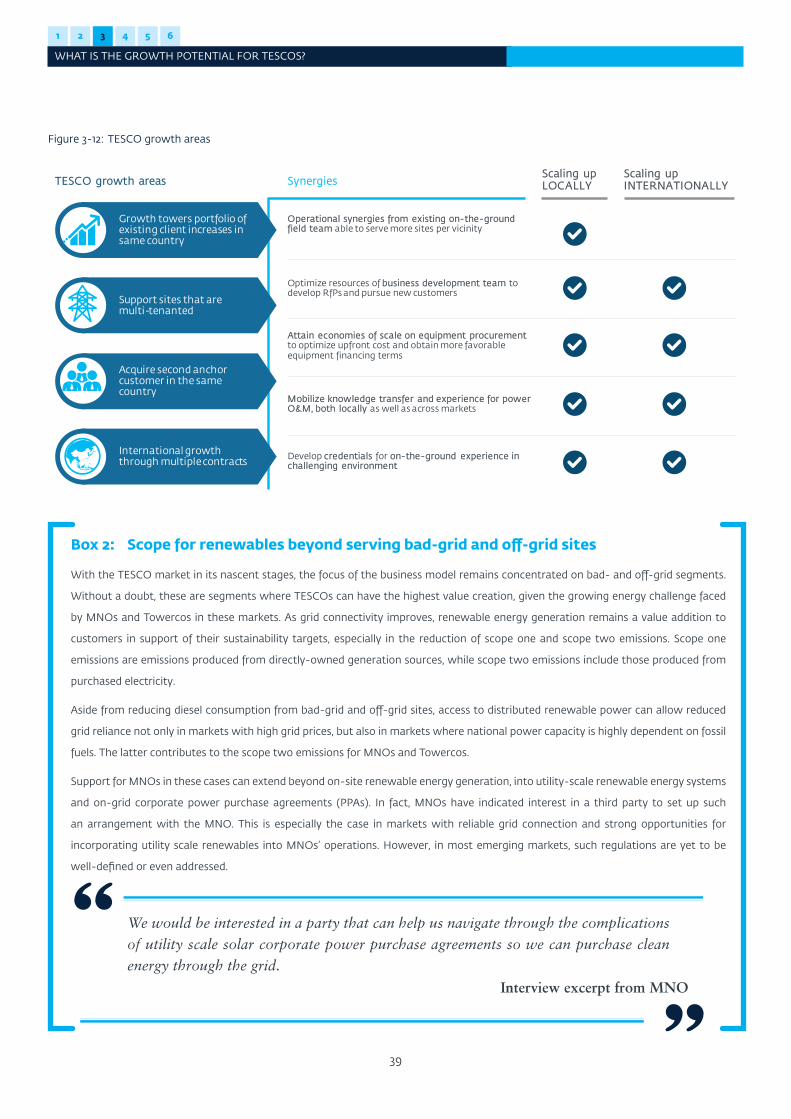
1 2 3 4 5 6
WHAT IS THE GROWTH POTENTIAL FOR TESCOS?
39
Figure 3-12: TESCO growth areas
TESCO growth areas Synergies
Optimize resources of business development team to develop RfPs and pursue new customers
Operational synergies from existing on-the-ground field team able to serve more sites per vicinity
Attain economies of scale on equipment procurement to optimize upfront cost and obtain more favorable equipment financing terms
Mobilize knowledge transfer and experience for power O&M, both locally as well as across markets
Develop credentials for on-the-ground experience in challenging environment
Growth towers portfolio of existing client increases in same country
Support sites that are multi-tenanted
International growth through multiple contracts
Acquire second anchor customer in the same country
Scaling up INTERNATIONALLY
Scaling up LOCALLY
Box 2: Scope for renewables beyond serving bad-grid and off-grid sites
With the TESCO market in its nascent stages, the focus of the business model remains concentrated on bad- and off-grid segments.
Without a doubt, these are segments where TESCOs can have the highest value creation, given the growing energy challenge faced
by MNOs and Towercos in these markets. As grid connectivity improves, renewable energy generation remains a value addition to
customers in support of their sustainability targets, especially in the reduction of scope one and scope two emissions. Scope one
emissions are emissions produced from directly-owned generation sources, while scope two emissions include those produced from
purchased electricity.
Aside from reducing diesel consumption from bad-grid and off-grid sites, access to distributed renewable power can allow reduced
grid reliance not only in markets with high grid prices, but also in markets where national power capacity is highly dependent on fossil
fuels. The latter contributes to the scope two emissions for MNOs and Towercos.
Support for MNOs in these cases can extend beyond on-site renewable energy generation, into utility-scale renewable energy systems
and on-grid corporate power purchase agreements (PPAs). In fact, MNOs have indicated interest in a third party to set up such
an arrangement with the MNO. This is especially the case in markets with reliable grid connection and strong opportunities for
incorporating utility scale renewables into MNOs’ operations. However, in most emerging markets, such regulations are yet to be
well-defined or even addressed.
We would be interested in a party that can help us navigate through the complications of utility scale solar corporate power purchase agreements so we can purchase clean energy through the grid.
Interview excerpt from MNO

1 2 3 4 5 6
WHAT IS THE GROWTH POTENTIAL FOR TESCOS?
40
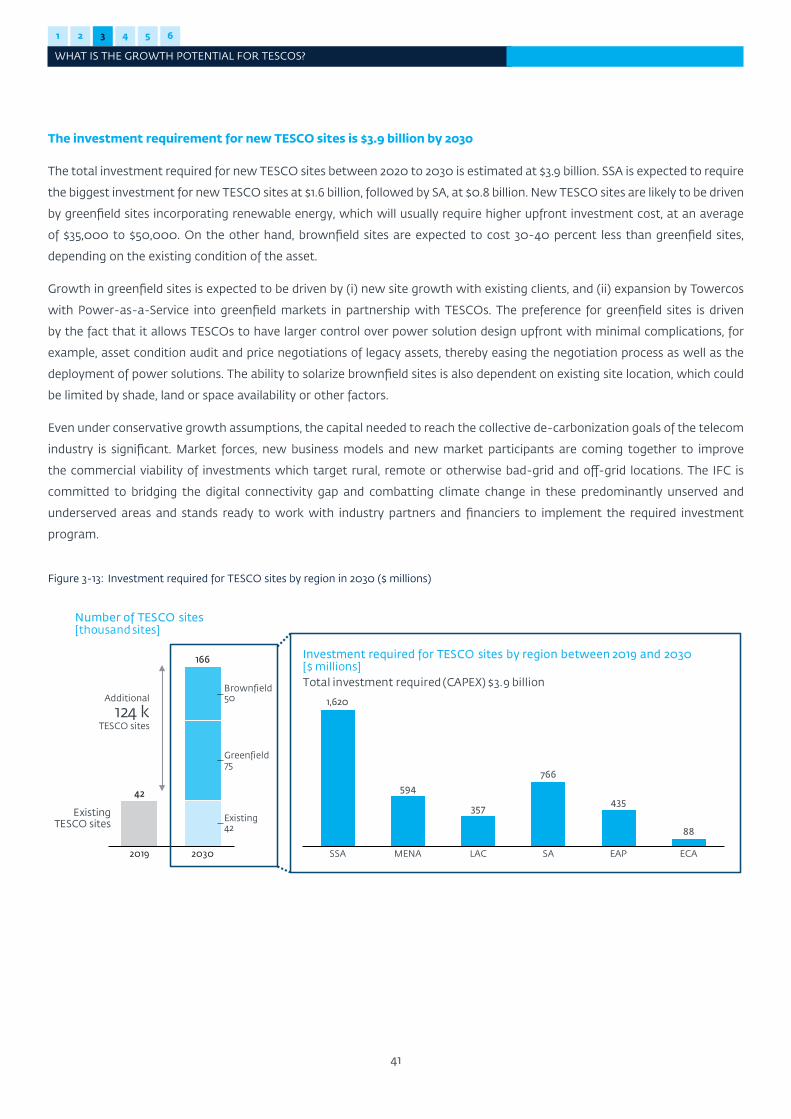
1 2 3 4 5 6
WHAT IS THE GROWTH POTENTIAL FOR TESCOS?
41
The investment requirement for new TESCO sites is $3.9 billion by 2030
The total investment required for new TESCO sites between 2020 to 2030 is estimated at $3.9 billion. SSA is expected to require
the biggest investment for new TESCO sites at $1.6 billion, followed by SA, at $0.8 billion. New TESCO sites are likely to be driven
by greenfield sites incorporating renewable energy, which will usually require higher upfront investment cost, at an average
of $35,000 to $50,000. On the other hand, brownfield sites are expected to cost 30-40 percent less than greenfield sites,
depending on the existing condition of the asset.
Growth in greenfield sites is expected to be driven by (i) new site growth with existing clients, and (ii) expansion by Towercos
with Power-as-a-Service into greenfield markets in partnership with TESCOs. The preference for greenfield sites is driven
by the fact that it allows TESCOs to have larger control over power solution design upfront with minimal complications, for
example, asset condition audit and price negotiations of legacy assets, thereby easing the negotiation process as well as the
deployment of power solutions. The ability to solarize brownfield sites is also dependent on existing site location, which could
be limited by shade, land or space availability or other factors.
Even under conservative growth assumptions, the capital needed to reach the collective de-carbonization goals of the telecom
industry is significant. Market forces, new business models and new market participants are coming together to improve
the commercial viability of investments which target rural, remote or otherwise bad-grid and off-grid locations. The IFC is
committed to bridging the digital connectivity gap and combatting climate change in these predominantly unserved and
underserved areas and stands ready to work with industry partners and financiers to implement the required investment
program.
Figure 3-13: Investment required for TESCO sites by region in 2030 ($ millions)
594
357
766
435
88
1,620
SSA LACMENA SA EAP ECA
Greenfield75
2019 2030
Existing42
Brownfield50
42
166 Investment required for TESCO sites by region between 2019 and 2030 [$ millions]
Existing TESCO sites
Total investment required (CAPEX) $3.9 billionAdditional
124 k TESCO sites
Number of TESCO sites [thousand sites]
Chapter 4
WHAT ARE THE DIFFERENT TYPES OF TESCOS?
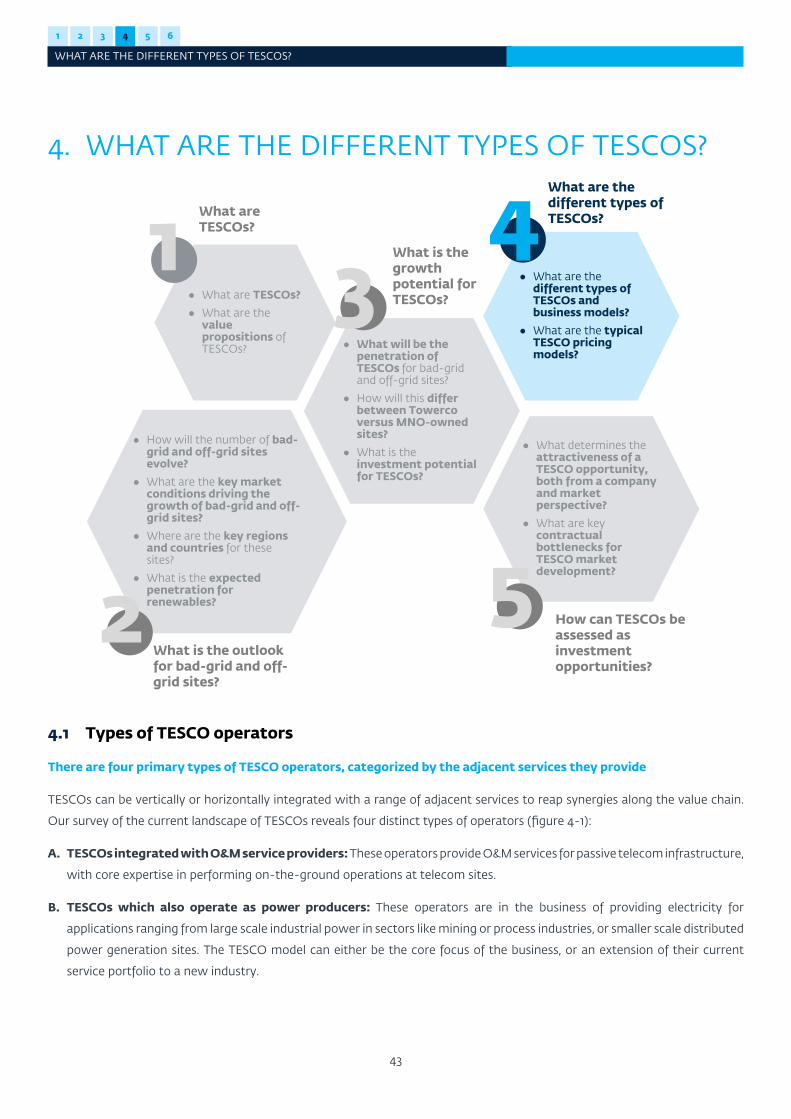
1 2 3 4 5 6
WHAT ARE THE DIFFERENT TYPES OF TESCOS?
43
4. WHAT ARE THE DIFFERENT TYPES OF TESCOS?
● What will be the penetration of TESCOs for bad-grid and off-grid sites?
● How will this differ between Towercoversus MNO-owned sites?
● What is the investment potential for TESCOs?
● What determines the attractiveness of a TESCO opportunity, both from a company and market perspective?
● What are key contractual bottlenecks for TESCO market development?
● What are TESCOs?
● What are the value propositions of TESCOs?
How can TESCOs be assessed as investment opportunities?
What are TESCOs?
What is the growth potential for TESCOs?
5
31
● How will the number of bad-grid and off-grid sites evolve?
● What are the key market conditions driving the growth of bad-grid and off-grid sites?
● Where are the key regions and countries for these sites?
● What is the expected penetration for renewables?
What is the outlook for bad-grid and off-grid sites?
2
● What are the different types of TESCOs and business models?
● What are the typical TESCO pricing models?
What are the different types of TESCOs?4
4.1 Types of TESCO operators
There are four primary types of TESCO operators, categorized by the adjacent services they provide
TESCOs can be vertically or horizontally integrated with a range of adjacent services to reap synergies along the value chain.
Our survey of the current landscape of TESCOs reveals four distinct types of operators (figure 4-1):
A. TESCOs integrated with O&M service providers: These operators provide O&M services for passive telecom infrastructure,
with core expertise in performing on-the-ground operations at telecom sites.
B. TESCOs which also operate as power producers: These operators are in the business of providing electricity for
applications ranging from large scale industrial power in sectors like mining or process industries, or smaller scale distributed
power generation sites. The TESCO model can either be the core focus of the business, or an extension of their current
service portfolio to a new industry.
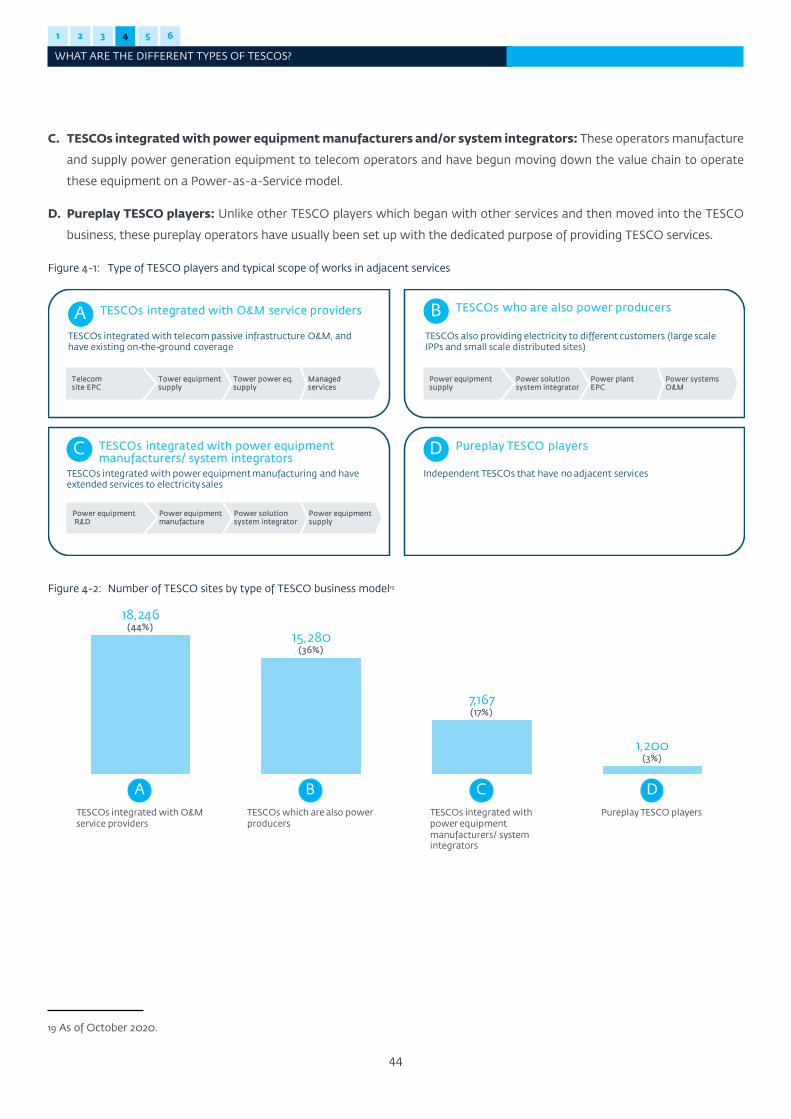
1 2 3 4 5 6
WHAT ARE THE DIFFERENT TYPES OF TESCOS?
44
C. TESCOs integrated with power equipment manufacturers and/or system integrators: These operators manufacture
and supply power generation equipment to telecom operators and have begun moving down the value chain to operate
these equipment on a Power-as-a-Service model.
D. Pureplay TESCO players: Unlike other TESCO players which began with other services and then moved into the TESCO
business, these pureplay operators have usually been set up with the dedicated purpose of providing TESCO services.
19 As of October 2020.
Figure 4-1: Type of TESCO players and typical scope of works in adjacent services
Power systems O&M
Power plant EPC
Power solution system integrator
Power equipment supply
TESCOs who are also power producersBTESCOs also providing electricity to different customers (large scale IPPs and small scale distributed sites)
TESCOs integrated with O&M service providersA
Independent TESCOs that have no adjacent services
Pureplay TESCO playersD
Managed services
Tower power eq. supply
Tower equipment supply
Telecom site EPC
TESCOs integrated with telecom passive infrastructure O&M, and have existing on-the-ground coverage
TESCOs integrated with power equipment manufacturers/ system integrators
CTESCOs integrated with power equipment manufacturing and have extended services to electricity sales
Power equipment supply
Power solution system integrator
Power equipment manufacture
Power equipmentR&D
Figure 4-2: Number of TESCO sites by type of TESCO business model19
TESCOs integrated with power equipment manufacturers/ system integrators
TESCOs integrated with O&M service providers
TESCOs which are also power producers
18,246(44%)
Pureplay TESCO players
1,200(3%)
15,280(36%)
7,167(17%)
CA B D
1 2 3 4 5 6
WHAT ARE THE DIFFERENT TYPES OF TESCOS?
45
TESCOs vertically integrated with O&M service providers and TESCOs that are also power producers are the most
common type of player
TESCOs integrated with O&M service providers are the most common type of TESCO player, having close to 44 percent share
of the market. This group is followed by TESCOs which are also power producers, with 36 percent market share. Finally, TESCOs
integrated with power equipment manufacturers or system integrators have a 17 percent market share. Pure TESCO players
are the least common, with just three percent of the market (figure 4-2).
The key success factors for a TESCO are optimizing site technology coupled with a strong focus on efficiency,
operations improvement, and investment in people
For a TESCO, the most important goal is to optimize energy costs and prolong the power asset’s lifetime. Therefore, the key
success factors for a TESCO are (i) optimized technology and (ii) efficiently run O&M power assets.
Optimizing technology includes optimizing the solar PV and storage solution, improving the generator fuel efficiency through
appropriate power asset design and sizing, and introducing remote monitoring systems (RMS) to track energy consumption,
monitor site activities and identify potential faults without the need for physical site visits (boxes 3 and 4).
Efficient O&M of power assets includes:
• Developing field management expertise to optimize the number of site visits required and effective coordination of on-
the-ground teams.
• Having trained personnel and energy management expertise to be able to predict equipment failure and therefore optimize
preventive maintenance and spare part management and avoid repeat site visits.
• Identifying faults remotely to ensure technicians are equipped with the right tools and equipment spare parts and avoid
visits that could be handled remotely.
• Having comprehensive security systems in place to reduce diesel and battery theft.
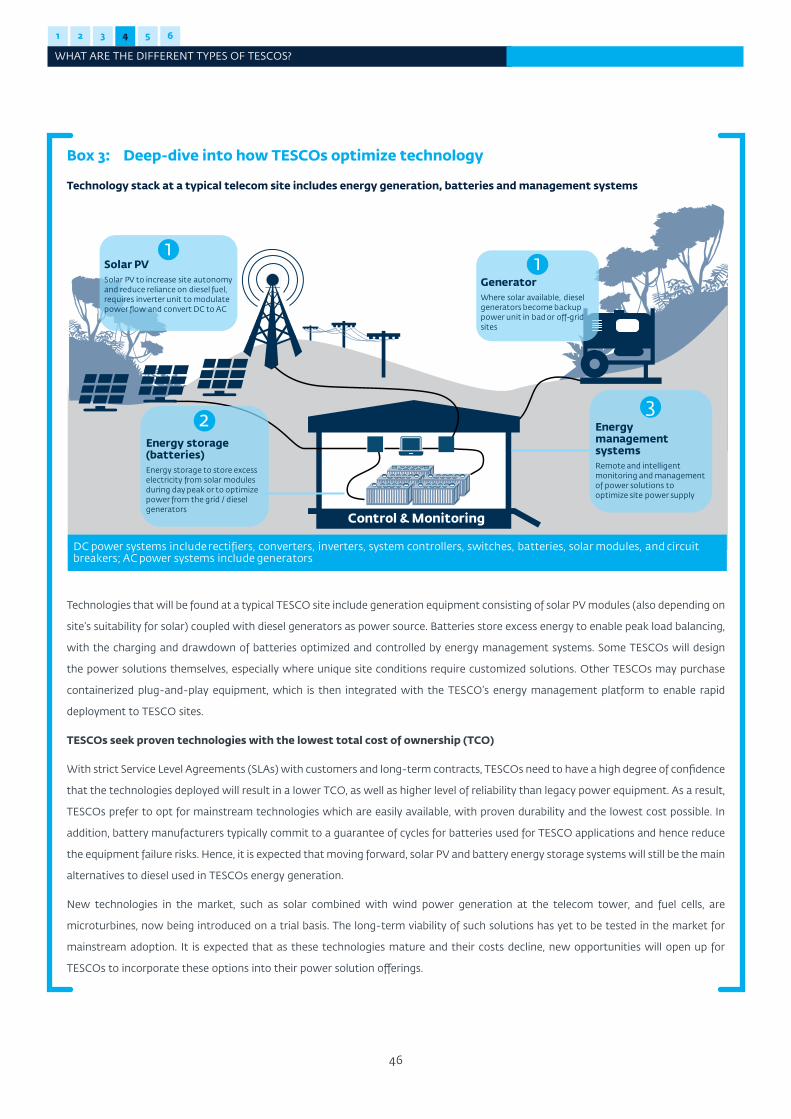
1 2 3 4 5 6
WHAT ARE THE DIFFERENT TYPES OF TESCOS?
46
Box 3: Deep-dive into how TESCOs optimize technology
Technology stack at a typical telecom site includes energy generation, batteries and management systems
Control & Monitoring
DC power systems include rectifiers, converters, inverters, system controllers, switches, batteries, solar modules, and circuit breakers; AC power systems include generators
GeneratorWhere solar available, diesel generators become backup power unit in bad or off-grid sites
Solar PVSolar PV to increase site autonomy and reduce reliance on diesel fuel, requires inverter unit to modulate power flow and convert DC to AC
Energy management systemsRemote and intelligent monitoring and management of power solutions to optimize site power supply
Energy storage (batteries)Energy storage to store excess electricity from solar modules during day peak or to optimize power from the grid / diesel generators
11
32
Technologies that will be found at a typical TESCO site include generation equipment consisting of solar PV modules (also depending on
site’s suitability for solar) coupled with diesel generators as power source. Batteries store excess energy to enable peak load balancing,
with the charging and drawdown of batteries optimized and controlled by energy management systems. Some TESCOs will design
the power solutions themselves, especially where unique site conditions require customized solutions. Other TESCOs may purchase
containerized plug-and-play equipment, which is then integrated with the TESCO’s energy management platform to enable rapid
deployment to TESCO sites.
TESCOs seek proven technologies with the lowest total cost of ownership (TCO)
With strict Service Level Agreements (SLAs) with customers and long-term contracts, TESCOs need to have a high degree of confidence
that the technologies deployed will result in a lower TCO, as well as higher level of reliability than legacy power equipment. As a result,
TESCOs prefer to opt for mainstream technologies which are easily available, with proven durability and the lowest cost possible. In
addition, battery manufacturers typically commit to a guarantee of cycles for batteries used for TESCO applications and hence reduce
the equipment failure risks. Hence, it is expected that moving forward, solar PV and battery energy storage systems will still be the main
alternatives to diesel used in TESCOs energy generation.
New technologies in the market, such as solar combined with wind power generation at the telecom tower, and fuel cells, are
microturbines, now being introduced on a trial basis. The long-term viability of such solutions has yet to be tested in the market for
mainstream adoption. It is expected that as these technologies mature and their costs decline, new opportunities will open up for
TESCOs to incorporate these options into their power solution offerings.
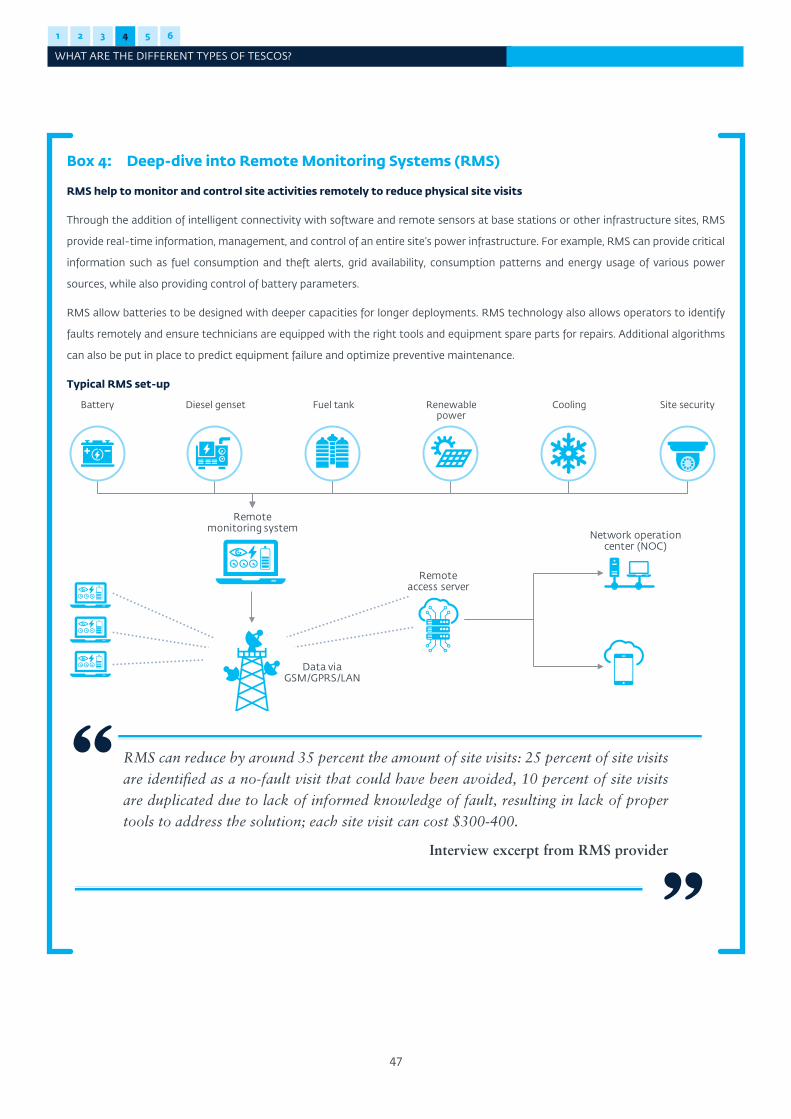
1 2 3 4 5 6
WHAT ARE THE DIFFERENT TYPES OF TESCOS?
47
Box 4: Deep-dive into Remote Monitoring Systems (RMS)
RMS help to monitor and control site activities remotely to reduce physical site visits
Through the addition of intelligent connectivity with software and remote sensors at base stations or other infrastructure sites, RMS
provide real-time information, management, and control of an entire site’s power infrastructure. For example, RMS can provide critical
information such as fuel consumption and theft alerts, grid availability, consumption patterns and energy usage of various power
sources, while also providing control of battery parameters.
RMS allow batteries to be designed with deeper capacities for longer deployments. RMS technology also allows operators to identify
faults remotely and ensure technicians are equipped with the right tools and equipment spare parts for repairs. Additional algorithms
can also be put in place to predict equipment failure and optimize preventive maintenance.
Typical RMS set-up
Renewable
powerCooling
Data via GSM/GPRS/LAN
Network operation center (NOC)
Site securityFuel tankDiesel gensetBattery
Remote access server
Remote monitoring system
RMS can reduce by around 35 percent the amount of site visits: 25 percent of site visits are identified as a no-fault visit that could have been avoided, 10 percent of site visits are duplicated due to lack of informed knowledge of fault, resulting in lack of proper tools to address the solution; each site visit can cost $300-400.
Interview excerpt from RMS provider
1 2 3 4 5 6
WHAT ARE THE DIFFERENT TYPES OF TESCOS?
48
1 2 3 4 5 6
WHAT ARE THE DIFFERENT TYPES OF TESCOS?
49
4.2 TESCO business models
A. O&M service providers can achieve strong operational synergies in the TESCO business
TESCOs integrated with O&M service providers typically manage a large number of telecom sites on passive infrastructure O&M
contracts. Consequently, such TESCOs can benefit from existing on-the-ground coverage across geographies and economies
of scale in O&M.
The integration of TESCO and O&M services provides an array of benefits. In particular, TESCOs integrated with O&M service
providers have shown the ability to scale up the TESCO business quickly by leveraging existing passive infrastructure O&M.
Existing site presence also allows them to retain insights into the conditions of legacy power equipment, enabling better
equipment audit and pricing. It also facilitates power asset deployment due to the familiarity of local operating conditions
Significant operational synergies can be extracted from their existing passive infrastructure O&M contracts, including:
• Using existing field teams with strong on-the-ground familiarity and knowledge
• Maximizing the value addition of each site visit by combining both TESCO and O&M activities into a single site visit, which
would incur only a marginal cost
• Leveraging in-house expertise in O&M activities, such as optimizing equipment spare parts and reducing theft
• Having a proven track record to operate and service telecom sites in challenging rural environments
• Integrating both TESCO and O&M services, providing customers a single point of contact for managing external vendors
and accountability
The core competency of an O&M service provider in achieving cost savings through optimizing operations and prolonging the
life of an asset is highly aligned with the core efforts required by a TESCO to succeed.
Nevertheless, the shorter term of passive infrastructure contracts, typically three years, is shorter than TESCO contracts of
around 10 years. This poses a risk in decoupling of some of the synergies identified, in case the duration of the O&M contract is
not aligned with the TESCO contract duration.
B. TESCOs integrated with power production benefit from expertise in solar-powered systems and
can provide a full range of energy supply
TESCOs that are power producers not only supply power to telecom towers, but, depending on their strategy, also to commercial
and industrial customers, as well as residential customers or entire communities. Such a model is referred to as the Anchor-
Business-Community (ABC) model (see box 5). These TESCOs can either be small scale distributed power producers, or larger
scale independent power producers. They may operate power plants ranging from utility-scale plants to mini-grids used for
rural electrification where telecom sites are typically the anchor clients. Being renewable energy players (largely solar), the core
advantage of such players is the familiarity and capability in solar PV systems power design.
In addition, small-scale distributed power players could benefit from synergies if the tower site also powers other tenants.
As they already have distributed power licenses, distributed power players face fewer administrative hurdles in also acting as
1 2 3 4 5 6
WHAT ARE THE DIFFERENT TYPES OF TESCOS?
50
a TESCO. However, this model would add to operational complexity of the distributed power players which would need to
manage the requirements of numerous power off-takers. Distributed power players that also provide community power for
rural electrification could also lose access to subsidies for rural electrification once they take on commercial telecom sites as
anchor clients.
Large-scale independent power producers do not enjoy significant operational synergies in operating a TESCO model with
their existing large-scale power plant activities due to the different consumption profile of the off-takers. Telecom operators
require secure and reliable power throughout the day with very stringent SLA standards, coupled with site-level knowledge
and O&M capabilities to manage the uptime of hundreds or thousands of remote tower sites.
These operational requirements are a stark difference from the typical business model required to manage large-scale power
plants. Large-scale power producers may thus require additional time to adapt their operational capabilities to the needs
of telecom sites. Some players have shown the ability to build this up organically, while others have opted to outsource this
operational component.
C. Power equipment manufacturers can leverage the TESCO model as a form of equipment financing
and have strong power solution technical competencies
The key competencies of power equipment manufacturers include equipment R&D and manufacturing of specific components
such as diesel gensets, primary and backup power systems, and power electronics. Various power equipment suppliers have
also developed plug-and-play systems specifically for use on bad-grid or off-grid sites.
A key benefit of integrating TESCO services and power equipment manufacturing is that it allows equipment manufacturers
to leverage on the TESCO model as a form of equipment financing, driving power equipment sales and diversifying into an
additional source of recurring revenue. In addition, power equipment manufacturers typically have R&D capabilities, offering
opportunities to incorporate innovative technologies into the TESCO sites.
TESCOs that are tied to the technology of in-house power equipment need to ensure that their core competency remains
technologically relevant in order to retain their competitive edge. In addition, some flexibility in deploying a third-party power
equipment that could be more cost effective or suited to the specific needs of the sites would be required by such TESCOs.
Importantly, there is a potential divergence on incentives for such a TESCO in optimizing site assets, given that its core business
model is the sale of power equipment.
D. Pure TESCO players specialize in the TESCO model
Pureplay TESCO players do not have separate business segments to leverage on for business synergies. Such players have shown
the capability to develop in-house capabilities for power O&M, and typically obtain their power equipment via partnerships
with energy systems integrators. Pure TESCO players are also technology agnostic, having the advantage of being able to
switch between power equipment suppliers based on site requirements and technology advancements and have shown strong
flexibility in adapting to the working conditions and demands of various customers. However, pureplay TESCO players will
either need to develop their capabilities organically or partner with local O&M operators as they scale across different markets.
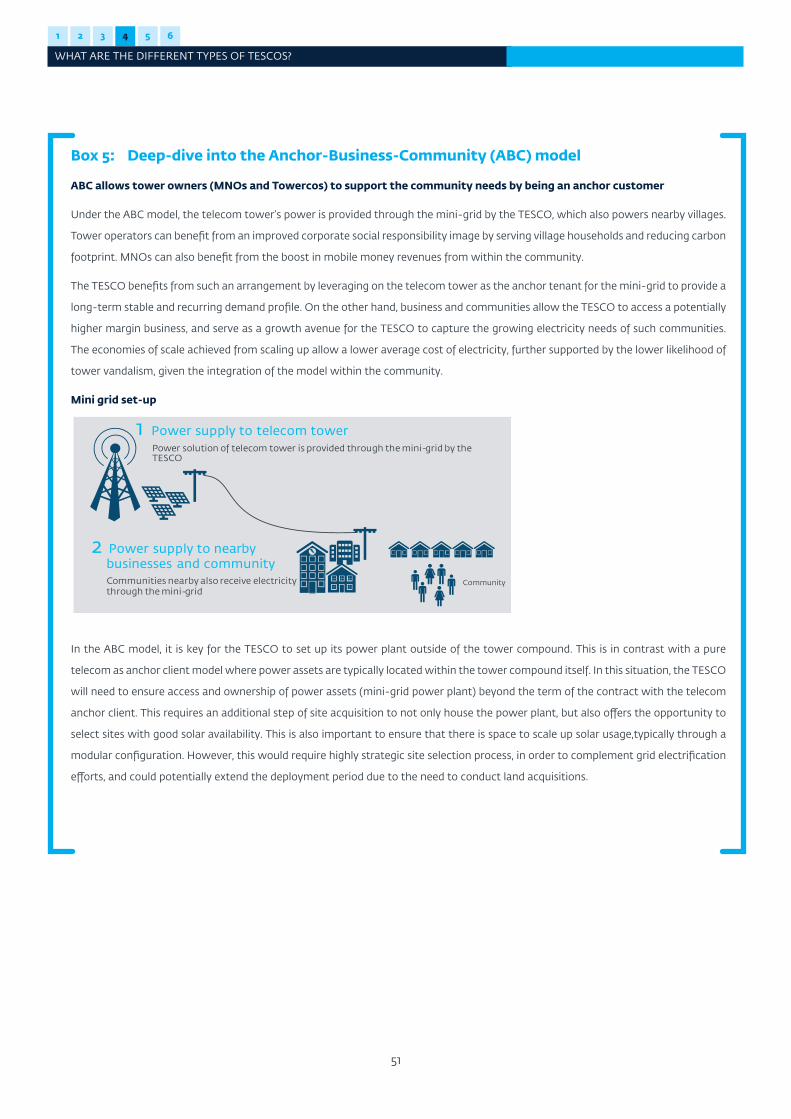
1 2 3 4 5 6
WHAT ARE THE DIFFERENT TYPES OF TESCOS?
51
Box 5: Deep-dive into the Anchor-Business-Community (ABC) model
ABC allows tower owners (MNOs and Towercos) to support the community needs by being an anchor customer
Under the ABC model, the telecom tower’s power is provided through the mini-grid by the TESCO, which also powers nearby villages.
Tower operators can benefit from an improved corporate social responsibility image by serving village households and reducing carbon
footprint. MNOs can also benefit from the boost in mobile money revenues from within the community.
The TESCO benefits from such an arrangement by leveraging on the telecom tower as the anchor tenant for the mini-grid to provide a
long-term stable and recurring demand profile. On the other hand, business and communities allow the TESCO to access a potentially
higher margin business, and serve as a growth avenue for the TESCO to capture the growing electricity needs of such communities.
The economies of scale achieved from scaling up allow a lower average cost of electricity, further supported by the lower likelihood of
tower vandalism, given the integration of the model within the community.
Mini grid set-up
1 Power supply to telecom towerPower solution of telecom tower is provided through the mini-grid by the TESCO
2 Power supply to nearby businesses and communityCommunities nearby also receive electricity through the mini-grid
1 Power supply to telecom towerPower solution of telecom tower is provided through the mini-grid by the TESCO
2 Power supply to nearby businesses and communityCommunities nearby also receive electricity through the mini-grid
Community
In the ABC model, it is key for the TESCO to set up its power plant outside of the tower compound. This is in contrast with a pure
telecom as anchor client model where power assets are typically located within the tower compound itself. In this situation, the TESCO
will need to ensure access and ownership of power assets (mini-grid power plant) beyond the term of the contract with the telecom
anchor client. This requires an additional step of site acquisition to not only house the power plant, but also offers the opportunity to
select sites with good solar availability. This is also important to ensure that there is space to scale up solar usage,typically through a
modular configuration. However, this would require highly strategic site selection process, in order to complement grid electrification
efforts, and could potentially extend the deployment period due to the need to conduct land acquisitions.
1 2 3 4 5 6
WHAT ARE THE DIFFERENT TYPES OF TESCOS?
52
4.3 TESCO revenue model
Fixed pricing where the TESCO bears CAPEX cost is the most common TESCO pricing model
There are a number of alternative pricing structures available for TESCOs and their customers (MNOs or Towercos), ranging
from a direct pass-through of costs from TESCO to customers, fixed monthly fees where the TESCO bears the CAPEX of power
assets, and contracts with savings agreements between TESCO and the customer where the tower owner bears the CAPEX
while the TESCO is contracted to run the operations whilst ensuring savings from operational efficiency. Each model is detailed
below:
• Cost pass-through model: The customer pays a fixed monthly fee for power operations (with or without CAPEX), plus
a variable fee which covers all variable energy generation costs, such as utility bills and diesel fuel cost. The customer
typically retains some control of power solution design while outsourcing power solution, maintenance and operations to
the TESCO.
• Fixed monthly fee model: The MNO or Towerco pays a single fixed fee to the TESCO based on a specific matrix of site
type such as site load, site criticality, grid connectivity, level of O&M required, which covers all costs for infrastructure, O&M
and energy.
• Savings agreement model: The MNO or Towerco bears the CAPEX, and the TESCO receives a fixed monthly fee to cover
power operations cost, in addition to a bonus payment corresponding to a proportion of variable costs the TESCO saves
for the customer.
Among the three models, the fixed monthly fee model is most typical. Under this model, the TESCO bears all costs incurred in
power generation and retains any cost savings achieved. Such an arrangement ensures that the TESCO is highly incentivized
to maximize cost efficiency. In a competitive market, a portion of these cost savings will also be passed on to the MNO or
Towerco. However, while it retains cost savings, the TESCO also bears the risk of uncertainty in evolving generation costs if site
conditions change.
A detailed assessment of the pros and cons of each model for TESCOs is presented in figure 4-3.
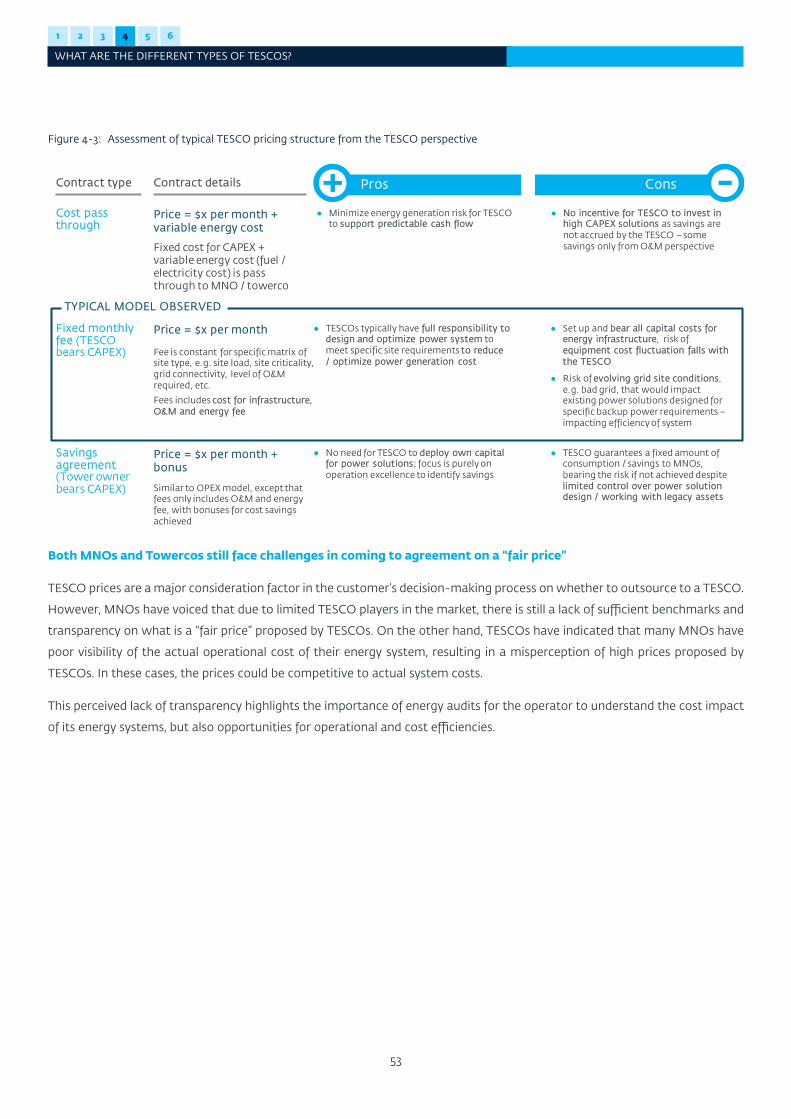
1 2 3 4 5 6
WHAT ARE THE DIFFERENT TYPES OF TESCOS?
53
Figure 4-3: Assessment of typical TESCO pricing structure from the TESCO perspective
Contract type Contract details
Cost pass through
Price = $x per month + variable energy cost
Fixed cost for CAPEX + variable energy cost (fuel / electricity cost) is pass through to MNO / towerco
Fixed monthly fee (TESCO bears CAPEX) Fee is constant for specific matrix of
site type, e.g. site load, site criticality, grid connectivity, level of O&Mrequired, etc.
Fees includes cost for infrastructure, O&M and energy fee
Savings agreement (Tower owner bears CAPEX)
Price = $x per month
Similar to OPEX model, except that fees only includes O&M and energy fee, with bonuses for cost savings achieved
Price = $x per month + bonus
● Minimize energy generation risk for TESCO to support predictable cash flow
● TESCOs typically have full responsibility to design and optimize power system to meet specific site requirements to reduce / optimize power generation cost
● No need for TESCO to deploy own capital for power solutions; focus is purely on operation excellence to identify savings
● No incentive for TESCO to invest in high CAPEX solutions as savings are not accrued by the TESCO –some savings only from O&M perspective
TYPICAL MODEL OBSERVED
● TESCO guarantees a fixed amount of consumption / savings to MNOs, bearing the risk if not achieved despite limited control over power solution design / working with legacy assets
● Set up and bear all capital costs for energy infrastructure, risk of equipment cost fluctuation falls with the TESCO
● Risk of evolving grid site conditions, e.g. bad grid, that would impact existing power solutions designed for specific backup power requirements –impacting efficiency of system
Pros Cons
Both MNOs and Towercos still face challenges in coming to agreement on a “fair price”
TESCO prices are a major consideration factor in the customer’s decision-making process on whether to outsource to a TESCO.
However, MNOs have voiced that due to limited TESCO players in the market, there is still a lack of sufficient benchmarks and
transparency on what is a “fair price” proposed by TESCOs. On the other hand, TESCOs have indicated that many MNOs have
poor visibility of the actual operational cost of their energy system, resulting in a misperception of high prices proposed by
TESCOs. In these cases, the prices could be competitive to actual system costs.
This perceived lack of transparency highlights the importance of energy audits for the operator to understand the cost impact
of its energy systems, but also opportunities for operational and cost efficiencies.
Chapter 5
HOW CAN TESCOS BE ASSESSED AS INVESTMENT OPPORTUNITIES?
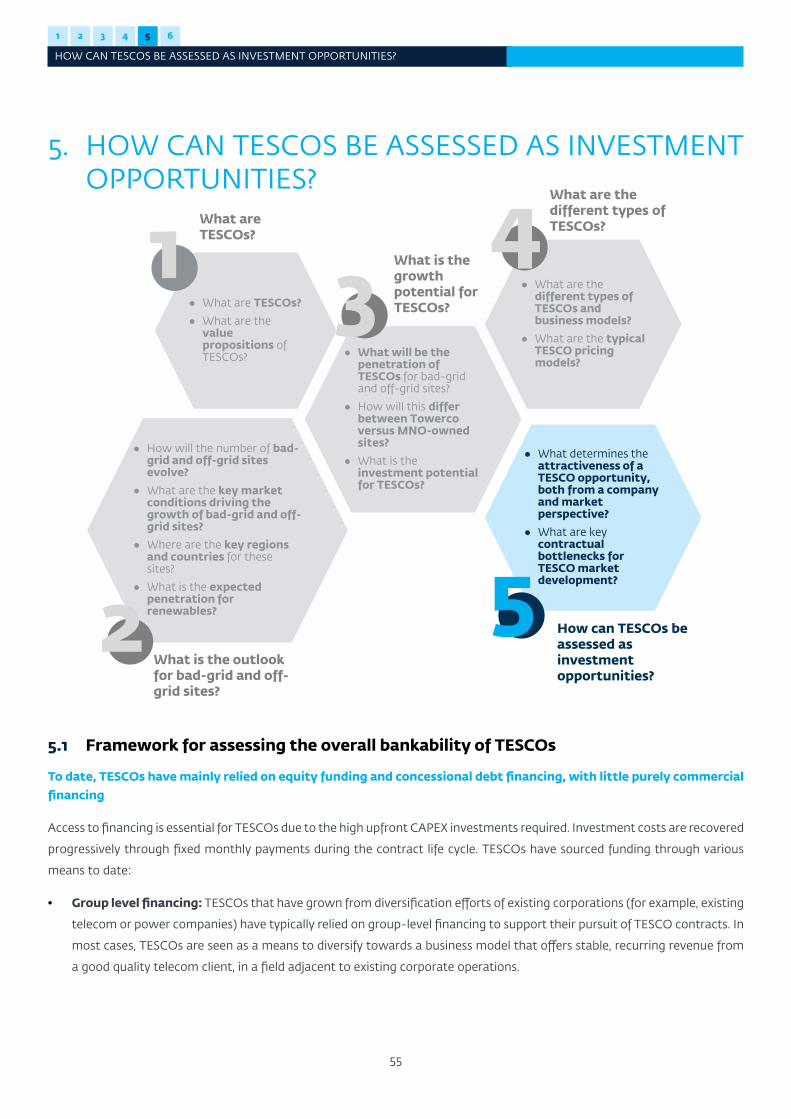
1 2 3 4 5 6
HOW CAN TESCOS BE ASSESSED AS INVESTMENT OPPORTUNITIES?
55
5. HOW CAN TESCOS BE ASSESSED AS INVESTMENT OPPORTUNITIES?
● What are the different types of TESCOs and business models?
● What are the typical TESCO pricing models?
● What will be the penetration of TESCOs for bad-grid and off-grid sites?
● How will this differ between Towercoversus MNO-owned sites?
● What is the investment potential for TESCOs?
● What are TESCOs?
● What are the value propositions of TESCOs?
What are TESCOs?
What is the growth potential for TESCOs?
What are the different types of TESCOs?4
31
● How will the number of bad-grid and off-grid sites evolve?
● What are the key market conditions driving the growth of bad-grid and off-grid sites?
● Where are the key regions and countries for these sites?
● What is the expected penetration for renewables?
What is the outlook for bad-grid and off-grid sites?
2
● What determines the attractiveness of a TESCO opportunity, both from a company and market perspective?
● What are key contractual bottlenecks for TESCO market development?
How can TESCOs be assessed as investment opportunities?
55.1 Framework for assessing the overall bankability of TESCOs
To date, TESCOs have mainly relied on equity funding and concessional debt financing, with little purely commercial financing
Access to financing is essential for TESCOs due to the high upfront CAPEX investments required. Investment costs are recovered
progressively through fixed monthly payments during the contract life cycle. TESCOs have sourced funding through various
means to date:
• Group level financing: TESCOs that have grown from diversification efforts of existing corporations (for example, existing
telecom or power companies) have typically relied on group-level financing to support their pursuit of TESCO contracts. In
most cases, TESCOs are seen as a means to diversify towards a business model that offers stable, recurring revenue from
a good quality telecom client, in a field adjacent to existing corporate operations.
1 2 3 4 5 6
HOW CAN TESCOS BE ASSESSED AS INVESTMENT OPPORTUNITIES?
56
• Equity and concessional funding: Independent TESCO operators (TESCOs which did not emerge from existing business
operations) have relied on either equity capital from strategic investors, development financial institutions or various types
of concessional funding to back their operations. The initial investors who backed TESCO projects saw an alignment with
their sustainability strategies or socio-economic development objectives. The investor base is starting to slowly expand,
but it continues to be dominated by investors with a longer-term investment horizon or strategic interests. Concessional
finance funding sources such as grants or subsidized lending rates are also available in some instances, especially when tied
to operations in challenging regions. They are also used in TESCO projects which are expected to have a high development
impact.
For investors, the upside benefit from TESCOs is expected to come from margin improvements over time and a diversification of
business lines, as opposed to an appreciation in the value of the underlying assets. This could lead to a mergers and acquisitions
market, as economies of scale grow in importance as the market matures. This would offer opportunities for investors to
monetize their stakes.
In principle, TESCOs can be attractive borrowers for financial institutions
Solid contractual agreements with good off-takers and high Environmental, Social and Corporate Governance (ESG) scores can
position TESCOs as ideal borrowers to access credit from financial institutions, including development banks and commercial
lenders.
TESCOs are seen as creditworthy because of their long-term contracts with MNOs or Towercos. Given that MNOs and Towercos
are themselves large corporations with predictable cashflows, and that power solutions are an essential service for MNOs to
maintain site availability, the risk of payment disruption to TESCOs is small. It is extremely important to note that the TESCO
industry is still young, with few contracts in place and hence contractual terms have not stabilized yet. In contrast to Towercos
which are Real Estate Investment Trust (REIT)-like investments, TESCOs pledge their creditworthiness on the quality of their
clients and contract portfolio. The bankability of TESCO contracts is discussed in Chapter 5.2.
TESCOs also enjoy long-term, predictable cashflows at good margins. The TESCO business model of solarizing or hybridizing
existing diesel sites has clear commercial benefits, both for TESCOs and their customers, with an expected payback within three
to five years. Moreover, TESCOs can offer attractive margins on earnings before interest, taxes, depreciation, and amortization
of about 40-50 percent once sites are commissioned. Long-term contracts of around 10 years also offer cashflow predictability
for financiers.
Finally, the ESG score of TESCO projects plays a strong role in a financial institutions’ evaluation of potential lending or
investment targets. With the carbon reductions achieved through substituting diesel generation with solar PV energy, TESCOs
would be given a high ESG score, and might even be able to benefit from preferential rates under green financing schemes.
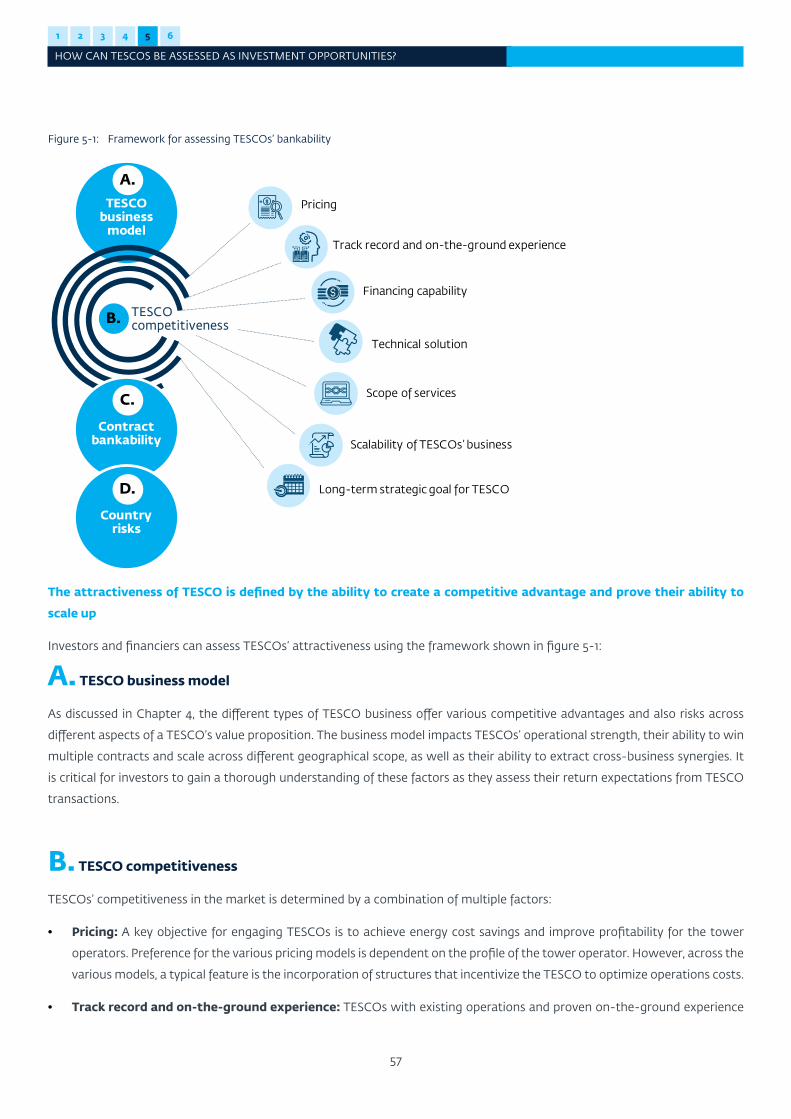
1 2 3 4 5 6
HOW CAN TESCOS BE ASSESSED AS INVESTMENT OPPORTUNITIES?
57
Figure 5-1: Framework for assessing TESCOs’ bankability
TESCObusiness
model
A.Pricing
Financing capability
Scalability of TESCOs’ business
Track record and on-the-ground experience
Technical solution
Long-term strategic goal for TESCO
Scope of services
TESCOcompetitivenessB.
Contractbankability
Countryrisks
C.
D.
The attractiveness of TESCO is defined by the ability to create a competitive advantage and prove their ability to
scale up
Investors and financiers can assess TESCOs’ attractiveness using the framework shown in figure 5-1:
A. TESCO business model
As discussed in Chapter 4, the different types of TESCO business offer various competitive advantages and also risks across
different aspects of a TESCO’s value proposition. The business model impacts TESCOs’ operational strength, their ability to win
multiple contracts and scale across different geographical scope, as well as their ability to extract cross-business synergies. It
is critical for investors to gain a thorough understanding of these factors as they assess their return expectations from TESCO
transactions.
B. TESCO competitiveness
TESCOs’ competitiveness in the market is determined by a combination of multiple factors:
• Pricing: A key objective for engaging TESCOs is to achieve energy cost savings and improve profitability for the tower
operators. Preference for the various pricing models is dependent on the profile of the tower operator. However, across the
various models, a typical feature is the incorporation of structures that incentivize the TESCO to optimize operations costs.
• Track record and on-the-ground experience: TESCOs with existing operations and proven on-the-ground experience
1 2 3 4 5 6
HOW CAN TESCOS BE ASSESSED AS INVESTMENT OPPORTUNITIES?
58
in managing sites in challenging and remote locations, such as through existing
O&M operations in the target country, are viewed favorably. This is due to the
existing familiarity with the local operating environment, which is also expected
to speed up the deployment of power solutions.
• Financing capability: TESCOs also need to show their clients that they have
the financial capacity to manage the growth in sites and load throughout
the term of the contract. This requires committed investors and alignment of
interests, as TESCOs implement long-term projects. Financiers and investors
look in turn for a strong balance sheet and credentials to ensure that TESCOs
can deliver on project commitments
• Technical solution: TESCOs need to show technologically-reliable power
solutions to meet or improve uptime requirements, comply with SLAs and
deliver on cost savings through operational excellence. In addition, TESCOs are
also assessed on their ability to inject new technology and R&D capabilities into
their plans. A highly-skilled local workforce is also an essential differentiator,
complemented by centralized corporate support functions.
• Scope of services: An additional (and optional) consideration for tower
operators is to look for TESCOs that can also deliver on site maintenance of
passive infrastructure. The advantages for such a multi-service TESCO is that
it relieves the pressure and complications of dispersed site maintenance for
operator and allows a single point of contact of accountability for the tower
operator.
• Scalability of TESCOs’ business: TESCOs can follow a variety of growth
strategies, including growing with the same anchor customer across markets,
serving a second customer in existing markets, supporting sites which are multi-
tenant or focusing on international growth by securing multiple contacts with
various clients. A TESCO’s track record in maintaining strategic relationships
with key telecommunications companies and delivering a range of good quality
services for them is also a key indicator of potential scalability. TESCOs also
need to demonstrate capability to successfully replicate the business model
across geographies and to diversify their service offering to meet their clients’
needs.
• Long-term strategic goal for TESCOs: The TESCO model requires long-term
service commitments, hence investors will need to evaluate TESCOs’ longer
term strategic goals. This would include assessing TESCO’s project pipeline
and their growth strategies. With long business development periods and
uncertainties in the negotiation process, a strong pipeline of projects is crucial
in ensuring business growth.
We look for TESCOs who can decrease our OPEX and achieve zero CAPEX, have strong operational teams, and deliver on site modernization plans and bring in green energy.
Interview excerpt from MNO
We look for TESCOs with “boots on the ground”, who already understand the local operational environment and have a strong balance sheet.
Interview excerpt from TESCO financier
1 2 3 4 5 6
HOW CAN TESCOS BE ASSESSED AS INVESTMENT OPPORTUNITIES?
59
Box 6: The development impact of TESCOs
TESCOs’ attractiveness can also be assessed through their development impact, including the benefits they deliver to stakeholders and
the regional economy. Any systemic market changes which the TESCO can induce along the mobile connectivity value chain is also
important.
TESCOs can contribute to increased access to mobile connectivity when serving bad-grid and off-grid areas with a low
population coverage or a nascent TESCO market segment
Key benefits to stakeholders include increased access to quality mobile connectivity which is achieved through energy cost savings for
mobile or tower operators and by supporting network deployment in previously unprofitable areas, such as remote or mountainous
regions. As such, TESCOs’ investment can result in increased population coverage of mobile telephony or broadband network, including
3G or higher-speed mobile network. It can also result in increased penetration rate of mobile telephony or broadband as operators pass
through part of the energy cost savings to end-users.
The magnitude of these stakeholder benefits depends on the efficiency of the investment and the initial level of access to mobile
connectivity in the target countries, relative to other emerging markets. The higher the quantum of impact per dollar invested, the
higher the magnitude of the benefits. In general, TESCO investments in countries with relatively low access to mobile connectivity are
likely to generate larger stakeholders benefits than investments in countries with relatively high levels of access to mobile connectivity.
Given the link between internet access, GDP and jobs, these outcomes have the potential to result in benefits to the economy in terms
of GDP growth and employment. This impact is especially visible in low-income countries or regions with high level of informality or
unemployment.
Beyond the TESCO, these benefits can also result in systemic market changes along the mobile connectivity value chain, especially
in the tower market segment or in the broader market of mobile connectivity. In countries with no or few TESCOs, investments can
increase the competitiveness of the market for mobile connectivity by creating or deepening the TESCO market segment through
demonstration and replication channels. Successful expansion of the first mover would demonstrate the commercial viability of the
TESCO’s business model and trigger replication by new entrants, thereby resulting in a market-wide propagation of the stakeholder
benefits described above.
TESCOs can contribute to environmental sustainability when scaling up greener power solutions in countries where telecom
contributes to a high share of greenhouse gas emissions
By employing greener power solutions, TESCO investment can deliver the social benefit of improved environmental sustainability. In
a setting where telecommunications have a large contribution to greenhouse gas emissions due to a reliance on fossil fuels, TESCO
C. Contract bankability
Scrutiny of key contractual terms is necessary in the absence of contract standardization. Key considerations to assess the
bankability of TESCO contracts are detailed in Chapter 5.2.
D. Country risks
Various country-level factors also drive the attractiveness of a TESCO investments. These include the size of market as well as
other profitability drivers and macro-risk factors, which are especially prevalent in emerging markets. The country and market
risk considerations for TESCOs are explored in greater detail in Chapter 5.3.
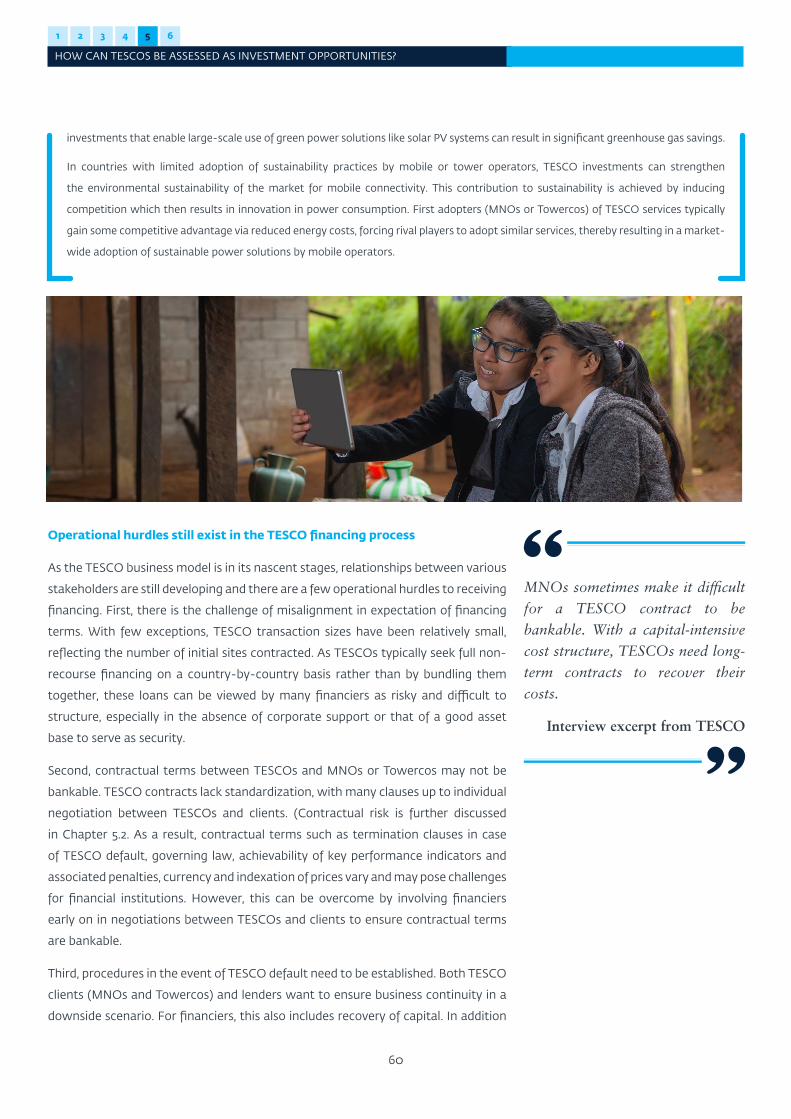
1 2 3 4 5 6
HOW CAN TESCOS BE ASSESSED AS INVESTMENT OPPORTUNITIES?
60
investments that enable large-scale use of green power solutions like solar PV systems can result in significant greenhouse gas savings.
In countries with limited adoption of sustainability practices by mobile or tower operators, TESCO investments can strengthen
the environmental sustainability of the market for mobile connectivity. This contribution to sustainability is achieved by inducing
competition which then results in innovation in power consumption. First adopters (MNOs or Towercos) of TESCO services typically
gain some competitive advantage via reduced energy costs, forcing rival players to adopt similar services, thereby resulting in a market-
wide adoption of sustainable power solutions by mobile operators.
MNOs sometimes make it difficult for a TESCO contract to be bankable. With a capital-intensive cost structure, TESCOs need long-term contracts to recover their costs.
Interview excerpt from TESCO
Operational hurdles still exist in the TESCO financing process
As the TESCO business model is in its nascent stages, relationships between various
stakeholders are still developing and there are a few operational hurdles to receiving
financing. First, there is the challenge of misalignment in expectation of financing
terms. With few exceptions, TESCO transaction sizes have been relatively small,
reflecting the number of initial sites contracted. As TESCOs typically seek full non-
recourse financing on a country-by-country basis rather than by bundling them
together, these loans can be viewed by many financiers as risky and difficult to
structure, especially in the absence of corporate support or that of a good asset
base to serve as security.
Second, contractual terms between TESCOs and MNOs or Towercos may not be
bankable. TESCO contracts lack standardization, with many clauses up to individual
negotiation between TESCOs and clients. (Contractual risk is further discussed
in Chapter 5.2. As a result, contractual terms such as termination clauses in case
of TESCO default, governing law, achievability of key performance indicators and
associated penalties, currency and indexation of prices vary and may pose challenges
for financial institutions. However, this can be overcome by involving financiers
early on in negotiations between TESCOs and clients to ensure contractual terms
are bankable.
Third, procedures in the event of TESCO default need to be established. Both TESCO
clients (MNOs and Towercos) and lenders want to ensure business continuity in a
downside scenario. For financiers, this also includes recovery of capital. In addition
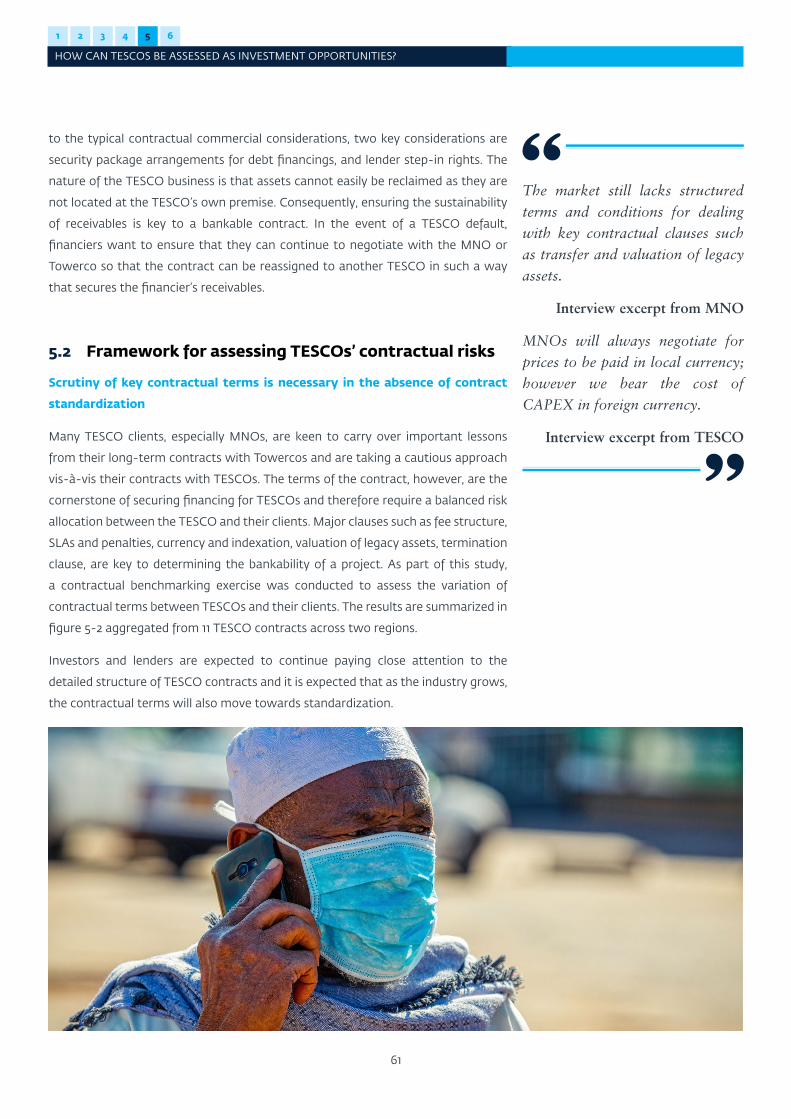
1 2 3 4 5 6
HOW CAN TESCOS BE ASSESSED AS INVESTMENT OPPORTUNITIES?
61
The market still lacks structured terms and conditions for dealing with key contractual clauses such as transfer and valuation of legacy assets.
Interview excerpt from MNO
MNOs will always negotiate for prices to be paid in local currency; however we bear the cost of CAPEX in foreign currency.
Interview excerpt from TESCO
to the typical contractual commercial considerations, two key considerations are
security package arrangements for debt financings, and lender step-in rights. The
nature of the TESCO business is that assets cannot easily be reclaimed as they are
not located at the TESCO’s own premise. Consequently, ensuring the sustainability
of receivables is key to a bankable contract. In the event of a TESCO default,
financiers want to ensure that they can continue to negotiate with the MNO or
Towerco so that the contract can be reassigned to another TESCO in such a way
that secures the financier’s receivables.
5.2 Framework for assessing TESCOs’ contractual risks
Scrutiny of key contractual terms is necessary in the absence of contract
standardization
Many TESCO clients, especially MNOs, are keen to carry over important lessons
from their long-term contracts with Towercos and are taking a cautious approach
vis-à-vis their contracts with TESCOs. The terms of the contract, however, are the
cornerstone of securing financing for TESCOs and therefore require a balanced risk
allocation between the TESCO and their clients. Major clauses such as fee structure,
SLAs and penalties, currency and indexation, valuation of legacy assets, termination
clause, are key to determining the bankability of a project. As part of this study,
a contractual benchmarking exercise was conducted to assess the variation of
contractual terms between TESCOs and their clients. The results are summarized in
figure 5-2 aggregated from 11 TESCO contracts across two regions.
Investors and lenders are expected to continue paying close attention to the
detailed structure of TESCO contracts and it is expected that as the industry grows,
the contractual terms will also move towards standardization.
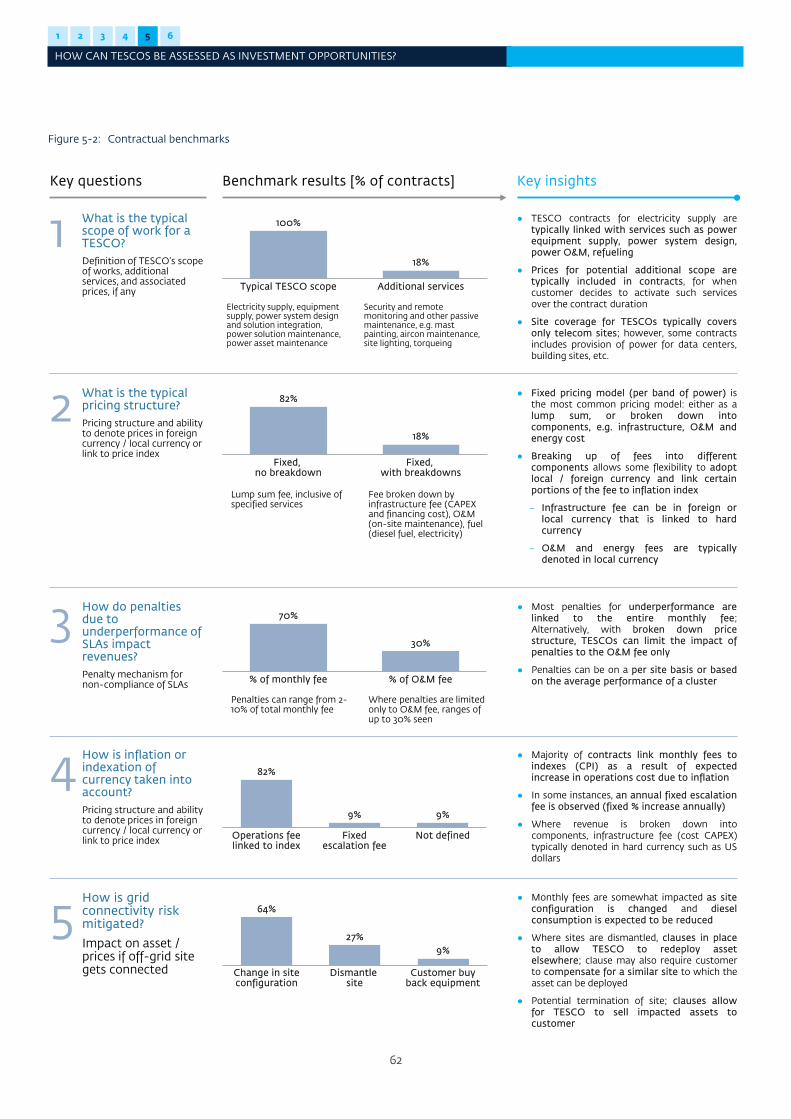
1 2 3 4 5 6
HOW CAN TESCOS BE ASSESSED AS INVESTMENT OPPORTUNITIES?
62
Figure 5-2: Contractual benchmarks
Typical TESCO scope Additional services
100%
18%
Lump sum fee, inclusive of specified services
Fee broken down by infrastructure fee (CAPEX and financing cost), O&M (on-site maintenance), fuel (diesel fuel, electricity)
Electricity supply, equipment supply, power system design and solution integration, power solution maintenance, power asset maintenance
Security and remote monitoring and other passive maintenance, e.g. mast painting, aircon maintenance, site lighting, torqueing
Fixed, no breakdown
Fixed, with breakdowns
82%
18%
Benchmark results [% of contracts]
% of O&M fee
30%
% of monthly fee
70%
Penalties can range from 2-10% of total monthly fee
Where penalties are limited only to O&M fee, ranges of up to 30% seen
Operations fee linked to index
Not definedFixed escalation fee
9%
82%
9%
1 What is the typical scope of work for a TESCO?Definition of TESCO’s scope of works, additional services, and associated prices, if any
What is the typical pricing structure?Pricing structure and ability to denote prices in foreign currency / local currency or link to price index
2
Key questions
3 How do penalties due to underperformance of SLAs impact revenues?Penalty mechanism for non-compliance of SLAs
How is inflation or indexation of currency taken into account?Pricing structure and ability to denote prices in foreign currency / local currency or link to price index
4
● TESCO contracts for electricity supply aretypically linked with services such as powerequipment supply, power system design,power O&M, refueling
● Prices for potential additional scope aretypically included in contracts, for whencustomer decides to activate such servicesover the contract duration
● Site coverage for TESCOs typically coversonly telecom sites; however, some contractsincludes provision of power for data centers,building sites, etc.
● Fixed pricing model (per band of power) isthe most common pricing model: either as alump sum, or broken down intocomponents, e.g. infrastructure, O&M andenergy cost
● Breaking up of fees into differentcomponents allows some flexibility to adoptlocal / foreign currency and link certainportions of the fee to inflation index
– Infrastructure fee can be in foreign orlocal currency that is linked to hardcurrency
– O&M and energy fees are typicallydenoted in local currency
Key insights
● Most penalties for underperformance arelinked to the entire monthly fee;Alternatively, with broken down pricestructure, TESCOs can limit the impact ofpenalties to the O&M fee only
● Penalties can be on a per site basis or basedon the average performance of a cluster
● Majority of contracts link monthly fees toindexes (CPI) as a result of expectedincrease in operations cost due to inflation
● In some instances, an annual fixed escalationfee is observed (fixed % increase annually)
● Where revenue is broken down intocomponents, infrastructure fee (cost CAPEX)typically denoted in hard currency such as USdollars
27%
Change in site configuration
64%
Dismantle site
Customer buy back equipment
9%
How is grid connectivity risk mitigated?
Impact on asset / prices if off-grid site gets connected
5● Monthly fees are somewhat impacted as site
configuration is changed and dieselconsumption is expected to be reduced
● Where sites are dismantled, clauses in placeto allow TESCO to redeploy assetelsewhere; clause may also require customerto compensate for a similar site to which theasset can be deployed
● Potential termination of site; clauses allowfor TESCO to sell impacted assets tocustomer
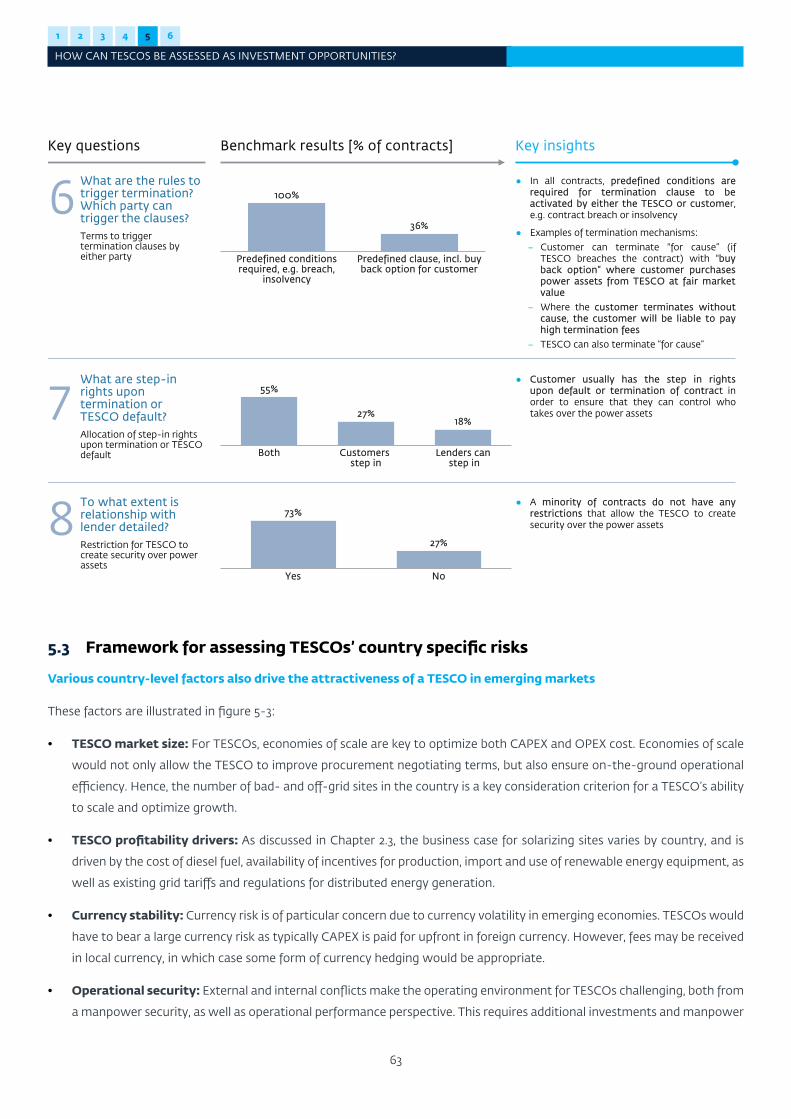
1 2 3 4 5 6
HOW CAN TESCOS BE ASSESSED AS INVESTMENT OPPORTUNITIES?
63
18%
Both Customers step in
Lenders canstep in
27%
55%
27%
Yes No
73%
Predefined conditions required, e.g. breach,
insolvency
Predefined clause, incl. buy back option for customer
36%
100%6
7
What are the rules to trigger termination? Which party can trigger the clauses?Terms to trigger termination clauses by either party
What are step-in rights upon termination or TESCO default?Allocation of step-in rights upon termination or TESCO default
8 To what extent is relationship with lender detailed?Restriction for TESCO to create security over power assets
● In all contracts, predefined conditions arerequired for termination clause to beactivated by either the TESCO or customer,e.g. contract breach or insolvency
● Examples of termination mechanisms:– Customer can terminate "for cause“ (if
TESCO breaches the contract) with "buyback option“ where customer purchasespower assets from TESCO at fair marketvalue
– Where the customer terminates withoutcause, the customer will be liable to payhigh termination fees
– TESCO can also terminate “for cause”
● Customer usually has the step in rightsupon default or termination of contract inorder to ensure that they can control whotakes over the power assets
● A minority of contracts do not have anyrestrictions that allow the TESCO to createsecurity over the power assets
Benchmark results [% of contracts]Key questions Key insights
5.3 Framework for assessing TESCOs’ country specific risks
Various country-level factors also drive the attractiveness of a TESCO in emerging markets
These factors are illustrated in figure 5-3:
• TESCO market size: For TESCOs, economies of scale are key to optimize both CAPEX and OPEX cost. Economies of scale
would not only allow the TESCO to improve procurement negotiating terms, but also ensure on-the-ground operational
efficiency. Hence, the number of bad- and off-grid sites in the country is a key consideration criterion for a TESCO’s ability
to scale and optimize growth.
• TESCO profitability drivers: As discussed in Chapter 2.3, the business case for solarizing sites varies by country, and is
driven by the cost of diesel fuel, availability of incentives for production, import and use of renewable energy equipment, as
well as existing grid tariffs and regulations for distributed energy generation.
• Currency stability: Currency risk is of particular concern due to currency volatility in emerging economies. TESCOs would
have to bear a large currency risk as typically CAPEX is paid for upfront in foreign currency. However, fees may be received
in local currency, in which case some form of currency hedging would be appropriate.
• Operational security: External and internal conflicts make the operating environment for TESCOs challenging, both from
a manpower security, as well as operational performance perspective. This requires additional investments and manpower
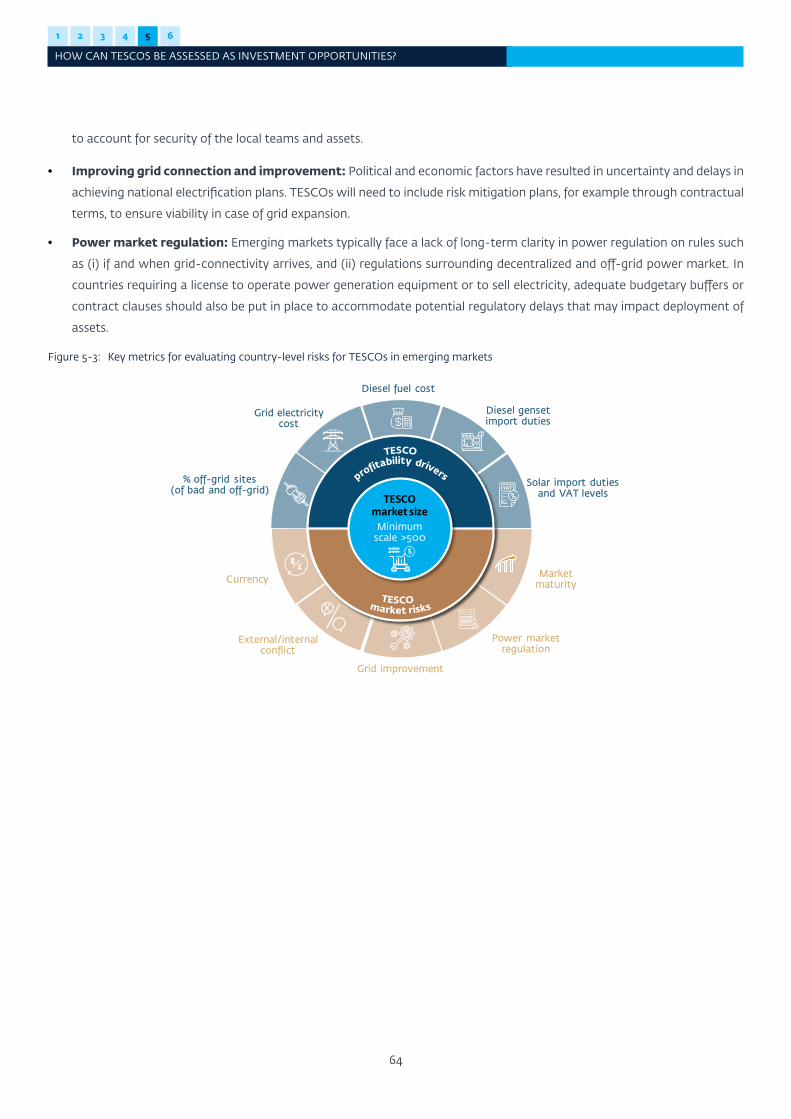
1 2 3 4 5 6
HOW CAN TESCOS BE ASSESSED AS INVESTMENT OPPORTUNITIES?
64
to account for security of the local teams and assets.
• Improving grid connection and improvement: Political and economic factors have resulted in uncertainty and delays in
achieving national electrification plans. TESCOs will need to include risk mitigation plans, for example through contractual
terms, to ensure viability in case of grid expansion.
• Power market regulation: Emerging markets typically face a lack of long-term clarity in power regulation on rules such
as (i) if and when grid-connectivity arrives, and (ii) regulations surrounding decentralized and off-grid power market. In
countries requiring a license to operate power generation equipment or to sell electricity, adequate budgetary buffers or
contract clauses should also be put in place to accommodate potential regulatory delays that may impact deployment of
assets.
Figure 5-3: Key metrics for evaluating country-level risks for TESCOs in emerging markets
Solar import dutiesand VAT levels
Diesel gensetimport duties
Diesel fuel cost
% off-grid sites(of bad and off-grid)
Currency
External/internalconflict
Power marketregulation
Marketmaturity
Grid electricitycost
Grid improvement
x
TESCOmarket size
Minimumscale >500
1 2 3 4 5 6
HOW CAN TESCOS BE ASSESSED AS INVESTMENT OPPORTUNITIES?
65
Chapter 6
CONCLUSION
67
6. CONCLUSIONThis report holistically assesses the TESCO landscape and presents a quantitative sizing of the addressable market for TESCOs,
an assessment of the market outlook, the relationship between the key stakeholders and types of TESCO players, as well as
a framework for approaching TESCOs as investment opportunities. These aspects, many of which are industry firsts, aim to
address the bankability of TESCOs. The report is intended as a call to action for further market development, especially in light
of urgent connectivity needs and climate change mitigation requirements in underserved regions of the world.
In an ever-growing, energy-hungry telecommunications sector, TESCOs can be a catalyst for a transition towards renewable
power generation at telecom sites. TESCOs are putting forward a value proposition to industry stakeholders, government
counterparts and end users themselves which goes beyond cost savings. As the digital divide continues to grow, TESCOs offer a
way to bridge the gap between those who have ample digital access and those who do not. While grid availability and reliability
are expected to improve in some regions, the demand for telecommunication towers is expected to exceed the rate of power
grid connectivity. This growth is driven by the continued increase in mobile penetration and network densification, coupled
with the push to increase mobile coverage in unserved and underserved areas. Today, TESCOs own or manage nearly half of
renewable powered telecom sites globally, yet this is a small fraction of the total present and future need. The scalability of the
TESCO business model is not without its challenges. TESCOs must demonstrate excellence in multiple areas, including telecom
know-how, general site management, energy expertise and deployment of cutting-edge technology solutions. As with any
nascent business model, the TESCOs’ ability to overcome operational challenges during this early phase is critical if they are to
achieve high degree of degree of market penetration.
The total investment required for new TESCO sites is estimated at $3.9 billion for the next ten years. The telecommunications
industry is starting to come together in order to reach its collective connectivity and de-carbonization goals. New technologies
and business models are improving the commercial viability of investments which target rural, remote or otherwise off-grid
and bad-grid locations. The collective power of stakeholders to drive successful operational execution can achieve the projected
quadrupling of the number of TESCO sites over the next ten years.
1 2 3 4 5 6
CONCLUSION
ANNEXES
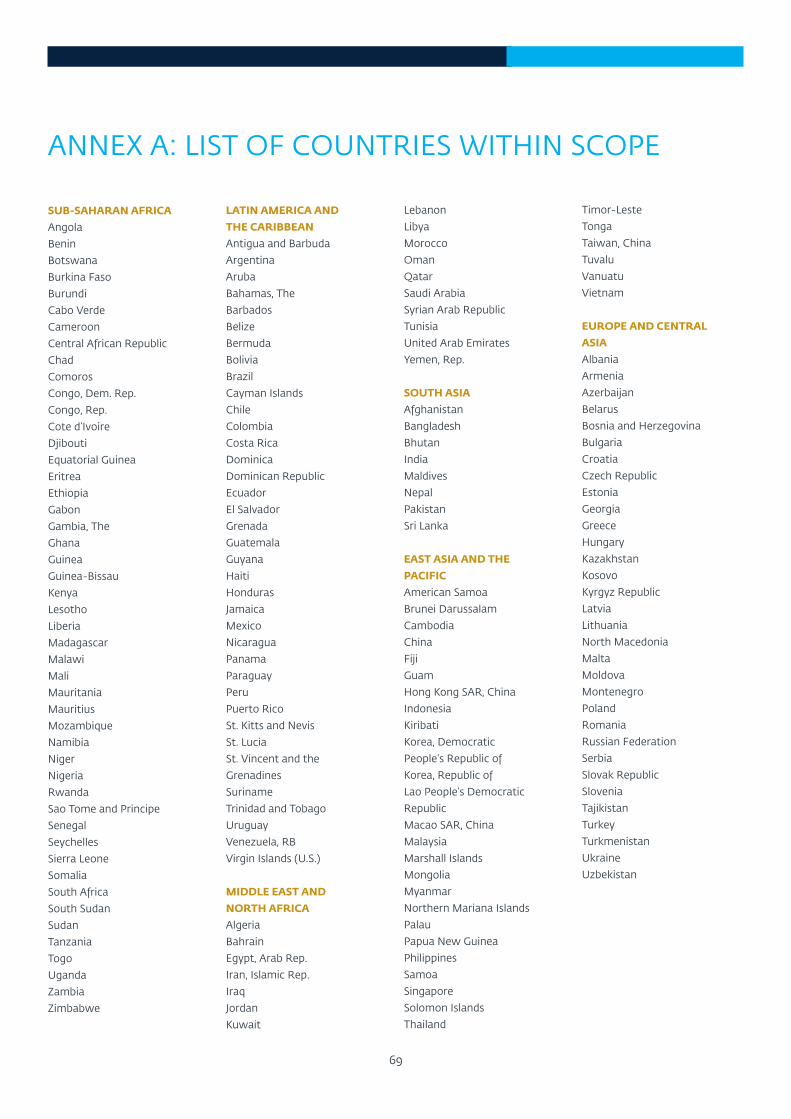
69
ANNEX A: LIST OF COUNTRIES WITHIN SCOPE
SUB-SAHARAN AFRICAAngola
Benin
Botswana
Burkina Faso
Burundi
Cabo Verde
Cameroon
Central African Republic
Chad
Comoros
Congo, Dem. Rep.
Congo, Rep.
Cote d’Ivoire
Djibouti
Equatorial Guinea
Eritrea
Ethiopia
Gabon
Gambia, The
Ghana
Guinea
Guinea-Bissau
Kenya
Lesotho
Liberia
Madagascar
Malawi
Mali
Mauritania
Mauritius
Mozambique
Namibia
Niger
Nigeria
Rwanda
Sao Tome and Principe
Senegal
Seychelles
Sierra Leone
Somalia
South Africa
South Sudan
Sudan
Tanzania
Togo
Uganda
Zambia
Zimbabwe
LATIN AMERICA ANDTHE CARIBBEANAntigua and Barbuda
Argentina
Aruba
Bahamas, The
Barbados
Belize
Bermuda
Bolivia
Brazil
Cayman Islands
Chile
Colombia
Costa Rica
Dominica
Dominican Republic
Ecuador
El Salvador
Grenada
Guatemala
Guyana
Haiti
Honduras
Jamaica
Mexico
Nicaragua
Panama
Paraguay
Peru
Puerto Rico
St. Kitts and Nevis
St. Lucia
St. Vincent and the
Grenadines
Suriname
Trinidad and Tobago
Uruguay
Venezuela, RB
Virgin Islands (U.S.)
MIDDLE EAST ANDNORTH AFRICAAlgeria
Bahrain
Egypt, Arab Rep.
Iran, Islamic Rep.
Iraq
Jordan
Kuwait
Lebanon
Libya
Morocco
Oman
Qatar
Saudi Arabia
Syrian Arab Republic
Tunisia
United Arab Emirates
Yemen, Rep.
SOUTH ASIAAfghanistan
Bangladesh
Bhutan
India
Maldives
Nepal
Pakistan
Sri Lanka
EAST ASIA AND THE PACIFICAmerican Samoa
Brunei Darussalam
Cambodia
China
Fiji
Guam
Hong Kong SAR, China
Indonesia
Kiribati
Korea, Democratic
People’s Republic of
Korea, Republic of
Lao People’s Democratic
Republic
Macao SAR, China
Malaysia
Marshall Islands
Mongolia
Myanmar
Northern Mariana Islands
Palau
Papua New Guinea
Philippines
Samoa
Singapore
Solomon Islands
Thailand
Timor-Leste
Tonga
Taiwan, China
Tuvalu
Vanuatu
Vietnam
EUROPE AND CENTRAL ASIAAlbania
Armenia
Azerbaijan
Belarus
Bosnia and Herzegovina
Bulgaria
Croatia
Czech Republic
Estonia
Georgia
Greece
Hungary
Kazakhstan
Kosovo
Kyrgyz Republic
Latvia
Lithuania
North Macedonia
Malta
Moldova
Montenegro
Poland
Romania
Russian Federation
Serbia
Slovak Republic
Slovenia
Tajikistan
Turkey
Turkmenistan
Ukraine
Uzbekistan
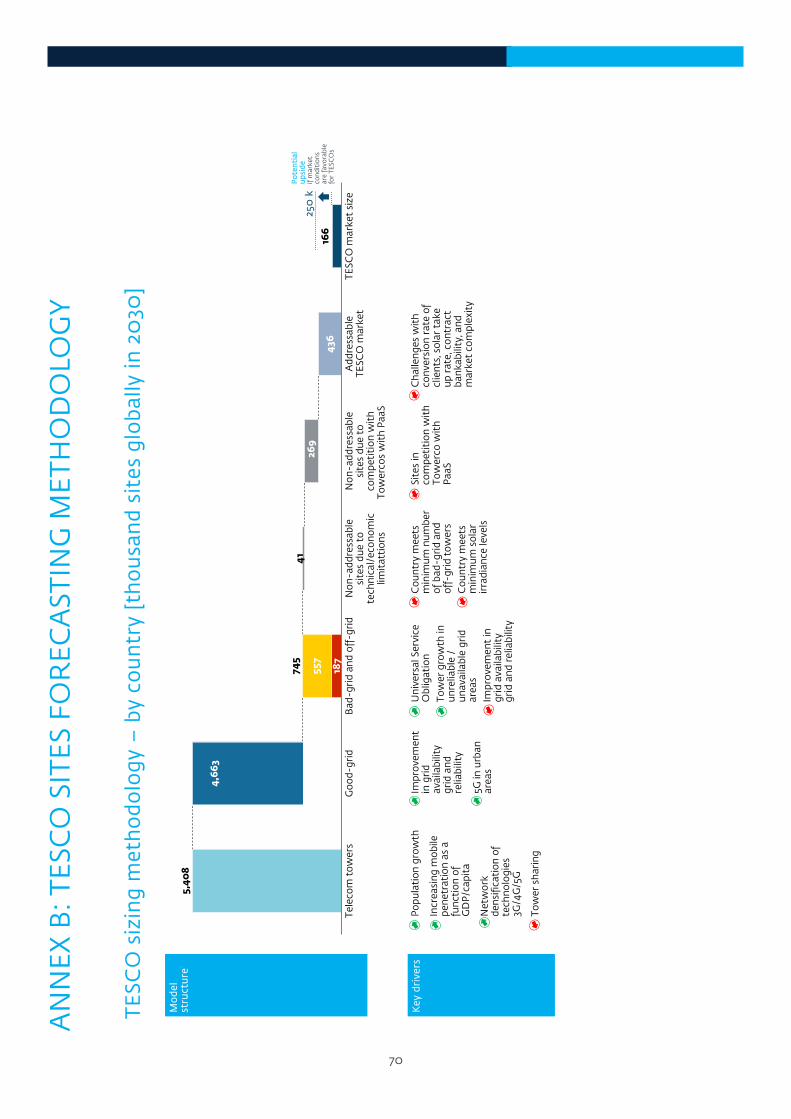
70
AN
NEX
B: T
ESC
O S
ITES
FO
REC
AST
ING
MET
HO
DO
LOG
Y
TESC
O s
izin
g m
eth
odo
logy
–by
co
un
try
[th
ou
san
d si
tes
glo
bally
in 2
030
]
Non
-add
ress
able
si
tes
due
to
tech
nica
l/ec
onom
ic
limit
atti
ons
Goo
d-gr
idTe
leco
m t
ower
sB
ad-g
rid
and
off-
grid
Non
-add
ress
able
si
tes
due
to
com
peti
tion
wit
h To
wer
cos
wit
h Pa
aS
Add
ress
able
TE
SCO
mar
ket
TESC
O m
arke
t si
ze
166
5,40
8
745
187
557
4126
9
436
Po
ten
tial
u
psi
deif
mar
ket
cond
itio
ns
are
favo
rabl
e fo
r TE
SCO
s
250
k
Mo
del
stru
ctu
re
●Po
pula
tion
gro
wth
●In
crea
sing
mob
ile
pene
trat
ion
as a
fu
ncti
on o
f G
DP/
capi
ta
●N
etw
ork
dens
ifica
tion
of
tech
nolo
gies
3G
/4G
/5G
●To
wer
sha
ring
●Im
prov
emen
t in
gri
d av
aila
bilit
y gr
id a
nd
relia
bilit
y
●C
ount
ry m
eets
m
inim
um n
umbe
r of
bad
-gri
d an
d of
f-gr
id t
ower
s●
Cou
ntry
mee
ts
min
imum
sol
ar
irra
dian
ce le
vels
Key
dri
vers
●Si
tes
in
com
peti
tion
wit
h To
wer
cow
ith
PaaS
●U
nive
rsal
Ser
vice
O
blig
atio
n ●
Tow
er g
row
th in
un
relia
ble
/ un
avai
labl
e gr
id
area
s●
Impr
ovem
ent
in
grid
ava
ilabi
lity
grid
and
rel
iabi
lity
●C
halle
nges
wit
h co
nver
sion
rat
e of
cl
ient
s, s
olar
tak
e up
rat
e, c
ontr
act
bank
abili
ty, a
nd
mar
ket
com
plex
ity
4,66
3
●5G
in u
rban
ar
eas
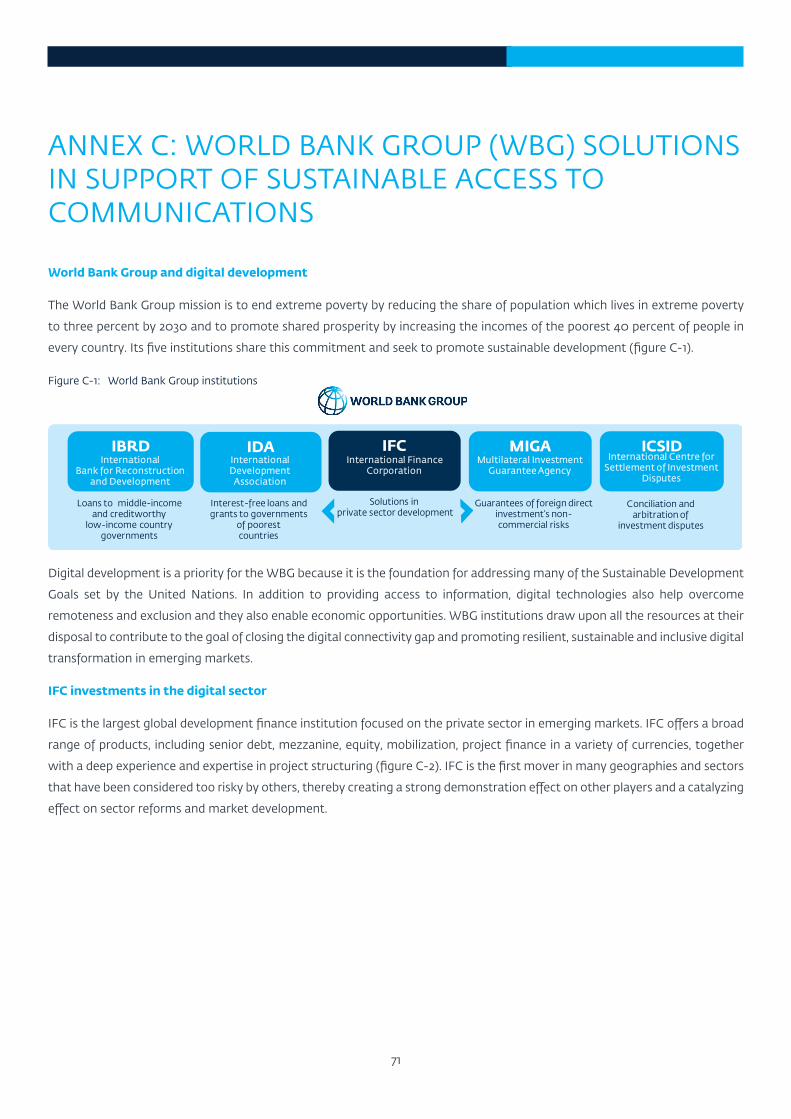
71
ANNEX C: WORLD BANK GROUP (WBG) SOLUTIONS IN SUPPORT OF SUSTAINABLE ACCESS TO COMMUNICATIONS
World Bank Group and digital development
The World Bank Group mission is to end extreme poverty by reducing the share of population which lives in extreme poverty
to three percent by 2030 and to promote shared prosperity by increasing the incomes of the poorest 40 percent of people in
every country. Its five institutions share this commitment and seek to promote sustainable development (figure C-1).
Figure C-1: World Bank Group institutions
ICSIDMIGAIDA IFCIBRD
Conciliation and arbitration of
investment disputes
Guarantees of foreign direct investment’s non-commercial risks
Interest-free loans and grants to governments
of poorestcountries
Solutions in private sector development
Loans to middle-income and creditworthy
low-income country governments
International Development Association
InternationalBank for Reconstruction
and Development
International Finance Corporation
Multilateral Investment Guarantee Agency
International Centre for Settlement of Investment
Disputes
Digital development is a priority for the WBG because it is the foundation for addressing many of the Sustainable Development
Goals set by the United Nations. In addition to providing access to information, digital technologies also help overcome
remoteness and exclusion and they also enable economic opportunities. WBG institutions draw upon all the resources at their
disposal to contribute to the goal of closing the digital connectivity gap and promoting resilient, sustainable and inclusive digital
transformation in emerging markets.
IFC investments in the digital sector
IFC is the largest global development finance institution focused on the private sector in emerging markets. IFC offers a broad
range of products, including senior debt, mezzanine, equity, mobilization, project finance in a variety of currencies, together
with a deep experience and expertise in project structuring (figure C-2). IFC is the first mover in many geographies and sectors
that have been considered too risky by others, thereby creating a strong demonstration effect on other players and a catalyzing
effect on sector reforms and market development.
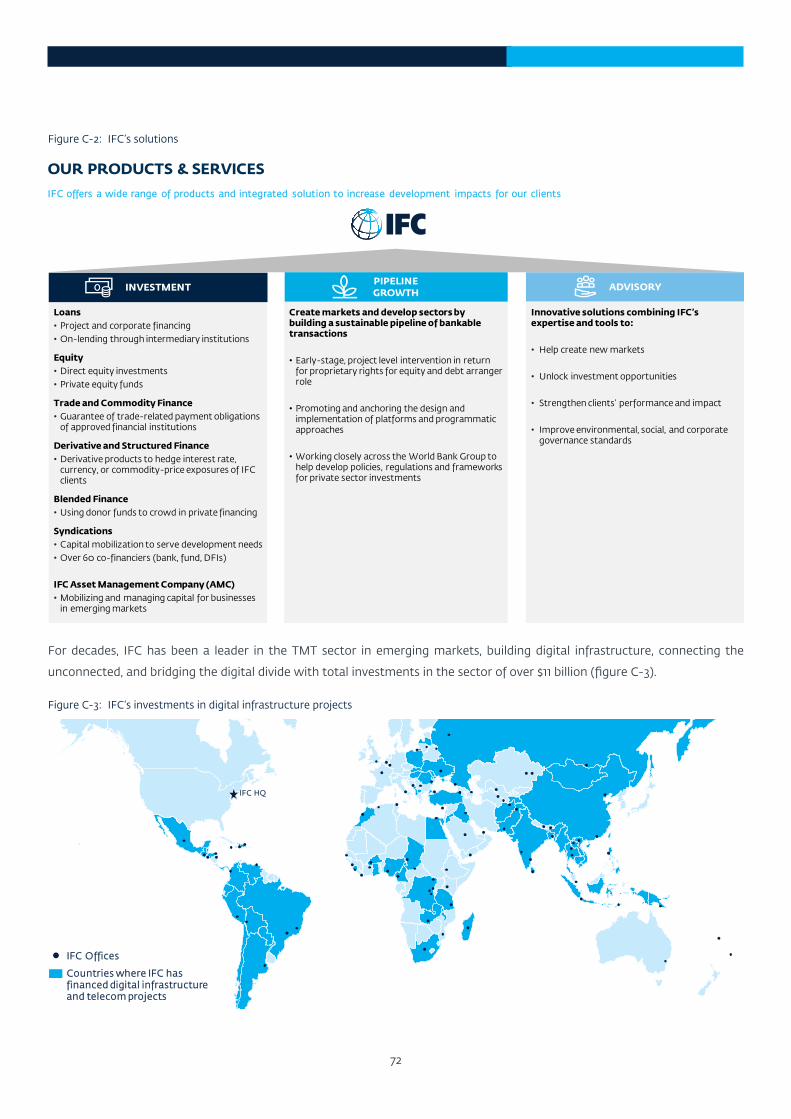
72
Figure C-2: IFC’s solutions
OUR PRODUCTS & SERVICESIFC offers a wide range of products and integrated solution to increase development impacts for our clients
ADVISORY
Loans • Project and corporate financing • On-lending through intermediary institutions
Equity• Direct equity investments• Private equity funds
Trade and Commodity Finance• Guarantee of trade-related payment obligations
of approved financial institutions
Derivative and Structured Finance• Derivative products to hedge interest rate,
currency, or commodity-price exposures of IFC clients
Blended Finance• Using donor funds to crowd in private financing
Syndications• Capital mobilization to serve development needs• Over 60 co-financiers (bank, fund, DFIs)
IFC Asset Management Company (AMC)• Mobilizing and managing capital for businesses
in emerging markets
Create markets and develop sectors by building a sustainable pipeline of bankable transactions
• Early-stage, project level intervention in return for proprietary rights for equity and debt arranger role
• Promoting and anchoring the design and implementation of platforms and programmatic approaches
• Working closely across the World Bank Group to help develop policies, regulations and frameworks for private sector investments
Innovative solutions combining IFC’sexpertise and tools to:
• Help create new markets
• Unlock investment opportunities
• Strengthen clients’ performance and impact
• Improve environmental, social, and corporate governance standards
INVESTMENTPIPELINEGROWTH
For decades, IFC has been a leader in the TMT sector in emerging markets, building digital infrastructure, connecting the
unconnected, and bridging the digital divide with total investments in the sector of over $11 billion (figure C-3).
Figure C-3: IFC’s investments in digital infrastructure projects
IFC HQ
Countries where IFC has financed digital infrastructure and telecom projects
IFC Offices
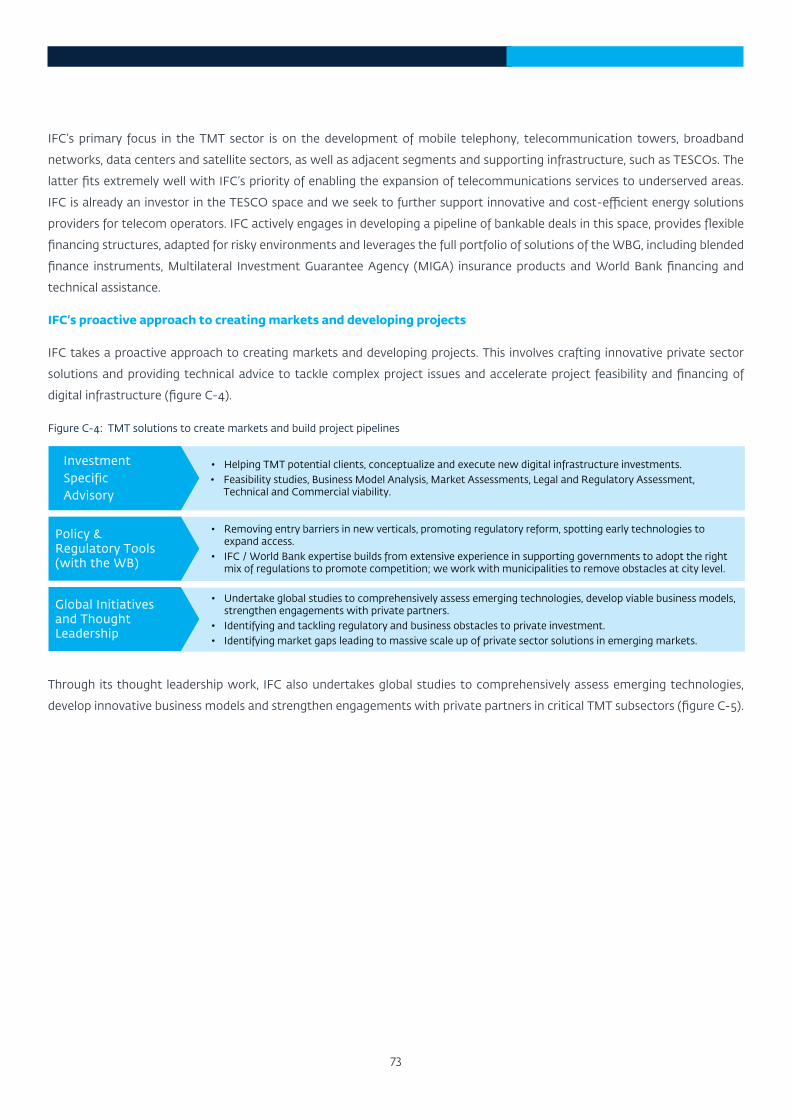
73
IFC’s primary focus in the TMT sector is on the development of mobile telephony, telecommunication towers, broadband
networks, data centers and satellite sectors, as well as adjacent segments and supporting infrastructure, such as TESCOs. The
latter fits extremely well with IFC’s priority of enabling the expansion of telecommunications services to underserved areas.
IFC is already an investor in the TESCO space and we seek to further support innovative and cost-efficient energy solutions
providers for telecom operators. IFC actively engages in developing a pipeline of bankable deals in this space, provides flexible
financing structures, adapted for risky environments and leverages the full portfolio of solutions of the WBG, including blended
finance instruments, Multilateral Investment Guarantee Agency (MIGA) insurance products and World Bank financing and
technical assistance.
IFC’s proactive approach to creating markets and developing projects
IFC takes a proactive approach to creating markets and developing projects. This involves crafting innovative private sector
solutions and providing technical advice to tackle complex project issues and accelerate project feasibility and financing of
digital infrastructure (figure C-4).
Figure C-4: TMT solutions to create markets and build project pipelines
• Undertake global studies to comprehensively assess emerging technologies, develop viable business models, strengthen engagements with private partners.
• Identifying and tackling regulatory and business obstacles to private investment. • Identifying market gaps leading to massive scale up of private sector solutions in emerging markets.
• Removing entry barriers in new verticals, promoting regulatory reform, spotting early technologies to expand access.
• IFC / World Bank expertise builds from extensive experience in supporting governments to adopt the right mix of regulations to promote competition; we work with municipalities to remove obstacles at city level.
• Helping TMT potential clients, conceptualize and execute new digital infrastructure investments. • Feasibility studies, Business Model Analysis, Market Assessments, Legal and Regulatory Assessment,
Technical and Commercial viability.
InvestmentSpecific Advisory
Policy & Regulatory Tools (with the WB)
Global Initiatives and Thought Leadership
Through its thought leadership work, IFC also undertakes global studies to comprehensively assess emerging technologies,
develop innovative business models and strengthen engagements with private partners in critical TMT subsectors (figure C-5).
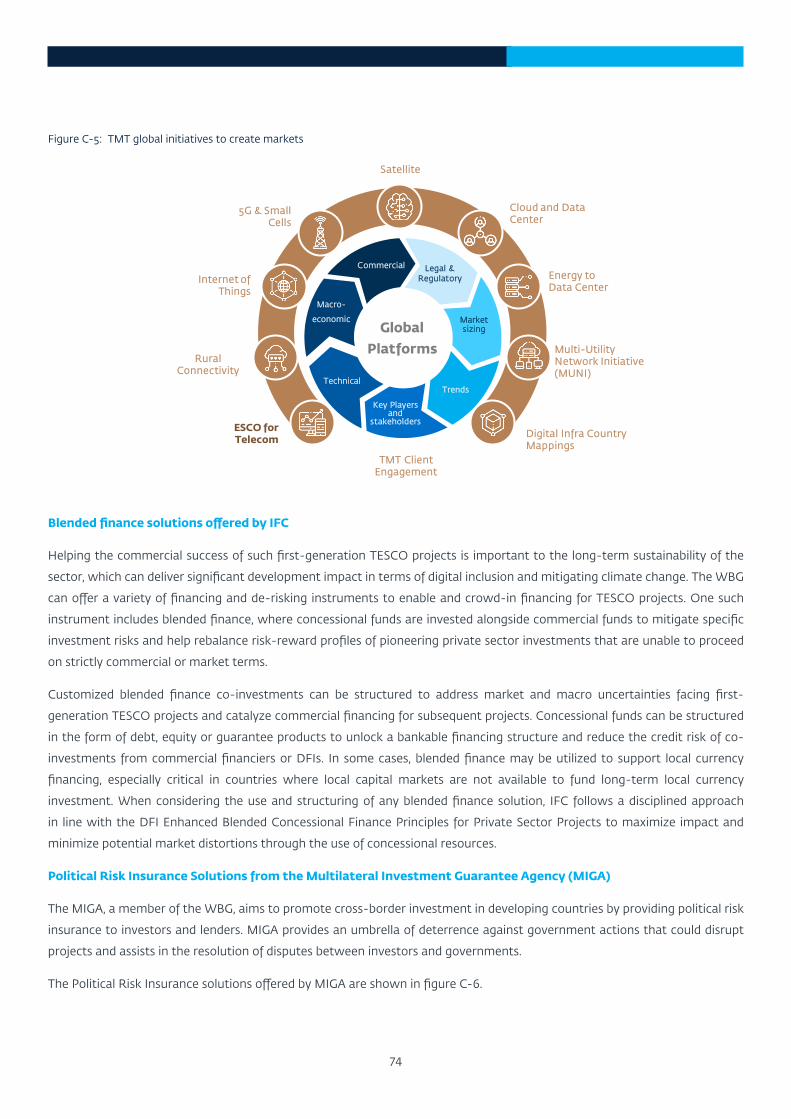
74
Figure C-5: TMT global initiatives to create markets
ESCO for Telecom
Internet of Things
5G & Small Cells
Rural Connectivity
Digital Infra Country Mappings
Multi-Utility Network Initiative (MUNI)
Cloud and Data Center
Satellite
Global Platforms
Legal & Regulatory
Market sizing
Trends
Key Players and
stakeholders
Technical
Macro-
economic
CommercialEnergy to Data Center
TMT Client Engagement
Blended finance solutions offered by IFC
Helping the commercial success of such first-generation TESCO projects is important to the long-term sustainability of the
sector, which can deliver significant development impact in terms of digital inclusion and mitigating climate change. The WBG
can offer a variety of financing and de-risking instruments to enable and crowd-in financing for TESCO projects. One such
instrument includes blended finance, where concessional funds are invested alongside commercial funds to mitigate specific
investment risks and help rebalance risk-reward profiles of pioneering private sector investments that are unable to proceed
on strictly commercial or market terms.
Customized blended finance co-investments can be structured to address market and macro uncertainties facing first-
generation TESCO projects and catalyze commercial financing for subsequent projects. Concessional funds can be structured
in the form of debt, equity or guarantee products to unlock a bankable financing structure and reduce the credit risk of co-
investments from commercial financiers or DFIs. In some cases, blended finance may be utilized to support local currency
financing, especially critical in countries where local capital markets are not available to fund long-term local currency
investment. When considering the use and structuring of any blended finance solution, IFC follows a disciplined approach
in line with the DFI Enhanced Blended Concessional Finance Principles for Private Sector Projects to maximize impact and
minimize potential market distortions through the use of concessional resources.
Political Risk Insurance Solutions from the Multilateral Investment Guarantee Agency (MIGA)
The MIGA, a member of the WBG, aims to promote cross-border investment in developing countries by providing political risk
insurance to investors and lenders. MIGA provides an umbrella of deterrence against government actions that could disrupt
projects and assists in the resolution of disputes between investors and governments.
The Political Risk Insurance solutions offered by MIGA are shown in figure C-6.
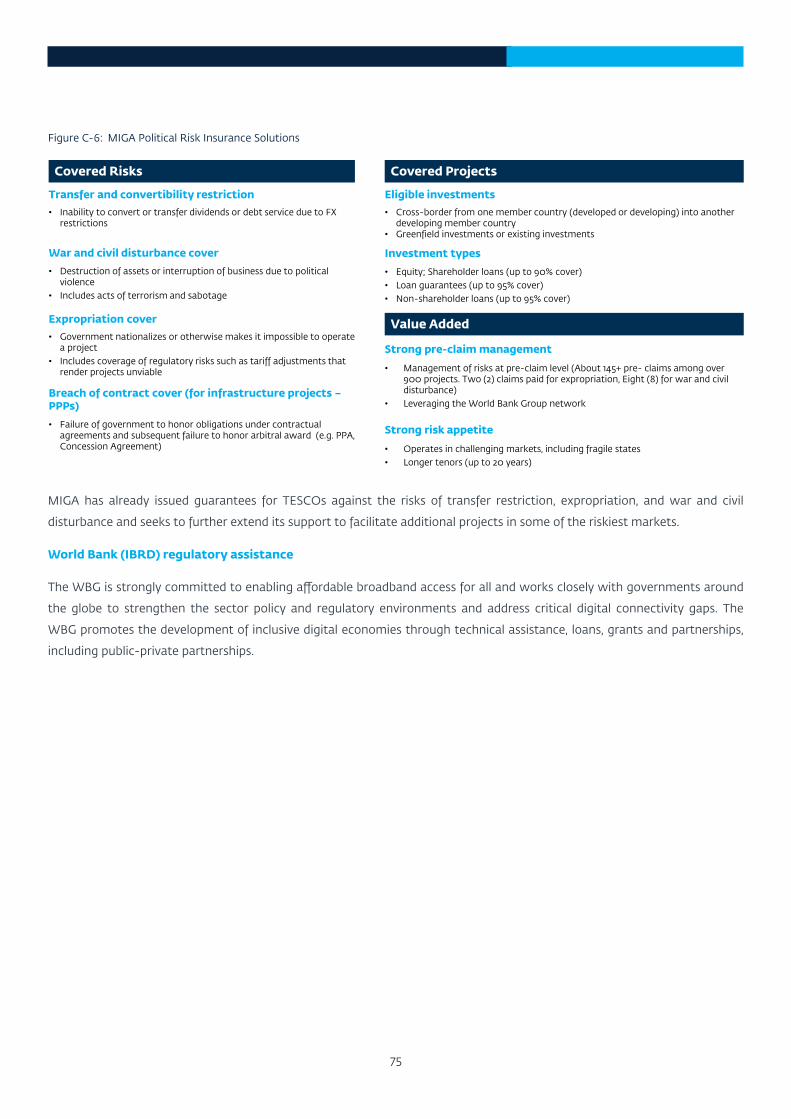
75
Figure C-6: MIGA Political Risk Insurance Solutions
• Inability to convert or transfer dividends or debt service due to FX restrictions
• Failure of government to honor obligations under contractual agreements and subsequent failure to honor arbitral award (e.g. PPA, Concession Agreement)
• Government nationalizes or otherwise makes it impossible to operate a project
• Includes coverage of regulatory risks such as tariff adjustments that render projects unviable
Transfer and convertibility restriction
Breach of contract cover (for infrastructure projects –PPPs)
Expropriation cover
Covered Risks
Value Added
• Management of risks at pre-claim level (About 145+ pre- claims among over 900 projects. Two (2) claims paid for expropriation, Eight (8) for war and civil disturbance)
• Leveraging the World Bank Group network
Strong pre-claim management
• Operates in challenging markets, including fragile states• Longer tenors (up to 20 years)
Strong risk appetite
Covered Projects
• Cross-border from one member country (developed or developing) into another developing member country
• Greenfield investments or existing investments
Eligible investments
• Equity; Shareholder loans (up to 90% cover)• Loan guarantees (up to 95% cover)• Non-shareholder loans (up to 95% cover)
Investment types
• Destruction of assets or interruption of business due to political violence
• Includes acts of terrorism and sabotage
War and civil disturbance cover
MIGA has already issued guarantees for TESCOs against the risks of transfer restriction, expropriation, and war and civil
disturbance and seeks to further extend its support to facilitate additional projects in some of the riskiest markets.
World Bank (IBRD) regulatory assistance
The WBG is strongly committed to enabling affordable broadband access for all and works closely with governments around
the globe to strengthen the sector policy and regulatory environments and address critical digital connectivity gaps. The
WBG promotes the development of inclusive digital economies through technical assistance, loans, grants and partnerships,
including public-private partnerships.

IFC2121 Pennsylvania Avenue NWWashington DC 20433 USA
www.ifc.org/tmt