Embed Size (px)
Citation preview
>> Employed by a non-US affiliate of MLPF&S and is not registered/qualified as a research analyst under the FINRA rules. Refer to "Other Important Disclosures" for information on certain BofA Merrill Lynch entities that take responsibility for this report in particular jurisdictions. BofA Merrill Lynch does and seeks to do business with companies covered in its research reports. As a result, investors should be aware that the firm may have a conflict of interest that could affect the objectivity of this report. Investors should consider this report as only a single factor in making their investment decision. Refer to important disclosures on page 132 to 133. Link to Definitions on page 131. 11356692
Thematic Investing Thematic Investing
Safer world primer – global safety & security
Equity | Global | Thematic Investing 12 February 2014
Sarbjit Nahal >> +44 20 7996 8031 Equity Strategist MLI (UK) [email protected] Valery Lucas-Leclin >> +44 20 7996 8058 Equity Strategist Merrill Lynch (France) [email protected]
Click the image above to watch the video.
Safety & security, a global thematic mega-trend
As part of our work on global megatrends, we update our report on safety & security with a Primer and Primer Picks reports. It may sound trite, but it’s not safe out there. Every year 2.3mn people are killed at work (Source: ILO), 1.3mn lose their lives in road accidents, and 15,000+ die in terrorist attacks (Source: NCTC). Globalisation is driving the need for safety and posing new challenges from EM growth to outsourcing, the food supply chain, a degrading environment, and new diseases. We believe some corporates may push the boundaries of safety in their efforts to exploit new resources.
From cybersecurity to “Cybergeddon” to cyber-opportunities The “threatscape” is changing fast, with cybersecurity attacks and critical infrastructure breakdowns being recognised as one of the top five global risks today (Source: WEF), and cyber eclipsing terrorism as a threat. The average cost of cyber attacks for US companies reached a record US$11.6mn in 2013 (Source: Ponemon), while cybercrime costs the global economy an estimated US$500bn annually (Source: CSIS & McAfee). Cybersecurity has become a homeland security issue, with a worst-case “Cybergeddon” scenario now on the table. Positively, IT is also enabling new safety & security solutions and opportunities across sectors.
Investors need to play safe Public opinion has become more sensitive to issues of quality, security, health & safety, environmental protection and social responsibility, which has led to the proliferation, strengthening and convergence of regulation and the development of non-regulatory standards. As a result, corporates are increasingly being forced to adapt to new best practices on safety & security. We believe that investors need to focus on this shift and look for long-term solutions to the ever-growing raft of threats against people, governments, infrastructure and society as a whole.
Eight entry points for investors, US$1.5tn+ market (2020e) We have mapped efforts to promote safety & security across a number of global sector value chains to highlight the diverse range of entry points for investors wishing to play the “Safer World” theme: 1) Auto; 2) Commercial & Residential; 3) Cybersecurity; 4) Homeland; 5) Life Sciences; 6) Oil & Gas; 7) Testing, Inspection & Certification (TIC); and 8) Workplace. We believe these entry points will represent a combined US$1.5tn+ market by 2020.
BofAML Global Safety & Security stock list & Primer Picks Together with our sector analysts, we have created a list of over 80 global stocks – including 30 new names – covered by BofAML that have exposure to safety & security-related themes and solutions. We examine their exposure to the theme and their long-term growth prospects. Our Buy-rated stocks with material exposure to the theme are detailed in an accompanying Primer Picks report, as is our full stock list.
Un
auth
ori
zed
red
istr
ibu
tio
n o
f th
is r
epo
rt is
pro
hib
ited
.T
his
rep
ort
is in
ten
ded
fo
r ke
gan
.love
ly@
bam
l.co
m.
2
Themat ic Inves t ing 12 February 2014
Contents Safer world 3
BofAML Global Safer World Exposure stock list 4
Auto 16
Commercial & Residential 35
Cybersecurity 46
Homeland 73
Life Science Tools 86
Oil & Gas 95
Testing, Inspection & Certification (TIC) 113
Workplace 123
Themat ic Inves t ing 12 February 2014
3
Safer world Our review of global safety and security issues vis-à-vis the Auto, Commercial and Residential, Cybersecurity, Homeland, Life Sciences, Oil & Gas, TIC and Workplace sectors confirms our belief that investors need to focus on long-term solutions to the ever growing and changing array of safety and security threats against people, governments, infrastructure, and society as a whole:
It’s an unsafe world for all of us: 2.3 million people are killed and 270 million injured every year on the job or in the workplace (Source: ILO); 1.3 million are killed (2.2% of all deaths) and 50 million more injured in motor vehicle collisions every year (Source: WHO); and 15,000+ died in global terrorist attacks last year (Source: NCTC).
Globalisation is driving the need for safety with challenges including the global food supply chain, the outsourcing of critical functions, food mislabelling, counterfeit drugs, toxic toys, declining air, water and soil quality, forensic backlogs, tropical diseases, and hospital-acquired infections, among others.
Risky businesses are getting riskier such as in the oil and gas sector where companies attempt to drill ever-deeper using ageing equipment or develop onshore with corroding pipelines, as well as opening themselves up to largely unknown environments such as the Arctic.
The rapidly changing “threatscape” is most visible with the rise in cybersecurity attacks and critical infrastructure breakdowns. Cybersecurity has become a homeland security issue, with a worst-case “Cybergeddon” scenario on the table. Positively, IT is also enabling new safety & security solutions and opportunities across sectors.
Growing regulations - As public opinion has become more sensitive on quality, health & safety, environmental protection and social responsibility, this has led to the multiplication, strengthening and convergence of regulation and the development of non-regulatory standards and best practice standards. This is forcing corporates to adapt to new best practice on safety and security.
BofAML Global Safer World Exposure stock list Together with our sector analysts, we have created a list of over 80 global stocks covered by BofAML, based on our estimates of their current exposure to safety and security-related themes and solutions, and the role that these could play in driving long-term growth.
BofAML Global Safer World Exposure stock list is not a recommended list either individually or as a group of stocks. Investors should consider the fundamentals of the companies and their own individual circumstances / objectives before making any investment decisions
Themat ic Inves t ing 12 February 2014
4
BofAML Global Safer World Exposure stock list We have mapped safety and security across a number of global sector value chains to highlight the diverse range of entry points for investors wishing to play the theme: 1) Auto; 2) Commercial & Residential; 3) Cybersecurity; 4) Homeland; 5) Life Sciences; 6) Oil & Gas; 7) Testing, Inspection & Certification (TIC); and 8) Workplace. We examine these areas more fully in standalone sections of this report.
For each theme, together with our BofAML Global Research sector analysts, we have estimated the level and materiality of companies’ exposure to safety and security-related themes, and the role of promoting safety and security as a long-term growth driver. We have characterised each company’s exposure as follows:
Low – safety and security-related products, services, and solutions are not material to global revenues and/or growth but are one factor, among others, for the business model, strategy and R&D of the company.
Medium – safety and security-related products, services, and solutions are an important factor for the business model, strategy and R&D of the company; material to sales and/or growth.
High – safety and security-related products, services, and solutions are core to the business model, strategy and R&D of the company; material sales and/or growth driver; pure play (ie, 100% of sales from products, services or solutions which help to promote safety and security).
Although it is difficult to accurately gauge the link between such exposure and share price performance (as many factors outside the scope of this analysis are likely to play a role in short- and long-term price development), we still consider that safety and security exposure is an important and positive point to track given that it is a megatrend with a 25-50Y lifespan.
The aim of our Global Safer World Exposure stock list and its eight underlying themes is to provide investors with information to identify company and sub-sector specific risks and opportunities that are inherent in the promotion of the safety and security theme.
Themat ic Inves t ing 12 February 2014
5
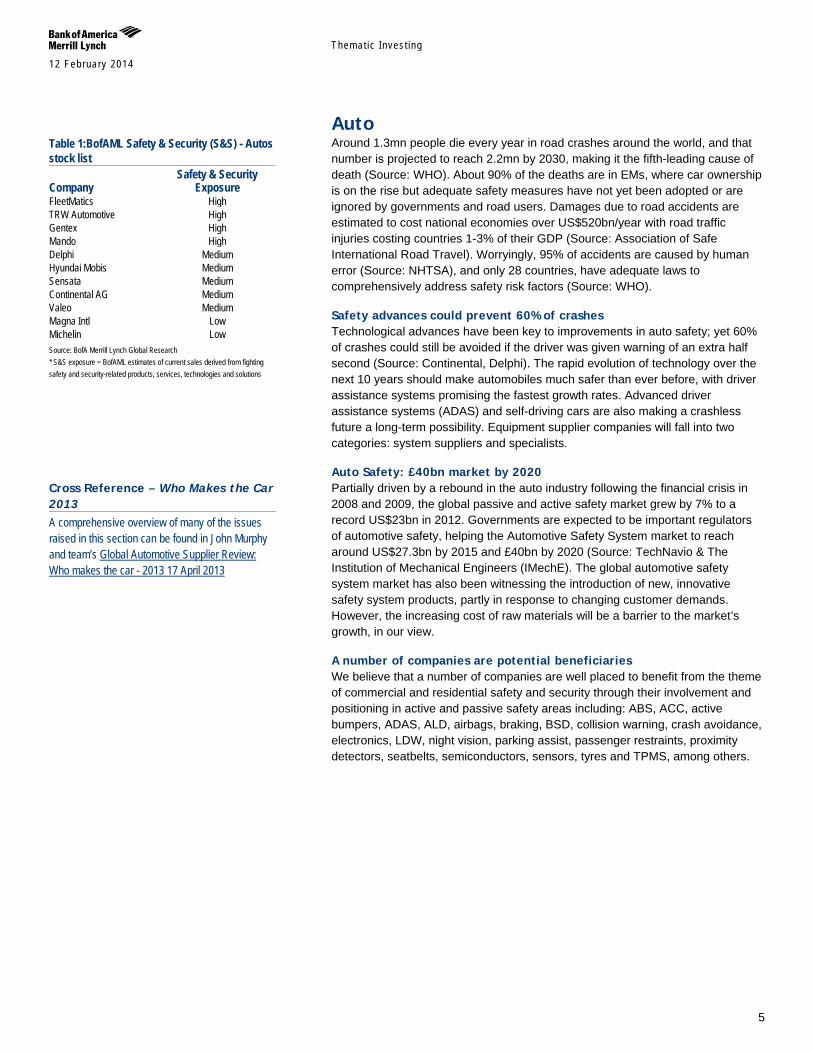
Auto Around 1.3mn people die every year in road crashes around the world, and that number is projected to reach 2.2mn by 2030, making it the fifth-leading cause of death (Source: WHO). About 90% of the deaths are in EMs, where car ownership is on the rise but adequate safety measures have not yet been adopted or are ignored by governments and road users. Damages due to road accidents are estimated to cost national economies over US$520bn/year with road traffic injuries costing countries 1-3% of their GDP (Source: Association of Safe International Road Travel). Worryingly, 95% of accidents are caused by human error (Source: NHTSA), and only 28 countries, have adequate laws to comprehensively address safety risk factors (Source: WHO).
Safety advances could prevent 60% of crashes Technological advances have been key to improvements in auto safety; yet 60% of crashes could still be avoided if the driver was given warning of an extra half second (Source: Continental, Delphi). The rapid evolution of technology over the next 10 years should make automobiles much safer than ever before, with driver assistance systems promising the fastest growth rates. Advanced driver assistance systems (ADAS) and self-driving cars are also making a crashless future a long-term possibility. Equipment supplier companies will fall into two categories: system suppliers and specialists.
Auto Safety: £40bn market by 2020 Partially driven by a rebound in the auto industry following the financial crisis in 2008 and 2009, the global passive and active safety market grew by 7% to a record US$23bn in 2012. Governments are expected to be important regulators of automotive safety, helping the Automotive Safety System market to reach around US$27.3bn by 2015 and £40bn by 2020 (Source: TechNavio & The Institution of Mechanical Engineers (IMechE). The global automotive safety system market has also been witnessing the introduction of new, innovative safety system products, partly in response to changing customer demands. However, the increasing cost of raw materials will be a barrier to the market’s growth, in our view.
A number of companies are potential beneficiaries We believe that a number of companies are well placed to benefit from the theme of commercial and residential safety and security through their involvement and positioning in active and passive safety areas including: ABS, ACC, active bumpers, ADAS, ALD, airbags, braking, BSD, collision warning, crash avoidance, electronics, LDW, night vision, parking assist, passenger restraints, proximity detectors, seatbelts, semiconductors, sensors, tyres and TPMS, among others.
Table 1:BofAML Safety & Security (S&S) - Autos stock list Safety & Security Company Exposure FleetMatics High TRW Automotive High Gentex High Mando High Delphi Medium Hyundai Mobis Medium Sensata Medium Continental AG Medium Valeo Medium Magna Intl Low Michelin Low Source: BofA Merrill Lynch Global Research * S&S exposure = BofAML estimates of current sales derived from fighting safety and security-related products, services, technologies and solutions
Cross Reference – Who Makes the Car 2013 A comprehensive overview of many of the issues raised in this section can be found in John Murphy and team’s Global Automotive Supplier Review: Who makes the car - 2013 17 April 2013
Themat ic Inves t ing 12 February 2014
6
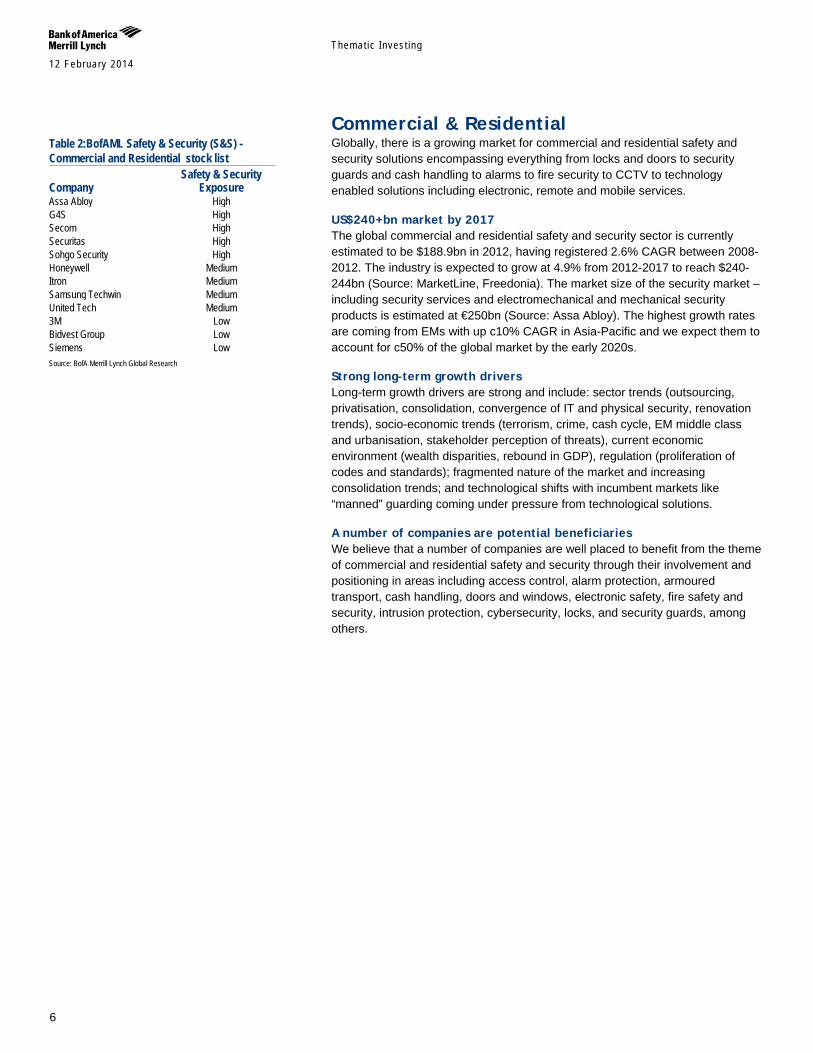
Commercial & Residential Globally, there is a growing market for commercial and residential safety and security solutions encompassing everything from locks and doors to security guards and cash handling to alarms to fire security to CCTV to technology enabled solutions including electronic, remote and mobile services.
US$240+bn market by 2017 The global commercial and residential safety and security sector is currently estimated to be $188.9bn in 2012, having registered 2.6% CAGR between 2008-2012. The industry is expected to grow at 4.9% from 2012-2017 to reach $240-244bn (Source: MarketLine, Freedonia). The market size of the security market – including security services and electromechanical and mechanical security products is estimated at €250bn (Source: Assa Abloy). The highest growth rates are coming from EMs with up c10% CAGR in Asia-Pacific and we expect them to account for c50% of the global market by the early 2020s.
Strong long-term growth drivers Long-term growth drivers are strong and include: sector trends (outsourcing, privatisation, consolidation, convergence of IT and physical security, renovation trends), socio-economic trends (terrorism, crime, cash cycle, EM middle class and urbanisation, stakeholder perception of threats), current economic environment (wealth disparities, rebound in GDP), regulation (proliferation of codes and standards); fragmented nature of the market and increasing consolidation trends; and technological shifts with incumbent markets like “manned” guarding coming under pressure from technological solutions.
A number of companies are potential beneficiaries We believe that a number of companies are well placed to benefit from the theme of commercial and residential safety and security through their involvement and positioning in areas including access control, alarm protection, armoured transport, cash handling, doors and windows, electronic safety, fire safety and security, intrusion protection, cybersecurity, locks, and security guards, among others.
Table 2:BofAML Safety & Security (S&S) - Commercial and Residential stock list Safety & Security Company Exposure Assa Abloy High G4S High Secom High Securitas High Sohgo Security High Honeywell Medium Itron Medium Samsung Techwin Medium United Tech Medium 3M Low Bidvest Group Low Siemens Low Source: BofA Merrill Lynch Global Research
Themat ic Inves t ing 12 February 2014
7
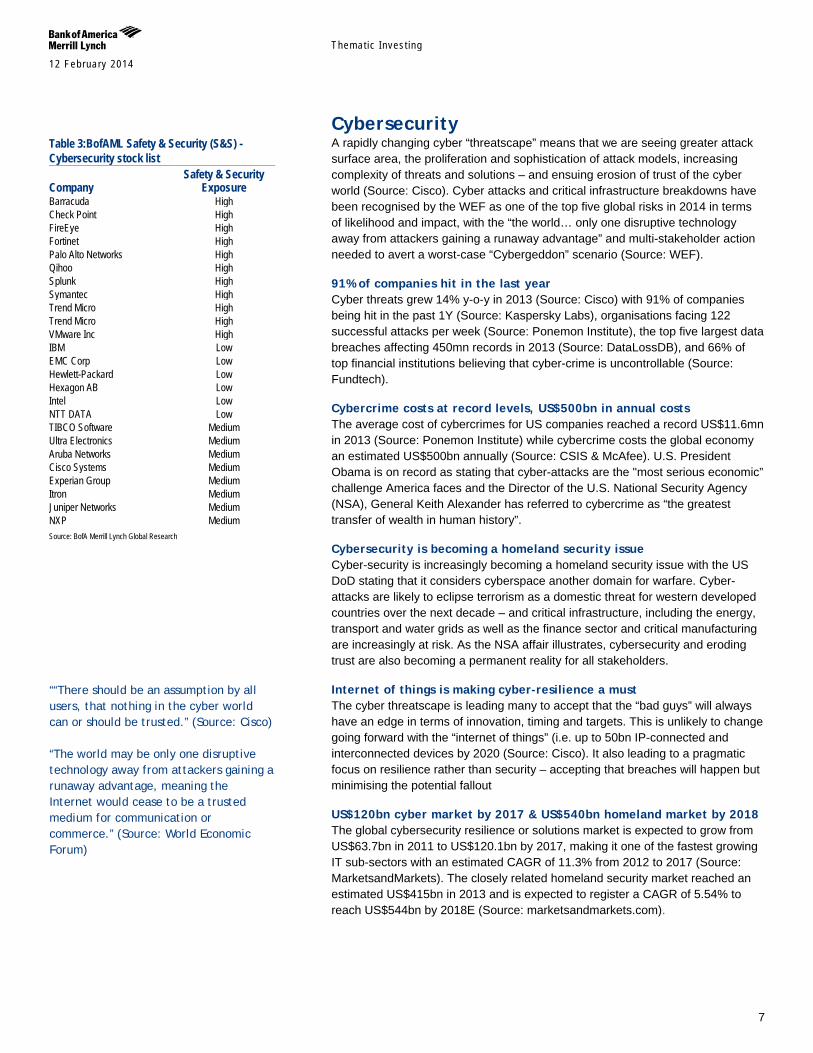
Cybersecurity A rapidly changing cyber “threatscape” means that we are seeing greater attack surface area, the proliferation and sophistication of attack models, increasing complexity of threats and solutions – and ensuing erosion of trust of the cyber world (Source: Cisco). Cyber attacks and critical infrastructure breakdowns have been recognised by the WEF as one of the top five global risks in 2014 in terms of likelihood and impact, with the “the world… only one disruptive technology away from attackers gaining a runaway advantage” and multi-stakeholder action needed to avert a worst-case “Cybergeddon” scenario (Source: WEF).
91% of companies hit in the last year Cyber threats grew 14% y-o-y in 2013 (Source: Cisco) with 91% of companies being hit in the past 1Y (Source: Kaspersky Labs), organisations facing 122 successful attacks per week (Source: Ponemon Institute), the top five largest data breaches affecting 450mn records in 2013 (Source: DataLossDB), and 66% of top financial institutions believing that cyber-crime is uncontrollable (Source: Fundtech).
Cybercrime costs at record levels, US$500bn in annual costs The average cost of cybercrimes for US companies reached a record US$11.6mn in 2013 (Source: Ponemon Institute) while cybercrime costs the global economy an estimated US$500bn annually (Source: CSIS & McAfee). U.S. President Obama is on record as stating that cyber-attacks are the "most serious economic” challenge America faces and the Director of the U.S. National Security Agency (NSA), General Keith Alexander has referred to cybercrime as “the greatest transfer of wealth in human history”.
Cybersecurity is becoming a homeland security issue Cyber-security is increasingly becoming a homeland security issue with the US DoD stating that it considers cyberspace another domain for warfare. Cyber-attacks are likely to eclipse terrorism as a domestic threat for western developed countries over the next decade – and critical infrastructure, including the energy, transport and water grids as well as the finance sector and critical manufacturing are increasingly at risk. As the NSA affair illustrates, cybersecurity and eroding trust are also becoming a permanent reality for all stakeholders.
Internet of things is making cyber-resilience a must The cyber threatscape is leading many to accept that the “bad guys” will always have an edge in terms of innovation, timing and targets. This is unlikely to change going forward with the “internet of things” (i.e. up to 50bn IP-connected and interconnected devices by 2020 (Source: Cisco). It also leading to a pragmatic focus on resilience rather than security – accepting that breaches will happen but minimising the potential fallout
US$120bn cyber market by 2017 & US$540bn homeland market by 2018 The global cybersecurity resilience or solutions market is expected to grow from US$63.7bn in 2011 to US$120.1bn by 2017, making it one of the fastest growing IT sub-sectors with an estimated CAGR of 11.3% from 2012 to 2017 (Source: MarketsandMarkets). The closely related homeland security market reached an estimated US$415bn in 2013 and is expected to register a CAGR of 5.54% to reach US$544bn by 2018E (Source: marketsandmarkets.com).
Table 3:BofAML Safety & Security (S&S) - Cybersecurity stock list Safety & Security Company Exposure Barracuda High Check Point High FireEye High Fortinet High Palo Alto Networks High Qihoo High Splunk High Symantec High Trend Micro High Trend Micro High VMware Inc High IBM Low EMC Corp Low Hewlett-Packard Low Hexagon AB Low Intel Low NTT DATA Low TIBCO Software Medium Ultra Electronics Medium Aruba Networks Medium Cisco Systems Medium Experian Group Medium Itron Medium Juniper Networks Medium NXP Medium Source: BofA Merrill Lynch Global Research
““There should be an assumption by all users, that nothing in the cyber world can or should be trusted.” (Source: Cisco) “The world may be only one disruptive technology away from attackers gaining a runaway advantage, meaning the Internet would cease to be a trusted medium for communication or commerce.” (Source: World Economic Forum)
Themat ic Inves t ing 12 February 2014
8
Companies & governments need to step up their efforts Investments in cybersecurity make good business sense as the Pareto principle (80-20 rule) applies, with 80%+ of breaches avoidable through reasonable controls. The market is, however, significantly under-penetrated, with cybersecurity spending only representing 3.8% of IT budgets (Source: PWC), major gaps in cyber skills sets, and governments failing to regulate.
A number of companies are potential beneficiaries We believe that a number of companies are well placed to benefit from the theme of Cybersecurity through their involvement and positioning in areas including anti-virus, archiving, back-up & recovery, cloud, compliance, consulting, consumer security, content security, client end-point security, critical infrastructure, data analytics, data encryption, data loss, enterprise security, firewalls, homeland security, honeypotting, ID management, intrusion detection, messaging, mobile security, networks, prevention, SaaS, virtualisation, VPN, web security, among others.
Themat ic Inves t ing 12 February 2014
9
Homeland Our overview on homeland security relates to safeguarding the internal environment of a country from disruptive activities that can potentially lead to disorder, loss of citizen’s lives and destruction of public and private property. This increasingly encompasses cyber-security with the US DoD stating that it considers cyberspace another domain for warfare, and cyber attacks likely to eclipse terrorism as a domestic threat for Western developed countries over the next decade.
U$S540bn+ market by 2018E Since the 9/11 attack, the homeland security market has grown from US$30bn to an estimated US$415bn in 2013 (Source: Researchandmarkets.com). A growing range of risks, including cross-border terrorism, cybercrime, piracy, drug trade, human trafficking, internal dissent, separatist movements, have expanded the remit of the market to encompass aviation security, mass transit security, maritime security, security, cyber-security, border security, CBRN Security, counter-terror intelligence, IT & C3I, and first responders. It also increasingly encompasses critical infrastructure, including the energy, transport and water grids as well as critical manufacturing. The homeland security market is expected to register a CAGR of 5.54% to reach US$544bn by 2018 (Source: Researchandmarkets.com).
Cyber, EMs & critical infrastructure are key drivers While U.S. and European defence spending is under pressure in the face of fiscal austerity, governments in developed markets largely insulate homeland spending expenditure from cuts and will continue to do so. The two main areas of defence growth in the homeland area are cybersecurity, where specialisation is key, and EM exports, where competition is fierce. This should mainly benefit European and US actors with high levels of cyber-security know-how and global footprints.
Emerging challenges, arms-like controls on cyber-technology Amid growing cyber-security and homeland defence concerns, the 41 arms-exporting country signatories to the Wassenaar Agreement have agreed in December 2013 that export controls should be established for "Internet Protocol (IP) network surveillance systems or equipment. Efforts to place controls on devices and software could create substantial challenges for cybersecurity-exposes businesses that outsource software or hardware development or that do not currently need export licences for sales abroad (Source: WilmerHale).
A number of companies are potential beneficiaries We believe that a number of companies are well placed to benefit from the theme of homeland security through their involvement and positioning in areas including cybersecurity, critical infrastructure, next generation detection and inspection, CBRNE threats, biometric identification, airports, ports and borders, counter-terrorism intelligence among others.
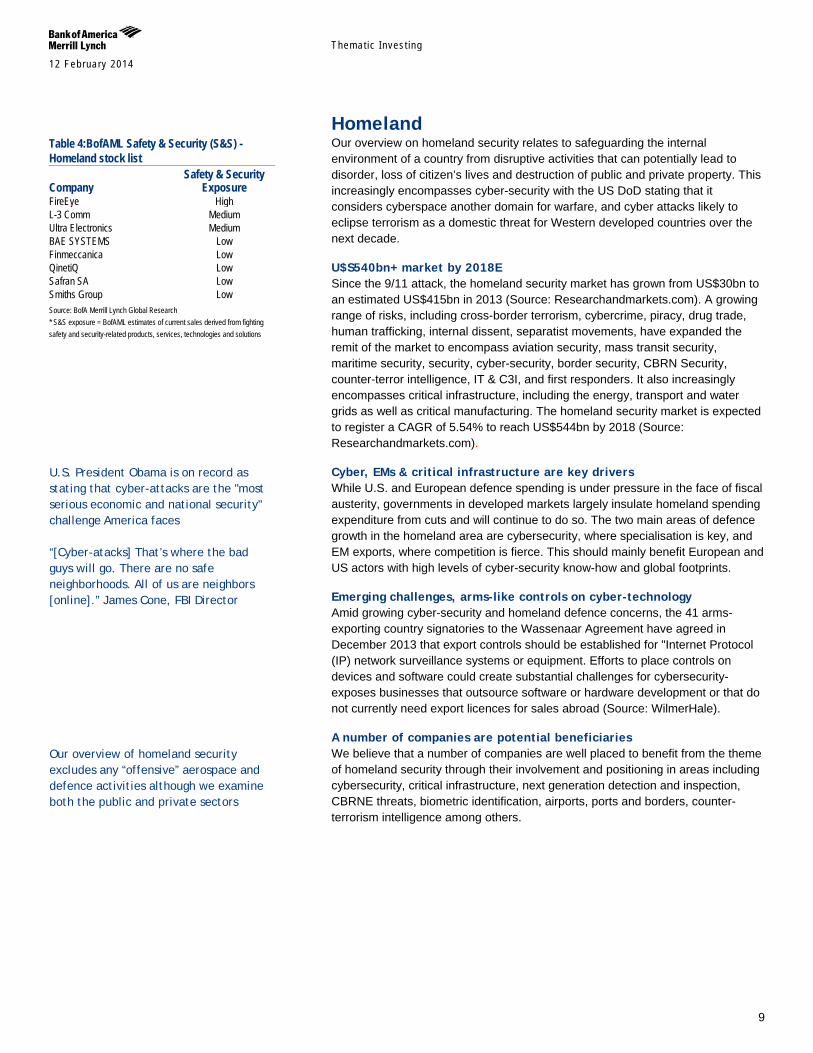
Table 4:BofAML Safety & Security (S&S) - Homeland stock list Safety & Security Company Exposure FireEye High L-3 Comm Medium Ultra Electronics Medium BAE SYSTEMS Low Finmeccanica Low QinetiQ Low Safran SA Low Smiths Group Low Source: BofA Merrill Lynch Global Research * S&S exposure = BofAML estimates of current sales derived from fighting safety and security-related products, services, technologies and solutions
U.S. President Obama is on record as stating that cyber-attacks are the "most serious economic and national security" challenge America faces “[Cyber-atacks] That’s where the bad guys will go. There are no safe neighborhoods. All of us are neighbors [online].” James Cone, FBI Director
Our overview of homeland security excludes any “offensive” aerospace and defence activities although we examine both the public and private sectors
Themat ic Inves t ing 12 February 2014
10
Life Science Tools Safety and security are key to both the drug development industry and the academic biomedical research community, and set to become even more pertinent on the back of the genomic and biotech outlook. Globalisation is also driving the need for a healthier, cleaner and safer world – with challenges encompassing the global food supply chain, declining water, soil and air quality, forensic backlogs, flu pandemics, hospital-acquired infections, food mislabelling, counterfeit drugs and toxic toys, among others.
Life sciences is responding to the diverse safety challenges The life science tools sector is responding to many of these challenges. The sector is composed of a diverse set of companies that supply equipment, analytical instruments, consumables, services, and software to research and commercial laboratories.
US$80-85bn market, c4% growth This sector is a US$80-85bn market which our Life Sciences & Diagnostic Tools team estimate is growing organically at a rate of approximately 4% annually. The key customers for most life science companies come from the drug development industry and academic biomedical research community. However, companies also supply products and services to labs serving industrial and applied market customers (e.g., forensics, food and consumer product safety, and environmental monitoring), which account for a significant proportion of revenue streams. We remain bullish on the long-term outlook for the overall LST sector, given our view that there are still many opportunities for growth and the relatively high barriers to entry.
A number of companies are potential beneficiaries We believe that a number of companies in the life sciences sector including those that primarily sell analytical instruments and lab equipment and those that primarily sell consumables and services are well placed to benefit from their positions in enhancing safety and security.
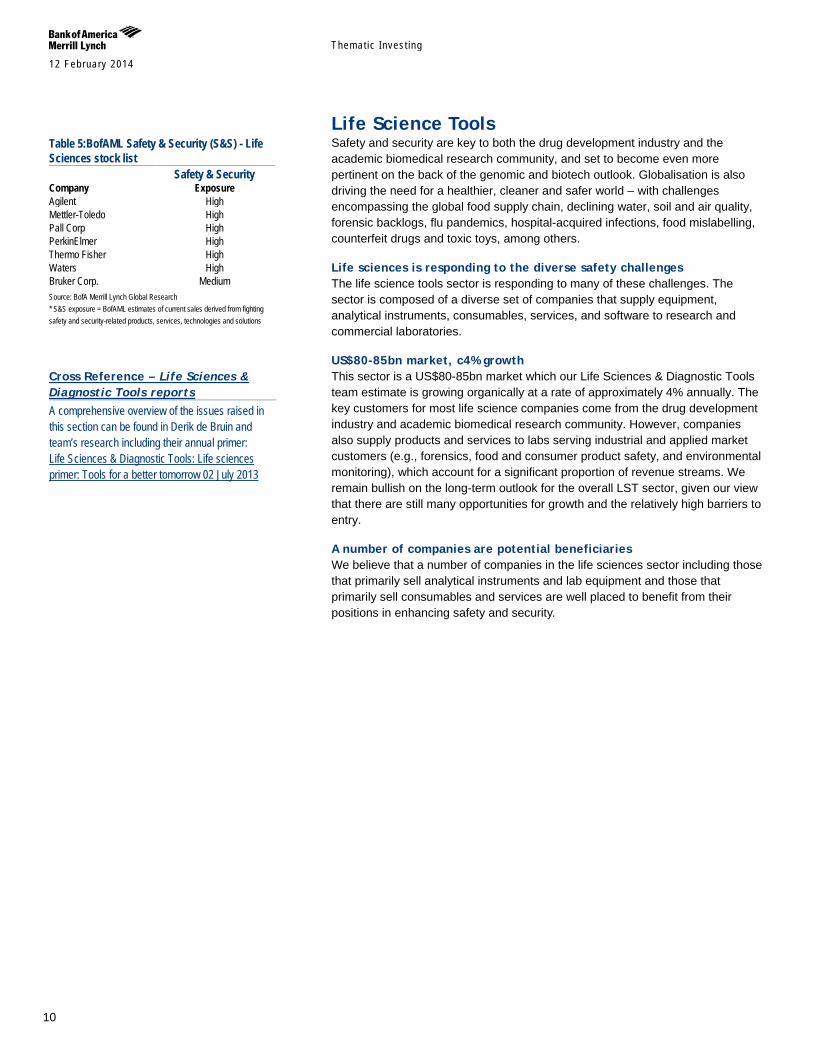
Table 5:BofAML Safety & Security (S&S) - Life Sciences stock list Safety & Security Company Exposure Agilent High Mettler-Toledo High Pall Corp High PerkinElmer High Thermo Fisher High Waters High Bruker Corp. Medium Source: BofA Merrill Lynch Global Research * S&S exposure = BofAML estimates of current sales derived from fighting safety and security-related products, services, technologies and solutions
Cross Reference – Life Sciences & Diagnostic Tools reports A comprehensive overview of the issues raised in this section can be found in Derik de Bruin and team’s research including their annual primer: Life Sciences & Diagnostic Tools: Life sciences primer: Tools for a better tomorrow 02 July 2013
Themat ic Inves t ing 12 February 2014
11
Oil & Gas History has shown that it tends to takes a major disaster to spring the industry into action on issues like safety. The Gulf of Mexico spill did just that, putting safety firmly on investor, regulator and stakeholder agendas. Macondo forced the entire industry, from mature supermajors to NOCs (national oil companies), to look again at how E&P is conducted. We expect stricter safety regulations and higher production and consumer costs to be on the cards for years to come.
Risky business getting riskier O&G is inherently risky business, with a worker in the oil & gas industry seven times more vulnerable to death on the job than in other industries (Source: CDC NIOSH). The sector is also facing a range of known but significant safety challenges today on ever-deeper water environments, pipeline corrosion, shale gas and oil sands – and lesser known but perhaps even more challenging conditions with pre-salt and especially the Arctic.
Deepwater getting deeper & riskier We continue to believe that the industry will face growing safety challenges in the coming years as it attempts to uncover new resources in ever-deeper water environments using ageing equipment. Our Offshore & Marine team estimates that 45% of global jackup rigs are 30 years old or more, after the industry’s hesitation on the inevitable demolishing of older units.
Pipeline corrosion, a major hidden risk A large proportion of O&G infrastructure is old, rusty and corroding and needs to be replaced, posing major safety risks. Sixty percent of US pipelines are over 40 years old, despite having a typical design life of 20-25 years, and globally an estimated 67% of pipelines are >21Y (Source: Shawcor, Douglas Westwood). In the US alone, this has resulted in US$6.6bn in pipeline damages and 2.3bn bbls spilled over the past 20 years (Source: PHMSA).
New geographies and geologies, new risks With the majority of giant oil fields past their production peak globally, the world needs the equivalent of 4-6 more Saudi Arabias if it is to maintain current levels of production by 2030. This means increasing reliance on more difficult types of hydrocarbons and complex E&P – with new safety challenges emerging on shale gas, oil sands, pre-salt and the Arctic.
A number of companies are potential beneficiaries We believe that a number of companies are well placed to benefit from the theme of oil & gas safety and security through their involvement and positioning in areas including rig builders, rig technology, drillers, drilling rig equipment and oilfield consumables and products companies, pipeline infrastructure, insurance companies and TIC (testing, inspection, certification) companies, among others.
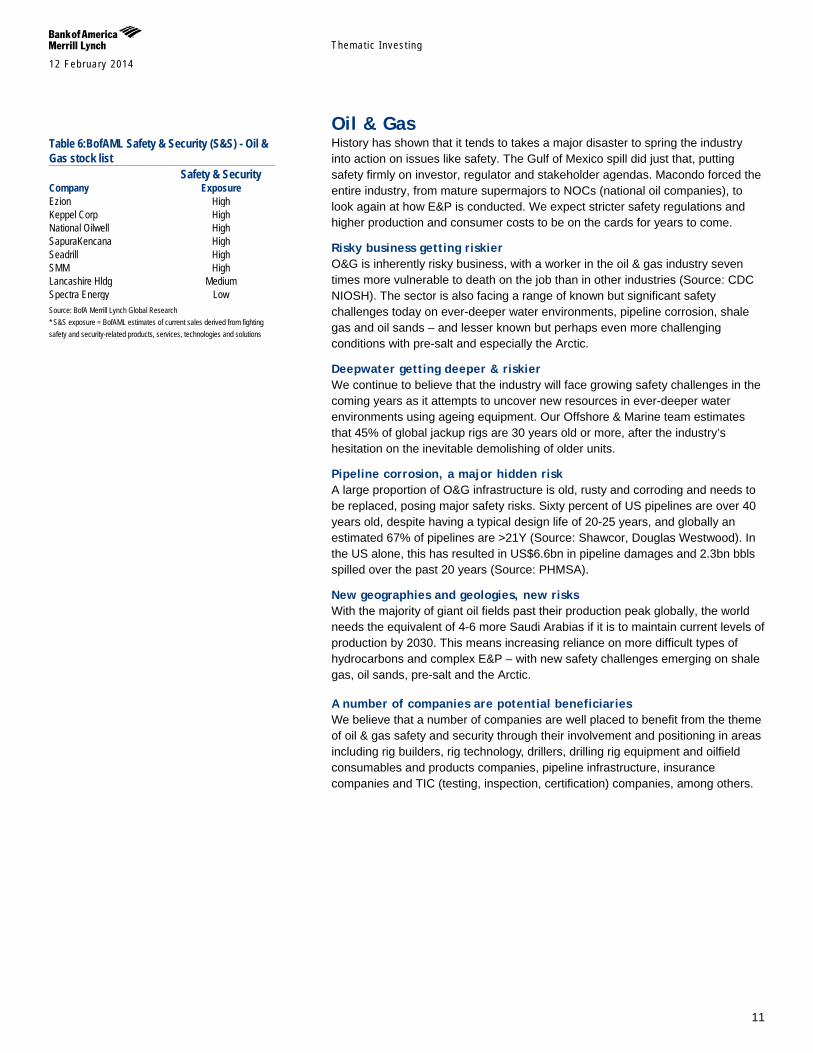
Table 6:BofAML Safety & Security (S&S) - Oil & Gas stock list Safety & Security Company Exposure Ezion High Keppel Corp High National Oilwell High SapuraKencana High Seadrill High SMM High Lancashire Hldg Medium Spectra Energy Low Source: BofA Merrill Lynch Global Research * S&S exposure = BofAML estimates of current sales derived from fighting safety and security-related products, services, technologies and solutions
Themat ic Inves t ing 12 February 2014
12
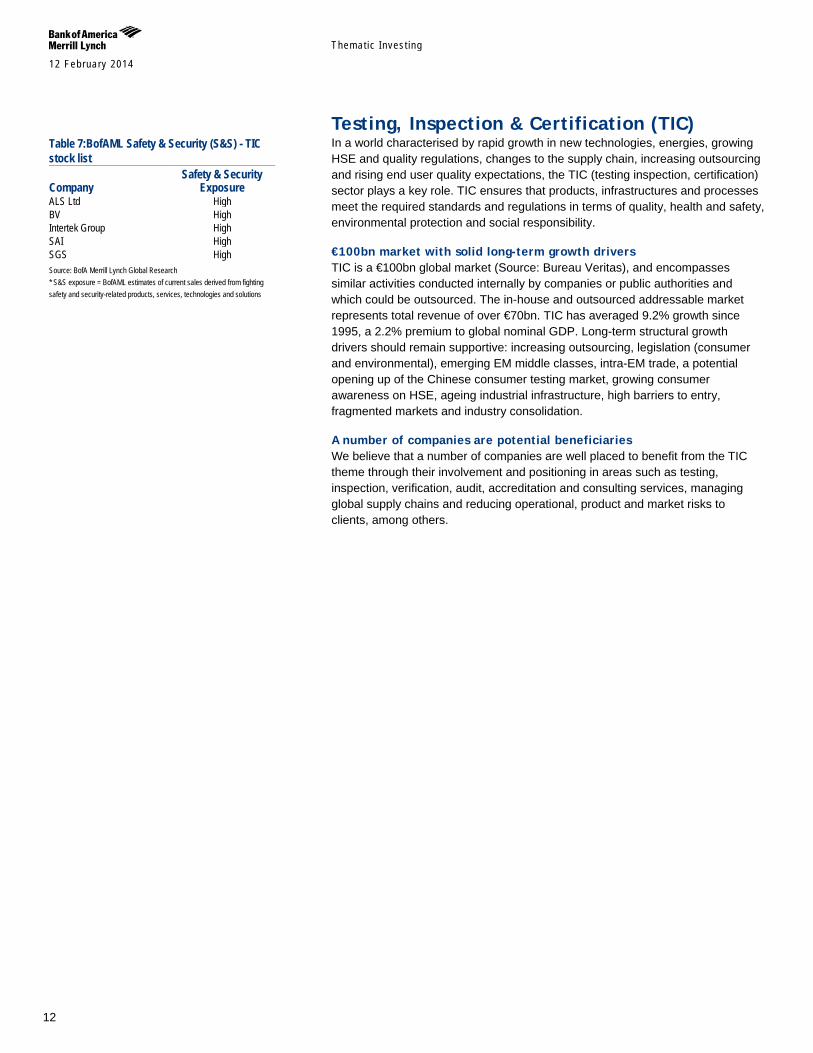
Testing, Inspection & Certification (TIC) In a world characterised by rapid growth in new technologies, energies, growing HSE and quality regulations, changes to the supply chain, increasing outsourcing and rising end user quality expectations, the TIC (testing inspection, certification) sector plays a key role. TIC ensures that products, infrastructures and processes meet the required standards and regulations in terms of quality, health and safety, environmental protection and social responsibility.
€100bn market with solid long-term growth drivers TIC is a €100bn global market (Source: Bureau Veritas), and encompasses similar activities conducted internally by companies or public authorities and which could be outsourced. The in-house and outsourced addressable market represents total revenue of over €70bn. TIC has averaged 9.2% growth since 1995, a 2.2% premium to global nominal GDP. Long-term structural growth drivers should remain supportive: increasing outsourcing, legislation (consumer and environmental), emerging EM middle classes, intra-EM trade, a potential opening up of the Chinese consumer testing market, growing consumer awareness on HSE, ageing industrial infrastructure, high barriers to entry, fragmented markets and industry consolidation.
A number of companies are potential beneficiaries We believe that a number of companies are well placed to benefit from the TIC theme through their involvement and positioning in areas such as testing, inspection, verification, audit, accreditation and consulting services, managing global supply chains and reducing operational, product and market risks to clients, among others.
Table 7:BofAML Safety & Security (S&S) - TIC stock list Safety & Security Company Exposure ALS Ltd High BV High Intertek Group High SAI High SGS High Source: BofA Merrill Lynch Global Research * S&S exposure = BofAML estimates of current sales derived from fighting safety and security-related products, services, technologies and solutions
Themat ic Inves t ing 12 February 2014
13
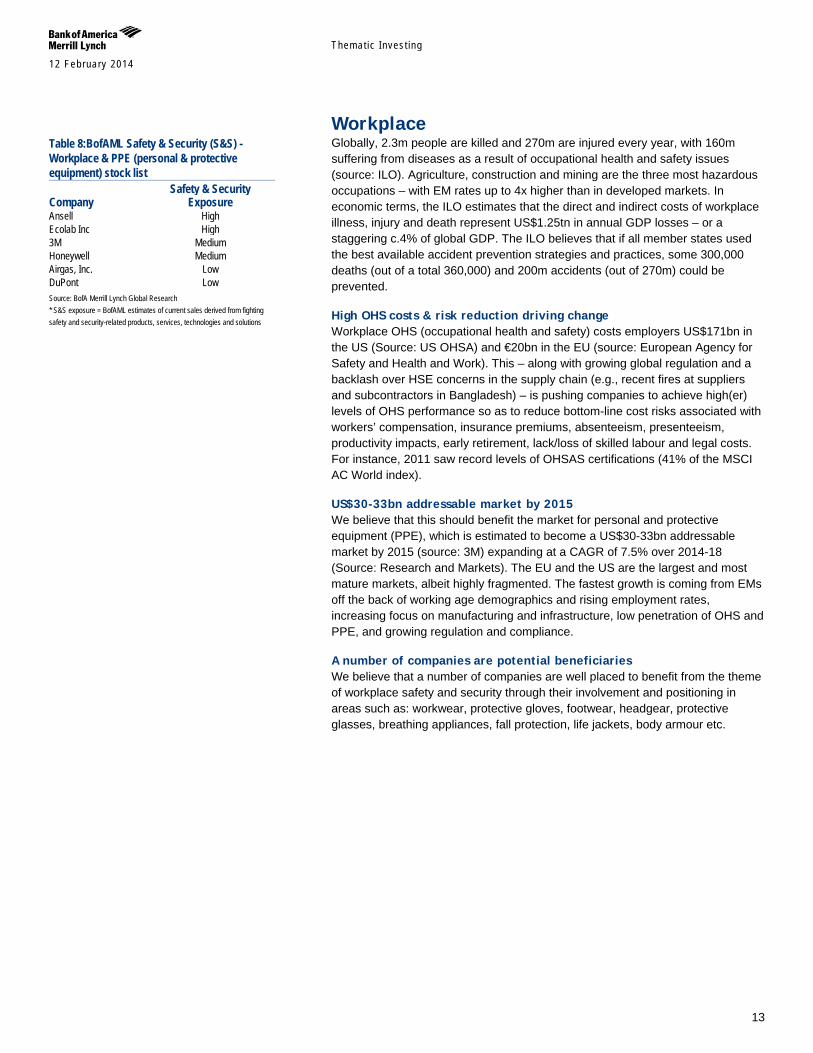
Workplace Globally, 2.3m people are killed and 270m are injured every year, with 160m suffering from diseases as a result of occupational health and safety issues (source: ILO). Agriculture, construction and mining are the three most hazardous occupations – with EM rates up to 4x higher than in developed markets. In economic terms, the ILO estimates that the direct and indirect costs of workplace illness, injury and death represent US$1.25tn in annual GDP losses – or a staggering c.4% of global GDP. The ILO believes that if all member states used the best available accident prevention strategies and practices, some 300,000 deaths (out of a total 360,000) and 200m accidents (out of 270m) could be prevented.
High OHS costs & risk reduction driving change Workplace OHS (occupational health and safety) costs employers US$171bn in the US (Source: US OHSA) and €20bn in the EU (source: European Agency for Safety and Health and Work). This – along with growing global regulation and a backlash over HSE concerns in the supply chain (e.g., recent fires at suppliers and subcontractors in Bangladesh) – is pushing companies to achieve high(er) levels of OHS performance so as to reduce bottom-line cost risks associated with workers’ compensation, insurance premiums, absenteeism, presenteeism, productivity impacts, early retirement, lack/loss of skilled labour and legal costs. For instance, 2011 saw record levels of OHSAS certifications (41% of the MSCI AC World index).
US$30-33bn addressable market by 2015 We believe that this should benefit the market for personal and protective equipment (PPE), which is estimated to become a US$30-33bn addressable market by 2015 (source: 3M) expanding at a CAGR of 7.5% over 2014-18 (Source: Research and Markets). The EU and the US are the largest and most mature markets, albeit highly fragmented. The fastest growth is coming from EMs off the back of working age demographics and rising employment rates, increasing focus on manufacturing and infrastructure, low penetration of OHS and PPE, and growing regulation and compliance.
A number of companies are potential beneficiaries We believe that a number of companies are well placed to benefit from the theme of workplace safety and security through their involvement and positioning in areas such as: workwear, protective gloves, footwear, headgear, protective glasses, breathing appliances, fall protection, life jackets, body armour etc.
Table 8:BofAML Safety & Security (S&S) - Workplace & PPE (personal & protective equipment) stock list Safety & Security Company Exposure Ansell High Ecolab Inc High 3M Medium Honeywell Medium Airgas, Inc. Low DuPont Low Source: BofA Merrill Lynch Global Research * S&S exposure = BofAML estimates of current sales derived from fighting safety and security-related products, services, technologies and solutions
Themat ic Inves t ing 12 February 2014
14
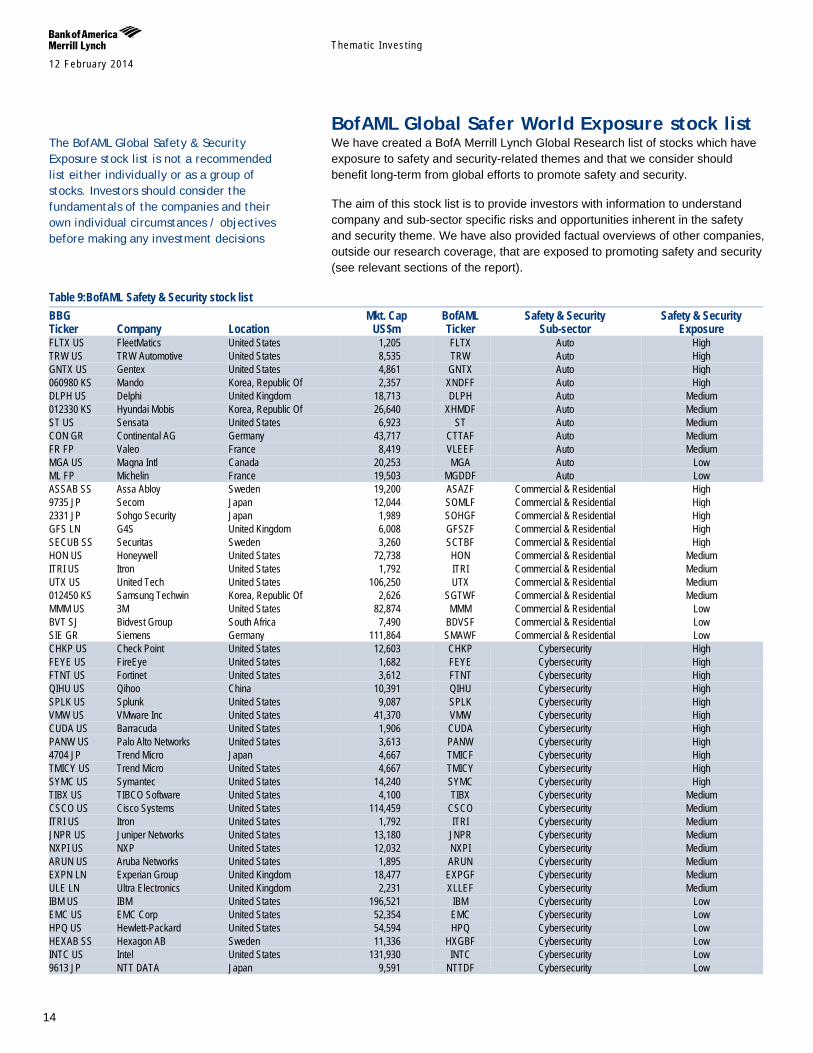
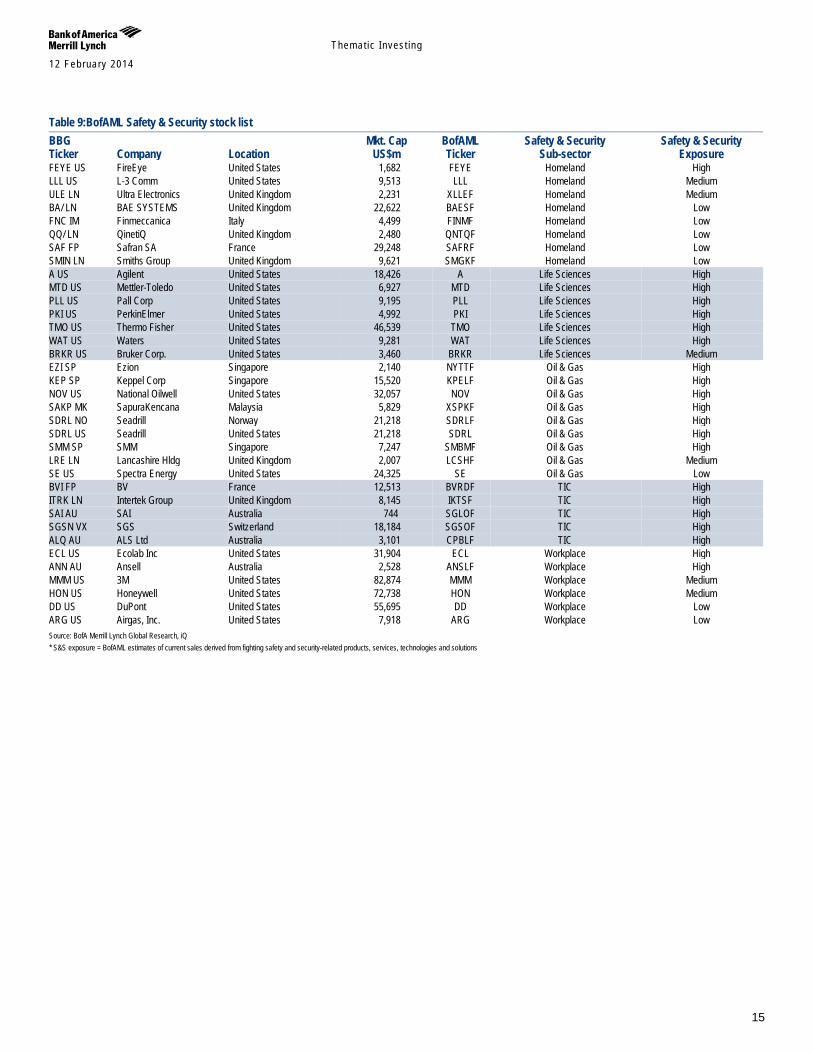
BofAML Global Safer World Exposure stock list We have created a BofA Merrill Lynch Global Research list of stocks which have exposure to safety and security-related themes and that we consider should benefit long-term from global efforts to promote safety and security.
The aim of this stock list is to provide investors with information to understand company and sub-sector specific risks and opportunities inherent in the safety and security theme. We have also provided factual overviews of other companies, outside our research coverage, that are exposed to promoting safety and security (see relevant sections of the report).
Table 9:BofAML Safety & Security stock list BBG Mkt. Cap BofAML Safety & Security Safety & Security Ticker Company Location US$m Ticker Sub-sector Exposure FLTX US FleetMatics United States 1,205 FLTX Auto High TRW US TRW Automotive United States 8,535 TRW Auto High GNTX US Gentex United States 4,861 GNTX Auto High 060980 KS Mando Korea, Republic Of 2,357 XNDFF Auto High DLPH US Delphi United Kingdom 18,713 DLPH Auto Medium 012330 KS Hyundai Mobis Korea, Republic Of 26,640 XHMDF Auto Medium ST US Sensata United States 6,923 ST Auto Medium CON GR Continental AG Germany 43,717 CTTAF Auto Medium FR FP Valeo France 8,419 VLEEF Auto Medium MGA US Magna Intl Canada 20,253 MGA Auto Low ML FP Michelin France 19,503 MGDDF Auto Low ASSAB SS Assa Abloy Sweden 19,200 ASAZF Commercial & Residential High 9735 JP Secom Japan 12,044 SOMLF Commercial & Residential High 2331 JP Sohgo Security Japan 1,989 SOHGF Commercial & Residential High GFS LN G4S United Kingdom 6,008 GFSZF Commercial & Residential High SECUB SS Securitas Sweden 3,260 SCTBF Commercial & Residential High HON US Honeywell United States 72,738 HON Commercial & Residential Medium ITRI US Itron United States 1,792 ITRI Commercial & Residential Medium UTX US United Tech United States 106,250 UTX Commercial & Residential Medium 012450 KS Samsung Techwin Korea, Republic Of 2,626 SGTWF Commercial & Residential Medium MMM US 3M United States 82,874 MMM Commercial & Residential Low BVT SJ Bidvest Group South Africa 7,490 BDVSF Commercial & Residential Low SIE GR Siemens Germany 111,864 SMAWF Commercial & Residential Low CHKP US Check Point United States 12,603 CHKP Cybersecurity High FEYE US FireEye United States 1,682 FEYE Cybersecurity High FTNT US Fortinet United States 3,612 FTNT Cybersecurity High QIHU US Qihoo China 10,391 QIHU Cybersecurity High SPLK US Splunk United States 9,087 SPLK Cybersecurity High VMW US VMware Inc United States 41,370 VMW Cybersecurity High CUDA US Barracuda United States 1,906 CUDA Cybersecurity High PANW US Palo Alto Networks United States 3,613 PANW Cybersecurity High 4704 JP Trend Micro Japan 4,667 TMICF Cybersecurity High TMICY US Trend Micro United States 4,667 TMICY Cybersecurity High SYMC US Symantec United States 14,240 SYMC Cybersecurity High TIBX US TIBCO Software United States 4,100 TIBX Cybersecurity Medium CSCO US Cisco Systems United States 114,459 CSCO Cybersecurity Medium ITRI US Itron United States 1,792 ITRI Cybersecurity Medium JNPR US Juniper Networks United States 13,180 JNPR Cybersecurity Medium NXPI US NXP United States 12,032 NXPI Cybersecurity Medium ARUN US Aruba Networks United States 1,895 ARUN Cybersecurity Medium EXPN LN Experian Group United Kingdom 18,477 EXPGF Cybersecurity Medium ULE LN Ultra Electronics United Kingdom 2,231 XLLEF Cybersecurity Medium IBM US IBM United States 196,521 IBM Cybersecurity Low EMC US EMC Corp United States 52,354 EMC Cybersecurity Low HPQ US Hewlett-Packard United States 54,594 HPQ Cybersecurity Low HEXAB SS Hexagon AB Sweden 11,336 HXGBF Cybersecurity Low INTC US Intel United States 131,930 INTC Cybersecurity Low 9613 JP NTT DATA Japan 9,591 NTTDF Cybersecurity Low
The BofAML Global Safety & Security Exposure stock list is not a recommended list either individually or as a group of stocks. Investors should consider the fundamentals of the companies and their own individual circumstances / objectives before making any investment decisions
Themat ic Inves t ing 12 February 2014
15
Table 9:BofAML Safety & Security stock list BBG Mkt. Cap BofAML Safety & Security Safety & Security Ticker Company Location US$m Ticker Sub-sector Exposure FEYE US FireEye United States 1,682 FEYE Homeland High LLL US L-3 Comm United States 9,513 LLL Homeland Medium ULE LN Ultra Electronics United Kingdom 2,231 XLLEF Homeland Medium BA/ LN BAE SYSTEMS United Kingdom 22,622 BAESF Homeland Low FNC IM Finmeccanica Italy 4,499 FINMF Homeland Low QQ/ LN QinetiQ United Kingdom 2,480 QNTQF Homeland Low SAF FP Safran SA France 29,248 SAFRF Homeland Low SMIN LN Smiths Group United Kingdom 9,621 SMGKF Homeland Low A US Agilent United States 18,426 A Life Sciences High MTD US Mettler-Toledo United States 6,927 MTD Life Sciences High PLL US Pall Corp United States 9,195 PLL Life Sciences High PKI US PerkinElmer United States 4,992 PKI Life Sciences High TMO US Thermo Fisher United States 46,539 TMO Life Sciences High WAT US Waters United States 9,281 WAT Life Sciences High BRKR US Bruker Corp. United States 3,460 BRKR Life Sciences Medium EZI SP Ezion Singapore 2,140 NYTTF Oil & Gas High KEP SP Keppel Corp Singapore 15,520 KPELF Oil & Gas High NOV US National Oilwell United States 32,057 NOV Oil & Gas High SAKP MK SapuraKencana Malaysia 5,829 XSPKF Oil & Gas High SDRL NO Seadrill Norway 21,218 SDRLF Oil & Gas High SDRL US Seadrill United States 21,218 SDRL Oil & Gas High SMM SP SMM Singapore 7,247 SMBMF Oil & Gas High LRE LN Lancashire Hldg United Kingdom 2,007 LCSHF Oil & Gas Medium SE US Spectra Energy United States 24,325 SE Oil & Gas Low BVI FP BV France 12,513 BVRDF TIC High ITRK LN Intertek Group United Kingdom 8,145 IKTSF TIC High SAI AU SAI Australia 744 SGLOF TIC High SGSN VX SGS Switzerland 18,184 SGSOF TIC High ALQ AU ALS Ltd Australia 3,101 CPBLF TIC High ECL US Ecolab Inc United States 31,904 ECL Workplace High ANN AU Ansell Australia 2,528 ANSLF Workplace High MMM US 3M United States 82,874 MMM Workplace Medium HON US Honeywell United States 72,738 HON Workplace Medium DD US DuPont United States 55,695 DD Workplace Low ARG US Airgas, Inc. United States 7,918 ARG Workplace Low Source: BofA Merrill Lynch Global Research, iQ * S&S exposure = BofAML estimates of current sales derived from fighting safety and security-related products, services, technologies and solutions
Themat ic Inves t ing 12 February 2014
16
Auto Around 1.3mn people die every year in road crashes around the world, and that number is projected to reach 2.2mn by 2030, making it the fifth-leading cause of death (Source: WHO). About 90% of the deaths are in EMs, where car ownership is on the rise but adequate safety measures have not yet been adopted or are ignored by governments and road users. Damages due to road accidents are estimated to cost national economies over US$520bn/year with road traffic injuries costing countries 1-3% of their GDP (Source: Association of Safe International Road Travel). Worryingly, 95% of accidents are caused by human error (Source: NHTSA), and only 28 countries, have adequate laws to comprehensively address safety risk factors (Source: WHO).
Safety advances could prevent 60% of crashes Technological advances have been key to improvements in auto safety; yet 60% of crashes could still be avoided if the driver was given warning of an extra half second (Source: Continental, Delphi). The rapid evolution of technology over the next 10 years should make automobiles much safer than ever before, with driver assistance systems promising the fastest growth rates. Advanced driver assistance systems (ADAS) and self-driving cars are also making a crashless future a long-term possibility. Equipment supplier companies will fall into two categories: system suppliers and specialists.
Auto Safety: £40bn market by 2020 Partially driven by a rebound in the auto industry following the financial crisis in 2008 and 2009, the global passive and active safety market grew by 7% to a record US$23bn in 2012. Governments are expected to be important regulators of automotive safety, helping the Automotive Safety System market to reach around US$27.3bn by 2015 and £40bn by 2020 (Source: TechNavio & The Institution of Mechanical Engineers (IMechE). The global automotive safety system market has also been witnessing the introduction of new, innovative safety system products, partly in response to changing customer demands. However, the increasing cost of raw materials will be a barrier to the market’s growth, in our view.
A number of companies are potential beneficiaries We believe that a number of companies are well placed to benefit from the theme of commercial and residential safety and security through their involvement and positioning in active and passive safety areas including: ABS, ACC, active bumpers, ADAS, ALD, airbags, braking, BSD, collision warning, crash avoidance, electronics, LDW, night vision, parking assist, passenger restraints, proximity detectors, seatbelts, semiconductors, sensors, tyres and TPMS, among others.
Table 10:BofAML Safety & Security (S&S) - Autos stock list Safety & Security Company Exposure FleetMatics High TRW Automotive High Gentex High Mando High Delphi Medium Hyundai Mobis Medium Sensata Medium Continental AG Medium Valeo Medium Magna Intl Low Michelin Low Source: BofA Merrill Lynch Global Research * S&S exposure = BofAML estimates of current sales derived from fighting safety and security-related products, services, technologies and solutions
Cross Reference – Who Makes the Car 2013 A comprehensive overview of many of the issues raised in this section can be found in John Murphy and team’s Global Automotive Supplier Review: Who makes the car - 2013 17 April 2013
Themat ic Inves t ing 12 February 2014
17
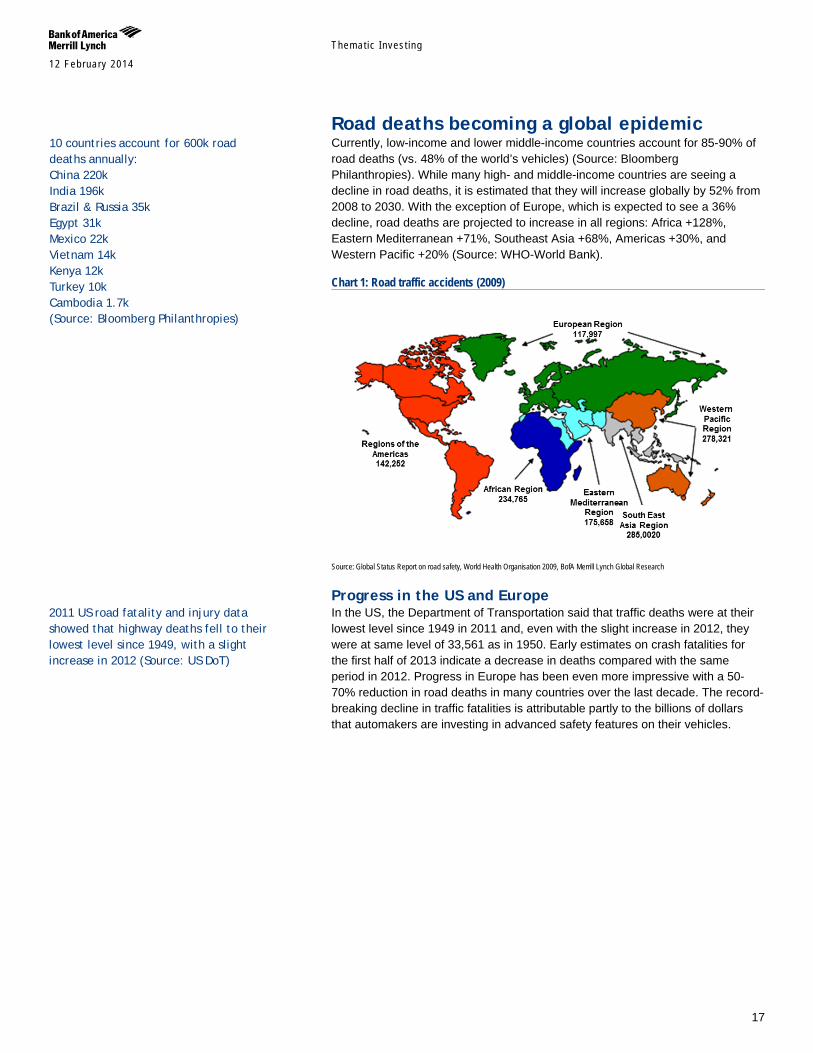
Road deaths becoming a global epidemic Currently, low-income and lower middle-income countries account for 85-90% of road deaths (vs. 48% of the world’s vehicles) (Source: Bloomberg Philanthropies). While many high- and middle-income countries are seeing a decline in road deaths, it is estimated that they will increase globally by 52% from 2008 to 2030. With the exception of Europe, which is expected to see a 36% decline, road deaths are projected to increase in all regions: Africa +128%, Eastern Mediterranean +71%, Southeast Asia +68%, Americas +30%, and Western Pacific +20% (Source: WHO-World Bank).
Chart 1: Road traffic accidents (2009)
Source: Global Status Report on road safety, World Health Organisation 2009, BofA Merrill Lynch Global Research
Progress in the US and Europe In the US, the Department of Transportation said that traffic deaths were at their lowest level since 1949 in 2011 and, even with the slight increase in 2012, they were at same level of 33,561 as in 1950. Early estimates on crash fatalities for the first half of 2013 indicate a decrease in deaths compared with the same period in 2012. Progress in Europe has been even more impressive with a 50-70% reduction in road deaths in many countries over the last decade. The record-breaking decline in traffic fatalities is attributable partly to the billions of dollars that automakers are investing in advanced safety features on their vehicles.
2011 US road fatality and injury data showed that highway deaths fell to their lowest level since 1949, with a slight increase in 2012 (Source: US DoT)
10 countries account for 600k road deaths annually: China 220k India 196k Brazil & Russia 35k Egypt 31k Mexico 22k Vietnam 14k Kenya 12k Turkey 10k Cambodia 1.7k (Source: Bloomberg Philanthropies)
Themat ic Inves t ing 12 February 2014
18
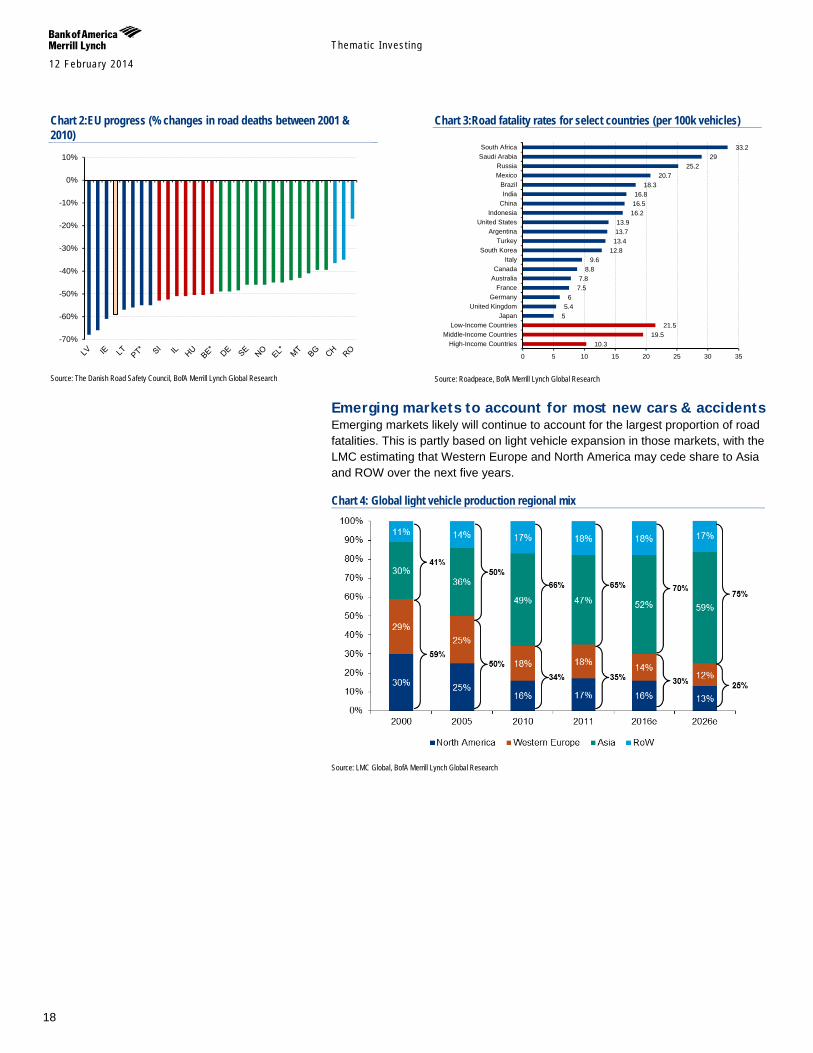
Chart 2:EU progress (% changes in road deaths between 2001 & 2010)
Source: The Danish Road Safety Council, BofA Merrill Lynch Global Research
Chart 3:Road fatality rates for select countries (per 100k vehicles)
Source: Roadpeace, BofA Merrill Lynch Global Research
Emerging markets to account for most new cars & accidents Emerging markets likely will continue to account for the largest proportion of road fatalities. This is partly based on light vehicle expansion in those markets, with the LMC estimating that Western Europe and North America may cede share to Asia and ROW over the next five years.
Chart 4: Global light vehicle production regional mix
Source: LMC Global, BofA Merrill Lynch Global Research
-70%
-60%
-50%
-40%
-30%
-20%
-10%
0%
10%
10.3 19.5
21.5 5 5.4
6 7.5 7.8
8.8 9.6
12.8 13.4 13.7 13.9
16.2 16.5 16.8
18.3 20.7
25.2 29
33.2
0 5 10 15 20 25 30 35
High-Income CountriesMiddle-Income Countries
Low-Income CountriesJapan
United KingdomGermany
FranceAustraliaCanada
ItalySouth Korea
TurkeyArgentina
United StatesIndonesia
ChinaIndia
BrazilMexicoRussia
Saudi ArabiaSouth Africa
Themat ic Inves t ing 12 February 2014
19
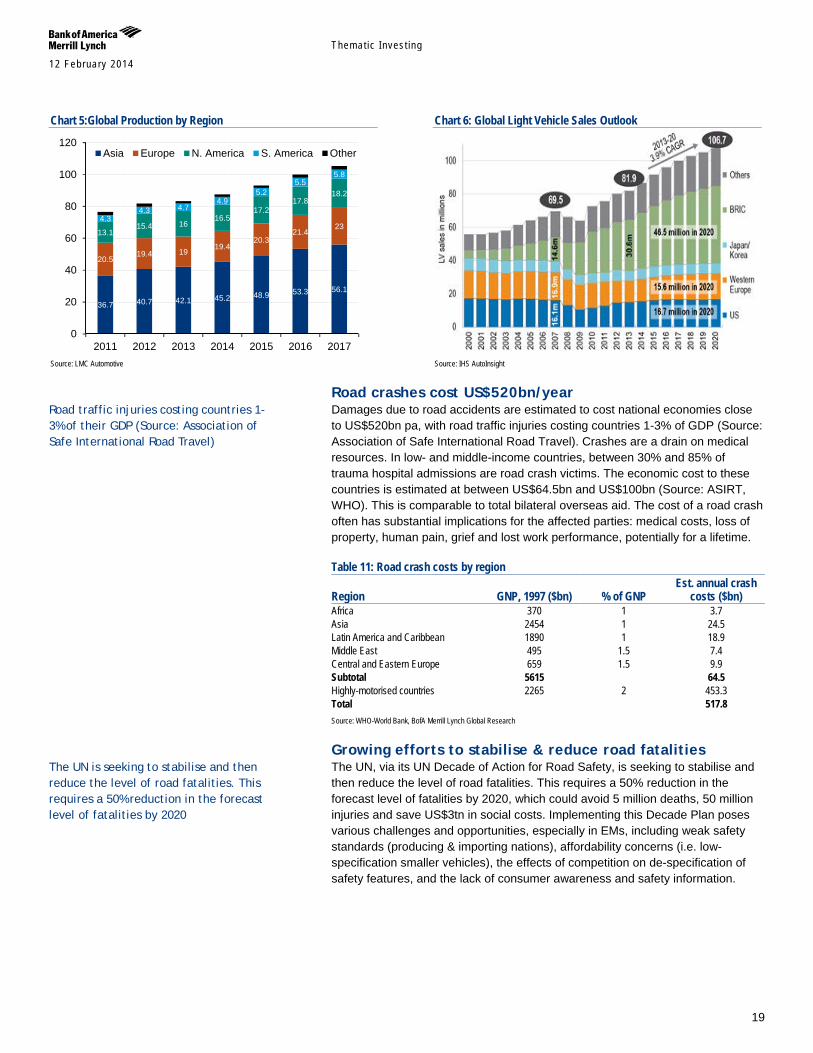
Chart 5:Global Production by Region
Source: LMC Automotive
Chart 6: Global Light Vehicle Sales Outlook
Source: IHS AutoInsight
Road crashes cost US$520bn/year Damages due to road accidents are estimated to cost national economies close to US$520bn pa, with road traffic injuries costing countries 1-3% of GDP (Source: Association of Safe International Road Travel). Crashes are a drain on medical resources. In low- and middle-income countries, between 30% and 85% of trauma hospital admissions are road crash victims. The economic cost to these countries is estimated at between US$64.5bn and US$100bn (Source: ASIRT, WHO). This is comparable to total bilateral overseas aid. The cost of a road crash often has substantial implications for the affected parties: medical costs, loss of property, human pain, grief and lost work performance, potentially for a lifetime.
Table 11: Road crash costs by region
Region GNP, 1997 ($bn) % of GNP Est. annual crash
costs ($bn) Africa 370 1 3.7 Asia 2454 1 24.5 Latin America and Caribbean 1890 1 18.9 Middle East 495 1.5 7.4 Central and Eastern Europe 659 1.5 9.9 Subtotal 5615 64.5 Highly-motorised countries 2265 2 453.3 Total 517.8 Source: WHO-World Bank, BofA Merrill Lynch Global Research
Growing efforts to stabilise & reduce road fatalities The UN, via its UN Decade of Action for Road Safety, is seeking to stabilise and then reduce the level of road fatalities. This requires a 50% reduction in the forecast level of fatalities by 2020, which could avoid 5 million deaths, 50 million injuries and save US$3tn in social costs. Implementing this Decade Plan poses various challenges and opportunities, especially in EMs, including weak safety standards (producing & importing nations), affordability concerns (i.e. low-specification smaller vehicles), the effects of competition on de-specification of safety features, and the lack of consumer awareness and safety information.
36.7 40.7 42.1 45.2 48.9 53.3 56.1
20.5 19.4 19 19.4
20.3 21.4
23 13.1
15.4 16 16.5
17.2 17.8
18.2
4.3 4.3 4.7
4.9 5.2
5.5 5.8
0
20
40
60
80
100
120
2011 2012 2013 2014 2015 2016 2017
Asia Europe N. America S. America Other
Road traffic injuries costing countries 1-3% of their GDP (Source: Association of Safe International Road Travel)
The UN is seeking to stabilise and then reduce the level of road fatalities. This requires a 50% reduction in the forecast level of fatalities by 2020
Themat ic Inves t ing 12 February 2014
20
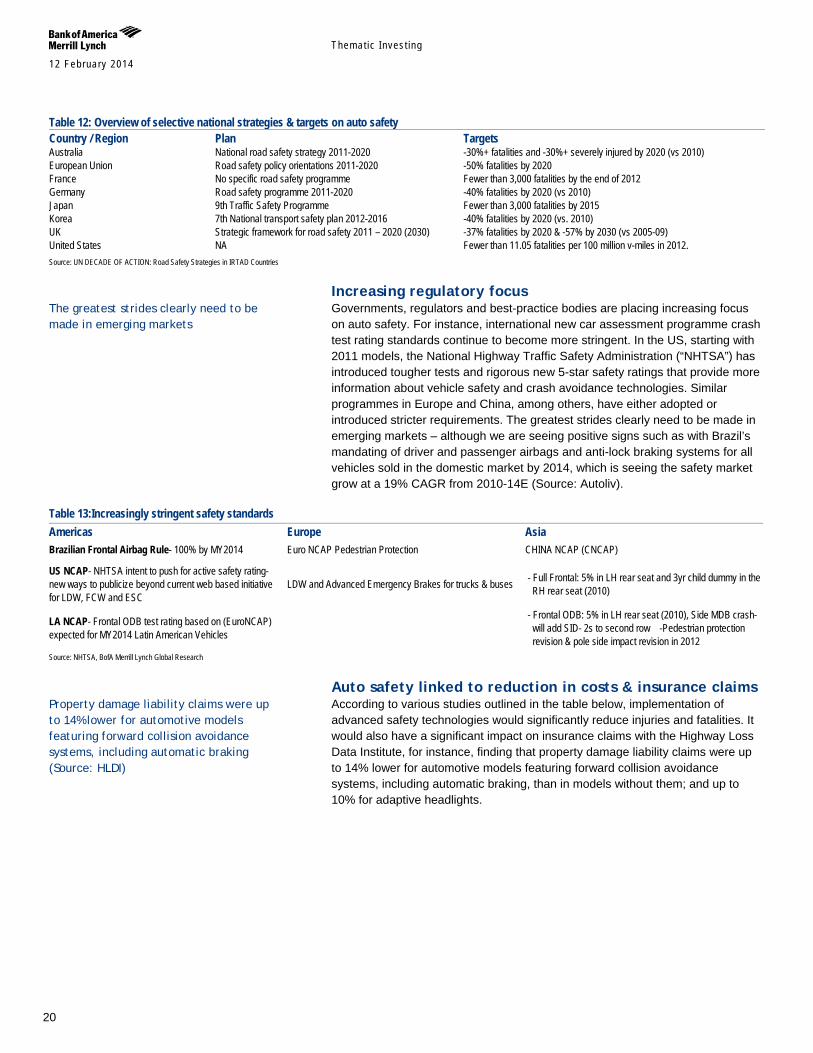
Table 12: Overview of selective national strategies & targets on auto safety Country / Region Plan Targets Australia National road safety strategy 2011-2020 -30%+ fatalities and -30%+ severely injured by 2020 (vs 2010) European Union Road safety policy orientations 2011-2020 -50% fatalities by 2020 France No specific road safety programme Fewer than 3,000 fatalities by the end of 2012 Germany Road safety programme 2011-2020 -40% fatalities by 2020 (vs 2010) Japan 9th Traffic Safety Programme Fewer than 3,000 fatalities by 2015 Korea 7th National transport safety plan 2012-2016 -40% fatalities by 2020 (vs. 2010) UK Strategic framework for road safety 2011 – 2020 (2030) -37% fatalities by 2020 & -57% by 2030 (vs 2005-09) United States NA Fewer than 11.05 fatalities per 100 million v-miles in 2012. Source: UN DECADE OF ACTION: Road Safety Strategies in IRTAD Countries
Increasing regulatory focus Governments, regulators and best-practice bodies are placing increasing focus on auto safety. For instance, international new car assessment programme crash test rating standards continue to become more stringent. In the US, starting with 2011 models, the National Highway Traffic Safety Administration (“NHTSA”) has introduced tougher tests and rigorous new 5-star safety ratings that provide more information about vehicle safety and crash avoidance technologies. Similar programmes in Europe and China, among others, have either adopted or introduced stricter requirements. The greatest strides clearly need to be made in emerging markets – although we are seeing positive signs such as with Brazil’s mandating of driver and passenger airbags and anti-lock braking systems for all vehicles sold in the domestic market by 2014, which is seeing the safety market grow at a 19% CAGR from 2010-14E (Source: Autoliv).
Table 13:Increasingly stringent safety standards Americas Europe Asia Brazilian Frontal Airbag Rule- 100% by MY2014 Euro NCAP Pedestrian Protection CHINA NCAP (CNCAP)
US NCAP- NHTSA intent to push for active safety rating- new ways to publicize beyond current web based initiative for LDW, FCW and ESC
LDW and Advanced Emergency Brakes for trucks & buses - Full Frontal: 5% in LH rear seat and 3yr child dummy in the RH rear seat (2010)
LA NCAP- Frontal ODB test rating based on (EuroNCAP) expected for MY2014 Latin American Vehicles
- Frontal ODB: 5% in LH rear seat (2010), Side MDB crash- will add SID- 2s to second row -Pedestrian protection revision & pole side impact revision in 2012
Source: NHTSA, BofA Merrill Lynch Global Research
Auto safety linked to reduction in costs & insurance claims According to various studies outlined in the table below, implementation of advanced safety technologies would significantly reduce injuries and fatalities. It would also have a significant impact on insurance claims with the Highway Loss Data Institute, for instance, finding that property damage liability claims were up to 14% lower for automotive models featuring forward collision avoidance systems, including automatic braking, than in models without them; and up to 10% for adaptive headlights.
The greatest strides clearly need to be made in emerging markets
Property damage liability claims were up to 14% lower for automotive models featuring forward collision avoidance systems, including automatic braking (Source: HLDI)
Themat ic Inves t ing 12 February 2014
21
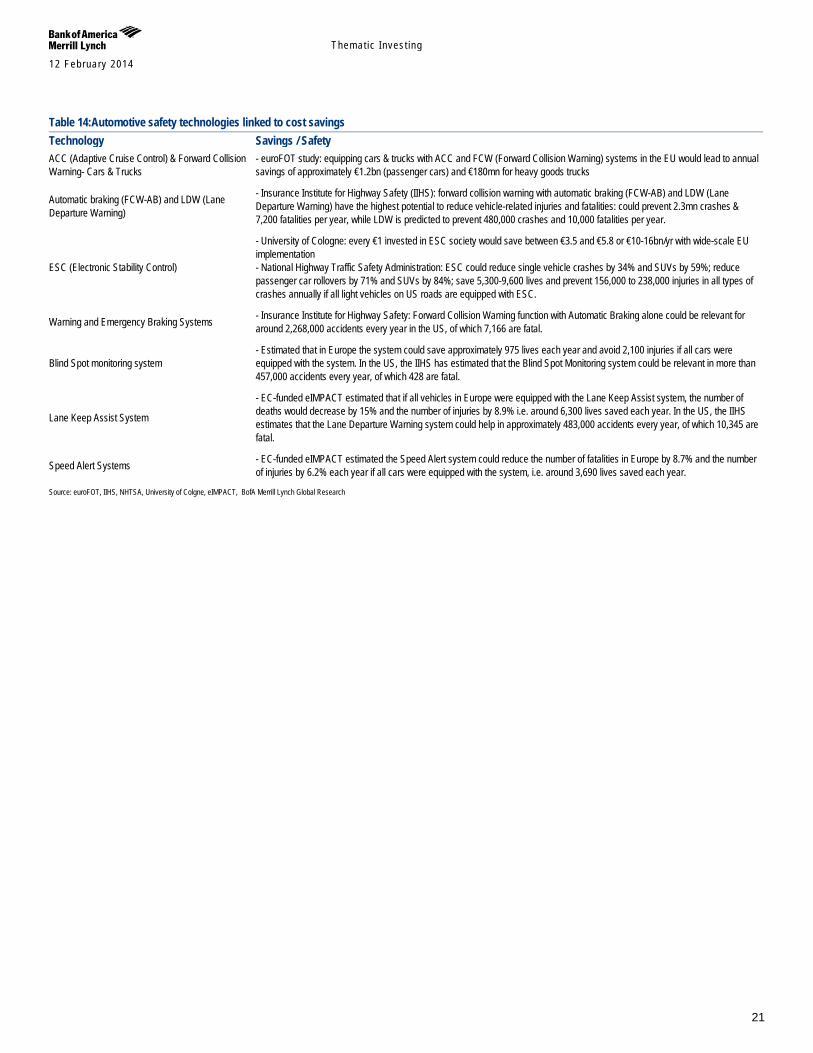
Table 14:Automotive safety technologies linked to cost savings Technology Savings / Safety ACC (Adaptive Cruise Control) & Forward Collision Warning- Cars & Trucks
- euroFOT study: equipping cars & trucks with ACC and FCW (Forward Collision Warning) systems in the EU would lead to annual savings of approximately €1.2bn (passenger cars) and €180mn for heavy goods trucks
Automatic braking (FCW-AB) and LDW (Lane Departure Warning)
- Insurance Institute for Highway Safety (IIHS): forward collision warning with automatic braking (FCW-AB) and LDW (Lane Departure Warning) have the highest potential to reduce vehicle-related injuries and fatalities: could prevent 2.3mn crashes & 7,200 fatalities per year, while LDW is predicted to prevent 480,000 crashes and 10,000 fatalities per year.
ESC (Electronic Stability Control)
- University of Cologne: every €1 invested in ESC society would save between €3.5 and €5.8 or €10-16bn/yr with wide-scale EU implementation - National Highway Traffic Safety Administration: ESC could reduce single vehicle crashes by 34% and SUVs by 59%; reduce passenger car rollovers by 71% and SUVs by 84%; save 5,300-9,600 lives and prevent 156,000 to 238,000 injuries in all types of crashes annually if all light vehicles on US roads are equipped with ESC.
Warning and Emergency Braking Systems - Insurance Institute for Highway Safety: Forward Collision Warning function with Automatic Braking alone could be relevant for around 2,268,000 accidents every year in the US, of which 7,166 are fatal.
Blind Spot monitoring system - Estimated that in Europe the system could save approximately 975 lives each year and avoid 2,100 injuries if all cars were equipped with the system. In the US, the IIHS has estimated that the Blind Spot Monitoring system could be relevant in more than 457,000 accidents every year, of which 428 are fatal.
Lane Keep Assist System
- EC-funded eIMPACT estimated that if all vehicles in Europe were equipped with the Lane Keep Assist system, the number of deaths would decrease by 15% and the number of injuries by 8.9% i.e. around 6,300 lives saved each year. In the US, the IIHS estimates that the Lane Departure Warning system could help in approximately 483,000 accidents every year, of which 10,345 are fatal.
Speed Alert Systems - EC-funded eIMPACT estimated the Speed Alert system could reduce the number of fatalities in Europe by 8.7% and the number of injuries by 6.2% each year if all cars were equipped with the system, i.e. around 3,690 lives saved each year.
Source: euroFOT, IIHS, NHTSA, University of Colgne, eIMPACT, BofA Merrill Lynch Global Research
Themat ic Inves t ing 12 February 2014
22
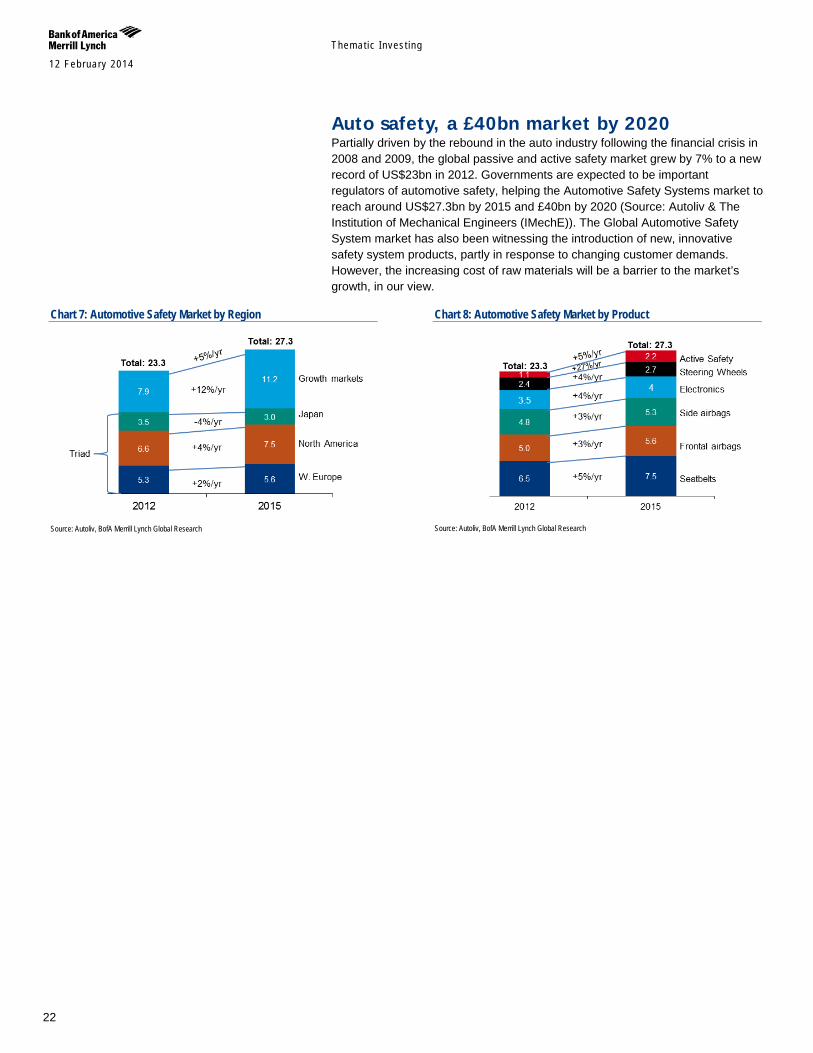
Auto safety, a £40bn market by 2020 Partially driven by the rebound in the auto industry following the financial crisis in 2008 and 2009, the global passive and active safety market grew by 7% to a new record of US$23bn in 2012. Governments are expected to be important regulators of automotive safety, helping the Automotive Safety Systems market to reach around US$27.3bn by 2015 and £40bn by 2020 (Source: Autoliv & The Institution of Mechanical Engineers (IMechE)). The Global Automotive Safety System market has also been witnessing the introduction of new, innovative safety system products, partly in response to changing customer demands. However, the increasing cost of raw materials will be a barrier to the market’s growth, in our view.
Chart 7: Automotive Safety Market by Region
Source: Autoliv, BofA Merrill Lynch Global Research
Chart 8: Automotive Safety Market by Product
Source: Autoliv, BofA Merrill Lynch Global Research
Themat ic Inves t ing 12 February 2014
23
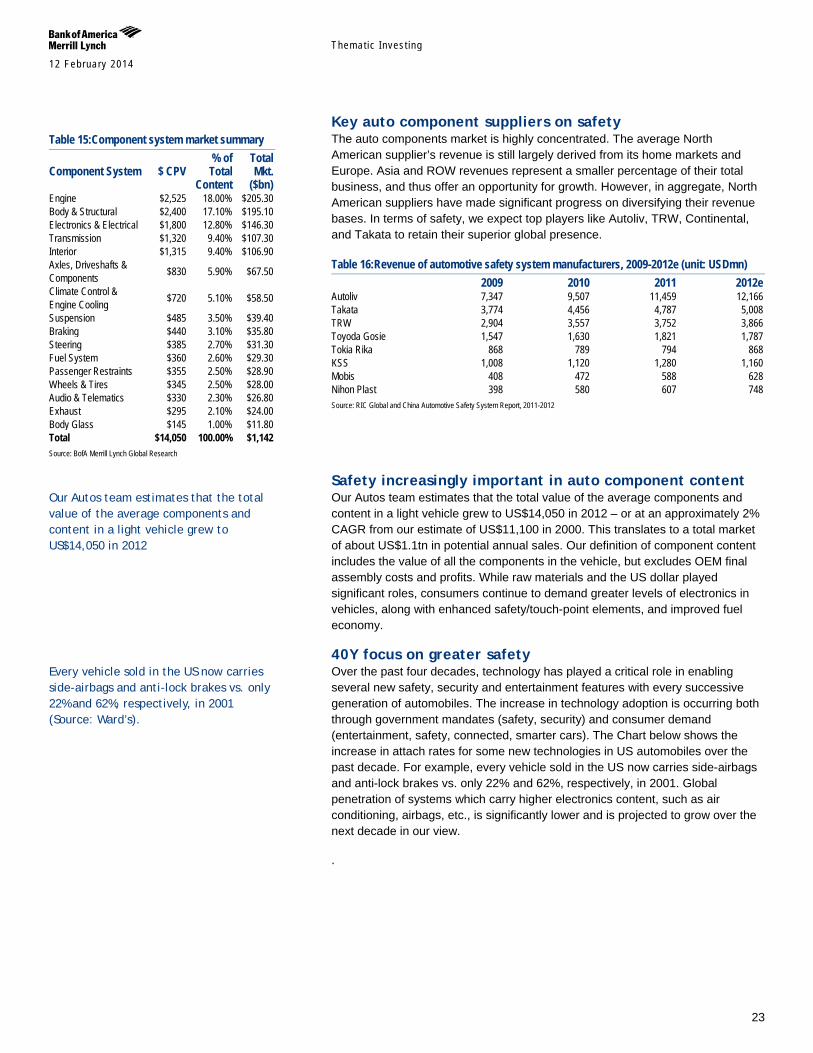
Key auto component suppliers on safety The auto components market is highly concentrated. The average North American supplier’s revenue is still largely derived from its home markets and Europe. Asia and ROW revenues represent a smaller percentage of their total business, and thus offer an opportunity for growth. However, in aggregate, North American suppliers have made significant progress on diversifying their revenue bases. In terms of safety, we expect top players like Autoliv, TRW, Continental, and Takata to retain their superior global presence.
Table 16:Revenue of automotive safety system manufacturers, 2009-2012e (unit: USDmn) 2009 2010 2011 2012e Autoliv 7,347 9,507 11,459 12,166 Takata 3,774 4,456 4,787 5,008 TRW 2,904 3,557 3,752 3,866 Toyoda Gosie 1,547 1,630 1,821 1,787 Tokia Rika 868 789 794 868 KSS 1,008 1,120 1,280 1,160 Mobis 408 472 588 628 Nihon Plast 398 580 607 748 Source: RIC Global and China Automotive Safety System Report, 2011-2012
Safety increasingly important in auto component content Our Autos team estimates that the total value of the average components and content in a light vehicle grew to US$14,050 in 2012 – or at an approximately 2% CAGR from our estimate of US$11,100 in 2000. This translates to a total market of about US$1.1tn in potential annual sales. Our definition of component content includes the value of all the components in the vehicle, but excludes OEM final assembly costs and profits. While raw materials and the US dollar played significant roles, consumers continue to demand greater levels of electronics in vehicles, along with enhanced safety/touch-point elements, and improved fuel economy.
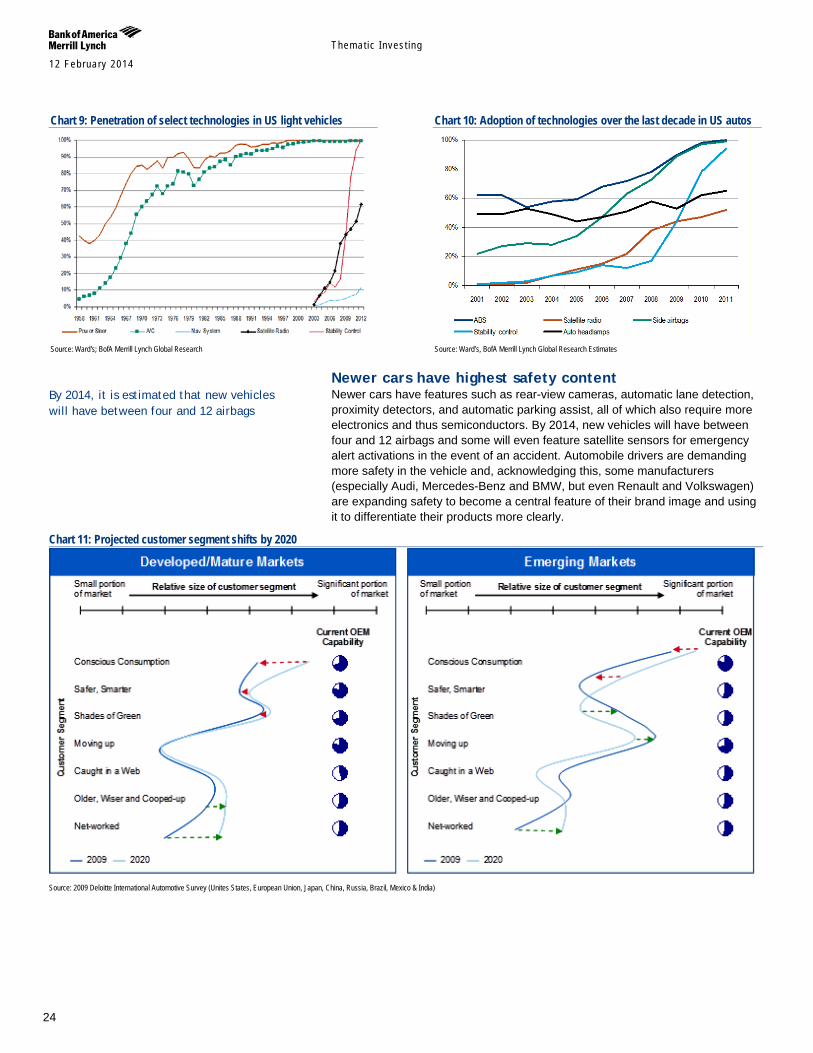
40Y focus on greater safety Over the past four decades, technology has played a critical role in enabling several new safety, security and entertainment features with every successive generation of automobiles. The increase in technology adoption is occurring both through government mandates (safety, security) and consumer demand (entertainment, safety, connected, smarter cars). The Chart below shows the increase in attach rates for some new technologies in US automobiles over the past decade. For example, every vehicle sold in the US now carries side-airbags and anti-lock brakes vs. only 22% and 62%, respectively, in 2001. Global penetration of systems which carry higher electronics content, such as air conditioning, airbags, etc., is significantly lower and is projected to grow over the next decade in our view.
.
Table 15:Component system market summary
Component System $ CPV % of Total
Content
Total Mkt.
($bn) Engine $2,525 18.00% $205.30 Body & Structural $2,400 17.10% $195.10 Electronics & Electrical $1,800 12.80% $146.30 Transmission $1,320 9.40% $107.30 Interior $1,315 9.40% $106.90 Axles, Driveshafts & Components $830 5.90% $67.50
Climate Control & Engine Cooling $720 5.10% $58.50
Suspension $485 3.50% $39.40 Braking $440 3.10% $35.80 Steering $385 2.70% $31.30 Fuel System $360 2.60% $29.30 Passenger Restraints $355 2.50% $28.90 Wheels & Tires $345 2.50% $28.00 Audio & Telematics $330 2.30% $26.80 Exhaust $295 2.10% $24.00 Body Glass $145 1.00% $11.80 Total $14,050 100.00% $1,142 Source: BofA Merrill Lynch Global Research
Our Autos team estimates that the total value of the average components and content in a light vehicle grew to US$14,050 in 2012
Every vehicle sold in the US now carries side-airbags and anti-lock brakes vs. only 22% and 62%, respectively, in 2001 (Source: Ward’s).
Themat ic Inves t ing 12 February 2014
24
Chart 9: Penetration of select technologies in US light vehicles
Source: Ward's; BofA Merrill Lynch Global Research
Chart 10: Adoption of technologies over the last decade in US autos
Source: Ward’s, BofA Merrill Lynch Global Research Estimates
Newer cars have highest safety content Newer cars have features such as rear-view cameras, automatic lane detection, proximity detectors, and automatic parking assist, all of which also require more electronics and thus semiconductors. By 2014, new vehicles will have between four and 12 airbags and some will even feature satellite sensors for emergency alert activations in the event of an accident. Automobile drivers are demanding more safety in the vehicle and, acknowledging this, some manufacturers (especially Audi, Mercedes-Benz and BMW, but even Renault and Volkswagen) are expanding safety to become a central feature of their brand image and using it to differentiate their products more clearly.
Chart 11: Projected customer segment shifts by 2020
Source: 2009 Deloitte International Automotive Survey (Unites States, European Union, Japan, China, Russia, Brazil, Mexico & India)
By 2014, it is estimated that new vehicles will have between four and 12 airbags
Themat ic Inves t ing 12 February 2014
25
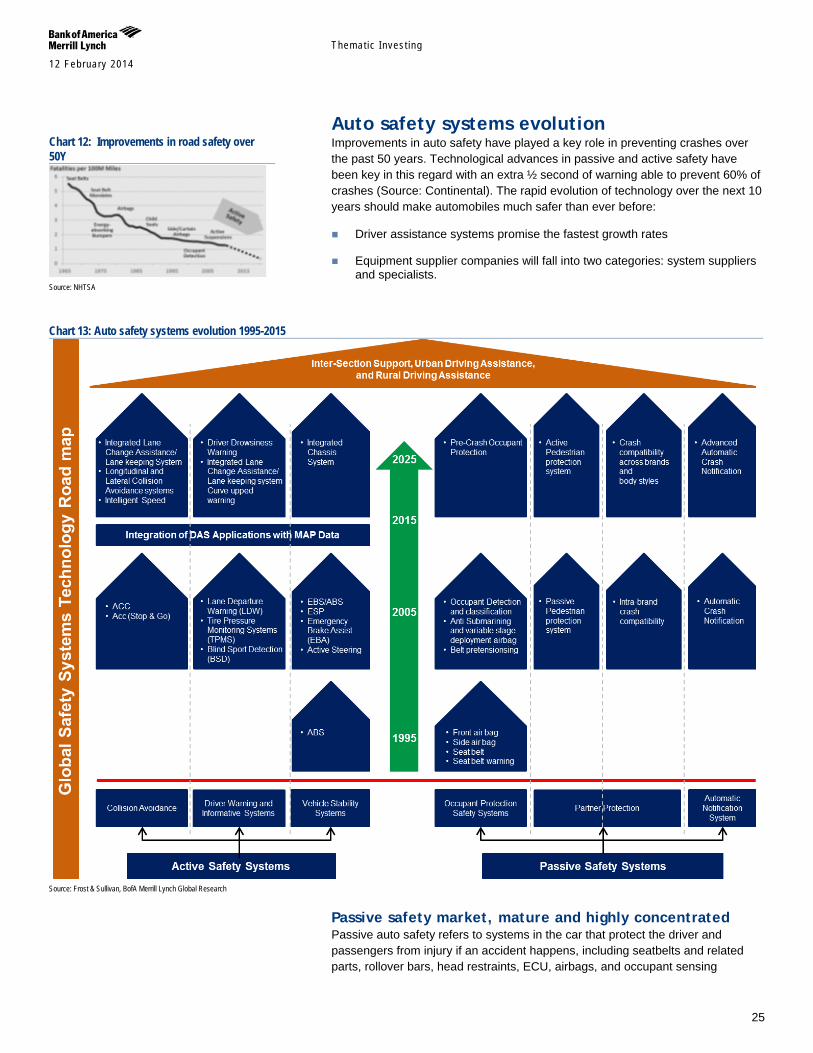
Auto safety systems evolution Improvements in auto safety have played a key role in preventing crashes over the past 50 years. Technological advances in passive and active safety have been key in this regard with an extra ½ second of warning able to prevent 60% of crashes (Source: Continental). The rapid evolution of technology over the next 10 years should make automobiles much safer than ever before:
Driver assistance systems promise the fastest growth rates
Equipment supplier companies will fall into two categories: system suppliers and specialists.
Chart 13: Auto safety systems evolution 1995-2015
Source: Frost & Sullivan, BofA Merrill Lynch Global Research
Passive safety market, mature and highly concentrated Passive auto safety refers to systems in the car that protect the driver and passengers from injury if an accident happens, including seatbelts and related parts, rollover bars, head restraints, ECU, airbags, and occupant sensing
Chart 12: Improvements in road safety over 50Y
Source: NHTSA
Themat ic Inves t ing 12 February 2014
26
systems. We estimate the safety restraint market to be worth about US$29bn and there is currently a high level of outsourcing.
Dominated by three players The passive safety market was largely consolidated during the 1990s, leading to the domination of several large players – Autoliv, TRW and Takata.
Side airbags & EMs are key drivers Growth is slowing as the market for traditional passive safety is becoming rather mature. The main growth drivers today are the rising penetration of side airbags and increased safety content in emerging markets. Other growth drivers include: the $39bn suspension market (suspension parts become more integrated with active safety systems); $US36bn braking market (active safety); and $31bn steering market (active safety).
Table 17:Passenger Restraints market Description Airbags, seat belts, safety electronics and other passive components Estimated % CPV $355 Estimated market size $28.9bn Current Outsourcing High Concentration Medium Growth Potential Low
Major trend Side airbags growth continues, increasing safety content per vehicle in emerging markets, active safety pervades other systems
Top five suppliers Autoliv, Hyundai Mobis, Takata Toyota Gosei/Tokai Rika, TRW Automotive Source: BofA Merrill Lynch Global Research
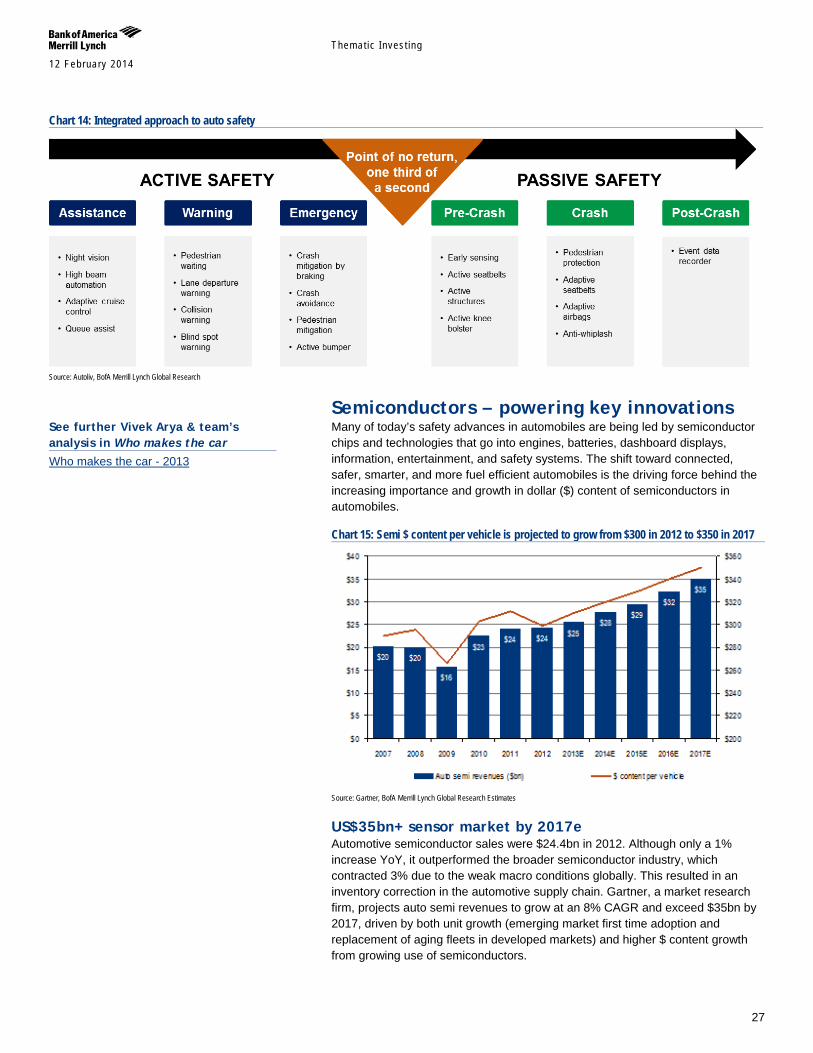
Active safety growing fastest Active safety refers to devices and systems that help keep a car under control and prevent an accident, including lane departure warning, blind spot detection, adaptive cruise control, radar and parking radar (e.g. LRR narrow band), infrared night vision (e.g. automatic animal detection), brake controls (integration with airbag ECU), and stereo vision (pedestrian detection), among others. These devices are usually automated to help compensate for human error, the single biggest cause of car accidents. Although the market size is currently limited, technological advances, government regulations and customer preferences should mean active safety forms an increasingly important part of the total auto safety market.
Increasingly integrated approach to safety Technological advances should blur the distinction between the active and passive segments of the automotive safety market over time.
Themat ic Inves t ing 12 February 2014
27
Chart 14: Integrated approach to auto safety
Source: Autoliv, BofA Merrill Lynch Global Research
Semiconductors – powering key innovations Many of today’s safety advances in automobiles are being led by semiconductor chips and technologies that go into engines, batteries, dashboard displays, information, entertainment, and safety systems. The shift toward connected, safer, smarter, and more fuel efficient automobiles is the driving force behind the increasing importance and growth in dollar ($) content of semiconductors in automobiles.
Chart 15: Semi $ content per vehicle is projected to grow from $300 in 2012 to $350 in 2017
Source: Gartner, BofA Merrill Lynch Global Research Estimates
US$35bn+ sensor market by 2017e Automotive semiconductor sales were $24.4bn in 2012. Although only a 1% increase YoY, it outperformed the broader semiconductor industry, which contracted 3% due to the weak macro conditions globally. This resulted in an inventory correction in the automotive supply chain. Gartner, a market research firm, projects auto semi revenues to grow at an 8% CAGR and exceed $35bn by 2017, driven by both unit growth (emerging market first time adoption and replacement of aging fleets in developed markets) and higher $ content growth from growing use of semiconductors.
See further Vivek Arya & team’s analysis in Who makes the car Who makes the car - 2013
Themat ic Inves t ing 12 February 2014
28
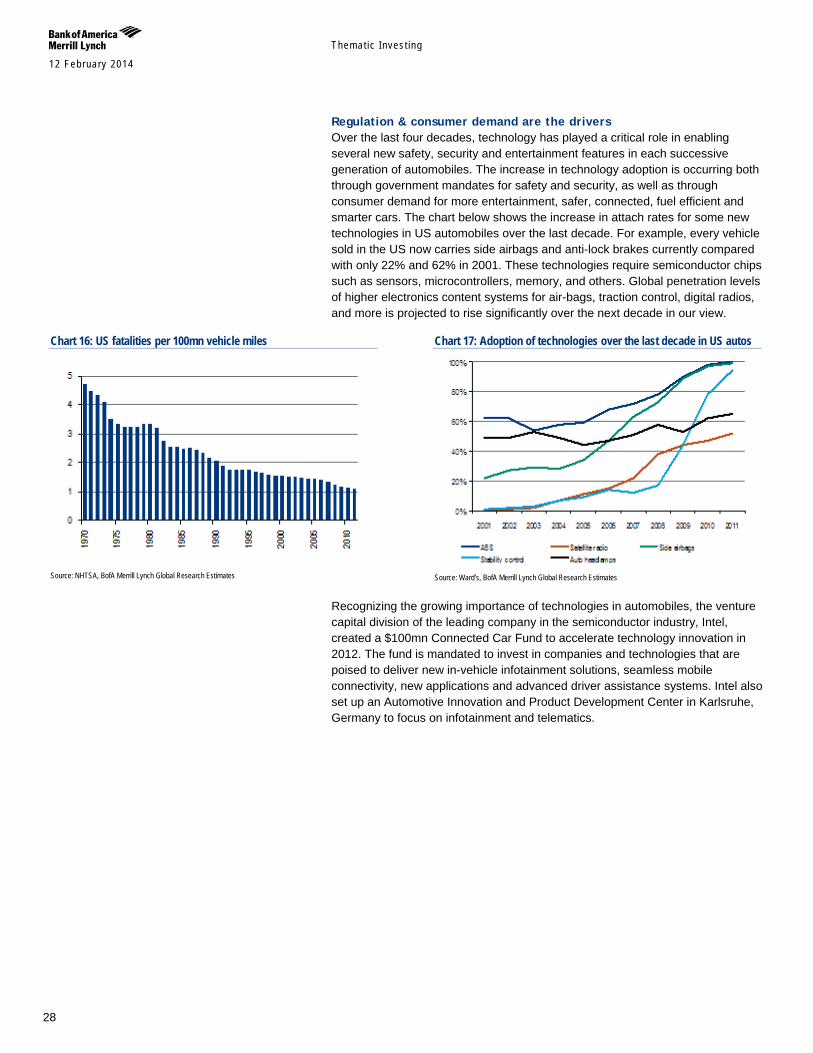
Regulation & consumer demand are the drivers Over the last four decades, technology has played a critical role in enabling several new safety, security and entertainment features in each successive generation of automobiles. The increase in technology adoption is occurring both through government mandates for safety and security, as well as through consumer demand for more entertainment, safer, connected, fuel efficient and smarter cars. The chart below shows the increase in attach rates for some new technologies in US automobiles over the last decade. For example, every vehicle sold in the US now carries side airbags and anti-lock brakes currently compared with only 22% and 62% in 2001. These technologies require semiconductor chips such as sensors, microcontrollers, memory, and others. Global penetration levels of higher electronics content systems for air-bags, traction control, digital radios, and more is projected to rise significantly over the next decade in our view.
Chart 16: US fatalities per 100mn vehicle miles
Source: NHTSA, BofA Merrill Lynch Global Research Estimates
Chart 17: Adoption of technologies over the last decade in US autos
Source: Ward’s, BofA Merrill Lynch Global Research Estimates
Recognizing the growing importance of technologies in automobiles, the venture capital division of the leading company in the semiconductor industry, Intel, created a $100mn Connected Car Fund to accelerate technology innovation in 2012. The fund is mandated to invest in companies and technologies that are poised to deliver new in-vehicle infotainment solutions, seamless mobile connectivity, new applications and advanced driver assistance systems. Intel also set up an Automotive Innovation and Product Development Center in Karlsruhe, Germany to focus on infotainment and telematics.
Themat ic Inves t ing 12 February 2014
29
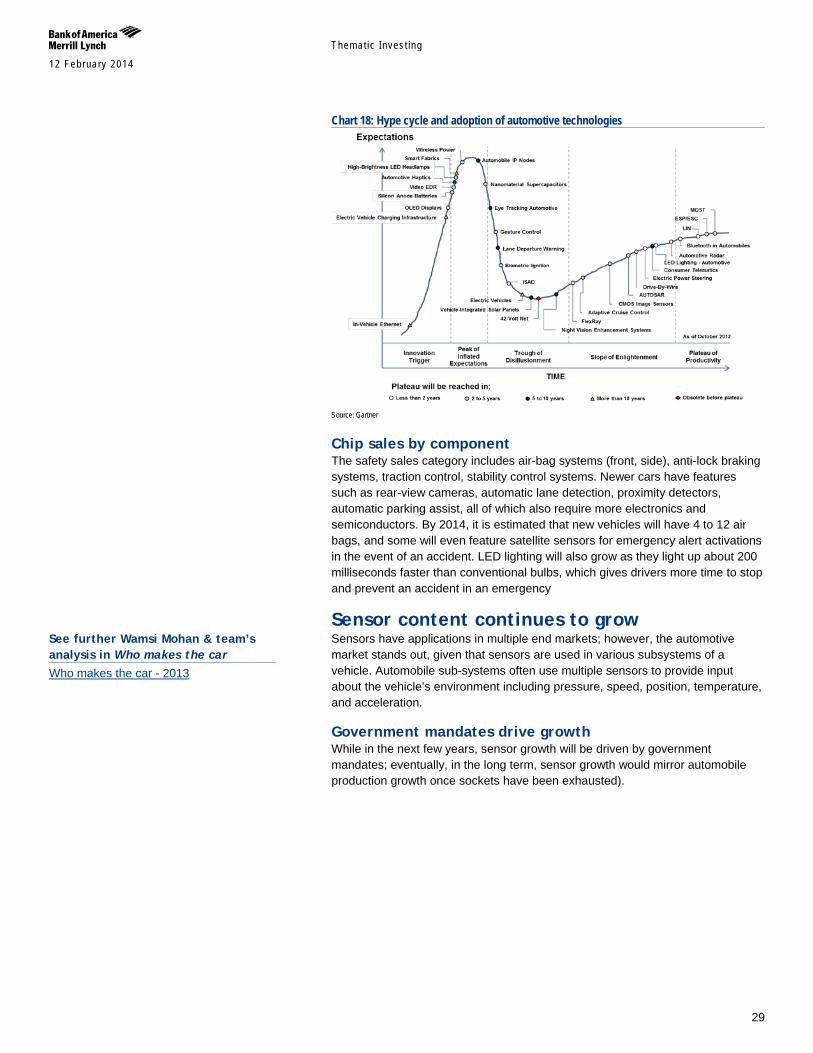
Chart 18: Hype cycle and adoption of automotive technologies
Source: Gartner
Chip sales by component The safety sales category includes air-bag systems (front, side), anti-lock braking systems, traction control, stability control systems. Newer cars have features such as rear-view cameras, automatic lane detection, proximity detectors, automatic parking assist, all of which also require more electronics and semiconductors. By 2014, it is estimated that new vehicles will have 4 to 12 air bags, and some will even feature satellite sensors for emergency alert activations in the event of an accident. LED lighting will also grow as they light up about 200 milliseconds faster than conventional bulbs, which gives drivers more time to stop and prevent an accident in an emergency
Sensor content continues to grow Sensors have applications in multiple end markets; however, the automotive market stands out, given that sensors are used in various subsystems of a vehicle. Automobile sub-systems often use multiple sensors to provide input about the vehicle’s environment including pressure, speed, position, temperature, and acceleration.
Government mandates drive growth While in the next few years, sensor growth will be driven by government mandates; eventually, in the long term, sensor growth would mirror automobile production growth once sockets have been exhausted).
See further Wamsi Mohan & team’s analysis in Who makes the car Who makes the car - 2013
Themat ic Inves t ing 12 February 2014
30
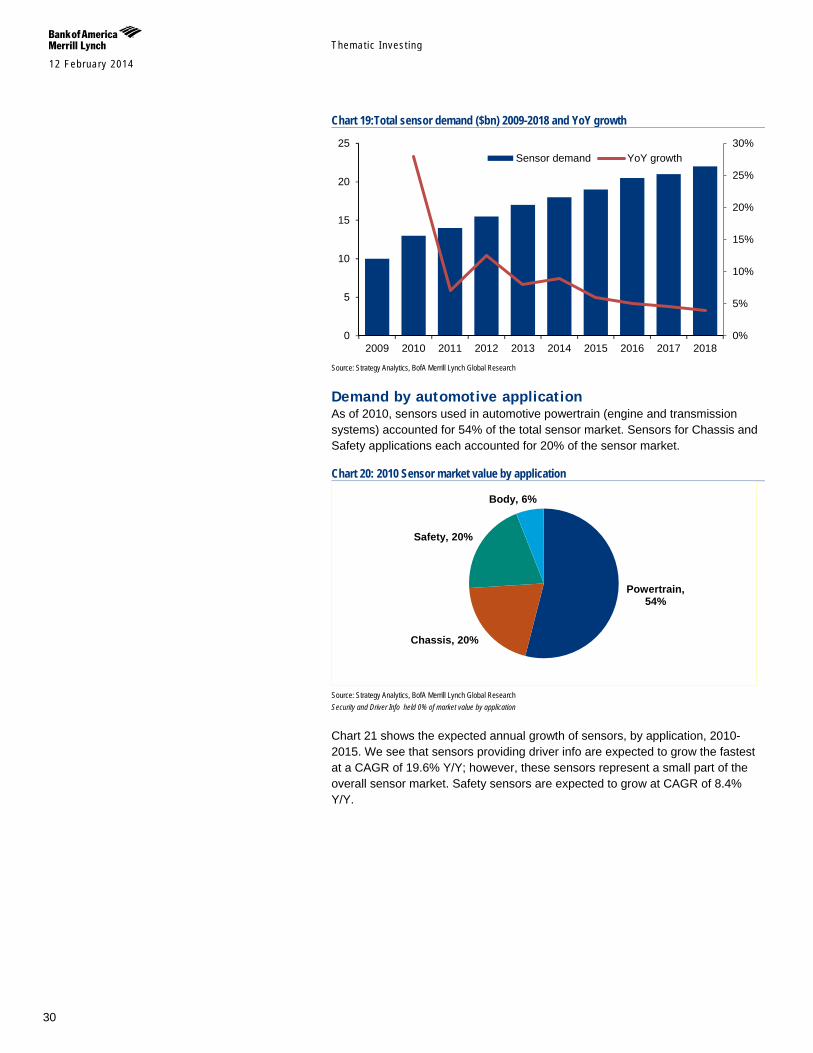
Chart 19:Total sensor demand ($bn) 2009-2018 and YoY growth
Source: Strategy Analytics, BofA Merrill Lynch Global Research
Demand by automotive application As of 2010, sensors used in automotive powertrain (engine and transmission systems) accounted for 54% of the total sensor market. Sensors for Chassis and Safety applications each accounted for 20% of the sensor market.
Chart 20: 2010 Sensor market value by application
Source: Strategy Analytics, BofA Merrill Lynch Global Research Security and Driver Info held 0% of market value by application
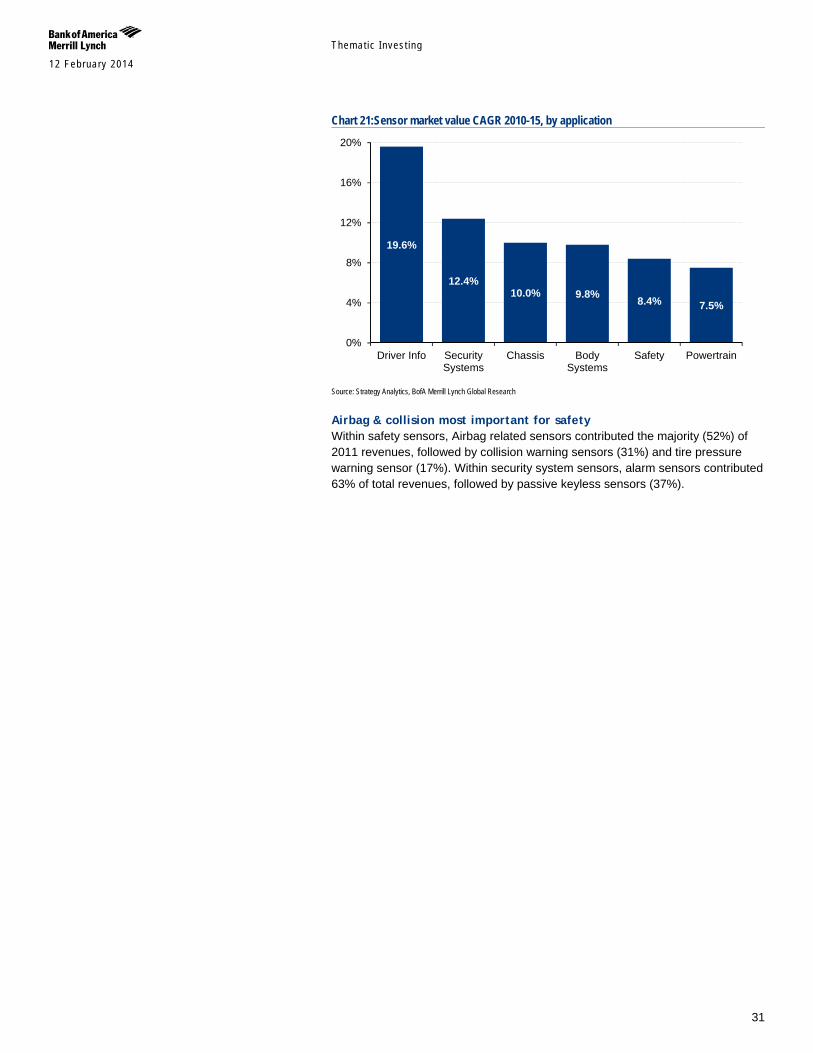
Chart 21 shows the expected annual growth of sensors, by application, 2010-2015. We see that sensors providing driver info are expected to grow the fastest at a CAGR of 19.6% Y/Y; however, these sensors represent a small part of the overall sensor market. Safety sensors are expected to grow at CAGR of 8.4% Y/Y.
0%
5%
10%
15%
20%
25%
30%
0
5
10
15
20
25
2009 2010 2011 2012 2013 2014 2015 2016 2017 2018
Sensor demand YoY growth
Powertrain, 54%
Chassis, 20%
Safety, 20%
Body, 6%
Themat ic Inves t ing 12 February 2014
31
Chart 21:Sensor market value CAGR 2010-15, by application
Source: Strategy Analytics, BofA Merrill Lynch Global Research
Airbag & collision most important for safety Within safety sensors, Airbag related sensors contributed the majority (52%) of 2011 revenues, followed by collision warning sensors (31%) and tire pressure warning sensor (17%). Within security system sensors, alarm sensors contributed 63% of total revenues, followed by passive keyless sensors (37%).
19.6%
12.4% 10.0% 9.8% 8.4% 7.5%
0%
4%
8%
12%
16%
20%
Driver Info SecuritySystems
Chassis BodySystems
Safety Powertrain
Themat ic Inves t ing 12 February 2014
32
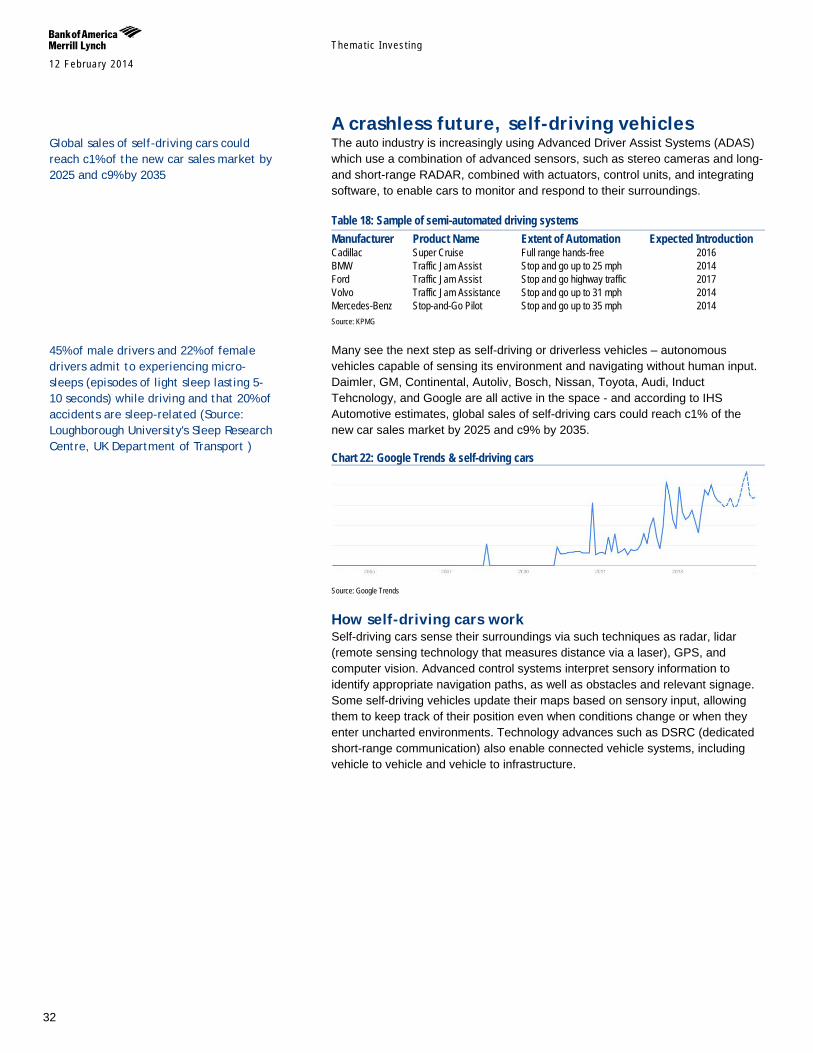
A crashless future, self-driving vehicles The auto industry is increasingly using Advanced Driver Assist Systems (ADAS) which use a combination of advanced sensors, such as stereo cameras and long- and short-range RADAR, combined with actuators, control units, and integrating software, to enable cars to monitor and respond to their surroundings.
Table 18: Sample of semi-automated driving systems Manufacturer Product Name Extent of Automation Expected Introduction Cadillac Super Cruise Full range hands-free 2016 BMW Traffic Jam Assist Stop and go up to 25 mph 2014 Ford Traffic Jam Assist Stop and go highway traffic 2017 Volvo Traffic Jam Assistance Stop and go up to 31 mph 2014 Mercedes-Benz Stop-and-Go Pilot Stop and go up to 35 mph 2014 Source: KPMG
Many see the next step as self-driving or driverless vehicles – autonomous vehicles capable of sensing its environment and navigating without human input. Daimler, GM, Continental, Autoliv, Bosch, Nissan, Toyota, Audi, Induct Tehcnology, and Google are all active in the space - and according to IHS Automotive estimates, global sales of self-driving cars could reach c1% of the new car sales market by 2025 and c9% by 2035.
Chart 22: Google Trends & self-driving cars
Source: Google Trends
How self-driving cars work Self-driving cars sense their surroundings via such techniques as radar, lidar (remote sensing technology that measures distance via a laser), GPS, and computer vision. Advanced control systems interpret sensory information to identify appropriate navigation paths, as well as obstacles and relevant signage. Some self-driving vehicles update their maps based on sensory input, allowing them to keep track of their position even when conditions change or when they enter uncharted environments. Technology advances such as DSRC (dedicated short-range communication) also enable connected vehicle systems, including vehicle to vehicle and vehicle to infrastructure.
Global sales of self-driving cars could reach c1% of the new car sales market by 2025 and c9% by 2035
45% of male drivers and 22% of female drivers admit to experiencing micro-sleeps (episodes of light sleep lasting 5-10 seconds) while driving and that 20% of accidents are sleep-related (Source: Loughborough University's Sleep Research Centre, UK Department of Transport )
Themat ic Inves t ing 12 February 2014
33
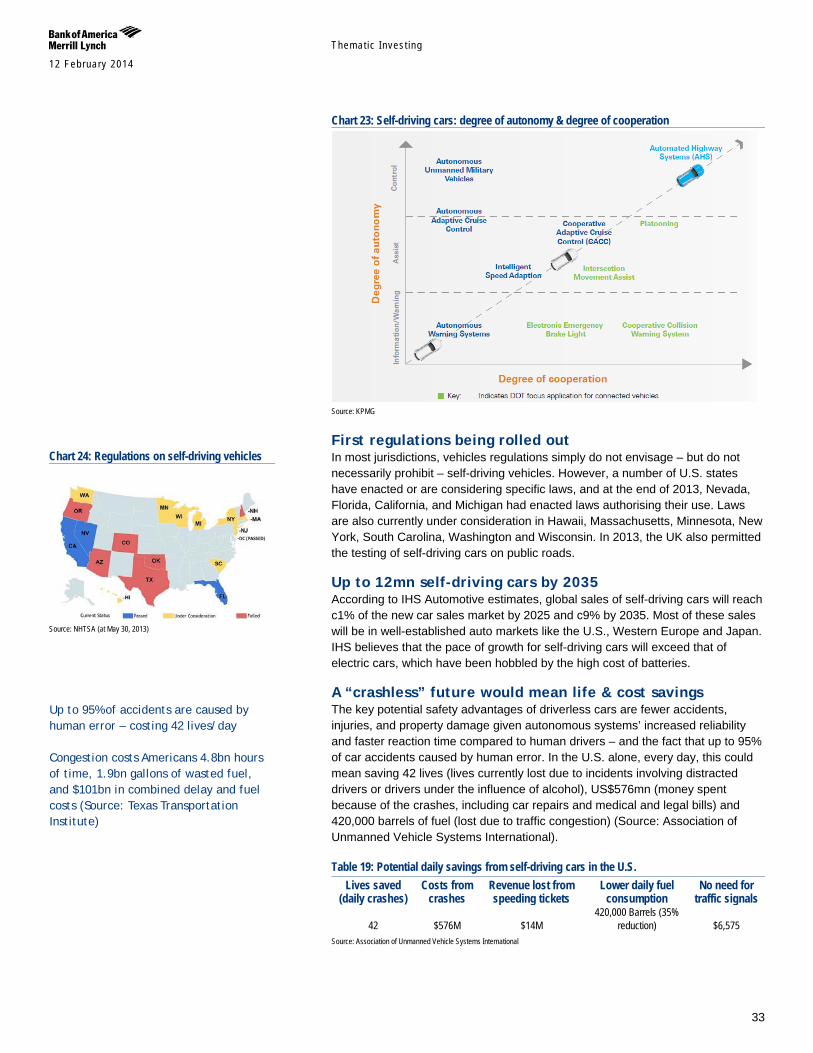
Chart 23: Self-driving cars: degree of autonomy & degree of cooperation
Source: KPMG
First regulations being rolled out In most jurisdictions, vehicles regulations simply do not envisage – but do not necessarily prohibit – self-driving vehicles. However, a number of U.S. states have enacted or are considering specific laws, and at the end of 2013, Nevada, Florida, California, and Michigan had enacted laws authorising their use. Laws are also currently under consideration in Hawaii, Massachusetts, Minnesota, New York, South Carolina, Washington and Wisconsin. In 2013, the UK also permitted the testing of self-driving cars on public roads.
Up to 12mn self-driving cars by 2035 According to IHS Automotive estimates, global sales of self-driving cars will reach c1% of the new car sales market by 2025 and c9% by 2035. Most of these sales will be in well-established auto markets like the U.S., Western Europe and Japan. IHS believes that the pace of growth for self-driving cars will exceed that of electric cars, which have been hobbled by the high cost of batteries.
A “crashless” future would mean life & cost savings The key potential safety advantages of driverless cars are fewer accidents, injuries, and property damage given autonomous systems’ increased reliability and faster reaction time compared to human drivers – and the fact that up to 95% of car accidents caused by human error. In the U.S. alone, every day, this could mean saving 42 lives (lives currently lost due to incidents involving distracted drivers or drivers under the influence of alcohol), US$576mn (money spent because of the crashes, including car repairs and medical and legal bills) and 420,000 barrels of fuel (lost due to traffic congestion) (Source: Association of Unmanned Vehicle Systems International).
Table 19: Potential daily savings from self-driving cars in the U.S. Lives saved
(daily crashes) Costs from
crashes Revenue lost from speeding tickets
Lower daily fuel consumption
No need for traffic signals
42 $576M $14M 420,000 Barrels (35%
reduction) $6,575 Source: Association of Unmanned Vehicle Systems International
Chart 24: Regulations on self-driving vehicles
Source: NHTSA (at May 30, 2013)
Up to 95% of accidents are caused by human error – costing 42 lives/day Congestion costs Americans 4.8bn hours of time, 1.9bn gallons of wasted fuel, and $101bn in combined delay and fuel costs (Source: Texas Transportation Institute)
Themat ic Inves t ing 12 February 2014
34
Major implications for safety technologies & insurers The move to self-driving vehicles could fundamentally shift the focus of auto safety away from crash worthiness – and significantly reduce amounts of structural steel, roll cages, and air bags, among other safety features – making vehicles much lighter and more fuel efficient. It could have a large effect on the insurance industry – potentially changing underwriting models (which are based on driver behaviour) by shifting the liability of accidents to manufacturers, and it could even eventually end the need for car insurance (Source: KPMG).
Many challenges remain Self-driving vehicles are not without their issues and some of the potential concerns raised include: liability for damage, IT/software reliability, cyber-security, lack of regulation, over-reliance on automation reducing manual driving skills, and reduced business and job losses (e.g. drivers, parking attendants, accident and emergency services, lawyers, insurance). Cost also remains an issue – with surveys showing that up to 60% of consumers expressing positive sentiments on self-driving cars, but the numbers dropping off if additional costs are invoked.
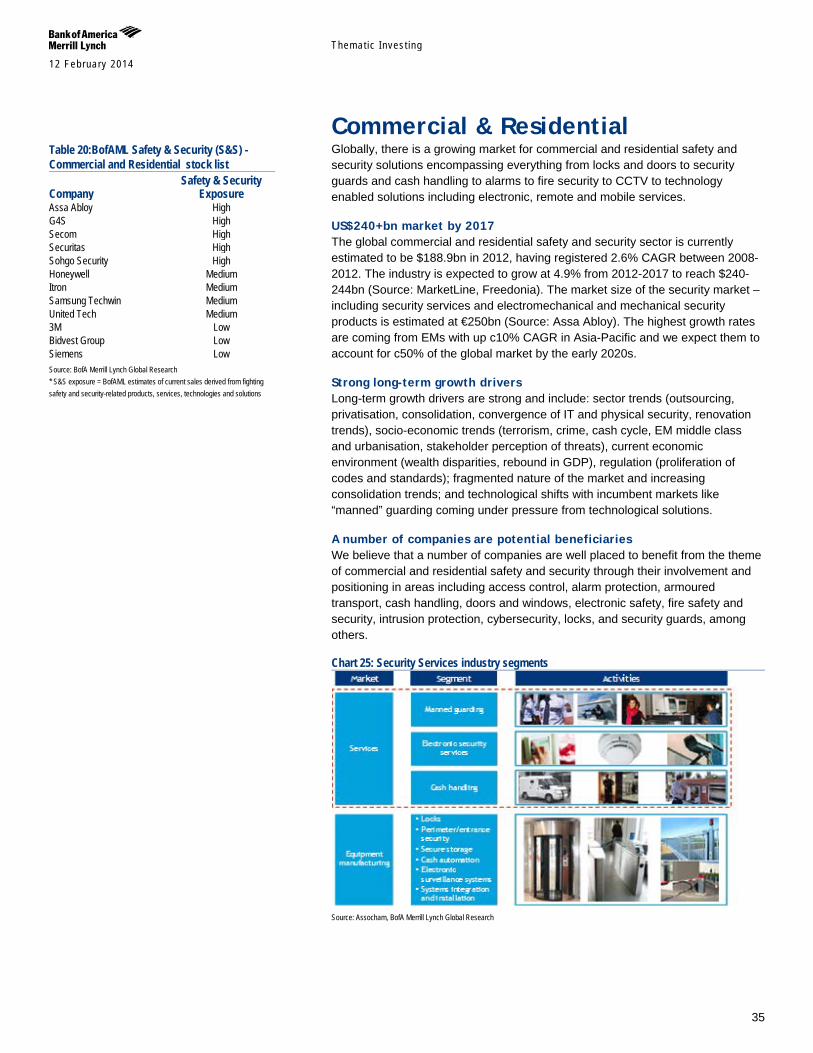
Themat ic Inves t ing 12 February 2014
35
Commercial & Residential Globally, there is a growing market for commercial and residential safety and security solutions encompassing everything from locks and doors to security guards and cash handling to alarms to fire security to CCTV to technology enabled solutions including electronic, remote and mobile services.
US$240+bn market by 2017 The global commercial and residential safety and security sector is currently estimated to be $188.9bn in 2012, having registered 2.6% CAGR between 2008-2012. The industry is expected to grow at 4.9% from 2012-2017 to reach $240-244bn (Source: MarketLine, Freedonia). The market size of the security market – including security services and electromechanical and mechanical security products is estimated at €250bn (Source: Assa Abloy). The highest growth rates are coming from EMs with up c10% CAGR in Asia-Pacific and we expect them to account for c50% of the global market by the early 2020s.
Strong long-term growth drivers Long-term growth drivers are strong and include: sector trends (outsourcing, privatisation, consolidation, convergence of IT and physical security, renovation trends), socio-economic trends (terrorism, crime, cash cycle, EM middle class and urbanisation, stakeholder perception of threats), current economic environment (wealth disparities, rebound in GDP), regulation (proliferation of codes and standards); fragmented nature of the market and increasing consolidation trends; and technological shifts with incumbent markets like “manned” guarding coming under pressure from technological solutions.
A number of companies are potential beneficiaries We believe that a number of companies are well placed to benefit from the theme of commercial and residential safety and security through their involvement and positioning in areas including access control, alarm protection, armoured transport, cash handling, doors and windows, electronic safety, fire safety and security, intrusion protection, cybersecurity, locks, and security guards, among others.
Chart 25: Security Services industry segments
Source: Assocham, BofA Merrill Lynch Global Research
Table 20:BofAML Safety & Security (S&S) - Commercial and Residential stock list Safety & Security Company Exposure Assa Abloy High G4S High Secom High Securitas High Sohgo Security High Honeywell Medium Itron Medium Samsung Techwin Medium United Tech Medium 3M Low Bidvest Group Low Siemens Low Source: BofA Merrill Lynch Global Research * S&S exposure = BofAML estimates of current sales derived from fighting safety and security-related products, services, technologies and solutions
Themat ic Inves t ing 12 February 2014
36
US$240bn+ industry by 2017E The global commercial and residential safety and security sector was worth an estimated US$188.9bn in 2012, having registered 2.6% CAGR from 2008-2012. The industry is expected to record 4.9% CAGR from 2012-17 to US$240-244bn (Source: MarketLine, Freedonia). Assa Abloy estimates the value of the security market, including security services and electromechanical and mechanical security products, at €250bn. The highest growth rates are coming from EMs with up c10% CAGR in Asia-Pacific and we expect them to account for c50% of the global market by the early 2020s.
Strong l/t growth drivers Long-term growth drivers include sector trends (outsourcing, privatisation, consolidation, convergence of IT and physical security), socio-economic trends (terrorism, crime, cash cycle, EM middle class expansion and urbanisation, stakeholder perception of threats), and the current economic environment (wealth disparities, rebound in GDP). See below for the demand drivers in more detail:
Increased privatisation & outsourcing – many countries are choosing to outsource their security service needs to private organisations. The main aim is to control or reduce public spending and, sometimes, to open the market for competition.
Continued industrialisation – an increase in industrial activity leads to the creation of new factories and offices with their own specific security needs.
Increased urbanisation – globally, urbanization leads to greater population density and social differences. This disparity can give rise to social tension and insecurity, creating a need for additional security services.
Growing middle class – to some extent in mature markets, but particularly in developing markets, an increase in disposable income and personal net worth is seeing more people coming out of poverty and forming a growing middle class. As people have more to protect and can afford to do so, this fuels demand for security services.
Investment in infrastructure – investments in real estate, public transport, public logistic hubs and other infrastructure create a need to safeguard these assets, in turn increasing demand for security services.
Renovation nation – more than a quarter (approximately 17 million) of US homes were built prior to 2002 and may require updated fire safety equipment (Source: Kidde).
Technological shifts - with incumbent markets like “manned” guarding coming under pressure from remote and mobile solutions.
Globalisation - Expanding foreign trade and rising immigration stimulates increased transport of people and cargo. Growth in air, rail, road and maritime transport increases the risk of security breaches. (Source:OECD)
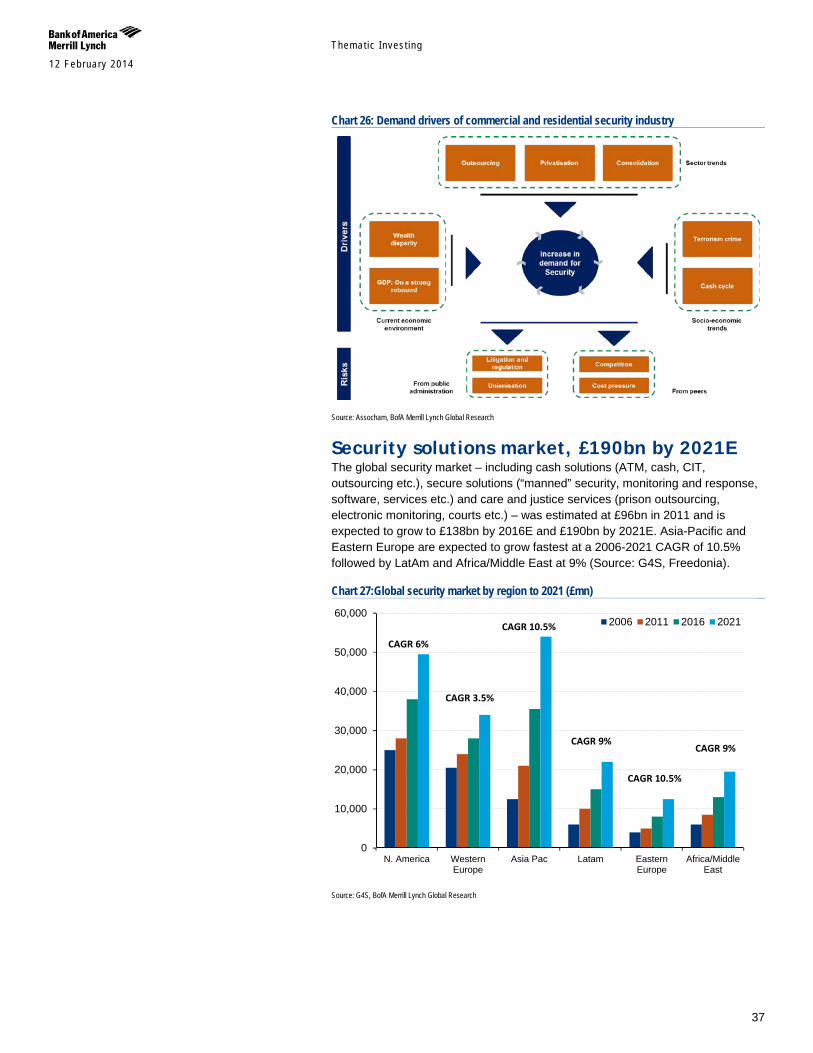
Themat ic Inves t ing 12 February 2014
37
Chart 26: Demand drivers of commercial and residential security industry
Source: Assocham, BofA Merrill Lynch Global Research
Security solutions market, £190bn by 2021E The global security market – including cash solutions (ATM, cash, CIT, outsourcing etc.), secure solutions (“manned” security, monitoring and response, software, services etc.) and care and justice services (prison outsourcing, electronic monitoring, courts etc.) – was estimated at £96bn in 2011 and is expected to grow to £138bn by 2016E and £190bn by 2021E. Asia-Pacific and Eastern Europe are expected to grow fastest at a 2006-2021 CAGR of 10.5% followed by LatAm and Africa/Middle East at 9% (Source: G4S, Freedonia).
Chart 27:Global security market by region to 2021 (£mn)
Source: G4S, BofA Merrill Lynch Global Research
0
10,000
20,000
30,000
40,000
50,000
60,000
N. America WesternEurope
Asia Pac Latam EasternEurope
Africa/MiddleEast
2006 2011 2016 2021
CAGR 9%
CAGR 6%
CAGR 3.5%
CAGR 10.5%
CAGR 9%
CAGR 10.5%
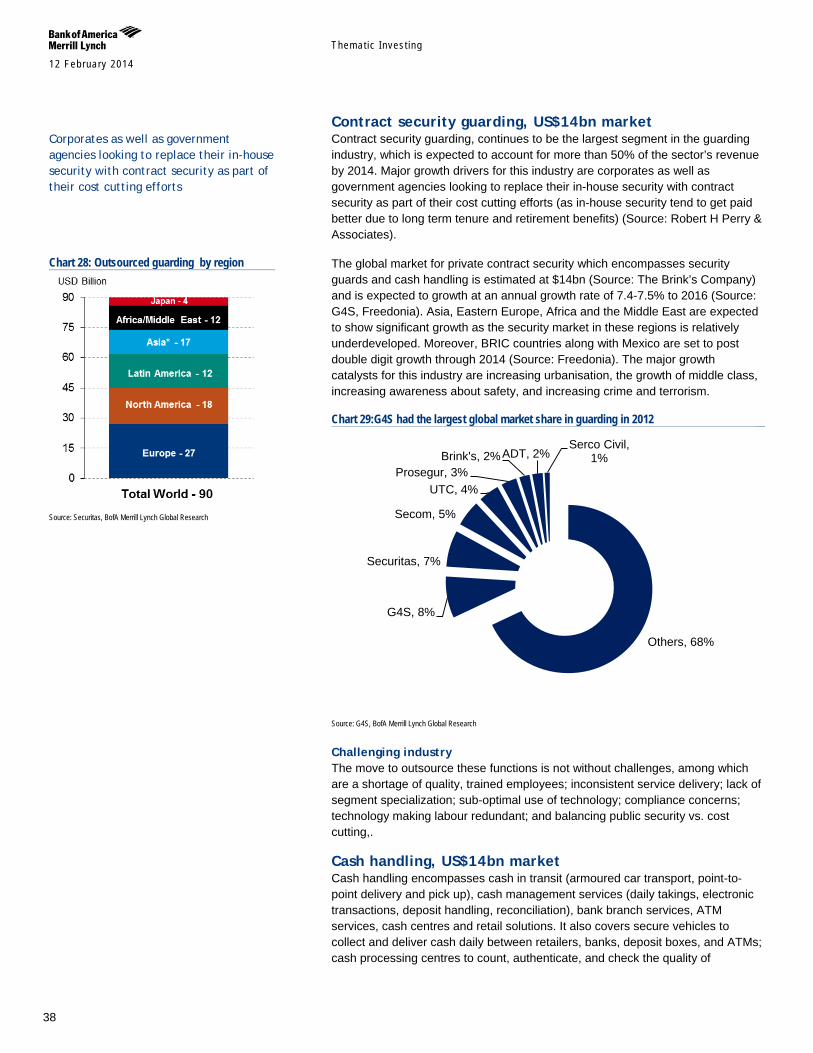
Themat ic Inves t ing 12 February 2014
38
Contract security guarding, US$14bn market Contract security guarding, continues to be the largest segment in the guarding industry, which is expected to account for more than 50% of the sector’s revenue by 2014. Major growth drivers for this industry are corporates as well as government agencies looking to replace their in-house security with contract security as part of their cost cutting efforts (as in-house security tend to get paid better due to long term tenure and retirement benefits) (Source: Robert H Perry & Associates).
The global market for private contract security which encompasses security guards and cash handling is estimated at $14bn (Source: The Brink’s Company) and is expected to growth at an annual growth rate of 7.4-7.5% to 2016 (Source: G4S, Freedonia). Asia, Eastern Europe, Africa and the Middle East are expected to show significant growth as the security market in these regions is relatively underdeveloped. Moreover, BRIC countries along with Mexico are set to post double digit growth through 2014 (Source: Freedonia). The major growth catalysts for this industry are increasing urbanisation, the growth of middle class, increasing awareness about safety, and increasing crime and terrorism.
Chart 29:G4S had the largest global market share in guarding in 2012
Source: G4S, BofA Merrill Lynch Global Research
Challenging industry The move to outsource these functions is not without challenges, among which are a shortage of quality, trained employees; inconsistent service delivery; lack of segment specialization; sub-optimal use of technology; compliance concerns; technology making labour redundant; and balancing public security vs. cost cutting,.
Cash handling, US$14bn market Cash handling encompasses cash in transit (armoured car transport, point-to-point delivery and pick up), cash management services (daily takings, electronic transactions, deposit handling, reconciliation), bank branch services, ATM services, cash centres and retail solutions. It also covers secure vehicles to collect and deliver cash daily between retailers, banks, deposit boxes, and ATMs; cash processing centres to count, authenticate, and check the quality of
Others, 68%
G4S, 8%
Securitas, 7%
Secom, 5%
UTC, 4% Prosegur, 3%
Brink's, 2% ADT, 2% Serco Civil,
1%
Corporates as well as government agencies looking to replace their in-house security with contract security as part of their cost cutting efforts
Chart 28: Outsourced guarding by region
Source: Securitas, BofA Merrill Lynch Global Research
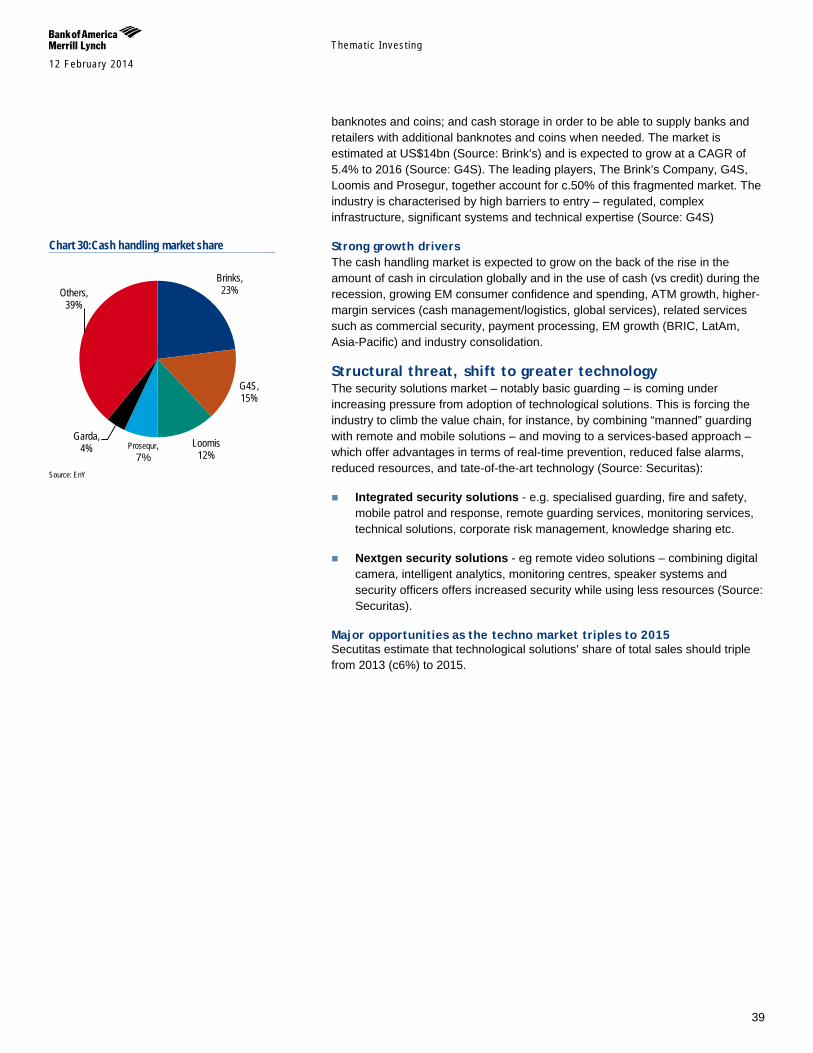
Themat ic Inves t ing 12 February 2014
39
banknotes and coins; and cash storage in order to be able to supply banks and retailers with additional banknotes and coins when needed. The market is estimated at US$14bn (Source: Brink’s) and is expected to grow at a CAGR of 5.4% to 2016 (Source: G4S). The leading players, The Brink’s Company, G4S, Loomis and Prosegur, together account for c.50% of this fragmented market. The industry is characterised by high barriers to entry – regulated, complex infrastructure, significant systems and technical expertise (Source: G4S)
Strong growth drivers The cash handling market is expected to grow on the back of the rise in the amount of cash in circulation globally and in the use of cash (vs credit) during the recession, growing EM consumer confidence and spending, ATM growth, higher-margin services (cash management/logistics, global services), related services such as commercial security, payment processing, EM growth (BRIC, LatAm, Asia-Pacific) and industry consolidation.
Structural threat, shift to greater technology The security solutions market – notably basic guarding – is coming under increasing pressure from adoption of technological solutions. This is forcing the industry to climb the value chain, for instance, by combining “manned” guarding with remote and mobile solutions – and moving to a services-based approach – which offer advantages in terms of real-time prevention, reduced false alarms, reduced resources, and tate-of-the-art technology (Source: Securitas):
Integrated security solutions - e.g. specialised guarding, fire and safety, mobile patrol and response, remote guarding services, monitoring services, technical solutions, corporate risk management, knowledge sharing etc.
Nextgen security solutions - eg remote video solutions – combining digital camera, intelligent analytics, monitoring centres, speaker systems and security officers offers increased security while using less resources (Source: Securitas).
Major opportunities as the techno market triples to 2015 Secutitas estimate that technological solutions’ share of total sales should triple from 2013 (c6%) to 2015.
Chart 30:Cash handling market share
Source: EnY
Brinks, 23%
G4S, 15%
Loomis 12%
Prosequr, 7%
Garda, 4%
Others, 39%
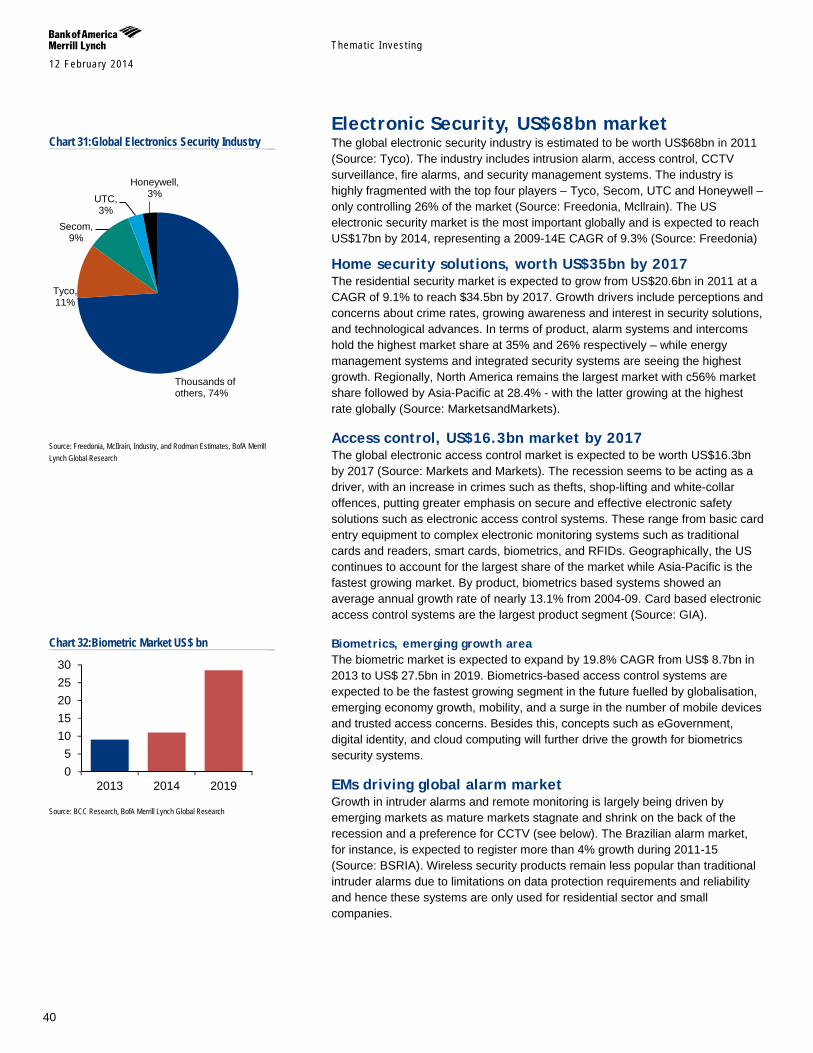
Themat ic Inves t ing 12 February 2014
40
Electronic Security, US$68bn market The global electronic security industry is estimated to be worth US$68bn in 2011 (Source: Tyco). The industry includes intrusion alarm, access control, CCTV surveillance, fire alarms, and security management systems. The industry is highly fragmented with the top four players – Tyco, Secom, UTC and Honeywell – only controlling 26% of the market (Source: Freedonia, Mcllrain). The US electronic security market is the most important globally and is expected to reach US$17bn by 2014, representing a 2009-14E CAGR of 9.3% (Source: Freedonia)
Home security solutions, worth US$35bn by 2017 The residential security market is expected to grow from US$20.6bn in 2011 at a CAGR of 9.1% to reach $34.5bn by 2017. Growth drivers include perceptions and concerns about crime rates, growing awareness and interest in security solutions, and technological advances. In terms of product, alarm systems and intercoms hold the highest market share at 35% and 26% respectively – while energy management systems and integrated security systems are seeing the highest growth. Regionally, North America remains the largest market with c56% market share followed by Asia-Pacific at 28.4% - with the latter growing at the highest rate globally (Source: MarketsandMarkets).
Access control, US$16.3bn market by 2017 The global electronic access control market is expected to be worth US$16.3bn by 2017 (Source: Markets and Markets). The recession seems to be acting as a driver, with an increase in crimes such as thefts, shop-lifting and white-collar offences, putting greater emphasis on secure and effective electronic safety solutions such as electronic access control systems. These range from basic card entry equipment to complex electronic monitoring systems such as traditional cards and readers, smart cards, biometrics, and RFIDs. Geographically, the US continues to account for the largest share of the market while Asia-Pacific is the fastest growing market. By product, biometrics based systems showed an average annual growth rate of nearly 13.1% from 2004-09. Card based electronic access control systems are the largest product segment (Source: GIA).
Biometrics, emerging growth area The biometric market is expected to expand by 19.8% CAGR from US$ 8.7bn in 2013 to US$ 27.5bn in 2019. Biometrics-based access control systems are expected to be the fastest growing segment in the future fuelled by globalisation, emerging economy growth, mobility, and a surge in the number of mobile devices and trusted access concerns. Besides this, concepts such as eGovernment, digital identity, and cloud computing will further drive the growth for biometrics security systems.
EMs driving global alarm market Growth in intruder alarms and remote monitoring is largely being driven by emerging markets as mature markets stagnate and shrink on the back of the recession and a preference for CCTV (see below). The Brazilian alarm market, for instance, is expected to register more than 4% growth during 2011-15 (Source: BSRIA). Wireless security products remain less popular than traditional intruder alarms due to limitations on data protection requirements and reliability and hence these systems are only used for residential sector and small companies.
Chart 31:Global Electronics Security Industry
Source: Freedonia, McIIrain, Industry, and Rodman Estimates, BofA Merrill Lynch Global Research
Chart 32:Biometric Market US$ bn
Source: BCC Research, BofA Merrill Lynch Global Research
Tyco, 11%
Secom, 9%
UTC, 3%
Honeywell, 3%
Thousands of others, 74%
05
1015202530
2013 2014 2019
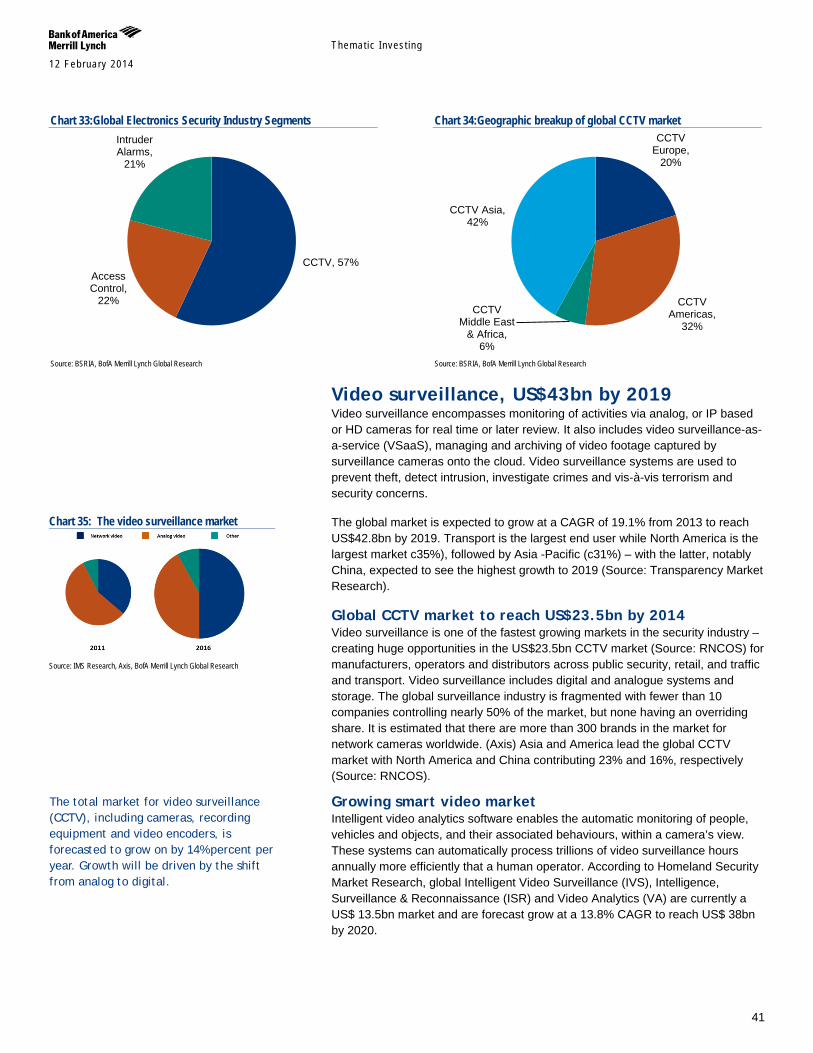
Themat ic Inves t ing 12 February 2014
41
Chart 33:Global Electronics Security Industry Segments
Source: BSRIA, BofA Merrill Lynch Global Research
Chart 34:Geographic breakup of global CCTV market
Source: BSRIA, BofA Merrill Lynch Global Research
Video surveillance, US$43bn by 2019 Video surveillance encompasses monitoring of activities via analog, or IP based or HD cameras for real time or later review. It also includes video surveillance-as-a-service (VSaaS), managing and archiving of video footage captured by surveillance cameras onto the cloud. Video surveillance systems are used to prevent theft, detect intrusion, investigate crimes and vis-à-vis terrorism and security concerns.
The global market is expected to grow at a CAGR of 19.1% from 2013 to reach US$42.8bn by 2019. Transport is the largest end user while North America is the largest market c35%), followed by Asia -Pacific (c31%) – with the latter, notably China, expected to see the highest growth to 2019 (Source: Transparency Market Research).
Global CCTV market to reach US$23.5bn by 2014 Video surveillance is one of the fastest growing markets in the security industry – creating huge opportunities in the US$23.5bn CCTV market (Source: RNCOS) for manufacturers, operators and distributors across public security, retail, and traffic and transport. Video surveillance includes digital and analogue systems and storage. The global surveillance industry is fragmented with fewer than 10 companies controlling nearly 50% of the market, but none having an overriding share. It is estimated that there are more than 300 brands in the market for network cameras worldwide. (Axis) Asia and America lead the global CCTV market with North America and China contributing 23% and 16%, respectively (Source: RNCOS).
Growing smart video market Intelligent video analytics software enables the automatic monitoring of people, vehicles and objects, and their associated behaviours, within a camera’s view. These systems can automatically process trillions of video surveillance hours annually more efficiently that a human operator. According to Homeland Security Market Research, global Intelligent Video Surveillance (IVS), Intelligence, Surveillance & Reconnaissance (ISR) and Video Analytics (VA) are currently a US$ 13.5bn market and are forecast grow at a 13.8% CAGR to reach US$ 38bn by 2020.
CCTV, 57% Access Control,
22%
Intruder Alarms,
21%
CCTV Europe,
20%
CCTV Americas,
32% CCTV
Middle East & Africa,
6%
CCTV Asia, 42%
Chart 35: The video surveillance market
Source: IMS Research, Axis, BofA Merrill Lynch Global Research
The total market for video surveillance (CCTV), including cameras, recording equipment and video encoders, is forecasted to grow on by 14% percent per year. Growth will be driven by the shift from analog to digital.
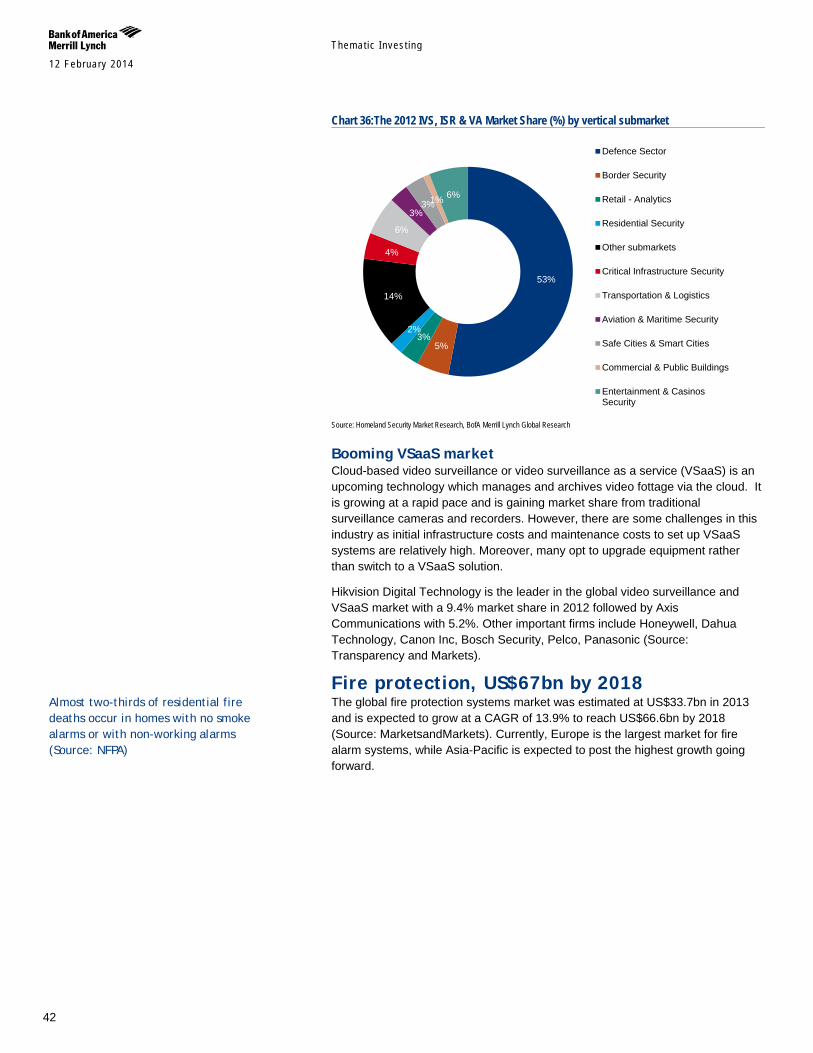
Themat ic Inves t ing 12 February 2014
42
Chart 36:The 2012 IVS, ISR & VA Market Share (%) by vertical submarket
Source: Homeland Security Market Research, BofA Merrill Lynch Global Research
Booming VSaaS market Cloud-based video surveillance or video surveillance as a service (VSaaS) is an upcoming technology which manages and archives video fottage via the cloud. It is growing at a rapid pace and is gaining market share from traditional surveillance cameras and recorders. However, there are some challenges in this industry as initial infrastructure costs and maintenance costs to set up VSaaS systems are relatively high. Moreover, many opt to upgrade equipment rather than switch to a VSaaS solution.
Hikvision Digital Technology is the leader in the global video surveillance and VSaaS market with a 9.4% market share in 2012 followed by Axis Communications with 5.2%. Other important firms include Honeywell, Dahua Technology, Canon Inc, Bosch Security, Pelco, Panasonic (Source: Transparency and Markets).
Fire protection, US$67bn by 2018 The global fire protection systems market was estimated at US$33.7bn in 2013 and is expected to grow at a CAGR of 13.9% to reach US$66.6bn by 2018 (Source: MarketsandMarkets). Currently, Europe is the largest market for fire alarm systems, while Asia-Pacific is expected to post the highest growth going forward.
53%
5% 3%
2%
14%
4%
6%
3% 3% 1% 6%
Defence Sector
Border Security
Retail - Analytics
Residential Security
Other submarkets
Critical Infrastructure Security
Transportation & Logistics
Aviation & Maritime Security
Safe Cities & Smart Cities
Commercial & Public Buildings
Entertainment & CasinosSecurity
Almost two-thirds of residential fire deaths occur in homes with no smoke alarms or with non-working alarms (Source: NFPA)
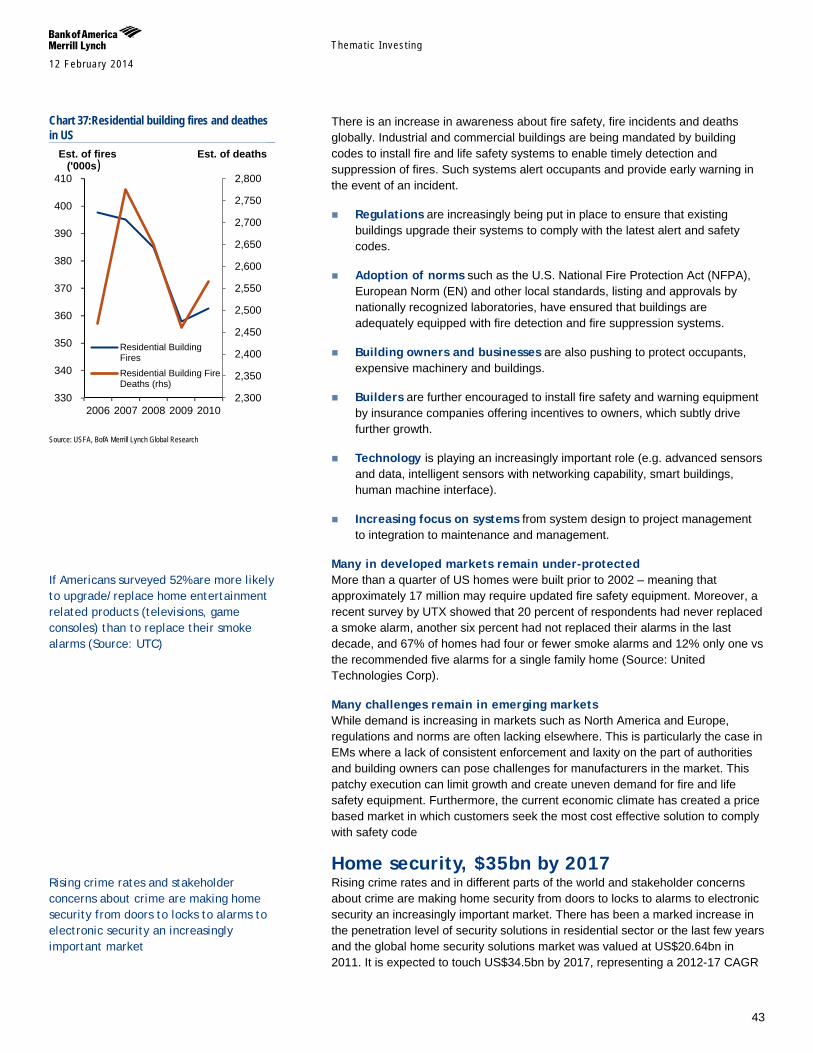
Themat ic Inves t ing 12 February 2014
43
There is an increase in awareness about fire safety, fire incidents and deaths globally. Industrial and commercial buildings are being mandated by building codes to install fire and life safety systems to enable timely detection and suppression of fires. Such systems alert occupants and provide early warning in the event of an incident.
Regulations are increasingly being put in place to ensure that existing buildings upgrade their systems to comply with the latest alert and safety codes.
Adoption of norms such as the U.S. National Fire Protection Act (NFPA), European Norm (EN) and other local standards, listing and approvals by nationally recognized laboratories, have ensured that buildings are adequately equipped with fire detection and fire suppression systems.
Building owners and businesses are also pushing to protect occupants, expensive machinery and buildings.
Builders are further encouraged to install fire safety and warning equipment by insurance companies offering incentives to owners, which subtly drive further growth.
Technology is playing an increasingly important role (e.g. advanced sensors and data, intelligent sensors with networking capability, smart buildings, human machine interface).
Increasing focus on systems from system design to project management to integration to maintenance and management.
Many in developed markets remain under-protected More than a quarter of US homes were built prior to 2002 – meaning that approximately 17 million may require updated fire safety equipment. Moreover, a recent survey by UTX showed that 20 percent of respondents had never replaced a smoke alarm, another six percent had not replaced their alarms in the last decade, and 67% of homes had four or fewer smoke alarms and 12% only one vs the recommended five alarms for a single family home (Source: United Technologies Corp).
Many challenges remain in emerging markets While demand is increasing in markets such as North America and Europe, regulations and norms are often lacking elsewhere. This is particularly the case in EMs where a lack of consistent enforcement and laxity on the part of authorities and building owners can pose challenges for manufacturers in the market. This patchy execution can limit growth and create uneven demand for fire and life safety equipment. Furthermore, the current economic climate has created a price based market in which customers seek the most cost effective solution to comply with safety code
Home security, $35bn by 2017 Rising crime rates and in different parts of the world and stakeholder concerns about crime are making home security from doors to locks to alarms to electronic security an increasingly important market. There has been a marked increase in the penetration level of security solutions in residential sector or the last few years and the global home security solutions market was valued at US$20.64bn in 2011. It is expected to touch US$34.5bn by 2017, representing a 2012-17 CAGR
Chart 37:Residential building fires and deathes in US
Source: USFA, BofA Merrill Lynch Global Research
If Americans surveyed 52% are more likely to upgrade/replace home entertainment related products (televisions, game consoles) than to replace their smoke alarms (Source: UTC)
Rising crime rates and stakeholder concerns about crime are making home security from doors to locks to alarms to electronic security an increasingly important market
2,300
2,350
2,400
2,450
2,500
2,550
2,600
2,650
2,700
2,750
2,800
330
340
350
360
370
380
390
400
410
2006 2007 2008 2009 2010
Residential BuildingFiresResidential Building FireDeaths (rhs)
Est. of fires ('000s)
Est. of deaths
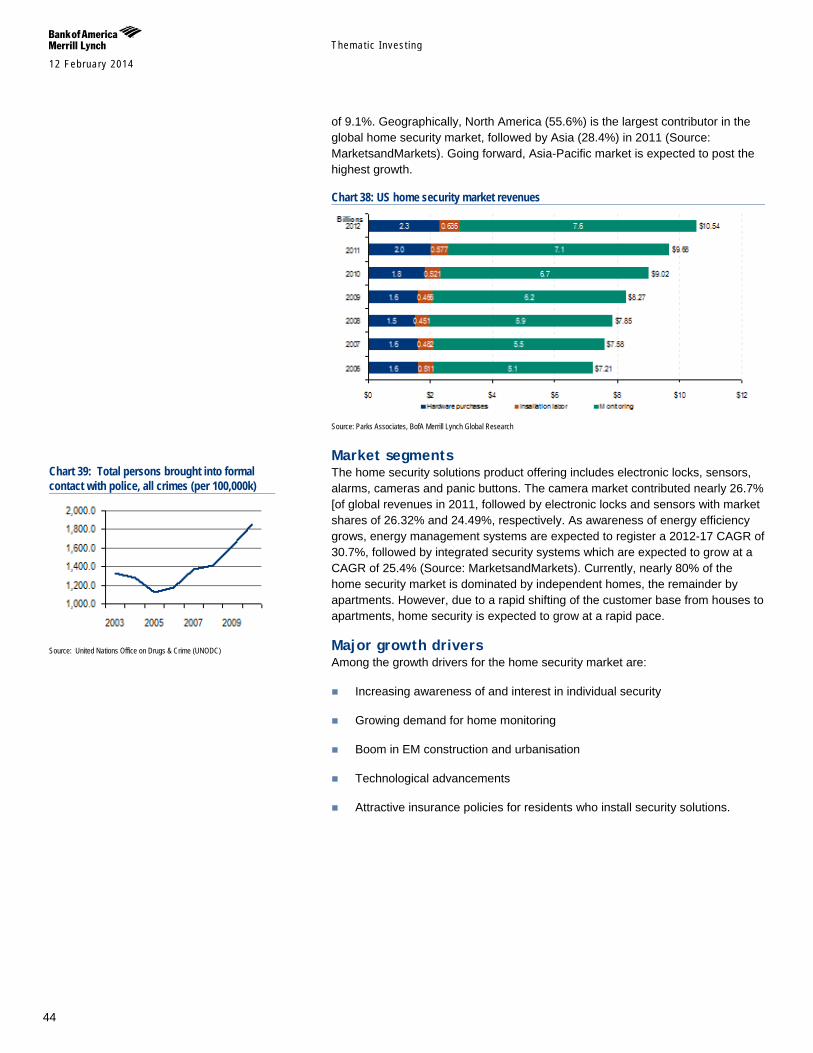
Themat ic Inves t ing 12 February 2014
44
of 9.1%. Geographically, North America (55.6%) is the largest contributor in the global home security market, followed by Asia (28.4%) in 2011 (Source: MarketsandMarkets). Going forward, Asia-Pacific market is expected to post the highest growth.
Chart 38: US home security market revenues
Source: Parks Associates, BofA Merrill Lynch Global Research
Market segments The home security solutions product offering includes electronic locks, sensors, alarms, cameras and panic buttons. The camera market contributed nearly 26.7% [of global revenues in 2011, followed by electronic locks and sensors with market shares of 26.32% and 24.49%, respectively. As awareness of energy efficiency grows, energy management systems are expected to register a 2012-17 CAGR of 30.7%, followed by integrated security systems which are expected to grow at a CAGR of 25.4% (Source: MarketsandMarkets). Currently, nearly 80% of the home security market is dominated by independent homes, the remainder by apartments. However, due to a rapid shifting of the customer base from houses to apartments, home security is expected to grow at a rapid pace.
Major growth drivers Among the growth drivers for the home security market are:
Increasing awareness of and interest in individual security
Growing demand for home monitoring
Boom in EM construction and urbanisation
Technological advancements
Attractive insurance policies for residents who install security solutions.
Chart 39: Total persons brought into formal contact with police, all crimes (per 100,000k)
Source: United Nations Office on Drugs & Crime (UNODC)
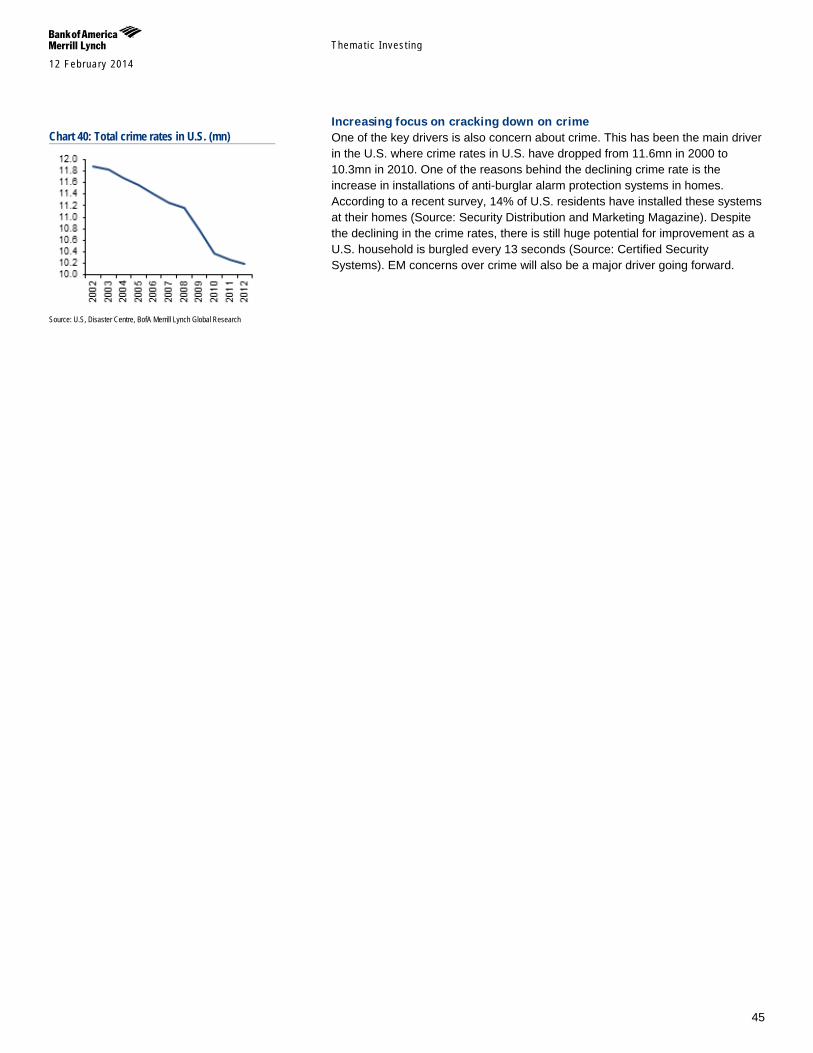
Themat ic Inves t ing 12 February 2014
45
Increasing focus on cracking down on crime One of the key drivers is also concern about crime. This has been the main driver in the U.S. where crime rates in U.S. have dropped from 11.6mn in 2000 to 10.3mn in 2010. One of the reasons behind the declining crime rate is the increase in installations of anti-burglar alarm protection systems in homes. According to a recent survey, 14% of U.S. residents have installed these systems at their homes (Source: Security Distribution and Marketing Magazine). Despite the declining in the crime rates, there is still huge potential for improvement as a U.S. household is burgled every 13 seconds (Source: Certified Security Systems). EM concerns over crime will also be a major driver going forward.
Chart 40: Total crime rates in U.S. (mn)
Source: U.S, Disaster Centre, BofA Merrill Lynch Global Research
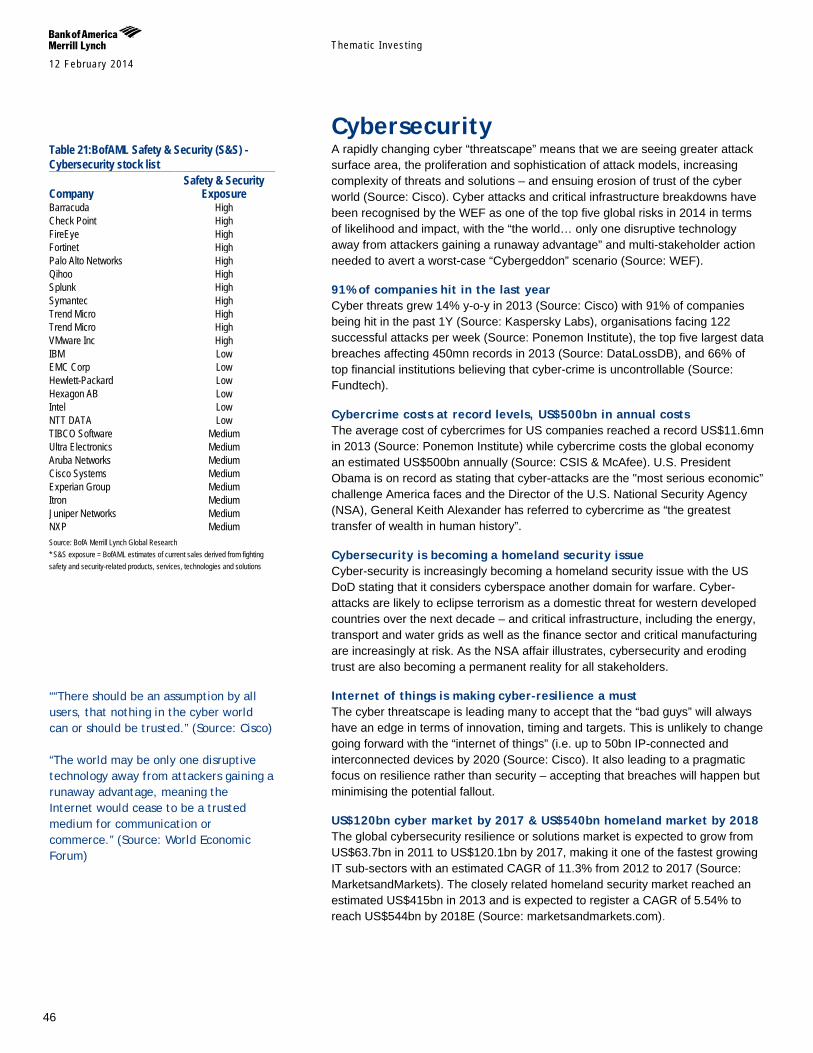
Themat ic Inves t ing 12 February 2014
46
Cybersecurity A rapidly changing cyber “threatscape” means that we are seeing greater attack surface area, the proliferation and sophistication of attack models, increasing complexity of threats and solutions – and ensuing erosion of trust of the cyber world (Source: Cisco). Cyber attacks and critical infrastructure breakdowns have been recognised by the WEF as one of the top five global risks in 2014 in terms of likelihood and impact, with the “the world… only one disruptive technology away from attackers gaining a runaway advantage” and multi-stakeholder action needed to avert a worst-case “Cybergeddon” scenario (Source: WEF).
91% of companies hit in the last year Cyber threats grew 14% y-o-y in 2013 (Source: Cisco) with 91% of companies being hit in the past 1Y (Source: Kaspersky Labs), organisations facing 122 successful attacks per week (Source: Ponemon Institute), the top five largest data breaches affecting 450mn records in 2013 (Source: DataLossDB), and 66% of top financial institutions believing that cyber-crime is uncontrollable (Source: Fundtech).
Cybercrime costs at record levels, US$500bn in annual costs The average cost of cybercrimes for US companies reached a record US$11.6mn in 2013 (Source: Ponemon Institute) while cybercrime costs the global economy an estimated US$500bn annually (Source: CSIS & McAfee). U.S. President Obama is on record as stating that cyber-attacks are the "most serious economic” challenge America faces and the Director of the U.S. National Security Agency (NSA), General Keith Alexander has referred to cybercrime as “the greatest transfer of wealth in human history”.
Cybersecurity is becoming a homeland security issue Cyber-security is increasingly becoming a homeland security issue with the US DoD stating that it considers cyberspace another domain for warfare. Cyber-attacks are likely to eclipse terrorism as a domestic threat for western developed countries over the next decade – and critical infrastructure, including the energy, transport and water grids as well as the finance sector and critical manufacturing are increasingly at risk. As the NSA affair illustrates, cybersecurity and eroding trust are also becoming a permanent reality for all stakeholders.
Internet of things is making cyber-resilience a must The cyber threatscape is leading many to accept that the “bad guys” will always have an edge in terms of innovation, timing and targets. This is unlikely to change going forward with the “internet of things” (i.e. up to 50bn IP-connected and interconnected devices by 2020 (Source: Cisco). It also leading to a pragmatic focus on resilience rather than security – accepting that breaches will happen but minimising the potential fallout.
US$120bn cyber market by 2017 & US$540bn homeland market by 2018 The global cybersecurity resilience or solutions market is expected to grow from US$63.7bn in 2011 to US$120.1bn by 2017, making it one of the fastest growing IT sub-sectors with an estimated CAGR of 11.3% from 2012 to 2017 (Source: MarketsandMarkets). The closely related homeland security market reached an estimated US$415bn in 2013 and is expected to register a CAGR of 5.54% to reach US$544bn by 2018E (Source: marketsandmarkets.com).
Table 21:BofAML Safety & Security (S&S) - Cybersecurity stock list Safety & Security Company Exposure Barracuda High Check Point High FireEye High Fortinet High Palo Alto Networks High Qihoo High Splunk High Symantec High Trend Micro High Trend Micro High VMware Inc High IBM Low EMC Corp Low Hewlett-Packard Low Hexagon AB Low Intel Low NTT DATA Low TIBCO Software Medium Ultra Electronics Medium Aruba Networks Medium Cisco Systems Medium Experian Group Medium Itron Medium Juniper Networks Medium NXP Medium Source: BofA Merrill Lynch Global Research * S&S exposure = BofAML estimates of current sales derived from fighting safety and security-related products, services, technologies and solutions
““There should be an assumption by all users, that nothing in the cyber world can or should be trusted.” (Source: Cisco) “The world may be only one disruptive technology away from attackers gaining a runaway advantage, meaning the Internet would cease to be a trusted medium for communication or commerce.” (Source: World Economic Forum)
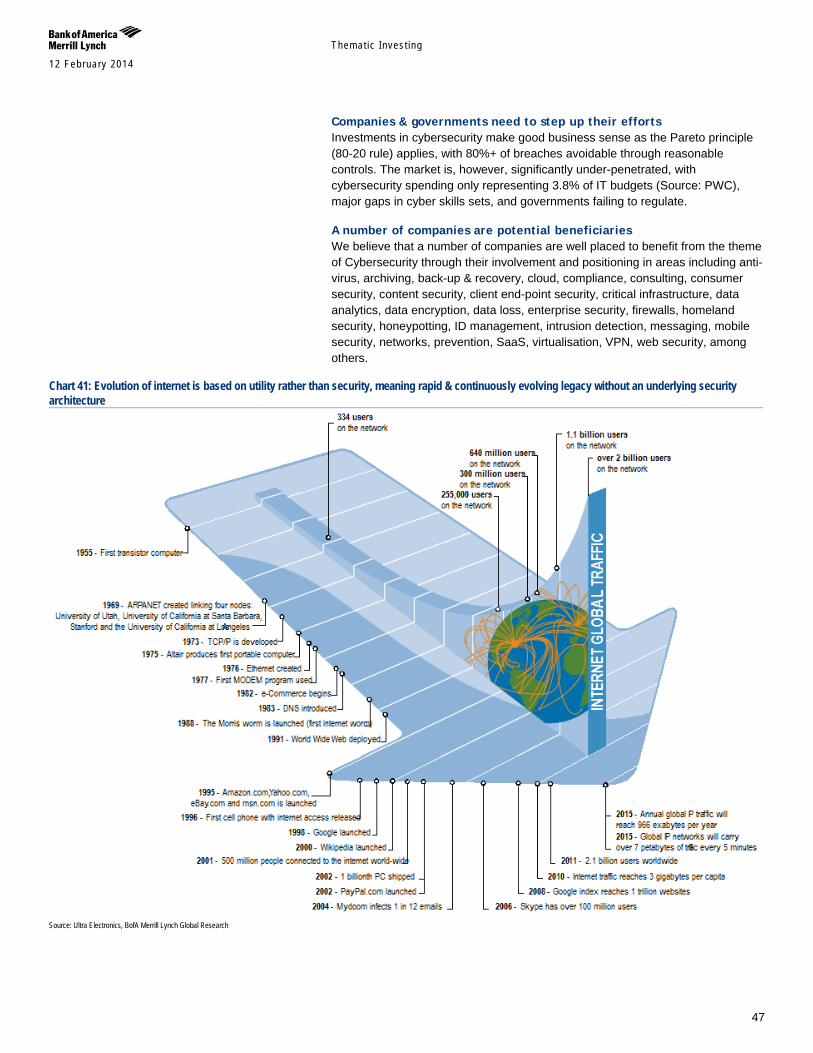
Themat ic Inves t ing 12 February 2014
47
Companies & governments need to step up their efforts Investments in cybersecurity make good business sense as the Pareto principle (80-20 rule) applies, with 80%+ of breaches avoidable through reasonable controls. The market is, however, significantly under-penetrated, with cybersecurity spending only representing 3.8% of IT budgets (Source: PWC), major gaps in cyber skills sets, and governments failing to regulate.
A number of companies are potential beneficiaries We believe that a number of companies are well placed to benefit from the theme of Cybersecurity through their involvement and positioning in areas including anti-virus, archiving, back-up & recovery, cloud, compliance, consulting, consumer security, content security, client end-point security, critical infrastructure, data analytics, data encryption, data loss, enterprise security, firewalls, homeland security, honeypotting, ID management, intrusion detection, messaging, mobile security, networks, prevention, SaaS, virtualisation, VPN, web security, among others.
Chart 41: Evolution of internet is based on utility rather than security, meaning rapid & continuously evolving legacy without an underlying security architecture
Source: Ultra Electronics, BofA Merrill Lynch Global Research
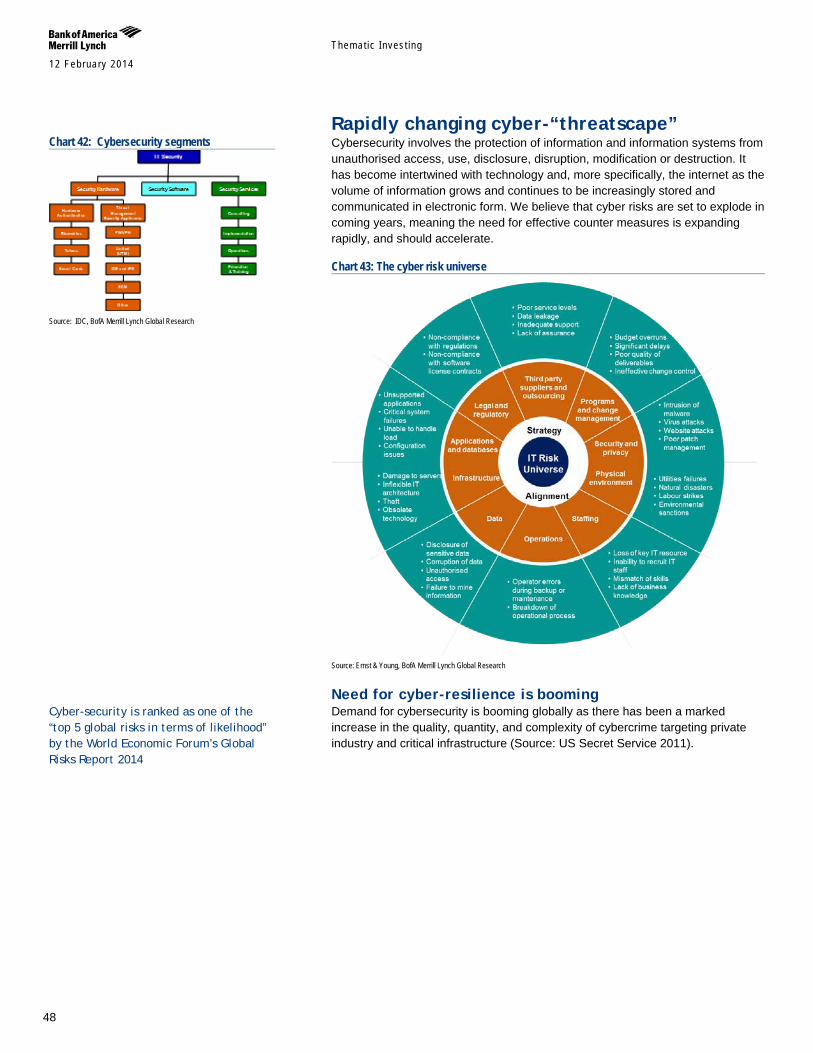
Themat ic Inves t ing 12 February 2014
48
Rapidly changing cyber-“threatscape” Cybersecurity involves the protection of information and information systems from unauthorised access, use, disclosure, disruption, modification or destruction. It has become intertwined with technology and, more specifically, the internet as the volume of information grows and continues to be increasingly stored and communicated in electronic form. We believe that cyber risks are set to explode in coming years, meaning the need for effective counter measures is expanding rapidly, and should accelerate.
Chart 43: The cyber risk universe
Source: Ernst & Young, BofA Merrill Lynch Global Research
Need for cyber-resilience is booming Demand for cybersecurity is booming globally as there has been a marked increase in the quality, quantity, and complexity of cybercrime targeting private industry and critical infrastructure (Source: US Secret Service 2011).
Chart 42: Cybersecurity segments
Source: IDC, BofA Merrill Lynch Global Research
Cyber-security is ranked as one of the “top 5 global risks in terms of likelihood” by the World Economic Forum’s Global Risks Report 2014
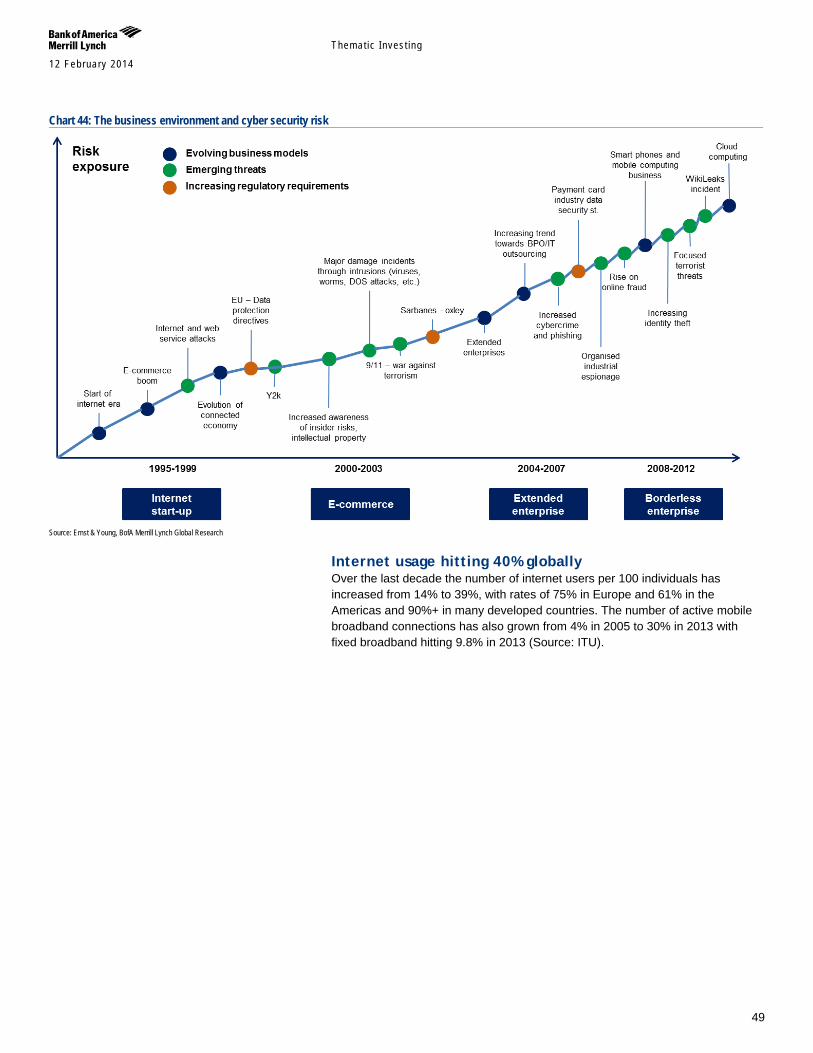
Themat ic Inves t ing 12 February 2014
49
Chart 44: The business environment and cyber security risk
Source: Ernst & Young, BofA Merrill Lynch Global Research
Internet usage hitting 40% globally Over the last decade the number of internet users per 100 individuals has increased from 14% to 39%, with rates of 75% in Europe and 61% in the Americas and 90%+ in many developed countries. The number of active mobile broadband connections has also grown from 4% in 2005 to 30% in 2013 with fixed broadband hitting 9.8% in 2013 (Source: ITU).
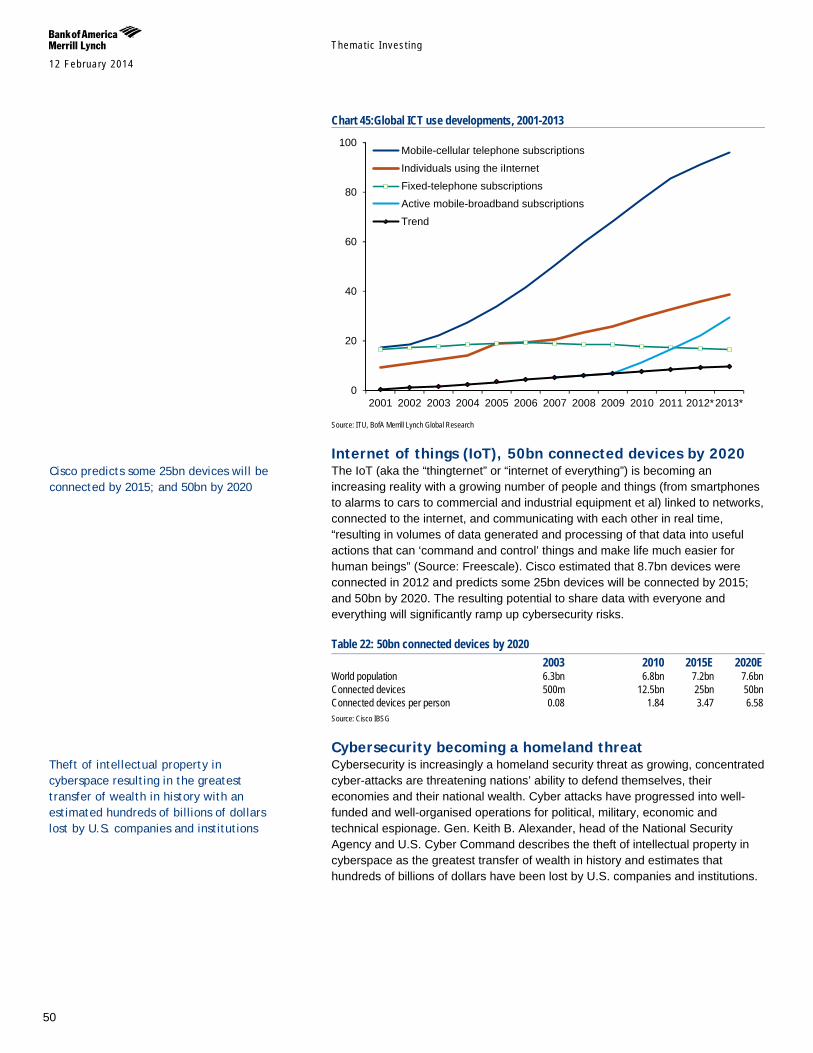
Themat ic Inves t ing 12 February 2014
50
Chart 45:Global ICT use developments, 2001-2013
Source: ITU, BofA Merrill Lynch Global Research
Internet of things (IoT), 50bn connected devices by 2020 The IoT (aka the “thingternet” or “internet of everything”) is becoming an increasing reality with a growing number of people and things (from smartphones to alarms to cars to commercial and industrial equipment et al) linked to networks, connected to the internet, and communicating with each other in real time, “resulting in volumes of data generated and processing of that data into useful actions that can ‘command and control’ things and make life much easier for human beings” (Source: Freescale). Cisco estimated that 8.7bn devices were connected in 2012 and predicts some 25bn devices will be connected by 2015; and 50bn by 2020. The resulting potential to share data with everyone and everything will significantly ramp up cybersecurity risks.
Table 22: 50bn connected devices by 2020 2003 2010 2015E 2020E World population 6.3bn 6.8bn 7.2bn 7.6bn Connected devices 500m 12.5bn 25bn 50bn Connected devices per person 0.08 1.84 3.47 6.58 Source: Cisco IBSG
Cybersecurity becoming a homeland threat Cybersecurity is increasingly a homeland security threat as growing, concentrated cyber-attacks are threatening nations’ ability to defend themselves, their economies and their national wealth. Cyber attacks have progressed into well-funded and well-organised operations for political, military, economic and technical espionage. Gen. Keith B. Alexander, head of the National Security Agency and U.S. Cyber Command describes the theft of intellectual property in cyberspace as the greatest transfer of wealth in history and estimates that hundreds of billions of dollars have been lost by U.S. companies and institutions.
0
20
40
60
80
100
2001 2002 2003 2004 2005 2006 2007 2008 2009 2010 2011 2012*2013*
Mobile-cellular telephone subscriptions
Individuals using the iInternet
Fixed-telephone subscriptions
Active mobile-broadband subscriptions
Trend
Theft of intellectual property in cyberspace resulting in the greatest transfer of wealth in history with an estimated hundreds of billions of dollars lost by U.S. companies and institutions
Cisco predicts some 25bn devices will be connected by 2015; and 50bn by 2020
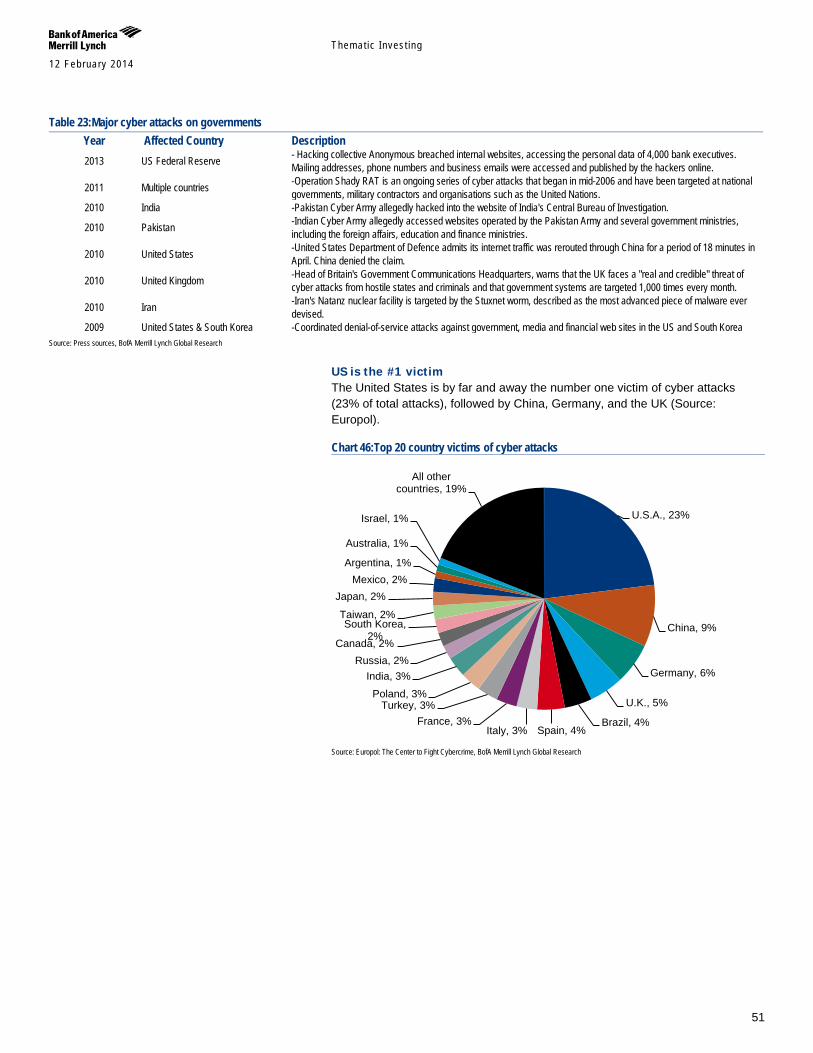
Themat ic Inves t ing 12 February 2014
51
Table 23:Major cyber attacks on governments Year Affected Country Description 2013 US Federal Reserve - Hacking collective Anonymous breached internal websites, accessing the personal data of 4,000 bank executives.
Mailing addresses, phone numbers and business emails were accessed and published by the hackers online.
2011 Multiple countries -Operation Shady RAT is an ongoing series of cyber attacks that began in mid-2006 and have been targeted at national governments, military contractors and organisations such as the United Nations.
2010 India -Pakistan Cyber Army allegedly hacked into the website of India's Central Bureau of Investigation.
2010 Pakistan -Indian Cyber Army allegedly accessed websites operated by the Pakistan Army and several government ministries, including the foreign affairs, education and finance ministries.
2010 United States -United States Department of Defence admits its internet traffic was rerouted through China for a period of 18 minutes in April. China denied the claim.
2010 United Kingdom -Head of Britain's Government Communications Headquarters, warns that the UK faces a "real and credible" threat of cyber attacks from hostile states and criminals and that government systems are targeted 1,000 times every month.
2010 Iran -Iran's Natanz nuclear facility is targeted by the Stuxnet worm, described as the most advanced piece of malware ever devised.
2009 United States & South Korea -Coordinated denial-of-service attacks against government, media and financial web sites in the US and South Korea Source: Press sources, BofA Merrill Lynch Global Research
US is the #1 victim The United States is by far and away the number one victim of cyber attacks (23% of total attacks), followed by China, Germany, and the UK (Source: Europol).
Chart 46:Top 20 country victims of cyber attacks
Source: Europol: The Center to Fight Cybercrime, BofA Merrill Lynch Global Research
U.S.A., 23%
China, 9%
Germany, 6%
U.K., 5%
Brazil, 4% Spain, 4% Italy, 3%
France, 3% Turkey, 3%
Poland, 3%
India, 3% Russia, 2%
Canada, 2%
South Korea, 2%
Taiwan, 2%
Japan, 2% Mexico, 2%
Argentina, 1%
Australia, 1%
Israel, 1%
All other countries, 19%
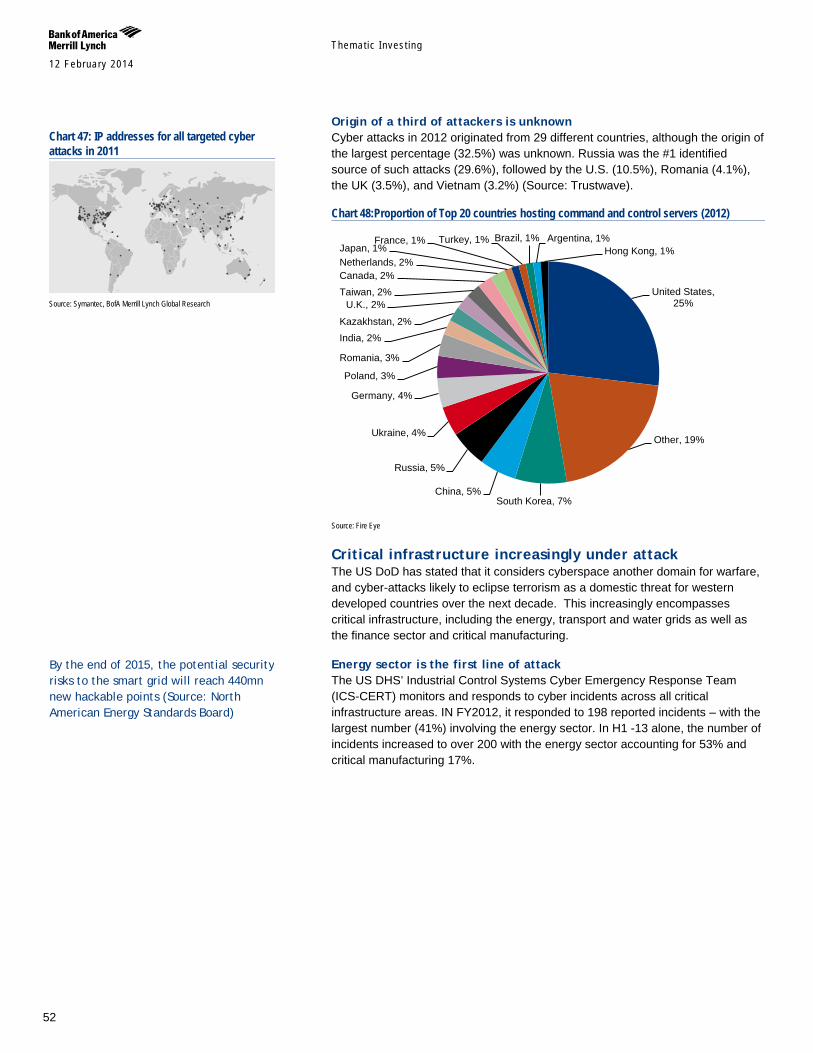
Themat ic Inves t ing 12 February 2014
52
Origin of a third of attackers is unknown Cyber attacks in 2012 originated from 29 different countries, although the origin of the largest percentage (32.5%) was unknown. Russia was the #1 identified source of such attacks (29.6%), followed by the U.S. (10.5%), Romania (4.1%), the UK (3.5%), and Vietnam (3.2%) (Source: Trustwave).
Chart 48:Proportion of Top 20 countries hosting command and control servers (2012)
Source: Fire Eye
Critical infrastructure increasingly under attack The US DoD has stated that it considers cyberspace another domain for warfare, and cyber-attacks likely to eclipse terrorism as a domestic threat for western developed countries over the next decade. This increasingly encompasses critical infrastructure, including the energy, transport and water grids as well as the finance sector and critical manufacturing.
Energy sector is the first line of attack The US DHS’ Industrial Control Systems Cyber Emergency Response Team (ICS-CERT) monitors and responds to cyber incidents across all critical infrastructure areas. IN FY2012, it responded to 198 reported incidents – with the largest number (41%) involving the energy sector. In H1 -13 alone, the number of incidents increased to over 200 with the energy sector accounting for 53% and critical manufacturing 17%.
United States, 25%
Other, 19%
South Korea, 7% China, 5%
Russia, 5%
Ukraine, 4%
Germany, 4%
Poland, 3%
Romania, 3%
India, 2% Kazakhstan, 2%
U.K., 2% Taiwan, 2% Canada, 2% Netherlands, 2% Japan, 1%
France, 1% Turkey, 1% Brazil, 1% Argentina, 1% Hong Kong, 1%
Chart 47: IP addresses for all targeted cyber attacks in 2011
Source: Symantec, BofA Merrill Lynch Global Research
By the end of 2015, the potential security risks to the smart grid will reach 440mn new hackable points (Source: North American Energy Standards Board)
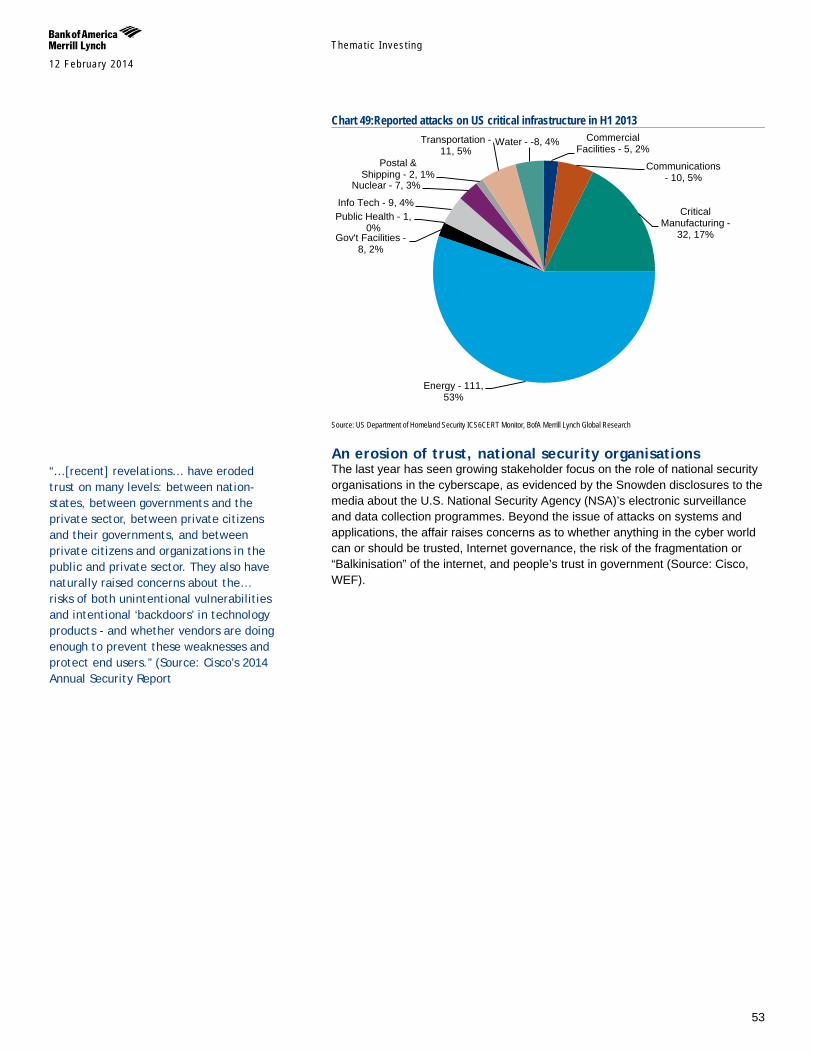
Themat ic Inves t ing 12 February 2014
53
Chart 49:Reported attacks on US critical infrastructure in H1 2013
Source: US Department of Homeland Security ICS6CERT Monitor, BofA Merrill Lynch Global Research
An erosion of trust, national security organisations The last year has seen growing stakeholder focus on the role of national security organisations in the cyberscape, as evidenced by the Snowden disclosures to the media about the U.S. National Security Agency (NSA)’s electronic surveillance and data collection programmes. Beyond the issue of attacks on systems and applications, the affair raises concerns as to whether anything in the cyber world can or should be trusted, Internet governance, the risk of the fragmentation or “Balkinisation” of the internet, and people’s trust in government (Source: Cisco, WEF).
Commercial Facilities - 5, 2%
Communications - 10, 5%
Critical Manufacturing -
32, 17%
Energy - 111, 53%
Gov't Facilities - 8, 2%
Public Health - 1, 0%
Info Tech - 9, 4%
Nuclear - 7, 3%
Postal & Shipping - 2, 1%
Transportation - 11, 5%
Water - -8, 4%
“…[recent] revelations… have eroded trust on many levels: between nation-states, between governments and the private sector, between private citizens and their governments, and between private citizens and organizations in the public and private sector. They also have naturally raised concerns about the… risks of both unintentional vulnerabilities and intentional ‘backdoors’ in technology products - and whether vendors are doing enough to prevent these weaknesses and protect end users.” (Source: Cisco’s 2014 Annual Security Report
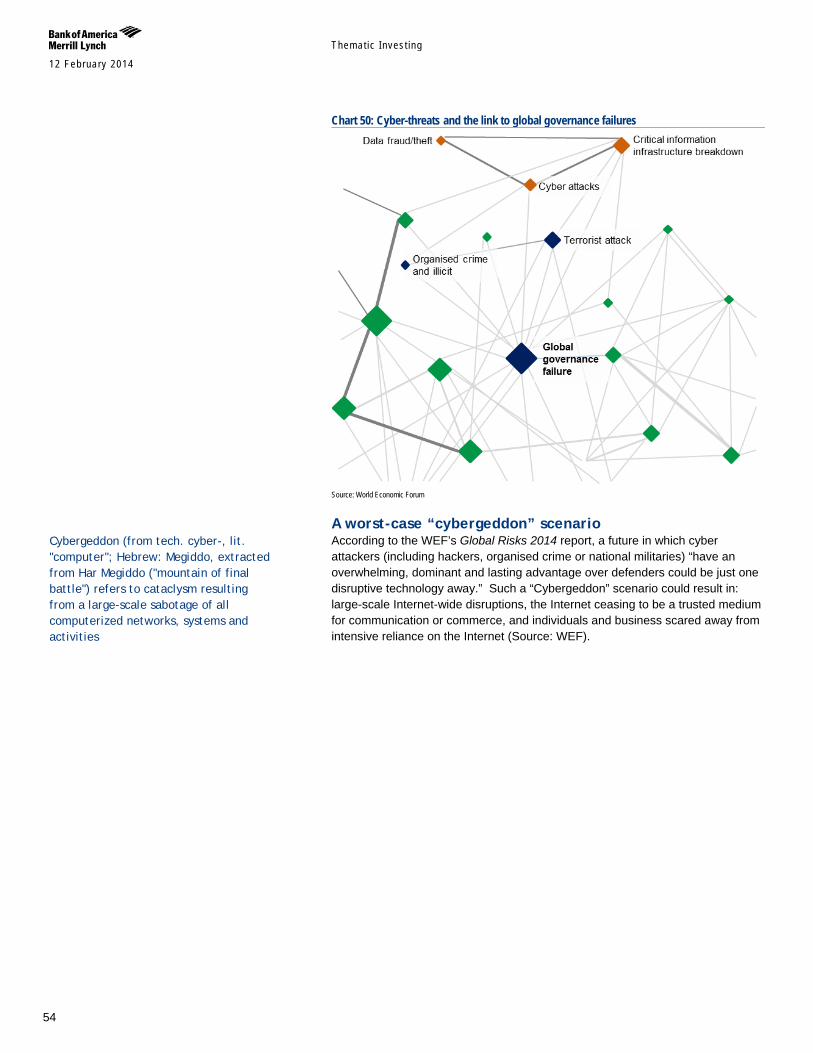
Themat ic Inves t ing 12 February 2014
54
Chart 50: Cyber-threats and the link to global governance failures
Source: World Economic Forum
A worst-case “cybergeddon” scenario According to the WEF’s Global Risks 2014 report, a future in which cyber attackers (including hackers, organised crime or national militaries) “have an overwhelming, dominant and lasting advantage over defenders could be just one disruptive technology away.” Such a “Cybergeddon” scenario could result in: large-scale Internet-wide disruptions, the Internet ceasing to be a trusted medium for communication or commerce, and individuals and business scared away from intensive reliance on the Internet (Source: WEF).
Cybergeddon (from tech. cyber-, lit. "computer"; Hebrew: Megiddo, extracted from Har Megiddo ("mountain of final battle") refers to cataclysm resulting from a large-scale sabotage of all computerized networks, systems and activities
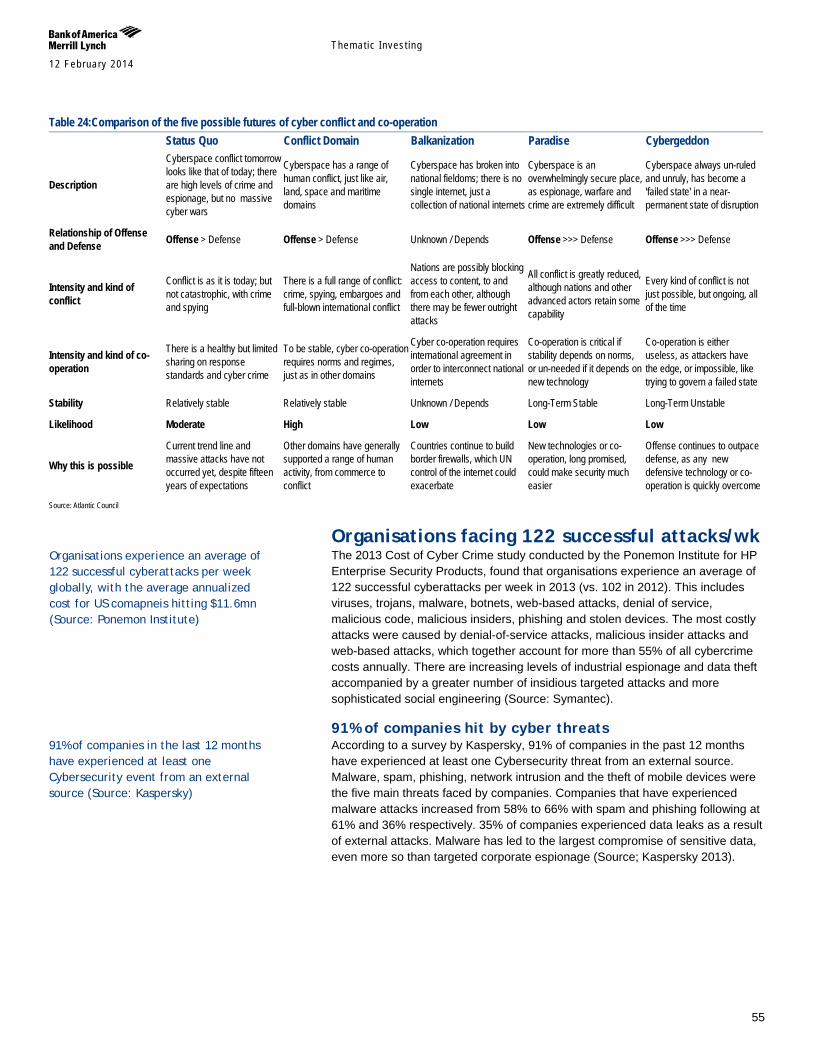
Themat ic Inves t ing 12 February 2014
55
Table 24:Comparison of the five possible futures of cyber conflict and co-operation Status Quo Conflict Domain Balkanization Paradise Cybergeddon
Description
Cyberspace conflict tomorrow looks like that of today; there are high levels of crime and espionage, but no massive cyber wars
Cyberspace has a range of human conflict, just like air, land, space and maritime domains
Cyberspace has broken into national fieldoms; there is no single internet, just a collection of national internets
Cyberspace is an overwhelmingly secure place, as espionage, warfare and crime are extremely difficult
Cyberspace always un-ruled and unruly, has become a 'failed state' in a near-permanent state of disruption
Relationship of Offense and Defense Offense > Defense Offense > Defense Unknown / Depends Offense >>> Defense Offense >>> Defense
Intensity and kind of conflict
Conflict is as it is today; but not catastrophic, with crime and spying
There is a full range of conflict: crime, spying, embargoes and full-blown international conflict
Nations are possibly blocking access to content, to and from each other, although there may be fewer outright attacks
All conflict is greatly reduced, although nations and other advanced actors retain some capability
Every kind of conflict is not just possible, but ongoing, all of the time
Intensity and kind of co-operation
There is a healthy but limited sharing on response standards and cyber crime
To be stable, cyber co-operation requires norms and regimes, just as in other domains
Cyber co-operation requires international agreement in order to interconnect national internets
Co-operation is critical if stability depends on norms, or un-needed if it depends on new technology
Co-operation is either useless, as attackers have the edge, or impossible, like trying to govern a failed state
Stability Relatively stable Relatively stable Unknown / Depends Long-Term Stable Long-Term Unstable
Likelihood Moderate High Low Low Low
Why this is possible
Current trend line and massive attacks have not occurred yet, despite fifteen years of expectations
Other domains have generally supported a range of human activity, from commerce to conflict
Countries continue to build border firewalls, which UN control of the internet could exacerbate
New technologies or co-operation, long promised, could make security much easier
Offense continues to outpace defense, as any new defensive technology or co-operation is quickly overcome
Source: Atlantic Council
Organisations facing 122 successful attacks/wk The 2013 Cost of Cyber Crime study conducted by the Ponemon Institute for HP Enterprise Security Products, found that organisations experience an average of 122 successful cyberattacks per week in 2013 (vs. 102 in 2012). This includes viruses, trojans, malware, botnets, web-based attacks, denial of service, malicious code, malicious insiders, phishing and stolen devices. The most costly attacks were caused by denial-of-service attacks, malicious insider attacks and web-based attacks, which together account for more than 55% of all cybercrime costs annually. There are increasing levels of industrial espionage and data theft accompanied by a greater number of insidious targeted attacks and more sophisticated social engineering (Source: Symantec).
91% of companies hit by cyber threats According to a survey by Kaspersky, 91% of companies in the past 12 months have experienced at least one Cybersecurity threat from an external source. Malware, spam, phishing, network intrusion and the theft of mobile devices were the five main threats faced by companies. Companies that have experienced malware attacks increased from 58% to 66% with spam and phishing following at 61% and 36% respectively. 35% of companies experienced data leaks as a result of external attacks. Malware has led to the largest compromise of sensitive data, even more so than targeted corporate espionage (Source; Kaspersky 2013).
91% of companies in the last 12 months have experienced at least one Cybersecurity event from an external source (Source: Kaspersky)
Organisations experience an average of 122 successful cyberattacks per week globally, with the average annualized cost for US comapneis hitting $11.6mn (Source: Ponemon Institute)
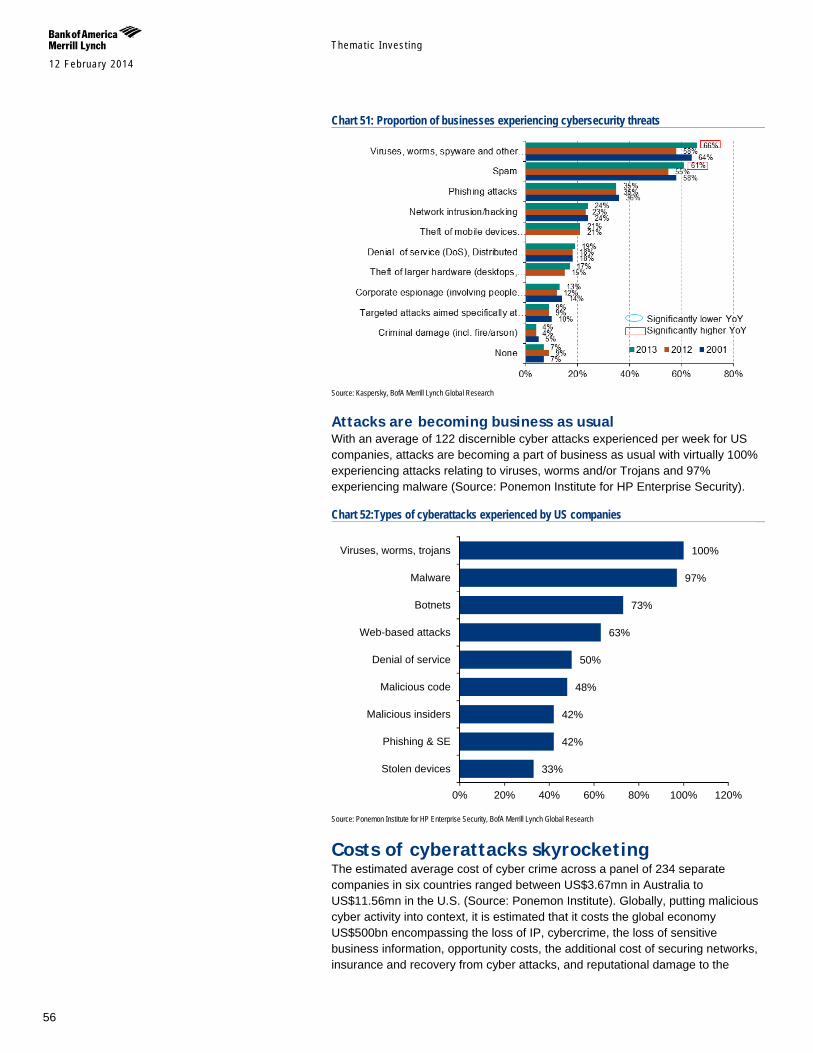
Themat ic Inves t ing 12 February 2014
56
Chart 51: Proportion of businesses experiencing cybersecurity threats
Source: Kaspersky, BofA Merrill Lynch Global Research
Attacks are becoming business as usual With an average of 122 discernible cyber attacks experienced per week for US companies, attacks are becoming a part of business as usual with virtually 100% experiencing attacks relating to viruses, worms and/or Trojans and 97% experiencing malware (Source: Ponemon Institute for HP Enterprise Security).
Chart 52:Types of cyberattacks experienced by US companies
Source: Ponemon Institute for HP Enterprise Security, BofA Merrill Lynch Global Research
Costs of cyberattacks skyrocketing The estimated average cost of cyber crime across a panel of 234 separate companies in six countries ranged between US$3.67mn in Australia to US$11.56mn in the U.S. (Source: Ponemon Institute). Globally, putting malicious cyber activity into context, it is estimated that it costs the global economy US$500bn encompassing the loss of IP, cybercrime, the loss of sensitive business information, opportunity costs, the additional cost of securing networks, insurance and recovery from cyber attacks, and reputational damage to the
33%
42%
42%
48%
50%
63%
73%
97%
100%
0% 20% 40% 60% 80% 100% 120%
Stolen devices
Phishing & SE
Malicious insiders
Malicious code
Denial of service
Web-based attacks
Botnets
Malware
Viruses, worms, trojans
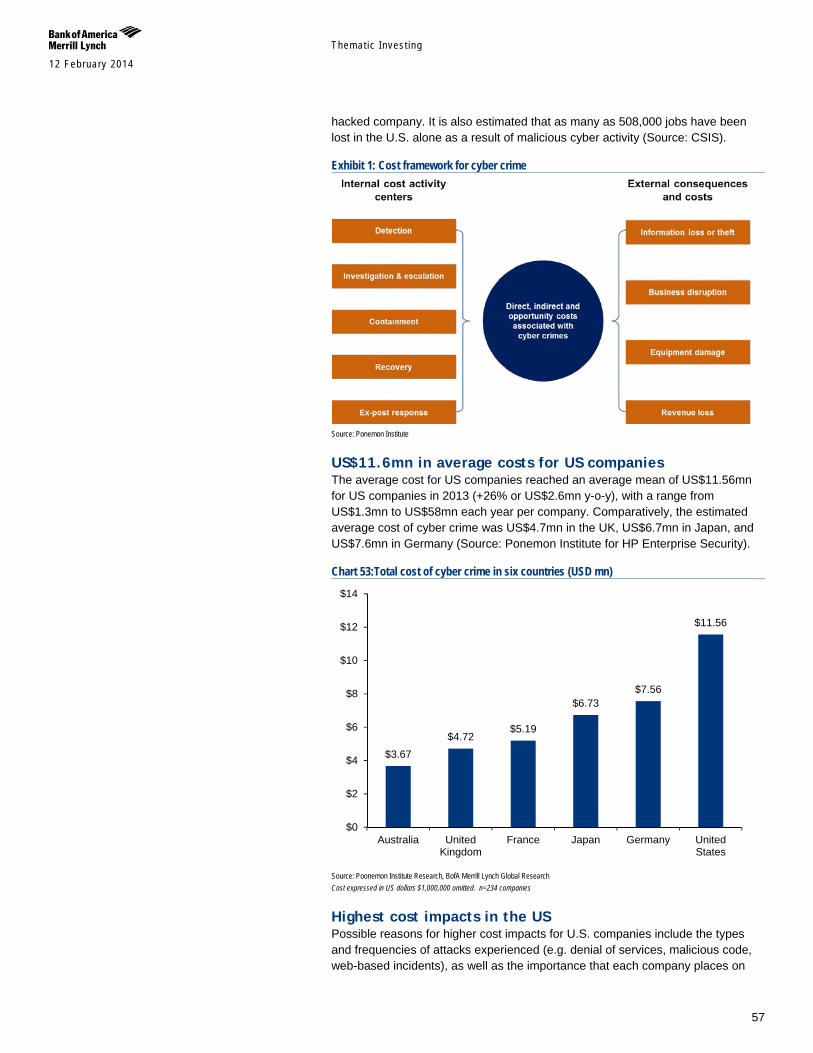
Themat ic Inves t ing 12 February 2014
57
hacked company. It is also estimated that as many as 508,000 jobs have been lost in the U.S. alone as a result of malicious cyber activity (Source: CSIS).
Exhibit 1: Cost framework for cyber crime
Source: Ponemon Institute
US$11.6mn in average costs for US companies The average cost for US companies reached an average mean of US$11.56mn for US companies in 2013 (+26% or US$2.6mn y-o-y), with a range from US$1.3mn to US$58mn each year per company. Comparatively, the estimated average cost of cyber crime was US$4.7mn in the UK, US$6.7mn in Japan, and US$7.6mn in Germany (Source: Ponemon Institute for HP Enterprise Security).
Chart 53:Total cost of cyber crime in six countries (USD mn)
Source: Poonemon Institute Research, BofA Merrill Lynch Global Research Cost expressed in US dollars $1,000,000 omitted. n=234 companies
Highest cost impacts in the US Possible reasons for higher cost impacts for U.S. companies include the types and frequencies of attacks experienced (e.g. denial of services, malicious code, web-based incidents), as well as the importance that each company places on
$3.67 $4.72
$5.19
$6.73 $7.56
$11.56
$0
$2
$4
$6
$8
$10
$12
$14
Australia UnitedKingdom
France Japan Germany UnitedStates
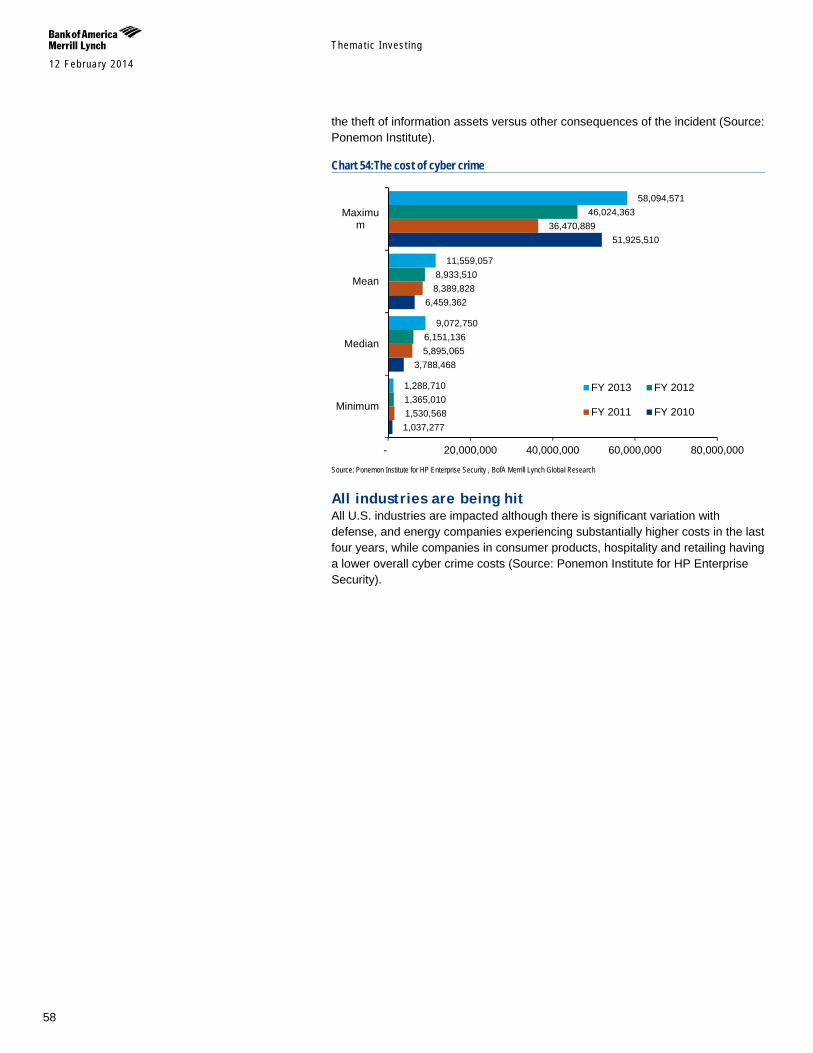
Themat ic Inves t ing 12 February 2014
58
the theft of information assets versus other consequences of the incident (Source: Ponemon Institute).
Chart 54:The cost of cyber crime
Source: Ponemon Institute for HP Enterprise Security , BofA Merrill Lynch Global Research
All industries are being hit All U.S. industries are impacted although there is significant variation with defense, and energy companies experiencing substantially higher costs in the last four years, while companies in consumer products, hospitality and retailing having a lower overall cyber crime costs (Source: Ponemon Institute for HP Enterprise Security).
1,037,277
3,788,468
6,459,362
51,925,510
1,530,568
5,895,065
8,389,828
36,470,889
1,365,010
6,151,136
8,933,510
46,024,363
1,288,710
9,072,750
11,559,057
58,094,571
- 20,000,000 40,000,000 60,000,000 80,000,000
Minimum
Median
Mean
Maximum
FY 2013 FY 2012
FY 2011 FY 2010
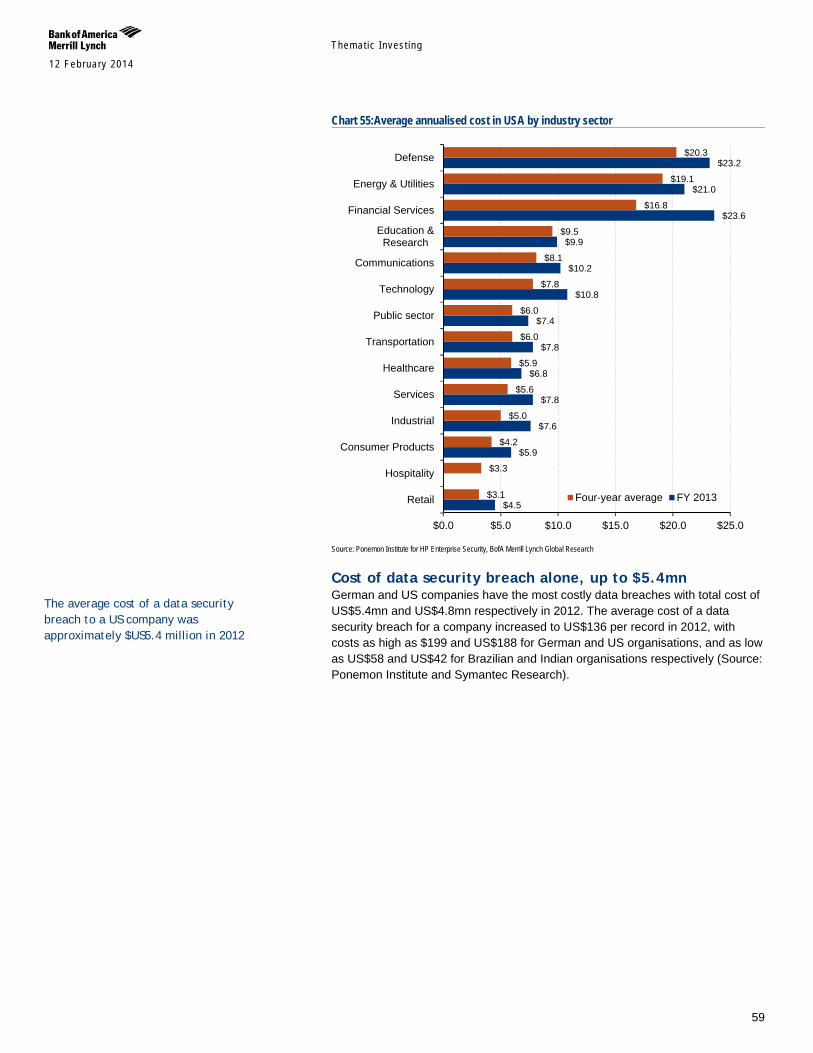
Themat ic Inves t ing 12 February 2014
59
Chart 55:Average annualised cost in USA by industry sector
Source: Ponemon Institute for HP Enterprise Security, BofA Merrill Lynch Global Research
Cost of data security breach alone, up to $5.4mn German and US companies have the most costly data breaches with total cost of US$5.4mn and US$4.8mn respectively in 2012. The average cost of a data security breach for a company increased to US$136 per record in 2012, with costs as high as $199 and US$188 for German and US organisations, and as low as US$58 and US$42 for Brazilian and Indian organisations respectively (Source: Ponemon Institute and Symantec Research).
$4.5
$5.9
$7.6
$7.8
$6.8
$7.8
$7.4
$10.8
$10.2
$9.9
$23.6
$21.0
$23.2
$3.1
$3.3
$4.2
$5.0
$5.6
$5.9
$6.0
$6.0
$7.8
$8.1
$9.5
$16.8
$19.1
$20.3
$0.0 $5.0 $10.0 $15.0 $20.0 $25.0
Retail
Hospitality
Consumer Products
Industrial
Services
Healthcare
Transportation
Public sector
Technology
Communications
Education &Research
Financial Services
Energy & Utilities
Defense
Four-year average FY 2013
The average cost of a data security breach to a US company was approximately $US5.4 million in 2012
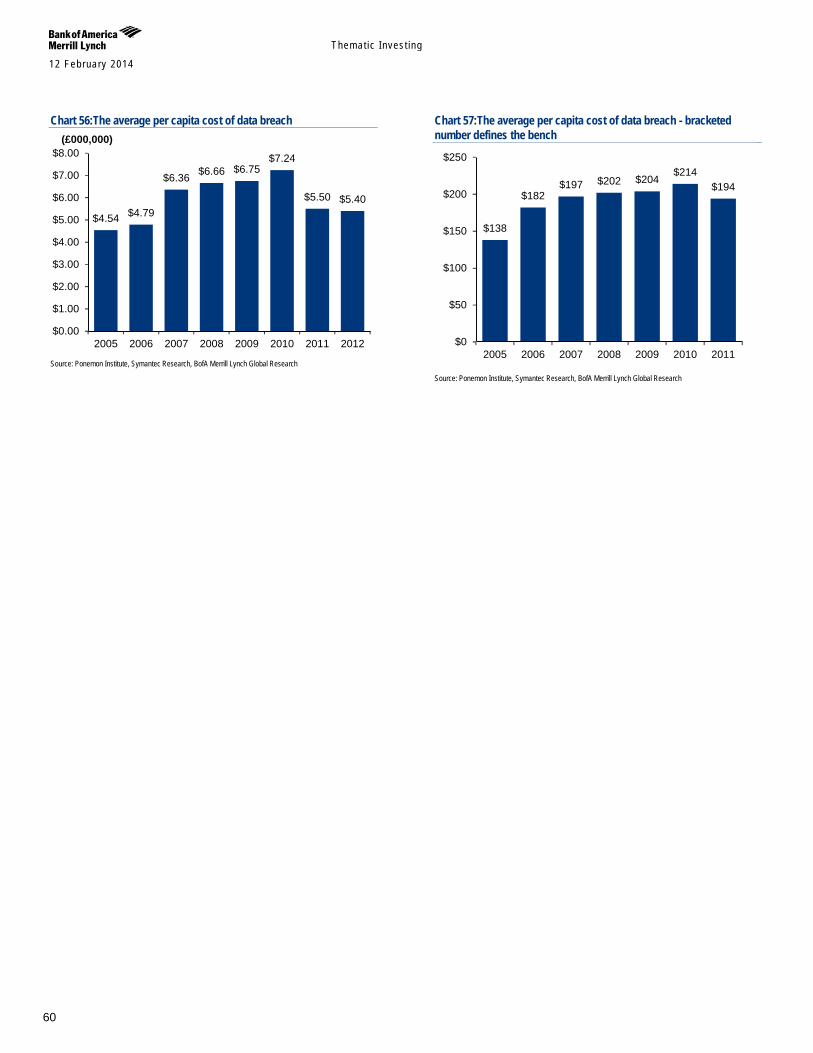
Themat ic Inves t ing 12 February 2014
60
Chart 56:The average per capita cost of data breach
Source: Ponemon Institute, Symantec Research, BofA Merrill Lynch Global Research
Chart 57:The average per capita cost of data breach - bracketed number defines the bench
Source: Ponemon Institute, Symantec Research, BofA Merrill Lynch Global Research
$4.54 $4.79
$6.36 $6.66 $6.75 $7.24
$5.50 $5.40
$0.00
$1.00
$2.00
$3.00
$4.00
$5.00
$6.00
$7.00
$8.00
2005 2006 2007 2008 2009 2010 2011 2012
(£000,000)
$138
$182 $197 $202 $204
$214 $194
$0
$50
$100
$150
$200
$250
2005 2006 2007 2008 2009 2010 2011
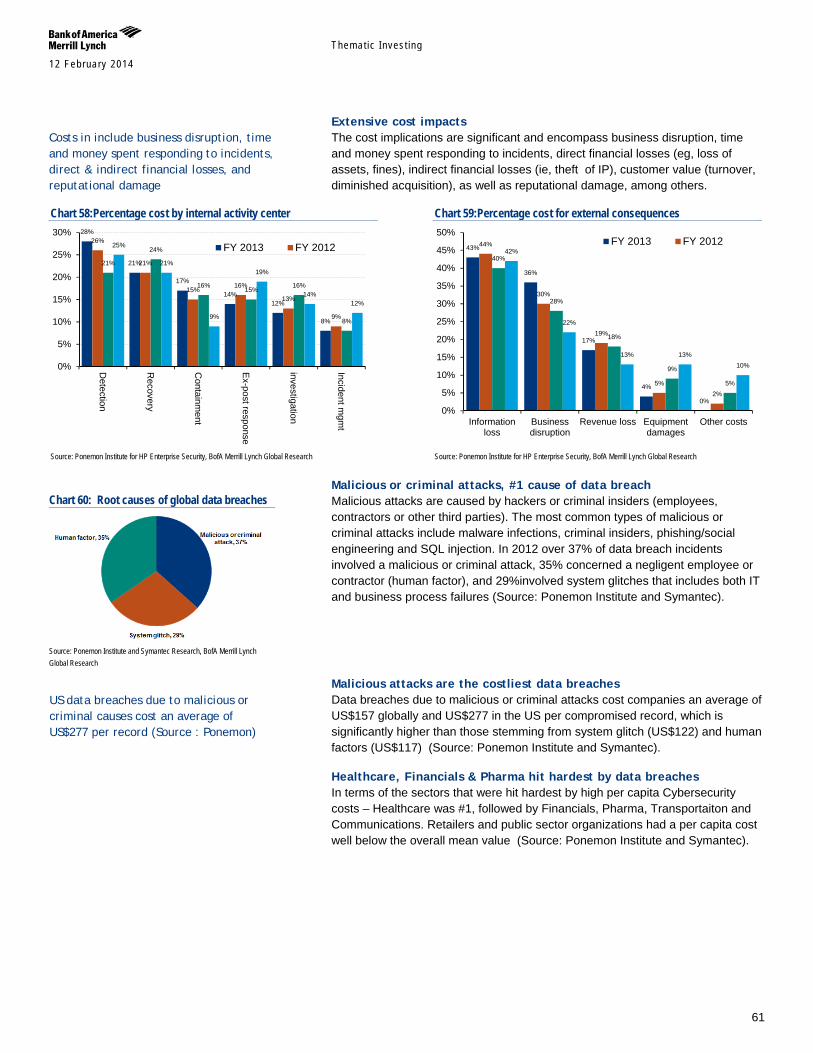
Themat ic Inves t ing 12 February 2014
61
Extensive cost impacts The cost implications are significant and encompass business disruption, time and money spent responding to incidents, direct financial losses (eg, loss of assets, fines), indirect financial losses (ie, theft of IP), customer value (turnover, diminished acquisition), as well as reputational damage, among others.
Chart 58:Percentage cost by internal activity center
Source: Ponemon Institute for HP Enterprise Security, BofA Merrill Lynch Global Research
Chart 59:Percentage cost for external consequences
Source: Ponemon Institute for HP Enterprise Security, BofA Merrill Lynch Global Research
Malicious or criminal attacks, #1 cause of data breach Malicious attacks are caused by hackers or criminal insiders (employees, contractors or other third parties). The most common types of malicious or criminal attacks include malware infections, criminal insiders, phishing/social engineering and SQL injection. In 2012 over 37% of data breach incidents involved a malicious or criminal attack, 35% concerned a negligent employee or contractor (human factor), and 29%involved system glitches that includes both IT and business process failures (Source: Ponemon Institute and Symantec).
Malicious attacks are the costliest data breaches Data breaches due to malicious or criminal attacks cost companies an average of US$157 globally and US$277 in the US per compromised record, which is significantly higher than those stemming from system glitch (US$122) and human factors (US$117) (Source: Ponemon Institute and Symantec).
Healthcare, Financials & Pharma hit hardest by data breaches In terms of the sectors that were hit hardest by high per capita Cybersecurity costs – Healthcare was #1, followed by Financials, Pharma, Transportaiton and Communications. Retailers and public sector organizations had a per capita cost well below the overall mean value (Source: Ponemon Institute and Symantec).
28%
21%
17%
14% 12%
8%
26%
21%
15% 16%
13%
9%
21%
24%
16% 15%
16%
8%
25%
21%
9%
19%
14% 12%
0%
5%
10%
15%
20%
25%
30%
Detection
Recovery
Containm
ent
Ex-post response
investigation
Incident mgm
t
FY 2013 FY 2012 43%
36%
17%
4%
0%
44%
30%
19%
5% 2%
40%
28%
18%
9%
5%
42%
22%
13% 13% 10%
0%
5%
10%
15%
20%
25%
30%
35%
40%
45%
50%
Informationloss
Businessdisruption
Revenue loss Equipmentdamages
Other costs
FY 2013 FY 2012
Costs in include business disruption, time and money spent responding to incidents, direct & indirect financial losses, and reputational damage
Chart 60: Root causes of global data breaches
Source: Ponemon Institute and Symantec Research, BofA Merrill Lynch Global Research
US data breaches due to malicious or criminal causes cost an average of US$277 per record (Source : Ponemon)
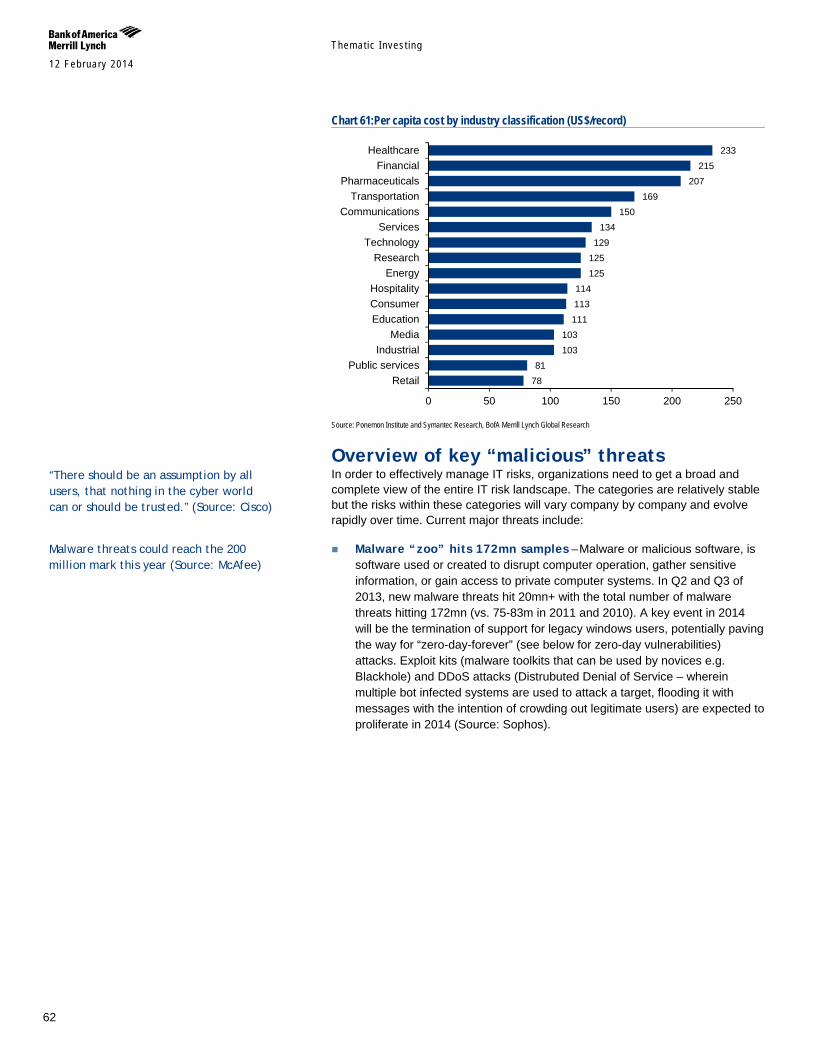
Themat ic Inves t ing 12 February 2014
62
Chart 61:Per capita cost by industry classification (US$/record)
Source: Ponemon Institute and Symantec Research, BofA Merrill Lynch Global Research
Overview of key “malicious” threats In order to effectively manage IT risks, organizations need to get a broad and complete view of the entire IT risk landscape. The categories are relatively stable but the risks within these categories will vary company by company and evolve rapidly over time. Current major threats include:
Malware “zoo” hits 172mn samples – Malware or malicious software, is software used or created to disrupt computer operation, gather sensitive information, or gain access to private computer systems. In Q2 and Q3 of 2013, new malware threats hit 20mn+ with the total number of malware threats hitting 172mn (vs. 75-83m in 2011 and 2010). A key event in 2014 will be the termination of support for legacy windows users, potentially paving the way for “zero-day-forever” (see below for zero-day vulnerabilities) attacks. Exploit kits (malware toolkits that can be used by novices e.g. Blackhole) and DDoS attacks (Distrubuted Denial of Service – wherein multiple bot infected systems are used to attack a target, flooding it with messages with the intention of crowding out legitimate users) are expected to proliferate in 2014 (Source: Sophos).
78 81
103 103
111 113 114
125 125 129
134 150
169 207
215 233
0 50 100 150 200 250
RetailPublic services
IndustrialMedia
EducationConsumerHospitality
EnergyResearch
TechnologyServices
CommunicationsTransportation
PharmaceuticalsFinancial
Healthcare
Malware threats could reach the 200 million mark this year (Source: McAfee)
“There should be an assumption by all users, that nothing in the cyber world can or should be trusted.” (Source: Cisco)
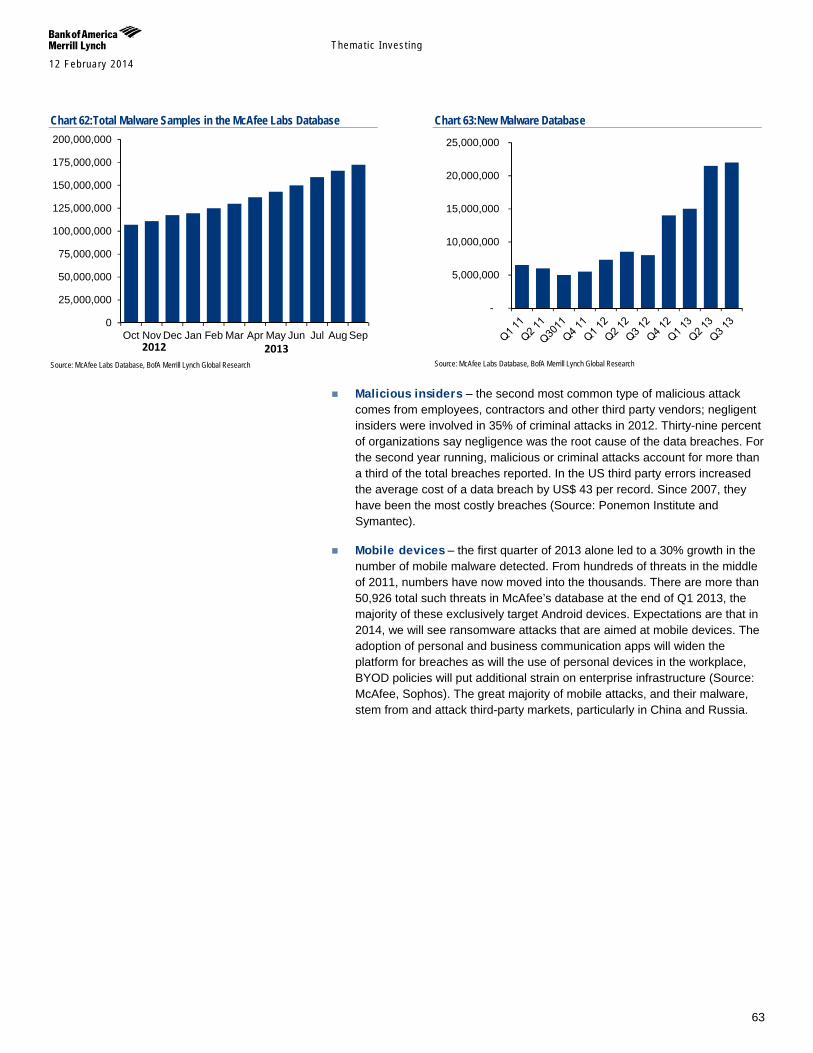
Themat ic Inves t ing 12 February 2014
63
Chart 62:Total Malware Samples in the McAfee Labs Database
Source: McAfee Labs Database, BofA Merrill Lynch Global Research
Chart 63:New Malware Database
Source: McAfee Labs Database, BofA Merrill Lynch Global Research
Malicious insiders – the second most common type of malicious attack comes from employees, contractors and other third party vendors; negligent insiders were involved in 35% of criminal attacks in 2012. Thirty-nine percent of organizations say negligence was the root cause of the data breaches. For the second year running, malicious or criminal attacks account for more than a third of the total breaches reported. In the US third party errors increased the average cost of a data breach by US$ 43 per record. Since 2007, they have been the most costly breaches (Source: Ponemon Institute and Symantec).
Mobile devices – the first quarter of 2013 alone led to a 30% growth in the number of mobile malware detected. From hundreds of threats in the middle of 2011, numbers have now moved into the thousands. There are more than 50,926 total such threats in McAfee’s database at the end of Q1 2013, the majority of these exclusively target Android devices. Expectations are that in 2014, we will see ransomware attacks that are aimed at mobile devices. The adoption of personal and business communication apps will widen the platform for breaches as will the use of personal devices in the workplace, BYOD policies will put additional strain on enterprise infrastructure (Source: McAfee, Sophos). The great majority of mobile attacks, and their malware, stem from and attack third-party markets, particularly in China and Russia.
0
25,000,000
50,000,000
75,000,000
100,000,000
125,000,000
150,000,000
175,000,000
200,000,000
Oct Nov Dec Jan Feb Mar Apr May Jun Jul Aug Sep2012 2013
-
5,000,000
10,000,000
15,000,000
20,000,000
25,000,000
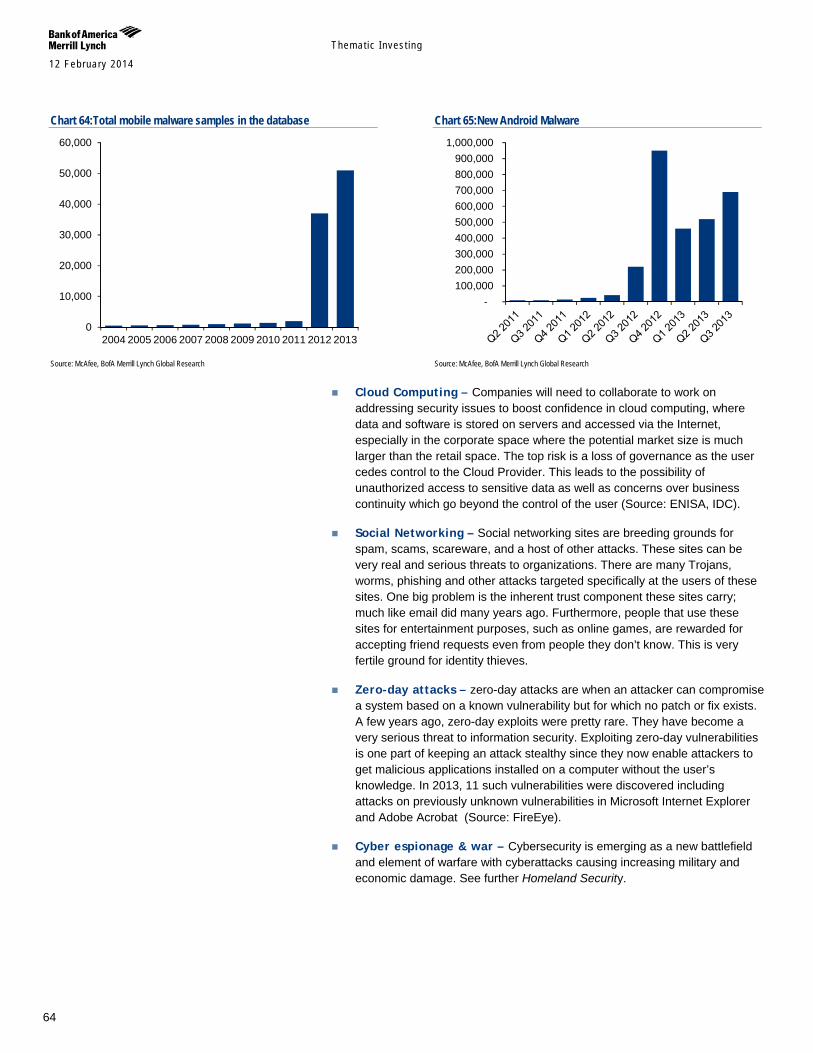
Themat ic Inves t ing 12 February 2014
64
Chart 64:Total mobile malware samples in the database
Source: McAfee, BofA Merrill Lynch Global Research
Chart 65:New Android Malware
Source: McAfee, BofA Merrill Lynch Global Research
Cloud Computing – Companies will need to collaborate to work on addressing security issues to boost confidence in cloud computing, where data and software is stored on servers and accessed via the Internet, especially in the corporate space where the potential market size is much larger than the retail space. The top risk is a loss of governance as the user cedes control to the Cloud Provider. This leads to the possibility of unauthorized access to sensitive data as well as concerns over business continuity which go beyond the control of the user (Source: ENISA, IDC).
Social Networking – Social networking sites are breeding grounds for spam, scams, scareware, and a host of other attacks. These sites can be very real and serious threats to organizations. There are many Trojans, worms, phishing and other attacks targeted specifically at the users of these sites. One big problem is the inherent trust component these sites carry; much like email did many years ago. Furthermore, people that use these sites for entertainment purposes, such as online games, are rewarded for accepting friend requests even from people they don’t know. This is very fertile ground for identity thieves.
Zero-day attacks – zero-day attacks are when an attacker can compromise a system based on a known vulnerability but for which no patch or fix exists. A few years ago, zero-day exploits were pretty rare. They have become a very serious threat to information security. Exploiting zero-day vulnerabilities is one part of keeping an attack stealthy since they now enable attackers to get malicious applications installed on a computer without the user’s knowledge. In 2013, 11 such vulnerabilities were discovered including attacks on previously unknown vulnerabilities in Microsoft Internet Explorer and Adobe Acrobat (Source: FireEye).
Cyber espionage & war – Cybersecurity is emerging as a new battlefield and element of warfare with cyberattacks causing increasing military and economic damage. See further Homeland Security.
0
10,000
20,000
30,000
40,000
50,000
60,000
2004 2005 2006 2007 2008 2009 2010 2011 2012 2013
- 100,000 200,000 300,000 400,000 500,000 600,000 700,000 800,000 900,000
1,000,000
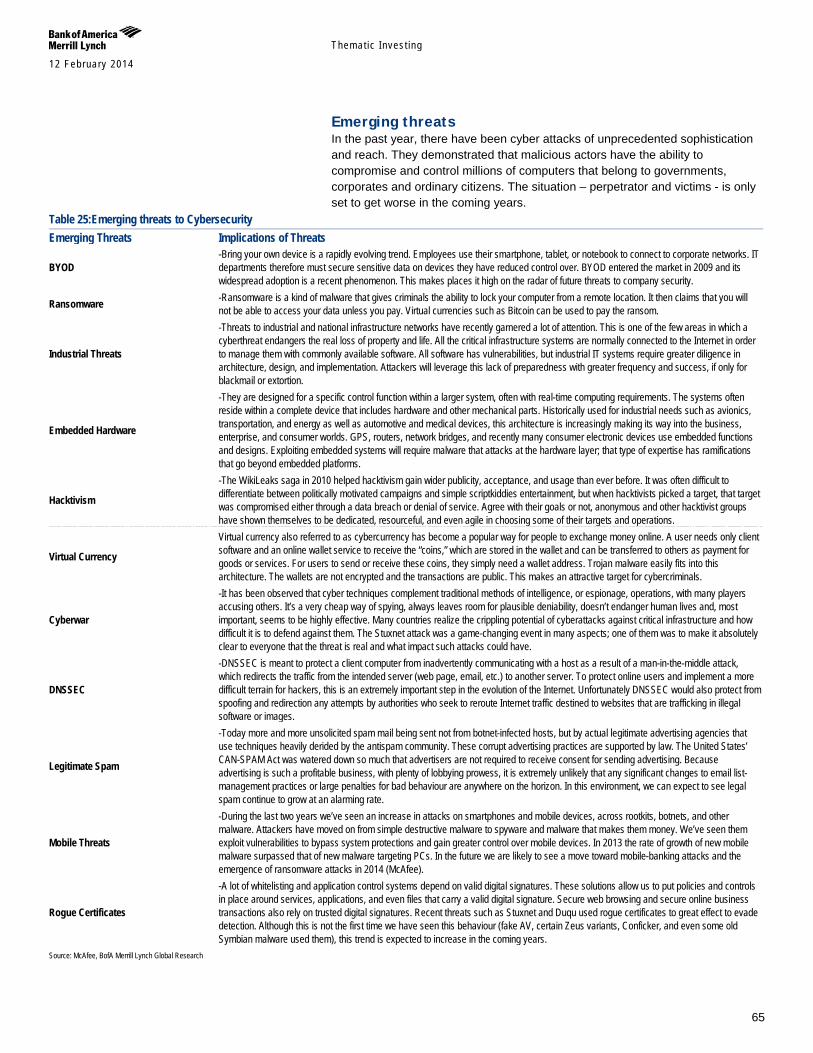
Themat ic Inves t ing 12 February 2014
65
Emerging threats In the past year, there have been cyber attacks of unprecedented sophistication and reach. They demonstrated that malicious actors have the ability to compromise and control millions of computers that belong to governments, corporates and ordinary citizens. The situation – perpetrator and victims - is only set to get worse in the coming years.
Table 25:Emerging threats to Cybersecurity Emerging Threats Implications of Threats
BYOD -Bring your own device is a rapidly evolving trend. Employees use their smartphone, tablet, or notebook to connect to corporate networks. IT departments therefore must secure sensitive data on devices they have reduced control over. BYOD entered the market in 2009 and its widespread adoption is a recent phenomenon. This makes places it high on the radar of future threats to company security.
Ransomware -Ransomware is a kind of malware that gives criminals the ability to lock your computer from a remote location. It then claims that you will not be able to access your data unless you pay. Virtual currencies such as Bitcoin can be used to pay the ransom.
Industrial Threats
-Threats to industrial and national infrastructure networks have recently garnered a lot of attention. This is one of the few areas in which a cyberthreat endangers the real loss of property and life. All the critical infrastructure systems are normally connected to the Internet in order to manage them with commonly available software. All software has vulnerabilities, but industrial IT systems require greater diligence in architecture, design, and implementation. Attackers will leverage this lack of preparedness with greater frequency and success, if only for blackmail or extortion.
Embedded Hardware
-They are designed for a specific control function within a larger system, often with real-time computing requirements. The systems often reside within a complete device that includes hardware and other mechanical parts. Historically used for industrial needs such as avionics, transportation, and energy as well as automotive and medical devices, this architecture is increasingly making its way into the business, enterprise, and consumer worlds. GPS, routers, network bridges, and recently many consumer electronic devices use embedded functions and designs. Exploiting embedded systems will require malware that attacks at the hardware layer; that type of expertise has ramifications that go beyond embedded platforms.
Hacktivism
-The WikiLeaks saga in 2010 helped hacktivism gain wider publicity, acceptance, and usage than ever before. It was often difficult to differentiate between politically motivated campaigns and simple scriptkiddies entertainment, but when hacktivists picked a target, that target was compromised either through a data breach or denial of service. Agree with their goals or not, anonymous and other hacktivist groups have shown themselves to be dedicated, resourceful, and even agile in choosing some of their targets and operations.
Virtual Currency
Virtual currency also referred to as cybercurrency has become a popular way for people to exchange money online. A user needs only client software and an online wallet service to receive the “coins,” which are stored in the wallet and can be transferred to others as payment for goods or services. For users to send or receive these coins, they simply need a wallet address. Trojan malware easily fits into this architecture. The wallets are not encrypted and the transactions are public. This makes an attractive target for cybercriminals.
Cyberwar
-It has been observed that cyber techniques complement traditional methods of intelligence, or espionage, operations, with many players accusing others. It’s a very cheap way of spying, always leaves room for plausible deniability, doesn’t endanger human lives and, most important, seems to be highly effective. Many countries realize the crippling potential of cyberattacks against critical infrastructure and how difficult it is to defend against them. The Stuxnet attack was a game-changing event in many aspects; one of them was to make it absolutely clear to everyone that the threat is real and what impact such attacks could have.
DNSSEC
-DNSSEC is meant to protect a client computer from inadvertently communicating with a host as a result of a man-in-the-middle attack, which redirects the traffic from the intended server (web page, email, etc.) to another server. To protect online users and implement a more difficult terrain for hackers, this is an extremely important step in the evolution of the Internet. Unfortunately DNSSEC would also protect from spoofing and redirection any attempts by authorities who seek to reroute Internet traffic destined to websites that are trafficking in illegal software or images.
Legitimate Spam
-Today more and more unsolicited spam mail being sent not from botnet-infected hosts, but by actual legitimate advertising agencies that use techniques heavily derided by the antispam community. These corrupt advertising practices are supported by law. The United States’ CAN-SPAM Act was watered down so much that advertisers are not required to receive consent for sending advertising. Because advertising is such a profitable business, with plenty of lobbying prowess, it is extremely unlikely that any significant changes to email list-management practices or large penalties for bad behaviour are anywhere on the horizon. In this environment, we can expect to see legal spam continue to grow at an alarming rate.
Mobile Threats
-During the last two years we’ve seen an increase in attacks on smartphones and mobile devices, across rootkits, botnets, and other malware. Attackers have moved on from simple destructive malware to spyware and malware that makes them money. We’ve seen them exploit vulnerabilities to bypass system protections and gain greater control over mobile devices. In 2013 the rate of growth of new mobile malware surpassed that of new malware targeting PCs. In the future we are likely to see a move toward mobile-banking attacks and the emergence of ransomware attacks in 2014 (McAfee).
Rogue Certificates
-A lot of whitelisting and application control systems depend on valid digital signatures. These solutions allow us to put policies and controls in place around services, applications, and even files that carry a valid digital signature. Secure web browsing and secure online business transactions also rely on trusted digital signatures. Recent threats such as Stuxnet and Duqu used rogue certificates to great effect to evade detection. Although this is not the first time we have seen this behaviour (fake AV, certain Zeus variants, Conficker, and even some old Symbian malware used them), this trend is expected to increase in the coming years.
Source: McAfee, BofA Merrill Lynch Global Research
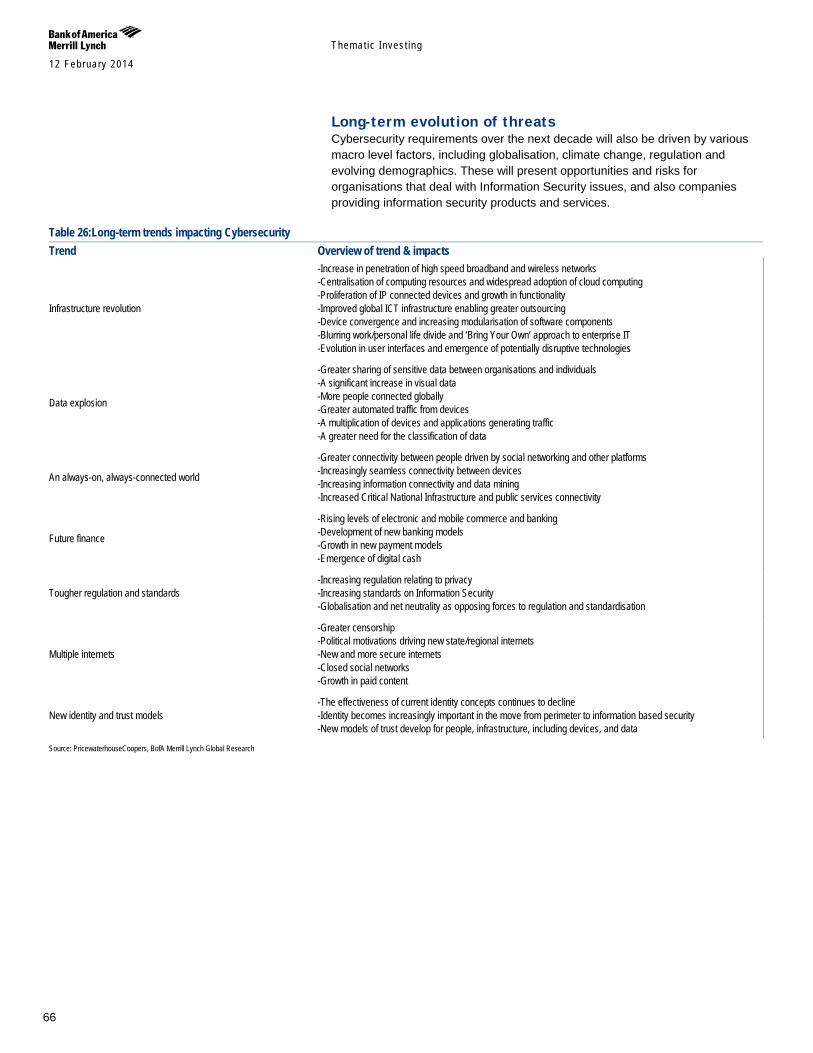
Themat ic Inves t ing 12 February 2014
66
Long-term evolution of threats Cybersecurity requirements over the next decade will also be driven by various macro level factors, including globalisation, climate change, regulation and evolving demographics. These will present opportunities and risks for organisations that deal with Information Security issues, and also companies providing information security products and services.
Table 26:Long-term trends impacting Cybersecurity Trend Overview of trend & impacts
Infrastructure revolution
-Increase in penetration of high speed broadband and wireless networks -Centralisation of computing resources and widespread adoption of cloud computing -Proliferation of IP connected devices and growth in functionality -Improved global ICT infrastructure enabling greater outsourcing -Device convergence and increasing modularisation of software components -Blurring work/personal life divide and ‘Bring Your Own’ approach to enterprise IT -Evolution in user interfaces and emergence of potentially disruptive technologies
Data explosion
-Greater sharing of sensitive data between organisations and individuals -A significant increase in visual data -More people connected globally -Greater automated traffic from devices -A multiplication of devices and applications generating traffic -A greater need for the classification of data
An always-on, always-connected world
-Greater connectivity between people driven by social networking and other platforms -Increasingly seamless connectivity between devices -Increasing information connectivity and data mining -Increased Critical National Infrastructure and public services connectivity
Future finance
-Rising levels of electronic and mobile commerce and banking -Development of new banking models -Growth in new payment models -Emergence of digital cash
Tougher regulation and standards -Increasing regulation relating to privacy -Increasing standards on Information Security -Globalisation and net neutrality as opposing forces to regulation and standardisation
Multiple internets
-Greater censorship -Political motivations driving new state/regional internets -New and more secure internets -Closed social networks -Growth in paid content
New identity and trust models -The effectiveness of current identity concepts continues to decline -Identity becomes increasingly important in the move from perimeter to information based security -New models of trust develop for people, infrastructure, including devices, and data
Source: PricewaterhouseCoopers, BofA Merrill Lynch Global Research
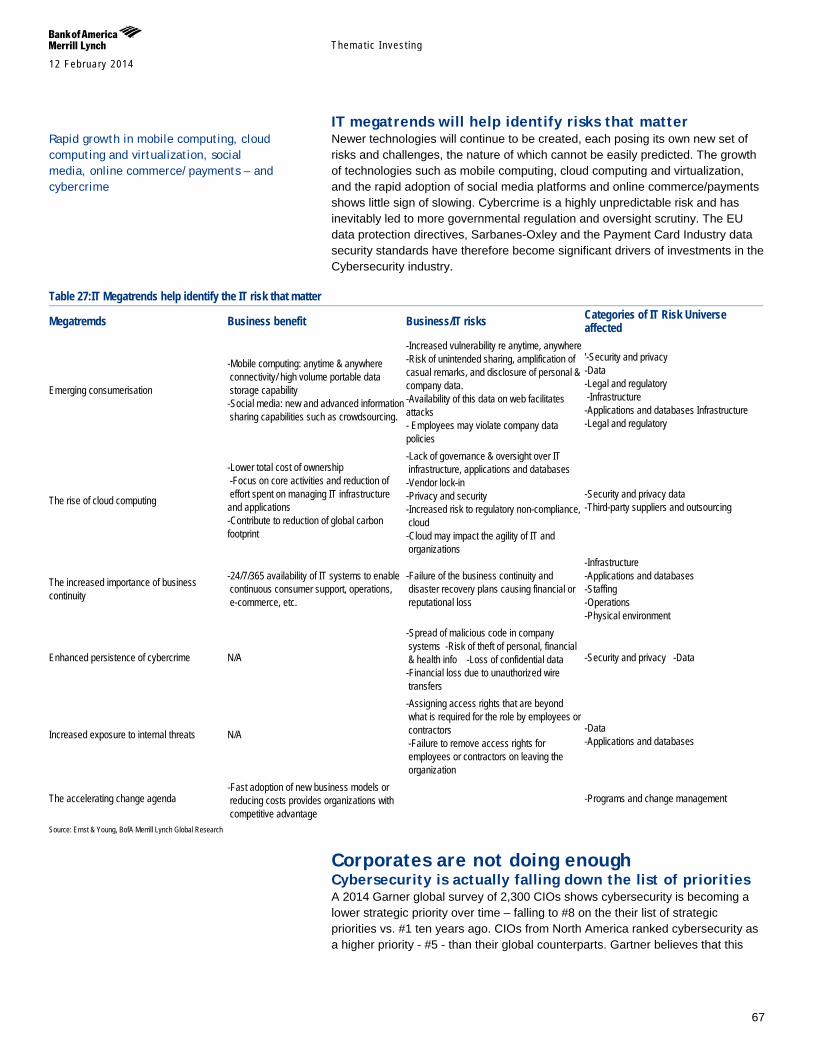
Themat ic Inves t ing 12 February 2014
67
IT megatrends will help identify risks that matter Newer technologies will continue to be created, each posing its own new set of risks and challenges, the nature of which cannot be easily predicted. The growth of technologies such as mobile computing, cloud computing and virtualization, and the rapid adoption of social media platforms and online commerce/payments shows little sign of slowing. Cybercrime is a highly unpredictable risk and has inevitably led to more governmental regulation and oversight scrutiny. The EU data protection directives, Sarbanes-Oxley and the Payment Card Industry data security standards have therefore become significant drivers of investments in the Cybersecurity industry.
Table 27:IT Megatrends help identify the IT risk that matter
Megatremds Business benefit Business/IT risks Categories of IT Risk Universe affected
Emerging consumerisation
-Mobile computing: anytime & anywhere connectivity/ high volume portable data storage capability -Social media: new and advanced information sharing capabilities such as crowdsourcing.
-Increased vulnerability re anytime, anywhere -Risk of unintended sharing, amplification of casual remarks, and disclosure of personal & company data. -Availability of this data on web facilitates attacks - Employees may violate company data policies
'-Security and privacy -Data -Legal and regulatory -Infrastructure -Applications and databases Infrastructure -Legal and regulatory
The rise of cloud computing
-Lower total cost of ownership -Focus on core activities and reduction of effort spent on managing IT infrastructure and applications -Contribute to reduction of global carbon footprint
-Lack of governance & oversight over IT infrastructure, applications and databases -Vendor lock-in -Privacy and security -Increased risk to regulatory non-compliance, cloud -Cloud may impact the agility of IT and organizations
-Security and privacy data -Third-party suppliers and outsourcing
The increased importance of business continuity
-24/7/365 availability of IT systems to enable continuous consumer support, operations, e-commerce, etc.
-Failure of the business continuity and disaster recovery plans causing financial or reputational loss
-Infrastructure -Applications and databases -Staffing -Operations -Physical environment
Enhanced persistence of cybercrime N/A
-Spread of malicious code in company systems -Risk of theft of personal, financial & health info -Loss of confidential data -Financial loss due to unauthorized wire transfers
-Security and privacy -Data
Increased exposure to internal threats N/A
-Assigning access rights that are beyond what is required for the role by employees or contractors -Failure to remove access rights for employees or contractors on leaving the organization
-Data -Applications and databases
The accelerating change agenda -Fast adoption of new business models or reducing costs provides organizations with competitive advantage
-Programs and change management
Source: Ernst & Young, BofA Merrill Lynch Global Research
Corporates are not doing enough Cybersecurity is actually falling down the list of priorities A 2014 Garner global survey of 2,300 CIOs shows cybersecurity is becoming a lower strategic priority over time – falling to #8 on the their list of strategic priorities vs. #1 ten years ago. CIOs from North America ranked cybersecurity as a higher priority - #5 - than their global counterparts. Gartner believes that this
Rapid growth in mobile computing, cloud computing and virtualization, social media, online commerce/payments – and cybercrime
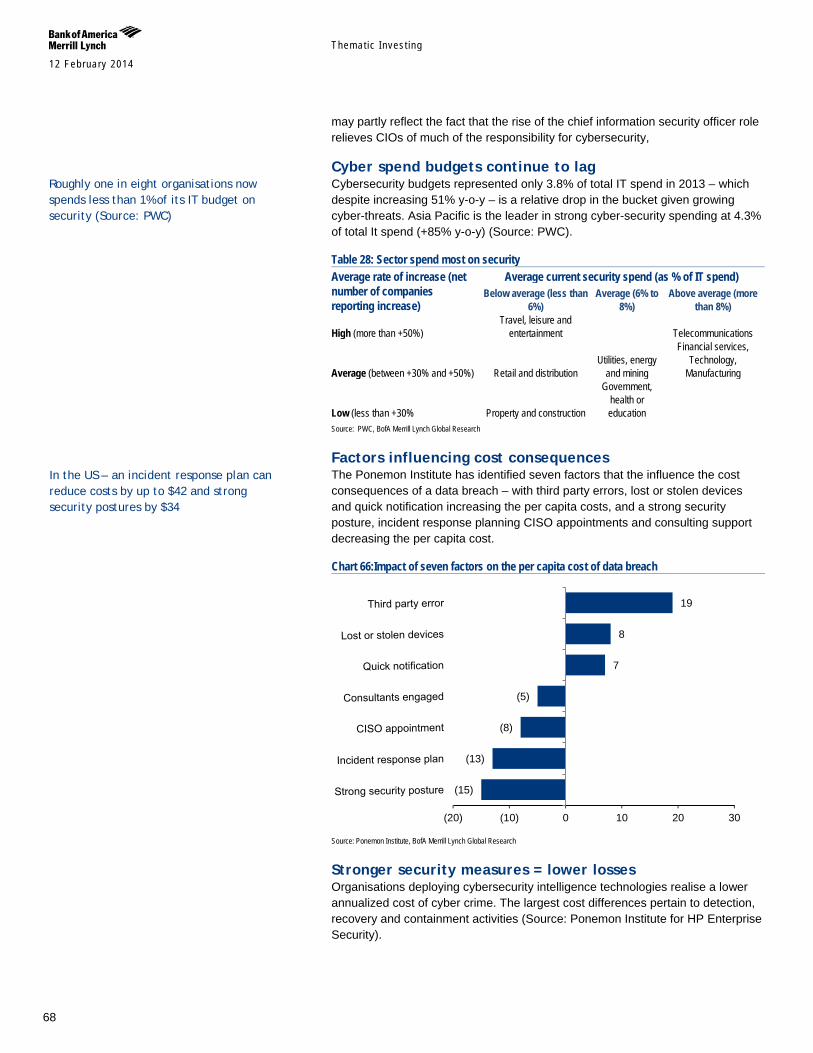
Themat ic Inves t ing 12 February 2014
68
may partly reflect the fact that the rise of the chief information security officer role relieves CIOs of much of the responsibility for cybersecurity,
Cyber spend budgets continue to lag Cybersecurity budgets represented only 3.8% of total IT spend in 2013 – which despite increasing 51% y-o-y – is a relative drop in the bucket given growing cyber-threats. Asia Pacific is the leader in strong cyber-security spending at 4.3% of total It spend (+85% y-o-y) (Source: PWC).
Table 28: Sector spend most on security Average rate of increase (net number of companies reporting increase)
Average current security spend (as % of IT spend) Below average (less than
6%) Average (6% to
8%) Above average (more
than 8%)
High (more than +50%) Travel, leisure and
entertainment Telecommunications
Average (between +30% and +50%) Retail and distribution Utilities, energy
and mining
Financial services, Technology,
Manufacturing
Low (less than +30% Property and construction
Government, health or education
Source: PWC, BofA Merrill Lynch Global Research
Factors influencing cost consequences The Ponemon Institute has identified seven factors that the influence the cost consequences of a data breach – with third party errors, lost or stolen devices and quick notification increasing the per capita costs, and a strong security posture, incident response planning CISO appointments and consulting support decreasing the per capita cost.
Chart 66:Impact of seven factors on the per capita cost of data breach
Source: Ponemon Institute, BofA Merrill Lynch Global Research
Stronger security measures = lower losses Organisations deploying cybersecurity intelligence technologies realise a lower annualized cost of cyber crime. The largest cost differences pertain to detection, recovery and containment activities (Source: Ponemon Institute for HP Enterprise Security).
(15)
(13)
(8)
(5)
7
8
19
(20) (10) 0 10 20 30
Roughly one in eight organisations now spends less than 1% of its IT budget on security (Source: PWC)
In the US – an incident response plan can reduce costs by up to $42 and strong security postures by $34
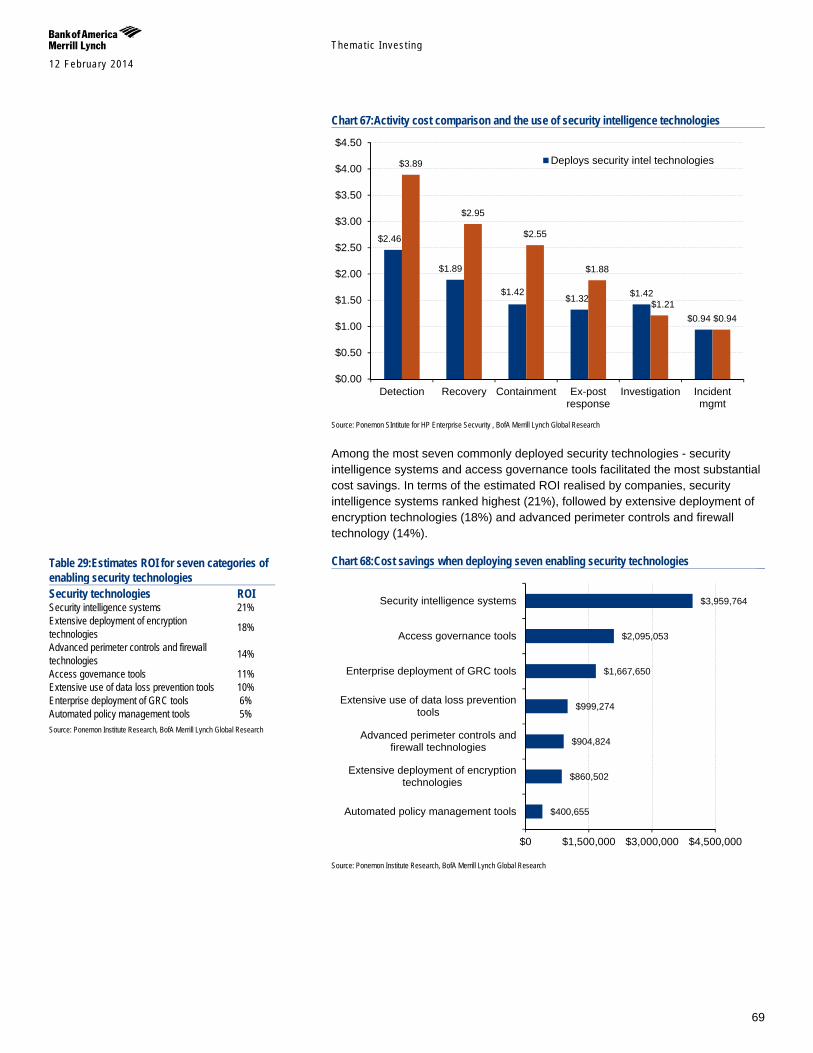
Themat ic Inves t ing 12 February 2014
69
Chart 67:Activity cost comparison and the use of security intelligence technologies
Source: Ponemon SIntitute for HP Enterprise Secvurity , BofA Merrill Lynch Global Research
Among the most seven commonly deployed security technologies - security intelligence systems and access governance tools facilitated the most substantial cost savings. In terms of the estimated ROI realised by companies, security intelligence systems ranked highest (21%), followed by extensive deployment of encryption technologies (18%) and advanced perimeter controls and firewall technology (14%).
Chart 68:Cost savings when deploying seven enabling security technologies
Source: Ponemon Institute Research, BofA Merrill Lynch Global Research
$2.46
$1.89
$1.42 $1.32 $1.42
$0.94
$3.89
$2.95
$2.55
$1.88
$1.21 $0.94
$0.00
$0.50
$1.00
$1.50
$2.00
$2.50
$3.00
$3.50
$4.00
$4.50
Detection Recovery Containment Ex-postresponse
Investigation Incidentmgmt
Deploys security intel technologies
$400,655
$860,502
$904,824
$999,274
$1,667,650
$2,095,053
$3,959,764
$0 $1,500,000 $3,000,000 $4,500,000
Automated policy management tools
Extensive deployment of encryptiontechnologies
Advanced perimeter controls andfirewall technologies
Extensive use of data loss preventiontools
Enterprise deployment of GRC tools
Access governance tools
Security intelligence systems
Table 29:Estimates ROI for seven categories of enabling security technologies Security technologies ROI Security intelligence systems 21% Extensive deployment of encryption technologies 18%
Advanced perimeter controls and firewall technologies 14%
Access governance tools 11% Extensive use of data loss prevention tools 10% Enterprise deployment of GRC tools 6% Automated policy management tools 5% Source: Ponemon Institute Research, BofA Merrill Lynch Global Research
Themat ic Inves t ing 12 February 2014
70
Companies need to adopt a lifecycle cost approach There is a need for a proactive approach to cybersecurity from all stakeholders given the rising complexity and volume of threats. Organisations need to consider both the potential benefits and costs of their approach to Information Security with a holistic approach like the ‘Total Lifecycle Cost of Information Security’ model.
Table 30: Total lifecycle cost of Information security
Definition Total Lifecycle Cost of Information Security =
Lifecycle costs of deploying and operating security solutions +
Reputational value +
Intellectual Property value +
Operational effectiveness +
Financial impact of incidents
Hardware/ software solutions Brand volume R&D information Productivity Direct financial l loss from attack
Training
Customer satisfaction/ confidence
Customer databases
Ability to service customers
Consultancy costs Competitive information
Cost to serve customers
People costs Source: PWC, BofA Merrill Lynch Global Research
And governments are not doing enough In a worst case scenario, cyber-attacks have the ability to trigger a financial crisis by hitting banks, cause national emergencies by infiltrating the IT systems of hospitals or water treatment plants, and bring countries to a standstill by taking out power plants. As a result, we are seeing a growing talk by governments on mitigating the risks associated with cyber attacks, but their efforts are still far from par with the growing nature of the threats:
U.S., lack of federal regulation U.S. President Obama is on record as stating that cyber-attacks are the "most serious economic and national security" challenge America faces. However, there are few federal cybersecurity regulations (ex-those focusing on specific industries). A proposed Cybersecurity Act would have created voluntary "best practice standards" for protection of key infrastructure, but was voted down in the Senate, including over business burden and civil liberties concerns. In February 2013, President Obama proposed the Executive Order Improving Critical Infrastructure Cybersecurity which seeks to enhance information flow between DHS and critical infrastructure companies. The SEC has also introduced cyber disclosure guidance on risk factors in financial statements (i.e. if “these issues are among the most significant factors that make an investment in the company speculative or risky,” according to the SEC’s guidance).
Europe, proposed cybersecurity Directive In 2013 the EU published a new cybersecurity strategy including a proposed Cybersecurity Directive which would impose a legal obligation on companies to ensure they have suitable Cybersecurity systems in place, require notification of potential security risks and for actual incidents to be reported to cybersecurity authorities that will be established across Europe. The Directive could mean a ramping up of spend in the space with operators of critical infrastructures in some sectors (financial services, transport, energy, health), enablers of information society services (notably: app stores e-commerce platforms, Internet payment, cloud computing, search engines, social networks) and public administrations obliged to adopt risk management practices and report major security incidents on their core services. EU governments are also stepping up their cybersecurity efforts with the UK investing £180mn in 2013-14 and £210mn in 2014-15.
U.S. President Obama is on record as stating that cyber-attacks are the "most serious economic and national security" challenge America faces
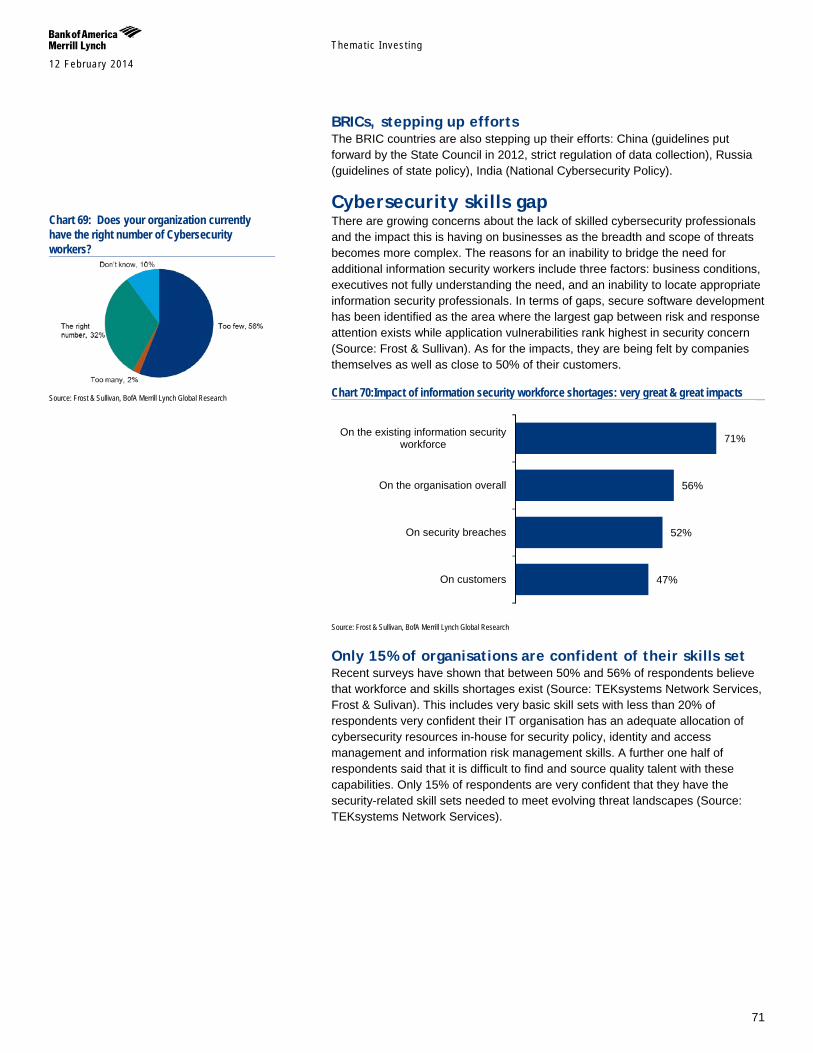
Themat ic Inves t ing 12 February 2014
71
BRICs, stepping up efforts The BRIC countries are also stepping up their efforts: China (guidelines put forward by the State Council in 2012, strict regulation of data collection), Russia (guidelines of state policy), India (National Cybersecurity Policy).
Cybersecurity skills gap There are growing concerns about the lack of skilled cybersecurity professionals and the impact this is having on businesses as the breadth and scope of threats becomes more complex. The reasons for an inability to bridge the need for additional information security workers include three factors: business conditions, executives not fully understanding the need, and an inability to locate appropriate information security professionals. In terms of gaps, secure software development has been identified as the area where the largest gap between risk and response attention exists while application vulnerabilities rank highest in security concern (Source: Frost & Sullivan). As for the impacts, they are being felt by companies themselves as well as close to 50% of their customers.
Chart 70:Impact of information security workforce shortages: very great & great impacts
Source: Frost & Sullivan, BofA Merrill Lynch Global Research
Only 15% of organisations are confident of their skills set Recent surveys have shown that between 50% and 56% of respondents believe that workforce and skills shortages exist (Source: TEKsystems Network Services, Frost & Sulivan). This includes very basic skill sets with less than 20% of respondents very confident their IT organisation has an adequate allocation of cybersecurity resources in-house for security policy, identity and access management and information risk management skills. A further one half of respondents said that it is difficult to find and source quality talent with these capabilities. Only 15% of respondents are very confident that they have the security-related skill sets needed to meet evolving threat landscapes (Source: TEKsystems Network Services).
47%
52%
56%
71%
On customers
On security breaches
On the organisation overall
On the existing information securityworkforce
Chart 69: Does your organization currently have the right number of Cybersecurity workers?
Source: Frost & Sullivan, BofA Merrill Lynch Global Research
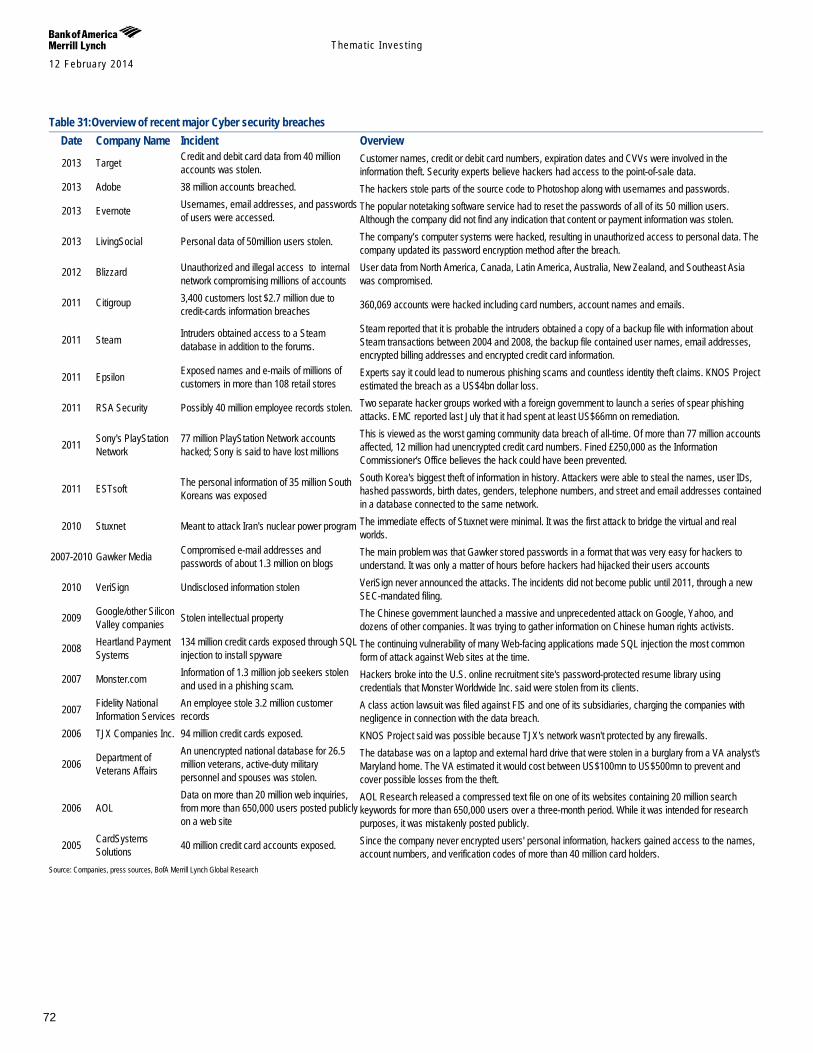
Themat ic Inves t ing 12 February 2014
72
Table 31:Overview of recent major Cyber security breaches Date Company Name Incident Overview
2013 Target Credit and debit card data from 40 million accounts was stolen.
Customer names, credit or debit card numbers, expiration dates and CVVs were involved in the information theft. Security experts believe hackers had access to the point-of-sale data.
2013 Adobe 38 million accounts breached. The hackers stole parts of the source code to Photoshop along with usernames and passwords.
2013 Evernote Usernames, email addresses, and passwords of users were accessed.
The popular notetaking software service had to reset the passwords of all of its 50 million users. Although the company did not find any indication that content or payment information was stolen.
2013 LivingSocial Personal data of 50million users stolen. The company’s computer systems were hacked, resulting in unauthorized access to personal data. The company updated its password encryption method after the breach.
2012 Blizzard Unauthorized and illegal access to internal network compromising millions of accounts
User data from North America, Canada, Latin America, Australia, New Zealand, and Southeast Asia was compromised.
2011 Citigroup 3,400 customers lost $2.7 million due to credit-cards information breaches 360,069 accounts were hacked including card numbers, account names and emails.
2011 Steam Intruders obtained access to a Steam database in addition to the forums.
Steam reported that it is probable the intruders obtained a copy of a backup file with information about Steam transactions between 2004 and 2008, the backup file contained user names, email addresses, encrypted billing addresses and encrypted credit card information.
2011 Epsilon Exposed names and e-mails of millions of customers in more than 108 retail stores
Experts say it could lead to numerous phishing scams and countless identity theft claims. KNOS Project estimated the breach as a US$4bn dollar loss.
2011 RSA Security Possibly 40 million employee records stolen. Two separate hacker groups worked with a foreign government to launch a series of spear phishing attacks. EMC reported last July that it had spent at least US$66mn on remediation.
2011 Sony's PlayStation Network
77 million PlayStation Network accounts hacked; Sony is said to have lost millions
This is viewed as the worst gaming community data breach of all-time. Of more than 77 million accounts affected, 12 million had unencrypted credit card numbers. Fined £250,000 as the Information Commissioner's Office believes the hack could have been prevented.
2011 ESTsoft The personal information of 35 million South Koreans was exposed
South Korea's biggest theft of information in history. Attackers were able to steal the names, user IDs, hashed passwords, birth dates, genders, telephone numbers, and street and email addresses contained in a database connected to the same network.
2010 Stuxnet Meant to attack Iran's nuclear power program The immediate effects of Stuxnet were minimal. It was the first attack to bridge the virtual and real worlds.
2007-2010 Gawker Media Compromised e-mail addresses and passwords of about 1.3 million on blogs
The main problem was that Gawker stored passwords in a format that was very easy for hackers to understand. It was only a matter of hours before hackers had hijacked their users accounts
2010 VeriSign Undisclosed information stolen VeriSign never announced the attacks. The incidents did not become public until 2011, through a new SEC-mandated filing.
2009 Google/other Silicon Valley companies Stolen intellectual property The Chinese government launched a massive and unprecedented attack on Google, Yahoo, and
dozens of other companies. It was trying to gather information on Chinese human rights activists.
2008 Heartland Payment Systems
134 million credit cards exposed through SQL injection to install spyware
The continuing vulnerability of many Web-facing applications made SQL injection the most common form of attack against Web sites at the time.
2007 Monster.com Information of 1.3 million job seekers stolen and used in a phishing scam.
Hackers broke into the U.S. online recruitment site's password-protected resume library using credentials that Monster Worldwide Inc. said were stolen from its clients.
2007 Fidelity National Information Services
An employee stole 3.2 million customer records
A class action lawsuit was filed against FIS and one of its subsidiaries, charging the companies with negligence in connection with the data breach.
2006 TJX Companies Inc. 94 million credit cards exposed. KNOS Project said was possible because TJX's network wasn't protected by any firewalls.
2006 Department of Veterans Affairs
An unencrypted national database for 26.5 million veterans, active-duty military personnel and spouses was stolen.
The database was on a laptop and external hard drive that were stolen in a burglary from a VA analyst's Maryland home. The VA estimated it would cost between US$100mn to US$500mn to prevent and cover possible losses from the theft.
2006 AOL Data on more than 20 million web inquiries, from more than 650,000 users posted publicly on a web site
AOL Research released a compressed text file on one of its websites containing 20 million search keywords for more than 650,000 users over a three-month period. While it was intended for research purposes, it was mistakenly posted publicly.
2005 CardSystems Solutions 40 million credit card accounts exposed. Since the company never encrypted users' personal information, hackers gained access to the names,
account numbers, and verification codes of more than 40 million card holders. Source: Companies, press sources, BofA Merrill Lynch Global Research
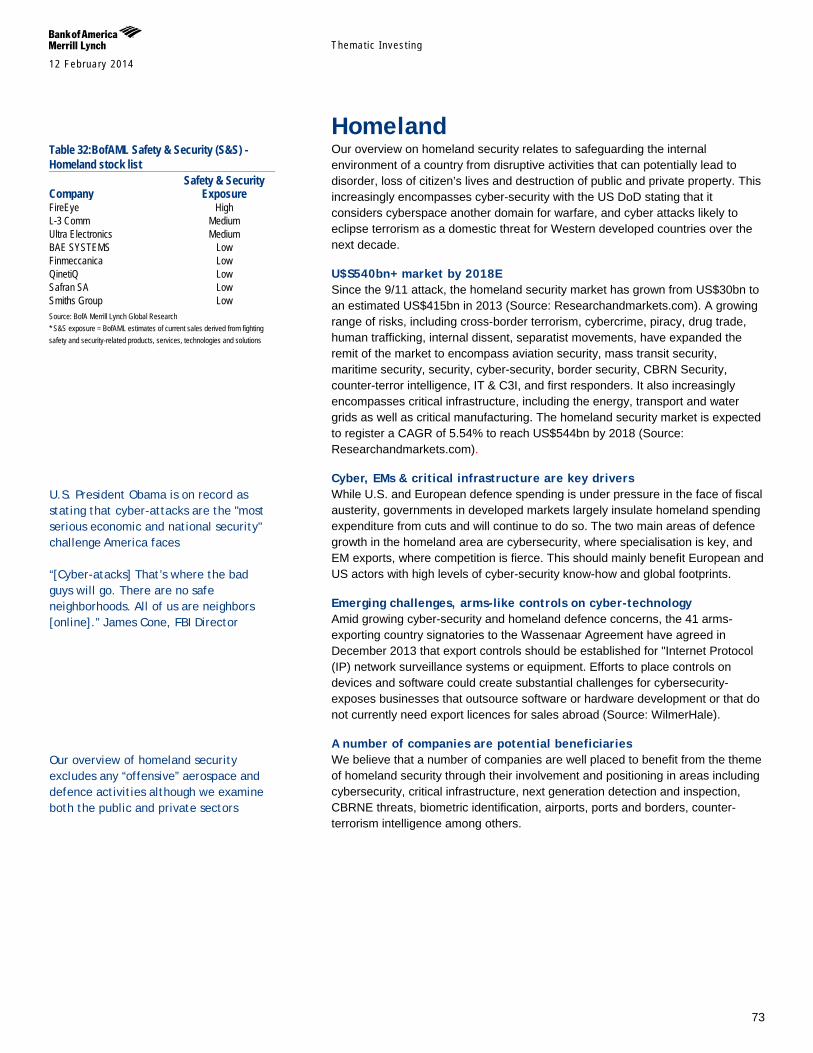
Themat ic Inves t ing 12 February 2014
73
Homeland Our overview on homeland security relates to safeguarding the internal environment of a country from disruptive activities that can potentially lead to disorder, loss of citizen’s lives and destruction of public and private property. This increasingly encompasses cyber-security with the US DoD stating that it considers cyberspace another domain for warfare, and cyber attacks likely to eclipse terrorism as a domestic threat for Western developed countries over the next decade.
U$S540bn+ market by 2018E Since the 9/11 attack, the homeland security market has grown from US$30bn to an estimated US$415bn in 2013 (Source: Researchandmarkets.com). A growing range of risks, including cross-border terrorism, cybercrime, piracy, drug trade, human trafficking, internal dissent, separatist movements, have expanded the remit of the market to encompass aviation security, mass transit security, maritime security, security, cyber-security, border security, CBRN Security, counter-terror intelligence, IT & C3I, and first responders. It also increasingly encompasses critical infrastructure, including the energy, transport and water grids as well as critical manufacturing. The homeland security market is expected to register a CAGR of 5.54% to reach US$544bn by 2018 (Source: Researchandmarkets.com).
Cyber, EMs & critical infrastructure are key drivers While U.S. and European defence spending is under pressure in the face of fiscal austerity, governments in developed markets largely insulate homeland spending expenditure from cuts and will continue to do so. The two main areas of defence growth in the homeland area are cybersecurity, where specialisation is key, and EM exports, where competition is fierce. This should mainly benefit European and US actors with high levels of cyber-security know-how and global footprints.
Emerging challenges, arms-like controls on cyber-technology Amid growing cyber-security and homeland defence concerns, the 41 arms-exporting country signatories to the Wassenaar Agreement have agreed in December 2013 that export controls should be established for "Internet Protocol (IP) network surveillance systems or equipment. Efforts to place controls on devices and software could create substantial challenges for cybersecurity-exposes businesses that outsource software or hardware development or that do not currently need export licences for sales abroad (Source: WilmerHale).
A number of companies are potential beneficiaries We believe that a number of companies are well placed to benefit from the theme of homeland security through their involvement and positioning in areas including cybersecurity, critical infrastructure, next generation detection and inspection, CBRNE threats, biometric identification, airports, ports and borders, counter-terrorism intelligence among others.
Table 32:BofAML Safety & Security (S&S) - Homeland stock list Safety & Security Company Exposure FireEye High L-3 Comm Medium Ultra Electronics Medium BAE SYSTEMS Low Finmeccanica Low QinetiQ Low Safran SA Low Smiths Group Low Source: BofA Merrill Lynch Global Research * S&S exposure = BofAML estimates of current sales derived from fighting safety and security-related products, services, technologies and solutions
U.S. President Obama is on record as stating that cyber-attacks are the "most serious economic and national security" challenge America faces “[Cyber-atacks] That’s where the bad guys will go. There are no safe neighborhoods. All of us are neighbors [online].” James Cone, FBI Director
Our overview of homeland security excludes any “offensive” aerospace and defence activities although we examine both the public and private sectors
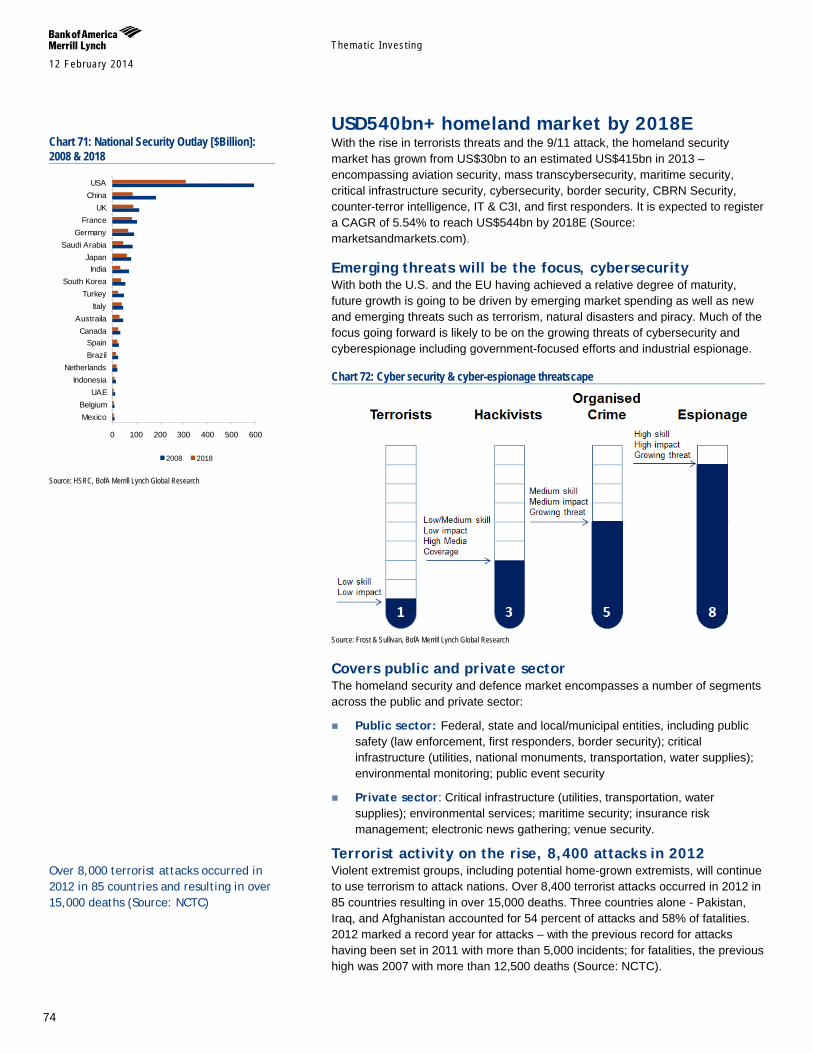
Themat ic Inves t ing 12 February 2014
74
USD540bn+ homeland market by 2018E With the rise in terrorists threats and the 9/11 attack, the homeland security market has grown from US$30bn to an estimated US$415bn in 2013 – encompassing aviation security, mass transcybersecurity, maritime security, critical infrastructure security, cybersecurity, border security, CBRN Security, counter-terror intelligence, IT & C3I, and first responders. It is expected to register a CAGR of 5.54% to reach US$544bn by 2018E (Source: marketsandmarkets.com).
Emerging threats will be the focus, cybersecurity With both the U.S. and the EU having achieved a relative degree of maturity, future growth is going to be driven by emerging market spending as well as new and emerging threats such as terrorism, natural disasters and piracy. Much of the focus going forward is likely to be on the growing threats of cybersecurity and cyberespionage including government-focused efforts and industrial espionage.
Chart 72: Cyber security & cyber-espionage threatscape
Source: Frost & Sullivan, BofA Merrill Lynch Global Research
Covers public and private sector The homeland security and defence market encompasses a number of segments across the public and private sector:
Public sector: Federal, state and local/municipal entities, including public safety (law enforcement, first responders, border security); critical infrastructure (utilities, national monuments, transportation, water supplies); environmental monitoring; public event security
Private sector: Critical infrastructure (utilities, transportation, water supplies); environmental services; maritime security; insurance risk management; electronic news gathering; venue security.
Terrorist activity on the rise, 8,400 attacks in 2012 Violent extremist groups, including potential home-grown extremists, will continue to use terrorism to attack nations. Over 8,400 terrorist attacks occurred in 2012 in 85 countries resulting in over 15,000 deaths. Three countries alone - Pakistan, Iraq, and Afghanistan accounted for 54 percent of attacks and 58% of fatalities. 2012 marked a record year for attacks – with the previous record for attacks having been set in 2011 with more than 5,000 incidents; for fatalities, the previous high was 2007 with more than 12,500 deaths (Source: NCTC).
Chart 71: National Security Outlay [$Billion]: 2008 & 2018
Source: HSRC, BofA Merrill Lynch Global Research
Over 8,000 terrorist attacks occurred in 2012 in 85 countries and resulting in over 15,000 deaths (Source: NCTC)
0 100 200 300 400 500 600
MexicoBelgium
UAEIndonesia
NetherlandsBrazilSpain
CanadaAustraila
ItalyTurkey
South KoreaIndia
JapanSaudi Arabia
GermanyFrance
UKChinaUSA
2008 2018
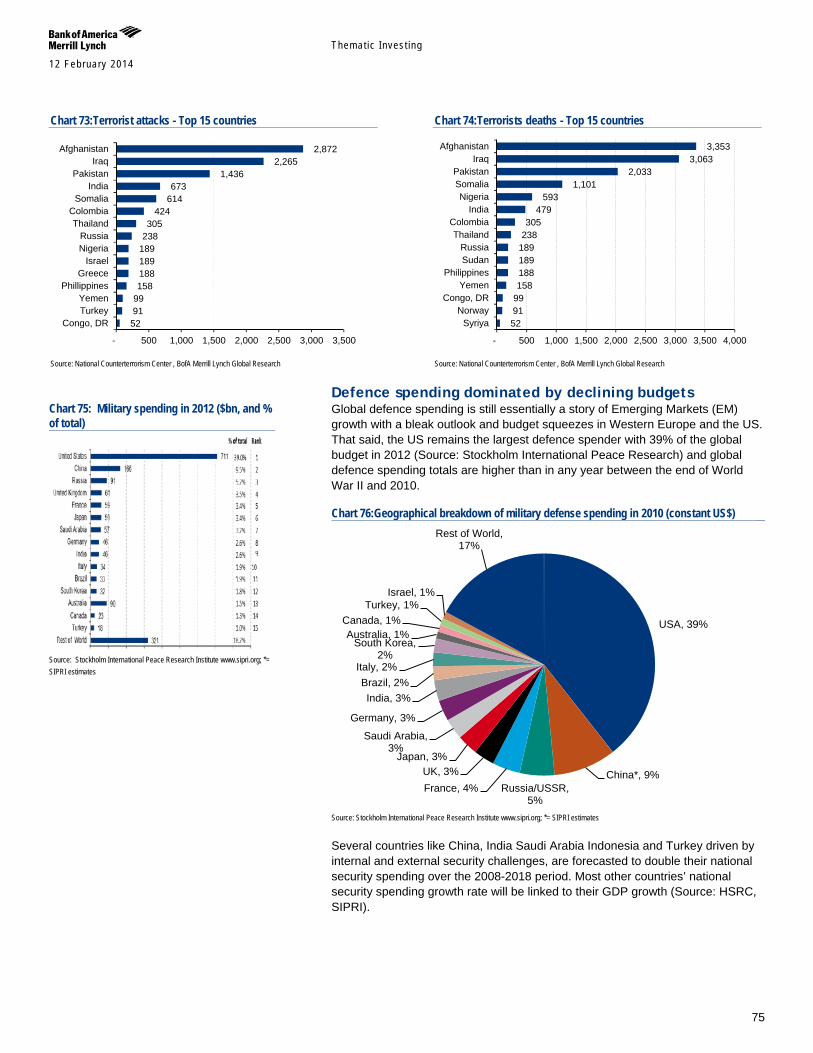
Themat ic Inves t ing 12 February 2014
75
Chart 73:Terrorist attacks - Top 15 countries
Source: National Counterterrorism Center , BofA Merrill Lynch Global Research
Chart 74:Terrorists deaths - Top 15 countries
Source: National Counterterrorism Center , BofA Merrill Lynch Global Research
Defence spending dominated by declining budgets Global defence spending is still essentially a story of Emerging Markets (EM) growth with a bleak outlook and budget squeezes in Western Europe and the US. That said, the US remains the largest defence spender with 39% of the global budget in 2012 (Source: Stockholm International Peace Research) and global defence spending totals are higher than in any year between the end of World War II and 2010.
Chart 76:Geographical breakdown of military defense spending in 2010 (constant US$)
Source: Stockholm International Peace Research Institute www.sipri.org; *= SIPRI estimates
Several countries like China, India Saudi Arabia Indonesia and Turkey driven by internal and external security challenges, are forecasted to double their national security spending over the 2008-2018 period. Most other countries’ national security spending growth rate will be linked to their GDP growth (Source: HSRC, SIPRI).
52 91 99 158 188 189 189 238 305
424 614 673
1,436 2,265
2,872
- 500 1,000 1,500 2,000 2,500 3,000 3,500
Congo, DRTurkeyYemen
PhillippinesGreece
IsraelNigeriaRussia
ThailandColombia
SomaliaIndia
PakistanIraq
Afghanistan
52 91 99 158 188 189 189 238 305
479 593
1,101 2,033
3,063 3,353
- 500 1,000 1,500 2,000 2,500 3,000 3,500 4,000
SyriyaNorway
Congo, DRYemen
PhilippinesSudanRussia
ThailandColombia
IndiaNigeria
SomaliaPakistan
IraqAfghanistan
USA, 39%
China*, 9% Russia/USSR,
5% France, 4% UK, 3%
Japan, 3%
Saudi Arabia, 3%
Germany, 3%
India, 3% Brazil, 2%
Italy, 2%
South Korea, 2%
Australia, 1% Canada, 1%
Turkey, 1% Israel, 1%
Rest of World, 17%
Chart 75: Military spending in 2012 ($bn, and % of total)
Source: Stockholm International Peace Research Institute www.sipri.org; *= SIPRI estimates
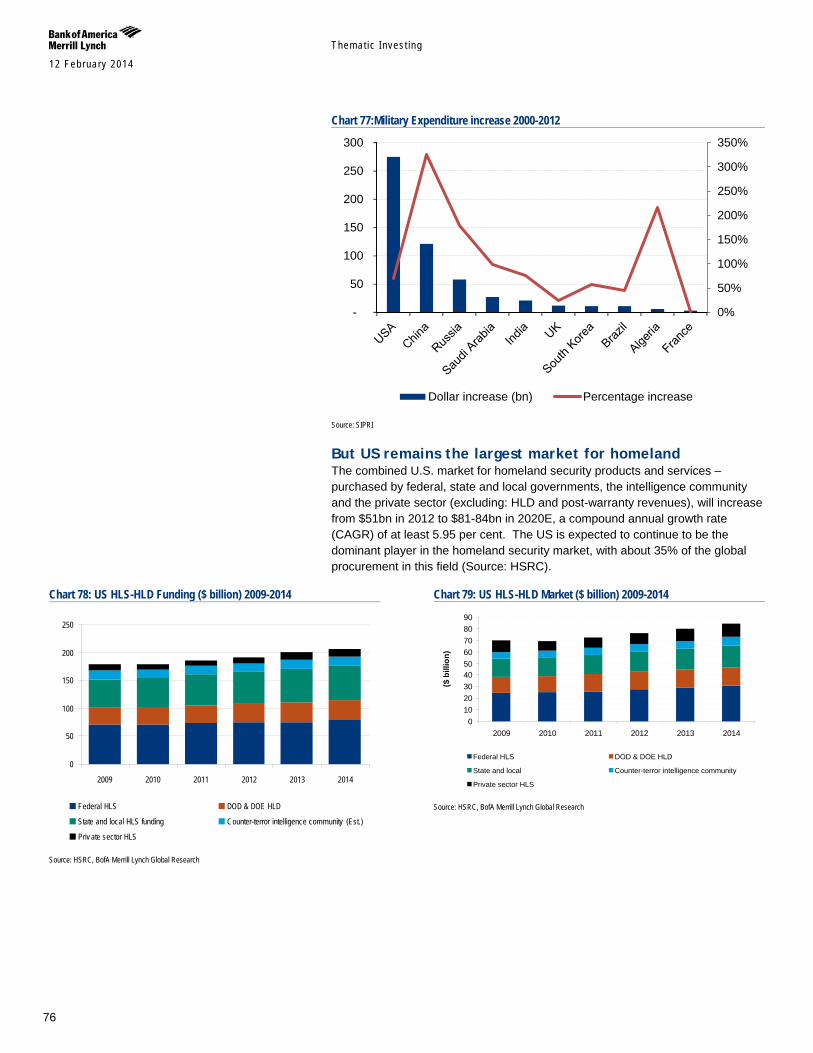
Themat ic Inves t ing 12 February 2014
76
Chart 77:Military Expenditure increase 2000-2012
Source: SIPRI
But US remains the largest market for homeland The combined U.S. market for homeland security products and services – purchased by federal, state and local governments, the intelligence community and the private sector (excluding: HLD and post-warranty revenues), will increase from $51bn in 2012 to $81-84bn in 2020E, a compound annual growth rate (CAGR) of at least 5.95 per cent. The US is expected to continue to be the dominant player in the homeland security market, with about 35% of the global procurement in this field (Source: HSRC).
0%
50%
100%
150%
200%
250%
300%
350%
-
50
100
150
200
250
300
Dollar increase (bn) Percentage increase
Chart 78: US HLS-HLD Funding ($ billion) 2009-2014
Source: HSRC, BofA Merrill Lynch Global Research
Chart 79: US HLS-HLD Market ($ billion) 2009-2014
Source: HSRC, BofA Merrill Lynch Global Research
0
50
100
150
200
250
2009 2010 2011 2012 2013 2014
Federal HLS DOD & DOE HLD
State and local HLS funding Counter-terror intelligence community (Est.)
Priv ate sector HLS
0102030405060708090
2009 2010 2011 2012 2013 2014
($ b
illio
n)
Federal HLS DOD & DOE HLD
State and local Counter-terror intelligence community
Private sector HLS
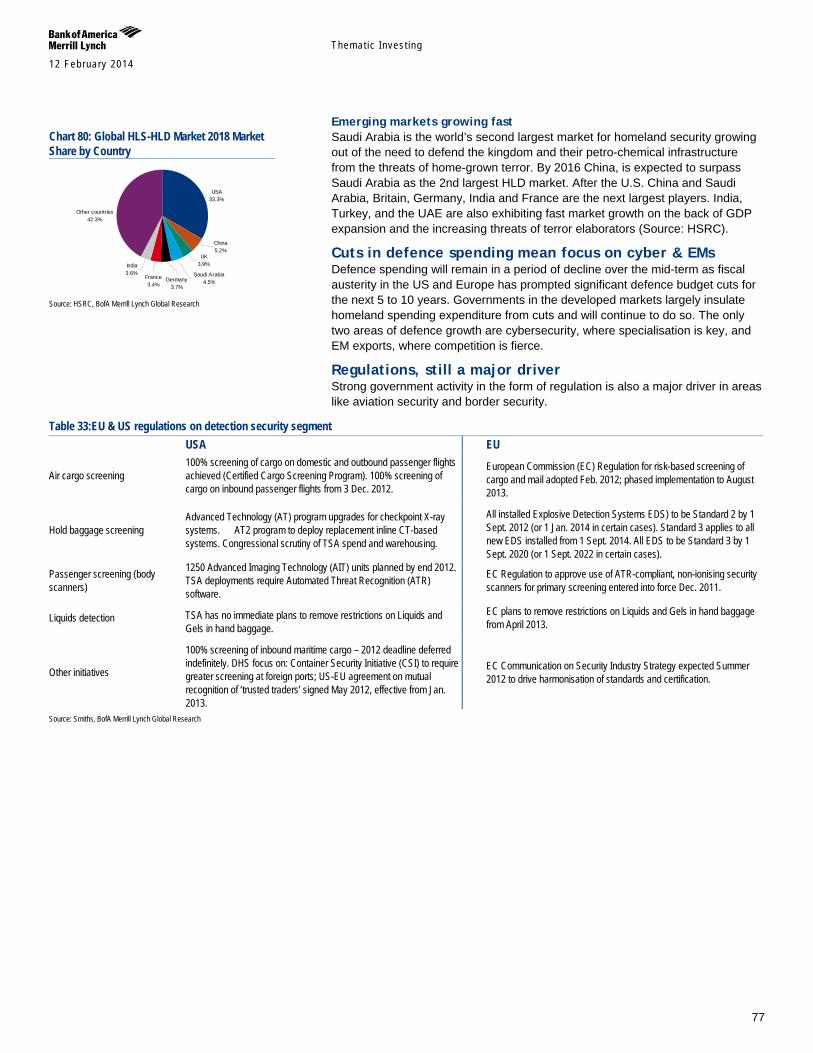
Themat ic Inves t ing 12 February 2014
77
Emerging markets growing fast Saudi Arabia is the world’s second largest market for homeland security growing out of the need to defend the kingdom and their petro-chemical infrastructure from the threats of home-grown terror. By 2016 China, is expected to surpass Saudi Arabia as the 2nd largest HLD market. After the U.S. China and Saudi Arabia, Britain, Germany, India and France are the next largest players. India, Turkey, and the UAE are also exhibiting fast market growth on the back of GDP expansion and the increasing threats of terror elaborators (Source: HSRC).
Cuts in defence spending mean focus on cyber & EMs Defence spending will remain in a period of decline over the mid-term as fiscal austerity in the US and Europe has prompted significant defence budget cuts for the next 5 to 10 years. Governments in the developed markets largely insulate homeland spending expenditure from cuts and will continue to do so. The only two areas of defence growth are cybersecurity, where specialisation is key, and EM exports, where competition is fierce.
Regulations, still a major driver Strong government activity in the form of regulation is also a major driver in areas like aviation security and border security.
Table 33:EU & US regulations on detection security segment USA EU
Air cargo screening 100% screening of cargo on domestic and outbound passenger flights achieved (Certified Cargo Screening Program). 100% screening of cargo on inbound passenger flights from 3 Dec. 2012.
European Commission (EC) Regulation for risk-based screening of cargo and mail adopted Feb. 2012; phased implementation to August 2013.
Hold baggage screening Advanced Technology (AT) program upgrades for checkpoint X-ray systems. AT2 program to deploy replacement inline CT-based systems. Congressional scrutiny of TSA spend and warehousing.
All installed Explosive Detection Systems EDS) to be Standard 2 by 1 Sept. 2012 (or 1 Jan. 2014 in certain cases). Standard 3 applies to all new EDS installed from 1 Sept. 2014. All EDS to be Standard 3 by 1 Sept. 2020 (or 1 Sept. 2022 in certain cases).
Passenger screening (body scanners)
1250 Advanced Imaging Technology (AIT) units planned by end 2012. TSA deployments require Automated Threat Recognition (ATR) software.
EC Regulation to approve use of ATR-compliant, non-ionising security scanners for primary screening entered into force Dec. 2011.
Liquids detection TSA has no immediate plans to remove restrictions on Liquids and Gels in hand baggage.
EC plans to remove restrictions on Liquids and Gels in hand baggage from April 2013.
Other initiatives
100% screening of inbound maritime cargo – 2012 deadline deferred indefinitely. DHS focus on: Container Security Initiative (CSI) to require greater screening at foreign ports; US-EU agreement on mutual recognition of ‘trusted traders’ signed May 2012, effective from Jan. 2013.
EC Communication on Security Industry Strategy expected Summer 2012 to drive harmonisation of standards and certification.
Source: Smiths, BofA Merrill Lynch Global Research
Chart 80: Global HLS-HLD Market 2018 Market Share by Country
Source: HSRC, BofA Merrill Lynch Global Research
USA33.3%
China5.2%
UK3.9%
Saudi Arabia4.5%Germany
3.7%
France3.4%
India3.6%
Other countries42.3%
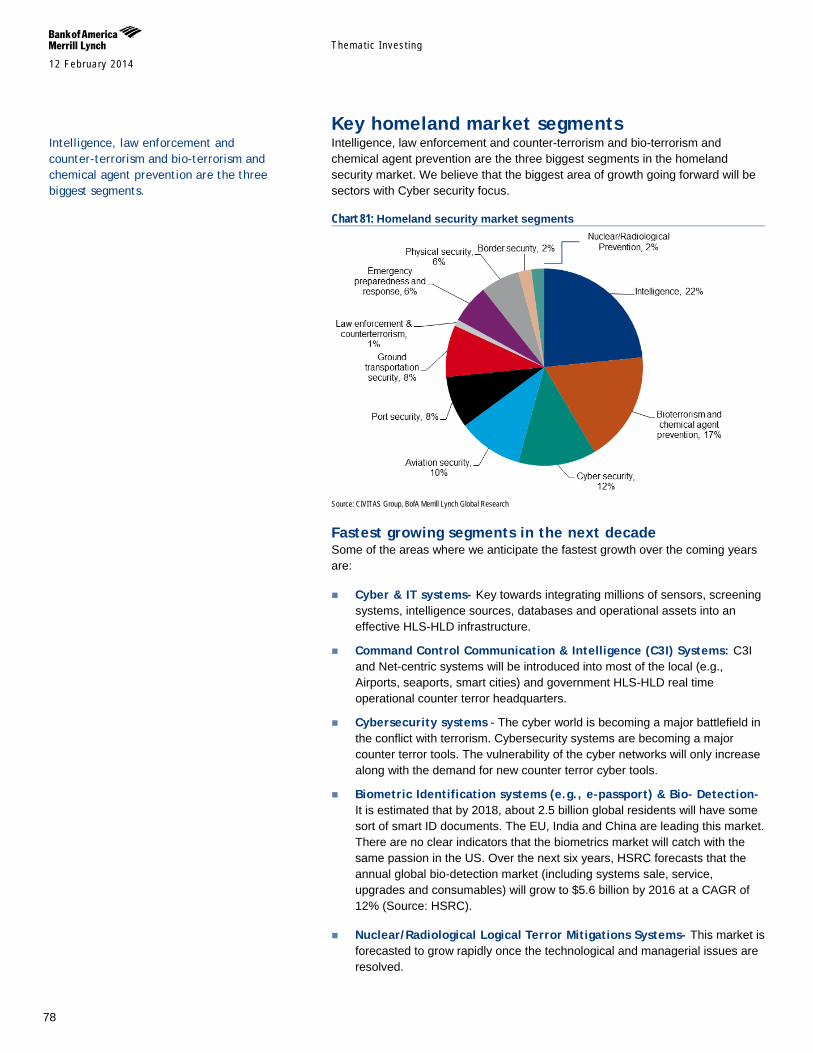
Themat ic Inves t ing 12 February 2014
78
Key homeland market segments Intelligence, law enforcement and counter-terrorism and bio-terrorism and chemical agent prevention are the three biggest segments in the homeland security market. We believe that the biggest area of growth going forward will be sectors with Cyber security focus.
Chart 81: Homeland security market segments
Source: CIVITAS Group, BofA Merrill Lynch Global Research
Fastest growing segments in the next decade Some of the areas where we anticipate the fastest growth over the coming years are:
Cyber & IT systems- Key towards integrating millions of sensors, screening systems, intelligence sources, databases and operational assets into an effective HLS-HLD infrastructure.
Command Control Communication & Intelligence (C3I) Systems: C3I and Net-centric systems will be introduced into most of the local (e.g., Airports, seaports, smart cities) and government HLS-HLD real time operational counter terror headquarters.
Cybersecurity systems - The cyber world is becoming a major battlefield in the conflict with terrorism. Cybersecurity systems are becoming a major counter terror tools. The vulnerability of the cyber networks will only increase along with the demand for new counter terror cyber tools.
Biometric Identification systems (e.g., e-passport) & Bio- Detection- It is estimated that by 2018, about 2.5 billion global residents will have some sort of smart ID documents. The EU, India and China are leading this market. There are no clear indicators that the biometrics market will catch with the same passion in the US. Over the next six years, HSRC forecasts that the annual global bio-detection market (including systems sale, service, upgrades and consumables) will grow to $5.6 billion by 2016 at a CAGR of 12% (Source: HSRC).
Nuclear/Radiological Logical Terror Mitigations Systems- This market is forecasted to grow rapidly once the technological and managerial issues are resolved.
Intelligence, law enforcement and counter-terrorism and bio-terrorism and chemical agent prevention are the three biggest segments.
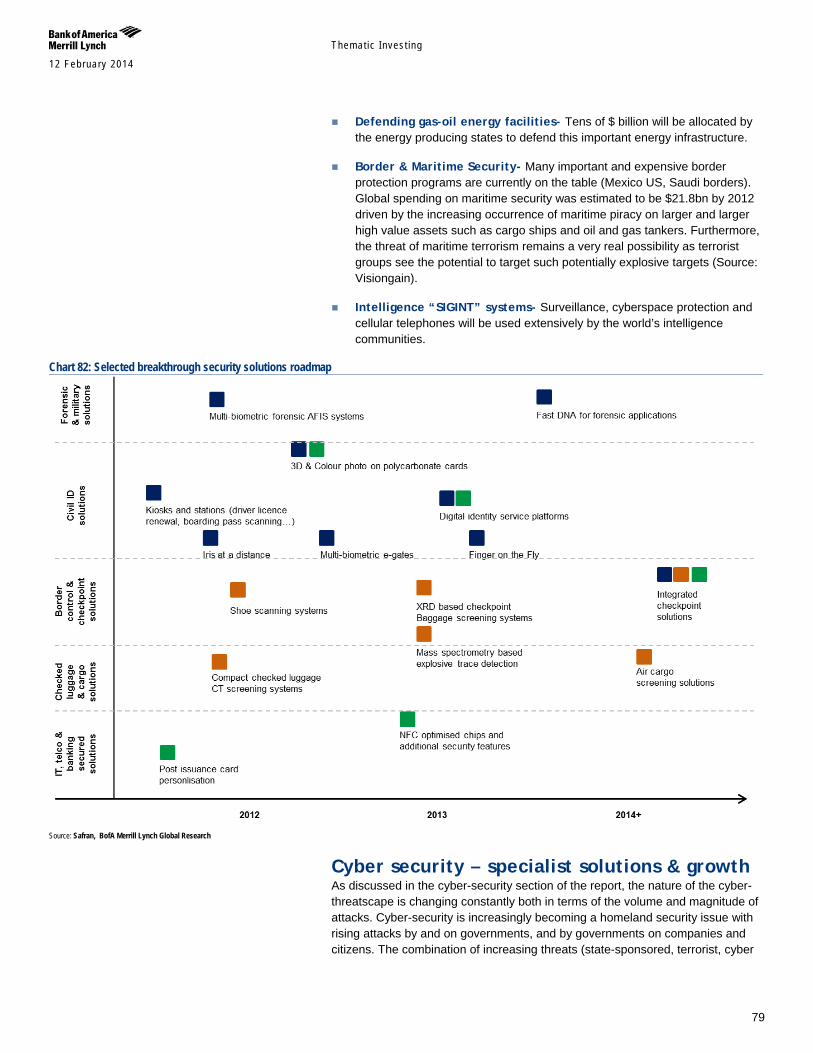
Themat ic Inves t ing 12 February 2014
79
Defending gas-oil energy facilities- Tens of $ billion will be allocated by the energy producing states to defend this important energy infrastructure.
Border & Maritime Security- Many important and expensive border protection programs are currently on the table (Mexico US, Saudi borders). Global spending on maritime security was estimated to be $21.8bn by 2012 driven by the increasing occurrence of maritime piracy on larger and larger high value assets such as cargo ships and oil and gas tankers. Furthermore, the threat of maritime terrorism remains a very real possibility as terrorist groups see the potential to target such potentially explosive targets (Source: Visiongain).
Intelligence “SIGINT” systems- Surveillance, cyberspace protection and cellular telephones will be used extensively by the world’s intelligence communities.
Chart 82: Selected breakthrough security solutions roadmap
Source: Safran, BofA Merrill Lynch Global Research
Cyber security – specialist solutions & growth As discussed in the cyber-security section of the report, the nature of the cyber-threatscape is changing constantly both in terms of the volume and magnitude of attacks. Cyber-security is increasingly becoming a homeland security issue with rising attacks by and on governments, and by governments on companies and citizens. The combination of increasing threats (state-sponsored, terrorist, cyber
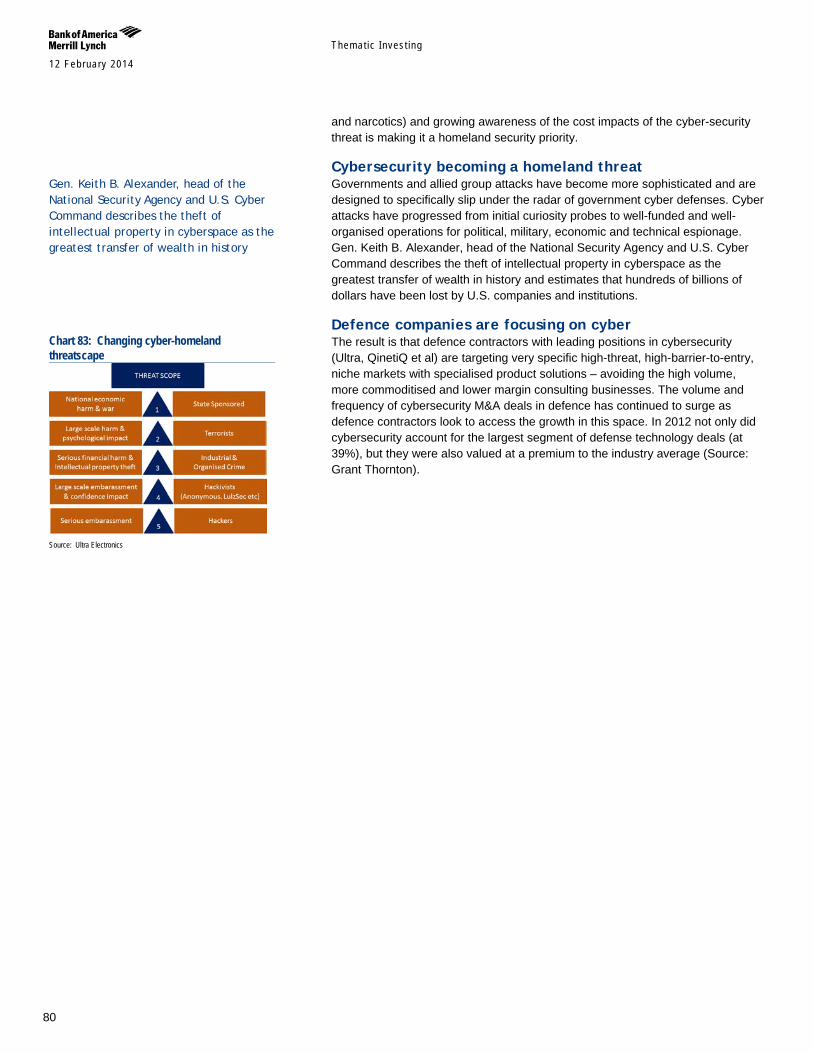
Themat ic Inves t ing 12 February 2014
80
and narcotics) and growing awareness of the cost impacts of the cyber-security threat is making it a homeland security priority.
Cybersecurity becoming a homeland threat Governments and allied group attacks have become more sophisticated and are designed to specifically slip under the radar of government cyber defenses. Cyber attacks have progressed from initial curiosity probes to well-funded and well-organised operations for political, military, economic and technical espionage. Gen. Keith B. Alexander, head of the National Security Agency and U.S. Cyber Command describes the theft of intellectual property in cyberspace as the greatest transfer of wealth in history and estimates that hundreds of billions of dollars have been lost by U.S. companies and institutions.
Defence companies are focusing on cyber The result is that defence contractors with leading positions in cybersecurity (Ultra, QinetiQ et al) are targeting very specific high-threat, high-barrier-to-entry, niche markets with specialised product solutions – avoiding the high volume, more commoditised and lower margin consulting businesses. The volume and frequency of cybersecurity M&A deals in defence has continued to surge as defence contractors look to access the growth in this space. In 2012 not only did cybersecurity account for the largest segment of defense technology deals (at 39%), but they were also valued at a premium to the industry average (Source: Grant Thornton).
Gen. Keith B. Alexander, head of the National Security Agency and U.S. Cyber Command describes the theft of intellectual property in cyberspace as the greatest transfer of wealth in history
Chart 83: Changing cyber-homeland threatscape
Source: Ultra Electronics
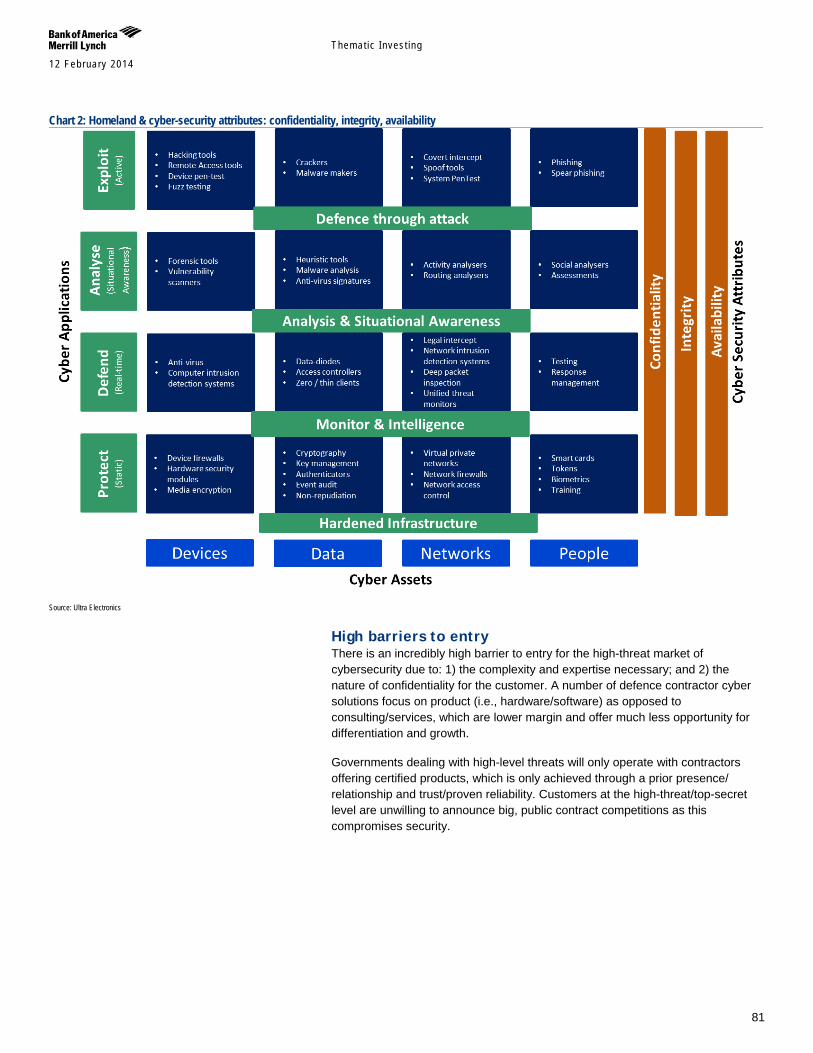
Themat ic Inves t ing 12 February 2014
81
Chart 2: Homeland & cyber-security attributes: confidentiality, integrity, availability
Source: Ultra Electronics
High barriers to entry There is an incredibly high barrier to entry for the high-threat market of cybersecurity due to: 1) the complexity and expertise necessary; and 2) the nature of confidentiality for the customer. A number of defence contractor cyber solutions focus on product (i.e., hardware/software) as opposed to consulting/services, which are lower margin and offer much less opportunity for differentiation and growth.
Governments dealing with high-level threats will only operate with contractors offering certified products, which is only achieved through a prior presence/ relationship and trust/proven reliability. Customers at the high-threat/top-secret level are unwilling to announce big, public contract competitions as this compromises security.
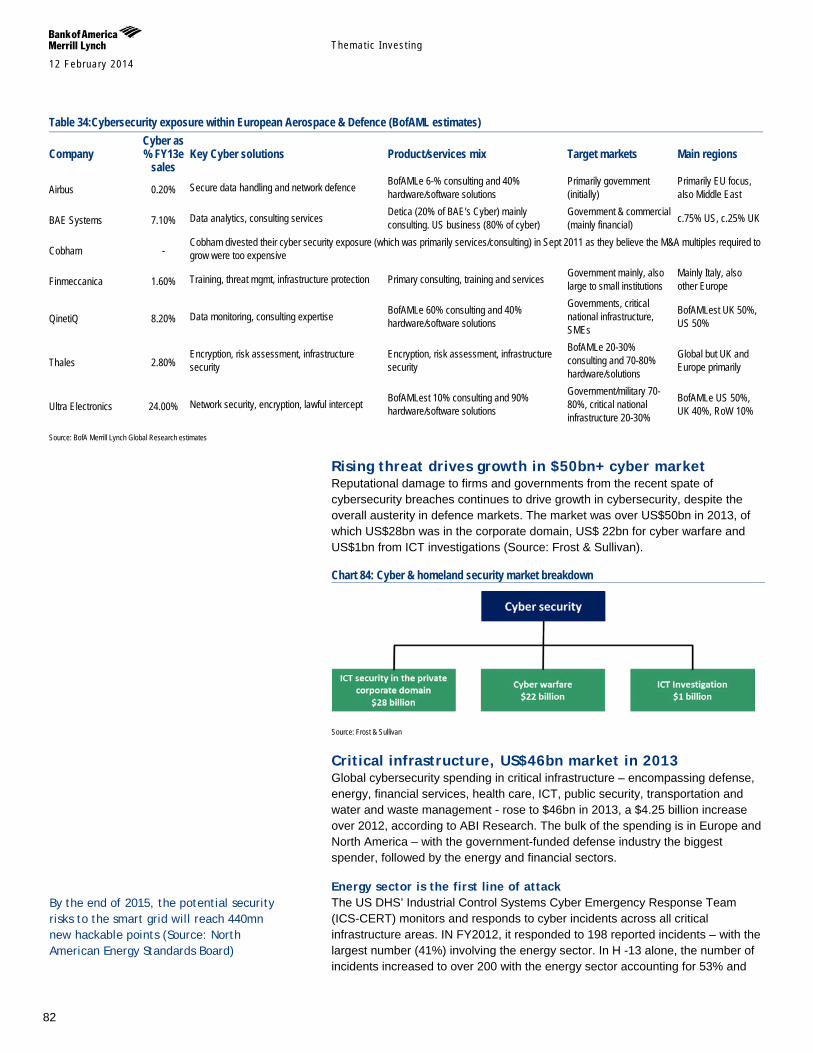
Themat ic Inves t ing 12 February 2014
82
Table 34:Cybersecurity exposure within European Aerospace & Defence (BofAML estimates)
Company Cyber as % FY13e
sales Key Cyber solutions Product/services mix Target markets Main regions
Airbus 0.20% Secure data handling and network defence BofAMLe 6-% consulting and 40% hardware/software solutions
Primarily government (initially)
Primarily EU focus, also Middle East
BAE Systems 7.10% Data analytics, consulting services Detica (20% of BAE's Cyber) mainly consulting. US business (80% of cyber)
Government & commercial (mainly financial) c.75% US, c.25% UK
Cobham - Cobham divested their cyber security exposure (which was primarily services/consulting) in Sept 2011 as they believe the M&A multiples required to grow were too expensive
Finmeccanica 1.60% Training, threat mgmt, infrastructure protection Primary consulting, training and services Government mainly, also large to small institutions
Mainly Italy, also other Europe
QinetiQ 8.20% Data monitoring, consulting expertise BofAMLe 60% consulting and 40% hardware/software solutions
Governments, critical national infrastructure, SMEs
BofAMLest UK 50%, US 50%
Thales 2.80% Encryption, risk assessment, infrastructure security
Encryption, risk assessment, infrastructure security
BofAMLe 20-30% consulting and 70-80% hardware/solutions
Global but UK and Europe primarily
Ultra Electronics 24.00% Network security, encryption, lawful intercept BofAMLest 10% consulting and 90% hardware/software solutions
Government/military 70-80%, critical national infrastructure 20-30%
BofAMLe US 50%, UK 40%, RoW 10%
Source: BofA Merrill Lynch Global Research estimates
Rising threat drives growth in $50bn+ cyber market Reputational damage to firms and governments from the recent spate of cybersecurity breaches continues to drive growth in cybersecurity, despite the overall austerity in defence markets. The market was over US$50bn in 2013, of which US$28bn was in the corporate domain, US$ 22bn for cyber warfare and US$1bn from ICT investigations (Source: Frost & Sullivan).
Chart 84: Cyber & homeland security market breakdown
Source: Frost & Sullivan
Critical infrastructure, US$46bn market in 2013 Global cybersecurity spending in critical infrastructure – encompassing defense, energy, financial services, health care, ICT, public security, transportation and water and waste management - rose to $46bn in 2013, a $4.25 billion increase over 2012, according to ABI Research. The bulk of the spending is in Europe and North America – with the government-funded defense industry the biggest spender, followed by the energy and financial sectors.
Energy sector is the first line of attack The US DHS’ Industrial Control Systems Cyber Emergency Response Team (ICS-CERT) monitors and responds to cyber incidents across all critical infrastructure areas. IN FY2012, it responded to 198 reported incidents – with the largest number (41%) involving the energy sector. In H -13 alone, the number of incidents increased to over 200 with the energy sector accounting for 53% and
By the end of 2015, the potential security risks to the smart grid will reach 440mn new hackable points (Source: North American Energy Standards Board)
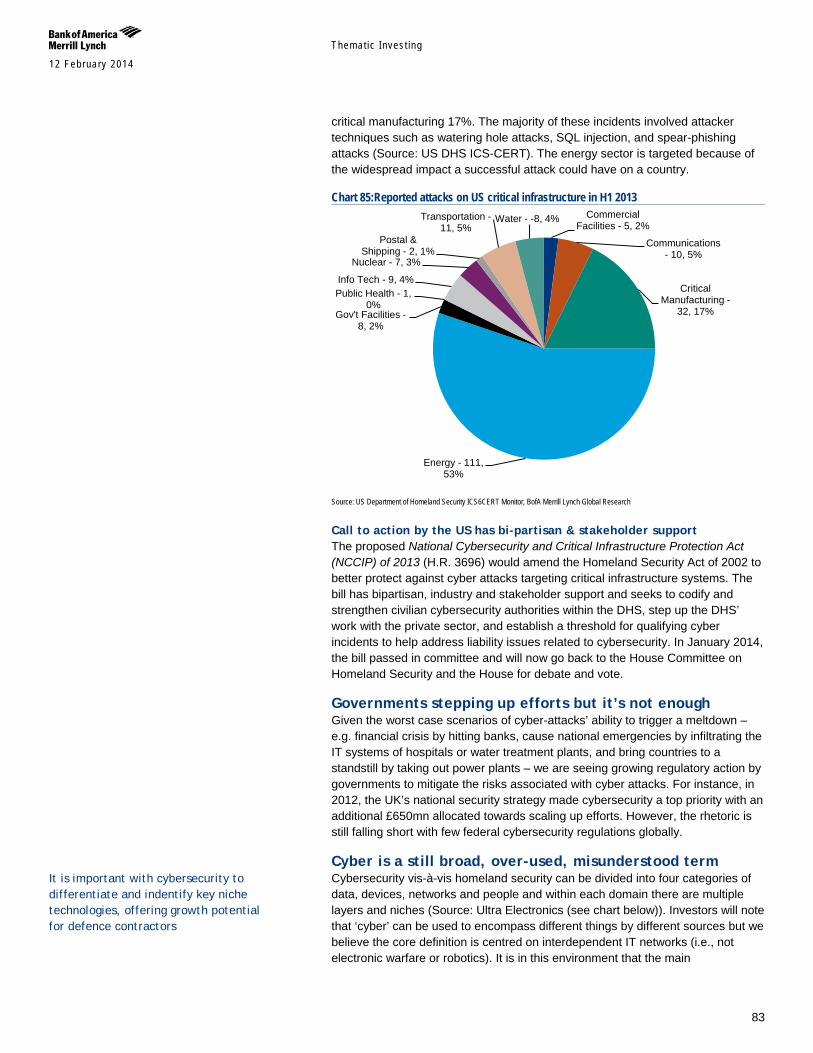
Themat ic Inves t ing 12 February 2014
83
critical manufacturing 17%. The majority of these incidents involved attacker techniques such as watering hole attacks, SQL injection, and spear-phishing attacks (Source: US DHS ICS-CERT). The energy sector is targeted because of the widespread impact a successful attack could have on a country.
Chart 85:Reported attacks on US critical infrastructure in H1 2013
Source: US Department of Homeland Security ICS6CERT Monitor, BofA Merrill Lynch Global Research
Call to action by the US has bi-partisan & stakeholder support The proposed National Cybersecurity and Critical Infrastructure Protection Act (NCCIP) of 2013 (H.R. 3696) would amend the Homeland Security Act of 2002 to better protect against cyber attacks targeting critical infrastructure systems. The bill has bipartisan, industry and stakeholder support and seeks to codify and strengthen civilian cybersecurity authorities within the DHS, step up the DHS’ work with the private sector, and establish a threshold for qualifying cyber incidents to help address liability issues related to cybersecurity. In January 2014, the bill passed in committee and will now go back to the House Committee on Homeland Security and the House for debate and vote.
Governments stepping up efforts but it’s not enough Given the worst case scenarios of cyber-attacks’ ability to trigger a meltdown – e.g. financial crisis by hitting banks, cause national emergencies by infiltrating the IT systems of hospitals or water treatment plants, and bring countries to a standstill by taking out power plants – we are seeing growing regulatory action by governments to mitigate the risks associated with cyber attacks. For instance, in 2012, the UK’s national security strategy made cybersecurity a top priority with an additional £650mn allocated towards scaling up efforts. However, the rhetoric is still falling short with few federal cybersecurity regulations globally.
Cyber is a still broad, over-used, misunderstood term Cybersecurity vis-à-vis homeland security can be divided into four categories of data, devices, networks and people and within each domain there are multiple layers and niches (Source: Ultra Electronics (see chart below)). Investors will note that ‘cyber’ can be used to encompass different things by different sources but we believe the core definition is centred on interdependent IT networks (i.e., not electronic warfare or robotics). It is in this environment that the main
Commercial Facilities - 5, 2%
Communications - 10, 5%
Critical Manufacturing -
32, 17%
Energy - 111, 53%
Gov't Facilities - 8, 2%
Public Health - 1, 0%
Info Tech - 9, 4%
Nuclear - 7, 3%
Postal & Shipping - 2, 1%
Transportation - 11, 5%
Water - -8, 4%
It is important with cybersecurity to differentiate and indentify key niche technologies, offering growth potential for defence contractors
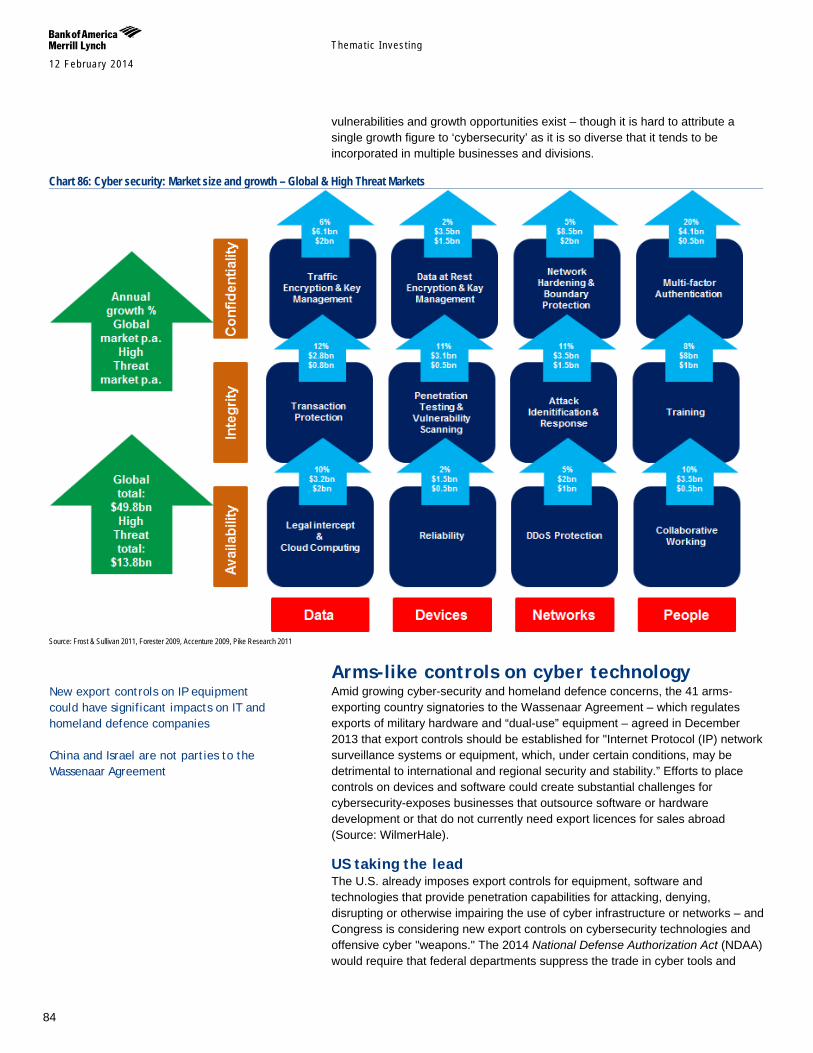
Themat ic Inves t ing 12 February 2014
84
vulnerabilities and growth opportunities exist – though it is hard to attribute a single growth figure to ‘cybersecurity’ as it is so diverse that it tends to be incorporated in multiple businesses and divisions.
Chart 86: Cyber security: Market size and growth – Global & High Threat Markets
Source: Frost & Sullivan 2011, Forester 2009, Accenture 2009, Pike Research 2011
Arms-like controls on cyber technology Amid growing cyber-security and homeland defence concerns, the 41 arms-exporting country signatories to the Wassenaar Agreement – which regulates exports of military hardware and “dual-use” equipment – agreed in December 2013 that export controls should be established for "Internet Protocol (IP) network surveillance systems or equipment, which, under certain conditions, may be detrimental to international and regional security and stability.” Efforts to place controls on devices and software could create substantial challenges for cybersecurity-exposes businesses that outsource software or hardware development or that do not currently need export licences for sales abroad (Source: WilmerHale).
US taking the lead The U.S. already imposes export controls for equipment, software and technologies that provide penetration capabilities for attacking, denying, disrupting or otherwise impairing the use of cyber infrastructure or networks – and Congress is considering new export controls on cybersecurity technologies and offensive cyber "weapons." The 2014 National Defense Authorization Act (NDAA) would require that federal departments suppress the trade in cyber tools and
New export controls on IP equipment could have significant impacts on IT and homeland defence companies China and Israel are not parties to the Wassenaar Agreement

Themat ic Inves t ing 12 February 2014
85
infrastructure that can be used for criminal, terrorist or military activities (ex-legitimate purposes of self-defence), and ask the President to study ways to contain the proliferation of "cyber weapons."
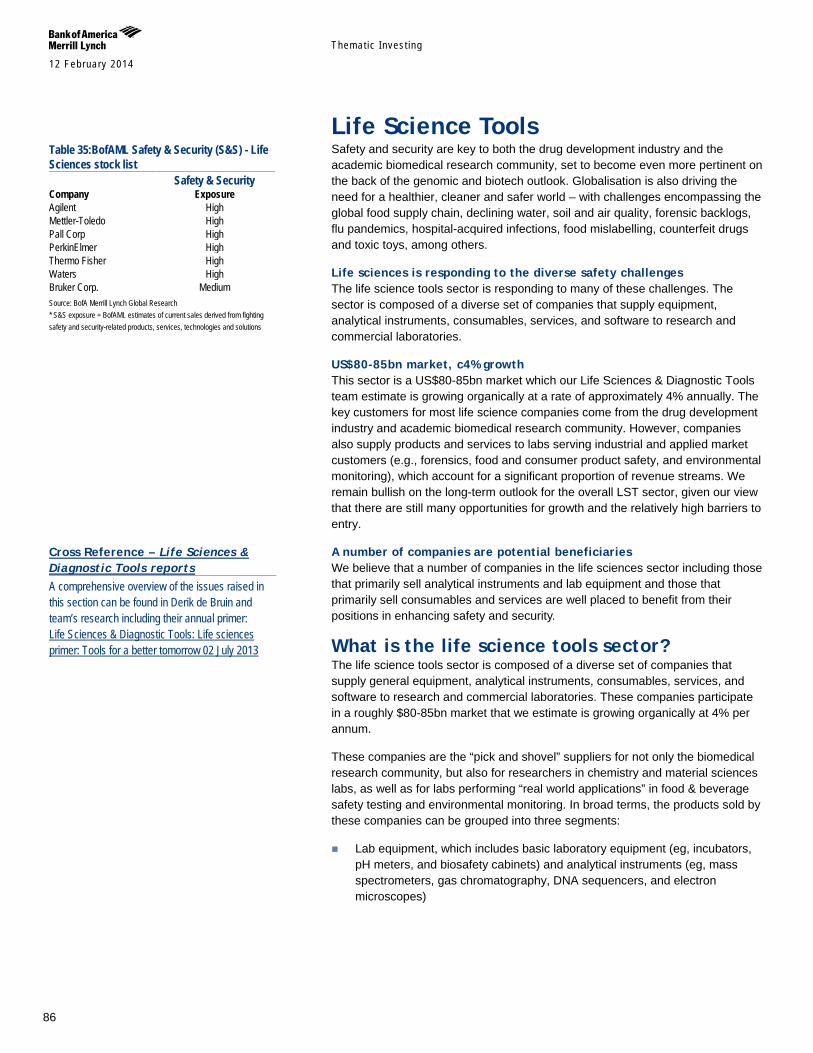
Themat ic Inves t ing 12 February 2014
86
Life Science Tools Safety and security are key to both the drug development industry and the academic biomedical research community, set to become even more pertinent on the back of the genomic and biotech outlook. Globalisation is also driving the need for a healthier, cleaner and safer world – with challenges encompassing the global food supply chain, declining water, soil and air quality, forensic backlogs, flu pandemics, hospital-acquired infections, food mislabelling, counterfeit drugs and toxic toys, among others.
Life sciences is responding to the diverse safety challenges The life science tools sector is responding to many of these challenges. The sector is composed of a diverse set of companies that supply equipment, analytical instruments, consumables, services, and software to research and commercial laboratories.
US$80-85bn market, c4% growth This sector is a US$80-85bn market which our Life Sciences & Diagnostic Tools team estimate is growing organically at a rate of approximately 4% annually. The key customers for most life science companies come from the drug development industry and academic biomedical research community. However, companies also supply products and services to labs serving industrial and applied market customers (e.g., forensics, food and consumer product safety, and environmental monitoring), which account for a significant proportion of revenue streams. We remain bullish on the long-term outlook for the overall LST sector, given our view that there are still many opportunities for growth and the relatively high barriers to entry.
A number of companies are potential beneficiaries We believe that a number of companies in the life sciences sector including those that primarily sell analytical instruments and lab equipment and those that primarily sell consumables and services are well placed to benefit from their positions in enhancing safety and security.
What is the life science tools sector? The life science tools sector is composed of a diverse set of companies that supply general equipment, analytical instruments, consumables, services, and software to research and commercial laboratories. These companies participate in a roughly $80-85bn market that we estimate is growing organically at 4% per annum.
These companies are the “pick and shovel” suppliers for not only the biomedical research community, but also for researchers in chemistry and material sciences labs, as well as for labs performing “real world applications” in food & beverage safety testing and environmental monitoring. In broad terms, the products sold by these companies can be grouped into three segments:
Lab equipment, which includes basic laboratory equipment (eg, incubators, pH meters, and biosafety cabinets) and analytical instruments (eg, mass spectrometers, gas chromatography, DNA sequencers, and electron microscopes)
Table 35:BofAML Safety & Security (S&S) - Life Sciences stock list Safety & Security Company Exposure Agilent High Mettler-Toledo High Pall Corp High PerkinElmer High Thermo Fisher High Waters High Bruker Corp. Medium Source: BofA Merrill Lynch Global Research * S&S exposure = BofAML estimates of current sales derived from fighting safety and security-related products, services, technologies and solutions
Cross Reference – Life Sciences & Diagnostic Tools reports A comprehensive overview of the issues raised in this section can be found in Derik de Bruin and team’s research including their annual primer: Life Sciences & Diagnostic Tools: Life sciences primer: Tools for a better tomorrow 02 July 2013
Themat ic Inves t ing 12 February 2014
87
Lab consumables, which includes general laboratory disposables (eg, pipettes, microscope slides, glassware), chemicals & biochemicals, and reagents (eg, PCR master mix, reverse transcriptase, and fluorescent probes)
Software and laboratory services
Defensive characteristics Diversified end markets While the key customers for most companies lie within the drug development industry and academic biomedical research community, the term “life sciences tools” is somewhat of a misnomer, as these companies also supply products and services to labs serving cyclical industrial and applied market customers (forensics, food and consumer product safety, and environmental monitoring).
Leveraging technologies across end markets; regulations a plus for tools The sector appears defensive in nature given the ability to leverage technologies across various end markets (eg, the same technology used to analyze a protein in a biotech lab can also be used to examine crude oil samples or determine pesticide contamination of food) and because growth does not depend on the long-term survival of a single entity or funding source.
In addition, the sector is an attractive source of growth for healthcare investors facing maturing markets and greater government regulation because of continuous product innovation and the opening of new markets due to a growing demand for alternative energy and the globalization of R&D, food production and drug manufacturing. Unlike most other areas of healthcare and industry where regulation can be a negative catalyst for growth, increased government regulation in areas such as drug safety, food safety, and environmental quality, is often advantageous to the tools sector.
High barriers to entry in the life sciences marketplace The life sciences sector benefits from high barriers to entry, especially for high end consumables and analytical instruments. Not only is there significant brand loyalty, but the globalization of R&D and the need for worldwide distribution and service organizations precludes many smaller companies from entering the market as well. In addition, the fact that many of the end markets are regulated (eg, drug manufacturing, environmental monitoring and food safety) means that switching costs are high and customers are less willing to try products from “unproven” vendors.
Even in the emerging markets, where there is more price sensitivity, there is a focus on purchasing premium brands, especially if the customer is collaborating with scientists in other countries or conducting outsourced R&D work. In countries like China, there is even a certain prestige factor associated with labs which own the newest instruments from premium-brand manufacturers and that often impacts purchasing decisions. Regarding pricing, it is worth noting that the life sciences sector still benefits from pricing power as scientists are willing to pay a premium for new technologies, reliable supplies, fast delivery, and consistently high quality products. Bullish on long-term prospects Overall, despite near-term headwinds from various government austerity measures, we are bullish on the long-term prospects of the life sciences tools sector, as we think there are still opportunities for growth in this still relatively
Unlike most other areas of healthcare and industry where regulation is potentially a negative catalyst for growth, increased government regulation is frequently advantageous to the tools sector
The sector enjoys high barriers to entry
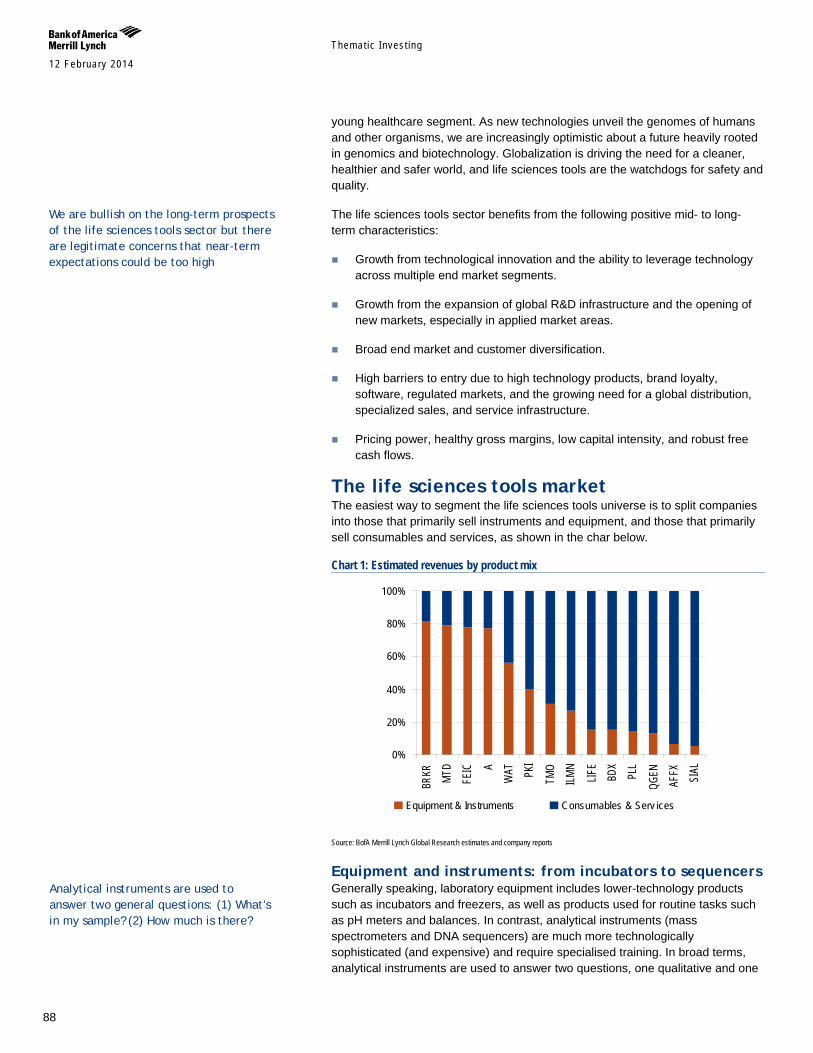
Themat ic Inves t ing 12 February 2014
88
young healthcare segment. As new technologies unveil the genomes of humans and other organisms, we are increasingly optimistic about a future heavily rooted in genomics and biotechnology. Globalization is driving the need for a cleaner, healthier and safer world, and life sciences tools are the watchdogs for safety and quality.
The life sciences tools sector benefits from the following positive mid- to long-term characteristics:
Growth from technological innovation and the ability to leverage technology across multiple end market segments.
Growth from the expansion of global R&D infrastructure and the opening of new markets, especially in applied market areas.
Broad end market and customer diversification.
High barriers to entry due to high technology products, brand loyalty, software, regulated markets, and the growing need for a global distribution, specialized sales, and service infrastructure.
Pricing power, healthy gross margins, low capital intensity, and robust free cash flows.
The life sciences tools market The easiest way to segment the life sciences tools universe is to split companies into those that primarily sell instruments and equipment, and those that primarily sell consumables and services, as shown in the char below.
Chart 1: Estimated revenues by product mix
Source: BofA Merrill Lynch Global Research estimates and company reports
Equipment and instruments: from incubators to sequencers Generally speaking, laboratory equipment includes lower-technology products such as incubators and freezers, as well as products used for routine tasks such as pH meters and balances. In contrast, analytical instruments (mass spectrometers and DNA sequencers) are much more technologically sophisticated (and expensive) and require specialised training. In broad terms, analytical instruments are used to answer two questions, one qualitative and one
0%
20%
40%
60%
80%
100%
BRKR MT
DFE
IC AW
AT PKI
TMO
ILMN
LIFE
BDX
PLL
QGEN
AFFX SIAL
Equipment & Instruments Consumables & Serv ices
We are bullish on the long-term prospects of the life sciences tools sector but there are legitimate concerns that near-term expectations could be too high
Analytical instruments are used to answer two general questions: (1) What’s in my sample? (2) How much is there?
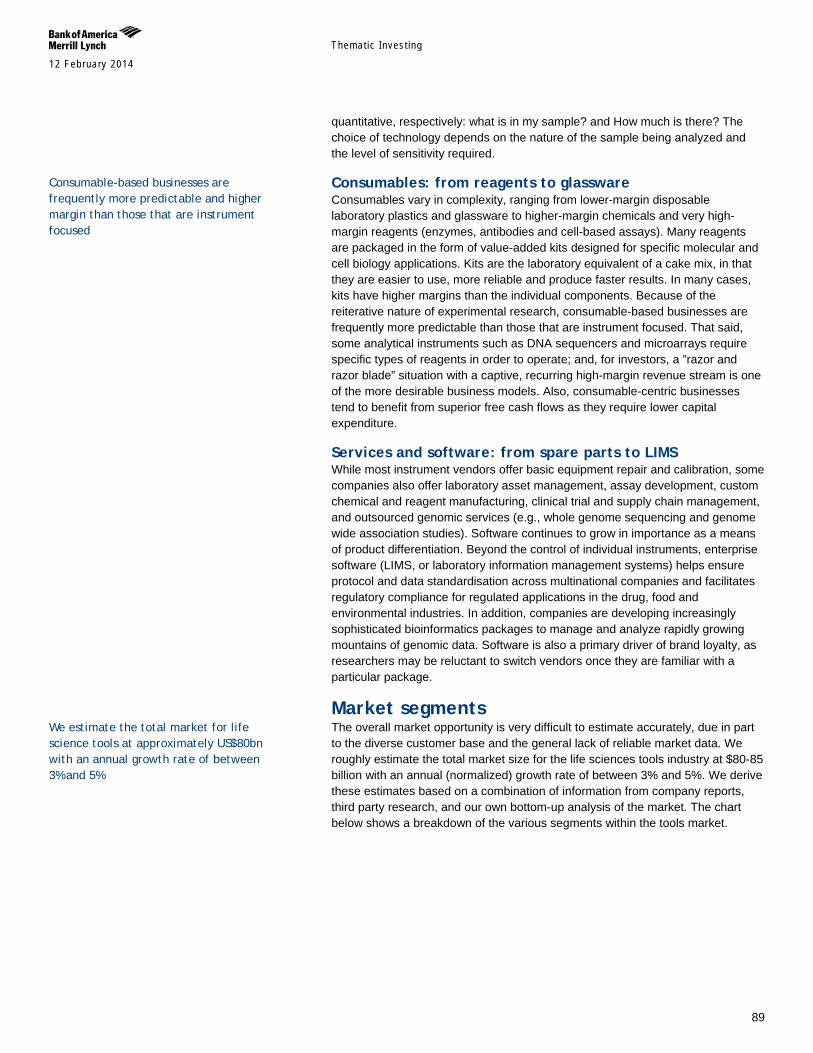
Themat ic Inves t ing 12 February 2014
89
quantitative, respectively: what is in my sample? and How much is there? The choice of technology depends on the nature of the sample being analyzed and the level of sensitivity required.
Consumables: from reagents to glassware Consumables vary in complexity, ranging from lower-margin disposable laboratory plastics and glassware to higher-margin chemicals and very high-margin reagents (enzymes, antibodies and cell-based assays). Many reagents are packaged in the form of value-added kits designed for specific molecular and cell biology applications. Kits are the laboratory equivalent of a cake mix, in that they are easier to use, more reliable and produce faster results. In many cases, kits have higher margins than the individual components. Because of the reiterative nature of experimental research, consumable-based businesses are frequently more predictable than those that are instrument focused. That said, some analytical instruments such as DNA sequencers and microarrays require specific types of reagents in order to operate; and, for investors, a ”razor and razor blade” situation with a captive, recurring high-margin revenue stream is one of the more desirable business models. Also, consumable-centric businesses tend to benefit from superior free cash flows as they require lower capital expenditure.
Services and software: from spare parts to LIMS While most instrument vendors offer basic equipment repair and calibration, some companies also offer laboratory asset management, assay development, custom chemical and reagent manufacturing, clinical trial and supply chain management, and outsourced genomic services (e.g., whole genome sequencing and genome wide association studies). Software continues to grow in importance as a means of product differentiation. Beyond the control of individual instruments, enterprise software (LIMS, or laboratory information management systems) helps ensure protocol and data standardisation across multinational companies and facilitates regulatory compliance for regulated applications in the drug, food and environmental industries. In addition, companies are developing increasingly sophisticated bioinformatics packages to manage and analyze rapidly growing mountains of genomic data. Software is also a primary driver of brand loyalty, as researchers may be reluctant to switch vendors once they are familiar with a particular package.
Market segments The overall market opportunity is very difficult to estimate accurately, due in part to the diverse customer base and the general lack of reliable market data. We roughly estimate the total market size for the life sciences tools industry at $80-85 billion with an annual (normalized) growth rate of between 3% and 5%. We derive these estimates based on a combination of information from company reports, third party research, and our own bottom-up analysis of the market. The chart below shows a breakdown of the various segments within the tools market.
Consumable-based businesses are frequently more predictable and higher margin than those that are instrument focused
We estimate the total market for life science tools at approximately US$80bn with an annual growth rate of between 3% and 5%
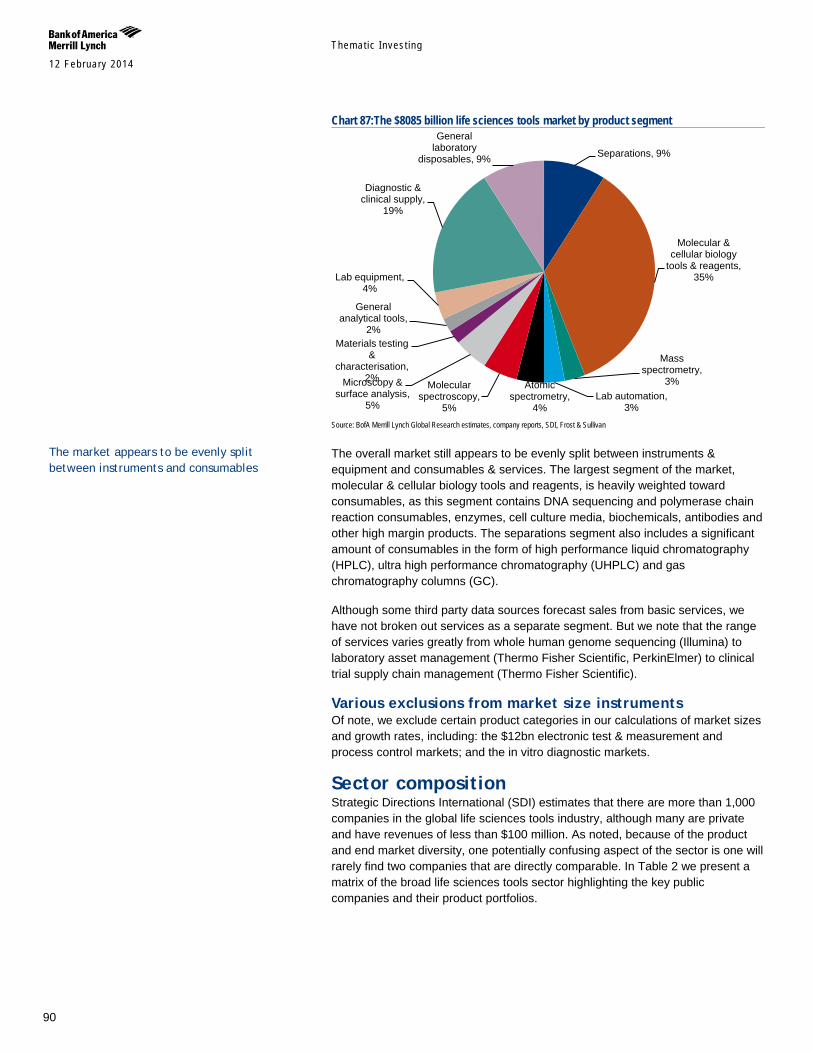
Themat ic Inves t ing 12 February 2014
90
Chart 87:The $8085 billion life sciences tools market by product segment
Source: BofA Merrill Lynch Global Research estimates, company reports, SDI, Frost & Sullivan
The overall market still appears to be evenly split between instruments & equipment and consumables & services. The largest segment of the market, molecular & cellular biology tools and reagents, is heavily weighted toward consumables, as this segment contains DNA sequencing and polymerase chain reaction consumables, enzymes, cell culture media, biochemicals, antibodies and other high margin products. The separations segment also includes a significant amount of consumables in the form of high performance liquid chromatography (HPLC), ultra high performance chromatography (UHPLC) and gas chromatography columns (GC).
Although some third party data sources forecast sales from basic services, we have not broken out services as a separate segment. But we note that the range of services varies greatly from whole human genome sequencing (Illumina) to laboratory asset management (Thermo Fisher Scientific, PerkinElmer) to clinical trial supply chain management (Thermo Fisher Scientific).
Various exclusions from market size instruments Of note, we exclude certain product categories in our calculations of market sizes and growth rates, including: the $12bn electronic test & measurement and process control markets; and the in vitro diagnostic markets.
Sector composition Strategic Directions International (SDI) estimates that there are more than 1,000 companies in the global life sciences tools industry, although many are private and have revenues of less than $100 million. As noted, because of the product and end market diversity, one potentially confusing aspect of the sector is one will rarely find two companies that are directly comparable. In Table 2 we present a matrix of the broad life sciences tools sector highlighting the key public companies and their product portfolios.
Separations, 9%
Molecular & cellular biology
tools & reagents, 35%
Mass spectrometry,
3% Lab automation,
3%
Atomic spectrometry,
4%
Molecular spectroscopy,
5%
Microscopy & surface analysis,
5%
Materials testing &
characterisation, 2%
General analytical tools,
2%
Lab equipment, 4%
Diagnostic & clinical supply,
19%
General laboratory
disposables, 9%
The market appears to be evenly split between instruments and consumables
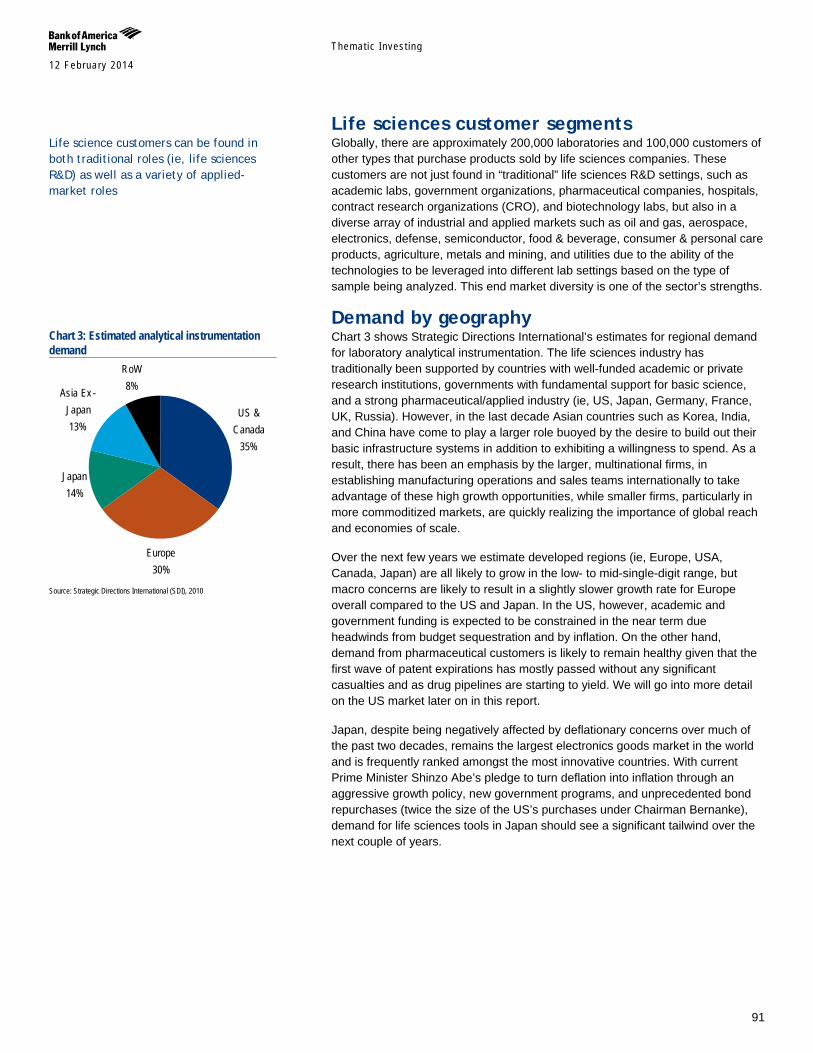
Themat ic Inves t ing 12 February 2014
91
Life sciences customer segments Globally, there are approximately 200,000 laboratories and 100,000 customers of other types that purchase products sold by life sciences companies. These customers are not just found in “traditional” life sciences R&D settings, such as academic labs, government organizations, pharmaceutical companies, hospitals, contract research organizations (CRO), and biotechnology labs, but also in a diverse array of industrial and applied markets such as oil and gas, aerospace, electronics, defense, semiconductor, food & beverage, consumer & personal care products, agriculture, metals and mining, and utilities due to the ability of the technologies to be leveraged into different lab settings based on the type of sample being analyzed. This end market diversity is one of the sector’s strengths.
Demand by geography Chart 3 shows Strategic Directions International’s estimates for regional demand for laboratory analytical instrumentation. The life sciences industry has traditionally been supported by countries with well-funded academic or private research institutions, governments with fundamental support for basic science, and a strong pharmaceutical/applied industry (ie, US, Japan, Germany, France, UK, Russia). However, in the last decade Asian countries such as Korea, India, and China have come to play a larger role buoyed by the desire to build out their basic infrastructure systems in addition to exhibiting a willingness to spend. As a result, there has been an emphasis by the larger, multinational firms, in establishing manufacturing operations and sales teams internationally to take advantage of these high growth opportunities, while smaller firms, particularly in more commoditized markets, are quickly realizing the importance of global reach and economies of scale.
Over the next few years we estimate developed regions (ie, Europe, USA, Canada, Japan) are all likely to grow in the low- to mid-single-digit range, but macro concerns are likely to result in a slightly slower growth rate for Europe overall compared to the US and Japan. In the US, however, academic and government funding is expected to be constrained in the near term due headwinds from budget sequestration and by inflation. On the other hand, demand from pharmaceutical customers is likely to remain healthy given that the first wave of patent expirations has mostly passed without any significant casualties and as drug pipelines are starting to yield. We will go into more detail on the US market later on in this report.
Japan, despite being negatively affected by deflationary concerns over much of the past two decades, remains the largest electronics goods market in the world and is frequently ranked amongst the most innovative countries. With current Prime Minister Shinzo Abe’s pledge to turn deflation into inflation through an aggressive growth policy, new government programs, and unprecedented bond repurchases (twice the size of the US’s purchases under Chairman Bernanke), demand for life sciences tools in Japan should see a significant tailwind over the next couple of years.
Life science customers can be found in both traditional roles (ie, life sciences R&D) as well as a variety of applied-market roles
Chart 3: Estimated analytical instrumentation demand
Source: Strategic Directions International (SDI), 2010
Europe30%
Japan14%
RoW8%Asia Ex -
Japan13%
US & Canada
35%
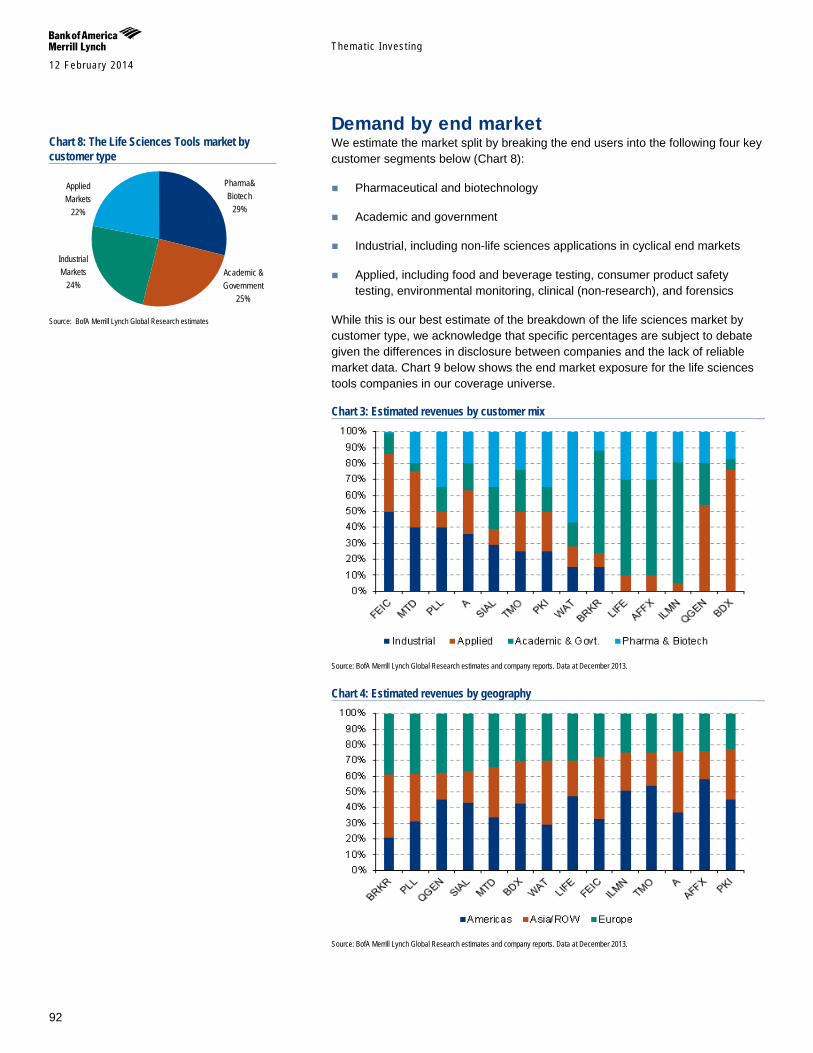
Themat ic Inves t ing 12 February 2014
92
Demand by end market We estimate the market split by breaking the end users into the following four key customer segments below (Chart 8):
Pharmaceutical and biotechnology
Academic and government
Industrial, including non-life sciences applications in cyclical end markets
Applied, including food and beverage testing, consumer product safety testing, environmental monitoring, clinical (non-research), and forensics
While this is our best estimate of the breakdown of the life sciences market by customer type, we acknowledge that specific percentages are subject to debate given the differences in disclosure between companies and the lack of reliable market data. Chart 9 below shows the end market exposure for the life sciences tools companies in our coverage universe.
Chart 3: Estimated revenues by customer mix
Source: BofA Merrill Lynch Global Research estimates and company reports. Data at December 2013.
Chart 4: Estimated revenues by geography
Source: BofA Merrill Lynch Global Research estimates and company reports. Data at December 2013.
Chart 8: The Life Sciences Tools market by customer type
Source: BofA Merrill Lynch Global Research estimates
Applied Markets
22%
Industrial Markets
24%Academic & Government
25%
Pharma& Biotech
29%
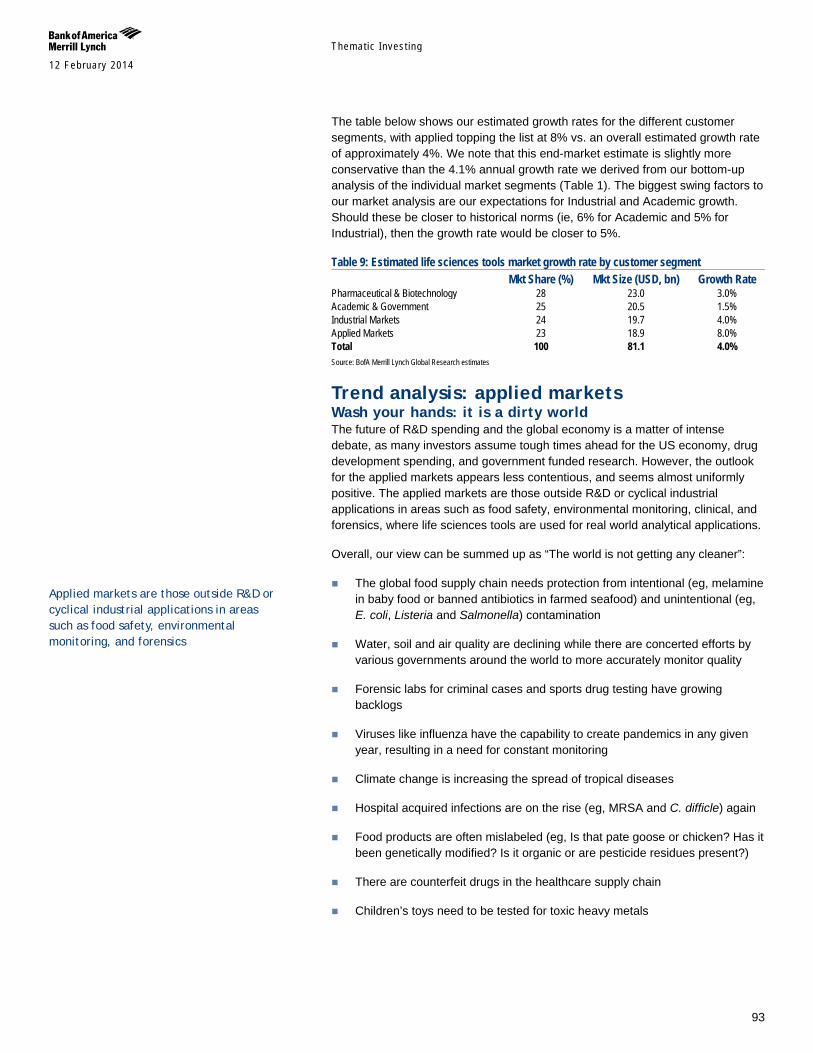
Themat ic Inves t ing 12 February 2014
93
The table below shows our estimated growth rates for the different customer segments, with applied topping the list at 8% vs. an overall estimated growth rate of approximately 4%. We note that this end-market estimate is slightly more conservative than the 4.1% annual growth rate we derived from our bottom-up analysis of the individual market segments (Table 1). The biggest swing factors to our market analysis are our expectations for Industrial and Academic growth. Should these be closer to historical norms (ie, 6% for Academic and 5% for Industrial), then the growth rate would be closer to 5%. Table 9: Estimated life sciences tools market growth rate by customer segment Mkt Share (%) Mkt Size (USD, bn) Growth Rate Pharmaceutical & Biotechnology 28 23.0 3.0% Academic & Government 25 20.5 1.5% Industrial Markets 24 19.7 4.0% Applied Markets 23 18.9 8.0% Total 100 81.1 4.0% Source: BofA Merrill Lynch Global Research estimates
Trend analysis: applied markets Wash your hands: it is a dirty world The future of R&D spending and the global economy is a matter of intense debate, as many investors assume tough times ahead for the US economy, drug development spending, and government funded research. However, the outlook for the applied markets appears less contentious, and seems almost uniformly positive. The applied markets are those outside R&D or cyclical industrial applications in areas such as food safety, environmental monitoring, clinical, and forensics, where life sciences tools are used for real world analytical applications.
Overall, our view can be summed up as “The world is not getting any cleaner”:
The global food supply chain needs protection from intentional (eg, melamine in baby food or banned antibiotics in farmed seafood) and unintentional (eg, E. coli, Listeria and Salmonella) contamination
Water, soil and air quality are declining while there are concerted efforts by various governments around the world to more accurately monitor quality
Forensic labs for criminal cases and sports drug testing have growing backlogs
Viruses like influenza have the capability to create pandemics in any given year, resulting in a need for constant monitoring
Climate change is increasing the spread of tropical diseases
Hospital acquired infections are on the rise (eg, MRSA and C. difficle) again
Food products are often mislabeled (eg, Is that pate goose or chicken? Has it been genetically modified? Is it organic or are pesticide residues present?)
There are counterfeit drugs in the healthcare supply chain
Children’s toys need to be tested for toxic heavy metals
Applied markets are those outside R&D or cyclical industrial applications in areas such as food safety, environmental monitoring, and forensics
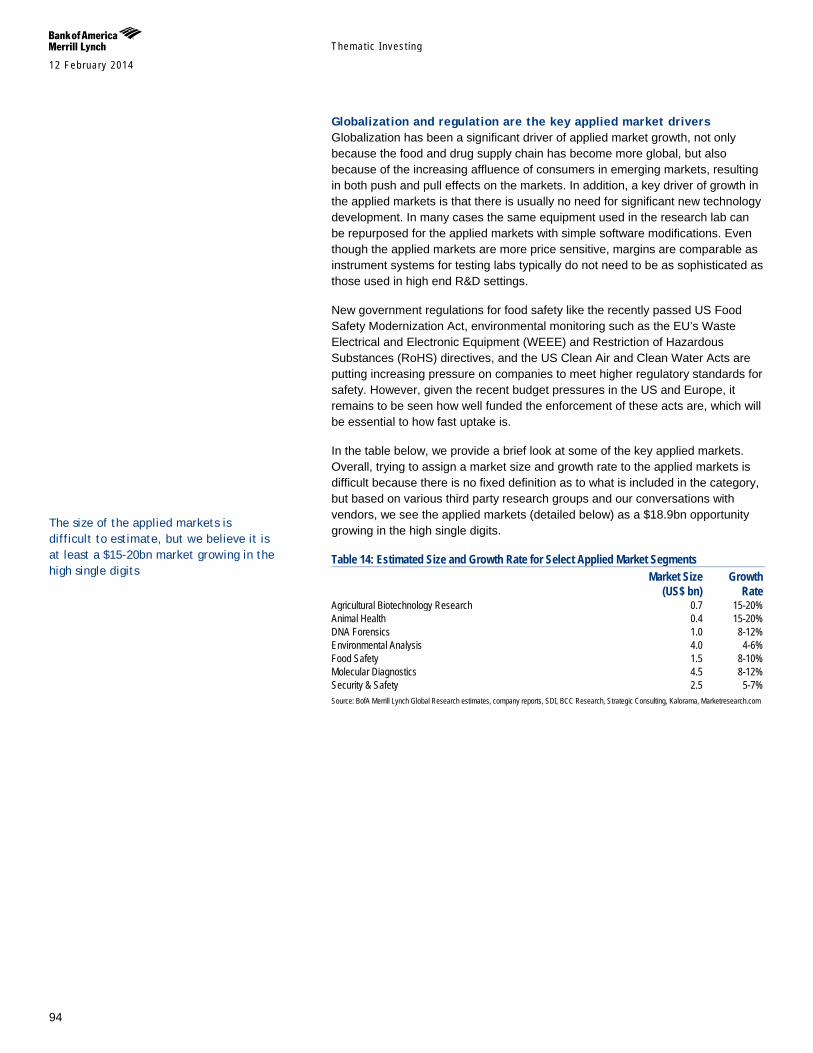
Themat ic Inves t ing 12 February 2014
94
Globalization and regulation are the key applied market drivers Globalization has been a significant driver of applied market growth, not only because the food and drug supply chain has become more global, but also because of the increasing affluence of consumers in emerging markets, resulting in both push and pull effects on the markets. In addition, a key driver of growth in the applied markets is that there is usually no need for significant new technology development. In many cases the same equipment used in the research lab can be repurposed for the applied markets with simple software modifications. Even though the applied markets are more price sensitive, margins are comparable as instrument systems for testing labs typically do not need to be as sophisticated as those used in high end R&D settings.
New government regulations for food safety like the recently passed US Food Safety Modernization Act, environmental monitoring such as the EU’s Waste Electrical and Electronic Equipment (WEEE) and Restriction of Hazardous Substances (RoHS) directives, and the US Clean Air and Clean Water Acts are putting increasing pressure on companies to meet higher regulatory standards for safety. However, given the recent budget pressures in the US and Europe, it remains to be seen how well funded the enforcement of these acts are, which will be essential to how fast uptake is.
In the table below, we provide a brief look at some of the key applied markets. Overall, trying to assign a market size and growth rate to the applied markets is difficult because there is no fixed definition as to what is included in the category, but based on various third party research groups and our conversations with vendors, we see the applied markets (detailed below) as a $18.9bn opportunity growing in the high single digits. Table 14: Estimated Size and Growth Rate for Select Applied Market Segments Market Size Growth (US$ bn) Rate Agricultural Biotechnology Research 0.7 15-20% Animal Health 0.4 15-20% DNA Forensics 1.0 8-12% Environmental Analysis 4.0 4-6% Food Safety 1.5 8-10% Molecular Diagnostics 4.5 8-12% Security & Safety 2.5 5-7% Source: BofA Merrill Lynch Global Research estimates, company reports, SDI, BCC Research, Strategic Consulting, Kalorama, Marketresearch.com
The size of the applied markets is difficult to estimate, but we believe it is at least a $15-20bn market growing in the high single digits
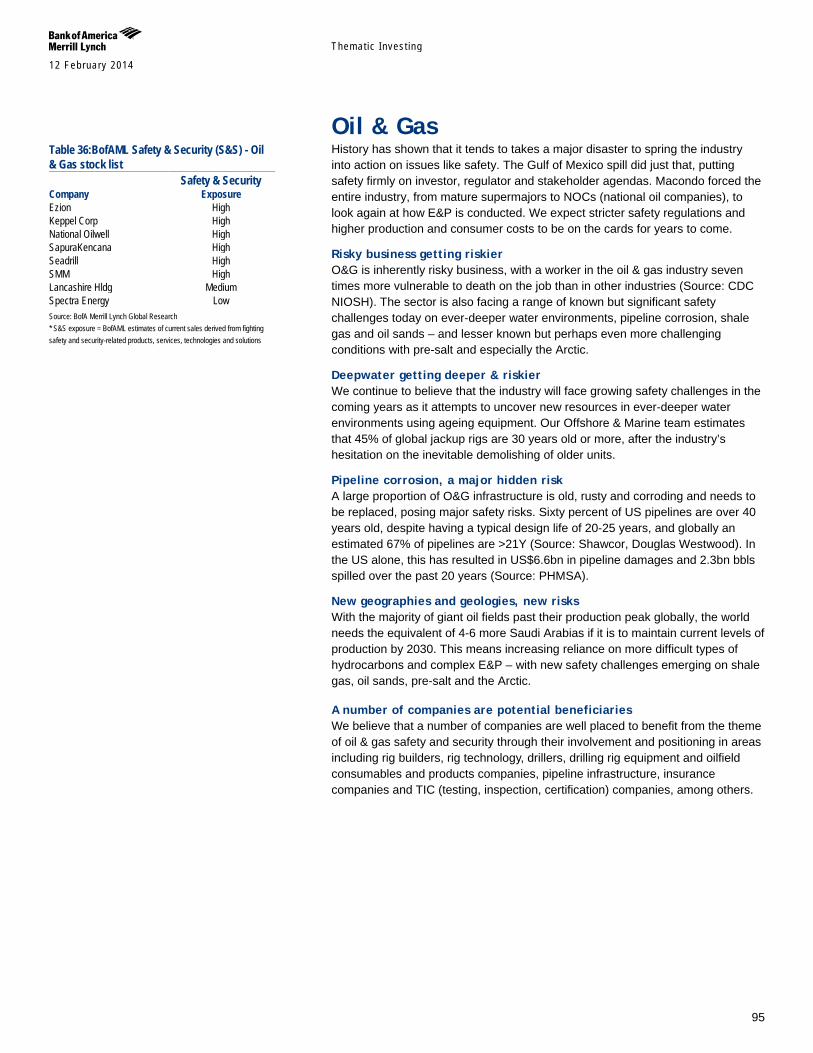
Themat ic Inves t ing 12 February 2014
95
Oil & Gas History has shown that it tends to takes a major disaster to spring the industry into action on issues like safety. The Gulf of Mexico spill did just that, putting safety firmly on investor, regulator and stakeholder agendas. Macondo forced the entire industry, from mature supermajors to NOCs (national oil companies), to look again at how E&P is conducted. We expect stricter safety regulations and higher production and consumer costs to be on the cards for years to come.
Risky business getting riskier O&G is inherently risky business, with a worker in the oil & gas industry seven times more vulnerable to death on the job than in other industries (Source: CDC NIOSH). The sector is also facing a range of known but significant safety challenges today on ever-deeper water environments, pipeline corrosion, shale gas and oil sands – and lesser known but perhaps even more challenging conditions with pre-salt and especially the Arctic.
Deepwater getting deeper & riskier We continue to believe that the industry will face growing safety challenges in the coming years as it attempts to uncover new resources in ever-deeper water environments using ageing equipment. Our Offshore & Marine team estimates that 45% of global jackup rigs are 30 years old or more, after the industry’s hesitation on the inevitable demolishing of older units.
Pipeline corrosion, a major hidden risk A large proportion of O&G infrastructure is old, rusty and corroding and needs to be replaced, posing major safety risks. Sixty percent of US pipelines are over 40 years old, despite having a typical design life of 20-25 years, and globally an estimated 67% of pipelines are >21Y (Source: Shawcor, Douglas Westwood). In the US alone, this has resulted in US$6.6bn in pipeline damages and 2.3bn bbls spilled over the past 20 years (Source: PHMSA).
New geographies and geologies, new risks With the majority of giant oil fields past their production peak globally, the world needs the equivalent of 4-6 more Saudi Arabias if it is to maintain current levels of production by 2030. This means increasing reliance on more difficult types of hydrocarbons and complex E&P – with new safety challenges emerging on shale gas, oil sands, pre-salt and the Arctic.
A number of companies are potential beneficiaries We believe that a number of companies are well placed to benefit from the theme of oil & gas safety and security through their involvement and positioning in areas including rig builders, rig technology, drillers, drilling rig equipment and oilfield consumables and products companies, pipeline infrastructure, insurance companies and TIC (testing, inspection, certification) companies, among others.
Table 36:BofAML Safety & Security (S&S) - Oil & Gas stock list Safety & Security Company Exposure Ezion High Keppel Corp High National Oilwell High SapuraKencana High Seadrill High SMM High Lancashire Hldg Medium Spectra Energy Low Source: BofA Merrill Lynch Global Research * S&S exposure = BofAML estimates of current sales derived from fighting safety and security-related products, services, technologies and solutions
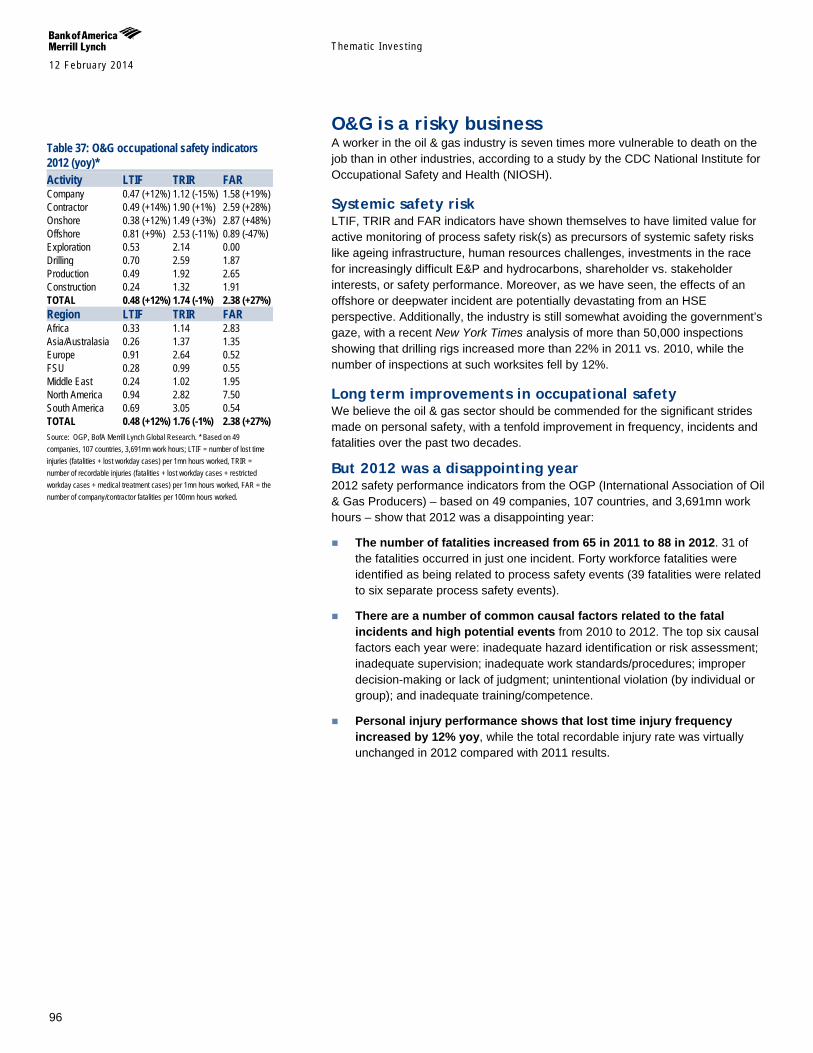
Themat ic Inves t ing 12 February 2014
96
O&G is a risky business A worker in the oil & gas industry is seven times more vulnerable to death on the job than in other industries, according to a study by the CDC National Institute for Occupational Safety and Health (NIOSH).
Systemic safety risk LTIF, TRIR and FAR indicators have shown themselves to have limited value for active monitoring of process safety risk(s) as precursors of systemic safety risks like ageing infrastructure, human resources challenges, investments in the race for increasingly difficult E&P and hydrocarbons, shareholder vs. stakeholder interests, or safety performance. Moreover, as we have seen, the effects of an offshore or deepwater incident are potentially devastating from an HSE perspective. Additionally, the industry is still somewhat avoiding the government’s gaze, with a recent New York Times analysis of more than 50,000 inspections showing that drilling rigs increased more than 22% in 2011 vs. 2010, while the number of inspections at such worksites fell by 12%.
Long term improvements in occupational safety We believe the oil & gas sector should be commended for the significant strides made on personal safety, with a tenfold improvement in frequency, incidents and fatalities over the past two decades.
But 2012 was a disappointing year 2012 safety performance indicators from the OGP (International Association of Oil & Gas Producers) – based on 49 companies, 107 countries, and 3,691mn work hours – show that 2012 was a disappointing year:
The number of fatalities increased from 65 in 2011 to 88 in 2012. 31 of the fatalities occurred in just one incident. Forty workforce fatalities were identified as being related to process safety events (39 fatalities were related to six separate process safety events).
There are a number of common causal factors related to the fatal incidents and high potential events from 2010 to 2012. The top six causal factors each year were: inadequate hazard identification or risk assessment; inadequate supervision; inadequate work standards/procedures; improper decision-making or lack of judgment; unintentional violation (by individual or group); and inadequate training/competence.
Personal injury performance shows that lost time injury frequency increased by 12% yoy, while the total recordable injury rate was virtually unchanged in 2012 compared with 2011 results.
Table 37: O&G occupational safety indicators 2012 (yoy)* Activity LTIF TRIR FAR Company 0.47 (+12%) 1.12 (-15%) 1.58 (+19%) Contractor 0.49 (+14%) 1.90 (+1%) 2.59 (+28%) Onshore 0.38 (+12%) 1.49 (+3%) 2.87 (+48%) Offshore 0.81 (+9%) 2.53 (-11%) 0.89 (-47%) Exploration 0.53 2.14 0.00 Drilling 0.70 2.59 1.87 Production 0.49 1.92 2.65 Construction 0.24 1.32 1.91 TOTAL 0.48 (+12%) 1.74 (-1%) 2.38 (+27%) Region LTIF TRIR FAR Africa 0.33 1.14 2.83 Asia/Australasia 0.26 1.37 1.35 Europe 0.91 2.64 0.52 FSU 0.28 0.99 0.55 Middle East 0.24 1.02 1.95 North America 0.94 2.82 7.50 South America 0.69 3.05 0.54 TOTAL 0.48 (+12%) 1.76 (-1%) 2.38 (+27%) Source: OGP, BofA Merrill Lynch Global Research. * Based on 49 companies, 107 countries, 3,691mn work hours; LTIF = number of lost time injuries (fatalities + lost workday cases) per 1mn hours worked, TRIR = number of recordable injuries (fatalities + lost workday cases + restricted workday cases + medical treatment cases) per 1mn hours worked, FAR = the number of company/contractor fatalities per 100mn hours worked.
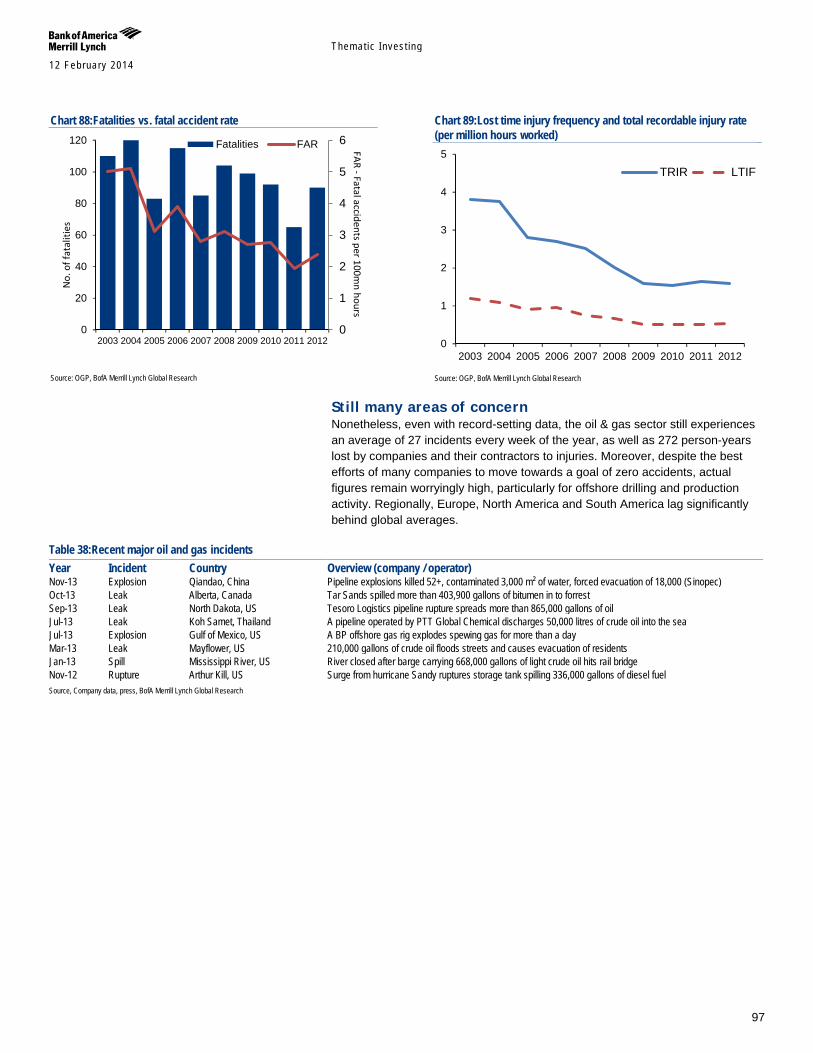
Themat ic Inves t ing 12 February 2014
97
Chart 88:Fatalities vs. fatal accident rate
Source: OGP, BofA Merrill Lynch Global Research
Chart 89:Lost time injury frequency and total recordable injury rate (per million hours worked)
Source: OGP, BofA Merrill Lynch Global Research
Still many areas of concern Nonetheless, even with record-setting data, the oil & gas sector still experiences an average of 27 incidents every week of the year, as well as 272 person-years lost by companies and their contractors to injuries. Moreover, despite the best efforts of many companies to move towards a goal of zero accidents, actual figures remain worryingly high, particularly for offshore drilling and production activity. Regionally, Europe, North America and South America lag significantly behind global averages.
Table 38:Recent major oil and gas incidents Year Incident Country Overview (company / operator) Nov-13 Explosion Qiandao, China Pipeline explosions killed 52+, contaminated 3,000 m² of water, forced evacuation of 18,000 (Sinopec) Oct-13 Leak Alberta, Canada Tar Sands spilled more than 403,900 gallons of bitumen in to forrest Sep-13 Leak North Dakota, US Tesoro Logistics pipeline rupture spreads more than 865,000 gallons of oil Jul-13 Leak Koh Samet, Thailand A pipeline operated by PTT Global Chemical discharges 50,000 litres of crude oil into the sea Jul-13 Explosion Gulf of Mexico, US A BP offshore gas rig explodes spewing gas for more than a day Mar-13 Leak Mayflower, US 210,000 gallons of crude oil floods streets and causes evacuation of residents Jan-13 Spill Mississippi River, US River closed after barge carrying 668,000 gallons of light crude oil hits rail bridge Nov-12 Rupture Arthur Kill, US Surge from hurricane Sandy ruptures storage tank spilling 336,000 gallons of diesel fuel Source, Company data, press, BofA Merrill Lynch Global Research
0
1
2
3
4
5
6
0
20
40
60
80
100
120
2003 2004 2005 2006 2007 2008 2009 2010 2011 2012
Fatalities FAR
No.
of f
atal
ities
FAR - Fatal accidents per 100mn hours
0
1
2
3
4
5
2003 2004 2005 2006 2007 2008 2009 2010 2011 2012
TRIR LTIF
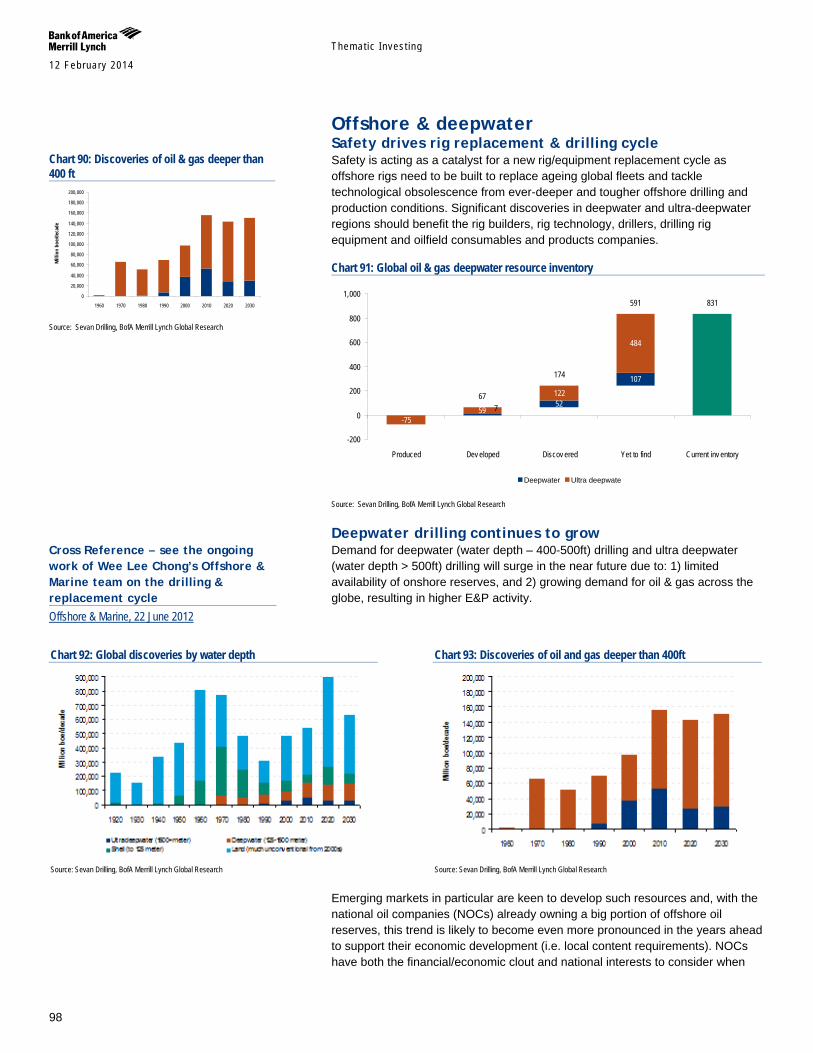
Themat ic Inves t ing 12 February 2014
98
Offshore & deepwater Safety drives rig replacement & drilling cycle Safety is acting as a catalyst for a new rig/equipment replacement cycle as offshore rigs need to be built to replace ageing global fleets and tackle technological obsolescence from ever-deeper and tougher offshore drilling and production conditions. Significant discoveries in deepwater and ultra-deepwater regions should benefit the rig builders, rig technology, drillers, drilling rig equipment and oilfield consumables and products companies.
Chart 91: Global oil & gas deepwater resource inventory
Source: Sevan Drilling, BofA Merrill Lynch Global Research
Deepwater drilling continues to grow Demand for deepwater (water depth – 400-500ft) drilling and ultra deepwater (water depth > 500ft) drilling will surge in the near future due to: 1) limited availability of onshore reserves, and 2) growing demand for oil & gas across the globe, resulting in higher E&P activity.
Chart 92: Global discoveries by water depth
Source: Sevan Drilling, BofA Merrill Lynch Global Research
Chart 93: Discoveries of oil and gas deeper than 400ft
Source: Sevan Drilling, BofA Merrill Lynch Global Research
Emerging markets in particular are keen to develop such resources and, with the national oil companies (NOCs) already owning a big portion of offshore oil reserves, this trend is likely to become even more pronounced in the years ahead to support their economic development (i.e. local content requirements). NOCs have both the financial/economic clout and national interests to consider when
52
107
-7559
122
484
67
174
591 831
7
-200
0
200
400
600
800
1,000
Produced Dev eloped Discov ered Yet to find Current inv entory
Deepwater Ultra deepwate
Chart 90: Discoveries of oil & gas deeper than 400 ft
Source: Sevan Drilling, BofA Merrill Lynch Global Research
Cross Reference – see the ongoing work of Wee Lee Chong’s Offshore & Marine team on the drilling & replacement cycle Offshore & Marine, 22 June 2012
0
20,000
40,000
60,000
80,000
100,000
120,000
140,000
160,000
180,000
200,000
1960 1970 1980 1990 2000 2010 2020 2030
Mill
ion
boe/
deca
de
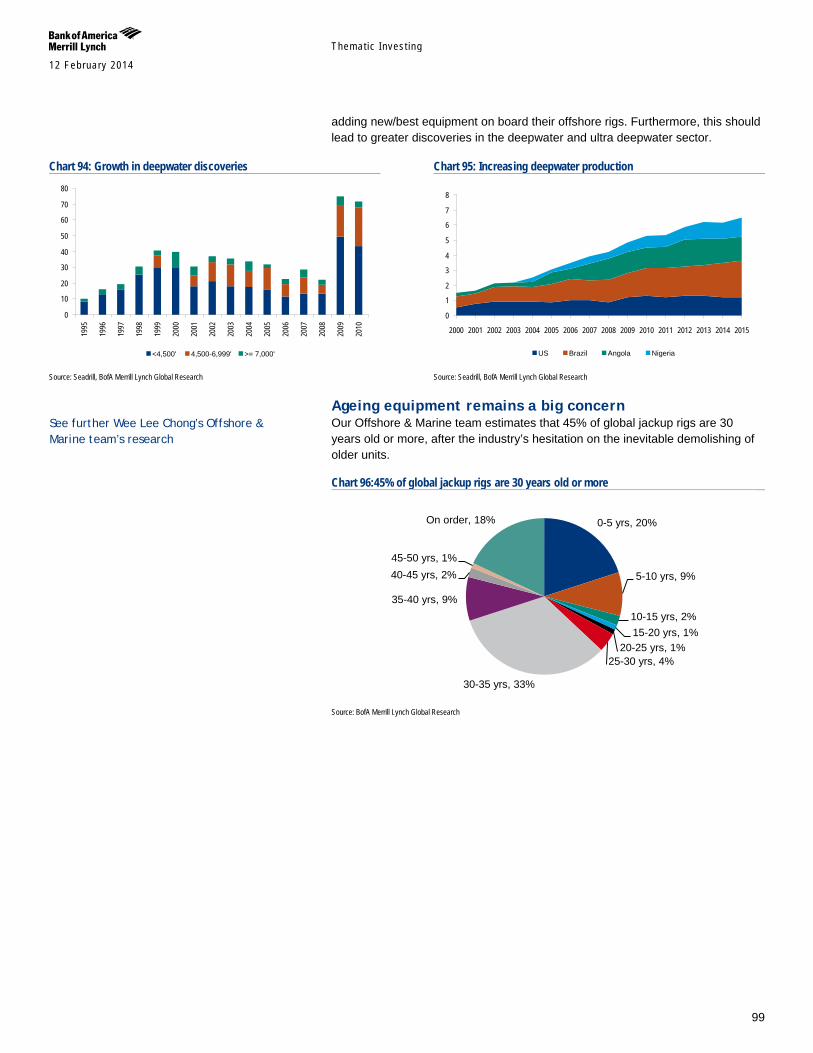
Themat ic Inves t ing 12 February 2014
99
adding new/best equipment on board their offshore rigs. Furthermore, this should lead to greater discoveries in the deepwater and ultra deepwater sector.
Ageing equipment remains a big concern Our Offshore & Marine team estimates that 45% of global jackup rigs are 30 years old or more, after the industry’s hesitation on the inevitable demolishing of older units.
Chart 96:45% of global jackup rigs are 30 years old or more
Source: BofA Merrill Lynch Global Research
0-5 yrs, 20%
5-10 yrs, 9%
10-15 yrs, 2% 15-20 yrs, 1%
20-25 yrs, 1% 25-30 yrs, 4%
30-35 yrs, 33%
35-40 yrs, 9%
40-45 yrs, 2% 45-50 yrs, 1%
On order, 18%
Chart 94: Growth in deepwater discoveries
Source: Seadrill, BofA Merrill Lynch Global Research
Chart 95: Increasing deepwater production
Source: Seadrill, BofA Merrill Lynch Global Research
0
10
20
30
40
50
60
70
80
1995
1996
1997
1998
1999
2000
2001
2002
2003
2004
2005
2006
2007
2008
2009
2010
<4,500' 4,500-6,999' >= 7,000'
0
1
2
3
4
5
6
7
8
2000 2001 2002 2003 2004 2005 2006 2007 2008 2009 2010 2011 2012 2013 2014 2015
US Brazil Angola Nigeria
See further Wee Lee Chong’s Offshore & Marine team’s research
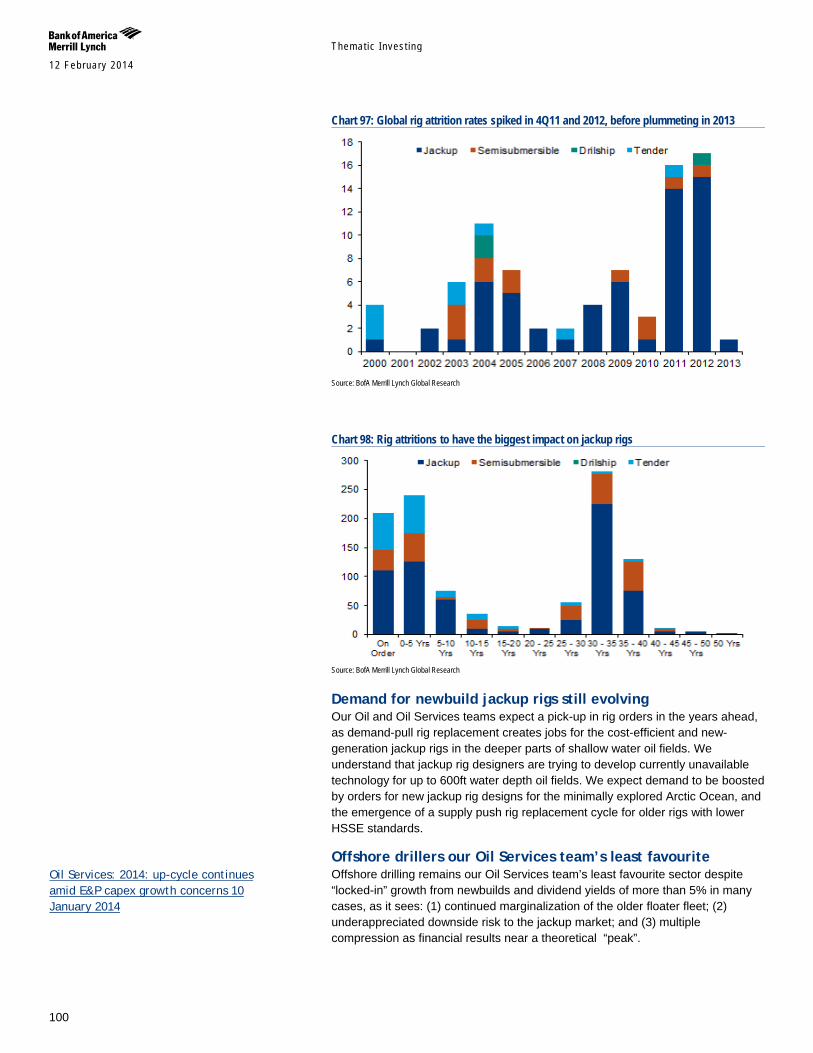
Themat ic Inves t ing 12 February 2014
100
Chart 97: Global rig attrition rates spiked in 4Q11 and 2012, before plummeting in 2013
Source: BofA Merrill Lynch Global Research
Chart 98: Rig attritions to have the biggest impact on jackup rigs
Source: BofA Merrill Lynch Global Research
Demand for newbuild jackup rigs still evolving Our Oil and Oil Services teams expect a pick-up in rig orders in the years ahead, as demand-pull rig replacement creates jobs for the cost-efficient and new-generation jackup rigs in the deeper parts of shallow water oil fields. We understand that jackup rig designers are trying to develop currently unavailable technology for up to 600ft water depth oil fields. We expect demand to be boosted by orders for new jackup rig designs for the minimally explored Arctic Ocean, and the emergence of a supply push rig replacement cycle for older rigs with lower HSSE standards.
Offshore drillers our Oil Services team’s least favourite Offshore drilling remains our Oil Services team’s least favourite sector despite “locked-in” growth from newbuilds and dividend yields of more than 5% in many cases, as it sees: (1) continued marginalization of the older floater fleet; (2) underappreciated downside risk to the jackup market; and (3) multiple compression as financial results near a theoretical “peak”.
Oil Services: 2014: up-cycle continues amid E&P capex growth concerns 10 January 2014
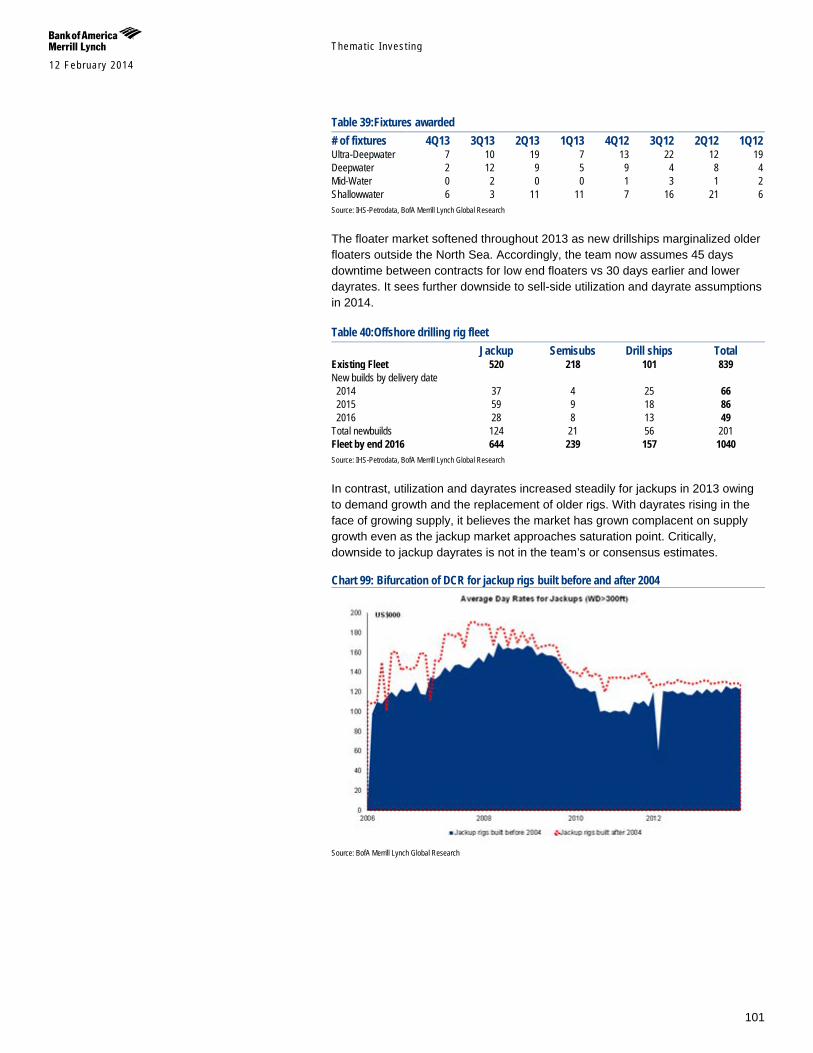
Themat ic Inves t ing 12 February 2014
101
Table 39:Fixtures awarded # of fixtures 4Q13 3Q13 2Q13 1Q13 4Q12 3Q12 2Q12 1Q12 Ultra-Deepwater 7 10 19 7 13 22 12 19 Deepwater 2 12 9 5 9 4 8 4 Mid-Water 0 2 0 0 1 3 1 2 Shallowwater 6 3 11 11 7 16 21 6 Source: IHS-Petrodata, BofA Merrill Lynch Global Research
The floater market softened throughout 2013 as new drillships marginalized older floaters outside the North Sea. Accordingly, the team now assumes 45 days downtime between contracts for low end floaters vs 30 days earlier and lower dayrates. It sees further downside to sell-side utilization and dayrate assumptions in 2014.
Table 40:Offshore drilling rig fleet Jackup Semisubs Drill ships Total Existing Fleet 520 218 101 839 New builds by delivery date 2014 37 4 25 66 2015 59 9 18 86 2016 28 8 13 49 Total newbuilds 124 21 56 201 Fleet by end 2016 644 239 157 1040 Source: IHS-Petrodata, BofA Merrill Lynch Global Research
In contrast, utilization and dayrates increased steadily for jackups in 2013 owing to demand growth and the replacement of older rigs. With dayrates rising in the face of growing supply, it believes the market has grown complacent on supply growth even as the jackup market approaches saturation point. Critically, downside to jackup dayrates is not in the team’s or consensus estimates.
Chart 99: Bifurcation of DCR for jackup rigs built before and after 2004
Source: BofA Merrill Lynch Global Research
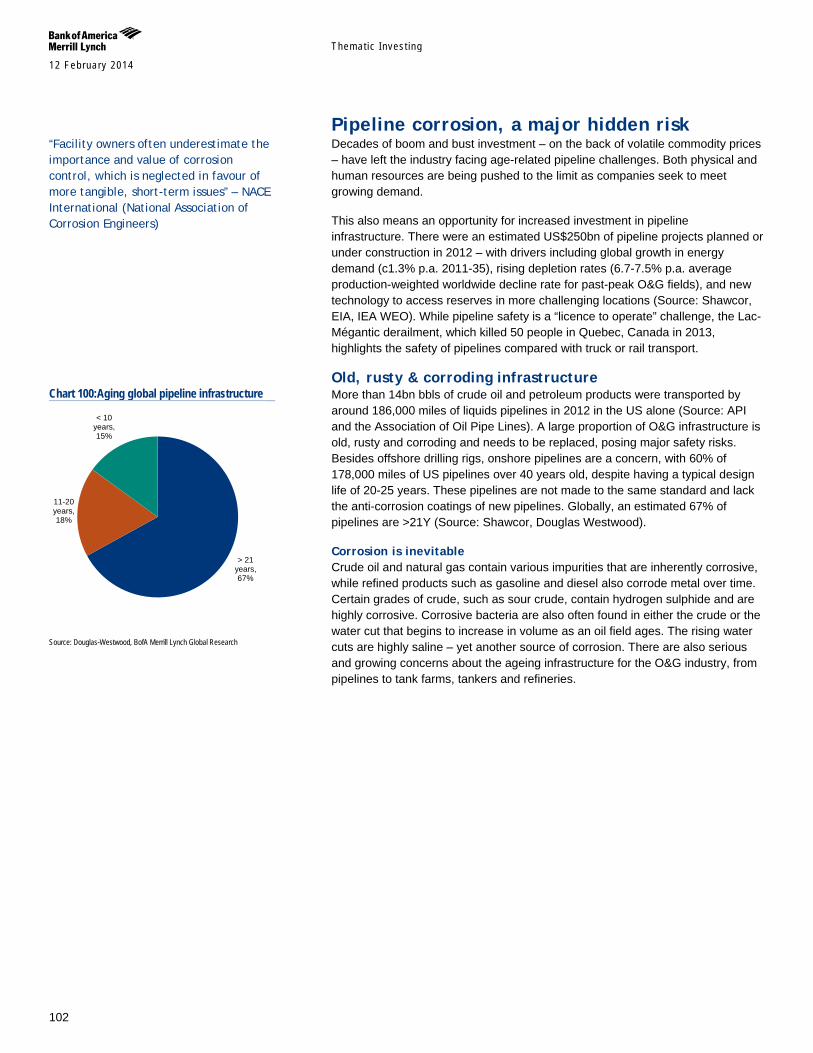
Themat ic Inves t ing 12 February 2014
102
Pipeline corrosion, a major hidden risk Decades of boom and bust investment – on the back of volatile commodity prices – have left the industry facing age-related pipeline challenges. Both physical and human resources are being pushed to the limit as companies seek to meet growing demand.
This also means an opportunity for increased investment in pipeline infrastructure. There were an estimated US$250bn of pipeline projects planned or under construction in 2012 – with drivers including global growth in energy demand (c1.3% p.a. 2011-35), rising depletion rates (6.7-7.5% p.a. average production-weighted worldwide decline rate for past-peak O&G fields), and new technology to access reserves in more challenging locations (Source: Shawcor, EIA, IEA WEO). While pipeline safety is a “licence to operate” challenge, the Lac-Mégantic derailment, which killed 50 people in Quebec, Canada in 2013, highlights the safety of pipelines compared with truck or rail transport.
Old, rusty & corroding infrastructure More than 14bn bbls of crude oil and petroleum products were transported by around 186,000 miles of liquids pipelines in 2012 in the US alone (Source: API and the Association of Oil Pipe Lines). A large proportion of O&G infrastructure is old, rusty and corroding and needs to be replaced, posing major safety risks. Besides offshore drilling rigs, onshore pipelines are a concern, with 60% of 178,000 miles of US pipelines over 40 years old, despite having a typical design life of 20-25 years. These pipelines are not made to the same standard and lack the anti-corrosion coatings of new pipelines. Globally, an estimated 67% of pipelines are >21Y (Source: Shawcor, Douglas Westwood).
Corrosion is inevitable Crude oil and natural gas contain various impurities that are inherently corrosive, while refined products such as gasoline and diesel also corrode metal over time. Certain grades of crude, such as sour crude, contain hydrogen sulphide and are highly corrosive. Corrosive bacteria are also often found in either the crude or the water cut that begins to increase in volume as an oil field ages. The rising water cuts are highly saline – yet another source of corrosion. There are also serious and growing concerns about the ageing infrastructure for the O&G industry, from pipelines to tank farms, tankers and refineries.
“Facility owners often underestimate the importance and value of corrosion control, which is neglected in favour of more tangible, short-term issues” – NACE International (National Association of Corrosion Engineers)
Chart 100:Aging global pipeline infrastructure
Source: Douglas-Westwood, BofA Merrill Lynch Global Research
> 21 years, 67%
11-20 years, 18%
< 10 years, 15%
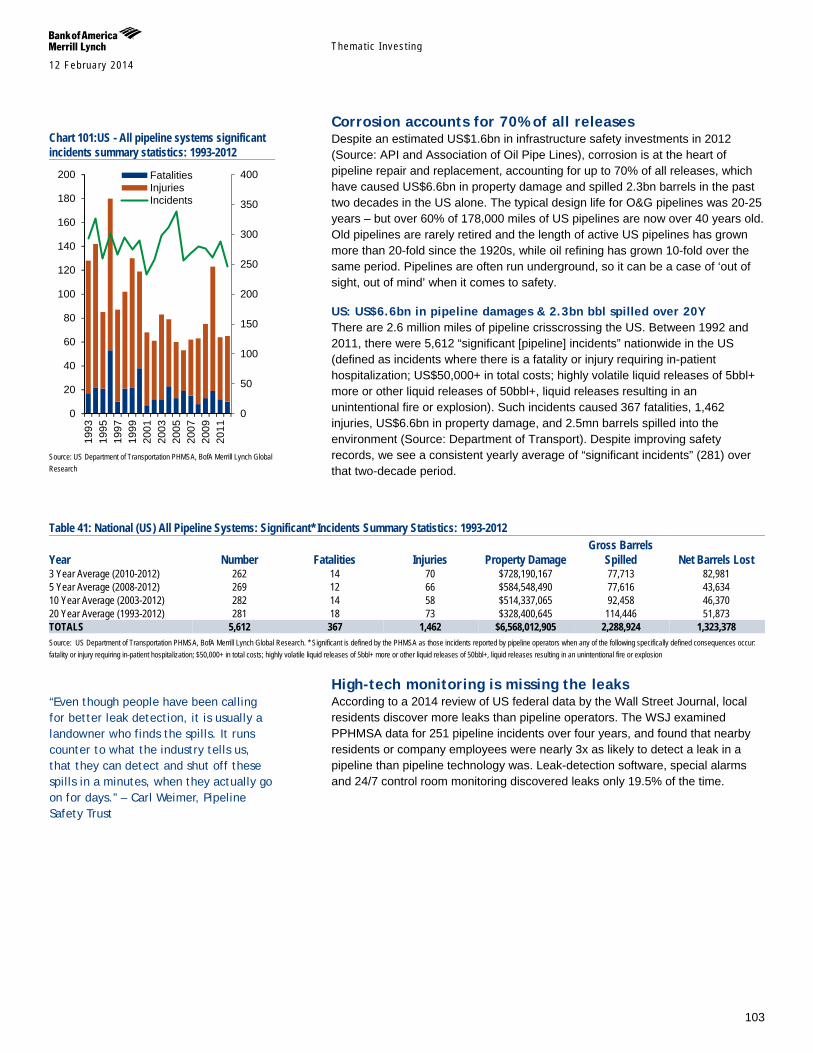
Themat ic Inves t ing 12 February 2014
103
Corrosion accounts for 70% of all releases Despite an estimated US$1.6bn in infrastructure safety investments in 2012 (Source: API and Association of Oil Pipe Lines), corrosion is at the heart of pipeline repair and replacement, accounting for up to 70% of all releases, which have caused US$6.6bn in property damage and spilled 2.3bn barrels in the past two decades in the US alone. The typical design life for O&G pipelines was 20-25 years – but over 60% of 178,000 miles of US pipelines are now over 40 years old. Old pipelines are rarely retired and the length of active US pipelines has grown more than 20-fold since the 1920s, while oil refining has grown 10-fold over the same period. Pipelines are often run underground, so it can be a case of ‘out of sight, out of mind’ when it comes to safety.
US: US$6.6bn in pipeline damages & 2.3bn bbl spilled over 20Y There are 2.6 million miles of pipeline crisscrossing the US. Between 1992 and 2011, there were 5,612 “significant [pipeline] incidents” nationwide in the US (defined as incidents where there is a fatality or injury requiring in-patient hospitalization; US$50,000+ in total costs; highly volatile liquid releases of 5bbl+ more or other liquid releases of 50bbl+, liquid releases resulting in an unintentional fire or explosion). Such incidents caused 367 fatalities, 1,462 injuries, US$6.6bn in property damage, and 2.5mn barrels spilled into the environment (Source: Department of Transport). Despite improving safety records, we see a consistent yearly average of “significant incidents” (281) over that two-decade period.
Table 41: National (US) All Pipeline Systems: Significant* Incidents Summary Statistics: 1993-2012
Year Number Fatalities Injuries Property Damage Gross Barrels
Spilled Net Barrels Lost 3 Year Average (2010-2012) 262 14 70 $728,190,167 77,713 82,981 5 Year Average (2008-2012) 269 12 66 $584,548,490 77,616 43,634 10 Year Average (2003-2012) 282 14 58 $514,337,065 92,458 46,370 20 Year Average (1993-2012) 281 18 73 $328,400,645 114,446 51,873 TOTALS 5,612 367 1,462 $6,568,012,905 2,288,924 1,323,378 Source: US Department of Transportation PHMSA, BofA Merrill Lynch Global Research. * Significant is defined by the PHMSA as those incidents reported by pipeline operators when any of the following specifically defined consequences occur: fatality or injury requiring in-patient hospitalization; $50,000+ in total costs; highly volatile liquid releases of 5bbl+ more or other liquid releases of 50bbl+, liquid releases resulting in an unintentional fire or explosion
High-tech monitoring is missing the leaks According to a 2014 review of US federal data by the Wall Street Journal, local residents discover more leaks than pipeline operators. The WSJ examined PPHMSA data for 251 pipeline incidents over four years, and found that nearby residents or company employees were nearly 3x as likely to detect a leak in a pipeline than pipeline technology was. Leak-detection software, special alarms and 24/7 control room monitoring discovered leaks only 19.5% of the time.
Chart 101:US - All pipeline systems significant incidents summary statistics: 1993-2012
Source: US Department of Transportation PHMSA, BofA Merrill Lynch Global Research
0
50
100
150
200
250
300
350
400
0
20
40
60
80
100
120
140
160
180
200
1993
1995
1997
1999
2001
2003
2005
2007
2009
2011
FatalitiesInjuriesIncidents
“Even though people have been calling for better leak detection, it is usually a landowner who finds the spills. It runs counter to what the industry tells us, that they can detect and shut off these spills in a minutes, when they actually go on for days.” – Carl Weimer, Pipeline Safety Trust
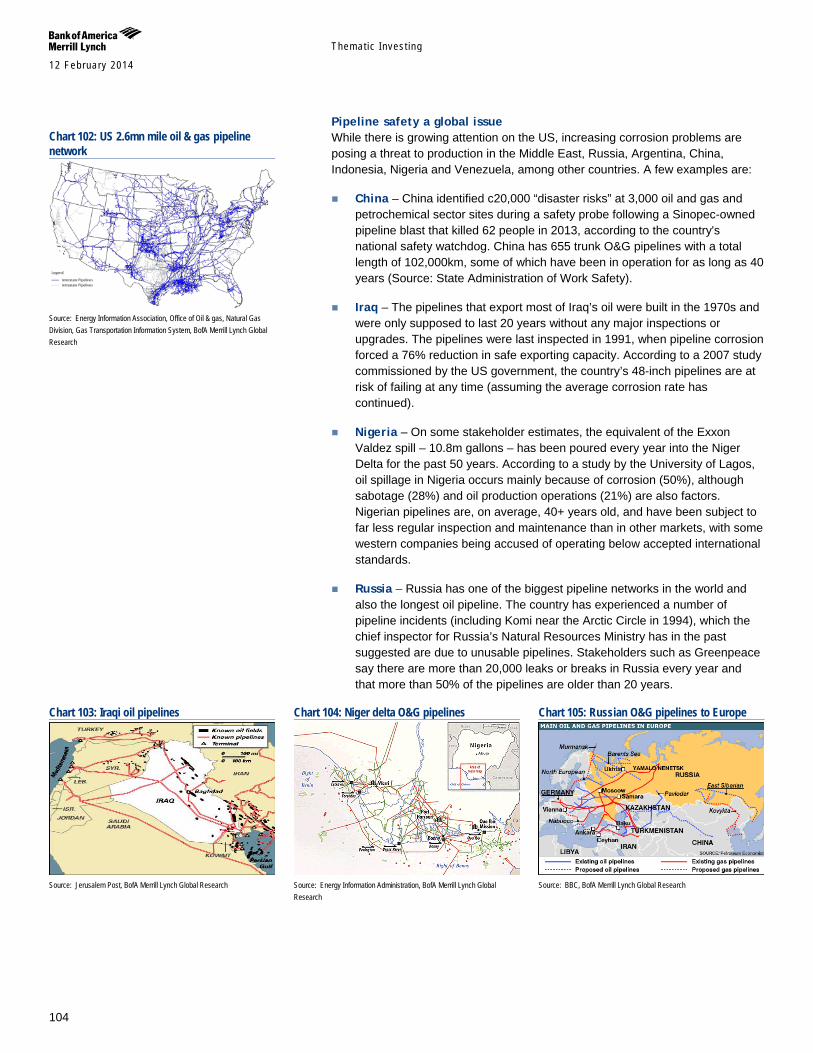
Themat ic Inves t ing 12 February 2014
104
Pipeline safety a global issue While there is growing attention on the US, increasing corrosion problems are posing a threat to production in the Middle East, Russia, Argentina, China, Indonesia, Nigeria and Venezuela, among other countries. A few examples are:
China – China identified c20,000 “disaster risks” at 3,000 oil and gas and petrochemical sector sites during a safety probe following a Sinopec-owned pipeline blast that killed 62 people in 2013, according to the country's national safety watchdog. China has 655 trunk O&G pipelines with a total length of 102,000km, some of which have been in operation for as long as 40 years (Source: State Administration of Work Safety).
Iraq – The pipelines that export most of Iraq’s oil were built in the 1970s and were only supposed to last 20 years without any major inspections or upgrades. The pipelines were last inspected in 1991, when pipeline corrosion forced a 76% reduction in safe exporting capacity. According to a 2007 study commissioned by the US government, the country’s 48-inch pipelines are at risk of failing at any time (assuming the average corrosion rate has continued).
Nigeria – On some stakeholder estimates, the equivalent of the Exxon Valdez spill – 10.8m gallons – has been poured every year into the Niger Delta for the past 50 years. According to a study by the University of Lagos, oil spillage in Nigeria occurs mainly because of corrosion (50%), although sabotage (28%) and oil production operations (21%) are also factors. Nigerian pipelines are, on average, 40+ years old, and have been subject to far less regular inspection and maintenance than in other markets, with some western companies being accused of operating below accepted international standards.
Russia – Russia has one of the biggest pipeline networks in the world and also the longest oil pipeline. The country has experienced a number of pipeline incidents (including Komi near the Arctic Circle in 1994), which the chief inspector for Russia’s Natural Resources Ministry has in the past suggested are due to unusable pipelines. Stakeholders such as Greenpeace say there are more than 20,000 leaks or breaks in Russia every year and that more than 50% of the pipelines are older than 20 years.
Chart 102: US 2.6mn mile oil & gas pipeline network
Source: Energy Information Association, Office of Oil & gas, Natural Gas Division, Gas Transportation Information System, BofA Merrill Lynch Global Research
Chart 103: Iraqi oil pipelines
Source: Jerusalem Post, BofA Merrill Lynch Global Research
Chart 104: Niger delta O&G pipelines
Source: Energy Information Administration, BofA Merrill Lynch Global Research
Chart 105: Russian O&G pipelines to Europe
Source: BBC, BofA Merrill Lynch Global Research
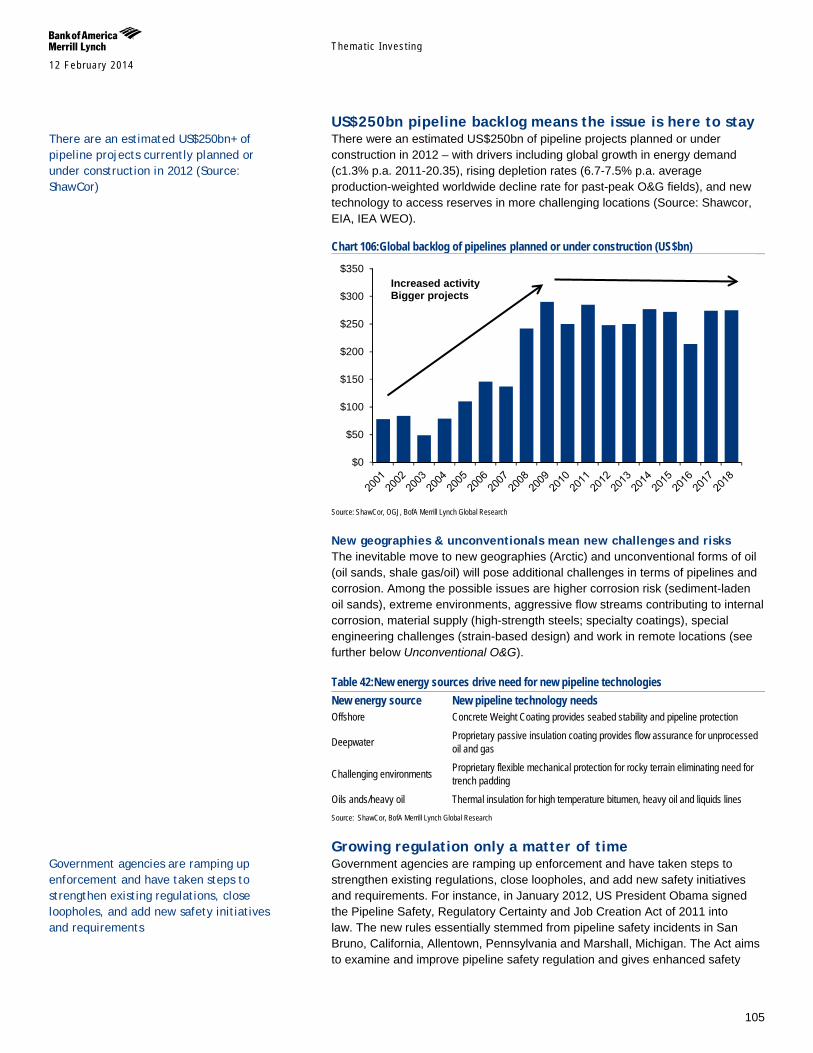
Themat ic Inves t ing 12 February 2014
105
US$250bn pipeline backlog means the issue is here to stay There were an estimated US$250bn of pipeline projects planned or under construction in 2012 – with drivers including global growth in energy demand (c1.3% p.a. 2011-20.35), rising depletion rates (6.7-7.5% p.a. average production-weighted worldwide decline rate for past-peak O&G fields), and new technology to access reserves in more challenging locations (Source: Shawcor, EIA, IEA WEO).
Chart 106:Global backlog of pipelines planned or under construction (US$bn)
Source: ShawCor, OGJ, BofA Merrill Lynch Global Research
New geographies & unconventionals mean new challenges and risks The inevitable move to new geographies (Arctic) and unconventional forms of oil (oil sands, shale gas/oil) will pose additional challenges in terms of pipelines and corrosion. Among the possible issues are higher corrosion risk (sediment-laden oil sands), extreme environments, aggressive flow streams contributing to internal corrosion, material supply (high-strength steels; specialty coatings), special engineering challenges (strain-based design) and work in remote locations (see further below Unconventional O&G).
Table 42:New energy sources drive need for new pipeline technologies New energy source New pipeline technology needs Offshore Concrete Weight Coating provides seabed stability and pipeline protection
Deepwater Proprietary passive insulation coating provides flow assurance for unprocessed oil and gas
Challenging environments Proprietary flexible mechanical protection for rocky terrain eliminating need for trench padding
Oils ands/heavy oil Thermal insulation for high temperature bitumen, heavy oil and liquids lines Source: ShawCor, BofA Merrill Lynch Global Research
Growing regulation only a matter of time Government agencies are ramping up enforcement and have taken steps to strengthen existing regulations, close loopholes, and add new safety initiatives and requirements. For instance, in January 2012, US President Obama signed the Pipeline Safety, Regulatory Certainty and Job Creation Act of 2011 into law. The new rules essentially stemmed from pipeline safety incidents in San Bruno, California, Allentown, Pennsylvania and Marshall, Michigan. The Act aims to examine and improve pipeline safety regulation and gives enhanced safety
$0
$50
$100
$150
$200
$250
$300
$350Increased activity Bigger projects
There are an estimated US$250bn+ of pipeline projects currently planned or under construction in 2012 (Source: ShawCor)
Government agencies are ramping up enforcement and have taken steps to strengthen existing regulations, close loopholes, and add new safety initiatives and requirements
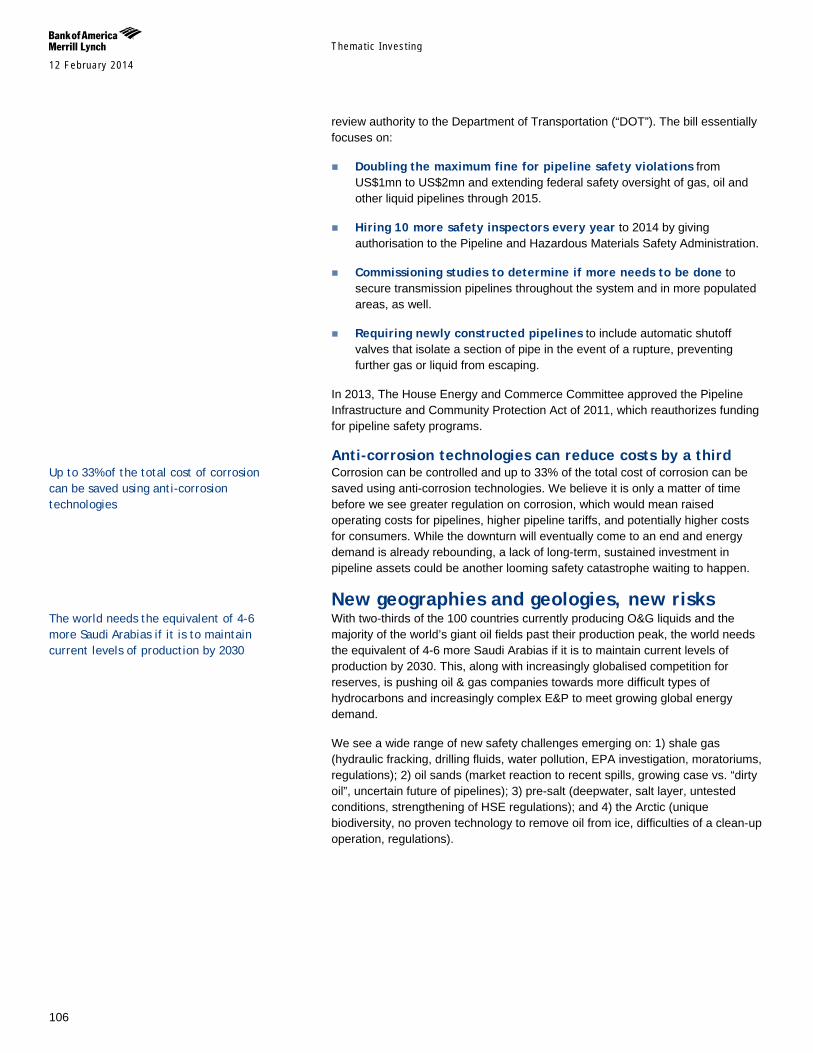
Themat ic Inves t ing 12 February 2014
106
review authority to the Department of Transportation (“DOT”). The bill essentially focuses on:
Doubling the maximum fine for pipeline safety violations from US$1mn to US$2mn and extending federal safety oversight of gas, oil and other liquid pipelines through 2015.
Hiring 10 more safety inspectors every year to 2014 by giving authorisation to the Pipeline and Hazardous Materials Safety Administration.
Commissioning studies to determine if more needs to be done to secure transmission pipelines throughout the system and in more populated areas, as well.
Requiring newly constructed pipelines to include automatic shutoff valves that isolate a section of pipe in the event of a rupture, preventing further gas or liquid from escaping.
In 2013, The House Energy and Commerce Committee approved the Pipeline Infrastructure and Community Protection Act of 2011, which reauthorizes funding for pipeline safety programs.
Anti-corrosion technologies can reduce costs by a third Corrosion can be controlled and up to 33% of the total cost of corrosion can be saved using anti-corrosion technologies. We believe it is only a matter of time before we see greater regulation on corrosion, which would mean raised operating costs for pipelines, higher pipeline tariffs, and potentially higher costs for consumers. While the downturn will eventually come to an end and energy demand is already rebounding, a lack of long-term, sustained investment in pipeline assets could be another looming safety catastrophe waiting to happen.
New geographies and geologies, new risks With two-thirds of the 100 countries currently producing O&G liquids and the majority of the world’s giant oil fields past their production peak, the world needs the equivalent of 4-6 more Saudi Arabias if it is to maintain current levels of production by 2030. This, along with increasingly globalised competition for reserves, is pushing oil & gas companies towards more difficult types of hydrocarbons and increasingly complex E&P to meet growing global energy demand.
We see a wide range of new safety challenges emerging on: 1) shale gas (hydraulic fracking, drilling fluids, water pollution, EPA investigation, moratoriums, regulations); 2) oil sands (market reaction to recent spills, growing case vs. “dirty oil”, uncertain future of pipelines); 3) pre-salt (deepwater, salt layer, untested conditions, strengthening of HSE regulations); and 4) the Arctic (unique biodiversity, no proven technology to remove oil from ice, difficulties of a clean-up operation, regulations).
Up to 33% of the total cost of corrosion can be saved using anti-corrosion technologies
The world needs the equivalent of 4-6 more Saudi Arabias if it is to maintain current levels of production by 2030
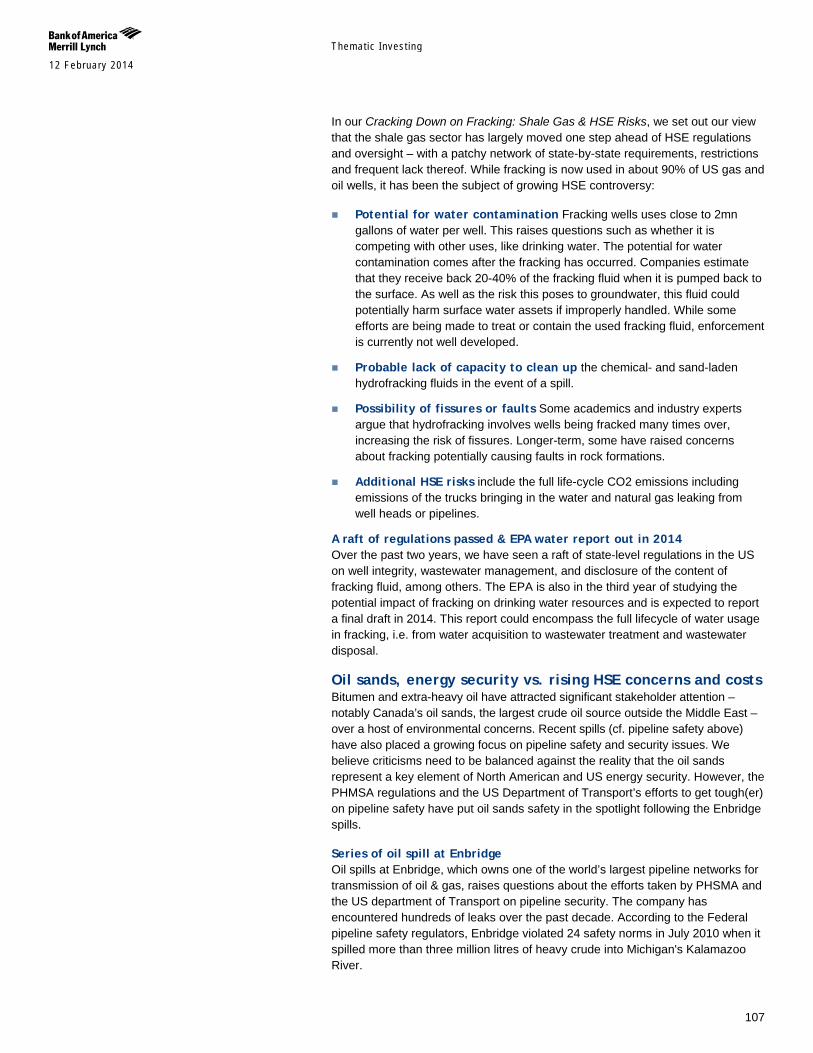
Themat ic Inves t ing 12 February 2014
107
In our Cracking Down on Fracking: Shale Gas & HSE Risks, we set out our view that the shale gas sector has largely moved one step ahead of HSE regulations and oversight – with a patchy network of state-by-state requirements, restrictions and frequent lack thereof. While fracking is now used in about 90% of US gas and oil wells, it has been the subject of growing HSE controversy:
Potential for water contamination Fracking wells uses close to 2mn gallons of water per well. This raises questions such as whether it is competing with other uses, like drinking water. The potential for water contamination comes after the fracking has occurred. Companies estimate that they receive back 20-40% of the fracking fluid when it is pumped back to the surface. As well as the risk this poses to groundwater, this fluid could potentially harm surface water assets if improperly handled. While some efforts are being made to treat or contain the used fracking fluid, enforcement is currently not well developed.
Probable lack of capacity to clean up the chemical- and sand-laden hydrofracking fluids in the event of a spill.
Possibility of fissures or faults Some academics and industry experts argue that hydrofracking involves wells being fracked many times over, increasing the risk of fissures. Longer-term, some have raised concerns about fracking potentially causing faults in rock formations.
Additional HSE risks include the full life-cycle CO2 emissions including emissions of the trucks bringing in the water and natural gas leaking from well heads or pipelines.
A raft of regulations passed & EPA water report out in 2014 Over the past two years, we have seen a raft of state-level regulations in the US on well integrity, wastewater management, and disclosure of the content of fracking fluid, among others. The EPA is also in the third year of studying the potential impact of fracking on drinking water resources and is expected to report a final draft in 2014. This report could encompass the full lifecycle of water usage in fracking, i.e. from water acquisition to wastewater treatment and wastewater disposal.
Oil sands, energy security vs. rising HSE concerns and costs Bitumen and extra-heavy oil have attracted significant stakeholder attention – notably Canada’s oil sands, the largest crude oil source outside the Middle East – over a host of environmental concerns. Recent spills (cf. pipeline safety above) have also placed a growing focus on pipeline safety and security issues. We believe criticisms need to be balanced against the reality that the oil sands represent a key element of North American and US energy security. However, the PHMSA regulations and the US Department of Transport’s efforts to get tough(er) on pipeline safety have put oil sands safety in the spotlight following the Enbridge spills.
Series of oil spill at Enbridge Oil spills at Enbridge, which owns one of the world’s largest pipeline networks for transmission of oil & gas, raises questions about the efforts taken by PHSMA and the US department of Transport on pipeline security. The company has encountered hundreds of leaks over the past decade. According to the Federal pipeline safety regulators, Enbridge violated 24 safety norms in July 2010 when it spilled more than three million litres of heavy crude into Michigan's Kalamazoo River.
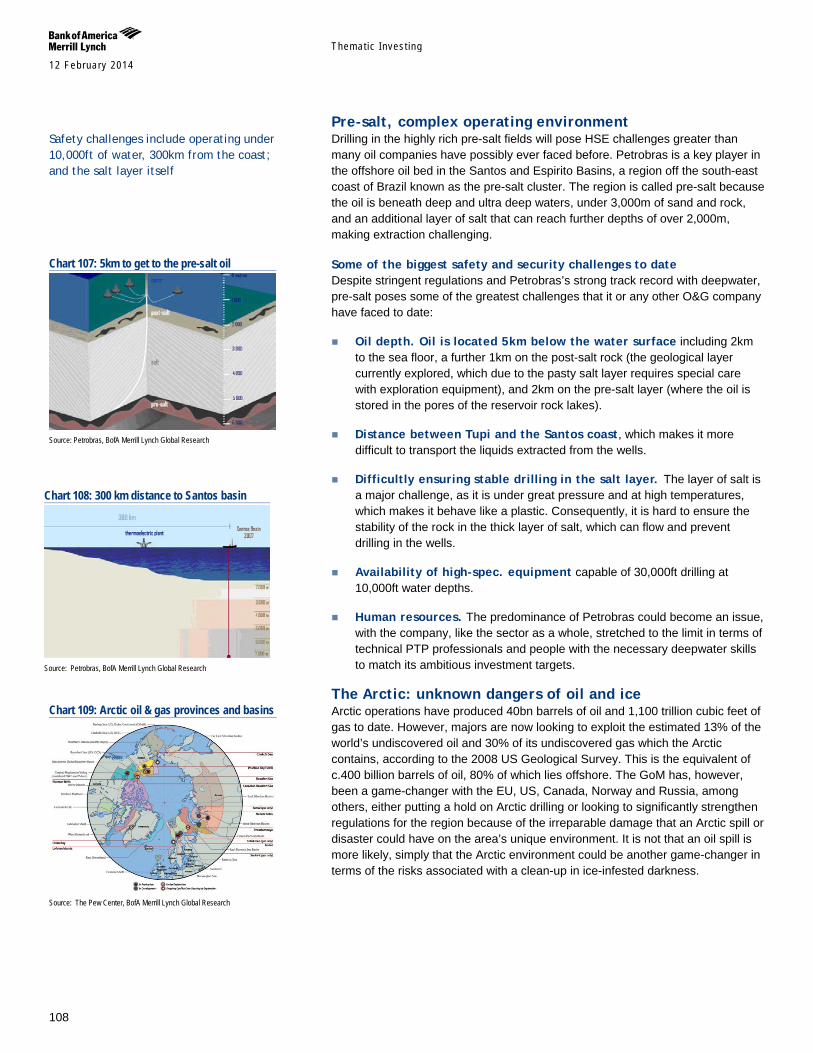
Themat ic Inves t ing 12 February 2014
108
Pre-salt, complex operating environment Drilling in the highly rich pre-salt fields will pose HSE challenges greater than many oil companies have possibly ever faced before. Petrobras is a key player in the offshore oil bed in the Santos and Espirito Basins, a region off the south-east coast of Brazil known as the pre-salt cluster. The region is called pre-salt because the oil is beneath deep and ultra deep waters, under 3,000m of sand and rock, and an additional layer of salt that can reach further depths of over 2,000m, making extraction challenging.
Some of the biggest safety and security challenges to date Despite stringent regulations and Petrobras’s strong track record with deepwater, pre-salt poses some of the greatest challenges that it or any other O&G company have faced to date:
Oil depth. Oil is located 5km below the water surface including 2km to the sea floor, a further 1km on the post-salt rock (the geological layer currently explored, which due to the pasty salt layer requires special care with exploration equipment), and 2km on the pre-salt layer (where the oil is stored in the pores of the reservoir rock lakes).
Distance between Tupi and the Santos coast, which makes it more difficult to transport the liquids extracted from the wells.
Difficultly ensuring stable drilling in the salt layer. The layer of salt is a major challenge, as it is under great pressure and at high temperatures, which makes it behave like a plastic. Consequently, it is hard to ensure the stability of the rock in the thick layer of salt, which can flow and prevent drilling in the wells.
Availability of high-spec. equipment capable of 30,000ft drilling at 10,000ft water depths.
Human resources. The predominance of Petrobras could become an issue, with the company, like the sector as a whole, stretched to the limit in terms of technical PTP professionals and people with the necessary deepwater skills to match its ambitious investment targets.
The Arctic: unknown dangers of oil and ice Arctic operations have produced 40bn barrels of oil and 1,100 trillion cubic feet of gas to date. However, majors are now looking to exploit the estimated 13% of the world’s undiscovered oil and 30% of its undiscovered gas which the Arctic contains, according to the 2008 US Geological Survey. This is the equivalent of c.400 billion barrels of oil, 80% of which lies offshore. The GoM has, however, been a game-changer with the EU, US, Canada, Norway and Russia, among others, either putting a hold on Arctic drilling or looking to significantly strengthen regulations for the region because of the irreparable damage that an Arctic spill or disaster could have on the area’s unique environment. It is not that an oil spill is more likely, simply that the Arctic environment could be another game-changer in terms of the risks associated with a clean-up in ice-infested darkness.
Safety challenges include operating under 10,000ft of water, 300km from the coast; and the salt layer itself
Chart 107: 5km to get to the pre-salt oil
Source: Petrobras, BofA Merrill Lynch Global Research
Chart 108: 300 km distance to Santos basin
Source: Petrobras, BofA Merrill Lynch Global Research
Chart 109: Arctic oil & gas provinces and basins
Source: The Pew Center, BofA Merrill Lynch Global Research
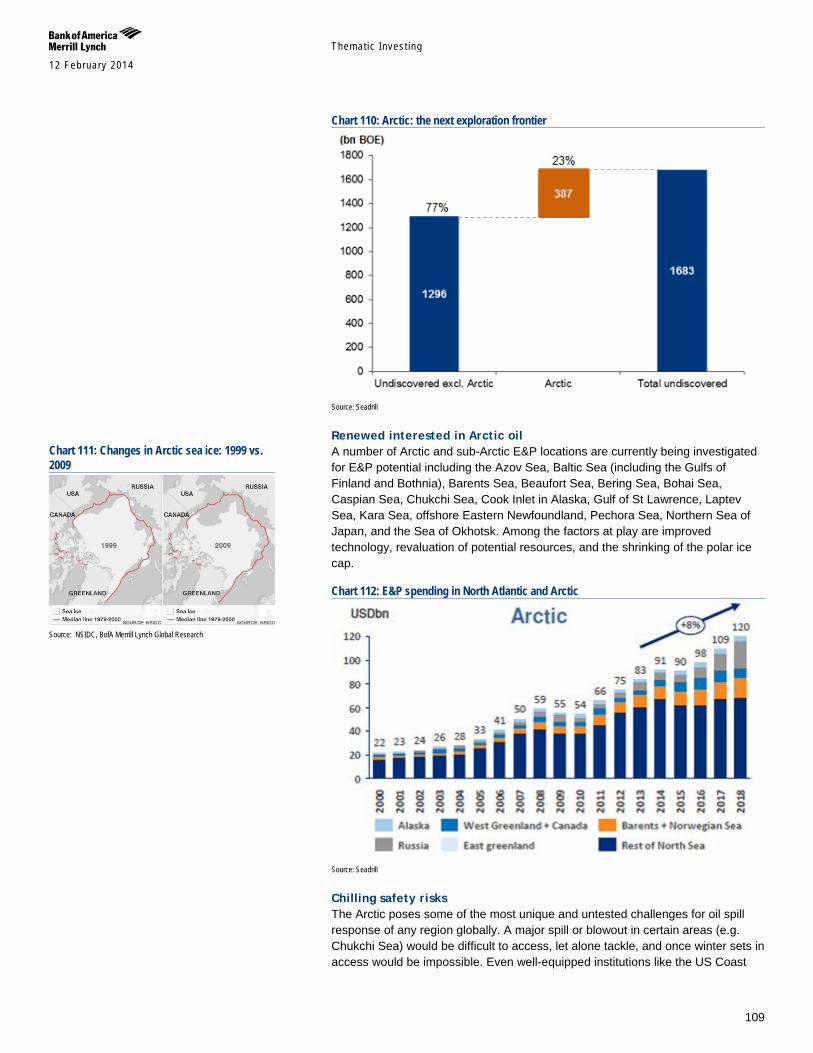
Themat ic Inves t ing 12 February 2014
109
Chart 110: Arctic: the next exploration frontier
Source: Seadrill
Renewed interested in Arctic oil A number of Arctic and sub-Arctic E&P locations are currently being investigated for E&P potential including the Azov Sea, Baltic Sea (including the Gulfs of Finland and Bothnia), Barents Sea, Beaufort Sea, Bering Sea, Bohai Sea, Caspian Sea, Chukchi Sea, Cook Inlet in Alaska, Gulf of St Lawrence, Laptev Sea, Kara Sea, offshore Eastern Newfoundland, Pechora Sea, Northern Sea of Japan, and the Sea of Okhotsk. Among the factors at play are improved technology, revaluation of potential resources, and the shrinking of the polar ice cap.
Chart 112: E&P spending in North Atlantic and Arctic
Source: Seadrill
Chilling safety risks The Arctic poses some of the most unique and untested challenges for oil spill response of any region globally. A major spill or blowout in certain areas (e.g. Chukchi Sea) would be difficult to access, let alone tackle, and once winter sets in access would be impossible. Even well-equipped institutions like the US Coast
Chart 111: Changes in Arctic sea ice: 1999 vs. 2009
Source: NSIDC, BofA Merrill Lynch Global Research
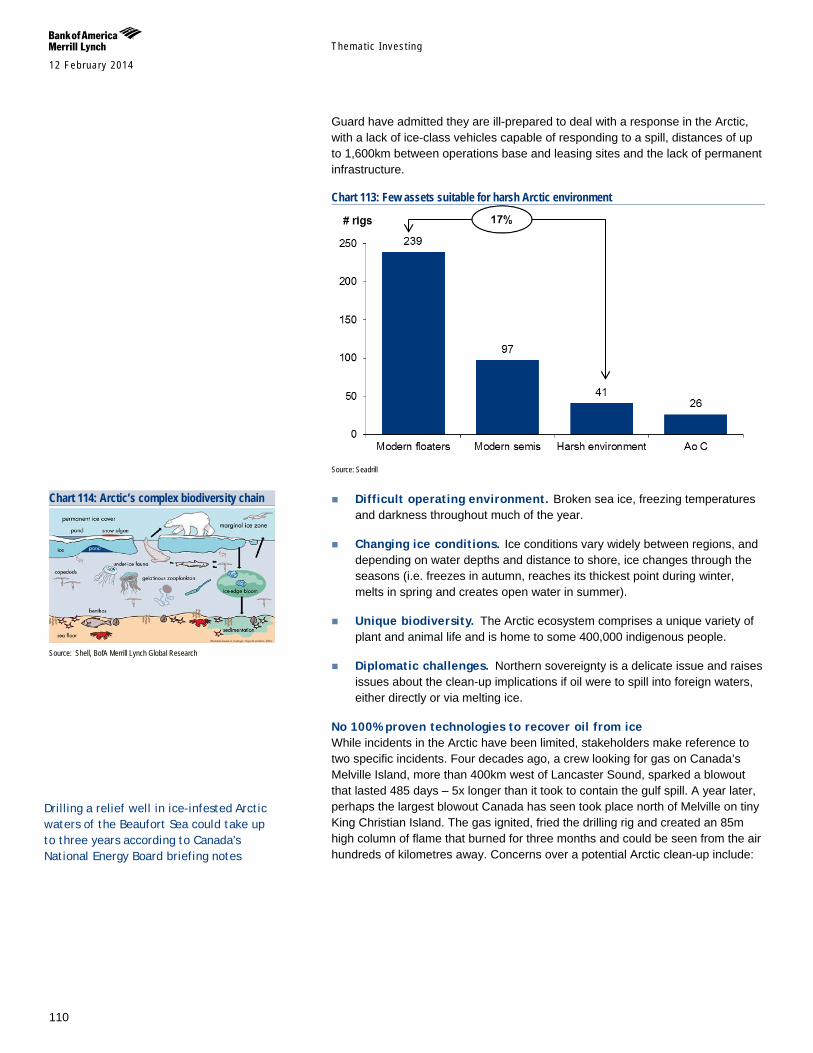
Themat ic Inves t ing 12 February 2014
110
Guard have admitted they are ill-prepared to deal with a response in the Arctic, with a lack of ice-class vehicles capable of responding to a spill, distances of up to 1,600km between operations base and leasing sites and the lack of permanent infrastructure.
Chart 113: Few assets suitable for harsh Arctic environment
Source: Seadrill
Difficult operating environment. Broken sea ice, freezing temperatures
and darkness throughout much of the year.
Changing ice conditions. Ice conditions vary widely between regions, and depending on water depths and distance to shore, ice changes through the seasons (i.e. freezes in autumn, reaches its thickest point during winter, melts in spring and creates open water in summer).
Unique biodiversity. The Arctic ecosystem comprises a unique variety of plant and animal life and is home to some 400,000 indigenous people.
Diplomatic challenges. Northern sovereignty is a delicate issue and raises issues about the clean-up implications if oil were to spill into foreign waters, either directly or via melting ice.
No 100% proven technologies to recover oil from ice While incidents in the Arctic have been limited, stakeholders make reference to two specific incidents. Four decades ago, a crew looking for gas on Canada’s Melville Island, more than 400km west of Lancaster Sound, sparked a blowout that lasted 485 days – 5x longer than it took to contain the gulf spill. A year later, perhaps the largest blowout Canada has seen took place north of Melville on tiny King Christian Island. The gas ignited, fried the drilling rig and created an 85m high column of flame that burned for three months and could be seen from the air hundreds of kilometres away. Concerns over a potential Arctic clean-up include:
Chart 114: Arctic’s complex biodiversity chain
Source: Shell, BofA Merrill Lynch Global Research
Drilling a relief well in ice-infested Arctic waters of the Beaufort Sea could take up to three years according to Canada’s National Energy Board briefing notes
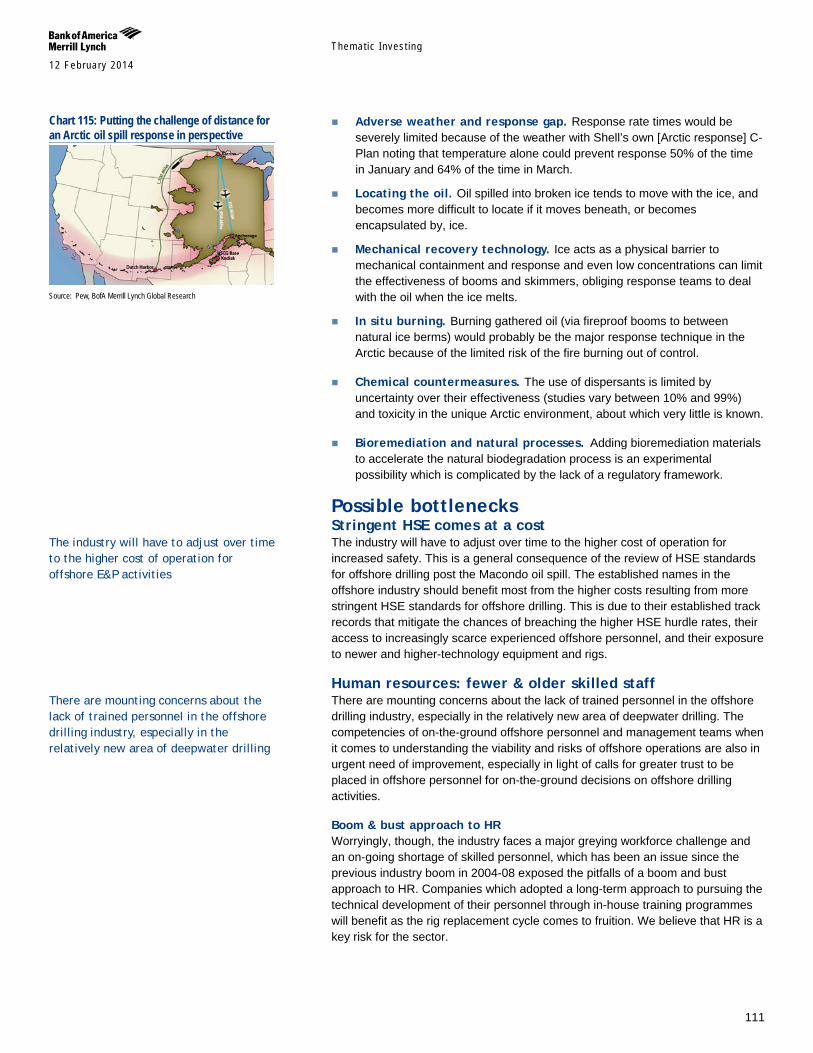
Themat ic Inves t ing 12 February 2014
111
Adverse weather and response gap. Response rate times would be severely limited because of the weather with Shell’s own [Arctic response] C-Plan noting that temperature alone could prevent response 50% of the time in January and 64% of the time in March.
Locating the oil. Oil spilled into broken ice tends to move with the ice, and becomes more difficult to locate if it moves beneath, or becomes encapsulated by, ice.
Mechanical recovery technology. Ice acts as a physical barrier to mechanical containment and response and even low concentrations can limit the effectiveness of booms and skimmers, obliging response teams to deal with the oil when the ice melts.
In situ burning. Burning gathered oil (via fireproof booms to between natural ice berms) would probably be the major response technique in the Arctic because of the limited risk of the fire burning out of control.
Chemical countermeasures. The use of dispersants is limited by uncertainty over their effectiveness (studies vary between 10% and 99%) and toxicity in the unique Arctic environment, about which very little is known.
Bioremediation and natural processes. Adding bioremediation materials to accelerate the natural biodegradation process is an experimental possibility which is complicated by the lack of a regulatory framework.
Possible bottlenecks Stringent HSE comes at a cost The industry will have to adjust over time to the higher cost of operation for increased safety. This is a general consequence of the review of HSE standards for offshore drilling post the Macondo oil spill. The established names in the offshore industry should benefit most from the higher costs resulting from more stringent HSE standards for offshore drilling. This is due to their established track records that mitigate the chances of breaching the higher HSE hurdle rates, their access to increasingly scarce experienced offshore personnel, and their exposure to newer and higher-technology equipment and rigs.
Human resources: fewer & older skilled staff There are mounting concerns about the lack of trained personnel in the offshore drilling industry, especially in the relatively new area of deepwater drilling. The competencies of on-the-ground offshore personnel and management teams when it comes to understanding the viability and risks of offshore operations are also in urgent need of improvement, especially in light of calls for greater trust to be placed in offshore personnel for on-the-ground decisions on offshore drilling activities.
Boom & bust approach to HR Worryingly, though, the industry faces a major greying workforce challenge and an on-going shortage of skilled personnel, which has been an issue since the previous industry boom in 2004-08 exposed the pitfalls of a boom and bust approach to HR. Companies which adopted a long-term approach to pursuing the technical development of their personnel through in-house training programmes will benefit as the rig replacement cycle comes to fruition. We believe that HR is a key risk for the sector.
Chart 115: Putting the challenge of distance for an Arctic oil spill response in perspective
Source: Pew, BofA Merrill Lynch Global Research
The industry will have to adjust over time to the higher cost of operation for offshore E&P activities
There are mounting concerns about the lack of trained personnel in the offshore drilling industry, especially in the relatively new area of deepwater drilling
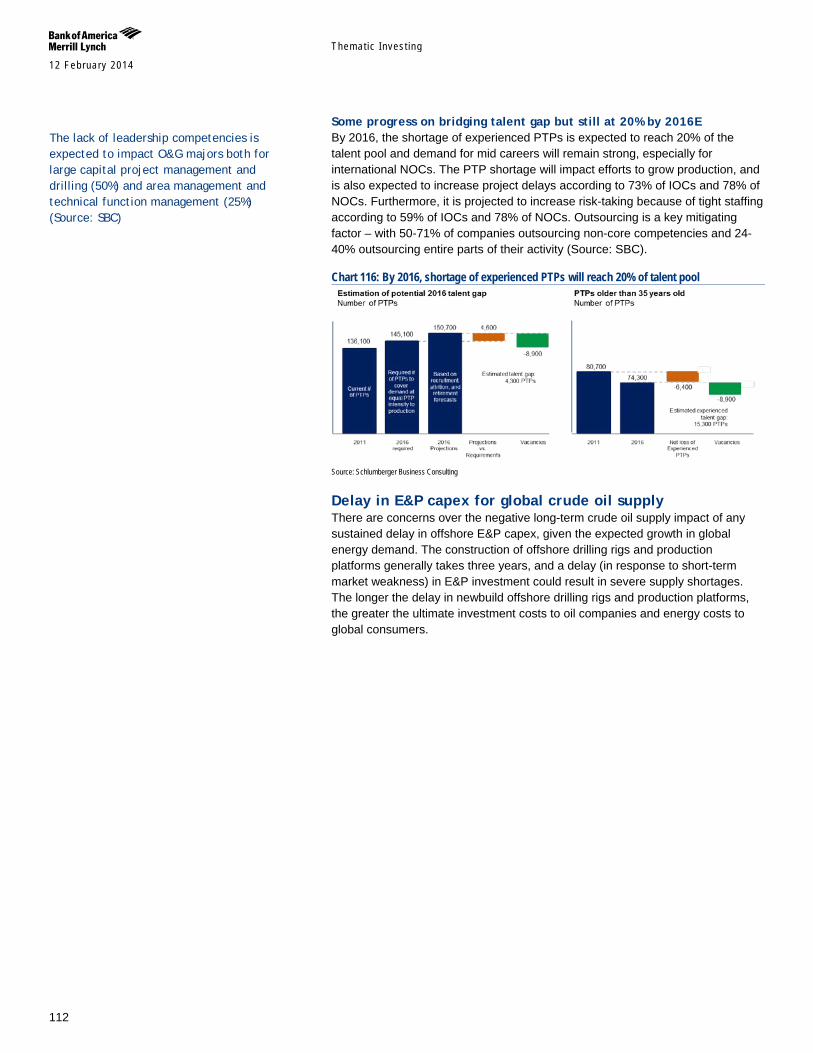
Themat ic Inves t ing 12 February 2014
112
Some progress on bridging talent gap but still at 20% by 2016E By 2016, the shortage of experienced PTPs is expected to reach 20% of the talent pool and demand for mid careers will remain strong, especially for international NOCs. The PTP shortage will impact efforts to grow production, and is also expected to increase project delays according to 73% of IOCs and 78% of NOCs. Furthermore, it is projected to increase risk-taking because of tight staffing according to 59% of IOCs and 78% of NOCs. Outsourcing is a key mitigating factor – with 50-71% of companies outsourcing non-core competencies and 24-40% outsourcing entire parts of their activity (Source: SBC).
Chart 116: By 2016, shortage of experienced PTPs will reach 20% of talent pool
Source: Schlumberger Business Consulting
Delay in E&P capex for global crude oil supply There are concerns over the negative long-term crude oil supply impact of any sustained delay in offshore E&P capex, given the expected growth in global energy demand. The construction of offshore drilling rigs and production platforms generally takes three years, and a delay (in response to short-term market weakness) in E&P investment could result in severe supply shortages. The longer the delay in newbuild offshore drilling rigs and production platforms, the greater the ultimate investment costs to oil companies and energy costs to global consumers.
The lack of leadership competencies is expected to impact O&G majors both for large capital project management and drilling (50%) and area management and technical function management (25%) (Source: SBC)
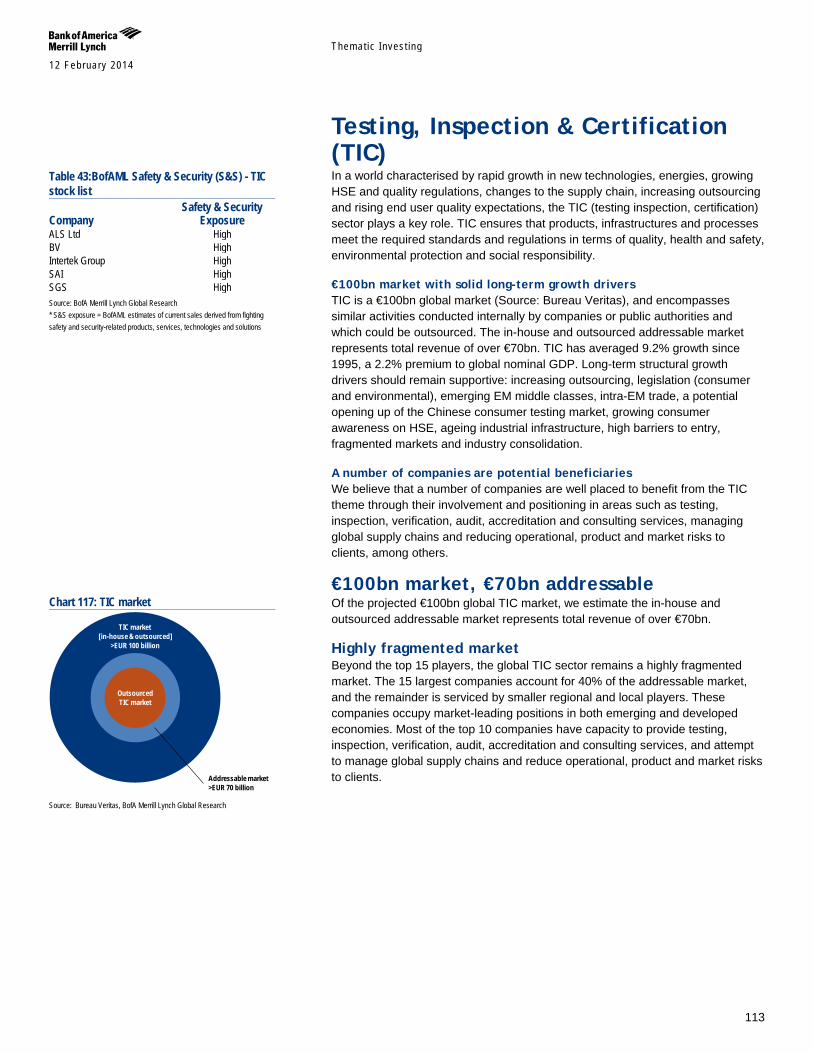
Themat ic Inves t ing 12 February 2014
113
Testing, Inspection & Certification (TIC) In a world characterised by rapid growth in new technologies, energies, growing HSE and quality regulations, changes to the supply chain, increasing outsourcing and rising end user quality expectations, the TIC (testing inspection, certification) sector plays a key role. TIC ensures that products, infrastructures and processes meet the required standards and regulations in terms of quality, health and safety, environmental protection and social responsibility.
€100bn market with solid long-term growth drivers TIC is a €100bn global market (Source: Bureau Veritas), and encompasses similar activities conducted internally by companies or public authorities and which could be outsourced. The in-house and outsourced addressable market represents total revenue of over €70bn. TIC has averaged 9.2% growth since 1995, a 2.2% premium to global nominal GDP. Long-term structural growth drivers should remain supportive: increasing outsourcing, legislation (consumer and environmental), emerging EM middle classes, intra-EM trade, a potential opening up of the Chinese consumer testing market, growing consumer awareness on HSE, ageing industrial infrastructure, high barriers to entry, fragmented markets and industry consolidation.
A number of companies are potential beneficiaries We believe that a number of companies are well placed to benefit from the TIC theme through their involvement and positioning in areas such as testing, inspection, verification, audit, accreditation and consulting services, managing global supply chains and reducing operational, product and market risks to clients, among others.
€100bn market, €70bn addressable Of the projected €100bn global TIC market, we estimate the in-house and outsourced addressable market represents total revenue of over €70bn.
Highly fragmented market Beyond the top 15 players, the global TIC sector remains a highly fragmented market. The 15 largest companies account for 40% of the addressable market, and the remainder is serviced by smaller regional and local players. These companies occupy market-leading positions in both emerging and developed economies. Most of the top 10 companies have capacity to provide testing, inspection, verification, audit, accreditation and consulting services, and attempt to manage global supply chains and reduce operational, product and market risks to clients.
Table 43:BofAML Safety & Security (S&S) - TIC stock list Safety & Security Company Exposure ALS Ltd High BV High Intertek Group High SAI High SGS High Source: BofA Merrill Lynch Global Research * S&S exposure = BofAML estimates of current sales derived from fighting safety and security-related products, services, technologies and solutions
Chart 117: TIC market
Source: Bureau Veritas, BofA Merrill Lynch Global Research
Addressable market>EUR 70 billion
TIC market[in-house & outsourced]
>EUR 100 billion
OutsourcedTIC market
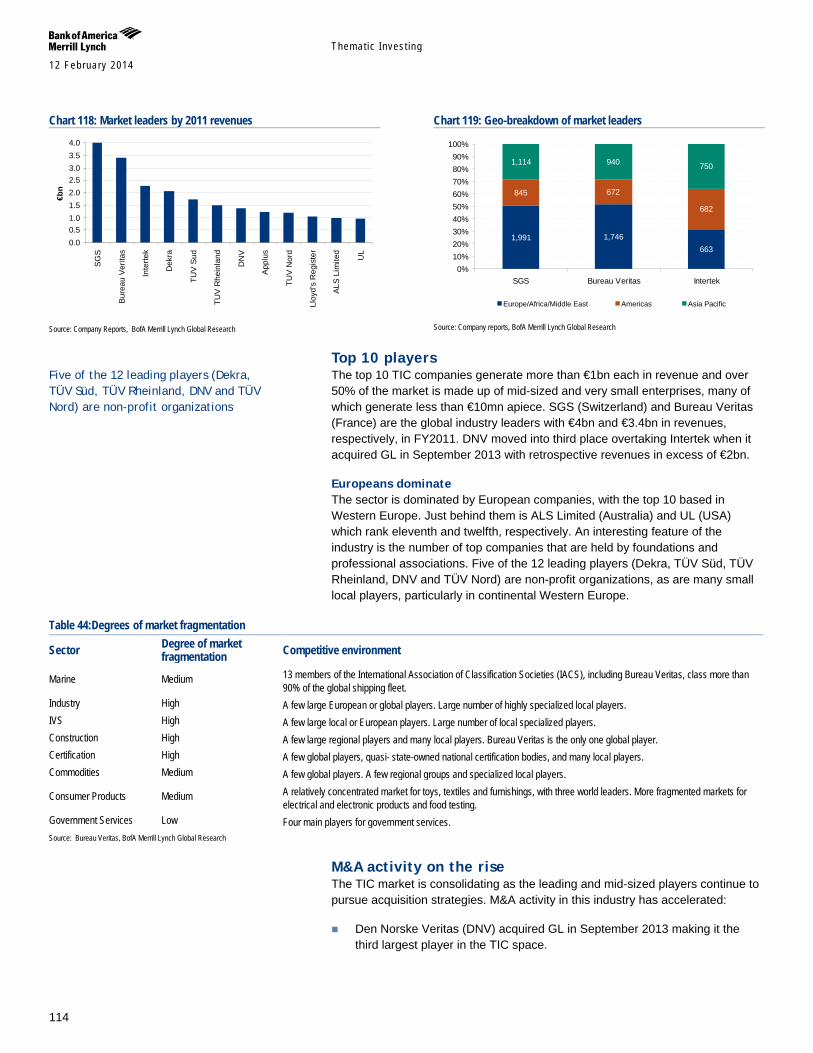
Themat ic Inves t ing 12 February 2014
114
Top 10 players The top 10 TIC companies generate more than €1bn each in revenue and over 50% of the market is made up of mid-sized and very small enterprises, many of which generate less than €10mn apiece. SGS (Switzerland) and Bureau Veritas (France) are the global industry leaders with €4bn and €3.4bn in revenues, respectively, in FY2011. DNV moved into third place overtaking Intertek when it acquired GL in September 2013 with retrospective revenues in excess of €2bn.
Europeans dominate The sector is dominated by European companies, with the top 10 based in Western Europe. Just behind them is ALS Limited (Australia) and UL (USA) which rank eleventh and twelfth, respectively. An interesting feature of the industry is the number of top companies that are held by foundations and professional associations. Five of the 12 leading players (Dekra, TÜV Süd, TÜV Rheinland, DNV and TÜV Nord) are non-profit organizations, as are many small local players, particularly in continental Western Europe.
Table 44:Degrees of market fragmentation
Sector Degree of market fragmentation Competitive environment
Marine Medium 13 members of the International Association of Classification Societies (IACS), including Bureau Veritas, class more than 90% of the global shipping fleet.
Industry High A few large European or global players. Large number of highly specialized local players. IVS High A few large local or European players. Large number of local specialized players. Construction High A few large regional players and many local players. Bureau Veritas is the only one global player. Certification High A few global players, quasi- state-owned national certification bodies, and many local players. Commodities Medium A few global players. A few regional groups and specialized local players.
Consumer Products Medium A relatively concentrated market for toys, textiles and furnishings, with three world leaders. More fragmented markets for electrical and electronic products and food testing.
Government Services Low Four main players for government services. Source: Bureau Veritas, BofA Merrill Lynch Global Research
M&A activity on the rise The TIC market is consolidating as the leading and mid-sized players continue to pursue acquisition strategies. M&A activity in this industry has accelerated:
Den Norske Veritas (DNV) acquired GL in September 2013 making it the third largest player in the TIC space.
Chart 118: Market leaders by 2011 revenues
Source: Company Reports, BofA Merrill Lynch Global Research
Chart 119: Geo-breakdown of market leaders
Source: Company reports, BofA Merrill Lynch Global Research
Five of the 12 leading players (Dekra, TÜV Süd, TÜV Rheinland, DNV and TÜV Nord) are non-profit organizations
0.00.51.01.52.02.53.03.54.0
SG
S
Bur
eau
Ver
itas
Inte
rtek
Dek
ra
TUV
Sud
TUV
Rhe
inla
nd
DN
V
App
lus
TUV
Nor
d
Lloy
d's
Reg
iste
r
ALS
Lim
ited
UL
€bn
0.00.51.01.52.02.53.03.54.0
SG
S
Bur
eau
Ver
itas
Inte
rtek
Dek
ra
TUV
Sud
TUV
Rhe
inla
nd
DN
V
App
lus
TUV
Nor
d
Lloy
d's
Reg
iste
r
ALS
Lim
ited
UL
€bn
1,991 1,746663
845 672
682
1,114 940 750
0%10%20%30%40%50%60%70%80%90%
100%
SGS Bureau Veritas Intertek
Europe/Africa/Middle East Americas Asia Pacific
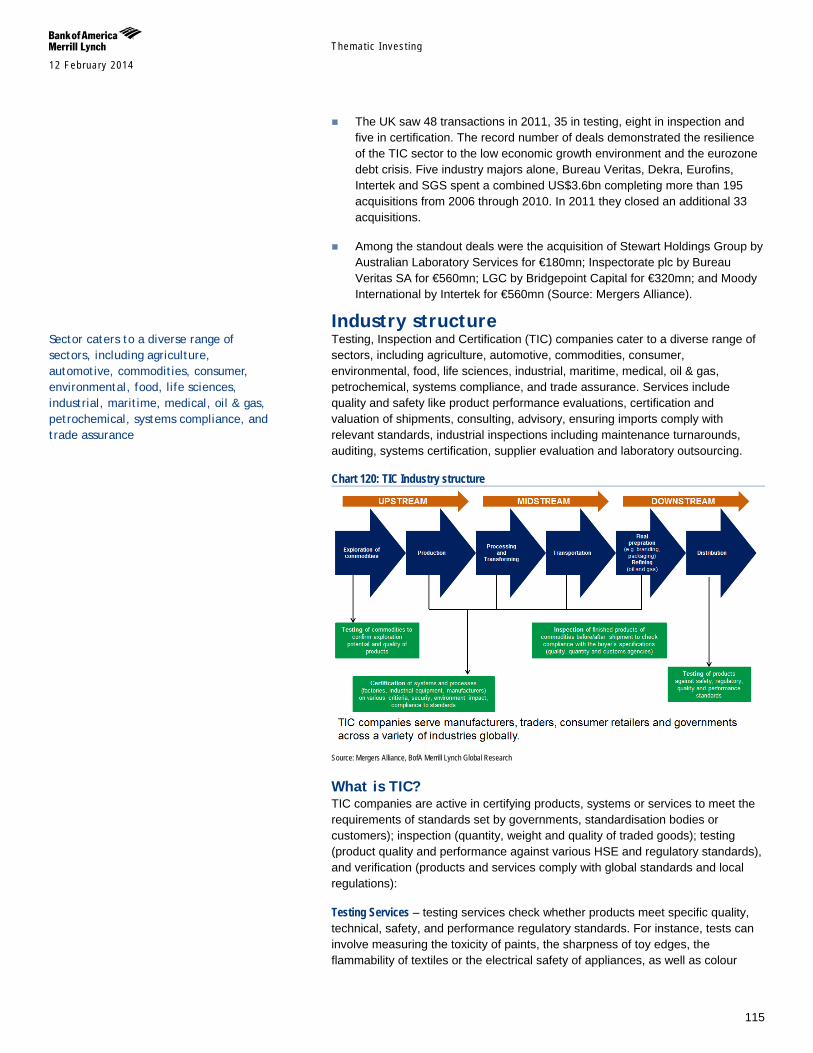
Themat ic Inves t ing 12 February 2014
115
The UK saw 48 transactions in 2011, 35 in testing, eight in inspection and five in certification. The record number of deals demonstrated the resilience of the TIC sector to the low economic growth environment and the eurozone debt crisis. Five industry majors alone, Bureau Veritas, Dekra, Eurofins, Intertek and SGS spent a combined US$3.6bn completing more than 195 acquisitions from 2006 through 2010. In 2011 they closed an additional 33 acquisitions.
Among the standout deals were the acquisition of Stewart Holdings Group by Australian Laboratory Services for €180mn; Inspectorate plc by Bureau Veritas SA for €560mn; LGC by Bridgepoint Capital for €320mn; and Moody International by Intertek for €560mn (Source: Mergers Alliance).
Industry structure Testing, Inspection and Certification (TIC) companies cater to a diverse range of sectors, including agriculture, automotive, commodities, consumer, environmental, food, life sciences, industrial, maritime, medical, oil & gas, petrochemical, systems compliance, and trade assurance. Services include quality and safety like product performance evaluations, certification and valuation of shipments, consulting, advisory, ensuring imports comply with relevant standards, industrial inspections including maintenance turnarounds, auditing, systems certification, supplier evaluation and laboratory outsourcing.
Chart 120: TIC Industry structure
Source: Mergers Alliance, BofA Merrill Lynch Global Research
What is TIC? TIC companies are active in certifying products, systems or services to meet the requirements of standards set by governments, standardisation bodies or customers); inspection (quantity, weight and quality of traded goods); testing (product quality and performance against various HSE and regulatory standards), and verification (products and services comply with global standards and local regulations):
Testing Services – testing services check whether products meet specific quality, technical, safety, and performance regulatory standards. For instance, tests can involve measuring the toxicity of paints, the sharpness of toy edges, the flammability of textiles or the electrical safety of appliances, as well as colour
Sector caters to a diverse range of sectors, including agriculture, automotive, commodities, consumer, environmental, food, life sciences, industrial, maritime, medical, oil & gas, petrochemical, systems compliance, and trade assurance
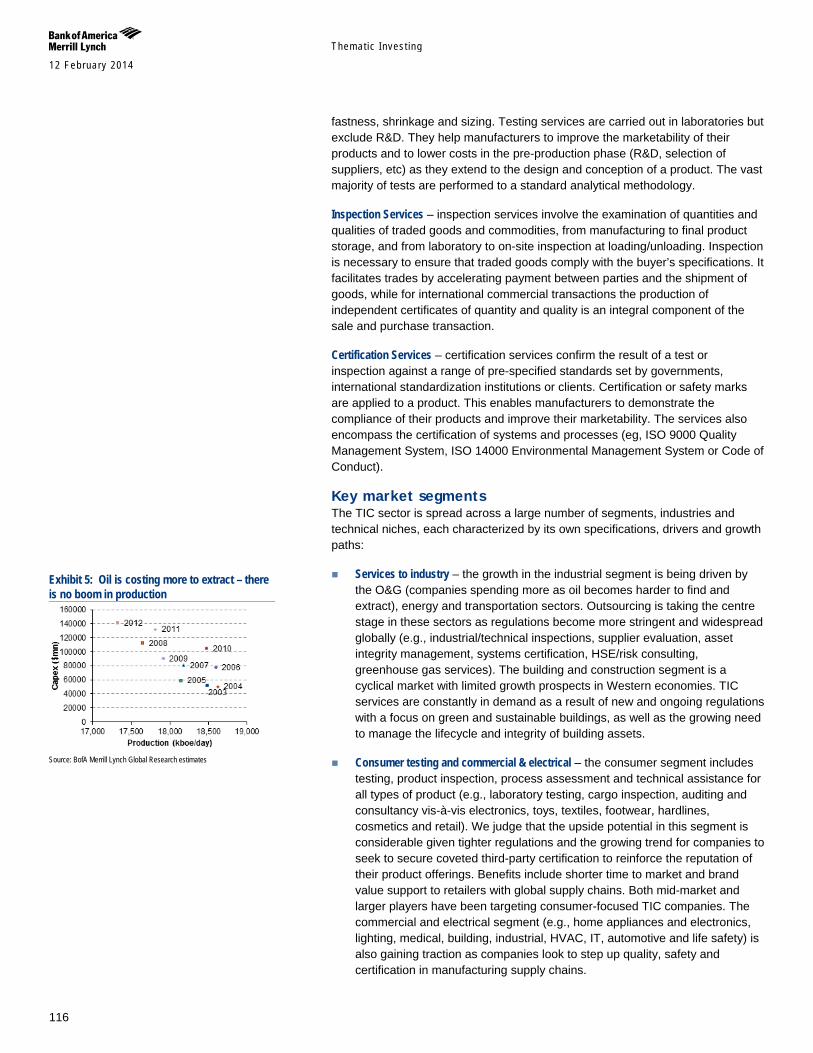
Themat ic Inves t ing 12 February 2014
116
fastness, shrinkage and sizing. Testing services are carried out in laboratories but exclude R&D. They help manufacturers to improve the marketability of their products and to lower costs in the pre-production phase (R&D, selection of suppliers, etc) as they extend to the design and conception of a product. The vast majority of tests are performed to a standard analytical methodology.
Inspection Services – inspection services involve the examination of quantities and qualities of traded goods and commodities, from manufacturing to final product storage, and from laboratory to on-site inspection at loading/unloading. Inspection is necessary to ensure that traded goods comply with the buyer’s specifications. It facilitates trades by accelerating payment between parties and the shipment of goods, while for international commercial transactions the production of independent certificates of quantity and quality is an integral component of the sale and purchase transaction.
Certification Services – certification services confirm the result of a test or inspection against a range of pre-specified standards set by governments, international standardization institutions or clients. Certification or safety marks are applied to a product. This enables manufacturers to demonstrate the compliance of their products and improve their marketability. The services also encompass the certification of systems and processes (eg, ISO 9000 Quality Management System, ISO 14000 Environmental Management System or Code of Conduct).
Key market segments The TIC sector is spread across a large number of segments, industries and technical niches, each characterized by its own specifications, drivers and growth paths:
Services to industry – the growth in the industrial segment is being driven by the O&G (companies spending more as oil becomes harder to find and extract), energy and transportation sectors. Outsourcing is taking the centre stage in these sectors as regulations become more stringent and widespread globally (e.g., industrial/technical inspections, supplier evaluation, asset integrity management, systems certification, HSE/risk consulting, greenhouse gas services). The building and construction segment is a cyclical market with limited growth prospects in Western economies. TIC services are constantly in demand as a result of new and ongoing regulations with a focus on green and sustainable buildings, as well as the growing need to manage the lifecycle and integrity of building assets.
Consumer testing and commercial & electrical – the consumer segment includes testing, product inspection, process assessment and technical assistance for all types of product (e.g., laboratory testing, cargo inspection, auditing and consultancy vis-à-vis electronics, toys, textiles, footwear, hardlines, cosmetics and retail). We judge that the upside potential in this segment is considerable given tighter regulations and the growing trend for companies to seek to secure coveted third-party certification to reinforce the reputation of their product offerings. Benefits include shorter time to market and brand value support to retailers with global supply chains. Both mid-market and larger players have been targeting consumer-focused TIC companies. The commercial and electrical segment (e.g., home appliances and electronics, lighting, medical, building, industrial, HVAC, IT, automotive and life safety) is also gaining traction as companies look to step up quality, safety and certification in manufacturing supply chains.
Exhibit 5: Oil is costing more to extract – there is no boom in production
Source: BofA Merrill Lynch Global Research estimates
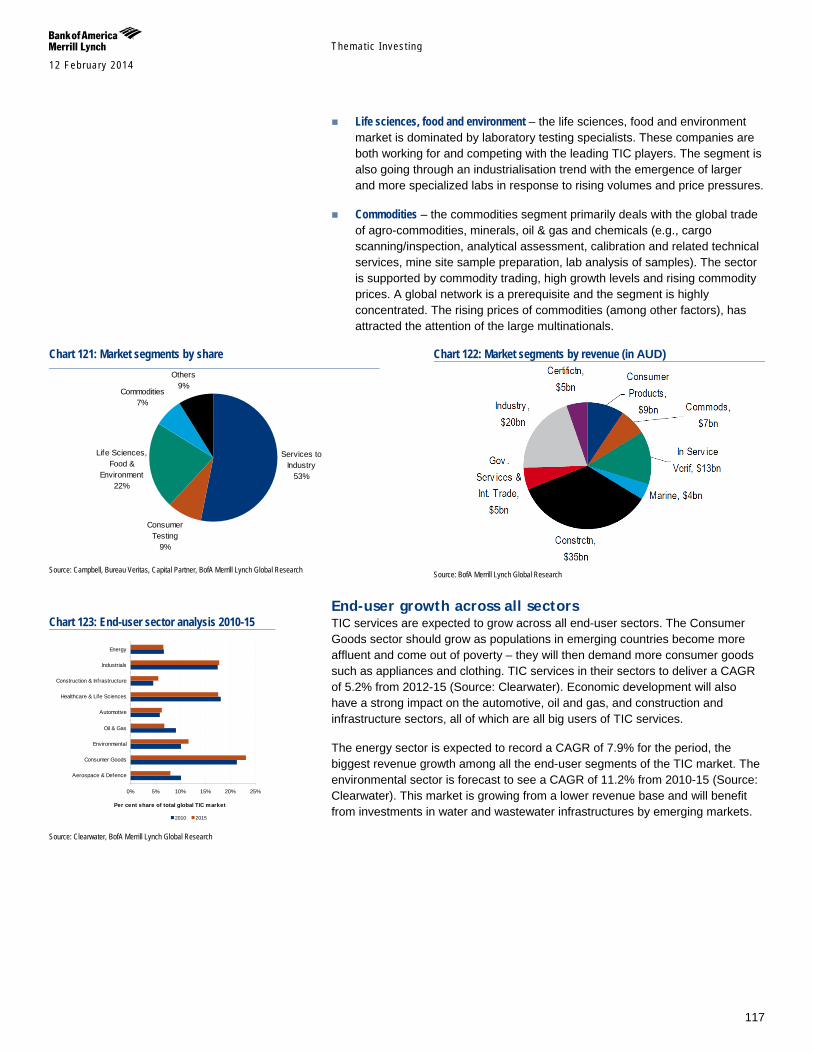
Themat ic Inves t ing 12 February 2014
117
Life sciences, food and environment – the life sciences, food and environment market is dominated by laboratory testing specialists. These companies are both working for and competing with the leading TIC players. The segment is also going through an industrialisation trend with the emergence of larger and more specialized labs in response to rising volumes and price pressures.
Commodities – the commodities segment primarily deals with the global trade of agro-commodities, minerals, oil & gas and chemicals (e.g., cargo scanning/inspection, analytical assessment, calibration and related technical services, mine site sample preparation, lab analysis of samples). The sector is supported by commodity trading, high growth levels and rising commodity prices. A global network is a prerequisite and the segment is highly concentrated. The rising prices of commodities (among other factors), has attracted the attention of the large multinationals.
End-user growth across all sectors TIC services are expected to grow across all end-user sectors. The Consumer Goods sector should grow as populations in emerging countries become more affluent and come out of poverty – they will then demand more consumer goods such as appliances and clothing. TIC services in their sectors to deliver a CAGR of 5.2% from 2012-15 (Source: Clearwater). Economic development will also have a strong impact on the automotive, oil and gas, and construction and infrastructure sectors, all of which are all big users of TIC services.
The energy sector is expected to record a CAGR of 7.9% for the period, the biggest revenue growth among all the end-user segments of the TIC market. The environmental sector is forecast to see a CAGR of 11.2% from 2010-15 (Source: Clearwater). This market is growing from a lower revenue base and will benefit from investments in water and wastewater infrastructures by emerging markets.
Chart 121: Market segments by share
Source: Campbell, Bureau Veritas, Capital Partner, BofA Merrill Lynch Global Research
Chart 122: Market segments by revenue (in AUD)
Source: BofA Merrill Lynch Global Research
Chart 123: End-user sector analysis 2010-15
Source: Clearwater, BofA Merrill Lynch Global Research
Services to Industry
53%
Consumer Testing
9%
Commodities7%
Life Sciences, Food &
Environment22%
Others9%
0% 5% 10% 15% 20% 25%
Aerospace & Defence
Consumer Goods
Environmental
Oil & Gas
Automotive
Healthcare & Life Sciences
Construction & Infrastructure
Industrials
Energy
Per cent share of total global TIC market
2010 2015
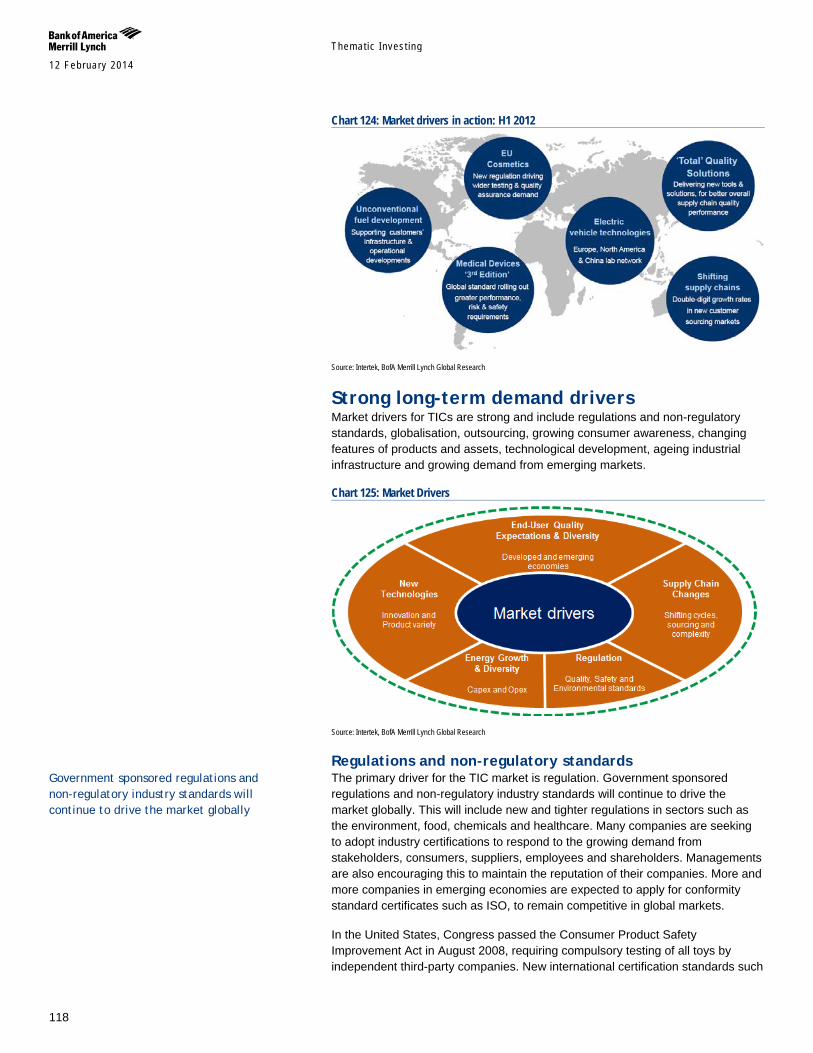
Themat ic Inves t ing 12 February 2014
118
Chart 124: Market drivers in action: H1 2012
Source: Intertek, BofA Merrill Lynch Global Research
Strong long-term demand drivers Market drivers for TICs are strong and include regulations and non-regulatory standards, globalisation, outsourcing, growing consumer awareness, changing features of products and assets, technological development, ageing industrial infrastructure and growing demand from emerging markets.
Chart 125: Market Drivers
Source: Intertek, BofA Merrill Lynch Global Research
Regulations and non-regulatory standards The primary driver for the TIC market is regulation. Government sponsored regulations and non-regulatory industry standards will continue to drive the market globally. This will include new and tighter regulations in sectors such as the environment, food, chemicals and healthcare. Many companies are seeking to adopt industry certifications to respond to the growing demand from stakeholders, consumers, suppliers, employees and shareholders. Managements are also encouraging this to maintain the reputation of their companies. More and more companies in emerging economies are expected to apply for conformity standard certificates such as ISO, to remain competitive in global markets.
In the United States, Congress passed the Consumer Product Safety Improvement Act in August 2008, requiring compulsory testing of all toys by independent third-party companies. New international certification standards such
Government sponsored regulations and non-regulatory industry standards will continue to drive the market globally
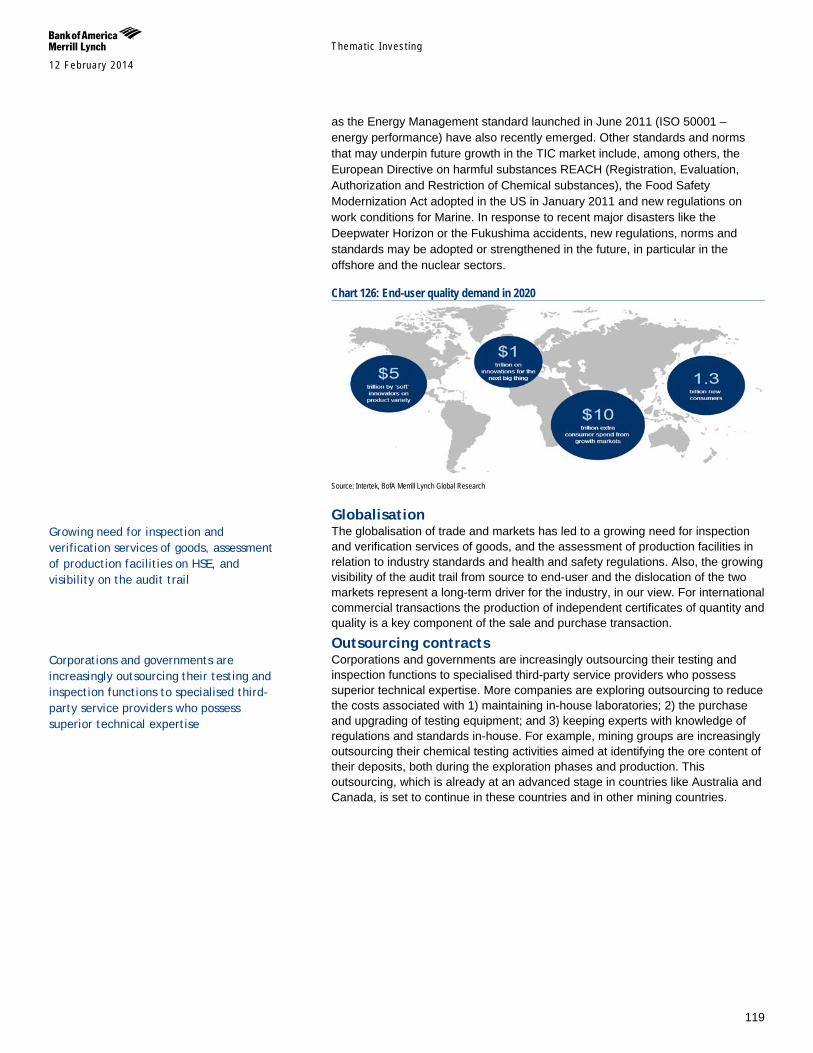
Themat ic Inves t ing 12 February 2014
119
as the Energy Management standard launched in June 2011 (ISO 50001 – energy performance) have also recently emerged. Other standards and norms that may underpin future growth in the TIC market include, among others, the European Directive on harmful substances REACH (Registration, Evaluation, Authorization and Restriction of Chemical substances), the Food Safety Modernization Act adopted in the US in January 2011 and new regulations on work conditions for Marine. In response to recent major disasters like the Deepwater Horizon or the Fukushima accidents, new regulations, norms and standards may be adopted or strengthened in the future, in particular in the offshore and the nuclear sectors.
Chart 126: End-user quality demand in 2020
Source: Intertek, BofA Merrill Lynch Global Research
Globalisation The globalisation of trade and markets has led to a growing need for inspection and verification services of goods, and the assessment of production facilities in relation to industry standards and health and safety regulations. Also, the growing visibility of the audit trail from source to end-user and the dislocation of the two markets represent a long-term driver for the industry, in our view. For international commercial transactions the production of independent certificates of quantity and quality is a key component of the sale and purchase transaction.
Outsourcing contracts Corporations and governments are increasingly outsourcing their testing and inspection functions to specialised third-party service providers who possess superior technical expertise. More companies are exploring outsourcing to reduce the costs associated with 1) maintaining in-house laboratories; 2) the purchase and upgrading of testing equipment; and 3) keeping experts with knowledge of regulations and standards in-house. For example, mining groups are increasingly outsourcing their chemical testing activities aimed at identifying the ore content of their deposits, both during the exploration phases and production. This outsourcing, which is already at an advanced stage in countries like Australia and Canada, is set to continue in these countries and in other mining countries.
Growing need for inspection and verification services of goods, assessment of production facilities on HSE, and visibility on the audit trail
Corporations and governments are increasingly outsourcing their testing and inspection functions to specialised third-party service providers who possess superior technical expertise
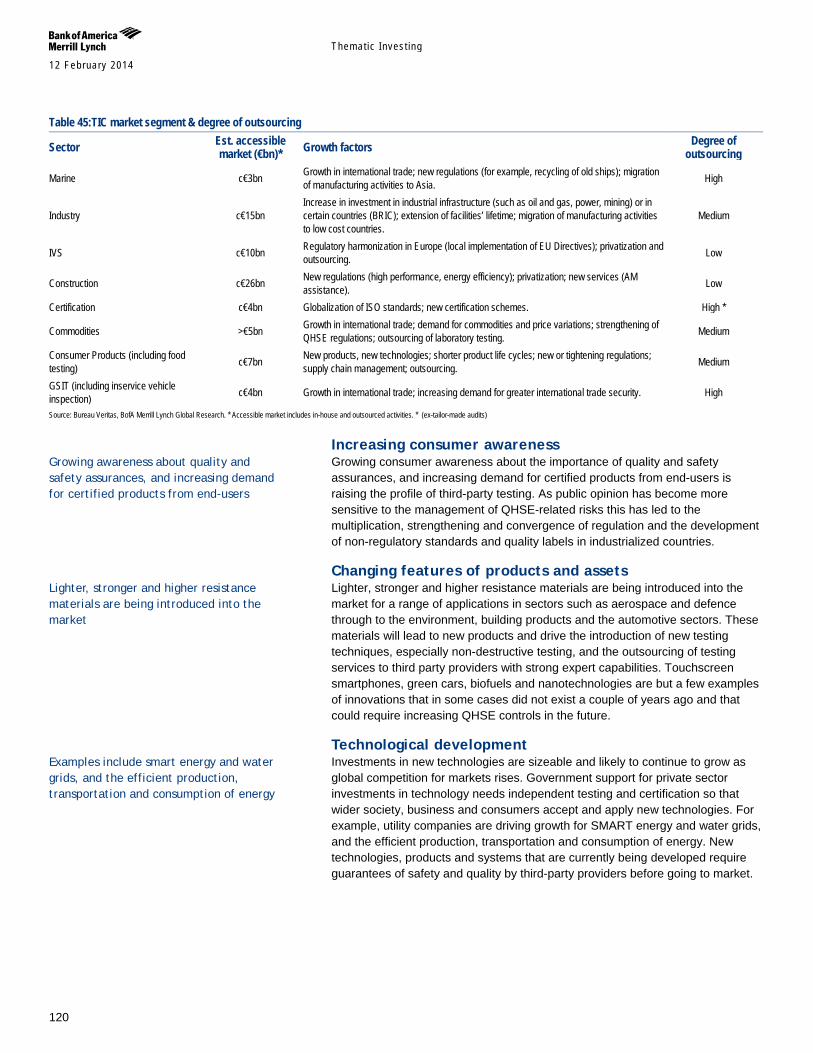
Themat ic Inves t ing 12 February 2014
120
Table 45:TIC market segment & degree of outsourcing
Sector Est. accessible market (€bn)* Growth factors Degree of
outsourcing
Marine c€3bn Growth in international trade; new regulations (for example, recycling of old ships); migration of manufacturing activities to Asia. High
Industry c€15bn Increase in investment in industrial infrastructure (such as oil and gas, power, mining) or in certain countries (BRIC); extension of facilities’ lifetime; migration of manufacturing activities to low cost countries.
Medium
IVS c€10bn Regulatory harmonization in Europe (local implementation of EU Directives); privatization and outsourcing. Low
Construction c€26bn New regulations (high performance, energy efficiency); privatization; new services (AM assistance). Low
Certification c€4bn Globalization of ISO standards; new certification schemes. High *
Commodities >€5bn Growth in international trade; demand for commodities and price variations; strengthening of QHSE regulations; outsourcing of laboratory testing. Medium
Consumer Products (including food testing) c€7bn New products, new technologies; shorter product life cycles; new or tightening regulations;
supply chain management; outsourcing. Medium
GSIT (including inservice vehicle inspection) c€4bn Growth in international trade; increasing demand for greater international trade security. High
Source: Bureau Veritas, BofA Merrill Lynch Global Research. * Accessible market includes in-house and outsourced activities. * (ex-tailor-made audits)
Increasing consumer awareness Growing consumer awareness about the importance of quality and safety assurances, and increasing demand for certified products from end-users is raising the profile of third-party testing. As public opinion has become more sensitive to the management of QHSE-related risks this has led to the multiplication, strengthening and convergence of regulation and the development of non-regulatory standards and quality labels in industrialized countries.
Changing features of products and assets Lighter, stronger and higher resistance materials are being introduced into the market for a range of applications in sectors such as aerospace and defence through to the environment, building products and the automotive sectors. These materials will lead to new products and drive the introduction of new testing techniques, especially non-destructive testing, and the outsourcing of testing services to third party providers with strong expert capabilities. Touchscreen smartphones, green cars, biofuels and nanotechnologies are but a few examples of innovations that in some cases did not exist a couple of years ago and that could require increasing QHSE controls in the future.
Technological development Investments in new technologies are sizeable and likely to continue to grow as global competition for markets rises. Government support for private sector investments in technology needs independent testing and certification so that wider society, business and consumers accept and apply new technologies. For example, utility companies are driving growth for SMART energy and water grids, and the efficient production, transportation and consumption of energy. New technologies, products and systems that are currently being developed require guarantees of safety and quality by third-party providers before going to market.
Growing awareness about quality and safety assurances, and increasing demand for certified products from end-users
Lighter, stronger and higher resistance materials are being introduced into the market
Examples include smart energy and water grids, and the efficient production, transportation and consumption of energy
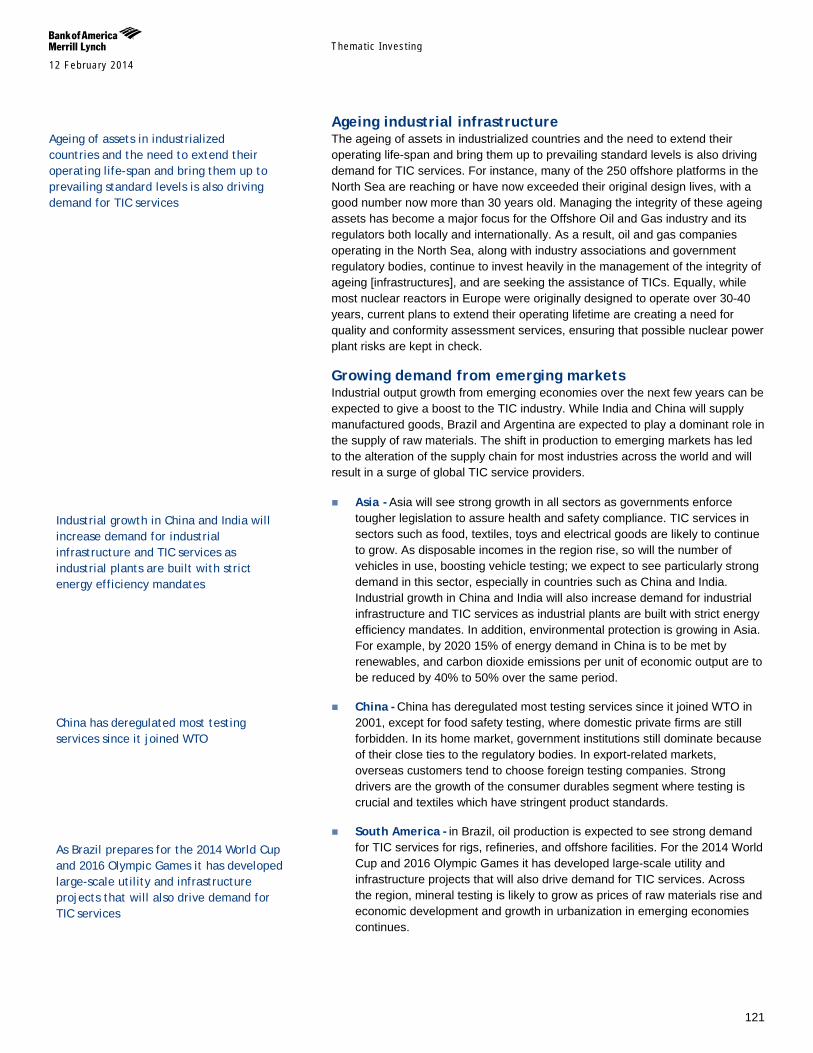
Themat ic Inves t ing 12 February 2014
121
Ageing industrial infrastructure The ageing of assets in industrialized countries and the need to extend their operating life-span and bring them up to prevailing standard levels is also driving demand for TIC services. For instance, many of the 250 offshore platforms in the North Sea are reaching or have now exceeded their original design lives, with a good number now more than 30 years old. Managing the integrity of these ageing assets has become a major focus for the Offshore Oil and Gas industry and its regulators both locally and internationally. As a result, oil and gas companies operating in the North Sea, along with industry associations and government regulatory bodies, continue to invest heavily in the management of the integrity of ageing [infrastructures], and are seeking the assistance of TICs. Equally, while most nuclear reactors in Europe were originally designed to operate over 30-40 years, current plans to extend their operating lifetime are creating a need for quality and conformity assessment services, ensuring that possible nuclear power plant risks are kept in check.
Growing demand from emerging markets Industrial output growth from emerging economies over the next few years can be expected to give a boost to the TIC industry. While India and China will supply manufactured goods, Brazil and Argentina are expected to play a dominant role in the supply of raw materials. The shift in production to emerging markets has led to the alteration of the supply chain for most industries across the world and will result in a surge of global TIC service providers. Asia - Asia will see strong growth in all sectors as governments enforce
tougher legislation to assure health and safety compliance. TIC services in sectors such as food, textiles, toys and electrical goods are likely to continue to grow. As disposable incomes in the region rise, so will the number of vehicles in use, boosting vehicle testing; we expect to see particularly strong demand in this sector, especially in countries such as China and India. Industrial growth in China and India will also increase demand for industrial infrastructure and TIC services as industrial plants are built with strict energy efficiency mandates. In addition, environmental protection is growing in Asia. For example, by 2020 15% of energy demand in China is to be met by renewables, and carbon dioxide emissions per unit of economic output are to be reduced by 40% to 50% over the same period.
China - China has deregulated most testing services since it joined WTO in 2001, except for food safety testing, where domestic private firms are still forbidden. In its home market, government institutions still dominate because of their close ties to the regulatory bodies. In export-related markets, overseas customers tend to choose foreign testing companies. Strong drivers are the growth of the consumer durables segment where testing is crucial and textiles which have stringent product standards.
South America - in Brazil, oil production is expected to see strong demand for TIC services for rigs, refineries, and offshore facilities. For the 2014 World Cup and 2016 Olympic Games it has developed large-scale utility and infrastructure projects that will also drive demand for TIC services. Across the region, mineral testing is likely to grow as prices of raw materials rise and economic development and growth in urbanization in emerging economies continues.
Ageing of assets in industrialized countries and the need to extend their operating life-span and bring them up to prevailing standard levels is also driving demand for TIC services
Industrial growth in China and India will increase demand for industrial infrastructure and TIC services as industrial plants are built with strict energy efficiency mandates
China has deregulated most testing services since it joined WTO
As Brazil prepares for the 2014 World Cup and 2016 Olympic Games it has developed large-scale utility and infrastructure projects that will also drive demand for TIC services

Themat ic Inves t ing 12 February 2014
122
Africa & Middle East - food testing is a growth market in this region. As these regions emerge economically, more industrial, energy, water and transport infrastructure projects will take place, thus boosting the market for TIC services across the region.
Themat ic Inves t ing 12 February 2014
123
Workplace Globally, 2.3m people are killed and 270m are injured every year, with 160m suffering from diseases as a result of occupational health and safety issues (source: ILO). Agriculture, construction and mining are the three most hazardous occupations – with EM rates up to 4x higher than in developed markets. In economic terms, the ILO estimates that the direct and indirect costs of workplace illness, injury and death represent US$1.25tn in annual GDP losses – or a staggering c.4% of global GDP. The ILO believes that if all member states used the best available accident prevention strategies and practices, some 300,000 deaths (out of a total 360,000) and 200m accidents (out of 270m) could be prevented.
High OHS costs & risk reduction driving change Workplace OHS (occupational health and safety) costs employers US$171bn in the US (Source: US OHSA) and €20bn in the EU (source: European Agency for Safety and Health and Work). This – along with growing global regulation and a backlash over HSE concerns in the supply chain (e.g., recent fires at suppliers and subcontractors in Bangladesh) – is pushing companies to achieve high(er) levels of OHS performance so as to reduce bottom-line cost risks associated with workers’ compensation, insurance premiums, absenteeism, presenteeism, productivity impacts, early retirement, lack/loss of skilled labour and legal costs. For instance, 2011 saw record levels of OHSAS certifications (41% of the MSCI AC World index).
US$30-33bn addressable market by 2015 We believe that this should benefit the market for personal and protective equipment (PPE), which is estimated to become a US$30-33bn addressable market by 2015 (source: 3M) expanding at a CAGR of 7.5% over 2014-18 (Source: Research and Markets). The EU and the US are the largest and most mature markets, albeit highly fragmented. The fastest growth is coming from EMs off the back of working age demographics and rising employment rates, increasing focus on manufacturing and infrastructure, low penetration of OHS and PPE, and growing regulation and compliance.
A number of companies are potential beneficiaries We believe that a number of companies are well placed to benefit from the theme of workplace safety and security through their involvement and positioning in areas such as: workwear, protective gloves, footwear, headgear, protective glasses, breathing appliances, fall protection, life jackets, body armour etc.
Table 46:BofAML Safety & Security (S&S) - Workplace & PPE (personal & protective equipment) stock list Safety & Security Company Exposure Ansell High Ecolab Inc High 3M Medium Honeywell Medium Airgas, Inc. Low DuPont Low Source: BofA Merrill Lynch Global Research * S&S exposure = BofAML estimates of current sales derived from fighting safety and security-related products, services, technologies and solutions
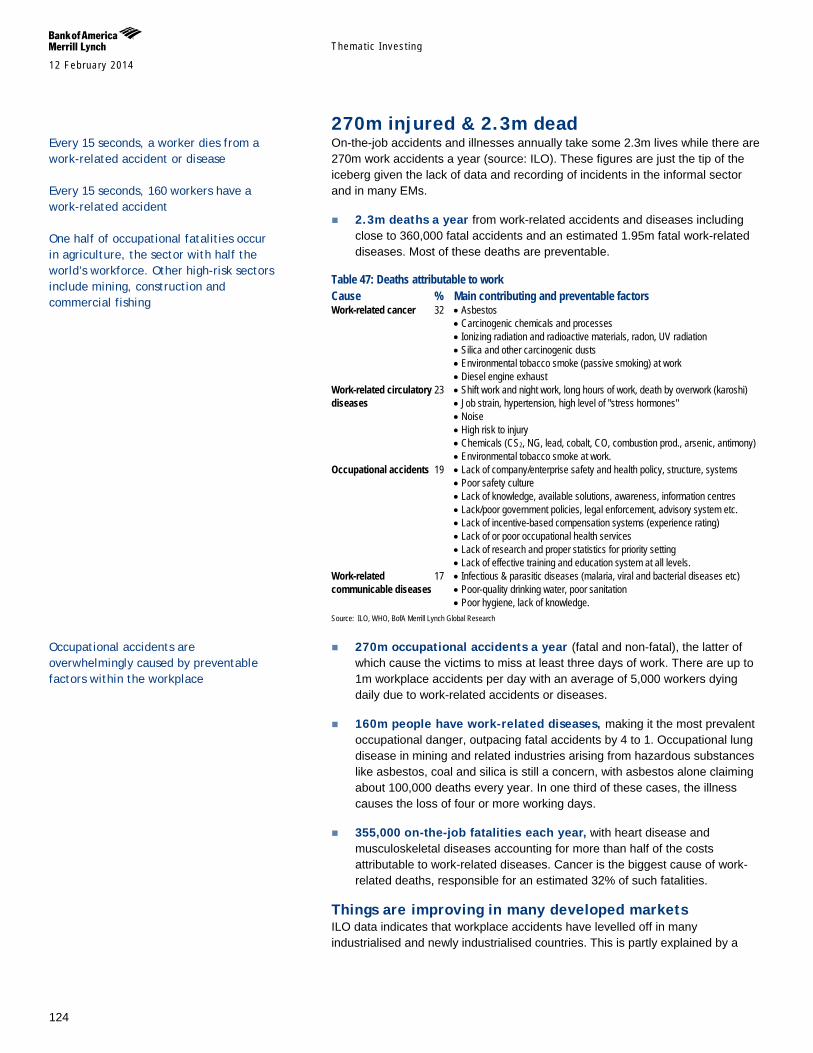
Themat ic Inves t ing 12 February 2014
124
270m injured & 2.3m dead On-the-job accidents and illnesses annually take some 2.3m lives while there are 270m work accidents a year (source: ILO). These figures are just the tip of the iceberg given the lack of data and recording of incidents in the informal sector and in many EMs.
2.3m deaths a year from work-related accidents and diseases including close to 360,000 fatal accidents and an estimated 1.95m fatal work-related diseases. Most of these deaths are preventable.
Table 47: Deaths attributable to work Cause % Main contributing and preventable factors Work-related cancer 32 • Asbestos
• Carcinogenic chemicals and processes • Ionizing radiation and radioactive materials, radon, UV radiation • Silica and other carcinogenic dusts • Environmental tobacco smoke (passive smoking) at work • Diesel engine exhaust
Work-related circulatory diseases
23 • Shift work and night work, long hours of work, death by overwork (karoshi) • Job strain, hypertension, high level of "stress hormones" • Noise • High risk to injury • Chemicals (CS2, NG, lead, cobalt, CO, combustion prod., arsenic, antimony) • Environmental tobacco smoke at work.
Occupational accidents 19 • Lack of company/enterprise safety and health policy, structure, systems • Poor safety culture • Lack of knowledge, available solutions, awareness, information centres • Lack/poor government policies, legal enforcement, advisory system etc. • Lack of incentive-based compensation systems (experience rating) • Lack of or poor occupational health services • Lack of research and proper statistics for priority setting • Lack of effective training and education system at all levels.
Work-related communicable diseases
17 • Infectious & parasitic diseases (malaria, viral and bacterial diseases etc) • Poor-quality drinking water, poor sanitation • Poor hygiene, lack of knowledge.
Source: ILO, WHO, BofA Merrill Lynch Global Research
270m occupational accidents a year (fatal and non-fatal), the latter of which cause the victims to miss at least three days of work. There are up to 1m workplace accidents per day with an average of 5,000 workers dying daily due to work-related accidents or diseases.
160m people have work-related diseases, making it the most prevalent occupational danger, outpacing fatal accidents by 4 to 1. Occupational lung disease in mining and related industries arising from hazardous substances like asbestos, coal and silica is still a concern, with asbestos alone claiming about 100,000 deaths every year. In one third of these cases, the illness causes the loss of four or more working days.
355,000 on-the-job fatalities each year, with heart disease and musculoskeletal diseases accounting for more than half of the costs attributable to work-related diseases. Cancer is the biggest cause of work-related deaths, responsible for an estimated 32% of such fatalities.
Things are improving in many developed markets ILO data indicates that workplace accidents have levelled off in many industrialised and newly industrialised countries. This is partly explained by a
Every 15 seconds, a worker dies from a work-related accident or disease Every 15 seconds, 160 workers have a work-related accident One half of occupational fatalities occur in agriculture, the sector with half the world’s workforce. Other high-risk sectors include mining, construction and commercial fishing
Occupational accidents are overwhelmingly caused by preventable factors within the workplace
Themat ic Inves t ing 12 February 2014
125
stronger focus on safety in such countries – as well as the developmental shift to less dangerous jobs, such as in the services industry.
EM rates are up to 4x higher There are big regional variations in occupational safety data with many EMs having fatality rates four times those in the “safest” developed markets. These markets show important differences versus DMs:
70% of the economically active population work in agriculture
Informal workforce (e.g. self-employed, household-based unpaid labour, street vendors etc)
Migrant workforces
Such work tends to be unregulated and work-related accidents, disease and deaths are less likely to be recorded. Moreover, with increasing industrialisation and [more of] the workforce coming from rural areas with limited industrial experience and safety training, EM occupational accident rates are set to increase going forward.
Demographics play a role The ILO predicts that a growing number of young (aged 15 to 24) and older people (aged 60+) will enter the workforce over the next one to two decades. Workers in these two age groups tend to suffer higher on-the-job accident rates.
Global economic crisis may be making things worse Occupational safety may be another victim of the global economic crisis. There are growing concerns that the slowdown will have negative effects on safety-related priorities and spending, possibly endangering the health and safety of workers. There is a danger that potential compromises in H&S due to a cost-cutting environment may lead to an increase in the number of workplace accidents and diseases.
Higher risk sectors While no sector can be considered safe per se, according to the World Health Organisation’s comparative risk assessments of occupational hazards, workplace fatalities are clustered primarily in the agricultural, construction and mining sectors. EM workers tend to be at greatest risk given the frequent lack of a strong safety culture and regulations and non-use of suitable PPE.
Agriculture Agriculture currently employs about half of the world's global labour force – mainly in EMs – and the ILO estimates that up to 170,000 agricultural workers are killed each year, or 2x the rate of other sectors. Key fatality and risk factors include physical hazards (weather, terrain, fires); machinery (tractors and harvesters account for the highest rate of injury and death); toxicological hazards in work and living conditions (pesticides, fertilisers, agro-chemicals and fuels); dust; and allergies and disorders (contact with animals and dangerous plants). Agricultural work is also associated with a higher risk of particular cancers, respiratory diseases and injuries – while noise-induced hearing loss, musculoskeletal disorders, and stress and psychological disorders are frequent. Migrant workers are also at greater risk of infectious diseases (TB, STDs). Worryingly, actual fatality and injury rates may be significantly higher given the lack of proper documentation, non/under-recording and reporting of deaths, injuries and
Among the factors that can play out in a sector’s OHS risk profile are: the prevalence of chemical substances, dust, fibres and air pollution; noise and vibration; fire; radiation; and ergonomic considerations (e.g. lighting, design of equipment and tasks).
The use of pesticides causes some 70,000 poisoning deaths each year, and at least seven million cases of acute and long term non-fatal illness (source: ILO/WHO).
Themat ic Inves t ing 12 February 2014
126
occupational diseases, and the exclusion of many workers from government employment benefit schemes. The long-term nature of exposure to issues like pesticides further complicates matters.
Construction At least 60,000 fatal workplace accidents occur on building sites worldwide every year. About 17% of all fatal workplace accidents take place in this sector, with serious injuries and ill health accounting for hundreds of thousands of cases. Safety risks include falls, crush injuries and the impact of falling objects, and electrocution. Health problems include deafness, vibration syndromes, back injuries, other musculoskeletal disorders, and exposure to hazardous substances (solvents, isocyanates, pesticides in timbers, chemical treatments for damp courses, fire retardants, welding fumes) and to dust and fibres (cement dust, silica, wood dust, fibreboard and, worst of all, asbestos). Stress is also an issue, notably the fear of falling. Finally, economic and housing conditions can mean greater risk exposure to diseases like tuberculosis, cholera, dengue, malaria and HIV/AIDS. Actual OHS figures are thought to be significantly higher as only <20% of injuries are believed to be reported and occupational disease is rarely factored in.
Mining Mining is one of the most hazardous occupations, accounting for only 1% of the global workforce, but up to 5% of fatal accidents at work (at least 15,000 per year) (source: ILO). Factors such as pneumoconiosis, hearing loss and the effects of vibration account for many occupational diseases, disabilities and fatalities. Comprehensive, reliable global data on injuries is more difficult to obtain, but they are thought to be significant.
Fishing and ship-breaking are also recognised by the ILO and WHO as particularly hazardous sectors. Much tougher to collate data for but nonetheless high OHS risk is the informal sector (e.g., manual collection and recycling of waste etc.), which accounts for at least half of workers in EMs in South Asia and Africa.
Workplace costs are 4% of global GDP In economic terms, the ILO estimates that the direct and indirect costs of workplace illness, injury and deaths represent US$1.25tn in annual GDP losses. Its estimate is based on a calculation that accidents and work-related illnesses cost some 4% of annual GDP. Aside from workers’ compensation payments, according to the ILO, the range of socio-economic costs include:
Absenteeism: An average of 5% of the work force is absent from work every day, varying from 2% to 10%, depending on the sector, type of work and management culture.
Unemployment: On average, one-third of the unemployed have an impairment of working capacity that is not great enough for them to be entitled to a personal disability pension or compensation but which seriously reduces their re-employability.
Earlier retirement: In high(er) income countries, about 40% of all retirements before the statutory age are caused by disability. On average, this shortens working life by about five years, and it is equivalent to 14% of the lifetime working capacity of the employed labour force.
Greater poverty: Occupational injuries have a knock-on impact on the
At least 60,000 fatal workplace accidents occur on building sites worldwide every year
Mining accounts for only 1% of the global workforce, but up to 5% of fatal accidents at work
US$1.25tn is siphoned off by direct and indirect costs – or 20x more than all official development assistance to EMs
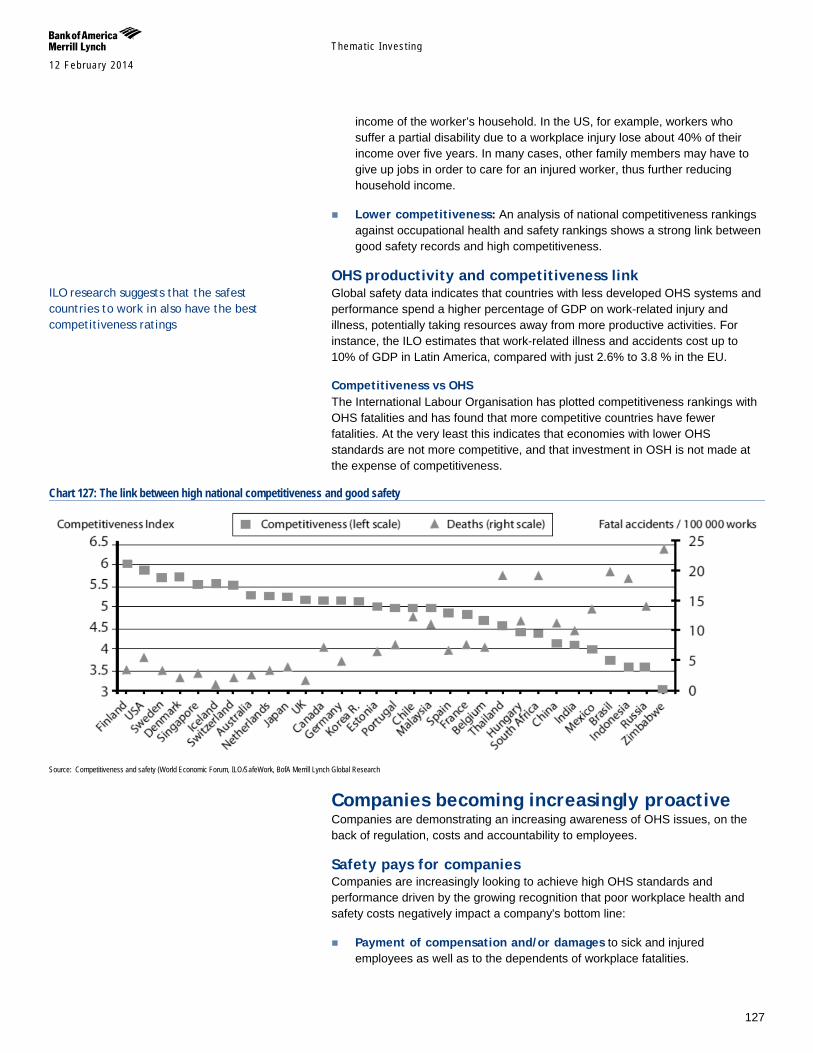
Themat ic Inves t ing 12 February 2014
127
income of the worker’s household. In the US, for example, workers who suffer a partial disability due to a workplace injury lose about 40% of their income over five years. In many cases, other family members may have to give up jobs in order to care for an injured worker, thus further reducing household income.
Lower competitiveness: An analysis of national competitiveness rankings against occupational health and safety rankings shows a strong link between good safety records and high competitiveness.
OHS productivity and competitiveness link Global safety data indicates that countries with less developed OHS systems and performance spend a higher percentage of GDP on work-related injury and illness, potentially taking resources away from more productive activities. For instance, the ILO estimates that work-related illness and accidents cost up to 10% of GDP in Latin America, compared with just 2.6% to 3.8 % in the EU.
Competitiveness vs OHS The International Labour Organisation has plotted competitiveness rankings with OHS fatalities and has found that more competitive countries have fewer fatalities. At the very least this indicates that economies with lower OHS standards are not more competitive, and that investment in OSH is not made at the expense of competitiveness.
Chart 127: The link between high national competitiveness and good safety
Source: Competitiveness and safety (World Economic Forum, ILO/SafeWork, BofA Merrill Lynch Global Research
Companies becoming increasingly proactive Companies are demonstrating an increasing awareness of OHS issues, on the back of regulation, costs and accountability to employees.
Safety pays for companies Companies are increasingly looking to achieve high OHS standards and performance driven by the growing recognition that poor workplace health and safety costs negatively impact a company's bottom line:
Payment of compensation and/or damages to sick and injured employees as well as to the dependents of workplace fatalities.
ILO research suggests that the safest countries to work in also have the best competitiveness ratings
Themat ic Inves t ing 12 February 2014
128
Absenteeism, presenteeism and productivity, including risks of more downtime, loss of productivity, underutilisation of production plants, decreased economies of scale, low morale, loss of skilled and experienced employees, and greater challenges in attracting new talent.
Associated costs including legal costs, payment of danger bonuses, higher insurance premiums, material damage to equipment and premises due to incidents and accidents, fines, disputes with trade unions, public authorities and/or local residents, loss of image, loss of custom vis-à-vis subcontractors, loss of the "licence to operate".
Hundreds of billions in direct costs for business The direct costs of occupational safety incidents to businesses are very high. In the EU alone, for instance, 150m workdays are lost each year due to work accidents, and the insurance costs to be borne by industry add up to €20bn (source: European Agency for Safety and Health At Work). US businesses spend US$170.9bn a year on costs associated with occupational injuries and illnesses (source: US OHSA).
Random safety inspections could save US business US$6bn a year In terms of the effectiveness of OHSA [Occupational Safety & Health Administration (U.S.)), recent research shows that OHS workplace inspections improve safety and save billions of dollars for employers through reduced workers' compensation costs. A California-based study showed that companies subject to random government OHS inspections showed a 9.4% decrease in injury rates compared with uninspected firms in the four years following the inspection. It showed no evidence of a negative impact on jobs, employment, or profitability of the inspected firms, and the decrease in injuries led to a 26% reduction in workers' compensation costs, translating into average savings of US$350,000 per company (source: Levine et al, Science 2012). Extrapolated nationally for the US, this would mean savings of c.US$6bn annually.
OHSAS 18001 certification on the rise Management commitment and management systems are playing an increasingly important role in tackling workplace safety. Safety is becoming a key performance driver and indicator for end customers, with 2011 seeing record levels of OHSAS certifications - 41% of the MSCI AC World (vs. 9% in 2002 and 16% in 2006) and the trend likely to continue in coming years. The belief and evidence is that companies that have an occupational safety and health management system to better manage OH&S risks have better
41% of the MSCI world have occupational health & safety management systems in place OHSAS 18001 is a standard for OHS management systems designed to help organisations put in place demonstrably sound occupational H&S performance. It is widely seen as the world’s most recognised OHS management systems standard
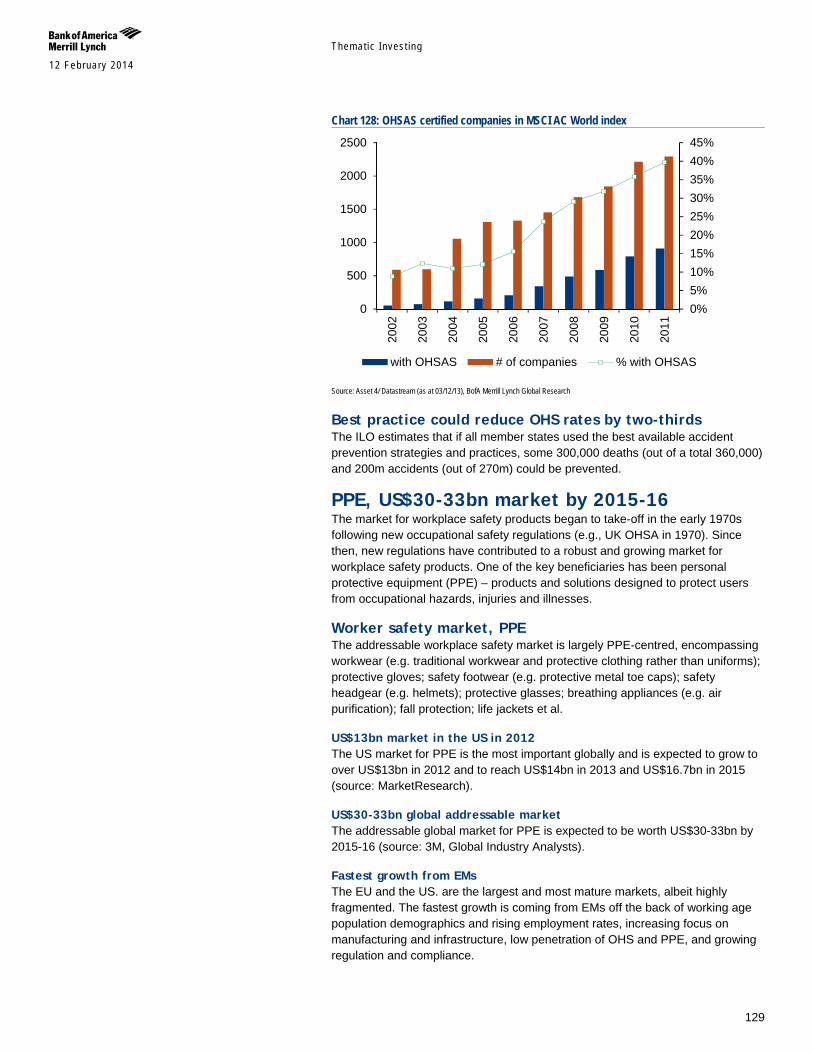
Themat ic Inves t ing 12 February 2014
129
Chart 128: OHSAS certified companies in MSCI AC World index
Source: Asset 4/ Datastream (as at 03/12/13), BofA Merrill Lynch Global Research
Best practice could reduce OHS rates by two-thirds The ILO estimates that if all member states used the best available accident prevention strategies and practices, some 300,000 deaths (out of a total 360,000) and 200m accidents (out of 270m) could be prevented.
PPE, US$30-33bn market by 2015-16 The market for workplace safety products began to take-off in the early 1970s following new occupational safety regulations (e.g., UK OHSA in 1970). Since then, new regulations have contributed to a robust and growing market for workplace safety products. One of the key beneficiaries has been personal protective equipment (PPE) – products and solutions designed to protect users from occupational hazards, injuries and illnesses.
Worker safety market, PPE The addressable workplace safety market is largely PPE-centred, encompassing workwear (e.g. traditional workwear and protective clothing rather than uniforms); protective gloves; safety footwear (e.g. protective metal toe caps); safety headgear (e.g. helmets); protective glasses; breathing appliances (e.g. air purification); fall protection; life jackets et al.
US$13bn market in the US in 2012 The US market for PPE is the most important globally and is expected to grow to over US$13bn in 2012 and to reach US$14bn in 2013 and US$16.7bn in 2015 (source: MarketResearch).
US$30-33bn global addressable market The addressable global market for PPE is expected to be worth US$30-33bn by 2015-16 (source: 3M, Global Industry Analysts).
Fastest growth from EMs The EU and the US. are the largest and most mature markets, albeit highly fragmented. The fastest growth is coming from EMs off the back of working age population demographics and rising employment rates, increasing focus on manufacturing and infrastructure, low penetration of OHS and PPE, and growing regulation and compliance.
0%5%10%15%20%25%30%35%40%45%
0
500
1000
1500
2000
2500
2002
2003
2004
2005
2006
2007
2008
2009
2010
2011
with OHSAS # of companies % with OHSAS
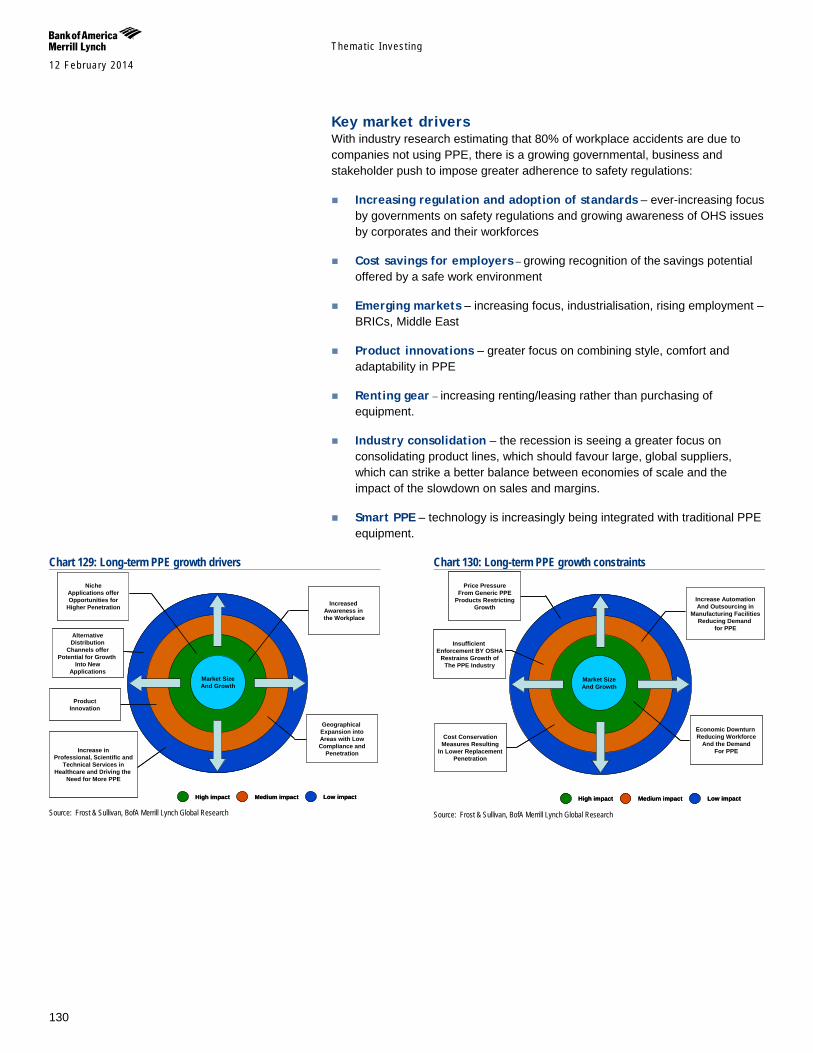
Themat ic Inves t ing 12 February 2014
130
Key market drivers With industry research estimating that 80% of workplace accidents are due to companies not using PPE, there is a growing governmental, business and stakeholder push to impose greater adherence to safety regulations:
Increasing regulation and adoption of standards – ever-increasing focus by governments on safety regulations and growing awareness of OHS issues by corporates and their workforces
Cost savings for employers – growing recognition of the savings potential offered by a safe work environment
Emerging markets – increasing focus, industrialisation, rising employment – BRICs, Middle East
Product innovations – greater focus on combining style, comfort and adaptability in PPE
Renting gear – increasing renting/leasing rather than purchasing of equipment.
Industry consolidation – the recession is seeing a greater focus on consolidating product lines, which should favour large, global suppliers, which can strike a better balance between economies of scale and the impact of the slowdown on sales and margins.
Smart PPE – technology is increasingly being integrated with traditional PPE equipment.
Chart 129: Long-term PPE growth drivers
Source: Frost & Sullivan, BofA Merrill Lynch Global Research
Chart 130: Long-term PPE growth constraints
Source: Frost & Sullivan, BofA Merrill Lynch Global Research
Market SizeAnd Growth
Increased Awareness in the Workplace
Geographical Expansion intoAreas with LowCompliance and
Penetration
NicheApplications offerOpportunities for
Higher Penetration
AlternativeDistribution
Channels offerPotential for Growth
Into NewApplications
ProductInnovation
Increase inProfessional, Scientific and
Technical Services inHealthcare and Driving the
Need for More PPE
High impact Medium impact Low impact
Market SizeAnd Growth
Increase AutomationAnd Outsourcing in
Manufacturing FacilitiesReducing Demand
for PPE
Economic Downturn Reducing Workforce
And the DemandFor PPE
Price PressureFrom Generic PPE
Products RestrictingGrowth
Insufficient Enforcement BY OSHA
Restrains Growth ofThe PPE Industry
High impact Medium impact Low impact
Cost ConservationMeasures Resulting
In Lower ReplacementPenetration

Themat ic Inves t ing 12 February 2014
131
Link to Definitions Industrials Click here for definitions of commonly used terms.
Macro Click here for definitions of commonly used terms.
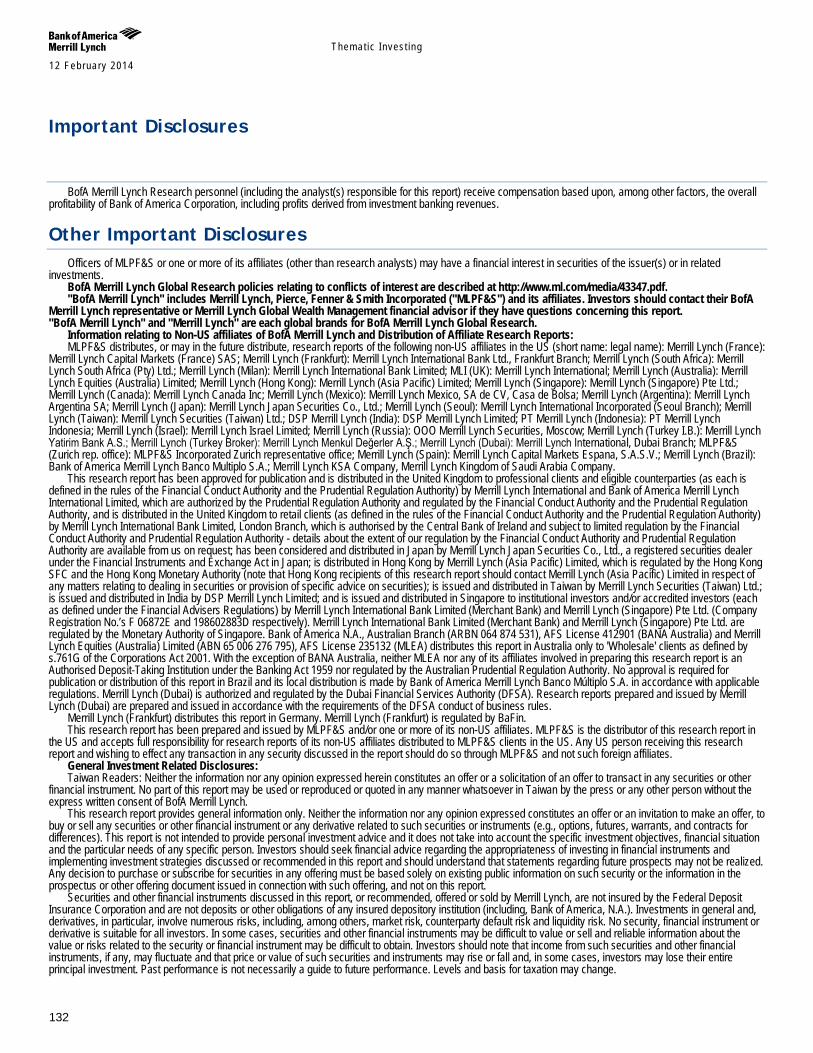
Themat ic Inves t ing 12 February 2014
132
Important Disclosures
BofA Merrill Lynch Research personnel (including the analyst(s) responsible for this report) receive compensation based upon, among other factors, the overall profitability of Bank of America Corporation, including profits derived from investment banking revenues.
Other Important Disclosures
Officers of MLPF&S or one or more of its affiliates (other than research analysts) may have a financial interest in securities of the issuer(s) or in related investments.
BofA Merrill Lynch Global Research policies relating to conflicts of interest are described at http://www.ml.com/media/43347.pdf. "BofA Merrill Lynch" includes Merrill Lynch, Pierce, Fenner & Smith Incorporated ("MLPF&S") and its affiliates. Investors should contact their BofA
Merrill Lynch representative or Merrill Lynch Global Wealth Management financial advisor if they have questions concerning this report. "BofA Merrill Lynch" and "Merrill Lynch" are each global brands for BofA Merrill Lynch Global Research.
Information relating to Non-US affiliates of BofA Merrill Lynch and Distribution of Affiliate Research Reports: MLPF&S distributes, or may in the future distribute, research reports of the following non-US affiliates in the US (short name: legal name): Merrill Lynch (France):
Merrill Lynch Capital Markets (France) SAS; Merrill Lynch (Frankfurt): Merrill Lynch International Bank Ltd., Frankfurt Branch; Merrill Lynch (South Africa): Merrill Lynch South Africa (Pty) Ltd.; Merrill Lynch (Milan): Merrill Lynch International Bank Limited; MLI (UK): Merrill Lynch International; Merrill Lynch (Australia): Merrill Lynch Equities (Australia) Limited; Merrill Lynch (Hong Kong): Merrill Lynch (Asia Pacific) Limited; Merrill Lynch (Singapore): Merrill Lynch (Singapore) Pte Ltd.; Merrill Lynch (Canada): Merrill Lynch Canada Inc; Merrill Lynch (Mexico): Merrill Lynch Mexico, SA de CV, Casa de Bolsa; Merrill Lynch (Argentina): Merrill Lynch Argentina SA; Merrill Lynch (Japan): Merrill Lynch Japan Securities Co., Ltd.; Merrill Lynch (Seoul): Merrill Lynch International Incorporated (Seoul Branch); Merrill Lynch (Taiwan): Merrill Lynch Securities (Taiwan) Ltd.; DSP Merrill Lynch (India): DSP Merrill Lynch Limited; PT Merrill Lynch (Indonesia): PT Merrill Lynch Indonesia; Merrill Lynch (Israel): Merrill Lynch Israel Limited; Merrill Lynch (Russia): OOO Merrill Lynch Securities, Moscow; Merrill Lynch (Turkey I.B.): Merrill Lynch Yatirim Bank A.S.; Merrill Lynch (Turkey Broker): Merrill Lynch Menkul Değerler A.Ş.; Merrill Lynch (Dubai): Merrill Lynch International, Dubai Branch; MLPF&S (Zurich rep. office): MLPF&S Incorporated Zurich representative office; Merrill Lynch (Spain): Merrill Lynch Capital Markets Espana, S.A.S.V.; Merrill Lynch (Brazil): Bank of America Merrill Lynch Banco Multiplo S.A.; Merrill Lynch KSA Company, Merrill Lynch Kingdom of Saudi Arabia Company.
This research report has been approved for publication and is distributed in the United Kingdom to professional clients and eligible counterparties (as each is defined in the rules of the Financial Conduct Authority and the Prudential Regulation Authority) by Merrill Lynch International and Bank of America Merrill Lynch International Limited, which are authorized by the Prudential Regulation Authority and regulated by the Financial Conduct Authority and the Prudential Regulation Authority, and is distributed in the United Kingdom to retail clients (as defined in the rules of the Financial Conduct Authority and the Prudential Regulation Authority) by Merrill Lynch International Bank Limited, London Branch, which is authorised by the Central Bank of Ireland and subject to limited regulation by the Financial Conduct Authority and Prudential Regulation Authority - details about the extent of our regulation by the Financial Conduct Authority and Prudential Regulation Authority are available from us on request; has been considered and distributed in Japan by Merrill Lynch Japan Securities Co., Ltd., a registered securities dealer under the Financial Instruments and Exchange Act in Japan; is distributed in Hong Kong by Merrill Lynch (Asia Pacific) Limited, which is regulated by the Hong Kong SFC and the Hong Kong Monetary Authority (note that Hong Kong recipients of this research report should contact Merrill Lynch (Asia Pacific) Limited in respect of any matters relating to dealing in securities or provision of specific advice on securities); is issued and distributed in Taiwan by Merrill Lynch Securities (Taiwan) Ltd.; is issued and distributed in India by DSP Merrill Lynch Limited; and is issued and distributed in Singapore to institutional investors and/or accredited investors (each as defined under the Financial Advisers Regulations) by Merrill Lynch International Bank Limited (Merchant Bank) and Merrill Lynch (Singapore) Pte Ltd. (Company Registration No.’s F 06872E and 198602883D respectively). Merrill Lynch International Bank Limited (Merchant Bank) and Merrill Lynch (Singapore) Pte Ltd. are regulated by the Monetary Authority of Singapore. Bank of America N.A., Australian Branch (ARBN 064 874 531), AFS License 412901 (BANA Australia) and Merrill Lynch Equities (Australia) Limited (ABN 65 006 276 795), AFS License 235132 (MLEA) distributes this report in Australia only to 'Wholesale' clients as defined by s.761G of the Corporations Act 2001. With the exception of BANA Australia, neither MLEA nor any of its affiliates involved in preparing this research report is an Authorised Deposit-Taking Institution under the Banking Act 1959 nor regulated by the Australian Prudential Regulation Authority. No approval is required for publication or distribution of this report in Brazil and its local distribution is made by Bank of America Merrill Lynch Banco Múltiplo S.A. in accordance with applicable regulations. Merrill Lynch (Dubai) is authorized and regulated by the Dubai Financial Services Authority (DFSA). Research reports prepared and issued by Merrill Lynch (Dubai) are prepared and issued in accordance with the requirements of the DFSA conduct of business rules.
Merrill Lynch (Frankfurt) distributes this report in Germany. Merrill Lynch (Frankfurt) is regulated by BaFin. This research report has been prepared and issued by MLPF&S and/or one or more of its non-US affiliates. MLPF&S is the distributor of this research report in
the US and accepts full responsibility for research reports of its non-US affiliates distributed to MLPF&S clients in the US. Any US person receiving this research report and wishing to effect any transaction in any security discussed in the report should do so through MLPF&S and not such foreign affiliates.
General Investment Related Disclosures: Taiwan Readers: Neither the information nor any opinion expressed herein constitutes an offer or a solicitation of an offer to transact in any securities or other
financial instrument. No part of this report may be used or reproduced or quoted in any manner whatsoever in Taiwan by the press or any other person without the express written consent of BofA Merrill Lynch.
This research report provides general information only. Neither the information nor any opinion expressed constitutes an offer or an invitation to make an offer, to buy or sell any securities or other financial instrument or any derivative related to such securities or instruments (e.g., options, futures, warrants, and contracts for differences). This report is not intended to provide personal investment advice and it does not take into account the specific investment objectives, financial situation and the particular needs of any specific person. Investors should seek financial advice regarding the appropriateness of investing in financial instruments and implementing investment strategies discussed or recommended in this report and should understand that statements regarding future prospects may not be realized. Any decision to purchase or subscribe for securities in any offering must be based solely on existing public information on such security or the information in the prospectus or other offering document issued in connection with such offering, and not on this report.
Securities and other financial instruments discussed in this report, or recommended, offered or sold by Merrill Lynch, are not insured by the Federal Deposit Insurance Corporation and are not deposits or other obligations of any insured depository institution (including, Bank of America, N.A.). Investments in general and, derivatives, in particular, involve numerous risks, including, among others, market risk, counterparty default risk and liquidity risk. No security, financial instrument or derivative is suitable for all investors. In some cases, securities and other financial instruments may be difficult to value or sell and reliable information about the value or risks related to the security or financial instrument may be difficult to obtain. Investors should note that income from such securities and other financial instruments, if any, may fluctuate and that price or value of such securities and instruments may rise or fall and, in some cases, investors may lose their entire principal investment. Past performance is not necessarily a guide to future performance. Levels and basis for taxation may change.
Themat ic Inves t ing 12 February 2014
133
This report may contain a short-term trading idea or recommendation, which highlights a specific near-term catalyst or event impacting the company or the market that is anticipated to have a short-term price impact on the equity securities of the company. Short-term trading ideas and recommendations are different from and do not affect a stock's fundamental equity rating, which reflects both a longer term total return expectation and attractiveness for investment relative to other stocks within its Coverage Cluster. Short-term trading ideas and recommendations may be more or less positive than a stock's fundamental equity rating.
BofA Merrill Lynch is aware that the implementation of the ideas expressed in this report may depend upon an investor's ability to "short" securities or other financial instruments and that such action may be limited by regulations prohibiting or restricting "shortselling" in many jurisdictions. Investors are urged to seek advice regarding the applicability of such regulations prior to executing any short idea contained in this report.
Foreign currency rates of exchange may adversely affect the value, price or income of any security or financial instrument mentioned in this report. Investors in such securities and instruments, including ADRs, effectively assume currency risk.
UK Readers: The protections provided by the U.K. regulatory regime, including the Financial Services Scheme, do not apply in general to business coordinated by BofA Merrill Lynch entities located outside of the United Kingdom. BofA Merrill Lynch Global Research policies relating to conflicts of interest are described at http://www.ml.com/media/43347.pdf.
MLPF&S or one of its affiliates is a regular issuer of traded financial instruments linked to securities that may have been recommended in this report. MLPF&S or one of its affiliates may, at any time, hold a trading position (long or short) in the securities and financial instruments discussed in this report.
BofA Merrill Lynch, through business units other than BofA Merrill Lynch Global Research, may have issued and may in the future issue trading ideas or recommendations that are inconsistent with, and reach different conclusions from, the information presented in this report. Such ideas or recommendations reflect the different time frames, assumptions, views and analytical methods of the persons who prepared them, and BofA Merrill Lynch is under no obligation to ensure that such other trading ideas or recommendations are brought to the attention of any recipient of this report.
In the event that the recipient received this report pursuant to a contract between the recipient and MLPF&S for the provision of research services for a separate fee, and in connection therewith MLPF&S may be deemed to be acting as an investment adviser, such status relates, if at all, solely to the person with whom MLPF&S has contracted directly and does not extend beyond the delivery of this report (unless otherwise agreed specifically in writing by MLPF&S). MLPF&S is and continues to act solely as a broker-dealer in connection with the execution of any transactions, including transactions in any securities mentioned in this report.
Copyright and General Information regarding Research Reports: Copyright 2014 Merrill Lynch, Pierce, Fenner & Smith Incorporated. All rights reserved. iQmethod, iQmethod 2.0, iQprofile, iQtoolkit, iQworks are service marks
of Bank of America Corporation. iQanalytics®, iQcustom®, iQdatabase® are registered service marks of Bank of America Corporation. This research report is prepared for the use of BofA Merrill Lynch clients and may not be redistributed, retransmitted or disclosed, in whole or in part, or in any form or manner, without the express written consent of BofA Merrill Lynch. BofA Merrill Lynch Global Research reports are distributed simultaneously to internal and client websites and other portals by BofA Merrill Lynch and are not publicly-available materials. Any unauthorized use or disclosure is prohibited. Receipt and review of this research report constitutes your agreement not to redistribute, retransmit, or disclose to others the contents, opinions, conclusion, or information contained in this report (including any investment recommendations, estimates or price targets) without first obtaining expressed permission from an authorized officer of BofA Merrill Lynch.
Materials prepared by BofA Merrill Lynch Global Research personnel are based on public information. Facts and views presented in this material have not been reviewed by, and may not reflect information known to, professionals in other business areas of BofA Merrill Lynch, including investment banking personnel. BofA Merrill Lynch has established information barriers between BofA Merrill Lynch Global Research and certain business groups. As a result, BofA Merrill Lynch does not disclose certain client relationships with, or compensation received from, such companies in research reports. To the extent this report discusses any legal proceeding or issues, it has not been prepared as nor is it intended to express any legal conclusion, opinion or advice. Investors should consult their own legal advisers as to issues of law relating to the subject matter of this report. BofA Merrill Lynch Global Research personnel’s knowledge of legal proceedings in which any BofA Merrill Lynch entity and/or its directors, officers and employees may be plaintiffs, defendants, co-defendants or co-plaintiffs with or involving companies mentioned in this report is based on public information. Facts and views presented in this material that relate to any such proceedings have not been reviewed by, discussed with, and may not reflect information known to, professionals in other business areas of BofA Merrill Lynch in connection with the legal proceedings or matters relevant to such proceedings.
This report has been prepared independently of any issuer of securities mentioned herein and not in connection with any proposed offering of securities or as agent of any issuer of any securities. None of MLPF&S, any of its affiliates or their research analysts has any authority whatsoever to make any representation or warranty on behalf of the issuer(s). BofA Merrill Lynch Global Research policy prohibits research personnel from disclosing a recommendation, investment rating, or investment thesis for review by an issuer prior to the publication of a research report containing such rating, recommendation or investment thesis.
Any information relating to the tax status of financial instruments discussed herein is not intended to provide tax advice or to be used by anyone to provide tax advice. Investors are urged to seek tax advice based on their particular circumstances from an independent tax professional.
The information herein (other than disclosure information relating to BofA Merrill Lynch and its affiliates) was obtained from various sources and we do not guarantee its accuracy. This report may contain links to third-party websites. BofA Merrill Lynch is not responsible for the content of any third-party website or any linked content contained in a third-party website. Content contained on such third-party websites is not part of this report and is not incorporated by reference into this report. The inclusion of a link in this report does not imply any endorsement by or any affiliation with BofA Merrill Lynch. Access to any third-party website is at your own risk, and you should always review the terms and privacy policies at third-party websites before submitting any personal information to them. BofA Merrill Lynch is not responsible for such terms and privacy policies and expressly disclaims any liability for them.
Subject to the quiet period applicable under laws of the various jurisdictions in which we distribute research reports and other legal and BofA Merrill Lynch policy-related restrictions on the publication of research reports, fundamental equity reports are produced on a regular basis as necessary to keep the investment recommendation current.
Certain outstanding reports may contain discussions and/or investment opinions relating to securities, financial instruments and/or issuers that are no longer current. Always refer to the most recent research report relating to a company or issuer prior to making an investment decision.
In some cases, a company or issuer may be classified as Restricted or may be Under Review or Extended Review. In each case, investors should consider any investment opinion relating to such company or issuer (or its security and/or financial instruments) to be suspended or withdrawn and should not rely on the analyses and investment opinion(s) pertaining to such issuer (or its securities and/or financial instruments) nor should the analyses or opinion(s) be considered a solicitation of any kind. Sales persons and financial advisors affiliated with MLPF&S or any of its affiliates may not solicit purchases of securities or financial instruments that are Restricted or Under Review and may only solicit securities under Extended Review in accordance with firm policies.
Neither BofA Merrill Lynch nor any officer or employee of BofA Merrill Lynch accepts any liability whatsoever for any direct, indirect or consequential damages or losses arising from any use of this report or its contents.