Embed Size (px)
Citation preview
Investment Solutions by Epsilon
A Mutual Fund (“Fonds Commun de Placement”) governed by the Laws of Luxembourg
Subscriptions cannot be accepted on the basis of this financial report. Subscriptions are only valid if made on the basis of the current Prospectus, the Key Investor Information Document, accompanied by a copy of the latest annual report or a copy of the subsequent semi-annual report if it has been published.
Annual report as at 31 December 2015
Investment Solutions by Epsilon
Table of contents
Organisation of the Fund 6 Board of Directors of the Management Company’s report on the management of the Fund
10
Report of the Réviseur d’Entreprises Agréé 14 Comparative Net Asset Values over the last three years/periods
16
Combined Statement of Net Assets 19 Combined Statement of Changes in Net Assets 20 Investment Solutions by Epsilon - Soluzione Attiva Protetta 5 2017
21
Statement of Net Assets 21 Statement of Changes in Net Assets 22 Portfolio 23 Swap contracts 24 Investment Solutions by Epsilon - Soluzione Attiva Protetta 6 2017
25
Statement of Net Assets 25 Statement of Changes in Net Assets 26 Portfolio 27 Swap contracts 28 Investment Solutions by Epsilon - Soluzione Attiva Protetta 7 2017
29
Statement of Net Assets 29 Statement of Changes in Net Assets 30 Portfolio 31 Swap contracts 32 Investment Solutions by Epsilon - Soluzione Attiva Protetta 9 2017
33
Statement of Net Assets 33 Statement of Changes in Net Assets 34 Portfolio 35 Swap contracts 36 Investment Solutions by Epsilon - Soluzione Attiva Protetta 12 2017
37
Statement of Net Assets 37 Statement of Changes in Net Assets 38 Portfolio 39 Swap contracts 40 Investment Solutions by Epsilon - Forex Coupon 2016
41
Statement of Net Assets 41 Statement of Changes in Net Assets 42 Portfolio 43 Option contracts 44 Forward foreign exchange contracts 45 Swap contracts 46
Investment Solutions by Epsilon - Forex Coupon 2017
47
Statement of Net Assets 47 Statement of Changes in Net Assets 48 Portfolio 49 Option contracts 50 Forward foreign exchange contracts 51 Swap contracts 52 Investment Solutions by Epsilon - Forex Coupon 2017-2
53
Statement of Net Assets 53 Statement of Changes in Net Assets 54 Portfolio 55 Option contracts 57 Forward foreign exchange contracts 58 Swap contracts 59 Investment Solutions by Epsilon - Forex Coupon 2017-3
60
Statement of Net Assets 60 Statement of Changes in Net Assets 61 Portfolio 62 Option contracts 64 Forward foreign exchange contracts 65 Swap contracts 66 Investment Solutions by Epsilon - Forex Coupon 2017-4
67
Statement of Net Assets 67 Statement of Changes in Net Assets 68 Portfolio 69 Option contracts 71 Forward foreign exchange contracts 72 Swap contracts 73 Investment Solutions by Epsilon - Forex Coupon 2017-5
74
Statement of Net Assets 74 Statement of Changes in Net Assets 75 Portfolio 76 Option contracts 78 Forward foreign exchange contracts 79 Swap contracts 80 Investment Solutions by Epsilon - Forex Coupon 2017-6
81
Statement of Net Assets 81 Statement of Changes in Net Assets 82 Portfolio 83 Option contracts 85 Forward foreign exchange contracts 86 Swap contracts 87 Investment Solutions by Epsilon - Forex Coupon 2017-7
88
Statement of Net Assets 88 Statement of Changes in Net Assets 89 Portfolio 90 Option contracts 92
2
Investment Solutions by Epsilon
Table of contents
Forward foreign exchange contracts 93 Swap contracts 94 Investment Solution by Epsilon - Forex Coupon 2018-1
95
Statement of Net Assets 95 Statement of Changes in Net Assets 96 Portfolio 97 Option contracts 99 Forward foreign exchange contracts 100 Swap contracts 101 Investment Solutions by Epsilon - Cedola x 4 - 06/2011
102
Statement of Net Assets 102 Statement of Changes in Net Assets 103 Portfolio 104 Investment Solutions by Epsilon - Cedola x 4 - 07/2011
106
Statement of Net Assets 106 Statement of Changes in Net Assets 107 Portfolio 108 Investment Solutions by Epsilon - Cedola x 4 - 09/2011
110
Statement of Net Assets 110 Statement of Changes in Net Assets 111 Portfolio 112 Investment Solutions by Epsilon - Cedola x 4 - 11/2011
113
Statement of Net Assets 113 Statement of Changes in Net Assets 114 Portfolio 115 Investment Solution by Epsilon - Cedola x 4 - 12/2011
116
Statement of Net Assets 116 Statement of Changes in Net Assets 117 Portfolio 118 Swap contracts 119 Investment Solution by Epsilon - Cedola x 4 - 02/2012
120
Statement of Net Assets 120 Statement of Changes in Net Assets 121 Portfolio 122 Swap contracts 123 Investment Solution by Epsilon - Cedola x 4 - 03/2012
124
Statement of Net Assets 124 Statement of Changes in Net Assets 125 Portfolio 126 Swap contracts 127 Investment Solutions by Epsilon - Cedola x 4 Indexed - 05/2012
128
Statement of Net Assets 128
Statement of Changes in Net Assets 129 Portfolio 130 Swap contracts 131 Investment Solutions by Epsilon - Cedola x 4 Indexed - 07/2012
132
Statement of Net Assets 132 Statement of Changes in Net Assets 133 Portfolio 134 Swap contracts 136 Investment Solutions by Epsilon - Cedola x 4 Indexed - 09/2012
137
Statement of Net Assets 137 Statement of Changes in Net Assets 138 Portfolio 139 Swap contracts 141 Investment Solutions by Epsilon - Cedola x 4 Indexed - 10/2012
142
Statement of Net Assets 142 Statement of Changes in Net Assets 143 Portfolio 144 Swap contracts 146 Investment Solutions by Epsilon - Flexible Equity Coupon 2017-1
147
Statement of Net Assets 147 Statement of Changes in Net Assets 148 Portfolio 149 Swap contracts 150 Investment Solutions by Epsilon - Valore Cedola x 5 - 12/2012
151
Statement of Net Assets 151 Statement of Changes in Net Assets 152 Portfolio 153 Commitments on future contracts 155 Forward foreign exchange contracts 156 Swap contracts 157 Investment Solutions by Epsilon - Valore Cedola x 5 - 02/2013
158
Statement of Net Assets 158 Statement of Changes in Net Assets 159 Portfolio 160 Commitments on future contracts 162 Forward foreign exchange contracts 163 Swap contracts 164 Investment Solutions by Epsilon - Valore Cedola x 5 - 04/2013
165
Statement of Net Assets 165 Statement of Changes in Net Assets 166 Portfolio 167 Commitments on future contracts 169 Forward foreign exchange contracts 170 Swap contracts 171
3
Investment Solutions by Epsilon
Table of contents
Investment Solutions by Epsilon - Valore Cedola x 5 - 06/2013
172
Statement of Net Assets 172 Statement of Changes in Net Assets 173 Portfolio 174 Commitments on future contracts 176 Forward foreign exchange contracts 177 Swap contracts 178 Investment Solutions by Epsilon - Valore Cedola x 5 - 07/2013
179
Statement of Net Assets 179 Statement of Changes in Net Assets 180 Portfolio 181 Commitments on future contracts 183 Forward foreign exchange contracts 184 Swap contracts 185 Investment Solutions by Epsilon - Valore Cedola x 5 - 10/2013
186
Statement of Net Assets 186 Statement of Changes in Net Assets 187 Portfolio 188 Commitments on future contracts 190 Forward foreign exchange contracts 191 Swap contracts 192 Investment Solutions by Epsilon - Valore Cedola x 5 - 12/2013
193
Statement of Net Assets 193 Statement of Changes in Net Assets 194 Portfolio 195 Commitments on future contracts 197 Forward foreign exchange contracts 198 Swap contracts 199 Investment Solutions by Epsilon - Valore Cedola x 5 - 02/2014
200
Statement of Net Assets 200 Statement of Changes in Net Assets 201 Portfolio 202 Commitments on future contracts 204 Forward foreign exchange contracts 205 Swap contracts 206 Investment Solutions by Epsilon - Valore Cedola x 5 - 04/2014
207
Statement of Net Assets 207 Statement of Changes in Net Assets 208 Portfolio 209 Commitments on future contracts 211 Forward foreign exchange contracts 212 Swap contracts 213 Investment Solutions by Epsilon - Valore Cedola x 5 - 11/2014
214
Statement of Net Assets 214 Statement of Changes in Net Assets 215 Portfolio 216 Commitments on future contracts 218
Forward foreign exchange contracts 219 Swap contracts 220 Investment Solutions by Epsilon - Valore Cedola Globale - 02/20151
221
Statement of Net Assets 221 Statement of Changes in Net Assets 222 Portfolio 223 Commitments on future contracts 230 Forward foreign exchange contracts 231 Swap contracts 232 Investment Solutions by Epsilon - Valore Cedola Globale - 04/20152
233
Statement of Net Assets 233 Statement of Changes in Net Assets 234 Portfolio 235 Commitments on future contracts 242 Forward foreign exchange contracts 243 Swap contracts 244 Investment Solutions by Epsilon - Valore Cedola Globale - 07/20153
245
Statement of Net Assets 245 Statement of Changes in Net Assets 246 Portfolio 247 Commitments on future contracts 253 Forward foreign exchange contracts 254 Swap contracts 255 Investment Solutions by Epsilon - Valore Cedola Globale - 09/20154
256
Statement of Net Assets 256 Statement of Changes in Net Assets 257 Portfolio 258 Commitments on future contracts 260 Investment Solutions by Epsilon - Global Coupon -10/2013
261
Statement of Net Assets 261 Statement of Changes in Net Assets 262 Portfolio 263 Commitments on future contracts 264 Option contracts 265 Forward foreign exchange contracts 266 Swap contracts 267 Investment Solutions by Epsilon - Global Coupon -06/2014
268
Statement of Net Assets 268 Statement of Changes in Net Assets 269 Portfolio 270 Commitments on future contracts 272 Forward foreign exchange contracts 273 Swap contracts 274
1 The Sub-Fund was launched on 3 February 2015 2 The Sub-Fund was launched on 21 April 2015 3 The Sub-Fund was launched on 7 July 2015 4 The Sub-Fund was launched on 22 September 2015
4
Investment Solutions by Epsilon
Table of contents
Investment Solutions by Epsilon - Global Coupon -11/2014
275
Statement of Net Assets 275 Statement of Changes in Net Assets 276 Portfolio 277 Commitments on future contracts 279 Forward foreign exchange contracts 280 Swap contracts 281 Investment Solutions by Epsilon - Global Diversified Allocation - 02/20155
282
Statement of Net Assets 282 Statement of Changes in Net Assets 283 Portfolio 284 Commitments on future contracts 288 Forward foreign exchange contracts 289 Swap contracts 290 Investment Solutions by Epsilon - Global Dynamic Multitrender - 06/20156
291
Statement of Net Assets 291 Statement of Changes in Net Assets 292 Portfolio 293 Commitments on future contracts 297 Forward foreign exchange contracts 298 Investment Solutions by Epsilon - Global Income Multitrender - 09/20157
299
Statement of Net Assets 299 Statement of Changes in Net Assets 300 Portfolio 301 Commitments on future contracts 306 Investment Solutions by Epsilon - Equity Coupon -02/2014
307
Statement of Net Assets 307 Statement of Changes in Net Assets 308 Portfolio 309 Commitments on future contracts 310 Forward foreign exchange contracts 311 Swap contracts 312 Investment Solutions by Epsilon - Equity Coupon -04/2014
313
Statement of Net Assets 313 Statement of Changes in Net Assets 314 Portfolio 315 Commitments on future contracts 316 Forward foreign exchange contracts 317 Swap contracts 318 Investment Solutions by Epsilon - Soluzione Flessibile Protetta - 02/2014
319
Statement of Net Assets 319 Statement of Changes in Net Assets 320 Portfolio 321
5 The Sub-Fund was launched on 16 February 2015 6 The Sub-Fund was launched on 8 June 2015 7 The Sub-Fund was launched on 21 September 2015
Investment Solutions by Epsilon - Soluzione Flessibile Protetta - 04/2014
322
Statement of Net Assets 322 Statement of Changes in Net Assets 323 Portfolio 324 Notes 325
5
ORGANISATION OF THE FUND Investment Solutions by Epsilon MANAGEMENT COMPANY AND PROMOTER
Eurizon Capital S.A. 8, avenue de la Liberté L-1930 Luxembourg (Grand Duchy of Luxembourg) R.C.S. Luxembourg B 28.536
BOARD OF DIRECTORS OF THE MANAGEMENT COMPANY
Chairman of the Board of Directors Mr. Tommaso CORCOS Managing Director of Eurizon Capital SGR S.p.A., Milan Resident of Milan (Italy) Vice-Chairman of the Board of Directors Mr. Daniel GROS Vice chairman of Eurizon Capital SGR S.p.A., Milan Resident of Brussels (Belgium) Managing Director Mr. Massimo MAZZINI General Manager of Eurizon Capital S.A., Luxembourg Resident of Luxembourg (Grand Duchy of Luxembourg) (until 7 July 2015) Managing Director Mr. Bruno ALFIERI General Manager of Eurizon Capital S.A., Luxembourg Resident of Luxembourg (Grand Duchy of Luxembourg) (since 8 July 2015) Director Mr. Massimo MAZZINI Head of Marketing and Business Development of Eurizon Capital SGR S.p.A., Milan Resident of Milan (Italy) (since 8 July 2015) Director Mr. Bruno ALFIERI General Manager and Director of Fideuram Bank Luxembourg S.A., Luxembourg Resident of Luxembourg (Grand Duchy of Luxembourg) (until 7 July 2015) Director Mr. Massimo TORCHIANA Co-General Manager of Eurizon Capital S.A., Luxembourg Resident of Luxembourg (Grand Duchy of Luxembourg)
Director Mr. Alex SCHMITT Independent Director, Lawyer, Luxembourg Resident of Luxembourg (Grand Duchy of Luxembourg)
6
ORGANISATION OF THE FUND Investment Solutions by Epsilon
Director Claudio SOZZINI Independent Director Resident of Milan (Italy)
Director Ms. Zhen GAO Independent Director, Managing Partner of Mandarin Capital Partners, Resident of Beijing, People’s Republic of China (since 10 September 2015)
DEPOSITARY BANK AND PAYING AGENT
State Street Bank Luxembourg S.C.A. 49, avenue J.F. Kennedy L-1855 Luxembourg (Grand Duchy of Luxembourg)
LOCAL PAYING AGENTS
Italy: State Street Bank S.p.A., 10, via Ferrante Aporti I-20125, Milan
ADMINISTRATIVE AGENT, REGISTRAR AND TRANSFER AGENT
State Street Bank Luxembourg S.C.A. 49, avenue J.F. Kennedy L-1855 Luxembourg (Grand Duchy of Luxembourg)
(these functions have been delegated by Eurizon Capital S.A.)
INVESTMENT MANAGER
Epsilon Associati SGR S.p.A. 3, Piazzetta Giordano dell’Amore I-20121 Milan (Italy)
(this function has been delegated by Eurizon Capital S.A.)
INDEPENDENT AUDITOR OF THE INVESTMENT FUND AND OF THE MANAGEMENT COMPANY
KPMG Luxembourg, Société coopérative 39, avenue J.F. Kennedy L-1855 Luxembourg (Grand Duchy of Luxembourg)
7
ORGANISATION OF THE FUND Investment Solutions by Epsilon
CONSTITUTION Investment Solutions by Epsilon (the “Fund”) was created in the Grand Duchy of Luxembourg on 23 November 2010 in the form of a mutual investment fund in transferable securities governed by the Law of Luxembourg, and is subject to Part I of the Law of 17 December 2010 on Undertakings for Collective Investment (“UCI”). The management regulations (the “Management Regulations”), after having been approved by the Board of Directors of the management company Eurizon Capital S.A. (the “Management Company”), have been signed by State Street Bank Luxembourg S.A., the Custodian Bank, on 23 November 2010 and the notification of the filing with the “Registre du Commerce et des Sociétés” in Luxembourg has been published in the “Mémorial, Recueil des Sociétés et Associations” on 13 December 2010. Amendments were made to the Management Regulations and the mention of the filing with the “Registre du Commerce et des Sociétés” in Luxembourg was published in the “Mémorial, Recueil des Sociétés et Associations” on 23 July 2012, on 30 April 2013, on10 February 2014, on 28 April 2014, on 27 June 2014 and on 25 September 2015. The Management Regulations in force have been filed with the “Registre du Commerce et des Sociétés” in Luxembourg, where they may be consulted, and where copies can be obtained. The Fund has been established for an indefinite period. The Fund is an umbrella fund. The Sub-Funds which are active on 31 December 2015 are listed below:
Investment Solutions by Epsilon - Soluzione Attiva Protetta 5 2017 launched on 1 April 2011, Investment Solutions by Epsilon - Soluzione Attiva Protetta 6 2017 launched on 16 May 2011, Investment Solutions by Epsilon - Soluzione Attiva Protetta 7 2017 launched on 27June 2011, Investment Solutions by Epsilon - Soluzione Attiva Protetta 9 2017 launched on 25 July 2011, Investment Solutions by Epsilon - Soluzione Attiva Protetta 12 2017 launched on 26 September 2011, Investment Solutions by Epsilon - Forex Coupon 2016 launched on 12 September 2011, Investment Solutions by Epsilon - Forex Coupon 2017 launched on 19 December 2011, Investment Solutions by Epsilon - Forex Coupon 2017-2 launched on 20 February 2012, Investment Solutions by Epsilon - Forex Coupon 2017-3 launched on 2 April 2012, Investment Solutions by Epsilon - Forex Coupon 2017-4 launched on 14 May 2012, Investment Solutions by Epsilon - Forex Coupon 2017-5 launched on 2 July 2012, Investment Solutions by Epsilon - Forex Coupon 2017-6 launched on 14 September 2012, Investment Solutions by Epsilon - Forex Coupon 2017-7 launched on 30 October 2012, Investment Solutions by Epsilon - Forex Coupon 2018-1 launched on 11 December 2012, Investment Solutions by Epsilon - Cedola x 4 - 06/2011 launched on 15 June 2011, Investment Solutions by Epsilon - Cedola x 4 - 07/2011 launched on 25 July 2011, Investment Solutions by Epsilon - Cedola x 4 - 09/2011 launched on 26 September 2011, Investment Solutions by Epsilon - Cedola x 4 - 11/2011 launched on 14 November 2011, Investment Solutions by Epsilon - Cedola x 4 - 12/2011 launched on 19 December 2011, Investment Solutions by Epsilon - Cedola x 4 - 02/2012 launched on 6 February 2012, Investment Solutions by Epsilon - Cedola x 4 - 03/2012 launched on 26 March 2012, Investment Solutions by Epsilon - Cedola x 4 Indexed - 05/2012 launched on 7 May 2012, Investment Solutions by Epsilon - Cedola x 4 Indexed - 07/2012 launched on 2 July 2012, Investment Solutions by Epsilon - Cedola x 4 Indexed - 09/2012 launched on 10 September 2012, Investment Solutions by Epsilon - Cedola x 4 Indexed - 10/2012 launched on 19 October 2012, Investment Solutions by Epsilon - Flexible Equity Coupon 2017-1 launched on 14 May 2012, Investment Solutions by Epsilon - Valore Cedola x 5 - 12/2012 launched on 11 December 2012, Investment Solutions by Epsilon - Valore Cedola x 5 - 02/2013 launched on 5 February 2013, Investment Solutions by Epsilon - Valore Cedola x 5 - 04/2013 launched on 9 April 2013, Investment Solutions by Epsilon - Valore Cedola x 5 - 06/2013 launched on 4 June 2013, Investment Solutions by Epsilon - Valore Cedola x 5 - 07/2013 launched on 23 July 2013, Investment Solutions by Epsilon - Valore Cedola x 5 - 10/2013 launched on 8 October 2013, Investment Solutions by Epsilon - Valore Cedola x 5 - 12/2013 launched on 10 December 2013, Investment Solutions by Epsilon - Valore Cedola x 5 - 02/2014 launched on 24 February 2014, Investment Solutions by Epsilon - Valore Cedola x 5 - 04/2014 launched on 29 April 2014, Investment Solutions by Epsilon - Valore Cedola x 5 - 11/2014 launched on 10 November 2014, Investment Solutions by Epsilon - Valore Cedola Globale - 02/2015 launched on 3 February 2015, Investment Solutions by Epsilon - Valore Cedola Globale - 04/2015 launched on 21 April 2015,
8
ORGANISATION OF THE FUND Investment Solutions by Epsilon
Investment Solutions by Epsilon - Valore Cedola Globale - 07/2015 launched on 7 July 2015 Investment Solutions by Epsilon - Valore Cedola Globale - 09/2015 launched on 22 September 2015 Investment Solutions by Epsilon - Global Coupon - 10/2013 launched on 1 October 2013, Investment Solutions by Epsilon - Global Coupon - 06/2014 launched on 20 June 2014, Investment Solutions by Epsilon - Global Coupon - 11/2014 launched on 4 November 2014, Investment Solutions by Epsilon - Global Diversified Allocation - 02/2015 launched on 16 February 2015, Investment Solutions by Epsilon - Global Dynamic Multitrender - 06/2015 launched on 8 June 2015, Investment Solutions by Epsilon - Global Income Multitrender 09/2015 launched on 21 September 2015 Investment Solutions by Epsilon - Equity Coupon - 02/2014 launched on 11 February 2014, Investment Solutions by Epsilon - Equity Coupon - 04/2014 launched on 29 April 2014, Investment Solutions by Epsilon - Soluzione Flessibile Protetta - 02/2014 launched on 11 February 2014, Investment Solutions by Epsilon - Soluzione Flessibile Protetta - 04/2014 launched on 29 April 2014. The different Units which are available to investors for all Sub-Funds are detailed in note 9 “Units of the Fund” of the notes to the financial statements. GENERAL MEETING The Annual General Meeting of the Management Company is held in Luxembourg, at the registered office, on the last Tuesday in March at 3 p.m. and if such day is not a business day in the Grand Duchy of Luxembourg, the next business day. INFORMATION FOR UNITHOLDERS Copies of audited annual reports as at 31 December and copies of the unaudited semi-annual reports as at 30 June are available free of charge to Unitholders at the Custodian Bank, other establishments specified by the latter, and at the registered office of the Management Company. The periodic reports contain all information relative to the Fund and to the composition and development of its assets. The financial year begins on 1 January and ends on 31 December. The Net Asset Value as well as the subscription and redemption prices of the Fund Units can also be obtained from the Custodian Bank. Other information intended for participants is published in the “Mémorial, Recueil des Sociétés et Associations” and in the “Registre de Commerce et des Sociétés” in Luxembourg, if this publication is specified by the Management Regulations or by law. GLOBAL EXPOSURE The method used to calculate the global exposure is the commitment approach.
9
BOARD OF DIRECTORS OF THE MANAGEMENT COMPANY’S REPORT ON THE MANAGEMENT OF THE FUND
Dear Unitholders,
Market Performance
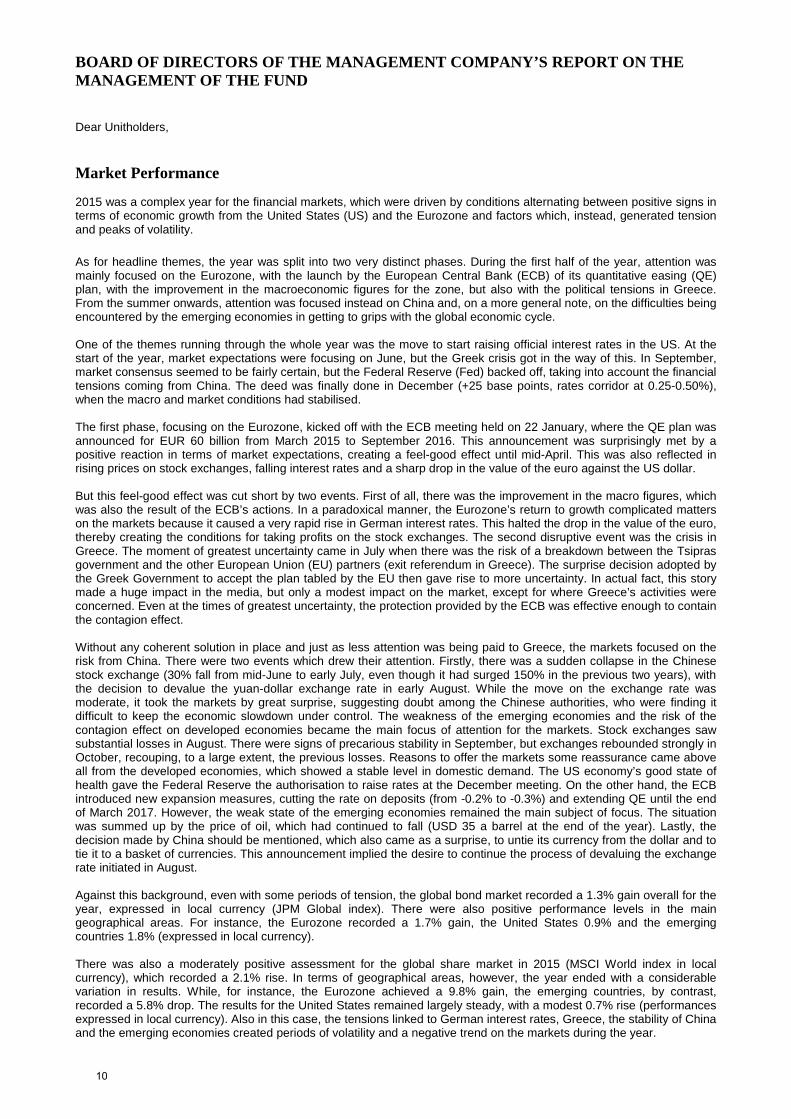
2015 was a complex year for the financial markets, which were driven by conditions alternating between positive signs in terms of economic growth from the United States (US) and the Eurozone and factors which, instead, generated tension and peaks of volatility. As for headline themes, the year was split into two very distinct phases. During the first half of the year, attention was mainly focused on the Eurozone, with the launch by the European Central Bank (ECB) of its quantitative easing (QE) plan, with the improvement in the macroeconomic figures for the zone, but also with the political tensions in Greece. From the summer onwards, attention was focused instead on China and, on a more general note, on the difficulties being encountered by the emerging economies in getting to grips with the global economic cycle. One of the themes running through the whole year was the move to start raising official interest rates in the US. At the start of the year, market expectations were focusing on June, but the Greek crisis got in the way of this. In September, market consensus seemed to be fairly certain, but the Federal Reserve (Fed) backed off, taking into account the financial tensions coming from China. The deed was finally done in December (+25 base points, rates corridor at 0.25-0.50%), when the macro and market conditions had stabilised. The first phase, focusing on the Eurozone, kicked off with the ECB meeting held on 22 January, where the QE plan was announced for EUR 60 billion from March 2015 to September 2016. This announcement was surprisingly met by a positive reaction in terms of market expectations, creating a feel-good effect until mid-April. This was also reflected in rising prices on stock exchanges, falling interest rates and a sharp drop in the value of the euro against the US dollar. But this feel-good effect was cut short by two events. First of all, there was the improvement in the macro figures, which was also the result of the ECB’s actions. In a paradoxical manner, the Eurozone’s return to growth complicated matters on the markets because it caused a very rapid rise in German interest rates. This halted the drop in the value of the euro, thereby creating the conditions for taking profits on the stock exchanges. The second disruptive event was the crisis in Greece. The moment of greatest uncertainty came in July when there was the risk of a breakdown between the Tsipras government and the other European Union (EU) partners (exit referendum in Greece). The surprise decision adopted by the Greek Government to accept the plan tabled by the EU then gave rise to more uncertainty. In actual fact, this story made a huge impact in the media, but only a modest impact on the market, except for where Greece’s activities were concerned. Even at the times of greatest uncertainty, the protection provided by the ECB was effective enough to contain the contagion effect. Without any coherent solution in place and just as less attention was being paid to Greece, the markets focused on the risk from China. There were two events which drew their attention. Firstly, there was a sudden collapse in the Chinese stock exchange (30% fall from mid-June to early July, even though it had surged 150% in the previous two years), with the decision to devalue the yuan-dollar exchange rate in early August. While the move on the exchange rate was moderate, it took the markets by great surprise, suggesting doubt among the Chinese authorities, who were finding it difficult to keep the economic slowdown under control. The weakness of the emerging economies and the risk of the contagion effect on developed economies became the main focus of attention for the markets. Stock exchanges saw substantial losses in August. There were signs of precarious stability in September, but exchanges rebounded strongly in October, recouping, to a large extent, the previous losses. Reasons to offer the markets some reassurance came above all from the developed economies, which showed a stable level in domestic demand. The US economy’s good state of health gave the Federal Reserve the authorisation to raise rates at the December meeting. On the other hand, the ECB introduced new expansion measures, cutting the rate on deposits (from -0.2% to -0.3%) and extending QE until the end of March 2017. However, the weak state of the emerging economies remained the main subject of focus. The situation was summed up by the price of oil, which had continued to fall (USD 35 a barrel at the end of the year). Lastly, the decision made by China should be mentioned, which also came as a surprise, to untie its currency from the dollar and to tie it to a basket of currencies. This announcement implied the desire to continue the process of devaluing the exchange rate initiated in August. Against this background, even with some periods of tension, the global bond market recorded a 1.3% gain overall for the year, expressed in local currency (JPM Global index). There were also positive performance levels in the main geographical areas. For instance, the Eurozone recorded a 1.7% gain, the United States 0.9% and the emerging countries 1.8% (expressed in local currency). There was also a moderately positive assessment for the global share market in 2015 (MSCI World index in local currency), which recorded a 2.1% rise. In terms of geographical areas, however, the year ended with a considerable variation in results. While, for instance, the Eurozone achieved a 9.8% gain, the emerging countries, by contrast, recorded a 5.8% drop. The results for the United States remained largely steady, with a modest 0.7% rise (performances expressed in local currency). Also in this case, the tensions linked to German interest rates, Greece, the stability of China and the emerging economies created periods of volatility and a negative trend on the markets during the year.
10
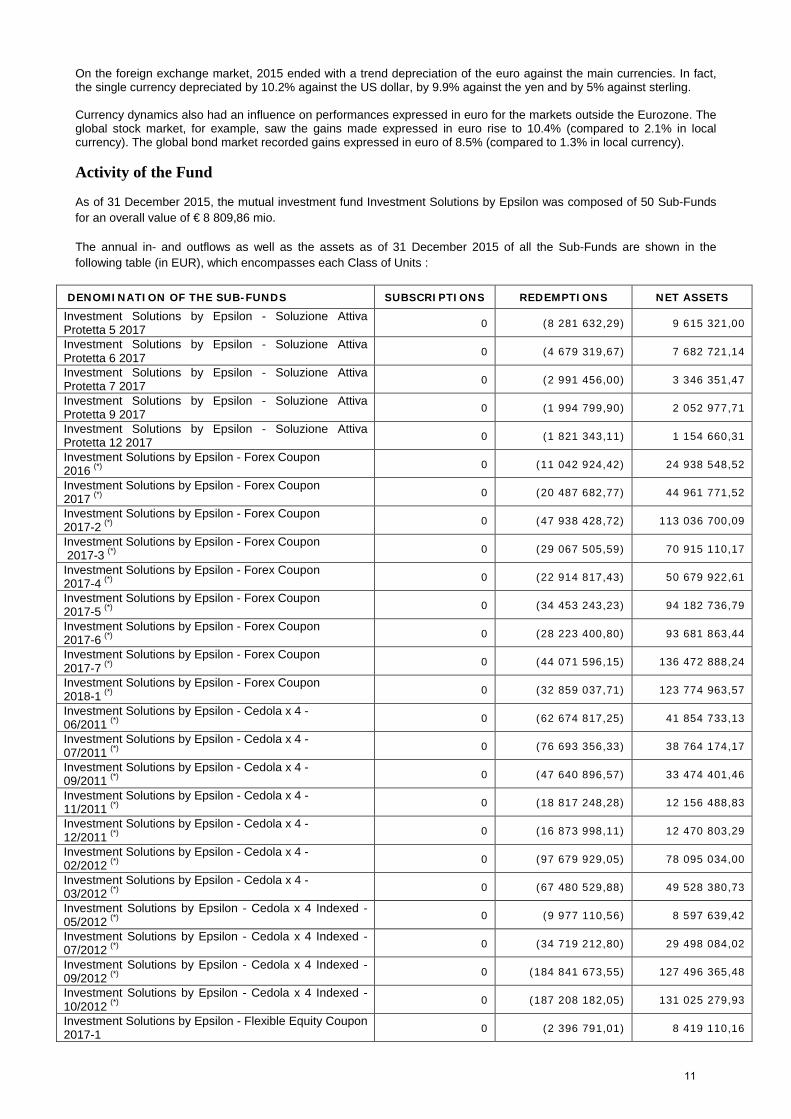
On the foreign exchange market, 2015 ended with a trend depreciation of the euro against the main currencies. In fact, the single currency depreciated by 10.2% against the US dollar, by 9.9% against the yen and by 5% against sterling. Currency dynamics also had an influence on performances expressed in euro for the markets outside the Eurozone. The global stock market, for example, saw the gains made expressed in euro rise to 10.4% (compared to 2.1% in local currency). The global bond market recorded gains expressed in euro of 8.5% (compared to 1.3% in local currency). Activity of the Fund As of 31 December 2015, the mutual investment fund Investment Solutions by Epsilon was composed of 50 Sub-Funds for an overall value of € 8 809,86 mio.
The annual in- and outflows as well as the assets as of 31 December 2015 of all the Sub-Funds are shown in the following table (in EUR), which encompasses each Class of Units :
DENOMINATION OF THE SUB-FUNDS SUBSCRIPTIONS REDEMPTIONS NET ASSETS
Investment Solutions by Epsilon - Soluzione Attiva Protetta 5 2017 0 (8 281 632,29) 9 615 321,00
Investment Solutions by Epsilon - Soluzione Attiva Protetta 6 2017 0 (4 679 319,67) 7 682 721,14
Investment Solutions by Epsilon - Soluzione Attiva Protetta 7 2017 0 (2 991 456,00) 3 346 351,47
Investment Solutions by Epsilon - Soluzione Attiva Protetta 9 2017 0 (1 994 799,90) 2 052 977,71
Investment Solutions by Epsilon - Soluzione Attiva Protetta 12 2017 0 (1 821 343,11) 1 154 660,31
Investment Solutions by Epsilon - Forex Coupon 2016 (*) 0 (11 042 924,42) 24 938 548,52
Investment Solutions by Epsilon - Forex Coupon 2017 (*) 0 (20 487 682,77) 44 961 771,52
Investment Solutions by Epsilon - Forex Coupon 2017-2 (*) 0 (47 938 428,72) 113 036 700,09
Investment Solutions by Epsilon - Forex Coupon 2017-3 (*) 0 (29 067 505,59) 70 915 110,17
Investment Solutions by Epsilon - Forex Coupon 2017-4 (*) 0 (22 914 817,43) 50 679 922,61
Investment Solutions by Epsilon - Forex Coupon 2017-5 (*) 0 (34 453 243,23) 94 182 736,79
Investment Solutions by Epsilon - Forex Coupon 2017-6 (*) 0 (28 223 400,80) 93 681 863,44
Investment Solutions by Epsilon - Forex Coupon 2017-7 (*) 0 (44 071 596,15) 136 472 888,24
Investment Solutions by Epsilon - Forex Coupon 2018-1 (*) 0 (32 859 037,71) 123 774 963,57
Investment Solutions by Epsilon - Cedola x 4 - 06/2011 (*) 0 (62 674 817,25) 41 854 733,13
Investment Solutions by Epsilon - Cedola x 4 - 07/2011 (*) 0 (76 693 356,33) 38 764 174,17
Investment Solutions by Epsilon - Cedola x 4 - 09/2011 (*) 0 (47 640 896,57) 33 474 401,46
Investment Solutions by Epsilon - Cedola x 4 - 11/2011 (*) 0 (18 817 248,28) 12 156 488,83
Investment Solutions by Epsilon - Cedola x 4 - 12/2011 (*) 0 (16 873 998,11) 12 470 803,29
Investment Solutions by Epsilon - Cedola x 4 - 02/2012 (*) 0 (97 679 929,05) 78 095 034,00
Investment Solutions by Epsilon - Cedola x 4 - 03/2012 (*) 0 (67 480 529,88) 49 528 380,73
Investment Solutions by Epsilon - Cedola x 4 Indexed - 05/2012 (*) 0 (9 977 110,56) 8 597 639,42
Investment Solutions by Epsilon - Cedola x 4 Indexed - 07/2012 (*) 0 (34 719 212,80) 29 498 084,02
Investment Solutions by Epsilon - Cedola x 4 Indexed - 09/2012 (*) 0 (184 841 673,55) 127 496 365,48
Investment Solutions by Epsilon - Cedola x 4 Indexed - 10/2012 (*) 0 (187 208 182,05) 131 025 279,93
Investment Solutions by Epsilon - Flexible Equity Coupon 2017-1 0 (2 396 791,01) 8 419 110,16
11
Investment Solutions by Epsilon - Valore Cedola x 5 - 12/2012 (*) 0 (511 690 778,84) 443 262 729,00
Investment Solutions by Epsilon - Valore Cedola x 5 - 02/2013 (*) 0 (380 260 350,54) 516 043 792,87
Investment Solutions by Epsilon - Valore Cedola x 5 - 04/2013 (*) 0 (104 234 262,95) 144 564 377,27
Investment Solutions by Epsilon - Valore Cedola x 5 - 06/2013 (*) 0 (143 402 990,30) 172 654 983,97
Investment Solutions by Epsilon - Valore Cedola x 5 - 07/2013 (*) 0 (198 578 716,18) 233 358 497,20
Investment Solutions by Epsilon - Valore Cedola x 5 - 10/2013 (*) 0 (222 047 731,40) 201 707 494,64
Investment Solutions by Epsilon - Valore Cedola x 5 - 12/2013 (*) 0 (364 734 119,72) 395 141 020,57
Investment Solutions by Epsilon - Valore Cedola x 5 - 02/2014 (*) 0 (110 434 563,25) 356 061 521,89
Investment Solutions by Epsilon - Valore Cedola x 5 - 04/2014 (*) 0 (77 031 247,48) 409 581 496,28
Investment Solutions by Epsilon - Valore Cedola x 5 - 11/2014 365 905 928,00 (35 553 955,86) 846 254 368,99
Investment Solutions by Epsilon - Valore Cedola Globale - 02/2015 1 165 780 146,00 (18 431 545,96) 1 109 656 377,05
Investment Solutions by Epsilon - Valore Cedola Globale - 04/2015 501 335 081,16 (10 406 769,50) 486 128 808,86
Investment Solutions by Epsilon - Valore Cedola Globale - 07/2015 278 802 215,42 (3 416 823,23) 275 461 658,83
Investment Solutions by Epsilon - Valore Cedola Globale - 09/2015 280 522 392,06 (1 584 892,41) 278 820 873,13
Investment Solutions by Epsilon - Global Coupon - 10/2013 (*) 0 (19 313 084,83) 59 297 791,25
Investment Solutions by Epsilon - Global Coupon - 06/2014 (*) 0 (39 681 664,45) 125 583 872,62
Investment Solutions by Epsilon - Global Coupon - 11/2014 (*) 0 (14 092 169,99) 65 538 264,60
Investment Solutions by Epsilon - Global Diversified Allocation - 02/2015 302 941 584,98 (22 442 280,99) 270 419 933,40
Investment Solutions by Epsilon - Global Dynamic Multitrender - 06/2015 86 290 392,25 (4 712 013,54) 80 958 298,41
Investment Solutions by Epsilon - Global Income Multitrender - 09/2015 216 801 342,06 (1 677 536,43) 212 802 789,99
Investment Solutions by Epsilon - Equity Coupon 02/2014 (*) 0 (93 113 213,16) 163 737 941,69
Investment Solutions by Epsilon - Equity Coupon 04/2014 (*) 0 (18 433 169,03) 52 304 356,49
Investment Solutions by Epsilon - Soluzione Flessibile Protetta 02/2014 0 (138 005 481,69) 469 731 082,43
Investment Solutions by Epsilon - Soluzione Flessibile Protetta 04/2014 0 (20 093 789,58) 92 916 267,57
Investment Solutions by Epsilon 3 198 379 081,93 (3 651 204 084,54) 8 809 865 630,20
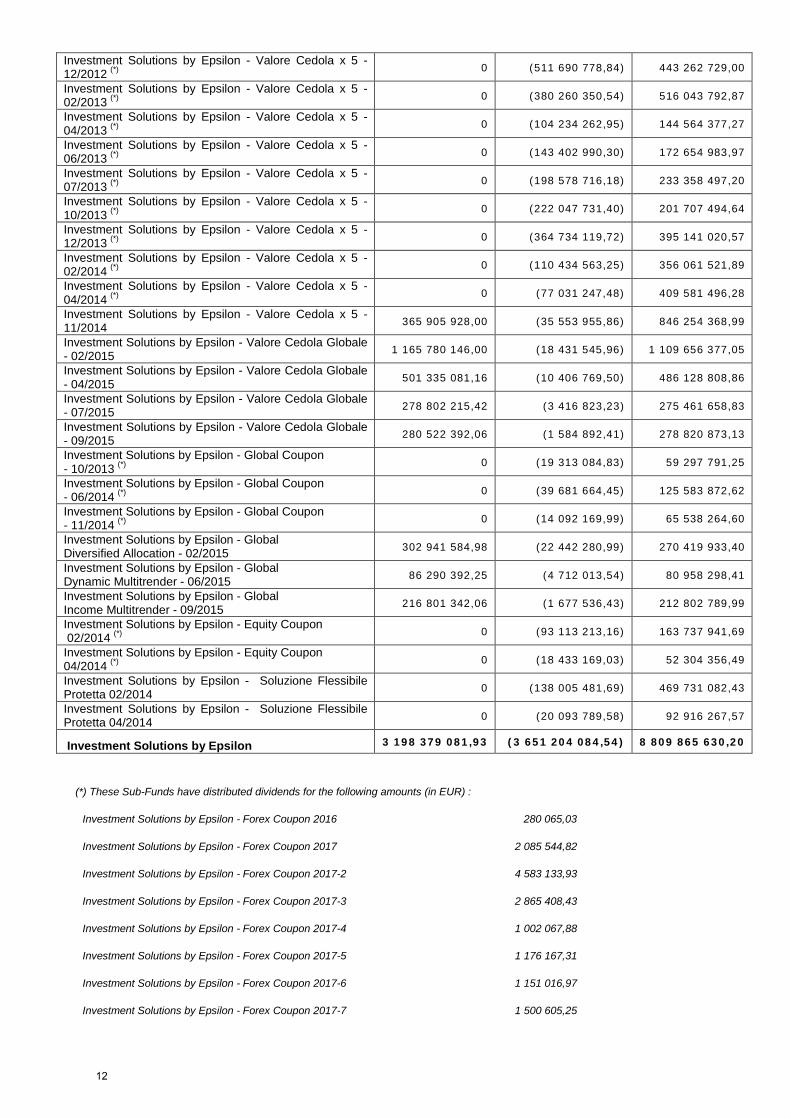
(*) These Sub-Funds have distributed dividends for the following amounts (in EUR) :
Investment Solutions by Epsilon - Forex Coupon 2016 280 065,03
Investment Solutions by Epsilon - Forex Coupon 2017 2 085 544,82
Investment Solutions by Epsilon - Forex Coupon 2017-2 4 583 133,93
Investment Solutions by Epsilon - Forex Coupon 2017-3 2 865 408,43
Investment Solutions by Epsilon - Forex Coupon 2017-4 1 002 067,88
Investment Solutions by Epsilon - Forex Coupon 2017-5 1 176 167,31
Investment Solutions by Epsilon - Forex Coupon 2017-6 1 151 016,97
Investment Solutions by Epsilon - Forex Coupon 2017-7 1 500 605,25
12
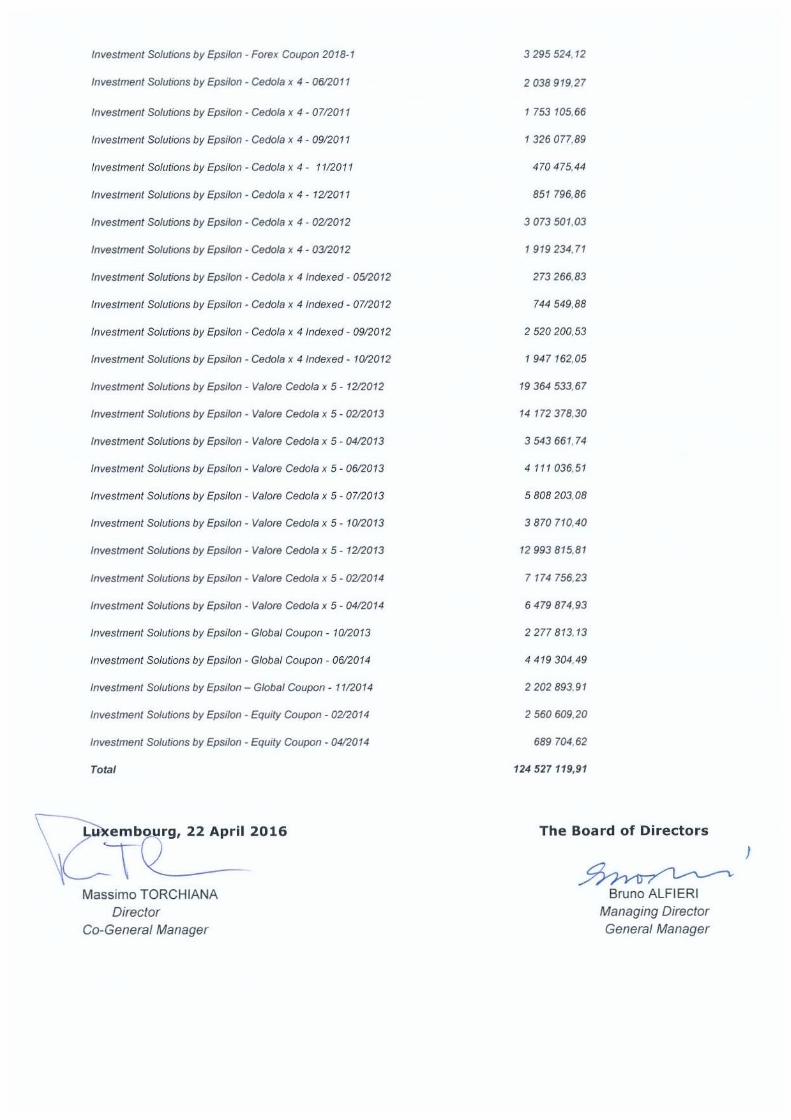
Investment Solutions by Epsilon - Forex Coupon 2018-1
Investment Solutions by Epsilon - Gedo/ax 4 - 0612011
Investment Solutions by Epsilon - Cedola x 4 - 0712011
Investment Solutions by Epsilon - Gedo/a x 4 - 0912011
Investment Solutions by Epsilon - Gedo/a x 4 - 1112011
Investment Solutions by Epsilon - Cedola x 4 - 1212011
Investment Solutions by Epsilon - Gedo/ax 4 - 0212012
Investment Solutions by Epsilon - Cedola x 4 - 0312012
Investment Solutions by Epsilon - Gedo/ax 4 Indexed - 0512012
Investment Solutions by Epsilon - Cedola x 4 Indexed - 0712012
Investment Solutions by Epsilon - Cedola x 4 Indexed - 0912012
Investment Solutions by Epsilon - Gedo/ax 4 Indexed - 1012012
Investment Solutions by Epsilon - Va/ore Gedo/ax 5 - 1212012
Investment Solutions by Epsilon - Va/ore Gedo/ax 5 - 0212013
Investment Solutions by Epsilon - Va/ore Gedo/ax 5- 0412013
Investment Solutions by Epsilon - Va/ore Cedola x 5 - 0612013
Investment Solutions by Epsilon - Va/ore Cedola x 5 - 0712013
Investment Solutions by Epsilon - Va/ore Gedo/ax 5 - 1012013
Investment Solutions by Epsilon - Va/ore Gedo/ax 5- 1212013
Investment Solutions by Epsilon - Va/ore Gedo/ax 5 - 0212014
Investment Solutions by Epsilon - Va/ore Gedo/ax 5 - 0412014
Investment Solutions by Epsilon - Global Coupon - 1012013
Investment Solutions by Epsilon - Global Coupon - 0612014
Investment Solutions by Epsilon - Global Coupon - 1112014
Investment Solutions by Epsilon - Equity Coupon - 0212014
Investment Solutions by Epsilon - Equity Coupon - 0412014
Total
cerc2016 Massimo TORCHIANA
Director Co-General Manager
3 295524,12
2 038 919,27
1 753 105,66
1326077,89
470 475,44
851 796,86
3 073 501,03
1919234,71
273 266,83
744 549,88
2 520 200,53
1 947162,05
19 364 533,67
14 172 378,30
3 543 661, 74
4111036,51
5 808 203,08
3 870 710,40
12 993 815,81
7 174 756,23
6 479 874,93
2 277813,13
4 419 304,49
2 202 893,91
2 560 609,20
689 704.62
124 527 119,91
The Board of Directors
~ Bruno ALFI ERi
Managing Director General Manager
)
To the Unitholders of Investment Solutions by Epsilon 8, Avenue de la Liberté L-1930 Luxembourg
REPORT OF THE REVISEUR D’ENTREPRISES AGREE
We have audited the accompanying financial statements of Investment Solutions by Epsilon and each of its sub-funds, which comprise the statement of net assets, the portfolio, the commitments on future contracts, the option contracts, the forward foreign exchange contracts and the swap contracts as at 31 December 2015 and the statement of changes in net assets for the year then ended, and a summary of significant accounting policies and other explanatory information.
Board of Directors of the Management Company responsibility for the financial statements
The Board of Directors of the Management Company is responsible for the preparation and fair presentation of these financial statements in accordance with Luxembourg legal and regulatory requirements relating to the preparation of the financial statements, and for such internal control as the Board of Directors of the Management Company determines is necessary to enable the preparation of financial statements that are free from material misstatement, whether due to fraud or error.
Responsibility of the Réviseur d’Entreprises agréé
Our responsibility is to express an opinion on these financial statements based on our audit. We conducted our audit in accordance with International Standards on Auditing as adopted for Luxembourg by the Commission de Surveillance du Secteur Financier. Those standards require that we comply with ethical requirements and plan and perform the audit to obtain reasonable assurance about whether the financial statements are free from material misstatement.
An audit involves performing procedures to obtain audit evidence about the amounts and disclosures in the financial statements. The procedures selected depend on the judgement of the Réviseur d’Entreprises agréé, including the assessment of the risks of material misstatement of the financial statements, whether due to fraud or error. In making those risk assessments, the Réviseur d’Entreprises agréé considers internal control relevant to the entity’s preparation and fair presentation of the financial statements in order to design audit procedures that are appropriate in the circumstances, but not for the purpose of expressing an opinion on the effectiveness of the entity’s internal control.
An audit also includes evaluating the appropriateness of accounting policies used and the reasonableness of accounting estimates made by the Board of Directors of the Management Company, as well as evaluating the overall presentation of the financial statements.
We believe that the audit evidence we have obtained is sufficient and appropriate to provide a basis for our audit opinion.
14
Opinion
In our opinion, the financial statements give a true and fair view of the financial position of Investment Solutions by Epsilon and each of its sub-funds as of 31 December 2015 and of the results of their operations and changes in their net assets for the year then ended in accordance with Luxembourg legal and regulatory requirements relating to the preparation of the financial statements.
Other maller
Supplementary information included in the annual report has been reviewed in the context of our mandate but has not been subject to specific audit procedures carried out in accordance with the standards described above. Consequently, we express no opinion on such information. However, we have no observation to make concerning such information in the context of the financial statements taken as a whole.
Luxembourg, 25 April 2016 KPMG Luxembourg Societe cooperative Cabinet de revision agree
15
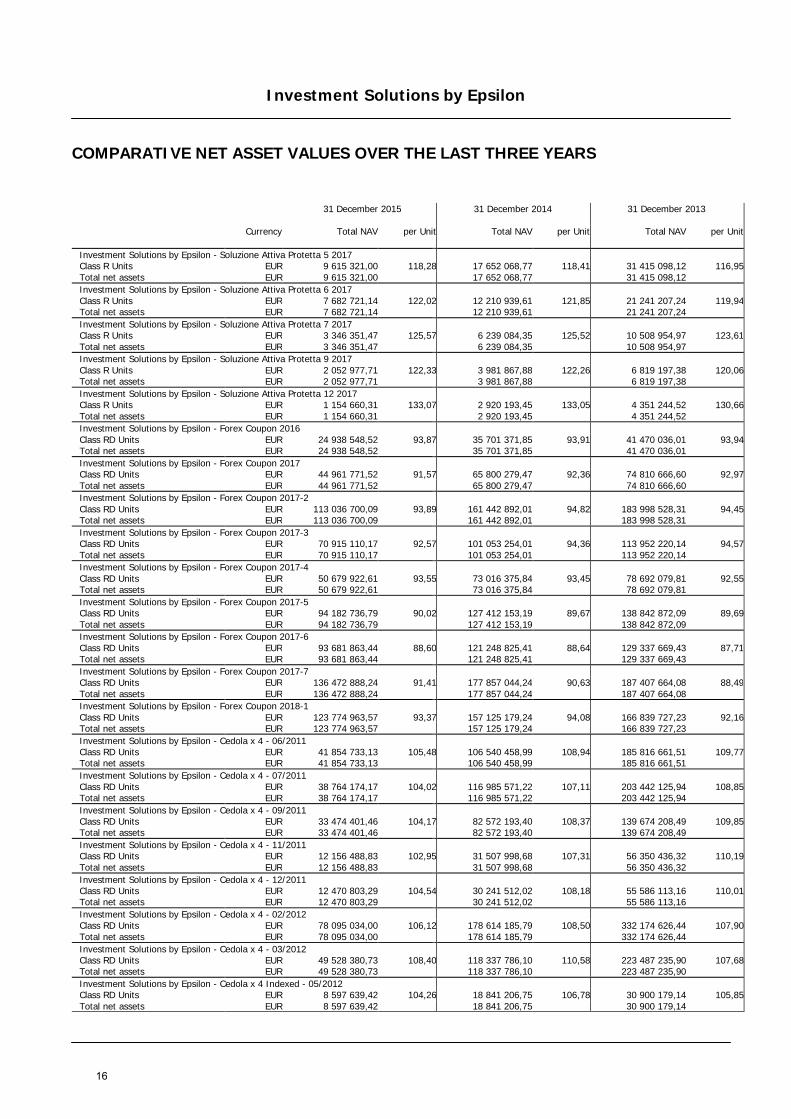
Investment Solutions by Epsilon
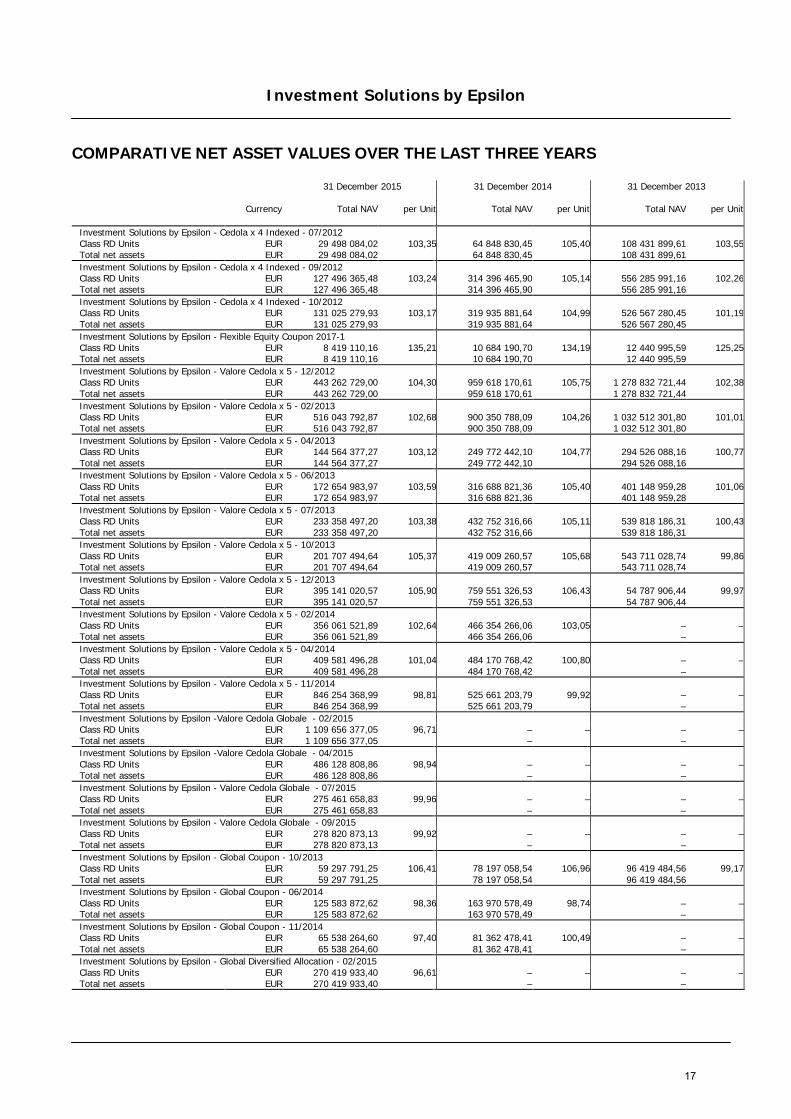
COMPARATIVE NET ASSET VALUES OVER THE LAST THREE YEARS
31 December 2015 31 December 2014 31 December 2013 Currency Total NAV per Unit Total NAV per Unit Total NAV per Unit Investment Solutions by Epsilon - Soluzione Attiva Protetta 5 2017 Class R Units EUR 9 615 321,00 118,28 17 652 068,77 118,41 31 415 098,12 116,95 Total net assets EUR 9 615 321,00 17 652 068,77 31 415 098,12 Investment Solutions by Epsilon - Soluzione Attiva Protetta 6 2017 Class R Units EUR 7 682 721,14 122,02 12 210 939,61 121,85 21 241 207,24 119,94 Total net assets EUR 7 682 721,14 12 210 939,61 21 241 207,24 Investment Solutions by Epsilon - Soluzione Attiva Protetta 7 2017 Class R Units EUR 3 346 351,47 125,57 6 239 084,35 125,52 10 508 954,97 123,61 Total net assets EUR 3 346 351,47 6 239 084,35 10 508 954,97 Investment Solutions by Epsilon - Soluzione Attiva Protetta 9 2017 Class R Units EUR 2 052 977,71 122,33 3 981 867,88 122,26 6 819 197,38 120,06 Total net assets EUR 2 052 977,71 3 981 867,88 6 819 197,38 Investment Solutions by Epsilon - Soluzione Attiva Protetta 12 2017 Class R Units EUR 1 154 660,31 133,07 2 920 193,45 133,05 4 351 244,52 130,66 Total net assets EUR 1 154 660,31 2 920 193,45 4 351 244,52 Investment Solutions by Epsilon - Forex Coupon 2016 Class RD Units EUR 24 938 548,52 93,87 35 701 371,85 93,91 41 470 036,01 93,94 Total net assets EUR 24 938 548,52 35 701 371,85 41 470 036,01 Investment Solutions by Epsilon - Forex Coupon 2017 Class RD Units EUR 44 961 771,52 91,57 65 800 279,47 92,36 74 810 666,60 92,97 Total net assets EUR 44 961 771,52 65 800 279,47 74 810 666,60 Investment Solutions by Epsilon - Forex Coupon 2017-2 Class RD Units EUR 113 036 700,09 93,89 161 442 892,01 94,82 183 998 528,31 94,45 Total net assets EUR 113 036 700,09 161 442 892,01 183 998 528,31 Investment Solutions by Epsilon - Forex Coupon 2017-3 Class RD Units EUR 70 915 110,17 92,57 101 053 254,01 94,36 113 952 220,14 94,57 Total net assets EUR 70 915 110,17 101 053 254,01 113 952 220,14 Investment Solutions by Epsilon - Forex Coupon 2017-4 Class RD Units EUR 50 679 922,61 93,55 73 016 375,84 93,45 78 692 079,81 92,55 Total net assets EUR 50 679 922,61 73 016 375,84 78 692 079,81 Investment Solutions by Epsilon - Forex Coupon 2017-5 Class RD Units EUR 94 182 736,79 90,02 127 412 153,19 89,67 138 842 872,09 89,69 Total net assets EUR 94 182 736,79 127 412 153,19 138 842 872,09 Investment Solutions by Epsilon - Forex Coupon 2017-6 Class RD Units EUR 93 681 863,44 88,60 121 248 825,41 88,64 129 337 669,43 87,71 Total net assets EUR 93 681 863,44 121 248 825,41 129 337 669,43 Investment Solutions by Epsilon - Forex Coupon 2017-7 Class RD Units EUR 136 472 888,24 91,41 177 857 044,24 90,63 187 407 664,08 88,49 Total net assets EUR 136 472 888,24 177 857 044,24 187 407 664,08 Investment Solutions by Epsilon - Forex Coupon 2018-1 Class RD Units EUR 123 774 963,57 93,37 157 125 179,24 94,08 166 839 727,23 92,16 Total net assets EUR 123 774 963,57 157 125 179,24 166 839 727,23 Investment Solutions by Epsilon - Cedola x 4 - 06/2011 Class RD Units EUR 41 854 733,13 105,48 106 540 458,99 108,94 185 816 661,51 109,77 Total net assets EUR 41 854 733,13 106 540 458,99 185 816 661,51 Investment Solutions by Epsilon - Cedola x 4 - 07/2011 Class RD Units EUR 38 764 174,17 104,02 116 985 571,22 107,11 203 442 125,94 108,85 Total net assets EUR 38 764 174,17 116 985 571,22 203 442 125,94 Investment Solutions by Epsilon - Cedola x 4 - 09/2011 Class RD Units EUR 33 474 401,46 104,17 82 572 193,40 108,37 139 674 208,49 109,85 Total net assets EUR 33 474 401,46 82 572 193,40 139 674 208,49 Investment Solutions by Epsilon - Cedola x 4 - 11/2011 Class RD Units EUR 12 156 488,83 102,95 31 507 998,68 107,31 56 350 436,32 110,19 Total net assets EUR 12 156 488,83 31 507 998,68 56 350 436,32 Investment Solutions by Epsilon - Cedola x 4 - 12/2011 Class RD Units EUR 12 470 803,29 104,54 30 241 512,02 108,18 55 586 113,16 110,01 Total net assets EUR 12 470 803,29 30 241 512,02 55 586 113,16 Investment Solutions by Epsilon - Cedola x 4 - 02/2012 Class RD Units EUR 78 095 034,00 106,12 178 614 185,79 108,50 332 174 626,44 107,90 Total net assets EUR 78 095 034,00 178 614 185,79 332 174 626,44 Investment Solutions by Epsilon - Cedola x 4 - 03/2012 Class RD Units EUR 49 528 380,73 108,40 118 337 786,10 110,58 223 487 235,90 107,68 Total net assets EUR 49 528 380,73 118 337 786,10 223 487 235,90 Investment Solutions by Epsilon - Cedola x 4 Indexed - 05/2012 Class RD Units EUR 8 597 639,42 104,26 18 841 206,75 106,78 30 900 179,14 105,85 Total net assets EUR 8 597 639,42 18 841 206,75 30 900 179,14
16
Investment Solutions by Epsilon
COMPARATIVE NET ASSET VALUES OVER THE LAST THREE YEARS
31 December 2015 31 December 2014 31 December 2013 Currency Total NAV per Unit Total NAV per Unit Total NAV per Unit Investment Solutions by Epsilon - Cedola x 4 Indexed - 07/2012 Class RD Units EUR 29 498 084,02 103,35 64 848 830,45 105,40 108 431 899,61 103,55 Total net assets EUR 29 498 084,02 64 848 830,45 108 431 899,61 Investment Solutions by Epsilon - Cedola x 4 Indexed - 09/2012 Class RD Units EUR 127 496 365,48 103,24 314 396 465,90 105,14 556 285 991,16 102,26 Total net assets EUR 127 496 365,48 314 396 465,90 556 285 991,16 Investment Solutions by Epsilon - Cedola x 4 Indexed - 10/2012 Class RD Units EUR 131 025 279,93 103,17 319 935 881,64 104,99 526 567 280,45 101,19 Total net assets EUR 131 025 279,93 319 935 881,64 526 567 280,45 Investment Solutions by Epsilon - Flexible Equity Coupon 2017-1 Class RD Units EUR 8 419 110,16 135,21 10 684 190,70 134,19 12 440 995,59 125,25 Total net assets EUR 8 419 110,16 10 684 190,70 12 440 995,59 Investment Solutions by Epsilon - Valore Cedola x 5 - 12/2012 Class RD Units EUR 443 262 729,00 104,30 959 618 170,61 105,75 1 278 832 721,44 102,38 Total net assets EUR 443 262 729,00 959 618 170,61 1 278 832 721,44 Investment Solutions by Epsilon - Valore Cedola x 5 - 02/2013 Class RD Units EUR 516 043 792,87 102,68 900 350 788,09 104,26 1 032 512 301,80 101,01 Total net assets EUR 516 043 792,87 900 350 788,09 1 032 512 301,80 Investment Solutions by Epsilon - Valore Cedola x 5 - 04/2013 Class RD Units EUR 144 564 377,27 103,12 249 772 442,10 104,77 294 526 088,16 100,77 Total net assets EUR 144 564 377,27 249 772 442,10 294 526 088,16 Investment Solutions by Epsilon - Valore Cedola x 5 - 06/2013 Class RD Units EUR 172 654 983,97 103,59 316 688 821,36 105,40 401 148 959,28 101,06 Total net assets EUR 172 654 983,97 316 688 821,36 401 148 959,28 Investment Solutions by Epsilon - Valore Cedola x 5 - 07/2013 Class RD Units EUR 233 358 497,20 103,38 432 752 316,66 105,11 539 818 186,31 100,43 Total net assets EUR 233 358 497,20 432 752 316,66 539 818 186,31 Investment Solutions by Epsilon - Valore Cedola x 5 - 10/2013 Class RD Units EUR 201 707 494,64 105,37 419 009 260,57 105,68 543 711 028,74 99,86 Total net assets EUR 201 707 494,64 419 009 260,57 543 711 028,74 Investment Solutions by Epsilon - Valore Cedola x 5 - 12/2013 Class RD Units EUR 395 141 020,57 105,90 759 551 326,53 106,43 54 787 906,44 99,97 Total net assets EUR 395 141 020,57 759 551 326,53 54 787 906,44 Investment Solutions by Epsilon - Valore Cedola x 5 - 02/2014 Class RD Units EUR 356 061 521,89 102,64 466 354 266,06 103,05 – – Total net assets EUR 356 061 521,89 466 354 266,06 – Investment Solutions by Epsilon - Valore Cedola x 5 - 04/2014 Class RD Units EUR 409 581 496,28 101,04 484 170 768,42 100,80 – – Total net assets EUR 409 581 496,28 484 170 768,42 – Investment Solutions by Epsilon - Valore Cedola x 5 - 11/2014 Class RD Units EUR 846 254 368,99 98,81 525 661 203,79 99,92 – – Total net assets EUR 846 254 368,99 525 661 203,79 – Investment Solutions by Epsilon -Valore Cedola Globale - 02/2015 Class RD Units EUR 1 109 656 377,05 96,71 – – – – Total net assets EUR 1 109 656 377,05 – – Investment Solutions by Epsilon -Valore Cedola Globale - 04/2015 Class RD Units EUR 486 128 808,86 98,94 – – – – Total net assets EUR 486 128 808,86 – – Investment Solutions by Epsilon - Valore Cedola Globale - 07/2015 Class RD Units EUR 275 461 658,83 99,96 – – – – Total net assets EUR 275 461 658,83 – – Investment Solutions by Epsilon - Valore Cedola Globale - 09/2015 Class RD Units EUR 278 820 873,13 99,92 – – – – Total net assets EUR 278 820 873,13 – – Investment Solutions by Epsilon - Global Coupon - 10/2013 Class RD Units EUR 59 297 791,25 106,41 78 197 058,54 106,96 96 419 484,56 99,17 Total net assets EUR 59 297 791,25 78 197 058,54 96 419 484,56 Investment Solutions by Epsilon - Global Coupon - 06/2014 Class RD Units EUR 125 583 872,62 98,36 163 970 578,49 98,74 – – Total net assets EUR 125 583 872,62 163 970 578,49 – Investment Solutions by Epsilon - Global Coupon - 11/2014 Class RD Units EUR 65 538 264,60 97,40 81 362 478,41 100,49 – – Total net assets EUR 65 538 264,60 81 362 478,41 – Investment Solutions by Epsilon - Global Diversified Allocation - 02/2015 Class RD Units EUR 270 419 933,40 96,61 – – – – Total net assets EUR 270 419 933,40 – –
17
Investment Solutions by Epsilon
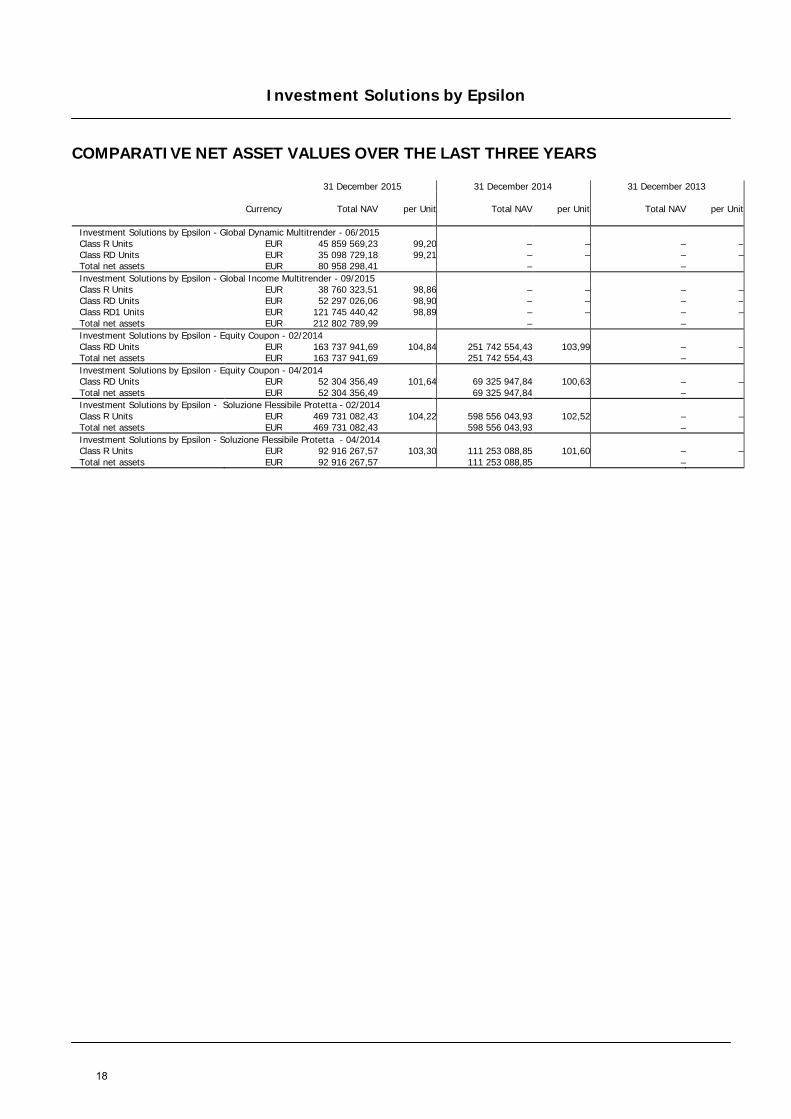
COMPARATIVE NET ASSET VALUES OVER THE LAST THREE YEARS
31 December 2015 31 December 2014 31 December 2013 Currency Total NAV per Unit Total NAV per Unit Total NAV per Unit Investment Solutions by Epsilon - Global Dynamic Multitrender - 06/2015 Class R Units EUR 45 859 569,23 99,20 – – – – Class RD Units EUR 35 098 729,18 99,21 – – – – Total net assets EUR 80 958 298,41 – – Investment Solutions by Epsilon - Global Income Multitrender - 09/2015 Class R Units EUR 38 760 323,51 98,86 – – – – Class RD Units EUR 52 297 026,06 98,90 – – – – Class RD1 Units EUR 121 745 440,42 98,89 – – – – Total net assets EUR 212 802 789,99 – – Investment Solutions by Epsilon - Equity Coupon - 02/2014 Class RD Units EUR 163 737 941,69 104,84 251 742 554,43 103,99 – – Total net assets EUR 163 737 941,69 251 742 554,43 – Investment Solutions by Epsilon - Equity Coupon - 04/2014 Class RD Units EUR 52 304 356,49 101,64 69 325 947,84 100,63 – – Total net assets EUR 52 304 356,49 69 325 947,84 – Investment Solutions by Epsilon - Soluzione Flessibile Protetta - 02/2014 Class R Units EUR 469 731 082,43 104,22 598 556 043,93 102,52 – – Total net assets EUR 469 731 082,43 598 556 043,93 – Investment Solutions by Epsilon - Soluzione Flessibile Protetta - 04/2014 Class R Units EUR 92 916 267,57 103,30 111 253 088,85 101,60 – – Total net assets EUR 92 916 267,57 111 253 088,85 –
18
Investment Solutions by Epsilon
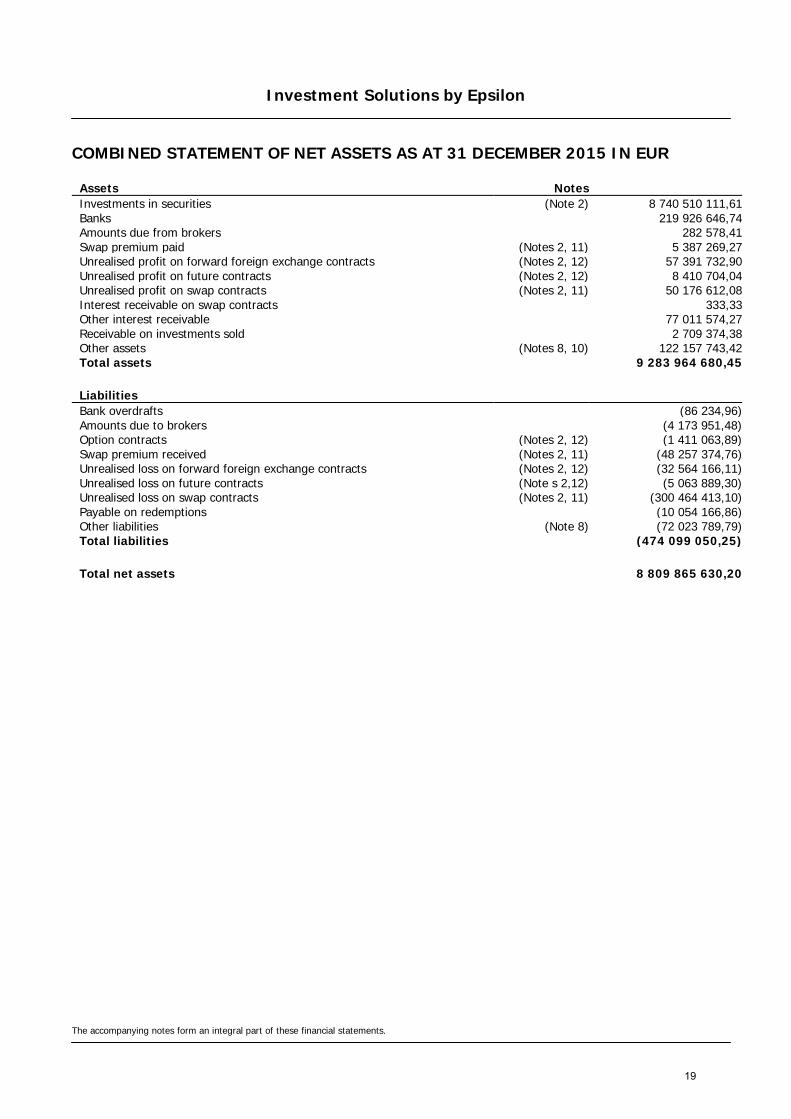
COMBINED STATEMENT OF NET ASSETS AS AT 31 DECEMBER 2015 IN EUR
The accompanying notes form an integral part of these financial statements.
Assets Notes Investments in securities (Note 2) 8 740 510 111,61 Banks 219 926 646,74 Amounts due from brokers 282 578,41 Swap premium paid (Notes 2, 11) 5 387 269,27 Unrealised profit on forward foreign exchange contracts (Notes 2, 12) 57 391 732,90 Unrealised profit on future contracts (Notes 2, 12) 8 410 704,04 Unrealised profit on swap contracts (Notes 2, 11) 50 176 612,08 Interest receivable on swap contracts 333,33 Other interest receivable 77 011 574,27 Receivable on investments sold 2 709 374,38 Other assets (Notes 8, 10) 122 157 743,42 Total assets 9 283 964 680,45
Liabilities Bank overdrafts (86 234,96) Amounts due to brokers (4 173 951,48) Option contracts (Notes 2, 12) (1 411 063,89) Swap premium received (Notes 2, 11) (48 257 374,76) Unrealised loss on forward foreign exchange contracts (Notes 2, 12) (32 564 166,11) Unrealised loss on future contracts (Note s 2,12) (5 063 889,30) Unrealised loss on swap contracts (Notes 2, 11) (300 464 413,10) Payable on redemptions (10 054 166,86) Other liabilities (Note 8) (72 023 789,79) Total liabilities (474 099 050,25)
Total net assets 8 809 865 630,20
19
Investment Solutions by Epsilon
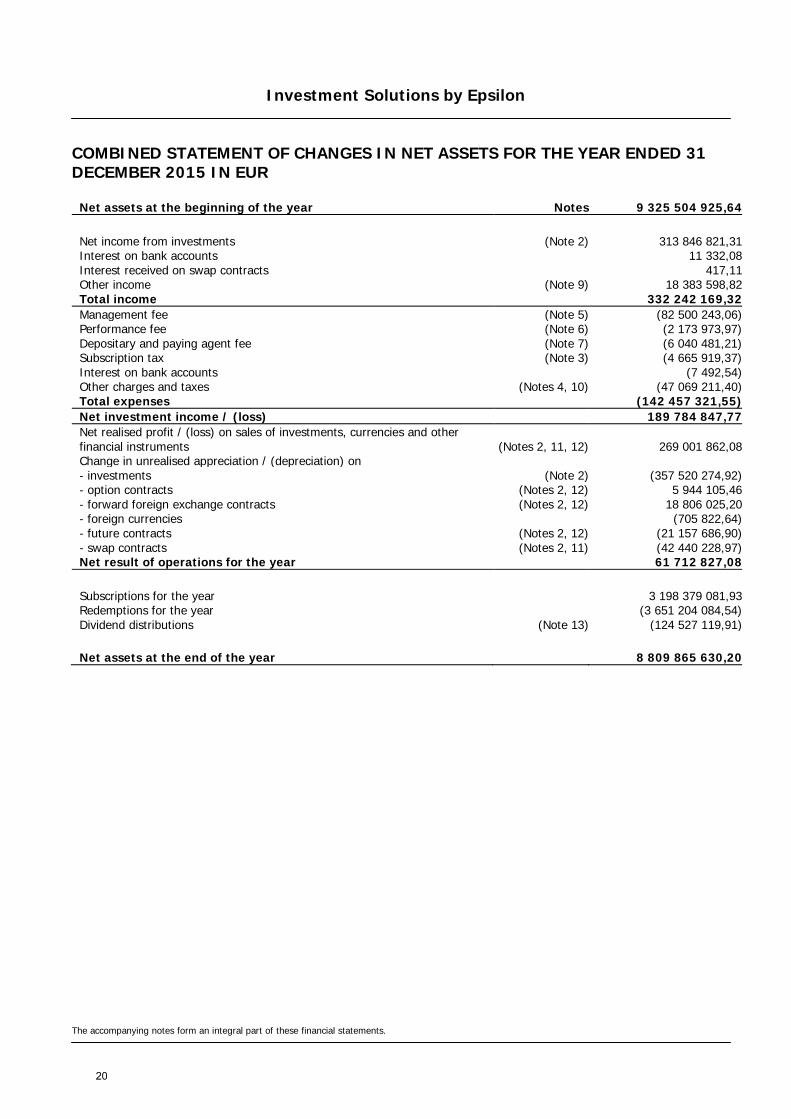
COMBINED STATEMENT OF CHANGES IN NET ASSETS FOR THE YEAR ENDED 31 DECEMBER 2015 IN EUR
The accompanying notes form an integral part of these financial statements.
Net assets at the beginning of the year Notes 9 325 504 925,64
Net income from investments (Note 2) 313 846 821,31 Interest on bank accounts 11 332,08 Interest received on swap contracts 417,11 Other income (Note 9) 18 383 598,82 Total income 332 242 169,32 Management fee (Note 5) (82 500 243,06) Performance fee (Note 6) (2 173 973,97) Depositary and paying agent fee (Note 7) (6 040 481,21) Subscription tax (Note 3) (4 665 919,37) Interest on bank accounts (7 492,54) Other charges and taxes (Notes 4, 10) (47 069 211,40) Total expenses (142 457 321,55) Net investment income / (loss) 189 784 847,77 Net realised profit / (loss) on sales of investments, currencies and other financial instruments (Notes 2, 11, 12) 269 001 862,08 Change in unrealised appreciation / (depreciation) on - investments (Note 2) (357 520 274,92) - option contracts (Notes 2, 12) 5 944 105,46 - forward foreign exchange contracts (Notes 2, 12) 18 806 025,20 - foreign currencies (705 822,64) - future contracts (Notes 2, 12) (21 157 686,90) - swap contracts (Notes 2, 11) (42 440 228,97) Net result of operations for the year 61 712 827,08
Subscriptions for the year 3 198 379 081,93 Redemptions for the year (3 651 204 084,54) Dividend distributions (Note 13) (124 527 119,91)
Net assets at the end of the year 8 809 865 630,20
20

Investment Solutions by Epsilon - Soluzione Attiva Protetta 5 2017
STATEMENT OF NET ASSETS AS AT 31 DECEMBER 2015 IN EUR
The accompanying notes form an integral part of these financial statements.
Assets Notes Investments in securities (Note 2) 8 594 901,61 Banks 146 555,87 Unrealised profit on swap contracts (Notes 2, 11) 1 335 646,07 Other interest receivable 95 293,97 Other assets (Notes 8, 10) 49 604,51 Total assets 10 222 002,03
Liabilities Swap premium received (Notes 2, 11) (490 344,78) Unrealised loss on swap contracts (Notes 2, 11) (38 909,50) Other liabilities (Note 8) (77 426,75) Total liabilities (606 681,03)
Total net assets 9 615 321,00
Currency Net Asset Value per Unit Units outstanding
Class R Units EUR 118,28 81 292,834
21

Investment Solutions by Epsilon - Soluzione Attiva Protetta 5 2017
STATEMENT OF CHANGES IN NET ASSETS FOR THE YEAR ENDED 31 DECEMBER 2015 IN EUR
The accompanying notes form an integral part of these financial statements.
Net assets at the beginning of the year Notes 17 652 068,77
Net income from investments (Note 2) 517 824,17 Other income (Note 9) 117 964,23 Total income 635 788,40 Management fee (Note 5) (126 883,14) Depositary and paying agent fee (Note 7) (9 054,24) Subscription tax (Note 3) (6 222,89) Other charges and taxes (Notes 4, 10) (149 286,25) Total expenses (291 446,52) Net investment income / (loss) 344 341,88 Net realised profit / (loss) on sales of investments, currencies and other financial instruments (Notes 2, 11) 1 652 934,42 Change in unrealised appreciation / (depreciation) on - investments (Note 2) (994 669,04) - swap contracts (Notes 2, 11) (757 722,74) Net result of operations for the year 244 884,52
Redemptions for the year (8 281 632,29)
Net assets at the end of the year 9 615 321,00
22

Investment Solutions by Epsilon - Soluzione Attiva Protetta 5 2017
The accompanying notes form an integral part of these financial statements.
PORTFOLIO AS AT 31 DECEMBER 2015 IN EUR
Nominal / Quantity Description Currency Acquisition cost Carrying amount value
% of Net Assets
PORTFOLIO 8 221 098,03 8 594 901,61 89,39
TRANSFERABLE SECURITIES AND MONEY MARKET INSTRUMENTS ADMITTED TO OFFICIAL STOCK EXCHANGE LISTING 8 221 098,03 8 594 901,61 89,39
Ordinary Bonds 8 221 098,03 8 594 901,61 89,39
ITALY 8 221 098,03 8 594 901,61 89,39
Government 8 221 098,03 8 594 901,61 89,39 1 750 000,00 BTP 4.00% 01/02/2017 EUR 1 750 000,00 1 826 317,50 18,99 1 686 000,00 BTP 4.75% 01/05/2017 EUR 1 625 163,72 1 792 032,54 18,64 1 768 321,50 BTP 2.10% 15/09/2016 EUR 1 739 067,04 1 791 981,64 18,64 1 735 000,00 BTP 3.75% 01/08/2016 EUR 1 735 000,00 1 772 996,50 18,44
785 000,00 BTP 3.75% 15/04/2016 EUR 785 000,00 793 564,35 8,25 598 000,00 BTP 4.75% 15/09/2016 EUR 586 867,27 618 009,08 6,43
Total Portfolio 8 221 098,03 8 594 901,61 89,39
23

Investment Solutions by Epsilon - Soluzione Attiva Protetta 5 2017
The accompanying notes form an integral part of these financial statements.
SWAP CONTRACTS AS AT 31 DECEMBER 2015
Underlying name Currency Position Notional Counterparty Maturity
Interest receivable/
(payable) (EUR)
Unrealised profit / (loss)
(EUR)
EQUITY SWAP CONTRACTS 769 501,32 BASKET SWAP EUR L 8 204 000,00 BANCA IMI SPA 12/05/2017 769 501,32
Counterparty Currency Notional Maturity Interest
receivable (EUR) Interest
payable (EUR)
Unrealised profit / (loss)
(EUR)
ASSET SWAP CONTRACTS (38 909,50) BANCA IMI SPA EUR 8 204 000,00 15/04/2016 (38 909,51)
INTEREST RATE SWAP CONTRACTS 566 144,75 BANCA IMI SPA EUR 8 204 000,00 12/05/2017 566 144,75
24
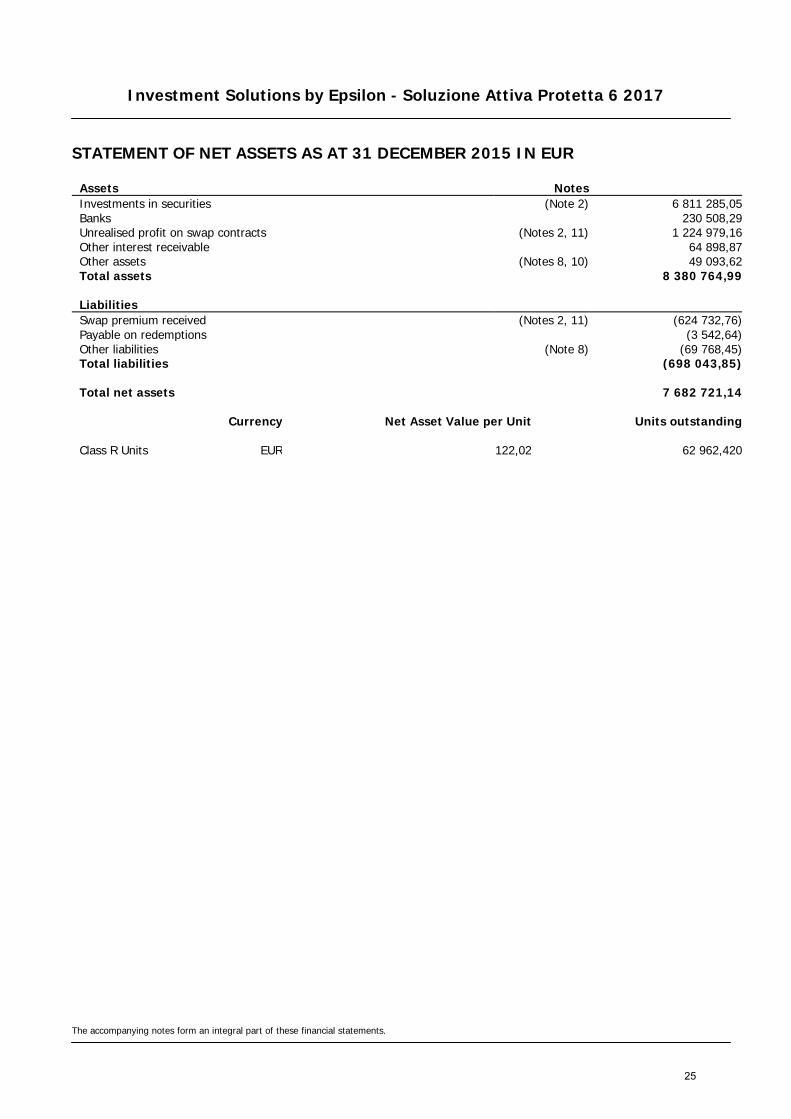
Investment Solutions by Epsilon - Soluzione Attiva Protetta 6 2017
STATEMENT OF NET ASSETS AS AT 31 DECEMBER 2015 IN EUR
The accompanying notes form an integral part of these financial statements.
Assets Notes Investments in securities (Note 2) 6 811 285,05 Banks 230 508,29 Unrealised profit on swap contracts (Notes 2, 11) 1 224 979,16 Other interest receivable 64 898,87 Other assets (Notes 8, 10) 49 093,62 Total assets 8 380 764,99
Liabilities Swap premium received (Notes 2, 11) (624 732,76) Payable on redemptions (3 542,64) Other liabilities (Note 8) (69 768,45) Total liabilities (698 043,85)
Total net assets 7 682 721,14
Currency Net Asset Value per Unit Units outstanding
Class R Units EUR 122,02 62 962,420
25
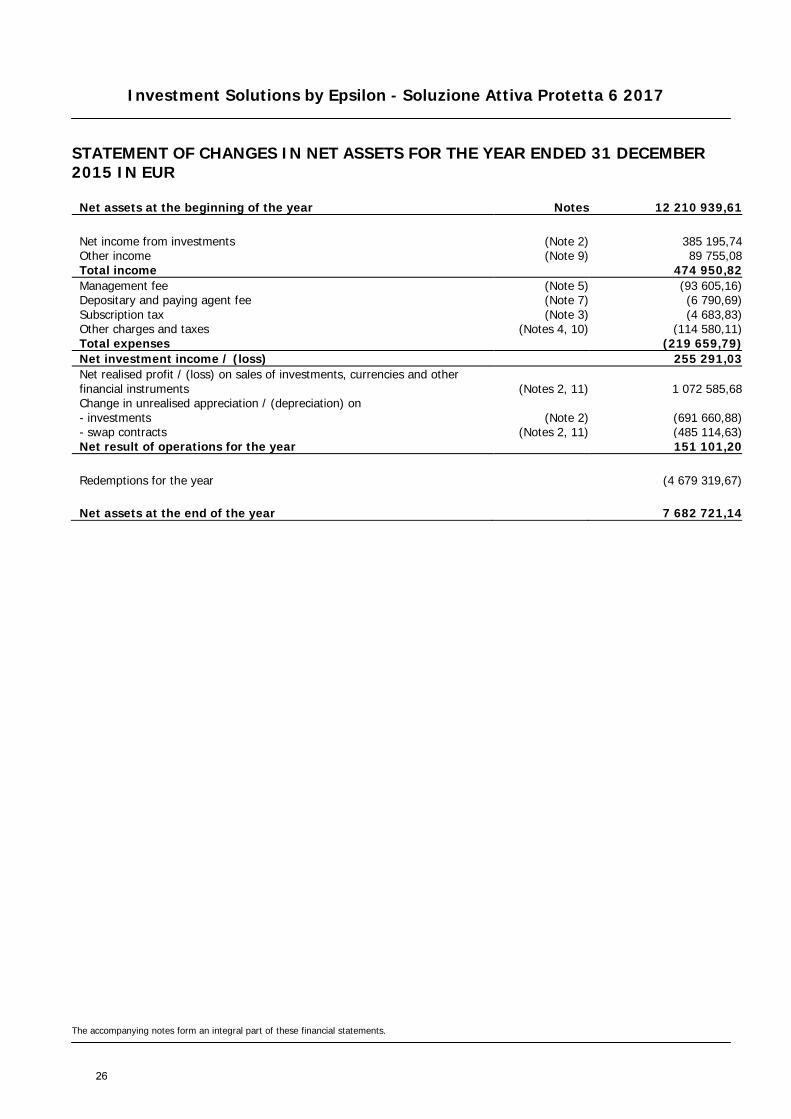
Investment Solutions by Epsilon - Soluzione Attiva Protetta 6 2017
STATEMENT OF CHANGES IN NET ASSETS FOR THE YEAR ENDED 31 DECEMBER 2015 IN EUR
The accompanying notes form an integral part of these financial statements.
Net assets at the beginning of the year Notes 12 210 939,61
Net income from investments (Note 2) 385 195,74 Other income (Note 9) 89 755,08 Total income 474 950,82 Management fee (Note 5) (93 605,16) Depositary and paying agent fee (Note 7) (6 790,69) Subscription tax (Note 3) (4 683,83) Other charges and taxes (Notes 4, 10) (114 580,11) Total expenses (219 659,79) Net investment income / (loss) 255 291,03 Net realised profit / (loss) on sales of investments, currencies and other financial instruments (Notes 2, 11) 1 072 585,68 Change in unrealised appreciation / (depreciation) on - investments (Note 2) (691 660,88) - swap contracts (Notes 2, 11) (485 114,63) Net result of operations for the year 151 101,20
Redemptions for the year (4 679 319,67)
Net assets at the end of the year 7 682 721,14
26

Investment Solutions by Epsilon - Soluzione Attiva Protetta 6 2017
The accompanying notes form an integral part of these financial statements.
PORTFOLIO AS AT 31 DECEMBER 2015 IN EUR
Nominal / Quantity Description Currency Acquisition cost Carrying amount value
% of Net Assets
PORTFOLIO 6 389 107,88 6 811 285,05 88,66
TRANSFERABLE SECURITIES AND MONEY MARKET INSTRUMENTS ADMITTED TO OFFICIAL STOCK EXCHANGE LISTING 6 389 107,88 6 811 285,05 88,66
Ordinary Bonds 6 389 107,88 6 811 285,05 88,66
ITALY 6 389 107,88 6 811 285,05 88,66
Government 6 389 107,88 6 811 285,05 88,66 1 532 545,30 BTP 2.10% 15/09/2016 EUR 1 490 689,25 1 553 050,76 20,21 1 348 000,00 BTP 4.00% 01/02/2017 EUR 1 348 000,00 1 406 786,28 18,31 1 309 000,00 BTP 4.75% 01/05/2017 EUR 1 261 767,09 1 391 323,01 18,11 1 150 000,00 BTP 4.75% 01/06/2017 EUR 1 098 890,67 1 227 487,00 15,98
650 000,00 BTP 3.75% 01/08/2016 EUR 650 000,00 664 235,00 8,65 550 000,00 BTP 4.75% 15/09/2016 EUR 539 760,87 568 403,00 7,40
Total Portfolio 6 389 107,88 6 811 285,05 88,66
27

Investment Solutions by Epsilon - Soluzione Attiva Protetta 6 2017
The accompanying notes form an integral part of these financial statements.
SWAP CONTRACTS AS AT 31 DECEMBER 2015
Underlying name Currency Position Notional Counterparty Maturity
Interest receivable/
(payable) (EUR)
Unrealised profit / (loss)
(EUR)
EQUITY SWAP CONTRACTS 629 440,31 BASKET SWAP EUR L 6 437 000,00 BANCA IMI SPA 23/06/2017 — 629 440,31
Counterparty Currency Notional Maturity Interest
receivable (EUR) Interest
payable (EUR)
Unrealised profit / (loss)
(EUR)
ASSET SWAP CONTRACTS — — 63 874,71 BANCA IMI SPA EUR 6 437 000,00 23/06/2017 — — 63 874,71
INTEREST RATE SWAP CONTRACTS — — 531 664,14 BANCA IMI SPA EUR 6 437 000,00 23/06/2017 — — 531 664,14
28

Investment Solutions by Epsilon - Soluzione Attiva Protetta 7 2017
STATEMENT OF NET ASSETS AS AT 31 DECEMBER 2015 IN EUR
The accompanying notes form an integral part of these financial statements.
Assets Notes Investments in securities (Note 2) 2 868 832,42 Banks 159 309,05 Unrealised profit on swap contracts (Notes 2, 11) 594 668,05 Other interest receivable 28 663,10 Other assets (Notes 8, 10) 27 767,98 Total assets 3 679 240,60
Liabilities Swap premium received (Notes 2, 11) (295 397,70) Other liabilities (Note 8) (37 491,43) Total liabilities (332 889,13)
Total net assets 3 346 351,47
Currency Net Asset Value per Unit Units outstanding
Class R Units EUR 125,57 26 649,235
29

Investment Solutions by Epsilon - Soluzione Attiva Protetta 7 2017
STATEMENT OF CHANGES IN NET ASSETS FOR THE YEAR ENDED 31 DECEMBER 2015 IN EUR
The accompanying notes form an integral part of these financial statements.
Net assets at the beginning of the year Notes 6 239 084,35
Net income from investments (Note 2) 177 182,61 Other income (Note 9) 44 302,64 Total income 221 485,25 Management fee (Note 5) (44 250,21) Depositary and paying agent fee (Note 7) (3 448,02) Subscription tax (Note 3) (2 187,06) Other charges and taxes (Notes 4, 10) (59 876,47) Total expenses (109 761,76) Net investment income / (loss) 111 723,49 Net realised profit / (loss) on sales of investments, currencies and other financial instruments (Notes 2, 11) 796 127,55 Change in unrealised appreciation / (depreciation) on - investments (Note 2) (395 276,63) - swap contracts (Notes 2, 11) (413 851,29) Net result of operations for the year 98 723,12
Redemptions for the year (2 991 456,00)
Net assets at the end of the year 3 346 351,47
30
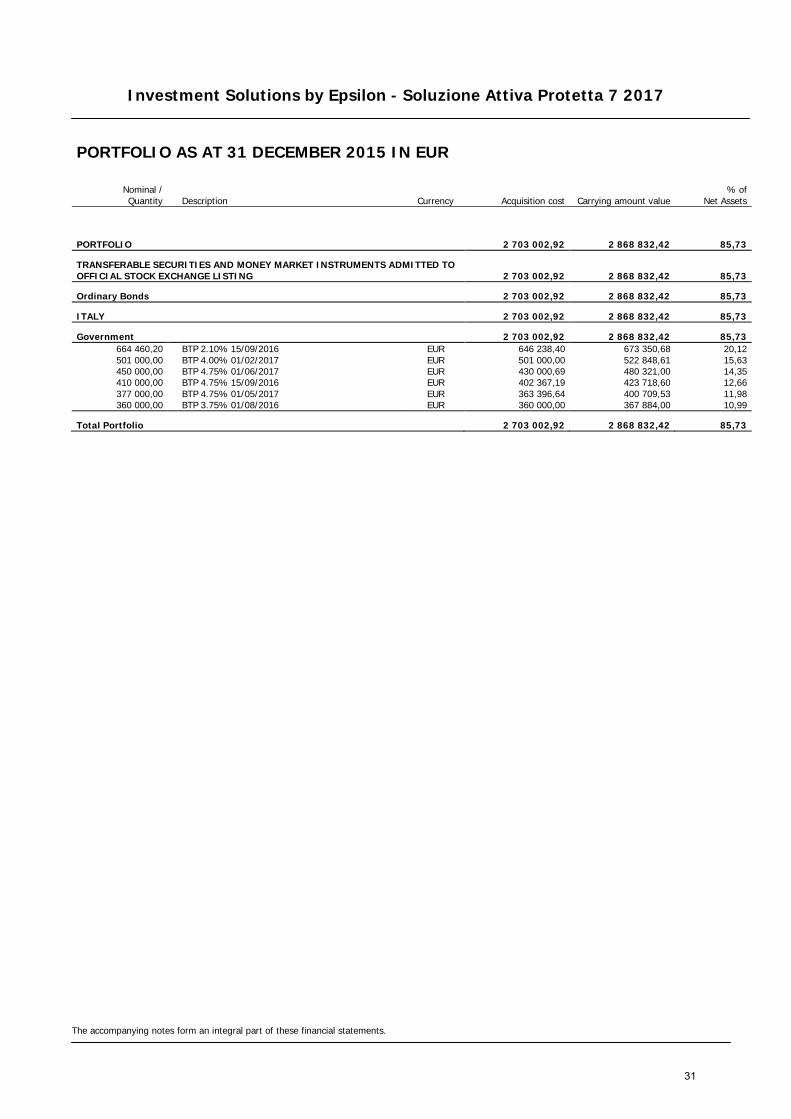
Investment Solutions by Epsilon - Soluzione Attiva Protetta 7 2017
The accompanying notes form an integral part of these financial statements.
PORTFOLIO AS AT 31 DECEMBER 2015 IN EUR
Nominal / Quantity Description Currency Acquisition cost Carrying amount value
% of Net Assets
PORTFOLIO 2 703 002,92 2 868 832,42 85,73
TRANSFERABLE SECURITIES AND MONEY MARKET INSTRUMENTS ADMITTED TO OFFICIAL STOCK EXCHANGE LISTING 2 703 002,92 2 868 832,42 85,73
Ordinary Bonds 2 703 002,92 2 868 832,42 85,73
ITALY 2 703 002,92 2 868 832,42 85,73
Government 2 703 002,92 2 868 832,42 85,73 664 460,20 BTP 2.10% 15/09/2016 EUR 646 238,40 673 350,68 20,12 501 000,00 BTP 4.00% 01/02/2017 EUR 501 000,00 522 848,61 15,63 450 000,00 BTP 4.75% 01/06/2017 EUR 430 000,69 480 321,00 14,35 410 000,00 BTP 4.75% 15/09/2016 EUR 402 367,19 423 718,60 12,66 377 000,00 BTP 4.75% 01/05/2017 EUR 363 396,64 400 709,53 11,98 360 000,00 BTP 3.75% 01/08/2016 EUR 360 000,00 367 884,00 10,99
Total Portfolio 2 703 002,92 2 868 832,42 85,73
31

Investment Solutions by Epsilon - Soluzione Attiva Protetta 7 2017
The accompanying notes form an integral part of these financial statements.
SWAP CONTRACTS AS AT 31 DECEMBER 2015
Underlying name Currency Position Notional Counterparty Maturity
Interest receivable/
(payable) (EUR)
Unrealised profit / (loss)
(EUR)
EQUITY SWAP CONTRACTS 301 635,27 BASKET SWAP EUR L 2 718 000,00 BANCA IMI SPA 21/07/2017 — 301 635,27
Counterparty Currency Notional Maturity Interest
receivable (EUR) Interest
payable (EUR)
Unrealised profit / (loss)
(EUR)
ASSET SWAP CONTRACTS — — 32 151,77 BANCA IMI SPA EUR 2 718 000,00 21/07/2017 — — 32 151,77
INTEREST RATE SWAP CONTRACTS — — 260 881,01 BANCA IMI SPA EUR 2 718 000,00 21/07/2017 — — 260 881,01
32

Investment Solutions by Epsilon - Soluzione Attiva Protetta 9 2017
STATEMENT OF NET ASSETS AS AT 31 DECEMBER 2015 IN EUR
The accompanying notes form an integral part of these financial statements.
Assets Notes Investments in securities (Note 2) 1 882 728,84 Banks 36 466,27 Unrealised profit on swap contracts (Notes 2, 11) 353 447,53 Other interest receivable 21 946,75 Other assets (Notes 8, 10) 20 744,02 Total assets 2 315 333,41
Liabilities Swap premium received (Notes 2, 11) (127 690,90) Unrealised loss on swap contracts (Notes 2, 11) (108 148,97) Other liabilities (Note 8) (26 515,83) Total liabilities (262 355,70)
Total net assets 2 052 977,71
Currency Net Asset Value per Unit Units outstanding
Class R Units EUR 122,33 16 781,692
33

Investment Solutions by Epsilon - Soluzione Attiva Protetta 9 2017
STATEMENT OF CHANGES IN NET ASSETS FOR THE YEAR ENDED 31 DECEMBER 2015 IN EUR
The accompanying notes form an integral part of these financial statements.
Net assets at the beginning of the year Notes 3 981 867,88
Net income from investments (Note 2) 116 148,73 Other income (Note 9) 24 576,65 Total income 140 725,38 Management fee (Note 5) (28 461,81) Depositary and paying agent fee (Note 7) (2 378,21) Subscription tax (Note 3) (1 390,95) Other charges and taxes (Notes 4, 10) (37 872,86) Total expenses (70 103,83) Net investment income / (loss) 70 621,55 Net realised profit / (loss) on sales of investments, currencies and other financial instruments (Notes 2, 11) 390 526,19 Change in unrealised appreciation / (depreciation) on - investments (Note 2) (268 606,79) - swap contracts (Notes 2, 11) (126 631,22) Net result of operations for the year 65 909,73
Redemptions for the year (1 994 799,90)
Net assets at the end of the year 2 052 977,71
34
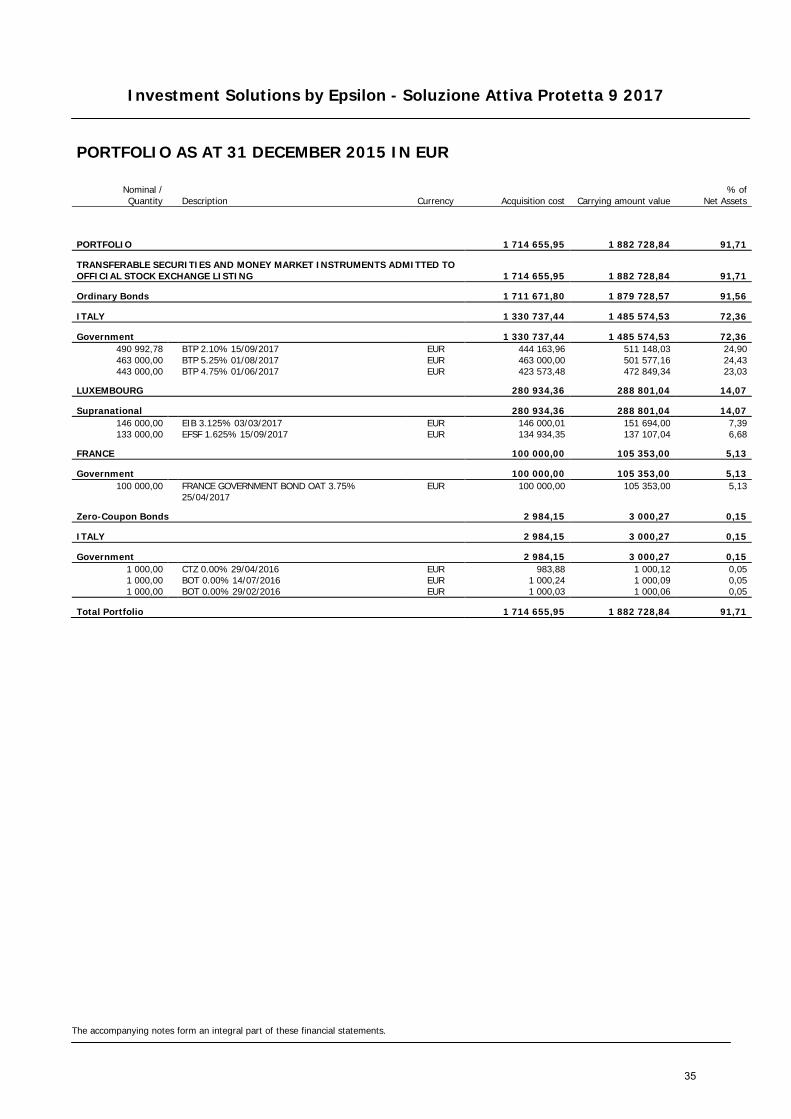
Investment Solutions by Epsilon - Soluzione Attiva Protetta 9 2017
The accompanying notes form an integral part of these financial statements.
PORTFOLIO AS AT 31 DECEMBER 2015 IN EUR
Nominal / Quantity Description Currency Acquisition cost Carrying amount value
% of Net Assets
PORTFOLIO 1 714 655,95 1 882 728,84 91,71
TRANSFERABLE SECURITIES AND MONEY MARKET INSTRUMENTS ADMITTED TO OFFICIAL STOCK EXCHANGE LISTING 1 714 655,95 1 882 728,84 91,71
Ordinary Bonds 1 711 671,80 1 879 728,57 91,56
ITALY 1 330 737,44 1 485 574,53 72,36
Government 1 330 737,44 1 485 574,53 72,36 490 992,78 BTP 2.10% 15/09/2017 EUR 444 163,96 511 148,03 24,90 463 000,00 BTP 5.25% 01/08/2017 EUR 463 000,00 501 577,16 24,43 443 000,00 BTP 4.75% 01/06/2017 EUR 423 573,48 472 849,34 23,03
LUXEMBOURG 280 934,36 288 801,04 14,07
Supranational 280 934,36 288 801,04 14,07 146 000,00 EIB 3.125% 03/03/2017 EUR 146 000,01 151 694,00 7,39 133 000,00 EFSF 1.625% 15/09/2017 EUR 134 934,35 137 107,04 6,68
FRANCE 100 000,00 105 353,00 5,13
Government 100 000,00 105 353,00 5,13 100 000,00
FRANCE GOVERNMENT BOND OAT 3.75% 25/04/2017
EUR 100 000,00 105 353,00 5,13
Zero-Coupon Bonds 2 984,15 3 000,27 0,15
ITALY 2 984,15 3 000,27 0,15
Government 2 984,15 3 000,27 0,15 1 000,00 CTZ 0.00% 29/04/2016 EUR 983,88 1 000,12 0,05 1 000,00 BOT 0.00% 14/07/2016 EUR 1 000,24 1 000,09 0,05 1 000,00 BOT 0.00% 29/02/2016 EUR 1 000,03 1 000,06 0,05
Total Portfolio 1 714 655,95 1 882 728,84 91,71
35

Investment Solutions by Epsilon - Soluzione Attiva Protetta 9 2017
The accompanying notes form an integral part of these financial statements.
SWAP CONTRACTS AS AT 31 DECEMBER 2015
Underlying name Currency Position Notional Counterparty Maturity
Interest receivable/
(payable) (EUR)
Unrealised profit / (loss)
(EUR)
EQUITY SWAP CONTRACTS 208 029,43 BASKET SWAP EUR L 1 707 000,00 BANCA IMI SPA 22/09/2017 — 208 029,43
Counterparty Currency Notional Maturity Interest
receivable (EUR) Interest
payable (EUR)
Unrealised profit / (loss)
(EUR)
ASSET SWAP CONTRACTS — — (108 148,97) BANCA IMI SPA EUR 1 707 000,00 22/09/2017 — — (108 148,97)
INTEREST RATE SWAP CONTRACTS — — 145 418,10 BANCA IMI SPA EUR 1 707 000,00 22/09/2017 — — 145 418,10
36
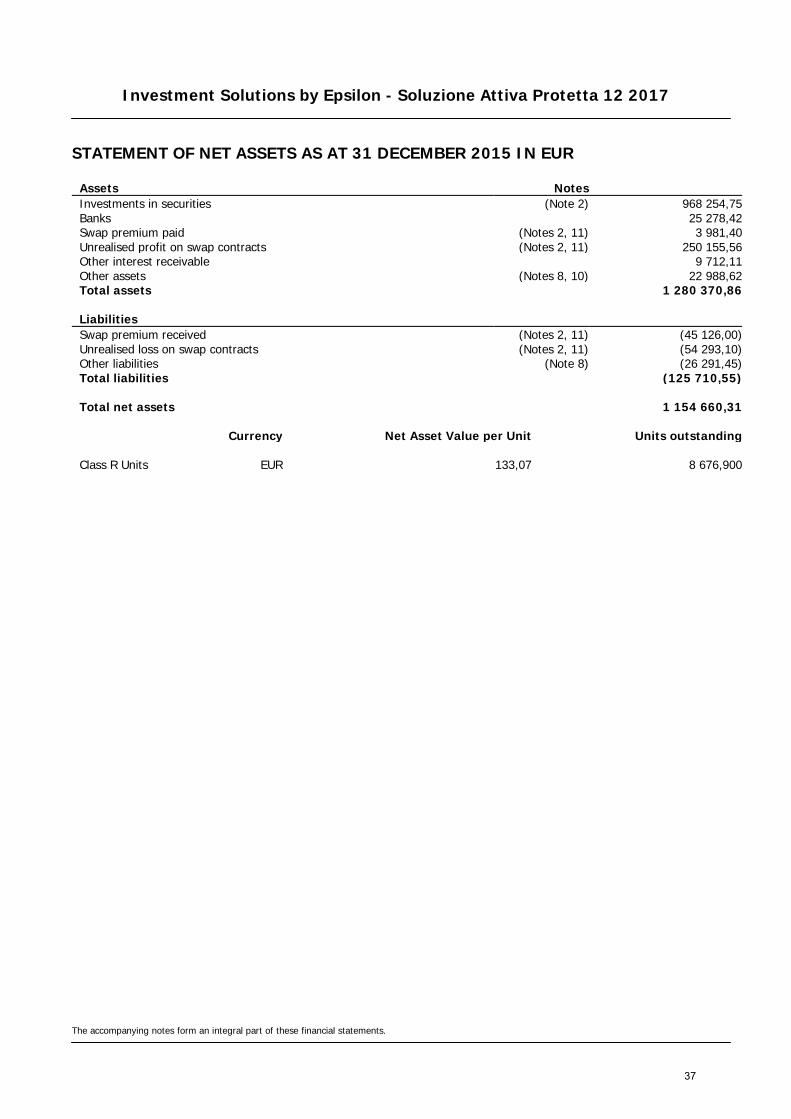
Investment Solutions by Epsilon - Soluzione Attiva Protetta 12 2017
STATEMENT OF NET ASSETS AS AT 31 DECEMBER 2015 IN EUR
The accompanying notes form an integral part of these financial statements.
Assets Notes Investments in securities (Note 2) 968 254,75 Banks 25 278,42 Swap premium paid (Notes 2, 11) 3 981,40 Unrealised profit on swap contracts (Notes 2, 11) 250 155,56 Other interest receivable 9 712,11 Other assets (Notes 8, 10) 22 988,62 Total assets 1 280 370,86
Liabilities Swap premium received (Notes 2, 11) (45 126,00) Unrealised loss on swap contracts (Notes 2, 11) (54 293,10) Other liabilities (Note 8) (26 291,45) Total liabilities (125 710,55)
Total net assets 1 154 660,31
Currency Net Asset Value per Unit Units outstanding
Class R Units EUR 133,07 8 676,900
37

Investment Solutions by Epsilon - Soluzione Attiva Protetta 12 2017
STATEMENT OF CHANGES IN NET ASSETS FOR THE YEAR ENDED 31 DECEMBER 2015 IN EUR
The accompanying notes form an integral part of these financial statements.
Net assets at the beginning of the year Notes 2 920 193,45
Net income from investments (Note 2) 63 298,30 Other income (Note 9) 21 396,90 Total income 84 695,20 Management fee (Note 5) (17 672,83) Depositary and paying agent fee (Note 7) (1 646,50) Subscription tax (Note 3) (814,88) Other charges and taxes (Notes 4, 10) (32 799,78) Total expenses (52 933,99) Net investment income / (loss) 31 761,21 Net realised profit / (loss) on sales of investments, currencies and other financial instruments (Notes 2, 11) 448 806,49 Change in unrealised appreciation / (depreciation) on - investments (Note 2) (225 898,23) - swap contracts (Notes 2, 11) (198 859,50) Net result of operations for the year 55 809,97
Redemptions for the year (1 821 343,11)
Net assets at the end of the year 1 154 660,31
38
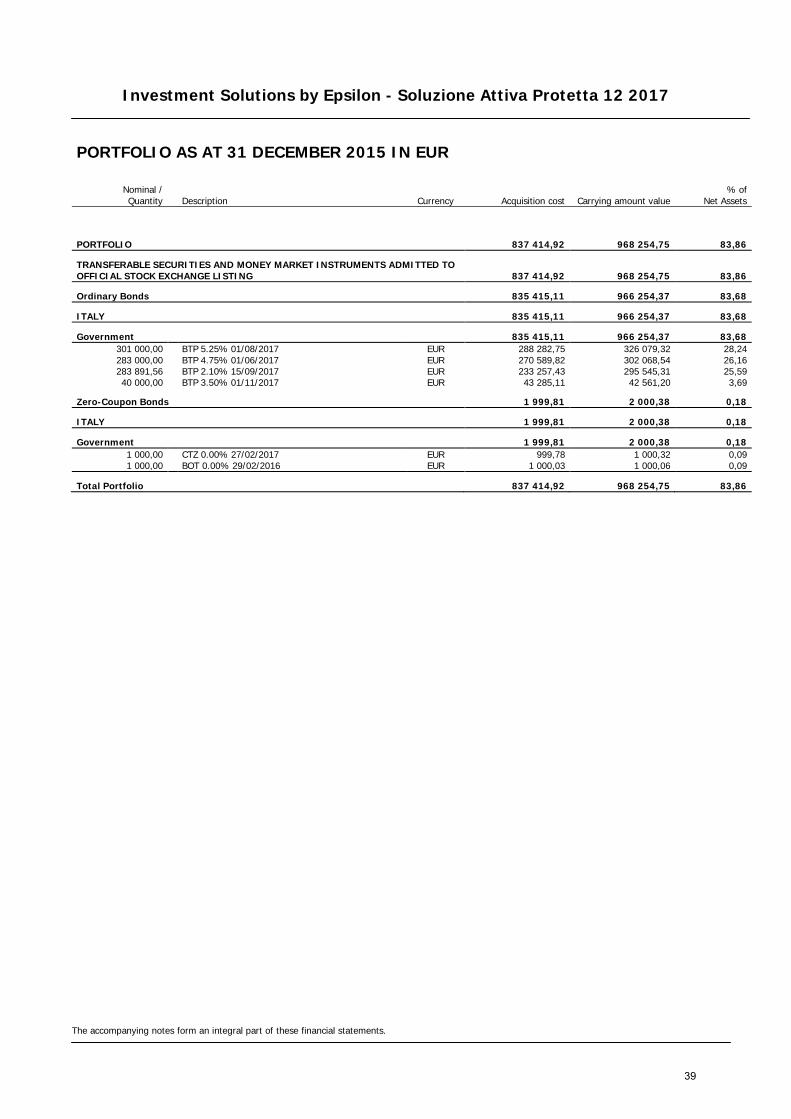
Investment Solutions by Epsilon - Soluzione Attiva Protetta 12 2017
The accompanying notes form an integral part of these financial statements.
PORTFOLIO AS AT 31 DECEMBER 2015 IN EUR
Nominal / Quantity Description Currency Acquisition cost Carrying amount value
% of Net Assets
PORTFOLIO 837 414,92 968 254,75 83,86
TRANSFERABLE SECURITIES AND MONEY MARKET INSTRUMENTS ADMITTED TO OFFICIAL STOCK EXCHANGE LISTING 837 414,92 968 254,75 83,86
Ordinary Bonds 835 415,11 966 254,37 83,68
ITALY 835 415,11 966 254,37 83,68
Government 835 415,11 966 254,37 83,68 301 000,00 BTP 5.25% 01/08/2017 EUR 288 282,75 326 079,32 28,24 283 000,00 BTP 4.75% 01/06/2017 EUR 270 589,82 302 068,54 26,16 283 891,56 BTP 2.10% 15/09/2017 EUR 233 257,43 295 545,31 25,59 40 000,00 BTP 3.50% 01/11/2017 EUR 43 285,11 42 561,20 3,69
Zero-Coupon Bonds 1 999,81 2 000,38 0,18
ITALY 1 999,81 2 000,38 0,18
Government 1 999,81 2 000,38 0,18 1 000,00 CTZ 0.00% 27/02/2017 EUR 999,78 1 000,32 0,09 1 000,00 BOT 0.00% 29/02/2016 EUR 1 000,03 1 000,06 0,09
Total Portfolio 837 414,92 968 254,75 83,86
39
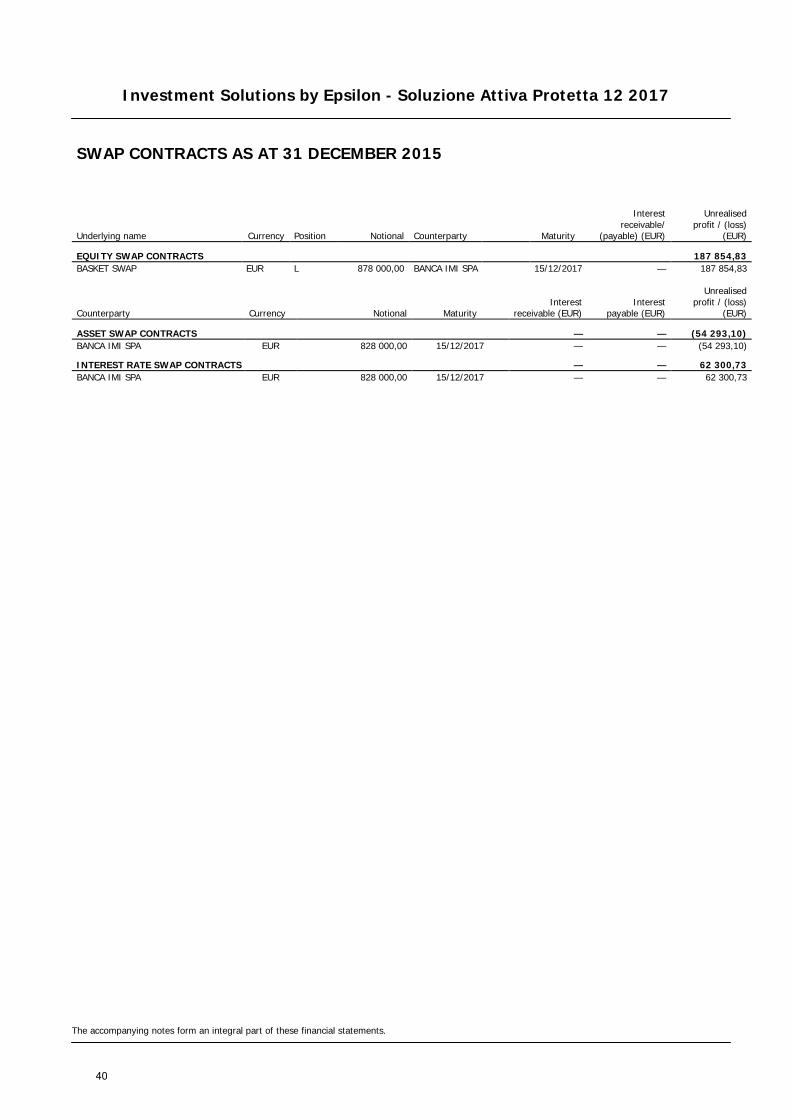
Investment Solutions by Epsilon - Soluzione Attiva Protetta 12 2017
The accompanying notes form an integral part of these financial statements.
SWAP CONTRACTS AS AT 31 DECEMBER 2015
Underlying name Currency Position Notional Counterparty Maturity
Interest receivable/
(payable) (EUR)
Unrealised profit / (loss)
(EUR)
EQUITY SWAP CONTRACTS 187 854,83 BASKET SWAP EUR L 878 000,00 BANCA IMI SPA 15/12/2017 — 187 854,83
Counterparty Currency Notional Maturity Interest
receivable (EUR) Interest
payable (EUR)
Unrealised profit / (loss)
(EUR)
ASSET SWAP CONTRACTS — — (54 293,10) BANCA IMI SPA EUR 828 000,00 15/12/2017 — — (54 293,10)
INTEREST RATE SWAP CONTRACTS — — 62 300,73 BANCA IMI SPA EUR 828 000,00 15/12/2017 — — 62 300,73
40

Investment Solutions by Epsilon - Forex Coupon 2016
STATEMENT OF NET ASSETS AS AT 31 DECEMBER 2015 IN EUR
The accompanying notes form an integral part of these financial statements.
Assets Notes Investments in securities (Note 2) 29 008 355,96 Banks 819 736,71 Swap premium paid (Notes 2, 11) 381 369,19 Unrealised profit on forward foreign exchange contracts (Notes 2, 12) 412 393,67 Other interest receivable 452 162,20 Other assets (Notes 8, 10) 147 537,88 Total assets 31 221 555,61
Liabilities Option contracts (Notes 2, 12) (513 272,12) Unrealised loss on forward foreign exchange contracts (Notes 2, 12) (361 605,42) Unrealised loss on swap contracts (Notes 2, 11) (5 165 090,96) Payable on redemptions (69 913,24) Other liabilities (Note 8) (173 125,35) Total liabilities (6 283 007,09)
Total net assets 24 938 548,52
Currency Net Asset Value per Unit Units outstanding
Class RD Units EUR 93,87 265 683,646
41
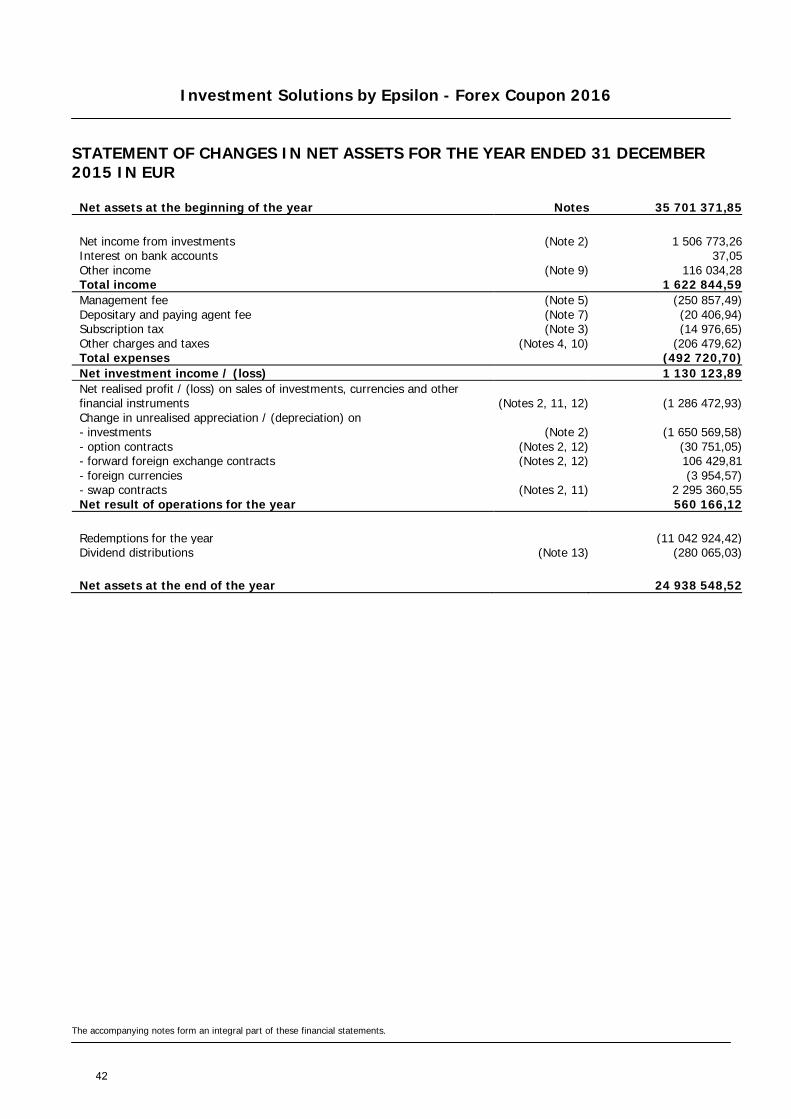
Investment Solutions by Epsilon - Forex Coupon 2016
STATEMENT OF CHANGES IN NET ASSETS FOR THE YEAR ENDED 31 DECEMBER 2015 IN EUR
The accompanying notes form an integral part of these financial statements.
Net assets at the beginning of the year Notes 35 701 371,85
Net income from investments (Note 2) 1 506 773,26 Interest on bank accounts 37,05 Other income (Note 9) 116 034,28 Total income 1 622 844,59 Management fee (Note 5) (250 857,49) Depositary and paying agent fee (Note 7) (20 406,94) Subscription tax (Note 3) (14 976,65) Other charges and taxes (Notes 4, 10) (206 479,62) Total expenses (492 720,70) Net investment income / (loss) 1 130 123,89 Net realised profit / (loss) on sales of investments, currencies and other financial instruments (Notes 2, 11, 12) (1 286 472,93) Change in unrealised appreciation / (depreciation) on - investments (Note 2) (1 650 569,58) - option contracts (Notes 2, 12) (30 751,05) - forward foreign exchange contracts (Notes 2, 12) 106 429,81 - foreign currencies (3 954,57) - swap contracts (Notes 2, 11) 2 295 360,55 Net result of operations for the year 560 166,12
Redemptions for the year (11 042 924,42) Dividend distributions (Note 13) (280 065,03)
Net assets at the end of the year 24 938 548,52
42
Investment Solutions by Epsilon - Forex Coupon 2016
The accompanying notes form an integral part of these financial statements.
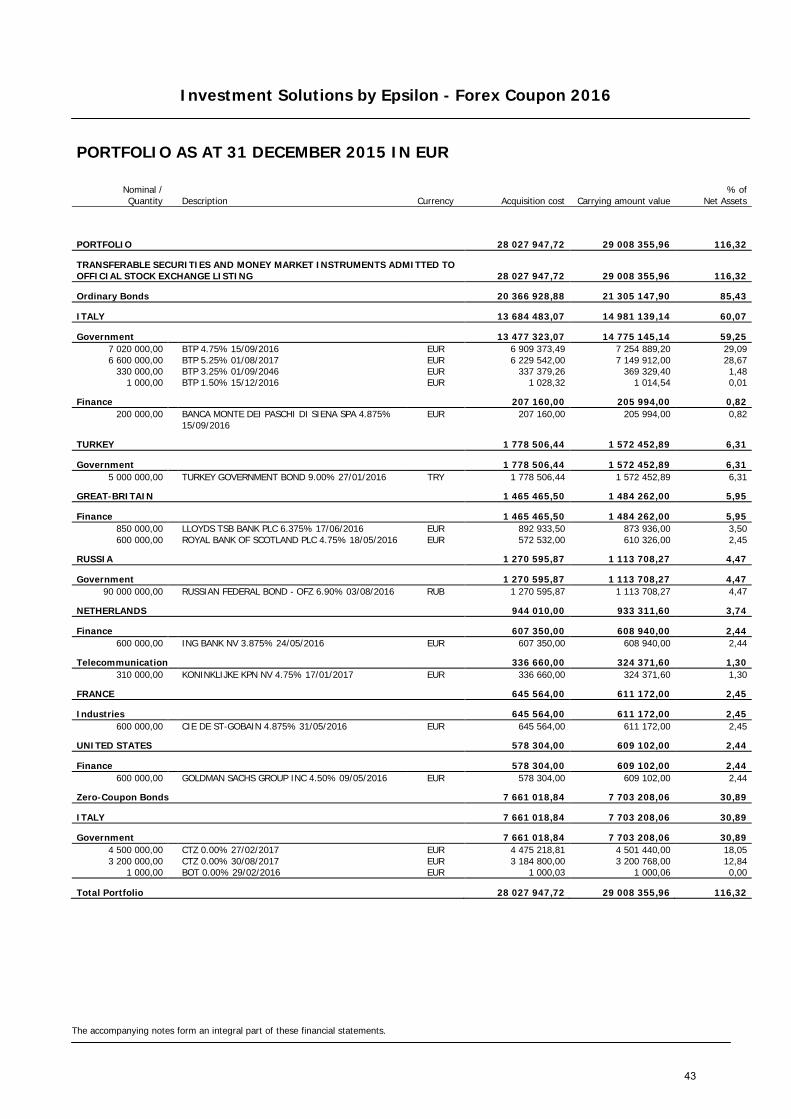
PORTFOLIO AS AT 31 DECEMBER 2015 IN EUR
Nominal / Quantity Description Currency Acquisition cost Carrying amount value
% of Net Assets
PORTFOLIO 28 027 947,72 29 008 355,96 116,32
TRANSFERABLE SECURITIES AND MONEY MARKET INSTRUMENTS ADMITTED TO OFFICIAL STOCK EXCHANGE LISTING 28 027 947,72 29 008 355,96 116,32
Ordinary Bonds 20 366 928,88 21 305 147,90 85,43
ITALY 13 684 483,07 14 981 139,14 60,07
Government 13 477 323,07 14 775 145,14 59,25 7 020 000,00 BTP 4.75% 15/09/2016 EUR 6 909 373,49 7 254 889,20 29,09 6 600 000,00 BTP 5.25% 01/08/2017 EUR 6 229 542,00 7 149 912,00 28,67
330 000,00 BTP 3.25% 01/09/2046 EUR 337 379,26 369 329,40 1,48 1 000,00 BTP 1.50% 15/12/2016 EUR 1 028,32 1 014,54 0,01
Finance 207 160,00 205 994,00 0,82 200 000,00
BANCA MONTE DEI PASCHI DI SIENA SPA 4.875% 15/09/2016
EUR 207 160,00 205 994,00 0,82
TURKEY 1 778 506,44 1 572 452,89 6,31
Government 1 778 506,44 1 572 452,89 6,31 5 000 000,00 TURKEY GOVERNMENT BOND 9.00% 27/01/2016 TRY 1 778 506,44 1 572 452,89 6,31
GREAT-BRITAIN 1 465 465,50 1 484 262,00 5,95
Finance 1 465 465,50 1 484 262,00 5,95 850 000,00 LLOYDS TSB BANK PLC 6.375% 17/06/2016 EUR 892 933,50 873 936,00 3,50 600 000,00 ROYAL BANK OF SCOTLAND PLC 4.75% 18/05/2016 EUR 572 532,00 610 326,00 2,45
RUSSIA 1 270 595,87 1 113 708,27 4,47
Government 1 270 595,87 1 113 708,27 4,47 90 000 000,00 RUSSIAN FEDERAL BOND - OFZ 6.90% 03/08/2016 RUB 1 270 595,87 1 113 708,27 4,47
NETHERLANDS 944 010,00 933 311,60 3,74
Finance 607 350,00 608 940,00 2,44 600 000,00 ING BANK NV 3.875% 24/05/2016 EUR 607 350,00 608 940,00 2,44
Telecommunication 336 660,00 324 371,60 1,30 310 000,00 KONINKLIJKE KPN NV 4.75% 17/01/2017 EUR 336 660,00 324 371,60 1,30
FRANCE 645 564,00 611 172,00 2,45
Industries 645 564,00 611 172,00 2,45 600 000,00 CIE DE ST-GOBAIN 4.875% 31/05/2016 EUR 645 564,00 611 172,00 2,45
UNITED STATES 578 304,00 609 102,00 2,44
Finance 578 304,00 609 102,00 2,44 600 000,00 GOLDMAN SACHS GROUP INC 4.50% 09/05/2016 EUR 578 304,00 609 102,00 2,44
Zero-Coupon Bonds 7 661 018,84 7 703 208,06 30,89
ITALY 7 661 018,84 7 703 208,06 30,89
Government 7 661 018,84 7 703 208,06 30,89 4 500 000,00 CTZ 0.00% 27/02/2017 EUR 4 475 218,81 4 501 440,00 18,05 3 200 000,00 CTZ 0.00% 30/08/2017 EUR 3 184 800,00 3 200 768,00 12,84
1 000,00 BOT 0.00% 29/02/2016 EUR 1 000,03 1 000,06 0,00
Total Portfolio 28 027 947,72 29 008 355,96 116,32
43
Investment Solutions by Epsilon - Forex Coupon 2016
The accompanying notes form an integral part of these financial statements.
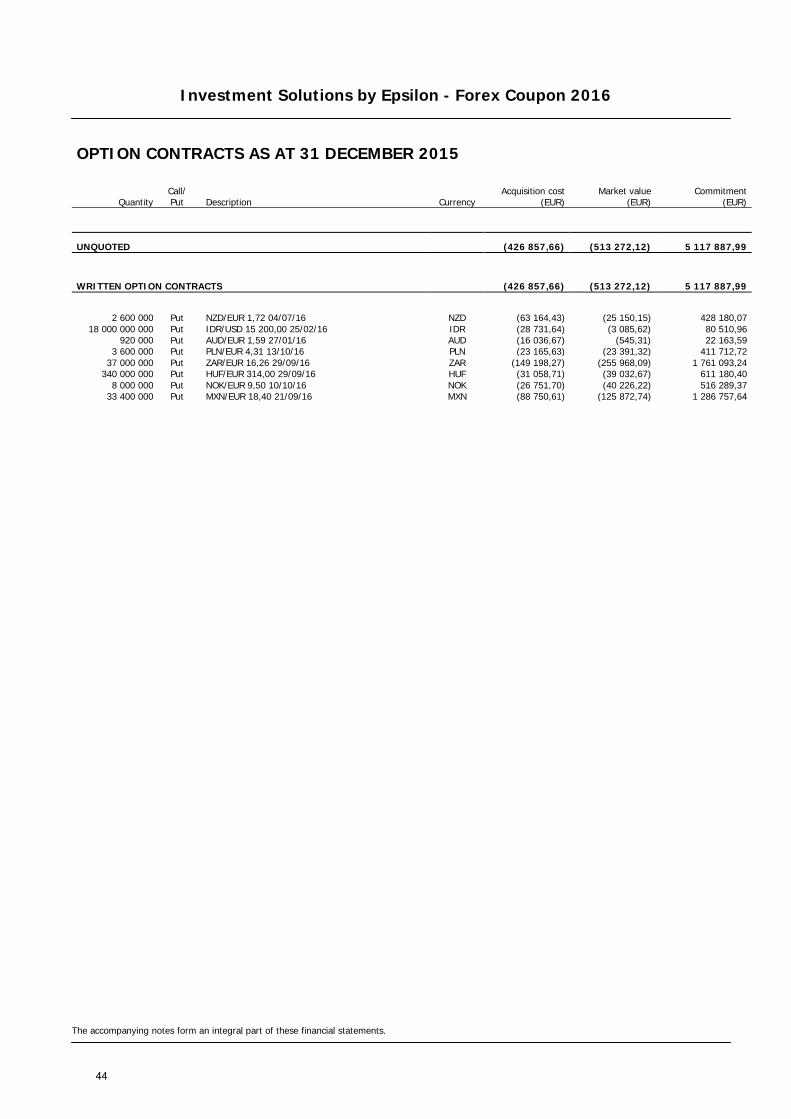
OPTION CONTRACTS AS AT 31 DECEMBER 2015
Quantity Call/ Put Description Currency
Acquisition cost (EUR)
Market value (EUR)
Commitment (EUR)
UNQUOTED (426 857,66) (513 272,12) 5 117 887,99
WRITTEN OPTION CONTRACTS (426 857,66) (513 272,12) 5 117 887,99
2 600 000 Put NZD/EUR 1,72 04/07/16 NZD (63 164,43) (25 150,15) 428 180,07
18 000 000 000 Put IDR/USD 15 200,00 25/02/16 IDR (28 731,64) (3 085,62) 80 510,96 920 000 Put AUD/EUR 1,59 27/01/16 AUD (16 036,67) (545,31) 22 163,59
3 600 000 Put PLN/EUR 4,31 13/10/16 PLN (23 165,63) (23 391,32) 411 712,72 37 000 000 Put ZAR/EUR 16,26 29/09/16 ZAR (149 198,27) (255 968,09) 1 761 093,24
340 000 000 Put HUF/EUR 314,00 29/09/16 HUF (31 058,71) (39 032,67) 611 180,40 8 000 000 Put NOK/EUR 9,50 10/10/16 NOK (26 751,70) (40 226,22) 516 289,37
33 400 000 Put MXN/EUR 18,40 21/09/16 MXN (88 750,61) (125 872,74) 1 286 757,64
44
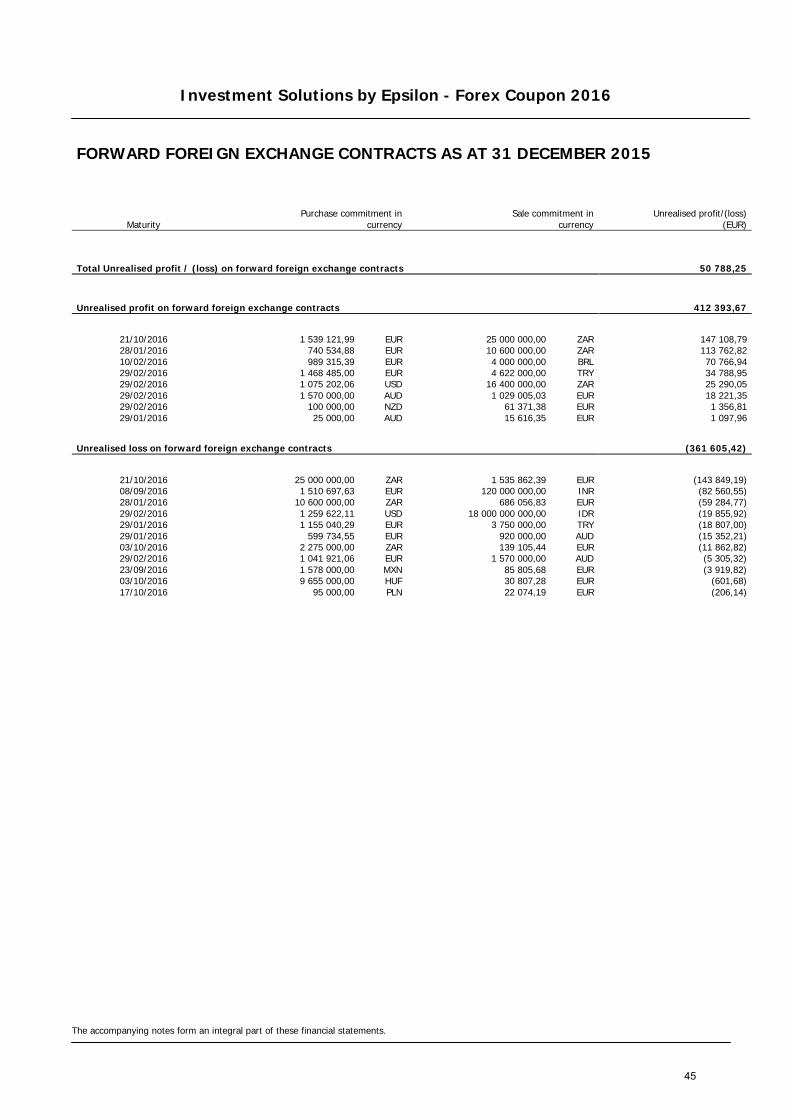
Investment Solutions by Epsilon - Forex Coupon 2016
The accompanying notes form an integral part of these financial statements.
FORWARD FOREIGN EXCHANGE CONTRACTS AS AT 31 DECEMBER 2015
Maturity Purchase commitment in
currency Sale commitment in
currency
Unrealised profit/(loss) (EUR)
Total Unrealised profit / (loss) on forward foreign exchange contracts 50 788,25
Unrealised profit on forward foreign exchange contracts 412 393,67
21/10/2016 1 539 121,99 EUR 25 000 000,00 ZAR 147 108,79 28/01/2016 740 534,88 EUR 10 600 000,00 ZAR 113 762,82 10/02/2016 989 315,39 EUR 4 000 000,00 BRL 70 766,94 29/02/2016 1 468 485,00 EUR 4 622 000,00 TRY 34 788,95 29/02/2016 1 075 202,06 USD 16 400 000,00 ZAR 25 290,05 29/02/2016 1 570 000,00 AUD 1 029 005,03 EUR 18 221,35 29/02/2016 100 000,00 NZD 61 371,38 EUR 1 356,81 29/01/2016 25 000,00 AUD 15 616,35 EUR 1 097,96
Unrealised loss on forward foreign exchange contracts (361 605,42)
21/10/2016 25 000 000,00 ZAR 1 535 862,39 EUR (143 849,19) 08/09/2016 1 510 697,63 EUR 120 000 000,00 INR (82 560,55) 28/01/2016 10 600 000,00 ZAR 686 056,83 EUR (59 284,77) 29/02/2016 1 259 622,11 USD 18 000 000 000,00 IDR (19 855,92) 29/01/2016 1 155 040,29 EUR 3 750 000,00 TRY (18 807,00) 29/01/2016 599 734,55 EUR 920 000,00 AUD (15 352,21) 03/10/2016 2 275 000,00 ZAR 139 105,44 EUR (11 862,82) 29/02/2016 1 041 921,06 EUR 1 570 000,00 AUD (5 305,32) 23/09/2016 1 578 000,00 MXN 85 805,68 EUR (3 919,82) 03/10/2016 9 655 000,00 HUF 30 807,28 EUR (601,68) 17/10/2016 95 000,00 PLN 22 074,19 EUR (206,14)
45
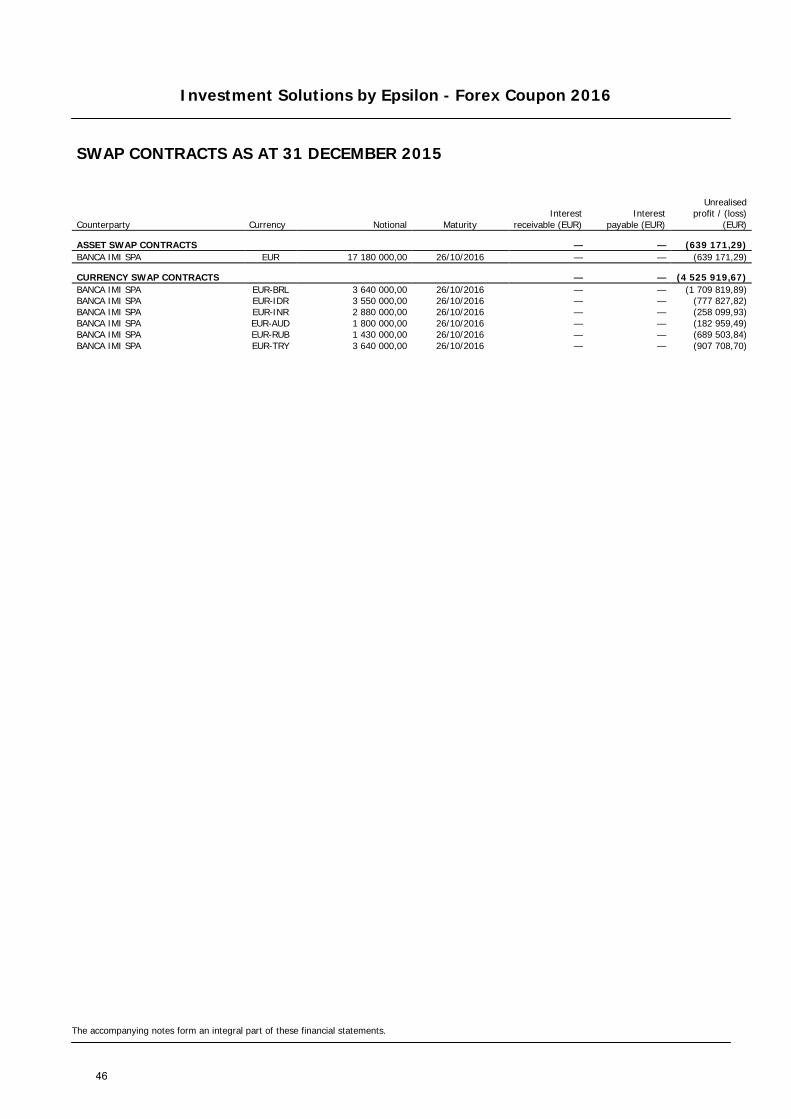
Investment Solutions by Epsilon - Forex Coupon 2016
The accompanying notes form an integral part of these financial statements.
SWAP CONTRACTS AS AT 31 DECEMBER 2015
Counterparty Currency Notional Maturity Interest
receivable (EUR) Interest
payable (EUR)
Unrealised
profit / (loss) (EUR)
ASSET SWAP CONTRACTS — — (639 171,29) BANCA IMI SPA EUR 17 180 000,00 26/10/2016 — — (639 171,29)
CURRENCY SWAP CONTRACTS — — (4 525 919,67) BANCA IMI SPA EUR-BRL 3 640 000,00 26/10/2016 — — (1 709 819,89) BANCA IMI SPA EUR-IDR 3 550 000,00 26/10/2016 — — (777 827,82) BANCA IMI SPA EUR-INR 2 880 000,00 26/10/2016 — — (258 099,93) BANCA IMI SPA EUR-AUD 1 800 000,00 26/10/2016 — — (182 959,49) BANCA IMI SPA EUR-RUB 1 430 000,00 26/10/2016 — — (689 503,84) BANCA IMI SPA EUR-TRY 3 640 000,00 26/10/2016 — — (907 708,70)
46
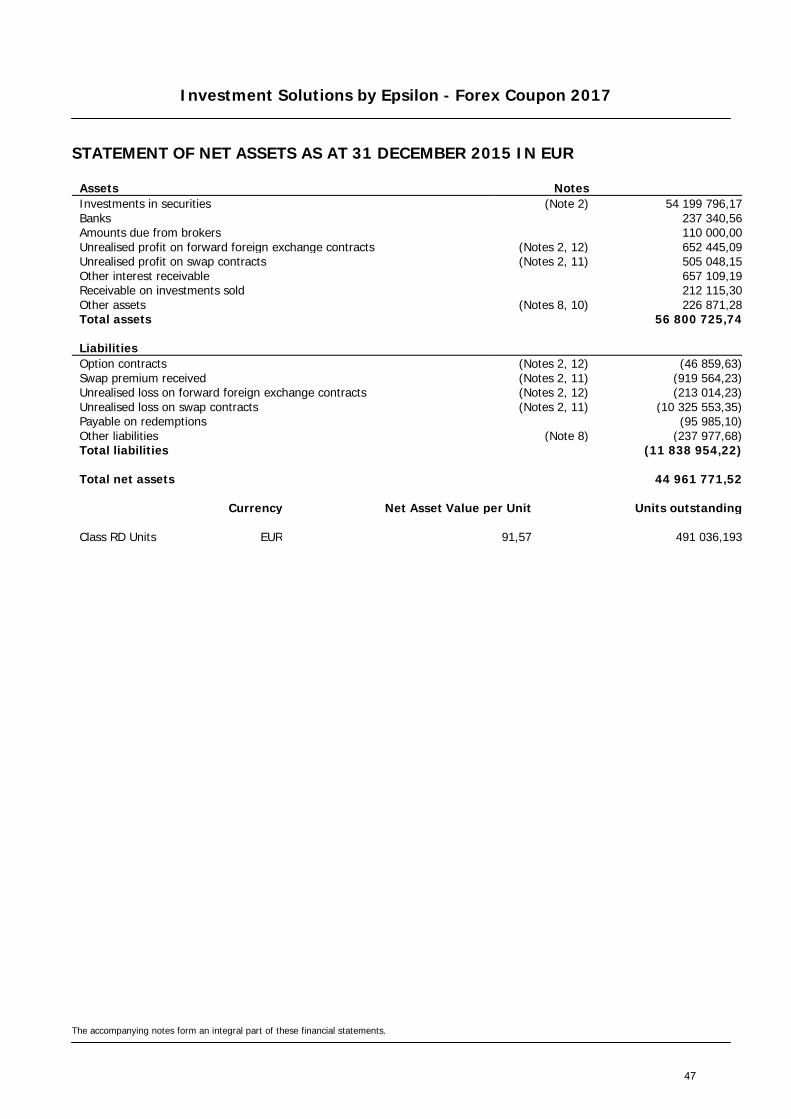
Investment Solutions by Epsilon - Forex Coupon 2017
STATEMENT OF NET ASSETS AS AT 31 DECEMBER 2015 IN EUR
The accompanying notes form an integral part of these financial statements.
Assets Notes Investments in securities (Note 2) 54 199 796,17 Banks 237 340,56 Amounts due from brokers 110 000,00 Unrealised profit on forward foreign exchange contracts (Notes 2, 12) 652 445,09 Unrealised profit on swap contracts (Notes 2, 11) 505 048,15 Other interest receivable 657 109,19 Receivable on investments sold 212 115,30 Other assets (Notes 8, 10) 226 871,28 Total assets 56 800 725,74
Liabilities Option contracts (Notes 2, 12) (46 859,63) Swap premium received (Notes 2, 11) (919 564,23) Unrealised loss on forward foreign exchange contracts (Notes 2, 12) (213 014,23) Unrealised loss on swap contracts (Notes 2, 11) (10 325 553,35) Payable on redemptions (95 985,10) Other liabilities (Note 8) (237 977,68) Total liabilities (11 838 954,22)
Total net assets 44 961 771,52
Currency Net Asset Value per Unit Units outstanding
Class RD Units EUR 91,57 491 036,193
47

Investment Solutions by Epsilon - Forex Coupon 2017
STATEMENT OF CHANGES IN NET ASSETS FOR THE YEAR ENDED 31 DECEMBER 2015 IN EUR
The accompanying notes form an integral part of these financial statements.
Net assets at the beginning of the year Notes 65 800 279,47
Net income from investments (Note 2) 2 575 524,16 Interest on bank accounts 216,74 Other income (Note 9) 75 976,23 Total income 2 651 717,13 Management fee (Note 5) (458 255,03) Depositary and paying agent fee (Note 7) (36 909,53) Subscription tax (Note 3) (27 134,42) Interest on bank accounts (339,27) Other charges and taxes (Notes 4, 10) (239 508,87) Total expenses (762 147,12) Net investment income / (loss) 1 889 570,01 Net realised profit / (loss) on sales of investments, currencies and other financial instruments (Notes 2, 11, 12) 800 494,78 Change in unrealised appreciation / (depreciation) on - investments (Note 2) (2 399 453,04) - option contracts (Notes 2, 12) 50 164,06 - forward foreign exchange contracts (Notes 2, 12) 458 499,13 - foreign currencies 139,13 - swap contracts (Notes 2, 11) 935 305,57 Net result of operations for the year 1 734 719,64
Redemptions for the year (20 487 682,77) Dividend distributions (Note 13) (2 085 544,82)
Net assets at the end of the year 44 961 771,52
48
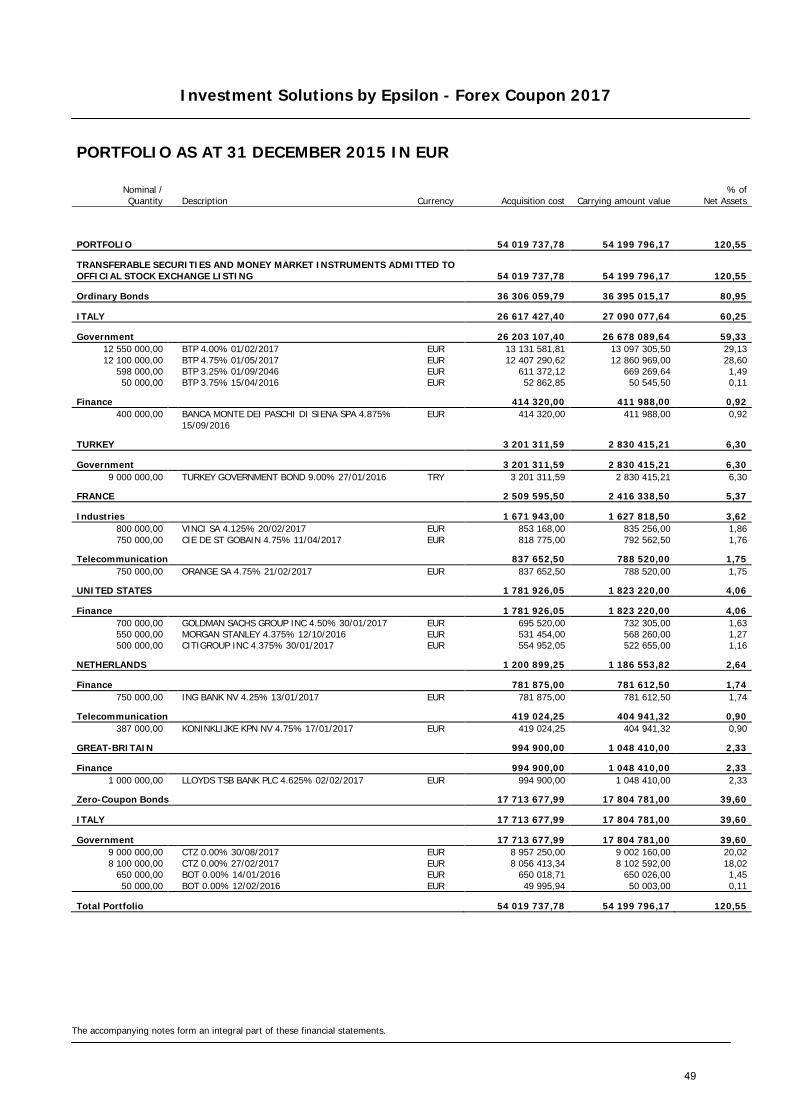
Investment Solutions by Epsilon - Forex Coupon 2017
The accompanying notes form an integral part of these financial statements.
PORTFOLIO AS AT 31 DECEMBER 2015 IN EUR
Nominal / Quantity Description Currency Acquisition cost Carrying amount value
% of Net Assets
PORTFOLIO 54 019 737,78 54 199 796,17 120,55
TRANSFERABLE SECURITIES AND MONEY MARKET INSTRUMENTS ADMITTED TO OFFICIAL STOCK EXCHANGE LISTING 54 019 737,78 54 199 796,17 120,55
Ordinary Bonds 36 306 059,79 36 395 015,17 80,95
ITALY 26 617 427,40 27 090 077,64 60,25
Government 26 203 107,40 26 678 089,64 59,33 12 550 000,00 BTP 4.00% 01/02/2017 EUR 13 131 581,81 13 097 305,50 29,13 12 100 000,00 BTP 4.75% 01/05/2017 EUR 12 407 290,62 12 860 969,00 28,60
598 000,00 BTP 3.25% 01/09/2046 EUR 611 372,12 669 269,64 1,49 50 000,00 BTP 3.75% 15/04/2016 EUR 52 862,85 50 545,50 0,11
Finance 414 320,00 411 988,00 0,92 400 000,00
BANCA MONTE DEI PASCHI DI SIENA SPA 4.875% 15/09/2016
EUR 414 320,00 411 988,00 0,92
TURKEY 3 201 311,59 2 830 415,21 6,30
Government 3 201 311,59 2 830 415,21 6,30 9 000 000,00 TURKEY GOVERNMENT BOND 9.00% 27/01/2016 TRY 3 201 311,59 2 830 415,21 6,30
FRANCE 2 509 595,50 2 416 338,50 5,37
Industries 1 671 943,00 1 627 818,50 3,62 800 000,00 VINCI SA 4.125% 20/02/2017 EUR 853 168,00 835 256,00 1,86 750 000,00 CIE DE ST GOBAIN 4.75% 11/04/2017 EUR 818 775,00 792 562,50 1,76
Telecommunication 837 652,50 788 520,00 1,75 750 000,00 ORANGE SA 4.75% 21/02/2017 EUR 837 652,50 788 520,00 1,75
UNITED STATES 1 781 926,05 1 823 220,00 4,06
Finance 1 781 926,05 1 823 220,00 4,06 700 000,00 GOLDMAN SACHS GROUP INC 4.50% 30/01/2017 EUR 695 520,00 732 305,00 1,63 550 000,00 MORGAN STANLEY 4.375% 12/10/2016 EUR 531 454,00 568 260,00 1,27 500 000,00 CITIGROUP INC 4.375% 30/01/2017 EUR 554 952,05 522 655,00 1,16
NETHERLANDS 1 200 899,25 1 186 553,82 2,64
Finance 781 875,00 781 612,50 1,74 750 000,00 ING BANK NV 4.25% 13/01/2017 EUR 781 875,00 781 612,50 1,74
Telecommunication 419 024,25 404 941,32 0,90 387 000,00 KONINKLIJKE KPN NV 4.75% 17/01/2017 EUR 419 024,25 404 941,32 0,90
GREAT-BRITAIN 994 900,00 1 048 410,00 2,33
Finance 994 900,00 1 048 410,00 2,33 1 000 000,00 LLOYDS TSB BANK PLC 4.625% 02/02/2017 EUR 994 900,00 1 048 410,00 2,33
Zero-Coupon Bonds 17 713 677,99 17 804 781,00 39,60
ITALY 17 713 677,99 17 804 781,00 39,60
Government 17 713 677,99 17 804 781,00 39,60 9 000 000,00 CTZ 0.00% 30/08/2017 EUR 8 957 250,00 9 002 160,00 20,02 8 100 000,00 CTZ 0.00% 27/02/2017 EUR 8 056 413,34 8 102 592,00 18,02
650 000,00 BOT 0.00% 14/01/2016 EUR 650 018,71 650 026,00 1,45 50 000,00 BOT 0.00% 12/02/2016 EUR 49 995,94 50 003,00 0,11
Total Portfolio 54 019 737,78 54 199 796,17 120,55
49
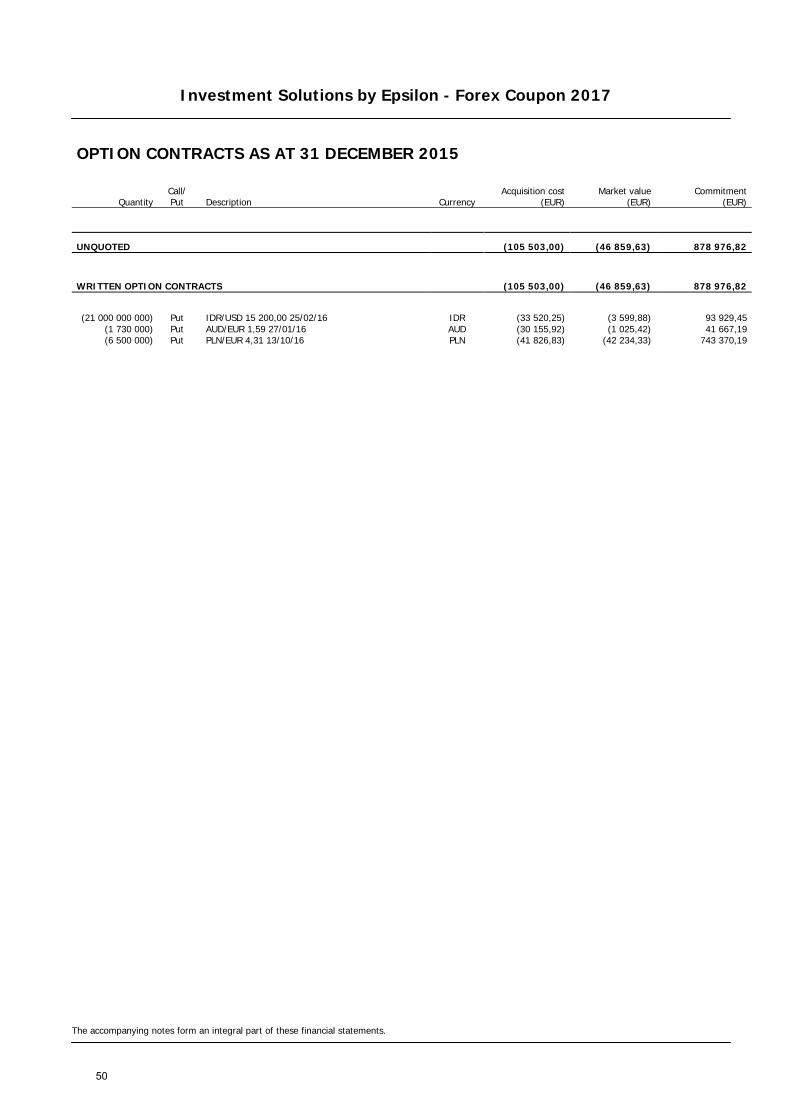
Investment Solutions by Epsilon - Forex Coupon 2017
The accompanying notes form an integral part of these financial statements.
OPTION CONTRACTS AS AT 31 DECEMBER 2015
Quantity Call/ Put Description Currency
Acquisition cost (EUR)
Market value (EUR)
Commitment (EUR)
UNQUOTED (105 503,00) (46 859,63) 878 976,82
WRITTEN OPTION CONTRACTS (105 503,00) (46 859,63) 878 976,82
(21 000 000 000) Put IDR/USD 15 200,00 25/02/16 IDR (33 520,25) (3 599,88) 93 929,45
(1 730 000) Put AUD/EUR 1,59 27/01/16 AUD (30 155,92) (1 025,42) 41 667,19 (6 500 000) Put PLN/EUR 4,31 13/10/16 PLN (41 826,83) (42 234,33) 743 370,19
50
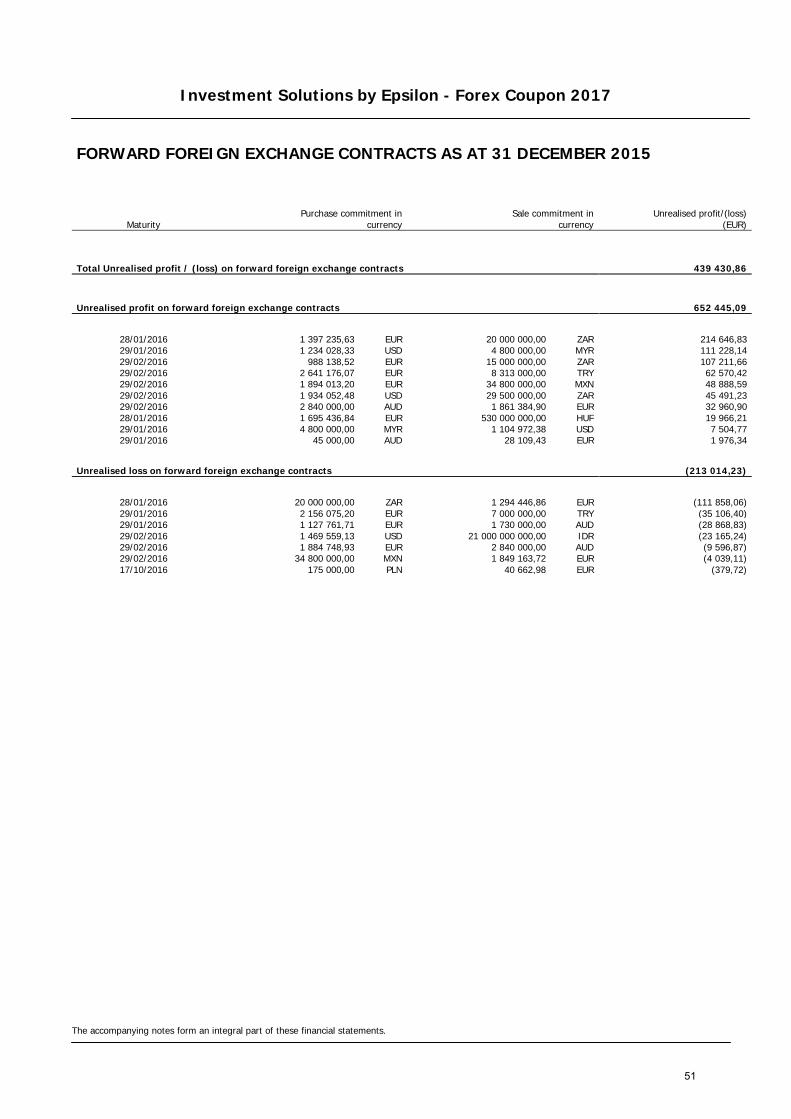
Investment Solutions by Epsilon - Forex Coupon 2017
The accompanying notes form an integral part of these financial statements.
FORWARD FOREIGN EXCHANGE CONTRACTS AS AT 31 DECEMBER 2015
Maturity Purchase commitment in
currency Sale commitment in
currency
Unrealised profit/(loss) (EUR)
Total Unrealised profit / (loss) on forward foreign exchange contracts 439 430,86
Unrealised profit on forward foreign exchange contracts 652 445,09
28/01/2016 1 397 235,63 EUR 20 000 000,00 ZAR 214 646,83 29/01/2016 1 234 028,33 USD 4 800 000,00 MYR 111 228,14 29/02/2016 988 138,52 EUR 15 000 000,00 ZAR 107 211,66 29/02/2016 2 641 176,07 EUR 8 313 000,00 TRY 62 570,42 29/02/2016 1 894 013,20 EUR 34 800 000,00 MXN 48 888,59 29/02/2016 1 934 052,48 USD 29 500 000,00 ZAR 45 491,23 29/02/2016 2 840 000,00 AUD 1 861 384,90 EUR 32 960,90 28/01/2016 1 695 436,84 EUR 530 000 000,00 HUF 19 966,21 29/01/2016 4 800 000,00 MYR 1 104 972,38 USD 7 504,77 29/01/2016 45 000,00 AUD 28 109,43 EUR 1 976,34
Unrealised loss on forward foreign exchange contracts (213 014,23)
28/01/2016 20 000 000,00 ZAR 1 294 446,86 EUR (111 858,06) 29/01/2016 2 156 075,20 EUR 7 000 000,00 TRY (35 106,40) 29/01/2016 1 127 761,71 EUR 1 730 000,00 AUD (28 868,83) 29/02/2016 1 469 559,13 USD 21 000 000 000,00 IDR (23 165,24) 29/02/2016 1 884 748,93 EUR 2 840 000,00 AUD (9 596,87) 29/02/2016 34 800 000,00 MXN 1 849 163,72 EUR (4 039,11) 17/10/2016 175 000,00 PLN 40 662,98 EUR (379,72)
51
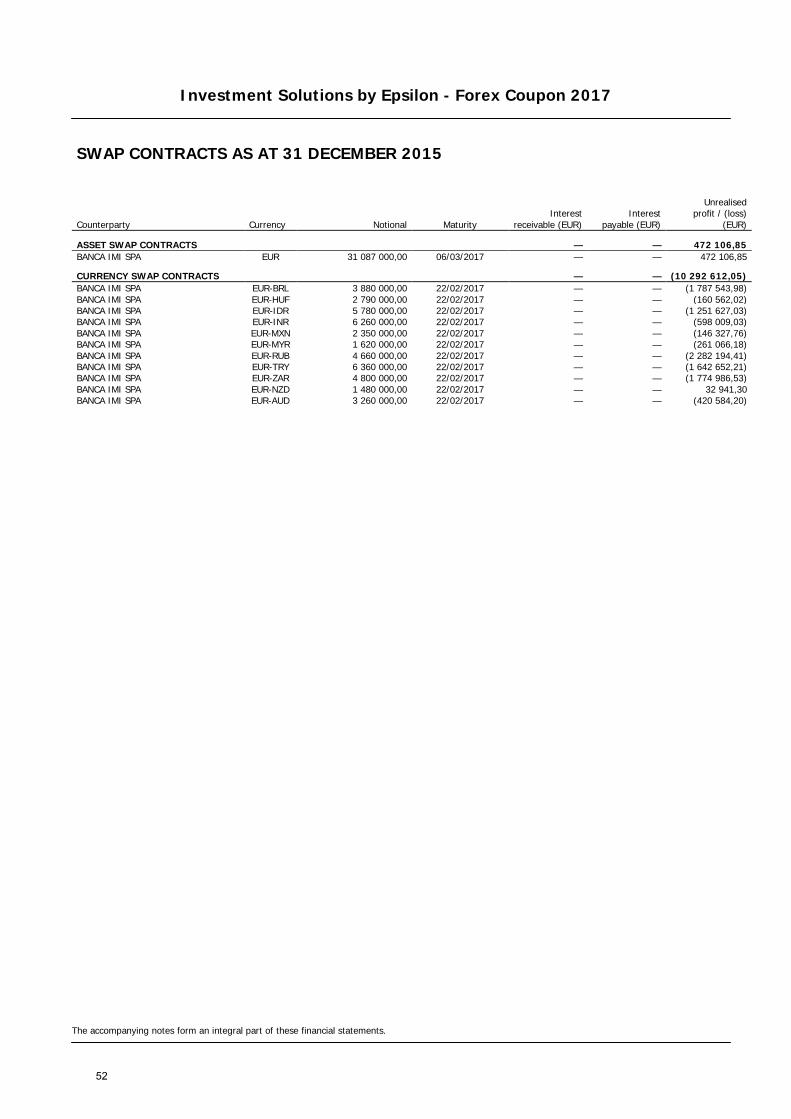
Investment Solutions by Epsilon - Forex Coupon 2017
The accompanying notes form an integral part of these financial statements.
SWAP CONTRACTS AS AT 31 DECEMBER 2015
Counterparty Currency Notional Maturity Interest
receivable (EUR) Interest
payable (EUR)
Unrealised
profit / (loss) (EUR)
ASSET SWAP CONTRACTS — — 472 106,85 BANCA IMI SPA EUR 31 087 000,00 06/03/2017 — — 472 106,85
CURRENCY SWAP CONTRACTS — — (10 292 612,05) BANCA IMI SPA EUR-BRL 3 880 000,00 22/02/2017 — — (1 787 543,98) BANCA IMI SPA EUR-HUF 2 790 000,00 22/02/2017 — — (160 562,02) BANCA IMI SPA EUR-IDR 5 780 000,00 22/02/2017 — — (1 251 627,03) BANCA IMI SPA EUR-INR 6 260 000,00 22/02/2017 — — (598 009,03) BANCA IMI SPA EUR-MXN 2 350 000,00 22/02/2017 — — (146 327,76) BANCA IMI SPA EUR-MYR 1 620 000,00 22/02/2017 — — (261 066,18) BANCA IMI SPA EUR-RUB 4 660 000,00 22/02/2017 — — (2 282 194,41) BANCA IMI SPA EUR-TRY 6 360 000,00 22/02/2017 — — (1 642 652,21) BANCA IMI SPA EUR-ZAR 4 800 000,00 22/02/2017 — — (1 774 986,53) BANCA IMI SPA EUR-NZD 1 480 000,00 22/02/2017 — — 32 941,30 BANCA IMI SPA EUR-AUD 3 260 000,00 22/02/2017 — — (420 584,20)
52
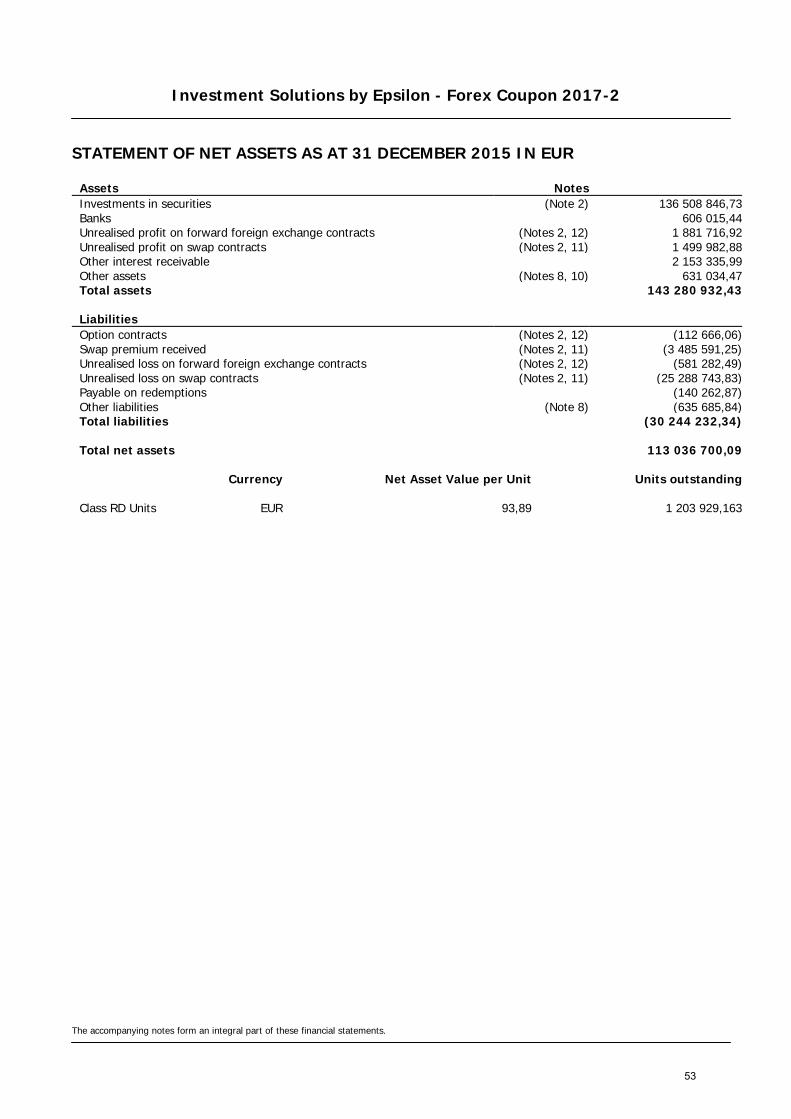
Investment Solutions by Epsilon - Forex Coupon 2017-2
STATEMENT OF NET ASSETS AS AT 31 DECEMBER 2015 IN EUR
The accompanying notes form an integral part of these financial statements.
Assets Notes Investments in securities (Note 2) 136 508 846,73 Banks 606 015,44 Unrealised profit on forward foreign exchange contracts (Notes 2, 12) 1 881 716,92 Unrealised profit on swap contracts (Notes 2, 11) 1 499 982,88 Other interest receivable 2 153 335,99 Other assets (Notes 8, 10) 631 034,47 Total assets 143 280 932,43
Liabilities Option contracts (Notes 2, 12) (112 666,06) Swap premium received (Notes 2, 11) (3 485 591,25) Unrealised loss on forward foreign exchange contracts (Notes 2, 12) (581 282,49) Unrealised loss on swap contracts (Notes 2, 11) (25 288 743,83) Payable on redemptions (140 262,87) Other liabilities (Note 8) (635 685,84) Total liabilities (30 244 232,34)
Total net assets 113 036 700,09
Currency Net Asset Value per Unit Units outstanding
Class RD Units EUR 93,89 1 203 929,163
53

Investment Solutions by Epsilon - Forex Coupon 2017-2
STATEMENT OF CHANGES IN NET ASSETS FOR THE YEAR ENDED 31 DECEMBER 2015 IN EUR
The accompanying notes form an integral part of these financial statements.
Net assets at the beginning of the year Notes 161 442 892,01
Net income from investments (Note 2) 7 273 082,07 Interest on bank accounts 651,99 Other income (Note 9) 214 864,13 Total income 7 488 598,19 Management fee (Note 5) (1 118 387,70) Depositary and paying agent fee (Note 7) (89 424,98) Subscription tax (Note 3) (66 650,21) Interest on bank accounts (945,77) Other charges and taxes (Notes 4, 10) (591 727,85) Total expenses (1 867 136,51) Net investment income / (loss) 5 621 461,68 Net realised profit / (loss) on sales of investments, currencies and other financial instruments (Notes 2, 11, 12) 1 945 008,30 Change in unrealised appreciation / (depreciation) on - investments (Note 2) (5 985 993,76) - option contracts (Notes 2, 12) 185 012,81 - forward foreign exchange contracts (Notes 2, 12) 1 575 353,79 - foreign currencies 851,05 - swap contracts (Notes 2, 11) 773 676,86 Net result of operations for the year 4 115 370,73
Redemptions for the year (47 938 428,72) Dividend distributions (Note 13) (4 583 133,93)
Net assets at the end of the year 113 036 700,09
54
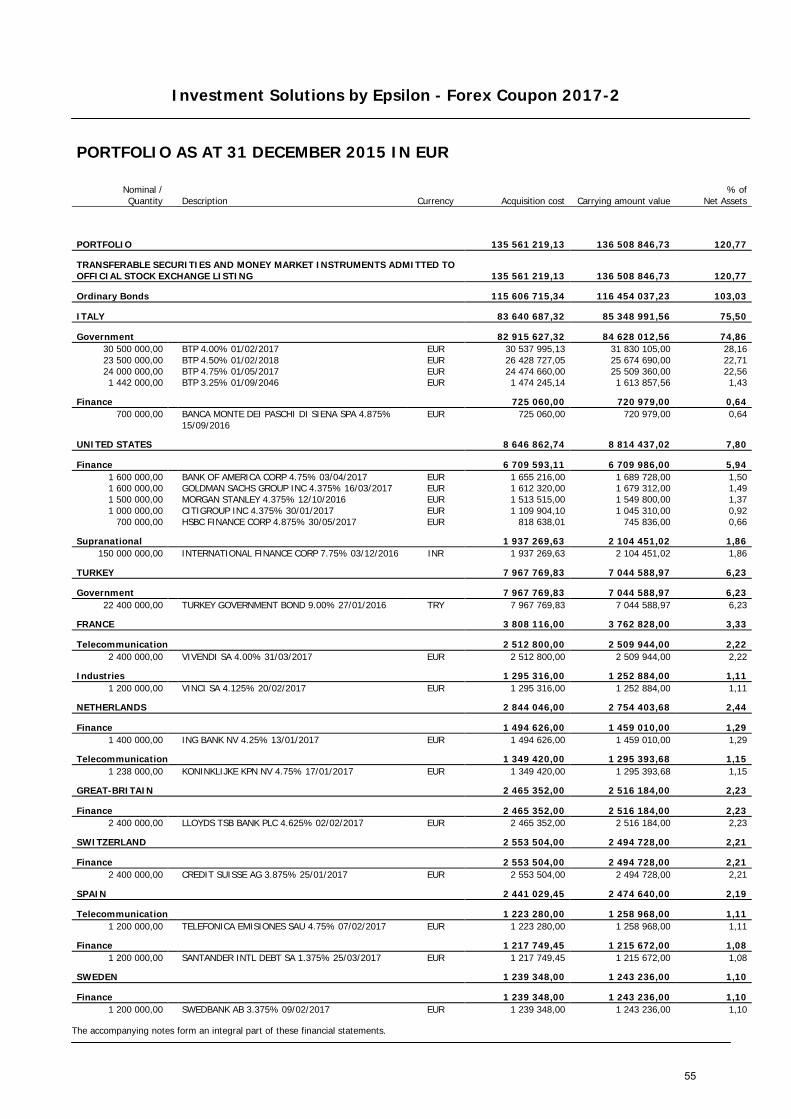
Investment Solutions by Epsilon - Forex Coupon 2017-2
The accompanying notes form an integral part of these financial statements.
PORTFOLIO AS AT 31 DECEMBER 2015 IN EUR
Nominal / Quantity Description Currency Acquisition cost Carrying amount value
% of Net Assets
PORTFOLIO 135 561 219,13 136 508 846,73 120,77
TRANSFERABLE SECURITIES AND MONEY MARKET INSTRUMENTS ADMITTED TO OFFICIAL STOCK EXCHANGE LISTING 135 561 219,13 136 508 846,73 120,77
Ordinary Bonds 115 606 715,34 116 454 037,23 103,03
ITALY 83 640 687,32 85 348 991,56 75,50
Government 82 915 627,32 84 628 012,56 74,86 30 500 000,00 BTP 4.00% 01/02/2017 EUR 30 537 995,13 31 830 105,00 28,16 23 500 000,00 BTP 4.50% 01/02/2018 EUR 26 428 727,05 25 674 690,00 22,71 24 000 000,00 BTP 4.75% 01/05/2017 EUR 24 474 660,00 25 509 360,00 22,56 1 442 000,00 BTP 3.25% 01/09/2046 EUR 1 474 245,14 1 613 857,56 1,43
Finance 725 060,00 720 979,00 0,64 700 000,00
BANCA MONTE DEI PASCHI DI SIENA SPA 4.875% 15/09/2016
EUR 725 060,00 720 979,00 0,64
UNITED STATES 8 646 862,74 8 814 437,02 7,80
Finance 6 709 593,11 6 709 986,00 5,94 1 600 000,00 BANK OF AMERICA CORP 4.75% 03/04/2017 EUR 1 655 216,00 1 689 728,00 1,50 1 600 000,00 GOLDMAN SACHS GROUP INC 4.375% 16/03/2017 EUR 1 612 320,00 1 679 312,00 1,49 1 500 000,00 MORGAN STANLEY 4.375% 12/10/2016 EUR 1 513 515,00 1 549 800,00 1,37 1 000 000,00 CITIGROUP INC 4.375% 30/01/2017 EUR 1 109 904,10 1 045 310,00 0,92
700 000,00 HSBC FINANCE CORP 4.875% 30/05/2017 EUR 818 638,01 745 836,00 0,66
Supranational 1 937 269,63 2 104 451,02 1,86 150 000 000,00 INTERNATIONAL FINANCE CORP 7.75% 03/12/2016 INR 1 937 269,63 2 104 451,02 1,86
TURKEY 7 967 769,83 7 044 588,97 6,23
Government 7 967 769,83 7 044 588,97 6,23 22 400 000,00 TURKEY GOVERNMENT BOND 9.00% 27/01/2016 TRY 7 967 769,83 7 044 588,97 6,23
FRANCE 3 808 116,00 3 762 828,00 3,33
Telecommunication 2 512 800,00 2 509 944,00 2,22 2 400 000,00 VIVENDI SA 4.00% 31/03/2017 EUR 2 512 800,00 2 509 944,00 2,22
Industries 1 295 316,00 1 252 884,00 1,11 1 200 000,00 VINCI SA 4.125% 20/02/2017 EUR 1 295 316,00 1 252 884,00 1,11
NETHERLANDS 2 844 046,00 2 754 403,68 2,44
Finance 1 494 626,00 1 459 010,00 1,29 1 400 000,00 ING BANK NV 4.25% 13/01/2017 EUR 1 494 626,00 1 459 010,00 1,29
Telecommunication 1 349 420,00 1 295 393,68 1,15 1 238 000,00 KONINKLIJKE KPN NV 4.75% 17/01/2017 EUR 1 349 420,00 1 295 393,68 1,15
GREAT-BRITAIN 2 465 352,00 2 516 184,00 2,23
Finance 2 465 352,00 2 516 184,00 2,23 2 400 000,00 LLOYDS TSB BANK PLC 4.625% 02/02/2017 EUR 2 465 352,00 2 516 184,00 2,23
SWITZERLAND 2 553 504,00 2 494 728,00 2,21
Finance 2 553 504,00 2 494 728,00 2,21 2 400 000,00 CREDIT SUISSE AG 3.875% 25/01/2017 EUR 2 553 504,00 2 494 728,00 2,21
SPAIN 2 441 029,45 2 474 640,00 2,19
Telecommunication 1 223 280,00 1 258 968,00 1,11 1 200 000,00 TELEFONICA EMISIONES SAU 4.75% 07/02/2017 EUR 1 223 280,00 1 258 968,00 1,11
Finance 1 217 749,45 1 215 672,00 1,08 1 200 000,00 SANTANDER INTL DEBT SA 1.375% 25/03/2017 EUR 1 217 749,45 1 215 672,00 1,08
SWEDEN 1 239 348,00 1 243 236,00 1,10
Finance 1 239 348,00 1 243 236,00 1,10 1 200 000,00 SWEDBANK AB 3.375% 09/02/2017 EUR 1 239 348,00 1 243 236,00 1,10
55
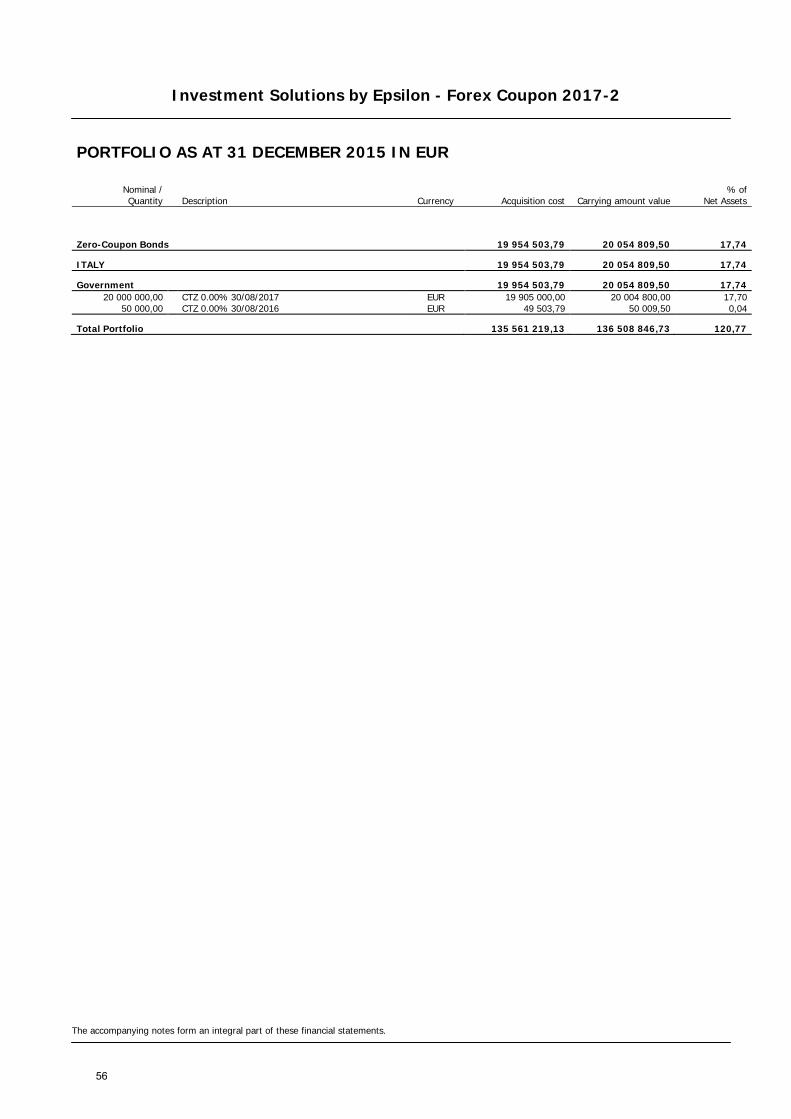
Investment Solutions by Epsilon - Forex Coupon 2017-2
The accompanying notes form an integral part of these financial statements.
PORTFOLIO AS AT 31 DECEMBER 2015 IN EUR
Nominal / Quantity Description Currency Acquisition cost Carrying amount value
% of Net Assets
Zero-Coupon Bonds 19 954 503,79 20 054 809,50 17,74
ITALY 19 954 503,79 20 054 809,50 17,74
Government 19 954 503,79 20 054 809,50 17,74 20 000 000,00 CTZ 0.00% 30/08/2017 EUR 19 905 000,00 20 004 800,00 17,70
50 000,00 CTZ 0.00% 30/08/2016 EUR 49 503,79 50 009,50 0,04
Total Portfolio 135 561 219,13 136 508 846,73 120,77
56

Investment Solutions by Epsilon - Forex Coupon 2017-2
The accompanying notes form an integral part of these financial statements.
OPTION CONTRACTS AS AT 31 DECEMBER 2015
Quantity Call/ Put Description Currency
Acquisition cost (EUR)
Market value (EUR)
Commitment (EUR)
UNQUOTED (344 145,81) (112 666,06) 2 104 056,97
WRITTEN OPTION CONTRACTS (344 145,81) (112 666,06) 2 104 056,97
(20 000 000 000) Put IDR/USD 15 200,00 25/02/16 IDR (31 924,05) (3 428,46) 89 456,62
(11 900 000) Put AUD/EUR 1,60 27/01/16 AUD (209 263,41) (5 276,16) 184 766,04 (16 000 000) Put PLN/EUR 4,31 13/10/16 PLN (102 958,35) (103 961,44) 1 829 834,31
57
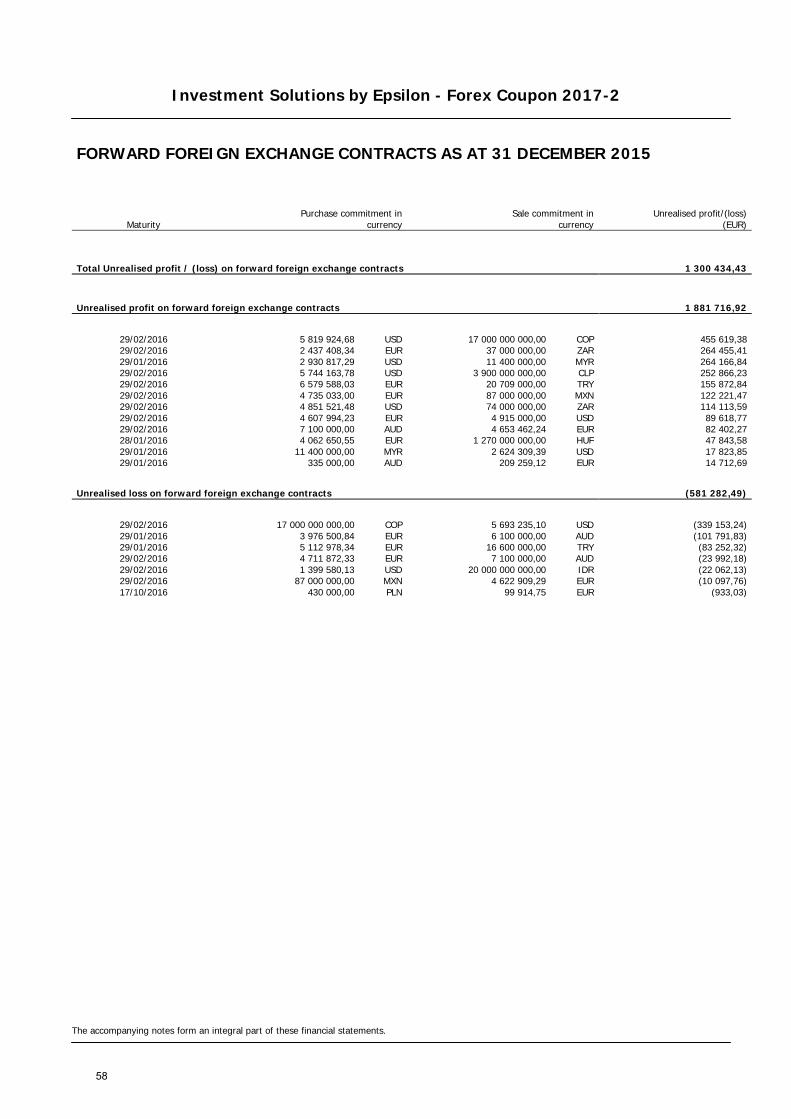
Investment Solutions by Epsilon - Forex Coupon 2017-2
The accompanying notes form an integral part of these financial statements.
FORWARD FOREIGN EXCHANGE CONTRACTS AS AT 31 DECEMBER 2015
Maturity Purchase commitment in
currency Sale commitment in
currency
Unrealised profit/(loss) (EUR)
Total Unrealised profit / (loss) on forward foreign exchange contracts 1 300 434,43
Unrealised profit on forward foreign exchange contracts 1 881 716,92
29/02/2016 5 819 924,68 USD 17 000 000 000,00 COP 455 619,38 29/02/2016 2 437 408,34 EUR 37 000 000,00 ZAR 264 455,41 29/01/2016 2 930 817,29 USD 11 400 000,00 MYR 264 166,84 29/02/2016 5 744 163,78 USD 3 900 000 000,00 CLP 252 866,23 29/02/2016 6 579 588,03 EUR 20 709 000,00 TRY 155 872,84 29/02/2016 4 735 033,00 EUR 87 000 000,00 MXN 122 221,47 29/02/2016 4 851 521,48 USD 74 000 000,00 ZAR 114 113,59 29/02/2016 4 607 994,23 EUR 4 915 000,00 USD 89 618,77 29/02/2016 7 100 000,00 AUD 4 653 462,24 EUR 82 402,27 28/01/2016 4 062 650,55 EUR 1 270 000 000,00 HUF 47 843,58 29/01/2016 11 400 000,00 MYR 2 624 309,39 USD 17 823,85 29/01/2016 335 000,00 AUD 209 259,12 EUR 14 712,69
Unrealised loss on forward foreign exchange contracts (581 282,49)
29/02/2016 17 000 000 000,00 COP 5 693 235,10 USD (339 153,24) 29/01/2016 3 976 500,84 EUR 6 100 000,00 AUD (101 791,83) 29/01/2016 5 112 978,34 EUR 16 600 000,00 TRY (83 252,32) 29/02/2016 4 711 872,33 EUR 7 100 000,00 AUD (23 992,18) 29/02/2016 1 399 580,13 USD 20 000 000 000,00 IDR (22 062,13) 29/02/2016 87 000 000,00 MXN 4 622 909,29 EUR (10 097,76) 17/10/2016 430 000,00 PLN 99 914,75 EUR (933,03)
58

Investment Solutions by Epsilon - Forex Coupon 2017-2
The accompanying notes form an integral part of these financial statements.
SWAP CONTRACTS AS AT 31 DECEMBER 2015
Counterparty Currency Notional Maturity Interest
receivable (EUR) Interest
payable (EUR)
Unrealised
profit / (loss) (EUR)
ASSET SWAP CONTRACTS — — 1 427 697,14 BANCA IMI SPA EUR 99 038 000,00 11/04/2017 — — 1 427 697,14
CURRENCY SWAP CONTRACTS — — (25 216 458,09) BANCA IMI SPA EUR-NOK 3 500 000,00 04/04/2017 — — (684 745,87) BANCA IMI SPA EUR-MXN 9 600 000,00 04/04/2017 — — (921 224,73) BANCA IMI SPA EUR-BRL 11 300 000,00 04/04/2017 — — (5 049 640,27) BANCA IMI SPA EUR-AUD 9 000 000,00 04/04/2017 — — (1 141 663,95) BANCA IMI SPA EUR-RUB 8 600 000,00 04/04/2017 — — (4 265 813,79) BANCA IMI SPA EUR-ZAR 9 650 000,00 04/04/2017 — — (3 452 745,68) BANCA IMI SPA EUR-IDR 10 900 000,00 04/04/2017 — — (2 538 257,93) BANCA IMI SPA EUR-TRY 10 800 000,00 04/04/2017 — — (2 819 817,58) BANCA IMI SPA EUR-INR 7 470 000,00 04/04/2017 — — (593 469,17) BANCA IMI SPA EUR-MYR 3 950 000,00 04/04/2017 — — (594 020,79) BANCA IMI SPA EUR-COP 5 900 000,00 04/04/2017 — — (1 928 667,16) BANCA IMI SPA EUR-CLP 6 600 000,00 04/04/2017 — — (1 093 378,50) BANCA IMI SPA EUR-HUF 6 550 000,00 04/04/2017 — — (205 298,41) BANCA IMI SPA EUR-NZD 5 500 000,00 04/04/2017 — — 72 285,74
59

Investment Solutions by Epsilon - Forex Coupon 2017-3
STATEMENT OF NET ASSETS AS AT 31 DECEMBER 2015 IN EUR
The accompanying notes form an integral part of these financial statements.
Assets Notes Investments in securities (Note 2) 85 726 392,83 Banks 977 238,46 Unrealised profit on forward foreign exchange contracts (Notes 2, 12) 1 068 266,27 Unrealised profit on swap contracts (Notes 2, 11) 820 026,74 Other interest receivable 1 237 425,20 Other assets (Notes 8, 10) 441 366,10 Total assets 90 270 715,60
Liabilities Option contracts (Notes 2, 12) (70 444,00) Swap premium received (Notes 2, 11) (2 103 213,00) Unrealised loss on forward foreign exchange contracts (Notes 2, 12) (372 522,09) Unrealised loss on swap contracts (Notes 2, 11) (16 312 565,07) Payable on redemptions (70 149,36) Other liabilities (Note 8) (426 711,91) Total liabilities (19 355 605,43)
Total net assets 70 915 110,17
Currency Net Asset Value per Unit Units outstanding
Class RD Units EUR 92,57 766 055,562
60

Investment Solutions by Epsilon - Forex Coupon 2017-3
STATEMENT OF CHANGES IN NET ASSETS FOR THE YEAR ENDED 31 DECEMBER 2015 IN EUR
The accompanying notes form an integral part of these financial statements.
Net assets at the beginning of the year Notes 101 053 254,01
Net income from investments (Note 2) 4 467 074,86 Interest on bank accounts 406,15 Other income (Note 9) 140 820,46 Total income 4 608 301,47 Management fee (Note 5) (705 102,22) Depositary and paying agent fee (Note 7) (56 549,01) Subscription tax (Note 3) (42 015,90) Interest on bank accounts (117,92) Other charges and taxes (Notes 4, 10) (383 052,92) Total expenses (1 186 837,97) Net investment income / (loss) 3 421 463,50 Net realised profit / (loss) on sales of investments, currencies and other financial instruments (Notes 2, 11, 12) 3 270 587,37 Change in unrealised appreciation / (depreciation) on - investments (Note 2) (4 700 241,81) - option contracts (Notes 2, 12) 141 192,51 - forward foreign exchange contracts (Notes 2, 12) 787 911,47 - foreign currencies 36,59 - swap contracts (Notes 2, 11) (1 126 179,45) Net result of operations for the year 1 794 770,18
Redemptions for the year (29 067 505,59) Dividend distributions (Note 13) (2 865 408,43)
Net assets at the end of the year 70 915 110,17
61
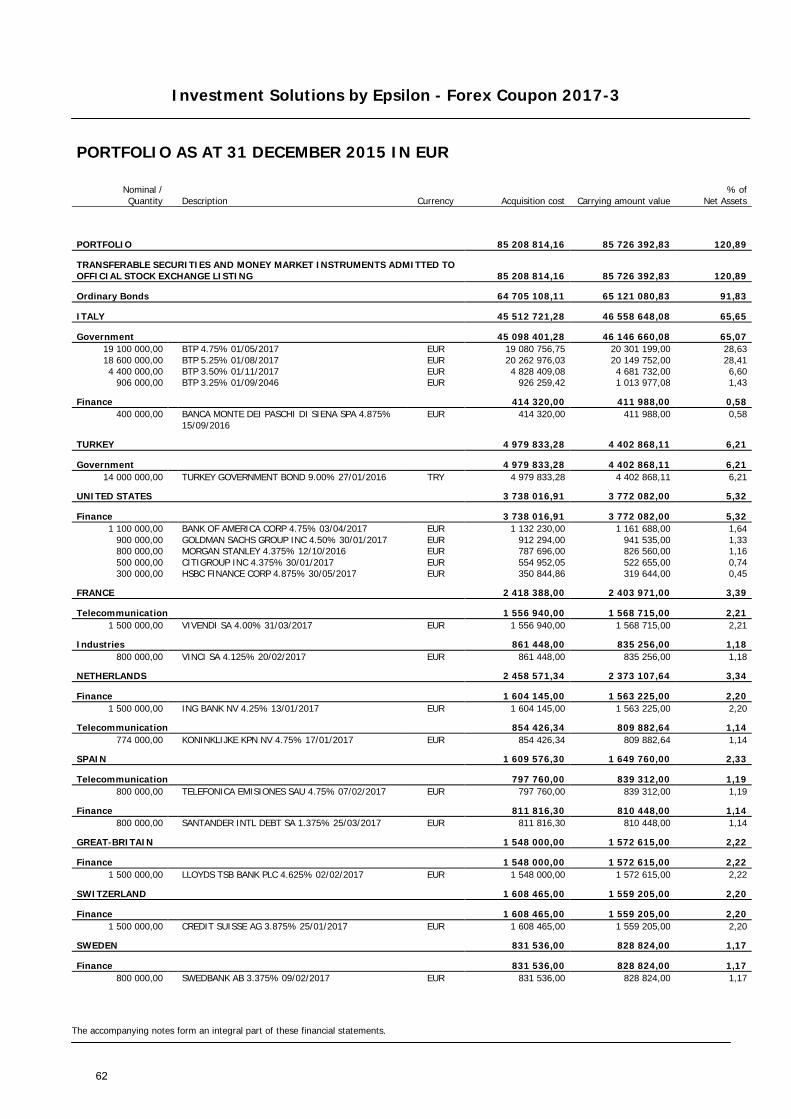
Investment Solutions by Epsilon - Forex Coupon 2017-3
The accompanying notes form an integral part of these financial statements.
PORTFOLIO AS AT 31 DECEMBER 2015 IN EUR
Nominal / Quantity Description Currency Acquisition cost Carrying amount value
% of Net Assets
PORTFOLIO 85 208 814,16 85 726 392,83 120,89
TRANSFERABLE SECURITIES AND MONEY MARKET INSTRUMENTS ADMITTED TO OFFICIAL STOCK EXCHANGE LISTING 85 208 814,16 85 726 392,83 120,89
Ordinary Bonds 64 705 108,11 65 121 080,83 91,83
ITALY 45 512 721,28 46 558 648,08 65,65
Government 45 098 401,28 46 146 660,08 65,07 19 100 000,00 BTP 4.75% 01/05/2017 EUR 19 080 756,75 20 301 199,00 28,63 18 600 000,00 BTP 5.25% 01/08/2017 EUR 20 262 976,03 20 149 752,00 28,41 4 400 000,00 BTP 3.50% 01/11/2017 EUR 4 828 409,08 4 681 732,00 6,60
906 000,00 BTP 3.25% 01/09/2046 EUR 926 259,42 1 013 977,08 1,43
Finance 414 320,00 411 988,00 0,58 400 000,00
BANCA MONTE DEI PASCHI DI SIENA SPA 4.875% 15/09/2016
EUR 414 320,00 411 988,00 0,58
TURKEY 4 979 833,28 4 402 868,11 6,21
Government 4 979 833,28 4 402 868,11 6,21 14 000 000,00 TURKEY GOVERNMENT BOND 9.00% 27/01/2016 TRY 4 979 833,28 4 402 868,11 6,21
UNITED STATES 3 738 016,91 3 772 082,00 5,32
Finance 3 738 016,91 3 772 082,00 5,32 1 100 000,00 BANK OF AMERICA CORP 4.75% 03/04/2017 EUR 1 132 230,00 1 161 688,00 1,64
900 000,00 GOLDMAN SACHS GROUP INC 4.50% 30/01/2017 EUR 912 294,00 941 535,00 1,33 800 000,00 MORGAN STANLEY 4.375% 12/10/2016 EUR 787 696,00 826 560,00 1,16 500 000,00 CITIGROUP INC 4.375% 30/01/2017 EUR 554 952,05 522 655,00 0,74 300 000,00 HSBC FINANCE CORP 4.875% 30/05/2017 EUR 350 844,86 319 644,00 0,45
FRANCE 2 418 388,00 2 403 971,00 3,39
Telecommunication 1 556 940,00 1 568 715,00 2,21 1 500 000,00 VIVENDI SA 4.00% 31/03/2017 EUR 1 556 940,00 1 568 715,00 2,21
Industries 861 448,00 835 256,00 1,18 800 000,00 VINCI SA 4.125% 20/02/2017 EUR 861 448,00 835 256,00 1,18
NETHERLANDS 2 458 571,34 2 373 107,64 3,34
Finance 1 604 145,00 1 563 225,00 2,20 1 500 000,00 ING BANK NV 4.25% 13/01/2017 EUR 1 604 145,00 1 563 225,00 2,20
Telecommunication 854 426,34 809 882,64 1,14 774 000,00 KONINKLIJKE KPN NV 4.75% 17/01/2017 EUR 854 426,34 809 882,64 1,14
SPAIN 1 609 576,30 1 649 760,00 2,33
Telecommunication 797 760,00 839 312,00 1,19 800 000,00 TELEFONICA EMISIONES SAU 4.75% 07/02/2017 EUR 797 760,00 839 312,00 1,19
Finance 811 816,30 810 448,00 1,14 800 000,00 SANTANDER INTL DEBT SA 1.375% 25/03/2017 EUR 811 816,30 810 448,00 1,14
GREAT-BRITAIN 1 548 000,00 1 572 615,00 2,22
Finance 1 548 000,00 1 572 615,00 2,22 1 500 000,00 LLOYDS TSB BANK PLC 4.625% 02/02/2017 EUR 1 548 000,00 1 572 615,00 2,22
SWITZERLAND 1 608 465,00 1 559 205,00 2,20
Finance 1 608 465,00 1 559 205,00 2,20 1 500 000,00 CREDIT SUISSE AG 3.875% 25/01/2017 EUR 1 608 465,00 1 559 205,00 2,20
SWEDEN 831 536,00 828 824,00 1,17
Finance 831 536,00 828 824,00 1,17 800 000,00 SWEDBANK AB 3.375% 09/02/2017 EUR 831 536,00 828 824,00 1,17
62
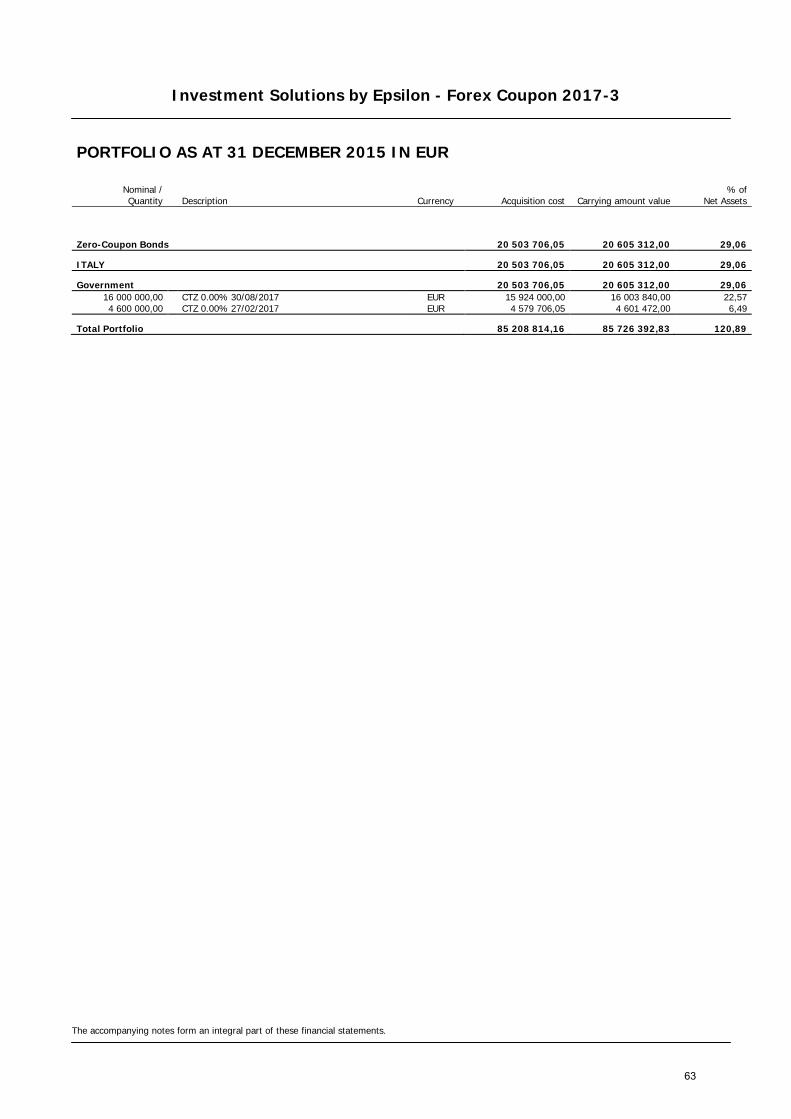
Investment Solutions by Epsilon - Forex Coupon 2017-3
The accompanying notes form an integral part of these financial statements.
PORTFOLIO AS AT 31 DECEMBER 2015 IN EUR
Nominal / Quantity Description Currency Acquisition cost Carrying amount value
% of Net Assets
Zero-Coupon Bonds 20 503 706,05 20 605 312,00 29,06
ITALY 20 503 706,05 20 605 312,00 29,06
Government 20 503 706,05 20 605 312,00 29,06 16 000 000,00 CTZ 0.00% 30/08/2017 EUR 15 924 000,00 16 003 840,00 22,57 4 600 000,00 CTZ 0.00% 27/02/2017 EUR 4 579 706,05 4 601 472,00 6,49
Total Portfolio 85 208 814,16 85 726 392,83 120,89
63

Investment Solutions by Epsilon - Forex Coupon 2017-3
The accompanying notes form an integral part of these financial statements.
OPTION CONTRACTS AS AT 31 DECEMBER 2015
Quantity Call/ Put Description Currency
Acquisition cost (EUR)
Market value (EUR)
Commitment (EUR)
UNQUOTED (216 190,21) (70 444,00) 1 316 006,02
WRITTEN OPTION CONTRACTS (216 190,21) (70 444,00) 1 316 006,02
(12 500 000 000) Put IDR/USD 15 200,00 25/02/16 IDR (19 952,53) (2 142,79) 55 910,39
(7 500 000) Put AUD/EUR 1,60 27/01/16 AUD (131 888,71) (3 325,31) 116 449,19 (10 000 000) Put PLN/EUR 4,31 13/10/16 PLN (64 348,97) (64 975,90) 1 143 646,45
64

Investment Solutions by Epsilon - Forex Coupon 2017-3
The accompanying notes form an integral part of these financial statements.
FORWARD FOREIGN EXCHANGE CONTRACTS AS AT 31 DECEMBER 2015
Maturity Purchase commitment in
currency Sale commitment in
currency
Unrealised profit/(loss) (EUR)
Total Unrealised profit / (loss) on forward foreign exchange contracts 695 744,18
Unrealised profit on forward foreign exchange contracts 1 068 266,27
29/02/2016 3 697 363,92 USD 10 800 000 000,00 COP 289 452,32 29/01/2016 1 851 042,50 USD 7 200 000,00 MYR 166 842,22 29/02/2016 3 637 970,40 USD 2 470 000 000,00 CLP 160 148,61 29/02/2016 4 119 510,28 EUR 12 966 000,00 TRY 97 592,70 29/02/2016 2 938 986,00 EUR 54 000 000,00 MXN 75 861,60 29/02/2016 3 048 591,20 USD 46 500 000,00 ZAR 71 706,51 29/02/2016 3 000 118,32 EUR 3 200 000,00 USD 58 347,93 10/02/2016 791 452,31 EUR 3 200 000,00 BRL 56 613,55 29/02/2016 4 400 000,00 AUD 2 883 835,75 EUR 51 066,20 28/01/2016 1 711 431,53 EUR 535 000 000,00 HUF 20 154,58 29/01/2016 7 200 000,00 MYR 1 657 458,56 USD 11 257,17 29/01/2016 210 000,00 AUD 131 177,36 EUR 9 222,88
Unrealised loss on forward foreign exchange contracts (372 522,09)
29/02/2016 10 800 000 000,00 COP 3 616 878,77 USD (215 462,06) 29/01/2016 2 477 164,46 EUR 3 800 000,00 AUD (63 411,30) 29/01/2016 3 234 112,81 EUR 10 500 000,00 TRY (52 659,60) 29/02/2016 2 920 033,55 EUR 4 400 000,00 AUD (14 868,40) 29/02/2016 874 737,58 USD 12 500 000 000,00 IDR (13 788,83) 29/02/2016 54 000 000,00 MXN 2 869 391,97 EUR (6 267,57) 29/02/2016 1 600 000,00 MXN 90 311,79 EUR (5 478,47) 17/10/2016 270 000,00 PLN 62 737,17 EUR (585,86)
65
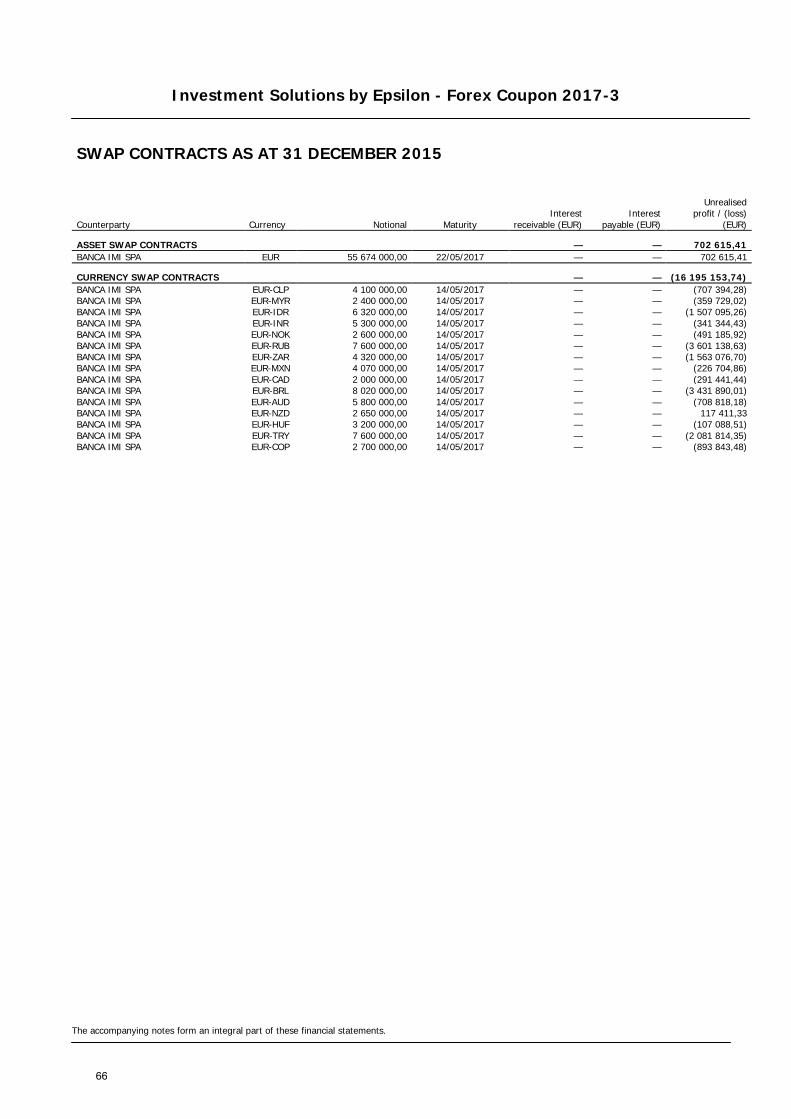
Investment Solutions by Epsilon - Forex Coupon 2017-3
The accompanying notes form an integral part of these financial statements.
SWAP CONTRACTS AS AT 31 DECEMBER 2015
Counterparty Currency Notional Maturity Interest
receivable (EUR) Interest
payable (EUR)
Unrealised
profit / (loss) (EUR)
ASSET SWAP CONTRACTS — — 702 615,41 BANCA IMI SPA EUR 55 674 000,00 22/05/2017 — — 702 615,41
CURRENCY SWAP CONTRACTS — — (16 195 153,74) BANCA IMI SPA EUR-CLP 4 100 000,00 14/05/2017 — — (707 394,28) BANCA IMI SPA EUR-MYR 2 400 000,00 14/05/2017 — — (359 729,02) BANCA IMI SPA EUR-IDR 6 320 000,00 14/05/2017 — — (1 507 095,26) BANCA IMI SPA EUR-INR 5 300 000,00 14/05/2017 — — (341 344,43) BANCA IMI SPA EUR-NOK 2 600 000,00 14/05/2017 — — (491 185,92) BANCA IMI SPA EUR-RUB 7 600 000,00 14/05/2017 — — (3 601 138,63) BANCA IMI SPA EUR-ZAR 4 320 000,00 14/05/2017 — — (1 563 076,70) BANCA IMI SPA EUR-MXN 4 070 000,00 14/05/2017 — — (226 704,86) BANCA IMI SPA EUR-CAD 2 000 000,00 14/05/2017 — — (291 441,44) BANCA IMI SPA EUR-BRL 8 020 000,00 14/05/2017 — — (3 431 890,01) BANCA IMI SPA EUR-AUD 5 800 000,00 14/05/2017 — — (708 818,18) BANCA IMI SPA EUR-NZD 2 650 000,00 14/05/2017 — — 117 411,33 BANCA IMI SPA EUR-HUF 3 200 000,00 14/05/2017 — — (107 088,51) BANCA IMI SPA EUR-TRY 7 600 000,00 14/05/2017 — — (2 081 814,35) BANCA IMI SPA EUR-COP 2 700 000,00 14/05/2017 — — (893 843,48)
66
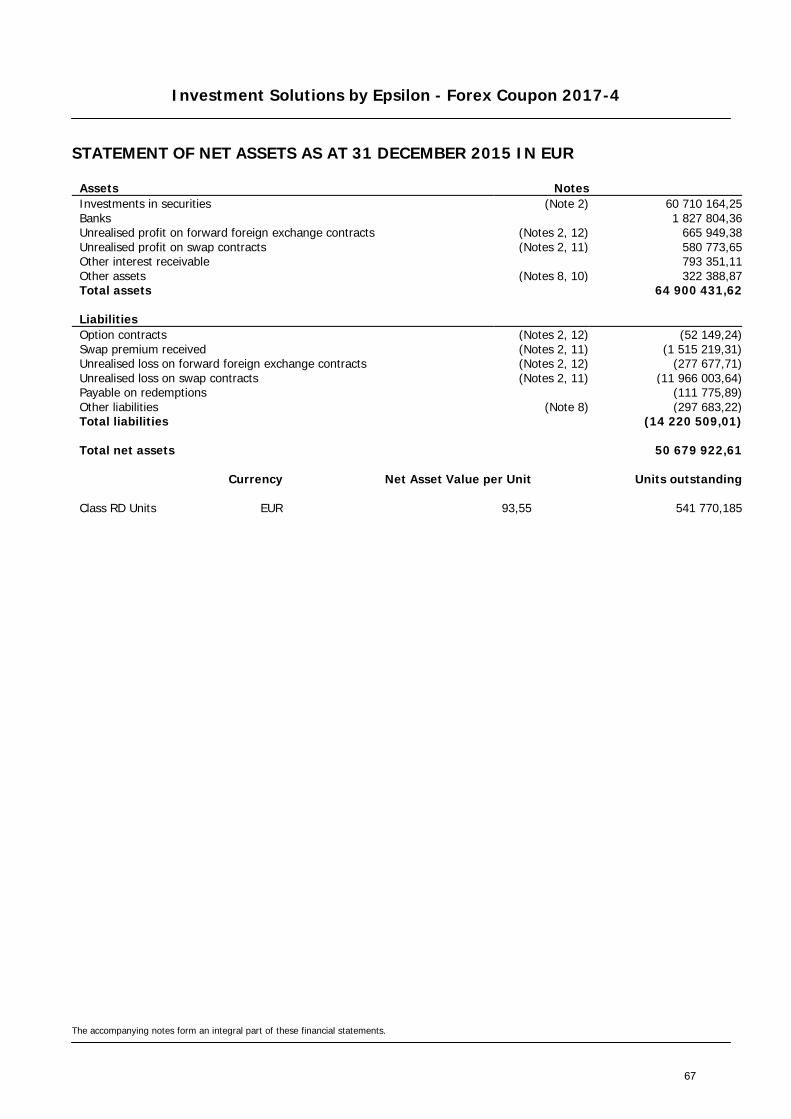
Investment Solutions by Epsilon - Forex Coupon 2017-4
STATEMENT OF NET ASSETS AS AT 31 DECEMBER 2015 IN EUR
The accompanying notes form an integral part of these financial statements.
Assets Notes Investments in securities (Note 2) 60 710 164,25 Banks 1 827 804,36 Unrealised profit on forward foreign exchange contracts (Notes 2, 12) 665 949,38 Unrealised profit on swap contracts (Notes 2, 11) 580 773,65 Other interest receivable 793 351,11 Other assets (Notes 8, 10) 322 388,87 Total assets 64 900 431,62
Liabilities Option contracts (Notes 2, 12) (52 149,24) Swap premium received (Notes 2, 11) (1 515 219,31) Unrealised loss on forward foreign exchange contracts (Notes 2, 12) (277 677,71) Unrealised loss on swap contracts (Notes 2, 11) (11 966 003,64) Payable on redemptions (111 775,89) Other liabilities (Note 8) (297 683,22) Total liabilities (14 220 509,01)
Total net assets 50 679 922,61
Currency Net Asset Value per Unit Units outstanding
Class RD Units EUR 93,55 541 770,185
67

Investment Solutions by Epsilon - Forex Coupon 2017-4
STATEMENT OF CHANGES IN NET ASSETS FOR THE YEAR ENDED 31 DECEMBER 2015 IN EUR
The accompanying notes form an integral part of these financial statements.
Net assets at the beginning of the year Notes 73 016 375,84
Net income from investments (Note 2) 3 066 854,73 Interest on bank accounts 276,34 Other income (Note 9) 80 297,93 Total income 3 147 429,00 Management fee (Note 5) (519 823,96) Depositary and paying agent fee (Note 7) (41 816,81) Subscription tax (Note 3) (30 998,02) Interest on bank accounts (73,38) Other charges and taxes (Notes 4, 10) (260 272,90) Total expenses (852 985,07) Net investment income / (loss) 2 294 443,93 Net realised profit / (loss) on sales of investments, currencies and other financial instruments (Notes 2, 11, 12) 2 143 604,21 Change in unrealised appreciation / (depreciation) on - investments (Note 2) (3 265 249,37) - option contracts (Notes 2, 12) 113 424,24 - forward foreign exchange contracts (Notes 2, 12) 409 723,43 - foreign currencies (340,94) - swap contracts (Notes 2, 11) (115 173,42) Net result of operations for the year 1 580 432,08
Redemptions for the year (22 914 817,43) Dividend distributions (Note 13) (1 002 067,88)
Net assets at the end of the year 50 679 922,61
68
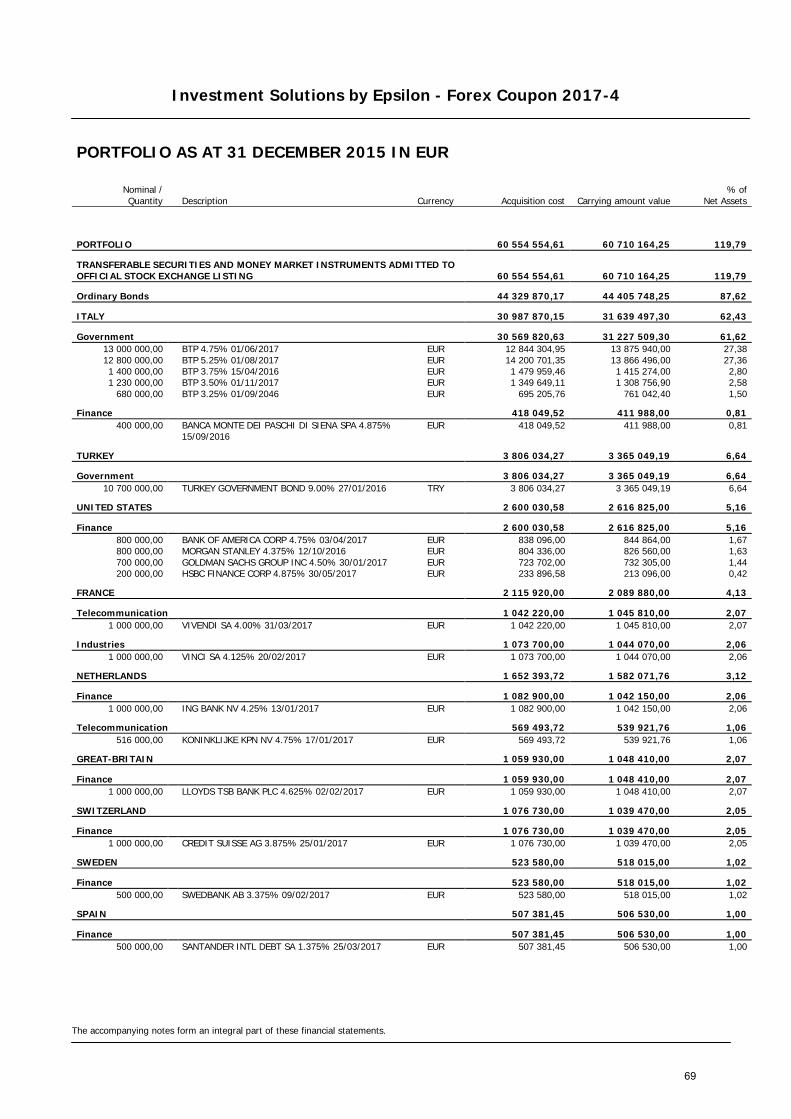
Investment Solutions by Epsilon - Forex Coupon 2017-4
The accompanying notes form an integral part of these financial statements.
PORTFOLIO AS AT 31 DECEMBER 2015 IN EUR
Nominal / Quantity Description Currency Acquisition cost Carrying amount value
% of Net Assets
PORTFOLIO 60 554 554,61 60 710 164,25 119,79
TRANSFERABLE SECURITIES AND MONEY MARKET INSTRUMENTS ADMITTED TO OFFICIAL STOCK EXCHANGE LISTING 60 554 554,61 60 710 164,25 119,79
Ordinary Bonds 44 329 870,17 44 405 748,25 87,62
ITALY 30 987 870,15 31 639 497,30 62,43
Government 30 569 820,63 31 227 509,30 61,62 13 000 000,00 BTP 4.75% 01/06/2017 EUR 12 844 304,95 13 875 940,00 27,38 12 800 000,00 BTP 5.25% 01/08/2017 EUR 14 200 701,35 13 866 496,00 27,36 1 400 000,00 BTP 3.75% 15/04/2016 EUR 1 479 959,46 1 415 274,00 2,80 1 230 000,00 BTP 3.50% 01/11/2017 EUR 1 349 649,11 1 308 756,90 2,58
680 000,00 BTP 3.25% 01/09/2046 EUR 695 205,76 761 042,40 1,50
Finance 418 049,52 411 988,00 0,81 400 000,00
BANCA MONTE DEI PASCHI DI SIENA SPA 4.875% 15/09/2016
EUR 418 049,52 411 988,00 0,81
TURKEY 3 806 034,27 3 365 049,19 6,64
Government 3 806 034,27 3 365 049,19 6,64 10 700 000,00 TURKEY GOVERNMENT BOND 9.00% 27/01/2016 TRY 3 806 034,27 3 365 049,19 6,64
UNITED STATES 2 600 030,58 2 616 825,00 5,16
Finance 2 600 030,58 2 616 825,00 5,16 800 000,00 BANK OF AMERICA CORP 4.75% 03/04/2017 EUR 838 096,00 844 864,00 1,67 800 000,00 MORGAN STANLEY 4.375% 12/10/2016 EUR 804 336,00 826 560,00 1,63 700 000,00 GOLDMAN SACHS GROUP INC 4.50% 30/01/2017 EUR 723 702,00 732 305,00 1,44 200 000,00 HSBC FINANCE CORP 4.875% 30/05/2017 EUR 233 896,58 213 096,00 0,42
FRANCE 2 115 920,00 2 089 880,00 4,13
Telecommunication 1 042 220,00 1 045 810,00 2,07 1 000 000,00 VIVENDI SA 4.00% 31/03/2017 EUR 1 042 220,00 1 045 810,00 2,07
Industries 1 073 700,00 1 044 070,00 2,06 1 000 000,00 VINCI SA 4.125% 20/02/2017 EUR 1 073 700,00 1 044 070,00 2,06
NETHERLANDS 1 652 393,72 1 582 071,76 3,12
Finance 1 082 900,00 1 042 150,00 2,06 1 000 000,00 ING BANK NV 4.25% 13/01/2017 EUR 1 082 900,00 1 042 150,00 2,06
Telecommunication 569 493,72 539 921,76 1,06 516 000,00 KONINKLIJKE KPN NV 4.75% 17/01/2017 EUR 569 493,72 539 921,76 1,06
GREAT-BRITAIN 1 059 930,00 1 048 410,00 2,07
Finance 1 059 930,00 1 048 410,00 2,07 1 000 000,00 LLOYDS TSB BANK PLC 4.625% 02/02/2017 EUR 1 059 930,00 1 048 410,00 2,07
SWITZERLAND 1 076 730,00 1 039 470,00 2,05
Finance 1 076 730,00 1 039 470,00 2,05 1 000 000,00 CREDIT SUISSE AG 3.875% 25/01/2017 EUR 1 076 730,00 1 039 470,00 2,05
SWEDEN 523 580,00 518 015,00 1,02
Finance 523 580,00 518 015,00 1,02 500 000,00 SWEDBANK AB 3.375% 09/02/2017 EUR 523 580,00 518 015,00 1,02
SPAIN 507 381,45 506 530,00 1,00
Finance 507 381,45 506 530,00 1,00 500 000,00 SANTANDER INTL DEBT SA 1.375% 25/03/2017 EUR 507 381,45 506 530,00 1,00
69

Investment Solutions by Epsilon - Forex Coupon 2017-4
The accompanying notes form an integral part of these financial statements.
PORTFOLIO AS AT 31 DECEMBER 2015 IN EUR
Nominal / Quantity Description Currency Acquisition cost Carrying amount value
% of Net Assets
Zero-Coupon Bonds 16 224 684,44 16 304 416,00 32,17
ITALY 16 224 684,44 16 304 416,00 32,17
Government 16 224 684,44 16 304 416,00 32,17 10 000 000,00 CTZ 0.00% 30/08/2017 EUR 9 952 500,00 10 002 400,00 19,74 6 300 000,00 CTZ 0.00% 27/02/2017 EUR 6 272 184,44 6 302 016,00 12,43
Total Portfolio 60 554 554,61 60 710 164,25 119,79
70
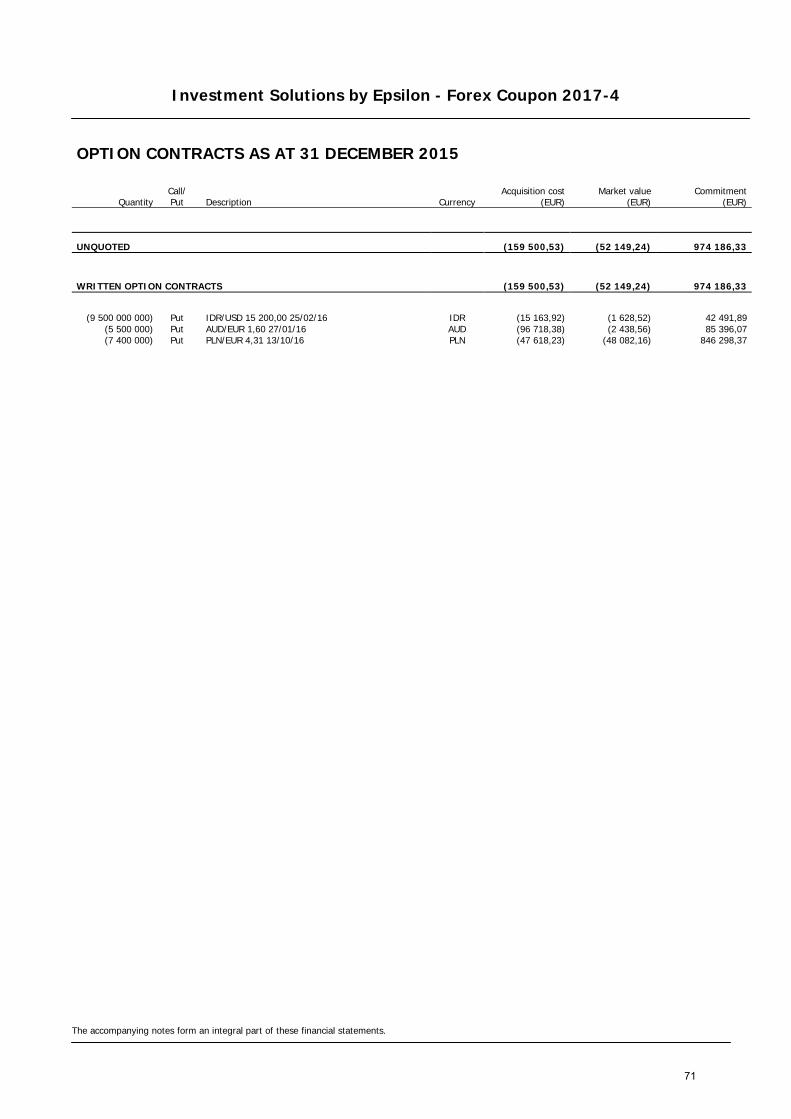
Investment Solutions by Epsilon - Forex Coupon 2017-4
The accompanying notes form an integral part of these financial statements.
OPTION CONTRACTS AS AT 31 DECEMBER 2015
Quantity Call/ Put Description Currency
Acquisition cost (EUR)
Market value (EUR)
Commitment (EUR)
UNQUOTED (159 500,53) (52 149,24) 974 186,33
WRITTEN OPTION CONTRACTS (159 500,53) (52 149,24) 974 186,33
(9 500 000 000) Put IDR/USD 15 200,00 25/02/16 IDR (15 163,92) (1 628,52) 42 491,89
(5 500 000) Put AUD/EUR 1,60 27/01/16 AUD (96 718,38) (2 438,56) 85 396,07 (7 400 000) Put PLN/EUR 4,31 13/10/16 PLN (47 618,23) (48 082,16) 846 298,37
71
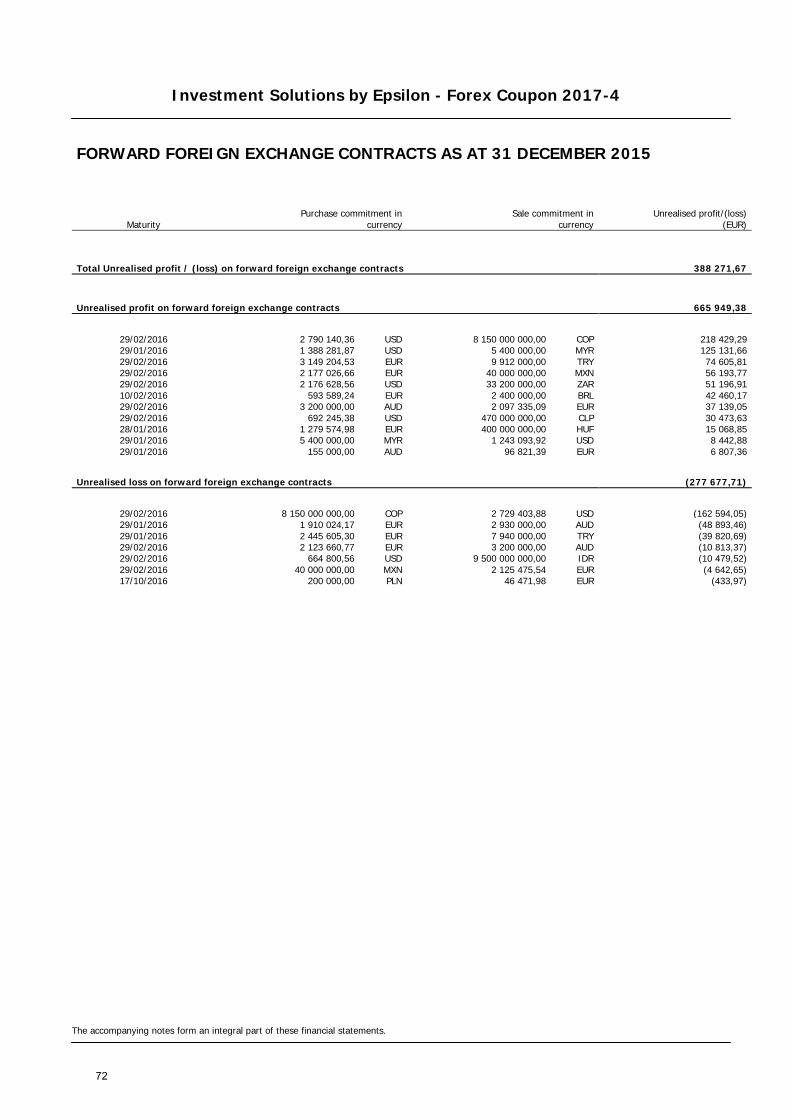
Investment Solutions by Epsilon - Forex Coupon 2017-4
The accompanying notes form an integral part of these financial statements.
FORWARD FOREIGN EXCHANGE CONTRACTS AS AT 31 DECEMBER 2015
Maturity Purchase commitment in
currency Sale commitment in
currency
Unrealised profit/(loss) (EUR)
Total Unrealised profit / (loss) on forward foreign exchange contracts 388 271,67
Unrealised profit on forward foreign exchange contracts 665 949,38
29/02/2016 2 790 140,36 USD 8 150 000 000,00 COP 218 429,29 29/01/2016 1 388 281,87 USD 5 400 000,00 MYR 125 131,66 29/02/2016 3 149 204,53 EUR 9 912 000,00 TRY 74 605,81 29/02/2016 2 177 026,66 EUR 40 000 000,00 MXN 56 193,77 29/02/2016 2 176 628,56 USD 33 200 000,00 ZAR 51 196,91 10/02/2016 593 589,24 EUR 2 400 000,00 BRL 42 460,17 29/02/2016 3 200 000,00 AUD 2 097 335,09 EUR 37 139,05 29/02/2016 692 245,38 USD 470 000 000,00 CLP 30 473,63 28/01/2016 1 279 574,98 EUR 400 000 000,00 HUF 15 068,85 29/01/2016 5 400 000,00 MYR 1 243 093,92 USD 8 442,88 29/01/2016 155 000,00 AUD 96 821,39 EUR 6 807,36
Unrealised loss on forward foreign exchange contracts (277 677,71)
29/02/2016 8 150 000 000,00 COP 2 729 403,88 USD (162 594,05) 29/01/2016 1 910 024,17 EUR 2 930 000,00 AUD (48 893,46) 29/01/2016 2 445 605,30 EUR 7 940 000,00 TRY (39 820,69) 29/02/2016 2 123 660,77 EUR 3 200 000,00 AUD (10 813,37) 29/02/2016 664 800,56 USD 9 500 000 000,00 IDR (10 479,52) 29/02/2016 40 000 000,00 MXN 2 125 475,54 EUR (4 642,65) 17/10/2016 200 000,00 PLN 46 471,98 EUR (433,97)
72
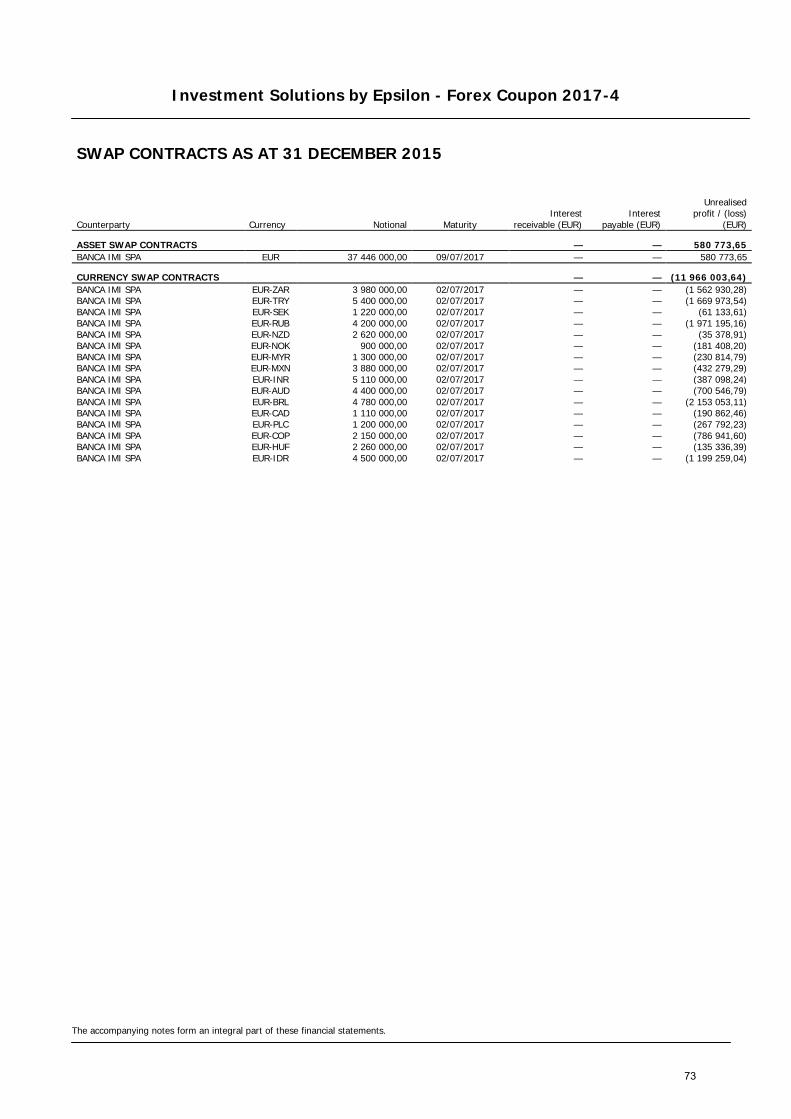
Investment Solutions by Epsilon - Forex Coupon 2017-4
The accompanying notes form an integral part of these financial statements.
SWAP CONTRACTS AS AT 31 DECEMBER 2015
Counterparty Currency Notional Maturity Interest
receivable (EUR) Interest
payable (EUR)
Unrealised
profit / (loss) (EUR)
ASSET SWAP CONTRACTS — — 580 773,65 BANCA IMI SPA EUR 37 446 000,00 09/07/2017 — — 580 773,65
CURRENCY SWAP CONTRACTS — — (11 966 003,64) BANCA IMI SPA EUR-ZAR 3 980 000,00 02/07/2017 — — (1 562 930,28) BANCA IMI SPA EUR-TRY 5 400 000,00 02/07/2017 — — (1 669 973,54) BANCA IMI SPA EUR-SEK 1 220 000,00 02/07/2017 — — (61 133,61) BANCA IMI SPA EUR-RUB 4 200 000,00 02/07/2017 — — (1 971 195,16) BANCA IMI SPA EUR-NZD 2 620 000,00 02/07/2017 — — (35 378,91) BANCA IMI SPA EUR-NOK 900 000,00 02/07/2017 — — (181 408,20) BANCA IMI SPA EUR-MYR 1 300 000,00 02/07/2017 — — (230 814,79) BANCA IMI SPA EUR-MXN 3 880 000,00 02/07/2017 — — (432 279,29) BANCA IMI SPA EUR-INR 5 110 000,00 02/07/2017 — — (387 098,24) BANCA IMI SPA EUR-AUD 4 400 000,00 02/07/2017 — — (700 546,79) BANCA IMI SPA EUR-BRL 4 780 000,00 02/07/2017 — — (2 153 053,11) BANCA IMI SPA EUR-CAD 1 110 000,00 02/07/2017 — — (190 862,46) BANCA IMI SPA EUR-PLC 1 200 000,00 02/07/2017 — — (267 792,23) BANCA IMI SPA EUR-COP 2 150 000,00 02/07/2017 — — (786 941,60) BANCA IMI SPA EUR-HUF 2 260 000,00 02/07/2017 — — (135 336,39) BANCA IMI SPA EUR-IDR 4 500 000,00 02/07/2017 — — (1 199 259,04)
73

Investment Solutions by Epsilon - Forex Coupon 2017-5
STATEMENT OF NET ASSETS AS AT 31 DECEMBER 2015 IN EUR
The accompanying notes form an integral part of these financial statements.
Assets Notes Investments in securities (Note 2) 116 876 289,27 Banks 1 800 314,64 Unrealised profit on forward foreign exchange contracts (Notes 2, 12) 1 765 299,81 Unrealised profit on swap contracts (Notes 2, 11) 1 926 837,59 Other interest receivable 1 551 091,47 Other assets (Notes 8, 10) 575 463,94 Total assets 124 495 296,72
Liabilities Option contracts (Notes 2, 12) (94 284,61) Swap premium received (Notes 2, 11) (5 052 950,14) Unrealised loss on forward foreign exchange contracts (Notes 2, 12) (435 565,78) Unrealised loss on swap contracts (Notes 2, 11) (24 077 169,26) Payable on redemptions (187 443,94) Other liabilities (Note 8) (465 146,20) Total liabilities (30 312 559,93)
Total net assets 94 182 736,79
Currency Net Asset Value per Unit Units outstanding
Class RD Units EUR 90,02 1 046 248,083
74

Investment Solutions by Epsilon - Forex Coupon 2017-5
STATEMENT OF CHANGES IN NET ASSETS FOR THE YEAR ENDED 31 DECEMBER 2015 IN EUR
The accompanying notes form an integral part of these financial statements.
Net assets at the beginning of the year Notes 127 412 153,19
Net income from investments (Note 2) 5 918 137,86 Interest on bank accounts 628,80 Other income (Note 9) 85 124,82 Total income 6 003 891,48 Management fee (Note 5) (922 383,91) Depositary and paying agent fee (Note 7) (73 806,42) Subscription tax (Note 3) (55 118,65) Interest on bank accounts (31,22) Other charges and taxes (Notes 4, 10) (412 250,64) Total expenses (1 463 590,84) Net investment income / (loss) 4 540 300,64 Net realised profit / (loss) on sales of investments, currencies and other financial instruments (Notes 2, 11, 12) 1 517 253,76 Change in unrealised appreciation / (depreciation) on - investments (Note 2) (5 130 168,71) - option contracts (Notes 2, 12) 68 723,93 - forward foreign exchange contracts (Notes 2, 12) 1 464 155,13 - foreign currencies 850,15 - swap contracts (Notes 2, 11) (61 120,76) Net result of operations for the year 2 399 994,14
Redemptions for the year (34 453 243,23) Dividend distributions (Note 13) (1 176 167,31)
Net assets at the end of the year 94 182 736,79
75
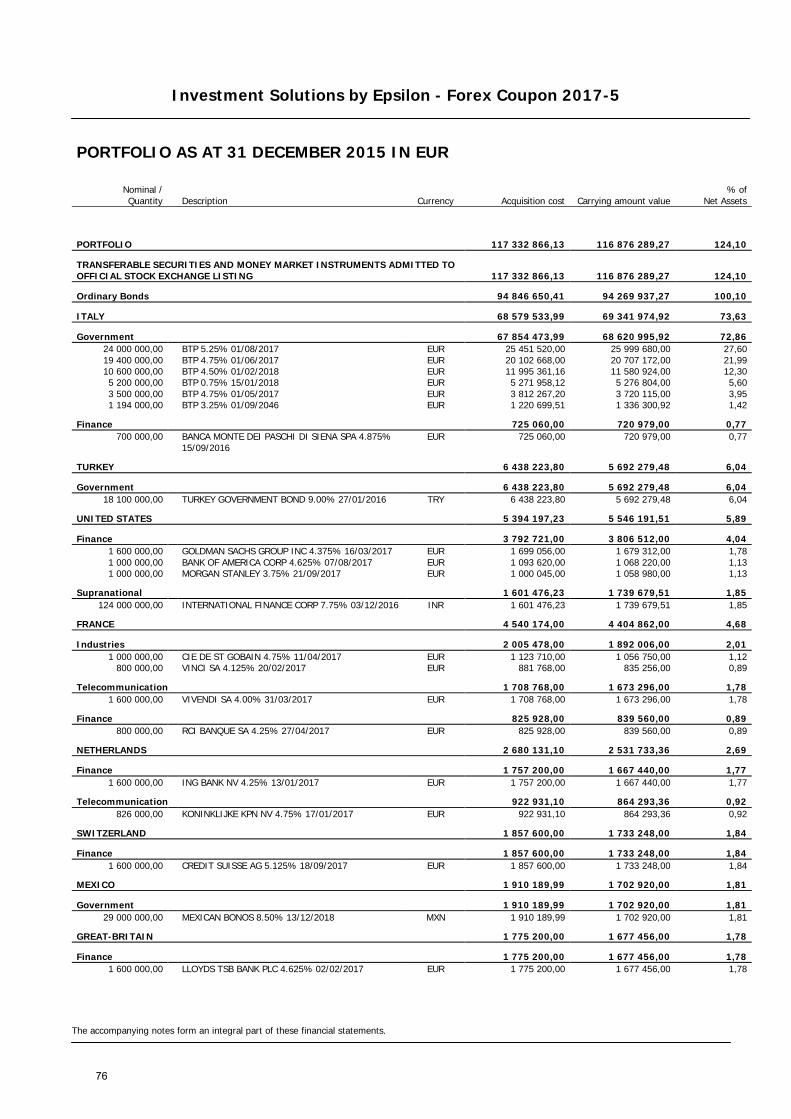
Investment Solutions by Epsilon - Forex Coupon 2017-5
The accompanying notes form an integral part of these financial statements.
PORTFOLIO AS AT 31 DECEMBER 2015 IN EUR
Nominal / Quantity Description Currency Acquisition cost Carrying amount value
% of Net Assets
PORTFOLIO 117 332 866,13 116 876 289,27 124,10
TRANSFERABLE SECURITIES AND MONEY MARKET INSTRUMENTS ADMITTED TO OFFICIAL STOCK EXCHANGE LISTING 117 332 866,13 116 876 289,27 124,10
Ordinary Bonds 94 846 650,41 94 269 937,27 100,10
ITALY 68 579 533,99 69 341 974,92 73,63
Government 67 854 473,99 68 620 995,92 72,86 24 000 000,00 BTP 5.25% 01/08/2017 EUR 25 451 520,00 25 999 680,00 27,60 19 400 000,00 BTP 4.75% 01/06/2017 EUR 20 102 668,00 20 707 172,00 21,99 10 600 000,00 BTP 4.50% 01/02/2018 EUR 11 995 361,16 11 580 924,00 12,30 5 200 000,00 BTP 0.75% 15/01/2018 EUR 5 271 958,12 5 276 804,00 5,60 3 500 000,00 BTP 4.75% 01/05/2017 EUR 3 812 267,20 3 720 115,00 3,95 1 194 000,00 BTP 3.25% 01/09/2046 EUR 1 220 699,51 1 336 300,92 1,42
Finance 725 060,00 720 979,00 0,77 700 000,00
BANCA MONTE DEI PASCHI DI SIENA SPA 4.875% 15/09/2016
EUR 725 060,00 720 979,00 0,77
TURKEY 6 438 223,80 5 692 279,48 6,04
Government 6 438 223,80 5 692 279,48 6,04 18 100 000,00 TURKEY GOVERNMENT BOND 9.00% 27/01/2016 TRY 6 438 223,80 5 692 279,48 6,04
UNITED STATES 5 394 197,23 5 546 191,51 5,89
Finance 3 792 721,00 3 806 512,00 4,04 1 600 000,00 GOLDMAN SACHS GROUP INC 4.375% 16/03/2017 EUR 1 699 056,00 1 679 312,00 1,78 1 000 000,00 BANK OF AMERICA CORP 4.625% 07/08/2017 EUR 1 093 620,00 1 068 220,00 1,13 1 000 000,00 MORGAN STANLEY 3.75% 21/09/2017 EUR 1 000 045,00 1 058 980,00 1,13
Supranational 1 601 476,23 1 739 679,51 1,85 124 000 000,00 INTERNATIONAL FINANCE CORP 7.75% 03/12/2016 INR 1 601 476,23 1 739 679,51 1,85
FRANCE 4 540 174,00 4 404 862,00 4,68
Industries 2 005 478,00 1 892 006,00 2,01 1 000 000,00 CIE DE ST GOBAIN 4.75% 11/04/2017 EUR 1 123 710,00 1 056 750,00 1,12
800 000,00 VINCI SA 4.125% 20/02/2017 EUR 881 768,00 835 256,00 0,89
Telecommunication 1 708 768,00 1 673 296,00 1,78 1 600 000,00 VIVENDI SA 4.00% 31/03/2017 EUR 1 708 768,00 1 673 296,00 1,78
Finance 825 928,00 839 560,00 0,89 800 000,00 RCI BANQUE SA 4.25% 27/04/2017 EUR 825 928,00 839 560,00 0,89
NETHERLANDS 2 680 131,10 2 531 733,36 2,69
Finance 1 757 200,00 1 667 440,00 1,77 1 600 000,00 ING BANK NV 4.25% 13/01/2017 EUR 1 757 200,00 1 667 440,00 1,77
Telecommunication 922 931,10 864 293,36 0,92 826 000,00 KONINKLIJKE KPN NV 4.75% 17/01/2017 EUR 922 931,10 864 293,36 0,92
SWITZERLAND 1 857 600,00 1 733 248,00 1,84
Finance 1 857 600,00 1 733 248,00 1,84 1 600 000,00 CREDIT SUISSE AG 5.125% 18/09/2017 EUR 1 857 600,00 1 733 248,00 1,84
MEXICO 1 910 189,99 1 702 920,00 1,81
Government 1 910 189,99 1 702 920,00 1,81 29 000 000,00 MEXICAN BONOS 8.50% 13/12/2018 MXN 1 910 189,99 1 702 920,00 1,81
GREAT-BRITAIN 1 775 200,00 1 677 456,00 1,78
Finance 1 775 200,00 1 677 456,00 1,78 1 600 000,00 LLOYDS TSB BANK PLC 4.625% 02/02/2017 EUR 1 775 200,00 1 677 456,00 1,78
76
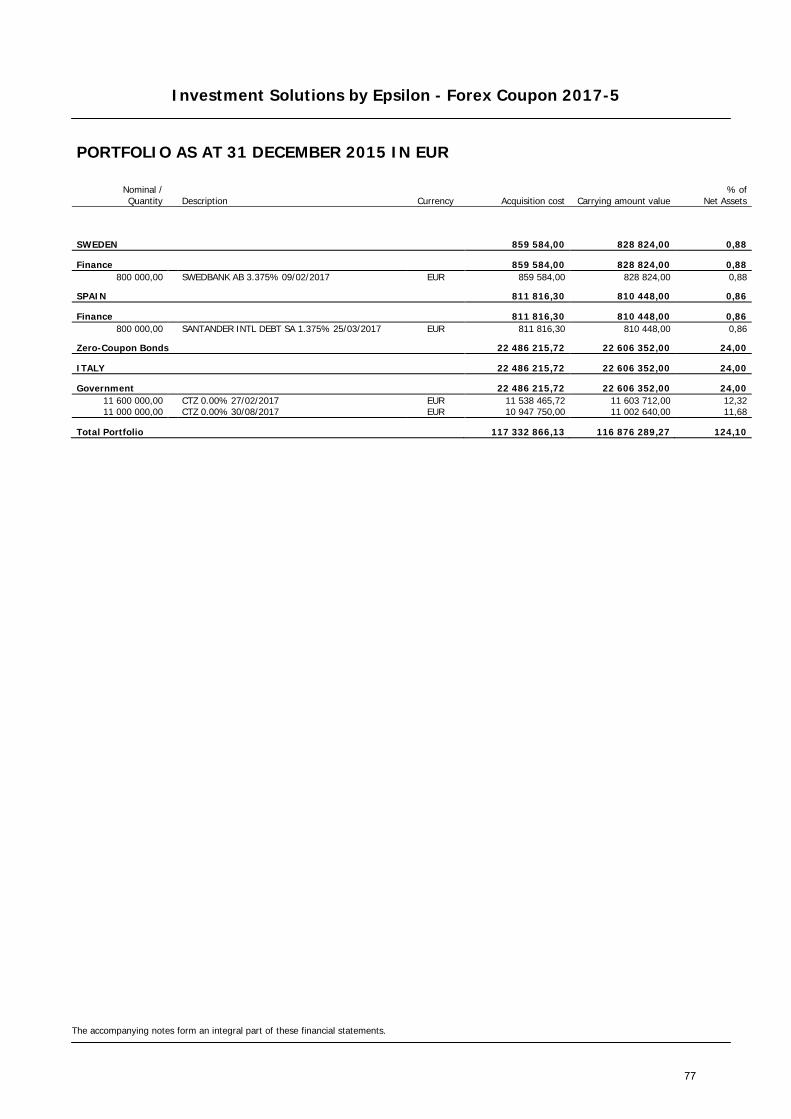
Investment Solutions by Epsilon - Forex Coupon 2017-5
The accompanying notes form an integral part of these financial statements.
PORTFOLIO AS AT 31 DECEMBER 2015 IN EUR
Nominal / Quantity Description Currency Acquisition cost Carrying amount value
% of Net Assets
SWEDEN 859 584,00 828 824,00 0,88
Finance 859 584,00 828 824,00 0,88 800 000,00 SWEDBANK AB 3.375% 09/02/2017 EUR 859 584,00 828 824,00 0,88
SPAIN 811 816,30 810 448,00 0,86
Finance 811 816,30 810 448,00 0,86 800 000,00 SANTANDER INTL DEBT SA 1.375% 25/03/2017 EUR 811 816,30 810 448,00 0,86
Zero-Coupon Bonds 22 486 215,72 22 606 352,00 24,00
ITALY 22 486 215,72 22 606 352,00 24,00
Government 22 486 215,72 22 606 352,00 24,00 11 600 000,00 CTZ 0.00% 27/02/2017 EUR 11 538 465,72 11 603 712,00 12,32 11 000 000,00 CTZ 0.00% 30/08/2017 EUR 10 947 750,00 11 002 640,00 11,68
Total Portfolio 117 332 866,13 116 876 289,27 124,10
77

Investment Solutions by Epsilon - Forex Coupon 2017-5
The accompanying notes form an integral part of these financial statements.
OPTION CONTRACTS AS AT 31 DECEMBER 2015
Quantity Call/ Put Description Currency
Acquisition cost (EUR)
Market value (EUR)
Commitment (EUR)
UNQUOTED (153 427,72) (94 284,61) 1 720 792,42
WRITTEN OPTION CONTRACTS (153 427,72) (94 284,61) 1 720 792,42
(42 100 000 000) Put IDR/USD 15 200,00 25/02/16 IDR (67 200,11) (7 216,91) 188 306,18
(13 400 000) Put PLN/EUR 4,31 13/10/16 PLN (86 227,61) (87 067,70) 1 532 486,24
78
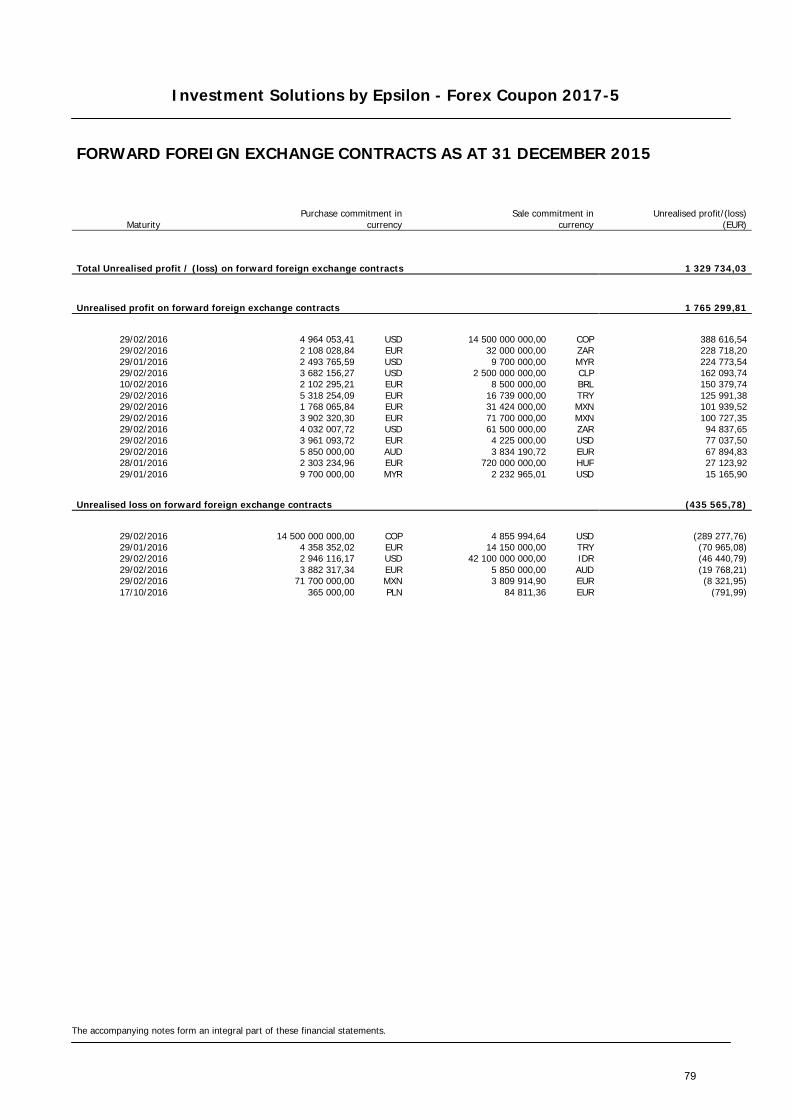
Investment Solutions by Epsilon - Forex Coupon 2017-5
The accompanying notes form an integral part of these financial statements.
FORWARD FOREIGN EXCHANGE CONTRACTS AS AT 31 DECEMBER 2015
Maturity Purchase commitment in
currency Sale commitment in
currency
Unrealised profit/(loss) (EUR)
Total Unrealised profit / (loss) on forward foreign exchange contracts 1 329 734,03
Unrealised profit on forward foreign exchange contracts 1 765 299,81
29/02/2016 4 964 053,41 USD 14 500 000 000,00 COP 388 616,54 29/02/2016 2 108 028,84 EUR 32 000 000,00 ZAR 228 718,20 29/01/2016 2 493 765,59 USD 9 700 000,00 MYR 224 773,54 29/02/2016 3 682 156,27 USD 2 500 000 000,00 CLP 162 093,74 10/02/2016 2 102 295,21 EUR 8 500 000,00 BRL 150 379,74 29/02/2016 5 318 254,09 EUR 16 739 000,00 TRY 125 991,38 29/02/2016 1 768 065,84 EUR 31 424 000,00 MXN 101 939,52 29/02/2016 3 902 320,30 EUR 71 700 000,00 MXN 100 727,35 29/02/2016 4 032 007,72 USD 61 500 000,00 ZAR 94 837,65 29/02/2016 3 961 093,72 EUR 4 225 000,00 USD 77 037,50 29/02/2016 5 850 000,00 AUD 3 834 190,72 EUR 67 894,83 28/01/2016 2 303 234,96 EUR 720 000 000,00 HUF 27 123,92 29/01/2016 9 700 000,00 MYR 2 232 965,01 USD 15 165,90
Unrealised loss on forward foreign exchange contracts (435 565,78)
29/02/2016 14 500 000 000,00 COP 4 855 994,64 USD (289 277,76) 29/01/2016 4 358 352,02 EUR 14 150 000,00 TRY (70 965,08) 29/02/2016 2 946 116,17 USD 42 100 000 000,00 IDR (46 440,79) 29/02/2016 3 882 317,34 EUR 5 850 000,00 AUD (19 768,21) 29/02/2016 71 700 000,00 MXN 3 809 914,90 EUR (8 321,95) 17/10/2016 365 000,00 PLN 84 811,36 EUR (791,99)
79

Investment Solutions by Epsilon - Forex Coupon 2017-5
The accompanying notes form an integral part of these financial statements.
SWAP CONTRACTS AS AT 31 DECEMBER 2015
Counterparty Currency Notional Maturity Interest
receivable (EUR) Interest
payable (EUR)
Unrealised
profit / (loss) (EUR)
ASSET SWAP CONTRACTS — — 1 926 837,59 BANCA IMI SPA EUR 77 726 000,00 21/09/2017 — — 1 926 837,59
CURRENCY SWAP CONTRACTS — — (24 077 169,26) BANCA IMI SPA EUR-CAD 2 000 000,00 20/09/2017 — — (319 921,08) BANCA IMI SPA EUR-COP 3 500 000,00 20/09/2017 — — (1 191 867,84) BANCA IMI SPA EUR-RUB 8 600 000,00 20/09/2017 — — (4 123 427,89) BANCA IMI SPA EUR-ZAR 9 300 000,00 20/09/2017 — — (3 511 839,03) BANCA IMI SPA EUR-HUF 3 500 000,00 20/09/2017 — — (270 020,86) BANCA IMI SPA EUR-SEK 2 300 000,00 20/09/2017 — — (138 833,48) BANCA IMI SPA EUR-CLP 3 500 000,00 20/09/2017 — — (737 761,32) BANCA IMI SPA EUR-AUD 4 500 000,00 20/09/2017 — — (705 662,77) BANCA IMI SPA EUR-NZD 3 900 000,00 20/09/2017 — — (75 852,19) BANCA IMI SPA EUR-MXN 4 700 000,00 20/09/2017 — — (589 063,12) BANCA IMI SPA EUR-BRL 10 700 000,00 20/09/2017 — — (4 764 487,76) BANCA IMI SPA EUR-IDR 10 800 000,00 20/09/2017 — — (2 595 549,52) BANCA IMI SPA EUR-INR 8 000 000,00 20/09/2017 — — (682 474,32) BANCA IMI SPA EUR-NOK 1 500 000,00 20/09/2017 — — (323 733,95) BANCA IMI SPA EUR-TRY 10 300 000,00 20/09/2017 — — (3 214 232,94) BANCA IMI SPA EUR-MYR 2 000 000,00 20/09/2017 — — (341 825,24) BANCA IMI SPA EUR-PEN 3 000 000,00 20/09/2017 — — (490 615,95)
80
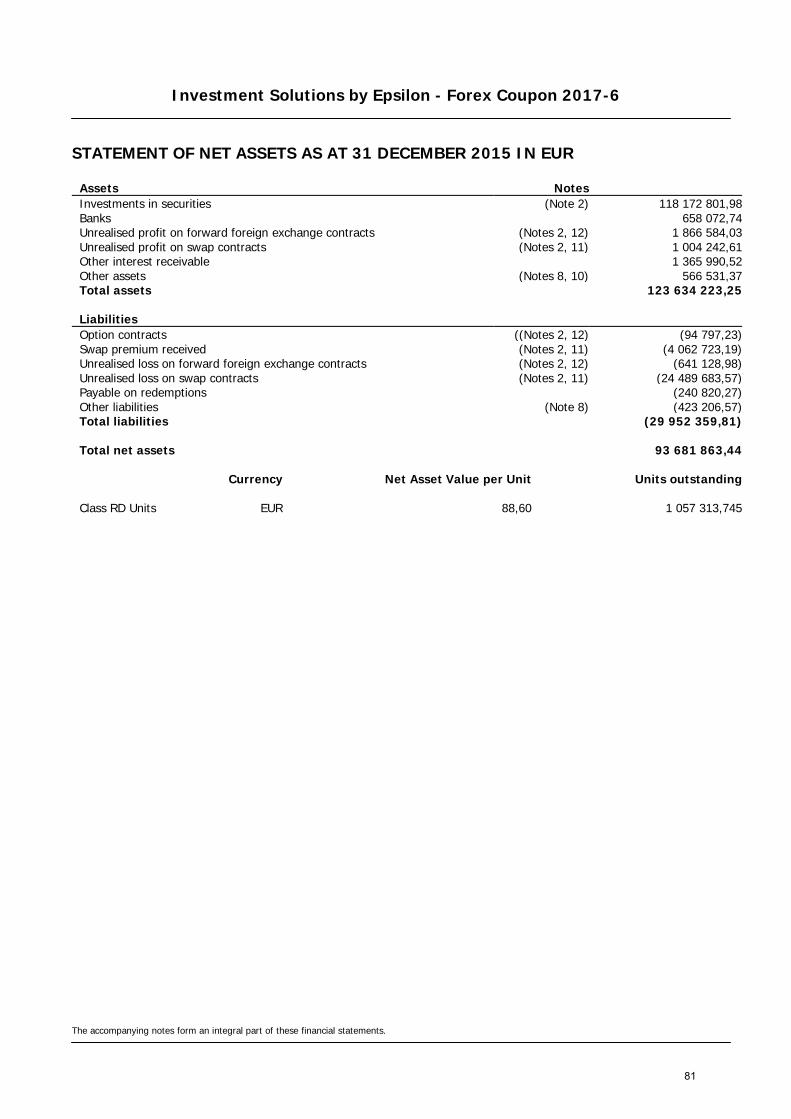
Investment Solutions by Epsilon - Forex Coupon 2017-6
STATEMENT OF NET ASSETS AS AT 31 DECEMBER 2015 IN EUR
The accompanying notes form an integral part of these financial statements.
Assets Notes Investments in securities (Note 2) 118 172 801,98 Banks 658 072,74 Unrealised profit on forward foreign exchange contracts (Notes 2, 12) 1 866 584,03 Unrealised profit on swap contracts (Notes 2, 11) 1 004 242,61 Other interest receivable 1 365 990,52 Other assets (Notes 8, 10) 566 531,37 Total assets 123 634 223,25
Liabilities Option contracts ((Notes 2, 12) (94 797,23) Swap premium received (Notes 2, 11) (4 062 723,19) Unrealised loss on forward foreign exchange contracts (Notes 2, 12) (641 128,98) Unrealised loss on swap contracts (Notes 2, 11) (24 489 683,57) Payable on redemptions (240 820,27) Other liabilities (Note 8) (423 206,57) Total liabilities (29 952 359,81)
Total net assets 93 681 863,44
Currency Net Asset Value per Unit Units outstanding
Class RD Units EUR 88,60 1 057 313,745
81
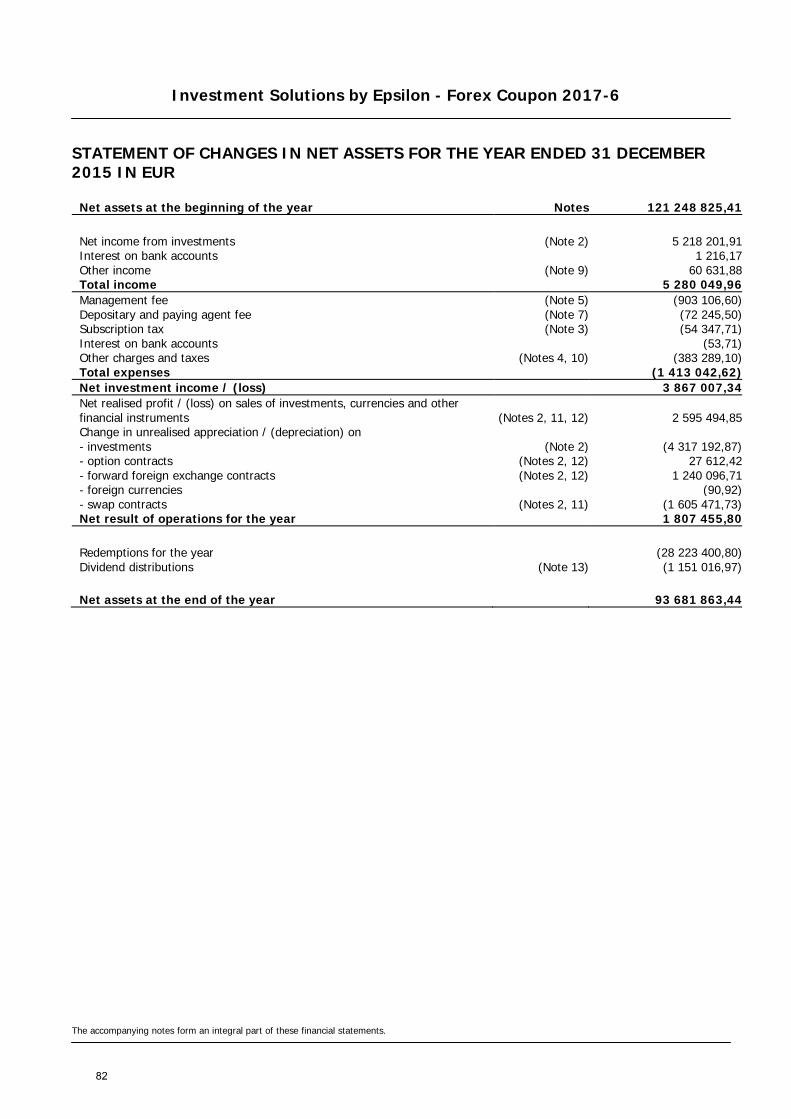
Investment Solutions by Epsilon - Forex Coupon 2017-6
STATEMENT OF CHANGES IN NET ASSETS FOR THE YEAR ENDED 31 DECEMBER 2015 IN EUR
The accompanying notes form an integral part of these financial statements.
Net assets at the beginning of the year Notes 121 248 825,41
Net income from investments (Note 2) 5 218 201,91 Interest on bank accounts 1 216,17 Other income (Note 9) 60 631,88 Total income 5 280 049,96 Management fee (Note 5) (903 106,60) Depositary and paying agent fee (Note 7) (72 245,50) Subscription tax (Note 3) (54 347,71) Interest on bank accounts (53,71) Other charges and taxes (Notes 4, 10) (383 289,10) Total expenses (1 413 042,62) Net investment income / (loss) 3 867 007,34 Net realised profit / (loss) on sales of investments, currencies and other financial instruments (Notes 2, 11, 12) 2 595 494,85 Change in unrealised appreciation / (depreciation) on - investments (Note 2) (4 317 192,87) - option contracts (Notes 2, 12) 27 612,42 - forward foreign exchange contracts (Notes 2, 12) 1 240 096,71 - foreign currencies (90,92) - swap contracts (Notes 2, 11) (1 605 471,73) Net result of operations for the year 1 807 455,80
Redemptions for the year (28 223 400,80) Dividend distributions (Note 13) (1 151 016,97)
Net assets at the end of the year 93 681 863,44
82

Investment Solutions by Epsilon - Forex Coupon 2017-6
The accompanying notes form an integral part of these financial statements.
PORTFOLIO AS AT 31 DECEMBER 2015 IN EUR
Nominal / Quantity Description Currency Acquisition cost Carrying amount value
% of Net Assets
PORTFOLIO 117 954 546,33 118 172 801,98 126,14
TRANSFERABLE SECURITIES AND MONEY MARKET INSTRUMENTS ADMITTED TO OFFICIAL STOCK EXCHANGE LISTING 117 954 546,33 118 172 801,98 126,14
Ordinary Bonds 90 839 443,83 90 915 841,98 97,05
ITALY 63 083 110,46 64 752 945,32 69,12
Government 62 351 523,80 64 031 966,32 68,35 25 900 000,00 BTP 3.50% 01/11/2017 EUR 25 579 099,00 27 558 377,00 29,42 12 350 000,00 BTP 5.25% 01/08/2017 EUR 13 182 081,25 13 379 002,00 14,28 11 100 000,00 BTP 4.50% 01/02/2018 EUR 12 565 265,49 12 127 194,00 12,94 6 600 000,00 BTP 4.75% 01/05/2017 EUR 7 188 846,72 7 015 074,00 7,49 2 600 000,00 BTP 0.75% 15/01/2018 EUR 2 635 979,06 2 638 402,00 2,82 1 174 000,00 BTP 3.25% 01/09/2046 EUR 1 200 252,28 1 313 917,32 1,40
Finance 731 586,66 720 979,00 0,77 700 000,00
BANCA MONTE DEI PASCHI DI SIENA SPA 4.875% 15/09/2016
EUR 731 586,66 720 979,00 0,77
UNITED STATES 6 072 592,06 5 992 576,45 6,40
Finance 4 587 352,01 4 379 164,00 4,68 1 200 000,00 GOLDMAN SACHS GROUP INC 4.375% 16/03/2017 EUR 1 307 904,00 1 259 484,00 1,35 1 100 000,00 MORGAN STANLEY 5.50% 02/10/2017 EUR 1 236 246,00 1 198 802,00 1,28 1 100 000,00 BANK OF AMERICA CORP 4.625% 07/08/2017 EUR 1 224 564,00 1 175 042,00 1,25
700 000,00 HSBC FINANCE CORP 4.875% 30/05/2017 EUR 818 638,01 745 836,00 0,80
Supranational 1 485 240,05 1 613 412,45 1,72 115 000 000,00 INTERNATIONAL FINANCE CORP 7.75% 03/12/2016 INR 1 485 240,05 1 613 412,45 1,72
TURKEY 6 260 373,16 5 535 034,19 5,91
Government 6 260 373,16 5 535 034,19 5,91 17 600 000,00 TURKEY GOVERNMENT BOND 9.00% 27/01/2016 TRY 6 260 373,16 5 535 034,19 5,91
FRANCE 5 106 795,00 5 011 390,00 5,35
Finance 2 345 850,00 2 385 925,00 2,55 1 500 000,00 CREDIT AGRICOLE SA 1.875% 18/10/2017 EUR 1 507 050,00 1 546 365,00 1,65
800 000,00 RCI BANQUE SA 4.25% 27/04/2017 EUR 838 800,00 839 560,00 0,90
Telecommunication 1 633 185,00 1 568 715,00 1,67 1 500 000,00 VIVENDI SA 4.00% 31/03/2017 EUR 1 633 185,00 1 568 715,00 1,67
Industries 1 127 760,00 1 056 750,00 1,13 1 000 000,00 CIE DE ST GOBAIN 4.75% 11/04/2017 EUR 1 127 760,00 1 056 750,00 1,13
GREAT-BRITAIN 3 280 290,00 3 123 375,00 3,33
Finance 1 693 635,00 1 572 615,00 1,68 1 500 000,00 LLOYDS TSB BANK PLC 4.625% 02/02/2017 EUR 1 693 635,00 1 572 615,00 1,68
Telecommunication 1 586 655,00 1 550 760,00 1,65 1 500 000,00 EE FINANCE PLC 3.50% 06/02/2017 EUR 1 586 655,00 1 550 760,00 1,65
NETHERLANDS 2 583 016,50 2 404 817,64 2,57
Finance 1 712 460,00 1 594 935,00 1,70 1 500 000,00 ING GROEP NV 4.75% 31/05/2017 EUR 1 712 460,00 1 594 935,00 1,70
Telecommunication 870 556,50 809 882,64 0,87 774 000,00 KONINKLIJKE KPN NV 4.75% 17/01/2017 EUR 870 556,50 809 882,64 0,87
MEXICO 1 976 058,64 1 761 641,38 1,88
Government 1 976 058,64 1 761 641,38 1,88 30 000 000,00 MEXICAN BONOS 8.50% 13/12/2018 MXN 1 976 058,64 1 761 641,38 1,88
SWITZERLAND 1 766 880,00 1 624 920,00 1,73
Finance 1 766 880,00 1 624 920,00 1,73 1 500 000,00 CREDIT SUISSE AG 5.125% 18/09/2017 EUR 1 766 880,00 1 624 920,00 1,73
83
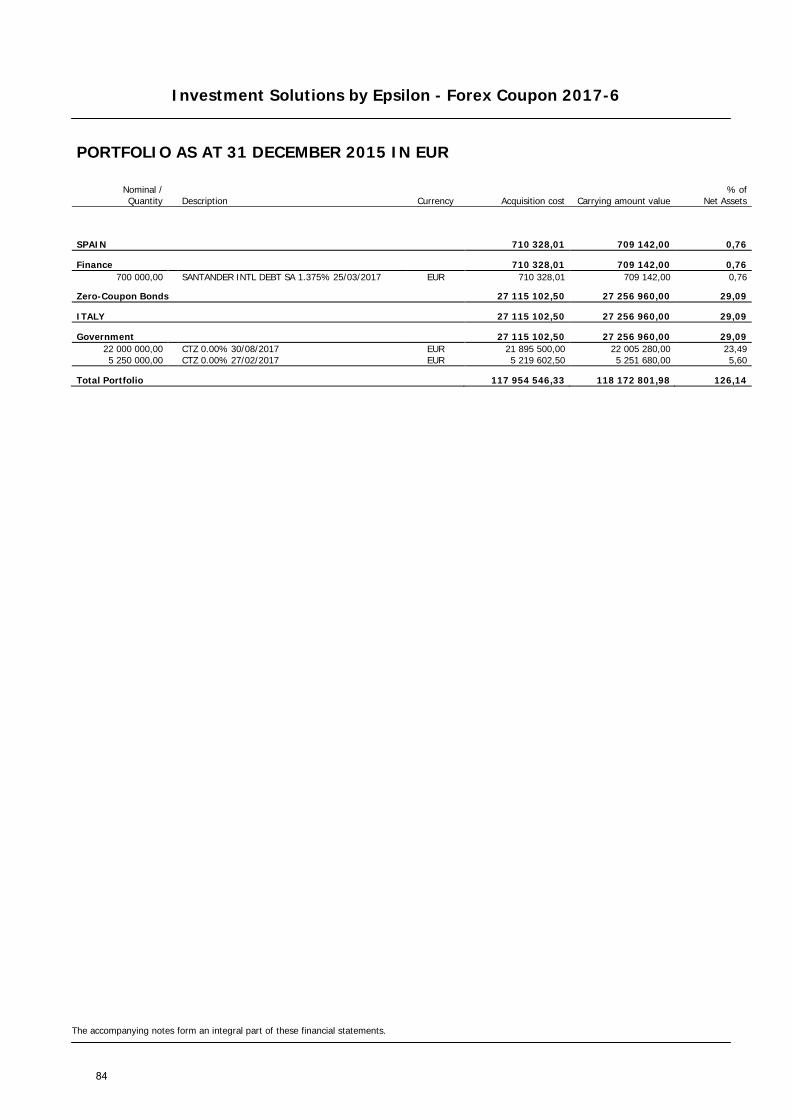
Investment Solutions by Epsilon - Forex Coupon 2017-6
The accompanying notes form an integral part of these financial statements.
PORTFOLIO AS AT 31 DECEMBER 2015 IN EUR
Nominal / Quantity Description Currency Acquisition cost Carrying amount value
% of Net Assets
SPAIN 710 328,01 709 142,00 0,76
Finance 710 328,01 709 142,00 0,76 700 000,00 SANTANDER INTL DEBT SA 1.375% 25/03/2017 EUR 710 328,01 709 142,00 0,76
Zero-Coupon Bonds 27 115 102,50 27 256 960,00 29,09
ITALY 27 115 102,50 27 256 960,00 29,09
Government 27 115 102,50 27 256 960,00 29,09 22 000 000,00 CTZ 0.00% 30/08/2017 EUR 21 895 500,00 22 005 280,00 23,49 5 250 000,00 CTZ 0.00% 27/02/2017 EUR 5 219 602,50 5 251 680,00 5,60
Total Portfolio 117 954 546,33 118 172 801,98 126,14
84

Investment Solutions by Epsilon - Forex Coupon 2017-6
The accompanying notes form an integral part of these financial statements.
OPTION CONTRACTS AS AT 31 DECEMBER 2015
Quantity Call/ Put Description Currency
Acquisition cost (EUR)
Market value (EUR)
Commitment (EUR)
UNQUOTED (152 794,25) (94 797,23) 1 728 650,62
WRITTEN OPTION CONTRACTS (152 794,25) (94 797,23) 1 728 650,62
(41 300 000 000) PUT IDR/USD PUT 15 200,00 25/02/16 IDR (65 923,15) (7 079,77) 184 727,92
(13 500 000) PUT PLN/EUR PUT 4,31 13/10/16 PLN (86 871,10) (87 717,46) 1 543 922,70
85
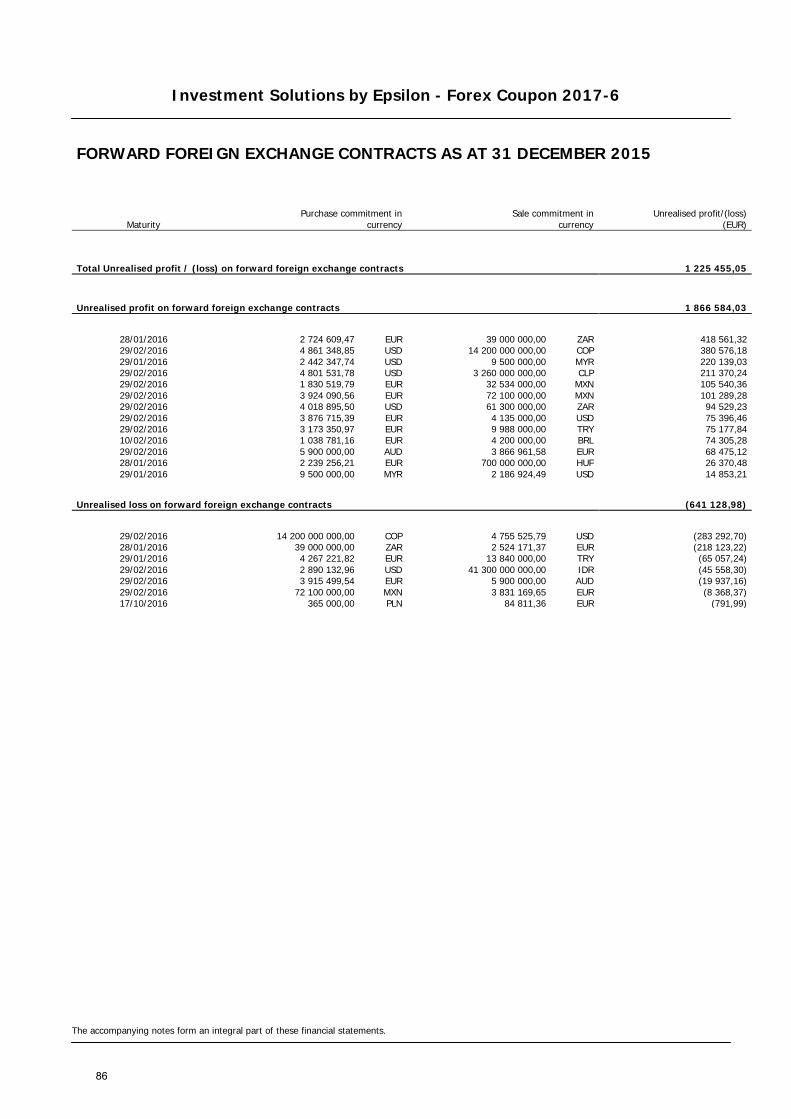
Investment Solutions by Epsilon - Forex Coupon 2017-6
The accompanying notes form an integral part of these financial statements.
FORWARD FOREIGN EXCHANGE CONTRACTS AS AT 31 DECEMBER 2015
Maturity Purchase commitment in
currency Sale commitment in
currency
Unrealised profit/(loss) (EUR)
Total Unrealised profit / (loss) on forward foreign exchange contracts 1 225 455,05
Unrealised profit on forward foreign exchange contracts 1 866 584,03
28/01/2016 2 724 609,47 EUR 39 000 000,00 ZAR 418 561,32 29/02/2016 4 861 348,85 USD 14 200 000 000,00 COP 380 576,18 29/01/2016 2 442 347,74 USD 9 500 000,00 MYR 220 139,03 29/02/2016 4 801 531,78 USD 3 260 000 000,00 CLP 211 370,24 29/02/2016 1 830 519,79 EUR 32 534 000,00 MXN 105 540,36 29/02/2016 3 924 090,56 EUR 72 100 000,00 MXN 101 289,28 29/02/2016 4 018 895,50 USD 61 300 000,00 ZAR 94 529,23 29/02/2016 3 876 715,39 EUR 4 135 000,00 USD 75 396,46 29/02/2016 3 173 350,97 EUR 9 988 000,00 TRY 75 177,84 10/02/2016 1 038 781,16 EUR 4 200 000,00 BRL 74 305,28 29/02/2016 5 900 000,00 AUD 3 866 961,58 EUR 68 475,12 28/01/2016 2 239 256,21 EUR 700 000 000,00 HUF 26 370,48 29/01/2016 9 500 000,00 MYR 2 186 924,49 USD 14 853,21
Unrealised loss on forward foreign exchange contracts (641 128,98)
29/02/2016 14 200 000 000,00 COP 4 755 525,79 USD (283 292,70) 28/01/2016 39 000 000,00 ZAR 2 524 171,37 EUR (218 123,22) 29/01/2016 4 267 221,82 EUR 13 840 000,00 TRY (65 057,24) 29/02/2016 2 890 132,96 USD 41 300 000 000,00 IDR (45 558,30) 29/02/2016 3 915 499,54 EUR 5 900 000,00 AUD (19 937,16) 29/02/2016 72 100 000,00 MXN 3 831 169,65 EUR (8 368,37) 17/10/2016 365 000,00 PLN 84 811,36 EUR (791,99)
86

Investment Solutions by Epsilon - Forex Coupon 2017-6
The accompanying notes form an integral part of these financial statements.
SWAP CONTRACTS AS AT 31 DECEMBER 2015
Counterparty Currency Notional Maturity Interest
receivable (EUR) Interest
payable (EUR)
Unrealised
profit / (loss) (EUR)
ASSET SWAP CONTRACTS — — 1 004 242,61 BANCA IMI SPA EUR 74 924 000,00 09/11/2017 — — 1 004 242,61
CURRENCY SWAP CONTRACTS — — (24 489 683,57) BANCA IMI SPA EUR-MXN 3 650 000,00 31/10/2017 — — (452 490,83) BANCA IMI SPA EUR-PEN 2 800 000,00 31/10/2017 — — (485 790,57) BANCA IMI SPA EUR-INR 8 400 000,00 31/10/2017 — — (689 147,85) BANCA IMI SPA EUR-NOK 1 400 000,00 31/10/2017 — — (316 490,00) BANCA IMI SPA EUR-MYR 2 800 000,00 31/10/2017 — — (526 156,85) BANCA IMI SPA EUR-COP 4 400 000,00 31/10/2017 — — (1 516 242,99) BANCA IMI SPA EUR-CLP 5 600 000,00 31/10/2017 — — (1 200 851,40) BANCA IMI SPA EUR-BRL 10 000 000,00 31/10/2017 — — (4 611 528,40) BANCA IMI SPA EUR-CAD 1 800 000,00 31/10/2017 — — (293 467,68) BANCA IMI SPA EUR-ZAR 8 600 000,00 31/10/2017 — — (3 139 822,68) BANCA IMI SPA EUR-HUF 4 200 000,00 31/10/2017 — — (305 585,11) BANCA IMI SPA EUR-TRY 8 300 000,00 31/10/2017 — — (2 781 996,98) BANCA IMI SPA EUR-RUB 10 100 000,00 31/10/2017 — — (5 020 140,76) BANCA IMI SPA EUR-AUD 5 300 000,00 31/10/2017 — — (878 810,49) BANCA IMI SPA EUR-NZD 2 900 000,00 31/10/2017 — — (69 850,79) BANCA IMI SPA EUR-IDR 8 100 000,00 31/10/2017 — — (2 124 341,97) BANCA IMI SPA EUR-SEK 1 400 000,00 31/10/2017 — — (76 968,22)
87

Investment Solutions by Epsilon - Forex Coupon 2017-7
STATEMENT OF NET ASSETS AS AT 31 DECEMBER 2015 IN EUR
The accompanying notes form an integral part of these financial statements.
Assets Notes Investments in securities (Note 2) 169 294 149,29 Banks 2 480 973,03 Unrealised profit on forward foreign exchange contracts (Notes 2, 12) 3 083 671,40 Unrealised profit on swap contracts (Notes 2, 11) 2 241 978,42 Other interest receivable 1 880 848,80 Other assets (Notes 8, 10) 859 051,92 Total assets 179 840 672,86
Liabilities Option contracts (Notes 2, 12) (129 466,21) Swap premium received (Notes 2, 11) (7 142 658,43) Unrealised loss on forward foreign exchange contracts (Notes 2, 12) (887 021,09) Unrealised loss on swap contracts (Notes 2, 11) (32 884 256,85) Payable on redemptions (189 196,17) Other liabilities (Note 8) (2 135 185,87) Total liabilities (43 367 784,62)
Total net assets 136 472 888,24
Currency Net Asset Value per Unit Units outstanding
Class RD Units EUR 91,41 1 493 043,845
88

Investment Solutions by Epsilon - Forex Coupon 2017-7
STATEMENT OF CHANGES IN NET ASSETS FOR THE YEAR ENDED 31 DECEMBER 2015 IN EUR
The accompanying notes form an integral part of these financial statements.
Net assets at the beginning of the year Notes 177 857 044,24
Net income from investments (Note 2) 7 530 287,16 Interest on bank accounts 1 536,11 Other income (Note 9) 90 902,65 Total income 7 622 725,92 Management fee (Note 5) (1 311 128,69) Depositary and paying agent fee (Note 7) (104 698,75) Subscription tax (Note 3) (78 707,36) Interest on bank accounts (219,79) Other charges and taxes (Notes 4, 10) (546 153,80) Total expenses (2 040 908,39) Net investment income / (loss) 5 581 817,53 Net realised profit / (loss) on sales of investments, currencies and other financial instruments (Notes 2, 11, 12) 1 373 869,72 Change in unrealised appreciation / (depreciation) on - investments (Note 2) (5 672 124,07) - option contracts (Notes 2, 12) (56 452,43) - forward foreign exchange contracts (Notes 2, 12) 2 420 401,67 - foreign currencies 54,07 - swap contracts (Notes 2, 11) 540 478,91 Net result of operations for the year 4 188 045,40
Redemptions for the year (44 071 596,15) Dividend distributions (Note 13) (1 500 605,25)
Net assets at the end of the year 136 472 888,24
89
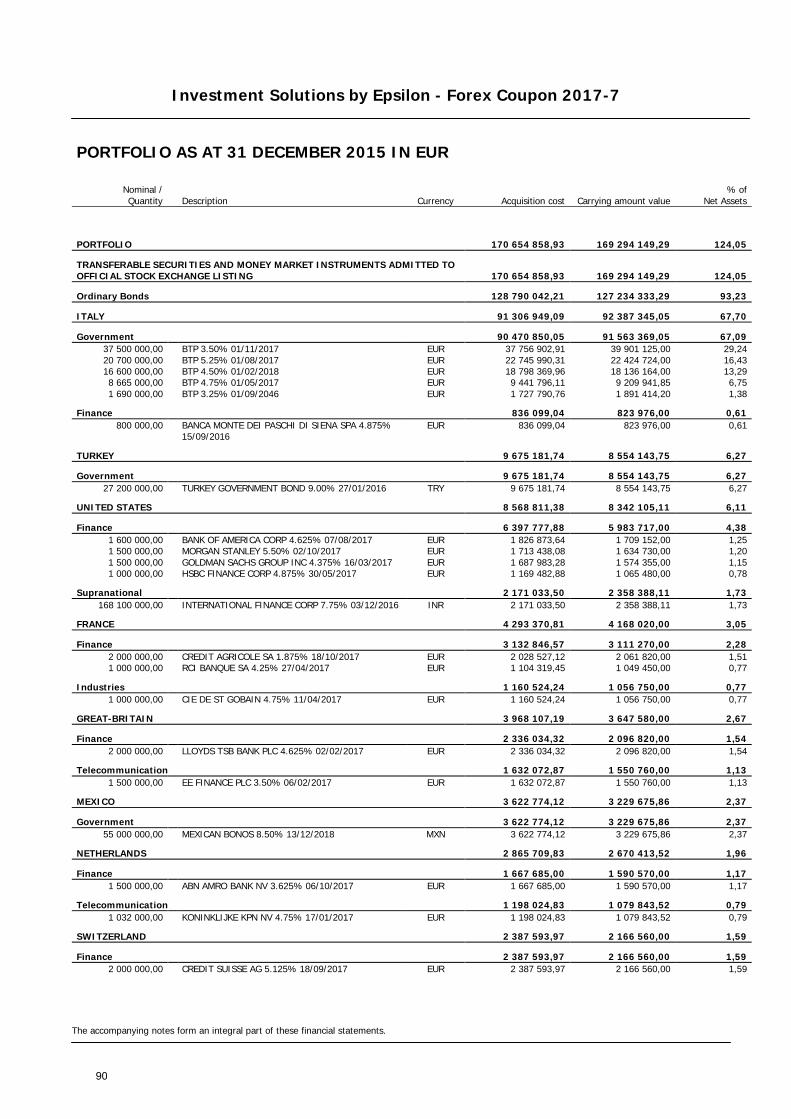
Investment Solutions by Epsilon - Forex Coupon 2017-7
The accompanying notes form an integral part of these financial statements.
PORTFOLIO AS AT 31 DECEMBER 2015 IN EUR
Nominal / Quantity Description Currency Acquisition cost Carrying amount value
% of Net Assets
PORTFOLIO 170 654 858,93 169 294 149,29 124,05
TRANSFERABLE SECURITIES AND MONEY MARKET INSTRUMENTS ADMITTED TO OFFICIAL STOCK EXCHANGE LISTING 170 654 858,93 169 294 149,29 124,05
Ordinary Bonds 128 790 042,21 127 234 333,29 93,23
ITALY 91 306 949,09 92 387 345,05 67,70
Government 90 470 850,05 91 563 369,05 67,09 37 500 000,00 BTP 3.50% 01/11/2017 EUR 37 756 902,91 39 901 125,00 29,24 20 700 000,00 BTP 5.25% 01/08/2017 EUR 22 745 990,31 22 424 724,00 16,43 16 600 000,00 BTP 4.50% 01/02/2018 EUR 18 798 369,96 18 136 164,00 13,29 8 665 000,00 BTP 4.75% 01/05/2017 EUR 9 441 796,11 9 209 941,85 6,75 1 690 000,00 BTP 3.25% 01/09/2046 EUR 1 727 790,76 1 891 414,20 1,38
Finance 836 099,04 823 976,00 0,61 800 000,00
BANCA MONTE DEI PASCHI DI SIENA SPA 4.875% 15/09/2016
EUR 836 099,04 823 976,00 0,61
TURKEY 9 675 181,74 8 554 143,75 6,27
Government 9 675 181,74 8 554 143,75 6,27 27 200 000,00 TURKEY GOVERNMENT BOND 9.00% 27/01/2016 TRY 9 675 181,74 8 554 143,75 6,27
UNITED STATES 8 568 811,38 8 342 105,11 6,11
Finance 6 397 777,88 5 983 717,00 4,38 1 600 000,00 BANK OF AMERICA CORP 4.625% 07/08/2017 EUR 1 826 873,64 1 709 152,00 1,25 1 500 000,00 MORGAN STANLEY 5.50% 02/10/2017 EUR 1 713 438,08 1 634 730,00 1,20 1 500 000,00 GOLDMAN SACHS GROUP INC 4.375% 16/03/2017 EUR 1 687 983,28 1 574 355,00 1,15 1 000 000,00 HSBC FINANCE CORP 4.875% 30/05/2017 EUR 1 169 482,88 1 065 480,00 0,78
Supranational 2 171 033,50 2 358 388,11 1,73 168 100 000,00 INTERNATIONAL FINANCE CORP 7.75% 03/12/2016 INR 2 171 033,50 2 358 388,11 1,73
FRANCE 4 293 370,81 4 168 020,00 3,05
Finance 3 132 846,57 3 111 270,00 2,28 2 000 000,00 CREDIT AGRICOLE SA 1.875% 18/10/2017 EUR 2 028 527,12 2 061 820,00 1,51 1 000 000,00 RCI BANQUE SA 4.25% 27/04/2017 EUR 1 104 319,45 1 049 450,00 0,77
Industries 1 160 524,24 1 056 750,00 0,77 1 000 000,00 CIE DE ST GOBAIN 4.75% 11/04/2017 EUR 1 160 524,24 1 056 750,00 0,77
GREAT-BRITAIN 3 968 107,19 3 647 580,00 2,67
Finance 2 336 034,32 2 096 820,00 1,54 2 000 000,00 LLOYDS TSB BANK PLC 4.625% 02/02/2017 EUR 2 336 034,32 2 096 820,00 1,54
Telecommunication 1 632 072,87 1 550 760,00 1,13 1 500 000,00 EE FINANCE PLC 3.50% 06/02/2017 EUR 1 632 072,87 1 550 760,00 1,13
MEXICO 3 622 774,12 3 229 675,86 2,37
Government 3 622 774,12 3 229 675,86 2,37 55 000 000,00 MEXICAN BONOS 8.50% 13/12/2018 MXN 3 622 774,12 3 229 675,86 2,37
NETHERLANDS 2 865 709,83 2 670 413,52 1,96
Finance 1 667 685,00 1 590 570,00 1,17 1 500 000,00 ABN AMRO BANK NV 3.625% 06/10/2017 EUR 1 667 685,00 1 590 570,00 1,17
Telecommunication 1 198 024,83 1 079 843,52 0,79 1 032 000,00 KONINKLIJKE KPN NV 4.75% 17/01/2017 EUR 1 198 024,83 1 079 843,52 0,79
SWITZERLAND 2 387 593,97 2 166 560,00 1,59
Finance 2 387 593,97 2 166 560,00 1,59 2 000 000,00 CREDIT SUISSE AG 5.125% 18/09/2017 EUR 2 387 593,97 2 166 560,00 1,59
90
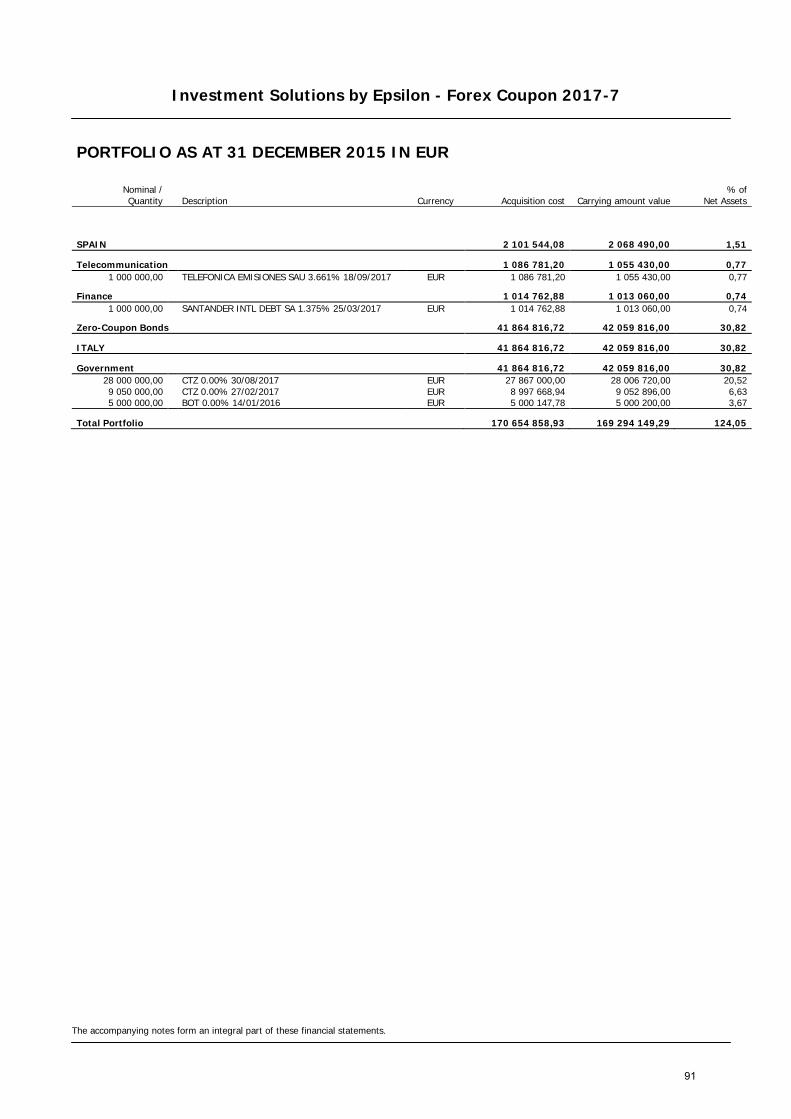
Investment Solutions by Epsilon - Forex Coupon 2017-7
The accompanying notes form an integral part of these financial statements.
PORTFOLIO AS AT 31 DECEMBER 2015 IN EUR
Nominal / Quantity Description Currency Acquisition cost Carrying amount value
% of Net Assets
SPAIN 2 101 544,08 2 068 490,00 1,51
Telecommunication 1 086 781,20 1 055 430,00 0,77 1 000 000,00 TELEFONICA EMISIONES SAU 3.661% 18/09/2017 EUR 1 086 781,20 1 055 430,00 0,77
Finance 1 014 762,88 1 013 060,00 0,74 1 000 000,00 SANTANDER INTL DEBT SA 1.375% 25/03/2017 EUR 1 014 762,88 1 013 060,00 0,74
Zero-Coupon Bonds 41 864 816,72 42 059 816,00 30,82
ITALY 41 864 816,72 42 059 816,00 30,82
Government 41 864 816,72 42 059 816,00 30,82 28 000 000,00 CTZ 0.00% 30/08/2017 EUR 27 867 000,00 28 006 720,00 20,52 9 050 000,00 CTZ 0.00% 27/02/2017 EUR 8 997 668,94 9 052 896,00 6,63 5 000 000,00 BOT 0.00% 14/01/2016 EUR 5 000 147,78 5 000 200,00 3,67
Total Portfolio 170 654 858,93 169 294 149,29 124,05
91
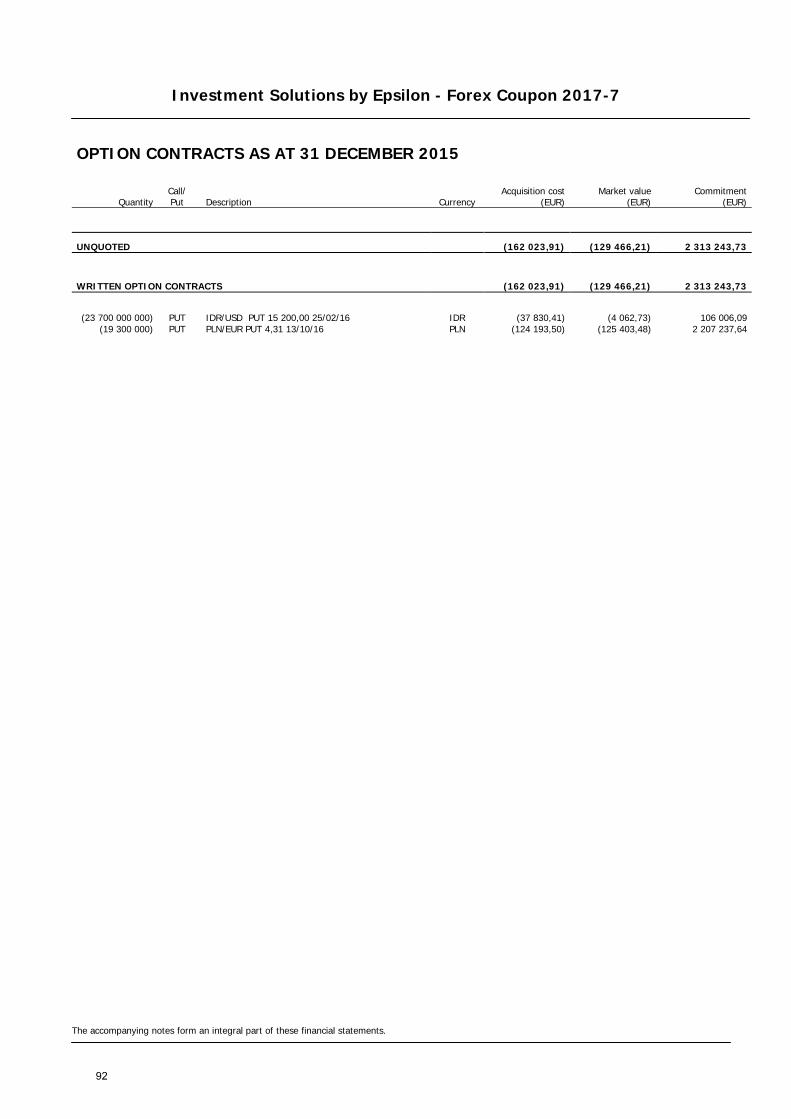
Investment Solutions by Epsilon - Forex Coupon 2017-7
The accompanying notes form an integral part of these financial statements.
OPTION CONTRACTS AS AT 31 DECEMBER 2015
Quantity Call/ Put Description Currency
Acquisition cost (EUR)
Market value (EUR)
Commitment (EUR)
UNQUOTED (162 023,91) (129 466,21) 2 313 243,73
WRITTEN OPTION CONTRACTS (162 023,91) (129 466,21) 2 313 243,73
(23 700 000 000) PUT IDR/USD PUT 15 200,00 25/02/16 IDR (37 830,41) (4 062,73) 106 006,09
(19 300 000) PUT PLN/EUR PUT 4,31 13/10/16 PLN (124 193,50) (125 403,48) 2 207 237,64
92
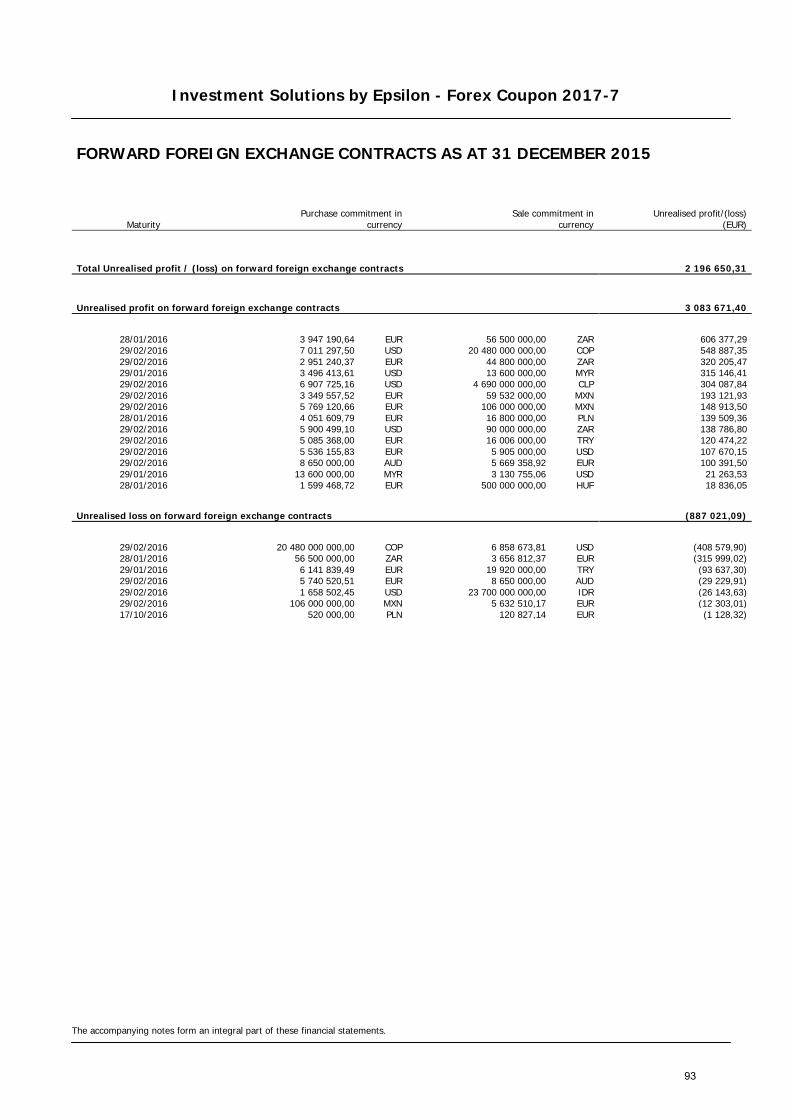
Investment Solutions by Epsilon - Forex Coupon 2017-7
The accompanying notes form an integral part of these financial statements.
FORWARD FOREIGN EXCHANGE CONTRACTS AS AT 31 DECEMBER 2015
Maturity Purchase commitment in
currency Sale commitment in
currency
Unrealised profit/(loss) (EUR)
Total Unrealised profit / (loss) on forward foreign exchange contracts 2 196 650,31
Unrealised profit on forward foreign exchange contracts 3 083 671,40
28/01/2016 3 947 190,64 EUR 56 500 000,00 ZAR 606 377,29 29/02/2016 7 011 297,50 USD 20 480 000 000,00 COP 548 887,35 29/02/2016 2 951 240,37 EUR 44 800 000,00 ZAR 320 205,47 29/01/2016 3 496 413,61 USD 13 600 000,00 MYR 315 146,41 29/02/2016 6 907 725,16 USD 4 690 000 000,00 CLP 304 087,84 29/02/2016 3 349 557,52 EUR 59 532 000,00 MXN 193 121,93 29/02/2016 5 769 120,66 EUR 106 000 000,00 MXN 148 913,50 28/01/2016 4 051 609,79 EUR 16 800 000,00 PLN 139 509,36 29/02/2016 5 900 499,10 USD 90 000 000,00 ZAR 138 786,80 29/02/2016 5 085 368,00 EUR 16 006 000,00 TRY 120 474,22 29/02/2016 5 536 155,83 EUR 5 905 000,00 USD 107 670,15 29/02/2016 8 650 000,00 AUD 5 669 358,92 EUR 100 391,50 29/01/2016 13 600 000,00 MYR 3 130 755,06 USD 21 263,53 28/01/2016 1 599 468,72 EUR 500 000 000,00 HUF 18 836,05
Unrealised loss on forward foreign exchange contracts (887 021,09)
29/02/2016 20 480 000 000,00 COP 6 858 673,81 USD (408 579,90) 28/01/2016 56 500 000,00 ZAR 3 656 812,37 EUR (315 999,02) 29/01/2016 6 141 839,49 EUR 19 920 000,00 TRY (93 637,30) 29/02/2016 5 740 520,51 EUR 8 650 000,00 AUD (29 229,91) 29/02/2016 1 658 502,45 USD 23 700 000 000,00 IDR (26 143,63) 29/02/2016 106 000 000,00 MXN 5 632 510,17 EUR (12 303,01) 17/10/2016 520 000,00 PLN 120 827,14 EUR (1 128,32)
93
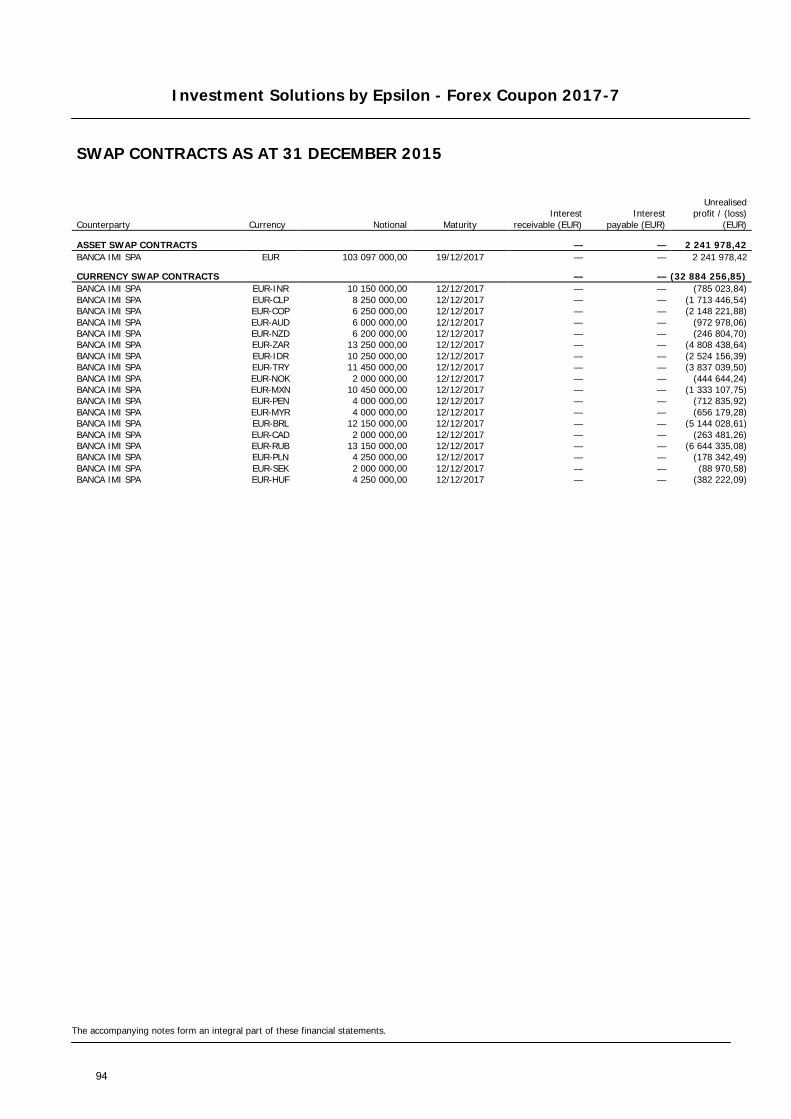
Investment Solutions by Epsilon - Forex Coupon 2017-7
The accompanying notes form an integral part of these financial statements.
SWAP CONTRACTS AS AT 31 DECEMBER 2015
Counterparty Currency Notional Maturity Interest
receivable (EUR) Interest
payable (EUR)
Unrealised
profit / (loss) (EUR)
ASSET SWAP CONTRACTS — — 2 241 978,42 BANCA IMI SPA EUR 103 097 000,00 19/12/2017 — — 2 241 978,42
CURRENCY SWAP CONTRACTS — — (32 884 256,85) BANCA IMI SPA EUR-INR 10 150 000,00 12/12/2017 — — (785 023,84) BANCA IMI SPA EUR-CLP 8 250 000,00 12/12/2017 — — (1 713 446,54) BANCA IMI SPA EUR-COP 6 250 000,00 12/12/2017 — — (2 148 221,88) BANCA IMI SPA EUR-AUD 6 000 000,00 12/12/2017 — — (972 978,06) BANCA IMI SPA EUR-NZD 6 200 000,00 12/12/2017 — — (246 804,70) BANCA IMI SPA EUR-ZAR 13 250 000,00 12/12/2017 — — (4 808 438,64) BANCA IMI SPA EUR-IDR 10 250 000,00 12/12/2017 — — (2 524 156,39) BANCA IMI SPA EUR-TRY 11 450 000,00 12/12/2017 — — (3 837 039,50) BANCA IMI SPA EUR-NOK 2 000 000,00 12/12/2017 — — (444 644,24) BANCA IMI SPA EUR-MXN 10 450 000,00 12/12/2017 — — (1 333 107,75) BANCA IMI SPA EUR-PEN 4 000 000,00 12/12/2017 — — (712 835,92) BANCA IMI SPA EUR-MYR 4 000 000,00 12/12/2017 — — (656 179,28) BANCA IMI SPA EUR-BRL 12 150 000,00 12/12/2017 — — (5 144 028,61) BANCA IMI SPA EUR-CAD 2 000 000,00 12/12/2017 — — (263 481,26) BANCA IMI SPA EUR-RUB 13 150 000,00 12/12/2017 — — (6 644 335,08) BANCA IMI SPA EUR-PLN 4 250 000,00 12/12/2017 — — (178 342,49) BANCA IMI SPA EUR-SEK 2 000 000,00 12/12/2017 — — (88 970,58) BANCA IMI SPA EUR-HUF 4 250 000,00 12/12/2017 — — (382 222,09)
94

Investment Solutions by Epsilon - Forex Coupon 2018-1
STATEMENT OF NET ASSETS AS AT 31 DECEMBER 2015 IN EUR
The accompanying notes form an integral part of these financial statements.
Assets Notes Investments in securities (Note 2) 147 710 005,63 Banks 2 029 371,35 Unrealised profit on forward foreign exchange contracts (Notes 2, 12) 2 205 312,96 Unrealised profit on swap contracts (Notes 2, 11) 2 095 916,81 Other interest receivable 1 689 064,74 Other assets (Notes 8, 10) 792 597,91 Total assets 156 522 269,40
Liabilities Option contracts (Notes 2, 12) (111 108,79) Swap premium received (Notes 2, 11) (6 178 205,07) Unrealised loss on forward foreign exchange contracts (Notes 2, 12) (749 788,20) Unrealised loss on swap contracts (Notes 2, 11) (25 038 529,77) Payable on redemptions (114 794,37) Other liabilities (Note 8) (554 879,63) Total liabilities (32 747 305,83)
Total net assets 123 774 963,57
Currency Net Asset Value per Unit Units outstanding
Class RD Units EUR 93,37 1 325 669,869
95

Investment Solutions by Epsilon - Forex Coupon 2018-1
STATEMENT OF CHANGES IN NET ASSETS FOR THE YEAR ENDED 31 DECEMBER 2015 IN EUR
The accompanying notes form an integral part of these financial statements.
Net assets at the beginning of the year Notes 157 125 179,24
Net income from investments (Note 2) 6 419 579,83 Interest on bank accounts 1 499,90 Other income (Note 9) 76 241,17 Total income 6 497 320,90 Management fee (Note 5) (1 147 451,58) Depositary and paying agent fee (Note 7) (91 659,12) Subscription tax (Note 3) (69 115,50) Interest on bank accounts (72,26) Other charges and taxes (Notes 4, 10) (466 925,01) Total expenses (1 775 223,47) Net investment income / (loss) 4 722 097,43 Net realised profit / (loss) on sales of investments, currencies and other financial instruments (Notes 2, 11, 12) 5 057 459,46 Change in unrealised appreciation / (depreciation) on - investments (Note 2) (5 674 607,79) - option contracts (Notes 2, 12) (1 072,06) - forward foreign exchange contracts (Notes 2, 12) 1 505 947,06 - foreign currencies 477,09 - swap contracts (Notes 2, 11) (2 805 955,03) Net result of operations for the year 2 804 346,16
Redemptions for the year (32 859 037,71) Dividend distributions (Note 13) (3 295 524,12)
Net assets at the end of the year 123 774 963,57
96
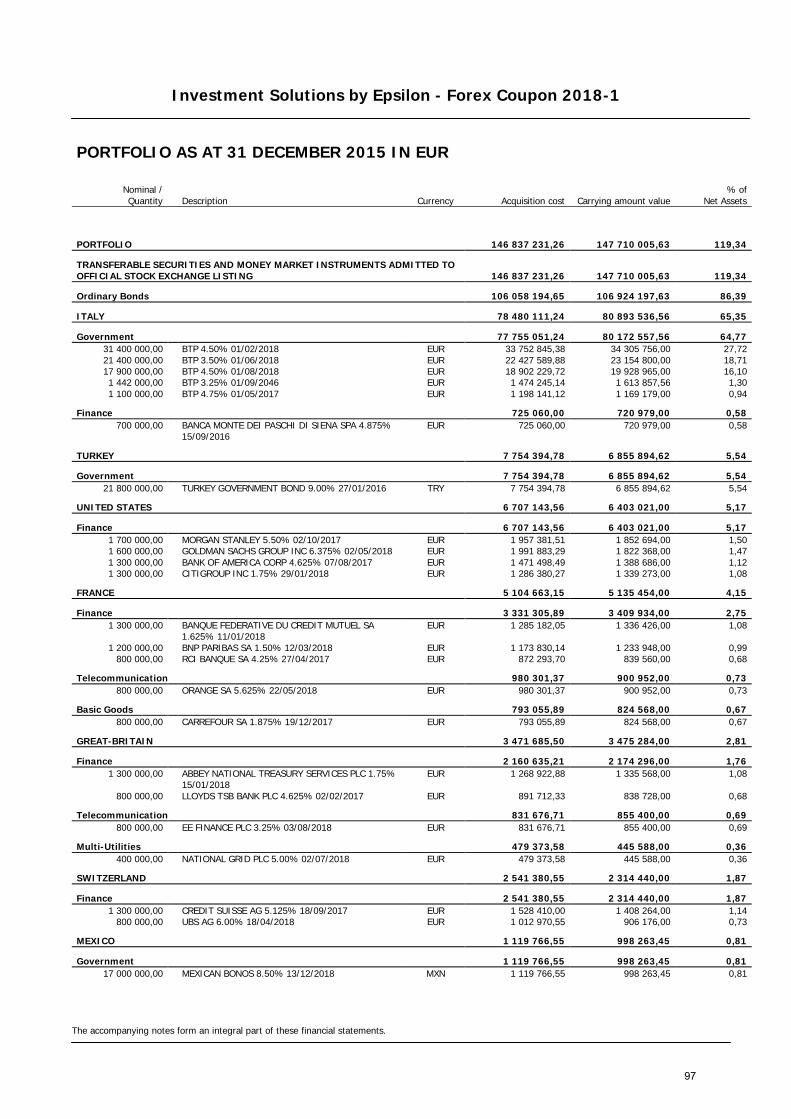
Investment Solutions by Epsilon - Forex Coupon 2018-1
The accompanying notes form an integral part of these financial statements.
PORTFOLIO AS AT 31 DECEMBER 2015 IN EUR
Nominal / Quantity Description Currency Acquisition cost Carrying amount value
% of Net Assets
PORTFOLIO 146 837 231,26 147 710 005,63 119,34
TRANSFERABLE SECURITIES AND MONEY MARKET INSTRUMENTS ADMITTED TO OFFICIAL STOCK EXCHANGE LISTING 146 837 231,26 147 710 005,63 119,34
Ordinary Bonds 106 058 194,65 106 924 197,63 86,39
ITALY 78 480 111,24 80 893 536,56 65,35
Government 77 755 051,24 80 172 557,56 64,77 31 400 000,00 BTP 4.50% 01/02/2018 EUR 33 752 845,38 34 305 756,00 27,72 21 400 000,00 BTP 3.50% 01/06/2018 EUR 22 427 589,88 23 154 800,00 18,71 17 900 000,00 BTP 4.50% 01/08/2018 EUR 18 902 229,72 19 928 965,00 16,10 1 442 000,00 BTP 3.25% 01/09/2046 EUR 1 474 245,14 1 613 857,56 1,30 1 100 000,00 BTP 4.75% 01/05/2017 EUR 1 198 141,12 1 169 179,00 0,94
Finance 725 060,00 720 979,00 0,58 700 000,00
BANCA MONTE DEI PASCHI DI SIENA SPA 4.875% 15/09/2016
EUR 725 060,00 720 979,00 0,58
TURKEY 7 754 394,78 6 855 894,62 5,54
Government 7 754 394,78 6 855 894,62 5,54 21 800 000,00 TURKEY GOVERNMENT BOND 9.00% 27/01/2016 TRY 7 754 394,78 6 855 894,62 5,54
UNITED STATES 6 707 143,56 6 403 021,00 5,17
Finance 6 707 143,56 6 403 021,00 5,17 1 700 000,00 MORGAN STANLEY 5.50% 02/10/2017 EUR 1 957 381,51 1 852 694,00 1,50 1 600 000,00 GOLDMAN SACHS GROUP INC 6.375% 02/05/2018 EUR 1 991 883,29 1 822 368,00 1,47 1 300 000,00 BANK OF AMERICA CORP 4.625% 07/08/2017 EUR 1 471 498,49 1 388 686,00 1,12 1 300 000,00 CITIGROUP INC 1.75% 29/01/2018 EUR 1 286 380,27 1 339 273,00 1,08
FRANCE 5 104 663,15 5 135 454,00 4,15
Finance 3 331 305,89 3 409 934,00 2,75 1 300 000,00
BANQUE FEDERATIVE DU CREDIT MUTUEL SA 1.625% 11/01/2018
EUR 1 285 182,05 1 336 426,00 1,08
1 200 000,00 BNP PARIBAS SA 1.50% 12/03/2018 EUR 1 173 830,14 1 233 948,00 0,99 800 000,00 RCI BANQUE SA 4.25% 27/04/2017 EUR 872 293,70 839 560,00 0,68
Telecommunication 980 301,37 900 952,00 0,73 800 000,00 ORANGE SA 5.625% 22/05/2018 EUR 980 301,37 900 952,00 0,73
Basic Goods 793 055,89 824 568,00 0,67 800 000,00 CARREFOUR SA 1.875% 19/12/2017 EUR 793 055,89 824 568,00 0,67
GREAT-BRITAIN 3 471 685,50 3 475 284,00 2,81
Finance 2 160 635,21 2 174 296,00 1,76 1 300 000,00
ABBEY NATIONAL TREASURY SERVICES PLC 1.75% 15/01/2018
EUR 1 268 922,88 1 335 568,00 1,08
800 000,00 LLOYDS TSB BANK PLC 4.625% 02/02/2017 EUR 891 712,33 838 728,00 0,68
Telecommunication 831 676,71 855 400,00 0,69 800 000,00 EE FINANCE PLC 3.25% 03/08/2018 EUR 831 676,71 855 400,00 0,69
Multi-Utilities 479 373,58 445 588,00 0,36 400 000,00 NATIONAL GRID PLC 5.00% 02/07/2018 EUR 479 373,58 445 588,00 0,36
SWITZERLAND 2 541 380,55 2 314 440,00 1,87
Finance 2 541 380,55 2 314 440,00 1,87 1 300 000,00 CREDIT SUISSE AG 5.125% 18/09/2017 EUR 1 528 410,00 1 408 264,00 1,14
800 000,00 UBS AG 6.00% 18/04/2018 EUR 1 012 970,55 906 176,00 0,73
MEXICO 1 119 766,55 998 263,45 0,81
Government 1 119 766,55 998 263,45 0,81 17 000 000,00 MEXICAN BONOS 8.50% 13/12/2018 MXN 1 119 766,55 998 263,45 0,81
97
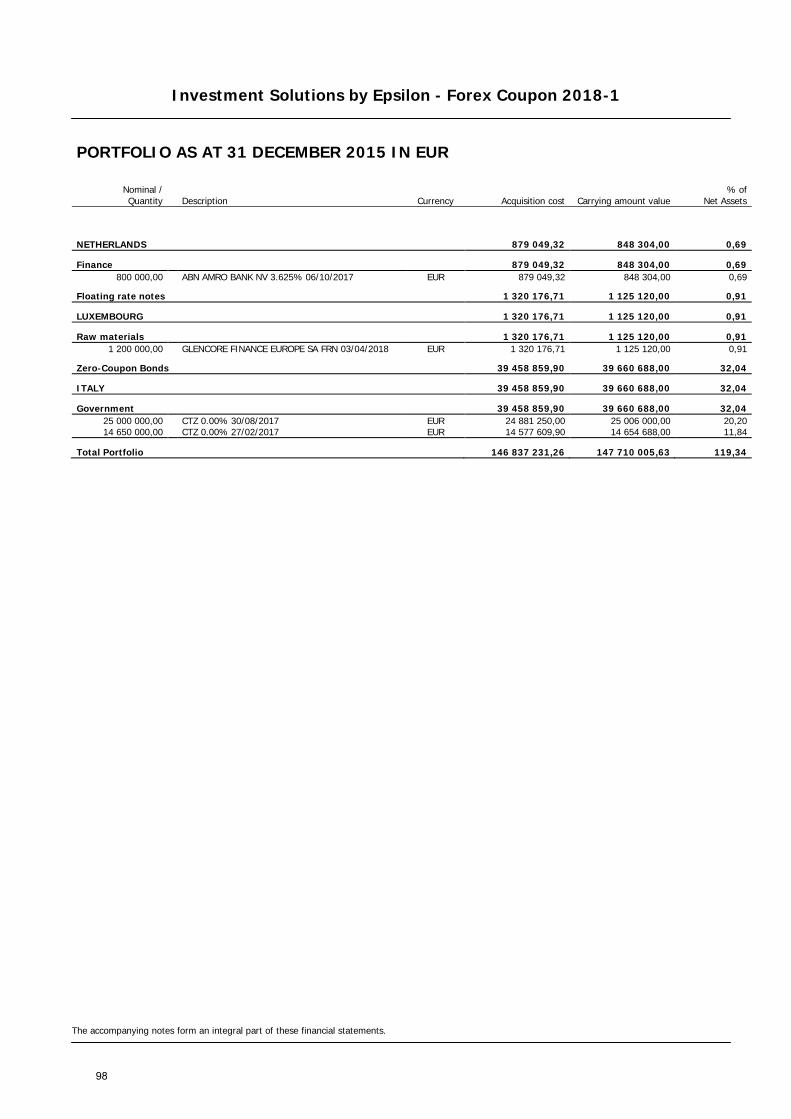
Investment Solutions by Epsilon - Forex Coupon 2018-1
The accompanying notes form an integral part of these financial statements.
PORTFOLIO AS AT 31 DECEMBER 2015 IN EUR
Nominal / Quantity Description Currency Acquisition cost Carrying amount value
% of Net Assets
NETHERLANDS 879 049,32 848 304,00 0,69
Finance 879 049,32 848 304,00 0,69 800 000,00 ABN AMRO BANK NV 3.625% 06/10/2017 EUR 879 049,32 848 304,00 0,69
Floating rate notes 1 320 176,71 1 125 120,00 0,91
LUXEMBOURG 1 320 176,71 1 125 120,00 0,91
Raw materials 1 320 176,71 1 125 120,00 0,91 1 200 000,00 GLENCORE FINANCE EUROPE SA FRN 03/04/2018 EUR 1 320 176,71 1 125 120,00 0,91
Zero-Coupon Bonds 39 458 859,90 39 660 688,00 32,04
ITALY 39 458 859,90 39 660 688,00 32,04
Government 39 458 859,90 39 660 688,00 32,04 25 000 000,00 CTZ 0.00% 30/08/2017 EUR 24 881 250,00 25 006 000,00 20,20 14 650 000,00 CTZ 0.00% 27/02/2017 EUR 14 577 609,90 14 654 688,00 11,84
Total Portfolio 146 837 231,26 147 710 005,63 119,34
98
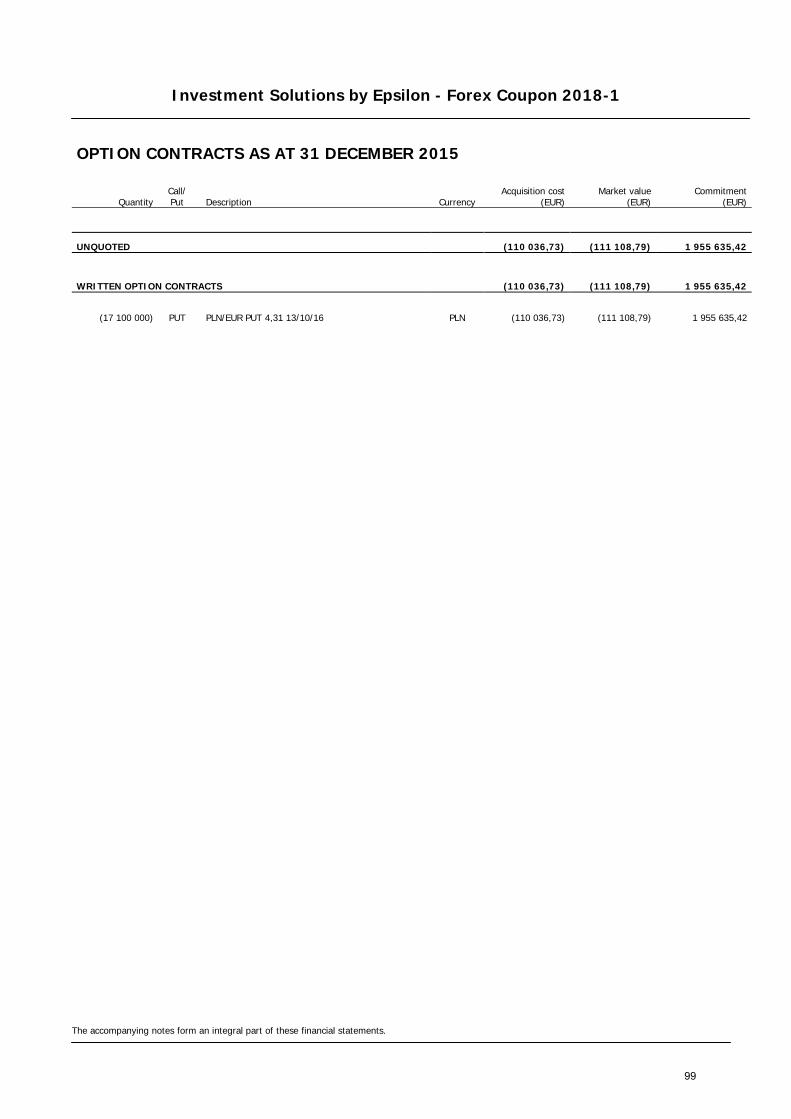
Investment Solutions by Epsilon - Forex Coupon 2018-1
The accompanying notes form an integral part of these financial statements.
OPTION CONTRACTS AS AT 31 DECEMBER 2015
Quantity Call/ Put Description Currency
Acquisition cost (EUR)
Market value (EUR)
Commitment (EUR)
UNQUOTED (110 036,73) (111 108,79) 1 955 635,42
WRITTEN OPTION CONTRACTS (110 036,73) (111 108,79) 1 955 635,42
(17 100 000) PUT PLN/EUR PUT 4,31 13/10/16 PLN (110 036,73) (111 108,79) 1 955 635,42
99

Investment Solutions by Epsilon - Forex Coupon 2018-1
The accompanying notes form an integral part of these financial statements.
FORWARD FOREIGN EXCHANGE CONTRACTS AS AT 31 DECEMBER 2015
Maturity Purchase commitment in
currency Sale commitment in
currency
Unrealised profit/(loss) (EUR)
Total Unrealised profit / (loss) on forward foreign exchange contracts 1 455 524,76
Unrealised profit on forward foreign exchange contracts 2 205 312,96
28/01/2016 3 423 227,28 EUR 49 000 000,00 ZAR 525 884,73 29/02/2016 6 110 920,92 USD 17 850 000 000,00 COP 478 400,36 29/01/2016 3 059 361,90 USD 11 900 000,00 MYR 275 753,09 29/02/2016 6 038 736,28 USD 4 100 000 000,00 CLP 265 833,72 29/02/2016 6 395 312,54 EUR 20 129 000,00 TRY 151 507,29 29/02/2016 5 137 782,93 EUR 94 400 000,00 MXN 132 617,31 29/02/2016 5 284 224,75 USD 80 600 000,00 ZAR 124 291,29 29/02/2016 7 700 000,00 AUD 5 046 712,57 EUR 89 365,84 29/02/2016 3 468 886,80 EUR 3 700 000,00 USD 67 464,78 29/02/2016 1 049 676,56 EUR 18 656 000,00 MXN 60 520,10 29/01/2016 11 900 000,00 MYR 2 739 410,68 USD 18 605,60 28/01/2016 1 279 574,98 EUR 400 000 000,00 HUF 15 068,85
Unrealised loss on forward foreign exchange contracts (749 788,20)
29/02/2016 17 850 000 000,00 COP 5 977 896,85 USD (356 110,90) 28/01/2016 49 000 000,00 ZAR 3 171 394,80 EUR (274 052,25) 29/01/2016 5 355 610,04 EUR 17 370 000,00 TRY (81 650,60) 29/02/2016 5 110 058,72 EUR 7 700 000,00 AUD (26 019,69) 29/02/2016 94 400 000,00 MXN 5 016 122,26 EUR (10 956,64) 17/10/2016 460 000,00 PLN 106 885,54 EUR (998,12)
100
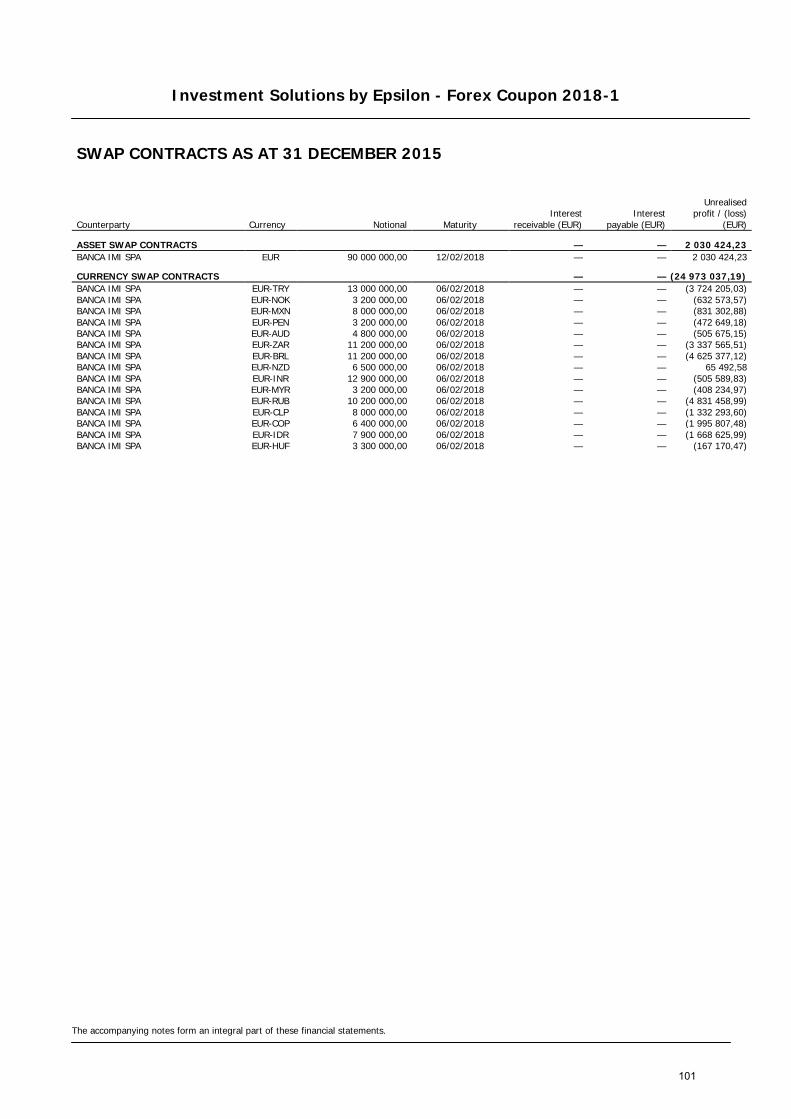
Investment Solutions by Epsilon - Forex Coupon 2018-1
The accompanying notes form an integral part of these financial statements.
SWAP CONTRACTS AS AT 31 DECEMBER 2015
Counterparty Currency Notional Maturity Interest
receivable (EUR) Interest
payable (EUR)
Unrealised
profit / (loss) (EUR)
ASSET SWAP CONTRACTS — — 2 030 424,23 BANCA IMI SPA EUR 90 000 000,00 12/02/2018 — — 2 030 424,23
CURRENCY SWAP CONTRACTS — — (24 973 037,19) BANCA IMI SPA EUR-TRY 13 000 000,00 06/02/2018 — — (3 724 205,03) BANCA IMI SPA EUR-NOK 3 200 000,00 06/02/2018 — — (632 573,57) BANCA IMI SPA EUR-MXN 8 000 000,00 06/02/2018 — — (831 302,88) BANCA IMI SPA EUR-PEN 3 200 000,00 06/02/2018 — — (472 649,18) BANCA IMI SPA EUR-AUD 4 800 000,00 06/02/2018 — — (505 675,15) BANCA IMI SPA EUR-ZAR 11 200 000,00 06/02/2018 — — (3 337 565,51) BANCA IMI SPA EUR-BRL 11 200 000,00 06/02/2018 — — (4 625 377,12) BANCA IMI SPA EUR-NZD 6 500 000,00 06/02/2018 — — 65 492,58 BANCA IMI SPA EUR-INR 12 900 000,00 06/02/2018 — — (505 589,83) BANCA IMI SPA EUR-MYR 3 200 000,00 06/02/2018 — — (408 234,97) BANCA IMI SPA EUR-RUB 10 200 000,00 06/02/2018 — — (4 831 458,99) BANCA IMI SPA EUR-CLP 8 000 000,00 06/02/2018 — — (1 332 293,60) BANCA IMI SPA EUR-COP 6 400 000,00 06/02/2018 — — (1 995 807,48) BANCA IMI SPA EUR-IDR 7 900 000,00 06/02/2018 — — (1 668 625,99) BANCA IMI SPA EUR-HUF 3 300 000,00 06/02/2018 — — (167 170,47)
101
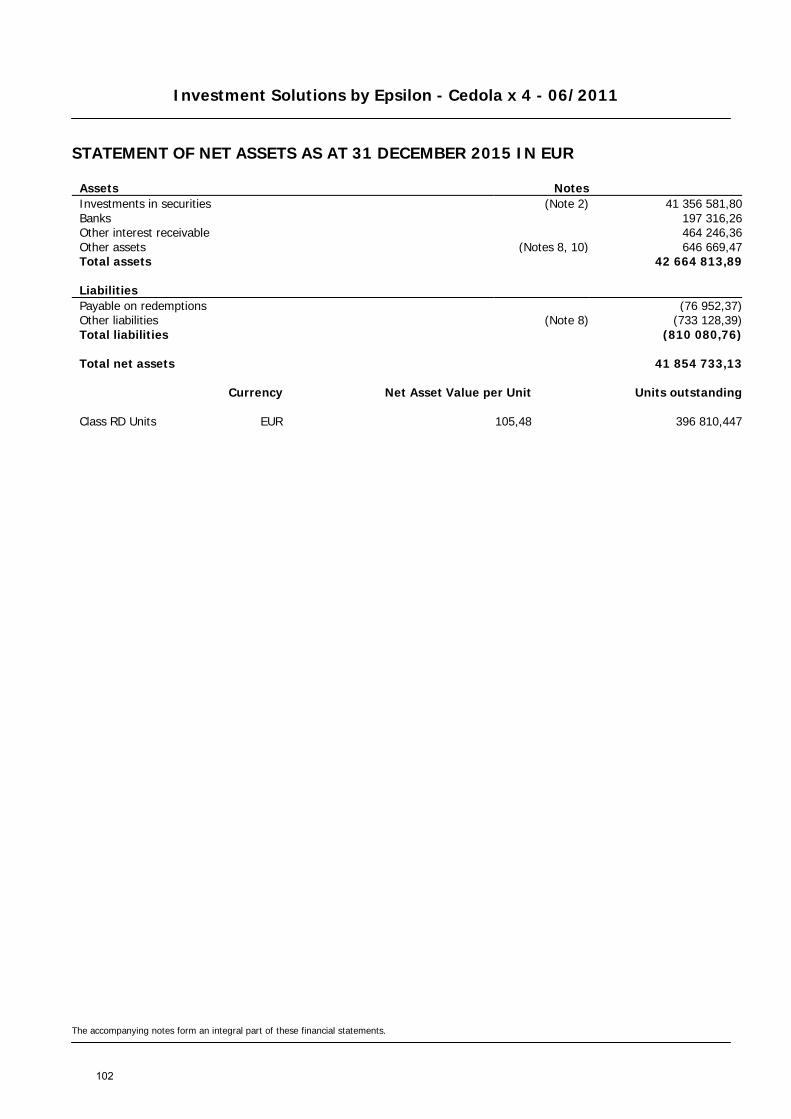
Investment Solutions by Epsilon - Cedola x 4 - 06/2011
STATEMENT OF NET ASSETS AS AT 31 DECEMBER 2015 IN EUR
The accompanying notes form an integral part of these financial statements.
Assets Notes Investments in securities (Note 2) 41 356 581,80 Banks 197 316,26 Other interest receivable 464 246,36 Other assets (Notes 8, 10) 646 669,47 Total assets 42 664 813,89
Liabilities Payable on redemptions (76 952,37) Other liabilities (Note 8) (733 128,39) Total liabilities (810 080,76)
Total net assets 41 854 733,13
Currency Net Asset Value per Unit Units outstanding
Class RD Units EUR 105,48 396 810,447
102
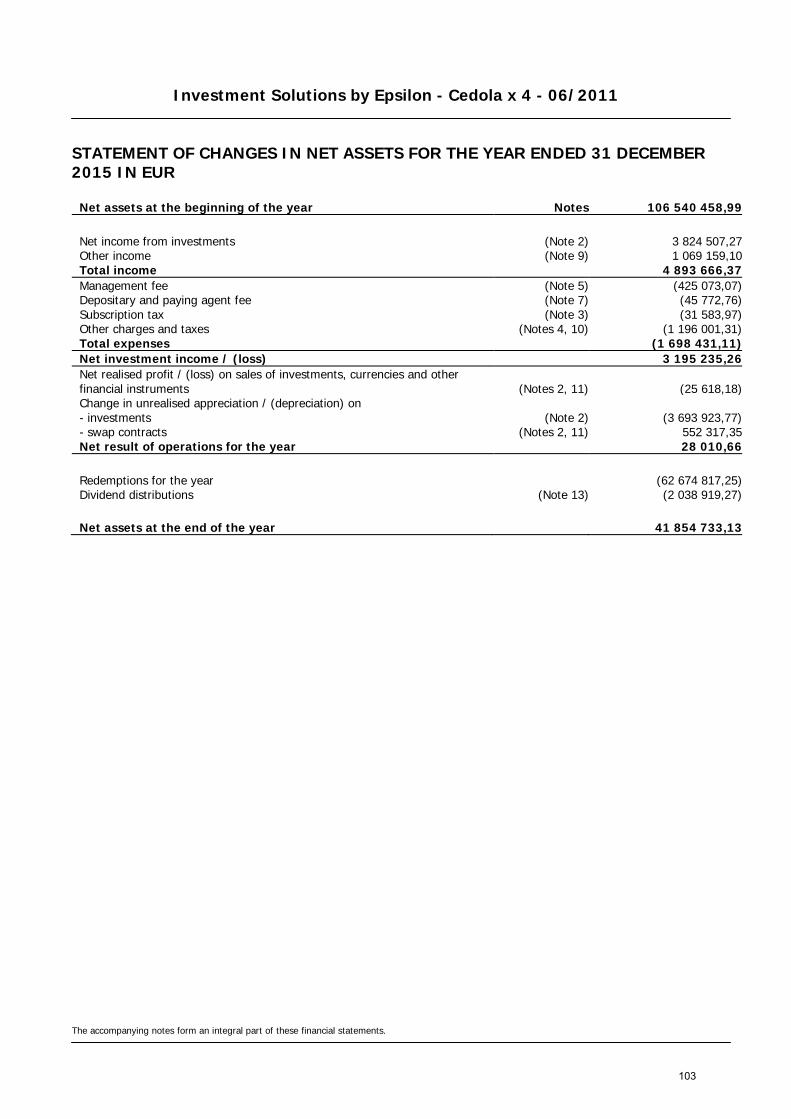
Investment Solutions by Epsilon - Cedola x 4 - 06/2011
STATEMENT OF CHANGES IN NET ASSETS FOR THE YEAR ENDED 31 DECEMBER 2015 IN EUR
The accompanying notes form an integral part of these financial statements.
Net assets at the beginning of the year Notes 106 540 458,99
Net income from investments (Note 2) 3 824 507,27 Other income (Note 9) 1 069 159,10 Total income 4 893 666,37 Management fee (Note 5) (425 073,07) Depositary and paying agent fee (Note 7) (45 772,76) Subscription tax (Note 3) (31 583,97) Other charges and taxes (Notes 4, 10) (1 196 001,31) Total expenses (1 698 431,11) Net investment income / (loss) 3 195 235,26 Net realised profit / (loss) on sales of investments, currencies and other financial instruments (Notes 2, 11) (25 618,18) Change in unrealised appreciation / (depreciation) on - investments (Note 2) (3 693 923,77) - swap contracts (Notes 2, 11) 552 317,35 Net result of operations for the year 28 010,66
Redemptions for the year (62 674 817,25) Dividend distributions (Note 13) (2 038 919,27)
Net assets at the end of the year 41 854 733,13
103
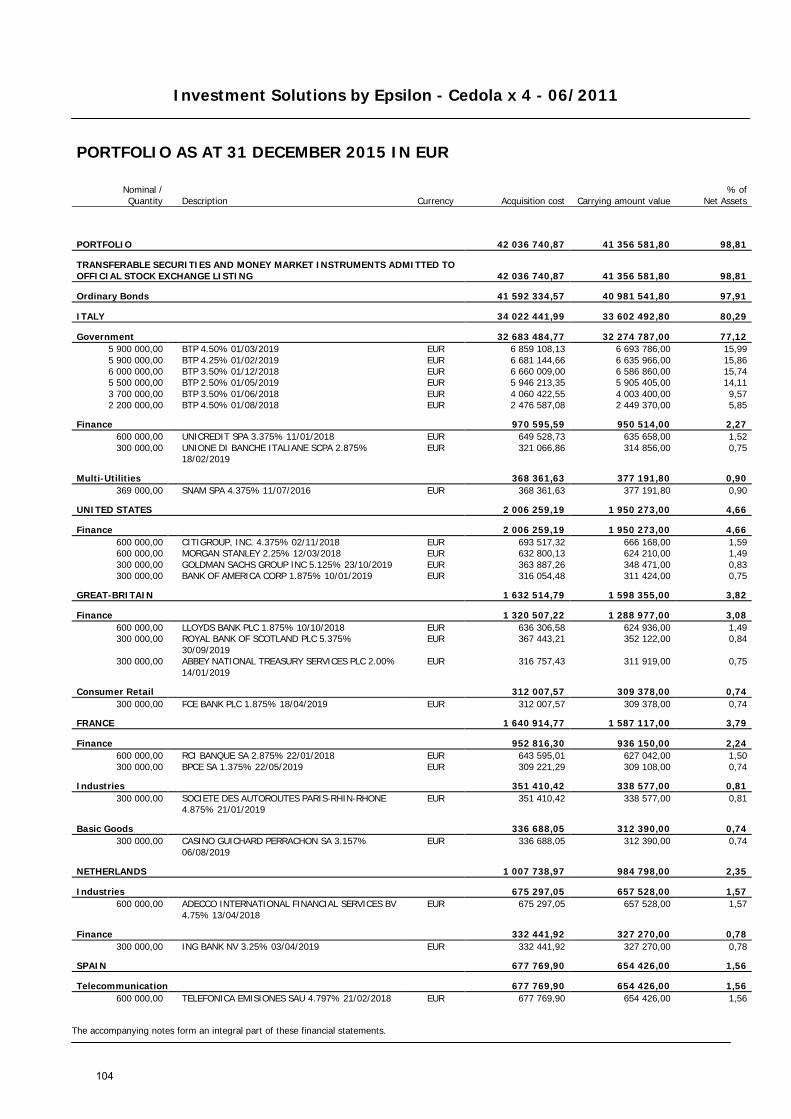
Investment Solutions by Epsilon - Cedola x 4 - 06/2011
The accompanying notes form an integral part of these financial statements.
PORTFOLIO AS AT 31 DECEMBER 2015 IN EUR
Nominal / Quantity Description Currency Acquisition cost Carrying amount value
% of Net Assets
PORTFOLIO 42 036 740,87 41 356 581,80 98,81
TRANSFERABLE SECURITIES AND MONEY MARKET INSTRUMENTS ADMITTED TO OFFICIAL STOCK EXCHANGE LISTING 42 036 740,87 41 356 581,80 98,81
Ordinary Bonds 41 592 334,57 40 981 541,80 97,91
ITALY 34 022 441,99 33 602 492,80 80,29
Government 32 683 484,77 32 274 787,00 77,12 5 900 000,00 BTP 4.50% 01/03/2019 EUR 6 859 108,13 6 693 786,00 15,99 5 900 000,00 BTP 4.25% 01/02/2019 EUR 6 681 144,66 6 635 966,00 15,86 6 000 000,00 BTP 3.50% 01/12/2018 EUR 6 660 009,00 6 586 860,00 15,74 5 500 000,00 BTP 2.50% 01/05/2019 EUR 5 946 213,35 5 905 405,00 14,11 3 700 000,00 BTP 3.50% 01/06/2018 EUR 4 060 422,55 4 003 400,00 9,57 2 200 000,00 BTP 4.50% 01/08/2018 EUR 2 476 587,08 2 449 370,00 5,85
Finance 970 595,59 950 514,00 2,27 600 000,00 UNICREDIT SPA 3.375% 11/01/2018 EUR 649 528,73 635 658,00 1,52 300 000,00
UNIONE DI BANCHE ITALIANE SCPA 2.875% 18/02/2019
EUR 321 066,86 314 856,00 0,75
Multi-Utilities 368 361,63 377 191,80 0,90 369 000,00 SNAM SPA 4.375% 11/07/2016 EUR 368 361,63 377 191,80 0,90
UNITED STATES 2 006 259,19 1 950 273,00 4,66
Finance 2 006 259,19 1 950 273,00 4,66 600 000,00 CITIGROUP, INC. 4.375% 02/11/2018 EUR 693 517,32 666 168,00 1,59 600 000,00 MORGAN STANLEY 2.25% 12/03/2018 EUR 632 800,13 624 210,00 1,49 300 000,00 GOLDMAN SACHS GROUP INC 5.125% 23/10/2019 EUR 363 887,26 348 471,00 0,83 300 000,00 BANK OF AMERICA CORP 1.875% 10/01/2019 EUR 316 054,48 311 424,00 0,75
GREAT-BRITAIN 1 632 514,79 1 598 355,00 3,82
Finance 1 320 507,22 1 288 977,00 3,08 600 000,00 LLOYDS BANK PLC 1.875% 10/10/2018 EUR 636 306,58 624 936,00 1,49 300 000,00
ROYAL BANK OF SCOTLAND PLC 5.375% 30/09/2019
EUR 367 443,21 352 122,00 0,84
300 000,00
ABBEY NATIONAL TREASURY SERVICES PLC 2.00% 14/01/2019
EUR 316 757,43 311 919,00 0,75
Consumer Retail 312 007,57 309 378,00 0,74 300 000,00 FCE BANK PLC 1.875% 18/04/2019 EUR 312 007,57 309 378,00 0,74
FRANCE 1 640 914,77 1 587 117,00 3,79
Finance 952 816,30 936 150,00 2,24 600 000,00 RCI BANQUE SA 2.875% 22/01/2018 EUR 643 595,01 627 042,00 1,50 300 000,00 BPCE SA 1.375% 22/05/2019 EUR 309 221,29 309 108,00 0,74
Industries 351 410,42 338 577,00 0,81 300 000,00
SOCIETE DES AUTOROUTES PARIS-RHIN-RHONE 4.875% 21/01/2019
EUR 351 410,42 338 577,00 0,81
Basic Goods 336 688,05 312 390,00 0,74 300 000,00
CASINO GUICHARD PERRACHON SA 3.157% 06/08/2019
EUR 336 688,05 312 390,00 0,74
NETHERLANDS 1 007 738,97 984 798,00 2,35
Industries 675 297,05 657 528,00 1,57 600 000,00
ADECCO INTERNATIONAL FINANCIAL SERVICES BV 4.75% 13/04/2018
EUR 675 297,05 657 528,00 1,57
Finance 332 441,92 327 270,00 0,78 300 000,00 ING BANK NV 3.25% 03/04/2019 EUR 332 441,92 327 270,00 0,78
SPAIN 677 769,90 654 426,00 1,56
Telecommunication 677 769,90 654 426,00 1,56 600 000,00 TELEFONICA EMISIONES SAU 4.797% 21/02/2018 EUR 677 769,90 654 426,00 1,56
104
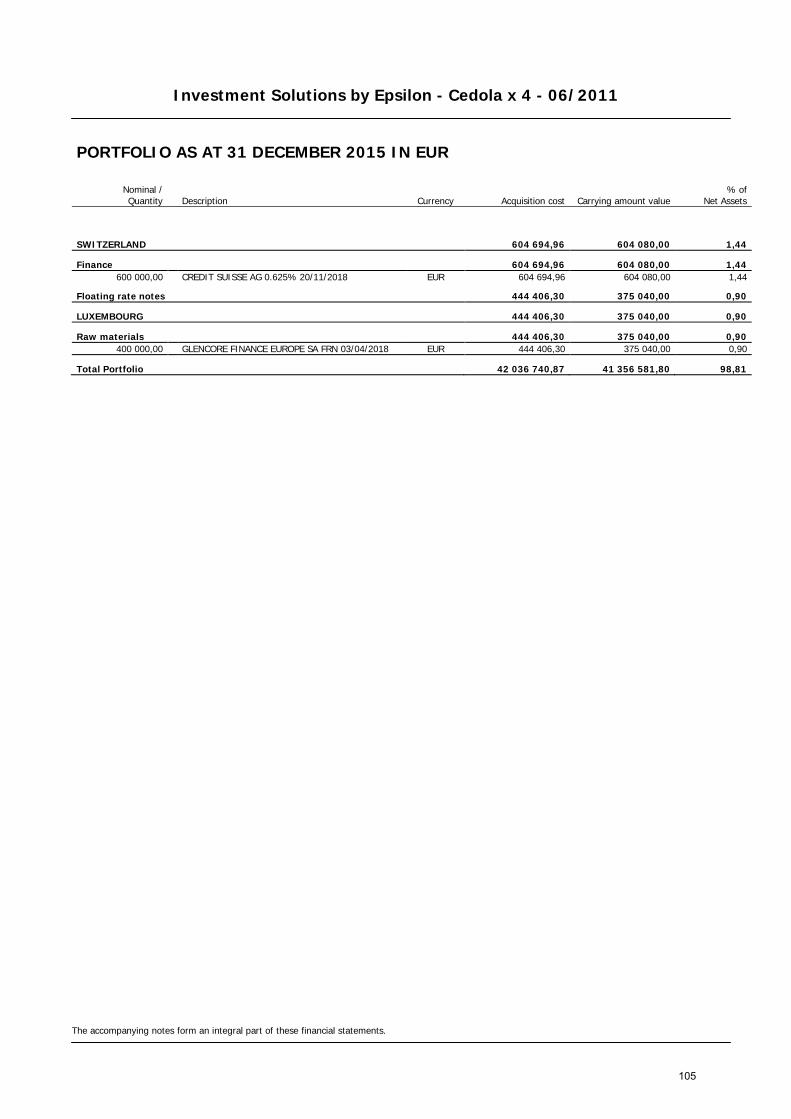
Investment Solutions by Epsilon - Cedola x 4 - 06/2011
The accompanying notes form an integral part of these financial statements.
PORTFOLIO AS AT 31 DECEMBER 2015 IN EUR
Nominal / Quantity Description Currency Acquisition cost Carrying amount value
% of Net Assets
SWITZERLAND 604 694,96 604 080,00 1,44
Finance 604 694,96 604 080,00 1,44 600 000,00 CREDIT SUISSE AG 0.625% 20/11/2018 EUR 604 694,96 604 080,00 1,44
Floating rate notes 444 406,30 375 040,00 0,90
LUXEMBOURG 444 406,30 375 040,00 0,90
Raw materials 444 406,30 375 040,00 0,90 400 000,00 GLENCORE FINANCE EUROPE SA FRN 03/04/2018 EUR 444 406,30 375 040,00 0,90
Total Portfolio 42 036 740,87 41 356 581,80 98,81
105

Investment Solutions by Epsilon - Cedola x 4 - 07/2011
STATEMENT OF NET ASSETS AS AT 31 DECEMBER 2015 IN EUR
The accompanying notes form an integral part of these financial statements.
Assets Notes Investments in securities (Note 2) 38 071 507,11 Banks 142 038,02 Other interest receivable 405 131,57 Receivable on investments sold 419 103,48 Other assets (Notes 8, 10) 890 452,10 Total assets 39 928 232,28
Liabilities Payable on redemptions (192 594,03) Other liabilities (Note 8) (971 464,08) Total liabilities (1 164 058,11)
Total net assets 38 764 174,17
Currency Net Asset Value per Unit Units outstanding
Class RD Units EUR 104,02 372 654,820
106

Investment Solutions by Epsilon - Cedola x 4 - 07/2011
STATEMENT OF CHANGES IN NET ASSETS FOR THE YEAR ENDED 31 DECEMBER 2015 IN EUR
The accompanying notes form an integral part of these financial statements.
Net assets at the beginning of the year Notes 116 985 571,22
Net income from investments (Note 2) 3 419 102,27 Other income (Note 9) 1 116 186,67 Total income 4 535 288,94 Management fee (Note 5) (460 122,69) Depositary and paying agent fee (Note 7) (49 550,93) Subscription tax (Note 3) (33 649,65) Other charges and taxes (Notes 4, 10) (1 263 327,63) Total expenses (1 806 650,90) Net investment income / (loss) 2 728 638,04 Net realised profit / (loss) on sales of investments, currencies and other financial instruments (Notes 2, 11) 742 769,93 Change in unrealised appreciation / (depreciation) on - investments (Note 2) (4 835 201,87) - swap contracts (Notes 2, 11) 1 588 858,84 Net result of operations for the year 225 064,94
Redemptions for the year (76 693 356,33) Dividend distributions (Note 13) (1 753 105,66)
Net assets at the end of the year 38 764 174,17
107
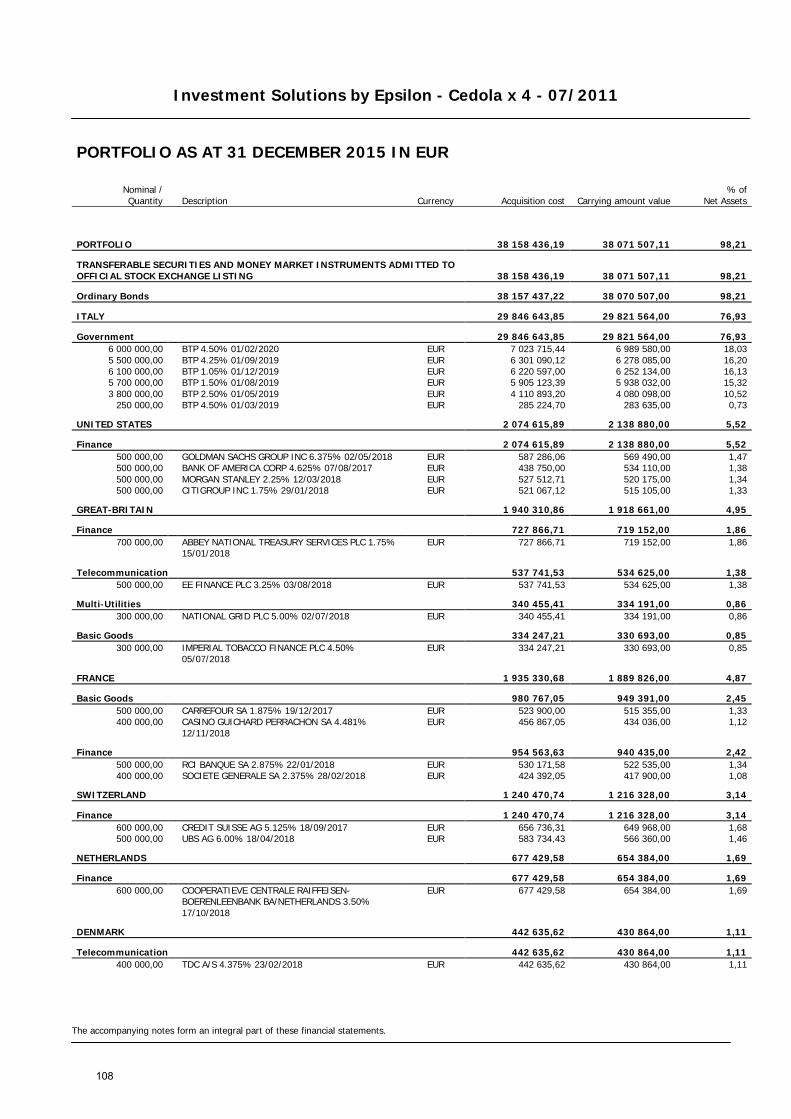
Investment Solutions by Epsilon - Cedola x 4 - 07/2011
The accompanying notes form an integral part of these financial statements.
PORTFOLIO AS AT 31 DECEMBER 2015 IN EUR
Nominal / Quantity Description Currency Acquisition cost Carrying amount value
% of Net Assets
PORTFOLIO 38 158 436,19 38 071 507,11 98,21
TRANSFERABLE SECURITIES AND MONEY MARKET INSTRUMENTS ADMITTED TO OFFICIAL STOCK EXCHANGE LISTING 38 158 436,19 38 071 507,11 98,21
Ordinary Bonds 38 157 437,22 38 070 507,00 98,21
ITALY 29 846 643,85 29 821 564,00 76,93
Government 29 846 643,85 29 821 564,00 76,93 6 000 000,00 BTP 4.50% 01/02/2020 EUR 7 023 715,44 6 989 580,00 18,03 5 500 000,00 BTP 4.25% 01/09/2019 EUR 6 301 090,12 6 278 085,00 16,20 6 100 000,00 BTP 1.05% 01/12/2019 EUR 6 220 597,00 6 252 134,00 16,13 5 700 000,00 BTP 1.50% 01/08/2019 EUR 5 905 123,39 5 938 032,00 15,32 3 800 000,00 BTP 2.50% 01/05/2019 EUR 4 110 893,20 4 080 098,00 10,52
250 000,00 BTP 4.50% 01/03/2019 EUR 285 224,70 283 635,00 0,73
UNITED STATES 2 074 615,89 2 138 880,00 5,52
Finance 2 074 615,89 2 138 880,00 5,52 500 000,00 GOLDMAN SACHS GROUP INC 6.375% 02/05/2018 EUR 587 286,06 569 490,00 1,47 500 000,00 BANK OF AMERICA CORP 4.625% 07/08/2017 EUR 438 750,00 534 110,00 1,38 500 000,00 MORGAN STANLEY 2.25% 12/03/2018 EUR 527 512,71 520 175,00 1,34 500 000,00 CITIGROUP INC 1.75% 29/01/2018 EUR 521 067,12 515 105,00 1,33
GREAT-BRITAIN 1 940 310,86 1 918 661,00 4,95
Finance 727 866,71 719 152,00 1,86 700 000,00
ABBEY NATIONAL TREASURY SERVICES PLC 1.75% 15/01/2018
EUR 727 866,71 719 152,00 1,86
Telecommunication 537 741,53 534 625,00 1,38 500 000,00 EE FINANCE PLC 3.25% 03/08/2018 EUR 537 741,53 534 625,00 1,38
Multi-Utilities 340 455,41 334 191,00 0,86 300 000,00 NATIONAL GRID PLC 5.00% 02/07/2018 EUR 340 455,41 334 191,00 0,86
Basic Goods 334 247,21 330 693,00 0,85 300 000,00
IMPERIAL TOBACCO FINANCE PLC 4.50% 05/07/2018
EUR 334 247,21 330 693,00 0,85
FRANCE 1 935 330,68 1 889 826,00 4,87
Basic Goods 980 767,05 949 391,00 2,45 500 000,00 CARREFOUR SA 1.875% 19/12/2017 EUR 523 900,00 515 355,00 1,33 400 000,00
CASINO GUICHARD PERRACHON SA 4.481% 12/11/2018
EUR 456 867,05 434 036,00 1,12
Finance 954 563,63 940 435,00 2,42 500 000,00 RCI BANQUE SA 2.875% 22/01/2018 EUR 530 171,58 522 535,00 1,34 400 000,00 SOCIETE GENERALE SA 2.375% 28/02/2018 EUR 424 392,05 417 900,00 1,08
SWITZERLAND 1 240 470,74 1 216 328,00 3,14
Finance 1 240 470,74 1 216 328,00 3,14 600 000,00 CREDIT SUISSE AG 5.125% 18/09/2017 EUR 656 736,31 649 968,00 1,68 500 000,00 UBS AG 6.00% 18/04/2018 EUR 583 734,43 566 360,00 1,46
NETHERLANDS 677 429,58 654 384,00 1,69
Finance 677 429,58 654 384,00 1,69 600 000,00
COOPERATIEVE CENTRALE RAIFFEISEN-BOERENLEENBANK BA/NETHERLANDS 3.50% 17/10/2018
EUR 677 429,58 654 384,00 1,69
DENMARK 442 635,62 430 864,00 1,11
Telecommunication 442 635,62 430 864,00 1,11 400 000,00 TDC A/S 4.375% 23/02/2018 EUR 442 635,62 430 864,00 1,11
108
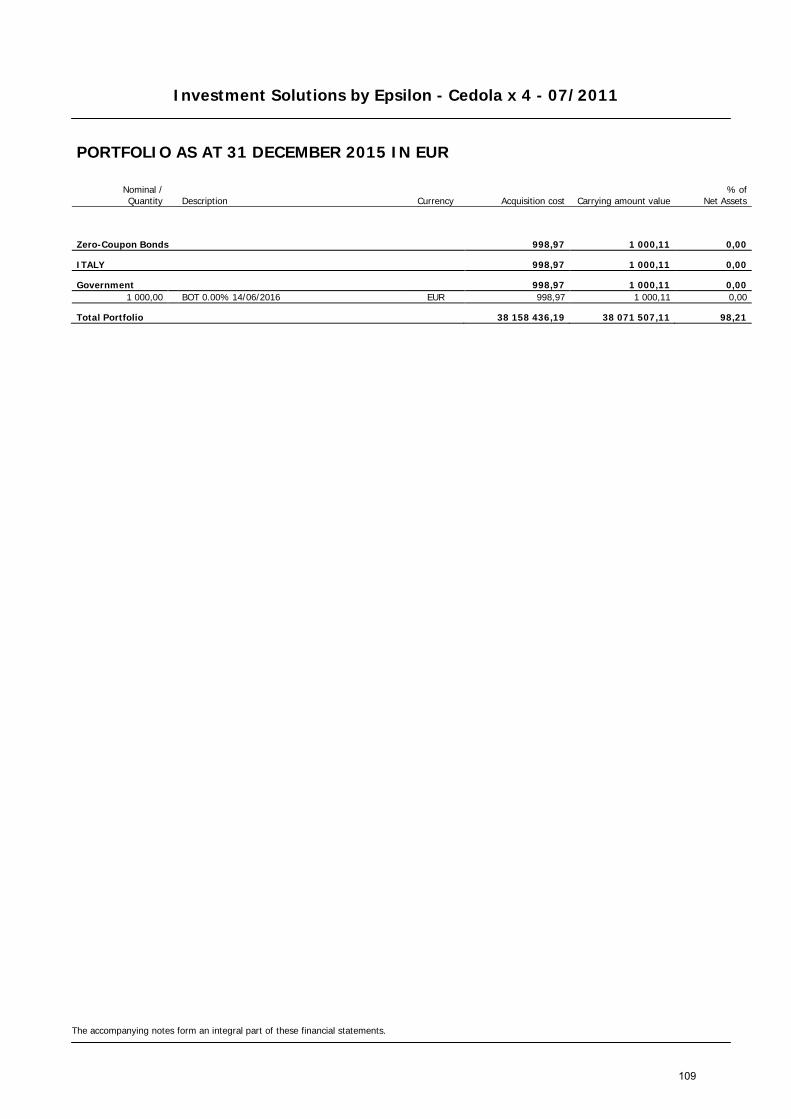
Investment Solutions by Epsilon - Cedola x 4 - 07/2011
The accompanying notes form an integral part of these financial statements.
PORTFOLIO AS AT 31 DECEMBER 2015 IN EUR
Nominal / Quantity Description Currency Acquisition cost Carrying amount value
% of Net Assets
Zero-Coupon Bonds 998,97 1 000,11 0,00
ITALY 998,97 1 000,11 0,00
Government 998,97 1 000,11 0,00 1 000,00 BOT 0.00% 14/06/2016 EUR 998,97 1 000,11 0,00
Total Portfolio 38 158 436,19 38 071 507,11 98,21
109

Investment Solutions by Epsilon - Cedola x 4 - 09/2011
STATEMENT OF NET ASSETS AS AT 31 DECEMBER 2015 IN EUR
The accompanying notes form an integral part of these financial statements.
Assets Notes Investments in securities (Note 2) 33 092 055,97 Banks 201 393,02 Other interest receivable 322 783,59 Other assets (Notes 8, 10) 811 670,77 Total assets 34 427 903,35
Liabilities Payable on redemptions (77 148,72) Other liabilities (Note 8) (876 353,17) Total liabilities (953 501,89)
Total net assets 33 474 401,46
Currency Net Asset Value per Unit Units outstanding
Class RD Units EUR 104,17 321 343,209
110

Investment Solutions by Epsilon - Cedola x 4 - 09/2011
STATEMENT OF CHANGES IN NET ASSETS FOR THE YEAR ENDED 31 DECEMBER 2015 IN EUR
The accompanying notes form an integral part of these financial statements.
Net assets at the beginning of the year Notes 82 572 193,40
Net income from investments (Note 2) 2 275 014,33 Other income (Note 9) 861 836,18 Total income 3 136 850,51 Management fee (Note 5) (347 565,48) Depositary and paying agent fee (Note 7) (37 459,18) Subscription tax (Note 3) (26 001,31) Other charges and taxes (Notes 4, 10) (976 582,94) Total expenses (1 387 608,91) Net investment income / (loss) 1 749 241,60 Net realised profit / (loss) on sales of investments, currencies and other financial instruments (Notes 2, 11) 48 645,90 Change in unrealised appreciation / (depreciation) on - investments (Note 2) (5 381 581,05) - swap contracts (Notes 2, 11) 3 452 876,07 Net result of operations for the year (130 817,48)
Redemptions for the year (47 640 896,57) Dividend distributions (Note 13) (1 326 077,89)
Net assets at the end of the year 33 474 401,46
111
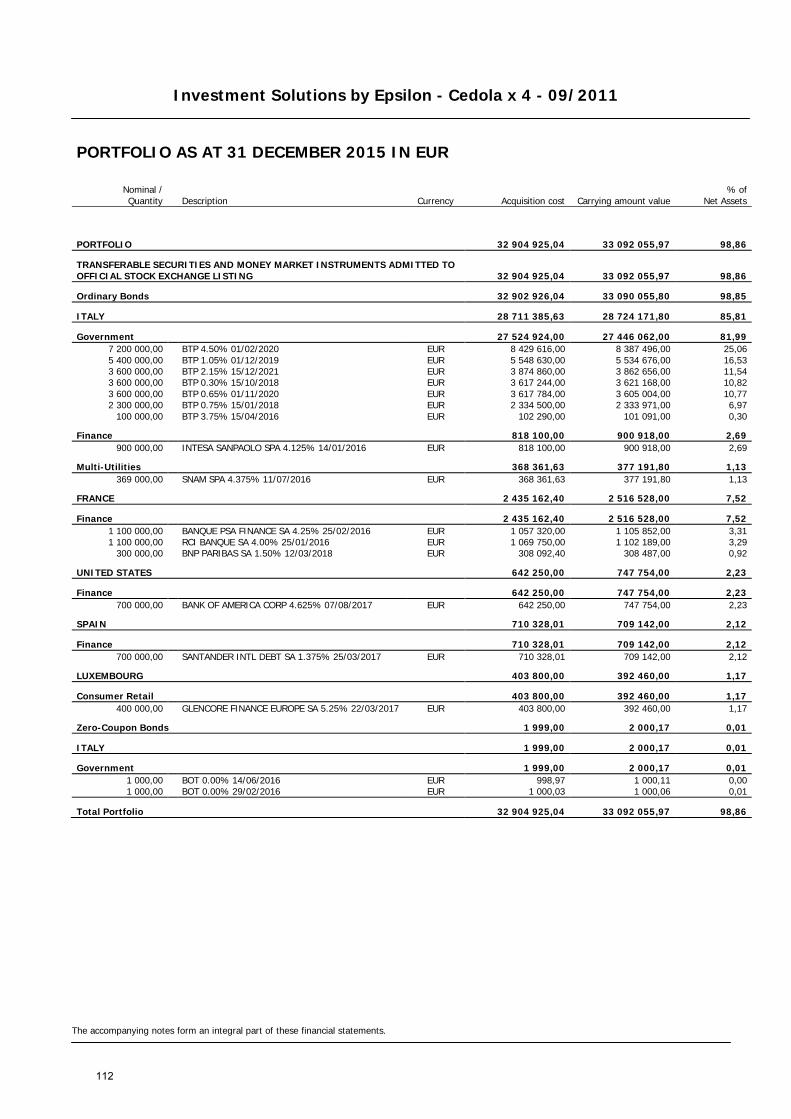
Investment Solutions by Epsilon - Cedola x 4 - 09/2011
The accompanying notes form an integral part of these financial statements.
PORTFOLIO AS AT 31 DECEMBER 2015 IN EUR
Nominal / Quantity Description Currency Acquisition cost Carrying amount value
% of Net Assets
PORTFOLIO 32 904 925,04 33 092 055,97 98,86
TRANSFERABLE SECURITIES AND MONEY MARKET INSTRUMENTS ADMITTED TO OFFICIAL STOCK EXCHANGE LISTING 32 904 925,04 33 092 055,97 98,86
Ordinary Bonds 32 902 926,04 33 090 055,80 98,85
ITALY 28 711 385,63 28 724 171,80 85,81
Government 27 524 924,00 27 446 062,00 81,99 7 200 000,00 BTP 4.50% 01/02/2020 EUR 8 429 616,00 8 387 496,00 25,06 5 400 000,00 BTP 1.05% 01/12/2019 EUR 5 548 630,00 5 534 676,00 16,53 3 600 000,00 BTP 2.15% 15/12/2021 EUR 3 874 860,00 3 862 656,00 11,54 3 600 000,00 BTP 0.30% 15/10/2018 EUR 3 617 244,00 3 621 168,00 10,82 3 600 000,00 BTP 0.65% 01/11/2020 EUR 3 617 784,00 3 605 004,00 10,77 2 300 000,00 BTP 0.75% 15/01/2018 EUR 2 334 500,00 2 333 971,00 6,97
100 000,00 BTP 3.75% 15/04/2016 EUR 102 290,00 101 091,00 0,30
Finance 818 100,00 900 918,00 2,69 900 000,00 INTESA SANPAOLO SPA 4.125% 14/01/2016 EUR 818 100,00 900 918,00 2,69
Multi-Utilities 368 361,63 377 191,80 1,13 369 000,00 SNAM SPA 4.375% 11/07/2016 EUR 368 361,63 377 191,80 1,13
FRANCE 2 435 162,40 2 516 528,00 7,52
Finance 2 435 162,40 2 516 528,00 7,52 1 100 000,00 BANQUE PSA FINANCE SA 4.25% 25/02/2016 EUR 1 057 320,00 1 105 852,00 3,31 1 100 000,00 RCI BANQUE SA 4.00% 25/01/2016 EUR 1 069 750,00 1 102 189,00 3,29
300 000,00 BNP PARIBAS SA 1.50% 12/03/2018 EUR 308 092,40 308 487,00 0,92
UNITED STATES 642 250,00 747 754,00 2,23
Finance 642 250,00 747 754,00 2,23 700 000,00 BANK OF AMERICA CORP 4.625% 07/08/2017 EUR 642 250,00 747 754,00 2,23
SPAIN 710 328,01 709 142,00 2,12
Finance 710 328,01 709 142,00 2,12 700 000,00 SANTANDER INTL DEBT SA 1.375% 25/03/2017 EUR 710 328,01 709 142,00 2,12
LUXEMBOURG 403 800,00 392 460,00 1,17
Consumer Retail 403 800,00 392 460,00 1,17 400 000,00 GLENCORE FINANCE EUROPE SA 5.25% 22/03/2017 EUR 403 800,00 392 460,00 1,17
Zero-Coupon Bonds 1 999,00 2 000,17 0,01
ITALY 1 999,00 2 000,17 0,01
Government 1 999,00 2 000,17 0,01 1 000,00 BOT 0.00% 14/06/2016 EUR 998,97 1 000,11 0,00 1 000,00 BOT 0.00% 29/02/2016 EUR 1 000,03 1 000,06 0,01
Total Portfolio 32 904 925,04 33 092 055,97 98,86
112

Investment Solutions by Epsilon - Cedola x 4 - 11/2011
STATEMENT OF NET ASSETS AS AT 31 DECEMBER 2015 IN EUR
The accompanying notes form an integral part of these financial statements.
Assets Notes Investments in securities (Note 2) 10 926 956,66 Banks 1 242 177,96 Other interest receivable 110 954,10 Other assets (Notes 8, 10) 368 396,15 Total assets 12 648 484,87
Liabilities Payable on redemptions (100 881,17) Other liabilities (Note 8) (391 114,87) Total liabilities (491 996,04)
Total net assets 12 156 488,83
Currency Net Asset Value per Unit Units outstanding
Class RD Units EUR 102,95 118 086,797
113

Investment Solutions by Epsilon - Cedola x 4 - 11/2011
STATEMENT OF CHANGES IN NET ASSETS FOR THE YEAR ENDED 31 DECEMBER 2015 IN EUR
The accompanying notes form an integral part of these financial statements.
Net assets at the beginning of the year Notes 31 507 998,68
Net income from investments (Note 2) 821 229,07 Other income (Note 9) 355 808,34 Total income 1 177 037,41 Management fee (Note 5) (125 780,99) Depositary and paying agent fee (Note 7) (13 836,43) Subscription tax (Note 3) (9 296,35) Other charges and taxes (Notes 4, 10) (402 391,49) Total expenses (551 305,26) Net investment income / (loss) 625 732,15 Net realised profit / (loss) on sales of investments, currencies and other financial instruments (Notes 2, 11) (962 643,70) Change in unrealised appreciation / (depreciation) on - investments (Note 2) (972 732,57) - swap contracts (Notes 2, 11) 1 245 857,99 Net result of operations for the year (63 786,13)
Redemptions for the year (18 817 248,28) Dividend distributions (Note 13) (470 475,44)
Net assets at the end of the year 12 156 488,83
114
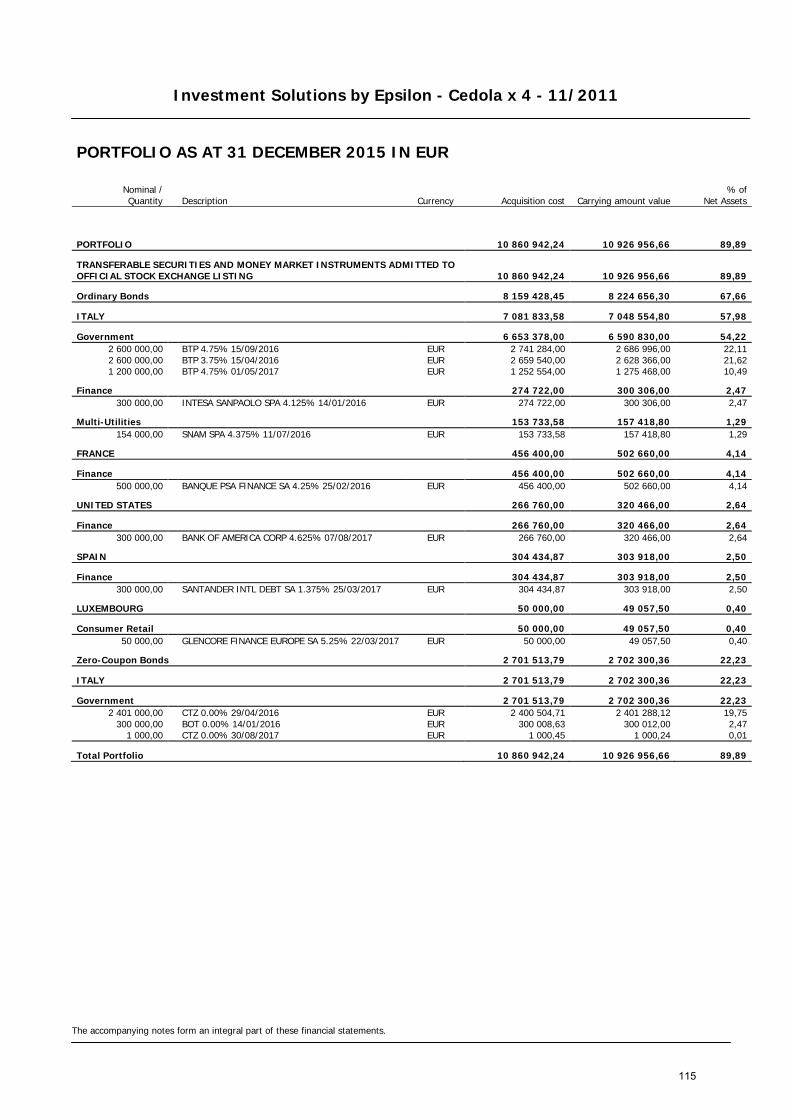
Investment Solutions by Epsilon - Cedola x 4 - 11/2011
The accompanying notes form an integral part of these financial statements.
PORTFOLIO AS AT 31 DECEMBER 2015 IN EUR
Nominal / Quantity Description Currency Acquisition cost Carrying amount value
% of Net Assets
PORTFOLIO 10 860 942,24 10 926 956,66 89,89
TRANSFERABLE SECURITIES AND MONEY MARKET INSTRUMENTS ADMITTED TO OFFICIAL STOCK EXCHANGE LISTING 10 860 942,24 10 926 956,66 89,89
Ordinary Bonds 8 159 428,45 8 224 656,30 67,66
ITALY 7 081 833,58 7 048 554,80 57,98
Government 6 653 378,00 6 590 830,00 54,22 2 600 000,00 BTP 4.75% 15/09/2016 EUR 2 741 284,00 2 686 996,00 22,11 2 600 000,00 BTP 3.75% 15/04/2016 EUR 2 659 540,00 2 628 366,00 21,62 1 200 000,00 BTP 4.75% 01/05/2017 EUR 1 252 554,00 1 275 468,00 10,49
Finance 274 722,00 300 306,00 2,47 300 000,00 INTESA SANPAOLO SPA 4.125% 14/01/2016 EUR 274 722,00 300 306,00 2,47
Multi-Utilities 153 733,58 157 418,80 1,29 154 000,00 SNAM SPA 4.375% 11/07/2016 EUR 153 733,58 157 418,80 1,29
FRANCE 456 400,00 502 660,00 4,14
Finance 456 400,00 502 660,00 4,14 500 000,00 BANQUE PSA FINANCE SA 4.25% 25/02/2016 EUR 456 400,00 502 660,00 4,14
UNITED STATES 266 760,00 320 466,00 2,64
Finance 266 760,00 320 466,00 2,64 300 000,00 BANK OF AMERICA CORP 4.625% 07/08/2017 EUR 266 760,00 320 466,00 2,64
SPAIN 304 434,87 303 918,00 2,50
Finance 304 434,87 303 918,00 2,50 300 000,00 SANTANDER INTL DEBT SA 1.375% 25/03/2017 EUR 304 434,87 303 918,00 2,50
LUXEMBOURG 50 000,00 49 057,50 0,40
Consumer Retail 50 000,00 49 057,50 0,40 50 000,00 GLENCORE FINANCE EUROPE SA 5.25% 22/03/2017 EUR 50 000,00 49 057,50 0,40
Zero-Coupon Bonds 2 701 513,79 2 702 300,36 22,23
ITALY 2 701 513,79 2 702 300,36 22,23
Government 2 701 513,79 2 702 300,36 22,23 2 401 000,00 CTZ 0.00% 29/04/2016 EUR 2 400 504,71 2 401 288,12 19,75
300 000,00 BOT 0.00% 14/01/2016 EUR 300 008,63 300 012,00 2,47 1 000,00 CTZ 0.00% 30/08/2017 EUR 1 000,45 1 000,24 0,01
Total Portfolio 10 860 942,24 10 926 956,66 89,89
115
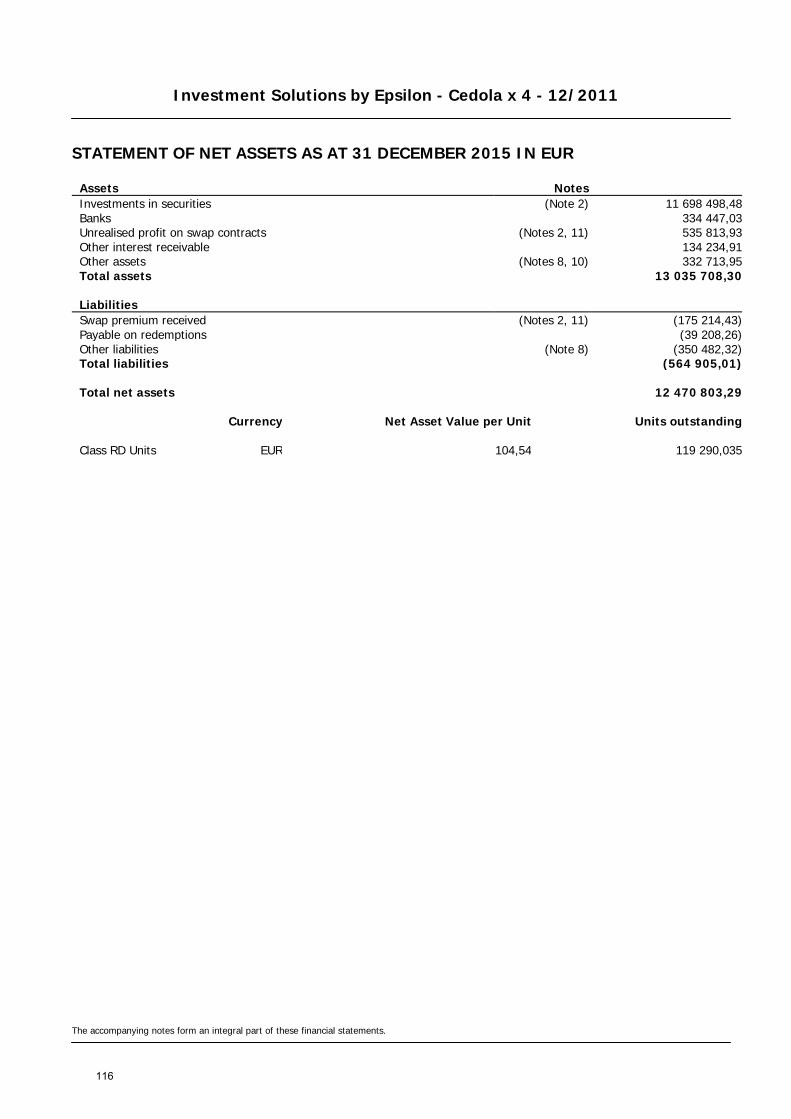
Investment Solutions by Epsilon - Cedola x 4 - 12/2011
STATEMENT OF NET ASSETS AS AT 31 DECEMBER 2015 IN EUR
The accompanying notes form an integral part of these financial statements.
Assets Notes Investments in securities (Note 2) 11 698 498,48 Banks 334 447,03 Unrealised profit on swap contracts (Notes 2, 11) 535 813,93 Other interest receivable 134 234,91 Other assets (Notes 8, 10) 332 713,95 Total assets 13 035 708,30
Liabilities Swap premium received (Notes 2, 11) (175 214,43) Payable on redemptions (39 208,26) Other liabilities (Note 8) (350 482,32) Total liabilities (564 905,01)
Total net assets 12 470 803,29
Currency Net Asset Value per Unit Units outstanding
Class RD Units EUR 104,54 119 290,035
116

Investment Solutions by Epsilon - Cedola x 4 - 12/2011
STATEMENT OF CHANGES IN NET ASSETS FOR THE YEAR ENDED 31 DECEMBER 2015 IN EUR
The accompanying notes form an integral part of these financial statements.
Net assets at the beginning of the year Notes 30 241 512,02
Net income from investments (Note 2) 732 394,39 Other income (Note 9) 274 691,82 Total income 1 007 086,21 Management fee (Note 5) (121 166,40) Depositary and paying agent fee (Note 7) (14 647,53) Subscription tax (Note 3) (9 036,29) Other charges and taxes (Notes 4, 10) (322 995,69) Total expenses (467 845,91) Net investment income / (loss) 539 240,30 Net realised profit / (loss) on sales of investments, currencies and other financial instruments (Notes 2, 11) (100 057,31) Change in unrealised appreciation / (depreciation) on - investments (Note 2) (955 442,25) - swap contracts (Notes 2, 11) 471 345,50 Net result of operations for the year (44 913,76)
Redemptions for the year (16 873 998,11) Dividend distributions (Note 13) (851 796,86)
Net assets at the end of the year 12 470 803,29
117
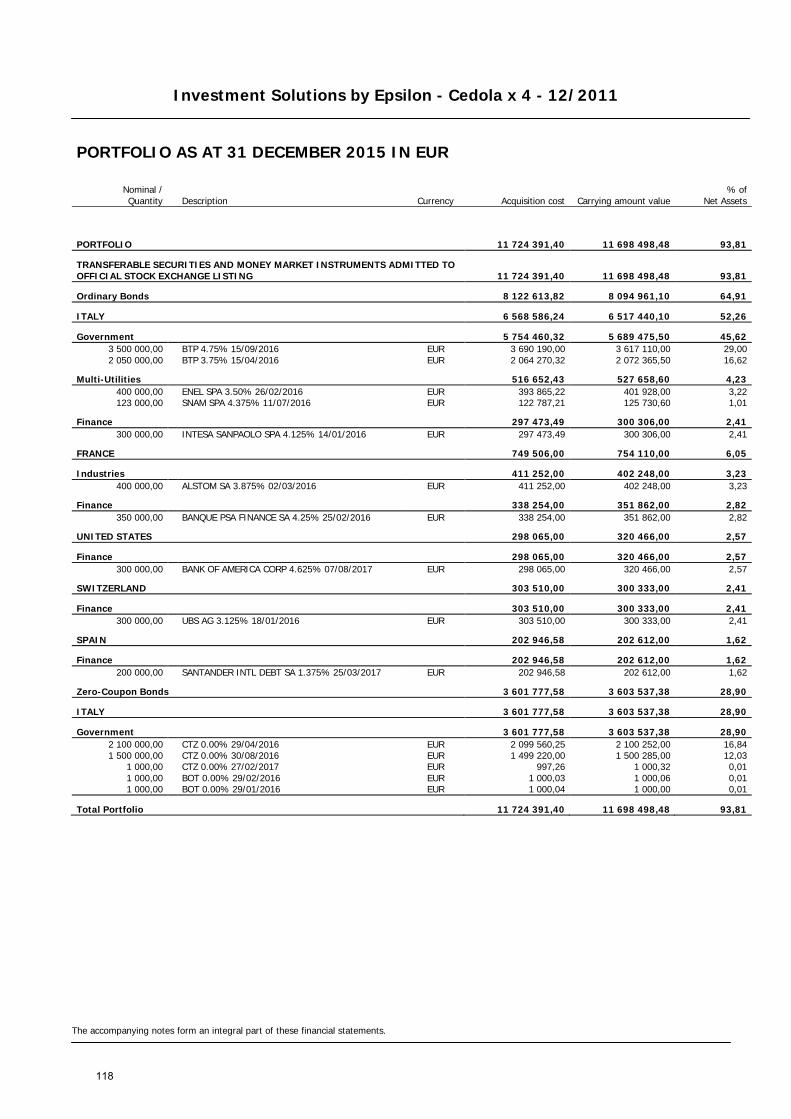
Investment Solutions by Epsilon - Cedola x 4 - 12/2011
The accompanying notes form an integral part of these financial statements.
PORTFOLIO AS AT 31 DECEMBER 2015 IN EUR
Nominal / Quantity Description Currency Acquisition cost Carrying amount value
% of Net Assets
PORTFOLIO 11 724 391,40 11 698 498,48 93,81
TRANSFERABLE SECURITIES AND MONEY MARKET INSTRUMENTS ADMITTED TO OFFICIAL STOCK EXCHANGE LISTING 11 724 391,40 11 698 498,48 93,81
Ordinary Bonds 8 122 613,82 8 094 961,10 64,91
ITALY 6 568 586,24 6 517 440,10 52,26
Government 5 754 460,32 5 689 475,50 45,62 3 500 000,00 BTP 4.75% 15/09/2016 EUR 3 690 190,00 3 617 110,00 29,00 2 050 000,00 BTP 3.75% 15/04/2016 EUR 2 064 270,32 2 072 365,50 16,62
Multi-Utilities 516 652,43 527 658,60 4,23 400 000,00 ENEL SPA 3.50% 26/02/2016 EUR 393 865,22 401 928,00 3,22 123 000,00 SNAM SPA 4.375% 11/07/2016 EUR 122 787,21 125 730,60 1,01
Finance 297 473,49 300 306,00 2,41 300 000,00 INTESA SANPAOLO SPA 4.125% 14/01/2016 EUR 297 473,49 300 306,00 2,41
FRANCE 749 506,00 754 110,00 6,05
Industries 411 252,00 402 248,00 3,23 400 000,00 ALSTOM SA 3.875% 02/03/2016 EUR 411 252,00 402 248,00 3,23
Finance 338 254,00 351 862,00 2,82 350 000,00 BANQUE PSA FINANCE SA 4.25% 25/02/2016 EUR 338 254,00 351 862,00 2,82
UNITED STATES 298 065,00 320 466,00 2,57
Finance 298 065,00 320 466,00 2,57 300 000,00 BANK OF AMERICA CORP 4.625% 07/08/2017 EUR 298 065,00 320 466,00 2,57
SWITZERLAND 303 510,00 300 333,00 2,41
Finance 303 510,00 300 333,00 2,41 300 000,00 UBS AG 3.125% 18/01/2016 EUR 303 510,00 300 333,00 2,41
SPAIN 202 946,58 202 612,00 1,62
Finance 202 946,58 202 612,00 1,62 200 000,00 SANTANDER INTL DEBT SA 1.375% 25/03/2017 EUR 202 946,58 202 612,00 1,62
Zero-Coupon Bonds 3 601 777,58 3 603 537,38 28,90
ITALY 3 601 777,58 3 603 537,38 28,90
Government 3 601 777,58 3 603 537,38 28,90 2 100 000,00 CTZ 0.00% 29/04/2016 EUR 2 099 560,25 2 100 252,00 16,84 1 500 000,00 CTZ 0.00% 30/08/2016 EUR 1 499 220,00 1 500 285,00 12,03
1 000,00 CTZ 0.00% 27/02/2017 EUR 997,26 1 000,32 0,01 1 000,00 BOT 0.00% 29/02/2016 EUR 1 000,03 1 000,06 0,01 1 000,00 BOT 0.00% 29/01/2016 EUR 1 000,04 1 000,00 0,01
Total Portfolio 11 724 391,40 11 698 498,48 93,81
118
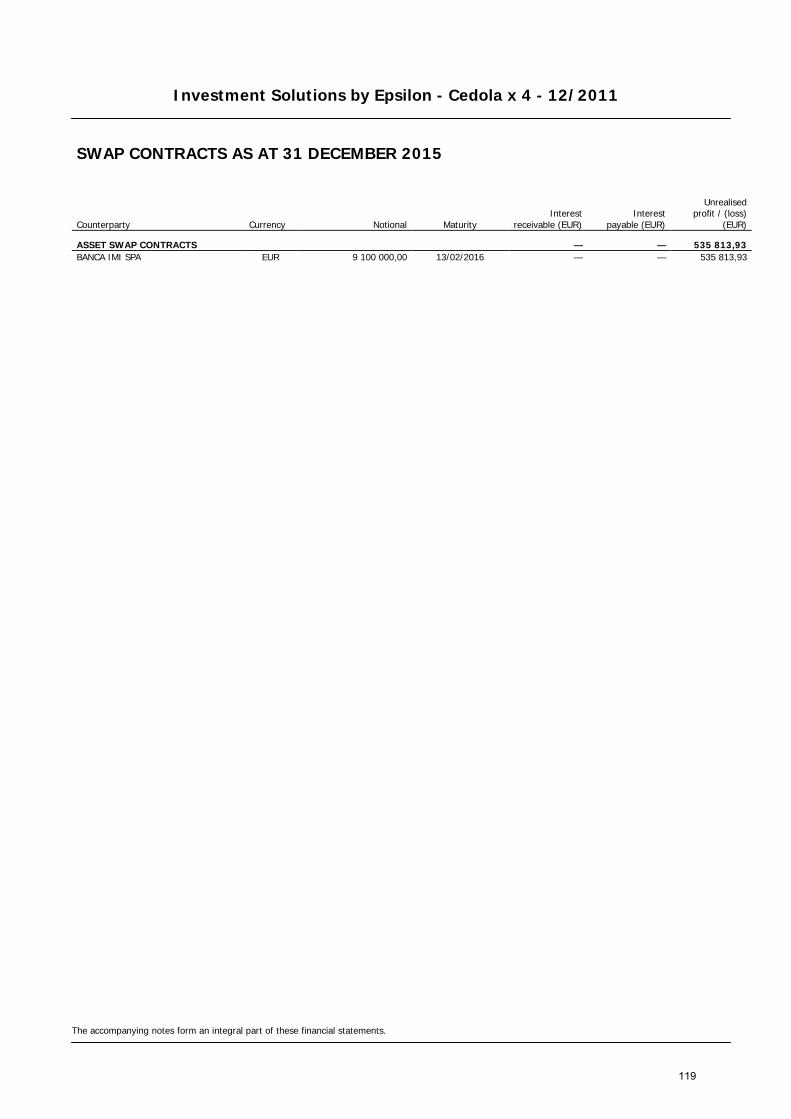
Investment Solutions by Epsilon - Cedola x 4 - 12/2011
The accompanying notes form an integral part of these financial statements.
SWAP CONTRACTS AS AT 31 DECEMBER 2015
Counterparty Currency Notional Maturity Interest
receivable (EUR) Interest
payable (EUR)
Unrealised
profit / (loss) (EUR)
ASSET SWAP CONTRACTS — — 535 813,93 BANCA IMI SPA EUR 9 100 000,00 13/02/2016 — — 535 813,93
119

Investment Solutions by Epsilon - Cedola x 4 - 02/2012
STATEMENT OF NET ASSETS AS AT 31 DECEMBER 2015 IN EUR
The accompanying notes form an integral part of these financial statements.
Assets Notes Investments in securities (Note 2) 77 142 710,07 Banks 258 542,14 Unrealised profit on swap contracts (Notes 2, 11) 1 774 650,80 Other interest receivable 1 380 390,64 Other assets (Notes 8, 10) 1 895 257,90 Total assets 82 451 551,55
Liabilities Swap premium received (Notes 2, 11) (2 297 717,66) Payable on redemptions (90 168,80) Other liabilities (Note 8) (1 968 631,09) Total liabilities (4 356 517,55)
Total net assets 78 095 034,00
Currency Net Asset Value per Unit Units outstanding
Class RD Units EUR 106,12 735 899,689
120

Investment Solutions by Epsilon - Cedola x 4 - 02/2012
STATEMENT OF CHANGES IN NET ASSETS FOR THE YEAR ENDED 31 DECEMBER 2015 IN EUR
The accompanying notes form an integral part of these financial statements.
Net assets at the beginning of the year Notes 178 614 185,79
Net income from investments (Note 2) 5 564 748,13 Other income (Note 9) 1 364 597,36 Total income 6 929 345,49 Management fee (Note 5) (728 530,63) Depositary and paying agent fee (Note 7) (77 981,73) Subscription tax (Note 3) (54 817,24) Other charges and taxes (Notes 4, 10) (1 615 819,55) Total expenses (2 477 149,15) Net investment income / (loss) 4 452 196,34 Net realised profit / (loss) on sales of investments, currencies and other financial instruments (Notes 2, 11) 3 810 847,01 Change in unrealised appreciation / (depreciation) on - investments (Note 2) (7 572 530,83) - swap contracts (Notes 2, 11) (456 234,23) Net result of operations for the year 234 278,29
Redemptions for the year (97 679 929,05) Dividend distributions (Note 13) (3 073 501,03)
Net assets at the end of the year 78 095 034,00
121
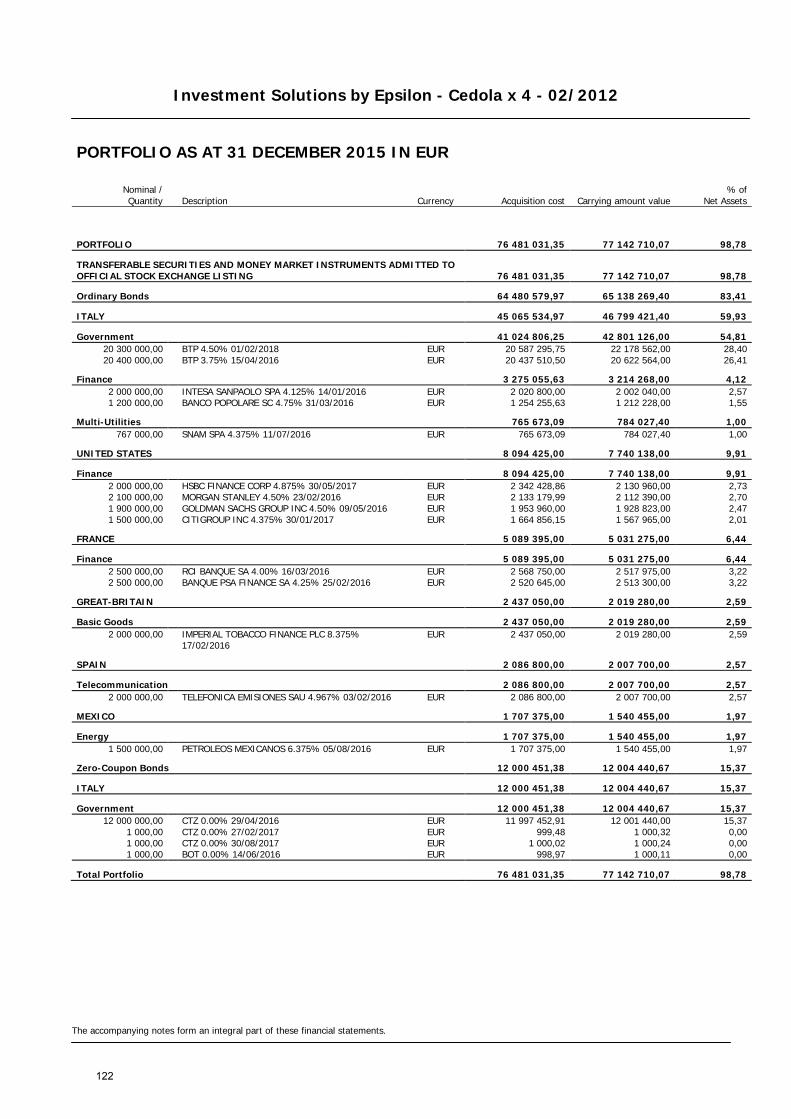
Investment Solutions by Epsilon - Cedola x 4 - 02/2012
The accompanying notes form an integral part of these financial statements.
PORTFOLIO AS AT 31 DECEMBER 2015 IN EUR
Nominal / Quantity Description Currency Acquisition cost Carrying amount value
% of Net Assets
PORTFOLIO 76 481 031,35 77 142 710,07 98,78
TRANSFERABLE SECURITIES AND MONEY MARKET INSTRUMENTS ADMITTED TO OFFICIAL STOCK EXCHANGE LISTING 76 481 031,35 77 142 710,07 98,78
Ordinary Bonds 64 480 579,97 65 138 269,40 83,41
ITALY 45 065 534,97 46 799 421,40 59,93
Government 41 024 806,25 42 801 126,00 54,81 20 300 000,00 BTP 4.50% 01/02/2018 EUR 20 587 295,75 22 178 562,00 28,40 20 400 000,00 BTP 3.75% 15/04/2016 EUR 20 437 510,50 20 622 564,00 26,41
Finance 3 275 055,63 3 214 268,00 4,12 2 000 000,00 INTESA SANPAOLO SPA 4.125% 14/01/2016 EUR 2 020 800,00 2 002 040,00 2,57 1 200 000,00 BANCO POPOLARE SC 4.75% 31/03/2016 EUR 1 254 255,63 1 212 228,00 1,55
Multi-Utilities 765 673,09 784 027,40 1,00 767 000,00 SNAM SPA 4.375% 11/07/2016 EUR 765 673,09 784 027,40 1,00
UNITED STATES 8 094 425,00 7 740 138,00 9,91
Finance 8 094 425,00 7 740 138,00 9,91 2 000 000,00 HSBC FINANCE CORP 4.875% 30/05/2017 EUR 2 342 428,86 2 130 960,00 2,73 2 100 000,00 MORGAN STANLEY 4.50% 23/02/2016 EUR 2 133 179,99 2 112 390,00 2,70 1 900 000,00 GOLDMAN SACHS GROUP INC 4.50% 09/05/2016 EUR 1 953 960,00 1 928 823,00 2,47 1 500 000,00 CITIGROUP INC 4.375% 30/01/2017 EUR 1 664 856,15 1 567 965,00 2,01
FRANCE 5 089 395,00 5 031 275,00 6,44
Finance 5 089 395,00 5 031 275,00 6,44 2 500 000,00 RCI BANQUE SA 4.00% 16/03/2016 EUR 2 568 750,00 2 517 975,00 3,22 2 500 000,00 BANQUE PSA FINANCE SA 4.25% 25/02/2016 EUR 2 520 645,00 2 513 300,00 3,22
GREAT-BRITAIN 2 437 050,00 2 019 280,00 2,59
Basic Goods 2 437 050,00 2 019 280,00 2,59 2 000 000,00
IMPERIAL TOBACCO FINANCE PLC 8.375% 17/02/2016
EUR 2 437 050,00 2 019 280,00 2,59
SPAIN 2 086 800,00 2 007 700,00 2,57
Telecommunication 2 086 800,00 2 007 700,00 2,57 2 000 000,00 TELEFONICA EMISIONES SAU 4.967% 03/02/2016 EUR 2 086 800,00 2 007 700,00 2,57
MEXICO 1 707 375,00 1 540 455,00 1,97
Energy 1 707 375,00 1 540 455,00 1,97 1 500 000,00 PETROLEOS MEXICANOS 6.375% 05/08/2016 EUR 1 707 375,00 1 540 455,00 1,97
Zero-Coupon Bonds 12 000 451,38 12 004 440,67 15,37
ITALY 12 000 451,38 12 004 440,67 15,37
Government 12 000 451,38 12 004 440,67 15,37 12 000 000,00 CTZ 0.00% 29/04/2016 EUR 11 997 452,91 12 001 440,00 15,37
1 000,00 CTZ 0.00% 27/02/2017 EUR 999,48 1 000,32 0,00 1 000,00 CTZ 0.00% 30/08/2017 EUR 1 000,02 1 000,24 0,00 1 000,00 BOT 0.00% 14/06/2016 EUR 998,97 1 000,11 0,00
Total Portfolio 76 481 031,35 77 142 710,07 98,78
122

Investment Solutions by Epsilon - Cedola x 4 - 02/2012
The accompanying notes form an integral part of these financial statements.
SWAP CONTRACTS AS AT 31 DECEMBER 2015
Counterparty Currency Notional Maturity Interest
receivable (EUR) Interest
payable (EUR)
Unrealised
profit / (loss) (EUR)
ASSET SWAP CONTRACTS — — 1 774 650,80 BANCA IMI SPA EUR 64 267 000,00 04/04/2016 — — 1 774 650,80
123
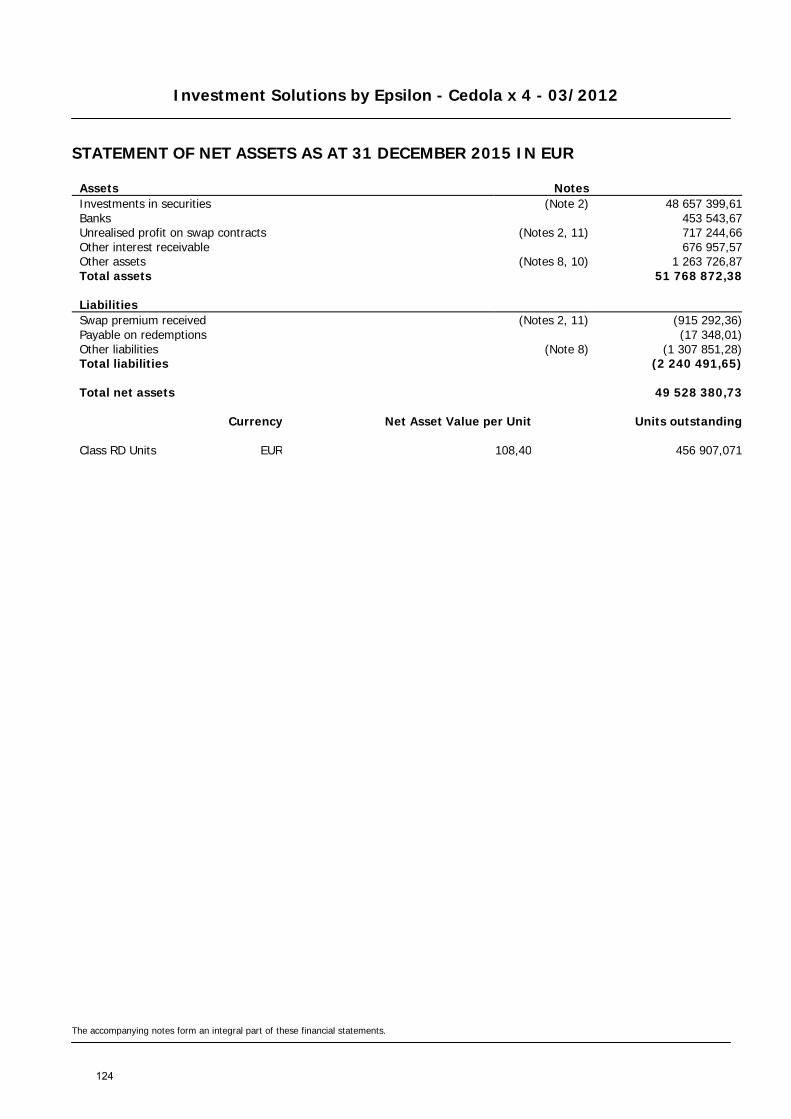
Investment Solutions by Epsilon - Cedola x 4 - 03/2012
STATEMENT OF NET ASSETS AS AT 31 DECEMBER 2015 IN EUR
The accompanying notes form an integral part of these financial statements.
Assets Notes Investments in securities (Note 2) 48 657 399,61 Banks 453 543,67 Unrealised profit on swap contracts (Notes 2, 11) 717 244,66 Other interest receivable 676 957,57 Other assets (Notes 8, 10) 1 263 726,87 Total assets 51 768 872,38
Liabilities Swap premium received (Notes 2, 11) (915 292,36) Payable on redemptions (17 348,01) Other liabilities (Note 8) (1 307 851,28) Total liabilities (2 240 491,65)
Total net assets 49 528 380,73
Currency Net Asset Value per Unit Units outstanding
Class RD Units EUR 108,40 456 907,071
124
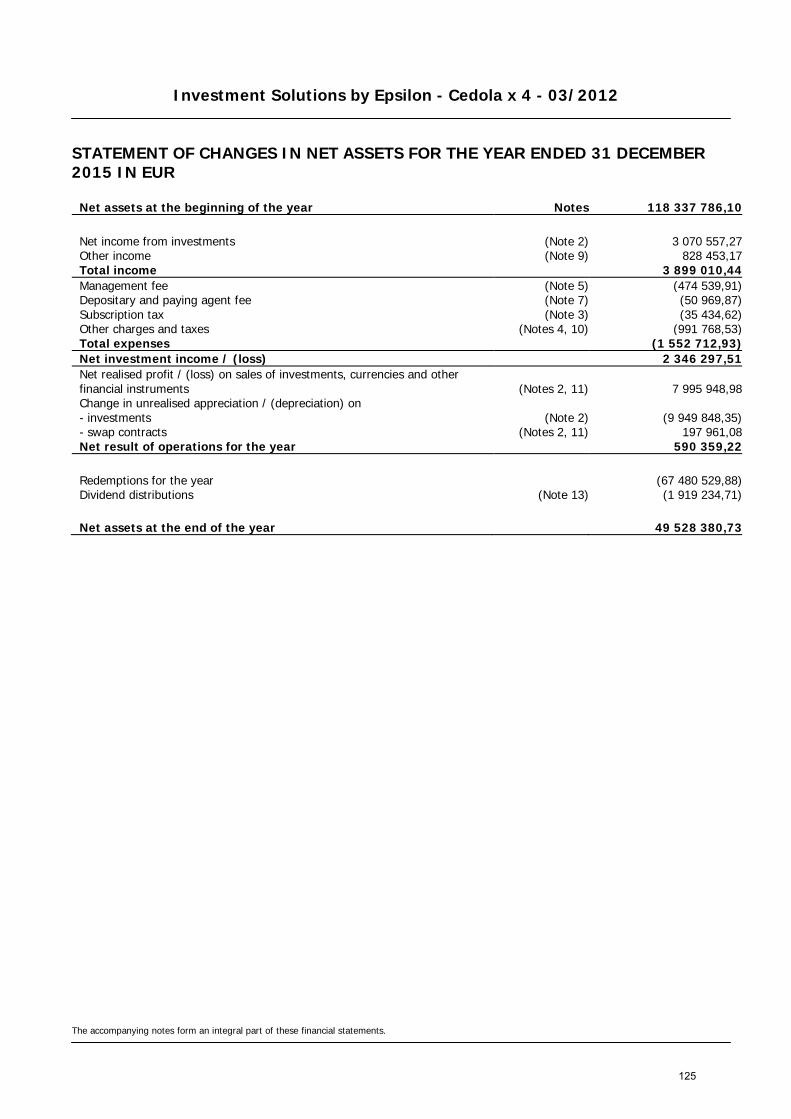
Investment Solutions by Epsilon - Cedola x 4 - 03/2012
STATEMENT OF CHANGES IN NET ASSETS FOR THE YEAR ENDED 31 DECEMBER 2015 IN EUR
The accompanying notes form an integral part of these financial statements.
Net assets at the beginning of the year Notes 118 337 786,10
Net income from investments (Note 2) 3 070 557,27 Other income (Note 9) 828 453,17 Total income 3 899 010,44 Management fee (Note 5) (474 539,91) Depositary and paying agent fee (Note 7) (50 969,87) Subscription tax (Note 3) (35 434,62) Other charges and taxes (Notes 4, 10) (991 768,53) Total expenses (1 552 712,93) Net investment income / (loss) 2 346 297,51 Net realised profit / (loss) on sales of investments, currencies and other financial instruments (Notes 2, 11) 7 995 948,98 Change in unrealised appreciation / (depreciation) on - investments (Note 2) (9 949 848,35) - swap contracts (Notes 2, 11) 197 961,08 Net result of operations for the year 590 359,22
Redemptions for the year (67 480 529,88) Dividend distributions (Note 13) (1 919 234,71)
Net assets at the end of the year 49 528 380,73
125
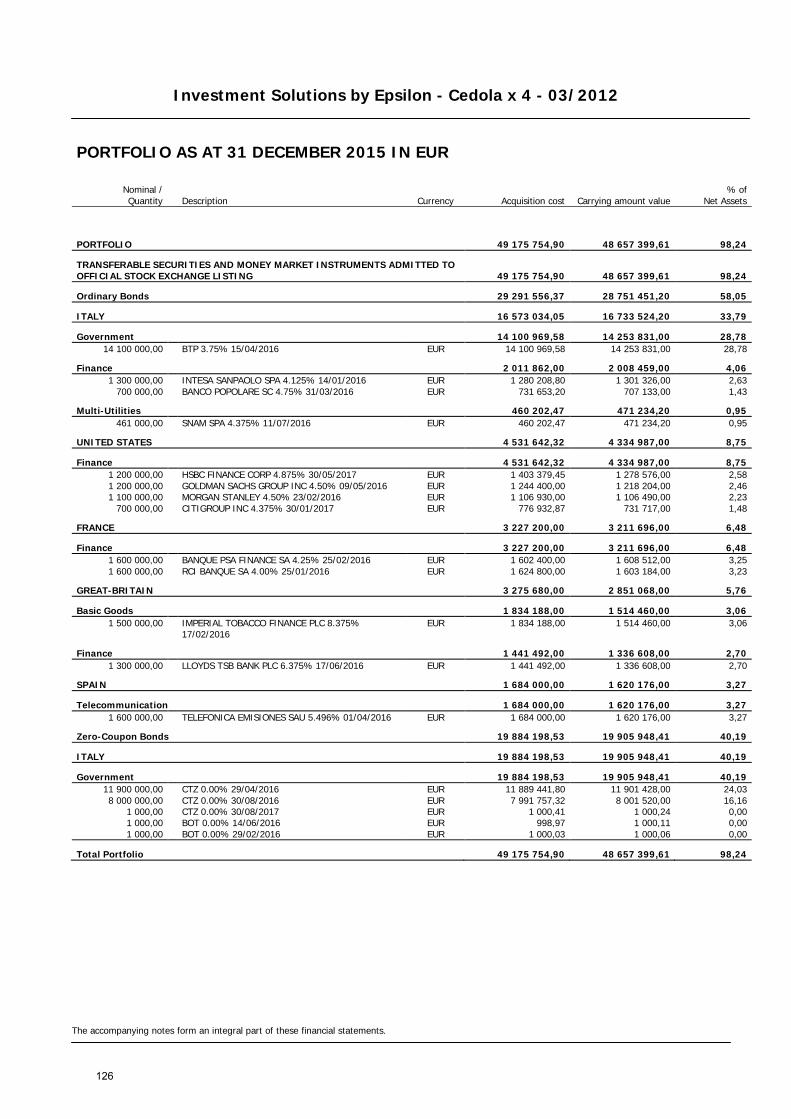
Investment Solutions by Epsilon - Cedola x 4 - 03/2012
The accompanying notes form an integral part of these financial statements.
PORTFOLIO AS AT 31 DECEMBER 2015 IN EUR
Nominal / Quantity Description Currency Acquisition cost Carrying amount value
% of Net Assets
PORTFOLIO 49 175 754,90 48 657 399,61 98,24
TRANSFERABLE SECURITIES AND MONEY MARKET INSTRUMENTS ADMITTED TO OFFICIAL STOCK EXCHANGE LISTING 49 175 754,90 48 657 399,61 98,24
Ordinary Bonds 29 291 556,37 28 751 451,20 58,05
ITALY 16 573 034,05 16 733 524,20 33,79
Government 14 100 969,58 14 253 831,00 28,78 14 100 000,00 BTP 3.75% 15/04/2016 EUR 14 100 969,58 14 253 831,00 28,78
Finance 2 011 862,00 2 008 459,00 4,06 1 300 000,00 INTESA SANPAOLO SPA 4.125% 14/01/2016 EUR 1 280 208,80 1 301 326,00 2,63
700 000,00 BANCO POPOLARE SC 4.75% 31/03/2016 EUR 731 653,20 707 133,00 1,43
Multi-Utilities 460 202,47 471 234,20 0,95 461 000,00 SNAM SPA 4.375% 11/07/2016 EUR 460 202,47 471 234,20 0,95
UNITED STATES 4 531 642,32 4 334 987,00 8,75
Finance 4 531 642,32 4 334 987,00 8,75 1 200 000,00 HSBC FINANCE CORP 4.875% 30/05/2017 EUR 1 403 379,45 1 278 576,00 2,58 1 200 000,00 GOLDMAN SACHS GROUP INC 4.50% 09/05/2016 EUR 1 244 400,00 1 218 204,00 2,46 1 100 000,00 MORGAN STANLEY 4.50% 23/02/2016 EUR 1 106 930,00 1 106 490,00 2,23
700 000,00 CITIGROUP INC 4.375% 30/01/2017 EUR 776 932,87 731 717,00 1,48
FRANCE 3 227 200,00 3 211 696,00 6,48
Finance 3 227 200,00 3 211 696,00 6,48 1 600 000,00 BANQUE PSA FINANCE SA 4.25% 25/02/2016 EUR 1 602 400,00 1 608 512,00 3,25 1 600 000,00 RCI BANQUE SA 4.00% 25/01/2016 EUR 1 624 800,00 1 603 184,00 3,23
GREAT-BRITAIN 3 275 680,00 2 851 068,00 5,76
Basic Goods 1 834 188,00 1 514 460,00 3,06 1 500 000,00
IMPERIAL TOBACCO FINANCE PLC 8.375% 17/02/2016
EUR 1 834 188,00 1 514 460,00 3,06
Finance 1 441 492,00 1 336 608,00 2,70 1 300 000,00 LLOYDS TSB BANK PLC 6.375% 17/06/2016 EUR 1 441 492,00 1 336 608,00 2,70
SPAIN 1 684 000,00 1 620 176,00 3,27
Telecommunication 1 684 000,00 1 620 176,00 3,27 1 600 000,00 TELEFONICA EMISIONES SAU 5.496% 01/04/2016 EUR 1 684 000,00 1 620 176,00 3,27
Zero-Coupon Bonds 19 884 198,53 19 905 948,41 40,19
ITALY 19 884 198,53 19 905 948,41 40,19
Government 19 884 198,53 19 905 948,41 40,19 11 900 000,00 CTZ 0.00% 29/04/2016 EUR 11 889 441,80 11 901 428,00 24,03 8 000 000,00 CTZ 0.00% 30/08/2016 EUR 7 991 757,32 8 001 520,00 16,16
1 000,00 CTZ 0.00% 30/08/2017 EUR 1 000,41 1 000,24 0,00 1 000,00 BOT 0.00% 14/06/2016 EUR 998,97 1 000,11 0,00 1 000,00 BOT 0.00% 29/02/2016 EUR 1 000,03 1 000,06 0,00
Total Portfolio 49 175 754,90 48 657 399,61 98,24
126
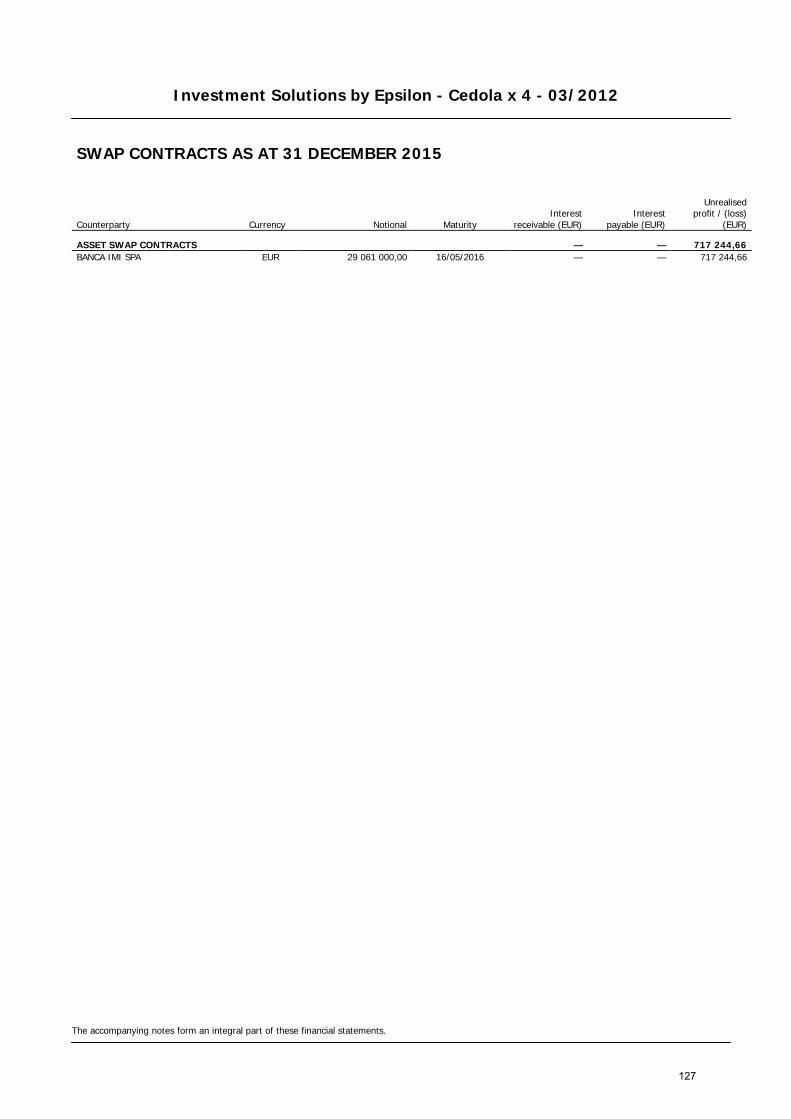
Investment Solutions by Epsilon - Cedola x 4 - 03/2012
The accompanying notes form an integral part of these financial statements.
SWAP CONTRACTS AS AT 31 DECEMBER 2015
Counterparty Currency Notional Maturity Interest
receivable (EUR) Interest
payable (EUR)
Unrealised
profit / (loss) (EUR)
ASSET SWAP CONTRACTS — — 717 244,66 BANCA IMI SPA EUR 29 061 000,00 16/05/2016 — — 717 244,66
127

Investment Solutions by Epsilon - Cedola x 4 Indexed - 05/2012
STATEMENT OF NET ASSETS AS AT 31 DECEMBER 2015 IN EUR
The accompanying notes form an integral part of these financial statements.
Assets Notes Investments in securities (Note 2) 8 384 475,98 Banks 268 824,37 Unrealised profit on swap contracts (Notes 2, 11) 45 861,51 Other interest receivable 162 325,37 Other assets (Notes 8, 10) 60 790,02 Total assets 8 922 277,25
Liabilities Swap premium received (Notes 2, 11) (196 286,95) Payable on redemptions (43 386,76) Other liabilities (Note 8) (84 964,12) Total liabilities (324 637,83)
Total net assets 8 597 639,42
Currency Net Asset Value per Unit Units outstanding
Class RD Units EUR 104,26 82 463,053
128

Investment Solutions by Epsilon - Cedola x 4 Indexed - 05/2012
STATEMENT OF CHANGES IN NET ASSETS FOR THE YEAR ENDED 31 DECEMBER 2015 IN EUR
The accompanying notes form an integral part of these financial statements.
Net assets at the beginning of the year Notes 18 841 206,75
Net income from investments (Note 2) 651 657,87 Other income (Note 9) 113 089,34 Total income 764 747,21 Management fee (Note 5) (79 137,27) Depositary and paying agent fee (Note 7) (8 864,66) Subscription tax (Note 3) (6 015,03) Other charges and taxes (Notes 4, 10) (137 176,84) Total expenses (231 193,80) Net investment income / (loss) 533 553,41 Net realised profit / (loss) on sales of investments, currencies and other financial instruments (Notes 2, 11) 535 047,71 Change in unrealised appreciation / (depreciation) on - investments (Note 2) (1 284 147,71) - swap contracts (Notes 2, 11) 222 356,65 Net result of operations for the year 6 810,06
Redemptions for the year (9 977 110,56) Dividend distributions (Note 13) (273 266,83)
Net assets at the end of the year 8 597 639,42
129
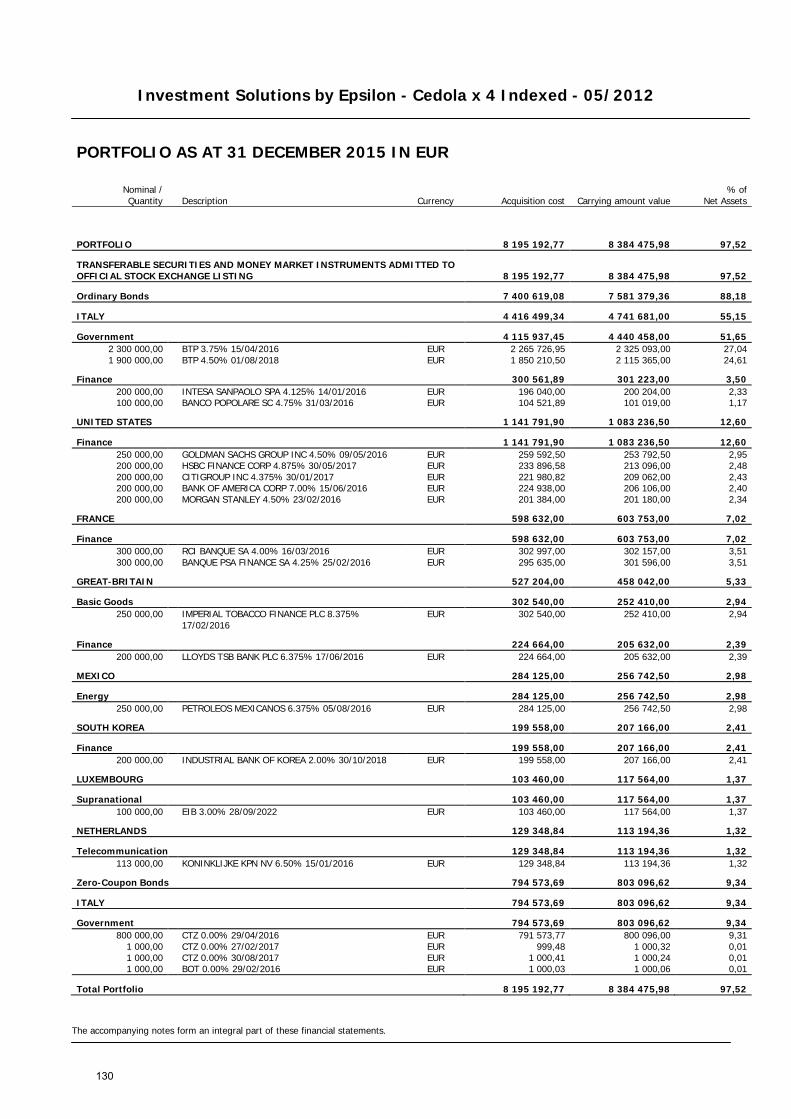
Investment Solutions by Epsilon - Cedola x 4 Indexed - 05/2012
The accompanying notes form an integral part of these financial statements.
PORTFOLIO AS AT 31 DECEMBER 2015 IN EUR
Nominal / Quantity Description Currency Acquisition cost Carrying amount value
% of Net Assets
PORTFOLIO 8 195 192,77 8 384 475,98 97,52
TRANSFERABLE SECURITIES AND MONEY MARKET INSTRUMENTS ADMITTED TO OFFICIAL STOCK EXCHANGE LISTING 8 195 192,77 8 384 475,98 97,52
Ordinary Bonds 7 400 619,08 7 581 379,36 88,18
ITALY 4 416 499,34 4 741 681,00 55,15
Government 4 115 937,45 4 440 458,00 51,65 2 300 000,00 BTP 3.75% 15/04/2016 EUR 2 265 726,95 2 325 093,00 27,04 1 900 000,00 BTP 4.50% 01/08/2018 EUR 1 850 210,50 2 115 365,00 24,61
Finance 300 561,89 301 223,00 3,50 200 000,00 INTESA SANPAOLO SPA 4.125% 14/01/2016 EUR 196 040,00 200 204,00 2,33 100 000,00 BANCO POPOLARE SC 4.75% 31/03/2016 EUR 104 521,89 101 019,00 1,17
UNITED STATES 1 141 791,90 1 083 236,50 12,60
Finance 1 141 791,90 1 083 236,50 12,60 250 000,00 GOLDMAN SACHS GROUP INC 4.50% 09/05/2016 EUR 259 592,50 253 792,50 2,95 200 000,00 HSBC FINANCE CORP 4.875% 30/05/2017 EUR 233 896,58 213 096,00 2,48 200 000,00 CITIGROUP INC 4.375% 30/01/2017 EUR 221 980,82 209 062,00 2,43 200 000,00 BANK OF AMERICA CORP 7.00% 15/06/2016 EUR 224 938,00 206 106,00 2,40 200 000,00 MORGAN STANLEY 4.50% 23/02/2016 EUR 201 384,00 201 180,00 2,34
FRANCE 598 632,00 603 753,00 7,02
Finance 598 632,00 603 753,00 7,02 300 000,00 RCI BANQUE SA 4.00% 16/03/2016 EUR 302 997,00 302 157,00 3,51 300 000,00 BANQUE PSA FINANCE SA 4.25% 25/02/2016 EUR 295 635,00 301 596,00 3,51
GREAT-BRITAIN 527 204,00 458 042,00 5,33
Basic Goods 302 540,00 252 410,00 2,94 250 000,00
IMPERIAL TOBACCO FINANCE PLC 8.375% 17/02/2016
EUR 302 540,00 252 410,00 2,94
Finance 224 664,00 205 632,00 2,39 200 000,00 LLOYDS TSB BANK PLC 6.375% 17/06/2016 EUR 224 664,00 205 632,00 2,39
MEXICO 284 125,00 256 742,50 2,98
Energy 284 125,00 256 742,50 2,98 250 000,00 PETROLEOS MEXICANOS 6.375% 05/08/2016 EUR 284 125,00 256 742,50 2,98
SOUTH KOREA 199 558,00 207 166,00 2,41
Finance 199 558,00 207 166,00 2,41 200 000,00 INDUSTRIAL BANK OF KOREA 2.00% 30/10/2018 EUR 199 558,00 207 166,00 2,41
LUXEMBOURG 103 460,00 117 564,00 1,37
Supranational 103 460,00 117 564,00 1,37 100 000,00 EIB 3.00% 28/09/2022 EUR 103 460,00 117 564,00 1,37
NETHERLANDS 129 348,84 113 194,36 1,32
Telecommunication 129 348,84 113 194,36 1,32 113 000,00 KONINKLIJKE KPN NV 6.50% 15/01/2016 EUR 129 348,84 113 194,36 1,32
Zero-Coupon Bonds 794 573,69 803 096,62 9,34
ITALY 794 573,69 803 096,62 9,34
Government 794 573,69 803 096,62 9,34 800 000,00 CTZ 0.00% 29/04/2016 EUR 791 573,77 800 096,00 9,31
1 000,00 CTZ 0.00% 27/02/2017 EUR 999,48 1 000,32 0,01 1 000,00 CTZ 0.00% 30/08/2017 EUR 1 000,41 1 000,24 0,01 1 000,00 BOT 0.00% 29/02/2016 EUR 1 000,03 1 000,06 0,01
Total Portfolio 8 195 192,77 8 384 475,98 97,52
130
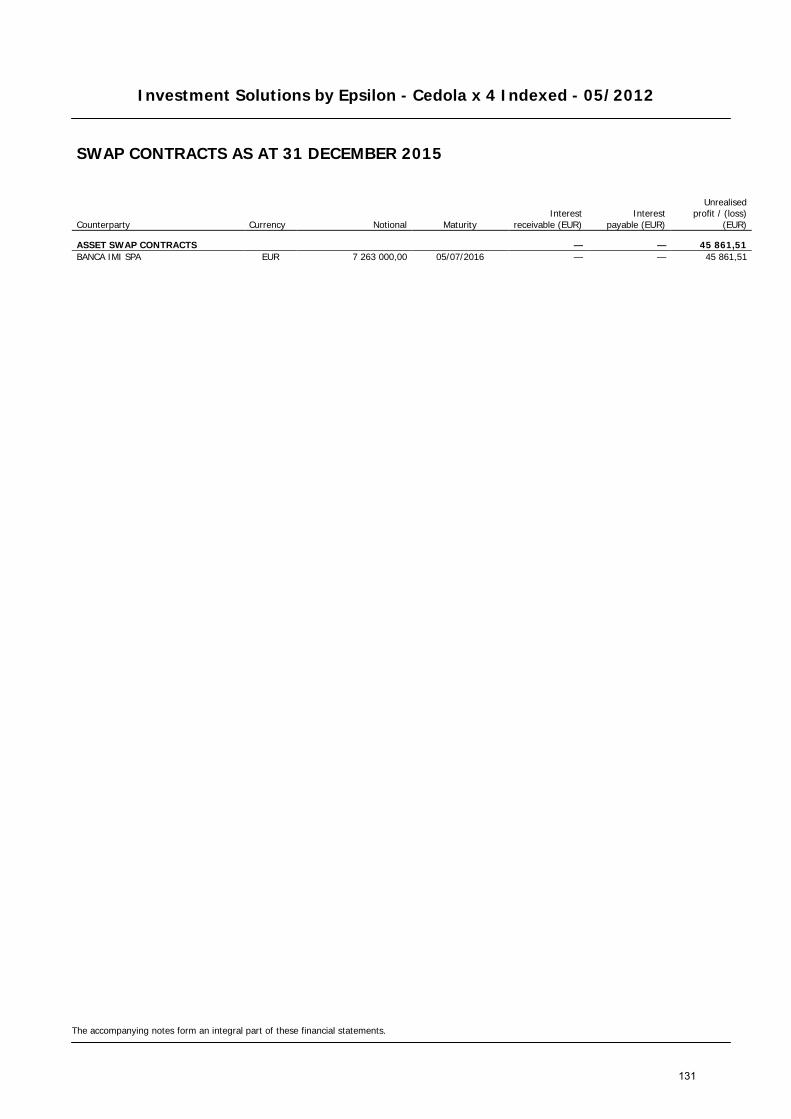
Investment Solutions by Epsilon - Cedola x 4 Indexed - 05/2012
The accompanying notes form an integral part of these financial statements.
SWAP CONTRACTS AS AT 31 DECEMBER 2015
Counterparty Currency Notional Maturity Interest
receivable (EUR) Interest
payable (EUR)
Unrealised
profit / (loss) (EUR)
ASSET SWAP CONTRACTS — — 45 861,51 BANCA IMI SPA EUR 7 263 000,00 05/07/2016 — — 45 861,51
131

Investment Solutions by Epsilon - Cedola x 4 Indexed - 07/2012
STATEMENT OF NET ASSETS AS AT 31 DECEMBER 2015 IN EUR
The accompanying notes form an integral part of these financial statements.
Assets Notes Investments in securities (Note 2) 29 648 465,42 Banks 356 027,26 Unrealised profit on swap contracts (Notes 2, 11) 245 916,04 Other interest receivable 592 758,29 Other assets (Notes 8, 10) 244 340,23 Total assets 31 087 507,24
Liabilities Swap premium received (Notes 2, 11) (1 245 464,63) Payable on redemptions (29 152,64) Other liabilities (Note 8) (314 805,95) Total liabilities (1 589 423,22)
Total net assets 29 498 084,02
Currency Net Asset Value per Unit Units outstanding
Class RD Units EUR 103,35 285 430,286
132

Investment Solutions by Epsilon - Cedola x 4 Indexed - 07/2012
STATEMENT OF CHANGES IN NET ASSETS FOR THE YEAR ENDED 31 DECEMBER 2015 IN EUR
The accompanying notes form an integral part of these financial statements.
Net assets at the beginning of the year Notes 64 848 830,45
Net income from investments (Note 2) 2 495 690,54 Other income (Note 9) 303 875,41 Total income 2 799 565,95 Management fee (Note 5) (275 177,05) Depositary and paying agent fee (Note 7) (29 726,19) Subscription tax (Note 3) (20 803,80) Other charges and taxes (Notes 4, 10) (391 361,79) Total expenses (717 068,83) Net investment income / (loss) 2 082 497,12 Net realised profit / (loss) on sales of investments, currencies and other financial instruments (Notes 2, 11) 379 269,93 Change in unrealised appreciation / (depreciation) on - investments (Note 2) (3 443 693,89) - swap contracts (Notes 2, 11) 1 094 943,09 Net result of operations for the year 113 016,25
Redemptions for the year (34 719 212,80) Dividend distributions (Note 13) (744 549,88)
Net assets at the end of the year 29 498 084,02
133
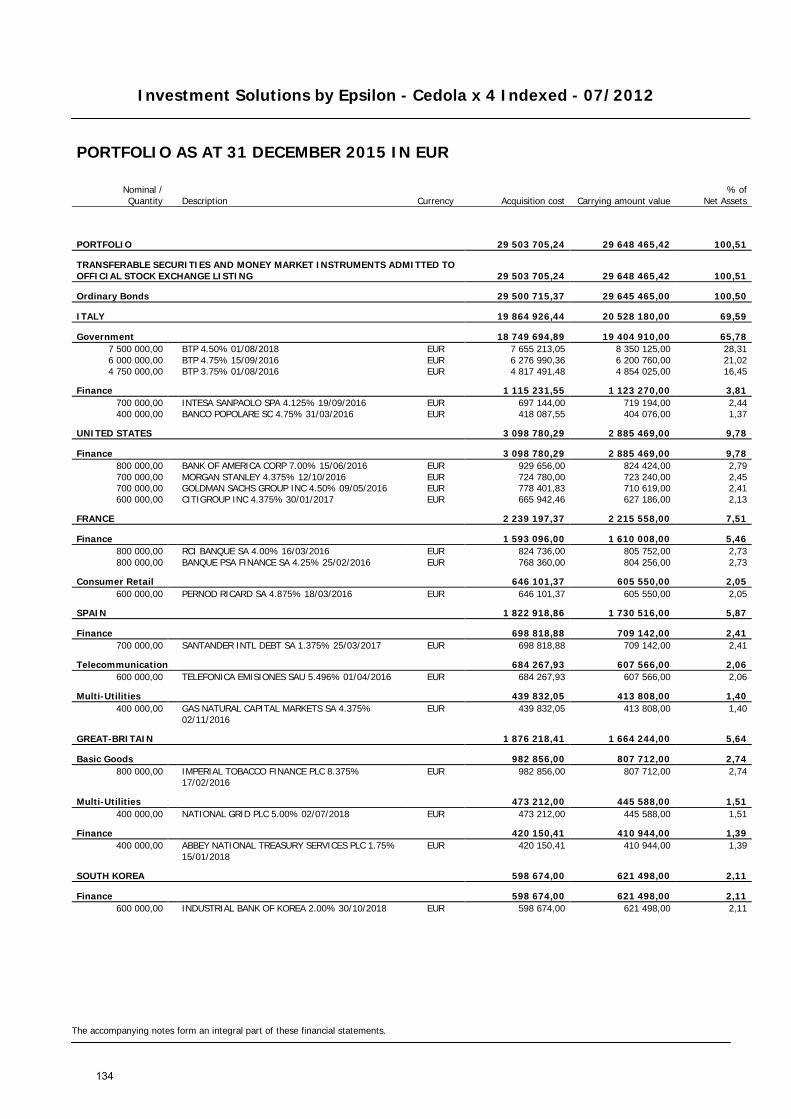
Investment Solutions by Epsilon - Cedola x 4 Indexed - 07/2012
The accompanying notes form an integral part of these financial statements.
PORTFOLIO AS AT 31 DECEMBER 2015 IN EUR
Nominal / Quantity Description Currency Acquisition cost Carrying amount value
% of Net Assets
PORTFOLIO 29 503 705,24 29 648 465,42 100,51
TRANSFERABLE SECURITIES AND MONEY MARKET INSTRUMENTS ADMITTED TO OFFICIAL STOCK EXCHANGE LISTING 29 503 705,24 29 648 465,42 100,51
Ordinary Bonds 29 500 715,37 29 645 465,00 100,50
ITALY 19 864 926,44 20 528 180,00 69,59
Government 18 749 694,89 19 404 910,00 65,78 7 500 000,00 BTP 4.50% 01/08/2018 EUR 7 655 213,05 8 350 125,00 28,31 6 000 000,00 BTP 4.75% 15/09/2016 EUR 6 276 990,36 6 200 760,00 21,02 4 750 000,00 BTP 3.75% 01/08/2016 EUR 4 817 491,48 4 854 025,00 16,45
Finance 1 115 231,55 1 123 270,00 3,81 700 000,00 INTESA SANPAOLO SPA 4.125% 19/09/2016 EUR 697 144,00 719 194,00 2,44 400 000,00 BANCO POPOLARE SC 4.75% 31/03/2016 EUR 418 087,55 404 076,00 1,37
UNITED STATES 3 098 780,29 2 885 469,00 9,78
Finance 3 098 780,29 2 885 469,00 9,78 800 000,00 BANK OF AMERICA CORP 7.00% 15/06/2016 EUR 929 656,00 824 424,00 2,79 700 000,00 MORGAN STANLEY 4.375% 12/10/2016 EUR 724 780,00 723 240,00 2,45 700 000,00 GOLDMAN SACHS GROUP INC 4.50% 09/05/2016 EUR 778 401,83 710 619,00 2,41 600 000,00 CITIGROUP INC 4.375% 30/01/2017 EUR 665 942,46 627 186,00 2,13
FRANCE 2 239 197,37 2 215 558,00 7,51
Finance 1 593 096,00 1 610 008,00 5,46 800 000,00 RCI BANQUE SA 4.00% 16/03/2016 EUR 824 736,00 805 752,00 2,73 800 000,00 BANQUE PSA FINANCE SA 4.25% 25/02/2016 EUR 768 360,00 804 256,00 2,73
Consumer Retail 646 101,37 605 550,00 2,05 600 000,00 PERNOD RICARD SA 4.875% 18/03/2016 EUR 646 101,37 605 550,00 2,05
SPAIN 1 822 918,86 1 730 516,00 5,87
Finance 698 818,88 709 142,00 2,41 700 000,00 SANTANDER INTL DEBT SA 1.375% 25/03/2017 EUR 698 818,88 709 142,00 2,41
Telecommunication 684 267,93 607 566,00 2,06 600 000,00 TELEFONICA EMISIONES SAU 5.496% 01/04/2016 EUR 684 267,93 607 566,00 2,06
Multi-Utilities 439 832,05 413 808,00 1,40 400 000,00
GAS NATURAL CAPITAL MARKETS SA 4.375% 02/11/2016
EUR 439 832,05 413 808,00 1,40
GREAT-BRITAIN 1 876 218,41 1 664 244,00 5,64
Basic Goods 982 856,00 807 712,00 2,74 800 000,00
IMPERIAL TOBACCO FINANCE PLC 8.375% 17/02/2016
EUR 982 856,00 807 712,00 2,74
Multi-Utilities 473 212,00 445 588,00 1,51 400 000,00 NATIONAL GRID PLC 5.00% 02/07/2018 EUR 473 212,00 445 588,00 1,51
Finance 420 150,41 410 944,00 1,39 400 000,00
ABBEY NATIONAL TREASURY SERVICES PLC 1.75% 15/01/2018
EUR 420 150,41 410 944,00 1,39
SOUTH KOREA 598 674,00 621 498,00 2,11
Finance 598 674,00 621 498,00 2,11 600 000,00 INDUSTRIAL BANK OF KOREA 2.00% 30/10/2018 EUR 598 674,00 621 498,00 2,11
134
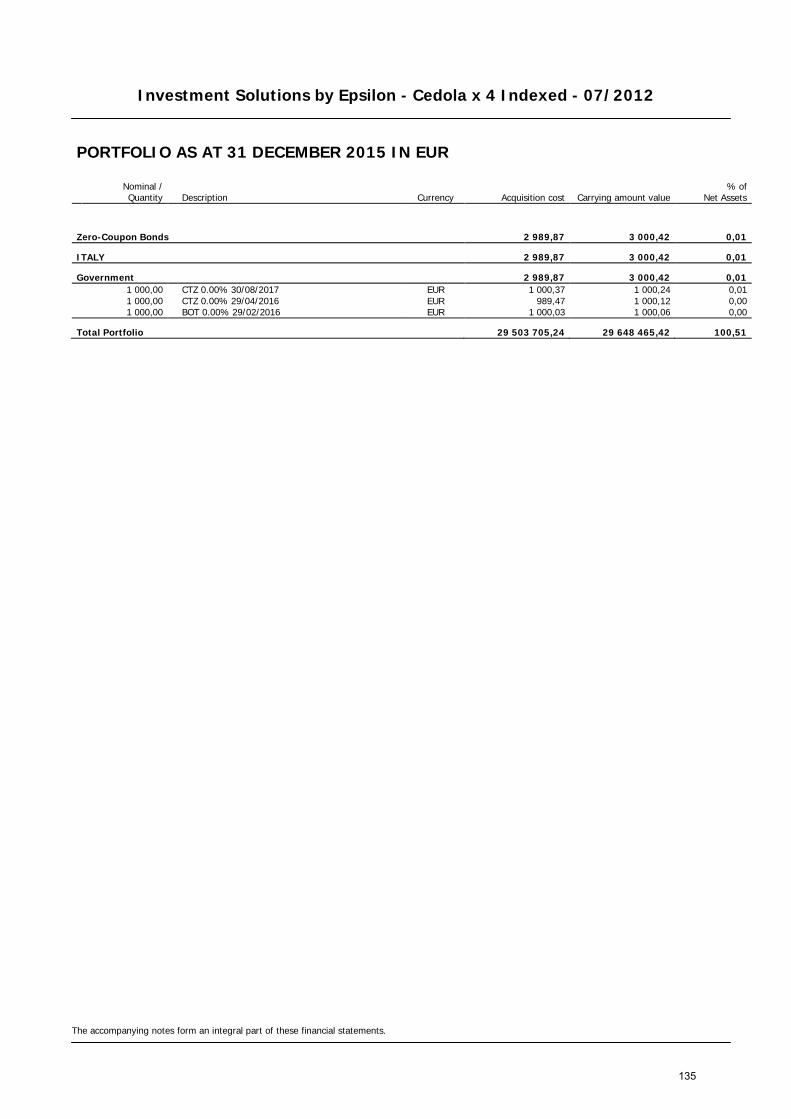
Investment Solutions by Epsilon - Cedola x 4 Indexed - 07/2012
The accompanying notes form an integral part of these financial statements.
PORTFOLIO AS AT 31 DECEMBER 2015 IN EUR
Nominal / Quantity Description Currency Acquisition cost Carrying amount value
% of Net Assets
Zero-Coupon Bonds 2 989,87 3 000,42 0,01
ITALY 2 989,87 3 000,42 0,01
Government 2 989,87 3 000,42 0,01 1 000,00 CTZ 0.00% 30/08/2017 EUR 1 000,37 1 000,24 0,01 1 000,00 CTZ 0.00% 29/04/2016 EUR 989,47 1 000,12 0,00 1 000,00 BOT 0.00% 29/02/2016 EUR 1 000,03 1 000,06 0,00
Total Portfolio 29 503 705,24 29 648 465,42 100,51
135
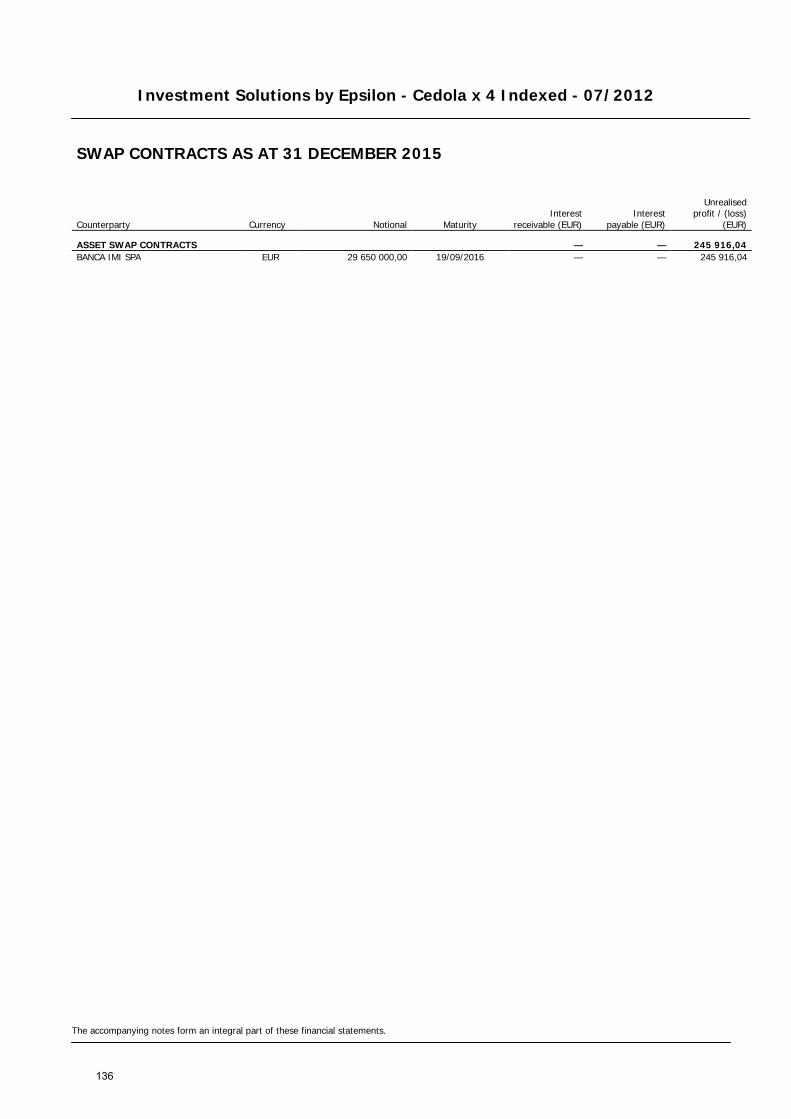
Investment Solutions by Epsilon - Cedola x 4 Indexed - 07/2012
The accompanying notes form an integral part of these financial statements.
SWAP CONTRACTS AS AT 31 DECEMBER 2015
Counterparty Currency Notional Maturity Interest
receivable (EUR) Interest
payable (EUR)
Unrealised
profit / (loss) (EUR)
ASSET SWAP CONTRACTS — — 245 916,04 BANCA IMI SPA EUR 29 650 000,00 19/09/2016 — — 245 916,04
136

Investment Solutions by Epsilon - Cedola x 4 Indexed - 09/2012
STATEMENT OF NET ASSETS AS AT 31 DECEMBER 2015 IN EUR
The accompanying notes form an integral part of these financial statements.
Assets Notes Investments in securities (Note 2) 128 517 075,87 Banks 753 240,26 Unrealised profit on swap contracts (Notes 2, 11) 1 759 011,33 Other interest receivable 1 651 210,67 Other assets (Notes 8, 10) 1 397 287,85 Total assets 134 077 825,98
Liabilities Swap premium received (Notes 2, 11) (4 589 875,86) Payable on redemptions (256 388,74) Other liabilities (Note 8) (1 735 195,90) Total liabilities (6 581 460,50)
Total net assets 127 496 365,48
Currency Net Asset Value per Unit Units outstanding
Class RD Units EUR 103,24 1 234 945,285
137
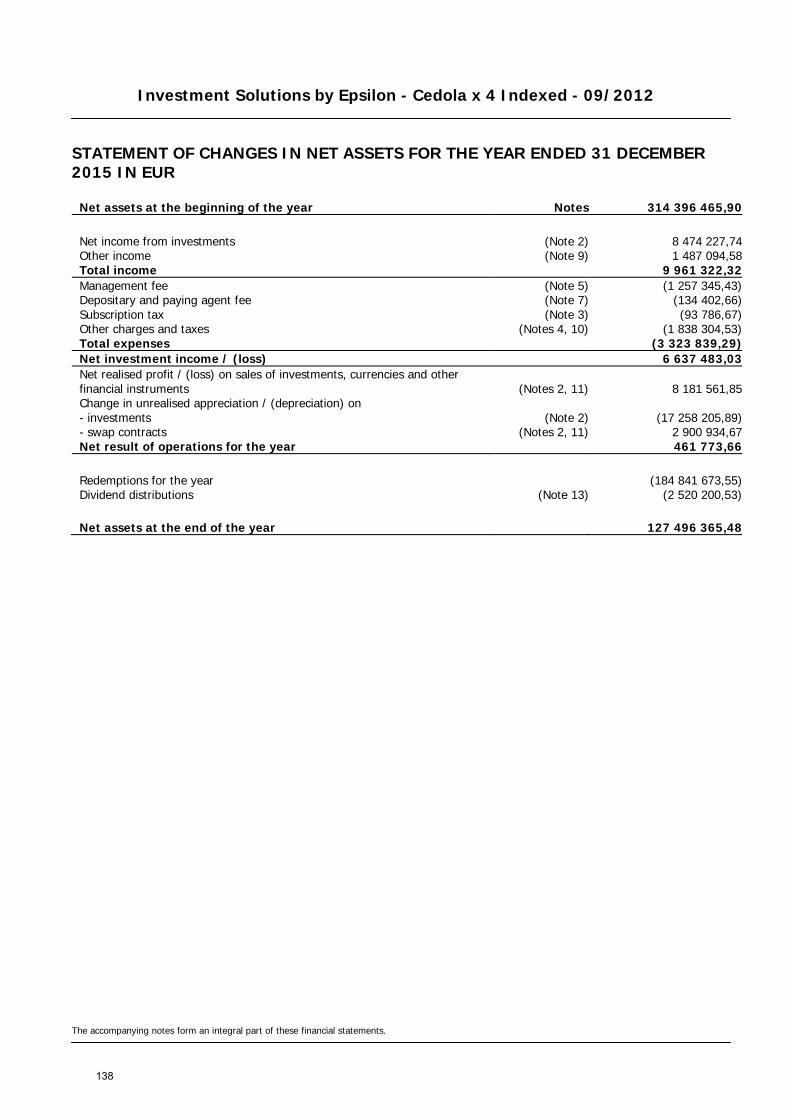
Investment Solutions by Epsilon - Cedola x 4 Indexed - 09/2012
STATEMENT OF CHANGES IN NET ASSETS FOR THE YEAR ENDED 31 DECEMBER 2015 IN EUR
The accompanying notes form an integral part of these financial statements.
Net assets at the beginning of the year Notes 314 396 465,90
Net income from investments (Note 2) 8 474 227,74 Other income (Note 9) 1 487 094,58 Total income 9 961 322,32 Management fee (Note 5) (1 257 345,43) Depositary and paying agent fee (Note 7) (134 402,66) Subscription tax (Note 3) (93 786,67) Other charges and taxes (Notes 4, 10) (1 838 304,53) Total expenses (3 323 839,29) Net investment income / (loss) 6 637 483,03 Net realised profit / (loss) on sales of investments, currencies and other financial instruments (Notes 2, 11) 8 181 561,85 Change in unrealised appreciation / (depreciation) on - investments (Note 2) (17 258 205,89) - swap contracts (Notes 2, 11) 2 900 934,67 Net result of operations for the year 461 773,66
Redemptions for the year (184 841 673,55) Dividend distributions (Note 13) (2 520 200,53)
Net assets at the end of the year 127 496 365,48
138
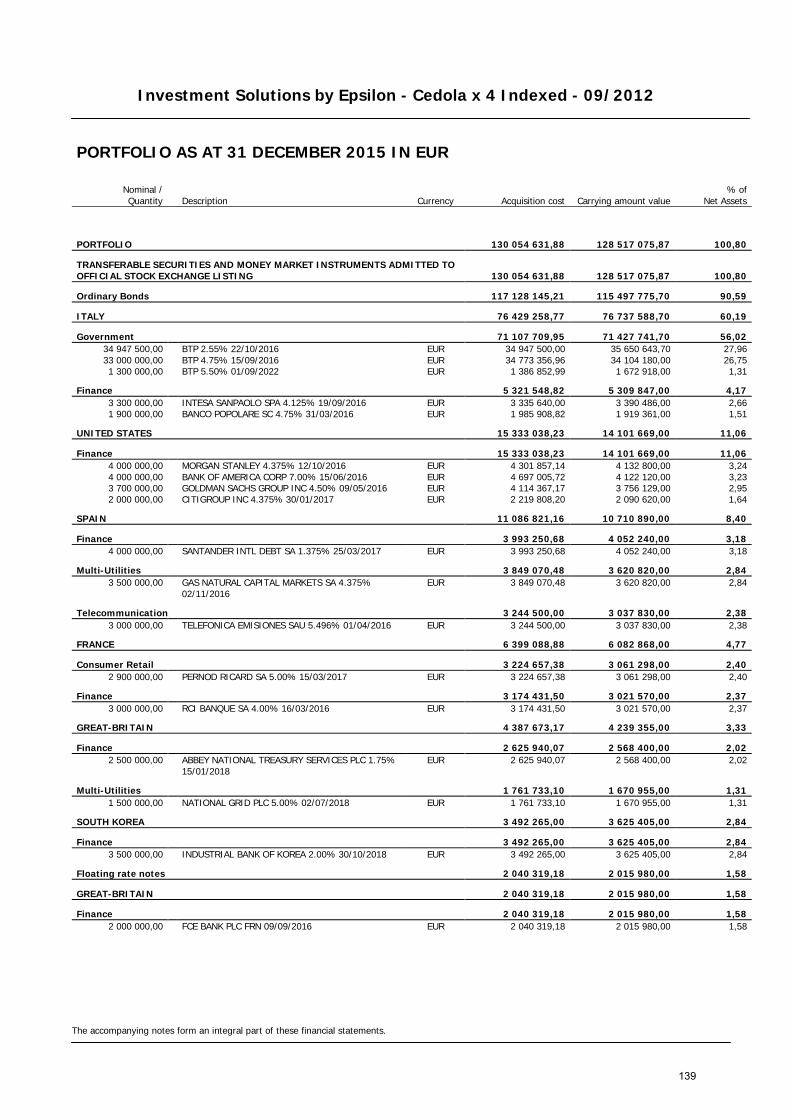
Investment Solutions by Epsilon - Cedola x 4 Indexed - 09/2012
The accompanying notes form an integral part of these financial statements.
PORTFOLIO AS AT 31 DECEMBER 2015 IN EUR
Nominal / Quantity Description Currency Acquisition cost Carrying amount value
% of Net Assets
PORTFOLIO 130 054 631,88 128 517 075,87 100,80
TRANSFERABLE SECURITIES AND MONEY MARKET INSTRUMENTS ADMITTED TO OFFICIAL STOCK EXCHANGE LISTING 130 054 631,88 128 517 075,87 100,80
Ordinary Bonds 117 128 145,21 115 497 775,70 90,59
ITALY 76 429 258,77 76 737 588,70 60,19
Government 71 107 709,95 71 427 741,70 56,02 34 947 500,00 BTP 2.55% 22/10/2016 EUR 34 947 500,00 35 650 643,70 27,96 33 000 000,00 BTP 4.75% 15/09/2016 EUR 34 773 356,96 34 104 180,00 26,75 1 300 000,00 BTP 5.50% 01/09/2022 EUR 1 386 852,99 1 672 918,00 1,31
Finance 5 321 548,82 5 309 847,00 4,17 3 300 000,00 INTESA SANPAOLO SPA 4.125% 19/09/2016 EUR 3 335 640,00 3 390 486,00 2,66 1 900 000,00 BANCO POPOLARE SC 4.75% 31/03/2016 EUR 1 985 908,82 1 919 361,00 1,51
UNITED STATES 15 333 038,23 14 101 669,00 11,06
Finance 15 333 038,23 14 101 669,00 11,06 4 000 000,00 MORGAN STANLEY 4.375% 12/10/2016 EUR 4 301 857,14 4 132 800,00 3,24 4 000 000,00 BANK OF AMERICA CORP 7.00% 15/06/2016 EUR 4 697 005,72 4 122 120,00 3,23 3 700 000,00 GOLDMAN SACHS GROUP INC 4.50% 09/05/2016 EUR 4 114 367,17 3 756 129,00 2,95 2 000 000,00 CITIGROUP INC 4.375% 30/01/2017 EUR 2 219 808,20 2 090 620,00 1,64
SPAIN 11 086 821,16 10 710 890,00 8,40
Finance 3 993 250,68 4 052 240,00 3,18 4 000 000,00 SANTANDER INTL DEBT SA 1.375% 25/03/2017 EUR 3 993 250,68 4 052 240,00 3,18
Multi-Utilities 3 849 070,48 3 620 820,00 2,84 3 500 000,00
GAS NATURAL CAPITAL MARKETS SA 4.375% 02/11/2016
EUR 3 849 070,48 3 620 820,00 2,84
Telecommunication 3 244 500,00 3 037 830,00 2,38 3 000 000,00 TELEFONICA EMISIONES SAU 5.496% 01/04/2016 EUR 3 244 500,00 3 037 830,00 2,38
FRANCE 6 399 088,88 6 082 868,00 4,77
Consumer Retail 3 224 657,38 3 061 298,00 2,40 2 900 000,00 PERNOD RICARD SA 5.00% 15/03/2017 EUR 3 224 657,38 3 061 298,00 2,40
Finance 3 174 431,50 3 021 570,00 2,37 3 000 000,00 RCI BANQUE SA 4.00% 16/03/2016 EUR 3 174 431,50 3 021 570,00 2,37
GREAT-BRITAIN 4 387 673,17 4 239 355,00 3,33
Finance 2 625 940,07 2 568 400,00 2,02 2 500 000,00
ABBEY NATIONAL TREASURY SERVICES PLC 1.75% 15/01/2018
EUR 2 625 940,07 2 568 400,00 2,02
Multi-Utilities 1 761 733,10 1 670 955,00 1,31 1 500 000,00 NATIONAL GRID PLC 5.00% 02/07/2018 EUR 1 761 733,10 1 670 955,00 1,31
SOUTH KOREA 3 492 265,00 3 625 405,00 2,84
Finance 3 492 265,00 3 625 405,00 2,84 3 500 000,00 INDUSTRIAL BANK OF KOREA 2.00% 30/10/2018 EUR 3 492 265,00 3 625 405,00 2,84
Floating rate notes 2 040 319,18 2 015 980,00 1,58
GREAT-BRITAIN 2 040 319,18 2 015 980,00 1,58
Finance 2 040 319,18 2 015 980,00 1,58 2 000 000,00 FCE BANK PLC FRN 09/09/2016 EUR 2 040 319,18 2 015 980,00 1,58
139
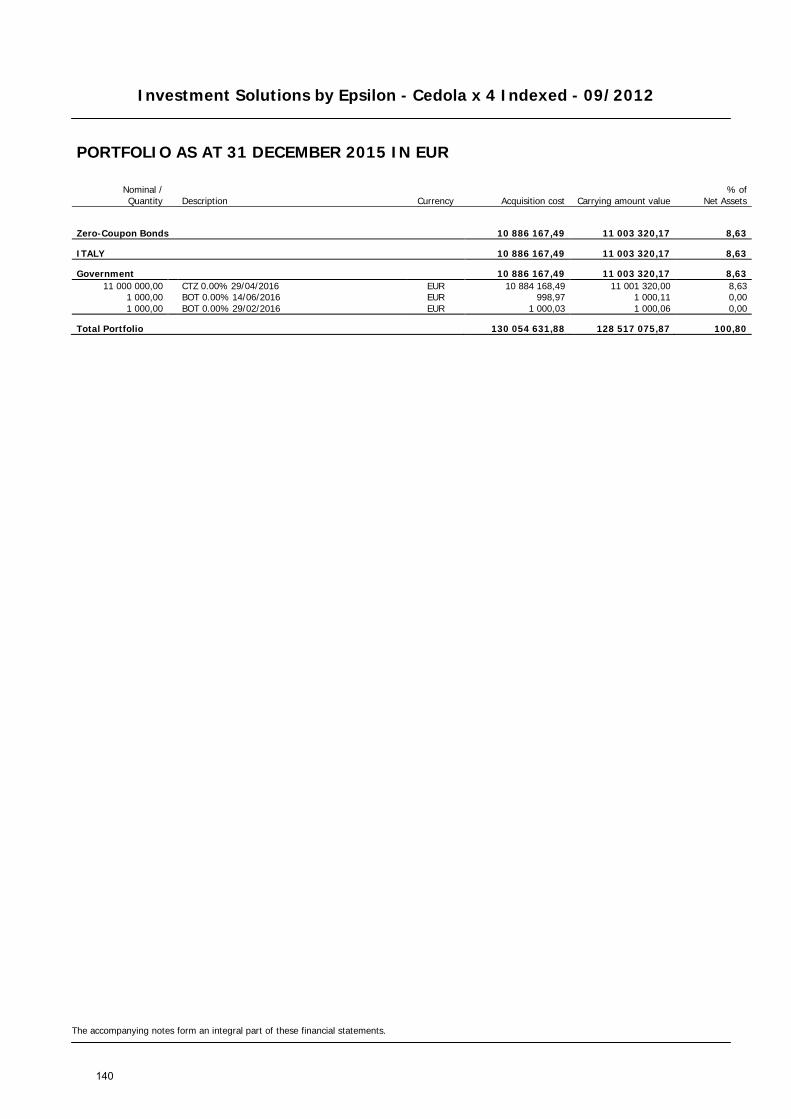
Investment Solutions by Epsilon - Cedola x 4 Indexed - 09/2012
The accompanying notes form an integral part of these financial statements.
PORTFOLIO AS AT 31 DECEMBER 2015 IN EUR
Nominal / Quantity Description Currency Acquisition cost Carrying amount value
% of Net Assets
Zero-Coupon Bonds 10 886 167,49 11 003 320,17 8,63
ITALY 10 886 167,49 11 003 320,17 8,63
Government 10 886 167,49 11 003 320,17 8,63 11 000 000,00 CTZ 0.00% 29/04/2016 EUR 10 884 168,49 11 001 320,00 8,63
1 000,00 BOT 0.00% 14/06/2016 EUR 998,97 1 000,11 0,00 1 000,00 BOT 0.00% 29/02/2016 EUR 1 000,03 1 000,06 0,00
Total Portfolio 130 054 631,88 128 517 075,87 100,80
140
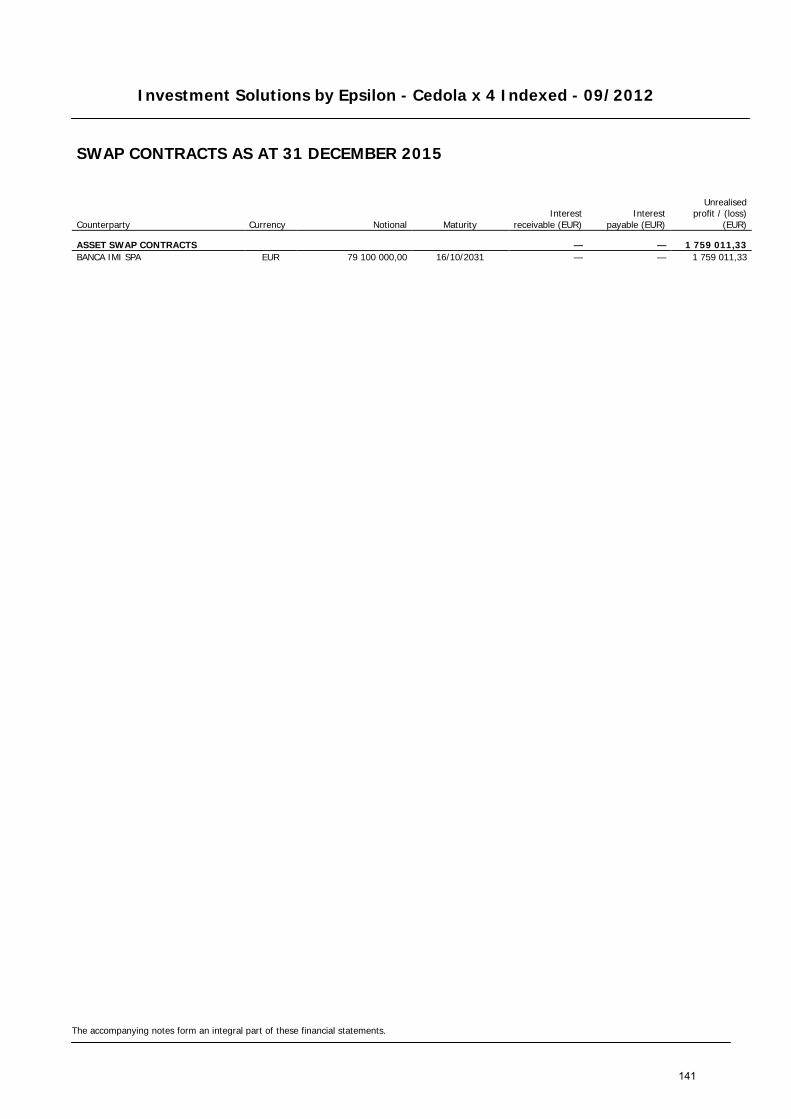
Investment Solutions by Epsilon - Cedola x 4 Indexed - 09/2012
The accompanying notes form an integral part of these financial statements.
SWAP CONTRACTS AS AT 31 DECEMBER 2015
Counterparty Currency Notional Maturity Interest
receivable (EUR) Interest
payable (EUR)
Unrealised
profit / (loss) (EUR)
ASSET SWAP CONTRACTS — — 1 759 011,33 BANCA IMI SPA EUR 79 100 000,00 16/10/2031 — — 1 759 011,33
141
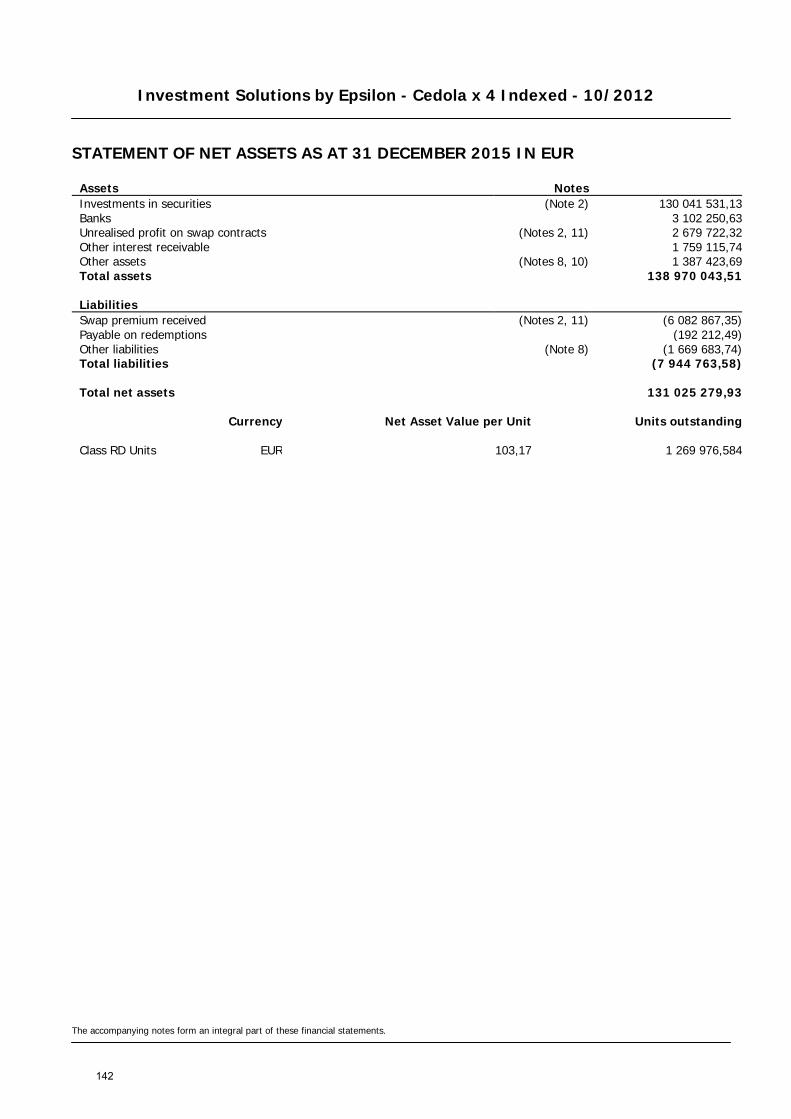
Investment Solutions by Epsilon - Cedola x 4 Indexed - 10/2012
STATEMENT OF NET ASSETS AS AT 31 DECEMBER 2015 IN EUR
The accompanying notes form an integral part of these financial statements.
Assets Notes Investments in securities (Note 2) 130 041 531,13 Banks 3 102 250,63 Unrealised profit on swap contracts (Notes 2, 11) 2 679 722,32 Other interest receivable 1 759 115,74 Other assets (Notes 8, 10) 1 387 423,69 Total assets 138 970 043,51
Liabilities Swap premium received (Notes 2, 11) (6 082 867,35) Payable on redemptions (192 212,49) Other liabilities (Note 8) (1 669 683,74) Total liabilities (7 944 763,58)
Total net assets 131 025 279,93
Currency Net Asset Value per Unit Units outstanding
Class RD Units EUR 103,17 1 269 976,584
142

Investment Solutions by Epsilon - Cedola x 4 Indexed - 10/2012
STATEMENT OF CHANGES IN NET ASSETS FOR THE YEAR ENDED 31 DECEMBER 2015 IN EUR
The accompanying notes form an integral part of these financial statements.
Net assets at the beginning of the year Notes 319 935 881,64
Net income from investments (Note 2) 8 714 850,35 Other income (Note 9) 1 153 247,24 Total income 9 868 097,59 Management fee (Note 5) (1 275 028,16) Depositary and paying agent fee (Note 7) (136 262,69) Subscription tax (Note 3) (95 065,96) Other charges and taxes (Notes 4, 10) (1 587 734,84) Total expenses (3 094 091,65) Net investment income / (loss) 6 774 005,94 Net realised profit / (loss) on sales of investments, currencies and other financial instruments (Notes 2, 11) 9 554 226,48 Change in unrealised appreciation / (depreciation) on - investments (Note 2) (17 314 436,27) - swap contracts (Notes 2, 11) 1 230 946,24 Net result of operations for the year 244 742,39
Redemptions for the year (187 208 182,05) Dividend distributions (Note 13) (1 947 162,05)
Net assets at the end of the year 131 025 279,93
143
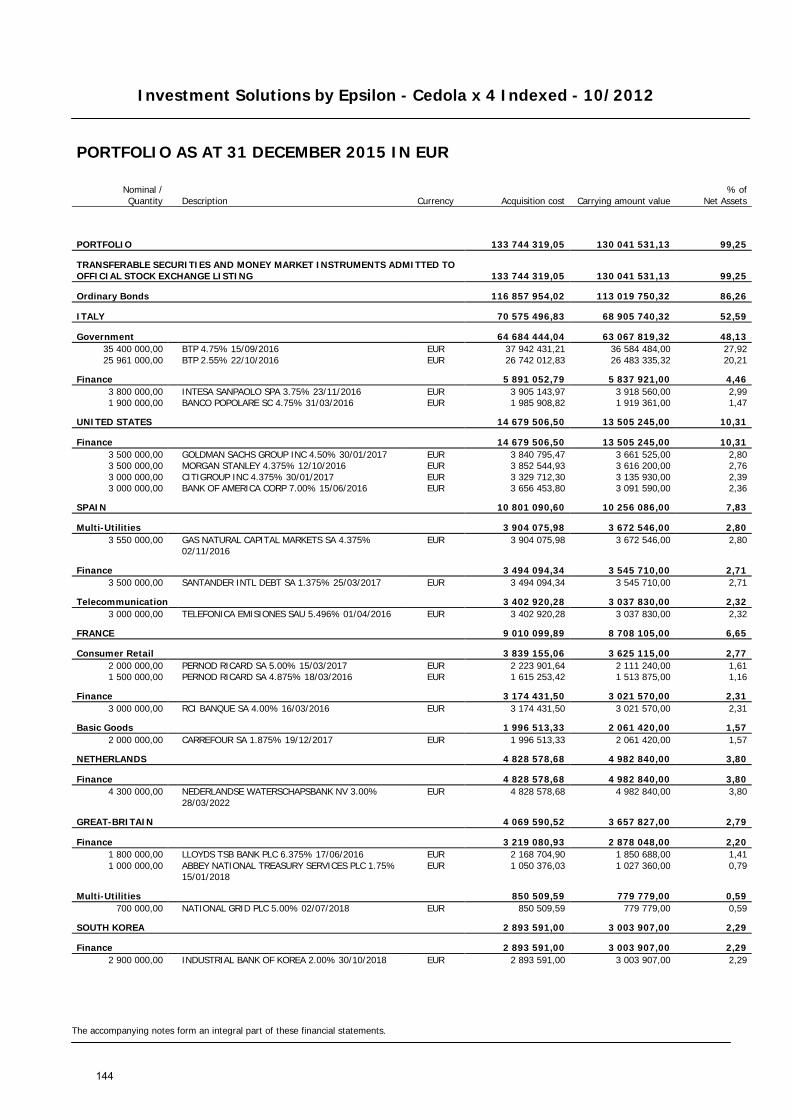
Investment Solutions by Epsilon - Cedola x 4 Indexed - 10/2012
The accompanying notes form an integral part of these financial statements.
PORTFOLIO AS AT 31 DECEMBER 2015 IN EUR
Nominal / Quantity Description Currency Acquisition cost Carrying amount value
% of Net Assets
PORTFOLIO 133 744 319,05 130 041 531,13 99,25
TRANSFERABLE SECURITIES AND MONEY MARKET INSTRUMENTS ADMITTED TO OFFICIAL STOCK EXCHANGE LISTING 133 744 319,05 130 041 531,13 99,25
Ordinary Bonds 116 857 954,02 113 019 750,32 86,26
ITALY 70 575 496,83 68 905 740,32 52,59
Government 64 684 444,04 63 067 819,32 48,13 35 400 000,00 BTP 4.75% 15/09/2016 EUR 37 942 431,21 36 584 484,00 27,92 25 961 000,00 BTP 2.55% 22/10/2016 EUR 26 742 012,83 26 483 335,32 20,21
Finance 5 891 052,79 5 837 921,00 4,46 3 800 000,00 INTESA SANPAOLO SPA 3.75% 23/11/2016 EUR 3 905 143,97 3 918 560,00 2,99 1 900 000,00 BANCO POPOLARE SC 4.75% 31/03/2016 EUR 1 985 908,82 1 919 361,00 1,47
UNITED STATES 14 679 506,50 13 505 245,00 10,31
Finance 14 679 506,50 13 505 245,00 10,31 3 500 000,00 GOLDMAN SACHS GROUP INC 4.50% 30/01/2017 EUR 3 840 795,47 3 661 525,00 2,80 3 500 000,00 MORGAN STANLEY 4.375% 12/10/2016 EUR 3 852 544,93 3 616 200,00 2,76 3 000 000,00 CITIGROUP INC 4.375% 30/01/2017 EUR 3 329 712,30 3 135 930,00 2,39 3 000 000,00 BANK OF AMERICA CORP 7.00% 15/06/2016 EUR 3 656 453,80 3 091 590,00 2,36
SPAIN 10 801 090,60 10 256 086,00 7,83
Multi-Utilities 3 904 075,98 3 672 546,00 2,80 3 550 000,00
GAS NATURAL CAPITAL MARKETS SA 4.375% 02/11/2016
EUR 3 904 075,98 3 672 546,00 2,80
Finance 3 494 094,34 3 545 710,00 2,71 3 500 000,00 SANTANDER INTL DEBT SA 1.375% 25/03/2017 EUR 3 494 094,34 3 545 710,00 2,71
Telecommunication 3 402 920,28 3 037 830,00 2,32 3 000 000,00 TELEFONICA EMISIONES SAU 5.496% 01/04/2016 EUR 3 402 920,28 3 037 830,00 2,32
FRANCE 9 010 099,89 8 708 105,00 6,65
Consumer Retail 3 839 155,06 3 625 115,00 2,77 2 000 000,00 PERNOD RICARD SA 5.00% 15/03/2017 EUR 2 223 901,64 2 111 240,00 1,61 1 500 000,00 PERNOD RICARD SA 4.875% 18/03/2016 EUR 1 615 253,42 1 513 875,00 1,16
Finance 3 174 431,50 3 021 570,00 2,31 3 000 000,00 RCI BANQUE SA 4.00% 16/03/2016 EUR 3 174 431,50 3 021 570,00 2,31
Basic Goods 1 996 513,33 2 061 420,00 1,57 2 000 000,00 CARREFOUR SA 1.875% 19/12/2017 EUR 1 996 513,33 2 061 420,00 1,57
NETHERLANDS 4 828 578,68 4 982 840,00 3,80
Finance 4 828 578,68 4 982 840,00 3,80 4 300 000,00
NEDERLANDSE WATERSCHAPSBANK NV 3.00% 28/03/2022
EUR 4 828 578,68 4 982 840,00 3,80
GREAT-BRITAIN 4 069 590,52 3 657 827,00 2,79
Finance 3 219 080,93 2 878 048,00 2,20 1 800 000,00 LLOYDS TSB BANK PLC 6.375% 17/06/2016 EUR 2 168 704,90 1 850 688,00 1,41 1 000 000,00
ABBEY NATIONAL TREASURY SERVICES PLC 1.75% 15/01/2018
EUR 1 050 376,03 1 027 360,00 0,79
Multi-Utilities 850 509,59 779 779,00 0,59 700 000,00 NATIONAL GRID PLC 5.00% 02/07/2018 EUR 850 509,59 779 779,00 0,59
SOUTH KOREA 2 893 591,00 3 003 907,00 2,29
Finance 2 893 591,00 3 003 907,00 2,29 2 900 000,00 INDUSTRIAL BANK OF KOREA 2.00% 30/10/2018 EUR 2 893 591,00 3 003 907,00 2,29
144
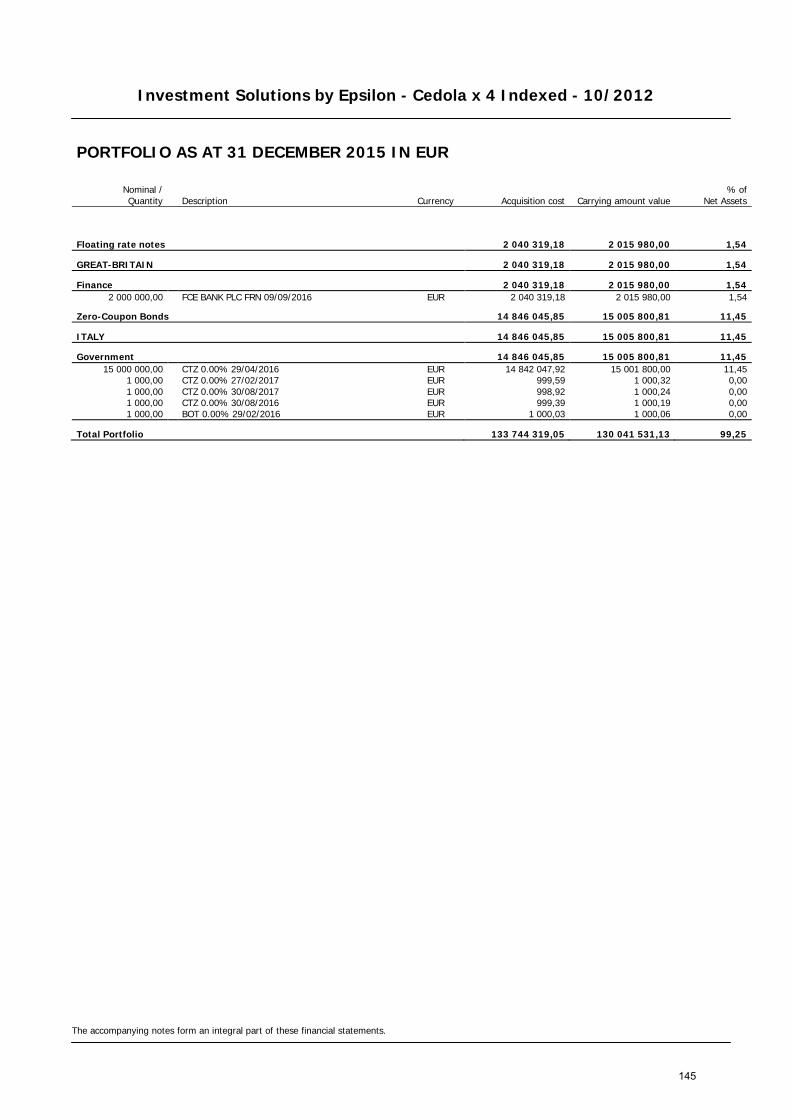
Investment Solutions by Epsilon - Cedola x 4 Indexed - 10/2012
The accompanying notes form an integral part of these financial statements.
PORTFOLIO AS AT 31 DECEMBER 2015 IN EUR
Nominal / Quantity Description Currency Acquisition cost Carrying amount value
% of Net Assets
Floating rate notes 2 040 319,18 2 015 980,00 1,54
GREAT-BRITAIN 2 040 319,18 2 015 980,00 1,54
Finance 2 040 319,18 2 015 980,00 1,54 2 000 000,00 FCE BANK PLC FRN 09/09/2016 EUR 2 040 319,18 2 015 980,00 1,54
Zero-Coupon Bonds 14 846 045,85 15 005 800,81 11,45
ITALY 14 846 045,85 15 005 800,81 11,45
Government 14 846 045,85 15 005 800,81 11,45 15 000 000,00 CTZ 0.00% 29/04/2016 EUR 14 842 047,92 15 001 800,00 11,45
1 000,00 CTZ 0.00% 27/02/2017 EUR 999,59 1 000,32 0,00 1 000,00 CTZ 0.00% 30/08/2017 EUR 998,92 1 000,24 0,00 1 000,00 CTZ 0.00% 30/08/2016 EUR 999,39 1 000,19 0,00 1 000,00 BOT 0.00% 29/02/2016 EUR 1 000,03 1 000,06 0,00
Total Portfolio 133 744 319,05 130 041 531,13 99,25
145

Investment Solutions by Epsilon - Cedola x 4 Indexed - 10/2012
The accompanying notes form an integral part of these financial statements.
SWAP CONTRACTS AS AT 31 DECEMBER 2015
Counterparty Currency Notional Maturity Interest
receivable (EUR) Interest
payable (EUR)
Unrealised
profit / (loss) (EUR)
ASSET SWAP CONTRACTS — — 2 679 722,32 BANCA IMI SPA EUR 87 950 000,00 16/12/2019 — — 2 679 722,32
146
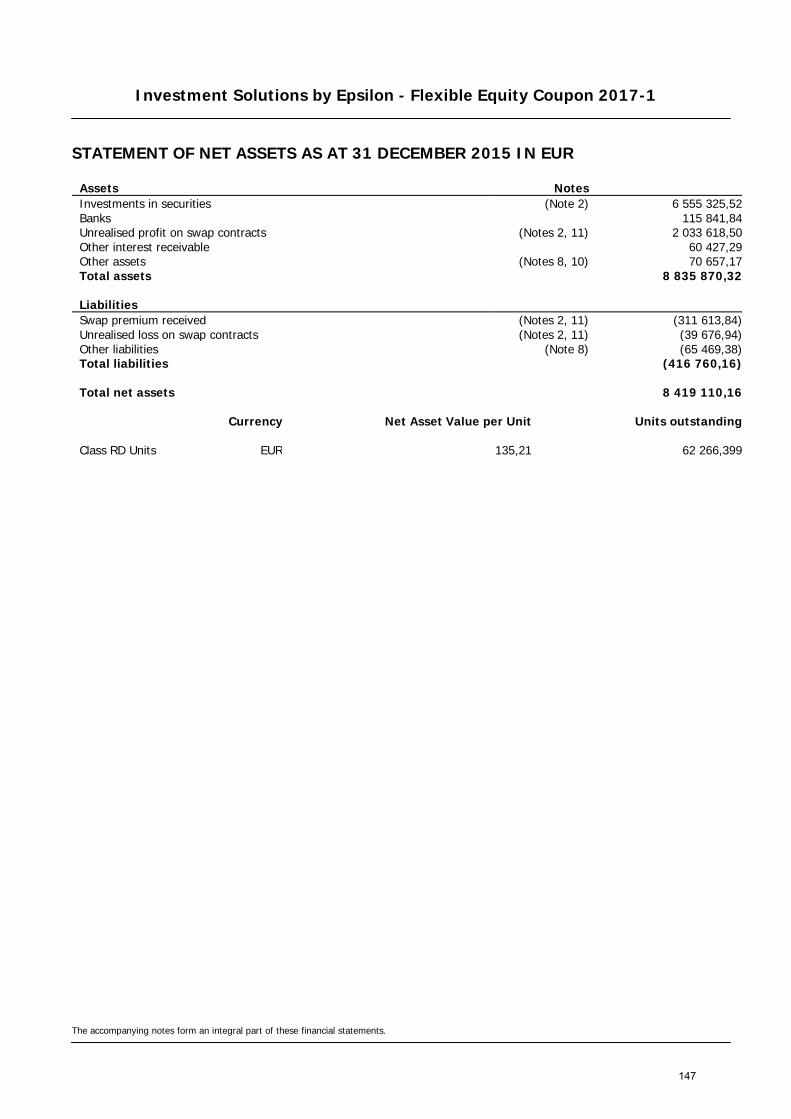
Investment Solutions by Epsilon - Flexible Equity Coupon 2017-1
STATEMENT OF NET ASSETS AS AT 31 DECEMBER 2015 IN EUR
The accompanying notes form an integral part of these financial statements.
Assets Notes Investments in securities (Note 2) 6 555 325,52 Banks 115 841,84 Unrealised profit on swap contracts (Notes 2, 11) 2 033 618,50 Other interest receivable 60 427,29 Other assets (Notes 8, 10) 70 657,17 Total assets 8 835 870,32
Liabilities Swap premium received (Notes 2, 11) (311 613,84) Unrealised loss on swap contracts (Notes 2, 11) (39 676,94) Other liabilities (Note 8) (65 469,38) Total liabilities (416 760,16)
Total net assets 8 419 110,16
Currency Net Asset Value per Unit Units outstanding
Class RD Units EUR 135,21 62 266,399
147

Investment Solutions by Epsilon - Flexible Equity Coupon 2017-1
STATEMENT OF CHANGES IN NET ASSETS FOR THE YEAR ENDED 31 DECEMBER 2015 IN EUR
The accompanying notes form an integral part of these financial statements.
Net assets at the beginning of the year Notes 10 684 190,70
Net income from investments (Note 2) 360 303,88 Other income (Note 9) 27 012,87 Total income 387 316,75 Management fee (Note 5) (67 880,79) Depositary and paying agent fee (Note 7) (6 612,19) Subscription tax (Note 3) (4 681,60) Other charges and taxes (Notes 4, 10) (60 262,51) Total expenses (139 437,09) Net investment income / (loss) 247 879,66 Net realised profit / (loss) on sales of investments, currencies and other financial instruments (Notes 2, 11) 437 227,86 Change in unrealised appreciation / (depreciation) on - investments (Note 2) (360 684,85) - swap contracts (Notes 2, 11) (192 712,20) Net result of operations for the year 131 710,47
Redemptions for the year (2 396 791,01)
Net assets at the end of the year 8 419 110,16
148
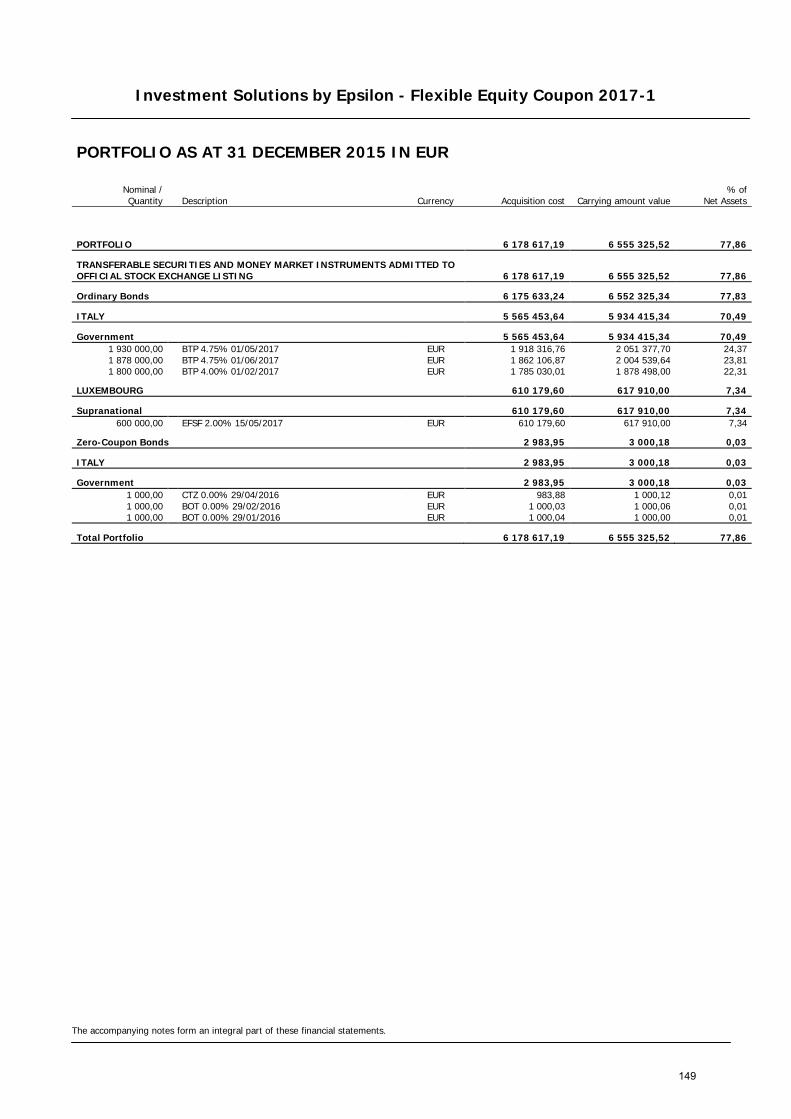
Investment Solutions by Epsilon - Flexible Equity Coupon 2017-1
The accompanying notes form an integral part of these financial statements.
PORTFOLIO AS AT 31 DECEMBER 2015 IN EUR
Nominal / Quantity Description Currency Acquisition cost Carrying amount value
% of Net Assets
PORTFOLIO 6 178 617,19 6 555 325,52 77,86
TRANSFERABLE SECURITIES AND MONEY MARKET INSTRUMENTS ADMITTED TO OFFICIAL STOCK EXCHANGE LISTING 6 178 617,19 6 555 325,52 77,86
Ordinary Bonds 6 175 633,24 6 552 325,34 77,83
ITALY 5 565 453,64 5 934 415,34 70,49
Government 5 565 453,64 5 934 415,34 70,49 1 930 000,00 BTP 4.75% 01/05/2017 EUR 1 918 316,76 2 051 377,70 24,37 1 878 000,00 BTP 4.75% 01/06/2017 EUR 1 862 106,87 2 004 539,64 23,81 1 800 000,00 BTP 4.00% 01/02/2017 EUR 1 785 030,01 1 878 498,00 22,31
LUXEMBOURG 610 179,60 617 910,00 7,34
Supranational 610 179,60 617 910,00 7,34 600 000,00 EFSF 2.00% 15/05/2017 EUR 610 179,60 617 910,00 7,34
Zero-Coupon Bonds 2 983,95 3 000,18 0,03
ITALY 2 983,95 3 000,18 0,03
Government 2 983,95 3 000,18 0,03 1 000,00 CTZ 0.00% 29/04/2016 EUR 983,88 1 000,12 0,01 1 000,00 BOT 0.00% 29/02/2016 EUR 1 000,03 1 000,06 0,01 1 000,00 BOT 0.00% 29/01/2016 EUR 1 000,04 1 000,00 0,01
Total Portfolio 6 178 617,19 6 555 325,52 77,86
149
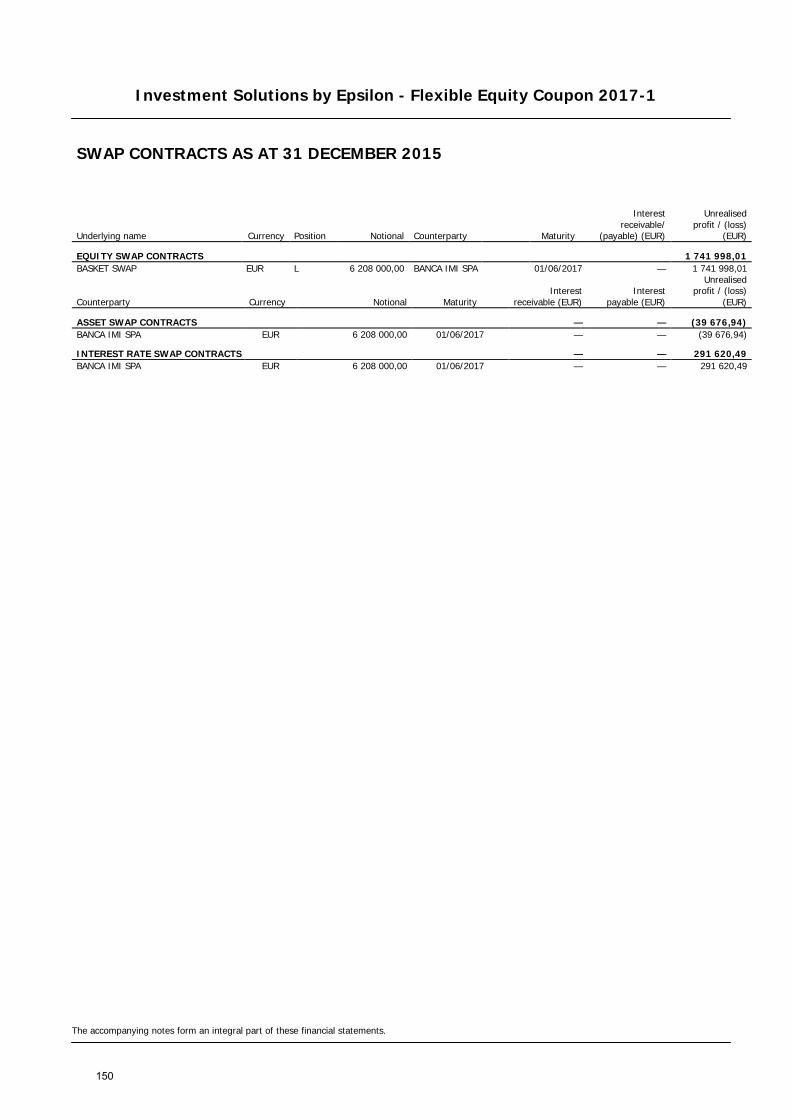
Investment Solutions by Epsilon - Flexible Equity Coupon 2017-1
The accompanying notes form an integral part of these financial statements.
SWAP CONTRACTS AS AT 31 DECEMBER 2015
Underlying name Currency Position Notional Counterparty Maturity
Interest receivable/
(payable) (EUR)
Unrealised profit / (loss)
(EUR)
EQUITY SWAP CONTRACTS 1 741 998,01 BASKET SWAP EUR L 6 208 000,00 BANCA IMI SPA 01/06/2017 — 1 741 998,01
Counterparty Currency Notional Maturity Interest
receivable (EUR) Interest
payable (EUR)
Unrealised profit / (loss)
(EUR)
ASSET SWAP CONTRACTS — — (39 676,94) BANCA IMI SPA EUR 6 208 000,00 01/06/2017 — — (39 676,94)
INTEREST RATE SWAP CONTRACTS — — 291 620,49 BANCA IMI SPA EUR 6 208 000,00 01/06/2017 — — 291 620,49
150
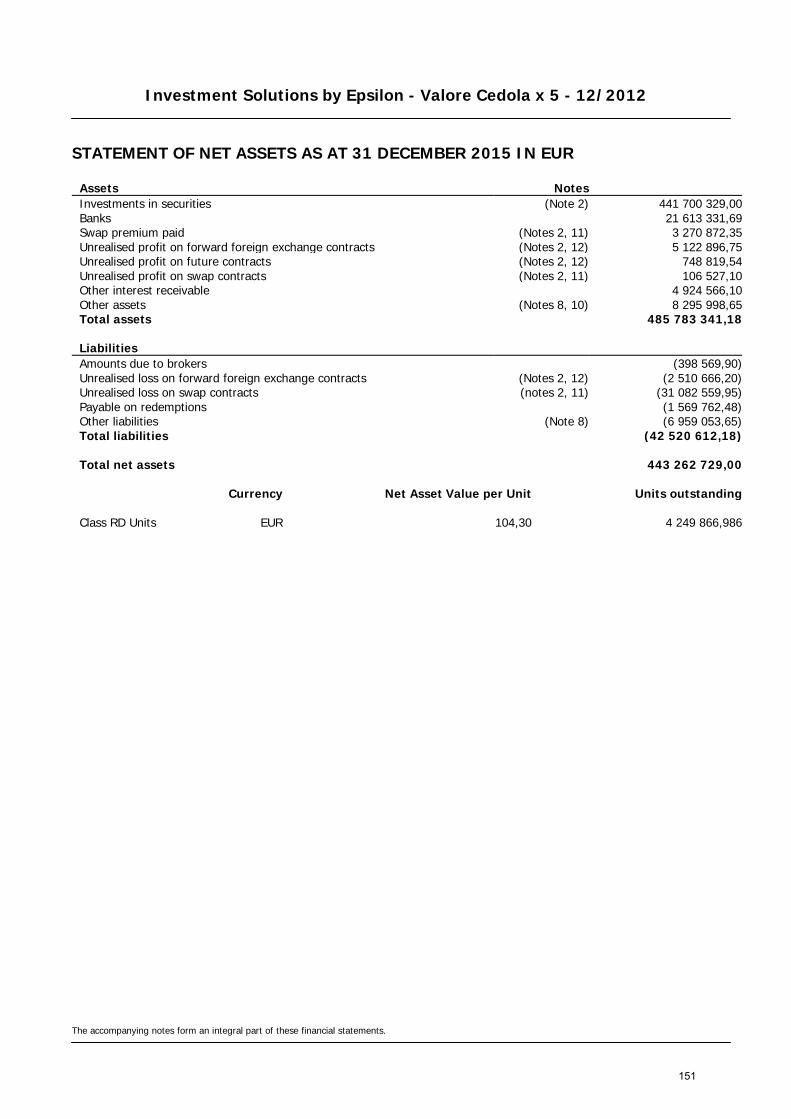
Investment Solutions by Epsilon - Valore Cedola x 5 - 12/2012
STATEMENT OF NET ASSETS AS AT 31 DECEMBER 2015 IN EUR
The accompanying notes form an integral part of these financial statements.
Assets Notes Investments in securities (Note 2) 441 700 329,00 Banks 21 613 331,69 Swap premium paid (Notes 2, 11) 3 270 872,35 Unrealised profit on forward foreign exchange contracts (Notes 2, 12) 5 122 896,75 Unrealised profit on future contracts (Notes 2, 12) 748 819,54 Unrealised profit on swap contracts (Notes 2, 11) 106 527,10 Other interest receivable 4 924 566,10 Other assets (Notes 8, 10) 8 295 998,65 Total assets 485 783 341,18
Liabilities Amounts due to brokers (398 569,90) Unrealised loss on forward foreign exchange contracts (Notes 2, 12) (2 510 666,20) Unrealised loss on swap contracts (notes 2, 11) (31 082 559,95) Payable on redemptions (1 569 762,48) Other liabilities (Note 8) (6 959 053,65) Total liabilities (42 520 612,18)
Total net assets 443 262 729,00
Currency Net Asset Value per Unit Units outstanding
Class RD Units EUR 104,30 4 249 866,986
151

Investment Solutions by Epsilon - Valore Cedola x 5 - 12/2012
STATEMENT OF CHANGES IN NET ASSETS FOR THE YEAR ENDED 31 DECEMBER 2015 IN EUR
The accompanying notes form an integral part of these financial statements.
Net assets at the beginning of the year Notes 959 618 170,61
Net income from investments (Note 2) 26 105 870,76 Interest on bank accounts 728,15 Other income (Note 9) 2 066 672,98 Total income 28 173 271,89 Management fee (Note 5) (5 388 321,57) Depositary and paying agent fee (Note 7) (431 488,93) Subscription tax (Note 3) (303 945,81) Interest on bank accounts (938,39) Other charges and taxes (Notes 4, 10) (4 368 622,10) Total expenses (10 493 316,80) Net investment income / (loss) 17 679 955,09 Net realised profit / (loss) on sales of investments, currencies and other financial instruments (Notes 2, 11, 12) 46 002 715,01 Change in unrealised appreciation / (depreciation) on - investments (Note 2) (33 894 925,23) - option contracts (Notes 2, 12) 89 700,16 - forward foreign exchange contracts (Notes 2, 12) 1 635 319,01 - foreign currencies (77 647,44) - future contracts (Notes 2, 12) (4 248 061,06) - swap contracts (Notes 2, 11) (12 487 184,64) Net result of operations for the year 14 699 870,90
Redemptions for the year (511 690 778,84) Dividend distributions (Note 13) (19 364 533,67)
Net assets at the end of the year 443 262 729,00
152
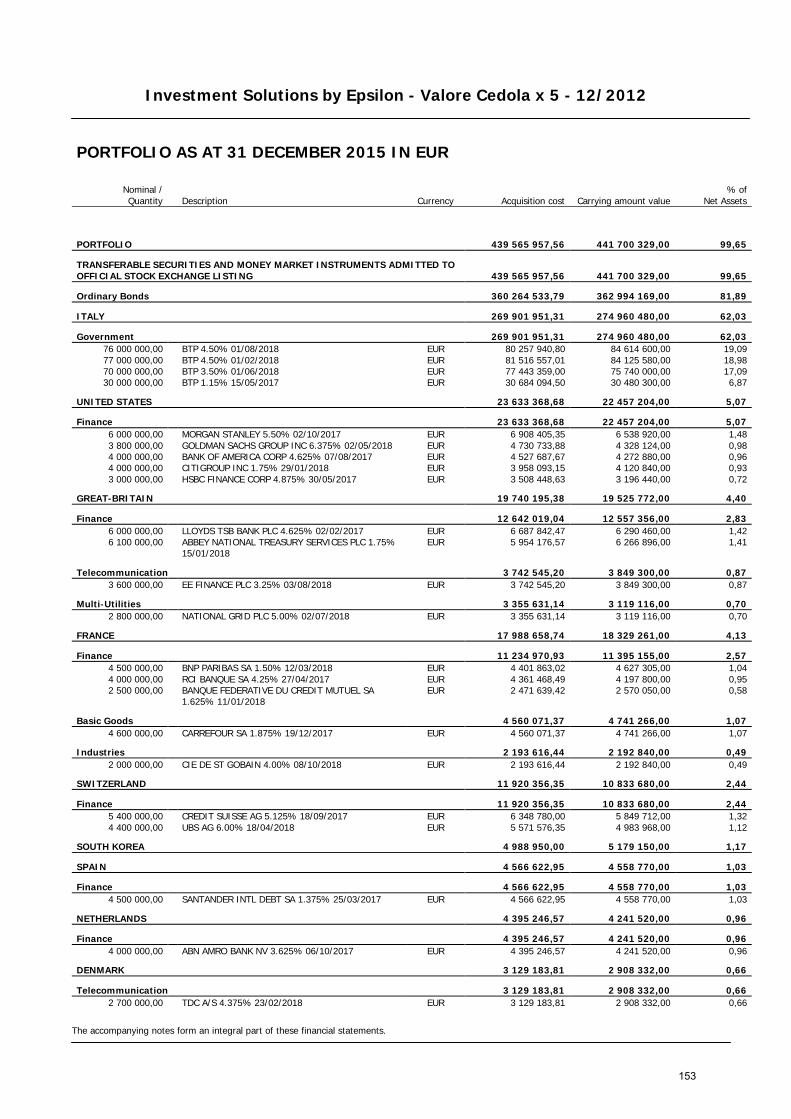
Investment Solutions by Epsilon - Valore Cedola x 5 - 12/2012
The accompanying notes form an integral part of these financial statements.
PORTFOLIO AS AT 31 DECEMBER 2015 IN EUR
Nominal / Quantity Description Currency Acquisition cost Carrying amount value
% of Net Assets
PORTFOLIO 439 565 957,56 441 700 329,00 99,65
TRANSFERABLE SECURITIES AND MONEY MARKET INSTRUMENTS ADMITTED TO OFFICIAL STOCK EXCHANGE LISTING 439 565 957,56 441 700 329,00 99,65
Ordinary Bonds 360 264 533,79 362 994 169,00 81,89
ITALY 269 901 951,31 274 960 480,00 62,03
Government 269 901 951,31 274 960 480,00 62,03 76 000 000,00 BTP 4.50% 01/08/2018 EUR 80 257 940,80 84 614 600,00 19,09 77 000 000,00 BTP 4.50% 01/02/2018 EUR 81 516 557,01 84 125 580,00 18,98 70 000 000,00 BTP 3.50% 01/06/2018 EUR 77 443 359,00 75 740 000,00 17,09 30 000 000,00 BTP 1.15% 15/05/2017 EUR 30 684 094,50 30 480 300,00 6,87
UNITED STATES 23 633 368,68 22 457 204,00 5,07
Finance 23 633 368,68 22 457 204,00 5,07 6 000 000,00 MORGAN STANLEY 5.50% 02/10/2017 EUR 6 908 405,35 6 538 920,00 1,48 3 800 000,00 GOLDMAN SACHS GROUP INC 6.375% 02/05/2018 EUR 4 730 733,88 4 328 124,00 0,98 4 000 000,00 BANK OF AMERICA CORP 4.625% 07/08/2017 EUR 4 527 687,67 4 272 880,00 0,96 4 000 000,00 CITIGROUP INC 1.75% 29/01/2018 EUR 3 958 093,15 4 120 840,00 0,93 3 000 000,00 HSBC FINANCE CORP 4.875% 30/05/2017 EUR 3 508 448,63 3 196 440,00 0,72
GREAT-BRITAIN 19 740 195,38 19 525 772,00 4,40
Finance 12 642 019,04 12 557 356,00 2,83 6 000 000,00 LLOYDS TSB BANK PLC 4.625% 02/02/2017 EUR 6 687 842,47 6 290 460,00 1,42 6 100 000,00
ABBEY NATIONAL TREASURY SERVICES PLC 1.75% 15/01/2018
EUR 5 954 176,57 6 266 896,00 1,41
Telecommunication 3 742 545,20 3 849 300,00 0,87 3 600 000,00 EE FINANCE PLC 3.25% 03/08/2018 EUR 3 742 545,20 3 849 300,00 0,87
Multi-Utilities 3 355 631,14 3 119 116,00 0,70 2 800 000,00 NATIONAL GRID PLC 5.00% 02/07/2018 EUR 3 355 631,14 3 119 116,00 0,70
FRANCE 17 988 658,74 18 329 261,00 4,13
Finance 11 234 970,93 11 395 155,00 2,57 4 500 000,00 BNP PARIBAS SA 1.50% 12/03/2018 EUR 4 401 863,02 4 627 305,00 1,04 4 000 000,00 RCI BANQUE SA 4.25% 27/04/2017 EUR 4 361 468,49 4 197 800,00 0,95 2 500 000,00
BANQUE FEDERATIVE DU CREDIT MUTUEL SA 1.625% 11/01/2018
EUR 2 471 639,42 2 570 050,00 0,58
Basic Goods 4 560 071,37 4 741 266,00 1,07 4 600 000,00 CARREFOUR SA 1.875% 19/12/2017 EUR 4 560 071,37 4 741 266,00 1,07
Industries 2 193 616,44 2 192 840,00 0,49 2 000 000,00 CIE DE ST GOBAIN 4.00% 08/10/2018 EUR 2 193 616,44 2 192 840,00 0,49
SWITZERLAND 11 920 356,35 10 833 680,00 2,44
Finance 11 920 356,35 10 833 680,00 2,44 5 400 000,00 CREDIT SUISSE AG 5.125% 18/09/2017 EUR 6 348 780,00 5 849 712,00 1,32 4 400 000,00 UBS AG 6.00% 18/04/2018 EUR 5 571 576,35 4 983 968,00 1,12
SOUTH KOREA 4 988 950,00 5 179 150,00 1,17
SPAIN 4 566 622,95 4 558 770,00 1,03
Finance 4 566 622,95 4 558 770,00 1,03 4 500 000,00 SANTANDER INTL DEBT SA 1.375% 25/03/2017 EUR 4 566 622,95 4 558 770,00 1,03
NETHERLANDS 4 395 246,57 4 241 520,00 0,96
Finance 4 395 246,57 4 241 520,00 0,96 4 000 000,00 ABN AMRO BANK NV 3.625% 06/10/2017 EUR 4 395 246,57 4 241 520,00 0,96
DENMARK 3 129 183,81 2 908 332,00 0,66
Telecommunication 3 129 183,81 2 908 332,00 0,66 2 700 000,00 TDC A/S 4.375% 23/02/2018 EUR 3 129 183,81 2 908 332,00 0,66
153
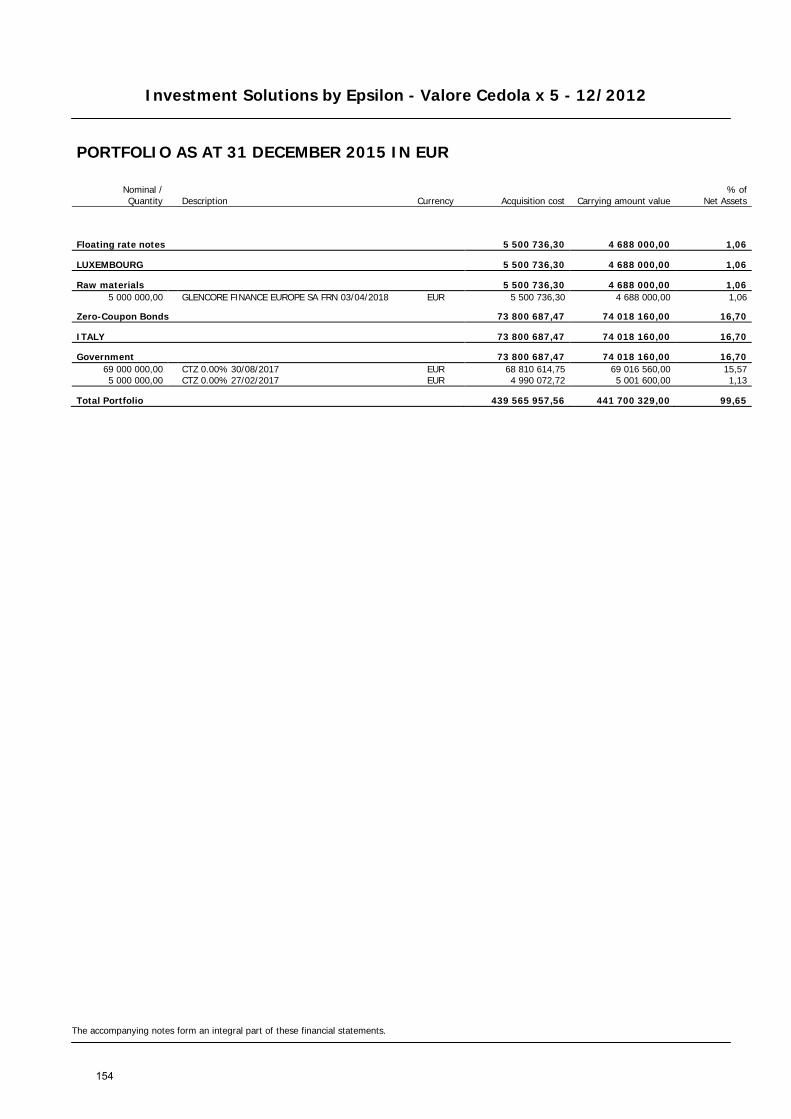
Investment Solutions by Epsilon - Valore Cedola x 5 - 12/2012
The accompanying notes form an integral part of these financial statements.
PORTFOLIO AS AT 31 DECEMBER 2015 IN EUR
Nominal / Quantity Description Currency Acquisition cost Carrying amount value
% of Net Assets
Floating rate notes 5 500 736,30 4 688 000,00 1,06
LUXEMBOURG 5 500 736,30 4 688 000,00 1,06
Raw materials 5 500 736,30 4 688 000,00 1,06 5 000 000,00 GLENCORE FINANCE EUROPE SA FRN 03/04/2018 EUR 5 500 736,30 4 688 000,00 1,06
Zero-Coupon Bonds 73 800 687,47 74 018 160,00 16,70
ITALY 73 800 687,47 74 018 160,00 16,70
Government 73 800 687,47 74 018 160,00 16,70 69 000 000,00 CTZ 0.00% 30/08/2017 EUR 68 810 614,75 69 016 560,00 15,57 5 000 000,00 CTZ 0.00% 27/02/2017 EUR 4 990 072,72 5 001 600,00 1,13
Total Portfolio 439 565 957,56 441 700 329,00 99,65
154
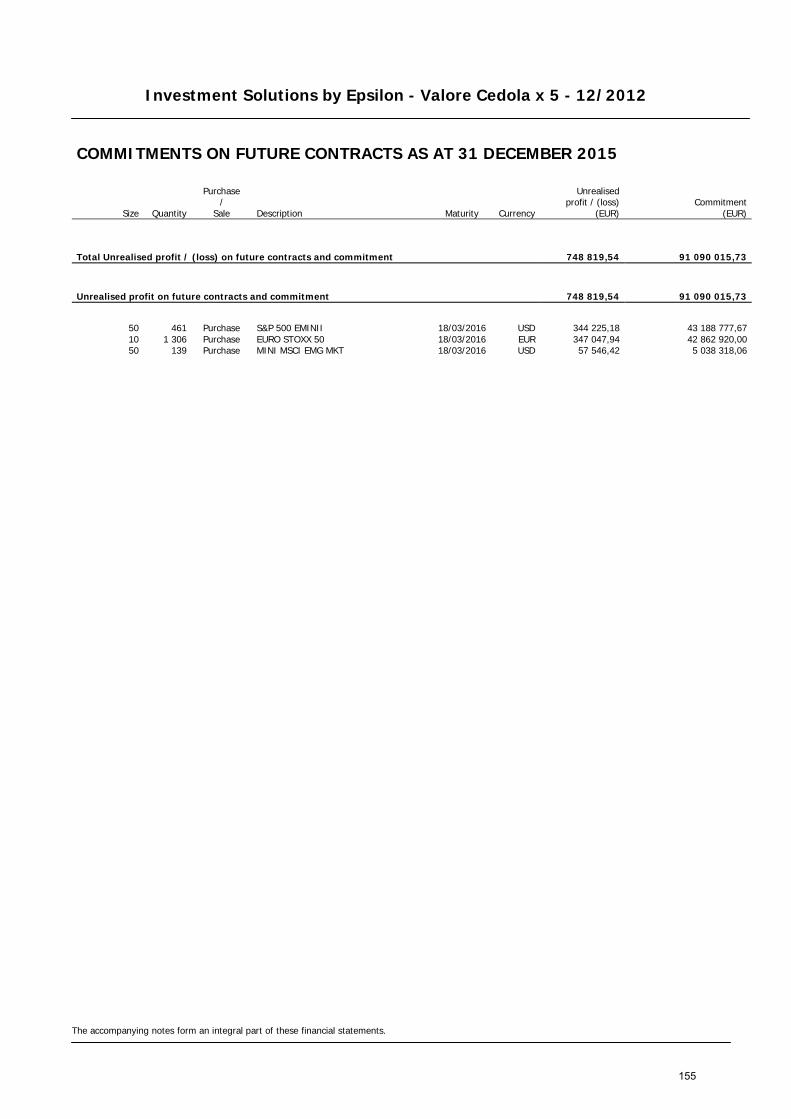
Investment Solutions by Epsilon - Valore Cedola x 5 - 12/2012
The accompanying notes form an integral part of these financial statements.
COMMITMENTS ON FUTURE CONTRACTS AS AT 31 DECEMBER 2015
Size Quantity
Purchase /
Sale Description Maturity Currency
Unrealised profit / (loss)
(EUR) Commitment
(EUR)
Total Unrealised profit / (loss) on future contracts and commitment 748 819,54 91 090 015,73
Unrealised profit on future contracts and commitment 748 819,54 91 090 015,73
50 461 Purchase S&P 500 EMINII 18/03/2016 USD 344 225,18 43 188 777,67 10 1 306 Purchase EURO STOXX 50 18/03/2016 EUR 347 047,94 42 862 920,00 50 139 Purchase MINI MSCI EMG MKT 18/03/2016 USD 57 546,42 5 038 318,06
155
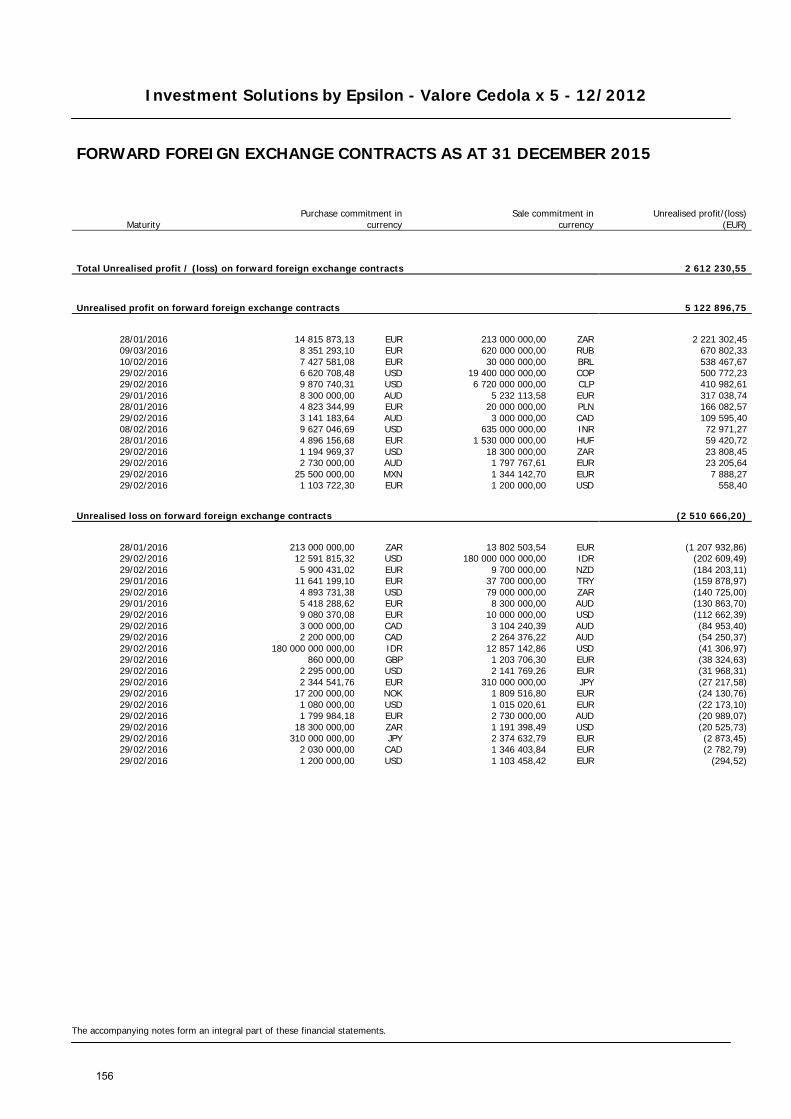
Investment Solutions by Epsilon - Valore Cedola x 5 - 12/2012
The accompanying notes form an integral part of these financial statements.
FORWARD FOREIGN EXCHANGE CONTRACTS AS AT 31 DECEMBER 2015
Maturity Purchase commitment in
currency Sale commitment in
currency
Unrealised profit/(loss) (EUR)
Total Unrealised profit / (loss) on forward foreign exchange contracts 2 612 230,55
Unrealised profit on forward foreign exchange contracts 5 122 896,75
28/01/2016 14 815 873,13 EUR 213 000 000,00 ZAR 2 221 302,45 09/03/2016 8 351 293,10 EUR 620 000 000,00 RUB 670 802,33 10/02/2016 7 427 581,08 EUR 30 000 000,00 BRL 538 467,67 29/02/2016 6 620 708,48 USD 19 400 000 000,00 COP 500 772,23 29/02/2016 9 870 740,31 USD 6 720 000 000,00 CLP 410 982,61 29/01/2016 8 300 000,00 AUD 5 232 113,58 EUR 317 038,74 28/01/2016 4 823 344,99 EUR 20 000 000,00 PLN 166 082,57 29/02/2016 3 141 183,64 AUD 3 000 000,00 CAD 109 595,40 08/02/2016 9 627 046,69 USD 635 000 000,00 INR 72 971,27 28/01/2016 4 896 156,68 EUR 1 530 000 000,00 HUF 59 420,72 29/02/2016 1 194 969,37 USD 18 300 000,00 ZAR 23 808,45 29/02/2016 2 730 000,00 AUD 1 797 767,61 EUR 23 205,64 29/02/2016 25 500 000,00 MXN 1 344 142,70 EUR 7 888,27 29/02/2016 1 103 722,30 EUR 1 200 000,00 USD 558,40
Unrealised loss on forward foreign exchange contracts (2 510 666,20)
28/01/2016 213 000 000,00 ZAR 13 802 503,54 EUR (1 207 932,86) 29/02/2016 12 591 815,32 USD 180 000 000 000,00 IDR (202 609,49) 29/02/2016 5 900 431,02 EUR 9 700 000,00 NZD (184 203,11) 29/01/2016 11 641 199,10 EUR 37 700 000,00 TRY (159 878,97) 29/02/2016 4 893 731,38 USD 79 000 000,00 ZAR (140 725,00) 29/01/2016 5 418 288,62 EUR 8 300 000,00 AUD (130 863,70) 29/02/2016 9 080 370,08 EUR 10 000 000,00 USD (112 662,39) 29/02/2016 3 000 000,00 CAD 3 104 240,39 AUD (84 953,40) 29/02/2016 2 200 000,00 CAD 2 264 376,22 AUD (54 250,37) 29/02/2016 180 000 000 000,00 IDR 12 857 142,86 USD (41 306,97) 29/02/2016 860 000,00 GBP 1 203 706,30 EUR (38 324,63) 29/02/2016 2 295 000,00 USD 2 141 769,26 EUR (31 968,31) 29/02/2016 2 344 541,76 EUR 310 000 000,00 JPY (27 217,58) 29/02/2016 17 200 000,00 NOK 1 809 516,80 EUR (24 130,76) 29/02/2016 1 080 000,00 USD 1 015 020,61 EUR (22 173,10) 29/02/2016 1 799 984,18 EUR 2 730 000,00 AUD (20 989,07) 29/02/2016 18 300 000,00 ZAR 1 191 398,49 USD (20 525,73) 29/02/2016 310 000 000,00 JPY 2 374 632,79 EUR (2 873,45) 29/02/2016 2 030 000,00 CAD 1 346 403,84 EUR (2 782,79) 29/02/2016 1 200 000,00 USD 1 103 458,42 EUR (294,52)
156
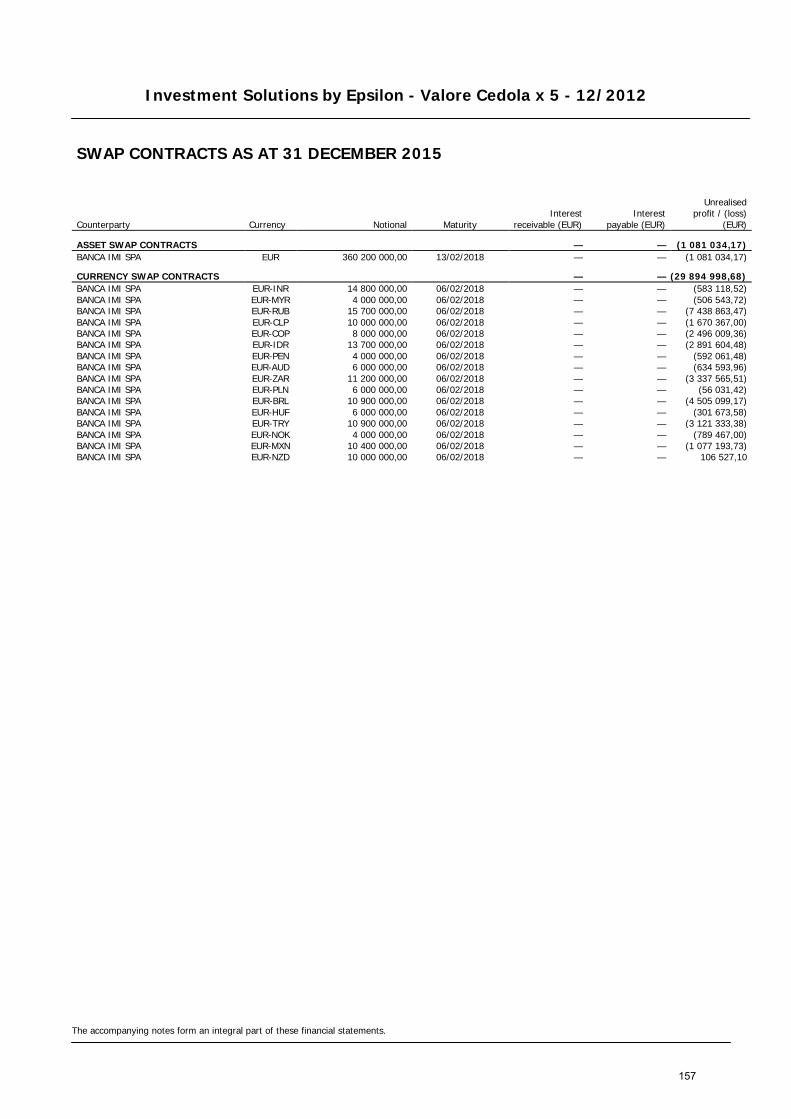
Investment Solutions by Epsilon - Valore Cedola x 5 - 12/2012
The accompanying notes form an integral part of these financial statements.
SWAP CONTRACTS AS AT 31 DECEMBER 2015
Counterparty Currency Notional Maturity Interest
receivable (EUR) Interest
payable (EUR)
Unrealised
profit / (loss) (EUR)
ASSET SWAP CONTRACTS — — (1 081 034,17) BANCA IMI SPA EUR 360 200 000,00 13/02/2018 — — (1 081 034,17)
CURRENCY SWAP CONTRACTS — — (29 894 998,68) BANCA IMI SPA EUR-INR 14 800 000,00 06/02/2018 — — (583 118,52) BANCA IMI SPA EUR-MYR 4 000 000,00 06/02/2018 — — (506 543,72) BANCA IMI SPA EUR-RUB 15 700 000,00 06/02/2018 — — (7 438 863,47) BANCA IMI SPA EUR-CLP 10 000 000,00 06/02/2018 — — (1 670 367,00) BANCA IMI SPA EUR-COP 8 000 000,00 06/02/2018 — — (2 496 009,36) BANCA IMI SPA EUR-IDR 13 700 000,00 06/02/2018 — — (2 891 604,48) BANCA IMI SPA EUR-PEN 4 000 000,00 06/02/2018 — — (592 061,48) BANCA IMI SPA EUR-AUD 6 000 000,00 06/02/2018 — — (634 593,96) BANCA IMI SPA EUR-ZAR 11 200 000,00 06/02/2018 — — (3 337 565,51) BANCA IMI SPA EUR-PLN 6 000 000,00 06/02/2018 — — (56 031,42) BANCA IMI SPA EUR-BRL 10 900 000,00 06/02/2018 — — (4 505 099,17) BANCA IMI SPA EUR-HUF 6 000 000,00 06/02/2018 — — (301 673,58) BANCA IMI SPA EUR-TRY 10 900 000,00 06/02/2018 — — (3 121 333,38) BANCA IMI SPA EUR-NOK 4 000 000,00 06/02/2018 — — (789 467,00) BANCA IMI SPA EUR-MXN 10 400 000,00 06/02/2018 — — (1 077 193,73) BANCA IMI SPA EUR-NZD 10 000 000,00 06/02/2018 — — 106 527,10
157

Investment Solutions by Epsilon - Valore Cedola x 5 - 02/2013
STATEMENT OF NET ASSETS AS AT 31 DECEMBER 2015 IN EUR
The accompanying notes form an integral part of these financial statements.
Assets Notes Investments in securities (Note 2) 517 514 044,00 Banks 24 375 930,03 Swap premium paid (Notes 2, 11) 206 662,09 Unrealised profit on forward foreign exchange contracts (Notes 2,12) 4 813 155,15 Unrealised profit on future contracts (Notes 2,12) 807 310,57 Other interest receivable 5 538 288,31 Other assets (Notes 8, 10) 7 170 369,48 Total assets 560 425 759,63
Liabilities Amounts due to brokers (466 027,08) Unrealised loss on forward foreign exchange contracts (Notes 2, 12) (2 522 731,86) Unrealised loss on swap contracts (Notes2, 11) (35 357 053,33) Payable on redemptions (895 878,28) Other liabilities (Note 8) (5 140 276,21) Total liabilities (44 381 966,76)
Total net assets 516 043 792,87
Currency Net Asset Value per Unit Units outstanding
Class RD Units EUR 102,68 5 025 873,312
158
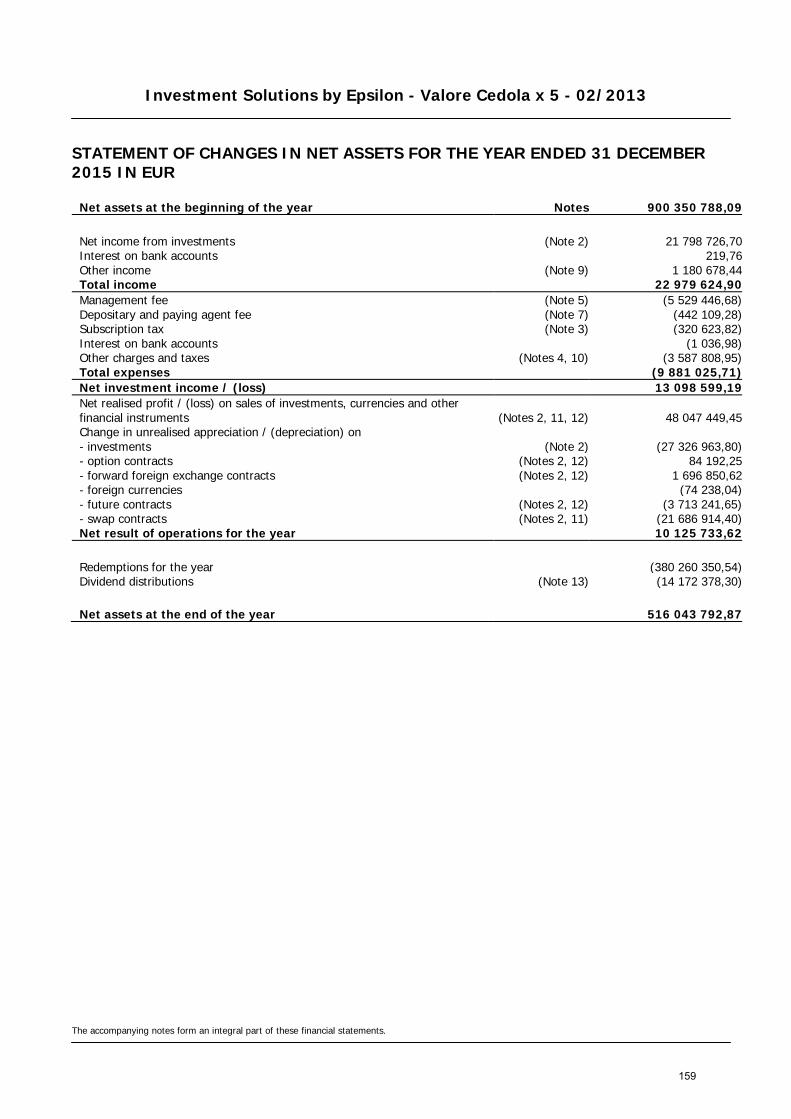
Investment Solutions by Epsilon - Valore Cedola x 5 - 02/2013
STATEMENT OF CHANGES IN NET ASSETS FOR THE YEAR ENDED 31 DECEMBER 2015 IN EUR
The accompanying notes form an integral part of these financial statements.
Net assets at the beginning of the year Notes 900 350 788,09
Net income from investments (Note 2) 21 798 726,70 Interest on bank accounts 219,76 Other income (Note 9) 1 180 678,44 Total income 22 979 624,90 Management fee (Note 5) (5 529 446,68) Depositary and paying agent fee (Note 7) (442 109,28) Subscription tax (Note 3) (320 623,82) Interest on bank accounts (1 036,98) Other charges and taxes (Notes 4, 10) (3 587 808,95) Total expenses (9 881 025,71) Net investment income / (loss) 13 098 599,19 Net realised profit / (loss) on sales of investments, currencies and other financial instruments (Notes 2, 11, 12) 48 047 449,45 Change in unrealised appreciation / (depreciation) on - investments (Note 2) (27 326 963,80) - option contracts (Notes 2, 12) 84 192,25 - forward foreign exchange contracts (Notes 2, 12) 1 696 850,62 - foreign currencies (74 238,04) - future contracts (Notes 2, 12) (3 713 241,65) - swap contracts (Notes 2, 11) (21 686 914,40) Net result of operations for the year 10 125 733,62
Redemptions for the year (380 260 350,54) Dividend distributions (Note 13) (14 172 378,30)
Net assets at the end of the year 516 043 792,87
159
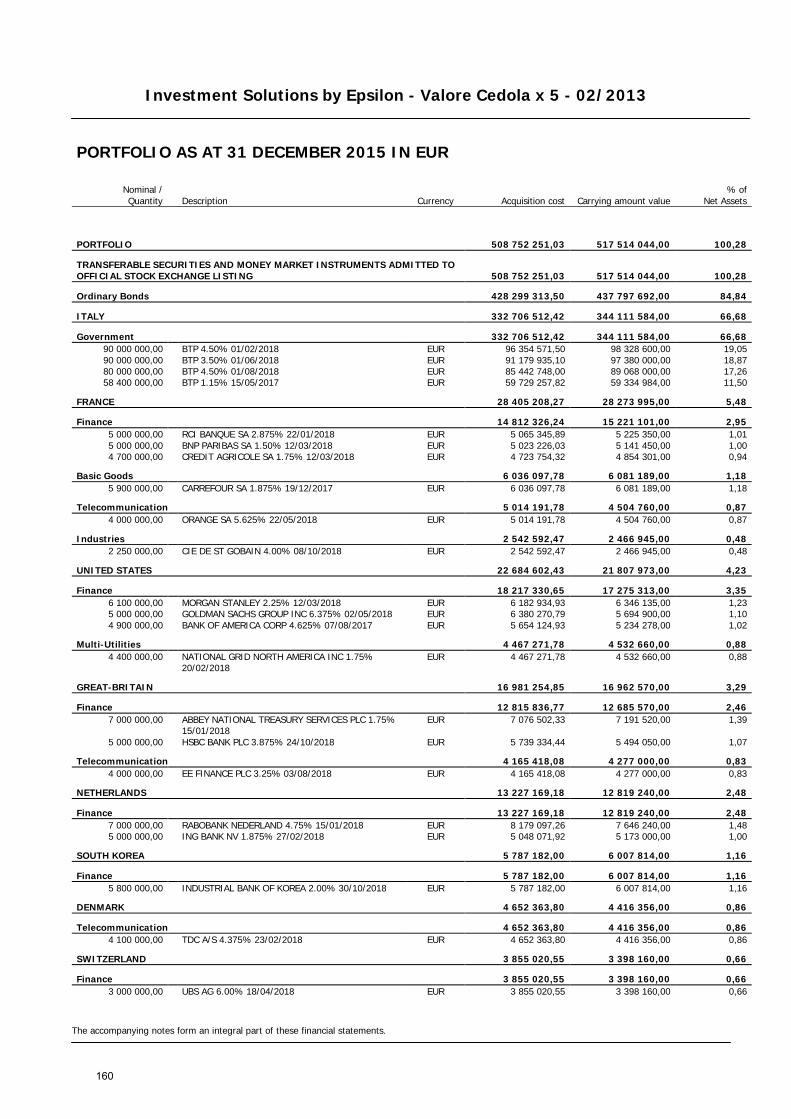
Investment Solutions by Epsilon - Valore Cedola x 5 - 02/2013
The accompanying notes form an integral part of these financial statements.
PORTFOLIO AS AT 31 DECEMBER 2015 IN EUR
Nominal / Quantity Description Currency Acquisition cost Carrying amount value
% of Net Assets
PORTFOLIO 508 752 251,03 517 514 044,00 100,28
TRANSFERABLE SECURITIES AND MONEY MARKET INSTRUMENTS ADMITTED TO OFFICIAL STOCK EXCHANGE LISTING 508 752 251,03 517 514 044,00 100,28
Ordinary Bonds 428 299 313,50 437 797 692,00 84,84
ITALY 332 706 512,42 344 111 584,00 66,68
Government 332 706 512,42 344 111 584,00 66,68 90 000 000,00 BTP 4.50% 01/02/2018 EUR 96 354 571,50 98 328 600,00 19,05 90 000 000,00 BTP 3.50% 01/06/2018 EUR 91 179 935,10 97 380 000,00 18,87 80 000 000,00 BTP 4.50% 01/08/2018 EUR 85 442 748,00 89 068 000,00 17,26 58 400 000,00 BTP 1.15% 15/05/2017 EUR 59 729 257,82 59 334 984,00 11,50
FRANCE 28 405 208,27 28 273 995,00 5,48
Finance 14 812 326,24 15 221 101,00 2,95 5 000 000,00 RCI BANQUE SA 2.875% 22/01/2018 EUR 5 065 345,89 5 225 350,00 1,01 5 000 000,00 BNP PARIBAS SA 1.50% 12/03/2018 EUR 5 023 226,03 5 141 450,00 1,00 4 700 000,00 CREDIT AGRICOLE SA 1.75% 12/03/2018 EUR 4 723 754,32 4 854 301,00 0,94
Basic Goods 6 036 097,78 6 081 189,00 1,18 5 900 000,00 CARREFOUR SA 1.875% 19/12/2017 EUR 6 036 097,78 6 081 189,00 1,18
Telecommunication 5 014 191,78 4 504 760,00 0,87 4 000 000,00 ORANGE SA 5.625% 22/05/2018 EUR 5 014 191,78 4 504 760,00 0,87
Industries 2 542 592,47 2 466 945,00 0,48 2 250 000,00 CIE DE ST GOBAIN 4.00% 08/10/2018 EUR 2 542 592,47 2 466 945,00 0,48
UNITED STATES 22 684 602,43 21 807 973,00 4,23
Finance 18 217 330,65 17 275 313,00 3,35 6 100 000,00 MORGAN STANLEY 2.25% 12/03/2018 EUR 6 182 934,93 6 346 135,00 1,23 5 000 000,00 GOLDMAN SACHS GROUP INC 6.375% 02/05/2018 EUR 6 380 270,79 5 694 900,00 1,10 4 900 000,00 BANK OF AMERICA CORP 4.625% 07/08/2017 EUR 5 654 124,93 5 234 278,00 1,02
Multi-Utilities 4 467 271,78 4 532 660,00 0,88 4 400 000,00
NATIONAL GRID NORTH AMERICA INC 1.75% 20/02/2018
EUR 4 467 271,78 4 532 660,00 0,88
GREAT-BRITAIN 16 981 254,85 16 962 570,00 3,29
Finance 12 815 836,77 12 685 570,00 2,46 7 000 000,00
ABBEY NATIONAL TREASURY SERVICES PLC 1.75% 15/01/2018
EUR 7 076 502,33 7 191 520,00 1,39
5 000 000,00 HSBC BANK PLC 3.875% 24/10/2018 EUR 5 739 334,44 5 494 050,00 1,07
Telecommunication 4 165 418,08 4 277 000,00 0,83 4 000 000,00 EE FINANCE PLC 3.25% 03/08/2018 EUR 4 165 418,08 4 277 000,00 0,83
NETHERLANDS 13 227 169,18 12 819 240,00 2,48
Finance 13 227 169,18 12 819 240,00 2,48 7 000 000,00 RABOBANK NEDERLAND 4.75% 15/01/2018 EUR 8 179 097,26 7 646 240,00 1,48 5 000 000,00 ING BANK NV 1.875% 27/02/2018 EUR 5 048 071,92 5 173 000,00 1,00
SOUTH KOREA 5 787 182,00 6 007 814,00 1,16
Finance 5 787 182,00 6 007 814,00 1,16 5 800 000,00 INDUSTRIAL BANK OF KOREA 2.00% 30/10/2018 EUR 5 787 182,00 6 007 814,00 1,16
DENMARK 4 652 363,80 4 416 356,00 0,86
Telecommunication 4 652 363,80 4 416 356,00 0,86 4 100 000,00 TDC A/S 4.375% 23/02/2018 EUR 4 652 363,80 4 416 356,00 0,86
SWITZERLAND 3 855 020,55 3 398 160,00 0,66
Finance 3 855 020,55 3 398 160,00 0,66 3 000 000,00 UBS AG 6.00% 18/04/2018 EUR 3 855 020,55 3 398 160,00 0,66
160

Investment Solutions by Epsilon - Valore Cedola x 5 - 02/2013
The accompanying notes form an integral part of these financial statements.
PORTFOLIO AS AT 31 DECEMBER 2015 IN EUR
Nominal / Quantity Description Currency Acquisition cost Carrying amount value
% of Net Assets
Floating rate notes 6 244 980,38 5 297 440,00 1,02
LUXEMBOURG 6 244 980,38 5 297 440,00 1,02
Raw materials 6 244 980,38 5 297 440,00 1,02 5 650 000,00 GLENCORE FINANCE EUROPE SA FRN 03/04/2018 EUR 6 244 980,38 5 297 440,00 1,02
Zero-Coupon Bonds 74 207 957,15 74 418 912,00 14,42
ITALY 74 207 957,15 74 418 912,00 14,42
Government 74 207 957,15 74 418 912,00 14,42 61 200 000,00 CTZ 0.00% 30/08/2017 EUR 61 031 472,00 61 214 688,00 11,86 13 200 000,00 CTZ 0.00% 27/02/2017 EUR 13 176 485,15 13 204 224,00 2,56
Total Portfolio 508 752 251,03 517 514 044,00 100,28
161
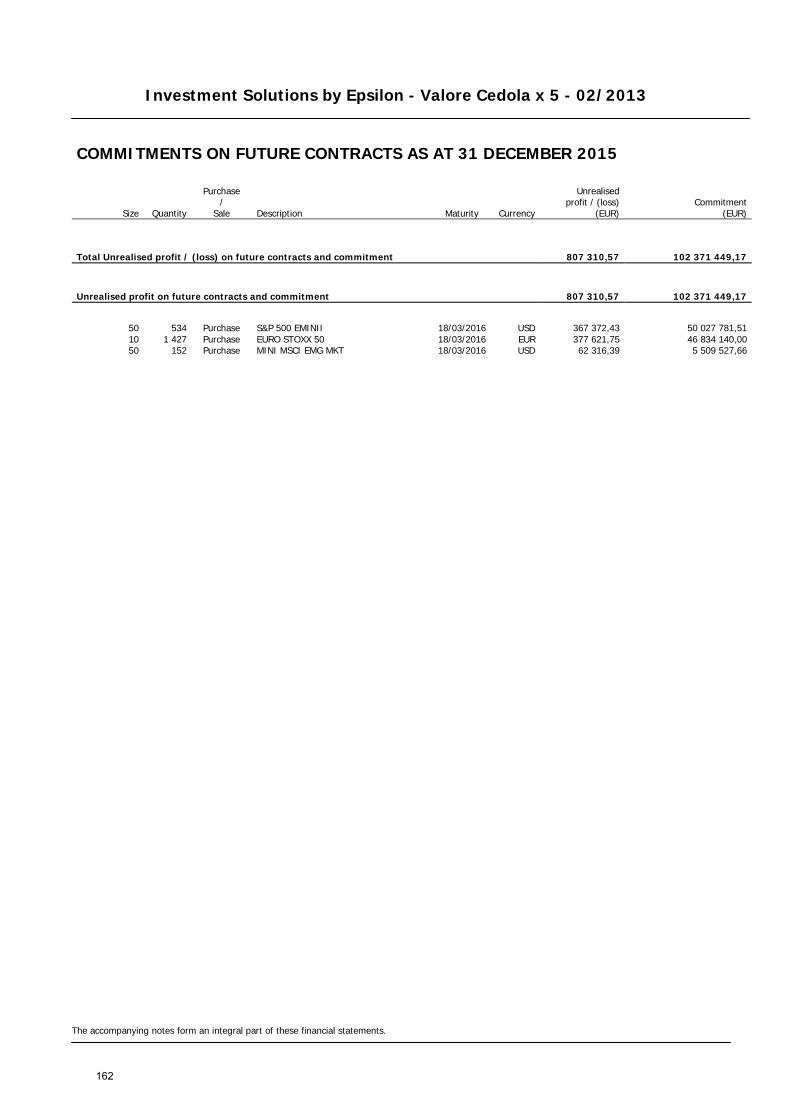
Investment Solutions by Epsilon - Valore Cedola x 5 - 02/2013
The accompanying notes form an integral part of these financial statements.
COMMITMENTS ON FUTURE CONTRACTS AS AT 31 DECEMBER 2015
Size Quantity
Purchase /
Sale Description Maturity Currency
Unrealised profit / (loss)
(EUR) Commitment
(EUR)
Total Unrealised profit / (loss) on future contracts and commitment 807 310,57 102 371 449,17
Unrealised profit on future contracts and commitment 807 310,57 102 371 449,17
50 534 Purchase S&P 500 EMINII 18/03/2016 USD 367 372,43 50 027 781,51 10 1 427 Purchase EURO STOXX 50 18/03/2016 EUR 377 621,75 46 834 140,00 50 152 Purchase MINI MSCI EMG MKT 18/03/2016 USD 62 316,39 5 509 527,66
162
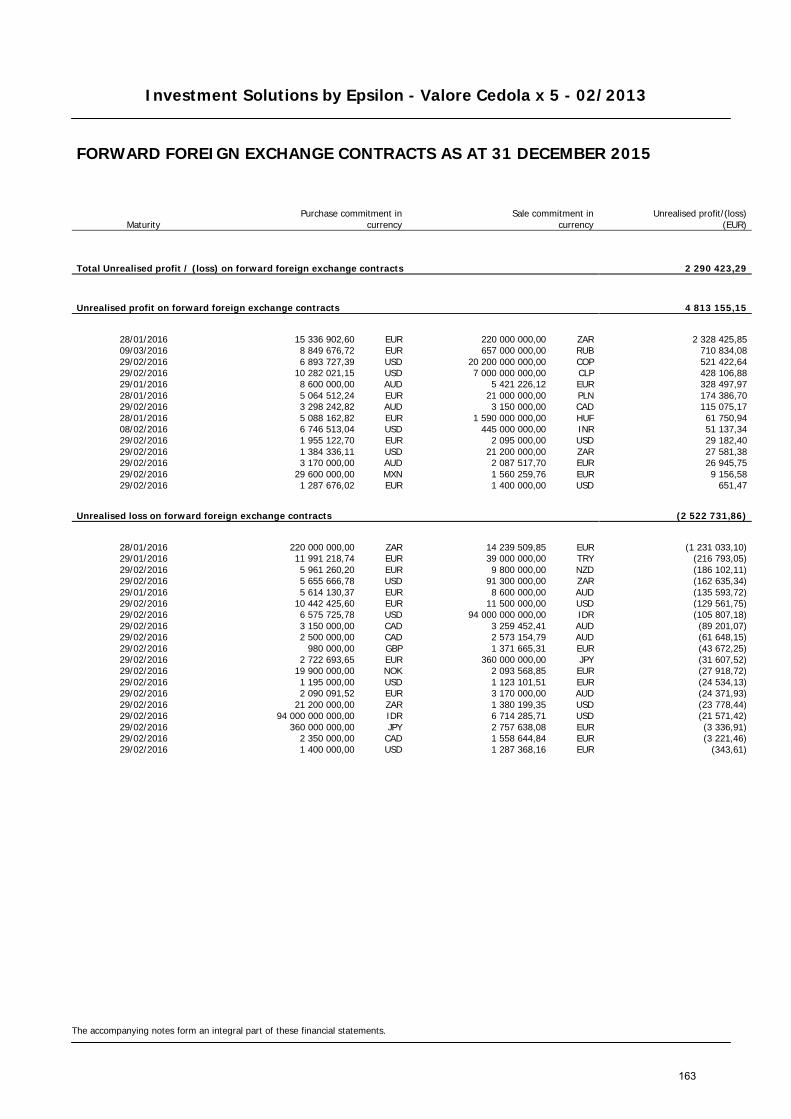
Investment Solutions by Epsilon - Valore Cedola x 5 - 02/2013
The accompanying notes form an integral part of these financial statements.
FORWARD FOREIGN EXCHANGE CONTRACTS AS AT 31 DECEMBER 2015
Maturity Purchase commitment in
currency Sale commitment in
currency
Unrealised profit/(loss) (EUR)
Total Unrealised profit / (loss) on forward foreign exchange contracts 2 290 423,29
Unrealised profit on forward foreign exchange contracts 4 813 155,15
28/01/2016 15 336 902,60 EUR 220 000 000,00 ZAR 2 328 425,85 09/03/2016 8 849 676,72 EUR 657 000 000,00 RUB 710 834,08 29/02/2016 6 893 727,39 USD 20 200 000 000,00 COP 521 422,64 29/02/2016 10 282 021,15 USD 7 000 000 000,00 CLP 428 106,88 29/01/2016 8 600 000,00 AUD 5 421 226,12 EUR 328 497,97 28/01/2016 5 064 512,24 EUR 21 000 000,00 PLN 174 386,70 29/02/2016 3 298 242,82 AUD 3 150 000,00 CAD 115 075,17 28/01/2016 5 088 162,82 EUR 1 590 000 000,00 HUF 61 750,94 08/02/2016 6 746 513,04 USD 445 000 000,00 INR 51 137,34 29/02/2016 1 955 122,70 EUR 2 095 000,00 USD 29 182,40 29/02/2016 1 384 336,11 USD 21 200 000,00 ZAR 27 581,38 29/02/2016 3 170 000,00 AUD 2 087 517,70 EUR 26 945,75 29/02/2016 29 600 000,00 MXN 1 560 259,76 EUR 9 156,58 29/02/2016 1 287 676,02 EUR 1 400 000,00 USD 651,47
Unrealised loss on forward foreign exchange contracts (2 522 731,86)
28/01/2016 220 000 000,00 ZAR 14 239 509,85 EUR (1 231 033,10) 29/01/2016 11 991 218,74 EUR 39 000 000,00 TRY (216 793,05) 29/02/2016 5 961 260,20 EUR 9 800 000,00 NZD (186 102,11) 29/02/2016 5 655 666,78 USD 91 300 000,00 ZAR (162 635,34) 29/01/2016 5 614 130,37 EUR 8 600 000,00 AUD (135 593,72) 29/02/2016 10 442 425,60 EUR 11 500 000,00 USD (129 561,75) 29/02/2016 6 575 725,78 USD 94 000 000 000,00 IDR (105 807,18) 29/02/2016 3 150 000,00 CAD 3 259 452,41 AUD (89 201,07) 29/02/2016 2 500 000,00 CAD 2 573 154,79 AUD (61 648,15) 29/02/2016 980 000,00 GBP 1 371 665,31 EUR (43 672,25) 29/02/2016 2 722 693,65 EUR 360 000 000,00 JPY (31 607,52) 29/02/2016 19 900 000,00 NOK 2 093 568,85 EUR (27 918,72) 29/02/2016 1 195 000,00 USD 1 123 101,51 EUR (24 534,13) 29/02/2016 2 090 091,52 EUR 3 170 000,00 AUD (24 371,93) 29/02/2016 21 200 000,00 ZAR 1 380 199,35 USD (23 778,44) 29/02/2016 94 000 000 000,00 IDR 6 714 285,71 USD (21 571,42) 29/02/2016 360 000 000,00 JPY 2 757 638,08 EUR (3 336,91) 29/02/2016 2 350 000,00 CAD 1 558 644,84 EUR (3 221,46) 29/02/2016 1 400 000,00 USD 1 287 368,16 EUR (343,61)
163

Investment Solutions by Epsilon - Valore Cedola x 5 - 02/2013
The accompanying notes form an integral part of these financial statements.
SWAP CONTRACTS AS AT 31 DECEMBER 2015
Counterparty Currency Notional Maturity Interest
receivable (EUR) Interest
payable (EUR)
Unrealised
profit / (loss) (EUR)
ASSET SWAP CONTRACTS — — (1 161 318,98) BANCA IMI SPA EUR 391 050 000,00 18/04/2018 — — (1 161 318,98)
CURRENCY SWAP CONTRACTS — — (34 195 734,35) BANCA IMI SPA EUR-BRL 8 200 000,00 10/04/2018 — — (3 460 703,65) BANCA IMI SPA EUR-PEN 5 200 000,00 10/04/2018 — — (896 015,12) BANCA IMI SPA EUR-IDR 8 100 000,00 10/04/2018 — — (1 793 213,96) BANCA IMI SPA EUR-NZD 13 000 000,00 10/04/2018 — — (551 957,90) BANCA IMI SPA EUR-HUF 7 800 000,00 10/04/2018 — — (275 812,60) BANCA IMI SPA EUR-TRY 10 200 000,00 10/04/2018 — — (3 148 165,23) BANCA IMI SPA EUR-NOK 5 200 000,00 10/04/2018 — — (1 034 523,62) BANCA IMI SPA EUR-MXN 18 200 000,00 10/04/2018 — — (2 788 683,36) BANCA IMI SPA EUR-INR 16 000 000,00 10/04/2018 — — (577 793,28) BANCA IMI SPA EUR-AUD 7 800 000,00 10/04/2018 — — (1 105 271,93) BANCA IMI SPA EUR-ZAR 15 800 000,00 10/04/2018 — — (5 060 072,29) BANCA IMI SPA EUR-PLN 7 800 000,00 10/04/2018 — — (165 870,58) BANCA IMI SPA EUR-CLP 13 000 000,00 10/04/2018 — — (2 618 885,10) BANCA IMI SPA EUR-COP 10 400 000,00 10/04/2018 — — (3 323 985,08) BANCA IMI SPA EUR-MYR 5 200 000,00 10/04/2018 — — (890 837,07) BANCA IMI SPA EUR-RUB 13 800 000,00 10/04/2018 — — (6 503 943,58)
164
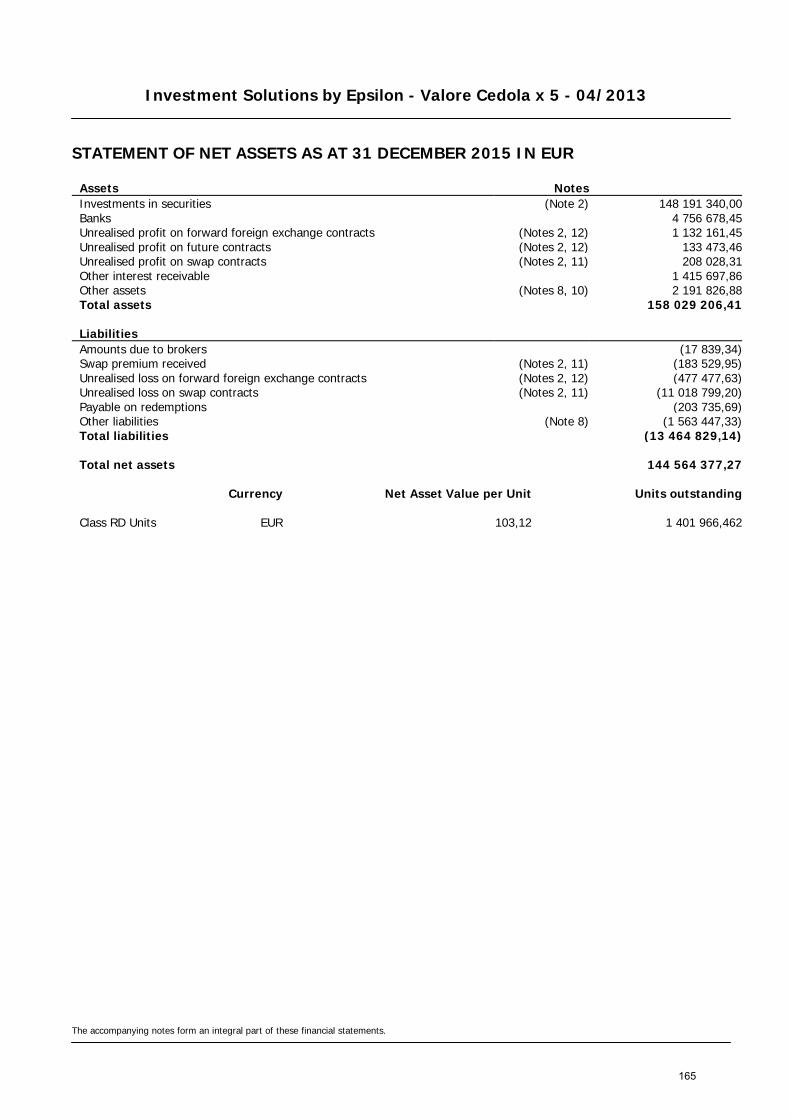
Investment Solutions by Epsilon - Valore Cedola x 5 - 04/2013
STATEMENT OF NET ASSETS AS AT 31 DECEMBER 2015 IN EUR
The accompanying notes form an integral part of these financial statements.
Assets Notes Investments in securities (Note 2) 148 191 340,00 Banks 4 756 678,45 Unrealised profit on forward foreign exchange contracts (Notes 2, 12) 1 132 161,45 Unrealised profit on future contracts (Notes 2, 12) 133 473,46 Unrealised profit on swap contracts (Notes 2, 11) 208 028,31 Other interest receivable 1 415 697,86 Other assets (Notes 8, 10) 2 191 826,88 Total assets 158 029 206,41
Liabilities Amounts due to brokers (17 839,34) Swap premium received (Notes 2, 11) (183 529,95) Unrealised loss on forward foreign exchange contracts (Notes 2, 12) (477 477,63) Unrealised loss on swap contracts (Notes 2, 11) (11 018 799,20) Payable on redemptions (203 735,69) Other liabilities (Note 8) (1 563 447,33) Total liabilities (13 464 829,14)
Total net assets 144 564 377,27
Currency Net Asset Value per Unit Units outstanding
Class RD Units EUR 103,12 1 401 966,462
165
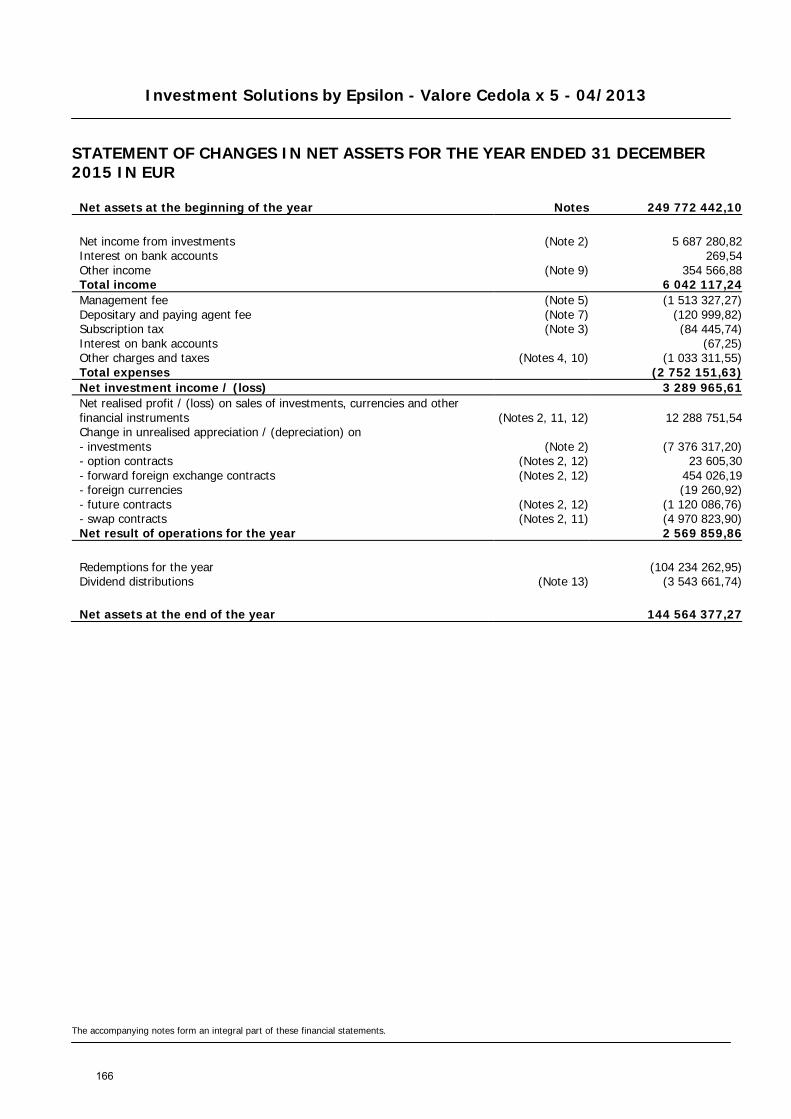
Investment Solutions by Epsilon - Valore Cedola x 5 - 04/2013
STATEMENT OF CHANGES IN NET ASSETS FOR THE YEAR ENDED 31 DECEMBER 2015 IN EUR
The accompanying notes form an integral part of these financial statements.
Net assets at the beginning of the year Notes 249 772 442,10
Net income from investments (Note 2) 5 687 280,82 Interest on bank accounts 269,54 Other income (Note 9) 354 566,88 Total income 6 042 117,24 Management fee (Note 5) (1 513 327,27) Depositary and paying agent fee (Note 7) (120 999,82) Subscription tax (Note 3) (84 445,74) Interest on bank accounts (67,25) Other charges and taxes (Notes 4, 10) (1 033 311,55) Total expenses (2 752 151,63) Net investment income / (loss) 3 289 965,61 Net realised profit / (loss) on sales of investments, currencies and other financial instruments (Notes 2, 11, 12) 12 288 751,54 Change in unrealised appreciation / (depreciation) on - investments (Note 2) (7 376 317,20) - option contracts (Notes 2, 12) 23 605,30 - forward foreign exchange contracts (Notes 2, 12) 454 026,19 - foreign currencies (19 260,92) - future contracts (Notes 2, 12) (1 120 086,76) - swap contracts (Notes 2, 11) (4 970 823,90) Net result of operations for the year 2 569 859,86
Redemptions for the year (104 234 262,95) Dividend distributions (Note 13) (3 543 661,74)
Net assets at the end of the year 144 564 377,27
166
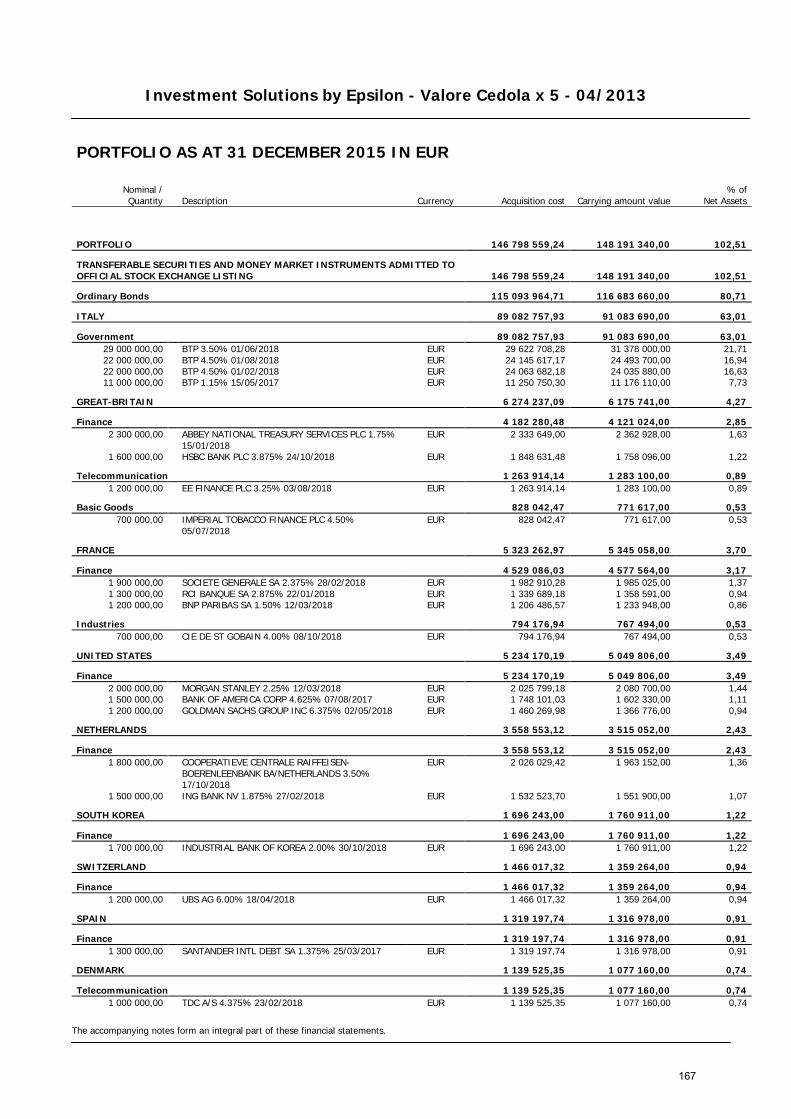
Investment Solutions by Epsilon - Valore Cedola x 5 - 04/2013
The accompanying notes form an integral part of these financial statements.
PORTFOLIO AS AT 31 DECEMBER 2015 IN EUR
Nominal / Quantity Description Currency Acquisition cost Carrying amount value
% of Net Assets
PORTFOLIO 146 798 559,24 148 191 340,00 102,51
TRANSFERABLE SECURITIES AND MONEY MARKET INSTRUMENTS ADMITTED TO OFFICIAL STOCK EXCHANGE LISTING 146 798 559,24 148 191 340,00 102,51
Ordinary Bonds 115 093 964,71 116 683 660,00 80,71
ITALY 89 082 757,93 91 083 690,00 63,01
Government 89 082 757,93 91 083 690,00 63,01 29 000 000,00 BTP 3.50% 01/06/2018 EUR 29 622 708,28 31 378 000,00 21,71 22 000 000,00 BTP 4.50% 01/08/2018 EUR 24 145 617,17 24 493 700,00 16,94 22 000 000,00 BTP 4.50% 01/02/2018 EUR 24 063 682,18 24 035 880,00 16,63 11 000 000,00 BTP 1.15% 15/05/2017 EUR 11 250 750,30 11 176 110,00 7,73
GREAT-BRITAIN 6 274 237,09 6 175 741,00 4,27
Finance 4 182 280,48 4 121 024,00 2,85 2 300 000,00
ABBEY NATIONAL TREASURY SERVICES PLC 1.75% 15/01/2018
EUR 2 333 649,00 2 362 928,00 1,63
1 600 000,00 HSBC BANK PLC 3.875% 24/10/2018 EUR 1 848 631,48 1 758 096,00 1,22
Telecommunication 1 263 914,14 1 283 100,00 0,89 1 200 000,00 EE FINANCE PLC 3.25% 03/08/2018 EUR 1 263 914,14 1 283 100,00 0,89
Basic Goods 828 042,47 771 617,00 0,53 700 000,00
IMPERIAL TOBACCO FINANCE PLC 4.50% 05/07/2018
EUR 828 042,47 771 617,00 0,53
FRANCE 5 323 262,97 5 345 058,00 3,70
Finance 4 529 086,03 4 577 564,00 3,17 1 900 000,00 SOCIETE GENERALE SA 2.375% 28/02/2018 EUR 1 982 910,28 1 985 025,00 1,37 1 300 000,00 RCI BANQUE SA 2.875% 22/01/2018 EUR 1 339 689,18 1 358 591,00 0,94 1 200 000,00 BNP PARIBAS SA 1.50% 12/03/2018 EUR 1 206 486,57 1 233 948,00 0,86
Industries 794 176,94 767 494,00 0,53 700 000,00 CIE DE ST GOBAIN 4.00% 08/10/2018 EUR 794 176,94 767 494,00 0,53
UNITED STATES 5 234 170,19 5 049 806,00 3,49
Finance 5 234 170,19 5 049 806,00 3,49 2 000 000,00 MORGAN STANLEY 2.25% 12/03/2018 EUR 2 025 799,18 2 080 700,00 1,44 1 500 000,00 BANK OF AMERICA CORP 4.625% 07/08/2017 EUR 1 748 101,03 1 602 330,00 1,11 1 200 000,00 GOLDMAN SACHS GROUP INC 6.375% 02/05/2018 EUR 1 460 269,98 1 366 776,00 0,94
NETHERLANDS 3 558 553,12 3 515 052,00 2,43
Finance 3 558 553,12 3 515 052,00 2,43 1 800 000,00
COOPERATIEVE CENTRALE RAIFFEISEN-BOERENLEENBANK BA/NETHERLANDS 3.50% 17/10/2018
EUR 2 026 029,42 1 963 152,00 1,36
1 500 000,00 ING BANK NV 1.875% 27/02/2018 EUR 1 532 523,70 1 551 900,00 1,07
SOUTH KOREA 1 696 243,00 1 760 911,00 1,22
Finance 1 696 243,00 1 760 911,00 1,22 1 700 000,00 INDUSTRIAL BANK OF KOREA 2.00% 30/10/2018 EUR 1 696 243,00 1 760 911,00 1,22
SWITZERLAND 1 466 017,32 1 359 264,00 0,94
Finance 1 466 017,32 1 359 264,00 0,94 1 200 000,00 UBS AG 6.00% 18/04/2018 EUR 1 466 017,32 1 359 264,00 0,94
SPAIN 1 319 197,74 1 316 978,00 0,91
Finance 1 319 197,74 1 316 978,00 0,91 1 300 000,00 SANTANDER INTL DEBT SA 1.375% 25/03/2017 EUR 1 319 197,74 1 316 978,00 0,91
DENMARK 1 139 525,35 1 077 160,00 0,74
Telecommunication 1 139 525,35 1 077 160,00 0,74 1 000 000,00 TDC A/S 4.375% 23/02/2018 EUR 1 139 525,35 1 077 160,00 0,74
167

Investment Solutions by Epsilon - Valore Cedola x 5 - 04/2013
The accompanying notes form an integral part of these financial statements.
PORTFOLIO AS AT 31 DECEMBER 2015 IN EUR
Nominal / Quantity Description Currency Acquisition cost Carrying amount value
% of Net Assets
Floating rate notes 1 791 546,29 1 500 160,00 1,04
LUXEMBOURG 1 791 546,29 1 500 160,00 1,04
Raw materials 1 791 546,29 1 500 160,00 1,04 1 600 000,00 GLENCORE FINANCE EUROPE SA FRN 03/04/2018 EUR 1 791 546,29 1 500 160,00 1,04
Zero-Coupon Bonds 29 913 048,24 30 007 520,00 20,76
ITALY 29 913 048,24 30 007 520,00 20,76
Government 29 913 048,24 30 007 520,00 20,76 26 000 000,00 CTZ 0.00% 30/08/2017 EUR 25 921 308,24 26 006 240,00 17,99 4 000 000,00 CTZ 0.00% 27/02/2017 EUR 3 991 740,00 4 001 280,00 2,77
Total Portfolio 146 798 559,24 148 191 340,00 102,51
168

Investment Solutions by Epsilon - Valore Cedola x 5 - 04/2013
The accompanying notes form an integral part of these financial statements.
COMMITMENTS ON FUTURE CONTRACTS AS AT 31 DECEMBER 2015
Size Quantity
Purchase /
Sale Description Maturity Currency
Unrealised profit / (loss)
(EUR) Commitment
(EUR)
Total Unrealised profit / (loss) on future contracts and commitment 133 473,46 25 920 612,57
Unrealised profit on future contracts and commitment 133 473,46 25 920 612,57
50 121 Purchase S&P 500 E MINII INDEX 18/03/2016 USD 9 467,00 11 335 883,08 10 398 Purchase EURO STOXX 50 18/03/2016 EUR 105 802,64 13 062 360,00 50 42 Purchase MINI MSCI EMG 18/03/2016 USD 18 203,82 1 522 369,49
169
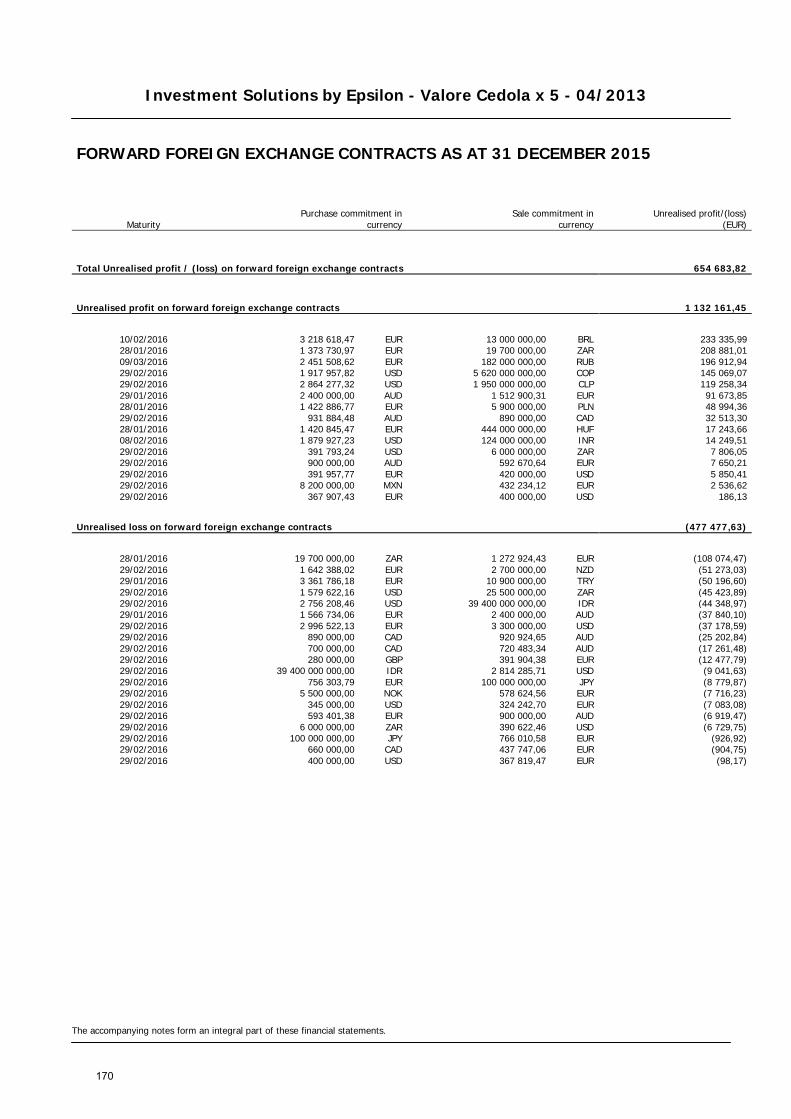
Investment Solutions by Epsilon - Valore Cedola x 5 - 04/2013
The accompanying notes form an integral part of these financial statements.
FORWARD FOREIGN EXCHANGE CONTRACTS AS AT 31 DECEMBER 2015
Maturity Purchase commitment in
currency Sale commitment in
currency
Unrealised profit/(loss) (EUR)
Total Unrealised profit / (loss) on forward foreign exchange contracts 654 683,82
Unrealised profit on forward foreign exchange contracts 1 132 161,45
10/02/2016 3 218 618,47 EUR 13 000 000,00 BRL 233 335,99 28/01/2016 1 373 730,97 EUR 19 700 000,00 ZAR 208 881,01 09/03/2016 2 451 508,62 EUR 182 000 000,00 RUB 196 912,94 29/02/2016 1 917 957,82 USD 5 620 000 000,00 COP 145 069,07 29/02/2016 2 864 277,32 USD 1 950 000 000,00 CLP 119 258,34 29/01/2016 2 400 000,00 AUD 1 512 900,31 EUR 91 673,85 28/01/2016 1 422 886,77 EUR 5 900 000,00 PLN 48 994,36 29/02/2016 931 884,48 AUD 890 000,00 CAD 32 513,30 28/01/2016 1 420 845,47 EUR 444 000 000,00 HUF 17 243,66 08/02/2016 1 879 927,23 USD 124 000 000,00 INR 14 249,51 29/02/2016 391 793,24 USD 6 000 000,00 ZAR 7 806,05 29/02/2016 900 000,00 AUD 592 670,64 EUR 7 650,21 29/02/2016 391 957,77 EUR 420 000,00 USD 5 850,41 29/02/2016 8 200 000,00 MXN 432 234,12 EUR 2 536,62 29/02/2016 367 907,43 EUR 400 000,00 USD 186,13
Unrealised loss on forward foreign exchange contracts (477 477,63)
28/01/2016 19 700 000,00 ZAR 1 272 924,43 EUR (108 074,47) 29/02/2016 1 642 388,02 EUR 2 700 000,00 NZD (51 273,03) 29/01/2016 3 361 786,18 EUR 10 900 000,00 TRY (50 196,60) 29/02/2016 1 579 622,16 USD 25 500 000,00 ZAR (45 423,89) 29/02/2016 2 756 208,46 USD 39 400 000 000,00 IDR (44 348,97) 29/01/2016 1 566 734,06 EUR 2 400 000,00 AUD (37 840,10) 29/02/2016 2 996 522,13 EUR 3 300 000,00 USD (37 178,59) 29/02/2016 890 000,00 CAD 920 924,65 AUD (25 202,84) 29/02/2016 700 000,00 CAD 720 483,34 AUD (17 261,48) 29/02/2016 280 000,00 GBP 391 904,38 EUR (12 477,79) 29/02/2016 39 400 000 000,00 IDR 2 814 285,71 USD (9 041,63) 29/02/2016 756 303,79 EUR 100 000 000,00 JPY (8 779,87) 29/02/2016 5 500 000,00 NOK 578 624,56 EUR (7 716,23) 29/02/2016 345 000,00 USD 324 242,70 EUR (7 083,08) 29/02/2016 593 401,38 EUR 900 000,00 AUD (6 919,47) 29/02/2016 6 000 000,00 ZAR 390 622,46 USD (6 729,75) 29/02/2016 100 000 000,00 JPY 766 010,58 EUR (926,92) 29/02/2016 660 000,00 CAD 437 747,06 EUR (904,75) 29/02/2016 400 000,00 USD 367 819,47 EUR (98,17)
170
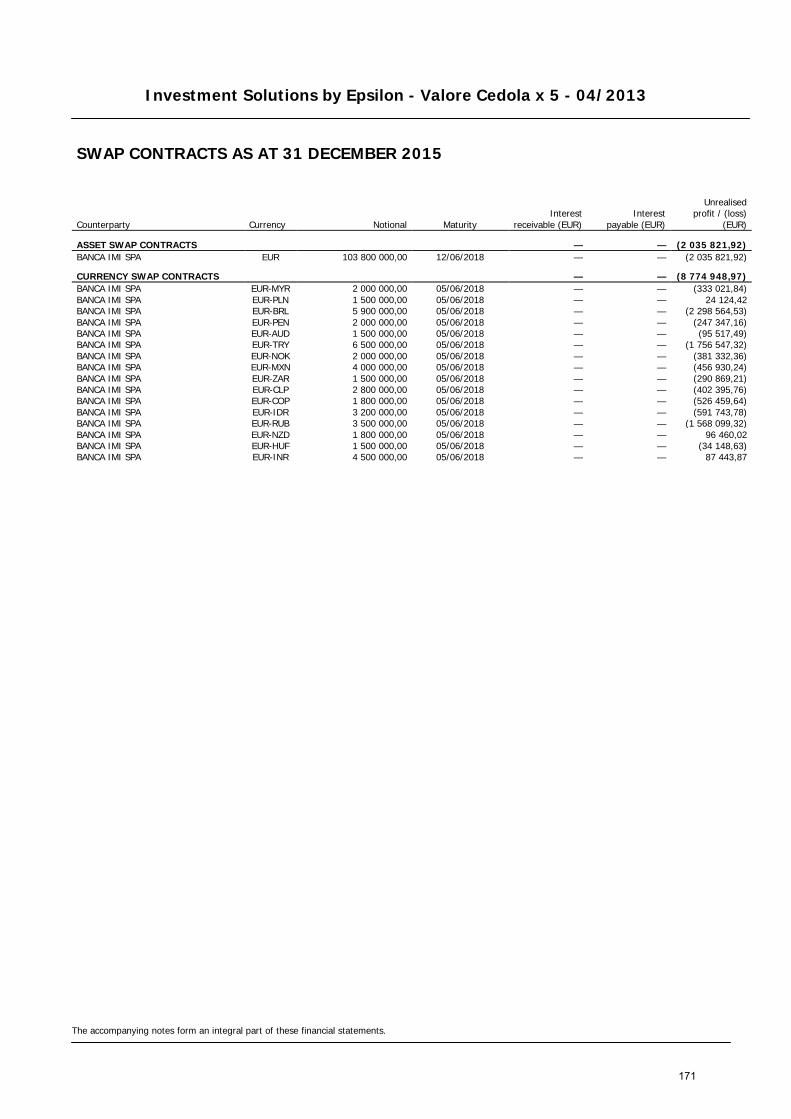
Investment Solutions by Epsilon - Valore Cedola x 5 - 04/2013
The accompanying notes form an integral part of these financial statements.
SWAP CONTRACTS AS AT 31 DECEMBER 2015
Counterparty Currency Notional Maturity Interest
receivable (EUR) Interest
payable (EUR)
Unrealised
profit / (loss) (EUR)
ASSET SWAP CONTRACTS — — (2 035 821,92) BANCA IMI SPA EUR 103 800 000,00 12/06/2018 — — (2 035 821,92)
CURRENCY SWAP CONTRACTS — — (8 774 948,97) BANCA IMI SPA EUR-MYR 2 000 000,00 05/06/2018 — — (333 021,84) BANCA IMI SPA EUR-PLN 1 500 000,00 05/06/2018 — — 24 124,42 BANCA IMI SPA EUR-BRL 5 900 000,00 05/06/2018 — — (2 298 564,53) BANCA IMI SPA EUR-PEN 2 000 000,00 05/06/2018 — — (247 347,16) BANCA IMI SPA EUR-AUD 1 500 000,00 05/06/2018 — — (95 517,49) BANCA IMI SPA EUR-TRY 6 500 000,00 05/06/2018 — — (1 756 547,32) BANCA IMI SPA EUR-NOK 2 000 000,00 05/06/2018 — — (381 332,36) BANCA IMI SPA EUR-MXN 4 000 000,00 05/06/2018 — — (456 930,24) BANCA IMI SPA EUR-ZAR 1 500 000,00 05/06/2018 — — (290 869,21) BANCA IMI SPA EUR-CLP 2 800 000,00 05/06/2018 — — (402 395,76) BANCA IMI SPA EUR-COP 1 800 000,00 05/06/2018 — — (526 459,64) BANCA IMI SPA EUR-IDR 3 200 000,00 05/06/2018 — — (591 743,78) BANCA IMI SPA EUR-RUB 3 500 000,00 05/06/2018 — — (1 568 099,32) BANCA IMI SPA EUR-NZD 1 800 000,00 05/06/2018 — — 96 460,02 BANCA IMI SPA EUR-HUF 1 500 000,00 05/06/2018 — — (34 148,63) BANCA IMI SPA EUR-INR 4 500 000,00 05/06/2018 — — 87 443,87
171

Investment Solutions by Epsilon - Valore Cedola x 5 - 06/2013
STATEMENT OF NET ASSETS AS AT 31 DECEMBER 2015 IN EUR
The accompanying notes form an integral part of these financial statements.
Assets Notes Investments in securities (Note 2) 178 641 700,50 Banks 4 878 758,18 Swap premium paid (Notes 2, 11) 217 015,94 Unrealised profit on forward foreign exchange contracts (Notes 2, 12) 1 936 651,36 Unrealised profit on future contracts (Notes 2, 12) 249 343,72 Unrealised profit on swap contracts (Notes 2, 11) 196 369,79 Other interest receivable 1 657 366,06 Other assets (Notes 8, 10) 3 098 301,18 Total assets 190 875 506,73
Liabilities Amounts due to brokers (131 665,04) Unrealised loss on forward foreign exchange contracts (Notes 2, 12) (1 133 586,11) Unrealised loss on swap contracts (Notes 2, 11) (14 184 222,49) Payable on redemptions (470 471,83) Other liabilities (Note 8) (2 300 577,29) Total liabilities (18 220 522,76)
Total net assets 172 654 983,97
Currency Net Asset Value per Unit Units outstanding
Class RD Units EUR 103,59 1 666 752,761
172
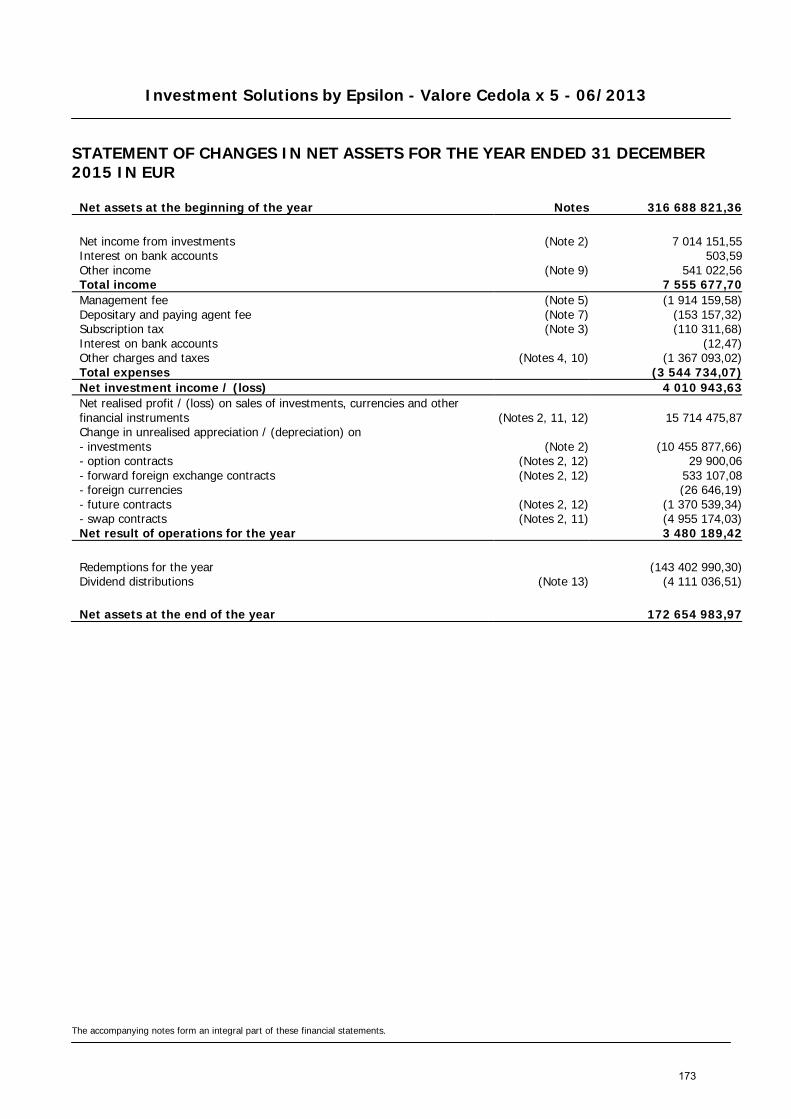
Investment Solutions by Epsilon - Valore Cedola x 5 - 06/2013
STATEMENT OF CHANGES IN NET ASSETS FOR THE YEAR ENDED 31 DECEMBER 2015 IN EUR
The accompanying notes form an integral part of these financial statements.
Net assets at the beginning of the year Notes 316 688 821,36
Net income from investments (Note 2) 7 014 151,55 Interest on bank accounts 503,59 Other income (Note 9) 541 022,56 Total income 7 555 677,70 Management fee (Note 5) (1 914 159,58) Depositary and paying agent fee (Note 7) (153 157,32) Subscription tax (Note 3) (110 311,68) Interest on bank accounts (12,47) Other charges and taxes (Notes 4, 10) (1 367 093,02) Total expenses (3 544 734,07) Net investment income / (loss) 4 010 943,63 Net realised profit / (loss) on sales of investments, currencies and other financial instruments (Notes 2, 11, 12) 15 714 475,87 Change in unrealised appreciation / (depreciation) on - investments (Note 2) (10 455 877,66) - option contracts (Notes 2, 12) 29 900,06 - forward foreign exchange contracts (Notes 2, 12) 533 107,08 - foreign currencies (26 646,19) - future contracts (Notes 2, 12) (1 370 539,34) - swap contracts (Notes 2, 11) (4 955 174,03) Net result of operations for the year 3 480 189,42
Redemptions for the year (143 402 990,30) Dividend distributions (Note 13) (4 111 036,51)
Net assets at the end of the year 172 654 983,97
173
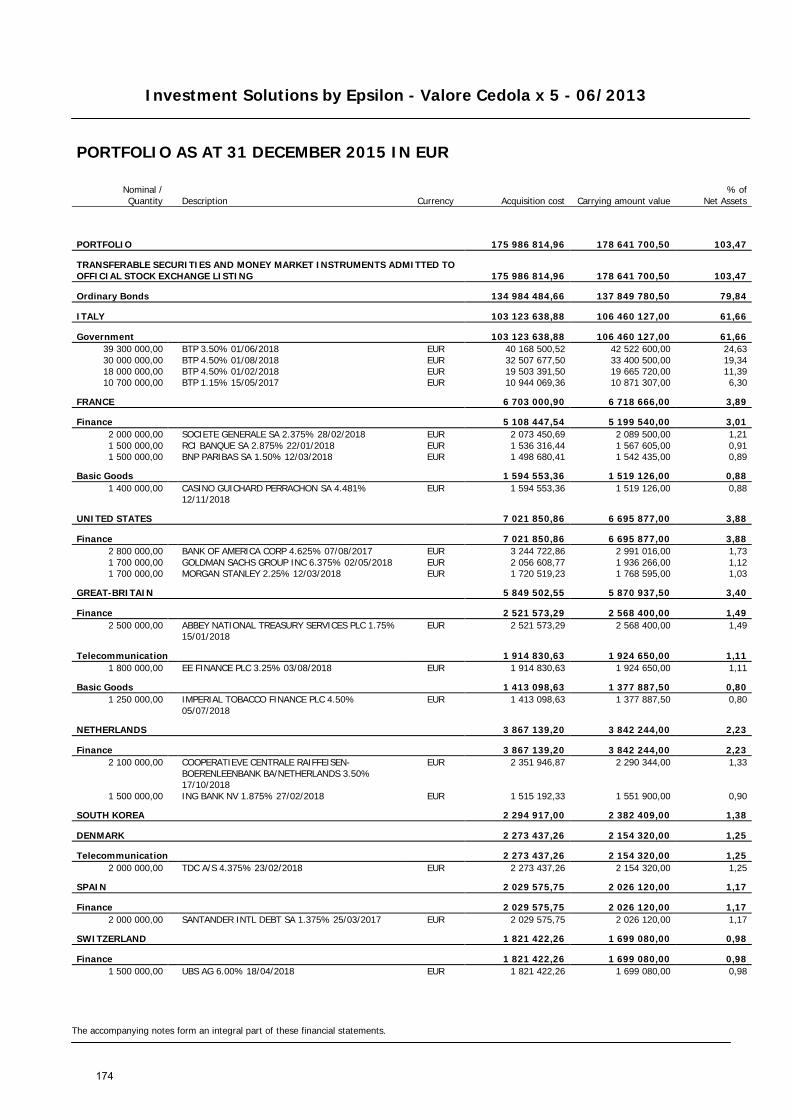
Investment Solutions by Epsilon - Valore Cedola x 5 - 06/2013
The accompanying notes form an integral part of these financial statements.
PORTFOLIO AS AT 31 DECEMBER 2015 IN EUR
Nominal / Quantity Description Currency Acquisition cost Carrying amount value
% of Net Assets
PORTFOLIO 175 986 814,96 178 641 700,50 103,47
TRANSFERABLE SECURITIES AND MONEY MARKET INSTRUMENTS ADMITTED TO OFFICIAL STOCK EXCHANGE LISTING 175 986 814,96 178 641 700,50 103,47
Ordinary Bonds 134 984 484,66 137 849 780,50 79,84
ITALY 103 123 638,88 106 460 127,00 61,66
Government 103 123 638,88 106 460 127,00 61,66 39 300 000,00 BTP 3.50% 01/06/2018 EUR 40 168 500,52 42 522 600,00 24,63 30 000 000,00 BTP 4.50% 01/08/2018 EUR 32 507 677,50 33 400 500,00 19,34 18 000 000,00 BTP 4.50% 01/02/2018 EUR 19 503 391,50 19 665 720,00 11,39 10 700 000,00 BTP 1.15% 15/05/2017 EUR 10 944 069,36 10 871 307,00 6,30
FRANCE 6 703 000,90 6 718 666,00 3,89
Finance 5 108 447,54 5 199 540,00 3,01 2 000 000,00 SOCIETE GENERALE SA 2.375% 28/02/2018 EUR 2 073 450,69 2 089 500,00 1,21 1 500 000,00 RCI BANQUE SA 2.875% 22/01/2018 EUR 1 536 316,44 1 567 605,00 0,91 1 500 000,00 BNP PARIBAS SA 1.50% 12/03/2018 EUR 1 498 680,41 1 542 435,00 0,89
Basic Goods 1 594 553,36 1 519 126,00 0,88 1 400 000,00
CASINO GUICHARD PERRACHON SA 4.481% 12/11/2018
EUR 1 594 553,36 1 519 126,00 0,88
UNITED STATES 7 021 850,86 6 695 877,00 3,88
Finance 7 021 850,86 6 695 877,00 3,88 2 800 000,00 BANK OF AMERICA CORP 4.625% 07/08/2017 EUR 3 244 722,86 2 991 016,00 1,73 1 700 000,00 GOLDMAN SACHS GROUP INC 6.375% 02/05/2018 EUR 2 056 608,77 1 936 266,00 1,12 1 700 000,00 MORGAN STANLEY 2.25% 12/03/2018 EUR 1 720 519,23 1 768 595,00 1,03
GREAT-BRITAIN 5 849 502,55 5 870 937,50 3,40
Finance 2 521 573,29 2 568 400,00 1,49 2 500 000,00
ABBEY NATIONAL TREASURY SERVICES PLC 1.75% 15/01/2018
EUR 2 521 573,29 2 568 400,00 1,49
Telecommunication 1 914 830,63 1 924 650,00 1,11 1 800 000,00 EE FINANCE PLC 3.25% 03/08/2018 EUR 1 914 830,63 1 924 650,00 1,11
Basic Goods 1 413 098,63 1 377 887,50 0,80 1 250 000,00
IMPERIAL TOBACCO FINANCE PLC 4.50% 05/07/2018
EUR 1 413 098,63 1 377 887,50 0,80
NETHERLANDS 3 867 139,20 3 842 244,00 2,23
Finance 3 867 139,20 3 842 244,00 2,23 2 100 000,00
COOPERATIEVE CENTRALE RAIFFEISEN-BOERENLEENBANK BA/NETHERLANDS 3.50% 17/10/2018
EUR 2 351 946,87 2 290 344,00 1,33
1 500 000,00 ING BANK NV 1.875% 27/02/2018 EUR 1 515 192,33 1 551 900,00 0,90
SOUTH KOREA 2 294 917,00 2 382 409,00 1,38
DENMARK 2 273 437,26 2 154 320,00 1,25
Telecommunication 2 273 437,26 2 154 320,00 1,25 2 000 000,00 TDC A/S 4.375% 23/02/2018 EUR 2 273 437,26 2 154 320,00 1,25
SPAIN 2 029 575,75 2 026 120,00 1,17
Finance 2 029 575,75 2 026 120,00 1,17 2 000 000,00 SANTANDER INTL DEBT SA 1.375% 25/03/2017 EUR 2 029 575,75 2 026 120,00 1,17
SWITZERLAND 1 821 422,26 1 699 080,00 0,98
Finance 1 821 422,26 1 699 080,00 0,98 1 500 000,00 UBS AG 6.00% 18/04/2018 EUR 1 821 422,26 1 699 080,00 0,98
174

Investment Solutions by Epsilon - Valore Cedola x 5 - 06/2013
The accompanying notes form an integral part of these financial statements.
PORTFOLIO AS AT 31 DECEMBER 2015 IN EUR
Nominal / Quantity Description Currency Acquisition cost Carrying amount value
% of Net Assets
Floating rate notes 2 100 529,99 1 781 440,00 1,03
LUXEMBOURG 2 100 529,99 1 781 440,00 1,03
Raw materials 2 100 529,99 1 781 440,00 1,03 1 900 000,00 GLENCORE FINANCE EUROPE SA FRN 03/04/2018 EUR 2 100 529,99 1 781 440,00 1,03
Zero-Coupon Bonds 38 901 800,31 39 010 480,00 22,60
ITALY 38 901 800,31 39 010 480,00 22,60
Government 38 901 800,31 39 010 480,00 22,60 25 000 000,00 CTZ 0.00% 30/08/2017 EUR 24 929 823,97 25 006 000,00 14,49 14 000 000,00 CTZ 0.00% 27/02/2017 EUR 13 971 976,34 14 004 480,00 8,11
Total Portfolio 175 986 814,96 178 641 700,50 103,47
175
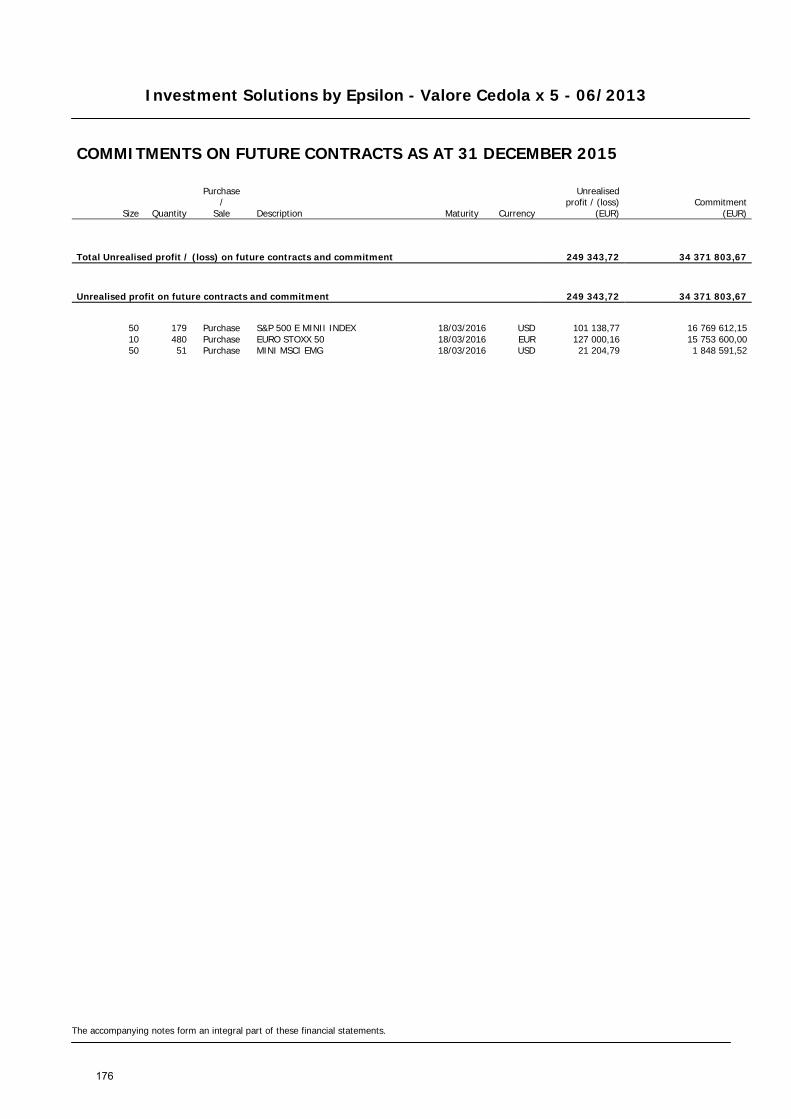
Investment Solutions by Epsilon - Valore Cedola x 5 - 06/2013
The accompanying notes form an integral part of these financial statements.
COMMITMENTS ON FUTURE CONTRACTS AS AT 31 DECEMBER 2015
Size Quantity
Purchase /
Sale Description Maturity Currency
Unrealised profit / (loss)
(EUR) Commitment
(EUR)
Total Unrealised profit / (loss) on future contracts and commitment 249 343,72 34 371 803,67
Unrealised profit on future contracts and commitment 249 343,72 34 371 803,67
50 179 Purchase S&P 500 E MINII INDEX 18/03/2016 USD 101 138,77 16 769 612,15 10 480 Purchase EURO STOXX 50 18/03/2016 EUR 127 000,16 15 753 600,00 50 51 Purchase MINI MSCI EMG 18/03/2016 USD 21 204,79 1 848 591,52
176
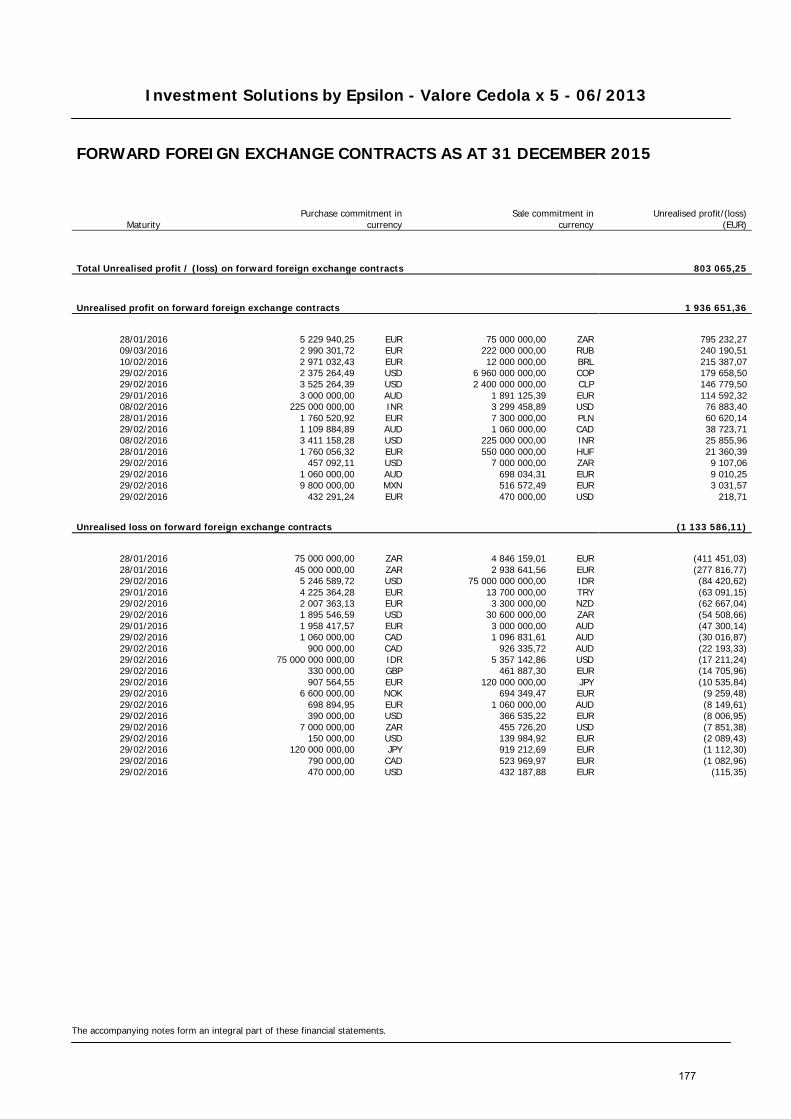
Investment Solutions by Epsilon - Valore Cedola x 5 - 06/2013
The accompanying notes form an integral part of these financial statements.
FORWARD FOREIGN EXCHANGE CONTRACTS AS AT 31 DECEMBER 2015
Maturity Purchase commitment in
currency Sale commitment in
currency
Unrealised profit/(loss) (EUR)
Total Unrealised profit / (loss) on forward foreign exchange contracts 803 065,25
Unrealised profit on forward foreign exchange contracts 1 936 651,36
28/01/2016 5 229 940,25 EUR 75 000 000,00 ZAR 795 232,27 09/03/2016 2 990 301,72 EUR 222 000 000,00 RUB 240 190,51 10/02/2016 2 971 032,43 EUR 12 000 000,00 BRL 215 387,07 29/02/2016 2 375 264,49 USD 6 960 000 000,00 COP 179 658,50 29/02/2016 3 525 264,39 USD 2 400 000 000,00 CLP 146 779,50 29/01/2016 3 000 000,00 AUD 1 891 125,39 EUR 114 592,32 08/02/2016 225 000 000,00 INR 3 299 458,89 USD 76 883,40 28/01/2016 1 760 520,92 EUR 7 300 000,00 PLN 60 620,14 29/02/2016 1 109 884,89 AUD 1 060 000,00 CAD 38 723,71 08/02/2016 3 411 158,28 USD 225 000 000,00 INR 25 855,96 28/01/2016 1 760 056,32 EUR 550 000 000,00 HUF 21 360,39 29/02/2016 457 092,11 USD 7 000 000,00 ZAR 9 107,06 29/02/2016 1 060 000,00 AUD 698 034,31 EUR 9 010,25 29/02/2016 9 800 000,00 MXN 516 572,49 EUR 3 031,57 29/02/2016 432 291,24 EUR 470 000,00 USD 218,71
Unrealised loss on forward foreign exchange contracts (1 133 586,11)
28/01/2016 75 000 000,00 ZAR 4 846 159,01 EUR (411 451,03) 28/01/2016 45 000 000,00 ZAR 2 938 641,56 EUR (277 816,77) 29/02/2016 5 246 589,72 USD 75 000 000 000,00 IDR (84 420,62) 29/01/2016 4 225 364,28 EUR 13 700 000,00 TRY (63 091,15) 29/02/2016 2 007 363,13 EUR 3 300 000,00 NZD (62 667,04) 29/02/2016 1 895 546,59 USD 30 600 000,00 ZAR (54 508,66) 29/01/2016 1 958 417,57 EUR 3 000 000,00 AUD (47 300,14) 29/02/2016 1 060 000,00 CAD 1 096 831,61 AUD (30 016,87) 29/02/2016 900 000,00 CAD 926 335,72 AUD (22 193,33) 29/02/2016 75 000 000 000,00 IDR 5 357 142,86 USD (17 211,24) 29/02/2016 330 000,00 GBP 461 887,30 EUR (14 705,96) 29/02/2016 907 564,55 EUR 120 000 000,00 JPY (10 535,84) 29/02/2016 6 600 000,00 NOK 694 349,47 EUR (9 259,48) 29/02/2016 698 894,95 EUR 1 060 000,00 AUD (8 149,61) 29/02/2016 390 000,00 USD 366 535,22 EUR (8 006,95) 29/02/2016 7 000 000,00 ZAR 455 726,20 USD (7 851,38) 29/02/2016 150 000,00 USD 139 984,92 EUR (2 089,43) 29/02/2016 120 000 000,00 JPY 919 212,69 EUR (1 112,30) 29/02/2016 790 000,00 CAD 523 969,97 EUR (1 082,96) 29/02/2016 470 000,00 USD 432 187,88 EUR (115,35)
177

Investment Solutions by Epsilon - Valore Cedola x 5 - 06/2013
The accompanying notes form an integral part of these financial statements.
SWAP CONTRACTS AS AT 31 DECEMBER 2015
Counterparty Currency Notional Maturity Interest
receivable (EUR) Interest
payable (EUR)
Unrealised
profit / (loss) (EUR)
ASSET SWAP CONTRACTS — — (3 055 342,13) BANCA IMI SPA EUR 127 550 000,00 30/07/2018 — — (3 055 342,13)
CURRENCY SWAP CONTRACTS — — (10 932 510,57) BANCA IMI SPA EUR-PLN 2 400 000,00 24/07/2018 — — 2 874,57 BANCA IMI SPA EUR-BRL 6 000 000,00 24/07/2018 — — (2 121 492,90) BANCA IMI SPA EUR-MXN 5 600 000,00 24/07/2018 — — (776 703,20) BANCA IMI SPA EUR-AUD 1 200 000,00 24/07/2018 — — (32 532,63) BANCA IMI SPA EUR-TRY 6 500 000,00 24/07/2018 — — (1 559 048,13) BANCA IMI SPA EUR-NOK 1 600 000,00 24/07/2018 — — (277 254,34) BANCA IMI SPA EUR-PEN 1 600 000,00 24/07/2018 — — (144 592,63) BANCA IMI SPA EUR-ZAR 4 200 000,00 24/07/2018 — — (1 063 783,68) BANCA IMI SPA EUR-CLP 4 000 000,00 24/07/2018 — — (584 201,08) BANCA IMI SPA EUR-COP 3 200 000,00 24/07/2018 — — (908 981,54) BANCA IMI SPA EUR-RUB 5 700 000,00 24/07/2018 — — (2 617 639,27) BANCA IMI SPA EUR-IDR 5 200 000,00 24/07/2018 — — (779 989,40) BANCA IMI SPA EUR-MYR 1 600 000,00 24/07/2018 — — (203 580,16) BANCA IMI SPA EUR-NZD 2 000 000,00 24/07/2018 — — 71 695,04 BANCA IMI SPA EUR-INR 4 210 000,00 24/07/2018 — — 121 800,18 BANCA IMI SPA EUR-HUF 2 400 000,00 24/07/2018 — — (59 081,40)
178

Investment Solutions by Epsilon - Valore Cedola x 5 - 07/2013
STATEMENT OF NET ASSETS AS AT 31 DECEMBER 2015 IN EUR
The accompanying notes form an integral part of these financial statements.
Assets Notes Investments in securities (Note 2) 236 412 534,00 Banks 10 756 423,87 Swap premium paid (Notes 2, 11) (594 935,88) Unrealised profit on forward foreign exchange contracts (Notes 2, 12) 2 044 660,37 Unrealised profit on future contracts (Notes 2, 12) 294 171,03 Unrealised profit on swap contracts (Notes 2, 11) 577 459,06 Other interest receivable 2 628 022,73 Other assets (Notes 8, 10) 4 518 322,86 Total assets 256 636 658,04
Liabilities Amounts due to brokers (118 012,41) Unrealised loss on forward foreign exchange contracts (Notes 2, 12) (871 355,41) Unrealised loss on swap contracts (Notes 2, 11) (18 591 352,08) Payable on redemptions (403 196,18) Other liabilities (Note 8) (3 294 244,76) Total liabilities (23 278 160,84)
Total net assets 233 358 497,20
Currency Net Asset Value per Units Units outstanding
Class RD Units EUR 103,38 2 257 279,386
179

Investment Solutions by Epsilon - Valore Cedola x 5 - 07/2013
STATEMENT OF CHANGES IN NET ASSETS FOR THE YEAR ENDED 31 DECEMBER 2015 IN EUR
The accompanying notes form an integral part of these financial statements.
Net assets at the beginning of the year Notes 432 752 316,66
Net income from investments (Note 2) 10 999 787,87 Interest on bank accounts 572,37 Other income (Note 9) 699 256,84 Total income 11 699 617,08 Management fee (Note 5) (2 651 150,41) Depositary and paying agent fee (Note 7) (212 131,07) Subscription tax (Note 3) (153 002,56) Interest on bank accounts (8,08) Other charges and taxes (Notes 4, 10) (1 826 420,63) Total expenses (4 842 712,75) Net investment income / (loss) 6 856 904,33 Net realised profit / (loss) on sales of investments, currencies and other financial instruments (Notes 2, 11, 12) 20 238 491,69 Change in unrealised appreciation / (depreciation) on - investments (Note 2) (14 816 068,57) - option contracts (Notes 2, 12) 40 129,02 - forward foreign exchange contracts (Notes 2, 12) 936 572,54 - foreign currencies (35 931,26) - future contracts (Notes 2, 12) (1 922 041,48) - swap contracts (Notes 2, 11) (6 304 956,47) Net result of operations for the year 4 993 099,80
Redemptions for the year (198 578 716,18) Dividend distributions (Note 13) (5 808 203,08)
Net assets at the end of the year 233 358 497,20
180
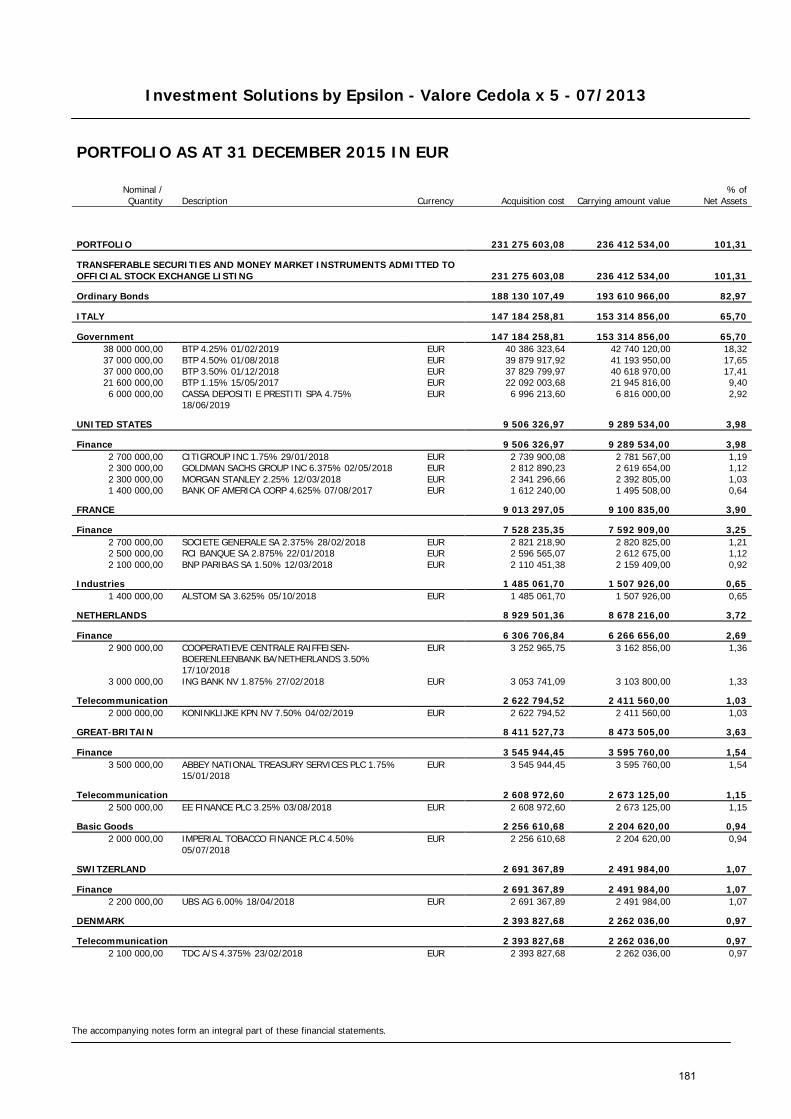
Investment Solutions by Epsilon - Valore Cedola x 5 - 07/2013
The accompanying notes form an integral part of these financial statements.
PORTFOLIO AS AT 31 DECEMBER 2015 IN EUR
Nominal / Quantity Description Currency Acquisition cost Carrying amount value
% of Net Assets
PORTFOLIO 231 275 603,08 236 412 534,00 101,31
TRANSFERABLE SECURITIES AND MONEY MARKET INSTRUMENTS ADMITTED TO OFFICIAL STOCK EXCHANGE LISTING 231 275 603,08 236 412 534,00 101,31
Ordinary Bonds 188 130 107,49 193 610 966,00 82,97
ITALY 147 184 258,81 153 314 856,00 65,70
Government 147 184 258,81 153 314 856,00 65,70 38 000 000,00 BTP 4.25% 01/02/2019 EUR 40 386 323,64 42 740 120,00 18,32 37 000 000,00 BTP 4.50% 01/08/2018 EUR 39 879 917,92 41 193 950,00 17,65 37 000 000,00 BTP 3.50% 01/12/2018 EUR 37 829 799,97 40 618 970,00 17,41 21 600 000,00 BTP 1.15% 15/05/2017 EUR 22 092 003,68 21 945 816,00 9,40 6 000 000,00
CASSA DEPOSITI E PRESTITI SPA 4.75% 18/06/2019
EUR 6 996 213,60 6 816 000,00 2,92
UNITED STATES 9 506 326,97 9 289 534,00 3,98
Finance 9 506 326,97 9 289 534,00 3,98 2 700 000,00 CITIGROUP INC 1.75% 29/01/2018 EUR 2 739 900,08 2 781 567,00 1,19 2 300 000,00 GOLDMAN SACHS GROUP INC 6.375% 02/05/2018 EUR 2 812 890,23 2 619 654,00 1,12 2 300 000,00 MORGAN STANLEY 2.25% 12/03/2018 EUR 2 341 296,66 2 392 805,00 1,03 1 400 000,00 BANK OF AMERICA CORP 4.625% 07/08/2017 EUR 1 612 240,00 1 495 508,00 0,64
FRANCE 9 013 297,05 9 100 835,00 3,90
Finance 7 528 235,35 7 592 909,00 3,25 2 700 000,00 SOCIETE GENERALE SA 2.375% 28/02/2018 EUR 2 821 218,90 2 820 825,00 1,21 2 500 000,00 RCI BANQUE SA 2.875% 22/01/2018 EUR 2 596 565,07 2 612 675,00 1,12 2 100 000,00 BNP PARIBAS SA 1.50% 12/03/2018 EUR 2 110 451,38 2 159 409,00 0,92
Industries 1 485 061,70 1 507 926,00 0,65 1 400 000,00 ALSTOM SA 3.625% 05/10/2018 EUR 1 485 061,70 1 507 926,00 0,65
NETHERLANDS 8 929 501,36 8 678 216,00 3,72
Finance 6 306 706,84 6 266 656,00 2,69 2 900 000,00
COOPERATIEVE CENTRALE RAIFFEISEN-BOERENLEENBANK BA/NETHERLANDS 3.50% 17/10/2018
EUR 3 252 965,75 3 162 856,00 1,36
3 000 000,00 ING BANK NV 1.875% 27/02/2018 EUR 3 053 741,09 3 103 800,00 1,33
Telecommunication 2 622 794,52 2 411 560,00 1,03 2 000 000,00 KONINKLIJKE KPN NV 7.50% 04/02/2019 EUR 2 622 794,52 2 411 560,00 1,03
GREAT-BRITAIN 8 411 527,73 8 473 505,00 3,63
Finance 3 545 944,45 3 595 760,00 1,54 3 500 000,00
ABBEY NATIONAL TREASURY SERVICES PLC 1.75% 15/01/2018
EUR 3 545 944,45 3 595 760,00 1,54
Telecommunication 2 608 972,60 2 673 125,00 1,15 2 500 000,00 EE FINANCE PLC 3.25% 03/08/2018 EUR 2 608 972,60 2 673 125,00 1,15
Basic Goods 2 256 610,68 2 204 620,00 0,94 2 000 000,00
IMPERIAL TOBACCO FINANCE PLC 4.50% 05/07/2018
EUR 2 256 610,68 2 204 620,00 0,94
SWITZERLAND 2 691 367,89 2 491 984,00 1,07
Finance 2 691 367,89 2 491 984,00 1,07 2 200 000,00 UBS AG 6.00% 18/04/2018 EUR 2 691 367,89 2 491 984,00 1,07
DENMARK 2 393 827,68 2 262 036,00 0,97
Telecommunication 2 393 827,68 2 262 036,00 0,97 2 100 000,00 TDC A/S 4.375% 23/02/2018 EUR 2 393 827,68 2 262 036,00 0,97
181
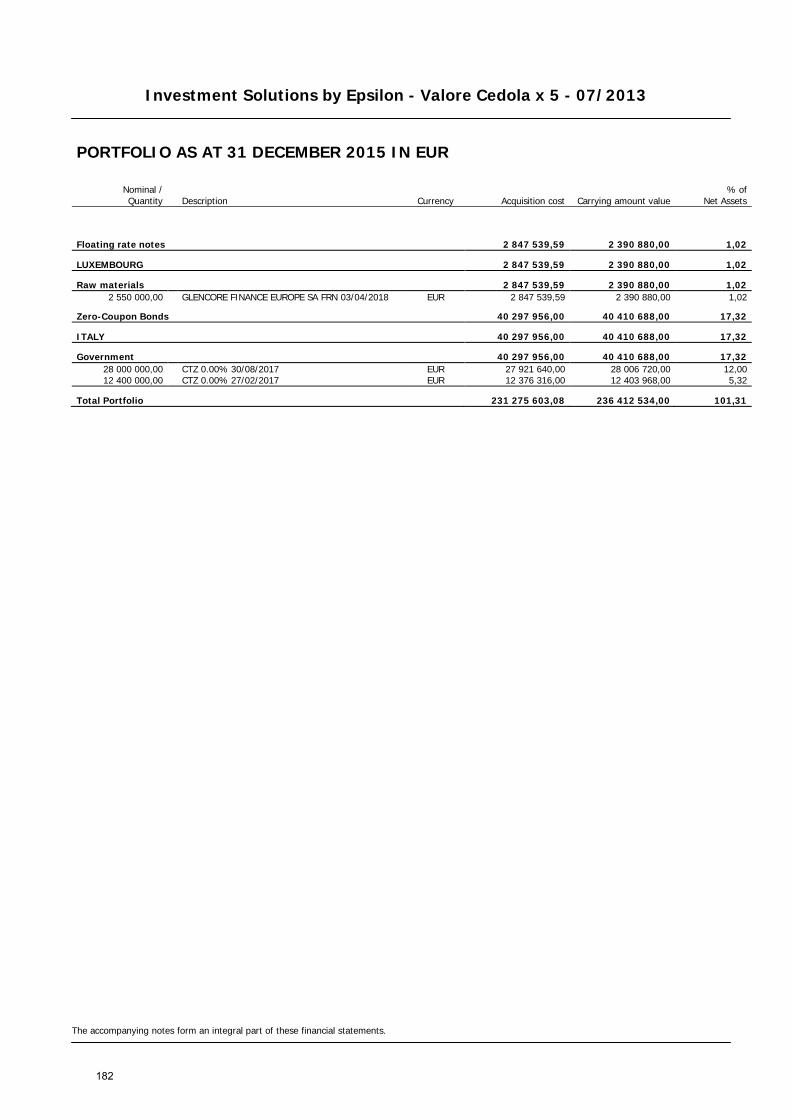
Investment Solutions by Epsilon - Valore Cedola x 5 - 07/2013
The accompanying notes form an integral part of these financial statements.
PORTFOLIO AS AT 31 DECEMBER 2015 IN EUR
Nominal / Quantity Description Currency Acquisition cost Carrying amount value
% of Net Assets
Floating rate notes 2 847 539,59 2 390 880,00 1,02
LUXEMBOURG 2 847 539,59 2 390 880,00 1,02
Raw materials 2 847 539,59 2 390 880,00 1,02 2 550 000,00 GLENCORE FINANCE EUROPE SA FRN 03/04/2018 EUR 2 847 539,59 2 390 880,00 1,02
Zero-Coupon Bonds 40 297 956,00 40 410 688,00 17,32
ITALY 40 297 956,00 40 410 688,00 17,32
Government 40 297 956,00 40 410 688,00 17,32 28 000 000,00 CTZ 0.00% 30/08/2017 EUR 27 921 640,00 28 006 720,00 12,00 12 400 000,00 CTZ 0.00% 27/02/2017 EUR 12 376 316,00 12 403 968,00 5,32
Total Portfolio 231 275 603,08 236 412 534,00 101,31
182
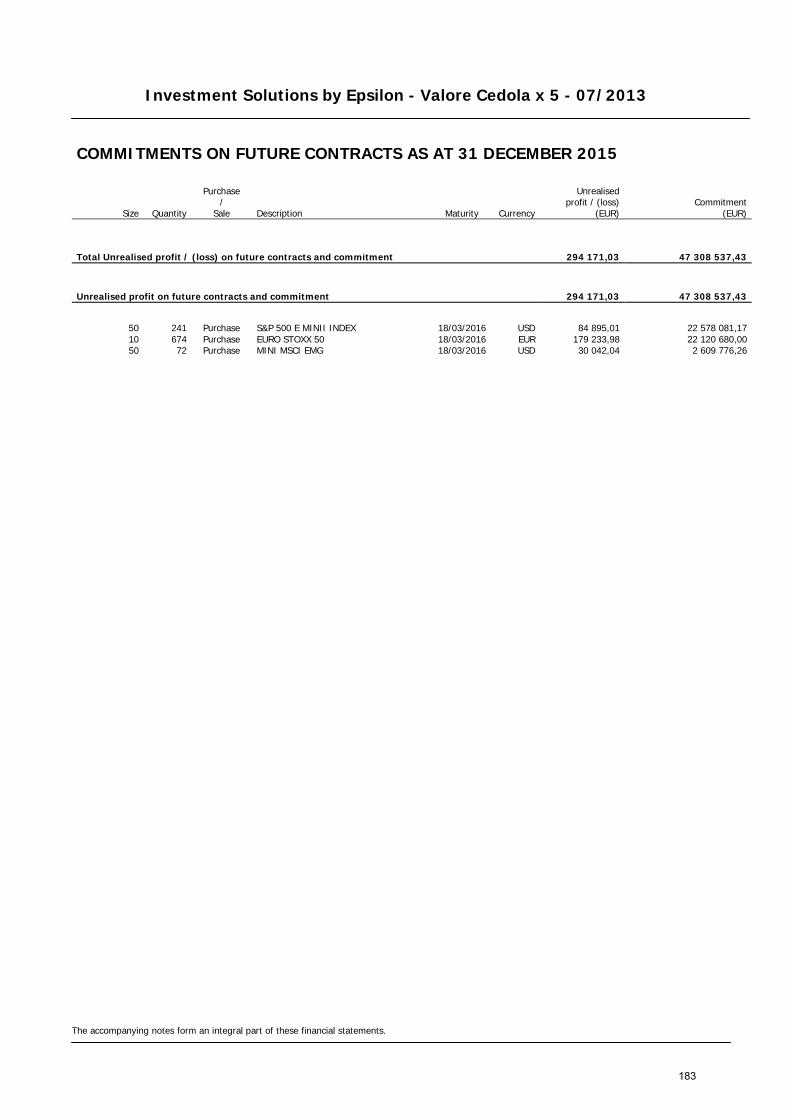
Investment Solutions by Epsilon - Valore Cedola x 5 - 07/2013
The accompanying notes form an integral part of these financial statements.
COMMITMENTS ON FUTURE CONTRACTS AS AT 31 DECEMBER 2015
Size Quantity
Purchase /
Sale Description Maturity Currency
Unrealised profit / (loss)
(EUR) Commitment
(EUR)
Total Unrealised profit / (loss) on future contracts and commitment 294 171,03 47 308 537,43
Unrealised profit on future contracts and commitment 294 171,03 47 308 537,43
50 241 Purchase S&P 500 E MINII INDEX 18/03/2016 USD 84 895,01 22 578 081,17 10 674 Purchase EURO STOXX 50 18/03/2016 EUR 179 233,98 22 120 680,00 50 72 Purchase MINI MSCI EMG 18/03/2016 USD 30 042,04 2 609 776,26
183

Investment Solutions by Epsilon - Valore Cedola x 5 - 07/2013
The accompanying notes form an integral part of these financial statements.
FORWARD FOREIGN EXCHANGE CONTRACTS AS AT 31 DECEMBER 2015
Maturity Purchase commitment in
currency Sale commitment in
currency
Unrealised profit/(loss) (EUR)
Total Unrealised profit / (loss) on forward foreign exchange contracts 1 173 304,96
Unrealised profit on forward foreign exchange contracts 2 044 660,37
28/01/2016 3 905 022,05 EUR 56 000 000,00 ZAR 593 773,42 09/03/2016 4 296 875,00 EUR 319 000 000,00 RUB 345 138,62 10/02/2016 3 713 790,54 EUR 15 000 000,00 BRL 269 233,83 29/02/2016 3 358 132,55 USD 9 840 000 000,00 COP 253 999,94 29/02/2016 4 994 124,56 USD 3 400 000 000,00 CLP 207 937,63 29/01/2016 4 200 000,00 AUD 2 647 575,55 EUR 160 429,24 28/01/2016 2 484 022,67 EUR 10 300 000,00 PLN 85 532,52 29/02/2016 1 602 003,66 AUD 1 530 000,00 CAD 55 893,66 28/01/2016 2 486 479,57 EUR 777 000 000,00 HUF 30 176,41 29/02/2016 947 231,28 EUR 1 015 000,00 USD 14 138,48 29/02/2016 1 430 000,00 AUD 941 687,79 EUR 12 155,34 29/02/2016 594 219,74 USD 9 100 000,00 ZAR 11 839,18 29/02/2016 13 300 000,00 MXN 701 062,66 EUR 4 114,28 29/02/2016 588 651,90 EUR 640 000,00 USD 297,82
Unrealised loss on forward foreign exchange contracts (871 355,41)
28/01/2016 56 000 000,00 ZAR 3 618 465,39 EUR (307 216,76) 29/02/2016 2 858 971,73 EUR 4 700 000,00 NZD (89 253,05) 29/01/2016 5 890 836,33 EUR 19 100 000,00 TRY (87 959,19) 29/02/2016 4 756 908,01 USD 68 000 000 000,00 IDR (76 541,37) 29/02/2016 2 558 368,43 USD 41 300 000,00 ZAR (73 568,89) 29/01/2016 2 741 784,60 EUR 4 200 000,00 AUD (66 220,19) 29/02/2016 1 530 000,00 CAD 1 583 162,60 AUD (43 326,24) 29/02/2016 1 200 000,00 CAD 1 235 114,30 AUD (29 591,11) 29/02/2016 440 000,00 GBP 615 849,73 EUR (19 607,95) 29/02/2016 68 000 000 000,00 IDR 4 857 142,86 USD (15 604,85) 29/02/2016 1 210 086,07 EUR 160 000 000,00 JPY (14 047,78) 29/02/2016 9 000 000,00 NOK 946 840,18 EUR (12 626,56) 29/02/2016 560 000,00 USD 526 306,98 EUR (11 497,16) 29/02/2016 942 848,85 EUR 1 430 000,00 AUD (10 994,28) 29/02/2016 9 100 000,00 ZAR 592 444,06 USD (10 206,79) 29/02/2016 160 000 000,00 JPY 1 225 616,93 EUR (1 483,08) 29/02/2016 1 060 000,00 CAD 703 048,31 EUR (1 453,08) 29/02/2016 640 000,00 USD 588 511,16 EUR (157,08)
184
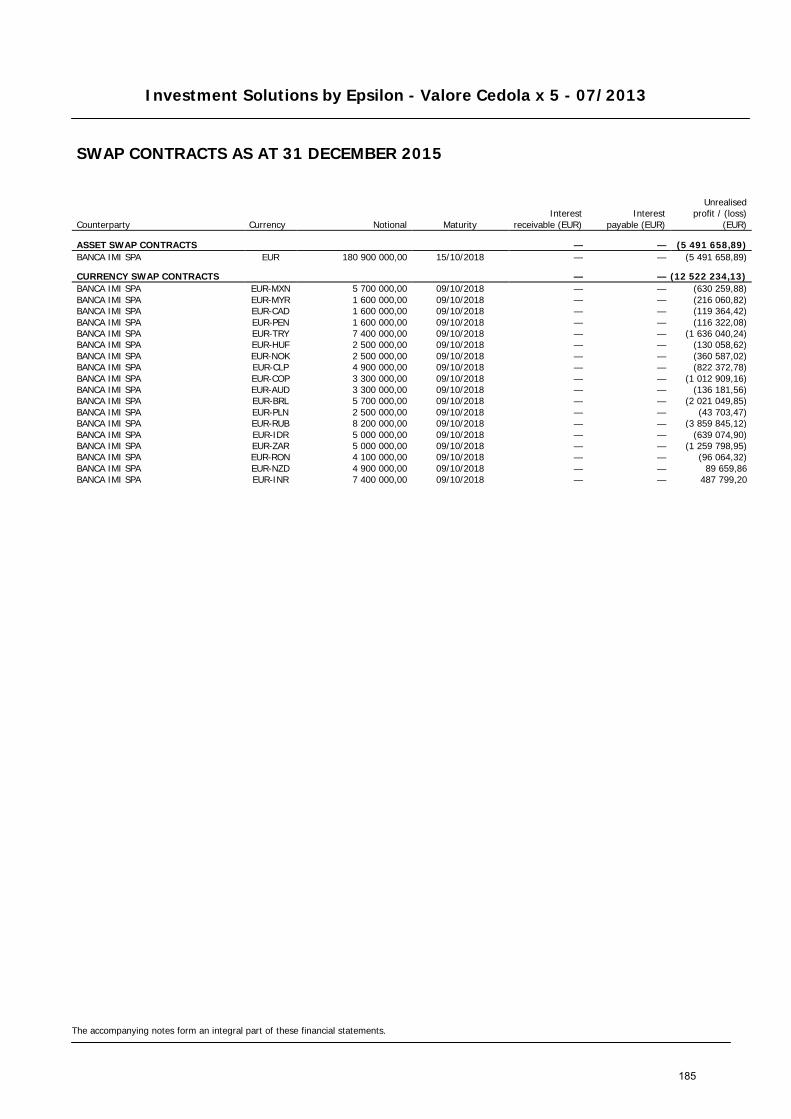
Investment Solutions by Epsilon - Valore Cedola x 5 - 07/2013
The accompanying notes form an integral part of these financial statements.
SWAP CONTRACTS AS AT 31 DECEMBER 2015
Counterparty Currency Notional Maturity Interest
receivable (EUR) Interest
payable (EUR)
Unrealised
profit / (loss) (EUR)
ASSET SWAP CONTRACTS — — (5 491 658,89) BANCA IMI SPA EUR 180 900 000,00 15/10/2018 — — (5 491 658,89)
CURRENCY SWAP CONTRACTS — — (12 522 234,13) BANCA IMI SPA EUR-MXN 5 700 000,00 09/10/2018 — — (630 259,88) BANCA IMI SPA EUR-MYR 1 600 000,00 09/10/2018 — — (216 060,82) BANCA IMI SPA EUR-CAD 1 600 000,00 09/10/2018 — — (119 364,42) BANCA IMI SPA EUR-PEN 1 600 000,00 09/10/2018 — — (116 322,08) BANCA IMI SPA EUR-TRY 7 400 000,00 09/10/2018 — — (1 636 040,24) BANCA IMI SPA EUR-HUF 2 500 000,00 09/10/2018 — — (130 058,62) BANCA IMI SPA EUR-NOK 2 500 000,00 09/10/2018 — — (360 587,02) BANCA IMI SPA EUR-CLP 4 900 000,00 09/10/2018 — — (822 372,78) BANCA IMI SPA EUR-COP 3 300 000,00 09/10/2018 — — (1 012 909,16) BANCA IMI SPA EUR-AUD 3 300 000,00 09/10/2018 — — (136 181,56) BANCA IMI SPA EUR-BRL 5 700 000,00 09/10/2018 — — (2 021 049,85) BANCA IMI SPA EUR-PLN 2 500 000,00 09/10/2018 — — (43 703,47) BANCA IMI SPA EUR-RUB 8 200 000,00 09/10/2018 — — (3 859 845,12) BANCA IMI SPA EUR-IDR 5 000 000,00 09/10/2018 — — (639 074,90) BANCA IMI SPA EUR-ZAR 5 000 000,00 09/10/2018 — — (1 259 798,95) BANCA IMI SPA EUR-RON 4 100 000,00 09/10/2018 — — (96 064,32) BANCA IMI SPA EUR-NZD 4 900 000,00 09/10/2018 — — 89 659,86 BANCA IMI SPA EUR-INR 7 400 000,00 09/10/2018 — — 487 799,20
185

Investment Solutions by Epsilon - Valore Cedola x 5 - 10/2013
STATEMENT OF NET ASSETS AS AT 31 DECEMBER 2015 IN EUR
The accompanying notes form an integral part of these financial statements.
Assets Notes Investments in securities (Note 2) 197 296 329,00 Banks 9 949 518,72 Amounts due from brokers 37 364,95 Unrealised profit on forward foreign exchange contracts (Notes 2, 12) 1 422 688,40 Unrealised profit on future contracts (Notes 2, 12) 198 554,25 Unrealised profit on swap contracts (Notes 2, 11) 348 906,84 Other interest receivable 2 162 993,99 Other assets (Notes 8, 10) 4 844 845,03 Total assets 216 261 201,18
Liabilities Swap premium received (Notes 2, 11) (216 094,97) Unrealised loss on forward foreign exchange contracts (Notes 2, 12) (1 338 848,30) Unrealised loss on swap contracts (Notes 2, 11) (4 920 790,09) Payable on redemptions (492 478,68) Other liabilities (Note 8) (7 585 494,50) Total liabilities (14 553 706,54)
Total net assets 201 707 494,64
Currency Net Asset Value per Units Units outstanding
Class RD Units EUR 105,37 1 914 194,549
186
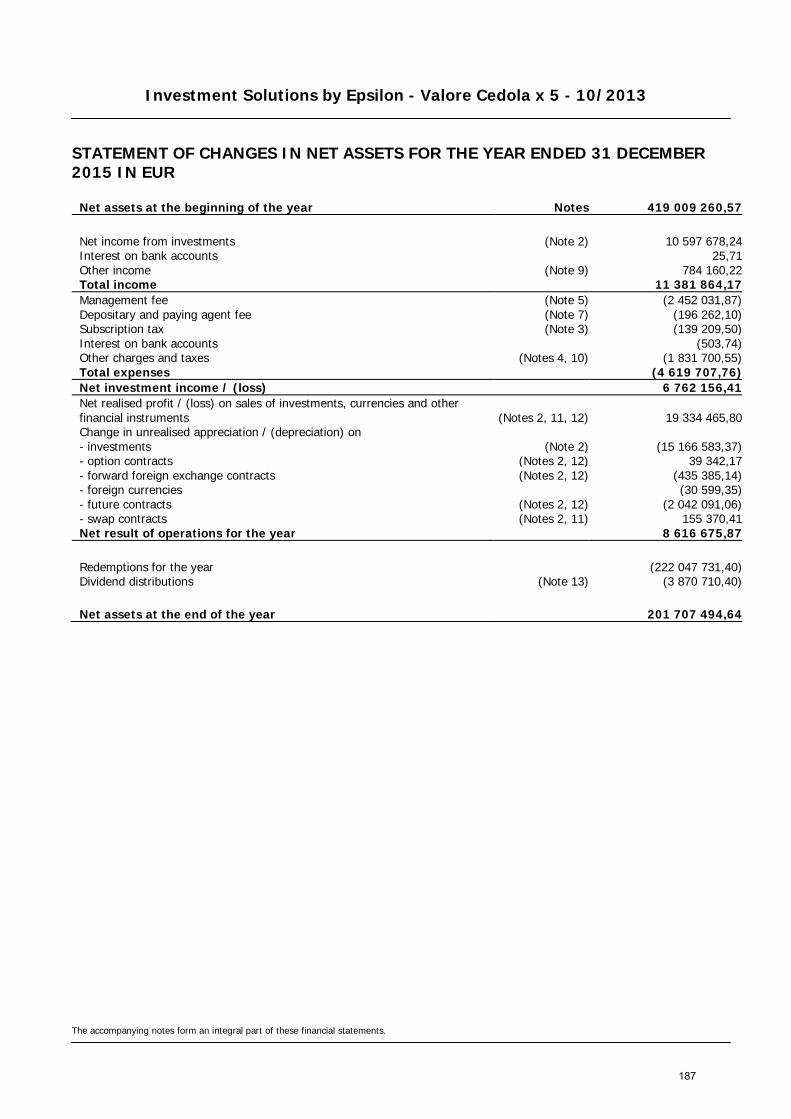
Investment Solutions by Epsilon - Valore Cedola x 5 - 10/2013
STATEMENT OF CHANGES IN NET ASSETS FOR THE YEAR ENDED 31 DECEMBER 2015 IN EUR
The accompanying notes form an integral part of these financial statements.
Net assets at the beginning of the year Notes 419 009 260,57
Net income from investments (Note 2) 10 597 678,24 Interest on bank accounts 25,71 Other income (Note 9) 784 160,22 Total income 11 381 864,17 Management fee (Note 5) (2 452 031,87) Depositary and paying agent fee (Note 7) (196 262,10) Subscription tax (Note 3) (139 209,50) Interest on bank accounts (503,74) Other charges and taxes (Notes 4, 10) (1 831 700,55) Total expenses (4 619 707,76) Net investment income / (loss) 6 762 156,41 Net realised profit / (loss) on sales of investments, currencies and other financial instruments (Notes 2, 11, 12) 19 334 465,80 Change in unrealised appreciation / (depreciation) on - investments (Note 2) (15 166 583,37) - option contracts (Notes 2, 12) 39 342,17 - forward foreign exchange contracts (Notes 2, 12) (435 385,14) - foreign currencies (30 599,35) - future contracts (Notes 2, 12) (2 042 091,06) - swap contracts (Notes 2, 11) 155 370,41 Net result of operations for the year 8 616 675,87
Redemptions for the year (222 047 731,40) Dividend distributions (Note 13) (3 870 710,40)
Net assets at the end of the year 201 707 494,64
187
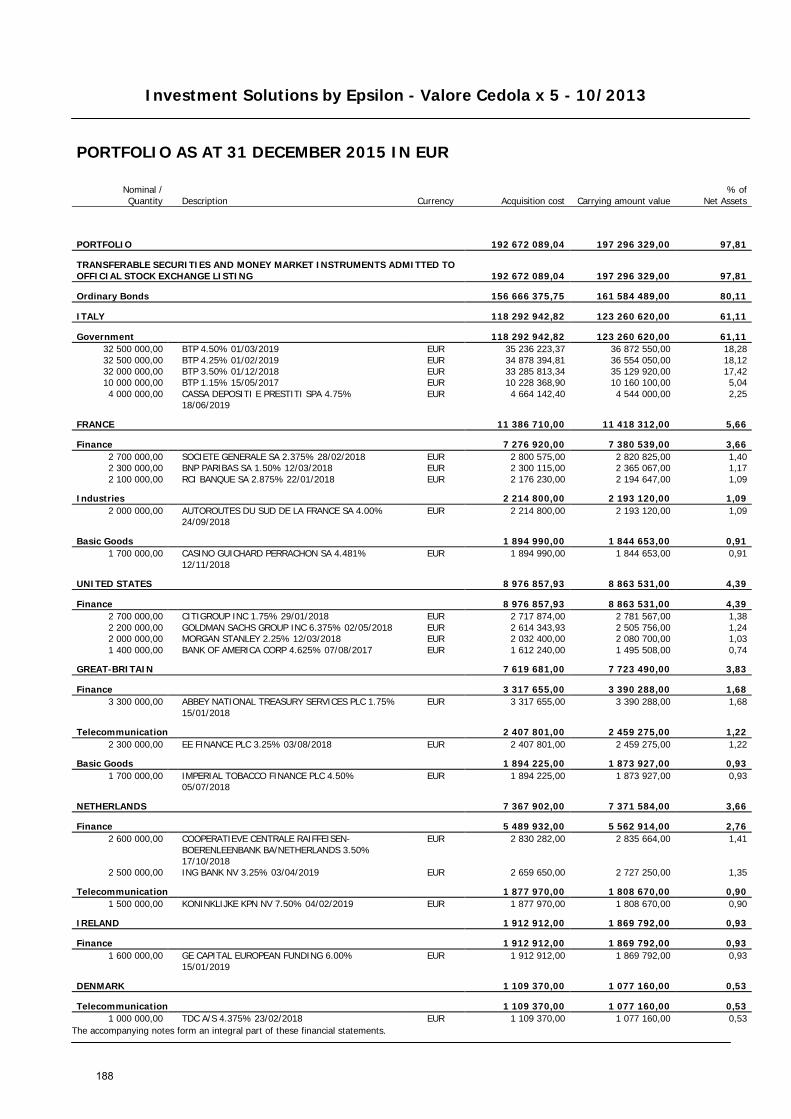
Investment Solutions by Epsilon - Valore Cedola x 5 - 10/2013
The accompanying notes form an integral part of these financial statements.
PORTFOLIO AS AT 31 DECEMBER 2015 IN EUR
Nominal / Quantity Description Currency Acquisition cost Carrying amount value
% of Net Assets
PORTFOLIO 192 672 089,04 197 296 329,00 97,81
TRANSFERABLE SECURITIES AND MONEY MARKET INSTRUMENTS ADMITTED TO OFFICIAL STOCK EXCHANGE LISTING 192 672 089,04 197 296 329,00 97,81
Ordinary Bonds 156 666 375,75 161 584 489,00 80,11
ITALY 118 292 942,82 123 260 620,00 61,11
Government 118 292 942,82 123 260 620,00 61,11 32 500 000,00 BTP 4.50% 01/03/2019 EUR 35 236 223,37 36 872 550,00 18,28 32 500 000,00 BTP 4.25% 01/02/2019 EUR 34 878 394,81 36 554 050,00 18,12 32 000 000,00 BTP 3.50% 01/12/2018 EUR 33 285 813,34 35 129 920,00 17,42 10 000 000,00 BTP 1.15% 15/05/2017 EUR 10 228 368,90 10 160 100,00 5,04 4 000 000,00
CASSA DEPOSITI E PRESTITI SPA 4.75% 18/06/2019
EUR 4 664 142,40 4 544 000,00 2,25
FRANCE 11 386 710,00 11 418 312,00 5,66
Finance 7 276 920,00 7 380 539,00 3,66 2 700 000,00 SOCIETE GENERALE SA 2.375% 28/02/2018 EUR 2 800 575,00 2 820 825,00 1,40 2 300 000,00 BNP PARIBAS SA 1.50% 12/03/2018 EUR 2 300 115,00 2 365 067,00 1,17 2 100 000,00 RCI BANQUE SA 2.875% 22/01/2018 EUR 2 176 230,00 2 194 647,00 1,09
Industries 2 214 800,00 2 193 120,00 1,09 2 000 000,00
AUTOROUTES DU SUD DE LA FRANCE SA 4.00% 24/09/2018
EUR 2 214 800,00 2 193 120,00 1,09
Basic Goods 1 894 990,00 1 844 653,00 0,91 1 700 000,00
CASINO GUICHARD PERRACHON SA 4.481% 12/11/2018
EUR 1 894 990,00 1 844 653,00 0,91
UNITED STATES 8 976 857,93 8 863 531,00 4,39
Finance 8 976 857,93 8 863 531,00 4,39 2 700 000,00 CITIGROUP INC 1.75% 29/01/2018 EUR 2 717 874,00 2 781 567,00 1,38 2 200 000,00 GOLDMAN SACHS GROUP INC 6.375% 02/05/2018 EUR 2 614 343,93 2 505 756,00 1,24 2 000 000,00 MORGAN STANLEY 2.25% 12/03/2018 EUR 2 032 400,00 2 080 700,00 1,03 1 400 000,00 BANK OF AMERICA CORP 4.625% 07/08/2017 EUR 1 612 240,00 1 495 508,00 0,74
GREAT-BRITAIN 7 619 681,00 7 723 490,00 3,83
Finance 3 317 655,00 3 390 288,00 1,68 3 300 000,00
ABBEY NATIONAL TREASURY SERVICES PLC 1.75% 15/01/2018
EUR 3 317 655,00 3 390 288,00 1,68
Telecommunication 2 407 801,00 2 459 275,00 1,22 2 300 000,00 EE FINANCE PLC 3.25% 03/08/2018 EUR 2 407 801,00 2 459 275,00 1,22
Basic Goods 1 894 225,00 1 873 927,00 0,93 1 700 000,00
IMPERIAL TOBACCO FINANCE PLC 4.50% 05/07/2018
EUR 1 894 225,00 1 873 927,00 0,93
NETHERLANDS 7 367 902,00 7 371 584,00 3,66
Finance 5 489 932,00 5 562 914,00 2,76 2 600 000,00
COOPERATIEVE CENTRALE RAIFFEISEN-BOERENLEENBANK BA/NETHERLANDS 3.50% 17/10/2018
EUR 2 830 282,00 2 835 664,00 1,41
2 500 000,00 ING BANK NV 3.25% 03/04/2019 EUR 2 659 650,00 2 727 250,00 1,35
Telecommunication 1 877 970,00 1 808 670,00 0,90 1 500 000,00 KONINKLIJKE KPN NV 7.50% 04/02/2019 EUR 1 877 970,00 1 808 670,00 0,90
IRELAND 1 912 912,00 1 869 792,00 0,93
Finance 1 912 912,00 1 869 792,00 0,93 1 600 000,00
GE CAPITAL EUROPEAN FUNDING 6.00% 15/01/2019
EUR 1 912 912,00 1 869 792,00 0,93
DENMARK 1 109 370,00 1 077 160,00 0,53
Telecommunication 1 109 370,00 1 077 160,00 0,53 1 000 000,00 TDC A/S 4.375% 23/02/2018 EUR 1 109 370,00 1 077 160,00 0,53
188

Investment Solutions by Epsilon - Valore Cedola x 5 - 10/2013
The accompanying notes form an integral part of these financial statements.
PORTFOLIO AS AT 31 DECEMBER 2015 IN EUR
Nominal / Quantity Description Currency Acquisition cost Carrying amount value
% of Net Assets
Floating rate notes 2 581 498,50 2 203 360,00 1,09
LUXEMBOURG 2 581 498,50 2 203 360,00 1,09
Raw materials 2 581 498,50 2 203 360,00 1,09 2 350 000,00 GLENCORE FINANCE EUROPE SA FRN 03/04/2018 EUR 2 581 498,50 2 203 360,00 1,09
Zero-Coupon Bonds 33 424 214,79 33 508 480,00 16,61
ITALY 33 424 214,79 33 508 480,00 16,61
Government 33 424 214,79 33 508 480,00 16,61 28 000 000,00 CTZ 0.00% 30/08/2017 EUR 27 933 637,21 28 006 720,00 13,88 5 500 000,00 CTZ 0.00% 27/02/2017 EUR 5 490 577,58 5 501 760,00 2,73
Total Portfolio 192 672 089,04 197 296 329,00 97,81
189

Investment Solutions by Epsilon - Valore Cedola x 5 - 10/2013
The accompanying notes form an integral part of these financial statements.
COMMITMENTS ON FUTURE CONTRACTS AS AT 31 DECEMBER 2015
Size Quantity
Purchase /
Sale Description Maturity Currency
Unrealised profit / (loss)
(EUR) Commitment
(EUR)
Total Unrealised profit / (loss) on future contracts and commitment 198 554,25 33 182 841,18
Unrealised profit on future contracts and commitment 198 554,25 33 182 841,18
50 115 Purchase S&P 500 E MINII INDEX 18/03/2016 USD 8 997,56 10 773 773,17 10 611 Purchase EURO STOXX 50 18/03/2016 EUR 162 283,96 20 053 020,00 50 65 Purchase MINI MSCI EMG 18/03/2016 USD 27 272,73 2 356 048,01
190
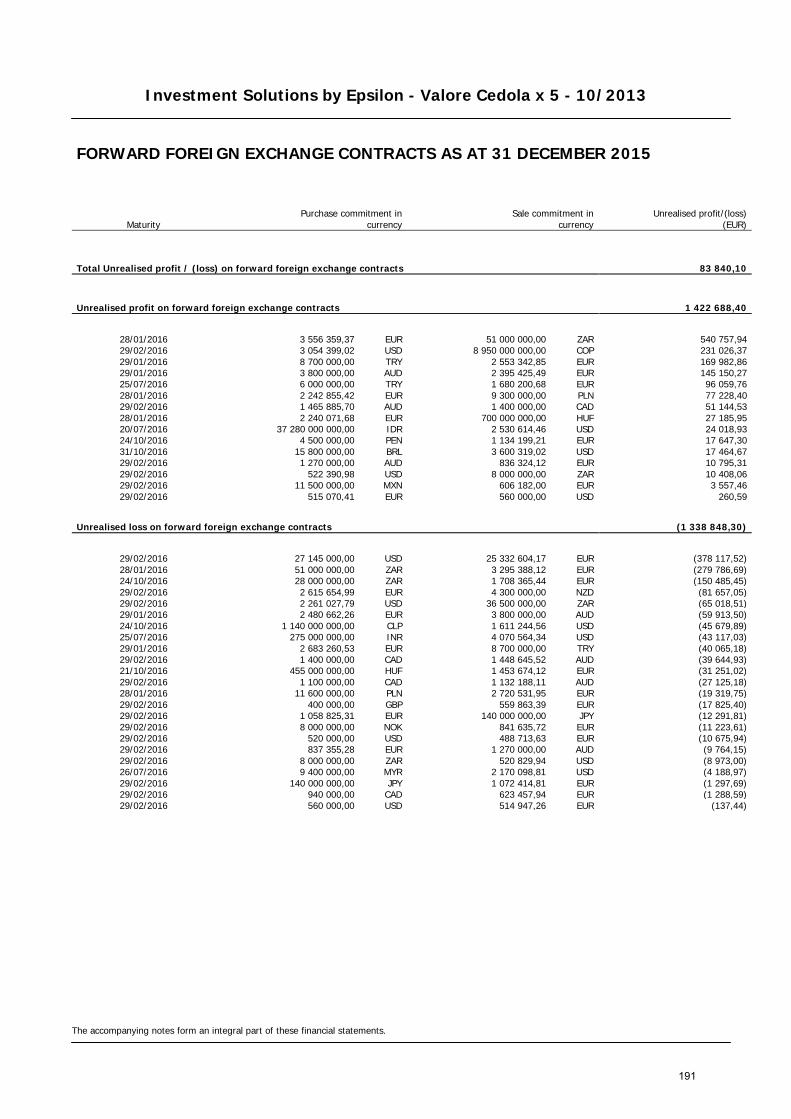
Investment Solutions by Epsilon - Valore Cedola x 5 - 10/2013
The accompanying notes form an integral part of these financial statements.
FORWARD FOREIGN EXCHANGE CONTRACTS AS AT 31 DECEMBER 2015
Maturity Purchase commitment in
currency Sale commitment in
currency
Unrealised profit/(loss) (EUR)
Total Unrealised profit / (loss) on forward foreign exchange contracts 83 840,10
Unrealised profit on forward foreign exchange contracts 1 422 688,40
28/01/2016 3 556 359,37 EUR 51 000 000,00 ZAR 540 757,94 29/02/2016 3 054 399,02 USD 8 950 000 000,00 COP 231 026,37 29/01/2016 8 700 000,00 TRY 2 553 342,85 EUR 169 982,86 29/01/2016 3 800 000,00 AUD 2 395 425,49 EUR 145 150,27 25/07/2016 6 000 000,00 TRY 1 680 200,68 EUR 96 059,76 28/01/2016 2 242 855,42 EUR 9 300 000,00 PLN 77 228,40 29/02/2016 1 465 885,70 AUD 1 400 000,00 CAD 51 144,53 28/01/2016 2 240 071,68 EUR 700 000 000,00 HUF 27 185,95 20/07/2016 37 280 000 000,00 IDR 2 530 614,46 USD 24 018,93 24/10/2016 4 500 000,00 PEN 1 134 199,21 EUR 17 647,30 31/10/2016 15 800 000,00 BRL 3 600 319,02 USD 17 464,67 29/02/2016 1 270 000,00 AUD 836 324,12 EUR 10 795,31 29/02/2016 522 390,98 USD 8 000 000,00 ZAR 10 408,06 29/02/2016 11 500 000,00 MXN 606 182,00 EUR 3 557,46 29/02/2016 515 070,41 EUR 560 000,00 USD 260,59
Unrealised loss on forward foreign exchange contracts (1 338 848,30)
29/02/2016 27 145 000,00 USD 25 332 604,17 EUR (378 117,52) 28/01/2016 51 000 000,00 ZAR 3 295 388,12 EUR (279 786,69) 24/10/2016 28 000 000,00 ZAR 1 708 365,44 EUR (150 485,45) 29/02/2016 2 615 654,99 EUR 4 300 000,00 NZD (81 657,05) 29/02/2016 2 261 027,79 USD 36 500 000,00 ZAR (65 018,51) 29/01/2016 2 480 662,26 EUR 3 800 000,00 AUD (59 913,50) 24/10/2016 1 140 000 000,00 CLP 1 611 244,56 USD (45 679,89) 25/07/2016 275 000 000,00 INR 4 070 564,34 USD (43 117,03) 29/01/2016 2 683 260,53 EUR 8 700 000,00 TRY (40 065,18) 29/02/2016 1 400 000,00 CAD 1 448 645,52 AUD (39 644,93) 21/10/2016 455 000 000,00 HUF 1 453 674,12 EUR (31 251,02) 29/02/2016 1 100 000,00 CAD 1 132 188,11 AUD (27 125,18) 28/01/2016 11 600 000,00 PLN 2 720 531,95 EUR (19 319,75) 29/02/2016 400 000,00 GBP 559 863,39 EUR (17 825,40) 29/02/2016 1 058 825,31 EUR 140 000 000,00 JPY (12 291,81) 29/02/2016 8 000 000,00 NOK 841 635,72 EUR (11 223,61) 29/02/2016 520 000,00 USD 488 713,63 EUR (10 675,94) 29/02/2016 837 355,28 EUR 1 270 000,00 AUD (9 764,15) 29/02/2016 8 000 000,00 ZAR 520 829,94 USD (8 973,00) 26/07/2016 9 400 000,00 MYR 2 170 098,81 USD (4 188,97) 29/02/2016 140 000 000,00 JPY 1 072 414,81 EUR (1 297,69) 29/02/2016 940 000,00 CAD 623 457,94 EUR (1 288,59) 29/02/2016 560 000,00 USD 514 947,26 EUR (137,44)
191

Investment Solutions by Epsilon - Valore Cedola x 5 - 10/2013
The accompanying notes form an integral part of these financial statements.
SWAP CONTRACTS AS AT 31 DECEMBER 2015
Counterparty Currency Notional Maturity Interest
receivable (EUR) Interest
payable (EUR)
Unrealised
profit / (loss) (EUR)
ASSET SWAP CONTRACTS — — (3 364 122,57) BANCA IMI SPA EUR 164 900 000,00 19/12/2018 — — (3 364 122,57)
CURRENCY SWAP CONTRACTS — — (1 207 760,68) BANCA IMI SPA EUR-NZD 4 900 000,00 07/01/2019 — — 218 235,71 BANCA IMI SPA EUR-AUD 3 300 000,00 07/01/2019 — — 130 671,13 BANCA IMI SPA EUR-NOK 3 300 000,00 07/01/2019 — — (376 828,51) BANCA IMI SPA EUR-COP 3 300 000,00 07/01/2019 — — (816 275,33) BANCA IMI SPA EUR-RON 4 100 000,00 07/01/2019 — — (10 763,12) BANCA IMI SPA EUR-MXN 6 600 000,00 07/01/2019 — — (352 800,56)
192

Investment Solutions by Epsilon - Valore Cedola x 5 - 12/2013
STATEMENT OF NET ASSETS AS AT 31 DECEMBER 2015 IN EUR
The accompanying notes form an integral part of these financial statements.
Assets Notes Investments in securities (Note 2) 369 911 203,00 Banks 20 602 756,26 Swap premium paid (Notes 2, 11) (526 912,30) Unrealised profit on forward foreign exchange contracts (Notes 2, 12) 1 803 859,64 Unrealised profit on future contracts (Notes 2, 12) 520 667,44 Unrealised profit on swap contracts (Notes 2, 11) 3 552 305,22 Other interest receivable 3 844 550,51 Other assets (Notes 8, 10) 8 016 343,48 Total assets 407 724 773,25
Liabilities Amounts due to brokers (17 474,13) Unrealised loss on forward foreign exchange contracts (Notes 2, 12) (3 706 188,00) Unrealised loss on swap contracts (Notes 2, 11) (2 129 150,01) Payable on redemptions (1 250 424,17) Other liabilities (Note 8) (5 480 516,37) Total liabilities (12 583 752,68)
Total net assets 395 141 020,57
Currency Net Asset Value per Units Units outstanding
Class RD Units EUR 105,90 3 731 308,940
193
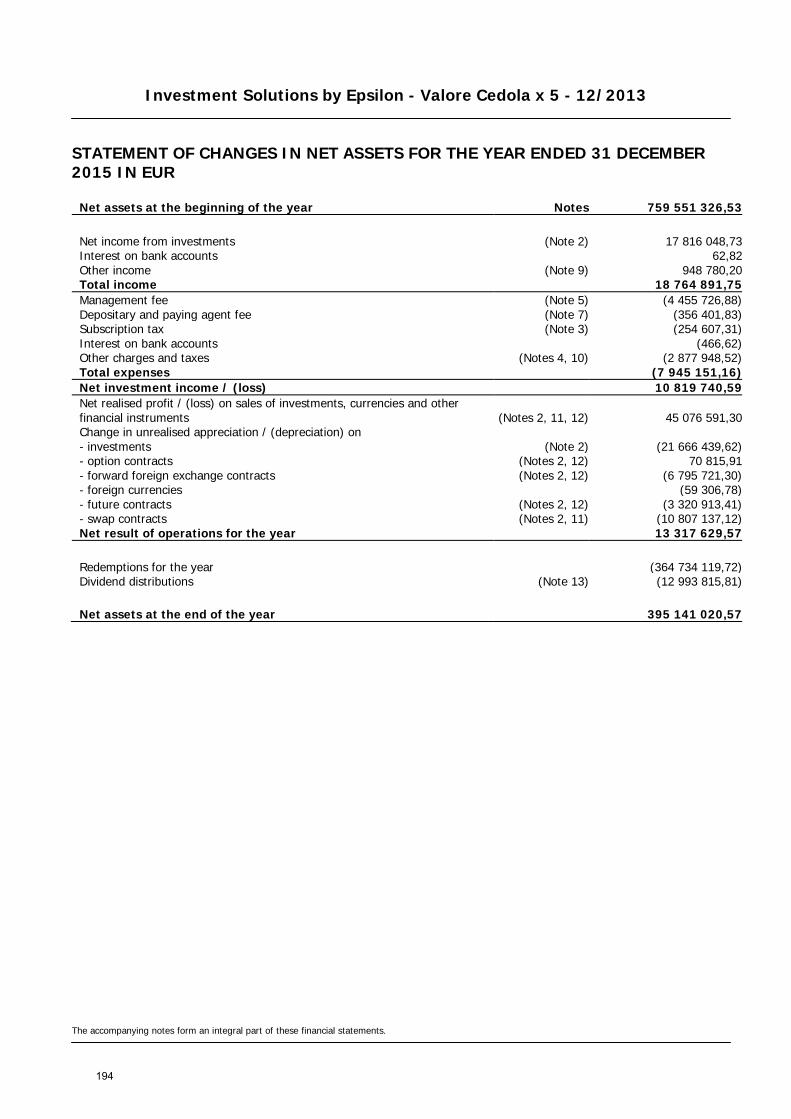
Investment Solutions by Epsilon - Valore Cedola x 5 - 12/2013
STATEMENT OF CHANGES IN NET ASSETS FOR THE YEAR ENDED 31 DECEMBER 2015 IN EUR
The accompanying notes form an integral part of these financial statements.
Net assets at the beginning of the year Notes 759 551 326,53
Net income from investments (Note 2) 17 816 048,73 Interest on bank accounts 62,82 Other income (Note 9) 948 780,20 Total income 18 764 891,75 Management fee (Note 5) (4 455 726,88) Depositary and paying agent fee (Note 7) (356 401,83) Subscription tax (Note 3) (254 607,31) Interest on bank accounts (466,62) Other charges and taxes (Notes 4, 10) (2 877 948,52) Total expenses (7 945 151,16) Net investment income / (loss) 10 819 740,59 Net realised profit / (loss) on sales of investments, currencies and other financial instruments (Notes 2, 11, 12) 45 076 591,30 Change in unrealised appreciation / (depreciation) on - investments (Note 2) (21 666 439,62) - option contracts (Notes 2, 12) 70 815,91 - forward foreign exchange contracts (Notes 2, 12) (6 795 721,30) - foreign currencies (59 306,78) - future contracts (Notes 2, 12) (3 320 913,41) - swap contracts (Notes 2, 11) (10 807 137,12) Net result of operations for the year 13 317 629,57
Redemptions for the year (364 734 119,72) Dividend distributions (Note 13) (12 993 815,81)
Net assets at the end of the year 395 141 020,57
194
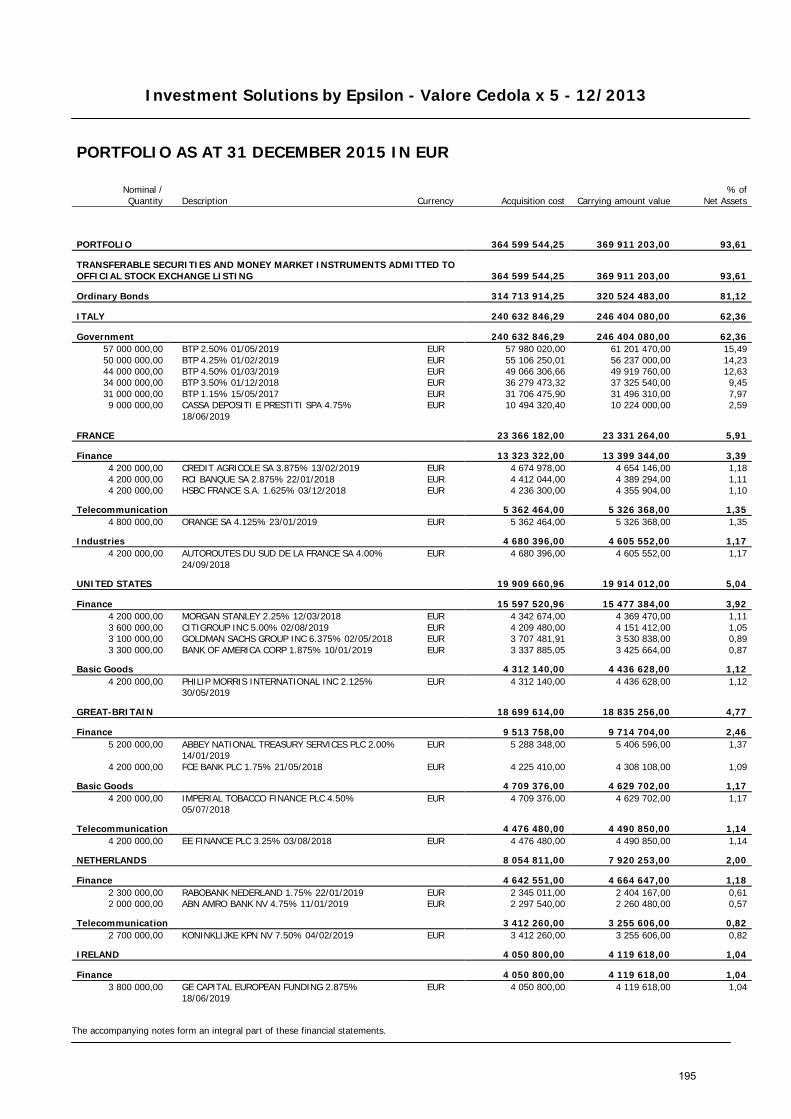
Investment Solutions by Epsilon - Valore Cedola x 5 - 12/2013
The accompanying notes form an integral part of these financial statements.
PORTFOLIO AS AT 31 DECEMBER 2015 IN EUR
Nominal / Quantity Description Currency Acquisition cost Carrying amount value
% of Net Assets
PORTFOLIO 364 599 544,25 369 911 203,00 93,61
TRANSFERABLE SECURITIES AND MONEY MARKET INSTRUMENTS ADMITTED TO OFFICIAL STOCK EXCHANGE LISTING 364 599 544,25 369 911 203,00 93,61
Ordinary Bonds 314 713 914,25 320 524 483,00 81,12
ITALY 240 632 846,29 246 404 080,00 62,36
Government 240 632 846,29 246 404 080,00 62,36 57 000 000,00 BTP 2.50% 01/05/2019 EUR 57 980 020,00 61 201 470,00 15,49 50 000 000,00 BTP 4.25% 01/02/2019 EUR 55 106 250,01 56 237 000,00 14,23 44 000 000,00 BTP 4.50% 01/03/2019 EUR 49 066 306,66 49 919 760,00 12,63 34 000 000,00 BTP 3.50% 01/12/2018 EUR 36 279 473,32 37 325 540,00 9,45 31 000 000,00 BTP 1.15% 15/05/2017 EUR 31 706 475,90 31 496 310,00 7,97 9 000 000,00
CASSA DEPOSITI E PRESTITI SPA 4.75% 18/06/2019
EUR 10 494 320,40 10 224 000,00 2,59
FRANCE 23 366 182,00 23 331 264,00 5,91
Finance 13 323 322,00 13 399 344,00 3,39 4 200 000,00 CREDIT AGRICOLE SA 3.875% 13/02/2019 EUR 4 674 978,00 4 654 146,00 1,18 4 200 000,00 RCI BANQUE SA 2.875% 22/01/2018 EUR 4 412 044,00 4 389 294,00 1,11 4 200 000,00 HSBC FRANCE S.A. 1.625% 03/12/2018 EUR 4 236 300,00 4 355 904,00 1,10
Telecommunication 5 362 464,00 5 326 368,00 1,35 4 800 000,00 ORANGE SA 4.125% 23/01/2019 EUR 5 362 464,00 5 326 368,00 1,35
Industries 4 680 396,00 4 605 552,00 1,17 4 200 000,00
AUTOROUTES DU SUD DE LA FRANCE SA 4.00% 24/09/2018
EUR 4 680 396,00 4 605 552,00 1,17
UNITED STATES 19 909 660,96 19 914 012,00 5,04
Finance 15 597 520,96 15 477 384,00 3,92 4 200 000,00 MORGAN STANLEY 2.25% 12/03/2018 EUR 4 342 674,00 4 369 470,00 1,11 3 600 000,00 CITIGROUP INC 5.00% 02/08/2019 EUR 4 209 480,00 4 151 412,00 1,05 3 100 000,00 GOLDMAN SACHS GROUP INC 6.375% 02/05/2018 EUR 3 707 481,91 3 530 838,00 0,89 3 300 000,00 BANK OF AMERICA CORP 1.875% 10/01/2019 EUR 3 337 885,05 3 425 664,00 0,87
Basic Goods 4 312 140,00 4 436 628,00 1,12 4 200 000,00
PHILIP MORRIS INTERNATIONAL INC 2.125% 30/05/2019
EUR 4 312 140,00 4 436 628,00 1,12
GREAT-BRITAIN 18 699 614,00 18 835 256,00 4,77
Finance 9 513 758,00 9 714 704,00 2,46 5 200 000,00
ABBEY NATIONAL TREASURY SERVICES PLC 2.00% 14/01/2019
EUR 5 288 348,00 5 406 596,00 1,37
4 200 000,00 FCE BANK PLC 1.75% 21/05/2018 EUR 4 225 410,00 4 308 108,00 1,09
Basic Goods 4 709 376,00 4 629 702,00 1,17 4 200 000,00
IMPERIAL TOBACCO FINANCE PLC 4.50% 05/07/2018
EUR 4 709 376,00 4 629 702,00 1,17
Telecommunication 4 476 480,00 4 490 850,00 1,14 4 200 000,00 EE FINANCE PLC 3.25% 03/08/2018 EUR 4 476 480,00 4 490 850,00 1,14
NETHERLANDS 8 054 811,00 7 920 253,00 2,00
Finance 4 642 551,00 4 664 647,00 1,18 2 300 000,00 RABOBANK NEDERLAND 1.75% 22/01/2019 EUR 2 345 011,00 2 404 167,00 0,61 2 000 000,00 ABN AMRO BANK NV 4.75% 11/01/2019 EUR 2 297 540,00 2 260 480,00 0,57
Telecommunication 3 412 260,00 3 255 606,00 0,82 2 700 000,00 KONINKLIJKE KPN NV 7.50% 04/02/2019 EUR 3 412 260,00 3 255 606,00 0,82
IRELAND 4 050 800,00 4 119 618,00 1,04
Finance 4 050 800,00 4 119 618,00 1,04 3 800 000,00
GE CAPITAL EUROPEAN FUNDING 2.875% 18/06/2019
EUR 4 050 800,00 4 119 618,00 1,04
195
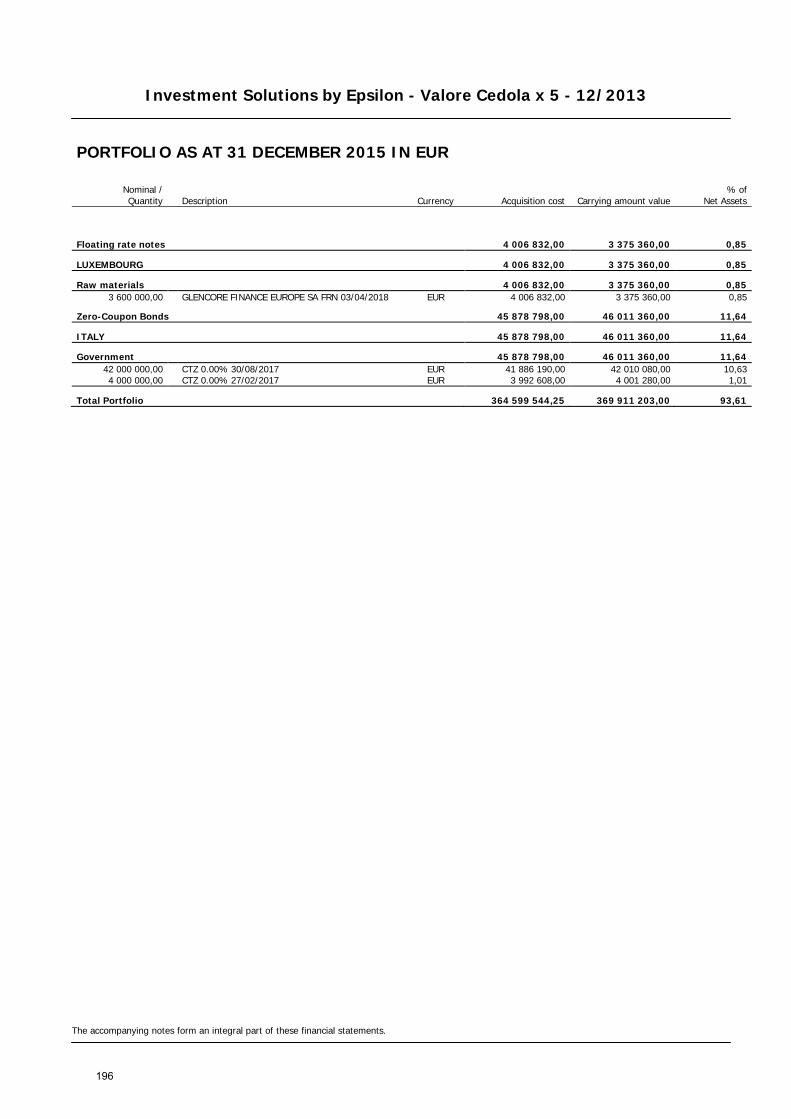
Investment Solutions by Epsilon - Valore Cedola x 5 - 12/2013
The accompanying notes form an integral part of these financial statements.
PORTFOLIO AS AT 31 DECEMBER 2015 IN EUR
Nominal / Quantity Description Currency Acquisition cost Carrying amount value
% of Net Assets
Floating rate notes 4 006 832,00 3 375 360,00 0,85
LUXEMBOURG 4 006 832,00 3 375 360,00 0,85
Raw materials 4 006 832,00 3 375 360,00 0,85 3 600 000,00 GLENCORE FINANCE EUROPE SA FRN 03/04/2018 EUR 4 006 832,00 3 375 360,00 0,85
Zero-Coupon Bonds 45 878 798,00 46 011 360,00 11,64
ITALY 45 878 798,00 46 011 360,00 11,64
Government 45 878 798,00 46 011 360,00 11,64 42 000 000,00 CTZ 0.00% 30/08/2017 EUR 41 886 190,00 42 010 080,00 10,63 4 000 000,00 CTZ 0.00% 27/02/2017 EUR 3 992 608,00 4 001 280,00 1,01
Total Portfolio 364 599 544,25 369 911 203,00 93,61
196
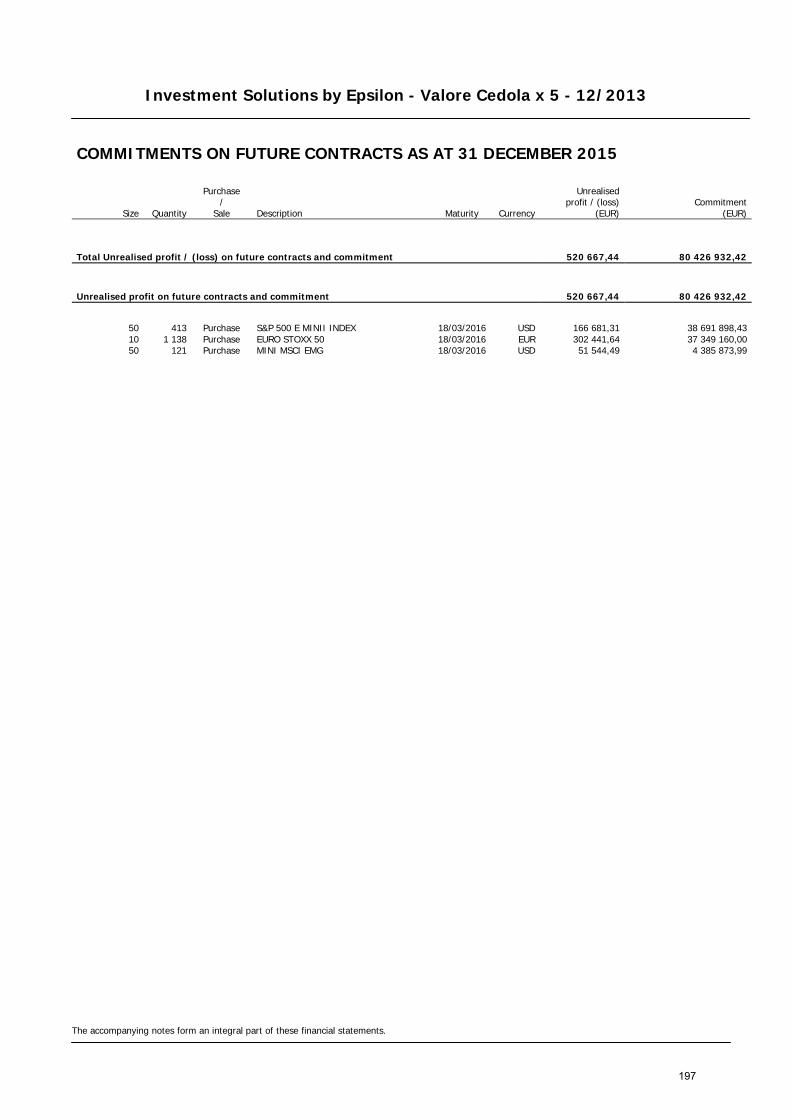
Investment Solutions by Epsilon - Valore Cedola x 5 - 12/2013
The accompanying notes form an integral part of these financial statements.
COMMITMENTS ON FUTURE CONTRACTS AS AT 31 DECEMBER 2015
Size Quantity
Purchase /
Sale Description Maturity Currency
Unrealised profit / (loss)
(EUR) Commitment
(EUR)
Total Unrealised profit / (loss) on future contracts and commitment 520 667,44 80 426 932,42
Unrealised profit on future contracts and commitment 520 667,44 80 426 932,42
50 413 Purchase S&P 500 E MINII INDEX 18/03/2016 USD 166 681,31 38 691 898,43 10 1 138 Purchase EURO STOXX 50 18/03/2016 EUR 302 441,64 37 349 160,00 50 121 Purchase MINI MSCI EMG 18/03/2016 USD 51 544,49 4 385 873,99
197
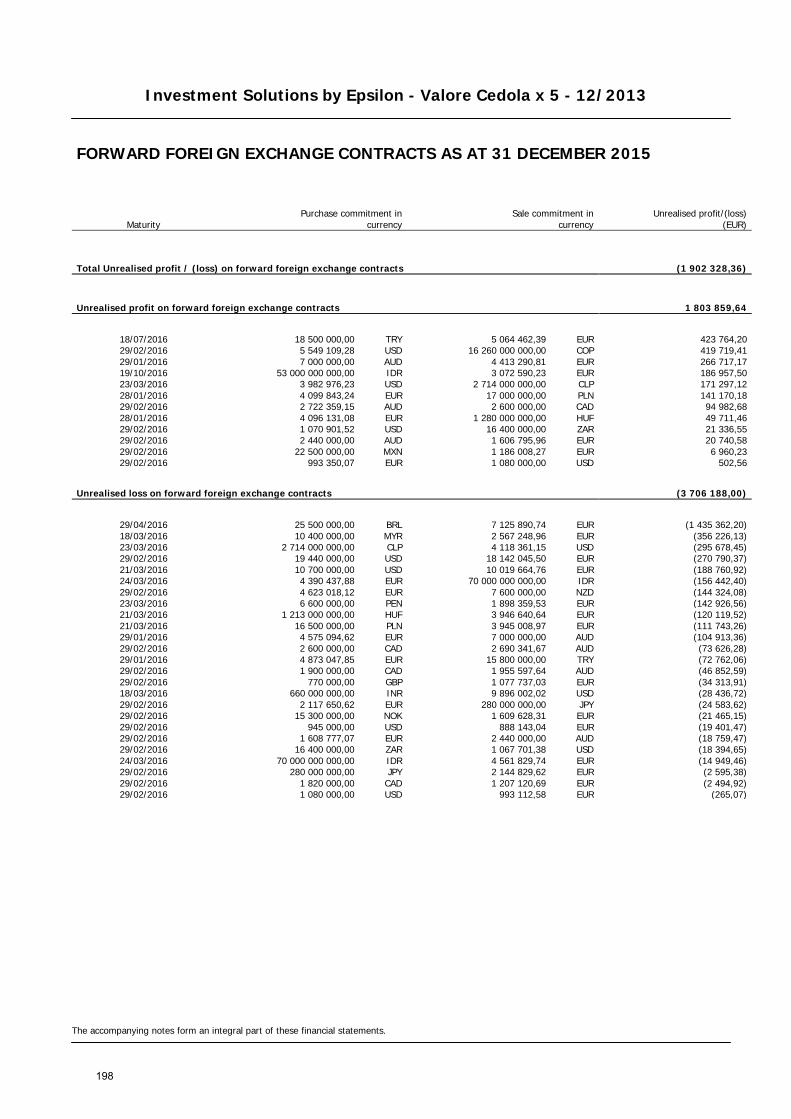
Investment Solutions by Epsilon - Valore Cedola x 5 - 12/2013
The accompanying notes form an integral part of these financial statements.
FORWARD FOREIGN EXCHANGE CONTRACTS AS AT 31 DECEMBER 2015
Maturity Purchase commitment in
currency Sale commitment in
currency
Unrealised profit/(loss) (EUR)
Total Unrealised profit / (loss) on forward foreign exchange contracts (1 902 328,36)
Unrealised profit on forward foreign exchange contracts 1 803 859,64
18/07/2016 18 500 000,00 TRY 5 064 462,39 EUR 423 764,20 29/02/2016 5 549 109,28 USD 16 260 000 000,00 COP 419 719,41 29/01/2016 7 000 000,00 AUD 4 413 290,81 EUR 266 717,17 19/10/2016 53 000 000 000,00 IDR 3 072 590,23 EUR 186 957,50 23/03/2016 3 982 976,23 USD 2 714 000 000,00 CLP 171 297,12 28/01/2016 4 099 843,24 EUR 17 000 000,00 PLN 141 170,18 29/02/2016 2 722 359,15 AUD 2 600 000,00 CAD 94 982,68 28/01/2016 4 096 131,08 EUR 1 280 000 000,00 HUF 49 711,46 29/02/2016 1 070 901,52 USD 16 400 000,00 ZAR 21 336,55 29/02/2016 2 440 000,00 AUD 1 606 795,96 EUR 20 740,58 29/02/2016 22 500 000,00 MXN 1 186 008,27 EUR 6 960,23 29/02/2016 993 350,07 EUR 1 080 000,00 USD 502,56
Unrealised loss on forward foreign exchange contracts (3 706 188,00)
29/04/2016 25 500 000,00 BRL 7 125 890,74 EUR (1 435 362,20) 18/03/2016 10 400 000,00 MYR 2 567 248,96 EUR (356 226,13) 23/03/2016 2 714 000 000,00 CLP 4 118 361,15 USD (295 678,45) 29/02/2016 19 440 000,00 USD 18 142 045,50 EUR (270 790,37) 21/03/2016 10 700 000,00 USD 10 019 664,76 EUR (188 760,92) 24/03/2016 4 390 437,88 EUR 70 000 000 000,00 IDR (156 442,40) 29/02/2016 4 623 018,12 EUR 7 600 000,00 NZD (144 324,08) 23/03/2016 6 600 000,00 PEN 1 898 359,53 EUR (142 926,56) 21/03/2016 1 213 000 000,00 HUF 3 946 640,64 EUR (120 119,52) 21/03/2016 16 500 000,00 PLN 3 945 008,97 EUR (111 743,26) 29/01/2016 4 575 094,62 EUR 7 000 000,00 AUD (104 913,36) 29/02/2016 2 600 000,00 CAD 2 690 341,67 AUD (73 626,28) 29/01/2016 4 873 047,85 EUR 15 800 000,00 TRY (72 762,06) 29/02/2016 1 900 000,00 CAD 1 955 597,64 AUD (46 852,59) 29/02/2016 770 000,00 GBP 1 077 737,03 EUR (34 313,91) 18/03/2016 660 000 000,00 INR 9 896 002,02 USD (28 436,72) 29/02/2016 2 117 650,62 EUR 280 000 000,00 JPY (24 583,62) 29/02/2016 15 300 000,00 NOK 1 609 628,31 EUR (21 465,15) 29/02/2016 945 000,00 USD 888 143,04 EUR (19 401,47) 29/02/2016 1 608 777,07 EUR 2 440 000,00 AUD (18 759,47) 29/02/2016 16 400 000,00 ZAR 1 067 701,38 USD (18 394,65) 24/03/2016 70 000 000 000,00 IDR 4 561 829,74 EUR (14 949,46) 29/02/2016 280 000 000,00 JPY 2 144 829,62 EUR (2 595,38) 29/02/2016 1 820 000,00 CAD 1 207 120,69 EUR (2 494,92) 29/02/2016 1 080 000,00 USD 993 112,58 EUR (265,07)
198
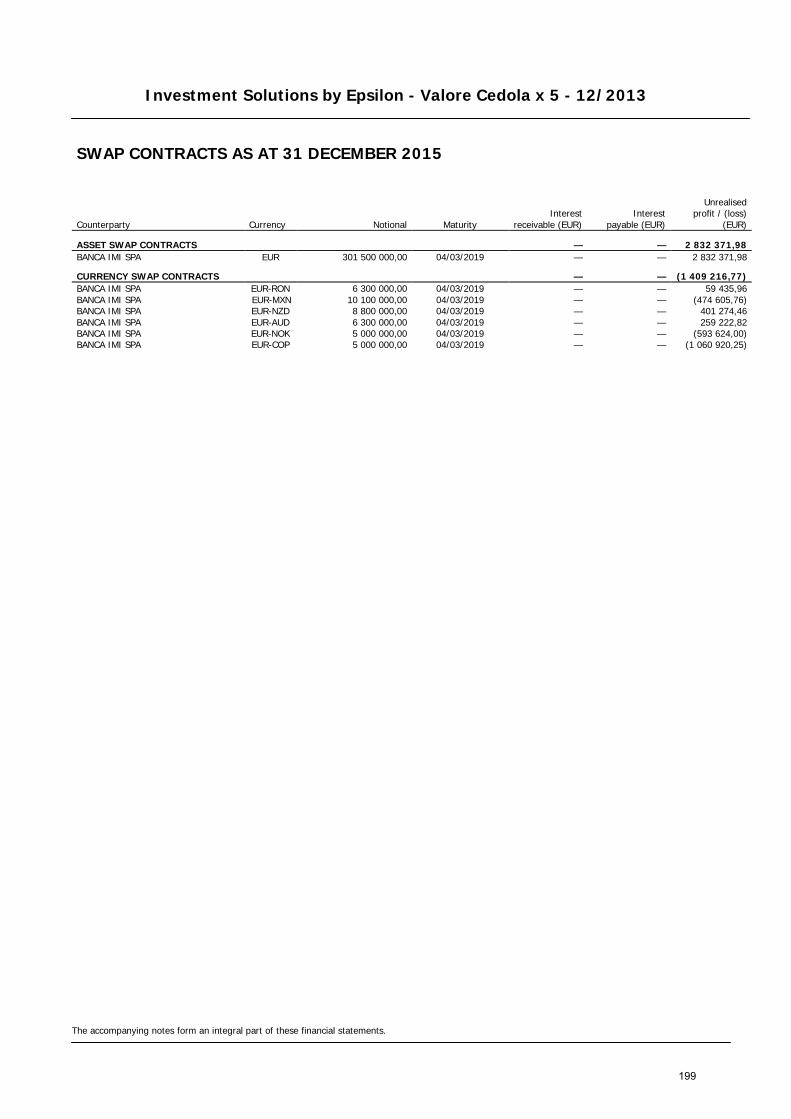
Investment Solutions by Epsilon - Valore Cedola x 5 - 12/2013
The accompanying notes form an integral part of these financial statements.
SWAP CONTRACTS AS AT 31 DECEMBER 2015
Counterparty Currency Notional Maturity Interest
receivable (EUR) Interest
payable (EUR)
Unrealised
profit / (loss) (EUR)
ASSET SWAP CONTRACTS — — 2 832 371,98 BANCA IMI SPA EUR 301 500 000,00 04/03/2019 — — 2 832 371,98
CURRENCY SWAP CONTRACTS — — (1 409 216,77) BANCA IMI SPA EUR-RON 6 300 000,00 04/03/2019 — — 59 435,96 BANCA IMI SPA EUR-MXN 10 100 000,00 04/03/2019 — — (474 605,76) BANCA IMI SPA EUR-NZD 8 800 000,00 04/03/2019 — — 401 274,46 BANCA IMI SPA EUR-AUD 6 300 000,00 04/03/2019 — — 259 222,82 BANCA IMI SPA EUR-NOK 5 000 000,00 04/03/2019 — — (593 624,00) BANCA IMI SPA EUR-COP 5 000 000,00 04/03/2019 — — (1 060 920,25)
199

Investment Solutions by Epsilon - Valore Cedola x 5 - 02/2014
STATEMENT OF NET ASSETS AS AT 31 DECEMBER 2015 IN EUR
The accompanying notes form an integral part of these financial statements.
Assets Notes Investments in securities (Note 2) 344 050 508,00 Banks 8 984 379,11 Amounts due from brokers 44 796,75 Swap premium paid (Notes 2, 11) (501 171,03) Unrealised profit on forward foreign exchange contracts (Notes 2, 12) 1 000 389,90 Unrealised profit on future contracts (Notes 2, 12) 361 706,43 Unrealised profit on swap contracts (Notes 2, 11) 2 130 819,47 Other interest receivable 2 489 323,05 Other assets (Notes 8, 10) 4 724 916,71 Total assets 363 285 668,39
Liabilities Unrealised loss on forward foreign exchange contracts (Notes 2, 12) (2 875 109,52) Unrealised loss on swap contracts (Notes 2, 11) (1 858 361,73) Payable on redemptions (381 880,75) Other liabilities (Note 8) (2 108 794,50) Total liabilities (7 224 146,50)
Total net assets 356 061 521,89
Currency Net Asset Value per Unit Units outstanding
Class RD Units EUR 102,64 3 469 118,268
200
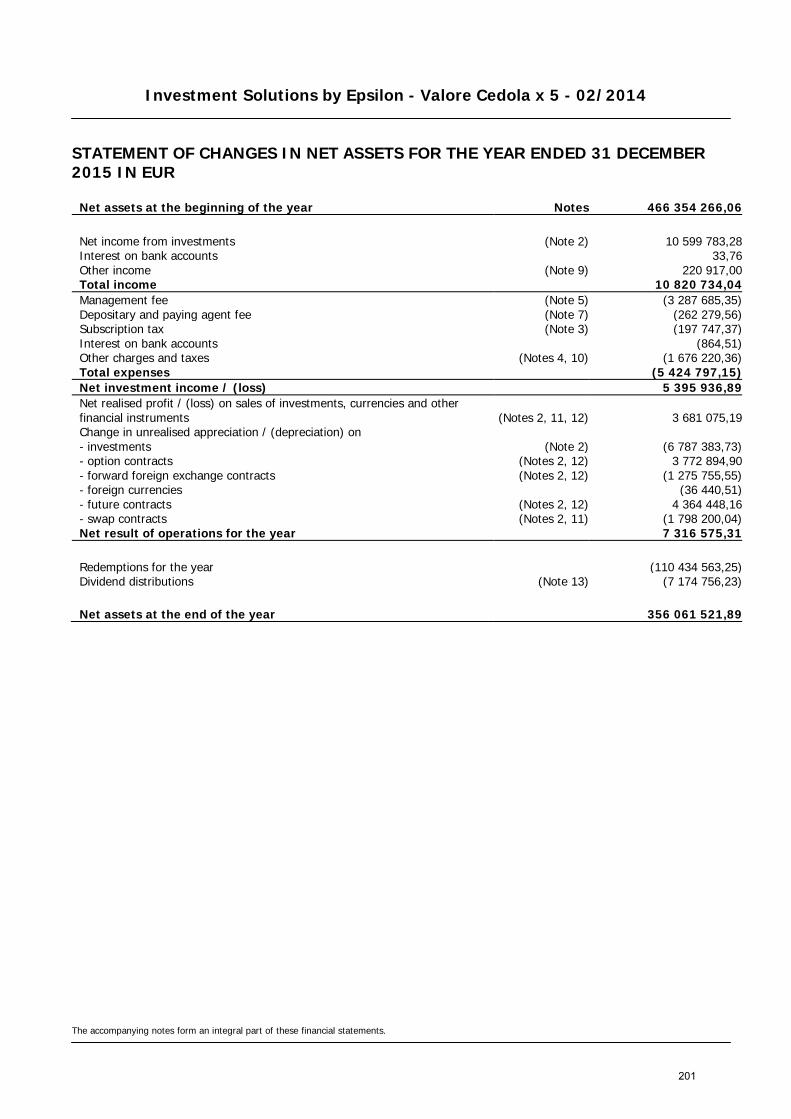
Investment Solutions by Epsilon - Valore Cedola x 5 - 02/2014
STATEMENT OF CHANGES IN NET ASSETS FOR THE YEAR ENDED 31 DECEMBER 2015 IN EUR
The accompanying notes form an integral part of these financial statements.
Net assets at the beginning of the year Notes 466 354 266,06
Net income from investments (Note 2) 10 599 783,28 Interest on bank accounts 33,76 Other income (Note 9) 220 917,00 Total income 10 820 734,04 Management fee (Note 5) (3 287 685,35) Depositary and paying agent fee (Note 7) (262 279,56) Subscription tax (Note 3) (197 747,37) Interest on bank accounts (864,51) Other charges and taxes (Notes 4, 10) (1 676 220,36) Total expenses (5 424 797,15) Net investment income / (loss) 5 395 936,89 Net realised profit / (loss) on sales of investments, currencies and other financial instruments (Notes 2, 11, 12) 3 681 075,19 Change in unrealised appreciation / (depreciation) on - investments (Note 2) (6 787 383,73) - option contracts (Notes 2, 12) 3 772 894,90 - forward foreign exchange contracts (Notes 2, 12) (1 275 755,55) - foreign currencies (36 440,51) - future contracts (Notes 2, 12) 4 364 448,16 - swap contracts (Notes 2, 11) (1 798 200,04) Net result of operations for the year 7 316 575,31
Redemptions for the year (110 434 563,25) Dividend distributions (Note 13) (7 174 756,23)
Net assets at the end of the year 356 061 521,89
201
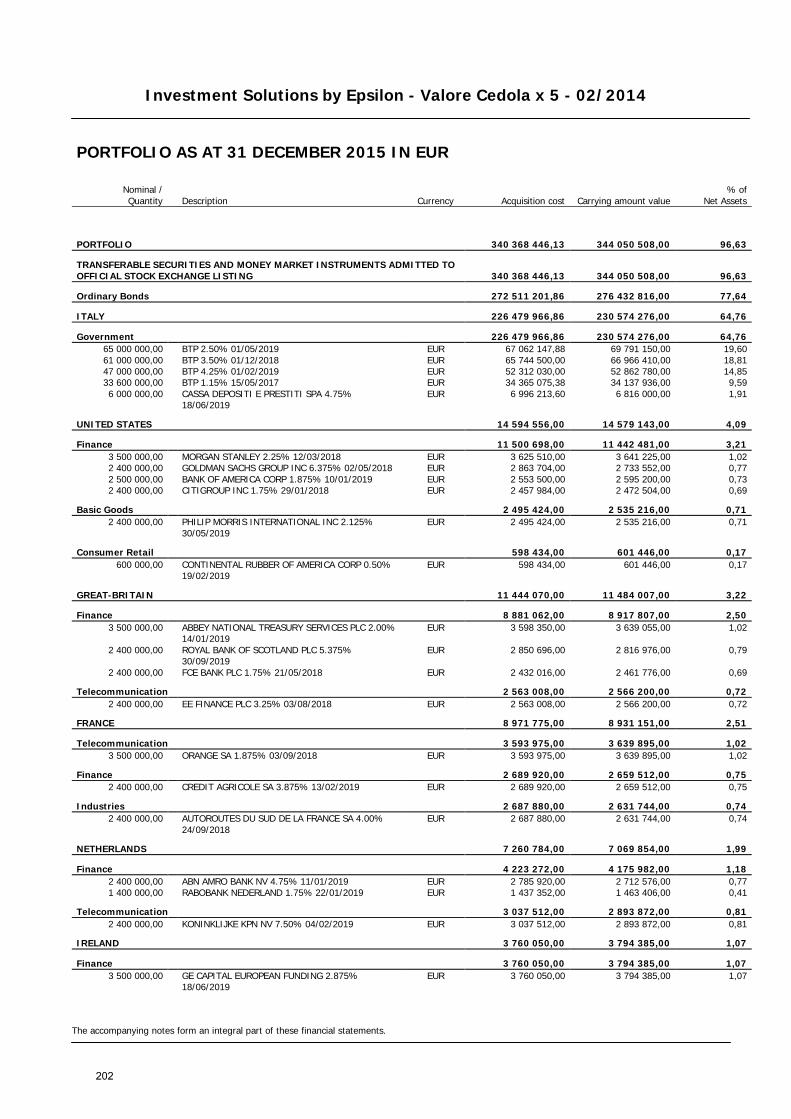
Investment Solutions by Epsilon - Valore Cedola x 5 - 02/2014
The accompanying notes form an integral part of these financial statements.
PORTFOLIO AS AT 31 DECEMBER 2015 IN EUR
Nominal / Quantity Description Currency Acquisition cost Carrying amount value
% of Net Assets
PORTFOLIO 340 368 446,13 344 050 508,00 96,63
TRANSFERABLE SECURITIES AND MONEY MARKET INSTRUMENTS ADMITTED TO OFFICIAL STOCK EXCHANGE LISTING 340 368 446,13 344 050 508,00 96,63
Ordinary Bonds 272 511 201,86 276 432 816,00 77,64
ITALY 226 479 966,86 230 574 276,00 64,76
Government 226 479 966,86 230 574 276,00 64,76 65 000 000,00 BTP 2.50% 01/05/2019 EUR 67 062 147,88 69 791 150,00 19,60 61 000 000,00 BTP 3.50% 01/12/2018 EUR 65 744 500,00 66 966 410,00 18,81 47 000 000,00 BTP 4.25% 01/02/2019 EUR 52 312 030,00 52 862 780,00 14,85 33 600 000,00 BTP 1.15% 15/05/2017 EUR 34 365 075,38 34 137 936,00 9,59 6 000 000,00
CASSA DEPOSITI E PRESTITI SPA 4.75% 18/06/2019
EUR 6 996 213,60 6 816 000,00 1,91
UNITED STATES 14 594 556,00 14 579 143,00 4,09
Finance 11 500 698,00 11 442 481,00 3,21 3 500 000,00 MORGAN STANLEY 2.25% 12/03/2018 EUR 3 625 510,00 3 641 225,00 1,02 2 400 000,00 GOLDMAN SACHS GROUP INC 6.375% 02/05/2018 EUR 2 863 704,00 2 733 552,00 0,77 2 500 000,00 BANK OF AMERICA CORP 1.875% 10/01/2019 EUR 2 553 500,00 2 595 200,00 0,73 2 400 000,00 CITIGROUP INC 1.75% 29/01/2018 EUR 2 457 984,00 2 472 504,00 0,69
Basic Goods 2 495 424,00 2 535 216,00 0,71 2 400 000,00
PHILIP MORRIS INTERNATIONAL INC 2.125% 30/05/2019
EUR 2 495 424,00 2 535 216,00 0,71
Consumer Retail 598 434,00 601 446,00 0,17 600 000,00
CONTINENTAL RUBBER OF AMERICA CORP 0.50% 19/02/2019
EUR 598 434,00 601 446,00 0,17
GREAT-BRITAIN 11 444 070,00 11 484 007,00 3,22
Finance 8 881 062,00 8 917 807,00 2,50 3 500 000,00
ABBEY NATIONAL TREASURY SERVICES PLC 2.00% 14/01/2019
EUR 3 598 350,00 3 639 055,00 1,02
2 400 000,00
ROYAL BANK OF SCOTLAND PLC 5.375% 30/09/2019
EUR 2 850 696,00 2 816 976,00 0,79
2 400 000,00 FCE BANK PLC 1.75% 21/05/2018 EUR 2 432 016,00 2 461 776,00 0,69
Telecommunication 2 563 008,00 2 566 200,00 0,72 2 400 000,00 EE FINANCE PLC 3.25% 03/08/2018 EUR 2 563 008,00 2 566 200,00 0,72
FRANCE 8 971 775,00 8 931 151,00 2,51
Telecommunication 3 593 975,00 3 639 895,00 1,02 3 500 000,00 ORANGE SA 1.875% 03/09/2018 EUR 3 593 975,00 3 639 895,00 1,02
Finance 2 689 920,00 2 659 512,00 0,75 2 400 000,00 CREDIT AGRICOLE SA 3.875% 13/02/2019 EUR 2 689 920,00 2 659 512,00 0,75
Industries 2 687 880,00 2 631 744,00 0,74 2 400 000,00
AUTOROUTES DU SUD DE LA FRANCE SA 4.00% 24/09/2018
EUR 2 687 880,00 2 631 744,00 0,74
NETHERLANDS 7 260 784,00 7 069 854,00 1,99
Finance 4 223 272,00 4 175 982,00 1,18 2 400 000,00 ABN AMRO BANK NV 4.75% 11/01/2019 EUR 2 785 920,00 2 712 576,00 0,77 1 400 000,00 RABOBANK NEDERLAND 1.75% 22/01/2019 EUR 1 437 352,00 1 463 406,00 0,41
Telecommunication 3 037 512,00 2 893 872,00 0,81 2 400 000,00 KONINKLIJKE KPN NV 7.50% 04/02/2019 EUR 3 037 512,00 2 893 872,00 0,81
IRELAND 3 760 050,00 3 794 385,00 1,07
Finance 3 760 050,00 3 794 385,00 1,07 3 500 000,00
GE CAPITAL EUROPEAN FUNDING 2.875% 18/06/2019
EUR 3 760 050,00 3 794 385,00 1,07
202

Investment Solutions by Epsilon - Valore Cedola x 5 - 02/2014
The accompanying notes form an integral part of these financial statements.
PORTFOLIO AS AT 31 DECEMBER 2015 IN EUR
Nominal / Quantity Description Currency Acquisition cost Carrying amount value
% of Net Assets
Floating rate notes 2 670 840,00 2 250 240,00 0,63
LUXEMBOURG 2 670 840,00 2 250 240,00 0,63
Raw materials 2 670 840,00 2 250 240,00 0,63 2 400 000,00 GLENCORE FINANCE EUROPE SA FRN 03/04/2018 EUR 2 670 840,00 2 250 240,00 0,63
Zero-Coupon Bonds 65 186 404,27 65 367 452,00 18,36
ITALY 65 186 404,27 65 367 452,00 18,36
Government 65 186 404,27 65 367 452,00 18,36 43 250 000,00 CTZ 0.00% 30/08/2017 EUR 43 132 975,00 43 260 380,00 12,15 22 100 000,00 CTZ 0.00% 27/02/2017 EUR 22 053 429,27 22 107 072,00 6,21
Total Portfolio 340 368 446,13 344 050 508,00 96,63
203
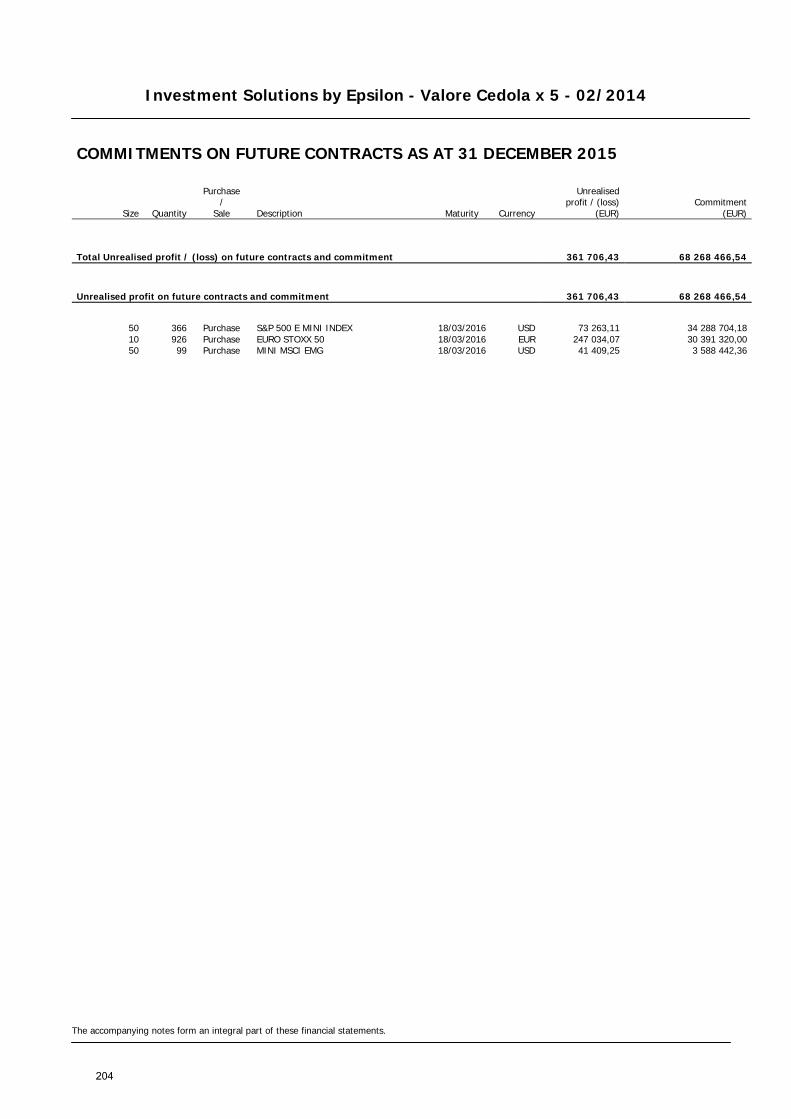
Investment Solutions by Epsilon - Valore Cedola x 5 - 02/2014
The accompanying notes form an integral part of these financial statements.
COMMITMENTS ON FUTURE CONTRACTS AS AT 31 DECEMBER 2015
Size Quantity
Purchase /
Sale Description Maturity Currency
Unrealised profit / (loss)
(EUR) Commitment
(EUR)
Total Unrealised profit / (loss) on future contracts and commitment 361 706,43 68 268 466,54
Unrealised profit on future contracts and commitment 361 706,43 68 268 466,54
50 366 Purchase S&P 500 E MINI INDEX 18/03/2016 USD 73 263,11 34 288 704,18 10 926 Purchase EURO STOXX 50 18/03/2016 EUR 247 034,07 30 391 320,00 50 99 Purchase MINI MSCI EMG 18/03/2016 USD 41 409,25 3 588 442,36
204
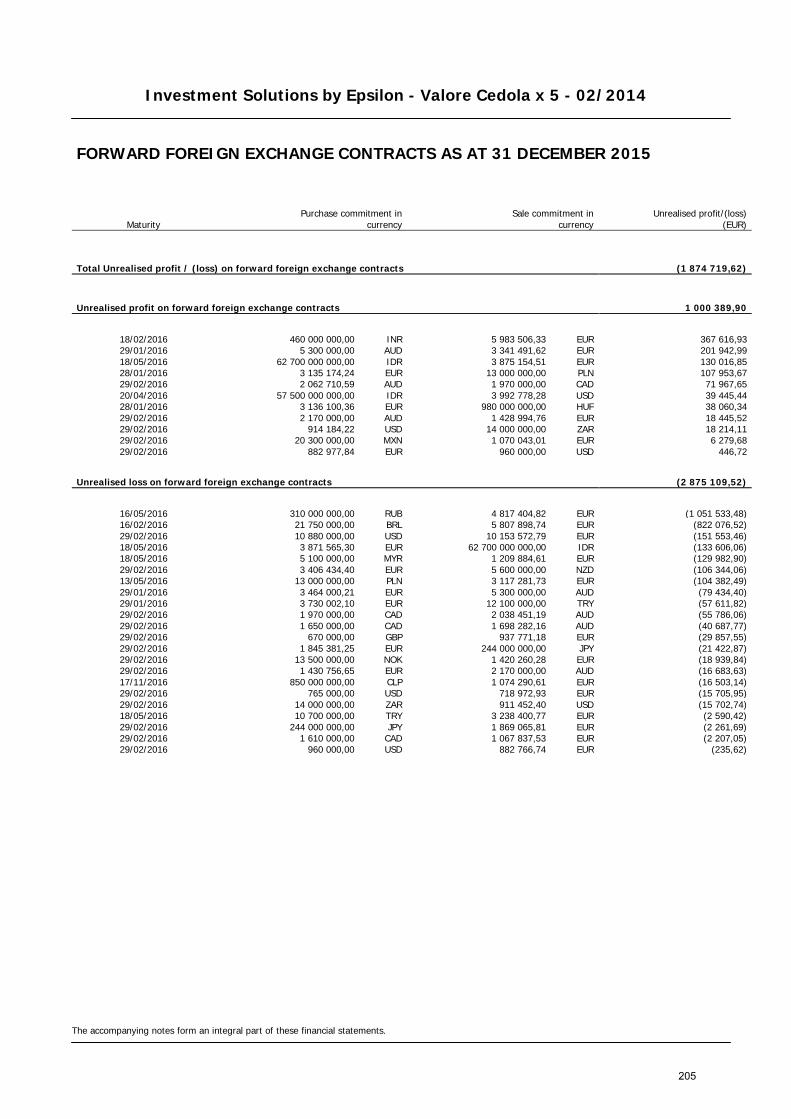
Investment Solutions by Epsilon - Valore Cedola x 5 - 02/2014
The accompanying notes form an integral part of these financial statements.
FORWARD FOREIGN EXCHANGE CONTRACTS AS AT 31 DECEMBER 2015
Maturity Purchase commitment in
currency Sale commitment in
currency
Unrealised profit/(loss) (EUR)
Total Unrealised profit / (loss) on forward foreign exchange contracts (1 874 719,62)
Unrealised profit on forward foreign exchange contracts 1 000 389,90
18/02/2016 460 000 000,00 INR 5 983 506,33 EUR 367 616,93 29/01/2016 5 300 000,00 AUD 3 341 491,62 EUR 201 942,99 18/05/2016 62 700 000 000,00 IDR 3 875 154,51 EUR 130 016,85 28/01/2016 3 135 174,24 EUR 13 000 000,00 PLN 107 953,67 29/02/2016 2 062 710,59 AUD 1 970 000,00 CAD 71 967,65 20/04/2016 57 500 000 000,00 IDR 3 992 778,28 USD 39 445,44 28/01/2016 3 136 100,36 EUR 980 000 000,00 HUF 38 060,34 29/02/2016 2 170 000,00 AUD 1 428 994,76 EUR 18 445,52 29/02/2016 914 184,22 USD 14 000 000,00 ZAR 18 214,11 29/02/2016 20 300 000,00 MXN 1 070 043,01 EUR 6 279,68 29/02/2016 882 977,84 EUR 960 000,00 USD 446,72
Unrealised loss on forward foreign exchange contracts (2 875 109,52)
16/05/2016 310 000 000,00 RUB 4 817 404,82 EUR (1 051 533,48) 16/02/2016 21 750 000,00 BRL 5 807 898,74 EUR (822 076,52) 29/02/2016 10 880 000,00 USD 10 153 572,79 EUR (151 553,46) 18/05/2016 3 871 565,30 EUR 62 700 000 000,00 IDR (133 606,06) 18/05/2016 5 100 000,00 MYR 1 209 884,61 EUR (129 982,90) 29/02/2016 3 406 434,40 EUR 5 600 000,00 NZD (106 344,06) 13/05/2016 13 000 000,00 PLN 3 117 281,73 EUR (104 382,49) 29/01/2016 3 464 000,21 EUR 5 300 000,00 AUD (79 434,40) 29/01/2016 3 730 002,10 EUR 12 100 000,00 TRY (57 611,82) 29/02/2016 1 970 000,00 CAD 2 038 451,19 AUD (55 786,06) 29/02/2016 1 650 000,00 CAD 1 698 282,16 AUD (40 687,77) 29/02/2016 670 000,00 GBP 937 771,18 EUR (29 857,55) 29/02/2016 1 845 381,25 EUR 244 000 000,00 JPY (21 422,87) 29/02/2016 13 500 000,00 NOK 1 420 260,28 EUR (18 939,84) 29/02/2016 1 430 756,65 EUR 2 170 000,00 AUD (16 683,63) 17/11/2016 850 000 000,00 CLP 1 074 290,61 EUR (16 503,14) 29/02/2016 765 000,00 USD 718 972,93 EUR (15 705,95) 29/02/2016 14 000 000,00 ZAR 911 452,40 USD (15 702,74) 18/05/2016 10 700 000,00 TRY 3 238 400,77 EUR (2 590,42) 29/02/2016 244 000 000,00 JPY 1 869 065,81 EUR (2 261,69) 29/02/2016 1 610 000,00 CAD 1 067 837,53 EUR (2 207,05) 29/02/2016 960 000,00 USD 882 766,74 EUR (235,62)
205
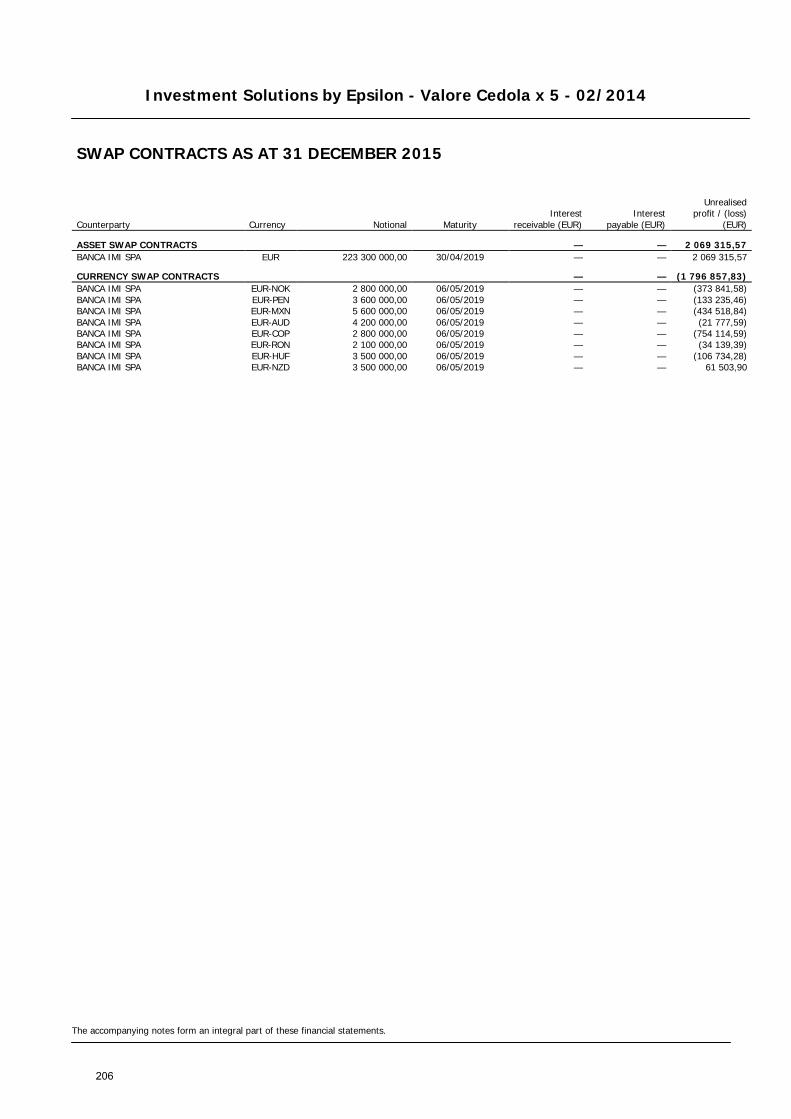
Investment Solutions by Epsilon - Valore Cedola x 5 - 02/2014
The accompanying notes form an integral part of these financial statements.
SWAP CONTRACTS AS AT 31 DECEMBER 2015
Counterparty Currency Notional Maturity Interest
receivable (EUR) Interest
payable (EUR)
Unrealised
profit / (loss) (EUR)
ASSET SWAP CONTRACTS — — 2 069 315,57 BANCA IMI SPA EUR 223 300 000,00 30/04/2019 — — 2 069 315,57
CURRENCY SWAP CONTRACTS — — (1 796 857,83) BANCA IMI SPA EUR-NOK 2 800 000,00 06/05/2019 — — (373 841,58) BANCA IMI SPA EUR-PEN 3 600 000,00 06/05/2019 — — (133 235,46) BANCA IMI SPA EUR-MXN 5 600 000,00 06/05/2019 — — (434 518,84) BANCA IMI SPA EUR-AUD 4 200 000,00 06/05/2019 — — (21 777,59) BANCA IMI SPA EUR-COP 2 800 000,00 06/05/2019 — — (754 114,59) BANCA IMI SPA EUR-RON 2 100 000,00 06/05/2019 — — (34 139,39) BANCA IMI SPA EUR-HUF 3 500 000,00 06/05/2019 — — (106 734,28) BANCA IMI SPA EUR-NZD 3 500 000,00 06/05/2019 — — 61 503,90
206

Investment Solutions by Epsilon - Valore Cedola x 5 - 04/2014
STATEMENT OF NET ASSETS AS AT 31 DECEMBER 2015 IN EUR
The accompanying notes form an integral part of these financial statements.
Assets Notes Investments in securities (Note 2) 394 528 149,00 Banks 10 299 557,54 Swap premium paid (Notes 2, 11) (649 759,05) Unrealised profit on forward foreign exchange contracts (Notes 2, 12) 1 086 035,44 Unrealised profit on future contracts (Notes 2, 12) 560 008,22 Unrealised profit on swap contracts (Notes 2, 11) 1 434 394,89 Other interest receivable 2 505 313,18 Other assets (Notes 8, 10) 5 161 588,26 Total assets 414 925 287,48
Liabilities Amounts due to brokers (354 029,40) Unrealised loss on forward foreign exchange contracts (Notes 2, 12) (1 141 238,21) Unrealised loss on swap contracts (Notes 2, 11) (1 501 997,08) Payable on redemptions (484 563,09) Other liabilities (Note 8) (1 861 963,42) Total liabilities (5 343 791,20)
Total net assets 409 581 496,28
Currency Net Asset Value per Unit Units outstanding
Class RD Units EUR 101,04 4 053 774,028
207
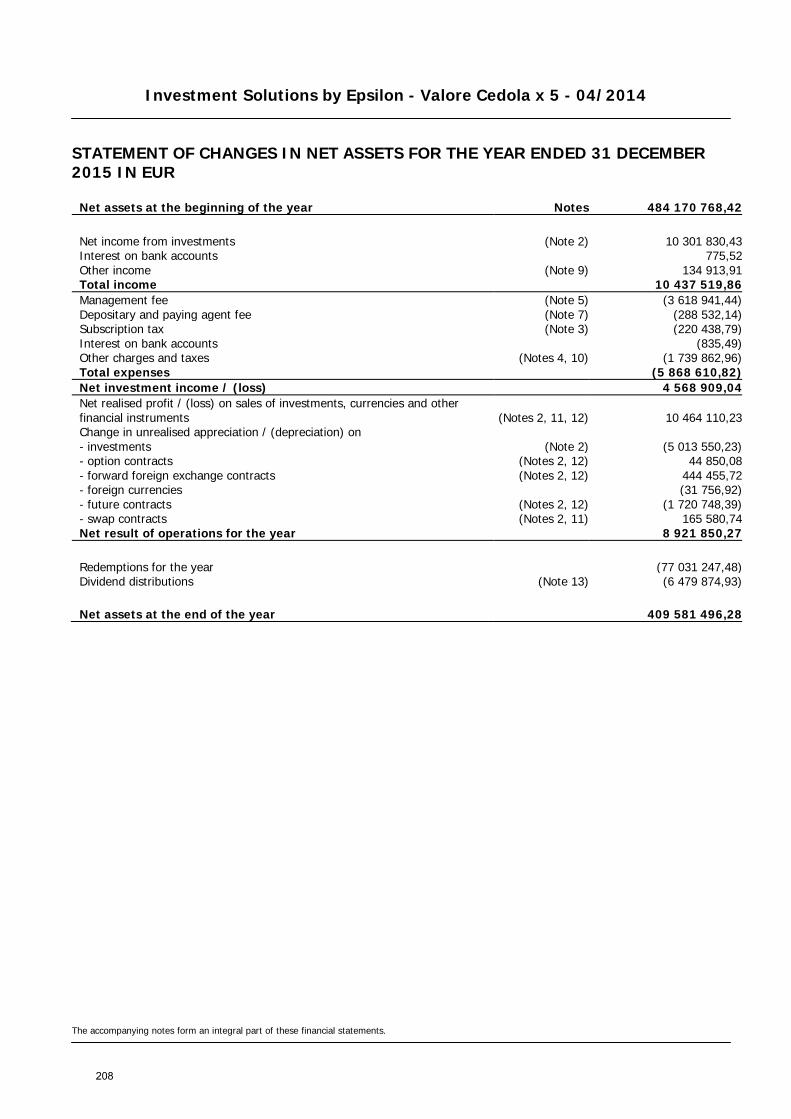
Investment Solutions by Epsilon - Valore Cedola x 5 - 04/2014
STATEMENT OF CHANGES IN NET ASSETS FOR THE YEAR ENDED 31 DECEMBER 2015 IN EUR
The accompanying notes form an integral part of these financial statements.
Net assets at the beginning of the year Notes 484 170 768,42
Net income from investments (Note 2) 10 301 830,43 Interest on bank accounts 775,52 Other income (Note 9) 134 913,91 Total income 10 437 519,86 Management fee (Note 5) (3 618 941,44) Depositary and paying agent fee (Note 7) (288 532,14) Subscription tax (Note 3) (220 438,79) Interest on bank accounts (835,49) Other charges and taxes (Notes 4, 10) (1 739 862,96) Total expenses (5 868 610,82) Net investment income / (loss) 4 568 909,04 Net realised profit / (loss) on sales of investments, currencies and other financial instruments (Notes 2, 11, 12) 10 464 110,23 Change in unrealised appreciation / (depreciation) on - investments (Note 2) (5 013 550,23) - option contracts (Notes 2, 12) 44 850,08 - forward foreign exchange contracts (Notes 2, 12) 444 455,72 - foreign currencies (31 756,92) - future contracts (Notes 2, 12) (1 720 748,39) - swap contracts (Notes 2, 11) 165 580,74 Net result of operations for the year 8 921 850,27
Redemptions for the year (77 031 247,48) Dividend distributions (Note 13) (6 479 874,93)
Net assets at the end of the year 409 581 496,28
208
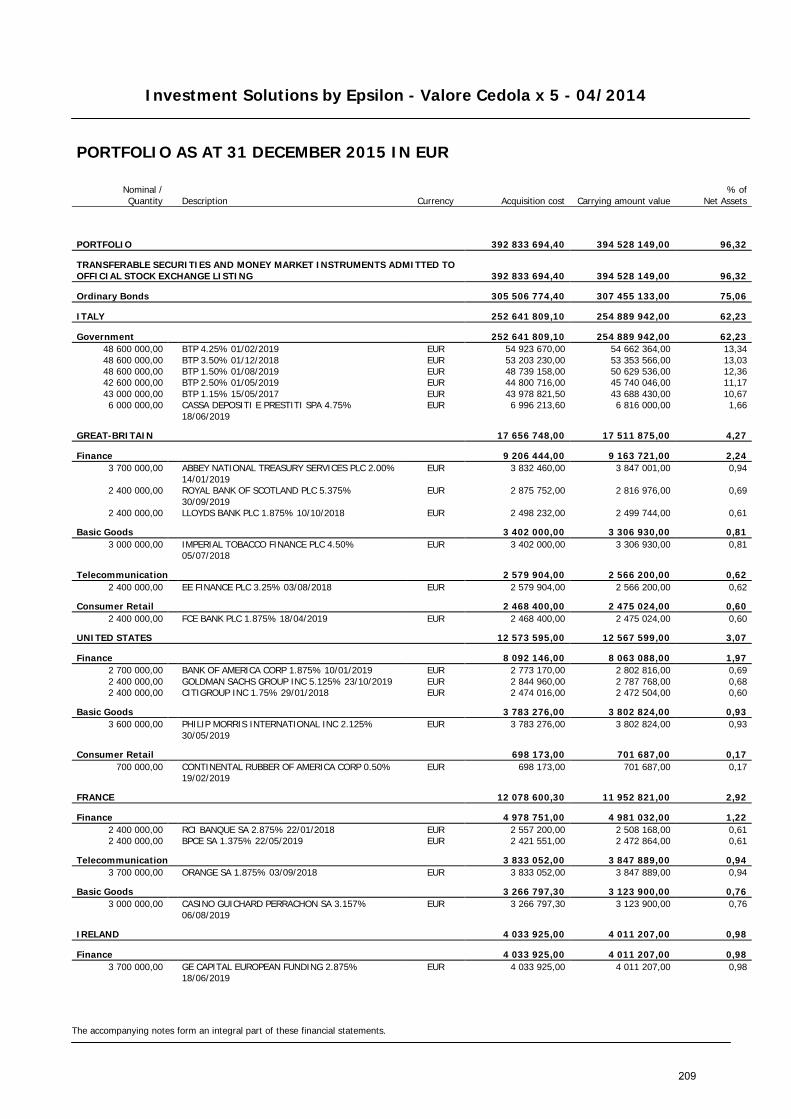
Investment Solutions by Epsilon - Valore Cedola x 5 - 04/2014
The accompanying notes form an integral part of these financial statements.
PORTFOLIO AS AT 31 DECEMBER 2015 IN EUR
Nominal / Quantity Description Currency Acquisition cost Carrying amount value
% of Net Assets
PORTFOLIO 392 833 694,40 394 528 149,00 96,32
TRANSFERABLE SECURITIES AND MONEY MARKET INSTRUMENTS ADMITTED TO OFFICIAL STOCK EXCHANGE LISTING 392 833 694,40 394 528 149,00 96,32
Ordinary Bonds 305 506 774,40 307 455 133,00 75,06
ITALY 252 641 809,10 254 889 942,00 62,23
Government 252 641 809,10 254 889 942,00 62,23 48 600 000,00 BTP 4.25% 01/02/2019 EUR 54 923 670,00 54 662 364,00 13,34 48 600 000,00 BTP 3.50% 01/12/2018 EUR 53 203 230,00 53 353 566,00 13,03 48 600 000,00 BTP 1.50% 01/08/2019 EUR 48 739 158,00 50 629 536,00 12,36 42 600 000,00 BTP 2.50% 01/05/2019 EUR 44 800 716,00 45 740 046,00 11,17 43 000 000,00 BTP 1.15% 15/05/2017 EUR 43 978 821,50 43 688 430,00 10,67 6 000 000,00
CASSA DEPOSITI E PRESTITI SPA 4.75% 18/06/2019
EUR 6 996 213,60 6 816 000,00 1,66
GREAT-BRITAIN 17 656 748,00 17 511 875,00 4,27
Finance 9 206 444,00 9 163 721,00 2,24 3 700 000,00
ABBEY NATIONAL TREASURY SERVICES PLC 2.00% 14/01/2019
EUR 3 832 460,00 3 847 001,00 0,94
2 400 000,00
ROYAL BANK OF SCOTLAND PLC 5.375% 30/09/2019
EUR 2 875 752,00 2 816 976,00 0,69
2 400 000,00 LLOYDS BANK PLC 1.875% 10/10/2018 EUR 2 498 232,00 2 499 744,00 0,61
Basic Goods 3 402 000,00 3 306 930,00 0,81 3 000 000,00
IMPERIAL TOBACCO FINANCE PLC 4.50% 05/07/2018
EUR 3 402 000,00 3 306 930,00 0,81
Telecommunication 2 579 904,00 2 566 200,00 0,62 2 400 000,00 EE FINANCE PLC 3.25% 03/08/2018 EUR 2 579 904,00 2 566 200,00 0,62
Consumer Retail 2 468 400,00 2 475 024,00 0,60 2 400 000,00 FCE BANK PLC 1.875% 18/04/2019 EUR 2 468 400,00 2 475 024,00 0,60
UNITED STATES 12 573 595,00 12 567 599,00 3,07
Finance 8 092 146,00 8 063 088,00 1,97 2 700 000,00 BANK OF AMERICA CORP 1.875% 10/01/2019 EUR 2 773 170,00 2 802 816,00 0,69 2 400 000,00 GOLDMAN SACHS GROUP INC 5.125% 23/10/2019 EUR 2 844 960,00 2 787 768,00 0,68 2 400 000,00 CITIGROUP INC 1.75% 29/01/2018 EUR 2 474 016,00 2 472 504,00 0,60
Basic Goods 3 783 276,00 3 802 824,00 0,93 3 600 000,00
PHILIP MORRIS INTERNATIONAL INC 2.125% 30/05/2019
EUR 3 783 276,00 3 802 824,00 0,93
Consumer Retail 698 173,00 701 687,00 0,17 700 000,00
CONTINENTAL RUBBER OF AMERICA CORP 0.50% 19/02/2019
EUR 698 173,00 701 687,00 0,17
FRANCE 12 078 600,30 11 952 821,00 2,92
Finance 4 978 751,00 4 981 032,00 1,22 2 400 000,00 RCI BANQUE SA 2.875% 22/01/2018 EUR 2 557 200,00 2 508 168,00 0,61 2 400 000,00 BPCE SA 1.375% 22/05/2019 EUR 2 421 551,00 2 472 864,00 0,61
Telecommunication 3 833 052,00 3 847 889,00 0,94 3 700 000,00 ORANGE SA 1.875% 03/09/2018 EUR 3 833 052,00 3 847 889,00 0,94
Basic Goods 3 266 797,30 3 123 900,00 0,76 3 000 000,00
CASINO GUICHARD PERRACHON SA 3.157% 06/08/2019
EUR 3 266 797,30 3 123 900,00 0,76
IRELAND 4 033 925,00 4 011 207,00 0,98
Finance 4 033 925,00 4 011 207,00 0,98 3 700 000,00
GE CAPITAL EUROPEAN FUNDING 2.875% 18/06/2019
EUR 4 033 925,00 4 011 207,00 0,98
209
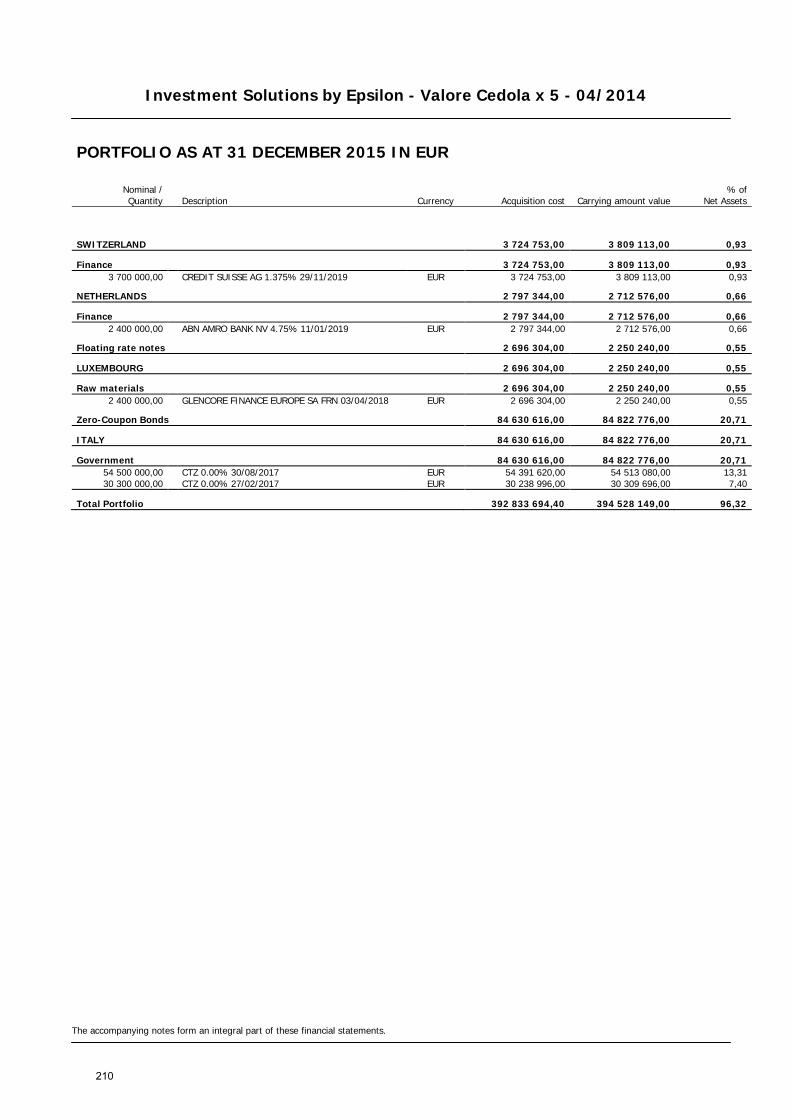
Investment Solutions by Epsilon - Valore Cedola x 5 - 04/2014
The accompanying notes form an integral part of these financial statements.
PORTFOLIO AS AT 31 DECEMBER 2015 IN EUR
Nominal / Quantity Description Currency Acquisition cost Carrying amount value
% of Net Assets
SWITZERLAND 3 724 753,00 3 809 113,00 0,93
Finance 3 724 753,00 3 809 113,00 0,93 3 700 000,00 CREDIT SUISSE AG 1.375% 29/11/2019 EUR 3 724 753,00 3 809 113,00 0,93
NETHERLANDS 2 797 344,00 2 712 576,00 0,66
Finance 2 797 344,00 2 712 576,00 0,66 2 400 000,00 ABN AMRO BANK NV 4.75% 11/01/2019 EUR 2 797 344,00 2 712 576,00 0,66
Floating rate notes 2 696 304,00 2 250 240,00 0,55
LUXEMBOURG 2 696 304,00 2 250 240,00 0,55
Raw materials 2 696 304,00 2 250 240,00 0,55 2 400 000,00 GLENCORE FINANCE EUROPE SA FRN 03/04/2018 EUR 2 696 304,00 2 250 240,00 0,55
Zero-Coupon Bonds 84 630 616,00 84 822 776,00 20,71
ITALY 84 630 616,00 84 822 776,00 20,71
Government 84 630 616,00 84 822 776,00 20,71 54 500 000,00 CTZ 0.00% 30/08/2017 EUR 54 391 620,00 54 513 080,00 13,31 30 300 000,00 CTZ 0.00% 27/02/2017 EUR 30 238 996,00 30 309 696,00 7,40
Total Portfolio 392 833 694,40 394 528 149,00 96,32
210
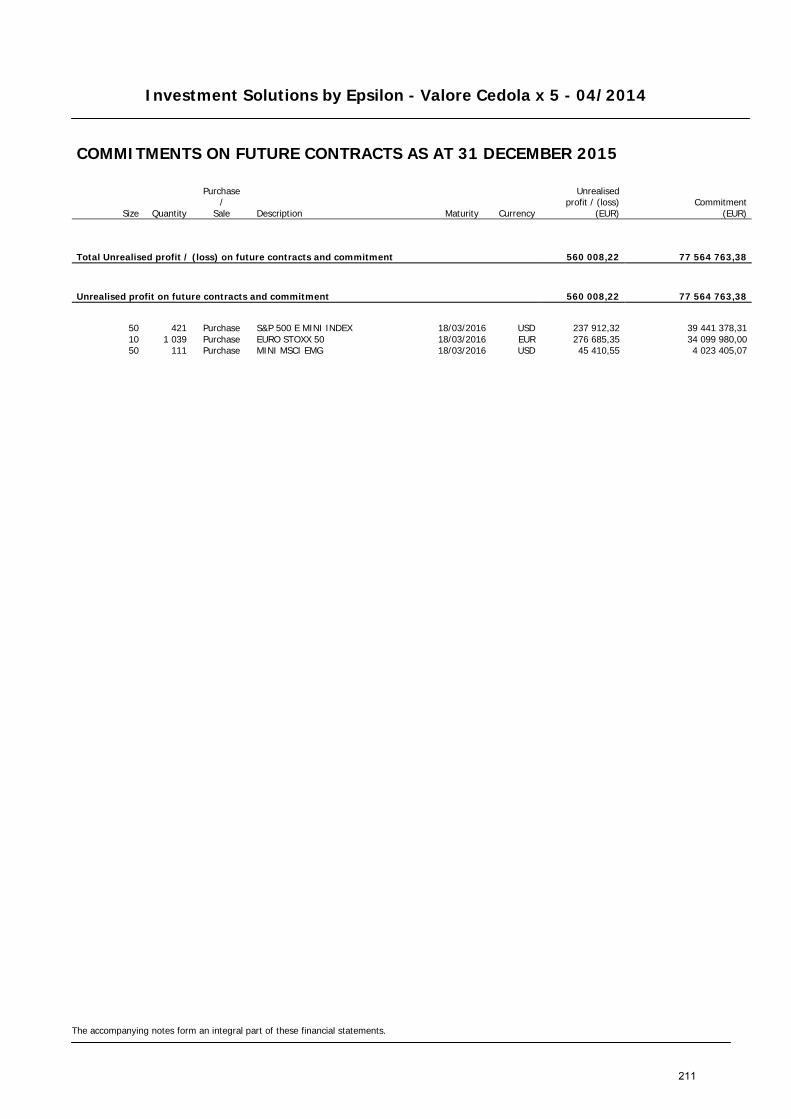
Investment Solutions by Epsilon - Valore Cedola x 5 - 04/2014
The accompanying notes form an integral part of these financial statements.
COMMITMENTS ON FUTURE CONTRACTS AS AT 31 DECEMBER 2015
Size Quantity
Purchase /
Sale Description Maturity Currency
Unrealised profit / (loss)
(EUR) Commitment
(EUR)
Total Unrealised profit / (loss) on future contracts and commitment 560 008,22 77 564 763,38
Unrealised profit on future contracts and commitment 560 008,22 77 564 763,38
50 421 Purchase S&P 500 E MINI INDEX 18/03/2016 USD 237 912,32 39 441 378,31 10 1 039 Purchase EURO STOXX 50 18/03/2016 EUR 276 685,35 34 099 980,00 50 111 Purchase MINI MSCI EMG 18/03/2016 USD 45 410,55 4 023 405,07
211
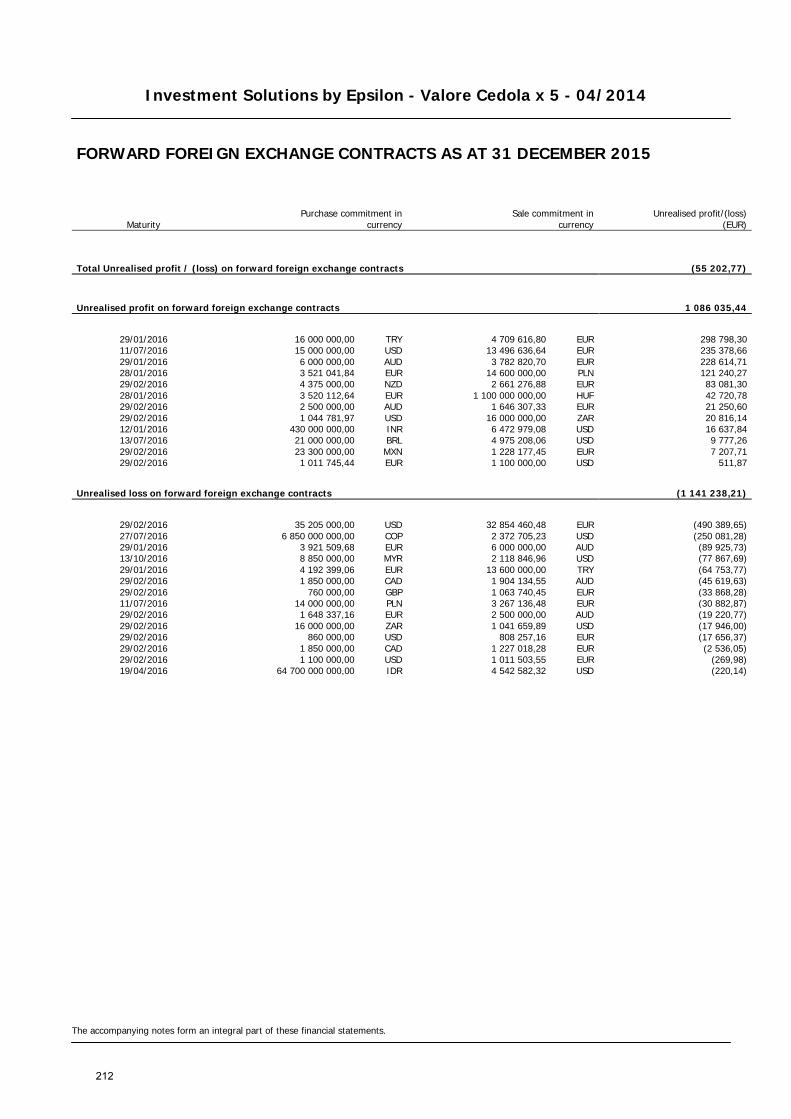
Investment Solutions by Epsilon - Valore Cedola x 5 - 04/2014
The accompanying notes form an integral part of these financial statements.
FORWARD FOREIGN EXCHANGE CONTRACTS AS AT 31 DECEMBER 2015
Maturity Purchase commitment in
currency Sale commitment in
currency
Unrealised profit/(loss) (EUR)
Total Unrealised profit / (loss) on forward foreign exchange contracts (55 202,77)
Unrealised profit on forward foreign exchange contracts 1 086 035,44
29/01/2016 16 000 000,00 TRY 4 709 616,80 EUR 298 798,30 11/07/2016 15 000 000,00 USD 13 496 636,64 EUR 235 378,66 29/01/2016 6 000 000,00 AUD 3 782 820,70 EUR 228 614,71 28/01/2016 3 521 041,84 EUR 14 600 000,00 PLN 121 240,27 29/02/2016 4 375 000,00 NZD 2 661 276,88 EUR 83 081,30 28/01/2016 3 520 112,64 EUR 1 100 000 000,00 HUF 42 720,78 29/02/2016 2 500 000,00 AUD 1 646 307,33 EUR 21 250,60 29/02/2016 1 044 781,97 USD 16 000 000,00 ZAR 20 816,14 12/01/2016 430 000 000,00 INR 6 472 979,08 USD 16 637,84 13/07/2016 21 000 000,00 BRL 4 975 208,06 USD 9 777,26 29/02/2016 23 300 000,00 MXN 1 228 177,45 EUR 7 207,71 29/02/2016 1 011 745,44 EUR 1 100 000,00 USD 511,87
Unrealised loss on forward foreign exchange contracts (1 141 238,21)
29/02/2016 35 205 000,00 USD 32 854 460,48 EUR (490 389,65) 27/07/2016 6 850 000 000,00 COP 2 372 705,23 USD (250 081,28) 29/01/2016 3 921 509,68 EUR 6 000 000,00 AUD (89 925,73) 13/10/2016 8 850 000,00 MYR 2 118 846,96 USD (77 867,69) 29/01/2016 4 192 399,06 EUR 13 600 000,00 TRY (64 753,77) 29/02/2016 1 850 000,00 CAD 1 904 134,55 AUD (45 619,63) 29/02/2016 760 000,00 GBP 1 063 740,45 EUR (33 868,28) 11/07/2016 14 000 000,00 PLN 3 267 136,48 EUR (30 882,87) 29/02/2016 1 648 337,16 EUR 2 500 000,00 AUD (19 220,77) 29/02/2016 16 000 000,00 ZAR 1 041 659,89 USD (17 946,00) 29/02/2016 860 000,00 USD 808 257,16 EUR (17 656,37) 29/02/2016 1 850 000,00 CAD 1 227 018,28 EUR (2 536,05) 29/02/2016 1 100 000,00 USD 1 011 503,55 EUR (269,98) 19/04/2016 64 700 000 000,00 IDR 4 542 582,32 USD (220,14)
212
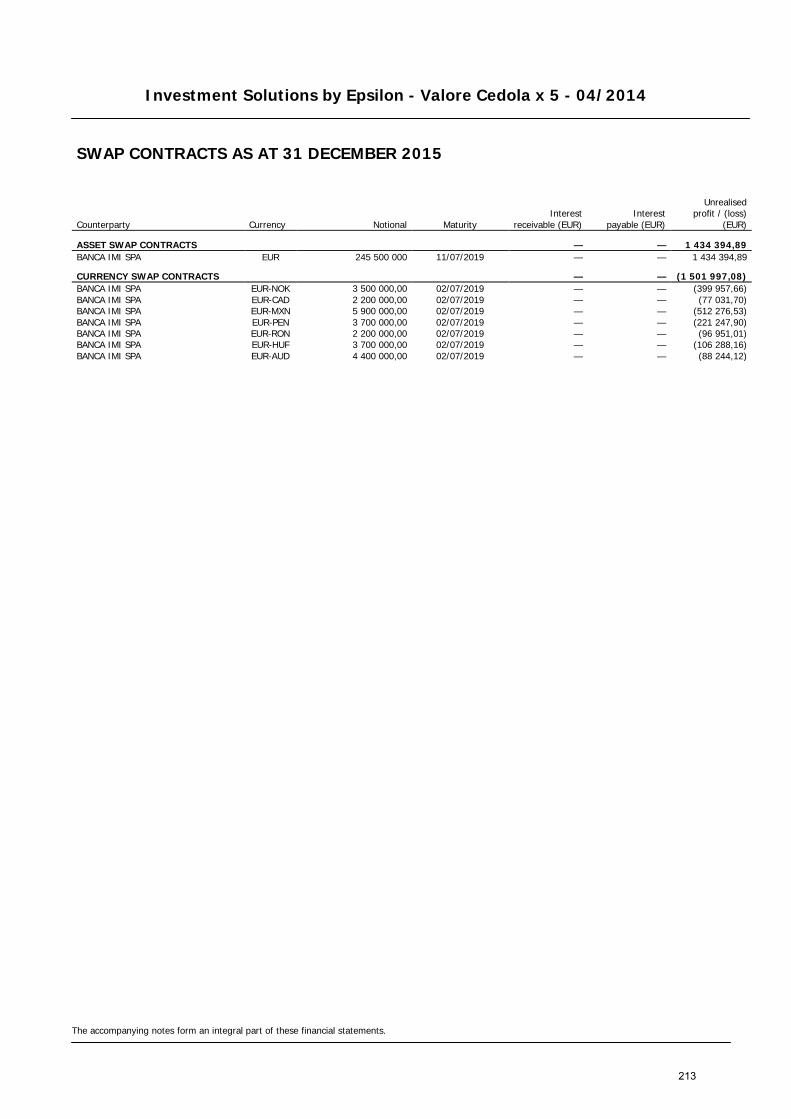
Investment Solutions by Epsilon - Valore Cedola x 5 - 04/2014
The accompanying notes form an integral part of these financial statements.
SWAP CONTRACTS AS AT 31 DECEMBER 2015
Counterparty Currency Notional Maturity Interest
receivable (EUR) Interest
payable (EUR)
Unrealised
profit / (loss) (EUR)
ASSET SWAP CONTRACTS — — 1 434 394,89 BANCA IMI SPA EUR 245 500 000 11/07/2019 — — 1 434 394,89
CURRENCY SWAP CONTRACTS — — (1 501 997,08) BANCA IMI SPA EUR-NOK 3 500 000,00 02/07/2019 — — (399 957,66) BANCA IMI SPA EUR-CAD 2 200 000,00 02/07/2019 — — (77 031,70) BANCA IMI SPA EUR-MXN 5 900 000,00 02/07/2019 — — (512 276,53) BANCA IMI SPA EUR-PEN 3 700 000,00 02/07/2019 — — (221 247,90) BANCA IMI SPA EUR-RON 2 200 000,00 02/07/2019 — — (96 951,01) BANCA IMI SPA EUR-HUF 3 700 000,00 02/07/2019 — — (106 288,16) BANCA IMI SPA EUR-AUD 4 400 000,00 02/07/2019 — — (88 244,12)
213
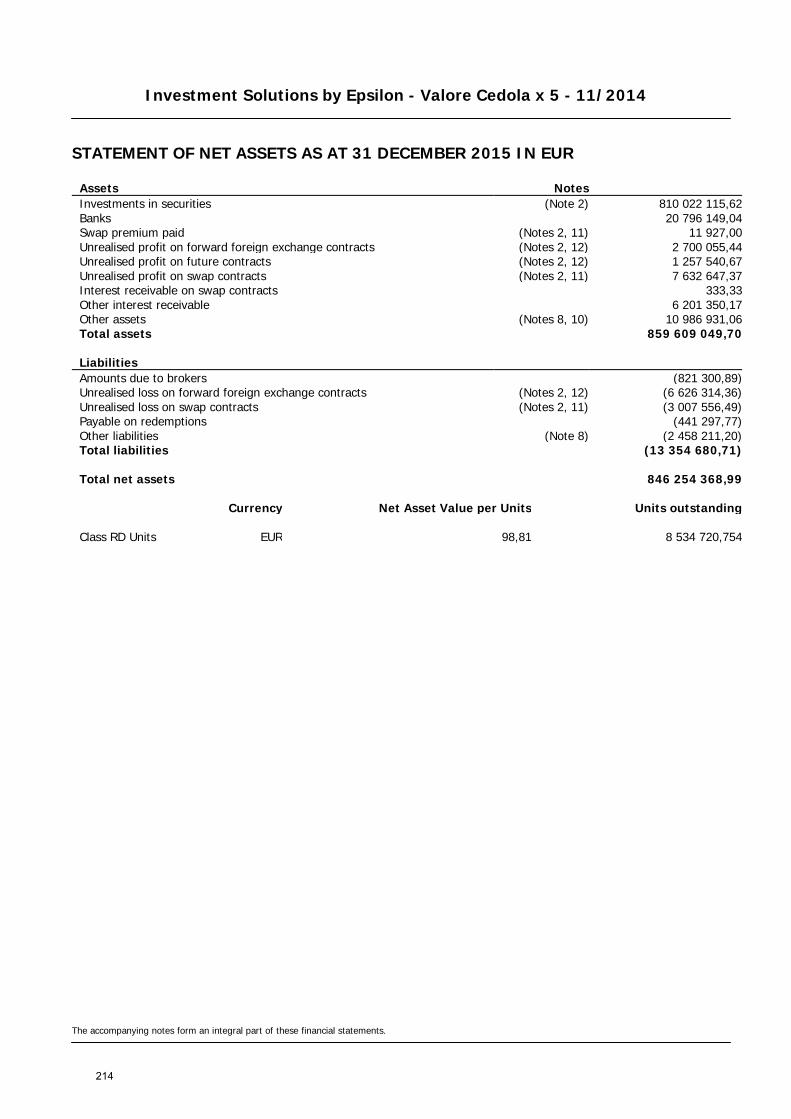
Investment Solutions by Epsilon - Valore Cedola x 5 - 11/2014
STATEMENT OF NET ASSETS AS AT 31 DECEMBER 2015 IN EUR
The accompanying notes form an integral part of these financial statements.
Assets Notes Investments in securities (Note 2) 810 022 115,62 Banks 20 796 149,04 Swap premium paid (Notes 2, 11) 11 927,00 Unrealised profit on forward foreign exchange contracts (Notes 2, 12) 2 700 055,44 Unrealised profit on future contracts (Notes 2, 12) 1 257 540,67 Unrealised profit on swap contracts (Notes 2, 11) 7 632 647,37 Interest receivable on swap contracts 333,33 Other interest receivable 6 201 350,17 Other assets (Notes 8, 10) 10 986 931,06 Total assets 859 609 049,70
Liabilities Amounts due to brokers (821 300,89) Unrealised loss on forward foreign exchange contracts (Notes 2, 12) (6 626 314,36) Unrealised loss on swap contracts (Notes 2, 11) (3 007 556,49) Payable on redemptions (441 297,77) Other liabilities (Note 8) (2 458 211,20) Total liabilities (13 354 680,71)
Total net assets 846 254 368,99
Currency Net Asset Value per Units Units outstanding
Class RD Units EUR 98,81 8 534 720,754
214
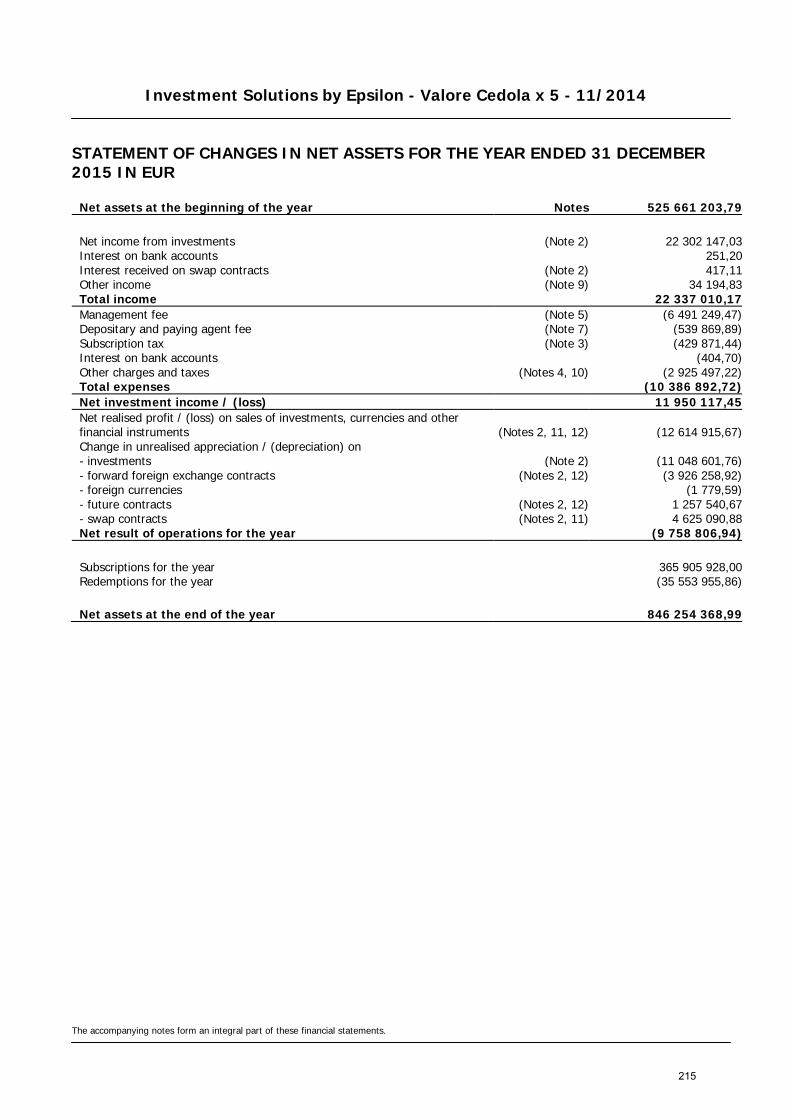
Investment Solutions by Epsilon - Valore Cedola x 5 - 11/2014
STATEMENT OF CHANGES IN NET ASSETS FOR THE YEAR ENDED 31 DECEMBER 2015 IN EUR
The accompanying notes form an integral part of these financial statements.
Net assets at the beginning of the year Notes 525 661 203,79
Net income from investments (Note 2) 22 302 147,03 Interest on bank accounts 251,20 Interest received on swap contracts (Note 2) 417,11 Other income (Note 9) 34 194,83 Total income 22 337 010,17 Management fee (Note 5) (6 491 249,47) Depositary and paying agent fee (Note 7) (539 869,89) Subscription tax (Note 3) (429 871,44) Interest on bank accounts (404,70) Other charges and taxes (Notes 4, 10) (2 925 497,22) Total expenses (10 386 892,72) Net investment income / (loss) 11 950 117,45 Net realised profit / (loss) on sales of investments, currencies and other financial instruments (Notes 2, 11, 12) (12 614 915,67) Change in unrealised appreciation / (depreciation) on - investments (Note 2) (11 048 601,76) - forward foreign exchange contracts (Notes 2, 12) (3 926 258,92) - foreign currencies (1 779,59) - future contracts (Notes 2, 12) 1 257 540,67 - swap contracts (Notes 2, 11) 4 625 090,88 Net result of operations for the year (9 758 806,94)
Subscriptions for the year 365 905 928,00 Redemptions for the year (35 553 955,86)
Net assets at the end of the year 846 254 368,99
215
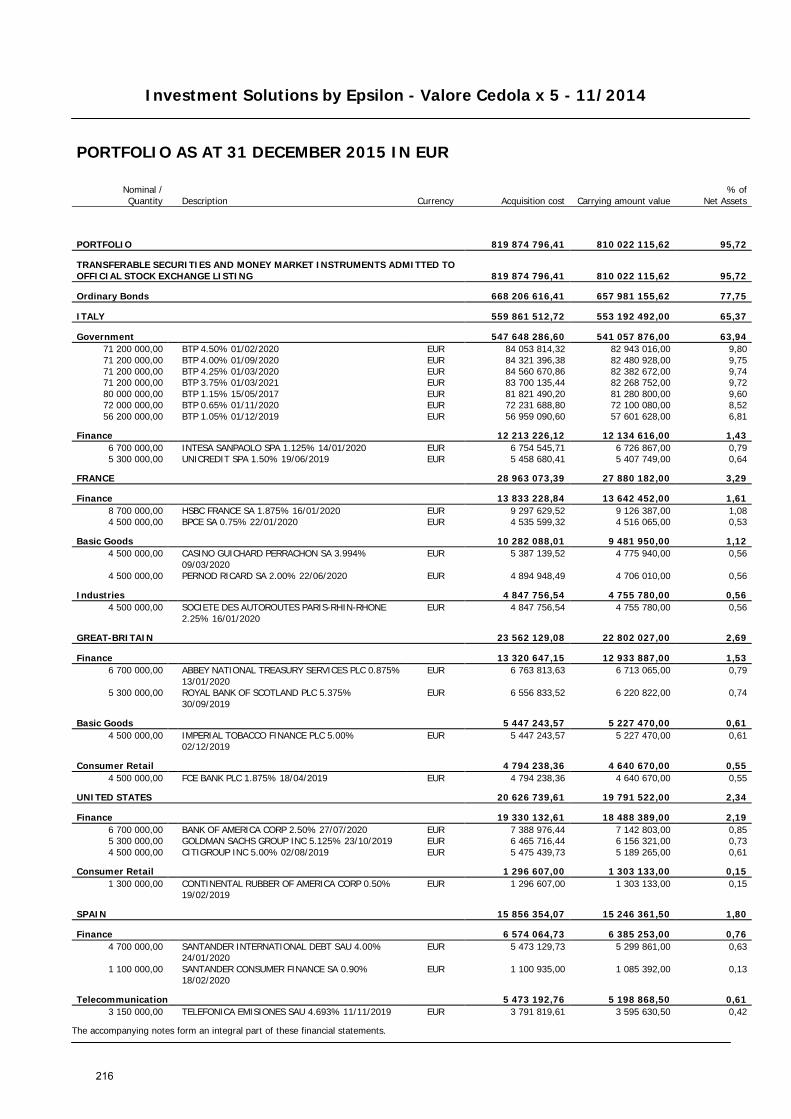
Investment Solutions by Epsilon - Valore Cedola x 5 - 11/2014
The accompanying notes form an integral part of these financial statements.
PORTFOLIO AS AT 31 DECEMBER 2015 IN EUR
Nominal / Quantity Description Currency Acquisition cost Carrying amount value
% of Net Assets
PORTFOLIO 819 874 796,41 810 022 115,62 95,72
TRANSFERABLE SECURITIES AND MONEY MARKET INSTRUMENTS ADMITTED TO OFFICIAL STOCK EXCHANGE LISTING 819 874 796,41 810 022 115,62 95,72
Ordinary Bonds 668 206 616,41 657 981 155,62 77,75
ITALY 559 861 512,72 553 192 492,00 65,37
Government 547 648 286,60 541 057 876,00 63,94 71 200 000,00 BTP 4.50% 01/02/2020 EUR 84 053 814,32 82 943 016,00 9,80 71 200 000,00 BTP 4.00% 01/09/2020 EUR 84 321 396,38 82 480 928,00 9,75 71 200 000,00 BTP 4.25% 01/03/2020 EUR 84 560 670,86 82 382 672,00 9,74 71 200 000,00 BTP 3.75% 01/03/2021 EUR 83 700 135,44 82 268 752,00 9,72 80 000 000,00 BTP 1.15% 15/05/2017 EUR 81 821 490,20 81 280 800,00 9,60 72 000 000,00 BTP 0.65% 01/11/2020 EUR 72 231 688,80 72 100 080,00 8,52 56 200 000,00 BTP 1.05% 01/12/2019 EUR 56 959 090,60 57 601 628,00 6,81
Finance 12 213 226,12 12 134 616,00 1,43 6 700 000,00 INTESA SANPAOLO SPA 1.125% 14/01/2020 EUR 6 754 545,71 6 726 867,00 0,79 5 300 000,00 UNICREDIT SPA 1.50% 19/06/2019 EUR 5 458 680,41 5 407 749,00 0,64
FRANCE 28 963 073,39 27 880 182,00 3,29
Finance 13 833 228,84 13 642 452,00 1,61 8 700 000,00 HSBC FRANCE SA 1.875% 16/01/2020 EUR 9 297 629,52 9 126 387,00 1,08 4 500 000,00 BPCE SA 0.75% 22/01/2020 EUR 4 535 599,32 4 516 065,00 0,53
Basic Goods 10 282 088,01 9 481 950,00 1,12 4 500 000,00
CASINO GUICHARD PERRACHON SA 3.994% 09/03/2020
EUR 5 387 139,52 4 775 940,00 0,56
4 500 000,00 PERNOD RICARD SA 2.00% 22/06/2020 EUR 4 894 948,49 4 706 010,00 0,56
Industries 4 847 756,54 4 755 780,00 0,56 4 500 000,00
SOCIETE DES AUTOROUTES PARIS-RHIN-RHONE 2.25% 16/01/2020
EUR 4 847 756,54 4 755 780,00 0,56
GREAT-BRITAIN 23 562 129,08 22 802 027,00 2,69
Finance 13 320 647,15 12 933 887,00 1,53 6 700 000,00
ABBEY NATIONAL TREASURY SERVICES PLC 0.875% 13/01/2020
EUR 6 763 813,63 6 713 065,00 0,79
5 300 000,00
ROYAL BANK OF SCOTLAND PLC 5.375% 30/09/2019
EUR 6 556 833,52 6 220 822,00 0,74
Basic Goods 5 447 243,57 5 227 470,00 0,61 4 500 000,00
IMPERIAL TOBACCO FINANCE PLC 5.00% 02/12/2019
EUR 5 447 243,57 5 227 470,00 0,61
Consumer Retail 4 794 238,36 4 640 670,00 0,55 4 500 000,00 FCE BANK PLC 1.875% 18/04/2019 EUR 4 794 238,36 4 640 670,00 0,55
UNITED STATES 20 626 739,61 19 791 522,00 2,34
Finance 19 330 132,61 18 488 389,00 2,19 6 700 000,00 BANK OF AMERICA CORP 2.50% 27/07/2020 EUR 7 388 976,44 7 142 803,00 0,85 5 300 000,00 GOLDMAN SACHS GROUP INC 5.125% 23/10/2019 EUR 6 465 716,44 6 156 321,00 0,73 4 500 000,00 CITIGROUP INC 5.00% 02/08/2019 EUR 5 475 439,73 5 189 265,00 0,61
Consumer Retail 1 296 607,00 1 303 133,00 0,15 1 300 000,00
CONTINENTAL RUBBER OF AMERICA CORP 0.50% 19/02/2019
EUR 1 296 607,00 1 303 133,00 0,15
SPAIN 15 856 354,07 15 246 361,50 1,80
Finance 6 574 064,73 6 385 253,00 0,76 4 700 000,00
SANTANDER INTERNATIONAL DEBT SAU 4.00% 24/01/2020
EUR 5 473 129,73 5 299 861,00 0,63
1 100 000,00
SANTANDER CONSUMER FINANCE SA 0.90% 18/02/2020
EUR 1 100 935,00 1 085 392,00 0,13
Telecommunication 5 473 192,76 5 198 868,50 0,61 3 150 000,00 TELEFONICA EMISIONES SAU 4.693% 11/11/2019 EUR 3 791 819,61 3 595 630,50 0,42
216
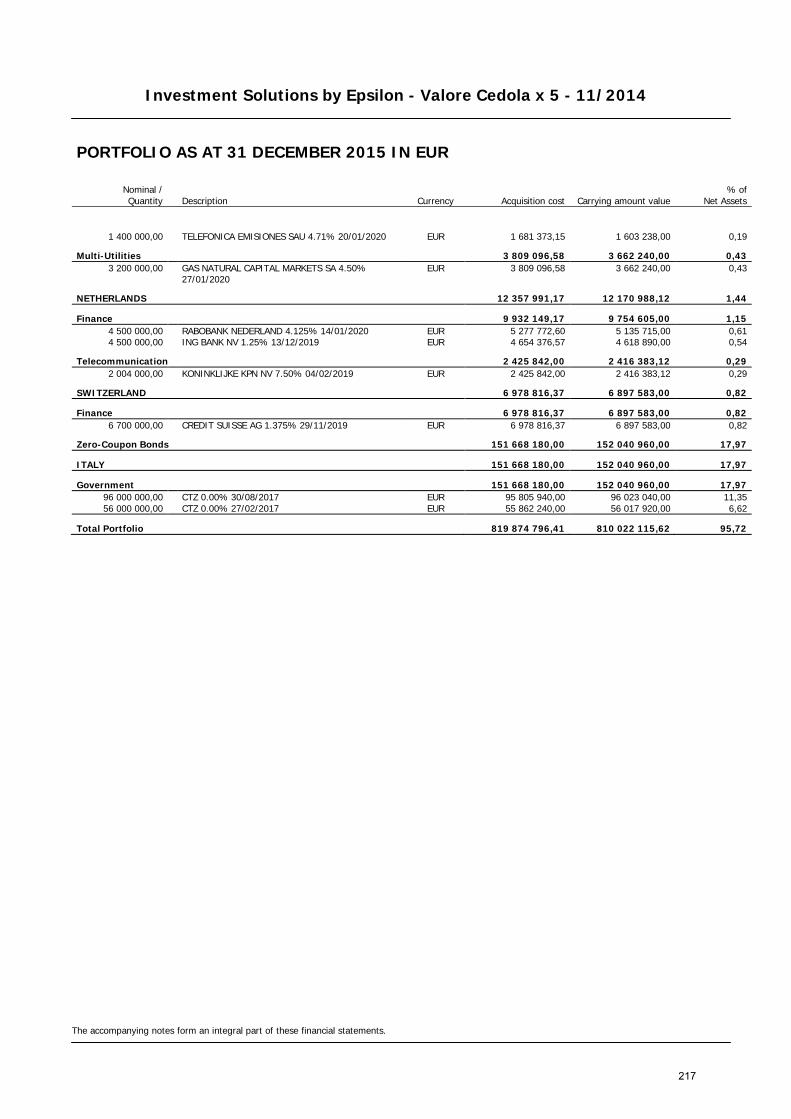
Investment Solutions by Epsilon - Valore Cedola x 5 - 11/2014
The accompanying notes form an integral part of these financial statements.
PORTFOLIO AS AT 31 DECEMBER 2015 IN EUR
Nominal / Quantity Description Currency Acquisition cost Carrying amount value
% of Net Assets
1 400 000,00 TELEFONICA EMISIONES SAU 4.71% 20/01/2020 EUR 1 681 373,15 1 603 238,00 0,19
Multi-Utilities 3 809 096,58 3 662 240,00 0,43 3 200 000,00
GAS NATURAL CAPITAL MARKETS SA 4.50% 27/01/2020
EUR 3 809 096,58 3 662 240,00 0,43
NETHERLANDS 12 357 991,17 12 170 988,12 1,44
Finance 9 932 149,17 9 754 605,00 1,15 4 500 000,00 RABOBANK NEDERLAND 4.125% 14/01/2020 EUR 5 277 772,60 5 135 715,00 0,61 4 500 000,00 ING BANK NV 1.25% 13/12/2019 EUR 4 654 376,57 4 618 890,00 0,54
Telecommunication 2 425 842,00 2 416 383,12 0,29 2 004 000,00 KONINKLIJKE KPN NV 7.50% 04/02/2019 EUR 2 425 842,00 2 416 383,12 0,29
SWITZERLAND 6 978 816,37 6 897 583,00 0,82
Finance 6 978 816,37 6 897 583,00 0,82 6 700 000,00 CREDIT SUISSE AG 1.375% 29/11/2019 EUR 6 978 816,37 6 897 583,00 0,82
Zero-Coupon Bonds 151 668 180,00 152 040 960,00 17,97
ITALY 151 668 180,00 152 040 960,00 17,97
Government 151 668 180,00 152 040 960,00 17,97 96 000 000,00 CTZ 0.00% 30/08/2017 EUR 95 805 940,00 96 023 040,00 11,35 56 000 000,00 CTZ 0.00% 27/02/2017 EUR 55 862 240,00 56 017 920,00 6,62
Total Portfolio 819 874 796,41 810 022 115,62 95,72
217
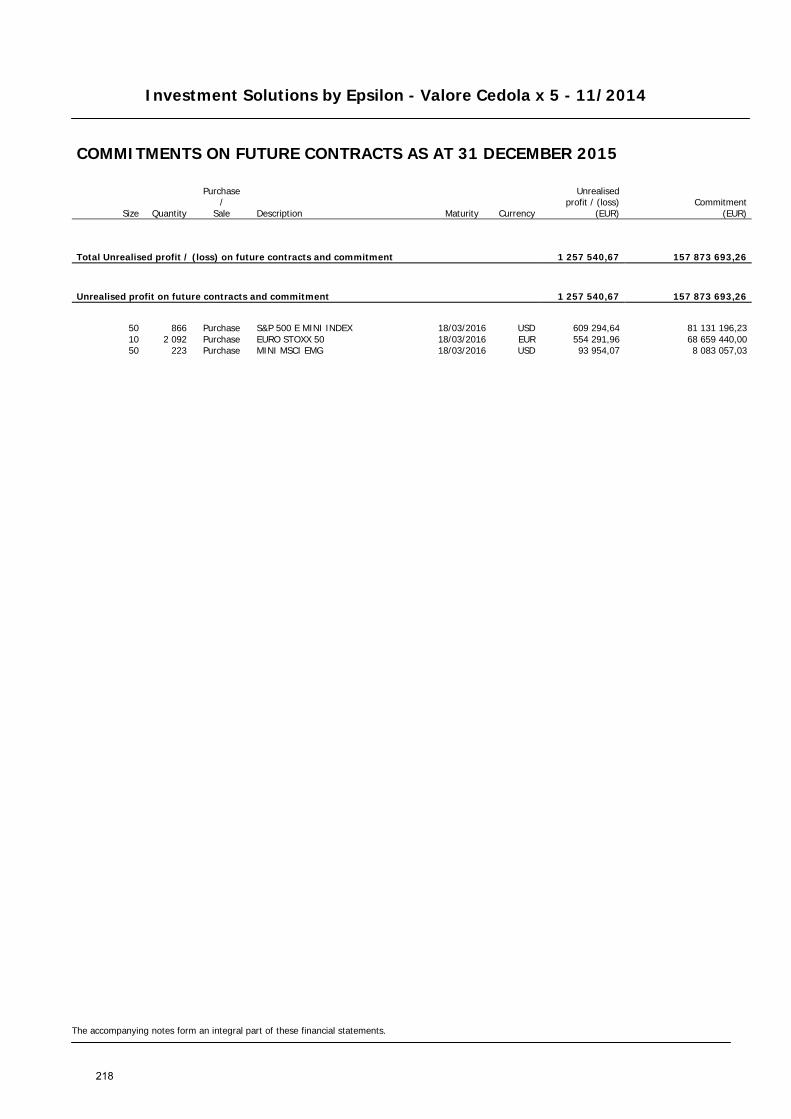
Investment Solutions by Epsilon - Valore Cedola x 5 - 11/2014
The accompanying notes form an integral part of these financial statements.
COMMITMENTS ON FUTURE CONTRACTS AS AT 31 DECEMBER 2015
Size Quantity
Purchase /
Sale Description Maturity Currency
Unrealised profit / (loss)
(EUR) Commitment
(EUR)
Total Unrealised profit / (loss) on future contracts and commitment 1 257 540,67 157 873 693,26
Unrealised profit on future contracts and commitment 1 257 540,67 157 873 693,26
50 866 Purchase S&P 500 E MINI INDEX 18/03/2016 USD 609 294,64 81 131 196,23 10 2 092 Purchase EURO STOXX 50 18/03/2016 EUR 554 291,96 68 659 440,00 50 223 Purchase MINI MSCI EMG 18/03/2016 USD 93 954,07 8 083 057,03
218
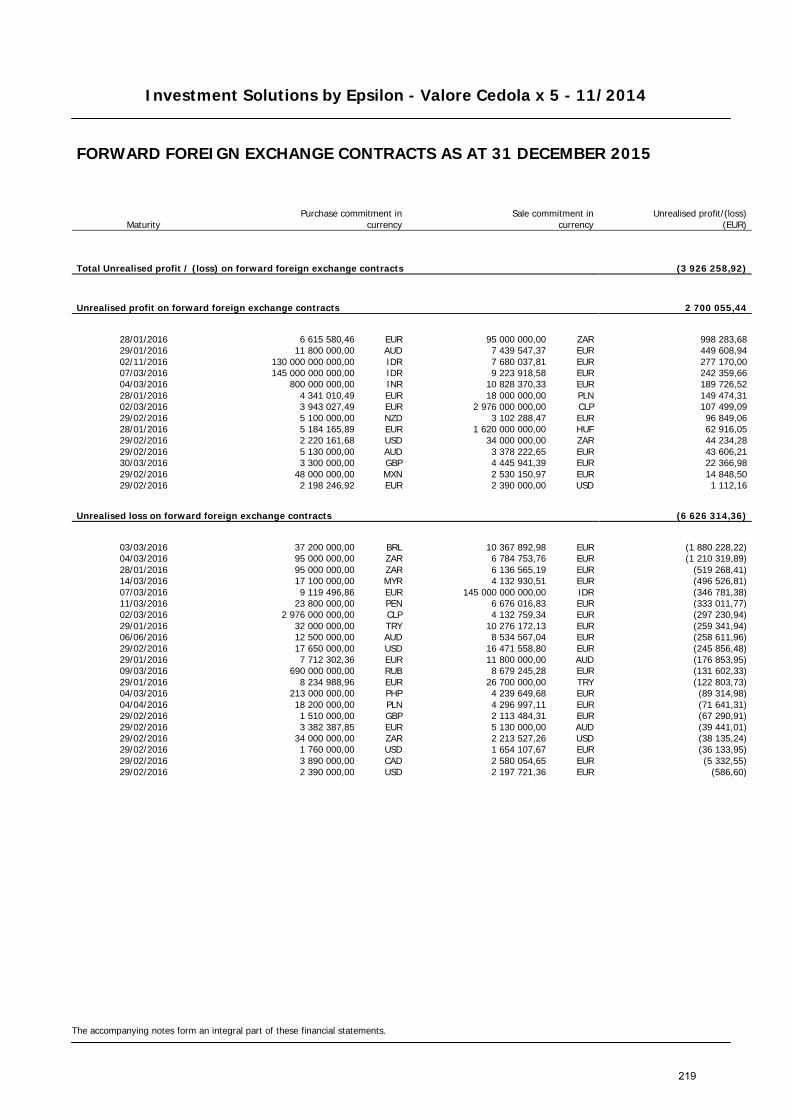
Investment Solutions by Epsilon - Valore Cedola x 5 - 11/2014
The accompanying notes form an integral part of these financial statements.
FORWARD FOREIGN EXCHANGE CONTRACTS AS AT 31 DECEMBER 2015
Maturity Purchase commitment in
currency Sale commitment in
currency
Unrealised profit/(loss) (EUR)
Total Unrealised profit / (loss) on forward foreign exchange contracts (3 926 258,92)
Unrealised profit on forward foreign exchange contracts 2 700 055,44
28/01/2016 6 615 580,46 EUR 95 000 000,00 ZAR 998 283,68 29/01/2016 11 800 000,00 AUD 7 439 547,37 EUR 449 608,94 02/11/2016 130 000 000 000,00 IDR 7 680 037,81 EUR 277 170,00 07/03/2016 145 000 000 000,00 IDR 9 223 918,58 EUR 242 359,66 04/03/2016 800 000 000,00 INR 10 828 370,33 EUR 189 726,52 28/01/2016 4 341 010,49 EUR 18 000 000,00 PLN 149 474,31 02/03/2016 3 943 027,49 EUR 2 976 000 000,00 CLP 107 499,09 29/02/2016 5 100 000,00 NZD 3 102 288,47 EUR 96 849,06 28/01/2016 5 184 165,89 EUR 1 620 000 000,00 HUF 62 916,05 29/02/2016 2 220 161,68 USD 34 000 000,00 ZAR 44 234,28 29/02/2016 5 130 000,00 AUD 3 378 222,65 EUR 43 606,21 30/03/2016 3 300 000,00 GBP 4 445 941,39 EUR 22 366,98 29/02/2016 48 000 000,00 MXN 2 530 150,97 EUR 14 848,50 29/02/2016 2 198 246,92 EUR 2 390 000,00 USD 1 112,16
Unrealised loss on forward foreign exchange contracts (6 626 314,36)
03/03/2016 37 200 000,00 BRL 10 367 892,98 EUR (1 880 228,22) 04/03/2016 95 000 000,00 ZAR 6 784 753,76 EUR (1 210 319,89) 28/01/2016 95 000 000,00 ZAR 6 136 565,19 EUR (519 268,41) 14/03/2016 17 100 000,00 MYR 4 132 930,51 EUR (496 526,81) 07/03/2016 9 119 496,86 EUR 145 000 000 000,00 IDR (346 781,38) 11/03/2016 23 800 000,00 PEN 6 676 016,83 EUR (333 011,77) 02/03/2016 2 976 000 000,00 CLP 4 132 759,34 EUR (297 230,94) 29/01/2016 32 000 000,00 TRY 10 276 172,13 EUR (259 341,94) 06/06/2016 12 500 000,00 AUD 8 534 567,04 EUR (258 611,96) 29/02/2016 17 650 000,00 USD 16 471 558,80 EUR (245 856,48) 29/01/2016 7 712 302,36 EUR 11 800 000,00 AUD (176 853,95) 09/03/2016 690 000 000,00 RUB 8 679 245,28 EUR (131 602,33) 29/01/2016 8 234 988,96 EUR 26 700 000,00 TRY (122 803,73) 04/03/2016 213 000 000,00 PHP 4 239 649,68 EUR (89 314,98) 04/04/2016 18 200 000,00 PLN 4 296 997,11 EUR (71 641,31) 29/02/2016 1 510 000,00 GBP 2 113 484,31 EUR (67 290,91) 29/02/2016 3 382 387,85 EUR 5 130 000,00 AUD (39 441,01) 29/02/2016 34 000 000,00 ZAR 2 213 527,26 USD (38 135,24) 29/02/2016 1 760 000,00 USD 1 654 107,67 EUR (36 133,95) 29/02/2016 3 890 000,00 CAD 2 580 054,65 EUR (5 332,55) 29/02/2016 2 390 000,00 USD 2 197 721,36 EUR (586,60)
219
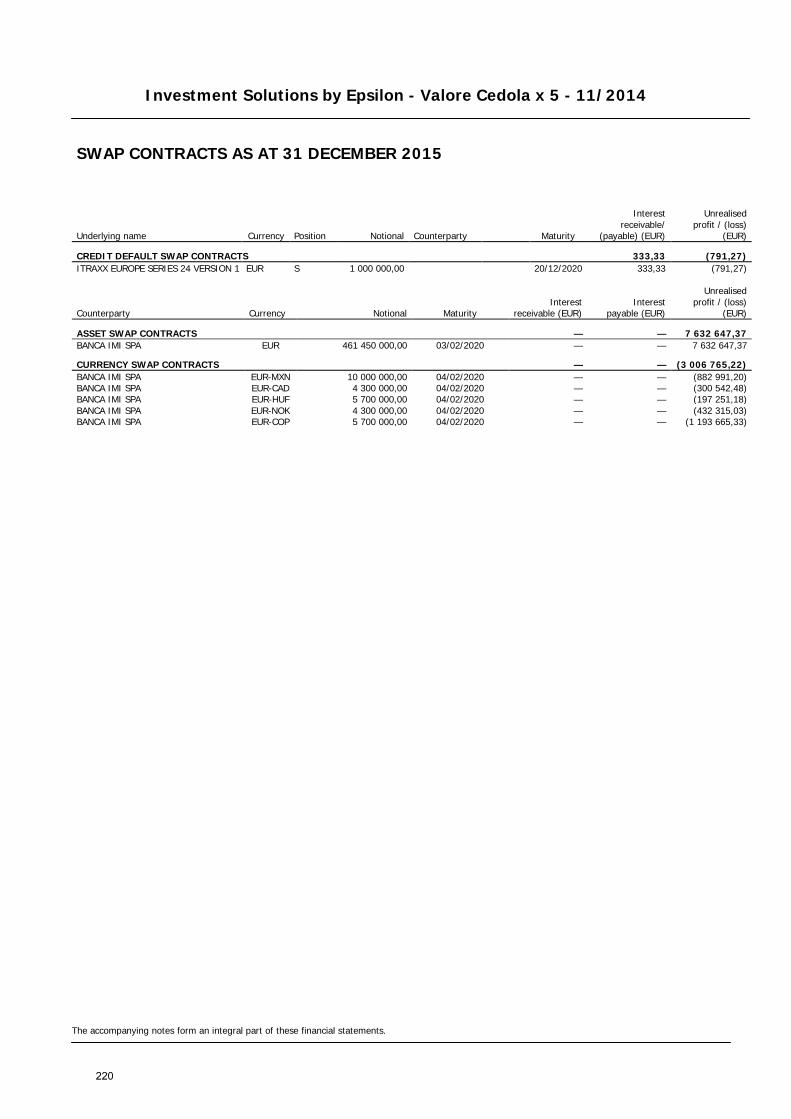
Investment Solutions by Epsilon - Valore Cedola x 5 - 11/2014
The accompanying notes form an integral part of these financial statements.
SWAP CONTRACTS AS AT 31 DECEMBER 2015
Underlying name Currency Position Notional Counterparty Maturity
Interest receivable/
(payable) (EUR)
Unrealised profit / (loss)
(EUR)
CREDIT DEFAULT SWAP CONTRACTS 333,33 (791,27) ITRAXX EUROPE SERIES 24 VERSION 1 EUR S 1 000 000,00 20/12/2020 333,33 (791,27)
Counterparty Currency Notional Maturity Interest
receivable (EUR) Interest
payable (EUR)
Unrealised
profit / (loss) (EUR)
ASSET SWAP CONTRACTS — — 7 632 647,37 BANCA IMI SPA EUR 461 450 000,00 03/02/2020 — — 7 632 647,37
CURRENCY SWAP CONTRACTS — — (3 006 765,22) BANCA IMI SPA EUR-MXN 10 000 000,00 04/02/2020 — — (882 991,20) BANCA IMI SPA EUR-CAD 4 300 000,00 04/02/2020 — — (300 542,48) BANCA IMI SPA EUR-HUF 5 700 000,00 04/02/2020 — — (197 251,18) BANCA IMI SPA EUR-NOK 4 300 000,00 04/02/2020 — — (432 315,03) BANCA IMI SPA EUR-COP 5 700 000,00 04/02/2020 — — (1 193 665,33)
220
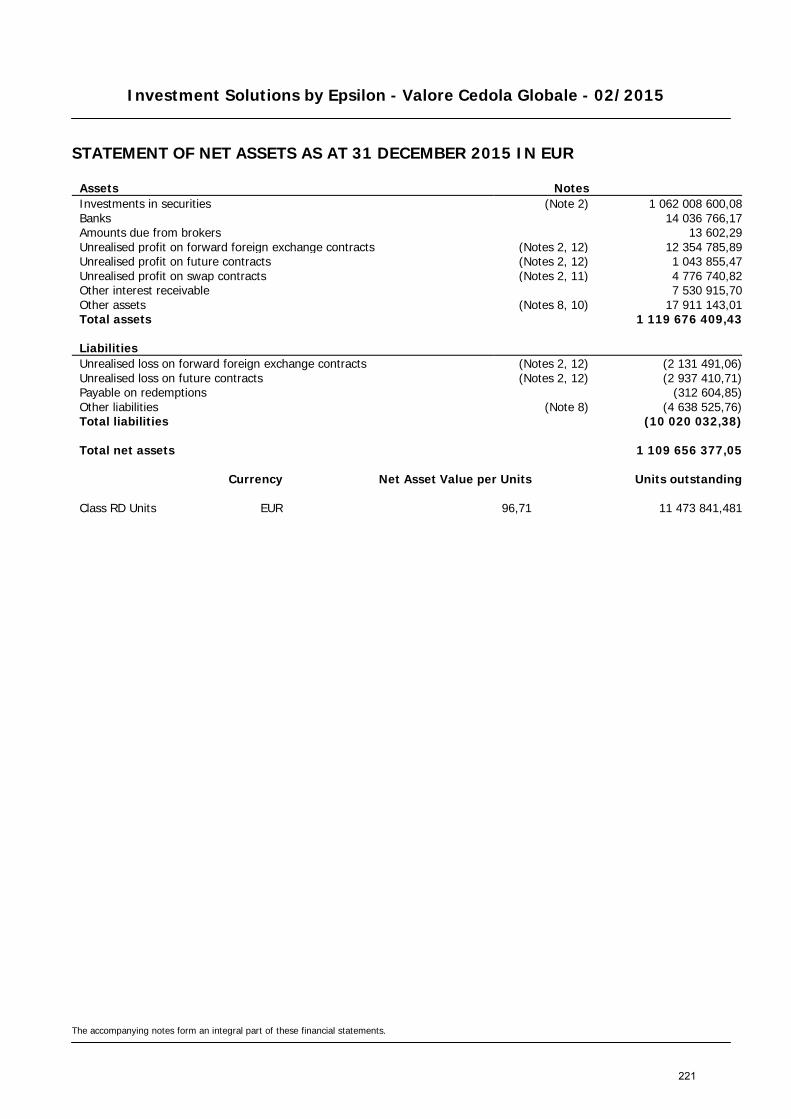
Investment Solutions by Epsilon - Valore Cedola Globale - 02/2015
STATEMENT OF NET ASSETS AS AT 31 DECEMBER 2015 IN EUR
The accompanying notes form an integral part of these financial statements.
Assets Notes Investments in securities (Note 2) 1 062 008 600,08 Banks 14 036 766,17 Amounts due from brokers 13 602,29 Unrealised profit on forward foreign exchange contracts (Notes 2, 12) 12 354 785,89 Unrealised profit on future contracts (Notes 2, 12) 1 043 855,47 Unrealised profit on swap contracts (Notes 2, 11) 4 776 740,82 Other interest receivable 7 530 915,70 Other assets (Notes 8, 10) 17 911 143,01 Total assets 1 119 676 409,43
Liabilities Unrealised loss on forward foreign exchange contracts (Notes 2, 12) (2 131 491,06) Unrealised loss on future contracts (Notes 2, 12) (2 937 410,71) Payable on redemptions (312 604,85) Other liabilities (Note 8) (4 638 525,76) Total liabilities (10 020 032,38)
Total net assets 1 109 656 377,05
Currency Net Asset Value per Units Units outstanding
Class RD Units EUR 96,71 11 473 841,481
221
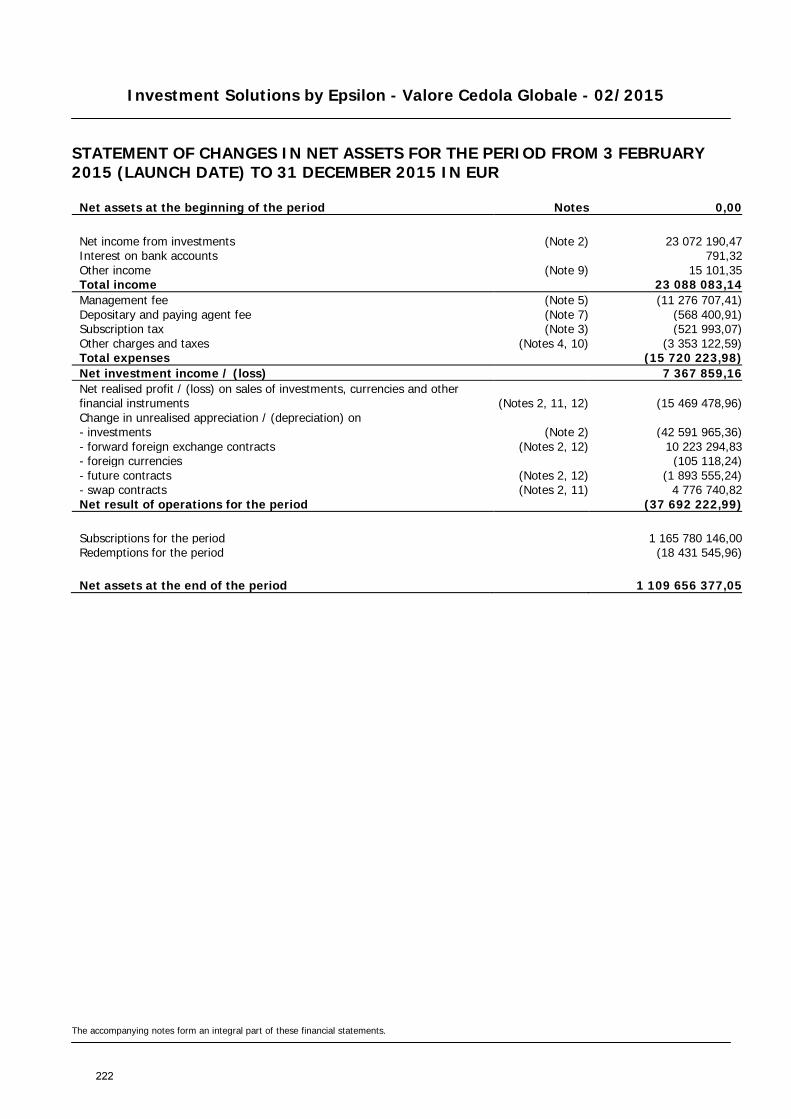
Investment Solutions by Epsilon - Valore Cedola Globale - 02/2015
STATEMENT OF CHANGES IN NET ASSETS FOR THE PERIOD FROM 3 FEBRUARY 2015 (LAUNCH DATE) TO 31 DECEMBER 2015 IN EUR
The accompanying notes form an integral part of these financial statements.
Net assets at the beginning of the period Notes 0,00
Net income from investments (Note 2) 23 072 190,47 Interest on bank accounts 791,32 Other income (Note 9) 15 101,35 Total income 23 088 083,14 Management fee (Note 5) (11 276 707,41) Depositary and paying agent fee (Note 7) (568 400,91) Subscription tax (Note 3) (521 993,07) Other charges and taxes (Notes 4, 10) (3 353 122,59) Total expenses (15 720 223,98) Net investment income / (loss) 7 367 859,16 Net realised profit / (loss) on sales of investments, currencies and other financial instruments (Notes 2, 11, 12) (15 469 478,96) Change in unrealised appreciation / (depreciation) on - investments (Note 2) (42 591 965,36) - forward foreign exchange contracts (Notes 2, 12) 10 223 294,83 - foreign currencies (105 118,24) - future contracts (Notes 2, 12) (1 893 555,24) - swap contracts (Notes 2, 11) 4 776 740,82 Net result of operations for the period (37 692 222,99)
Subscriptions for the period 1 165 780 146,00 Redemptions for the period (18 431 545,96)
Net assets at the end of the period 1 109 656 377,05
222
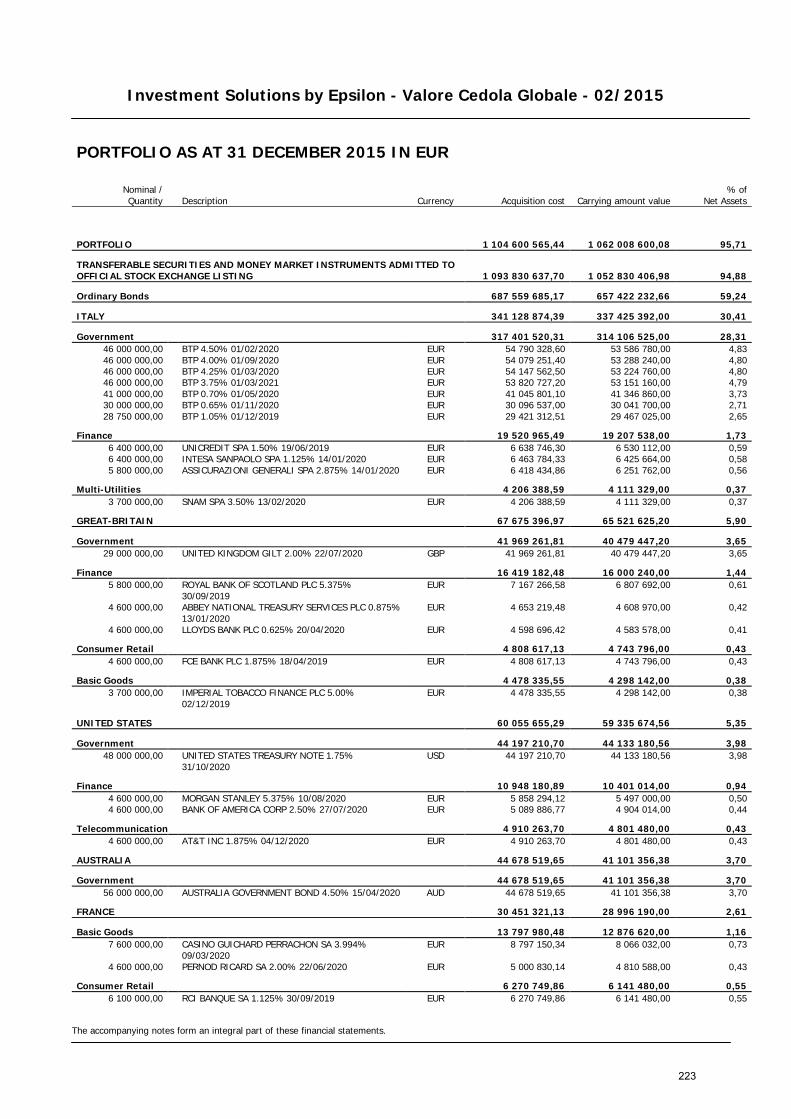
Investment Solutions by Epsilon - Valore Cedola Globale - 02/2015
The accompanying notes form an integral part of these financial statements.
PORTFOLIO AS AT 31 DECEMBER 2015 IN EUR
Nominal / Quantity Description Currency Acquisition cost Carrying amount value
% of Net Assets
PORTFOLIO 1 104 600 565,44 1 062 008 600,08 95,71
TRANSFERABLE SECURITIES AND MONEY MARKET INSTRUMENTS ADMITTED TO OFFICIAL STOCK EXCHANGE LISTING 1 093 830 637,70 1 052 830 406,98 94,88
Ordinary Bonds 687 559 685,17 657 422 232,66 59,24
ITALY 341 128 874,39 337 425 392,00 30,41
Government 317 401 520,31 314 106 525,00 28,31 46 000 000,00 BTP 4.50% 01/02/2020 EUR 54 790 328,60 53 586 780,00 4,83 46 000 000,00 BTP 4.00% 01/09/2020 EUR 54 079 251,40 53 288 240,00 4,80 46 000 000,00 BTP 4.25% 01/03/2020 EUR 54 147 562,50 53 224 760,00 4,80 46 000 000,00 BTP 3.75% 01/03/2021 EUR 53 820 727,20 53 151 160,00 4,79 41 000 000,00 BTP 0.70% 01/05/2020 EUR 41 045 801,10 41 346 860,00 3,73 30 000 000,00 BTP 0.65% 01/11/2020 EUR 30 096 537,00 30 041 700,00 2,71 28 750 000,00 BTP 1.05% 01/12/2019 EUR 29 421 312,51 29 467 025,00 2,65
Finance 19 520 965,49 19 207 538,00 1,73 6 400 000,00 UNICREDIT SPA 1.50% 19/06/2019 EUR 6 638 746,30 6 530 112,00 0,59 6 400 000,00 INTESA SANPAOLO SPA 1.125% 14/01/2020 EUR 6 463 784,33 6 425 664,00 0,58 5 800 000,00 ASSICURAZIONI GENERALI SPA 2.875% 14/01/2020 EUR 6 418 434,86 6 251 762,00 0,56
Multi-Utilities 4 206 388,59 4 111 329,00 0,37 3 700 000,00 SNAM SPA 3.50% 13/02/2020 EUR 4 206 388,59 4 111 329,00 0,37
GREAT-BRITAIN 67 675 396,97 65 521 625,20 5,90
Government 41 969 261,81 40 479 447,20 3,65 29 000 000,00 UNITED KINGDOM GILT 2.00% 22/07/2020 GBP 41 969 261,81 40 479 447,20 3,65
Finance 16 419 182,48 16 000 240,00 1,44 5 800 000,00
ROYAL BANK OF SCOTLAND PLC 5.375% 30/09/2019
EUR 7 167 266,58 6 807 692,00 0,61
4 600 000,00
ABBEY NATIONAL TREASURY SERVICES PLC 0.875% 13/01/2020
EUR 4 653 219,48 4 608 970,00 0,42
4 600 000,00 LLOYDS BANK PLC 0.625% 20/04/2020 EUR 4 598 696,42 4 583 578,00 0,41
Consumer Retail 4 808 617,13 4 743 796,00 0,43 4 600 000,00 FCE BANK PLC 1.875% 18/04/2019 EUR 4 808 617,13 4 743 796,00 0,43
Basic Goods 4 478 335,55 4 298 142,00 0,38 3 700 000,00
IMPERIAL TOBACCO FINANCE PLC 5.00% 02/12/2019
EUR 4 478 335,55 4 298 142,00 0,38
UNITED STATES 60 055 655,29 59 335 674,56 5,35
Government 44 197 210,70 44 133 180,56 3,98 48 000 000,00
UNITED STATES TREASURY NOTE 1.75% 31/10/2020
USD 44 197 210,70 44 133 180,56 3,98
Finance 10 948 180,89 10 401 014,00 0,94 4 600 000,00 MORGAN STANLEY 5.375% 10/08/2020 EUR 5 858 294,12 5 497 000,00 0,50 4 600 000,00 BANK OF AMERICA CORP 2.50% 27/07/2020 EUR 5 089 886,77 4 904 014,00 0,44
Telecommunication 4 910 263,70 4 801 480,00 0,43 4 600 000,00 AT&T INC 1.875% 04/12/2020 EUR 4 910 263,70 4 801 480,00 0,43
AUSTRALIA 44 678 519,65 41 101 356,38 3,70
Government 44 678 519,65 41 101 356,38 3,70 56 000 000,00 AUSTRALIA GOVERNMENT BOND 4.50% 15/04/2020 AUD 44 678 519,65 41 101 356,38 3,70
FRANCE 30 451 321,13 28 996 190,00 2,61
Basic Goods 13 797 980,48 12 876 620,00 1,16 7 600 000,00
CASINO GUICHARD PERRACHON SA 3.994% 09/03/2020
EUR 8 797 150,34 8 066 032,00 0,73
4 600 000,00 PERNOD RICARD SA 2.00% 22/06/2020 EUR 5 000 830,14 4 810 588,00 0,43
Consumer Retail 6 270 749,86 6 141 480,00 0,55 6 100 000,00 RCI BANQUE SA 1.125% 30/09/2019 EUR 6 270 749,86 6 141 480,00 0,55
223
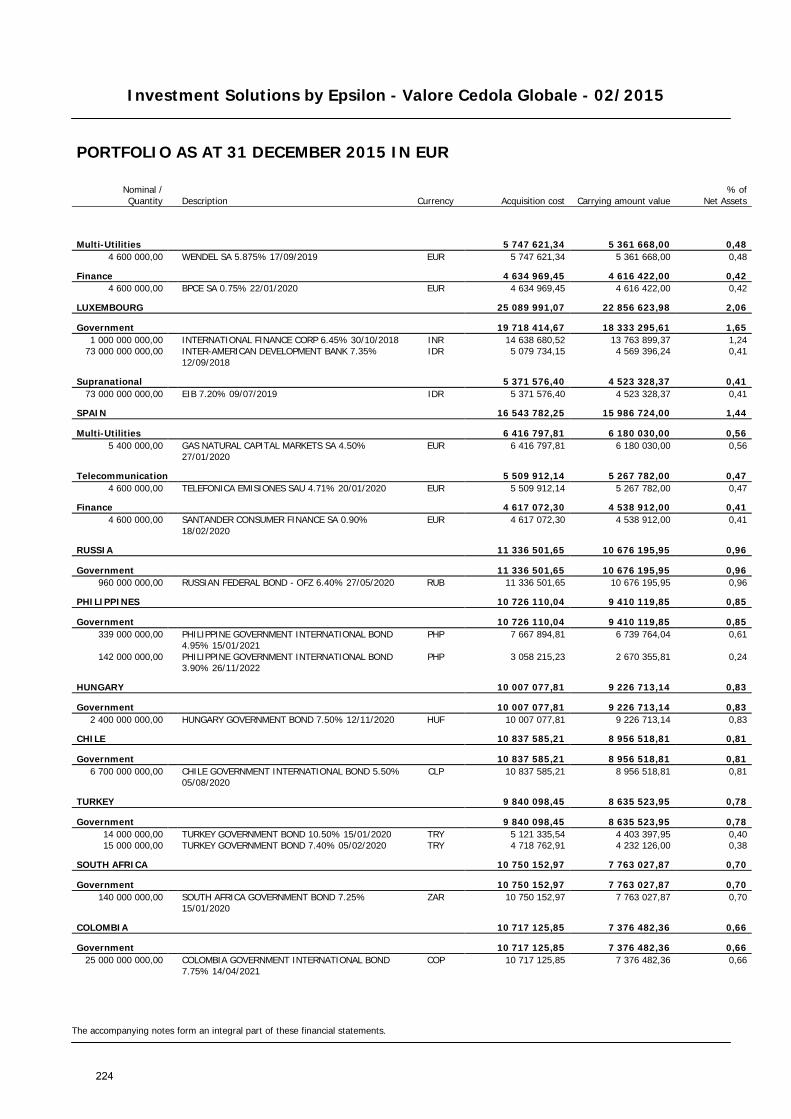
Investment Solutions by Epsilon - Valore Cedola Globale - 02/2015
The accompanying notes form an integral part of these financial statements.
PORTFOLIO AS AT 31 DECEMBER 2015 IN EUR
Nominal / Quantity Description Currency Acquisition cost Carrying amount value
% of Net Assets
Multi-Utilities 5 747 621,34 5 361 668,00 0,48 4 600 000,00 WENDEL SA 5.875% 17/09/2019 EUR 5 747 621,34 5 361 668,00 0,48
Finance 4 634 969,45 4 616 422,00 0,42 4 600 000,00 BPCE SA 0.75% 22/01/2020 EUR 4 634 969,45 4 616 422,00 0,42
LUXEMBOURG 25 089 991,07 22 856 623,98 2,06
Government 19 718 414,67 18 333 295,61 1,65 1 000 000 000,00 INTERNATIONAL FINANCE CORP 6.45% 30/10/2018 INR 14 638 680,52 13 763 899,37 1,24
73 000 000 000,00
INTER-AMERICAN DEVELOPMENT BANK 7.35% 12/09/2018
IDR 5 079 734,15 4 569 396,24 0,41
Supranational 5 371 576,40 4 523 328,37 0,41 73 000 000 000,00 EIB 7.20% 09/07/2019 IDR 5 371 576,40 4 523 328,37 0,41
SPAIN 16 543 782,25 15 986 724,00 1,44
Multi-Utilities 6 416 797,81 6 180 030,00 0,56 5 400 000,00
GAS NATURAL CAPITAL MARKETS SA 4.50% 27/01/2020
EUR 6 416 797,81 6 180 030,00 0,56
Telecommunication 5 509 912,14 5 267 782,00 0,47 4 600 000,00 TELEFONICA EMISIONES SAU 4.71% 20/01/2020 EUR 5 509 912,14 5 267 782,00 0,47
Finance 4 617 072,30 4 538 912,00 0,41 4 600 000,00
SANTANDER CONSUMER FINANCE SA 0.90% 18/02/2020
EUR 4 617 072,30 4 538 912,00 0,41
RUSSIA 11 336 501,65 10 676 195,95 0,96
Government 11 336 501,65 10 676 195,95 0,96 960 000 000,00 RUSSIAN FEDERAL BOND - OFZ 6.40% 27/05/2020 RUB 11 336 501,65 10 676 195,95 0,96
PHILIPPINES 10 726 110,04 9 410 119,85 0,85
Government 10 726 110,04 9 410 119,85 0,85 339 000 000,00
PHILIPPINE GOVERNMENT INTERNATIONAL BOND 4.95% 15/01/2021
PHP 7 667 894,81 6 739 764,04 0,61
142 000 000,00
PHILIPPINE GOVERNMENT INTERNATIONAL BOND 3.90% 26/11/2022
PHP 3 058 215,23 2 670 355,81 0,24
HUNGARY 10 007 077,81 9 226 713,14 0,83
Government 10 007 077,81 9 226 713,14 0,83 2 400 000 000,00 HUNGARY GOVERNMENT BOND 7.50% 12/11/2020 HUF 10 007 077,81 9 226 713,14 0,83
CHILE 10 837 585,21 8 956 518,81 0,81
Government 10 837 585,21 8 956 518,81 0,81 6 700 000 000,00
CHILE GOVERNMENT INTERNATIONAL BOND 5.50% 05/08/2020
CLP 10 837 585,21 8 956 518,81 0,81
TURKEY 9 840 098,45 8 635 523,95 0,78
Government 9 840 098,45 8 635 523,95 0,78 14 000 000,00 TURKEY GOVERNMENT BOND 10.50% 15/01/2020 TRY 5 121 335,54 4 403 397,95 0,40 15 000 000,00 TURKEY GOVERNMENT BOND 7.40% 05/02/2020 TRY 4 718 762,91 4 232 126,00 0,38
SOUTH AFRICA 10 750 152,97 7 763 027,87 0,70
Government 10 750 152,97 7 763 027,87 0,70 140 000 000,00
SOUTH AFRICA GOVERNMENT BOND 7.25% 15/01/2020
ZAR 10 750 152,97 7 763 027,87 0,70
COLOMBIA 10 717 125,85 7 376 482,36 0,66
Government 10 717 125,85 7 376 482,36 0,66 25 000 000 000,00
COLOMBIA GOVERNMENT INTERNATIONAL BOND 7.75% 14/04/2021
COP 10 717 125,85 7 376 482,36 0,66
224
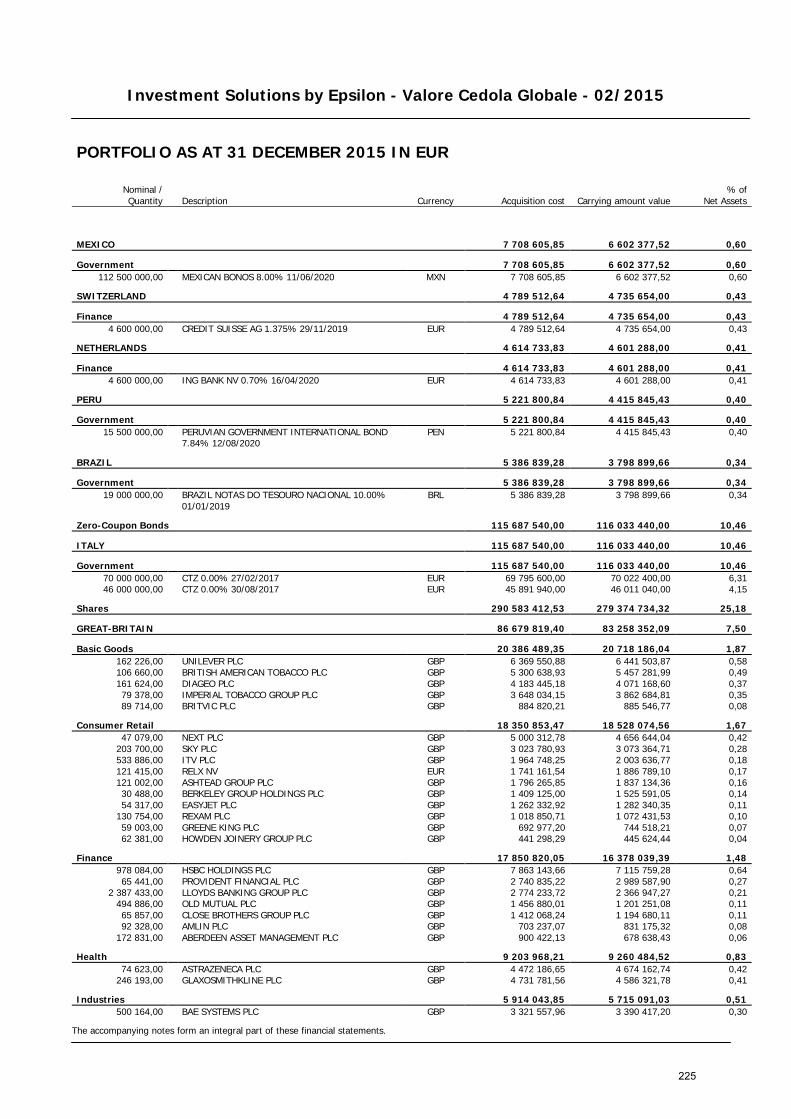
Investment Solutions by Epsilon - Valore Cedola Globale - 02/2015
The accompanying notes form an integral part of these financial statements.
PORTFOLIO AS AT 31 DECEMBER 2015 IN EUR
Nominal / Quantity Description Currency Acquisition cost Carrying amount value
% of Net Assets
MEXICO 7 708 605,85 6 602 377,52 0,60
Government 7 708 605,85 6 602 377,52 0,60 112 500 000,00 MEXICAN BONOS 8.00% 11/06/2020 MXN 7 708 605,85 6 602 377,52 0,60
SWITZERLAND 4 789 512,64 4 735 654,00 0,43
Finance 4 789 512,64 4 735 654,00 0,43 4 600 000,00 CREDIT SUISSE AG 1.375% 29/11/2019 EUR 4 789 512,64 4 735 654,00 0,43
NETHERLANDS 4 614 733,83 4 601 288,00 0,41
Finance 4 614 733,83 4 601 288,00 0,41 4 600 000,00 ING BANK NV 0.70% 16/04/2020 EUR 4 614 733,83 4 601 288,00 0,41
PERU 5 221 800,84 4 415 845,43 0,40
Government 5 221 800,84 4 415 845,43 0,40 15 500 000,00
PERUVIAN GOVERNMENT INTERNATIONAL BOND 7.84% 12/08/2020
PEN 5 221 800,84 4 415 845,43 0,40
BRAZIL 5 386 839,28 3 798 899,66 0,34
Government 5 386 839,28 3 798 899,66 0,34 19 000 000,00
BRAZIL NOTAS DO TESOURO NACIONAL 10.00% 01/01/2019
BRL 5 386 839,28 3 798 899,66 0,34
Zero-Coupon Bonds 115 687 540,00 116 033 440,00 10,46
ITALY 115 687 540,00 116 033 440,00 10,46
Government 115 687 540,00 116 033 440,00 10,46 70 000 000,00 CTZ 0.00% 27/02/2017 EUR 69 795 600,00 70 022 400,00 6,31 46 000 000,00 CTZ 0.00% 30/08/2017 EUR 45 891 940,00 46 011 040,00 4,15
Shares 290 583 412,53 279 374 734,32 25,18
GREAT-BRITAIN 86 679 819,40 83 258 352,09 7,50
Basic Goods 20 386 489,35 20 718 186,04 1,87 162 226,00 UNILEVER PLC GBP 6 369 550,88 6 441 503,87 0,58 106 660,00 BRITISH AMERICAN TOBACCO PLC GBP 5 300 638,93 5 457 281,99 0,49 161 624,00 DIAGEO PLC GBP 4 183 445,18 4 071 168,60 0,37 79 378,00 IMPERIAL TOBACCO GROUP PLC GBP 3 648 034,15 3 862 684,81 0,35 89 714,00 BRITVIC PLC GBP 884 820,21 885 546,77 0,08
Consumer Retail 18 350 853,47 18 528 074,56 1,67 47 079,00 NEXT PLC GBP 5 000 312,78 4 656 644,04 0,42
203 700,00 SKY PLC GBP 3 023 780,93 3 073 364,71 0,28 533 886,00 ITV PLC GBP 1 964 748,25 2 003 636,77 0,18 121 415,00 RELX NV EUR 1 741 161,54 1 886 789,10 0,17 121 002,00 ASHTEAD GROUP PLC GBP 1 796 265,85 1 837 134,36 0,16 30 488,00 BERKELEY GROUP HOLDINGS PLC GBP 1 409 125,00 1 525 591,05 0,14 54 317,00 EASYJET PLC GBP 1 262 332,92 1 282 340,35 0,11
130 754,00 REXAM PLC GBP 1 018 850,71 1 072 431,53 0,10 59 003,00 GREENE KING PLC GBP 692 977,20 744 518,21 0,07 62 381,00 HOWDEN JOINERY GROUP PLC GBP 441 298,29 445 624,44 0,04
Finance 17 850 820,05 16 378 039,39 1,48 978 084,00 HSBC HOLDINGS PLC GBP 7 863 143,66 7 115 759,28 0,64 65 441,00 PROVIDENT FINANCIAL PLC GBP 2 740 835,22 2 989 587,90 0,27
2 387 433,00 LLOYDS BANKING GROUP PLC GBP 2 774 233,72 2 366 947,27 0,21 494 886,00 OLD MUTUAL PLC GBP 1 456 880,01 1 201 251,08 0,11 65 857,00 CLOSE BROTHERS GROUP PLC GBP 1 412 068,24 1 194 680,11 0,11 92 328,00 AMLIN PLC GBP 703 237,07 831 175,32 0,08
172 831,00 ABERDEEN ASSET MANAGEMENT PLC GBP 900 422,13 678 638,43 0,06
Health 9 203 968,21 9 260 484,52 0,83 74 623,00 ASTRAZENECA PLC GBP 4 472 186,65 4 674 162,74 0,42
246 193,00 GLAXOSMITHKLINE PLC GBP 4 731 781,56 4 586 321,78 0,41
Industries 5 914 043,85 5 715 091,03 0,51 500 164,00 BAE SYSTEMS PLC GBP 3 321 557,96 3 390 417,20 0,30
225
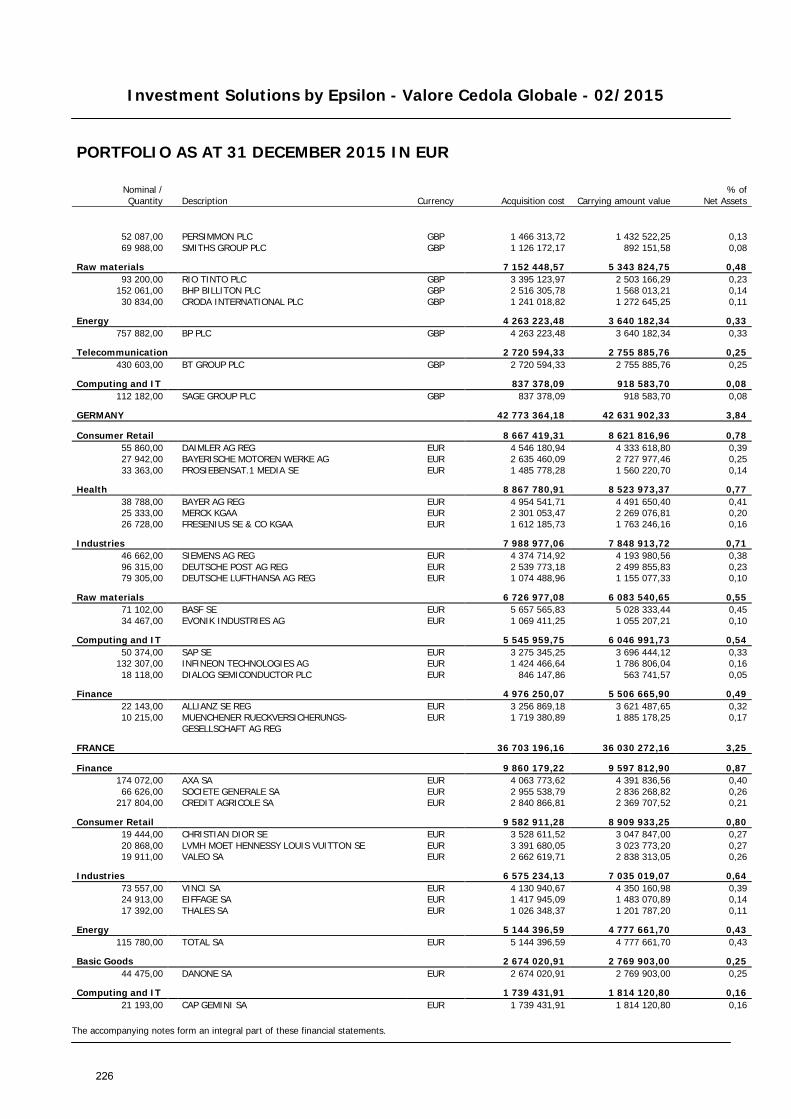
Investment Solutions by Epsilon - Valore Cedola Globale - 02/2015
The accompanying notes form an integral part of these financial statements.
PORTFOLIO AS AT 31 DECEMBER 2015 IN EUR
Nominal / Quantity Description Currency Acquisition cost Carrying amount value
% of Net Assets
52 087,00 PERSIMMON PLC GBP 1 466 313,72 1 432 522,25 0,13 69 988,00 SMITHS GROUP PLC GBP 1 126 172,17 892 151,58 0,08
Raw materials 7 152 448,57 5 343 824,75 0,48 93 200,00 RIO TINTO PLC GBP 3 395 123,97 2 503 166,29 0,23
152 061,00 BHP BILLITON PLC GBP 2 516 305,78 1 568 013,21 0,14 30 834,00 CRODA INTERNATIONAL PLC GBP 1 241 018,82 1 272 645,25 0,11
Energy 4 263 223,48 3 640 182,34 0,33 757 882,00 BP PLC GBP 4 263 223,48 3 640 182,34 0,33
Telecommunication 2 720 594,33 2 755 885,76 0,25 430 603,00 BT GROUP PLC GBP 2 720 594,33 2 755 885,76 0,25
Computing and IT 837 378,09 918 583,70 0,08 112 182,00 SAGE GROUP PLC GBP 837 378,09 918 583,70 0,08
GERMANY 42 773 364,18 42 631 902,33 3,84
Consumer Retail 8 667 419,31 8 621 816,96 0,78 55 860,00 DAIMLER AG REG EUR 4 546 180,94 4 333 618,80 0,39 27 942,00 BAYERISCHE MOTOREN WERKE AG EUR 2 635 460,09 2 727 977,46 0,25 33 363,00 PROSIEBENSAT.1 MEDIA SE EUR 1 485 778,28 1 560 220,70 0,14
Health 8 867 780,91 8 523 973,37 0,77 38 788,00 BAYER AG REG EUR 4 954 541,71 4 491 650,40 0,41 25 333,00 MERCK KGAA EUR 2 301 053,47 2 269 076,81 0,20 26 728,00 FRESENIUS SE & CO KGAA EUR 1 612 185,73 1 763 246,16 0,16
Industries 7 988 977,06 7 848 913,72 0,71 46 662,00 SIEMENS AG REG EUR 4 374 714,92 4 193 980,56 0,38 96 315,00 DEUTSCHE POST AG REG EUR 2 539 773,18 2 499 855,83 0,23 79 305,00 DEUTSCHE LUFTHANSA AG REG EUR 1 074 488,96 1 155 077,33 0,10
Raw materials 6 726 977,08 6 083 540,65 0,55 71 102,00 BASF SE EUR 5 657 565,83 5 028 333,44 0,45 34 467,00 EVONIK INDUSTRIES AG EUR 1 069 411,25 1 055 207,21 0,10
Computing and IT 5 545 959,75 6 046 991,73 0,54 50 374,00 SAP SE EUR 3 275 345,25 3 696 444,12 0,33
132 307,00 INFINEON TECHNOLOGIES AG EUR 1 424 466,64 1 786 806,04 0,16 18 118,00 DIALOG SEMICONDUCTOR PLC EUR 846 147,86 563 741,57 0,05
Finance 4 976 250,07 5 506 665,90 0,49 22 143,00 ALLIANZ SE REG EUR 3 256 869,18 3 621 487,65 0,32 10 215,00
MUENCHENER RUECKVERSICHERUNGS-GESELLSCHAFT AG REG
EUR 1 719 380,89 1 885 178,25 0,17
FRANCE 36 703 196,16 36 030 272,16 3,25
Finance 9 860 179,22 9 597 812,90 0,87 174 072,00 AXA SA EUR 4 063 773,62 4 391 836,56 0,40 66 626,00 SOCIETE GENERALE SA EUR 2 955 538,79 2 836 268,82 0,26
217 804,00 CREDIT AGRICOLE SA EUR 2 840 866,81 2 369 707,52 0,21
Consumer Retail 9 582 911,28 8 909 933,25 0,80 19 444,00 CHRISTIAN DIOR SE EUR 3 528 611,52 3 047 847,00 0,27 20 868,00 LVMH MOET HENNESSY LOUIS VUITTON SE EUR 3 391 680,05 3 023 773,20 0,27 19 911,00 VALEO SA EUR 2 662 619,71 2 838 313,05 0,26
Industries 6 575 234,13 7 035 019,07 0,64 73 557,00 VINCI SA EUR 4 130 940,67 4 350 160,98 0,39 24 913,00 EIFFAGE SA EUR 1 417 945,09 1 483 070,89 0,14 17 392,00 THALES SA EUR 1 026 348,37 1 201 787,20 0,11
Energy 5 144 396,59 4 777 661,70 0,43 115 780,00 TOTAL SA EUR 5 144 396,59 4 777 661,70 0,43
Basic Goods 2 674 020,91 2 769 903,00 0,25 44 475,00 DANONE SA EUR 2 674 020,91 2 769 903,00 0,25
Computing and IT 1 739 431,91 1 814 120,80 0,16 21 193,00 CAP GEMINI SA EUR 1 739 431,91 1 814 120,80 0,16
226
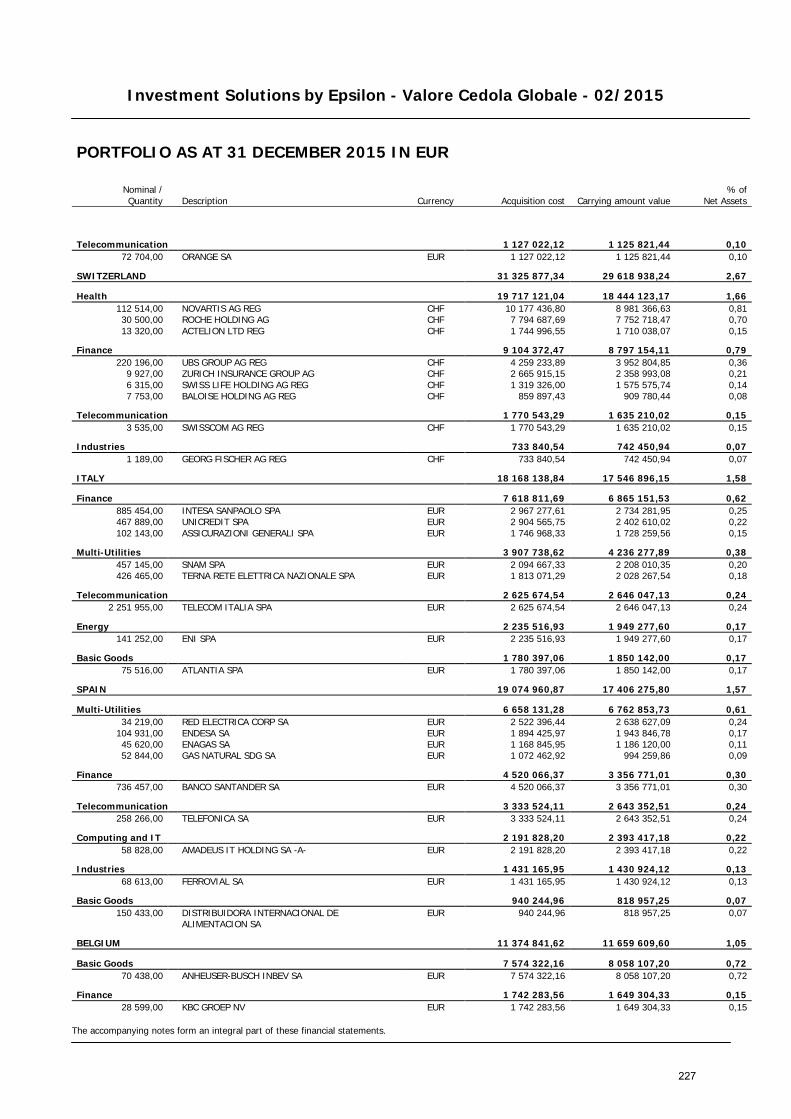
Investment Solutions by Epsilon - Valore Cedola Globale - 02/2015
The accompanying notes form an integral part of these financial statements.
PORTFOLIO AS AT 31 DECEMBER 2015 IN EUR
Nominal / Quantity Description Currency Acquisition cost Carrying amount value
% of Net Assets
Telecommunication 1 127 022,12 1 125 821,44 0,10 72 704,00 ORANGE SA EUR 1 127 022,12 1 125 821,44 0,10
SWITZERLAND 31 325 877,34 29 618 938,24 2,67
Health 19 717 121,04 18 444 123,17 1,66 112 514,00 NOVARTIS AG REG CHF 10 177 436,80 8 981 366,63 0,81 30 500,00 ROCHE HOLDING AG CHF 7 794 687,69 7 752 718,47 0,70 13 320,00 ACTELION LTD REG CHF 1 744 996,55 1 710 038,07 0,15
Finance 9 104 372,47 8 797 154,11 0,79 220 196,00 UBS GROUP AG REG CHF 4 259 233,89 3 952 804,85 0,36
9 927,00 ZURICH INSURANCE GROUP AG CHF 2 665 915,15 2 358 993,08 0,21 6 315,00 SWISS LIFE HOLDING AG REG CHF 1 319 326,00 1 575 575,74 0,14 7 753,00 BALOISE HOLDING AG REG CHF 859 897,43 909 780,44 0,08
Telecommunication 1 770 543,29 1 635 210,02 0,15 3 535,00 SWISSCOM AG REG CHF 1 770 543,29 1 635 210,02 0,15
Industries 733 840,54 742 450,94 0,07 1 189,00 GEORG FISCHER AG REG CHF 733 840,54 742 450,94 0,07
ITALY 18 168 138,84 17 546 896,15 1,58
Finance 7 618 811,69 6 865 151,53 0,62 885 454,00 INTESA SANPAOLO SPA EUR 2 967 277,61 2 734 281,95 0,25 467 889,00 UNICREDIT SPA EUR 2 904 565,75 2 402 610,02 0,22 102 143,00 ASSICURAZIONI GENERALI SPA EUR 1 746 968,33 1 728 259,56 0,15
Multi-Utilities 3 907 738,62 4 236 277,89 0,38 457 145,00 SNAM SPA EUR 2 094 667,33 2 208 010,35 0,20 426 465,00 TERNA RETE ELETTRICA NAZIONALE SPA EUR 1 813 071,29 2 028 267,54 0,18
Telecommunication 2 625 674,54 2 646 047,13 0,24 2 251 955,00 TELECOM ITALIA SPA EUR 2 625 674,54 2 646 047,13 0,24
Energy 2 235 516,93 1 949 277,60 0,17 141 252,00 ENI SPA EUR 2 235 516,93 1 949 277,60 0,17
Basic Goods 1 780 397,06 1 850 142,00 0,17 75 516,00 ATLANTIA SPA EUR 1 780 397,06 1 850 142,00 0,17
SPAIN 19 074 960,87 17 406 275,80 1,57
Multi-Utilities 6 658 131,28 6 762 853,73 0,61 34 219,00 RED ELECTRICA CORP SA EUR 2 522 396,44 2 638 627,09 0,24
104 931,00 ENDESA SA EUR 1 894 425,97 1 943 846,78 0,17 45 620,00 ENAGAS SA EUR 1 168 845,95 1 186 120,00 0,11 52 844,00 GAS NATURAL SDG SA EUR 1 072 462,92 994 259,86 0,09
Finance 4 520 066,37 3 356 771,01 0,30 736 457,00 BANCO SANTANDER SA EUR 4 520 066,37 3 356 771,01 0,30
Telecommunication 3 333 524,11 2 643 352,51 0,24 258 266,00 TELEFONICA SA EUR 3 333 524,11 2 643 352,51 0,24
Computing and IT 2 191 828,20 2 393 417,18 0,22 58 828,00 AMADEUS IT HOLDING SA -A- EUR 2 191 828,20 2 393 417,18 0,22
Industries 1 431 165,95 1 430 924,12 0,13 68 613,00 FERROVIAL SA EUR 1 431 165,95 1 430 924,12 0,13
Basic Goods 940 244,96 818 957,25 0,07 150 433,00
DISTRIBUIDORA INTERNACIONAL DE ALIMENTACION SA
EUR 940 244,96 818 957,25 0,07
BELGIUM 11 374 841,62 11 659 609,60 1,05
Basic Goods 7 574 322,16 8 058 107,20 0,72 70 438,00 ANHEUSER-BUSCH INBEV SA EUR 7 574 322,16 8 058 107,20 0,72
Finance 1 742 283,56 1 649 304,33 0,15 28 599,00 KBC GROEP NV EUR 1 742 283,56 1 649 304,33 0,15
227
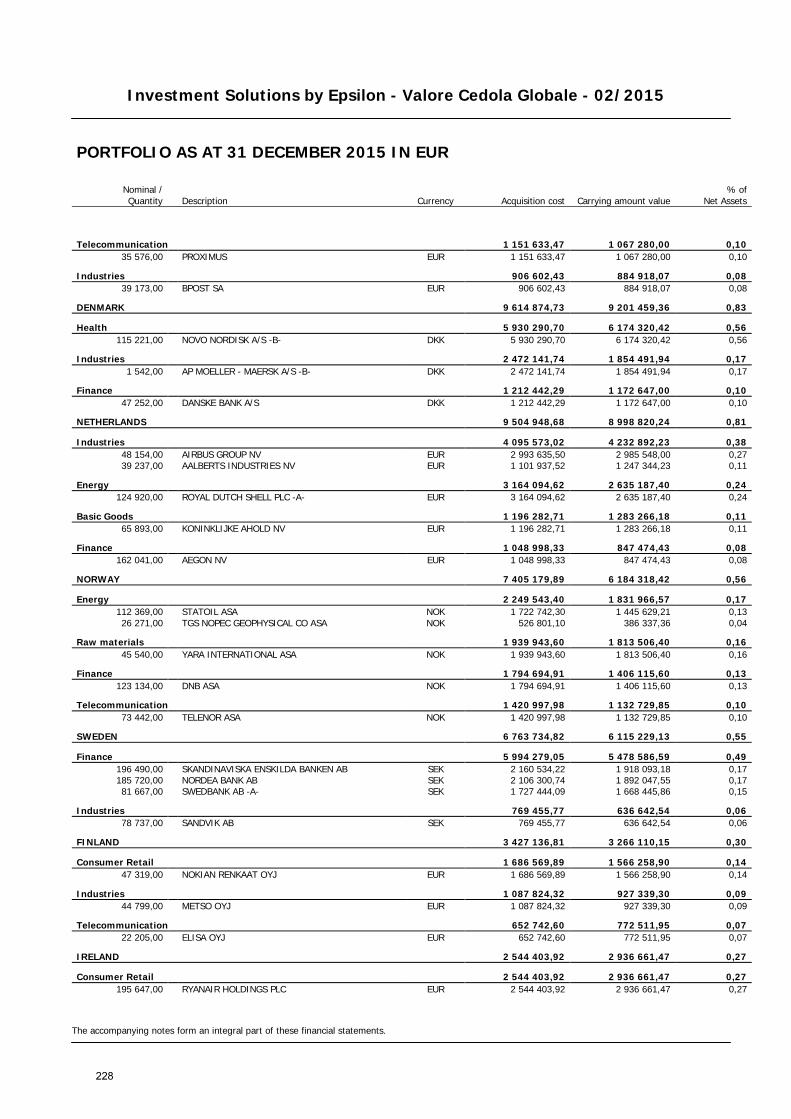
Investment Solutions by Epsilon - Valore Cedola Globale - 02/2015
The accompanying notes form an integral part of these financial statements.
PORTFOLIO AS AT 31 DECEMBER 2015 IN EUR
Nominal / Quantity Description Currency Acquisition cost Carrying amount value
% of Net Assets
Telecommunication 1 151 633,47 1 067 280,00 0,10 35 576,00 PROXIMUS EUR 1 151 633,47 1 067 280,00 0,10
Industries 906 602,43 884 918,07 0,08 39 173,00 BPOST SA EUR 906 602,43 884 918,07 0,08
DENMARK 9 614 874,73 9 201 459,36 0,83
Health 5 930 290,70 6 174 320,42 0,56 115 221,00 NOVO NORDISK A/S -B- DKK 5 930 290,70 6 174 320,42 0,56
Industries 2 472 141,74 1 854 491,94 0,17 1 542,00 AP MOELLER - MAERSK A/S -B- DKK 2 472 141,74 1 854 491,94 0,17
Finance 1 212 442,29 1 172 647,00 0,10 47 252,00 DANSKE BANK A/S DKK 1 212 442,29 1 172 647,00 0,10
NETHERLANDS 9 504 948,68 8 998 820,24 0,81
Industries 4 095 573,02 4 232 892,23 0,38 48 154,00 AIRBUS GROUP NV EUR 2 993 635,50 2 985 548,00 0,27 39 237,00 AALBERTS INDUSTRIES NV EUR 1 101 937,52 1 247 344,23 0,11
Energy 3 164 094,62 2 635 187,40 0,24 124 920,00 ROYAL DUTCH SHELL PLC -A- EUR 3 164 094,62 2 635 187,40 0,24
Basic Goods 1 196 282,71 1 283 266,18 0,11 65 893,00 KONINKLIJKE AHOLD NV EUR 1 196 282,71 1 283 266,18 0,11
Finance 1 048 998,33 847 474,43 0,08 162 041,00 AEGON NV EUR 1 048 998,33 847 474,43 0,08
NORWAY 7 405 179,89 6 184 318,42 0,56
Energy 2 249 543,40 1 831 966,57 0,17 112 369,00 STATOIL ASA NOK 1 722 742,30 1 445 629,21 0,13 26 271,00 TGS NOPEC GEOPHYSICAL CO ASA NOK 526 801,10 386 337,36 0,04
Raw materials 1 939 943,60 1 813 506,40 0,16 45 540,00 YARA INTERNATIONAL ASA NOK 1 939 943,60 1 813 506,40 0,16
Finance 1 794 694,91 1 406 115,60 0,13 123 134,00 DNB ASA NOK 1 794 694,91 1 406 115,60 0,13
Telecommunication 1 420 997,98 1 132 729,85 0,10 73 442,00 TELENOR ASA NOK 1 420 997,98 1 132 729,85 0,10
SWEDEN 6 763 734,82 6 115 229,13 0,55
Finance 5 994 279,05 5 478 586,59 0,49 196 490,00 SKANDINAVISKA ENSKILDA BANKEN AB SEK 2 160 534,22 1 918 093,18 0,17 185 720,00 NORDEA BANK AB SEK 2 106 300,74 1 892 047,55 0,17 81 667,00 SWEDBANK AB -A- SEK 1 727 444,09 1 668 445,86 0,15
Industries 769 455,77 636 642,54 0,06 78 737,00 SANDVIK AB SEK 769 455,77 636 642,54 0,06
FINLAND 3 427 136,81 3 266 110,15 0,30
Consumer Retail 1 686 569,89 1 566 258,90 0,14 47 319,00 NOKIAN RENKAAT OYJ EUR 1 686 569,89 1 566 258,90 0,14
Industries 1 087 824,32 927 339,30 0,09 44 799,00 METSO OYJ EUR 1 087 824,32 927 339,30 0,09
Telecommunication 652 742,60 772 511,95 0,07 22 205,00 ELISA OYJ EUR 652 742,60 772 511,95 0,07
IRELAND 2 544 403,92 2 936 661,47 0,27
Consumer Retail 2 544 403,92 2 936 661,47 0,27 195 647,00 RYANAIR HOLDINGS PLC EUR 2 544 403,92 2 936 661,47 0,27
228
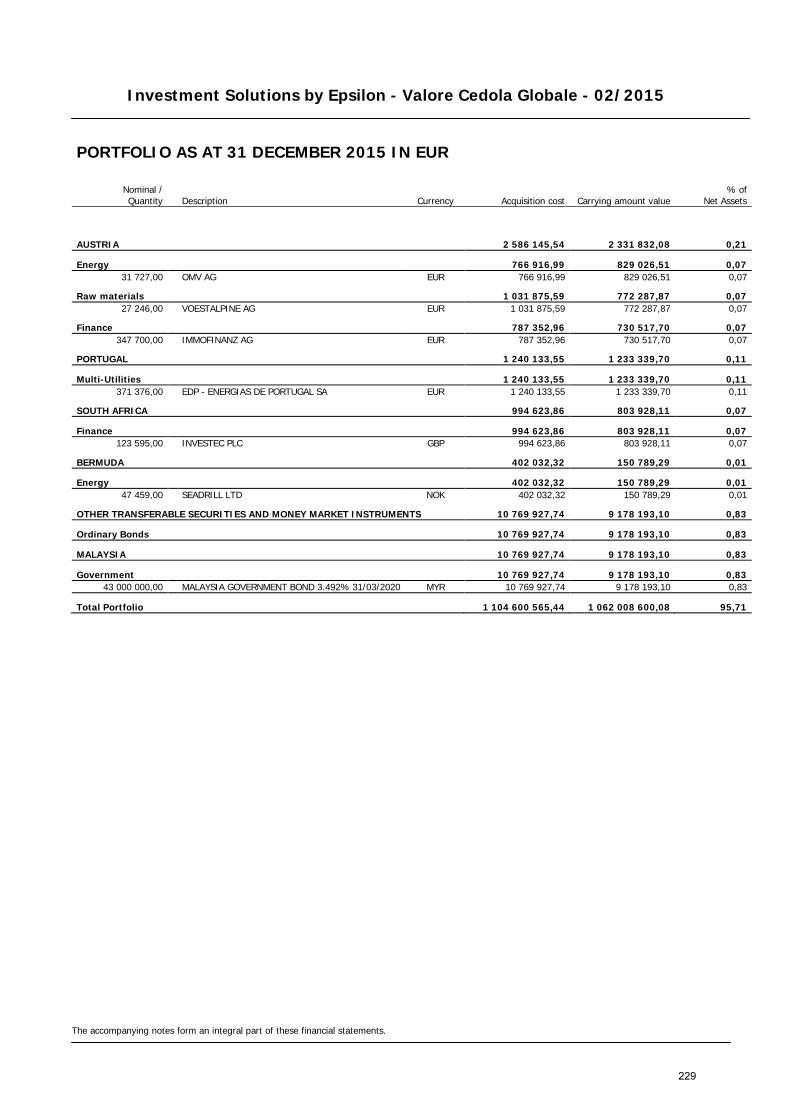
Investment Solutions by Epsilon - Valore Cedola Globale - 02/2015
The accompanying notes form an integral part of these financial statements.
PORTFOLIO AS AT 31 DECEMBER 2015 IN EUR
Nominal / Quantity Description Currency Acquisition cost Carrying amount value
% of Net Assets
AUSTRIA 2 586 145,54 2 331 832,08 0,21
Energy 766 916,99 829 026,51 0,07 31 727,00 OMV AG EUR 766 916,99 829 026,51 0,07
Raw materials 1 031 875,59 772 287,87 0,07 27 246,00 VOESTALPINE AG EUR 1 031 875,59 772 287,87 0,07
Finance 787 352,96 730 517,70 0,07 347 700,00 IMMOFINANZ AG EUR 787 352,96 730 517,70 0,07
PORTUGAL 1 240 133,55 1 233 339,70 0,11
Multi-Utilities 1 240 133,55 1 233 339,70 0,11 371 376,00 EDP - ENERGIAS DE PORTUGAL SA EUR 1 240 133,55 1 233 339,70 0,11
SOUTH AFRICA 994 623,86 803 928,11 0,07
Finance 994 623,86 803 928,11 0,07 123 595,00 INVESTEC PLC GBP 994 623,86 803 928,11 0,07
BERMUDA 402 032,32 150 789,29 0,01
Energy 402 032,32 150 789,29 0,01 47 459,00 SEADRILL LTD NOK 402 032,32 150 789,29 0,01
OTHER TRANSFERABLE SECURITIES AND MONEY MARKET INSTRUMENTS 10 769 927,74 9 178 193,10 0,83
Ordinary Bonds 10 769 927,74 9 178 193,10 0,83
MALAYSIA 10 769 927,74 9 178 193,10 0,83
Government 10 769 927,74 9 178 193,10 0,83 43 000 000,00 MALAYSIA GOVERNMENT BOND 3.492% 31/03/2020 MYR 10 769 927,74 9 178 193,10 0,83
Total Portfolio 1 104 600 565,44 1 062 008 600,08 95,71
229
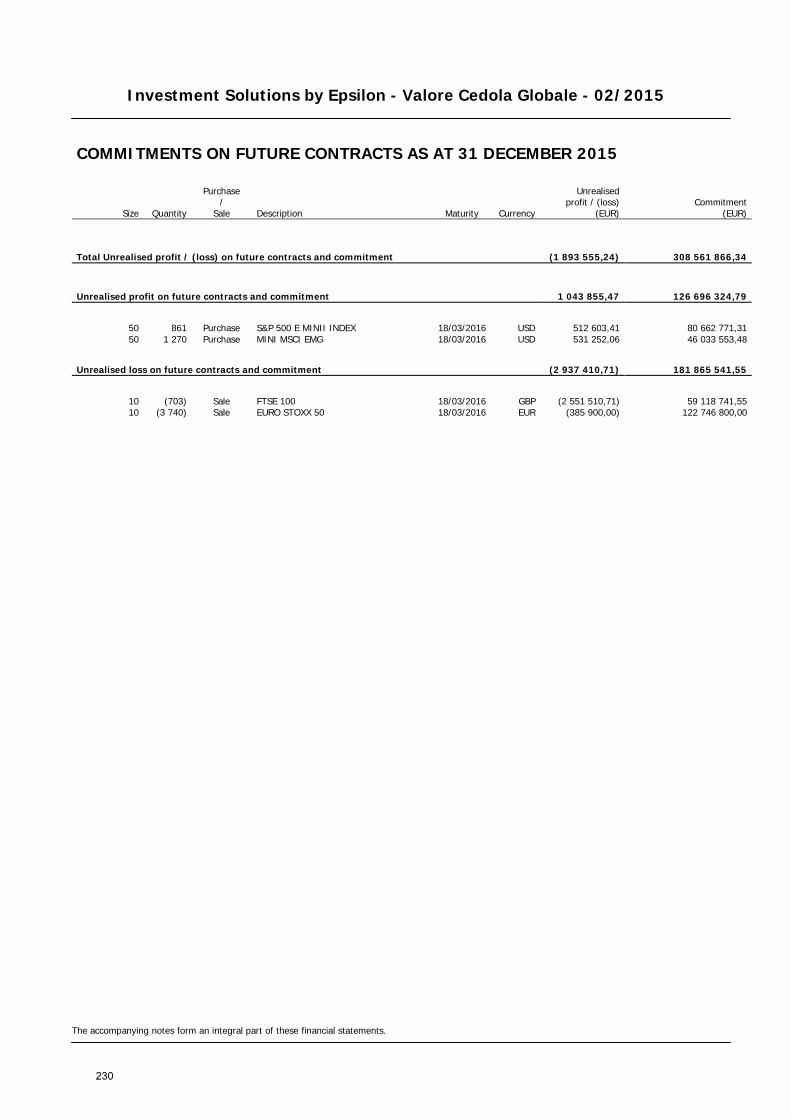
Investment Solutions by Epsilon - Valore Cedola Globale - 02/2015
The accompanying notes form an integral part of these financial statements.
COMMITMENTS ON FUTURE CONTRACTS AS AT 31 DECEMBER 2015
Size Quantity
Purchase /
Sale Description Maturity Currency
Unrealised profit / (loss)
(EUR) Commitment
(EUR)
Total Unrealised profit / (loss) on future contracts and commitment (1 893 555,24) 308 561 866,34
Unrealised profit on future contracts and commitment 1 043 855,47 126 696 324,79
50 861 Purchase S&P 500 E MINII INDEX 18/03/2016 USD 512 603,41 80 662 771,31 50 1 270 Purchase MINI MSCI EMG 18/03/2016 USD 531 252,06 46 033 553,48
Unrealised loss on future contracts and commitment (2 937 410,71) 181 865 541,55
10 (703) Sale FTSE 100 18/03/2016 GBP (2 551 510,71) 59 118 741,55 10 (3 740) Sale EURO STOXX 50 18/03/2016 EUR (385 900,00) 122 746 800,00
230
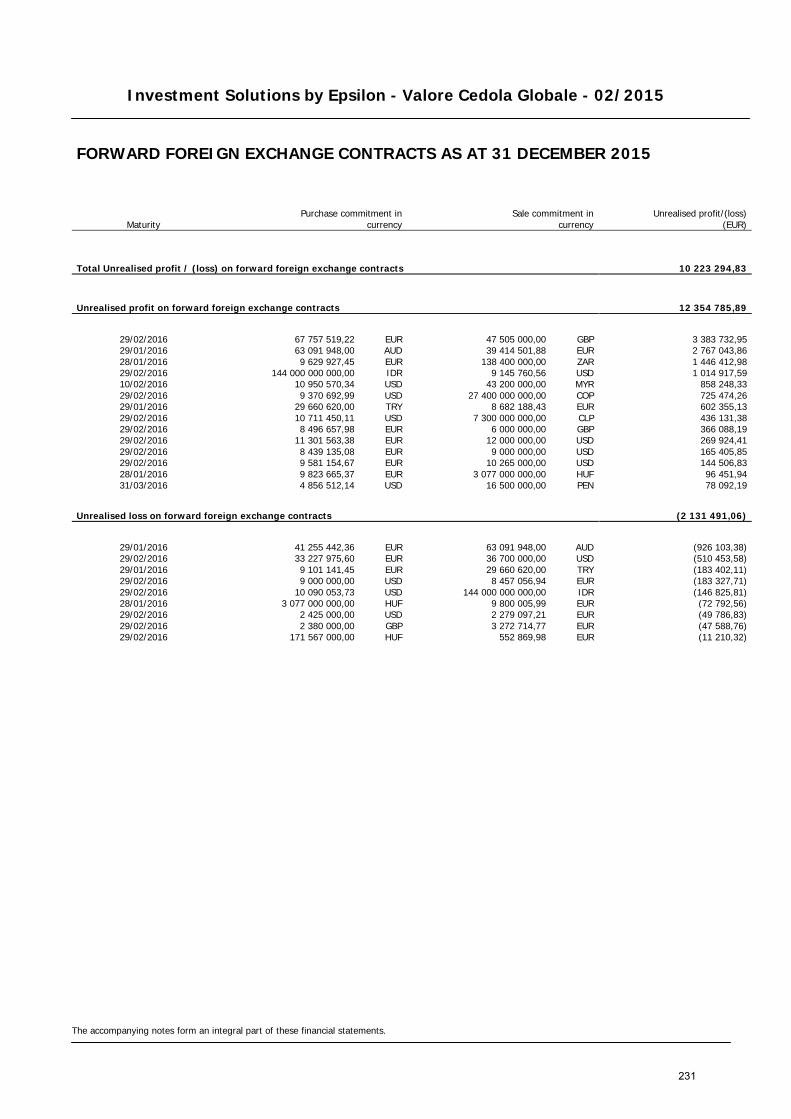
Investment Solutions by Epsilon - Valore Cedola Globale - 02/2015
The accompanying notes form an integral part of these financial statements.
FORWARD FOREIGN EXCHANGE CONTRACTS AS AT 31 DECEMBER 2015
Maturity Purchase commitment in
currency Sale commitment in
currency
Unrealised profit/(loss) (EUR)
Total Unrealised profit / (loss) on forward foreign exchange contracts 10 223 294,83
Unrealised profit on forward foreign exchange contracts 12 354 785,89
29/02/2016 67 757 519,22 EUR 47 505 000,00 GBP 3 383 732,95 29/01/2016 63 091 948,00 AUD 39 414 501,88 EUR 2 767 043,86 28/01/2016 9 629 927,45 EUR 138 400 000,00 ZAR 1 446 412,98 29/02/2016 144 000 000 000,00 IDR 9 145 760,56 USD 1 014 917,59 10/02/2016 10 950 570,34 USD 43 200 000,00 MYR 858 248,33 29/02/2016 9 370 692,99 USD 27 400 000 000,00 COP 725 474,26 29/01/2016 29 660 620,00 TRY 8 682 188,43 EUR 602 355,13 29/02/2016 10 711 450,11 USD 7 300 000 000,00 CLP 436 131,38 29/02/2016 8 496 657,98 EUR 6 000 000,00 GBP 366 088,19 29/02/2016 11 301 563,38 EUR 12 000 000,00 USD 269 924,41 29/02/2016 8 439 135,08 EUR 9 000 000,00 USD 165 405,85 29/02/2016 9 581 154,67 EUR 10 265 000,00 USD 144 506,83 28/01/2016 9 823 665,37 EUR 3 077 000 000,00 HUF 96 451,94 31/03/2016 4 856 512,14 USD 16 500 000,00 PEN 78 092,19
Unrealised loss on forward foreign exchange contracts (2 131 491,06)
29/01/2016 41 255 442,36 EUR 63 091 948,00 AUD (926 103,38) 29/02/2016 33 227 975,60 EUR 36 700 000,00 USD (510 453,58) 29/01/2016 9 101 141,45 EUR 29 660 620,00 TRY (183 402,11) 29/02/2016 9 000 000,00 USD 8 457 056,94 EUR (183 327,71) 29/02/2016 10 090 053,73 USD 144 000 000 000,00 IDR (146 825,81) 28/01/2016 3 077 000 000,00 HUF 9 800 005,99 EUR (72 792,56) 29/02/2016 2 425 000,00 USD 2 279 097,21 EUR (49 786,83) 29/02/2016 2 380 000,00 GBP 3 272 714,77 EUR (47 588,76) 29/02/2016 171 567 000,00 HUF 552 869,98 EUR (11 210,32)
231

Investment Solutions by Epsilon - Valore Cedola Globale - 02/2015
The accompanying notes form an integral part of these financial statements.
SWAP CONTRACTS AS AT 31 DECEMBER 2015
Counterparty Currency Notional Maturity Interest
receivable (EUR) Interest
payable (EUR)
Unrealised
profit / (loss) (EUR)
ASSET SWAP CONTRACTS — — 4 776 740,82 BANCA IMI SPA EUR 402 400 000,00 21/04/2020 — — 4 776 740,82
232
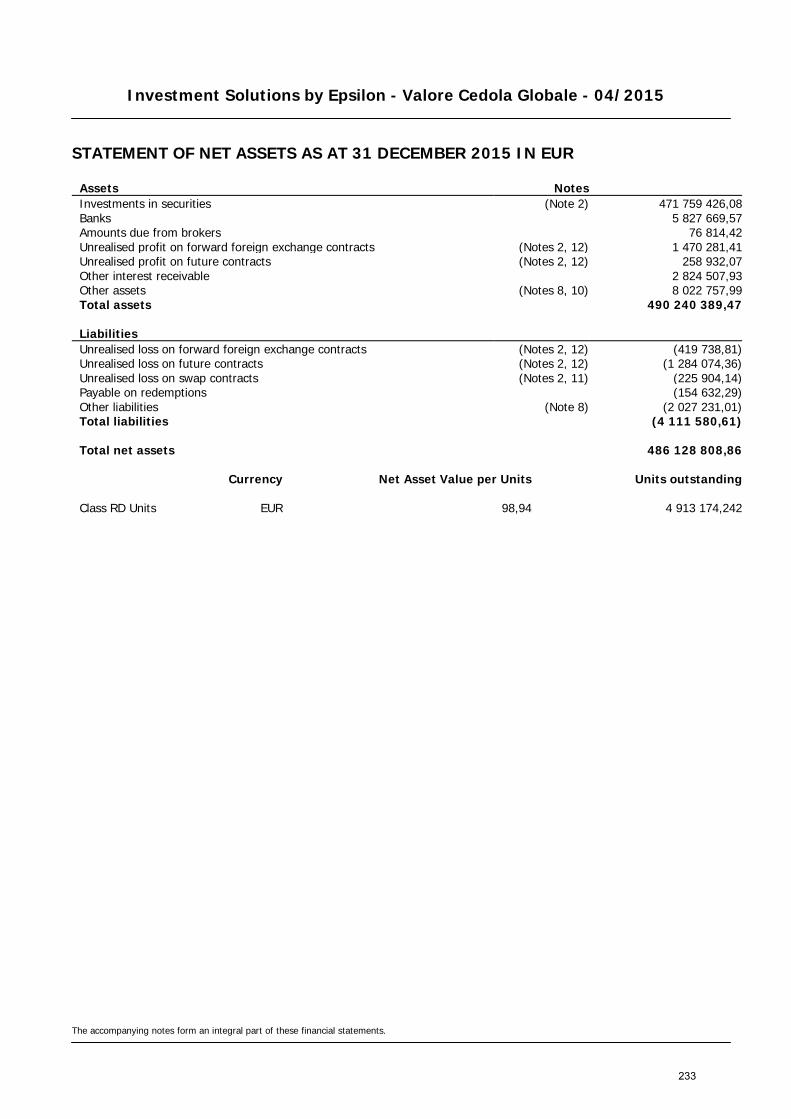
Investment Solutions by Epsilon - Valore Cedola Globale - 04/2015
STATEMENT OF NET ASSETS AS AT 31 DECEMBER 2015 IN EUR
The accompanying notes form an integral part of these financial statements.
Assets Notes Investments in securities (Note 2) 471 759 426,08 Banks 5 827 669,57 Amounts due from brokers 76 814,42 Unrealised profit on forward foreign exchange contracts (Notes 2, 12) 1 470 281,41 Unrealised profit on future contracts (Notes 2, 12) 258 932,07 Other interest receivable 2 824 507,93 Other assets (Notes 8, 10) 8 022 757,99 Total assets 490 240 389,47
Liabilities Unrealised loss on forward foreign exchange contracts (Notes 2, 12) (419 738,81) Unrealised loss on future contracts (Notes 2, 12) (1 284 074,36) Unrealised loss on swap contracts (Notes 2, 11) (225 904,14) Payable on redemptions (154 632,29) Other liabilities (Note 8) (2 027 231,01) Total liabilities (4 111 580,61)
Total net assets 486 128 808,86
Currency Net Asset Value per Units Units outstanding
Class RD Units EUR 98,94 4 913 174,242
233

Investment Solutions by Epsilon - Valore Cedola Globale - 04/2015
STATEMENT OF CHANGES IN NET ASSETS FOR THE PERIOD FROM 21 APRIL 2015 (LAUNCH DATE) TO 31 DECEMBER 2015 IN EUR
The accompanying notes form an integral part of these financial statements.
Net assets at the beginning of the period Notes 0,00
Net income from investments (Note 2) 6 740 921,83 Other income (Note 9) 3 485,09 Total income 6 744 406,92 Management fee (Note 5) (3 494 498,57) Depositary and paying agent fee (Note 7) (183 182,00) Subscription tax (Note 3) (175 755,88) Other charges and taxes (Notes 4, 10) (1 008 043,26) Total expenses (4 861 479,71) Net investment income / (loss) 1 882 927,21 Net realised profit / (loss) on sales of investments, currencies and other financial instruments (Notes 2, 11, 12) (1 634 528,71) Change in unrealised appreciation / (depreciation) on - investments (Note 2) (4 835 830,13) - forward foreign exchange contracts (Notes 2, 12) 1 050 542,60 - foreign currencies (11 567,34) - future contracts (Notes 2, 12) (1 025 142,29) - swap contracts (Notes 2, 11) (225 904,14) Net result of operations for the period (4 799 502,80)
Subscriptions for the period 501 335 081,16 Redemptions for the period (10 406 769,50)
Net assets at the end of the period 486 128 808,86
234
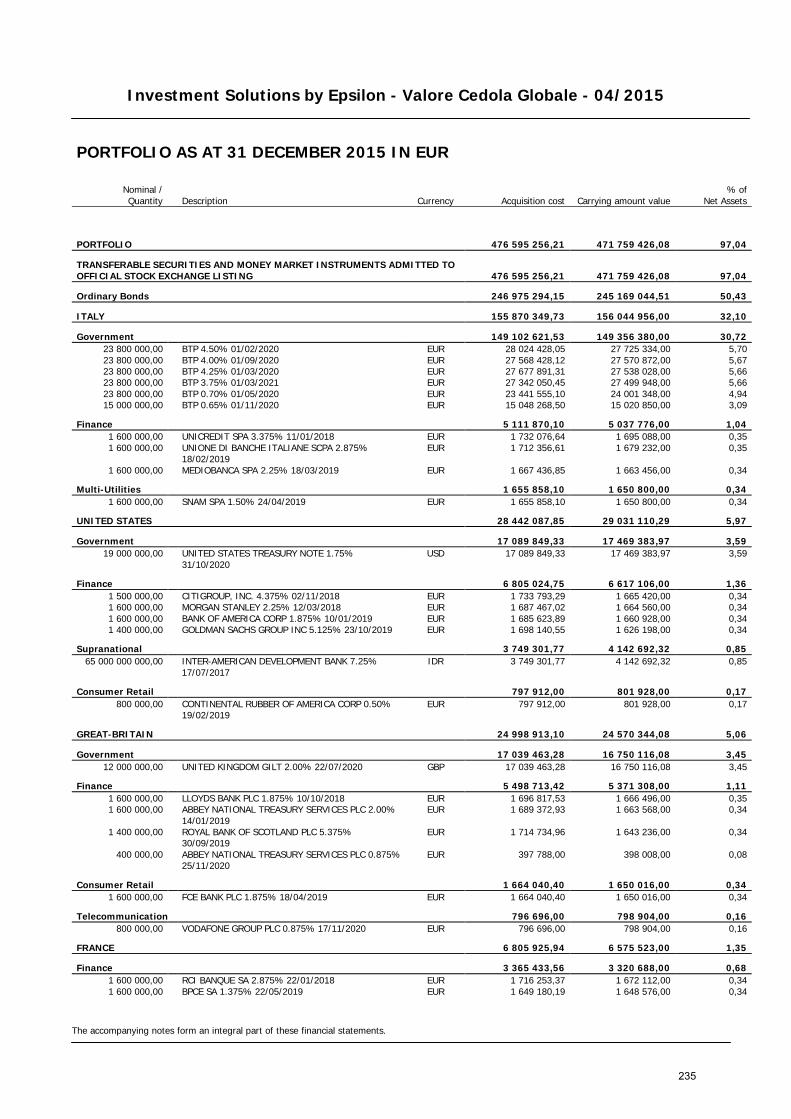
Investment Solutions by Epsilon - Valore Cedola Globale - 04/2015
The accompanying notes form an integral part of these financial statements.
PORTFOLIO AS AT 31 DECEMBER 2015 IN EUR
Nominal / Quantity Description Currency Acquisition cost Carrying amount value
% of Net Assets
PORTFOLIO 476 595 256,21 471 759 426,08 97,04
TRANSFERABLE SECURITIES AND MONEY MARKET INSTRUMENTS ADMITTED TO OFFICIAL STOCK EXCHANGE LISTING 476 595 256,21 471 759 426,08 97,04
Ordinary Bonds 246 975 294,15 245 169 044,51 50,43
ITALY 155 870 349,73 156 044 956,00 32,10
Government 149 102 621,53 149 356 380,00 30,72 23 800 000,00 BTP 4.50% 01/02/2020 EUR 28 024 428,05 27 725 334,00 5,70 23 800 000,00 BTP 4.00% 01/09/2020 EUR 27 568 428,12 27 570 872,00 5,67 23 800 000,00 BTP 4.25% 01/03/2020 EUR 27 677 891,31 27 538 028,00 5,66 23 800 000,00 BTP 3.75% 01/03/2021 EUR 27 342 050,45 27 499 948,00 5,66 23 800 000,00 BTP 0.70% 01/05/2020 EUR 23 441 555,10 24 001 348,00 4,94 15 000 000,00 BTP 0.65% 01/11/2020 EUR 15 048 268,50 15 020 850,00 3,09
Finance 5 111 870,10 5 037 776,00 1,04 1 600 000,00 UNICREDIT SPA 3.375% 11/01/2018 EUR 1 732 076,64 1 695 088,00 0,35 1 600 000,00
UNIONE DI BANCHE ITALIANE SCPA 2.875% 18/02/2019
EUR 1 712 356,61 1 679 232,00 0,35
1 600 000,00 MEDIOBANCA SPA 2.25% 18/03/2019 EUR 1 667 436,85 1 663 456,00 0,34
Multi-Utilities 1 655 858,10 1 650 800,00 0,34 1 600 000,00 SNAM SPA 1.50% 24/04/2019 EUR 1 655 858,10 1 650 800,00 0,34
UNITED STATES 28 442 087,85 29 031 110,29 5,97
Government 17 089 849,33 17 469 383,97 3,59 19 000 000,00
UNITED STATES TREASURY NOTE 1.75% 31/10/2020
USD 17 089 849,33 17 469 383,97 3,59
Finance 6 805 024,75 6 617 106,00 1,36 1 500 000,00 CITIGROUP, INC. 4.375% 02/11/2018 EUR 1 733 793,29 1 665 420,00 0,34 1 600 000,00 MORGAN STANLEY 2.25% 12/03/2018 EUR 1 687 467,02 1 664 560,00 0,34 1 600 000,00 BANK OF AMERICA CORP 1.875% 10/01/2019 EUR 1 685 623,89 1 660 928,00 0,34 1 400 000,00 GOLDMAN SACHS GROUP INC 5.125% 23/10/2019 EUR 1 698 140,55 1 626 198,00 0,34
Supranational 3 749 301,77 4 142 692,32 0,85 65 000 000 000,00
INTER-AMERICAN DEVELOPMENT BANK 7.25% 17/07/2017
IDR 3 749 301,77 4 142 692,32 0,85
Consumer Retail 797 912,00 801 928,00 0,17 800 000,00
CONTINENTAL RUBBER OF AMERICA CORP 0.50% 19/02/2019
EUR 797 912,00 801 928,00 0,17
GREAT-BRITAIN 24 998 913,10 24 570 344,08 5,06
Government 17 039 463,28 16 750 116,08 3,45 12 000 000,00 UNITED KINGDOM GILT 2.00% 22/07/2020 GBP 17 039 463,28 16 750 116,08 3,45
Finance 5 498 713,42 5 371 308,00 1,11 1 600 000,00 LLOYDS BANK PLC 1.875% 10/10/2018 EUR 1 696 817,53 1 666 496,00 0,35 1 600 000,00
ABBEY NATIONAL TREASURY SERVICES PLC 2.00% 14/01/2019
EUR 1 689 372,93 1 663 568,00 0,34
1 400 000,00
ROYAL BANK OF SCOTLAND PLC 5.375% 30/09/2019
EUR 1 714 734,96 1 643 236,00 0,34
400 000,00
ABBEY NATIONAL TREASURY SERVICES PLC 0.875% 25/11/2020
EUR 397 788,00 398 008,00 0,08
Consumer Retail 1 664 040,40 1 650 016,00 0,34 1 600 000,00 FCE BANK PLC 1.875% 18/04/2019 EUR 1 664 040,40 1 650 016,00 0,34
Telecommunication 796 696,00 798 904,00 0,16 800 000,00 VODAFONE GROUP PLC 0.875% 17/11/2020 EUR 796 696,00 798 904,00 0,16
FRANCE 6 805 925,94 6 575 523,00 1,35
Finance 3 365 433,56 3 320 688,00 0,68 1 600 000,00 RCI BANQUE SA 2.875% 22/01/2018 EUR 1 716 253,37 1 672 112,00 0,34 1 600 000,00 BPCE SA 1.375% 22/05/2019 EUR 1 649 180,19 1 648 576,00 0,34
235
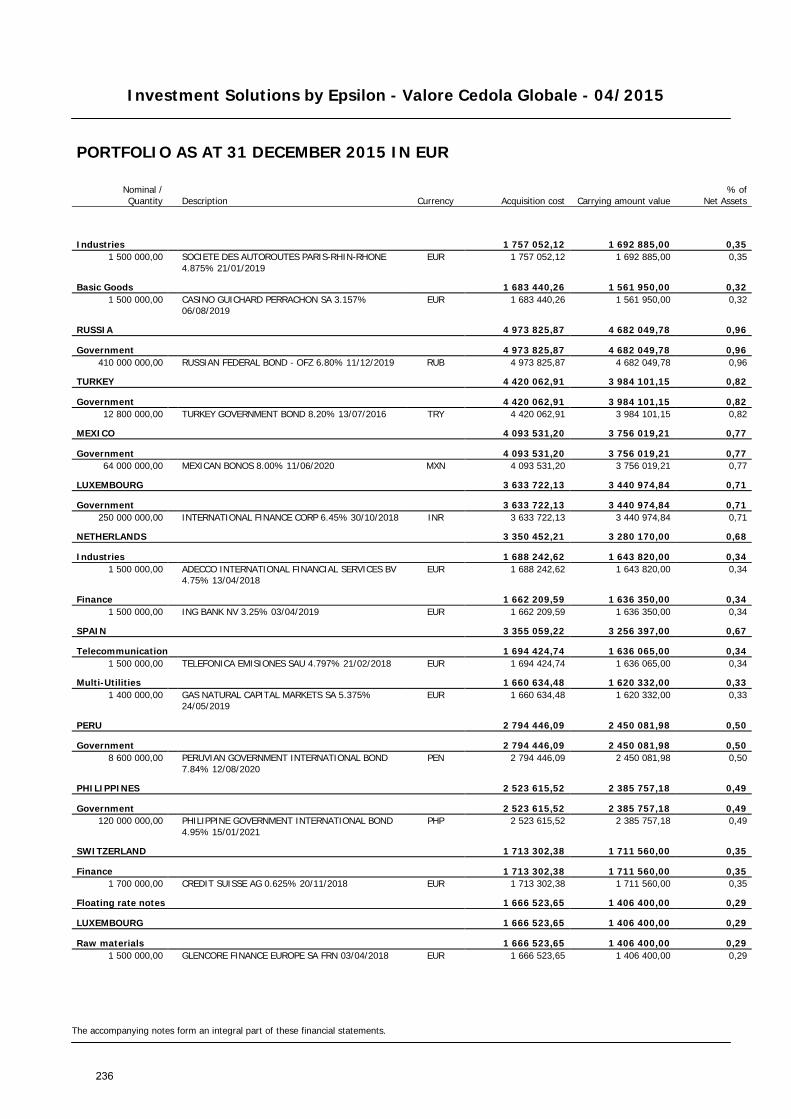
Investment Solutions by Epsilon - Valore Cedola Globale - 04/2015
The accompanying notes form an integral part of these financial statements.
PORTFOLIO AS AT 31 DECEMBER 2015 IN EUR
Nominal / Quantity Description Currency Acquisition cost Carrying amount value
% of Net Assets
Industries 1 757 052,12 1 692 885,00 0,35 1 500 000,00
SOCIETE DES AUTOROUTES PARIS-RHIN-RHONE 4.875% 21/01/2019
EUR 1 757 052,12 1 692 885,00 0,35
Basic Goods 1 683 440,26 1 561 950,00 0,32 1 500 000,00
CASINO GUICHARD PERRACHON SA 3.157% 06/08/2019
EUR 1 683 440,26 1 561 950,00 0,32
RUSSIA 4 973 825,87 4 682 049,78 0,96
Government 4 973 825,87 4 682 049,78 0,96 410 000 000,00 RUSSIAN FEDERAL BOND - OFZ 6.80% 11/12/2019 RUB 4 973 825,87 4 682 049,78 0,96
TURKEY 4 420 062,91 3 984 101,15 0,82
Government 4 420 062,91 3 984 101,15 0,82 12 800 000,00 TURKEY GOVERNMENT BOND 8.20% 13/07/2016 TRY 4 420 062,91 3 984 101,15 0,82
MEXICO 4 093 531,20 3 756 019,21 0,77
Government 4 093 531,20 3 756 019,21 0,77 64 000 000,00 MEXICAN BONOS 8.00% 11/06/2020 MXN 4 093 531,20 3 756 019,21 0,77
LUXEMBOURG 3 633 722,13 3 440 974,84 0,71
Government 3 633 722,13 3 440 974,84 0,71 250 000 000,00 INTERNATIONAL FINANCE CORP 6.45% 30/10/2018 INR 3 633 722,13 3 440 974,84 0,71
NETHERLANDS 3 350 452,21 3 280 170,00 0,68
Industries 1 688 242,62 1 643 820,00 0,34 1 500 000,00
ADECCO INTERNATIONAL FINANCIAL SERVICES BV 4.75% 13/04/2018
EUR 1 688 242,62 1 643 820,00 0,34
Finance 1 662 209,59 1 636 350,00 0,34 1 500 000,00 ING BANK NV 3.25% 03/04/2019 EUR 1 662 209,59 1 636 350,00 0,34
SPAIN 3 355 059,22 3 256 397,00 0,67
Telecommunication 1 694 424,74 1 636 065,00 0,34 1 500 000,00 TELEFONICA EMISIONES SAU 4.797% 21/02/2018 EUR 1 694 424,74 1 636 065,00 0,34
Multi-Utilities 1 660 634,48 1 620 332,00 0,33 1 400 000,00
GAS NATURAL CAPITAL MARKETS SA 5.375% 24/05/2019
EUR 1 660 634,48 1 620 332,00 0,33
PERU 2 794 446,09 2 450 081,98 0,50
Government 2 794 446,09 2 450 081,98 0,50 8 600 000,00
PERUVIAN GOVERNMENT INTERNATIONAL BOND 7.84% 12/08/2020
PEN 2 794 446,09 2 450 081,98 0,50
PHILIPPINES 2 523 615,52 2 385 757,18 0,49
Government 2 523 615,52 2 385 757,18 0,49 120 000 000,00
PHILIPPINE GOVERNMENT INTERNATIONAL BOND 4.95% 15/01/2021
PHP 2 523 615,52 2 385 757,18 0,49
SWITZERLAND 1 713 302,38 1 711 560,00 0,35
Finance 1 713 302,38 1 711 560,00 0,35 1 700 000,00 CREDIT SUISSE AG 0.625% 20/11/2018 EUR 1 713 302,38 1 711 560,00 0,35
Floating rate notes 1 666 523,65 1 406 400,00 0,29
LUXEMBOURG 1 666 523,65 1 406 400,00 0,29
Raw materials 1 666 523,65 1 406 400,00 0,29 1 500 000,00 GLENCORE FINANCE EUROPE SA FRN 03/04/2018 EUR 1 666 523,65 1 406 400,00 0,29
236
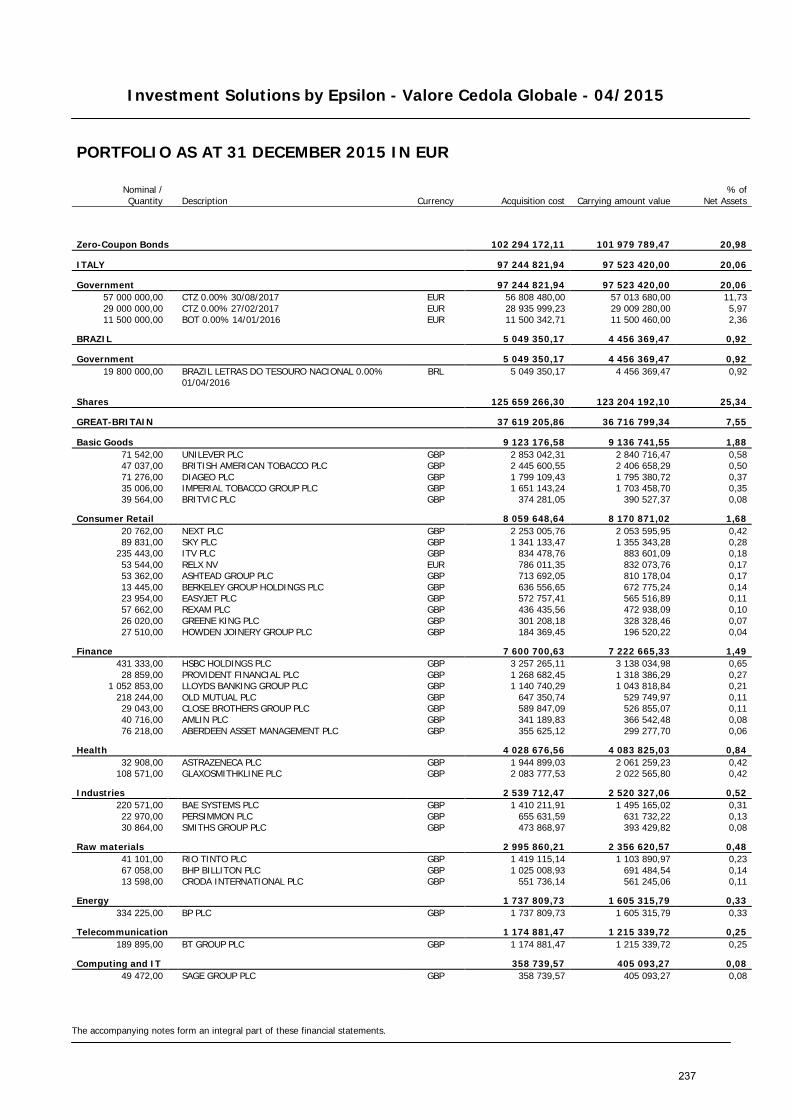
Investment Solutions by Epsilon - Valore Cedola Globale - 04/2015
The accompanying notes form an integral part of these financial statements.
PORTFOLIO AS AT 31 DECEMBER 2015 IN EUR
Nominal / Quantity Description Currency Acquisition cost Carrying amount value
% of Net Assets
Zero-Coupon Bonds 102 294 172,11 101 979 789,47 20,98
ITALY 97 244 821,94 97 523 420,00 20,06
Government 97 244 821,94 97 523 420,00 20,06 57 000 000,00 CTZ 0.00% 30/08/2017 EUR 56 808 480,00 57 013 680,00 11,73 29 000 000,00 CTZ 0.00% 27/02/2017 EUR 28 935 999,23 29 009 280,00 5,97 11 500 000,00 BOT 0.00% 14/01/2016 EUR 11 500 342,71 11 500 460,00 2,36
BRAZIL 5 049 350,17 4 456 369,47 0,92
Government 5 049 350,17 4 456 369,47 0,92 19 800 000,00
BRAZIL LETRAS DO TESOURO NACIONAL 0.00% 01/04/2016
BRL 5 049 350,17 4 456 369,47 0,92
Shares 125 659 266,30 123 204 192,10 25,34
GREAT-BRITAIN 37 619 205,86 36 716 799,34 7,55
Basic Goods 9 123 176,58 9 136 741,55 1,88 71 542,00 UNILEVER PLC GBP 2 853 042,31 2 840 716,47 0,58 47 037,00 BRITISH AMERICAN TOBACCO PLC GBP 2 445 600,55 2 406 658,29 0,50 71 276,00 DIAGEO PLC GBP 1 799 109,43 1 795 380,72 0,37 35 006,00 IMPERIAL TOBACCO GROUP PLC GBP 1 651 143,24 1 703 458,70 0,35 39 564,00 BRITVIC PLC GBP 374 281,05 390 527,37 0,08
Consumer Retail 8 059 648,64 8 170 871,02 1,68 20 762,00 NEXT PLC GBP 2 253 005,76 2 053 595,95 0,42 89 831,00 SKY PLC GBP 1 341 133,47 1 355 343,28 0,28
235 443,00 ITV PLC GBP 834 478,76 883 601,09 0,18 53 544,00 RELX NV EUR 786 011,35 832 073,76 0,17 53 362,00 ASHTEAD GROUP PLC GBP 713 692,05 810 178,04 0,17 13 445,00 BERKELEY GROUP HOLDINGS PLC GBP 636 556,65 672 775,24 0,14 23 954,00 EASYJET PLC GBP 572 757,41 565 516,89 0,11 57 662,00 REXAM PLC GBP 436 435,56 472 938,09 0,10 26 020,00 GREENE KING PLC GBP 301 208,18 328 328,46 0,07 27 510,00 HOWDEN JOINERY GROUP PLC GBP 184 369,45 196 520,22 0,04
Finance 7 600 700,63 7 222 665,33 1,49 431 333,00 HSBC HOLDINGS PLC GBP 3 257 265,11 3 138 034,98 0,65 28 859,00 PROVIDENT FINANCIAL PLC GBP 1 268 682,45 1 318 386,29 0,27
1 052 853,00 LLOYDS BANKING GROUP PLC GBP 1 140 740,29 1 043 818,84 0,21 218 244,00 OLD MUTUAL PLC GBP 647 350,74 529 749,97 0,11 29 043,00 CLOSE BROTHERS GROUP PLC GBP 589 847,09 526 855,07 0,11 40 716,00 AMLIN PLC GBP 341 189,83 366 542,48 0,08 76 218,00 ABERDEEN ASSET MANAGEMENT PLC GBP 355 625,12 299 277,70 0,06
Health 4 028 676,56 4 083 825,03 0,84 32 908,00 ASTRAZENECA PLC GBP 1 944 899,03 2 061 259,23 0,42
108 571,00 GLAXOSMITHKLINE PLC GBP 2 083 777,53 2 022 565,80 0,42
Industries 2 539 712,47 2 520 327,06 0,52 220 571,00 BAE SYSTEMS PLC GBP 1 410 211,91 1 495 165,02 0,31 22 970,00 PERSIMMON PLC GBP 655 631,59 631 732,22 0,13 30 864,00 SMITHS GROUP PLC GBP 473 868,97 393 429,82 0,08
Raw materials 2 995 860,21 2 356 620,57 0,48 41 101,00 RIO TINTO PLC GBP 1 419 115,14 1 103 890,97 0,23 67 058,00 BHP BILLITON PLC GBP 1 025 008,93 691 484,54 0,14 13 598,00 CRODA INTERNATIONAL PLC GBP 551 736,14 561 245,06 0,11
Energy 1 737 809,73 1 605 315,79 0,33 334 225,00 BP PLC GBP 1 737 809,73 1 605 315,79 0,33
Telecommunication 1 174 881,47 1 215 339,72 0,25 189 895,00 BT GROUP PLC GBP 1 174 881,47 1 215 339,72 0,25
Computing and IT 358 739,57 405 093,27 0,08 49 472,00 SAGE GROUP PLC GBP 358 739,57 405 093,27 0,08
237
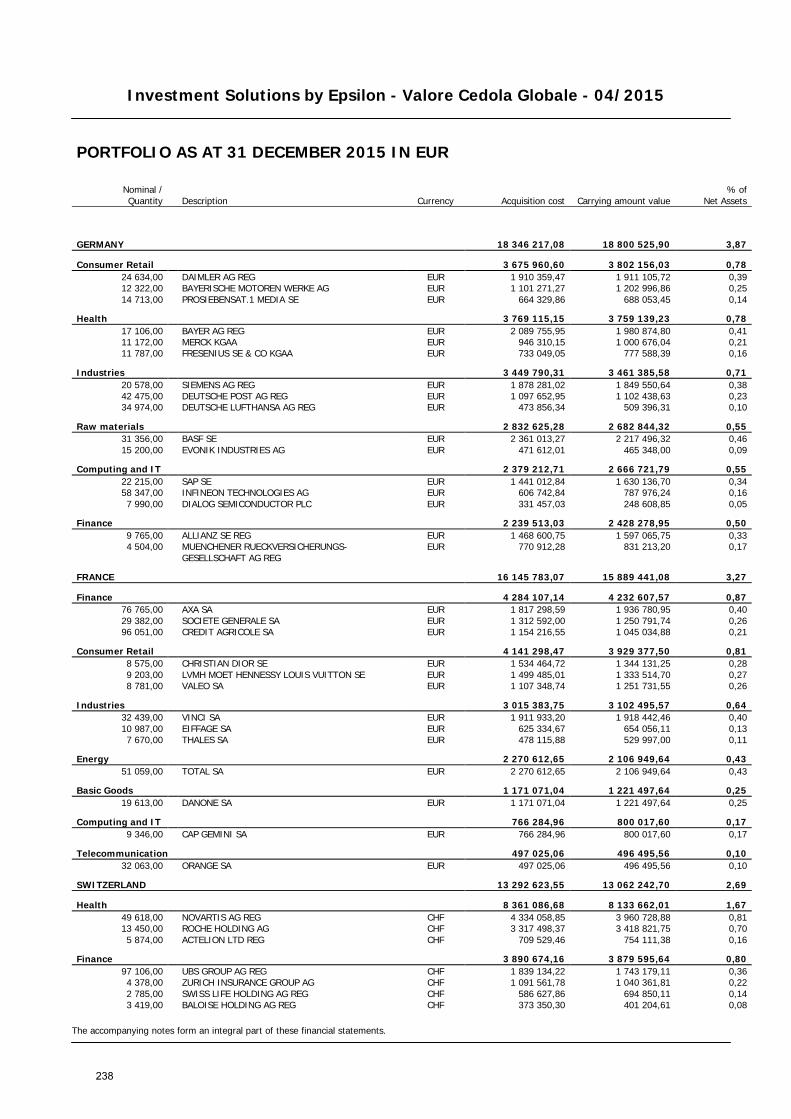
Investment Solutions by Epsilon - Valore Cedola Globale - 04/2015
The accompanying notes form an integral part of these financial statements.
PORTFOLIO AS AT 31 DECEMBER 2015 IN EUR
Nominal / Quantity Description Currency Acquisition cost Carrying amount value
% of Net Assets
GERMANY 18 346 217,08 18 800 525,90 3,87
Consumer Retail 3 675 960,60 3 802 156,03 0,78 24 634,00 DAIMLER AG REG EUR 1 910 359,47 1 911 105,72 0,39 12 322,00 BAYERISCHE MOTOREN WERKE AG EUR 1 101 271,27 1 202 996,86 0,25 14 713,00 PROSIEBENSAT.1 MEDIA SE EUR 664 329,86 688 053,45 0,14
Health 3 769 115,15 3 759 139,23 0,78 17 106,00 BAYER AG REG EUR 2 089 755,95 1 980 874,80 0,41 11 172,00 MERCK KGAA EUR 946 310,15 1 000 676,04 0,21 11 787,00 FRESENIUS SE & CO KGAA EUR 733 049,05 777 588,39 0,16
Industries 3 449 790,31 3 461 385,58 0,71 20 578,00 SIEMENS AG REG EUR 1 878 281,02 1 849 550,64 0,38 42 475,00 DEUTSCHE POST AG REG EUR 1 097 652,95 1 102 438,63 0,23 34 974,00 DEUTSCHE LUFTHANSA AG REG EUR 473 856,34 509 396,31 0,10
Raw materials 2 832 625,28 2 682 844,32 0,55 31 356,00 BASF SE EUR 2 361 013,27 2 217 496,32 0,46 15 200,00 EVONIK INDUSTRIES AG EUR 471 612,01 465 348,00 0,09
Computing and IT 2 379 212,71 2 666 721,79 0,55 22 215,00 SAP SE EUR 1 441 012,84 1 630 136,70 0,34 58 347,00 INFINEON TECHNOLOGIES AG EUR 606 742,84 787 976,24 0,16 7 990,00 DIALOG SEMICONDUCTOR PLC EUR 331 457,03 248 608,85 0,05
Finance 2 239 513,03 2 428 278,95 0,50 9 765,00 ALLIANZ SE REG EUR 1 468 600,75 1 597 065,75 0,33 4 504,00
MUENCHENER RUECKVERSICHERUNGS-GESELLSCHAFT AG REG
EUR 770 912,28 831 213,20 0,17
FRANCE 16 145 783,07 15 889 441,08 3,27
Finance 4 284 107,14 4 232 607,57 0,87 76 765,00 AXA SA EUR 1 817 298,59 1 936 780,95 0,40 29 382,00 SOCIETE GENERALE SA EUR 1 312 592,00 1 250 791,74 0,26 96 051,00 CREDIT AGRICOLE SA EUR 1 154 216,55 1 045 034,88 0,21
Consumer Retail 4 141 298,47 3 929 377,50 0,81 8 575,00 CHRISTIAN DIOR SE EUR 1 534 464,72 1 344 131,25 0,28 9 203,00 LVMH MOET HENNESSY LOUIS VUITTON SE EUR 1 499 485,01 1 333 514,70 0,27 8 781,00 VALEO SA EUR 1 107 348,74 1 251 731,55 0,26
Industries 3 015 383,75 3 102 495,57 0,64 32 439,00 VINCI SA EUR 1 911 933,20 1 918 442,46 0,40 10 987,00 EIFFAGE SA EUR 625 334,67 654 056,11 0,13 7 670,00 THALES SA EUR 478 115,88 529 997,00 0,11
Energy 2 270 612,65 2 106 949,64 0,43 51 059,00 TOTAL SA EUR 2 270 612,65 2 106 949,64 0,43
Basic Goods 1 171 071,04 1 221 497,64 0,25 19 613,00 DANONE SA EUR 1 171 071,04 1 221 497,64 0,25
Computing and IT 766 284,96 800 017,60 0,17 9 346,00 CAP GEMINI SA EUR 766 284,96 800 017,60 0,17
Telecommunication 497 025,06 496 495,56 0,10 32 063,00 ORANGE SA EUR 497 025,06 496 495,56 0,10
SWITZERLAND 13 292 623,55 13 062 242,70 2,69
Health 8 361 086,68 8 133 662,01 1,67 49 618,00 NOVARTIS AG REG CHF 4 334 058,85 3 960 728,88 0,81 13 450,00 ROCHE HOLDING AG CHF 3 317 498,37 3 418 821,75 0,70 5 874,00 ACTELION LTD REG CHF 709 529,46 754 111,38 0,16
Finance 3 890 674,16 3 879 595,64 0,80 97 106,00 UBS GROUP AG REG CHF 1 839 134,22 1 743 179,11 0,36 4 378,00 ZURICH INSURANCE GROUP AG CHF 1 091 561,78 1 040 361,81 0,22 2 785,00 SWISS LIFE HOLDING AG REG CHF 586 627,86 694 850,11 0,14 3 419,00 BALOISE HOLDING AG REG CHF 373 350,30 401 204,61 0,08
238
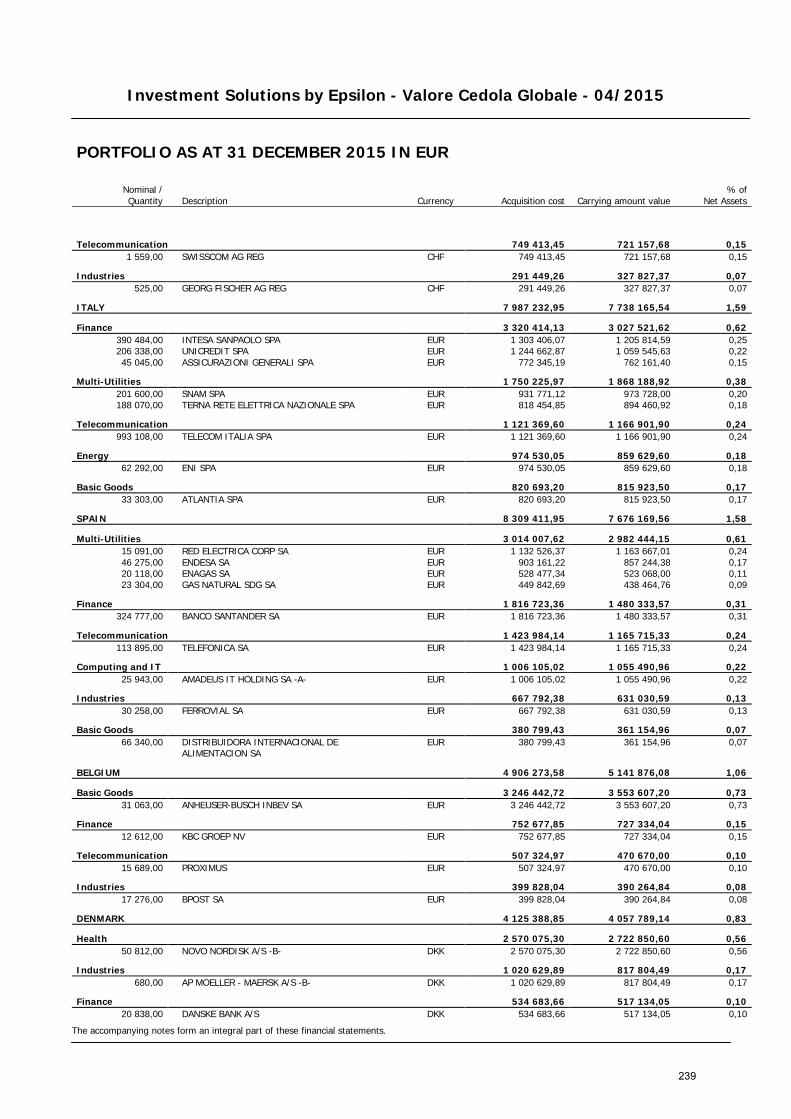
Investment Solutions by Epsilon - Valore Cedola Globale - 04/2015
The accompanying notes form an integral part of these financial statements.
PORTFOLIO AS AT 31 DECEMBER 2015 IN EUR
Nominal / Quantity Description Currency Acquisition cost Carrying amount value
% of Net Assets
Telecommunication 749 413,45 721 157,68 0,15 1 559,00 SWISSCOM AG REG CHF 749 413,45 721 157,68 0,15
Industries 291 449,26 327 827,37 0,07 525,00 GEORG FISCHER AG REG CHF 291 449,26 327 827,37 0,07
ITALY 7 987 232,95 7 738 165,54 1,59
Finance 3 320 414,13 3 027 521,62 0,62 390 484,00 INTESA SANPAOLO SPA EUR 1 303 406,07 1 205 814,59 0,25 206 338,00 UNICREDIT SPA EUR 1 244 662,87 1 059 545,63 0,22 45 045,00 ASSICURAZIONI GENERALI SPA EUR 772 345,19 762 161,40 0,15
Multi-Utilities 1 750 225,97 1 868 188,92 0,38 201 600,00 SNAM SPA EUR 931 771,12 973 728,00 0,20 188 070,00 TERNA RETE ELETTRICA NAZIONALE SPA EUR 818 454,85 894 460,92 0,18
Telecommunication 1 121 369,60 1 166 901,90 0,24 993 108,00 TELECOM ITALIA SPA EUR 1 121 369,60 1 166 901,90 0,24
Energy 974 530,05 859 629,60 0,18 62 292,00 ENI SPA EUR 974 530,05 859 629,60 0,18
Basic Goods 820 693,20 815 923,50 0,17 33 303,00 ATLANTIA SPA EUR 820 693,20 815 923,50 0,17
SPAIN 8 309 411,95 7 676 169,56 1,58
Multi-Utilities 3 014 007,62 2 982 444,15 0,61 15 091,00 RED ELECTRICA CORP SA EUR 1 132 526,37 1 163 667,01 0,24 46 275,00 ENDESA SA EUR 903 161,22 857 244,38 0,17 20 118,00 ENAGAS SA EUR 528 477,34 523 068,00 0,11 23 304,00 GAS NATURAL SDG SA EUR 449 842,69 438 464,76 0,09
Finance 1 816 723,36 1 480 333,57 0,31 324 777,00 BANCO SANTANDER SA EUR 1 816 723,36 1 480 333,57 0,31
Telecommunication 1 423 984,14 1 165 715,33 0,24 113 895,00 TELEFONICA SA EUR 1 423 984,14 1 165 715,33 0,24
Computing and IT 1 006 105,02 1 055 490,96 0,22 25 943,00 AMADEUS IT HOLDING SA -A- EUR 1 006 105,02 1 055 490,96 0,22
Industries 667 792,38 631 030,59 0,13 30 258,00 FERROVIAL SA EUR 667 792,38 631 030,59 0,13
Basic Goods 380 799,43 361 154,96 0,07 66 340,00
DISTRIBUIDORA INTERNACIONAL DE ALIMENTACION SA
EUR 380 799,43 361 154,96 0,07
BELGIUM 4 906 273,58 5 141 876,08 1,06
Basic Goods 3 246 442,72 3 553 607,20 0,73 31 063,00 ANHEUSER-BUSCH INBEV SA EUR 3 246 442,72 3 553 607,20 0,73
Finance 752 677,85 727 334,04 0,15 12 612,00 KBC GROEP NV EUR 752 677,85 727 334,04 0,15
Telecommunication 507 324,97 470 670,00 0,10 15 689,00 PROXIMUS EUR 507 324,97 470 670,00 0,10
Industries 399 828,04 390 264,84 0,08 17 276,00 BPOST SA EUR 399 828,04 390 264,84 0,08
DENMARK 4 125 388,85 4 057 789,14 0,83
Health 2 570 075,30 2 722 850,60 0,56 50 812,00 NOVO NORDISK A/S -B- DKK 2 570 075,30 2 722 850,60 0,56
Industries 1 020 629,89 817 804,49 0,17 680,00 AP MOELLER - MAERSK A/S -B- DKK 1 020 629,89 817 804,49 0,17
Finance 534 683,66 517 134,05 0,10 20 838,00 DANSKE BANK A/S DKK 534 683,66 517 134,05 0,10
239
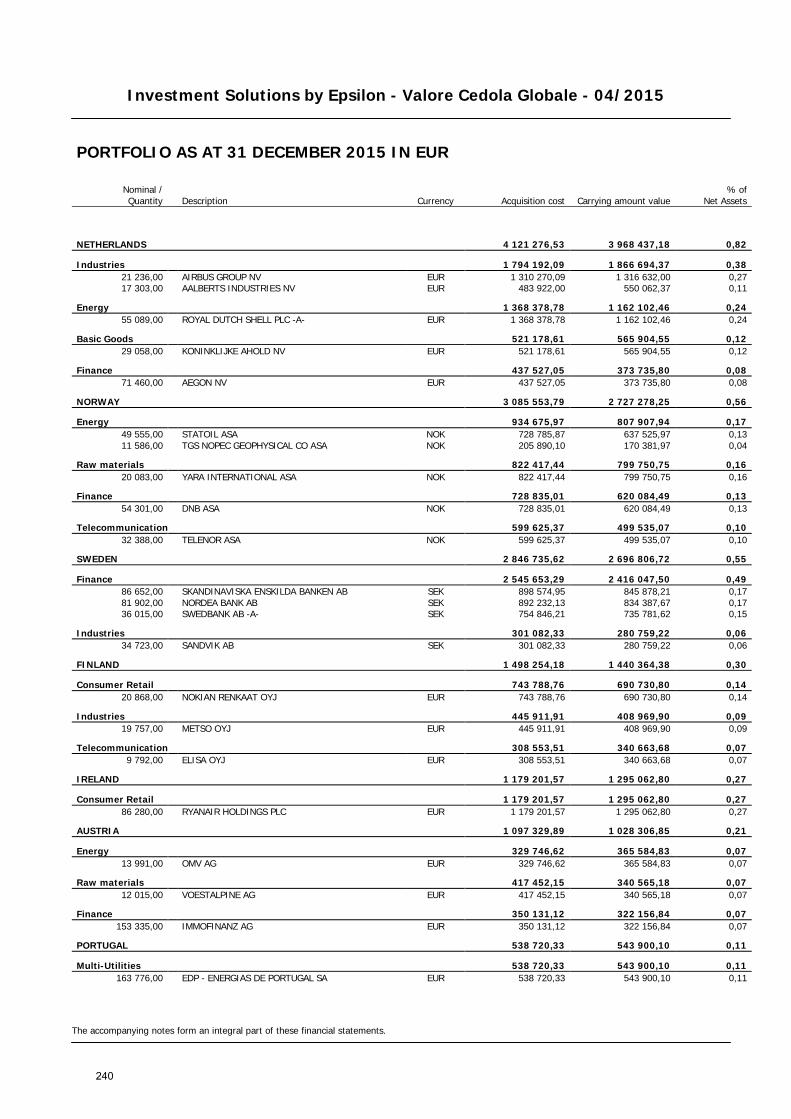
Investment Solutions by Epsilon - Valore Cedola Globale - 04/2015
The accompanying notes form an integral part of these financial statements.
PORTFOLIO AS AT 31 DECEMBER 2015 IN EUR
Nominal / Quantity Description Currency Acquisition cost Carrying amount value
% of Net Assets
NETHERLANDS 4 121 276,53 3 968 437,18 0,82
Industries 1 794 192,09 1 866 694,37 0,38 21 236,00 AIRBUS GROUP NV EUR 1 310 270,09 1 316 632,00 0,27 17 303,00 AALBERTS INDUSTRIES NV EUR 483 922,00 550 062,37 0,11
Energy 1 368 378,78 1 162 102,46 0,24 55 089,00 ROYAL DUTCH SHELL PLC -A- EUR 1 368 378,78 1 162 102,46 0,24
Basic Goods 521 178,61 565 904,55 0,12 29 058,00 KONINKLIJKE AHOLD NV EUR 521 178,61 565 904,55 0,12
Finance 437 527,05 373 735,80 0,08 71 460,00 AEGON NV EUR 437 527,05 373 735,80 0,08
NORWAY 3 085 553,79 2 727 278,25 0,56
Energy 934 675,97 807 907,94 0,17 49 555,00 STATOIL ASA NOK 728 785,87 637 525,97 0,13 11 586,00 TGS NOPEC GEOPHYSICAL CO ASA NOK 205 890,10 170 381,97 0,04
Raw materials 822 417,44 799 750,75 0,16 20 083,00 YARA INTERNATIONAL ASA NOK 822 417,44 799 750,75 0,16
Finance 728 835,01 620 084,49 0,13 54 301,00 DNB ASA NOK 728 835,01 620 084,49 0,13
Telecommunication 599 625,37 499 535,07 0,10 32 388,00 TELENOR ASA NOK 599 625,37 499 535,07 0,10
SWEDEN 2 846 735,62 2 696 806,72 0,55
Finance 2 545 653,29 2 416 047,50 0,49 86 652,00 SKANDINAVISKA ENSKILDA BANKEN AB SEK 898 574,95 845 878,21 0,17 81 902,00 NORDEA BANK AB SEK 892 232,13 834 387,67 0,17 36 015,00 SWEDBANK AB -A- SEK 754 846,21 735 781,62 0,15
Industries 301 082,33 280 759,22 0,06 34 723,00 SANDVIK AB SEK 301 082,33 280 759,22 0,06
FINLAND 1 498 254,18 1 440 364,38 0,30
Consumer Retail 743 788,76 690 730,80 0,14 20 868,00 NOKIAN RENKAAT OYJ EUR 743 788,76 690 730,80 0,14
Industries 445 911,91 408 969,90 0,09 19 757,00 METSO OYJ EUR 445 911,91 408 969,90 0,09
Telecommunication 308 553,51 340 663,68 0,07 9 792,00 ELISA OYJ EUR 308 553,51 340 663,68 0,07
IRELAND 1 179 201,57 1 295 062,80 0,27
Consumer Retail 1 179 201,57 1 295 062,80 0,27 86 280,00 RYANAIR HOLDINGS PLC EUR 1 179 201,57 1 295 062,80 0,27
AUSTRIA 1 097 329,89 1 028 306,85 0,21
Energy 329 746,62 365 584,83 0,07 13 991,00 OMV AG EUR 329 746,62 365 584,83 0,07
Raw materials 417 452,15 340 565,18 0,07 12 015,00 VOESTALPINE AG EUR 417 452,15 340 565,18 0,07
Finance 350 131,12 322 156,84 0,07 153 335,00 IMMOFINANZ AG EUR 350 131,12 322 156,84 0,07
PORTUGAL 538 720,33 543 900,10 0,11
Multi-Utilities 538 720,33 543 900,10 0,11 163 776,00 EDP - ENERGIAS DE PORTUGAL SA EUR 538 720,33 543 900,10 0,11
240
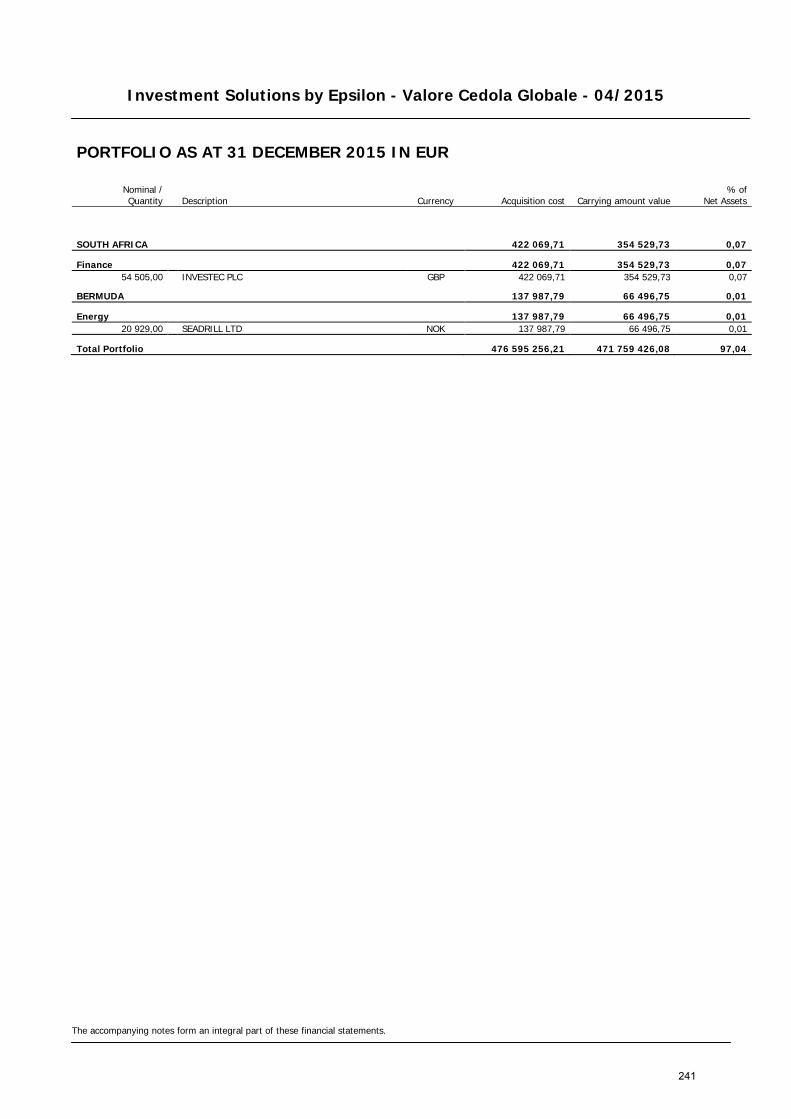
Investment Solutions by Epsilon - Valore Cedola Globale - 04/2015
The accompanying notes form an integral part of these financial statements.
PORTFOLIO AS AT 31 DECEMBER 2015 IN EUR
Nominal / Quantity Description Currency Acquisition cost Carrying amount value
% of Net Assets
SOUTH AFRICA 422 069,71 354 529,73 0,07
Finance 422 069,71 354 529,73 0,07 54 505,00 INVESTEC PLC GBP 422 069,71 354 529,73 0,07
BERMUDA 137 987,79 66 496,75 0,01
Energy 137 987,79 66 496,75 0,01 20 929,00 SEADRILL LTD NOK 137 987,79 66 496,75 0,01
Total Portfolio 476 595 256,21 471 759 426,08 97,04
241
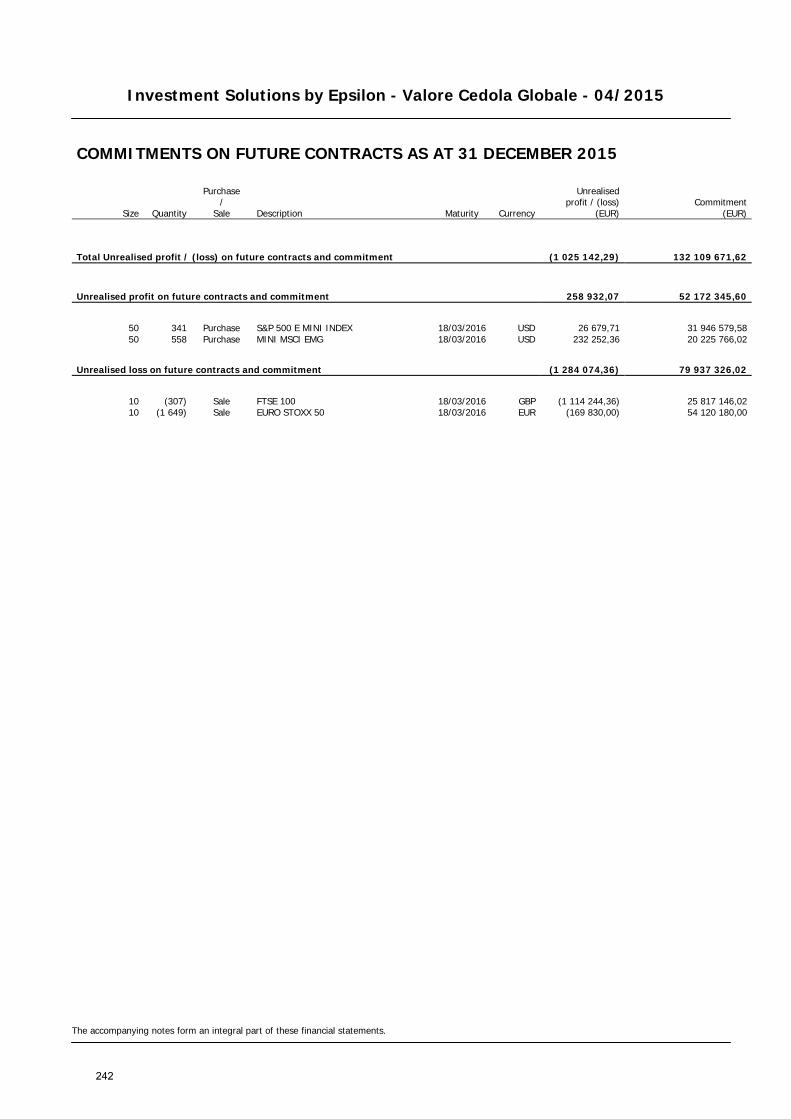
Investment Solutions by Epsilon - Valore Cedola Globale - 04/2015
The accompanying notes form an integral part of these financial statements.
COMMITMENTS ON FUTURE CONTRACTS AS AT 31 DECEMBER 2015
Size Quantity
Purchase /
Sale Description Maturity Currency
Unrealised profit / (loss)
(EUR) Commitment
(EUR)
Total Unrealised profit / (loss) on future contracts and commitment (1 025 142,29) 132 109 671,62
Unrealised profit on future contracts and commitment 258 932,07 52 172 345,60
50 341 Purchase S&P 500 E MINI INDEX 18/03/2016 USD 26 679,71 31 946 579,58 50 558 Purchase MINI MSCI EMG 18/03/2016 USD 232 252,36 20 225 766,02
Unrealised loss on future contracts and commitment (1 284 074,36) 79 937 326,02
10 (307) Sale FTSE 100 18/03/2016 GBP (1 114 244,36) 25 817 146,02 10 (1 649) Sale EURO STOXX 50 18/03/2016 EUR (169 830,00) 54 120 180,00
242

Investment Solutions by Epsilon - Valore Cedola Globale - 04/2015
The accompanying notes form an integral part of these financial statements.
FORWARD FOREIGN EXCHANGE CONTRACTS AS AT 31 DECEMBER 2015
Maturity Purchase commitment in
currency Sale commitment in
currency
Unrealised profit/(loss) (EUR)
Total Unrealised profit / (loss) on forward foreign exchange contracts 1 050 542,60
Unrealised profit on forward foreign exchange contracts 1 470 281,41
29/02/2016 15 867 853,94 EUR 11 125 000,00 GBP 792 422,46 29/01/2016 13 309 595,00 TRY 3 895 954,02 EUR 270 294,51 29/02/2016 3 681 885,13 EUR 2 600 000,00 GBP 158 638,22 29/02/2016 4 897 344,13 EUR 5 200 000,00 USD 116 967,24 29/02/2016 3 281 885,87 EUR 3 500 000,00 USD 64 324,50 31/03/2016 2 678 440,03 USD 9 100 000,00 PEN 43 069,03 29/02/2016 1 628 749,62 EUR 1 745 000,00 USD 24 565,45
Unrealised loss on forward foreign exchange contracts (419 738,81)
29/02/2016 14 576 850,33 EUR 16 100 000,00 USD (223 931,95) 29/01/2016 4 083 950,60 EUR 13 309 595,00 TRY (82 297,93) 29/02/2016 3 500 000,00 USD 3 288 855,48 EUR (71 294,11) 29/02/2016 1 105 000,00 GBP 1 519 474,72 EUR (22 094,78) 29/02/2016 980 000,00 USD 921 037,22 EUR (20 120,04)
243

Investment Solutions by Epsilon - Valore Cedola Globale - 04/2015
The accompanying notes form an integral part of these financial statements.
SWAP CONTRACTS AS AT 31 DECEMBER 2015
Counterparty Currency Notional Maturity Interest
receivable (EUR) Interest
payable (EUR)
Unrealised
profit / (loss) (EUR)
ASSET SWAP CONTRACTS — — (225 904,14) BANCA IMI SPA EUR 169 300 000,00 07/07/2020 — — (225 904,14)
244
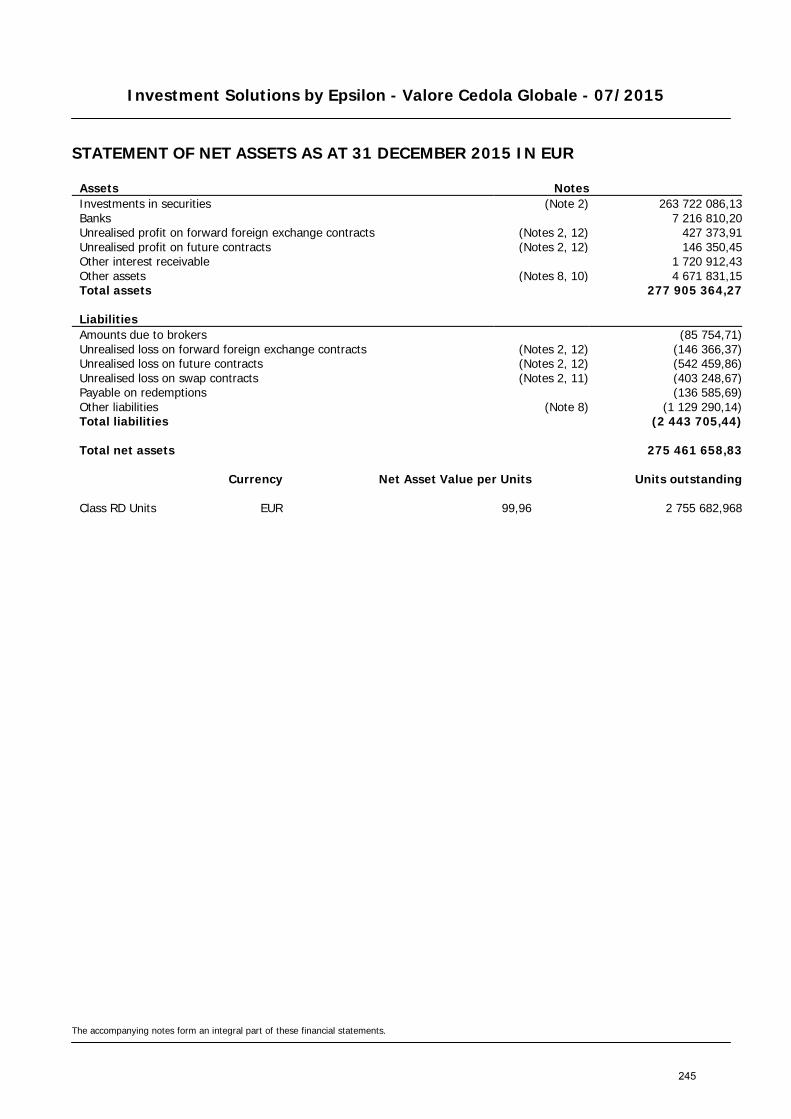
Investment Solutions by Epsilon - Valore Cedola Globale - 07/2015
STATEMENT OF NET ASSETS AS AT 31 DECEMBER 2015 IN EUR
The accompanying notes form an integral part of these financial statements.
Assets Notes Investments in securities (Note 2) 263 722 086,13 Banks 7 216 810,20 Unrealised profit on forward foreign exchange contracts (Notes 2, 12) 427 373,91 Unrealised profit on future contracts (Notes 2, 12) 146 350,45 Other interest receivable 1 720 912,43 Other assets (Notes 8, 10) 4 671 831,15 Total assets 277 905 364,27
Liabilities Amounts due to brokers (85 754,71) Unrealised loss on forward foreign exchange contracts (Notes 2, 12) (146 366,37) Unrealised loss on future contracts (Notes 2, 12) (542 459,86) Unrealised loss on swap contracts (Notes 2, 11) (403 248,67) Payable on redemptions (136 585,69) Other liabilities (Note 8) (1 129 290,14) Total liabilities (2 443 705,44)
Total net assets 275 461 658,83
Currency Net Asset Value per Units Units outstanding
Class RD Units EUR 99,96 2 755 682,968
245
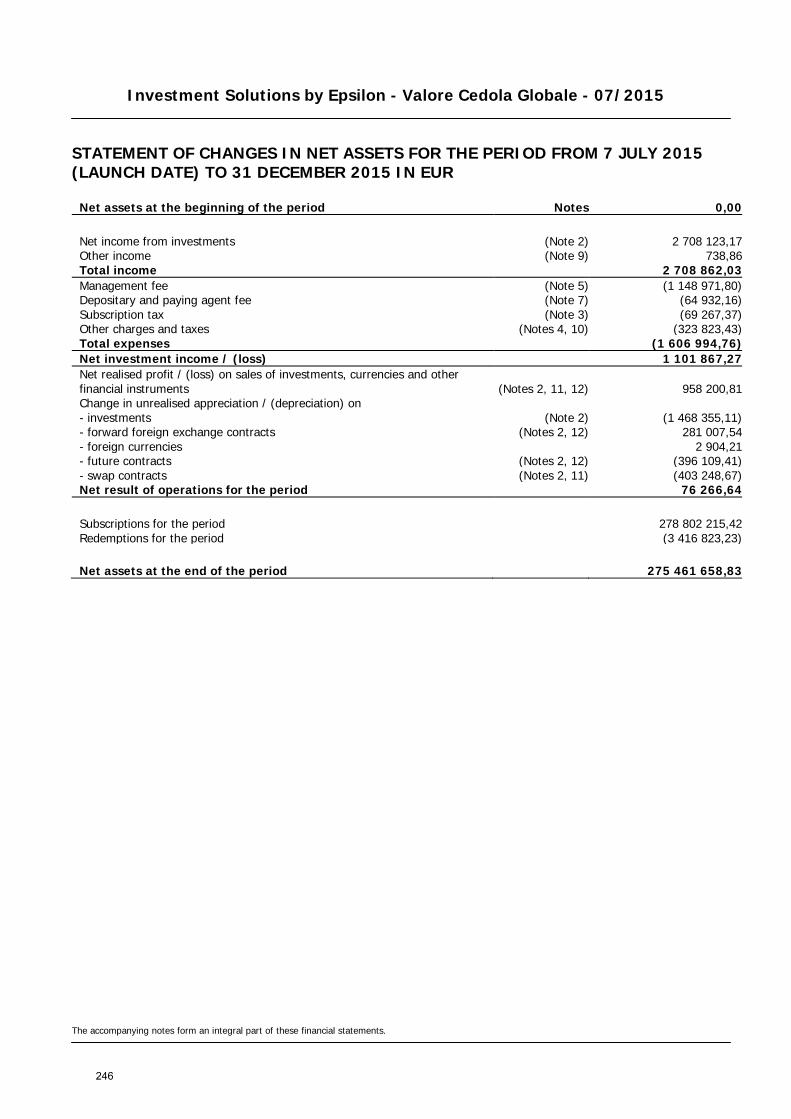
Investment Solutions by Epsilon - Valore Cedola Globale - 07/2015
STATEMENT OF CHANGES IN NET ASSETS FOR THE PERIOD FROM 7 JULY 2015 (LAUNCH DATE) TO 31 DECEMBER 2015 IN EUR
The accompanying notes form an integral part of these financial statements.
Net assets at the beginning of the period Notes 0,00
Net income from investments (Note 2) 2 708 123,17 Other income (Note 9) 738,86 Total income 2 708 862,03 Management fee (Note 5) (1 148 971,80) Depositary and paying agent fee (Note 7) (64 932,16) Subscription tax (Note 3) (69 267,37) Other charges and taxes (Notes 4, 10) (323 823,43) Total expenses (1 606 994,76) Net investment income / (loss) 1 101 867,27 Net realised profit / (loss) on sales of investments, currencies and other financial instruments (Notes 2, 11, 12) 958 200,81 Change in unrealised appreciation / (depreciation) on - investments (Note 2) (1 468 355,11) - forward foreign exchange contracts (Notes 2, 12) 281 007,54 - foreign currencies 2 904,21 - future contracts (Notes 2, 12) (396 109,41) - swap contracts (Notes 2, 11) (403 248,67) Net result of operations for the period 76 266,64
Subscriptions for the period 278 802 215,42 Redemptions for the period (3 416 823,23)
Net assets at the end of the period 275 461 658,83
246
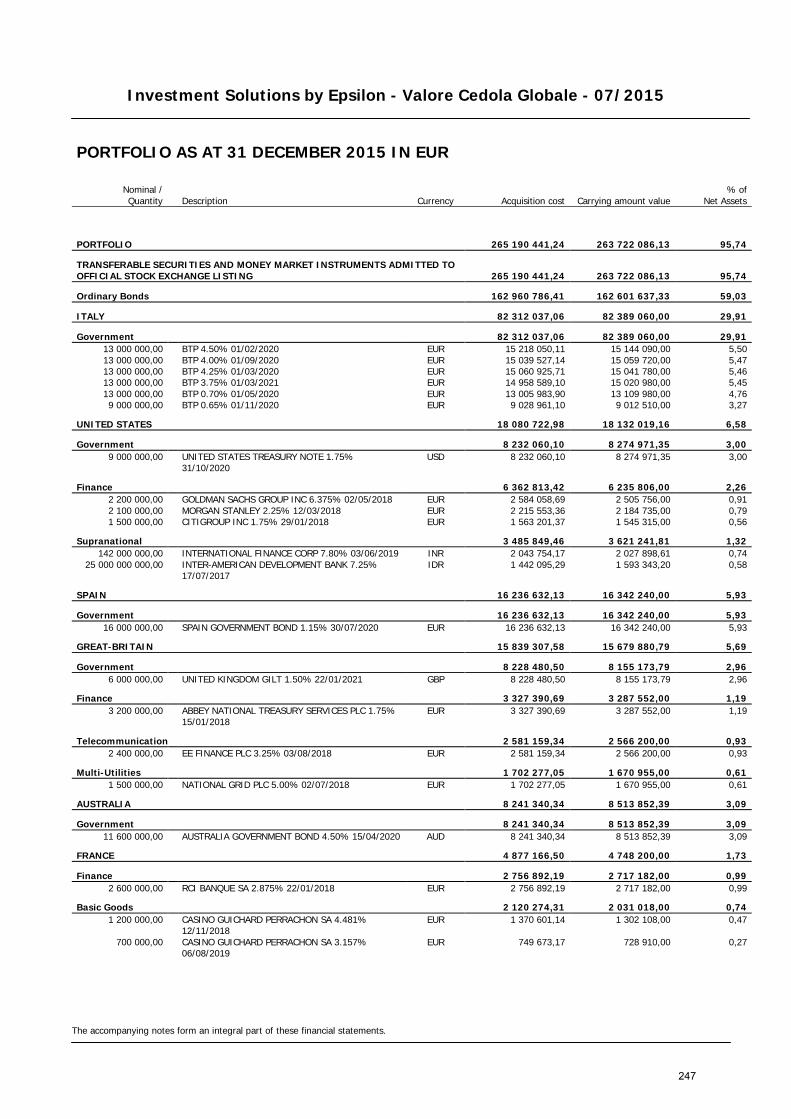
Investment Solutions by Epsilon - Valore Cedola Globale - 07/2015
The accompanying notes form an integral part of these financial statements.
PORTFOLIO AS AT 31 DECEMBER 2015 IN EUR
Nominal / Quantity Description Currency Acquisition cost Carrying amount value
% of Net Assets
PORTFOLIO 265 190 441,24 263 722 086,13 95,74
TRANSFERABLE SECURITIES AND MONEY MARKET INSTRUMENTS ADMITTED TO OFFICIAL STOCK EXCHANGE LISTING 265 190 441,24 263 722 086,13 95,74
Ordinary Bonds 162 960 786,41 162 601 637,33 59,03
ITALY 82 312 037,06 82 389 060,00 29,91
Government 82 312 037,06 82 389 060,00 29,91 13 000 000,00 BTP 4.50% 01/02/2020 EUR 15 218 050,11 15 144 090,00 5,50 13 000 000,00 BTP 4.00% 01/09/2020 EUR 15 039 527,14 15 059 720,00 5,47 13 000 000,00 BTP 4.25% 01/03/2020 EUR 15 060 925,71 15 041 780,00 5,46 13 000 000,00 BTP 3.75% 01/03/2021 EUR 14 958 589,10 15 020 980,00 5,45 13 000 000,00 BTP 0.70% 01/05/2020 EUR 13 005 983,90 13 109 980,00 4,76 9 000 000,00 BTP 0.65% 01/11/2020 EUR 9 028 961,10 9 012 510,00 3,27
UNITED STATES 18 080 722,98 18 132 019,16 6,58
Government 8 232 060,10 8 274 971,35 3,00 9 000 000,00
UNITED STATES TREASURY NOTE 1.75% 31/10/2020
USD 8 232 060,10 8 274 971,35 3,00
Finance 6 362 813,42 6 235 806,00 2,26 2 200 000,00 GOLDMAN SACHS GROUP INC 6.375% 02/05/2018 EUR 2 584 058,69 2 505 756,00 0,91 2 100 000,00 MORGAN STANLEY 2.25% 12/03/2018 EUR 2 215 553,36 2 184 735,00 0,79 1 500 000,00 CITIGROUP INC 1.75% 29/01/2018 EUR 1 563 201,37 1 545 315,00 0,56
Supranational 3 485 849,46 3 621 241,81 1,32 142 000 000,00 INTERNATIONAL FINANCE CORP 7.80% 03/06/2019 INR 2 043 754,17 2 027 898,61 0,74
25 000 000 000,00
INTER-AMERICAN DEVELOPMENT BANK 7.25% 17/07/2017
IDR 1 442 095,29 1 593 343,20 0,58
SPAIN 16 236 632,13 16 342 240,00 5,93
Government 16 236 632,13 16 342 240,00 5,93 16 000 000,00 SPAIN GOVERNMENT BOND 1.15% 30/07/2020 EUR 16 236 632,13 16 342 240,00 5,93
GREAT-BRITAIN 15 839 307,58 15 679 880,79 5,69
Government 8 228 480,50 8 155 173,79 2,96 6 000 000,00 UNITED KINGDOM GILT 1.50% 22/01/2021 GBP 8 228 480,50 8 155 173,79 2,96
Finance 3 327 390,69 3 287 552,00 1,19 3 200 000,00
ABBEY NATIONAL TREASURY SERVICES PLC 1.75% 15/01/2018
EUR 3 327 390,69 3 287 552,00 1,19
Telecommunication 2 581 159,34 2 566 200,00 0,93 2 400 000,00 EE FINANCE PLC 3.25% 03/08/2018 EUR 2 581 159,34 2 566 200,00 0,93
Multi-Utilities 1 702 277,05 1 670 955,00 0,61 1 500 000,00 NATIONAL GRID PLC 5.00% 02/07/2018 EUR 1 702 277,05 1 670 955,00 0,61
AUSTRALIA 8 241 340,34 8 513 852,39 3,09
Government 8 241 340,34 8 513 852,39 3,09 11 600 000,00 AUSTRALIA GOVERNMENT BOND 4.50% 15/04/2020 AUD 8 241 340,34 8 513 852,39 3,09
FRANCE 4 877 166,50 4 748 200,00 1,73
Finance 2 756 892,19 2 717 182,00 0,99 2 600 000,00 RCI BANQUE SA 2.875% 22/01/2018 EUR 2 756 892,19 2 717 182,00 0,99
Basic Goods 2 120 274,31 2 031 018,00 0,74 1 200 000,00
CASINO GUICHARD PERRACHON SA 4.481% 12/11/2018
EUR 1 370 601,14 1 302 108,00 0,47
700 000,00
CASINO GUICHARD PERRACHON SA 3.157% 06/08/2019
EUR 749 673,17 728 910,00 0,27
247
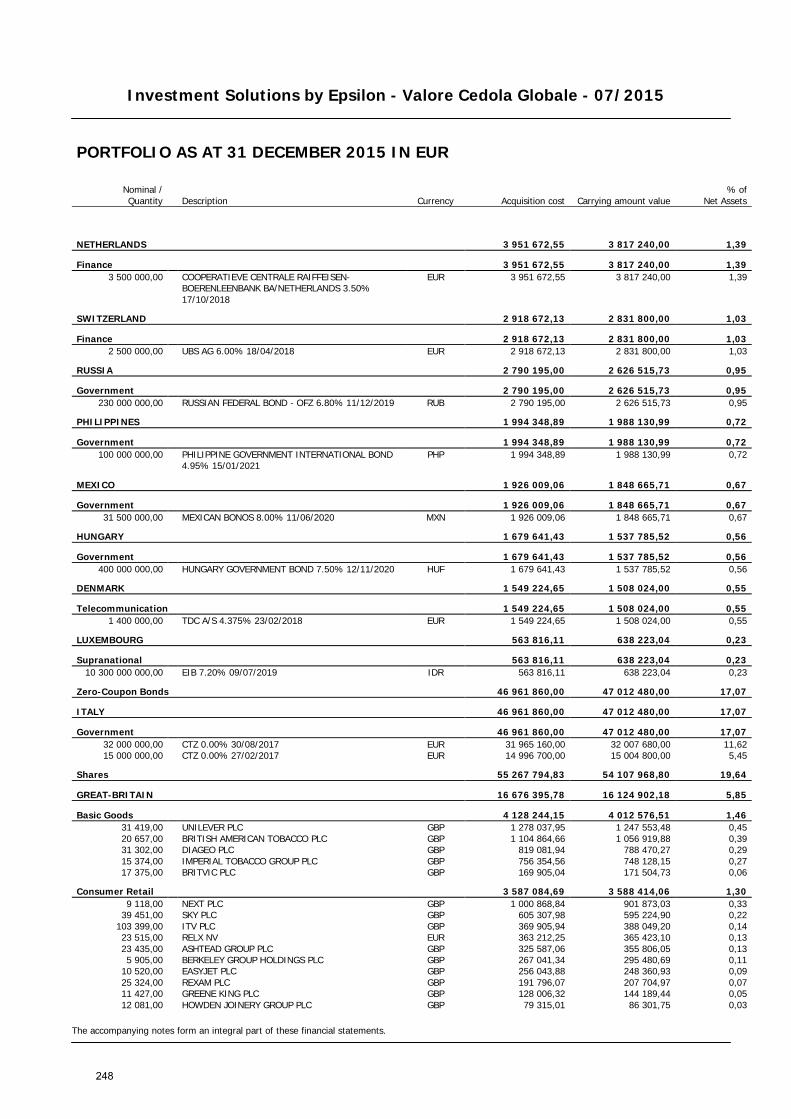
Investment Solutions by Epsilon - Valore Cedola Globale - 07/2015
The accompanying notes form an integral part of these financial statements.
PORTFOLIO AS AT 31 DECEMBER 2015 IN EUR
Nominal / Quantity Description Currency Acquisition cost Carrying amount value
% of Net Assets
NETHERLANDS 3 951 672,55 3 817 240,00 1,39
Finance 3 951 672,55 3 817 240,00 1,39 3 500 000,00
COOPERATIEVE CENTRALE RAIFFEISEN-BOERENLEENBANK BA/NETHERLANDS 3.50% 17/10/2018
EUR 3 951 672,55 3 817 240,00 1,39
SWITZERLAND 2 918 672,13 2 831 800,00 1,03
Finance 2 918 672,13 2 831 800,00 1,03 2 500 000,00 UBS AG 6.00% 18/04/2018 EUR 2 918 672,13 2 831 800,00 1,03
RUSSIA 2 790 195,00 2 626 515,73 0,95
Government 2 790 195,00 2 626 515,73 0,95 230 000 000,00 RUSSIAN FEDERAL BOND - OFZ 6.80% 11/12/2019 RUB 2 790 195,00 2 626 515,73 0,95
PHILIPPINES 1 994 348,89 1 988 130,99 0,72
Government 1 994 348,89 1 988 130,99 0,72 100 000 000,00
PHILIPPINE GOVERNMENT INTERNATIONAL BOND 4.95% 15/01/2021
PHP 1 994 348,89 1 988 130,99 0,72
MEXICO 1 926 009,06 1 848 665,71 0,67
Government 1 926 009,06 1 848 665,71 0,67 31 500 000,00 MEXICAN BONOS 8.00% 11/06/2020 MXN 1 926 009,06 1 848 665,71 0,67
HUNGARY 1 679 641,43 1 537 785,52 0,56
Government 1 679 641,43 1 537 785,52 0,56 400 000 000,00 HUNGARY GOVERNMENT BOND 7.50% 12/11/2020 HUF 1 679 641,43 1 537 785,52 0,56
DENMARK 1 549 224,65 1 508 024,00 0,55
Telecommunication 1 549 224,65 1 508 024,00 0,55 1 400 000,00 TDC A/S 4.375% 23/02/2018 EUR 1 549 224,65 1 508 024,00 0,55
LUXEMBOURG 563 816,11 638 223,04 0,23
Supranational 563 816,11 638 223,04 0,23 10 300 000 000,00 EIB 7.20% 09/07/2019 IDR 563 816,11 638 223,04 0,23
Zero-Coupon Bonds 46 961 860,00 47 012 480,00 17,07
ITALY 46 961 860,00 47 012 480,00 17,07
Government 46 961 860,00 47 012 480,00 17,07 32 000 000,00 CTZ 0.00% 30/08/2017 EUR 31 965 160,00 32 007 680,00 11,62 15 000 000,00 CTZ 0.00% 27/02/2017 EUR 14 996 700,00 15 004 800,00 5,45
Shares 55 267 794,83 54 107 968,80 19,64
GREAT-BRITAIN 16 676 395,78 16 124 902,18 5,85
Basic Goods 4 128 244,15 4 012 576,51 1,46 31 419,00 UNILEVER PLC GBP 1 278 037,95 1 247 553,48 0,45 20 657,00 BRITISH AMERICAN TOBACCO PLC GBP 1 104 864,66 1 056 919,88 0,39 31 302,00 DIAGEO PLC GBP 819 081,94 788 470,27 0,29 15 374,00 IMPERIAL TOBACCO GROUP PLC GBP 756 354,56 748 128,15 0,27 17 375,00 BRITVIC PLC GBP 169 905,04 171 504,73 0,06
Consumer Retail 3 587 084,69 3 588 414,06 1,30 9 118,00 NEXT PLC GBP 1 000 868,84 901 873,03 0,33
39 451,00 SKY PLC GBP 605 307,98 595 224,90 0,22 103 399,00 ITV PLC GBP 369 905,94 388 049,20 0,14 23 515,00 RELX NV EUR 363 212,25 365 423,10 0,13 23 435,00 ASHTEAD GROUP PLC GBP 325 587,06 355 806,05 0,13 5 905,00 BERKELEY GROUP HOLDINGS PLC GBP 267 041,34 295 480,69 0,11
10 520,00 EASYJET PLC GBP 256 043,88 248 360,93 0,09 25 324,00 REXAM PLC GBP 191 796,07 207 704,97 0,07 11 427,00 GREENE KING PLC GBP 128 006,32 144 189,44 0,05 12 081,00 HOWDEN JOINERY GROUP PLC GBP 79 315,01 86 301,75 0,03
248
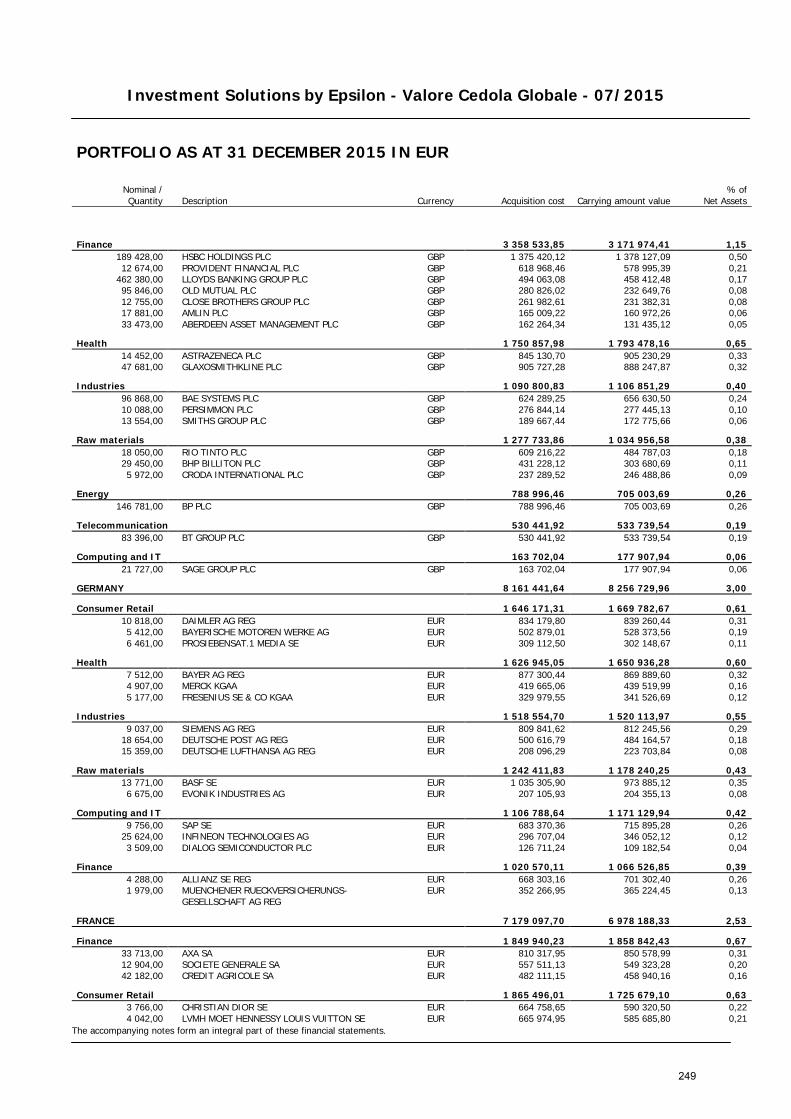
Investment Solutions by Epsilon - Valore Cedola Globale - 07/2015
The accompanying notes form an integral part of these financial statements.
PORTFOLIO AS AT 31 DECEMBER 2015 IN EUR
Nominal / Quantity Description Currency Acquisition cost Carrying amount value
% of Net Assets
Finance 3 358 533,85 3 171 974,41 1,15 189 428,00 HSBC HOLDINGS PLC GBP 1 375 420,12 1 378 127,09 0,50 12 674,00 PROVIDENT FINANCIAL PLC GBP 618 968,46 578 995,39 0,21
462 380,00 LLOYDS BANKING GROUP PLC GBP 494 063,08 458 412,48 0,17 95 846,00 OLD MUTUAL PLC GBP 280 826,02 232 649,76 0,08 12 755,00 CLOSE BROTHERS GROUP PLC GBP 261 982,61 231 382,31 0,08 17 881,00 AMLIN PLC GBP 165 009,22 160 972,26 0,06 33 473,00 ABERDEEN ASSET MANAGEMENT PLC GBP 162 264,34 131 435,12 0,05
Health 1 750 857,98 1 793 478,16 0,65 14 452,00 ASTRAZENECA PLC GBP 845 130,70 905 230,29 0,33 47 681,00 GLAXOSMITHKLINE PLC GBP 905 727,28 888 247,87 0,32
Industries 1 090 800,83 1 106 851,29 0,40 96 868,00 BAE SYSTEMS PLC GBP 624 289,25 656 630,50 0,24 10 088,00 PERSIMMON PLC GBP 276 844,14 277 445,13 0,10 13 554,00 SMITHS GROUP PLC GBP 189 667,44 172 775,66 0,06
Raw materials 1 277 733,86 1 034 956,58 0,38 18 050,00 RIO TINTO PLC GBP 609 216,22 484 787,03 0,18 29 450,00 BHP BILLITON PLC GBP 431 228,12 303 680,69 0,11 5 972,00 CRODA INTERNATIONAL PLC GBP 237 289,52 246 488,86 0,09
Energy 788 996,46 705 003,69 0,26 146 781,00 BP PLC GBP 788 996,46 705 003,69 0,26
Telecommunication 530 441,92 533 739,54 0,19 83 396,00 BT GROUP PLC GBP 530 441,92 533 739,54 0,19
Computing and IT 163 702,04 177 907,94 0,06 21 727,00 SAGE GROUP PLC GBP 163 702,04 177 907,94 0,06
GERMANY 8 161 441,64 8 256 729,96 3,00
Consumer Retail 1 646 171,31 1 669 782,67 0,61 10 818,00 DAIMLER AG REG EUR 834 179,80 839 260,44 0,31 5 412,00 BAYERISCHE MOTOREN WERKE AG EUR 502 879,01 528 373,56 0,19 6 461,00 PROSIEBENSAT.1 MEDIA SE EUR 309 112,50 302 148,67 0,11
Health 1 626 945,05 1 650 936,28 0,60 7 512,00 BAYER AG REG EUR 877 300,44 869 889,60 0,32 4 907,00 MERCK KGAA EUR 419 665,06 439 519,99 0,16 5 177,00 FRESENIUS SE & CO KGAA EUR 329 979,55 341 526,69 0,12
Industries 1 518 554,70 1 520 113,97 0,55 9 037,00 SIEMENS AG REG EUR 809 841,62 812 245,56 0,29
18 654,00 DEUTSCHE POST AG REG EUR 500 616,79 484 164,57 0,18 15 359,00 DEUTSCHE LUFTHANSA AG REG EUR 208 096,29 223 703,84 0,08
Raw materials 1 242 411,83 1 178 240,25 0,43 13 771,00 BASF SE EUR 1 035 305,90 973 885,12 0,35 6 675,00 EVONIK INDUSTRIES AG EUR 207 105,93 204 355,13 0,08
Computing and IT 1 106 788,64 1 171 129,94 0,42 9 756,00 SAP SE EUR 683 370,36 715 895,28 0,26
25 624,00 INFINEON TECHNOLOGIES AG EUR 296 707,04 346 052,12 0,12 3 509,00 DIALOG SEMICONDUCTOR PLC EUR 126 711,24 109 182,54 0,04
Finance 1 020 570,11 1 066 526,85 0,39 4 288,00 ALLIANZ SE REG EUR 668 303,16 701 302,40 0,26 1 979,00
MUENCHENER RUECKVERSICHERUNGS-GESELLSCHAFT AG REG
EUR 352 266,95 365 224,45 0,13
FRANCE 7 179 097,70 6 978 188,33 2,53
Finance 1 849 940,23 1 858 842,43 0,67 33 713,00 AXA SA EUR 810 317,95 850 578,99 0,31 12 904,00 SOCIETE GENERALE SA EUR 557 511,13 549 323,28 0,20 42 182,00 CREDIT AGRICOLE SA EUR 482 111,15 458 940,16 0,16
Consumer Retail 1 865 496,01 1 725 679,10 0,63 3 766,00 CHRISTIAN DIOR SE EUR 664 758,65 590 320,50 0,22 4 042,00 LVMH MOET HENNESSY LOUIS VUITTON SE EUR 665 974,95 585 685,80 0,21
249
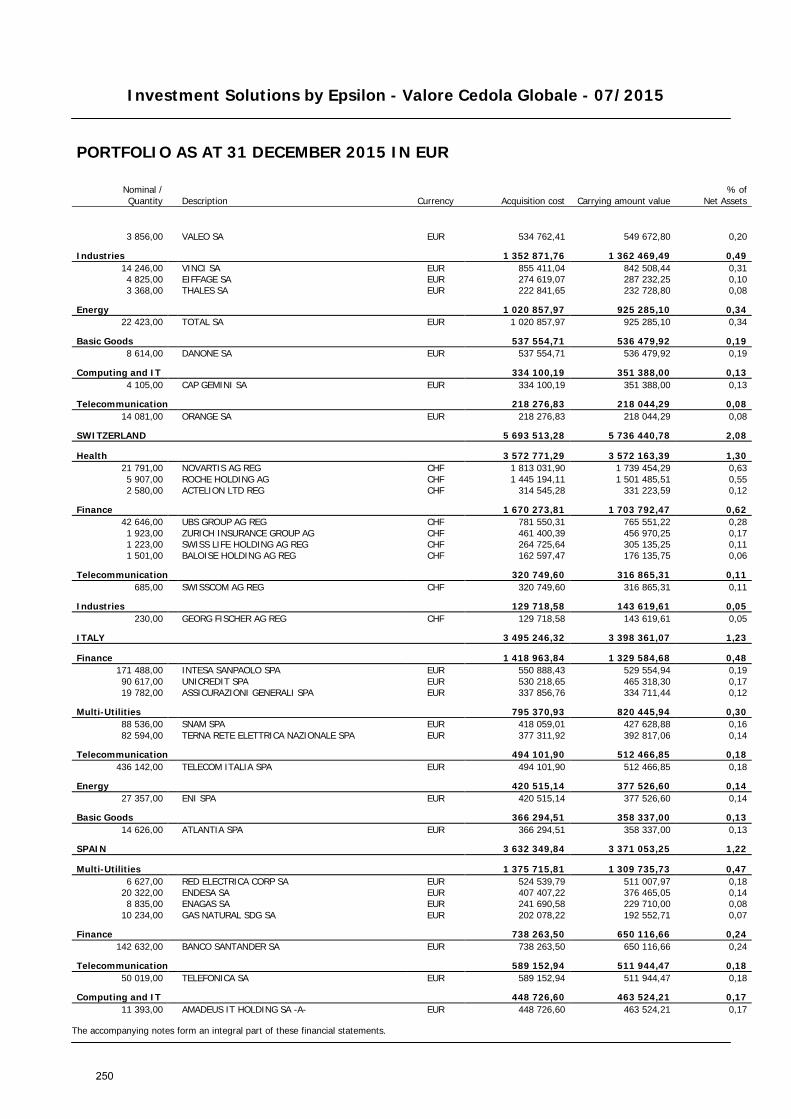
Investment Solutions by Epsilon - Valore Cedola Globale - 07/2015
The accompanying notes form an integral part of these financial statements.
PORTFOLIO AS AT 31 DECEMBER 2015 IN EUR
Nominal / Quantity Description Currency Acquisition cost Carrying amount value
% of Net Assets
3 856,00 VALEO SA EUR 534 762,41 549 672,80 0,20
Industries 1 352 871,76 1 362 469,49 0,49 14 246,00 VINCI SA EUR 855 411,04 842 508,44 0,31 4 825,00 EIFFAGE SA EUR 274 619,07 287 232,25 0,10 3 368,00 THALES SA EUR 222 841,65 232 728,80 0,08
Energy 1 020 857,97 925 285,10 0,34 22 423,00 TOTAL SA EUR 1 020 857,97 925 285,10 0,34
Basic Goods 537 554,71 536 479,92 0,19 8 614,00 DANONE SA EUR 537 554,71 536 479,92 0,19
Computing and IT 334 100,19 351 388,00 0,13 4 105,00 CAP GEMINI SA EUR 334 100,19 351 388,00 0,13
Telecommunication 218 276,83 218 044,29 0,08 14 081,00 ORANGE SA EUR 218 276,83 218 044,29 0,08
SWITZERLAND 5 693 513,28 5 736 440,78 2,08
Health 3 572 771,29 3 572 163,39 1,30 21 791,00 NOVARTIS AG REG CHF 1 813 031,90 1 739 454,29 0,63 5 907,00 ROCHE HOLDING AG CHF 1 445 194,11 1 501 485,51 0,55 2 580,00 ACTELION LTD REG CHF 314 545,28 331 223,59 0,12
Finance 1 670 273,81 1 703 792,47 0,62 42 646,00 UBS GROUP AG REG CHF 781 550,31 765 551,22 0,28 1 923,00 ZURICH INSURANCE GROUP AG CHF 461 400,39 456 970,25 0,17 1 223,00 SWISS LIFE HOLDING AG REG CHF 264 725,64 305 135,25 0,11 1 501,00 BALOISE HOLDING AG REG CHF 162 597,47 176 135,75 0,06
Telecommunication 320 749,60 316 865,31 0,11 685,00 SWISSCOM AG REG CHF 320 749,60 316 865,31 0,11
Industries 129 718,58 143 619,61 0,05 230,00 GEORG FISCHER AG REG CHF 129 718,58 143 619,61 0,05
ITALY 3 495 246,32 3 398 361,07 1,23
Finance 1 418 963,84 1 329 584,68 0,48 171 488,00 INTESA SANPAOLO SPA EUR 550 888,43 529 554,94 0,19 90 617,00 UNICREDIT SPA EUR 530 218,65 465 318,30 0,17 19 782,00 ASSICURAZIONI GENERALI SPA EUR 337 856,76 334 711,44 0,12
Multi-Utilities 795 370,93 820 445,94 0,30 88 536,00 SNAM SPA EUR 418 059,01 427 628,88 0,16 82 594,00 TERNA RETE ELETTRICA NAZIONALE SPA EUR 377 311,92 392 817,06 0,14
Telecommunication 494 101,90 512 466,85 0,18 436 142,00 TELECOM ITALIA SPA EUR 494 101,90 512 466,85 0,18
Energy 420 515,14 377 526,60 0,14 27 357,00 ENI SPA EUR 420 515,14 377 526,60 0,14
Basic Goods 366 294,51 358 337,00 0,13 14 626,00 ATLANTIA SPA EUR 366 294,51 358 337,00 0,13
SPAIN 3 632 349,84 3 371 053,25 1,22
Multi-Utilities 1 375 715,81 1 309 735,73 0,47 6 627,00 RED ELECTRICA CORP SA EUR 524 539,79 511 007,97 0,18
20 322,00 ENDESA SA EUR 407 407,22 376 465,05 0,14 8 835,00 ENAGAS SA EUR 241 690,58 229 710,00 0,08
10 234,00 GAS NATURAL SDG SA EUR 202 078,22 192 552,71 0,07
Finance 738 263,50 650 116,66 0,24 142 632,00 BANCO SANTANDER SA EUR 738 263,50 650 116,66 0,24
Telecommunication 589 152,94 511 944,47 0,18 50 019,00 TELEFONICA SA EUR 589 152,94 511 944,47 0,18
Computing and IT 448 726,60 463 524,21 0,17 11 393,00 AMADEUS IT HOLDING SA -A- EUR 448 726,60 463 524,21 0,17
250
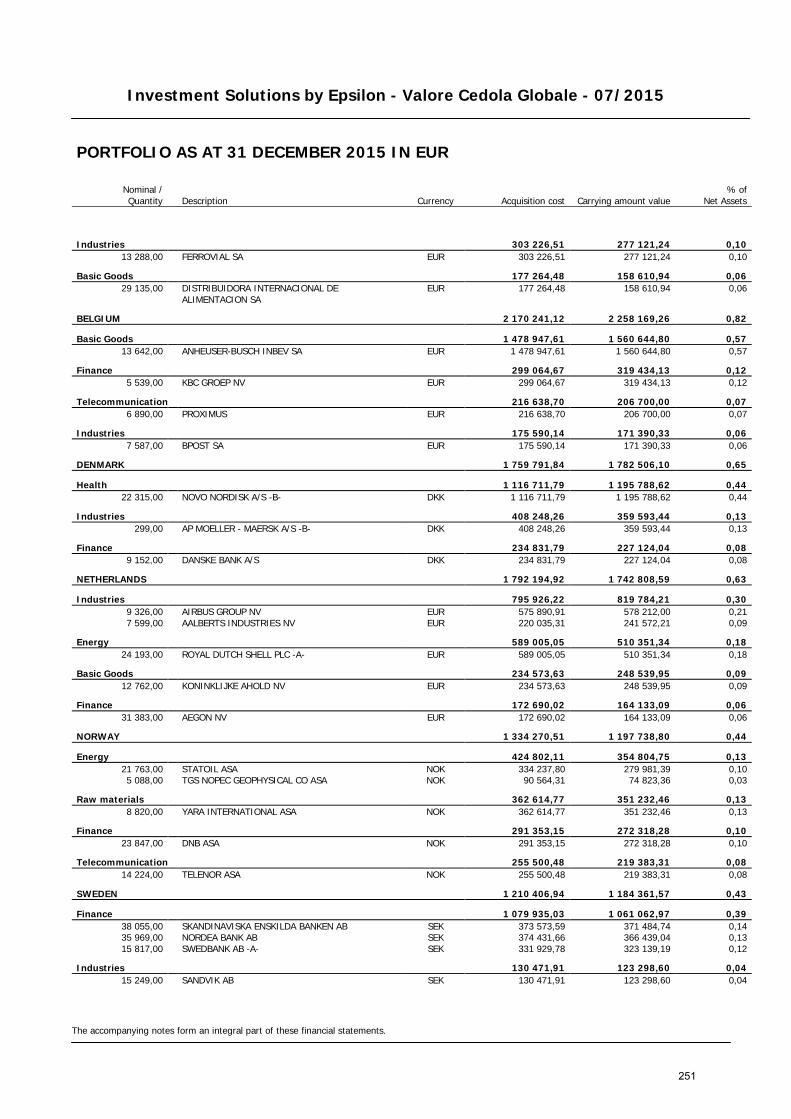
Investment Solutions by Epsilon - Valore Cedola Globale - 07/2015
The accompanying notes form an integral part of these financial statements.
PORTFOLIO AS AT 31 DECEMBER 2015 IN EUR
Nominal / Quantity Description Currency Acquisition cost Carrying amount value
% of Net Assets
Industries 303 226,51 277 121,24 0,10 13 288,00 FERROVIAL SA EUR 303 226,51 277 121,24 0,10
Basic Goods 177 264,48 158 610,94 0,06 29 135,00
DISTRIBUIDORA INTERNACIONAL DE ALIMENTACION SA
EUR 177 264,48 158 610,94 0,06
BELGIUM 2 170 241,12 2 258 169,26 0,82
Basic Goods 1 478 947,61 1 560 644,80 0,57 13 642,00 ANHEUSER-BUSCH INBEV SA EUR 1 478 947,61 1 560 644,80 0,57
Finance 299 064,67 319 434,13 0,12 5 539,00 KBC GROEP NV EUR 299 064,67 319 434,13 0,12
Telecommunication 216 638,70 206 700,00 0,07 6 890,00 PROXIMUS EUR 216 638,70 206 700,00 0,07
Industries 175 590,14 171 390,33 0,06 7 587,00 BPOST SA EUR 175 590,14 171 390,33 0,06
DENMARK 1 759 791,84 1 782 506,10 0,65
Health 1 116 711,79 1 195 788,62 0,44 22 315,00 NOVO NORDISK A/S -B- DKK 1 116 711,79 1 195 788,62 0,44
Industries 408 248,26 359 593,44 0,13 299,00 AP MOELLER - MAERSK A/S -B- DKK 408 248,26 359 593,44 0,13
Finance 234 831,79 227 124,04 0,08 9 152,00 DANSKE BANK A/S DKK 234 831,79 227 124,04 0,08
NETHERLANDS 1 792 194,92 1 742 808,59 0,63
Industries 795 926,22 819 784,21 0,30 9 326,00 AIRBUS GROUP NV EUR 575 890,91 578 212,00 0,21 7 599,00 AALBERTS INDUSTRIES NV EUR 220 035,31 241 572,21 0,09
Energy 589 005,05 510 351,34 0,18 24 193,00 ROYAL DUTCH SHELL PLC -A- EUR 589 005,05 510 351,34 0,18
Basic Goods 234 573,63 248 539,95 0,09 12 762,00 KONINKLIJKE AHOLD NV EUR 234 573,63 248 539,95 0,09
Finance 172 690,02 164 133,09 0,06 31 383,00 AEGON NV EUR 172 690,02 164 133,09 0,06
NORWAY 1 334 270,51 1 197 738,80 0,44
Energy 424 802,11 354 804,75 0,13 21 763,00 STATOIL ASA NOK 334 237,80 279 981,39 0,10 5 088,00 TGS NOPEC GEOPHYSICAL CO ASA NOK 90 564,31 74 823,36 0,03
Raw materials 362 614,77 351 232,46 0,13 8 820,00 YARA INTERNATIONAL ASA NOK 362 614,77 351 232,46 0,13
Finance 291 353,15 272 318,28 0,10 23 847,00 DNB ASA NOK 291 353,15 272 318,28 0,10
Telecommunication 255 500,48 219 383,31 0,08 14 224,00 TELENOR ASA NOK 255 500,48 219 383,31 0,08
SWEDEN 1 210 406,94 1 184 361,57 0,43
Finance 1 079 935,03 1 061 062,97 0,39 38 055,00 SKANDINAVISKA ENSKILDA BANKEN AB SEK 373 573,59 371 484,74 0,14 35 969,00 NORDEA BANK AB SEK 374 431,66 366 439,04 0,13 15 817,00 SWEDBANK AB -A- SEK 331 929,78 323 139,19 0,12
Industries 130 471,91 123 298,60 0,04 15 249,00 SANDVIK AB SEK 130 471,91 123 298,60 0,04
251
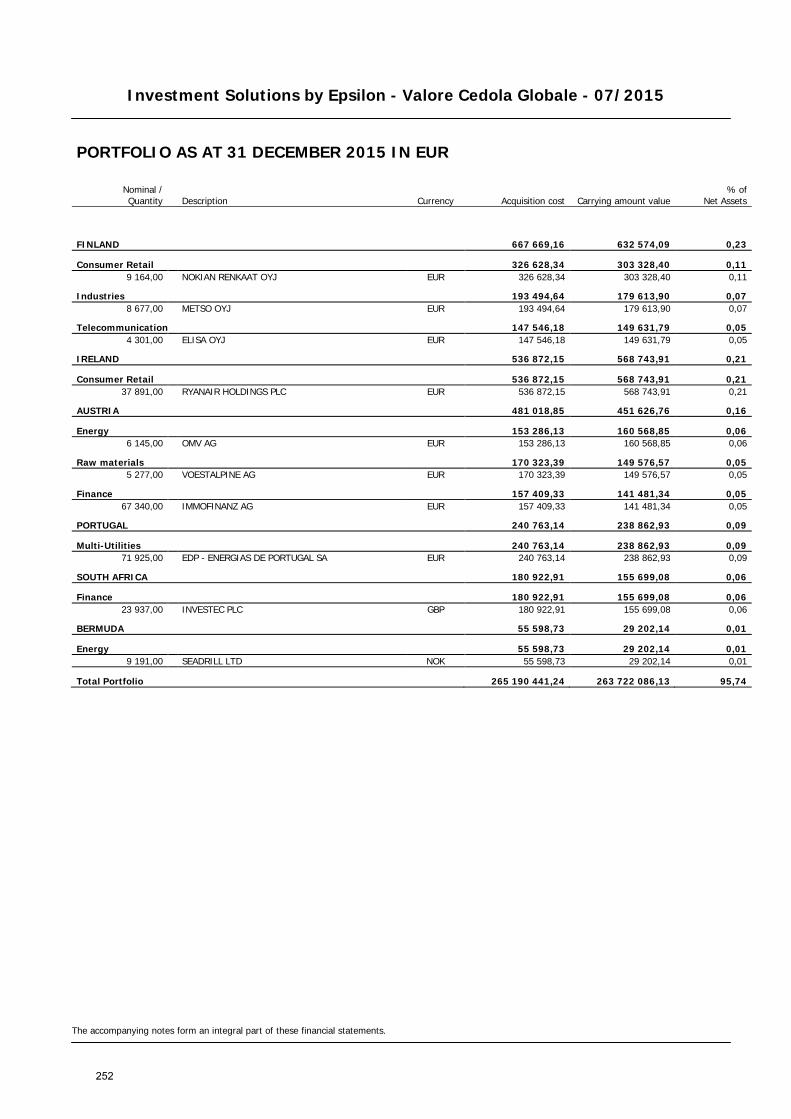
Investment Solutions by Epsilon - Valore Cedola Globale - 07/2015
The accompanying notes form an integral part of these financial statements.
PORTFOLIO AS AT 31 DECEMBER 2015 IN EUR
Nominal / Quantity Description Currency Acquisition cost Carrying amount value
% of Net Assets
FINLAND 667 669,16 632 574,09 0,23
Consumer Retail 326 628,34 303 328,40 0,11 9 164,00 NOKIAN RENKAAT OYJ EUR 326 628,34 303 328,40 0,11
Industries 193 494,64 179 613,90 0,07 8 677,00 METSO OYJ EUR 193 494,64 179 613,90 0,07
Telecommunication 147 546,18 149 631,79 0,05 4 301,00 ELISA OYJ EUR 147 546,18 149 631,79 0,05
IRELAND 536 872,15 568 743,91 0,21
Consumer Retail 536 872,15 568 743,91 0,21 37 891,00 RYANAIR HOLDINGS PLC EUR 536 872,15 568 743,91 0,21
AUSTRIA 481 018,85 451 626,76 0,16
Energy 153 286,13 160 568,85 0,06 6 145,00 OMV AG EUR 153 286,13 160 568,85 0,06
Raw materials 170 323,39 149 576,57 0,05 5 277,00 VOESTALPINE AG EUR 170 323,39 149 576,57 0,05
Finance 157 409,33 141 481,34 0,05 67 340,00 IMMOFINANZ AG EUR 157 409,33 141 481,34 0,05
PORTUGAL 240 763,14 238 862,93 0,09
Multi-Utilities 240 763,14 238 862,93 0,09 71 925,00 EDP - ENERGIAS DE PORTUGAL SA EUR 240 763,14 238 862,93 0,09
SOUTH AFRICA 180 922,91 155 699,08 0,06
Finance 180 922,91 155 699,08 0,06 23 937,00 INVESTEC PLC GBP 180 922,91 155 699,08 0,06
BERMUDA 55 598,73 29 202,14 0,01
Energy 55 598,73 29 202,14 0,01 9 191,00 SEADRILL LTD NOK 55 598,73 29 202,14 0,01
Total Portfolio 265 190 441,24 263 722 086,13 95,74
252
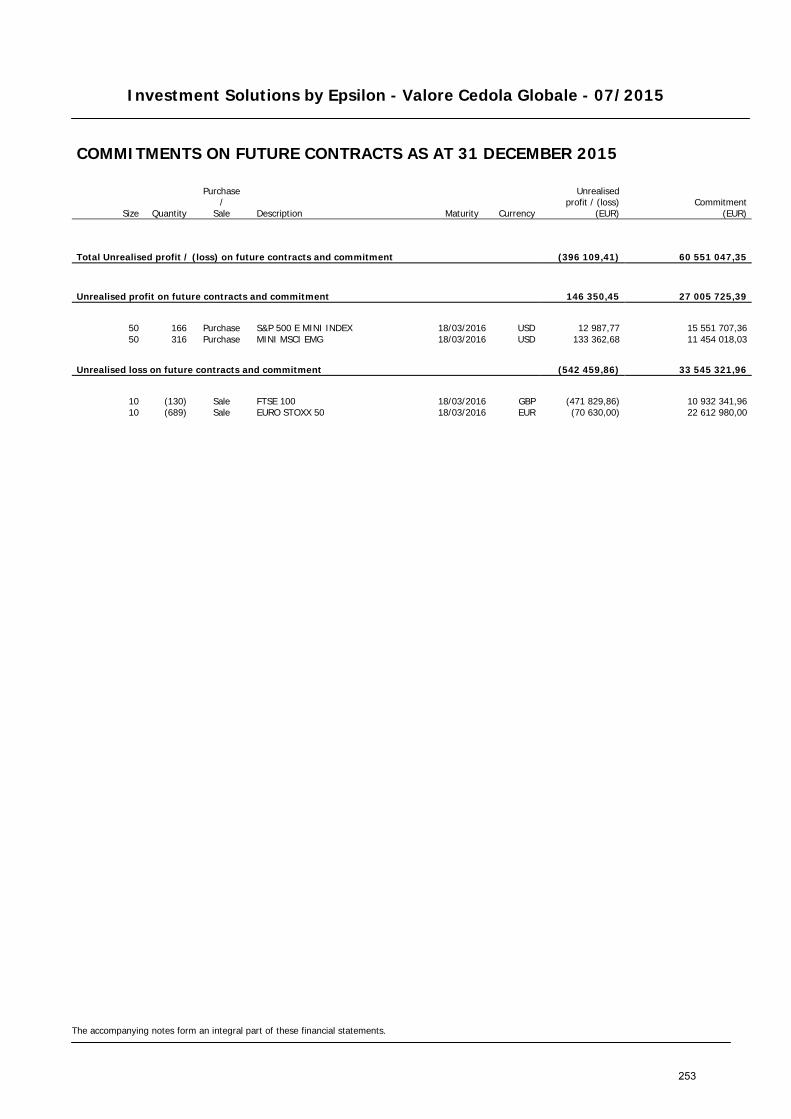
Investment Solutions by Epsilon - Valore Cedola Globale - 07/2015
The accompanying notes form an integral part of these financial statements.
COMMITMENTS ON FUTURE CONTRACTS AS AT 31 DECEMBER 2015
Size Quantity
Purchase /
Sale Description Maturity Currency
Unrealised profit / (loss)
(EUR) Commitment
(EUR)
Total Unrealised profit / (loss) on future contracts and commitment (396 109,41) 60 551 047,35
Unrealised profit on future contracts and commitment 146 350,45 27 005 725,39
50 166 Purchase S&P 500 E MINI INDEX 18/03/2016 USD 12 987,77 15 551 707,36 50 316 Purchase MINI MSCI EMG 18/03/2016 USD 133 362,68 11 454 018,03
Unrealised loss on future contracts and commitment (542 459,86) 33 545 321,96
10 (130) Sale FTSE 100 18/03/2016 GBP (471 829,86) 10 932 341,96 10 (689) Sale EURO STOXX 50 18/03/2016 EUR (70 630,00) 22 612 980,00
253
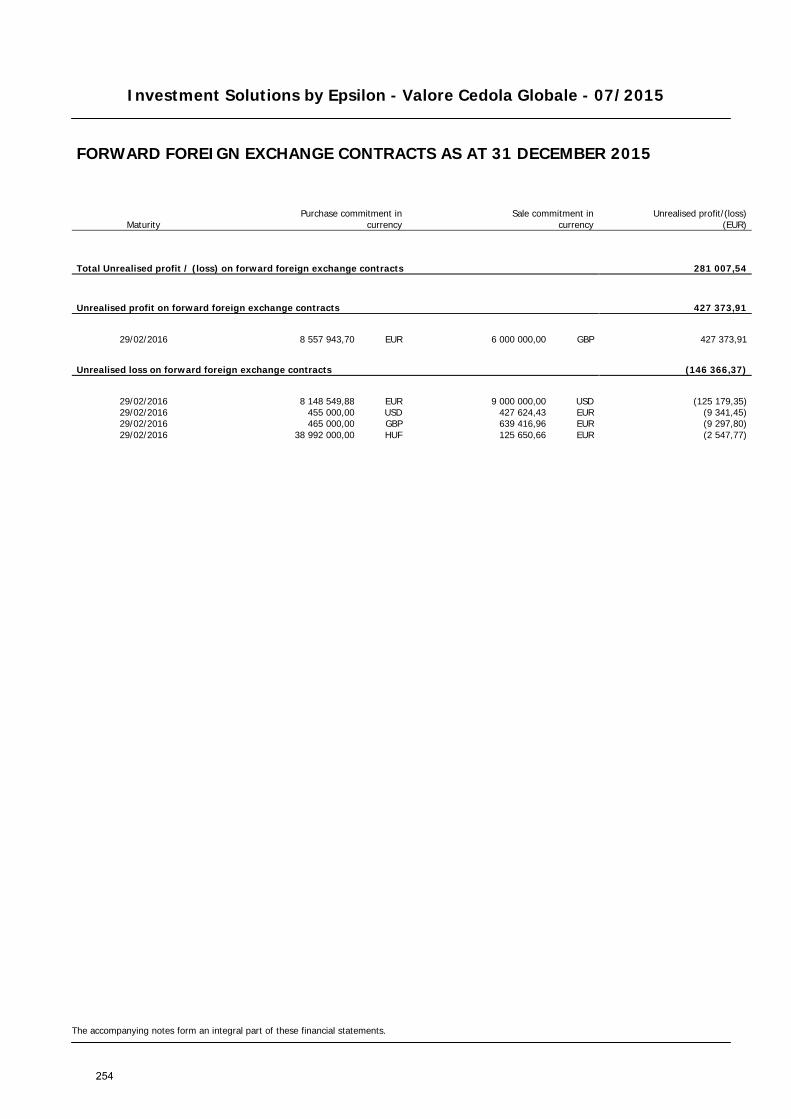
Investment Solutions by Epsilon - Valore Cedola Globale - 07/2015
The accompanying notes form an integral part of these financial statements.
FORWARD FOREIGN EXCHANGE CONTRACTS AS AT 31 DECEMBER 2015
Maturity Purchase commitment in
currency Sale commitment in
currency
Unrealised profit/(loss) (EUR)
Total Unrealised profit / (loss) on forward foreign exchange contracts 281 007,54
Unrealised profit on forward foreign exchange contracts 427 373,91
29/02/2016 8 557 943,70 EUR 6 000 000,00 GBP 427 373,91
Unrealised loss on forward foreign exchange contracts (146 366,37)
29/02/2016 8 148 549,88 EUR 9 000 000,00 USD (125 179,35) 29/02/2016 455 000,00 USD 427 624,43 EUR (9 341,45) 29/02/2016 465 000,00 GBP 639 416,96 EUR (9 297,80) 29/02/2016 38 992 000,00 HUF 125 650,66 EUR (2 547,77)
254

Investment Solutions by Epsilon - Valore Cedola Globale - 07/2015
The accompanying notes form an integral part of these financial statements.
SWAP CONTRACTS AS AT 31 DECEMBER 2015
Counterparty Currency Notional Maturity Interest
receivable (EUR) Interest
payable (EUR)
Unrealised
profit / (loss) (EUR)
ASSET SWAP CONTRACTS — — (403 248,67) BANCA IMI SPA EUR 114 800 000,00 22/09/2020 — — (403 248,67)
255

Investment Solutions by Epsilon - Valore Cedola Globale - 09/2015
STATEMENT OF NET ASSETS AS AT 31 DECEMBER 2015 IN EUR
The accompanying notes form an integral part of these financial statements.
Assets Notes Investments in securities (Note 2) 269 333 322,10 Banks 4 019 432,12 Unrealised profit on future contracts (Notes 2, 12) 148 107,56 Other interest receivable 1 036 514,88 Other assets (Notes 8, 10) 4 858 833,11 Total assets 279 396 209,77
Liabilities Amounts due to brokers (177 405,17) Unrealised loss on future contracts (Notes 2, 12) (23 964,37) Payable on redemptions (40 104,51) Other liabilities (Note 8) (333 862,59) Total liabilities (575 336,64)
Total net assets 278 820 873,13
Currency Net Asset Value per Units Units outstanding
Class RD Units EUR 99,92 2 790 461,249
256
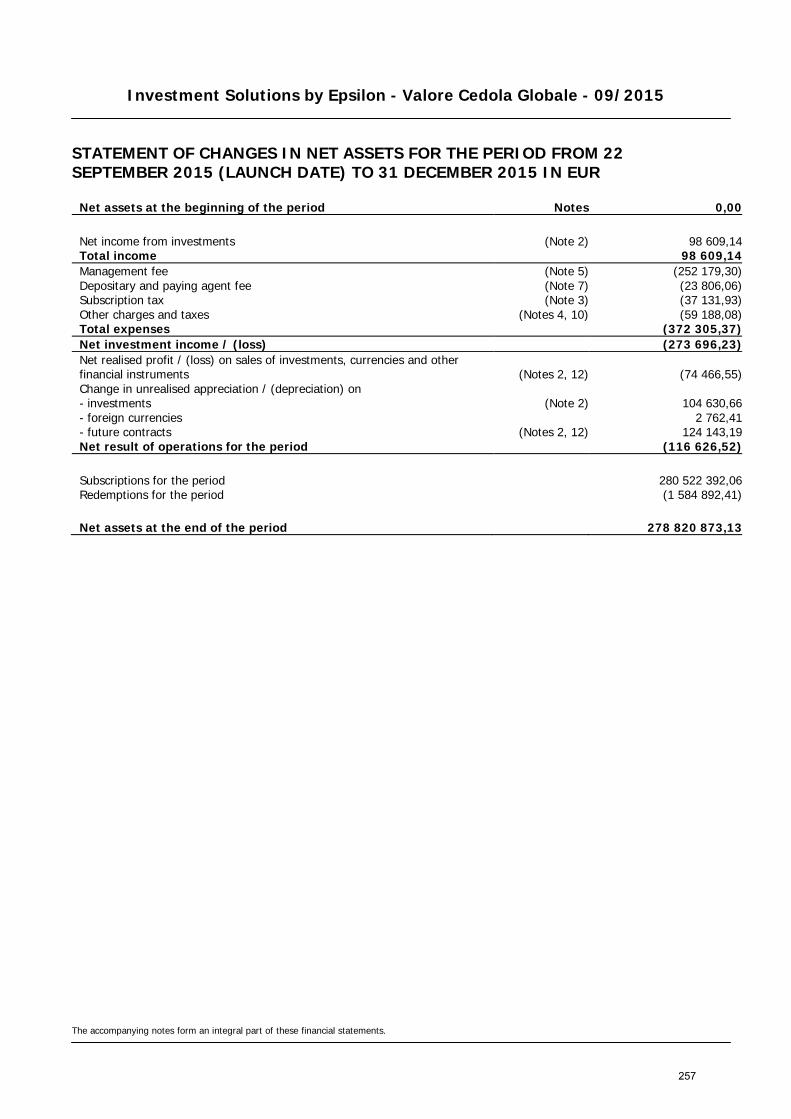
Investment Solutions by Epsilon - Valore Cedola Globale - 09/2015
STATEMENT OF CHANGES IN NET ASSETS FOR THE PERIOD FROM 22 SEPTEMBER 2015 (LAUNCH DATE) TO 31 DECEMBER 2015 IN EUR
The accompanying notes form an integral part of these financial statements.
Net assets at the beginning of the period Notes 0,00
Net income from investments (Note 2) 98 609,14 Total income 98 609,14 Management fee (Note 5) (252 179,30) Depositary and paying agent fee (Note 7) (23 806,06) Subscription tax (Note 3) (37 131,93) Other charges and taxes (Notes 4, 10) (59 188,08) Total expenses (372 305,37) Net investment income / (loss) (273 696,23) Net realised profit / (loss) on sales of investments, currencies and other financial instruments (Notes 2, 12) (74 466,55) Change in unrealised appreciation / (depreciation) on - investments (Note 2) 104 630,66 - foreign currencies 2 762,41 - future contracts (Notes 2, 12) 124 143,19 Net result of operations for the period (116 626,52)
Subscriptions for the period 280 522 392,06 Redemptions for the period (1 584 892,41)
Net assets at the end of the period 278 820 873,13
257
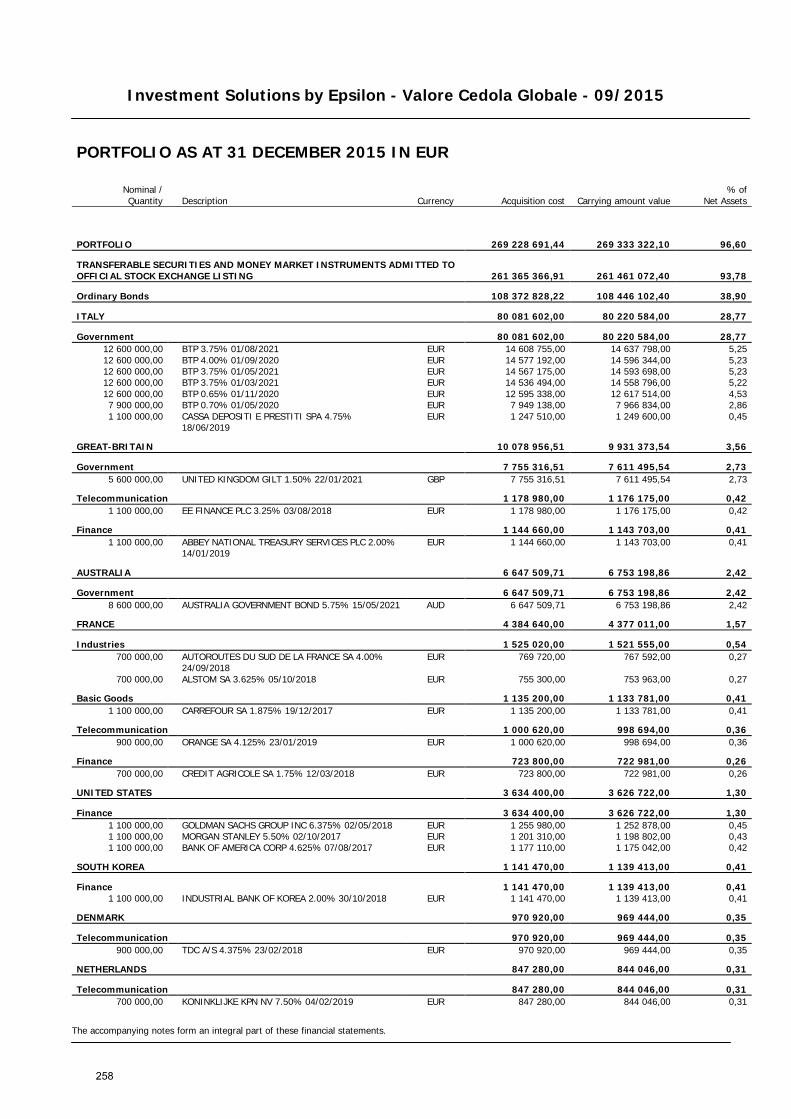
Investment Solutions by Epsilon - Valore Cedola Globale - 09/2015
The accompanying notes form an integral part of these financial statements.
PORTFOLIO AS AT 31 DECEMBER 2015 IN EUR
Nominal / Quantity Description Currency Acquisition cost Carrying amount value
% of Net Assets
PORTFOLIO 269 228 691,44 269 333 322,10 96,60
TRANSFERABLE SECURITIES AND MONEY MARKET INSTRUMENTS ADMITTED TO OFFICIAL STOCK EXCHANGE LISTING 261 365 366,91 261 461 072,40 93,78
Ordinary Bonds 108 372 828,22 108 446 102,40 38,90
ITALY 80 081 602,00 80 220 584,00 28,77
Government 80 081 602,00 80 220 584,00 28,77 12 600 000,00 BTP 3.75% 01/08/2021 EUR 14 608 755,00 14 637 798,00 5,25 12 600 000,00 BTP 4.00% 01/09/2020 EUR 14 577 192,00 14 596 344,00 5,23 12 600 000,00 BTP 3.75% 01/05/2021 EUR 14 567 175,00 14 593 698,00 5,23 12 600 000,00 BTP 3.75% 01/03/2021 EUR 14 536 494,00 14 558 796,00 5,22 12 600 000,00 BTP 0.65% 01/11/2020 EUR 12 595 338,00 12 617 514,00 4,53 7 900 000,00 BTP 0.70% 01/05/2020 EUR 7 949 138,00 7 966 834,00 2,86 1 100 000,00
CASSA DEPOSITI E PRESTITI SPA 4.75% 18/06/2019
EUR 1 247 510,00 1 249 600,00 0,45
GREAT-BRITAIN 10 078 956,51 9 931 373,54 3,56
Government 7 755 316,51 7 611 495,54 2,73 5 600 000,00 UNITED KINGDOM GILT 1.50% 22/01/2021 GBP 7 755 316,51 7 611 495,54 2,73
Telecommunication 1 178 980,00 1 176 175,00 0,42 1 100 000,00 EE FINANCE PLC 3.25% 03/08/2018 EUR 1 178 980,00 1 176 175,00 0,42
Finance 1 144 660,00 1 143 703,00 0,41 1 100 000,00
ABBEY NATIONAL TREASURY SERVICES PLC 2.00% 14/01/2019
EUR 1 144 660,00 1 143 703,00 0,41
AUSTRALIA 6 647 509,71 6 753 198,86 2,42
Government 6 647 509,71 6 753 198,86 2,42 8 600 000,00 AUSTRALIA GOVERNMENT BOND 5.75% 15/05/2021 AUD 6 647 509,71 6 753 198,86 2,42
FRANCE 4 384 640,00 4 377 011,00 1,57
Industries 1 525 020,00 1 521 555,00 0,54 700 000,00
AUTOROUTES DU SUD DE LA FRANCE SA 4.00% 24/09/2018
EUR 769 720,00 767 592,00 0,27
700 000,00 ALSTOM SA 3.625% 05/10/2018 EUR 755 300,00 753 963,00 0,27
Basic Goods 1 135 200,00 1 133 781,00 0,41 1 100 000,00 CARREFOUR SA 1.875% 19/12/2017 EUR 1 135 200,00 1 133 781,00 0,41
Telecommunication 1 000 620,00 998 694,00 0,36 900 000,00 ORANGE SA 4.125% 23/01/2019 EUR 1 000 620,00 998 694,00 0,36
Finance 723 800,00 722 981,00 0,26 700 000,00 CREDIT AGRICOLE SA 1.75% 12/03/2018 EUR 723 800,00 722 981,00 0,26
UNITED STATES 3 634 400,00 3 626 722,00 1,30
Finance 3 634 400,00 3 626 722,00 1,30 1 100 000,00 GOLDMAN SACHS GROUP INC 6.375% 02/05/2018 EUR 1 255 980,00 1 252 878,00 0,45 1 100 000,00 MORGAN STANLEY 5.50% 02/10/2017 EUR 1 201 310,00 1 198 802,00 0,43 1 100 000,00 BANK OF AMERICA CORP 4.625% 07/08/2017 EUR 1 177 110,00 1 175 042,00 0,42
SOUTH KOREA 1 141 470,00 1 139 413,00 0,41
Finance 1 141 470,00 1 139 413,00 0,41 1 100 000,00 INDUSTRIAL BANK OF KOREA 2.00% 30/10/2018 EUR 1 141 470,00 1 139 413,00 0,41
DENMARK 970 920,00 969 444,00 0,35
Telecommunication 970 920,00 969 444,00 0,35 900 000,00 TDC A/S 4.375% 23/02/2018 EUR 970 920,00 969 444,00 0,35
NETHERLANDS 847 280,00 844 046,00 0,31
Telecommunication 847 280,00 844 046,00 0,31 700 000,00 KONINKLIJKE KPN NV 7.50% 04/02/2019 EUR 847 280,00 844 046,00 0,31
258
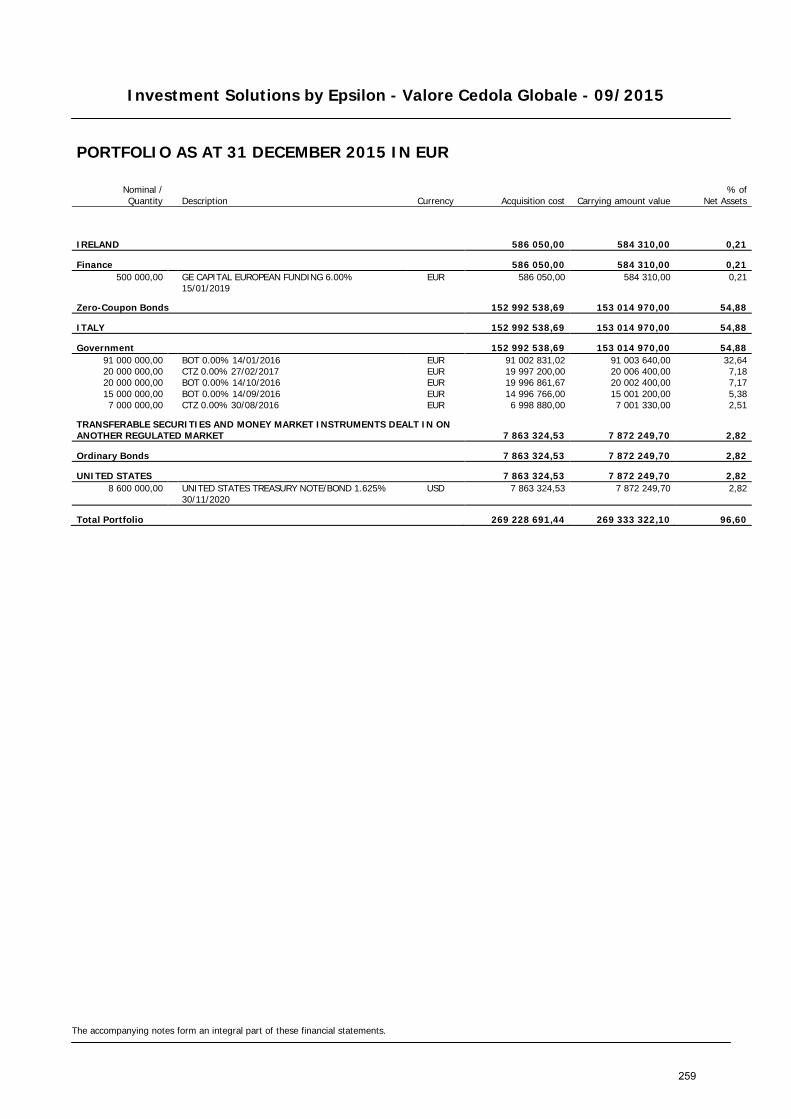
Investment Solutions by Epsilon - Valore Cedola Globale - 09/2015
The accompanying notes form an integral part of these financial statements.
PORTFOLIO AS AT 31 DECEMBER 2015 IN EUR
Nominal / Quantity Description Currency Acquisition cost Carrying amount value
% of Net Assets
IRELAND 586 050,00 584 310,00 0,21
Finance 586 050,00 584 310,00 0,21 500 000,00
GE CAPITAL EUROPEAN FUNDING 6.00% 15/01/2019
EUR 586 050,00 584 310,00 0,21
Zero-Coupon Bonds 152 992 538,69 153 014 970,00 54,88
ITALY 152 992 538,69 153 014 970,00 54,88
Government 152 992 538,69 153 014 970,00 54,88 91 000 000,00 BOT 0.00% 14/01/2016 EUR 91 002 831,02 91 003 640,00 32,64 20 000 000,00 CTZ 0.00% 27/02/2017 EUR 19 997 200,00 20 006 400,00 7,18 20 000 000,00 BOT 0.00% 14/10/2016 EUR 19 996 861,67 20 002 400,00 7,17 15 000 000,00 BOT 0.00% 14/09/2016 EUR 14 996 766,00 15 001 200,00 5,38 7 000 000,00 CTZ 0.00% 30/08/2016 EUR 6 998 880,00 7 001 330,00 2,51
TRANSFERABLE SECURITIES AND MONEY MARKET INSTRUMENTS DEALT IN ON ANOTHER REGULATED MARKET 7 863 324,53 7 872 249,70 2,82
Ordinary Bonds 7 863 324,53 7 872 249,70 2,82
UNITED STATES 7 863 324,53 7 872 249,70 2,82 8 600 000,00
UNITED STATES TREASURY NOTE/BOND 1.625% 30/11/2020
USD 7 863 324,53 7 872 249,70 2,82
Total Portfolio 269 228 691,44 269 333 322,10 96,60
259
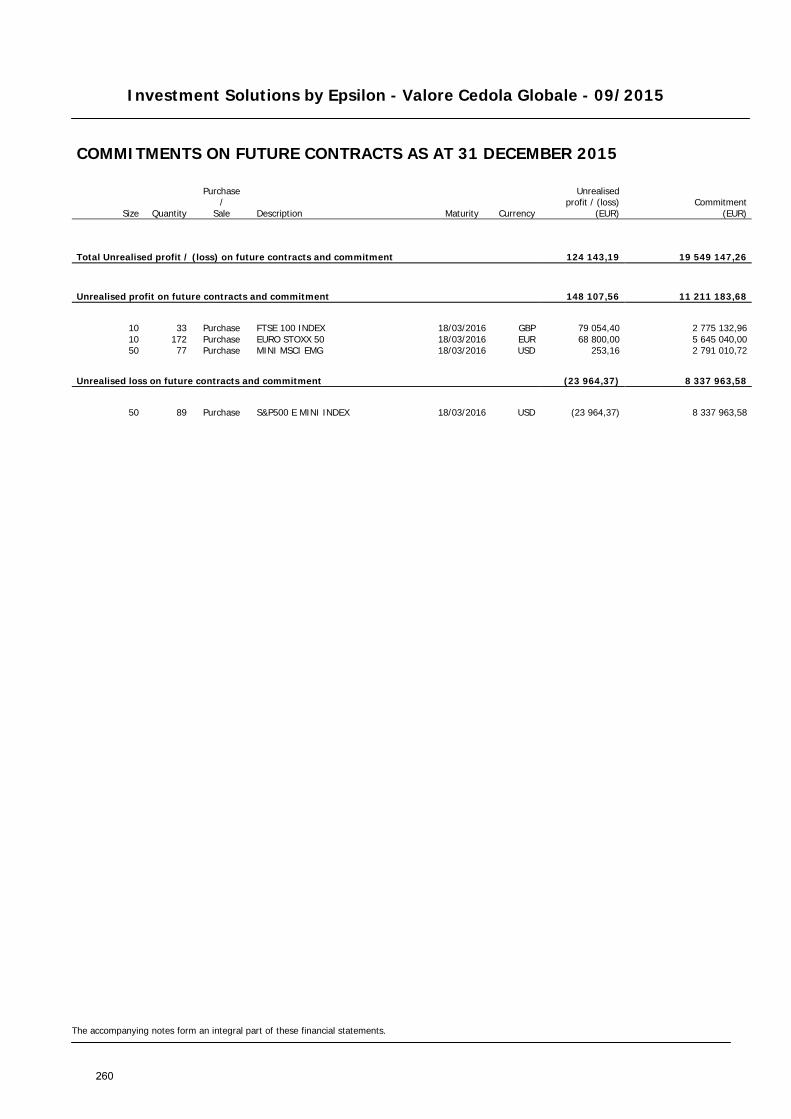
Investment Solutions by Epsilon - Valore Cedola Globale - 09/2015
The accompanying notes form an integral part of these financial statements.
COMMITMENTS ON FUTURE CONTRACTS AS AT 31 DECEMBER 2015
Size Quantity
Purchase /
Sale Description Maturity Currency
Unrealised profit / (loss)
(EUR) Commitment
(EUR)
Total Unrealised profit / (loss) on future contracts and commitment 124 143,19 19 549 147,26
Unrealised profit on future contracts and commitment 148 107,56 11 211 183,68
10 33 Purchase FTSE 100 INDEX 18/03/2016 GBP 79 054,40 2 775 132,96 10 172 Purchase EURO STOXX 50 18/03/2016 EUR 68 800,00 5 645 040,00 50 77 Purchase MINI MSCI EMG 18/03/2016 USD 253,16 2 791 010,72
Unrealised loss on future contracts and commitment (23 964,37) 8 337 963,58
50 89 Purchase S&P500 E MINI INDEX 18/03/2016 USD (23 964,37) 8 337 963,58
260
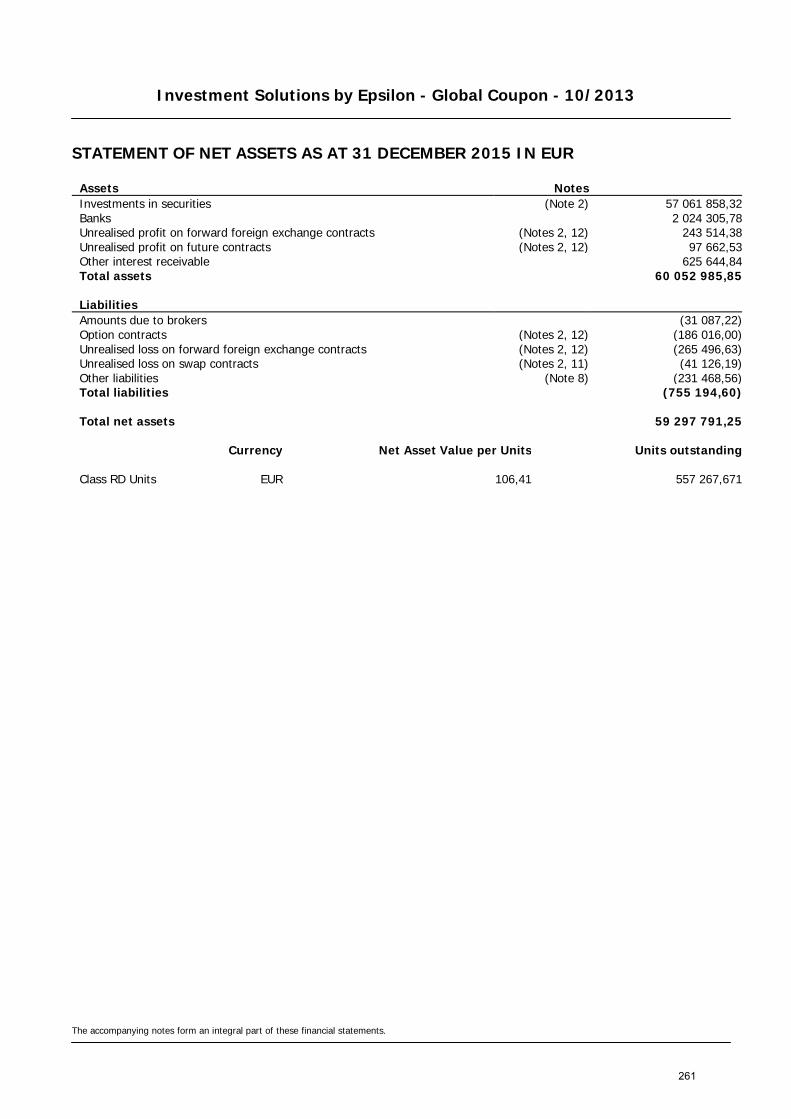
Investment Solutions by Epsilon - Global Coupon - 10/2013
STATEMENT OF NET ASSETS AS AT 31 DECEMBER 2015 IN EUR
The accompanying notes form an integral part of these financial statements.
Assets Notes Investments in securities (Note 2) 57 061 858,32 Banks 2 024 305,78 Unrealised profit on forward foreign exchange contracts (Notes 2, 12) 243 514,38 Unrealised profit on future contracts (Notes 2, 12) 97 662,53 Other interest receivable 625 644,84 Total assets 60 052 985,85
Liabilities Amounts due to brokers (31 087,22) Option contracts (Notes 2, 12) (186 016,00) Unrealised loss on forward foreign exchange contracts (Notes 2, 12) (265 496,63) Unrealised loss on swap contracts (Notes 2, 11) (41 126,19) Other liabilities (Note 8) (231 468,56) Total liabilities (755 194,60)
Total net assets 59 297 791,25
Currency Net Asset Value per Units Units outstanding
Class RD Units EUR 106,41 557 267,671
261

Investment Solutions by Epsilon - Global Coupon - 10/2013
STATEMENT OF CHANGES IN NET ASSETS FOR THE YEAR ENDED 31 DECEMBER 2015 IN EUR
The accompanying notes form an integral part of these financial statements.
Net assets at the beginning of the year Notes 78 197 058,54
Net income from investments (Note 2) 2 771 599,70 Interest on bank accounts 112,48 Total income 2 771 712,18 Management fee (Note 5) (902 664,99) Depositary and paying agent fee (Note 7) (44 609,51) Subscription tax (Note 3) (33 279,74) Interest on bank accounts (325,12) Other charges and taxes (Notes 4, 10) (55 137,07) Total expenses (1 036 016,43) Net investment income / (loss) 1 735 695,75 Net realised profit / (loss) on sales of investments, currencies and other financial instruments (Notes 2, 11, 12) 3 346 595,25 Change in unrealised appreciation / (depreciation) on - investments (Note 2) (1 674 988,75) - option contracts (Notes 2, 12) 19 763,16 - forward foreign exchange contracts (Notes 2, 12) 197 836,61 - foreign currencies (12 666,45) - future contracts (Notes 2, 12) (706 796,77) - swap contracts (Notes 2, 11) (213 808,13) Net result of operations for the year 2 691 630,67
Redemptions for the year (19 313 084,83) Dividend distributions (Note 13) (2 277 813,13)
Net assets at the end of the year 59 297 791,25
262
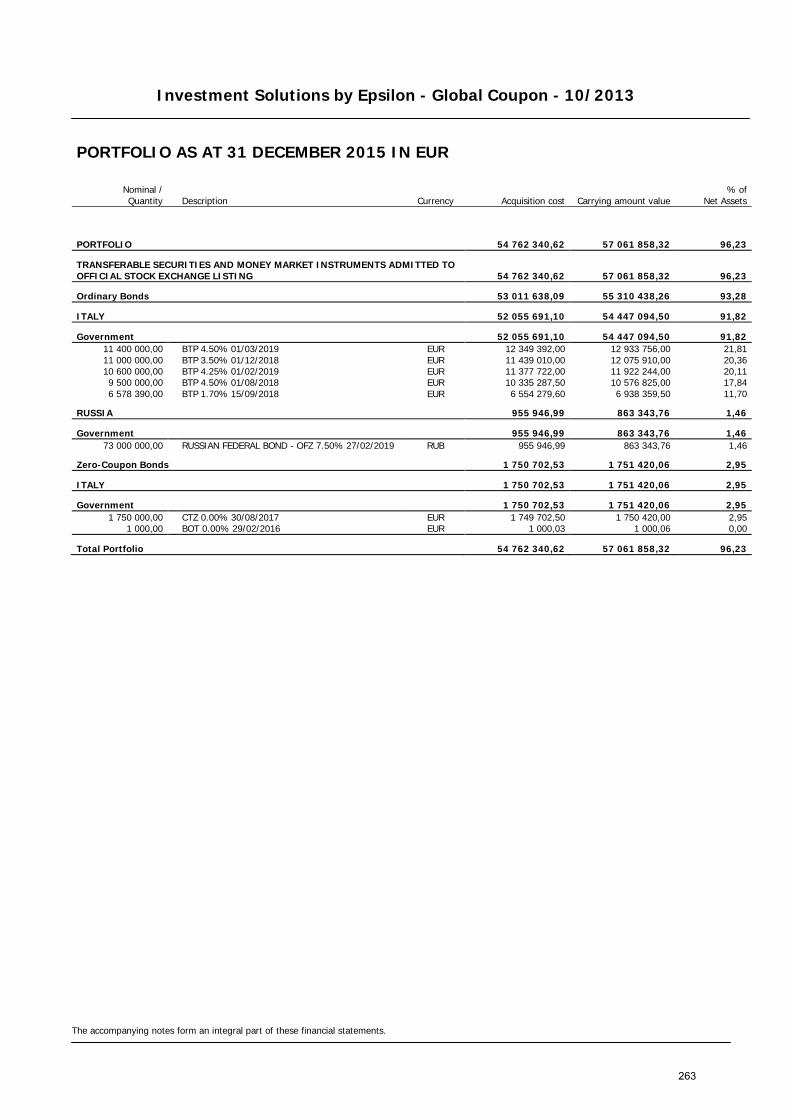
Investment Solutions by Epsilon - Global Coupon - 10/2013
The accompanying notes form an integral part of these financial statements.
PORTFOLIO AS AT 31 DECEMBER 2015 IN EUR
Nominal / Quantity Description Currency Acquisition cost Carrying amount value
% of Net Assets
PORTFOLIO 54 762 340,62 57 061 858,32 96,23
TRANSFERABLE SECURITIES AND MONEY MARKET INSTRUMENTS ADMITTED TO OFFICIAL STOCK EXCHANGE LISTING 54 762 340,62 57 061 858,32 96,23
Ordinary Bonds 53 011 638,09 55 310 438,26 93,28
ITALY 52 055 691,10 54 447 094,50 91,82
Government 52 055 691,10 54 447 094,50 91,82 11 400 000,00 BTP 4.50% 01/03/2019 EUR 12 349 392,00 12 933 756,00 21,81 11 000 000,00 BTP 3.50% 01/12/2018 EUR 11 439 010,00 12 075 910,00 20,36 10 600 000,00 BTP 4.25% 01/02/2019 EUR 11 377 722,00 11 922 244,00 20,11 9 500 000,00 BTP 4.50% 01/08/2018 EUR 10 335 287,50 10 576 825,00 17,84 6 578 390,00 BTP 1.70% 15/09/2018 EUR 6 554 279,60 6 938 359,50 11,70
RUSSIA 955 946,99 863 343,76 1,46
Government 955 946,99 863 343,76 1,46 73 000 000,00 RUSSIAN FEDERAL BOND - OFZ 7.50% 27/02/2019 RUB 955 946,99 863 343,76 1,46
Zero-Coupon Bonds 1 750 702,53 1 751 420,06 2,95
ITALY 1 750 702,53 1 751 420,06 2,95
Government 1 750 702,53 1 751 420,06 2,95 1 750 000,00 CTZ 0.00% 30/08/2017 EUR 1 749 702,50 1 750 420,00 2,95
1 000,00 BOT 0.00% 29/02/2016 EUR 1 000,03 1 000,06 0,00
Total Portfolio 54 762 340,62 57 061 858,32 96,23
263

Investment Solutions by Epsilon - Global Coupon - 10/2013
The accompanying notes form an integral part of these financial statements.
COMMITMENTS ON FUTURE CONTRACTS AS AT 31 DECEMBER 2015
Size Quantity
Purchase /
Sale Description Maturity Currency
Unrealised profit / (loss)
(EUR) Commitment
(EUR)
Total Unrealised profit / (loss) on future contracts and commitment 97 662,53 20 833 903,70
Unrealised profit on future contracts and commitment 97 662,53 20 833 903,70
50 108 Purchase S&P 500 E MINI INDEX 18/03/2016 USD 8 449,87 10 117 978,28 10 300 Purchase EURO STOXX 50 18/03/2016 EUR 79 375,09 9 846 000,00 50 24 Purchase MINI MSCI EMG 18/03/2016 USD 9 837,57 869 925,42
264
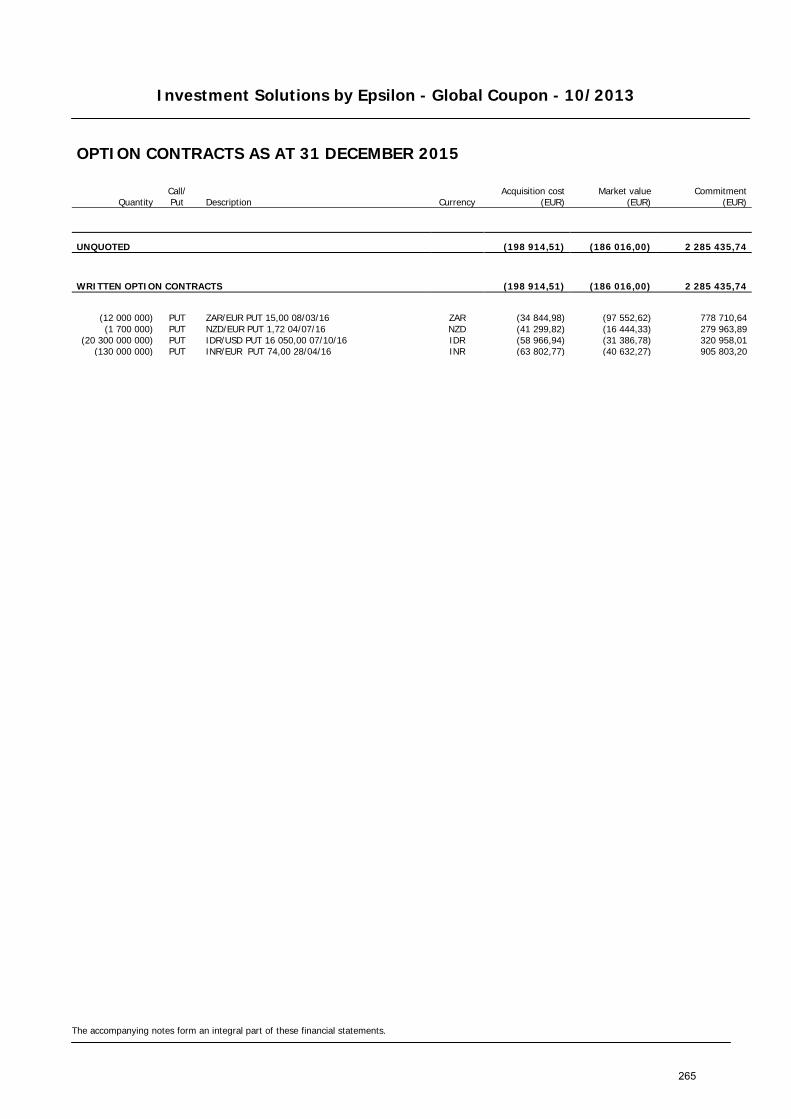
Investment Solutions by Epsilon - Global Coupon - 10/2013
The accompanying notes form an integral part of these financial statements.
OPTION CONTRACTS AS AT 31 DECEMBER 2015
Quantity Call/ Put Description Currency
Acquisition cost (EUR)
Market value (EUR)
Commitment (EUR)
UNQUOTED (198 914,51) (186 016,00) 2 285 435,74
WRITTEN OPTION CONTRACTS (198 914,51) (186 016,00) 2 285 435,74
(12 000 000) PUT ZAR/EUR PUT 15,00 08/03/16 ZAR (34 844,98) (97 552,62) 778 710,64 (1 700 000) PUT NZD/EUR PUT 1,72 04/07/16 NZD (41 299,82) (16 444,33) 279 963,89
(20 300 000 000) PUT IDR/USD PUT 16 050,00 07/10/16 IDR (58 966,94) (31 386,78) 320 958,01 (130 000 000) PUT INR/EUR PUT 74,00 28/04/16 INR (63 802,77) (40 632,27) 905 803,20
265
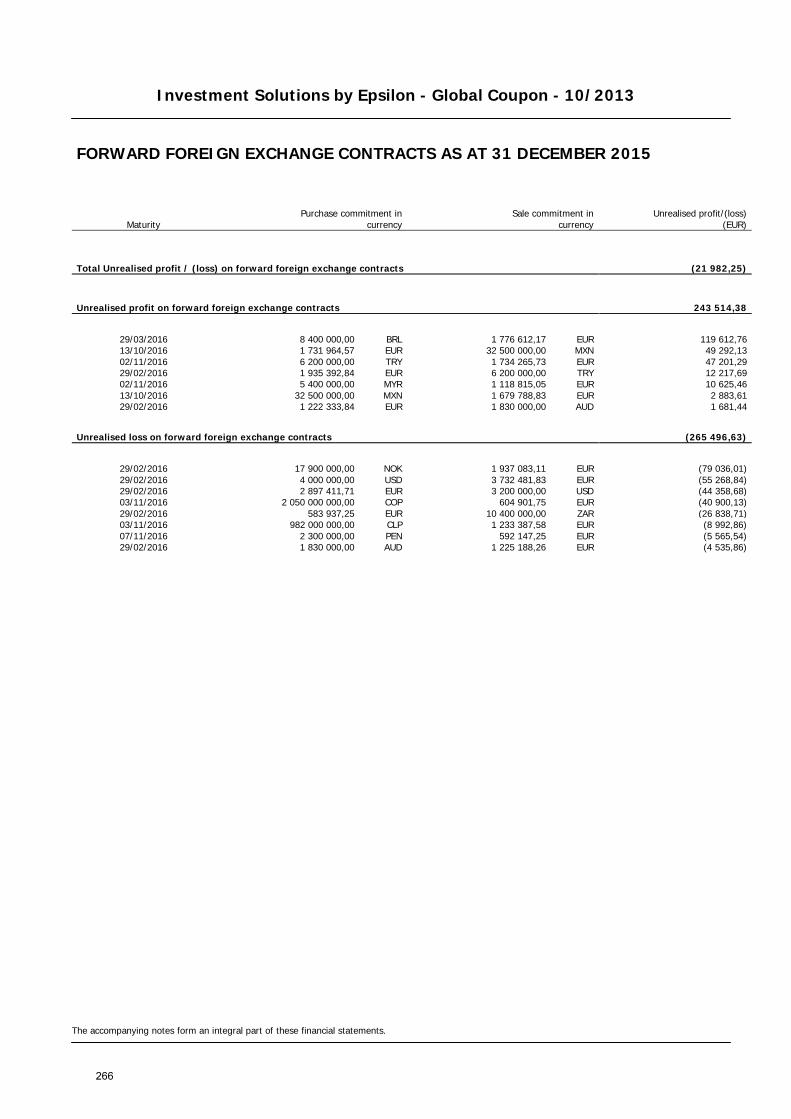
Investment Solutions by Epsilon - Global Coupon - 10/2013
The accompanying notes form an integral part of these financial statements.
FORWARD FOREIGN EXCHANGE CONTRACTS AS AT 31 DECEMBER 2015
Maturity Purchase commitment in
currency Sale commitment in
currency
Unrealised profit/(loss) (EUR)
Total Unrealised profit / (loss) on forward foreign exchange contracts (21 982,25)
Unrealised profit on forward foreign exchange contracts 243 514,38
29/03/2016 8 400 000,00 BRL 1 776 612,17 EUR 119 612,76 13/10/2016 1 731 964,57 EUR 32 500 000,00 MXN 49 292,13 02/11/2016 6 200 000,00 TRY 1 734 265,73 EUR 47 201,29 29/02/2016 1 935 392,84 EUR 6 200 000,00 TRY 12 217,69 02/11/2016 5 400 000,00 MYR 1 118 815,05 EUR 10 625,46 13/10/2016 32 500 000,00 MXN 1 679 788,83 EUR 2 883,61 29/02/2016 1 222 333,84 EUR 1 830 000,00 AUD 1 681,44
Unrealised loss on forward foreign exchange contracts (265 496,63)
29/02/2016 17 900 000,00 NOK 1 937 083,11 EUR (79 036,01) 29/02/2016 4 000 000,00 USD 3 732 481,83 EUR (55 268,84) 29/02/2016 2 897 411,71 EUR 3 200 000,00 USD (44 358,68) 03/11/2016 2 050 000 000,00 COP 604 901,75 EUR (40 900,13) 29/02/2016 583 937,25 EUR 10 400 000,00 ZAR (26 838,71) 03/11/2016 982 000 000,00 CLP 1 233 387,58 EUR (8 992,86) 07/11/2016 2 300 000,00 PEN 592 147,25 EUR (5 565,54) 29/02/2016 1 830 000,00 AUD 1 225 188,26 EUR (4 535,86)
266
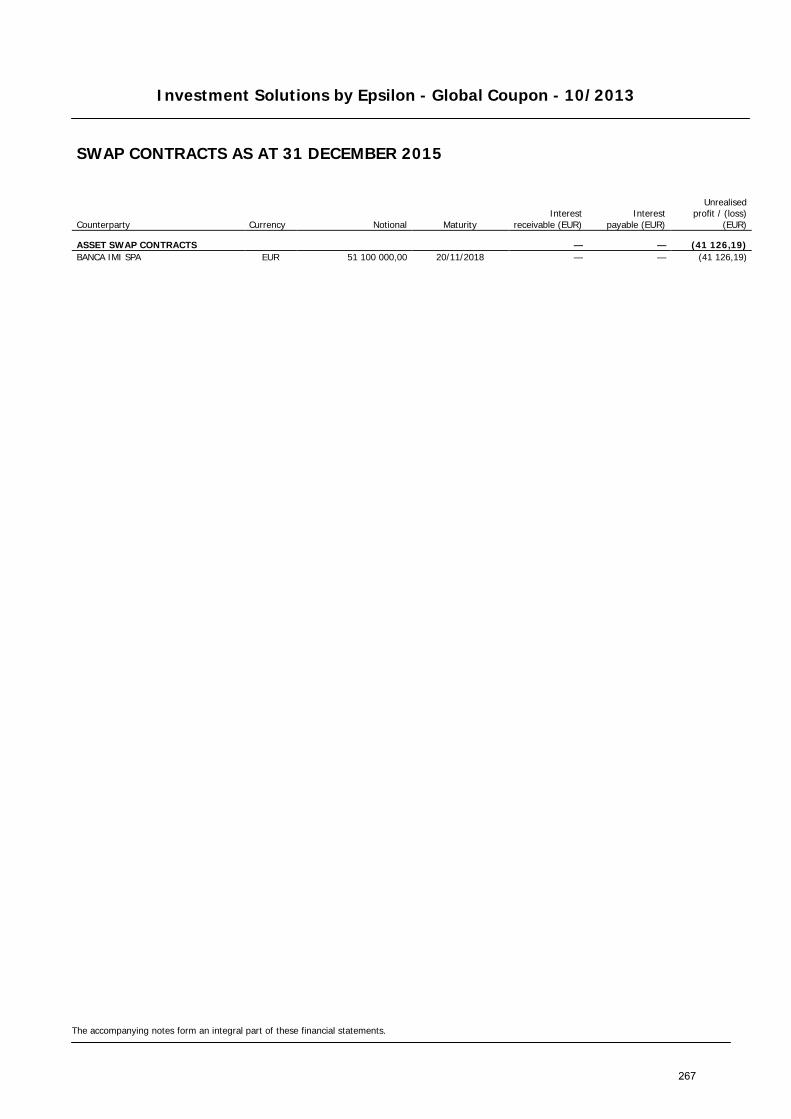
Investment Solutions by Epsilon - Global Coupon - 10/2013
The accompanying notes form an integral part of these financial statements.
SWAP CONTRACTS AS AT 31 DECEMBER 2015
Counterparty Currency Notional Maturity Interest
receivable (EUR) Interest
payable (EUR)
Unrealised
profit / (loss) (EUR)
ASSET SWAP CONTRACTS — — (41 126,19) BANCA IMI SPA EUR 51 100 000,00 20/11/2018 — — (41 126,19)
267

Investment Solutions by Epsilon - Global Coupon - 06/2014
STATEMENT OF NET ASSETS AS AT 31 DECEMBER 2015 IN EUR
The accompanying notes form an integral part of these financial statements.
Assets Notes Investments in securities (Note 2) 117 311 429,81 Banks 3 433 654,26 Swap premium paid 1 805 288,11 Unrealised profit on forward foreign exchange contracts (Notes 2, 12) 1 409 848,32 Unrealised profit on future contracts (Notes 2, 12) 307 261,19 Unrealised profit on swap contracts (Notes 2, 11) 1 317 709,76 Other interest receivable 1 031 648,09 Total assets 126 616 839,54
Liabilities Amounts due to brokers (163 832,92) Unrealised loss on forward foreign exchange contracts (Notes 2, 12) (384 036,77) Other liabilities (Note 8) (485 097,23) Total liabilities (1 032 966,92)
Total net assets 125 583 872,62
Currency Net Asset Value per Units Units outstanding
Class RD Units EUR 98,36 1 276 718,396
268
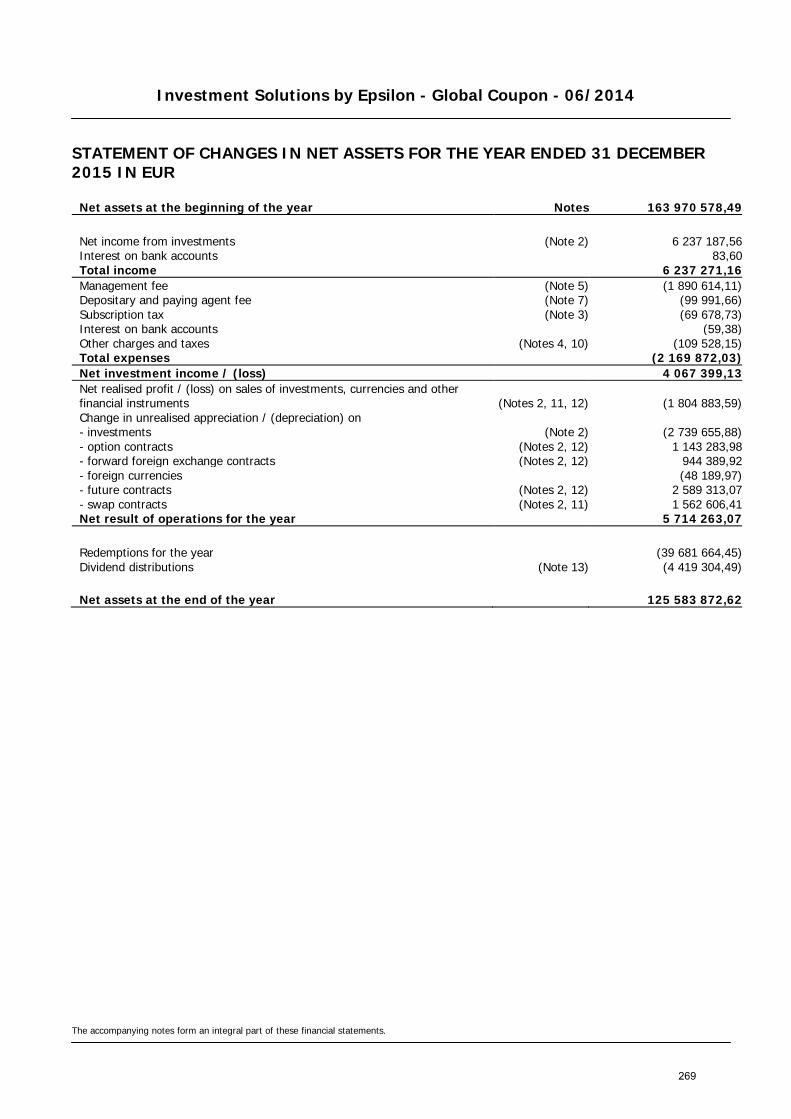
Investment Solutions by Epsilon - Global Coupon - 06/2014
STATEMENT OF CHANGES IN NET ASSETS FOR THE YEAR ENDED 31 DECEMBER 2015 IN EUR
The accompanying notes form an integral part of these financial statements.
Net assets at the beginning of the year Notes 163 970 578,49
Net income from investments (Note 2) 6 237 187,56 Interest on bank accounts 83,60 Total income 6 237 271,16 Management fee (Note 5) (1 890 614,11) Depositary and paying agent fee (Note 7) (99 991,66) Subscription tax (Note 3) (69 678,73) Interest on bank accounts (59,38) Other charges and taxes (Notes 4, 10) (109 528,15) Total expenses (2 169 872,03) Net investment income / (loss) 4 067 399,13 Net realised profit / (loss) on sales of investments, currencies and other financial instruments (Notes 2, 11, 12) (1 804 883,59) Change in unrealised appreciation / (depreciation) on - investments (Note 2) (2 739 655,88) - option contracts (Notes 2, 12) 1 143 283,98 - forward foreign exchange contracts (Notes 2, 12) 944 389,92 - foreign currencies (48 189,97) - future contracts (Notes 2, 12) 2 589 313,07 - swap contracts (Notes 2, 11) 1 562 606,41 Net result of operations for the year 5 714 263,07
Redemptions for the year (39 681 664,45) Dividend distributions (Note 13) (4 419 304,49)
Net assets at the end of the year 125 583 872,62
269
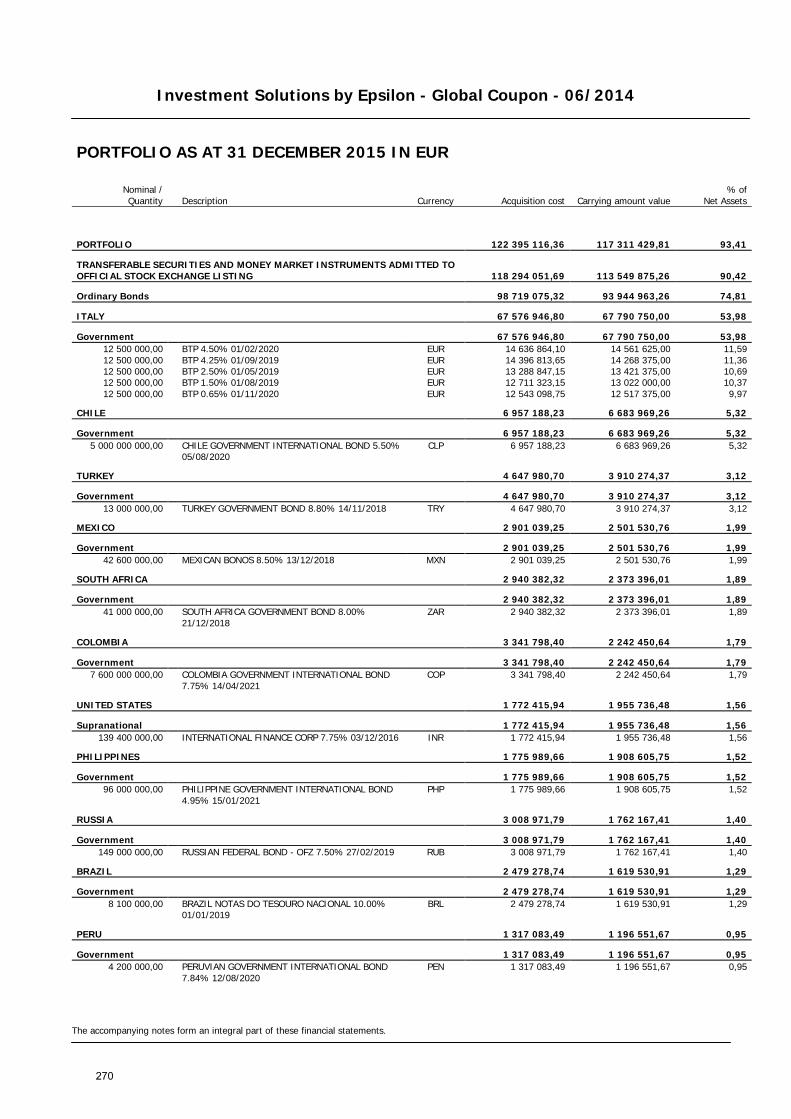
Investment Solutions by Epsilon - Global Coupon - 06/2014
The accompanying notes form an integral part of these financial statements.
PORTFOLIO AS AT 31 DECEMBER 2015 IN EUR
Nominal / Quantity Description Currency Acquisition cost Carrying amount value
% of Net Assets
PORTFOLIO 122 395 116,36 117 311 429,81 93,41
TRANSFERABLE SECURITIES AND MONEY MARKET INSTRUMENTS ADMITTED TO OFFICIAL STOCK EXCHANGE LISTING 118 294 051,69 113 549 875,26 90,42
Ordinary Bonds 98 719 075,32 93 944 963,26 74,81
ITALY 67 576 946,80 67 790 750,00 53,98
Government 67 576 946,80 67 790 750,00 53,98 12 500 000,00 BTP 4.50% 01/02/2020 EUR 14 636 864,10 14 561 625,00 11,59 12 500 000,00 BTP 4.25% 01/09/2019 EUR 14 396 813,65 14 268 375,00 11,36 12 500 000,00 BTP 2.50% 01/05/2019 EUR 13 288 847,15 13 421 375,00 10,69 12 500 000,00 BTP 1.50% 01/08/2019 EUR 12 711 323,15 13 022 000,00 10,37 12 500 000,00 BTP 0.65% 01/11/2020 EUR 12 543 098,75 12 517 375,00 9,97
CHILE 6 957 188,23 6 683 969,26 5,32
Government 6 957 188,23 6 683 969,26 5,32 5 000 000 000,00
CHILE GOVERNMENT INTERNATIONAL BOND 5.50% 05/08/2020
CLP 6 957 188,23 6 683 969,26 5,32
TURKEY 4 647 980,70 3 910 274,37 3,12
Government 4 647 980,70 3 910 274,37 3,12 13 000 000,00 TURKEY GOVERNMENT BOND 8.80% 14/11/2018 TRY 4 647 980,70 3 910 274,37 3,12
MEXICO 2 901 039,25 2 501 530,76 1,99
Government 2 901 039,25 2 501 530,76 1,99 42 600 000,00 MEXICAN BONOS 8.50% 13/12/2018 MXN 2 901 039,25 2 501 530,76 1,99
SOUTH AFRICA 2 940 382,32 2 373 396,01 1,89
Government 2 940 382,32 2 373 396,01 1,89 41 000 000,00
SOUTH AFRICA GOVERNMENT BOND 8.00% 21/12/2018
ZAR 2 940 382,32 2 373 396,01 1,89
COLOMBIA 3 341 798,40 2 242 450,64 1,79
Government 3 341 798,40 2 242 450,64 1,79 7 600 000 000,00
COLOMBIA GOVERNMENT INTERNATIONAL BOND 7.75% 14/04/2021
COP 3 341 798,40 2 242 450,64 1,79
UNITED STATES 1 772 415,94 1 955 736,48 1,56
Supranational 1 772 415,94 1 955 736,48 1,56 139 400 000,00 INTERNATIONAL FINANCE CORP 7.75% 03/12/2016 INR 1 772 415,94 1 955 736,48 1,56
PHILIPPINES 1 775 989,66 1 908 605,75 1,52
Government 1 775 989,66 1 908 605,75 1,52 96 000 000,00
PHILIPPINE GOVERNMENT INTERNATIONAL BOND 4.95% 15/01/2021
PHP 1 775 989,66 1 908 605,75 1,52
RUSSIA 3 008 971,79 1 762 167,41 1,40
Government 3 008 971,79 1 762 167,41 1,40 149 000 000,00 RUSSIAN FEDERAL BOND - OFZ 7.50% 27/02/2019 RUB 3 008 971,79 1 762 167,41 1,40
BRAZIL 2 479 278,74 1 619 530,91 1,29
Government 2 479 278,74 1 619 530,91 1,29 8 100 000,00
BRAZIL NOTAS DO TESOURO NACIONAL 10.00% 01/01/2019
BRL 2 479 278,74 1 619 530,91 1,29
PERU 1 317 083,49 1 196 551,67 0,95
Government 1 317 083,49 1 196 551,67 0,95 4 200 000,00
PERUVIAN GOVERNMENT INTERNATIONAL BOND 7.84% 12/08/2020
PEN 1 317 083,49 1 196 551,67 0,95
270
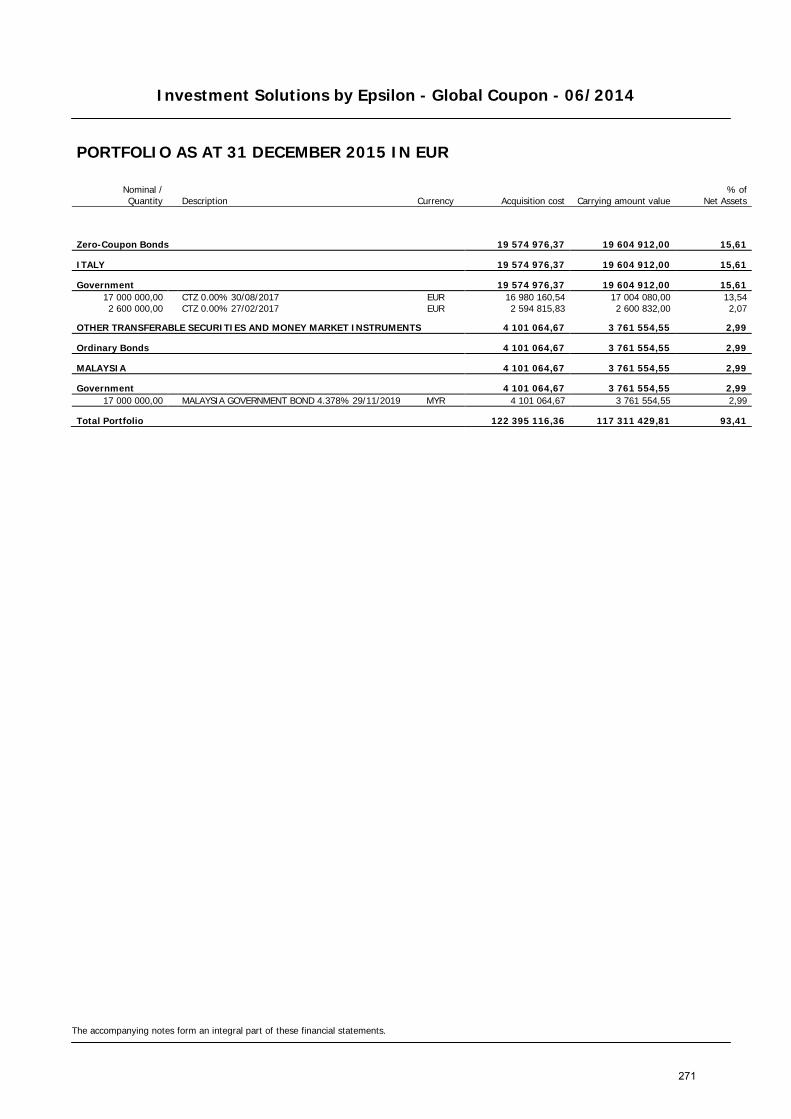
Investment Solutions by Epsilon - Global Coupon - 06/2014
The accompanying notes form an integral part of these financial statements.
PORTFOLIO AS AT 31 DECEMBER 2015 IN EUR
Nominal / Quantity Description Currency Acquisition cost Carrying amount value
% of Net Assets
Zero-Coupon Bonds 19 574 976,37 19 604 912,00 15,61
ITALY 19 574 976,37 19 604 912,00 15,61
Government 19 574 976,37 19 604 912,00 15,61 17 000 000,00 CTZ 0.00% 30/08/2017 EUR 16 980 160,54 17 004 080,00 13,54 2 600 000,00 CTZ 0.00% 27/02/2017 EUR 2 594 815,83 2 600 832,00 2,07
OTHER TRANSFERABLE SECURITIES AND MONEY MARKET INSTRUMENTS 4 101 064,67 3 761 554,55 2,99
Ordinary Bonds 4 101 064,67 3 761 554,55 2,99
MALAYSIA 4 101 064,67 3 761 554,55 2,99
Government 4 101 064,67 3 761 554,55 2,99 17 000 000,00 MALAYSIA GOVERNMENT BOND 4.378% 29/11/2019 MYR 4 101 064,67 3 761 554,55 2,99
Total Portfolio 122 395 116,36 117 311 429,81 93,41
271
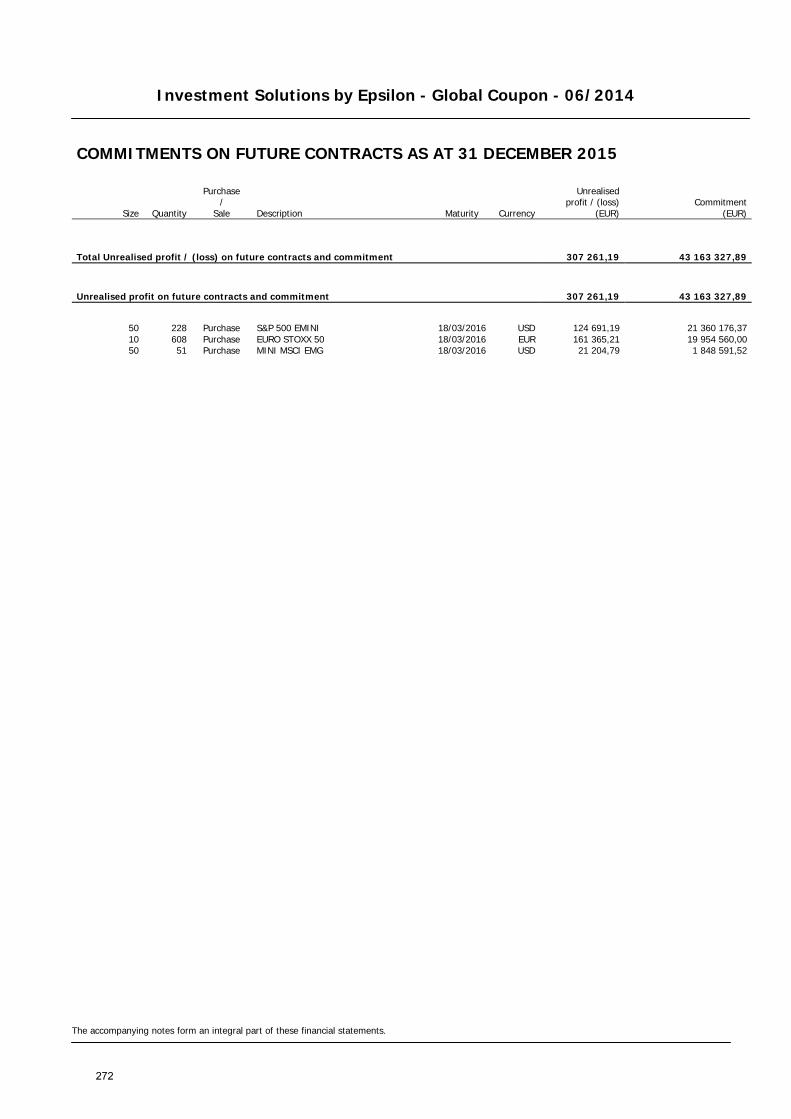
Investment Solutions by Epsilon - Global Coupon - 06/2014
The accompanying notes form an integral part of these financial statements.
COMMITMENTS ON FUTURE CONTRACTS AS AT 31 DECEMBER 2015
Size Quantity
Purchase /
Sale Description Maturity Currency
Unrealised profit / (loss)
(EUR) Commitment
(EUR)
Total Unrealised profit / (loss) on future contracts and commitment 307 261,19 43 163 327,89
Unrealised profit on future contracts and commitment 307 261,19 43 163 327,89
50 228 Purchase S&P 500 EMINI 18/03/2016 USD 124 691,19 21 360 176,37 10 608 Purchase EURO STOXX 50 18/03/2016 EUR 161 365,21 19 954 560,00 50 51 Purchase MINI MSCI EMG 18/03/2016 USD 21 204,79 1 848 591,52
272
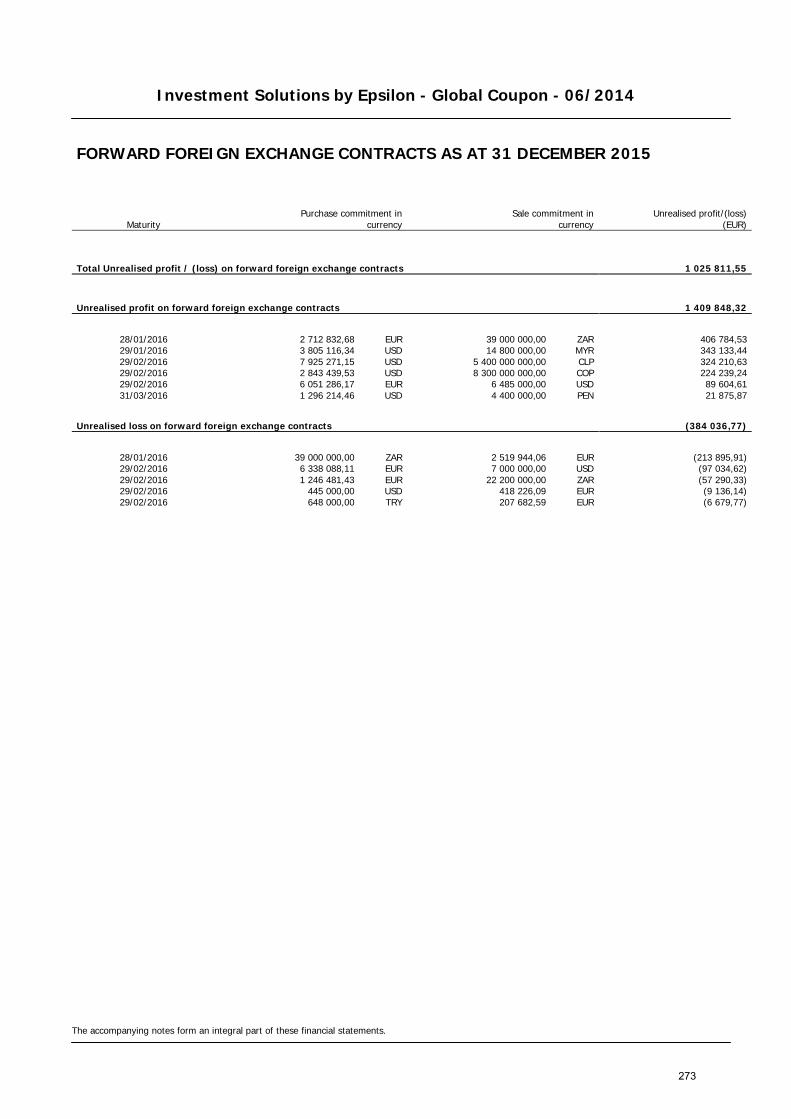
Investment Solutions by Epsilon - Global Coupon - 06/2014
The accompanying notes form an integral part of these financial statements.
FORWARD FOREIGN EXCHANGE CONTRACTS AS AT 31 DECEMBER 2015
Maturity Purchase commitment in
currency Sale commitment in
currency
Unrealised profit/(loss) (EUR)
Total Unrealised profit / (loss) on forward foreign exchange contracts 1 025 811,55
Unrealised profit on forward foreign exchange contracts 1 409 848,32
28/01/2016 2 712 832,68 EUR 39 000 000,00 ZAR 406 784,53 29/01/2016 3 805 116,34 USD 14 800 000,00 MYR 343 133,44 29/02/2016 7 925 271,15 USD 5 400 000 000,00 CLP 324 210,63 29/02/2016 2 843 439,53 USD 8 300 000 000,00 COP 224 239,24 29/02/2016 6 051 286,17 EUR 6 485 000,00 USD 89 604,61 31/03/2016 1 296 214,46 USD 4 400 000,00 PEN 21 875,87
Unrealised loss on forward foreign exchange contracts (384 036,77)
28/01/2016 39 000 000,00 ZAR 2 519 944,06 EUR (213 895,91) 29/02/2016 6 338 088,11 EUR 7 000 000,00 USD (97 034,62) 29/02/2016 1 246 481,43 EUR 22 200 000,00 ZAR (57 290,33) 29/02/2016 445 000,00 USD 418 226,09 EUR (9 136,14) 29/02/2016 648 000,00 TRY 207 682,59 EUR (6 679,77)
273

Investment Solutions by Epsilon - Global Coupon - 06/2014
The accompanying notes form an integral part of these financial statements.
SWAP CONTRACTS AS AT 31 DECEMBER 2015
Counterparty Currency Notional Maturity Interest
receivable (EUR) Interest
payable (EUR)
Unrealised
profit / (loss) (EUR)
ASSET SWAP CONTRACTS — — 1 317 709,76 BANCA IMI SPA EUR 83 600 000,00 22/07/2019 — — 1 317 709,76
274

Investment Solutions by Epsilon - Global Coupon - 11/2014
STATEMENT OF NET ASSETS AS AT 31 DECEMBER 2015 IN EUR
The accompanying notes form an integral part of these financial statements.
Assets Notes Investments in securities (Note 2) 62 696 324,26 Banks 1 571 125,66 Unrealised profit on forward foreign exchange contracts (Notes 2, 12) 941 558,60 Unrealised profit on future contracts (Notes 2, 12) 121 388,23 Unrealised profit on swap contracts (Notes 2, 11) 49 670,70 Other interest receivable 688 972,40 Total assets 66 069 039,85
Liabilities Amounts due to brokers (59 351,19) Unrealised loss on forward foreign exchange contracts (213 167,49) Other liabilities (Note 8) (258 256,57) Total liabilities (530 775,25)
Total net assets 65 538 264,60
Currency Net Asset Value per Units Units outstanding
Class RD Units EUR 97,40 672 863,244
275
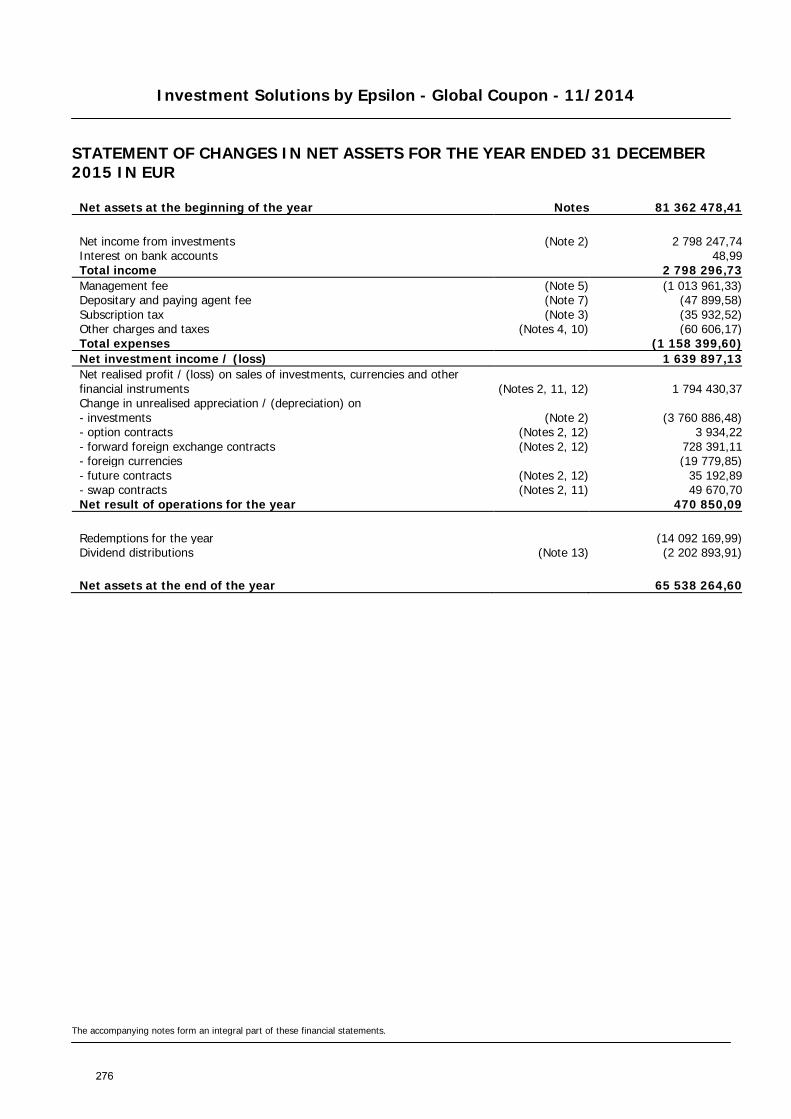
Investment Solutions by Epsilon - Global Coupon - 11/2014
STATEMENT OF CHANGES IN NET ASSETS FOR THE YEAR ENDED 31 DECEMBER 2015 IN EUR
The accompanying notes form an integral part of these financial statements.
Net assets at the beginning of the year Notes 81 362 478,41
Net income from investments (Note 2) 2 798 247,74 Interest on bank accounts 48,99 Total income 2 798 296,73 Management fee (Note 5) (1 013 961,33) Depositary and paying agent fee (Note 7) (47 899,58) Subscription tax (Note 3) (35 932,52) Other charges and taxes (Notes 4, 10) (60 606,17) Total expenses (1 158 399,60) Net investment income / (loss) 1 639 897,13 Net realised profit / (loss) on sales of investments, currencies and other financial instruments (Notes 2, 11, 12) 1 794 430,37 Change in unrealised appreciation / (depreciation) on - investments (Note 2) (3 760 886,48) - option contracts (Notes 2, 12) 3 934,22 - forward foreign exchange contracts (Notes 2, 12) 728 391,11 - foreign currencies (19 779,85) - future contracts (Notes 2, 12) 35 192,89 - swap contracts (Notes 2, 11) 49 670,70 Net result of operations for the year 470 850,09
Redemptions for the year (14 092 169,99) Dividend distributions (Note 13) (2 202 893,91)
Net assets at the end of the year 65 538 264,60
276
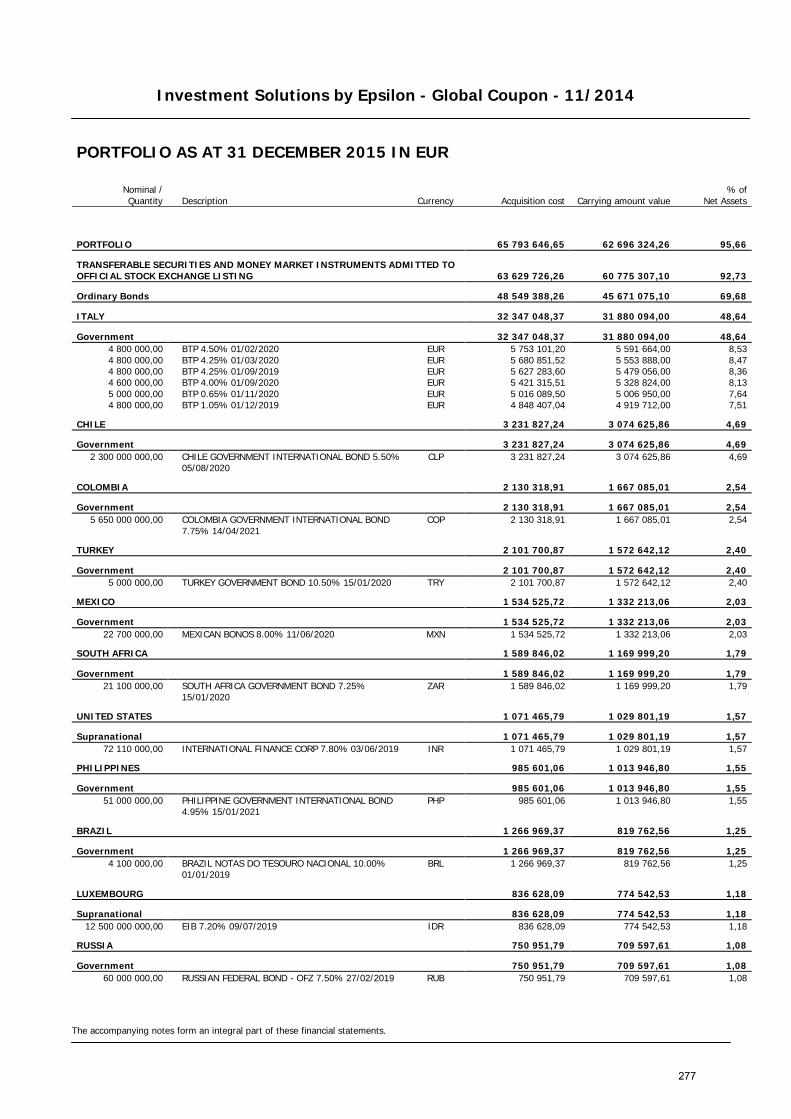
Investment Solutions by Epsilon - Global Coupon - 11/2014
The accompanying notes form an integral part of these financial statements.
PORTFOLIO AS AT 31 DECEMBER 2015 IN EUR
Nominal / Quantity Description Currency Acquisition cost Carrying amount value
% of Net Assets
PORTFOLIO 65 793 646,65 62 696 324,26 95,66
TRANSFERABLE SECURITIES AND MONEY MARKET INSTRUMENTS ADMITTED TO OFFICIAL STOCK EXCHANGE LISTING 63 629 726,26 60 775 307,10 92,73
Ordinary Bonds 48 549 388,26 45 671 075,10 69,68
ITALY 32 347 048,37 31 880 094,00 48,64
Government 32 347 048,37 31 880 094,00 48,64 4 800 000,00 BTP 4.50% 01/02/2020 EUR 5 753 101,20 5 591 664,00 8,53 4 800 000,00 BTP 4.25% 01/03/2020 EUR 5 680 851,52 5 553 888,00 8,47 4 800 000,00 BTP 4.25% 01/09/2019 EUR 5 627 283,60 5 479 056,00 8,36 4 600 000,00 BTP 4.00% 01/09/2020 EUR 5 421 315,51 5 328 824,00 8,13 5 000 000,00 BTP 0.65% 01/11/2020 EUR 5 016 089,50 5 006 950,00 7,64 4 800 000,00 BTP 1.05% 01/12/2019 EUR 4 848 407,04 4 919 712,00 7,51
CHILE 3 231 827,24 3 074 625,86 4,69
Government 3 231 827,24 3 074 625,86 4,69 2 300 000 000,00
CHILE GOVERNMENT INTERNATIONAL BOND 5.50% 05/08/2020
CLP 3 231 827,24 3 074 625,86 4,69
COLOMBIA 2 130 318,91 1 667 085,01 2,54
Government 2 130 318,91 1 667 085,01 2,54 5 650 000 000,00
COLOMBIA GOVERNMENT INTERNATIONAL BOND 7.75% 14/04/2021
COP 2 130 318,91 1 667 085,01 2,54
TURKEY 2 101 700,87 1 572 642,12 2,40
Government 2 101 700,87 1 572 642,12 2,40 5 000 000,00 TURKEY GOVERNMENT BOND 10.50% 15/01/2020 TRY 2 101 700,87 1 572 642,12 2,40
MEXICO 1 534 525,72 1 332 213,06 2,03
Government 1 534 525,72 1 332 213,06 2,03 22 700 000,00 MEXICAN BONOS 8.00% 11/06/2020 MXN 1 534 525,72 1 332 213,06 2,03
SOUTH AFRICA 1 589 846,02 1 169 999,20 1,79
Government 1 589 846,02 1 169 999,20 1,79 21 100 000,00
SOUTH AFRICA GOVERNMENT BOND 7.25% 15/01/2020
ZAR 1 589 846,02 1 169 999,20 1,79
UNITED STATES 1 071 465,79 1 029 801,19 1,57
Supranational 1 071 465,79 1 029 801,19 1,57 72 110 000,00 INTERNATIONAL FINANCE CORP 7.80% 03/06/2019 INR 1 071 465,79 1 029 801,19 1,57
PHILIPPINES 985 601,06 1 013 946,80 1,55
Government 985 601,06 1 013 946,80 1,55 51 000 000,00
PHILIPPINE GOVERNMENT INTERNATIONAL BOND 4.95% 15/01/2021
PHP 985 601,06 1 013 946,80 1,55
BRAZIL 1 266 969,37 819 762,56 1,25
Government 1 266 969,37 819 762,56 1,25 4 100 000,00
BRAZIL NOTAS DO TESOURO NACIONAL 10.00% 01/01/2019
BRL 1 266 969,37 819 762,56 1,25
LUXEMBOURG 836 628,09 774 542,53 1,18
Supranational 836 628,09 774 542,53 1,18 12 500 000 000,00 EIB 7.20% 09/07/2019 IDR 836 628,09 774 542,53 1,18
RUSSIA 750 951,79 709 597,61 1,08
Government 750 951,79 709 597,61 1,08 60 000 000,00 RUSSIAN FEDERAL BOND - OFZ 7.50% 27/02/2019 RUB 750 951,79 709 597,61 1,08
277
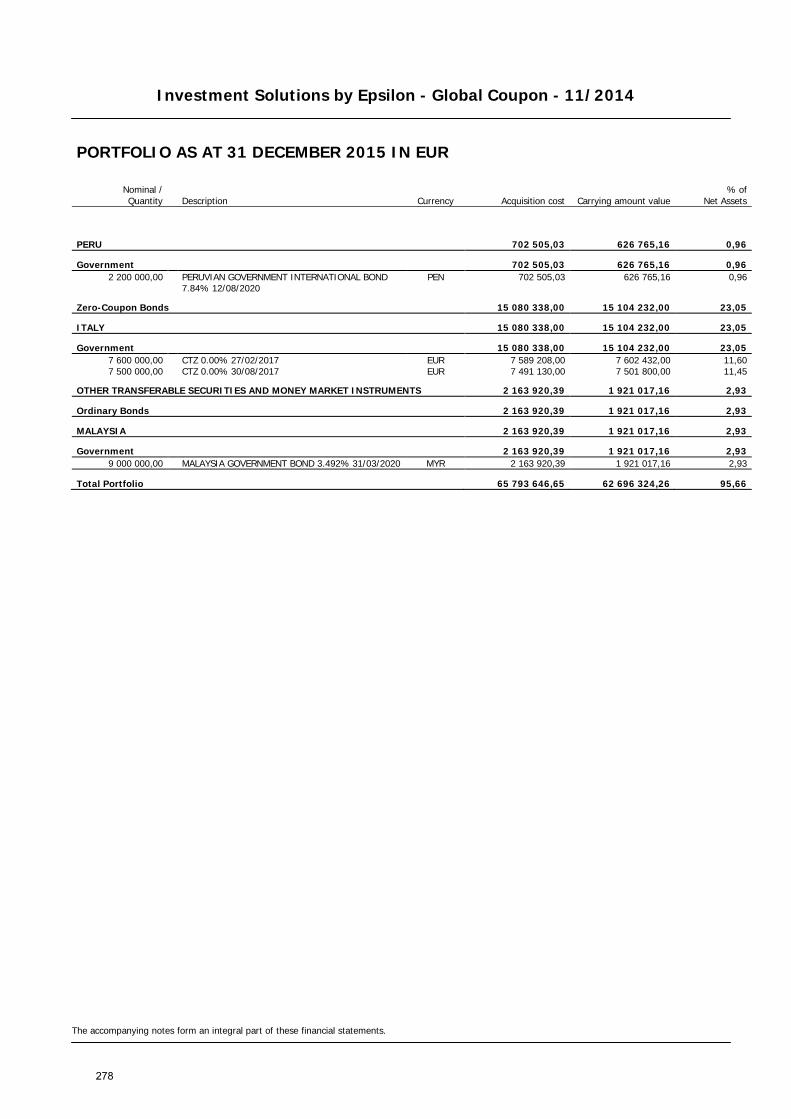
Investment Solutions by Epsilon - Global Coupon - 11/2014
The accompanying notes form an integral part of these financial statements.
PORTFOLIO AS AT 31 DECEMBER 2015 IN EUR
Nominal / Quantity Description Currency Acquisition cost Carrying amount value
% of Net Assets
PERU 702 505,03 626 765,16 0,96
Government 702 505,03 626 765,16 0,96 2 200 000,00
PERUVIAN GOVERNMENT INTERNATIONAL BOND 7.84% 12/08/2020
PEN 702 505,03 626 765,16 0,96
Zero-Coupon Bonds 15 080 338,00 15 104 232,00 23,05
ITALY 15 080 338,00 15 104 232,00 23,05
Government 15 080 338,00 15 104 232,00 23,05 7 600 000,00 CTZ 0.00% 27/02/2017 EUR 7 589 208,00 7 602 432,00 11,60 7 500 000,00 CTZ 0.00% 30/08/2017 EUR 7 491 130,00 7 501 800,00 11,45
OTHER TRANSFERABLE SECURITIES AND MONEY MARKET INSTRUMENTS 2 163 920,39 1 921 017,16 2,93
Ordinary Bonds 2 163 920,39 1 921 017,16 2,93
MALAYSIA 2 163 920,39 1 921 017,16 2,93
Government 2 163 920,39 1 921 017,16 2,93 9 000 000,00 MALAYSIA GOVERNMENT BOND 3.492% 31/03/2020 MYR 2 163 920,39 1 921 017,16 2,93
Total Portfolio 65 793 646,65 62 696 324,26 95,66
278

Investment Solutions by Epsilon - Global Coupon - 11/2014
The accompanying notes form an integral part of these financial statements.
COMMITMENTS ON FUTURE CONTRACTS AS AT 31 DECEMBER 2015
Size Quantity
Purchase /
Sale Description Maturity Currency
Unrealised profit / (loss)
(EUR) Commitment
(EUR)
Total Unrealised profit / (loss) on future contracts and commitment 121 388,23 22 284 232,38
Unrealised profit on future contracts and commitment 121 388,23 22 284 232,38
50 115 Purchase S&P 500 E MINII INDEX 18/03/2016 USD 25 340,14 10 773 773,17 10 322 Purchase EURO STOXX 50 18/03/2016 EUR 85 978,86 10 568 040,00 50 26 Purchase MINI MSCI EMG 18/03/2016 USD 10 069,23 942 419,21
279
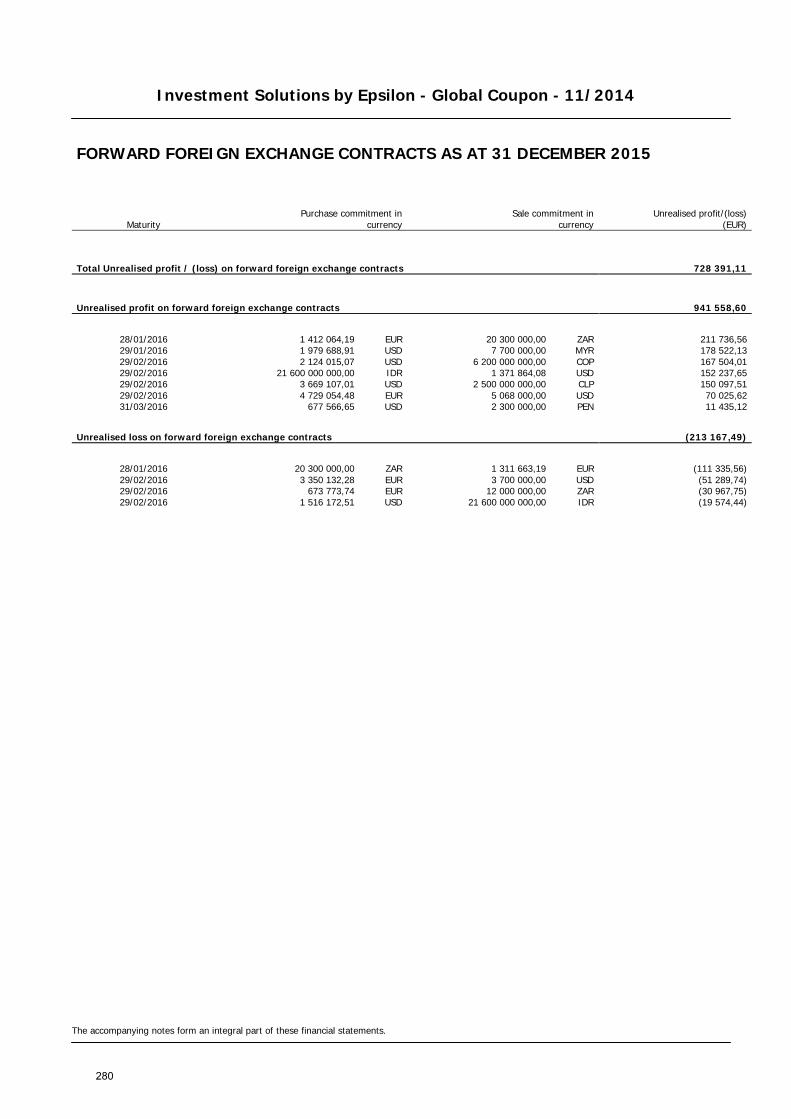
Investment Solutions by Epsilon - Global Coupon - 11/2014
The accompanying notes form an integral part of these financial statements.
FORWARD FOREIGN EXCHANGE CONTRACTS AS AT 31 DECEMBER 2015
Maturity Purchase commitment in
currency Sale commitment in
currency
Unrealised profit/(loss) (EUR)
Total Unrealised profit / (loss) on forward foreign exchange contracts 728 391,11
Unrealised profit on forward foreign exchange contracts 941 558,60
28/01/2016 1 412 064,19 EUR 20 300 000,00 ZAR 211 736,56 29/01/2016 1 979 688,91 USD 7 700 000,00 MYR 178 522,13 29/02/2016 2 124 015,07 USD 6 200 000 000,00 COP 167 504,01 29/02/2016 21 600 000 000,00 IDR 1 371 864,08 USD 152 237,65 29/02/2016 3 669 107,01 USD 2 500 000 000,00 CLP 150 097,51 29/02/2016 4 729 054,48 EUR 5 068 000,00 USD 70 025,62 31/03/2016 677 566,65 USD 2 300 000,00 PEN 11 435,12
Unrealised loss on forward foreign exchange contracts (213 167,49)
28/01/2016 20 300 000,00 ZAR 1 311 663,19 EUR (111 335,56) 29/02/2016 3 350 132,28 EUR 3 700 000,00 USD (51 289,74) 29/02/2016 673 773,74 EUR 12 000 000,00 ZAR (30 967,75) 29/02/2016 1 516 172,51 USD 21 600 000 000,00 IDR (19 574,44)
280

Investment Solutions by Epsilon - Global Coupon - 11/2014
The accompanying notes form an integral part of these financial statements.
SWAP CONTRACTS AS AT 31 DECEMBER 2015
Counterparty Currency Notional Maturity Interest
receivable (EUR) Interest
payable (EUR)
Unrealised
profit / (loss) (EUR)
ASSET SWAP CONTRACTS — — 49 670,70 BANCA IMI SPA EUR 39 300 000,00 11/12/2019 — — 49 670,70
281
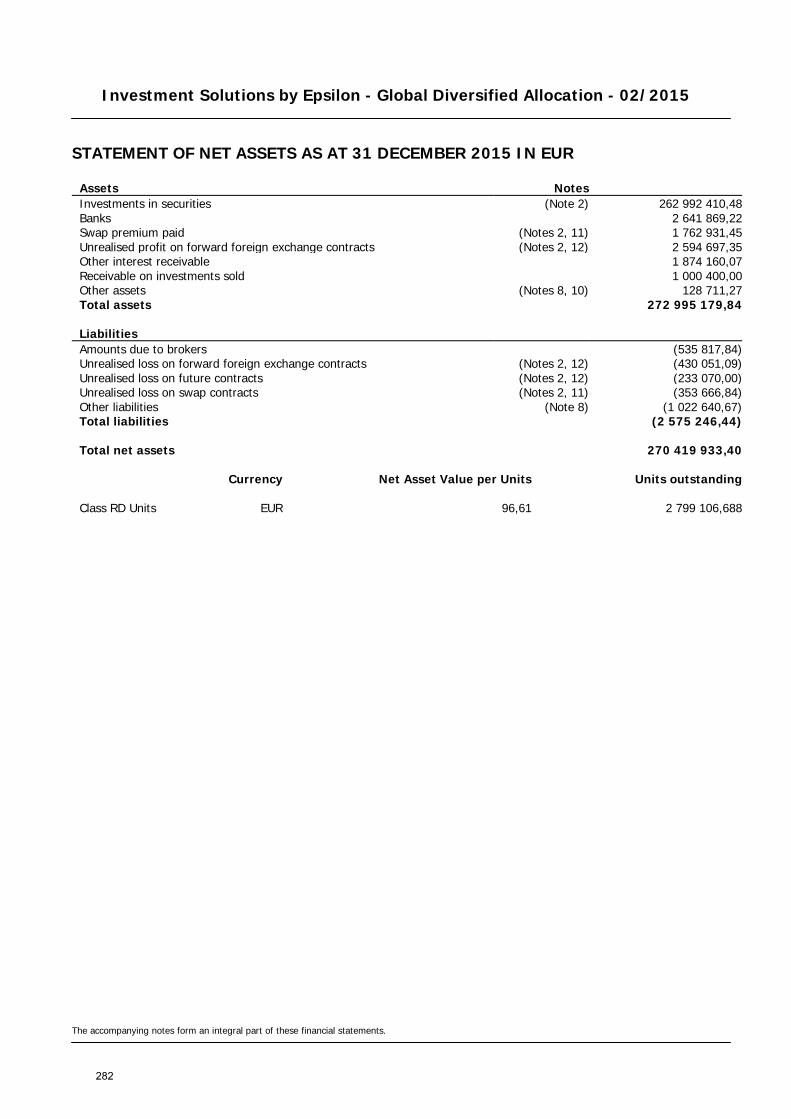
Investment Solutions by Epsilon - Global Diversified Allocation - 02/2015
STATEMENT OF NET ASSETS AS AT 31 DECEMBER 2015 IN EUR
The accompanying notes form an integral part of these financial statements.
Assets Notes Investments in securities (Note 2) 262 992 410,48 Banks 2 641 869,22 Swap premium paid (Notes 2, 11) 1 762 931,45 Unrealised profit on forward foreign exchange contracts (Notes 2, 12) 2 594 697,35 Other interest receivable 1 874 160,07 Receivable on investments sold 1 000 400,00 Other assets (Notes 8, 10) 128 711,27 Total assets 272 995 179,84
Liabilities Amounts due to brokers (535 817,84) Unrealised loss on forward foreign exchange contracts (Notes 2, 12) (430 051,09) Unrealised loss on future contracts (Notes 2, 12) (233 070,00) Unrealised loss on swap contracts (Notes 2, 11) (353 666,84) Other liabilities (Note 8) (1 022 640,67) Total liabilities (2 575 246,44)
Total net assets 270 419 933,40
Currency Net Asset Value per Units Units outstanding
Class RD Units EUR 96,61 2 799 106,688
282
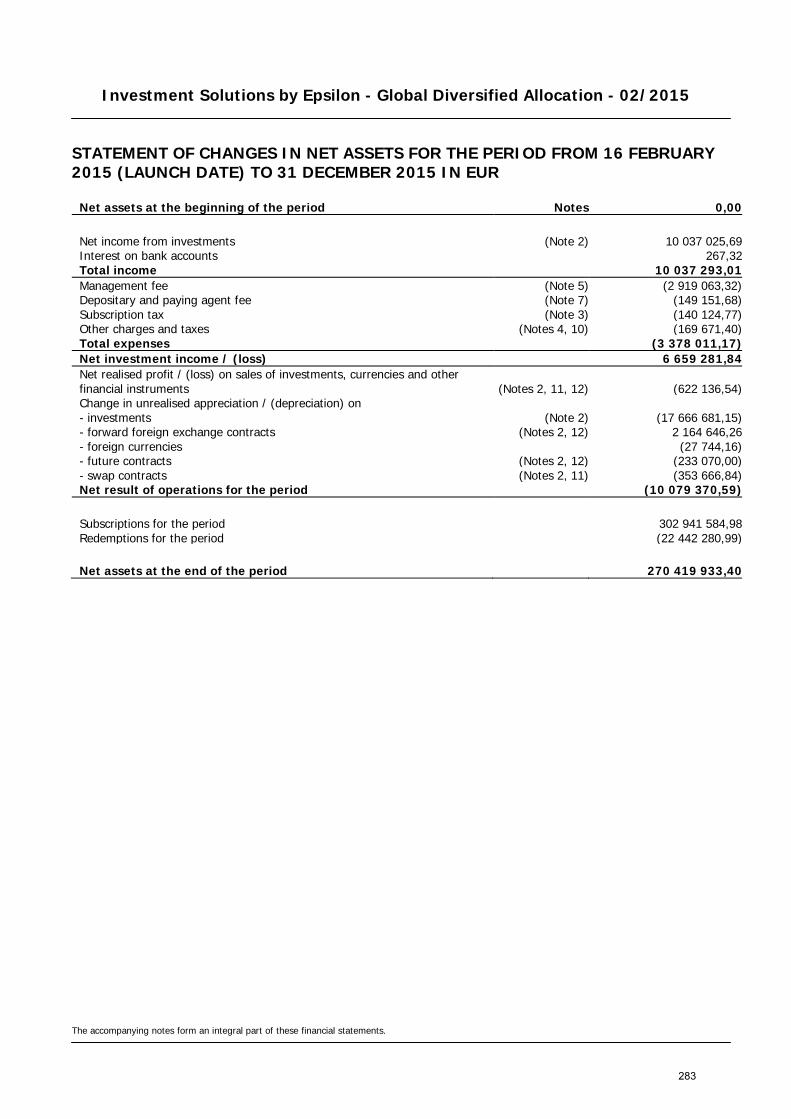
Investment Solutions by Epsilon - Global Diversified Allocation - 02/2015
STATEMENT OF CHANGES IN NET ASSETS FOR THE PERIOD FROM 16 FEBRUARY 2015 (LAUNCH DATE) TO 31 DECEMBER 2015 IN EUR
The accompanying notes form an integral part of these financial statements.
Net assets at the beginning of the period Notes 0,00
Net income from investments (Note 2) 10 037 025,69 Interest on bank accounts 267,32 Total income 10 037 293,01 Management fee (Note 5) (2 919 063,32) Depositary and paying agent fee (Note 7) (149 151,68) Subscription tax (Note 3) (140 124,77) Other charges and taxes (Notes 4, 10) (169 671,40) Total expenses (3 378 011,17) Net investment income / (loss) 6 659 281,84 Net realised profit / (loss) on sales of investments, currencies and other financial instruments (Notes 2, 11, 12) (622 136,54) Change in unrealised appreciation / (depreciation) on - investments (Note 2) (17 666 681,15) - forward foreign exchange contracts (Notes 2, 12) 2 164 646,26 - foreign currencies (27 744,16) - future contracts (Notes 2, 12) (233 070,00) - swap contracts (Notes 2, 11) (353 666,84) Net result of operations for the period (10 079 370,59)
Subscriptions for the period 302 941 584,98 Redemptions for the period (22 442 280,99)
Net assets at the end of the period 270 419 933,40
283
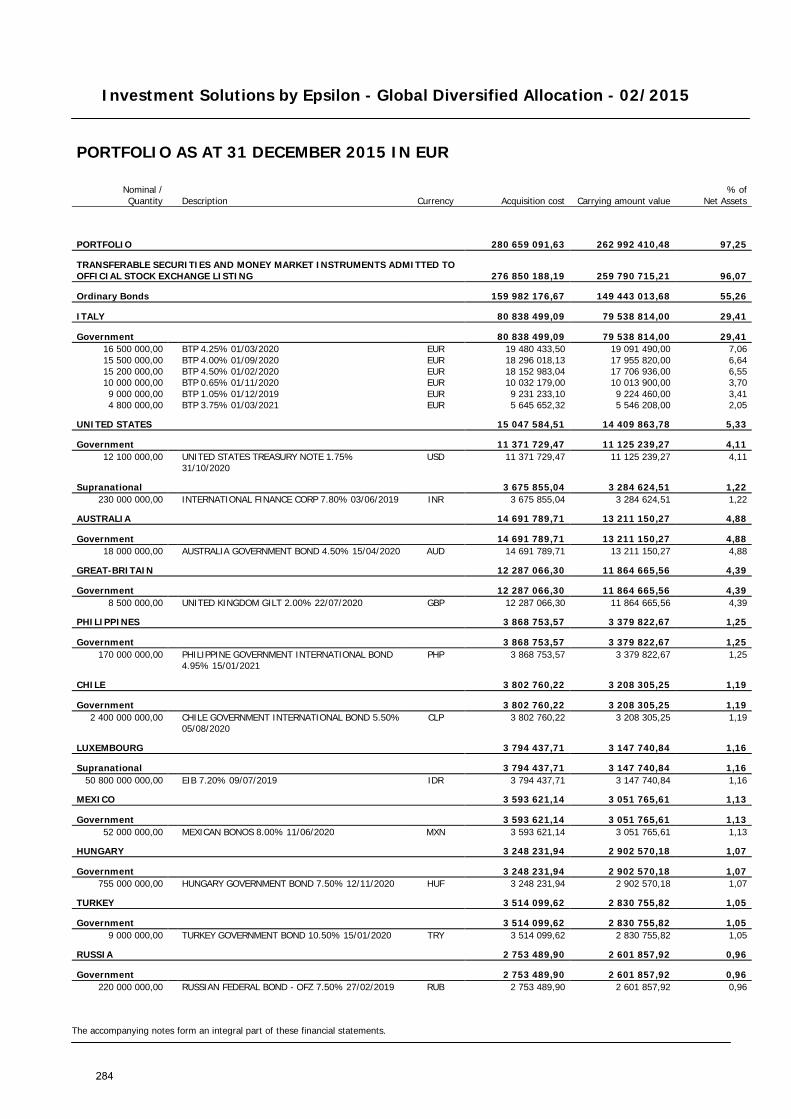
Investment Solutions by Epsilon - Global Diversified Allocation - 02/2015
The accompanying notes form an integral part of these financial statements.
PORTFOLIO AS AT 31 DECEMBER 2015 IN EUR
Nominal / Quantity Description Currency Acquisition cost Carrying amount value
% of Net Assets
PORTFOLIO 280 659 091,63 262 992 410,48 97,25
TRANSFERABLE SECURITIES AND MONEY MARKET INSTRUMENTS ADMITTED TO OFFICIAL STOCK EXCHANGE LISTING 276 850 188,19 259 790 715,21 96,07
Ordinary Bonds 159 982 176,67 149 443 013,68 55,26
ITALY 80 838 499,09 79 538 814,00 29,41
Government 80 838 499,09 79 538 814,00 29,41 16 500 000,00 BTP 4.25% 01/03/2020 EUR 19 480 433,50 19 091 490,00 7,06 15 500 000,00 BTP 4.00% 01/09/2020 EUR 18 296 018,13 17 955 820,00 6,64 15 200 000,00 BTP 4.50% 01/02/2020 EUR 18 152 983,04 17 706 936,00 6,55 10 000 000,00 BTP 0.65% 01/11/2020 EUR 10 032 179,00 10 013 900,00 3,70 9 000 000,00 BTP 1.05% 01/12/2019 EUR 9 231 233,10 9 224 460,00 3,41 4 800 000,00 BTP 3.75% 01/03/2021 EUR 5 645 652,32 5 546 208,00 2,05
UNITED STATES 15 047 584,51 14 409 863,78 5,33
Government 11 371 729,47 11 125 239,27 4,11 12 100 000,00
UNITED STATES TREASURY NOTE 1.75% 31/10/2020
USD 11 371 729,47 11 125 239,27 4,11
Supranational 3 675 855,04 3 284 624,51 1,22 230 000 000,00 INTERNATIONAL FINANCE CORP 7.80% 03/06/2019 INR 3 675 855,04 3 284 624,51 1,22
AUSTRALIA 14 691 789,71 13 211 150,27 4,88
Government 14 691 789,71 13 211 150,27 4,88 18 000 000,00 AUSTRALIA GOVERNMENT BOND 4.50% 15/04/2020 AUD 14 691 789,71 13 211 150,27 4,88
GREAT-BRITAIN 12 287 066,30 11 864 665,56 4,39
Government 12 287 066,30 11 864 665,56 4,39 8 500 000,00 UNITED KINGDOM GILT 2.00% 22/07/2020 GBP 12 287 066,30 11 864 665,56 4,39
PHILIPPINES 3 868 753,57 3 379 822,67 1,25
Government 3 868 753,57 3 379 822,67 1,25 170 000 000,00
PHILIPPINE GOVERNMENT INTERNATIONAL BOND 4.95% 15/01/2021
PHP 3 868 753,57 3 379 822,67 1,25
CHILE 3 802 760,22 3 208 305,25 1,19
Government 3 802 760,22 3 208 305,25 1,19 2 400 000 000,00
CHILE GOVERNMENT INTERNATIONAL BOND 5.50% 05/08/2020
CLP 3 802 760,22 3 208 305,25 1,19
LUXEMBOURG 3 794 437,71 3 147 740,84 1,16
Supranational 3 794 437,71 3 147 740,84 1,16 50 800 000 000,00 EIB 7.20% 09/07/2019 IDR 3 794 437,71 3 147 740,84 1,16
MEXICO 3 593 621,14 3 051 765,61 1,13
Government 3 593 621,14 3 051 765,61 1,13 52 000 000,00 MEXICAN BONOS 8.00% 11/06/2020 MXN 3 593 621,14 3 051 765,61 1,13
HUNGARY 3 248 231,94 2 902 570,18 1,07
Government 3 248 231,94 2 902 570,18 1,07 755 000 000,00 HUNGARY GOVERNMENT BOND 7.50% 12/11/2020 HUF 3 248 231,94 2 902 570,18 1,07
TURKEY 3 514 099,62 2 830 755,82 1,05
Government 3 514 099,62 2 830 755,82 1,05 9 000 000,00 TURKEY GOVERNMENT BOND 10.50% 15/01/2020 TRY 3 514 099,62 2 830 755,82 1,05
RUSSIA 2 753 489,90 2 601 857,92 0,96
Government 2 753 489,90 2 601 857,92 0,96 220 000 000,00 RUSSIAN FEDERAL BOND - OFZ 7.50% 27/02/2019 RUB 2 753 489,90 2 601 857,92 0,96
284
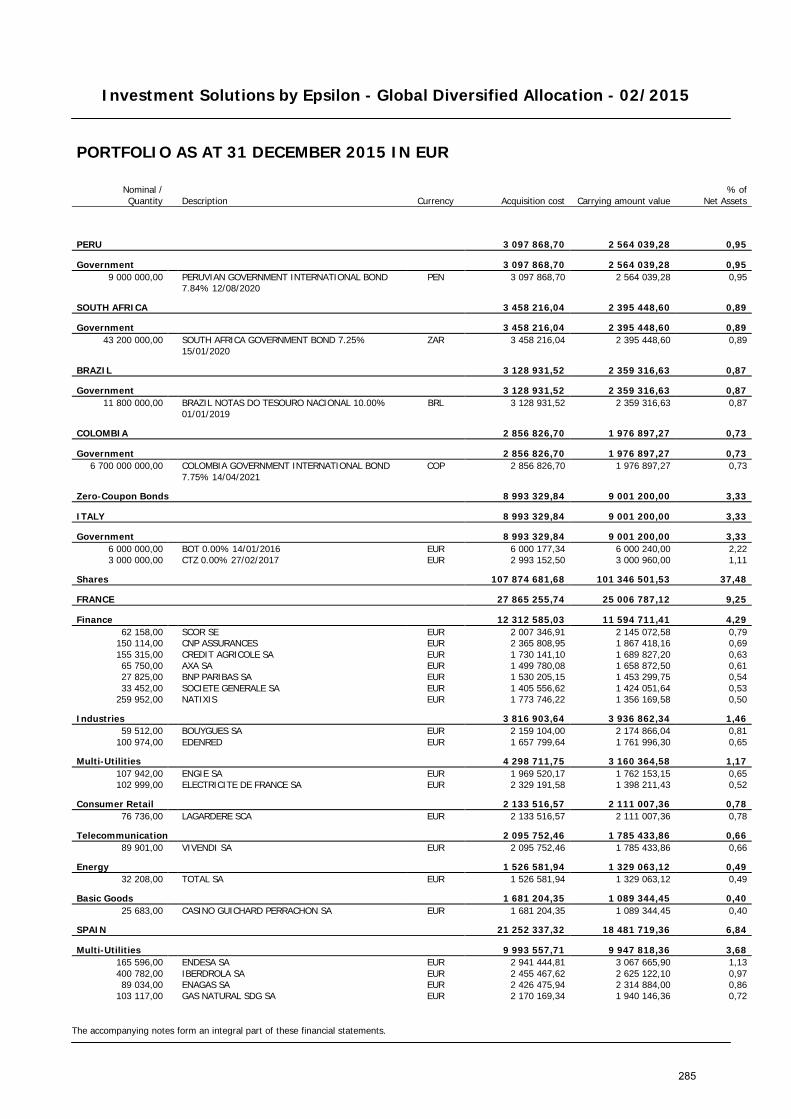
Investment Solutions by Epsilon - Global Diversified Allocation - 02/2015
The accompanying notes form an integral part of these financial statements.
PORTFOLIO AS AT 31 DECEMBER 2015 IN EUR
Nominal / Quantity Description Currency Acquisition cost Carrying amount value
% of Net Assets
PERU 3 097 868,70 2 564 039,28 0,95
Government 3 097 868,70 2 564 039,28 0,95 9 000 000,00
PERUVIAN GOVERNMENT INTERNATIONAL BOND 7.84% 12/08/2020
PEN 3 097 868,70 2 564 039,28 0,95
SOUTH AFRICA 3 458 216,04 2 395 448,60 0,89
Government 3 458 216,04 2 395 448,60 0,89 43 200 000,00
SOUTH AFRICA GOVERNMENT BOND 7.25% 15/01/2020
ZAR 3 458 216,04 2 395 448,60 0,89
BRAZIL 3 128 931,52 2 359 316,63 0,87
Government 3 128 931,52 2 359 316,63 0,87 11 800 000,00
BRAZIL NOTAS DO TESOURO NACIONAL 10.00% 01/01/2019
BRL 3 128 931,52 2 359 316,63 0,87
COLOMBIA 2 856 826,70 1 976 897,27 0,73
Government 2 856 826,70 1 976 897,27 0,73 6 700 000 000,00
COLOMBIA GOVERNMENT INTERNATIONAL BOND 7.75% 14/04/2021
COP 2 856 826,70 1 976 897,27 0,73
Zero-Coupon Bonds 8 993 329,84 9 001 200,00 3,33
ITALY 8 993 329,84 9 001 200,00 3,33
Government 8 993 329,84 9 001 200,00 3,33 6 000 000,00 BOT 0.00% 14/01/2016 EUR 6 000 177,34 6 000 240,00 2,22 3 000 000,00 CTZ 0.00% 27/02/2017 EUR 2 993 152,50 3 000 960,00 1,11
Shares 107 874 681,68 101 346 501,53 37,48
FRANCE 27 865 255,74 25 006 787,12 9,25
Finance 12 312 585,03 11 594 711,41 4,29 62 158,00 SCOR SE EUR 2 007 346,91 2 145 072,58 0,79
150 114,00 CNP ASSURANCES EUR 2 365 808,95 1 867 418,16 0,69 155 315,00 CREDIT AGRICOLE SA EUR 1 730 141,10 1 689 827,20 0,63 65 750,00 AXA SA EUR 1 499 780,08 1 658 872,50 0,61 27 825,00 BNP PARIBAS SA EUR 1 530 205,15 1 453 299,75 0,54 33 452,00 SOCIETE GENERALE SA EUR 1 405 556,62 1 424 051,64 0,53
259 952,00 NATIXIS EUR 1 773 746,22 1 356 169,58 0,50
Industries 3 816 903,64 3 936 862,34 1,46 59 512,00 BOUYGUES SA EUR 2 159 104,00 2 174 866,04 0,81
100 974,00 EDENRED EUR 1 657 799,64 1 761 996,30 0,65
Multi-Utilities 4 298 711,75 3 160 364,58 1,17 107 942,00 ENGIE SA EUR 1 969 520,17 1 762 153,15 0,65 102 999,00 ELECTRICITE DE FRANCE SA EUR 2 329 191,58 1 398 211,43 0,52
Consumer Retail 2 133 516,57 2 111 007,36 0,78 76 736,00 LAGARDERE SCA EUR 2 133 516,57 2 111 007,36 0,78
Telecommunication 2 095 752,46 1 785 433,86 0,66 89 901,00 VIVENDI SA EUR 2 095 752,46 1 785 433,86 0,66
Energy 1 526 581,94 1 329 063,12 0,49 32 208,00 TOTAL SA EUR 1 526 581,94 1 329 063,12 0,49
Basic Goods 1 681 204,35 1 089 344,45 0,40 25 683,00 CASINO GUICHARD PERRACHON SA EUR 1 681 204,35 1 089 344,45 0,40
SPAIN 21 252 337,32 18 481 719,36 6,84
Multi-Utilities 9 993 557,71 9 947 818,36 3,68 165 596,00 ENDESA SA EUR 2 941 444,81 3 067 665,90 1,13 400 782,00 IBERDROLA SA EUR 2 455 467,62 2 625 122,10 0,97 89 034,00 ENAGAS SA EUR 2 426 475,94 2 314 884,00 0,86
103 117,00 GAS NATURAL SDG SA EUR 2 170 169,34 1 940 146,36 0,72
285
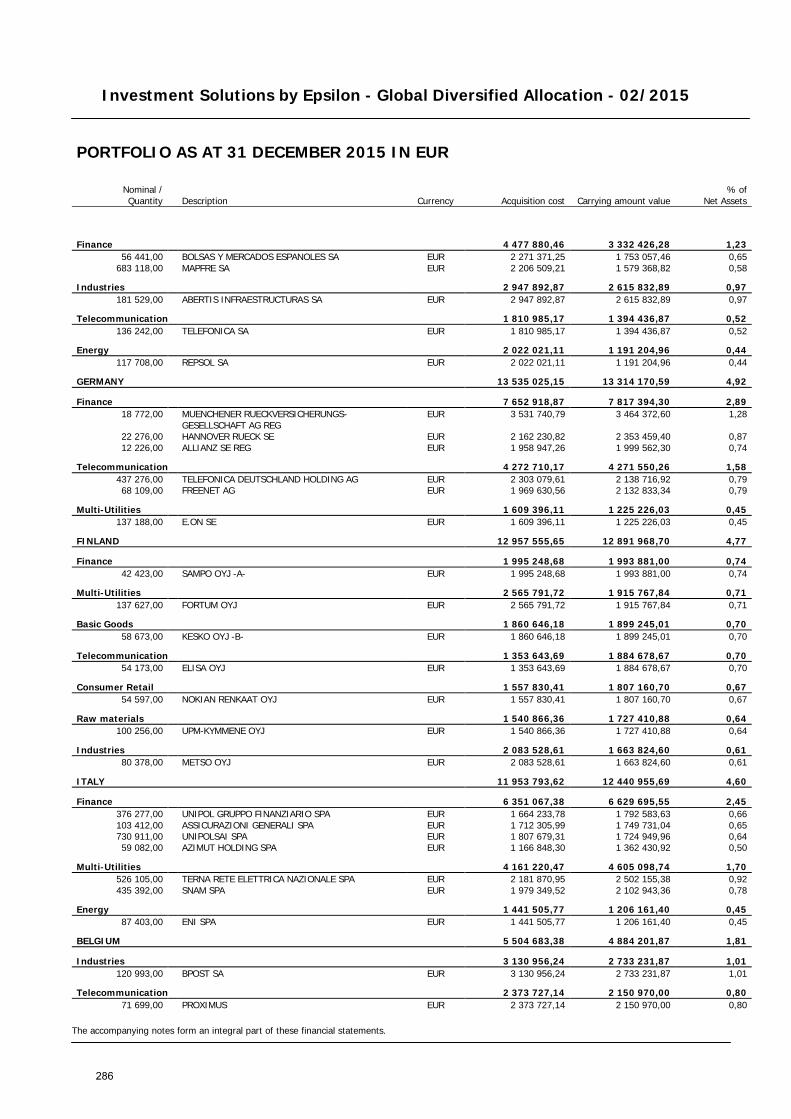
Investment Solutions by Epsilon - Global Diversified Allocation - 02/2015
The accompanying notes form an integral part of these financial statements.
PORTFOLIO AS AT 31 DECEMBER 2015 IN EUR
Nominal / Quantity Description Currency Acquisition cost Carrying amount value
% of Net Assets
Finance 4 477 880,46 3 332 426,28 1,23 56 441,00 BOLSAS Y MERCADOS ESPANOLES SA EUR 2 271 371,25 1 753 057,46 0,65
683 118,00 MAPFRE SA EUR 2 206 509,21 1 579 368,82 0,58
Industries 2 947 892,87 2 615 832,89 0,97 181 529,00 ABERTIS INFRAESTRUCTURAS SA EUR 2 947 892,87 2 615 832,89 0,97
Telecommunication 1 810 985,17 1 394 436,87 0,52 136 242,00 TELEFONICA SA EUR 1 810 985,17 1 394 436,87 0,52
Energy 2 022 021,11 1 191 204,96 0,44 117 708,00 REPSOL SA EUR 2 022 021,11 1 191 204,96 0,44
GERMANY 13 535 025,15 13 314 170,59 4,92
Finance 7 652 918,87 7 817 394,30 2,89 18 772,00
MUENCHENER RUECKVERSICHERUNGS-GESELLSCHAFT AG REG
EUR 3 531 740,79 3 464 372,60 1,28
22 276,00 HANNOVER RUECK SE EUR 2 162 230,82 2 353 459,40 0,87 12 226,00 ALLIANZ SE REG EUR 1 958 947,26 1 999 562,30 0,74
Telecommunication 4 272 710,17 4 271 550,26 1,58 437 276,00 TELEFONICA DEUTSCHLAND HOLDING AG EUR 2 303 079,61 2 138 716,92 0,79 68 109,00 FREENET AG EUR 1 969 630,56 2 132 833,34 0,79
Multi-Utilities 1 609 396,11 1 225 226,03 0,45 137 188,00 E.ON SE EUR 1 609 396,11 1 225 226,03 0,45
FINLAND 12 957 555,65 12 891 968,70 4,77
Finance 1 995 248,68 1 993 881,00 0,74 42 423,00 SAMPO OYJ -A- EUR 1 995 248,68 1 993 881,00 0,74
Multi-Utilities 2 565 791,72 1 915 767,84 0,71 137 627,00 FORTUM OYJ EUR 2 565 791,72 1 915 767,84 0,71
Basic Goods 1 860 646,18 1 899 245,01 0,70 58 673,00 KESKO OYJ -B- EUR 1 860 646,18 1 899 245,01 0,70
Telecommunication 1 353 643,69 1 884 678,67 0,70 54 173,00 ELISA OYJ EUR 1 353 643,69 1 884 678,67 0,70
Consumer Retail 1 557 830,41 1 807 160,70 0,67 54 597,00 NOKIAN RENKAAT OYJ EUR 1 557 830,41 1 807 160,70 0,67
Raw materials 1 540 866,36 1 727 410,88 0,64 100 256,00 UPM-KYMMENE OYJ EUR 1 540 866,36 1 727 410,88 0,64
Industries 2 083 528,61 1 663 824,60 0,61 80 378,00 METSO OYJ EUR 2 083 528,61 1 663 824,60 0,61
ITALY 11 953 793,62 12 440 955,69 4,60
Finance 6 351 067,38 6 629 695,55 2,45 376 277,00 UNIPOL GRUPPO FINANZIARIO SPA EUR 1 664 233,78 1 792 583,63 0,66 103 412,00 ASSICURAZIONI GENERALI SPA EUR 1 712 305,99 1 749 731,04 0,65 730 911,00 UNIPOLSAI SPA EUR 1 807 679,31 1 724 949,96 0,64 59 082,00 AZIMUT HOLDING SPA EUR 1 166 848,30 1 362 430,92 0,50
Multi-Utilities 4 161 220,47 4 605 098,74 1,70 526 105,00 TERNA RETE ELETTRICA NAZIONALE SPA EUR 2 181 870,95 2 502 155,38 0,92 435 392,00 SNAM SPA EUR 1 979 349,52 2 102 943,36 0,78
Energy 1 441 505,77 1 206 161,40 0,45 87 403,00 ENI SPA EUR 1 441 505,77 1 206 161,40 0,45
BELGIUM 5 504 683,38 4 884 201,87 1,81
Industries 3 130 956,24 2 733 231,87 1,01 120 993,00 BPOST SA EUR 3 130 956,24 2 733 231,87 1,01
Telecommunication 2 373 727,14 2 150 970,00 0,80 71 699,00 PROXIMUS EUR 2 373 727,14 2 150 970,00 0,80
286
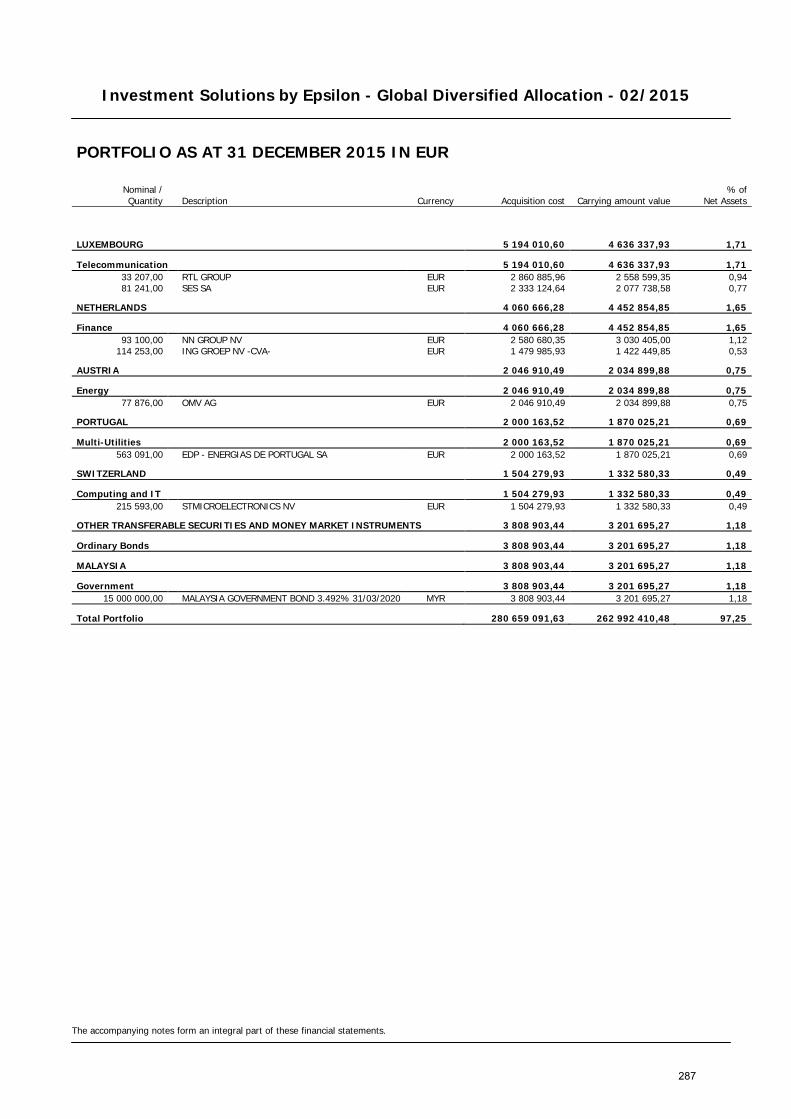
Investment Solutions by Epsilon - Global Diversified Allocation - 02/2015
The accompanying notes form an integral part of these financial statements.
PORTFOLIO AS AT 31 DECEMBER 2015 IN EUR
Nominal / Quantity Description Currency Acquisition cost Carrying amount value
% of Net Assets
LUXEMBOURG 5 194 010,60 4 636 337,93 1,71
Telecommunication 5 194 010,60 4 636 337,93 1,71 33 207,00 RTL GROUP EUR 2 860 885,96 2 558 599,35 0,94 81 241,00 SES SA EUR 2 333 124,64 2 077 738,58 0,77
NETHERLANDS 4 060 666,28 4 452 854,85 1,65
Finance 4 060 666,28 4 452 854,85 1,65 93 100,00 NN GROUP NV EUR 2 580 680,35 3 030 405,00 1,12
114 253,00 ING GROEP NV -CVA- EUR 1 479 985,93 1 422 449,85 0,53
AUSTRIA 2 046 910,49 2 034 899,88 0,75
Energy 2 046 910,49 2 034 899,88 0,75 77 876,00 OMV AG EUR 2 046 910,49 2 034 899,88 0,75
PORTUGAL 2 000 163,52 1 870 025,21 0,69
Multi-Utilities 2 000 163,52 1 870 025,21 0,69 563 091,00 EDP - ENERGIAS DE PORTUGAL SA EUR 2 000 163,52 1 870 025,21 0,69
SWITZERLAND 1 504 279,93 1 332 580,33 0,49
Computing and IT 1 504 279,93 1 332 580,33 0,49 215 593,00 STMICROELECTRONICS NV EUR 1 504 279,93 1 332 580,33 0,49
OTHER TRANSFERABLE SECURITIES AND MONEY MARKET INSTRUMENTS 3 808 903,44 3 201 695,27 1,18
Ordinary Bonds 3 808 903,44 3 201 695,27 1,18
MALAYSIA 3 808 903,44 3 201 695,27 1,18
Government 3 808 903,44 3 201 695,27 1,18 15 000 000,00 MALAYSIA GOVERNMENT BOND 3.492% 31/03/2020 MYR 3 808 903,44 3 201 695,27 1,18
Total Portfolio 280 659 091,63 262 992 410,48 97,25
287
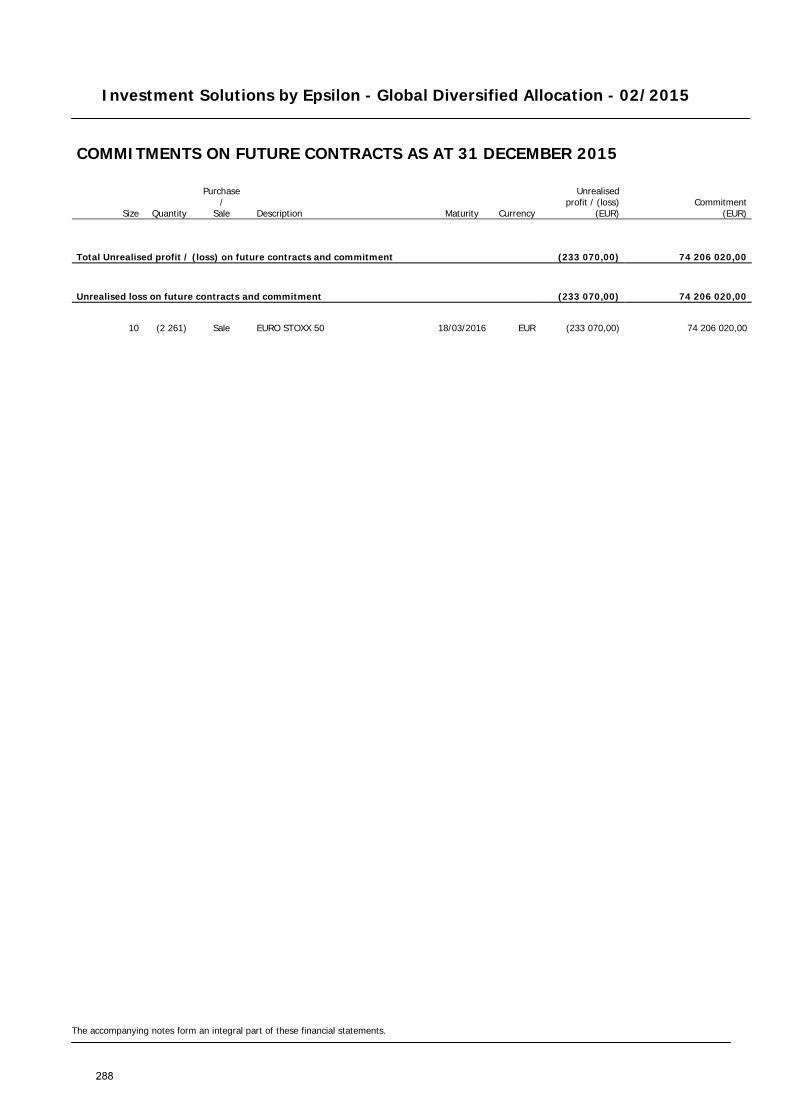
Investment Solutions by Epsilon - Global Diversified Allocation - 02/2015
The accompanying notes form an integral part of these financial statements.
COMMITMENTS ON FUTURE CONTRACTS AS AT 31 DECEMBER 2015
Size Quantity
Purchase /
Sale Description Maturity Currency
Unrealised profit / (loss)
(EUR) Commitment
(EUR)
Total Unrealised profit / (loss) on future contracts and commitment (233 070,00) 74 206 020,00
Unrealised loss on future contracts and commitment (233 070,00) 74 206 020,00
10 (2 261) Sale EURO STOXX 50 18/03/2016 EUR (233 070,00) 74 206 020,00
288
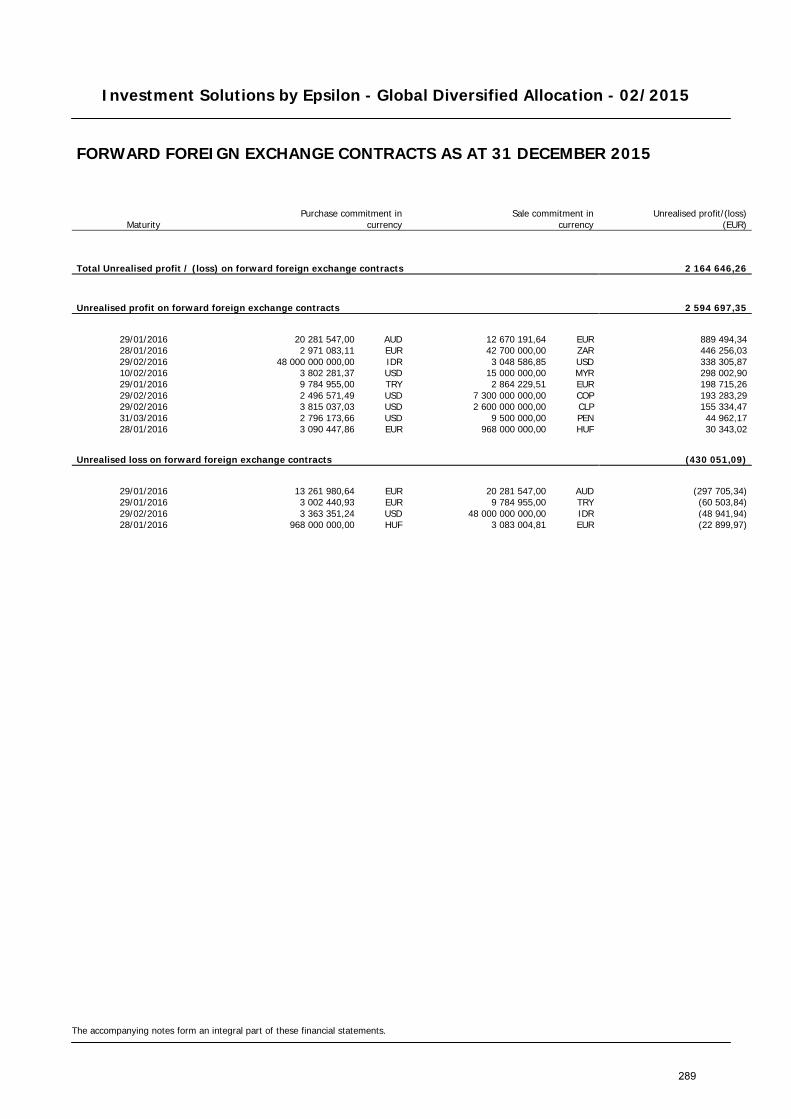
Investment Solutions by Epsilon - Global Diversified Allocation - 02/2015
The accompanying notes form an integral part of these financial statements.
FORWARD FOREIGN EXCHANGE CONTRACTS AS AT 31 DECEMBER 2015
Maturity Purchase commitment in
currency Sale commitment in
currency
Unrealised profit/(loss) (EUR)
Total Unrealised profit / (loss) on forward foreign exchange contracts 2 164 646,26
Unrealised profit on forward foreign exchange contracts 2 594 697,35
29/01/2016 20 281 547,00 AUD 12 670 191,64 EUR 889 494,34 28/01/2016 2 971 083,11 EUR 42 700 000,00 ZAR 446 256,03 29/02/2016 48 000 000 000,00 IDR 3 048 586,85 USD 338 305,87 10/02/2016 3 802 281,37 USD 15 000 000,00 MYR 298 002,90 29/01/2016 9 784 955,00 TRY 2 864 229,51 EUR 198 715,26 29/02/2016 2 496 571,49 USD 7 300 000 000,00 COP 193 283,29 29/02/2016 3 815 037,03 USD 2 600 000 000,00 CLP 155 334,47 31/03/2016 2 796 173,66 USD 9 500 000,00 PEN 44 962,17 28/01/2016 3 090 447,86 EUR 968 000 000,00 HUF 30 343,02
Unrealised loss on forward foreign exchange contracts (430 051,09)
29/01/2016 13 261 980,64 EUR 20 281 547,00 AUD (297 705,34) 29/01/2016 3 002 440,93 EUR 9 784 955,00 TRY (60 503,84) 29/02/2016 3 363 351,24 USD 48 000 000 000,00 IDR (48 941,94) 28/01/2016 968 000 000,00 HUF 3 083 004,81 EUR (22 899,97)
289

Investment Solutions by Epsilon - Global Diversified Allocation - 02/2015
The accompanying notes form an integral part of these financial statements.
SWAP CONTRACTS AS AT 31 DECEMBER 2015
Counterparty Currency Notional Maturity Interest
receivable (EUR) Interest
payable (EUR)
Unrealised
profit / (loss) (EUR)
ASSET SWAP CONTRACTS — — (353 666,84) BANCA IMI SPA EUR 145 500 000,00 20/03/2020 — — (353 666,84)
290
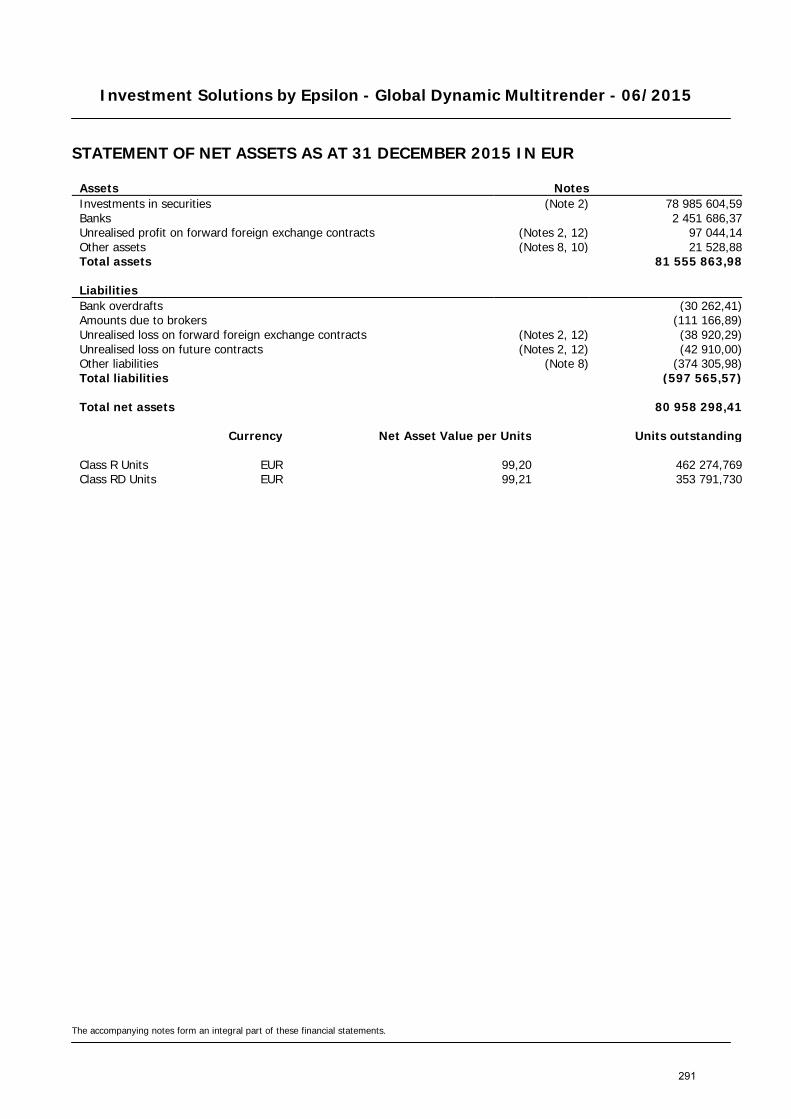
Investment Solutions by Epsilon - Global Dynamic Multitrender - 06/2015
STATEMENT OF NET ASSETS AS AT 31 DECEMBER 2015 IN EUR
The accompanying notes form an integral part of these financial statements.
Assets Notes Investments in securities (Note 2) 78 985 604,59 Banks 2 451 686,37 Unrealised profit on forward foreign exchange contracts (Notes 2, 12) 97 044,14 Other assets (Notes 8, 10) 21 528,88 Total assets 81 555 863,98
Liabilities Bank overdrafts (30 262,41) Amounts due to brokers (111 166,89) Unrealised loss on forward foreign exchange contracts (Notes 2, 12) (38 920,29) Unrealised loss on future contracts (Notes 2, 12) (42 910,00) Other liabilities (Note 8) (374 305,98) Total liabilities (597 565,57)
Total net assets 80 958 298,41
Currency Net Asset Value per Units Units outstanding
Class R Units EUR 99,20 462 274,769 Class RD Units EUR 99,21 353 791,730
291
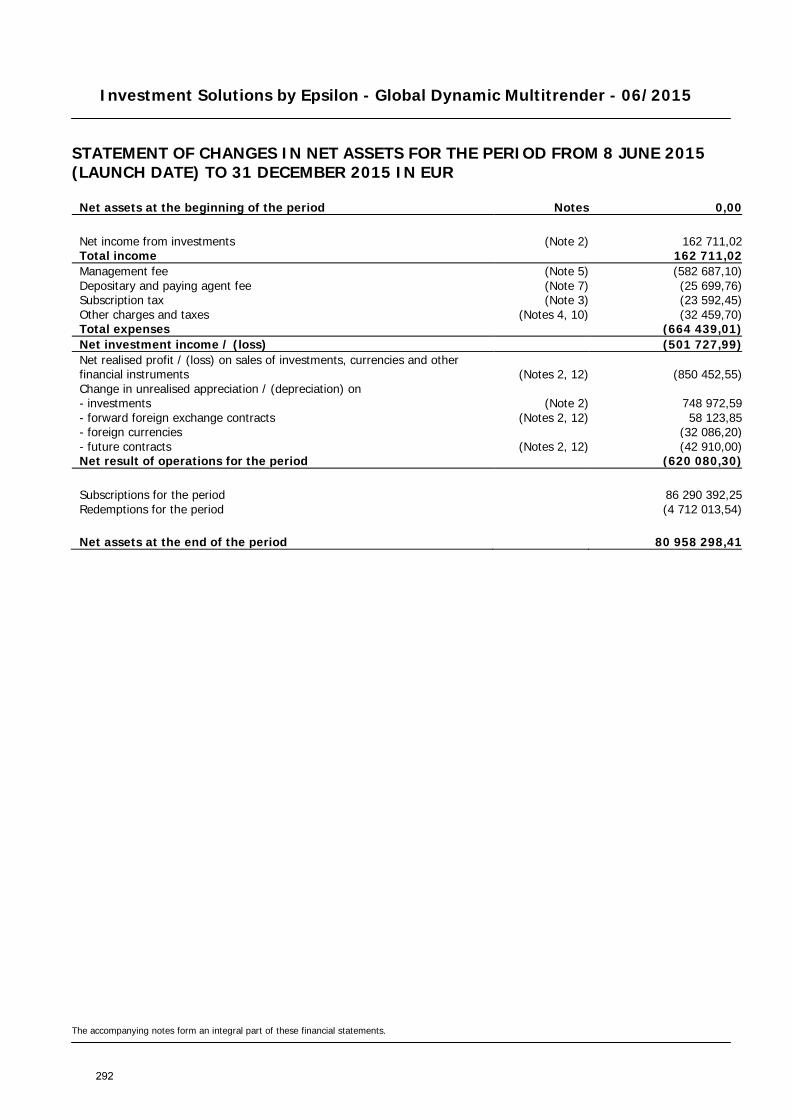
Investment Solutions by Epsilon - Global Dynamic Multitrender - 06/2015
STATEMENT OF CHANGES IN NET ASSETS FOR THE PERIOD FROM 8 JUNE 2015 (LAUNCH DATE) TO 31 DECEMBER 2015 IN EUR
The accompanying notes form an integral part of these financial statements.
Net assets at the beginning of the period Notes 0,00
Net income from investments (Note 2) 162 711,02 Total income 162 711,02 Management fee (Note 5) (582 687,10) Depositary and paying agent fee (Note 7) (25 699,76) Subscription tax (Note 3) (23 592,45) Other charges and taxes (Notes 4, 10) (32 459,70) Total expenses (664 439,01) Net investment income / (loss) (501 727,99) Net realised profit / (loss) on sales of investments, currencies and other financial instruments (Notes 2, 12) (850 452,55) Change in unrealised appreciation / (depreciation) on - investments (Note 2) 748 972,59 - forward foreign exchange contracts (Notes 2, 12) 58 123,85 - foreign currencies (32 086,20) - future contracts (Notes 2, 12) (42 910,00) Net result of operations for the period (620 080,30)
Subscriptions for the period 86 290 392,25 Redemptions for the period (4 712 013,54)
Net assets at the end of the period 80 958 298,41
292
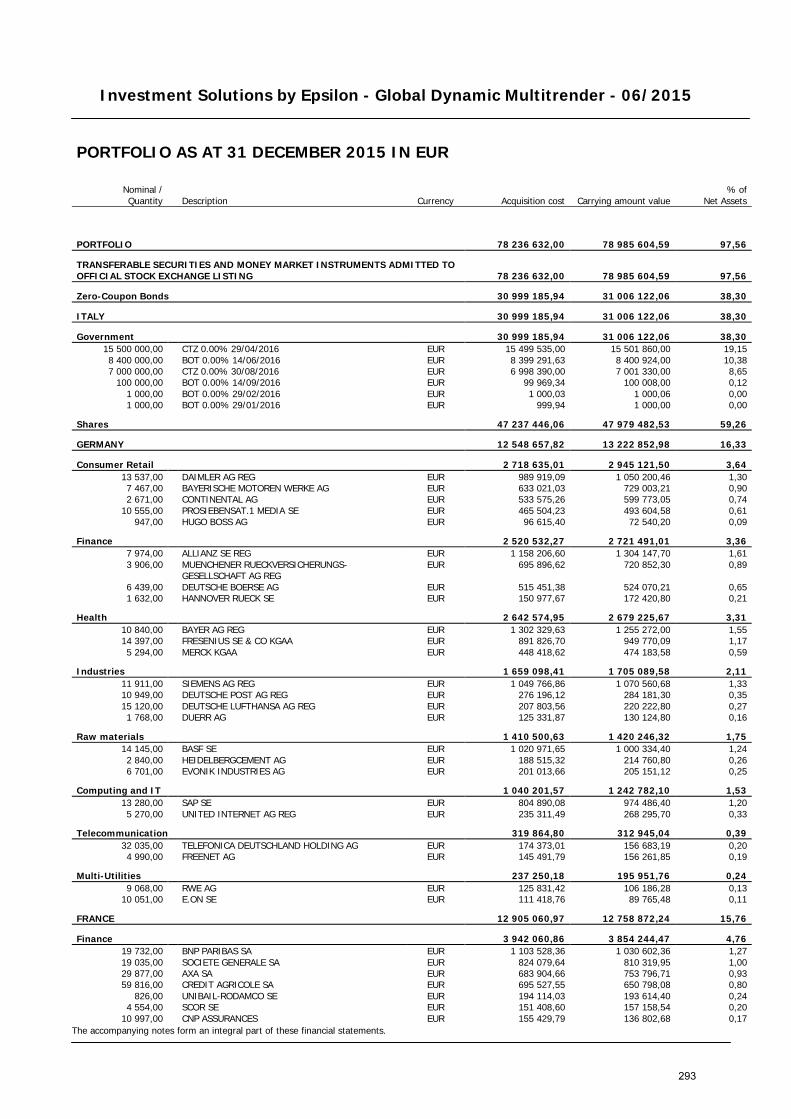
Investment Solutions by Epsilon - Global Dynamic Multitrender - 06/2015
The accompanying notes form an integral part of these financial statements.
PORTFOLIO AS AT 31 DECEMBER 2015 IN EUR
Nominal / Quantity Description Currency Acquisition cost Carrying amount value
% of Net Assets
PORTFOLIO 78 236 632,00 78 985 604,59 97,56
TRANSFERABLE SECURITIES AND MONEY MARKET INSTRUMENTS ADMITTED TO OFFICIAL STOCK EXCHANGE LISTING 78 236 632,00 78 985 604,59 97,56
Zero-Coupon Bonds 30 999 185,94 31 006 122,06 38,30
ITALY 30 999 185,94 31 006 122,06 38,30
Government 30 999 185,94 31 006 122,06 38,30 15 500 000,00 CTZ 0.00% 29/04/2016 EUR 15 499 535,00 15 501 860,00 19,15 8 400 000,00 BOT 0.00% 14/06/2016 EUR 8 399 291,63 8 400 924,00 10,38 7 000 000,00 CTZ 0.00% 30/08/2016 EUR 6 998 390,00 7 001 330,00 8,65
100 000,00 BOT 0.00% 14/09/2016 EUR 99 969,34 100 008,00 0,12 1 000,00 BOT 0.00% 29/02/2016 EUR 1 000,03 1 000,06 0,00 1 000,00 BOT 0.00% 29/01/2016 EUR 999,94 1 000,00 0,00
Shares 47 237 446,06 47 979 482,53 59,26
GERMANY 12 548 657,82 13 222 852,98 16,33
Consumer Retail 2 718 635,01 2 945 121,50 3,64 13 537,00 DAIMLER AG REG EUR 989 919,09 1 050 200,46 1,30 7 467,00 BAYERISCHE MOTOREN WERKE AG EUR 633 021,03 729 003,21 0,90 2 671,00 CONTINENTAL AG EUR 533 575,26 599 773,05 0,74
10 555,00 PROSIEBENSAT.1 MEDIA SE EUR 465 504,23 493 604,58 0,61 947,00 HUGO BOSS AG EUR 96 615,40 72 540,20 0,09
Finance 2 520 532,27 2 721 491,01 3,36 7 974,00 ALLIANZ SE REG EUR 1 158 206,60 1 304 147,70 1,61 3 906,00
MUENCHENER RUECKVERSICHERUNGS-GESELLSCHAFT AG REG
EUR 695 896,62 720 852,30 0,89
6 439,00 DEUTSCHE BOERSE AG EUR 515 451,38 524 070,21 0,65 1 632,00 HANNOVER RUECK SE EUR 150 977,67 172 420,80 0,21
Health 2 642 574,95 2 679 225,67 3,31 10 840,00 BAYER AG REG EUR 1 302 329,63 1 255 272,00 1,55 14 397,00 FRESENIUS SE & CO KGAA EUR 891 826,70 949 770,09 1,17 5 294,00 MERCK KGAA EUR 448 418,62 474 183,58 0,59
Industries 1 659 098,41 1 705 089,58 2,11 11 911,00 SIEMENS AG REG EUR 1 049 766,86 1 070 560,68 1,33 10 949,00 DEUTSCHE POST AG REG EUR 276 196,12 284 181,30 0,35 15 120,00 DEUTSCHE LUFTHANSA AG REG EUR 207 803,56 220 222,80 0,27 1 768,00 DUERR AG EUR 125 331,87 130 124,80 0,16
Raw materials 1 410 500,63 1 420 246,32 1,75 14 145,00 BASF SE EUR 1 020 971,65 1 000 334,40 1,24 2 840,00 HEIDELBERGCEMENT AG EUR 188 515,32 214 760,80 0,26 6 701,00 EVONIK INDUSTRIES AG EUR 201 013,66 205 151,12 0,25
Computing and IT 1 040 201,57 1 242 782,10 1,53 13 280,00 SAP SE EUR 804 890,08 974 486,40 1,20 5 270,00 UNITED INTERNET AG REG EUR 235 311,49 268 295,70 0,33
Telecommunication 319 864,80 312 945,04 0,39 32 035,00 TELEFONICA DEUTSCHLAND HOLDING AG EUR 174 373,01 156 683,19 0,20 4 990,00 FREENET AG EUR 145 491,79 156 261,85 0,19
Multi-Utilities 237 250,18 195 951,76 0,24 9 068,00 RWE AG EUR 125 831,42 106 186,28 0,13
10 051,00 E.ON SE EUR 111 418,76 89 765,48 0,11
FRANCE 12 905 060,97 12 758 872,24 15,76
Finance 3 942 060,86 3 854 244,47 4,76 19 732,00 BNP PARIBAS SA EUR 1 103 528,36 1 030 602,36 1,27 19 035,00 SOCIETE GENERALE SA EUR 824 079,64 810 319,95 1,00 29 877,00 AXA SA EUR 683 904,66 753 796,71 0,93 59 816,00 CREDIT AGRICOLE SA EUR 695 527,55 650 798,08 0,80
826,00 UNIBAIL-RODAMCO SE EUR 194 114,03 193 614,40 0,24 4 554,00 SCOR SE EUR 151 408,60 157 158,54 0,20
10 997,00 CNP ASSURANCES EUR 155 429,79 136 802,68 0,17
293
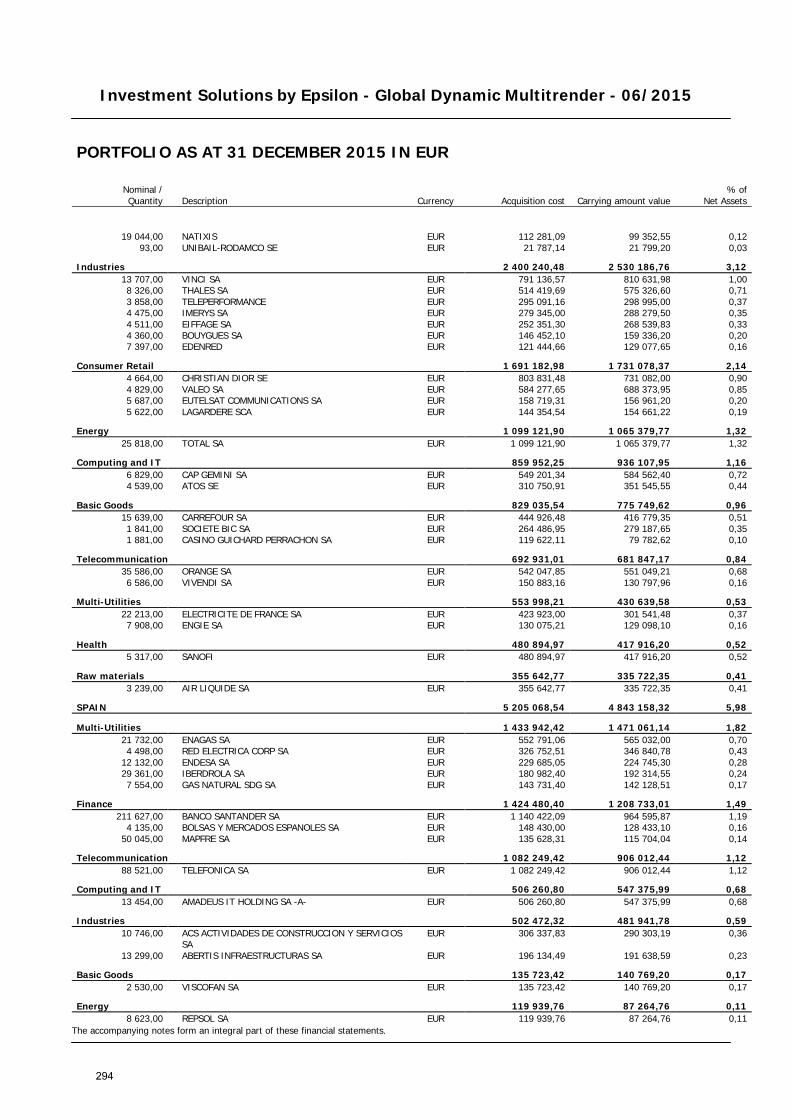
Investment Solutions by Epsilon - Global Dynamic Multitrender - 06/2015
The accompanying notes form an integral part of these financial statements.
PORTFOLIO AS AT 31 DECEMBER 2015 IN EUR
Nominal / Quantity Description Currency Acquisition cost Carrying amount value
% of Net Assets
19 044,00 NATIXIS EUR 112 281,09 99 352,55 0,12 93,00 UNIBAIL-RODAMCO SE EUR 21 787,14 21 799,20 0,03
Industries 2 400 240,48 2 530 186,76 3,12 13 707,00 VINCI SA EUR 791 136,57 810 631,98 1,00 8 326,00 THALES SA EUR 514 419,69 575 326,60 0,71 3 858,00 TELEPERFORMANCE EUR 295 091,16 298 995,00 0,37 4 475,00 IMERYS SA EUR 279 345,00 288 279,50 0,35 4 511,00 EIFFAGE SA EUR 252 351,30 268 539,83 0,33 4 360,00 BOUYGUES SA EUR 146 452,10 159 336,20 0,20 7 397,00 EDENRED EUR 121 444,66 129 077,65 0,16
Consumer Retail 1 691 182,98 1 731 078,37 2,14 4 664,00 CHRISTIAN DIOR SE EUR 803 831,48 731 082,00 0,90 4 829,00 VALEO SA EUR 584 277,65 688 373,95 0,85 5 687,00 EUTELSAT COMMUNICATIONS SA EUR 158 719,31 156 961,20 0,20 5 622,00 LAGARDERE SCA EUR 144 354,54 154 661,22 0,19
Energy 1 099 121,90 1 065 379,77 1,32 25 818,00 TOTAL SA EUR 1 099 121,90 1 065 379,77 1,32
Computing and IT 859 952,25 936 107,95 1,16 6 829,00 CAP GEMINI SA EUR 549 201,34 584 562,40 0,72 4 539,00 ATOS SE EUR 310 750,91 351 545,55 0,44
Basic Goods 829 035,54 775 749,62 0,96 15 639,00 CARREFOUR SA EUR 444 926,48 416 779,35 0,51 1 841,00 SOCIETE BIC SA EUR 264 486,95 279 187,65 0,35 1 881,00 CASINO GUICHARD PERRACHON SA EUR 119 622,11 79 782,62 0,10
Telecommunication 692 931,01 681 847,17 0,84 35 586,00 ORANGE SA EUR 542 047,85 551 049,21 0,68 6 586,00 VIVENDI SA EUR 150 883,16 130 797,96 0,16
Multi-Utilities 553 998,21 430 639,58 0,53 22 213,00 ELECTRICITE DE FRANCE SA EUR 423 923,00 301 541,48 0,37 7 908,00 ENGIE SA EUR 130 075,21 129 098,10 0,16
Health 480 894,97 417 916,20 0,52 5 317,00 SANOFI EUR 480 894,97 417 916,20 0,52
Raw materials 355 642,77 335 722,35 0,41 3 239,00 AIR LIQUIDE SA EUR 355 642,77 335 722,35 0,41
SPAIN 5 205 068,54 4 843 158,32 5,98
Multi-Utilities 1 433 942,42 1 471 061,14 1,82 21 732,00 ENAGAS SA EUR 552 791,06 565 032,00 0,70 4 498,00 RED ELECTRICA CORP SA EUR 326 752,51 346 840,78 0,43
12 132,00 ENDESA SA EUR 229 685,05 224 745,30 0,28 29 361,00 IBERDROLA SA EUR 180 982,40 192 314,55 0,24 7 554,00 GAS NATURAL SDG SA EUR 143 731,40 142 128,51 0,17
Finance 1 424 480,40 1 208 733,01 1,49 211 627,00 BANCO SANTANDER SA EUR 1 140 422,09 964 595,87 1,19
4 135,00 BOLSAS Y MERCADOS ESPANOLES SA EUR 148 430,00 128 433,10 0,16 50 045,00 MAPFRE SA EUR 135 628,31 115 704,04 0,14
Telecommunication 1 082 249,42 906 012,44 1,12 88 521,00 TELEFONICA SA EUR 1 082 249,42 906 012,44 1,12
Computing and IT 506 260,80 547 375,99 0,68 13 454,00 AMADEUS IT HOLDING SA -A- EUR 506 260,80 547 375,99 0,68
Industries 502 472,32 481 941,78 0,59 10 746,00
ACS ACTIVIDADES DE CONSTRUCCION Y SERVICIOS SA
EUR 306 337,83 290 303,19 0,36
13 299,00 ABERTIS INFRAESTRUCTURAS SA EUR 196 134,49 191 638,59 0,23
Basic Goods 135 723,42 140 769,20 0,17 2 530,00 VISCOFAN SA EUR 135 723,42 140 769,20 0,17
Energy 119 939,76 87 264,76 0,11 8 623,00 REPSOL SA EUR 119 939,76 87 264,76 0,11
294
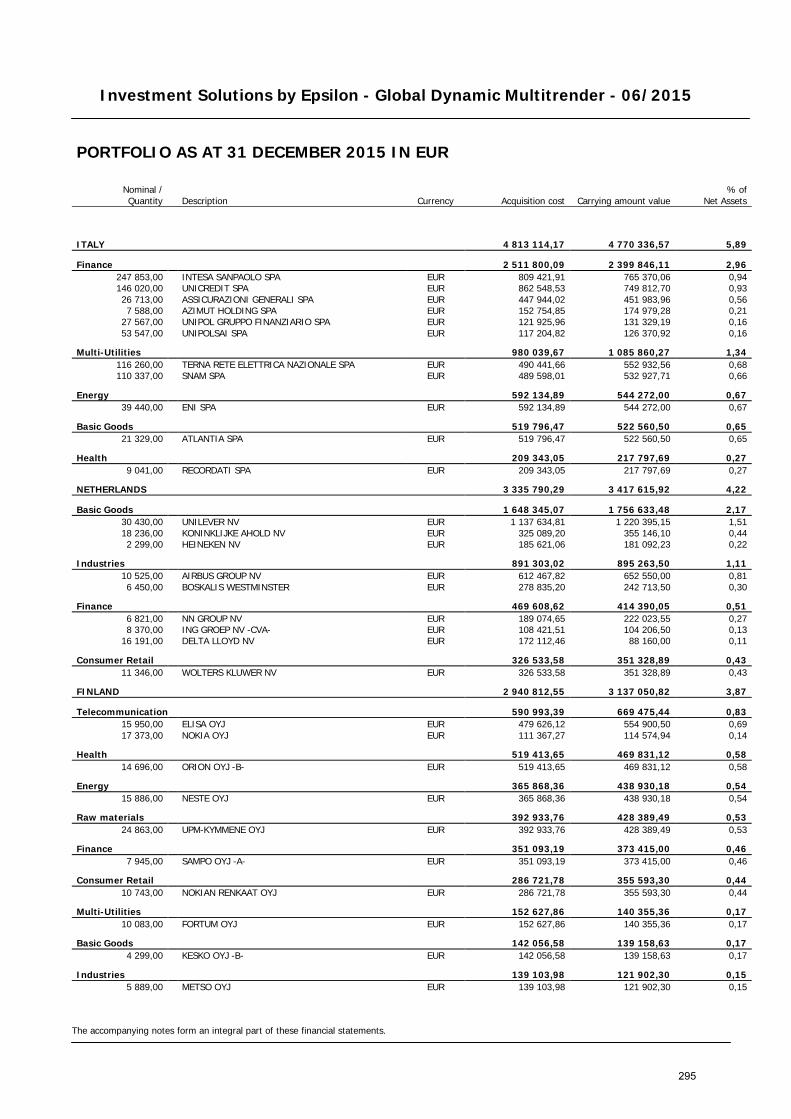
Investment Solutions by Epsilon - Global Dynamic Multitrender - 06/2015
The accompanying notes form an integral part of these financial statements.
PORTFOLIO AS AT 31 DECEMBER 2015 IN EUR
Nominal / Quantity Description Currency Acquisition cost Carrying amount value
% of Net Assets
ITALY 4 813 114,17 4 770 336,57 5,89
Finance 2 511 800,09 2 399 846,11 2,96 247 853,00 INTESA SANPAOLO SPA EUR 809 421,91 765 370,06 0,94 146 020,00 UNICREDIT SPA EUR 862 548,53 749 812,70 0,93 26 713,00 ASSICURAZIONI GENERALI SPA EUR 447 944,02 451 983,96 0,56 7 588,00 AZIMUT HOLDING SPA EUR 152 754,85 174 979,28 0,21
27 567,00 UNIPOL GRUPPO FINANZIARIO SPA EUR 121 925,96 131 329,19 0,16 53 547,00 UNIPOLSAI SPA EUR 117 204,82 126 370,92 0,16
Multi-Utilities 980 039,67 1 085 860,27 1,34 116 260,00 TERNA RETE ELETTRICA NAZIONALE SPA EUR 490 441,66 552 932,56 0,68 110 337,00 SNAM SPA EUR 489 598,01 532 927,71 0,66
Energy 592 134,89 544 272,00 0,67 39 440,00 ENI SPA EUR 592 134,89 544 272,00 0,67
Basic Goods 519 796,47 522 560,50 0,65 21 329,00 ATLANTIA SPA EUR 519 796,47 522 560,50 0,65
Health 209 343,05 217 797,69 0,27 9 041,00 RECORDATI SPA EUR 209 343,05 217 797,69 0,27
NETHERLANDS 3 335 790,29 3 417 615,92 4,22
Basic Goods 1 648 345,07 1 756 633,48 2,17 30 430,00 UNILEVER NV EUR 1 137 634,81 1 220 395,15 1,51 18 236,00 KONINKLIJKE AHOLD NV EUR 325 089,20 355 146,10 0,44 2 299,00 HEINEKEN NV EUR 185 621,06 181 092,23 0,22
Industries 891 303,02 895 263,50 1,11 10 525,00 AIRBUS GROUP NV EUR 612 467,82 652 550,00 0,81 6 450,00 BOSKALIS WESTMINSTER EUR 278 835,20 242 713,50 0,30
Finance 469 608,62 414 390,05 0,51 6 821,00 NN GROUP NV EUR 189 074,65 222 023,55 0,27 8 370,00 ING GROEP NV -CVA- EUR 108 421,51 104 206,50 0,13
16 191,00 DELTA LLOYD NV EUR 172 112,46 88 160,00 0,11
Consumer Retail 326 533,58 351 328,89 0,43 11 346,00 WOLTERS KLUWER NV EUR 326 533,58 351 328,89 0,43
FINLAND 2 940 812,55 3 137 050,82 3,87
Telecommunication 590 993,39 669 475,44 0,83 15 950,00 ELISA OYJ EUR 479 626,12 554 900,50 0,69 17 373,00 NOKIA OYJ EUR 111 367,27 114 574,94 0,14
Health 519 413,65 469 831,12 0,58 14 696,00 ORION OYJ -B- EUR 519 413,65 469 831,12 0,58
Energy 365 868,36 438 930,18 0,54 15 886,00 NESTE OYJ EUR 365 868,36 438 930,18 0,54
Raw materials 392 933,76 428 389,49 0,53 24 863,00 UPM-KYMMENE OYJ EUR 392 933,76 428 389,49 0,53
Finance 351 093,19 373 415,00 0,46 7 945,00 SAMPO OYJ -A- EUR 351 093,19 373 415,00 0,46
Consumer Retail 286 721,78 355 593,30 0,44 10 743,00 NOKIAN RENKAAT OYJ EUR 286 721,78 355 593,30 0,44
Multi-Utilities 152 627,86 140 355,36 0,17 10 083,00 FORTUM OYJ EUR 152 627,86 140 355,36 0,17
Basic Goods 142 056,58 139 158,63 0,17 4 299,00 KESKO OYJ -B- EUR 142 056,58 139 158,63 0,17
Industries 139 103,98 121 902,30 0,15 5 889,00 METSO OYJ EUR 139 103,98 121 902,30 0,15
295
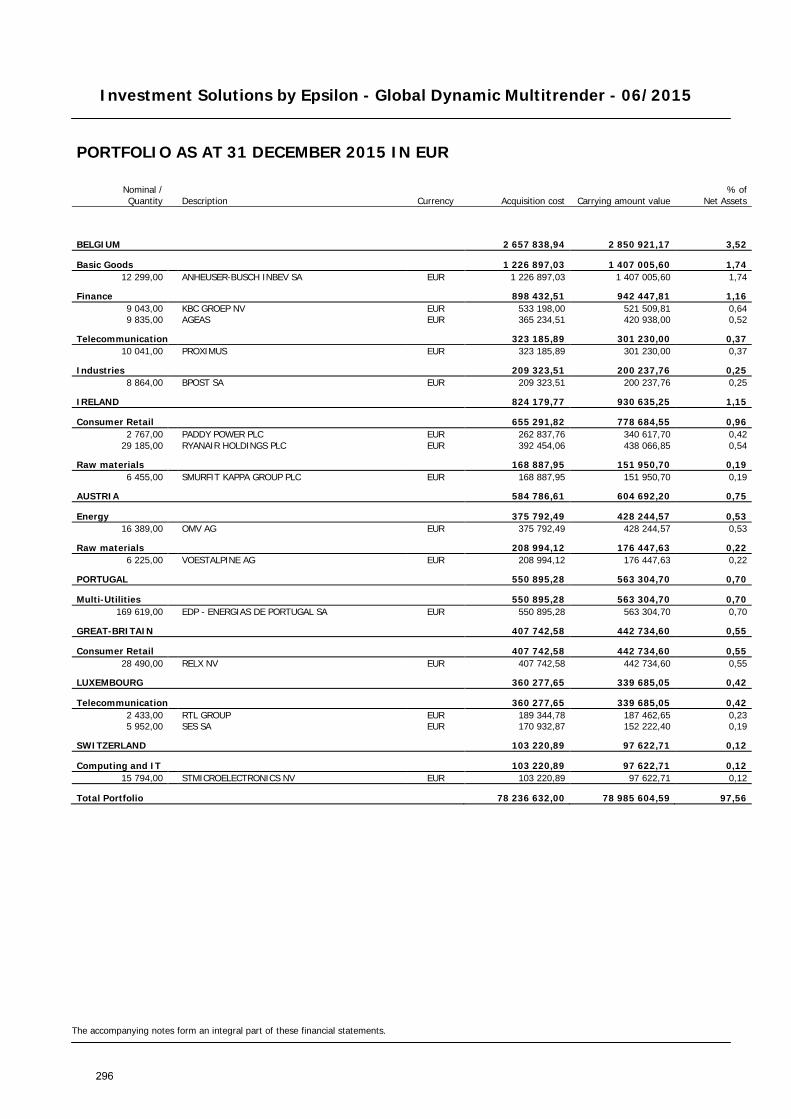
Investment Solutions by Epsilon - Global Dynamic Multitrender - 06/2015
The accompanying notes form an integral part of these financial statements.
PORTFOLIO AS AT 31 DECEMBER 2015 IN EUR
Nominal / Quantity Description Currency Acquisition cost Carrying amount value
% of Net Assets
BELGIUM 2 657 838,94 2 850 921,17 3,52
Basic Goods 1 226 897,03 1 407 005,60 1,74 12 299,00 ANHEUSER-BUSCH INBEV SA EUR 1 226 897,03 1 407 005,60 1,74
Finance 898 432,51 942 447,81 1,16 9 043,00 KBC GROEP NV EUR 533 198,00 521 509,81 0,64 9 835,00 AGEAS EUR 365 234,51 420 938,00 0,52
Telecommunication 323 185,89 301 230,00 0,37 10 041,00 PROXIMUS EUR 323 185,89 301 230,00 0,37
Industries 209 323,51 200 237,76 0,25 8 864,00 BPOST SA EUR 209 323,51 200 237,76 0,25
IRELAND 824 179,77 930 635,25 1,15
Consumer Retail 655 291,82 778 684,55 0,96 2 767,00 PADDY POWER PLC EUR 262 837,76 340 617,70 0,42
29 185,00 RYANAIR HOLDINGS PLC EUR 392 454,06 438 066,85 0,54
Raw materials 168 887,95 151 950,70 0,19 6 455,00 SMURFIT KAPPA GROUP PLC EUR 168 887,95 151 950,70 0,19
AUSTRIA 584 786,61 604 692,20 0,75
Energy 375 792,49 428 244,57 0,53 16 389,00 OMV AG EUR 375 792,49 428 244,57 0,53
Raw materials 208 994,12 176 447,63 0,22 6 225,00 VOESTALPINE AG EUR 208 994,12 176 447,63 0,22
PORTUGAL 550 895,28 563 304,70 0,70
Multi-Utilities 550 895,28 563 304,70 0,70 169 619,00 EDP - ENERGIAS DE PORTUGAL SA EUR 550 895,28 563 304,70 0,70
GREAT-BRITAIN 407 742,58 442 734,60 0,55
Consumer Retail 407 742,58 442 734,60 0,55 28 490,00 RELX NV EUR 407 742,58 442 734,60 0,55
LUXEMBOURG 360 277,65 339 685,05 0,42
Telecommunication 360 277,65 339 685,05 0,42 2 433,00 RTL GROUP EUR 189 344,78 187 462,65 0,23 5 952,00 SES SA EUR 170 932,87 152 222,40 0,19
SWITZERLAND 103 220,89 97 622,71 0,12
Computing and IT 103 220,89 97 622,71 0,12 15 794,00 STMICROELECTRONICS NV EUR 103 220,89 97 622,71 0,12
Total Portfolio 78 236 632,00 78 985 604,59 97,56
296
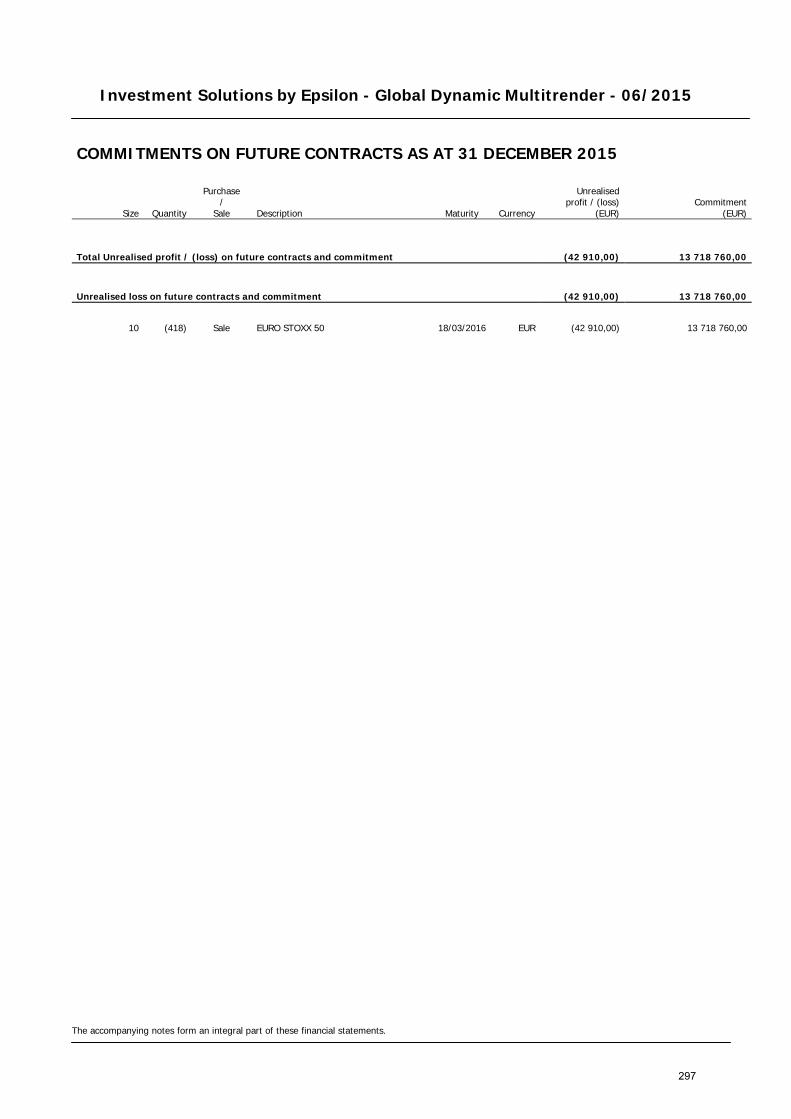
Investment Solutions by Epsilon - Global Dynamic Multitrender - 06/2015
The accompanying notes form an integral part of these financial statements.
COMMITMENTS ON FUTURE CONTRACTS AS AT 31 DECEMBER 2015
Size Quantity
Purchase /
Sale Description Maturity Currency
Unrealised profit / (loss)
(EUR) Commitment
(EUR)
Total Unrealised profit / (loss) on future contracts and commitment (42 910,00) 13 718 760,00
Unrealised loss on future contracts and commitment (42 910,00) 13 718 760,00
10 (418) Sale EURO STOXX 50 18/03/2016 EUR (42 910,00) 13 718 760,00
297
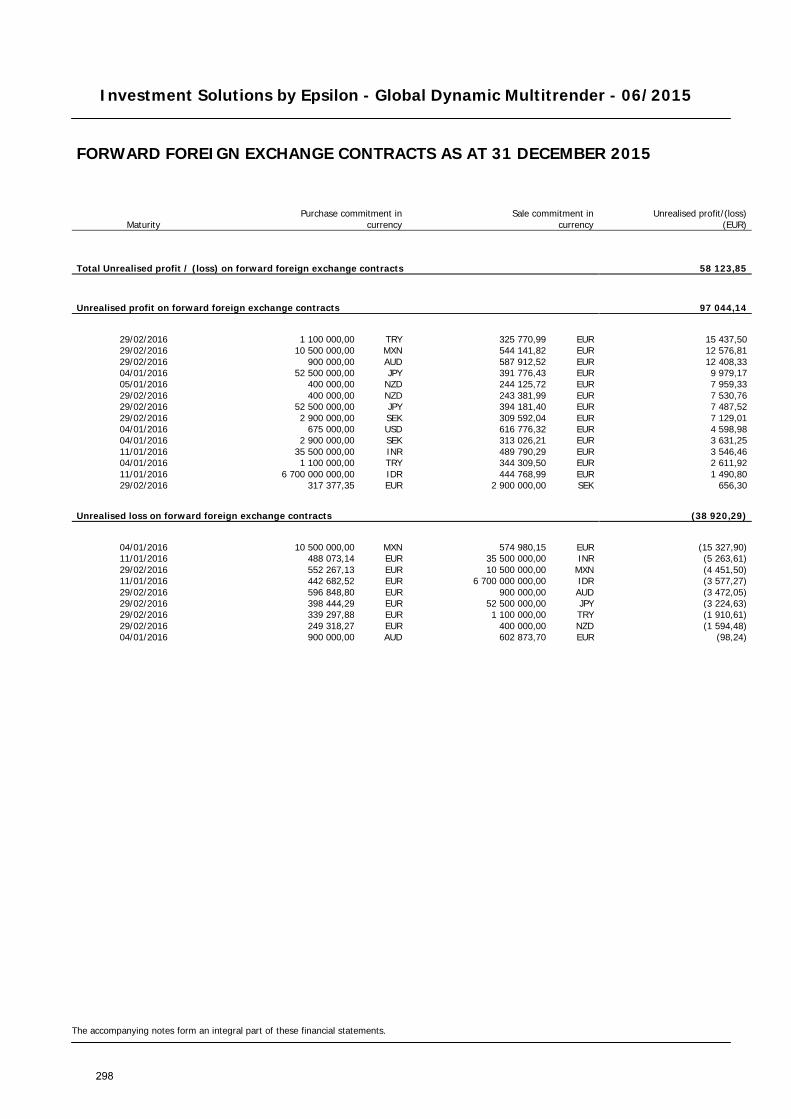
Investment Solutions by Epsilon - Global Dynamic Multitrender - 06/2015
The accompanying notes form an integral part of these financial statements.
FORWARD FOREIGN EXCHANGE CONTRACTS AS AT 31 DECEMBER 2015
Maturity Purchase commitment in
currency Sale commitment in
currency
Unrealised profit/(loss) (EUR)
Total Unrealised profit / (loss) on forward foreign exchange contracts 58 123,85
Unrealised profit on forward foreign exchange contracts 97 044,14
29/02/2016 1 100 000,00 TRY 325 770,99 EUR 15 437,50 29/02/2016 10 500 000,00 MXN 544 141,82 EUR 12 576,81 29/02/2016 900 000,00 AUD 587 912,52 EUR 12 408,33 04/01/2016 52 500 000,00 JPY 391 776,43 EUR 9 979,17 05/01/2016 400 000,00 NZD 244 125,72 EUR 7 959,33 29/02/2016 400 000,00 NZD 243 381,99 EUR 7 530,76 29/02/2016 52 500 000,00 JPY 394 181,40 EUR 7 487,52 29/02/2016 2 900 000,00 SEK 309 592,04 EUR 7 129,01 04/01/2016 675 000,00 USD 616 776,32 EUR 4 598,98 04/01/2016 2 900 000,00 SEK 313 026,21 EUR 3 631,25 11/01/2016 35 500 000,00 INR 489 790,29 EUR 3 546,46 04/01/2016 1 100 000,00 TRY 344 309,50 EUR 2 611,92 11/01/2016 6 700 000 000,00 IDR 444 768,99 EUR 1 490,80 29/02/2016 317 377,35 EUR 2 900 000,00 SEK 656,30
Unrealised loss on forward foreign exchange contracts (38 920,29)
04/01/2016 10 500 000,00 MXN 574 980,15 EUR (15 327,90) 11/01/2016 488 073,14 EUR 35 500 000,00 INR (5 263,61) 29/02/2016 552 267,13 EUR 10 500 000,00 MXN (4 451,50) 11/01/2016 442 682,52 EUR 6 700 000 000,00 IDR (3 577,27) 29/02/2016 596 848,80 EUR 900 000,00 AUD (3 472,05) 29/02/2016 398 444,29 EUR 52 500 000,00 JPY (3 224,63) 29/02/2016 339 297,88 EUR 1 100 000,00 TRY (1 910,61) 29/02/2016 249 318,27 EUR 400 000,00 NZD (1 594,48) 04/01/2016 900 000,00 AUD 602 873,70 EUR (98,24)
298
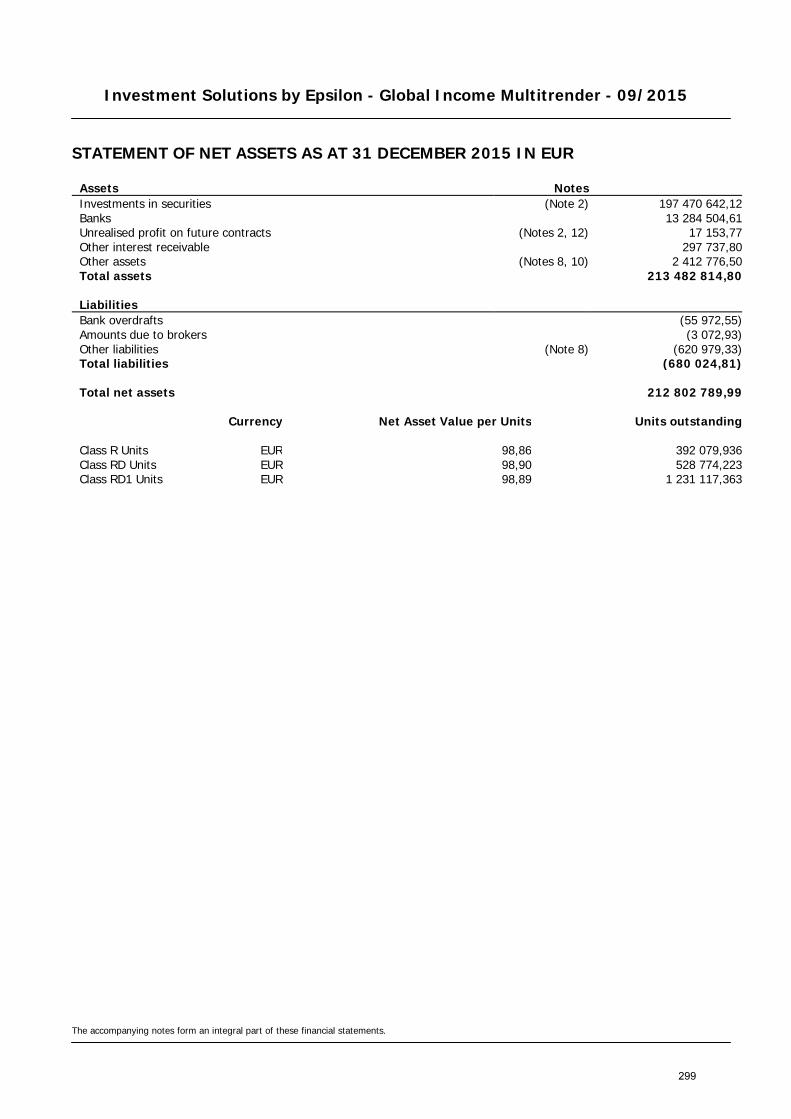
Investment Solutions by Epsilon - Global Income Multitrender - 09/2015
STATEMENT OF NET ASSETS AS AT 31 DECEMBER 2015 IN EUR
The accompanying notes form an integral part of these financial statements.
Assets Notes Investments in securities (Note 2) 197 470 642,12 Banks 13 284 504,61 Unrealised profit on future contracts (Notes 2, 12) 17 153,77 Other interest receivable 297 737,80 Other assets (Notes 8, 10) 2 412 776,50 Total assets 213 482 814,80
Liabilities Bank overdrafts (55 972,55) Amounts due to brokers (3 072,93) Other liabilities (Note 8) (620 979,33) Total liabilities (680 024,81)
Total net assets 212 802 789,99
Currency Net Asset Value per Units Units outstanding
Class R Units EUR 98,86 392 079,936 Class RD Units EUR 98,90 528 774,223 Class RD1 Units EUR 98,89 1 231 117,363
299
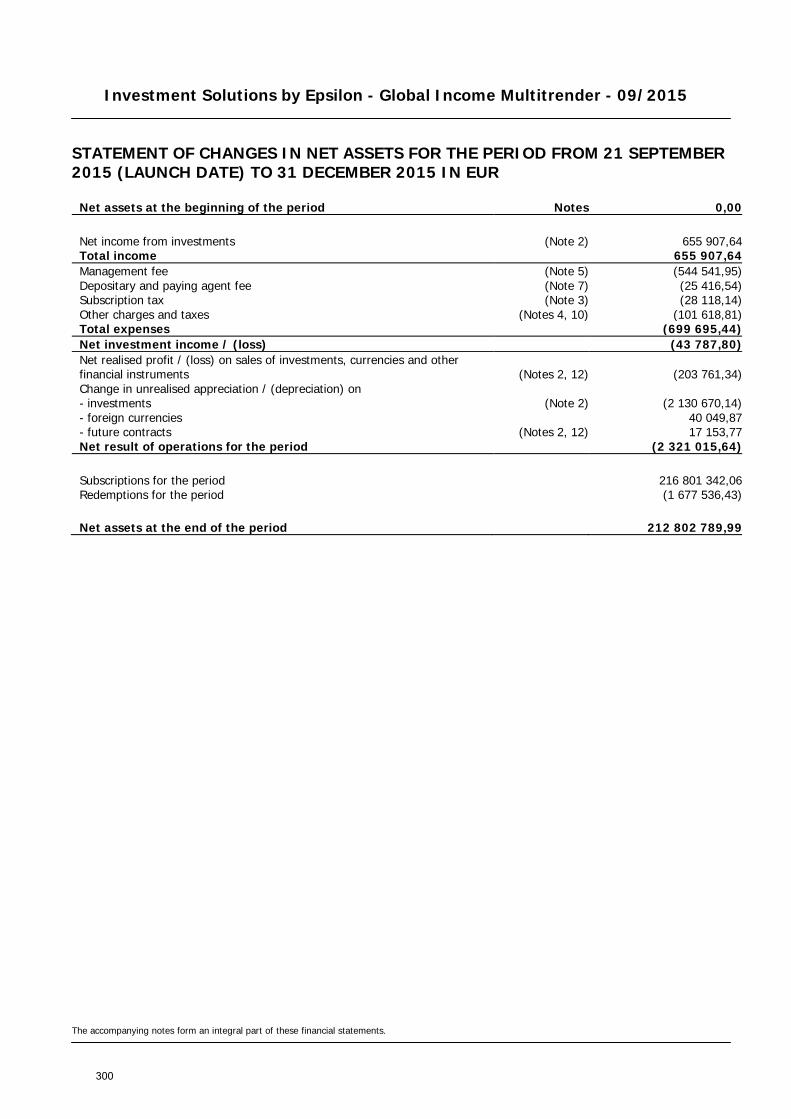
Investment Solutions by Epsilon - Global Income Multitrender - 09/2015
STATEMENT OF CHANGES IN NET ASSETS FOR THE PERIOD FROM 21 SEPTEMBER 2015 (LAUNCH DATE) TO 31 DECEMBER 2015 IN EUR
The accompanying notes form an integral part of these financial statements.
Net assets at the beginning of the period Notes 0,00
Net income from investments (Note 2) 655 907,64 Total income 655 907,64 Management fee (Note 5) (544 541,95) Depositary and paying agent fee (Note 7) (25 416,54) Subscription tax (Note 3) (28 118,14) Other charges and taxes (Notes 4, 10) (101 618,81) Total expenses (699 695,44) Net investment income / (loss) (43 787,80) Net realised profit / (loss) on sales of investments, currencies and other financial instruments (Notes 2, 12) (203 761,34) Change in unrealised appreciation / (depreciation) on - investments (Note 2) (2 130 670,14) - foreign currencies 40 049,87 - future contracts (Notes 2, 12) 17 153,77 Net result of operations for the period (2 321 015,64)
Subscriptions for the period 216 801 342,06 Redemptions for the period (1 677 536,43)
Net assets at the end of the period 212 802 789,99
300
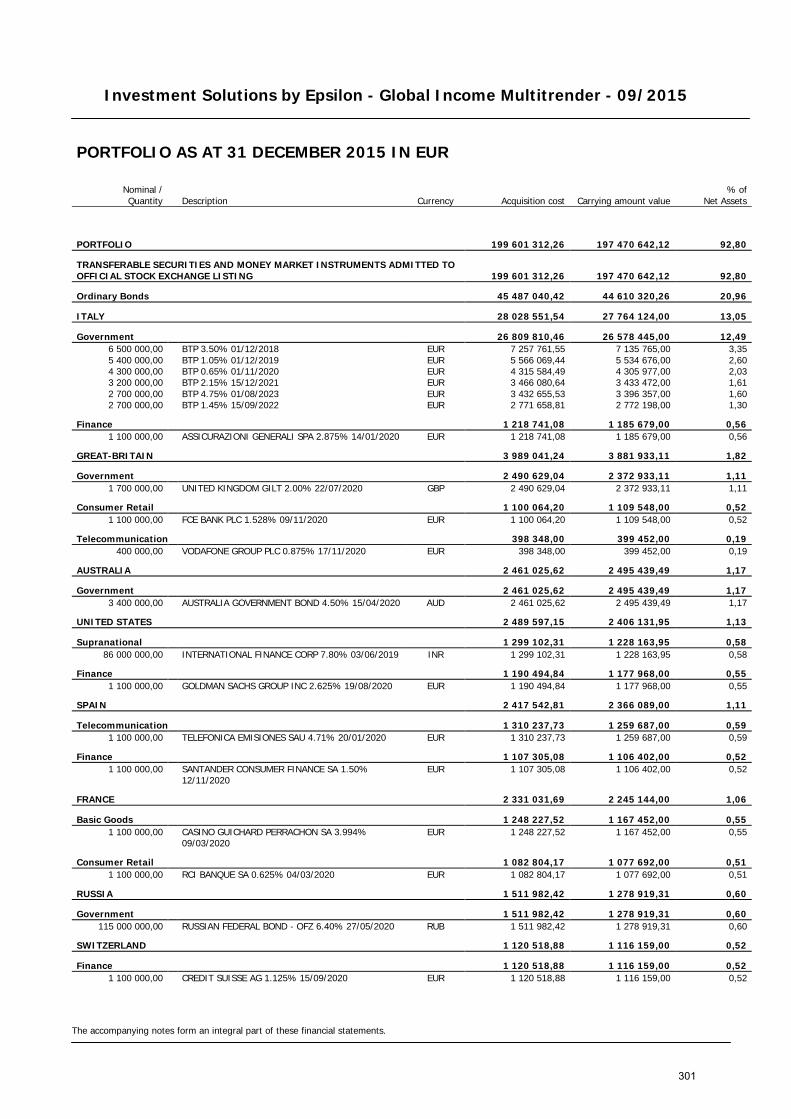
Investment Solutions by Epsilon - Global Income Multitrender - 09/2015
The accompanying notes form an integral part of these financial statements.
PORTFOLIO AS AT 31 DECEMBER 2015 IN EUR
Nominal / Quantity Description Currency Acquisition cost Carrying amount value
% of Net Assets
PORTFOLIO 199 601 312,26 197 470 642,12 92,80
TRANSFERABLE SECURITIES AND MONEY MARKET INSTRUMENTS ADMITTED TO OFFICIAL STOCK EXCHANGE LISTING 199 601 312,26 197 470 642,12 92,80
Ordinary Bonds 45 487 040,42 44 610 320,26 20,96
ITALY 28 028 551,54 27 764 124,00 13,05
Government 26 809 810,46 26 578 445,00 12,49 6 500 000,00 BTP 3.50% 01/12/2018 EUR 7 257 761,55 7 135 765,00 3,35 5 400 000,00 BTP 1.05% 01/12/2019 EUR 5 566 069,44 5 534 676,00 2,60 4 300 000,00 BTP 0.65% 01/11/2020 EUR 4 315 584,49 4 305 977,00 2,03 3 200 000,00 BTP 2.15% 15/12/2021 EUR 3 466 080,64 3 433 472,00 1,61 2 700 000,00 BTP 4.75% 01/08/2023 EUR 3 432 655,53 3 396 357,00 1,60 2 700 000,00 BTP 1.45% 15/09/2022 EUR 2 771 658,81 2 772 198,00 1,30
Finance 1 218 741,08 1 185 679,00 0,56 1 100 000,00 ASSICURAZIONI GENERALI SPA 2.875% 14/01/2020 EUR 1 218 741,08 1 185 679,00 0,56
GREAT-BRITAIN 3 989 041,24 3 881 933,11 1,82
Government 2 490 629,04 2 372 933,11 1,11 1 700 000,00 UNITED KINGDOM GILT 2.00% 22/07/2020 GBP 2 490 629,04 2 372 933,11 1,11
Consumer Retail 1 100 064,20 1 109 548,00 0,52 1 100 000,00 FCE BANK PLC 1.528% 09/11/2020 EUR 1 100 064,20 1 109 548,00 0,52
Telecommunication 398 348,00 399 452,00 0,19 400 000,00 VODAFONE GROUP PLC 0.875% 17/11/2020 EUR 398 348,00 399 452,00 0,19
AUSTRALIA 2 461 025,62 2 495 439,49 1,17
Government 2 461 025,62 2 495 439,49 1,17 3 400 000,00 AUSTRALIA GOVERNMENT BOND 4.50% 15/04/2020 AUD 2 461 025,62 2 495 439,49 1,17
UNITED STATES 2 489 597,15 2 406 131,95 1,13
Supranational 1 299 102,31 1 228 163,95 0,58 86 000 000,00 INTERNATIONAL FINANCE CORP 7.80% 03/06/2019 INR 1 299 102,31 1 228 163,95 0,58
Finance 1 190 494,84 1 177 968,00 0,55 1 100 000,00 GOLDMAN SACHS GROUP INC 2.625% 19/08/2020 EUR 1 190 494,84 1 177 968,00 0,55
SPAIN 2 417 542,81 2 366 089,00 1,11
Telecommunication 1 310 237,73 1 259 687,00 0,59 1 100 000,00 TELEFONICA EMISIONES SAU 4.71% 20/01/2020 EUR 1 310 237,73 1 259 687,00 0,59
Finance 1 107 305,08 1 106 402,00 0,52 1 100 000,00
SANTANDER CONSUMER FINANCE SA 1.50% 12/11/2020
EUR 1 107 305,08 1 106 402,00 0,52
FRANCE 2 331 031,69 2 245 144,00 1,06
Basic Goods 1 248 227,52 1 167 452,00 0,55 1 100 000,00
CASINO GUICHARD PERRACHON SA 3.994% 09/03/2020
EUR 1 248 227,52 1 167 452,00 0,55
Consumer Retail 1 082 804,17 1 077 692,00 0,51 1 100 000,00 RCI BANQUE SA 0.625% 04/03/2020 EUR 1 082 804,17 1 077 692,00 0,51
RUSSIA 1 511 982,42 1 278 919,31 0,60
Government 1 511 982,42 1 278 919,31 0,60 115 000 000,00 RUSSIAN FEDERAL BOND - OFZ 6.40% 27/05/2020 RUB 1 511 982,42 1 278 919,31 0,60
SWITZERLAND 1 120 518,88 1 116 159,00 0,52
Finance 1 120 518,88 1 116 159,00 0,52 1 100 000,00 CREDIT SUISSE AG 1.125% 15/09/2020 EUR 1 120 518,88 1 116 159,00 0,52
301
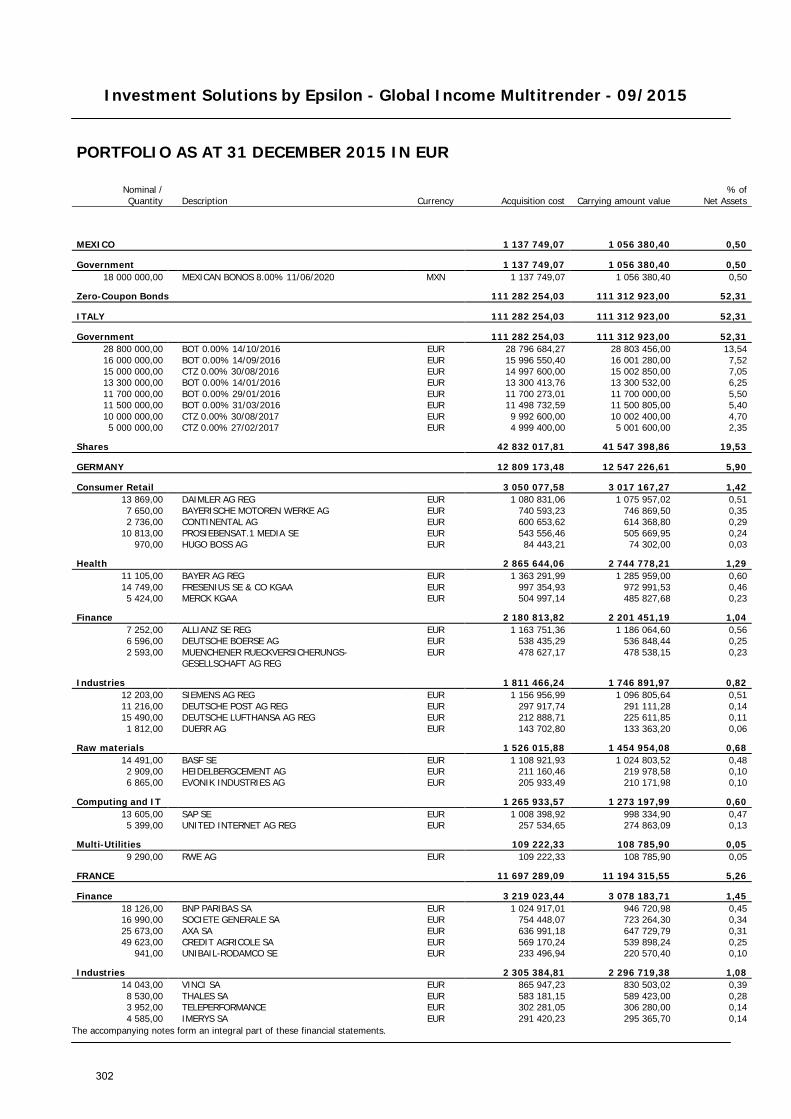
Investment Solutions by Epsilon - Global Income Multitrender - 09/2015
The accompanying notes form an integral part of these financial statements.
PORTFOLIO AS AT 31 DECEMBER 2015 IN EUR
Nominal / Quantity Description Currency Acquisition cost Carrying amount value
% of Net Assets
MEXICO 1 137 749,07 1 056 380,40 0,50
Government 1 137 749,07 1 056 380,40 0,50 18 000 000,00 MEXICAN BONOS 8.00% 11/06/2020 MXN 1 137 749,07 1 056 380,40 0,50
Zero-Coupon Bonds 111 282 254,03 111 312 923,00 52,31
ITALY 111 282 254,03 111 312 923,00 52,31
Government 111 282 254,03 111 312 923,00 52,31 28 800 000,00 BOT 0.00% 14/10/2016 EUR 28 796 684,27 28 803 456,00 13,54 16 000 000,00 BOT 0.00% 14/09/2016 EUR 15 996 550,40 16 001 280,00 7,52 15 000 000,00 CTZ 0.00% 30/08/2016 EUR 14 997 600,00 15 002 850,00 7,05 13 300 000,00 BOT 0.00% 14/01/2016 EUR 13 300 413,76 13 300 532,00 6,25 11 700 000,00 BOT 0.00% 29/01/2016 EUR 11 700 273,01 11 700 000,00 5,50 11 500 000,00 BOT 0.00% 31/03/2016 EUR 11 498 732,59 11 500 805,00 5,40 10 000 000,00 CTZ 0.00% 30/08/2017 EUR 9 992 600,00 10 002 400,00 4,70 5 000 000,00 CTZ 0.00% 27/02/2017 EUR 4 999 400,00 5 001 600,00 2,35
Shares 42 832 017,81 41 547 398,86 19,53
GERMANY 12 809 173,48 12 547 226,61 5,90
Consumer Retail 3 050 077,58 3 017 167,27 1,42 13 869,00 DAIMLER AG REG EUR 1 080 831,06 1 075 957,02 0,51 7 650,00 BAYERISCHE MOTOREN WERKE AG EUR 740 593,23 746 869,50 0,35 2 736,00 CONTINENTAL AG EUR 600 653,62 614 368,80 0,29
10 813,00 PROSIEBENSAT.1 MEDIA SE EUR 543 556,46 505 669,95 0,24 970,00 HUGO BOSS AG EUR 84 443,21 74 302,00 0,03
Health 2 865 644,06 2 744 778,21 1,29 11 105,00 BAYER AG REG EUR 1 363 291,99 1 285 959,00 0,60 14 749,00 FRESENIUS SE & CO KGAA EUR 997 354,93 972 991,53 0,46 5 424,00 MERCK KGAA EUR 504 997,14 485 827,68 0,23
Finance 2 180 813,82 2 201 451,19 1,04 7 252,00 ALLIANZ SE REG EUR 1 163 751,36 1 186 064,60 0,56 6 596,00 DEUTSCHE BOERSE AG EUR 538 435,29 536 848,44 0,25 2 593,00
MUENCHENER RUECKVERSICHERUNGS-GESELLSCHAFT AG REG
EUR 478 627,17 478 538,15 0,23
Industries 1 811 466,24 1 746 891,97 0,82 12 203,00 SIEMENS AG REG EUR 1 156 956,99 1 096 805,64 0,51 11 216,00 DEUTSCHE POST AG REG EUR 297 917,74 291 111,28 0,14 15 490,00 DEUTSCHE LUFTHANSA AG REG EUR 212 888,71 225 611,85 0,11 1 812,00 DUERR AG EUR 143 702,80 133 363,20 0,06
Raw materials 1 526 015,88 1 454 954,08 0,68 14 491,00 BASF SE EUR 1 108 921,93 1 024 803,52 0,48 2 909,00 HEIDELBERGCEMENT AG EUR 211 160,46 219 978,58 0,10 6 865,00 EVONIK INDUSTRIES AG EUR 205 933,49 210 171,98 0,10
Computing and IT 1 265 933,57 1 273 197,99 0,60 13 605,00 SAP SE EUR 1 008 398,92 998 334,90 0,47 5 399,00 UNITED INTERNET AG REG EUR 257 534,65 274 863,09 0,13
Multi-Utilities 109 222,33 108 785,90 0,05 9 290,00 RWE AG EUR 109 222,33 108 785,90 0,05
FRANCE 11 697 289,09 11 194 315,55 5,26
Finance 3 219 023,44 3 078 183,71 1,45 18 126,00 BNP PARIBAS SA EUR 1 024 917,01 946 720,98 0,45 16 990,00 SOCIETE GENERALE SA EUR 754 448,07 723 264,30 0,34 25 673,00 AXA SA EUR 636 991,18 647 729,79 0,31 49 623,00 CREDIT AGRICOLE SA EUR 569 170,24 539 898,24 0,25
941,00 UNIBAIL-RODAMCO SE EUR 233 496,94 220 570,40 0,10
Industries 2 305 384,81 2 296 719,38 1,08 14 043,00 VINCI SA EUR 865 947,23 830 503,02 0,39 8 530,00 THALES SA EUR 583 181,15 589 423,00 0,28 3 952,00 TELEPERFORMANCE EUR 302 281,05 306 280,00 0,14 4 585,00 IMERYS SA EUR 291 420,23 295 365,70 0,14
302
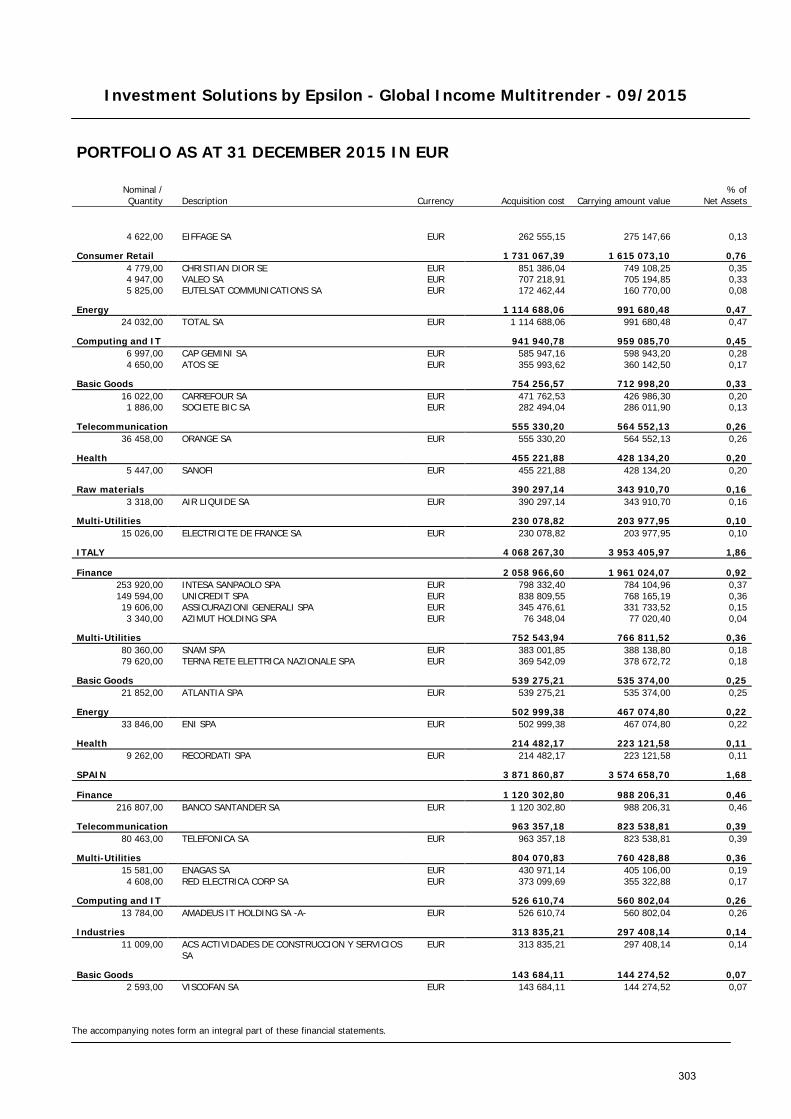
Investment Solutions by Epsilon - Global Income Multitrender - 09/2015
The accompanying notes form an integral part of these financial statements.
PORTFOLIO AS AT 31 DECEMBER 2015 IN EUR
Nominal / Quantity Description Currency Acquisition cost Carrying amount value
% of Net Assets
4 622,00 EIFFAGE SA EUR 262 555,15 275 147,66 0,13
Consumer Retail 1 731 067,39 1 615 073,10 0,76 4 779,00 CHRISTIAN DIOR SE EUR 851 386,04 749 108,25 0,35 4 947,00 VALEO SA EUR 707 218,91 705 194,85 0,33 5 825,00 EUTELSAT COMMUNICATIONS SA EUR 172 462,44 160 770,00 0,08
Energy 1 114 688,06 991 680,48 0,47 24 032,00 TOTAL SA EUR 1 114 688,06 991 680,48 0,47
Computing and IT 941 940,78 959 085,70 0,45 6 997,00 CAP GEMINI SA EUR 585 947,16 598 943,20 0,28 4 650,00 ATOS SE EUR 355 993,62 360 142,50 0,17
Basic Goods 754 256,57 712 998,20 0,33 16 022,00 CARREFOUR SA EUR 471 762,53 426 986,30 0,20 1 886,00 SOCIETE BIC SA EUR 282 494,04 286 011,90 0,13
Telecommunication 555 330,20 564 552,13 0,26 36 458,00 ORANGE SA EUR 555 330,20 564 552,13 0,26
Health 455 221,88 428 134,20 0,20 5 447,00 SANOFI EUR 455 221,88 428 134,20 0,20
Raw materials 390 297,14 343 910,70 0,16 3 318,00 AIR LIQUIDE SA EUR 390 297,14 343 910,70 0,16
Multi-Utilities 230 078,82 203 977,95 0,10 15 026,00 ELECTRICITE DE FRANCE SA EUR 230 078,82 203 977,95 0,10
ITALY 4 068 267,30 3 953 405,97 1,86
Finance 2 058 966,60 1 961 024,07 0,92 253 920,00 INTESA SANPAOLO SPA EUR 798 332,40 784 104,96 0,37 149 594,00 UNICREDIT SPA EUR 838 809,55 768 165,19 0,36 19 606,00 ASSICURAZIONI GENERALI SPA EUR 345 476,61 331 733,52 0,15 3 340,00 AZIMUT HOLDING SPA EUR 76 348,04 77 020,40 0,04
Multi-Utilities 752 543,94 766 811,52 0,36 80 360,00 SNAM SPA EUR 383 001,85 388 138,80 0,18 79 620,00 TERNA RETE ELETTRICA NAZIONALE SPA EUR 369 542,09 378 672,72 0,18
Basic Goods 539 275,21 535 374,00 0,25 21 852,00 ATLANTIA SPA EUR 539 275,21 535 374,00 0,25
Energy 502 999,38 467 074,80 0,22 33 846,00 ENI SPA EUR 502 999,38 467 074,80 0,22
Health 214 482,17 223 121,58 0,11 9 262,00 RECORDATI SPA EUR 214 482,17 223 121,58 0,11
SPAIN 3 871 860,87 3 574 658,70 1,68
Finance 1 120 302,80 988 206,31 0,46 216 807,00 BANCO SANTANDER SA EUR 1 120 302,80 988 206,31 0,46
Telecommunication 963 357,18 823 538,81 0,39 80 463,00 TELEFONICA SA EUR 963 357,18 823 538,81 0,39
Multi-Utilities 804 070,83 760 428,88 0,36 15 581,00 ENAGAS SA EUR 430 971,14 405 106,00 0,19 4 608,00 RED ELECTRICA CORP SA EUR 373 099,69 355 322,88 0,17
Computing and IT 526 610,74 560 802,04 0,26 13 784,00 AMADEUS IT HOLDING SA -A- EUR 526 610,74 560 802,04 0,26
Industries 313 835,21 297 408,14 0,14 11 009,00
ACS ACTIVIDADES DE CONSTRUCCION Y SERVICIOS SA
EUR 313 835,21 297 408,14 0,14
Basic Goods 143 684,11 144 274,52 0,07 2 593,00 VISCOFAN SA EUR 143 684,11 144 274,52 0,07
303
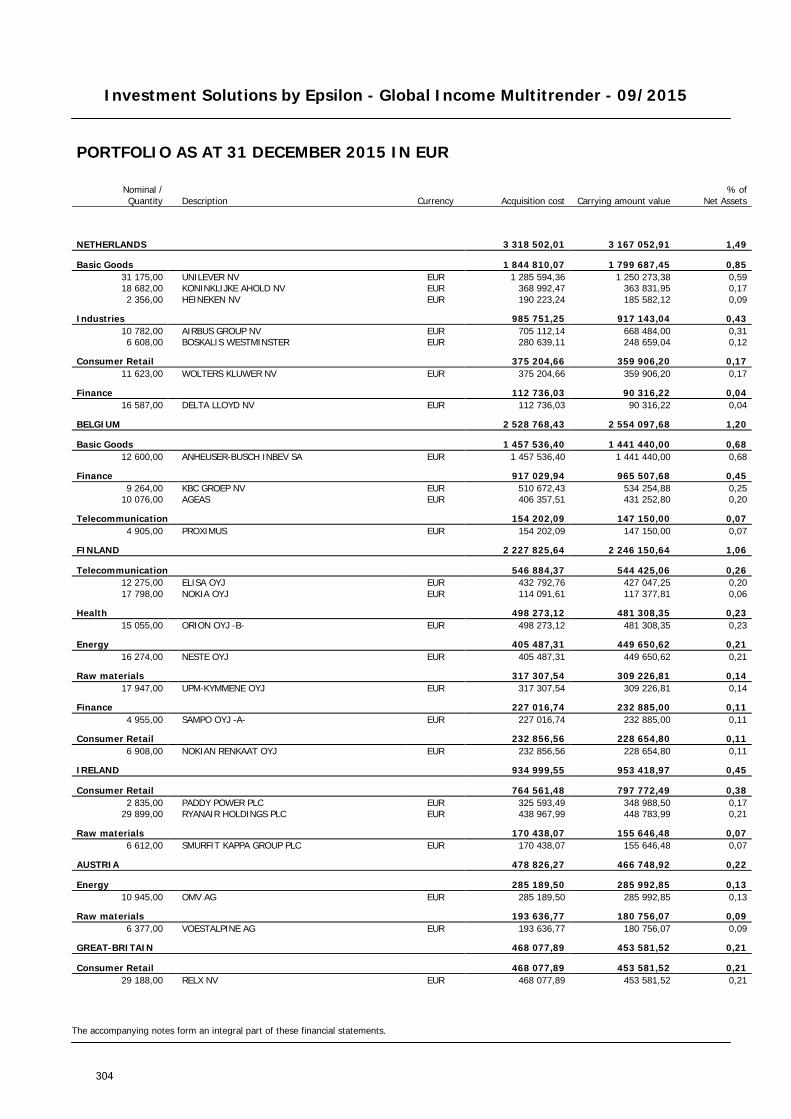
Investment Solutions by Epsilon - Global Income Multitrender - 09/2015
The accompanying notes form an integral part of these financial statements.
PORTFOLIO AS AT 31 DECEMBER 2015 IN EUR
Nominal / Quantity Description Currency Acquisition cost Carrying amount value
% of Net Assets
NETHERLANDS 3 318 502,01 3 167 052,91 1,49
Basic Goods 1 844 810,07 1 799 687,45 0,85 31 175,00 UNILEVER NV EUR 1 285 594,36 1 250 273,38 0,59 18 682,00 KONINKLIJKE AHOLD NV EUR 368 992,47 363 831,95 0,17 2 356,00 HEINEKEN NV EUR 190 223,24 185 582,12 0,09
Industries 985 751,25 917 143,04 0,43 10 782,00 AIRBUS GROUP NV EUR 705 112,14 668 484,00 0,31 6 608,00 BOSKALIS WESTMINSTER EUR 280 639,11 248 659,04 0,12
Consumer Retail 375 204,66 359 906,20 0,17 11 623,00 WOLTERS KLUWER NV EUR 375 204,66 359 906,20 0,17
Finance 112 736,03 90 316,22 0,04 16 587,00 DELTA LLOYD NV EUR 112 736,03 90 316,22 0,04
BELGIUM 2 528 768,43 2 554 097,68 1,20
Basic Goods 1 457 536,40 1 441 440,00 0,68 12 600,00 ANHEUSER-BUSCH INBEV SA EUR 1 457 536,40 1 441 440,00 0,68
Finance 917 029,94 965 507,68 0,45 9 264,00 KBC GROEP NV EUR 510 672,43 534 254,88 0,25
10 076,00 AGEAS EUR 406 357,51 431 252,80 0,20
Telecommunication 154 202,09 147 150,00 0,07 4 905,00 PROXIMUS EUR 154 202,09 147 150,00 0,07
FINLAND 2 227 825,64 2 246 150,64 1,06
Telecommunication 546 884,37 544 425,06 0,26 12 275,00 ELISA OYJ EUR 432 792,76 427 047,25 0,20 17 798,00 NOKIA OYJ EUR 114 091,61 117 377,81 0,06
Health 498 273,12 481 308,35 0,23 15 055,00 ORION OYJ -B- EUR 498 273,12 481 308,35 0,23
Energy 405 487,31 449 650,62 0,21 16 274,00 NESTE OYJ EUR 405 487,31 449 650,62 0,21
Raw materials 317 307,54 309 226,81 0,14 17 947,00 UPM-KYMMENE OYJ EUR 317 307,54 309 226,81 0,14
Finance 227 016,74 232 885,00 0,11 4 955,00 SAMPO OYJ -A- EUR 227 016,74 232 885,00 0,11
Consumer Retail 232 856,56 228 654,80 0,11 6 908,00 NOKIAN RENKAAT OYJ EUR 232 856,56 228 654,80 0,11
IRELAND 934 999,55 953 418,97 0,45
Consumer Retail 764 561,48 797 772,49 0,38 2 835,00 PADDY POWER PLC EUR 325 593,49 348 988,50 0,17
29 899,00 RYANAIR HOLDINGS PLC EUR 438 967,99 448 783,99 0,21
Raw materials 170 438,07 155 646,48 0,07 6 612,00 SMURFIT KAPPA GROUP PLC EUR 170 438,07 155 646,48 0,07
AUSTRIA 478 826,27 466 748,92 0,22
Energy 285 189,50 285 992,85 0,13 10 945,00 OMV AG EUR 285 189,50 285 992,85 0,13
Raw materials 193 636,77 180 756,07 0,09 6 377,00 VOESTALPINE AG EUR 193 636,77 180 756,07 0,09
GREAT-BRITAIN 468 077,89 453 581,52 0,21
Consumer Retail 468 077,89 453 581,52 0,21 29 188,00 RELX NV EUR 468 077,89 453 581,52 0,21
304
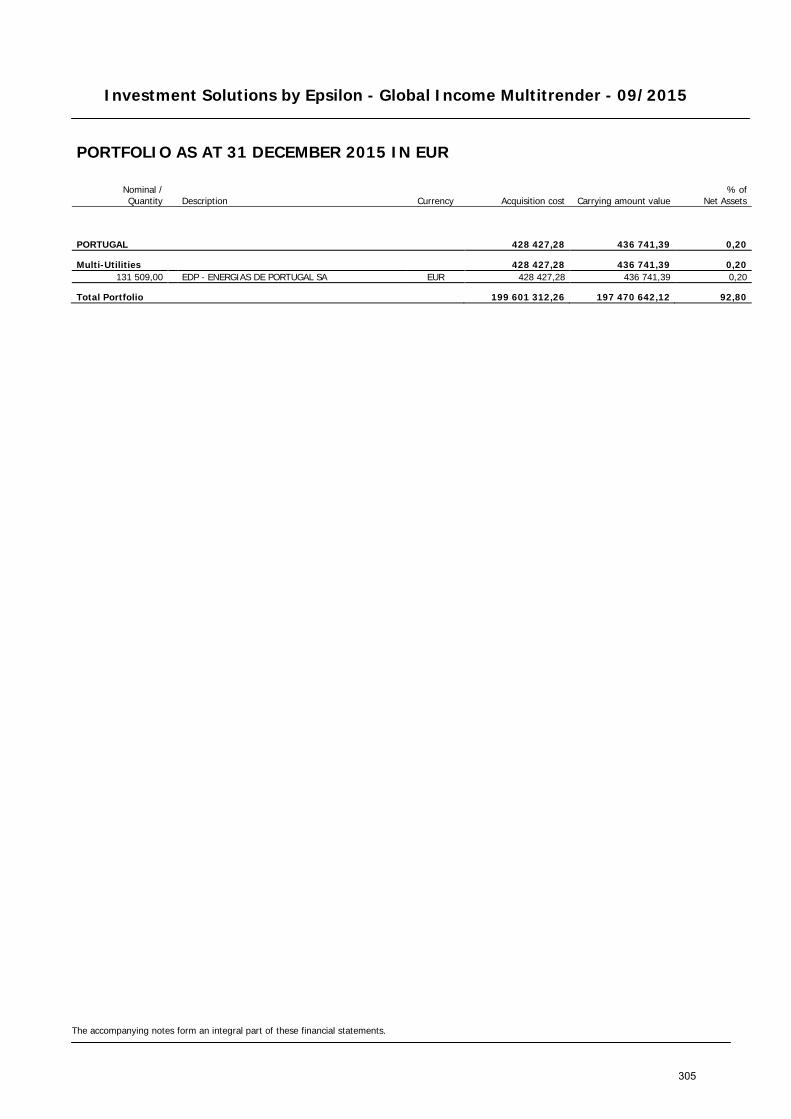
Investment Solutions by Epsilon - Global Income Multitrender - 09/2015
The accompanying notes form an integral part of these financial statements.
PORTFOLIO AS AT 31 DECEMBER 2015 IN EUR
Nominal / Quantity Description Currency Acquisition cost Carrying amount value
% of Net Assets
PORTUGAL 428 427,28 436 741,39 0,20
Multi-Utilities 428 427,28 436 741,39 0,20 131 509,00 EDP - ENERGIAS DE PORTUGAL SA EUR 428 427,28 436 741,39 0,20
Total Portfolio 199 601 312,26 197 470 642,12 92,80
305
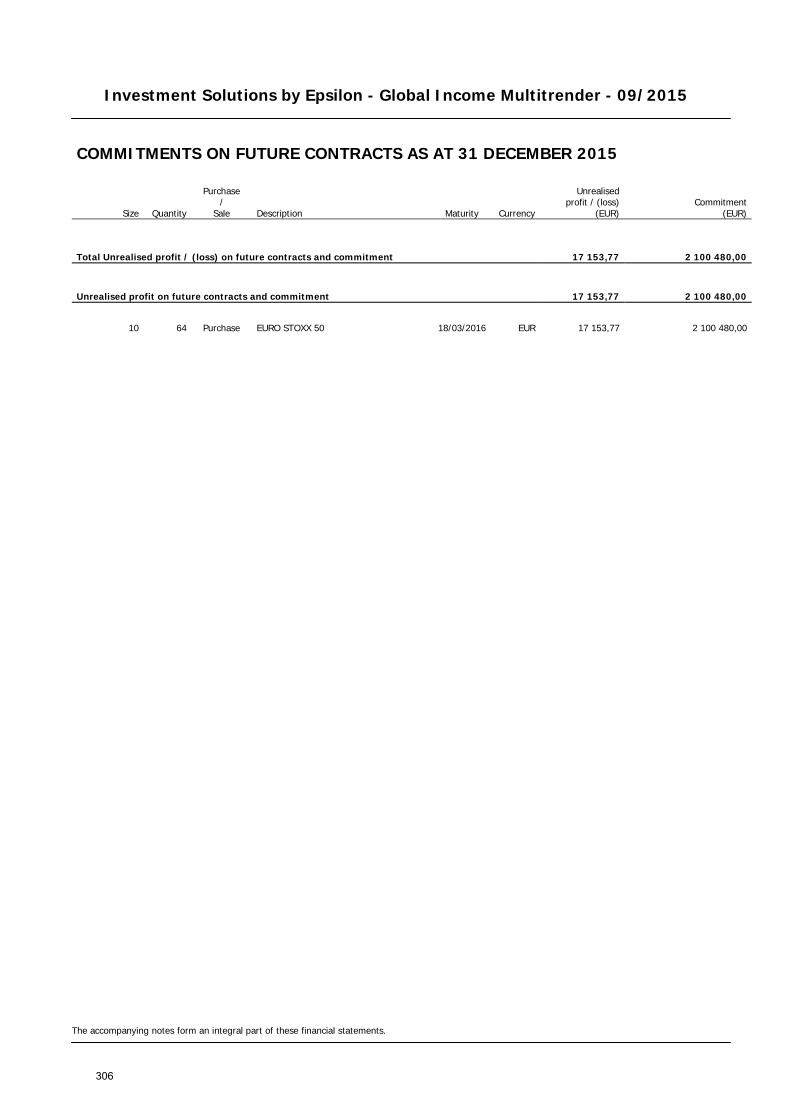
Investment Solutions by Epsilon - Global Income Multitrender - 09/2015
The accompanying notes form an integral part of these financial statements.
COMMITMENTS ON FUTURE CONTRACTS AS AT 31 DECEMBER 2015
Size Quantity
Purchase /
Sale Description Maturity Currency
Unrealised profit / (loss)
(EUR) Commitment
(EUR)
Total Unrealised profit / (loss) on future contracts and commitment 17 153,77 2 100 480,00
Unrealised profit on future contracts and commitment 17 153,77 2 100 480,00
10 64 Purchase EURO STOXX 50 18/03/2016 EUR 17 153,77 2 100 480,00
306

Investment Solutions by Epsilon - Equity Coupon - 02/2014
STATEMENT OF NET ASSETS AS AT 31 DECEMBER 2015 IN EUR
The accompanying notes form an integral part of these financial statements.
Assets Notes Investments in securities (Note 2) 154 536 800,00 Banks 2 965 961,23 Unrealised profit on forward foreign exchange contracts (Notes 2, 12) 957 142,87 Unrealised profit on future contracts (Notes 2, 12) 939 707,08 Unrealised profit on swap contracts (Notes 2, 11) 3 232 814,22 Other interest receivable 1 025 364,03 Other assets (Notes 8, 10) 2 991 339,52 Total assets 166 649 128,95
Liabilities Amounts due to brokers (587 884,66) Unrealised loss on forward foreign exchange contracts (Notes 2, 12) (652 742,89) Other liabilities (Note 8) (1 670 559,71) Total liabilities (2 911 187,26)
Total net assets 163 737 941,69
Currency Net Asset Value per Unit Units outstanding
Class RD Units EUR 104,84 1 561 767,750
307
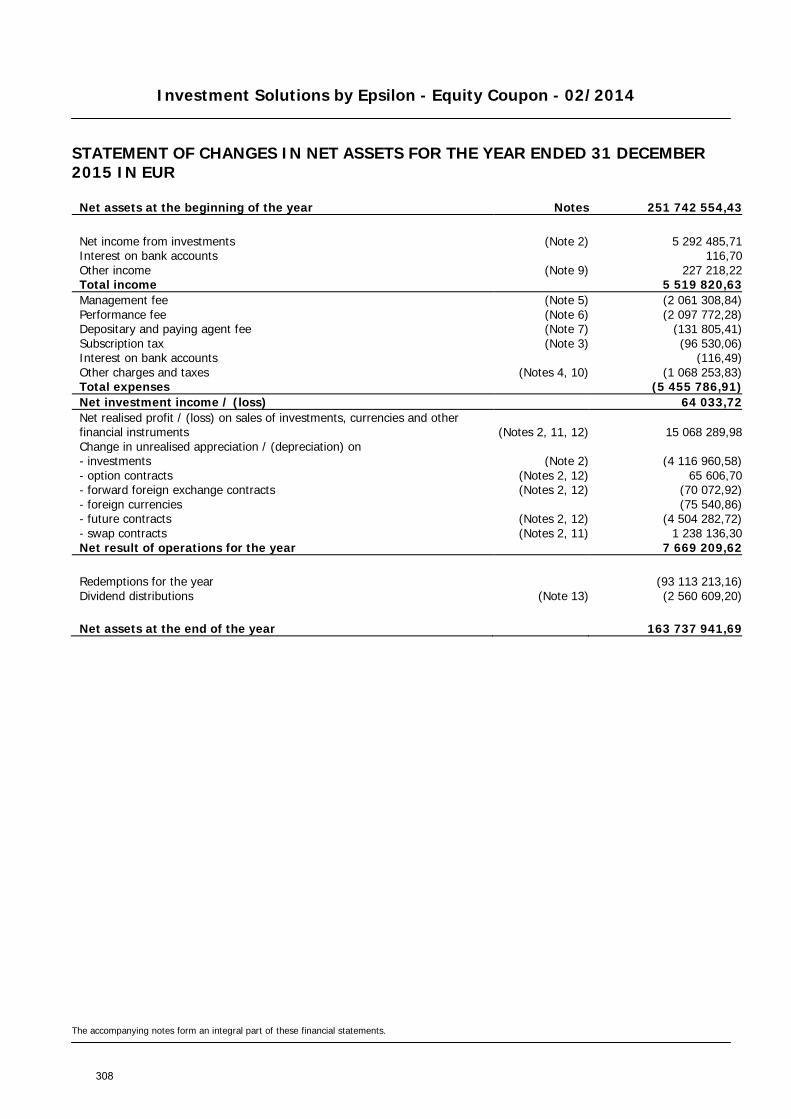
Investment Solutions by Epsilon - Equity Coupon - 02/2014
STATEMENT OF CHANGES IN NET ASSETS FOR THE YEAR ENDED 31 DECEMBER 2015 IN EUR
The accompanying notes form an integral part of these financial statements.
Net assets at the beginning of the year Notes 251 742 554,43
Net income from investments (Note 2) 5 292 485,71 Interest on bank accounts 116,70 Other income (Note 9) 227 218,22 Total income 5 519 820,63 Management fee (Note 5) (2 061 308,84) Performance fee (Note 6) (2 097 772,28) Depositary and paying agent fee (Note 7) (131 805,41) Subscription tax (Note 3) (96 530,06) Interest on bank accounts (116,49) Other charges and taxes (Notes 4, 10) (1 068 253,83) Total expenses (5 455 786,91) Net investment income / (loss) 64 033,72 Net realised profit / (loss) on sales of investments, currencies and other financial instruments (Notes 2, 11, 12) 15 068 289,98 Change in unrealised appreciation / (depreciation) on - investments (Note 2) (4 116 960,58) - option contracts (Notes 2, 12) 65 606,70 - forward foreign exchange contracts (Notes 2, 12) (70 072,92) - foreign currencies (75 540,86) - future contracts (Notes 2, 12) (4 504 282,72) - swap contracts (Notes 2, 11) 1 238 136,30 Net result of operations for the year 7 669 209,62
Redemptions for the year (93 113 213,16) Dividend distributions (Note 13) (2 560 609,20)
Net assets at the end of the year 163 737 941,69
308
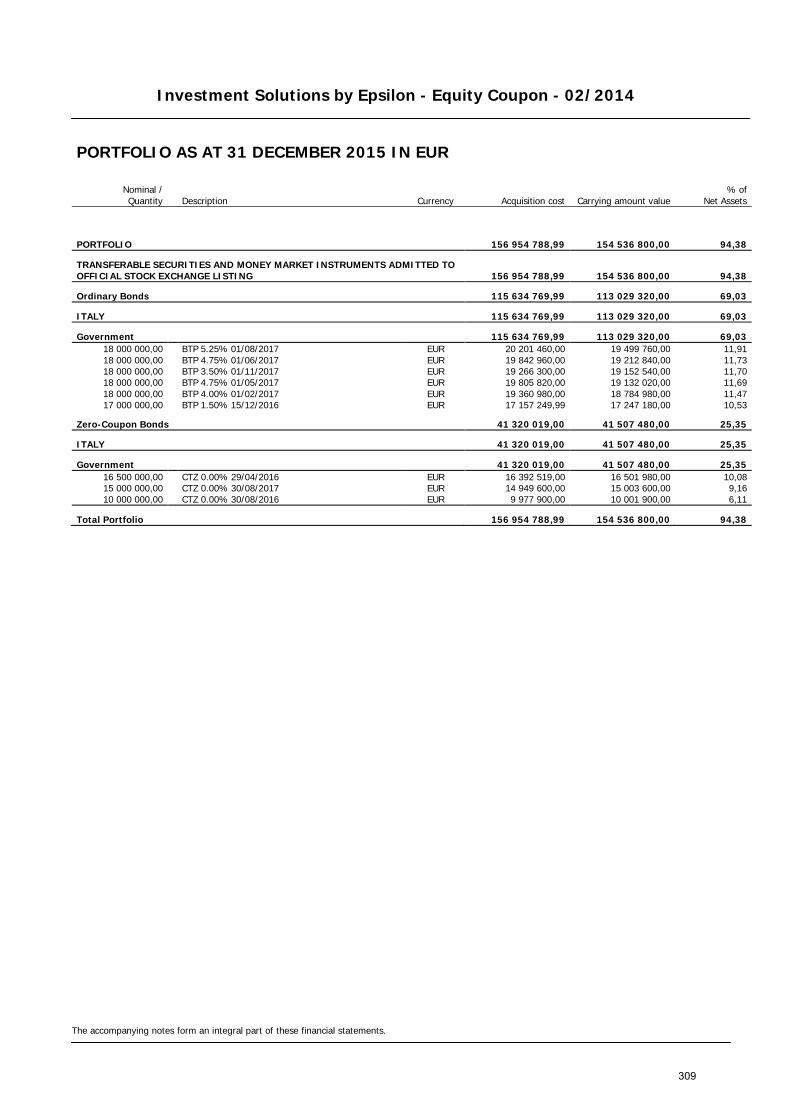
Investment Solutions by Epsilon - Equity Coupon - 02/2014
The accompanying notes form an integral part of these financial statements.
PORTFOLIO AS AT 31 DECEMBER 2015 IN EUR
Nominal / Quantity Description Currency Acquisition cost Carrying amount value
% of Net Assets
PORTFOLIO 156 954 788,99 154 536 800,00 94,38
TRANSFERABLE SECURITIES AND MONEY MARKET INSTRUMENTS ADMITTED TO OFFICIAL STOCK EXCHANGE LISTING 156 954 788,99 154 536 800,00 94,38
Ordinary Bonds 115 634 769,99 113 029 320,00 69,03
ITALY 115 634 769,99 113 029 320,00 69,03
Government 115 634 769,99 113 029 320,00 69,03 18 000 000,00 BTP 5.25% 01/08/2017 EUR 20 201 460,00 19 499 760,00 11,91 18 000 000,00 BTP 4.75% 01/06/2017 EUR 19 842 960,00 19 212 840,00 11,73 18 000 000,00 BTP 3.50% 01/11/2017 EUR 19 266 300,00 19 152 540,00 11,70 18 000 000,00 BTP 4.75% 01/05/2017 EUR 19 805 820,00 19 132 020,00 11,69 18 000 000,00 BTP 4.00% 01/02/2017 EUR 19 360 980,00 18 784 980,00 11,47 17 000 000,00 BTP 1.50% 15/12/2016 EUR 17 157 249,99 17 247 180,00 10,53
Zero-Coupon Bonds 41 320 019,00 41 507 480,00 25,35
ITALY 41 320 019,00 41 507 480,00 25,35
Government 41 320 019,00 41 507 480,00 25,35 16 500 000,00 CTZ 0.00% 29/04/2016 EUR 16 392 519,00 16 501 980,00 10,08 15 000 000,00 CTZ 0.00% 30/08/2017 EUR 14 949 600,00 15 003 600,00 9,16 10 000 000,00 CTZ 0.00% 30/08/2016 EUR 9 977 900,00 10 001 900,00 6,11
Total Portfolio 156 954 788,99 154 536 800,00 94,38
309

Investment Solutions by Epsilon - Equity Coupon - 02/2014
The accompanying notes form an integral part of these financial statements.
COMMITMENTS ON FUTURE CONTRACTS AS AT 31 DECEMBER 2015
Size Quantity
Purchase /
Sale Description Maturity Currency
Unrealised profit / (loss)
(EUR) Commitment
(EUR)
Total Unrealised profit / (loss) on future contracts and commitment 939 707,08 106 501 604,88
Unrealised profit on future contracts and commitment 939 707,08 106 501 604,88
50 517 Purchase S&P 500 E MINI INDEX 18/03/2016 USD 341 550,95 48 435 136,78 10 1 534 Purchase EURO STOXX 50 18/03/2016 EUR 428 714,34 50 345 880,00 50 213 Purchase MINI MSCI EMG 18/03/2016 USD 169 441,79 7 720 588,10
310

Investment Solutions by Epsilon - Equity Coupon - 02/2014
The accompanying notes form an integral part of these financial statements.
FORWARD FOREIGN EXCHANGE CONTRACTS AS AT 31 DECEMBER 2015
Maturity Purchase commitment in
currency Sale commitment in
currency
Unrealised profit/(loss) (EUR)
Total Unrealised profit / (loss) on forward foreign exchange contracts 304 399,98
Unrealised profit on forward foreign exchange contracts 957 142,87
29/02/2016 42 100 559,71 EUR 44 755 000,00 USD 957 142,87
Unrealised loss on forward foreign exchange contracts (652 742,89)
29/02/2016 41 665 000,00 USD 38 892 072,98 EUR (589 303,17) 29/02/2016 3 090 000,00 USD 2 904 086,75 EUR (63 439,72)
311

Investment Solutions by Epsilon - Equity Coupon - 02/2014
The accompanying notes form an integral part of these financial statements.
SWAP CONTRACTS AS AT 31 DECEMBER 2015
Counterparty Currency Notional Maturity Interest
receivable (EUR) Interest
payable (EUR)
Unrealised
profit / (loss) (EUR)
ASSET SWAP CONTRACTS — — 3 232 814,22 BANCA IMI SPA EUR 108 000 000,00 30/04/2018 — — 3 232 814,22
312

Investment Solutions by Epsilon - Equity Coupon - 04/2014
STATEMENT OF NET ASSETS AS AT 31 DECEMBER 2015 IN EUR
The accompanying notes form an integral part of these financial statements.
Assets Notes Investments in securities (Note 2) 49 121 123,00 Banks 1 888 244,96 Unrealised profit on forward foreign exchange contracts (Notes 2, 12) 231 292,60 Unrealised profit on future contracts (Notes 2, 12) 198 690,36 Unrealised profit on swap contracts (Notes 2, 11) 386 676,22 Other interest receivable 257 860,44 Other assets (Notes 8, 10) 864 786,52 Total assets 52 948 674,10
Liabilities Amounts due to brokers (93 659,76) Unrealised loss on forward foreign exchange contracts (Notes 2, 12) (159 033,12) Other liabilities (Note 8) (391 624,73) Total liabilities (644 317,61)
Total net assets 52 304 356,49
Currency Net Asset Value per Unit Units outstanding
Class RD Units EUR 101,64 514 594,465
313
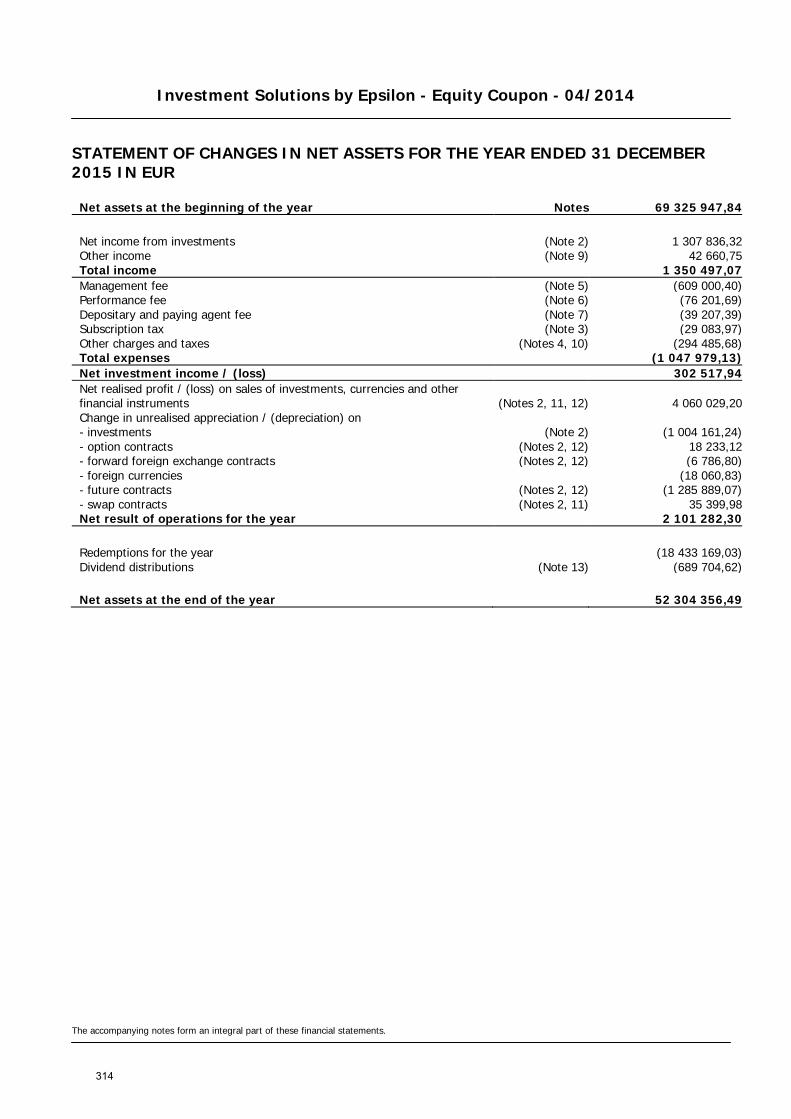
Investment Solutions by Epsilon - Equity Coupon - 04/2014
STATEMENT OF CHANGES IN NET ASSETS FOR THE YEAR ENDED 31 DECEMBER 2015 IN EUR
The accompanying notes form an integral part of these financial statements.
Net assets at the beginning of the year Notes 69 325 947,84
Net income from investments (Note 2) 1 307 836,32 Other income (Note 9) 42 660,75 Total income 1 350 497,07 Management fee (Note 5) (609 000,40) Performance fee (Note 6) (76 201,69) Depositary and paying agent fee (Note 7) (39 207,39) Subscription tax (Note 3) (29 083,97) Other charges and taxes (Notes 4, 10) (294 485,68) Total expenses (1 047 979,13) Net investment income / (loss) 302 517,94 Net realised profit / (loss) on sales of investments, currencies and other financial instruments (Notes 2, 11, 12) 4 060 029,20 Change in unrealised appreciation / (depreciation) on - investments (Note 2) (1 004 161,24) - option contracts (Notes 2, 12) 18 233,12 - forward foreign exchange contracts (Notes 2, 12) (6 786,80) - foreign currencies (18 060,83) - future contracts (Notes 2, 12) (1 285 889,07) - swap contracts (Notes 2, 11) 35 399,98 Net result of operations for the year 2 101 282,30
Redemptions for the year (18 433 169,03) Dividend distributions (Note 13) (689 704,62)
Net assets at the end of the year 52 304 356,49
314
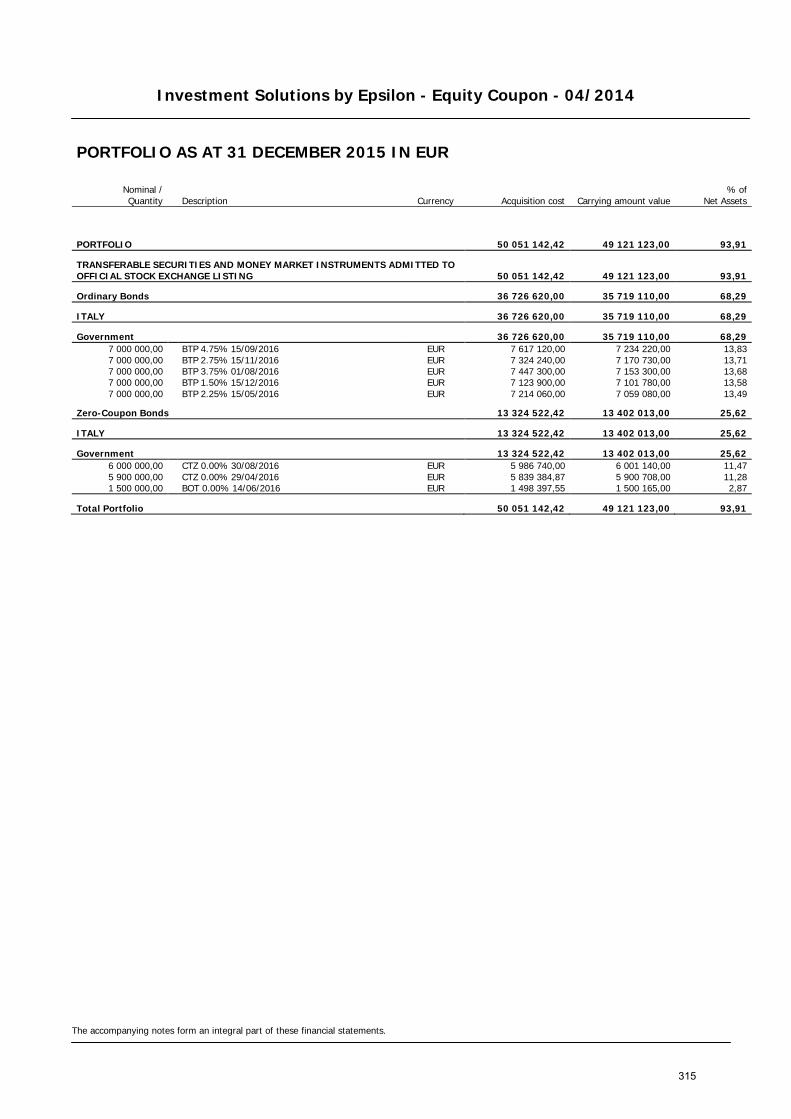
Investment Solutions by Epsilon - Equity Coupon - 04/2014
The accompanying notes form an integral part of these financial statements.
PORTFOLIO AS AT 31 DECEMBER 2015 IN EUR
Nominal / Quantity Description Currency Acquisition cost Carrying amount value
% of Net Assets
PORTFOLIO 50 051 142,42 49 121 123,00 93,91
TRANSFERABLE SECURITIES AND MONEY MARKET INSTRUMENTS ADMITTED TO OFFICIAL STOCK EXCHANGE LISTING 50 051 142,42 49 121 123,00 93,91
Ordinary Bonds 36 726 620,00 35 719 110,00 68,29
ITALY 36 726 620,00 35 719 110,00 68,29
Government 36 726 620,00 35 719 110,00 68,29 7 000 000,00 BTP 4.75% 15/09/2016 EUR 7 617 120,00 7 234 220,00 13,83 7 000 000,00 BTP 2.75% 15/11/2016 EUR 7 324 240,00 7 170 730,00 13,71 7 000 000,00 BTP 3.75% 01/08/2016 EUR 7 447 300,00 7 153 300,00 13,68 7 000 000,00 BTP 1.50% 15/12/2016 EUR 7 123 900,00 7 101 780,00 13,58 7 000 000,00 BTP 2.25% 15/05/2016 EUR 7 214 060,00 7 059 080,00 13,49
Zero-Coupon Bonds 13 324 522,42 13 402 013,00 25,62
ITALY 13 324 522,42 13 402 013,00 25,62
Government 13 324 522,42 13 402 013,00 25,62 6 000 000,00 CTZ 0.00% 30/08/2016 EUR 5 986 740,00 6 001 140,00 11,47 5 900 000,00 CTZ 0.00% 29/04/2016 EUR 5 839 384,87 5 900 708,00 11,28 1 500 000,00 BOT 0.00% 14/06/2016 EUR 1 498 397,55 1 500 165,00 2,87
Total Portfolio 50 051 142,42 49 121 123,00 93,91
315
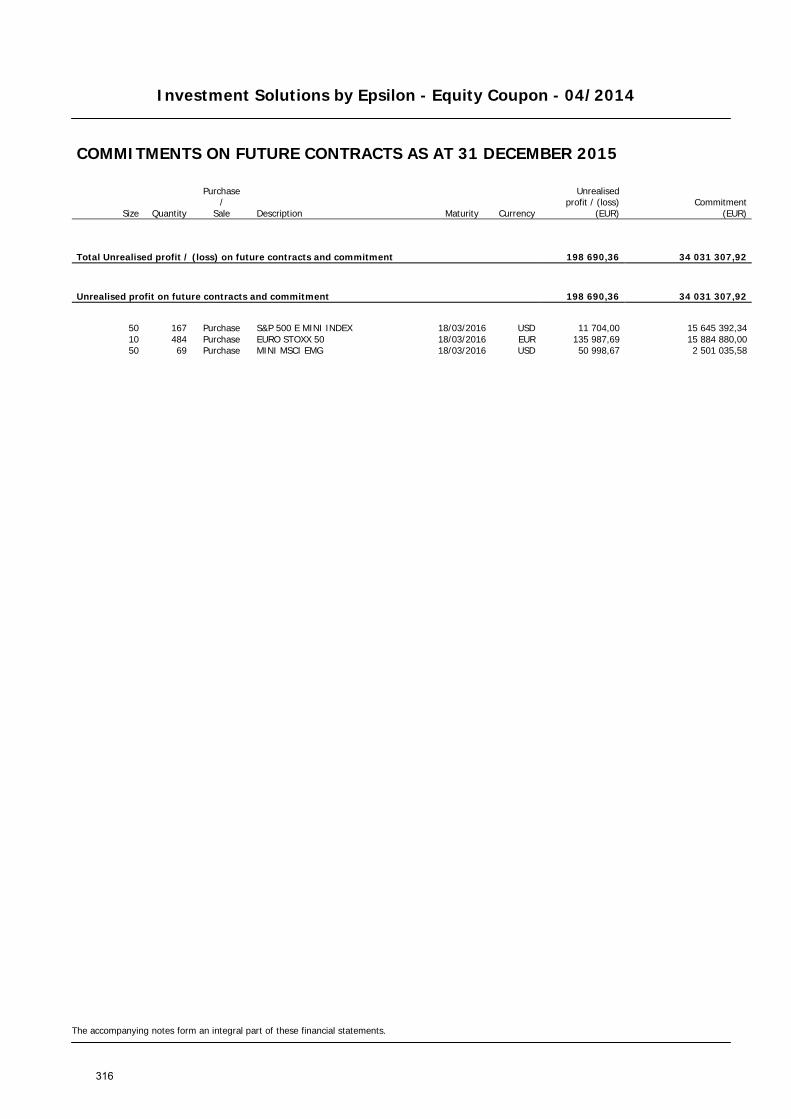
Investment Solutions by Epsilon - Equity Coupon - 04/2014
The accompanying notes form an integral part of these financial statements.
COMMITMENTS ON FUTURE CONTRACTS AS AT 31 DECEMBER 2015
Size Quantity
Purchase /
Sale Description Maturity Currency
Unrealised profit / (loss)
(EUR) Commitment
(EUR)
Total Unrealised profit / (loss) on future contracts and commitment 198 690,36 34 031 307,92
Unrealised profit on future contracts and commitment 198 690,36 34 031 307,92
50 167 Purchase S&P 500 E MINI INDEX 18/03/2016 USD 11 704,00 15 645 392,34 10 484 Purchase EURO STOXX 50 18/03/2016 EUR 135 987,69 15 884 880,00 50 69 Purchase MINI MSCI EMG 18/03/2016 USD 50 998,67 2 501 035,58
316
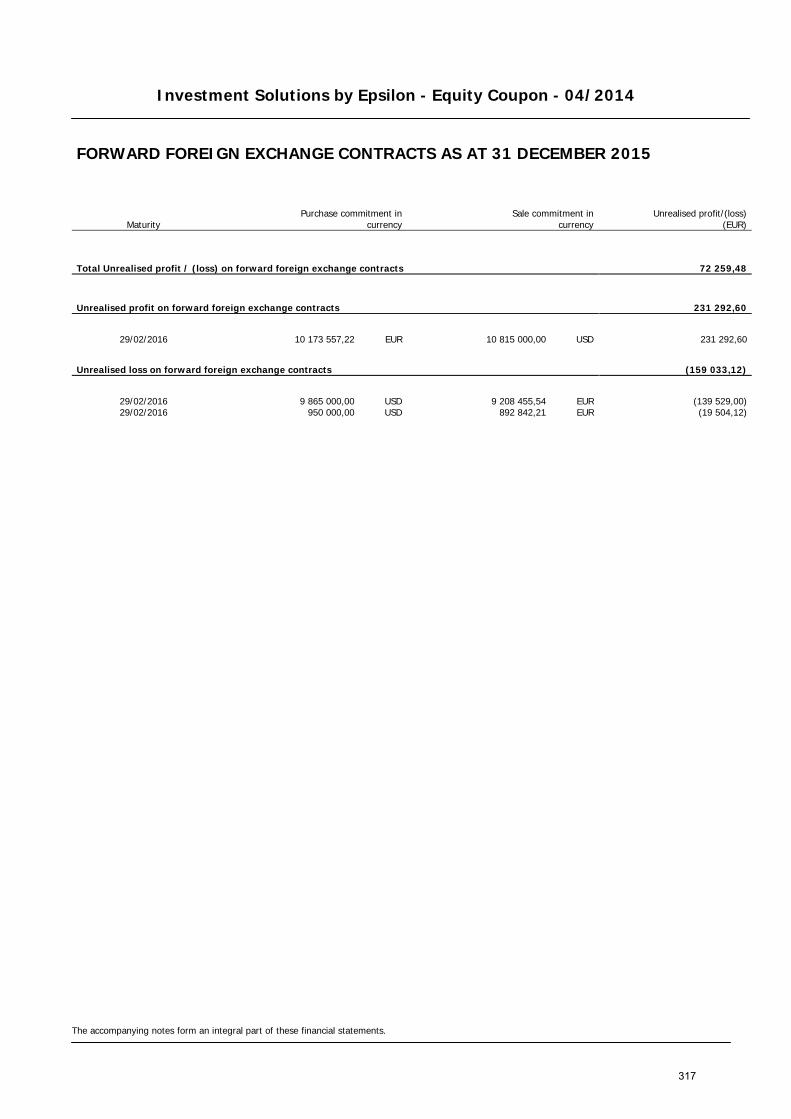
Investment Solutions by Epsilon - Equity Coupon - 04/2014
The accompanying notes form an integral part of these financial statements.
FORWARD FOREIGN EXCHANGE CONTRACTS AS AT 31 DECEMBER 2015
Maturity Purchase commitment in
currency Sale commitment in
currency
Unrealised profit/(loss) (EUR)
Total Unrealised profit / (loss) on forward foreign exchange contracts 72 259,48
Unrealised profit on forward foreign exchange contracts 231 292,60
29/02/2016 10 173 557,22 EUR 10 815 000,00 USD 231 292,60
Unrealised loss on forward foreign exchange contracts (159 033,12)
29/02/2016 9 865 000,00 USD 9 208 455,54 EUR (139 529,00) 29/02/2016 950 000,00 USD 892 842,21 EUR (19 504,12)
317

Investment Solutions by Epsilon - Equity Coupon - 04/2014
The accompanying notes form an integral part of these financial statements.
SWAP CONTRACTS AS AT 31 DECEMBER 2015
Counterparty Currency Notional Maturity Interest
receivable (EUR) Interest
payable (EUR)
Unrealised
profit / (loss) (EUR)
ASSET SWAP CONTRACTS — — 386 676,22 BANCA IMI SPA EUR 35 000 000,00 11/07/2016 — — 386 676,22
318
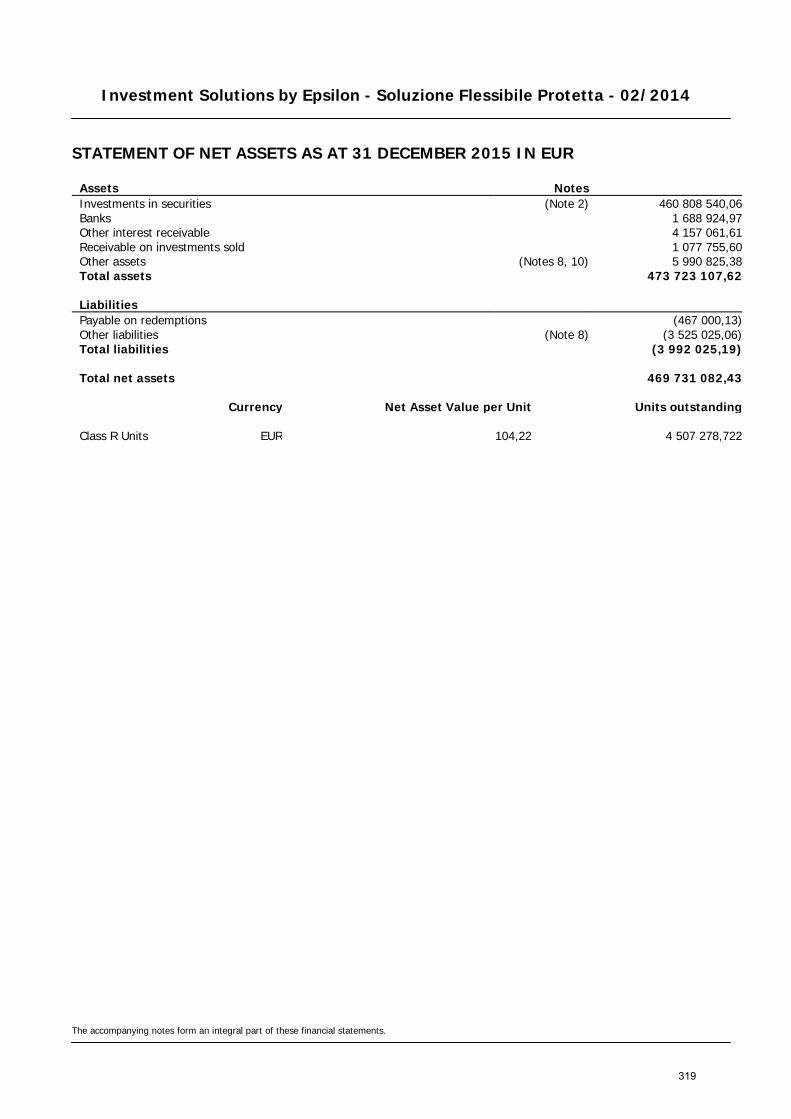
Investment Solutions by Epsilon - Soluzione Flessibile Protetta - 02/2014
STATEMENT OF NET ASSETS AS AT 31 DECEMBER 2015 IN EUR
The accompanying notes form an integral part of these financial statements.
Assets Notes Investments in securities (Note 2) 460 808 540,06 Banks 1 688 924,97 Other interest receivable 4 157 061,61 Receivable on investments sold 1 077 755,60 Other assets (Notes 8, 10) 5 990 825,38 Total assets 473 723 107,62
Liabilities Payable on redemptions (467 000,13) Other liabilities (Note 8) (3 525 025,06) Total liabilities (3 992 025,19)
Total net assets 469 731 082,43
Currency Net Asset Value per Unit Units outstanding
Class R Units EUR 104,22 4 507 278,722
319
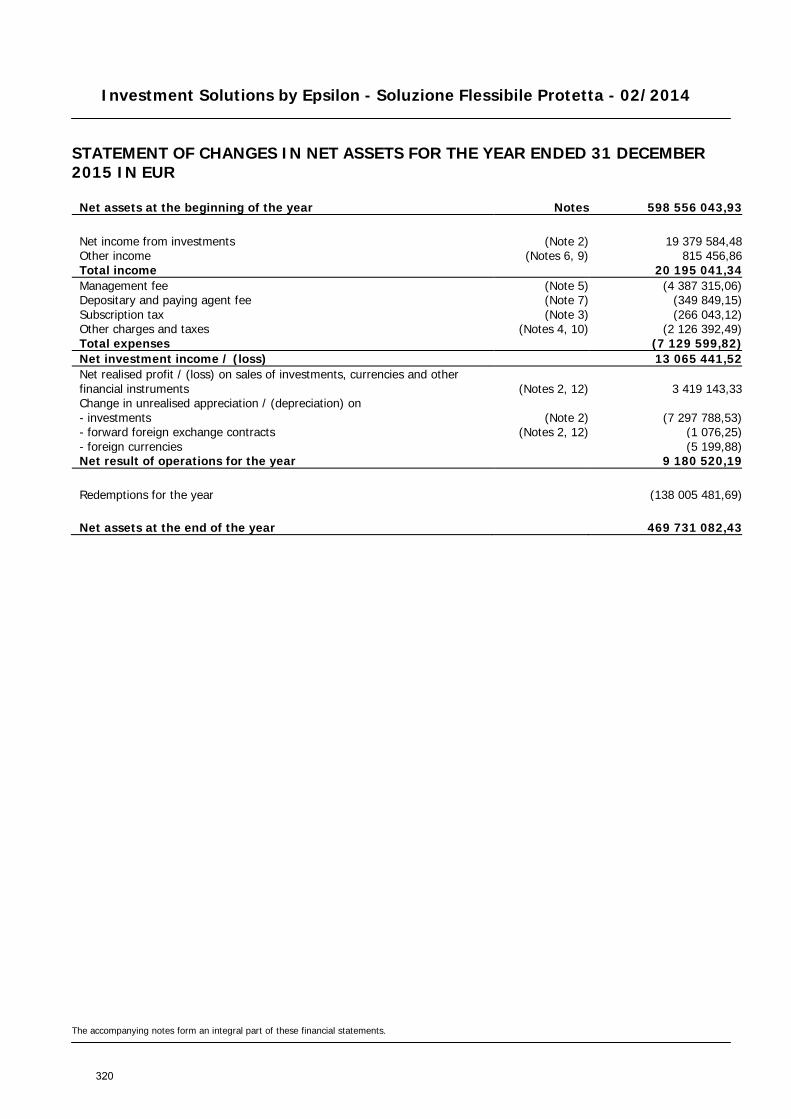
Investment Solutions by Epsilon - Soluzione Flessibile Protetta - 02/2014
STATEMENT OF CHANGES IN NET ASSETS FOR THE YEAR ENDED 31 DECEMBER 2015 IN EUR
The accompanying notes form an integral part of these financial statements.
Net assets at the beginning of the year Notes 598 556 043,93
Net income from investments (Note 2) 19 379 584,48 Other income (Notes 6, 9) 815 456,86 Total income 20 195 041,34 Management fee (Note 5) (4 387 315,06) Depositary and paying agent fee (Note 7) (349 849,15) Subscription tax (Note 3) (266 043,12) Other charges and taxes (Notes 4, 10) (2 126 392,49) Total expenses (7 129 599,82) Net investment income / (loss) 13 065 441,52 Net realised profit / (loss) on sales of investments, currencies and other financial instruments (Notes 2, 12) 3 419 143,33 Change in unrealised appreciation / (depreciation) on - investments (Note 2) (7 297 788,53) - forward foreign exchange contracts (Notes 2, 12) (1 076,25) - foreign currencies (5 199,88) Net result of operations for the year 9 180 520,19
Redemptions for the year (138 005 481,69)
Net assets at the end of the year 469 731 082,43
320
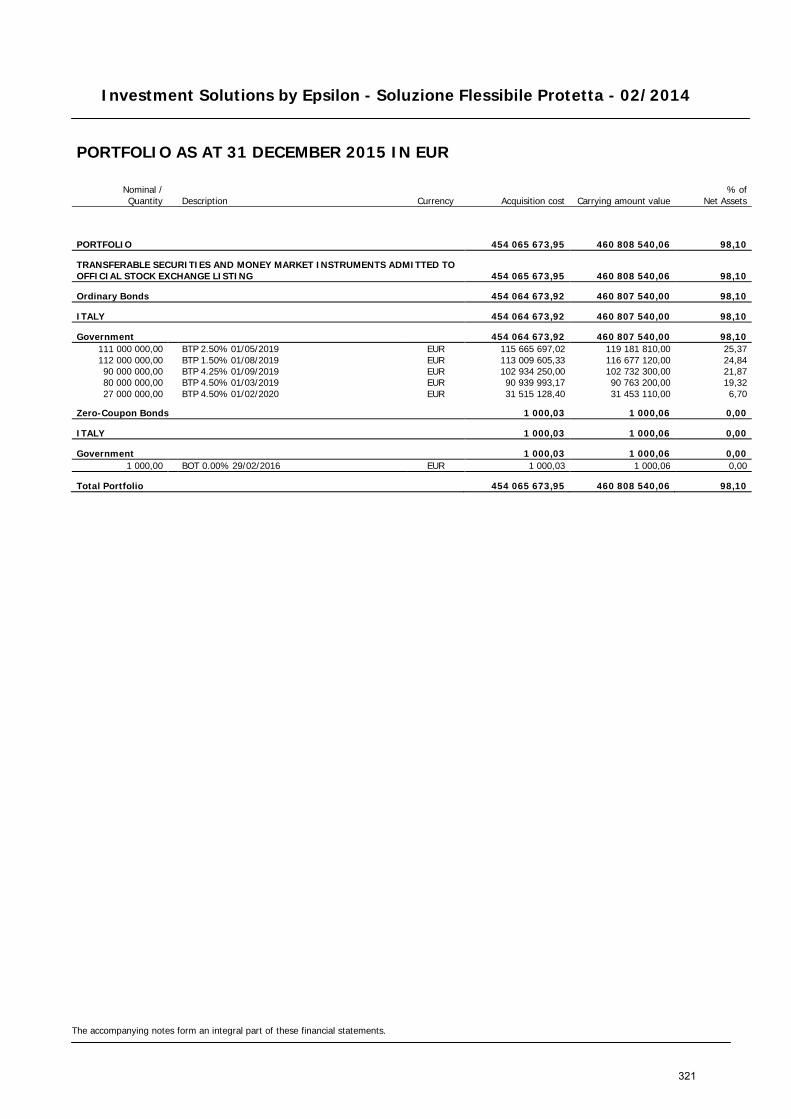
Investment Solutions by Epsilon - Soluzione Flessibile Protetta - 02/2014
The accompanying notes form an integral part of these financial statements.
PORTFOLIO AS AT 31 DECEMBER 2015 IN EUR
Nominal / Quantity Description Currency Acquisition cost Carrying amount value
% of Net Assets
PORTFOLIO 454 065 673,95 460 808 540,06 98,10
TRANSFERABLE SECURITIES AND MONEY MARKET INSTRUMENTS ADMITTED TO OFFICIAL STOCK EXCHANGE LISTING 454 065 673,95 460 808 540,06 98,10
Ordinary Bonds 454 064 673,92 460 807 540,00 98,10
ITALY 454 064 673,92 460 807 540,00 98,10
Government 454 064 673,92 460 807 540,00 98,10 111 000 000,00 BTP 2.50% 01/05/2019 EUR 115 665 697,02 119 181 810,00 25,37 112 000 000,00 BTP 1.50% 01/08/2019 EUR 113 009 605,33 116 677 120,00 24,84 90 000 000,00 BTP 4.25% 01/09/2019 EUR 102 934 250,00 102 732 300,00 21,87 80 000 000,00 BTP 4.50% 01/03/2019 EUR 90 939 993,17 90 763 200,00 19,32 27 000 000,00 BTP 4.50% 01/02/2020 EUR 31 515 128,40 31 453 110,00 6,70
Zero-Coupon Bonds 1 000,03 1 000,06 0,00
ITALY 1 000,03 1 000,06 0,00
Government 1 000,03 1 000,06 0,00 1 000,00 BOT 0.00% 29/02/2016 EUR 1 000,03 1 000,06 0,00
Total Portfolio 454 065 673,95 460 808 540,06 98,10
321
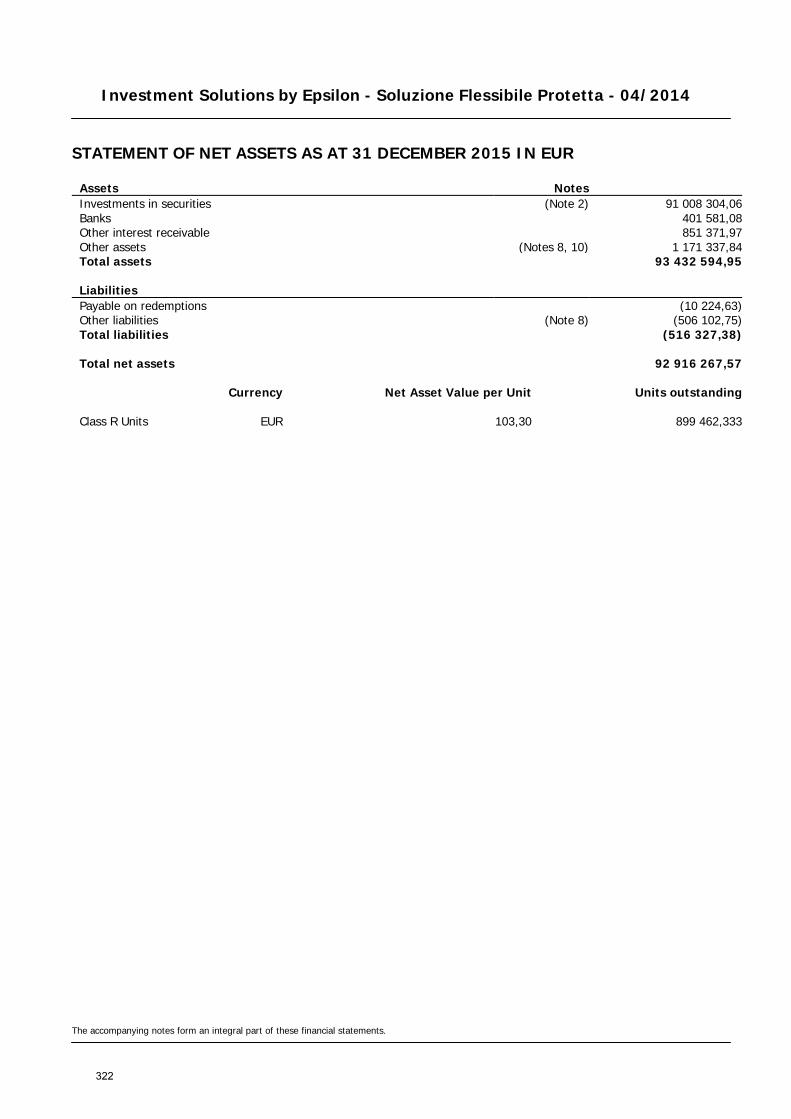
Investment Solutions by Epsilon - Soluzione Flessibile Protetta - 04/2014
STATEMENT OF NET ASSETS AS AT 31 DECEMBER 2015 IN EUR
The accompanying notes form an integral part of these financial statements.
Assets Notes Investments in securities (Note 2) 91 008 304,06 Banks 401 581,08 Other interest receivable 851 371,97 Other assets (Notes 8, 10) 1 171 337,84 Total assets 93 432 594,95
Liabilities Payable on redemptions (10 224,63) Other liabilities (Note 8) (506 102,75) Total liabilities (516 327,38)
Total net assets 92 916 267,57
Currency Net Asset Value per Unit Units outstanding
Class R Units EUR 103,30 899 462,333
322
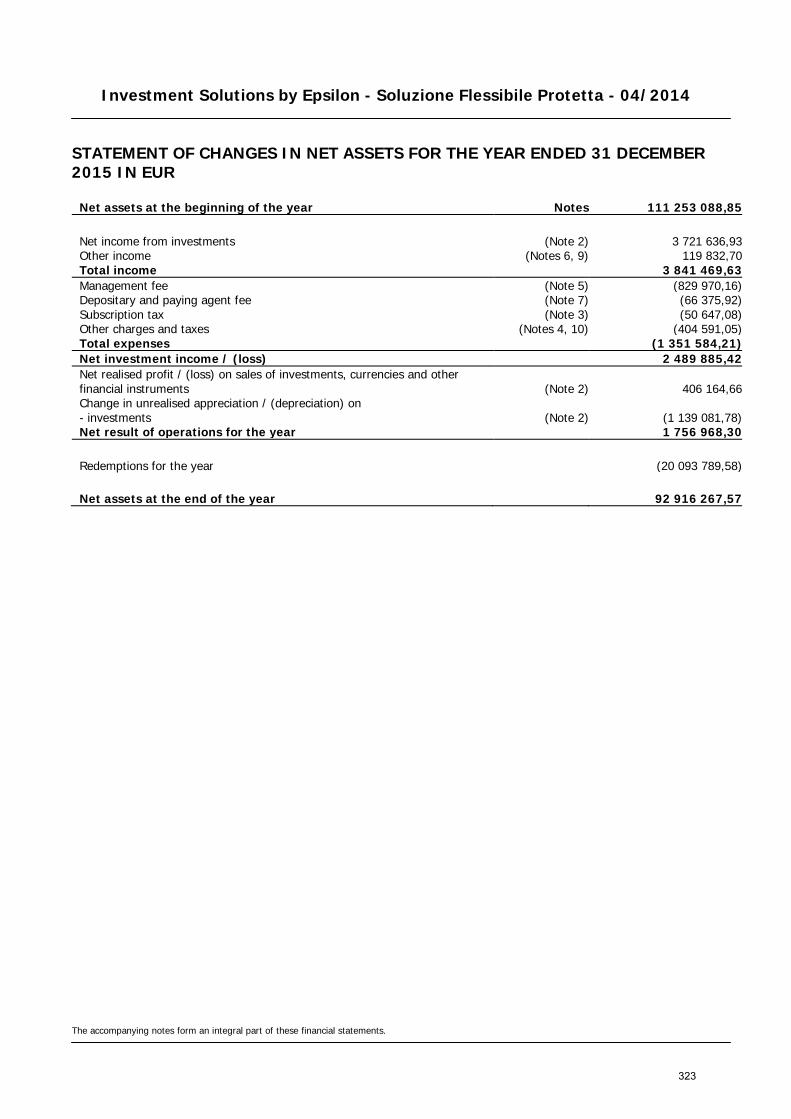
Investment Solutions by Epsilon - Soluzione Flessibile Protetta - 04/2014
STATEMENT OF CHANGES IN NET ASSETS FOR THE YEAR ENDED 31 DECEMBER 2015 IN EUR
The accompanying notes form an integral part of these financial statements.
Net assets at the beginning of the year Notes 111 253 088,85
Net income from investments (Note 2) 3 721 636,93 Other income (Notes 6, 9) 119 832,70 Total income 3 841 469,63 Management fee (Note 5) (829 970,16) Depositary and paying agent fee (Note 7) (66 375,92) Subscription tax (Note 3) (50 647,08) Other charges and taxes (Notes 4, 10) (404 591,05) Total expenses (1 351 584,21) Net investment income / (loss) 2 489 885,42 Net realised profit / (loss) on sales of investments, currencies and other financial instruments (Note 2) 406 164,66 Change in unrealised appreciation / (depreciation) on - investments (Note 2) (1 139 081,78) Net result of operations for the year 1 756 968,30
Redemptions for the year (20 093 789,58)
Net assets at the end of the year 92 916 267,57
323
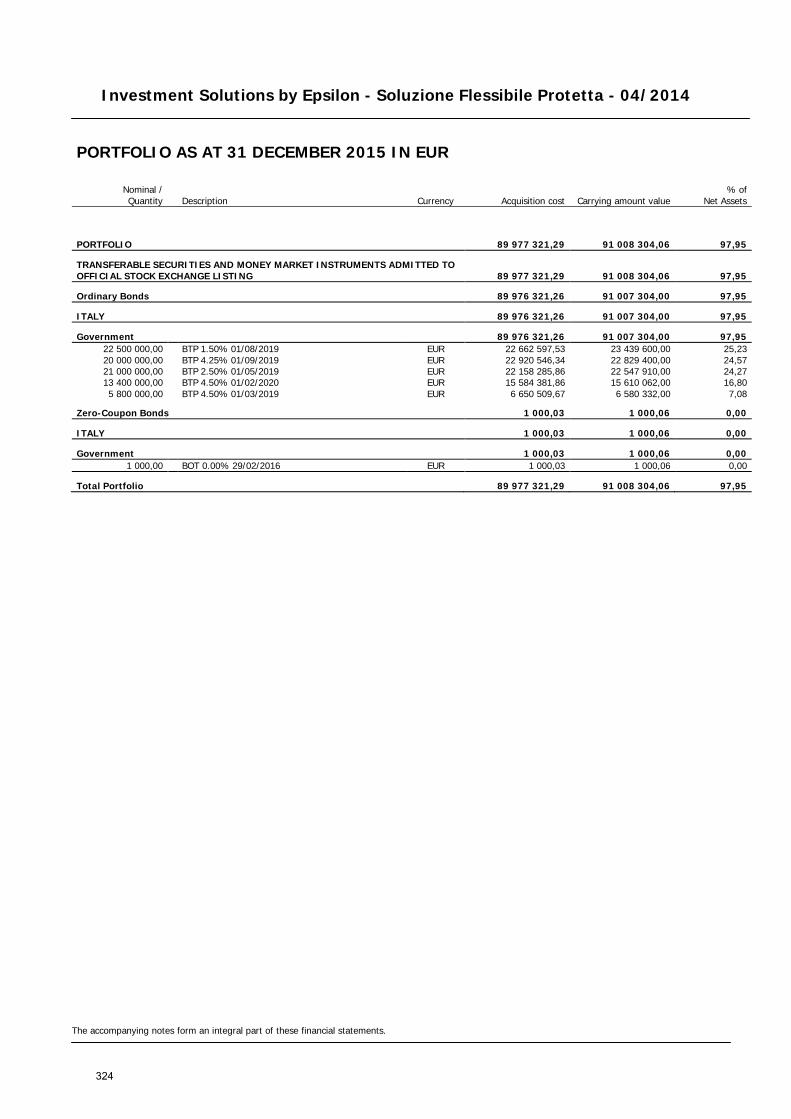
Investment Solutions by Epsilon - Soluzione Flessibile Protetta - 04/2014
The accompanying notes form an integral part of these financial statements.
PORTFOLIO AS AT 31 DECEMBER 2015 IN EUR
Nominal / Quantity Description Currency Acquisition cost Carrying amount value
% of Net Assets
PORTFOLIO 89 977 321,29 91 008 304,06 97,95
TRANSFERABLE SECURITIES AND MONEY MARKET INSTRUMENTS ADMITTED TO OFFICIAL STOCK EXCHANGE LISTING 89 977 321,29 91 008 304,06 97,95
Ordinary Bonds 89 976 321,26 91 007 304,00 97,95
ITALY 89 976 321,26 91 007 304,00 97,95
Government 89 976 321,26 91 007 304,00 97,95 22 500 000,00 BTP 1.50% 01/08/2019 EUR 22 662 597,53 23 439 600,00 25,23 20 000 000,00 BTP 4.25% 01/09/2019 EUR 22 920 546,34 22 829 400,00 24,57 21 000 000,00 BTP 2.50% 01/05/2019 EUR 22 158 285,86 22 547 910,00 24,27 13 400 000,00 BTP 4.50% 01/02/2020 EUR 15 584 381,86 15 610 062,00 16,80 5 800 000,00 BTP 4.50% 01/03/2019 EUR 6 650 509,67 6 580 332,00 7,08
Zero-Coupon Bonds 1 000,03 1 000,06 0,00
ITALY 1 000,03 1 000,06 0,00
Government 1 000,03 1 000,06 0,00 1 000,00 BOT 0.00% 29/02/2016 EUR 1 000,03 1 000,06 0,00
Total Portfolio 89 977 321,29 91 008 304,06 97,95
324
NOTES TO THE FINANCIAL STATEMENTS Investment Solutions by Epsilon ________________________________________________________________________________
1. ACTIVITY Investment Solutions by Epsilon (the “Fund”) was established in the Grand Duchy of Luxembourg on 23 November 2010 in accordance with Part I of the Law of 20 December 2002 as amended on Undertakings for Collective Investment. The Fund is subject to part I of the Luxembourg Law of 17 December 2010 relating to Undertaking for Collective Investment. The Fund is a joint ownership of transferable securities and other financial assets as authorized by law, managed by the Management Company on the basis of the risk spreading principle, on behalf of and in the sole interest of the co-owners (the “Unitholders”), who are committed only to the extent of their investment. Its assets are owned jointly and indivisibly by the Unitholders and constitute a holding separate from the Management Company’s holdings. All of the jointly owned Units have equal rights. There is no maximum limit set on the amount of wealth or the number of Units of jointly owned property which comprise the net assets of the Fund. The minimum net assets of the Fund are to be at least EUR 1 250 000,00. The respective rights and obligations of the Unitholders, the Management Company and the Custodian Bank are defined in the Management Regulations and laws. By agreement with the Custodian Bank and pursuant to the Laws of the Grand Duchy of Luxembourg, the Management Company may make amendments in the Management Regulations if it considers useful for the interest of Unitholders. These amendments are published in the “Mémorial, Recueil des Sociétés et Associations” and, in principle, become effective as of the time of their signature. 2. SUMMARY OF SIGNIFICANT ACCOUNTING POLICIES The Fund keeps the books of each Sub-Fund in its respective currency and the financial statements were prepared in EUR in accordance with the Luxembourg regulations relating to Undertakings for Collective Investment and in particular using the following valuation rules: a) Valuation of investment securities Investment securities, including zero-coupon bonds and money market instruments, quoted on an official stock exchange or on another regulated market are valued according to the last known price and, in the event of being quoted on several markets, according to the last known price of the principal market. Valuation of investment securities, including zero-coupon bonds and money market instruments, not quoted on an official stock exchange or on another regulated market is fixed in a reasonable way on the basis of the sale prices anticipated cautiously and in good faith or, in the absence of a market value, according to the probable value in the reasonable estimation of the Board of Directors of the Management Company. Investment securities switched from dirty price to clean price. b) Net realised profit / (loss) on sales of investments Realised profits or losses made on the sales of investments are calculated according to the average cost. c) Cost of purchase of securities in portfolios For securities denominated in currencies other than the base currency of the Sub-Fund, the purchase price is calculated based on the exchange rates prevailing at the date of the purchases. d) Forward foreign exchange contracts Forward foreign exchange contracts are valued at forward foreign exchange rates for the remaining period to run until maturity at the date of valuation. Unrealised profits and losses are recorded in the Statement of Net Assets and their variations in the Statement of Changes in Net Assets under the heading “Change in unrealised appreciation / (depreciation) on forward foreign exchange contracts“. e) Option contracts Option contracts quoted on an official stock exchange or on another regulated market are valued according to the last known market price or, if there are several markets, according to the last known price of the principal market.
325
NOTES TO THE FINANCIAL STATEMENTS Investment Solutions by Epsilon ________________________________________________________________________________
Option contracts not quoted on an official stock exchange or on another regulated market are valued at their last known market value or, in the absence of a market value, according to their probable market value in the reasonable estimation of the Board of Directors of the Management Company. Premiums received on the written option contracts are recorded as liabilities and premiums paid on purchased option contracts are recorded as assets. Unrealised profits and losses on option contracts are recorded in the Statement of Net Assets and their variations in the Statement of Changes in Net Assets under the heading “Change in unrealised appreciation / (depreciation) on option contracts“. f) Future contracts Commitments related to future contracts are recorded off balance sheet and future contracts are valued according to the last available contract price. Unrealised profits and losses on future contracts are recorded in the Statement of Net Assets and their variations in the Statement of Changes in Net Assets under the heading “Change in unrealised appreciation / (depreciation) on future contracts“. Guarantee deposits and margin calls are recorded under the Statement of Net Assets under the headings “Amounts due from brokers” and “Amounts due to brokers”. g) Swap contracts Swaps are, in general, contracts by which two parties commit themselves during a given period to exchange two flows, one in exchange of the other, determined on the basis of a nominal value. The flows may be linked to interest rate(s), exchange rate(s), share(s), index (es) or credit event(s). Swap contracts are valued using the difference between the values of forecasted flows the counterparty is to pay to the Sub-Fund and those owed by the Sub-Fund to its counterparties. Unrealised profits and losses on swap contracts are recorded in the Statement of Net Assets and their variations in the Statement of Changes in Net Assets under the heading “Change in unrealised appreciation / (depreciation) on swap contracts”. Except for the Credit Default Swap Contracts, all the Swap contracts are valued at dirty price, therefore the interest receivable and interest payable are included in the unrealised profit / (loss) of these swap contracts. h) Combined statements of the Fund The combined statements correspond to the sum of the statements of each Sub-Fund. i) Income Dividends are recognised on the date on which the Shares/Units concerned are quoted “ex-dividend“, net of withholding tax. Interest is calculated on a prorata temporis basis and recorded net of withholding tax. j) Translation of items expressed in foreign currencies Assets and liabilities denominated in foreign currencies are converted into the base currency of the Sub-Funds at the closing exchange rates prevailing at period-end date. Income and expenses denominated in currencies other than the base currency of the Sub-Funds are converted into the currency of the Sub-Funds at the closing exchange rates prevailing on the day of the transaction. The resulting realised and unrealised profit or loss made on foreign exchange is included in the Statement of Changes in Net Assets; any unrealised profit or loss on currencies of foreign cash positions, receivable on assets and payable on liabilities denominated in currencies other than the base currency of the Sub-Funds being recorded under the heading “Change in unrealised appreciation / (depreciation) on foreign currencies”. The exchange rates as at 31 December 2015 are the following:
Currency Exchange Rate
EUR/AUD 1,4931 EUR/BRL 4,2977 EUR/CAD 1,5090 EUR/CHF 1,0874 EUR/CLP 769,7522
326
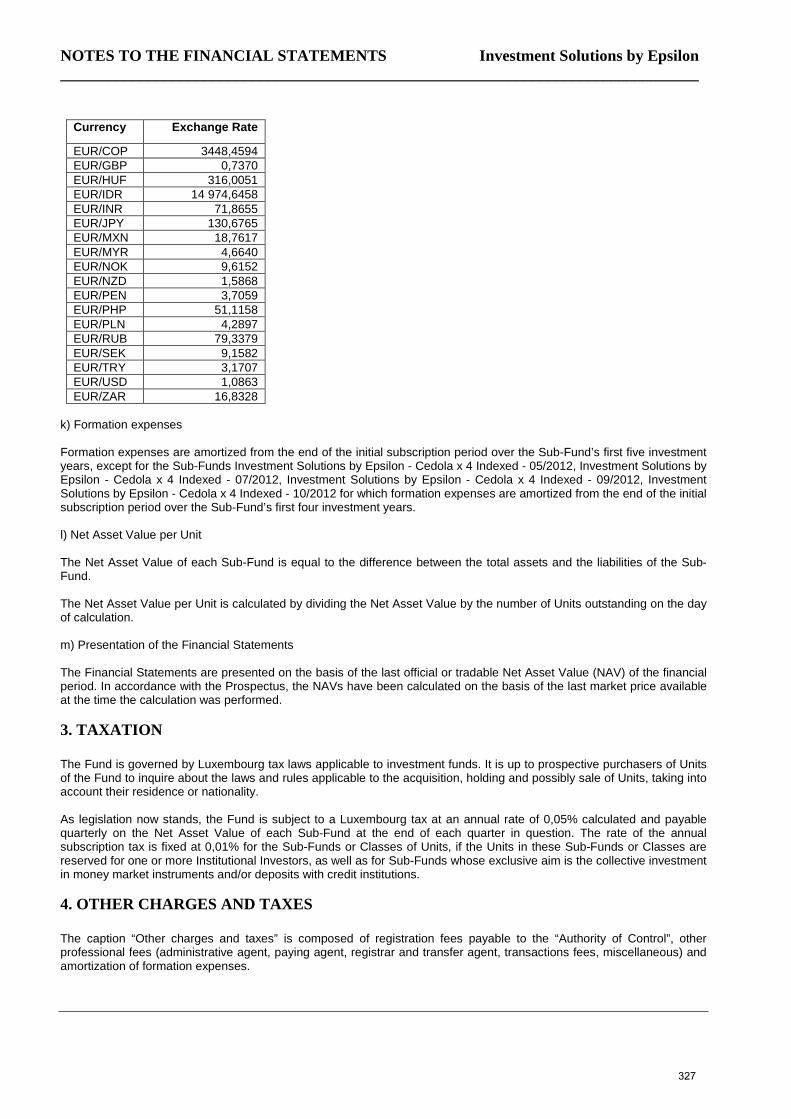
NOTES TO THE FINANCIAL STATEMENTS Investment Solutions by Epsilon ________________________________________________________________________________
Currency Exchange Rate
EUR/COP 3448,4594 EUR/GBP 0,7370 EUR/HUF 316,0051 EUR/IDR 14 974,6458 EUR/INR 71,8655 EUR/JPY 130,6765 EUR/MXN 18,7617 EUR/MYR 4,6640 EUR/NOK 9,6152 EUR/NZD 1,5868 EUR/PEN 3,7059 EUR/PHP 51,1158 EUR/PLN 4,2897 EUR/RUB 79,3379 EUR/SEK 9,1582 EUR/TRY 3,1707 EUR/USD 1,0863 EUR/ZAR 16,8328
k) Formation expenses Formation expenses are amortized from the end of the initial subscription period over the Sub-Fund’s first five investment years, except for the Sub-Funds Investment Solutions by Epsilon - Cedola x 4 Indexed - 05/2012, Investment Solutions by Epsilon - Cedola x 4 Indexed - 07/2012, Investment Solutions by Epsilon - Cedola x 4 Indexed - 09/2012, Investment Solutions by Epsilon - Cedola x 4 Indexed - 10/2012 for which formation expenses are amortized from the end of the initial subscription period over the Sub-Fund’s first four investment years. l) Net Asset Value per Unit The Net Asset Value of each Sub-Fund is equal to the difference between the total assets and the liabilities of the Sub-Fund. The Net Asset Value per Unit is calculated by dividing the Net Asset Value by the number of Units outstanding on the day of calculation. m) Presentation of the Financial Statements The Financial Statements are presented on the basis of the last official or tradable Net Asset Value (NAV) of the financial period. In accordance with the Prospectus, the NAVs have been calculated on the basis of the last market price available at the time the calculation was performed. 3. TAXATION The Fund is governed by Luxembourg tax laws applicable to investment funds. It is up to prospective purchasers of Units of the Fund to inquire about the laws and rules applicable to the acquisition, holding and possibly sale of Units, taking into account their residence or nationality. As legislation now stands, the Fund is subject to a Luxembourg tax at an annual rate of 0,05% calculated and payable quarterly on the Net Asset Value of each Sub-Fund at the end of each quarter in question. The rate of the annual subscription tax is fixed at 0,01% for the Sub-Funds or Classes of Units, if the Units in these Sub-Funds or Classes are reserved for one or more Institutional Investors, as well as for Sub-Funds whose exclusive aim is the collective investment in money market instruments and/or deposits with credit institutions. 4. OTHER CHARGES AND TAXES The caption “Other charges and taxes” is composed of registration fees payable to the “Authority of Control”, other professional fees (administrative agent, paying agent, registrar and transfer agent, transactions fees, miscellaneous) and amortization of formation expenses.
327
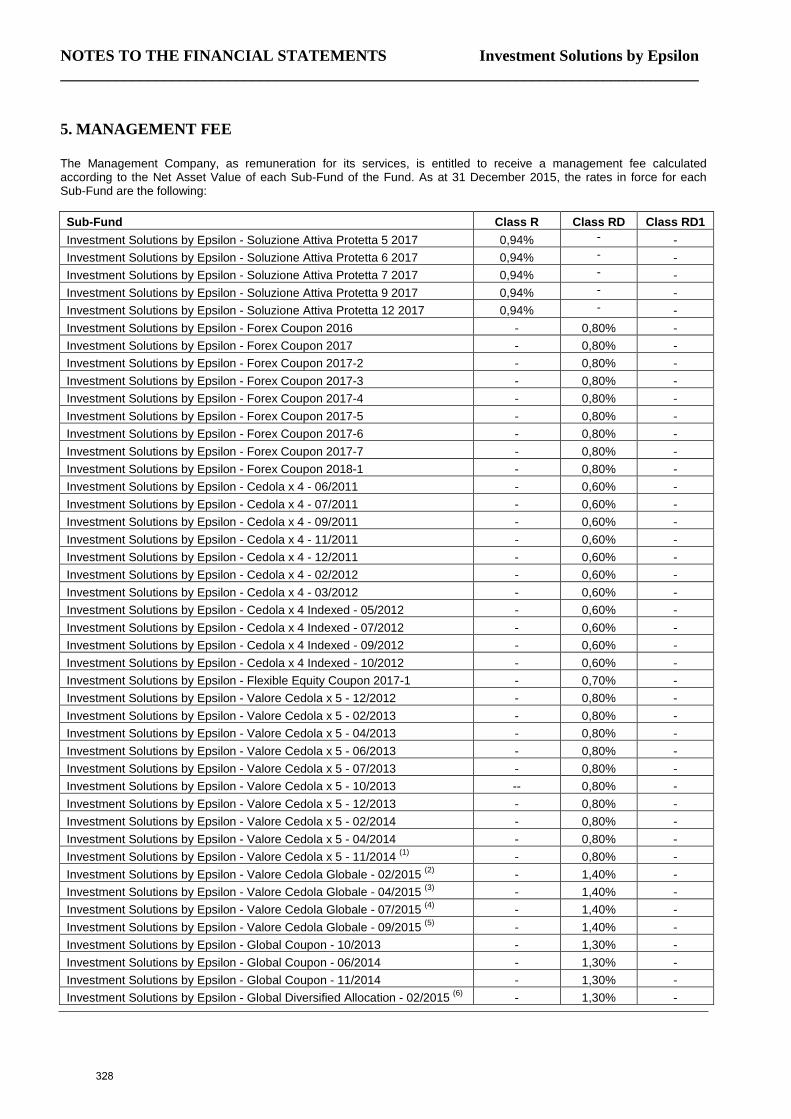
NOTES TO THE FINANCIAL STATEMENTS Investment Solutions by Epsilon ________________________________________________________________________________
5. MANAGEMENT FEE The Management Company, as remuneration for its services, is entitled to receive a management fee calculated according to the Net Asset Value of each Sub-Fund of the Fund. As at 31 December 2015, the rates in force for each Sub-Fund are the following: Sub-Fund Class R Class RD Class RD1 Investment Solutions by Epsilon - Soluzione Attiva Protetta 5 2017 0,94% - - Investment Solutions by Epsilon - Soluzione Attiva Protetta 6 2017 0,94% - - Investment Solutions by Epsilon - Soluzione Attiva Protetta 7 2017 0,94% - - Investment Solutions by Epsilon - Soluzione Attiva Protetta 9 2017 0,94% - - Investment Solutions by Epsilon - Soluzione Attiva Protetta 12 2017 0,94% - - Investment Solutions by Epsilon - Forex Coupon 2016 - 0,80% - Investment Solutions by Epsilon - Forex Coupon 2017 - 0,80% - Investment Solutions by Epsilon - Forex Coupon 2017-2 - 0,80% - Investment Solutions by Epsilon - Forex Coupon 2017-3 - 0,80% - Investment Solutions by Epsilon - Forex Coupon 2017-4 - 0,80% - Investment Solutions by Epsilon - Forex Coupon 2017-5 - 0,80% - Investment Solutions by Epsilon - Forex Coupon 2017-6 - 0,80% - Investment Solutions by Epsilon - Forex Coupon 2017-7 - 0,80% - Investment Solutions by Epsilon - Forex Coupon 2018-1 - 0,80% - Investment Solutions by Epsilon - Cedola x 4 - 06/2011 - 0,60% - Investment Solutions by Epsilon - Cedola x 4 - 07/2011 - 0,60% - Investment Solutions by Epsilon - Cedola x 4 - 09/2011 - 0,60% - Investment Solutions by Epsilon - Cedola x 4 - 11/2011 - 0,60% - Investment Solutions by Epsilon - Cedola x 4 - 12/2011 - 0,60% - Investment Solutions by Epsilon - Cedola x 4 - 02/2012 - 0,60% - Investment Solutions by Epsilon - Cedola x 4 - 03/2012 - 0,60% - Investment Solutions by Epsilon - Cedola x 4 Indexed - 05/2012 - 0,60% - Investment Solutions by Epsilon - Cedola x 4 Indexed - 07/2012 - 0,60% - Investment Solutions by Epsilon - Cedola x 4 Indexed - 09/2012 - 0,60% - Investment Solutions by Epsilon - Cedola x 4 Indexed - 10/2012 - 0,60% - Investment Solutions by Epsilon - Flexible Equity Coupon 2017-1 - 0,70% - Investment Solutions by Epsilon - Valore Cedola x 5 - 12/2012 - 0,80% - Investment Solutions by Epsilon - Valore Cedola x 5 - 02/2013 - 0,80% - Investment Solutions by Epsilon - Valore Cedola x 5 - 04/2013 - 0,80% - Investment Solutions by Epsilon - Valore Cedola x 5 - 06/2013 - 0,80% - Investment Solutions by Epsilon - Valore Cedola x 5 - 07/2013 - 0,80% - Investment Solutions by Epsilon - Valore Cedola x 5 - 10/2013 -- 0,80% - Investment Solutions by Epsilon - Valore Cedola x 5 - 12/2013 - 0,80% - Investment Solutions by Epsilon - Valore Cedola x 5 - 02/2014 - 0,80% - Investment Solutions by Epsilon - Valore Cedola x 5 - 04/2014 - 0,80% - Investment Solutions by Epsilon - Valore Cedola x 5 - 11/2014 (1) - 0,80% - Investment Solutions by Epsilon - Valore Cedola Globale - 02/2015 (2) - 1,40% - Investment Solutions by Epsilon - Valore Cedola Globale - 04/2015 (3) - 1,40% - Investment Solutions by Epsilon - Valore Cedola Globale - 07/2015 (4) - 1,40% - Investment Solutions by Epsilon - Valore Cedola Globale - 09/2015 (5) - 1,40% - Investment Solutions by Epsilon - Global Coupon - 10/2013 - 1,30% - Investment Solutions by Epsilon - Global Coupon - 06/2014 - 1,30% - Investment Solutions by Epsilon - Global Coupon - 11/2014 - 1,30% - Investment Solutions by Epsilon - Global Diversified Allocation - 02/2015 (6) - 1,30% -
328
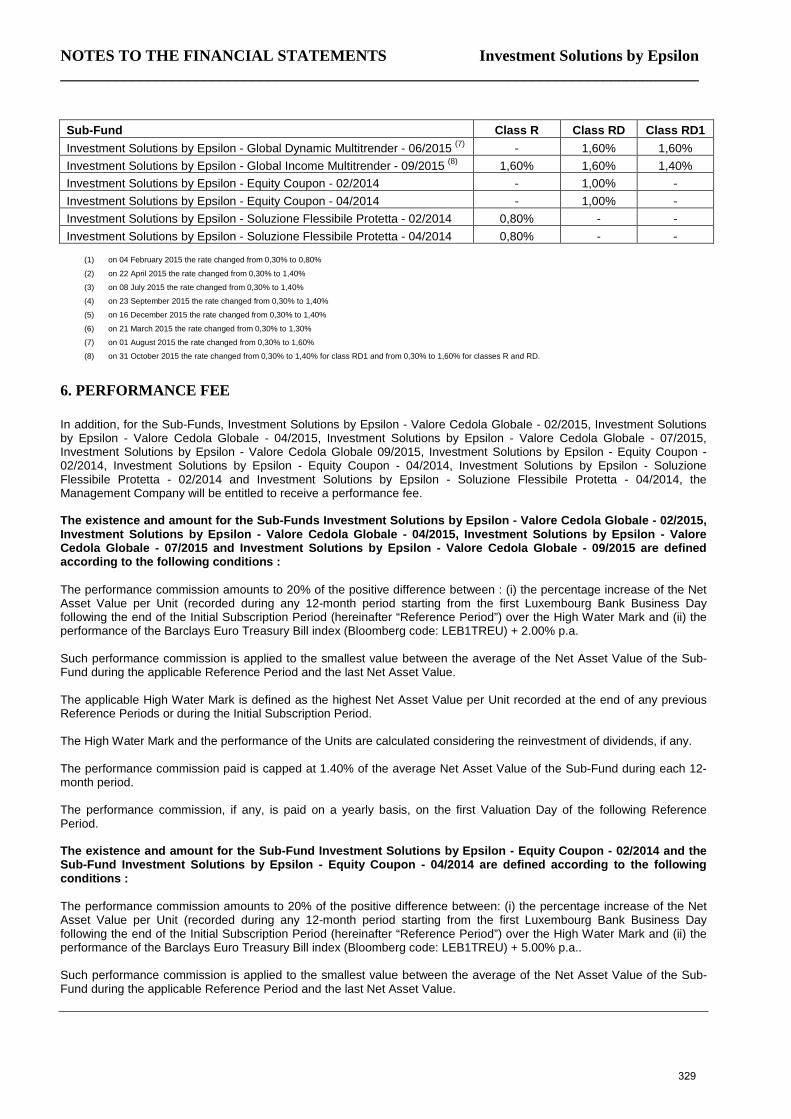
NOTES TO THE FINANCIAL STATEMENTS Investment Solutions by Epsilon ________________________________________________________________________________
Sub-Fund Class R Class RD Class RD1 Investment Solutions by Epsilon - Global Dynamic Multitrender - 06/2015 (7) - 1,60% 1,60% Investment Solutions by Epsilon - Global Income Multitrender - 09/2015 (8) 1,60% 1,60% 1,40% Investment Solutions by Epsilon - Equity Coupon - 02/2014 - 1,00% - Investment Solutions by Epsilon - Equity Coupon - 04/2014 - 1,00% - Investment Solutions by Epsilon - Soluzione Flessibile Protetta - 02/2014 0,80% - - Investment Solutions by Epsilon - Soluzione Flessibile Protetta - 04/2014 0,80% - -
(1) on 04 February 2015 the rate changed from 0,30% to 0,80%
(2) on 22 April 2015 the rate changed from 0,30% to 1,40%
(3) on 08 July 2015 the rate changed from 0,30% to 1,40%
(4) on 23 September 2015 the rate changed from 0,30% to 1,40%
(5) on 16 December 2015 the rate changed from 0,30% to 1,40%
(6) on 21 March 2015 the rate changed from 0,30% to 1,30%
(7) on 01 August 2015 the rate changed from 0,30% to 1,60%
(8) on 31 October 2015 the rate changed from 0,30% to 1,40% for class RD1 and from 0,30% to 1,60% for classes R and RD.
6. PERFORMANCE FEE In addition, for the Sub-Funds, Investment Solutions by Epsilon - Valore Cedola Globale - 02/2015, Investment Solutions by Epsilon - Valore Cedola Globale - 04/2015, Investment Solutions by Epsilon - Valore Cedola Globale - 07/2015, Investment Solutions by Epsilon - Valore Cedola Globale 09/2015, Investment Solutions by Epsilon - Equity Coupon - 02/2014, Investment Solutions by Epsilon - Equity Coupon - 04/2014, Investment Solutions by Epsilon - Soluzione Flessibile Protetta - 02/2014 and Investment Solutions by Epsilon - Soluzione Flessibile Protetta - 04/2014, the Management Company will be entitled to receive a performance fee. The existence and amount for the Sub-Funds Investment Solutions by Epsilon - Valore Cedola Globale - 02/2015, Investment Solutions by Epsilon - Valore Cedola Globale - 04/2015, Investment Solutions by Epsilon - Valore Cedola Globale - 07/2015 and Investment Solutions by Epsilon - Valore Cedola Globale - 09/2015 are defined according to the following conditions : The performance commission amounts to 20% of the positive difference between : (i) the percentage increase of the Net Asset Value per Unit (recorded during any 12-month period starting from the first Luxembourg Bank Business Day following the end of the Initial Subscription Period (hereinafter “Reference Period”) over the High Water Mark and (ii) the performance of the Barclays Euro Treasury Bill index (Bloomberg code: LEB1TREU) + 2.00% p.a. Such performance commission is applied to the smallest value between the average of the Net Asset Value of the Sub-Fund during the applicable Reference Period and the last Net Asset Value. The applicable High Water Mark is defined as the highest Net Asset Value per Unit recorded at the end of any previous Reference Periods or during the Initial Subscription Period. The High Water Mark and the performance of the Units are calculated considering the reinvestment of dividends, if any. The performance commission paid is capped at 1.40% of the average Net Asset Value of the Sub-Fund during each 12-month period. The performance commission, if any, is paid on a yearly basis, on the first Valuation Day of the following Reference Period. The existence and amount for the Sub-Fund Investment Solutions by Epsilon - Equity Coupon - 02/2014 and the Sub-Fund Investment Solutions by Epsilon - Equity Coupon - 04/2014 are defined according to the following conditions : The performance commission amounts to 20% of the positive difference between: (i) the percentage increase of the Net Asset Value per Unit (recorded during any 12-month period starting from the first Luxembourg Bank Business Day following the end of the Initial Subscription Period (hereinafter “Reference Period”) over the High Water Mark and (ii) the performance of the Barclays Euro Treasury Bill index (Bloomberg code: LEB1TREU) + 5.00% p.a.. Such performance commission is applied to the smallest value between the average of the Net Asset Value of the Sub-Fund during the applicable Reference Period and the last Net Asset Value.
329
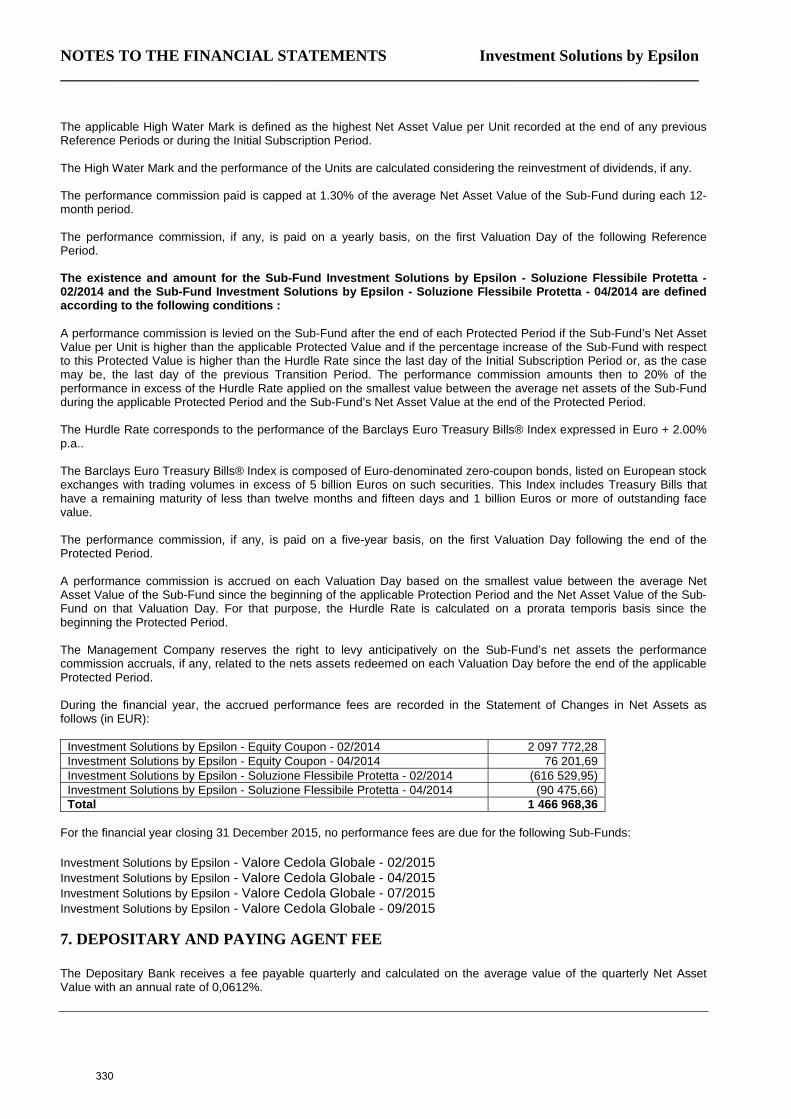
NOTES TO THE FINANCIAL STATEMENTS Investment Solutions by Epsilon ________________________________________________________________________________
The applicable High Water Mark is defined as the highest Net Asset Value per Unit recorded at the end of any previous Reference Periods or during the Initial Subscription Period. The High Water Mark and the performance of the Units are calculated considering the reinvestment of dividends, if any. The performance commission paid is capped at 1.30% of the average Net Asset Value of the Sub-Fund during each 12-month period. The performance commission, if any, is paid on a yearly basis, on the first Valuation Day of the following Reference Period. The existence and amount for the Sub-Fund Investment Solutions by Epsilon - Soluzione Flessibile Protetta - 02/2014 and the Sub-Fund Investment Solutions by Epsilon - Soluzione Flessibile Protetta - 04/2014 are defined according to the following conditions : A performance commission is levied on the Sub-Fund after the end of each Protected Period if the Sub-Fund’s Net Asset Value per Unit is higher than the applicable Protected Value and if the percentage increase of the Sub-Fund with respect to this Protected Value is higher than the Hurdle Rate since the last day of the Initial Subscription Period or, as the case may be, the last day of the previous Transition Period. The performance commission amounts then to 20% of the performance in excess of the Hurdle Rate applied on the smallest value between the average net assets of the Sub-Fund during the applicable Protected Period and the Sub-Fund’s Net Asset Value at the end of the Protected Period. The Hurdle Rate corresponds to the performance of the Barclays Euro Treasury Bills® Index expressed in Euro + 2.00% p.a.. The Barclays Euro Treasury Bills® Index is composed of Euro-denominated zero-coupon bonds, listed on European stock exchanges with trading volumes in excess of 5 billion Euros on such securities. This Index includes Treasury Bills that have a remaining maturity of less than twelve months and fifteen days and 1 billion Euros or more of outstanding face value. The performance commission, if any, is paid on a five-year basis, on the first Valuation Day following the end of the Protected Period. A performance commission is accrued on each Valuation Day based on the smallest value between the average Net Asset Value of the Sub-Fund since the beginning of the applicable Protection Period and the Net Asset Value of the Sub-Fund on that Valuation Day. For that purpose, the Hurdle Rate is calculated on a prorata temporis basis since the beginning the Protected Period. The Management Company reserves the right to levy anticipatively on the Sub-Fund’s net assets the performance commission accruals, if any, related to the nets assets redeemed on each Valuation Day before the end of the applicable Protected Period. During the financial year, the accrued performance fees are recorded in the Statement of Changes in Net Assets as follows (in EUR):
Investment Solutions by Epsilon - Equity Coupon - 02/2014 2 097 772,28 Investment Solutions by Epsilon - Equity Coupon - 04/2014 76 201,69 Investment Solutions by Epsilon - Soluzione Flessibile Protetta - 02/2014 (616 529,95) Investment Solutions by Epsilon - Soluzione Flessibile Protetta - 04/2014 (90 475,66) Total 1 466 968,36
For the financial year closing 31 December 2015, no performance fees are due for the following Sub-Funds: Investment Solutions by Epsilon - Valore Cedola Globale - 02/2015 Investment Solutions by Epsilon - Valore Cedola Globale - 04/2015 Investment Solutions by Epsilon - Valore Cedola Globale - 07/2015 Investment Solutions by Epsilon - Valore Cedola Globale - 09/2015 7. DEPOSITARY AND PAYING AGENT FEE The Depositary Bank receives a fee payable quarterly and calculated on the average value of the quarterly Net Asset Value with an annual rate of 0,0612%.
330
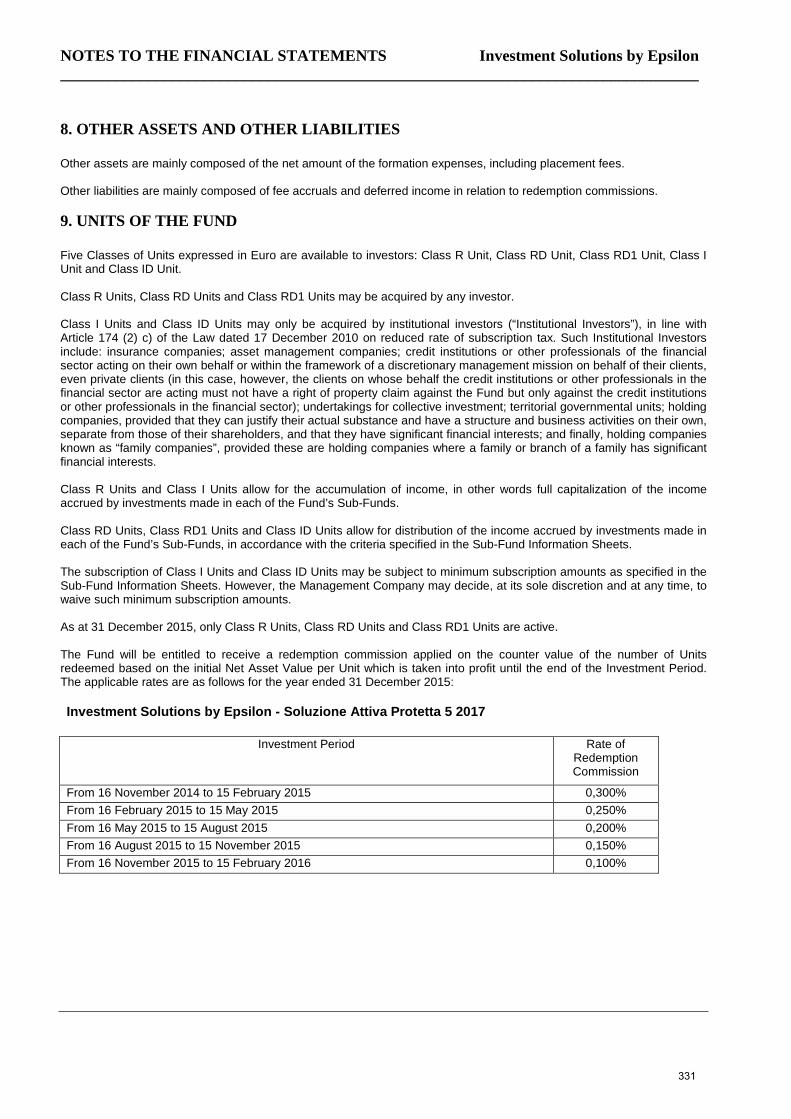
NOTES TO THE FINANCIAL STATEMENTS Investment Solutions by Epsilon ________________________________________________________________________________
8. OTHER ASSETS AND OTHER LIABILITIES Other assets are mainly composed of the net amount of the formation expenses, including placement fees. Other liabilities are mainly composed of fee accruals and deferred income in relation to redemption commissions. 9. UNITS OF THE FUND Five Classes of Units expressed in Euro are available to investors: Class R Unit, Class RD Unit, Class RD1 Unit, Class I Unit and Class ID Unit. Class R Units, Class RD Units and Class RD1 Units may be acquired by any investor. Class I Units and Class ID Units may only be acquired by institutional investors (“Institutional Investors”), in line with Article 174 (2) c) of the Law dated 17 December 2010 on reduced rate of subscription tax. Such Institutional Investors include: insurance companies; asset management companies; credit institutions or other professionals of the financial sector acting on their own behalf or within the framework of a discretionary management mission on behalf of their clients, even private clients (in this case, however, the clients on whose behalf the credit institutions or other professionals in the financial sector are acting must not have a right of property claim against the Fund but only against the credit institutions or other professionals in the financial sector); undertakings for collective investment; territorial governmental units; holding companies, provided that they can justify their actual substance and have a structure and business activities on their own, separate from those of their shareholders, and that they have significant financial interests; and finally, holding companies known as “family companies”, provided these are holding companies where a family or branch of a family has significant financial interests. Class R Units and Class I Units allow for the accumulation of income, in other words full capitalization of the income accrued by investments made in each of the Fund’s Sub-Funds. Class RD Units, Class RD1 Units and Class ID Units allow for distribution of the income accrued by investments made in each of the Fund’s Sub-Funds, in accordance with the criteria specified in the Sub-Fund Information Sheets. The subscription of Class I Units and Class ID Units may be subject to minimum subscription amounts as specified in the Sub-Fund Information Sheets. However, the Management Company may decide, at its sole discretion and at any time, to waive such minimum subscription amounts. As at 31 December 2015, only Class R Units, Class RD Units and Class RD1 Units are active. The Fund will be entitled to receive a redemption commission applied on the counter value of the number of Units redeemed based on the initial Net Asset Value per Unit which is taken into profit until the end of the Investment Period. The applicable rates are as follows for the year ended 31 December 2015: Investment Solutions by Epsilon - Soluzione Attiva Protetta 5 2017
Investment Period Rate of Redemption Commission
From 16 November 2014 to 15 February 2015 0,300% From 16 February 2015 to 15 May 2015 0,250% From 16 May 2015 to 15 August 2015 0,200% From 16 August 2015 to 15 November 2015 0,150% From 16 November 2015 to 15 February 2016 0,100%
331
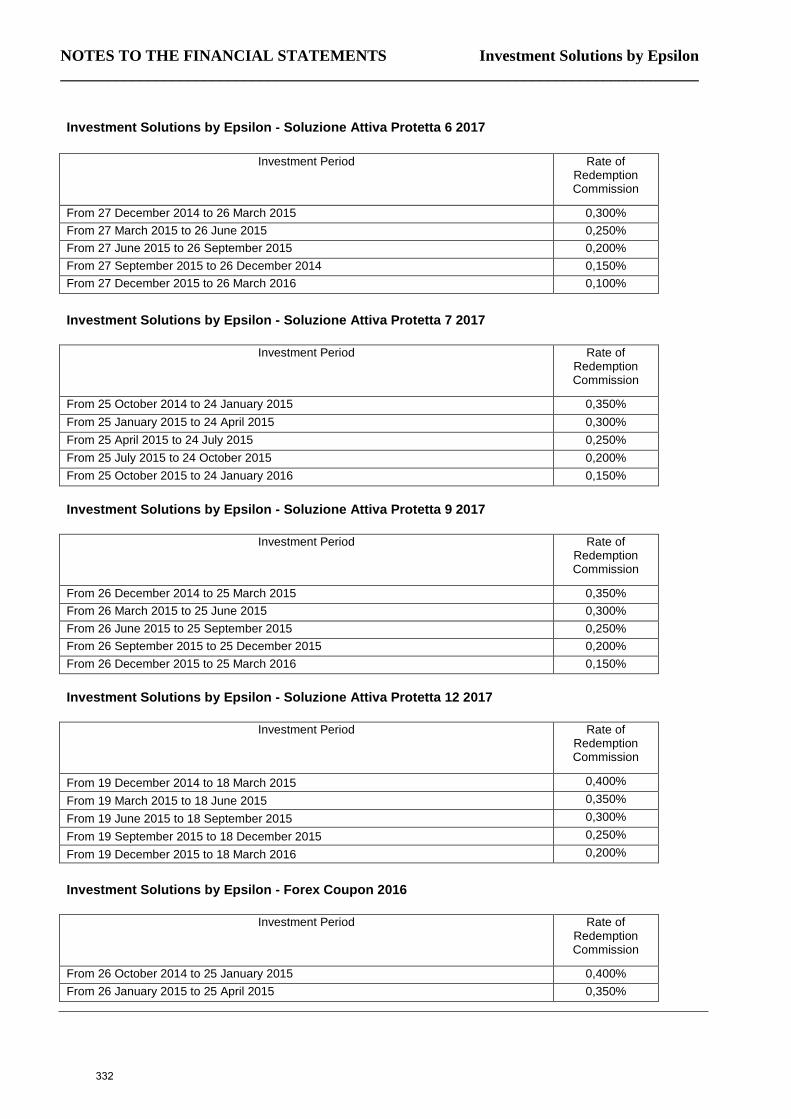
NOTES TO THE FINANCIAL STATEMENTS Investment Solutions by Epsilon ________________________________________________________________________________
Investment Solutions by Epsilon - Soluzione Attiva Protetta 6 2017
Investment Period Rate of Redemption Commission
From 27 December 2014 to 26 March 2015 0,300% From 27 March 2015 to 26 June 2015 0,250% From 27 June 2015 to 26 September 2015 0,200% From 27 September 2015 to 26 December 2014 0,150% From 27 December 2015 to 26 March 2016 0,100%
Investment Solutions by Epsilon - Soluzione Attiva Protetta 7 2017
Investment Period Rate of Redemption Commission
From 25 October 2014 to 24 January 2015 0,350% From 25 January 2015 to 24 April 2015 0,300% From 25 April 2015 to 24 July 2015 0,250% From 25 July 2015 to 24 October 2015 0,200% From 25 October 2015 to 24 January 2016 0,150% Investment Solutions by Epsilon - Soluzione Attiva Protetta 9 2017
Investment Period Rate of Redemption Commission
From 26 December 2014 to 25 March 2015 0,350% From 26 March 2015 to 25 June 2015 0,300% From 26 June 2015 to 25 September 2015 0,250% From 26 September 2015 to 25 December 2015 0,200% From 26 December 2015 to 25 March 2016 0,150% Investment Solutions by Epsilon - Soluzione Attiva Protetta 12 2017
Investment Period Rate of Redemption Commission
From 19 December 2014 to 18 March 2015 0,400% From 19 March 2015 to 18 June 2015 0,350% From 19 June 2015 to 18 September 2015 0,300% From 19 September 2015 to 18 December 2015 0,250% From 19 December 2015 to 18 March 2016 0,200%
Investment Solutions by Epsilon - Forex Coupon 2016
Investment Period Rate of Redemption Commission
From 26 October 2014 to 25 January 2015 0,400% From 26 January 2015 to 25 April 2015 0,350%
332
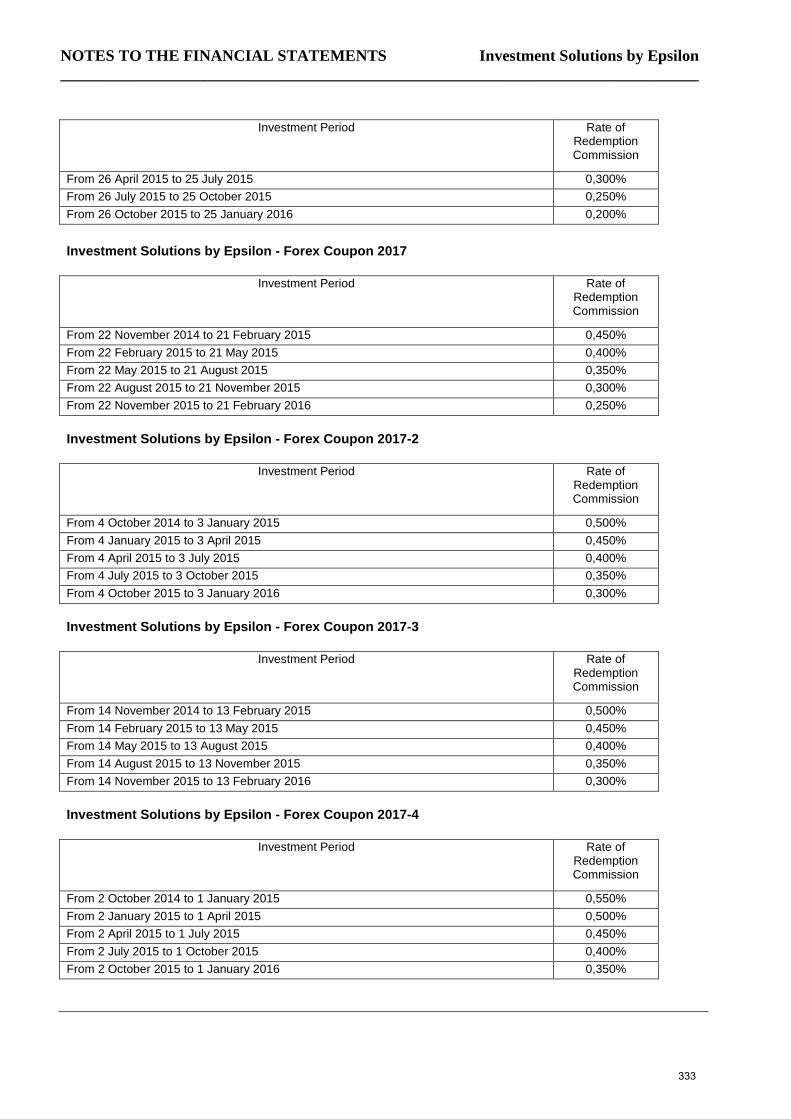
NOTES TO THE FINANCIAL STATEMENTS Investment Solutions by Epsilon ________________________________________________________________________________
Investment Period Rate of Redemption Commission
From 26 April 2015 to 25 July 2015 0,300% From 26 July 2015 to 25 October 2015 0,250% From 26 October 2015 to 25 January 2016 0,200%
Investment Solutions by Epsilon - Forex Coupon 2017
Investment Period Rate of Redemption Commission
From 22 November 2014 to 21 February 2015 0,450% From 22 February 2015 to 21 May 2015 0,400% From 22 May 2015 to 21 August 2015 0,350% From 22 August 2015 to 21 November 2015 0,300% From 22 November 2015 to 21 February 2016 0,250% Investment Solutions by Epsilon - Forex Coupon 2017-2
Investment Period Rate of Redemption Commission
From 4 October 2014 to 3 January 2015 0,500% From 4 January 2015 to 3 April 2015 0,450% From 4 April 2015 to 3 July 2015 0,400% From 4 July 2015 to 3 October 2015 0,350% From 4 October 2015 to 3 January 2016 0,300% Investment Solutions by Epsilon - Forex Coupon 2017-3
Investment Period Rate of Redemption Commission
From 14 November 2014 to 13 February 2015 0,500% From 14 February 2015 to 13 May 2015 0,450% From 14 May 2015 to 13 August 2015 0,400% From 14 August 2015 to 13 November 2015 0,350% From 14 November 2015 to 13 February 2016 0,300% Investment Solutions by Epsilon - Forex Coupon 2017-4
Investment Period Rate of Redemption Commission
From 2 October 2014 to 1 January 2015 0,550% From 2 January 2015 to 1 April 2015 0,500% From 2 April 2015 to 1 July 2015 0,450% From 2 July 2015 to 1 October 2015 0,400% From 2 October 2015 to 1 January 2016 0,350%
333
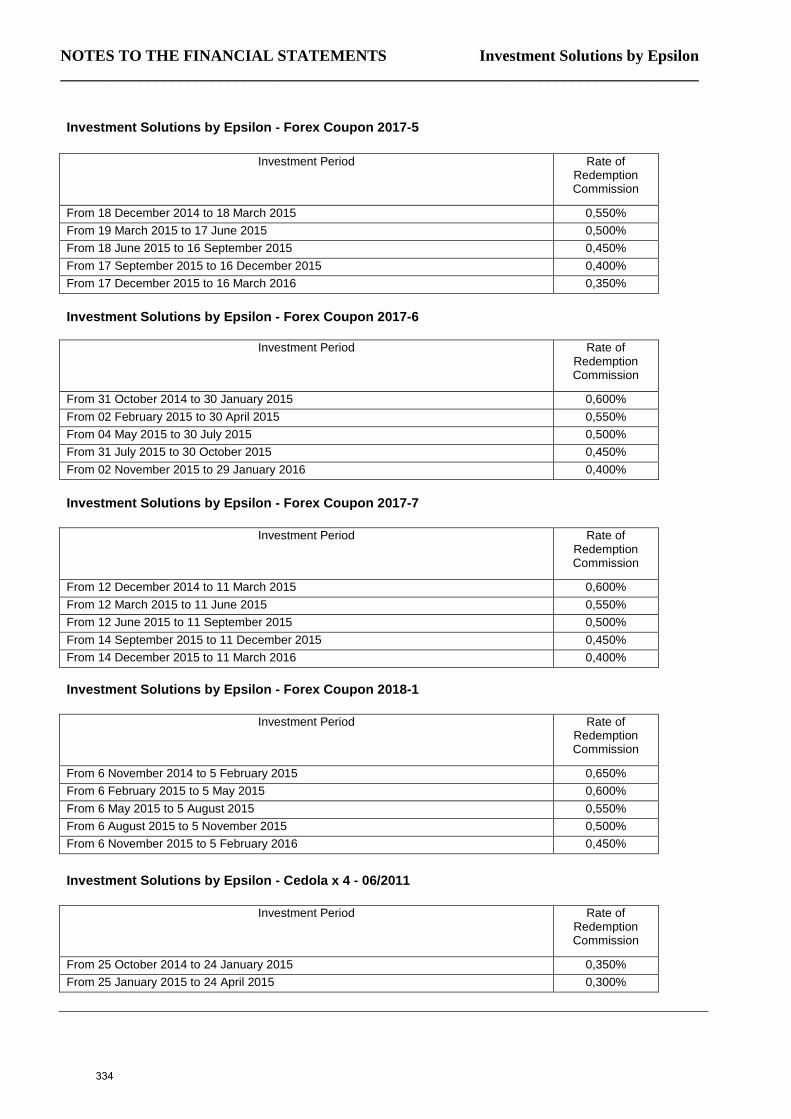
NOTES TO THE FINANCIAL STATEMENTS Investment Solutions by Epsilon ________________________________________________________________________________
Investment Solutions by Epsilon - Forex Coupon 2017-5
Investment Period Rate of Redemption Commission
From 18 December 2014 to 18 March 2015 0,550% From 19 March 2015 to 17 June 2015 0,500% From 18 June 2015 to 16 September 2015 0,450% From 17 September 2015 to 16 December 2015 0,400% From 17 December 2015 to 16 March 2016 0,350% Investment Solutions by Epsilon - Forex Coupon 2017-6
Investment Period Rate of Redemption Commission
From 31 October 2014 to 30 January 2015 0,600% From 02 February 2015 to 30 April 2015 0,550% From 04 May 2015 to 30 July 2015 0,500% From 31 July 2015 to 30 October 2015 0,450% From 02 November 2015 to 29 January 2016 0,400% Investment Solutions by Epsilon - Forex Coupon 2017-7
Investment Period Rate of Redemption Commission
From 12 December 2014 to 11 March 2015 0,600% From 12 March 2015 to 11 June 2015 0,550% From 12 June 2015 to 11 September 2015 0,500% From 14 September 2015 to 11 December 2015 0,450% From 14 December 2015 to 11 March 2016 0,400% Investment Solutions by Epsilon - Forex Coupon 2018-1
Investment Period Rate of Redemption Commission
From 6 November 2014 to 5 February 2015 0,650% From 6 February 2015 to 5 May 2015 0,600% From 6 May 2015 to 5 August 2015 0,550% From 6 August 2015 to 5 November 2015 0,500% From 6 November 2015 to 5 February 2016 0,450%
Investment Solutions by Epsilon - Cedola x 4 - 06/2011
Investment Period Rate of Redemption Commission
From 25 October 2014 to 24 January 2015 0,350% From 25 January 2015 to 24 April 2015 0,300%
334
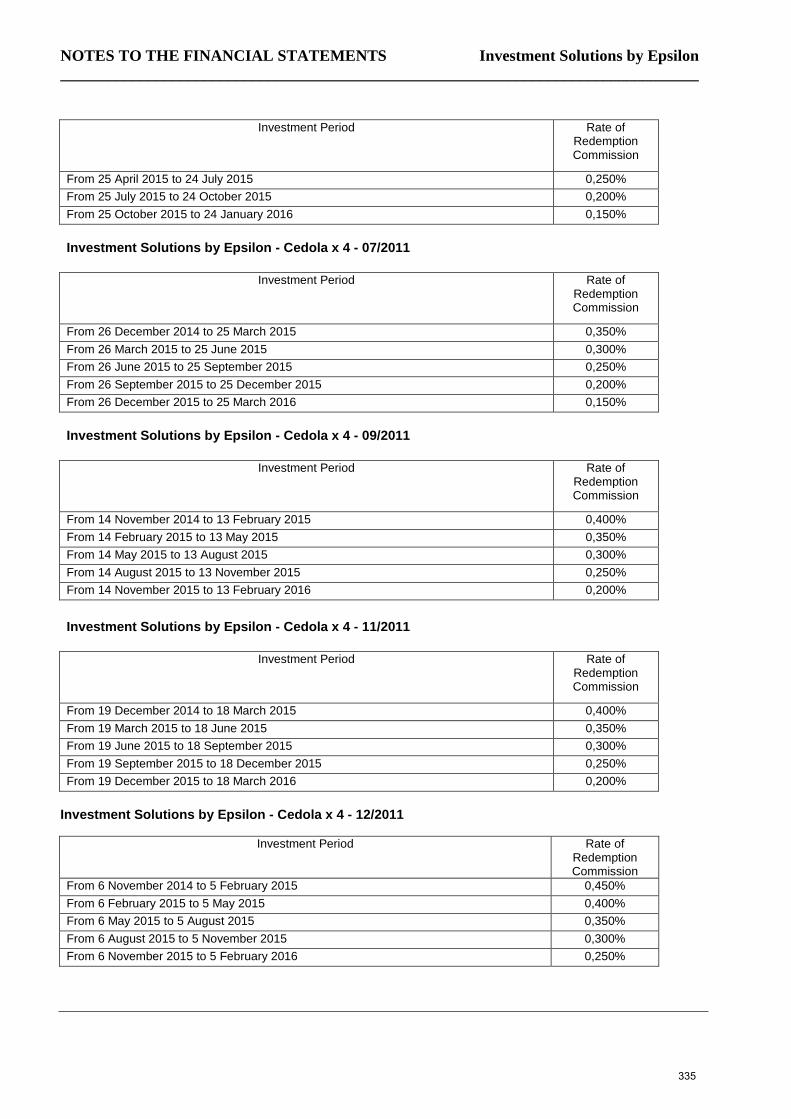
NOTES TO THE FINANCIAL STATEMENTS Investment Solutions by Epsilon ________________________________________________________________________________
Investment Period Rate of Redemption Commission
From 25 April 2015 to 24 July 2015 0,250% From 25 July 2015 to 24 October 2015 0,200% From 25 October 2015 to 24 January 2016 0,150% Investment Solutions by Epsilon - Cedola x 4 - 07/2011
Investment Period Rate of Redemption Commission
From 26 December 2014 to 25 March 2015 0,350% From 26 March 2015 to 25 June 2015 0,300% From 26 June 2015 to 25 September 2015 0,250% From 26 September 2015 to 25 December 2015 0,200% From 26 December 2015 to 25 March 2016 0,150% Investment Solutions by Epsilon - Cedola x 4 - 09/2011
Investment Period Rate of Redemption Commission
From 14 November 2014 to 13 February 2015 0,400% From 14 February 2015 to 13 May 2015 0,350% From 14 May 2015 to 13 August 2015 0,300% From 14 August 2015 to 13 November 2015 0,250% From 14 November 2015 to 13 February 2016 0,200%
Investment Solutions by Epsilon - Cedola x 4 - 11/2011
Investment Period Rate of Redemption Commission
From 19 December 2014 to 18 March 2015 0,400% From 19 March 2015 to 18 June 2015 0,350% From 19 June 2015 to 18 September 2015 0,300% From 19 September 2015 to 18 December 2015 0,250% From 19 December 2015 to 18 March 2016 0,200%
Investment Solutions by Epsilon - Cedola x 4 - 12/2011
Investment Period Rate of Redemption Commission
From 6 November 2014 to 5 February 2015 0,450% From 6 February 2015 to 5 May 2015 0,400% From 6 May 2015 to 5 August 2015 0,350% From 6 August 2015 to 5 November 2015 0,300% From 6 November 2015 to 5 February 2016 0,250%
335
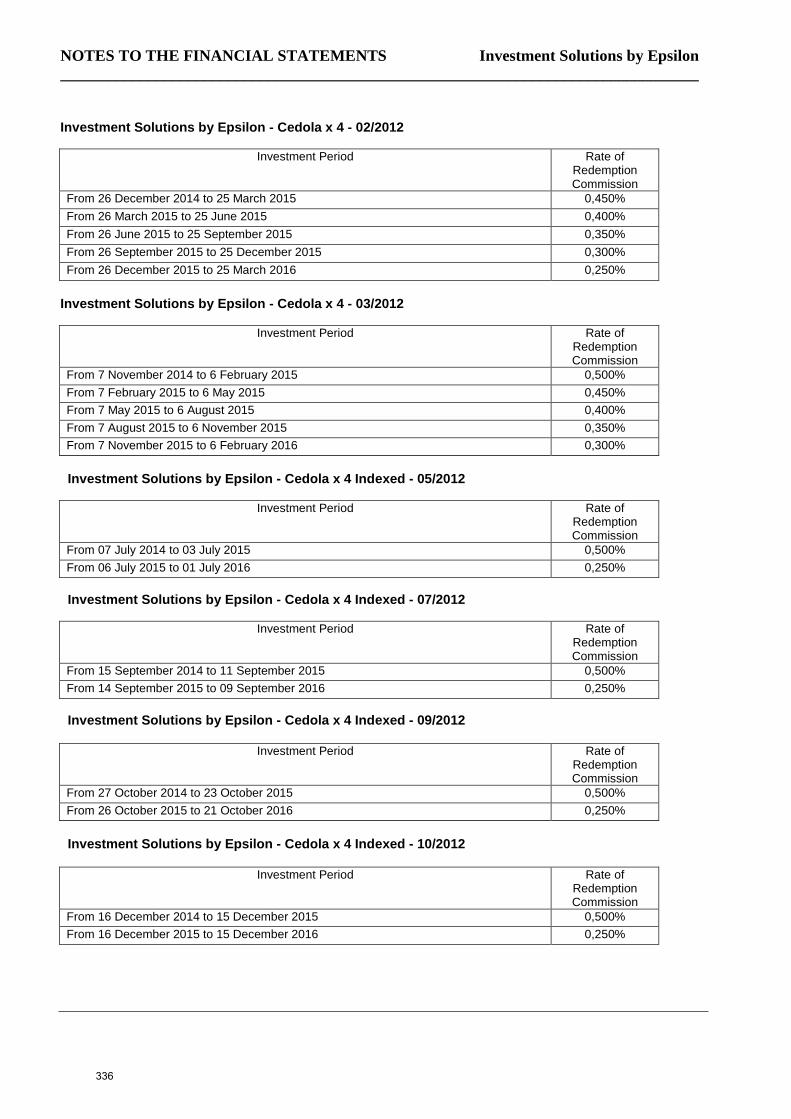
NOTES TO THE FINANCIAL STATEMENTS Investment Solutions by Epsilon ________________________________________________________________________________
Investment Solutions by Epsilon - Cedola x 4 - 02/2012
Investment Period Rate of Redemption Commission
From 26 December 2014 to 25 March 2015 0,450% From 26 March 2015 to 25 June 2015 0,400% From 26 June 2015 to 25 September 2015 0,350% From 26 September 2015 to 25 December 2015 0,300% From 26 December 2015 to 25 March 2016 0,250%
Investment Solutions by Epsilon - Cedola x 4 - 03/2012
Investment Period Rate of Redemption Commission
From 7 November 2014 to 6 February 2015 0,500% From 7 February 2015 to 6 May 2015 0,450% From 7 May 2015 to 6 August 2015 0,400% From 7 August 2015 to 6 November 2015 0,350% From 7 November 2015 to 6 February 2016 0,300%
Investment Solutions by Epsilon - Cedola x 4 Indexed - 05/2012
Investment Period Rate of Redemption Commission
From 07 July 2014 to 03 July 2015 0,500% From 06 July 2015 to 01 July 2016 0,250%
Investment Solutions by Epsilon - Cedola x 4 Indexed - 07/2012
Investment Period Rate of Redemption Commission
From 15 September 2014 to 11 September 2015 0,500% From 14 September 2015 to 09 September 2016 0,250%
Investment Solutions by Epsilon - Cedola x 4 Indexed - 09/2012
Investment Period Rate of Redemption Commission
From 27 October 2014 to 23 October 2015 0,500% From 26 October 2015 to 21 October 2016 0,250%
Investment Solutions by Epsilon - Cedola x 4 Indexed - 10/2012
Investment Period Rate of Redemption Commission
From 16 December 2014 to 15 December 2015 0,500% From 16 December 2015 to 15 December 2016 0,250%
336
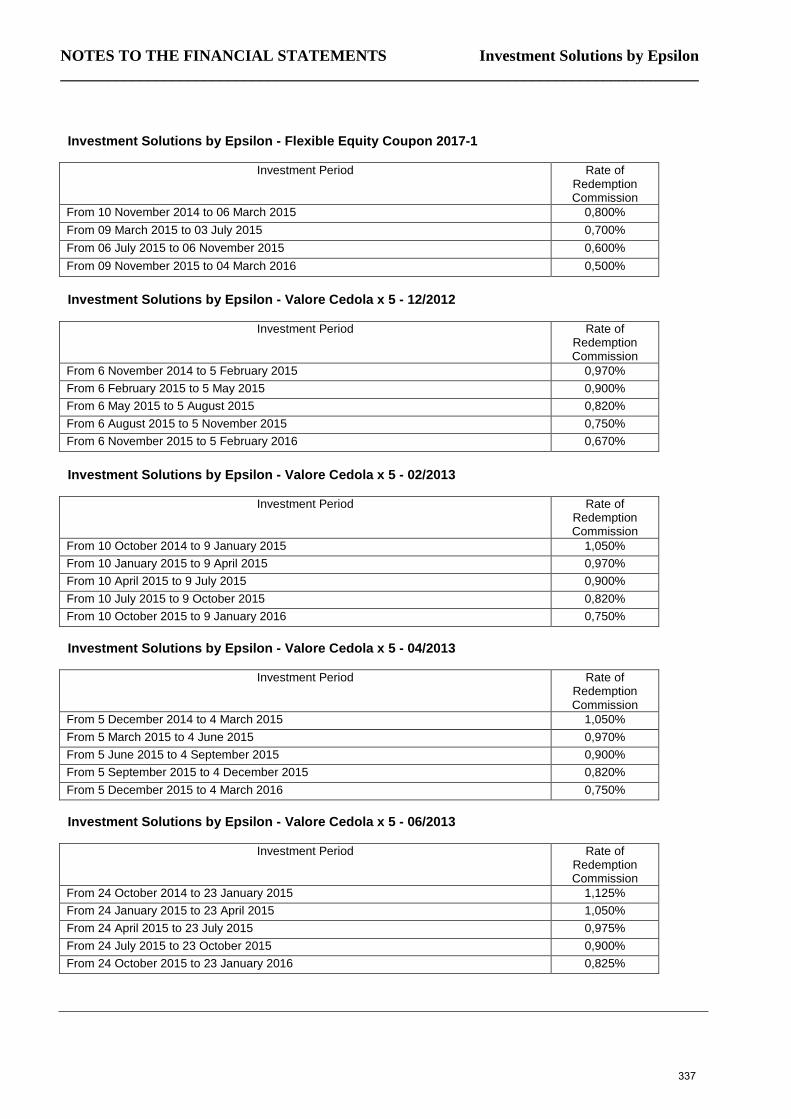
NOTES TO THE FINANCIAL STATEMENTS Investment Solutions by Epsilon ________________________________________________________________________________
Investment Solutions by Epsilon - Flexible Equity Coupon 2017-1
Investment Period Rate of Redemption Commission
From 10 November 2014 to 06 March 2015 0,800% From 09 March 2015 to 03 July 2015 0,700% From 06 July 2015 to 06 November 2015 0,600% From 09 November 2015 to 04 March 2016 0,500%
Investment Solutions by Epsilon - Valore Cedola x 5 - 12/2012
Investment Period Rate of Redemption Commission
From 6 November 2014 to 5 February 2015 0,970% From 6 February 2015 to 5 May 2015 0,900% From 6 May 2015 to 5 August 2015 0,820% From 6 August 2015 to 5 November 2015 0,750% From 6 November 2015 to 5 February 2016 0,670%
Investment Solutions by Epsilon - Valore Cedola x 5 - 02/2013
Investment Period Rate of Redemption Commission
From 10 October 2014 to 9 January 2015 1,050% From 10 January 2015 to 9 April 2015 0,970% From 10 April 2015 to 9 July 2015 0,900% From 10 July 2015 to 9 October 2015 0,820% From 10 October 2015 to 9 January 2016 0,750%
Investment Solutions by Epsilon - Valore Cedola x 5 - 04/2013
Investment Period Rate of Redemption Commission
From 5 December 2014 to 4 March 2015 1,050% From 5 March 2015 to 4 June 2015 0,970% From 5 June 2015 to 4 September 2015 0,900% From 5 September 2015 to 4 December 2015 0,820% From 5 December 2015 to 4 March 2016 0,750%
Investment Solutions by Epsilon - Valore Cedola x 5 - 06/2013
Investment Period Rate of Redemption Commission
From 24 October 2014 to 23 January 2015 1,125% From 24 January 2015 to 23 April 2015 1,050% From 24 April 2015 to 23 July 2015 0,975% From 24 July 2015 to 23 October 2015 0,900% From 24 October 2015 to 23 January 2016 0,825%
337
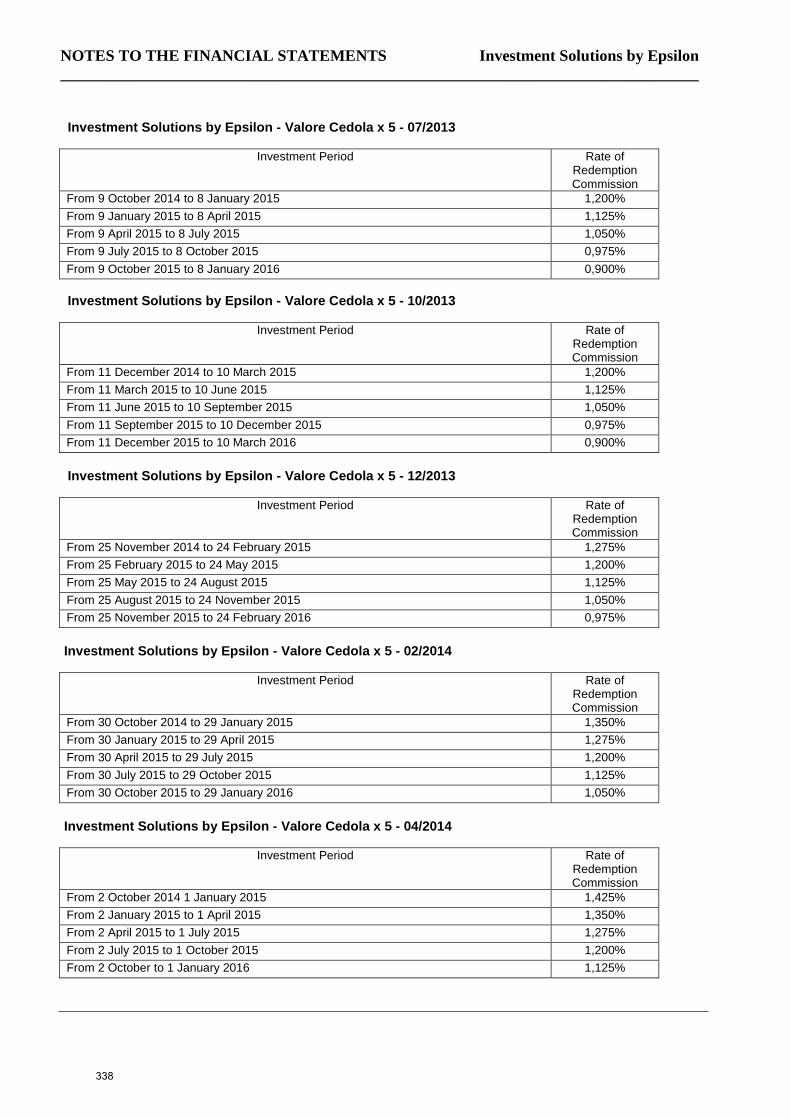
NOTES TO THE FINANCIAL STATEMENTS Investment Solutions by Epsilon ________________________________________________________________________________
Investment Solutions by Epsilon - Valore Cedola x 5 - 07/2013
Investment Period Rate of Redemption Commission
From 9 October 2014 to 8 January 2015 1,200% From 9 January 2015 to 8 April 2015 1,125% From 9 April 2015 to 8 July 2015 1,050% From 9 July 2015 to 8 October 2015 0,975% From 9 October 2015 to 8 January 2016 0,900%
Investment Solutions by Epsilon - Valore Cedola x 5 - 10/2013
Investment Period Rate of
Redemption Commission
From 11 December 2014 to 10 March 2015 1,200% From 11 March 2015 to 10 June 2015 1,125% From 11 June 2015 to 10 September 2015 1,050% From 11 September 2015 to 10 December 2015 0,975% From 11 December 2015 to 10 March 2016 0,900%
Investment Solutions by Epsilon - Valore Cedola x 5 - 12/2013
Investment Period Rate of
Redemption Commission
From 25 November 2014 to 24 February 2015 1,275% From 25 February 2015 to 24 May 2015 1,200% From 25 May 2015 to 24 August 2015 1,125% From 25 August 2015 to 24 November 2015 1,050% From 25 November 2015 to 24 February 2016 0,975%
Investment Solutions by Epsilon - Valore Cedola x 5 - 02/2014
Investment Period Rate of Redemption Commission
From 30 October 2014 to 29 January 2015 1,350% From 30 January 2015 to 29 April 2015 1,275% From 30 April 2015 to 29 July 2015 1,200% From 30 July 2015 to 29 October 2015 1,125% From 30 October 2015 to 29 January 2016 1,050%
Investment Solutions by Epsilon - Valore Cedola x 5 - 04/2014
Investment Period Rate of Redemption Commission
From 2 October 2014 1 January 2015 1,425% From 2 January 2015 to 1 April 2015 1,350% From 2 April 2015 to 1 July 2015 1,275% From 2 July 2015 to 1 October 2015 1,200% From 2 October to 1 January 2016 1,125%
338
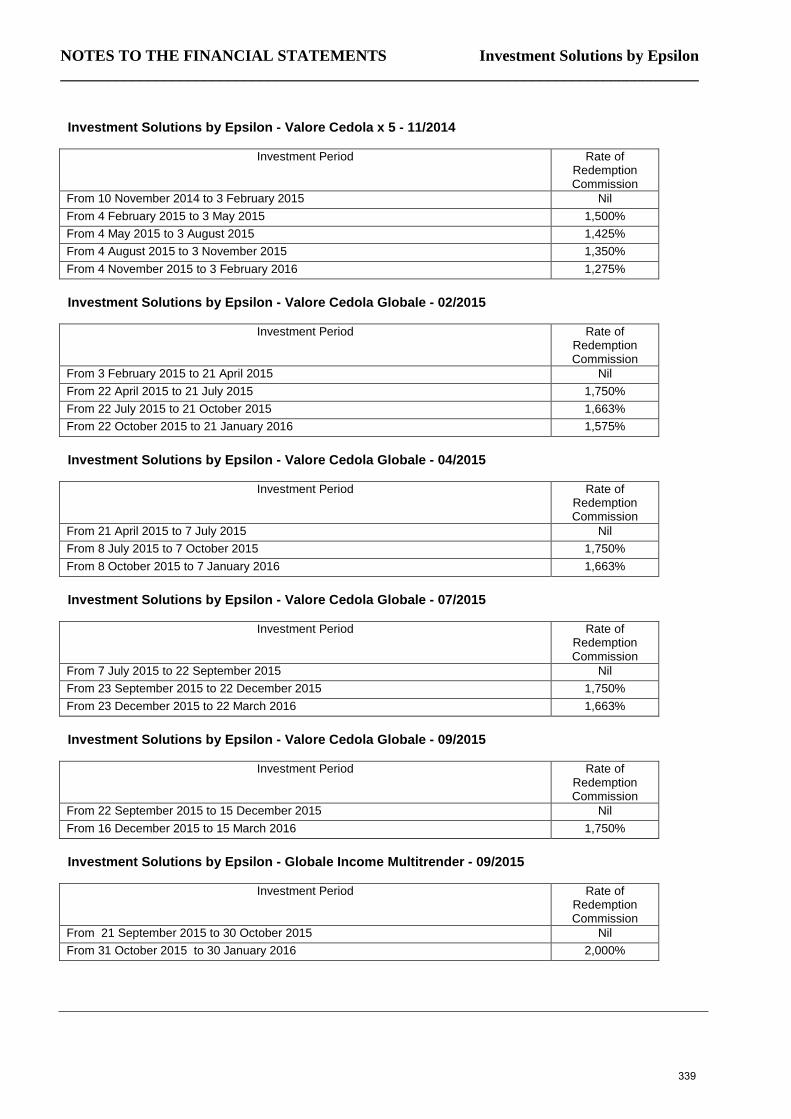
NOTES TO THE FINANCIAL STATEMENTS Investment Solutions by Epsilon ________________________________________________________________________________
Investment Solutions by Epsilon - Valore Cedola x 5 - 11/2014
Investment Period Rate of Redemption Commission
From 10 November 2014 to 3 February 2015 Nil From 4 February 2015 to 3 May 2015 1,500% From 4 May 2015 to 3 August 2015 1,425% From 4 August 2015 to 3 November 2015 1,350% From 4 November 2015 to 3 February 2016 1,275%
Investment Solutions by Epsilon - Valore Cedola Globale - 02/2015
Investment Period Rate of Redemption Commission
From 3 February 2015 to 21 April 2015 Nil From 22 April 2015 to 21 July 2015 1,750% From 22 July 2015 to 21 October 2015 1,663% From 22 October 2015 to 21 January 2016 1,575%
Investment Solutions by Epsilon - Valore Cedola Globale - 04/2015
Investment Period Rate of Redemption Commission
From 21 April 2015 to 7 July 2015 Nil From 8 July 2015 to 7 October 2015 1,750% From 8 October 2015 to 7 January 2016 1,663%
Investment Solutions by Epsilon - Valore Cedola Globale - 07/2015
Investment Period Rate of Redemption Commission
From 7 July 2015 to 22 September 2015 Nil From 23 September 2015 to 22 December 2015 1,750% From 23 December 2015 to 22 March 2016 1,663%
Investment Solutions by Epsilon - Valore Cedola Globale - 09/2015
Investment Period Rate of Redemption Commission
From 22 September 2015 to 15 December 2015 Nil From 16 December 2015 to 15 March 2016 1,750%
Investment Solutions by Epsilon - Globale Income Multitrender - 09/2015
Investment Period Rate of Redemption Commission
From 21 September 2015 to 30 October 2015 Nil From 31 October 2015 to 30 January 2016 2,000%
339
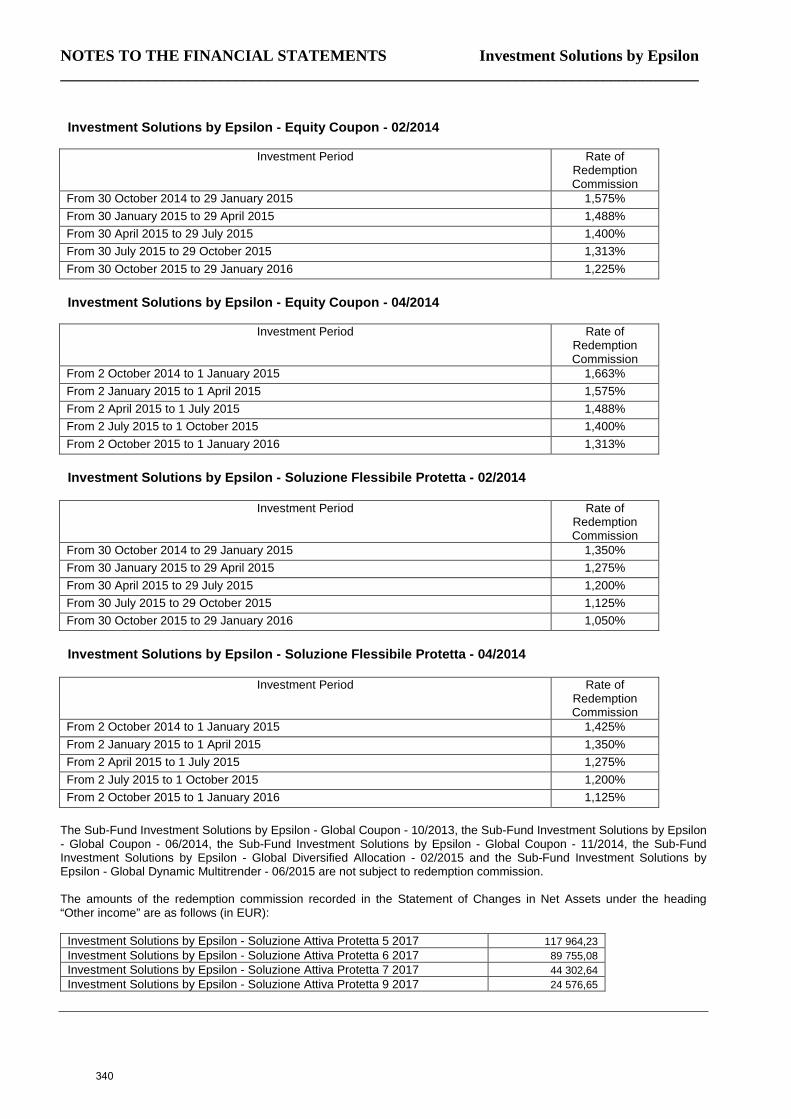
NOTES TO THE FINANCIAL STATEMENTS Investment Solutions by Epsilon ________________________________________________________________________________
Investment Solutions by Epsilon - Equity Coupon - 02/2014
Investment Period Rate of Redemption Commission
From 30 October 2014 to 29 January 2015 1,575% From 30 January 2015 to 29 April 2015 1,488% From 30 April 2015 to 29 July 2015 1,400% From 30 July 2015 to 29 October 2015 1,313% From 30 October 2015 to 29 January 2016 1,225%
Investment Solutions by Epsilon - Equity Coupon - 04/2014
Investment Period Rate of Redemption Commission
From 2 October 2014 to 1 January 2015 1,663% From 2 January 2015 to 1 April 2015 1,575% From 2 April 2015 to 1 July 2015 1,488% From 2 July 2015 to 1 October 2015 1,400% From 2 October 2015 to 1 January 2016 1,313%
Investment Solutions by Epsilon - Soluzione Flessibile Protetta - 02/2014
Investment Period Rate of Redemption Commission
From 30 October 2014 to 29 January 2015 1,350% From 30 January 2015 to 29 April 2015 1,275% From 30 April 2015 to 29 July 2015 1,200% From 30 July 2015 to 29 October 2015 1,125% From 30 October 2015 to 29 January 2016 1,050%
Investment Solutions by Epsilon - Soluzione Flessibile Protetta - 04/2014
Investment Period Rate of Redemption Commission
From 2 October 2014 to 1 January 2015 1,425% From 2 January 2015 to 1 April 2015 1,350% From 2 April 2015 to 1 July 2015 1,275% From 2 July 2015 to 1 October 2015 1,200% From 2 October 2015 to 1 January 2016 1,125%
The Sub-Fund Investment Solutions by Epsilon - Global Coupon - 10/2013, the Sub-Fund Investment Solutions by Epsilon - Global Coupon - 06/2014, the Sub-Fund Investment Solutions by Epsilon - Global Coupon - 11/2014, the Sub-Fund Investment Solutions by Epsilon - Global Diversified Allocation - 02/2015 and the Sub-Fund Investment Solutions by Epsilon - Global Dynamic Multitrender - 06/2015 are not subject to redemption commission. The amounts of the redemption commission recorded in the Statement of Changes in Net Assets under the heading “Other income” are as follows (in EUR):
Investment Solutions by Epsilon - Soluzione Attiva Protetta 5 2017 117 964,23 Investment Solutions by Epsilon - Soluzione Attiva Protetta 6 2017 89 755,08 Investment Solutions by Epsilon - Soluzione Attiva Protetta 7 2017 44 302,64 Investment Solutions by Epsilon - Soluzione Attiva Protetta 9 2017 24 576,65
340
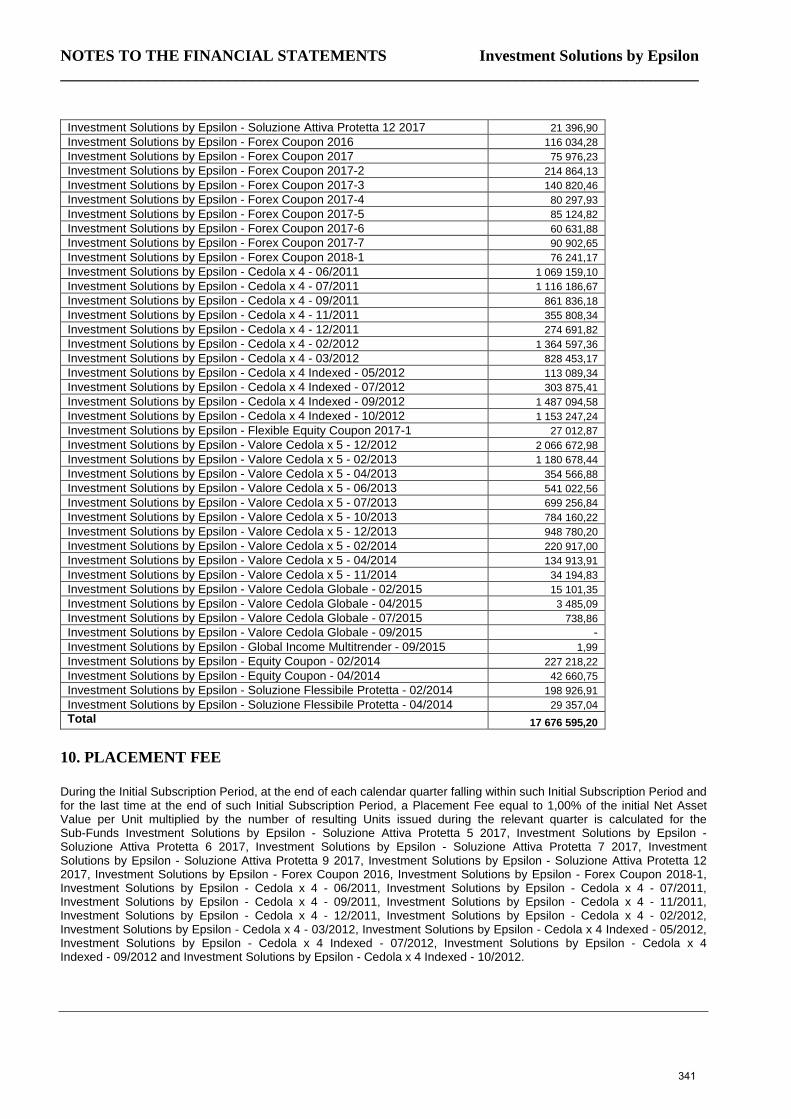
NOTES TO THE FINANCIAL STATEMENTS Investment Solutions by Epsilon ________________________________________________________________________________
Investment Solutions by Epsilon - Soluzione Attiva Protetta 12 2017 21 396,90 Investment Solutions by Epsilon - Forex Coupon 2016 116 034,28 Investment Solutions by Epsilon - Forex Coupon 2017 75 976,23 Investment Solutions by Epsilon - Forex Coupon 2017-2 214 864,13 Investment Solutions by Epsilon - Forex Coupon 2017-3 140 820,46 Investment Solutions by Epsilon - Forex Coupon 2017-4 80 297,93 Investment Solutions by Epsilon - Forex Coupon 2017-5 85 124,82 Investment Solutions by Epsilon - Forex Coupon 2017-6 60 631,88 Investment Solutions by Epsilon - Forex Coupon 2017-7 90 902,65 Investment Solutions by Epsilon - Forex Coupon 2018-1 76 241,17 Investment Solutions by Epsilon - Cedola x 4 - 06/2011 1 069 159,10 Investment Solutions by Epsilon - Cedola x 4 - 07/2011 1 116 186,67 Investment Solutions by Epsilon - Cedola x 4 - 09/2011 861 836,18 Investment Solutions by Epsilon - Cedola x 4 - 11/2011 355 808,34 Investment Solutions by Epsilon - Cedola x 4 - 12/2011 274 691,82 Investment Solutions by Epsilon - Cedola x 4 - 02/2012 1 364 597,36 Investment Solutions by Epsilon - Cedola x 4 - 03/2012 828 453,17 Investment Solutions by Epsilon - Cedola x 4 Indexed - 05/2012 113 089,34 Investment Solutions by Epsilon - Cedola x 4 Indexed - 07/2012 303 875,41 Investment Solutions by Epsilon - Cedola x 4 Indexed - 09/2012 1 487 094,58 Investment Solutions by Epsilon - Cedola x 4 Indexed - 10/2012 1 153 247,24 Investment Solutions by Epsilon - Flexible Equity Coupon 2017-1 27 012,87 Investment Solutions by Epsilon - Valore Cedola x 5 - 12/2012 2 066 672,98 Investment Solutions by Epsilon - Valore Cedola x 5 - 02/2013 1 180 678,44 Investment Solutions by Epsilon - Valore Cedola x 5 - 04/2013 354 566,88 Investment Solutions by Epsilon - Valore Cedola x 5 - 06/2013 541 022,56 Investment Solutions by Epsilon - Valore Cedola x 5 - 07/2013 699 256,84 Investment Solutions by Epsilon - Valore Cedola x 5 - 10/2013 784 160,22 Investment Solutions by Epsilon - Valore Cedola x 5 - 12/2013 948 780,20 Investment Solutions by Epsilon - Valore Cedola x 5 - 02/2014 220 917,00 Investment Solutions by Epsilon - Valore Cedola x 5 - 04/2014 134 913,91 Investment Solutions by Epsilon - Valore Cedola x 5 - 11/2014 34 194,83 Investment Solutions by Epsilon - Valore Cedola Globale - 02/2015 15 101,35 Investment Solutions by Epsilon - Valore Cedola Globale - 04/2015 3 485,09 Investment Solutions by Epsilon - Valore Cedola Globale - 07/2015 738,86 Investment Solutions by Epsilon - Valore Cedola Globale - 09/2015 - Investment Solutions by Epsilon - Global Income Multitrender - 09/2015 1,99 Investment Solutions by Epsilon - Equity Coupon - 02/2014 227 218,22 Investment Solutions by Epsilon - Equity Coupon - 04/2014 42 660,75 Investment Solutions by Epsilon - Soluzione Flessibile Protetta - 02/2014 198 926,91 Investment Solutions by Epsilon - Soluzione Flessibile Protetta - 04/2014 29 357,04 Total 17 676 595,20
10. PLACEMENT FEE During the Initial Subscription Period, at the end of each calendar quarter falling within such Initial Subscription Period and for the last time at the end of such Initial Subscription Period, a Placement Fee equal to 1,00% of the initial Net Asset Value per Unit multiplied by the number of resulting Units issued during the relevant quarter is calculated for the Sub-Funds Investment Solutions by Epsilon - Soluzione Attiva Protetta 5 2017, Investment Solutions by Epsilon - Soluzione Attiva Protetta 6 2017, Investment Solutions by Epsilon - Soluzione Attiva Protetta 7 2017, Investment Solutions by Epsilon - Soluzione Attiva Protetta 9 2017, Investment Solutions by Epsilon - Soluzione Attiva Protetta 12 2017, Investment Solutions by Epsilon - Forex Coupon 2016, Investment Solutions by Epsilon - Forex Coupon 2018-1, Investment Solutions by Epsilon - Cedola x 4 - 06/2011, Investment Solutions by Epsilon - Cedola x 4 - 07/2011, Investment Solutions by Epsilon - Cedola x 4 - 09/2011, Investment Solutions by Epsilon - Cedola x 4 - 11/2011, Investment Solutions by Epsilon - Cedola x 4 - 12/2011, Investment Solutions by Epsilon - Cedola x 4 - 02/2012, Investment Solutions by Epsilon - Cedola x 4 - 03/2012, Investment Solutions by Epsilon - Cedola x 4 Indexed - 05/2012, Investment Solutions by Epsilon - Cedola x 4 Indexed - 07/2012, Investment Solutions by Epsilon - Cedola x 4 Indexed - 09/2012 and Investment Solutions by Epsilon - Cedola x 4 Indexed - 10/2012.
341
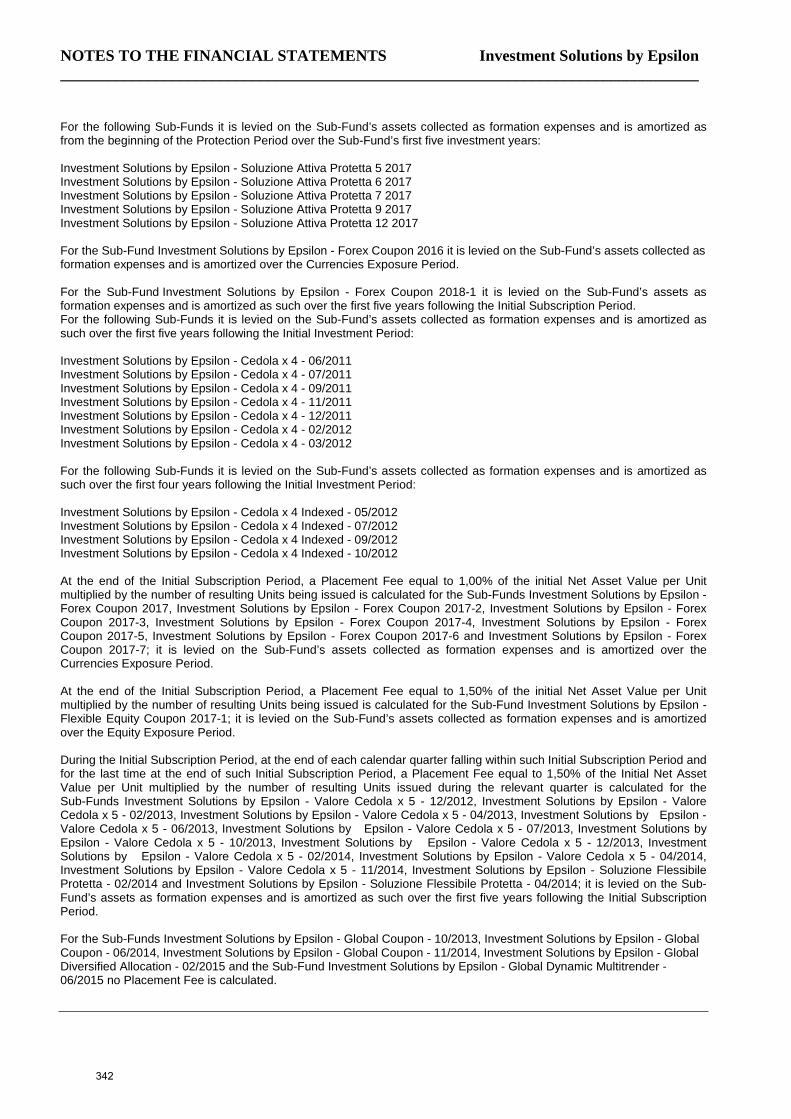
NOTES TO THE FINANCIAL STATEMENTS Investment Solutions by Epsilon ________________________________________________________________________________
For the following Sub-Funds it is levied on the Sub-Fund’s assets collected as formation expenses and is amortized as from the beginning of the Protection Period over the Sub-Fund’s first five investment years: Investment Solutions by Epsilon - Soluzione Attiva Protetta 5 2017 Investment Solutions by Epsilon - Soluzione Attiva Protetta 6 2017 Investment Solutions by Epsilon - Soluzione Attiva Protetta 7 2017 Investment Solutions by Epsilon - Soluzione Attiva Protetta 9 2017 Investment Solutions by Epsilon - Soluzione Attiva Protetta 12 2017 For the Sub-Fund Investment Solutions by Epsilon - Forex Coupon 2016 it is levied on the Sub-Fund’s assets collected as formation expenses and is amortized over the Currencies Exposure Period. For the Sub-Fund Investment Solutions by Epsilon - Forex Coupon 2018-1 it is levied on the Sub-Fund’s assets as formation expenses and is amortized as such over the first five years following the Initial Subscription Period. For the following Sub-Funds it is levied on the Sub-Fund’s assets collected as formation expenses and is amortized as such over the first five years following the Initial Investment Period: Investment Solutions by Epsilon - Cedola x 4 - 06/2011 Investment Solutions by Epsilon - Cedola x 4 - 07/2011 Investment Solutions by Epsilon - Cedola x 4 - 09/2011 Investment Solutions by Epsilon - Cedola x 4 - 11/2011 Investment Solutions by Epsilon - Cedola x 4 - 12/2011 Investment Solutions by Epsilon - Cedola x 4 - 02/2012 Investment Solutions by Epsilon - Cedola x 4 - 03/2012 For the following Sub-Funds it is levied on the Sub-Fund’s assets collected as formation expenses and is amortized as such over the first four years following the Initial Investment Period: Investment Solutions by Epsilon - Cedola x 4 Indexed - 05/2012 Investment Solutions by Epsilon - Cedola x 4 Indexed - 07/2012 Investment Solutions by Epsilon - Cedola x 4 Indexed - 09/2012 Investment Solutions by Epsilon - Cedola x 4 Indexed - 10/2012 At the end of the Initial Subscription Period, a Placement Fee equal to 1,00% of the initial Net Asset Value per Unit multiplied by the number of resulting Units being issued is calculated for the Sub-Funds Investment Solutions by Epsilon - Forex Coupon 2017, Investment Solutions by Epsilon - Forex Coupon 2017-2, Investment Solutions by Epsilon - Forex Coupon 2017-3, Investment Solutions by Epsilon - Forex Coupon 2017-4, Investment Solutions by Epsilon - Forex Coupon 2017-5, Investment Solutions by Epsilon - Forex Coupon 2017-6 and Investment Solutions by Epsilon - Forex Coupon 2017-7; it is levied on the Sub-Fund’s assets collected as formation expenses and is amortized over the Currencies Exposure Period. At the end of the Initial Subscription Period, a Placement Fee equal to 1,50% of the initial Net Asset Value per Unit multiplied by the number of resulting Units being issued is calculated for the Sub-Fund Investment Solutions by Epsilon - Flexible Equity Coupon 2017-1; it is levied on the Sub-Fund’s assets collected as formation expenses and is amortized over the Equity Exposure Period. During the Initial Subscription Period, at the end of each calendar quarter falling within such Initial Subscription Period and for the last time at the end of such Initial Subscription Period, a Placement Fee equal to 1,50% of the Initial Net Asset Value per Unit multiplied by the number of resulting Units issued during the relevant quarter is calculated for the Sub-Funds Investment Solutions by Epsilon - Valore Cedola x 5 - 12/2012, Investment Solutions by Epsilon - Valore Cedola x 5 - 02/2013, Investment Solutions by Epsilon - Valore Cedola x 5 - 04/2013, Investment Solutions by Epsilon - Valore Cedola x 5 - 06/2013, Investment Solutions by Epsilon - Valore Cedola x 5 - 07/2013, Investment Solutions by Epsilon - Valore Cedola x 5 - 10/2013, Investment Solutions by Epsilon - Valore Cedola x 5 - 12/2013, Investment Solutions by Epsilon - Valore Cedola x 5 - 02/2014, Investment Solutions by Epsilon - Valore Cedola x 5 - 04/2014, Investment Solutions by Epsilon - Valore Cedola x 5 - 11/2014, Investment Solutions by Epsilon - Soluzione Flessibile Protetta - 02/2014 and Investment Solutions by Epsilon - Soluzione Flessibile Protetta - 04/2014; it is levied on the Sub-Fund’s assets as formation expenses and is amortized as such over the first five years following the Initial Subscription Period. For the Sub-Funds Investment Solutions by Epsilon - Global Coupon - 10/2013, Investment Solutions by Epsilon - Global Coupon - 06/2014, Investment Solutions by Epsilon - Global Coupon - 11/2014, Investment Solutions by Epsilon - Global Diversified Allocation - 02/2015 and the Sub-Fund Investment Solutions by Epsilon - Global Dynamic Multitrender - 06/2015 no Placement Fee is calculated.
342
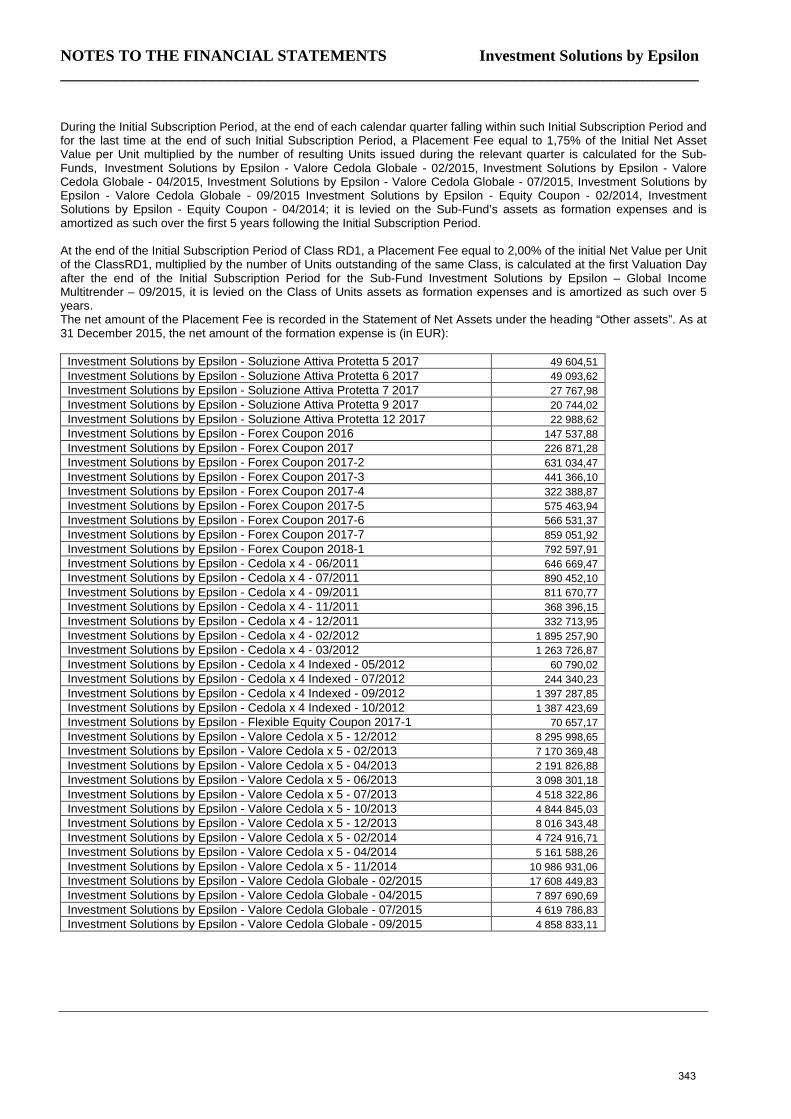
NOTES TO THE FINANCIAL STATEMENTS Investment Solutions by Epsilon ________________________________________________________________________________
During the Initial Subscription Period, at the end of each calendar quarter falling within such Initial Subscription Period and for the last time at the end of such Initial Subscription Period, a Placement Fee equal to 1,75% of the Initial Net Asset Value per Unit multiplied by the number of resulting Units issued during the relevant quarter is calculated for the Sub-Funds, Investment Solutions by Epsilon - Valore Cedola Globale - 02/2015, Investment Solutions by Epsilon - Valore Cedola Globale - 04/2015, Investment Solutions by Epsilon - Valore Cedola Globale - 07/2015, Investment Solutions by Epsilon - Valore Cedola Globale - 09/2015 Investment Solutions by Epsilon - Equity Coupon - 02/2014, Investment Solutions by Epsilon - Equity Coupon - 04/2014; it is levied on the Sub-Fund’s assets as formation expenses and is amortized as such over the first 5 years following the Initial Subscription Period. At the end of the Initial Subscription Period of Class RD1, a Placement Fee equal to 2,00% of the initial Net Value per Unit of the ClassRD1, multiplied by the number of Units outstanding of the same Class, is calculated at the first Valuation Day after the end of the Initial Subscription Period for the Sub-Fund Investment Solutions by Epsilon – Global Income Multitrender – 09/2015, it is levied on the Class of Units assets as formation expenses and is amortized as such over 5 years. The net amount of the Placement Fee is recorded in the Statement of Net Assets under the heading “Other assets”. As at 31 December 2015, the net amount of the formation expense is (in EUR):
Investment Solutions by Epsilon - Soluzione Attiva Protetta 5 2017 49 604,51 Investment Solutions by Epsilon - Soluzione Attiva Protetta 6 2017 49 093,62 Investment Solutions by Epsilon - Soluzione Attiva Protetta 7 2017 27 767,98 Investment Solutions by Epsilon - Soluzione Attiva Protetta 9 2017 20 744,02 Investment Solutions by Epsilon - Soluzione Attiva Protetta 12 2017 22 988,62 Investment Solutions by Epsilon - Forex Coupon 2016 147 537,88 Investment Solutions by Epsilon - Forex Coupon 2017 226 871,28 Investment Solutions by Epsilon - Forex Coupon 2017-2 631 034,47 Investment Solutions by Epsilon - Forex Coupon 2017-3 441 366,10 Investment Solutions by Epsilon - Forex Coupon 2017-4 322 388,87 Investment Solutions by Epsilon - Forex Coupon 2017-5 575 463,94 Investment Solutions by Epsilon - Forex Coupon 2017-6 566 531,37 Investment Solutions by Epsilon - Forex Coupon 2017-7 859 051,92 Investment Solutions by Epsilon - Forex Coupon 2018-1 792 597,91 Investment Solutions by Epsilon - Cedola x 4 - 06/2011 646 669,47 Investment Solutions by Epsilon - Cedola x 4 - 07/2011 890 452,10 Investment Solutions by Epsilon - Cedola x 4 - 09/2011 811 670,77 Investment Solutions by Epsilon - Cedola x 4 - 11/2011 368 396,15 Investment Solutions by Epsilon - Cedola x 4 - 12/2011 332 713,95 Investment Solutions by Epsilon - Cedola x 4 - 02/2012 1 895 257,90 Investment Solutions by Epsilon - Cedola x 4 - 03/2012 1 263 726,87 Investment Solutions by Epsilon - Cedola x 4 Indexed - 05/2012 60 790,02 Investment Solutions by Epsilon - Cedola x 4 Indexed - 07/2012 244 340,23 Investment Solutions by Epsilon - Cedola x 4 Indexed - 09/2012 1 397 287,85 Investment Solutions by Epsilon - Cedola x 4 Indexed - 10/2012 1 387 423,69 Investment Solutions by Epsilon - Flexible Equity Coupon 2017-1 70 657,17 Investment Solutions by Epsilon - Valore Cedola x 5 - 12/2012 8 295 998,65 Investment Solutions by Epsilon - Valore Cedola x 5 - 02/2013 7 170 369,48 Investment Solutions by Epsilon - Valore Cedola x 5 - 04/2013 2 191 826,88 Investment Solutions by Epsilon - Valore Cedola x 5 - 06/2013 3 098 301,18 Investment Solutions by Epsilon - Valore Cedola x 5 - 07/2013 4 518 322,86 Investment Solutions by Epsilon - Valore Cedola x 5 - 10/2013 4 844 845,03 Investment Solutions by Epsilon - Valore Cedola x 5 - 12/2013 8 016 343,48 Investment Solutions by Epsilon - Valore Cedola x 5 - 02/2014 4 724 916,71 Investment Solutions by Epsilon - Valore Cedola x 5 - 04/2014 5 161 588,26 Investment Solutions by Epsilon - Valore Cedola x 5 - 11/2014 10 986 931,06 Investment Solutions by Epsilon - Valore Cedola Globale - 02/2015 17 608 449,83 Investment Solutions by Epsilon - Valore Cedola Globale - 04/2015 7 897 690,69 Investment Solutions by Epsilon - Valore Cedola Globale - 07/2015 4 619 786,83 Investment Solutions by Epsilon - Valore Cedola Globale - 09/2015 4 858 833,11
343
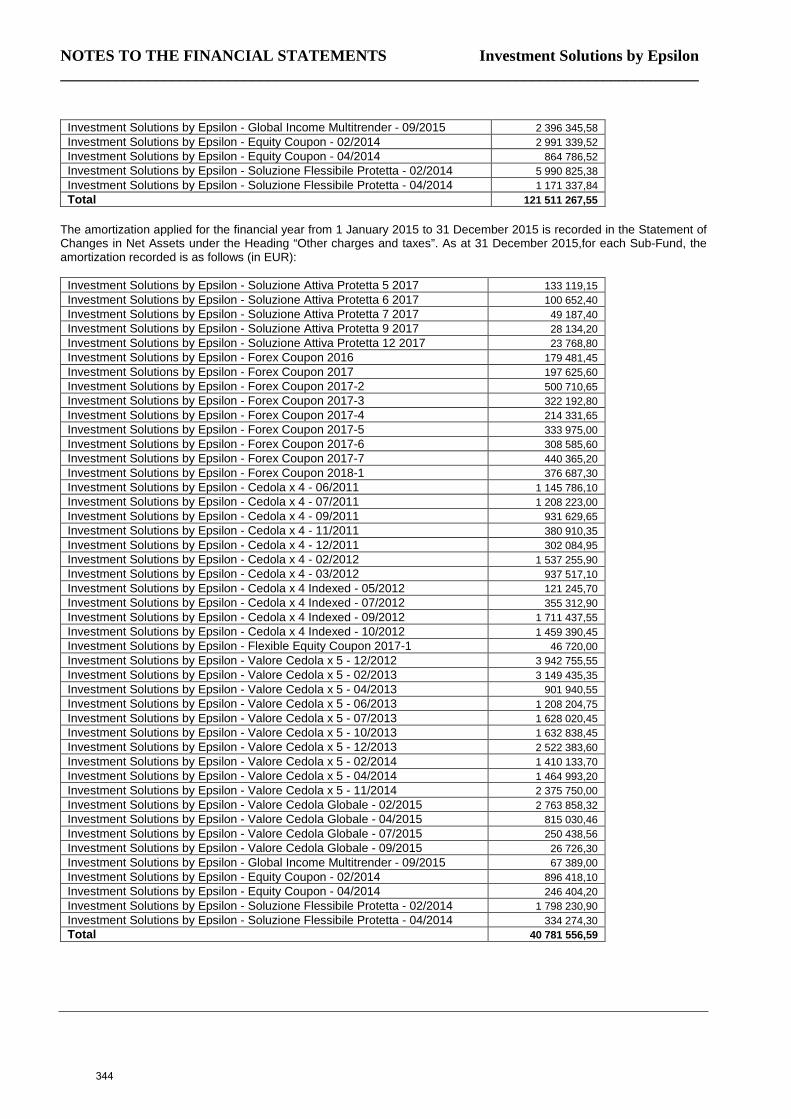
NOTES TO THE FINANCIAL STATEMENTS Investment Solutions by Epsilon ________________________________________________________________________________
Investment Solutions by Epsilon - Global Income Multitrender - 09/2015 2 396 345,58 Investment Solutions by Epsilon - Equity Coupon - 02/2014 2 991 339,52 Investment Solutions by Epsilon - Equity Coupon - 04/2014 864 786,52 Investment Solutions by Epsilon - Soluzione Flessibile Protetta - 02/2014 5 990 825,38 Investment Solutions by Epsilon - Soluzione Flessibile Protetta - 04/2014 1 171 337,84 Total 121 511 267,55
The amortization applied for the financial year from 1 January 2015 to 31 December 2015 is recorded in the Statement of Changes in Net Assets under the Heading “Other charges and taxes”. As at 31 December 2015,for each Sub-Fund, the amortization recorded is as follows (in EUR):
Investment Solutions by Epsilon - Soluzione Attiva Protetta 5 2017 133 119,15 Investment Solutions by Epsilon - Soluzione Attiva Protetta 6 2017 100 652,40 Investment Solutions by Epsilon - Soluzione Attiva Protetta 7 2017 49 187,40 Investment Solutions by Epsilon - Soluzione Attiva Protetta 9 2017 28 134,20 Investment Solutions by Epsilon - Soluzione Attiva Protetta 12 2017 23 768,80 Investment Solutions by Epsilon - Forex Coupon 2016 179 481,45 Investment Solutions by Epsilon - Forex Coupon 2017 197 625,60 Investment Solutions by Epsilon - Forex Coupon 2017-2 500 710,65 Investment Solutions by Epsilon - Forex Coupon 2017-3 322 192,80 Investment Solutions by Epsilon - Forex Coupon 2017-4 214 331,65 Investment Solutions by Epsilon - Forex Coupon 2017-5 333 975,00 Investment Solutions by Epsilon - Forex Coupon 2017-6 308 585,60 Investment Solutions by Epsilon - Forex Coupon 2017-7 440 365,20 Investment Solutions by Epsilon - Forex Coupon 2018-1 376 687,30 Investment Solutions by Epsilon - Cedola x 4 - 06/2011 1 145 786,10 Investment Solutions by Epsilon - Cedola x 4 - 07/2011 1 208 223,00 Investment Solutions by Epsilon - Cedola x 4 - 09/2011 931 629,65 Investment Solutions by Epsilon - Cedola x 4 - 11/2011 380 910,35 Investment Solutions by Epsilon - Cedola x 4 - 12/2011 302 084,95 Investment Solutions by Epsilon - Cedola x 4 - 02/2012 1 537 255,90 Investment Solutions by Epsilon - Cedola x 4 - 03/2012 937 517,10 Investment Solutions by Epsilon - Cedola x 4 Indexed - 05/2012 121 245,70 Investment Solutions by Epsilon - Cedola x 4 Indexed - 07/2012 355 312,90 Investment Solutions by Epsilon - Cedola x 4 Indexed - 09/2012 1 711 437,55 Investment Solutions by Epsilon - Cedola x 4 Indexed - 10/2012 1 459 390,45 Investment Solutions by Epsilon - Flexible Equity Coupon 2017-1 46 720,00 Investment Solutions by Epsilon - Valore Cedola x 5 - 12/2012 3 942 755,55 Investment Solutions by Epsilon - Valore Cedola x 5 - 02/2013 3 149 435,35 Investment Solutions by Epsilon - Valore Cedola x 5 - 04/2013 901 940,55 Investment Solutions by Epsilon - Valore Cedola x 5 - 06/2013 1 208 204,75 Investment Solutions by Epsilon - Valore Cedola x 5 - 07/2013 1 628 020,45 Investment Solutions by Epsilon - Valore Cedola x 5 - 10/2013 1 632 838,45 Investment Solutions by Epsilon - Valore Cedola x 5 - 12/2013 2 522 383,60 Investment Solutions by Epsilon - Valore Cedola x 5 - 02/2014 1 410 133,70 Investment Solutions by Epsilon - Valore Cedola x 5 - 04/2014 1 464 993,20 Investment Solutions by Epsilon - Valore Cedola x 5 - 11/2014 2 375 750,00 Investment Solutions by Epsilon - Valore Cedola Globale - 02/2015 2 763 858,32 Investment Solutions by Epsilon - Valore Cedola Globale - 04/2015 815 030,46 Investment Solutions by Epsilon - Valore Cedola Globale - 07/2015 250 438,56 Investment Solutions by Epsilon - Valore Cedola Globale - 09/2015 26 726,30 Investment Solutions by Epsilon - Global Income Multitrender - 09/2015 67 389,00 Investment Solutions by Epsilon - Equity Coupon - 02/2014 896 418,10 Investment Solutions by Epsilon - Equity Coupon - 04/2014 246 404,20 Investment Solutions by Epsilon - Soluzione Flessibile Protetta - 02/2014 1 798 230,90 Investment Solutions by Epsilon - Soluzione Flessibile Protetta - 04/2014 334 274,30 Total 40 781 556,59
344
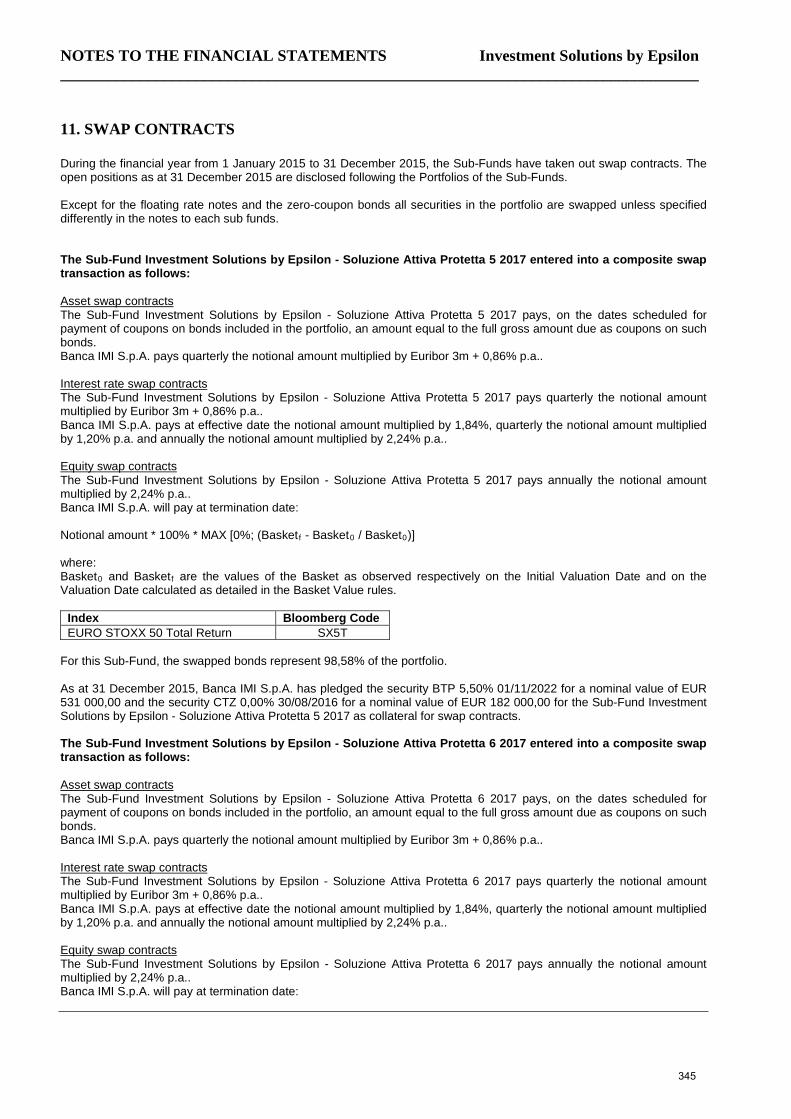
NOTES TO THE FINANCIAL STATEMENTS Investment Solutions by Epsilon ________________________________________________________________________________
11. SWAP CONTRACTS During the financial year from 1 January 2015 to 31 December 2015, the Sub-Funds have taken out swap contracts. The open positions as at 31 December 2015 are disclosed following the Portfolios of the Sub-Funds. Except for the floating rate notes and the zero-coupon bonds all securities in the portfolio are swapped unless specified differently in the notes to each sub funds. The Sub-Fund Investment Solutions by Epsilon - Soluzione Attiva Protetta 5 2017 entered into a composite swap transaction as follows: Asset swap contracts The Sub-Fund Investment Solutions by Epsilon - Soluzione Attiva Protetta 5 2017 pays, on the dates scheduled for payment of coupons on bonds included in the portfolio, an amount equal to the full gross amount due as coupons on such bonds. Banca IMI S.p.A. pays quarterly the notional amount multiplied by Euribor 3m + 0,86% p.a.. Interest rate swap contracts The Sub-Fund Investment Solutions by Epsilon - Soluzione Attiva Protetta 5 2017 pays quarterly the notional amount multiplied by Euribor 3m + 0,86% p.a.. Banca IMI S.p.A. pays at effective date the notional amount multiplied by 1,84%, quarterly the notional amount multiplied by 1,20% p.a. and annually the notional amount multiplied by 2,24% p.a.. Equity swap contracts The Sub-Fund Investment Solutions by Epsilon - Soluzione Attiva Protetta 5 2017 pays annually the notional amount multiplied by 2,24% p.a.. Banca IMI S.p.A. will pay at termination date: Notional amount * 100% * MAX [0%; (Basketf - Basket0 / Basket0)] where: Basket0 and Basketf are the values of the Basket as observed respectively on the Initial Valuation Date and on the Valuation Date calculated as detailed in the Basket Value rules.
Index Bloomberg Code EURO STOXX 50 Total Return SX5T
For this Sub-Fund, the swapped bonds represent 98,58% of the portfolio. As at 31 December 2015, Banca IMI S.p.A. has pledged the security BTP 5,50% 01/11/2022 for a nominal value of EUR 531 000,00 and the security CTZ 0,00% 30/08/2016 for a nominal value of EUR 182 000,00 for the Sub-Fund Investment Solutions by Epsilon - Soluzione Attiva Protetta 5 2017 as collateral for swap contracts. The Sub-Fund Investment Solutions by Epsilon - Soluzione Attiva Protetta 6 2017 entered into a composite swap transaction as follows: Asset swap contracts The Sub-Fund Investment Solutions by Epsilon - Soluzione Attiva Protetta 6 2017 pays, on the dates scheduled for payment of coupons on bonds included in the portfolio, an amount equal to the full gross amount due as coupons on such bonds. Banca IMI S.p.A. pays quarterly the notional amount multiplied by Euribor 3m + 0,86% p.a.. Interest rate swap contracts The Sub-Fund Investment Solutions by Epsilon - Soluzione Attiva Protetta 6 2017 pays quarterly the notional amount multiplied by Euribor 3m + 0,86% p.a.. Banca IMI S.p.A. pays at effective date the notional amount multiplied by 1,84%, quarterly the notional amount multiplied by 1,20% p.a. and annually the notional amount multiplied by 2,24% p.a.. Equity swap contracts The Sub-Fund Investment Solutions by Epsilon - Soluzione Attiva Protetta 6 2017 pays annually the notional amount multiplied by 2,24% p.a.. Banca IMI S.p.A. will pay at termination date:
345
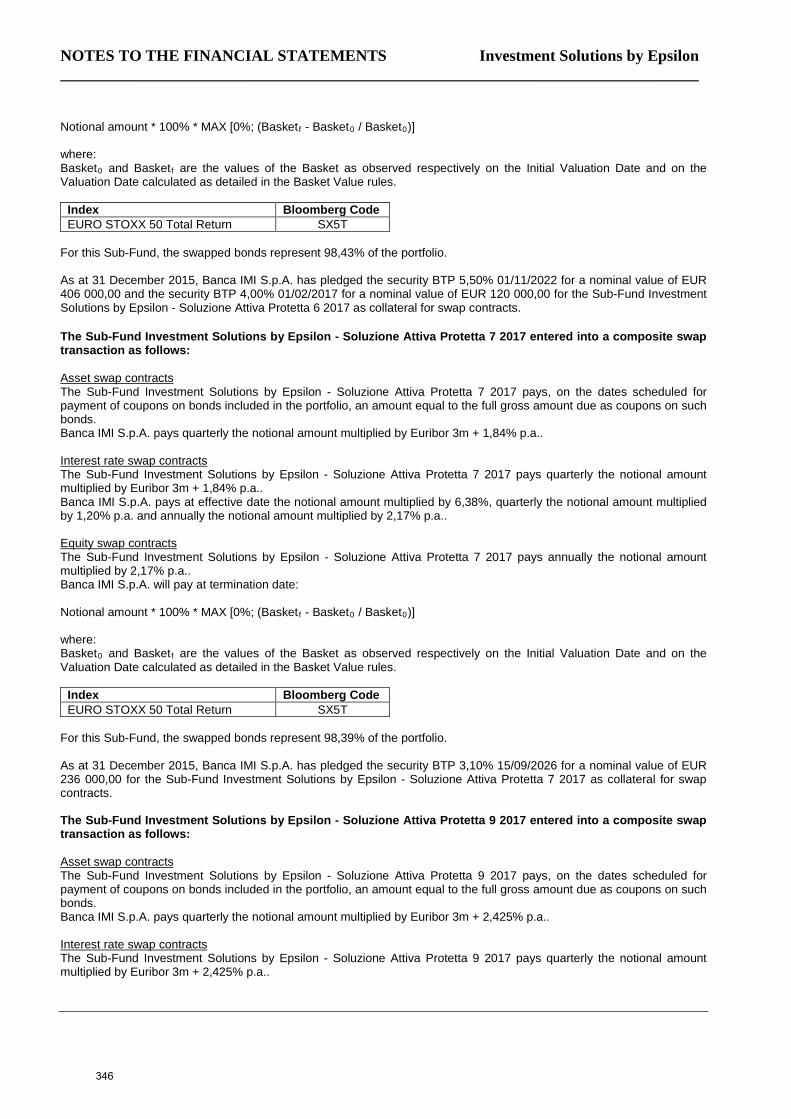
NOTES TO THE FINANCIAL STATEMENTS Investment Solutions by Epsilon ________________________________________________________________________________
Notional amount * 100% * MAX [0%; (Basketf - Basket0 / Basket0)] where: Basket0 and Basketf are the values of the Basket as observed respectively on the Initial Valuation Date and on the Valuation Date calculated as detailed in the Basket Value rules.
Index Bloomberg Code EURO STOXX 50 Total Return SX5T
For this Sub-Fund, the swapped bonds represent 98,43% of the portfolio. As at 31 December 2015, Banca IMI S.p.A. has pledged the security BTP 5,50% 01/11/2022 for a nominal value of EUR 406 000,00 and the security BTP 4,00% 01/02/2017 for a nominal value of EUR 120 000,00 for the Sub-Fund Investment Solutions by Epsilon - Soluzione Attiva Protetta 6 2017 as collateral for swap contracts. The Sub-Fund Investment Solutions by Epsilon - Soluzione Attiva Protetta 7 2017 entered into a composite swap transaction as follows: Asset swap contracts The Sub-Fund Investment Solutions by Epsilon - Soluzione Attiva Protetta 7 2017 pays, on the dates scheduled for payment of coupons on bonds included in the portfolio, an amount equal to the full gross amount due as coupons on such bonds. Banca IMI S.p.A. pays quarterly the notional amount multiplied by Euribor 3m + 1,84% p.a.. Interest rate swap contracts The Sub-Fund Investment Solutions by Epsilon - Soluzione Attiva Protetta 7 2017 pays quarterly the notional amount multiplied by Euribor 3m + 1,84% p.a.. Banca IMI S.p.A. pays at effective date the notional amount multiplied by 6,38%, quarterly the notional amount multiplied by 1,20% p.a. and annually the notional amount multiplied by 2,17% p.a.. Equity swap contracts The Sub-Fund Investment Solutions by Epsilon - Soluzione Attiva Protetta 7 2017 pays annually the notional amount multiplied by 2,17% p.a.. Banca IMI S.p.A. will pay at termination date: Notional amount * 100% * MAX [0%; (Basketf - Basket0 / Basket0)] where: Basket0 and Basketf are the values of the Basket as observed respectively on the Initial Valuation Date and on the Valuation Date calculated as detailed in the Basket Value rules.
Index Bloomberg Code EURO STOXX 50 Total Return SX5T
For this Sub-Fund, the swapped bonds represent 98,39% of the portfolio. As at 31 December 2015, Banca IMI S.p.A. has pledged the security BTP 3,10% 15/09/2026 for a nominal value of EUR 236 000,00 for the Sub-Fund Investment Solutions by Epsilon - Soluzione Attiva Protetta 7 2017 as collateral for swap contracts. The Sub-Fund Investment Solutions by Epsilon - Soluzione Attiva Protetta 9 2017 entered into a composite swap transaction as follows: Asset swap contracts The Sub-Fund Investment Solutions by Epsilon - Soluzione Attiva Protetta 9 2017 pays, on the dates scheduled for payment of coupons on bonds included in the portfolio, an amount equal to the full gross amount due as coupons on such bonds. Banca IMI S.p.A. pays quarterly the notional amount multiplied by Euribor 3m + 2,425% p.a.. Interest rate swap contracts The Sub-Fund Investment Solutions by Epsilon - Soluzione Attiva Protetta 9 2017 pays quarterly the notional amount multiplied by Euribor 3m + 2,425% p.a..
346
NOTES TO THE FINANCIAL STATEMENTS Investment Solutions by Epsilon ________________________________________________________________________________
Banca IMI S.p.A. pays at effective date the notional amount multiplied by 6,47%, quarterly the notional amount multiplied by 1,20% p.a. and annually the notional amount multiplied by 2,00% p.a.. Equity swap contracts The Sub-Fund Investment Solutions by Epsilon - Soluzione Attiva Protetta 9 2017 pays annually the notional amount multiplied by 2,00% p.a.. Banca IMI S.p.A. will pay at termination date: Notional amount * 100% * MAX [0%; (Basketf - Basket0 / Basket0)] where: Basket0 and Basketf are the values of the Basket as observed respectively on the Initial Valuation Date and on the Valuation Date calculated as detailed in the Basket Value rules.
Index Bloomberg Code EURO STOXX 50 Total Return SX5T
For this Sub-Fund, the swapped bonds represent 95,95% of the portfolio. As at 31 December 2015, Banca IMI S.p.A. has pledged the security BTP 3,10% 15/09/2026 for a nominal value of EUR 44 000,00, the security BTP 5,50% 01/11/2022 for a nominal value of EUR 29 000,00 and the security CTZ 0,00% 30/08/2016 for a nominal value of EUR 33 000,00 for the Sub-Fund Investment Solutions by Epsilon - Soluzione Attiva Protetta 9 2017 as collateral for swap contracts. The Sub-Fund Investment Solutions by Epsilon - Soluzione Attiva Protetta 12 2017 entered into a composite swap transaction as follows: Asset swap contracts The Sub-Fund Investment Solutions by Epsilon - Soluzione Attiva Protetta 12 2017 pays at effective date the notional amount multiplied by 1,03742% and, on the dates scheduled for payment of coupons on bonds included in the portfolio, an amount equal to the full gross amount due as coupons on such bonds. Banca IMI S.p.A. pays quarterly the notional amount multiplied by Euribor 3m + 3,390% p.a.. Interest rate swap contracts The Sub-Fund Investment Solutions by Epsilon - Soluzione Attiva Protetta 12 2017 pays quarterly the notional amount multiplied by Euribor 3m + 3,390% p.a.. Banca IMI S.p.A. pays at effective date the notional amount multiplied by 5,45%, quarterly the notional amount multiplied by 1,20% p.a. and annually the notional amount multiplied by 3,15% p.a.. Equity swap contracts The Sub-Fund Investment Solutions by Epsilon - Soluzione Attiva Protetta 12 2017 pays annually the notional amount multiplied by 3,15% p.a.. Banca IMI S.p.A. will pay at termination date: Notional amount * 100% * MAX [0%; (Basketf - (90% x Basket0) / Basket0) where: Basket0 and Basketf are the values of the Basket as observed respectively on the Initial Valuation Date and on the Valuation Date calculated as detailed in the Basket Value rules.
Index Bloomberg Code EURO STOXX 50 Total Return SX5T
For this Sub-Fund, the swapped bonds represent 91,00% of the portfolio. As at 31 December 2015, Banca IMI S.p.A. has pledged the security BTP 5,50% 01/11/2022 for a nominal value of EUR 124 000,00 for the Sub-Fund Investment Solutions by Epsilon - Soluzione Attiva Protetta 12 2017 as collateral for swap contracts.
347
NOTES TO THE FINANCIAL STATEMENTS Investment Solutions by Epsilon ________________________________________________________________________________
The Sub-Fund Investment Solutions by Epsilon - Forex Coupon 2016 entered into an asset swap transaction and cross currency interest rate swap transactions as follows: Asset swap contracts The Sub-Fund Investment Solutions by Epsilon - Forex Coupon 2016 pays, on the dates scheduled for payment of coupons on bonds included in the portfolio, an amount equal to the full gross amount due as coupons on such bonds, at each bond maturity date, an amount equal to the notional amount of the bonds in the reference portfolio with a bond maturity date preceding termination date, and, at termination date, an amount equal to the accrued interest (if any) for the running coupon of each bond in the reference portfolio. Banca IMI S.p.A. pays at effective date the notional amount multiplied by 2,8691225%, quarterly the notional amount multiplied by 1,00% p.a., annually the notional amount multiplied by 2,7750% p.a. and at termination date the notional amount multiplied by 0,0169628%. Cross currency interest rate swap contracts The Sub-Fund Investment Solutions by Epsilon - Forex Coupon 2016 entered into 6 cross currency interest rate swap contracts by which it will pay at termination date an amount to be determined in accordance with the contracts whereas Banca IMI S.p.A. pays annually and at termination date amounts determining in accordance with the contracts. For this Sub-Fund, the swapped bonds represent 14,27% of the portfolio. As at 31 December 2015, the Sub-Fund has pledged the security BTP 5,25% 01/08/2017 for a nominal value of EUR 4 528 000,00 to Banca IMI S.p.A. as collateral for swap contracts. The Sub-Fund Investment Solutions by Epsilon - Forex Coupon 2017 entered into an asset swap transaction and cross currency interest rate swap transactions as follows: Asset swap contracts The Sub-Fund Investment Solutions by Epsilon - Forex Coupon 2017 pays, on the dates scheduled for payment of coupons on bonds included in the portfolio, an amount equal to the full gross amount due as coupons on such bonds, at each bond maturity date, an amount equal to the notional amount of the bonds in the reference portfolio with a bond maturity date preceding termination date, and, at termination date, an amount equal to the accrued interest (if any) for the running coupon of each bond in the reference portfolio and the sum of non par repayment of the reference portfolio. Banca IMI S.p.A. pays at effective date the sum of Pull-to-Par of the reference portfolio, quarterly the notional amount multiplied by 1,00% p.a., annually the notional amount multiplied by 2,0200% p.a., and, at termination date an amount equal to the sum of the notional amount of the bonds in the reference portfolio with a bond maturity date preceding termination date. Cross currency interest rate swap contracts The Sub-Fund Investment Solutions by Epsilon - Forex Coupon 2017 entered into 11 cross currency interest rate swap contracts by which it will pay at termination date an amount to be determined in accordance with the contracts whereas Banca IMI S.p.A. pays annually and at termination date amounts determining in accordance with the contracts. For this Sub-Fund, the swapped bonds represent 52,97% of the portfolio. As at 31 December 2015, the Sub-Fund has pledged the security BTP 4,00% 01/02/2017 for a nominal value of EUR 10 400 000,00 to Banca IMI S.p.A. as collateral for swap contracts. The Sub-Fund Investment Solutions by Epsilon - Forex Coupon 2017-2 entered into an asset swap transaction and cross currency interest rate swap transactions as follows: Asset swap contracts The Sub-Fund Investment Solutions by Epsilon - Forex Coupon 2017-2 pays, on the dates scheduled for payment of coupons on bonds included in the portfolio, an amount equal to the full gross amount due as coupons on such bonds, at each bond maturity date, an amount equal to the notional amount of the bonds in the reference portfolio with a bond maturity date preceding termination date, and, at termination date, an amount equal to the accrued interest (if any) for the running coupon of each bond in the reference portfolio and the sum of non par repayment of the reference portfolio. Banca IMI S.p.A. pays at effective date the sum of Pull-to-Par of the reference portfolio, quarterly the notional amount multiplied by 1,00% p.a., annually the notional amount multiplied by 1,9350% p.a., and, at termination date an amount equal to the sum of the notional amount of the bonds in the reference portfolio with a bond maturity date preceding termination date.
348
NOTES TO THE FINANCIAL STATEMENTS Investment Solutions by Epsilon ________________________________________________________________________________
Cross currency interest rate swap contracts The Sub-Fund Investment Solutions by Epsilon - Forex Coupon 2017-2 entered into 14 cross currency interest rate swap contracts by which it will pay at termination date an amount to be determined in accordance with the contracts whereas Banca IMI S.p.A. pays annually and at termination date amounts determining in accordance with the contracts. For this Sub-Fund, the swapped bonds represent 33,73% of the portfolio. As at 31 December 2015, the Sub-Fund has pledged the security BTP 4,00% 01/02/2017 for a nominal value of EUR 26 322 000,00 to Banca IMI S.p.A. as collateral for swap contracts. The Sub-Fund Investment Solutions by Epsilon - Forex Coupon 2017-3 entered into an asset swap transaction and cross currency interest rate swap transactions as follows: Asset swap contracts The Sub-Fund Investment Solutions by Epsilon - Forex Coupon 2017-3 pays, on the dates scheduled for payment of coupons on bonds included in the portfolio, an amount equal to the full gross amount due as coupons on such bonds, at each bond maturity date, an amount equal to the notional amount of the bonds in the reference portfolio with a bond maturity date preceding termination date, and, at termination date, an amount equal to the accrued interest (if any) for the running coupon of each bond in the reference portfolio and the sum of non par repayment of the reference portfolio. Banca IMI S.p.A. pays at effective date the sum of Pull-to-Par of the reference portfolio, quarterly the notional amount multiplied by 1,00% p.a., annually the notional amount multiplied by 2,04% p.a. and at termination date an amount equal to the sum of the notional amount of the bonds in the reference portfolio with a bond maturity date preceding termination date. Cross currency interest rate swap contracts The Sub-Fund Investment Solutions by Epsilon - Forex Coupon 2017-3 entered into 15 cross currency interest rate swap contracts by which it will pay at termination date an amount to be determined in accordance with the contracts whereas Banca IMI S.p.A. pays annually and at termination date amounts determining in accordance with the contracts. For this Sub-Fund, the swapped bonds represent 60,79% of the portfolio. As at 31 December 2015, the Sub-Fund has pledged the security BTP 5,25% 01/08/2017 for a nominal value of EUR 16 338 000,00 to Banca IMI S.p.A. as collateral for swap contracts. The Sub-Fund Investment Solutions by Epsilon - Forex Coupon 2017-4 entered into an asset swap transaction and cross currency interest rate swap transactions as follows: Asset swap contracts The Sub-Fund Investment Solutions by Epsilon - Forex Coupon 2017-4 pays, on the dates scheduled for payment of coupons on bonds included in the portfolio, an amount equal to the full gross amount due as coupons on such bonds, at each bond maturity date, an amount equal to the notional amount of the bonds in the reference portfolio with a bond maturity date preceding termination date, and, at termination date, an amount equal to the accrued interest (if any) for the running coupon of each bond and the sum of non par repayment of the reference portfolio. Banca IMI S.p.A. pays at effective date the sum of Pull-to-Par of the reference portfolio, quarterly the total notional amount multiplied by 1,00% p.a., annually the total notional amount multiplied by 2,02% p.a. and at termination date, an amount equal to the sum of the notional amount of the bonds in the reference portfolio with a bond maturity date preceding termination date. Cross currency interest rate swap contracts The Sub-Fund Investment Solutions by Epsilon - Forex Coupon 2017-4 entered into 16 cross currency interest rate swap contracts by which it will pay at termination date an amount to be determined in accordance with the contracts whereas Banca IMI S.p.A. pays annually and at termination date amounts determining in accordance with the contracts. For this Sub-Fund, the swapped bonds represent 57,15% of the portfolio. As at 31 December 2015, the Sub-Fund has pledged the security BTP 4,75% 01/06/2017 for a nominal value of EUR 12 215 000,00 to Banca IMI S.p.A. as collateral for swap contracts.
349
NOTES TO THE FINANCIAL STATEMENTS Investment Solutions by Epsilon ________________________________________________________________________________
The Sub-Fund Investment Solutions by Epsilon - Forex Coupon 2017-5 entered into a composite swap transaction as follows: Asset swap contracts The Sub-Fund Investment Solutions by Epsilon - Forex Coupon 2017-5 pays, on the dates scheduled for payment of coupons on bonds included in the portfolio, an amount equal to the full gross amount due as coupons on such bonds, at each bond maturity date, an amount equal to the notional amount of the bonds in the reference portfolio with a bond maturity date preceding termination date, and, at termination date, an amount equal to the accrued interest (if any) for the running coupon of each bond and the sum of non par repayment of the reference portfolio. Banca IMI S.p.A. pays at effective date the sum of Pull-to-Par of the reference portfolio, quarterly the total notional amount multiplied by 1,00% p.a., annually the total notional amount multiplied by 1,33% p.a. and at termination date, an amount equal to the sum of the notional amount of the bonds in the reference portfolio with a bond maturity date preceding termination date. Cross currency interest rate swap contracts The Sub-Fund Investment Solutions by Epsilon - Forex Coupon 2017-5 entered into 17 cross currency interest rate swap contracts by which it will pay at termination date an amount to be determined in accordance with the contracts whereas Banca IMI S.p.A. pays annually and at termination date amounts determining in accordance with the contracts. For this Sub-Fund, the swapped bonds represent 28,44% of the portfolio. As at 31 December 2015, the Sub-Fund has pledged the security BTP 5,25% 01/08/2017 for a nominal value of EUR 15 011 000,00 and the security BTP 4,75% 01/06/2017 for a nominal value of EUR 10 549 000,00 to Banca IMI S.p.A. as collateral for swap contracts. The Sub-Fund Investment Solutions by Epsilon - Forex Coupon 2017-6 entered into a composite swap transaction as follows: Asset swap contracts The Sub-Fund Investment Solutions by Epsilon - Forex Coupon 2017-6 pays, on the dates scheduled for payment of coupons on bonds included in the portfolio, an amount equal to the full gross amount due as coupons on such bonds, at each bond maturity date, an amount equal to the notional amount of the bonds in the reference portfolio with a bond maturity date preceding termination date, and, at termination date, an amount equal to the accrued interest (if any) for the running coupon of each bond and the sum of non par repayment of the reference portfolio. Banca IMI S.p.A. pays at effective date the sum of Pull-to-Par of the reference portfolio, quarterly the total notional amount multiplied by 1,00% p.a., annually the total notional amount multiplied by 1,12% p.a. and at termination date, an amount equal to the sum of the notional amount of the bonds in the reference portfolio with a bond maturity date preceding termination date. Cross currency interest rate swap contracts The Sub-Fund Investment Solutions by Epsilon - Forex Coupon 2017-6 entered into 17 cross currency interest rate swap contracts by which it will pay at termination date an amount to be determined in accordance with the contracts whereas Banca IMI S.p.A. pays annually and at termination date amounts determining in accordance with the contracts. For this Sub-Fund, the swapped bonds represent 28,10% of the portfolio. As at 31 December 2015, the Sub-Fund has pledged the security BTP 5,25% 01/08/2017 for a nominal value of EUR 12 350 000,00, the security BTP 4,50% 01/02/2018 for a nominal value of EUR 11 065 000,00 and the security BTP 0,75% 15/01/2018 for a nominal value of EUR 1 775 000,00 to Banca IMI S.p.A. as collateral for swap contracts. The Sub-Fund Investment Solutions by Epsilon - Forex Coupon 2017-7 entered into a composite swap transaction as follows: Asset swap contracts The Sub-Fund Investment Solutions by Epsilon - Forex Coupon 2017-7 pays, on the dates scheduled for payment of coupons on bonds included in the portfolio, an amount equal to the full gross amount due as coupons on such bonds, at each bond maturity date, an amount equal to the notional amount of the bonds in the reference portfolio with a bond maturity date preceding termination date, and, at termination date, an amount equal to the accrued interest (if any) for the running coupon of each bond and the sum of non par repayment of the reference portfolio. Banca IMI S.p.A. pays at effective date the sum of Pull-to-Par of the reference portfolio, quarterly the total notional amount multiplied by 1,00% p.a., annually the total notional amount multiplied by 0,89% p.a. and at termination date, an amount equal to the sum of the notional amount of the bonds in the portfolio with a bond maturity date preceding termination date.
350
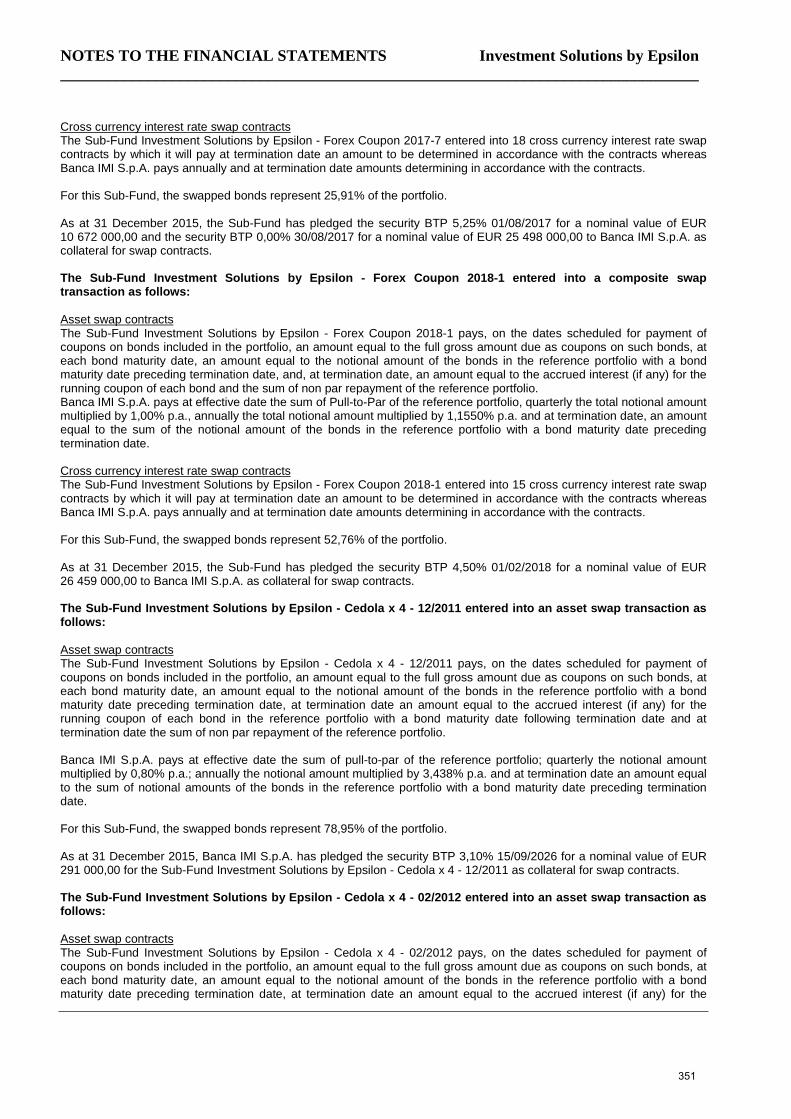
NOTES TO THE FINANCIAL STATEMENTS Investment Solutions by Epsilon ________________________________________________________________________________
Cross currency interest rate swap contracts The Sub-Fund Investment Solutions by Epsilon - Forex Coupon 2017-7 entered into 18 cross currency interest rate swap contracts by which it will pay at termination date an amount to be determined in accordance with the contracts whereas Banca IMI S.p.A. pays annually and at termination date amounts determining in accordance with the contracts. For this Sub-Fund, the swapped bonds represent 25,91% of the portfolio. As at 31 December 2015, the Sub-Fund has pledged the security BTP 5,25% 01/08/2017 for a nominal value of EUR 10 672 000,00 and the security BTP 0,00% 30/08/2017 for a nominal value of EUR 25 498 000,00 to Banca IMI S.p.A. as collateral for swap contracts. The Sub-Fund Investment Solutions by Epsilon - Forex Coupon 2018-1 entered into a composite swap transaction as follows: Asset swap contracts The Sub-Fund Investment Solutions by Epsilon - Forex Coupon 2018-1 pays, on the dates scheduled for payment of coupons on bonds included in the portfolio, an amount equal to the full gross amount due as coupons on such bonds, at each bond maturity date, an amount equal to the notional amount of the bonds in the reference portfolio with a bond maturity date preceding termination date, and, at termination date, an amount equal to the accrued interest (if any) for the running coupon of each bond and the sum of non par repayment of the reference portfolio. Banca IMI S.p.A. pays at effective date the sum of Pull-to-Par of the reference portfolio, quarterly the total notional amount multiplied by 1,00% p.a., annually the total notional amount multiplied by 1,1550% p.a. and at termination date, an amount equal to the sum of the notional amount of the bonds in the reference portfolio with a bond maturity date preceding termination date. Cross currency interest rate swap contracts The Sub-Fund Investment Solutions by Epsilon - Forex Coupon 2018-1 entered into 15 cross currency interest rate swap contracts by which it will pay at termination date an amount to be determined in accordance with the contracts whereas Banca IMI S.p.A. pays annually and at termination date amounts determining in accordance with the contracts. For this Sub-Fund, the swapped bonds represent 52,76% of the portfolio. As at 31 December 2015, the Sub-Fund has pledged the security BTP 4,50% 01/02/2018 for a nominal value of EUR 26 459 000,00 to Banca IMI S.p.A. as collateral for swap contracts. The Sub-Fund Investment Solutions by Epsilon - Cedola x 4 - 12/2011 entered into an asset swap transaction as follows: Asset swap contracts The Sub-Fund Investment Solutions by Epsilon - Cedola x 4 - 12/2011 pays, on the dates scheduled for payment of coupons on bonds included in the portfolio, an amount equal to the full gross amount due as coupons on such bonds, at each bond maturity date, an amount equal to the notional amount of the bonds in the reference portfolio with a bond maturity date preceding termination date, at termination date an amount equal to the accrued interest (if any) for the running coupon of each bond in the reference portfolio with a bond maturity date following termination date and at termination date the sum of non par repayment of the reference portfolio. Banca IMI S.p.A. pays at effective date the sum of pull-to-par of the reference portfolio; quarterly the notional amount multiplied by 0,80% p.a.; annually the notional amount multiplied by 3,438% p.a. and at termination date an amount equal to the sum of notional amounts of the bonds in the reference portfolio with a bond maturity date preceding termination date. For this Sub-Fund, the swapped bonds represent 78,95% of the portfolio. As at 31 December 2015, Banca IMI S.p.A. has pledged the security BTP 3,10% 15/09/2026 for a nominal value of EUR 291 000,00 for the Sub-Fund Investment Solutions by Epsilon - Cedola x 4 - 12/2011 as collateral for swap contracts. The Sub-Fund Investment Solutions by Epsilon - Cedola x 4 - 02/2012 entered into an asset swap transaction as follows: Asset swap contracts The Sub-Fund Investment Solutions by Epsilon - Cedola x 4 - 02/2012 pays, on the dates scheduled for payment of coupons on bonds included in the portfolio, an amount equal to the full gross amount due as coupons on such bonds, at each bond maturity date, an amount equal to the notional amount of the bonds in the reference portfolio with a bond maturity date preceding termination date, at termination date an amount equal to the accrued interest (if any) for the
351
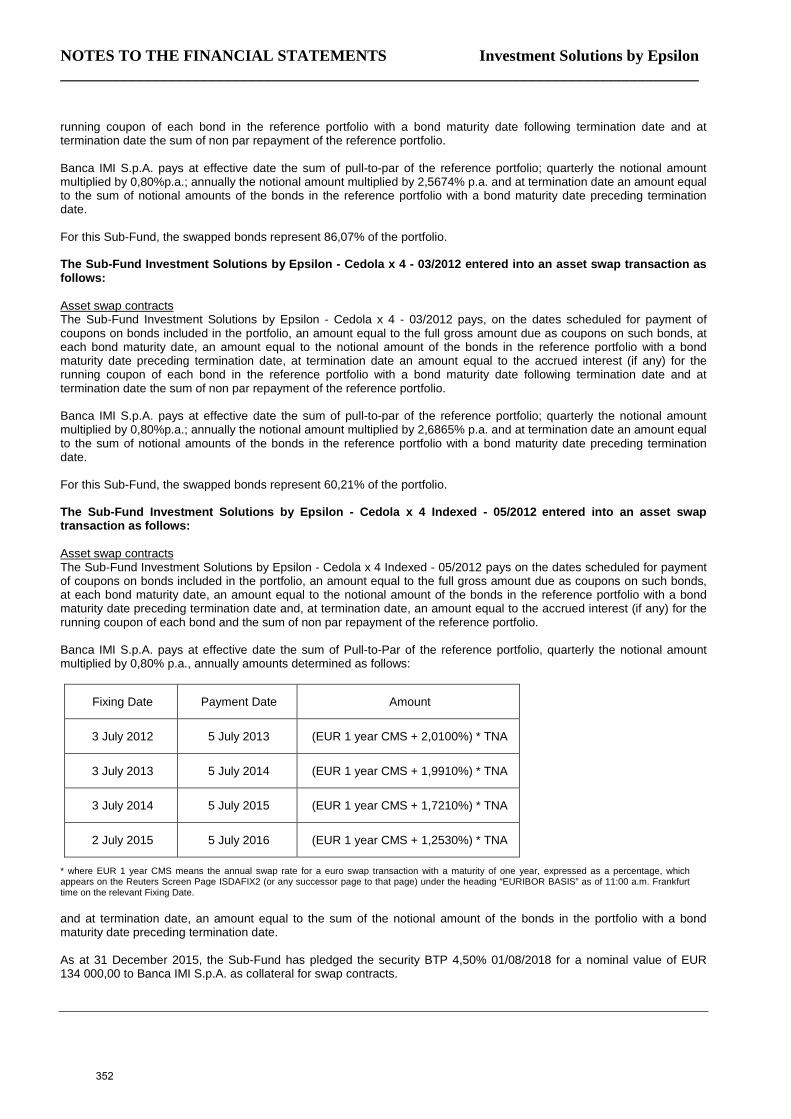
NOTES TO THE FINANCIAL STATEMENTS Investment Solutions by Epsilon ________________________________________________________________________________
running coupon of each bond in the reference portfolio with a bond maturity date following termination date and at termination date the sum of non par repayment of the reference portfolio. Banca IMI S.p.A. pays at effective date the sum of pull-to-par of the reference portfolio; quarterly the notional amount multiplied by 0,80%p.a.; annually the notional amount multiplied by 2,5674% p.a. and at termination date an amount equal to the sum of notional amounts of the bonds in the reference portfolio with a bond maturity date preceding termination date. For this Sub-Fund, the swapped bonds represent 86,07% of the portfolio. The Sub-Fund Investment Solutions by Epsilon - Cedola x 4 - 03/2012 entered into an asset swap transaction as follows: Asset swap contracts The Sub-Fund Investment Solutions by Epsilon - Cedola x 4 - 03/2012 pays, on the dates scheduled for payment of coupons on bonds included in the portfolio, an amount equal to the full gross amount due as coupons on such bonds, at each bond maturity date, an amount equal to the notional amount of the bonds in the reference portfolio with a bond maturity date preceding termination date, at termination date an amount equal to the accrued interest (if any) for the running coupon of each bond in the reference portfolio with a bond maturity date following termination date and at termination date the sum of non par repayment of the reference portfolio. Banca IMI S.p.A. pays at effective date the sum of pull-to-par of the reference portfolio; quarterly the notional amount multiplied by 0,80%p.a.; annually the notional amount multiplied by 2,6865% p.a. and at termination date an amount equal to the sum of notional amounts of the bonds in the reference portfolio with a bond maturity date preceding termination date. For this Sub-Fund, the swapped bonds represent 60,21% of the portfolio. The Sub-Fund Investment Solutions by Epsilon - Cedola x 4 Indexed - 05/2012 entered into an asset swap transaction as follows: Asset swap contracts The Sub-Fund Investment Solutions by Epsilon - Cedola x 4 Indexed - 05/2012 pays on the dates scheduled for payment of coupons on bonds included in the portfolio, an amount equal to the full gross amount due as coupons on such bonds, at each bond maturity date, an amount equal to the notional amount of the bonds in the reference portfolio with a bond maturity date preceding termination date and, at termination date, an amount equal to the accrued interest (if any) for the running coupon of each bond and the sum of non par repayment of the reference portfolio. Banca IMI S.p.A. pays at effective date the sum of Pull-to-Par of the reference portfolio, quarterly the notional amount multiplied by 0,80% p.a., annually amounts determined as follows:
Fixing Date Payment Date Amount
3 July 2012 5 July 2013 (EUR 1 year CMS + 2,0100%) * TNA
3 July 2013 5 July 2014 (EUR 1 year CMS + 1,9910%) * TNA
3 July 2014 5 July 2015 (EUR 1 year CMS + 1,7210%) * TNA
2 July 2015 5 July 2016 (EUR 1 year CMS + 1,2530%) * TNA
* where EUR 1 year CMS means the annual swap rate for a euro swap transaction with a maturity of one year, expressed as a percentage, which appears on the Reuters Screen Page ISDAFIX2 (or any successor page to that page) under the heading “EURIBOR BASIS” as of 11:00 a.m. Frankfurt time on the relevant Fixing Date. and at termination date, an amount equal to the sum of the notional amount of the bonds in the portfolio with a bond maturity date preceding termination date. As at 31 December 2015, the Sub-Fund has pledged the security BTP 4,50% 01/08/2018 for a nominal value of EUR 134 000,00 to Banca IMI S.p.A. as collateral for swap contracts.
352
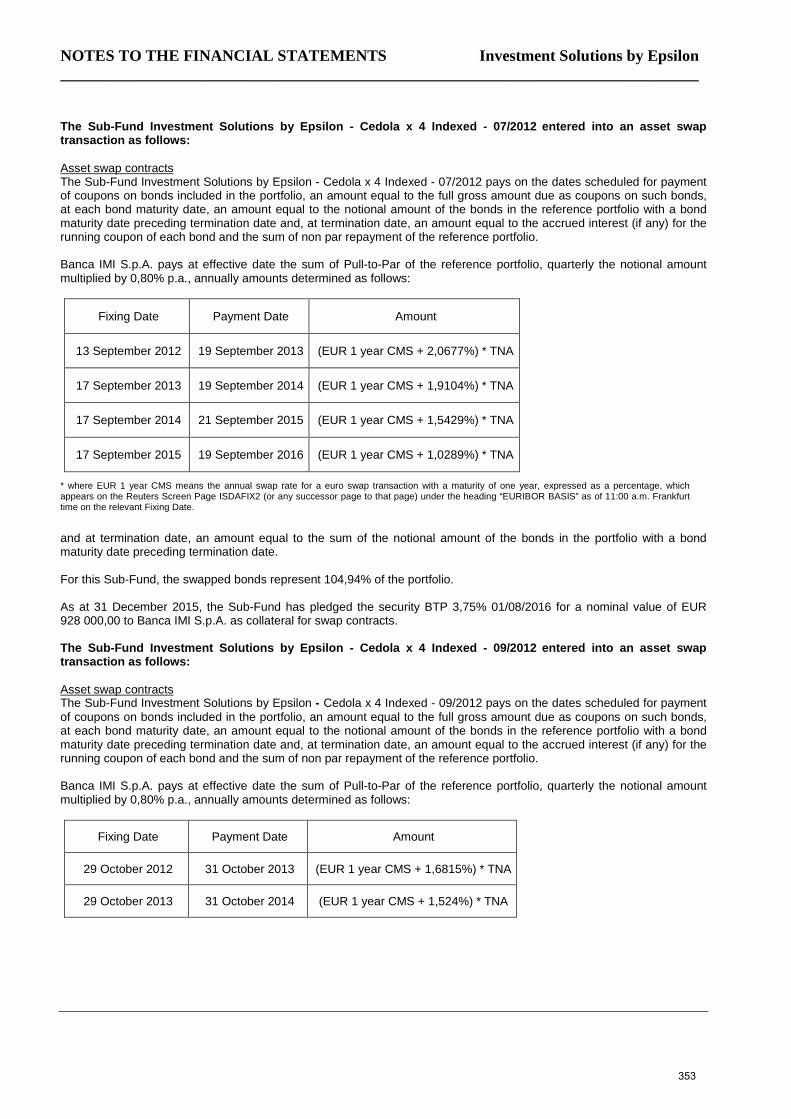
NOTES TO THE FINANCIAL STATEMENTS Investment Solutions by Epsilon ________________________________________________________________________________
The Sub-Fund Investment Solutions by Epsilon - Cedola x 4 Indexed - 07/2012 entered into an asset swap transaction as follows: Asset swap contracts The Sub-Fund Investment Solutions by Epsilon - Cedola x 4 Indexed - 07/2012 pays on the dates scheduled for payment of coupons on bonds included in the portfolio, an amount equal to the full gross amount due as coupons on such bonds, at each bond maturity date, an amount equal to the notional amount of the bonds in the reference portfolio with a bond maturity date preceding termination date and, at termination date, an amount equal to the accrued interest (if any) for the running coupon of each bond and the sum of non par repayment of the reference portfolio. Banca IMI S.p.A. pays at effective date the sum of Pull-to-Par of the reference portfolio, quarterly the notional amount multiplied by 0,80% p.a., annually amounts determined as follows:
Fixing Date Payment Date Amount
13 September 2012 19 September 2013 (EUR 1 year CMS + 2,0677%) * TNA
17 September 2013 19 September 2014 (EUR 1 year CMS + 1,9104%) * TNA
17 September 2014 21 September 2015 (EUR 1 year CMS + 1,5429%) * TNA
17 September 2015 19 September 2016 (EUR 1 year CMS + 1,0289%) * TNA
* where EUR 1 year CMS means the annual swap rate for a euro swap transaction with a maturity of one year, expressed as a percentage, which appears on the Reuters Screen Page ISDAFIX2 (or any successor page to that page) under the heading “EURIBOR BASIS” as of 11:00 a.m. Frankfurt time on the relevant Fixing Date.
and at termination date, an amount equal to the sum of the notional amount of the bonds in the portfolio with a bond maturity date preceding termination date. For this Sub-Fund, the swapped bonds represent 104,94% of the portfolio. As at 31 December 2015, the Sub-Fund has pledged the security BTP 3,75% 01/08/2016 for a nominal value of EUR 928 000,00 to Banca IMI S.p.A. as collateral for swap contracts. The Sub-Fund Investment Solutions by Epsilon - Cedola x 4 Indexed - 09/2012 entered into an asset swap transaction as follows: Asset swap contracts The Sub-Fund Investment Solutions by Epsilon - Cedola x 4 Indexed - 09/2012 pays on the dates scheduled for payment of coupons on bonds included in the portfolio, an amount equal to the full gross amount due as coupons on such bonds, at each bond maturity date, an amount equal to the notional amount of the bonds in the reference portfolio with a bond maturity date preceding termination date and, at termination date, an amount equal to the accrued interest (if any) for the running coupon of each bond and the sum of non par repayment of the reference portfolio. Banca IMI S.p.A. pays at effective date the sum of Pull-to-Par of the reference portfolio, quarterly the notional amount multiplied by 0,80% p.a., annually amounts determined as follows:
Fixing Date Payment Date Amount
29 October 2012 31 October 2013 (EUR 1 year CMS + 1,6815%) * TNA
29 October 2013 31 October 2014 (EUR 1 year CMS + 1,524%) * TNA
353
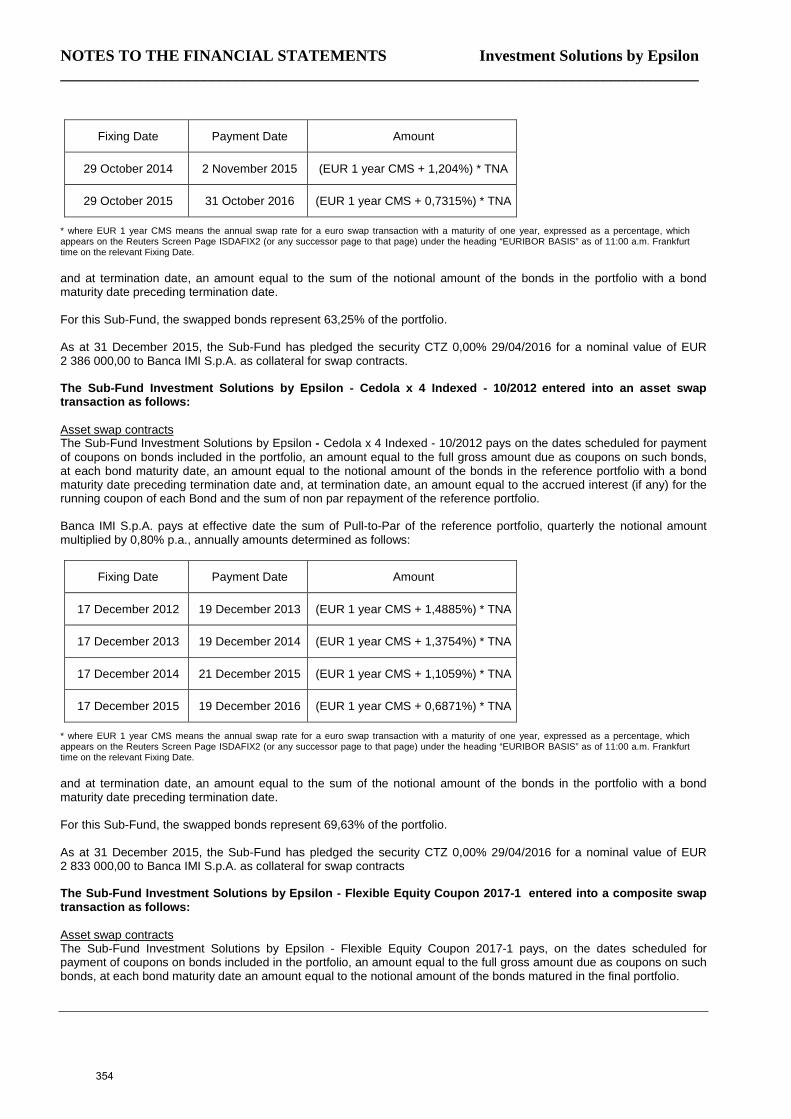
NOTES TO THE FINANCIAL STATEMENTS Investment Solutions by Epsilon ________________________________________________________________________________
Fixing Date Payment Date Amount
29 October 2014 2 November 2015 (EUR 1 year CMS + 1,204%) * TNA
29 October 2015 31 October 2016 (EUR 1 year CMS + 0,7315%) * TNA
* where EUR 1 year CMS means the annual swap rate for a euro swap transaction with a maturity of one year, expressed as a percentage, which appears on the Reuters Screen Page ISDAFIX2 (or any successor page to that page) under the heading “EURIBOR BASIS” as of 11:00 a.m. Frankfurt time on the relevant Fixing Date. and at termination date, an amount equal to the sum of the notional amount of the bonds in the portfolio with a bond maturity date preceding termination date. For this Sub-Fund, the swapped bonds represent 63,25% of the portfolio. As at 31 December 2015, the Sub-Fund has pledged the security CTZ 0,00% 29/04/2016 for a nominal value of EUR 2 386 000,00 to Banca IMI S.p.A. as collateral for swap contracts. The Sub-Fund Investment Solutions by Epsilon - Cedola x 4 Indexed - 10/2012 entered into an asset swap transaction as follows: Asset swap contracts The Sub-Fund Investment Solutions by Epsilon - Cedola x 4 Indexed - 10/2012 pays on the dates scheduled for payment of coupons on bonds included in the portfolio, an amount equal to the full gross amount due as coupons on such bonds, at each bond maturity date, an amount equal to the notional amount of the bonds in the reference portfolio with a bond maturity date preceding termination date and, at termination date, an amount equal to the accrued interest (if any) for the running coupon of each Bond and the sum of non par repayment of the reference portfolio. Banca IMI S.p.A. pays at effective date the sum of Pull-to-Par of the reference portfolio, quarterly the notional amount multiplied by 0,80% p.a., annually amounts determined as follows:
Fixing Date Payment Date Amount
17 December 2012 19 December 2013 (EUR 1 year CMS + 1,4885%) * TNA
17 December 2013 19 December 2014 (EUR 1 year CMS + 1,3754%) * TNA
17 December 2014 21 December 2015 (EUR 1 year CMS + 1,1059%) * TNA
17 December 2015 19 December 2016 (EUR 1 year CMS + 0,6871%) * TNA
* where EUR 1 year CMS means the annual swap rate for a euro swap transaction with a maturity of one year, expressed as a percentage, which appears on the Reuters Screen Page ISDAFIX2 (or any successor page to that page) under the heading “EURIBOR BASIS” as of 11:00 a.m. Frankfurt time on the relevant Fixing Date. and at termination date, an amount equal to the sum of the notional amount of the bonds in the portfolio with a bond maturity date preceding termination date. For this Sub-Fund, the swapped bonds represent 69,63% of the portfolio. As at 31 December 2015, the Sub-Fund has pledged the security CTZ 0,00% 29/04/2016 for a nominal value of EUR 2 833 000,00 to Banca IMI S.p.A. as collateral for swap contracts The Sub-Fund Investment Solutions by Epsilon - Flexible Equity Coupon 2017-1 entered into a composite swap transaction as follows: Asset swap contracts The Sub-Fund Investment Solutions by Epsilon - Flexible Equity Coupon 2017-1 pays, on the dates scheduled for payment of coupons on bonds included in the portfolio, an amount equal to the full gross amount due as coupons on such bonds, at each bond maturity date an amount equal to the notional amount of the bonds matured in the final portfolio.
354
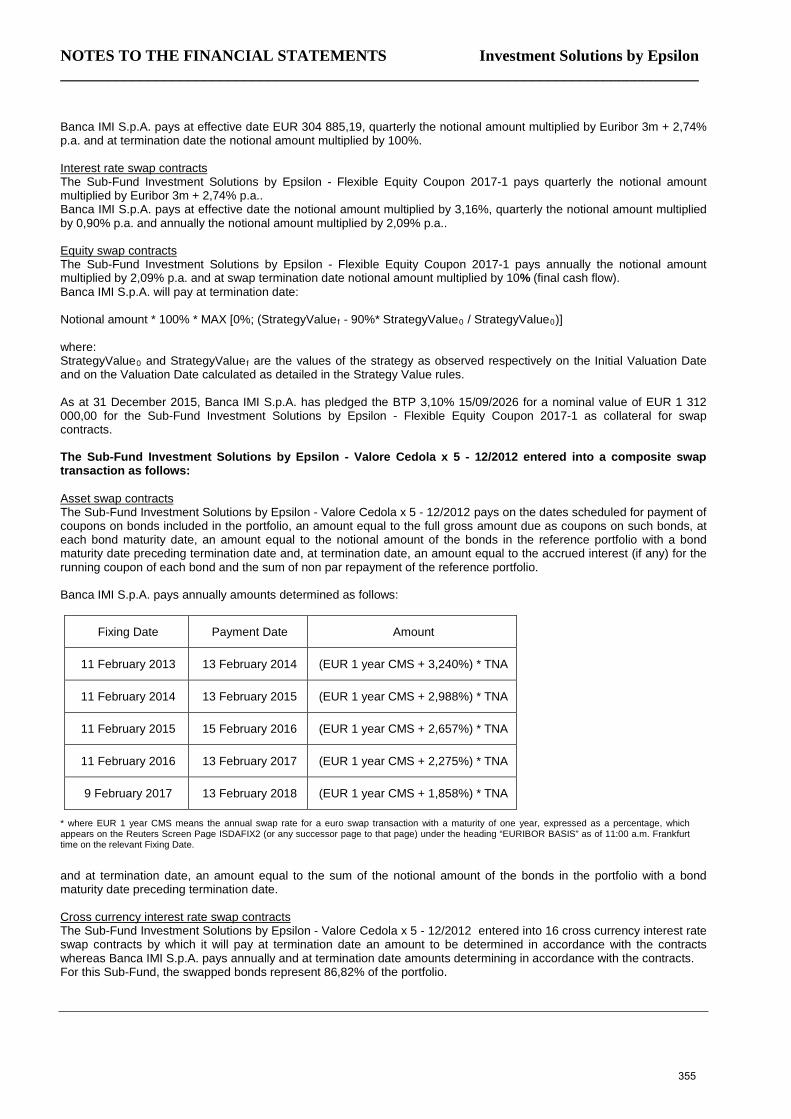
NOTES TO THE FINANCIAL STATEMENTS Investment Solutions by Epsilon ________________________________________________________________________________
Banca IMI S.p.A. pays at effective date EUR 304 885,19, quarterly the notional amount multiplied by Euribor 3m + 2,74% p.a. and at termination date the notional amount multiplied by 100%. Interest rate swap contracts The Sub-Fund Investment Solutions by Epsilon - Flexible Equity Coupon 2017-1 pays quarterly the notional amount multiplied by Euribor 3m + 2,74% p.a.. Banca IMI S.p.A. pays at effective date the notional amount multiplied by 3,16%, quarterly the notional amount multiplied by 0,90% p.a. and annually the notional amount multiplied by 2,09% p.a.. Equity swap contracts The Sub-Fund Investment Solutions by Epsilon - Flexible Equity Coupon 2017-1 pays annually the notional amount multiplied by 2,09% p.a. and at swap termination date notional amount multiplied by 10% (final cash flow). Banca IMI S.p.A. will pay at termination date: Notional amount * 100% * MAX [0%; (StrategyValuef - 90%* StrategyValue0 / StrategyValue0)] where: StrategyValue0 and StrategyValuef are the values of the strategy as observed respectively on the Initial Valuation Date and on the Valuation Date calculated as detailed in the Strategy Value rules. As at 31 December 2015, Banca IMI S.p.A. has pledged the BTP 3,10% 15/09/2026 for a nominal value of EUR 1 312 000,00 for the Sub-Fund Investment Solutions by Epsilon - Flexible Equity Coupon 2017-1 as collateral for swap contracts. The Sub-Fund Investment Solutions by Epsilon - Valore Cedola x 5 - 12/2012 entered into a composite swap transaction as follows: Asset swap contracts The Sub-Fund Investment Solutions by Epsilon - Valore Cedola x 5 - 12/2012 pays on the dates scheduled for payment of coupons on bonds included in the portfolio, an amount equal to the full gross amount due as coupons on such bonds, at each bond maturity date, an amount equal to the notional amount of the bonds in the reference portfolio with a bond maturity date preceding termination date and, at termination date, an amount equal to the accrued interest (if any) for the running coupon of each bond and the sum of non par repayment of the reference portfolio. Banca IMI S.p.A. pays annually amounts determined as follows:
Fixing Date Payment Date Amount
11 February 2013 13 February 2014 (EUR 1 year CMS + 3,240%) * TNA
11 February 2014 13 February 2015 (EUR 1 year CMS + 2,988%) * TNA
11 February 2015 15 February 2016 (EUR 1 year CMS + 2,657%) * TNA
11 February 2016 13 February 2017 (EUR 1 year CMS + 2,275%) * TNA
9 February 2017 13 February 2018 (EUR 1 year CMS + 1,858%) * TNA
* where EUR 1 year CMS means the annual swap rate for a euro swap transaction with a maturity of one year, expressed as a percentage, which appears on the Reuters Screen Page ISDAFIX2 (or any successor page to that page) under the heading “EURIBOR BASIS” as of 11:00 a.m. Frankfurt time on the relevant Fixing Date.
and at termination date, an amount equal to the sum of the notional amount of the bonds in the portfolio with a bond maturity date preceding termination date. Cross currency interest rate swap contracts The Sub-Fund Investment Solutions by Epsilon - Valore Cedola x 5 - 12/2012 entered into 16 cross currency interest rate swap contracts by which it will pay at termination date an amount to be determined in accordance with the contracts whereas Banca IMI S.p.A. pays annually and at termination date amounts determining in accordance with the contracts. For this Sub-Fund, the swapped bonds represent 86,82% of the portfolio.
355
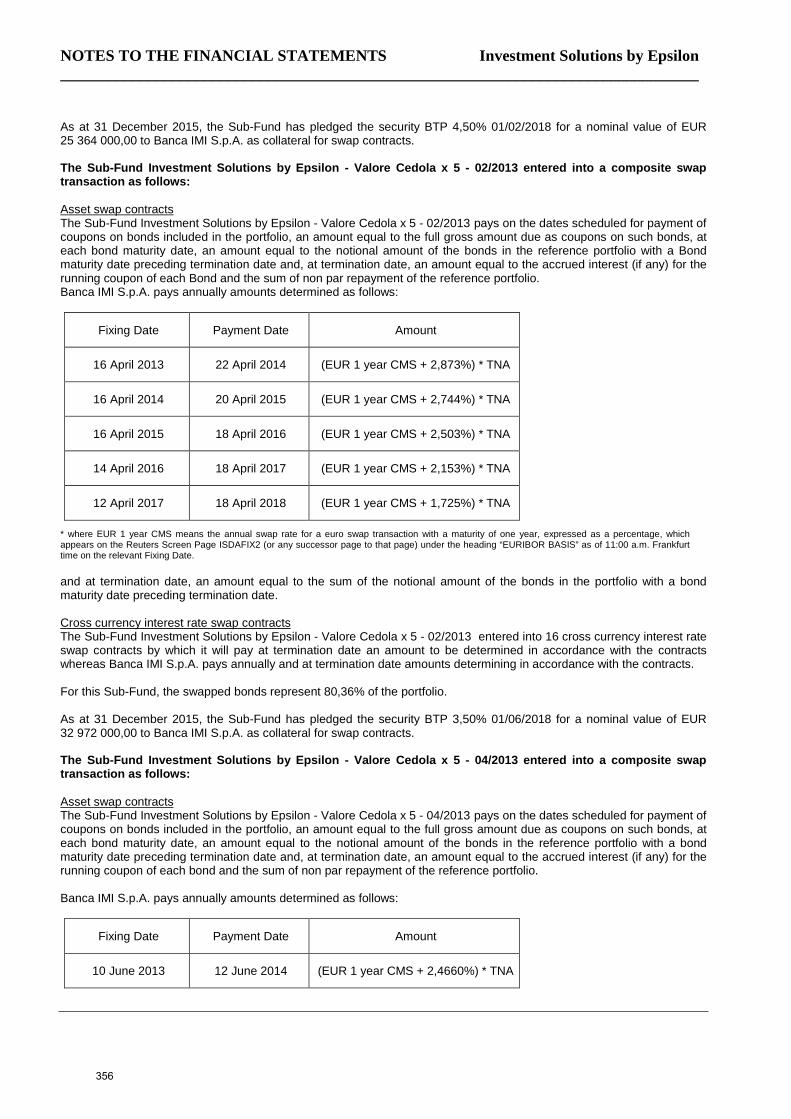
NOTES TO THE FINANCIAL STATEMENTS Investment Solutions by Epsilon ________________________________________________________________________________
As at 31 December 2015, the Sub-Fund has pledged the security BTP 4,50% 01/02/2018 for a nominal value of EUR 25 364 000,00 to Banca IMI S.p.A. as collateral for swap contracts. The Sub-Fund Investment Solutions by Epsilon - Valore Cedola x 5 - 02/2013 entered into a composite swap transaction as follows: Asset swap contracts The Sub-Fund Investment Solutions by Epsilon - Valore Cedola x 5 - 02/2013 pays on the dates scheduled for payment of coupons on bonds included in the portfolio, an amount equal to the full gross amount due as coupons on such bonds, at each bond maturity date, an amount equal to the notional amount of the bonds in the reference portfolio with a Bond maturity date preceding termination date and, at termination date, an amount equal to the accrued interest (if any) for the running coupon of each Bond and the sum of non par repayment of the reference portfolio. Banca IMI S.p.A. pays annually amounts determined as follows:
Fixing Date Payment Date Amount
16 April 2013 22 April 2014 (EUR 1 year CMS + 2,873%) * TNA
16 April 2014 20 April 2015 (EUR 1 year CMS + 2,744%) * TNA
16 April 2015 18 April 2016 (EUR 1 year CMS + 2,503%) * TNA
14 April 2016 18 April 2017 (EUR 1 year CMS + 2,153%) * TNA
12 April 2017 18 April 2018 (EUR 1 year CMS + 1,725%) * TNA
* where EUR 1 year CMS means the annual swap rate for a euro swap transaction with a maturity of one year, expressed as a percentage, which appears on the Reuters Screen Page ISDAFIX2 (or any successor page to that page) under the heading “EURIBOR BASIS” as of 11:00 a.m. Frankfurt time on the relevant Fixing Date. and at termination date, an amount equal to the sum of the notional amount of the bonds in the portfolio with a bond maturity date preceding termination date. Cross currency interest rate swap contracts The Sub-Fund Investment Solutions by Epsilon - Valore Cedola x 5 - 02/2013 entered into 16 cross currency interest rate swap contracts by which it will pay at termination date an amount to be determined in accordance with the contracts whereas Banca IMI S.p.A. pays annually and at termination date amounts determining in accordance with the contracts. For this Sub-Fund, the swapped bonds represent 80,36% of the portfolio. As at 31 December 2015, the Sub-Fund has pledged the security BTP 3,50% 01/06/2018 for a nominal value of EUR 32 972 000,00 to Banca IMI S.p.A. as collateral for swap contracts. The Sub-Fund Investment Solutions by Epsilon - Valore Cedola x 5 - 04/2013 entered into a composite swap transaction as follows: Asset swap contracts The Sub-Fund Investment Solutions by Epsilon - Valore Cedola x 5 - 04/2013 pays on the dates scheduled for payment of coupons on bonds included in the portfolio, an amount equal to the full gross amount due as coupons on such bonds, at each bond maturity date, an amount equal to the notional amount of the bonds in the reference portfolio with a bond maturity date preceding termination date and, at termination date, an amount equal to the accrued interest (if any) for the running coupon of each bond and the sum of non par repayment of the reference portfolio. Banca IMI S.p.A. pays annually amounts determined as follows:
Fixing Date Payment Date Amount
10 June 2013 12 June 2014 (EUR 1 year CMS + 2,4660%) * TNA
356
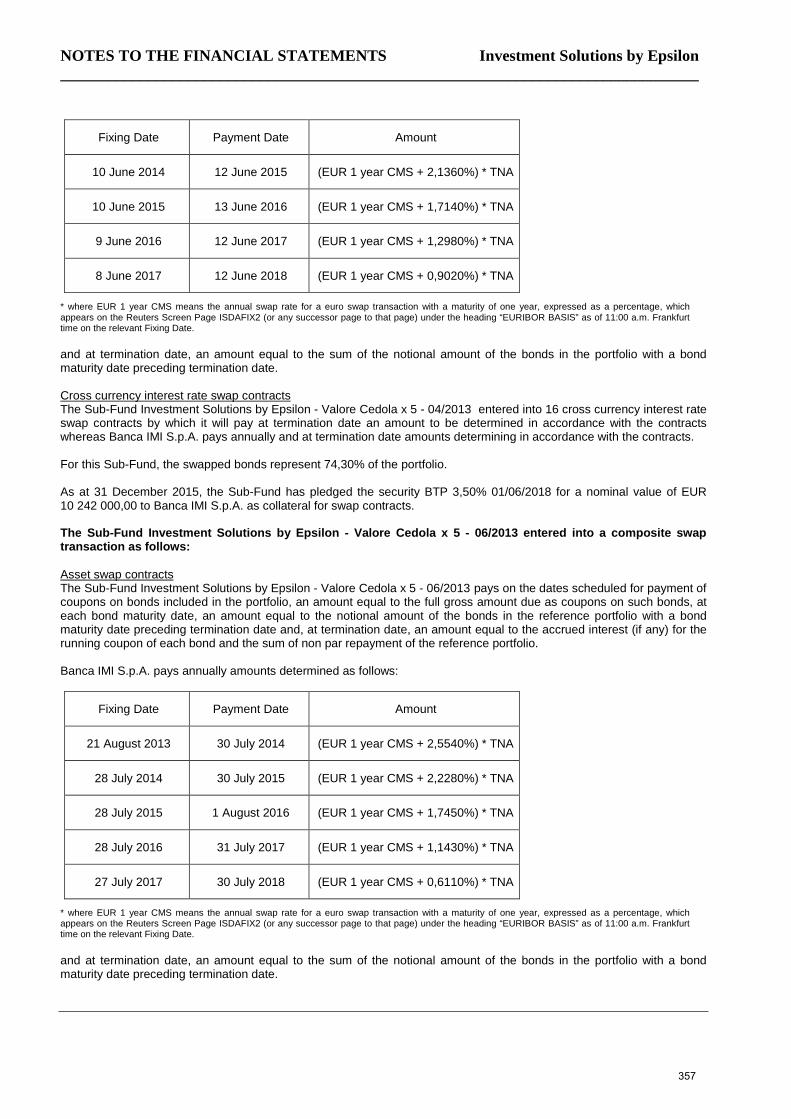
NOTES TO THE FINANCIAL STATEMENTS Investment Solutions by Epsilon ________________________________________________________________________________
Fixing Date Payment Date Amount
10 June 2014 12 June 2015 (EUR 1 year CMS + 2,1360%) * TNA
10 June 2015 13 June 2016 (EUR 1 year CMS + 1,7140%) * TNA
9 June 2016 12 June 2017 (EUR 1 year CMS + 1,2980%) * TNA
8 June 2017 12 June 2018 (EUR 1 year CMS + 0,9020%) * TNA
* where EUR 1 year CMS means the annual swap rate for a euro swap transaction with a maturity of one year, expressed as a percentage, which appears on the Reuters Screen Page ISDAFIX2 (or any successor page to that page) under the heading “EURIBOR BASIS” as of 11:00 a.m. Frankfurt time on the relevant Fixing Date. and at termination date, an amount equal to the sum of the notional amount of the bonds in the portfolio with a bond maturity date preceding termination date. Cross currency interest rate swap contracts The Sub-Fund Investment Solutions by Epsilon - Valore Cedola x 5 - 04/2013 entered into 16 cross currency interest rate swap contracts by which it will pay at termination date an amount to be determined in accordance with the contracts whereas Banca IMI S.p.A. pays annually and at termination date amounts determining in accordance with the contracts. For this Sub-Fund, the swapped bonds represent 74,30% of the portfolio. As at 31 December 2015, the Sub-Fund has pledged the security BTP 3,50% 01/06/2018 for a nominal value of EUR 10 242 000,00 to Banca IMI S.p.A. as collateral for swap contracts. The Sub-Fund Investment Solutions by Epsilon - Valore Cedola x 5 - 06/2013 entered into a composite swap transaction as follows: Asset swap contracts The Sub-Fund Investment Solutions by Epsilon - Valore Cedola x 5 - 06/2013 pays on the dates scheduled for payment of coupons on bonds included in the portfolio, an amount equal to the full gross amount due as coupons on such bonds, at each bond maturity date, an amount equal to the notional amount of the bonds in the reference portfolio with a bond maturity date preceding termination date and, at termination date, an amount equal to the accrued interest (if any) for the running coupon of each bond and the sum of non par repayment of the reference portfolio. Banca IMI S.p.A. pays annually amounts determined as follows:
Fixing Date Payment Date Amount
21 August 2013 30 July 2014 (EUR 1 year CMS + 2,5540%) * TNA
28 July 2014 30 July 2015 (EUR 1 year CMS + 2,2280%) * TNA
28 July 2015 1 August 2016 (EUR 1 year CMS + 1,7450%) * TNA
28 July 2016 31 July 2017 (EUR 1 year CMS + 1,1430%) * TNA
27 July 2017 30 July 2018 (EUR 1 year CMS + 0,6110%) * TNA
* where EUR 1 year CMS means the annual swap rate for a euro swap transaction with a maturity of one year, expressed as a percentage, which appears on the Reuters Screen Page ISDAFIX2 (or any successor page to that page) under the heading “EURIBOR BASIS” as of 11:00 a.m. Frankfurt time on the relevant Fixing Date. and at termination date, an amount equal to the sum of the notional amount of the bonds in the portfolio with a bond maturity date preceding termination date.
357
NOTES TO THE FINANCIAL STATEMENTS Investment Solutions by Epsilon ________________________________________________________________________________
Cross currency interest rate swap contracts The Sub-Fund Investment Solutions by Epsilon - Valore Cedola x 5 - 06/2013 entered into 16 cross currency interest rate swap contracts by which it will pay at termination date an amount to be determined in accordance with the contracts whereas Banca IMI S.p.A. pays annually and at termination date amounts determining in accordance with the contracts. For this Sub-Fund, the swapped bonds represent 75,72% of the portfolio. As at 31 December 2015, the Sub-Fund has pledged the security BTP 3,50% 01/06/2018 for a nominal value of EUR 11 974 000,00 to Banca IMI S.p.A. as collateral for swap contracts. The Sub-Fund Investment Solutions by Epsilon - Valore Cedola x 5 - 07/2013 entered into a composite swap transaction as follows: Asset swap contracts The Sub-Fund Investment Solutions by Epsilon - Valore Cedola x 5 - 07/2013 pays on the dates scheduled for payment of coupons on bonds included in the portfolio, an amount equal to the full gross amount due as coupons on such bonds, at each bond maturity date, an amount equal to the notional amount of the bonds in the reference portfolio with a bond maturity date preceding termination date and, at termination date, an amount equal to the accrued interest (if any) for the running coupon of each bond and the sum of non par repayment of the reference portfolio. Banca IMI S.p.A pays annually the notional amount multiplied by 2,9256% and at termination date an amount equal to the sum of notional amounts of the bonds in the reference portfolio with a bond maturity date preceding termination date. Cross currency interest rate swap contracts The Sub-Fund Investment Solutions by Epsilon - Valore Cedola x 5 - 07/2013 entered into 18 cross currency interest rate swap contracts by which it will pay at termination date an amount to be determined in accordance with the contracts whereas Banca IMI S.p.A. pays annually and at termination date amounts determining in accordance with the contracts. For this Sub-Fund, the swapped bonds represent 82,17% of the portfolio. As at 31 December 2015, the Sub-Fund has pledged the security BTP 3,50% 01/12/2018 for a nominal value of EUR 16 574 000,00 to Banca IMI S.p.A. as collateral for swap contracts. The Sub-Fund Investment Solutions by Epsilon - Valore Cedola x 5 - 10/2013 entered into an asset swap transaction as follows: Asset swap contracts The Sub-Fund Investment Solutions by Epsilon - Valore Cedola x 5 - 10/2013 pays on the dates scheduled for payment of coupons on bonds included in the portfolio, an amount equal to the full gross amount due as coupons on such bonds, at each bond maturity date, an amount equal to the notional amount of the bonds in the reference portfolio with a bond maturity date preceding termination date and, at termination date, an amount equal to the accrued interest (if any) for the running coupon of each bond and the sum of non par repayment of the reference portfolio. Banca IMI S.p.A. pays annually the notional amount multiplied by 3,5920%. Cross currency interest rate swap contracts The Sub-Fund Investment Solutions by Epsilon - Valore Cedola x 5 - 10/2013 entered into 6 cross currency interest rate swap contracts by which it will pay at termination date an amount to be determined in accordance with the contracts whereas Banca IMI S.p.A. pays annually and at termination date amounts determining in accordance with the contracts. For this Sub-Fund, the swapped bonds represent 90,38% of the portfolio. As at 31 December 2015, the Sub-Fund has pledged the security BTP 3,50% 01/12/2018 for a nominal value of EUR 4 372 000,00 to Banca IMI S.p.A. as collateral for swap contracts. The Sub-Fund Investment Solutions by Epsilon - Valore Cedola x 5 - 12/2013 entered into an asset swap transaction as follows: Asset swap contracts The Sub-Fund Investment Solutions by Epsilon - Valore Cedola x 5 - 12/2013 pays on the dates scheduled for payment of coupons on bonds included in the portfolio, an amount equal to the full gross amount due as coupons on such bonds and at termination date, an amount equal to the accrued interest (if any) for the running coupon of each bond with a bond maturity date following termination date. Banca IMI S.p.A. pays annually the notional amount multiplied by 3,3215%.
358
NOTES TO THE FINANCIAL STATEMENTS Investment Solutions by Epsilon ________________________________________________________________________________
Cross currency interest rate swap contracts The Sub-Fund Investment Solutions by Epsilon - Valore Cedola x 5 - 12/2013 entered into 6 cross currency interest rate swap contracts by which it will pay at termination date an amount to be determined in accordance with the contracts whereas Banca IMI S.p.A. pays annually and at termination date amounts determining in accordance with the contracts. For this Sub-Fund, the swapped bonds represent 87,85% of the portfolio. As at 31 December 2015, Banca IMI S.p.A. has pledged the security BTP 3,75% 01/08/2016 for a nominal value of EUR 1 060 000,00 for the Sub-Fund Investment Solutions by Epsilon - Valore Cedola x 5 - 12/2013 as collateral for swap contracts. The Sub-Fund Investment Solutions by Epsilon - Valore Cedola x 5 - 02/2014 entered into an asset swap transaction as follows: Asset swap contracts The Sub-Fund Investment Solutions by Epsilon - Valore Cedola x 5 - 02/2014 pays on the dates scheduled for payment of coupons on bonds included in the portfolio, an amount equal to the full gross amount due as coupons on such bonds, at termination date, an amount equal to the accrued interest (if any) for the running coupon of each Bond in the reference portfolio with a bond maturity date following termination date. Cross currency interest rate swap contracts The Sub-Fund Investment Solutions by Epsilon - Valore Cedola x 5 - 02/2014 entered into 8 cross currency interest rate swap contracts by which it will pay at termination date an amount to be determined in accordance with the contracts whereas Banca IMI S.p.A. pays annually and at termination date amounts determining in accordance with the contracts. The Sub-Fund Investment Solutions by Epsilon - Valore Cedola x 5 - 04/2014 entered into an asset swap transaction as follows: Asset swap contracts The Sub-Fund Investment Solutions by Epsilon - Valore Cedola x 5 - 04/2014 pays on the dates scheduled for payment of coupons on bonds included in the portfolio, an amount equal to the full gross amount due as coupons on such bonds, at termination date, an amount equal to the accrued interest (if any) for the running coupon of each Bond in the reference portfolio with a bond maturity date following termination date. Cross currency interest rate swap contracts The Sub-Fund Investment Solutions by Epsilon - Valore Cedola x 5 - 04/2014 entered into 7 cross currency interest rate swap contracts by which it will pay at termination date an amount to be determined in accordance with the contracts whereas Banca IMI S.p.A. pays annually and at termination date amounts determining in accordance with the contracts. The Sub-Fund Investment Solutions by Epsilon - Valore Cedola x 5 - 11/2014 entered into an asset swap transaction as follows: Asset swap contracts The Sub-Fund Investment Solutions by Epsilon - Valore Cedola x 5 - 11/2014 pays on the dates scheduled for payment of coupons on bonds included in the portfolio, an amount equal to the full gross amount due as coupons on such bonds, at termination date, an amount equal to the accrued interest (if any) for the running coupon of each Bond in the reference portfolio with a bond maturity date following termination date. Cross currency interest rate swap contracts The Sub-Fund Investment Solutions by Epsilon - Valore Cedola x 5 - 11/2014 entered into 5 cross currency interest rate swap contracts by which it will pay at termination date an amount to be determined in accordance with the contracts whereas Banca IMI S.p.A. pays annually and at termination date amounts determining in accordance with the contracts. Credit Default Swap Contracts The Counterparty JPMorgan Securities Plc. pays on the dates scheduled for payment to the Sub-Fund a fixed rate of 1,00% on a notional amount of EUR1 000 000,00 for the index ITRAXX EUROPE SERIES 24 VERSION 1 with an initial payment amount of EUR 14 371,14. Banca IMI S.p.A. pays annually the notional amount multiplied by 3,797%. For this Sub-Fund, the swapped bonds represent 61,22% of the portfolio.
359
NOTES TO THE FINANCIAL STATEMENTS Investment Solutions by Epsilon ________________________________________________________________________________
As at 31 December 2015, Banca IMI S.p.A. has pledged the security BTP 5,25% 01/08/2017 for a nominal value of EUR 1 400 000,00 and the security BTP 3,75% 01/03/2021 for a nominal value of EUR 3 300 000,00 for the Sub-Fund Investment Solutions by Epsilon - Valore Cedola x 5 - 11/2014 as collateral for swap contracts. The Sub-Fund Investment Solutions by Epsilon - Valore Cedola Globale - 02/2015 entered into an asset swap transaction as follows: Asset swap contracts The Sub-Fund Investment Solutions by Epsilon - Valore Cedola Globale - 02/2015 pays on the dates scheduled for payment of coupons on bonds included in the portfolio, an amount equal to the full gross amount due as coupons on such bonds, at termination date, an amount equal to the accrued interest (if any) for the running coupon of each Bond in the reference portfolio with a bond maturity date following termination date. Banca IMI S.p.A. pays annually the notional amount multiplied by 3,2030%. For this Sub-Fund, the swapped bonds represent 0,22% of the portfolio. As at 31 December 2015, Banca IMI S.p.A. has pledged the security CTZ 0,00% 29/04/2016 for a nominal value of EUR 4 170 000,00 for the Sub-Fund Investment Solutions by Epsilon - Valore Cedola Globale - 02/2015 as collateral for swap contracts. The Sub-Fund Investment Solutions by Epsilon - Valore Cedola Globale - 04/2015 entered into an asset swap transaction as follows: Asset swap contracts The Sub-Fund Investment Solutions by Epsilon - Valore Cedola Globale - 04/2015 pays on the dates scheduled for payment of coupons on bonds included in the portfolio, an amount equal to the full gross amount due as coupons on such bonds, at termination date, an amount equal to the accrued interest (if any) for the running coupon of each Bond in the reference portfolio with a bond maturity date following termination date. Banca IMI S.p.A. pays annually the notional amount multiplied by 2,9243%. For this Sub-Fund, the swapped bonds represent 0,26% of the portfolio. The Sub-Fund Investment Solutions by Epsilon - Valore Cedola Globale - 07/2015 entered into an asset swap transaction as follows: Asset swap contracts The Sub-Fund Investment Solutions by Epsilon - Valore Cedola Globale - 07/2015 pays on the dates scheduled for payment of coupons on bonds included in the portfolio, an amount equal to the full gross amount due as coupons on such bonds, at termination date, an amount equal to the accrued interest (if any) for the running coupon of each Bond in the reference portfolio with a bond maturity date following termination date. Banca IMI S.p.A. pays annually the notional amount multiplied by 2,5740%. For this Sub-Fund, the swapped bonds represent 0,32% of the portfolio. The Sub-Fund Investment Solutions by Epsilon - Global Coupon - 10/2013 entered into an asset swap transaction as follows: Asset swap contracts The Sub-Fund Investment Solutions by Epsilon - Global Coupon - 10/2013 pays on the dates scheduled for payment of coupons on bonds included in the portfolio, an amount equal to the full gross amount due as coupons on such bonds, at each bond maturity date, an amount equal to the notional amount of the bonds in the reference portfolio with a bond maturity date preceding termination date and, at termination date, an amount equal to the accrued interest (if any) for the running coupon of each Bond and the sum of non par repayment of the reference portfolio. Banca IMI S.p.A. pays annually the notional amount multiplied by 4,14%. For this Sub-Fund, the swapped bonds represent 41,27% of the portfolio.
360
NOTES TO THE FINANCIAL STATEMENTS Investment Solutions by Epsilon ________________________________________________________________________________
The Sub-Fund Investment Solutions by Epsilon - Global Coupon - 06/2014 entered into an asset swap transaction as follows: Asset swap contracts The Sub-Fund Investment Solutions by Epsilon - Global Coupon - 06/2014 pays on the dates scheduled for payment of coupons on bonds included in the portfolio, an amount equal to the full gross amount due as coupons on such bonds and at termination date, an amount equal to the accrued interest (if any) for the running coupon of each Bond with a bond maturity Date following termination date. Banca IMI S.p.A. pays annually the notional amount multiplied by 5,8255%. For this Sub-Fund, the swapped bonds represent 0,63% of the portfolio. As at 31 December 2015, Banca IMI S.p.A. has pledged the security BTP 1,15% 15/05/2017 for a nominal value of EUR 2 290 000,00 and the security BTP 4,50% 01/02/2018 for a nominal value of EUR 810 000,00 for the Sub-Fund Investment Solutions by Epsilon - Global Coupon - 06/2014 as collateral for swap contracts. The Sub-Fund Investment Solutions by Epsilon - Global Coupon - 11/2014 entered into an asset swap transaction as follows: Asset swap contracts The Sub-Fund Investment Solutions by Epsilon - Global Coupon - 11/2014 pays on the dates scheduled for payment of coupons on bonds included in the portfolio, an amount equal to the full gross amount due as coupons on such bonds and at termination date, an amount equal to the accrued interest (if any) for the running coupon of each Bond with a bond maturity Date following termination date. Banca IMI S.p.A. pays annually the notional amount multiplied by 5,1665%. For this Sub-Fund, the swapped bonds represent 0,19% of the portfolio. As at 31 December 2015, Banca IMI S.p.A. has pledged the security BTP 5,25% 01/08/2017 for a nominal value of EUR 255 000,00 for the Sub-Fund Investment Solutions by Epsilon - Global Coupon - 11/2014 as collateral for swap contracts. The Sub-Fund Investment Solutions by Epsilon - Global Diversified Allocation - 02/2015 entered into an asset swap transaction as follows: Asset swap contracts The Sub-Fund Investment Solutions by Epsilon - Global Diversified Allocation - 02/2015 pays on the dates scheduled for payment of coupons on bonds included in the portfolio, an amount equal to the full gross amount due as coupons on such bonds and at termination date, an amount equal to the accrued interest (if any) for the running coupon of each Bond with a bond maturity Date following termination date. Banca IMI S.p.A. pays annually the notional amount multiplied by 4,2115%. For this Sub-Fund, the swapped bonds represent 0,24% of the portfolio. As at 31 December 2015, Banca IMI S.p.A. has pledged the security BTP 3,10% 15/09/2026 for a nominal value of EUR 1 060 000,00 for the Sub-Fund Investment Solutions by Epsilon - Global Diversified Allocation - 02/2015 as collateral for swap contracts. The Sub-Fund Investment Solutions by Epsilon - Equity Coupon - 02/2014 entered into an asset swap transaction as follows: Asset swap contracts The Sub-Fund Investment Solutions by Epsilon - Equity Coupon - 02/2014 on the dates scheduled for payment of coupons on bonds included in the portfolio an amount equal to the full gross amount due as coupons on such bonds. Banca IMI S.p.A. pays annually the notional amount multiplied by 3,187%. For this Sub-Fund, the swapped bonds represent 72,73% of the portfolio.
361
NOTES TO THE FINANCIAL STATEMENTS Investment Solutions by Epsilon ________________________________________________________________________________
As at 31 December 2015, Banca IMI S.p.A. has pledged the security BTP 4,00% 01/02/2017 for a nominal value of EUR 2 600 000,00 for the Sub-Fund Investment Solutions by Epsilon - Equity Coupon - 02/2014 as collateral for swap contracts. The Sub-Fund Investment Solutions by Epsilon - Equity Coupon - 04/2014 entered into an asset swap transaction as follows: Asset swap contracts The Sub-Fund Investment Solutions by Epsilon - Equity Coupon - 04/2014 on the dates scheduled for payment of coupons on bonds included in the portfolio an amount equal to the full gross amount due as coupons on such bonds and at termination date an amount equal to the accrued interest for the running coupon of each bond with a bond maturity date following termination date. Banca IMI S.p.A. pays annually the notional amount multiplied by 3,3600%. For this Sub-Fund, the swapped bonds represent 72,31% of the portfolio. INTEREST RECEIVED AND PAID ON ASSET SWAP CONTRACTS The interest received and paid on asset swap contracts and the realised profit / (loss) on swap contracts are recorded under the heading “Net realised profit / (loss) on sales of investments, currencies and other financial instruments”. The details as at 31 December 2015 are as follows (in EUR):
Sub-Fund Interest received
Interest paid
Net realised profit / (loss) on swap contracts
Investment Solutions by Epsilon - Soluzione Attiva Protetta 5 2017 477 896,98 (775 684,64) 1 834 444,09 Investment Solutions by Epsilon - Soluzione Attiva Protetta 6 2017 385 162,53 (606 346,25) 1 109 546,91 Investment Solutions by Epsilon - Soluzione Attiva Protetta 7 2017 174 687,24 (277 761,72) 759 024,03 Investment Solutions by Epsilon - Soluzione Attiva Protetta 9 2017 113 054,11 (181 015,02) 370 635,35 Investment Solutions by Epsilon - Soluzione Attiva Protetta 12 2017 59 648,41 (100 997,90) 357 130,18 Investment Solutions by Epsilon - Forex Coupon 2016 1 570 241,00 (970 037,50) (2 892 615,69) Investment Solutions by Epsilon - Forex Coupon 2017 3 319 650,90 (1 738 132,50) (2 355 222,31) Investment Solutions by Epsilon - Forex Coupon 2017-2 7 923 696,30 (4 493 768,70) (4 996 317,35) Investment Solutions by Epsilon - Forex Coupon 2017-3 4 809 820,60 (2 852 844,97) (1 636 260,67) Investment Solutions by Epsilon - Forex Coupon 2017-4 3 319 277,20 (2 037 961,54) (1 562 914,82) Investment Solutions by Epsilon - Forex Coupon 2017-5 5 461 575,80 (3 705 127,47) (2 894 496,48) Investment Solutions by Epsilon - Forex Coupon 2017-6 4 989 023,80 (3 254 389,66) (1 971 352,35) Investment Solutions by Epsilon - Forex Coupon 2017-7 6 558 238,30 (4 675 770,58) (4 505 326,23) Investment Solutions by Epsilon - Forex Coupon 2018-1 6 634 130,00 (4 292 625,00) (1 235 524,16) Investment Solutions by Epsilon - Cedola x 4 – 06/2011 2 622 075,11 (38 000 646,91) 34 830 258,64 Investment Solutions by Epsilon - Cedola x 4 - 07/2011 5 204 072,00 (26 940 035,26) 20 147 008,55 Investment Solutions by Epsilon - Cedola x 4 - 09/2011 10 757 942,21 (13 548 885,48) (651 969,16) Investment Solutions by Epsilon - Cedola x 4 - 11/2011 899 372,80 (2 884 538,75) 744 222,09 Investment Solutions by Epsilon - Cedola x 4 - 12/2011 906 094,40 (1 797 350,00) 426 366,11 Investment Solutions by Epsilon - Cedola x 4 - 02/2012 3 738 468,00 (7 270 273,75) 4 029 156,12 Investment Solutions by Epsilon - Cedola x 4 - 03/2012 1 677 118,00 (3 883 061,00) 2 035 326,46 Investment Solutions by Epsilon - Cedola x 4 Indexed - 05/2012 266 771,38 (514 457,50) (10 396,70) Investment Solutions by Epsilon - Cedola x 4 Indexed - 07/2012 894 266,89 (1 928 226,00) (183 276,02) Investment Solutions by Epsilon - Cedola x 4 Indexed - 09/2012 2 066 670,00 (5 974 090,00) 597 832,72 Investment Solutions by Epsilon - Cedola x 4 Indexed - 10/2012 2 024 394,05 (6 438 607,50) 2 697 247,30 Investment Solutions by Epsilon - Flexible Equity Coupon 2017-1 308 980,19 (546 485,69) 620 960,49 Investment Solutions by Epsilon - Valore Cedola x 5 - 12/2012 28 116 722,50 (20 967 250,00) 2 413 897,97 Investment Solutions by Epsilon - Valore Cedola x 5 - 02/2013 20 665 136,00 (16 146 125,00) 13 733 138,12 Investment Solutions by Epsilon - Valore Cedola x 5 - 04/2013 5 076 008,00 (4 204 000,00) 2 734 889,23 Investment Solutions by Epsilon - Valore Cedola x 5 - 06/2013 6 606 514,00 (5 362 296,50) 1 846 951,04 Investment Solutions by Epsilon - Valore Cedola x 5 - 07/2013 8 335 160,39 (8 246 500,00) 4 110 573,87 Investment Solutions by Epsilon - Valore Cedola x 5 - 10/2013 6 652 403,00 (8 508 177,00) 1 478 898,93 Investment Solutions by Epsilon - Valore Cedola x 5 - 12/2013 17 385 207,56 (13 402 532,53) 6 350 465,64 Investment Solutions by Epsilon - Valore Cedola x 5 - 02/2014 7 070 562,33 (7 917 698,63) 2 423 369,08 Investment Solutions by Epsilon - Valore Cedola x 5 - 04/2014 6 350 129,30 (7 549 428,12) 953 237,39 Investment Solutions by Epsilon - Valore Cedola x 5 - 11/2014 417,11 (9 147 665,11) -
362
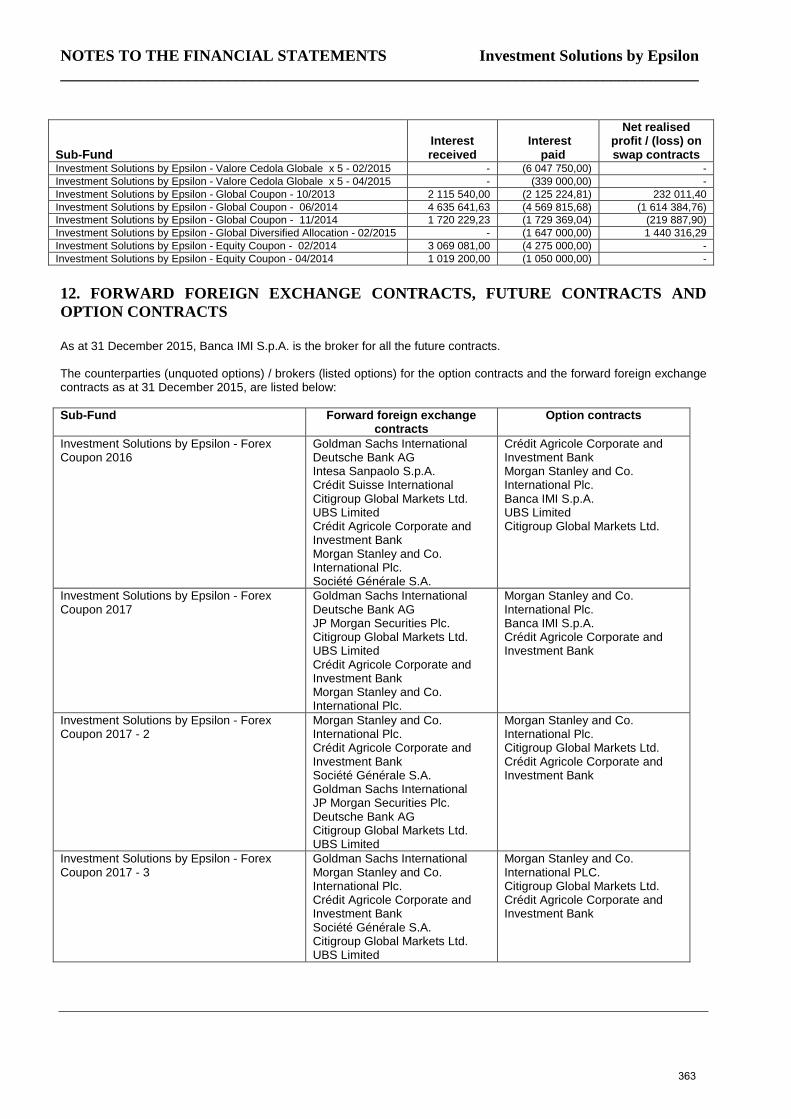
NOTES TO THE FINANCIAL STATEMENTS Investment Solutions by Epsilon ________________________________________________________________________________
Sub-Fund Interest received
Interest paid
Net realised profit / (loss) on swap contracts
Investment Solutions by Epsilon - Valore Cedola Globale x 5 - 02/2015 - (6 047 750,00) - Investment Solutions by Epsilon - Valore Cedola Globale x 5 - 04/2015 - (339 000,00) - Investment Solutions by Epsilon - Global Coupon - 10/2013 2 115 540,00 (2 125 224,81) 232 011,40 Investment Solutions by Epsilon - Global Coupon - 06/2014 4 635 641,63 (4 569 815,68) (1 614 384,76) Investment Solutions by Epsilon - Global Coupon - 11/2014 1 720 229,23 (1 729 369,04) (219 887,90) Investment Solutions by Epsilon - Global Diversified Allocation - 02/2015 - (1 647 000,00) 1 440 316,29 Investment Solutions by Epsilon - Equity Coupon - 02/2014 3 069 081,00 (4 275 000,00) - Investment Solutions by Epsilon - Equity Coupon - 04/2014 1 019 200,00 (1 050 000,00) -
12. FORWARD FOREIGN EXCHANGE CONTRACTS, FUTURE CONTRACTS AND OPTION CONTRACTS As at 31 December 2015, Banca IMI S.p.A. is the broker for all the future contracts. The counterparties (unquoted options) / brokers (listed options) for the option contracts and the forward foreign exchange contracts as at 31 December 2015, are listed below: Sub-Fund Forward foreign exchange
contracts Option contracts
Investment Solutions by Epsilon - Forex Coupon 2016
Goldman Sachs International Deutsche Bank AG Intesa Sanpaolo S.p.A. Crédit Suisse International Citigroup Global Markets Ltd. UBS Limited Crédit Agricole Corporate and Investment Bank Morgan Stanley and Co. International Plc. Société Générale S.A.
Crédit Agricole Corporate and Investment Bank Morgan Stanley and Co. International Plc. Banca IMI S.p.A. UBS Limited Citigroup Global Markets Ltd.
Investment Solutions by Epsilon - Forex Coupon 2017
Goldman Sachs International Deutsche Bank AG JP Morgan Securities Plc. Citigroup Global Markets Ltd. UBS Limited Crédit Agricole Corporate and Investment Bank Morgan Stanley and Co. International Plc.
Morgan Stanley and Co. International Plc. Banca IMI S.p.A. Crédit Agricole Corporate and Investment Bank
Investment Solutions by Epsilon - Forex Coupon 2017 - 2
Morgan Stanley and Co. International Plc. Crédit Agricole Corporate and Investment Bank Société Générale S.A. Goldman Sachs International JP Morgan Securities Plc. Deutsche Bank AG Citigroup Global Markets Ltd. UBS Limited
Morgan Stanley and Co. International Plc. Citigroup Global Markets Ltd. Crédit Agricole Corporate and Investment Bank
Investment Solutions by Epsilon - Forex Coupon 2017 - 3
Goldman Sachs International Morgan Stanley and Co. International Plc. Crédit Agricole Corporate and Investment Bank Société Générale S.A. Citigroup Global Markets Ltd. UBS Limited
Morgan Stanley and Co. International PLC. Citigroup Global Markets Ltd. Crédit Agricole Corporate and Investment Bank
363
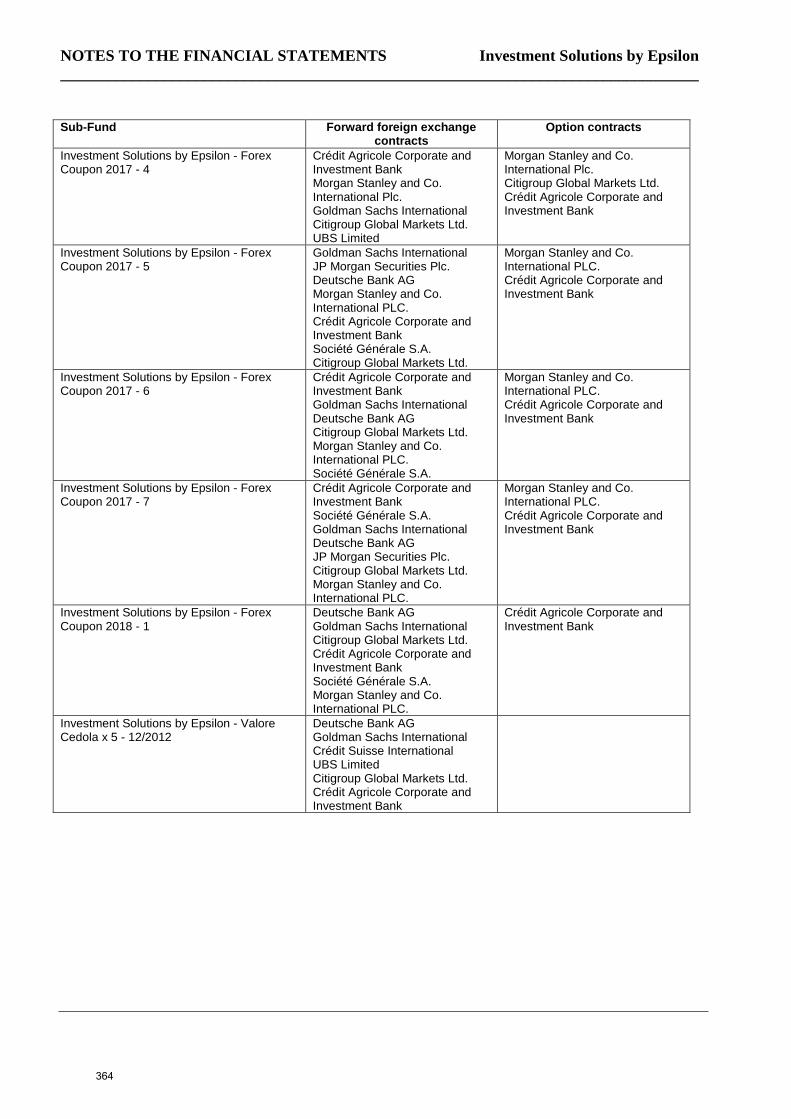
NOTES TO THE FINANCIAL STATEMENTS Investment Solutions by Epsilon ________________________________________________________________________________
Sub-Fund Forward foreign exchange contracts
Option contracts
Investment Solutions by Epsilon - Forex Coupon 2017 - 4
Crédit Agricole Corporate and Investment Bank Morgan Stanley and Co. International Plc. Goldman Sachs International Citigroup Global Markets Ltd. UBS Limited
Morgan Stanley and Co. International Plc. Citigroup Global Markets Ltd. Crédit Agricole Corporate and Investment Bank
Investment Solutions by Epsilon - Forex Coupon 2017 - 5
Goldman Sachs International JP Morgan Securities Plc. Deutsche Bank AG Morgan Stanley and Co. International PLC. Crédit Agricole Corporate and Investment Bank Société Générale S.A. Citigroup Global Markets Ltd.
Morgan Stanley and Co. International PLC. Crédit Agricole Corporate and Investment Bank
Investment Solutions by Epsilon - Forex Coupon 2017 - 6
Crédit Agricole Corporate and Investment Bank Goldman Sachs International Deutsche Bank AG Citigroup Global Markets Ltd. Morgan Stanley and Co. International PLC. Société Générale S.A.
Morgan Stanley and Co. International PLC. Crédit Agricole Corporate and Investment Bank
Investment Solutions by Epsilon - Forex Coupon 2017 - 7
Crédit Agricole Corporate and Investment Bank Société Générale S.A. Goldman Sachs International Deutsche Bank AG JP Morgan Securities Plc. Citigroup Global Markets Ltd. Morgan Stanley and Co. International PLC.
Morgan Stanley and Co. International PLC. Crédit Agricole Corporate and Investment Bank
Investment Solutions by Epsilon - Forex Coupon 2018 - 1
Deutsche Bank AG Goldman Sachs International Citigroup Global Markets Ltd. Crédit Agricole Corporate and Investment Bank Société Générale S.A. Morgan Stanley and Co. International PLC.
Crédit Agricole Corporate and Investment Bank
Investment Solutions by Epsilon - Valore Cedola x 5 - 12/2012
Deutsche Bank AG Goldman Sachs International Crédit Suisse International UBS Limited Citigroup Global Markets Ltd. Crédit Agricole Corporate and Investment Bank
364
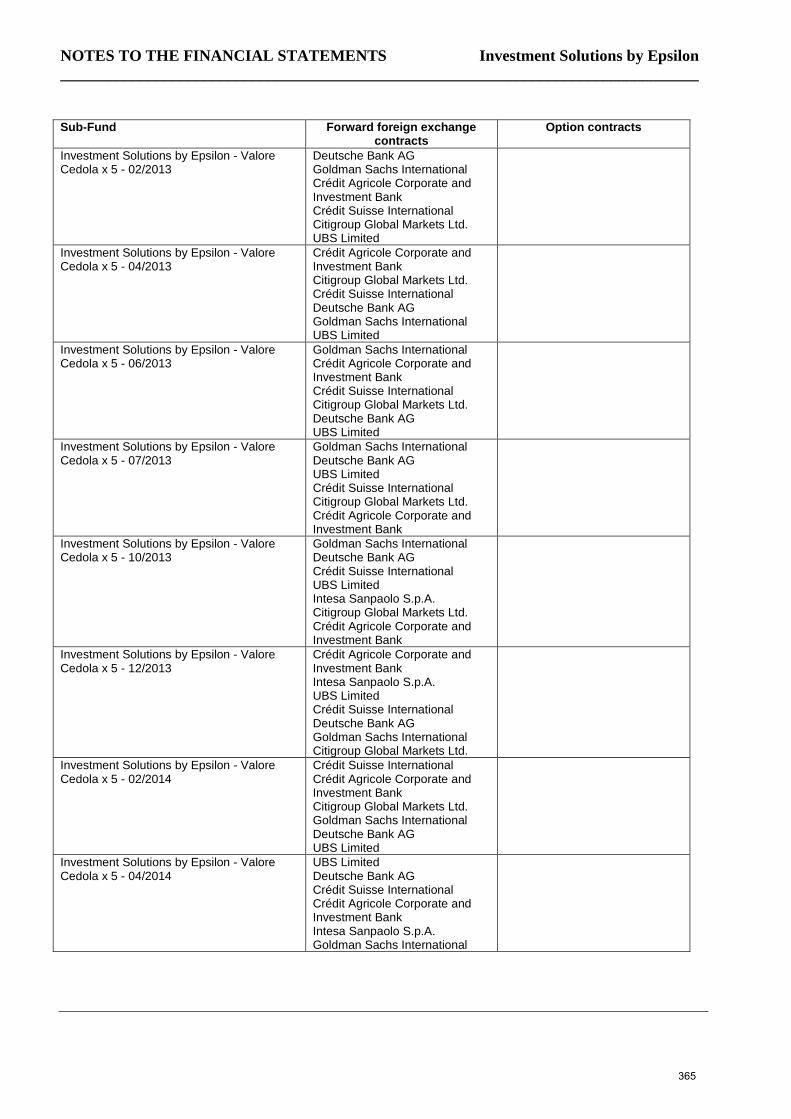
NOTES TO THE FINANCIAL STATEMENTS Investment Solutions by Epsilon ________________________________________________________________________________
Sub-Fund Forward foreign exchange contracts
Option contracts
Investment Solutions by Epsilon - Valore Cedola x 5 - 02/2013
Deutsche Bank AG Goldman Sachs International Crédit Agricole Corporate and Investment Bank Crédit Suisse International Citigroup Global Markets Ltd. UBS Limited
Investment Solutions by Epsilon - Valore Cedola x 5 - 04/2013
Crédit Agricole Corporate and Investment Bank Citigroup Global Markets Ltd. Crédit Suisse International Deutsche Bank AG Goldman Sachs International UBS Limited
Investment Solutions by Epsilon - Valore Cedola x 5 - 06/2013
Goldman Sachs International Crédit Agricole Corporate and Investment Bank Crédit Suisse International Citigroup Global Markets Ltd. Deutsche Bank AG UBS Limited
Investment Solutions by Epsilon - Valore Cedola x 5 - 07/2013
Goldman Sachs International Deutsche Bank AG UBS Limited Crédit Suisse International Citigroup Global Markets Ltd. Crédit Agricole Corporate and Investment Bank
Investment Solutions by Epsilon - Valore Cedola x 5 - 10/2013
Goldman Sachs International Deutsche Bank AG Crédit Suisse International UBS Limited Intesa Sanpaolo S.p.A. Citigroup Global Markets Ltd. Crédit Agricole Corporate and Investment Bank
Investment Solutions by Epsilon - Valore Cedola x 5 - 12/2013
Crédit Agricole Corporate and Investment Bank Intesa Sanpaolo S.p.A. UBS Limited Crédit Suisse International Deutsche Bank AG Goldman Sachs International Citigroup Global Markets Ltd.
Investment Solutions by Epsilon - Valore Cedola x 5 - 02/2014
Crédit Suisse International Crédit Agricole Corporate and Investment Bank Citigroup Global Markets Ltd. Goldman Sachs International Deutsche Bank AG UBS Limited
Investment Solutions by Epsilon - Valore Cedola x 5 - 04/2014
UBS Limited Deutsche Bank AG Crédit Suisse International Crédit Agricole Corporate and Investment Bank Intesa Sanpaolo S.p.A. Goldman Sachs International
365
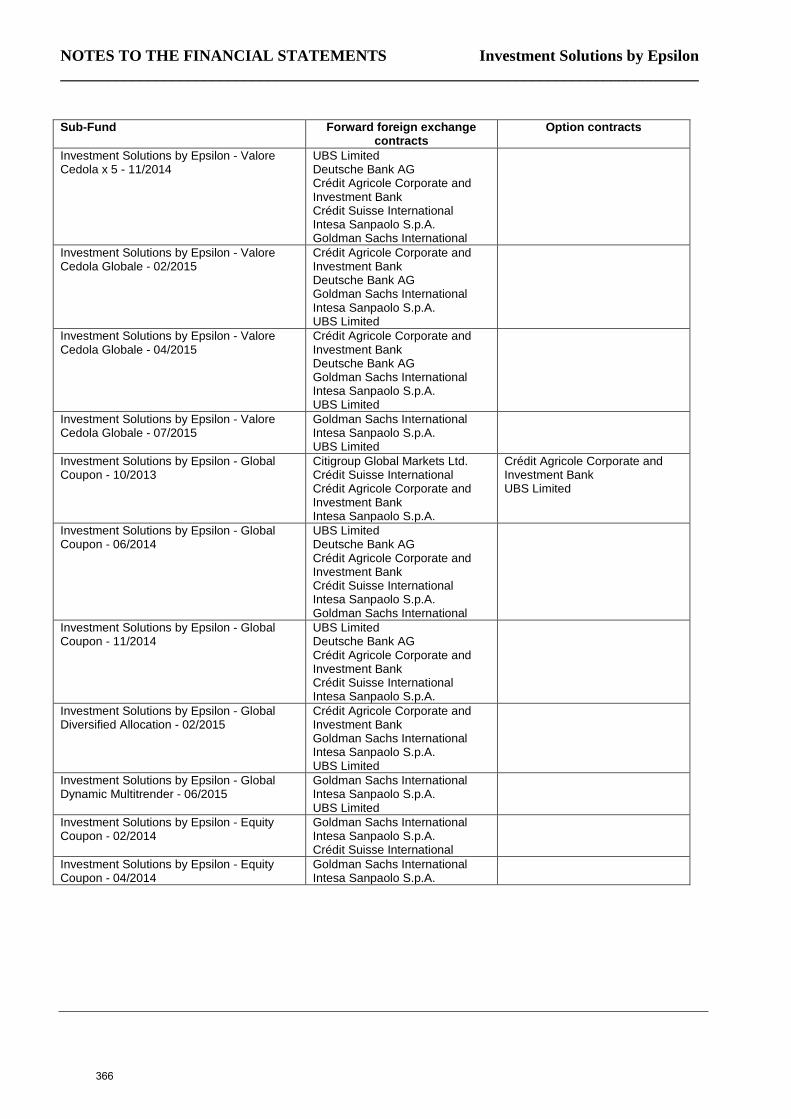
NOTES TO THE FINANCIAL STATEMENTS Investment Solutions by Epsilon ________________________________________________________________________________
Sub-Fund Forward foreign exchange contracts
Option contracts
Investment Solutions by Epsilon - Valore Cedola x 5 - 11/2014
UBS Limited Deutsche Bank AG Crédit Agricole Corporate and Investment Bank Crédit Suisse International Intesa Sanpaolo S.p.A. Goldman Sachs International
Investment Solutions by Epsilon - Valore Cedola Globale - 02/2015
Crédit Agricole Corporate and Investment Bank Deutsche Bank AG Goldman Sachs International Intesa Sanpaolo S.p.A. UBS Limited
Investment Solutions by Epsilon - Valore Cedola Globale - 04/2015
Crédit Agricole Corporate and Investment Bank Deutsche Bank AG Goldman Sachs International Intesa Sanpaolo S.p.A. UBS Limited
Investment Solutions by Epsilon - Valore Cedola Globale - 07/2015
Goldman Sachs International Intesa Sanpaolo S.p.A. UBS Limited
Investment Solutions by Epsilon - Global Coupon - 10/2013
Citigroup Global Markets Ltd. Crédit Suisse International Crédit Agricole Corporate and Investment Bank Intesa Sanpaolo S.p.A.
Crédit Agricole Corporate and Investment Bank UBS Limited
Investment Solutions by Epsilon - Global Coupon - 06/2014
UBS Limited Deutsche Bank AG Crédit Agricole Corporate and Investment Bank Crédit Suisse International Intesa Sanpaolo S.p.A. Goldman Sachs International
Investment Solutions by Epsilon - Global Coupon - 11/2014
UBS Limited Deutsche Bank AG Crédit Agricole Corporate and Investment Bank Crédit Suisse International Intesa Sanpaolo S.p.A.
Investment Solutions by Epsilon - Global Diversified Allocation - 02/2015
Crédit Agricole Corporate and Investment Bank Goldman Sachs International Intesa Sanpaolo S.p.A. UBS Limited
Investment Solutions by Epsilon - Global Dynamic Multitrender - 06/2015
Goldman Sachs International Intesa Sanpaolo S.p.A. UBS Limited
Investment Solutions by Epsilon - Equity Coupon - 02/2014
Goldman Sachs International Intesa Sanpaolo S.p.A. Crédit Suisse International
Investment Solutions by Epsilon - Equity Coupon - 04/2014
Goldman Sachs International Intesa Sanpaolo S.p.A.
366
NOTES TO THE FINANCIAL STATEMENTS Investment Solutions by Epsilon ________________________________________________________________________________
During the financial year certain Sub-Funds have taken out forward foreign exchange contracts, future contracts and option contracts. Details of open positions as at 31 December 2015 are disclosed following the Portfolios of the concerned Sub-Funds. As at 31 December 2015, the Sub-Fund Investment Solutions by Epsilon - Forex Coupon 2016 has received the security BTP 3,10% 15/09/2026 for a nominal value of EUR 56 000,00 from Crédit Suisse International as collateral for forward contracts. The Sub-fund has pledged the security BTP 5,25% 01/08/2017 for a nominal value of EUR 112 000,00 to Morgan Stanley and Co. International Plc. and the security BTP 4,75/% 15/09/2016 for a nominal value of EUR 311 000,00 to Crédit Agricole Corporate and Investment Bank as collateral for forward and option contracts. As at 31 December 2015, the Sub-Fund Investment Solutions by Epsilon - Forex Coupon 2017 has received a cash amount for a nominal value of USD 380 000,00 from Goldman Sachs International as collateral for forward contracts. The Sub-Fund has pledged a cash amount for a nominal value of EUR 110 000,00 to Crédit Agricole Corporate and Investment Bank as collateral for forward contracts. As at 31 December 2015, the Sub-Fund Investment Solutions by Epsilon - Forex Coupon 2017-2 has received a cash amount for a nominal value of USD 440 000,00 from Goldman Sachs International and a cash amount for a nominal value of EUR 120 000,00 from Société Générale S.A. as collateral for forward contracts and the security FRTR 4,00% 25/10/2038 for a nominal value of EUR 302 000,00 from Morgan Stanley and Co. International Plc. as collateral for forward and option contracts. As at 31 December 2015, the Sub-Fund Investment Solutions by Epsilon - Forex Coupon 2017-3 has received the security BTP 2,50% 01/05/2019 for a nominal value of EUR 262 000,00 from Morgan Stanley and Co. International Plc. as collateral for forward and option contracts and a cash amount for a nominal value of USD 330 000,00 from Goldman Sachs International as collateral for forward contracts. The Sub-fund has pledged the security BTP 4,75% 01/05/2017 for a nominal value of EUR 49 000,00 to Crédit Agricole Corporate and Investment Bank as collateral for forward and option contracts. As at 31 December 2015, the Sub-Fund Investment Solutions by Epsilon - Forex Coupon 2017-4 has received the security BUNDESOBLIGATION 0,75% 15/04/2018 for a nominal value of EUR 149 000,00 from Morgan Stanley and Co. International Plc. as collateral for forward and option contracts and a cash amount for a nominal value of USD 260 000,00 from Goldman Sachs International as collateral for forward contracts. As at 31 December 2015, the Sub-Fund Investment Solutions by Epsilon - Forex Coupon 2017-5 has received a cash amount for a nominal value of EUR 538 000,00 from Goldman Sachs International, a cash amount for a nominal value of EUR 110 000,00 from Société Générale S.A. as collateral for forward contracts and a cash amount for a nominal value of EUR 280 000,00 from Morgan Stanley and Co. International Plc. as collateral for forward and option contracts. As at 31 December 2015, the Sub-Fund Investment Solutions by Epsilon - Forex Coupon 2017-6 has received the security BTP 3,50% 01/11/2017 for a nominal value of EUR 410 000,00 from Morgan Stanley and Co. International Plc., a cash amount for a nominal value of EUR 100 000,00 from Société Générale S.A. and a cash amount for a nominal value of EUR 675 000,00 from Goldman Sachs International as collateral for forward contracts. As at 31 December 2015, the Sub-Fund Investment Solutions by Epsilon - Forex Coupon 2017-7 has received a cash amount for a nominal value of USD 780 000,00 from Goldman Sachs International, a cash amount for a nominal value of EUR 180 000,00 from Société Générale S.A. and a cash amount for a nominal value of EUR 264 792,00 from JP Morgan Securities Plc. as collateral for forward contracts, a cash amount for a nominal value of EUR 284 000,00 from Morgan Stanley and Co. International Plc. and a cash amount for a nominal value of EUR 140 000,00 from Crédit Agricole Corporate and Investment Bank as collateral for forward and option contracts. As at 31 December 2015, the Sub-Fund Investment Solutions by Epsilon - Forex Coupon 2018-1 has received a cash amount for a nominal value of EUR 275 000,00 from Deutsche Bank AG London, a cash amount for a nominal value of EUR 528 000,00 from Goldman Sachs International and a cash amount for a nominal value of EUR 259 000,00 from Morgan Stanley and Co. International Plc. as collateral for forward contracts. As at 31 December 2015, the Sub-Fund Investment Solutions by Epsilon - Valore Cedola x 5 - 12/2012 has received a cash amount for a nominal value of EUR 230 000,00 from Citigroup Global Markets Ltd, a cash amount for a nominal value of EUR 520 000,00 from UBS Limited, a cash amount for a nominal value of USD 1 357 000,00 from Crédit Suisse International, a cash amount for a nominal value of EUR 605 000,00 from Crédit Agricole Corporate and Investment Bank as collateral for forward contracts. The Sub-Fund has pledged the security CTZ 0,00% 30/08/2017 for a nominal value of EUR 9 500 000,00 to Banca IMI S.p.A. as collateral for future contracts. As at 31 December 2015, the Sub-Fund Investment Solutions by Epsilon - Valore Cedola x 5 - 02/2013 has received a cash amount for a nominal value of USD 1 040 000,00 from Goldman Sachs International, a cash amount for a nominal
367
NOTES TO THE FINANCIAL STATEMENTS Investment Solutions by Epsilon ________________________________________________________________________________
value of EUR 220 000,00 from Citigroup Global Markets Ltd., a cash amount for a nominal value of EUR 770 000,00 from UBS Limited, a cash amount for a nominal value of EUR 176 000,00 from Crédit Suisse International and a cash amount for a nominal value of EUR 165 000,00 from Crédit Agricole Corporate and Investment Bank as collateral for forward contracts. The Sub-Fund has pledged the security CTZ 0,00% 30/08/2017 for a nominal value of EUR 9 500 000,00 to Banca IMI S.p.A. as collateral for future contracts. As at 31 December 2015, the Sub-Fund Investment Solutions by Epsilon - Valore Cedola x 5 - 04/2013 has received a cash amount for a nominal value of EUR 130 000,00 from Citigroup Global Markets Ltd, a cash amount for a nominal value of EUR 140 000,00 from UBS Limited and a cash amount for a nominal value of EUR 360 000,00 from Crédit Agricole Corporate and Investment Bank as collateral for forward contracts. The Sub-Fund has pledged the security CTZ 0,00% 27/02/2017 for a nominal value of EUR 2 750 000,00 to Banca IMI S.p.A. as collateral for future contracts. As at 31 December 2015, the Sub-Fund Investment Solutions by Epsilon - Valore Cedola x 5 - 06/2013 has received a cash amount for a nominal value of EUR 40 000,00 from Goldman Sachs International, a cash amount for a nominal value of EUR 420 000,00 from Citigroup Global Markets Ltd. and a cash amount for a nominal value of EUR 180 000,00 from UBS Limited as collateral for forward contracts. The Sub-Fund has pledged the security CTZ 0,00% 27/02/2017 for a nominal value of EUR 3 500 000,00 to Banca IMI S.p.A. as collateral for future contracts. As at 31 December 2015, the Sub-Fund Investment Solutions by Epsilon - Valore Cedola x 5 - 07/2013 has received a cash amount for a nominal value of EUR 340 000,00 from Citigroup Global Markets Ltd., a cash amount for a nominal value of EUR 240 000,00 from UBS Limited, a cash amount for a nominal value of EUR 237 000,00 from Crédit Suisse International and a cash amount for a nominal value of EUR 305 000,00 from Crédit Agricole Corporate and Investment Bank for forward contracts. The Sub-Fund has pledged the security CTZ 0,00% 30/08/2017 for a nominal value of EUR 4 700 000,00 to Banca IMI S.p.A. as collateral for future contracts. As at 31 December 2015, the Sub-Fund Investment Solutions by Epsilon - Valore Cedola x 5 - 10/2013 has received a cash amount for a nominal value of EUR 170 000,00 from Citigroup Global Markets Ltd and a cash amount for a nominal value of EUR 123 000,00 from Crédit Agricole Corporate and Investment Bank as collateral for forward contracts. The Sub-Fund has pledged the security CTZ 0,00% 27/02/2017 for a nominal value of EUR 4 500 000,00 to Banca IMI S.p.A. as collateral for future contracts and the security BTP 3,50% 01/12/2018 for a nominal value of EUR 34 000,00 to UBS Limited as collateral for forward contracts. As at 31 December 2015, the Sub-Fund Investment Solutions by Epsilon - Valore Cedola x 5 - 12/2013 has received a cash amount for a nominal value of EUR 150 000,00 from UBS Limited as collateral for forward contracts. The Sub-Fund has pledged the security CTZ 0,00% 30/08/2017 for a nominal value of EUR 8 500 000,00 to Banca IMI S.p.A. as collateral for future contracts, the security BTP 3,50% 01/12/2018 for a nominal value of EUR 568 000,00 to Intesa Sanpaolo S.p.A., for a nominal value of EUR 25 000,00 to Crédit Suisse International, for a nominal value of EUR 1 398 000,00 to Crédit Agricole Corporate and Investment Bank, a cash amount for a nominal value of EUR 60 000,00 to Crédit Agricole Corporate and Investment Bank and a cash amount for a nominal value of EUR 150 000,00 to Citigroup Global Markets Ltd for forward contracts. As at 31 December 2015, the Sub-Fund Investment Solutions by Epsilon - Valore Cedola x 5 - 02/2014 has pledged the security CTZ 0,00% 27/02/2017 for a nominal value of EUR 7 000 000,00 to Banca IMI S.p.A. as collateral for future contracts, a cash amount for a nominal value of EUR 210 000,00 to Citigroup Global Markets Ltd, the security BTP 3,50% 01/12/2018 for a nominal value of EUR 906 000,00 to Crédit Agricole Corporate and Investment Bank, a cash amount for a nominal value of EUR 544 000,00 to Goldman Sachs International, the security BTP 4,25% 01/02/2019 for a nominal value of EUR 19 000,00 to Goldman Sachs International and the security BTP 2,50% 01/05/2019 for a nominal value of EUR 348 000,00 to UBS Limited as collateral for forward contracts. As at 31 December 2015, the Sub-Fund Investment Solutions by Epsilon - Valore Cedola x 5 - 04/2014 has pledged the security BTP 4,25% 01/02/2019 for a nominal value of EUR 292 000,00 to Crédit Suisse International and the security BTP 1,50% 01/08/2019 for a nominal value of EUR 794 000,00 to UBS Limited as collateral for forward contracts and the security CTZ 0,00% 30/08/2017 for a nominal value of EUR 7 650 000,00 to Banca IMI S.p.A. as collateral for future contracts. The Sub-Fund has received a cash amount of a nominal value of EUR 240 000,00 from Crédit Agricole Corporate and Investment Bank as collateral for forward contracts. As at 31 December 2015, the Sub-Fund Investment Solutions by Epsilon - Valore Cedola x 5 - 11/2014 has received a cash amount for a nominal value of EUR 500 000,00 from Crédit Agricole Corporate and Investment Bank as collateral for forward contracts. The Sub-Fund has pledged the security CTZ 0,00% 27/02/2017 for a nominal value of EUR 15 250 000,00 to Banca IMI S.p.A. as collateral for future contracts and the security BTP 1,05% 01/12/2019 for a nominal value of EUR 4 596 000,00 to Crédit Suisse International as collateral for forward contracts. As at 31 December 2015, the Sub-Fund Investment Solutions by Epsilon - Valore Cedola Globale - 02/2015 has received a cash amount for a nominal value of USD 570 000,00 from Goldman Sachs International, a cash amount for a nominal
368
NOTES TO THE FINANCIAL STATEMENTS Investment Solutions by Epsilon ________________________________________________________________________________
value of EUR 500 000,00 from Deutsche Bank AG London, a cash amount for a nominal value of EUR 1 830 000,00 from UBS Limited and a cash amount for a nominal value of EUR 7 430 000,00 from Intesa Sanpaolo S.p.A. as collateral for forward contracts. The Sub-Fund has pledged the security CTZ 0,00% 27/02/2017 for a nominal value of EUR 28 150 000,00 to Banca IMI S.p.A. as collateral for future contracts. As at 31 December 2015, the Sub-Fund Investment Solutions by Epsilon - Valore Cedola Globale - 04/2015 has pledged a cash amount for a nominal value of USD 100 000,00 to Goldman Sachs International, for a nominal value of EUR 30 000,00 to Crédit Agricole Corporate and Investment Bank and a cash amount for a nominal value of EUR 730 000,00 to Intesa Sanpaolo S.p.A. as collateral for forward contracts and the security CTZ 0,00% 27/02/2017 for a nominal value of EUR 11 500 000,00 to Banca IMI S.p.A. as collateral for future contracts. As at 31 December 2015, the Sub-Fund Investment Solutions by Epsilon - Valore Cedola Globale - 07/2015 has pledged the security BTP 4,50% 01/02/2020 for a nominal value of EUR 4 300 000,00 to Banca IMI S.p.A. as collateral for future contracts. As at 31 December 2015, the Sub-Fund Investment Solutions by Epsilon - Valore Cedola Globale - 09/2015 has pledged the security BTP 3,75% 01/05/2021 for a nominal value of EUR 1 300 000,00 to Banca IMI S.p.A. as collateral for future contracts. As at 31 December 2015, the Sub-Fund Investment Solutions by Epsilon - Global Coupon - 10/2013 has pledged the security BTP 4,25% 01/02/2019 for a nominal value of EUR 1 900 000,00 to Banca IMI S.p.A. as collateral for future contracts. As at 31 December 2015, the Sub-Fund Investment Solutions by Epsilon - Global Coupon - 06/2014 has received a cash amount for a nominal value of EUR 450 000,00 from UBS Limited and a cash amount for a nominal value of EUR 290 000,00 to Crédit Agricole Corporate and Investment Bank as collateral for forward contracts. The Sub-Fund has pledged the security BTP 4,50% 01/02/2020 for a nominal value of EUR 3 700 000,00 to Banca IMI S.p.A. as collateral for future contracts. As at 31 December 2015, the Sub-Fund Investment Solutions by Epsilon - Global Coupon - 11/2014 has received a cash amount for a nominal value of EUR 510 000,00 from UBS Limited and a cash amount for a nominal value of EUR 145 000,00 from Crédit Agricole Corporate and Investment Bank as collateral forward contracts. The Sub-Fund has pledged the security BTP 4,50% 01/02/2020 for a nominal value of EUR 2 000 000,00 to Banca IMI S.p.A. as collateral for future contracts. As at 31 December 2015, the Sub-Fund Investment Solutions by Epsilon - Global Diversified Allocation - 02/2015 has received a cash amount for a nominal value of EUR 640 000,00 from UBS Limited and a cash amount for a nominal value of EUR 1 470 000,00 from Intesa Sanpaolo S.p.A. as collateral for forward contracts. The Sub-Fund has pledged the security BTP 4,50% 01/02/2020 for a nominal value of EUR 9 300 000,00 to Banca IMI S.p.A. as collateral for future contracts. As at 31 December 2015, the Sub-Fund Investment Solutions by Epsilon - Global Dynamic Multitrender - 06/2015 has pledged the security CTZ 0,00% 30/08/2016 for a nominal value of EUR 2 650 000,00 to Banca IMI S.p.A. as collateral for future contracts. As at 31 December 2015, the Sub-Fund Investment Solutions by Epsilon - Global Income Multitrender - 09/2015 has pledged the security BOT 0,00% 14/10/2016 for a nominal value of EUR 850 000,00 to Banca IMI S.p.A. as collateral for future contracts. As at 31 December 2015, the Sub-Fund Investment Solutions by Epsilon - Equity Coupon - 02/2014 has received a cash amount for a nominal value of EUR 1 290 000,00 from Crédit Suisse International as collateral for forward contracts. The Sub-Fund has pledged the security CTZ 0,00% 30/08/2017 for a nominal value of EUR 11 500 000,00 to Banca IMI S.p.A. as collateral for future contracts and the security CTZ 0,00% 29/04/2016 for a nominal value of EUR 535 000,00 to Intesa Sanpaolo S.p.A. as collateral for forward contracts. As at 31 December 2015, the Sub-Fund Investment Solutions by Epsilon - Equity Coupon - 04/2014 has pledged the security CTZ 0,00% 30/08/2016 for a nominal value of EUR 3 400 000,00 to Banca IMI S.p.A. as collateral for future contracts.
369
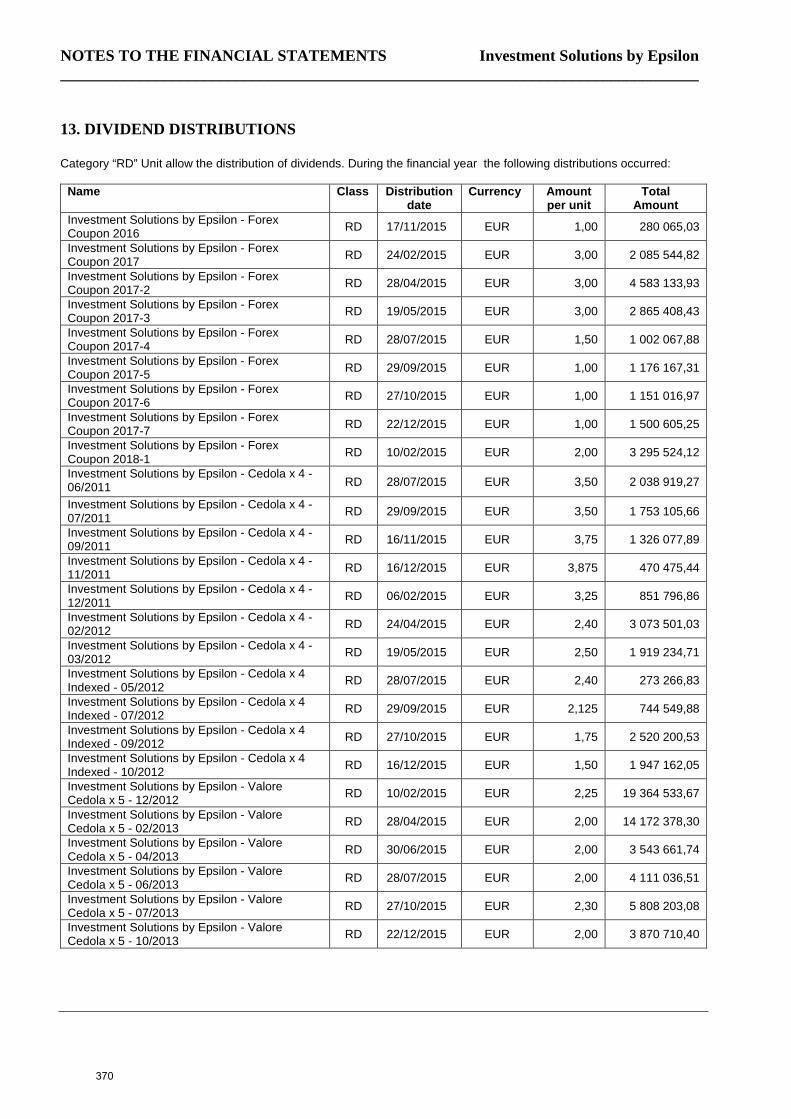
NOTES TO THE FINANCIAL STATEMENTS Investment Solutions by Epsilon ________________________________________________________________________________
13. DIVIDEND DISTRIBUTIONS Category “RD” Unit allow the distribution of dividends. During the financial year the following distributions occurred:
Name Class Distribution date
Currency Amount per unit
Total Amount
Investment Solutions by Epsilon - Forex Coupon 2016 RD 17/11/2015 EUR 1,00 280 065,03
Investment Solutions by Epsilon - Forex Coupon 2017 RD 24/02/2015 EUR 3,00 2 085 544,82
Investment Solutions by Epsilon - Forex Coupon 2017-2 RD 28/04/2015 EUR 3,00 4 583 133,93
Investment Solutions by Epsilon - Forex Coupon 2017-3 RD 19/05/2015 EUR 3,00 2 865 408,43
Investment Solutions by Epsilon - Forex Coupon 2017-4 RD 28/07/2015 EUR 1,50 1 002 067,88
Investment Solutions by Epsilon - Forex Coupon 2017-5 RD 29/09/2015 EUR 1,00 1 176 167,31
Investment Solutions by Epsilon - Forex Coupon 2017-6 RD 27/10/2015 EUR 1,00 1 151 016,97
Investment Solutions by Epsilon - Forex Coupon 2017-7 RD 22/12/2015 EUR 1,00 1 500 605,25
Investment Solutions by Epsilon - Forex Coupon 2018-1 RD 10/02/2015 EUR 2,00 3 295 524,12
Investment Solutions by Epsilon - Cedola x 4 - 06/2011 RD 28/07/2015 EUR 3,50 2 038 919,27
Investment Solutions by Epsilon - Cedola x 4 - 07/2011 RD 29/09/2015 EUR 3,50 1 753 105,66
Investment Solutions by Epsilon - Cedola x 4 - 09/2011 RD 16/11/2015 EUR 3,75 1 326 077,89
Investment Solutions by Epsilon - Cedola x 4 - 11/2011 RD 16/12/2015 EUR 3,875 470 475,44
Investment Solutions by Epsilon - Cedola x 4 - 12/2011 RD 06/02/2015 EUR 3,25 851 796,86
Investment Solutions by Epsilon - Cedola x 4 - 02/2012 RD 24/04/2015 EUR 2,40 3 073 501,03
Investment Solutions by Epsilon - Cedola x 4 - 03/2012 RD 19/05/2015 EUR 2,50 1 919 234,71
Investment Solutions by Epsilon - Cedola x 4 Indexed - 05/2012 RD 28/07/2015 EUR 2,40 273 266,83
Investment Solutions by Epsilon - Cedola x 4 Indexed - 07/2012 RD 29/09/2015 EUR 2,125 744 549,88
Investment Solutions by Epsilon - Cedola x 4 Indexed - 09/2012 RD 27/10/2015 EUR 1,75 2 520 200,53
Investment Solutions by Epsilon - Cedola x 4 Indexed - 10/2012 RD 16/12/2015 EUR 1,50 1 947 162,05
Investment Solutions by Epsilon - Valore Cedola x 5 - 12/2012 RD 10/02/2015 EUR 2,25 19 364 533,67
Investment Solutions by Epsilon - Valore Cedola x 5 - 02/2013 RD 28/04/2015 EUR 2,00 14 172 378,30
Investment Solutions by Epsilon - Valore Cedola x 5 - 04/2013 RD 30/06/2015 EUR 2,00 3 543 661,74
Investment Solutions by Epsilon - Valore Cedola x 5 - 06/2013 RD 28/07/2015 EUR 2,00 4 111 036,51
Investment Solutions by Epsilon - Valore Cedola x 5 - 07/2013 RD 27/10/2015 EUR 2,30 5 808 203,08
Investment Solutions by Epsilon - Valore Cedola x 5 - 10/2013 RD 22/12/2015 EUR 2,00 3 870 710,40
370
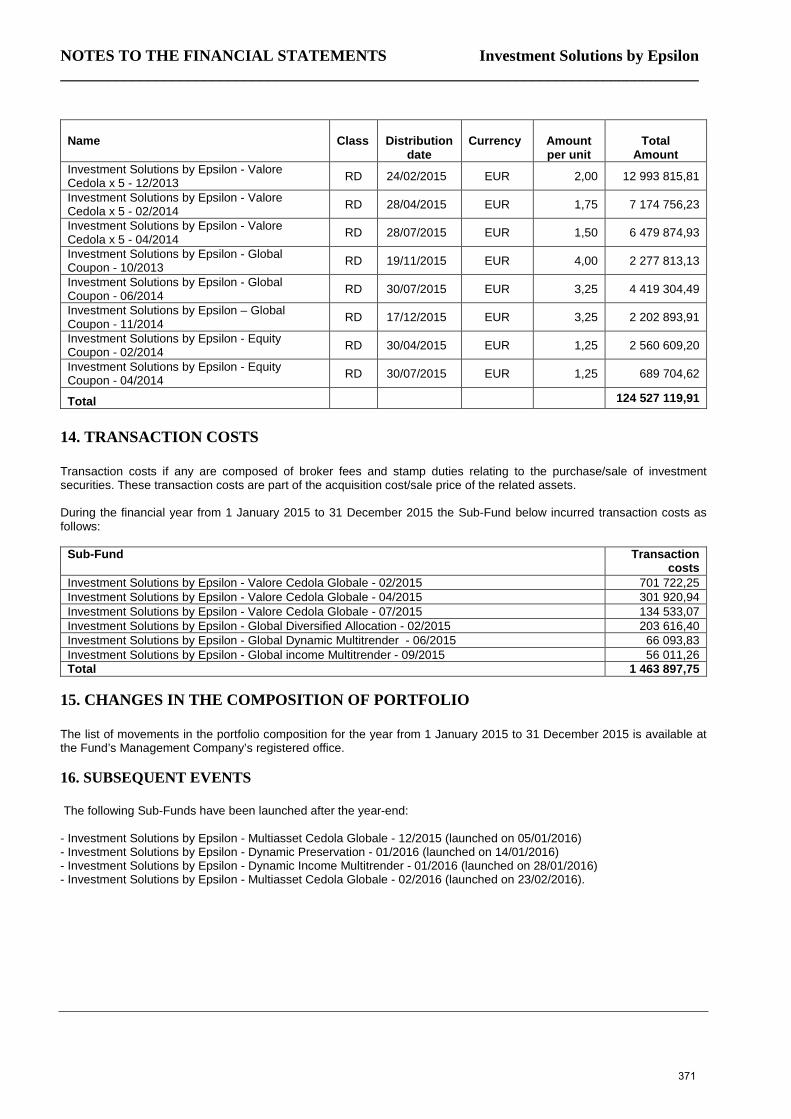
NOTES TO THE FINANCIAL STATEMENTS Investment Solutions by Epsilon ________________________________________________________________________________
Name
Class
Distribution
date
Currency
Amount per unit
Total
Amount Investment Solutions by Epsilon - Valore Cedola x 5 - 12/2013 RD 24/02/2015 EUR 2,00 12 993 815,81
Investment Solutions by Epsilon - Valore Cedola x 5 - 02/2014 RD 28/04/2015 EUR 1,75 7 174 756,23
Investment Solutions by Epsilon - Valore Cedola x 5 - 04/2014 RD 28/07/2015 EUR 1,50 6 479 874,93
Investment Solutions by Epsilon - Global Coupon - 10/2013 RD 19/11/2015 EUR 4,00 2 277 813,13
Investment Solutions by Epsilon - Global Coupon - 06/2014 RD 30/07/2015 EUR 3,25 4 419 304,49
Investment Solutions by Epsilon – Global Coupon - 11/2014 RD 17/12/2015 EUR 3,25 2 202 893,91
Investment Solutions by Epsilon - Equity Coupon - 02/2014 RD 30/04/2015 EUR 1,25 2 560 609,20
Investment Solutions by Epsilon - Equity Coupon - 04/2014 RD 30/07/2015 EUR 1,25 689 704,62
Total 124 527 119,91
14. TRANSACTION COSTS Transaction costs if any are composed of broker fees and stamp duties relating to the purchase/sale of investment securities. These transaction costs are part of the acquisition cost/sale price of the related assets. During the financial year from 1 January 2015 to 31 December 2015 the Sub-Fund below incurred transaction costs as follows:
Sub-Fund Transaction costs
Investment Solutions by Epsilon - Valore Cedola Globale - 02/2015 701 722,25 Investment Solutions by Epsilon - Valore Cedola Globale - 04/2015 301 920,94 Investment Solutions by Epsilon - Valore Cedola Globale - 07/2015 134 533,07 Investment Solutions by Epsilon - Global Diversified Allocation - 02/2015 203 616,40 Investment Solutions by Epsilon - Global Dynamic Multitrender - 06/2015 66 093,83 Investment Solutions by Epsilon - Global income Multitrender - 09/2015 56 011,26 Total 1 463 897,75
15. CHANGES IN THE COMPOSITION OF PORTFOLIO The list of movements in the portfolio composition for the year from 1 January 2015 to 31 December 2015 is available at the Fund’s Management Company’s registered office. 16. SUBSEQUENT EVENTS The following Sub-Funds have been launched after the year-end: - Investment Solutions by Epsilon - Multiasset Cedola Globale - 12/2015 (launched on 05/01/2016) - Investment Solutions by Epsilon - Dynamic Preservation - 01/2016 (launched on 14/01/2016) - Investment Solutions by Epsilon - Dynamic Income Multitrender - 01/2016 (launched on 28/01/2016) - Investment Solutions by Epsilon - Multiasset Cedola Globale - 02/2016 (launched on 23/02/2016).
371


