Embed Size (px)
Citation preview

Goldman Sachs Funds IISICAVSemi-Annual Report
Unaudited Financial Statements
AssetManagement
R.C.S. Luxembourg B 133 806
0522

Page
Directors and Other Information 1
Investment Adviser’s Report 3
Statement of Assets and Liabilities 5
Statement of Operations 7
Statement of Changes in Shareholders’ Equity 9
Statistical Information 11
Notes to the Financial Statements 14
Schedule of Investments 36
GOLDMAN SACHS FUNDS II—SPECIALIST PORTFOLIOS
Goldman Sachs Funds II—Global Multi-Manager Alternatives Portfolio 36
GOLDMAN SACHS FUNDS II—GLOBAL MANAGER STRATEGIES PORTFOLIOS
Goldman Sachs Funds II—Multi-Manager Emerging Markets Equity Portfolio 46
Goldman Sachs Funds II—Multi-Manager Europe Equity Portfolio 51
Goldman Sachs Funds II—Multi-Manager Global Equity Portfolio 53
Goldman Sachs Funds II—Multi-Manager US Equity Portfolio 57
Goldman Sachs Funds II—Multi-Manager US Small Cap Equity Portfolio 59
GOLDMAN SACHS FUNDS II—DEDICATED PORTFOLIOS
Goldman Sachs Funds II—Balanced Allocation Portfolio 63
Goldman Sachs Funds II—Strategic Factor Allocation Portfolio 66
Goldman Sachs Funds II—Tactical Tilt Overlay Portfolio 69
Goldman Sachs Funds II—Strategic Volatility Premium Portfolio 75
GOLDMAN SACHS FUNDS II—SELECT PORTFOLIOS I
Goldman Sachs Funds II—Income Multi-Sector Bond Portfolio I 77
GOLDMAN SACHS FUNDS II—SELECT PORTFOLIOS II
Goldman Sachs Funds II—G Emerging Markets Debt Broad Portfolio 82
APPENDICES
Appendix I—Advisory Fee Rates, Expense Caps and Total Net Expense Ratios 87
Appendix II—Portfolio and Share Class Launches, Closures and Mergers 89
Appendix III—Shareholder Concentration 90
Appendix IV—Securities Financing Transactions Regulation (“SFTR”) Disclosures 91
Additional Information 96
Goldman Sachs Funds IITable of Contents

GOLDMAN SACHS FUNDS IISociété d’Investissement à Capital VariableAn undertaking for collective investment organised under the laws ofthe Grand Duchy of Luxembourg
Board of DirectorsMs. Grainne Alexander (IRE)1
Mr. Jonathan Beinner (US)2
Mr. Frank Ennis (IRE)1
Mr. Glenn Thorpe (UK/AUS)2
Ms. Katherine Uniacke (US)2
Management CompanyGoldman Sachs Asset Management Fund Services Limited3
47-49 St. Stephen’s GreenDublin 2Ireland
AuditorPricewaterhouseCoopers, Société Coopérative2, rue Gerhard MercatorB.P. 1443L-2182 LuxembourgGrand Duchy of Luxembourg
Depositary, Domiciliary Agent, Administrator, Listing Agentand Luxembourg Paying AgentState Street Bank International GmbH, Luxembourg Branch49, avenue J.F. KennedyL-1855 LuxembourgGrand Duchy of Luxembourg
DistributorGoldman Sachs Asset Management Fund Services Limited3
47-49 St. Stephen’s GreenDublin 2Ireland
Investment AdviserGoldman Sachs Asset Management International3
Plumtree Court25 Shoe LaneLondon, EC4A 4AUUnited Kingdom
Investment Sub-Advisers4
Goldman Sachs Asset Management, L.P.3
200 West Street10282 New YorkUnited States of America
Goldman Sachs Asset Management (Hong Kong) Ltd.3
68th Floor Cheung Kong Center2 Queen’s Road CentralHong Kong
Goldman Sachs Asset Management (Singapore) Pte. Ltd.3
1 Raffles Link#07-01 South LobbySingapore 039393
Goldman Sachs Asset Management Co., Ltd.3
Roppongi Hills Mori Tower10-1, Roppongi 6-chomeMinato-Ku, Tokyo, 106-6147, Japan
Goldman Sachs Hedge Fund Strategies, LLC3
1 New York Plaza10004 New YorkUnited States of America
Goldman Sachs International3
Plumtree Court25 Shoe LaneLondon, EC4A 4AUUnited Kingdom
GS Investment Strategies, LLC3
200 West Street10282 New YorkUnited States of America
Legal AdviserArendt & Medernach S.A.41A, avenue J.F. KennedyL-2082 LuxembourgGrand Duchy of Luxembourg
Registered Officec/o State Street Bank International GmbH, Luxembourg Branch49, avenue J.F. KennedyL-1855 LuxembourgR.C.S. Luxembourg B133 806Grand Duchy of Luxembourg
Registrar and Transfer AgentRBC Investor Services Bank S.A.14, Porte de FranceL-4360 Esch-sur AlzetteGrand Duchy of Luxembourg
Goldman Sachs Funds IIDirectors and Other Information
1

Paying Agents:
Paying and Information Agent in AustriaRaiffeisen Bank International AGAm Stadtpark 91030 Vienna, Austria
Paying and Information Agent in BelgiumRBC Investor Services Belgium S.A.37 Boulevard du Roi Albert1030 Schaerbeek, Belgium
Representative in DenmarkStockRate Asset Management A/S18D, sdr. Jernbanevej3400 Hillerod, Denmark
Paying and Information Agent in FranceRBC Investor Services Bank France S.A.105, rue Réaumur75002 Paris, France
Paying and Information Agent in GermanyState Street Bank GmbHBrienner Strasse 5980333 Munich, Germany
Paying Agents in ItalySociété Générale Securities Services S.p.A.Maciachini Center MAC 2Via Benigno Crespi 19/A20159 Milan, Italy
AllFunds Bank S.A. Milan BranchVia Santa Margherita 720121 Milan, Italy
RBC Dexia Investor Services Bank S.A. Milan BranchVia Vittor Pisani 2620154 Milan, Italy
State Street Bank S.p.A.Via Ferrante Aporti 1020125 Milan, Italy
Paying Agents in Italy (Continued)BNP Paribas Securities Services – Succursale di MilanoVia Ansperto 520121 Milan, Italy
Banca Sella Holdings S.p.A.Piazza Gaudenzio Sella 1I-13900 Biella, Italy
Banca Monte Dei Paschi Di Siena S.p.A.Via Sassetti 450123 Firenze, Italy
Paying Agent in LiechtensteinLGT Bank AGHerrengasse 12FL-9490 Vaduz, Liechtenstein
Paying Agent in SwedenGlobal Transaction ServicesSEB Merchant BankingSergels Torg 2SE-10640 Stockholm, Sweden
Paying Agent in SwitzerlandGoldman Sachs Bank AG3
Claridenstrasse 258002 Zurich, Switzerland
Representative in SwitzerlandFirst Independent Fund Services AGKlausstrasse 338008 Zurich, Switzerland
The Fund’s Prospectus with its Supplements, Key Investor InformationDocument, Articles of Incorporation, Annual Report, Semi-AnnualReport and the list of all transactions carried out by the InvestmentAdviser during the year are available free of charge at the offices ofthe local Paying and Information Agents and the Swiss Representative.
1 Independent Directors.2 Director of the Fund employed by Goldman Sachs Group, Inc. or its direct or indirect subsidiary.3 Related party to Goldman Sachs Funds II.4 Refer to Note 6 for non-affiliated Investment Sub-Advisers.
Goldman Sachs Funds IIDirectors and Other Information
2

Dear Shareholders:
Enclosed is the report for the six months ended 31 May 2022.
A. Market Review1
The global economy experienced a number of headwinds during the reporting period, including the impact from theCOVID-19 pandemic and its variants, supply chain issues, rising inflation, monetary policy tightening and the outbreak of war inUkraine. In its April 2022 World Economic Outlook, the International Monetary Fund (“IMF”) said, “Global economic prospects haveworsened significantly since our last World Economic Outlook forecast in January 2022. At the time, we had projected the globalrecovery to strengthen from the second quarter of this year after a short-lived impact of the Omicron variant. Since then, the outlookhas deteriorated, largely because of Russia’s invasion of Ukraine—causing a tragic humanitarian crisis in Eastern Europe—and thesanctions aimed at pressuring Russia to end hostilities. This crisis unfolds while the global economy was on a mending path but had notyet fully recovered from the COVID-19 pandemic, with a significant divergence between the economic recoveries of advancedeconomies and emerging market and developing ones.� From a regional perspective, the IMF expects U.S. GDP growth to be 3.7% in2022, compared to 5.7% in 2021. Elsewhere, the IMF expects 2022 GDP growth in the eurozone, U.K. and Japan will be 2.8%, 3.7%and 2.4%, respectively. For comparison purposes, the GDP of these economies were 5.3%, 7.4% and 1.6%, respectively, in 2021.
Against this backdrop, global equities generated weak results. In the U.S., the market was negatively impacted by elevated inflation,Federal Reserve (�Fed�) interest rate hikes and the outbreak of war in Ukraine. For the six-months ended 31 May 2022, the S&P500 Index returned (9.05%). Equities outside the U.S. also performed poorly, as the war, surging inflation and other economic concernsweighed on investor sentiment. All told, international developed equities, as measured by the MSCI EAFE Index (net), returned(6.80%), while emerging markets equities, as measured by the MSCI Emerging Markets Index (net), fell 10.11%.*
The overall global fixed income market also declined. Both the Fed and Bank of England raised interest rates to fight inflation, while theEuropean Central Bank removed some monetary policy accommodation and is expected to push rates higher later in the year. Bothshort- and long-term U.S. Treasury yields moved sharply higher. Longer-term government yields in other developed countries alsoincreased. For the six months ended 31 May 2022, the Bloomberg U.S Aggregate Bond Index and Bloomberg Global Aggregate BondIndex returned (9.15%) and (11.18%), respectively. Riskier fixed income securities were also weak. The U.S. high-yield bond market, asmeasured by the Bloomberg U.S. Corporate High Yield—2% Issuer Cap Index, returned (6.26%), whereas the emerging market debtasset class, as measured by the JPMorgan EMBI Global Index, returned (13.84%) during the six months ended 31 May 2022.*
Goldman Sachs Funds IIInvestment Adviser’s Report
For the Period Ended 31 May 2022
3

B. Performance Overview (as at 31 May 2022)2
Average Annualised Net Return
CurrencyLaunch
Date6-Months3
(%)1-Year
(%)3-Years
(%)5-Years
(%)
SinceInception
(%)
Global Multi-Manager Alternatives Portfolio (Base Accumulation Share Class) USD 16-Dec-15 (3.70) (2.41) 3.46 1.78 2.21
ICE BofA 3 month US T-Bill USD 16-Dec-15 0.14 0.21 0.74 1.30 1.20
Multi-Manager Emerging Markets Equity Portfolio (�P� Accumulation Share Class) USD 31-Jan-12 (11.81) (20.67) 5.29 2.71 2.22
MSCI Emerging Markets Index (Total Return Net) USD 31-Jan-12 (10.11) (19.83) 4.99 3.80 2.96
Multi-Manager Europe Equity Portfolio (�P� Accumulation Share Class) EUR 18-Dec-09 0.39 3.40 9.91 4.26 7.06
MSCI Europe Index (Total Return Net) EUR 18-Dec-09 (1.48) 3.01 8.54 5.11 7.51
Multi-Manager Global Equity Portfolio (�P� Accumulation Share Class) USD 7-Mar-08 (13.98) (10.56) 12.30 8.64 5.25
MSCI World Index (Total Return Net) USD 7-Mar-08 (9.25) (4.82) 12.64 9.72 6.92
Multi-Manager US Equity Portfolio (�P� Accumulation Share Class) USD 16-May-08 (12.84) (5.14) 14.61 12.56 8.15
S&P 500 (Total Return Net) USD 16-May-08 (9.05) (0.73) 15.84 12.77 9.42
Multi-Manager US Small Cap Equity Portfolio (�P� Accumulation Share Class) USD 8-Dec-16 (12.50) (15.15) 7.36 6.63 5.54
Russell 2000 Index (Total Return Net) USD 8-Dec-16 (14.85) (17.19) 9.30 7.31 6.51
Balanced Allocation Portfolio (�P� Accumulation Share Class) USD 3-Dec-14 (6.76) (5.14) 5.59 4.44 4.00
50% J.P. Morgan Government Bond Index 1-10 US Index - / 50% MSCI World Index (Net)(70% Hedged to USD) USD 3-Dec-14 (6.39) (3.49) 7.09 6.00 5.48
Strategic Factor Allocation Portfolio (�P� Accumulation Share Class) USD 30-Sep-16 (4.91) 1.70 8.37 6.45 6.55
50% Bloomberg US Aggregate Bond Index (Total Return Gross) / 50% S&P 500 (Net Return) USD 30-Sep-16 (8.98) (4.33) 8.04 7.17 7.35
Tactical Tilt Overlay Portfolio (�P� Accumulation Share Class) USD 31-Oct-11 1.07 1.22 3.33 2.47 3.83
ICE BofA 3 month US T-Bill USD 31-Oct-11 0.14 0.21 0.74 1.30 0.86
Strategic Volatility Premium Portfolio (�P� Accumulation Share Class) USD 29-Mar-21 (2.36) (2.04) — — (0.95)
Bloomberg US Treasury 1-5 Yr Index (Total Return Gross) USD 29-Mar-21 (3.79) (4.50) — — (3.61)
Income Multi-Sector Bond Portfolio I (�I� (Dis) (Stable Monthly) Share Class) EUR 31-Jan-18 (10.38) (9.67) (2.83) — (1.43)
G Emerging Markets Debt Broad Portfolio (�I� (Dis) (Semi-Annual) Share Class) EUR 27-Jun-19 (11.22) (10.57) — — (2.05)
ICE BofA 3 month German Treasury Bill index EUR 27-Jun-19 (0.34) (0.63) — — (0.52)
Goldman Sachs Asset Management International
June 2022
All index returns are shown with income re-invested and, in contrast to the Share Classes, without the deduction of any fees orexpenses. Returns of the Share Classes are shown net of fees and expenses and after the reinvestment of dividends where applicableusing month end NAVs. For Share Classes where performance is shown relative to the index, it is for comparative purposes only.Reference to these benchmarks does not imply that the Share Classes will achieve returns, volatility or other results similar to thebenchmark.
* All returns in United States Dollar terms.
1 Any mention of an investment decision is intended only to illustrate our investment approach or strategy, and is not indicative of theperformance of our strategy as a whole. Any such illustration is not necessarily representative of other investment decisions.
This information discusses general market activity, industry or sector trends, or other broad-based economic, market or politicalconditions. Views, opinions and any economic and market forecasts presented herein are current as at the date of this report and maybe subject to change. This material should not be construed as research or investment advice.
Although certain information has been obtained from sources believed to be reliable, we do not guarantee its accuracy, completenessor fairness. We have relied upon and assumed without independent verification, the accuracy and completeness of all informationavailable from public sources.
The economic and market forecasts presented herein are for informational purposes as of the date of this report. There can be noassurance that the forecasts will be achieved.
Please see Additional Information section on page 96.
2 Past performance does not guarantee future results, which may vary. Returns are net of expenses and inclusive of dividends,where applicable.
3Cumulative Net Returns.
Goldman Sachs Funds IIInvestment Adviser’s Report
For the Period Ended 31 May 2022
4

Notes
GlobalMulti-Manager
AlternativesPortfolio
USD
Multi-ManagerEmerging
Markets EquityPortfolio
USD
Multi-ManagerEurope Equity
PortfolioEUR
Multi-ManagerGlobal Equity
PortfolioUSD
Multi-ManagerUS Equity
PortfolioUSD
Multi-ManagerUS Small Cap
EquityPortfolio
USD
BalancedAllocation
PortfolioUSD
StrategicFactor
AllocationPortfolio
USD
Tactical TiltOverlay
PortfolioUSD
StrategicVolatilityPremiumPortfolio
USDAssetsInvestments, at value, excluding derivatives 3(d) 237,162,945 582,773,795 447,795,366 1,181,246,819 874,465,708 456,993,305 202,793,398 695,570,564 2,034,968,970 713,024,334Unrealised gain on forward currency contracts and share class specific forward currency contracts 3(d) 3,393,322 — — 722,372 357 — 1,031,215 7,686,186 — 7,954,504Unrealised gain on futures and futures on duration hedging share classes 3(d) 1,759,225 — — — — — 341,869 354,811 7,779,323 166,308Unrealised gain on swap contracts and swap contracts on duration hedging share classes 3(d) — — — — — — 14,959 — 4,820,454 —Unrealised gain on contracts for difference 3(d) 254,095 — — — — — — — — —Upfront payments paid on swap transactions 3(d) — — — — — — 51,942 — 5,226,010 —Market value of purchased options 3(d) 2,706,799 — — — — — 45,716 83,093 5,403,116 90,007Cash 3(e) 65,657,850 8,164,175 89,695 7,805,021 1,083,650 5,911,906 5,025,594 47,931,692 54,332,466 76,756,031Due from Brokers 3(f),13 26,040,634 — — 4,500,000 — — 13,272,919 223,368,990 167,123,491 180,632,894Receivable for investments sold 2,098,442 12,256,276 2,104,820 104,169 1,128,117 1,708,872 — 18,843,727 — —Receivable for shares sold 287,734 938,512 882,128 4,184,546 6,369,636 1,172,438 — 191,716 5,382,565 536,184Dividends receivable excluding swap contracts and contracts for difference 3(b) 640,155 1,473,619 3,822,378 2,877,611 919,759 296,285 49,495 101,760 214,582 121,866Dividends receivable on contracts for difference 3(b) 59,855 — — — — — — — — —Interest receivable excluding swap contracts 3(b) — — — — — — — 10,996 842,580 6,961Interest receivable on swap contracts 3(b) — — — — — — 10,280 — 1,011,262 —Dividend tax reclaim receivable 5 41,378 34,287 824,170 128,259 — — — — — —Interest tax reclaim receivable 5 4,087 — — — — — — — — —Interest receivable on securities lending 6 — 12,695 51,895 18,416 — 1,562 — — — —Investment Adviser fees waived receivable 6 — — — — 241 — — — — —Other assets 59,079 432 2,395 1,723 67 57 734 1,895 26,155 —Total Assets 340,165,600 605,653,791 455,572,847 1,201,588,936 883,967,535 466,084,425 222,638,121 994,145,430 2,287,130,974 979,289,089LiabilitiesBank overdraft 154,738 — — — — — — — 1,552 —Due to Brokers 3(f),13 — — — — — — — — 1,880,000 —Unrealised loss on forward currency contracts and share class specific forward currency contracts 3(d) 11,825,703 52 — 5,126,013 1,265 — 7,754,754 944,297 47,931,402 —Unrealised loss on futures and futures on duration hedging share classes 3(d) 395,234 — — — — — 1,291,725 11,008,361 1,974,935 1,667,366Unrealised loss on swap contracts and swap contracts on duration hedging share classes 3(d) — — — — — — 43,032 — 4,413,008 —Unrealised loss on contracts for difference 3(d) 209,613 — — — — — — — — —Upfront payments received on swap transactions 3(d) — — — — — — — — — —Market value of written options 3(d) 95,244 — — — — — 285,665 703,352 31,101,908 44,005Payable for investments purchased 1,495,748 — 6,312,356 27,833 — 1,403,284 — — — 1,099,199Payable for shares redeemed 329,026 28,064,150 2,000 2,749,882 4,072,926 26,145 100,000 271,426 5,302,146 841,588Interest payable on swap contracts 3(b) — — — — — — 379 — 80,489 —Interest payable excluding swap contracts 3(b) 3,655 9,988 135,916 — — — — — — —Dividends payable on contracts for difference 3(b) 11,566 — — — — — — — — —Investment Adviser fee payable 6 417,590 1,581,212 1,049,296 2,079,655 1,393,272 1,264,306 88,870 529,457 516,850 211,455Performance fees payable 6 1,504 — — — — — — — — —Administration fees payable 6 — 21,152 30,744 48,283 24,151 15,111 22,246 72,882 114,307 73,336Depositary fees payable 6 — 116,859 62,413 79,465 70,837 63,309 16,411 39,597 73,549 43,028Distribution and servicing fees payable 6 4 — — — — — — — — —Transfer Agent fee payable 6 19,028 17,300 13,447 14,189 16,774 13,625 6,319 18,249 34,529 21,470Taxe d’abonnement payable 5 21,876 25,740 35,704 51,405 71,638 33,186 11,868 65,130 134,028 71,613Audit fee payable 60,422 32,267 20,251 32,267 23,217 23,217 32,267 32,267 38,300 31,714Management Company fees payable 6 8,393 10,097 12,188 19,928 24,832 12,183 4,691 17,440 51,778 26,135Directors fees payable 6 1,055 1,574 1,390 2,367 2,740 1,586 544 3,200 7,466 710Legal fees payable — 16,185 26,703 26,992 35,206 17,883 21,488 15,525 64,954 3,918Insurance fees payable — — — — — — — — — 458Printing fees payable 4,613 15,127 12,587 7,441 16,825 13,159 3,133 16,345 36,148 11,406Publishing fees payable 1,211 266 179 576 222 222 222 620 885 797Payable for Withholding Tax on Dividend and Interest Income 5 51,522 96,597 — 585,924 272,894 77,570 — — — —Tax reporting fees payable 41,518 23,897 20,271 31,696 23,258 23,617 24,927 33,329 40,966 4,383Paying Agency fee payable 4,110 4,162 3,506 4,162 4,162 4,162 4,162 4,162 4,162 4,477Regulatory reporting fees payable — 7,332 8,097 12,478 13,701 2,989 3,511 4,145 8,995 8,051Other liabilities 62,762 114,123 39,007 49,551 9,725 11,652 8,908 8,803 3,172 9,329Total Liabilities 15,216,135 30,158,080 7,786,055 10,950,107 6,077,645 3,007,206 9,725,122 13,788,587 93,815,529 4,174,438Shareholders’ Equity 324,949,465 575,495,711 447,786,792 1,190,638,829 877,889,890 463,077,219 212,912,999 980,356,843 2,193,315,445 975,114,651Swing Pricing 3(j) — — 850,795 1,190,639 — — — — — —Shareholders’ Equity (after Swing Pricing) 324,949,465 575,495,711 448,637,587 1,191,829,468 877,889,890 463,077,219 212,912,999 980,356,843 2,193,315,445 975,114,651
Please refer to Statistical information for Outstanding Shares and Net Asset Value Per Share as at 31 May 2022.
Goldman Sachs Funds II — Statement of Assets and LiabilitiesAs at 31 May 2022
The accompanying notes are an integral part of these financial statements.5

Notes
IncomeMulti-Sector
BondPortfolio I
EUR
G EmergingMarkets Debt
BroadPortfolio
EUR
CombinedTotal
Period Ended31 May 2022
USDAssetsInvestments, at value, excluding derivatives 3(d) 437,530,712 376,627,226 8,330,867,315Unrealised gain on forward currency contracts and share class specific forward currency contracts 3(d) 14,556,420 1,291,507 37,765,048Unrealised gain on futures and futures on duration hedging share classes 3(d) — 2,440,628 13,016,059Unrealised gain on swap contracts and swap contracts on duration hedging share classes 3(d) 26,284,925 307,959 33,323,040Unrealised gain on contracts for difference 3(d) — — 254,095Upfront payments paid on swap transactions 3(d) 5,753,184 1,148,057 12,670,906Market value of purchased options 3(d) — — 8,328,731Cash 3(e) 8,734,639 7,882,713 290,565,809Due from Brokers 3(f),13 74,553,465 104,673,951 806,936,297Receivable for investments sold — — 38,394,391Receivable for shares sold — — 20,008,311Dividends receivable excluding swap contracts and contracts for difference 3(b) 4,786 8,780 10,804,387Dividends receivable on contracts for difference 3(b) — — 59,855Interest receivable excluding swap contracts 3(b) 4,346,353 3,136,102 8,876,117Interest receivable on swap contracts 3(b) 665,155 182,257 1,929,332Dividend tax reclaim receivable 5 — — 1,086,816Interest tax reclaim receivable 5 22,484 — 28,173Interest receivable on securities lending 6 — — 88,266Investment Adviser fees waived receivable 6 — — 241Other assets 548 2,243 95,698Total Assets 572,452,671 497,701,423 9,615,098,887LiabilitiesBank overdraft — — 156,290Due to Brokers 3(f),13 42,576,434 24,158,696 73,370,008Unrealised loss on forward currency contracts and share class specific forward currency contracts 3(d) 24,626,325 23,703,796 125,357,128Unrealised loss on futures and futures on duration hedging share classes 3(d) — 121,994 16,468,307Unrealised loss on swap contracts and swap contracts on duration hedging share classes 3(d) 40,083,773 39,334,912 89,533,306Unrealised loss on contracts for difference 3(d) — — 209,613Upfront payments received on swap transactions 3(d) 7,144,341 2,809,903 10,663,484Market value of written options 3(d) — — 32,230,174Payable for investments purchased — — 10,788,175Payable for shares redeemed — — 41,759,432Interest payable on swap contracts 3(b) 535,620 906 655,621Interest payable excluding swap contracts 3(b) — — 159,243Dividends payable on contracts for difference 3(b) — — 11,566Investment Adviser fee payable 6 85,812 119,355 9,426,510Performance fees payable 6 — — 1,504Administration fees payable 6 31,300 29,483 489,516Depositary fees payable 6 29,982 26,352 630,263Distribution and servicing fees payable 6 — — 4Transfer Agent fee payable 6 2,590 2,331 181,160Taxe d’abonnement payable 5 7,795 6,865 540,436Audit fee payable 20,251 20,251 371,020Management Company fees payable 6 3,901 3,462 196,421Directors fees payable 6 1,752 1,595 26,317Legal fees payable 28,745 — 261,550Insurance fees payable — — 458Printing fees payable 5,166 4,407 147,936Publishing fees payable 36 35 5,289Payable for Withholding Tax on Dividend and Interest Income 5 — — 1,084,507Tax reporting fees payable 1,465 1,465 272,445Paying Agency fee payable 3,720 3,720 49,447Regulatory reporting fees payable 1,000 1,381 72,427Other liabilities 6,578 9,039 336,541Total Liabilities 115,196,586 90,359,948 415,456,098Shareholders’ Equity 457,256,085 407,341,475 9,199,642,789Swing Pricing 3(j) — — 2,102,053Shareholders’ Equity (after Swing Pricing) 457,256,085 407,341,475 9,201,744,842
Please refer to Statistical information for Outstanding Shares and Net Asset Value Per Share as at 31 May 2022.
Goldman Sachs Funds II — Statement of Assets and LiabilitiesAs at 31 May 2022
The accompanying notes are an integral part of these financial statements.6
Notes
GlobalMulti-Manager
AlternativesPortfolio
USD
Multi-ManagerEmerging
Markets EquityPortfolio
USD
Multi-ManagerEurope Equity
PortfolioEUR
Multi-ManagerGlobal Equity
PortfolioUSD
Multi-ManagerUS Equity
PortfolioUSD
Multi-ManagerUS Small Cap
EquityPortfolio
USD
BalancedAllocation
PortfolioUSD
StrategicFactor
AllocationPortfolio
USD
Tactical TiltOverlay
PortfolioUSD
StrategicVolatilityPremiumPortfolio
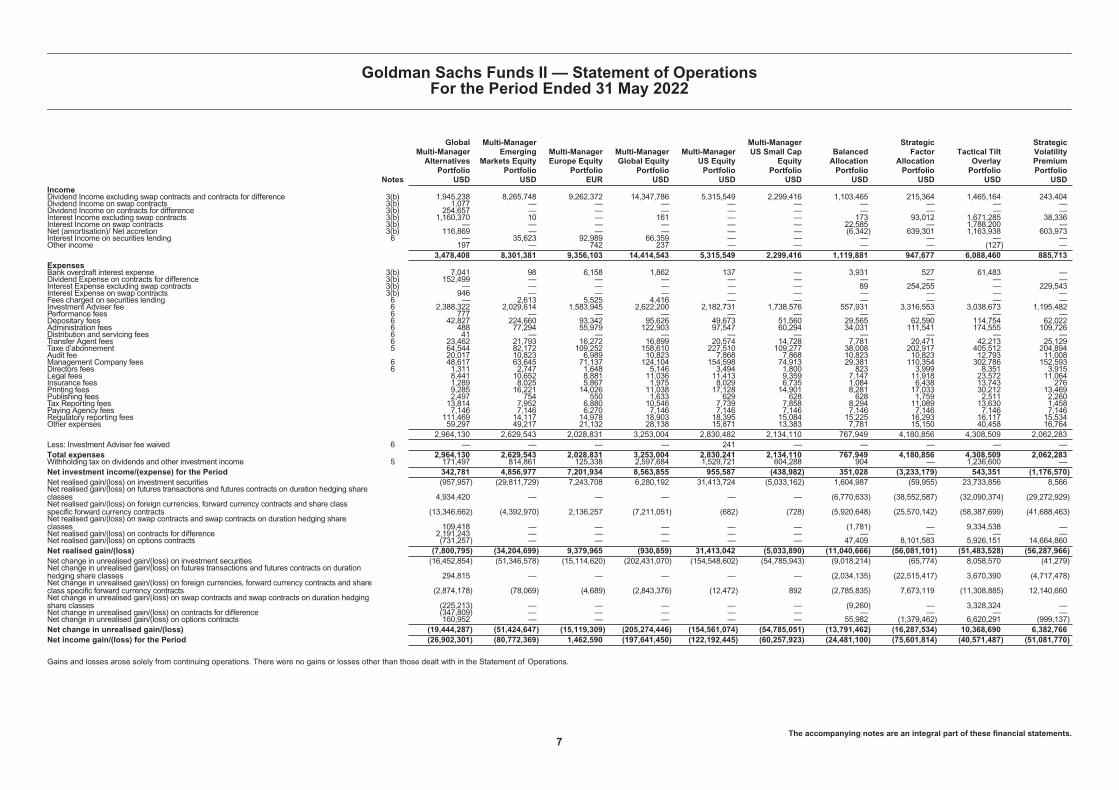
USDIncomeDividend Income excluding swap contracts and contracts for difference 3(b) 1,945,238 8,265,748 9,262,372 14,347,786 5,315,549 2,299,416 1,103,465 215,364 1,465,164 243,404Dividend Income on swap contracts 3(b) 1,077 — — — — — — — — —Dividend Income on contracts for difference 3(b) 254,657 — — — — — — — — —Interest Income excluding swap contracts 3(b) 1,160,370 10 — 161 — — 173 93,012 1,671,285 38,336Interest Income on swap contracts 3(b) — — — — — — 22,585 — 1,788,200 —Net (amortisation)/ Net accretion 3(b) 116,869 — — — — — (6,342) 639,301 1,163,938 603,973Interest Income on securities lending 6 — 35,623 92,989 66,359 — — — — — —Other income 197 — 742 237 — — — — (127) —
3,478,408 8,301,381 9,356,103 14,414,543 5,315,549 2,299,416 1,119,881 947,677 6,088,460 885,713ExpensesBank overdraft interest expense 3(b) 7,041 98 6,158 1,862 137 — 3,931 527 61,483 —Dividend Expense on contracts for difference 3(b) 152,499 — — — — — — — — —Interest Expense excluding swap contracts 3(b) — — — — — — 89 254,255 — 229,543Interest Expense on swap contracts 3(b) 946 — — — — — — — — —Fees charged on securities lending 6 — 2,613 5,525 4,416 — — — — — —Investment Adviser fee 6 2,388,322 2,029,614 1,583,945 2,622,200 2,182,731 1,738,576 557,931 3,316,553 3,038,673 1,195,482Performance fees 6 777 — — — — — — — — —Depositary fees 6 42,827 224,660 93,342 95,626 49,673 51,560 29,565 62,590 114,754 62,022Administration fees 6 488 77,294 55,979 122,903 97,547 60,294 34,031 111,541 174,555 109,726Distribution and servicing fees 6 41 — — — — — — — — —Transfer Agent fees 6 23,462 21,793 16,272 16,899 20,574 14,728 7,781 20,471 42,213 25,129Taxe d’abonnement 5 64,544 82,172 109,252 158,610 227,510 109,277 38,008 202,917 405,512 204,894Audit fee 20,017 10,823 6,989 10,823 7,868 7,868 10,823 10,823 12,793 11,008Management Company fees 6 48,617 63,645 71,137 124,104 154,598 74,913 29,381 110,354 302,786 152,593Directors fees 6 1,311 2,747 1,648 5,146 3,494 1,800 823 3,999 8,351 3,915Legal fees 8,441 10,652 8,881 11,036 11,413 9,359 7,147 11,918 23,572 11,064Insurance fees 1,289 8,025 5,867 1,975 8,029 6,735 1,084 6,438 13,743 276Printing fees 9,285 16,221 14,026 11,038 17,128 14,901 8,281 17,033 30,212 13,469Publishing fees 2,497 754 550 1,633 629 628 628 1,759 2,511 2,260Tax Reporting fees 13,814 7,952 6,880 10,546 7,739 7,858 8,294 11,089 13,630 1,458Paying Agency fees 7,146 7,146 6,270 7,146 7,146 7,146 7,146 7,146 7,146 7,146Regulatory reporting fees 111,469 14,117 14,978 18,903 18,395 15,084 15,225 16,293 16,117 15,534Other expenses 59,297 49,217 21,132 28,138 15,871 13,383 7,781 15,150 40,458 16,764
2,964,130 2,629,543 2,028,831 3,253,004 2,830,482 2,134,110 767,949 4,180,856 4,308,509 2,062,283Less: Investment Adviser fee waived 6 — — — — 241 — — — — —Total expenses 2,964,130 2,629,543 2,028,831 3,253,004 2,830,241 2,134,110 767,949 4,180,856 4,308,509 2,062,283Withholding tax on dividends and other investment income 5 171,497 814,861 125,338 2,597,684 1,529,721 604,288 904 — 1,236,600 —Net investment income/(expense) for the Period 342,781 4,856,977 7,201,934 8,563,855 955,587 (438,982) 351,028 (3,233,179) 543,351 (1,176,570)Net realised gain/(loss) on investment securities (957,957) (29,811,729) 7,243,708 6,280,192 31,413,724 (5,033,162) 1,604,987 (59,955) 23,733,856 8,566Net realised gain/(loss) on futures transactions and futures contracts on duration hedging shareclasses 4,934,420 — — — — — (6,770,633) (38,552,587) (32,090,374) (29,272,929)Net realised gain/(loss) on foreign currencies, forward currency contracts and share classspecific forward currency contracts (13,346,662) (4,392,970) 2,136,257 (7,211,051) (682) (728) (5,920,648) (25,570,142) (58,387,699) (41,688,463)Net realised gain/(loss) on swap contracts and swap contracts on duration hedging shareclasses 109,418 — — — — — (1,781) — 9,334,538 —Net realised gain/(loss) on contracts for difference 2,191,243 — — — — — — — — —Net realised gain/(loss) on options contracts (731,257) — — — — — 47,409 8,101,583 5,926,151 14,664,860Net realised gain/(loss) (7,800,795) (34,204,699) 9,379,965 (930,859) 31,413,042 (5,033,890) (11,040,666) (56,081,101) (51,483,528) (56,287,966)Net change in unrealised gain/(loss) on investment securities (16,452,854) (51,346,578) (15,114,620) (202,431,070) (154,548,602) (54,785,943) (9,018,214) (65,774) 8,058,570 (41,279)Net change in unrealised gain/(loss) on futures transactions and futures contracts on durationhedging share classes 294,815 — — — — — (2,034,135) (22,515,417) 3,670,390 (4,717,478)Net change in unrealised gain/(loss) on foreign currencies, forward currency contracts and shareclass specific forward currency contracts (2,874,178) (78,069) (4,689) (2,843,376) (12,472) 892 (2,785,835) 7,673,119 (11,308,885) 12,140,660Net change in unrealised gain/(loss) on swap contracts and swap contracts on duration hedgingshare classes (225,213) — — — — — (9,260) — 3,328,324 —Net change in unrealised gain/(loss) on contracts for difference (347,809) — — — — — — — — —Net change in unrealised gain/(loss) on options contracts 160,952 — — — — — 55,982 (1,379,462) 6,620,291 (999,137)Net change in unrealised gain/(loss) (19,444,287) (51,424,647) (15,119,309) (205,274,446) (154,561,074) (54,785,051) (13,791,462) (16,287,534) 10,368,690 6,382,766Net income gain/(loss) for the Period (26,902,301) (80,772,369) 1,462,590 (197,641,450) (122,192,445) (60,257,923) (24,481,100) (75,601,814) (40,571,487) (51,081,770)
Gains and losses arose solely from continuing operations. There were no gains or losses other than those dealt with in the Statement of Operations.
Goldman Sachs Funds II — Statement of OperationsFor the Period Ended 31 May 2022
The accompanying notes are an integral part of these financial statements.7

Notes
IncomeMulti-Sector
BondPortfolio I
EUR
G EmergingMarkets Debt
BroadPortfolio
EUR
CombinedTotal
Period Ended31 May 2022
USDIncomeDividend Income excluding swap contracts and contracts for difference 3(b) 15,672 19,425 45,476,567Dividend Income on swap contracts 3(b) — — 1,077Dividend Income on contracts for difference 3(b) — — 254,657Interest Income excluding swap contracts 3(b) 7,004,200 6,967,306 18,404,460Interest Income on swap contracts 3(b) 143,214 298,579 2,299,048Net (amortisation)/ Net accretion 3(b) (2,836,319) (1,299,641) (2,053,266)Interest Income on securities lending 6 — — 204,752Other income (113) — 1,002
4,326,654 5,985,669 64,588,297ExpensesBank overdraft interest expense 3(b) 646 97 82,706Dividend Expense on contracts for difference 3(b) — — 152,499Interest Expense excluding swap contracts 3(b) 83,332 61,755 644,235Interest Expense on swap contracts 3(b) — — 946Fees charged on securities lending 6 — — 13,135Investment Adviser fee 6 533,060 751,371 22,240,171Performance fees 6 — — 777Depositary fees 6 47,159 42,063 935,044Administration fees 6 56,638 52,411 970,766Distribution and servicing fees 6 — — 41Transfer Agent fees 6 2,028 1,920 215,397Taxe d’abonnement 5 23,669 21,214 1,663,792Audit fee 6,989 6,989 126,018Management Company fees 6 24,267 21,862 1,190,592Directors fees 6 1,883 1,728 37,398Legal fees 9,608 7,171 132,961Insurance fees 950 716 55,919Printing fees 9,058 8,440 172,408Publishing fees 110 110 14,150Tax Reporting fees 497 497 91,082Paying Agency fees 5,484 5,484 83,365Regulatory reporting fees 11,104 10,976 282,093Other expenses 10,485 9,117 291,078
826,967 1,003,921 29,396,573Less: Investment Adviser fee waived 6 — — 241Total expenses 826,967 1,003,921 29,396,332Withholding tax on dividends and other investment income 5 19,770 379 7,116,345Net investment income/(expense) for the Period 3,479,917 4,981,369 28,075,620Net realised gain/(loss) on investment securities (3,630,050) (4,250,045) 26,475,196Net realised gain/(loss) on futures transactions and futures contracts on duration hedging shareclasses 511,701 25,475,661 (73,031,234)Net realised gain/(loss) on foreign currencies, forward currency contracts and share classspecific forward currency contracts (6,349,578) (8,918,604) (171,032,265)Net realised gain/(loss) on swap contracts and swap contracts on duration hedging shareclasses (581,167) 3,172,741 12,306,346Net realised gain/(loss) on contracts for difference — — 2,191,243Net realised gain/(loss) on options contracts — — 28,008,746Net realised gain/(loss) (10,049,094) 15,479,753 (175,081,968)Net change in unrealised gain/(loss) on investment securities (28,361,253) (22,966,645) (554,063,085)Net change in unrealised gain/(loss) on futures transactions and futures contracts on durationhedging share classes — 7,346,376 (17,182,713)Net change in unrealised gain/(loss) on foreign currencies, forward currency contracts and shareclass specific forward currency contracts (5,626,401) (13,900,276) (21,673,936)Net change in unrealised gain/(loss) on swap contracts and swap contracts on duration hedgingshare classes (12,570,146) (42,787,952) (58,087,144)Net change in unrealised gain/(loss) on contracts for difference — — (347,809)Net change in unrealised gain/(loss) on options contracts — — 4,458,626Net change in unrealised gain/(loss) (46,557,800) (72,308,497) (646,896,061)Net income gain/(loss) for the Period (53,126,977) (51,847,375) (793,902,409)
Gains and losses arose solely from continuing operations. There were no gains or losses other than those dealt with in the Statement of Operations.
Goldman Sachs Funds II — Statement of OperationsFor the Period Ended 31 May 2022
The accompanying notes are an integral part of these financial statements.8

Notes
GlobalMulti-Manager
AlternativesPortfolio
USD
Multi-ManagerEmerging
Markets EquityPortfolio
USD
Multi-ManagerEurope Equity
PortfolioEUR
Multi-ManagerGlobal Equity
PortfolioUSD
Multi-ManagerUS Equity
PortfolioUSD
Multi-ManagerUS Small Cap
EquityPortfolio
USD
BalancedAllocation
PortfolioUSD
StrategicFactor
AllocationPortfolio
USD
Tactical TiltOverlay
PortfolioUSD
StrategicVolatilityPremiumPortfolio
USD
Shareholders’ Equity at the start of the Period 319,169,676 653,478,302 421,606,039 1,349,542,100 926,249,957 472,253,852 206,437,446 1,047,441,047 2,353,083,425 878,540,239Proceeds from shares issued 7 58,148,921 70,500,889 69,096,823 150,136,044 153,961,551 88,854,587 40,732,965 76,527,062 245,220,798 312,822,763Payment for shares redeemed 7 (25,196,806) (66,163,039) (42,461,470) (109,494,029) (79,107,151) (37,773,297) (9,580,502) (68,009,452) (364,417,291) (165,166,581)Net income gain/(loss) for the Period (26,902,301) (80,772,369) 1,462,590 (197,641,450) (122,192,445) (60,257,923) (24,481,100) (75,601,814) (40,571,487) (51,081,770)Distributions 8 (270,025) (1,548,072) (1,917,190) (1,903,836) (1,022,022) — (195,810) — — —Currency adjustment 16 — — — — — — — — — —
Shareholders’ Equity at 31 May 2022 324,949,465 575,495,711 447,786,792 1,190,638,829 877,889,890 463,077,219 212,912,999 980,356,843 2,193,315,445 975,114,651
Swing Pricing 3(j) — — 850,795 1,190,639 — — — — — —
Shareholders’ Equity (after Swing Pricing) 324,949,465 575,495,711 448,637,587 1,191,829,468 877,889,890 463,077,219 212,912,999 980,356,843 2,193,315,445 975,114,651
Goldman Sachs Funds II — Statement of Changes in Shareholder’s EquityFor the Period Ended 31 May 2022
The accompanying notes are an integral part of these financial statements.9

Notes
IncomeMulti-Sector
BondPortfolio I
EUR
G EmergingMarkets Debt
BroadPortfolio
EUR
CombinedTotal
Period Ended31 May 2022
USD
Shareholders’ Equity at the start of the Period 510,476,754 464,091,117 9,794,833,362Proceeds from shares issued 7 156,999,999 — 1,446,784,622Payment for shares redeemed 7 (157,093,691) — (1,145,453,718)Net income gain/(loss) for the Period (53,126,977) (51,847,375) (793,902,409)Distributions 8 — (4,902,267) (12,476,533)Currency adjustment 16 — — (90,142,535)
Shareholders’ Equity at 31 May 2022 457,256,085 407,341,475 9,199,642,789
Swing Pricing 3(j) — — 2,102,053
Shareholders’ Equity (after Swing Pricing) 457,256,085 407,341,475 9,201,744,842
Goldman Sachs Funds II — Statement of Changes in Shareholder’s EquityFor the Period Ended 31 May 2022
The accompanying notes are an integral part of these financial statements.10

OutstandingShares
as atNet Asset Value per Share
as at Net Assets as at
Currency 31-May-22 31-May-22 30-Nov-21 30-Nov-20 31-May-22 30-Nov-21 30-Nov-20
Global Multi-Manager Alternatives PortfolioBase Accumulation Share Class USD 3,407 115.16 119.59 113.65 392,316 318,550 817,141Other Currency Accumulation Share Class (Flat)(SEK Hedged Class) SEK 8,762 95.38 99.74 — 835,756 867,752 —Other Currency Accumulation Share Class(CHF Hedged Class) CHF 307 99.60 104.20 100.22 30,541 31,951 30,728Other Currency Accumulation Share Class(EUR Hedged Class) EUR 113,012 101.92 106.61 102.39 11,518,122 17,479,058 10,766,976Other Currency Accumulation Share Class(SEK Hedged Class) SEK 4,758 104.65 109.54 104.82 497,923 521,201 498,753Other Currency Share Class (EUR HedgedClass) (a) EUR — — 106.85 102.55 — 21,467 20,603Other Currency Share Class (GBP HedgedClass) GBP 311 108.26 112.59 107.37 33,678 35,025 33,400�E� Accumulation Share Class (EUR HedgedClass) EUR 89 101.69 106.58 102.57 9,067 54,517 9,146�I� Accumulation Share Class USD 116,029 124.05 128.30 121.24 14,393,725 8,575,327 8,830,069�I� Accumulation Share Class (CHF HedgedClass) CHF 53,524 100.27 104.52 99.84 5,366,872 4,776,040 4,223,870�I� Accumulation Share Class (EUR HedgedClass) EUR 371,455 109.37 113.91 108.49 40,626,818 42,083,225 49,852,711�I� Accumulation Share Class (Flat) (SEKHedged Class) SEK 1,989,121 95.78 99.68 — 190,526,715 186,174,621 —�I� Accumulation Share Class (SEK HedgedClass) SEK 3,811 110.06 114.65 109.02 419,498 436,983 599,629�P� Accumulation Share Class USD 23,232 116.76 121.09 114.98 2,712,650 2,329,229 1,939,740�P� Accumulation Share Class (EUR HedgedClass) EUR 175,047 102.95 107.60 103.01 18,021,681 18,372,401 18,065,150�P� Share Class USD 55,518 116.81 121.14 115.03 6,485,099 6,943,883 6,675,101�P� Share Class (EUR Hedged Class) EUR 116 103.61 108.23 103.55 12,051 12,587 12,043�P� Share Class (GBP Hedged Class) GBP 5,908 109.44 113.68 108.13 646,643 671,694 640,826�R� Accumulation Share Class USD 132,677 112.71 116.61 110.26 14,953,940 15,060,487 11,019,752�R� Accumulation Share Class (EUR HedgedClass) EUR 494,591 106.44 111.03 105.81 52,642,408 47,482,023 29,129,491�R� Share Class USD 486,529 119.38 123.76 117.02 58,081,419 49,757,915 30,498,097�R� Share Class (EUR Hedged Class) EUR 181,443 105.58 110.03 104.99 19,156,553 11,465,261 8,091,091�R� Share Class (GBP Hedged Class) GBP 353,290 111.90 116.22 110.21 39,532,468 39,886,717 33,780,481Multi-Manager Emerging Markets EquityPortfolioOther Currency Accumulation Share Class SEK 526,497 91.02 95.01 — 47,922,042 80,760 —�I� Accumulation Share Class USD 862,627 12.85 14.56 13.90 11,082,590 7,300,607 6,093,693�IO� Accumulation Share Class SEK 21,210,597 96.58 100.29 — 2,048,470,982 2,243,572,092 —�IO� Accumulation Share Class USD 7,974,426 12.71 14.38 13.71 101,392,896 153,736,880 165,030,674�P� Accumulation Share Class USD 4,008,286 12.55 14.23 13.65 50,287,502 50,842,474 45,050,170�P� Share Class USD 265,810 11.76 13.48 13.01 3,126,214 3,321,405 3,123,045�R� Accumulation Share Class USD 6,826,523 13.13 14.86 14.17 89,641,936 92,356,252 88,078,871�R� Share Class USD 9,082,811 11.73 13.48 12.99 106,509,767 97,060,047 75,636,471Multi-Manager Europe Equity Portfolio�I� Accumulation Share Class EUR 1,198,909 17.21 17.12 14.27 20,633,237 16,260,535 38,791,608�P� Accumulation Share Class EUR 4,875,948 23.39 23.30 19.49 114,070,767 112,451,539 107,150,255�P� Share Class EUR 630,055 20.80 20.90 17.56 13,106,876 17,711,819 15,447,394�R� Accumulation Share Class EUR 7,044,513 20.42 20.29 16.88 143,883,634 144,317,350 143,089,629�R� Share Class EUR 8,823,666 17.79 17.91 15.04 156,943,073 130,864,796 126,532,660Multi-Manager Global Equity PortfolioOther Currency Accumulation Share Class EUR 1,000 13.06 14.30 11.04 13,057 14,298 11,041Other Currency Accumulation Share Class SEK 2,498,025 101.01 108.06 — 252,316,367 91,854 —�I� Accumulation Share Class USD 1,673,751 25.05 29.08 23.58 41,924,836 51,782,385 38,148,613�IO� Accumulation Share Class SEK 52,796,217 110.17 117.23 — 5,816,810,548 6,751,638,137 —�IO� Accumulation Share Class USD 1,542,565 24.01 27.83 22.50 37,037,296 42,929,689 47,589,426�IP� Accumulation Share Class EUR 3,230,235 15.00 16.37 12.56 48,444,824 47,078,401 24,249,367�IP� Accumulation Share Class USD 578,193 13.98 16.21 13.11 8,085,848 9,232,924 3,876,518�P� Accumulation Share Class EUR 682,618 45.15 49.42 38.13 30,822,455 33,659,663 31,619,761�P� Accumulation Share Class USD 118,420 20.74 24.11 19.61 2,455,838 3,285,428 2,857,537�P� Share Class USD 1,402,892 19.53 22.74 18.53 27,392,861 28,003,417 27,042,122�R� Accumulation Share Class EUR 826,160 15.66 17.10 13.12 12,938,631 12,149,363 5,030,524�R� Accumulation Share Class USD 850,987 24.63 28.56 23.10 20,958,727 24,696,148 25,685,585�R� Accumulation Share Class (Long GlobalCCY vs. USD) EUR 532,707 13.22 15.54 12.70 7,042,712 13,261,522 10,404,445�R� Accumulation Share Class (Long GlobalCCY vs. USD) GBP 3,779,029 14.20 16.67 13.53 53,671,525 32,186,376 29,411,705�R� Share Class USD 11,669,581 22.46 26.22 21.35 262,114,188 276,928,976 194,747,761Multi-Manager US Equity PortfolioOther Currency Accumulation Share Class SEK 17,059 102.69 108.35 — 1,751,709 92,096 —�I� Accumulation Share Class USD 1,459,453 23.90 27.38 21.50 34,876,815 38,762,078 40,995,607�IO� Accumulation Share Class SEK 517,214 116.18 122.05 — 60,088,048 42,552,070 —�P� Accumulation Share Class USD 5,559,292 30.06 34.49 27.16 167,091,694 189,553,270 127,363,402�P� Share Class USD 789,159 30.03 34.46 27.14 23,696,747 26,322,565 20,788,181�R� Accumulation Share Class USD 9,524,591 32.69 37.42 29.31 311,355,163 336,022,226 197,307,020�R� Accumulation Share Class (EUR HedgedClass) (a) EUR 384,618 9.31 — — 3,579,181 — —�R� Share Class USD 10,454,281 31.64 36.32 28.59 330,738,747 330,859,828 160,810,751Multi-Manager US Small Cap Equity Portfolio�I� Accumulation Share Class USD 4,436,455 13.67 15.60 13.09 60,654,323 53,894,748 44,779,402
Goldman Sachs Funds IIStatistical Information
As at 31 May 2022
11

OutstandingShares
as atNet Asset Value per Share
as at Net Assets as at
Currency 31-May-22 31-May-22 30-Nov-21 30-Nov-20 31-May-22 30-Nov-21 30-Nov-20
Multi-Manager US Small Cap EquityPortfolio (Continued)�P� Accumulation Share Class USD 6,064,826 13.44 15.36 12.93 81,523,674 87,479,462 73,773,513�P� Share Class USD 442,698 13.44 15.35 12.92 5,948,284 13,558,272 9,791,078�R� Accumulation Share Class USD 8,872,720 13.84 15.77 13.20 122,813,439 137,494,654 135,412,969�R� Share Class USD 13,946,817 13.78 15.70 13.17 192,137,498 179,826,716 144,220,652Balanced Allocation Portfolio�I� Accumulation Share Class (EUR PartiallyHedged Class) EUR 747,437 94.00 100.66 — 70,261,972 50,099,299 —�P� Accumulation Share Class USD 230,088 134.17 143.90 131.02 30,869,865 33,412,398 41,685,902�R� Accumulation Share Class USD 52,106 141.79 151.71 137.48 7,387,906 8,052,335 3,938,124�R� Share Class USD 116,927 135.45 145.21 132.27 15,837,170 17,153,671 18,355,069�R� Share Class (EUR Partially Hedged Class) EUR 27 112.81 120.69 109.80 3,097 4,214,190 3,125,972�R� Share Class (GBP Partially Hedged Class) GBP 515,828 128.66 137.17 125.14 66,364,748 64,387,442 54,085,880Strategic Factor Allocation Portfolio�I� Accumulation Share Class USD 1,200,141 143.77 151.16 132.57 172,548,927 186,581,326 133,361,799�I� Accumulation Share Class (EUR HedgedClass) EUR 609,642 130.12 137.83 121.92 79,324,254 56,031,151 16,527,348�I� Share Class USD 82,869 141.07 148.32 130.08 11,690,602 12,291,396 2,326,254�P� Accumulation Share Class USD 1,660,221 143.28 150.68 132.21 237,869,669 251,486,202 226,605,331�P� Accumulation Share Class (CHF HedgedClass) CHF 2,295 121.04 128.31 113.89 277,794 294,479 123,654�P� Accumulation Share Class (EUR HedgedClass) EUR 1,517,813 128.48 136.13 120.47 195,005,847 206,572,335 165,359,664�P� Accumulation Share Class (GBP HedgedClass) GBP 821 129.50 136.50 120.08 106,349 101,361 107,036�P� Share Class USD 454,115 140.68 147.95 129.82 63,885,941 70,355,048 63,123,733�P� Share Class (EUR Hedged Class) EUR 99 126.11 133.61 118.23 12,499 13,242 11,717�R� Accumulation Share Class USD 482,994 147.32 154.55 134.96 71,153,317 87,277,288 68,624,600�R� Accumulation Share Class (EUR HedgedClass) EUR 764,472 127.32 134.58 118.53 97,332,999 104,436,953 80,866,589�R� Accumulation Share Class (GBP HedgedClass) GBP 96 138.17 145.17 127.10 13,265 147,805 12,201�R� Share Class USD 80,477 130.93 137.36 120.14 10,536,594 9,539,006 5,705,940�R� Share Class (GBP Hedged Class) GBP 83,690 133.43 140.31 123.03 11,167,016 12,174,802 10,243,855Tactical Tilt Overlay PortfolioOther Currency Accumulation Share Class(SEK Hedged Class) SEK 9,231 100.64 100.39 — 929,048 86,588 —�I� Accumulation Share Class USD 1,026,644 151.70 150.05 140.21 155,746,251 134,898,412 132,455,770�I� Accumulation Share Class (EUR HedgedClass) EUR 27,519 106.85 106.49 100.33 2,940,330 2,621,140 3,404,459�IO� Accumulation Share Class USD 2,571,950 167.08 164.64 152.70 429,719,908 616,709,020 618,654,610�IO� Accumulation Share Class (EUR HedgedClass) EUR 182,797 107.76 106.99 100.06 19,698,353 19,573,786 13,200,183�IO� Accumulation Share Class (GBP HedgedClass) GBP 643,112 110.09 108.71 101.06 70,798,557 84,113,195 75,206,207�IO� Accumulation Share Class (SEK HedgedClass) SEK 4,837,824 101.90 101.11 — 492,958,058 503,689,013 —�IP� Accumulation Share Class USD 5,473 104.11 102.62 — 569,814 364,153 —�IP� Accumulation Share Class (EUR HedgedClass) EUR 38,676 120.78 119.95 112.24 4,671,375 1,830,986 169,549�P� Accumulation Share Class USD 1,004,814 148.83 147.25 137.67 149,551,402 125,401,411 129,039,560�P� Accumulation Share Class (CHF HedgedClass) CHF 46,321 128.66 128.35 121.18 5,959,394 4,802,955 14,517,775�P� Accumulation Share Class (EUR HedgedClass) EUR 589,003 130.81 130.40 122.92 77,048,234 80,382,767 80,042,642�P� Accumulation Share Class (GBP HedgedClass) GBP 67,813 139.64 138.45 129.74 9,469,509 10,136,292 7,236,155�P� Share Class USD 201,983 134.45 133.02 124.54 27,157,374 25,982,455 25,404,697�P� Share Class (EUR Hedged Class) EUR 25,588 117.42 117.05 110.48 3,004,504 2,959,952 1,689,679�P� Share Class (GBP Hedged Class) GBP 5,670 125.80 124.73 117.02 713,253 730,965 8,944,643�R� Accumulation Share Class USD 1,176,541 140.67 138.85 129.18 165,508,888 176,306,383 156,473,406�R� Accumulation Share Class (CHF HedgedClass) CHF 61,425 117.60 117.04 109.99 7,223,661 6,102,503 4,295,401�R� Accumulation Share Class (EUR HedgedClass) EUR 2,253,500 121.53 120.86 113.39 273,878,334 274,721,642 212,942,184�R� Accumulation Share Class (GBP HedgedClass) GBP 544,161 128.76 127.36 118.80 70,067,637 68,715,898 21,298,142�R� Share Class USD 2,063,463 124.14 122.52 114.68 256,153,334 236,637,793 163,628,948�R� Share Class (EUR Hedged Class) EUR 1,043,269 106.87 106.28 100.26 111,498,836 83,147,529 55,818,867�R� Share Class (GBP Hedged Class) GBP 1,590,455 113.31 112.08 105.13 180,219,280 165,380,012 141,933,369Strategic Volatility Premium Portfolio�I� Accumulation Share Class USD 952,857 98.94 101.31 — 94,280,065 44,935,524 —�I� Accumulation Share Class (EUR HedgedClass) EUR 671,832 98.01 100.87 — 65,849,459 34,512,157 —�I� Share Class USD 255,035 98.96 101.32 — 25,237,300 57,651,721 —�P� Accumulation Share Class USD 697,027 98.89 101.28 — 68,927,796 46,055,488 —�P� Accumulation Share Class (CHF HedgedClass) CHF 15,852 97.69 100.69 — 1,548,519 1,279,134 —�P� Accumulation Share Class (EUR HedgedClass) EUR 155,886 97.95 100.83 — 15,268,840 13,477,906 —�P� Accumulation Share Class (GBP HedgedClass) GBP 77,606 98.89 101.29 — 7,674,523 8,073,788 —�P� Share Class USD 34,509 98.89 101.28 — 3,412,753 2,872,622 —
Goldman Sachs Funds IIStatistical Information
As at 31 May 2022
12

OutstandingShares
as atNet Asset Value per Share
as at Net Assets as at
Currency 31-May-22 31-May-22 30-Nov-21 30-Nov-20 31-May-22 30-Nov-21 30-Nov-20
Strategic Volatility PremiumPortfolio (Continued)�P� Share Class (CHF Hedged Class) CHF 500 97.66 100.66 — 48,831 50,330 —�P� Share Class (EUR Hedged Class) EUR 21,612 97.96 100.84 — 2,117,058 1,526,243 —�P� Share Class (GBP Hedged Class) GBP 106 98.88 101.28 — 10,465 10,718 —�R� Accumulation Share Class USD 817,319 99.10 101.40 — 81,000,264 85,492,775 —�R� Accumulation Share Class (EUR HedgedClass) EUR 1,925,941 98.18 100.98 — 189,085,496 193,171,689 —�R� Accumulation Share Class (GBP HedgedClass) GBP 152,462 99.11 101.43 — 15,110,155 15,202,333 —�R� Share Class USD 1,170,988 99.10 101.40 — 116,043,109 123,314,374 —�R� Share Class (CHF Hedged Class) CHF 55,410 97.90 100.82 — 5,424,671 4,735,667 —�R� Share Class (EUR Hedged Class) EUR 1,133,841 98.18 100.98 — 111,317,965 82,351,836 —�R� Share Class (GBP Hedged Class) GBP 1,114,328 99.11 101.43 — 110,438,750 86,916,356 —Income Multi-Sector Bond Portfolio I�I� (Dis) (Stable Monthly) Share Class EUR 5,201,859 87.90 98.08 99.27 457,256,085 510,476,754 516,700,008G Emerging Markets Debt Broad Portfolio�I� (Dis) (Semi-Annual) Share Class EUR 4,594,112 88.67 101.02 105.79 407,341,475 464,091,117 385,613,175
(a) Refer to Appendix II.
Goldman Sachs Funds IIStatistical Information
As at 31 May 2022
13

1 Organisat ion
Goldman Sachs Funds II (“the Fund”) was incorporated on 20 November 2007 under the laws of the GrandDuchy of Luxembourg as a “Société d’Investissement à Capital Variable” (“SICAV”), for an unlimited period oftime. The Fund is registered in accordance with Part I of the Law of 17 December 2010, as amended. The Fundappointed Goldman Sachs Asset Management Fund Services Limited (“GSAMFSL”) (the “ManagementCompany”) as its Management Company. GSAMFSL is authorised and regulated by the Central Bank of Ireland,and is a wholly owned indirect subsidiary of The Goldman Sachs Group, Inc.
Refer to Note 6 for details of functions the Management Company has delegated.
The Fund has appointed State Street Bank International GmbH, Luxembourg Branch, (the “Depositary”) to actas the Depositary of the Fund’s assets.
As at 31 May 2022, the Fund is comprised of twelve different portfolios (“the Portfolios”).
As at 31 May 2022, the Fund offered shares in the Portfolios as detailed in Appendix I.
Please refer to Appendix II for Portfolios and Share Classes that were launched, merged, closed or changedname during the period.
2 Investment Object ive Pol icies
The primary investment objectives of the Portfolios are detailed in the Prospectus and in the relevantSupplements of the Prospectus.
Fund Name Strategy Name
Global Multi-Manager Alternatives Portfolio Specialist Portfolios
Multi-Manager Emerging Markets Equity Portfolio Global Manager Strategies Portfolios
Multi-Manager Europe Equity Portfolio Global Manager Strategies Portfolios
Multi-Manager Global Equity Portfolio Global Manager Strategies Portfolios
Multi-Manager US Equity Portfolio Global Manager Strategies Portfolios
Multi-Manager US Small Cap Equity Portfolio Global Manager Strategies Portfolios
Balanced Allocation Portfolio Dedicated Portfolios
Strategic Factor Allocation Portfolio Dedicated Portfolios
Tactical Tilt Overlay Portfolio Dedicated Portfolios
Strategic Volatility Premium Portfolio Dedicated Portfolios
Income Multi-Sector Bond Portfolio I Select Portfolios I
G Emerging Markets Debt Broad Portfolio Select Portfolios II
3 Signif icant Accounting Pol icies
(a) Basis of Preparat ion of Financial Statements
The financial statements of the individual Portfolios are presented in their base currency while the CombinedTotal of all the Portfolios is presented in United States Dollars. The Board of Directors considers that thePortfolios’ base currency most accurately represents the economic effects of the underlying transactions, eventsand conditions of the Portfolios.
The financial statements have been prepared in accordance with Luxembourg legal regulatory requirementsrelating to investment funds. The financial statements have been prepared on a going concern basis as theDirectors are of the view that the Fund can continue in operational existence for the foreseeable future.
The preparation of financial statements requires the Board of Directors to make estimates and assumptions thatmay affect the amounts reported in the financial statements and accompanying notes. Refer to the Statement ofAssets and Liabilities and Note 4 where the Board of Directors was required to make certain estimates andassumptions to determine value. Actual results may differ from those estimates.
Goldman Sachs Funds IINotes to the Financial StatementsFor the Period Ended 31 May 2022
14

3 Signif icant Accounting Pol icies (Continued)
(b) Investment Transact ions, Related Investment Income and Operat ing Expenses
Investment transactions are recorded on a trade date basis plus one in accounting. Realised gains and lossesare based on the Weighted Average Cost Method. Dividend income and dividend expense are recorded on theex-dividend date and interest income and interest expense are accrued over the life of the investment. Interestincome includes accretion of market discount, original issue discounts and amortisation of premiums and isrecorded into income over the life of the underlying investment. Interest income and dividend income arerecognised on a gross basis before withholding tax, if any.
Operating expenses are recognised on an accrual basis.
(c) Transact ion Costs
Transaction costs are recognised in the Statement of Operations as part of net change in unrealised gain/(loss)on investment securities and net realised gain/(loss) on investment securities. Depositary based transactioncosts are included in ‘Depositary fees’ in the Statement of Operations.
Transaction costs for fixed income investments, forward currency contracts and other derivative contracts are notseparately identifiable. For these investments, transaction costs are included in the purchase and sales price andare part of the gross investment performance of each Portfolio.
(d) Financial Investment in Securi t ies and Valuat ion
i. Recognition and Derecognition
The Portfolios recognise financial assets and financial liabilities on the date they become a party to thecontractual provisions of the investment. Purchases and sales of financial assets and financial liabilities arerecognised using trade date plus one accounting. From trade date plus one, any gains and losses arising fromchanges in value of the financial assets or financial liabilities are recorded in the Statement of Operations.
Financial assets are derecognised when the rights to receive cash flows from the investments have expired or thePortfolio has transferred substantially all risks and rewards of ownership.
ii. Value Measurement Principles
The value of all securities and derivatives is determined according to the following policies:
(ii.1) Exchange Listed Assets and Liabilities
The value of exchange traded financial investments, including transferable securities admitted to an officialexchange listing or dealt in on any other regulated market that operates regularly, which comprise CommonStocks, Bonds, Real Estate Investment Trusts, Rights, Warrants, Mutual Funds, Options, Contracts forDifference and Futures Contracts, are valued based upon quoted market prices at the period end date withoutany deduction for estimated future transaction costs.
(ii.2) Debt Securities
Debt securities, comprising Bonds, Non-Agencies Asset Backed Obligations are valued at mid or bid dependingon fund methodology, by third party pricing service providerswithout any deduction for estimated futuretransaction costs.
When a debt security has been identified as being in default, the interest accrual on the defaulted security maybe stopped, and upon confirmation from relevant parties, the amount receivable may be written off.
(ii.3) Certificates of Deposit and Money Market Investments
Certificates of Deposit, Commercial Papers and Money Market Investments are valued at mid by third partyservice providers, or where such pricing service is unavailable, at cost which approximates market value.
Goldman Sachs Funds IINotes to the Financial StatementsFor the Period Ended 31 May 2022
15

3 Signif icant Accounting Pol icies (Continued)
(d) Financial Investment in Securi t ies and Valuat ion (Continued)
ii. Value Measurement Principles (Continued)
(ii.4) Shares in Collective Investment Schemes
The value of investments in open-ended investment funds, comprising Mutual Funds, are valued based upon theofficial net asset values per share as at the last available date as supplied by the funds, in accordance with thevaluation policy of the applicable fund as outlined in its prospectus.
(ii.5) Derivatives
A derivative is an instrument whose value is derived from an underlying instrument, index reference rate or acombination of these factors. Derivative instruments may be privately negotiated contracts which are oftenreferred to as over the counter (“OTC”) derivatives or they may be listed and traded on an exchange. Derivativecontracts may involve future commitments to purchase or sell financial instruments or commodities at specifiedterms on a specified date, or to exchange interest payment streams or currencies based on a notional orcontractual amount.
Derivative contracts are stated at market value and recognised as assets and liabilities in the Statement ofAssets and Liabilities. Gains and losses resulting from the change in the market value are reflected in theStatement of Operations as a component of net change in unrealised gain/(loss). Realised gains or losses arerecorded on termination or from periodic cash flow payments.
(ii.5) (a) Option Contracts
The Portfolios may enter into exchange traded and OTC option contracts with various counterparties. When thePortfolio purchases an option, an amount equal to market value which is based on the premium paid is recordedas an asset, the value of which is marked-to-market daily. When the Portfolio writes an option, an amount equalto market value which is based on the premium received by the Portfolio is recorded as a liability and is adjustedto the market value of the option written on each valuation date.
When options are closed, the difference between the premium and the amount paid or received, net of brokeragecommissions, or the full amount of the premium if the option expires worthless, is treated as realised gain or loss.The exercise of an option written by the Portfolio could result in the Portfolio buying or selling a financialinstrument at a price different from the current market value.
The fair value of an OTC contract is determined by using counterparty supplied valuations, an independentpricing service or valuation models which use market data inputs supplied by a third party pricing service, and istypically valued at mid. Exchange traded options are valued based on the exchange settlement/last sale prices,or, if the last settlement price is not available for any reason, at the midpoint of the bid and ask prices (or, in theabsence of two-way trading, at the last bid price for long positions and the last ask price for short positions), orindependent market quotes provided by a pricing service or counterparty.
(ii.5) (b) Futures Contracts
Futures contracts are contracts to buy or sell a standardised quantity of a specified commodity, security or indexand are valued based on exchange settlement/last sale prices, last bid or ask prices on the exchange, orindependent market quotes. Initial margin deposits, in either cash or securities, are required to trade in thefutures market. Unrealised gains or losses on futures contracts are recognised to reflect the market value of thecontracts and are included as a component of the unrealised gains or losses on the Portfolio’s Statement ofOperations. Variation margin is received or paid, depending on whether unrealised gains or losses are incurred.When the contract is terminated, the Portfolio will recognise a realised gain or loss equal to the differencebetween the value of the contract at the time it was entered into and the time it is closed.
(ii.5) (c) Swap Contracts
Swaps, comprising Interest Rate Swaps, Credit Default Swaps and Total Return Swaps, can be linked to anynumber of underlying investments and indices, and swap terms can vary greatly. Cash flows are exchangedbased on the underlying. Upfront payments, which represent a risk premium, are amortised or accreted over the
Goldman Sachs Funds IINotes to the Financial StatementsFor the Period Ended 31 May 2022
16

3 Signif icant Accounting Pol icies (Continued)
(d) Financial Investment in Securi t ies and Valuat ion (Continued)
ii. Value Measurement Principles (Continued)
(ii.5) Derivatives (Continued)
(ii.5) (c) Swap Contracts (Continued)
contract term. Swap agreements are carried at market value, typically valued at mid, and the value of the swapagreement is based on a counterparty provided price, third party pricing service or valuation model. The modelconsiders various inputs including the market value of the underlying, the risks associated with the underlyingand the specific terms of the contract. In connection with these agreements, securities or cash may be identifiedas collateral or margin in accordance with the terms of the respective swap agreements to provide assets ofvalue and recourse in the event of default or bankruptcy/insolvency. This collateral or margin is primarilydenominated in base currency, and is paid from the custody account to the broker.
For the period ended 31 May 2022, collateral related to total return swaps was pledged in the form of cash.Please refer to Note 13 and to Appendix IV for more information.
Total return swaps and more specifically OTC derivative transactions are entered into by the Portfolio under anInternational Swaps and Derivatives Associations, Inc. Master Agreement (“ISDA Master Agreement”) or similaragreement. An ISDA Master Agreement is a bilateral agreement between the Portfolio and a counterparty thatgoverns OTC derivative transactions (including total return swaps) entered into by the parties.
All returns from OTC derivative transactions will accrue to the Portfolio and are not subject to any returns sharingagreement with the Portfolio’s manager or any other third parties.
(ii.5) (d) Contracts for Difference
Contracts for difference are contracts entered into between a broker and the Portfolio under which the partiesagree to make payments to each other so as to replicate the economic consequences of holding a long or shortposition in the underlying security. Contracts for difference also mirror any corporate actions that take place. Incontracts for difference the unrealised appreciation/(depreciation) is disclosed in the Statement of Assets andLiabilities under “unrealised gain on contracts for difference” and “unrealised loss on contracts for difference”.Realised gains/(losses) and changes in unrealised appreciation/depreciation as a result thereof are included inthe Statement of Operations respectively under “Net realised gain/(loss) on contracts for difference” and “Netchange in unrealised gain/(loss) on contracts for difference”. The value of contracts for difference will be basedon the value of the underlying assets and vary similarly to the value of such underlying assets. Contracts fordifference will be valued at market value.
(ii.5) (e) Forward Foreign Currency Contracts
In a forward foreign currency contract, the Portfolio agrees to receive or deliver a fixed quantity of one currencyfor another, at a pre-determined price at a future date. Purchases and sales of forward foreign currency contractshaving the same notional value, settlement date and counterparty and right to settle net are generally offset(which result in a net foreign currency position of zero with the counterparty) and any realised gains or losses arerecognised on trade date plus one.
Forward foreign currency contracts are valued at mid by third party pricing service providers.
(ii.6) All Securities and Derivatives
If a quoted market price is not available from a third party pricing service or a dealer, or a quotation is believed tobe materially inaccurate, the market value of the investment is determined by using valuation techniques.Valuation techniques include the use of recent market transactions, reference to the current market value ofanother investment that is substantially the same, discounted cash flow analyses or any other techniques thatprovides a reliable estimate of prices obtained in actual market transactions. Such securities and derivativesshall be valued at their probable realisation value as determined by the Valuer. Please refer to Note 4 for furtherdetails.
Goldman Sachs Funds IINotes to the Financial StatementsFor the Period Ended 31 May 2022
17

3 Signif icant Accounting Pol icies (Continued)
(d) Financial Investment in Securi t ies and Valuat ion (Continued)
ii. Value Measurement Principles (Continued)
(ii.6) All Securities and Derivatives (Continued)
The investments have been valued in accordance with Luxembourg generally accepted accounting principlesthat may require the use of certain estimates and assumptions to determine value. Although these estimatesand assumptions are based on the best available information, actual results could be materially different fromthese estimates.
Refer to Note 4 for securities where the Valuer was used to determine probable realisation value.
(e) Cash
Cash is valued at cost, which approximates market value.
( f ) Due from/to Brokers
Due from brokers consists primarily of cash receivable for collateral from the Portfolios’ clearing brokers andvarious counterparties. Due to brokers consists primarily of cash payable for collateral to the Portfolios’ clearingbrokers and various counterparties.
Due from/to broker balances are valued at cost, which approximates market value. Refer to Note 13 for furtherdetails.
(g) Foreign Currency Translat ion
The books and records of all Portfolios are maintained in their base currency. Please refer to Appendix I for thebase currency of each Portfolio. Transactions in foreign currencies are translated at the foreign currencyexchange rate in effect at the date of the transaction. Assets and liabilities denominated in foreign currencies aretranslated into the base currency at the foreign currency closing exchange rate in effect at the period end date.Foreign currency exchange differences arising on translation and realised gains and losses on disposals orsettlements of assets and liabilities are recognised in the Statement of Operations. Foreign currency exchangegains or losses relating to investments, derivative financial investments, and all other foreign currency exchangegains or losses relating to monetary items, including cash and cash equivalents, are reflected in the net realisedgain/(loss) or net change in unrealised gain/(loss) in the Statement of Operations.
(h) Expenses
Expenses incurred by the Fund that do not specifically relate to an individual Portfolio or Share Class of aPortfolio are allocated to the Portfolios based on an allocation basis that depends upon the nature of thecharges. Expenses directly attributable to a Portfolio or Share Class are generally charged to that Portfolio orShare Class.
( i ) Income Equal isat ion Arrangements
Income equalisation arrangements may be applied in some or all of the Portfolios of the Fund. Where they areapplied, these arrangements are intended to ensure that the income per share which is distributed or deemeddistributed in respect of a distribution period is not affected by changes in the number of shares in issue duringthat period, and the amount of the first distribution received by a Shareholder in an impacted Portfolio followingthe purchase of shares in that Portfolio will represent partly participation in income received by the Portfolio andpartly a return of capital (the “equalisation amount”). The equalisation amounts are included within the proceedsfrom shares issued and the payment for shares redeemed in the Statement of Changes in Shareholders’ Equity.
( j ) Swing Pricing
On any Business Day the Management Company in consultation with its appointed delegate, Goldman SachsAsset Management International (“GSAMI”) as Investment Adviser, in conformity with guidelines established bythe Board of Directors, may determine to apply swing pricing (to include such reasonable factors as they see fit)to the net asset value per share. This method of net asset value calculation is intended to pass the estimated
Goldman Sachs Funds IINotes to the Financial StatementsFor the Period Ended 31 May 2022
18
3 Signif icant Accounting Pol icies (Continued)
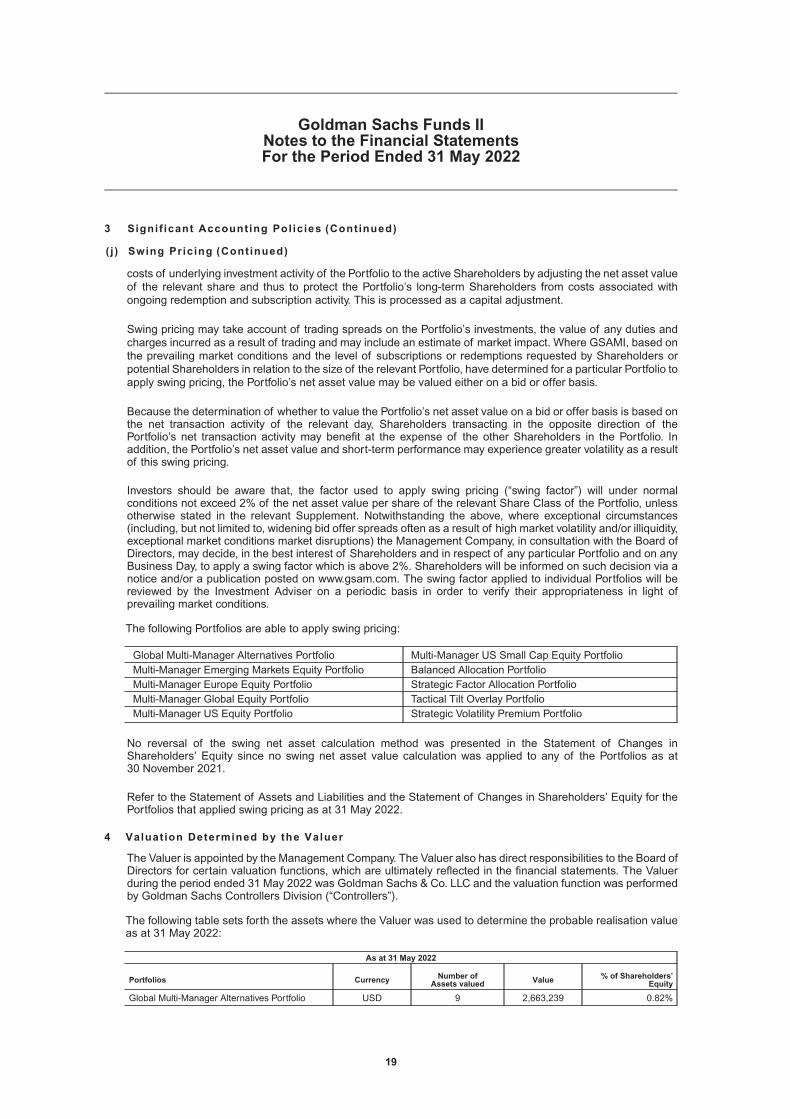
( j ) Swing Pricing (Continued)
costs of underlying investment activity of the Portfolio to the active Shareholders by adjusting the net asset valueof the relevant share and thus to protect the Portfolio’s long-term Shareholders from costs associated withongoing redemption and subscription activity. This is processed as a capital adjustment.
Swing pricing may take account of trading spreads on the Portfolio’s investments, the value of any duties andcharges incurred as a result of trading and may include an estimate of market impact. Where GSAMI, based onthe prevailing market conditions and the level of subscriptions or redemptions requested by Shareholders orpotential Shareholders in relation to the size of the relevant Portfolio, have determined for a particular Portfolio toapply swing pricing, the Portfolio’s net asset value may be valued either on a bid or offer basis.
Because the determination of whether to value the Portfolio’s net asset value on a bid or offer basis is based onthe net transaction activity of the relevant day, Shareholders transacting in the opposite direction of thePortfolio’s net transaction activity may benefit at the expense of the other Shareholders in the Portfolio. Inaddition, the Portfolio’s net asset value and short-term performance may experience greater volatility as a resultof this swing pricing.
Investors should be aware that, the factor used to apply swing pricing (“swing factor”) will under normalconditions not exceed 2% of the net asset value per share of the relevant Share Class of the Portfolio, unlessotherwise stated in the relevant Supplement. Notwithstanding the above, where exceptional circumstances(including, but not limited to, widening bid offer spreads often as a result of high market volatility and/or illiquidity,exceptional market conditions market disruptions) the Management Company, in consultation with the Board ofDirectors, may decide, in the best interest of Shareholders and in respect of any particular Portfolio and on anyBusiness Day, to apply a swing factor which is above 2%. Shareholders will be informed on such decision via anotice and/or a publication posted on www.gsam.com. The swing factor applied to individual Portfolios will bereviewed by the Investment Adviser on a periodic basis in order to verify their appropriateness in light ofprevailing market conditions.
The following Portfolios are able to apply swing pricing:
Global Multi-Manager Alternatives Portfolio Multi-Manager US Small Cap Equity PortfolioMulti-Manager Emerging Markets Equity Portfolio Balanced Allocation PortfolioMulti-Manager Europe Equity Portfolio Strategic Factor Allocation PortfolioMulti-Manager Global Equity Portfolio Tactical Tilt Overlay PortfolioMulti-Manager US Equity Portfolio Strategic Volatility Premium Portfolio
No reversal of the swing net asset calculation method was presented in the Statement of Changes inShareholders’ Equity since no swing net asset value calculation was applied to any of the Portfolios as at30 November 2021.
Refer to the Statement of Assets and Liabilities and the Statement of Changes in Shareholders’ Equity for thePortfolios that applied swing pricing as at 31 May 2022.
4 Valuat ion Determined by the Valuer
The Valuer is appointed by the Management Company. The Valuer also has direct responsibilities to the Board ofDirectors for certain valuation functions, which are ultimately reflected in the financial statements. The Valuerduring the period ended 31 May 2022 was Goldman Sachs & Co. LLC and the valuation function was performedby Goldman Sachs Controllers Division (“Controllers”).
The following table sets forth the assets where the Valuer was used to determine the probable realisation valueas at 31 May 2022:
As at 31 May 2022
Portfolios Currency Number ofAssets valued Value % of Shareholders’
Equity
Global Multi-Manager Alternatives Portfolio USD 9 2,663,239 0.82%
Goldman Sachs Funds IINotes to the Financial StatementsFor the Period Ended 31 May 2022
19

4 Valuat ion Determined by the Valuer (Continued)
As at 31 May 2022
Portfolios Currency Number ofAssets valued Value % of Shareholders’
Equity
Multi-Manager Emerging Markets Equity Portfolio USD 18 12,377,868 2.15%
Multi-Manager Europe Equity Portfolio EUR 1 21,698 0.00%
Multi-Manager Global Equity Portfolio USD 4 270,480 0.02%
Multi-Manager US Small Cap Equity Portfolio USD 1 21,462 0.00%
Securities traded on certain Asia Pacific/Middle Eastern exchanges may utilise international equity adjustedprices provided by an independent third party pricing service in order to more accurately reflect the value ofsecurities traded on markets which are closed at the valuation point.
The independent valuation service takes into account multiple factors including, but not limited to, movements inthe securities markets, certain depositary receipts, futures contracts and foreign currency exchange rates thathave occurred subsequent to the close of the foreign securities exchange. These investments are not included inthe above table.
5 Taxat ion
Taxation – Luxembourg
The Fund is not liable for any Luxembourg tax on profits or income. However, the Fund is liable in Luxembourg toan annual subscription tax (taxe d’abonnement) of 0.05% per annum. The taxable basis of the subscription taxis the aggregate net assets of the Fund as valued on the last day of each quarter. This rate is however 0.01% perannum for each of the following:
• undertakings whose exclusive object is the collective investment in Money Market Instruments and theplacing of deposits with credit institutions;
• undertakings whose exclusive object is the collective investment in deposits with credit institutions; and• individual compartments of undertakings for collective investment (“UCI”) with multiple compartments
referred to in the law dated 17 December 2010, as amended, as well as for individual classes of securitiesissued within a UCI or within a compartment of a UCI with multiple compartments, provided that the securitiesof such compartments or classes are reserved to one or more institutional investors.
Taxation – Belgium
The Fund may incur a liability to subscription tax at the rate of 0.0925% in respect of subscriptions made throughintermediaries situated in Belgium to the extent that net shares are outstanding as of 31 December of theprevious period.
Taxation – General
Each Portfolio may be subject to taxation on capital gains, interest and dividends in certain jurisdictions in whicheach Portfolio invests. It is the policy of each Portfolio to accrue for any such taxes on dividends and interestwhen the dividend is declared or interest is earned. At each valuation date, taxation on realised and unrealisedappreciation of securities may be accrued for at statutory rates.
Prospective investors should consult their own taxation advisers regarding the tax implications of investing in theFund in relation to their own individual circumstances as they may differ from the general statements that appearabove.
6 Signif icant Agreements and Related Part ies
Management Company
As outlined in Note 1, the Fund appointed GSAMFSL, a wholly-owned indirect subsidiary of The Goldman SachsGroup, Inc., as its Management Company.
Goldman Sachs Funds IINotes to the Financial StatementsFor the Period Ended 31 May 2022
20

6 Signif icant Agreements and Related Part ies (Continued)
Management Company (Continued)
The Portfolios pay the Management Company an annual fee which shall be accrued daily and generally paidmonthly in arrears.
Investment Adviser and Investment Sub-Advisers
The Management Company has appointed GSAMI (the “Investment Adviser”), a related party to the Fund, as itsdelegate to provide portfolio management services.
GSAMI has entered into sub-delegation agreements with each of the following affiliated InvestmentSub-Advisers:
• Goldman Sachs Asset Management, L.P.• Goldman Sachs Asset Management (Hong Kong) Ltd.• Goldman Sachs Asset Management (Singapore) Pte. Ltd.• Goldman Sachs Asset Management Co., Ltd.• Goldman Sachs Hedge Fund Strategies, LLC• Goldman Sachs International• GS Investment Strategies, LLC
GSAMI has entered into sub-advisory agreements with each of the following external Investment Sub-Advisers(“the External Managers”):
Portfolios External Managers*
Global Multi-Manager Alternatives Portfolio Algert Global LLCArtisan PartnersBardin Hill Arbitrage UCITS Management LPBrigade Capital Management LPCanyon Capital Advisors LLCCrabel Capital Management LLCFirst Pacific Advisors LLCGQG PartnersMarathon Asset Management LPMesirowSirios Capital Management LPTCW Investment Management Company LLCWellington Management Company LLP
Multi-Manager Emerging Markets Equity Portfolio Axiom International Investors LLCJ O Hambro Capital Management Ltd.Wellington Management Company LLP
Multi-Manager Europe Equity Portfolio ELEVA Capital LLPMandarine GestionWellington Management International Ltd.
Multi-Manager Global Equity Portfolio Baillie Gifford & Co.Sanders Capital LLCStrategic Global Advisors LLC
Multi-Manager US Equity Portfolio Diamond Hill InvestmentsFiera Capital CorporationWestfield Capital Management Co. LLC
Multi-Manager US Small Cap Equity Portfolio Boston PartnersBrown AdvisoryVictory Capital Management, Inc.
* None of these investment advisers are an affiliate of GSAMI. As compensation for the services rendered under the InvestmentAdvisory Agreement, GSAMI receives a fee, payable monthly, at an annual rate. A portion of the Investment Adviser’s fees may beremitted to the Investment Sub-Adviser.
Goldman Sachs Funds IINotes to the Financial StatementsFor the Period Ended 31 May 2022
21

6 Signif icant Agreements and Related Part ies (Continued)
Expense Cap
GSAMI has voluntarily agreed to limit total expenses in respect of certain Portfolios and certain Share Classes.Therefore, to the extent that total ordinary expenses would exceed the expense cap, GSAMI has voluntarilyagreed to bear any actual operating expenses that exceed any expense cap, either directly by waiving a portionof its fees or by reimbursement to the account of the relevant Share Class. The Investment Adviser may, in itssole discretion, designate which expenses of the Fund will be subject to any such expense cap imposed by theInvestment Adviser. The expense cap does not include the GSAMI fee portion paid to external InvestmentSub-Advisers. There is no guarantee that the existence or level of these expense caps will continue in the futureand no obligation on the part of GSAMI to agree to limit total expenses in this way. In addition, the Portfolios arenot obliged to reimburse GSAMI for prior financial year expense reimbursement, if any.
Details of advisory fees rates and the expense caps as of 31 May 2022 are detailed in Appendix I.
Director’s Remuneration
Ms. Grainne Alexander and Mr. Frank Ennis are independent Directors and have no executive function with theInvestment Adviser or its affiliated companies. The Fund pays each independent Director an annual fee for theirservices as a Director of the Fund.
Mr. Jonathan Beinner, Mr. Glenn Thorpe and Ms. Katherine Uniacke are affiliated with the Investment Adviser andreceive no compensation from the Fund.
Performance Fees
GSAMI is entitled to a performance fee on certain Share Classes of the Portfolios. For the Global Multi-ManagerAlternatives Portfolio the performance fee accrues daily and is paid annually out of the assets attributable toeach applicable Share Class. The performance fee is equal to 10% of the amount by which the Class NAV pershare exceeds such Class’ Benchmark Value per share, as defined within the Prospectus.
For the period ended 31 May 2022, the performance fees charged per share class were:
Base CurrencyAmount
in base currency
% ofShareholders
Equity*
Global Multi-Manager Alternatives PortfolioOther Currency Accumulation Share Class (EUR Hedged Class) USD 17 0.00�I� Accumulation Share Class (CHF Hedged Class) USD 1 0.00�I� Accumulation Share Class (EUR Hedged Class) USD 9 0.00�R� Accumulation Share Class USD 2 0.00�R� Accumulation Share Class (EUR Hedged Class) USD 10 0.00�R� Share Class (EUR Hedged Class) USD 668 0.00�R� Share Class (GBP Hedged Class) USD 70 0.00
* Percentage of the amount in fund base currency / Shareholders’ Equity in fund base currency of the share class as at period end.
There were no performance fees charged to other Share Classes of the mentioned Portfolio for the period ended31 May 2022.
Fees earned on other Goldman Sachs Funds
To the extent permitted by applicable law and the terms of the Prospectus, any Portfolio may invest all or someof its short term cash investments in any money market fund advised or managed by Goldman Sachs and mayinvest in other investment funds advised or managed by Goldman Sachs (together “Goldman Sachs Funds”).Subject to applicable law and the terms of the Prospectus, the Fund may be required to bear its proportionateshare of any fees (including investment advisory and management fees) applicable to its investment in suchinvestment funds.
For further details on investments into other Goldman Sachs Funds please refer to the Schedule of Investments.
All Portfolios invested in the Goldman Sachs Funds were invested in non-investment advisory fee bearing shareclasses. As a result, for the period ended 31 May 2022, there were no investment advisory fees earned on eachPortfolio’s investment in the Goldman Sachs Funds.
Goldman Sachs Funds IINotes to the Financial StatementsFor the Period Ended 31 May 2022
22

6 Signif icant Agreements and Related Part ies (Continued)
Commissions
In the normal course of its operations, each Portfolio may enter into transactions on securities or futurescontracts with the Goldman Sachs Funds or other Goldman Sachs affiliates (together “Goldman SachsAffiliates”). For the period ended 31 May 2022, the following transactions were entered into with Goldman SachsAffiliates with total brokerage commissions paid to Goldman Sachs Affiliates being split between commissionsrelated to security transactions and futures contracts:
Security Transactions Brokerage Commissions
Portfolios Currency Aggregate Value*
Percent oftotal securitytransactions Aggregate Value
Percent oftotal brokerage
commissionsFutures
Commissions**
Global Multi-Manager Alternatives Portfolio USD 17,083,370 1.85% 8,651 5.41% —
Multi-Manager Emerging Markets Equity Portfolio USD 2,194,762 0.34% 1,482 0.42% —
Multi-Manager Europe Equity Portfolio EUR 19,729,973 3.53% 7,651 2.95% —
Multi-Manager Global Equity Portfolio USD 4,320,786 0.72% 1,731 0.95% —
Multi-Manager US Equity Portfolio USD 32,857,581 7.99% 4,539 5.82% —
Multi-Manager US Small Cap Equity Portfolio USD 1,677,110 0.80% 2,918 1.82% —
Total (in USD) *** 79,938,899 27,777 —
* Represents the cost of securities (excluding futures transactions and investments in the Goldman Sachs Liquid Reserves Funds) fortransactions entered into with Goldman Sachs Affiliates.
** All portfolio futures transactions disclosed in this table were affected through Goldman Sachs.
*** The amount used is calculated using the average exchange rate disclosed in Note 10.
For all the remaining Portfolios there were no transactions with Goldman Sachs Affiliates, for the period ended31 May 2022.
All such transactions with Goldman Sachs Affiliates were entered into in the ordinary course of business and onnormal commercial terms.
Securities Lending
The securities lending agent is Goldman Sachs Agency Lending (“GSAL”), an affiliate of Goldman Sachs.Approved borrowers of GSAL may include Goldman Sachs International (“GSI”), an affiliate of the InvestmentAdviser, as well as other third parties. The Portfolios may lend portions of investments to third parties. In return,the Portfolios receive a fee that is negotiated for each transaction. The Portfolios receive G-10 (excluding Italy,Japan and the United States) government securities as collateral against the securities loaned. G-10 is made ofeleven industrial countries (Belgium, Canada, France, Germany, Italy, Japan, the Netherlands, Sweden,Switzerland, the United Kingdom and the United States) which consult and co-operate on economic, monetaryand financial matters. This collateral is maintained over the life of the loan for an amount not less than 105% ofthe value of lent securities, with any subsequent margin posted in the form of the aforementioned governmentsecurities or cash. In general, loans may be effected through the intermediary of prime financial institutions thatspecialise in such activities and in the way specified by them.
Collateral received by the Portfolios in the form of G-10 (excluding Italy, Japan and the United States)government securities or cash, denominated in their respective currencies, is held by the appointed tri-partycollateral manager in segregated accounts.
The following summarises the securities lent as at 31 May 2022 and the income earned by each Portfolio and thefees earned by Securities Lending Agent that is part of the Securities Lending program:
Portfolios Currency
MarketValue of
SecuritiesLent as at
31-May-2022
% ofShareholders’
Equity
% of TotalLendable
Assets*
MarketValue of
CollateralReceived
as at31-May-2022
Collateralas a
Percentageof the
MarketValue of
SecuritiesLent as at
31-May-2022
GrossIncome
Earned forthe Period
Ended31-May-2022
FeesCharged
for thePeriodEnded
31-May-2022
Net IncomeEarned forthe Period
Ended31-May-2022
Multi-Manager Emerging Markets EquityPortfolio
USD 701,630 0.12% 0.12% 773,547 110% 35,623 2,613 33,010
Goldman Sachs Funds IINotes to the Financial StatementsFor the Period Ended 31 May 2022
23

6 Signif icant Agreements and Related Part ies (Continued)
Securities Lending (Continued)
Portfolios Currency
MarketValue of
SecuritiesLent as at
31-May-2022
% ofShareholders’
Equity
% of TotalLendable
Assets*
MarketValue of
CollateralReceived
as at31-May-2022
Collateralas a
Percentageof the
MarketValue of
SecuritiesLent as at
31-May-2022
GrossIncome
Earned forthe Period
Ended31-May-2022
FeesCharged
for thePeriodEnded
31-May-2022
Net IncomeEarned forthe Period
Ended31-May-2022
Multi-Manager Europe Equity Portfolio EUR 2,847,749 0.63% 0.64% 3,139,664 110% 92,989 5,525 87,464
Multi-Manager Global Equity Portfolio USD — — — — — 66,359 4,416 61,943
Total (in USD) ** 204,752 13,135 191,617
* Lendable assets are defined as the aggregate market value of equities and bonds held in the portfolio.** The amount used is calculated using the average exchange rate disclosed in Note 10.
Administrator, Domiciliary Agent and Listing Agent
The Management Company has appointed State Street Bank International GmbH, Luxembourg Branch as thecentral administration agent of the Fund. The Fund has appointed State Street Bank International GmbH,Luxembourg Branch as its domiciliary and corporate agent, paying agent and as its listing agent in Luxembourg.
For its services as Administrator, Domiciliary Agent and Listing Agent, State Street Bank International GmbH,Luxembourg Branch receives a fee payable monthly in arrears and calculated on the Monthly Average NetAssets of each Portfolio.
For its Financial Reporting Services, State Street Bank International GmbH, Luxembourg Branch receives afixed fee per annum per Portfolio payable monthly in arrears.
Depositary
The Fund has appointed State Street Bank International GmbH, Luxembourg Branch as Depositary. For itsservices as Depositary, State Street Bank International GmbH, Luxembourg Branch charges a fee which is acombination of a basis point charge on assets and transaction-based charge which is dependent on the countryof transaction.
In addition, the Global Multi-Manager Alternatives Portfolio has entered into certain offset arrangements with thecustodian, which will result in a reduction of the Portfolio’s gross expenses in subsequent periods.
Distributor
The Fund has appointed the Management Company as principal distributor and the Management Companyappoints sub-distributors and oversees them. GSAMFSL may receive a portion of the sales charge imposed onthe sale of Portfolio shares.
For the period ended 31 May 2022, there were no retained sales charges for the Portfolios.
Please refer to the Prospectus for further details about distribution fees.
Out of its fees, the Distributor is responsible for remunerating third party sub-distributors.
Transfer Agent
The Management Company has appointed RBC Investor Services Bank S.A. (the “Transfer Agent”) to performregistrar and transfer agency functions in respect of the Fund pursuant to the Registrar and Transfer AgentAgreement between the Fund, the Management Company and the Transfer Agent.
The day-to-day services provided to the Fund by the Transfer Agent include receiving and processingsubscription and redemption orders, allotting and issuing shares and maintaining the shareholder register for theshares. The Transfer Agent is paid a fee quarterly in arrears out of the net assets of the Portfolio. The TransferAgent’s fee consists of both a fixed and variable fee.
Goldman Sachs Funds IINotes to the Financial StatementsFor the Period Ended 31 May 2022
24
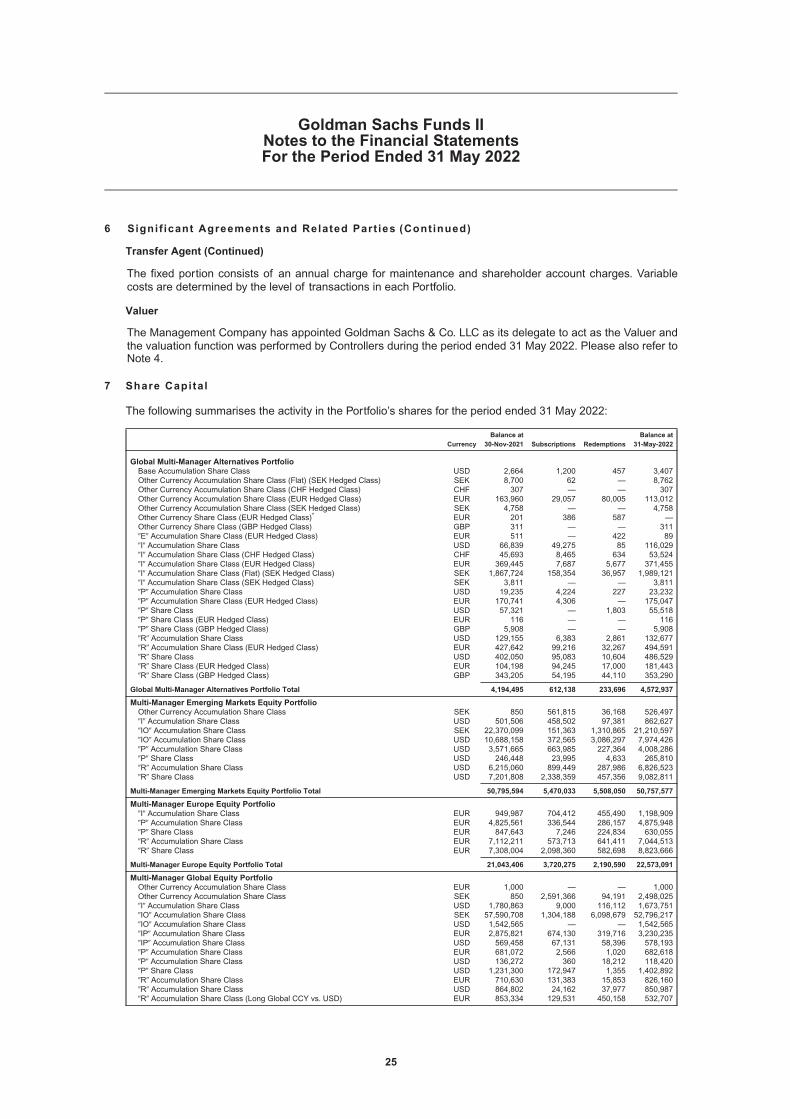
6 Signif icant Agreements and Related Part ies (Continued)
Transfer Agent (Continued)
The fixed portion consists of an annual charge for maintenance and shareholder account charges. Variablecosts are determined by the level of transactions in each Portfolio.
Valuer
The Management Company has appointed Goldman Sachs & Co. LLC as its delegate to act as the Valuer andthe valuation function was performed by Controllers during the period ended 31 May 2022. Please also refer toNote 4.
7 Share Capital
The following summarises the activity in the Portfolio’s shares for the period ended 31 May 2022:
CurrencyBalance at
30-Nov-2021 Subscriptions RedemptionsBalance at
31-May-2022
Global Multi-Manager Alternatives PortfolioBase Accumulation Share Class USD 2,664 1,200 457 3,407Other Currency Accumulation Share Class (Flat) (SEK Hedged Class) SEK 8,700 62 — 8,762Other Currency Accumulation Share Class (CHF Hedged Class) CHF 307 — — 307Other Currency Accumulation Share Class (EUR Hedged Class) EUR 163,960 29,057 80,005 113,012Other Currency Accumulation Share Class (SEK Hedged Class) SEK 4,758 — — 4,758Other Currency Share Class (EUR Hedged Class)* EUR 201 386 587 —Other Currency Share Class (GBP Hedged Class) GBP 311 — — 311�E� Accumulation Share Class (EUR Hedged Class) EUR 511 — 422 89�I� Accumulation Share Class USD 66,839 49,275 85 116,029�I� Accumulation Share Class (CHF Hedged Class) CHF 45,693 8,465 634 53,524�I� Accumulation Share Class (EUR Hedged Class) EUR 369,445 7,687 5,677 371,455�I� Accumulation Share Class (Flat) (SEK Hedged Class) SEK 1,867,724 158,354 36,957 1,989,121�I� Accumulation Share Class (SEK Hedged Class) SEK 3,811 — — 3,811�P� Accumulation Share Class USD 19,235 4,224 227 23,232�P� Accumulation Share Class (EUR Hedged Class) EUR 170,741 4,306 — 175,047�P� Share Class USD 57,321 — 1,803 55,518�P� Share Class (EUR Hedged Class) EUR 116 — — 116�P� Share Class (GBP Hedged Class) GBP 5,908 — — 5,908�R� Accumulation Share Class USD 129,155 6,383 2,861 132,677�R� Accumulation Share Class (EUR Hedged Class) EUR 427,642 99,216 32,267 494,591�R� Share Class USD 402,050 95,083 10,604 486,529�R� Share Class (EUR Hedged Class) EUR 104,198 94,245 17,000 181,443�R� Share Class (GBP Hedged Class) GBP 343,205 54,195 44,110 353,290
Global Multi-Manager Alternatives Portfolio Total 4,194,495 612,138 233,696 4,572,937
Multi-Manager Emerging Markets Equity PortfolioOther Currency Accumulation Share Class SEK 850 561,815 36,168 526,497�I� Accumulation Share Class USD 501,506 458,502 97,381 862,627�IO� Accumulation Share Class SEK 22,370,099 151,363 1,310,865 21,210,597�IO� Accumulation Share Class USD 10,688,158 372,565 3,086,297 7,974,426�P� Accumulation Share Class USD 3,571,665 663,985 227,364 4,008,286�P� Share Class USD 246,448 23,995 4,633 265,810�R� Accumulation Share Class USD 6,215,060 899,449 287,986 6,826,523�R� Share Class USD 7,201,808 2,338,359 457,356 9,082,811
Multi-Manager Emerging Markets Equity Portfolio Total 50,795,594 5,470,033 5,508,050 50,757,577
Multi-Manager Europe Equity Portfolio�I� Accumulation Share Class EUR 949,987 704,412 455,490 1,198,909�P� Accumulation Share Class EUR 4,825,561 336,544 286,157 4,875,948�P� Share Class EUR 847,643 7,246 224,834 630,055�R� Accumulation Share Class EUR 7,112,211 573,713 641,411 7,044,513�R� Share Class EUR 7,308,004 2,098,360 582,698 8,823,666
Multi-Manager Europe Equity Portfolio Total 21,043,406 3,720,275 2,190,590 22,573,091
Multi-Manager Global Equity PortfolioOther Currency Accumulation Share Class EUR 1,000 — — 1,000Other Currency Accumulation Share Class SEK 850 2,591,366 94,191 2,498,025�I� Accumulation Share Class USD 1,780,863 9,000 116,112 1,673,751�IO� Accumulation Share Class SEK 57,590,708 1,304,188 6,098,679 52,796,217�IO� Accumulation Share Class USD 1,542,565 — — 1,542,565�IP� Accumulation Share Class EUR 2,875,821 674,130 319,716 3,230,235�IP� Accumulation Share Class USD 569,458 67,131 58,396 578,193�P� Accumulation Share Class EUR 681,072 2,566 1,020 682,618�P� Accumulation Share Class USD 136,272 360 18,212 118,420�P� Share Class USD 1,231,300 172,947 1,355 1,402,892�R� Accumulation Share Class EUR 710,630 131,383 15,853 826,160�R� Accumulation Share Class USD 864,802 24,162 37,977 850,987�R� Accumulation Share Class (Long Global CCY vs. USD) EUR 853,334 129,531 450,158 532,707
Goldman Sachs Funds IINotes to the Financial StatementsFor the Period Ended 31 May 2022
25

7 Share Capital (Continued)
CurrencyBalance at
30-Nov-2021 Subscriptions RedemptionsBalance at
31-May-2022
Multi-Manager Global Equity Portfolio (Continued)�R� Accumulation Share Class (Long Global CCY vs. USD) GBP 1,930,443 2,296,749 448,163 3,779,029�R� Share Class USD 10,562,287 1,472,019 364,725 11,669,581
Multi-Manager Global Equity Portfolio Total 81,331,405 8,875,532 8,024,557 82,182,380
Multi-Manager US Equity PortfolioOther Currency Accumulation Share Class SEK 850 20,391 4,182 17,059�I� Accumulation Share Class USD 1,415,506 213,199 169,252 1,459,453�IO� Accumulation Share Class SEK 348,652 254,822 86,260 517,214�P� Accumulation Share Class USD 5,495,179 572,499 508,386 5,559,292�P� Share Class USD 763,821 25,338 — 789,159�R� Accumulation Share Class USD 8,980,366 1,524,525 980,300 9,524,591�R� Accumulation Share Class (EUR Hedged Class)* EUR — 384,619 1 384,618�R� Share Class USD 9,108,839 2,010,707 665,265 10,454,281
Multi-Manager US Equity Portfolio Total 26,113,213 5,006,100 2,413,646 28,705,667
Multi-Manager US Small Cap Equity Portfolio�I� Accumulation Share Class USD 3,455,527 1,254,273 273,345 4,436,455�P� Accumulation Share Class USD 5,696,107 814,574 445,855 6,064,826�P� Share Class USD 883,234 30,000 470,536 442,698�R� Accumulation Share Class USD 8,717,369 881,732 726,381 8,872,720�R� Share Class USD 11,455,180 3,161,236 669,599 13,946,817
Multi-Manager US Small Cap Equity Portfolio Total 30,207,417 6,141,815 2,585,716 33,763,516
Balanced Allocation Portfolio�I� Accumulation Share Class (EUR Partially Hedged Class) EUR 497,696 249,741 — 747,437�P� Accumulation Share Class USD 232,186 3,290 5,388 230,088�R� Accumulation Share Class USD 53,076 — 970 52,106�R� Share Class USD 118,128 1,513 2,714 116,927�R� Share Class (EUR Partially Hedged Class) EUR 34,917 — 34,890 27�R� Share Class (GBP Partially Hedged Class) GBP 469,394 66,928 20,494 515,828
Balanced Allocation Portfolio Total 1,405,397 321,472 64,456 1,662,413
Strategic Factor Allocation Portfolio�I� Accumulation Share Class USD 1,234,309 41,251 75,419 1,200,141�I� Accumulation Share Class (EUR Hedged Class) EUR 406,518 207,551 4,427 609,642�I� Share Class USD 82,869 — — 82,869�P� Accumulation Share Class USD 1,669,043 110,539 119,361 1,660,221�P� Accumulation Share Class (CHF Hedged Class) CHF 2,295 — — 2,295�P� Accumulation Share Class (EUR Hedged Class) EUR 1,517,454 9,091 8,732 1,517,813�P� Accumulation Share Class (GBP Hedged Class) GBP 743 78 — 821�P� Share Class USD 475,536 13,721 35,142 454,115�P� Share Class (EUR Hedged Class) EUR 99 — — 99�R� Accumulation Share Class USD 564,701 31,528 113,235 482,994�R� Accumulation Share Class (EUR Hedged Class) EUR 776,016 81,436 92,980 764,472�R� Accumulation Share Class (GBP Hedged Class) GBP 1,018 — 922 96�R� Share Class USD 69,443 11,549 515 80,477�R� Share Class (GBP Hedged Class) GBP 86,770 1,271 4,351 83,690
Strategic Factor Allocation Portfolio Total 6,886,814 508,015 455,084 6,939,745
Tactical Tilt Overlay PortfolioOther Currency Accumulation Share Class (SEK Hedged Class) SEK 863 8,368 — 9,231�I� Accumulation Share Class USD 898,999 157,367 29,722 1,026,644�I� Accumulation Share Class (EUR Hedged Class) EUR 24,615 2,904 — 27,519�IO� Accumulation Share Class USD 3,745,710 25,883 1,199,643 2,571,950�IO� Accumulation Share Class (EUR Hedged Class) EUR 182,943 18,861 19,007 182,797�IO� Accumulation Share Class (GBP Hedged Class) GBP 773,724 — 130,612 643,112�IO� Accumulation Share Class (SEK Hedged Class) SEK 4,981,739 321,455 465,370 4,837,824�IP� Accumulation Share Class USD 3,549 2,271 347 5,473�IP� Accumulation Share Class (EUR Hedged Class) EUR 15,264 26,193 2,781 38,676�P� Accumulation Share Class USD 851,600 231,191 77,977 1,004,814�P� Accumulation Share Class (CHF Hedged Class) CHF 37,422 9,799 900 46,321�P� Accumulation Share Class (EUR Hedged Class) EUR 616,433 11,361 38,791 589,003�P� Accumulation Share Class (GBP Hedged Class) GBP 73,213 — 5,400 67,813�P� Share Class USD 195,320 8,896 2,233 201,983�P� Share Class (EUR Hedged Class) EUR 25,288 300 — 25,588�P� Share Class (GBP Hedged Class) GBP 5,861 — 191 5,670�R� Accumulation Share Class USD 1,269,806 103,654 196,919 1,176,541�R� Accumulation Share Class (CHF Hedged Class) CHF 52,141 9,719 435 61,425�R� Accumulation Share Class (EUR Hedged Class) EUR 2,272,998 160,060 179,558 2,253,500�R� Accumulation Share Class (GBP Hedged Class) GBP 539,550 50,739 46,128 544,161�R� Share Class USD 1,931,351 396,514 264,402 2,063,463�R� Share Class (EUR Hedged Class) EUR 782,308 348,994 88,033 1,043,269�R� Share Class (GBP Hedged Class) GBP 1,475,588 209,300 94,433 1,590,455
Tactical Tilt Overlay Portfolio Total 20,756,285 2,103,829 2,842,882 20,017,232
Strategic Volatility Premium Portfolio�I� Accumulation Share Class USD 443,559 683,154 173,856 952,857�I� Accumulation Share Class (EUR Hedged Class) EUR 342,141 367,392 37,701 671,832
Goldman Sachs Funds IINotes to the Financial StatementsFor the Period Ended 31 May 2022
26

7 Share Capital (Continued)
CurrencyBalance at
30-Nov-2021 Subscriptions RedemptionsBalance at
31-May-2022
Strategic Volatility Premium Portfolio (Continued)�I� Share Class USD 569,004 14,813 328,782 255,035�P� Accumulation Share Class USD 454,757 417,734 175,464 697,027�P� Accumulation Share Class (CHF Hedged Class) CHF 12,704 3,248 100 15,852�P� Accumulation Share Class (EUR Hedged Class) EUR 133,667 62,240 40,021 155,886�P� Accumulation Share Class (GBP Hedged Class) GBP 79,706 — 2,100 77,606�P� Share Class USD 28,364 13,164 7,019 34,509�P� Share Class (CHF Hedged Class) CHF 500 — — 500�P� Share Class (EUR Hedged Class) EUR 15,135 6,708 231 21,612�P� Share Class (GBP Hedged Class) GBP 106 — — 106�R� Accumulation Share Class USD 843,088 132,694 158,463 817,319�R� Accumulation Share Class (EUR Hedged Class) EUR 1,913,051 250,781 237,891 1,925,941�R� Accumulation Share Class (GBP Hedged Class) GBP 149,886 10,364 7,788 152,462�R� Share Class USD 1,216,163 207,332 252,507 1,170,988�R� Share Class (CHF Hedged Class) CHF 46,972 8,438 — 55,410�R� Share Class (EUR Hedged Class) EUR 815,541 417,019 98,719 1,133,841�R� Share Class (GBP Hedged Class) GBP 856,937 319,193 61,802 1,114,328
Strategic Volatility Premium Portfolio Total 7,921,281 2,914,274 1,582,444 9,253,111
Income Multi-Sector Bond Portfolio I�I� (Dis) (Stable Monthly) Share Class EUR 5,204,770 1,598,452 1,601,363 5,201,859
Income Multi-Sector Bond Portfolio I Total 5,204,770 1,598,452 1,601,363 5,201,859
G Emerging Markets Debt Broad Portfolio�I� (Dis) (Semi-Annual) Share Class EUR 4,594,112 — — 4,594,112
G Emerging Markets Debt Broad Portfolio Total 4,594,112 — — 4,594,112
* Refer to Appendix II.
8 Distr ibut ions
The Fund intends that substantially all the net investment income, if any, of each Portfolio will be declared as adividend and paid at least annually to the Shareholders of the Distribution Share Classes of the Portfolios. Netcapital and currency gains realised on each Portfolio’s investments and/or capital attributable to certain ShareClasses may also be distributed to Shareholders of certain Distribution Share Classes of the Portfolios.
Generally no distributions will be paid in respect of the Accumulation Share Classes.
Please refer to the Prospectus for further details about distribution policies.
9 Financial Investments and Associated Risks
The Fund’s investing activities expose it to various types of risks that are associated with the financialinvestments and markets in which it and its underlying Portfolios invest (the “Investment Risks”). These may beboth derivative and non-derivative financial investments. The Fund’s underlying Portfolios’ investments arecomprised of debt, equity, derivative investments and investments in other funds at the period end. The Board ofDirectors has appointed the Management Company to be responsible for, among other things, investmentmanagement and risk management. The Management Company has delegated certain investmentmanagement functions to the Investment Adviser.
The main types of financial risks which the Fund is exposed to are market risk, liquidity risk and credit risk. TheProspectus provides details of these and other types of risk some of which are additional to that informationprovided in these financial statements.
Asset allocation is determined by the Fund’s Investment Adviser who manages the allocation of assets toachieve the investment objectives as detailed in the Prospectus. Achievement of the investment objectivesinvolves taking risks. The Investment Adviser exercises judgment based on analysis, research and riskmanagement techniques when making investment decisions. Divergence from the benchmark and/or the targetasset allocations and the composition of the portfolio is monitored in accordance with the Fund’s riskmanagement policy.
The risk management policies employed in relation to the Fund are outlined below:
Goldman Sachs Funds IINotes to the Financial StatementsFor the Period Ended 31 May 2022
27

9 Financial Investments and Associated Risks (Continued)
(a) Market Risk
The potential for changes in the market value of the Fund’s underlying Portfolios’ investments is referred to asmarket risk. Commonly used categories of market risk include currency risk, interest rate risk and other pricerisk.
(i) Currency risks may result from exposures to changes in spot prices, forward prices and volatilitiesof currency rates.
(ii) Interest rate risks may result from exposures to changes in the level, slope and curvature of thevarious yield curves, the volatility of interest rates, mortgage prepayment speeds and creditspreads.
(iii) Other price risks are the risk that the value of an investment will fluctuate as a result of changesin market prices other than those arising from currency risk or interest rate risk and may resultfrom exposures to changes in the prices and volatilities of individual equities, equity baskets,equity indices, and commodities.
The Fund’s market risk strategy is driven by the Fund’s underlying Portfolios’ investment risk and returnobjectives.
Market risk is managed through the application of risk budgeting principles. The Investment Adviser determinesan appropriate risk target, commonly referred to as Tracking Error, employing a risk budgeting framework.
The AM Risk Management group at Goldman Sachs (“AM Risk”) is responsible for overall risk governancestructure and establishing appropriate risk management best practices. The risk governance structure includesidentifying, measuring, monitoring, escalating and remediating applicable risks. AM Risk uses a number of riskmetrics to monitor the risk profile of funds on a regular and ongoing basis. GSAMFSL’s risk managementfunction, in association with AM Risk Management team, will seek to ensure that the risk profile of funds remainconsistent with applicable risk limits and internal thresholds which are established consistent with the risk profiledisclosed to investors. Adherence with these risk thresholds is monitored on a weekly basis with exceptionspromptly notified to the AM Chief Risk Officer and portfolio management teams. All governance exceptions arereported to the Risk Management Oversight Committee (“RMOC”) and the AM Risk Working Group. In addition,the GSAMFSL risk management function presents or provides written materials on the risks to the Board no lessfrequently than semi-annually.
(i) Currency Risk
The Fund may invest in financial investments and enter into transactions denominated in currencies other thanits Portfolios’ base currency. Consequently, the Fund may be exposed to risk that the exchange rate of its basecurrency relative to other foreign currencies may change in a manner that has an adverse effect on the value ofthat portion of the Fund’s assets or liabilities denominated in currencies other than the base currency.
When an investor invests into a Share Class which is in a different currency to the base currency of the Portfolioin which it invests, the currency risk of the investor will be different to the currency risk of the Portfolio.
(ii) Interest Rate Risk
The Fund may invest in fixed income securities and interest rate swaps contracts. Any change to relevant interestrates for particular securities may result in the Investment Adviser being unable to secure similar returns uponthe expiry of contracts or the sale of securities. In addition, changes to prevailing interest rates or changes inexpectations of future rates may result in an increase or decrease in the value of the securities held. In general,if interest rates rise, the value of fixed income securities will decline. A decline in interest rates will in general,have the opposite effect. All fixed income securities and floating rate securities, together with their interest rateand maturity date are disclosed in the Schedule of Investments. The Fund may invest in instruments in desiredcurrencies at fixed, floating and zero rates of interest.
Goldman Sachs Funds IINotes to the Financial StatementsFor the Period Ended 31 May 2022
28

9 Financial Investments and Associated Risks (Continued)
(a) Market Risk (Continued)
(iii) Other Price Risk
Other price risk is the risk that the value of a financial investment will fluctuate as a result of changes in market prices, other than those arising from currency risk or interest rate risk whether caused by factors specific to an individual investment, its issuer or any factor affecting financial investments traded in the market.
The Fund’s financial investments are carried at market value with market value changes recognised in the Statement of Operations, all changes in market conditions will directly affect Shareholders’ Equity.
The Fund’s investments in mutual funds are based upon the net asset value as supplied by the funds, in accordance with the valuation policy of the applicable fund as outlined in its Prospectus. While it is expected that the assets of the mutual funds will generally be valued by an independent third party administrator or other service provider, there may be circumstances in which certain securities or other assets of a mutual fund may not have a readily ascertainable market price. In such circumstances, the manager of the relevant mutual fund may be required to value such securities or instruments.
The London Inter-bank Offered Rate (“LIBOR”) is the average of interest rates estimated by leading banks in London, based on what they would be charged to borrow from other banks. The Funds may use LIBOR benchmarks, undertake transactions in instruments that are valued using LIBOR rates or enter into contracts which determine payment obligations by reference to LIBOR. Certain LIBORs ceased publication after 31 December 2021 and, in connection with those rates, the Funds have transitioned to successor or alternative reference rates as necessary. Other LIBORs will cease publication at dates announced or to be announced in the future. In some instances, regulators may restrict new use of LIBORs prior to the actual cessation date. Until then, Funds may continue to invest in instruments that reference LIBOR due to favourable liquidity or pricing. In advance of the expected future transition dates, regulators and market participants have worked to identify or develop successor reference rates and spreads (if any) to be utilised in existing contracts or instruments as part of the transition away from LIBOR. Nonetheless, the termination of LIBOR presents risks to the Funds. It is not possible to identify exhaustively those risks, but they include the risk that a suitable transition mechanism may not be found or may not be suitable for the Funds. In addition, any substitute reference rate and any pricing adjustments imposed unilaterally, by a regulator or by counterparties, may not be suitable for the Funds, resulting in costs incurred to close out positions and place replacement trades and the reduced effectiveness of any hedges.
(b) Liquidi ty Risk
Liquidity risk is the risk that the Fund will encounter difficulty in meeting obligations associated with financialliabilities that are settled by delivering cash or another financial asset. Among other things liquidity could beimpaired by an inability to access secured and/or unsecured sources of financing, an inability to sell assets orunforeseen outflows of cash or collateral or violations of counterparty or prime broker terms or covenants. Thissituation may arise due to circumstances outside of the Fund’s control, such as a general market disruption or anoperational problem affecting the Fund or third parties. Also, the ability to sell assets may be impaired if othermarket participants are seeking to sell similar assets at the same time.
The Fund’s investments include mutual funds, which may impose greater restrictions on redemptions than thoseimposed by the Fund. This may include offering less frequent redemption dates than are offered by the Fund toits shareholders.
The Funds’ financial investments include investments in derivative contracts traded over the counter, which arenot traded in an organised public market and which may be illiquid and in investments which may represent asignificant percentage of issue size. As a result, the Fund may not be able to liquidate quickly some of theseinvestments at an amount close to its market value in order to meet requirements, or to respond to specific eventssuch as deterioration in the credit-worthiness of any particular issuer. The forced liquidation of investmentpositions may cause financial losses.
The Fund provides for the subscription and redemption of shares and it is therefore exposed to the liquidity riskassociated with shareholder redemptions in accordance with the terms in the prospectus. The Fund’s underlyingPortfolios are managed to include liquid investments which the Investment Adviser believes are sufficient to meet
Goldman Sachs Funds IINotes to the Financial StatementsFor the Period Ended 31 May 2022
29

9 Financial Investments and Associated Risks (Continued)
(b) Liquidi ty Risk (Continued)
normal liquidity needs. Substantial redemptions of shares in the Fund could require the Fund to liquidate itsinvestments more rapidly than otherwise desirable in order to raise cash for the redemptions, and changes in theliquidity of the Portfolio’s underlying investments once acquired can adversely impact its position in this respect.
These factors could adversely affect the value of the shares redeemed and the valuation of the shares thatremain outstanding and the liquidity of the Portfolios’ remaining assets if more liquid assets have to be sold tomeet redemptions.
Please refer to Appendix III for details of Shareholders with holdings greater than 10% of the Portfolios’ netassets as at 31 May 2022.
Financing arrangements include reverse repurchase agreements, derivative transactions and lines of credit.Expiration or termination of available financing for leveraged positions, and the requirements to post collateral inrespect of changes in the market value of leveraged exposures or changes in advance rates or other terms andconditions of the Fund’s financing arrangements, can result in adverse effects to the Fund’s access to liquidityand ability to maintain leveraged positions, and may cause the Fund to incur material losses.
However, there is no guarantee that any such arrangements for obtaining leverage will be available, or, ifavailable, will be available on terms and conditions acceptable to the Fund. Unfavourable economic conditionsalso could increase funding costs, limit access to the capital markets or result in a decision by lenders not toextend credit to the Fund.
The use of leverage also increases risk as it magnifies the effect of any volatility in market values on the Fund’sequity.
A decline in the market value of the Fund’s assets may have particular adverse consequences in instanceswhere they have borrowed money on the market value of those assets. A decrease in the market value of thoseassets may result in the lender (including derivative counterparties) requiring the Fund to post additionalcollateral or otherwise sell assets at a time when it may not be in the Fund’s best interest to do so.
The redemption of Shares of a Portfolio may be temporarily suspended, or deferred, by the Board of Directors orthe Management Company on behalf of the Fund upon certain circumstances, and where it is deemed in thebest interests of Shareholders.
As of 31 May 2022, the Fund participated in a USD 450,000,000 committed, unsecured revolving line of creditfacility (the “facility”) together with other sub-funds of Goldman Sachs Funds SICAV and Goldman Sachs LuxInvestment Funds. This facility is to be used for temporary emergency purposes, or to allow for an orderlyliquidation of securities to meet redemption requests. The interest rate on borrowings is based on a referencerate related to the drawn currency (e.g. Federal Funds Rate). The facility also requires a fee to be paid by theFund based on the amount of the commitment that has not been utilised. For the period ended 31 May 2022 theFund did not have any borrowings under the facility.
(c) Credit Risk
Credit and counterparty risk is the risk that one party to a financial investment will cause a financial loss for theother party by failing to discharge an obligation.
Procedures have been adopted to reduce credit risk related to the Fund’s dealings with counterparties. Beforetransacting with any counterparty, the Investment Adviser or its affiliates evaluate both credit-worthiness andreputation by conducting a credit analysis of the party, their business and reputation. The credit risk of approvedcounterparties is then monitored on an ongoing basis, including periodic reviews of financial statements andinterim financial reports as needed.
In order to reduce exposure to credit losses, some over-the-counter derivative agreements entered into by theFund permit netting of transactions arising under such agreements, excluding those with counterpartiesexecuting only spot foreign exchange contracts. These netting rights provide for the reduction of credit risk on
Goldman Sachs Funds IINotes to the Financial StatementsFor the Period Ended 31 May 2022
30

9 Financial Investments and Associated Risks (Continued)
(c) Credit Risk (Continued)
favourable over-the-counter transactions with a single counterparty to the extent of the value of unfavourableover-the-counter transactions with the same counterparty upon the occurrence of an event of default ortermination event as all over-the-counter transactions with the counterparty under such agreement areterminated and amounts owed from and amounts payable to the counterparty are settled on a net basis.
Debt securities are subject to the risk of an issuer’s or a guarantor’s inability to meet principal and interestpayments on its obligations and are subject to price volatility due to factors such as interest rate sensitivity,market perception of the credit-worthiness of the issuer, and general market liquidity.
The Fund is subject to a number of risks relating to the insolvency, administration, liquidation or other formalprotection from creditors (“Insolvency”) of the Depositary or any sub-custodian. These risks include withoutlimitation:
1. The loss of all cash held with the Depositary or sub-custodian which is not being treated as client moneyboth at the level of the Depositary and any sub-custodians (“client money”).
2. The loss of all cash which the Depositary or sub-custodian has failed to treat as client money in accordancewith procedures (if any) agreed with the Fund.
3. The loss of some or all of any securities held on trust which have not been properly segregated and soidentified both at the level of the Depositary and any sub-custodians (“trust assets”) or client money held byor with the Depositary or sub-custodian.
4. The loss of some or all assets due to the incorrect operation of accounts by the Depositary or sub-custodianor due to the process of identifying and transferring the relevant Trust Assets and/or client money includingany deduction to meet the administrative costs of an insolvency.
5. Losses caused by prolonged delays in receiving transfers of balances and regaining control over therelevant assets.
An insolvency could cause severe disruption to the Fund’s investment activity. In some circumstances, this couldcause the Directors to temporarily suspend the calculation of the Net Asset Value and dealings in shares.
(d) Addit ional Risks
(i) Concentration Risk
The Fund may invest in a limited number of investments and investment themes. A consequence of a limitednumber of investments is that performance may be more favourably or unfavourably affected by the performanceof an individual investment.
(ii) Operational Risk
Operational risk is the potential for loss caused by a deficiency in information, communications, transactionprocessing and settlement, and accounting systems. The Fund’s service providers, including sub-custodians,maintain controls and procedures for the purpose of helping to manage operational risk. Reviews of the servicelevels of service providers are performed on a regular basis by the Investment Adviser. No assurance is giventhat these measures will be 100% effective.
(iii) Legal, Tax and Regulatory Risks
Legal, tax and regulatory changes could occur which may adversely affect the Fund.
With respect to tax, the Fund may be subject to taxation on capital gains, interest and dividends in certainjurisdictions where the Fund invests.
Goldman Sachs Funds IINotes to the Financial StatementsFor the Period Ended 31 May 2022
31

9 Financial Investments and Associated Risks (Continued)
(d) Addit ional Risks (Continued)
(iii) Legal, Tax and Regulatory Risks (Continued)
The interpretation and applicability of the tax law and regulations by tax authorities at times may not be clear orconsistent. Tax obligations where probable and estimable are recorded as liabilities. However, some taxobligations are subject to uncertainty and may result in additional tax liabilities, interest and penalties based onfuture actions, interpretations or judgments of these authorities covering current and past tax positions.Accounting standards may also change, creating or removing an obligation for the Fund to accrue for a potentialtax liability.
Consequently, it is possible that certain potential tax obligations which currently are not probable may become sowhich may result in additional tax liabilities for the Fund in the future and these additional liabilities may bematerial. Because of the foregoing uncertainties, the Net Asset Value may not reflect the tax liabilities ultimatelyborne by the Fund, including at the time of any subscriptions, redemptions or exchanges of interests in the Fund,which could have an adverse impact on investors at that time.
(iv) Non-Developed Markets Risk
The Fund may invest a portion of its capital in securities of companies based in non-developed or emergingmarkets or issued by governments of such countries. Investing in the securities of such companies and countriesinvolves certain considerations not usually associated with investing in securities of developed marketcompanies or countries, including, without limitation, less liquidity, greater price and foreign currency volatility,and greater legal, tax and regulatory risks.
(v) Small Capitalisation Companies Risk
The Fund may invest a portion of its capital in securities of companies with smaller capitalisation. Smallercapitalisation companies are generally not as well known to the investing public and have less investor followingthan larger capitalisation companies. Investing in the securities of such companies may involve certainconsiderations, including, without limitation, less liquidity, greater price volatility, and risks associated with limitedoperating histories and/or the availability of information pertaining to the company and its operations.
(vi) Investment Sub-Adviser Selection Risk
The investment decisions in respect of each Multi-Manager Portfolio and Global Multi-Manager AlternativesPortfolio will be made by its External Managers. The Investment Adviser in a Multi-Manager Portfolio and GlobalMulti-Manager Alternatives Portfolio will not make decisions with respect to the purchase, management,disposition, or other realisation of the Multi-Manager and Global Multi-Manager Alternatives Portfolio’sinvestments.
It is not intended that the External Managers will be selected from the Goldman Sachs Group or any of itsaffiliates. Consequently, the Investment Adviser has no control, directly or indirectly, over the business affairs ormarket conduct of the External Managers. In selecting the External Managers, the Investment Adviser hasundertaken reasonable investigative and due diligence procedures but is nevertheless reliant on informationsupplied to it by each of the External Managers as well as information in relation to the External Managersobtained from independent sources and from the public domain.
(vii) Sustainability Risk
Sustainability risk is defined in Article 3 of Regulation (EU) 2019/2088 (the “Sustainable Finance DisclosureRegulation”) as an environmental, social or governance event or condition, that if it occurs, could cause an actualor a potential material negative impact on the value of the investment. Please refer to the Prospectus forinformation on the integration of sustainability risks in our investment decision-making process.
Additional details of risks not disclosed in these Financial Statements can be found in the Prospectus.
Goldman Sachs Funds IINotes to the Financial StatementsFor the Period Ended 31 May 2022
32

10 Exchange Rates
The following exchange rate (against USD) was used to calculate the Combined Total, in the Statement of Assetsand Liabilities, for the period ended 31 May 2022:
Currency 31-May-2022
1 Euro (EUR) 1.071250 USD
The following average exchange rate (against USD) was used to calculate the Combined Total, in the Statementof Operations and in the Statement of Changes in Shareholders’ Equity (except for Shareholders’ Equity at thestart and end of the period) for the period ended 31 May 2022:
Currency
1 Euro (EUR) 1.105186 USD
The following exchange rates were used to convert amounts from local share class currencies to base Portfolios’currencies, for the period ended 31 May 2022:
Share Class CurrencyBase Currency
United States Dollar (USD)
1 Euro (EUR) 1.071250
1 Swedish Krona (SEK) 0.101820
1 Swiss Franc (CHF) 1.042209
1 United Kingdom Pound (GBP) 1.258900
11 Commission Recapture
All Portfolios may direct trades, subject to obtaining best price and execution, to various brokers who haveagreed to rebate a portion of the commissions generated. Such rebates are made directly to the applicablePortfolio as cash payments and are included in net realised gain and loss on investments in the Statement ofOperations.
Portfolios
Commissionspaid on securities
in the program(USD)
Commissionsreimbursed to
the portfolio(USD)
Percentagereimbursed
in the program
Multi-Manager US Equity Portfolio 25,611 15,939 62.23%
Multi-Manager US Small Cap Equity Portfolio 8,351 5,082 60.85%
Total 33,962 21,021 61.89%
12 Statement of Changes in each Portfol io
A Statement of Changes in each Portfolio is available, free of charge, upon request from the registered office.
13 Cash Collateral Information
The table below provides the cash collateral balances due from / due to the brokers in relation to the followinginvestments held as at 31 May 2022:
Portfolios CurrencyDue from /Due to brokers
Investmenttype
Cash collateralbalances
Global Multi-Manager Alternatives Portfolio USD
Due from Exchange Traded Derivatives 5,021,674
Due to Exchange Traded Derivatives —
Due from OTC Derivatives 21,018,960
Due to OTC Derivatives —
Multi-Manager Global Equity Portfolio USDDue from OTC Derivatives 4,500,000
Due to OTC Derivatives —
Goldman Sachs Funds IINotes to the Financial StatementsFor the Period Ended 31 May 2022
33

13 Cash Collateral Information (Continued)
Portfolios CurrencyDue from /Due to brokers
Investmenttype
Cash collateralbalances
Balanced Allocation Portfolio USD
Due from Exchange Traded Derivatives 3,863,452
Due to Exchange Traded Derivatives —
Due from OTC Derivatives 9,409,467
Due to OTC Derivatives —
Strategic Factor Allocation Portfolio USD
Due from Exchange Traded Derivatives 215,329,990
Due to Exchange Traded Derivatives —
Due from OTC Derivatives 8,039,000
Due to OTC Derivatives —
Tactical Tilt Overlay Portfolio USD
Due from Exchange Traded Derivatives 11,002,556
Due to Exchange Traded Derivatives —
Due from OTC Derivatives 156,120,935
Due to OTC Derivatives 1,880,000
Strategic Volatility Premium Portfolio USD
Due from Exchange Traded Derivatives 176,772,894
Due to Exchange Traded Derivatives —
Due from OTC Derivatives 3,860,000
Due to OTC Derivatives —
Income Multi-Sector Bond Portfolio I EURDue from OTC Derivatives 74,553,465
Due to OTC Derivatives 42,576,434
G Emerging Markets Debt Broad Portfolio EUR
Due from Exchange Traded Derivatives 4,180,520
Due to Exchange Traded Derivatives —
Due from OTC Derivatives 100,493,431
Due to OTC Derivatives 24,158,696
14 Commissions for Research and/or Execution
Certain Portfolios pay commission for execution only and/or execution and investment research. Thecommissions for execution are recognised in the transaction price. The Fund did not otherwise enter into anythird party commission arrangements for the period ended 31 May 2022.
15 Prospectus
As at 31 May 2022, the latest Prospectus of the Fund was issued in December 2021.
16 Currency Adjustment
In the Statement of Changes in Shareholders’ Equity, the opening value of the Fund has been restated at theexchange rates ruling at 30 November 2021, and the combined figures have been calculated using the averageexchange rates throughout the period. The resulting loss of USD 90,142,535 represents the movement inexchange rates between 1 December 2021 and 31 May 2022. This is a notional loss, which has no impact on theNet Asset Value of the individual Portfolios.
17 Cross Liabi l i t ies
In accordance with Luxembourg law, each Portfolio is “ring-fenced” and considered to constitute a single pool ofassets and liabilities, so that the rights of Shareholders and creditors in relation to each Portfolio should belimited to the assets of that Portfolio.
18 Contingent Liabi l i t ies
There were no contingent liabilities as at 31 May 2022.
Goldman Sachs Funds IINotes to the Financial StatementsFor the Period Ended 31 May 2022
34

19 Subsequent Events
There were no subsequent events to note.
20 Indemnif icat ions
The Fund may enter into contracts that contain a variety of indemnifications. The Fund’s maximum exposureunder these arrangements is unknown. However, the Fund has not had prior claims or losses pursuant to thesecontracts.
21 Approval of Financial Statements
The Board of Directors approved the Unaudited Semi-Annual Financial Statements on 19 July 2022.
22 Cross Sub-Fund investments
As at 31 May 2022, there was no cross sub-fund investment within the Fund.
Goldman Sachs Funds IINotes to the Financial StatementsFor the Period Ended 31 May 2022
35

Holdings Security Description Currency Interest Rate(a) Maturity Date(b)Market Value
USD
% ofShareholders’
Equity
Transferable securities admitted to an official exchange listing
Bonds – 27.80%
United States1,970,000 Federal Home Loan Bank Discount Notes USD 0.597% 01/06/2022 1,970,000 0.611,100,000 Federal Home Loan Bank Discount Notes USD 0.996% 03/06/2022 1,099,951 0.341,480,000 Federal Home Loan Bank Discount Notes USD 1.646% 06/06/2022 1,479,834 0.461,140,000 Federal Home Loan Bank Discount Notes USD 0.595% 08/06/2022 1,139,821 0.351,505,000 Federal Home Loan Bank Discount Notes USD 1.646% 09/06/2022 1,504,730 0.461,800,000 Federal Home Loan Bank Discount Notes USD 0.862% 10/06/2022 1,799,637 0.551,360,000 Federal Home Loan Bank Discount Notes USD 1.643% 13/06/2022 1,359,634 0.422,220,000 Federal Home Loan Bank Discount Notes USD 1.641% 14/06/2022 2,219,353 0.681,980,000 Federal Home Loan Bank Discount Notes USD 1.628% 15/06/2022 1,979,379 0.611,440,000 Federal Home Loan Bank Discount Notes USD 1.632% 16/06/2022 1,439,516 0.441,690,000 Federal Home Loan Bank Discount Notes USD 1.530% 17/06/2022 1,689,394 0.521,590,000 Federal Home Loan Bank Discount Notes USD 1.622% 21/06/2022 1,589,288 0.492,000,000 Federal Home Loan Bank Discount Notes USD 1.612% 22/06/2022 1,999,059 0.621,580,000 Federal Home Loan Bank Discount Notes USD 1.613% 23/06/2022 1,579,221 0.492,580,000 Federal Home Loan Bank Discount Notes USD 0.806% 24/06/2022 2,578,671 0.792,270,000 Federal Home Loan Bank Discount Notes USD 1.607% 27/06/2022 2,268,678 0.702,310,000 Federal Home Loan Bank Discount Notes USD 1.607% 28/06/2022 2,308,603 0.711,780,000 Federal Home Loan Bank Discount Notes USD 1.597% 29/06/2022 1,778,884 0.551,460,000 Federal Home Loan Bank Discount Notes USD 1.597% 30/06/2022 1,459,048 0.451,940,000 Federal Home Loan Bank Discount Notes USD 1.414% 01/07/2022 1,938,465 0.601,230,000 Federal Home Loan Bank Discount Notes USD 0.801% 06/07/2022 1,228,870 0.381,300,000 Federal Home Loan Bank Discount Notes USD 1.593% 07/07/2022 1,298,771 0.401,920,000 Federal Home Loan Bank Discount Notes USD 1.032% 08/07/2022 1,918,135 0.591,980,000 Federal Home Loan Bank Discount Notes USD 1.585% 11/07/2022 1,977,921 0.61
830,000 Federal Home Loan Bank Discount Notes USD 1.587% 14/07/2022 829,063 0.251,350,000 Federal Home Loan Bank Discount Notes USD 1.577% 15/07/2022 1,348,434 0.411,000,000 Federal Home Loan Bank Discount Notes USD 1.588% 18/07/2022 998,766 0.312,140,000 Federal Home Loan Bank Discount Notes USD 1.587% 19/07/2022 2,137,304 0.66
680,000 Federal Home Loan Bank Discount Notes USD 0.939% 22/07/2022 679,090 0.211,830,000 Federal Home Loan Bank Discount Notes USD 1.587% 29/07/2022 1,827,203 0.561,570,000 Federal Home Loan Bank Discount Notes USD 1.591% 01/08/2022 1,566,882 0.481,220,000 Federal Home Loan Bank Discount Notes USD 1.595% 05/08/2022 1,217,419 0.371,000,000 Federal Home Loan Bank Discount Notes USD 1.601% 08/08/2022 997,787 0.311,360,000 Federal Home Loan Bank Discount Notes USD 1.597% 12/08/2022 1,356,813 0.421,020,000 Federal Home Loan Bank Discount Notes USD 1.595% 15/08/2022 1,017,510 0.312,260,000 Federal Home Loan Bank Discount Notes USD 1.013% 17/08/2022 2,254,337 0.69
100,000 United States Treasury Bill USD 0.534% 09/06/2022 99,988 0.0319,749,999 United States Treasury Bill USD 0.819% 14/07/2022 19,731,452 6.071,601,000 United States Treasury Bill USD 0.855% 21/07/2022 1,599,154 0.49
11,000,000 United States Treasury Bill USD 0.820% 28/07/2022 10,985,170 3.38100,000 United States Treasury Bill USD 0.972% 04/08/2022 99,827 0.03
90,351,062 27.80
TOTAL BONDS(cost USD 90,364,645) 90,351,062 27.80
Holdings Security DescriptionMarket Value
USD
% ofShareholders’
Equity
Common Stocks – 38.76%Belgium
31,483 Anheuser-Busch InBev SA/NV 1,770,286 0.55
Brazil198,748 Itau Unibanco Holding SA—Preferred 1,105,494 0.3483,720 Petroleo Brasileiro SA ADR(c) 1,192,173 0.37
239,485 Petroleo Brasileiro SA—Preferred 1,545,951 0.4758,926 Vale SA 1,074,252 0.33
4,917,870 1.51
Canada15,682 Agnico Eagle Mines Ltd. 849,992 0.2636,337 Canadian Pacific Railway Ltd. 2,578,474 0.7919,654 Cenovus Energy, Inc. 464,632 0.1430,551 Enbridge, Inc. 1,418,392 0.4412,314 Fortis, Inc. 617,185 0.1915,301 Imperial Oil Ltd. 869,156 0.2729,416 Intertape Polymer Group, Inc. 912,248 0.28
Goldman Sachs Funds II—Global Multi-Manager Alternatives PortfolioSchedule of Investments
As at 31 May 2022
The accompanying notes are an integral part of these financial statements.
36

Holdings Security DescriptionMarket Value
USD
% ofShareholders’
Equity
Common Stocks – (Continued)Canada – (Continued)
6,549 Metro, Inc. 360,510 0.115,970 Nutrien Ltd. 581,120 0.18
54,900 Shaw Communications, Inc. Class B 1,565,563 0.48
10,217,272 3.14
China391,664 China Construction Bank Corp. Class H 291,517 0.0927,187 China Merchants Bank Co. Ltd. Class A 161,767 0.0537,009 China Merchants Bank Co. Ltd. Class H 234,993 0.0758,351 Hollysys Automation Technologies Ltd. 872,347 0.27
182,259 Zijin Mining Group Co. Ltd. Class A 274,315 0.09
1,834,939 0.57
Denmark11,334 Novo Nordisk A/S Class B 1,255,054 0.39
France3,143 Air Liquide SA 546,589 0.171,851 Capgemini SE 360,092 0.116,629 Sanofi 702,675 0.22
28,948 TotalEnergies SE 1,722,015 0.53
3,331,371 1.03
Germany100,375 ADVA Optical Networking SE 1,451,611 0.4525,322 ADVA Optical Networking SE (traded in Germany) 428,594 0.131,751 ADVA Optical Networking SE (traded in United States) 29,329 0.015,305 Deutsche Boerse AG 885,124 0.27
41,005 Deutsche Telekom AG 838,822 0.263,379 Volkswagen AG—Preferred 556,501 0.17
4,189,981 1.29
India39,425 Housing Development Finance Corp. Ltd. 1,166,897 0.3630,037 ICICI Bank Ltd. ADR(c) 574,758 0.182,632 Infosys Ltd. 50,840 0.01
1,792,495 0.55
Israel47,191 Tufin Software Technologies Ltd. 596,022 0.18
Italy20,540 Atlantia SpA 495,518 0.1563,254 Eni SpA 969,793 0.30
1,465,311 0.45
Luxembourg13,890 ArcelorMittal SA (traded in Netherlands) 450,482 0.146,618 ArcelorMittal SA (traded in United States) 214,622 0.06
665,104 0.20
Malta45,688 Aspire Global PLC(d) 502,411 0.15
Netherlands20,630 Boskalis Westminster 718,246 0.2216,926 Heineken NV 1,702,593 0.53
122,200 Intertrust NV(d) 2,539,591 0.78
4,960,430 1.53
Russia116,148 Gazprom PJSC(e) 0 -
9,184 LUKOIL PJSC(e) 0 -75,632 Rosneft Oil Co. PJSC(e) 0 -
0 -
South Korea10,646 Magnachip Semiconductor Corp. 207,278 0.06
Goldman Sachs Funds II—Global Multi-Manager Alternatives PortfolioSchedule of Investments
As at 31 May 2022
The accompanying notes are an integral part of these financial statements.
37

Holdings Security DescriptionMarket Value
USD
% ofShareholders’
Equity
Common Stocks – (Continued)Spain
77,581 Banco Bilbao Vizcaya Argentaria SA 420,862 0.13
Switzerland350,509 Glencore PLC 2,335,568 0.72
3,650 Nestle SA 444,847 0.1417,185 Novartis AG 1,552,113 0.485,329 Roche Holding AG 1,817,247 0.56
16,741 Vifor Pharma AG (traded in Switzerland) 2,896,306 0.897,924 Vifor Pharma AG (traded in United States)(e) 1,400,567 0.43
10,446,648 3.22
United Kingdom21,662 AstraZeneca PLC 2,832,839 0.87
132,339 HSBC Holdings PLC 888,258 0.2810,382 Linde PLC 3,364,702 1.0342,045 National Grid PLC 618,228 0.197,053 Reckitt Benckiser Group PLC 540,910 0.17
33,804 Shell PLC 1,024,634 0.31106,295 Tesco PLC 346,112 0.11
9,615,683 2.96
United States9,189 Activision Blizzard, Inc. 714,812 0.221,768 Alleghany Corp. 1,471,860 0.452,688 Analog Devices, Inc. 444,192 0.14
61,937 Anaplan, Inc. 4,060,590 1.256,594 Aon PLC Class A 1,817,900 0.562,968 Arthur J Gallagher & Co. 483,739 0.159,004 Biohaven Pharmaceutical Holding Co. Ltd. 1,286,311 0.406,800 Bristol-Myers Squibb Co. 504,628 0.16
57,550 CDK Global, Inc. 3,134,749 0.9718,493 Cerner Corp. 1,750,178 0.54
933 Charter Communications, Inc. Class A 472,714 0.1510,478 Cheniere Energy, Inc. 1,463,986 0.452,677 Cintas Corp. 1,054,015 0.32
68,802 Clear Channel Outdoor Holdings, Inc. 110,083 0.033,773 Coherent, Inc. 1,017,050 0.31
10,666 Comcast Corp. Class A 467,064 0.1430,135 Cornerstone Building Brands, Inc. 739,513 0.2337,427 Covetrus, Inc. 775,862 0.2412,622 Cumulus Media, Inc. Class A 145,658 0.056,135 Dentsply Sirona, Inc. 242,087 0.08
21,335 Exxon Mobil Corp. 2,113,445 0.6515,004 Hilton Worldwide Holdings, Inc. 2,107,462 0.6540,169 Mandiant, Inc. 885,726 0.2719,891 ManTech International Corp. Class A 1,895,413 0.582,663 Martin Marietta Materials, Inc. 900,334 0.28
17,435 Microsoft Corp. 4,722,270 1.4517,700 Monster Beverage Corp. 1,564,503 0.486,702 Motorola Solutions, Inc. 1,466,599 0.45
15,649 Newmont Corp. 1,080,094 0.3328,202 NextEra Energy, Inc. 2,152,800 0.6639,344 Nielsen Holdings PLC 1,006,813 0.3125,253 Oracle Corp. 1,821,499 0.564,275 Renewable Energy Group, Inc. 262,186 0.087,812 Republic Services, Inc. 1,052,355 0.325,282 S&P Global, Inc. 1,870,620 0.58
46,426 Sailpoint Technologies Holdings, Inc. 2,932,730 0.9079,696 Schlumberger NV 3,810,266 1.1728,741 Sciplay Corp. Class A 390,878 0.123,212 Sherwin-Williams Co. 856,383 0.26
71,906 Switch, Inc. Class A 2,413,884 0.7428,740 TEGNA, Inc. 623,945 0.1934,931 Tivity Health, Inc. 1,128,271 0.3521,767 T-Mobile US, Inc. 2,897,841 0.892,506 TransDigm Group, Inc. 1,510,466 0.47
109 UnitedHealth Group, Inc. 54,749 0.0210,401 Visa, Inc. Class A 2,206,988 0.68
Goldman Sachs Funds II—Global Multi-Manager Alternatives PortfolioSchedule of Investments
As at 31 May 2022
The accompanying notes are an integral part of these financial statements.
38

Holdings Security DescriptionMarket Value
USD
% ofShareholders’
Equity
Common Stocks – (Continued)United States – (Continued)
69,400 Welbilt, Inc. 1,638,534 0.502,418 Zendesk, Inc. 228,840 0.07
67,752,885 20.85
TOTAL COMMON STOCKS(cost USD 123,665,954) 125,941,902 38.76
Real Estate Investment Trusts – 0.89%United States
2,899 American Tower Corp. 747,362 0.23842 Equinix, Inc. 574,261 0.18
4,623 SBA Communications Corp. 1,560,077 0.48
2,881,700 0.89
TOTAL REAL ESTATE INVESTMENT TRUSTS(cost USD 2,775,276) 2,881,700 0.89
Mutual Funds – 5.21%Ireland
12,800,716 Goldman Sachs US$ Liquid Reserves Fund (X Distribution Class)(f)(g) 12,800,716 3.94207,865 KraneShares CSI China Internet UCITS ETF 4,125,704 1.27
16,926,420 5.21
TOTAL MUTUAL FUNDS(cost USD 19,354,683) 16,926,420 5.21
TOTAL TRANSFERABLE SECURITIES ADMITTED TO AN OFFICIAL EXCHANGE LISTING(cost USD 236,160,558) 236,101,084 72.66
Holdings Security Description Currency Interest Rate(a) Maturity Date(b)Market Value
USD
% ofShareholders’
Equity
Other Transferable Securities
Bonds – 0.03%United States
100,000 United States Treasury Bill USD 0.512% 02/06/2022 99,999 0.03
TOTAL BONDS(cost USD 99,999) 99,999 0.03
Holdings Security DescriptionMarket Value
USD
% ofShareholders’
Equity
Common Stocks – 0.30%Austria
43,971 Immofinanz AG(e) 961,862 0.30
United States3,675 Gymboree Holding Corp.(e) 0 -
TOTAL COMMON STOCKS(cost USD 1,167,468) 961,862 0.30
TOTAL OTHER TRANSFERABLE SECURITIES(cost USD 1,267,467) 1,061,861 0.33
MARKET VALUE OF INVESTMENTS EXCLUDING DERIVATIVES(cost USD 237,428,025) 237,162,945 72.99
Futures Contracts – 0.42%
Number ofContracts Security Description
CommitmentMarket Value
USD
UnrealisedGainUSD
% ofShareholders’
Equity
CAD6 S&P TSX 60 Index Futures 16/06/2022 Long 1,192,549 13,019 0.00
(9) S&P TSX 60 Index Futures 16/06/2022 Short (1,788,824) 57,003 0.02
(596,275) 70,022 0.02
EUR3 Amsterdam Index Futures 17/06/2022 Long 458,248 7,617 0.00
Goldman Sachs Funds II—Global Multi-Manager Alternatives PortfolioSchedule of Investments
As at 31 May 2022
The accompanying notes are an integral part of these financial statements.
39
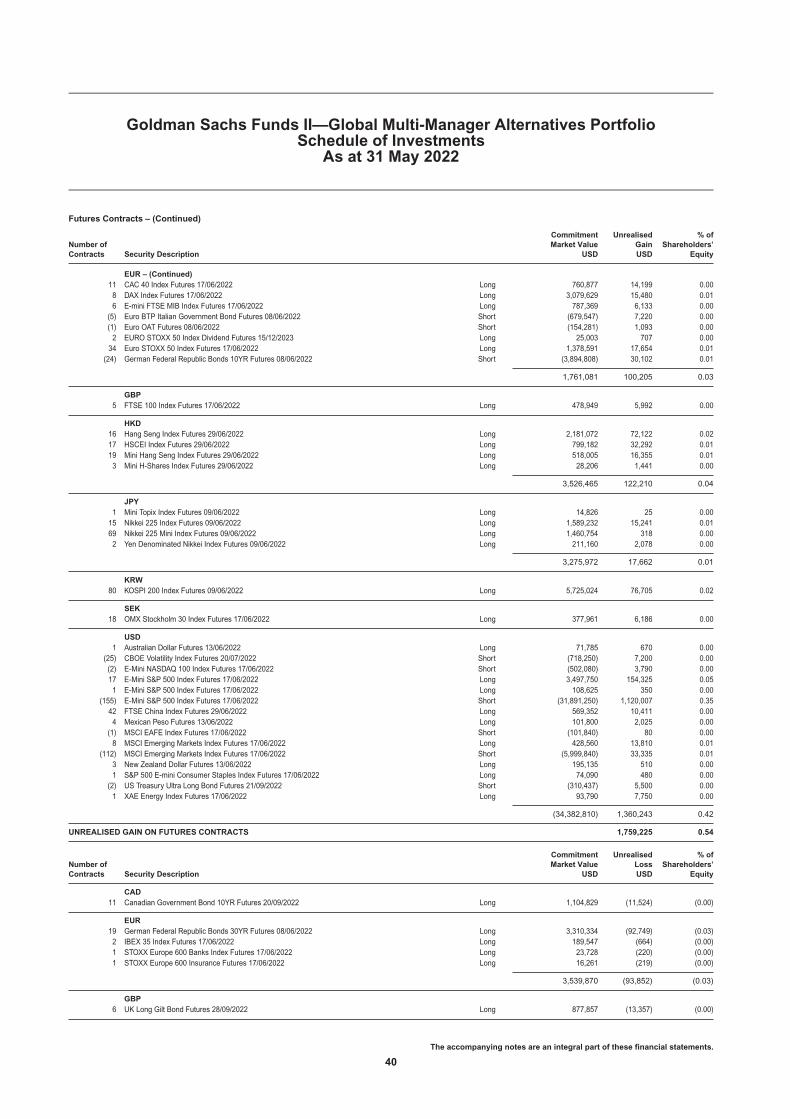
Futures Contracts – (Continued)
Number ofContracts Security Description
CommitmentMarket Value
USD
UnrealisedGainUSD
% ofShareholders’
Equity
EUR – (Continued)11 CAC 40 Index Futures 17/06/2022 Long 760,877 14,199 0.008 DAX Index Futures 17/06/2022 Long 3,079,629 15,480 0.016 E-mini FTSE MIB Index Futures 17/06/2022 Long 787,369 6,133 0.00
(5) Euro BTP Italian Government Bond Futures 08/06/2022 Short (679,547) 7,220 0.00(1) Euro OAT Futures 08/06/2022 Short (154,281) 1,093 0.00
2 EURO STOXX 50 Index Dividend Futures 15/12/2023 Long 25,003 707 0.0034 Euro STOXX 50 Index Futures 17/06/2022 Long 1,378,591 17,654 0.01
(24) German Federal Republic Bonds 10YR Futures 08/06/2022 Short (3,894,808) 30,102 0.01
1,761,081 100,205 0.03
GBP5 FTSE 100 Index Futures 17/06/2022 Long 478,949 5,992 0.00
HKD16 Hang Seng Index Futures 29/06/2022 Long 2,181,072 72,122 0.0217 HSCEI Index Futures 29/06/2022 Long 799,182 32,292 0.0119 Mini Hang Seng Index Futures 29/06/2022 Long 518,005 16,355 0.013 Mini H-Shares Index Futures 29/06/2022 Long 28,206 1,441 0.00
3,526,465 122,210 0.04
JPY1 Mini Topix Index Futures 09/06/2022 Long 14,826 25 0.00
15 Nikkei 225 Index Futures 09/06/2022 Long 1,589,232 15,241 0.0169 Nikkei 225 Mini Index Futures 09/06/2022 Long 1,460,754 318 0.002 Yen Denominated Nikkei Index Futures 09/06/2022 Long 211,160 2,078 0.00
3,275,972 17,662 0.01
KRW80 KOSPI 200 Index Futures 09/06/2022 Long 5,725,024 76,705 0.02
SEK18 OMX Stockholm 30 Index Futures 17/06/2022 Long 377,961 6,186 0.00
USD1 Australian Dollar Futures 13/06/2022 Long 71,785 670 0.00
(25) CBOE Volatility Index Futures 20/07/2022 Short (718,250) 7,200 0.00(2) E-Mini NASDAQ 100 Index Futures 17/06/2022 Short (502,080) 3,790 0.0017 E-Mini S&P 500 Index Futures 17/06/2022 Long 3,497,750 154,325 0.051 E-Mini S&P 500 Index Futures 17/06/2022 Long 108,625 350 0.00
(155) E-Mini S&P 500 Index Futures 17/06/2022 Short (31,891,250) 1,120,007 0.3542 FTSE China Index Futures 29/06/2022 Long 569,352 10,411 0.004 Mexican Peso Futures 13/06/2022 Long 101,800 2,025 0.00
(1) MSCI EAFE Index Futures 17/06/2022 Short (101,840) 80 0.008 MSCI Emerging Markets Index Futures 17/06/2022 Long 428,560 13,810 0.01
(112) MSCI Emerging Markets Index Futures 17/06/2022 Short (5,999,840) 33,335 0.013 New Zealand Dollar Futures 13/06/2022 Long 195,135 510 0.001 S&P 500 E-mini Consumer Staples Index Futures 17/06/2022 Long 74,090 480 0.00
(2) US Treasury Ultra Long Bond Futures 21/09/2022 Short (310,437) 5,500 0.001 XAE Energy Index Futures 17/06/2022 Long 93,790 7,750 0.00
(34,382,810) 1,360,243 0.42
UNREALISED GAIN ON FUTURES CONTRACTS 1,759,225 0.54
Number ofContracts Security Description
CommitmentMarket Value
USD
UnrealisedLossUSD
% ofShareholders’
Equity
CAD11 Canadian Government Bond 10YR Futures 20/09/2022 Long 1,104,829 (11,524) (0.00)
EUR19 German Federal Republic Bonds 30YR Futures 08/06/2022 Long 3,310,334 (92,749) (0.03)2 IBEX 35 Index Futures 17/06/2022 Long 189,547 (664) (0.00)1 STOXX Europe 600 Banks Index Futures 17/06/2022 Long 23,728 (220) (0.00)1 STOXX Europe 600 Insurance Futures 17/06/2022 Long 16,261 (219) (0.00)
3,539,870 (93,852) (0.03)
GBP6 UK Long Gilt Bond Futures 28/09/2022 Long 877,857 (13,357) (0.00)
Goldman Sachs Funds II—Global Multi-Manager Alternatives PortfolioSchedule of Investments
As at 31 May 2022
The accompanying notes are an integral part of these financial statements.
40

Futures Contracts – (Continued)
Number ofContracts Security Description
CommitmentMarket Value
USD
UnrealisedLossUSD
% ofShareholders’
Equity
JPY4 Japan Government Bonds 10YR Futures 13/06/2022 Long 4,647,536 (8,931) (0.01)
(2) Nikkei 225 Index Futures 09/06/2022 Short (423,407) (7,455) (0.00)5 TOPIX Index Futures 09/06/2022 Long 741,273 (4,349) (0.00)
4,965,402 (20,735) (0.01)
KRW30 US Dollar Index Futures 20/06/2022 Long 300,194 (7,529) (0.00)
USD(1) British Pound Futures 13/06/2022 Short (78,694) (625) (0.00)
(21) Canadian Dollar Futures 14/06/2022 Short (1,660,260) (6,030) (0.00)50 CBOE Volatility Index Futures 15/06/2022 Long 1,387,500 (35,350) (0.01)1 CBOE Volatility Index Futures 17/08/2022 Long 29,010 (90) (0.00)
(1) E-Mini Consumer Discretionary Select Sector Futures 17/06/2022 Short (154,190) (660) (0.00)(1) E-Mini S&P 500 Index Futures 17/06/2022 Short (94,590) (3,410) (0.00)
1 Mini-Russell 2000 Index Futures 17/06/2022 Long 93,230 (905) (0.00)(130) MSCI EAFE Index Futures 17/06/2022 Short (13,239,200) (29,420) (0.01)
(2) Swiss Franc Futures 13/06/2022 Short (260,700) (5,337) (0.00)76 US Treasury Long Bond Futures 21/09/2022 Long 10,571,125 (145,813) (0.05)11 US Treasury Notes 10YR Futures 21/09/2022 Long 1,313,125 (9,516) (0.01)6 US Treasury Ultra Long Notes 10YR Futures 21/09/2022 Long 770,250 (7,656) (0.00)
(1,323,394) (244,812) (0.08)
ZAR(2) FTSE/JSE Top 40 Index Futures 15/06/2022 Short (83,952) (3,425) (0.00)
UNREALISED LOSS ON FUTURES CONTRACTS (395,234) (0.12)
Forward Currency Contracts – 0.01%
CurrencyAmountBought Currency
AmountSold
MaturityDate
UnrealisedGainUSD
% ofShareholders’
Equity
BRL 488,093 USD 100,000 02/06/2022 3,781 0.00CLP 86,354,856 USD 100,000 06/06/2022 4,391 0.00USD 200,000 INR 15,322,026 06/06/2022 2,790 0.00KRW 127,494,789 USD 100,000 07/06/2022 2,801 0.00CLP 87,085,804 USD 100,000 09/06/2022 5,218 0.00TWD 2,912,504 USD 100,000 09/06/2022 412 0.00USD 400,000 INR 31,030,426 09/06/2022 828 0.00CLP 87,574,150 USD 100,000 10/06/2022 5,788 0.00USD 500,000 INR 38,571,712 10/06/2022 3,870 0.00INR 31,141,829 USD 400,000 13/06/2022 439 0.00KRW 127,243,689 USD 100,000 13/06/2022 2,418 0.00USD 400,000 INR 31,085,953 13/06/2022 280 0.00TWD 2,978,895 USD 100,000 16/06/2022 2,768 0.00AUD 960,000 USD 685,140 17/06/2022 4,151 0.00CAD 409,000 USD 314,902 17/06/2022 8,550 0.00CLP 86,604,856 USD 100,000 17/06/2022 4,477 0.00KRW 256,542,578 USD 200,000 17/06/2022 6,504 0.00USD 771,764 AUD 1,052,000 17/06/2022 16,420 0.00USD 8,472,502 EUR 7,702,000 17/06/2022 215,867 0.08USD 1,972,180 GBP 1,540,000 17/06/2022 33,442 0.01USD 81,487 NZD 121,000 17/06/2022 2,767 0.00USD 806,307 SEK 7,607,000 17/06/2022 31,422 0.01KRW 127,844,889 USD 100,000 21/06/2022 2,915 0.00USD 400,000 INR 31,117,446 21/06/2022 207 0.00AUD 187,369 EUR 125,000 22/06/2022 507 0.00AUD 664,733 GBP 375,000 22/06/2022 5,214 0.00AUD 4,400,000 JPY 397,205,820 22/06/2022 72,496 0.04AUD 400,000 NZD 437,304 22/06/2022 2,745 0.00AUD 2,100,000 USD 1,502,192 22/06/2022 5,758 0.00CAD 850,336 EUR 625,000 22/06/2022 2,279 0.00CAD 800,000 JPY 79,437,800 22/06/2022 15,282 0.00CAD 2,100,000 USD 1,641,936 22/06/2022 18,798 0.01CHF 605,148 GBP 500,000 22/06/2022 1,867 0.00CHF 2,250,000 USD 2,328,188 22/06/2022 19,236 0.01CLP 86,189,856 USD 100,000 22/06/2022 3,877 0.00CNH 11,403,525 USD 1,700,000 22/06/2022 7,426 0.00EUR 600,000 HUF 231,052,320 22/06/2022 18,951 0.00EUR 2,500,000 JPY 339,577,705 22/06/2022 41,603 0.02
Goldman Sachs Funds II—Global Multi-Manager Alternatives PortfolioSchedule of Investments
As at 31 May 2022
The accompanying notes are an integral part of these financial statements.
41

Forward Currency Contracts – (Continued)
CurrencyAmountBought Currency
AmountSold
MaturityDate
UnrealisedGainUSD
% ofShareholders’
Equity
GBP 1,750,000 JPY 277,378,794 22/06/2022 47,447 0.02MXN 18,500,000 USD 928,960 22/06/2022 10,932 0.00NOK 2,831,367 USD 300,000 22/06/2022 575 0.00NZD 3,000,000 JPY 245,202,420 22/06/2022 45,947 0.01PLN 430,735 USD 100,000 22/06/2022 673 0.00SEK 987,406 USD 100,000 22/06/2022 599 0.00USD 100,000 HUF 36,909,010 22/06/2022 252 0.00USD 5,193,309 JPY 662,500,000 22/06/2022 44,464 0.02USD 6,500,000 TRY 105,405,502 22/06/2022 233,415 0.08KRW 254,796,578 USD 200,000 23/06/2022 5,118 0.00CLP 167,178,998 USD 200,000 24/06/2022 1,409 0.00TWD 2,957,795 USD 100,000 24/06/2022 2,116 0.00USD 100,000 INR 7,777,913 24/06/2022 101 0.00KRW 379,739,013 USD 300,000 27/06/2022 5,720 0.00TWD 2,947,875 USD 100,000 27/06/2022 1,802 0.00CLP 84,047,756 USD 100,000 28/06/2022 1,179 0.00KRW 377,726,867 USD 300,000 30/06/2022 4,115 0.00TWD 2,936,165 USD 100,000 30/06/2022 1,426 0.00BRL 480,806 USD 100,000 05/07/2022 1,313 0.00
UNREALISED GAIN ON FORWARD CURRENCY CONTRACTS 987,148 0.31
CurrencyAmountBought Currency
AmountSold
MaturityDate
UnrealisedLossUSD
% ofShareholders’
Equity
USD 100,000 BRL 476,491 02/06/2022 (1,314) (0.00)INR 15,527,774 USD 200,000 06/06/2022 (141) (0.00)USD 100,000 CLP 86,990,200 06/06/2022 (5,159) (0.00)USD 100,000 KRW 126,475,911 07/06/2022 (1,980) (0.00)INR 30,529,649 USD 400,000 09/06/2022 (7,270) (0.00)USD 100,000 CLP 87,557,704 09/06/2022 (5,788) (0.00)USD 100,000 TWD 2,941,075 09/06/2022 (1,397) (0.00)INR 38,821,560 USD 500,000 10/06/2022 (656) (0.00)USD 100,000 CLP 86,164,144 10/06/2022 (4,085) (0.00)USD 100,000 KRW 128,897,211 16/06/2022 (3,754) (0.00)USD 100,000 TWD 2,911,518 16/06/2022 (443) (0.00)EUR 3,024,000 USD 3,328,297 17/06/2022 (86,532) (0.03)GBP 1,851,000 USD 2,388,084 17/06/2022 (57,821) (0.02)INR 31,096,148 USD 400,000 17/06/2022 (315) (0.00)NZD 106,000 USD 70,160 17/06/2022 (1,199) (0.00)SEK 2,536,000 USD 267,672 17/06/2022 (9,344) (0.00)USD 3,022,914 CAD 3,850,000 17/06/2022 (21,803) (0.00)USD 400,000 INR 31,158,760 17/06/2022 (490) (0.00)ZAR 1,701,000 USD 114,025 17/06/2022 (5,289) (0.00)INR 31,103,525 USD 400,000 21/06/2022 (386) (0.00)USD 600,000 KRW 764,248,806 21/06/2022 (15,221) (0.00)USD 200,000 TWD 5,933,530 21/06/2022 (4,794) (0.00)EUR 125,000 AUD 188,273 22/06/2022 (1,156) (0.00)EUR 250,000 CAD 343,364 22/06/2022 (3,466) (0.00)EUR 125,000 CHF 128,630 22/06/2022 (162) (0.00)EUR 2,800,000 GBP 2,386,902 22/06/2022 (2,591) (0.00)EUR 125,000 NOK 1,280,319 22/06/2022 (1,880) (0.00)EUR 4,875,000 USD 5,232,004 22/06/2022 (4,546) (0.01)GBP 375,000 AUD 661,983 22/06/2022 (3,238) (0.00)GBP 125,000 CHF 150,931 22/06/2022 (96) (0.00)GBP 3,058,701 EUR 3,600,000 22/06/2022 (9,477) (0.00)GBP 1,562,500 USD 1,968,156 22/06/2022 (1,023) (0.00)HUF 197,270,140 EUR 500,000 22/06/2022 (3,018) (0.00)JPY 307,499,900 AUD 3,400,000 22/06/2022 (51,604) (0.02)JPY 59,418,240 CAD 600,000 22/06/2022 (12,706) (0.01)JPY 340,359,397 EUR 2,500,000 22/06/2022 (35,529) (0.01)JPY 139,897,623 GBP 875,000 22/06/2022 (14,333) (0.01)JPY 197,879,920 NZD 2,400,000 22/06/2022 (23,406) (0.01)JPY 512,500,000 USD 4,018,148 22/06/2022 (35,079) (0.02)NZD 219,223 AUD 200,000 22/06/2022 (1,001) (0.00)NZD 2,100,000 USD 1,369,038 22/06/2022 (2,903) (0.00)TRY 51,866,013 USD 3,200,000 22/06/2022 (116,454) (0.03)USD 1,201,302 AUD 1,700,000 22/06/2022 (19,420) (0.01)USD 4,212,473 CAD 5,400,000 22/06/2022 (57,983) (0.02)USD 3,197,718 CHF 3,125,000 22/06/2022 (62,593) (0.02)USD 100,000 CLP 86,382,144 22/06/2022 (4,109) (0.00)
Goldman Sachs Funds II—Global Multi-Manager Alternatives PortfolioSchedule of Investments
As at 31 May 2022
The accompanying notes are an integral part of these financial statements.
42
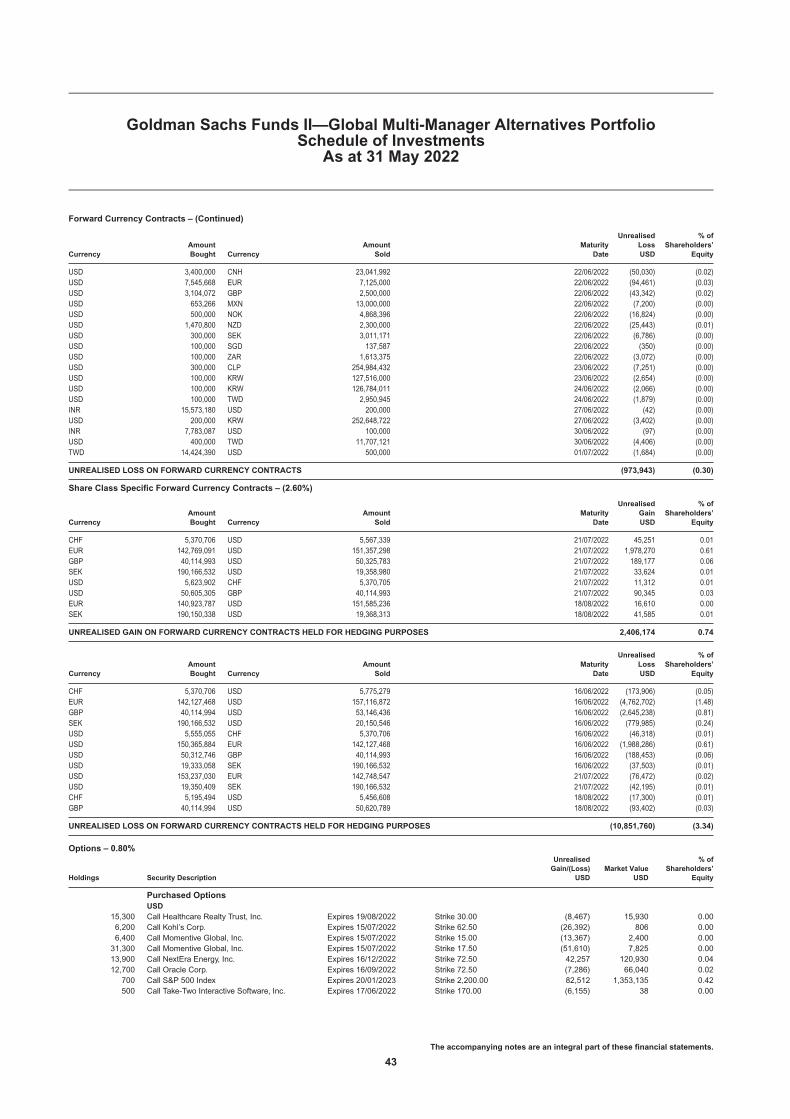
Forward Currency Contracts – (Continued)
CurrencyAmountBought Currency
AmountSold
MaturityDate
UnrealisedLossUSD
% ofShareholders’
Equity
USD 3,400,000 CNH 23,041,992 22/06/2022 (50,030) (0.02)USD 7,545,668 EUR 7,125,000 22/06/2022 (94,461) (0.03)USD 3,104,072 GBP 2,500,000 22/06/2022 (43,342) (0.02)USD 653,266 MXN 13,000,000 22/06/2022 (7,200) (0.00)USD 500,000 NOK 4,868,396 22/06/2022 (16,824) (0.00)USD 1,470,800 NZD 2,300,000 22/06/2022 (25,443) (0.01)USD 300,000 SEK 3,011,171 22/06/2022 (6,786) (0.00)USD 100,000 SGD 137,587 22/06/2022 (350) (0.00)USD 100,000 ZAR 1,613,375 22/06/2022 (3,072) (0.00)USD 300,000 CLP 254,984,432 23/06/2022 (7,251) (0.00)USD 100,000 KRW 127,516,000 23/06/2022 (2,654) (0.00)USD 100,000 KRW 126,784,011 24/06/2022 (2,066) (0.00)USD 100,000 TWD 2,950,945 24/06/2022 (1,879) (0.00)INR 15,573,180 USD 200,000 27/06/2022 (42) (0.00)USD 200,000 KRW 252,648,722 27/06/2022 (3,402) (0.00)INR 7,783,087 USD 100,000 30/06/2022 (97) (0.00)USD 400,000 TWD 11,707,121 30/06/2022 (4,406) (0.00)TWD 14,424,390 USD 500,000 01/07/2022 (1,684) (0.00)
UNREALISED LOSS ON FORWARD CURRENCY CONTRACTS (973,943) (0.30)
Share Class Specific Forward Currency Contracts – (2.60%)
CurrencyAmountBought Currency
AmountSold
MaturityDate
UnrealisedGainUSD
% ofShareholders’
Equity
CHF 5,370,706 USD 5,567,339 21/07/2022 45,251 0.01EUR 142,769,091 USD 151,357,298 21/07/2022 1,978,270 0.61GBP 40,114,993 USD 50,325,783 21/07/2022 189,177 0.06SEK 190,166,532 USD 19,358,980 21/07/2022 33,624 0.01USD 5,623,902 CHF 5,370,705 21/07/2022 11,312 0.01USD 50,605,305 GBP 40,114,993 21/07/2022 90,345 0.03EUR 140,923,787 USD 151,585,236 18/08/2022 16,610 0.00SEK 190,150,338 USD 19,368,313 18/08/2022 41,585 0.01
UNREALISED GAIN ON FORWARD CURRENCY CONTRACTS HELD FOR HEDGING PURPOSES 2,406,174 0.74
CurrencyAmountBought Currency
AmountSold
MaturityDate
UnrealisedLossUSD
% ofShareholders’
Equity
CHF 5,370,706 USD 5,775,279 16/06/2022 (173,906) (0.05)EUR 142,127,468 USD 157,116,872 16/06/2022 (4,762,702) (1.48)GBP 40,114,994 USD 53,146,436 16/06/2022 (2,645,238) (0.81)SEK 190,166,532 USD 20,150,546 16/06/2022 (779,985) (0.24)USD 5,555,055 CHF 5,370,706 16/06/2022 (46,318) (0.01)USD 150,365,884 EUR 142,127,468 16/06/2022 (1,988,286) (0.61)USD 50,312,746 GBP 40,114,993 16/06/2022 (188,453) (0.06)USD 19,333,058 SEK 190,166,532 16/06/2022 (37,503) (0.01)USD 153,237,030 EUR 142,748,547 21/07/2022 (76,472) (0.02)USD 19,350,409 SEK 190,166,532 21/07/2022 (42,195) (0.01)CHF 5,195,494 USD 5,456,608 18/08/2022 (17,300) (0.01)GBP 40,114,994 USD 50,620,789 18/08/2022 (93,402) (0.03)
UNREALISED LOSS ON FORWARD CURRENCY CONTRACTS HELD FOR HEDGING PURPOSES (10,851,760) (3.34)
Options – 0.80%
Holdings Security Description
UnrealisedGain/(Loss)
USDMarket Value
USD
% ofShareholders’
Equity
Purchased OptionsUSD
15,300 Call Healthcare Realty Trust, Inc. Expires 19/08/2022 Strike 30.00 (8,467) 15,930 0.006,200 Call Kohl’s Corp. Expires 15/07/2022 Strike 62.50 (26,392) 806 0.006,400 Call Momentive Global, Inc. Expires 15/07/2022 Strike 15.00 (13,367) 2,400 0.00
31,300 Call Momentive Global, Inc. Expires 15/07/2022 Strike 17.50 (51,610) 7,825 0.0013,900 Call NextEra Energy, Inc. Expires 16/12/2022 Strike 72.50 42,257 120,930 0.0412,700 Call Oracle Corp. Expires 16/09/2022 Strike 72.50 (7,286) 66,040 0.02
700 Call S&P 500 Index Expires 20/01/2023 Strike 2,200.00 82,512 1,353,135 0.42500 Call Take-Two Interactive Software, Inc. Expires 17/06/2022 Strike 170.00 (6,155) 38 0.00
Goldman Sachs Funds II—Global Multi-Manager Alternatives PortfolioSchedule of Investments
As at 31 May 2022
The accompanying notes are an integral part of these financial statements.
43

Options – (Continued)
Holdings Security Description
UnrealisedGain/(Loss)
USDMarket Value
USD
% ofShareholders’
Equity
Purchased Options – (Continued)USD – (Continued)
4,500 Call UnitedHealth Group, Inc. Expires 17/06/2022 Strike 250.00 187,844 1,133,775 0.353,700 Call Zendesk, Inc. Expires 15/07/2022 Strike 125.00 (32,517) 5,920 0.00
166,819 2,706,799 0.83
TOTAL PURCHASED OPTIONS(cost USD 2,539,980) 2,706,799 0.83
Expires 21/10/2022 Strike 60.00 (1,145) (6,500) (0.00)Expires 19/08/2022 Strike 85.00 2,544 (3,640) (0.00)
Written OptionsUSD
(6,500) Call 51job, Inc.(e)
(9,100) Call Activision Blizzard, Inc.(6,200) Call Kohl’s Corp. Expires 15/07/2022 Strike 70.00 3,311 (1,581) (0.00)
(37,700) Call Momentive Global, Inc. Expires 15/07/2022 Strike 22.50 13,392 (2,828) (0.00)Expires 17/06/2022 Strike 190.00 2,970 (150) (0.00)Expires 15/07/2022 Strike 145.00 7,595 (1,203) (0.00)Expires 19/08/2022 Strike 75.00 (2,554) (14,105) (0.01)Expires 20/05/2022 Strike 30.00 (4,030) (6,492) (0.00)
(500) Call Take-Two Interactive Software, Inc.(3,700) Call Zendesk, Inc.(9,100) Put Activision Blizzard, Inc.(4,900) Put Healthcare Trust of America, Inc.(e)
(6,200) Put Kohl’s Corp. Expires 15/07/2022 Strike 47.50 (51,099) (58,745) (0.02)
(29,016) (95,244) (0.03)
TOTAL WRITTEN OPTIONS(cost USD (66,227)) (95,244) (0.03)
TOTAL OPTIONS(cost USD 2,473,753) 2,611,555 0.80
Contracts for Difference – 0.01%
Quantity Security Description CurrencyCommitment
USD
UnrealisedGainUSD
% ofShareholders’
Equity
66,479 American Campus Communities, Inc. USD 4,308,504 12,802 0.01366 Coherent, Inc. USD 98,659 845 0.00
99,364 Crown Resorts Ltd. AUD 915,857 9,273 0.0010,441 Healthcare Trust of America, Inc. USD 308,532 1,671 0.00
150,216 HomeServe PLC GBP 2,201,205 112,427 0.043,764 II-VI, Inc. USD 234,083 1,377 0.00
306,329 Infomedia Ltd. AUD 374,904 13,982 0.0181,248 Irongate Group ZAR 109,640 1,115 0.00
206,963 John Menzies PLC GBP 1,555,459 5,211 0.00301,533 Meggitt PLC GBP 2,947,215 6,928 0.00
66,233 Preferred Apartment Communities, Inc. USD 1,651,851 4,636 0.004,112 PS Business Parks, Inc. USD 770,383 5,757 0.00
20,262 Schroders PLC GBP 631,319 22,626 0.011,534 Scientific Games Corp. USD 78,894 11,121 0.00
37,167 Ultra Electronics Holdings PLC GBP 1,538,440 28,074 0.01685,741 Uniti Group Ltd. AUD 2,428,819 12,387 0.00277,425 Western Areas Ltd. AUD 767,026 3,863 0.00
UNREALISED GAIN ON CONTRACTS FOR DIFFERENCE 254,095 0.08
Quantity Security Description CurrencyCommitment
USD
UnrealisedLossUSD
% ofShareholders’
Equity
82,746 ADTRAN, Inc. USD 1,540,731 (111,707) (0.04)48,351 Atlantia SpA EUR 1,166,446 (15,803) (0.01)
155,243 Avast PLC GBP 938,090 (11,726) (0.01)112,012 Brewin Dolphin Holdings PLC GBP 720,571 (2,820) (0.00)29,781 Clipper Logistics PLC(e) GBP 313,802 (8,248) (0.00)
583 GXO Logistics, Inc. USD 32,298 (1,364) (0.00)15,341 Healthcare Realty Trust, Inc. USD 436,912 (7,465) (0.00)
982,082 Investec Australia Property Fund AUD 1,339,476 (10,575) (0.00)3,925 Kohl’s Corp. USD 159,708 (6,174) (0.00)4,687 NortonLifeLock, Inc. USD 115,675 (3,515) (0.00)
Goldman Sachs Funds II—Global Multi-Manager Alternatives PortfolioSchedule of Investments
As at 31 May 2022
The accompanying notes are an integral part of these financial statements.
44

Contracts for Difference – (Continued)
Quantity Security Description CurrencyCommitment
USD
UnrealisedLossUSD
% ofShareholders’
Equity
13,126 Ramsay Health Care Ltd. AUD 734,598 (5,736) (0.00)17,216 Schroders PLC GBP 638,927 (24,480) (0.01)
UNREALISED LOSS ON CONTRACTS FOR DIFFERENCE (209,613) (0.07)
TOTAL CONTRACTS FOR DIFFERENCE(cost USD 22,118,221) 44,482 0.01
MARKET VALUE OF INVESTMENTS(cost USD 262,019,999) 232,750,592 71.63
OTHER ASSETS AND LIABILITIES 92,198,873 28.37
SHAREHOLDERS’ EQUITY 324,949,465 100.00
TOTAL INVESTMENTSMarket Value
USD
% ofShareholders’
Equity
Total Investments excluding derivatives (cost USD 237,428,025) 237,162,945 72.99Unrealised gain on futures contracts 1,759,225 0.54Unrealised loss on futures contracts (395,234) (0.12)Unrealised gain on forward currency contracts 987,148 0.31Unrealised loss on forward currency contracts (973,943) (0.30)Unrealised gain on forward currency contracts held for hedging purposes 2,406,174 0.74Unrealised loss on forward currency contracts held for hedging purposes (10,851,760) (3.34)Market value of purchased options (cost USD 2,539,980) 2,706,799 0.83Market value of written options (cost USD (66,227)) (95,244) (0.03)Unrealised gain on contracts for difference 254,095 0.08Unrealised loss on contracts for difference (209,613) (0.07)Other Assets and Liabilities 92,198,873 28.37
Shareholders’ Equity 324,949,465 100.00
The Futures Commission Merchants were Deutsche Bank AG and Morgan Stanley & Co., Inc.
The counterparties for forward currency contracts were Deutsche Bank AG, Morgan Stanley and Morgan Stanley & Co. LLC.
The counterparties for options contracts were Morgan Stanley & Co. International PLC and Morgan Stanley & Co., Inc.
The counterparty for contracts for difference was Morgan Stanley.
The maximum individual counterparty exposure as at 31 May 2022 is 1.20% of the NAV.
(a) Interest rates represent either the stated coupon rate, annualised discounted yield on date of purchase for discounted securities, or, for floating rate securities, the current reset ratewhich is based upon interest rates indices.
(b) Maturity dates represent either the stated date on the security, or the next interest reset date for floating rate securities or the prerefunded date for those type of securities.(c) Security holding is traded/held in USD. (ADR: American Depositary Receipt/GDR: Global Depositary Receipt).(d) 144A: This security is issued to qualified institutional investors, pursuant to private placements, and is transferable as stated in rule 144A of the US Securities Act of 1933.(e) Valuation of this security is determined by the Valuer. See Note 4.(f) A related party to Goldman Sachs Funds II.(g) The yield for this fund as at 31 May 2022 was 0.922%.
Goldman Sachs Funds II—Global Multi-Manager Alternatives PortfolioSchedule of Investments
As at 31 May 2022
The accompanying notes are an integral part of these financial statements.
45

HoldingsSecurityDescription
Market ValueUSD
% ofShareholders’
Equity
Transferable securities admitted to an official exchange listing
Common Stocks – 95.70%Argentina
1,530 MercadoLibre, Inc. 1,189,101 0.21
Brazil146,197 Azul SA ADR(a) 1,940,034 0.34
1,337,840 Banco Bradesco SA ADR(a) 5,766,090 1.00421,900 Banco do Brasil SA 3,295,827 0.57400,100 BB Seguridade Participacoes SA 2,274,813 0.4090,800 Cia Brasileira de Distribuicao 404,276 0.07
375,555 Cia Energetica de MinasGerais—Preferred 912,714 0.16
129,500 Cia Siderurgica Nacional SA 605,495 0.11140,600 EDP - Energias do Brasil SA 645,437 0.11113,300 Gerdau SA—Preferred 698,143 0.12513,600 Hapvida Participacoes e
Investimentos SA(b) 765,524 0.13173,236 Hypera SA 1,407,444 0.24894,364 Itau Unibanco Holding SA ADR(a) 4,927,946 0.86615,920 Itausa SA—Preferred 1,248,053 0.22252,000 JBS SA 1,916,617 0.33211,600 Localiza Rent a Car SA 2,593,766 0.45232,200 Marfrig Global Foods SA 765,261 0.13154,200 Metalurgica Gerdau SA—Preferred 398,033 0.0737,069 Pagseguro Digital Ltd. Class A 571,233 0.1073,664 StoneCo Ltd. Class A 741,060 0.13
305,891 Suzano SA ADR(a) 3,505,511 0.61243,000 TOTVS SA 1,445,672 0.25102,100 Usinas Siderurgicas de Minas
Gerais SA UsiminasClass A—Preferred 239,885 0.04
523,000 WEG SA 2,825,675 0.4953,000 XP, Inc. Class A 1,219,530 0.21
41,114,039 7.14
Cayman Islands156,264 Hello Group, Inc. ADR(a) 921,176 0.16
Chile527,872 Cencosud SA 833,596 0.14
China261,100 3SBio, Inc.(b) 194,314 0.03487,900 Agile Group Holdings Ltd. 207,379 0.04
2,878,600 Agricultural Bank of China Ltd.Class H 1,098,065 0.19
67,000 Airtac International Group 2,181,012 0.38724,300 Alibaba Group Holding Ltd. 8,851,778 1.54306,000 Aluminum Corp. of China Ltd.
Class H 138,687 0.02612,518 Anhui Conch Cement Co. Ltd.
Class H 3,108,071 0.5412,265 Autohome, Inc. ADR(a) 438,474 0.08
1,969,300 BAIC Motor Corp. Ltd. Class H(b) 633,002 0.1131,780 Baidu, Inc. ADR(a) 4,614,456 0.80
198,950 Baidu, Inc. Class A 3,771,021 0.658,136,000 Bank of China Ltd. Class H 3,267,354 0.573,094,000 Bank of Communications Co. Ltd.
Class H 2,108,645 0.37122,000 BYD Co. Ltd. Class H 4,337,837 0.75527,700 BYD Electronic International Co. Ltd. 1,174,133 0.2028,600 CanSino Biologics, Inc. Class H(b) 289,416 0.05
1,264,500 China Aoyuan Group Ltd.(c) 190,147 0.036,590,000 China Cinda Asset Management Co.
Ltd. Class H 1,117,359 0.192,016,900 China Construction Bank Corp.
Class H 1,501,187 0.261,607,700 China Feihe Ltd.(b) 1,630,419 0.281,864,500 China Galaxy Securities Co. Ltd.
Class H 1,029,923 0.18279,700 China Hongqiao Group Ltd. 347,063 0.06416,600 China International Capital Corp.
Ltd. Class H(b) 795,601 0.14
HoldingsSecurityDescription
Market ValueUSD
% ofShareholders’
Equity
Common Stocks – (Continued)China – (Continued)
2,061,000 China Longyuan Power Group Corp.Ltd. Class H 4,430,368 0.77
580,200 China Medical System Holdings Ltd. 860,425 0.15381,500 China Merchants Bank Co. Ltd.
Class H 2,422,384 0.422,812,275 China Oilfield Services Ltd. Class H 3,336,136 0.58
713,500 China Resources PharmaceuticalGroup Ltd.(b) 395,038 0.07
490,900 China Yangtze Power Co. Ltd.Class A 1,765,384 0.31
646,500 China Yongda Automobiles ServicesHoldings Ltd. 669,138 0.12
605,100 China Yuhua Education Corp. Ltd.(b) 86,853 0.0141,400 Contemporary Amperex Technology
Co. Ltd. Class A 2,524,754 0.44415,350 COSCO SHIPPING Holdings Co.
Ltd. Class H 735,978 0.13892,000 Country Garden Services Holdings
Co. Ltd. 3,543,686 0.621,596,600 CSPC Pharmaceutical Group Ltd. 1,712,947 0.30
11,276 Daqo New Energy Corp. ADR(a) 547,563 0.091,494,000 Dongfeng Motor Group Co. Ltd.
Class H 1,176,966 0.20534,400 East Money Information Co. Ltd.
Class A 1,808,733 0.31242,962 ENN Energy Holdings Ltd. 3,724,460 0.6540,532 FinVolution Group ADR(a) 171,045 0.03
+ 1,108,000 Guangzhou R&F Properties Co. Ltd.Class H 393,884 0.07
257,700 Guotai Junan Securities Co. Ltd.Class H(b) 333,588 0.06
3,641,700 Industrial & Commercial Bank ofChina Ltd. Class H 2,186,286 0.38
92,554 JD.com, Inc. Class A 2,633,025 0.46570,000 Jiangsu Expressway Co. Ltd.
Class H 588,967 0.10478,000 Jiumaojiu International Holdings
Ltd.(b) 1,123,293 0.1921,793 JOYY, Inc. ADR(a) 913,780 0.1661,300 Kingsoft Corp. Ltd. 206,821 0.04
286,900 KWG Group Holdings Ltd. 90,440 0.021,488,800 Lenovo Group Ltd. 1,468,049 0.25
23,538 Li Auto, Inc. ADR(a) 585,390 0.10146,200 Li Ning Co. Ltd. 1,142,119 0.20
+ 1,046,700 Logan Group Co. Ltd.(c) 290,781 0.05863,436 Longfor Group Holdings Ltd.(b) 4,312,699 0.75270,300 LONGi Green Energy Technology
Co. Ltd. Class A 3,202,860 0.5663,465 Lufax Holding Ltd. ADR(a) 398,560 0.07
675,700 Metallurgical Corp. of China Ltd.Class H 170,591 0.03
12,800 NetEase, Inc. 272,328 0.0510,277 NetEase, Inc. ADR(a) 1,078,057 0.1910,309 New Oriental Education &
Technology Group, Inc. ADR(a) 134,326 0.0211,409 Noah Holdings Ltd. ADR(a) 209,013 0.04
1,791,100 People’s Insurance Co. Group ofChina Ltd. Class H 564,484 0.10
3,090,000 PetroChina Co. Ltd. Class H 1,659,028 0.2914,257 Pinduoduo, Inc. ADR(a) 724,398 0.13
684,000 Ping An Insurance Group Co. ofChina Ltd. Class H 4,396,981 0.76
190,260 Proya Cosmetics Co. Ltd. Class A 4,425,425 0.7730,300 Shenzhen Mindray Bio-Medical
Electronics Co. Ltd. Class A 1,372,738 0.2413,900 Silergy Corp. 1,427,373 0.25
869,700 Sunac China Holdings Ltd.(c) 507,602 0.09387,995 Tencent Holdings Ltd. 17,930,786 3.11255,581 Tencent Music Entertainment Group
ADR(a) 1,067,051 0.18321,600 Topsports International Holdings
Ltd.(b) 238,496 0.04
Goldman Sachs Funds II—Multi-Manager Emerging Markets Equity PortfolioSchedule of Investments
As at 31 May 2022
The accompanying notes are an integral part of these financial statements.
46

HoldingsSecurityDescription
Market ValueUSD
% ofShareholders’
Equity
Common Stocks – (Continued)China – (Continued)
986,738 TravelSky Technology Ltd. Class H 1,609,220 0.2888,751 Trip.com Group Ltd. 1,961,354 0.3443,600 Trip.com Group Ltd. ADR(a) 959,636 0.17
120,268 Vipshop Holdings Ltd. ADR(a) 1,143,749 0.2012,825 Weibo Corp. ADR(a) 295,616 0.0550,800 WuXi AppTec Co. Ltd. Class H(b) 630,254 0.11
300,400 Wuxi Lead Intelligent Equipment Co.Ltd. Class A 2,177,373 0.38
771,000 Xiaomi Corp. Class B(b) 1,196,133 0.212,978,653 Xinyi Energy Holdings Ltd.(b) 1,640,841 0.282,045,504 Xinyi Solar Holdings Ltd. 3,651,928 0.63
188,200 Yunnan Botanee Bio-TechnologyGroup Co. Ltd. Class A 5,348,024 0.93
64,800 Yunnan Energy New Material Co.Ltd. Class A 2,113,149 0.37
956,000 Zhejiang Expressway Co. Ltd.Class H 844,266 0.15
292,300 Zhongsheng Group Holdings Ltd. 2,076,907 0.36320,100 Zoomlion Heavy Industry Science
and Technology Co. Ltd. Class H 197,906 0.03
154,832,776 26.90
Colombia71,263 Ecopetrol SA ADR(a) 1,240,689 0.22
Hong Kong243,600 AIA Group Ltd. 2,526,914 0.44230,500 China Gas Holdings Ltd. 344,216 0.06734,400 China Jinmao Holdings Group Ltd. 198,718 0.03344,548 China Resources Land Ltd. 1,539,797 0.27258,600 China Traditional Chinese Medicine
Holdings Co. Ltd. 136,695 0.02703,800 GCL Technology Holdings Ltd. 253,394 0.0462,377 Hong Kong Exchanges & Clearing
Ltd. 2,699,167 0.47382,100 Hopson Development Holdings Ltd. 622,294 0.11194,200 Kingboard Holdings Ltd. 930,839 0.16508,400 Kunlun Energy Co. Ltd. 439,234 0.08657,416 Lee & Man Paper Manufacturing Ltd. 320,346 0.06
1,835,000 Shimao Group Holdings Ltd.(c) 1,033,585 0.182,333,400 Sino Biopharmaceutical Ltd. 1,311,882 0.23
+ 2,508,000 Sun Art Retail Group Ltd. 755,004 0.131,634,300 Truly International Holdings Ltd. 469,684 0.08
13,581,769 2.36
Hungary13,555 OTP Bank Nyrt 328,325 0.06
India54,758 Adani Gas Ltd. 1,691,274 0.2914,000 Adani Green Energy Ltd. 339,746 0.0637,741 Adani Transmission Ltd. 998,989 0.1735,976 Apollo Hospitals Enterprise Ltd. 1,840,053 0.3246,870 Bajaj Finance Ltd. 3,660,085 0.647,099 Bajaj Finserv Ltd. 1,179,159 0.21
267,838 Bank of Baroda 344,874 0.06434,367 Bharti Airtel Ltd. 3,909,506 0.68
3,823 Deepak Nitrite Ltd. 98,042 0.0229,024 Divi’s Laboratories Ltd. 1,340,215 0.23
255,769 HDFC Bank Ltd. 4,567,443 0.7989,476 HDFC Bank Ltd. ADR(a) 5,130,554 0.89
179,259 Hindalco Industries Ltd. 972,279 0.17229,180 ICICI Bank Ltd. 2,215,336 0.3964,415 Indian Railway Catering & Tourism
Corp. Ltd. 572,998 0.10323,214 Infosys Ltd. 6,243,238 1.09151,166 Larsen & Toubro Ltd. GDR(a) 3,212,277 0.56452,067 Mahindra & Mahindra Ltd. GDR(a) 5,899,474 1.03467,145 Motherson Sumi Systems Ltd. 784,687 0.1435,600 Oberoi Realty Ltd. 368,443 0.06
690,600 Oil & Natural Gas Corp. Ltd. 1,344,294 0.231,638 Page Industries Ltd. 952,100 0.17
HoldingsSecurityDescription
Market ValueUSD
% ofShareholders’
Equity
Common Stocks – (Continued)India – (Continued)
2,200 Persistent Systems Ltd. 106,284 0.02149,711 Power Finance Corp. Ltd. 214,285 0.0479,300 Power Grid Corp. of India Ltd. 237,477 0.04
125,121 REC Ltd. 191,893 0.03171,152 Reliance Industries Ltd. 5,792,254 1.0126,831 Reliance Industries Ltd. GDR(a)(b) 1,811,092 0.3125,855 SRF Ltd. 818,229 0.1469,906 State Bank of India GDR(a) 4,166,398 0.7258,400 Sun Pharmaceutical Industries Ltd. 646,530 0.115,246 Tata Elxsi Ltd. 564,765 0.10
194,577 Tata Power Co. Ltd. 587,499 0.10117,771 Tata Steel Ltd. 1,596,497 0.28117,497 Tech Mahindra Ltd. 1,781,152 0.31105,041 Titan Co. Ltd. 2,990,740 0.5230,400 Varun Beverages Ltd. 413,018 0.07
187,600 Vedanta Ltd. 773,013 0.13
70,356,192 12.23
Indonesia6,708,400 Bank Central Asia Tbk PT 3,561,042 0.622,358,600 Bank Mandiri Persero Tbk PT 1,372,036 0.24
835,600 Bank Negara Indonesia Persero TbkPT 524,633 0.09
14,225,200 Bank Rakyat Indonesia Persero TbkPT 4,501,988 0.78
5,992,800 Telkom Indonesia Persero Tbk PT 1,768,717 0.31
11,728,416 2.04
Jersey1,368,865 Centamin PLC 1,411,699 0.25
Luxembourg13,775 Ternium SA ADR(a) 609,544 0.11
Malaysia478,000 Hartalega Holdings Bhd 458,513 0.08940,200 Kossan Rubber Industries Bhd 354,306 0.0639,900 Kuala Lumpur Kepong Bhd 233,037 0.04
931,100 Petronas Chemicals Group Bhd 2,181,817 0.381,754,900 Public Bank Bhd 1,895,781 0.33
642,700 Sime Darby Plantation Bhd 738,331 0.131,372,370 Supermax Corp. Bhd 329,106 0.052,141,600 Top Glove Corp. Bhd 684,764 0.12
6,875,655 1.19
Mexico295,600 Alfa SAB de CV Class A 217,093 0.0453,900 America Movil SAB de CV Class L
ADR(a) 1,185,800 0.211,430,700 America Movil SAB de CV—Series L 1,569,520 0.27
626,000 Bolsa Mexicana de Valores SAB deCV 1,230,769 0.21
765,082 Cemex SAB de CV ADR(a) 3,435,218 0.6033,000 Grupo Aeroportuario del Pacifico
SAB de CV Class B 484,713 0.0842,500 Grupo Aeroportuario del Sureste
SAB de CV Class B 920,770 0.16431,400 Grupo Bimbo SAB de CV Class A 1,335,288 0.23785,304 Grupo Financiero Banorte SAB de
CV Class O 5,074,888 0.88191,000 Grupo Financiero Inbursa SAB de
CV Class O 363,443 0.06319,761 Megacable Holdings SAB de CV 922,386 0.16185,500 Orbia Advance Corp. SAB de CV 489,211 0.09
1,884,660 Wal-Mart de Mexico SAB de CV 6,909,058 1.20
24,138,157 4.19
Panama16,500 Copa Holdings SA Class A 1,156,320 0.20
Goldman Sachs Funds II—Multi-Manager Emerging Markets Equity PortfolioSchedule of Investments
As at 31 May 2022
The accompanying notes are an integral part of these financial statements.
47

HoldingsSecurityDescription
Market ValueUSD
% ofShareholders’
Equity
Common Stocks – (Continued)Philippines
111,900 International Container TerminalServices, Inc. 463,513 0.08
Poland42,700 Bank Pekao SA 929,209 0.1674,787 KGHM Polska Miedz SA 2,555,293 0.44
185 LPP SA 453,916 0.08184,795 PGE Polska Grupa Energetyczna
SA 435,874 0.0823,700 Polski Koncern Naftowy ORLEN SA 414,439 0.07
4,788,731 0.83
Qatar614,878 Barwa Real Estate Co. 570,837 0.10652,742 Industries Qatar QSC 3,275,703 0.57179,200 Ooredoo QPSC 364,041 0.06
1,235,000 Qatar Aluminum Manufacturing Co. 691,016 0.12108,332 Qatar Islamic Bank SAQ 688,648 0.12202,255 United Development Co. QSC 80,062 0.02
5,670,307 0.99
Russia477,011 Gazprom PJSC ADR(a)(c) 0 -190,808 Globaltrans Investment PLC
GDR(a)(c) 0 -38,678 LUKOIL PJSC ADR(a)(c) 0 -
109,705 Magnit PJSC GDR(a)(c) 0 -13,330 Novolipetsk Steel PJSC GDR(a)(c) 0 -30,802 PhosAgro PJSC GDR(a)(c) 0 -
259,600 Sberbank of Russia PJSC(c) 0 -163,700 Surgutneftegas PJSC ADR(a)(c) 0 -
0 -
South Africa3,900 Anglo American Platinum Ltd. 423,979 0.07
41,237 Aspen Pharmacare Holdings Ltd. 428,434 0.0821,142 Capitec Bank Holdings Ltd. 3,065,517 0.5362,922 Clicks Group Ltd. 1,224,891 0.21
1,274,509 FirstRand Ltd. 5,881,250 1.0254,708 Investec Ltd. 337,840 0.0615,400 Kumba Iron Ore Ltd. 581,252 0.10
230,520 Mr Price Group Ltd. 3,049,190 0.53219,652 MTN Group Ltd. 2,377,468 0.4179,054 MultiChoice Group 673,646 0.127,523 Ninety One Ltd. 21,128 0.00
34,000 Remgro Ltd. 324,175 0.0629,604 Sasol Ltd. 788,195 0.14
269,200 Sibanye Stillwater Ltd. 878,267 0.15
20,055,232 3.48
South Korea1,700 BGF retail Co. Ltd. 251,397 0.04
31,338 BNK Financial Group, Inc. 199,080 0.03115,549 Cheil Worldwide, Inc. 2,421,148 0.42
3,218 CJ Corp. 221,113 0.0435,538 Hana Financial Group, Inc. 1,417,473 0.2519,900 Hankook Tire & Technology Co. Ltd. 571,755 0.1016,009 Hyundai Mobis Co. Ltd. 2,813,443 0.4920,607 Industrial Bank of Korea 186,864 0.038,100 JYP Entertainment Corp. 370,965 0.06
99,697 KB Financial Group, Inc. 4,860,283 0.84116,885 Kia Corp. 8,072,327 1.40
4,010 Korea Gas Corp. 143,565 0.0322,025 KT Corp. 671,884 0.122,000 Kumho Petrochemical Co. Ltd. 257,262 0.05
52,053 LG Display Co. Ltd. 727,007 0.139,574 LG Electronics, Inc. 807,941 0.141,562 LG Innotek Co. Ltd. 482,648 0.085,900 Meritz Financial Group, Inc. 155,574 0.03
11,079 NAVER Corp. 2,560,357 0.45
HoldingsSecurityDescription
Market ValueUSD
% ofShareholders’
Equity
Common Stocks – (Continued)South Korea – (Continued)
12,300 POSCO Holdings, Inc. 2,857,416 0.504,020 Samsung Biologics Co. Ltd.(b) 2,742,287 0.48
505,529 Samsung Electronics Co. Ltd. 27,447,572 4.771,477 Samsung Electronics Co. Ltd.
GDR(a) 1,978,442 0.3417,936 Samsung Electronics Co.
Ltd.—Preferred 878,477 0.159,200 Samsung Engineering Co. Ltd. 181,926 0.035,467 Samsung SDI Co. Ltd. 2,527,237 0.44
169,239 Shinhan Financial Group Co. Ltd. 5,878,894 1.0277,616 SK Hynix, Inc. 6,726,958 1.1747,191 SK Square Co. Ltd. 1,793,002 0.3172,998 SK Telecom Co. Ltd. 3,359,210 0.5865,965 Woori Financial Group, Inc. 791,034 0.14
84,354,541 14.66
Taiwan63,000 Asustek Computer, Inc. 738,080 0.13
1,066,100 Cathay Financial Holding Co. Ltd. 2,034,897 0.35283,000 Chailease Holding Co. Ltd. 2,179,199 0.38
1,356,800 CTBC Financial Holding Co. Ltd. 1,258,903 0.22274,000 Delta Electronics, Inc. 2,261,817 0.3989,400 E Ink Holdings, Inc. 620,995 0.1140,100 Eclat Textile Co. Ltd. 682,016 0.12
220,000 Evergreen Marine Corp. Taiwan Ltd. 1,056,178 0.181,384,860 Fubon Financial Holding Co. Ltd. 3,040,732 0.53
9,000 Global Unichip Corp. 169,440 0.03638,000 Hon Hai Precision Industry Co. Ltd. 2,472,421 0.4330,000 Kinsus Interconnect Technology
Corp. 178,210 0.03154,800 MediaTek, Inc. 4,784,974 0.8344,700 Nan Ya Printed Circuit Board Corp. 597,806 0.10
345,000 Nanya Technology Corp. 788,025 0.141,393,000 Primax Electronics Ltd. 2,946,944 0.51
49,000 Realtek Semiconductor Corp. 744,041 0.13226,800 Ruentex Development Co. Ltd. 598,388 0.11573,300 Taishin Financial Holding Co. Ltd. 352,837 0.06919,000 Taiwan Cement Corp. 1,346,753 0.24
1,258,400 Taiwan SemiconductorManufacturing Co. Ltd. 23,905,332 4.15
30,900 Taiwan SemiconductorManufacturing Co. Ltd. ADR(a) 2,937,045 0.51
763,000 Tong Yang Industry Co. Ltd. 1,047,256 0.1899,700 Unimicron Technology Corp. 731,055 0.13
1,730,000 United Microelectronics Corp. 3,037,009 0.53112,000 Win Semiconductors Corp. 861,533 0.15167,000 Winbond Electronics Corp. 166,661 0.03229,500 Wistron Corp. 223,870 0.0445,300 Yang Ming Marine Transport Corp. 192,826 0.03
3,447,000 Yuanta Financial Holding Co. Ltd. 2,879,526 0.50
64,834,769 11.27
Thailand690,600 Airports of Thailand PCL NVDR 1,406,264 0.24301,100 Bangkok Bank PCL 1,151,369 0.20331,300 Bangkok Chain Hospital PCL 196,534 0.03
1,840,600 Bangkok Dusit Medical ServicesPCL NVDR 1,383,717 0.24
226,000 Bumrungrad Hospital PCL 1,151,612 0.20149,800 Forth Corp. PCL 212,312 0.0435,900 Jasmine Telecom Systems PCL 326,268 0.06
222,300 Kasikornbank PCL 953,726 0.17410,000 Kasikornbank PCL NVDR 1,759,009 0.31
1,894,500 Krung Thai Bank PCL 835,280 0.14536,500 PTT Exploration & Production PCL 2,655,092 0.46904,800 PTT Exploration & Production PCL
NVDR 4,477,773 0.7854,400 Thonburi Healthcare Group PCL 119,229 0.02
19,161,600 TMBThanachart Bank PCL 710,413 0.12
17,338,598 3.01
Goldman Sachs Funds II—Multi-Manager Emerging Markets Equity PortfolioSchedule of Investments
As at 31 May 2022
The accompanying notes are an integral part of these financial statements.
48

HoldingsSecurityDescription
Market ValueUSD
% ofShareholders’
Equity
Common Stocks – (Continued)Turkey
701,633 Haci Omer Sabanci Holding AS 910,458 0.16
United Arab Emirates696,500 Abu Dhabi Commercial Bank PJSC 1,896,244 0.33392,631 Abu Dhabi Islamic Bank PJSC 891,505 0.15
2,988,353 Emaar Properties PJSC 4,639,163 0.81376,557 Emirates NBD Bank PJSC 1,348,124 0.2313,064 Emirates Telecommunications
Group Co. PJSC 107,765 0.022,731,536 Fertiglobe PLC 3,949,672 0.69
710,645 First Abu Dhabi Bank PJSC 4,149,498 0.7279,261 Yalla Group Ltd. ADR(a) 300,399 0.05
17,282,370 3.00
United Kingdom48,814 Anglo American PLC 2,387,716 0.41
United States16,800 Parade Technologies Ltd. 864,956 0.15
Uruguay16,800 Dlocal Ltd. 496,272 0.085,324 Globant SA 1,026,414 0.18
1,522,686 0.26
TOTAL COMMON STOCKS(cost USD 569,639,414) 550,791,331 95.70
Warrants – 0.00%Thailand
191,616 Ttb W1 exp. 05/25(c) 1,785 0.00
TOTAL WARRANTS(cost USD nil) 1,785 0.00
Mutual Funds – 3.76%Ireland
18,537,604 Goldman Sachs US$ LiquidReserves Fund (X DistributionClass)(d)(e) 18,537,604 3.22
5 Goldman Sachs US$ TreasuryLiquid Reserves Fund (X DistributionClass)(d)(f) 5 0.00
16,130 iShares China Large Cap UCITSETF 1,478,282 0.26
228,000 iShares MSCI Saudi Arabia CappedUCITS ETF 1,610,820 0.28
21,626,711 3.76
TOTAL MUTUAL FUNDS(cost USD 21,935,692) 21,626,711 3.76
TOTAL TRANSFERABLE SECURITIES ADMITTEDTO AN OFFICIAL EXCHANGE LISTING(cost USD 591,575,106) 572,419,827 99.46
HoldingsSecurityDescription
Market ValueUSD
% ofShareholders’
Equity
Other Transferable Securities
Common Stocks – -%Russia
198 PhosAgro PJSC GDR(a)(c) 0 -
TOTAL COMMON STOCKS(cost USD 4,639) 0 -
Warrants – 1.80%United Kingdom
179,982 HSBC Bank PLC exp. 02/24(c) 2,007,729 0.35259,487 HSBC Bank PLC exp. 04/24(c) 2,659,574 0.46
HoldingsSecurityDescription
Market ValueUSD
% ofShareholders’
Equity
Warrants – (Continued)United Kingdom – (Continued)
47,057 HSBC Bank PLC exp. 04/24(c) 1,844,389 0.32146,180 HSBC Bank PLC exp. 09/22(c) 3,842,276 0.67
10,353,968 1.80
TOTAL WARRANTS(cost USD 9,974,865) 10,353,968 1.80
TOTAL OTHER TRANSFERABLE SECURITIES(cost USD 9,979,504) 10,353,968 1.80
MARKET VALUE OF INVESTMENTS EXCLUDINGDERIVATIVES(cost USD 601,554,610) 582,773,795 101.26
Forward Currency Contracts – 0.00%
CurrencyAmountBought Currency
AmountSold
MaturityDate
UnrealisedLossUSD
% ofShareholders’
Equity
USD 160,070 ZAR 2,500,099 01/06/2022 (52) (0.00)
UNREALISED LOSS ON FORWARD CURRENCYCONTRACTS (52) (0.00)
MARKET VALUE OF INVESTMENTS(cost USD 601,554,610) 582,773,743 101.26
OTHER ASSETS AND LIABILITIES (7,278,032) (1.26)
SHAREHOLDERS’ EQUITY 575,495,711 100.00
TOTAL INVESTMENTSMarket Value
USD
% ofShareholders’
Equity
Total Investments excluding derivatives (cost USD601,554,610) 582,773,795 101.26
Unrealised loss on forward currency contracts (52) (0.00)Other Assets and Liabilities (7,278,032) (1.26)
Shareholders’ Equity 575,495,711 100.00
The counterparty for forward currency contracts was UBS AG.
The maximum individual counterparty exposure as at 31 May 2022 is 0.00% of the NAV.
+ A portion of these securities were on loan at 31 May 2022. See Note 6.(a) Security holding is traded/held in USD. (ADR: American Depositary Receipt/
GDR: Global Depositary Receipt).(b) 144A: This security is issued to qualified institutional investors, pursuant to private
placements, and is transferable as stated in rule 144A of the US Securities Act of1933.
(c) Valuation of this security is determined by the Valuer. See Note 4.(d) A related party to Goldman Sachs Funds II.(e) The yield for this fund as at 31 May 2022 was 0.922%.(f) The yield for this fund as at 31 May 2022 was 0.779%.
Goldman Sachs Funds II—Multi-Manager Emerging Markets Equity PortfolioSchedule of Investments
As at 31 May 2022
The accompanying notes are an integral part of these financial statements.
49

Allocation of Portfolio as at 31 May 2022
% ofShareholders’
Equity
Common StocksBanks 15.39Semiconductors 13.08Internet 8.53Diversified Financial Services 6.15Telecommunications 3.69Automobile Manufacturers 3.59Retail 3.54Oil & Gas 3.45Real Estate 3.36Chemicals 2.70Others 32.22
TOTAL COMMON STOCKS 95.70
Mutual Funds 3.76
WarrantsBanks 1.80
TOTAL WARRANTS 1.80
Unrealised Loss on Forward Currency Contracts (0.00)
Other Assets and Liabilities (1.26)
TOTAL 100.00
Goldman Sachs Funds II—Multi-Manager Emerging Markets Equity PortfolioSchedule of Investments
As at 31 May 2022
The accompanying notes are an integral part of these financial statements.
50

HoldingsSecurityDescription
Market ValueEUR
% ofShareholders’
Equity
Transferable securities admitted to an official exchange listing
Common Stocks – 97.39%Austria
33,411 Andritz AG 1,438,678 0.32+ 152,519 Erste Group Bank AG 4,458,130 0.99
44,290 Porr AG 556,282 0.1248,850 Vienna Insurance Group AG Wiener
Versicherung Gruppe 1,101,568 0.25
7,554,658 1.68
Belgium70,949 Anheuser-Busch InBev SA/NV 3,724,113 0.8377,781 UCB SA 6,392,043 1.42
10,116,156 2.25
Czech Republic54,146 Komercni Banka AS 1,589,597 0.35
Denmark25,898 DSV PANALPINA A/S 3,942,452 0.8887,351 Novo Nordisk A/S Class B 9,029,344 2.01
207,982 Tryg A/S 4,566,746 1.02
17,538,542 3.91
Finland467,327 Nordea Bank Abp 4,429,325 0.99
France46,297 Amundi SA(a) 2,513,927 0.56
162,900 Atos SE 3,966,615 0.88106,448 AXA SA 2,491,415 0.56164,179 BNP Paribas SA 8,744,174 1.9545,120 Bouygues SA 1,451,059 0.3291,335 Bureau Veritas SA 2,447,778 0.5521,173 Capgemini SE 3,845,017 0.8663,795 Compagnie de Saint-Gobain 3,526,588 0.7912,119 Danone SA 663,879 0.158,177 Dassault Aviation SA 1,292,784 0.29
294,743 Elis SA 4,359,249 0.9733,847 EssilorLuxottica SA 5,070,281 1.13
101,641 Imerys SA 3,480,188 0.789,074 Legrand SA 736,627 0.169,470 L’Oreal SA 3,116,103 0.698,324 LVMH Moet Hennessy Louis Vuitton
SE 4,976,087 1.1131,696 Pernod Ricard SA 5,803,538 1.2981,200 Publicis Groupe SA 4,160,688 0.9353,088 Safran SA 5,119,276 1.1413,680 Sanofi 1,353,636 0.3032,793 Schneider Electric SE 4,237,511 0.941,893 Somfy SA 260,855 0.06
103,248 Technip Energies NV 1,247,236 0.2818,808 Thales SA 2,158,218 0.48
181,811 TotalEnergies SE 10,095,965 2.25162,661 Veolia Environnement SA 4,297,504 0.9633,959 Vinci SA 3,055,970 0.68
94,472,168 21.06
Germany17,164 Allianz SE 3,343,204 0.7548,503 Beiersdorf AG 4,633,977 1.0351,570 Brenntag SE 3,739,856 0.83
283,713 Deutsche Telekom AG 5,417,783 1.2132,025 Fresenius Medical Care AG & Co.
KGaA 1,820,301 0.41214,884 Fresenius SE & Co. KGaA 6,869,841 1.5340,427 Fuchs Petrolub SE—Preferred 1,174,809 0.2610,407 GEA Group AG 394,529 0.095,935 Hannover Rueck SE 842,177 0.19
140,144 Hensoldt AG 3,216,305 0.7256,341 Jenoptik AG 1,469,373 0.3362,795 Mercedes-Benz Group AG 4,138,191 0.92
HoldingsSecurityDescription
Market ValueEUR
% ofShareholders’
Equity
Common Stocks – (Continued)Germany – (Continued)
21,257 MTU Aero Engines AG 3,916,602 0.8710,887 Rheinmetall AG 2,077,240 0.4611,199 SAP SE 1,037,027 0.2345,784 Siemens AG 5,640,589 1.2614,846 Siemens Healthineers AG(a) 835,830 0.1930,352 Symrise AG 3,115,633 0.69
158,169 United Internet AG 4,866,860 1.0915,274 Volkswagen AG—Preferred 2,348,225 0.5213,802 Washtec AG 685,269 0.15
61,583,621 13.73
Ireland77,381 CRH PLC 2,976,460 0.6679,819 Smurfit Kappa Group PLC 3,013,966 0.67
5,990,426 1.33
Italy139,454 Assicurazioni Generali SpA 2,360,956 0.53236,400 Eni SpA 3,383,357 0.7514,668 MARR SpA 203,885 0.05
5,948,198 1.33
Jordan60,387 Hikma Pharmaceuticals PLC 1,212,791 0.27
Luxembourg96,239 ArcelorMittal SA 2,913,636 0.65
Netherlands13,297 ASML Holding NV 7,181,710 1.6049,962 Heineken NV 4,691,432 1.05
797,648 Koninklijke KPN NV 2,697,645 0.6087,829 QIAGEN NV 3,817,048 0.859,499 Wolters Kluwer NV 876,758 0.19
19,264,593 4.29
Portugal307,791 Jeronimo Martins SGPS SA 5,872,652 1.31
Spain133,503 Almirall SA 1,399,111 0.31137,527 Banco Bilbao Vizcaya Argentaria SA 696,437 0.16
1,358,925 Banco Santander SA 4,105,992 0.9158,662 Ebro Foods SA 971,443 0.2228,566 Fluidra SA 713,007 0.16
+ 134,325 Grifols SA 2,624,711 0.5861,799 Grifols SA Class B—Preferred 742,206 0.17
360,498 Repsol SA 5,470,557 1.22
16,723,464 3.73
Sweden114,931 Alfa Laval AB 2,906,862 0.6569,973 Assa Abloy AB Class B 1,616,806 0.36
151,841 Essity AB Class B 3,727,828 0.83113,741 Hexpol AB 997,841 0.22106,161 Sandvik AB 2,045,320 0.4666,411 Svenska Cellulosa AB SCA Class B 1,122,945 0.25
524,575 Swedish Match AB 5,035,834 1.12113,865 Telia Co. AB 436,585 0.10172,774 Trelleborg AB Class B 3,767,161 0.84
21,657,182 4.83
Switzerland254,907 Glencore PLC 1,585,566 0.3523,646 Julius Baer Group Ltd. 1,133,686 0.2515,927 LafargeHolcim Ltd. 736,798 0.177,398 Lonza Group AG 4,164,444 0.93
79,216 Nestle SA 9,012,395 2.0179,866 Novartis AG 6,733,562 1.5023,216 Roche Holding AG 7,390,348 1.659,318 Sika AG 2,418,648 0.54
Goldman Sachs Funds II—Multi-Manager Europe Equity PortfolioSchedule of Investments
As at 31 May 2022
The accompanying notes are an integral part of these financial statements.
51

HoldingsSecurityDescription
Market ValueEUR
% ofShareholders’
Equity
Common Stocks – (Continued)Switzerland – (Continued)
30,765 STMicroelectronics NV 1,148,919 0.2611,182 Sulzer AG 731,604 0.16
285,937 UBS Group AG 5,032,377 1.123,106 Zurich Insurance Group AG 1,318,713 0.29
41,407,060 9.23
United Kingdom98,008 Anglo American PLC 4,475,165 1.0077,005 AstraZeneca PLC 9,400,511 2.10
253,057 Balfour Beatty PLC 776,769 0.17574,699 Beazley PLC 3,267,434 0.73363,909 BP PLC 1,875,908 0.42169,967 British American Tobacco PLC 7,018,866 1.56113,911 Bunzl PLC 3,750,890 0.84335,727 Compass Group PLC 6,995,127 1.56
1,318,414 ConvaTec Group PLC(a) 3,328,026 0.7441,889 Diageo PLC 1,805,142 0.40
314,625 GlaxoSmithKline PLC 6,386,111 1.42434,718 Hays PLC 627,345 0.14177,254 IMI PLC 2,955,827 0.6627,750 Linde PLC 8,384,662 1.87
15,683,348 Lloyds Banking Group PLC 8,260,593 1.84261,666 National Grid PLC 3,591,623 0.8030,399 Next PLC 2,304,911 0.51
315,638 OSB Group PLC 1,928,827 0.43532,511 Prudential PLC 6,552,030 1.46
9,228 Reckitt Benckiser Group PLC 660,645 0.15156,811 RELX PLC 4,190,517 0.93659,917 Rotork PLC 2,152,828 0.48331,949 RS Group PLC 3,768,331 0.8490,273 Savills PLC 1,168,008 0.2640,493 Shell PLC 1,145,749 0.26
332,986 Smith & Nephew PLC 5,081,226 1.13261,876 Smiths Group PLC 4,816,268 1.0750,601 Spectris PLC 1,795,241 0.40
127,686 Standard Chartered PLC 941,131 0.21238,807 Subsea 7 SA 2,325,481 0.52590,981 Taylor Wimpey PLC 900,076 0.20272,298 WPP PLC 2,942,047 0.66
115,573,315 25.76
United States149,024 Universal Music Group BV 3,092,993 0.69
TOTAL COMMON STOCKS(cost EUR 420,050,289) 436,940,377 97.39
Real Estate Investment Trusts – 0.24%United Kingdom
81,822 Segro PLC 1,061,068 0.24
TOTAL REAL ESTATE INVESTMENT TRUSTS(cost EUR 899,953) 1,061,068 0.24
Rights – 0.00%Spain
133,445 Almirall SA(b) 21,698 0.00
TOTAL RIGHTS(cost EUR nil) 21,698 0.00
HoldingsSecurityDescription
Market ValueEUR
% ofShareholders’
Equity
Mutual Funds – 2.18%Ireland
994 Goldman Sachs Euro LiquidReserves Fund (X AccumulationClass)(c)(d) 9,772,223 2.18
TOTAL MUTUAL FUNDS(cost EUR 9,774,630) 9,772,223 2.18
TOTAL TRANSFERABLE SECURITIES ADMITTEDTO AN OFFICIAL EXCHANGE LISTING(cost EUR 430,724,872) 447,795,366 99.81
MARKET VALUE OF INVESTMENTS(cost EUR 430,724,872) 447,795,366 99.81
OTHER ASSETS AND LIABILITIES 842,221 0.19
SHAREHOLDERS’ EQUITY 448,637,587 100.00
TOTAL INVESTMENTSMarket Value
EUR
% ofShareholders’
Equity
Total Investments (cost EUR 430,724,872) 447,795,366 99.81Other Assets and Liabilities 842,221 0.19
Shareholders’ Equity 448,637,587 100.00+ A portion of these securities were on loan at 31 May 2022. See Note 6.(a) 144A: This security is issued to qualified institutional investors, pursuant to private
placements, and is transferable as stated in rule 144A of the US Securities Act of1933.
(b) Valuation of this security is determined by the Valuer. See Note 4.(c) A related party to Goldman Sachs Funds II.(d) The yield for this fund as at 31 May 2022 was (0.589)%.
Allocation of Portfolio as at 31 May 2022
% ofShareholders’
Equity
Common StocksPharmaceuticals 11.73Food, Beverages & Tobacco 10.38Banks 8.52Insurance 5.78Oil & Gas 4.90Miscellaneous Manufacturing 4.20Healthcare Products 4.04Chemicals 3.65Aerospace & Defence 3.24Building Materials 2.94Others 38.01
TOTAL COMMON STOCKS 97.39
Mutual Funds 2.18
Real Estate Investment Trusts 0.24
RightsPharmaceuticals 0.00
TOTAL RIGHTS 0.00
Other Assets and Liabilities 0.19
TOTAL 100.00
Goldman Sachs Funds II—Multi-Manager Europe Equity PortfolioSchedule of Investments
As at 31 May 2022
The accompanying notes are an integral part of these financial statements.
52

HoldingsSecurityDescription
Market ValueUSD
% ofShareholders’
Equity
Transferable securities admitted to an official exchange listing
Common Stocks – 96.61%Austria
22,245 OMV AG 1,320,179 0.11
Bermuda8,540 Everest Re Group Ltd. 2,408,109 0.20
Brazil1,101,700 B3 SA - Brasil Bolsa Balcao 3,003,082 0.25
Canada141,881 CI Financial Corp. 1,789,854 0.15
2,516 Constellation Software, Inc. 3,951,713 0.33108,247 Gildan Activewear, Inc. 3,393,769 0.2829,477 Loblaw Cos. Ltd. 2,730,297 0.2314,079 Magna International, Inc. 907,978 0.0852,421 National Bank of Canada 4,009,262 0.345,202 Shopify, Inc. Class A 1,924,740 0.16
18,707,613 1.57
China242,628 Alibaba Group Holding Ltd. 2,965,193 0.25
3,844,000 China Construction Bank Corp.Class H 2,861,105 0.24
1,878,000 Industrial & Commercial Bank ofChina Ltd. Class H 1,127,453 0.09
4,516 KE Holdings, Inc. ADR(a) 57,714 0.0079,429 Li Auto, Inc. ADR(a) 1,975,399 0.17
106,600 Meituan Class B(b) 2,511,859 0.21398,500 Ping An Insurance Group Co. of
China Ltd. Class H 2,561,691 0.2244,650 Tencent Music Entertainment Group
ADR(a) 186,414 0.02
14,246,828 1.20
Denmark6,184 Genmab A/S 1,886,919 0.16
27,300 Pandora A/S 2,182,553 0.18
4,069,472 0.34
France193,917 BNP Paribas SA 11,063,890 0.9320,263 Ipsen SA 2,032,836 0.1714,165 L’Oreal SA 4,993,089 0.4211,500 Schneider Electric SE 1,591,909 0.1350,000 TotalEnergies SE 2,974,325 0.2515,688 Ubisoft Entertainment SA 816,256 0.07
23,472,305 1.97
Germany10,271 adidas AG 2,033,979 0.17
137,251 Bayerische Motoren Werke AG 11,822,692 0.9950,460 Covestro AG(b) 2,292,484 0.19
207,470 Daimler Truck Holding AG 6,485,320 0.5413,354 Deutsche Boerse AG 2,228,077 0.1943,361 Deutsche Post AG 1,776,962 0.15
511,595 E.ON SE 5,193,285 0.4427,870 LEG Immobilien AG 2,820,770 0.24
353,114 Mercedes-Benz Group AG 24,928,213 2.09
59,581,782 5.00
Hong Kong534,200 AIA Group Ltd. 5,541,368 0.47588,000 Brilliance China Automotive Holdings
Ltd.(c) 270,480 0.0244,500 Orient Overseas International Ltd. 1,368,462 0.11
7,180,310 0.60
HoldingsSecurityDescription
Market ValueUSD
% ofShareholders’
Equity
Common Stocks – (Continued)India
115,132 Housing Development Finance Corp.Ltd. 3,407,664 0.29
124,597 Reliance Industries Ltd. GDR(a)(b) 8,410,297 0.70
11,817,961 0.99
Ireland24,155 Accenture PLC Class A 7,250,606 0.61
137,563 CRH PLC 5,669,852 0.4881,813 Medtronic PLC 8,165,756 0.6897,944 Ryanair Holdings PLC 1,499,867 0.1352,692 Ryanair Holdings PLC ADR(a) 4,595,269 0.38
27,181,350 2.28
Israel342,810 Bank Leumi Le-Israel BM 3,363,613 0.2840,881 Mizrahi Tefahot Bank Ltd. 1,345,644 0.12
4,709,257 0.40
Japan61,400 Capcom Co. Ltd. 1,738,772 0.15
172,900 CyberAgent, Inc. 1,854,343 0.16103,100 Dai-ichi Life Holdings, Inc. 2,117,555 0.1837,200 Daito Trust Construction Co. Ltd. 3,280,278 0.2748,600 Daiwa House Industry Co. Ltd. 1,170,053 0.1033,400 Denso Corp. 2,037,360 0.1793,500 Honda Motor Co. Ltd. 2,318,670 0.1911,800 Hoshizaki Corp. 697,415 0.0644,900 Hoya Corp. 4,763,164 0.40
104,100 Idemitsu Kosan Co. Ltd. 2,831,854 0.24174,600 KDDI Corp. 6,087,027 0.51
5,500 Komatsu Ltd. 136,159 0.01376,700 Marubeni Corp. 3,955,814 0.3377,600 Mitsui & Co. Ltd. 1,952,560 0.163,700 Nintendo Co. Ltd. 1,644,607 0.14
46,400 Nitto Denko Corp. 3,360,930 0.28275,300 Olympus Corp. 5,721,063 0.4898,100 Renesas Electronics Corp. 1,151,333 0.105,800 SMC Corp. 2,996,619 0.25
57,044 Sumitomo Metal Mining Co. Ltd. 2,400,076 0.20220,700 Sumitomo Mitsui Financial Group,
Inc. 6,744,736 0.5737,200 Sysmex Corp. 2,416,722 0.20
61,377,110 5.15
Jersey21,060 Novocure Ltd. 1,713,442 0.14
Luxembourg112,293 Tenaris SA 1,910,267 0.1620,145 Ternium SA ADR(a) 891,416 0.07
2,801,683 0.23
Netherlands1,243 Adyen NV(b) 1,919,050 0.163,756 ASML Holding NV 2,173,154 0.18
728,882 ING Groep NV 8,228,226 0.69142,239 Prosus NV 7,323,833 0.6176,723 Wolters Kluwer NV 7,586,091 0.64
27,230,354 2.28
Norway143,703 Adevinta ASA 1,176,012 0.1081,866 Aker BP ASA 3,571,386 0.3089,805 Schibsted ASA Class A 1,879,745 0.16
6,627,143 0.56
Goldman Sachs Funds II—Multi-Manager Global Equity PortfolioSchedule of Investments
As at 31 May 2022
The accompanying notes are an integral part of these financial statements.
53

HoldingsSecurityDescription
Market ValueUSD
% ofShareholders’
Equity
Common Stocks – (Continued)Russia
84,342 Sberbank of Russia PJSC ADR(a)(c) 0 -10,517 VK Co. Ltd. GDR(a)(c) 0 -
0 -
Singapore123,800 DBS Group Holdings Ltd. 2,784,105 0.2332,699 Sea Ltd. ADR(a) 2,786,609 0.24
256,895 United Overseas Bank Ltd. 5,502,480 0.46
11,073,194 0.93
South Korea71,334 Coupang LLC Class A 987,262 0.08
414,342 Samsung Electronics Co. Ltd. 22,496,597 1.8989,400 SK Hynix, Inc. 7,748,275 0.65
31,232,134 2.62
Sweden292,340 Atlas Copco AB Class B 2,903,978 0.24136,885 Epiroc AB Class B 2,316,435 0.2063,779 Investor AB Class B 1,202,815 0.1025,993 Lundin Energy AB 1,277,253 0.116,289 Spotify Technology SA 704,682 0.06
8,405,163 0.71
Switzerland27,196 Compagnie Financiere Richemont
SA 2,990,285 0.2595,759 Nestle SA 11,670,722 0.98
109,000 Novartis AG 9,844,648 0.8356,681 Roche Holding AG 19,328,841 1.6233,672 Wizz Air Holdings PLC(b) 1,213,617 0.10
45,048,113 3.78
Taiwan378,000 Taiwan Semiconductor
Manufacturing Co. Ltd. 7,180,718 0.60237,835 Taiwan Semiconductor
Manufacturing Co. Ltd. ADR(a) 22,606,217 1.90
29,786,935 2.50
Thailand522,300 Kasikornbank PCL 2,240,807 0.19
United Kingdom113,986 3i Group PLC 1,841,784 0.16112,526 Auto Trader Group PLC(b) 831,822 0.07
1,855,634 Barclays PLC 3,980,177 0.33414,234 BP PLC 2,287,469 0.19146,258 CNH Industrial NV 2,177,836 0.18186,445 Evraz PLC(c) 0 -108,448 Farfetch Ltd. Class A 990,130 0.08174,647 GlaxoSmithKline PLC 3,797,477 0.3247,860 Michael Kors Holdings Ltd. 2,299,912 0.19
2,056,789 Natwest Group PLC 5,900,998 0.5024,567 Next PLC 1,995,436 0.17
406,702 Prudential PLC 5,360,612 0.4536,879 Rio Tinto PLC ADR(a) 2,729,784 0.23
198,680 Unilever PLC 9,439,466 0.79
43,632,903 3.66
United States20,554 Abbott Laboratories 2,369,260 0.2046,586 AbbVie, Inc. 6,875,162 0.586,274 ABIOMED, Inc. 1,630,675 0.14
20,972 Acuity Brands, Inc. 3,623,332 0.308,627 Adobe, Inc. 3,597,977 0.30
13,933 Agilent Technologies, Inc. 1,799,308 0.1546,230 Akamai Technologies, Inc. 4,647,502 0.3924,329 Albemarle Corp. 6,319,944 0.53
181,663 Albertsons Cos., Inc. 5,504,389 0.46
HoldingsSecurityDescription
Market ValueUSD
% ofShareholders’
Equity
Common Stocks – (Continued)United States – (Continued)
8,198 Allstate Corp. 1,106,320 0.0924,157 Alnylam Pharmaceuticals, Inc. 2,996,193 0.257,804 Alphabet, Inc. Class A 17,560,015 1.47
13,366 Alphabet, Inc. Class C 30,166,795 2.534,485 Amazon.com, Inc. 10,477,543 0.88
19,849 Amgen, Inc. 4,988,649 0.4210,507 Analog Devices, Inc. 1,736,282 0.1556,570 Anthem, Inc. 29,261,964 2.4616,110 Apollo Global Management, Inc. 949,040 0.08
173,173 Apple, Inc. 25,614,018 2.1541,474 Arthur J Gallagher & Co. 6,759,640 0.5712,701 Aspen Technology, Inc. 2,492,571 0.2112,515 Axon Enterprise, Inc. 1,247,871 0.1049,340 Baker Hughes Co. 1,837,915 0.1537,469 Bank of America Corp. 1,393,472 0.122,833 Booking Holdings, Inc. 6,297,759 0.53
112,288 Bristol-Myers Squibb Co. 8,332,892 0.708,650 Broadcom, Inc. 5,010,859 0.42
21,578 Broadridge Financial Solutions, Inc. 3,139,815 0.267,916 Brunswick Corp. 584,834 0.055,067 CACI International, Inc. Class A 1,435,076 0.12
37,335 Cadence Design Systems, Inc. 5,717,109 0.4878,726 Carlyle Group, Inc. 3,041,185 0.269,031 Carvana Co. 284,928 0.02
22,000 Cboe Global Markets, Inc. 2,450,580 0.2156,783 CBRE Group, Inc. Class A 4,720,371 0.4039,334 Celanese Corp. 6,217,525 0.5267,033 Certara, Inc. 1,371,495 0.1138,883 Charles Schwab Corp. 2,732,308 0.2327,189 Chegg, Inc. 523,660 0.0427,270 Chewy, Inc. Class A 717,746 0.0660,426 Cigna Corp. 16,331,939 1.3747,190 Cisco Systems, Inc. 2,119,775 0.18
146,421 Citigroup, Inc. 7,843,773 0.6626,349 Cloudflare, Inc. Class A 1,485,557 0.1234,587 CoStar Group, Inc. 2,111,190 0.184,170 Costco Wholesale Corp. 1,922,537 0.16
18,460 Crane Holdings Co. 1,747,793 0.1517,805 Datadog, Inc. Class A 1,721,922 0.1460,341 Dell Technologies, Inc. Class C 2,942,227 0.2534,930 Devon Energy Corp. 2,717,205 0.2322,860 DoorDash, Inc. Class A 1,782,166 0.1518,159 Dover Corp. 2,409,518 0.2020,330 DR Horton, Inc. 1,495,881 0.13
171,790 Dropbox, Inc. Class A 3,581,822 0.3020,155 EMCOR Group, Inc. 2,143,283 0.1817,355 Emerson Electric Co. 1,519,777 0.1323,444 Estee Lauder Cos., Inc. Class A 5,983,378 0.5014,131 Exact Sciences Corp. 726,616 0.0622,440 Exxon Mobil Corp. 2,222,906 0.194,170 FactSet Research Systems, Inc. 1,595,234 0.134,209 Fair Isaac Corp. 1,685,999 0.14
41,578 Fidelity National Financial, Inc. 1,742,118 0.1520,749 General Mills, Inc. 1,431,681 0.1240,408 GoDaddy, Inc. Class A 3,031,812 0.25
265,458 Halliburton Co. 11,021,816 0.9264,476 HCA Healthcare, Inc. 13,768,205 1.1621,766 Herbalife Nutrition Ltd. 487,994 0.0413,747 Hershey Co. 2,886,045 0.2426,702 Hologic, Inc. 2,016,268 0.1717,873 Howard Hughes Corp. 1,489,178 0.128,955 IAC Holdings, Inc. 758,399 0.069,705 IDEXX Laboratories, Inc. 3,815,909 0.32
11,010 Illumina, Inc. 2,680,164 0.2237,124 International Paper Co. 1,806,825 0.1580,056 Interpublic Group of Cos., Inc. 2,560,991 0.2154,291 Johnson & Johnson 9,557,931 0.8095,161 JPMorgan Chase & Co. 12,508,913 1.0514,437 Keysight Technologies, Inc. 2,096,108 0.1814,856 KLA Corp. 5,360,936 0.4518,673 Lennar Corp. Class A 1,494,027 0.13
Goldman Sachs Funds II—Multi-Manager Global Equity PortfolioSchedule of Investments
As at 31 May 2022
The accompanying notes are an integral part of these financial statements.
54

HoldingsSecurityDescription
Market ValueUSD
% ofShareholders’
Equity
Common Stocks – (Continued)United States – (Continued)
47,406 LKQ Corp. 2,440,935 0.207,555 Lowe’s Cos., Inc. 1,477,607 0.122,158 Markel Corp. 2,972,127 0.25
12,983 Marriott International, Inc. Class A 2,210,745 0.1911,795 Marsh & McLennan Cos., Inc. 1,874,933 0.1624,224 Martin Marietta Materials, Inc. 8,189,892 0.6916,352 Mastercard, Inc. Class A 5,829,161 0.4913,032 McKesson Corp. 4,278,927 0.36
112,645 Meta Platforms, Inc. Class A 21,831,727 1.8344,860 MetLife, Inc. 3,013,695 0.25
910 Mettler-Toledo International, Inc. 1,189,252 0.10346,260 Micron Technology, Inc. 25,135,013 2.11166,521 Microsoft Corp. 45,102,213 3.7823,443 Moderna, Inc. 3,442,839 0.2928,506 Moody’s Corp. 8,607,102 0.724,581 Netflix, Inc. 884,958 0.078,389 Norfolk Southern Corp. 2,015,877 0.17
37,730 NRG Energy, Inc. 1,738,976 0.1546,906 ON Semiconductor Corp. 2,814,360 0.24
119,319 Oscar Health, Inc. Class A 579,890 0.0513,094 Parker-Hannifin Corp. 3,540,487 0.3017,338 Paychex, Inc. 2,125,812 0.1825,215 Peloton Interactive, Inc. Class A 358,053 0.0354,700 PepsiCo, Inc. 9,058,320 0.7699,091 Pfizer, Inc. 5,159,668 0.4319,879 Phillips 66 2,053,302 0.17
108,268 Procter & Gamble Co. 15,855,849 1.3330,769 QUALCOMM, Inc. 4,257,814 0.3615,976 Regal Rexnord Corp. 1,985,497 0.1770,050 Regions Financial Corp. 1,526,390 0.1387,124 Royalty Pharma PLC Class A 3,542,462 0.3034,104 S&P Global, Inc. 12,077,932 1.01
102,466 Schlumberger NV 4,898,899 0.4135,505 Seagate Technology Holdings PLC 2,922,062 0.2519,083 Sealed Air Corp. 1,192,688 0.10
101,118 Service Corp. International 6,961,974 0.5815,894 SiteOne Landscape Supply, Inc. 2,116,286 0.1820,888 Snap-on, Inc. 4,607,266 0.398,467 Snowflake, Inc. Class A 1,082,845 0.09
14,796 STAAR Surgical Co. 978,607 0.0825,853 Starbucks Corp. 1,992,232 0.1750,722 Tapestry, Inc. 1,729,113 0.1515,200 Target Corp. 2,486,872 0.2118,065 Teladoc Health, Inc. 616,378 0.0534,963 Teradyne, Inc. 3,767,088 0.327,639 Tesla, Inc. 5,737,882 0.487,858 Thermo Fisher Scientific, Inc. 4,490,376 0.38
69,505 Trade Desk, Inc. Class A 3,566,997 0.3015,667 Twilio, Inc. Class A 1,658,979 0.1483,837 Tyson Foods, Inc. Class A 7,488,321 0.6310,890 Union Pacific Corp. 2,406,581 0.2049,637 UnitedHealth Group, Inc. 24,931,672 2.0965,692 Universal Music Group BV 1,460,582 0.129,808 VeriSign, Inc. 1,701,688 0.144,449 Vertex Pharmaceuticals, Inc. 1,193,533 0.10
31,299 Vimeo, Inc. 270,736 0.0222,218 Visa, Inc. Class A 4,714,437 0.4049,919 Walmart, Inc. 6,394,125 0.5412,117 Wayfair, Inc. Class A 683,156 0.06
156,821 Wells Fargo & Co. 7,187,106 0.6059,573 Western Alliance Bancorp 4,813,498 0.4083,600 Western Digital Corp. 5,010,984 0.4245,065 Westrock Co. 2,183,850 0.18
702,558,425 58.95
TOTAL COMMON STOCKS(cost USD 1,185,984,151) 1,151,425,654 96.61
Real Estate Investment Trusts – 0.35%France
92,389 Klepierre SA 2,089,293 0.17
HoldingsSecurityDescription
Market ValueUSD
% ofShareholders’
Equity
Real Estate Investment Trusts – (Continued)United States
7,490 Essex Property Trust, Inc. 2,127,796 0.18
TOTAL REAL ESTATE INVESTMENT TRUSTS(cost USD 4,316,798) 4,217,089 0.35
Mutual Funds – 2.15%Ireland
15,095,280 Goldman Sachs US$ LiquidReserves Fund (X DistributionClass)(d)(e) 15,095,280 1.27
175,850 iShares MSCI World UCITS ETF 10,508,796 0.88
25,604,076 2.15
TOTAL MUTUAL FUNDS(cost USD 25,537,202) 25,604,076 2.15
TOTAL TRANSFERABLE SECURITIES ADMITTEDTO AN OFFICIAL EXCHANGE LISTING(cost USD 1,215,838,151) 1,181,246,819 99.11
MARKET VALUE OF INVESTMENTS EXCLUDINGDERIVATIVES(cost USD 1,215,838,151) 1,181,246,819 99.11
Share Class Specific Forward Currency Contracts – (0.37%)
CurrencyAmountBought Currency
AmountSold
MaturityDate
UnrealisedGainUSD
% ofShareholders’
Equity
EUR 7,457,767 USD 7,902,525 21/07/2022 107,199 0.01GBP 59,030,651 USD 74,034,882 21/07/2022 299,692 0.02GBP 51,091,267 USD 64,037,222 18/08/2022 315,481 0.03
UNREALISED GAIN ON FORWARD CURRENCYCONTRACTS HELD FOR HEDGING PURPOSES 722,372 0.06
CurrencyAmountBought Currency
AmountSold
MaturityDate
UnrealisedLossUSD
% ofShareholders’
Equity
EUR 8,492,313 USD 9,388,305 16/06/2022 (284,932) (0.02)GBP 63,045,759 USD 83,398,722 16/06/2022 (4,029,734) (0.34)USD 9,035,916 EUR 8,492,313 16/06/2022 (67,457) (0.01)USD 79,220,808 GBP 63,045,759 16/06/2022 (148,179) (0.01)USD 8,009,651 EUR 7,457,767 21/07/2022 (74) (0.00)USD 73,756,295 GBP 59,030,650 21/07/2022 (578,278) (0.05)EUR 6,633,932 USD 7,153,956 18/08/2022 (17,359) (0.00)
UNREALISED LOSS ON FORWARD CURRENCYCONTRACTS HELD FOR HEDGING PURPOSES (5,126,013) (0.43)
MARKET VALUE OF INVESTMENTS(cost USD 1,215,838,151) 1,176,843,178 98.74
OTHER ASSETS AND LIABILITIES 14,986,290 1.26
SHAREHOLDERS’ EQUITY 1,191,829,468 100.00
TOTAL INVESTMENTSMarket Value
USD
% ofShareholders’
Equity
Total Investments excluding derivatives (costUSD 1,215,838,151) 1,181,246,819 99.11
Unrealised gain on forward currency contracts held for hedgingpurposes 722,372 0.06
Unrealised loss on forward currency contracts held for hedgingpurposes (5,126,013) (0.43)
Other Assets and Liabilities 14,986,290 1.26
Shareholders’ Equity 1,191,829,468 100.00
Goldman Sachs Funds II—Multi-Manager Global Equity PortfolioSchedule of Investments
As at 31 May 2022
The accompanying notes are an integral part of these financial statements.
55

The counterparty for forward currency contracts was Morgan Stanley & Co. LLC.
The maximum individual counterparty exposure as at 31 May 2022 is 0.08% of the NAV.
(a) Security holding is traded/held in USD. (ADR: American Depositary Receipt/GDR: Global Depositary Receipt).
(b) 144A: This security is issued to qualified institutional investors, pursuant to privateplacements, and is transferable as stated in rule 144A of the US Securities Act of1933.
(c) Valuation of this security is determined by the Valuer. See Note 4.(d) A related party to Goldman Sachs Funds II.(e) The yield for this fund as at 31 May 2022 was 0.922%.
Allocation of Portfolio as at 31 May 2022
% ofShareholders’
Equity
Common StocksInternet 10.09Semiconductors 9.37Banks 7.93Pharmaceuticals 7.22Software 7.13Healthcare Services 5.76Automobile Manufacturers 4.48Computers 3.80Food, Beverages & Tobacco 3.42Cosmetics/Personal Care 3.04Others 34.37
TOTAL COMMON STOCKS 96.61
Mutual Funds 2.15
Real Estate Investment Trusts 0.35
Unrealised Gain on Forward Currency Contracts Held for HedgingPurposes
0.06
Unrealised Loss on Forward Currency Contracts Held for HedgingPurposes
(0.43)
Other Assets and Liabilities 1.26
TOTAL 100.00
Goldman Sachs Funds II—Multi-Manager Global Equity PortfolioSchedule of Investments
As at 31 May 2022
The accompanying notes are an integral part of these financial statements.
56

HoldingsSecurityDescription
Market ValueUSD
% ofShareholders’
Equity
Transferable securities admitted to an official exchange listing
Common Stocks – 97.77%Australia
20,360 Atlassian Corp. PLC Class A 3,661,542 0.42
Canada129,070 Brookfield Asset Management, Inc.
Class A 6,521,907 0.74
Denmark70,770 Ascendis Pharma A/S ADR(a) 6,201,575 0.71
Ireland28,350 ICON PLC 6,366,843 0.7354,716 Medtronic PLC 5,461,204 0.62
11,828,047 1.35
United Kingdom50,241 Linde PLC 16,282,606 1.85
United States93,293 Abbott Laboratories 10,753,884 1.2232,111 AbbVie, Inc. 4,738,941 0.5416,120 Adobe, Inc. 6,723,007 0.7733,480 Advanced Micro Devices, Inc. 3,395,542 0.3920,697 Alphabet, Inc. Class A 46,570,941 5.307,905 Amazon.com, Inc. 18,467,108 2.10
228,835 American International Group, Inc. 13,402,866 1.5342,248 AMETEK, Inc. 5,073,140 0.5855,578 Analog Devices, Inc. 9,184,264 1.05
190,168 Apple, Inc. 28,127,749 3.2040,037 Applied Materials, Inc. 4,685,330 0.537,712 AutoZone, Inc. 15,960,909 1.82
248,562 Bank of America Corp. 9,244,021 1.0554,257 Becton Dickinson and Co. 13,722,138 1.5621,168 Berkshire Hathaway, Inc. Class B 6,688,665 0.768,120 Bio-Rad Laboratories, Inc. Class A 4,310,827 0.492,044 Booking Holdings, Inc. 4,543,812 0.52
84,944 BorgWarner, Inc. 3,368,030 0.38275,311 Carrier Global Corp. 10,731,662 1.2228,077 Caterpillar, Inc. 6,090,463 0.6936,128 CME Group, Inc. 7,167,073 0.8261,215 Cognizant Technology Solutions
Corp. Class A 4,534,195 0.5266,276 Colgate-Palmolive Co. 5,174,167 0.5973,717 Comcast Corp. Class A 3,228,067 0.37
167,401 ConocoPhillips 19,572,525 2.2311,790 Costco Wholesale Corp. 5,435,662 0.6212,084 Deere & Co. 4,340,089 0.4913,780 Dexcom, Inc. 4,370,603 0.5049,743 Dominion Energy, Inc. 4,193,335 0.4815,577 FactSet Research Systems, Inc. 5,958,981 0.6880,649 Fidelity National Information
Services, Inc. 8,414,110 0.9615,380 Fortinet, Inc. 4,495,728 0.51
176,135 Freeport-McMoRan, Inc. 7,008,412 0.80200,024 General Motors Co. 7,656,919 0.87113,639 Graco, Inc. 7,121,756 0.81267,892 Hanesbrands, Inc. 3,147,731 0.3654,260 Hartford Financial Services Group,
Inc. 3,902,379 0.4445,627 Home Depot, Inc. 13,798,974 1.5717,340 Honeywell International, Inc. 3,340,378 0.3827,957 Humana, Inc. 12,792,564 1.4681,723 Johnson & Johnson 14,387,334 1.64
164,556 KKR & Co., Inc. 8,996,277 1.027,910 Lam Research Corp. 4,073,413 0.46
55,211 Lowe’s Cos., Inc. 10,798,167 1.2333,140 Marriott International, Inc. Class A 5,643,079 0.6435,096 Marsh & McLennan Cos., Inc. 5,578,860 0.642,280 Martin Marietta Materials, Inc. 770,845 0.09
40,088 Mastercard, Inc. Class A 14,290,570 1.6363,844 Meta Platforms, Inc. Class A 12,373,606 1.415,309 Mettler-Toledo International, Inc. 6,938,173 0.79
HoldingsSecurityDescription
Market ValueUSD
% ofShareholders’
Equity
Common Stocks – (Continued)United States – (Continued)
194,880 MGM Resorts International 6,851,981 0.7876,990 Microchip Technology, Inc. 5,500,166 0.63
188,736 Microsoft Corp. 51,119,146 5.8248,426 Middleby Corp. 7,276,007 0.8371,213 Mondelez International, Inc. Class A 4,476,449 0.5158,409 Moody’s Corp. 17,636,013 2.0147,380 Morgan Stanley 4,082,735 0.4721,344 MSCI, Inc. 9,454,538 1.0834,956 Nasdaq, Inc. 5,420,627 0.62
119,676 NIKE, Inc. Class B 13,905,154 1.5834,450 NVIDIA Corp. 6,394,265 0.731,787 NVR, Inc. 7,831,653 0.89
109,737 Oracle Corp. 7,915,330 0.90100,238 Otis Worldwide Corp. 7,434,652 0.8522,311 Parker-Hannifin Corp. 6,032,671 0.69
120,915 PepsiCo, Inc. 20,023,524 2.28138,318 Pfizer, Inc. 7,202,218 0.8248,490 QUALCOMM, Inc. 6,710,046 0.7614,160 S&P Global, Inc. 5,014,764 0.5735,488 Salesforce, Inc. 5,697,953 0.6516,050 ServiceNow, Inc. 7,551,043 0.8650,604 Sherwin-Williams Co. 13,492,038 1.5424,850 Snowflake, Inc. Class A 3,178,067 0.3672,206 SS&C Technologies Holdings, Inc. 4,624,072 0.538,765 SVB Financial Group 4,251,025 0.48
23,866 Take-Two Interactive Software, Inc. 3,003,775 0.3410,688 Tesla, Inc. 8,028,077 0.9140,248 Texas Instruments, Inc. 7,018,446 0.808,374 Thermo Fisher Scientific, Inc. 4,785,239 0.55
134,609 TJX Cos., Inc. 8,487,097 0.9715,345 TransDigm Group, Inc. 9,249,045 1.05
162,240 Truist Financial Corp. 7,935,158 0.9052,461 Union Pacific Corp. 11,593,356 1.3234,709 UnitedHealth Group, Inc. 17,433,637 1.9980,995 Verizon Communications, Inc. 4,136,820 0.47
124,125 VF Corp. 6,247,211 0.7183,297 Visa, Inc. Class A 17,674,790 2.0165,604 Walt Disney Co. 7,133,779 0.8125,889 Waste Management, Inc. 4,106,254 0.4777,581 Wells Fargo & Co. 3,555,537 0.4132,668 Workday, Inc. Class A 5,071,054 0.5842,380 Zendesk, Inc. 4,010,843 0.46
813,833,526 92.70
TOTAL COMMON STOCKS(cost USD 738,740,665) 858,329,203 97.77
Real Estate Investment Trusts – 0.93%United States
9,956 SBA Communications Corp. 3,359,752 0.39119,830 Weyerhaeuser Co. 4,756,052 0.54
8,115,804 0.93
TOTAL REAL ESTATE INVESTMENT TRUSTS(cost USD 6,250,609) 8,115,804 0.93
Mutual Funds – 0.91%Ireland
8,020,701 Goldman Sachs US$ LiquidReserves Fund (X DistributionClass)(b)(c) 8,020,701 0.91
TOTAL MUTUAL FUNDS(cost USD 8,020,701) 8,020,701 0.91
TOTAL TRANSFERABLE SECURITIES ADMITTEDTO AN OFFICIAL EXCHANGE LISTING(cost USD 753,011,975) 874,465,708 99.61
Goldman Sachs Funds II—Multi-Manager US Equity PortfolioSchedule of Investments
As at 31 May 2022
The accompanying notes are an integral part of these financial statements.
57

MARKET VALUE OF INVESTMENTS EXCLUDINGDERIVATIVES(cost USD 753,011,975) 874,465,708 99.61
Share Class Specific Forward Currency Contracts – (0.00%)
CurrencyAmountBought Currency
AmountSold
MaturityDate
UnrealisedGainUSD
% ofShareholders’
Equity
EUR 24,833 USD 26,318 21/07/2022 352 0.00USD 26,675 EUR 24,833 21/07/2022 5 0.00
UNREALISED GAIN ON FORWARD CURRENCYCONTRACTS HELD FOR HEDGING PURPOSES 357 0.00
CurrencyAmountBought Currency
AmountSold
MaturityDate
UnrealisedLossUSD
% ofShareholders’
Equity
EUR 26,834 USD 29,667 16/06/2022 (902) (0.00)USD 28,456 EUR 26,834 16/06/2022 (309) (0.00)EUR 22,932 USD 24,721 18/08/2022 (52) (0.00)USD 826 EUR 770 18/08/2022 (2) (0.00)
UNREALISED LOSS ON FORWARD CURRENCYCONTRACTS HELD FOR HEDGING PURPOSES (1,265) (0.00)
MARKET VALUE OF INVESTMENTS(cost USD 753,011,975) 874,464,800 99.61
OTHER ASSETS AND LIABILITIES 3,425,090 0.39
SHAREHOLDERS’ EQUITY 877,889,890 100.00
TOTAL INVESTMENTSMarket Value
USD
% ofShareholders’
Equity
Total Investments excluding derivatives (cost USD753,011,975) 874,465,708 99.61
Unrealised gain on forward currency contracts held for hedgingpurposes 357 0.00
Unrealised loss on forward currency contracts held for hedgingpurposes (1,265) (0.00)
Other Assets and Liabilities 3,425,090 0.39
Shareholders’ Equity 877,889,890 100.00
The counterparty for forward currency contracts was Morgan Stanley & Co. LLC.
The maximum individual counterparty exposure as at 31 May 2022 is 0.00% of the NAV.
(a) Security holding is traded/held in USD. (ADR: American Depositary Receipt/GDR: Global Depositary Receipt).
(b) A related party to Goldman Sachs Funds II.(c) The yield for this fund as at 31 May 2022 was 0.922%.
Allocation of Portfolio as at 31 May 2022
% ofShareholders’
Equity
Common StocksSoftware 13.27Internet 9.79Diversified Financial Services 6.84Retail 6.21Semiconductors 5.35Pharmaceuticals 5.06Computers 4.23Healthcare Services 4.18Chemicals 3.39Insurance 3.37Others 36.08
TOTAL COMMON STOCKS 97.77
Real Estate Investment Trusts 0.93
Mutual Funds 0.91
Unrealised Gain on Forward Currency Contracts Held for HedgingPurposes
0.00
Unrealised Loss on Forward Currency Contracts Held for HedgingPurposes
(0.00)
Other Assets and Liabilities 0.39
TOTAL 100.00
Goldman Sachs Funds II—Multi-Manager US Equity PortfolioSchedule of Investments
As at 31 May 2022
The accompanying notes are an integral part of these financial statements.
58

HoldingsSecurityDescription
Market ValueUSD
% ofShareholders’
Equity
Transferable securities admitted to an official exchange listing
Common Stocks – 90.90%Australia
18,869 Opthea Ltd. ADR(a) 145,669 0.03
Bermuda28,847 Assured Guaranty Ltd. 1,682,069 0.3628,901 Axis Capital Holdings Ltd. 1,676,258 0.36
725 RenaissanceRe Holdings Ltd. 111,548 0.03
3,469,875 0.75
Canada7,650 Colliers International Group, Inc. 902,012 0.19
87,394 Enerplus Corp. 1,321,397 0.29
2,223,409 0.48
Costa Rica37,819 Establishment Labs Holdings, Inc. 2,382,597 0.52
Denmark14,350 Ascendis Pharma A/S ADR(a) 1,257,490 0.27
India108,683 MakeMyTrip Ltd. 3,046,385 0.6615,955 WNS Holdings Ltd. ADR(a) 1,167,108 0.25
4,213,493 0.91
Ireland17,539 Alkermes PLC 531,432 0.12
Israel55,150 Cognyte Software Ltd. 391,013 0.08
Puerto Rico11,971 EVERTEC, Inc. 455,736 0.10
Singapore18,600 Kulicke & Soffa Industries, Inc. 984,498 0.21
Thailand10,000 Fabrinet 864,900 0.19
United Kingdom76,171 Abcam PLC ADR(a) 1,127,331 0.248,835 Bicycle Therapeutics Ltd. ADR(a) 141,007 0.03
10,193 LivaNova PLC 673,400 0.1555,830 Nomad Foods Ltd. 1,178,013 0.25
3,119,751 0.67
United States9,404 AAR Corp. 455,342 0.10
76,053 ABM Industries, Inc. 3,653,586 0.7913,137 Acadia Healthcare Co., Inc. 940,609 0.2068,752 ACCO Brands Corp. 507,390 0.11
147,606 Accolade, Inc. 922,537 0.2026,839 ACI Worldwide, Inc. 700,498 0.1524,922 Acushnet Holdings Corp. 1,006,600 0.2212,625 ADTRAN, Inc. 235,078 0.0531,894 Advanced Energy Industries, Inc. 2,569,700 0.5592,275 agilon health, Inc. 1,818,740 0.398,275 Alamo Group, Inc. 966,106 0.21
91,718 Alignment Healthcare, Inc. 996,975 0.2214,175 ALLETE, Inc. 871,479 0.1916,424 Allison Transmission Holdings, Inc. 646,449 0.1437,797 Altra Industrial Motion Corp. 1,455,940 0.3115,654 American Eagle Outfitters, Inc. 185,578 0.047,952 Ameris Bancorp 360,385 0.08
18,075 AMERISAFE, Inc. 895,435 0.19307,563 ANGI Homeservices, Inc. Class A 1,703,899 0.3737,125 AngioDynamics, Inc. 725,794 0.1611,085 Apellis Pharmaceuticals, Inc. 466,679 0.1046,358 Apergy Corp. 1,105,175 0.2419,778 Applied Industrial Technologies, Inc. 2,016,367 0.4446,897 Array Technologies, Inc. 516,805 0.11
HoldingsSecurityDescription
Market ValueUSD
% ofShareholders’
Equity
Common Stocks – (Continued)United States – (Continued)
19,900 Artisan Partners AssetManagement, Inc. Class A 758,588 0.16
7,261 Arvinas, Inc. 301,985 0.0715,156 ASGN, Inc. 1,426,786 0.3118,450 Astec Industries, Inc. 849,991 0.1840,591 Avaya Holdings Corp. 150,999 0.0312,266 Avient Corp. 600,543 0.1350,424 Avnet, Inc. 2,410,771 0.5210,133 Axonics, Inc. 511,717 0.1159,455 AZEK Co., Inc. 1,247,366 0.271,410 Azenta, Inc. 106,779 0.02
21,175 Bank of Hawaii Corp. 1,659,908 0.3632,181 BankUnited, Inc. 1,333,259 0.2934,300 Beauty Health Co. 493,749 0.1148,431 Belden, Inc. 2,752,818 0.5936,705 Bellring Distribution LLC 942,951 0.2027,120 Bentley Systems, Inc. Class B 911,232 0.2062,808 BioCryst Pharmaceuticals, Inc. 598,560 0.1316,978 Biohaven Pharmaceutical Holding
Co. Ltd. 2,425,477 0.5236,444 Blackline, Inc. 2,630,892 0.5722,466 Blueprint Medicines Corp. 1,237,652 0.279,958 Boot Barn Holdings, Inc. 787,578 0.17
18,162 Box, Inc. Class A 482,746 0.1045,522 Bright Horizons Family Solutions,
Inc. 4,093,793 0.8840,993 BrightView Holdings, Inc. 527,990 0.1115,280 Brink’s Co. 915,730 0.2035,186 Bruker Corp. 2,200,181 0.488,852 BWX Technologies, Inc. 451,718 0.10
22,165 Cabot Corp. 1,696,066 0.3762,051 Cactus, Inc. Class A 3,391,087 0.7394,169 Callaway Golf Co. 2,025,575 0.441,615 Carlisle Cos., Inc. 403,056 0.09
21,013 Carter’s, Inc. 1,598,669 0.3518,674 Casey’s General Stores, Inc. 3,865,145 0.836,483 Catalent, Inc. 666,452 0.14
22,700 CBIZ, Inc. 918,215 0.2014,825 Central Garden & Pet Co. Class A 627,542 0.14
123,593 Change Healthcare, Inc. 2,943,985 0.644,896 Charles River Laboratories
International, Inc. 1,166,325 0.255,752 Chart Industries, Inc. 1,026,329 0.222,100 Chemed Corp. 1,025,430 0.22
17,836 Choice Hotels International, Inc. 2,267,312 0.4912,805 Churchill Downs, Inc. 2,584,945 0.569,225 Citi Trends, Inc. 268,817 0.06
81,088 Clarus Corp. 1,861,780 0.4017,228 CMC Materials, Inc. 3,050,734 0.6627,827 Cogent Communications Holdings,
Inc. 1,681,864 0.3614,050 Cohen & Steers, Inc. 1,072,436 0.2332,200 Cohu, Inc. 973,084 0.2111,860 Columbia Banking System, Inc. 353,191 0.0811,800 Columbia Sportswear Co. 898,688 0.1917,025 Columbus McKinnon Corp. 563,868 0.129,212 Comfort Systems USA, Inc. 830,922 0.18
65,833 CommScope Holding Co., Inc. 485,848 0.106,156 Concentrix Corp. 951,656 0.214,609 CONMED Corp. 527,177 0.11
40,150 Core & Main, Inc. Class A 989,296 0.2137,011 Couchbase, Inc. 506,310 0.1111,000 Crane Holdings Co. 1,041,480 0.2226,833 CryoPort, Inc. 694,975 0.1511,540 Curtiss-Wright Corp. 1,650,105 0.3655,725 Cushman & Wakefield PLC 1,035,928 0.2215,551 Customers Bancorp, Inc. 631,371 0.14
103,261 Delek US Holdings, Inc. 3,093,700 0.6720,495 DermTech, Inc. 146,539 0.0316,667 DigitalOcean Holdings, Inc. 807,349 0.1762,016 Dynatrace, Inc. 2,304,515 0.50
Goldman Sachs Funds II—Multi-Manager US Small Cap Equity PortfolioSchedule of Investments
As at 31 May 2022
The accompanying notes are an integral part of these financial statements.
59

HoldingsSecurityDescription
Market ValueUSD
% ofShareholders’
Equity
Common Stocks – (Continued)United States – (Continued)
19,475 Eagle Bancorp, Inc. 962,844 0.215,900 Eagle Materials, Inc. 774,434 0.17
32,883 Ecovyst, Inc. 336,064 0.078,075 Edgewell Personal Care Co. 292,477 0.06
43,098 elf Beauty, Inc. 1,119,686 0.2422,313 EMCOR Group, Inc. 2,372,764 0.5110,989 Employers Holdings, Inc. 448,571 0.1030,340 Encompass Health Corp. 1,969,066 0.4339,941 Energizer Holdings, Inc. 1,205,020 0.2611,993 EnerSys 823,439 0.1819,020 Entegris, Inc. 2,114,644 0.4634,007 Envestnet, Inc. 2,260,785 0.4937,106 Envista Holdings Corp. 1,593,703 0.3457,310 Equillium, Inc. 144,421 0.0321,721 Essent Group Ltd. 916,843 0.2014,566 Evercore, Inc. Class A 1,651,784 0.36
139,363 Evo Payments, Inc. Class A 3,220,679 0.7041,212 Evoqua Water Technologies Corp. 1,471,681 0.3268,900 EW Scripps Co. Class A 1,068,639 0.2334,180 Fate Therapeutics, Inc. 791,951 0.177,952 Federal Agricultural Mortgage Corp.
Class C 819,056 0.1822,165 First American Financial Corp. 1,326,575 0.2930,884 First Hawaiian, Inc. 792,175 0.1716,749 First Merchants Corp. 679,339 0.1526,951 First Watch Restaurant Group, Inc. 421,244 0.0913,700 Flywire Corp. 270,301 0.0618,555 Focus Financial Partners, Inc.
Class A 691,916 0.1530,674 Foot Locker, Inc. 993,838 0.216,700 Forward Air Corp. 613,385 0.13
31,263 Fresh Del Monte Produce, Inc. 790,329 0.178,676 Freshpet, Inc. 619,380 0.13
27,800 Frontier Group Holdings, Inc. 284,950 0.0620,866 FTI Consulting, Inc. 3,439,134 0.74
131,760 Genpact Ltd. 5,850,144 1.2614,031 Gentherm, Inc. 915,523 0.2013,825 Gibraltar Industries, Inc. 572,493 0.125,668 Gitlab, Inc. Class A 234,202 0.05
49,723 GrafTech International Ltd. 431,098 0.09178,343 Graphic Packaging Holding Co. 3,966,348 0.8632,874 Gray Television, Inc. 641,043 0.1411,312 Grocery Outlet Holding Corp. 431,327 0.0913,496 H&R Block, Inc. 472,090 0.107,064 Haemonetics Corp. 447,363 0.10
14,600 Hain Celestial Group, Inc. 379,016 0.0814,643 Halozyme Therapeutics, Inc. 693,932 0.1550,123 Hanesbrands, Inc. 588,945 0.1346,675 Hanger, Inc. 734,198 0.1615,737 Hanover Insurance Group, Inc. 2,303,267 0.5054,604 Harley-Davidson, Inc. 1,925,883 0.4239,869 HB Fuller Co. 2,791,627 0.6020,466 Health Catalyst, Inc. 297,985 0.0656,001 HealthEquity, Inc. 3,520,783 0.763,800 Helen of Troy Ltd. 690,726 0.15
92,525 Helix Energy Solutions Group, Inc. 438,569 0.091,987 Herc Holdings, Inc. 234,844 0.05
25,800 Hexcel Corp. 1,492,788 0.3231,158 Hillenbrand, Inc. 1,287,760 0.2811,724 Hostess Brands, Inc. 248,490 0.0520,267 Hub Group, Inc. Class A 1,474,830 0.3211,400 Hyatt Hotels Corp. Class A 997,386 0.22
106,227 IAA, Inc. 4,049,373 0.8713,200 ICF International, Inc. 1,330,560 0.294,892 IDEX Corp. 922,533 0.20
10,440 Impinj, Inc. 491,098 0.1124,931 Inari Medical, Inc. 1,646,693 0.3624,400 Independent Bank Corp. 2,014,220 0.43
264,384 Infinera Corp. 1,522,852 0.3310,606 Ingevity Corp. 739,556 0.1614,800 Ingredion, Inc. 1,407,480 0.30
HoldingsSecurityDescription
Market ValueUSD
% ofShareholders’
Equity
Common Stocks – (Continued)United States – (Continued)
11,800 Innospec, Inc. 1,216,226 0.2628,741 Insight Enterprises, Inc. 2,814,319 0.616,396 Inspire Medical Systems, Inc. 1,167,718 0.259,300 Integer Holdings Corp. 740,280 0.16
17,766 InterDigital, Inc. 1,133,826 0.2429,023 International Game Technology PLC 622,834 0.1315,029 Intra-Cellular Therapies, Inc. 865,971 0.1926,506 Jamf Holding Corp. 684,385 0.1514,915 John Bean Technologies Corp. 1,818,884 0.3913,325 Kaiser Aluminum Corp. 1,345,825 0.2949,262 KAR Auction Services, Inc. 780,310 0.174,140 Karuna Therapeutics, Inc. 431,140 0.09
28,725 Kennametal, Inc. 794,821 0.1730,413 Kezar Life Sciences, Inc. 155,106 0.0317,443 Knight-Swift Transportation
Holdings, Inc. 829,764 0.1815,123 Korn Ferry 912,976 0.20
145,950 Kosmos Energy Ltd. 1,176,357 0.2511,700 Lakeland Financial Corp. 846,612 0.184,875 Lancaster Colony Corp. 589,046 0.132,098 Landstar System, Inc. 313,189 0.07
29,195 Lattice Semiconductor Corp. 1,507,630 0.3316,949 LCI Industries 1,973,711 0.43
125,673 Leslie’s, Inc. 2,409,151 0.5211,969 Littelfuse, Inc. 3,183,754 0.6931,831 MACOM Technology Solutions
Holdings, Inc. 1,726,513 0.3753,800 Magnolia Oil & Gas Corp. Class A 1,539,218 0.3323,500 Manitowoc Co., Inc. 304,090 0.0742,046 ManTech International Corp. Class A 4,006,563 0.8720,092 Marqeta, Inc. Class A 216,391 0.0571,025 Marten Transport Ltd. 1,219,499 0.265,334 Masonite International Corp. 483,474 0.10
20,995 Matador Resources Co. 1,338,641 0.2963,250 Mattel, Inc. 1,555,317 0.3415,040 Maximus, Inc. 975,795 0.2114,550 McGrath RentCorp 1,183,497 0.267,346 Meritage Homes Corp. 621,986 0.13
11,125 MGE Energy, Inc. 884,326 0.1919,061 Minerals Technologies, Inc. 1,263,172 0.279,853 Mr Cooper Group, Inc. 430,182 0.09
14,560 MSA Safety, Inc. 1,862,224 0.4018,000 Mueller Industries, Inc. 969,300 0.213,200 Murphy USA, Inc. 803,648 0.176,475 MYR Group, Inc. 590,779 0.13
29,588 National Energy Services ReunitedCorp. 231,378 0.05
28,012 National Vision Holdings, Inc. 768,929 0.1725,000 Natus Medical, Inc. 821,750 0.1865,860 Navient Corp. 1,046,515 0.2330,850 NCR Corp. 1,063,708 0.237,912 Nelnet, Inc. Class A 665,083 0.14
154,809 NeoGenomics, Inc. 1,298,848 0.2837,350 NETGEAR, Inc. 709,277 0.1525,528 Neurocrine Biosciences, Inc. 2,362,106 0.5123,108 Nevro Corp. 993,413 0.2110,015 Nexstar Media Group, Inc. Class A 1,761,338 0.3868,449 NexTier Oilfield Solutions, Inc. 785,795 0.1716,790 NMI Holdings, Inc. Class A 307,593 0.0715,775 NorthWestern Corp. 958,804 0.2110,575 ONE Gas, Inc. 917,698 0.2019,859 Option Care Health, Inc. 600,735 0.1335,944 OrthoPediatrics Corp. 1,613,526 0.3539,625 PacWest Bancorp 1,237,092 0.277,544 Papa John’s International, Inc. 657,837 0.14
28,566 Par Pacific Holdings, Inc. 475,053 0.1058,523 Paya Holdings, Inc. 348,797 0.0818,346 Paymentus Holdings, Inc. Class A 278,492 0.0646,417 PDC Energy, Inc. 3,734,712 0.8114,600 PDL BioPharma, Inc.(b) 21,462 0.0018,355 Penn Virginia Corp. 814,962 0.18
Goldman Sachs Funds II—Multi-Manager US Small Cap Equity PortfolioSchedule of Investments
As at 31 May 2022
The accompanying notes are an integral part of these financial statements.
60

HoldingsSecurityDescription
Market ValueUSD
% ofShareholders’
Equity
Common Stocks – (Continued)United States – (Continued)
11,385 PennyMac Financial Services, Inc. 567,884 0.1232,500 Performance Food Group Co. 1,421,387 0.3135,401 PetIQ, Inc. 586,241 0.1344,698 Phreesia, Inc. 825,572 0.189,125 Pinnacle Financial Partners, Inc. 737,847 0.167,978 Planet Fitness, Inc. Class A 560,056 0.12
10,550 Plexus Corp. 881,452 0.1950,904 Porch Group, Inc. 218,887 0.0513,268 Power Integrations, Inc. 1,114,512 0.2431,362 PRA Group, Inc. 1,155,690 0.256,575 Preferred Bank 447,100 0.10
31,882 ProAssurance Corp. 707,143 0.155,955 PROG Holdings, Inc. 170,134 0.04
10,550 Progyny, Inc. 360,072 0.0848,755 PROS Holdings, Inc. 1,304,684 0.2861,189 Prosperity Bancshares, Inc. 4,401,325 0.955,934 Q2 Holdings, Inc. 313,137 0.07
13,275 Quaker Chemical Corp. 2,029,216 0.447,444 QuidelOrtho Corp. 754,747 0.16
22,066 R1 RCM, Inc. 466,696 0.1018,681 Rackspace Technology, Inc. 169,810 0.0451,409 Realogy Holdings Corp. 637,472 0.1433,875 Renasant Corp. 1,045,044 0.2371,027 Resideo Technologies, Inc. 1,684,050 0.3620,900 Ryan Specialty Group Holdings, Inc.
Class A 795,036 0.171,950 Safety Insurance Group, Inc. 181,194 0.04
44,475 Sally Beauty Holdings, Inc. 660,454 0.1426,500 ScanSource, Inc. 1,020,250 0.2228,969 Schweitzer-Mauduit International,
Inc. 781,584 0.1716,448 Science Applications International
Corp. 1,416,666 0.3114,866 SeaWorld Entertainment, Inc. 803,953 0.1713,150 Selective Insurance Group, Inc. 1,017,021 0.223,356 Shockwave Medical, Inc. 567,097 0.12
89,157 SI-BONE, Inc. 1,273,162 0.2712,100 Signet Jewelers Ltd. 701,074 0.1532,850 Silgan Holdings, Inc. 1,441,129 0.313,037 Silicon Laboratories, Inc. 454,274 0.10
60,611 Simply Good Foods Co. 2,442,017 0.536,881 Simpson Manufacturing Co., Inc. 727,803 0.164,932 SiteOne Landscape Supply, Inc. 656,696 0.142,454 SiTime Corp. 505,254 0.11
18,269 Skechers USA, Inc. Class A 706,280 0.15163,536 SLM Corp. 3,190,587 0.6930,709 SMART Global Holdings, Inc. 752,985 0.1612,264 Smartsheet, Inc. Class A 441,749 0.1024,500 Sonoco Products Co. 1,436,190 0.3127,943 South State Corp. 2,240,190 0.4824,511 Spectrum Brands Holdings, Inc. 2,180,744 0.4711,016 SpringWorks Therapeutics, Inc. 211,397 0.0510,618 Sprout Social, Inc. Class A 564,665 0.126,868 Standard Motor Products, Inc. 267,303 0.06
34,508 Steelcase, Inc. Class A 420,825 0.0930,682 Steven Madden Ltd. 1,155,484 0.2513,000 Stewart Information Services Corp. 715,000 0.1556,182 Stride, Inc. 2,196,154 0.4736,573 Summit Materials, Inc. Class A 996,980 0.2266,607 Sumo Logic, Inc. 560,831 0.1226,920 Surgery Partners, Inc. 1,062,263 0.2318,798 Syneos Health, Inc. 1,396,315 0.3028,432 Synovus Financial Corp. 1,188,173 0.2617,643 Take-Two Interactive Software, Inc. 2,220,548 0.489,411 TD SYNNEX Corp. 961,051 0.21
42,316 TEGNA, Inc. 918,680 0.206,879 Teleflex, Inc. 1,966,912 0.42
35,208 Telos Corp. 352,432 0.0830,879 Tempur Sealy International, Inc. 804,707 0.1715,928 Tenable Holdings, Inc. 809,780 0.178,919 Terex Corp. 316,089 0.07
HoldingsSecurityDescription
Market ValueUSD
% ofShareholders’
Equity
Common Stocks – (Continued)United States – (Continued)
77,019 Terminix Global Holdings, Inc. 3,374,973 0.733,145 Thor Industries, Inc. 234,114 0.058,296 Toll Brothers, Inc. 416,459 0.096,362 TopBuild Corp. 1,229,202 0.27
22,873 Travel & Leisure Co. 1,158,746 0.254,430 Trex Co., Inc. 279,356 0.06
35,900 TriMas Corp. 1,017,047 0.2213,253 TTEC Holdings, Inc. 890,734 0.1911,071 Turning Point Brands, Inc. 314,306 0.0720,300 UFP Industries, Inc. 1,561,882 0.3420,836 Ultra Clean Holdings, Inc. 692,380 0.1518,400 UMB Financial Corp. 1,677,896 0.3643,285 Umpqua Holdings Corp. 758,353 0.165,625 UniFirst Corp. 913,444 0.20
50,286 Unisys Corp. 604,438 0.1315,387 Universal Corp. 961,380 0.2177,708 Valley National Bancorp 976,401 0.219,773 Valmont Industries, Inc. 2,569,322 0.55
69,959 Valvoline, Inc. 2,326,137 0.5030,235 Varonis Systems, Inc. 1,005,314 0.2229,000 Verint Systems, Inc. 1,463,920 0.3237,437 Viad Corp. 1,116,746 0.2415,114 Victoria’s Secret & Co. 638,718 0.1443,911 Viper Energy Partners LP 1,475,410 0.3212,000 Visteon Corp. 1,283,280 0.2839,334 Vizio Holding Corp. Class A 345,353 0.0727,765 Wabash National Corp. 417,586 0.0916,009 Walker & Dunlop, Inc. 1,726,090 0.3727,555 Waste Connections, Inc. 3,519,325 0.765,650 Watts Water Technologies, Inc.
Class A 737,833 0.1645,714 Werner Enterprises, Inc. 1,834,503 0.4024,693 WESCO International, Inc. 3,057,240 0.6612,644 WEX, Inc. 2,139,997 0.461,289 White Mountains Insurance Group
Ltd. 1,622,271 0.358,472 Whiting Petroleum Corp. 770,444 0.175,638 Wingstop, Inc. 432,322 0.09
29,925 Wintrust Financial Corp. 2,585,520 0.5615,415 Woodward, Inc. 1,549,053 0.3336,134 Workiva, Inc. 2,595,867 0.5661,774 World Fuel Services Corp. 1,539,408 0.3311,491 World Wrestling Entertainment, Inc.
Class A 760,934 0.1616,550 Worthington Industries, Inc. 758,486 0.1622,973 Yelp, Inc. 685,285 0.1518,992 YETI Holdings, Inc. 865,276 0.1932,010 ZipRecruiter, Inc. Class A 571,699 0.12
119,327 Zuora, Inc. Class A 1,220,715 0.2696,899 Zurn Water Solutions Corp. 2,779,063 0.60
400,887,530 86.57
TOTAL COMMON STOCKS(cost USD 418,207,540) 420,927,393 90.90
Real Estate Investment Trusts – 3.32%United States
92,350 Apple Hospitality, Inc. 1,537,627 0.3319,847 Ares Commercial Real Estate Corp. 294,133 0.0636,376 Blackstone Mortgage Trust, Inc.
Class A 1,132,385 0.2457,100 Corporate Office Properties Trust 1,558,830 0.3438,467 Cousins Properties, Inc. 1,324,803 0.29
179,678 DigitalBridge Group, Inc. 1,105,020 0.2414,732 EastGroup Properties, Inc. 2,370,968 0.5118,700 First Industrial Realty Trust, Inc. 991,661 0.2151,600 Four Corners Property Trust, Inc. 1,413,840 0.3112,316 National Storage Affiliates Trust 652,502 0.1436,200 Rayonier, Inc. 1,501,576 0.32
Goldman Sachs Funds II—Multi-Manager US Small Cap Equity PortfolioSchedule of Investments
As at 31 May 2022
The accompanying notes are an integral part of these financial statements.
61

HoldingsSecurityDescription
Market ValueUSD
% ofShareholders’
Equity
Real Estate Investment Trusts – (Continued)United States – (Continued)
10,075 Spirit Realty Capital, Inc. 421,538 0.0945,820 Starwood Property Trust, Inc. 1,088,225 0.24
15,393,108 3.32
TOTAL REAL ESTATE INVESTMENT TRUSTS(cost USD 14,215,923) 15,393,108 3.32
Mutual Funds – 4.47%Ireland
20,672,798 Goldman Sachs US$ LiquidReserves Fund (X DistributionClass)(c)(d) 20,672,798 4.47
6 Goldman Sachs US$ TreasuryLiquid Reserves Fund (X DistributionClass)(c)(e) 6 0.00
20,672,804 4.47
TOTAL MUTUAL FUNDS(cost USD 20,672,804) 20,672,804 4.47
TOTAL TRANSFERABLE SECURITIES ADMITTEDTO AN OFFICIAL EXCHANGE LISTING(cost USD 453,096,267) 456,993,305 98.69
MARKET VALUE OF INVESTMENTS(cost USD 453,096,267) 456,993,305 98.69
OTHER ASSETS AND LIABILITIES 6,083,914 1.31
SHAREHOLDERS’ EQUITY 463,077,219 100.00
TOTAL INVESTMENTSMarket Value
USD
% ofShareholders’
Equity
Total Investments (cost USD 453,096,267) 456,993,305 98.69Other Assets and Liabilities 6,083,914 1.31
Shareholders’ Equity 463,077,219 100.00(a) Security holding is traded/held in USD. (ADR: American Depositary Receipt/
GDR: Global Depositary Receipt).(b) Valuation of this security is determined by the Valuer. See Note 4.(c) A related party to Goldman Sachs Funds II.(d) The yield for this fund as at 31 May 2022 was 0.922%.(e) The yield for this fund as at 31 May 2022 was 0.779%.
Allocation of Portfolio as at 31 May 2022
% ofShareholders’
Equity
Common StocksCommercial Services 8.00Software 7.39Banks 6.20Healthcare Products 4.64Computers 3.66Oil & Gas 3.41Machinery—Diversified 3.30Distribution/Wholesale 3.28Insurance 3.18Semiconductors 3.13Others 44.71
TOTAL COMMON STOCKS 90.90
Mutual Funds 4.47
Real Estate Investment Trusts 3.32
Other Assets and Liabilities 1.31
TOTAL 100.00
Goldman Sachs Funds II—Multi-Manager US Small Cap Equity PortfolioSchedule of Investments
As at 31 May 2022
The accompanying notes are an integral part of these financial statements.
62

Holdings Security DescriptionMarket Value
USD
% ofShareholders’
Equity
Transferable securities admitted to an official exchange listing
Mutual Funds – 95.25%Ireland
37,938,396 Goldman Sachs US$ Liquid Reserves Fund (X Distribution Class)(a)(b) 37,938,396 17.822,662 Goldman Sachs US$ Standard VNAV Fund (X Accumulation Class)(a)(c) 28,118,760 13.21
38,685,765 Goldman Sachs US$ Treasury Liquid Reserves Fund (X Distribution Class)(a)(d) 38,685,765 18.1721,306 Invesco Morningstar US Energy Infrastructure MLP UCITS ETF 940,660 0.44
444,004 iShares Core FTSE 100 UCITS ETF 4,220,236 1.9893,599 iShares Core MSCI Emerging Markets IMI UCITS ETF 2,939,945 1.3819,282 iShares Core MSCI Pacific ex-Japan UCITS ETF 3,267,721 1.5339,634 iShares Core S&P 500 UCITS ETF 16,739,816 7.8695,198 iShares Developed Markets Property Yield UCITS ETF 2,505,611 1.18
396,243 iShares Edge MSCI USA Value Factor UCITS ETF 3,505,760 1.6585,682 iShares Global Infrastructure UCITS ETF 2,884,771 1.35
157,866 iShares MSCI Europe ex-UK UCITS ETF 6,442,078 3.0352,804 iShares S&P 500 Energy Sector UCITS ETF 441,267 0.2168,084 iShares S&P 500 Health Care Sector UCITS ETF 682,883 0.32
128,235 iShares USD Treasury Bond 1-3 Year UCITS ETF 16,616,691 7.80110,321 iShares USD Treasury Bond 3-7 Year UCITS ETF 14,325,623 6.7321,049 iShares USD Treasury Bond 7-10 Year UCITS ETF 3,961,932 1.86
155,989 Vanguard FTSE Developed Europe ex UK UCITS ETF 5,806,012 2.73
190,023,927 89.25
Luxembourg1,718,637 Goldman Sachs Funds - Global High Yield Portfolio (IO Distribution Class)(a) 12,769,471 6.00
TOTAL MUTUAL FUNDS(cost USD 197,449,319) 202,793,398 95.25
TOTAL TRANSFERABLE SECURITIES ADMITTED TO AN OFFICIAL EXCHANGE LISTING(cost USD 197,449,319) 202,793,398 95.25
MARKET VALUE OF INVESTMENTS EXCLUDING DERIVATIVES(cost USD 197,449,319) 202,793,398 95.25
Futures Contracts – (0.45%)
Number ofContracts Security Description
CommitmentMarket Value
USD
UnrealisedGainUSD
% ofShareholders’
Equity
EUR183 EURO STOXX Banks Index 17/06/2022 Long 899,818 73,792 0.03
JPY42 TOPIX Index Futures 09/06/2022 Long 6,226,692 268,077 0.13
UNREALISED GAIN ON FUTURES CONTRACTS 341,869 0.16
Number ofContracts Security Description
CommitmentMarket Value
USD
UnrealisedLossUSD
% ofShareholders’
Equity
USD166 E-Mini S&P 500 Index Futures 17/06/2022 Long 34,154,500 (574,178) (0.27)105 Mini-Russell 2000 Index Futures 17/06/2022 Long 9,789,150 (556,852) (0.26)169 US Treasury Notes 10YR Futures 21/09/2022 Long 20,174,375 (121,992) (0.06)131 US Treasury Notes 2YR Futures 30/09/2022 Long 27,639,977 (30,125) (0.02)73 US Treasury Notes 5YR Futures 30/09/2022 Long 8,240,445 (8,578) (0.00)
99,998,447 (1,291,725) (0.61)
UNREALISED LOSS ON FUTURES CONTRACTS (1,291,725) (0.61)
Forward Currency Contracts – 0.11%
CurrencyAmountBought Currency
AmountSold
MaturityDate
UnrealisedGainUSD
% ofShareholders’
Equity
USD 1,340,727 AUD 1,840,000 15/06/2022 19,633 0.01USD 1,951,773 CHF 1,790,000 15/06/2022 84,998 0.04USD 498,359 DKK 3,330,000 15/06/2022 18,561 0.01USD 6,200,158 EUR 5,570,000 15/06/2022 229,691 0.11USD 2,768,591 GBP 2,075,000 15/06/2022 156,371 0.07USD 521,198 HKD 4,070,000 15/06/2022 2,373 0.00USD 74,208 ILS 240,000 15/06/2022 2,230 0.00
Goldman Sachs Funds II—Balanced Allocation PortfolioSchedule of Investments
As at 31 May 2022
The accompanying notes are an integral part of these financial statements.
63

Forward Currency Contracts – (Continued)
CurrencyAmountBought Currency
AmountSold
MaturityDate
UnrealisedGainUSD
% ofShareholders’
Equity
USD 4,334,261 JPY 499,000,000 15/06/2022 457,244 0.22USD 129,172 NOK 1,150,000 15/06/2022 7,098 0.00USD 40,553 NZD 60,000 15/06/2022 1,518 0.00USD 704,310 SEK 6,825,000 15/06/2022 9,133 0.01USD 198,994 SGD 270,000 15/06/2022 2,063 0.00
UNREALISED GAIN ON FORWARD CURRENCY CONTRACTS 990,913 0.47
CurrencyAmountBought Currency
AmountSold
MaturityDate
UnrealisedLossUSD
% ofShareholders’
Equity
JPY 828,000,000 USD 7,187,581 15/06/2022 (754,375) (0.36)USD 2,261,215 CAD 2,870,000 15/06/2022 (8,494) (0.00)
UNREALISED LOSS ON FORWARD CURRENCY CONTRACTS (762,869) (0.36)
Share Class Specific Forward Currency Contracts – (3.27%)
CurrencyAmountBought Currency
AmountSold
MaturityDate
UnrealisedGainUSD
% ofShareholders’
Equity
USD 4,438,905 GBP 3,494,000 15/06/2022 40,302 0.02
UNREALISED GAIN ON FORWARD CURRENCY CONTRACTS HELD FOR HEDGING PURPOSES 40,302 0.02
CurrencyAmountBought Currency
AmountSold
MaturityDate
UnrealisedLossUSD
% ofShareholders’
Equity
EUR 61,551,000 USD 68,594,896 15/06/2022 (2,618,560) (1.23)GBP 58,451,250 USD 77,891,654 15/06/2022 (4,307,276) (2.03)USD 3,526,950 EUR 3,352,000 15/06/2022 (66,049) (0.03)
UNREALISED LOSS ON FORWARD CURRENCY CONTRACTS HELD FOR HEDGING PURPOSES (6,991,885) (3.29)
Options – (0.11%)
Holdings Security Description
UnrealisedGain/(Loss)
USDMarket Value
USD
% ofShareholders’
Equity
Purchased OptionsEUR
150,000 Put EUR / Call USD Expires 07/03/2023 Strike 1.19 9,824 15,601 0.01
USD165 Call S&P 500 Index Expires 15/07/2022 Strike 4,050.00 5,909 30,115 0.01
TOTAL PURCHASED OPTIONS(cost USD 29,983) 45,716 0.02
Written OptionsEUR
(150,000) Put EUR / Call USD Expires 07/03/2023 Strike 1.19 (8,404) (15,601) (0.01)
USD(479) Put Health Care Select Sector Index Expires 30/12/2022 Strike 1,286.61 8,781 (28,845) (0.01)(161) Put S&P 500 Index Expires 19/08/2022 Strike 3,800.00 9,975 (14,699) (0.01)(285) Put S&P 500 Index Expires 30/12/2022 Strike 3,877.57 1,998 (59,368) (0.03)(166) Put S&P 500 Index Expires 30/12/2022 Strike 3,983.47 8,817 (40,244) (0.02)(157) Put S&P 500 Index Expires 30/12/2022 Strike 4,173.28 (12,131) (49,586) (0.02)(155) Put S&P 500 Index Expires 30/12/2022 Strike 4,210.38 (13,968) (51,493) (0.02)(165) Put S&P 500 Index Expires 20/01/2023 Strike 3,645.00 2,386 (25,829) (0.01)
5,858 (270,064) (0.12)
TOTAL WRITTEN OPTIONS(cost USD (283,119)) (285,665) (0.13)
TOTAL OPTIONS(cost USD (253,136)) (239,949) (0.11)
Goldman Sachs Funds II—Balanced Allocation PortfolioSchedule of Investments
As at 31 May 2022
The accompanying notes are an integral part of these financial statements.
64

Swap Contracts – (0.01%)Net LocalNotionalAmount Pay Receive Currency Maturity Date
UnrealisedGainUSD
% ofShareholders’
Equity
Total Return Swaps658,872 Floating (JPGSVENK Index) Floating (USD 1 month FEDL) USD 06/07/2022 14,959 0.01
UNREALISED GAIN ON TOTAL RETURN SWAPS 14,959 0.01
TOTAL UNREALISED GAIN ON SWAP CONTRACTS 14,959 0.01
Net LocalNotionalAmount Pay Receive Currency Maturity Date
UnrealisedLossUSD
% ofShareholders’
Equity
Credit Default Swaps990,000 Floating (Markit CDX North America
High Yield 38 Version 1 Index)Fixed 5.000% USD 20/06/2027 (38,329) (0.02)
UNREALISED LOSS ON CREDIT DEFAULT SWAPS (38,329) (0.02)
Total Return Swaps74 Floating (USD 1 month FEDL) Floating (S&P 500 Total Return Index) USD 03/06/2022 (4,703) (0.00)
UNREALISED LOSS ON TOTAL RETURN SWAPS (4,703) (0.00)
TOTAL UNREALISED LOSS ON SWAP CONTRACTS (43,032) (0.02)
MARKET VALUE OF INVESTMENTS(cost USD 197,196,183)
194,851,981 91.52
OTHER ASSETS AND LIABILITIES 18,061,018 8.48
SHAREHOLDERS’ EQUITY 212,912,999 100.00
TOTAL INVESTMENTSMarket Value
USD
% ofShareholders’
Equity
Total Investments excluding derivatives (cost USD 197,449,319) 202,793,398 95.25Unrealised gain on futures contracts 341,869 0.16Unrealised loss on futures contracts (1,291,725) (0.61)Unrealised gain on forward currency contracts 990,913 0.47Unrealised loss on forward currency contracts (762,869) (0.36)Unrealised gain on forward currency contracts held for hedging purposes 40,302 0.02Unrealised loss on forward currency contracts held for hedging purposes (6,991,885) (3.29)Market value of purchased options (cost USD 29,983) 45,716 0.02Market value of written options (cost USD (283,119)) (285,665) (0.13)Unrealised gain on swap contracts 14,959 0.01Unrealised loss on swap contracts (43,032) (0.02)Other Assets and Liabilities 18,061,018 8.48
Shareholders’ Equity 212,912,999 100.00
The Futures Commission Merchant was Bank of America NA.
The counterparty for forward currency contracts was Morgan Stanley & Co. LLC.
The counterparties for options contracts were Citibank NA, JP Morgan Chase Bank NA and Morgan Stanley & Co. International PLC.
The counterparties for swap contracts were JP Morgan Chase Bank NA and Morgan Stanley.
The maximum individual counterparty exposure as at 31 May 2022 is 0.49% of the NAV.
(a) A related party to Goldman Sachs Funds II.(b) The yield for this fund as at 31 May 2022 was 0.922%.(c) The yield for this fund as at 31 May 2022 was 1.012%.(d) The yield for this fund as at 31 May 2022 was 0.779%.
Goldman Sachs Funds II—Balanced Allocation PortfolioSchedule of Investments
As at 31 May 2022
The accompanying notes are an integral part of these financial statements.
65

Holdings Security Description Currency Interest Rate(a) Maturity Date(b)Market Value
USD
% ofShareholders’
Equity
Transferable securities admitted to an official exchange listing
Bonds – 59.53%United States
600,000 Federal Farm Credit Banks Funding Corp.(c) USD 0.890% 21/11/2022 599,178 0.06200,000 Federal Farm Credit Banks Funding Corp.(c) USD 0.835% 25/11/2022 199,662 0.02900,000 Federal Farm Credit Banks Funding Corp.(c) USD 0.900% 02/12/2022 898,542 0.09500,000 Federal Farm Credit Banks Funding Corp.(c) USD 0.830% 17/02/2023 500,240 0.05500,000 Federal Farm Credit Banks Funding Corp.(c) USD 0.855% 13/04/2023 499,165 0.05
1,000,000 Federal Farm Credit Banks Funding Corp.(c) USD 1.158% 23/10/2023 1,000,190 0.102,100,000 Federal Farm Credit Banks Funding Corp.(c) USD 1.163% 30/10/2023 2,100,441 0.21
96,000,000 Federal Home Loan Bank Discount Notes USD 0.996% 03/06/2022 95,995,680 9.7935,000,000 Federal Home Loan Bank Discount Notes USD 0.595% 08/06/2022 34,994,510 3.5735,000,000 Federal Home Loan Bank Discount Notes USD 0.862% 10/06/2022 34,992,942 3.5784,000,000 Federal Home Loan Bank Discount Notes USD 1.628% 15/06/2022 83,973,651 8.57
168,980,000 Federal Home Loan Bank Discount Notes USD 1.530% 17/06/2022 168,919,423 17.2320,100,000 Federal Home Loan Bank Discount Notes USD 1.612% 22/06/2022 20,090,543 2.0563,000,000 Federal Home Loan Bank Discount Notes USD 1.577% 15/07/2022 62,926,935 6.4229,300,000 Federal Home Loan Bank Discount Notes USD 1.577% 20/07/2022 29,262,317 2.9931,100,000 Federal Home Loan Bank Discount Notes USD 1.093% 24/08/2022 31,014,989 3.1612,800,000 Federal Home Loan Mortgage Corp. (FHLMC)(c) USD 0.875% 19/08/2022 12,795,392 1.312,800,000 Federal National Mortgage Association (FNMA)(c) USD 0.900% 29/07/2022 2,799,020 0.29
583,562,820 59.53
TOTAL BONDS(cost USD 583,610,832) 583,562,820 59.53
Holdings Security DescriptionMarket Value
USD
% ofShareholders’
Equity
Mutual Funds – 11.42%Ireland
16,437 Goldman Sachs US$ Liquid Reserves Fund (X Distribution Class)(d)(e) 16,437 0.00111,991,307 Goldman Sachs US$ Treasury Liquid Reserves Fund (X Distribution Class)(d)(f) 111,991,307 11.42
112,007,744 11.42
TOTAL MUTUAL FUNDS(cost USD 112,007,744) 112,007,744 11.42
TOTAL TRANSFERABLE SECURITIES ADMITTED TO AN OFFICIAL EXCHANGE LISTING(cost USD 695,618,576) 695,570,564 70.95
MARKET VALUE OF INVESTMENTS EXCLUDING DERIVATIVES(cost USD 695,618,576) 695,570,564 70.95
Futures Contracts – (1.09%)
Number ofContracts Security Description
CommitmentMarket Value
USD
UnrealisedGainUSD
% ofShareholders’
Equity
USD(219) US Treasury Long Bond Futures 21/09/2022 Short (30,502,594) 354,811 0.03
UNREALISED GAIN ON FUTURES CONTRACTS 354,811 0.03
Number ofContracts Security Description
CommitmentMarket Value
USD
UnrealisedLossUSD
% ofShareholders’
Equity
USD2,619 E-Mini S&P 500 Index Futures 17/06/2022 Long 540,987,187 (7,454,535) (0.76)4,230 US Treasury Notes 10YR Futures 21/09/2022 Long 505,022,344 (3,553,826) (0.36)
1,046,009,531 (11,008,361) (1.12)
UNREALISED LOSS ON FUTURES CONTRACTS (11,008,361) (1.12)
Forward Currency Contracts – 0.10%
CurrencyAmountBought Currency
AmountSold
MaturityDate
UnrealisedGainUSD
% ofShareholders’
Equity
AUD 20,590,000 USD 14,461,553 24/06/2022 313,691 0.03CAD 25,020,000 USD 19,476,124 24/06/2022 302,340 0.03
Goldman Sachs Funds II—Strategic Factor Allocation PortfolioSchedule of Investments
As at 31 May 2022
The accompanying notes are an integral part of these financial statements.
66
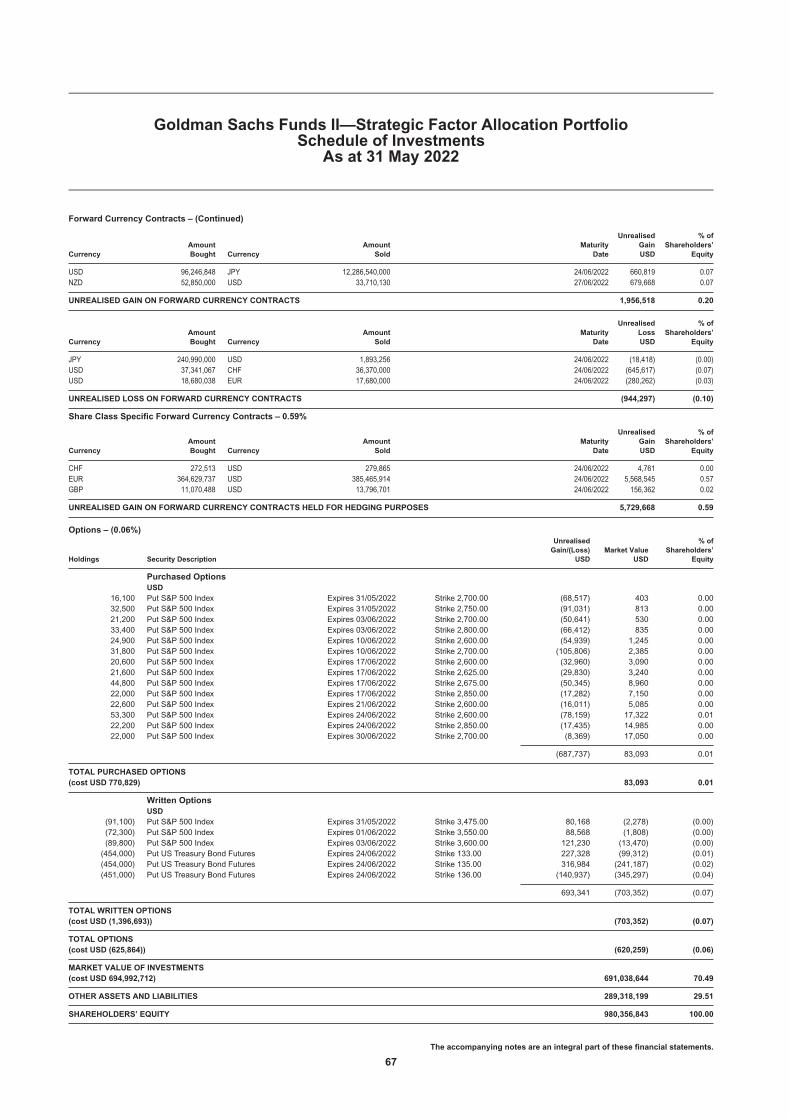
Forward Currency Contracts – (Continued)
CurrencyAmountBought Currency
AmountSold
MaturityDate
UnrealisedGainUSD
% ofShareholders’
Equity
USD 96,246,848 JPY 12,286,540,000 24/06/2022 660,819 0.07NZD 52,850,000 USD 33,710,130 27/06/2022 679,668 0.07
UNREALISED GAIN ON FORWARD CURRENCY CONTRACTS 1,956,518 0.20
CurrencyAmountBought Currency
AmountSold
MaturityDate
UnrealisedLossUSD
% ofShareholders’
Equity
JPY 240,990,000 USD 1,893,256 24/06/2022 (18,418) (0.00)USD 37,341,067 CHF 36,370,000 24/06/2022 (645,617) (0.07)USD 18,680,038 EUR 17,680,000 24/06/2022 (280,262) (0.03)
UNREALISED LOSS ON FORWARD CURRENCY CONTRACTS (944,297) (0.10)
Share Class Specific Forward Currency Contracts – 0.59%
CurrencyAmountBought Currency
AmountSold
MaturityDate
UnrealisedGainUSD
% ofShareholders’
Equity
CHF 272,513 USD 279,865 24/06/2022 4,761 0.00EUR 364,629,737 USD 385,465,914 24/06/2022 5,568,545 0.57GBP 11,070,488 USD 13,796,701 24/06/2022 156,362 0.02
UNREALISED GAIN ON FORWARD CURRENCY CONTRACTS HELD FOR HEDGING PURPOSES 5,729,668 0.59
Options – (0.06%)
Holdings Security Description
UnrealisedGain/(Loss)
USDMarket Value
USD
% ofShareholders’
Equity
Purchased OptionsUSD
16,100 Put S&P 500 Index Expires 31/05/2022 Strike 2,700.00 (68,517) 403 0.0032,500 Put S&P 500 Index Expires 31/05/2022 Strike 2,750.00 (91,031) 813 0.0021,200 Put S&P 500 Index Expires 03/06/2022 Strike 2,700.00 (50,641) 530 0.0033,400 Put S&P 500 Index Expires 03/06/2022 Strike 2,800.00 (66,412) 835 0.0024,900 Put S&P 500 Index Expires 10/06/2022 Strike 2,600.00 (54,939) 1,245 0.0031,800 Put S&P 500 Index Expires 10/06/2022 Strike 2,700.00 (105,806) 2,385 0.0020,600 Put S&P 500 Index Expires 17/06/2022 Strike 2,600.00 (32,960) 3,090 0.0021,600 Put S&P 500 Index Expires 17/06/2022 Strike 2,625.00 (29,830) 3,240 0.0044,800 Put S&P 500 Index Expires 17/06/2022 Strike 2,675.00 (50,345) 8,960 0.0022,000 Put S&P 500 Index Expires 17/06/2022 Strike 2,850.00 (17,282) 7,150 0.0022,600 Put S&P 500 Index Expires 21/06/2022 Strike 2,600.00 (16,011) 5,085 0.0053,300 Put S&P 500 Index Expires 24/06/2022 Strike 2,600.00 (78,159) 17,322 0.0122,200 Put S&P 500 Index Expires 24/06/2022 Strike 2,850.00 (17,435) 14,985 0.0022,000 Put S&P 500 Index Expires 30/06/2022 Strike 2,700.00 (8,369) 17,050 0.00
(687,737) 83,093 0.01
TOTAL PURCHASED OPTIONS(cost USD 770,829) 83,093 0.01
Written OptionsUSD
(91,100) Put S&P 500 Index Expires 31/05/2022 Strike 3,475.00 80,168 (2,278) (0.00)(72,300) Put S&P 500 Index Expires 01/06/2022 Strike 3,550.00 88,568 (1,808) (0.00)(89,800) Put S&P 500 Index Expires 03/06/2022 Strike 3,600.00 121,230 (13,470) (0.00)
(454,000) Put US Treasury Bond Futures Expires 24/06/2022 Strike 133.00 227,328 (99,312) (0.01)(454,000) Put US Treasury Bond Futures Expires 24/06/2022 Strike 135.00 316,984 (241,187) (0.02)(451,000) Put US Treasury Bond Futures Expires 24/06/2022 Strike 136.00 (140,937) (345,297) (0.04)
693,341 (703,352) (0.07)
TOTAL WRITTEN OPTIONS(cost USD (1,396,693)) (703,352) (0.07)
TOTAL OPTIONS(cost USD (625,864)) (620,259) (0.06)
MARKET VALUE OF INVESTMENTS(cost USD 694,992,712) 691,038,644 70.49
OTHER ASSETS AND LIABILITIES 289,318,199 29.51
SHAREHOLDERS’ EQUITY 980,356,843 100.00
Goldman Sachs Funds II—Strategic Factor Allocation PortfolioSchedule of Investments
As at 31 May 2022
The accompanying notes are an integral part of these financial statements.
67

TOTAL INVESTMENTSMarket Value
USD
% ofShareholders’
Equity
Total Investments excluding derivatives (cost USD 695,618,576) 695,570,564 70.95Unrealised gain on futures contracts 354,811 0.03Unrealised loss on futures contracts (11,008,361) (1.12)Unrealised gain on forward currency contracts 1,956,518 0.20Unrealised loss on forward currency contracts (944,297) (0.10)Unrealised gain on forward currency contracts held for hedging purposes 5,729,668 0.59Market value of purchased options (cost USD 770,829) 83,093 0.01Market value of written options (cost USD (1,396,693)) (703,352) (0.07)Other Assets and Liabilities 289,318,199 29.51
Shareholders’ Equity 980,356,843 100.00
The Futures Commission Merchant was Barclays Capital, Inc.
The counterparty for forward currency contracts was JP Morgan Chase Bank NA.
The counterparties for options contracts were Barclays Capital, Inc. and Morgan Stanley & Co. International PLC.
The maximum individual counterparty exposure as at 31 May 2022 is 0.78% of the NAV.
(a) Interest rates represent either the stated coupon rate, annualised discounted yield on date of purchase for discounted securities, or, for floating rate securities, the current reset ratewhich is based upon interest rates indices.
(b) Maturity dates represent either the stated date on the security, or the next interest reset date for floating rate securities or the prerefunded date for those type of securities.(c) Variable and floating coupon rates are those quoted as of 31 May 2022.(d) A related party to Goldman Sachs Funds II.(e) The yield for this fund as at 31 May 2022 was 0.922%.(f) The yield for this fund as at 31 May 2022 was 0.779%.
Goldman Sachs Funds II—Strategic Factor Allocation PortfolioSchedule of Investments
As at 31 May 2022
The accompanying notes are an integral part of these financial statements.
68

Holdings Security Description Currency Interest Rate(a) Maturity Date(b)Market Value
USD
% ofShareholders’
Equity
Transferable securities admitted to an official exchange listing
Bonds – 25.33%United States
1,600,000 Federal Farm Credit Banks Funding Corp.(c) USD 0.890% 21/11/2022 1,597,856 0.07600,000 Federal Farm Credit Banks Funding Corp.(c) USD 0.835% 25/11/2022 598,998 0.03
2,100,000 Federal Farm Credit Banks Funding Corp.(c) USD 0.900% 02/12/2022 2,096,598 0.101,100,000 Federal Farm Credit Banks Funding Corp.(c) USD 0.830% 17/02/2023 1,100,517 0.052,200,000 Federal Farm Credit Banks Funding Corp.(c) USD 1.158% 23/10/2023 2,203,627 0.104,500,000 Federal Farm Credit Banks Funding Corp.(c) USD 1.163% 30/10/2023 4,507,801 0.211,100,000 Federal Home Loan Bank Discount Notes USD 1.597% 30/06/2022 1,099,283 0.051,900,000 Federal Home Loan Bank Discount Notes USD 1.594% 12/07/2022 1,897,955 0.091,500,000 Federal Home Loan Bank Discount Notes USD 1.577% 15/07/2022 1,498,260 0.078,000,000 Federal Home Loan Bank Discount Notes USD 1.612% 18/08/2022 7,979,692 0.36
32,900,000 Federal Home Loan Mortgage Corp. (FHLMC)(c) USD 0.875% 19/08/2022 32,887,827 1.503,400,000 Federal National Mortgage Association (FNMA)(c) USD 0.900% 29/07/2022 3,398,912 0.168,600,000 United States Cash Management Bill USD 0.845% 19/07/2022 8,590,569 0.393,800,000 United States Cash Management Bill USD 1.024% 09/08/2022 3,792,662 0.17
12,600,000 United States Cash Management Bill USD 1.045% 16/08/2022 12,572,402 0.5718,400,000 United States Cash Management Bill USD 1.078% 23/08/2022 18,354,820 0.843,400,000 United States Cash Management Bill USD 1.089% 30/08/2022 3,390,905 0.152,900,000 United States Cash Management Bill USD 1.155% 06/09/2022 2,890,975 0.137,100,000 United States Cash Management Bill USD 1.179% 13/09/2022 7,076,105 0.32
800,000 United States Treasury Bill USD 0.717% 28/06/2022 799,586 0.04800,000 United States Treasury Bill USD 0.723% 07/07/2022 799,426 0.04500,000 United States Treasury Bill USD 0.807% 12/07/2022 499,548 0.02
1,400,000 United States Treasury Bill USD 0.855% 21/07/2022 1,398,386 0.0621,900,000 United States Treasury Bill USD 1.040% 11/08/2022 21,855,541 1.006,100,000 United States Treasury Bill USD 1.053% 18/08/2022 6,086,252 0.289,000,000 United States Treasury Bill USD 1.059% 25/08/2022 8,977,719 0.416,900,000 United States Treasury Bill USD 1.127% 01/09/2022 6,880,171 0.315,800,000 United States Treasury Bill USD 1.131% 08/09/2022 5,781,857 0.26
24,900,000 United States Treasury Bill USD 1.170% 15/09/2022 24,815,136 1.1320,000,000 United States Treasury Bill USD 1.439% 03/11/2022 19,878,727 0.9168,750,000 United States Treasury Floating Rate Note(c) USD 1.178% 31/07/2022 68,782,198 3.14
600,000 United States Treasury Floating Rate Note(c) USD 0.845% 31/10/2022 600,689 0.0338,700,000 United States Treasury Floating Rate Note(c) USD 1.172% 31/01/2023 38,765,176 1.7712,800,000 United States Treasury Floating Rate Note(c) USD 0.864% 30/04/2023 12,825,054 0.58
135,000,000 United States Treasury Floating Rate Note(c) USD 1.158% 31/10/2023 135,343,543 6.1775,000,000 United States Treasury Floating Rate Note(c) USD 0.988% 31/01/2024 75,100,261 3.42
200,000 United States Treasury Note/Bond USD 0.125% 31/08/2022 199,504 0.012,100,000 United States Treasury Note/Bond USD 0.125% 31/01/2023 2,077,277 0.095,100,000 United States Treasury Note/Bond USD 2.000% 15/02/2023 5,106,475 0.23
700,000 United States Treasury Note/Bond USD 0.125% 28/02/2023 691,031 0.03800,000 United States Treasury Note/Bond USD 2.625% 28/02/2023 804,531 0.04
555,603,852 25.33
TOTAL BONDS(cost USD 555,241,364) 555,603,852 25.33
Holdings Security DescriptionMarket Value
USD
% ofShareholders’
Equity
Mutual Funds – 21.31%Ireland
38,028 Goldman Sachs US$ Liquid Reserves Fund (X Distribution Class)(d)(e) 38,028 0.00322,729,003 Goldman Sachs US$ Treasury Liquid Reserves Fund (X Distribution Class)(d)(f) 322,729,003 14.71
658,951 Invesco Morningstar US Energy Infrastructure MLP UCITS ETF 29,092,687 1.335,832,765 iShares S&P 500 Energy Sector UCITS ETF 48,742,667 2.226,665,953 iShares S&P 500 Health Care Sector UCITS ETF 66,859,509 3.05
467,461,894 21.31
TOTAL MUTUAL FUNDS(cost USD 424,520,381) 467,461,894 21.31
TOTAL TRANSFERABLE SECURITIES ADMITTED TO AN OFFICIAL EXCHANGE LISTING(cost USD 979,761,745) 1,023,065,746 46.64
Goldman Sachs Funds II—Tactical Tilt Overlay PortfolioSchedule of Investments
As at 31 May 2022
The accompanying notes are an integral part of these financial statements.
69

Holdings Security Description Currency Interest Rate(a) Maturity Date(b)Market Value
USD
% ofShareholders’
Equity
Certificates of Deposit – 17.79%
Canada15,260,000 Bank Of Montreal(c) USD 1.080% 09/01/2023 15,248,616 0.70
Finland4,700,000 Nordea Bank Abp(c) USD 1.310% 23/12/2022 4,702,749 0.21
United States11,240,000 Bank of Nova Scotia(c) USD 1.210% 20/12/2022 11,240,924 0.5115,000,000 Barclays Bank PLC(c) USD 1.070% 16/02/2023 14,975,439 0.6814,822,000 Cooperatieve Centrale USD 1.500% 17/10/2022 14,811,007 0.682,773,000 Cooperatieve Centrale(c) USD 1.270% 25/11/2022 2,774,676 0.134,708,000 Credit Industriel et Commercial(c) USD 1.130% 13/10/2022 4,708,080 0.22
16,000,000 Credit Suisse USD 0.400% 10/11/2022 15,884,953 0.7314,894,000 DNB ASA(c) USD 1.360% 23/03/2023 14,911,534 0.689,699,000 Enel Finance America LLC(c) USD 1.580% 27/10/2022 9,698,998 0.445,300,000 HSBC Bank USD 0.450% 14/10/2022 5,274,268 0.249,513,000 HSBC Bank(c) USD 1.000% 18/11/2022 9,505,701 0.434,850,000 Ionic Capital II Trust(c) USD 1.030% 26/07/2022 4,850,348 0.226,000,000 J.P. Morgan Securities(c) USD 0.910% 01/09/2022 5,996,952 0.274,000,000 J.P. Morgan Securities(c) USD 1.110% 03/10/2022 4,000,682 0.187,848,000 Landesbank Baden-Wuerttemberg USD 1.250% 25/07/2022 7,847,897 0.368,000,000 Landesbank Baden-Wuerttemberg(c) USD 1.000% 12/10/2022 8,000,431 0.375,750,000 Lloyds Bank Corp. USD 0.230% 15/07/2022 5,744,099 0.26
12,000,000 Lloyds Bank Corp.(c) USD 1.050% 20/01/2023 11,984,309 0.5520,000,000 Macquarie Bank Ltd.(c) USD 1.110% 05/12/2022 19,988,759 0.917,881,000 Matchpoint Finance PLC(c) USD 1.210% 10/11/2022 7,884,164 0.36
13,000,000 MUFG Bank Ltd. USD 0.380% 04/11/2022 12,911,113 0.595,920,000 National Australia Bank Ltd. USD 0.000% 06/09/2022 5,895,376 0.276,063,000 National Bank of Kuwait SAKP USD 0.450% 01/06/2022 6,062,941 0.28
16,000,000 National Bank of Kuwait SAKP USD 1.050% 17/06/2022 16,000,752 0.731,570,000 National Bank of Kuwait SAKP USD 1.550% 12/08/2022 1,569,811 0.072,900,000 Natixis SA(c) USD 0.960% 17/06/2022 2,900,112 0.13
500,000 Natixis SA USD 0.230% 01/08/2022 499,234 0.027,800,000 Natixis SA USD 1.440% 02/08/2022 7,804,178 0.36
15,266,000 Norinchukin Bank(c) USD 1.000% 25/07/2022 15,263,366 0.706,000,000 Oversea Chinese Banking(c) USD 1.100% 23/09/2022 5,999,751 0.27
14,342,000 Sheffield Receivable(c) USD 0.990% 26/07/2022 14,339,733 0.6510,800,000 Skandinaviska Enskilda Banken AG USD 1.830% 05/10/2022 10,801,273 0.491,100,000 Skandinaviska Enskilda Banken AG USD 1.945% 27/10/2022 1,100,608 0.057,645,000 Standard Chartered Bank USD 1.150% 27/07/2022 7,646,445 0.357,158,000 Standard Chartered Bank USD 2.820% 26/05/2023 7,167,073 0.33
15,000,000 Sumitomo Mitsui Banking Corp.(c) USD 1.000% 31/03/2023 14,991,062 0.685,000,000 Sumitomo Mitsui Banking Corp. USD 2.700% 27/04/2023 4,999,340 0.236,000,000 Sumitomo Mitsui Trust Bank Ltd. USD 0.900% 17/06/2022 6,000,086 0.27
23,060,000 Svenska Handelsbanken AB USD 2.795% 25/05/2023 23,062,667 1.0515,000,000 Toronto Dominion Bank USD 2.690% 28/04/2023 14,998,996 0.686,980,000 UBS AG(c) USD 0.350% 02/12/2022 6,975,753 0.323,112,000 Westpac Banking Corp. USD 1.150% 07/09/2022 3,109,145 0.14
370,182,036 16.88
TOTAL CERTIFICATES OF DEPOSIT(cost USD 390,437,952) 390,133,401 17.79
Commercial Papers – 28.35%
United States6,000,000 ABN AMRO Funding USA LLC USD 0.000% 16/06/2022 5,997,648 0.276,945,000 Albion Capital Corp. SA / Albion Capital LLC USD 0.000% 20/07/2022 6,934,119 0.321,000,000 Alimentation Couche-Tard, Inc. USD 0.000% 07/06/2022 999,789 0.052,170,000 Antalis SA USD 0.000% 21/07/2022 2,166,495 0.106,121,000 Antalis SA USD 0.000% 26/07/2022 6,109,746 0.286,000,000 AT&T, Inc. USD 0.000% 21/06/2022 5,995,923 0.27
12,010,000 AT&T, Inc. USD 0.000% 16/08/2022 11,971,468 0.552,944,000 Atlantic Asset Securitization LLC USD 0.000% 09/06/2022 2,943,380 0.136,469,000 Australia & New Zealand Banking Group Ltd. USD 0.000% 25/05/2023 6,293,726 0.293,766,000 BASF SE USD 0.000% 06/09/2022 3,749,433 0.177,479,000 BASF SE USD 0.000% 03/10/2022 7,430,101 0.347,765,000 BNZ International Funding Ltd. USD 0.000% 01/07/2022 7,758,701 0.35
16,303,000 BofA Securities, Inc. USD 2.720% 16/05/2023 15,878,850 0.72
Goldman Sachs Funds II—Tactical Tilt Overlay PortfolioSchedule of Investments
As at 31 May 2022
The accompanying notes are an integral part of these financial statements.
70

Holdings Security Description Currency Interest Rate(a) Maturity Date(b)Market Value
USD
% ofShareholders’
Equity
Commercial Papers – (Continued)United States – (Continued)
4,000,000 BP Capital Markets PLC USD 0.000% 07/09/2022 3,985,238 0.185,091,000 Caisse d’Amortissement de la Dette Sociale USD 0.000% 27/06/2022 5,087,418 0.236,243,000 CDP Financial, Inc. USD 0.000% 01/08/2022 6,230,485 0.287,692,000 Charlotte-Mecklenburg USD 0.000% 01/06/2022 7,692,000 0.353,000,000 Citigroup Global Markets, Inc. USD 0.000% 06/09/2022 2,987,293 0.14
19,000,000 Citigroup Global Markets, Inc. USD 0.000% 21/10/2022 18,860,527 0.865,000,000 Commonwealth Bank of Australia USD 0.000% 21/06/2022 4,997,425 0.235,084,000 Commonwealth Bank of Australia(c) USD 0.980% 26/08/2022 5,082,785 0.236,100,000 Commonwealth Bank of Australia USD 0.000% 21/10/2022 6,056,555 0.285,780,000 Commonwealth Bank of Australia USD 0.000% 02/11/2022 5,733,538 0.264,500,000 Credit Agricole Corporate and Investment Bank USD 0.000% 28/11/2022 4,452,058 0.206,874,000 Credit Agricole SA USD 0.000% 18/08/2022 6,852,293 0.317,844,000 DBS Bank Ltd. USD 0.000% 19/07/2022 7,832,352 0.368,000,000 Dexia Credit Local SA USD 0.000% 01/07/2022 7,993,442 0.36
10,000,000 Dexia Credit Local SA USD 0.000% 20/07/2022 9,984,931 0.467,000,000 Dexia Credit Local SA(c) USD 0.000% 30/09/2022 6,961,096 0.327,151,000 DNB ASA USD 0.000% 23/11/2022 7,083,317 0.32
15,000,000 Dow Chemical Co. USD 0.000% 03/06/2022 14,998,722 0.685,000,000 Duke Energy Corp. USD 0.000% 08/07/2022 4,993,213 0.234,596,000 DZ Bank AG USD 0.000% 08/07/2022 4,591,144 0.217,835,000 DZ Bank AG USD 0.000% 02/08/2022 7,818,684 0.369,500,000 Enbridge, Inc. USD 0.000% 19/01/2023 9,354,339 0.432,000,000 Entergy Corp. USD 0.000% 03/06/2022 1,999,840 0.09
11,540,000 Entergy Corp. USD 0.000% 18/08/2022 11,501,862 0.521,999,000 Essilorluxottica USD 0.000% 22/06/2022 1,998,002 0.091,887,000 Fairway Finance Co. LLC USD 0.000% 07/06/2022 1,886,697 0.093,957,000 Fairway Finance Co. LLC USD 0.000% 13/07/2022 3,951,834 0.189,430,000 Federation des Caisses Desjardins du Quebec USD 0.000% 19/07/2022 9,416,164 0.436,664,000 Federation des Caisses Desjardins du Quebec USD 0.000% 28/07/2022 6,651,750 0.304,000,000 Fidelity National Information Services USD 0.000% 03/06/2022 3,999,669 0.185,500,000 Fidelity National Information Services USD 0.000% 13/06/2022 5,497,857 0.25
10,000,000 Fidelity National Information Services USD 0.000% 21/06/2022 9,993,204 0.466,000,000 First Abu Dhabi Bank PJSC USD 0.000% 07/06/2022 5,999,049 0.272,000,000 FMS Wertmanagement USD 0.000% 04/08/2022 1,995,450 0.095,510,000 Gotham Funding Corp. USD 0.000% 25/07/2022 5,499,814 0.256,304,000 Gotham Funding Corp. USD 0.000% 26/07/2022 6,292,027 0.291,153,000 GTA Funding LLC USD 0.300% 07/06/2022 1,152,813 0.057,905,000 GTA Funding LLC USD 0.000% 28/09/2022 7,860,073 0.367,439,000 ING Funding LLC USD 0.000% 26/07/2022 7,425,449 0.345,000,000 J.P. Morgan Securities USD 0.000% 15/07/2022 4,993,125 0.234,500,000 JP Morgan Securities LLC USD 0.000% 28/11/2022 4,452,261 0.20
11,000,000 KFW USD 0.000% 02/08/2022 10,976,342 0.501,883,000 Liberty Funding LLC USD 0.000% 17/06/2022 1,882,222 0.092,000,000 Lloyds Bank PLC USD 0.000% 15/06/2022 1,999,313 0.095,000,000 LMA Americas LLC USD 0.000% 08/06/2022 4,999,062 0.23
10,000,000 LMA Americas LLC USD 0.000% 21/11/2022 9,901,593 0.453,793,000 Macquarie Bank Ltd. USD 0.000% 05/08/2022 3,782,924 0.177,439,000 Mizuho Bank Ltd USD 0.000% 15/06/2022 7,436,378 0.348,000,000 Mizuho Bank Ltd. USD 0.000% 18/07/2022 7,988,085 0.364,400,000 Mondelez International, Inc. USD 0.000% 10/06/2022 4,398,747 0.20
13,338,000 National Australia Bank Ltd. USD 0.000% 01/11/2022 13,230,619 0.603,200,000 National Australia Bank Ltd. USD 0.000% 27/01/2023 3,147,858 0.145,000,000 National Bank of Canada USD 0.000% 17/06/2022 4,998,021 0.23
10,000,000 Nutrien Ltd. USD 0.000% 08/06/2022 9,997,631 0.464,500,000 Nutrien Ltd. USD 0.000% 28/06/2022 4,495,429 0.201,600,000 Nutrien Ltd. USD 0.000% 29/06/2022 1,598,297 0.075,000,000 Nutrien Ltd. USD 0.000% 30/06/2022 4,994,438 0.237,969,000 Pacific Life Short Term USD 0.000% 19/05/2023 7,752,551 0.352,750,000 Reckitt Benckiser Treasury USD 0.000% 29/06/2022 2,747,705 0.139,450,000 Royal Bank of Canada USD 0.000% 24/10/2022 9,374,423 0.436,119,000 Royal Bank of Canada USD 0.000% 09/11/2022 6,062,800 0.28
10,000,000 Salisbury Receivables Co.(c) USD 1.120% 01/02/2023 9,988,033 0.468,000,000 Skandinaviska Enskilda Banken AB USD 0.000% 22/06/2022 7,995,727 0.367,604,000 Societe Generale SA(c) USD 1.010% 08/12/2022 7,596,321 0.353,000,000 Spire, Inc. USD 0.000% 14/06/2022 2,998,728 0.143,000,000 Suncor Energy, Inc. USD 0.000% 26/07/2022 2,993,635 0.143,900,000 Svenska Handelsbanken AB USD 0.000% 05/12/2022 3,857,108 0.18
10,200,000 TELUS Corp. USD 0.000% 22/09/2022 10,143,830 0.464,000,000 The Stanley Works USD 0.000% 21/06/2022 3,997,818 0.187,777,000 The Stanley Works USD 0.000% 05/08/2022 7,758,137 0.35
Goldman Sachs Funds II—Tactical Tilt Overlay PortfolioSchedule of Investments
As at 31 May 2022
The accompanying notes are an integral part of these financial statements.
71

Holdings Security Description Currency Interest Rate(a) Maturity Date(b)Market Value
USD
% ofShareholders’
Equity
Commercial Papers – (Continued)United States – (Continued)
4,782,000 Thermo Fisher Scientific, Inc. USD 0.000% 01/06/2022 4,781,870 0.224,000,000 Transcanada Pipelines Ltd. USD 0.000% 09/06/2022 3,998,964 0.18
10,000,000 UBS AG USD 0.000% 12/07/2022 9,987,668 0.4610,000,000 Verizon Communications, Inc. USD 0.000% 05/07/2022 9,987,283 0.466,000,000 Verizon Communications, Inc. USD 0.000% 11/07/2022 5,990,953 0.273,294,000 Victory Receivables Corp. USD 0.000% 22/06/2022 3,292,172 0.15
15,000,000 VW Credit, Inc. USD 0.000% 26/08/2022 14,942,979 0.688,000,000 Walt Disney Co. USD 0.000% 15/06/2022 7,997,060 0.364,392,000 Waste Management, Inc. USD 0.000% 10/08/2022 4,379,388 0.202,867,000 Waste Management, Inc. USD 0.000% 08/11/2022 2,841,100 0.134,000,000 Westpac Banking Corp. USD 0.000% 30/09/2022 3,977,904 0.189,800,000 Westpac Banking Corp. USD 0.000% 12/10/2022 9,739,374 0.446,535,000 Westpac Banking Corp. USD 0.000% 01/11/2022 6,486,218 0.307,851,000 Xcel Energy, Inc. USD 0.000% 13/06/2022 7,847,941 0.36
621,769,823 28.35
TOTAL COMMERCIAL PAPERS(cost USD 622,595,878) 621,769,823 28.35
MARKET VALUE OF INVESTMENTS EXCLUDING DERIVATIVES(cost USD 1,992,795,575) 2,034,968,970 92.78
Futures Contracts – 0.26%
Number ofContracts Security Description
CommitmentMarket Value
USD
UnrealisedGainUSD
% ofShareholders’
Equity
EUR18,062 EURO STOXX Banks Index 17/06/2022 Long 88,811,523 7,779,323 0.35
UNREALISED GAIN ON FUTURES CONTRACTS 7,779,323 0.35
Number ofContracts Security Description
CommitmentMarket Value
USD
UnrealisedLossUSD
% ofShareholders’
Equity
USD1,822 US Treasury Notes 10YR Futures 21/09/2022 Long 217,501,250 (1,315,042) (0.06)2,376 US Treasury Notes 2YR Futures 30/09/2022 Long 501,317,439 (540,751) (0.02)1,014 US Treasury Notes 5YR Futures 30/09/2022 Long 114,463,172 (119,142) (0.01)
833,281,861 (1,974,935) (0.09)
UNREALISED LOSS ON FUTURES CONTRACTS (1,974,935) (0.09)
Share Class Specific Forward Currency Contracts – (2.19%)
CurrencyAmountBought Currency
AmountSold
MaturityDate
UnrealisedLossUSD
% ofShareholders’
Equity
CHF 13,061,000 USD 14,230,291 15/06/2022 (609,092) (0.03)EUR 500,418,000 USD 557,685,836 15/06/2022 (21,289,247) (0.97)GBP 340,521,000 USD 453,914,029 15/06/2022 (25,231,568) (1.15)SEK 528,630,000 USD 54,560,861 15/06/2022 (715,961) (0.03)USD 135,789 CHF 136,000 15/06/2022 (6,045) (0.00)USD 17,109,998 EUR 16,018,000 15/06/2022 (59,649) (0.01)USD 16,947,050 GBP 13,463,000 15/06/2022 (1,543) (0.00)USD 3,996,109 SEK 39,412,000 15/06/2022 (18,297) (0.00)
UNREALISED LOSS ON FORWARD CURRENCY CONTRACTS HELD FOR HEDGING PURPOSES (47,931,402) (2.19)
Options – (1.17%)
Holdings Security Description
UnrealisedGain/(Loss)
USDMarket Value
USD
% ofShareholders’
Equity
Purchased OptionsEUR
21,930,000 Put EUR / Call USD Expires 07/03/2023 Strike 1.19 1,436,217 2,280,841 0.11
Goldman Sachs Funds II—Tactical Tilt Overlay PortfolioSchedule of Investments
As at 31 May 2022
The accompanying notes are an integral part of these financial statements.
72

Options – (Continued)
Holdings Security Description
UnrealisedGain/(Loss)
USDMarket Value
USD
% ofShareholders’
Equity
Purchased Options – (Continued)USD
17,107 Call S&P 500 Index Expires 15/07/2022 Strike 4,050.00 612,679 3,122,275 0.14
TOTAL PURCHASED OPTIONS(cost USD 3,354,221) 5,403,116 0.25
Written OptionsEUR
(21,930,000) Put EUR / Call USD Expires 07/03/2023 Strike 1.19 (1,228,683) (2,280,841) (0.10)
USD(53,632) Put Health Care Select Sector Index Expires 30/12/2022 Strike 1,286.61 983,197 (3,229,645) (0.15)(16,408) Put S&P 500 Index Expires 19/08/2022 Strike 3,800.00 1,016,556 (1,497,974) (0.07)(32,555) Put S&P 500 Index Expires 30/12/2022 Strike 3,877.57 228,192 (6,781,550) (0.31)(17,448) Put S&P 500 Index Expires 30/12/2022 Strike 3,983.47 926,776 (4,229,940) (0.19)(16,240) Put S&P 500 Index Expires 30/12/2022 Strike 4,173.28 (1,254,812) (5,129,189) (0.24)(15,878) Put S&P 500 Index Expires 30/12/2022 Strike 4,210.38 (1,430,856) (5,274,870) (0.24)(17,107) Put S&P 500 Index Expires 20/01/2023 Strike 3,645.00 247,398 (2,677,899) (0.12)
716,451 (28,821,067) (1.32)
TOTAL WRITTEN OPTIONS(cost USD (30,589,676)) (31,101,908) (1.42)
TOTAL OPTIONS(cost USD (27,235,455)) (25,698,792) (1.17)
Swap Contracts – 0.02%Net LocalNotionalAmount Pay Receive Currency Maturity Date
UnrealisedGainUSD
% ofShareholders’
Equity
Total Return Swaps7,346,685 Floating (S&P 500 Total Return Index) Floating (USD 1 month FEDL) USD 03/06/2022 53,385 0.00
67,354,036 Floating (JPGSVENK Index) Floating (USD 1 month FEDL) USD 06/07/2022 1,529,227 0.0716,771 Floating (USD 3 month FEDL) Floating (Alerian MLP Infrastructure
Index)USD 04/04/2023 3,237,842 0.15
UNREALISED GAIN ON TOTAL RETURN SWAPS 4,820,454 0.22
TOTAL UNREALISED GAIN ON SWAP CONTRACTS 4,820,454 0.22
Net LocalNotionalAmount Pay Receive Currency Maturity Date
UnrealisedLossUSD
% ofShareholders’
Equity
Credit Default Swaps98,770,000 Floating (Markit CDX North America
High Yield 38 Version 1 Index)Fixed 5.000% USD 20/06/2027 (3,867,913) (0.18)
UNREALISED LOSS ON CREDIT DEFAULT SWAPS (3,867,913) (0.18)
Total Return Swaps7,814 Floating (USD 1 month FEDL) Floating (S&P 500 Total Return Index) USD 03/06/2022 (496,606) (0.02)
419 Floating (USD 1 month FEDL) Floating (S&P 500 Total Return Index) USD 03/06/2022 (26,628) (0.00)344 Floating (USD 1 month FEDL) Floating (S&P 500 Total Return Index) USD 03/06/2022 (21,861) (0.00)
UNREALISED LOSS ON TOTAL RETURN SWAPS (545,095) (0.02)
TOTAL UNREALISED LOSS ON SWAP CONTRACTS (4,413,008) (0.20)
MARKET VALUE OF INVESTMENTS(cost USD 1,965,560,120)
1,967,550,610 89.70
OTHER ASSETS AND LIABILITIES 225,764,835 10.30
SHAREHOLDERS’ EQUITY 2,193,315,445 100.00
Goldman Sachs Funds II—Tactical Tilt Overlay PortfolioSchedule of Investments
As at 31 May 2022
The accompanying notes are an integral part of these financial statements.
73

TOTAL INVESTMENTSMarket Value
USD
% ofShareholders’
Equity
Total Investments excluding derivatives (cost USD 1,992,795,575) 2,034,968,970 92.78Unrealised gain on futures contracts 7,779,323 0.35Unrealised loss on futures contracts (1,974,935) (0.09)Unrealised loss on forward currency contracts held for hedging purposes (47,931,402) (2.19)Market value of purchased options (cost USD 3,354,221) 5,403,116 0.25Market value of written options (cost USD (30,589,676)) (31,101,908) (1.42)Unrealised gain on swap contracts 4,820,454 0.22Unrealised loss on swap contracts (4,413,008) (0.20)Other Assets and Liabilities 225,764,835 10.30
Shareholders’ Equity 2,193,315,445 100.00
The Futures Commission Merchant was Morgan Stanley & Co., Inc.
The counterparty for forward currency contracts was Morgan Stanley & Co. LLC.
The counterparties for options contracts were Citibank NA, JP Morgan Chase Bank NA and Morgan Stanley & Co. International PLC.
The counterparties for swap contracts were Bank of America NA, JP Morgan Chase Bank NA and Merrill Lynch International.
The maximum individual counterparty exposure as at 31 May 2022 is 0.35% of the NAV.
(a) Interest rates represent either the stated coupon rate, annualised discounted yield on date of purchase for discounted securities, or, for floating rate securities, the current reset ratewhich is based upon interest rates indices.
(b) Maturity dates represent either the stated date on the security, or the next interest reset date for floating rate securities or the prerefunded date for those type of securities.(c) Variable and floating coupon rates are those quoted as of 31 May 2022.(d) A related party to Goldman Sachs Funds II.(e) The yield for this fund as at 31 May 2022 was 0.922%.(f) The yield for this fund as at 31 May 2022 was 0.779%.
Goldman Sachs Funds II—Tactical Tilt Overlay PortfolioSchedule of Investments
As at 31 May 2022
The accompanying notes are an integral part of these financial statements.
74

Holdings Security Description Currency Interest Rate(a) Maturity Date(b)Market Value
USD
% ofShareholders’
Equity
Transferable securities admitted to an official exchange listing
Bonds – 54.51%United States
100,000 Federal Farm Credit Banks Funding Corp.(c) USD 0.830% 17/02/2023 100,048 0.011,200,000 Federal Farm Credit Banks Funding Corp.(c) USD 1.158% 23/10/2023 1,200,228 0.122,500,000 Federal Farm Credit Banks Funding Corp.(c) USD 1.163% 30/10/2023 2,500,525 0.26
50,000,000 Federal Home Loan Bank Discount Notes USD 0.996% 03/06/2022 49,997,750 5.1360,000,000 Federal Home Loan Bank Discount Notes USD 0.595% 08/06/2022 59,990,589 6.1535,000,000 Federal Home Loan Bank Discount Notes USD 0.862% 10/06/2022 34,992,942 3.5985,000,000 Federal Home Loan Bank Discount Notes USD 1.628% 15/06/2022 84,973,337 8.71
154,850,000 Federal Home Loan Bank Discount Notes USD 1.530% 17/06/2022 154,794,488 15.8815,100,000 Federal Home Loan Bank Discount Notes USD 1.612% 22/06/2022 15,092,895 1.5552,750,000 Federal Home Loan Bank Discount Notes USD 1.577% 15/07/2022 52,688,823 5.4022,000,000 Federal Home Loan Bank Discount Notes USD 1.577% 20/07/2022 21,971,705 2.2530,000,000 Federal Home Loan Bank Discount Notes USD 1.595% 05/08/2022 29,936,525 3.0723,400,000 Federal Home Loan Bank Discount Notes USD 1.093% 24/08/2022 23,336,037 2.39
531,575,892 54.51
TOTAL BONDS(cost USD 531,626,044) 531,575,892 54.51
Holdings Security DescriptionMarket Value
USD
% ofShareholders’
Equity
Mutual Funds – 18.61%Ireland
181,448,442 Goldman Sachs US$ Treasury Liquid Reserves Fund (X Distribution Class)(d)(e) 181,448,442 18.61
TOTAL MUTUAL FUNDS(cost USD 181,448,442) 181,448,442 18.61
TOTAL TRANSFERABLE SECURITIES ADMITTED TO AN OFFICIAL EXCHANGE LISTING(cost USD 713,074,486) 713,024,334 73.12
MARKET VALUE OF INVESTMENTS EXCLUDING DERIVATIVES(cost USD 713,074,486) 713,024,334 73.12
Futures Contracts – (0.15%)
Number ofContracts Security Description
CommitmentMarket Value
USD
UnrealisedGainUSD
% ofShareholders’
Equity
USD20 E-Mini S&P 500 Index Futures 17/06/2022 Long 4,131,250 166,308 0.02
UNREALISED GAIN ON FUTURES CONTRACTS 166,308 0.02
Number ofContracts Security Description
CommitmentMarket Value
USD
UnrealisedLossUSD
% ofShareholders’
Equity
USD3,013 US Treasury Notes 2YR Futures 30/09/2022 Long 636,025,469 (529,170) (0.05)2,553 US Treasury Notes 5YR Futures 30/09/2022 Long 288,369,328 (1,138,196) (0.12)
924,394,797 (1,667,366) (0.17)
UNREALISED LOSS ON FUTURES CONTRACTS (1,667,366) (0.17)
Share Class Specific Forward Currency Contracts – 0.82%
CurrencyAmountBought Currency
AmountSold
MaturityDate
UnrealisedGainUSD
% ofShareholders’
Equity
CHF 7,003,737 USD 7,191,034 24/06/2022 124,027 0.01EUR 383,160,417 USD 404,982,935 24/06/2022 5,924,106 0.61GBP 133,137,034 USD 165,897,372 24/06/2022 1,906,371 0.20
UNREALISED GAIN ON FORWARD CURRENCY CONTRACTS HELD FOR HEDGING PURPOSES 7,954,504 0.82
Goldman Sachs Funds II—Strategic Volatility Premium PortfolioSchedule of Investments
As at 31 May 2022
The accompanying notes are an integral part of these financial statements.
75

Options – 0.00%
Holdings Security Description
UnrealisedGain/(Loss)
USDMarket Value
USD
% ofShareholders’
Equity
Purchased OptionsUSD
17,100 Put S&P 500 Index Expires 31/05/2022 Strike 2,700.00 (72,773) 428 0.0033,100 Put S&P 500 Index Expires 31/05/2022 Strike 2,750.00 (92,471) 827 0.0022,100 Put S&P 500 Index Expires 03/06/2022 Strike 2,700.00 (52,790) 553 0.0035,400 Put S&P 500 Index Expires 03/06/2022 Strike 2,800.00 (70,414) 885 0.0026,500 Put S&P 500 Index Expires 10/06/2022 Strike 2,600.00 (58,442) 1,325 0.0033,900 Put S&P 500 Index Expires 10/06/2022 Strike 2,700.00 (112,523) 2,542 0.0021,800 Put S&P 500 Index Expires 17/06/2022 Strike 2,600.00 (34,880) 3,270 0.0023,400 Put S&P 500 Index Expires 17/06/2022 Strike 2,625.00 (32,316) 3,510 0.0048,100 Put S&P 500 Index Expires 17/06/2022 Strike 2,675.00 (54,151) 9,620 0.0023,700 Put S&P 500 Index Expires 17/06/2022 Strike 2,850.00 (18,617) 7,702 0.0024,600 Put S&P 500 Index Expires 21/06/2022 Strike 2,600.00 (17,428) 5,535 0.0057,600 Put S&P 500 Index Expires 24/06/2022 Strike 2,600.00 (84,045) 18,720 0.0024,200 Put S&P 500 Index Expires 24/06/2022 Strike 2,850.00 (19,006) 16,335 0.0024,200 Put S&P 500 Index Expires 30/06/2022 Strike 2,700.00 (9,206) 18,755 0.01
(729,062) 90,007 0.01
TOTAL PURCHASED OPTIONS(cost USD 819,070) 90,007 0.01
Written OptionsUSD
(97,600) Put S&P 500 Index Expires 31/05/2022 Strike 3,475.00 85,888 (2,440) (0.00)(98,800) Put S&P 500 Index Expires 01/06/2022 Strike 3,550.00 121,030 (2,470) (0.00)(97,800) Put S&P 500 Index Expires 03/06/2022 Strike 3,600.00 132,030 (14,670) (0.00)(97,700) Put S&P 500 Index Expires 03/06/2022 Strike 3,735.00 73,275 (24,425) (0.01)
412,223 (44,005) (0.01)
TOTAL WRITTEN OPTIONS(cost USD (456,228)) (44,005) (0.01)
TOTAL OPTIONS(cost USD 362,842) 46,002 0.00
MARKET VALUE OF INVESTMENTS(cost USD 713,437,328) 719,523,782 73.79
OTHER ASSETS AND LIABILITIES 255,590,869 26.21
SHAREHOLDERS’ EQUITY 975,114,651 100.00
TOTAL INVESTMENTSMarket Value
USD
% ofShareholders’
Equity
Total Investments excluding derivatives (cost USD 713,074,486) 713,024,334 73.12Unrealised gain on futures contracts 166,308 0.02Unrealised loss on futures contracts (1,667,366) (0.17)Unrealised gain on forward currency contracts held for hedging purposes 7,954,504 0.82Market value of purchased options (cost USD 819,070) 90,007 0.01Market value of written options (cost USD (456,228)) (44,005) (0.01)Other Assets and Liabilities 255,590,869 26.21
Shareholders’ Equity 975,114,651 100.00
The Futures Commission Merchant was Barclays Capital, Inc.
The counterparty for forward currency contracts was BNP Paribas SA.
The counterparty for options contracts was Morgan Stanley & Co. International PLC.
The maximum individual counterparty exposure as at 31 May 2022 is 0.82% of the NAV.
(a) Interest rates represent either the stated coupon rate, annualised discounted yield on date of purchase for discounted securities, or, for floating rate securities, the current reset ratewhich is based upon interest rates indices.
(b) Maturity dates represent either the stated date on the security, or the next interest reset date for floating rate securities or the prerefunded date for those type of securities.(c) Variable and floating coupon rates are those quoted as of 31 May 2022.(d) A related party to Goldman Sachs Funds II.(e) The yield for this fund as at 31 May 2022 was 0.779%.
Goldman Sachs Funds II—Strategic Volatility Premium PortfolioSchedule of Investments
As at 31 May 2022
The accompanying notes are an integral part of these financial statements.
76

Holdings Security Description Currency Interest Rate(a) Maturity Date(b)Market Value
EUR
% ofShareholders’
Equity
Transferable securities admitted to an official exchange listing
Bonds – 86.31%Belgium
1,100,000 Ontex Group NV EUR 3.500% 15/07/2026 949,922 0.21
Bermuda2,300,000 Hiscox Ltd. GBP 2.000% 14/12/2022 2,694,430 0.598,600,000 Ooredoo International Finance Ltd. USD 3.250% 21/02/2023 8,054,097 1.76
10,748,527 2.35
British Virgin Islands2,910,000 Huarong Finance 2019 Co. Ltd. USD 2.125% 30/09/2023 2,640,012 0.58
Cayman Islands1,160,000 Baidu, Inc. USD 3.500% 28/11/2022 1,087,254 0.241,690,000 Hutchison Whampoa International 12 II Ltd. USD 3.250% 08/11/2022 1,582,834 0.34
2,670,088 0.58
China8,250,000 Industrial & Commercial Bank of China Ltd. USD 1.000% 20/07/2023 7,539,172 1.65
740,000 Industrial & Commercial Bank of China Ltd. USD 1.000% 09/09/2023 674,507 0.15
8,213,679 1.80
Denmark1,200,000 Nykredit Realkredit AS(c) EUR 0.875% 28/07/2031 1,096,236 0.24
France1,220,000 Faurecia SE EUR 3.750% 15/06/2028 1,071,441 0.231,425,000 Picard Groupe SAS EUR 3.875% 01/07/2026 1,269,589 0.28
2,341,030 0.51
Germany400,000 Commerzbank AG(c) EUR 4.000% 05/12/2030 394,940 0.09
1,725,000 IHO Verwaltungs GmbH(d) USD 6.000% 15/05/2027 1,473,395 0.321,275,000 Nidda Healthcare Holding GmbH EUR 3.500% 30/09/2024 1,190,965 0.26
3,059,300 0.67
Indonesia5,800,000 Indonesia Government International Bond USD 2.950% 11/01/2023 5,433,024 1.194,800,000 Perusahaan Gas Negara Tbk PT USD 5.125% 16/05/2024 4,584,499 1.00
10,017,523 2.19
Ireland1,525,000 Bank of Ireland Group PLC(c) USD 4.125% 19/09/2027 1,418,232 0.311,650,000 Dell Bank International DAC EUR 0.625% 17/10/2022 1,653,317 0.367,650,000 Phosagro OAO / Phosagro Bond Funding DAC USD 3.949% 24/04/2023 2,053,092 0.45
5,124,641 1.12
Isle Of Man1,275,000 Playtech PLC EUR 3.750% 12/10/2023 1,275,816 0.281,250,000 Playtech PLC EUR 4.250% 07/03/2026 1,240,125 0.27
2,515,941 0.55
Italy1,325,000 Banco BPM SpA EUR 2.500% 21/06/2024 1,328,869 0.291,075,000 FCA Bank SpA EUR 0.125% 16/11/2023 1,059,316 0.23
900,000 FCA Bank SpA EUR 1.473% 16/04/2024 875,610 0.191,125,000 Intesa Sanpaolo SpA EUR 6.625% 13/09/2023 1,182,454 0.261,225,000 Intesa Sanpaolo SpA(c) EUR 4.450% 15/09/2027 1,235,902 0.272,625,000 Nexi SpA EUR 2.125% 30/04/2029 2,194,671 0.481,700,000 UniCredit SpA(c) EUR 9.250% Perp. 1,700,289 0.37
9,577,111 2.09
Japan1,280,000 SoftBank Group Corp. EUR 3.125% 19/09/2025 1,179,571 0.26
Luxembourg1,000,000 ADLER Group SA EUR 1.875% 14/01/2026 572,970 0.121,300,000 Altice Financing SA EUR 2.250% 15/01/2025 1,227,317 0.27
Goldman Sachs Funds II—Income Multi-Sector Bond Portfolio ISchedule of Investments
As at 31 May 2022
The accompanying notes are an integral part of these financial statements.
77

Holdings Security Description Currency Interest Rate(a) Maturity Date(b)Market Value
EUR
% ofShareholders’
Equity
Bonds – (Continued)Luxembourg – (Continued)
2,900,000 Lincoln Financing SARL EUR 3.625% 01/04/2024 2,876,075 0.631,100,000 Simon International Finance SCA EUR 1.375% 18/11/2022 1,103,300 0.24
5,779,662 1.26
Mauritius2,300,000 Greenko Mauritius Ltd. USD 6.250% 21/02/2023 2,160,326 0.47
Netherlands2,400,000 Cooperatieve Rabobank UA EUR 4.125% 14/09/2022 2,426,088 0.531,325,000 Goodyear Europe BV EUR 2.750% 15/08/2028 1,099,651 0.24
3,525,739 0.77
Norway675,000 Adevinta ASA EUR 3.000% 15/11/2027 610,662 0.13
Portugal1,200,000 Banco Comercial Portugues SA(c) EUR 4.500% 07/12/2027 1,175,514 0.261,200,000 Caixa Geral de Depositos SA(c) EUR 5.750% 28/06/2028 1,229,520 0.27
2,405,034 0.53
Qatar10,960,000 Qatar Government International Bond USD 3.250% 02/06/2026 10,263,011 2.24
Saudi Arabia8,150,000 Saudi Government International Bond USD 4.000% 17/04/2025 7,767,702 1.70
Spain2,600,000 Banco de Sabadell SA EUR 5.625% 06/05/2026 2,658,292 0.581,800,000 CaixaBank SA EUR 1.125% 12/01/2023 1,809,180 0.40
4,467,472 0.98
Supranationals19,500,000 African Development Bank GBP 1.125% 18/06/2025 22,270,042 4.874,200,000 African Export-Import Bank USD 5.250% 11/10/2023 3,987,501 0.87
13,500,000 Asian Development Bank USD 0.625% 08/10/2024 12,001,738 2.633,325,000 Asian Development Bank USD 3.125% 26/09/2028 3,130,420 0.691,225,000 Clarios Global LP / Clarios US Finance Co. EUR 4.375% 15/05/2026 1,134,656 0.251,125,000 European Investment Bank GBP 1.375% 07/03/2025 1,297,489 0.283,900,000 European Investment Bank GBP 3.875% 08/06/2037 5,276,228 1.158,650,000 European Investment Bank GBP 5.000% 15/04/2039 13,414,428 2.937,700,000 Inter-American Development Bank GBP 1.250% 15/12/2025 8,793,449 1.927,150,000 Inter-American Development Bank USD 3.200% 07/08/2042 6,349,601 1.396,080,000 Inter-American Development Bank USD 4.375% 24/01/2044 6,408,959 1.40
11,275,000 International Bank for Reconstruction & Development GBP 0.250% 22/07/2026 12,303,588 2.6912,250,000 International Bank for Reconstruction & Development USD 0.750% 24/11/2027 10,173,819 2.2319,475,000 Nordic Investment Bank GBP 1.125% 18/06/2025 22,248,127 4.87
128,790,045 28.17
Sweden453,000 Intrum AB EUR 3.125% 15/07/2024 437,072 0.10241,000 Intrum AB EUR 4.875% 15/08/2025 233,927 0.05
2,675,000 Verisure Holding AB EUR 3.500% 15/05/2023 2,658,950 0.58
3,329,949 0.73
Switzerland2,350,000 Credit Suisse Group AG(c)(d) USD 7.500% Perp. 2,212,389 0.482,700,000 UBS AG / Stamford CT USD 7.625% 17/08/2022 2,545,801 0.56
4,758,190 1.04
United Arab Emirates543,000 Abu Dhabi National Energy Co. PJSC USD 3.625% 12/01/2023 510,287 0.11
United Kingdom1,600,000 Barclays PLC(c) GBP 2.375% 06/10/2023 1,877,677 0.41
275,000 Bellis Acquisition Co. PLC GBP 3.250% 16/02/2026 274,171 0.064,100,000 HSBC Holdings PLC(c) GBP 2.175% 27/06/2023 4,818,340 1.05
500,000 HSBC Holdings PLC(c) USD 3.803% 11/03/2025 466,044 0.101,600,000 HSBC Holdings PLC(c) USD 6.250% Perp. 1,511,012 0.331,950,000 Land Securities Capital Markets PLC—Series A5BR(c) GBP 5.391% 31/03/2027 2,443,123 0.54
10,580,000 LCR Finance PLC GBP 4.500% 07/12/2028 14,183,655 3.102,500,000 NatWest Markets PLC EUR 1.000% 28/05/2024 2,473,725 0.54
Goldman Sachs Funds II—Income Multi-Sector Bond Portfolio ISchedule of Investments
As at 31 May 2022
The accompanying notes are an integral part of these financial statements.
78

Holdings Security Description Currency Interest Rate(a) Maturity Date(b)Market Value
EUR
% ofShareholders’
Equity
Bonds – (Continued)United Kingdom – (Continued)
1,950,000 Network Rail Infrastructure Finance PLC GBP 4.750% 22/01/2024 2,393,740 0.5212,950,000 Network Rail Infrastructure Finance PLC GBP 4.750% 29/11/2035 18,723,408 4.102,050,000 Pinewood Finance Co. Ltd. GBP 3.250% 30/09/2025 2,275,911 0.506,750,000 Prs Finance PLC GBP 2.000% 23/01/2029 7,716,952 1.692,100,000 Rothesay Life PLC(c) GBP 5.500% 17/09/2029 2,540,930 0.562,850,000 Santander UK Group Holdings PLC(c) USD 3.373% 05/01/2024 2,661,268 0.58
13,500,000 United Kingdom Gilt GBP 4.250% 07/12/2040 20,253,151 4.433,475,000 Virgin Media Secured Finance PLC GBP 5.000% 15/04/2027 3,976,680 0.871,025,000 Virgin Money UK PLC(c) EUR 0.375% 27/05/2024 1,012,905 0.22
89,602,692 19.60
United States1,380,000 American Axle & Manufacturing, Inc. USD 6.875% 01/07/2028 1,241,517 0.274,950,000 Bank of America Corp.(c) EUR 1.379% 07/02/2025 4,935,595 1.081,350,000 Belden, Inc. EUR 3.875% 15/03/2028 1,259,051 0.271,400,000 Citigroup, Inc.—Series M(c) USD 6.300% Perp. 1,272,644 0.28
650,000 DISH DBS Corp. USD 5.875% 15/07/2022 607,906 0.13775,000 DISH DBS Corp. USD 7.375% 01/07/2028 569,720 0.12
1,410,000 EnLink Midstream Partners LP USD 4.400% 01/04/2024 1,316,219 0.291,900,000 Enterprise Products Operating LLC(c) USD 5.375% 15/02/2078 1,538,676 0.34
600,000 General Motors Co. USD 5.400% 02/10/2023 576,314 0.131,675,000 Genesis Energy LP / Genesis Energy Finance Corp. USD 6.250% 15/05/2026 1,493,232 0.331,420,000 Icahn Enterprises LP / Icahn Enterprises Finance Corp. USD 4.750% 15/09/2024 1,318,927 0.29
925,000 IQVIA, Inc. EUR 1.750% 15/03/2026 863,895 0.19345,000 IQVIA, Inc. EUR 2.875% 15/06/2028 320,288 0.07
1,250,000 JPMorgan Chase & Co.—Series HH(c) USD 4.600% Perp. 1,048,973 0.231,000,000 Level 3 Financing, Inc. USD 5.250% 15/03/2026 906,249 0.202,154,000 MGM Resorts International USD 6.750% 01/05/2025 2,033,356 0.445,050,000 Morgan Stanley(c) EUR 0.637% 26/07/2024 5,022,578 1.101,500,000 MPT Operating Partnership LP / MPT Finance Corp. USD 5.250% 01/08/2026 1,413,690 0.31
600,000 MPT Operating Partnership LP / MPT Finance Corp. USD 5.000% 15/10/2027 558,049 0.12815,000 MPT Operating Partnership LP / MPT Finance Corp. USD 4.625% 01/08/2029 716,318 0.16870,000 Navient Corp. USD 7.250% 25/09/2023 834,469 0.18457,000 NRG Energy, Inc. USD 6.625% 15/01/2027 436,203 0.09
1,500,000 OneMain Finance Corp. USD 8.875% 01/06/2025 1,463,244 0.321,350,000 Sabine Pass Liquefaction LLC USD 5.625% 15/04/2023 1,282,163 0.281,500,000 Service Properties Trust USD 4.650% 15/03/2024 1,303,376 0.282,500,000 Silgan Holdings, Inc. EUR 3.250% 15/03/2025 2,460,300 0.545,900,000 Southern Copper Corp. USD 3.500% 08/11/2022 5,530,992 1.212,550,000 Sprint Corp. USD 7.875% 15/09/2023 2,499,417 0.55
11,000,000 United States Treasury Note/Bond USD 1.250% 30/06/2028 9,330,988 2.0415,125,000 United States Treasury Note/Bond USD 2.500% 15/02/2045 12,212,953 2.672,550,000 Wells Fargo & Co. EUR 0.500% 26/04/2024 2,504,712 0.55
500,000 Wells Fargo Bank NA GBP 5.250% 01/08/2023 601,352 0.13395,000 WMG Acquisition Corp. EUR 2.750% 15/07/2028 361,919 0.08880,000 WMG Acquisition Corp. EUR 2.250% 15/08/2031 726,955 0.16
70,562,240 15.43
TOTAL BONDS(cost EUR 416,955,511) 394,666,592 86.31
Holdings Security DescriptionMarket Value
EUR
% ofShareholders’
Equity
Mutual Funds – 2.46%Ireland
12,033,453 Goldman Sachs US$ Liquid Reserves Fund (X Distribution Class)(e)(f) 11,233,096 2.46
TOTAL MUTUAL FUNDS(cost EUR 11,294,402) 11,233,096 2.46
TOTAL TRANSFERABLE SECURITIES ADMITTED TO AN OFFICIAL EXCHANGE LISTING(cost EUR 428,249,913) 405,899,688 88.77
Goldman Sachs Funds II—Income Multi-Sector Bond Portfolio ISchedule of Investments
As at 31 May 2022
The accompanying notes are an integral part of these financial statements.
79

Holdings Security Description Currency Interest Rate(a) Maturity Date(b)Market Value
EUR
% ofShareholders’
Equity
Transferable securities dealt in another regulated market
Bonds – 6.01%Canada
2,175,000 Bausch Health Cos., Inc.(d) USD 5.500% 01/11/2025 1,918,670 0.42555,000 GFL Environmental, Inc.(d) USD 5.125% 15/12/2026 516,791 0.11
1,430,000 MEG Energy Corp.(d) USD 5.875% 01/02/2029 1,324,043 0.29
3,759,504 0.82
Germany1,300,000 IHO Verwaltungs GmbH(d) USD 4.750% 15/09/2026 1,108,868 0.24
Luxembourg1,500,000 Dana Financing Luxembourg SARL(d) USD 5.750% 15/04/2025 1,381,856 0.301,400,000 Telenet Finance Luxembourg Notes SARL(d) USD 5.500% 01/03/2028 1,251,342 0.28
2,633,198 0.58
United States1,450,000 Allied Universal Holdco LLC / Allied Universal Finance Corp.(d) USD 6.625% 15/07/2026 1,340,024 0.29
308,000 Block, Inc.(d) USD 2.750% 01/06/2026 266,670 0.06220,000 County of Yuma AZ USD 0.888% 15/07/2024 196,993 0.04
1,365,000 CSC Holdings LLC(d) USD 7.500% 01/04/2028 1,188,203 0.261,500,000 Freedom Mortgage Corp.(d) USD 8.125% 15/11/2024 1,331,972 0.292,946,000 Level 3 Financing, Inc.(d) USD 4.625% 15/09/2027 2,530,054 0.55
500,000 Metropolitan Government Nashville & Davidson County Sports Authority USD 1.030% 01/08/2024 445,947 0.102,700,000 New York State Dormitory Authority USD 5.000% 15/03/2024 2,604,647 0.571,500,000 Prime Security Services Borrower LLC / Prime Finance, Inc.(d) USD 5.250% 15/04/2024 1,408,985 0.31
590,000 Sirius XM Radio, Inc.(d) USD 3.125% 01/09/2026 519,090 0.123,000,000 Standard Industries, Inc.(d) USD 5.000% 15/02/2027 2,704,201 0.591,440,000 Tallgrass Energy Partners LP / Tallgrass Energy Finance Corp.(d) USD 6.000% 31/12/2030 1,182,917 0.262,500,000 Torrance Joint Powers Financing Authority USD 2.105% 01/10/2026 2,201,809 0.48
700,000 Univar Solutions USA, Inc.(d) USD 5.125% 01/12/2027 640,373 0.141,500,000 Vistra Operations Co. LLC(d) USD 5.500% 01/09/2026 1,395,858 0.31
19,957,743 4.37
TOTAL BONDS(cost EUR 26,688,082) 27,459,313 6.01
Non-Agencies Asset Backed Obligations – 0.91%Ireland
4,345,532 Octagon Finance No 1 DAC Class A(c) EUR 1.967% 17/01/2023 4,171,711 0.91
TOTAL NON-AGENCIES ASSET BACKED OBLIGATIONS(cost EUR 4,344,558) 4,171,711 0.91
TOTAL TRANSFERABLE SECURITIES DEALT IN ANOTHER REGULATED MARKET(cost EUR 31,032,640) 31,631,024 6.92
MARKET VALUE OF INVESTMENTS EXCLUDING DERIVATIVES(cost EUR 459,282,553) 437,530,712 95.69
Forward Currency Contracts – (2.20%)
CurrencyAmountBought Currency
AmountSold
MaturityDate
UnrealisedGainEUR
% ofShareholders’
Equity
USD 35,098,442 EUR 31,873,327 06/06/2022 885,387 0.19USD 216,133,168 GBP 160,023,100 06/06/2022 13,671,033 2.99
UNREALISED GAIN ON FORWARD CURRENCY CONTRACTS 14,556,420 3.18
CurrencyAmountBought Currency
AmountSold
MaturityDate
UnrealisedLossEUR
% ofShareholders’
Equity
EUR 436,380,091 USD 493,448,245 06/06/2022 (24,173,981) (5.28)GBP 8,936,596 USD 11,736,756 06/06/2022 (452,344) (0.10)
UNREALISED LOSS ON FORWARD CURRENCY CONTRACTS (24,626,325) (5.38)
Goldman Sachs Funds II—Income Multi-Sector Bond Portfolio ISchedule of Investments
As at 31 May 2022
The accompanying notes are an integral part of these financial statements.
80

Swap Contracts – (3.02%)Net LocalNotionalAmount Pay Receive Currency Maturity Date
UnrealisedGainEUR
% ofShareholders’
Equity
Interest Rate Swaps21,900,000 Fixed 0.000% Floating (EUR 6 month EURIBOR) EUR 16/03/2025 242,549 0.0566,560,000 Fixed 0.500% Floating (GBP 1 month SONIA) GBP 16/03/2025 2,108,392 0.4619,790,000 Fixed 0.500% Floating (GBP 1 month SONIA) GBP 16/03/2027 899,551 0.2018,030,000 Fixed 0.750% Floating (GBP 1 month SONIA) GBP 16/03/2029 1,629,306 0.3622,140,000 Fixed 0.750% Floating (GBP 1 month SONIA) GBP 16/03/2032 2,773,068 0.617,420,000 Fixed 1.000% Floating (GBP 1 month SONIA) GBP 16/03/2037 1,595,362 0.35
19,930,000 Fixed 1.000% Floating (GBP 1 month SONIA) GBP 16/03/2042 5,601,378 1.2262,480,000 Fixed 0.250% Floating (USD 1 month SOFR) USD 16/03/2024 1,848,643 0.4029,970,000 Fixed 0.500% Floating (USD 1 month SOFR) USD 16/03/2025 1,167,731 0.2632,000,000 Fixed 1.000% Floating (USD 1 month SOFR) USD 16/03/2027 1,911,987 0.4220,460,000 Fixed 1.250% Floating (USD 1 month SOFR) USD 16/03/2029 1,484,977 0.3221,940,000 Fixed 1.750% Floating (USD 1 month SOFR) USD 16/03/2042 3,938,356 0.864,890,000 Fixed 1.750% Floating (USD 1 month SOFR) USD 16/03/2052 1,083,625 0.24
UNREALISED GAIN ON INTEREST RATE SWAPS 26,284,925 5.75
TOTAL UNREALISED GAIN ON SWAP CONTRACTS 26,284,925 5.75
Net LocalNotionalAmount Pay Receive Currency Maturity Date
UnrealisedLossEUR
% ofShareholders’
Equity
Interest Rate Swaps144,400,000 Floating (EUR 6 month EURIBOR) Fixed 0.000% EUR 16/03/2024 (2,946,743) (0.64)147,560,000 Floating (EUR 6 month EURIBOR) Fixed 0.000% EUR 16/03/2027 (9,555,074) (2.09)126,110,000 Floating (EUR 6 month EURIBOR) Fixed 0.250% EUR 16/03/2032 (18,129,058) (3.97)
3,750,000 Floating (EUR 6 month EURIBOR) Fixed 0.500% EUR 16/03/2037 (848,561) (0.19)35,110,000 Floating (EUR 6 month EURIBOR) Fixed 0.500% EUR 16/03/2042 (8,034,396) (1.76)1,590,000 Floating (EUR 6 month EURIBOR) Fixed 0.500% EUR 16/03/2052 (569,941) (0.12)
UNREALISED LOSS ON INTEREST RATE SWAPS (40,083,773) (8.77)
TOTAL UNREALISED LOSS ON SWAP CONTRACTS (40,083,773) (8.77)
MARKET VALUE OF INVESTMENTS(cost EUR 459,282,553)
413,661,959 90.47
OTHER ASSETS AND LIABILITIES 43,594,126 9.53
SHAREHOLDERS’ EQUITY 457,256,085 100.00
TOTAL INVESTMENTSMarket Value
EUR
% ofShareholders’
Equity
Total Investments excluding derivatives (cost EUR 459,282,553) 437,530,712 95.69Unrealised gain on forward currency contracts 14,556,420 3.18Unrealised loss on forward currency contracts (24,626,325) (5.38)Unrealised gain on swap contracts 26,284,925 5.75Unrealised loss on swap contracts (40,083,773) (8.77)Other Assets and Liabilities 43,594,126 9.53
Shareholders’ Equity 457,256,085 100.00
The counterparties for forward currency contracts were Barclays Bank PLC, BNP Paribas SA, HSBC Bank PLC, JP Morgan Chase Bank NA, Morgan Stanley & Co. International PLC,Natwest Markets PLC, Royal Bank of Canada, State Street Bank & Trust, UBS AG and Westpac Banking Corp.
The counterparties for swap contracts were Credit Suisse and Merrill Lynch International.
The maximum individual counterparty exposure as at 31 May 2022 is 2.04% of the NAV.
(a) Interest rates represent either the stated coupon rate, annualised discounted yield on date of purchase for discounted securities, or, for floating rate securities, the current reset ratewhich is based upon interest rates indices.
(b) Maturity dates represent either the stated date on the security, or the next interest reset date for floating rate securities or the prerefunded date for those type of securities.(c) Variable and floating coupon rates are those quoted as of 31 May 2022.(d) 144A: This security is issued to qualified institutional investors, pursuant to private placements, and is transferable as stated in rule 144A of the US Securities Act of 1933.(e) A related party to Goldman Sachs Funds II.(f) The yield for this fund as at 31 May 2022 was 0.922%.
Goldman Sachs Funds II—Income Multi-Sector Bond Portfolio ISchedule of Investments
As at 31 May 2022
The accompanying notes are an integral part of these financial statements.
81

Holdings Security Description Currency Interest Rate(a) Maturity Date(b)Market Value
EUR
% ofShareholders’
Equity
Transferable securities admitted to an official exchange listing
Bonds – 87.60%Australia
7,450,000 Santos Finance Ltd. USD 5.250% 13/03/2029 6,895,589 1.69
Bermuda4,350,000 Tengizchevroil Finance Co. International Ltd. USD 4.000% 15/08/2026 3,632,530 0.89
British Virgin Islands770,000 HKT Capital No 4 Ltd. USD 3.000% 14/07/2026 695,174 0.17
3,830,000 HKT Capital No 5 Ltd. USD 3.250% 30/09/2029 3,313,482 0.81280,000 Huarong Finance 2019 Co. Ltd. USD 3.375% 24/02/2030 214,779 0.05310,000 Huarong Finance II Co. Ltd. USD 5.000% 19/11/2025 286,578 0.07260,000 Huarong Finance II Co. Ltd. USD 4.625% 03/06/2026 235,426 0.06200,000 Huarong Finance II Co. Ltd. USD 4.875% 22/11/2026 182,497 0.04
1,490,000 SF Holding Investment 2021 Ltd. USD 2.375% 17/11/2026 1,293,737 0.322,510,000 SF Holding Investment 2021 Ltd. USD 3.125% 17/11/2031 2,019,282 0.50
8,240,955 2.02
Cayman Islands260,000 Aldar Sukuk Ltd. USD 4.750% 29/09/2025 248,246 0.06
3,570,000 Aldar Sukuk No 2 Ltd. USD 3.875% 22/10/2029 3,231,121 0.791,130,000 China Mengniu Dairy Co. Ltd. USD 1.875% 17/06/2025 995,766 0.242,440,000 China Mengniu Dairy Co. Ltd. USD 2.500% 17/06/2030 1,980,335 0.492,490,000 CK Hutchison International 20 Ltd. USD 2.500% 08/05/2030 2,068,926 0.517,540,000 DP World Crescent Ltd. USD 4.848% 26/09/2028 7,126,365 1.752,500,000 ENN Energy Holdings Ltd. USD 2.625% 17/09/2030 2,003,367 0.492,270,000 Haidilao International Holding Ltd. USD 2.150% 14/01/2026 1,727,001 0.429,130,000 HPHT Finance 21 II Ltd. USD 1.500% 17/09/2026 7,728,945 1.902,770,000 JD.com, Inc. USD 3.375% 14/01/2030 2,388,148 0.595,780,000 KSA Sukuk Ltd. USD 2.250% 17/05/2031 4,876,243 1.208,000,000 MAF Global Securities Ltd. USD 4.750% 07/05/2024 7,532,808 1.852,700,000 MAF Sukuk Ltd. USD 3.933% 28/02/2030 2,443,421 0.604,460,000 Meituan USD 2.125% 28/10/2025 3,748,066 0.92
780,000 Sharjah Sukuk Program Ltd. USD 3.234% 23/10/2029 673,101 0.16
48,771,859 11.97
Chile1,890,000 Chile Government International Bond USD 2.750% 31/01/2027 1,694,605 0.42
16,890,000 Chile Government International Bond USD 2.450% 31/01/2031 13,955,162 3.431,170,000 Chile Government International Bond USD 3.500% 31/01/2034 1,015,729 0.25
10,150,000 Cia Cervecerias Unidas SA USD 3.350% 19/01/2032 8,401,879 2.063,260,000 Enel Americas SA USD 4.000% 25/10/2026 3,005,515 0.74
470,000 Falabella SA USD 3.750% 30/10/2027 412,701 0.107,916,893 GNL Quintero SA USD 4.634% 31/07/2029 7,183,865 1.763,020,000 Inversiones CMPC SA USD 4.375% 04/04/2027 2,793,426 0.683,130,000 Inversiones CMPC SA USD 3.000% 06/04/2031 2,467,660 0.611,660,000 Sociedad Quimica y Minera de Chile SA USD 3.625% 03/04/2023 1,553,919 0.388,870,000 Sociedad Quimica y Minera de Chile SA USD 4.250% 07/05/2029 8,108,029 1.99
50,592,490 12.42
Hong Kong1,830,000 Bank of East Asia Ltd.(c) USD 4.875% 22/04/2032 1,706,877 0.42
Hungary1,200,000 Hungary Government International Bond USD 2.125% 22/09/2031 904,005 0.221,790,000 Hungary Government International Bond EUR 1.750% 05/06/2035 1,429,002 0.35
2,333,007 0.57
India250,000 Reliance Industries Ltd. USD 4.125% 28/01/2025 235,306 0.06
1,070,000 Reliance Industries Ltd. USD 3.667% 30/11/2027 976,204 0.249,900,000 Reliance Industries Ltd. USD 2.875% 12/01/2032 7,933,355 1.95
9,144,865 2.25
Indonesia1,720,000 Indonesia Government International Bond USD 4.100% 24/04/2028 1,625,920 0.401,950,000 Indonesia Government International Bond USD 1.850% 12/03/2031 1,540,432 0.38
200,000 Perusahaan Gas Negara Tbk PT USD 5.125% 16/05/2024 191,021 0.05
Goldman Sachs Funds II—G Emerging Markets Debt Broad PortfolioSchedule of Investments
As at 31 May 2022
The accompanying notes are an integral part of these financial statements.
82

Holdings Security Description Currency Interest Rate(a) Maturity Date(b)Market Value
EUR
% ofShareholders’
Equity
Bonds – (Continued)Indonesia – (Continued)
1,180,000 Perusahaan Penerbit SBSN Indonesia III USD 2.550% 09/06/2031 973,465 0.243,770,000 Tower Bersama Infrastructure Tbk PT USD 4.250% 21/01/2025 3,488,460 0.85
7,819,298 1.92
Israel2,260,000 Israel Government International Bond USD 2.500% 15/01/2030 1,997,608 0.49
Mauritius2,970,000 UPL Corp. Ltd. USD 4.500% 08/03/2028 2,424,310 0.602,450,000 UPL Corp. Ltd. USD 4.625% 16/06/2030 1,926,165 0.47
4,350,475 1.07
Mexico2,510,000 Banco Santander Mexico SA Institucion de Banca Multiple Grupo Financiero
Santander USD 4.125% 09/11/2022 2,353,015 0.583,160,000 Banco Santander Mexico SA Institucion de Banca Multiple Grupo Financiero
Santander USD 5.375% 17/04/2025 3,023,571 0.743,950,000 BBVA Bancomer SA USD 1.875% 18/09/2025 3,386,077 0.835,610,000 Becle SAB de CV USD 2.500% 14/10/2031 4,414,684 1.089,740,000 GCC SAB de CV USD 3.614% 20/04/2032 7,878,967 1.936,260,000 Gruma SAB de CV USD 4.875% 01/12/2024 5,941,522 1.462,560,000 Mexico City Airport Trust USD 4.250% 31/10/2026 2,229,620 0.552,270,000 Mexico City Airport Trust USD 3.875% 30/04/2028 1,904,469 0.477,911,000 Mexico Government International Bond USD 2.659% 24/05/2031 6,398,957 1.57
11,740,000 Mexico Government International Bond USD 4.750% 27/04/2032 11,022,176 2.71
48,553,058 11.92
Morocco1,580,000 Morocco Government International Bond EUR 1.500% 27/11/2031 1,188,184 0.29
Netherlands1,590,000 Lukoil International Finance BV USD 4.563% 24/04/2023 1,057,526 0.266,070,000 Lukoil International Finance BV USD 4.750% 02/11/2026 3,399,767 0.84
620,000 Lukoil Securities BV USD 3.875% 06/05/2030 309,638 0.0810,270,000 NE Property BV EUR 1.875% 09/10/2026 9,100,196 2.23
550,000 NE Property BV EUR 3.375% 14/07/2027 508,063 0.132,490,000 Prosus NV USD 3.257% 19/01/2027 2,091,949 0.514,000,000 Prosus NV USD 3.680% 21/01/2030 3,152,859 0.77
19,619,998 4.82
Panama1,090,000 Autoridad del Canal de Panama(d) USD 4.950% 29/07/2035 1,100,442 0.273,030,000 Banco Latinoamericano de Comercio Exterior SA USD 2.375% 14/09/2025 2,639,275 0.65
820,000 Banco Nacional de Panama USD 2.500% 11/08/2030 625,908 0.153,170,000 Panama Government International Bond USD 2.252% 29/09/2032 2,425,527 0.59
600,000 Panama Notas del Tesoro(d) USD 3.750% 17/04/2026 552,265 0.14
7,343,417 1.80
Peru3,300,000 Banco Internacional del Peru SAA Interbank USD 3.250% 04/10/2026 2,883,746 0.717,350,000 Consorcio Transmantaro SA USD 4.700% 16/04/2034 6,432,323 1.58
576,500 Corp. Lindley SA USD 4.625% 12/04/2023 538,829 0.131,770,000 Transportadora de Gas del Peru SA USD 4.250% 30/04/2028 1,592,174 0.39
11,447,072 2.81
Qatar5,320,000 Qatar Energy USD 2.250% 12/07/2031 4,419,884 1.091,110,000 Qatar Government International Bond USD 4.000% 14/03/2029 1,078,267 0.26
15,730,000 Qatar Government International Bond USD 3.750% 16/04/2030 15,023,345 3.697,041,102 Ras Laffan Liquefied Natural Gas Co. Ltd. III USD 5.838% 30/09/2027 6,897,569 1.69
27,419,065 6.73
Romania3,550,000 Romanian Government International Bond USD 3.000% 27/02/2027 3,055,610 0.753,290,000 Romanian Government International Bond USD 3.000% 14/02/2031 2,600,436 0.646,800,000 Romanian Government International Bond EUR 2.000% 28/01/2032 5,190,576 1.273,850,000 Romanian Government International Bond USD 3.625% 27/03/2032 3,087,251 0.76
13,933,873 3.42
Goldman Sachs Funds II—G Emerging Markets Debt Broad PortfolioSchedule of Investments
As at 31 May 2022
The accompanying notes are an integral part of these financial statements.
83

Holdings Security Description Currency Interest Rate(a) Maturity Date(b)Market Value
EUR
% ofShareholders’
Equity
Bonds – (Continued)Russia
600,000 Russian Foreign Bond - Eurobond USD 4.250% 23/06/2027 119,020 0.03
Saudi Arabia2,320,000 Saudi Government International Bond USD 2.500% 03/02/2027 2,108,845 0.52
24,150,000 Saudi Government International Bond USD 3.625% 04/03/2028 22,825,556 5.601,130,000 Saudi Government International Bond USD 2.250% 02/02/2033 928,921 0.23
25,863,322 6.35
Singapore200,000 ABJA Investment Co. Pte Ltd. USD 4.450% 24/07/2023 188,332 0.04
5,850,000 ABJA Investment Co. Pte Ltd. USD 5.450% 24/01/2028 5,488,215 1.35
5,676,547 1.39
South Korea3,050,000 LG Chem Ltd. USD 2.375% 07/07/2031 2,433,423 0.602,100,000 Shinhan Bank Co. Ltd. USD 3.750% 20/09/2027 1,912,461 0.472,130,000 Shinhan Bank Co. Ltd. USD 4.500% 26/03/2028 2,002,737 0.491,140,000 Shinhan Bank Co. Ltd. USD 4.375% 13/04/2032 1,048,699 0.26
7,397,320 1.82
Supranationals1,320,000 African Export-Import Bank USD 4.125% 20/06/2024 1,223,346 0.301,230,000 African Export-Import Bank USD 2.634% 17/05/2026 1,046,496 0.261,860,000 African Export-Import Bank USD 3.798% 17/05/2031 1,528,352 0.37
3,798,194 0.93
Thailand2,230,000 Bangkok Bank PCL(c) USD 3.466% 23/09/2036 1,797,094 0.44
Turkey4,350,000 Anadolu Efes Biracilik ve Malt Sanayii AS USD 3.375% 29/06/2028 3,167,328 0.78
United Arab Emirates5,540,000 Abu Dhabi Crude Oil Pipeline LLC USD 3.650% 02/11/2029 5,073,916 1.251,290,000 Abu Dhabi Government International Bond USD 1.700% 02/03/2031 1,049,217 0.261,000,000 Finance Department Government of Sharjah USD 3.625% 10/03/2033 811,433 0.20
10,810,000 National Central Cooling Co. PJSC USD 2.500% 21/10/2027 9,250,435 2.277,400,000 NBK SPC Ltd.(c) USD 1.625% 15/09/2027 6,234,306 1.53
22,419,307 5.51
United Kingdom2,170,000 Prudential PLC(c) USD 2.950% 03/11/2033 1,793,985 0.44
United States5,590,000 Hikma Finance USA LLC USD 3.250% 09/07/2025 4,982,732 1.225,730,000 Wipro IT Services LLC USD 1.500% 23/06/2026 4,834,061 1.19
9,816,793 2.41
TOTAL BONDS(cost EUR 368,649,083) 356,839,130 87.60
Holdings Security DescriptionMarket Value
EUR
% ofShareholders’
Equity
Mutual Funds – 4.53%Ireland
19,760,816 Goldman Sachs US$ Treasury Liquid Reserves Fund (X Distribution Class)(e)(f) 18,446,504 4.53
TOTAL MUTUAL FUNDS(cost EUR 18,510,154) 18,446,504 4.53
TOTAL TRANSFERABLE SECURITIES ADMITTED TO AN OFFICIAL EXCHANGE LISTING(cost EUR 387,159,237) 375,285,634 92.13
Holdings Security Description Currency Interest Rate(a) Maturity Date(b)Market Value
EUR
% ofShareholders’
Equity
Transferable securities dealt in another regulated market
Bonds – 0.33%Mexico
1,260,000 Becle SAB de CV(d) USD 2.500% 14/10/2031 991,533 0.24
Goldman Sachs Funds II—G Emerging Markets Debt Broad PortfolioSchedule of Investments
As at 31 May 2022
The accompanying notes are an integral part of these financial statements.
84

Holdings Security Description Currency Interest Rate(a) Maturity Date(b)Market Value
EUR
% ofShareholders’
Equity
Bonds – (Continued)Peru
400,000 Consorcio Transmantaro SA(d) USD 4.700% 16/04/2034 350,059 0.09
TOTAL BONDS(cost EUR 1,449,676) 1,341,592 0.33
TOTAL TRANSFERABLE SECURITIES DEALT IN ANOTHER REGULATED MARKET(cost EUR 1,449,676) 1,341,592 0.33
MARKET VALUE OF INVESTMENTS EXCLUDING DERIVATIVES(cost EUR 388,608,913) 376,627,226 92.46
Futures Contracts – 0.57%
Number ofContracts Security Description
CommitmentMarket Value
EUR
UnrealisedGainEUR
% ofShareholders’
Equity
EUR(40) German Federal Republic Bonds 5Y Futures 08/09/2022 Short (5,005,200) 22,800 0.01
USD(151) US Treasury Long Bond Futures 21/09/2022 Short (19,606,215) 281,914 0.07(801) US Treasury Notes 10YR Futures 21/09/2022 Short (89,259,635) 817,943 0.20(91) US Treasury Notes 2YR Futures 30/09/2022 Short (17,923,259) 35,674 0.01
(1,057) US Treasury Notes 5YR Futures 30/09/2022 Short (111,381,232) 618,470 0.15(531) US Treasury Ultra Long Notes 10YR Futures 21/09/2022 Short (63,633,261) 663,827 0.16
(301,803,602) 2,417,828 0.59
UNREALISED GAIN ON FUTURES CONTRACTS 2,440,628 0.60
Number ofContracts Security Description
CommitmentMarket Value
EUR
UnrealisedLossEUR
% ofShareholders’
Equity
EUR93 German Federal Republic Bonds 2YR Futures 08/09/2022 Long 10,170,945 (12,890) (0.00)
USD33 US Treasury Ultra Long Bond Futures 21/09/2022 Long 4,781,535 (109,104) (0.03)
UNREALISED LOSS ON FUTURES CONTRACTS (121,994) (0.03)
Forward Currency Contracts – (5.50%)
CurrencyAmountBought Currency
AmountSold
MaturityDate
UnrealisedGainEUR
% ofShareholders’
Equity
USD 52,599,944 EUR 47,802,027 06/06/2022 1,291,507 0.32
UNREALISED GAIN ON FORWARD CURRENCY CONTRACTS 1,291,507 0.32
CurrencyAmountBought Currency
AmountSold
MaturityDate
UnrealisedLossEUR
% ofShareholders’
Equity
EUR 451,403,847 USD 509,041,278 06/06/2022 (23,703,796) (5.82)
UNREALISED LOSS ON FORWARD CURRENCY CONTRACTS (23,703,796) (5.82)
Swap Contracts – (9.58%)Net LocalNotionalAmount Pay Receive Currency Maturity Date
UnrealisedGainEUR
% ofShareholders’
Equity
Interest Rate Swaps870,000 Fixed 0.500% Floating (EUR 6 month EURIBOR) EUR 16/03/2042 239,859 0.06
UNREALISED GAIN ON INTEREST RATE SWAPS 239,859 0.06
Credit Default Swaps2,650,000 Floating (Indonesia Government
International Bond)Fixed 1.000% USD 20/06/2027 8,585 0.00
Goldman Sachs Funds II—G Emerging Markets Debt Broad PortfolioSchedule of Investments
As at 31 May 2022
The accompanying notes are an integral part of these financial statements.
85

Swap Contracts – (Continued)
Net LocalNotionalAmount Pay Receive Currency Maturity Date
UnrealisedGainEUR
% ofShareholders’
Equity
Credit Default Swaps – (Continued)2,170,000 Floating (Peruvian Government
International Bond)Fixed 1.000% USD 20/06/2027 9,487 0.01
5,390,000 Floating (Philippine GovernmentInternational Bond)
Fixed 1.000% USD 20/06/2027 50,028 0.01
UNREALISED GAIN ON CREDIT DEFAULT SWAPS 68,100 0.02
TOTAL UNREALISED GAIN ON SWAP CONTRACTS 307,959 0.08
Net LocalNotionalAmount Pay Receive Currency Maturity Date
UnrealisedLossEUR
% ofShareholders’
Equity
Interest Rate Swaps11,670,000 Floating (EUR 6 month EURIBOR) Fixed 0.000% EUR 16/03/2025 (240,177) (0.06)
316,950,000 Floating (EUR 6 month EURIBOR) Fixed 0.000% EUR 16/03/2027 (23,437,640) (5.75)99,630,000 Floating (EUR 6 month EURIBOR) Fixed 0.250% EUR 16/03/2032 (15,552,003) (3.82)
UNREALISED LOSS ON INTEREST RATE SWAPS (39,229,820) (9.63)
Credit Default Swaps1,390,000 Floating (Chile Government International
Bond)Fixed 1.000% USD 20/06/2027 (7,943) (0.00)
2,650,000 Floating (iTraxx Asia ex-Japan IGSeries 37 Version 1 Index)
Fixed 1.000% USD 20/06/2027 (2,598) (0.00)
3,330,000 Floating (Mexico GovernmentInternational Bond)
Fixed 1.000% USD 20/06/2027 (10,300) (0.01)
6,620,000 Floating (Panama GovernmentInternational Bond)
Fixed 1.000% USD 20/06/2027 (84,251) (0.02)
UNREALISED LOSS ON CREDIT DEFAULT SWAPS (105,092) (0.03)
TOTAL UNREALISED LOSS ON SWAP CONTRACTS (39,334,912) (9.66)
MARKET VALUE OF INVESTMENTS(cost EUR 388,608,913)
317,506,618 77.95
OTHER ASSETS AND LIABILITIES 89,834,857 22.05
SHAREHOLDERS’ EQUITY 407,341,475 100.00
TOTAL INVESTMENTSMarket Value
EUR
% ofShareholders’
Equity
Total Investments excluding derivatives (cost EUR 388,608,913) 376,627,226 92.46Unrealised gain on futures contracts 2,440,628 0.60Unrealised loss on futures contracts (121,994) (0.03)Unrealised gain on forward currency contracts 1,291,507 0.32Unrealised loss on forward currency contracts (23,703,796) (5.82)Unrealised gain on swap contracts 307,959 0.08Unrealised loss on swap contracts (39,334,912) (9.66)Other Assets and Liabilities 89,834,857 22.05
Shareholders’ Equity 407,341,475 100.00
The Futures Commission Merchant was Bank of America NA.
The counterparties for forward currency contracts were Australia and New Zealand Banking Group Ltd., Barclays Bank PLC, BNP Paribas SA, Citibank NA, Deutsche Bank AG, JP MorganChase Bank NA and Morgan Stanley & Co. International PLC.
The counterparty for swap contracts was Merrill Lynch International.
The maximum individual counterparty exposure as at 31 May 2022 is 0.60% of the NAV.
(a) Interest rates represent either the stated coupon rate, annualised discounted yield on date of purchase for discounted securities, or, for floating rate securities, the current reset ratewhich is based upon interest rates indices.
(b) Maturity dates represent either the stated date on the security, or the next interest reset date for floating rate securities or the prerefunded date for those type of securities.(c) Variable and floating coupon rates are those quoted as of 31 May 2022.(d) 144A: This security is issued to qualified institutional investors, pursuant to private placements, and is transferable as stated in rule 144A of the US Securities Act of 1933.(e) A related party to Goldman Sachs Funds II.(f) The yield for this fund as at 31 May 2022 was 0.779%.
Goldman Sachs Funds II—G Emerging Markets Debt Broad PortfolioSchedule of Investments
As at 31 May 2022
The accompanying notes are an integral part of these financial statements.
86

CurrencyInceptionDate
Advisory FeeRate
ExpenseCap(a)
Total NetExpense
Ratio(b)
Global Multi-Manager Alternatives Portfolio(c) USDBase Accumulation Share Class USD 16 December 2015 2.15% 2.55% 2.44%Other Currency Accumulation Share Class (Flat) (SEK Hedged Class) SEK 27 September 2021 2.30% 2.70% 2.58%Other Currency Accumulation Share Class (CHF Hedged Class) CHF 16 December 2015 2.15% 2.55% 2.43%Other Currency Accumulation Share Class (EUR Hedged Class) EUR 16 December 2015 2.15% 2.55% 2.41%Other Currency Accumulation Share Class (SEK Hedged Class) SEK 19 January 2016 2.15% 2.55% 2.43%Other Currency Share Class (EUR Hedged Class)(d) EUR 16 December 2015 2.15% 2.55% 2.41%Other Currency Share Class (GBP Hedged Class) GBP 16 December 2015 2.15% 2.55% 2.43%�E� Accumulation Share Class (EUR Hedged Class) EUR 27 January 2016 2.15% 3.05% 2.82%�I� Accumulation Share Class USD 27 January 2016 1.40% 1.76% 1.62%�I� Accumulation Share Class (CHF Hedged Class) CHF 30 March 2017 1.40% 1.76% 1.61%�I� Accumulation Share Class (EUR Hedged Class) EUR 27 January 2016 1.40% 1.76% 1.61%�I� Accumulation Share Class (Flat) (SEK Hedged Class) SEK 13 August 2021 1.65% 2.01% 1.86%�I� Accumulation Share Class (SEK Hedged Class) SEK 19 January 2016 1.40% 1.76% 1.61%�P� Accumulation Share Class USD 16 December 2015 1.90% 2.30% 2.16%�P� Accumulation Share Class (EUR Hedged Class) EUR 16 December 2015 1.90% 2.30% 2.16%�P� Share Class USD 16 December 2015 1.90% 2.30% 2.16%�P� Share Class (EUR Hedged Class) EUR 16 December 2015 1.90% 2.30% 2.16%�P� Share Class (GBP Hedged Class) GBP 16 December 2015 1.90% 2.30% 2.16%�R� Accumulation Share Class USD 15 November 2017 1.40% 1.80% 1.68%�R� Accumulation Share Class (EUR Hedged Class) EUR 16 December 2015 1.40% 1.80% 1.68%�R� Share Class USD 16 December 2015 1.40% 1.80% 1.68%�R� Share Class (EUR Hedged Class) EUR 16 December 2015 1.40% 1.80% 1.70%�R� Share Class (GBP Hedged Class) GBP 16 December 2015 1.40% 1.80% 1.68%
Multi-Manager Emerging Markets Equity Portfolio(e) USDOther Currency Accumulation Share Class SEK 6 July 2021 0.65% 1.15% 1.51%�I� Accumulation Share Class USD 12 December 2013 0.30% 0.76% 1.05%�IO� Accumulation Share Class SEK 20 May 2021 0.00% 0.46% 0.75%�IO� Accumulation Share Class USD 8 January 2013 0.00% 0.46% 0.74%�P� Accumulation Share Class USD 31 January 2012 0.55% 1.05% 1.35%�P� Share Class USD 31 January 2012 0.55% 1.05% 1.35%�R� Accumulation Share Class USD 13 December 2012 0.00% 0.50% 0.82%�R� Share Class USD 13 December 2012 0.00% 0.50% 0.82%
Multi-Manager Europe Equity Portfolio(e) EUR�I� Accumulation Share Class EUR 12 December 2013 0.30% 0.56% 0.99%�P� Accumulation Share Class EUR 18 December 2009 0.55% 0.85% 1.29%�P� Share Class EUR 18 December 2009 0.55% 0.85% 1.29%�R� Accumulation Share Class EUR 13 December 2012 0.00% 0.30% 0.76%�R� Share Class EUR 13 December 2012 0.00% 0.30% 0.76%
Multi-Manager Global Equity Portfolio(e) USDOther Currency Accumulation Share Class EUR 10 June 2020 0.65% 0.91% 1.16%Other Currency Accumulation Share Class SEK 6 July 2021 0.65% 0.95% 1.21%�I� Accumulation Share Class USD 14 November 2012 0.30% 0.56% 0.74%�IO� Accumulation Share Class SEK 19 May 2021 0.00% 0.26% 0.44%�IO� Accumulation Share Class USD 16 January 2013 0.00% 0.26% 0.44%�IP� Accumulation Share Class EUR 12 February 2019 0.05% 0.31% 0.49%�IP� Accumulation Share Class USD 27 March 2019 0.05% 0.31% 0.49%�P� Accumulation Share Class EUR 8 December 2008 0.55% 0.85% 1.04%�P� Accumulation Share Class USD 7 March 2008 0.55% 0.85% 1.04%�P� Share Class USD 7 March 2008 0.55% 0.85% 1.05%�R� Accumulation Share Class EUR 20 November 2017 0.00% 0.30% 0.52%�R� Accumulation Share Class USD 13 December 2012 0.00% 0.30% 0.51%�R� Accumulation Share Class (Long Global CCY vs. USD) EUR 29 September 2017 0.00% 0.30% 0.50%�R� Accumulation Share Class (Long Global CCY vs. USD) GBP 7 July 2017 0.00% 0.30% 0.52%�R� Share Class USD 13 December 2012 0.00% 0.30% 0.51%
Multi-Manager US Equity Portfolio(e) USDOther Currency Accumulation Share Class SEK 20 September 2021 0.65% 0.95% 1.17%�I� Accumulation Share Class USD 12 December 2013 0.30% 0.56% 0.72%�IO� Accumulation Share Class SEK 19 May 2021 0.00% 0.26% 0.42%�P� Accumulation Share Class USD 16 May 2008 0.55% 0.85% 1.02%�P� Share Class USD 16 May 2008 0.55% 0.85% 1.02%�R� Accumulation Share Class USD 13 December 2012 0.00% 0.30% 0.49%�R� Accumulation Share Class (EUR Hedged Class)(d) EUR 25 January 2022 0.00% 0.30% 0.62%�R� Share Class USD 13 December 2012 0.00% 0.30% 0.49%
Multi-Manager US Small Cap Equity Portfolio(e) USD�I� Accumulation Share Class USD 8 December 2016 0.30% 0.56% 1.02%�P� Accumulation Share Class USD 8 December 2016 0.55% 0.85% 1.32%�P� Share Class USD 8 December 2016 0.55% 0.85% 1.31%�R� Accumulation Share Class USD 8 December 2016 0.00% 0.30% 0.79%�R� Share Class USD 8 December 2016 0.00% 0.30% 0.79%
Balanced Allocation Portfolio USD�I� Accumulation Share Class (EUR Partially Hedged Class) EUR 17 August 2021 0.75% 0.96% 0.90%�P� Accumulation Share Class USD 3 December 2014 0.75% 1.00% 0.94%�R� Accumulation Share Class USD 16 March 2016 0.25% 0.50% 0.46%�R� Share Class USD 16 March 2016 0.25% 0.50% 0.46%�R� Share Class (EUR Partially Hedged Class) EUR 12 September 2017 0.25% 0.50% 0.01%�R� Share Class (GBP Partially Hedged Class) GBP 13 May 2016 0.25% 0.50% 0.46%
Strategic Factor Allocation Portfolio USD�I� Accumulation Share Class USD 30 September 2016 0.75% 0.96% 0.83%�I� Accumulation Share Class (EUR Hedged Class) EUR 5 December 2016 0.75% 0.96% 0.83%�I� Share Class USD 30 September 2016 0.75% 0.96% 0.83%�P� Accumulation Share Class USD 30 September 2016 0.75% 1.00% 0.88%�P� Accumulation Share Class (CHF Hedged Class) CHF 7 August 2017 0.75% 1.00% 0.88%
Goldman Sachs Funds IIAppendix I—Advisory Fee Rates, Expense Caps
and Total Net Expense RatiosAs at 31 May 2022
87

CurrencyInceptionDate
Advisory FeeRate
ExpenseCap(a)
Total NetExpense
Ratio(b)
Strategic Factor Allocation Portfolio (Continued)�P� Accumulation Share Class (EUR Hedged Class) EUR 30 September 2016 0.75% 1.00% 0.88%�P� Accumulation Share Class (GBP Hedged Class) GBP 24 May 2017 0.75% 1.00% 0.88%�P� Share Class USD 30 September 2016 0.75% 1.00% 0.88%�P� Share Class (EUR Hedged Class) EUR 30 September 2016 0.75% 1.00% 0.88%�R� Accumulation Share Class USD 15 December 2016 0.25% 0.50% 0.40%�R� Accumulation Share Class (EUR Hedged Class) EUR 24 May 2017 0.25% 0.50% 0.40%�R� Accumulation Share Class (GBP Hedged Class) GBP 30 September 2016 0.25% 0.50% 0.39%�R� Share Class USD 15 November 2017 0.25% 0.50% 0.40%�R� Share Class (GBP Hedged Class) GBP 30 September 2016 0.25% 0.50% 0.40%
Tactical Tilt Overlay Portfolio USDOther Currency Accumulation Share Class (SEK Hedged Class) SEK 20 September 2021 1.00% 1.30% 1.15%�I� Accumulation Share Class USD 30 December 2011 0.75% 0.96% 0.81%�I� Accumulation Share Class (EUR Hedged Class) EUR 23 December 2019 0.75% 0.96% 0.81%�IO� Accumulation Share Class USD 15 December 2011 0.00% 0.21% 0.06%�IO� Accumulation Share Class (EUR Hedged Class) EUR 14 June 2019 0.00% 0.21% 0.06%�IO� Accumulation Share Class (GBP Hedged Class) GBP 14 June 2019 0.00% 0.21% 0.06%�IO� Accumulation Share Class (SEK Hedged Class) SEK 19 May 2021 0.00% 0.21% 0.06%�IP� Accumulation Share Class USD 6 April 2021 0.05% 0.26% 0.12%�IP� Accumulation Share Class (EUR Hedged Class) EUR 20 March 2020 0.05% 0.26% 0.12%�P� Accumulation Share Class USD 31 October 2011 0.75% 1.05% 0.87%�P� Accumulation Share Class (CHF Hedged Class) CHF 15 November 2011 0.75% 1.05% 0.87%�P� Accumulation Share Class (EUR Hedged Class) EUR 31 October 2011 0.75% 1.05% 0.86%�P� Accumulation Share Class (GBP Hedged Class) GBP 31 October 2011 0.75% 1.05% 0.86%�P� Share Class USD 31 October 2011 0.75% 1.05% 0.86%�P� Share Class (EUR Hedged Class) EUR 31 October 2011 0.75% 1.05% 0.86%�P� Share Class (GBP Hedged Class) GBP 31 October 2011 0.75% 1.05% 0.86%�R� Accumulation Share Class USD 17 December 2012 0.25% 0.55% 0.38%�R� Accumulation Share Class (CHF Hedged Class) CHF 15 January 2013 0.25% 0.55% 0.39%�R� Accumulation Share Class (EUR Hedged Class) EUR 15 January 2013 0.25% 0.55% 0.38%�R� Accumulation Share Class (GBP Hedged Class) GBP 15 January 2013 0.25% 0.55% 0.38%�R� Share Class USD 17 December 2012 0.25% 0.55% 0.38%�R� Share Class (EUR Hedged Class) EUR 15 January 2013 0.25% 0.55% 0.39%�R� Share Class (GBP Hedged Class) GBP 15 January 2013 0.25% 0.55% 0.38%
Strategic Volatility Premium Portfolio USD�I� Accumulation Share Class USD 29 March 2021 0.40% 0.61% 0.48%�I� Accumulation Share Class (EUR Hedged Class) EUR 29 March 2021 0.40% 0.61% 0.48%�I� Share Class USD 29 March 2021 0.40% 0.61% 0.48%�P� Accumulation Share Class USD 29 March 2021 0.40% 0.65% 0.53%�P� Accumulation Share Class (CHF Hedged Class) CHF 29 March 2021 0.40% 0.65% 0.53%�P� Accumulation Share Class (EUR Hedged Class) EUR 29 March 2021 0.40% 0.65% 0.53%�P� Accumulation Share Class (GBP Hedged Class) GBP 29 March 2021 0.40% 0.65% 0.53%�P� Share Class USD 29 March 2021 0.40% 0.65% 0.53%�P� Share Class (CHF Hedged Class) CHF 29 March 2021 0.40% 0.65% 0.53%�P� Share Class (EUR Hedged Class) EUR 29 March 2021 0.40% 0.65% 0.54%�P� Share Class (GBP Hedged Class) GBP 29 March 2021 0.40% 0.65% 0.53%�R� Accumulation Share Class USD 29 March 2021 0.20% 0.45% 0.35%�R� Accumulation Share Class (EUR Hedged Class) EUR 29 March 2021 0.20% 0.45% 0.35%�R� Accumulation Share Class (GBP Hedged Class) GBP 29 March 2021 0.20% 0.45% 0.35%�R� Share Class USD 29 March 2021 0.20% 0.45% 0.35%�R� Share Class (CHF Hedged Class) CHF 29 March 2021 0.20% 0.45% 0.35%�R� Share Class (EUR Hedged Class) EUR 29 March 2021 0.20% 0.45% 0.35%�R� Share Class (GBP Hedged Class) GBP 29 March 2021 0.20% 0.45% 0.35%
Income Multi-Sector Bond Portfolio I EUR�I� (Dis) (Stable Monthly) Share Class(f) EUR 31 January 2018 0.22% — 0.31%
G Emerging Markets Debt Broad Portfolio EUR�I� (Dis) (Semi-Annual) Share Class EUR 27 June 2019 0.34% 0.82% 0.43%
(a) Refer to Note 6.(b) The Total Expense Ratio (�TER�) expresses the sum of all costs, commissions and performance fees (excluding dealing commissions and market costs) charged on an ongoing basis to the
Portfolios’ assets (operating net expenses) taken retrospectively as a percentage of the Portfolios’ assets, and is calculated using the following formula:Total operating net expenses in CU* /Average portfolios’ assets in CU* x 100 = TER %.The TER is calculated for the Period from 1 December 2021 to 31 May 2022. TER’s are annualised for Portfolios operating less than one year.* CU = Currency units in the Portfolio’s base currency.
(c) The expense cap does not include performance fees.(d) Refer to Appendix II.(e) The expense cap does not include the GSAMI fee portion paid to external Sub-Investment Advisers.(f) An Expense Cap was not applicable for this Share Class as at 31 May 2022.
The above expense ratios are an average throughout the period to 31 May 2022. The above Expense Caps represent the expense cap levels at period end 31 May 2022.
Goldman Sachs Funds IIAppendix I—Advisory Fee Rates, Expense Caps
and Total Net Expense RatiosAs at 31 May 2022
88

During the period, the following Share Class was launched:
Portfolios Share Classes
Currencyof the
Share Classes Launch Date
Multi-Manager US Equity Portfolio �R� Accumulation Share Class (EUR Hedged Class) EUR 25 January 2022
During the period, the following Share Class was closed:
Portfolios Share Classes
Currencyof the
Share Classes Close Date
Global Multi-Manager Alternatives Portfolio Other Currency Share Class (EUR Hedged Class) EUR 20 May 2022
Goldman Sachs Funds IIAppendix II—Portfolio and Share Class Launches,
Closures and MergersAs at 31 May 2022
89

The following table sets forth details of shareholders with holdings greater than 10% of the Portfolios’ net assets as at 31 May2022:
Portfolios
% of
Shareholders’ Equity
Investor /
Distributor
Global Multi-Manager Alternatives Portfolio
Shareholder 1 29.51% Investor
Shareholder 2 20.64% Investor
Other Shareholders 49.85%
Total 100.00%
Multi-Manager Emerging Markets Equity Portfolio
Shareholder 1 25.66% Investor
Other Shareholders 74.34%
Total 100.00%
Multi-Manager Europe Equity Portfolio
Shareholder 11 10.38% Investor
Other Shareholders 89.62%
Total 100.00%
Multi-Manager Global Equity Portfolio
Shareholder 1 27.65% Investor
Shareholder 2 11.04% Investor
Other Shareholders 61.31%
Total 100.00%
Balanced Allocation Portfolio
Shareholder 11 35.35% Investor
Other Shareholders 64.65%
Total 100.00%
Strategic Factor Allocation Portfolio
Shareholder 11 14.78% Investor
Other Shareholders 85.22%
Total 100.00%
Tactical Tilt Overlay Portfolio
Shareholder 1 12.48% Investor
Other Shareholders 87.52%
Total 100.00%
Strategic Volatility Premium Portfolio
Shareholder 11 12.19% Investor
Other Shareholders 87.81%
Total 100.00%
Income Multi-Sector Bond Portfolio I
Shareholder 1 100.00% Distributor
Total 100.00%
G Emerging Markets Debt Broad Portfolio
Shareholder 1 100.00% Investor
Total 100.00%
1 A related party to Goldman Sachs Funds II.
There were no shareholder concentrations greater than 10% for other Portfolios as at 31 May 2022.
Goldman Sachs Funds IIAppendix III—Shareholder Concentration
As at 31 May 2022
90

The Management Company is required to make available a Semi-Annual Report for the financial period for each of its Funds,containing certain disclosures as set out in Article 13 of the European Commission Regulation 2015/2365 on transparency ofsecurities financing transactions and of reuse (the “Regulation”). The disclosures set out below are included to meet therequirements of the Regulation.
I. Global Data
Please refer to Note 6 Securities lending for details on the amount of securities lent expressed as an absolute amount, as aproportion of total lendable assets and as a proportion of the Shareholders’ Equity.
Please refer to the different Schedule of Investments for details on the amount of Total Return Swap (�TRS�) an absolute amountand as a proportion of the Shareholders’ Equity.
II. Concentration Data
The table below shows the 10 largest issuers of total non-cash collateral received by Portfolio that is outstanding as at 31 May2022. Please refer to Note 13 for cash collateral information.
PortfolioPortfoliocurrency Non-cash collateral Issuer
Market value ofcollateral received
% of Shareholders’Equity
Multi-Manager Emerging Markets EquityPortfolio
USD Federal Republic of Germany 773,547 0.13%
Multi-Manager Europe Equity Portfolio EUR Federal Republic of Germany 3,139,664 0.70%
The table below shows the top 10 counterparties by Portfolio, across each type of Securities Financing transaction (“SFT”) andTRS with respect to outstanding transactions as at 31 May 2022:
Securities Lending
PortfolioPortfoliocurrency Counterparty
Market value ofsecurities lent out
% of Shareholders’Equity
Multi-Manager Emerging Markets EquityPortfolio
USD Barclays Bank PLC 701,630 0.12%
Multi-Manager Europe Equity Portfolio EURUBS AG 595,904 0.13%
Merrill Lynch International 2,251,845 0.50%
Total Return Swaps
PortfolioPortfolioCurrency Counterparty
Net UnrealisedGain / (Loss) USD
% of Shareholders’Equity
Balanced Allocation Portfolio USD JP Morgan Chase Bank NA 10,256 0.00%
Tactical Tilt Overlay Portfolio USDBank of America NA 3,237,843 0.15%
JP Morgan Chase Bank NA 1,037,516 0.05%
Goldman Sachs Funds IIAppendix IV—Securities Financing Transactions Regulation (“SFTR”)
DisclosuresFor the Period Ended 31 May 2022
91

III. Transaction Data
The below table summarises the country of counterparty establishment across each type of SFT and TRS by Portfolio, as at31 May 2022:
SecuritiesLending Total Return Swaps
PortfolioPortfoliocurrency
Counterparty’scountry ofincorporation
Market value ofsecurities lent out
Net UnrealisedGain / (Loss) Total
Multi-Manager Emerging Markets EquityPortfolio
USD United Kingdom 701,630 — 701,630
Multi-Manager Europe Equity Portfolio EURSwitzerland 595,904 — 595,904
United Kingdom 2,251,845 — 2,251,845
Balanced Allocation Portfolio USD United Kingdom — 10,256 10,256
Tactical Tilt Overlay Portfolio USDUnited Kingdom — 1,037,516 1,037,516
United States — 3,237,843 3,237,843
The below table summarises the currency of the collateral received and pledged by Portfolio across each type of SFT and TRSas at 31 May 2022 :
Non Cashcollateral Cash collateral
SecuritiesLending
OTCderivatives1
PortfolioPortfoliocurrency
Currency ofthe collateral
Market Valueof the
collateralreceived
Market Valueof the
collateralreceived /(pledged) Total
Multi-Manager Emerging Markets EquityPortfolio
USD EUR 773,547 — 773,547
Multi-Manager Europe Equity Portfolio EUR EUR 3,139,664 — 3,139,664
Balanced Allocation Portfolio USD USD — (9,409,467) (9,409,467)
Tactical Tilt Overlay Portfolio USD USD — (154,240,935) (154,240,935)
1 Total return swaps are typically traded under ISDA master agreements (“ISDAs”) which govern various types of swap and FX transactions executed between the Portfolio and each swapcounterparty. Under the ISDAs, collateral is calculated daily on an aggregate, net basis across all transactions and therefore, a portion of such collateral is related to derivative transactions whichare not in scope for SFTR.
Please refer to Note 6 Securities lending for details on the quality of the non-cash collateral received.
Goldman Sachs Funds IIAppendix IV—Securities Financing Transactions Regulation (“SFTR”)
DisclosuresFor the Period Ended 31 May 2022
92

III. Transaction Data (Continued)
The below table summarises the maturity tenor of the collateral received and pledged by Portfolio across each type of SFT andTRS as at 31 May 2022:
Non Cashcollateral Cash collateral
SecuritiesLending
OTCderivatives1
PortfolioPortfoliocurrency Maturity Tenor
Market Valueof the
collateralreceived
Market Valueof the
collateralreceived /(pledged) Total
Multi-Manager Emerging Markets EquityPortfolio
USD
Less than one day — — —
One day to one week — — —
One week to one month — — —
One to three months — — —
Three months to one year — — —
Above one year 773,547 — 773,547
Open Maturity — — —
Total 773,547 — 773,547
Multi-Manager Europe Equity Portfolio EUR
Less than one day — — —
One day to one week — — —
One week to one month — — —
One to three months — — —
Three months to one year — — —
Above one year 3,139,664 — 3,139,664
Open Maturity — — —
Total 3,139,664 — 3,139,664
Balanced Allocation Portfolio USD
Less than one day — — —
One day to one week — — —
One week to one month — — —
One to three months — — —
Three months to one year — — —
Above one year — — —
Open Maturity — (9,409,467) (9,409,467)
Total — (9,409,467) (9,409,467)
Tactical Tilt Overlay Portfolio USD
Less than one day — — —
One day to one week — — —
One week to one month — — —
One to three months — — —
Three months to one year — — —
Above one year — — —
Open Maturity — (154,240,935) (154,240,935)
Total — (154,240,935) (154,240,935)
1 Total return swaps are typically traded under ISDA master agreements (“ISDAs”) which govern various types of swap and FX transactions executed between the Portfolio and each swapcounterparty. Under the ISDAs, collateral is calculated daily on an aggregate, net basis across all transactions and therefore, a portion of such collateral is related to derivative transactions whichare not in scope for SFTR.
Goldman Sachs Funds IIAppendix IV—Securities Financing Transactions Regulation (“SFTR”)
DisclosuresFor the Period Ended 31 May 2022
93
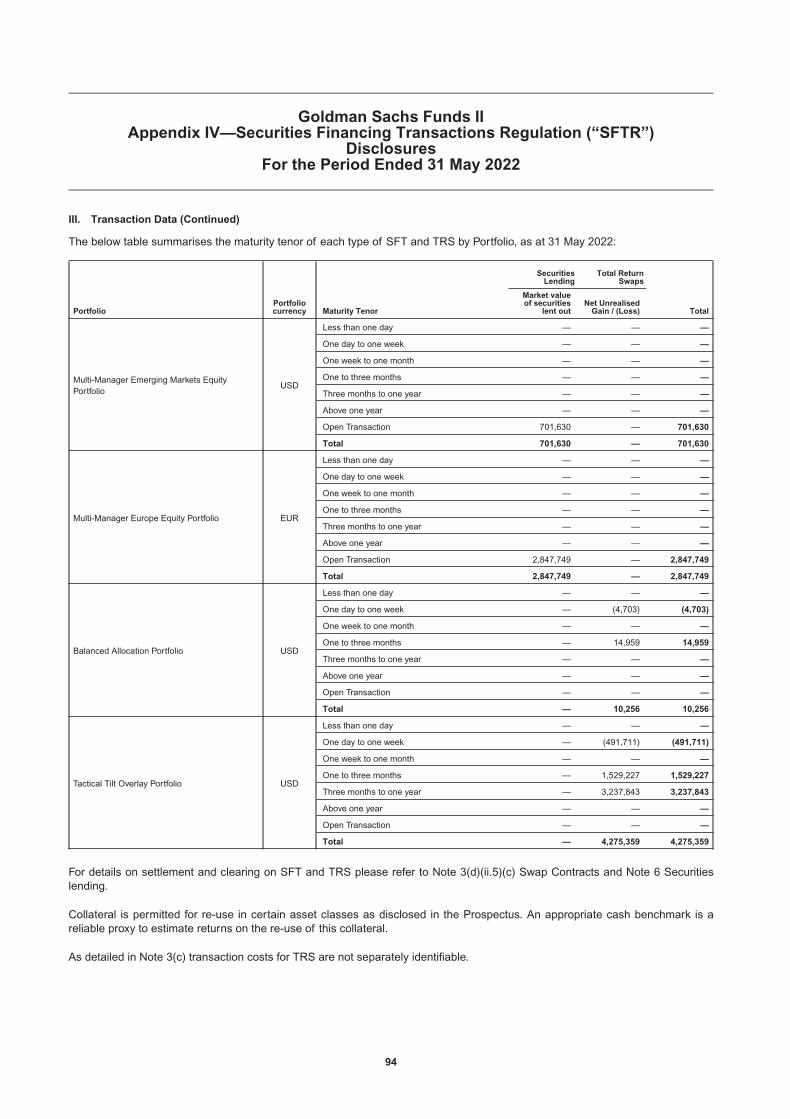
III. Transaction Data (Continued)
The below table summarises the maturity tenor of each type of SFT and TRS by Portfolio, as at 31 May 2022:
SecuritiesLending
Total ReturnSwaps
PortfolioPortfoliocurrency Maturity Tenor
Market valueof securities
lent outNet Unrealised
Gain / (Loss) Total
Multi-Manager Emerging Markets EquityPortfolio
USD
Less than one day — — —
One day to one week — — —
One week to one month — — —
One to three months — — —
Three months to one year — — —
Above one year — — —
Open Transaction 701,630 — 701,630
Total 701,630 — 701,630
Multi-Manager Europe Equity Portfolio EUR
Less than one day — — —
One day to one week — — —
One week to one month — — —
One to three months — — —
Three months to one year — — —
Above one year — — —
Open Transaction 2,847,749 — 2,847,749
Total 2,847,749 — 2,847,749
Balanced Allocation Portfolio USD
Less than one day — — —
One day to one week — (4,703) (4,703)
One week to one month — — —
One to three months — 14,959 14,959
Three months to one year — — —
Above one year — — —
Open Transaction — — —
Total — 10,256 10,256
Tactical Tilt Overlay Portfolio USD
Less than one day — — —
One day to one week — (491,711) (491,711)
One week to one month — — —
One to three months — 1,529,227 1,529,227
Three months to one year — 3,237,843 3,237,843
Above one year — — —
Open Transaction — — —
Total — 4,275,359 4,275,359
For details on settlement and clearing on SFT and TRS please refer to Note 3(d)(ii.5)(c) Swap Contracts and Note 6 Securitieslending.
Collateral is permitted for re-use in certain asset classes as disclosed in the Prospectus. An appropriate cash benchmark is areliable proxy to estimate returns on the re-use of this collateral.
As detailed in Note 3(c) transaction costs for TRS are not separately identifiable.
Goldman Sachs Funds IIAppendix IV—Securities Financing Transactions Regulation (“SFTR”)
DisclosuresFor the Period Ended 31 May 2022
94

IV. Safekeeping of Collateral
The below table summarises the amount of collateral received by Portfolio, as at 31 May 2022:
PortfolioPortfoliocurrency Custodian
Collateral ReceivedBalance
Multi-Manager Emerging Markets Equity Portfolio USD Bank of New York Mellon Corp. 773,547
Multi-Manager Europe Equity Portfolio EUR Bank of New York Mellon Corp. 3,139,664
Tactical Tilt Overlay Portfolio USDState Street Bank International GmbH, LuxembourgBranch
1,880,000
The below table summarises the proportion of collateral pledged by Portfolio, held in segregated accounts or in pooled accountsas at 31 May 2022:
Portfolio Counterparty% of collateral held in:
Segregated accounts Pooled accounts Total
Balanced Allocation Portfolio Morgan Stanley 100% — 100%
Tactical Tilt Overlay Portfolio
Citibank NA 100% — 100%
Credit Suisse 100% — 100%
JP Morgan Chase Bank NA 100% — 100%
Merrill Lynch International 100% — 100%
Morgan Stanley 100% — 100%
Goldman Sachs Funds IIAppendix IV—Securities Financing Transactions Regulation (“SFTR”)
DisclosuresFor the Period Ended 31 May 2022
95

Offering Documents
This material is provided at your request for informational purposes only and does not constitute a solicitation inany jurisdiction in which such a solicitation is unlawful or to any person to whom it is unlawful. It only containsselected information with regards to the Fund and does not constitute an offer to buy shares in the Fund. Prior toan investment, prospective investors should carefully read the latest Key Investor Information Document (KIID)as well as the offering documentation, including but not limited to the Fund’s prospectus which contains inter aliaa comprehensive disclosure of applicable risks. The relevant articles of association, prospectus, supplement,KIID and latest annual/semi-annual report are available free of charge from the Fund’s paying and informationagent and/or from your financial adviser.
Distribution of Shares
Shares of the Fund may not be registered for public distribution in a number of jurisdictions (including but notlimited to any Latin American, African or Asian countries). Therefore, the shares of the Fund must not bemarketed or offered in or to residents of any such jurisdictions unless such marketing or offering is made incompliance with applicable exemptions for the private placement of collective investment schemes and otherapplicable jurisdictional rules and regulations.
Investment Advice and Potential Loss
Financial advisers generally suggest a diversified portfolio of investments. The Fund described herein does notrepresent a diversified investment by itself. This material must not be construed as investment or tax advice.Prospective investors should consult their financial and tax adviser before investing in order to determinewhether an investment would be suitable for them. An investor should only invest if he/she has thenecessary financial resources to bear a complete loss of this investment.
Past performance does not guarantee future results, which may vary. The value of investments and theincome derived from investments will fluctuate and can go down as well as up. A loss of principal mayoccur.
Index Benchmarks
References to indices, benchmarks or other measures of relative market performance over a specified period oftime are provided for your information only and do not imply that the portfolio will achieve similar results. Theindex composition may not reflect the manner in which a portfolio is constructed. While an adviser seeks todesign a portfolio which reflects appropriate risk and return features, portfolio characteristics may deviate fromthose of the benchmark.
Confidentiality
No part of this material may, without Goldman Sachs’ prior written consent, be (i) copied, photocopied orduplicated in any form, by any means, or (ii) distributed to any person that is not an employee, officer, director, orauthorised agent of the recipient.
Important information for Swiss Investors
The Prospectus, KIID, the articles, the annual and semi-annual reports of the Fund may be obtained free ofcharge from the Swiss Representative. In respect of the shares distributed in Switzerland to Qualified Investors,the place of performance and the place of jurisdiction is at the registered office of the Swiss Representative.
Swiss Representative: First Independent Fund Services AG,Klausstrasse 33, 8008 Zurich, Switzerland.Paying Agent: Goldman Sachs Bank AG, Claridenstrasse 25, 8002 Zurich, Switzerland.
© 2022 Goldman Sachs. All rights reserved.
Goldman Sachs Funds IIAdditional Information
96

AssetManagement
SICAVIIAENG


