Embed Size (px)
Citation preview
MPRAMunich Personal RePEc Archive
Is Large More Effective than Small isBeautiful? Size and Performance ofPrimary Schools in Poland
Jan Herczynski and Mikolaj Herbst
University of Warsaw, Centre for European Regional and LocalStudies (EUROREG)
2004
Online at http://mpra.ub.uni-muenchen.de/6139/MPRA Paper No. 6139, posted 7. December 2007 00:22 UTC
Is Large More Effective than Small is Beautiful?
Size and Performance of Primary Schools in Poland1
Mikołaj Herbst and Jan Herczy�ski2
Warsaw University
November 2004
Abstract
We investigate the size-related features of the production function of Polish primary schools.
The interplay of small schools ineffectiveness and of organizational and social difficulties
appearing in large schools implies that the relationship between school size and student
achievement is non-linear, with the optimal size crucially dependent on the social
characteristics of the served population (such as average income per capita). Busing is found
to have negative effect on performance, related to average distance of student transportation.
The findings present several challenges to consolidation policies on quality ground, quite
independent of the more common cost considerations.
Keywords:
school production function, educational achievement, school size, class size, school
consolidation
Introduction
The massive demographic changes put a serious adaptation stress on the school systems
throughout the Central and Eastern Europe. As student numbers decline, the school and class
sizes also decline, decreasing the efficiency (through higher unit costs) of provision of
1 The research was financed by the CERGE-EI Foundation within the Global Development Network programme. 2 Mikołaj Herbst is assistant professor in Warsaw University, Centre for European Regional and Local Studies.
E-mail: [email protected]
Jan Herczy�ski is assistant professor in Warsaw University, Interdisciplinary Centre for Mathematical and
Computational Modelling. E-mail: [email protected]
2
education, and hindering the efforts to improve quality. This adaptation stress is particularly
painful in Poland, with its huge rural population living in relatively underdeveloped and poor
areas. The dilemmas facing the local governments, the owners of Polish primary and
secondary schools since 1996 and 1998 respectively, may be summarized crudely as either
maintaining small, inefficient rural schools, often considered to be academically rather poor,
or consolidating them into larger schools, and encountering stiff opposition from parents and
teachers alike, as well as significant student transportation problems (interestingly, school
consolidation is usually referred to in Poland as network rationalization, a term which tries to
hide the stark reality of school closures).
In this context the research into the quality of education becomes particularly relevant. The
local governments in Poland, although largely motivated by the financial constraints under
which they operate, are very sensitive to the issues of education quality, in part because the
school budgets form a very substantive part of local budgets, and in part because of the
political pressure coming from the parents as voters. It was nevertheless very difficult for
them to take education quality into account, because the available measures of school quality
were very indirect. The situation changed after the introduction in 2002 of first independent
national test of students’ skills, administered and assessed across Poland by the National
Examination Commission. In the first reaction, many mayors felt the temptation to “punish”
and “reward” school principals based on the outcomes of the students’ tests, in near total
oblivion to the fact that the test results, according to numerous and well established research,
depend crucially on the parental characteristics (primarily, the social and economic status
SES), and also on peer effects (poor students put into a strong performing peer group improve
their results considerably). It is therefore clear that better understanding of factors influencing
the school outcomes, with special emphasis on factors under the influence of local
governments, such as the use of different school resources, may have significant and positive
impact on local education policies.
The economic interest in organizational factors influencing the education quality, with
parental characteristics controlled, is due to the debate over the education production function.
While there is no doubts that the per student costs incurred in larger, consolidated schools are
lower, the real question is whether those resources (inputs) are necessarily used in a more
efficient manner when judged from the quality (output) point of view. There are grounds to
believe that in larger schools, due to their lower per student expenditures, funds freed through
3
higher student teacher ratio can be used more effectively to improve school equipment and
teaching condition, and also perhaps to employ better teachers. On the other hand, it is also
often asserted that smaller schools, with their more immediate contact between the students
and teachers, and safer teaching ambience (including reduced risks of drugs and other social
problems), promote better learning. The factors shaping the efficiency of use of education
resources are affected by legal and organizational constraints under which the schools operate
in each country, as well as by historical differences and by mentality of all employed in the
sector. In other words, education production function necessarily has national characteristics,
and the present study aims to capture those characteristics for Poland.
In this respect Poland is fortunate because the data coming from the universal tests (three
consecutive years already) allows for the first time to analyze empirically the impact of school
organization and management on the educational outcomes of pupils. The researchers can also
include in the analysis the controversial issue of school consolidation. After reviewing the
methodological approaches in analyzing the effects of different patterns of resource use on the
quality of education, we focus on the test results of primary school graduates in Mazowsze, a
major, centrally located region of Poland.
Basing on the international literature review, and preliminary observations on the
determinants of school achievement in Poland (Herczynski, Herbst 2002, Herbst 2004), in the
present study we will seek the answers to the following questions:
��What is the school-size effect on average students performance? Is it linear? Is it
different in impoverished and affluent communities?
��Does the number of classes in a single grade influence educational outcomes?
��Does class size matter for the achievements?
��What is the effect of rural busing (and in general traveling to distant school) on school
performance?
Literature review
School consolidation has two effects on the schools which remain in operation:
��Increased average school size, class size and the number of classes per grade,
��Diversified social and economic status (SES) of the students’ parents.
4
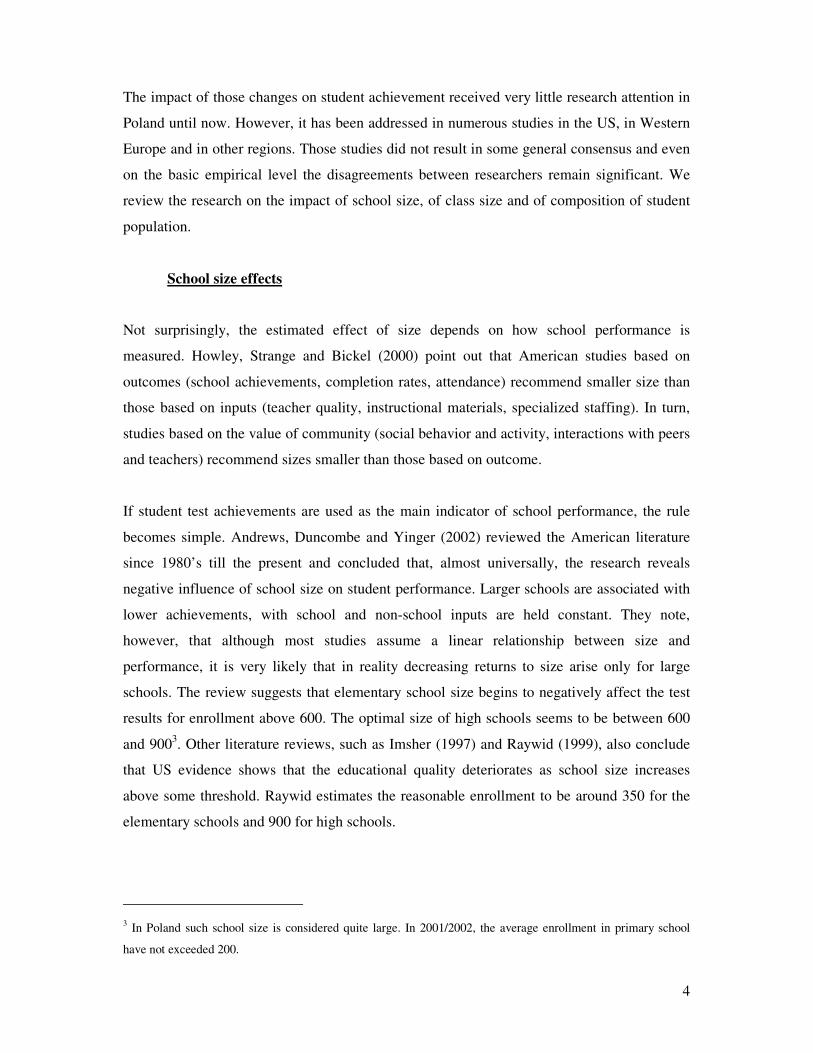
The impact of those changes on student achievement received very little research attention in
Poland until now. However, it has been addressed in numerous studies in the US, in Western
Europe and in other regions. Those studies did not result in some general consensus and even
on the basic empirical level the disagreements between researchers remain significant. We
review the research on the impact of school size, of class size and of composition of student
population.
School size effects
Not surprisingly, the estimated effect of size depends on how school performance is
measured. Howley, Strange and Bickel (2000) point out that American studies based on
outcomes (school achievements, completion rates, attendance) recommend smaller size than
those based on inputs (teacher quality, instructional materials, specialized staffing). In turn,
studies based on the value of community (social behavior and activity, interactions with peers
and teachers) recommend sizes smaller than those based on outcome.
If student test achievements are used as the main indicator of school performance, the rule
becomes simple. Andrews, Duncombe and Yinger (2002) reviewed the American literature
since 1980’s till the present and concluded that, almost universally, the research reveals
negative influence of school size on student performance. Larger schools are associated with
lower achievements, with school and non-school inputs are held constant. They note,
however, that although most studies assume a linear relationship between size and
performance, it is very likely that in reality decreasing returns to size arise only for large
schools. The review suggests that elementary school size begins to negatively affect the test
results for enrollment above 600. The optimal size of high schools seems to be between 600
and 9003. Other literature reviews, such as Imsher (1997) and Raywid (1999), also conclude
that US evidence shows that the educational quality deteriorates as school size increases
above some threshold. Raywid estimates the reasonable enrollment to be around 350 for the
elementary schools and 900 for high schools.
3 In Poland such school size is considered quite large. In 2001/2002, the average enrollment in primary school
have not exceeded 200.
5
Some studies reveal that school size has different effect on performance depending on the
social status (SES) of students. A short review of this more nuanced research is offered by
Howley, Strange and Bickel (2000). For instance, Howley (1994) demonstrates that smaller
school size improves the achievements in schools serving impoverished communities.
Friedkin and Necochea (1988), working with California school data at fourth grade level, also
concluded that smaller school size benefited school performance in impoverished
communities, but larger schools were more efficient in relatively wealthy areas. Due to the
nature of school work, namely to the cooperative process of learning, it is not surprising that
social characteristics of student population influence the productivity function. For students
coming from impoverished and educationally disadvantaged communities, with often lower
motivation and lower interest in academic subjects, smaller schools become more efficient
despite higher per student costs.
Finally, a number of studies indicate that small and large schools differ substantially in equity
effect. Lee and Smith (1996) found that although, at student level, poverty exerts a strong
negative effect on high school performance, this effect is sharply reduced in schools with
enrollment below 300. The difference in equity effects was also found within the so called
Matthew Project – a large scale research conducted in four US states (Howley and Bickel
1999). In all the states the relationship between SES and student performance in small schools
was substantially weaker (between 20% and 70%) than in large schools. In other words,
smaller schools seem to be a stronger instrument of equalization of students’ chances.
It must be said, however, that it is not clear to what extent the observed difference in equity
effect is directly related to school size. Student communities in rural or underdeveloped areas
(where average school size is relatively small) are frequently characterized by low variation in
SES. The weak relationship between SES and achievements may be reflection of this fact, and
not the equalizing power of small school.
Class size effects
In theory, small classes should favor high achievements, other inputs controlled. In a small
class student have better access to the teacher and increased use of school equipment. The
teachers can, in turn, spend more time working with individual students and better adjust the
curriculum and textbook material to match specific needs of every student group.
6
Surprisingly, the empirical evidence for the impact of class size on educational achievements
is less than conclusive. Hanushek (1996) shows that of the 277 empirical studies published
between 1966 and 1995, less than 5% found a negative and statistically significant
relationship between class size (or student-teacher ratio) and performance, while almost the
same number displayed positive and significant relationship.
Akerhielm (1995) names two main reasons why past research has revealed such inconsistent
result. First, due to missing data on actual class size, the student-teacher ratio for the entire
school was frequently used. This led to measurement errors not only because the aggregate
ratio was different than class level one, but also because different grades and individual
classes may receive different didactic input. Moreover, missing teacher data led researchers to
use student-employee ration in place of student-teacher ratio (including administration and
support didactic staff such as counselors), further depressing the accuracy of indicators used.
The second reason is that allocation of students to individual classes, including to classes of
different size, is rarely a random process. For example, if a school decides to assign poorly
skilled pupils to smaller classes in order to provide them easier access to teachers and school
equipment, we may expect the estimated effect of class size on performance to be upward
biased. More ambitious students may also want to migrate to “better” classes, pushing up their
size. Using actual class size data from US National Education Longitudinal Study (NELS) of
1988, and applying instrumental variables technique (2SLS) to correct for non-random
distribution of pupils among classes, Akerhielm demonstrated that the effect of increasing
class size is negative and significant for science and history achievement, and negative but
insignificant for mathematics and English achievement of 8th graders. Interestingly, if OLS
estimation was applied directly instead of 2SLS, the effect of class size turned out to be
positive for the achievements in all investigated subjects. This observation, concludes
Akerhielm, explains the unclear evidence from the past.
In turn, Wößmann and West (2002), have applied a method combining school fixed effects
and instrumental variables to estimate the effect of class size on student performance within
TIMSS (Third International Mathematics and Science Study) in 18 countries. They found
considerable beneficial effects of smaller classes only in two countries (Greece and Iceland)
and no class-size effect in other two (Japan and Singapore). In eleven countries the impact of
7
class size on school achievements was negligible. Similarly, Hoxby (2000) used 2SLS
techniques to separate the variation of class size due to small variation in size of student
populations, and concluded that there is no impact of class size on student achievement.
It is also worth noting that in some transition economies under financial distress, schools try
to compensate for the very high per student costs by reducing the per class costs (see
Herczy�ski 2003). This means that in some circumstances smaller classes, especially in rural
areas, may be associated with actually reduced student access to various school resources,
including qualified teachers and school equipment.
Busing and school composition
Consolidation of schools involves busing pupils to distant facilities. It is frequently argued
that besides reducing per student expenditures, busing improves the educational opportunities
for rural pupils. Unable to hire good teachers for a large number of small schools, and to
equip them all equally well, local governments may use consolidation to improve the access
of wider groups of children to significantly better educational services. On the other hand,
busing may introduce additional stress of its own on the students, and reduce parental
cooperation and involvement in the school, especially for weaker students. The impact of
school consolidation on student achievement is therefore a complex issue.
Indeed, there exists evidence proving that busing exerts direct adverse influence on students.
Howley and Howley (2001) cites the study of Lu and Tweeten (1973) who confirmed a
negative impact of duration of bus ride in Oklahoma on students achievements. Fox (1996)
found that long bus rides reduce the number of household activities, limit recreational and
sleep time, depress academic attentiveness and extracurricular participation.
There are also indirect effects of busing, namely changes in social composition of the schools.
Restructuring of schools as a result of the consolidation process affects the learning conditions
of both ‘indigenous’ and ‘newcomer’ students, that is of those who do and who do not change
the school. Typically, SES of pupils bused to the school from distant localities is, on average,
lower than SES of indigenous students. Indeed, it is a basic belief standing behind the idea of
school consolidation (besides, naturally, cost reduction), that children from educationally
8
disadvantaged environment would benefit in their learning and in educational achievements,
if they are mixed with those coming from better educated families.
Compositional effects are commonly recognized as a crucial determinant of educational
achievement since the publication of Coleman Report (1966). Although Coleman et al.
focused mainly on interactions between pupils, later research revealed that school
composition affects also teachers and school management. A recent review of the existing
studies led Thrupp, Lauder and Robinson (2002) to conclude that there exist three principal
types of compositional effects. First, classmates learn from one another directly, acting as
mutual learning resources, for example when the vocabulary of a student increases through
interaction with other children, whose vocabulary is larger than his own. Peer effects may also
arise because of shared aspirations and beliefs, through classroom disruption or learning
atmosphere (peer pressure). Second, teachers may change the teaching methods in response to
changes in class composition, for instance by adapting to weaker students (instruction
effects). Finally, school composition do have impact on school curriculum, that has to be
adjusted to the capacities of the pupils (managerial effects). Thus, the actual curriculum
followed in the school is clearly dependent an the average ability of the schoolmates, and not
only on one’s own performance.
Inspired by Coleman, many researchers conducted empirical research on the compositional
effects in schools. The analysis of peer effects is rather difficult because the those effects (like
a class performing significantly better than other classes) are often due to selection (see
Hoxby 2000a). Thus it is not surprising that the results are mixed. Strand (1998) finds no
evidence for the compositional effects examining data on about 1700 students in 57
elementary schools in UK. In turn, Driessen (2002), applying multilevel analysis to Dutch
primary schools, finds strong impact of school composition on the language performance of
grade four pupils, weak effect on the math performance on the same grade and language
performance on eighth grade, and finally, no effect on math performance on eighth grade.
In US, Hanushek, Kain, Markman and Rivkin (2001) have examined data on about 600,000
students (three age cohorts) from over 3000 public elementary schools in Texas. Removing
school and grade fixed effects in addition to observable family and school characteristics, they
found peer achievements to have positive effect on student achievement growth. Similar
results were obtained by Vidgor and Nechyba (2004), who used data on all primary schools in
9
North Carolina. Controlling for family education, school resources and introducing school
fixed effects, they found a significant, positive relationship between peer ability on third grade
and achievements on fifth grade. Similarly, Hoxby (2000a) controlling for selection (either of
the school or of the class, either by the parents or by the school system) finds significant
impact of peers. Hoxby also finds that not all peer effects are due to the mean achievements of
other students in the class. For instance, peer effects are stronger within race groups than
across them. Moreover, in more female classes all students do better in math, even though
average math results of male and female students are similar. This may point to instructional
effects rather than peer pressure or learning from peers.
In general one has to agree with Thrupp, Lauder and Robinson claim (2002) that the balance
of American and European evidence reaffirms the conclusions of Coleman report, that school
composition exerts strong influence on student performance.
Leaving aside possible direct adverse impact of busing on student performance and focusing
on school compositional effects, the findings of Coleman and his successors suggest that
school consolidation and busing of pupils may be beneficent for the children from poor and
uneducated environment. What about students from well situated/middle class families? Are
they harmed by the changing social composition of their school (association with low SES
children) in result of consolidation process? According to Coleman et. al (1966), not
necessarily. Integration is asymmetric in effects, they claim, and has its greatest effect on
those from educationally deficient backgrounds. Middle class children learn a lot at home, and
family education makes them ‘resistant’ to the possible adverse influence of peers.
The asymmetry of compositional effects was confirmed in numerous studies, not only related
to schooling. One of the most interesting was the experimental research by Falk and Ichino
(2003), who found that productivity at office work depends on peer performance and this
relationship is much stronger for low-productive workers than for highly productive ones.
According to a large part of available studies, the policy of mixing social classes in schools is
promising and should help improve the average outcomes and reduce the gap in achievements
between the children from middle class and poor, uneducated families. There are however
reasons to believe that influence of poorly endowed peers on the well situated ones is not
linear. As stated in Coleman Report, there is a threshold point, at which the negative effects of
10
peer poverty become much greater. It is because the numerical majority in a school sets the
tone. The authors estimate that the threshold is around 60% of middle-class. Below this
number, the impact of peers with low SES on the achievements of other students becomes
significant. Similarly, the study of desegregated schools in Texas (Hanushek, Kain, Rivkin
2002) shows that if the number of black students in the school is large, the positive impact of
desegregation decreases, especially for gifted students.
Conceptual framework and data
According to Lee and Barro (1997) the general form of educational quality determination
function is:
where f and r refer to family factors and to school resources respectively, and Q is measured
by average test score. In this simple framework f is supposed to capture the effect of social
environment on the educational outcome of an individual, while r refers to educational
processes taking place within the school. Thus human capital and recurrent income (and other
home resources important for education, such as family library and internet access at home)
are included in f, while student teacher ratio and teacher qualifications (and other relevant
school resources, like school equipment) is expressed by s.
For the purpose of our research, we consider separately a category of school characteristics
related to scale of operation. We assume that r in equation (2) accounts only for those school
resources that are not directly linked to size, such as per student expenditures, teacher
qualifications and experience. The factor n will cover the size–related features of school,
including school and grade enrollment, class size, and the number of classes per grade.
The main goal of this paper is to verify the impact of n on average educational outcome Q of
schools as both f and r are controlled. We also want to investigate the importance of changes
in school mix, inevitably accompanying the increase of average school size in the districts
undergoing consolidation process. As noted in the introduction, consolidation has both direct
),( )1( 1 iii sfQQ =
),,( )2( 2 iiii nrfQQ =
11
and indirect impact on the achievements of students, including those who remain in their old
school as local school networks is changed.
We conduct our analysis at the school level, with no data on individual students, so we cannot
investigate the nature of school compositional effects for different groups of students involved
in the process of consolidation. We can however verify the net effect of diversity resulting
from school consolidation and from busing on the average educational achievement of school
community. After including compositional effect d related to the shift in school size, the
general form of educational quality function will look as in equation 3:
For the purpose of empirical tests, most of the relationships between the endogenous variable
and the regressors are assumed linear. For the impact of school and grade enrollment on
student performance both linear and quadratic specification have been tested, because of
expected decreasing returns to size, as discussed in the literature on the subject. Additionally,
in one of the equations grade size is expressed by the number of classes instead of enrollment.
This takes into account the influence the number of classes on the functioning of the school
and thus, possibly, on its performance. In order to avoid assumptions on the functional form
of the relationship, instead of using one variable, the number of classes was introduced to the
specification as the set of k dummy variables for schools having 1 to k classes at 6th grade.
The dependent variable used in all specifications is the average test score (measured at school
level) of students of the final, 6th grade in the universal tests administered by Centralna
Komisja Egzaminacyjna (CKE, Central Examination Commission) in 2002. Our source of
data is regional branch of CKE, whose jurisdiction includes the capital city of Warsaw and the
surrounding Mazowsze Region, and covers about 1,700 primary schools.
The students solve test problems in 5 different areas, with the maximal number of points to be
obtained equal 50. We do not analyze separate skill areas and use only the total student
scores. The average score in the region is 30,43.
),,,( )3( 3 iiiii dnrfQQ =
12
Data on school enrollment, grade enrollment, and number of classes per grade come from
annual statistical report S-02 submitted by schools to Central Statistical Office. We use the
data from academic year 2001/2002.
Family resources are approximated by two school level variables: per pupil parental
contribution to school budget in the scholar year 2000/2001 (the latest available) and share of
pupils receiving social benefits in school community in 2001/2002. The source of the former
variable is statistical report S-02, the latter comes from another schools report, namely S-09.
We do not use other variables, such as education level of parents, if they are available only at
the level of local governments.
The variables expressing the level of school resources (other than those related to size) used in
our analysis are: teachers and administration salaries per student (calculated per student),
headmaster’s years of experience and headmaster’s education (dummy indicating MA level or
above). First of those was taken from 2001 obligatory report EN-3, prepared by the schools.
The other variables come from the EWIKAN database on teachers, maintained by thee
Ministry of Education and Sports.
Finally, data on busing and share of students living more than 3 km, more than 5 km and more
than 10 km from school is taken again from S-02.
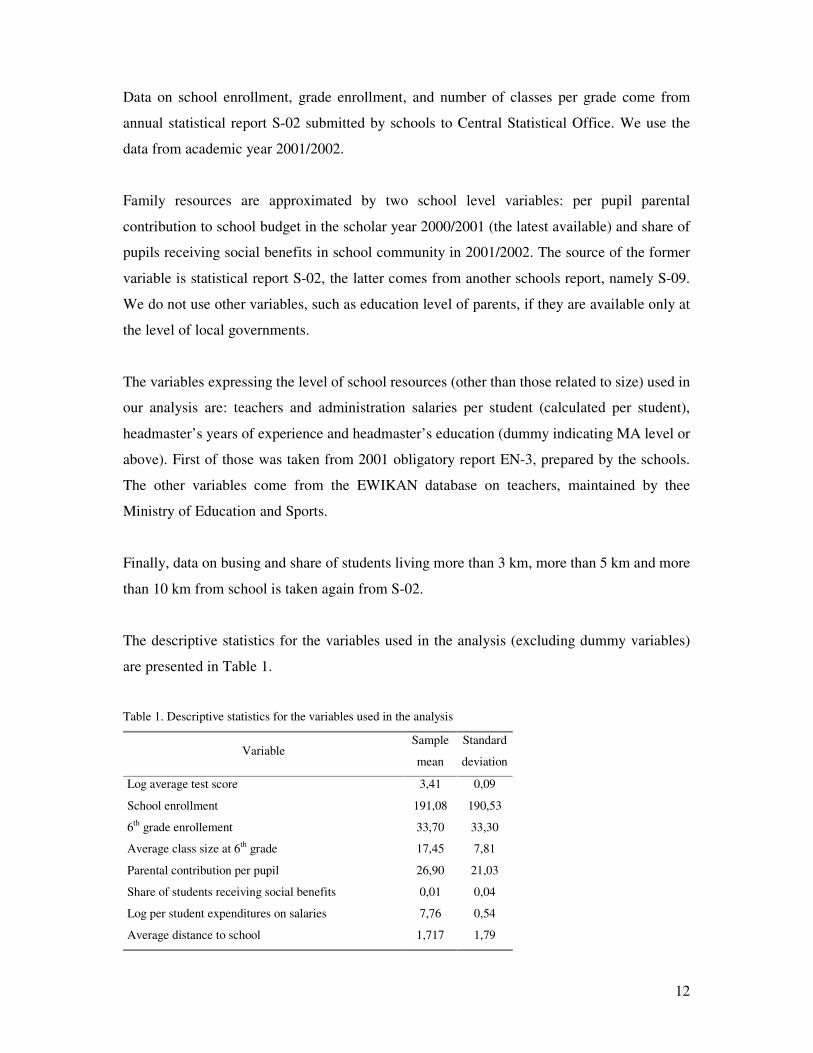
The descriptive statistics for the variables used in the analysis (excluding dummy variables)
are presented in Table 1.
Table 1. Descriptive statistics for the variables used in the analysis
Variable Sample
mean
Standard
deviation
Log average test score 3,41 0,09 School enrollment 191,08 190,53 6th grade enrollement 33,70 33,30 Average class size at 6th grade 17,45 7,81 Parental contribution per pupil 26,90 21,03 Share of students receiving social benefits 0,01 0,04 Log per student expenditures on salaries 7,76 0,54
Average distance to school 1,717 1,79
13
Share of bused students 0,129 0,21 Share of students living more than 3km from school 0,15 0,23 Headmaster’s experience (yrs) 9,25 6,59
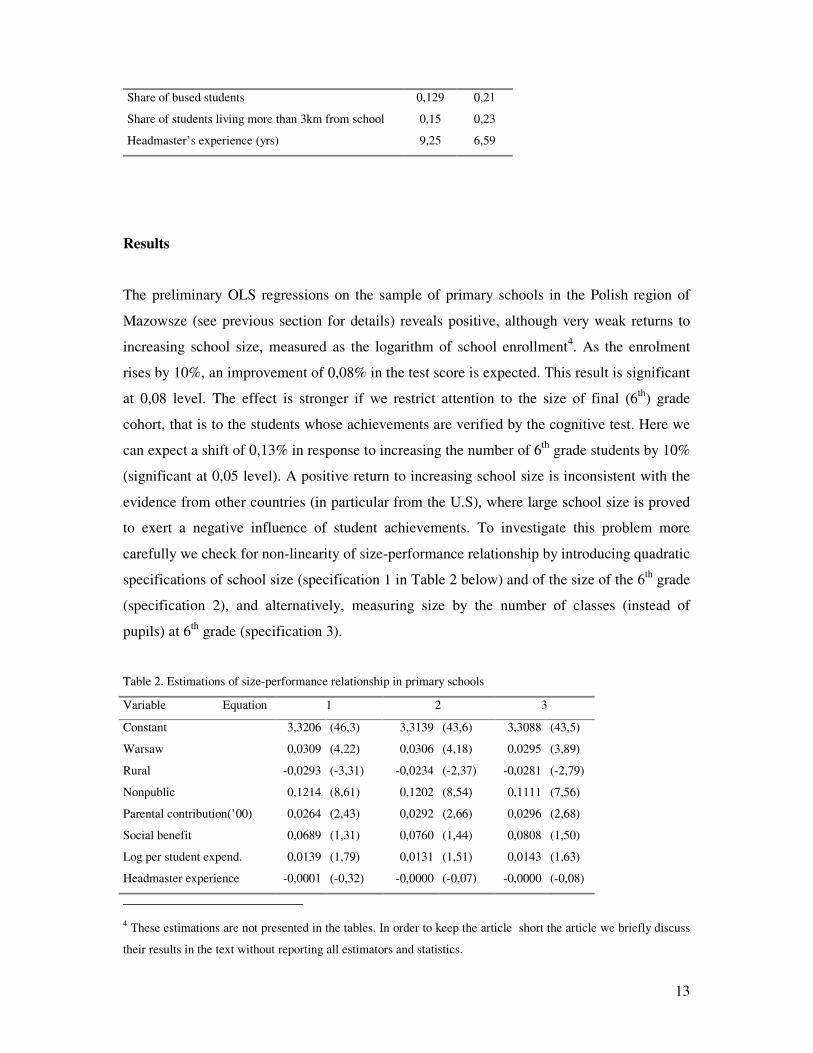
Results
The preliminary OLS regressions on the sample of primary schools in the Polish region of
Mazowsze (see previous section for details) reveals positive, although very weak returns to
increasing school size, measured as the logarithm of school enrollment4. As the enrolment
rises by 10%, an improvement of 0,08% in the test score is expected. This result is significant
at 0,08 level. The effect is stronger if we restrict attention to the size of final (6th) grade
cohort, that is to the students whose achievements are verified by the cognitive test. Here we
can expect a shift of 0,13% in response to increasing the number of 6th grade students by 10%
(significant at 0,05 level). A positive return to increasing school size is inconsistent with the
evidence from other countries (in particular from the U.S), where large school size is proved
to exert a negative influence of student achievements. To investigate this problem more
carefully we check for non-linearity of size-performance relationship by introducing quadratic
specifications of school size (specification 1 in Table 2 below) and of the size of the 6th grade
(specification 2), and alternatively, measuring size by the number of classes (instead of
pupils) at 6th grade (specification 3).
Table 2. Estimations of size-performance relationship in primary schools
Variable Equation 1 2 3
Constant 3,3206 (46,3) 3,3139 (43,6) 3,3088 (43,5)
Warsaw 0,0309 (4,22) 0,0306 (4,18) 0,0295 (3,89)
Rural -0,0293 (-3,31) -0,0234 (-2,37) -0,0281 (-2,79)
Nonpublic 0,1214 (8,61) 0,1202 (8,54) 0,1111 (7,56)
Parental contribution(’00) 0,0264 (2,43) 0,0292 (2,66) 0,0296 (2,68)
Social benefit 0,0689 (1,31) 0,0760 (1,44) 0,0808 (1,50)
Log per student expend. 0,0139 (1,79) 0,0131 (1,51) 0,0143 (1,63)
Headmaster experience -0,0001 (-0,32) -0,0000 (-0,07) -0,0000 (-0,08)
4 These estimations are not presented in the tables. In order to keep the article short the article we briefly discuss
their results in the text without reporting all estimators and statistics.
14
Headmaster MA, PhD -0,0153 (-2,26) -0,0142 (-2,05) -0,0143 (-2,06)
Avg class size -0,0006 (-0,09)
Avg class size 6th grade -0,0005 (-0,08)
Enrollment 0,0001 (2,34)
Enrollment sq -7,6e-8 (-1,81)
enrollment at 6th grade 0,0007 (2,45)
enrollment at 6th grade sq -3,07e-6 (-2,29)
Avg class size grade 6 (1) 0,0004 (0,64)
Avg class size grade 6 (2) -0.0007 (-2,38)
Avg class size grade 6 (3) -0.0005 (-1,42)
Avg class size grade 6 (4) -0.0006 (-1,70)
Avg class size grade 6 (5) -0.0009 (-1,37)
Avg class size grade 6 (6) -0,0010 (-1,78)
Avg class size grade 6 (>6) 0,0212 (3,15)
2 classes at 6th grade 0.0281 (1,98)
3 classes at 6th grade 0,0325 (2,02)
4 classes at 6th grade 0,0313 (1,72)
5 classes at 6th grade 0,0614 (3,20)
6 classes at 6th grade 0,0330 (1,32)
>6 classes at 6th grade -0,5154 (-3,19)
F (r,df) 17,95 (11,1164) 17,44 (11,1140) 9,65 (21,1130)
Adjusted R2 0,15 0,14 0,15
N 1176 1152 1152
Heteroscedasticity adjusted t-statistics are reported in parentheses
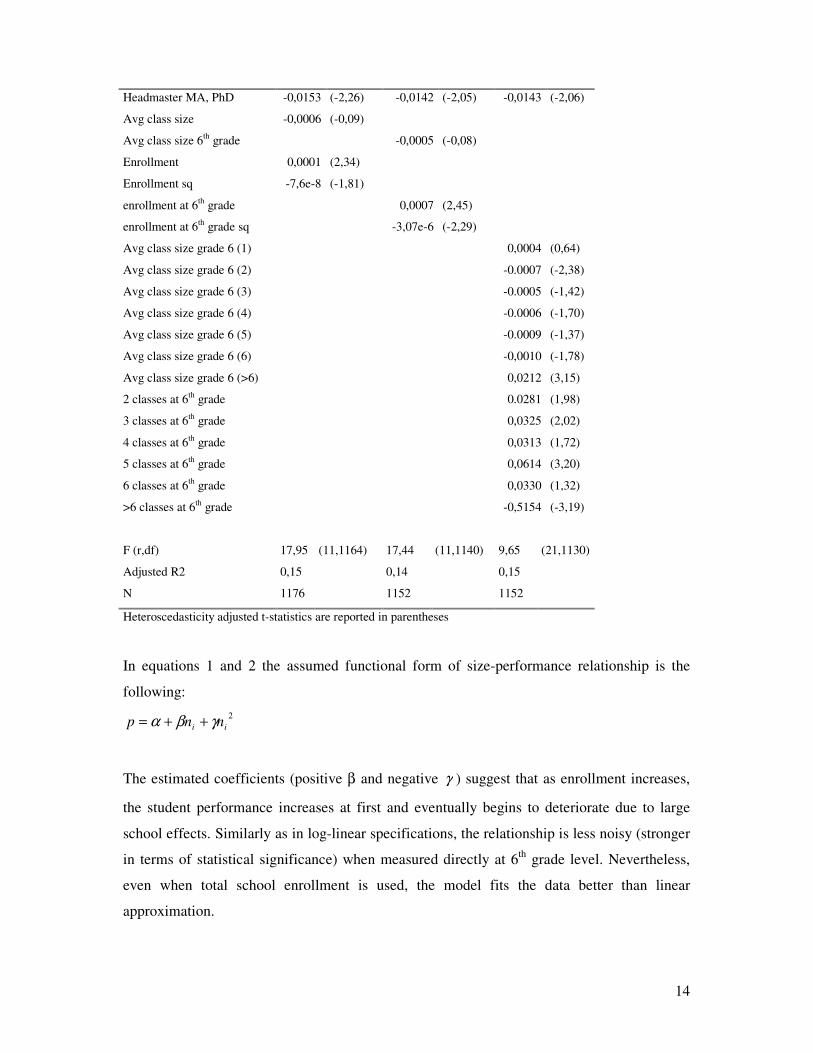
In equations 1 and 2 the assumed functional form of size-performance relationship is the
following: 2
ii nnp γβα ++=
The estimated coefficients (positive β and negative γ ) suggest that as enrollment increases,
the student performance increases at first and eventually begins to deteriorate due to large
school effects. Similarly as in log-linear specifications, the relationship is less noisy (stronger
in terms of statistical significance) when measured directly at 6th grade level. Nevertheless,
even when total school enrollment is used, the model fits the data better than linear
approximation.
15
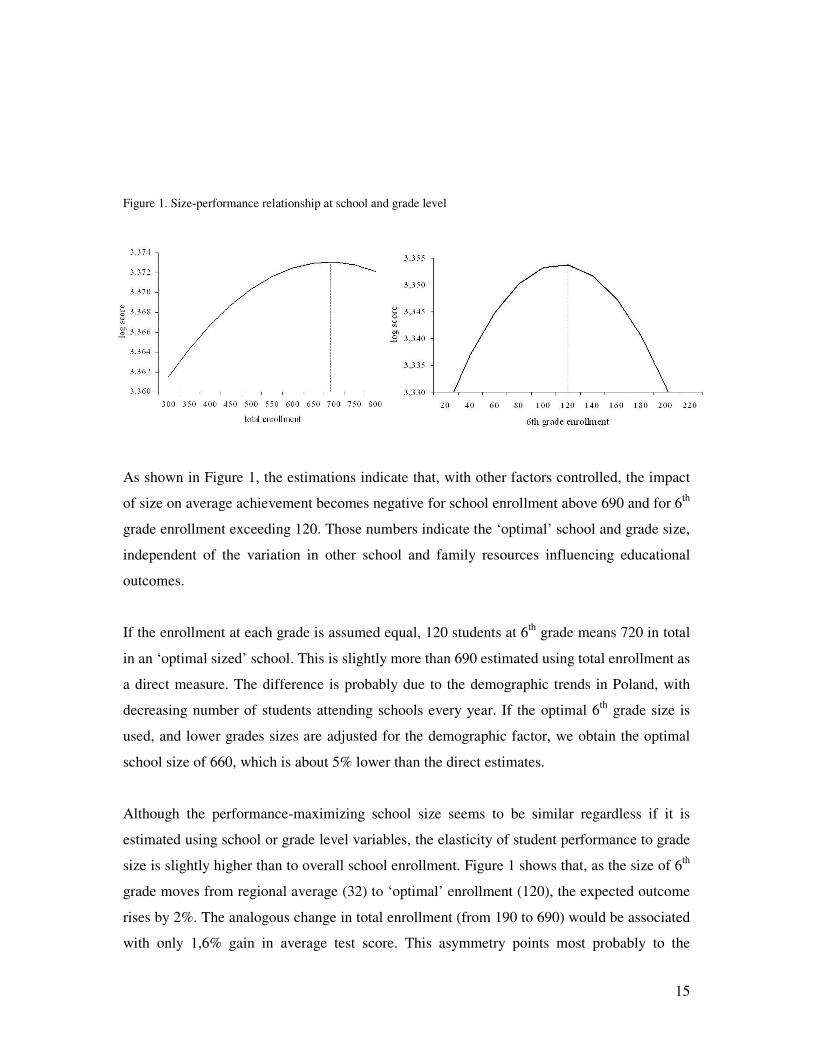
Figure 1. Size-performance relationship at school and grade level
As shown in Figure 1, the estimations indicate that, with other factors controlled, the impact
of size on average achievement becomes negative for school enrollment above 690 and for 6th
grade enrollment exceeding 120. Those numbers indicate the ‘optimal’ school and grade size,
independent of the variation in other school and family resources influencing educational
outcomes.
If the enrollment at each grade is assumed equal, 120 students at 6th grade means 720 in total
in an ‘optimal sized’ school. This is slightly more than 690 estimated using total enrollment as
a direct measure. The difference is probably due to the demographic trends in Poland, with
decreasing number of students attending schools every year. If the optimal 6th grade size is
used, and lower grades sizes are adjusted for the demographic factor, we obtain the optimal
school size of 660, which is about 5% lower than the direct estimates.
Although the performance-maximizing school size seems to be similar regardless if it is
estimated using school or grade level variables, the elasticity of student performance to grade
size is slightly higher than to overall school enrollment. Figure 1 shows that, as the size of 6th
grade moves from regional average (32) to ‘optimal’ enrollment (120), the expected outcome
rises by 2%. The analogous change in total enrollment (from 190 to 690) would be associated
with only 1,6% gain in average test score. This asymmetry points most probably to the
16
difference in the teaching process between early grades (grades 1 through 3 are referred to as
‘initial teaching’, with one teacher per class) and later grades (subject teaching with multiple
teachers). The size effects are stronger for later grades, because the effective use of school
resources is more difficult at this stage of instructional process.
While enrollment is the most common measure of school or grade size, it may not be fully
adequate for the managerial and instructional processes taking place in schools. It might be
the case that the relationship between size and performance is related more to the number of
classes, than pupils. Creating new class is a ‘milestone’ in the process of increasing school
size. It affects school functioning in more ways than just enrolling additional students. In
particular, it requires employment of more teachers and it intensifies the use of school
resources such as space and laboratories. It also make the school structure more complicated
and imposes greater requirements on school administration. Moreover, if the effect of creating
each additional class at given grade is investigated separately (as it is in equation 3, see
below), we are able to obtain the approximation of the shape of size-performance relationship
without assuming a priori any functional form (linear, log-linear, quadratic, etc.).
Equation 3 includes dummies for schools having from 2 to 6 classes at final grade. Schools
with only one class are used as a reference category. Equation 3 also includes the variables for
the average size of sixth grade class when there are two, three etc. classes at grade 6th (those
variables are zero for schools with a different number of 6th grade classes).
The results of the estimation show (although not all the class variables are statistically
significant) that the average test score increases till the number of classes reaches five, and
then starts falling. Unfortunately, there are very few schools with more than 6 classes at 6th
grade in the sample (they were given a common dummy variable) so the coefficient for
‘above six’ variable is not credible.
An interesting observation can be made about class-size variable, that is calculated separately
for each group of schools according to the number of classes at final grade. Generally, the
impact of class-size on educational outcome is negative, independently on the size of school.
The only exceptions are observed in schools with one class at 6th grade (in those schools class
size is simply grade size), where the class-size variable is statistically insignificant even at
17
α=0,5 and in very large facilities having over 6 classes per grade, being too few to produce
any credible result.
However, although class-size impacts performance negatively for almost all school sizes, the
strength of this effect depends on school size. Generally, as the number of classes at grade 6
(and thus enrollment at grade 6) increases, so does the magnitude of the impact of class-size
on average achievement. For example, if we take schools with three classes in the final grade,
an increase in average class size by 10 students would be associated, ceteris paribus, with a
drop in average test score by 0,5%. In turn, similar change in school with six classes at final
grade would have effect twice as strong.
As the regression coefficients discussed here are not significant, further research is needed to
understand their behavior. We can put forward a hypothesis, however, that for larger schools
the importance of smaller classes increases. In other words, while very large schools, through
difficulties of management and of creating an atmosphere suitable for learning, have negative
impact on student achievement, there is some compensation which can be derived from using
smaller classes.
Interestingly, the obtained optimal school size is very close to that stated by Andrews,
Duncombe and Yinger (2002) on the basis on the review of American literature, namely 600
students for an elementary school. At the same time, Andrews et al. report that most of the
existing research that test only for linear relationship between school size and performance,
prove this relationship to be negative. The conclusion must be drawn that, if we consider the
influence of size on school outcome to be nonlinear as in (a), large part of American schools
is probably located at the downward section of the curve. The average size of Polish
elementary school is much smaller (below 200). Only about 3% of schools in Warsaw region
enroll more than 690 pupils, and 4% enroll more than 120 pupils at 6th grade. Therefore, vast
majority of them place themselves on the upward section of the curve presented on Figure 1.
This would explain why linear or log-linear specifications return positive relationship between
size and performance, as opposed to most of US research.
As discussed in previous section, some research showed that large school size has stronger
negative effect on student performance in communities characterized by low SES. The
argument is that middle class children obtain much of their education at home and their
18
educational outcomes rely less on school quality and resources. In turn, the achievements of
students from low educated and poor environment depend heavily on school performance,
since school has to compensate them for the education they do not receive at home. Smaller
schools allow better communication between students and teachers, ease the adjustment of
curriculum to the capabilities of the children, and are in general exhibit more ‘individual’
approach to the pupil. One may say that if school has to fulfill some functions of the family, it
should resemble the family itself. This reasoning explains the finding of US research that for
poorer communities smaller schools are more efficient. We may now test this hypothesis in
the Polish conditions.
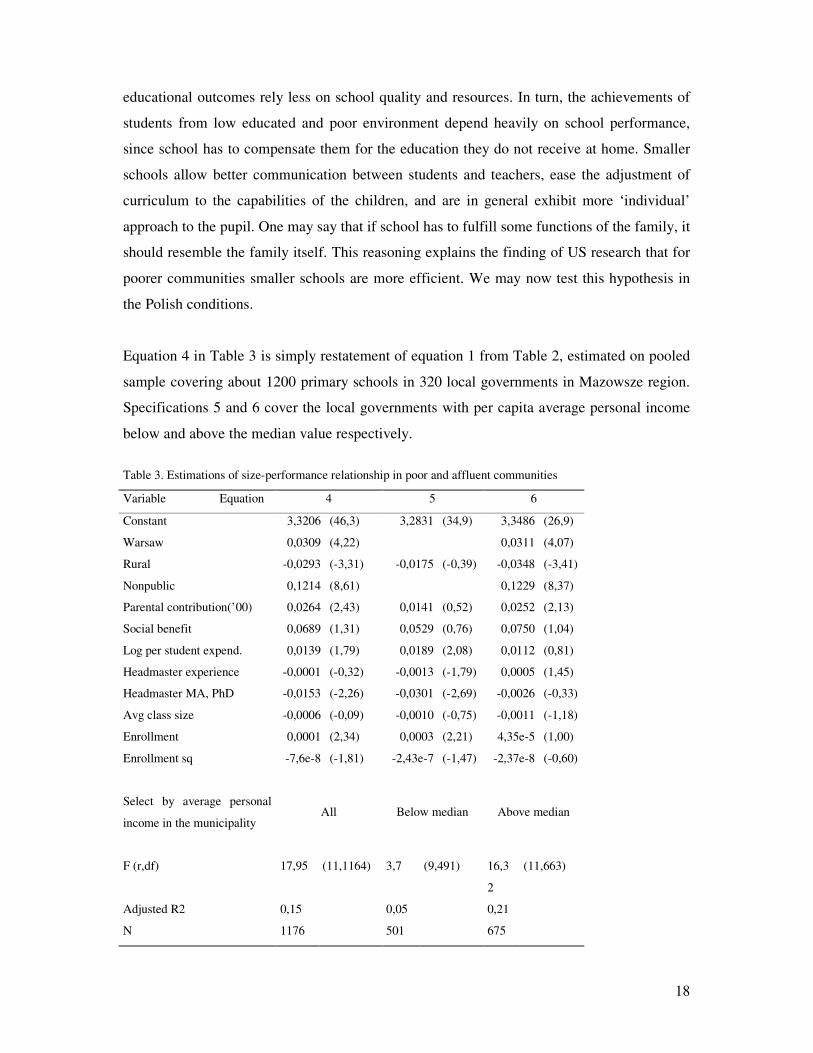
Equation 4 in Table 3 is simply restatement of equation 1 from Table 2, estimated on pooled
sample covering about 1200 primary schools in 320 local governments in Mazowsze region.
Specifications 5 and 6 cover the local governments with per capita average personal income
below and above the median value respectively.
Table 3. Estimations of size-performance relationship in poor and affluent communities
Variable Equation 4 5 6
Constant 3,3206 (46,3) 3,2831 (34,9) 3,3486 (26,9)
Warsaw 0,0309 (4,22) 0,0311 (4,07)
Rural -0,0293 (-3,31) -0,0175 (-0,39) -0,0348 (-3,41)
Nonpublic 0,1214 (8,61) 0,1229 (8,37)
Parental contribution(’00) 0,0264 (2,43) 0,0141 (0,52) 0,0252 (2,13)
Social benefit 0,0689 (1,31) 0,0529 (0,76) 0,0750 (1,04)
Log per student expend. 0,0139 (1,79) 0,0189 (2,08) 0,0112 (0,81)
Headmaster experience -0,0001 (-0,32) -0,0013 (-1,79) 0,0005 (1,45)
Headmaster MA, PhD -0,0153 (-2,26) -0,0301 (-2,69) -0,0026 (-0,33)
Avg class size -0,0006 (-0,09) -0,0010 (-0,75) -0,0011 (-1,18)
Enrollment 0,0001 (2,34) 0,0003 (2,21) 4,35e-5 (1,00)
Enrollment sq -7,6e-8 (-1,81) -2,43e-7 (-1,47) -2,37e-8 (-0,60)
Select by average personal
income in the municipality All Below median Above median
F (r,df) 17,95 (11,1164) 3,7 (9,491) 16,3
2
(11,663)
Adjusted R2 0,15 0,05 0,21
N 1176 501 675
19
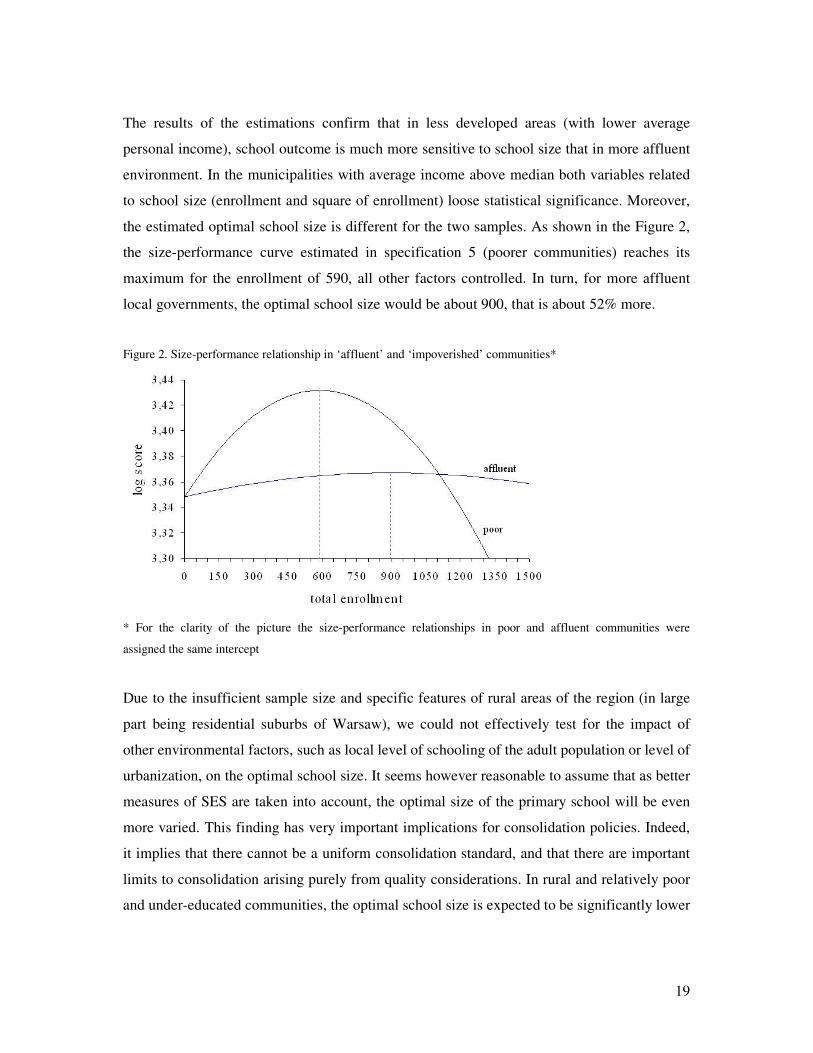
The results of the estimations confirm that in less developed areas (with lower average
personal income), school outcome is much more sensitive to school size that in more affluent
environment. In the municipalities with average income above median both variables related
to school size (enrollment and square of enrollment) loose statistical significance. Moreover,
the estimated optimal school size is different for the two samples. As shown in the Figure 2,
the size-performance curve estimated in specification 5 (poorer communities) reaches its
maximum for the enrollment of 590, all other factors controlled. In turn, for more affluent
local governments, the optimal school size would be about 900, that is about 52% more.
Figure 2. Size-performance relationship in ‘affluent’ and ‘impoverished’ communities*
* For the clarity of the picture the size-performance relationships in poor and affluent communities were
assigned the same intercept
Due to the insufficient sample size and specific features of rural areas of the region (in large
part being residential suburbs of Warsaw), we could not effectively test for the impact of
other environmental factors, such as local level of schooling of the adult population or level of
urbanization, on the optimal school size. It seems however reasonable to assume that as better
measures of SES are taken into account, the optimal size of the primary school will be even
more varied. This finding has very important implications for consolidation policies. Indeed,
it implies that there cannot be a uniform consolidation standard, and that there are important
limits to consolidation arising purely from quality considerations. In rural and relatively poor
and under-educated communities, the optimal school size is expected to be significantly lower
20
than in the more affluent cities. This may be in contrast to purely financial considerations,
which will in general favor most consolidation moves.
School consolidation involve busing students from small localities to the facilities in distant
towns. This may have both direct and indirect (through school compositional effects) impact
on achievements, as described earlier in this text. Since we have no access to data on
individual students in Polish schools, the importance of different effects related to busing
cannot be addressed separately. What is however feasible, is to verify the net impact of busing
on the performance of school to which pupils are bused.
In the following specifications busing to school is expressed by three different variables: share
of bused students in school community, share of students living in distant localities, and thus
allowed by the regulations to benefit from school transport and average distance from home
town to school among students living more than 3 km away.
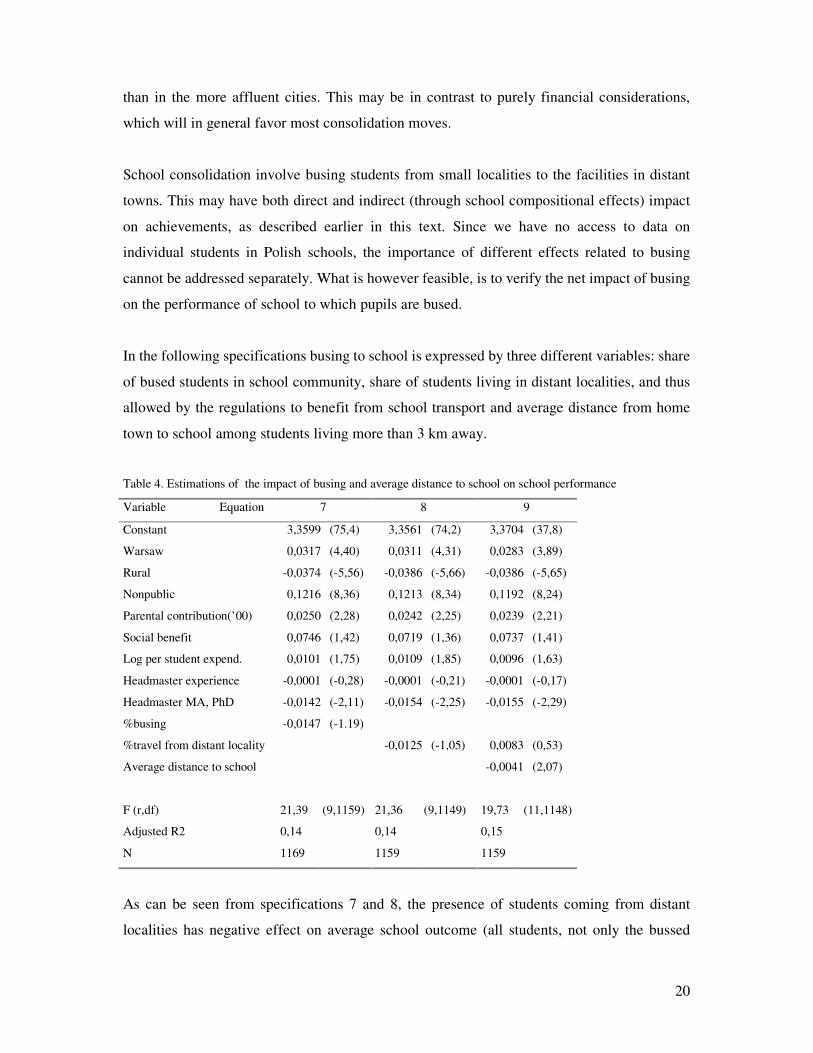
Table 4. Estimations of the impact of busing and average distance to school on school performance
Variable Equation 7 8 9
Constant 3,3599 (75,4) 3,3561 (74,2) 3,3704 (37,8)
Warsaw 0,0317 (4,40) 0,0311 (4,31) 0,0283 (3,89)
Rural -0,0374 (-5,56) -0,0386 (-5,66) -0,0386 (-5,65)
Nonpublic 0,1216 (8,36) 0,1213 (8,34) 0,1192 (8,24)
Parental contribution(’00) 0,0250 (2,28) 0,0242 (2,25) 0,0239 (2,21)
Social benefit 0,0746 (1,42) 0,0719 (1,36) 0,0737 (1,41)
Log per student expend. 0,0101 (1,75) 0,0109 (1,85) 0,0096 (1,63)
Headmaster experience -0,0001 (-0,28) -0,0001 (-0,21) -0,0001 (-0,17)
Headmaster MA, PhD -0,0142 (-2,11) -0,0154 (-2,25) -0,0155 (-2,29)
%busing -0,0147 (-1.19)
%travel from distant locality -0,0125 (-1,05) 0,0083 (0,53)
Average distance to school -0,0041 (2,07)
F (r,df) 21,39 (9,1159) 21,36 (9,1149) 19,73 (11,1148)
Adjusted R2 0,14 0,14 0,15
N 1169 1159 1159
As can be seen from specifications 7 and 8, the presence of students coming from distant
localities has negative effect on average school outcome (all students, not only the bussed
21
students), however both magnitude and statistical importance of this result is very low. An
increase in the share of bused (or simply living in big distance from school) students by 10
percentage points would be associated, ceteris paribus, with a drop in average test score by
0,13% to 0,15%. What exerts stronger influence on school performance is the average
distance challenged by the pupils living more than 3 km away from school. As it increases by
1 km, the expected drop in average test score is about 0,5%, with statistical significance
confirmed at 5% level. This is a rather unexpected finding and it certainly needs more
detailed analysis (preferably on a larger school sample and individual student data). Two
possible ad-hoc explanations may be however formulated. First, it is possible that we observe
mainly direct adverse effects of student transportation, restricted to ‘traveling’ students
(average busing distance is related to the time spent by students on the bus). We may also
suspect the magnitude of school compositional effects to depend on school catchment area.
This may occur if students from remote, small villages come from less educated families and
have much lower motivation to study that do the children bused from closer localities.
However, it seems that the quality of education is largely uniform (and very low) among
Polish rural areas, and thus the compositional effect mentioned above should be reflected also
by the impact of the share of bused students in school community. Therefore, of the two
immediate explanations of estimation results, direct adverse effects of busing seem to be more
probable.
The conducted analysis reveals a very interesting quality trade-off which must be faced by
any consolidation policy, and which is completely independent of any cost considerations.
Indeed, given small size of most Polish primary schools, consolidation will increase the size
of the remaining schools in the municipality and thus will contribute to better student
outcomes. On the other hand, it will also increase the distances travelled and depress the test
results. To see this trade-off more clearly, let us consider a simple example of a rural local
government facing the decision to close a small school of 50 students and of moving them to a
nearby larger school of 250 students. Keeping other factors constant, the size increase will
benefit both ‘indigenous’ students (estimated increase of 0,8%) and ‘new-coming’ students
(increase of 5,4%), thus the benefits for the ‘new-comers’ are, not surprisingly, much larger5.
However, we need to take into account also the net effect of increased busing distance. The
5 The estimation are based on the coefficients from equation 5 in Table 3, thus we assume that the municipality
considered in this example is rather poor (below median personal income).
22
estimated drop in average school performance due to 1 km increase in average distance to
school among students living at least 3 km away is about 0,41%, ceteris paribus (see equation
9 in Table 4). Assuming for the moment that busing has symmetric influence on local students
and newcomers (this assumption is not realistic, but unavoidable with the aggregated data we
use), the benefits of consolidation for the ‘indigenous’ students are wiped out as the distance
between schools exceeds 2 km. If the distance is larger than 13,5 km, also the benefits for
‘new-comers’ are overset by the negative influence of the busing.
Although such threshold distances based on estimated equations can be only treated as
putative, they are helpful in understanding the nature of the trade-off between the rewards of
more effective larger schools and quality losses due to longer distance busing.
Finally we pause to make a few remarks about the behavior of control variables used in
Tables 2-4. The very significant positive impact of non-public schools is due to their selective
intake, their graduates score on average 12% above other students. The use of dummy
variables for Warsaw and for rural schools means that the reference are urban schools outside
of Warsaw. Warsaw students outperform other urban students by 3%, and the rural schools
students by 6%. This is not surprising, given that, living in a metropolis, children have access
to educational resources unavailable elsewhere. The gap may also partially reflect the
difference in quality of parents education, although parents’ socioeconomic status is proxied
by other variables in the specification. We note that 3% score difference amounts to one full
point received in the test (see previous section) and is considered an important difference of
test results.
In general, per student spending is not significant for students outcomes, in contrast to parents
SES. This finding is in line with part of American literature (see Hanushek 1986, 1996),
although the heated debate about the impact of financial resources on student outcomes
continues. Interestingly, however, we note that an exception is specification 5, which is
restricted to poorer communities. It seems that in poor environment, where as discussed
above, school must take over some functions of the family, the equalizing function of
education spending becomes relevant.
Finally, the results concerning the importance of headmaster’s qualifications are rather
unexpected. Headmaster’s experience (years of service as school director) is irrelevant for
student achievements, but whether he/she has a degree is significant, and impacts students
23
results negatively. This probably reflects some weakness of data, partly related to the fact that
latest available information on teachers education was from 2000, that is two years before the
school test investigated in this article took place.
Conclusions and recommendations
Our analysis showed that there are indeed two conflicting influences on student achievements
related to school size. A very small school finds it difficult to use its resources effectively,
especially teacher and space resources, however when the school size becomes excessive the
negative effects appear, probably due to poor control over student behavior and learning,
inability to adjust the curriculum and instructional methods to students needs etc. When the
student specific factors (SES and similar) and the school specific factors (teacher
qualifications and similar) are controlled, the average student outcomes initially improve as
school size grows, and then begin to decline (see Figure 1). The optimal size of Polish
primary schools (for the whole sample) seems to be about 690 students of the whole school,
and about 120 students in the final sixth grade. This means that most of Polish primary
schools are on the increasing part of the curve, and some degree of consolidation would be
beneficial. On the other hand, there are also primary schools with an excessive number of
students for effective functioning of the school.
Nevertheless, more detailed analysis shows that the optimal size of the school depends on
many factors related not only to the school itself, but also to the social environment in which
it operates. Indeed, we have shown that the optimal size of a primary school is much smaller
in poorer local governments (under 600) than it is in affluent ones (over 900). We may
therefore expect the effective rural schools to be significantly smaller than urban ones. The
analysis of a larger sample (not restricted to the Mazowsze region) would probably show even
more variation in the optimal school size due to local characteristics (for instance, the level of
schooling of the local population). This implies that the consolidation process cannot be
uniform across the country, but that each community must weight its special conditions to
determine the optimal network of its primary schools.
24
Our research, in line with some of the studies cited in the introductory chapter, did not reveal
strong, significant impact of class sizes on student achievements. In other words, in their
search for improvement of school outcomes, the local governments should not pursue policies
directed at either increasing or decreasing the class size (such policies have more financial
than outcome related goals). We noted, however, that for large schools there is some negative
impact of large classes, and this impact become more pronounced the larger the school
becomes. This means that for large urban primary school, if the policy option of dividing
them into smaller organizational units is for a number of reasons not practicable, the proper
advice would be to decrease the sizes of classes, especially of 6th grade classes.
Finally, we have found a negative impact of long distance busing on average outcome of the
whole school community (including both bused and ‘local’ students). It is important to stress,
that it was the average distance traveled by transported students that showed to affect school
performance more significantly than the number (share) of students being bused. Thus,
consolidation may have worse effects on the functioning and performance of remaining
schools if it involves an excessive increase of their catchment areas.
The limitations of our dataset (no data on individual students) preclude more careful analysis
of direct and indirect effects of busing. The observations we made suggest however that in
any consolidation policies a difficult trade-off must be made. On the one hand, most rural
schools have small sizes and consolidation leading to their increase may hopefully result in
improvements of the students outcomes. On the other hand, transporting students from far
away will in general depress the test results. Thus from the point of view of the effectiveness
of schools, that is of their ability to teach well and to allow their graduates to compete with
graduates of urban schools, irrespective of cost considerations, the local governments are
faced with a very difficult balancing choice. At present, no detailed analysis of this trade-off
between increasing school size and transporting students from far away exists to help local
governments make correct choices. This remains one of the key challenges to researchers
working on the school production function in Poland.
Bibliography
Akerhielm, K. (1995). Does Class Size Matter? Economics of Education Review, vol. 14 No 3, 229-241
25
Andrews, M., Duncombe W., Yinger J. (2002). Revisiting economies of size in American education: are we any
closer to a consensus?. Economics of Education Review, 21, 245-262
Coleman J., Armor D., Crain R., Miller N., Stephan W., Walberg H., Wortman P. (1966), Equality of
educational opportunity, US Government Printing Office
Driessen, G. (2002). School composition and achievement in primary education: A large-scale multilevel
approach. Studies in Educational Evaluation 28, 347-368
Falk A., Ichino A. (2003). Clean Evidence on Peer effects, working paper, University of Zurich, European
University Institute
Fox, M. (1996). Rural Transportation as a daily constraint in students’ lives. Rural Educator, 17(2), 22-27
Friedkin, N., Necochea, J. (1988). School system size and performance: A contingency perspective. Educational
Evaluation and Policy Analysis, 10(3), 237-49
Hanushek E.,A.(1986). The economics of schooling: Production and efficiency in public schools, Journal of
Economic Literature (24) 1986, 1141-1177
Hanushek, E.,A. (1996). School Resources and Student Performance in Gary Burtless, ed., Does Money Matter?
The Effects of School Resources on Student Achievement and Adult Success. Brookings Institution, Washigton,
D.C., pp.43-73
Hanushek, E., A., Kain, J.,F., Markman, J.,M., Rivkin S.,G. (2001). Does peer ability affect student
achievement? NBER working paper No. 8502
Hanushek, E., A., Kain, J.,F., Rivkin S.,G. (2002). New Evidence about Brown vs. Board of Education: the
Complex Effects of School Racial Composition on Achievement. NBER working paper No. 8741
Herbst, M., (2004). Human capital formation in Poland. Where does educational quality come from?, DISES
working paper no 99, Universita degli Studi di Trieste
Herczy�ski J. (2003). The Financing of Georgian Education. Problems of Economic Transition (45) No. 10, 5-57
Herczy�ski J., Herbst M. (2002). Pierwsza odsłona. Społeczne i terytorialne zró�nicowanie wyników
sprawdzianu szóstoklasistów i egzaminu gimnazjalnego przeprowadzonych wiosn� 2002 roku, (Spatial and
social differentiation of school outcomes in Poland), Fundacja Klub Obywatelski, Warsaw
26
Howley, C. (1994). The academic effectiveness of small-scale schooling, ERIC Digest, ERIC Clearinghouse on
Rural Education and Small Schools (ERIC Document Reproduction service No. ED 372 897)
Howley, C.B., Bickel, R. (1999). The Matthew project: National Report. ERIC Document Reproduction Service
No. ED 433 174
Howley, A., Howley, C. (2001). Rural School Busing. ERIC Digest, ERIC Clearinghouse on Rural Education
and Small Schools, EDO-RC-01-7
Howley, C., Strange, M., Bickel, R. (2000). Research About School Size and School Performance in
Impoverished Communities. Eric Digest. ERIC Clearinghouse on Rural Education and Small Schools, EDO-
RC-00-10
Hoxby, C. (2000). The Effects of Class Size on Student Achievement: New Evidence from Population variation.
The Quarterly Journal of Economics 115 (4) 1239-1285
Hoxby, C. (2000a). Peer Effects in the Classroom: Learning from Gender and Race Variation. NBER Working
Paper No. 7867
Imsher, K. (1997). School Size. ERIC Digest. ERIC Document Reproduction Service No. ED 414 615
Lee J.W., Barro R.J. (1997). Schooling quality in a cross-section of countries, NBER working paper 1997
Lee, V., Smith, J.(1996). High school size: Which works best and for whom? Educational Evaluation and Policy
Analysis, 19(3), 205-27
Lu, Y-C., Tweeten, L. (1973). The impact of busing on student achievement. Growth and Change 4(4), 44-46
Raywid, M.A. (1999). Current Literature on Small Schools. ERIC Digest. ERIC Document Reproduction
Service No. ED 425 049
Strand, S. (1998). A “value-added” analysis of the 1996 primary school performance tables. Educational
Research, 40(2), 123-137
Thrupp, M., Lauder, H., Robinson, T. (2002). School composition and peer effects. International Journal of
Educational Research, 37, 483-504
Vidgor, J., Nechyba T. (2004). Peer Effects in North Carolina Public Schools. Paper for the CESifo/PEPG
Conference on Schooling and Human Capital Formation in the Global Economy

27
Wößmann and West (2002) Class Size Effects in School Systems Across the World: Evidence from Between-
Grade Variation in TIMMS, IZA Discussion Paper 458