Embed Size (px)
Citation preview
70:4 (2014) 71–81 | www.jurnalteknologi.utm.my | eISSN 2180–3722 |
Full paper
Full paper
Full paper
Full paper
Jurnal Teknologi
Jurnal
Teknologi
Jurnal
Teknologi
Jurnal
Teknologi
An Investigation Into Qualitative Differences Between Bus Users and Operators for Intercity Travel in Malaysia
Anil Minhansa*, Shamsuddin Shahidb, Ishtiaque Ahmedb
aSenior Lecturer, Faculty of Civil Engineering, Universiti Teknologi Malaysia, 81310 UTM Johor Bahru, Johor, Malaysia bAssociate Professor, Faculty of Civil Engineering, Universiti Teknologi Malaysia, 81310 UTM Johor Bahru, Johor, Malaysia
*Corresponding author: [email protected]
Article history
Received :26 May 2014 Received in revised form :
25 July 2014
Accepted :6 August 2014
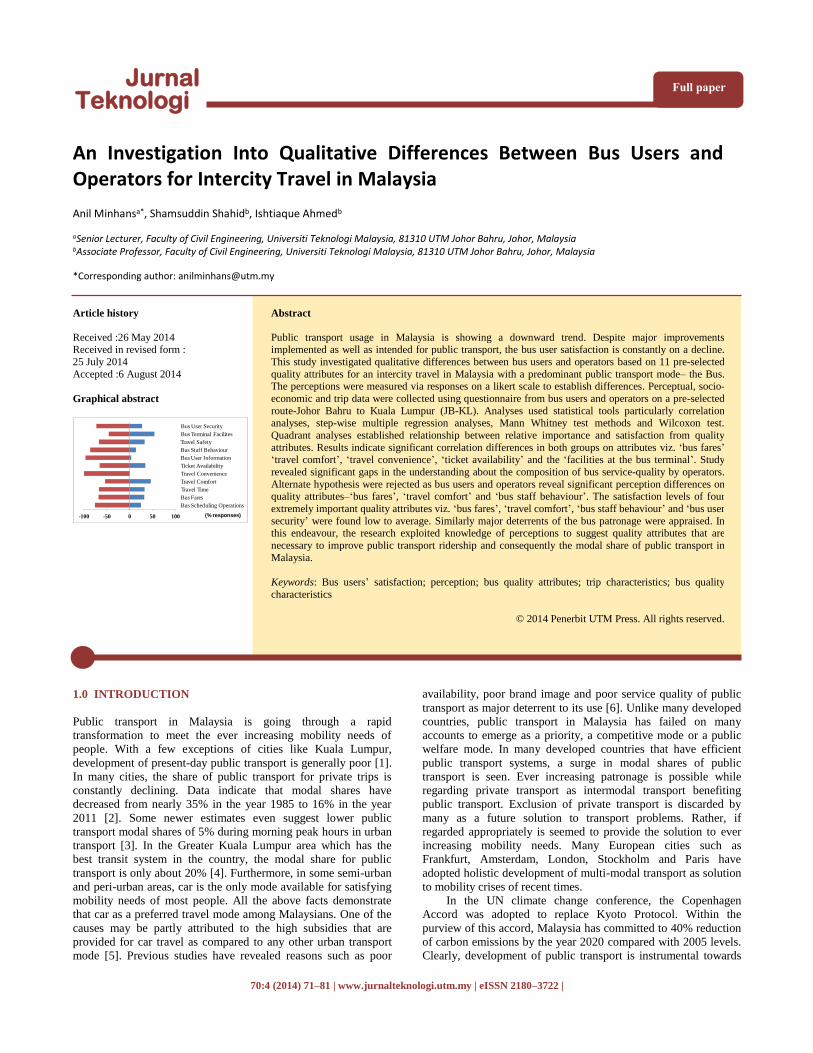
Graphical abstract
Abstract
Public transport usage in Malaysia is showing a downward trend. Despite major improvements implemented as well as intended for public transport, the bus user satisfaction is constantly on a decline.
This study investigated qualitative differences between bus users and operators based on 11 pre-selected
quality attributes for an intercity travel in Malaysia with a predominant public transport mode– the Bus. The perceptions were measured via responses on a likert scale to establish differences. Perceptual, socio-
economic and trip data were collected using questionnaire from bus users and operators on a pre-selected
route-Johor Bahru to Kuala Lumpur (JB-KL). Analyses used statistical tools particularly correlation analyses, step-wise multiple regression analyses, Mann Whitney test methods and Wilcoxon test.
Quadrant analyses established relationship between relative importance and satisfaction from quality
attributes. Results indicate significant correlation differences in both groups on attributes viz. ‘bus fares’ ‘travel comfort’, ‘travel convenience’, ‘ticket availability’ and the ‘facilities at the bus terminal’. Study
revealed significant gaps in the understanding about the composition of bus service-quality by operators.
Alternate hypothesis were rejected as bus users and operators reveal significant perception differences on quality attributes–‘bus fares’, ‘travel comfort’ and ‘bus staff behaviour’. The satisfaction levels of four
extremely important quality attributes viz. ‘bus fares’, ‘travel comfort’, ‘bus staff behaviour’ and ‘bus user
security’ were found low to average. Similarly major deterrents of the bus patronage were appraised. In this endeavour, the research exploited knowledge of perceptions to suggest quality attributes that are
necessary to improve public transport ridership and consequently the modal share of public transport in
Malaysia.
Keywords: Bus users’ satisfaction; perception; bus quality attributes; trip characteristics; bus quality
characteristics
© 2014 Penerbit UTM Press. All rights reserved.
1.0 INTRODUCTION
Public transport in Malaysia is going through a rapid
transformation to meet the ever increasing mobility needs of
people. With a few exceptions of cities like Kuala Lumpur,
development of present-day public transport is generally poor [1].
In many cities, the share of public transport for private trips is
constantly declining. Data indicate that modal shares have
decreased from nearly 35% in the year 1985 to 16% in the year
2011 [2]. Some newer estimates even suggest lower public
transport modal shares of 5% during morning peak hours in urban
transport [3]. In the Greater Kuala Lumpur area which has the
best transit system in the country, the modal share for public
transport is only about 20% [4]. Furthermore, in some semi-urban
and peri-urban areas, car is the only mode available for satisfying
mobility needs of most people. All the above facts demonstrate
that car as a preferred travel mode among Malaysians. One of the
causes may be partly attributed to the high subsidies that are
provided for car travel as compared to any other urban transport
mode [5]. Previous studies have revealed reasons such as poor
availability, poor brand image and poor service quality of public
transport as major deterrent to its use [6]. Unlike many developed
countries, public transport in Malaysia has failed on many
accounts to emerge as a priority, a competitive mode or a public
welfare mode. In many developed countries that have efficient
public transport systems, a surge in modal shares of public
transport is seen. Ever increasing patronage is possible while
regarding private transport as intermodal transport benefiting
public transport. Exclusion of private transport is discarded by
many as a future solution to transport problems. Rather, if
regarded appropriately is seemed to provide the solution to ever
increasing mobility needs. Many European cities such as
Frankfurt, Amsterdam, London, Stockholm and Paris have
adopted holistic development of multi-modal transport as solution
to mobility crises of recent times.
In the UN climate change conference, the Copenhagen
Accord was adopted to replace Kyoto Protocol. Within the
purview of this accord, Malaysia has committed to 40% reduction
of carbon emissions by the year 2020 compared with 2005 levels.
Clearly, development of public transport is instrumental towards
-100 -50 0 50 100
Bus Scheduling Operations
Bus Fares
Travel Time
Travel Comfort
Travel Convenience
Ticket Availability
Bus User Information
Bus Staff Behaviour
Travel Safety
Bus Terminal Facilites
Bus User Security
(% responses)
72 Anil Minhans, Shamsuddin Shahid & Ishtiaque Ahmed / Jurnal Teknologi (Sciences & Engineering) 70:4 (2014) 71–81
achieving such ambitious goals. Many studies reveal that transport
sector amounts to 28% Green House Gases (GHG)[7], of which,
cars and trucks combined together contribute to 80% GHG from
transport sector [8]. Also, total transport sector is believed to
consume 70% of total petroleum products [9]. Traffic experts
debate that transit modes can secure more than double the
mobility demand (trip-km) with the amount of petroleum used in
personalised transport [10]. Some even argue that total costs of
traveling by car ignore the external costs to ecology, environment
and society [11]. All the above considerations including goals of
accessibility, mobility, safety and economics justify a great
requirement to develop public transport in Malaysia.
Notwithstanding the UN commitment to cut GHG and the overall
goal to improve environmental quality, car ownership is rising in
Malaysia such that it is placed third in the world with 93% car
ownership. This phenomenon is attributed to high subsidies on
fuel, soft loans, overall low cost of travel by car (parking, vehicle
taxes etc.) and significantly due to an underdeveloped public
transport. Furthermore, vehicle sales in Malaysia are dominated
by local car manufacturers by virtue of government policies (on
tariff and non-tariff barriers) that protect the local automotive
industry. Equally contributing to the rise of personalised vehicles
is unavailability of public transport, poor transport services, and
poor image of public transport. These forces prevent the users
from using alternative modes such as buses, trains, taxis etc [12].
Process of operational planning in public transport envisages
greatly on the travel needs and the public attitude formation
towards quality of travel and patronage. This study attempts to
investigate the factors affecting quality of inter-state bus travel,
and consequently its role in satisfying users. It analyses the
perceptions of passengers with operators, and attempts to
understand the differences. The study of such differences on
quality aspects is extremely necessary to find gaps. Thereby, this
study suggests a general advice to counter such differences. In this
endeavour, the importance of quality factors and their role in the
overall satisfaction of user are further identified.
Different sources of information on customer satisfaction are
reviewed in this study. However, there are limited details to allow
the comparisons between passenger’s and the bus operator’s point
of view in Malaysian context. These are important to understand
whether the operators and users relate to the quality in a similar
manner. Few studies have been conducted in the past to gain
information regarding the effectiveness of bus services as they
involved multiple stakeholders, resources and planning efforts by
both the bus operators and the local authorities of Malaysia [13-
15]. This study is conducted keeping satisfaction survey approach
in consideration to investigate the degree of satisfaction that the
bus users’ enjoys during their travel. Passenger perceptions can
reveal type of quality related improvements necessary to increase
patronage. The expectations of the study are towards developing
an understanding on aspects of planning, operational design,
scheduling, and traffic management of public transport system
particularly for a typical interstate route (JB-KL route). This paper
also delivers the critical information about the strategies to
improve the effectiveness of bus travel from bus users’ and
operators’ perspective through the evaluation of compiled socio-
economic data, trip data and travel behaviour data. The following
key objectives were underlined for this study:
i. To study the factors those contributes towards the bus
users’ satisfaction.
ii. To assess the perceptions of bus users and operators
towards satisfactory intercity bus travel.
iii. To identify the main factors that improve bus user
perceptions towards quality of intercity bus travel.
Finally, this research concludes by extending a few suggestions to
improve bus user’s satisfaction.
2.0 LITERATURE REVIEW
The increasing travel demand and preferences in using private
vehicle is causing traffic congestion around the world. Most
people are now highly dependent on private vehicles.16 This
problem is attributed to the attractiveness of car which lots of
people prefer to drive. Congestion results in longer travel times
for many bus passengers as well as car users [17]. In addition to
congestion, private vehicle usage is also affecting the safety of the
road users [18], a high consumption of non-renewable resources
[19], and causing serious threat to the quality of human
environments [20]. In order to prevent the problems caused by
this increase in private vehicle usage, traffic experts highly
recommend the city authorities to provide an attractive public
transport service as an alternative. Many advocacy forums suggest
public transport as the solution for sustainable transport in the
future such as L’Union internationale des transports publics
(UITP), Institute of Transportation and Developmental Policy
(ITDP), Deutsche Gesellschaft für Internationale Zusammenarbeit
(GIZ) etc. However, in order to attract more passengers to use
public transport, the key players must provide high service quality
offerings and a wide range of mobility options to different
customers [21-22]. It is therefore, extremely important to gain the
knowledge about needs of public transport users’ and critically
assess their satisfaction or dissatisfaction to plan, design, develop
and operate an attractive public transport system.
Public transport operators as well as city authorities are now
realizing the importance of customer satisfaction. Customer
satisfactions are used as measurement values to indicate the
success of the operation of public transport companies. According
to Oliver [23] and Budiono [24], satisfaction is defined as the
customer’s fulfilment of their needs. It is a judgment that a
product or service feature, or the product or service itself, gives a
pleasurable level of consumption-related fulfilment, including
levels of under or over fulfilment. Needs fulfilment is a
comparative processes giving rise to the satisfaction responses.
According to Parasuraman et al. [25], service quality is defined as
a comparison between customer expectation and perception of
service. Service quality in general consists of five distinct
dimensions which are tangibility (physical facilities, equipment,
and appearance of personnel), reliability (ability to perform the
promised service dependably and accurately), responsiveness
(willingness to help customer and provide prompt service),
assurance (knowledge and courtesy of employees to inspire trust
and confidence), and empathy (caring and individualized attention
the firm provides to its customer). The relationship between
quality and satisfaction is complex, due to a high reliance on the
performance dimension used in quality judgments than those used
in satisfaction judgments. Performance based quality is a result of
ideal expectation and preference of individual consumer. Quality
is one of the key dimensions which focus on consumer’s
satisfaction judgments. Quality is the totality of features and
characteristics of a product or service that relies on its ability to
satisfy stated and implied needs. Thus, service features determine
quality which in turn satisfies consumer needs.
Gatersleben and Uzzell [26] investigated the effective
experiences of daily commute using surveys involving Surrey
University’s employees. The results revealed that commuting by
car as well as by public transport can be stressful because of
delays caused by the traffic volume. Public transport was
considered as unpleasant as public transport users’ expressed
more negative attitudes toward their daily commute than users of
other transport modes. The negative attitudes were related to
stress as well as boredom caused by unusual delays and longer
waiting time. Gatersleben and Uzzell [27] also suggest that public
73 Anil Minhans, Shamsuddin Shahid & Ishtiaque Ahmed / Jurnal Teknologi (Sciences & Engineering) 70:4 (2014) 71–81
transport is stressful due to unpredictability and longer travel
times.
The UK Department for transport has also conducted several
studies regarding customers’ need in public transport. Service
attributes such as frequency of services; services that are reliable
and fares that offer value for money are revealed as most
important needs of UK public transport users. Such studies have
also revealed that buses need to have a broad range of destinations
to fulfil travel demand of customers [28]. Public transport users
have also reported the importance of understandable time table
information at the bus stops and in local newspapers in order to
make them aware of the services (Department of Transport
2013)[29]. Furthermore, simple ticketing is also revealed as an
important consideration in order to influence users to use more
public transport.
Fujii et al. [30] conducted an investigation in Osaka, Japan
during a temporary closure of freeway that connected between
Osaka and Sakai City. The survey was distributed at three
tollgates from 6:00 am to 8:30 am. An important finding was that
the closure of the freeway increased public transport use.
Secondly, it was also found that the expected commute time by
public transport was overestimated by automobile commuters.
Finally, people who corrected their commute time continued to
use public transport when the freeway was reopened.
Vugt et al. [31] conducted an investigation of the motivating
factors underlying the decision to commute by car or public
transport. A total of 192 employees of a publishing company
participated and filled in a questionnaire containing questions
relating to social value orientation, the commuting situation and a
series of post-experimental questions. The findings provided
strong evidence to support conclusion that individuals preferred
options yielding shorter travel time as well as frequent public
transport.
Fellesson and Friman [32] conducted a transnational
comparison of customers’ perceived service- satisfaction
involving public transport in eight cities (Stockholm, Barcelona,
Copenhagen, Geneva, Helsinki, Vienna, Berlin, Manchester and
Oslo) in Europe. The result showed supply, reliability,
information and bus stop environment as key factors affecting
users’ opinion. Furthermore, it was concluded that differences in
public transport technology and infrastructure may cause
differences in individual satisfaction level.
Eboli and Mazzulla [33] investigated the importance of
service quality attributes for customer satisfaction with a bus
transit service in Cosenza, Italy. Respondents were asked to rate
the importance and satisfaction with 16 service quality attributes
[bus stop availability, route characteristics, frequency, reliability,
bus stop furniture, bus overcrowding, cleanliness, cost,
information, promotion, safety on board, personal security,
personnel, complaints, environmental protection and bus stop
maintenance]. The result shows how important the reliability,
frequency, information, promotion, personnel and complaint are
to satisfy the passenger needs.
Beirão and Sarsfield Cabral [17] summarises the advantages
in using public transport according to Portugal public transport
users. The result highlights the importance of a cost effective and
less stressful public transport service. Public transport was
perceived as less stressful since there was no need to drive, it was
possible to relax and one was able to read or rest. Travel time on
exclusive bus lanes was found faster than the Car. There were
significantly less overall exhaust emissions. Furthermore, there
were opportunities of socialising with fellow passengers while
travelling. Beirão had also conducted in-depth interviews in Porto
to find out dissatisfying factors. Customers reported factors e.g.
wasted time during waiting and idling, over-crowded conditions,
lack of comfort, uncertainty of time, lack of control, unreliability,
long waiting times, need to transfer, inability to change route to
avoid traffic congestion, lack of flexibility, and long walking time
emerged as the most dissatisfying factors concerning public
transport.
Fellesson and Friman [34] conducted a mailed survey to
investigate factors affecting customer satisfaction in Sweden
towards public transport. The results showed that overall
satisfaction was highly dependent on the attributes that customer
feels important. Also, it is highly related to the remembered
frequencies of negative critical incidents such as the unexpected
bad behaviour of driver or the departure of bus before its planned
schedule. Friman examined the effect of quality improvements in
public transport on customer satisfaction and frequency of
perceived negative critical incidents. The studies were conducted
in 13 regions in Sweden probing quality improvements in public
transport. Data were collected before and after implementation.
Comparison of passenger reaction was considered a way to
understand the type of improvement necessary to enhance
customer satisfaction. The study concluded that customer
satisfaction was influenced by quality improvements only to a
limited extent. Furthermore, the effect was directionally opposite
in that respondents reported less satisfaction and higher
frequencies of negative critical incidents after the quality
improvements had been implemented. Thus, quality
improvements do not always boost customer satisfaction.
Safety and security issues were found by Smith and Clarke
[35] as a constraint for people to choose public transport as
preferred choice of travel mode. Pick pocketing, overcharging in
conjunction with overcrowding and lack of supervisory control
were deemed as important factors dissuading public transport use.
UK Department for Transport reported that young people were
also involved in vandalism, damage of public property as well as
other crimes involving public transport. These factors are found to
have significant effect on the public transport usage by patrons.
Also, service recovery and information about service
improvement do not always seem to increase customer
satisfaction. Many studies revealed that environmental concerns
such as reducing pollution and congestion could become an
effective campaign to attract people using public transport [36-
38]. Research shows that public transport is still an alternative and
attractive mode of travel choice for lots of people all over the
world.
2.0 RESEARCH METHODS
This assessment involves the inter-city bus travel between cities
of Johor Bahru (JB) and Kuala Lumpur (KL), Malaysia. The
survey was divided into two main parts: bus users’ survey and
operators’ survey. Both surveys sought information by
investigating whether the bus operators and governmental policies
are considerate towards bus users’ needs as a priority.
The passenger surveys were conducted at both Larkin
Terminal (Johor Bahru) and Terminal Bersepadu Selatan (Kuala
Lumpur). The survey focusing on ten bus operators were
conducted to seek opinions. The research methodology included
the pre-orientation of respondent’s to prevailing quality-related
issues and problems of intercity bus travel from Johor Bahru to
Kuala Lumpur. A pilot study was conducted to determine a
comprehensive set of attributes that bus users, operators and
experts believed to describe the quality of travel in Malaysia. A
total of 36 sub-attributes were initially chosen and this effort
simplified the selection of 11 service-quality attributes finally for
studying the differences between the users’ and operators’
perceptions. These were related to: (i) bus-scheduling operations,
(ii) bus fares, (iii) travel time, (iv) travel comfort, (v) travel
74 Anil Minhans, Shamsuddin Shahid & Ishtiaque Ahmed / Jurnal Teknologi (Sciences & Engineering) 70:4 (2014) 71–81
convenience, (vi) ticket availability, (vii) bus-user information,
(viii) bus-staff behaviour, (ix) travel safety, (x) bus-terminal
facilities and (xi) bus-user security. Equally, sub-attributes were
statistically clustered to aid the statistical analyses.
Questionnaires were distributed at both Larkin terminal in
Johor Bahru and TBS terminal in Kuala Lumpur, where bus users
boarded or alighted. The sampled bus users completed the survey
and the collection was done instantaneously. The questionnaire-
based surveys were conducted at the end of the trip which covered
both an outward and return trip, in order to represent the range of
the individual bus users’ journeys on each route. Furthermore,
careful consideration was made to ensure that bus users’
responses were addressed to specific bus operators. By this
consideration, the bus users’ responses were only referred to the
specific bus operator and the comparison between operator and
passenger perceptions were made more representative.
Since, the bus operators had no central database containing
information about the operating elements such as headway,
capacity, cycle time, operating time, operating speed, costs etc. of
all the services run by them, sampling plans were derived on the
basis of various sources such as regional websites, individual
operator websites in addition to publicly available timetables
(where possible). This information was deemed important for
defining many service quality attributes. All the relevant bus
operators were notified by a letter of authority to gain their
cooperation. Also attention was given to ensure the reliability of
data i.e. respondents who had 2 years patronage or more were
chosen.
Survey questions were framed based on extensive literature
review on customer needs and satisfaction in the Malaysian
context. Hence a frame of reference was developed to ensure the
validity of comparisons and further analyses. Also, data collection
was restricted to a short span of four days to minimise any
changes that might occur in opinion as a result of longer duration
of data collection. The questionnaire, for this purpose, was a 4-
page self-administered set of questions, handed out to passengers
that used the same bus. Below is a summary of the type of data
collected from the questionnaire.
personal data such as age, gender, household size,
income status, auto-ownership education etc.
trip data such as origin-destination, location, travel
time, access and travel distance, travel costs etc.
perception and satisfaction data regarding bus travel
elements containing but not limited to- headway,
punctuality, comfort, convenience, bus-staff conduct,
facilities at station, other important aspects of journey
etc. It also included the study of preferences those
contribute to satisfaction among different bus users and
their relative importance in defining quality of travel.
Unstructured miscellaneous data which respondents
thought it to be appropriate and necessary. An open
space was demarcated for receiving comments.
This research took account of both secondary and primary
data.
Additionally, information was also obtained through
observations, mainly about local site conditions, bus-related
quality problems, prevailing passenger demand at certain time
periods and passenger behaviour. The samples were collected at
the terminals to generate as close as possible the accurate number
of responses from each operator as well as bus user. The sample
sizes were chosen to have low margins of error to enable
comparison across results. A total of 10 operators and 100
passengers were finally analysed. Samples sizes of 100 generate
results with a maximum margin of error of around 0%, for both
passenger (100) and operator samples (10). The multivariate
analysis was done on the data for each respondent [bus user and
operator] to find out the most agreed and disputed statements
[level-of-agreement]. The specific multivariate technique was
conducted for descriptive correlation among attributes of interests
using SPSS software.
All qualitative sub-attributes were evaluated using a five-
point Likert scale of 1 to 5 in the increasing order of their travel
satisfaction or bus quality perceptions. Thereby, the number ‘1’
indicated the worst and ‘5’ indicated the best service respectively.
The number ‘3’ was used as the mid-point which meant a neutral
state. Information was mostly obtained through self-completed
questionnaire. The questionnaire was designed to reflect the
profile of bus users in different socio-economic groups. Later, the
respondents were briefly interviewed to obtain general and
specific information regarding the existing situation of bus
services, and the measures that they believe could improve
effectiveness of bus travel.
The satisfaction level on different service quality attributes,
relations among service quality attribute in both bus users’ and
operators’ opinion and their differences were analysed. Statistical
analysis such as estimation of median and standard deviation of
responses, Pearson correlation among the service quality related
issues, and Mann-Whitney U test between passenger and operator
responses were conducted. The Mann-Whitney U test between the
bus users and the operator’s responses is conducted to understand
the difference in opinions among bus users and operators on bus
service quality.
Median Scores were calculated to understand the satisfaction
level of respondents via different questions related to bus service
quality. The median values of bus user and operator responses to
different survey quality attributes were examined [Table 7]. A
high median value meant high satisfaction and a low median
value meant a low level of satisfaction. Similarly comparison on
the satisfaction levels of bus users and operators on different
service quality issues were also drawn.
Eleven alternate hypotheses were finally formed to analyse
the responses of bus users and operators [Table 7]. Disagreements
and agreements in responses were based on the mean, median and
standard deviation. For example, regarding the bus cleanliness
[Hypothesis 4], of the bus user responses is 3, which means bus
cleanliness as average. On the other hand, median value of 4 for
operator’s responses to the same question means that satisfaction
level of operators regarding this attribute is higher than bus users,
thereby indicating disagreement.
The mean and median scores of the responses by bus users
and operators were obtained [refer Table 7] and later tested for the
significance of mean. This is conducted to understand the
unanimity or dispute of respondents to a certain question
addressing a particular quality attribute. If the mean of the
responses to a certain question is statistically significant, it can be
considered that the most of the responses are near to mean
response. In other words it means that most of the respondents
agree in their opinion. On the other hand, a non-significant mean
of responses indicates that the respondents are very diverse in
opinion and therefore, they have not agreed to a particular
opinion. In the present study, non-parametric Wilcoxon test is
carried out to measure the significance of mean score of the
responses.
Data Analysis was conducted in three steps; first correlation
analysis was undertaken to measure linear correlation between
variables. Also, regression analyses were conducted to examine
the attributes constituting overall quality. Then, comparison
analysis was performed between bus user and operator to evaluate
the overall satisfaction of travel. Third, a relationship analysis
using Quadrant analysis between satisfactory and important
factors was performed to evaluate the key quality factors.
75 Anil Minhans, Shamsuddin Shahid & Ishtiaque Ahmed / Jurnal Teknologi (Sciences & Engineering) 70:4 (2014) 71–81
Quadrant analyses suggested the most important attributes and
their corresponding derived-satisfaction levels.
3.0 DATA ANALYSIS
3.1 Profile of Bus Users and Operators
A total of 127 questionnaires were filled out by passengers of 10
bus companies at the TBS [KL Terminal] and Larkin [JB
Terminal] respectively. However, only 100 questionnaires from
bus users were used for analyses, of which a total of 55%
questionnaires forms were filled in TBS Terminal and 45% in
Larkin Terminal.
The bus users consisted of 98 men and 2 women with the
following frequency distribution:7% age of 16-20; 82% age of 21-
30; 9% age of 30-40 and 2% age of 40-50 respectively. Students
constituted 48% passengers followed by 21 % privately employed
30% public-employed, 15% self-employed and 1 % unemployed
respondents.
Households with only 2 members constituted 28% of total
bus users followed by 2-4 members [30%], 4-6 members [38%]
and 6-10 members [17%]. Also, surveys reported 67% married
and 33% unmarried bus users. A total of 56% bus users owned
automobile and 44 % reported to have no access to automobile.
Income status of the bus users revealed that a majority
earned a monthly income between RM 2,000 to 4,000 [46%]
followed by RM 5,000 to 7,000 [24%], RM 1000 and less earners
[22%] and RM 8,000-13,000 [8%]. Purpose of trips were highly
varied with 15.3% respondents reported work trips followed by
16.7% educational trips; 11.3% return-to home trips; 8.7%
business trips; 20% leisure trips; 3.3% shopping trips; 14.7 %
vacation trips and 10% trips had other purposes. Ethnicity of the
surveyed bus users’ followed nearly the census population
distribution with 57% Malay, 20% Chinese, 10% Indian and 13%
with foreigner status.
Number of staff per trip in the bus was mostly 2 people and
numbers of seats per bus were between 33 to 40 seats. In most
cases, travel time was between 3.5 to 4 hours. Numbers of trips
from JB to KL were more than 100 departures per day by a total
of 10 operators. Most operators reported that each bus needed
maintenance up to 4 times month.
Bus operators’ profile indicated that 50% belonged to age
group 26-30 years followed by 21-25 years [30%], 41-45 years
[10%] and greater than 56 years [10%]. Bus operators were
predominantly from Malay ethnicity [80%] followed by each
Chinese [10%] and Indian ethnicity [10%]. A total of 60%
surveyed operators were males.
3.2 First Estimation: The Correlation Between the Attributes
and Their Satisfaction from Attributes
A correlation matrix is used to reveal whether the different
questions in the survey addressing quality attributes have
relationships to one another. For the purposes of this study, it is
assumed that the interrelations amongst attributes indicate that
they share common factors and represent latent dimensions of
service quality or characteristics. Correlation coefficient among
different service quality related issues are calculated from the
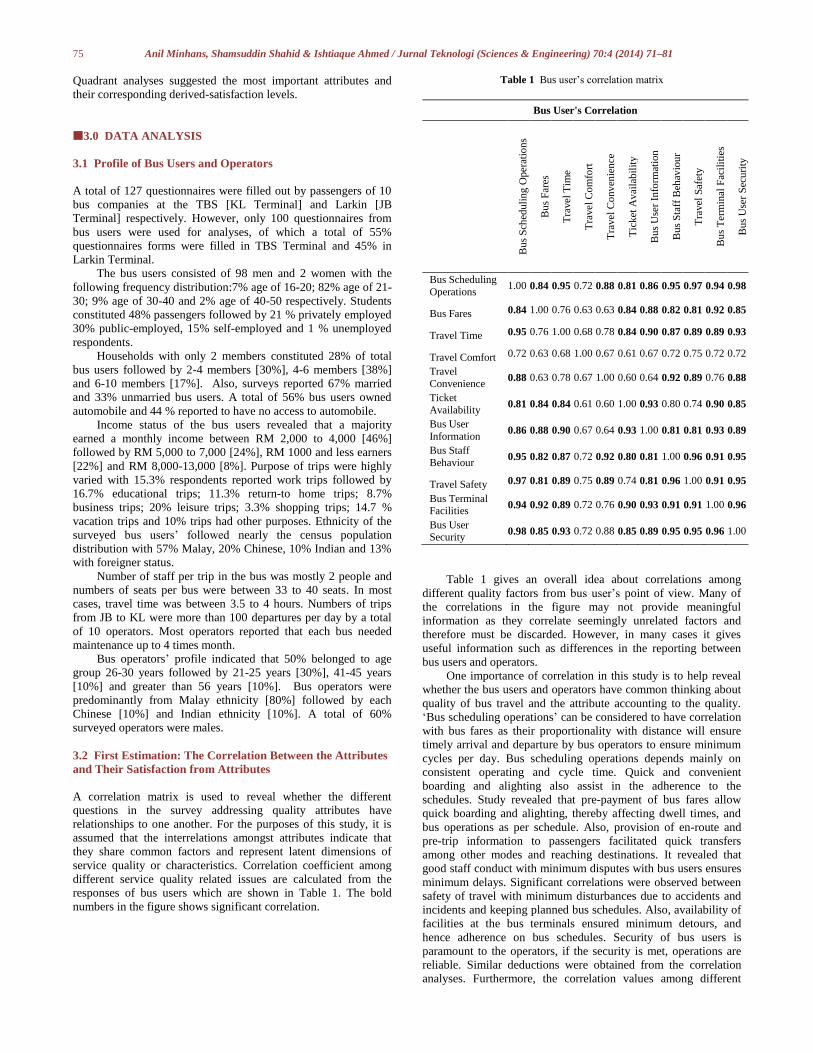
responses of bus users which are shown in Table 1. The bold
numbers in the figure shows significant correlation.
Table 1 Bus user’s correlation matrix
Bus User's Correlation
Bu
s S
ched
uli
ng
Oper
atio
ns
Bu
s F
ares
Tra
vel
Tim
e
Tra
vel
Co
mfo
rt
Tra
vel
Co
nv
enie
nce
Tic
ket
Av
aila
bil
ity
Bu
s U
ser
Info
rmat
ion
Bu
s S
taff
Beh
avio
ur
Tra
vel
Saf
ety
Bu
s T
erm
inal
Fac
ilit
ies
Bu
s U
ser
Sec
uri
ty
Bus Scheduling
Operations 1.00 0.84 0.95 0.72 0.88 0.81 0.86 0.95 0.97 0.94 0.98
Bus Fares 0.84 1.00 0.76 0.63 0.63 0.84 0.88 0.82 0.81 0.92 0.85
Travel Time 0.95 0.76 1.00 0.68 0.78 0.84 0.90 0.87 0.89 0.89 0.93
Travel Comfort 0.72 0.63 0.68 1.00 0.67 0.61 0.67 0.72 0.75 0.72 0.72
Travel
Convenience 0.88 0.63 0.78 0.67 1.00 0.60 0.64 0.92 0.89 0.76 0.88
Ticket
Availability 0.81 0.84 0.84 0.61 0.60 1.00 0.93 0.80 0.74 0.90 0.85
Bus User
Information 0.86 0.88 0.90 0.67 0.64 0.93 1.00 0.81 0.81 0.93 0.89
Bus Staff
Behaviour 0.95 0.82 0.87 0.72 0.92 0.80 0.81 1.00 0.96 0.91 0.95
Travel Safety 0.97 0.81 0.89 0.75 0.89 0.74 0.81 0.96 1.00 0.91 0.95
Bus Terminal Facilities
0.94 0.92 0.89 0.72 0.76 0.90 0.93 0.91 0.91 1.00 0.96
Bus User Security
0.98 0.85 0.93 0.72 0.88 0.85 0.89 0.95 0.95 0.96 1.00
Table 1 gives an overall idea about correlations among
different quality factors from bus user’s point of view. Many of
the correlations in the figure may not provide meaningful
information as they correlate seemingly unrelated factors and
therefore must be discarded. However, in many cases it gives
useful information such as differences in the reporting between
bus users and operators.
One importance of correlation in this study is to help reveal
whether the bus users and operators have common thinking about
quality of bus travel and the attribute accounting to the quality.
‘Bus scheduling operations’ can be considered to have correlation
with bus fares as their proportionality with distance will ensure
timely arrival and departure by bus operators to ensure minimum
cycles per day. Bus scheduling operations depends mainly on
consistent operating and cycle time. Quick and convenient
boarding and alighting also assist in the adherence to the
schedules. Study revealed that pre-payment of bus fares allow
quick boarding and alighting, thereby affecting dwell times, and
bus operations as per schedule. Also, provision of en-route and
pre-trip information to passengers facilitated quick transfers
among other modes and reaching destinations. It revealed that
good staff conduct with minimum disputes with bus users ensures
minimum delays. Significant correlations were observed between
safety of travel with minimum disturbances due to accidents and
incidents and keeping planned bus schedules. Also, availability of
facilities at the bus terminals ensured minimum detours, and
hence adherence on bus schedules. Security of bus users is
paramount to the operators, if the security is met, operations are
reliable. Similar deductions were obtained from the correlation
analyses. Furthermore, the correlation values among different
76 Anil Minhans, Shamsuddin Shahid & Ishtiaque Ahmed / Jurnal Teknologi (Sciences & Engineering) 70:4 (2014) 71–81
service quality issues from operator’s point-of-view are shown in
Table 2 and can be interpreted in the similar way.
Table 2 Bus operator’s correlation matrix
Operator’s Correlation
Bu
s S
ched
uli
ng
Oper
atio
ns
Bu
s F
ares
Tra
vel
Tim
e
Tra
vel
Co
mfo
rt
Tra
vel
Co
nv
enie
nce
Tic
ket
Av
aila
bil
ity
Bu
s U
ser
Info
rmat
ion
Bu
s S
taff
Beh
avio
ur
Tra
vel
Saf
ety
Bu
s T
erm
inal
Fac
ilit
ies
Bu
s U
ser
Sec
uri
ty
Bus Scheduling
Operations 1.00 0.96 0.88 0.77 0.86 0.90 0.93 0.92 0.97 0.97 0.94
Bus Fares 0.96 1.00 0.92 0.79 0.86 0.88 0.88 0.88 0.91 0.92 0.90
Travel Time 0.88 0.92 1.00 0.87 0.60 0.89 0.89 0.81 0.81 0.76 0.89
Travel Comfort 0.77 0.79 0.87 1.00 0.51 0.90 0.80 0.60 0.79 0.64 0.78
Travel
Convenience 0.86 0.86 0.60 0.51 1.00 0.69 0.69 0.79 0.84 0.94 0.75
Ticket Availability 0.90 0.88 0.89 0.90 0.69 1.00 0.91 0.79 0.87 0.82 0.96
Bus User Information 0.93 0.88 0.89 0.80 0.69 0.91 1.00 0.86 0.93 0.86 0.94
Bus Staff
Behaviour 0.92 0.88 0.81 0.60 0.79 0.79 0.86 1.00 0.86 0.93 0.91
Travel Safety 0.97 0.91 0.81 0.79 0.84 0.87 0.93 0.86 1.00 0.93 0.89
Bus Terminal
Facilities 0.97 0.92 0.76 0.64 0.94 0.82 0.86 0.93 0.93 1.00 0.90
Bus User
Security 0.94 0.90 0.89 0.78 0.75 0.96 0.94 0.91 0.89 0.90 1.00
To draw comparison between the opinions of bus users and
operators, correlation is compared of one qualifying attribute with
the other defining attributes. Percentage differences in the
correlation coefficients are obtained [Table 4]. The bus user’s
views are fixed and operator’s views are compared to form a
range of -0.05 to +0.05 [signifying ± 5% differences of views],
which are treated as similar views. Likewise, a range of +0.05 to
+0.10 is assigned for very dissimilar views of users with operators
in increasing importance of the given attribute. Similarly, a range
of +0.10 to 1.0 is assigned to reflect extremely dissimilar views,
while users depicting their utmost importance. The negative sign
of the difference of correlation coefficient means that operators
define more importance of an attribute than the bus users. The
scheme of ranges followed in this study is explained in Table 3.
Extremely high correlation differences are found in the qualifying
attribute ‘travel time’ with defining attributes ‘travel convenience’
and ‘bus terminal facilities’ stated by the users. Likewise, ‘travel
comfort’ is seen to correlate extremely well with ‘travel
convenience’ and ‘bus staff behaviour’. The qualifying attribute
‘travel convenience’ is well correlated with defining attributes
‘bus staff behaviour’ and ‘bus user security’.
Extremely dissimilar views were observed on attributes such
as ‘travel time’, ‘travel comfort’ and ‘travel convenience’. For
example, high correlation of travel time with travel convenience
and bus terminal facilities is observed in the bus user’s data. It can
be construed that travel time is more when boarding and alighting
times are more. Also, travel time is affected by the bus terminal
facilities, which may be true for people coming late during bus
halt midway of journey.
Travel comfort correlated highly with travel convenience and
bus staff behaviour by the users. It correlated differently with
ticket availability and bus user information by the bus operators.
Based on bus users, travel convenience is affected highly by bus
staff behaviour and bus user security. It is differently correlated
with bus terminal facilities by the bus operators.
Table 3 Semantics of ranges for differences of views
Difference of
correlation coefficient
[expressed in %]
Description
-100 to -10 Extremely dissimilar views with users and operators depict
extreme importance of one
attribute over another
-10 to -5 Very dissimilar views with users and operators depict moderate
importance of one attribute over
another
-5 to5 Somewhat similar views of
operators and users
5 to 10 Very dissimilar views with operators and users depict
moderate importance of one
attribute over another
10 to 100 Extremely dissimilar views with operators and users depict
extreme importance of one
attribute over another
According to operators, bus fares correlated extremely well
with bus scheduling operations, travel time, travel comfort and
travel convenience. Likewise, bus user security is extremely well
correlated with travel comfort, ticket availability and bus user
information as per operators.
Similarly moderately different correlations of users were also
formed. Bus users perceive longer travel time as an effect of
ineffective bus scheduling operations. However, operators
perceive operations to be more correlated with travel comfort,
travel convenience and bus user information. Travel comfort for
bus operators is a featured correlation with bus user security.
While bus users’ data were able to correlate travel safety with bus
user security, the operators’ data were not found to establish any
correlation. Users depict a correlation of bus user security
[security of users through installing CCTV, security staff, lighting
systems and storage lockers] with bus terminal facilities. The
responses of bus operators failed to depict any correlation in this
respect. While the correlations that are conducted provide
meaningful inferences, some can be deemed purely coincidental
and random. There are also many similar views between user and
operators given in the Table 4.
77 Anil Minhans, Shamsuddin Shahid & Ishtiaque Ahmed / Jurnal Teknologi (Sciences & Engineering) 70:4 (2014) 71–81
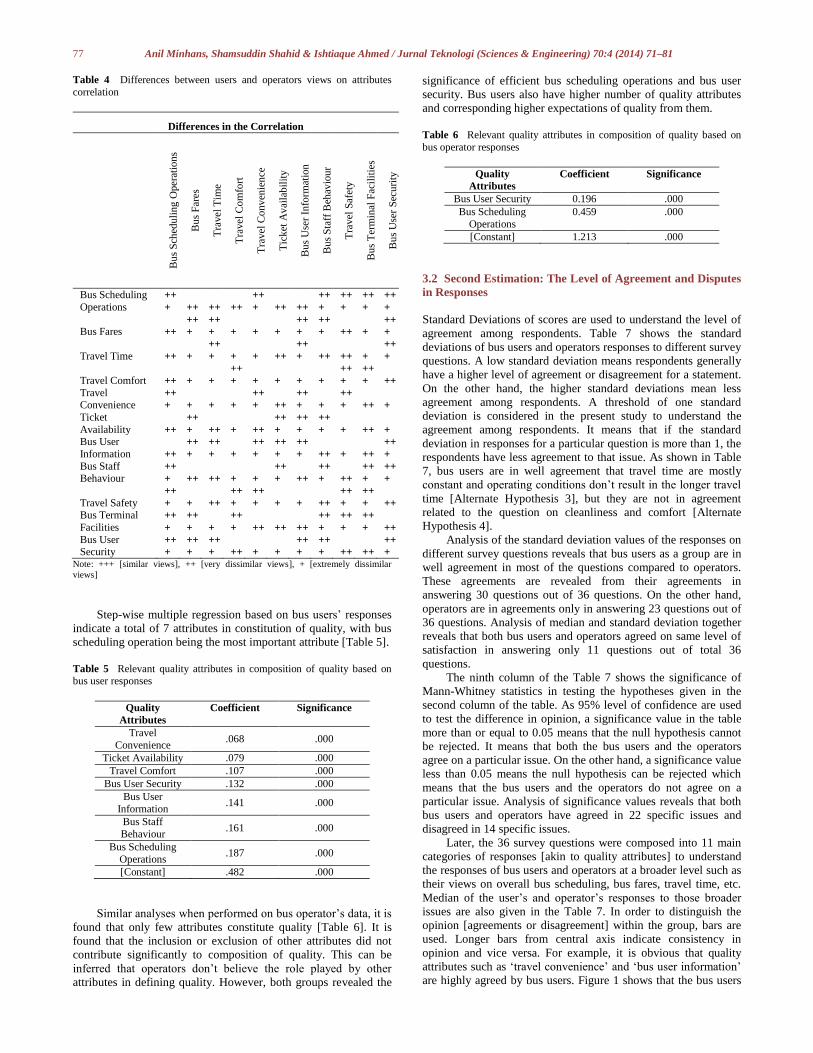
Table 4 Differences between users and operators views on attributes
correlation
Differences in the Correlation
Bu
s S
ched
uli
ng
Oper
atio
ns
Bu
s F
ares
Tra
vel
Tim
e
Tra
vel
Co
mfo
rt
Tra
vel
Co
nv
enie
nce
Tic
ket
Av
aila
bil
ity
Bu
s U
ser
Info
rmat
ion
Bu
s S
taff
Beh
avio
ur
Tra
vel
Saf
ety
Bu
s T
erm
inal
Fac
ilit
ies
Bu
s U
ser
Sec
uri
ty
Bus Scheduling
Operations
++
+ ++ ++ ++
++
+ ++ ++
++
+
++
+
++
+
++
+
Bus Fares ++
++
+
++
+ + + +
++
+
++
+ ++ +
++
+
Travel Time ++ +
++
+ + + ++
++
+ ++ ++ +
++
+
Travel Comfort ++ + +
++
+ + + + +
++
+
++
+ ++
Travel Convenience
++
+ + + +
++
+ ++
++
+ +
++
+ ++ +
Ticket
Availability ++
++
+ ++ + ++
++
+
++
+
++
+ + ++ +
Bus User
Information ++
++
+
++
+ +
++
+
++
+
++
+ ++ + ++
++
+
Bus Staff Behaviour
++
+ ++ ++ + +
++
+ ++
++
+ ++
++
+
++
+
Travel Safety
++
+ + ++
++
+
++
+ + + ++
++
+
++
+ ++
Bus Terminal
Facilities ++
+
++
+ +
++
+ ++ ++ ++
++
+
++
+
++
+ ++
Bus User Security
++
+
++
+
++
+ ++ + +
++
+
++
+ ++ ++
++
+ Note: +++ [similar views], ++ [very dissimilar views], + [extremely dissimilar
views]
Step-wise multiple regression based on bus users’ responses
indicate a total of 7 attributes in constitution of quality, with bus
scheduling operation being the most important attribute [Table 5].
Table 5 Relevant quality attributes in composition of quality based on bus user responses
Quality
Attributes
Coefficient Significance
Travel
Convenience .068 .000
Ticket Availability .079 .000
Travel Comfort .107 .000
Bus User Security .132 .000
Bus User
Information .141 .000
Bus Staff
Behaviour .161 .000
Bus Scheduling
Operations .187 .000
[Constant] .482 .000
Similar analyses when performed on bus operator’s data, it is
found that only few attributes constitute quality [Table 6]. It is
found that the inclusion or exclusion of other attributes did not
contribute significantly to composition of quality. This can be
inferred that operators don’t believe the role played by other
attributes in defining quality. However, both groups revealed the
significance of efficient bus scheduling operations and bus user
security. Bus users also have higher number of quality attributes
and corresponding higher expectations of quality from them.
Table 6 Relevant quality attributes in composition of quality based on
bus operator responses
Quality
Attributes
Coefficient Significance
Bus User Security 0.196 .000
Bus Scheduling
Operations
0.459 .000
[Constant] 1.213 .000
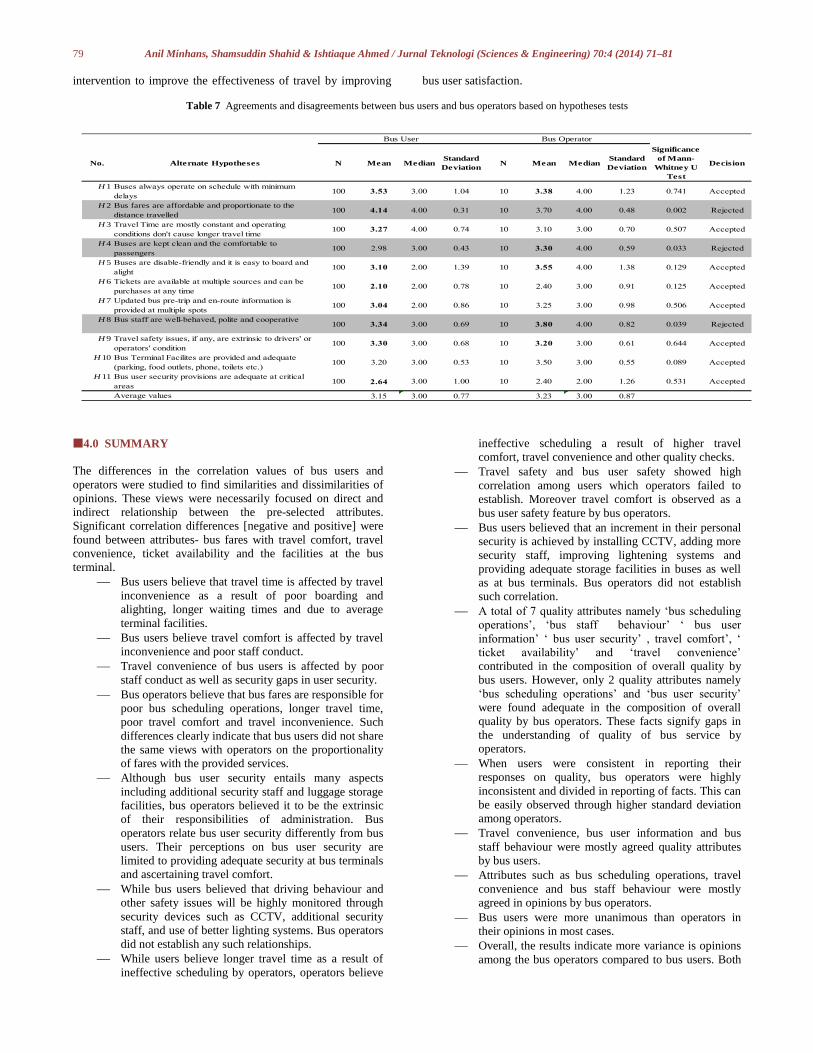
3.2 Second Estimation: The Level of Agreement and Disputes
in Responses
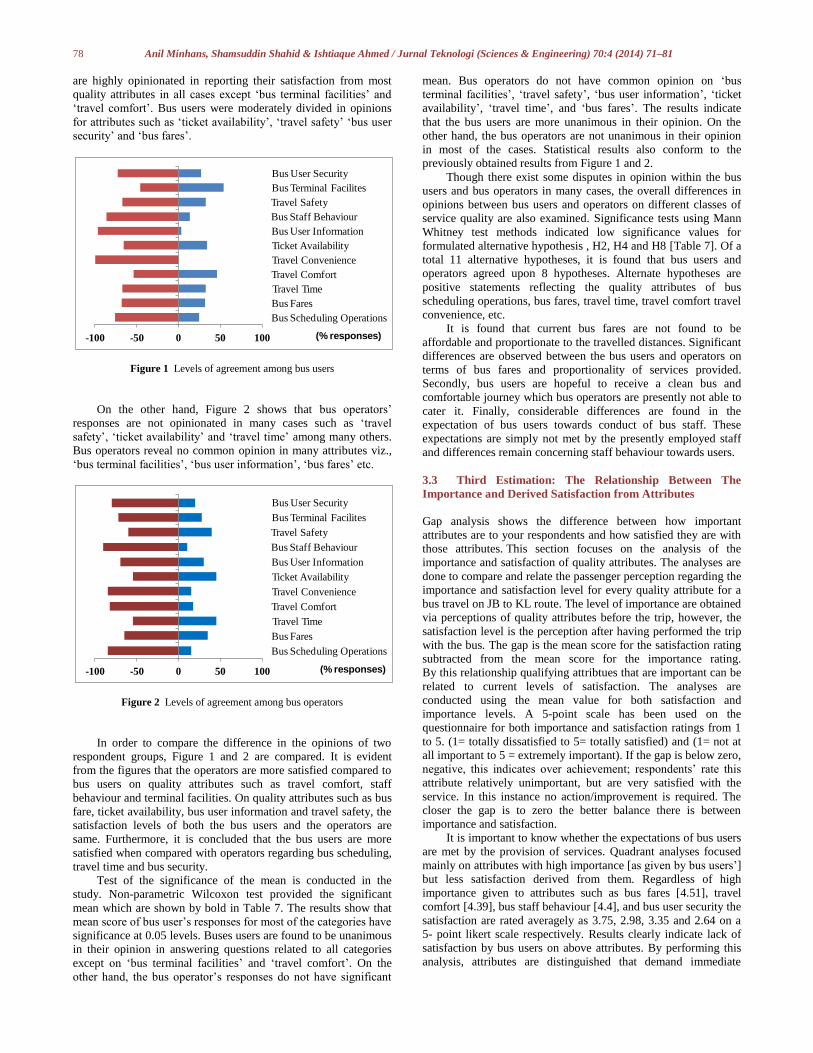
Standard Deviations of scores are used to understand the level of
agreement among respondents. Table 7 shows the standard
deviations of bus users and operators responses to different survey
questions. A low standard deviation means respondents generally
have a higher level of agreement or disagreement for a statement.
On the other hand, the higher standard deviations mean less
agreement among respondents. A threshold of one standard
deviation is considered in the present study to understand the
agreement among respondents. It means that if the standard
deviation in responses for a particular question is more than 1, the
respondents have less agreement to that issue. As shown in Table
7, bus users are in well agreement that travel time are mostly
constant and operating conditions don’t result in the longer travel
time [Alternate Hypothesis 3], but they are not in agreement
related to the question on cleanliness and comfort [Alternate
Hypothesis 4].
Analysis of the standard deviation values of the responses on
different survey questions reveals that bus users as a group are in
well agreement in most of the questions compared to operators.
These agreements are revealed from their agreements in
answering 30 questions out of 36 questions. On the other hand,
operators are in agreements only in answering 23 questions out of
36 questions. Analysis of median and standard deviation together
reveals that both bus users and operators agreed on same level of
satisfaction in answering only 11 questions out of total 36
questions.
The ninth column of the Table 7 shows the significance of
Mann-Whitney statistics in testing the hypotheses given in the
second column of the table. As 95% level of confidence are used
to test the difference in opinion, a significance value in the table
more than or equal to 0.05 means that the null hypothesis cannot
be rejected. It means that both the bus users and the operators
agree on a particular issue. On the other hand, a significance value
less than 0.05 means the null hypothesis can be rejected which
means that the bus users and the operators do not agree on a
particular issue. Analysis of significance values reveals that both
bus users and operators have agreed in 22 specific issues and
disagreed in 14 specific issues.
Later, the 36 survey questions were composed into 11 main
categories of responses [akin to quality attributes] to understand
the responses of bus users and operators at a broader level such as
their views on overall bus scheduling, bus fares, travel time, etc.
Median of the user’s and operator’s responses to those broader
issues are also given in the Table 7. In order to distinguish the
opinion [agreements or disagreement] within the group, bars are
used. Longer bars from central axis indicate consistency in
opinion and vice versa. For example, it is obvious that quality
attributes such as ‘travel convenience’ and ‘bus user information’
are highly agreed by bus users. Figure 1 shows that the bus users
78 Anil Minhans, Shamsuddin Shahid & Ishtiaque Ahmed / Jurnal Teknologi (Sciences & Engineering) 70:4 (2014) 71–81
are highly opinionated in reporting their satisfaction from most
quality attributes in all cases except ‘bus terminal facilities’ and
‘travel comfort’. Bus users were moderately divided in opinions
for attributes such as ‘ticket availability’, ‘travel safety’ ‘bus user
security’ and ‘bus fares’.
Figure 1 Levels of agreement among bus users
On the other hand, Figure 2 shows that bus operators’
responses are not opinionated in many cases such as ‘travel
safety’, ‘ticket availability’ and ‘travel time’ among many others.
Bus operators reveal no common opinion in many attributes viz.,
‘bus terminal facilities’, ‘bus user information’, ‘bus fares’ etc.
Figure 2 Levels of agreement among bus operators
In order to compare the difference in the opinions of two
respondent groups, Figure 1 and 2 are compared. It is evident
from the figures that the operators are more satisfied compared to
bus users on quality attributes such as travel comfort, staff
behaviour and terminal facilities. On quality attributes such as bus
fare, ticket availability, bus user information and travel safety, the
satisfaction levels of both the bus users and the operators are
same. Furthermore, it is concluded that the bus users are more
satisfied when compared with operators regarding bus scheduling,
travel time and bus security.
Test of the significance of the mean is conducted in the
study. Non-parametric Wilcoxon test provided the significant
mean which are shown by bold in Table 7. The results show that
mean score of bus user’s responses for most of the categories have
significance at 0.05 levels. Buses users are found to be unanimous
in their opinion in answering questions related to all categories
except on ‘bus terminal facilities’ and ‘travel comfort’. On the
other hand, the bus operator’s responses do not have significant
mean. Bus operators do not have common opinion on ‘bus
terminal facilities’, ‘travel safety’, ‘bus user information’, ‘ticket
availability’, ‘travel time’, and ‘bus fares’. The results indicate
that the bus users are more unanimous in their opinion. On the
other hand, the bus operators are not unanimous in their opinion
in most of the cases. Statistical results also conform to the
previously obtained results from Figure 1 and 2.
Though there exist some disputes in opinion within the bus
users and bus operators in many cases, the overall differences in
opinions between bus users and operators on different classes of
service quality are also examined. Significance tests using Mann
Whitney test methods indicated low significance values for
formulated alternative hypothesis , H2, H4 and H8 [Table 7]. Of a
total 11 alternative hypotheses, it is found that bus users and
operators agreed upon 8 hypotheses. Alternate hypotheses are
positive statements reflecting the quality attributes of bus
scheduling operations, bus fares, travel time, travel comfort travel
convenience, etc.
It is found that current bus fares are not found to be
affordable and proportionate to the travelled distances. Significant
differences are observed between the bus users and operators on
terms of bus fares and proportionality of services provided.
Secondly, bus users are hopeful to receive a clean bus and
comfortable journey which bus operators are presently not able to
cater it. Finally, considerable differences are found in the
expectation of bus users towards conduct of bus staff. These
expectations are simply not met by the presently employed staff
and differences remain concerning staff behaviour towards users.
3.3 Third Estimation: The Relationship Between The
Importance and Derived Satisfaction from Attributes
Gap analysis shows the difference between how important
attributes are to your respondents and how satisfied they are with
those attributes. This section focuses on the analysis of the
importance and satisfaction of quality attributes. The analyses are
done to compare and relate the passenger perception regarding the
importance and satisfaction level for every quality attribute for a
bus travel on JB to KL route. The level of importance are obtained
via perceptions of quality attributes before the trip, however, the
satisfaction level is the perception after having performed the trip
with the bus. The gap is the mean score for the satisfaction rating
subtracted from the mean score for the importance rating.
By this relationship qualifying attribtues that are important can be
related to current levels of satisfaction. The analyses are
conducted using the mean value for both satisfaction and
importance levels. A 5-point scale has been used on the
questionnaire for both importance and satisfaction ratings from 1
to 5. (1= totally dissatisfied to 5= totally satisfied) and (1= not at
all important to 5 = extremely important). If the gap is below zero,
negative, this indicates over achievement; respondents’ rate this
attribute relatively unimportant, but are very satisfied with the
service. In this instance no action/improvement is required. The
closer the gap is to zero the better balance there is between
importance and satisfaction.
It is important to know whether the expectations of bus users
are met by the provision of services. Quadrant analyses focused
mainly on attributes with high importance [as given by bus users’]
but less satisfaction derived from them. Regardless of high
importance given to attributes such as bus fares [4.51], travel
comfort [4.39], bus staff behaviour [4.4], and bus user security the
satisfaction are rated averagely as 3.75, 2.98, 3.35 and 2.64 on a
5- point likert scale respectively. Results clearly indicate lack of
satisfaction by bus users on above attributes. By performing this
analysis, attributes are distinguished that demand immediate
-100 -50 0 50 100
Bus Scheduling Operations
Bus Fares
Travel Time
Travel Comfort
Travel Convenience
Ticket Availability
Bus User Information
Bus Staff Behaviour
Travel Safety
Bus Terminal Facilites
Bus User Security
(% responses)
-100 -50 0 50 100
Bus Scheduling Operations
Bus Fares
Travel Time
Travel Comfort
Travel Convenience
Ticket Availability
Bus User Information
Bus Staff Behaviour
Travel Safety
Bus Terminal Facilites
Bus User Security
(% responses)
79 Anil Minhans, Shamsuddin Shahid & Ishtiaque Ahmed / Jurnal Teknologi (Sciences & Engineering) 70:4 (2014) 71–81
intervention to improve the effectiveness of travel by improving bus user satisfaction.
Table 7 Agreements and disagreements between bus users and bus operators based on hypotheses tests
4.0 SUMMARY
The differences in the correlation values of bus users and
operators were studied to find similarities and dissimilarities of
opinions. These views were necessarily focused on direct and
indirect relationship between the pre-selected attributes.
Significant correlation differences [negative and positive] were
found between attributes- bus fares with travel comfort, travel
convenience, ticket availability and the facilities at the bus
terminal.
Bus users believe that travel time is affected by travel
inconvenience as a result of poor boarding and
alighting, longer waiting times and due to average
terminal facilities.
Bus users believe travel comfort is affected by travel
inconvenience and poor staff conduct.
Travel convenience of bus users is affected by poor
staff conduct as well as security gaps in user security.
Bus operators believe that bus fares are responsible for
poor bus scheduling operations, longer travel time,
poor travel comfort and travel inconvenience. Such
differences clearly indicate that bus users did not share
the same views with operators on the proportionality
of fares with the provided services.
Although bus user security entails many aspects
including additional security staff and luggage storage
facilities, bus operators believed it to be the extrinsic
of their responsibilities of administration. Bus
operators relate bus user security differently from bus
users. Their perceptions on bus user security are
limited to providing adequate security at bus terminals
and ascertaining travel comfort.
While bus users believed that driving behaviour and
other safety issues will be highly monitored through
security devices such as CCTV, additional security
staff, and use of better lighting systems. Bus operators
did not establish any such relationships.
While users believe longer travel time as a result of
ineffective scheduling by operators, operators believe
ineffective scheduling a result of higher travel
comfort, travel convenience and other quality checks.
Travel safety and bus user safety showed high
correlation among users which operators failed to
establish. Moreover travel comfort is observed as a
bus user safety feature by bus operators.
Bus users believed that an increment in their personal
security is achieved by installing CCTV, adding more
security staff, improving lightening systems and
providing adequate storage facilities in buses as well
as at bus terminals. Bus operators did not establish
such correlation.
A total of 7 quality attributes namely ‘bus scheduling
operations’, ‘bus staff behaviour’ ‘ bus user
information’ ‘ bus user security’ , travel comfort’, ‘
ticket availability’ and ‘travel convenience’
contributed in the composition of overall quality by
bus users. However, only 2 quality attributes namely
‘bus scheduling operations’ and ‘bus user security’
were found adequate in the composition of overall
quality by bus operators. These facts signify gaps in
the understanding of quality of bus service by
operators.
When users were consistent in reporting their
responses on quality, bus operators were highly
inconsistent and divided in reporting of facts. This can
be easily observed through higher standard deviation
among operators.
Travel convenience, bus user information and bus
staff behaviour were mostly agreed quality attributes
by bus users.
Attributes such as bus scheduling operations, travel
convenience and bus staff behaviour were mostly
agreed in opinions by bus operators.
Bus users were more unanimous than operators in
their opinions in most cases.
Overall, the results indicate more variance is opinions
among the bus operators compared to bus users. Both
Table 8 Agreements and disagreements between Bus users and Bus operators based on hypotheses tests No. Alternate Hypotheses N Mean Median
Standard
DeviationN Mean Median
Standard
Deviation
Significance
of Mann-
Whitney U
Test
Decision
H 1 Buses always operate on schedule with minimum
delays100 3.53 3.00 1.04 10 3.38 4.00 1.23 0.741 Accepted
H 2 Bus fares are affordable and proportionate to the
distance travelled100 4.14 4.00 0.31 10 3.70 4.00 0.48 0.002 Rejected
H 3 Travel Time are mostly constant and operating
conditions don't cause longer travel time100 3.27 4.00 0.74 10 3.10 3.00 0.70 0.507 Accepted
H 4 Buses are kept clean and the comfortable to
passengers100 2.98 3.00 0.43 10 3.30 4.00 0.59 0.033 Rejected
H 5 Buses are disable-friendly and it is easy to board and
alight100 3.10 2.00 1.39 10 3.55 4.00 1.38 0.129 Accepted
H 6 Tickets are available at multiple sources and can be
purchases at any time100 2.10 2.00 0.78 10 2.40 3.00 0.91 0.125 Accepted
H 7 Updated bus pre-trip and en-route information is
provided at multiple spots100 3.04 2.00 0.86 10 3.25 3.00 0.98 0.506 Accepted
H 8 Bus staff are well-behaved, polite and cooperative100 3.34 3.00 0.69 10 3.80 4.00 0.82 0.039 Rejected
H 9 Travel safety issues, if any, are extrinsic to drivers' or
operators' condition100 3.30 3.00 0.68 10 3.20 3.00 0.61 0.644 Accepted
H 10 Bus Terminal Facilites are provided and adequate
(parking, food outlets, phone, toilets etc.)100 3.20 3.00 0.53 10 3.50 3.00 0.55 0.089 Accepted
H 11 Bus user security provisions are adequate at critical
areas 100 2.64 3.00 1.00 10 2.40 2.00 1.26 0.531 Accepted
Average values 3.15 3.00 0.77 3.23 3.00 0.87
Bus User Bus Operator
80 Anil Minhans, Shamsuddin Shahid & Ishtiaque Ahmed / Jurnal Teknologi (Sciences & Engineering) 70:4 (2014) 71–81
groups shared similar views on most bus service
quality issues.
The disagreements in opinions between users and
operators were found only in three quality attributes
namely, bus fares, bus comfort and bus staff
behaviour. Both groups were divided on opinion about
equity of bus fares and equitable transport services.
Bus users failed to agree that the buses were kept
clean and made comfortable for their use. Also, bus
users were highly dissatisfied by the poor staff
conduct.
Equity of bus fares, travel comfort, bus staff behaviour
and bus user security are rated very important and
lowly satisfied quality attributes by bus users. At a
time when poor provision and satisfaction in public
transport is regarded as one of the main deterrents of
public transport use in Malaysia, it certainly requires
immediate intervention.
Operators revealed contentment from the majority of
the quality related issues except bus user security
provisions at critical areas
Significant improvements will be necessary in the realm of
cleanliness, travel comfort and convenience, information, staff
behaviour and user safety to substantiate the current fare levels.
The users disagree with operators on cleanliness and
comfortability during travel. Therefore, bus physical condition,
seat comfort, air conditioning, bus entry and exit must be
improved to increase user satisfaction.
Issues of poor bus staff behaviour have contributed to poor
quality of bus travel. Therefore, bus staff must be constantly
monitored and trained to ensure professional staff conduct at all
times.
To focus upon the perception of bus users is an effective
way to identify their needs and discover means to satisfy them.
This research was able to establish factors that make intercity
travel attractive and marketable to its users. According to the
results of this study, most passengers were not completely
satisfied with public bus transport servicing the JB-KL route.
Further studies will be required to investigate the role of user
satisfaction in the mode choice for different purposes of travel.
It is more important to improve public transport in the light
of ever increasing private car usage in Malaysia which is
causing many problems of traffic congestion, a high level of
pollution, a high consumption of non-renewable energy
resource, a high number of traffic accidents and it poses a severe
threat to the overall quality of life. Public bus transport should
become the solution for sustainable transport in the future for
Malaysia. On the contrary, modal shares of public transport
modes are constantly dwindling due to fewer quality provisions
by operators and expectations by users, an apparent reason for
user dissatisfaction. This study identified numerous quality
attributes that have a strong influence on user satisfaction. In
order to keep bus passengers satisfied as well as to attract new
users, public transport needs to improve the quality of its
services conducive to passenger needs and expectations.
Acknowledgement
The Author [Principal Investigator] does hereby acknowledge
Ministry of Higher Education [MOHE] and Universiti
Teknologi Malaysia [UTM] for providing grant for this research
[PY/2014/02339] and Research Management Center [RMC] for
logistical assistance provided throughout the course of this
project.
References [1] A. S. I. Almselati, R. Rahmat, O. Jaafar. 2011. An Overview of Urban
Transport in Malaysia. Social Sci. 6: 24–33.
[2] A. Nurdden, R. A. O. Rahmat, A. Ismail. 2007. Effect of Transportation Policies on Modal Shift from Private Car to Public
Transport in Malaysia. Journal of Applied Sciences. 7(7).
[3] H. Hussein, N. M. Yaacob 2012. Development of Accessible Design in
Malaysia. Procedia-Social and Behavioral Sciences. 68: 121–133.
[4] S. Tamrin. 2013. Only 5% Using Public Transport During Morning
Peak Period. The Star. December 3, 2013.
[5] A. Minhans, A. Moghaddasi. 2013. Transport Cost Analysis of City Bus and Private Car Usage in Johor Bahru, Malaysia. Jurnal
Teknologi. 65(3).
[6] Z. Zakaria, Z. H. Hussin, M. F. A Batau, Z. Zakaria. 2010. Service
Quality of Malaysian Public Transports: A Case Study in Malaysia.
Cross-Cultural Communication. 6(2).
[7] D. A. Lashof, D. R. Ahuja. 1990. Relative Contributions of
Greenhouse Gas Emissions tTo Global Warming. Nature Weekly
Journal of Science. Nature Publishing Group. [8] D. L. Greene, S. Plotkin. 2011. Reducing Greenhouse Gas Emission
From US Transportation. Arlington: Pew Center on Global Climate
Change. Environmental Protection Agency. United States.
http://www.epa.gov.
[9] W. Ross Morrow, K. S. Gallagher, G. Collantes, H. Lee. 2010.
Analysis of Policies to Reduce Oil Consumption and Greenhouse-gas
Emissions From The US Transportation Sector. Energy Policy. 38(3):
1305–1320. [10] S. N. Salahudin, M. M. Abdullah, N. A. Newaz. 2013. Emissions:
Sources, Policies and Development in Malaysia. International Journal
of Education and Research. 1(7).
[11] V. R. Vuchic. 2007. Urban Transit Systems and Technology. ISBN:
978-0-471-75823-5.Wiley Publishing.
[12] A. Minhans, N. H. Zaki, R. Belwal. 2013. Traffic Impact Assessment:
A Case of Proposed Hypermarket in Skudai Town of Malaysia. Jurnal Teknologi. 65(3).
[13] A. R. M. Nor .2004. Transport for the Under-served in Malaysia: The
Roles of Minibuses in Malaysian Towns and Cities. Penerbit Universiti
Kebangsaan Malaysia.
[14] M. A.Rahim, A. C. Er., R. Katiman, M. Aishah, S. Zaini, M. N. Hasan,
A. C. R. Rosniza. Assessing Public Transport Service Attributes Using
Factor Analysis. World Applied Sciences Journal. 2011;13(13 Special
Issue):07–12. [15] O. C. Chuen, M. R. Karim, S. Yusoff. 2014. Mode Choice Between
Private and Public Transport In Klang Valley, Malaysia. The Scientific
World Journal.
[16] A. Ellaway, S. Macintyre, R. Hiscock, A. Kearns.2003. In the Driving
Seat: Psychosocial Benefits from Private Motor Vehicle Transport
Compared to Public Transport. Transportation Research Part F. Traffic
Psychology and Behaviour. 6(3): 217–231.
[17] G. Beirão, J. Sarsfield Cabral. 2007. Understanding Attitudes Towards Public Transport and Private Car: A Qualitative Study. Transport
Policy. 14(6): 478–489.
[18] C. Dhingra, S. Kodukula. 2010. Public Bicycle Schemes: Applying the
Concept in Developing Cities. GTZ Sustainbale Urban Project. New
Delhi. 32.
[19] D. Aßmann, N. Sieber. 2005. Transport in Developing Countries:
Renewable Energy Versus Energy Reduction? Transport Reviews. 25(6): 719–738.
[20] D. L. Greene, M. Wegener. 1997. Sustainable Transport. Journal of
Transport Geography. 5(3): 177–190.
[21] J. Anable. 2005. ‘Complacent Car Addicts’ or ‘Aspiring
Environmentalists’? Identifying Travel Behaviour Segments Using
Attitude Theory. Transport Policy. 12(1): 65–78.
[22] R. Belwal, A. Minhans, A. M. Al-Balushi. 2013. Perception of Taxi
Services in Oman–A Cross Examination of Citizens’ and Taxi Drivers’ Perception. Jurnal Teknologi. 65(3).
[23] R. L. Oliver. 2010. Satisfaction: A Behavioral Perspective on the
Consumer. 2nd Edition. ME Sharpe. Armonk, NewYork.
[24] O. A. Budiono. 2009. Customer Satisfaction in Public Bus Transport.
Master of Service Science Program. Karlstad University, Sweden.
[25] A. Parasuraman, V. A. Zeithaml, L. L. Berry. 1994. Alternative Scales
for Measuring Service Quality: A comparative assessment based on psychometric and diagnostic criteria. Journal of Retailing. 70(3): 201–
230.
[26] B. Gatersleben, D. Uzzell. 2003. Local Transport Problems and
Possible Solutions: Comparing Perceptions of Residents, Elected
Members, Officers and Organisations. Local Environment. 8(4): 387–
405.
81 Anil Minhans, Shamsuddin Shahid & Ishtiaque Ahmed / Jurnal Teknologi (Sciences & Engineering) 70:4 (2014) 71–81
[27] B. Gatersleben, D. Uzzell. 2007. Affective Appraisals of the Daily
Commute Comparing Perceptions of Drivers, Cyclists, Walkers, and
Users of Public Transport. Environment and Behavior. 39(3): 416–431.
[28] P. Goodwin, G. Lyons. 2010. Public Attitudes to Transport: Interpreting the Evidence. Transportation Planning and Technology.
33(1):3–17.
[29] P. Goodwin, G. Lyons. 2009. Public Attitudes to Transport:
Scrutinising the Evidence. Proceedings of the 41st Universities
Transport Study Group Conference. London, UK, 5-7 January 2009.
[30] S. Fujii, T. Gärling, R. Kitamura. 2001. Changes in Drivers’
Perceptions and Use of Public Transport during a Freeway Closure Effects of Temporary Structural Change on Cooperation in a Real-Life
Social Dilemma. Environment and Behavior. 33(6): 796–808.
[31] M. Vugt, R. M. Meertens, P. A. Lange. 1995. Car Versus Public
Transportation? The Role of Social Value Orientations in a Real‐Life Social Dilemma1. Journal of Applied Social Psychology. 25(3): 258–
278.
[32] M. Fellesson, M. Friman. 2012. Perceived Satisfaction with Public
Transport Service In Nine European Cities. In: Journal of the
Transportation Research Forum. 3.
[33] L. Eboli, G. Mazzulla. 2007. Service Quality Attributes Affecting Customer Satisfaction for Bus Transit. Journal of Public
Transportation. 2007. Citeseer.
[34] M. Friman. 2004. Implementing Quality Improvements in Public
Transport. Journal of Public Transportation. 7(4).
[35] M. J. Smith, R. V. Clarke. 2000. Crime and Public Transport. Crime
And Justice. 169–233.
[36] L. Chapman. 2007. Transport and Climate Change: A Review. Journal of Transport Geography. 15(5): 354–367.
[37] Research Results Digest. 2009. Public Transportation’s Role in
Addressing Global Climate Change. Transit Cooperative Research
Program.
[38] Research Results Digest. 2010. Performance Measurement and
Outcomes. Transit Cooperative Research Program.


