Embed Size (px)
Citation preview
1
K-ras Asp12 mutant neither interacts with Raf, nor signals through Erk, and is less tumorigenic
than K-ras Val12
Maria Virtudes Céspedes1, Francesc Josep Sancho2, Silvia Guerrero3, Matilde Parreño1, Isolda
Casanova1, Miguel Angel Pavón1, Eugenio Marcuello4 Manuel Trias5, Marta Cascante6, Gabriel
Capellà7 and Ramon Mangues1
AFFILIATION OF AUTHORS:
(1) Grup d�Oncogenesi i Antitumorals, Institut de Recerca, Hospital de la Santa Creu i Sant Pau
(HSCSP), Barcelona, Spain. (2) Depatment of Pathology, HSCSP, Spain (3) Advanced in vitro cell
technologies, Parc Científic de Barcelona, Spain (4) Department of Medical Oncology, HSCSP, Spain.
(5) Department of Surgery, HSCSP, Spain. (6) Centre Recerca en Química Teòrica-Parc Cientific de
Barcelona, IDIBAPS, University of Barcelona, Spain.(7) Laboratori de Recerca Traslacional,
IDIBELL-Institut Català d�Oncologia, Barcelona, Spain
RUNNING TITLE: Nature of Ras mutation influences tumorigenesis and signaling
KEY WORDS: xenograft model, K-Ras mutation, transformation, tumorigenicity, signal transduction
ABBREVIATIONS: Asp12, codon 12 mutation to aspartic acid; Val12, codon 12 mutation to valine;
Cys12, codon 12 mutation to cysteine; Erk, extracellular signal-regulated kinase; FBS, fetal bovine
serum; IPTG, isopropyl-β-D-thiogalactopyranoside.
Correspondence should be addressed to:
R. Mangues PhD, GOA, Laboratori d'Investigació Gastrointestinal, Institut de Recerca, Hospital de la
Santa Creu i Sant Pau. Av. Sant Antoni M Claret, 167, 08025 Barcelona. Spain. Phone: +34-
932919106. FAX: +34-934552331 (e-mail: [email protected]).
The Author 2006. Published by Oxford University Press. All rights reserved. For permissions, please email: [email protected]
Carcinogenesis Advance Access published May 4, 2006 by guest on February 21, 2016
http://carcin.oxfordjournals.org/D
ownloaded from
2
ABSTRACT
Different mutant amino acids in the Ras proteins lead to distinct transforming capacities and different
aggressiveness in human tumors. K-Ras Asp12 (K12D) is more prevalent in benign than in malignant
human colorectal tumors, whereas K-Ras Val12 (K12V) associates with more advanced and metastatic
carcinomas, higher recurrence and decreased survival. Here, we tested, in a nude mouse xenograft
model, whether different human K-Ras oncogenes mutated at codon 12 to Val, Asp or Cys would
confer NIH3T3 fibroblasts distinct oncogenic phenotypes. We studied tumor histology and growth,
apoptotic and mitotic rates, activation of signal transduction pathways downstream of Ras and
regulation of the cell cycle and apoptotic proteins in tumors derived from the implanted transformants.
We found that the K12V oncogene induces a more aggressive tumorigenic phenotype than the K12D
oncogene, whereas K12C does not induce tumors in this model. Thus, K12V mutant tumors proliferate
about seven times faster, and have higher cellularity and mitotic rates than the K12D mutant tumors. A
molecular analysis of the induced tumors shows that the K12V mutant protein interacts with Raf-1 and
transduces signals mainly through the Erk pathway. Unexpectedly, in tumors induced by the K12D
oncogene, the K-Ras mutant protein does not interact with Raf-1 nor activates the Erk canonical
pathway. Instead, it transduces signals through the PI3K/Akt, JNK, p38 and FAK pathways. Finally,
the higher growth rate of the K12V tumors associates with enhanced Rb phosphorylation, and PCNA
and Cyclin B upregulation, consistent with faster G1/S and G2/M transitions, without alteration of
apoptotic regulation.
by guest on February 21, 2016http://carcin.oxfordjournals.org/
Dow
nloaded from
3
INTRODUCTION
The ras genes code for proteins that transduce signals through different effectors (Raf, PI3K,
Ral-GDS, Ras-GAP...), which regulate diverse cell functions (1). They become oncogenic by single
point mutations, mainly at codons 12 or 13 (2), which lead to constitutive signaling and cell
transformation associated with changes in morphology, increased proliferation and/or inhibition of
apoptosis (3).
Using K-ras, the most clinically relevant ras gene, to transfect NIH3T3 cells, we have
previously demonstrated differences in predisposition to apoptosis and signaling through the Ras
downstream antiapoptotic pathway PI3K/Akt between codon 12 and codon 13 mutants (4). We have
also demonstrated that these differences were maintained when the transformants were implanted in
vivo, producing sarcomas of different type and aggressiveness (5). These experiments were performed
on the basis of previous reports describing different transformation capacities for ras genes bearing
codon 12 or codon 13 mutations in vitro (6, 7) and different aggressiveness of human tumors bearing
K-Ras codon 12 or codon 13 mutations (8).
There is also evidence suggesting that the malignant potential of tumor cells may be
influenced, not only by the mutated codon in the ras gene but by different alterations within single
codons. Thus, distinct mutant amino acids in the Ras proteins lead to different capacities for foci
formation in cultured cells: H-Ras Val12 being highly transforming, whereas K-Ras Asp12 (K12D)
being only moderately transforming (7, 9). K-Ras mutants also associate with different aggressiveness
in human tumors. Thus, in aberrant crypt foci of human colon, K12D is as frequent as K-Ras Val12
(K12V), however, only the latter predominates in adenocarcinomas (10). Moreover, K12V is more
prevalent in primary and metastatic deposits of Dukes' C/D than in primary Dukes A/B colorectal
carcinomas, whereas K12D does not associate with metastatic capacity (11, 12). In addition, K12V
increases the risk of tumor recurrence and death in colorectal carcinomas and is an independent
predictor of decreased overall survival (13). In contrast, K12D is not associated with alteration of any
by guest on February 21, 2016http://carcin.oxfordjournals.org/
Dow
nloaded from
4
of these parameters. Finally, in lung adenocarcinomas K12V confers poorer prognosis than K12D
(14).
Here, we tested, in vitro and in vivo, whether different human K-Ras oncogenes mutated at
codon 12 to Val, Asp or Cys would confer the cultured cells or tumors distinct oncogenic phenotypes.
We have generated stable transfectants of NIH3T3 cells expressing these different mutants, using
empty vector transfected cells as a control, and injected them into nude mice. We have studied the K-
Ras transfectant cells in vitro for differences in morphology and growth, and the tumors generated
after their implantation in nude mice for possible differences in histology and growth, apoptotic and
mitotic rates, K-Ras interaction with effectors, activation of downstream signaling and the regulation
of cell cycle proteins.
We found, in vitro before their injection in mice, an increase in proliferation of single
unattached cells for the K12V or Asp12 transformants, as compared to K12C cells. In vivo, whereas
K12C did not induce tumors, the K12V mutant yielded tumors with significantly higher growth and
mitotic rates and higher cellularity than the K12D mutant. These functional differences associate with
differences in the K-Ras interaction with its effectors and in downstream signaling. Thus, the K12V
mutant interacts with Raf-1 and transduces signals mainly through the Erk pathways. In contrast, the
K12D mutant, unexpectedly, does not interact with Raf-1 nor transduces signals through the canonical
Erk pathway, but through the PI3K/Akt, JNK, p38 and FAK pathways, leading to less aggressive
tumors. Moreover, K12V tumors show enhanced phosphorylation of the Rb protein and upregulation
of PCNA and Cyclin B.
by guest on February 21, 2016http://carcin.oxfordjournals.org/
Dow
nloaded from
5
MATERIALS AND METHODS
Reagents
NIH3T3 cells were obtained from the American Type Culture Collection. Dulbecco�s MEM
(25 mM HEPES), FBS, glutamine, fungizone, penicillin/streptomicin, ampicillin, acrylamide, and bis-
acrylamide were obtained from Life Technologies, Inc. Hoescht, Tris-HCl, Triton X-100, SDS,
glycerol, benzamidine, phenylmethylsulfonyl fluoride, leupeptine, sucrose, sodium acetate, sodium
chloride, EDTA, EGTA, bromphenol blue, DTT, glycine, sodium ß-glycerophosphate, sodium
fluoride, and PPi were obtained from Sigma. Gentamicine sulfate was obtained from BioWhittaker and
neomycin (geneticin) from Life Technologies. APS, TEMED, and 2-ß-mercaptoethanol were from
Fluka. Sodium ortovanadate was from Panreac. Molecular weight markers were from Bio-Rad.
Generation of the transfectants
We used plasmids containing a K-ras minigene with a mutation to Val, Cys, Asp at the first
position of codon 12. Plasmids were a gift of Dr. Manuel Perucho of the Burham Institute at La Jolla,
CA, and were derived from pBR and contain a neo-resistance selectable gene under the thymidine
kinase gene promoter and an ampicillin resistance gene. The K-ras minigene contains all four coding
exons (4B is the fourth exon) separated by intronic regions, under the promoter of K-ras, and a
polyadenilation signal. Cells were estably transfected, using lipofectamine (Invitrogen), and selected
and maintained as previously described (4).
Characterization of the transfectants in vitro
The different transfectants were analyzed for morphological appearance, characterizing shape,
refringency and ability to grow in colonies, unattached as single cells or as spheroids. In addition, we
studied possible differences in cell death or apoptosis when cultured under the same conditions. We
also assessed their proliferation capacity measuring cell metabolic capacity (viability), using the XTT
kit (Roche Diagnostics). Briefly, cells were seeded into 96-well plates (5x10³ cells/well) in 100 µl of
media. We added 50 µl of a mixture containing XTT and electron coupling reagent to each particular
by guest on February 21, 2016http://carcin.oxfordjournals.org/
Dow
nloaded from
6
plate at different times. After 4 h of incubation at 37ºC we read the absorbance at 490 nm, represented
absorbance vs time and calculated duplication time. This assay was carried out in triplicates.
Evaluation of tumorigenicity in vivo
Animal experiments were performed according to the requirements of the Animal Committee
of the Institut de Recerca de l´Hospital de Sant Pau. Four week-old male Nu/Nu swiss mice, weighing
18-20 g (Charles River), were used to evaluate the tumorigenicity of the transfectants. Mice were
housed in a sterile environment; cages, water, and bedding were autoclaved and food was γ-ray
sterilized.
Nine animals per transformant were injected intramuscularly in the posterior right back with
100 µl of DMEM containing 106 cells of each studied clone (constituting four different groups: empty
vector 3T3wt, Asp12, Cys12 and Val12). Tumor volume was measured with a caliper using the
following formula: volume = length x width2 /2 every week over a period of 25 days. Animals that did
not develop macroscopically apparent tumors were also killed and samples of the tissue at the
injection site were taken for histological analysis. Mice were euthanized when tumors became too
large, if animals lost more than 10% of their body weight, or if they showed signs of pain during the
experiments. Tumor fragments were frozen in liquid nitrogen for molecular analysis or fixed on
formalin for histopathological analysis.
Histological analysis and Tumor growth
We evaluated cell morphology and histology of tumor sections of all generated tumours, after
H&E staining of formalin fixed tissue. Moreover, we evaluated tumor growth by measuring tumor
volume twice a week, starting when tumors were visible and until the end of the fourth week after
implantation. We also performed, at the end of the experiment, a mitotic count in 10 consecutive high-
power fields, in tumor sections, to compare the mitotic index between the groups. The presence of
apoptotic cells within the macroscopically viable tumor tissue was also assessed staining with Hoescht
(Roche). We also counted the apoptotic figures in ten consecutive high power fields in five different
tumor samples per group. The Hoescht and immunohistochemistry (IHC) analyses were performed on
formalin-fixed paraffin-embedded tumor tissue. Tissue sections (5µm) were dewaxed in xylene,
by guest on February 21, 2016http://carcin.oxfordjournals.org/
Dow
nloaded from
7
dehydrated, and rinsed three times with PBS. To perform the nuclear staining with Hoescht, sections
were permeabilized, incubated with 0,5% Triton X-100 in PBS pH 7,4 for 5 min at room temperature,
then rinsed again twice in PBS. Finally, cells were stained with Hoescht (1:5000 in PBS) for 1h and
rinsed with water. Sections were mounted and observed under a fluorescent microscope at 334 nm
absorption and 365 nm emission light.
Immunohistochemical Analysis of Tumors
We studied molecular markers for mesenchymal or epithelial cells by immunohistochemistry.
To carry out the IHC analysis, we deparaffinized and hydrated tumor sections, immersed them in an
aqueous solution, containing 10 mM citric acid/0.1mM Na citrate pH 6.0, and heated them for 10 min
to unmask antigenic epitopes. Sections were quenched for endogenous peroxidase, incubated with 3%
hydrogen peroxide for 10 min, and subsequently incubated with primary antibodies anti-vimentin
(Abcam), cytokeratins AE1/AE3 (DAKO), cyclin D1 (Lab vision) or p53 (Abcam) for 30 min.
Samples were finally developed using the DAKO cytomation EnVision Kit (DAKO), according to the
manufacturer, and co-stained with hematoxilin. We also studied the possible oncogenic activation by
upregulation of Cyclin D1 or the possible inactivation of the tumor suppressor p53, leading to its
overexpression, by Western Blot, as secondary hits during tumorigenesis.
Analysis of Ras interaction with effectors and downstream signaling
We studied the differential activation of the pathways downstream of two of the effectors of
Ras, Raf/Erk and PI3K/Akt, in K12V and K12D tumors, determining the amount of active K-Ras
bound to them and the activation of signal transduction pathwasys downstream of the K-Ras protein.
Ras pull-down analysis
We used GST-Ras binding domains (RBD) of Raf-1 and PI3K (GST-Raf-1 and GST-PI3K), to
measure the active (GTP-bound) K-Ras protein that interacted with these effectors in tumor lysates.
Plasmids containing pGEX-PI3K or pGEX-Raf-1 (Piero Crespo gift; CSIC, Spain) were transfected
into E. coli BL21 strain and induced their expression with IPTG (5mM), incubating for 3 h at 37°C
and pelleting at 2000g for 15 min at 4°C. Cell pellets were lysed by sonication on ice for 6 x 15 s and
by guest on February 21, 2016http://carcin.oxfordjournals.org/
Dow
nloaded from
8
separated by 60 s intervals. Cell debris was pelleted at 14000g for 30 min at 4°C. Supernatants
containing the GST fusion proteins were incubated with glutathione-agarose beads (Sigma), pre-
equilibrated with lysis buffer at a constant flow rate of 0.5 ml/min at 4°C. After protein adsorption, the
GSH sepharose was washed with 400 µl of washing buffer, concentrated to a 150 µl volume; protein
concentration was determined with an SDS�PAGE gel and a BSA standard curve, and visualized by
Coomassie brilliant blue R250 staining.
Following, we incubated approximately 20 µg of the purified GST-Raf-1 or GST-PI3K
proteins, immobilized on glutathione-agarose beads, with the 0.1 ml of tumor extract supernatants at
4ºC for 2 hours with gentle mixing. The beads were, then, washed five times with 400 µl of lysis
buffer and centrifuged (2000 rpm, 1s at 4ºC). The bead pellet and supernatant were resolved by SDS-
PAGE. Equivalent amounts of the fusion protein or GST alone were used. Resolved proteins were
electrotransferred onto nitrocellulose membranes. Membranes were blocked with TBS-T buffer and
nonfat milk), and shaken at RT for 1.5 h, incubated with K-Ras antibody for 1h and, then, with the
corresponding secondary antibody (1h) at 1:20000 dilution. Protein bands were detected by
chemiluminescence using Supersignal (Pierce).
Quantitation of K-Ras downstream protein expression or activation
Western blots for the assessment of protein expression of K-Ras, or Ras downstream effectors
were done in cell culture extracts and tumor samples of the different groups. To study phosphorylated
(active) forms of some of the proteins, whole cell lysates were prepared using a buffer containing
phosphatase and kinase inhibitors, as previously described (4). The amount of protein was quantitated
by the Bradford method using the Bio-Rad protein assay dye. 7.5% or 15% Polyacrylamide gel
electrophoresis was performed. Samples were denatured at 100°C for 3 min, and after loading 75 µg of
total protein, electrophoresis were run at 30�40 mAmp in Laemmli buffer with molecular weight
markers.
After the electrophoresis, samples were transferred at 200 mAmp overnight to nitrocellulose
membranes. To control for protein loading, membranes were incubated for 10 min in 2 g/liter
PonceauS (Sigma) in 3% acetic acid and rinsed with water. Afterwards, they were blocked in TBS-T
by guest on February 21, 2016http://carcin.oxfordjournals.org/
Dow
nloaded from
9
buffer, containing 5 g/100 ml of nonfat milk, and shaken at room temp for 1.5 h. Membranes were,
then, incubated with the corresponding primary antibody at the indicated dilution (in TBS-T buffer
with 1 g/liter BSA), shaken for 1 h at RT and then with the corresponding secondary antibody at the
indicated dilution. Dilutions for primary antibodies were as follows: K-Ras (Calbiochem), 1:2,000;
phospho-Erk1 and Erk2 (Promega), 1:20,000; PI3K (Santa Cruz), 1:5,000; phospho-p38 (Santa Cruz),
1:5,000; PCNA (Transduction Laboratories), 1:6,000; phospho-JNK1 and JNK2 (Promega), 1:10,000;
phospho-AKT (Biolabs), 1:10,000; FAK (Santa Cruz), 1:400; p53 (Calbiochem) ,1:7,000; Caspase 3
(Pharmigen), 1:8,000; Src (Biosource), p-Stat3 (Santa Cruz), Cyclin D1 (Upstate Cell Signaling),
Cyclin E (Pharmingen); cyclin B1 (Santa Cruz), 1:7,000 and c-Myc (Pharmingen). ß-actin (Santa
Cruz) at 1:2,000, was used as a control for protein loading. Secondary antibodies were POD-
conjugated goat anti-mouse, donkey anti-goat, and goat anti-rabbit (all from Boehringer-Mannheim)
and were all diluted 1:20,000. Protein bands were detected by chemiluminescence using Supersignal
(Pierce).
The chemiluminescent bands corresponding to expression or phosphorylated forms of the
different proteins were acquired using a Kodak 440 Digital Science Image Station. Quantitation and
analysis of the bands were performed using the Kodak 1D Image Analysis Software.
Statistical methods
Differences in tumor volume and number of mitotic or apoptotic figures between groups
(K12V and K12D) were analyzed using the Mann-Whitney test. The mean intensities of the
chemiluminecent bands, after Western Blot, of the K12V (n=9) and the K12D (n=9) tumor samples,
for each protein, were also compared using the same test. Differences were considered significant at a
p<.05.
by guest on February 21, 2016http://carcin.oxfordjournals.org/
Dow
nloaded from
10
RESULTS
We tested the hypothesis that the molecular nature of K-Ras codon 12 mutations would confer
tumors bearing them distinct transforming phenotypes. We used NIH3T3 fibroblast as the recipient
cell, because it is a reliable model to study transformation by ras and other oncogenes (15). We
selected stable transfectants, expressing constructs with K12V, K12D or K12C mutations and
performed an evaluation of some of the functional and molecular alterations associated with their
transformation in vitro and tumorigenesis in vivo
Differences in morphology and growth among K-Ras codon 12 transformants in culture
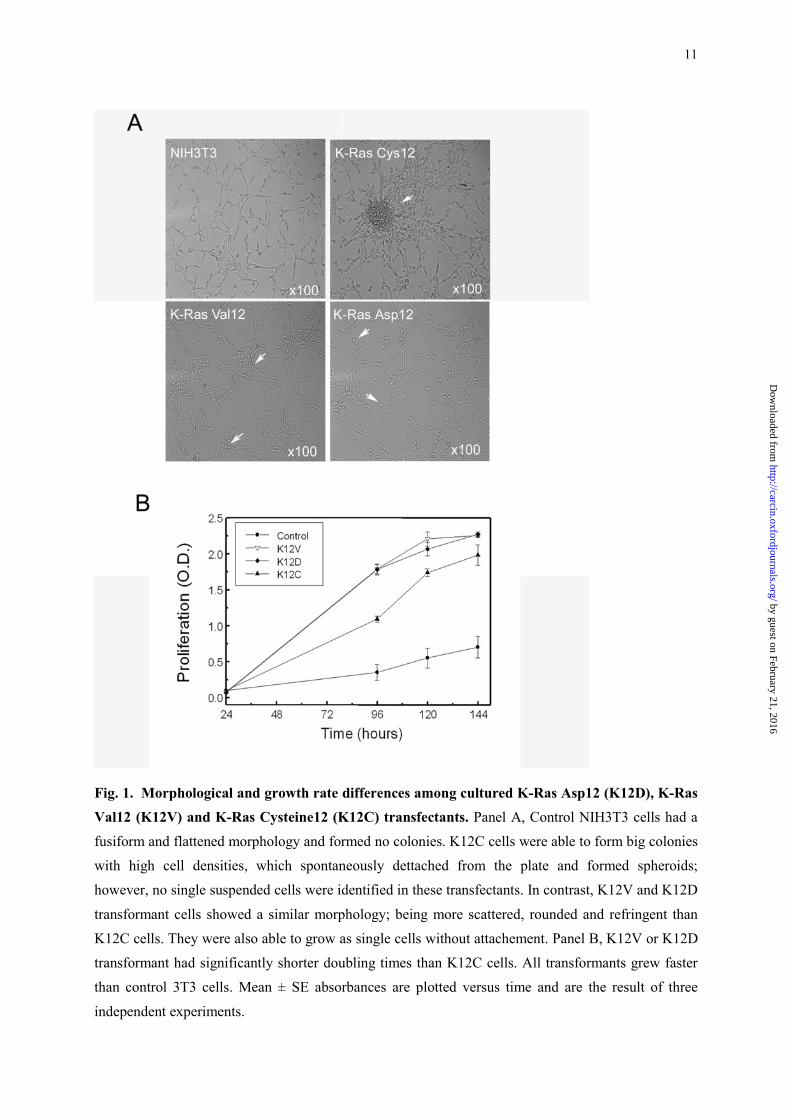
We first charactered in vitro the morphology and duplication time of all transformants. K12V
and K12D mutant cells in culture behaved in a similar manner, and differently from Cys12. Thus,
control NIH3T3 cells had a fusiform and flattened morphology and grew attached to the plate without
colony formation. K12C cells grew in group, with higher cell densities than control cells, and rapidly
formed big and dense colonies, which spontaneously dettached from the plate, forming spheroids. No
single suspended cells were identified in these transfectants (Figure 1, A). In contrast, K12V and
K12D transformant cells showed a similar morphology; being more scattered, rounded and refringent
than K12C cells (Figure 1, A); moreover, a high proportion of them were able to grow as single cells
without attachment. In addition, the doubling times for K12V (15.4±0.1h) or K12D (15.1±0.2 h)
transformants were significantly shorter than for K12C (20.6±0.3 h) transformants (Figure 1, B).
by guest on February 21, 2016http://carcin.oxfordjournals.org/
Dow
nloaded from
11
Fig. 1. Morphological and growth rate differences among cultured K-Ras Asp12 (K12D), K-Ras
Val12 (K12V) and K-Ras Cysteine12 (K12C) transfectants. Panel A, Control NIH3T3 cells had a
fusiform and flattened morphology and formed no colonies. K12C cells were able to form big colonies
with high cell densities, which spontaneously dettached from the plate and formed spheroids;
however, no single suspended cells were identified in these transfectants. In contrast, K12V and K12D
transformant cells showed a similar morphology; being more scattered, rounded and refringent than
K12C cells. They were also able to grow as single cells without attachement. Panel B, K12V or K12D
transformant had significantly shorter doubling times than K12C cells. All transformants grew faster
than control 3T3 cells. Mean ± SE absorbances are plotted versus time and are the result of three
independent experiments.
by guest on February 21, 2016http://carcin.oxfordjournals.org/
Dow
nloaded from
12
We did not find any difference among transformants in cell death or apoptosis. Thus, there
were no signs of cell death, nuclear condensation or fragmentation, in the K12V, K12D or K12C
transformants, when cultured under the same conditions (data not shown).
Tumorigenesis of K12V and K12D transfectants
First of all, we selected clones for each transfectant that expressed the exogenous mutant K-
Ras at a similar level before their injection in mice. This way, we ensured that the different tumor
phenotypes were due to the effect of their particular mutation, rather than to a variable level of
expression.
Only injection of K12V and K12D transfectants resulted in tumor development in nude mice.
The generation of tumors, from the initial inoculus, and until reaching a macroscopically detectable
tumor size, was faster in K12V than in K12D transformants.
by guest on February 21, 2016http://carcin.oxfordjournals.org/
Dow
nloaded from
13
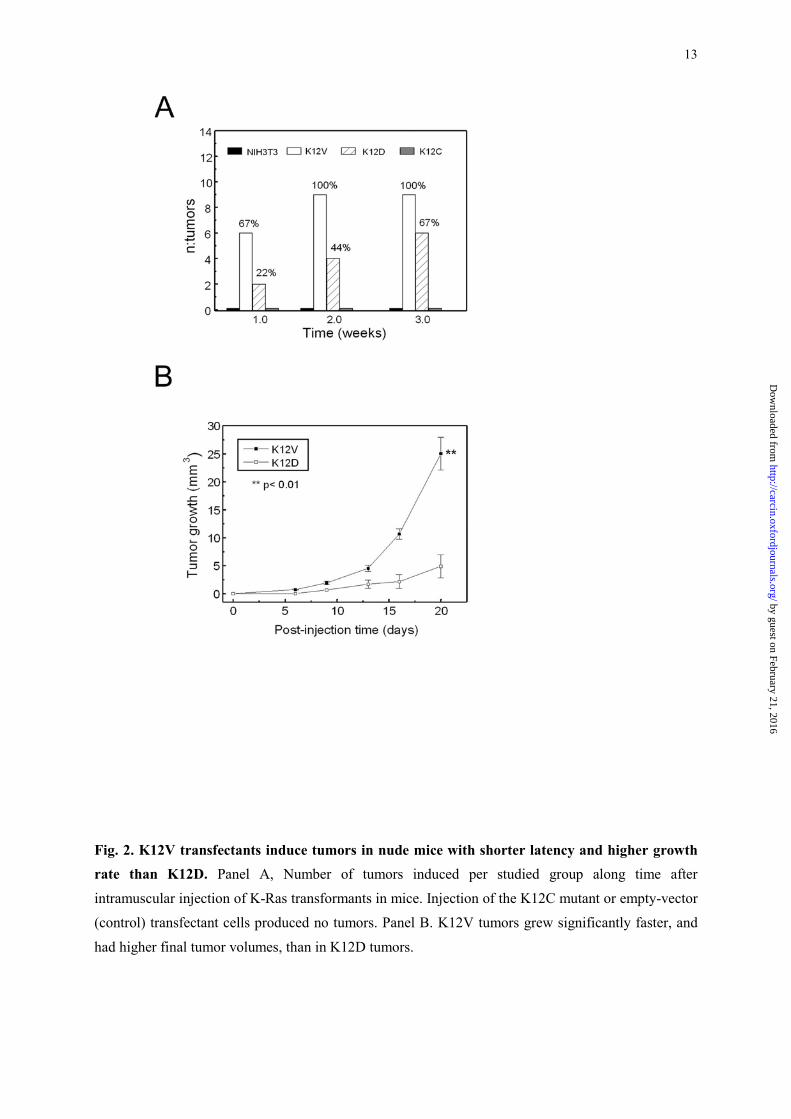
Fig. 2. K12V transfectants induce tumors in nude mice with shorter latency and higher growth rate than K12D. Panel A, Number of tumors induced per studied group along time after
intramuscular injection of K-Ras transformants in mice. Injection of the K12C mutant or empty-vector
(control) transfectant cells produced no tumors. Panel B. K12V tumors grew significantly faster, and
had higher final tumor volumes, than in K12D tumors.
by guest on February 21, 2016http://carcin.oxfordjournals.org/
Dow
nloaded from
14
At the end of the first week, 6 out of 9 K12V implants had already generated visible tumors
and by the end of the second week all 9 implants had generated tumors. In contrast, only 2 out of 9
K12D implants by the end of the first week and 4 out of 9 at the end of the second week generated
tumors (Figure 2, A). Thus, the appearance of K12D tumors always lagged behind K12V tumors. No
tumors were generated in any of the mice injected with the NIH3T3 cells transfected with the empty
vector or with the K12C mutant construct, after macroscopic or microscopic inspection of the
implanted area at the end of the study period. Moreover, K12V tumors grew significantly faster than
K12D tumors. The mean growth rate for K12V tumors was 30.4 ± 2.1 mm3/day, whereas it was 4.3 ±
2.2 mm3/day for K12D tumors (Table I). Twenty days after tumor inoculation, K12V mean tumor
volume (2,504±289 mm3) was approximately five times bigger than K12D mean tumor volume
(488±205 mm3) (Figure 2, B).
Analysis of the Tumor Phenotype of the K-Ras Mutants
We assessed the possible differences in histology and tumor growth by measuring tumor
volume along time, and the number of mitotic and apoptotic figures between K12V and K12D groups.
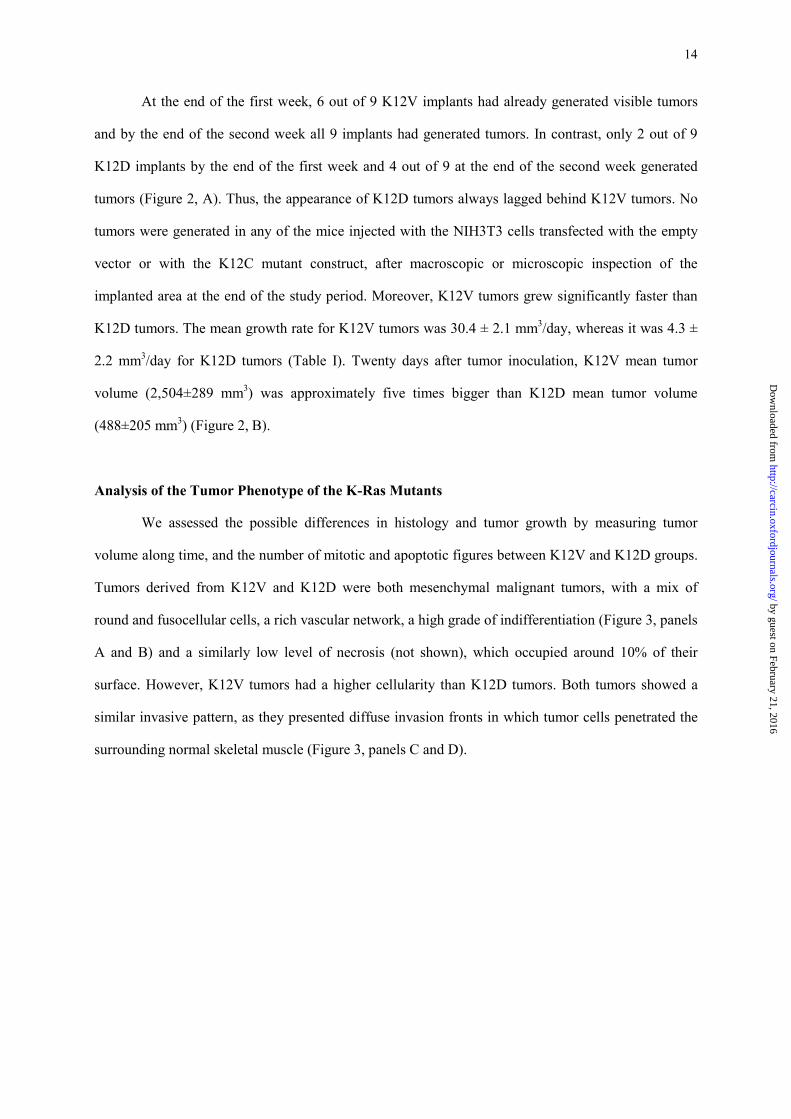
Tumors derived from K12V and K12D were both mesenchymal malignant tumors, with a mix of
round and fusocellular cells, a rich vascular network, a high grade of indifferentiation (Figure 3, panels
A and B) and a similarly low level of necrosis (not shown), which occupied around 10% of their
surface. However, K12V tumors had a higher cellularity than K12D tumors. Both tumors showed a
similar invasive pattern, as they presented diffuse invasion fronts in which tumor cells penetrated the
surrounding normal skeletal muscle (Figure 3, panels C and D).
by guest on February 21, 2016http://carcin.oxfordjournals.org/
Dow
nloaded from
15
Fig. 3. Histopathology of K12V and K12D tumors in nude mice. Both K12V (Panel A) and K12D
(Panel B) mutant tumors depict a mixed pattern of round and fusocellular cells and a rich vascular
network (white asterisk, 200x). The number of mitotic figures (arrows) was significantly higher in
K12V (Panel A) than in K12D (Panel B) tumors. K12V (Panel C) and K12D (Panel D) tumors present
also a diffuse invasion front, with small clusters of cells, invading the surrounding normal skeletal
muscle and adipose tissue (arrows; 100x). Apoptosis was negligible in both, K12V (Panel E) and
K12D (Panel F) tumors, after nuclear staining with the Hoescht (200x). H&E staining; Sm: skeletal
muscle; Tm, tumor; A, adipose tissue.
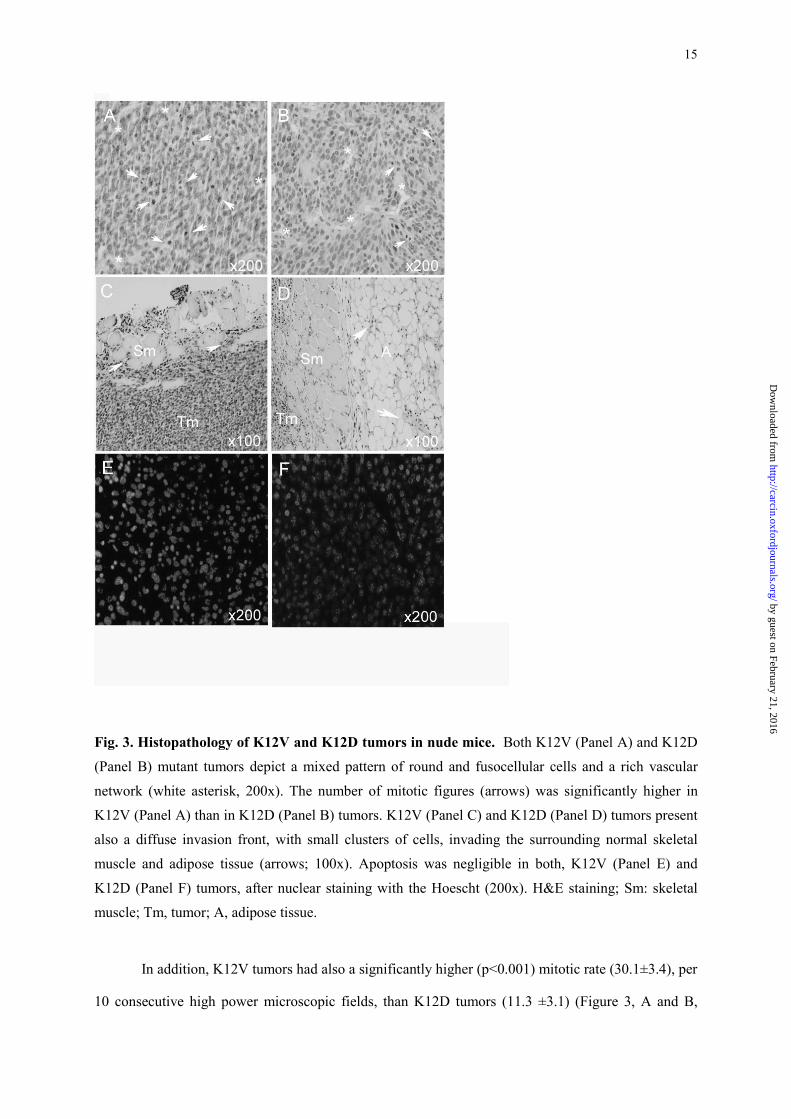
In addition, K12V tumors had also a significantly higher (p<0.001) mitotic rate (30.1±3.4), per
10 consecutive high power microscopic fields, than K12D tumors (11.3 ±3.1) (Figure 3, A and B,
by guest on February 21, 2016http://carcin.oxfordjournals.org/
Dow
nloaded from
16
Table I). A low number of apoptotic figures per 10 consecutive high power microscopic fields were
recorded in K12V (6.9 ± 1.3) or K12D (5.2 ± 0.9) tumors; these differences were not statistically
significant (Figure 3, E and F, Table I). Thus, despite of depicting the same histological appearance,
K12V tumors appear to be significantly more aggressive than K12D tumors, mainly because of
significantly higher proliferative and mitotic rates, which could lead to a higher cellularity.
Table I. Growth, mitotic and apoptotic rates in tumors derived from
K12V and K12D transfectants.
Transfectant-derived tumors
K-Ras Val12 (n=9)
K-Ras Asp12
(n=9)
Mean Growth Rate (mm3/day)
30.4 ± 2.1#
4.3 ± 2.2#
Mitotic Rate&
30.3 ± 3.4*
11.3 ± 3.1*
Apoptotic Rate& 6.9 ± 1.3 5.2 ± 0.9
Values are expressed as mean ± SD & Average count of 10 independent 100x fields per tumor *, # Statisticaly significant differences at a p< 0.01 (Mann Whitney U test)
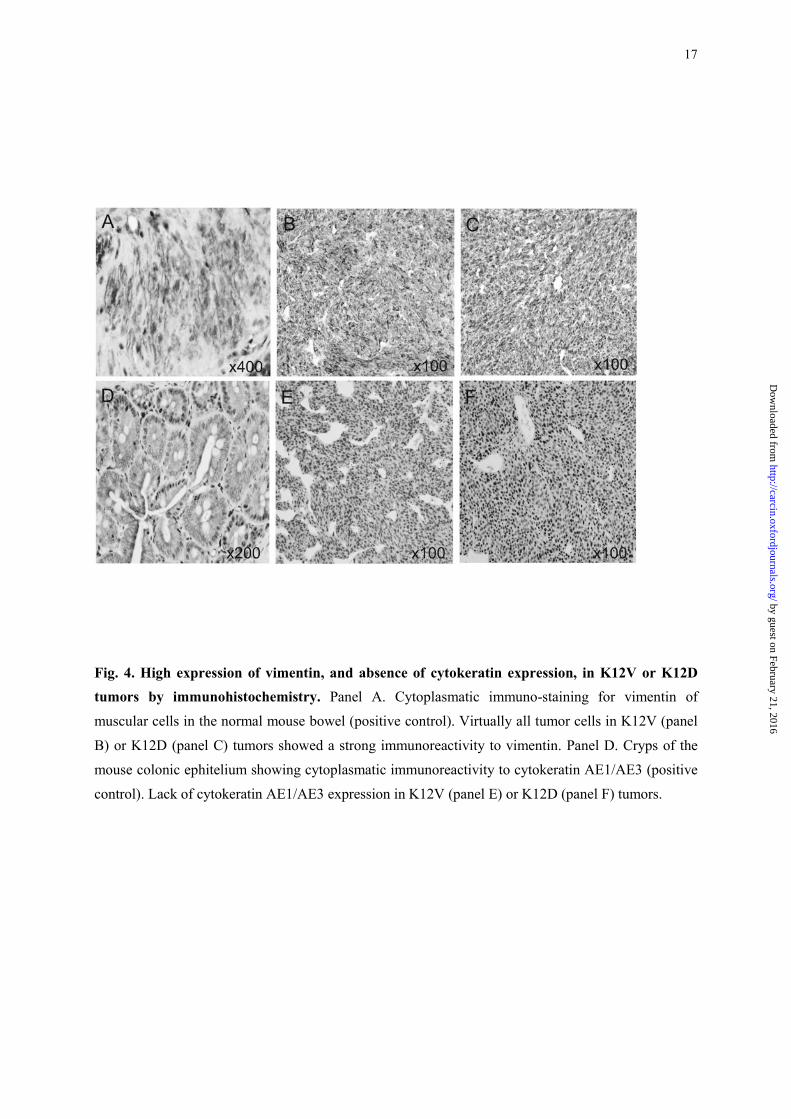
IHC analysis for epithelial and mesenchymal markers, showed that virtually all tumor cells in
K12V (panel B) or K12D (panel C) tumors showed a strong immunoreactivity to vimentin and a lack
of cytokeratin AE1/AE3 expression in K12V (panel E) or K12D (panel F) tumors.
by guest on February 21, 2016http://carcin.oxfordjournals.org/
Dow
nloaded from
17
Fig. 4. High expression of vimentin, and absence of cytokeratin expression, in K12V or K12D tumors by immunohistochemistry. Panel A. Cytoplasmatic immuno-staining for vimentin of
muscular cells in the normal mouse bowel (positive control). Virtually all tumor cells in K12V (panel
B) or K12D (panel C) tumors showed a strong immunoreactivity to vimentin. Panel D. Cryps of the
mouse colonic ephitelium showing cytoplasmatic immunoreactivity to cytokeratin AE1/AE3 (positive
control). Lack of cytokeratin AE1/AE3 expression in K12V (panel E) or K12D (panel F) tumors.
by guest on February 21, 2016http://carcin.oxfordjournals.org/
Dow
nloaded from
18
Regulation of the K-Ras mutant proteins and interaction with their effectors
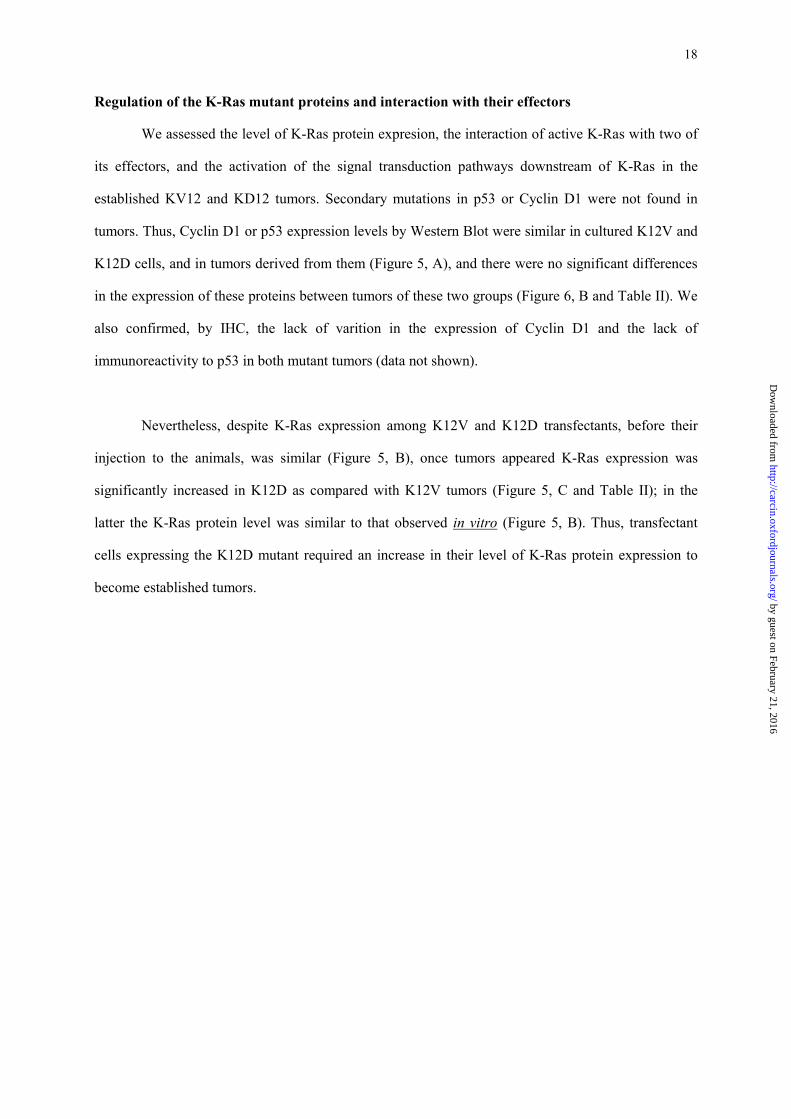
We assessed the level of K-Ras protein expresion, the interaction of active K-Ras with two of
its effectors, and the activation of the signal transduction pathways downstream of K-Ras in the
established KV12 and KD12 tumors. Secondary mutations in p53 or Cyclin D1 were not found in
tumors. Thus, Cyclin D1 or p53 expression levels by Western Blot were similar in cultured K12V and
K12D cells, and in tumors derived from them (Figure 5, A), and there were no significant differences
in the expression of these proteins between tumors of these two groups (Figure 6, B and Table II). We
also confirmed, by IHC, the lack of varition in the expression of Cyclin D1 and the lack of
immunoreactivity to p53 in both mutant tumors (data not shown).
Nevertheless, despite K-Ras expression among K12V and K12D transfectants, before their
injection to the animals, was similar (Figure 5, B), once tumors appeared K-Ras expression was
significantly increased in K12D as compared with K12V tumors (Figure 5, C and Table II); in the
latter the K-Ras protein level was similar to that observed in vitro (Figure 5, B). Thus, transfectant
cells expressing the K12D mutant required an increase in their level of K-Ras protein expression to
become established tumors.
by guest on February 21, 2016http://carcin.oxfordjournals.org/
Dow
nloaded from
19
Fig. 5. Comparison of CyclinD1, p53 and K-Ras expression between K12V or K12D cultured cells and established tumors, and K-Ras binding to effectors in tumors. Panel A. Cyclin D1 was
not upregulated in tumors as compared with K12V or K12D transformant cells; p53 levels were
similarly low in cultured K12V or K12D cells and derived tumors (control HCT116, mutant for p53,
show p53 overexpression). Panel B. K-Ras expression was similar in K12V and K12D cultured
transformants before its injection. Panel C, Established tumors (samples 10-18) derived from K12D
transformants expressed significantly higher levels of the K-Ras protein than K12V tumors (samples
1-9) (see Table II for quantitation). Panel C, In K12D tumors the active K-Ras protein is pulled-down
with Ras binding domain of PI3K (GST-PI3K), but not with the Ras binding domain of Raf-1 (GST-
Raf-1), whereas in K12V tumors both GST-PI3K and GST-Raf-1 pull down active K-Ras. V12 or
D12= pull-down extracts; Sp-V12 or Sp-D12= supernatants obtained after pull-down; C-V12 or C-
D12 = extracts that did not undergo pull down.
by guest on February 21, 2016http://carcin.oxfordjournals.org/
Dow
nloaded from
20
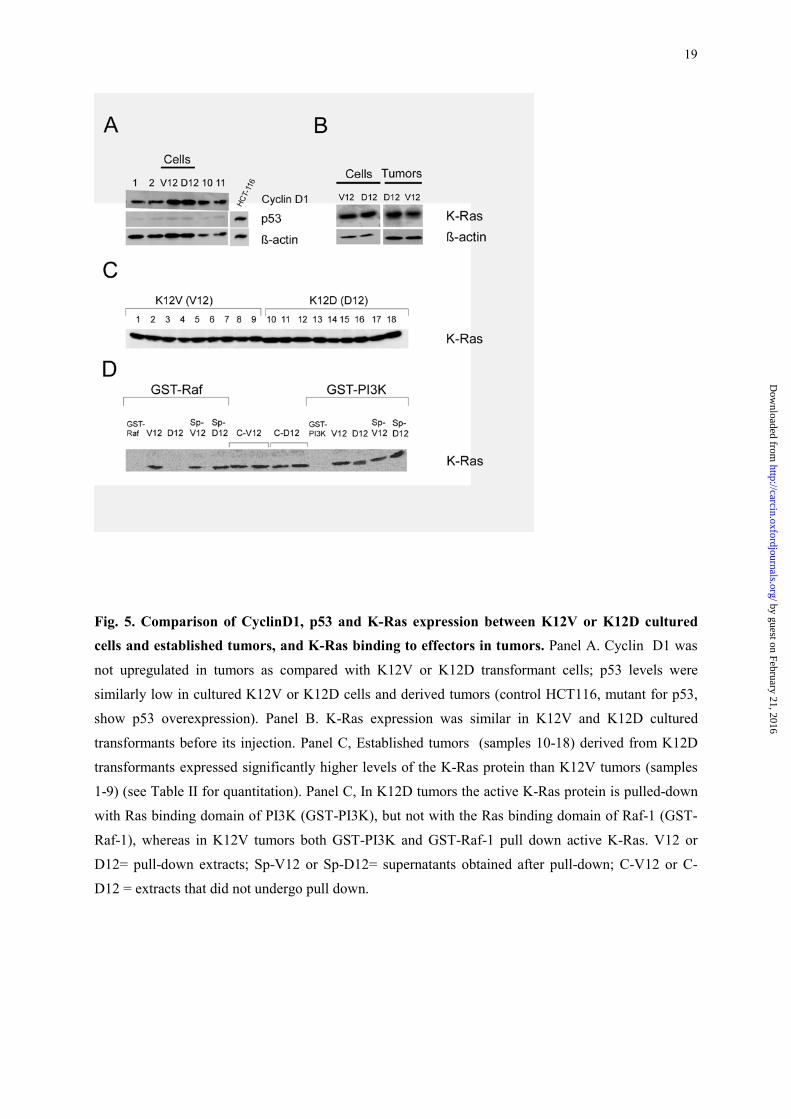
Following, we performed Ras pull down experiments to determine the levels of active K-Ras
bound to effectors (Figure 5, D). The Ras binding domain of PI3K (GST-PI3K) pulled down active K-
Ras from whole protein extracts in K12D (D12) tumors, whereas GST-Raf-1, unexpectedly, did not
pull down any active K-Ras in those tumors (Figure 5, D). We detected in the supernatants of K12D
(Sp-D12) the presence of K-Ras protein, despite we did not detected it bound to the Ras binding
domain of Raf-1, indicating that K12D may not interact with the effector Raf-1 (Figure 5, D). In
contrast, both GST-PI3K and GST-Raf-1 pulled down active K-Ras from K12V (V12)-derived tumors
(Figure 5, D). Thus, whereas the K12V mutant protein interacts with Raf-1 and PI3K, the K12D
mutant protein interacts with PI3K, but it does not interact with Raf-1.
Table II. Differences in protein band intensity in K-ras Val12 and K-ras Asp12 transfectant-derived
tumor samples
Ras downstream pathways Cell cycle and apoptotic regulators
Protein
Intensity (AU)*
p value
Protein
Intensity (AU)*
p value
K-Ras Val12
(n=9)
K-Ras Asp12
(n=9)
K-Ras Val12
(n=9)
K-Ras Asp12
(n=9)
K-Ras
128.4 ± 7.5
175.5 ± 11.6
3.7 10-3
Cyclin D1
10.1 ± 1.2
10.6 ± 1.3
N.S.
p-MAPK
18.0 ± 3.1
11.3 ± 2.6
0.010
Cyclin E 4.6 ± 0.7
13.4 ± 2.4
0.003
PI3K
1.8 ± 0.3
3.6 ± 0.3
1.2 10-4
PCNA 39.8 ± 3.5
29.2 ± 1.3
0.013
p-AKT
0.9 ± 0.1
1.5 ± 0.3
0.002
p-Rb 10.8 ± 1.4
6.9 ± 0.7
0.033
Src
2.6 ± 0.5
3.6 ± 0.67
0.029
Cyclin B1
7.3 ± 0.2
4.9 ± 0.3
0.008
p-JNK 1/2
21.9 ± 3.8
86.3 ±5.7
0.025
p53 13.9 ± 2.0
9.1 ± 1.3
N.S.
p-p38
7.4 ± 1.2
37.2 ± 12.4
0.001
Active-Caspase 9# 3.4 ± 1.1
2.8 ± 1.7
N.S.
p-STAT3
15.8 ± 1.2
18.9 ± 1.2
0.048
Active- Caspase 3# 1.4 ± 0.1
1.2 ± 0.7
N.S.
c-myc
8.0 ± 1.3
25.1 ± 5.7
0.010
p-FAK
9.0 ± 1.0
22.8 ± 2.6
2.1 10-4
β-actin 21.6 ± 1.5
22.2 ± 3.2
N.S.
Quantitation of band intensity was performed with Kodak 1D Image analysis software; * Values are expressed as
mean ± standard error (AU, arbitrary units); #Quantitated the cleaved caspase products. Statistical differences are
considered significant at a p<.05 (Mann Whitney U test). N.S.: Non significant differences. (p>0.05), β-actin was
used as a control for protein loading.
by guest on February 21, 2016http://carcin.oxfordjournals.org/
Dow
nloaded from
21
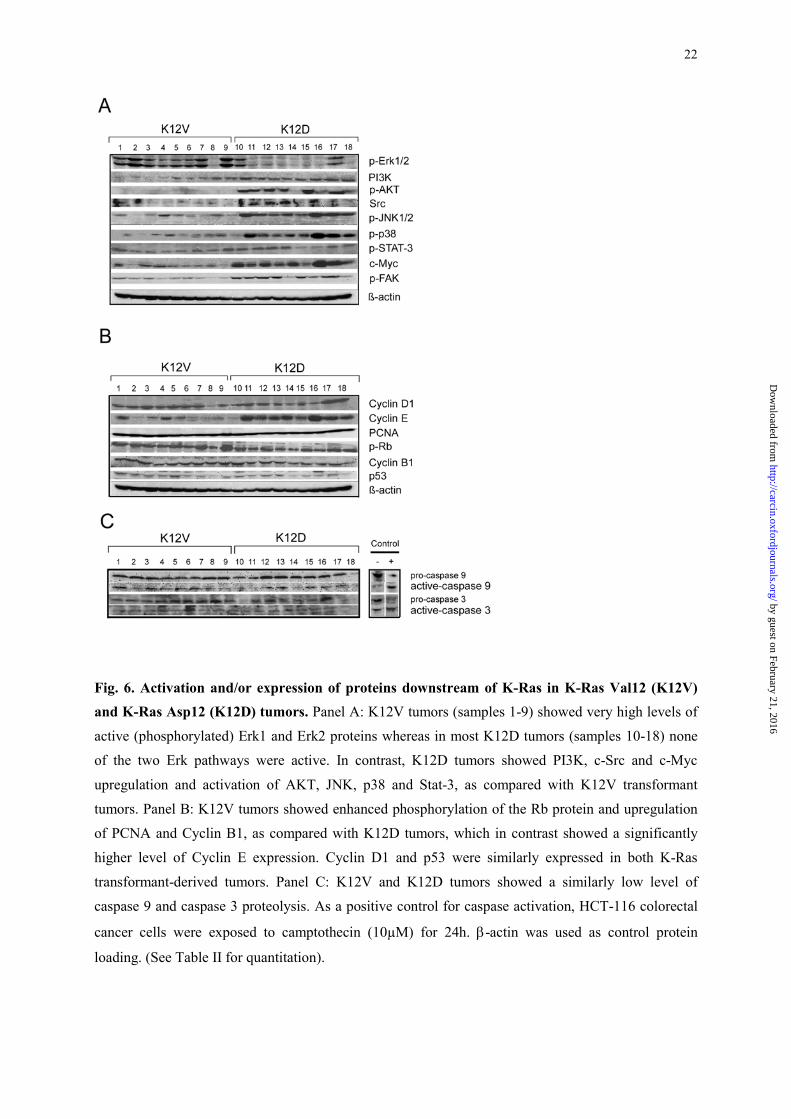
Analysis of the activation of the signaling pathways downstream of K-Ras
Next, we wanted to explore whether the differences in the interaction of K-Ras with its
effectors were translated into a differential activation of the pathways that transduce signals from
them. We considered the existence of differences in protein expression or activation between K12V
and K12D-derived tumors only when the mean of the quantitated bands reached statistical significance
(Table II). Thus, consistently with its interaction with Raf-1, tumors expressing the K12V mutant
protein showed a high activation (phosphorylation) of the Erk1 and Erk2 proteins (Figure 6, A and
Table II). On the other hand, most of the K12D tumors lacked any activation of the Erk1 or Erk2
proteins (Figure 6, A).
In contrast, and consistent with its interaction with PI3K and its lack of interaction with Raf-1,
K12D strongly activated Akt and did not activate the Erk pathway. Moreover, the interaction of the
K12V mutant with PI3K, which we observed, did not lead to the activation of Akt, since this protein
was not phosphorylated in those tumors. In addition to the PI3K upregulation and Akt activation, the
K12D mutant also activated the JNK, p38, Stat-3 and FAK pathways and upregulated Src and c-Myc
(Figure 6, A and Table II). Moreover, there was a strong correlation between the activation of the p38,
JNK pathways and c-myc upregulation in K12D tumors (Figure 6, A). In contrast, none of these
pathways or proteins were activated or upregulated in K12V tumors (Figure 6, A). Therefore, our
results indicate that K12V tumors transduce signals mainly through the canonical Erk pathway;
whereas multiple pathways, alternative to the canonical Erk pathway, maintain tumorigenesis in K12D
tumors.
by guest on February 21, 2016http://carcin.oxfordjournals.org/
Dow
nloaded from
22
Fig. 6. Activation and/or expression of proteins downstream of K-Ras in K-Ras Val12 (K12V) and K-Ras Asp12 (K12D) tumors. Panel A: K12V tumors (samples 1-9) showed very high levels of
active (phosphorylated) Erk1 and Erk2 proteins whereas in most K12D tumors (samples 10-18) none
of the two Erk pathways were active. In contrast, K12D tumors showed PI3K, c-Src and c-Myc
upregulation and activation of AKT, JNK, p38 and Stat-3, as compared with K12V transformant
tumors. Panel B: K12V tumors showed enhanced phosphorylation of the Rb protein and upregulation
of PCNA and Cyclin B1, as compared with K12D tumors, which in contrast showed a significantly
higher level of Cyclin E expression. Cyclin D1 and p53 were similarly expressed in both K-Ras
transformant-derived tumors. Panel C: K12V and K12D tumors showed a similarly low level of
caspase 9 and caspase 3 proteolysis. As a positive control for caspase activation, HCT-116 colorectal
cancer cells were exposed to camptothecin (10µM) for 24h. β-actin was used as control protein
loading. (See Table II for quantitation).
by guest on February 21, 2016http://carcin.oxfordjournals.org/
Dow
nloaded from
23
Analysis of cell cycle and apoptotic regulatory proteins
The established connections among Ras downstream pathways and cell cycle regulatory
proteins prompted us to evaluate whether the significantly different pathway activation associated with
the two K-Ras mutant proteins was also translated into differences in cell cycle or apoptotic
regulation. We observed that the K12V tumors, which show much higher growth and mitotic rates,
had an enhanced phosphorylation of pRb, and an increased in PCNA and cyclin B1 expression (Figure
6, B and Table II), which could explain their higher proliferative activity and faster G1/S and G2/M
transitions. In contrast, Cyclin E was significantly upregulated in K12D tumors, as compared with
K12D tumors (Figure 6, B and Table II). Finally, there were no differences in the levels of cyclin D1
expression between K12V and K12D tumors (Figure 6, B). No changes in apoptotic regulators were
observed. Thus, there was a similarly low level of procaspase 3 or 9 proteolysis in the studied tumors
from both groups (Figure 6, C and Table II), consistent with the similarly low level of apoptosis
observed with Hoescht staining (Figures 3, E and F, Table I).
DISCUSSION
We have demonstrated in an in vivo model that the K12V oncogene induces a more aggressive
tumor phenotype than the K12D oncogene. We found differences in tumor growth, cellularity and
mitotic rates, as well as in the interaction of the respective K-Ras mutant proteins with Ras effectors,
activation of downstream pathways, and deregulation of cell cycle regulatory proteins.
The K12V oncogene induces more aggressive tumors than K12D
The differences in in vivo tumorigenic capacity between K12V and K12D transformants were
not obvious in vitro. Thus, K12V or K12D cultured transformants had a similar behaviour, and appear
to be more aggressive than K12C. K12V and K12D cells look alike, being more rounded and
refringent, showing a higher level of cell dispersion, and having a higher proliferation rate than K12C
transformants. In contrast, K12C transformants were able to grow in suspension, forming spheroids
by guest on February 21, 2016http://carcin.oxfordjournals.org/
Dow
nloaded from
24
and maintaining the cell-cell contacts. Thus, it appears that K12C transformants are significantly more
dependent on cell-cell contacts for growth than K12D or K12V.
In vivo, K12V and K12D tumors were mesenchymal malignancies, both expressing vimentin,
but not cytokeratins; K12V tumors being more aggressive than K12D tumors. Thus, their latency for
tumor appearance was significantly shorter and their mean growth rate was about seven times higher
in K12V than in K12D tumors. In addition, this enhanced growth was associated with a higher mitotic
rate and a higher cellularity in K12V tumors, two markers for higher grade and poor prognosis in soft
tissue sarcomas (16). Moreover, despite the fact that both, K12V and K12D, cultured transfectant cells
displayed a similar level of K-Ras expression before its inoculation to mice, K12D established tumors
showed significantly higher K-Ras expression than K12V tumors. This is consistent with the K12D
mutant being less tumorigenic than the K12V mutant, similarly to our previous observation that weak
transformants (e.g. K-Ras codon 13 mutation) need to build up their level of expression before being
able of inducing tumorigenesis in vivo (5).
On the other hand, we could not study the aggressiveness of the K12C transfectants since they
did not form tumors. Whereas we did not expect the 3T3 cells transfected with the empty vector to be
tumorigenic, the lack of tumor formation by the K12C transformants was unexpected. We attribute
this finding to the influence of local growth factors and stroma cells in tumorigenicity, since here we
injected K12C cells in the back skeletal muscle, whereas in a previous experiment injecting the same
transfectant cells, subcutaneously, we were able to generate tumors (5).
K12D does not interact with Raf-1 nor activates the Erk pathway, whereas K12V does
In addition to the described differences in K-Ras expression levels, K12V and K12D tumors
showed dramatic differences in the interaction of their respective K-Ras mutant proteins with their
effectors and in the activation of signal transduction pathways downstream of K-Ras. Thus, whereas
the K12V mutant interacts with the Ras binding domain of both Raf-1 (GST-Raf-1) and PI3K (GST-
PI3K), the K12D mutant interacts with PI3K, but not with Raf-1. This is consistent with previous
observations that mutant amino acids at codon 12 induce structural changes in the effector domain of
the Ras protein (17), which, in turn, alter the affinity of the interaction of the Switch I for Raf-1 (18) or
by guest on February 21, 2016http://carcin.oxfordjournals.org/
Dow
nloaded from
25
the Switches I and II for PI3K (19). Specifically, Ras Asp12 substantially differs in the arrangement of
Gln-61, Tyr-32 and Pro-34, as compared to Ras Val12 or Ras wild type, significantly changing its
affinity for Raf-1 (20).
These altered interactions may lead to differential downstream signaling and regulation of K-
Ras transforming functions. Thus, consistent with its interaction with Raf-1, the K12V mutant
activates the Erk pathway; however, its interaction with PI3K does not lead to the activation of its
effector Akt (see Fig. 5 and 6). Nevertheless, we cannot exclude that other pathways downstream of
PI3K may be active. In contrast, and consistent with its interaction with PI3K and its lack of
interaction with Raf-1, K12D strongly activates Akt whereas it does not activate the Erk pathway.
Moreover, in addition to the PI3K/Akt pathway, the K12D mutant activates additional proteins such as
JNK, p38, Stat-3 and FAK.
Thus, the higher aggressiveness we observed in the K12V tumors may be due to the fact that
the K-Ras Val12 mutant activates mainly the Erk pathway, which is capable on its own of inducing
transformation (21). In contrast, K-Ras Asp12 tumors may be less aggressive because the pathways
this mutant protein activates, PI3K/Akt, JNK or p38, are not able on their own of transforming 3T3
cells (22, 23) but need their cooperative action (24). Thus, K12D transformation may be accomplished
through the cooperation of pathways downstream of Ras, which do not involve Raf-1 or Erk (24, 25).
This conclusion is also in agreement with the findings that transgenic (26) or �knock in� (27) mice,
expressing the K12V mutant, activate the Erk, but not the Akt, pathway and yield lung and intestinal
carcinomas, whereas K12D �knock in� mice activate the Akt, but not the Erk, pathway and yield only
lung and intestinal hyperplasias, rather than carcinomas (28).
The lack of Erk activation in K12D tumors was unexpected, being an exception to the
requirement of the canonical Raf/Erk pathway activation for tumorigenesis by Ras (29, 30). We think
the conclusion of such a requirement was drawn using mainly the H-ras Val12 oncogene; however,
our results suggest that it may not apply to other Ras oncogenes, such as the K12D mutant.
Therefore, K12V and K12D mutants appear to use two completely different pathway
activation patterns for cell transformation. Thus, in K12D tumors the concomitant activation of the
PI3K/Akt, JNK, p38 and FAK pathways, occurs in the absence of Erk activation. In contrast, K12V
tumors activate the Erk pathway, but none of the other pathways evaluated. These findings are
by guest on February 21, 2016http://carcin.oxfordjournals.org/
Dow
nloaded from
26
consistent with previous reports demonstrating that the activation of the Erk pathway, together with
JNK and p38, in a single tumor is unlikely to occur, since they show crossed downregulation. Thus,
p38 (31) or JNK (32) activation repress Erk activation; whereas, activated Erk downregulates the JNK
and p38 pathways (33). Similarly, the Ras effector MEKK (34) is known to activate p38 and Jnk
pathways, but not Erk (35,36). In addition, Src transformation requires activation of Jnk and p38 (37)
and inhibits Erk (38). Moreover, the strong correlation we observed in the activation of the p38 and
JNK in K12D tumors suggest that these pathways could be activated by the same effector of Ras in
these tumors; nevertheless, this aspect requires its direct evaluation.
K12V and K12D mutants differentially activate cell cycle regulatory proteins
We analyzed the cleavage of caspase 3 and caspase 9 in tumor tissue. Consistently with the
low level of chromatin condensation and fragmentation we reported with Hoescht staining, there was
also a low level of procaspase 3 or 9 activation in all studied tumors from both groups. Thus,
differences in proliferation rather than in apoptosis should account for the tumor growth differences
between groups.
Consistent with the dramatic increases in growth and mitotic rate in K12V, as compared to
K12D tumors, we expected that the differential patterns of pathway activation between the two K-Ras
mutant tumors led to a distinct deregulation of some of the proteins controlling the G1/S and G2/M
cell cycle phases.
Regarding the G1/S transition both mutants induced a similar expression of cyclin D1; the
K12V may do this by signaling through the Erk pathway, whereas K12D may use at least the
PI3K/Akt, JNK and p38 pathways to do so. Thus, the Raf/Erk pathway upregulates Cyclin D1 (39).
On the other hand, the PI3K/AKT pathway also upregulates Cyclin D1 (40), and in Src transformed
cells, JNK and p38 coactivation upregulates cyclin D1 and induces the G1/S transition (37).
Because the activation of Cyclin D-dependent kinases is responsible for Rb phosphorylation
and inducing the G1/S transition (37), the higher levels of Rb phosphorylation we observed in K12V,
as compared to K12D, tumors suggest that Erk activation is more efficient than the coactivation of the
PI3K/Akt, JNK, p38 pathways in inducing this transition. Moreover, the upregulation of PCNA (an S-
by guest on February 21, 2016http://carcin.oxfordjournals.org/
Dow
nloaded from
27
phase induced protein), observed in K12V tumors is also consistent with their higher proliferative
rates. On the other hand, the dramatic upregulation of Cyclin E and c-Myc, observed only in K12D
tumors, is consistent with Src transformation inducing c-Myc overexpression and activating the
cyclinE/CDK2 complex (41). In contrast, and consistently with the low levels of Cyclin E expression
observed in K12V tumors, Ras Val12 is only a weak Cyclin E activator (42).
Similarly, the pathway activation pattern induced by each K-Ras mutant may vary its
efficiency in activating the CyclinB/Cdc2 complex and in inducing the G2/M transition. Thus, K12V
may activate the Cyclin B/Cdc2 complexes through Erk (43,44), whereas K12D could do it through
the PI3K/Akt and JNK pathways. This is consistent with JNK phosphorylating Cdc2/cyclinB and
controling the G2 phase in Src transformed cells (45,46). It is also in agreemnet with PI3K/Akt
regulating cyclin B/Cdc2 and playing a role in the G2/M transition (47,48). In summary, the increased
Rb phosphorylation and PCNA and Cyclin B upregulation we observed in the K12V tumors suggest
that the activation of the Erk pathway is more efficient in inducing faster G1/S and G2/M transitions,
leading to significantly enhanced mitotic rate, growth and tumor cellularity, than the coactivation of
the PI3K/Akt, JNK, p38 and FAK pathways observed in the K12D tumors.
Cyclin D1 or p53 mutations did not occur as secondary hits during tumorigenesis, since we
found a similar level of Cyclin D1 and p53 in all tumors from both groups, by both IHC and WB,
which were also similar to the levels found cultures transformants before their injection.
Conclusion and clinical implications
In summary, we found that the K12V mutant protein induces very aggressive tumors by
interacting with its effector Raf-1 and activating the Erk pathway, which leads to an increase in Rb
phosphorylation and upregulation of PCNA and Cyclin B, which may, in turn, induce higher growth
and mitotic rates. In contrast, the K-Ras mutant protein induces significantly less aggressive tumors by
interacting with PI3K (but not with Raf), and activating the PI3K/Akt, JNK, p38 and FAK pathways
which leads to a less intense upregulation of the same cell cycle regulatory proteins and to a slower
tumor growth. Our results offer an explanation for the higher aggressiveness of the K12V, as
compared to K12D, tumors observed in clinic. Thus, K12D is more prevalent in benign than in
by guest on February 21, 2016http://carcin.oxfordjournals.org/
Dow
nloaded from
28
malignant human colorectal tumors (10), whereas K12V associates with more advanced and metastatic
colorectal carcinomas (11, 12), higher recurrence and decreased survival (13, 49).
Our observations demonstrate that the mutant amino acid in the K-Ras protein influences its in
vivo tumorigenic capacity. Therefore, despite most prognostic studies attribute to all Ras mutants
similar transforming properties, knowledge on the mutant amino acid may be critical in identifying
subsets of patients with different tumor aggressiveness. Our results also suggest that the Raf-1 (50) or
the MEK1 (51) inhibitors may not work in the subset of tumors bearing K12D mutations (and possibly
in other Ras mutant tumors) because these tumors do not use the canonical Raf/MEK/Erk pathway to
maintain their transforming state.
ACKNOWLEDGEMENTS
We would like to thank Judith Darrical (contract FIS 01A041) and QD for their technical assistance.
This work was supported in part by Grants of the Spanish Ministerio de Educacion y Ciencia SAF03-
07437 to RM and from the Ministerio de Sanidad, FIS 01/0853 to RM and FIS01/3085 to MP and
from Fundación BBVA to MC. RM and MP were supported partially by FIS contracts 98/3197 and
01/3085, respectively. RM is a researcher of the Catalonian Public Health System. The Grup
d�Oncogenesi i Antitumorals is supported by a Grant (SGR 1050) by AGAUR Agency of the
Generalitat de Catalunya. The research team belongs to the Network of Cooperative Research on
Cancer (C03/10), funded by the Instituto Carlos III, of the Spanish Ministerio de Sanidad.
REFERENCES
(1) Marshall, M.S. (1995) Ras target proteins in eukaryotic cells. Faseb J, 9, 1311-8.
(2) Barbacid, M. (1987) ras genes. Annu Rev Biochem, 56, 779-827.
(3) Downward, J. (1998) Ras signalling and apoptosis. Curr Opin Genet Dev, 8, 49-54.
(4) Guerrero, S., Casanova, I., Farre, L., Mazo, A., Capella, G. and Mangues, R. (2000) K-ras codon
12 mutation induces higher level of resistance to apoptosis and predisposition to anchorage-
by guest on February 21, 2016http://carcin.oxfordjournals.org/
Dow
nloaded from
29
independent growth than codon 13 mutation or proto-oncogene overexpression. Cancer Res, 60,
6750-6.
(5) Guerrero, S., Figueras, A., Casanova, I., Farre, L., Lloveras, B., Capella, G., Trias, M. and
Mangues, R. (2002) Codon 12 and codon 13 mutations at the K-ras gene induce different soft
tissue sarcoma types in nude mice. Faseb J, 16, 1642-4.
(6) Sloan, S.R., Newcomb, E.W. and Pellicer, A. (1990) Neutron radiation can activate K-ras via a
point mutation in codon 146 and induces a different spectrum of ras mutations than does gamma
radiation. Mol Cell Biol, 10, 405-8.
(7) Fasano, O., Aldrich, T., Tamanoi, F., Taparowsky, E., Furth, M. and Wigler, M. (1984) Analysis
of the transforming potential of the human H-ras gene by random mutagenesis. Proc Natl Acad Sci
U S A, 81, 4008-12.
(8) Capella, G., Cronauer-Mitra, S., Pienado, M.A. and Perucho, M. (1991) Frequency and spectrum
of mutations at codons 12 and 13 of the c-K-ras gene in human tumors. Environ Health Perspect,
93, 125-31.
(9) Seeburg, P.H., Colby, W.W., Capon, D.J., Goeddel, D.V. and Levinson, A.D. (1984) Biological
properties of human c-Ha-ras1 genes mutated at codon 12. Nature, 312, 71-5.
(10) Bartsch, D., Bastian, D., Barth, P., Schudy, A., Nies, C., Kisker, O., Wagner, H.J. and
Rothmund, M. (1998) K-ras oncogene mutations indicate malignancy in cystic tumors of the
pancreas. Ann Surg, 228, 79-86.
(11) Al-Mulla, F., Going, J.J., Sowden, E.T., Winter, A., Pickford, I.R. and Birnie, G.D. (1998)
Heterogeneity of mutant versus wild-type Ki-ras in primary and metastatic colorectal carcinomas,
and association of codon-12 valine with early mortality. J Pathol, 185, 130-8.
(12) Moerkerk, P., Arends, J.W., van Driel, M., de Bruine, A., de Goeij, A. and ten Kate, J. (1994)
Type and number of Ki-ras point mutations relate to stage of human colorectal cancer. Cancer
Res, 54, 3376-8.
(13) Span, M., Moerkerk, P.T., De Goeij, A.F. and Arends, J.W. (1996) A detailed analysis of K-
ras point mutations in relation to tumor progression and survival in colorectal cancer patients. Int J
Cancer, 69, 241-5.
by guest on February 21, 2016http://carcin.oxfordjournals.org/
Dow
nloaded from
30
(14) Keohavong, P., DeMichele, M.A., Melacrinos, A.C., Landreneau, R.J., Weyant, R.J. and
Siegfried, J.M. (1996) Detection of K-ras mutations in lung carcinomas: relationship to prognosis.
Clin Cancer Res, 2, 411-8.
(15) Bishop, J.M. (1987) The molecular genetics of cancer. Science, 235, 305-11.
(16) el-Jabbour, J.N., Akhtar, S.S., Kerr, G.R., McLaren, K.M., Smyth, J.F., Rodger, A. and
Leonard, R.C. (1990) Prognostic factors for survival in soft tissue sarcoma. Br J Cancer, 62, 857-
61.
(17) Pincus, M.R. and Brandt-Rauf, P.W. (1985) Structural effects of substitutions on the p21
proteins. Proc Natl Acad Sci U S A, 82, 3596-3600.
(18) Shirouzu, M., Koide, H., Fujita-Yoshigaki, J., Oshio, H., Toyama, Y., Yamasaki, K.,
Fuhrman, S.A., Villafranca, E., Kaziro, Y. and Yokoyama, S. (1994) Mutations that abolish the
ability of Ha-Ras to associate with Raf-1. Oncogene, 9, 2153-7.
(19) Pacold, M.E., Suire, S., Perisic, O., Lara-Gonzalez, S., Davis, C.T., Walker, E.H., Hawkins, P.T.,
Stephens, L., Eccleston, J.F. and Williams, R.L. (2000) Crystal structure and functional analysis of
Ras binding to its effector phosphoinositide 3-kinase gamma. Cell, 103, 931-43.
(20) Al-Mulla, F., Milner-White, E.J., Going, J.J. and Birnie, G.D. (1999) Structural differences
between valine-12 and aspartate-12 Ras proteins may modify carcinoma aggression. J Pathol, 187,
433-8.
(21) Robinson, M.J., Stippec, S.A., Goldsmith, E., White, M.A. and Cobb, M.H. (1998) A
constitutively active and nuclear form of the MAP kinase ERK2 is sufficient for neurite outgrowth
and cell transformation. Curr Biol, 8, 1141-50.
(22) Rennefahrt, U.E., Illert, B., Kerkhoff, E., Troppmair, J. and Rapp, U.R. (2002) Constitutive JNK
activation in NIH 3T3 fibroblasts induces a partially transformed phenotype. J Biol Chem, 277,
29510-8.
(23) Rodriguez-Viciana, P., Warne, P.H., Khwaja, A., Marte, B.M., Pappin, D., Das, P., Waterfield,
M.D., Ridley, A. and Downward, J. (1997) Role of phosphoinositide 3-OH kinase in cell
transformation and control of the actin cytoskeleton by Ras. Cell, 89, 457-67.
(24) Khosravi-Far, R., White, M.A., Westwick, J.K., Solski, P.A., Chrzanowska-Wodnicka, M., Van
Aelst, L., Wigler, M.H. and Der, C.J. (1996) Oncogenic Ras activation of Raf/mitogen-activated
by guest on February 21, 2016http://carcin.oxfordjournals.org/
Dow
nloaded from
31
protein kinase-independent pathways is sufficient to cause tumorigenic transformation. Mol Cell
Biol, 16, 3923-33.
(25) Joneson, T., White, M.A., Wigler, M.H. and Bar-Sagi, D. (1996) Stimulation of membrane
ruffling and MAP kinase activation by distinct effectors of RAS. Science, 271, 810-2.
(26) Janssen, K.P., el-Marjou, F., Pinto, D., Sastre, X., Rouillard, D., Fouquet, C., Soussi, T.,
Louvard, D. and Robine, S. (2002) Targeted expression of oncogenic K-ras in intestinal
epithelium causes spontaneous tumorigenesis in mice. Gastroenterology, 123, 492-504.
(27) Guerra, C., Mijimolle, N., Dhawahir, A., Dubus, P., Barradas, M., Serrano, M., Campuzano, V.
and Barbacid, M. (2003) Tumor induction by an endogenous K-ras oncogene is highly dependent
on cellular context. Cancer Cell, 4, 111-20.
(28) Tuveson, D.A., Shaw, A.T., Willis, N.A., Silver, D.P., Jackson, E.L., Chang, S., Mercer, K.L.,
Grochow, R., Hock, H., Crowley, D., Hingorani, S.R., Zaks, T., King, C., Jacobetz, M.A., Wang,
L., Bronson, R.T., Orkin, S.H., DePinho, R.A. and Jacks, T. (2004) Endogenous oncogenic K-
ras(G12D) stimulates proliferation and widespread neoplastic and developmental defects. Cancer
Cell, 5, 375-87.
(29) Troppmair, J., Bruder, J.T., Munoz, H., Lloyd, P.A., Kyriakis, J., Banerjee, P., Avruch, J. and
Rapp, U.R. (1994) Mitogen-activated protein kinase/extracellular signal-regulated protein kinase
activation by oncogenes, serum, and 12-O-tetradecanoylphorbol-13-acetate requires Raf and is
necessary for transformation. J Biol Chem, 269, 7030-5.
(30) Giehl, K. (2005) Oncogenic Ras in tumour progression and metastasis. Biol Chem, 386, 193-205.
(31) Schliess, F., Heinrich, S. and Haussinger, D. (1998) Hyperosmotic induction of the mitogen-
activated protein kinase phosphatase MKP-1 in H4IIE rat hepatoma cells. Arch Biochem Biophys,
351, 35-40.
(32) Shen, Y.H., Godlewski, J., Zhu, J., Sathyanarayana, P., Leaner, V., Birrer, M.J., Rana, A. and
Tzivion, G. (2003) Cross-talk between JNK/SAPK and ERK/MAPK pathways: sustained
activation of JNK blocks ERK activation by mitogenic factors. J Biol Chem, 278, 26715-21.
(33) Franklin, C.C. and Kraft, A.S. (1997) Conditional expression of the mitogen-activated protein
kinase (MAPK) phosphatase MKP-1 preferentially inhibits p38 MAPK and stress-activated
protein kinase in U937 cells. J Biol Chem, 272, 16917-23.
by guest on February 21, 2016http://carcin.oxfordjournals.org/
Dow
nloaded from
32
(34) Russell M, Lange-Carter CA, Johnson GL. (1995) Direct interaction between Ras and the kinase
domain of mitogen-activated protein kinase kinase kinase (MEKK1). J Biol Chem 270(20):11757-
60.
(35) Minden A, Lin A, McMahon M, Lange-Carter C, Derijard B, Davis RJ, Johnson GL, Karin M.
(1994) Differential activation of ERK and JNK mitogen-activated protein kinases by Raf-1 and
MEKK. Science 266(5191):1719-23.
(36) Lin A, Minden A, Martinetto H, Claret FX, Lange-Carter C, Mercurio F, Johnson GL, Karin M.
(1995) Identification of a dual specificity kinase that activates the Jun kinases and p38-Mpk2.
Science 268 (5208):286-90.
(37) Lee RJ, Albanese C, Stenger RJ, Watanabe G, Inghirami G, Haines GK 3rd, et al. pp60(v-src)
induction of cyclin D1 requires collaborative interactions between the extracellular signal-
regulated kinase, p38, and Jun kinase pathways. A role for cAMP response element-binding
protein and activating transcription factor-2 in pp60(v-src) signaling in breast cancer cells. J Biol
Chem. 1999, 274(11):7341-50.
(38) Stofega, M.R., Yu, C.L., Wu, J. and Jove, R. (1997) Activation of extracellular signal-regulated
kinase (ERK) by mitogenic stimuli is repressed in v-Src-transformed cells. Cell Growth Differ, 8,
113-9.
(39) Lavoie, J.N., L'Allemain, G., Brunet, A., Muller, R. and Pouyssegur, J. (1996) Cyclin D1
expression is regulated positively by the p42/p44MAPK and negatively by the p38/HOGMAPK
pathway. J Biol Chem, 271, 20608-16.
(40) Muise-Helmericks, R.C., Grimes, H.L., Bellacosa, A., Malstrom, S.E., Tsichlis, P.N. and Rosen,
N. (1998) Cyclin D expression is controlled post-transcriptionally via a phosphatidylinositol 3-
kinase/Akt-dependent pathway. J Biol Chem, 273, 29864-72.
(41) Leone, G., DeGregori, J., Sears, R., Jakoi, L. and Nevins, J.R. (1997) Myc and Ras collaborate in
inducing accumulation of active cyclin E/Cdk2 and E2F. Nature, 387, 422-6.
(42) Winston, J.T., Coats, S.R., Wang, Y.Z. and Pledger, W.J. (1996) Regulation of the cell cycle
machinery by oncogenic ras. Oncogene, 12, 127-34.
by guest on February 21, 2016http://carcin.oxfordjournals.org/
Dow
nloaded from
33
(43) Tamemoto, H., Kadowaki, T., Tobe, K., Ueki, K., Izumi, T., Chatani, Y., Kohno, M., Kasuga,
M., Yazaki, Y. and Akanuma, Y. (1992) Biphasic activation of two mitogen-activated protein
kinases during the cell cycle in mammalian cells. J Biol Chem, 267, 20293-7.
(44) Walsh, S., Margolis, S.S. and Kornbluth, S. (2003) Phosphorylation of the cyclin b1 cytoplasmic
retention sequence by mitogen-activated protein kinase and Plx. Mol Cancer Res, 1, 280-9.
(45) Roche, S., Fumagalli, S. and Courtneidge, S.A. (1995) Requirement for Src family protein
tyrosine kinases in G2 for fibroblast cell division. Science, 269, 1567-9.
(46) Goss, V.L., Cross, J.V., Ma, K., Qian, Y., Mola, P.W. and Templeton, D.J. (2003) SAPK/JNK
regulates cdc2/cyclin B kinase through phosphorylation and inhibition of cdc25c. Cell Signal, 15,
709-18.
(47) Liang, J. and Slingerland, J.M. (2003) Multiple roles of the PI3K/PKB (Akt) pathway in cell
cycle progression. Cell Cycle, 2, 339-45.
(48) Maller, J.L., Gross, S.D., Schwab, M.S., Finkielstein, C.V., Taieb, F.E. and Qian, Y.W. (2001)
Cell cycle transitions in early Xenopus development. Novartis Found Symp, 237, 58-73.
(49) Andreyev, H.J., Norman, A.R., Cunningham, D., Oates, J., Dix, B.R., Iacopetta, B.J., et
al..(2001) Kirsten ras mutations in patients with colorectal cancer: the 'RASCAL II' study. Br J
Cancer, 85, 692-6.
(50) Sridhar, S.S., Hedley, D. and Siu, L.L. (2005) Raf kinase as a target for anticancer therapeutics.
Mol Cancer Ther, 4, 677-85.
(51) Sebolt-Leopold, J.S. and Herrera, R. (2004) Targeting the mitogen-activated protein kinase
cascade to treat cancer. Nat Rev Cancer, 4, 937-47.
by guest on February 21, 2016http://carcin.oxfordjournals.org/
Dow
nloaded from


