Embed Size (px)
Citation preview
ROLE OF EXTENSION SERVICES ON PRODUCTION OF
SUGARCANE IN DISTRICT MARDAN AND CHARSADDA:
KHYBER PAKHTUNKHWA-PAKISTAN
BY
FAHEEM KHAN
A thesis submitted to The University of Agriculture, Peshawar-Pakistan in partial
fulfillment of the requirements for the degree of
DOCTOR OF PHILOSOPHY IN AGRICULTURE
(Agricultural Extension Education and Communication)
DEPARTMENT OF AGRICULTURAL EXTENSION EDUCATION
AND COMMUNICATION
FACULTY OF RURAL SOCIAL SCIENCES
THE UNIVERSITY OF AGRICULTURE PESHAWAR-PAKISTAN
OCTOBER, 2015
i
Table of Contents
Chapter No. Title Page No.
Acknowledgments ………………………………………… ii
Abstract …………………………………………………… iii
List of Tables ……………………………………………… iv-vi
List of Figures vii
List of Abbreviations……………………………………… viii-xi
I Introduction ……………………………………………… 1-9
II Review of Literature ……………………………………… 10-24
III Research Methodology …………………………………… 25-30
IV Results and Discussion …………………………………… 31-148
V Summary, Conclusions and Recommendations…………… 149-155
Literature Cited …………………………………………… 156-167
Appendix-A (Interview Schedule for Respondents)……… 168-176
Appendix-B (General Description of Research Area)……... 177-181
Appendix-C (Pictures Representation of “Gur” Production)… 182-183

ii
ACKNOWLEDGEMENTS
First and foremost, I am thankful to Almighty Allah, the Most Beneficent and the
Merciful, who bestowed upon me the courage and will to complete this study and
contribute to the noble field of knowledge. I must maintain the last Prophet and
Messenger Muhammad (P.B.U.H) who lit this world with knowledge and wisdom for the
mankind.
I am especially thankful to my supervisor Prof. Dr. Muhammad Zafarullah Khan
for his regular advice, encouragement and guidance during my academic pursuit. The
critical insight, constructive criticism and personal interest of my supervisor generate the
energy in me to complete this research study.
I express my deepest gratitude and profound regards to Prof. Dr. Iftikhar Ahmad,
Prof. Dr. Khalid Nawab, Dr. Ayesha, Department of Agricultural Extension Education
and Communication for their improvement of research language/techniques and Zelle
Huma, Department of Plant Protection of this University for their moral support.
My heartiest gratitude goes to Prof. (Rtd) Dr. Muhammad Akram, Department of
Agricultural Extension Education and Communication, Dr. Yousaf Hayat, Department of
Stat/Maths/Computer Science) of the University of Agriculture, Peshawar-Pakistan for
their help and cooperation extended in data analysis and tabulation of my research study.
I also received learned guidance from my entire learned faculty staff in different aspects
during the course of this undertaking. Moreover, Being a Higher Education Commission
(HEC), Islamabad-Pakistan "indigenous Scholar", I am thankful to HEC for financial
support.
Finally, I appreciate my family efforts especially my father Muhammad Shuaib (Late),
my brothers Kazim Khan and Asim Khan and other family members for their sacrifices,
understanding and being constant source of prayers and inspiration which enabled me to
complete my PhD work successfully.
(Faheem Khan)
iii
ROLE OF EXTENSION SERVICES ON PRODUCTION OF
SUGARCANE IN DISTRICT MARDAN AND CHARSADDA:
KHYBER PAKHTUNKHWA-PAKISTAN
Faheem Khan and Muhammad Zafarullah Khan
Department of Agricultural Extension Education and Communication
Faculty of Rural Social Sciences, The University of Agriculture, Peshawar-Pakistan
October, 2015
ABSTRACT
Sugarcane is the most important cash crop in Pakistan; however, yield ha-1 is low. The
present study was started to investigate in the year 2012 in order to examine the role of
extension services in promoting sugarcane production, analyze the existing techniques of
extension services, identify the main factors responsible for un-satisfactory performance
of extension services of sugarcane production and finally compare the present yield
against high yielding varieties. Two districts: Mardan and Charsadda (famous and most
important sugarcane growing areas of Khyber Pakhtunkhwa) were purposively selected
as sample frame locations for this research. Multi-stage sampling methods were used to
collect data from 336 sugarcane growers through pre-tested interview schedule. T-test
and chi-square test were conducted to treat multivariate variables. The study concentrated
on the views of share croppers, owner cultivator, owner–cum tenant and tenant farmers
keeping in view their landholding factors. Majority (80 %) of the farmers was illiterate
and depended on fellow farmers for information on new technologies of sugarcane. The
information was not only primitive but also scientifically un-recommended. Because of
high rates of illiteracy, the farmers could not be benefitted from the new information on
sugarcane technologies disseminated by electronic and print media. Consequently the
sugarcane yield remained low and could not increase. The sugarcane growers could not
get the modern technological information on sugarcane from the Extension Department
for a number of reasons: the limited visits by the extension workers to the sugarcane
growers’ fields (may be because of insufficient staff, lack of transport facilities and
absence of check and balance system) as majority of farmers were still growing the
outdated varieties. The Agriculture Extension Department was also responsible for non-
provision of HYV of sugarcane, information on IPM, weed control, recommended doses
and use of recommended insecticides and pesticides of sugarcane crop. The major
problems faced by sugarcane growers were shortage of irrigation water (canals and tube
wells), lack of well-organized water management systems, exploitation of sugar mills and
input unavailability (such as chemicals and machineries at the right time). The farmers
still use the outdated chemicals such as Regind, Millathian and Puradan. It is
recommended that required inputs may be made available in the local market at
reasonable prices when needed by the farmers. An improved sugarcane package may be
developed by the Agricultural Extension Department and not only publicize it but also
distribute the package to the farmers on their doorsteps in the form of literature to guide
them in a perfect sense by using important methods during demonstration sessions.
Subsidy on inputs and prices of Agricultural Machinery may be provided to the farming
community rather than exploiting under the umbrella of Government supervision.
iv
LIST OF TABLES
______________________________________________________________________
Table No. Title Page No.
Table. 1.1 Area, production and yield of sugarcane in Pakistan 2
Table. 1.2 Major and minor crops of Khyber Pakhtunkhwa 5
Table. 3.1 District wise area, production and yield of sugarcane in
year 2012-13 in Khyber Pakhtunkhwa 27
Table. 3.2 Procedure regarding sample selection 29
Table. 4.1 Distribution of respondents by literacy levels of the sample
respondents 33
Table. 4.2 Association between educational levels of the respondents
and sugarcane sroduction 34
Table. 4.3 Association of land size with sugarcane production 37
Table. 4.4 Association between tenural status and
sugarcane production 41
Table. 4.5 Association between soils used for sugarcane cultivation 44
with sugarcane production
Table. 4.6 Distribution of respondents stating the use of yarm yard manure 52
Table. 4.7 Distribution of respondents stating the use of irrigation water 54
Table. 4.8 Distribution of respondents stating their types of soil 57
Table. 4.9 Association of types of soil with sugarcane production 59
Table. 4.10 Association between sowing time of sugarcane 61
with sugarcane production
Table. 4.11 Association of agricultural machineries with sugarcane production 65
Table. 4.12 Distribution of respondents by source of agricultural information 67
Table. 4.13 Distribution of respondents stating types of canal water 76
Table. 4.14 Distribution of respondents stating sufficiency of irrigation water 77
Table. 4.15 Association of irrigation water with sugarcane production 78
Table. 4.16 Distribution of respondents stating expenses of 79
agricultural machinery
Table. 4.17 Distribution of respondents by cost (Rs) of inputs 80
Table. 4.18 Distribution of respondents stating the use of seeds 81
Table. 4.19 Association of sugarcane cultivation for “sugarmills” 85
Table. 4.20 Association of sugarcane cultivation for “Gur” production 86
Table. 4.21 Distribution of respondents stating yield of sugarcane 87
Table. 4.22 Number of respondents stating different of weeds 89
Table. 4.23 Number of respondents stating different methods for 91
weeds control
Table. 4.24 Number of respondents stating cultural methods 93
for weed control
Table. 4.25 Number of respondents stating about different 95
pests of sugarcane
Table. 4.26 Number of respondents stating use of pesticides 97
Table. 4.27 Number of respondents stating use of different weedicides 99
v
Table. 4.28 Number of respondents stating use of insecticides 100
Table. 4.29 Number of respondents stating acquaintance of 102
agricultural extension department
Table. 4.30 Association of field assistant of agricultural 103
extension department with sugarcane production
Table. 4.31 Number of responding stating type of acquaintance 104
about field assistant of agricultural extension department
Table. 4.32 Association between types of acquaintances with field 105
assistant of agricultural extension department and sugarcane
production agricultural extension department
and sugarcane production
Table. 4.33 Number of respondents by distance of villages from local market 107
Table. 4.34 Association of village distances from local market with 108
sugarcane production
Table. 4.35 Number of respondents stating road condition 109
Table. 4.36 Association between road condition and sugarcane production 110
Table. 4.37 Number of respondents stating awareness about 111
agricultural extension department
Table. 4.38 Association between awareness about agricultural 112
extension department with sugarcane production
Table. 4.39 Respondents sating visit to agricultural extension department 113
Table. 4.40 Association between visits of respondents to agricultural 114
extension department with sugarcane production
Table. 4.41 Frequency visit to agricultural extension department 115
Table. 4.42 Number of respondents stating distance of agricultural 117
extension department from village
Table. 4.43 Association between distances of agricultural 118
extension department from village with sugarcane production
Table. 4.44 Provision of sugarcane cultivation information through
field assistant of agricultural extension department 119
through field assistant
Table. 4.45 Association between field assistant visits with sugarcane production 121
Table. 4.46 Types of information through field assistant 122
Table. 4.47 Number of respondents stating various methods/techniques 123
of information through field assistant
Table. 4.48 Association of methods/techniques of agricultural information 124
with sugarcane production
Table. 4.49 Distribution of respondents stating effective methods of 125
agricultural information field assistant information
Table. 4.50 Used of informal methods of agricultural information 126
Table. 4.51 Number of respondents stating source of agricultural 127
information through friends/relatives
Table. 4.52 Distribution of respondents stating agricultural information 129
through television
Table. 4.53 Association of agricultural information through television 129
with sugarcane production
vi
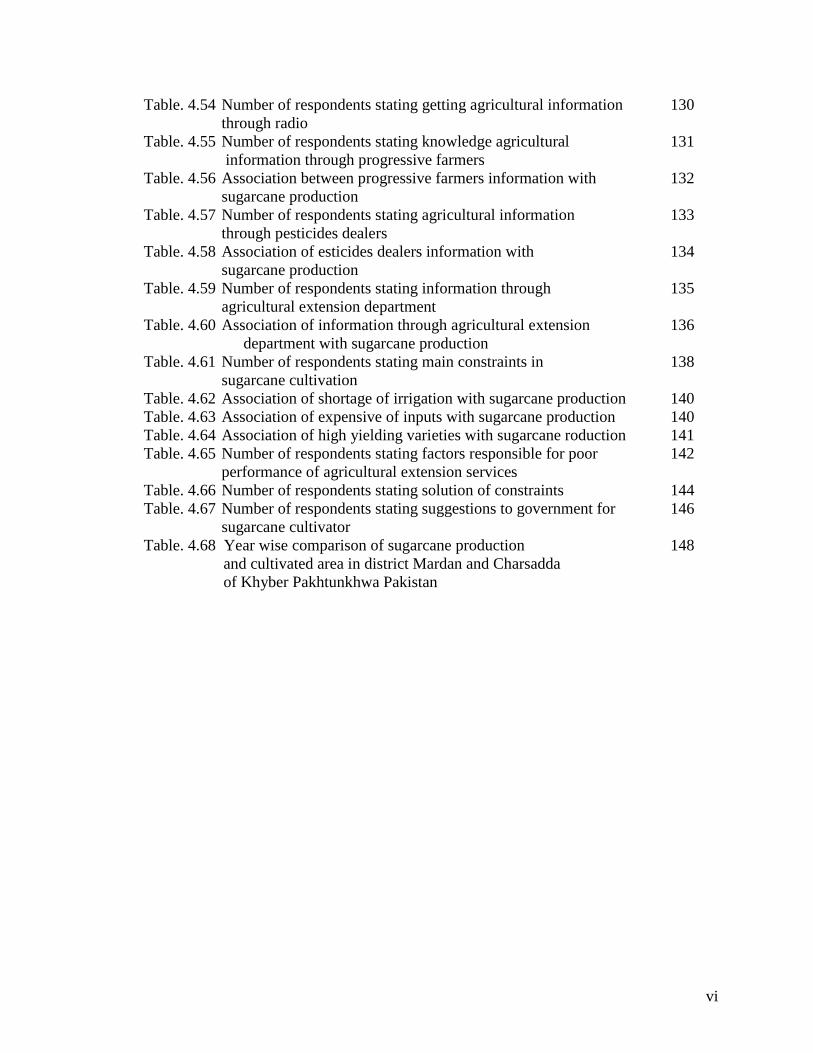
Table. 4.54 Number of respondents stating getting agricultural information 130
through radio
Table. 4.55 Number of respondents stating knowledge agricultural 131
information through progressive farmers
Table. 4.56 Association between progressive farmers information with 132
sugarcane production
Table. 4.57 Number of respondents stating agricultural information 133
through pesticides dealers
Table. 4.58 Association of esticides dealers information with 134
sugarcane production
Table. 4.59 Number of respondents stating information through 135
agricultural extension department
Table. 4.60 Association of information through agricultural extension 136
department with sugarcane production
Table. 4.61 Number of respondents stating main constraints in 138
sugarcane cultivation
Table. 4.62 Association of shortage of irrigation with sugarcane production 140
Table. 4.63 Association of expensive of inputs with sugarcane production 140
Table. 4.64 Association of high yielding varieties with sugarcane roduction 141
Table. 4.65 Number of respondents stating factors responsible for poor 142
performance of agricultural extension services
Table. 4.66 Number of respondents stating solution of constraints 144
Table. 4.67 Number of respondents stating suggestions to government for 146
sugarcane cultivator Table. 4.68 Year wise comparison of sugarcane production 148
and cultivated area in district Mardan and Charsadda
of Khyber Pakhtunkhwa Pakistan
vii
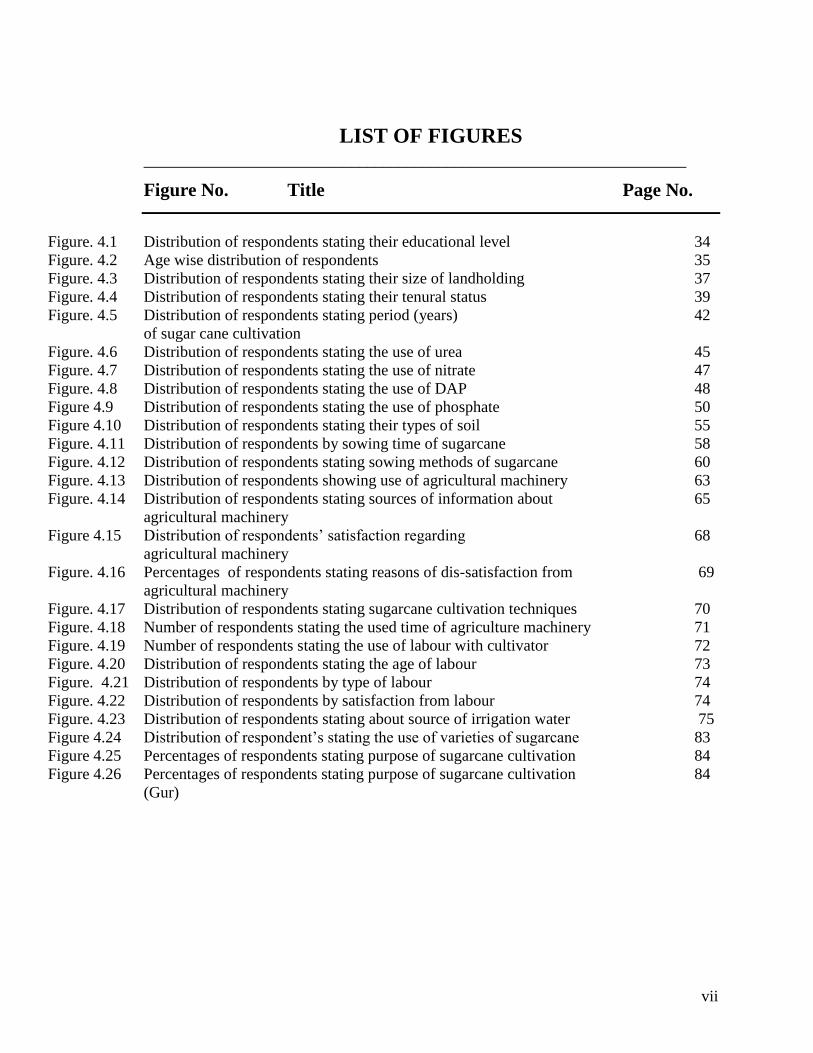
LIST OF FIGURES
____________________________________________________________________
Figure No. Title Page No.
Figure. 4.1 Distribution of respondents stating their educational level 34
Figure. 4.2 Age wise distribution of respondents 35
Figure. 4.3 Distribution of respondents stating their size of landholding 37
Figure. 4.4 Distribution of respondents stating their tenural status 39
Figure. 4.5 Distribution of respondents stating period (years) 42
of sugar cane cultivation
Figure. 4.6 Distribution of respondents stating the use of urea 45
Figure. 4.7 Distribution of respondents stating the use of nitrate 47
Figure. 4.8 Distribution of respondents stating the use of DAP 48
Figure 4.9 Distribution of respondents stating the use of phosphate 50
Figure 4.10 Distribution of respondents stating their types of soil 55
Figure. 4.11 Distribution of respondents by sowing time of sugarcane 58
Figure. 4.12 Distribution of respondents stating sowing methods of sugarcane 60
Figure. 4.13 Distribution of respondents showing use of agricultural machinery 63
Figure. 4.14 Distribution of respondents stating sources of information about 65
agricultural machinery
Figure 4.15 Distribution of respondents’ satisfaction regarding 68
agricultural machinery
Figure. 4.16 Percentages of respondents stating reasons of dis-satisfaction from 69
agricultural machinery
Figure. 4.17 Distribution of respondents stating sugarcane cultivation techniques 70
Figure. 4.18 Number of respondents stating the used time of agriculture machinery 71
Figure. 4.19 Number of respondents stating the use of labour with cultivator 72
Figure. 4.20 Distribution of respondents stating the age of labour 73
Figure. 4.21 Distribution of respondents by type of labour 74
Figure. 4.22 Distribution of respondents by satisfaction from labour 74
Figure. 4.23 Distribution of respondents stating about source of irrigation water 75
Figure 4.24 Distribution of respondent’s stating the use of varieties of sugarcane 83
Figure 4.25 Percentages of respondents stating purpose of sugarcane cultivation 84
Figure 4.26 Percentages of respondents stating purpose of sugarcane cultivation 84
(Gur)
viii
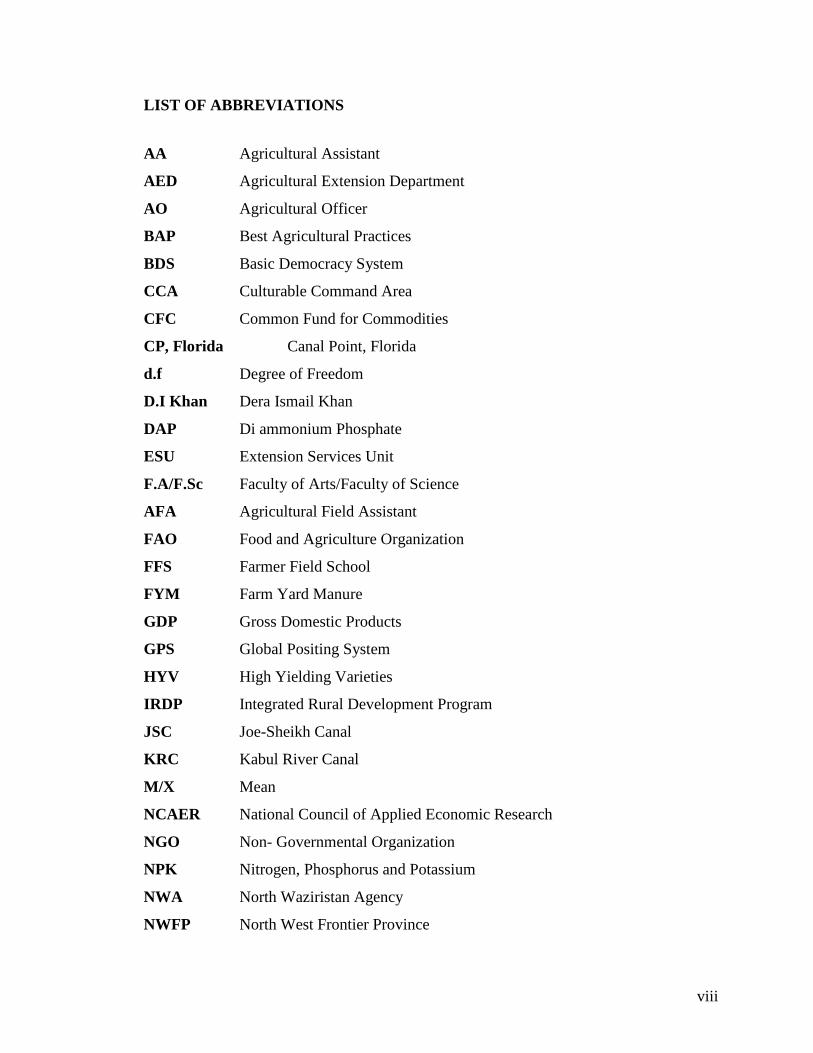
LIST OF ABBREVIATIONS
AA Agricultural Assistant
AED Agricultural Extension Department
AO Agricultural Officer
BAP Best Agricultural Practices
BDS Basic Democracy System
CCA Culturable Command Area
CFC Common Fund for Commodities
CP, Florida Canal Point, Florida
d.f Degree of Freedom
D.I Khan Dera Ismail Khan
DAP Di ammonium Phosphate
ESU Extension Services Unit
F.A/F.Sc Faculty of Arts/Faculty of Science
AFA Agricultural Field Assistant
FAO Food and Agriculture Organization
FFS Farmer Field School
FYM Farm Yard Manure
GDP Gross Domestic Products
GPS Global Positing System
HYV High Yielding Varieties
IRDP Integrated Rural Development Program
JSC Joe-Sheikh Canal
KRC Kabul River Canal
M/X Mean
NCAER National Council of Applied Economic Research
NGO Non- Governmental Organization
NPK Nitrogen, Phosphorus and Potassium
NWA North Waziristan Agency
NWFP North West Frontier Province
ix
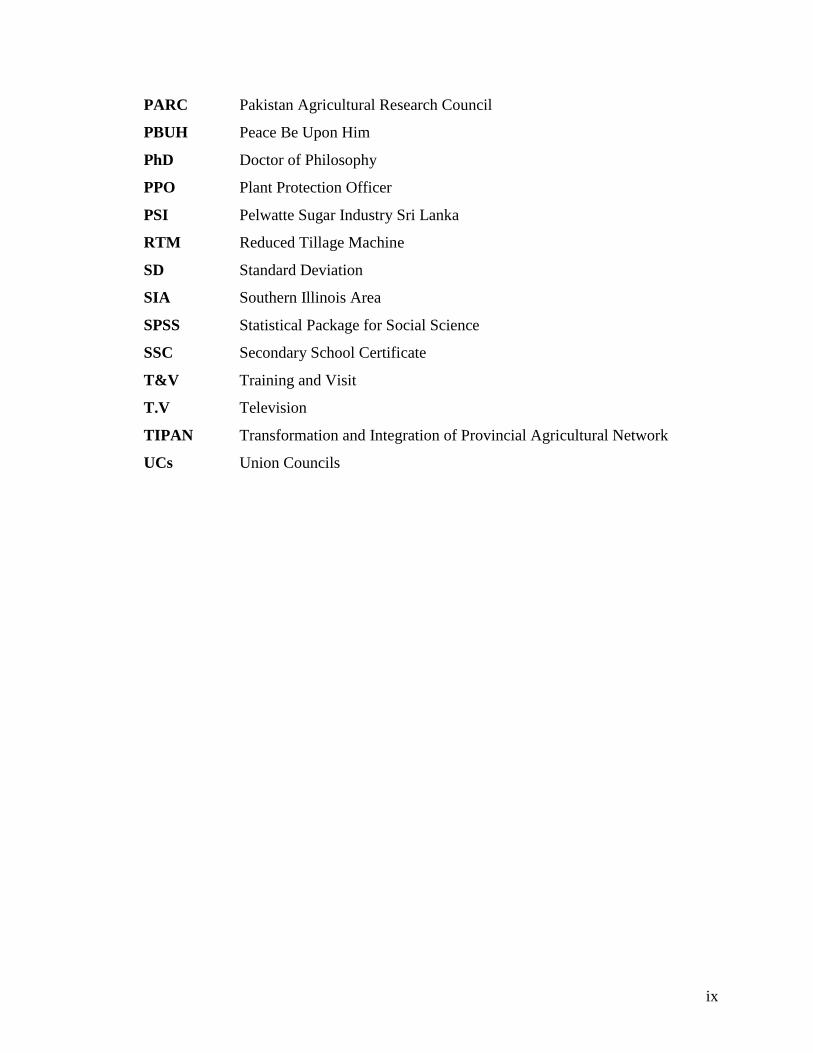
PARC Pakistan Agricultural Research Council
PBUH Peace Be Upon Him
PhD Doctor of Philosophy
PPO Plant Protection Officer
PSI Pelwatte Sugar Industry Sri Lanka
RTM Reduced Tillage Machine
SD Standard Deviation
SIA Southern Illinois Area
SPSS Statistical Package for Social Science
SSC Secondary School Certificate
T&V Training and Visit
T.V Television
TIPAN Transformation and Integration of Provincial Agricultural Network
UCs Union Councils
1
I. INTRODUCTION
1.1 Historical Background
It is theorized that sugarcane was first domesticated as a crop in New Guinea around
6000 BC. New Guinean farmers and other early cultivators of sugarcane chewed the plant
for its sweet juice. In the beginning farmers in Southeast Asia and else where boiled the
cane juice down to a viscous mass to facilitate transportation but the first known
production of crystalline sugar began in Northern India. Around the 8 century AD, Arab
traders introduced sugar from South Asia and the other parts of the Abbasid Caliphate in
Egypt, North Africa and Andalusia. By the 10th century, there was no village in
Mesopotamia that did not grow sugarcane. It was among the crops brought to the
Americas by the Andalusians from their fields in the Canary Island and the Portuguese
from their fields in the Madeira Island (Kew, 2014).
Sugarcane belongs to family Gramineae. It is a tall perennial grass with stalk ranges from
2-5 cm in diameter and 1-4 meter in height under tropical climatic conditions. It is
present from 10-25 cm below the ground. The leaf blade of sugarcane is long and narrow,
varying in width from 2-8 cm and up to 2 meter or more in length. Sugarcane is
primarily a tropical crop that usually requires 8-14 months to reach maturity. The high
temperature may permit rapid growth for 8 months or more in a yea (Zubair, 2014).
Sugarcane is one of the major cash crops of Pakistan. Sugarcane production generates
income for farming community and source of employment for the youth of Pakistan.
Sugarcane provides necessary raw materials to industries like sugarmills, chipboard and
paper industries. Its added value to agriculture and Gross Domestic Product (GDP) is
about 4% and 1%, respectively (GOP, 2012).
2
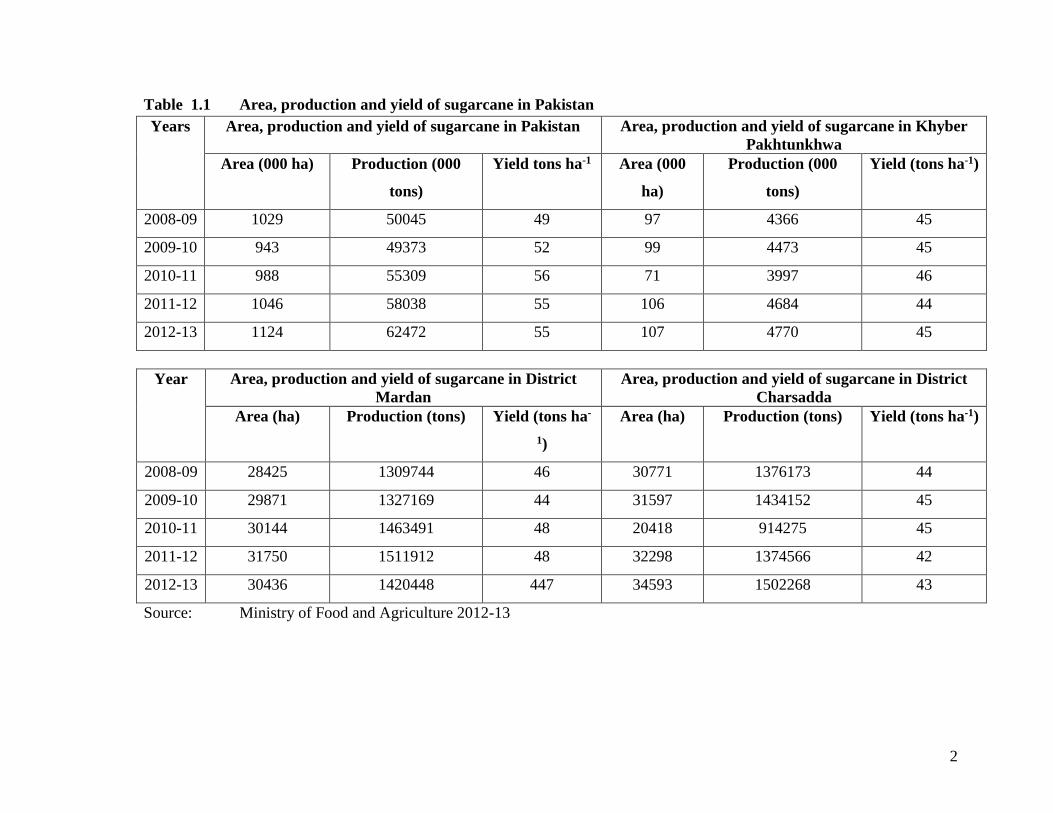
Table 1.1 Area, production and yield of sugarcane in Pakistan
Years Area, production and yield of sugarcane in Pakistan Area, production and yield of sugarcane in Khyber
Pakhtunkhwa
Area (000 ha) Production (000
tons)
Yield tons ha-1 Area (000
ha)
Production (000
tons)
Yield (tons ha-1)
2008-09 1029 50045 49 97 4366 45
2009-10 943 49373 52 99 4473 45
2010-11 988 55309 56 71 3997 46
2011-12 1046 58038 55 106 4684 44
2012-13 1124 62472 55 107 4770 45
Source: Ministry of Food and Agriculture 2012-13
Year Area, production and yield of sugarcane in District
Mardan
Area, production and yield of sugarcane in District
Charsadda
Area (ha) Production (tons) Yield (tons ha-
1)
Area (ha) Production (tons) Yield (tons ha-1)
2008-09 28425 1309744 46 30771 1376173 44
2009-10 29871 1327169 44 31597 1434152 45
2010-11 30144 1463491 48 20418 914275 45
2011-12 31750 1511912 48 32298 1374566 42
2012-13 30436 1420448 447 34593 1502268 43
3
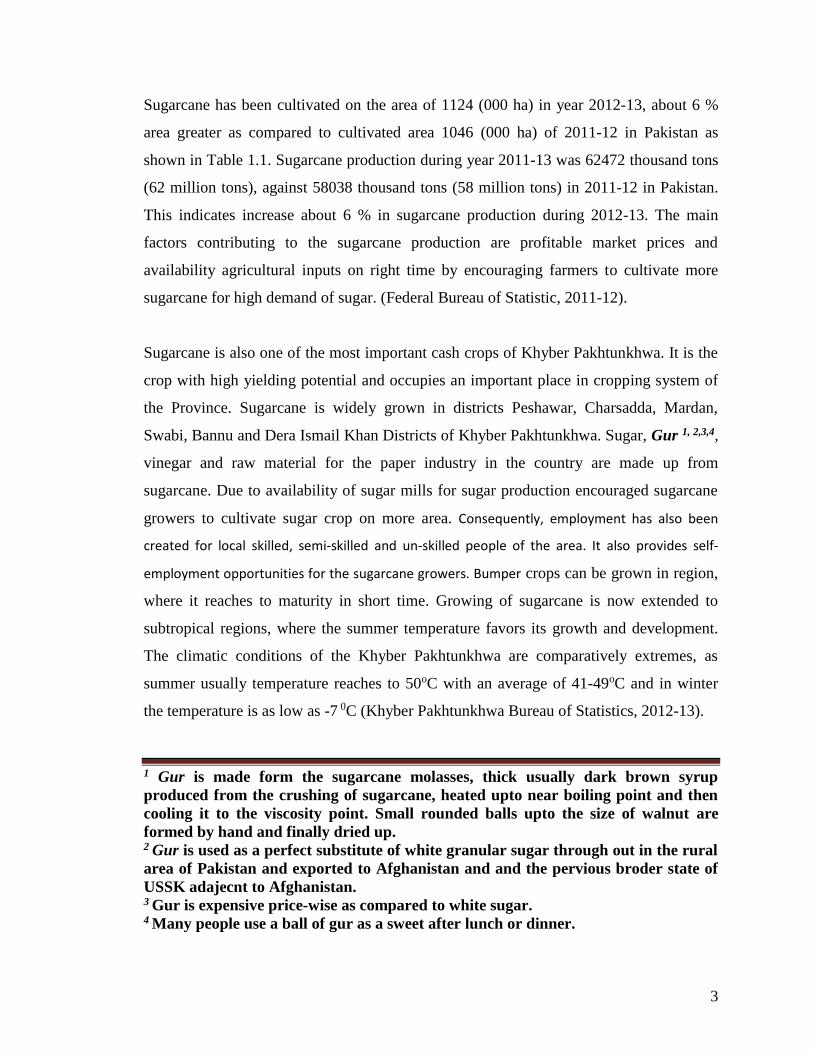
Sugarcane has been cultivated on the area of 1124 (000 ha) in year 2012-13, about 6 %
area greater as compared to cultivated area 1046 (000 ha) of 2011-12 in Pakistan as
shown in Table 1.1. Sugarcane production during year 2011-13 was 62472 thousand tons
(62 million tons), against 58038 thousand tons (58 million tons) in 2011-12 in Pakistan.
This indicates increase about 6 % in sugarcane production during 2012-13. The main
factors contributing to the sugarcane production are profitable market prices and
availability agricultural inputs on right time by encouraging farmers to cultivate more
sugarcane for high demand of sugar. (Federal Bureau of Statistic, 2011-12).
Sugarcane is also one of the most important cash crops of Khyber Pakhtunkhwa. It is the
crop with high yielding potential and occupies an important place in cropping system of
the Province. Sugarcane is widely grown in districts Peshawar, Charsadda, Mardan,
Swabi, Bannu and Dera Ismail Khan Districts of Khyber Pakhtunkhwa. Sugar, Gur 1, 2,3,4,
vinegar and raw material for the paper industry in the country are made up from
sugarcane. Due to availability of sugar mills for sugar production encouraged sugarcane
growers to cultivate sugar crop on more area. Consequently, employment has also been
created for local skilled, semi-skilled and un-skilled people of the area. It also provides self-
employment opportunities for the sugarcane growers. Bumper crops can be grown in region,
where it reaches to maturity in short time. Growing of sugarcane is now extended to
subtropical regions, where the summer temperature favors its growth and development.
The climatic conditions of the Khyber Pakhtunkhwa are comparatively extremes, as
summer usually temperature reaches to 50oC with an average of 41-49oC and in winter
the temperature is as low as -7 0C (Khyber Pakhtunkhwa Bureau of Statistics, 2012-13).
1 Gur is made form the sugarcane molasses, thick usually dark brown syrup
produced from the crushing of sugarcane, heated upto near boiling point and then
cooling it to the viscosity point. Small rounded balls upto the size of walnut are
formed by hand and finally dried up. 2 Gur is used as a perfect substitute of white granular sugar through out in the rural
area of Pakistan and exported to Afghanistan and and the pervious broder state of
USSK adajecnt to Afghanistan. 3 Gur is expensive price-wise as compared to white sugar. 4 Many people use a ball of gur as a sweet after lunch or dinner.
4
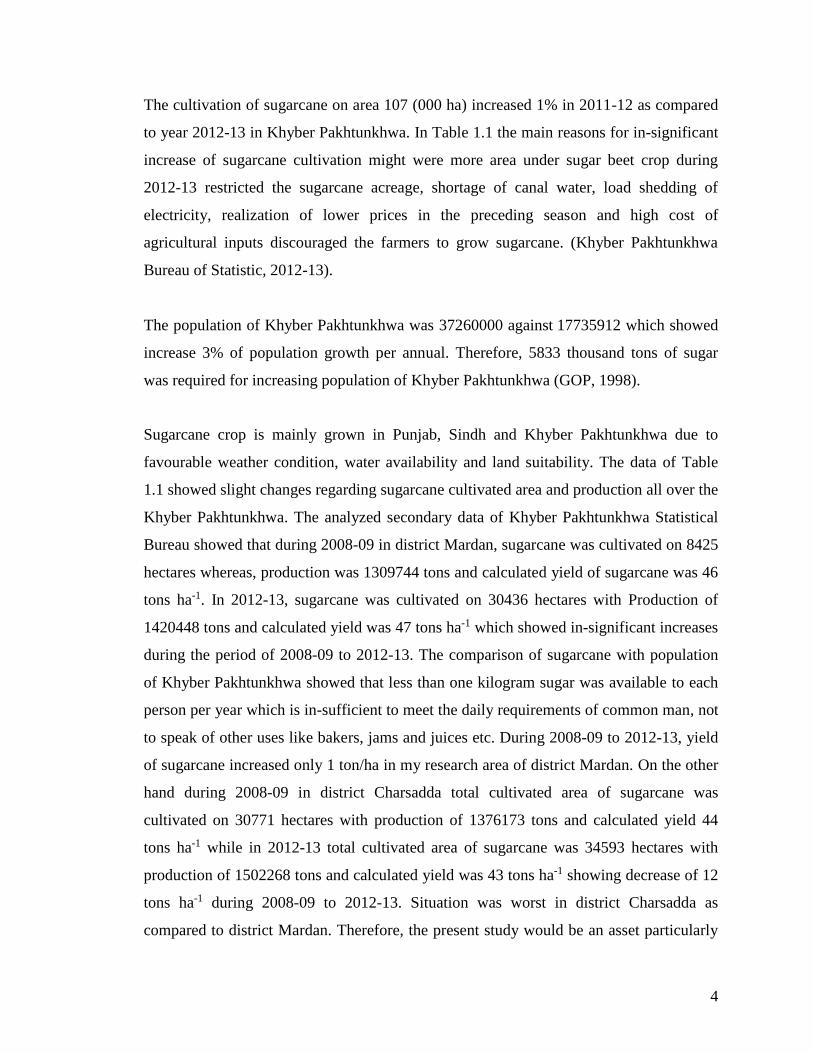
The cultivation of sugarcane on area 107 (000 ha) increased 1% in 2011-12 as compared
to year 2012-13 in Khyber Pakhtunkhwa. In Table 1.1 the main reasons for in-significant
increase of sugarcane cultivation might were more area under sugar beet crop during
2012-13 restricted the sugarcane acreage, shortage of canal water, load shedding of
electricity, realization of lower prices in the preceding season and high cost of
agricultural inputs discouraged the farmers to grow sugarcane. (Khyber Pakhtunkhwa
Bureau of Statistic, 2012-13).
The population of Khyber Pakhtunkhwa was 37260000 against 17735912 which showed
increase 3% of population growth per annual. Therefore, 5833 thousand tons of sugar
was required for increasing population of Khyber Pakhtunkhwa (GOP, 1998).
Sugarcane crop is mainly grown in Punjab, Sindh and Khyber Pakhtunkhwa due to
favourable weather condition, water availability and land suitability. The data of Table
1.1 showed slight changes regarding sugarcane cultivated area and production all over the
Khyber Pakhtunkhwa. The analyzed secondary data of Khyber Pakhtunkhwa Statistical
Bureau showed that during 2008-09 in district Mardan, sugarcane was cultivated on 8425
hectares whereas, production was 1309744 tons and calculated yield of sugarcane was 46
tons ha-1. In 2012-13, sugarcane was cultivated on 30436 hectares with Production of
1420448 tons and calculated yield was 47 tons ha-1 which showed in-significant increases
during the period of 2008-09 to 2012-13. The comparison of sugarcane with population
of Khyber Pakhtunkhwa showed that less than one kilogram sugar was available to each
person per year which is in-sufficient to meet the daily requirements of common man, not
to speak of other uses like bakers, jams and juices etc. During 2008-09 to 2012-13, yield
of sugarcane increased only 1 ton/ha in my research area of district Mardan. On the other
hand during 2008-09 in district Charsadda total cultivated area of sugarcane was
cultivated on 30771 hectares with production of 1376173 tons and calculated yield 44
tons ha-1 while in 2012-13 total cultivated area of sugarcane was 34593 hectares with
production of 1502268 tons and calculated yield was 43 tons ha-1 showing decrease of 12
tons ha-1 during 2008-09 to 2012-13. Situation was worst in district Charsadda as
compared to district Mardan. Therefore, the present study would be an asset particularly
5
for the policy makers for future planning. Because if attention is not paid to this situation
not only sugar crises will emerge but also big problem of un-employment will be created
for the local youth. Moreover, a serious political problem is expected to take place when
people will stand in long queues to get one kg or two kg sugar for one month (GOP,
2012-13).
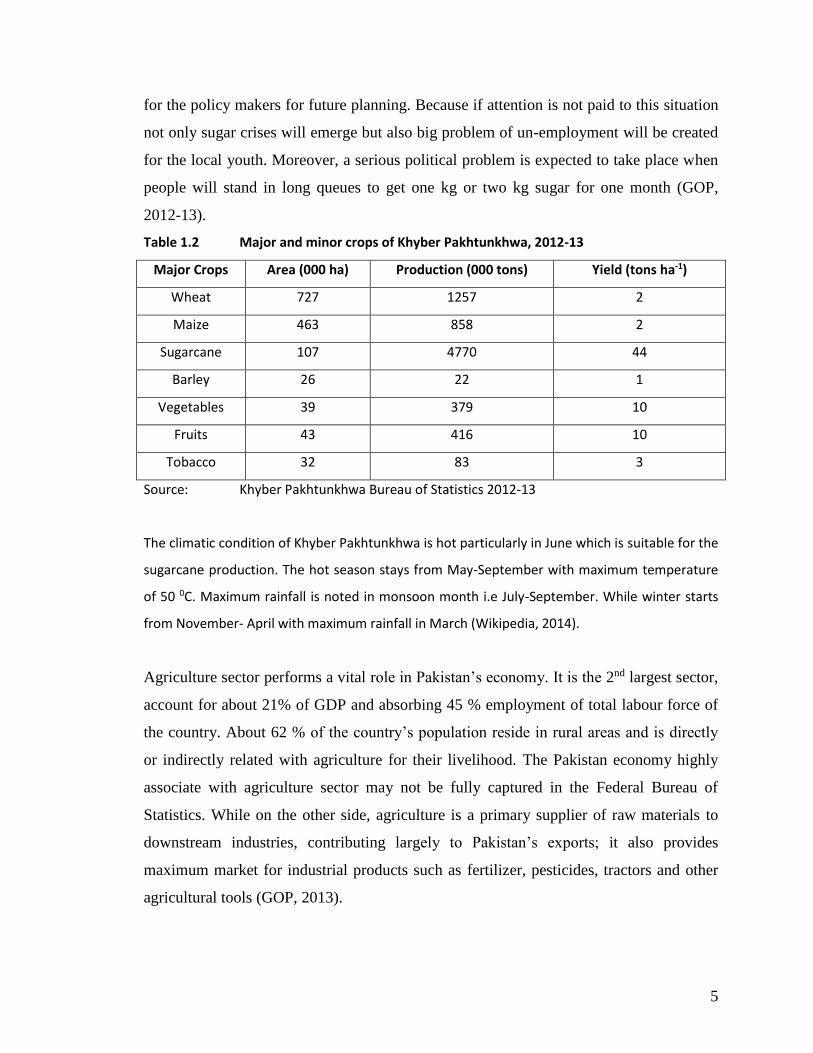
Table 1.2 Major and minor crops of Khyber Pakhtunkhwa, 2012-13
Major Crops Area (000 ha) Production (000 tons) Yield (tons ha-1)
Wheat 727 1257 2
Maize 463 858 2
Sugarcane 107 4770 44
Barley 26 22 1
Vegetables 39 379 10
Fruits 43 416 10
Tobacco 32 83 3
Source: Khyber Pakhtunkhwa Bureau of Statistics 2012-13
The climatic condition of Khyber Pakhtunkhwa is hot particularly in June which is suitable for the
sugarcane production. The hot season stays from May-September with maximum temperature
of 50 0C. Maximum rainfall is noted in monsoon month i.e July-September. While winter starts
from November- April with maximum rainfall in March (Wikipedia, 2014).
Agriculture sector performs a vital role in Pakistan’s economy. It is the 2nd largest sector,
account for about 21% of GDP and absorbing 45 % employment of total labour force of
the country. About 62 % of the country’s population reside in rural areas and is directly
or indirectly related with agriculture for their livelihood. The Pakistan economy highly
associate with agriculture sector may not be fully captured in the Federal Bureau of
Statistics. While on the other side, agriculture is a primary supplier of raw materials to
downstream industries, contributing largely to Pakistan’s exports; it also provides
maximum market for industrial products such as fertilizer, pesticides, tractors and other
agricultural tools (GOP, 2013).
6
The maximum performance of agriculture division exhibited a growth of about 3 %
mostly due to positive growth in agriculture connected sub sectors excluding minor
crops. Major crops accounted for about 32 % of agricultural cost added and practiced a
growth of about 3 % in year 2011-12 with negative growth of 0.2 % in 2010-2011. The
large growth in major crops is contributed by sugarcane, rice and cotton by about 6 %,
8% and 18% respectively in Pakistan. (GOP, 2011-12).
Agriculture Development in Khyber Pakhtunkhwa besides other constraints also
suffering from weak agricultural extension system that has hindered mechanized farming
and perpetuated low yield 45855 kg ha-1 of sugarcane as against the national average of
55981 kg ha-1. The research study shows that worldwide Agriculture has undergone
tremendous developments and different technologies are applied for ploughing, sowing,
harvesting and packing the crops but majority of the local farmers still use the traditional
ways of agriculture getting in minimum yield (kg ha-1). The in-effective use of inputs and
less resources of water decrease 30 to 40 % farm production and farmers get less income.
He further stated that only 20 % local farmers of Khyber Pakhtunkhwa use traditional
agricultural technologies. The reasons of use of traditional technologies are due to
finance shortage to buy modern technologies and lack of technical knowledge for their
use. The Agricultural extension department has failed to motivate local farmers to use
modern technologies and provide them technical knowledge (Tahir, 2011).
Agricultural extension services in Pakistan have been organized as a part of the Ministry
of Agriculture. Some methods and techniques of agricultural extension have been
applied and rejected, so the government is searching for agricultural extension services
which are cost effective, receptive to farmer’s requirements, efficient and socially
acceptable. The government of Pakistan intend toward the privatization of agricultural
extension for rural development. Different systems were introduced in Pakistan for the
farming community such as “farmers contact system” and “non-contact farmers System”
which could not show benefits for the farming community. The research findings showed
that the public and private extension systems present opposing, incompatible and
overlapping programs. The private and public extension has approach and supply
7
technology only to contact farmers which strictly limits the diffusion of technologies. The
private extension sector is maximum consideration on helping and requirements of larger
landholding’s farmers because the private extension basic goal to generate income. The
public agricultural extension sector declines toward educated farmers instead of less
educated farmers in Pakistan. The policy makers necessary to aware from strategies of
farmer’s community, such as: Private agricultural extension may not give the maximum
technologies and support to small farmers and the public or private agricultural extension
is searching to find out information/techniques to un-educated farmers/dealers (Davidson
et al., 2001).
The public agricultural extension department performed poor role in increasing the
agricultural productivity, while the private sector accelerates the development of
agriculture. Though agricultural extension programmes are usually prepared for educated
and large landholding’s size farmers. Agricultural extension services are traditionally
organized in Pakistan as part of Provisional Ministry of Agriculture. Several extension
models and styles have been used such as Village-AID program, Basic Democracy,
Integrated Rural Development Program (IRDP) and Training and Visit approach (T&V)
etc (GOP, 2005).
Training and Visit (T&V) system focused on agriculture which also affect from the
inherent inflexibility, such as over dependence on contact farmers to diffuse technical
information. These changes in programs created pressure on government to favor
privatization in Pakistan (Ahmad et al., 2000). The agricultural technologies and
techniques constantly changes in world. Therefore, the farmer needs to be aware of the
modern agricultural technologies and know how to use them. In order to increase yield
potential in world, public sector plays a dominant role in the provision of agricultural
extension services (Swanson et al., 1997). World-wide survey of FAO showed that 81%
of extension workers around the world perform function under the Ministry or
Department of Agriculture while 95% of extension services engaged the public extension
(Umali and Schwartz, 1994). The public agricultural extension performance in
developing countries failed to transfer agricultural technology to farmers. The large
8
number of farmers remains outside the ambit of extension provider. The farmers with
maximum action often avoid agricultural extension agents in liking to direct get in touch
with research scientist; Due to above reasons, dissatisfaction with technical competencies
and services of public region of agricultural extension (Prinsley et al., 1994). Now a
day’s 3 out of 4 farmers of Asia have no relationship with agricultural extension agents
(Maalouf et al., 1991). The performance of agricultural extension services are related
with different factors such as non-extension responsibilities, insufficient field information
of new technologies, lack of suitable technology, lack of safety and security, political
interference, improper policy, lack of qualified and trained staff, lack of coordination and
cooperation (Antholt., 1994). The public agricultural extension activities constantly fail
to contact with locate of definite wants and sending troubles of farmers to researchers in
other words they could not cater proper extension services for poor farmers (Ahmad,
1999).
The other research study showed the role of farmer field schools on sugarcane
productivity in Malakand Agency. Farmer Field School approach is meant to assist
sugarcane growers to find out and study about ecology and integrated crop management.
The research showed that greatest agricultural practices have brought a positive change in
the approach of sugarcane growers in study area through Farmers Field School Approach
(FSA) (Habib et al., 2007).
Sugarcane production with reference of extension services at union council Malakander-
Peshawar was studied in Khyber Pakhtunkhwa. The study found that extension services
were criticized and their role in adoption and diffusion technology was negligible, as area
under sugarcane cultivation was decreased in the study area and yield of sugarcane also
decreased by 31% during 2004-05 to 2009-10 years. The main factors responsible for low
sugarcane production were poor financial condition of the farmers, lack of technical
knowhow, unavailability and non availability of high prices of chemical fertilizers and
high yielding varieties in local market, in-efficient and in-effective role of extension staff
(Perviaz et al., 2013).
9
1.2 SIGNIFICANCE OF THE STUDY
In Pakistan generally and Khyber Pakhtunkhwa particularly population is increasing with
an accelerated rate (GOP, 1998). If the increasing of population is not checked could pose
serious threat for planners and politicians. Consequently, this could cause hunger, famine,
mal nutrition and unemployment. In the past, sugar crises created considerable problems
especially for poor and downtrodden people of this country because the price of sugar
goes behind purchasing power of common man. According to statistical data of Khyber
Pakhtunkhwa the area under sugarcane cropping cultivation during 2007-08 was 103
thousand hectares, production was 4751 thousand tons and calculated yield 46005 kg ha-1
for the same area whereas, during 2012-13 area under sugarcane cropping cultivation
increase to 107 thousand hectares, production came to 4770 thousand tons and calculated
yield 44579 kg ha-1 which indicate in-sufficient increase of an area of sugarcane 4%, 8%
production and calculated yield 1426 kg ha-1 show in Table 1.1. During same period
population of Khyber Pakhtunkhwa increased with accelerate rate thus, the available
amount of sugar is not enough for meeting requirements of increasing population. The
land and climate of major parts of Khyber Pakhtunkhwa like Mardan, Charsadda,
Peshawar and Dera Ismail Khan is most suitable for sugarcane cultivation, however, this
constituted a small fraction of total crops area of Khyber Pakhtunkhwa. The statistical
data showed that wide gap existed between demand and supply (GOP, 2012-13). In order
to fill this gap the present study is initiated which will be beneficial to planners, policy
makers, researchers, students, politicians and other stakeholders.
OBJECTIVES OF THE STUDY
The main objectives of this research study are:
1. To analyze the existing techniques of extension services in the study area.
2. To investigate the role of extension services in promoting sugarcane production.
3. To identify the main factors responsible for un-satisfactory performance of extension
services regarding sugarcane production.
4. To examine the present yield against high yielding varities in the study area.
5. To formulate recommendations and suggestions for policy makers of the country.
10
II. REVIEWS OF LITERATURE
Relevant and related studies available on the subject of proposed research are reviewed to
assess the work done, to get insights to research problem, to clarify concept and
highlights the background of the problem, to prepare a study design with improved focus
and coverage, to prevent dynamics of fieldwork, and present latest finding.
In fact the study presents appropriate viewpoint underlining require, significance and
future potentials for preferred development. It also provides way about the difficulty and
eliminates the view of needless repetition of effort created during the last three decades.
The search for significant studies resulted in a list of 34 publications on related aspects
are briefly reviewed in the section.
Marinho et al. (1976) performed an experiment on the influence of nitrogen, phosphorus
and potassium on the industrial yield of sugarcane plantation in several localities in
Alagoas. The results obtain indicated that in some cases low doses (50 kg/ha) of nitrogen
negatively affected cane and sugar yields, pool percentage and purity. Similarly negative
effects were noted with the application of more than (100 kg/ha) phosphorus on soils with
no phosphorus deficiency, especially if given to ratoon cane. Potassium did not depress
yields or cane juicy quality. It could show positive effect on juice quality even with levels
exceeding (50kg/ha) potassium. It is responsibilities of agricultural extension workers
that create awareness about recommend doses of nitrogen among sugarcane growers.
Jan (1977) concluded from the three years experiment at the Sugarcane Research Institute
Mardan that the yield of sugarcane per hectare was more with nitrogen application as
compared to phosphorus and potash application separately because phosphorus and
potash are more available in Peshawar valley. Experiments conducted at Mardan as on
cane trials for several years showed that nitrogen chemical fertilizers increase the cane
yield but decrease the sugar yield, but 125 kg nitrogen/ha application not only increase
the cane yield, but decrease the sugar yield on other hand more than 125 kg /ha
application of nitrogen inversely effect sugar yield. Application of 112 to 125 kg
nitrogen/ha for sugarcane and 135 to 168 kg/ha nitrogen for ratoon crop was
11
recommended for increase cane yield by 20-25 percent and sugar yield by 20-30 percent.
It is suggested from research study that government can create awareness among
sugarcane growers through agricultural extension department to use recommended doses
of nitrogen in the field.
Obien and Baltazar (1980) recommended various techniques to control weeds in crops
(Philippines) when some 106 weed species of 32 families become a problem in sugarcane
production. The authors observed that weed control should be started as soon as possible
after planting. The authors have stressed on combined cultural and chemical methods and
also have emphasized on cost reduction and revenue increasing practices, like inter
cropping. The extension workers create awareness among sugarcane growers to use
recommended techniques for weeds control in sugarcane field.
Qasim and Malik (1985) concluded that due to severe frost tillering, cane yield and
commercial cane sugar quality were severely affected. Young eyes were blinded and due
to inversion of crystalizable cane sugar, crystallization was a problem but inspire of all L-
62/96 was highly yielding variety. The experiment find out that the feasibility of inter
planting different crops in sugarcane for obtaining maximum return per unit area are
sugarcane alone, sugarcane with wheat, berseem and sugar beet. The maximum net
income of Rs. 2071/ha was given by the treatment sugarcane inter planted with sugar beet
as compared to mono sugarcane and sugar beet followed by maize. Agricultural
extension workers motivate sugarcane growers to cultivate recommended/high yielding
varieties and intercropping method for return maximum net income.
Dhawan (1989) study showed that the high yielding varieties have positive role in
productivity. It is conducted that total factors of productivity increase due to period of
time especially in green revolution period of grains. The total productivity factors
increase 1.1% crop growths per year in India due to use of inputs. The investment of
several types of inputs relate from the contribution of total factor productivity growth
which is explain 60% of total factors of productivity by public agricultural research and
extension. The improved rural market and irrigation investment provide and improved
12
environment for crop technology. It examines that public research; extension and
irrigation to total factors of productivity growth decline over time but after sometime its
return increase more than 50% due to improved irrigation system as compare to public
canal irrigation system. The origin of modern varieties shows positively significant
because of investment in public research and irrigation system. The agricultural extension
and research impact through the replacement of older generations of high yielding
varieties by newer generations which improve traits and direct expansion of high yielding
varieties to new area.
Gilbert (1990) founded that mostly farmers of rural areas are still exercise old techniques
for sugarcane cultivation. Rural farmers have different problems, which generate hurdles
in the acceptance of better practices. He also stated that modern technology, as adoption
and managed by farmers often did not perform as well as expected and additional
operation could be essential. He observed that some problems which occur to farmers in
the adoption improved farm practices were lack of knowledge and understanding of
farming pattern, inadequate advice from farmers to research department; was suggested
in research study that agricultural extension workers create awareness and provide
training among sugarcane growers to use modern technologies.
Birkhaeuser et al. (1991) studied that extension programs improve primarily the
productivity of farmers through innovation and training in African. The information of
farmers collects by extension agents when new technology provide to the farmers.
Extension agents provide training to farmers in existing techniques. The knowledge of
farmers improves through field demonstration model, training and group meeting etc.
The impact of extension service is homogenous in agricultural production. Extension
agents have some problems connected to analysis such as, (1) Endogenous Placement:
the government starts programs in those regions where the farmers are more responsive
to dissemination of innovation and training development. (2) Particularly farmers are
skilled and more knowledge about agricultural which provide advices to agricultural
agents. The agricultural agents prefer to work with such farmers. (3) The agricultural
agents visit the farmers at that time, when the farmers face problems. The research study
13
suggested that government start programmes in appropriate region, agricultural extension
agents provide equal attention to all farmers and regularly visit to farmer’s field.
Hassan (1992) reported that agricultural and rural extension services in Bangladesh have
been using various models or changing and modifying current models in order to advance
their act. This study compares two essential models T& V and advisory in arrange and
one integrated model of extension. The sugarcane extension services of the ministry of
industry initially followed the service delivery model, which was later changed into the
farmer model when it started to activity through supervised farmers. It was further
investigated with the extension education model by introducing multiple extension works
such as meeting, demonstration, visit etc and is presently an integrated extension model.
He further suggested that all agricultural extension models are beneficial for farmer’s
communities.
Kulander and Delman (1993) conducted a study base on the statement that the excellence
of human resources in agricultural extension organization is a determining factor in its
achievement or collapse. The study showed some of the main problems facing human
resources development in the agricultural extension system in China. It is argue that the
formal agricultural education sector could knowledge of problems in supplying the
necessary number of professionals desires to maintain the speed up agricultural progress
in China requirements, and that agricultural extension could experience in exacting, since
service in rural areas mainly at field level is believe unpleasant by graduates of
agricultural institutions, man power growth arrangement in the agricultural extension
organization stops enough contact between farmers and well educate extension workers.
It appears that the professional staff working at the higher levels of the agricultural
extension system is better catered for with regard to both pre and in-service training
opportunities than those working at lower levels of extension organization who only
receive training of a limited scope equipping them with general extension skills. The
research study suggests that only skilled agricultural extension agents can train farmers
and positive role in adoption of modern technologies.
14
Rosgrant and Evenson (1995) studied in India that the increase in productivity induces
public asset in research, extension, increase of human resources and infrastructure. The
total productivity index were dependent variable and independent variable consists of
technology variable like agricultural extension staff, agricultural research stocks, part of
crop field in new varieties, factor weighted domestic, innovation, infrastructure
technology such as figure of regulate markets, net irrigate field/net sown field, daily farm
wage per annual non-farm earning, percentage of rural male literate, crop farm price, agro
climatic dummy, annual rainfall, June rainfall, July rainfall and August rainfall. The
results of the paper showed that public research, extension expenditures, irrigation and
foreign private research positively impact on total factors of productivity. The research
study suggested that the development of market and infrastructure which directly and
indirectly decrease price of inputs, increase price of output and affect the rural
investment/return of investment. The short distance between leader and follower regions
decrease address transaction costs. The raise of transactions costs decreases the total
factors of productivity. The modification occur on irrigation system due to overtime such
as private tube well system instead of public canal irrigation system which increase the
productivity of privately irrigate area as compare to dependent area on canal.
Abbas et al. (2003) studied that the existing role of farmer’s extension contacts in the
distribution of suggested sugarcane production technologies in central Punjab Pakistan. It
was concluded from this study that average distance of Agricultural Office (AO) from the
villages were 10.22 km., the Agricultural Extension Agents (AEAs) paid visits per month
to large famers. The medium farmers visited Agricultural Officers (AOs) more than large
farmers. A significant proportion of medium farmers 89% visit irregularly to the office of
AOs, which was more than small farmers 60%. Majority (62%) large farmers did not
have time to contact AEAs. Mostly AEAs was not contacted by 22% farmers in the study
areas. Above 70% of small and medium farmers attend meeting with extension workers
which is more as compared to large farmers. AEAs provide recommended informations
to sugarcane growers like improved varieties, sowing techniques, chemical fertilizers
applications, plant protection methods, eradication of weeds and irrigation through
extension methods. The research study suggested that agricultural information are fruitful
15
for all categories of farmers.
Perera et al. (2003) studied that less adoption of recommended farming techniques has
somewhat been responsible for less sugarcane and sugar yield getting by sugarcane
farmers. Further, it examines the role of extension communication at farmer level in
relative to information and adoption of farming techniques by out grower’s farmers of Sri
Lankan sugar industry. The study showed that contact farmers exclusively depend on
their agricultural assistants for knowledge and activities whereas Non contract farmers
use other source also. Mostly contract farmers contributed high credibility to the
Agricultural Assistant/Field Assistant (AA/FAs) as well as high rating for AA/FAs role
and for input services. Majority contract farmers have medium technical knowledge and
adoption levels while that of non-contract farmers had significantly low technical
knowledge and adoption level. The extension communication activities were significantly
related to farmer’s knowledge and adoption. The research study recommended that
agricultural extension methods increased adoption rate of technical and modern
technologies which is fruitful for sugarcane production.
Owens and Eweg (2003) study explained that the public and private sugar industry in
South Africa had the assets to give successful extension activities for the small scale
sugarcane growers. In 1996, the South Africa sugar union planned to combine forces with
the Department of Agriculture and Environment Affairs to structure a private/public
partnership. The name of partnership was “Joint Venture” (JV). The results of association
indicates that sugarcane production and small scale sugarcane growers income from
sugarcane have improved since the completion of the JV, which has been mostly
recognized to extra land in production, improved sharing of better varieties, better
communication run to the farmers, and better skills and motivation of the extension
worker. There has been a large contribution to rural progress and capacity building in the
communities served by the JV. The partnership has only been responsible for move of
technical information but has encouraged a positive approach change in sugarcane
growers and service donor similar. The agricultural extension field technician has
16
identified amazing change and developed better ability and credibility as a result of this
Joint Venture.
Gilbert et al. (2004) studied that increasing soil organic matter and soil fertility are
necessary things in the sustainability of sugarcane production on mineral soils in Florida.
The use of mill mud, green manure and inorganic chemical fertilizer all significantly
increased plant sugarcane stalk number, stalk weight, sugarcane tons/ha and sucrose tons/ha
compared to unfertilized controls. The addition of green manure or chemical fertilizer
resulted in an increase of sugarcane 22 tons/ha and sucrose 2.7 tons/ha. In general, adding
mill mud to green manure or chemical fertilizer inputs always increasing yields, but adding
green manure or chemical fertilizer to mill mud supplied little additional advantage to
sugarcane. It is suggested in research study that agricultural extension agents create
awareness among famer’s communities to use green manure in the field.
Thanomsub (2004) studied that timing of irrigation directly affects production and charge of
sugarcane production in China. Irrigation useful during the periods of crop concern and
yield development formed 29.1-34.4 percent better yields than with no irrigation. Maximum
yields, however, were showed with irrigation apply during the periods of crop establishment
and vegetative growth, or vegetative growth and yield development, or from crop
establishment to yield formation. These irrigation periods identified no significant various in
yields among themselves, but they created 43.3-57.2 percent more yields than with no
irrigation. Stem height, stalk number and stalk/stool were the key yield components
determining yield increases connected with length of irrigation periods. Sugarcane
cultivated in this area, particularly on a clay soil, should be irrigated during the periods of
crop establishment and vegetative growth. The research study suggested that government
provide sufficient irrigation water to farmers.
Ram et al. (2005) studied that the growing of sugarcane on sloping soil getting high
intensity rainfall causes general soil erosion in Fiji. Soil loss was mostly affected by the
various cultivating strategies related with the saving practices. Trash acted as a buffer under
high intensity rain with the result that only 153 and 221 kg soil per hectare per year were
17
tough in the first and second ratoon crops, respectively, where the sugarcane was cultivated
uphill and downhill soil losses were 16 376, 259 and 2274 kg/ha per year, in sugarcane and
in the two succeeding ratoon crops, respectively. The very low soil loss in the first ratoon
crop could be attributed to the drought conditions prevailing that year. Cultivating sugarcane
across slope and conserving trash mulch therefore decrease soil erosion and with increase
time of cultivation will maintain sugarcane yield to give suitable economic return to the
farmers.
Rainbolt et al. (2006) studied the skill of mechanical cultivating of sugarcane is a main
factor in the long term sustainability of the Florida sugarcane industry. The small length of
seed pieces applied for mechanical cultivating and the physical damage constant from
chopper harvesters results in better susceptibility to stalk rot compared to hand cultivated
sugarcane seed on Histosol, soils where prophylactic fungicides show
useless. Consequently, more seeding rates are required for mechanical cultivating to get in-
sufficient shoot population. In November, mechanically harvested sugarcane pieces of each
cultivar were cultivated in a randomized split plot trial to assess the effect of treatment with
trinexapac ethyl on shoot population. Treatments showed in less average inter node length
in CP 89-2143, CP 88-1762, and CP 78-1628. The research study suggested that
extension workers create awareness among sugarcane growers to adopt mechanical
cultivators. The mechanical cultivators and use trinexapac ethyl increase yield of
sugarcane.
Iqbal (2006) reported that there are several reasons for less production of sugarcane like
size of landholding, education ratio, weak extension activities and provision of trainings,
weak financial resources of sugarcane growers, absent of new agro technical practices,
neglect use of the existing resources, unwillingness towards acceptance of modern
techniques, lack of knowledge about inputs and their presence like chemical fertilizers,
irrigation water, pesticides, high yielding varieties, new machinery, lack of information
sources, minute information about marketing, government’s top down programs, political
interference, and many other problems are faced by sugarcane growers. The research
study suggested that government provide modern technologies, high yielding varieties of
18
sugarcane, recommended doses of inputs to sugarcane growers through agricultural
extension department.
Singels et al. (2006) reported that more potential prices relation with sugar price create the
use of sugarcane for ethanol production and co-generation more attractive than producing
sucrose only. Growing sugarcane for mostly biomass, the key element for energy products,
requires a various production approach to optimally develop environmental, genetic and
capital resources, than that for producing more sucrose. Conducting field trials to decide the
potential for biomass production and to select best management practices is expensive and
time consuming use. The potential of manipulating age of harvest and row spacing to
increase fibre and sucrose production rates at various times of the year are recorded. The
research study recommended that extension workers motivate sugarcane growers to adopt
recommended agronomy practices. The modern agronomy practices increase sucrose rate
and sugarcane production in the study area.
Ahmad et al. (2007) Studied that Agricultural Extension Services and mass media
perform necessary position in the adoption of modern agricultural technologies.
Extension agents are significant association between research organization and farmers.
The study revealed that unfortunately the services of extension workers were not very
impressive. Results of the study showed that majority 85 % of the farmers were unaware
of the services of extension workers. Almost 88 % of the farmers did not get any benefit
from extension workers as against only 12 % farmers who got some benefits like
technical advices 9 %, demonstration 4 % and equipment 10%. Majority 83 % of the
farmers did not visit the local Agricultural Extension office and only 13 % of Agricultural
Extension workers visit to farmer field. The majority farmers which receive Agricultural
Extension Visits are big and influential famers. Only 5 % farmers paid visit once in years,
9 % at monthly, and 4 % at weekly basis visit to Local Agricultural Extension Office.
The study further identified that Radio and Tele Vision play an important role in the
process of technology transfer. The 84 % farmers own radio and listened Agricultural
Programs while 83 % farmers had TV set use for Agricultural Program. The research
study recommended that government keep check and balance on agricultural extension
19
department. The agricultural extension department provides information to sugarcane
growers through Radio and Tele Vision.
Ahmad et al. (2007) conducted study with focus on adoption of agricultural machinery,
chemical fertilizers and soil as well as plant protection measures. The result shows that
10 % of farmers had their own tractor and the remaining 90 % hired the tractors for
ploughing and threshing while 62 % of farmers used tractors for transportation purposes.
For the farm operation cultivator was used by 54 % of farmers, mould board plough by
33 %, harrow by 78 %, rotavator by 53 % and leveling blade by 65 %. Mostly 65 % of
farmers used broadcast method for chemical fertilizer application before sowing and 54
% applied it after sowing. The 31 % farmers use chemical fertilizers with irrigation water
after sowing. Majority 76 % of farmers practiced weed control measures, 6 % terracing
and 8 % plantation to protect soil. The research study concluded that use of tractor and
farm machinery is quiet sufficient. The study suggested that agricultural extension
workers provide information of recommended doses of chemical fertilizers and soil
protection measures to farmers.
Assefa et al. (2008) conduct a survey in the Amhara district of Ethiopian arrange to
increase insights into farm management practices, farmer’s perceptions of sugarcane stem
borers and the relation significance jointly with the result of stem borers in sugarcane
growers livelihood system. In research study, 56 % of the respondents identify stem
borers as one of the main significant production problem. The sugarcane growers were
aware of the effect of the stem borers on the excellence of sugarcane production;
however, their information about the effect of bores on sugarcane excellence is very low.
Sugarcane growers usually relied on natural control for stem borers and only few 15 % of
the sugarcane growers apply cultural practices for the control of stem borers. The
research study suggested that agricultural extension workers create awareness of stem
borers among sugarcane growers and provided them information of recommended control
methods.
Gul et al. (2008) studied eight early promising cultivars of sugarcane viz. MS 91, CP
1157, MS 91, CP 1157, MS 91. CP 1154, MS 91, CP 582, CP 87/1628, CP 87/1248, CP
20
85/1491, CP 80/1827 and Mardan-93 were tested against shoot borer (Chilo
infuscatellus), gurdaspur borer (Bissetia stniellus) and root borer (Emmalocera
depressella) at sugar Crop Research Institute Mardan during 2001 and 2002. The results
of research study showed that significantly lowest infestation of shoot and root borers
were recorded in plant crop varieties MS. 91- CP. 1154, while gurdaspur borer was
lowest in variety MS. 91- CP, 582. In ratoon crop damage of shoot borer was observed as
lowly in varieties MS. 91- CP. 1157 and MS. 91. CP.1154. Gurdapur borer was lowest in
variety CP. 87. 1248 while root borer was recorded minimum in variety M.S. 91. CP.582.
Significantly highest infestation of all borers was recorded in variety Mardan-93 in both
plant and ratoon crops. The research study recommended that agricultural extension
workers provide information of recommended sugarcane varieties to sugarcane growers.
Dercon et al. (2008) reported that improve roads are necessary for the new and profitable
agricultural extension activity. Results of the study showed that at least one visit of
agricultural extension agents reduce poverty level of 6 % and road improvement increase
consumption growth 17 %. The death shock reduces the income or consumption of
household. The poverty reduces due to agricultural extension officers because by visit to
farmers who has more than one hectare of land. Roads necessary for the agricultural
extension agents to communication and facilitation in rural area. The rural roads connect
from the local towns which decrease inputs prices in local market. The agricultural
extension agents are sources of information for the household about of new technology
and practices of new technology. The agricultural extension agents encourage household
to use of new technology. The agricultural extension agent affects the use of technology
(chemical fertilizers) and facilitation of technology. The agricultural extension service led
faster to increase consumption growth and reduce poverty level.
Gul et al. (2010) studied Gurdaspur borer which causes great losses to sugarcane
especially ratoon crop. In one way Gurdaspur damages the crop and the other way is
infestations paves way for certain diseases like red rot and ratoon stunting diseases.
Experiments were conducted at Sugar Crops Research Institute, Mardan in Sugarcane
ratoon crops during 2003-04. The results of the experiments showed that borer infestation
21
was significantly reduced as compared to highest infestation 5 % recorded during 2003.
While 2004 significantly lower infestation was recorded against the highest 5 % in 2003.
Among all the treatments it is recorded that highest cane and sugar yield received from
the combined application of Mechanical, Cultural and Chemical Control measures 69 and
9 tons/ha, respectively. The research study suggested that agricultural extension workers
motivate sugarcane growers to adopt combined application of Mechanical, Cultural and
Chemical against Gurdaspur borer in sugarcane crop.
Hussain and Khattak (2011) studied economic analysis of sugarcane crop in district
Charsadda. The results of the study showed that socio economic factors like capital
employment, labour employment, marketing, credit and financing and source of income
were more strongly associated to sugarcane production. Mostly farmer’s economy was
invested for preparation of land, water management, weed control, insecticides and
making of black sugar (Gur). The main varieties of sugarcane as 77/400, 44, Mardan-92,
48, 310 and 727082 were cultivated in the study area. Mostly profit was collected from
variety 77/400. For all varieties, average per acre cost was calculated as Rs. 35450.
Mostly charge arise on land rent, labour, input, seed, manure, irrigation, land preparation,
chemical fertilizers, hand weeding and making of black sugar (Gur). Sugarcane crop was
characterized by growing profits to balance. It was suggested in research study that
agricultural extension workers should create awareness of new techniques among
farmers.
Rasool et al. (2011) studied that sugarcane is a lengthy period plant and is proper for
intercropping with other less period plants to increase the sugarcane grower profits from
the per unit area. This research was planned to identify the possibility of wheat, lentil and
gram intercropping with autumn cultivated sugarcane crop. Sugarcane variety RB-72-454
was applied as test crop and cultivated at 1.2 meter row space in 1st week of September,
2004 while two rows of wheat and lentil crops were cultivated in month of November in
between sugarcane rows. Sugarcane crop were harvested in the month of December, 2005
while Lentil and gram were harvested in the month of April and wheat in May. The
finding of research show that sugarcane cultivated alone created most sugarcane
production of 131 tons/ha, while sugarcane intercropped with wheat created lowest
22
sugarcane production of 106 tons/ha. The production of wheat, lentil and gram were 1.18,
0.57 and 0.43 tons/ha respectively. In this research it was studied that intercropping of
wheat, lentil and gram with sugarcane, decreased sugarcane production by 19, 19 and 14
percent respectively. It was observed that sugarcane return more profitable of Rs. 15664
when sugarcane was cultivated without intercropping, whereas, intercropping of
sugarcane with wheat find out low return of Rs. 138889 ha1. The agricultural extension
workers create awareness among sugarcane growers that autumn cultivating of sugarcane
without any intercropping is maximum lucrative that intercropping with cereal and
leguminous crops.
Ullah et al. (2011) studied production, total price and net income of sugarcane crop on
field (farm) and Research Station District Mardan. The results showed that the yield of
sugarcane at research station was 9024 kg more than the farm level sugarcane, because of
using improved management practices and optimum level of inputs. The cost per acre and
net revenue per acre from sugarcane production at Mardan research station were Rs.
11513.12 and Rs. 20245.984 respectively more than the sugarcane production on farm
level. In the light of above results it were recommended that aware from improved
varieties of sugarcane and extension department should educate the sugarcane to develop
their production, net revenues from sugarcane production by adopting advance
management practices.
Ahmad et al. (2012) fined yield gaps in sugarcane growing area of districts Jhang and
Sargodha of Pakistan. Results of the study showed that 18 % and 40 % farmers of district
Jhang and Sargodha sown sugarcane crop in September- October respectively and 25 %
and 21 % of the crops were ratoon, whereas rest of farmers cultivated Sugarcane in
February-March. The farmers used 7.5-10 bags of urea ha-1, 62 % used 2.5-5 bags of di-
ammonium phosphate (DAP) per/ha and only 11 % farmers used Potassium K2SO4
chemical fertilizers for sugarcane at lower rate in district Jhang while 27 % of farmers
used 7.5-10 bags of urea’s ha-1, 77 % farmers used 2.5-5 bags of DAP ha-1, and only 10
% farmers used potassium chemical fertilizers, other farmers used of chemical fertilizers
for Sugarcane at lower rates in district Sargodha. The farmers used 31 % and 32 %
23
farmyard manure (FYM) in district Jhang and Sargodha respectively. The 51 % and 29 %
of farmers practiced optimum 16-20 irrigation in district Jhang and Sargodha
respectively. The Urea, DAP chemical fertilizers and number of irrigations water
positively affected sugarcane yield. The economic analysis of farmer’s data identify that
the best return was found for the farmers practicing of 14-15 irrigations, 4.5 bags/ha of
urea, 3.7 bags/ha of DAP and 0.8 begs/ha of Potash in district Sargodha. In district Jhang
was recommend the best return and sugarcane yield for the farmers practicing application
of 17-20 irrigation, 6.2 bags/ha of Urea, 5.6 begs/ha of DAP, and 1.2 bags/ha of Potash.
The research study concluded that agricultural extension workers provide information of
modern agronomic practices and recommended doses of inputs to farmers.
Perviaz et al. (2013) studied the importance of sugarcane at Khyber Pakhtunkhwa-
Pakistan. Results of the study showed that majority of respondents (91%) consist of small
size of landholding and poor financial resources and (90%) respondents were illiterate
and use traditional methods of cultivation. The respondents criticized the extension
service and their role in adoption and diffusion of technology was negligible. In the study
area the cultivated area of sugarcane decreased while yield of sugarcane also decreased
31% during the last five years. In the lights of above results the main factors responsible
for low sugarcane production were poor financial condition of farmers, lack of technical
knowledge, unavailability and high prices of chemical fertilizers and high yielding
varieties in local market, and in-efficient and ineffective role of extension staff. The
research study recommended for increase of sugarcane production that government keep
check and balance on agricultural extension department encourage small famers to invest
in agriculture through the provision of soft loans and technical assistance of new
technologies to sugarcane growers.
Zubair (2014) studied that sugarcane growers facing main constraints such as only 50-
60% area is under approved good quality varieties, control on spread of unapproved and
low sugar content varieties (CO-1148 in KPK, SPF-238 in Punjab and Disco in Sindh),
over expansion of sugar industry, defective cane procurement system i.e mainly through
middle man, untimely payment to farmers by sugar mills, weak varietal development
24
programme, increasing in cost of inputs, non- availability of drought and salt tolerant
sugarcane varieties, low seed rate, poor land preparation and poor plant protection.
All the research studies, reviewed above, were selected from a large number of research
publications on agricultural sub systems and found related to the specific aspects of
sugarcane and agricultural extension services. These studies were completed during 1976
to 2014 by researchers in 10 countries, 14 from Asia, 3 from Africa, 2 from Florida,
India, and Ethiopia and each one from Bangladesh, Philippine, Alagoas, china and Japan.
All reviews are relevant but the Asia based are more helpful to understand the contextual
perspective while in Pakistan, Bangladesh and India based studies are more appropriate
in terms of agro-rural, socio economic, religious and political administrative set up. The
aspects covered in review the sugarcane, production and agricultural extension system.
The review depicts the art of research studies on aspects of sugarcane production and
agricultural extension services. The perspective unravels the coverage of issues as facets
of one or two components. A holistic approach was imminent in view of the above
literature review in particular and the ground situation of overall agricultural extension
system in Pakistan in general. The propose research was an Endeavour to undertake in
depth study of agricultural extension and sugarcane production in selected districts, with
research specialist, agricultural extension and farmers engaged in their pursuits to
increase agricultural output and improve livelihood.
25
III. MATERIALS AND METHODS
This chapter deals with the materials and methods of the research study adopted by
researcher for the present study. It provides a method or path to complete primary data
from sugarcane growers, analyzing and interpretation of primary data. This chapter
provides information that what parameters and techniques were used to conduct this
study. Both primary as well as secondary data is collected and collated. The secondary
data is collected from various published and un-published sources. Primary data is
collected by the researcher through 336 interview schedules in the field personally.
Moreover, universe of the study, selection of sample techniques, selection of sample size,
development of interview schedule, and statistical analysis of the data is also included in
this chapter.
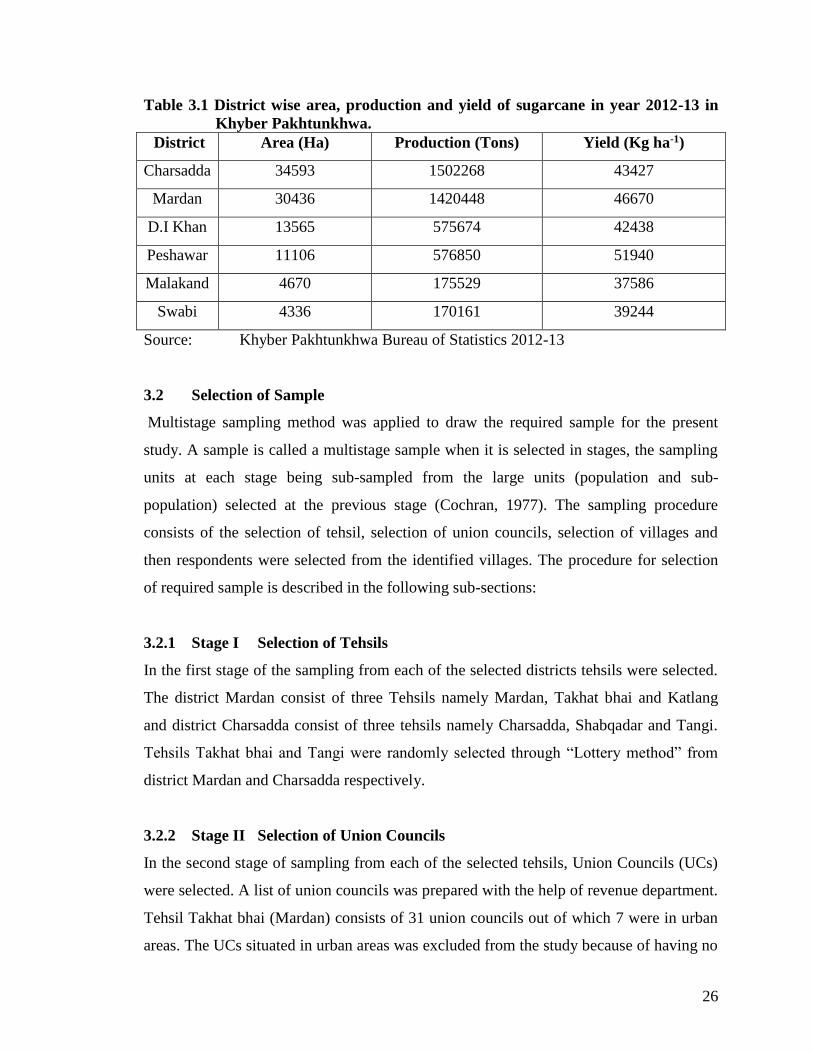
3.1 Universe of the Study
In Khyber Pakhtunkhwa, sugarcane is grown in Mardan, Charsadda, Peshawar, Dera
Ismail Khan, Malakand and Swabi districts. However, major areas of sugarcane
production are districts Mardan and Charsadda. These two districts are main area for
sugarcane cultivation because the sugarcane provides raw material for sugar industries.
Due to these industries employment opportunities are provided to skilled, semi-skilled
and un-skilled people. Additionally sugarcane cultivation also generates many self-
employment opportunities, such as hotels, tea shops, mechanic shops and use of private
transport where labours are working doing loading and un-loading activities and thus
earning their daily wages. These two districts (Mardan and Charsadda) were purposively
selected as universe of the study because of the major sugarcane growing districts as
shown in Table 3.1 (GOP, 2012-13).
The total area of the district Charsadda is about 99600 ha. Out of total area, cultivated
area of district Charsadda is 60756 ha (61 %) and irrigated area 85656 ha (86%). The
total area of Mardan is about 1, 63200 ha in which 1, 13799 ha (70 %) is cultivated and 1,
15546 ha (71 %) is irrigated. (GOP, 2012-13).
26
Table 3.1 District wise area, production and yield of sugarcane in year 2012-13 in
Khyber Pakhtunkhwa.
District Area (Ha) Production (Tons) Yield (Kg ha-1)
Charsadda 34593 1502268 43427
Mardan 30436 1420448 46670
D.I Khan 13565 575674 42438
Peshawar 11106 576850 51940
Malakand 4670 175529 37586
Swabi 4336 170161 39244
Source: Khyber Pakhtunkhwa Bureau of Statistics 2012-13
3.2 Selection of Sample
Multistage sampling method was applied to draw the required sample for the present
study. A sample is called a multistage sample when it is selected in stages, the sampling
units at each stage being sub-sampled from the large units (population and sub-
population) selected at the previous stage (Cochran, 1977). The sampling procedure
consists of the selection of tehsil, selection of union councils, selection of villages and
then respondents were selected from the identified villages. The procedure for selection
of required sample is described in the following sub-sections:
3.2.1 Stage I Selection of Tehsils
In the first stage of the sampling from each of the selected districts tehsils were selected.
The district Mardan consist of three Tehsils namely Mardan, Takhat bhai and Katlang
and district Charsadda consist of three tehsils namely Charsadda, Shabqadar and Tangi.
Tehsils Takhat bhai and Tangi were randomly selected through “Lottery method” from
district Mardan and Charsadda respectively.
3.2.2 Stage II Selection of Union Councils
In the second stage of sampling from each of the selected tehsils, Union Councils (UCs)
were selected. A list of union councils was prepared with the help of revenue department.
Tehsil Takhat bhai (Mardan) consists of 31 union councils out of which 7 were in urban
areas. The UCs situated in urban areas was excluded from the study because of having no
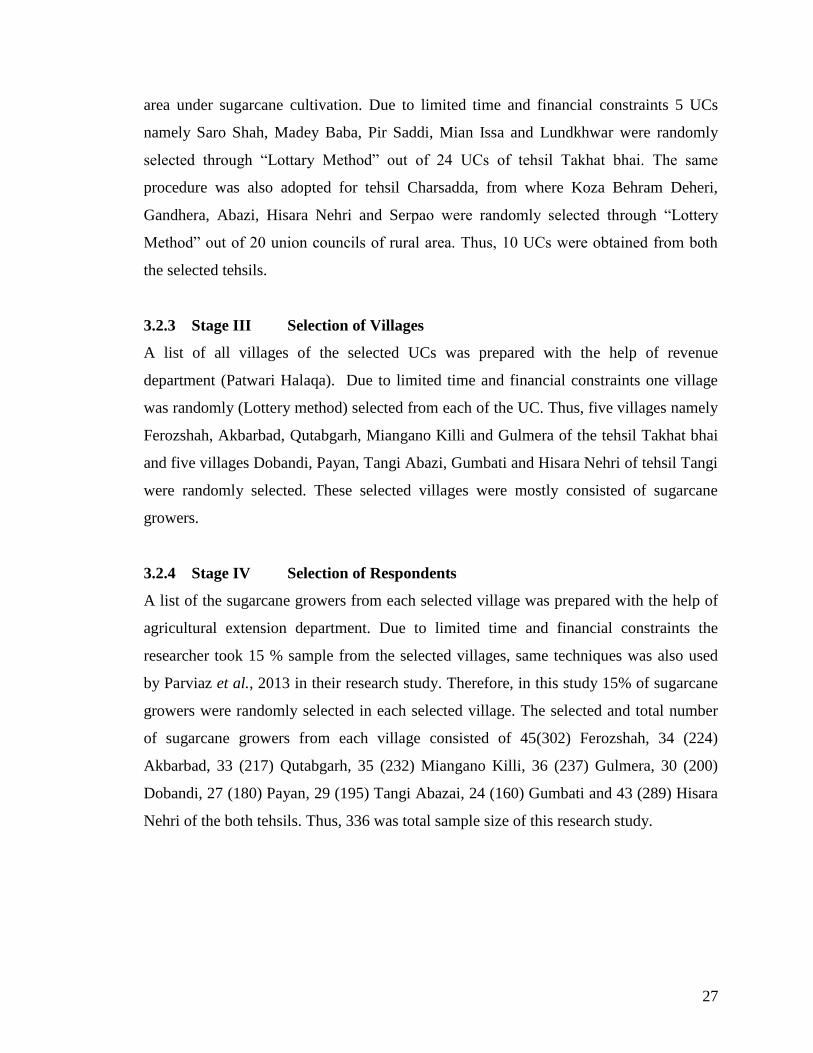
27
area under sugarcane cultivation. Due to limited time and financial constraints 5 UCs
namely Saro Shah, Madey Baba, Pir Saddi, Mian Issa and Lundkhwar were randomly
selected through “Lottary Method” out of 24 UCs of tehsil Takhat bhai. The same
procedure was also adopted for tehsil Charsadda, from where Koza Behram Deheri,
Gandhera, Abazi, Hisara Nehri and Serpao were randomly selected through “Lottery
Method” out of 20 union councils of rural area. Thus, 10 UCs were obtained from both
the selected tehsils.
3.2.3 Stage III Selection of Villages
A list of all villages of the selected UCs was prepared with the help of revenue
department (Patwari Halaqa). Due to limited time and financial constraints one village
was randomly (Lottery method) selected from each of the UC. Thus, five villages namely
Ferozshah, Akbarbad, Qutabgarh, Miangano Killi and Gulmera of the tehsil Takhat bhai
and five villages Dobandi, Payan, Tangi Abazi, Gumbati and Hisara Nehri of tehsil Tangi
were randomly selected. These selected villages were mostly consisted of sugarcane
growers.
3.2.4 Stage IV Selection of Respondents
A list of the sugarcane growers from each selected village was prepared with the help of
agricultural extension department. Due to limited time and financial constraints the
researcher took 15 % sample from the selected villages, same techniques was also used
by Parviaz et al., 2013 in their research study. Therefore, in this study 15% of sugarcane
growers were randomly selected in each selected village. The selected and total number
of sugarcane growers from each village consisted of 45(302) Ferozshah, 34 (224)
Akbarbad, 33 (217) Qutabgarh, 35 (232) Miangano Killi, 36 (237) Gulmera, 30 (200)
Dobandi, 27 (180) Payan, 29 (195) Tangi Abazai, 24 (160) Gumbati and 43 (289) Hisara
Nehri of the both tehsils. Thus, 336 was total sample size of this research study.
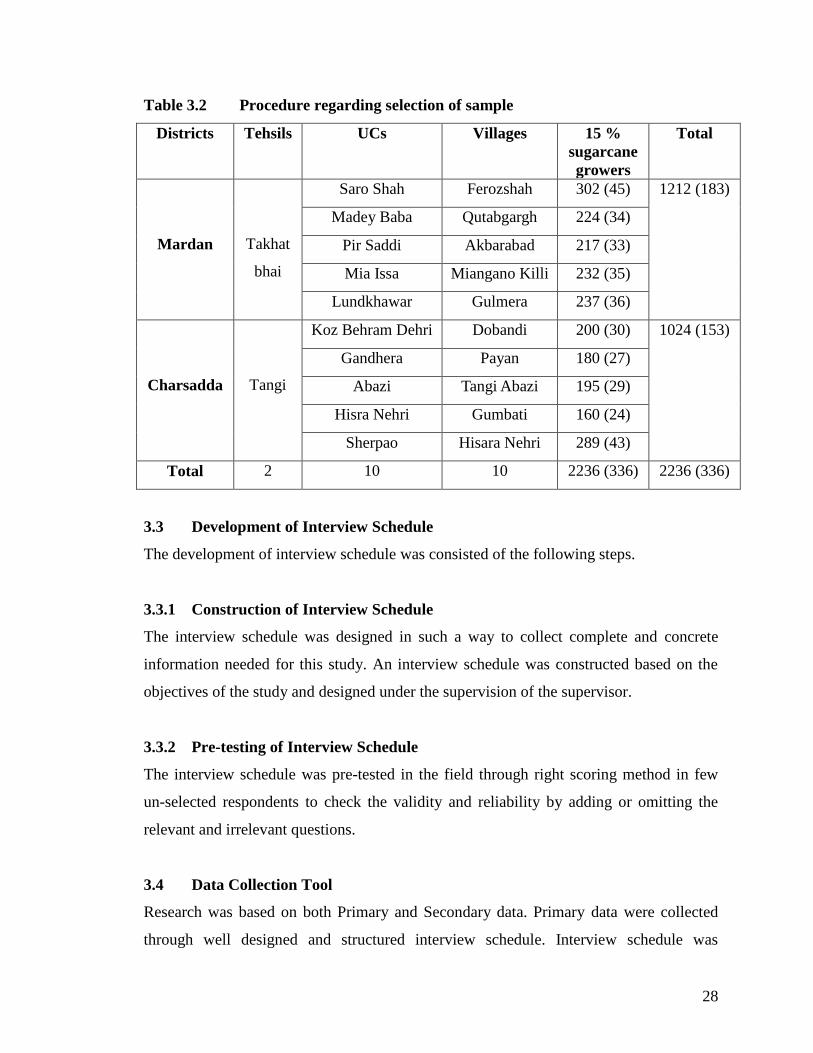
28
Table 3.2 Procedure regarding selection of sample
Districts Tehsils UCs Villages 15 %
sugarcane
growers
Total
Mardan
Takhat
bhai
Saro Shah Ferozshah 302 (45) 1212 (183)
Madey Baba Qutabgargh 224 (34)
Pir Saddi Akbarabad 217 (33)
Mia Issa Miangano Killi 232 (35)
Lundkhawar Gulmera 237 (36)
Charsadda
Tangi
Koz Behram Dehri Dobandi 200 (30) 1024 (153)
Gandhera Payan 180 (27)
Abazi Tangi Abazi 195 (29)
Hisra Nehri Gumbati 160 (24)
Sherpao Hisara Nehri 289 (43)
Total 2 10 10 2236 (336) 2236 (336)
3.3 Development of Interview Schedule
The development of interview schedule was consisted of the following steps.
3.3.1 Construction of Interview Schedule
The interview schedule was designed in such a way to collect complete and concrete
information needed for this study. An interview schedule was constructed based on the
objectives of the study and designed under the supervision of the supervisor.
3.3.2 Pre-testing of Interview Schedule
The interview schedule was pre-tested in the field through right scoring method in few
un-selected respondents to check the validity and reliability by adding or omitting the
relevant and irrelevant questions.
3.4 Data Collection Tool
Research was based on both Primary and Secondary data. Primary data were collected
through well designed and structured interview schedule. Interview schedule was
29
prepared keeping in view the topic and objectives of this study. The questions were
written in simple and understandable English. However, in order to maintain accuracy
and reliability questions were asked in pushto being native and local language.
3.4.1 Secondary Data
The secondary data collected from the published, un-published, research studies and
other sources of the authors relevant to this study and was placed in the shape of review
of literature. It is also used throughout the study in relevant places.
3.5 Interview Procedure
The interview was taken at the convenient places that are field, home and hujra
(community center) of farmers. They were interviewed at free time convenient to them.
3.6 Statistical Analysis of Data
The data is analyzed using Statistical Package for Social Science (SPSS). Results were
presented in frequency distribution Tables and percentages. The following tests were also
used for analysis of the data.
3.6.1 Paired t-test
To investigate the effect of extension services on the sugarcane production in the study
area, paired t-test was used. The paired t-test for convenient is described as:
nsd
dt
/ , which follow a t-distribution with (n-1) df
Where:
d= Difference between two sample observation (before and after extension services)
n= number of Pairs
Standard deviation = sd =__
2( )
1
id
n
d
is the standard derivation of all paired difference
and __
idd
n the mean of d-values.
30
3.6.2 Chi-Square
The chi-square (X2) is used to investigate the association between categorical variables.
The primary data of variables like age of sugarcane growers, educational levels, types of
labours, use of technologies etc indicate in the form of categories. The Chi-Square test
used to find the association between sugarcane production with age of sugarcane
growers, education, landholding size, field assistant, agricultural extension department
etc and socio-economic characteristics of sugarcane growers.
The chi-square for convenient is described as:
r
i ij
ijijc
j e
eO
1
2
1
2)(
This test under the null hypothesis (H0) follows a 2 distribution with (r-1) (c-1) degrees
of freedom in equation. Oij indicates the observed frequency and eij shows the expected
frequency.
Chi-square values are calculated by taking squared summation of frequencies for each
cell, dividing by the expected frequency. The calculated values are compared with
Tabulated value of chi-square for relevant degree of freedom at a specific probability
level to determine the significance of association. The relevant degree of freedom was
calculated as follows:
df = (r-1) (c-1) (Tai, 1978)
Condition for a chi-square test include that
1. The subjects for each group are randomly and independently selected
2. Each observation must qualify for one and only one category
3. Sample size must fairly be large such that no expected frequency is less than 5,
for r and c >2, or <10 if r=c=2.
However, third assumption violate in the primary data and therefore, Fisher Exact Test
used instead of simple chi-square. The relationship developed by Fisher is given in
equation below (Baily, 1982);
Fisher exact test = (a + b)! (c + d)! (a + c)! (b + d)!
N! a! b! c! d!
Where a, b, c and d were the observed numbers in four cells of contingency table and “N”
the total number of observations.
31
IV. RESULTS AND DISCUSSION
This section deals with results and discussion based on primary data as well as field
observations. In this section an attempt has been made to discuss and explain the results
obtained from sugarcane growers through statistical techniques. This section is divided
into two sections. Section “A” sugarcane crop and section “B” role of extension services
on sugarcane production and sugarcane growers profile are also discussed.
4.1. Education
Education is one of the most important and basic element for social, political and
economic development. The history of the developed nations showed that their economic
development have positive correlation with education. This can be supported with the
example that China got independence one year later than Pakistan in 1948. Due to
advancement in education, China reached the world market and economically showed
progress rapidly. Moreover, we can quote the examples of United Kingdom, America,
Germany, Russia etc. these countries are developed themselves due to education. Taking
the case of Pakistani people living in Islamabad and Peshawar etc are economically
developed because of education. In other words education and economic development
move hand by hand. During collection of primary data in the field researcher also
observed that educated farmers were more initiative and accepted new agricultural
technology quickly as compare to less educated or illiterate farmers. The data regarding
distribution of respondents by literacy levels of the respondents is presented in Table No.
4.1.
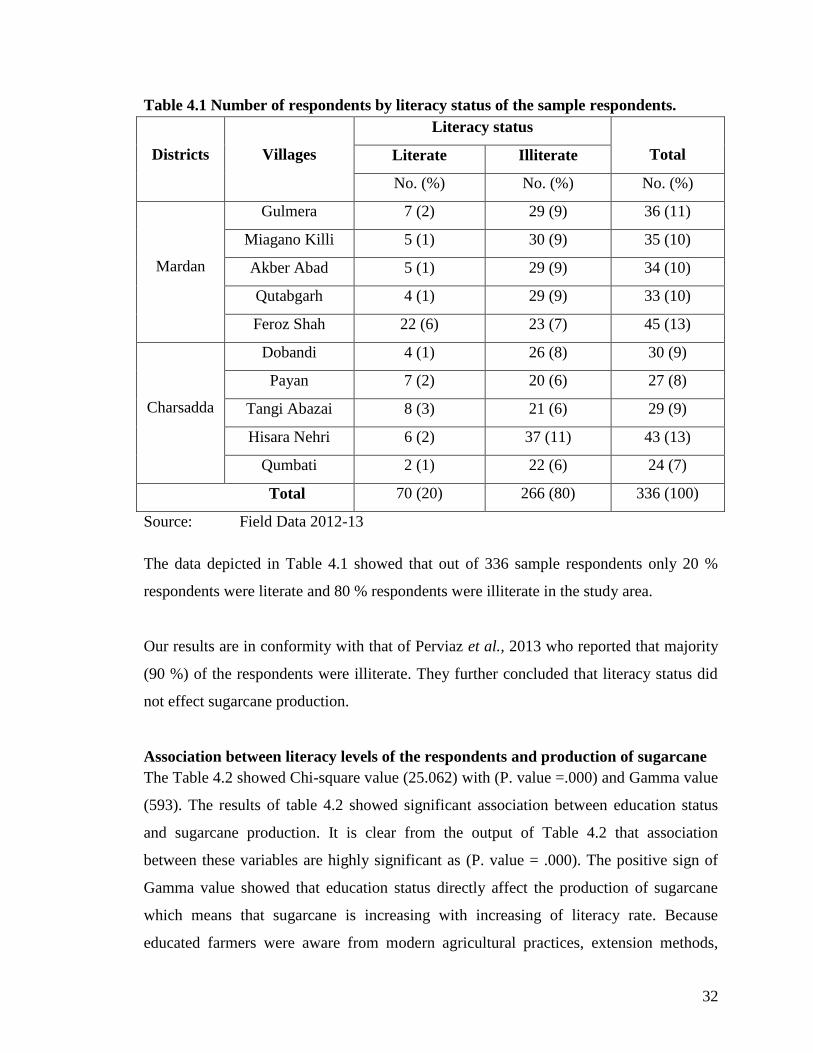
32
Table 4.1 Number of respondents by literacy status of the sample respondents.
Districts
Villages
Literacy status
Total Literate Illiterate
No. (%) No. (%) No. (%)
Mardan
Gulmera 7 (2) 29 (9) 36 (11)
Miagano Killi 5 (1) 30 (9) 35 (10)
Akber Abad 5 (1) 29 (9) 34 (10)
Qutabgarh 4 (1) 29 (9) 33 (10)
Feroz Shah 22 (6) 23 (7) 45 (13)
Charsadda
Dobandi 4 (1) 26 (8) 30 (9)
Payan 7 (2) 20 (6) 27 (8)
Tangi Abazai 8 (3) 21 (6) 29 (9)
Hisara Nehri 6 (2) 37 (11) 43 (13)
Qumbati 2 (1) 22 (6) 24 (7)
Total 70 (20) 266 (80) 336 (100)
Source: Field Data 2012-13
The data depicted in Table 4.1 showed that out of 336 sample respondents only 20 %
respondents were literate and 80 % respondents were illiterate in the study area.
Our results are in conformity with that of Perviaz et al., 2013 who reported that majority
(90 %) of the respondents were illiterate. They further concluded that literacy status did
not effect sugarcane production.
Association between literacy levels of the respondents and production of sugarcane
The Table 4.2 showed Chi-square value (25.062) with (P. value =.000) and Gamma value
(593). The results of table 4.2 showed significant association between education status
and sugarcane production. It is clear from the output of Table 4.2 that association
between these variables are highly significant as (P. value = .000). The positive sign of
Gamma value showed that education status directly affect the production of sugarcane
which means that sugarcane is increasing with increasing of literacy rate. Because
educated farmers were aware from modern agricultural practices, extension methods,
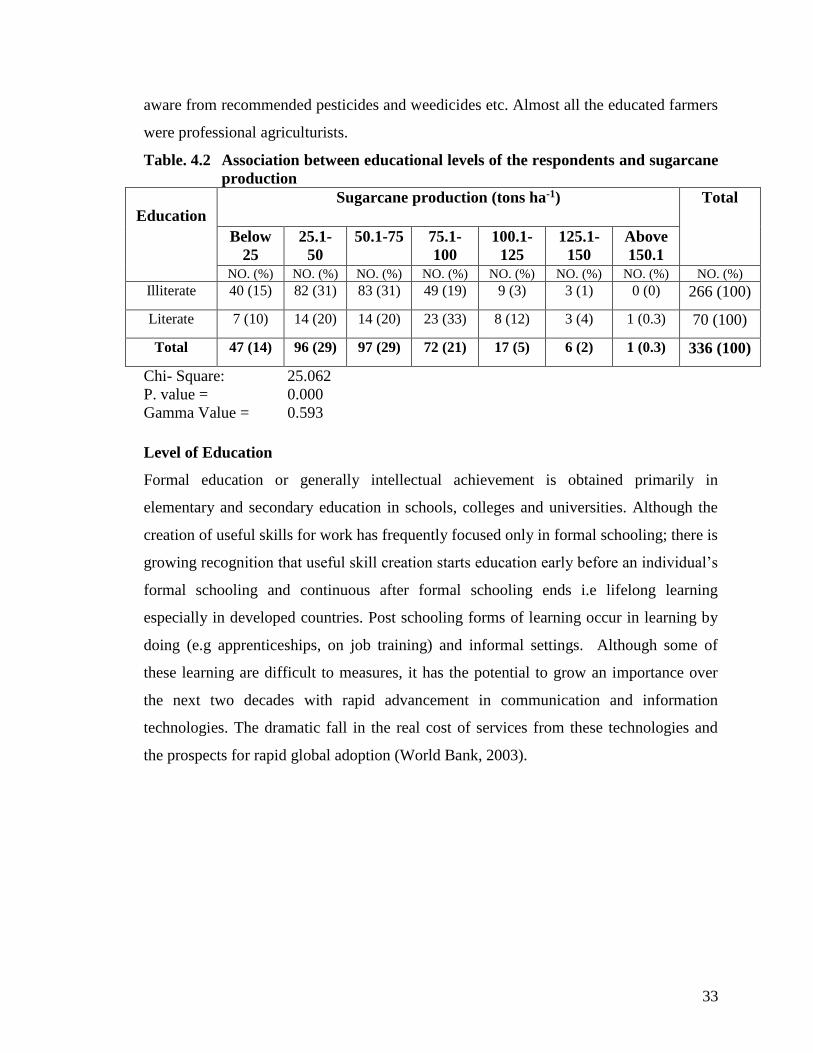
33
aware from recommended pesticides and weedicides etc. Almost all the educated farmers
were professional agriculturists.
Table. 4.2 Association between educational levels of the respondents and sugarcane
production
Education
Sugarcane production (tons ha-1) Total
Below
25
25.1-
50
50.1-75 75.1-
100
100.1-
125
125.1-
150
Above
150.1
NO. (%) NO. (%) NO. (%) NO. (%) NO. (%) NO. (%) NO. (%) NO. (%)
Illiterate 40 (15) 82 (31) 83 (31) 49 (19) 9 (3) 3 (1) 0 (0) 266 (100)
Literate 7 (10) 14 (20) 14 (20) 23 (33) 8 (12) 3 (4) 1 (0.3) 70 (100)
Total 47 (14) 96 (29) 97 (29) 72 (21) 17 (5) 6 (2) 1 (0.3) 336 (100)
Chi- Square: 25.062
P. value = 0.000
Gamma Value = 0.593
Level of Education
Formal education or generally intellectual achievement is obtained primarily in
elementary and secondary education in schools, colleges and universities. Although the
creation of useful skills for work has frequently focused only in formal schooling; there is
growing recognition that useful skill creation starts education early before an individual’s
formal schooling and continuous after formal schooling ends i.e lifelong learning
especially in developed countries. Post schooling forms of learning occur in learning by
doing (e.g apprenticeships, on job training) and informal settings. Although some of
these learning are difficult to measures, it has the potential to grow an importance over
the next two decades with rapid advancement in communication and information
technologies. The dramatic fall in the real cost of services from these technologies and
the prospects for rapid global adoption (World Bank, 2003).
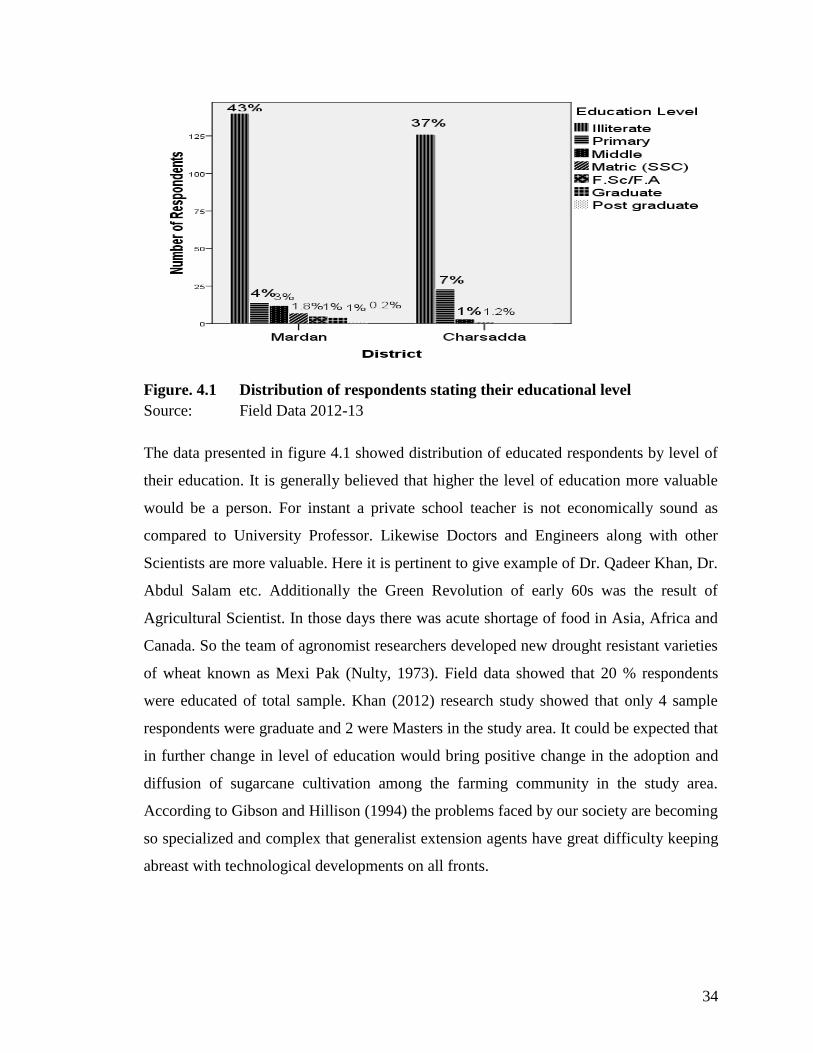
34
Figure. 4.1 Distribution of respondents stating their educational level
Source: Field Data 2012-13
The data presented in figure 4.1 showed distribution of educated respondents by level of
their education. It is generally believed that higher the level of education more valuable
would be a person. For instant a private school teacher is not economically sound as
compared to University Professor. Likewise Doctors and Engineers along with other
Scientists are more valuable. Here it is pertinent to give example of Dr. Qadeer Khan, Dr.
Abdul Salam etc. Additionally the Green Revolution of early 60s was the result of
Agricultural Scientist. In those days there was acute shortage of food in Asia, Africa and
Canada. So the team of agronomist researchers developed new drought resistant varieties
of wheat known as Mexi Pak (Nulty, 1973). Field data showed that 20 % respondents
were educated of total sample. Khan (2012) research study showed that only 4 sample
respondents were graduate and 2 were Masters in the study area. It could be expected that
in further change in level of education would bring positive change in the adoption and
diffusion of sugarcane cultivation among the farming community in the study area.
According to Gibson and Hillison (1994) the problems faced by our society are becoming
so specialized and complex that generalist extension agents have great difficulty keeping
abreast with technological developments on all fronts.
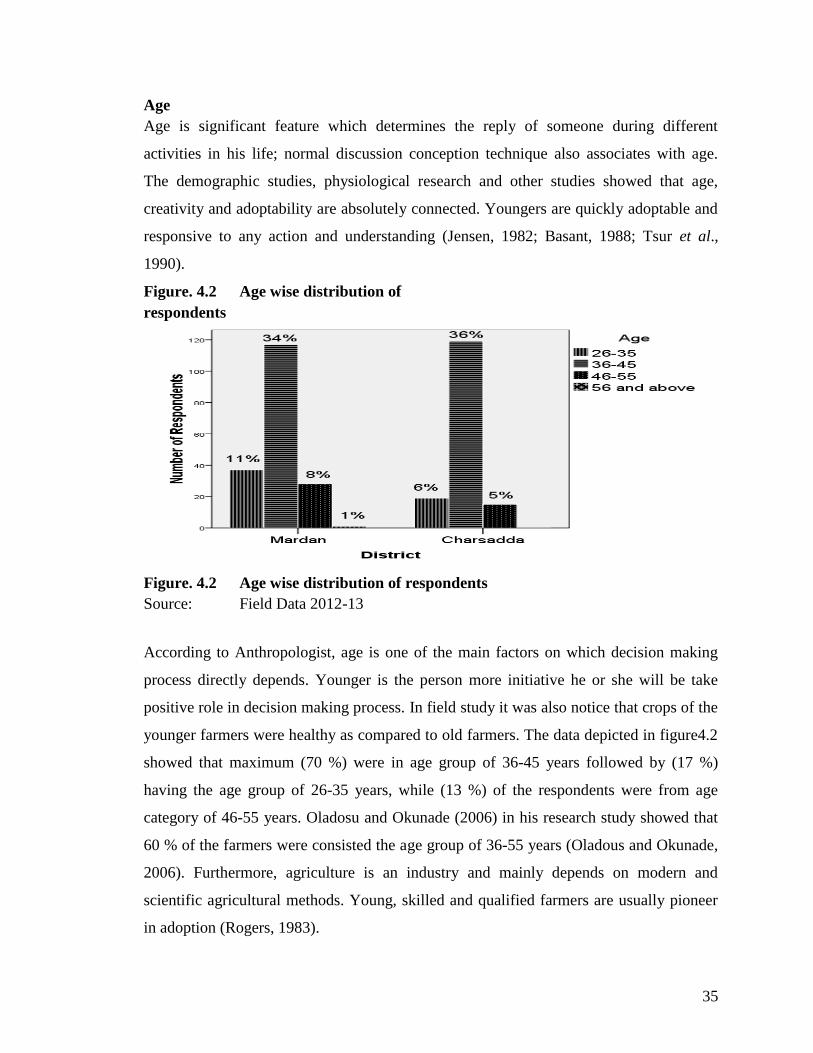
35
Age
Age is significant feature which determines the reply of someone during different
activities in his life; normal discussion conception technique also associates with age.
The demographic studies, physiological research and other studies showed that age,
creativity and adoptability are absolutely connected. Youngers are quickly adoptable and
responsive to any action and understanding (Jensen, 1982; Basant, 1988; Tsur et al.,
1990).
Figure. 4.2 Age wise distribution of
respondents
Figure. 4.2 Age wise distribution of respondents
Source: Field Data 2012-13
According to Anthropologist, age is one of the main factors on which decision making
process directly depends. Younger is the person more initiative he or she will be take
positive role in decision making process. In field study it was also notice that crops of the
younger farmers were healthy as compared to old farmers. The data depicted in figure4.2
showed that maximum (70 %) were in age group of 36-45 years followed by (17 %)
having the age group of 26-35 years, while (13 %) of the respondents were from age
category of 46-55 years. Oladosu and Okunade (2006) in his research study showed that
60 % of the farmers were consisted the age group of 36-55 years (Oladous and Okunade,
2006). Furthermore, agriculture is an industry and mainly depends on modern and
scientific agricultural methods. Young, skilled and qualified farmers are usually pioneer
in adoption (Rogers, 1983).
36
Size of Landholding
Farm size plays significant position in the adoption, diffusion and dissemination of
modern agricultural techniques among the farming community. Landholding size varies
from region to region and even significant differnce was recorded within the region of
country. So therefore the description of small, medium and large farmer’s depends on
individual landholding (Khan, 2012).
Small farms also identified as family farms have been defined in a variety of ways. The
majority of farmers used less than 2 hectares of land for farming activities. Others
express small farms as those depending on household members for the majority of the
labour or those with a subsistence direction, where the primary aim of the farm is to make
the bulk of the household’s utilization of staple foods (Hazell et al., 2007). Yet others
identify small farms as those with partial resources including land, capital, skills and
labour. Internationally Rural development strategy identifies smallholders as those with a
low benefit base, operating less than 2 hectares of crop land (World Bank, 2003). FAO,
research defines smallholders as farmers with incomplete resource endowments, relative
to other farmers in the sector (Dixon et al., 2003) defined that small farm are less than 2
hectares of land area and which depending on household members for most of the family
labour.
Farm size is positively correlated economically with mechanized farming. The green
revolution technology introduced in Pakistan and India also showed that farm size
contribute a lot in agricultural development. Different studies conducted regarding farm
size showed positive correlation with adoption and diffusion of modern technology.
(Dinar and Zilberman, 1991; Dinar et al., 1992; Dinar and Yaron, 1992).
Nulty (1972) revealed that if land is equally distributed among the farming community,
Pakistan will develop economically. The problem is further complicated due to the poor
position of the overwhelming majority of farmers because use of modern technology
requires timely availability of financial resources to use these inputs like fertilizers,
pesticides, insecticides and agricultural machinery.
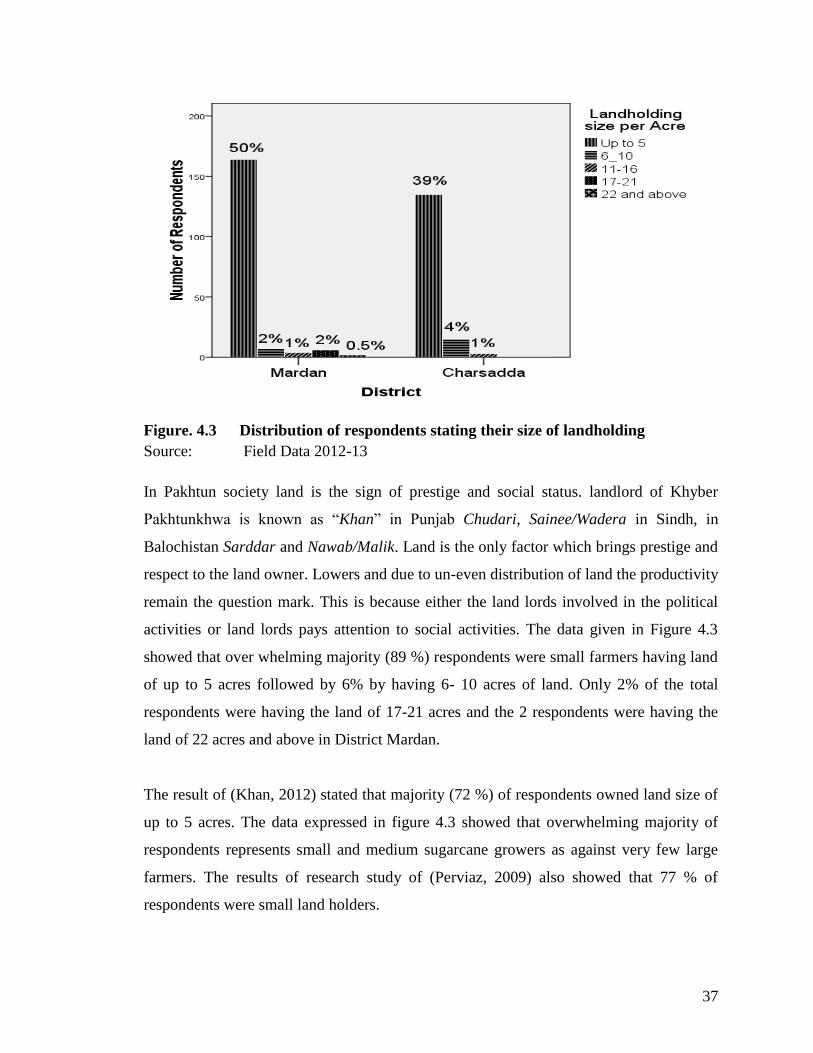
37
Figure. 4.3 Distribution of respondents stating their size of landholding
Source: Field Data 2012-13
In Pakhtun society land is the sign of prestige and social status. landlord of Khyber
Pakhtunkhwa is known as “Khan” in Punjab Chudari, Sainee/Wadera in Sindh, in
Balochistan Sarddar and Nawab/Malik. Land is the only factor which brings prestige and
respect to the land owner. Lowers and due to un-even distribution of land the productivity
remain the question mark. This is because either the land lords involved in the political
activities or land lords pays attention to social activities. The data given in Figure 4.3
showed that over whelming majority (89 %) respondents were small farmers having land
of up to 5 acres followed by 6% by having 6- 10 acres of land. Only 2% of the total
respondents were having the land of 17-21 acres and the 2 respondents were having the
land of 22 acres and above in District Mardan.
The result of (Khan, 2012) stated that majority (72 %) of respondents owned land size of
up to 5 acres. The data expressed in figure 4.3 showed that overwhelming majority of
respondents represents small and medium sugarcane growers as against very few large
farmers. The results of research study of (Perviaz, 2009) also showed that 77 % of
respondents were small land holders.
38
Land size and production of sugarcane
Table 4.3 showed Chi-square value (145.4) with (P. value = 0.000) and Gamma value
(0.593). The results confirmed the significant association between land size and
sugarcane production. It is clear from the output that the association is statistically highly
significant as (P. value = 0.000). The positive value of Gamma value showed that land
size is directly related to the sugarcane production. The rational is that agricultural
machineries, labours, time and other resources were efficiently utilized by the owner of
the large size of landholding and thus performed their job with keen interest. According
to law of diminishing returns states that in all productive processes, adding more of one
factor of production while holding all others constant will at some point yield lower per-
unit returns. The law of diminishing returns does not imply that adding more of a factor
will decrease the total production, a condition known as negative returns, though in fact
this is common. For example, the use of chemical fertilizer improves crop production on
farms and in gardens; but after some point use of chemical fertilizers adding more and
more chemical fertilizer directly effects yield. The majority farmers were cultivating four
or more crops. The size of farm plots was quite small and most of the farmers 71 % relied
on family labour for cultivation. The other 29 % applying a mixture of extended
household and family labour. The mostly 85 % cultivated less than 4 hectares of land for
their household requirements. About 48 % of the farmers answered that they did not
observe any hurdle in cultivating cash crops. However, about 52 % who farmed cash
crops were still poor and had to sell their cash crop in order to buy food. They also
identify that those farmers cultivating cash crops ended up destroying the fertility of soil
on their farms (Chapman et al., 2003). The results of research study of (Perviaz et al.,
2013) showed that majority of respondents (91 %) respondents were small farmers. Only
9 % were medium farmers i.e. 6-10 acres. None of the sample respondents owned having
more than 10 acres of land.
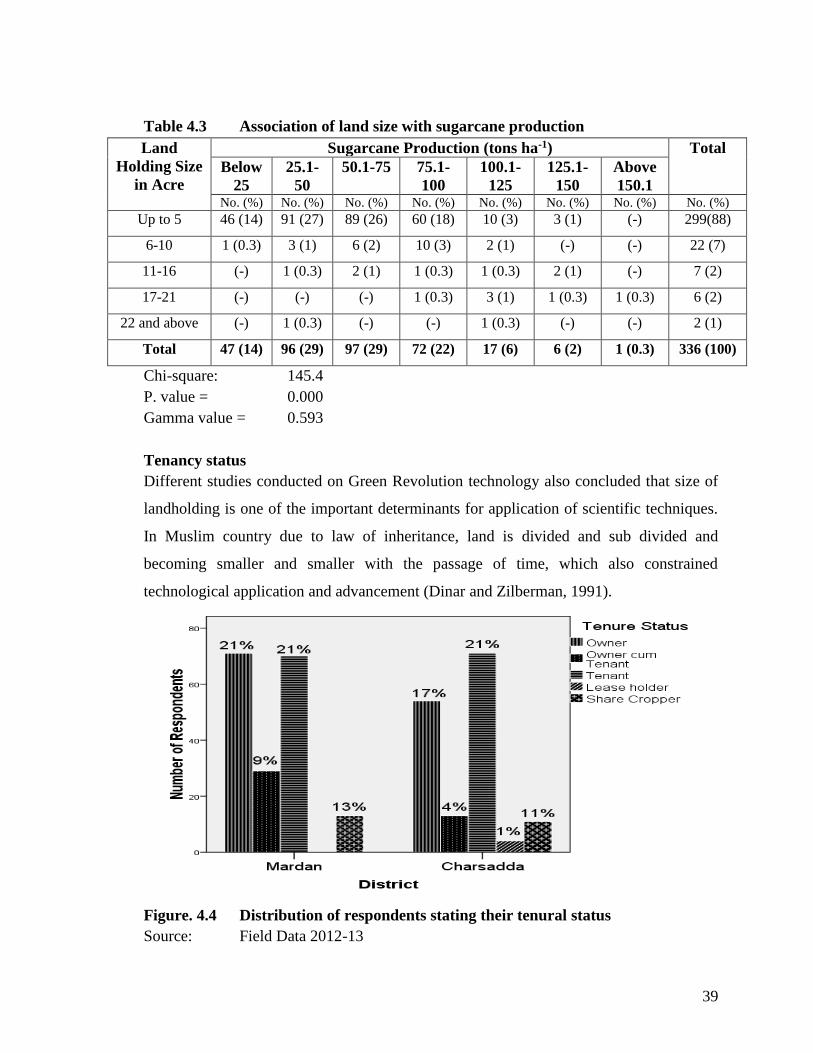
39
Table 4.3 Association of land size with sugarcane production
Land
Holding Size
in Acre
Sugarcane Production (tons ha-1) Total
Below
25
25.1-
50
50.1-75 75.1-
100
100.1-
125
125.1-
150
Above
150.1 No. (%) No. (%) No. (%) No. (%) No. (%) No. (%) No. (%) No. (%)
Up to 5 46 (14) 91 (27) 89 (26) 60 (18) 10 (3) 3 (1) (-) 299(88)
6-10 1 (0.3) 3 (1) 6 (2) 10 (3) 2 (1) (-) (-) 22 (7)
11-16 (-) 1 (0.3) 2 (1) 1 (0.3) 1 (0.3) 2 (1) (-) 7 (2)
17-21 (-) (-) (-) 1 (0.3) 3 (1) 1 (0.3) 1 (0.3) 6 (2)
22 and above (-) 1 (0.3) (-) (-) 1 (0.3) (-) (-) 2 (1)
Total 47 (14) 96 (29) 97 (29) 72 (22) 17 (6) 6 (2) 1 (0.3) 336 (100)
Chi-square: 145.4
P. value = 0.000
Gamma value = 0.593
Tenancy status
Different studies conducted on Green Revolution technology also concluded that size of
landholding is one of the important determinants for application of scientific techniques.
In Muslim country due to law of inheritance, land is divided and sub divided and
becoming smaller and smaller with the passage of time, which also constrained
technological application and advancement (Dinar and Zilberman, 1991).
Figure. 4.4 Distribution of respondents stating their tenural status
Source: Field Data 2012-13
40
Tenural status is of great importance as the limited land cannot be cultivated with any
mechanical tool. The rapid growth of people is producing pressure on present land as the
soil is not only a source of livelihood, but also a mean of social status, economic
prosperity, political significance and employment creating for farming community as
well.
The land reforms history has shown the tenancy as one of the key obstacles in the way of
agricultural growth. There is forever a difference between ‘have and have not” and this
difference possibly is never-ending. As a result which agricultural development becomes
sluggish and slow. There were two major types of tenants in the study area namely tenant
share cropper and tenant lease holder. Both were not completely using their resources.
The figure 4.4 revealed that mostly 42 % respondents were tenants/share cropper in the
study area followed 37 % who were owner and 13 % respondents were owner-cum
tenants. Only 1 % farmers were lease holder belong from district Charsadda. The overall
analysis showed that the majority of farmers in the study areas were tenants/share
cropper.
Thus results are confirmed by Pervaiz et al., 2003 and Khan, 2012 who observed that
only 48 % and 47 % of the farmers were owner cultivator in the study area respectively.
Tenural status of the respondents and sugarcane production
The data given in Table 4.4 showed chi-square value (85.784) with (P. value = 0.000) and
Gamma value (0.046) revealed in-significant between tenural sttus and sugarcane
production. The positive sign of Gamma value showed directly association between
tenural staus and sugarcane production. It means that the farmers having their own land
will get higher production rather than the tenants’ farmers by having keen interest in
sugarcane cultivation and applying modern cultivation practices for getting higher
income and socio economic conditions.
However, owner cum-tenant constituted a majority 42 % and these mainly include small
farmers. When owner-cum-tenant and owners were taken together these constituted 50%
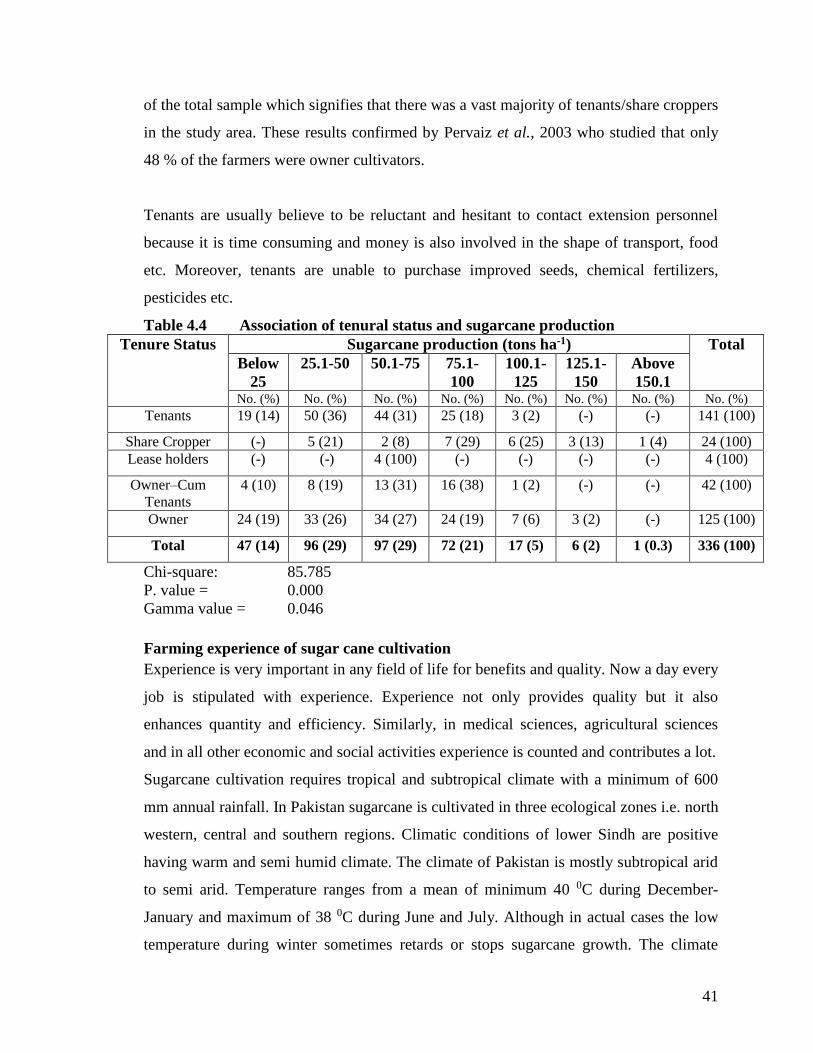
41
of the total sample which signifies that there was a vast majority of tenants/share croppers
in the study area. These results confirmed by Pervaiz et al., 2003 who studied that only
48 % of the farmers were owner cultivators.
Tenants are usually believe to be reluctant and hesitant to contact extension personnel
because it is time consuming and money is also involved in the shape of transport, food
etc. Moreover, tenants are unable to purchase improved seeds, chemical fertilizers,
pesticides etc.
Table 4.4 Association of tenural status and sugarcane production
Tenure Status Sugarcane production (tons ha-1) Total
Below
25
25.1-50 50.1-75 75.1-
100
100.1-
125
125.1-
150
Above
150.1 No. (%) No. (%) No. (%) No. (%) No. (%) No. (%) No. (%) No. (%)
Tenants 19 (14) 50 (36) 44 (31) 25 (18) 3 (2) (-) (-) 141 (100)
Share Cropper (-) 5 (21) 2 (8) 7 (29) 6 (25) 3 (13) 1 (4) 24 (100)
Lease holders (-) (-) 4 (100) (-) (-) (-) (-) 4 (100)
Owner–Cum
Tenants
4 (10) 8 (19) 13 (31) 16 (38) 1 (2) (-) (-) 42 (100)
Owner 24 (19) 33 (26) 34 (27) 24 (19) 7 (6) 3 (2) (-) 125 (100)
Total 47 (14) 96 (29) 97 (29) 72 (21) 17 (5) 6 (2) 1 (0.3) 336 (100)
Chi-square: 85.785
P. value = 0.000
Gamma value = 0.046
Farming experience of sugar cane cultivation
Experience is very important in any field of life for benefits and quality. Now a day every
job is stipulated with experience. Experience not only provides quality but it also
enhances quantity and efficiency. Similarly, in medical sciences, agricultural sciences
and in all other economic and social activities experience is counted and contributes a lot.
Sugarcane cultivation requires tropical and subtropical climate with a minimum of 600
mm annual rainfall. In Pakistan sugarcane is cultivated in three ecological zones i.e. north
western, central and southern regions. Climatic conditions of lower Sindh are positive
having warm and semi humid climate. The climate of Pakistan is mostly subtropical arid
to semi arid. Temperature ranges from a mean of minimum 40 0C during December-
January and maximum of 38 0C during June and July. Although in actual cases the low
temperature during winter sometimes retards or stops sugarcane growth. The climate
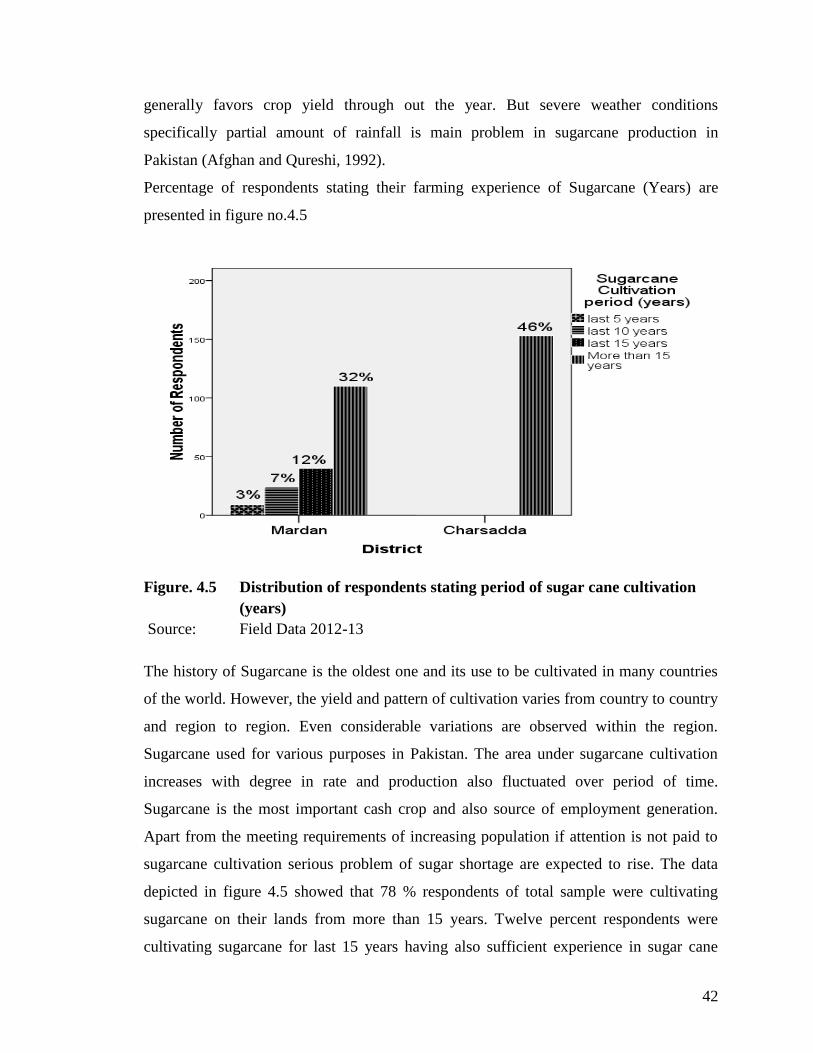
42
generally favors crop yield through out the year. But severe weather conditions
specifically partial amount of rainfall is main problem in sugarcane production in
Pakistan (Afghan and Qureshi, 1992).
Percentage of respondents stating their farming experience of Sugarcane (Years) are
presented in figure no.4.5
Figure. 4.5 Distribution of respondents stating period of sugar cane cultivation
(years)
Source: Field Data 2012-13
The history of Sugarcane is the oldest one and its use to be cultivated in many countries
of the world. However, the yield and pattern of cultivation varies from country to country
and region to region. Even considerable variations are observed within the region.
Sugarcane used for various purposes in Pakistan. The area under sugarcane cultivation
increases with degree in rate and production also fluctuated over period of time.
Sugarcane is the most important cash crop and also source of employment generation.
Apart from the meeting requirements of increasing population if attention is not paid to
sugarcane cultivation serious problem of sugar shortage are expected to rise. The data
depicted in figure 4.5 showed that 78 % respondents of total sample were cultivating
sugarcane on their lands from more than 15 years. Twelve percent respondents were
cultivating sugarcane for last 15 years having also sufficient experience in sugar cane
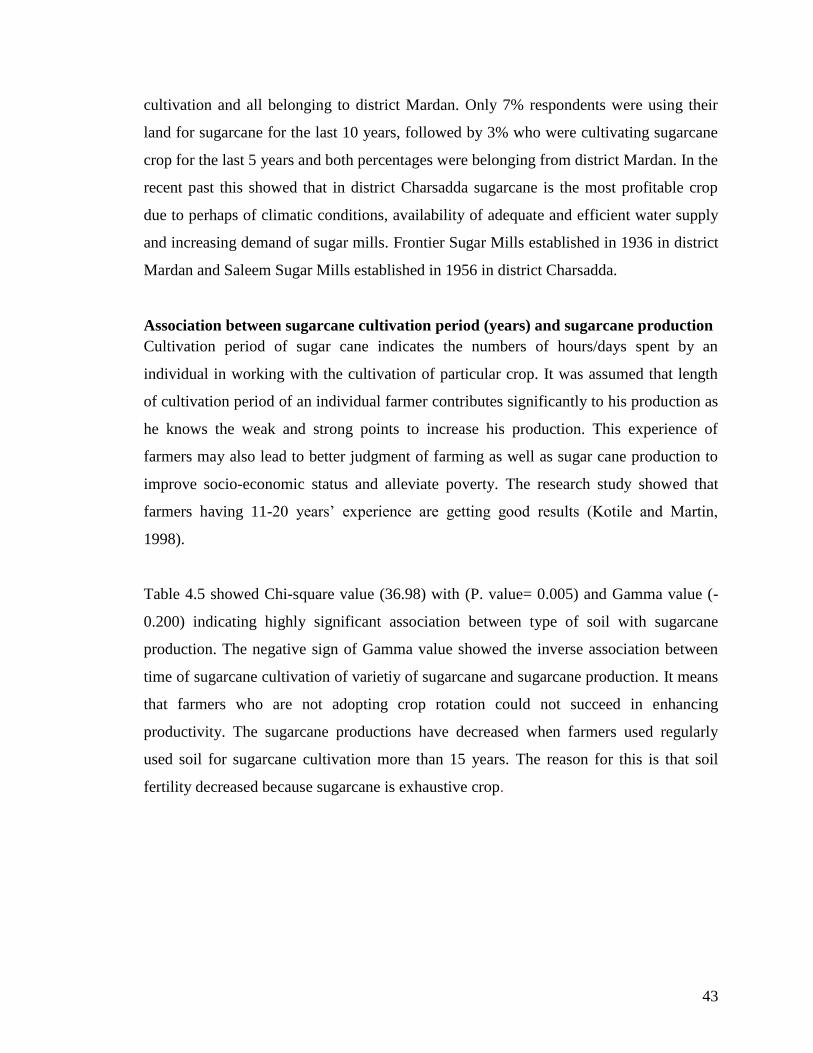
43
cultivation and all belonging to district Mardan. Only 7% respondents were using their
land for sugarcane for the last 10 years, followed by 3% who were cultivating sugarcane
crop for the last 5 years and both percentages were belonging from district Mardan. In the
recent past this showed that in district Charsadda sugarcane is the most profitable crop
due to perhaps of climatic conditions, availability of adequate and efficient water supply
and increasing demand of sugar mills. Frontier Sugar Mills established in 1936 in district
Mardan and Saleem Sugar Mills established in 1956 in district Charsadda.
Association between sugarcane cultivation period (years) and sugarcane production
Cultivation period of sugar cane indicates the numbers of hours/days spent by an
individual in working with the cultivation of particular crop. It was assumed that length
of cultivation period of an individual farmer contributes significantly to his production as
he knows the weak and strong points to increase his production. This experience of
farmers may also lead to better judgment of farming as well as sugar cane production to
improve socio-economic status and alleviate poverty. The research study showed that
farmers having 11-20 years’ experience are getting good results (Kotile and Martin,
1998).
Table 4.5 showed Chi-square value (36.98) with (P. value= 0.005) and Gamma value (-
0.200) indicating highly significant association between type of soil with sugarcane
production. The negative sign of Gamma value showed the inverse association between
time of sugarcane cultivation of varietiy of sugarcane and sugarcane production. It means
that farmers who are not adopting crop rotation could not succeed in enhancing
productivity. The sugarcane productions have decreased when farmers used regularly
used soil for sugarcane cultivation more than 15 years. The reason for this is that soil
fertility decreased because sugarcane is exhaustive crop.
44
Table. 4.5 Association between sugar cane cultivation periods with sugarcane
production
Soil Used
for
sugarcane
cultivation
period
(years)
Sugarcane production (tons ha-1) Total
No. (%)
Below
25
25.1-
50
50.1-75
75.1-100
100.1-
125
125.1-
150
Above
150.1 No. (%) No. (%) No. (%) No. (%) No. (%) No. (%) No. (%)
5 years 1 (0.3) 1 (0.3) 1 (0.3) 6 (2) (-) (-) (-) 9 (3)
Last 10 1 (0.3) 5 (1) 7 (2) 11 (3) (-) (-) (-) 24 (7)
Last 15 9 (3) 6 (2) 13 (4) 5 (1) 5 (1) 2 (1) (-) 40 (12)
More 15 36 (11) 84 (25) 76 (23) 50 (15) 12 (4) 4 (1) 1 (0.3) 263 (78)
Total 47 (14) 96 (28) 97 (29) 72 (21) 17 (5) 6 (2) 1 (0.3) 336 (100)
Chi-square: 36.980
P. value = 0.005
Gamma value = -0.200
Application of chemical fertilizers
Chemical fertilizers are very important factor to increase the production of crops. It plays
an important role to maintain and improve soil fertility. However, agricultural production
in Pakistan has not been increased in recent few years. To fulfill the need of growing
population, use of chemical fertilizer increase production. There are also many other
factors involved in achieving high crop yield as their proper use has important impact and
can be effective in a single crop season. Chemical fertilizer use has been increased
rapidly in Pakistan over the last many years. However, increase in yield is not
considerable. It is because of incorrect use of chemical fertilizers. The method of
application of chemical fertilizer is very important for raising good crops. Chemical
fertilizer applied in proper amount with appropriate method improves yield. Farmers
usually apply high amount of nitrogen and small quantities of Phosphate which might
have adverse effect on soil health. The farmers did not use balance chemical fertilizers
which result showed little increase in crop yield (GOP, 1997).
Distribution of respondents by use of Urea bag/ acre are presented in figureno.4.6
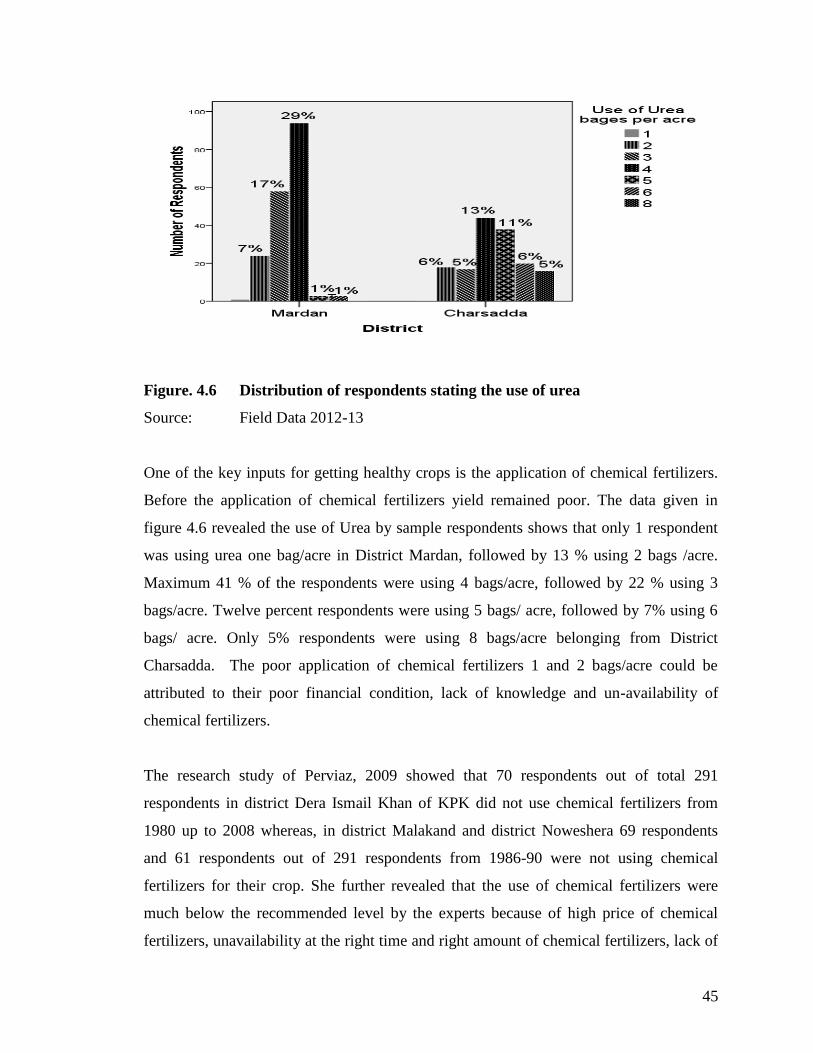
45
Figure. 4.6 Distribution of respondents stating the use of urea
Source: Field Data 2012-13
One of the key inputs for getting healthy crops is the application of chemical fertilizers.
Before the application of chemical fertilizers yield remained poor. The data given in
figure 4.6 revealed the use of Urea by sample respondents shows that only 1 respondent
was using urea one bag/acre in District Mardan, followed by 13 % using 2 bags /acre.
Maximum 41 % of the respondents were using 4 bags/acre, followed by 22 % using 3
bags/acre. Twelve percent respondents were using 5 bags/ acre, followed by 7% using 6
bags/ acre. Only 5% respondents were using 8 bags/acre belonging from District
Charsadda. The poor application of chemical fertilizers 1 and 2 bags/acre could be
attributed to their poor financial condition, lack of knowledge and un-availability of
chemical fertilizers.
The research study of Perviaz, 2009 showed that 70 respondents out of total 291
respondents in district Dera Ismail Khan of KPK did not use chemical fertilizers from
1980 up to 2008 whereas, in district Malakand and district Noweshera 69 respondents
and 61 respondents out of 291 respondents from 1986-90 were not using chemical
fertilizers for their crop. She further revealed that the use of chemical fertilizers were
much below the recommended level by the experts because of high price of chemical
fertilizers, unavailability at the right time and right amount of chemical fertilizers, lack of
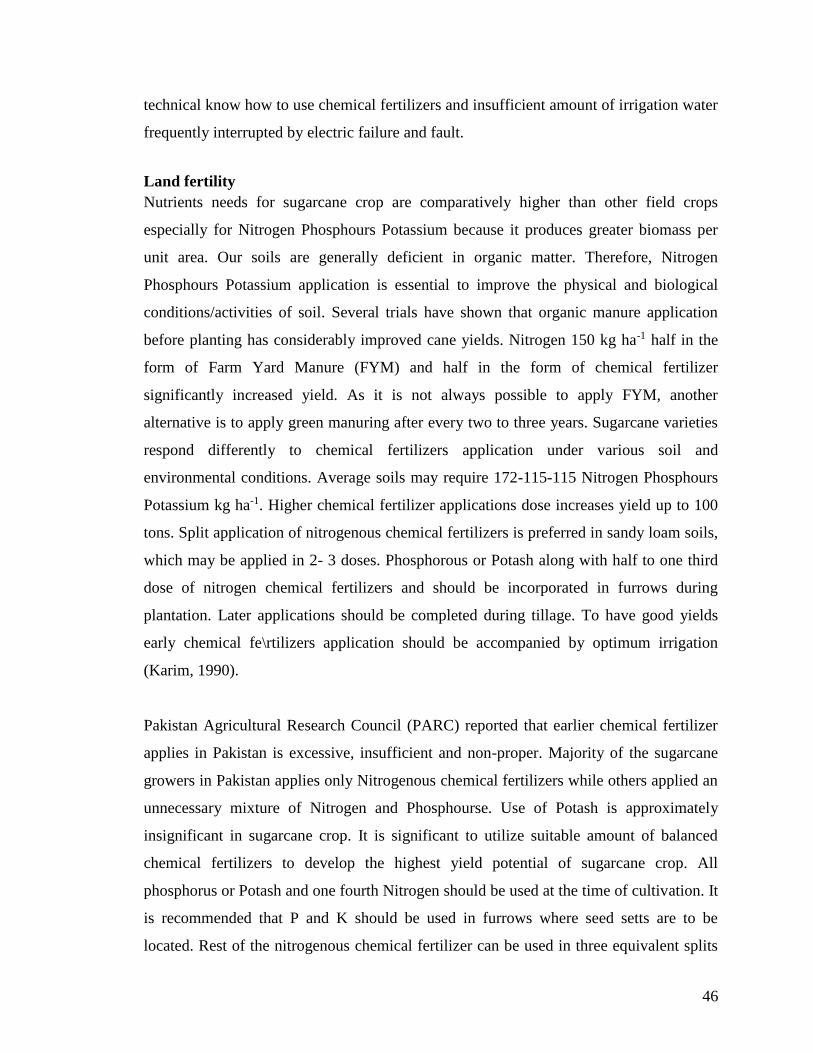
46
technical know how to use chemical fertilizers and insufficient amount of irrigation water
frequently interrupted by electric failure and fault.
Land fertility
Nutrients needs for sugarcane crop are comparatively higher than other field crops
especially for Nitrogen Phosphours Potassium because it produces greater biomass per
unit area. Our soils are generally deficient in organic matter. Therefore, Nitrogen
Phosphours Potassium application is essential to improve the physical and biological
conditions/activities of soil. Several trials have shown that organic manure application
before planting has considerably improved cane yields. Nitrogen 150 kg ha-1 half in the
form of Farm Yard Manure (FYM) and half in the form of chemical fertilizer
significantly increased yield. As it is not always possible to apply FYM, another
alternative is to apply green manuring after every two to three years. Sugarcane varieties
respond differently to chemical fertilizers application under various soil and
environmental conditions. Average soils may require 172-115-115 Nitrogen Phosphours
Potassium kg ha-1. Higher chemical fertilizer applications dose increases yield up to 100
tons. Split application of nitrogenous chemical fertilizers is preferred in sandy loam soils,
which may be applied in 2- 3 doses. Phosphorous or Potash along with half to one third
dose of nitrogen chemical fertilizers and should be incorporated in furrows during
plantation. Later applications should be completed during tillage. To have good yields
early chemical fe\rtilizers application should be accompanied by optimum irrigation
(Karim, 1990).
Pakistan Agricultural Research Council (PARC) reported that earlier chemical fertilizer
applies in Pakistan is excessive, insufficient and non-proper. Majority of the sugarcane
growers in Pakistan applies only Nitrogenous chemical fertilizers while others applied an
unnecessary mixture of Nitrogen and Phosphourse. Use of Potash is approximately
insignificant in sugarcane crop. It is significant to utilize suitable amount of balanced
chemical fertilizers to develop the highest yield potential of sugarcane crop. All
phosphorus or Potash and one fourth Nitrogen should be used at the time of cultivation. It
is recommended that P and K should be used in furrows where seed setts are to be
located. Rest of the nitrogenous chemical fertilizer can be used in three equivalent splits
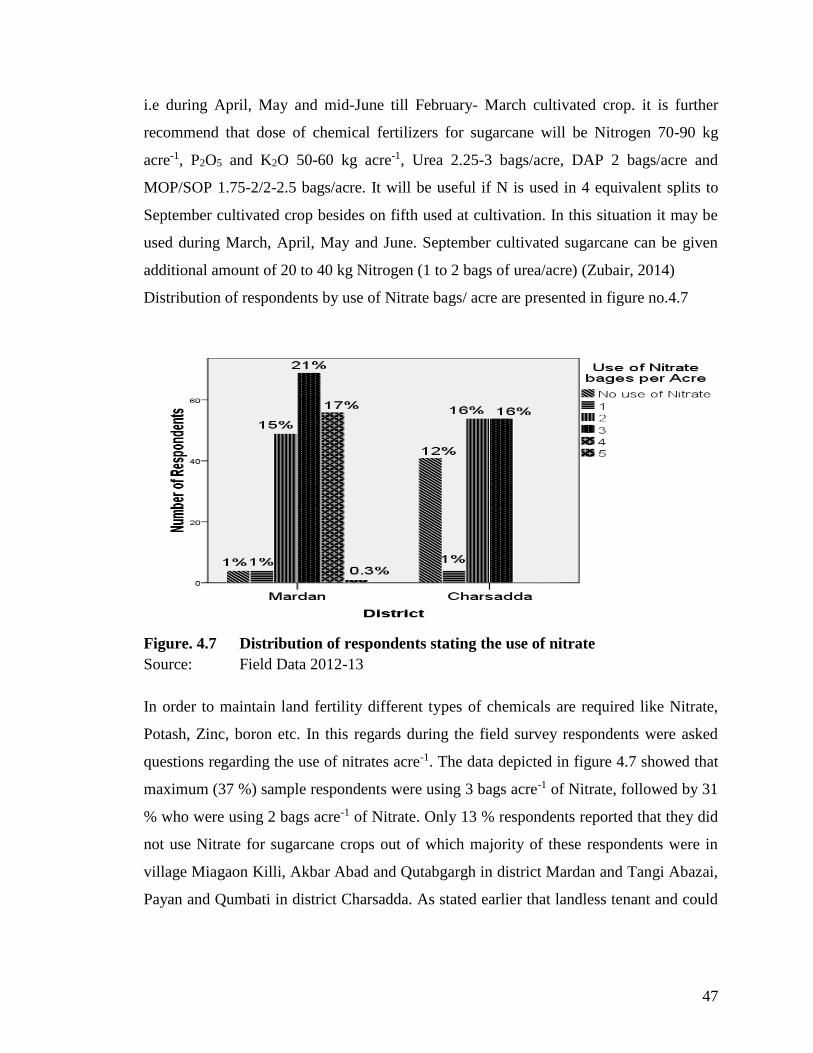
47
i.e during April, May and mid-June till February- March cultivated crop. it is further
recommend that dose of chemical fertilizers for sugarcane will be Nitrogen 70-90 kg
acre-1, P2O5 and K2O 50-60 kg acre-1, Urea 2.25-3 bags/acre, DAP 2 bags/acre and
MOP/SOP 1.75-2/2-2.5 bags/acre. It will be useful if N is used in 4 equivalent splits to
September cultivated crop besides on fifth used at cultivation. In this situation it may be
used during March, April, May and June. September cultivated sugarcane can be given
additional amount of 20 to 40 kg Nitrogen (1 to 2 bags of urea/acre) (Zubair, 2014)
Distribution of respondents by use of Nitrate bags/ acre are presented in figure no.4.7
Figure. 4.7 Distribution of respondents stating the use of nitrate
Source: Field Data 2012-13
In order to maintain land fertility different types of chemicals are required like Nitrate,
Potash, Zinc, boron etc. In this regards during the field survey respondents were asked
questions regarding the use of nitrates acre-1. The data depicted in figure 4.7 showed that
maximum (37 %) sample respondents were using 3 bags acre-1 of Nitrate, followed by 31
% who were using 2 bags acre-1 of Nitrate. Only 13 % respondents reported that they did
not use Nitrate for sugarcane crops out of which majority of these respondents were in
village Miagaon Killi, Akbar Abad and Qutabgargh in district Mardan and Tangi Abazai,
Payan and Qumbati in district Charsadda. As stated earlier that landless tenant and could
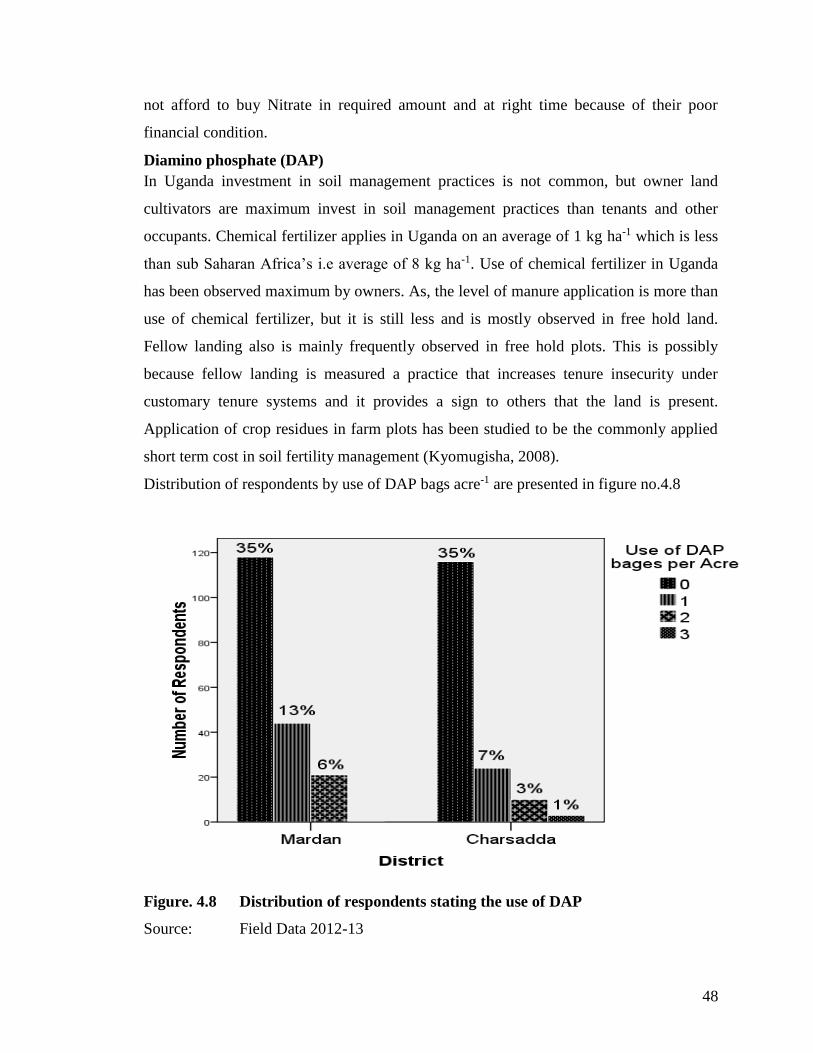
48
not afford to buy Nitrate in required amount and at right time because of their poor
financial condition.
Diamino phosphate (DAP)
In Uganda investment in soil management practices is not common, but owner land
cultivators are maximum invest in soil management practices than tenants and other
occupants. Chemical fertilizer applies in Uganda on an average of 1 kg ha-1 which is less
than sub Saharan Africa’s i.e average of 8 kg ha-1. Use of chemical fertilizer in Uganda
has been observed maximum by owners. As, the level of manure application is more than
use of chemical fertilizer, but it is still less and is mostly observed in free hold land.
Fellow landing also is mainly frequently observed in free hold plots. This is possibly
because fellow landing is measured a practice that increases tenure insecurity under
customary tenure systems and it provides a sign to others that the land is present.
Application of crop residues in farm plots has been studied to be the commonly applied
short term cost in soil fertility management (Kyomugisha, 2008).
Distribution of respondents by use of DAP bags acre-1 are presented in figure no.4.8
Figure. 4.8 Distribution of respondents stating the use of DAP
Source: Field Data 2012-13
49
DAP is the most appropriate chemical fertilizer for all types of crops because it contains
phosphorus, nitrogen and Potash. The data presented in figurre 4.8 showed that 1%
respondents used 3 bags acre-1 DAP. Out of 336 respondents only 3 respondents used
DAP 3 bags acre-1 in district Mardan. This could be attributed to non-availability and
high cost in district Mardan. Only 31 respondents reported that they used 2 bags acre-1 of
DAP. Out of these 31 % respondents 2, 7 and 12 were in villages Akber Abad, Qutabgarh
and Feroz Shah respectively in district Mardan and 6, 2 and 2 were in village Payan,
Hisara Nehri and Qumbati respectively of district Charsadda. In the study area 68
respondents were used 1 bag acre-1 of DAP. Out these 68 respondents 1, 22, 9 and 12
respondents were in village Gulmera, Akber Abad, Qutabgarh and Feroz Shah
respectively of district Mardan and 1, 8 and 15 respondents were in village Dobandi,
Payan and Hisara Nehri respectively in district Charsadda. The remaining 234
respondents did not use DAP. Out of these 234 respondents were 35, 35, 21, 17 and 10
were in villages Gulmera, Miagano Killi, Feroz Shah, Qutabgarh and Akber Abad
respectively in district Mardan and 29, 29, 23, 22 and 13 were in villages Dobandi, Tangi
Abazai, Hisara Nehri,Qumbati and Payan respectively in district Charsadda. During the
research area almost all sample respondents reported that DAP is not only costly but also
not available at right time, in require amount and in good quality.
DAP and Urea type chemical fertilizers are commonly used by the farmers but the
agriculture department is against its use. Likewise, Nitrogen Phosphours Potassium is
used in compound form while, recommendation is to use it separately. As the supply of
chemical fertilizer has also been controlled by the private sector for more than 10 years
when the government stopped the supply the motivation task then controlled by the
private sector. The role of the public sector extension workers is supplementary as
compared to that of the private sector. Updating knowledge about the types of chemical
fertilizer and its use with proper ratio was the main areas where the farmers asked for
intervention. The overall average of the five sampled districts highlight that main
assistance required by the highest number of farmers 38 % in the area of updating their
knowledge about types and proper ratio of chemical fertilizer to be used followed by the
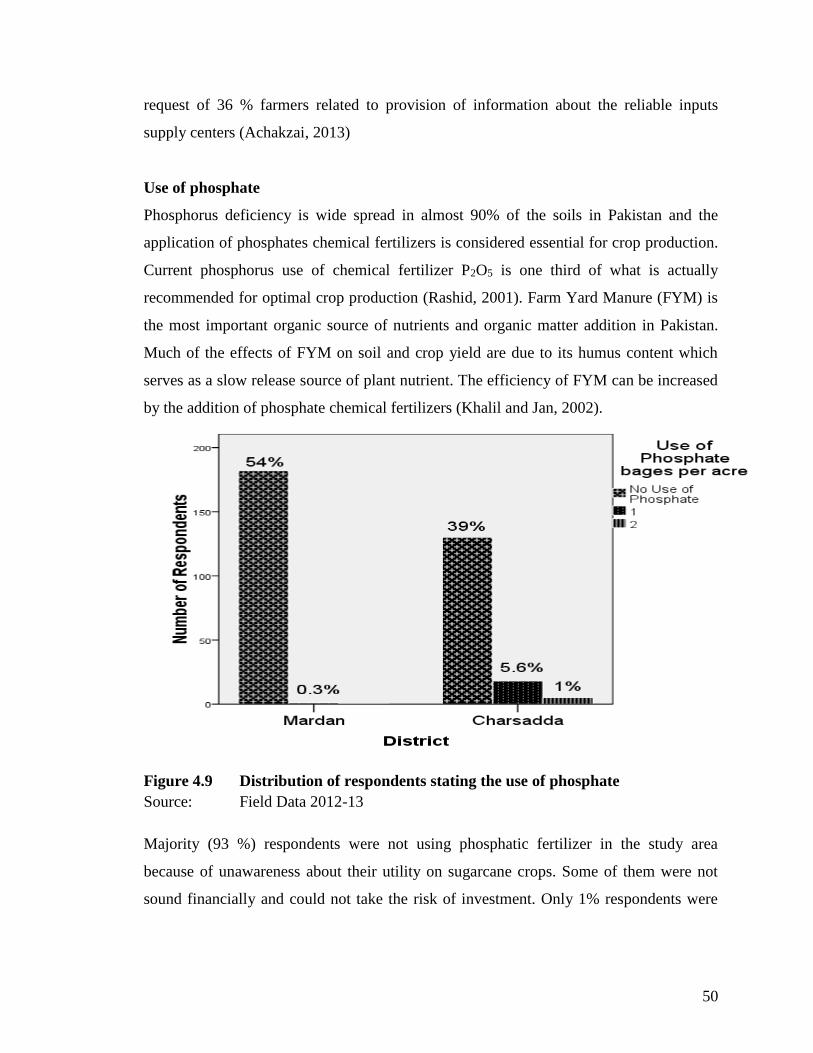
50
request of 36 % farmers related to provision of information about the reliable inputs
supply centers (Achakzai, 2013)
Use of phosphate
Phosphorus deficiency is wide spread in almost 90% of the soils in Pakistan and the
application of phosphates chemical fertilizers is considered essential for crop production.
Current phosphorus use of chemical fertilizer P2O5 is one third of what is actually
recommended for optimal crop production (Rashid, 2001). Farm Yard Manure (FYM) is
the most important organic source of nutrients and organic matter addition in Pakistan.
Much of the effects of FYM on soil and crop yield are due to its humus content which
serves as a slow release source of plant nutrient. The efficiency of FYM can be increased
by the addition of phosphate chemical fertilizers (Khalil and Jan, 2002).
Figure 4.9 Distribution of respondents stating the use of phosphate
Source: Field Data 2012-13
Majority (93 %) respondents were not using phosphatic fertilizer in the study area
because of unawareness about their utility on sugarcane crops. Some of them were not
sound financially and could not take the risk of investment. Only 1% respondents were
51
using 2 bags acre-1 of phosphate belonging to district Charsadda. The 6% respondents
were using 1 bag of phosphatic fertilizers who were from district Mardan.
Use of farm yard manure (FYM)
Farm Yard Manure (FYM) is a Heterogeneous organic material consisting of dung, crop
residue and household sweeping in various stages of decomposition. FYM is mostly
produced in farms and is an important organic resource for agricultural production in
livestock based farming systems in many countries including semi-arid regions of India
(Motavalli et al., 1994).
There is evidence from field research that high and sustainable yields are possible with
integrated use of chemical fertilizers and manure (Raman et al., 1996). However it is
important to identify the optimum dose of fertilizer required for maintaining adequate
supply of nutrients for increasing yield and reduced environmental pollution (Singh et al.,
1999).
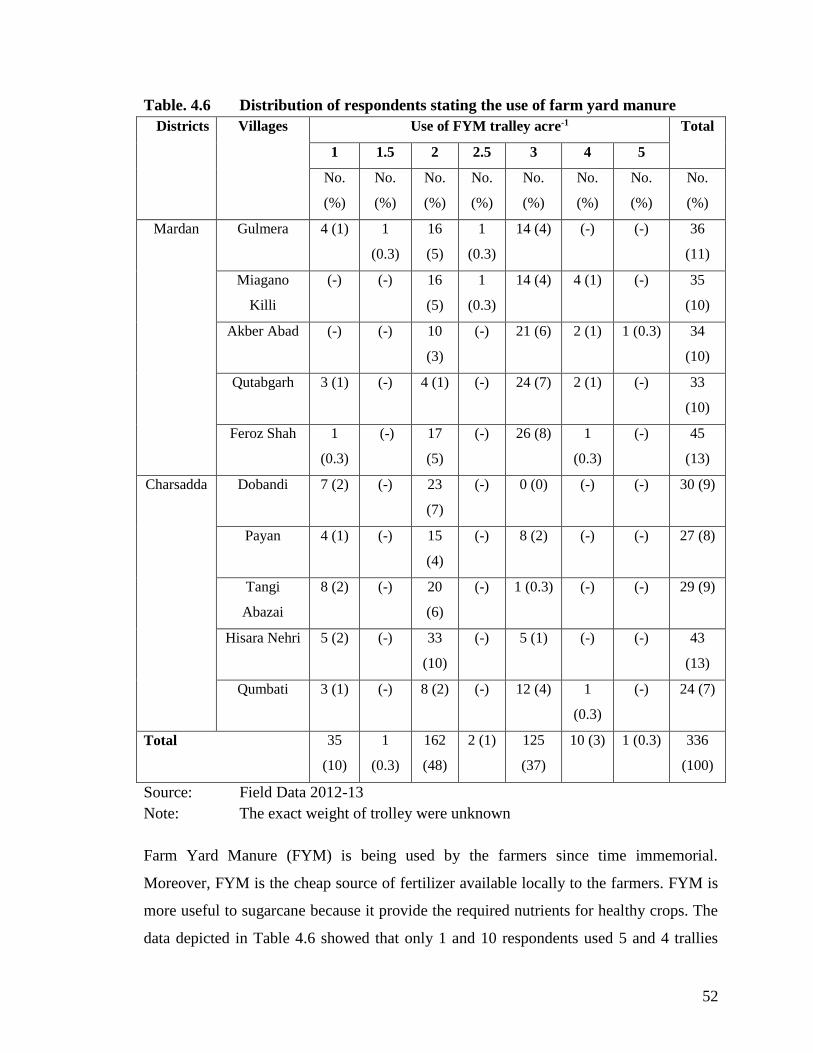
52
Table. 4.6 Distribution of respondents stating the use of farm yard manure
Districts Villages Use of FYM tralley acre-1 Total
1 1.5 2 2.5 3 4 5
No.
(%)
No.
(%)
No.
(%)
No.
(%)
No.
(%)
No.
(%)
No.
(%)
No.
(%)
Mardan Gulmera 4 (1) 1
(0.3)
16
(5)
1
(0.3)
14 (4) (-) (-) 36
(11)
Miagano
Killi
(-) (-) 16
(5)
1
(0.3)
14 (4) 4 (1) (-) 35
(10)
Akber Abad (-) (-) 10
(3)
(-) 21 (6) 2 (1) 1 (0.3) 34
(10)
Qutabgarh 3 (1) (-) 4 (1) (-) 24 (7) 2 (1) (-) 33
(10)
Feroz Shah 1
(0.3)
(-) 17
(5)
(-) 26 (8) 1
(0.3)
(-) 45
(13)
Charsadda Dobandi 7 (2) (-) 23
(7)
(-) 0 (0) (-) (-) 30 (9)
Payan 4 (1) (-) 15
(4)
(-) 8 (2) (-) (-) 27 (8)
Tangi
Abazai
8 (2) (-) 20
(6)
(-) 1 (0.3) (-) (-) 29 (9)
Hisara Nehri 5 (2) (-) 33
(10)
(-) 5 (1) (-) (-) 43
(13)
Qumbati 3 (1) (-) 8 (2) (-) 12 (4) 1
(0.3)
(-) 24 (7)
Total 35
(10)
1
(0.3)
162
(48)
2 (1) 125
(37)
10 (3) 1 (0.3) 336
(100)
Source: Field Data 2012-13
Note: The exact weight of trolley were unknown
Farm Yard Manure (FYM) is being used by the farmers since time immemorial.
Moreover, FYM is the cheap source of fertilizer available locally to the farmers. FYM is
more useful to sugarcane because it provide the required nutrients for healthy crops. The
data depicted in Table 4.6 showed that only 1 and 10 respondents used 5 and 4 trallies
53
acre-1 respectively. Majority (289) respondents used 2 to 3 trallies acre-1. 36 respondents
used 1 to 1.5 trallies acre-1. The overall analysis of data suggests that recommended
amount of FYM was used by less than 50 % respondents. This could be attributed to fact
that cattle dairy farming is not either profitable or youth feel shy about this profession.
The role of agricultural extension services needs to be activated in order to create
awareness among the farming community regarding dairy farming. If this situation is not
checked it will possess serious threat in future for shortage meat and dairy products
shortage. It could be concluded from the above discussion that FYM is not only
important for Sugarcane cultivation but also for other crops.
Use of irrigation
The availability of adequate and regular supply of water would enhance the application of
agricultural technologies thereby boosting overall agricultural productivity and improving
the economic status of poor farmers. Irrigations have been shown to increase crop yield
in arid and semi-arid climates (Hussain et al., 2007).
Pakistan lies in semi-arid to arid climate. Therefore cane growth suffers from shortage of
irrigation water. Cane needs about 2000 mm of water to produce maximum yield 48% is
needed during active growth between March to June in a critical period of cane growth
because moisture stress during this period can severely reduce cane yield. It is concluded
that water needs of sugarcane should be fulfilled through irrigation application at 9-12
days interval during pre-monsoon period. This interval may be gradually prolonged to
13-17 days during monsoon and up to 18-25 days after monsoon (Malik, 1989).
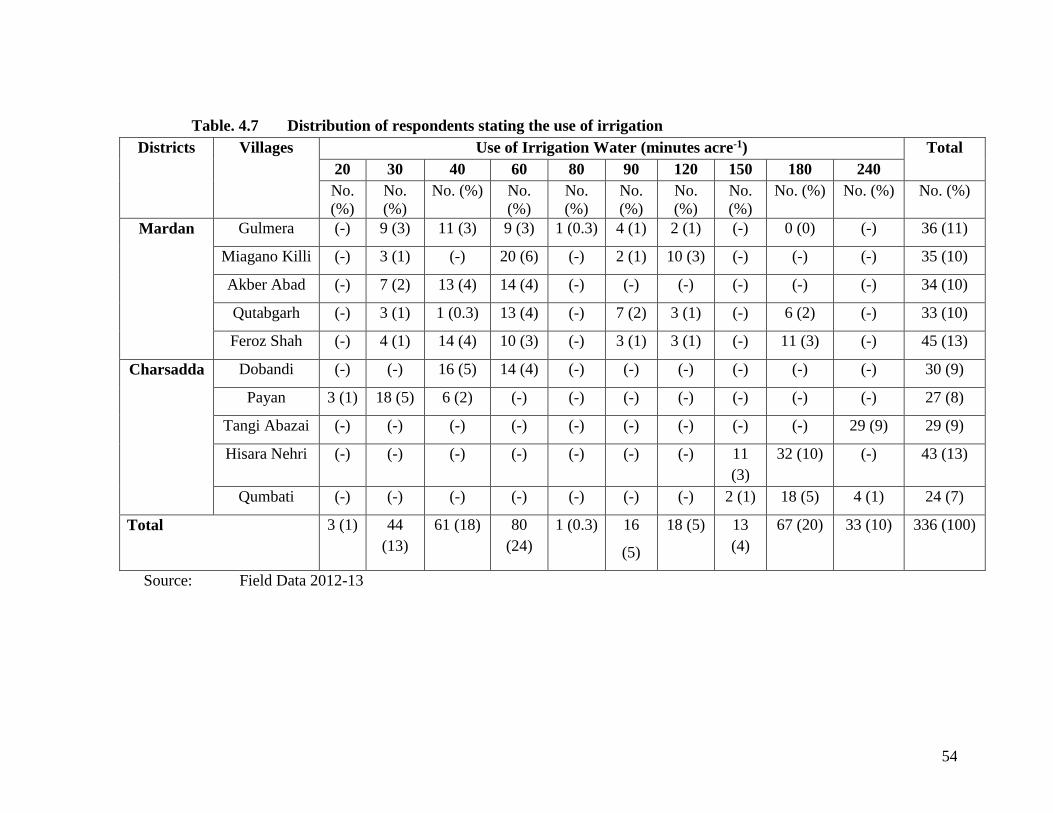
54
Table. 4.7 Distribution of respondents stating the use of irrigation
Districts Villages Use of Irrigation Water (minutes acre-1) Total
20 30 40 60 80 90 120 150 180 240
No.
(%)
No.
(%)
No. (%) No.
(%)
No.
(%)
No.
(%)
No.
(%)
No.
(%)
No. (%) No. (%) No. (%)
Mardan Gulmera (-) 9 (3) 11 (3) 9 (3) 1 (0.3) 4 (1) 2 (1) (-) 0 (0) (-) 36 (11)
Miagano Killi (-) 3 (1) (-) 20 (6) (-) 2 (1) 10 (3) (-) (-) (-) 35 (10)
Akber Abad (-) 7 (2) 13 (4) 14 (4) (-) (-) (-) (-) (-) (-) 34 (10)
Qutabgarh (-) 3 (1) 1 (0.3) 13 (4) (-) 7 (2) 3 (1) (-) 6 (2) (-) 33 (10)
Feroz Shah (-) 4 (1) 14 (4) 10 (3) (-) 3 (1) 3 (1) (-) 11 (3) (-) 45 (13)
Charsadda Dobandi (-) (-) 16 (5) 14 (4) (-) (-) (-) (-) (-) (-) 30 (9)
Payan 3 (1) 18 (5) 6 (2) (-) (-) (-) (-) (-) (-) (-) 27 (8)
Tangi Abazai (-) (-) (-) (-) (-) (-) (-) (-) (-) 29 (9) 29 (9)
Hisara Nehri (-) (-) (-) (-) (-) (-) (-) 11
(3)
32 (10) (-) 43 (13)
Qumbati (-) (-) (-) (-) (-) (-) (-) 2 (1) 18 (5) 4 (1) 24 (7)
Total 3 (1) 44
(13)
61 (18) 80
(24)
1 (0.3) 16
(5)
18 (5) 13
(4)
67 (20) 33 (10) 336 (100)
Source: Field Data 2012-13
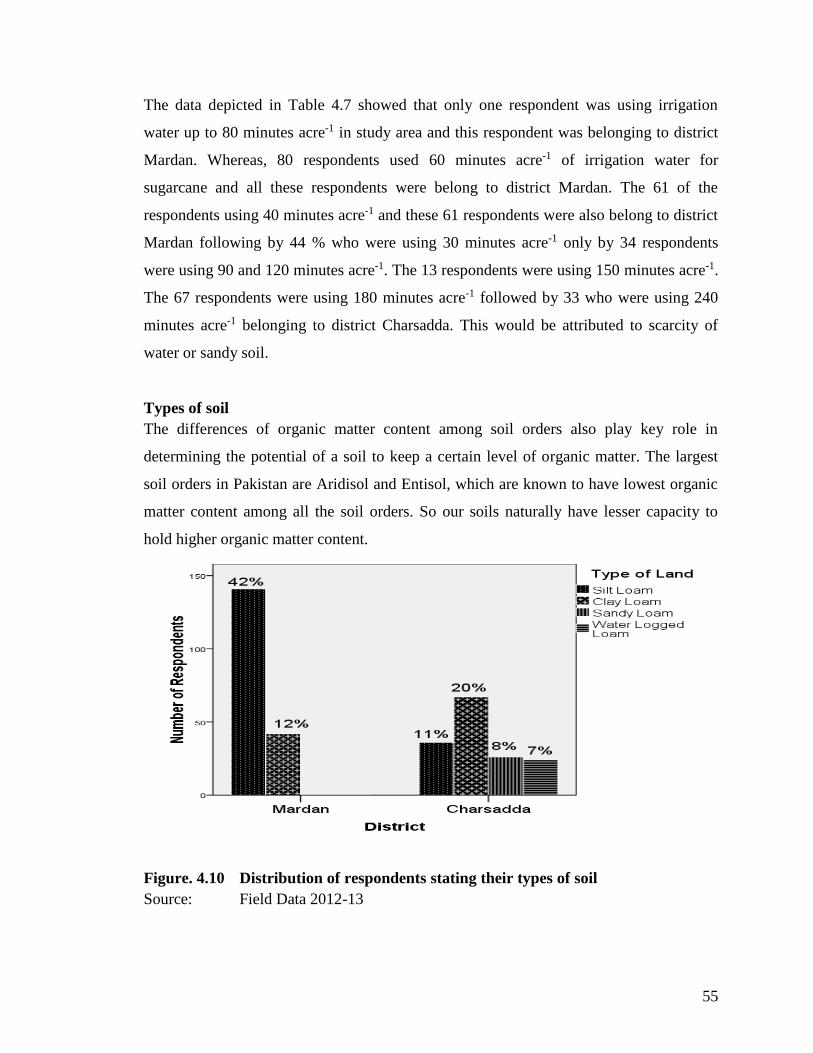
55
The data depicted in Table 4.7 showed that only one respondent was using irrigation
water up to 80 minutes acre-1 in study area and this respondent was belonging to district
Mardan. Whereas, 80 respondents used 60 minutes acre-1 of irrigation water for
sugarcane and all these respondents were belong to district Mardan. The 61 of the
respondents using 40 minutes acre-1 and these 61 respondents were also belong to district
Mardan following by 44 % who were using 30 minutes acre-1 only by 34 respondents
were using 90 and 120 minutes acre-1. The 13 respondents were using 150 minutes acre-1.
The 67 respondents were using 180 minutes acre-1 followed by 33 who were using 240
minutes acre-1 belonging to district Charsadda. This would be attributed to scarcity of
water or sandy soil.
Types of soil
The differences of organic matter content among soil orders also play key role in
determining the potential of a soil to keep a certain level of organic matter. The largest
soil orders in Pakistan are Aridisol and Entisol, which are known to have lowest organic
matter content among all the soil orders. So our soils naturally have lesser capacity to
hold higher organic matter content.
Figure. 4.10 Distribution of respondents stating their types of soil
Source: Field Data 2012-13
56
Soil is the main determine for growing various types of crops. The yield per acre depends
entirely on good quality of soil. During research study respondent were asked questions
regarding soils and their responses were recorded in figure4.10. Figure 4.10 showed that
majority (53 %) respondents were cultivated sugarcane in silt loam land and these 53 %
respondents where 11 % from district Charsadda and 42 % from district Mardan. Silt
loam soil is usually very fertile and need little chemical fertilizer due to soil erosion;
eroded soil is deposited at the lower end of land. Out of total sample, 32 % respondents
used clay loam land in study area for sugarcane cultivation. Only 7 % and 8%
respondents used water logged and sandy loam for sugarcane cultivation in the study area
respectively. From the figure 4.10 it could be concluded that nature of soil effect
sugarcane production.
The results of research study of Perviaz et al., 2013 showed that 11 %, 21 %, 53 % and
13 % were silt loam, clay loam, sandy loam and water logged soil respectively used in
district Peshawar for sugarcane cultivation.
Association between type of soil with production of sugarcane
The output of Table 4.8 showed Chi-square (93.888) with (P .value= 0.000) and Gamma
value (0.602). The Table 4.8 indicated the association between soil types and sugarcane
production is statistically highly significant as (P. value= 0.000). The positive sign of
Gama value showed types of soil directly related with sugarcane production. The fertile
and suitable soil increase production of sugarcane while less fertile and not suitable soil
decrease or adversely effect sugarcane production. The results confirm by Perviaz et al.,
2013 that 11% of the respondents were having silt loam and concluded that the type of
soil effect production of sugarcane. The research study reported that land salinization is a
major cause of desert formation in Pakistan. About 6.3 million ha are affected. Secondary
salinity is caused by seepage from irrigation canals, high salt concentrations in irrigation
water, insufficient leaching of salt and the use of irrigation water with a poor salt balance
(Qureshi and Barrett, 1998).
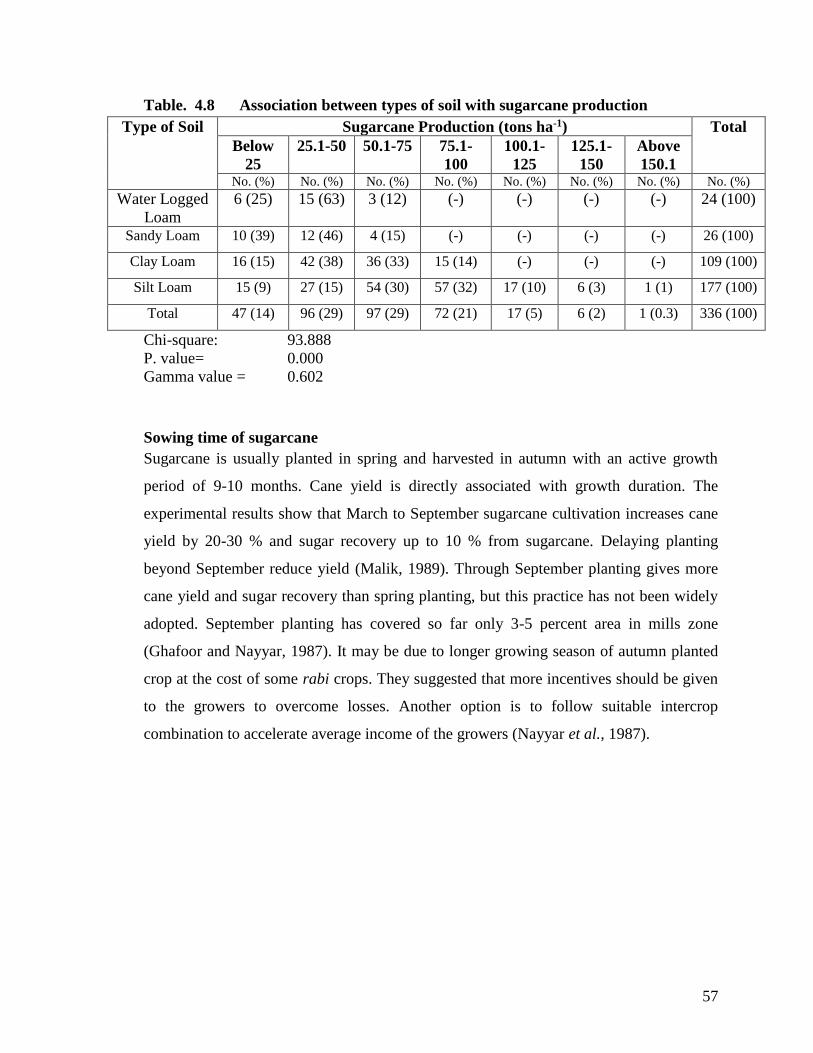
57
Table. 4.8 Association between types of soil with sugarcane production
Type of Soil Sugarcane Production (tons ha-1) Total
Below
25
25.1-50 50.1-75 75.1-
100
100.1-
125
125.1-
150
Above
150.1 No. (%) No. (%) No. (%) No. (%) No. (%) No. (%) No. (%) No. (%)
Water Logged
Loam
6 (25) 15 (63) 3 (12) (-) (-) (-) (-) 24 (100)
Sandy Loam 10 (39) 12 (46) 4 (15) (-) (-) (-) (-) 26 (100)
Clay Loam 16 (15) 42 (38) 36 (33) 15 (14) (-) (-) (-) 109 (100)
Silt Loam 15 (9) 27 (15) 54 (30) 57 (32) 17 (10) 6 (3) 1 (1) 177 (100)
Total 47 (14) 96 (29) 97 (29) 72 (21) 17 (5) 6 (2) 1 (0.3) 336 (100)
Chi-square: 93.888
P. value= 0.000
Gamma value = 0.602
Sowing time of sugarcane
Sugarcane is usually planted in spring and harvested in autumn with an active growth
period of 9-10 months. Cane yield is directly associated with growth duration. The
experimental results show that March to September sugarcane cultivation increases cane
yield by 20-30 % and sugar recovery up to 10 % from sugarcane. Delaying planting
beyond September reduce yield (Malik, 1989). Through September planting gives more
cane yield and sugar recovery than spring planting, but this practice has not been widely
adopted. September planting has covered so far only 3-5 percent area in mills zone
(Ghafoor and Nayyar, 1987). It may be due to longer growing season of autumn planted
crop at the cost of some rabi crops. They suggested that more incentives should be given
to the growers to overcome losses. Another option is to follow suitable intercrop
combination to accelerate average income of the growers (Nayyar et al., 1987).
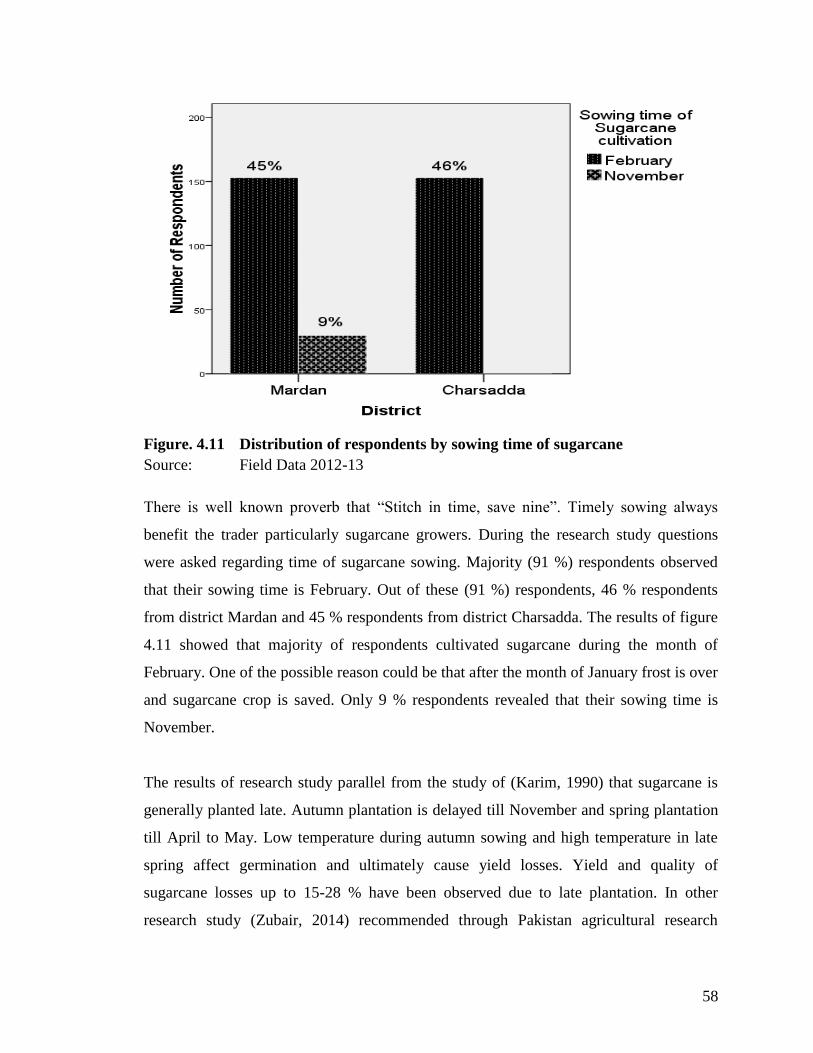
58
Figure. 4.11 Distribution of respondents by sowing time of sugarcane
Source: Field Data 2012-13
There is well known proverb that “Stitch in time, save nine”. Timely sowing always
benefit the trader particularly sugarcane growers. During the research study questions
were asked regarding time of sugarcane sowing. Majority (91 %) respondents observed
that their sowing time is February. Out of these (91 %) respondents, 46 % respondents
from district Mardan and 45 % respondents from district Charsadda. The results of figure
4.11 showed that majority of respondents cultivated sugarcane during the month of
February. One of the possible reason could be that after the month of January frost is over
and sugarcane crop is saved. Only 9 % respondents revealed that their sowing time is
November.
The results of research study parallel from the study of (Karim, 1990) that sugarcane is
generally planted late. Autumn plantation is delayed till November and spring plantation
till April to May. Low temperature during autumn sowing and high temperature in late
spring affect germination and ultimately cause yield losses. Yield and quality of
sugarcane losses up to 15-28 % have been observed due to late plantation. In other
research study (Zubair, 2014) recommended through Pakistan agricultural research
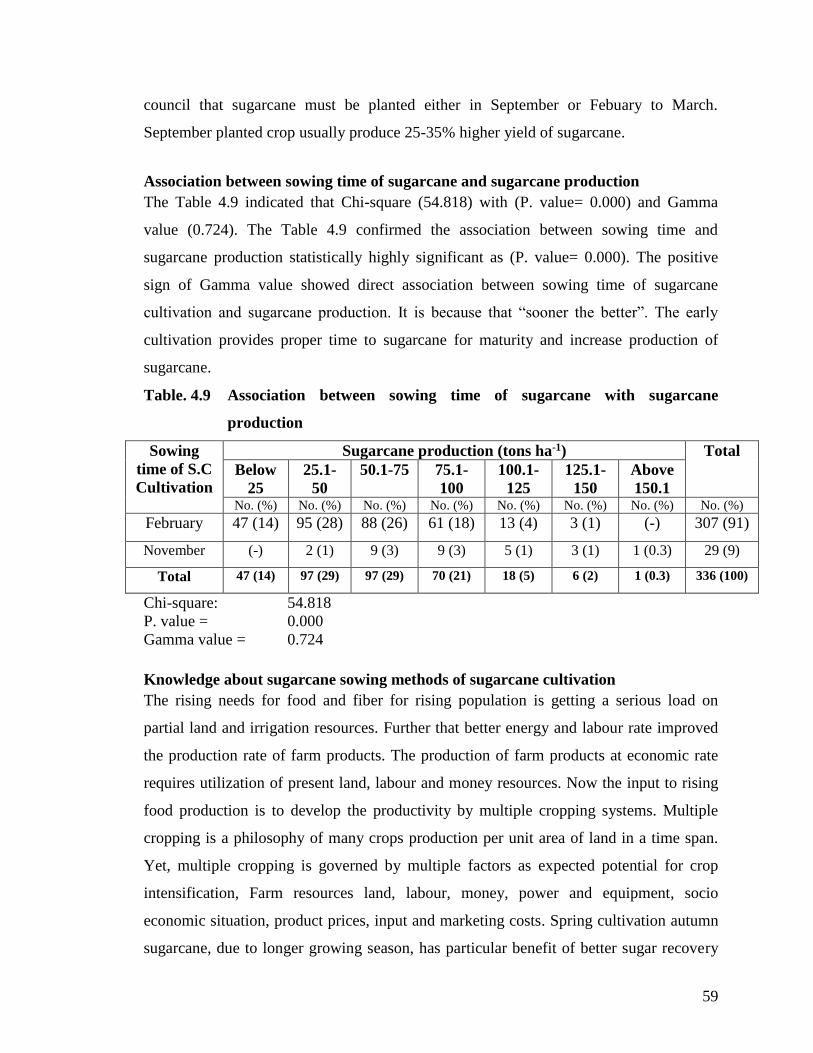
59
council that sugarcane must be planted either in September or Febuary to March.
September planted crop usually produce 25-35% higher yield of sugarcane.
Association between sowing time of sugarcane and sugarcane production
The Table 4.9 indicated that Chi-square (54.818) with (P. value= 0.000) and Gamma
value (0.724). The Table 4.9 confirmed the association between sowing time and
sugarcane production statistically highly significant as (P. value= 0.000). The positive
sign of Gamma value showed direct association between sowing time of sugarcane
cultivation and sugarcane production. It is because that “sooner the better”. The early
cultivation provides proper time to sugarcane for maturity and increase production of
sugarcane.
Table. 4.9 Association between sowing time of sugarcane with sugarcane
production
Sowing
time of S.C
Cultivation
Sugarcane production (tons ha-1) Total
Below
25
25.1-
50
50.1-75 75.1-
100
100.1-
125
125.1-
150
Above
150.1 No. (%) No. (%) No. (%) No. (%) No. (%) No. (%) No. (%) No. (%)
February 47 (14) 95 (28) 88 (26) 61 (18) 13 (4) 3 (1) (-) 307 (91)
November (-) 2 (1) 9 (3) 9 (3) 5 (1) 3 (1) 1 (0.3) 29 (9)
Total 47 (14) 97 (29) 97 (29) 70 (21) 18 (5) 6 (2) 1 (0.3) 336 (100)
Chi-square: 54.818
P. value = 0.000
Gamma value = 0.724
Knowledge about sugarcane sowing methods of sugarcane cultivation
The rising needs for food and fiber for rising population is getting a serious load on
partial land and irrigation resources. Further that better energy and labour rate improved
the production rate of farm products. The production of farm products at economic rate
requires utilization of present land, labour and money resources. Now the input to rising
food production is to develop the productivity by multiple cropping systems. Multiple
cropping is a philosophy of many crops production per unit area of land in a time span.
Yet, multiple cropping is governed by multiple factors as expected potential for crop
intensification, Farm resources land, labour, money, power and equipment, socio
economic situation, product prices, input and marketing costs. Spring cultivation autumn
sugarcane, due to longer growing season, has particular benefit of better sugar recovery
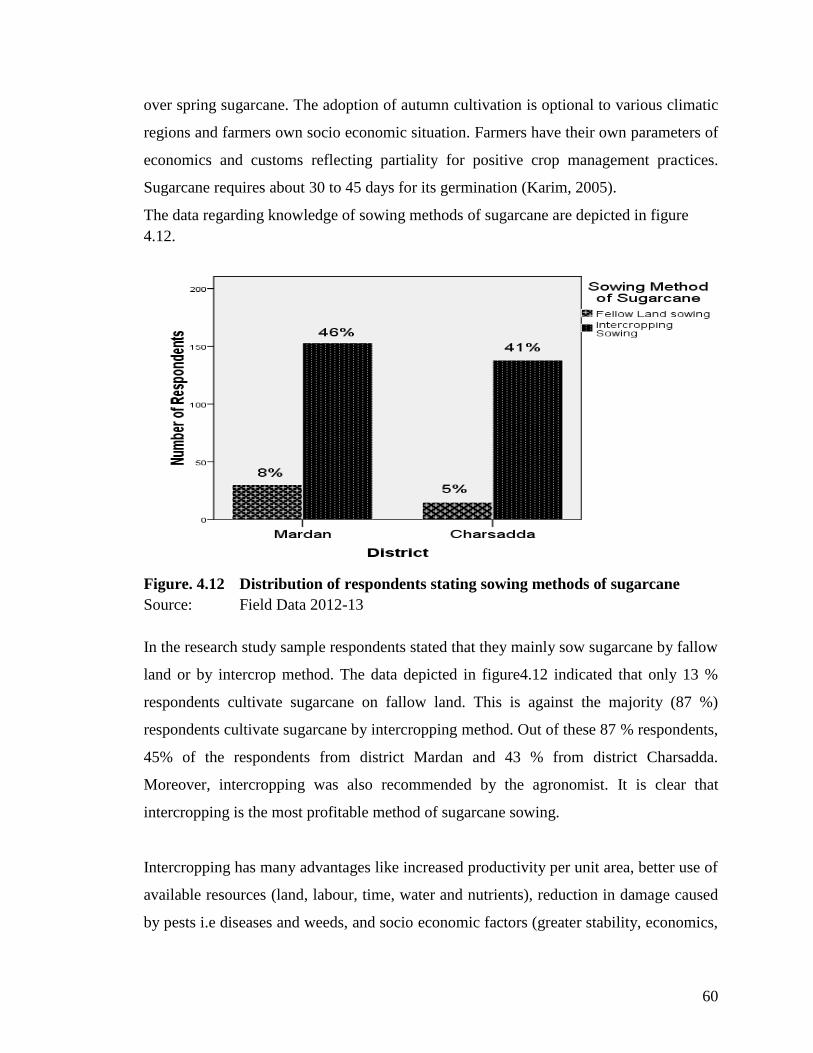
60
over spring sugarcane. The adoption of autumn cultivation is optional to various climatic
regions and farmers own socio economic situation. Farmers have their own parameters of
economics and customs reflecting partiality for positive crop management practices.
Sugarcane requires about 30 to 45 days for its germination (Karim, 2005).
The data regarding knowledge of sowing methods of sugarcane are depicted in figure
4.12.
Figure. 4.12 Distribution of respondents stating sowing methods of sugarcane
Source: Field Data 2012-13
In the research study sample respondents stated that they mainly sow sugarcane by fallow
land or by intercrop method. The data depicted in figure4.12 indicated that only 13 %
respondents cultivate sugarcane on fallow land. This is against the majority (87 %)
respondents cultivate sugarcane by intercropping method. Out of these 87 % respondents,
45% of the respondents from district Mardan and 43 % from district Charsadda.
Moreover, intercropping was also recommended by the agronomist. It is clear that
intercropping is the most profitable method of sugarcane sowing.
Intercropping has many advantages like increased productivity per unit area, better use of
available resources (land, labour, time, water and nutrients), reduction in damage caused
by pests i.e diseases and weeds, and socio economic factors (greater stability, economics,
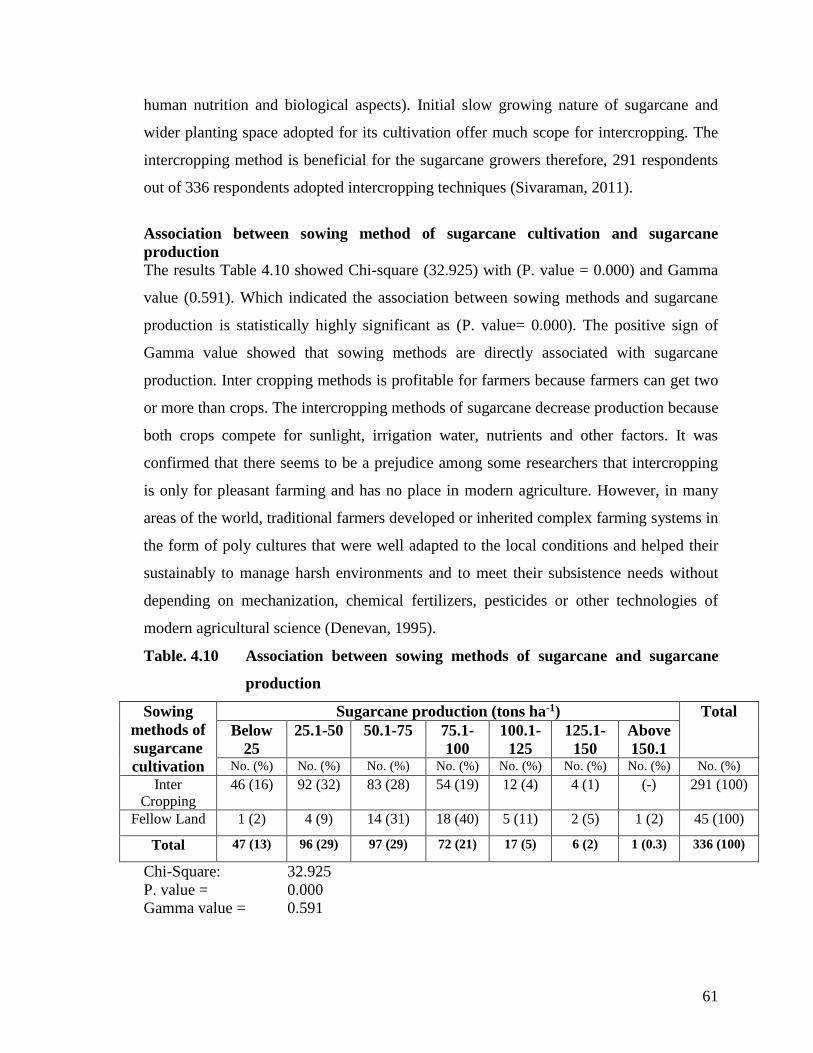
61
human nutrition and biological aspects). Initial slow growing nature of sugarcane and
wider planting space adopted for its cultivation offer much scope for intercropping. The
intercropping method is beneficial for the sugarcane growers therefore, 291 respondents
out of 336 respondents adopted intercropping techniques (Sivaraman, 2011).
Association between sowing method of sugarcane cultivation and sugarcane
production
The results Table 4.10 showed Chi-square (32.925) with (P. value = 0.000) and Gamma
value (0.591). Which indicated the association between sowing methods and sugarcane
production is statistically highly significant as (P. value= 0.000). The positive sign of
Gamma value showed that sowing methods are directly associated with sugarcane
production. Inter cropping methods is profitable for farmers because farmers can get two
or more than crops. The intercropping methods of sugarcane decrease production because
both crops compete for sunlight, irrigation water, nutrients and other factors. It was
confirmed that there seems to be a prejudice among some researchers that intercropping
is only for pleasant farming and has no place in modern agriculture. However, in many
areas of the world, traditional farmers developed or inherited complex farming systems in
the form of poly cultures that were well adapted to the local conditions and helped their
sustainably to manage harsh environments and to meet their subsistence needs without
depending on mechanization, chemical fertilizers, pesticides or other technologies of
modern agricultural science (Denevan, 1995).
Table. 4.10 Association between sowing methods of sugarcane and sugarcane
production
Sowing
methods of
sugarcane
cultivation
Sugarcane production (tons ha-1) Total
Below
25
25.1-50 50.1-75 75.1-
100
100.1-
125
125.1-
150
Above
150.1 No. (%) No. (%) No. (%) No. (%) No. (%) No. (%) No. (%) No. (%)
Inter
Cropping
46 (16) 92 (32) 83 (28) 54 (19) 12 (4) 4 (1) (-) 291 (100)
Fellow Land 1 (2) 4 (9) 14 (31) 18 (40) 5 (11) 2 (5) 1 (2) 45 (100)
Total 47 (13) 96 (29) 97 (29) 72 (21) 17 (5) 6 (2) 1 (0.3) 336 (100)
Chi-Square: 32.925
P. value = 0.000
Gamma value = 0.591
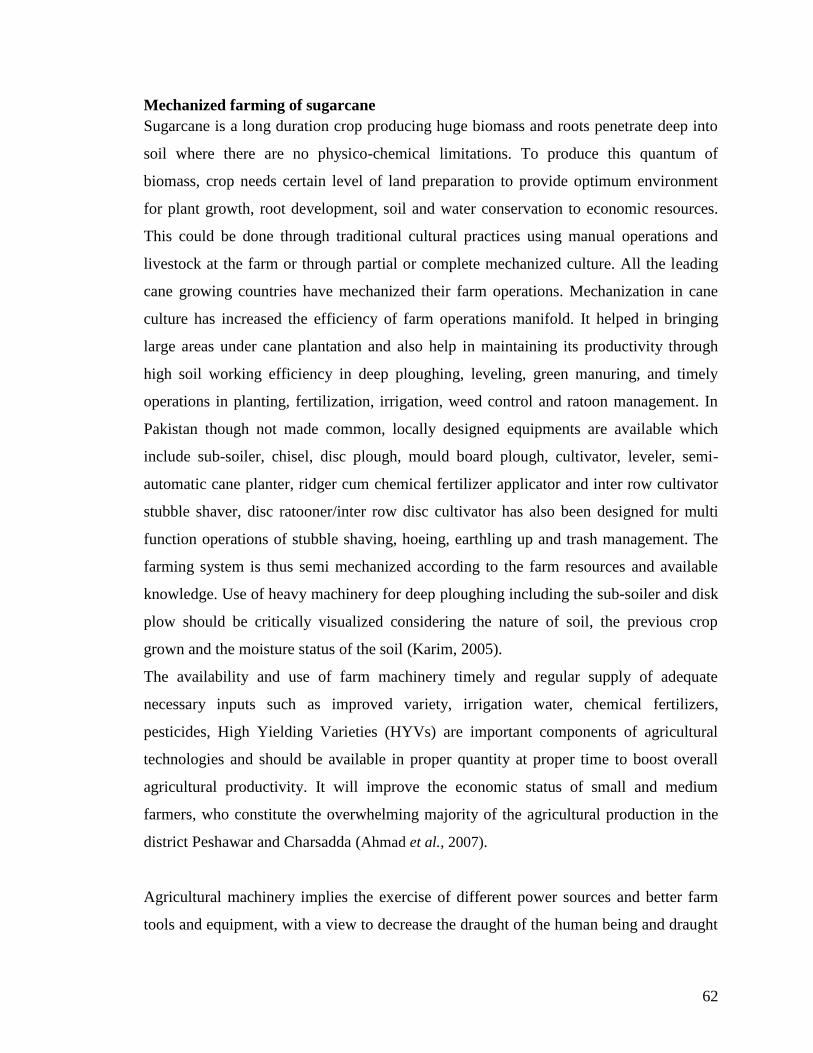
62
Mechanized farming of sugarcane
Sugarcane is a long duration crop producing huge biomass and roots penetrate deep into
soil where there are no physico-chemical limitations. To produce this quantum of
biomass, crop needs certain level of land preparation to provide optimum environment
for plant growth, root development, soil and water conservation to economic resources.
This could be done through traditional cultural practices using manual operations and
livestock at the farm or through partial or complete mechanized culture. All the leading
cane growing countries have mechanized their farm operations. Mechanization in cane
culture has increased the efficiency of farm operations manifold. It helped in bringing
large areas under cane plantation and also help in maintaining its productivity through
high soil working efficiency in deep ploughing, leveling, green manuring, and timely
operations in planting, fertilization, irrigation, weed control and ratoon management. In
Pakistan though not made common, locally designed equipments are available which
include sub-soiler, chisel, disc plough, mould board plough, cultivator, leveler, semi-
automatic cane planter, ridger cum chemical fertilizer applicator and inter row cultivator
stubble shaver, disc ratooner/inter row disc cultivator has also been designed for multi
function operations of stubble shaving, hoeing, earthling up and trash management. The
farming system is thus semi mechanized according to the farm resources and available
knowledge. Use of heavy machinery for deep ploughing including the sub-soiler and disk
plow should be critically visualized considering the nature of soil, the previous crop
grown and the moisture status of the soil (Karim, 2005).
The availability and use of farm machinery timely and regular supply of adequate
necessary inputs such as improved variety, irrigation water, chemical fertilizers,
pesticides, High Yielding Varieties (HYVs) are important components of agricultural
technologies and should be available in proper quantity at proper time to boost overall
agricultural productivity. It will improve the economic status of small and medium
farmers, who constitute the overwhelming majority of the agricultural production in the
district Peshawar and Charsadda (Ahmad et al., 2007).
Agricultural machinery implies the exercise of different power sources and better farm
tools and equipment, with a view to decrease the draught of the human being and draught
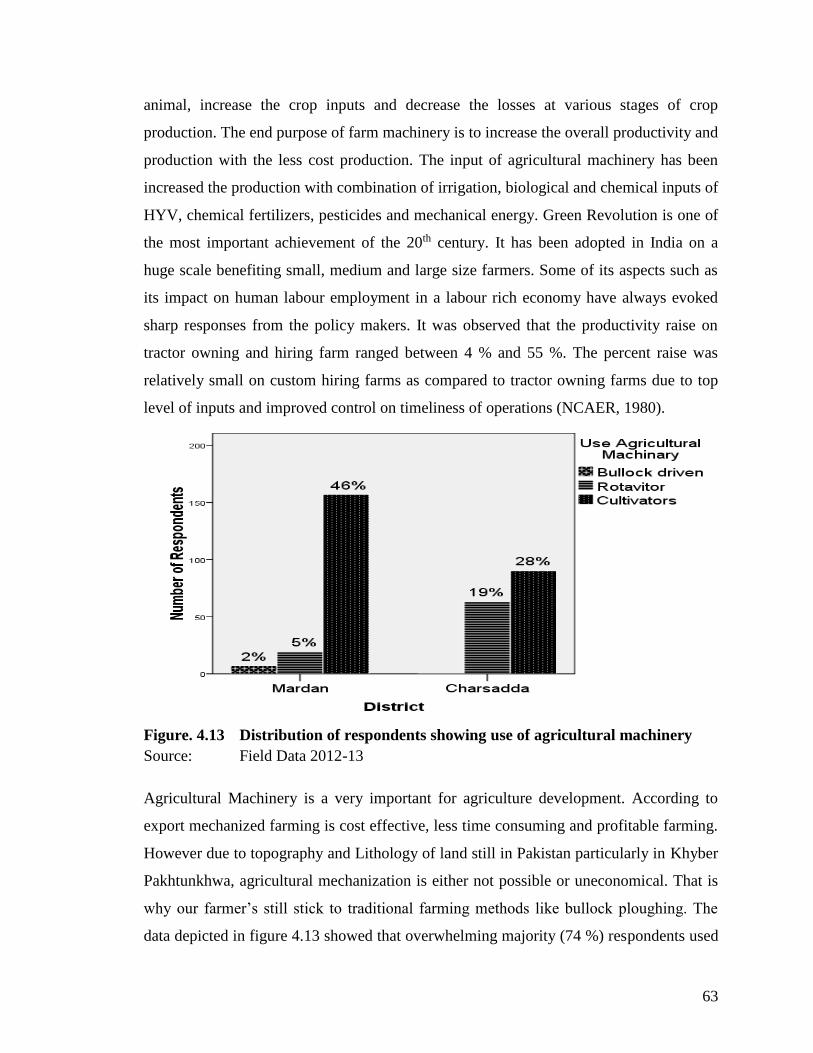
63
animal, increase the crop inputs and decrease the losses at various stages of crop
production. The end purpose of farm machinery is to increase the overall productivity and
production with the less cost production. The input of agricultural machinery has been
increased the production with combination of irrigation, biological and chemical inputs of
HYV, chemical fertilizers, pesticides and mechanical energy. Green Revolution is one of
the most important achievement of the 20th century. It has been adopted in India on a
huge scale benefiting small, medium and large size farmers. Some of its aspects such as
its impact on human labour employment in a labour rich economy have always evoked
sharp responses from the policy makers. It was observed that the productivity raise on
tractor owning and hiring farm ranged between 4 % and 55 %. The percent raise was
relatively small on custom hiring farms as compared to tractor owning farms due to top
level of inputs and improved control on timeliness of operations (NCAER, 1980).
Figure. 4.13 Distribution of respondents showing use of agricultural machinery
Source: Field Data 2012-13
Agricultural Machinery is a very important for agriculture development. According to
export mechanized farming is cost effective, less time consuming and profitable farming.
However due to topography and Lithology of land still in Pakistan particularly in Khyber
Pakhtunkhwa, agricultural mechanization is either not possible or uneconomical. That is
why our farmer’s still stick to traditional farming methods like bullock ploughing. The
data depicted in figure 4.13 showed that overwhelming majority (74 %) respondents used
64
cultivator for farming activities. Out of these 74 % respondents, 47 % in district Mardan
and 27 % in district Charsadda. Rotivator is very important but unfortunately it is used
only by 24 % of total respondents. Out These 27 % respondents, 5 % were in district
Mardan and 19 % were in district Charsadda. However, only 2 % respondents used
Bullock for agricultural purposes. Out of these 2 % respondents were present in district
Mardan and Charsadda. From the above data it is crystal clear that not only our farmer is
traditional but still using simple technology.
The majority (198) respondents out of 234 respondents were still stick to their traditional
method of broadcasting which is defective and results in low yield. It is further indicated
that 60 respondents out of 100 respondents used tractor for cultivation (Khan, 2012)
Association between agricultural machinery with sugarcane production
The Table 4.11 showed Chi-square (44.795) with (P. value = 0.000) and Gamma value
(0.180). It confirmed the association between type of agricultural machinery and
sugarcane production is statistically strongly significant as (P. value= 0.000). The
positive sign of Gamma value showed directly association between agricultural
machinery and sugarcane production. Due to cost effectiveness and technical efficiency
of the agricultural machinery saves time. Many other researchers have opinion that
greater is the use of agricultural machinery more will be production with less time and
cost consumptions. It recommended that the use of tractor and farm machinery is quite
sufficient in district Peshawar and Charsadda, However, the use of chemical fertilizer
though encouraging but not according to the recommendations. The soil protection
measures are better but need to be improved. Along with machinery other components of
technology may also be incorporated (Ahmad et al., 2007).
Table. 4.11 Agricultural machinery association with sugarcane production
Types of
Agricultural
Machinery
Sugarcane Production (tons ha-1) Total
Below
25
25.1-50 50.1-75 75.1-
100
100.1-
125
125.1-
150
Above
150.1 No. (%) No. (%) No. (%) No. (%) No. (%) No. (%) No. (%) No. (%)
Bullock driven 1 (0.3) 1 (0.3) 1 (0.3) 3 (1) 1 (0.3) (-) (-) 7 (2)
Rotivator 16 (5) 35 (10) 13 (4) 5 (1) 9 (3) 3 (1) 1 (0.3) 82 (24)
Cultivator 30 (9) 60 (18) 83 (25) 64 (19) 7 (2) 3 (1) (-) 247 (74)
Total 47 (14) 96 (29) 97 (29) 72 (21) 17 (5) 6 (2) 1 (0.3) 336 (100)
Chi-square: 44.795 P. value = 0.000
Gamma value = 0.180
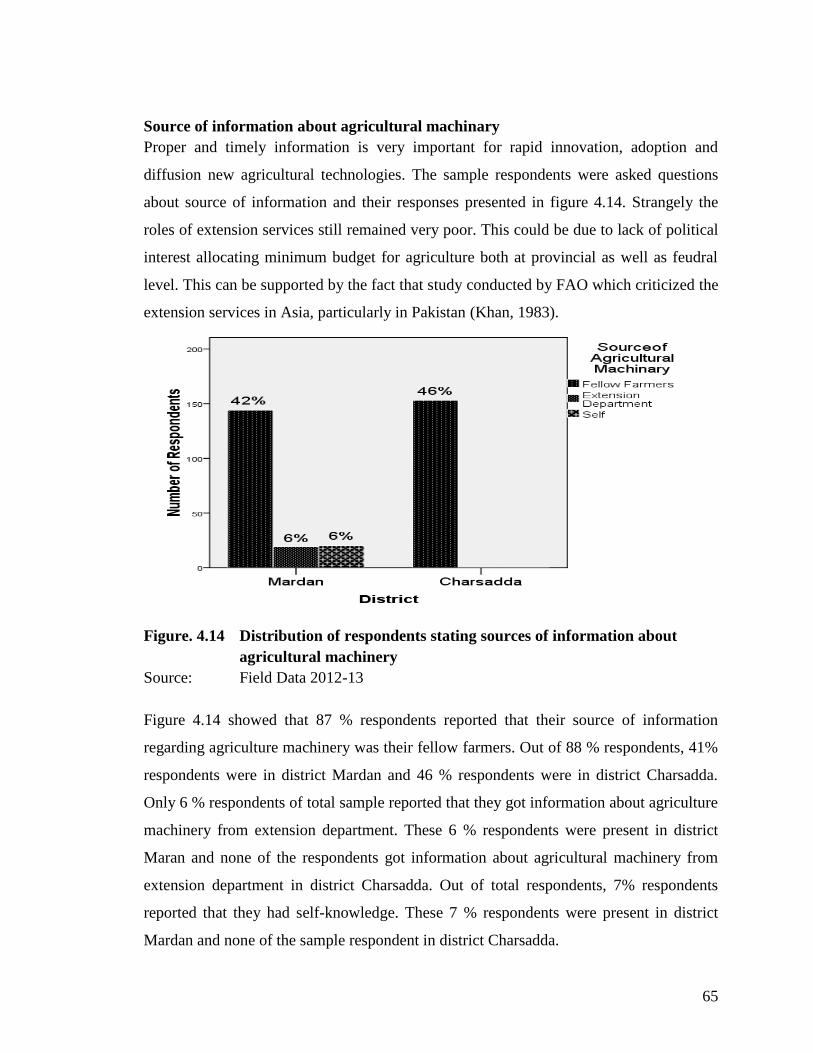
65
Source of information about agricultural machinary
Proper and timely information is very important for rapid innovation, adoption and
diffusion new agricultural technologies. The sample respondents were asked questions
about source of information and their responses presented in figure 4.14. Strangely the
roles of extension services still remained very poor. This could be due to lack of political
interest allocating minimum budget for agriculture both at provincial as well as feudral
level. This can be supported by the fact that study conducted by FAO which criticized the
extension services in Asia, particularly in Pakistan (Khan, 1983).
Figure. 4.14 Distribution of respondents stating sources of information about
agricultural machinery
Source: Field Data 2012-13
Figure 4.14 showed that 87 % respondents reported that their source of information
regarding agriculture machinery was their fellow farmers. Out of 88 % respondents, 41%
respondents were in district Mardan and 46 % respondents were in district Charsadda.
Only 6 % respondents of total sample reported that they got information about agriculture
machinery from extension department. These 6 % respondents were present in district
Maran and none of the respondents got information about agricultural machinery from
extension department in district Charsadda. Out of total respondents, 7% respondents
reported that they had self-knowledge. These 7 % respondents were present in district
Mardan and none of the sample respondent in district Charsadda.
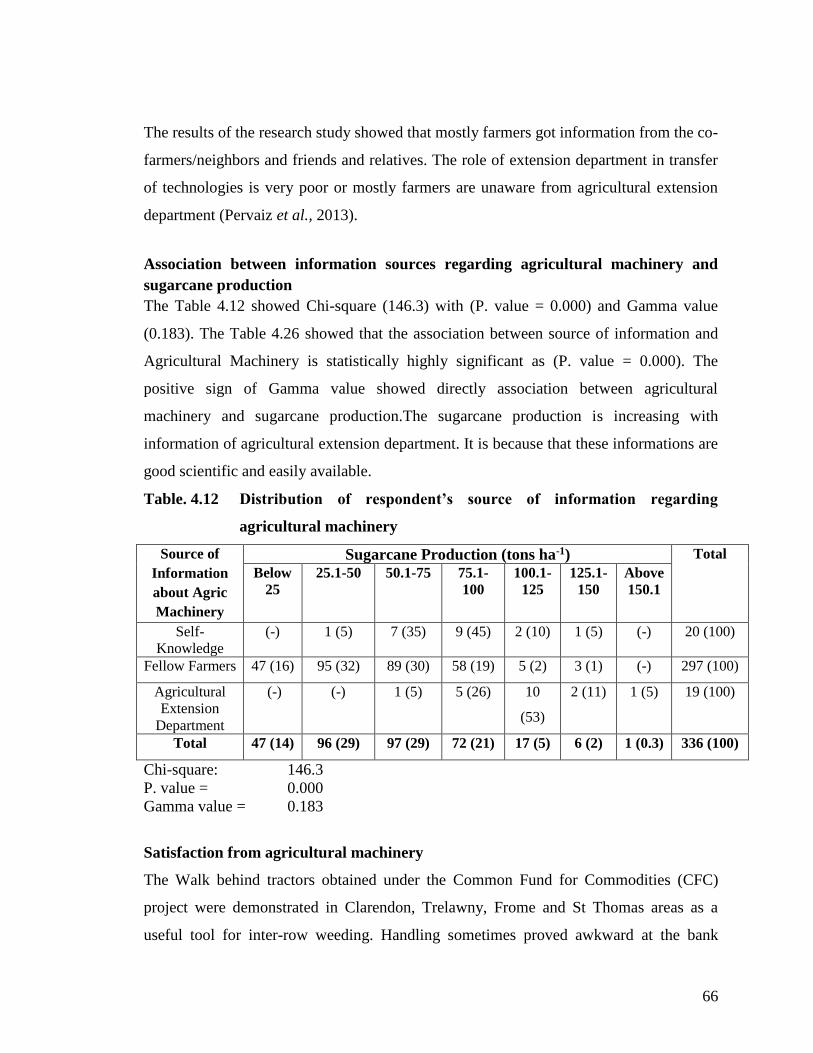
66
The results of the research study showed that mostly farmers got information from the co-
farmers/neighbors and friends and relatives. The role of extension department in transfer
of technologies is very poor or mostly farmers are unaware from agricultural extension
department (Pervaiz et al., 2013).
Association between information sources regarding agricultural machinery and
sugarcane production
The Table 4.12 showed Chi-square (146.3) with (P. value = 0.000) and Gamma value
(0.183). The Table 4.26 showed that the association between source of information and
Agricultural Machinery is statistically highly significant as (P. value = 0.000). The
positive sign of Gamma value showed directly association between agricultural
machinery and sugarcane production.The sugarcane production is increasing with
information of agricultural extension department. It is because that these informations are
good scientific and easily available.
Table. 4.12 Distribution of respondent’s source of information regarding
agricultural machinery
Source of
Information
about Agric
Machinery
Sugarcane Production (tons ha-1) Total
Below
25
25.1-50 50.1-75 75.1-
100
100.1-
125
125.1-
150
Above
150.1
Self-
Knowledge
(-) 1 (5) 7 (35) 9 (45) 2 (10) 1 (5) (-) 20 (100)
Fellow Farmers 47 (16) 95 (32) 89 (30) 58 (19) 5 (2) 3 (1) (-) 297 (100)
Agricultural
Extension
Department
(-) (-) 1 (5) 5 (26) 10
(53)
2 (11) 1 (5) 19 (100)
Total 47 (14) 96 (29) 97 (29) 72 (21) 17 (5) 6 (2) 1 (0.3) 336 (100)
Chi-square: 146.3
P. value = 0.000
Gamma value = 0.183
Satisfaction from agricultural machinery
The Walk behind tractors obtained under the Common Fund for Commodities (CFC)
project were demonstrated in Clarendon, Trelawny, Frome and St Thomas areas as a
useful tool for inter-row weeding. Handling sometimes proved awkward at the bank
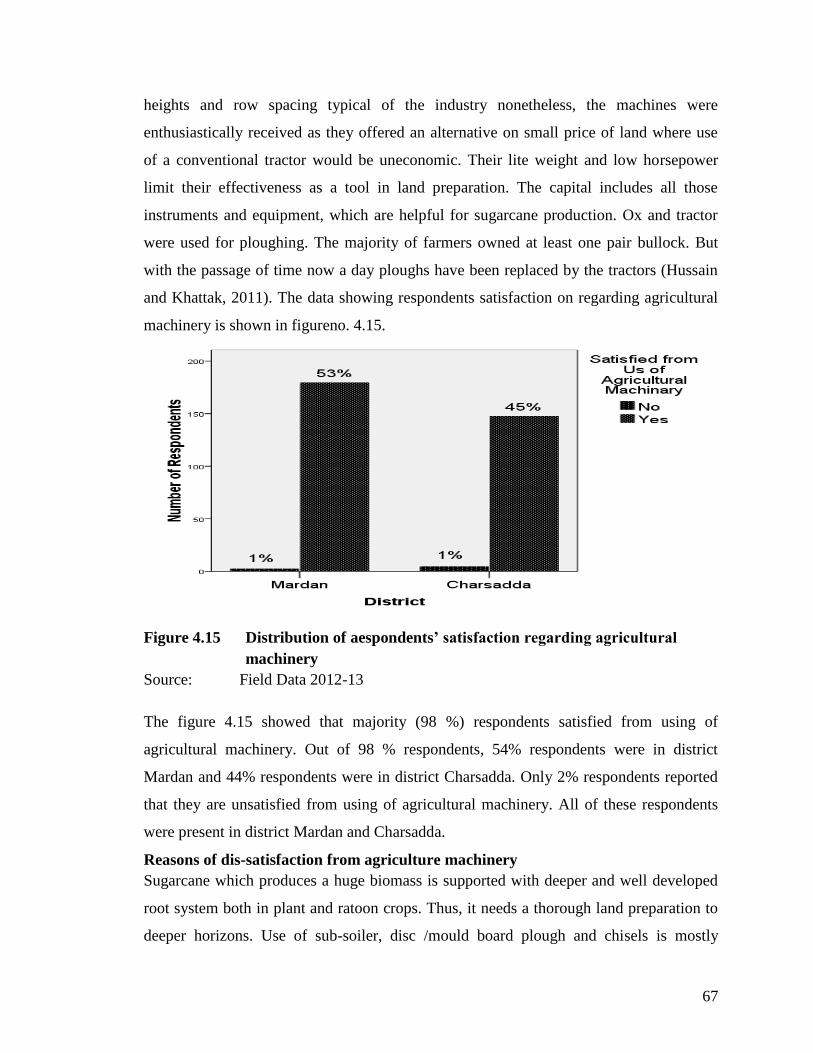
67
heights and row spacing typical of the industry nonetheless, the machines were
enthusiastically received as they offered an alternative on small price of land where use
of a conventional tractor would be uneconomic. Their lite weight and low horsepower
limit their effectiveness as a tool in land preparation. The capital includes all those
instruments and equipment, which are helpful for sugarcane production. Ox and tractor
were used for ploughing. The majority of farmers owned at least one pair bullock. But
with the passage of time now a day ploughs have been replaced by the tractors (Hussain
and Khattak, 2011). The data showing respondents satisfaction on regarding agricultural
machinery is shown in figureno. 4.15.
Figure 4.15 Distribution of aespondents’ satisfaction regarding agricultural
machinery
Source: Field Data 2012-13
The figure 4.15 showed that majority (98 %) respondents satisfied from using of
agricultural machinery. Out of 98 % respondents, 54% respondents were in district
Mardan and 44% respondents were in district Charsadda. Only 2% respondents reported
that they are unsatisfied from using of agricultural machinery. All of these respondents
were present in district Mardan and Charsadda.
Reasons of dis-satisfaction from agriculture machinery
Sugarcane which produces a huge biomass is supported with deeper and well developed
root system both in plant and ratoon crops. Thus, it needs a thorough land preparation to
deeper horizons. Use of sub-soiler, disc /mould board plough and chisels is mostly
68
lacking in our soils. Growers do not follow earthing up and ratoon showing delayed due
to lack of necessary equipment. Land leveling is not properly looked after. It affects
efficient use of water and crop growth (Karim, 1990).
The data in this regard can be represented in figureno. 4.16.
Figure. 4.16 Percentages of respondents stating reasons of dis-satisfaction from
agricultural machinery
Source: Field Data 2012-13
Figure 4.16 showed that 1.5 % respondents reported that weeds spreads rapidly through
agricultural machinery in stage of soil preparation for sugarcane cultivation. These 1.5%
respondents were present in district Mardan and Charsadda. Only 0.6 % respondents
reported that agriculture machinery is expensive. From the earlier discussion it is clear
that these information were based on estimations and assumptions but not relevant.
Techniques of sugarcane cultivation
Agricultural department of Punjab recommended that farmers generally do not adopt
optimum row spacing and seed rate, land is not deeply cultivated to attain a good seed
bed and defective seed placement reduces germination. Shallow planting leads to severe
lodging. Narrow spacing hinders post sowing operations. Seed quality and quantity is not
optimum, which results in a poor crop stand. Low seed rate and narrow spacing reduce
yield up to 30% (Karim, 1990).
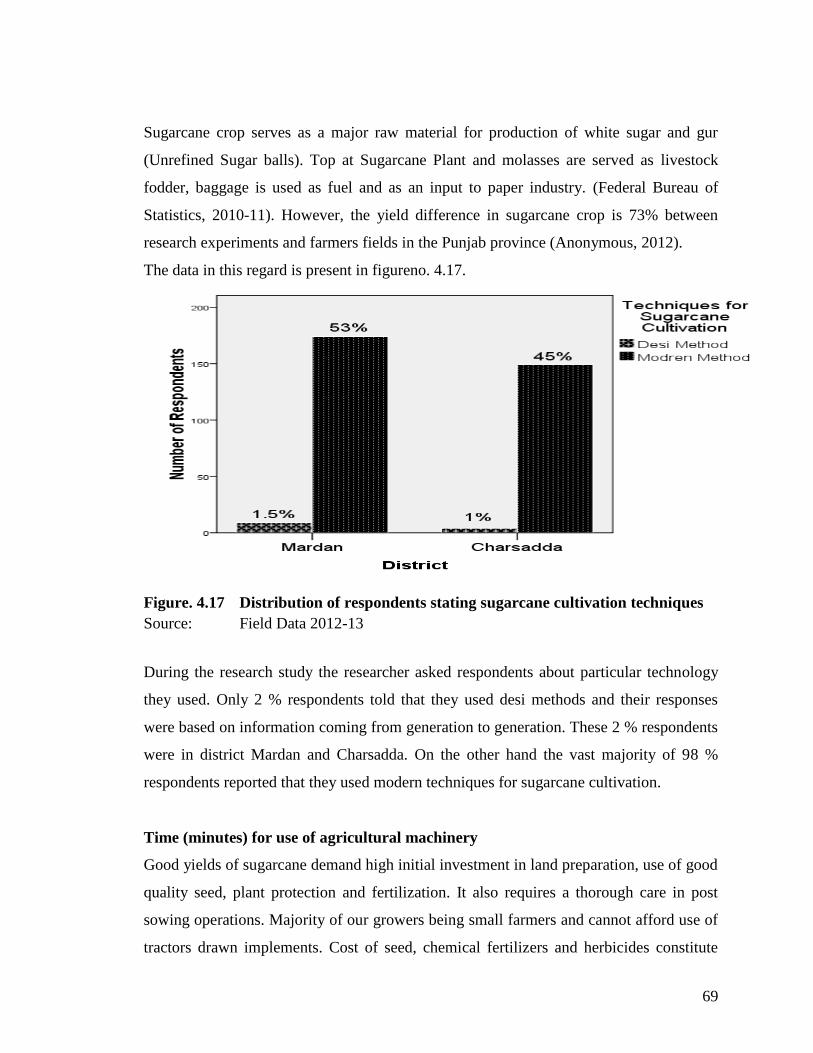
69
Sugarcane crop serves as a major raw material for production of white sugar and gur
(Unrefined Sugar balls). Top at Sugarcane Plant and molasses are served as livestock
fodder, baggage is used as fuel and as an input to paper industry. (Federal Bureau of
Statistics, 2010-11). However, the yield difference in sugarcane crop is 73% between
research experiments and farmers fields in the Punjab province (Anonymous, 2012).
The data in this regard is present in figureno. 4.17.
Figure. 4.17 Distribution of respondents stating sugarcane cultivation techniques
Source: Field Data 2012-13
During the research study the researcher asked respondents about particular technology
they used. Only 2 % respondents told that they used desi methods and their responses
were based on information coming from generation to generation. These 2 % respondents
were in district Mardan and Charsadda. On the other hand the vast majority of 98 %
respondents reported that they used modern techniques for sugarcane cultivation.
Time (minutes) for use of agricultural machinery
Good yields of sugarcane demand high initial investment in land preparation, use of good
quality seed, plant protection and fertilization. It also requires a thorough care in post
sowing operations. Majority of our growers being small farmers and cannot afford use of
tractors drawn implements. Cost of seed, chemical fertilizers and herbicides constitute
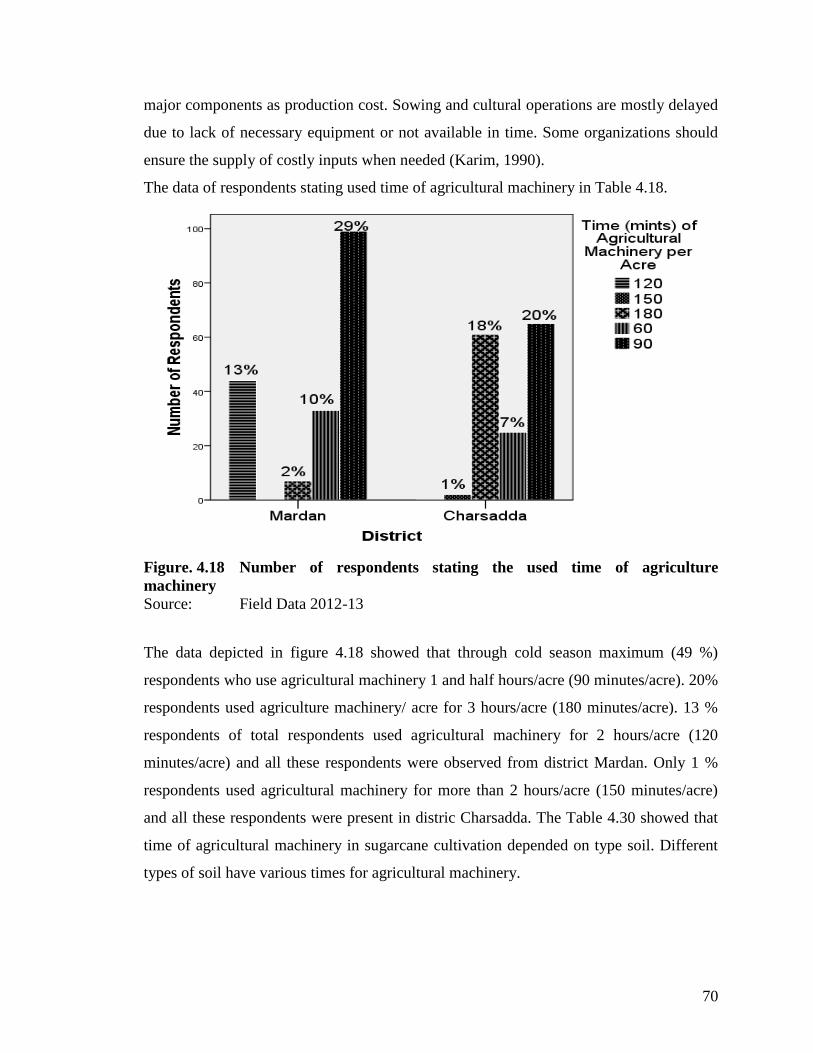
70
major components as production cost. Sowing and cultural operations are mostly delayed
due to lack of necessary equipment or not available in time. Some organizations should
ensure the supply of costly inputs when needed (Karim, 1990).
The data of respondents stating used time of agricultural machinery in Table 4.18.
Figure. 4.18 Number of respondents stating the used time of agriculture
machinery
Source: Field Data 2012-13
The data depicted in figure 4.18 showed that through cold season maximum (49 %)
respondents who use agricultural machinery 1 and half hours/acre (90 minutes/acre). 20%
respondents used agriculture machinery/ acre for 3 hours/acre (180 minutes/acre). 13 %
respondents of total respondents used agricultural machinery for 2 hours/acre (120
minutes/acre) and all these respondents were observed from district Mardan. Only 1 %
respondents used agricultural machinery for more than 2 hours/acre (150 minutes/acre)
and all these respondents were present in distric Charsadda. The Table 4.30 showed that
time of agricultural machinery in sugarcane cultivation depended on type soil. Different
types of soil have various times for agricultural machinery.
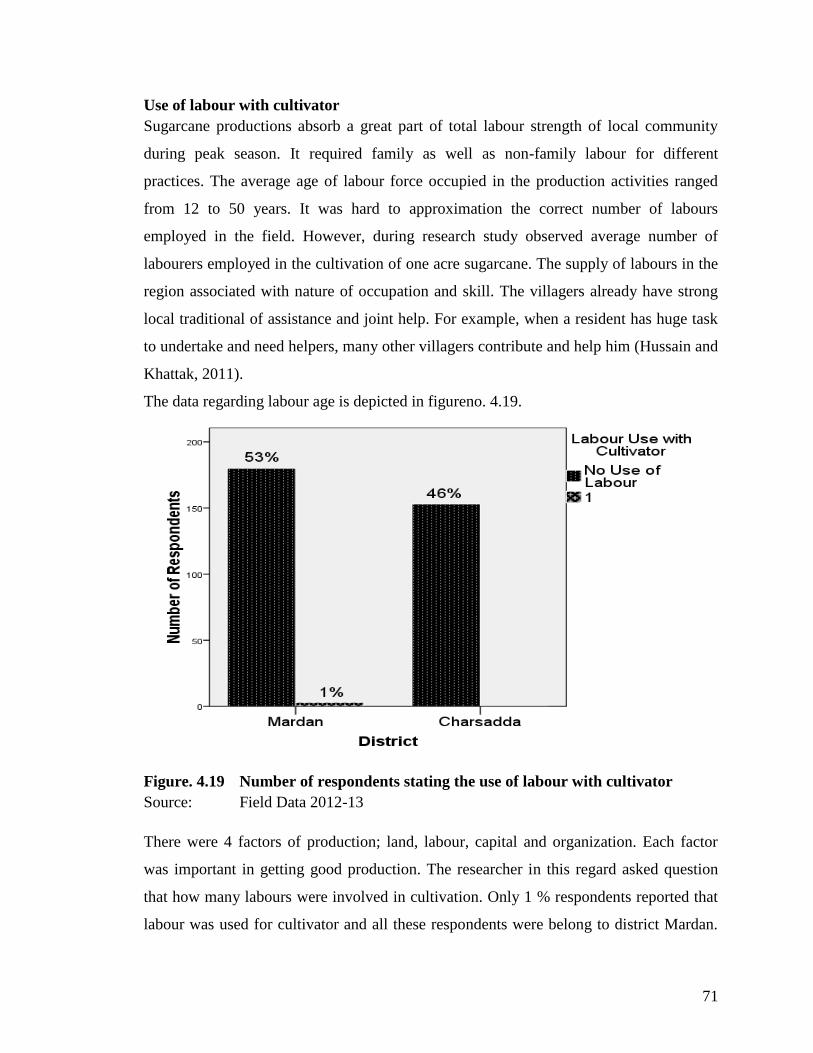
71
Use of labour with cultivator
Sugarcane productions absorb a great part of total labour strength of local community
during peak season. It required family as well as non-family labour for different
practices. The average age of labour force occupied in the production activities ranged
from 12 to 50 years. It was hard to approximation the correct number of labours
employed in the field. However, during research study observed average number of
labourers employed in the cultivation of one acre sugarcane. The supply of labours in the
region associated with nature of occupation and skill. The villagers already have strong
local traditional of assistance and joint help. For example, when a resident has huge task
to undertake and need helpers, many other villagers contribute and help him (Hussain and
Khattak, 2011).
The data regarding labour age is depicted in figureno. 4.19.
Figure. 4.19 Number of respondents stating the use of labour with cultivator
Source: Field Data 2012-13
There were 4 factors of production; land, labour, capital and organization. Each factor
was important in getting good production. The researcher in this regard asked question
that how many labours were involved in cultivation. Only 1 % respondents reported that
labour was used for cultivator and all these respondents were belong to district Mardan.
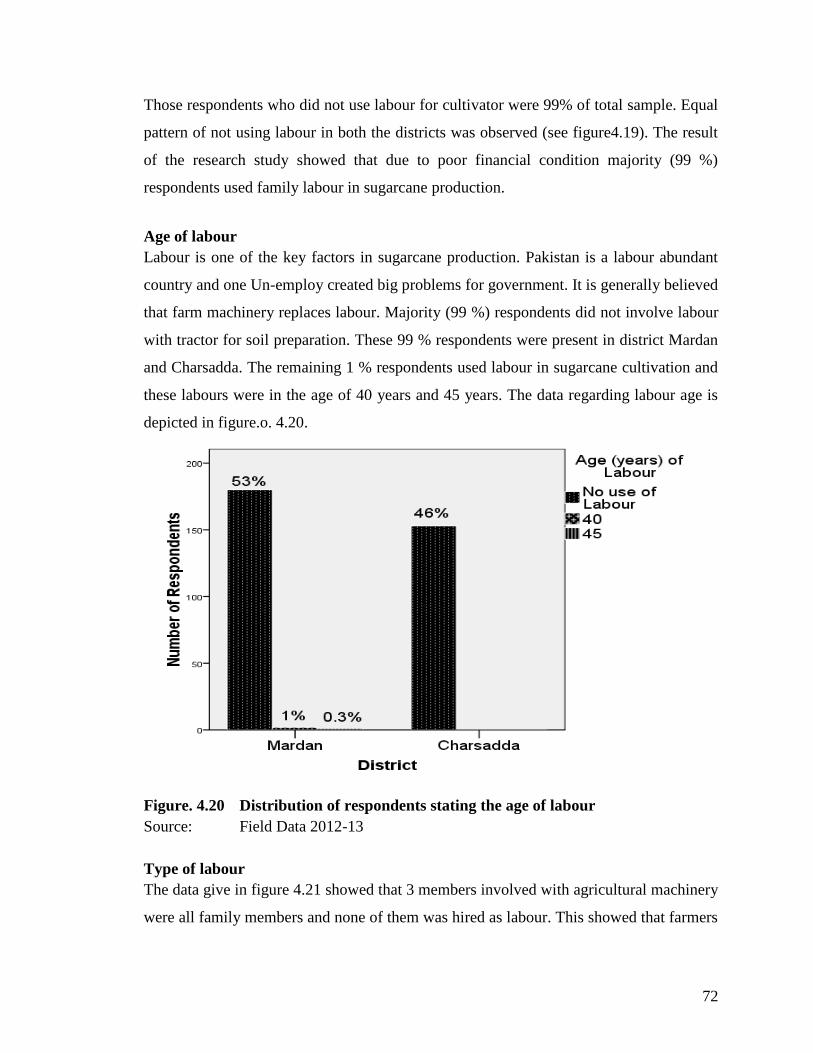
72
Those respondents who did not use labour for cultivator were 99% of total sample. Equal
pattern of not using labour in both the districts was observed (see figure4.19). The result
of the research study showed that due to poor financial condition majority (99 %)
respondents used family labour in sugarcane production.
Age of labour
Labour is one of the key factors in sugarcane production. Pakistan is a labour abundant
country and one Un-employ created big problems for government. It is generally believed
that farm machinery replaces labour. Majority (99 %) respondents did not involve labour
with tractor for soil preparation. These 99 % respondents were present in district Mardan
and Charsadda. The remaining 1 % respondents used labour in sugarcane cultivation and
these labours were in the age of 40 years and 45 years. The data regarding labour age is
depicted in figure.o. 4.20.
Figure. 4.20 Distribution of respondents stating the age of labour
Source: Field Data 2012-13
Type of labour
The data give in figure 4.21 showed that 3 members involved with agricultural machinery
were all family members and none of them was hired as labour. This showed that farmers
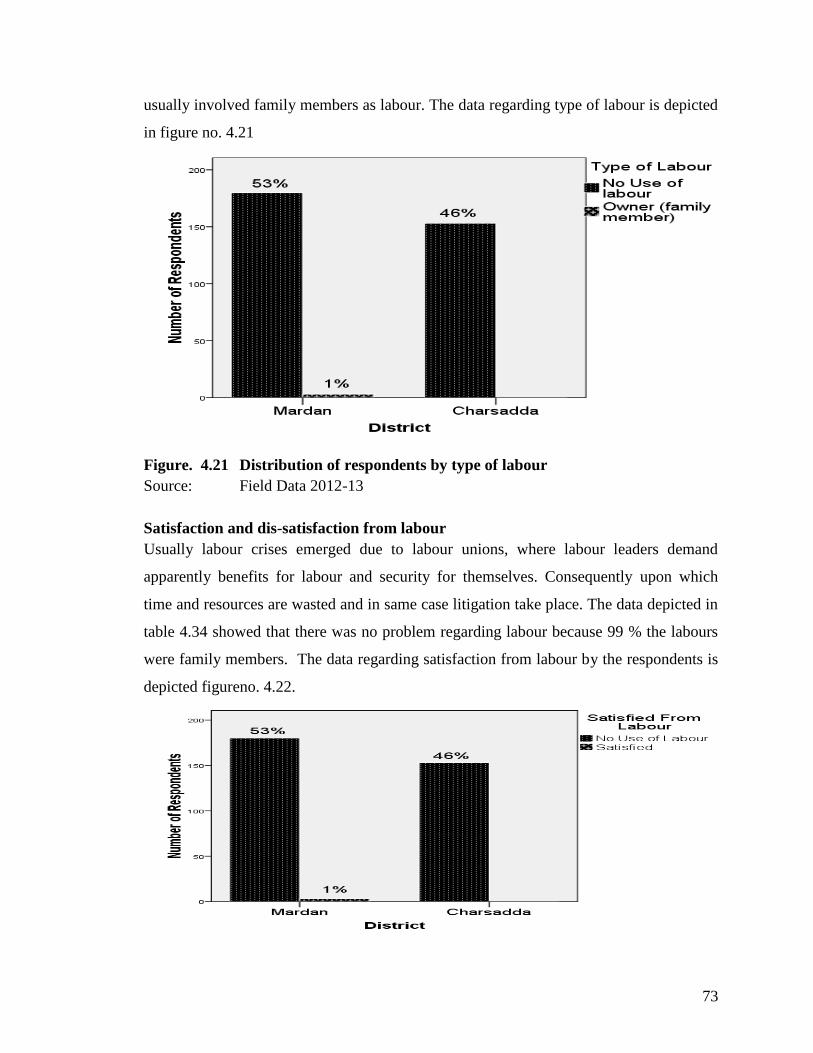
73
usually involved family members as labour. The data regarding type of labour is depicted
in figure no. 4.21
Figure. 4.21 Distribution of respondents by type of labour
Source: Field Data 2012-13
Satisfaction and dis-satisfaction from labour
Usually labour crises emerged due to labour unions, where labour leaders demand
apparently benefits for labour and security for themselves. Consequently upon which
time and resources are wasted and in same case litigation take place. The data depicted in
table 4.34 showed that there was no problem regarding labour because 99 % the labours
were family members. The data regarding satisfaction from labour by the respondents is
depicted figureno. 4.22.
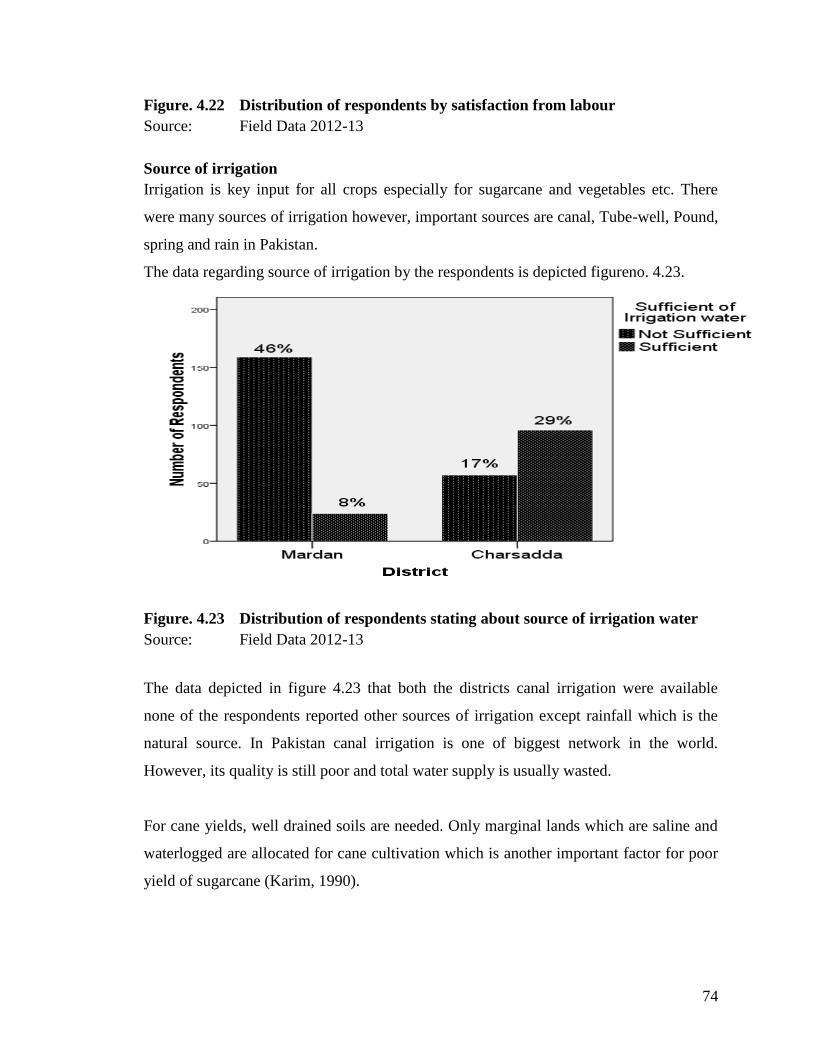
74
Figure. 4.22 Distribution of respondents by satisfaction from labour
Source: Field Data 2012-13
Source of irrigation
Irrigation is key input for all crops especially for sugarcane and vegetables etc. There
were many sources of irrigation however, important sources are canal, Tube-well, Pound,
spring and rain in Pakistan.
The data regarding source of irrigation by the respondents is depicted figureno. 4.23.
Figure. 4.23 Distribution of respondents stating about source of irrigation water
Source: Field Data 2012-13
The data depicted in figure 4.23 that both the districts canal irrigation were available
none of the respondents reported other sources of irrigation except rainfall which is the
natural source. In Pakistan canal irrigation is one of biggest network in the world.
However, its quality is still poor and total water supply is usually wasted.
For cane yields, well drained soils are needed. Only marginal lands which are saline and
waterlogged are allocated for cane cultivation which is another important factor for poor
yield of sugarcane (Karim, 1990).
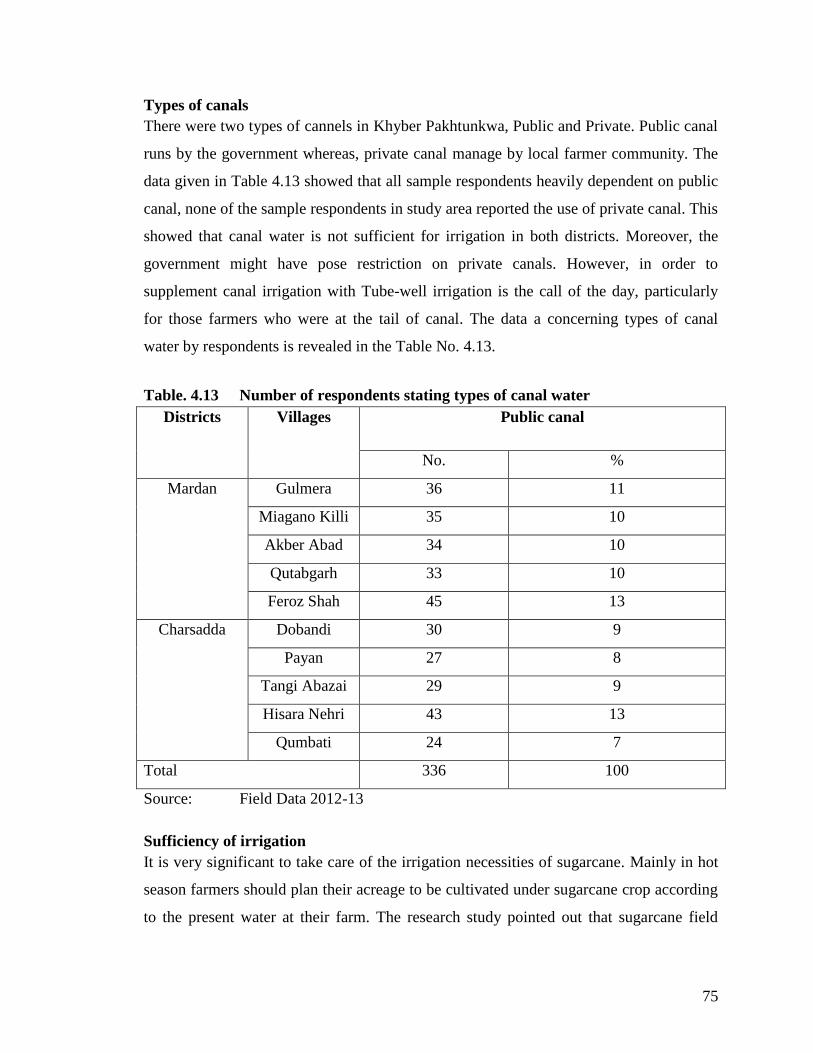
75
Types of canals
There were two types of cannels in Khyber Pakhtunkwa, Public and Private. Public canal
runs by the government whereas, private canal manage by local farmer community. The
data given in Table 4.13 showed that all sample respondents heavily dependent on public
canal, none of the sample respondents in study area reported the use of private canal. This
showed that canal water is not sufficient for irrigation in both districts. Moreover, the
government might have pose restriction on private canals. However, in order to
supplement canal irrigation with Tube-well irrigation is the call of the day, particularly
for those farmers who were at the tail of canal. The data a concerning types of canal
water by respondents is revealed in the Table No. 4.13.
Table. 4.13 Number of respondents stating types of canal water
Districts Villages Public canal
No. %
Mardan Gulmera 36 11
Miagano Killi 35 10
Akber Abad 34 10
Qutabgarh 33 10
Feroz Shah 45 13
Charsadda Dobandi 30 9
Payan 27 8
Tangi Abazai 29 9
Hisara Nehri 43 13
Qumbati 24 7
Total 336 100
Source: Field Data 2012-13
Sufficiency of irrigation
It is very significant to take care of the irrigation necessities of sugarcane. Mainly in hot
season farmers should plan their acreage to be cultivated under sugarcane crop according
to the present water at their farm. The research study pointed out that sugarcane field
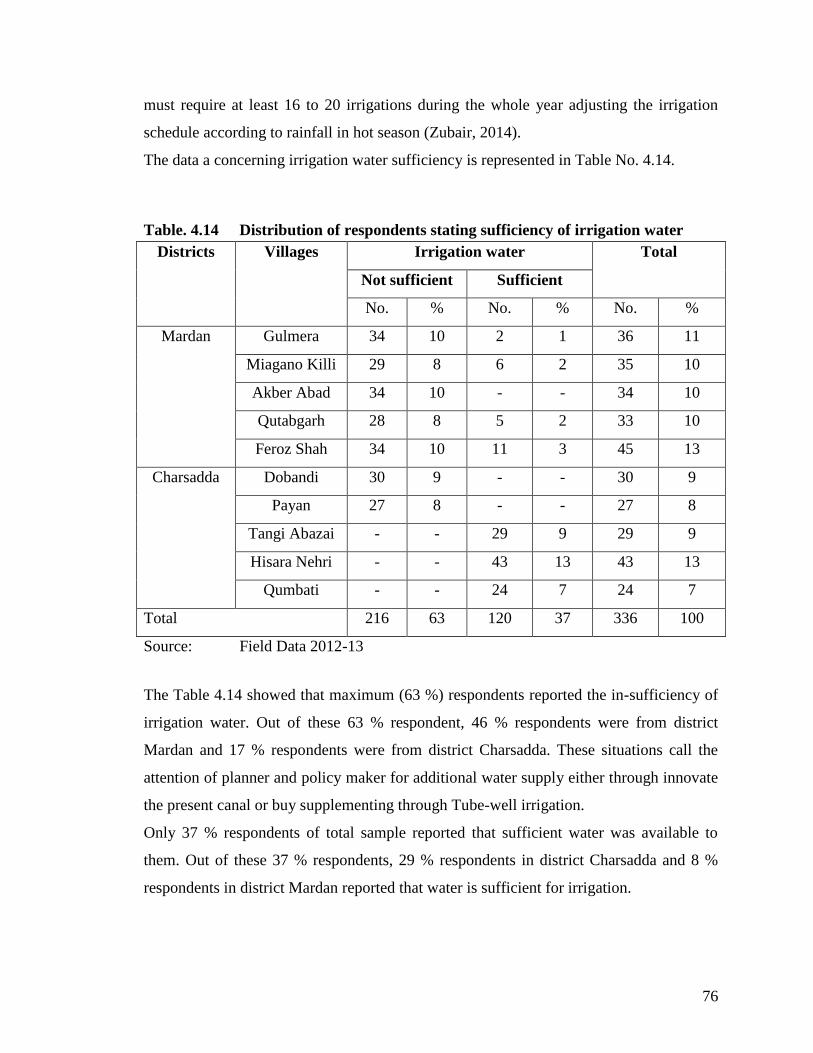
76
must require at least 16 to 20 irrigations during the whole year adjusting the irrigation
schedule according to rainfall in hot season (Zubair, 2014).
The data a concerning irrigation water sufficiency is represented in Table No. 4.14.
Table. 4.14 Distribution of respondents stating sufficiency of irrigation water
Districts Villages Irrigation water Total
Not sufficient Sufficient
No. % No. % No. %
Mardan Gulmera 34 10 2 1 36 11
Miagano Killi 29 8 6 2 35 10
Akber Abad 34 10 - - 34 10
Qutabgarh 28 8 5 2 33 10
Feroz Shah 34 10 11 3 45 13
Charsadda Dobandi 30 9 - - 30 9
Payan 27 8 - - 27 8
Tangi Abazai - - 29 9 29 9
Hisara Nehri - - 43 13 43 13
Qumbati - - 24 7 24 7
Total 216 63 120 37 336 100
Source: Field Data 2012-13
The Table 4.14 showed that maximum (63 %) respondents reported the in-sufficiency of
irrigation water. Out of these 63 % respondent, 46 % respondents were from district
Mardan and 17 % respondents were from district Charsadda. These situations call the
attention of planner and policy maker for additional water supply either through innovate
the present canal or buy supplementing through Tube-well irrigation.
Only 37 % respondents of total sample reported that sufficient water was available to
them. Out of these 37 % respondents, 29 % respondents in district Charsadda and 8 %
respondents in district Mardan reported that water is sufficient for irrigation.
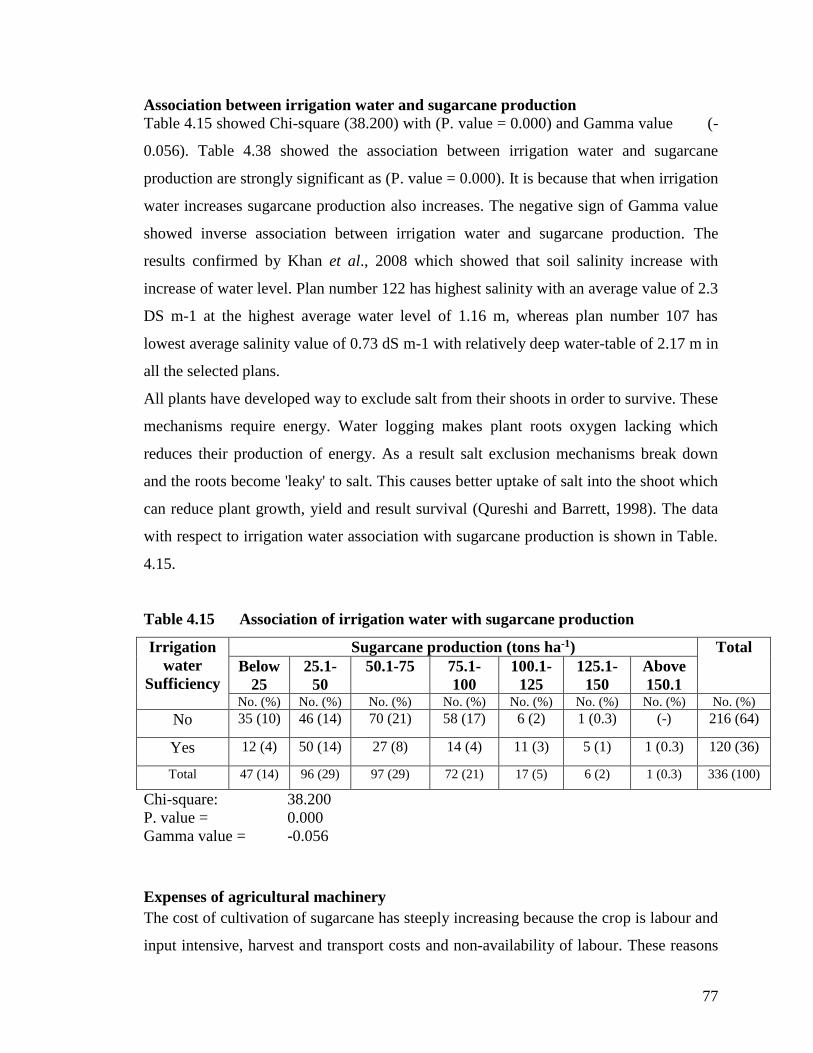
77
Association between irrigation water and sugarcane production
Table 4.15 showed Chi-square (38.200) with (P. value = 0.000) and Gamma value (-
0.056). Table 4.38 showed the association between irrigation water and sugarcane
production are strongly significant as (P. value = 0.000). It is because that when irrigation
water increases sugarcane production also increases. The negative sign of Gamma value
showed inverse association between irrigation water and sugarcane production. The
results confirmed by Khan et al., 2008 which showed that soil salinity increase with
increase of water level. Plan number 122 has highest salinity with an average value of 2.3
DS m-1 at the highest average water level of 1.16 m, whereas plan number 107 has
lowest average salinity value of 0.73 dS m-1 with relatively deep water-table of 2.17 m in
all the selected plans.
All plants have developed way to exclude salt from their shoots in order to survive. These
mechanisms require energy. Water logging makes plant roots oxygen lacking which
reduces their production of energy. As a result salt exclusion mechanisms break down
and the roots become 'leaky' to salt. This causes better uptake of salt into the shoot which
can reduce plant growth, yield and result survival (Qureshi and Barrett, 1998). The data
with respect to irrigation water association with sugarcane production is shown in Table.
4.15.
Table 4.15 Association of irrigation water with sugarcane production
Irrigation
water
Sufficiency
Sugarcane production (tons ha-1) Total
Below
25
25.1-
50
50.1-75 75.1-
100
100.1-
125
125.1-
150
Above
150.1 No. (%) No. (%) No. (%) No. (%) No. (%) No. (%) No. (%) No. (%)
No 35 (10) 46 (14) 70 (21) 58 (17) 6 (2) 1 (0.3) (-) 216 (64)
Yes 12 (4) 50 (14) 27 (8) 14 (4) 11 (3) 5 (1) 1 (0.3) 120 (36)
Total 47 (14) 96 (29) 97 (29) 72 (21) 17 (5) 6 (2) 1 (0.3) 336 (100)
Chi-square: 38.200
P. value = 0.000
Gamma value = -0.056
Expenses of agricultural machinery
The cost of cultivation of sugarcane has steeply increasing because the crop is labour and
input intensive, harvest and transport costs and non-availability of labour. These reasons
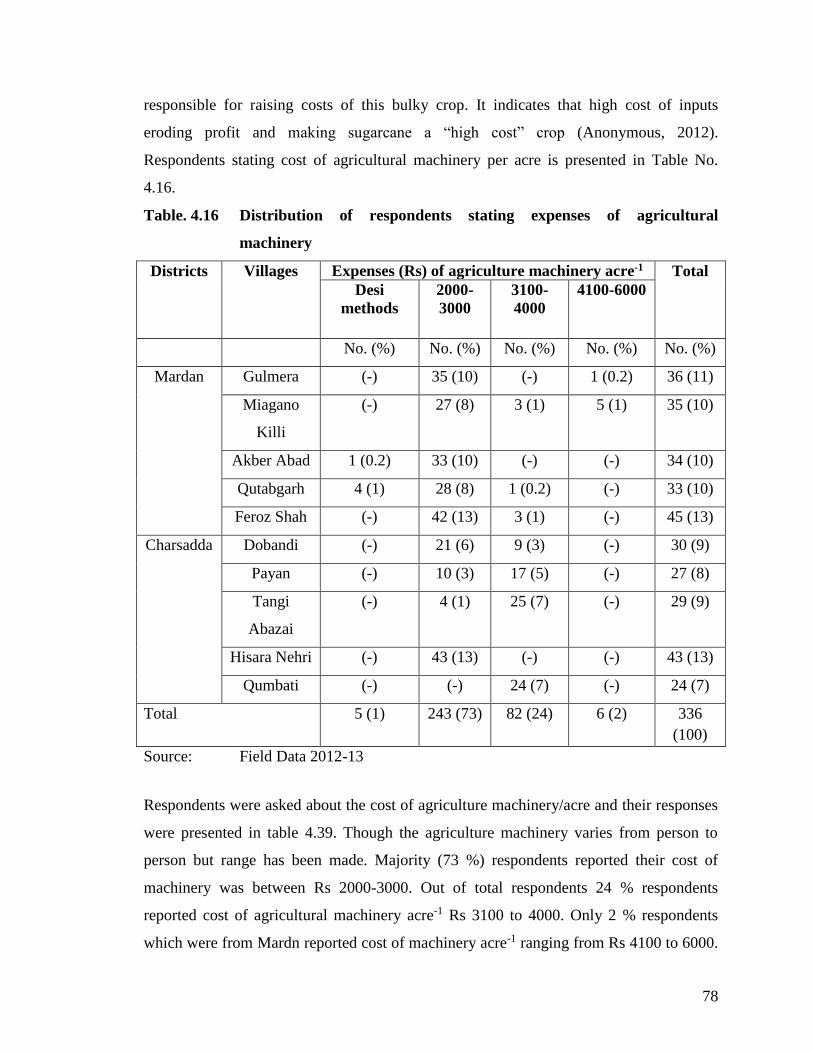
78
responsible for raising costs of this bulky crop. It indicates that high cost of inputs
eroding profit and making sugarcane a “high cost” crop (Anonymous, 2012).
Respondents stating cost of agricultural machinery per acre is presented in Table No.
4.16.
Table. 4.16 Distribution of respondents stating expenses of agricultural
machinery
Districts Villages Expenses (Rs) of agriculture machinery acre-1 Total
Desi
methods
2000-
3000
3100-
4000
4100-6000
No. (%) No. (%) No. (%) No. (%) No. (%)
Mardan Gulmera (-) 35 (10) (-) 1 (0.2) 36 (11)
Miagano
Killi
(-) 27 (8) 3 (1) 5 (1) 35 (10)
Akber Abad 1 (0.2) 33 (10) (-) (-) 34 (10)
Qutabgarh 4 (1) 28 (8) 1 (0.2) (-) 33 (10)
Feroz Shah (-) 42 (13) 3 (1) (-) 45 (13)
Charsadda Dobandi (-) 21 (6) 9 (3) (-) 30 (9)
Payan (-) 10 (3) 17 (5) (-) 27 (8)
Tangi
Abazai
(-) 4 (1) 25 (7) (-) 29 (9)
Hisara Nehri (-) 43 (13) (-) (-) 43 (13)
Qumbati (-) (-) 24 (7) (-) 24 (7)
Total 5 (1) 243 (73) 82 (24) 6 (2) 336
(100)
Source: Field Data 2012-13
Respondents were asked about the cost of agriculture machinery/acre and their responses
were presented in table 4.39. Though the agriculture machinery varies from person to
person but range has been made. Majority (73 %) respondents reported their cost of
machinery was between Rs 2000-3000. Out of total respondents 24 % respondents
reported cost of agricultural machinery acre-1 Rs 3100 to 4000. Only 2 % respondents
which were from Mardn reported cost of machinery acre-1 ranging from Rs 4100 to 6000.
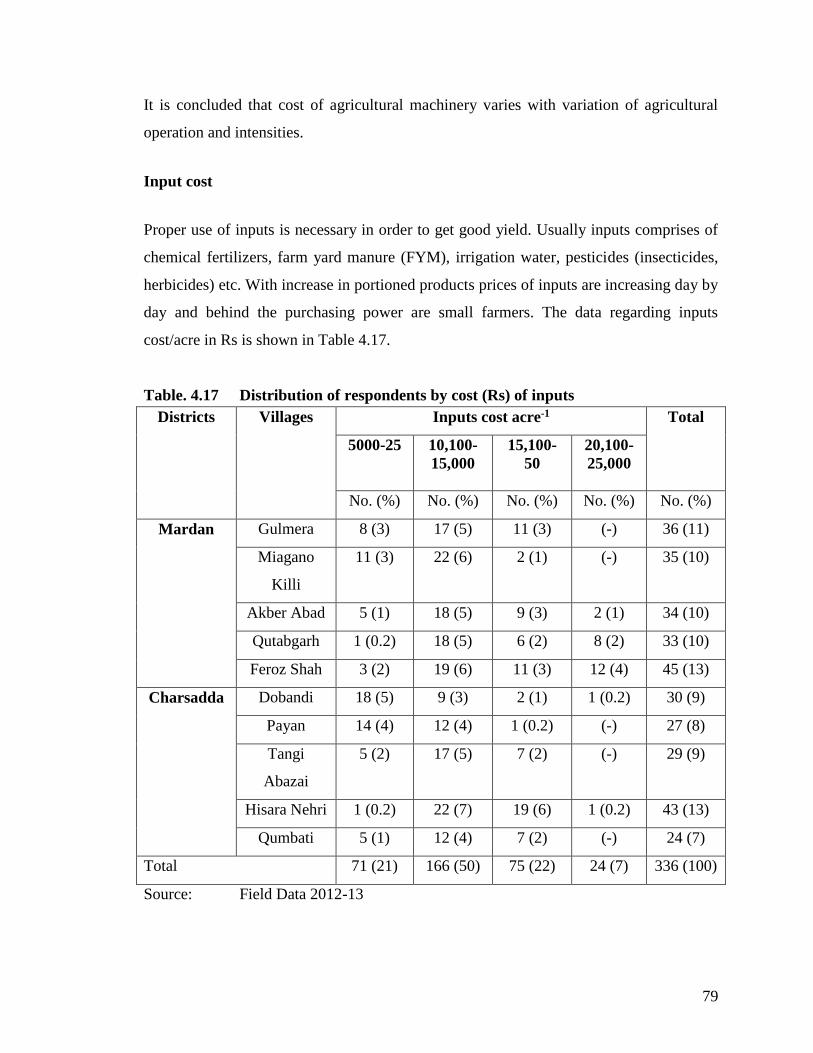
79
It is concluded that cost of agricultural machinery varies with variation of agricultural
operation and intensities.
Input cost
Proper use of inputs is necessary in order to get good yield. Usually inputs comprises of
chemical fertilizers, farm yard manure (FYM), irrigation water, pesticides (insecticides,
herbicides) etc. With increase in portioned products prices of inputs are increasing day by
day and behind the purchasing power are small farmers. The data regarding inputs
cost/acre in Rs is shown in Table 4.17.
Table. 4.17 Distribution of respondents by cost (Rs) of inputs
Districts Villages Inputs cost acre-1 Total
5000-25 10,100-
15,000
15,100-
50
20,100-
25,000
No. (%) No. (%) No. (%) No. (%) No. (%)
Mardan Gulmera 8 (3) 17 (5) 11 (3) (-) 36 (11)
Miagano
Killi
11 (3) 22 (6) 2 (1) (-) 35 (10)
Akber Abad 5 (1) 18 (5) 9 (3) 2 (1) 34 (10)
Qutabgarh 1 (0.2) 18 (5) 6 (2) 8 (2) 33 (10)
Feroz Shah 3 (2) 19 (6) 11 (3) 12 (4) 45 (13)
Charsadda Dobandi 18 (5) 9 (3) 2 (1) 1 (0.2) 30 (9)
Payan 14 (4) 12 (4) 1 (0.2) (-) 27 (8)
Tangi
Abazai
5 (2) 17 (5) 7 (2) (-) 29 (9)
Hisara Nehri 1 (0.2) 22 (7) 19 (6) 1 (0.2) 43 (13)
Qumbati 5 (1) 12 (4) 7 (2) (-) 24 (7)
Total 71 (21) 166 (50) 75 (22) 24 (7) 336 (100)
Source: Field Data 2012-13
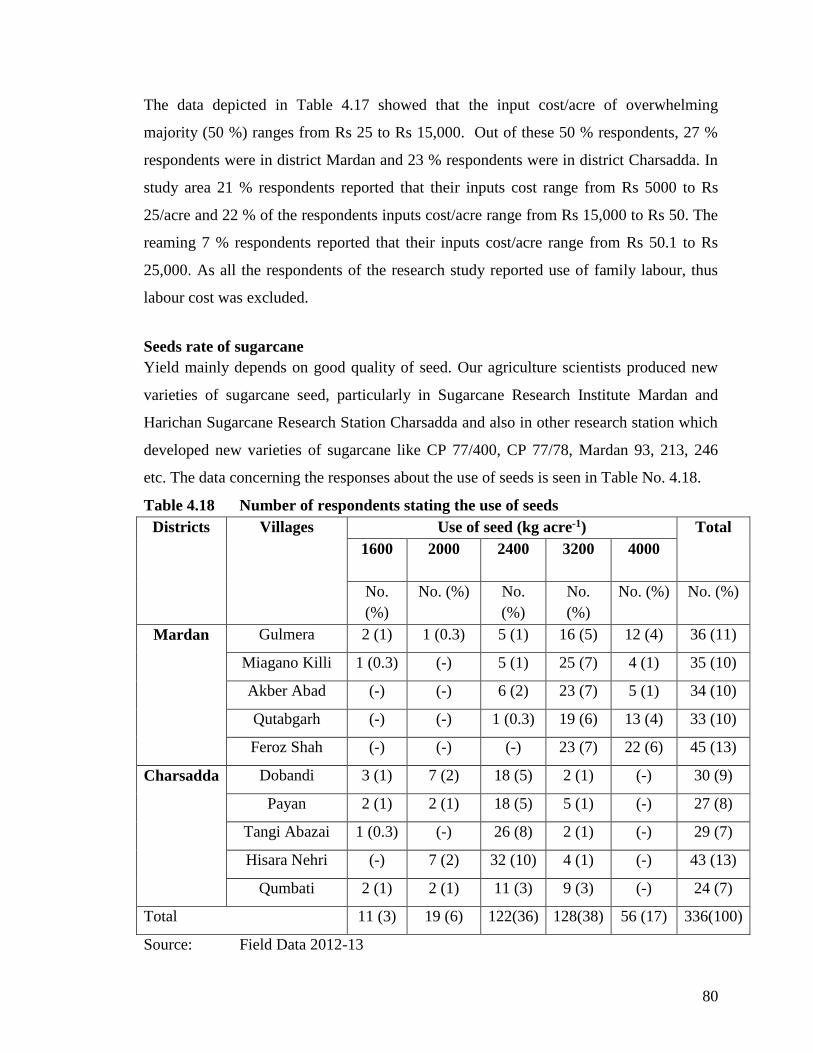
80
The data depicted in Table 4.17 showed that the input cost/acre of overwhelming
majority (50 %) ranges from Rs 25 to Rs 15,000. Out of these 50 % respondents, 27 %
respondents were in district Mardan and 23 % respondents were in district Charsadda. In
study area 21 % respondents reported that their inputs cost range from Rs 5000 to Rs
25/acre and 22 % of the respondents inputs cost/acre range from Rs 15,000 to Rs 50. The
reaming 7 % respondents reported that their inputs cost/acre range from Rs 50.1 to Rs
25,000. As all the respondents of the research study reported use of family labour, thus
labour cost was excluded.
Seeds rate of sugarcane
Yield mainly depends on good quality of seed. Our agriculture scientists produced new
varieties of sugarcane seed, particularly in Sugarcane Research Institute Mardan and
Harichan Sugarcane Research Station Charsadda and also in other research station which
developed new varieties of sugarcane like CP 77/400, CP 77/78, Mardan 93, 213, 246
etc. The data concerning the responses about the use of seeds is seen in Table No. 4.18.
Table 4.18 Number of respondents stating the use of seeds
Districts Villages Use of seed (kg acre-1) Total
1600
2000
2400
3200
4000
No.
(%)
No. (%) No.
(%)
No.
(%)
No. (%) No. (%)
Mardan Gulmera 2 (1) 1 (0.3) 5 (1) 16 (5) 12 (4) 36 (11)
Miagano Killi 1 (0.3) (-) 5 (1) 25 (7) 4 (1) 35 (10)
Akber Abad (-) (-) 6 (2) 23 (7) 5 (1) 34 (10)
Qutabgarh (-) (-) 1 (0.3) 19 (6) 13 (4) 33 (10)
Feroz Shah (-) (-) (-) 23 (7) 22 (6) 45 (13)
Charsadda Dobandi 3 (1) 7 (2) 18 (5) 2 (1) (-) 30 (9)
Payan 2 (1) 2 (1) 18 (5) 5 (1) (-) 27 (8)
Tangi Abazai 1 (0.3) (-) 26 (8) 2 (1) (-) 29 (7)
Hisara Nehri (-) 7 (2) 32 (10) 4 (1) (-) 43 (13)
Qumbati 2 (1) 2 (1) 11 (3) 9 (3) (-) 24 (7)
Total 11 (3) 19 (6) 122(36) 128(38) 56 (17) 336(100)
Source: Field Data 2012-13
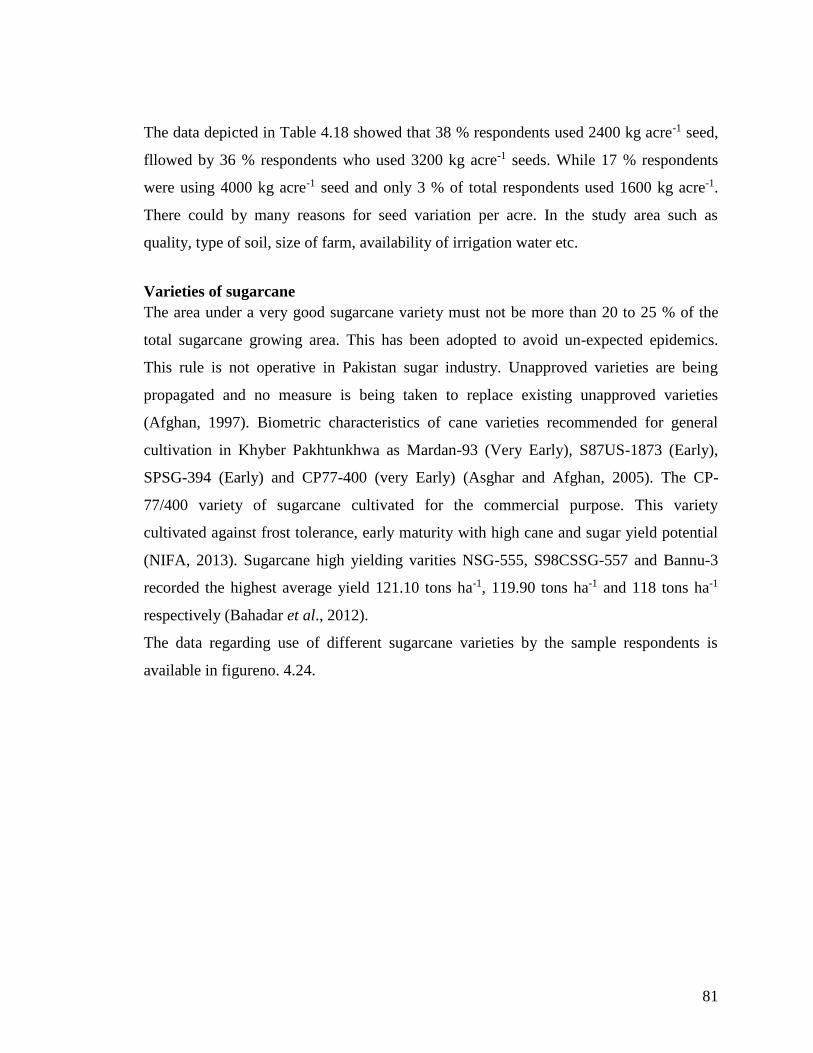
81
The data depicted in Table 4.18 showed that 38 % respondents used 2400 kg acre-1 seed,
fllowed by 36 % respondents who used 3200 kg acre-1 seeds. While 17 % respondents
were using 4000 kg acre-1 seed and only 3 % of total respondents used 1600 kg acre-1.
There could by many reasons for seed variation per acre. In the study area such as
quality, type of soil, size of farm, availability of irrigation water etc.
Varieties of sugarcane
The area under a very good sugarcane variety must not be more than 20 to 25 % of the
total sugarcane growing area. This has been adopted to avoid un-expected epidemics.
This rule is not operative in Pakistan sugar industry. Unapproved varieties are being
propagated and no measure is being taken to replace existing unapproved varieties
(Afghan, 1997). Biometric characteristics of cane varieties recommended for general
cultivation in Khyber Pakhtunkhwa as Mardan-93 (Very Early), S87US-1873 (Early),
SPSG-394 (Early) and CP77-400 (very Early) (Asghar and Afghan, 2005). The CP-
77/400 variety of sugarcane cultivated for the commercial purpose. This variety
cultivated against frost tolerance, early maturity with high cane and sugar yield potential
(NIFA, 2013). Sugarcane high yielding varities NSG-555, S98CSSG-557 and Bannu-3
recorded the highest average yield 121.10 tons ha-1, 119.90 tons ha-1 and 118 tons ha-1
respectively (Bahadar et al., 2012).
The data regarding use of different sugarcane varieties by the sample respondents is
available in figureno. 4.24.
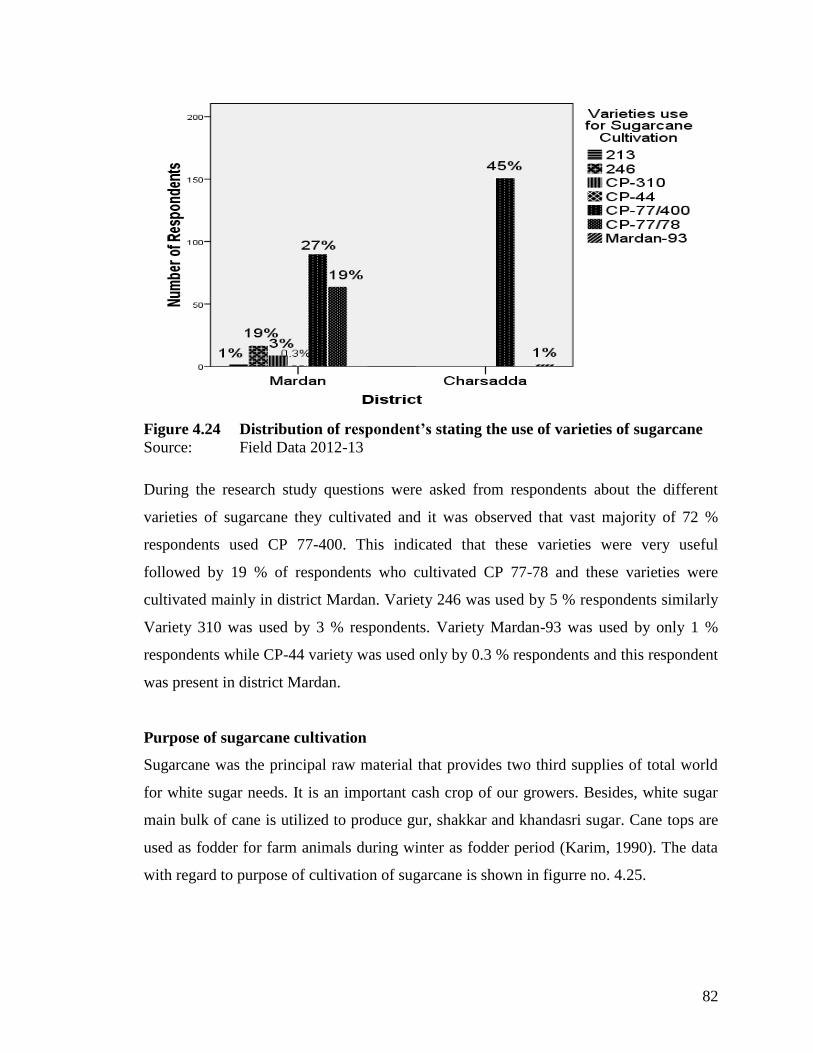
82
Figure 4.24 Distribution of respondent’s stating the use of varieties of sugarcane
Source: Field Data 2012-13
During the research study questions were asked from respondents about the different
varieties of sugarcane they cultivated and it was observed that vast majority of 72 %
respondents used CP 77-400. This indicated that these varieties were very useful
followed by 19 % of respondents who cultivated CP 77-78 and these varieties were
cultivated mainly in district Mardan. Variety 246 was used by 5 % respondents similarly
Variety 310 was used by 3 % respondents. Variety Mardan-93 was used by only 1 %
respondents while CP-44 variety was used only by 0.3 % respondents and this respondent
was present in district Mardan.
Purpose of sugarcane cultivation
Sugarcane was the principal raw material that provides two third supplies of total world
for white sugar needs. It is an important cash crop of our growers. Besides, white sugar
main bulk of cane is utilized to produce gur, shakkar and khandasri sugar. Cane tops are
used as fodder for farm animals during winter as fodder period (Karim, 1990). The data
with regard to purpose of cultivation of sugarcane is shown in figurre no. 4.25.
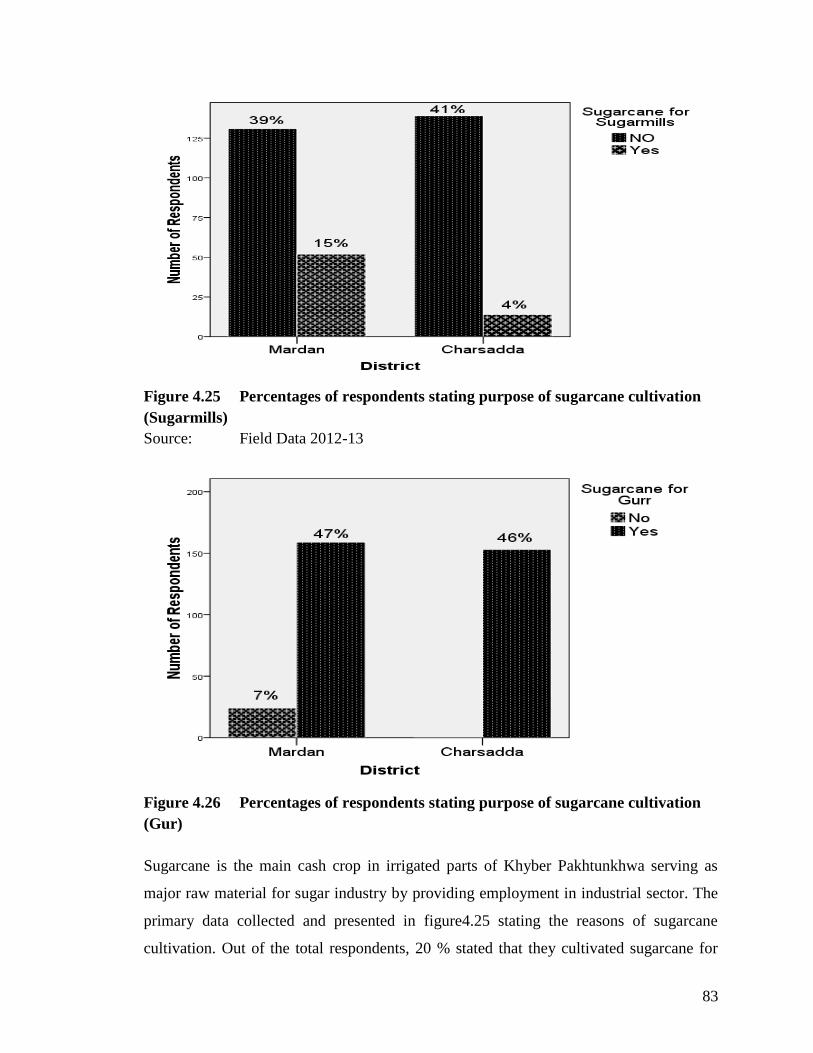
83
Figure 4.25 Percentages of respondents stating purpose of sugarcane cultivation
(Sugarmills)
Source: Field Data 2012-13
Figure 4.26 Percentages of respondents stating purpose of sugarcane cultivation
(Gur)
Sugarcane is the main cash crop in irrigated parts of Khyber Pakhtunkhwa serving as
major raw material for sugar industry by providing employment in industrial sector. The
primary data collected and presented in figure4.25 stating the reasons of sugarcane
cultivation. Out of the total respondents, 20 % stated that they cultivated sugarcane for
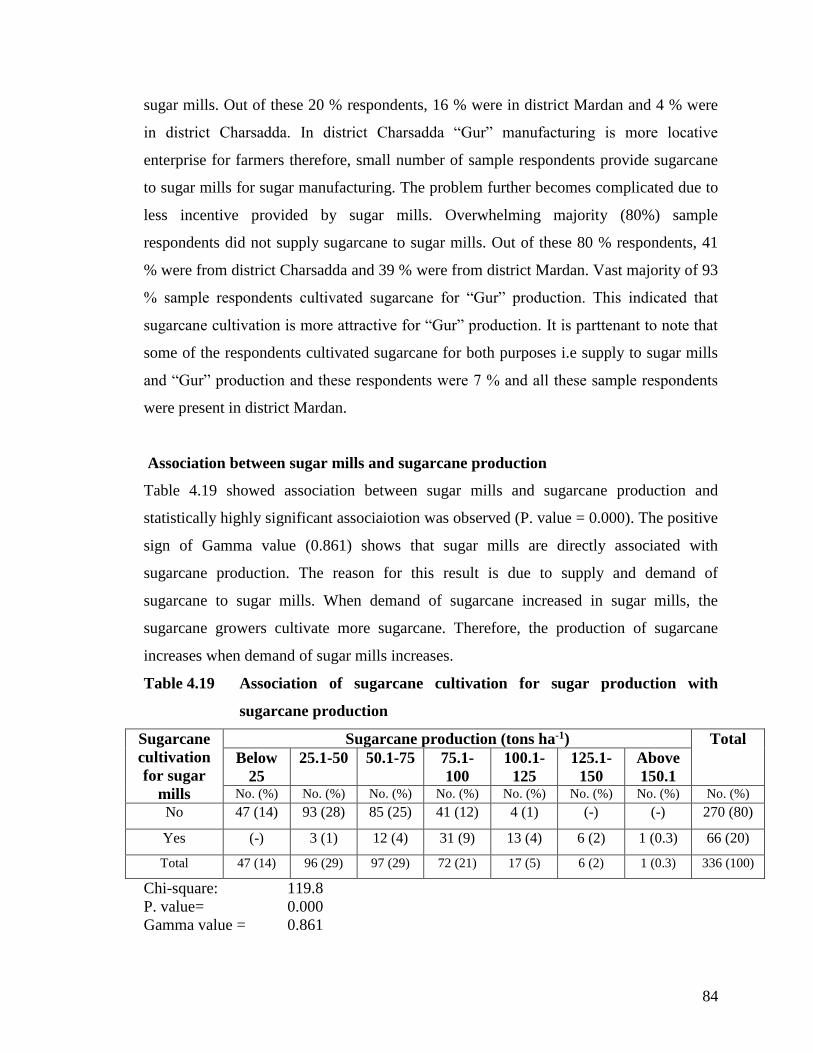
84
sugar mills. Out of these 20 % respondents, 16 % were in district Mardan and 4 % were
in district Charsadda. In district Charsadda “Gur” manufacturing is more locative
enterprise for farmers therefore, small number of sample respondents provide sugarcane
to sugar mills for sugar manufacturing. The problem further becomes complicated due to
less incentive provided by sugar mills. Overwhelming majority (80%) sample
respondents did not supply sugarcane to sugar mills. Out of these 80 % respondents, 41
% were from district Charsadda and 39 % were from district Mardan. Vast majority of 93
% sample respondents cultivated sugarcane for “Gur” production. This indicated that
sugarcane cultivation is more attractive for “Gur” production. It is parttenant to note that
some of the respondents cultivated sugarcane for both purposes i.e supply to sugar mills
and “Gur” production and these respondents were 7 % and all these sample respondents
were present in district Mardan.
Association between sugar mills and sugarcane production
Table 4.19 showed association between sugar mills and sugarcane production and
statistically highly significant associaiotion was observed (P. value = 0.000). The positive
sign of Gamma value (0.861) shows that sugar mills are directly associated with
sugarcane production. The reason for this result is due to supply and demand of
sugarcane to sugar mills. When demand of sugarcane increased in sugar mills, the
sugarcane growers cultivate more sugarcane. Therefore, the production of sugarcane
increases when demand of sugar mills increases.
Table 4.19 Association of sugarcane cultivation for sugar production with
sugarcane production
Sugarcane
cultivation
for sugar
mills
Sugarcane production (tons ha-1) Total
Below
25
25.1-50 50.1-75 75.1-
100
100.1-
125
125.1-
150
Above
150.1 No. (%) No. (%) No. (%) No. (%) No. (%) No. (%) No. (%) No. (%)
No 47 (14) 93 (28) 85 (25) 41 (12) 4 (1) (-) (-) 270 (80)
Yes (-) 3 (1) 12 (4) 31 (9) 13 (4) 6 (2) 1 (0.3) 66 (20)
Total 47 (14) 96 (29) 97 (29) 72 (21) 17 (5) 6 (2) 1 (0.3) 336 (100)
Chi-square: 119.8
P. value= 0.000
Gamma value = 0.861
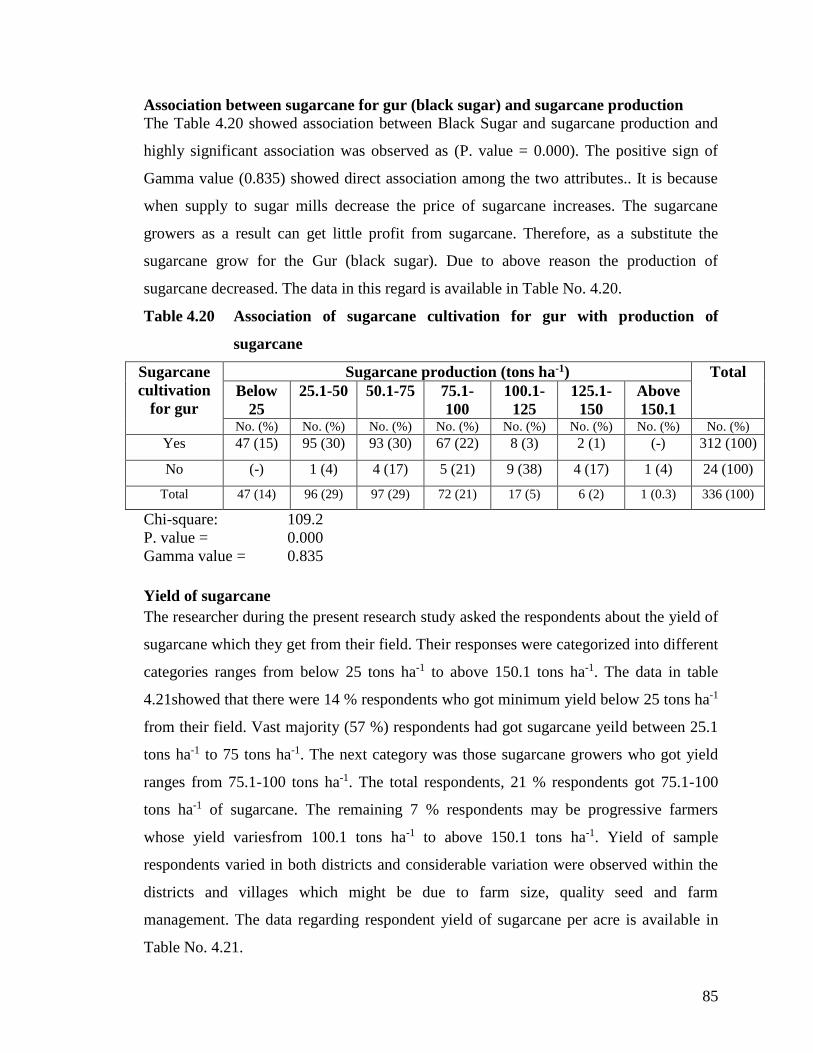
85
Association between sugarcane for gur (black sugar) and sugarcane production
The Table 4.20 showed association between Black Sugar and sugarcane production and
highly significant association was observed as (P. value = 0.000). The positive sign of
Gamma value (0.835) showed direct association among the two attributes.. It is because
when supply to sugar mills decrease the price of sugarcane increases. The sugarcane
growers as a result can get little profit from sugarcane. Therefore, as a substitute the
sugarcane grow for the Gur (black sugar). Due to above reason the production of
sugarcane decreased. The data in this regard is available in Table No. 4.20.
Table 4.20 Association of sugarcane cultivation for gur with production of
sugarcane
Sugarcane
cultivation
for gur
Sugarcane production (tons ha-1) Total
Below
25
25.1-50 50.1-75 75.1-
100
100.1-
125
125.1-
150
Above
150.1 No. (%) No. (%) No. (%) No. (%) No. (%) No. (%) No. (%) No. (%)
Yes 47 (15) 95 (30) 93 (30) 67 (22) 8 (3) 2 (1) (-) 312 (100)
No (-) 1 (4) 4 (17) 5 (21) 9 (38) 4 (17) 1 (4) 24 (100)
Total 47 (14) 96 (29) 97 (29) 72 (21) 17 (5) 6 (2) 1 (0.3) 336 (100)
Chi-square: 109.2
P. value = 0.000
Gamma value = 0.835
Yield of sugarcane
The researcher during the present research study asked the respondents about the yield of
sugarcane which they get from their field. Their responses were categorized into different
categories ranges from below 25 tons ha-1 to above 150.1 tons ha-1. The data in table
4.21showed that there were 14 % respondents who got minimum yield below 25 tons ha-1
from their field. Vast majority (57 %) respondents had got sugarcane yeild between 25.1
tons ha-1 to 75 tons ha-1. The next category was those sugarcane growers who got yield
ranges from 75.1-100 tons ha-1. The total respondents, 21 % respondents got 75.1-100
tons ha-1 of sugarcane. The remaining 7 % respondents may be progressive farmers
whose yield variesfrom 100.1 tons ha-1 to above 150.1 tons ha-1. Yield of sample
respondents varied in both districts and considerable variation were observed within the
districts and villages which might be due to farm size, quality seed and farm
management. The data regarding respondent yield of sugarcane per acre is available in
Table No. 4.21.
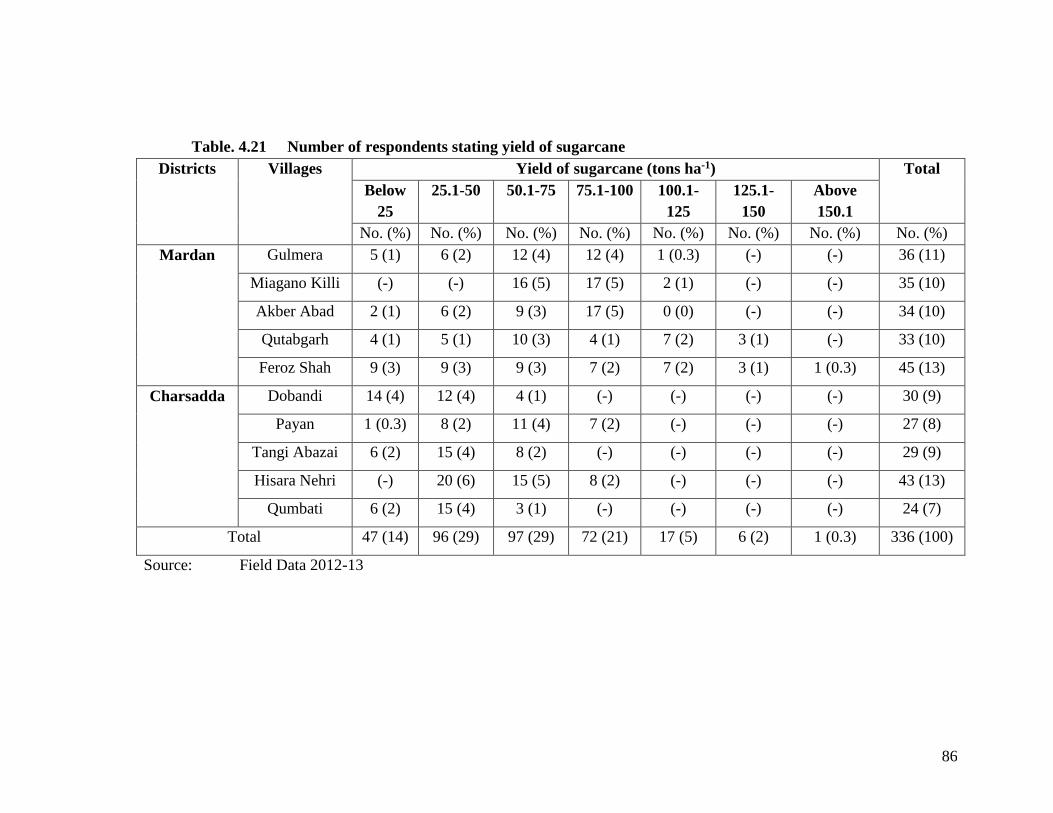
86
Table. 4.21 Number of respondents stating yield of sugarcane
Districts Villages Yield of sugarcane (tons ha-1) Total
Below
25
25.1-50 50.1-75 75.1-100 100.1-
125
125.1-
150
Above
150.1
No. (%) No. (%) No. (%) No. (%) No. (%) No. (%) No. (%) No. (%)
Mardan Gulmera 5 (1) 6 (2) 12 (4) 12 (4) 1 (0.3) (-) (-) 36 (11)
Miagano Killi (-) (-) 16 (5) 17 (5) 2 (1) (-) (-) 35 (10)
Akber Abad 2 (1) 6 (2) 9 (3) 17 (5) 0 (0) (-) (-) 34 (10)
Qutabgarh 4 (1) 5 (1) 10 (3) 4 (1) 7 (2) 3 (1) (-) 33 (10)
Feroz Shah 9 (3) 9 (3) 9 (3) 7 (2) 7 (2) 3 (1) 1 (0.3) 45 (13)
Charsadda Dobandi 14 (4) 12 (4) 4 (1) (-) (-) (-) (-) 30 (9)
Payan 1 (0.3) 8 (2) 11 (4) 7 (2) (-) (-) (-) 27 (8)
Tangi Abazai 6 (2) 15 (4) 8 (2) (-) (-) (-) (-) 29 (9)
Hisara Nehri (-) 20 (6) 15 (5) 8 (2) (-) (-) (-) 43 (13)
Qumbati 6 (2) 15 (4) 3 (1) (-) (-) (-) (-) 24 (7)
Total 47 (14) 96 (29) 97 (29) 72 (21) 17 (5) 6 (2) 1 (0.3) 336 (100)
Source: Field Data 2012-13
87
Weeds of sugarcane
Severe weed infestation is one of the causes of low yield both in plant and ratoon crops.
Weeds competition between early growths up till tillering is detrimental to obtain
optimum crop stand, growth and yield. Cane yield losses up to 24-50 % were observed
under check conditions. Chemical and mechanical weed control measures were found
equally effective. However, pre-emergence Gesapex x Combi application was more
efficient and economical than manual or bullock hoeing operations. It was further
observed that chemical control along with one inter-row cultivation during tillering gave
higher cane yield and cost benefit ratio 1:10 (Karim, 1990).
The data showing types of weeds observed by the respondents is shown in Table No.
4.22.
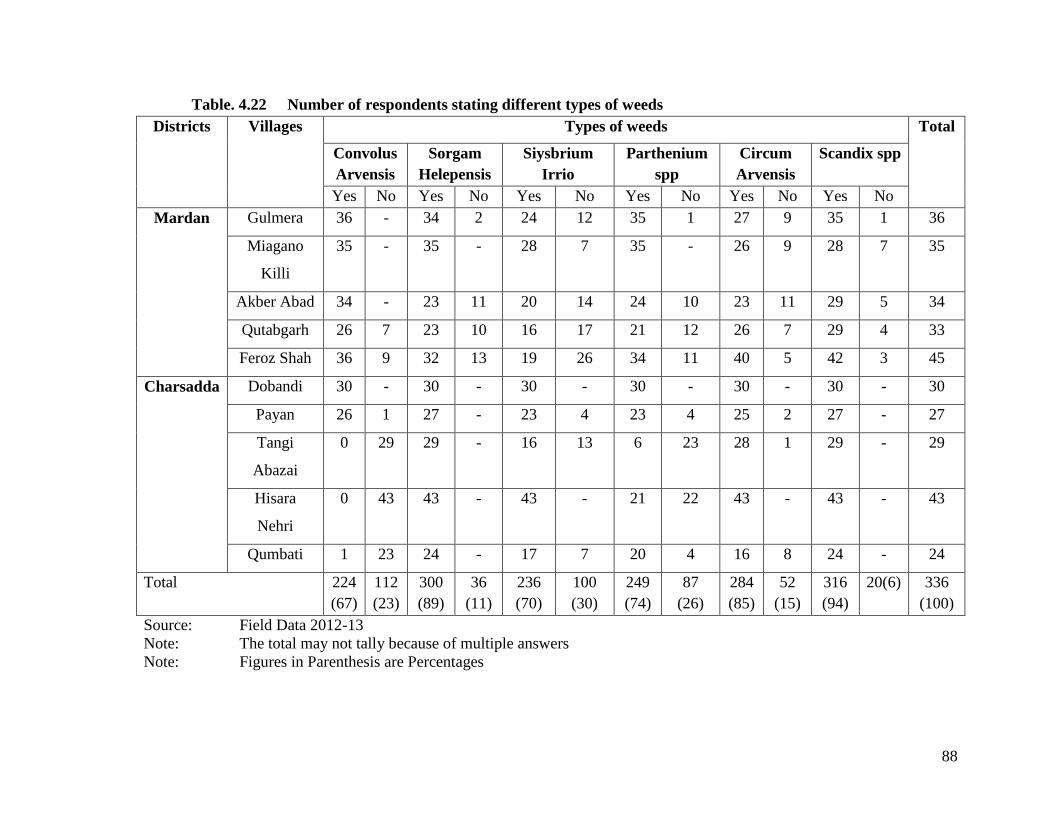
88
Table. 4.22 Number of respondents stating different types of weeds
Districts Villages Types of weeds Total
Convolus
Arvensis
Sorgam
Helepensis
Siysbrium
Irrio
Parthenium
spp
Circum
Arvensis
Scandix spp
Yes No Yes No Yes No Yes No Yes No Yes No
Mardan Gulmera 36 - 34 2 24 12 35 1 27 9 35 1 36
Miagano
Killi
35 - 35 - 28 7 35 - 26 9 28 7 35
Akber Abad 34 - 23 11 20 14 24 10 23 11 29 5 34
Qutabgarh 26 7 23 10 16 17 21 12 26 7 29 4 33
Feroz Shah 36 9 32 13 19 26 34 11 40 5 42 3 45
Charsadda Dobandi 30 - 30 - 30 - 30 - 30 - 30 - 30
Payan 26 1 27 - 23 4 23 4 25 2 27 - 27
Tangi
Abazai
0 29 29 - 16 13 6 23 28 1 29 - 29
Hisara
Nehri
0 43 43 - 43 - 21 22 43 - 43 - 43
Qumbati 1 23 24 - 17 7 20 4 16 8 24 - 24
Total 224
(67)
112
(23)
300
(89)
36
(11)
236
(70)
100
(30)
249
(74)
87
(26)
284
(85)
52
(15)
316
(94)
20(6) 336
(100)
Source: Field Data 2012-13
Note: The total may not tally because of multiple answers
Note: Figures in Parenthesis are Percentages
89
Weeds are common and main problem of the farmers across the country. There are many
types of weeds such as long leaves, plate leaves, parasitic weeds etc which results sever
threat to sugarcane yield. Due to fact respondents were asked questions regarding types
of weeds and results are showed in Table 4.22. The data in Table 4.48 showed that 67 %
sample respondents reported Convoluse arvensis in their fields. There were 89 % sample
respondents who reported Sorgham helepens is the sever problem followed by 70 %
sample respondents who reported that Sisybrium irrio was the big issue for them. The
severity of this weed in both districts was all most equal. The vast majority of 74 %
sample respondents faced the problem of Parthenium spp (local languge “Speen Guli”)
meaning white flower. There were 84 % sample respondents of total sample who reported
that Circum arvensis is one of the biggest weed problems for them. This weed is locally
known as “Genaki” and competence with plants taking nutrients from the land because its
root goes much deeper from than sugarcane. Consequently, upon which the yield of
sugarcane is badly affected. The last weed reported by 96 % sample respondents was
Scandix Spp and locally called “Dadam”.
The weed inflicted 20 to 30 % decreases in various crops on average. On national level
total monitory decreases due to weeds well surpass beyond 120 billion, whereas, wheat
alone reported for more than Pk Rs 30 billion (International 4th Weed Science
Conference, 2012). Furthermore, weed control is the most neglected aspect in cane
culture. Weeds alone may reduce 20-50 % cane yield (Karim, 1990).
Weeds control in sugarcane
For successful crop production man has been active since ages in destroying unwanted
plants from main crop. Various methods have been applied like hand pulling of weeds,
hand hoeing tools, use of livestock-bullocks, horses and utilizing modern farm machinery
for mechanical control of weeds. The latest techniques in this category are the use of
chemicals, the herbicides for control of weeds. Biological Control of weeds through
transgress induction of resistant genes in crop plants may also find its way in future. The
modern day technology is the integrated methods of weed control including the use of
cultural and chemical means. As for a long growing season crop like sugarcane single
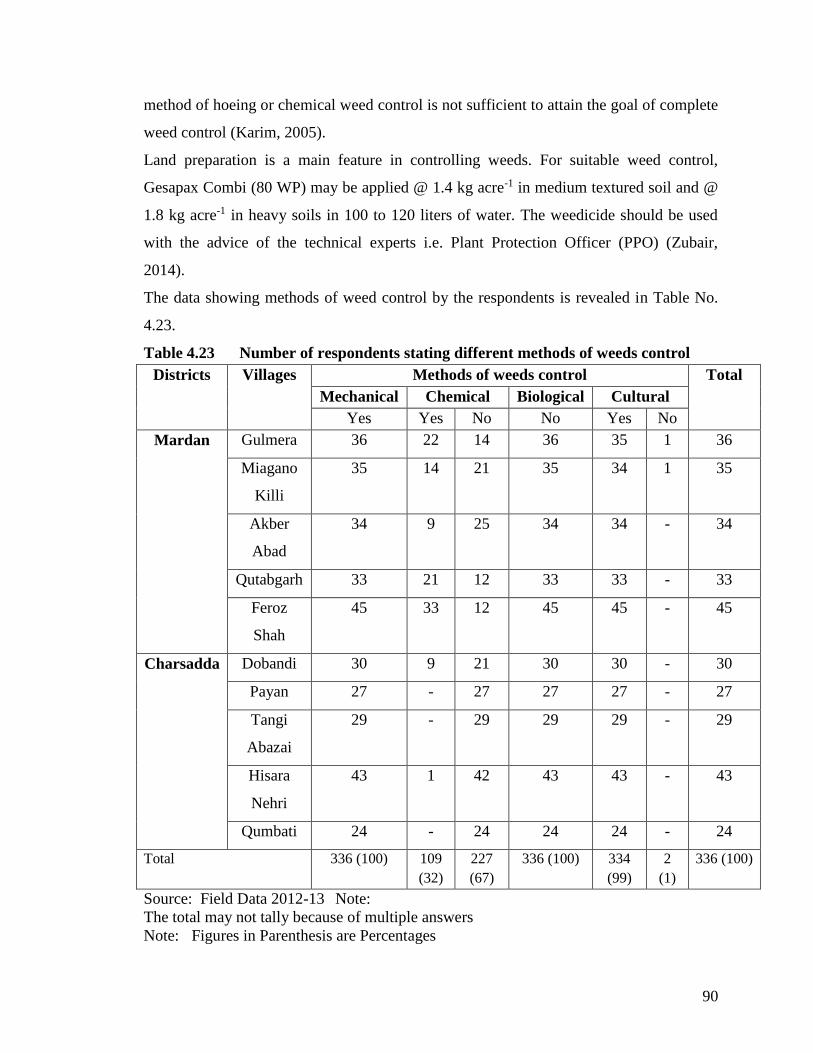
90
method of hoeing or chemical weed control is not sufficient to attain the goal of complete
weed control (Karim, 2005).
Land preparation is a main feature in controlling weeds. For suitable weed control,
Gesapax Combi (80 WP) may be applied @ 1.4 kg acre-1 in medium textured soil and @
1.8 kg acre-1 in heavy soils in 100 to 120 liters of water. The weedicide should be used
with the advice of the technical experts i.e. Plant Protection Officer (PPO) (Zubair,
2014).
The data showing methods of weed control by the respondents is revealed in Table No.
4.23.
Table 4.23 Number of respondents stating different methods of weeds control
Districts Villages Methods of weeds control Total
Mechanical Chemical Biological Cultural
Yes Yes No No Yes No
Mardan Gulmera 36 22 14 36 35 1 36
Miagano
Killi
35 14 21 35 34 1 35
Akber
Abad
34 9 25 34 34 - 34
Qutabgarh 33 21 12 33 33 - 33
Feroz
Shah
45 33 12 45 45 - 45
Charsadda Dobandi 30 9 21 30 30 - 30
Payan 27 - 27 27 27 - 27
Tangi
Abazai
29 - 29 29 29 - 29
Hisara
Nehri
43 1 42 43 43 - 43
Qumbati 24 - 24 24 24 - 24
Total 336 (100) 109
(32)
227
(67)
336 (100) 334
(99)
2
(1)
336 (100)
Source: Field Data 2012-13 Note:
The total may not tally because of multiple answers
Note: Figures in Parenthesis are Percentages
91
During the research study respondents were asked about how they control weeds. Many
and varied weeds control methods were stated by the respondents such as mechanical,
chemical, biological and culture. Mechanical method of weed control was reported by all
the respondents. However, 32 % respondents of total reported the use of chemical
method. There were 68 % who did not use chemical methods for weed control. Cultural
Method for weed control was reported by 99 % respondents while none of the
respondents used biological control method for weed irradication from their crops.
All control methods such as cultural, mechanical, biological and chemical individually
and in combination significantly reduced infestation of shoot gurdaspur and root borers as
compared to untreated plots during the growing period of plant and ratoon crops. When
mechanical, cultural, biological and chemical control applied in combination proved
significantly best control of borers and increased cane yield (Gul et al., 2008).
Specification of cultural method
Hand hoeing is the conventional method of weed control employed soon after planting
and as well as hoeing cane crop in inter-row spaces. In the past blind hoeing was a usual
practice before seed set germination. Hand tools “Khurpa” and “Baguri” are used for this
purpose. In dry method of planting, hoeing is done after planting and is completed within
12 -15 days of plantation. Hand hoeing is practiced in small size landholdings where
labour is less expensive and is easily available. Hoeing has been considered an essential
cultural operation for control of weeds. But many times field conditions do not permit
timely hoeing and some noxious weeds get established. Further that the hoeing of weeds
within cane shoots is very cumbersome, and nuts and grasses are difficult to control. The
modern philosophy of mechanization is the least tillage operation to zero tillage within
cane rows (Karim, 2005).
The data showing cultural methods for weed control is presented in Table No. 4.24.
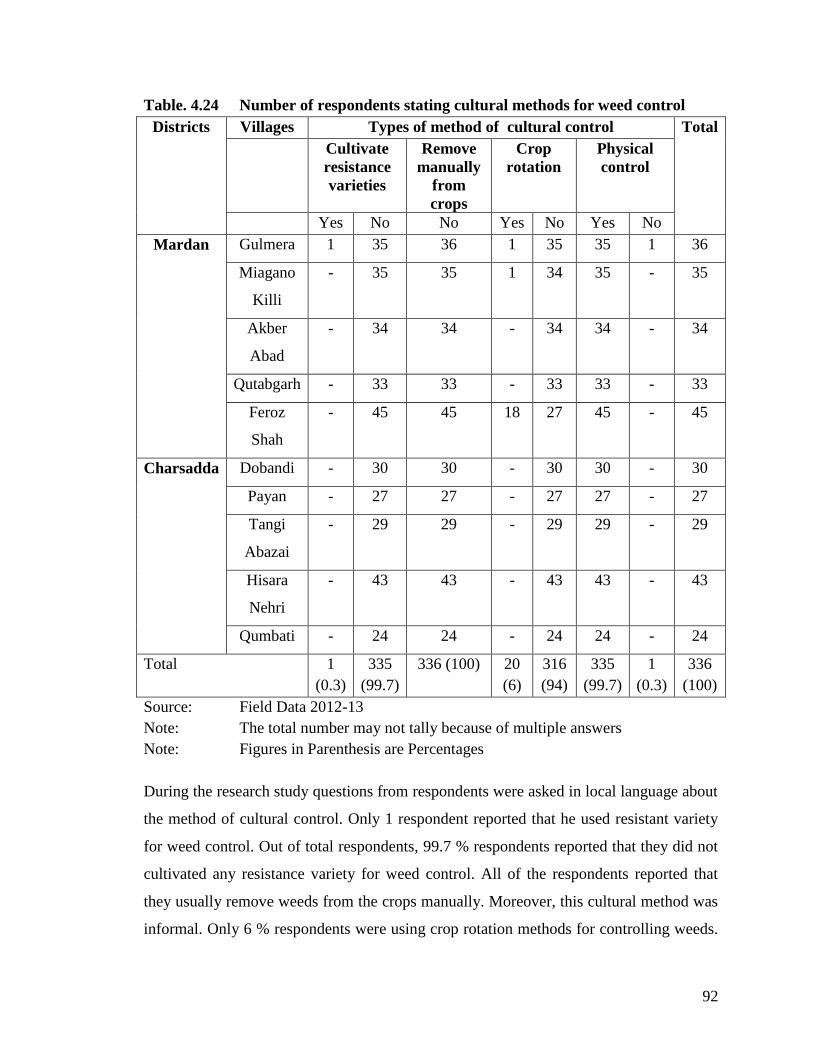
92
Table. 4.24 Number of respondents stating cultural methods for weed control
Districts Villages Types of method of cultural control Total
Cultivate
resistance
varieties
Remove
manually
from
crops
Crop
rotation
Physical
control
Yes No No Yes No Yes No
Mardan Gulmera 1 35 36 1 35 35 1 36
Miagano
Killi
- 35 35 1 34 35 - 35
Akber
Abad
- 34 34 - 34 34 - 34
Qutabgarh - 33 33 - 33 33 - 33
Feroz
Shah
- 45 45 18 27 45 - 45
Charsadda Dobandi - 30 30 - 30 30 - 30
Payan - 27 27 - 27 27 - 27
Tangi
Abazai
- 29 29 - 29 29 - 29
Hisara
Nehri
- 43 43 - 43 43 - 43
Qumbati - 24 24 - 24 24 - 24
Total 1
(0.3)
335
(99.7)
336 (100) 20
(6)
316
(94)
335
(99.7)
1
(0.3)
336
(100)
Source: Field Data 2012-13
Note: The total number may not tally because of multiple answers
Note: Figures in Parenthesis are Percentages
During the research study questions from respondents were asked in local language about
the method of cultural control. Only 1 respondent reported that he used resistant variety
for weed control. Out of total respondents, 99.7 % respondents reported that they did not
cultivated any resistance variety for weed control. All of the respondents reported that
they usually remove weeds from the crops manually. Moreover, this cultural method was
informal. Only 6 % respondents were using crop rotation methods for controlling weeds.
93
Strangely all these 6 % respondents were present in district Mardan. As against 94 %
respondents who did not use crop rotation method for weed control. Last cultural control
method was physical control and 99.7 % respondents used cultural method (physical
control) except one respondent did not use this method.
Infestation in sugarcane crop
Considerable losses in yield and quality are reported from insect infestation. Insects like
borers, pyrilla, mites, bugs and termites attack cane fields. Sometimes these hazards
create panics in certain regions and sometime their attack is localized. Rodents and wild
borer also cause considerable yield losses. Mosaic is a common disease in all the fields.
Red rot and smut also infect susceptible varieties sometime causing server losses (Karim,
1990).
Among the factors contributing low yield in our country, the attack of insect pests is
significance. Different insect pests like termites, borers, pyrilla, whitefly, bugs and mites
etc attack this crop and cause serious losses in terms of less yield and quality. Sugarcane
borers create tunnels in stubbles and internodes due to which food supply to aerial parts
of stem and leaves become stopped. Moreover, these tunnels cover way for diseases.
Without some useful measures the crop cannot be protected from the attack of insect
pests particularly borer (Gul et al, 2010).
The data in this regard of pest is revealed in Table No. 4.25.
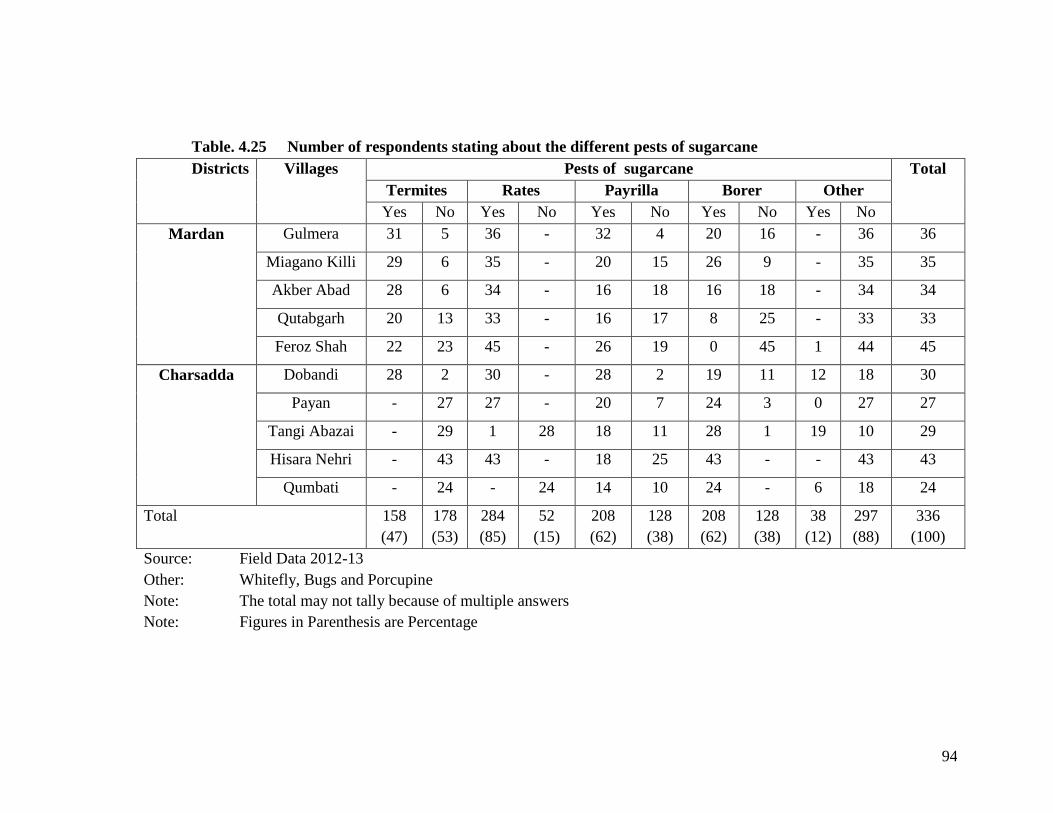
94
Table. 4.25 Number of respondents stating about the different pests of sugarcane
Districts Villages Pests of sugarcane Total
Termites Rates Payrilla Borer Other
Yes No Yes No Yes No Yes No Yes No
Mardan Gulmera 31 5 36 - 32 4 20 16 - 36 36
Miagano Killi 29 6 35 - 20 15 26 9 - 35 35
Akber Abad 28 6 34 - 16 18 16 18 - 34 34
Qutabgarh 20 13 33 - 16 17 8 25 - 33 33
Feroz Shah 22 23 45 - 26 19 0 45 1 44 45
Charsadda Dobandi 28 2 30 - 28 2 19 11 12 18 30
Payan - 27 27 - 20 7 24 3 0 27 27
Tangi Abazai - 29 1 28 18 11 28 1 19 10 29
Hisara Nehri - 43 43 - 18 25 43 - - 43 43
Qumbati - 24 - 24 14 10 24 - 6 18 24
Total 158
(47)
178
(53)
284
(85)
52
(15)
208
(62)
128
(38)
208
(62)
128
(38)
38
(12)
297
(88)
336
(100)
Source: Field Data 2012-13
Other: Whitefly, Bugs and Porcupine
Note: The total may not tally because of multiple answers
Note: Figures in Parenthesis are Percentage
95
During the research study respondents were asked questions about the attack of pest. 47
% respondents reported that termits damages their sugarcane crop. On the other hand, 53
% respondents stated that termites were not the problem for their crop. It is generally
believed that rates are trouble makers not only in houses but also in the field. The data in
table 4.25 showed that vast majority (85 %) respondents of the total reported that rates
were major problem for sugarcane whereas 15 % respondents reported that rates were not
main problem. Pyrilla and borer were another problems stated by 62 % respondents.
While 38 % respondents reported that pyrilla and borer were not problems. Only 12 %
respondents narrated mix problem while 88 % respondents of the total respondents
reported that there were some other Pests like whitefly, Mits, bugs etc regarding pests
attack on their sugarcane crop.
In Pakistan exact estimates of sugarcane yield losses due to insect attack are lacking but it
has been reported that borer like stem borer, Gurdaspur borer and Pyrilla cause a
reduction in sugarcane yield from 15%-20%, 10%-20% and 30%-35% respectively
(Zubair, 2014).
Pesticides application
Plant protection is defined in term of use of equipment and chemicals control methods.
Pest identification and advisory services are also remains in sugarcane mill zone.
Sugarcane has not received optimum plant protection measures comparable to cotton
crop (Karim, 1990). The use of the herbicide is positively depending on environments of
temperature, moisture and undisturbed identical soil surface to promote germination.
Some of the systematic and translocate herbicides are selective for one kind of plant,
while others are non-selective. They could be selective for broad leaf crops but non
selective for grasses and vice versa. Some are very short lived while others are more
persistent having long residual result (Karim, 2005).
The data showing the use of pesticides by respondents is presented in table No. 4.26.
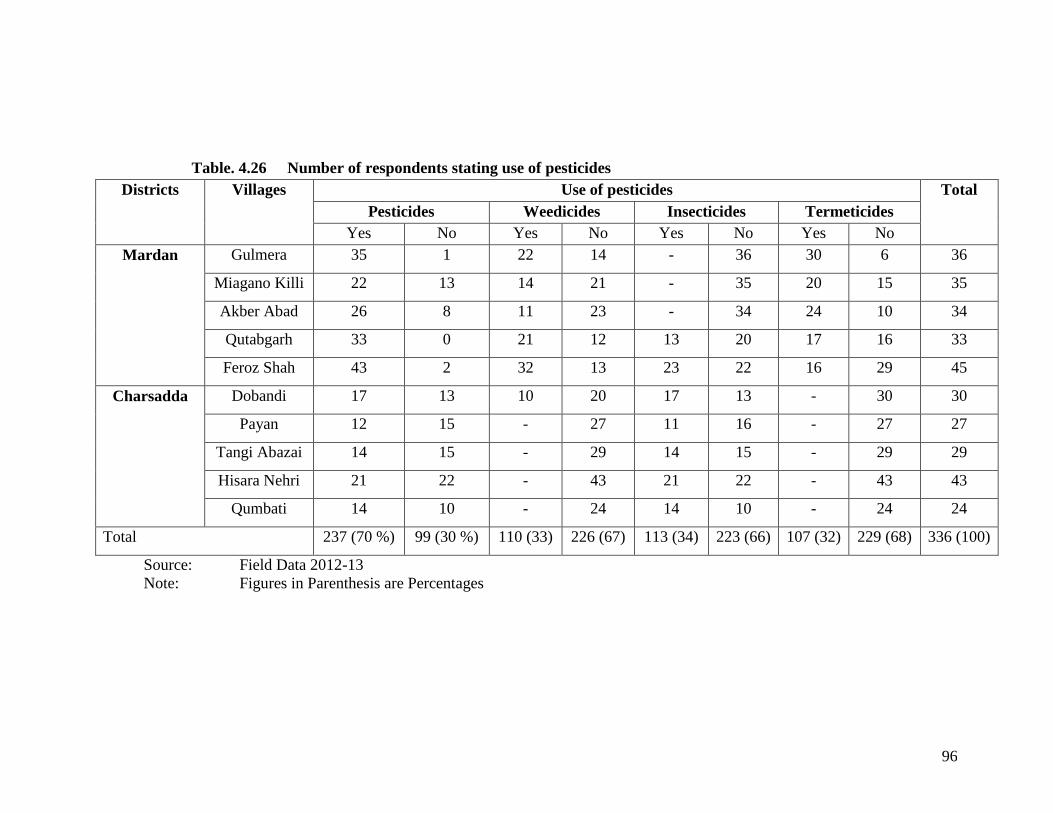
96
Table. 4.26 Number of respondents stating use of pesticides
Districts Villages Use of pesticides Total
Pesticides Weedicides Insecticides Termeticides
Yes No Yes No Yes No Yes No
Mardan Gulmera 35 1 22 14 - 36 30 6 36
Miagano Killi 22 13 14 21 - 35 20 15 35
Akber Abad 26 8 11 23 - 34 24 10 34
Qutabgarh 33 0 21 12 13 20 17 16 33
Feroz Shah 43 2 32 13 23 22 16 29 45
Charsadda Dobandi 17 13 10 20 17 13 - 30 30
Payan 12 15 - 27 11 16 - 27 27
Tangi Abazai 14 15 - 29 14 15 - 29 29
Hisara Nehri 21 22 - 43 21 22 - 43 43
Qumbati 14 10 - 24 14 10 - 24 24
Total 237 (70 %) 99 (30 %) 110 (33) 226 (67) 113 (34) 223 (66) 107 (32) 229 (68) 336 (100)
Source: Field Data 2012-13
Note: Figures in Parenthesis are Percentages
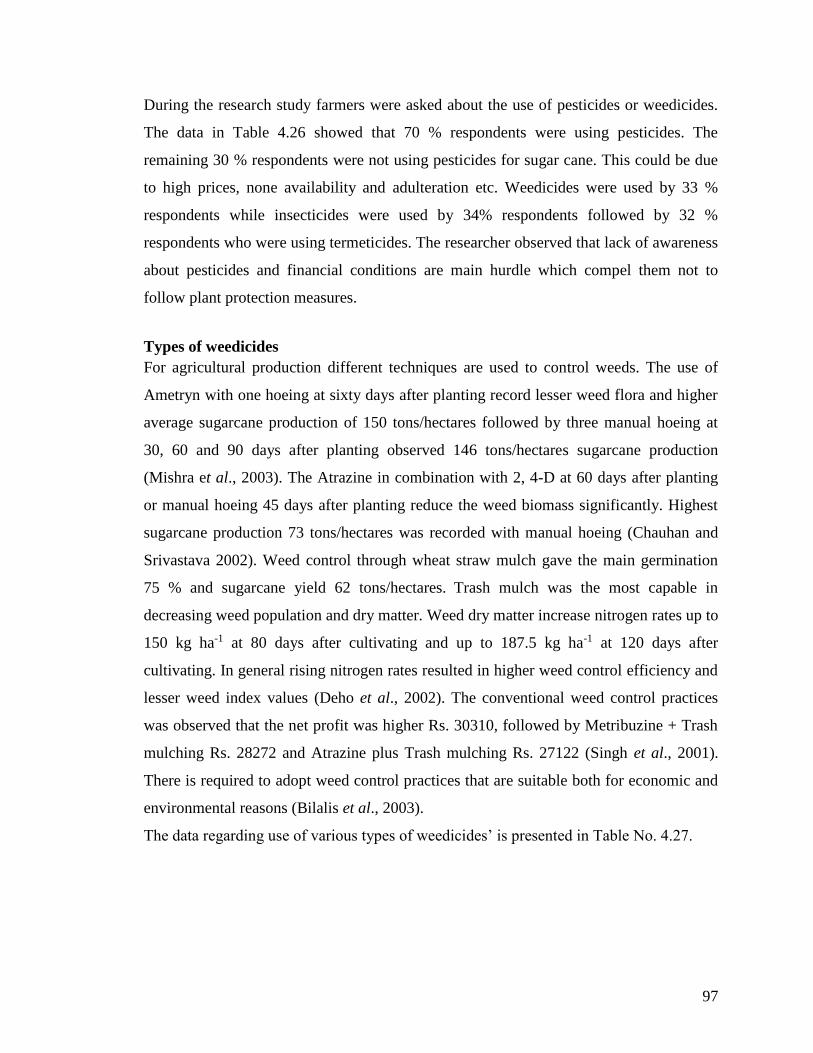
97
During the research study farmers were asked about the use of pesticides or weedicides.
The data in Table 4.26 showed that 70 % respondents were using pesticides. The
remaining 30 % respondents were not using pesticides for sugar cane. This could be due
to high prices, none availability and adulteration etc. Weedicides were used by 33 %
respondents while insecticides were used by 34% respondents followed by 32 %
respondents who were using termeticides. The researcher observed that lack of awareness
about pesticides and financial conditions are main hurdle which compel them not to
follow plant protection measures.
Types of weedicides
For agricultural production different techniques are used to control weeds. The use of
Ametryn with one hoeing at sixty days after planting record lesser weed flora and higher
average sugarcane production of 150 tons/hectares followed by three manual hoeing at
30, 60 and 90 days after planting observed 146 tons/hectares sugarcane production
(Mishra et al., 2003). The Atrazine in combination with 2, 4-D at 60 days after planting
or manual hoeing 45 days after planting reduce the weed biomass significantly. Highest
sugarcane production 73 tons/hectares was recorded with manual hoeing (Chauhan and
Srivastava 2002). Weed control through wheat straw mulch gave the main germination
75 % and sugarcane yield 62 tons/hectares. Trash mulch was the most capable in
decreasing weed population and dry matter. Weed dry matter increase nitrogen rates up to
150 kg ha-1 at 80 days after cultivating and up to 187.5 kg ha-1 at 120 days after
cultivating. In general rising nitrogen rates resulted in higher weed control efficiency and
lesser weed index values (Deho et al., 2002). The conventional weed control practices
was observed that the net profit was higher Rs. 30310, followed by Metribuzine + Trash
mulching Rs. 28272 and Atrazine plus Trash mulching Rs. 27122 (Singh et al., 2001).
There is required to adopt weed control practices that are suitable both for economic and
environmental reasons (Bilalis et al., 2003).
The data regarding use of various types of weedicides’ is presented in Table No. 4.27.
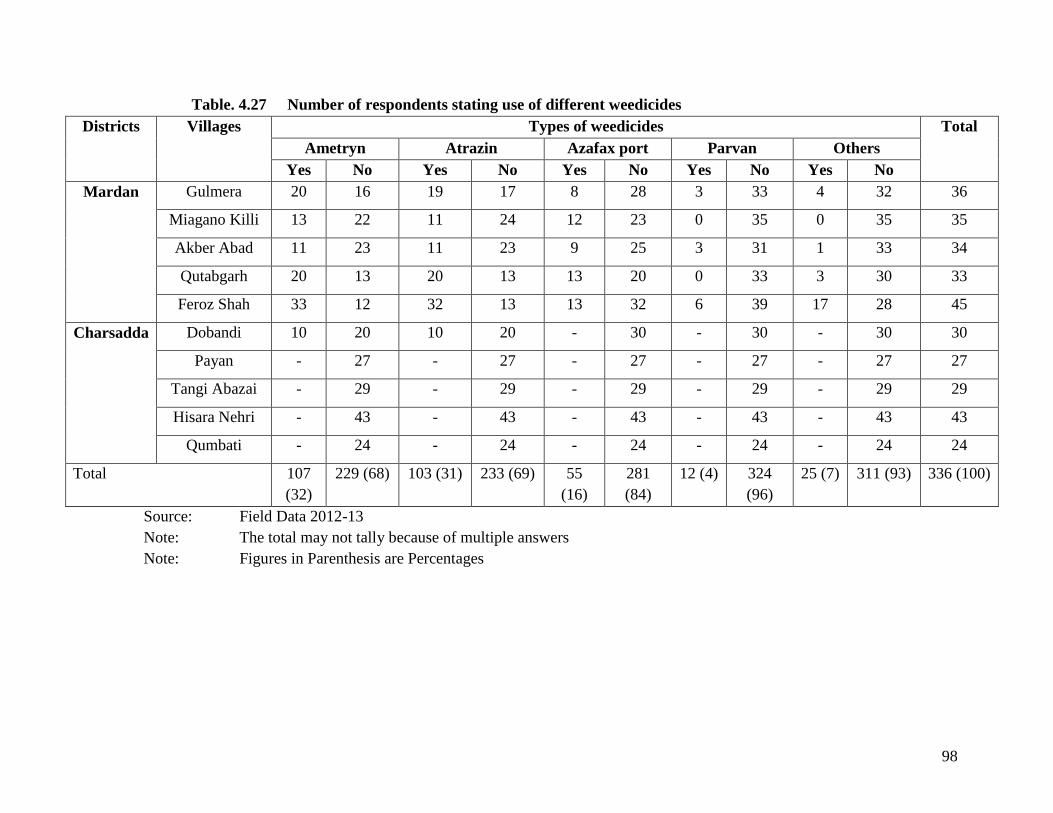
98
Table. 4.27 Number of respondents stating use of different weedicides
Districts Villages Types of weedicides Total
Ametryn Atrazin Azafax port Parvan Others
Yes No Yes No Yes No Yes No Yes No
Mardan Gulmera 20 16 19 17 8 28 3 33 4 32 36
Miagano Killi 13 22 11 24 12 23 0 35 0 35 35
Akber Abad 11 23 11 23 9 25 3 31 1 33 34
Qutabgarh 20 13 20 13 13 20 0 33 3 30 33
Feroz Shah 33 12 32 13 13 32 6 39 17 28 45
Charsadda Dobandi 10 20 10 20 - 30 - 30 - 30 30
Payan - 27 - 27 - 27 - 27 - 27 27
Tangi Abazai - 29 - 29 - 29 - 29 - 29 29
Hisara Nehri - 43 - 43 - 43 - 43 - 43 43
Qumbati - 24 - 24 - 24 - 24 - 24 24
Total 107
(32)
229 (68) 103 (31) 233 (69) 55
(16)
281
(84)
12 (4) 324
(96)
25 (7) 311 (93) 336 (100)
Source: Field Data 2012-13
Note: The total may not tally because of multiple answers
Note: Figures in Parenthesis are Percentages
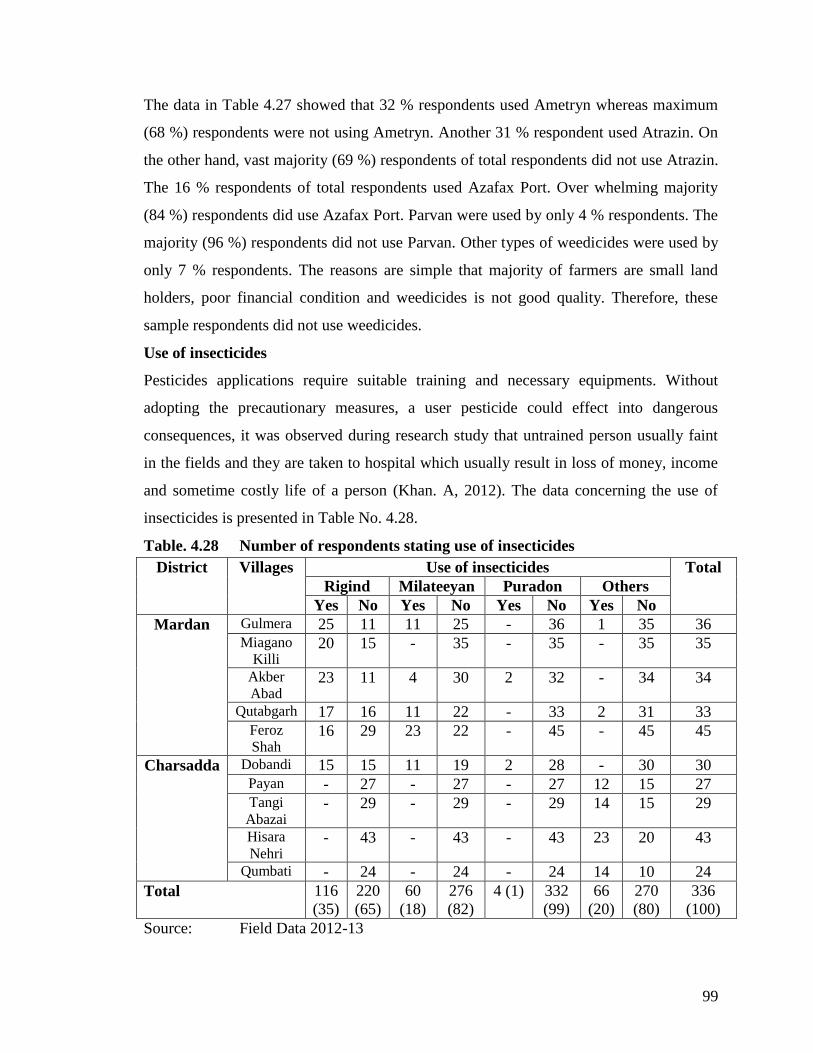
99
The data in Table 4.27 showed that 32 % respondents used Ametryn whereas maximum
(68 %) respondents were not using Ametryn. Another 31 % respondent used Atrazin. On
the other hand, vast majority (69 %) respondents of total respondents did not use Atrazin.
The 16 % respondents of total respondents used Azafax Port. Over whelming majority
(84 %) respondents did use Azafax Port. Parvan were used by only 4 % respondents. The
majority (96 %) respondents did not use Parvan. Other types of weedicides were used by
only 7 % respondents. The reasons are simple that majority of farmers are small land
holders, poor financial condition and weedicides is not good quality. Therefore, these
sample respondents did not use weedicides.
Use of insecticides
Pesticides applications require suitable training and necessary equipments. Without
adopting the precautionary measures, a user pesticide could effect into dangerous
consequences, it was observed during research study that untrained person usually faint
in the fields and they are taken to hospital which usually result in loss of money, income
and sometime costly life of a person (Khan. A, 2012). The data concerning the use of
insecticides is presented in Table No. 4.28.
Table. 4.28 Number of respondents stating use of insecticides
District Villages Use of insecticides Total
Rigind Milateeyan Puradon Others
Yes No Yes No Yes No Yes No
Mardan Gulmera 25 11 11 25 - 36 1 35 36 Miagano
Killi 20 15 - 35 - 35 - 35 35
Akber
Abad 23 11 4 30 2 32 - 34 34
Qutabgarh 17 16 11 22 - 33 2 31 33 Feroz
Shah 16 29 23 22 - 45 - 45 45
Charsadda Dobandi 15 15 11 19 2 28 - 30 30 Payan - 27 - 27 - 27 12 15 27 Tangi
Abazai - 29 - 29 - 29 14 15 29
Hisara
Nehri - 43 - 43 - 43 23 20 43
Qumbati - 24 - 24 - 24 14 10 24
Total 116
(35)
220
(65)
60
(18)
276
(82)
4 (1) 332
(99)
66
(20)
270
(80)
336
(100)
Source: Field Data 2012-13
100
It is depected from Table 4.28 that 35 % sample respondents use Rigind as instecides.
However, vast majority of 65 % sample respondents did not use this insecticide. There
were 18 % sample respondents who used millatyane and vast majority of 82 % samples
respondents did not use millatyane. It is remarkable that only 1 % samples respondents
did use Purodan as against over whelming majority of 99 % sample respondents who did
not use it.
Knowledge of sugarcane growers about agricultural extension workers
Agricultural development is a complex procedure; it requires the series of inputs that
must be made available at the same time. This timing is critical for the farmer. He must
plant his crops or breed his livestock at a particular time which he has very little control.
These inputs come from the researcher who provides the up-dated technical knowledge.
The extensionist who disseminates the specific information required and the merchant
who provides essential materials and buys the products at a fair price. Then it is the
farmer who must bring all these basic inputs together and turn them into a productive use.
The ultimate objective of agricultural extension worker is to help people to help
themselves in a manner that will improve their welfare. Basically, this means providing
farmers with a wide range of technical information that has been tested in conditions
similar to those faced by the farmers. Unfortunately it is observed that the extension
worker is not found as the primary source of information. Mostly farmers benefited from
fellow farmers and extension agent for acquiring knowledge and information (Khan,
2008).
The data regarding acquaintance of field assistants of agricultural extension department is
presented in table No. 4.29.
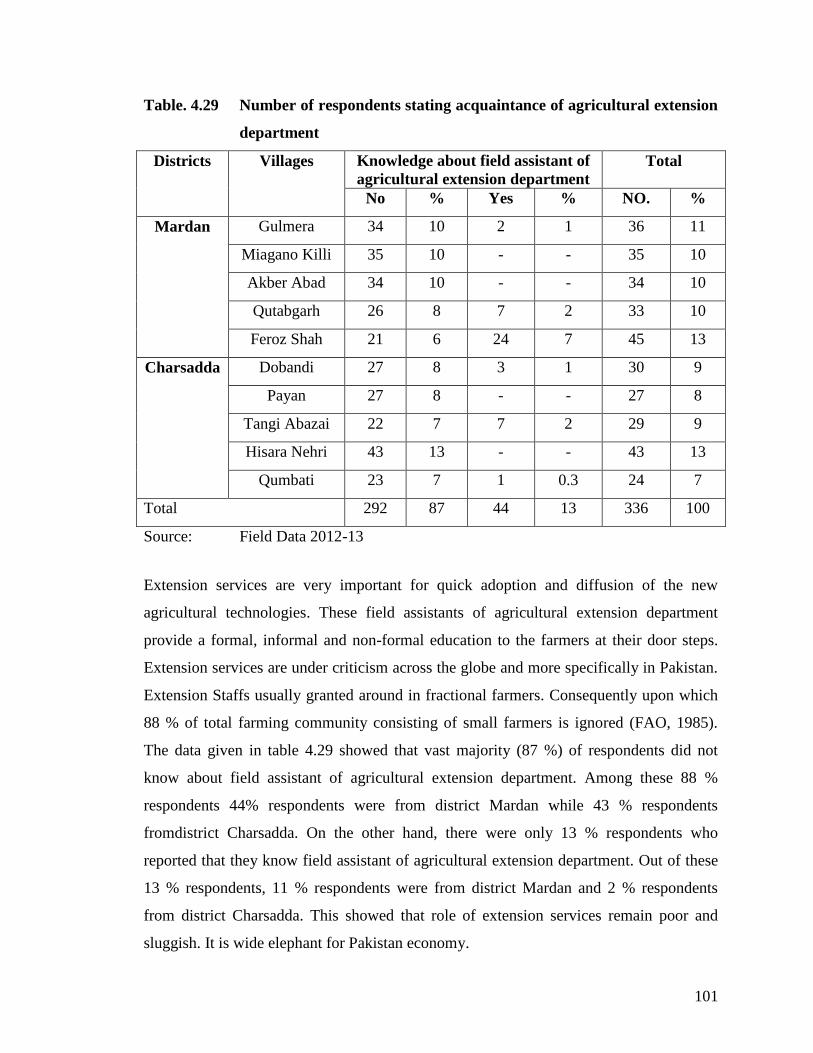
101
Table. 4.29 Number of respondents stating acquaintance of agricultural extension
department
Districts Villages Knowledge about field assistant of
agricultural extension department
Total
No % Yes % NO. %
Mardan Gulmera 34 10 2 1 36 11
Miagano Killi 35 10 - - 35 10
Akber Abad 34 10 - - 34 10
Qutabgarh 26 8 7 2 33 10
Feroz Shah 21 6 24 7 45 13
Charsadda Dobandi 27 8 3 1 30 9
Payan 27 8 - - 27 8
Tangi Abazai 22 7 7 2 29 9
Hisara Nehri 43 13 - - 43 13
Qumbati 23 7 1 0.3 24 7
Total 292 87 44 13 336 100
Source: Field Data 2012-13
Extension services are very important for quick adoption and diffusion of the new
agricultural technologies. These field assistants of agricultural extension department
provide a formal, informal and non-formal education to the farmers at their door steps.
Extension services are under criticism across the globe and more specifically in Pakistan.
Extension Staffs usually granted around in fractional farmers. Consequently upon which
88 % of total farming community consisting of small farmers is ignored (FAO, 1985).
The data given in table 4.29 showed that vast majority (87 %) of respondents did not
know about field assistant of agricultural extension department. Among these 88 %
respondents 44% respondents were from district Mardan while 43 % respondents
fromdistrict Charsadda. On the other hand, there were only 13 % respondents who
reported that they know field assistant of agricultural extension department. Out of these
13 % respondents, 11 % respondents were from district Mardan and 2 % respondents
from district Charsadda. This showed that role of extension services remain poor and
sluggish. It is wide elephant for Pakistan economy.
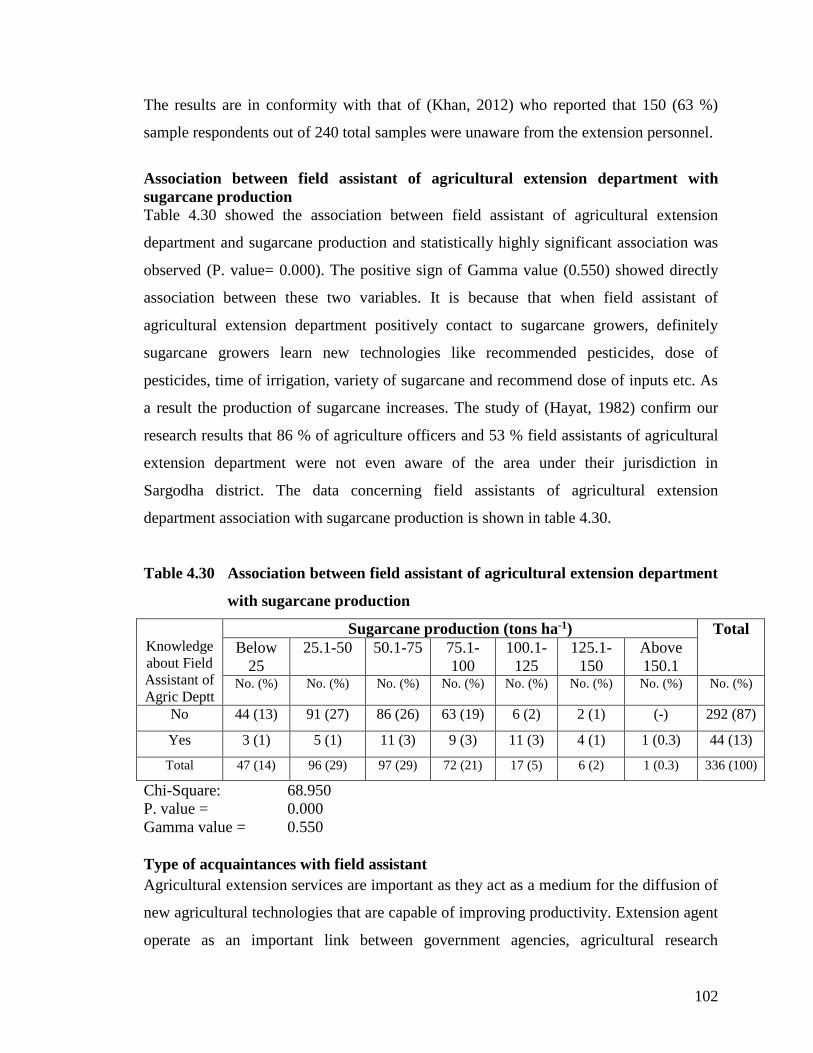
102
The results are in conformity with that of (Khan, 2012) who reported that 150 (63 %)
sample respondents out of 240 total samples were unaware from the extension personnel.
Association between field assistant of agricultural extension department with
sugarcane production
Table 4.30 showed the association between field assistant of agricultural extension
department and sugarcane production and statistically highly significant association was
observed (P. value= 0.000). The positive sign of Gamma value (0.550) showed directly
association between these two variables. It is because that when field assistant of
agricultural extension department positively contact to sugarcane growers, definitely
sugarcane growers learn new technologies like recommended pesticides, dose of
pesticides, time of irrigation, variety of sugarcane and recommend dose of inputs etc. As
a result the production of sugarcane increases. The study of (Hayat, 1982) confirm our
research results that 86 % of agriculture officers and 53 % field assistants of agricultural
extension department were not even aware of the area under their jurisdiction in
Sargodha district. The data concerning field assistants of agricultural extension
department association with sugarcane production is shown in table 4.30.
Table 4.30 Association between field assistant of agricultural extension department
with sugarcane production
Knowledge
about Field
Assistant of
Agric Deptt
Sugarcane production (tons ha-1) Total
Below
25
25.1-50 50.1-75 75.1-
100
100.1-
125
125.1-
150
Above
150.1 No. (%) No. (%) No. (%) No. (%) No. (%) No. (%) No. (%) No. (%)
No 44 (13) 91 (27) 86 (26) 63 (19) 6 (2) 2 (1) (-) 292 (87)
Yes 3 (1) 5 (1) 11 (3) 9 (3) 11 (3) 4 (1) 1 (0.3) 44 (13)
Total 47 (14) 96 (29) 97 (29) 72 (21) 17 (5) 6 (2) 1 (0.3) 336 (100)
Chi-Square: 68.950
P. value = 0.000
Gamma value = 0.550
Type of acquaintances with field assistant
Agricultural extension services are important as they act as a medium for the diffusion of
new agricultural technologies that are capable of improving productivity. Extension agent
operate as an important link between government agencies, agricultural research

103
institutions and the farmer. Agricultural extension agent are there in field to explain to
farmers the regularity of the supply of water and effectiveness with which new
agricultural inputs are utilized and the implication of its relationship with agricultural
productivity (Khan, 2008).
The data regarding type of acquaintance with field assistant of agricultural extension
department is presented in table No. 4.31.
Table. 4.31 Number of responding stating type of acquaintance about field assistant
of agricultural extension department
Districts Villages Type of acquaintance with field
assistant
Total
By face By name
No. % No. % No. %
Mardan Gulmera 2 1 - - 2 1
Miagano Killi - - - - - -
Akber Abad - - - - - -
Qutabgarh 5 2 2 1 7 3
Feroz Shah 16 5 8 2 24 7
Charsadda Dobandi - - 3 1 3 1
Payan - - - - - -
Tangi Abazai - - 7 2 7 2
Hisara Nehri - - - - - -
Qumbati - - 1 0.3 1 0.3
Total 23 7 21 6 44 13
Source: Field Data 2012-13
The data in table 4.31 reveals that 7 % respondents know field assistant of agricultural
extension department by face strangely enough all these 7 % respondents were in district
Mardan. The remaining 6 % respondents know field assistant by name. These 6 %
respondents were equally present in both districts Mardan and Charsadda. It can be
concluded from the above discussion that field assistant of agricultural extension
department has very little contact with farmers.
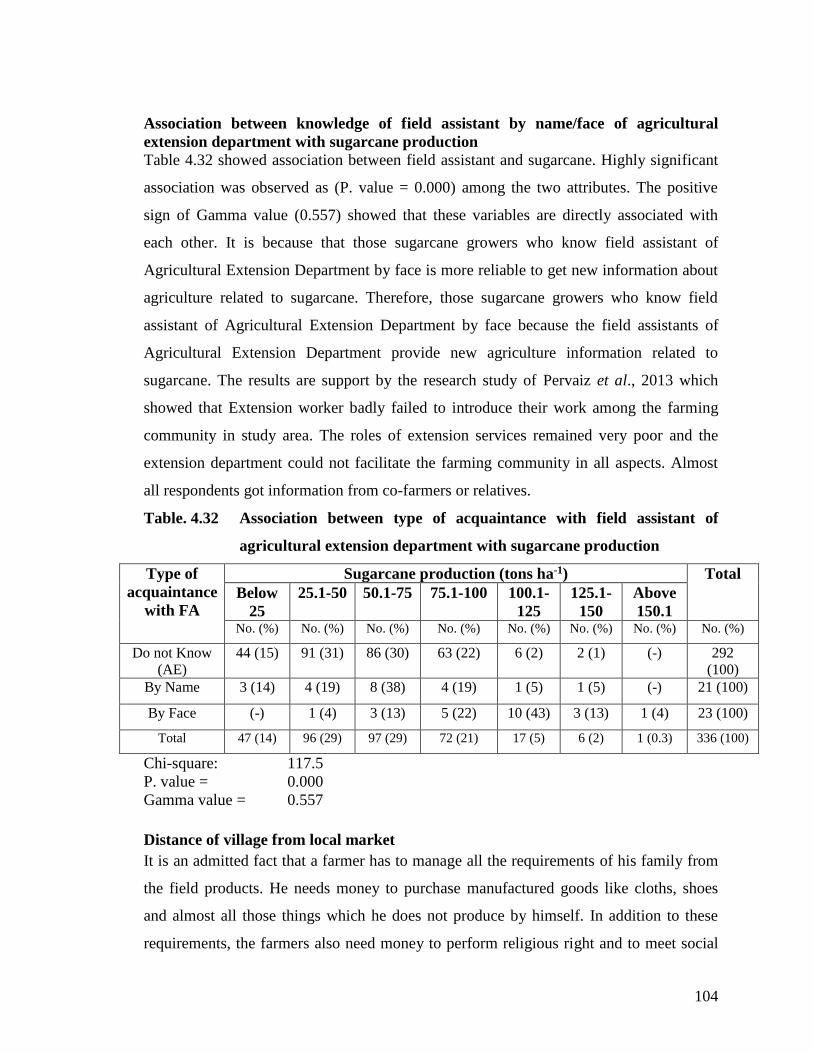
104
Association between knowledge of field assistant by name/face of agricultural
extension department with sugarcane production
Table 4.32 showed association between field assistant and sugarcane. Highly significant
association was observed as (P. value = 0.000) among the two attributes. The positive
sign of Gamma value (0.557) showed that these variables are directly associated with
each other. It is because that those sugarcane growers who know field assistant of
Agricultural Extension Department by face is more reliable to get new information about
agriculture related to sugarcane. Therefore, those sugarcane growers who know field
assistant of Agricultural Extension Department by face because the field assistants of
Agricultural Extension Department provide new agriculture information related to
sugarcane. The results are support by the research study of Pervaiz et al., 2013 which
showed that Extension worker badly failed to introduce their work among the farming
community in study area. The roles of extension services remained very poor and the
extension department could not facilitate the farming community in all aspects. Almost
all respondents got information from co-farmers or relatives.
Table. 4.32 Association between type of acquaintance with field assistant of
agricultural extension department with sugarcane production
Type of
acquaintance
with FA
Sugarcane production (tons ha-1) Total
Below
25
25.1-50 50.1-75 75.1-100 100.1-
125
125.1-
150
Above
150.1 No. (%) No. (%) No. (%) No. (%) No. (%) No. (%) No. (%) No. (%)
Do not Know
(AE)
44 (15) 91 (31) 86 (30) 63 (22) 6 (2) 2 (1) (-) 292
(100)
By Name 3 (14) 4 (19) 8 (38) 4 (19) 1 (5) 1 (5) (-) 21 (100)
By Face (-) 1 (4) 3 (13) 5 (22) 10 (43) 3 (13) 1 (4) 23 (100)
Total 47 (14) 96 (29) 97 (29) 72 (21) 17 (5) 6 (2) 1 (0.3) 336 (100)
Chi-square: 117.5
P. value = 0.000
Gamma value = 0.557
Distance of village from local market
It is an admitted fact that a farmer has to manage all the requirements of his family from
the field products. He needs money to purchase manufactured goods like cloths, shoes
and almost all those things which he does not produce by himself. In addition to these
requirements, the farmers also need money to perform religious right and to meet social
105
obligations like marriage and ceremonial functions in the society. For the procurement of
money there is no alternative for the farmers, no shortage and processing facilities in the
rural areas. Trapped by the pressing demand for money on the one hand and lack of
shortage facility on the other hand, the cultivator cannot wait but sell his grains in the
first instance to the buyer who is willing to buy irrespective of the price prevailing in the
market. In the absence of standard weights and measures, the cultivator may fooled by
the buyer taking advantages of his illiteracy and ignorance of the standard weight. The
middle men also usually deceive the farmers by buying superior quality grains and
paying the price of inferior goods. Our farmers are not aware of the quality of product
because of the absence of information’s regarding price and grading of agricultural
products etc. (Khan, 2008).
The majority of small and medium size farmers sold their produce in the village market,
while the big growers with heavy surplus preferred to sell their produce outside the
village markets. The major portion of surpluses is brought to the wholesale markets.
More than one third of the sugarcane growers were reported to produce black sugar
“Gur” and then sell it in the local market. Some of the farmers were found to sell
sugarcane to the mills because of expensive and time consuming task of producing black
sugar. The marketing of all sugarcane produce (apart from small quantity which growers
retain for home consumption) was controlled by local market (Hussain and Khattak,
2011).
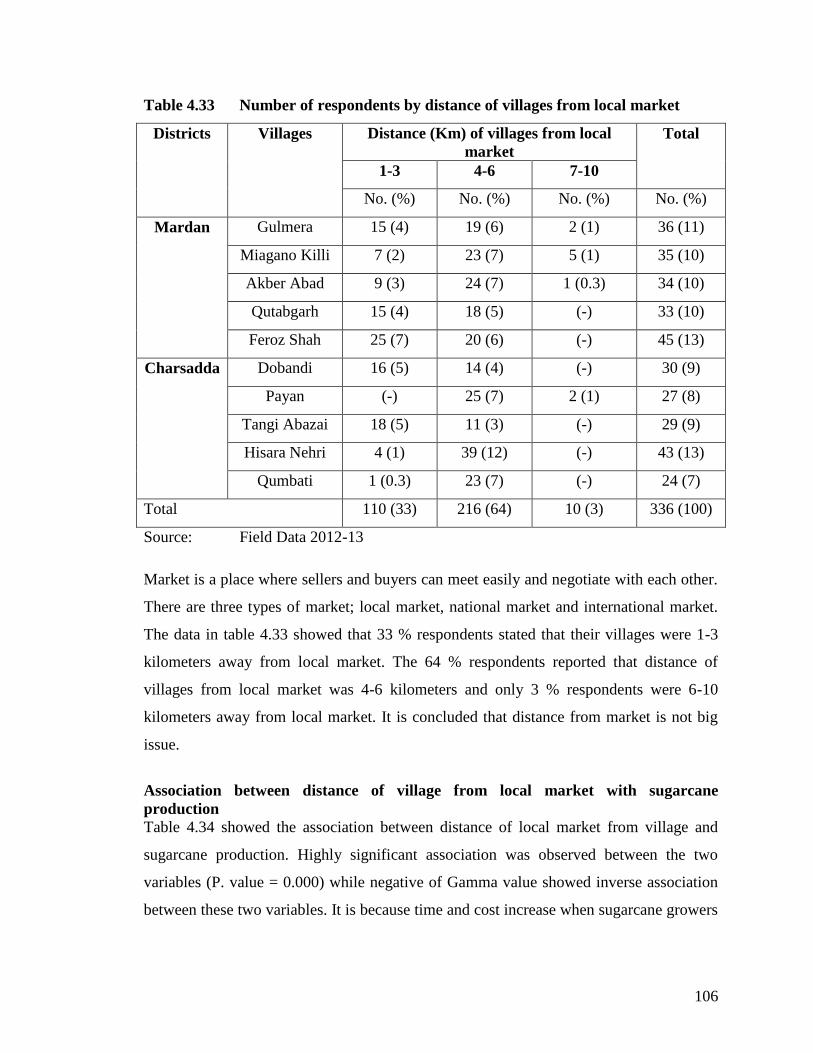
106
Table 4.33 Number of respondents by distance of villages from local market
Districts Villages Distance (Km) of villages from local
market
Total
1-3 4-6 7-10
No. (%) No. (%) No. (%) No. (%)
Mardan Gulmera 15 (4) 19 (6) 2 (1) 36 (11)
Miagano Killi 7 (2) 23 (7) 5 (1) 35 (10)
Akber Abad 9 (3) 24 (7) 1 (0.3) 34 (10)
Qutabgarh 15 (4) 18 (5) (-) 33 (10)
Feroz Shah 25 (7) 20 (6) (-) 45 (13)
Charsadda Dobandi 16 (5) 14 (4) (-) 30 (9)
Payan (-) 25 (7) 2 (1) 27 (8)
Tangi Abazai 18 (5) 11 (3) (-) 29 (9)
Hisara Nehri 4 (1) 39 (12) (-) 43 (13)
Qumbati 1 (0.3) 23 (7) (-) 24 (7)
Total 110 (33) 216 (64) 10 (3) 336 (100)
Source: Field Data 2012-13
Market is a place where sellers and buyers can meet easily and negotiate with each other.
There are three types of market; local market, national market and international market.
The data in table 4.33 showed that 33 % respondents stated that their villages were 1-3
kilometers away from local market. The 64 % respondents reported that distance of
villages from local market was 4-6 kilometers and only 3 % respondents were 6-10
kilometers away from local market. It is concluded that distance from market is not big
issue.
Association between distance of village from local market with sugarcane
production
Table 4.34 showed the association between distance of local market from village and
sugarcane production. Highly significant association was observed between the two
variables (P. value = 0.000) while negative of Gamma value showed inverse association
between these two variables. It is because time and cost increase when sugarcane growers
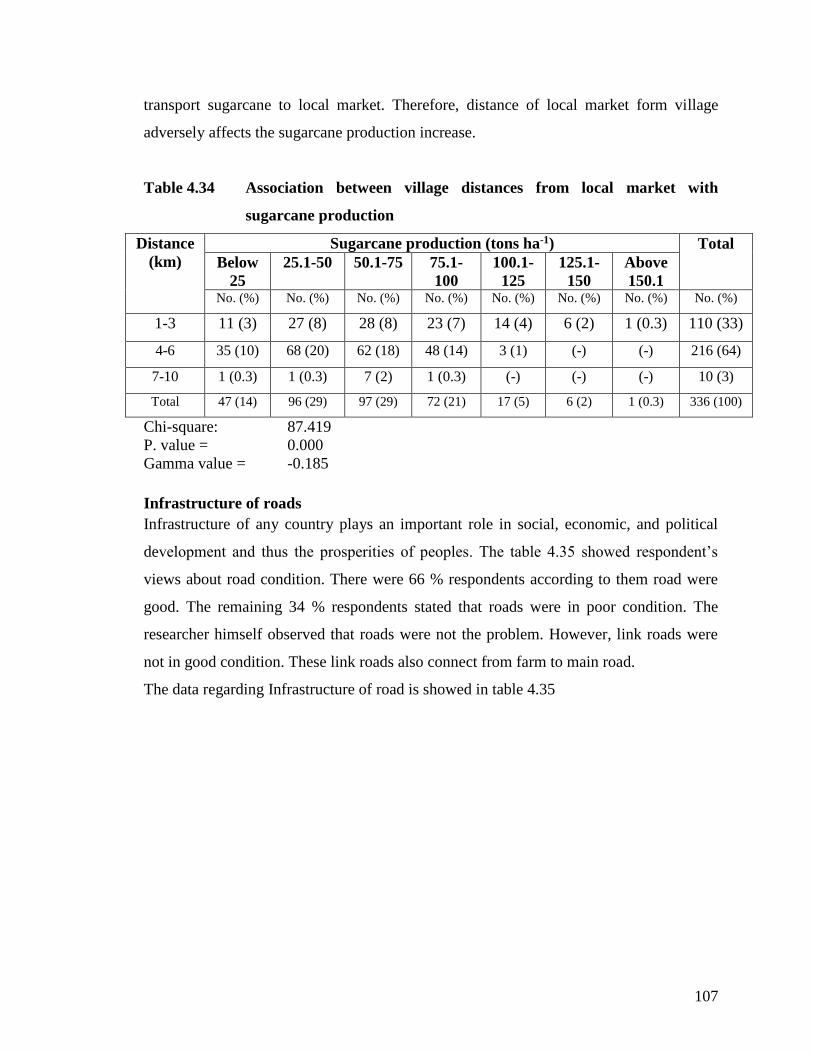
107
transport sugarcane to local market. Therefore, distance of local market form village
adversely affects the sugarcane production increase.
Table 4.34 Association between village distances from local market with
sugarcane production
Distance
(km)
Sugarcane production (tons ha-1) Total
Below
25
25.1-50 50.1-75 75.1-
100
100.1-
125
125.1-
150
Above
150.1 No. (%) No. (%) No. (%) No. (%) No. (%) No. (%) No. (%) No. (%)
1-3 11 (3) 27 (8) 28 (8) 23 (7) 14 (4) 6 (2) 1 (0.3) 110 (33)
4-6 35 (10) 68 (20) 62 (18) 48 (14) 3 (1) (-) (-) 216 (64)
7-10 1 (0.3) 1 (0.3) 7 (2) 1 (0.3) (-) (-) (-) 10 (3)
Total 47 (14) 96 (29) 97 (29) 72 (21) 17 (5) 6 (2) 1 (0.3) 336 (100)
Chi-square: 87.419
P. value = 0.000
Gamma value = -0.185
Infrastructure of roads
Infrastructure of any country plays an important role in social, economic, and political
development and thus the prosperities of peoples. The table 4.35 showed respondent’s
views about road condition. There were 66 % respondents according to them road were
good. The remaining 34 % respondents stated that roads were in poor condition. The
researcher himself observed that roads were not the problem. However, link roads were
not in good condition. These link roads also connect from farm to main road.
The data regarding Infrastructure of road is showed in table 4.35
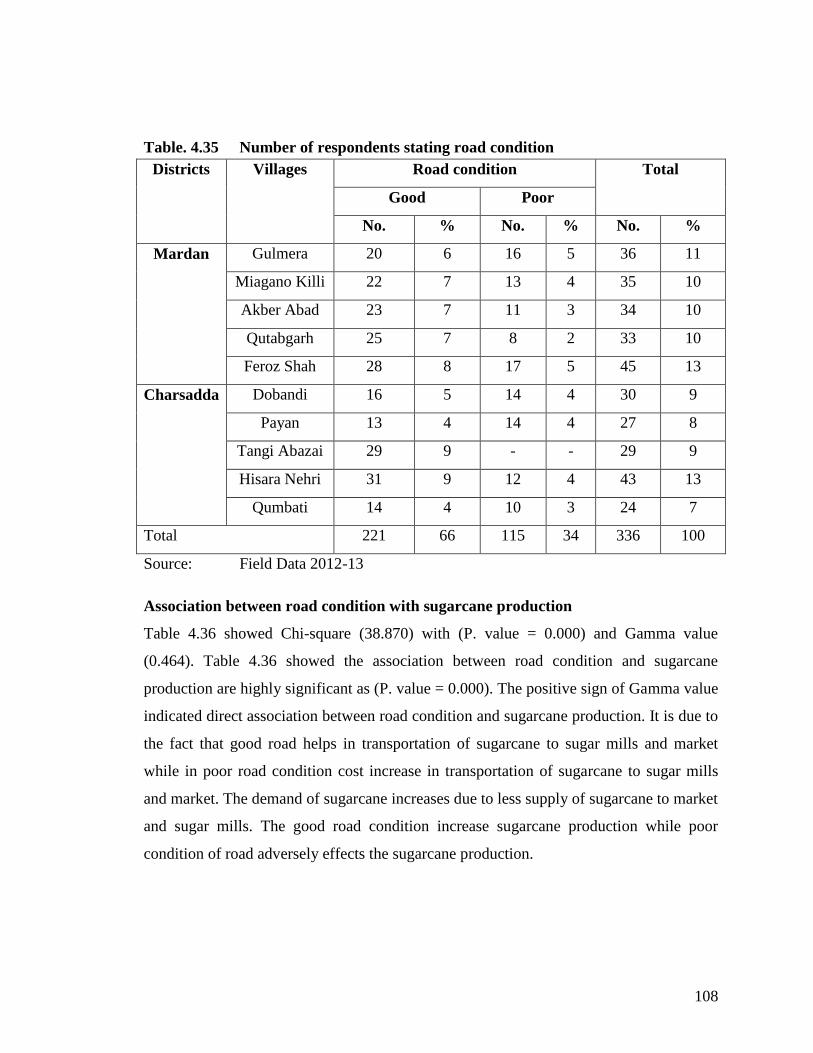
108
Table. 4.35 Number of respondents stating road condition
Districts Villages Road condition Total
Good Poor
No. % No. % No. %
Mardan Gulmera 20 6 16 5 36 11
Miagano Killi 22 7 13 4 35 10
Akber Abad 23 7 11 3 34 10
Qutabgarh 25 7 8 2 33 10
Feroz Shah 28 8 17 5 45 13
Charsadda Dobandi 16 5 14 4 30 9
Payan 13 4 14 4 27 8
Tangi Abazai 29 9 - - 29 9
Hisara Nehri 31 9 12 4 43 13
Qumbati 14 4 10 3 24 7
Total 221 66 115 34 336 100
Source: Field Data 2012-13
Association between road condition with sugarcane production
Table 4.36 showed Chi-square (38.870) with (P. value = 0.000) and Gamma value
(0.464). Table 4.36 showed the association between road condition and sugarcane
production are highly significant as (P. value = 0.000). The positive sign of Gamma value
indicated direct association between road condition and sugarcane production. It is due to
the fact that good road helps in transportation of sugarcane to sugar mills and market
while in poor road condition cost increase in transportation of sugarcane to sugar mills
and market. The demand of sugarcane increases due to less supply of sugarcane to market
and sugar mills. The good road condition increase sugarcane production while poor
condition of road adversely effects the sugarcane production.
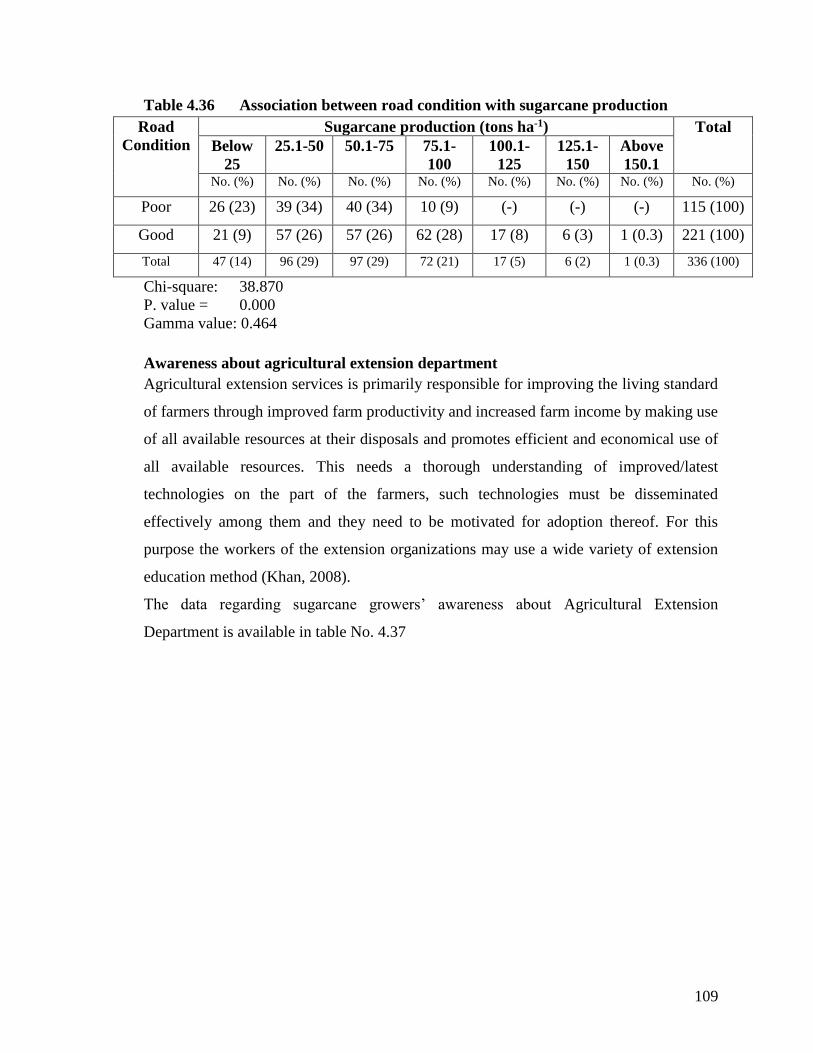
109
Table 4.36 Association between road condition with sugarcane production
Road
Condition
Sugarcane production (tons ha-1) Total
Below
25
25.1-50 50.1-75 75.1-
100
100.1-
125
125.1-
150
Above
150.1 No. (%) No. (%) No. (%) No. (%) No. (%) No. (%) No. (%) No. (%)
Poor 26 (23) 39 (34) 40 (34) 10 (9) (-) (-) (-) 115 (100)
Good 21 (9) 57 (26) 57 (26) 62 (28) 17 (8) 6 (3) 1 (0.3) 221 (100)
Total 47 (14) 96 (29) 97 (29) 72 (21) 17 (5) 6 (2) 1 (0.3) 336 (100)
Chi-square: 38.870
P. value = 0.000
Gamma value: 0.464
Awareness about agricultural extension department
Agricultural extension services is primarily responsible for improving the living standard
of farmers through improved farm productivity and increased farm income by making use
of all available resources at their disposals and promotes efficient and economical use of
all available resources. This needs a thorough understanding of improved/latest
technologies on the part of the farmers, such technologies must be disseminated
effectively among them and they need to be motivated for adoption thereof. For this
purpose the workers of the extension organizations may use a wide variety of extension
education method (Khan, 2008).
The data regarding sugarcane growers’ awareness about Agricultural Extension
Department is available in table No. 4.37
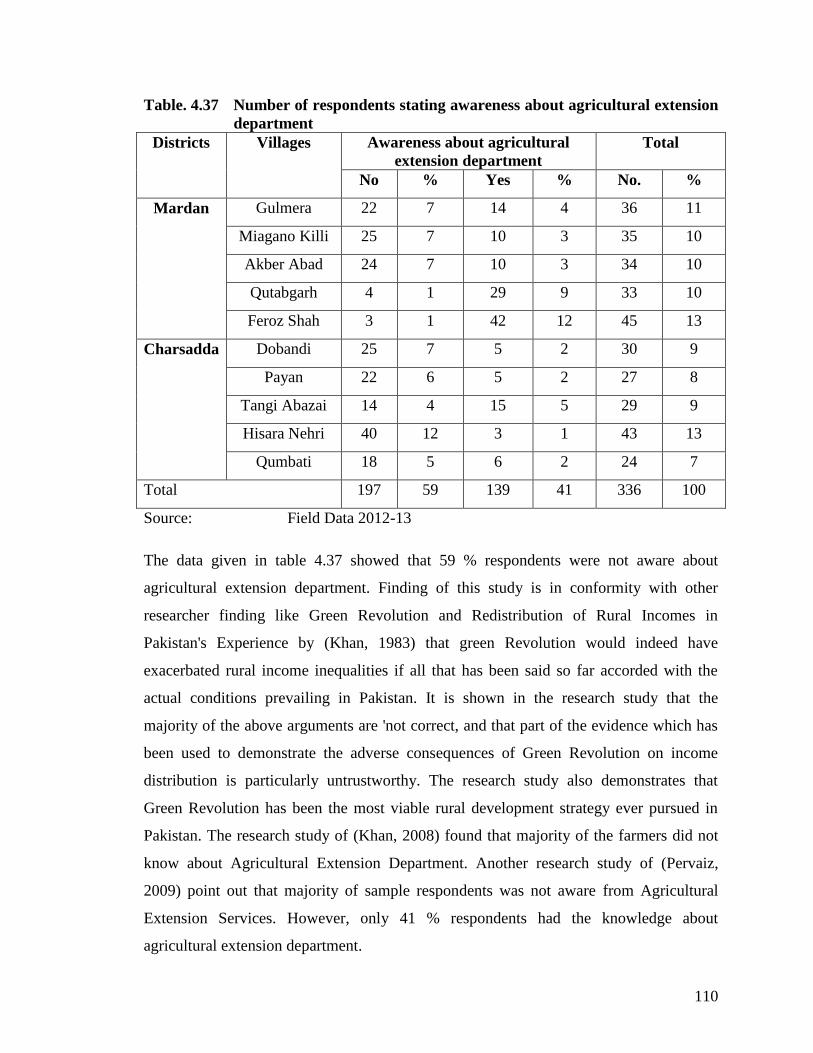
110
Table. 4.37 Number of respondents stating awareness about agricultural extension
department
Districts Villages Awareness about agricultural
extension department
Total
No % Yes % No. %
Mardan Gulmera 22 7 14 4 36 11
Miagano Killi 25 7 10 3 35 10
Akber Abad 24 7 10 3 34 10
Qutabgarh 4 1 29 9 33 10
Feroz Shah 3 1 42 12 45 13
Charsadda Dobandi 25 7 5 2 30 9
Payan 22 6 5 2 27 8
Tangi Abazai 14 4 15 5 29 9
Hisara Nehri 40 12 3 1 43 13
Qumbati 18 5 6 2 24 7
Total 197 59 139 41 336 100
Source: Field Data 2012-13
The data given in table 4.37 showed that 59 % respondents were not aware about
agricultural extension department. Finding of this study is in conformity with other
researcher finding like Green Revolution and Redistribution of Rural Incomes in
Pakistan's Experience by (Khan, 1983) that green Revolution would indeed have
exacerbated rural income inequalities if all that has been said so far accorded with the
actual conditions prevailing in Pakistan. It is shown in the research study that the
majority of the above arguments are 'not correct, and that part of the evidence which has
been used to demonstrate the adverse consequences of Green Revolution on income
distribution is particularly untrustworthy. The research study also demonstrates that
Green Revolution has been the most viable rural development strategy ever pursued in
Pakistan. The research study of (Khan, 2008) found that majority of the farmers did not
know about Agricultural Extension Department. Another research study of (Pervaiz,
2009) point out that majority of sample respondents was not aware from Agricultural
Extension Services. However, only 41 % respondents had the knowledge about
agricultural extension department.
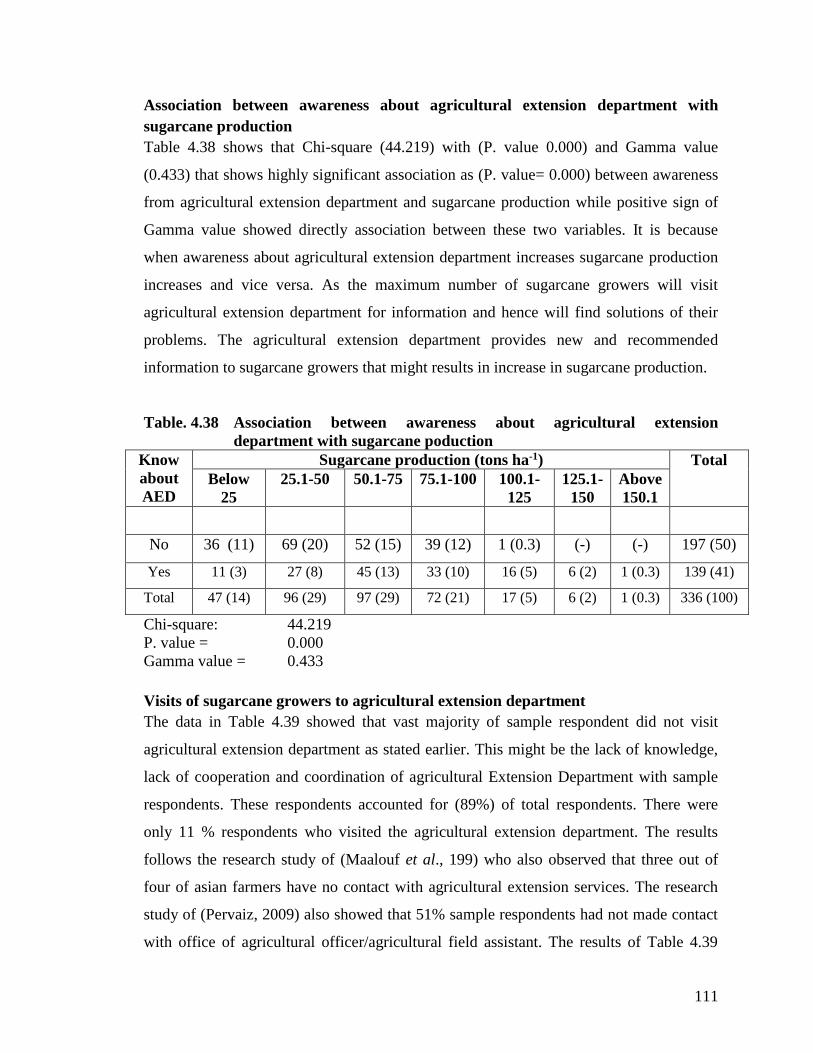
111
Association between awareness about agricultural extension department with
sugarcane production
Table 4.38 shows that Chi-square (44.219) with (P. value 0.000) and Gamma value
(0.433) that shows highly significant association as (P. value= 0.000) between awareness
from agricultural extension department and sugarcane production while positive sign of
Gamma value showed directly association between these two variables. It is because
when awareness about agricultural extension department increases sugarcane production
increases and vice versa. As the maximum number of sugarcane growers will visit
agricultural extension department for information and hence will find solutions of their
problems. The agricultural extension department provides new and recommended
information to sugarcane growers that might results in increase in sugarcane production.
Table. 4.38 Association between awareness about agricultural extension
department with sugarcane poduction
Know
about
AED
Sugarcane production (tons ha-1) Total
Below
25
25.1-50 50.1-75 75.1-100 100.1-
125
125.1-
150
Above
150.1
No 36 (11) 69 (20) 52 (15) 39 (12) 1 (0.3) (-) (-) 197 (50)
Yes 11 (3) 27 (8) 45 (13) 33 (10) 16 (5) 6 (2) 1 (0.3) 139 (41)
Total 47 (14) 96 (29) 97 (29) 72 (21) 17 (5) 6 (2) 1 (0.3) 336 (100)
Chi-square: 44.219
P. value = 0.000
Gamma value = 0.433
Visits of sugarcane growers to agricultural extension department
The data in Table 4.39 showed that vast majority of sample respondent did not visit
agricultural extension department as stated earlier. This might be the lack of knowledge,
lack of cooperation and coordination of agricultural Extension Department with sample
respondents. These respondents accounted for (89%) of total respondents. There were
only 11 % respondents who visited the agricultural extension department. The results
follows the research study of (Maalouf et al., 199) who also observed that three out of
four of asian farmers have no contact with agricultural extension services. The research
study of (Pervaiz, 2009) also showed that 51% sample respondents had not made contact
with office of agricultural officer/agricultural field assistant. The results of Table 4.39
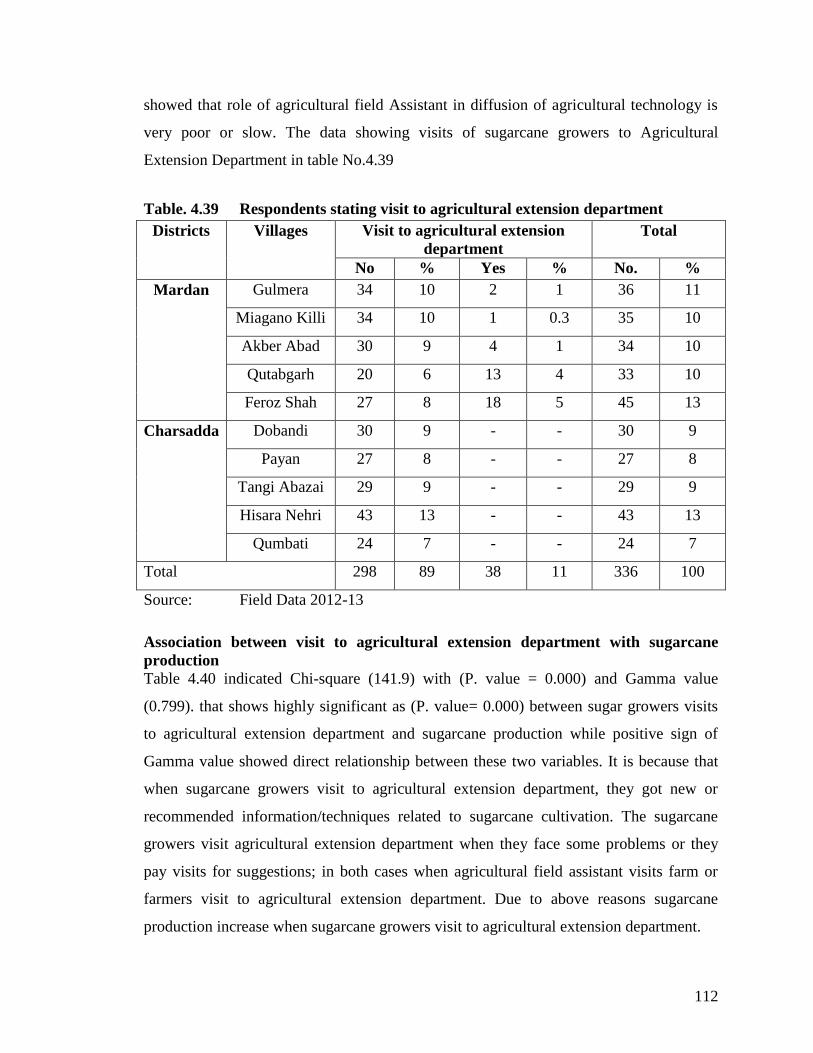
112
showed that role of agricultural field Assistant in diffusion of agricultural technology is
very poor or slow. The data showing visits of sugarcane growers to Agricultural
Extension Department in table No.4.39
Table. 4.39 Respondents stating visit to agricultural extension department
Districts Villages Visit to agricultural extension
department
Total
No % Yes % No. %
Mardan Gulmera 34 10 2 1 36 11
Miagano Killi 34 10 1 0.3 35 10
Akber Abad 30 9 4 1 34 10
Qutabgarh 20 6 13 4 33 10
Feroz Shah 27 8 18 5 45 13
Charsadda Dobandi 30 9 - - 30 9
Payan 27 8 - - 27 8
Tangi Abazai 29 9 - - 29 9
Hisara Nehri 43 13 - - 43 13
Qumbati 24 7 - - 24 7
Total 298 89 38 11 336 100
Source: Field Data 2012-13
Association between visit to agricultural extension department with sugarcane
production
Table 4.40 indicated Chi-square (141.9) with (P. value = 0.000) and Gamma value
(0.799). that shows highly significant as (P. value= 0.000) between sugar growers visits
to agricultural extension department and sugarcane production while positive sign of
Gamma value showed direct relationship between these two variables. It is because that
when sugarcane growers visit to agricultural extension department, they got new or
recommended information/techniques related to sugarcane cultivation. The sugarcane
growers visit agricultural extension department when they face some problems or they
pay visits for suggestions; in both cases when agricultural field assistant visits farm or
farmers visit to agricultural extension department. Due to above reasons sugarcane
production increase when sugarcane growers visit to agricultural extension department.
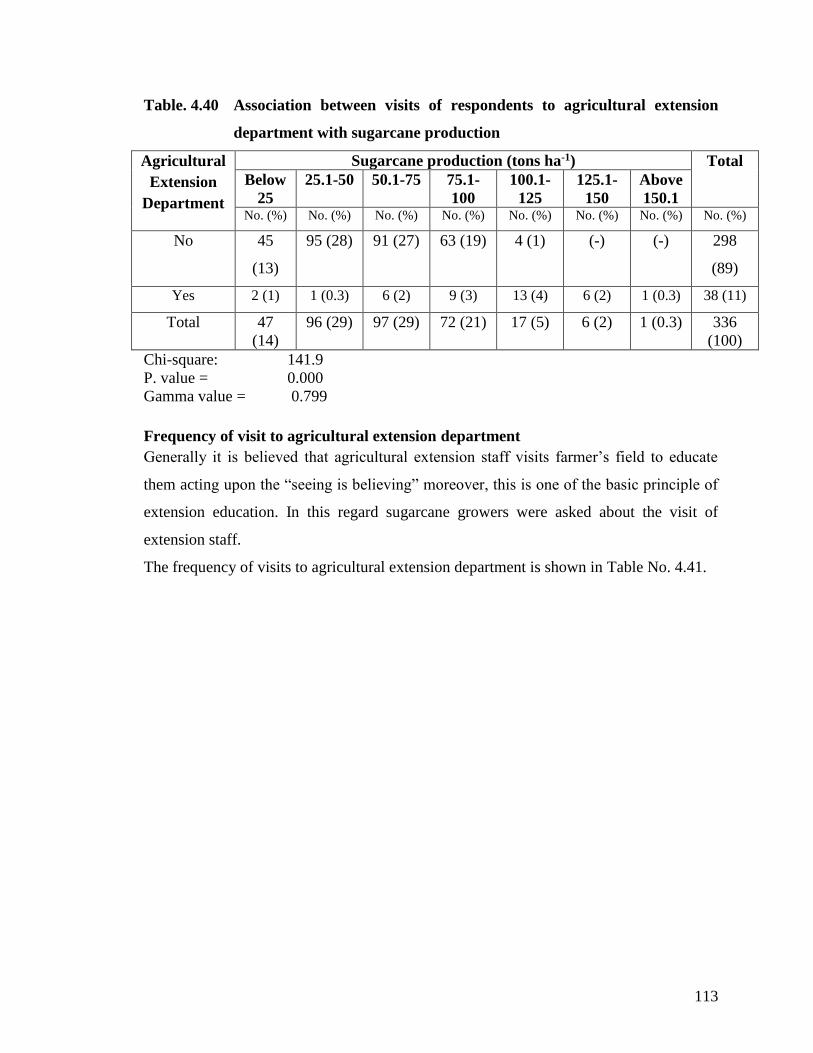
113
Table. 4.40 Association between visits of respondents to agricultural extension
department with sugarcane production
Agricultural
Extension
Department
Sugarcane production (tons ha-1) Total
Below
25
25.1-50 50.1-75 75.1-
100
100.1-
125
125.1-
150
Above
150.1 No. (%) No. (%) No. (%) No. (%) No. (%) No. (%) No. (%) No. (%)
No 45
(13)
95 (28) 91 (27) 63 (19) 4 (1) (-) (-) 298
(89)
Yes 2 (1) 1 (0.3) 6 (2) 9 (3) 13 (4) 6 (2) 1 (0.3) 38 (11)
Total 47
(14)
96 (29) 97 (29) 72 (21) 17 (5) 6 (2) 1 (0.3) 336
(100)
Chi-square: 141.9
P. value = 0.000
Gamma value = 0.799
Frequency of visit to agricultural extension department
Generally it is believed that agricultural extension staff visits farmer’s field to educate
them acting upon the “seeing is believing” moreover, this is one of the basic principle of
extension education. In this regard sugarcane growers were asked about the visit of
extension staff.
The frequency of visits to agricultural extension department is shown in Table No. 4.41.
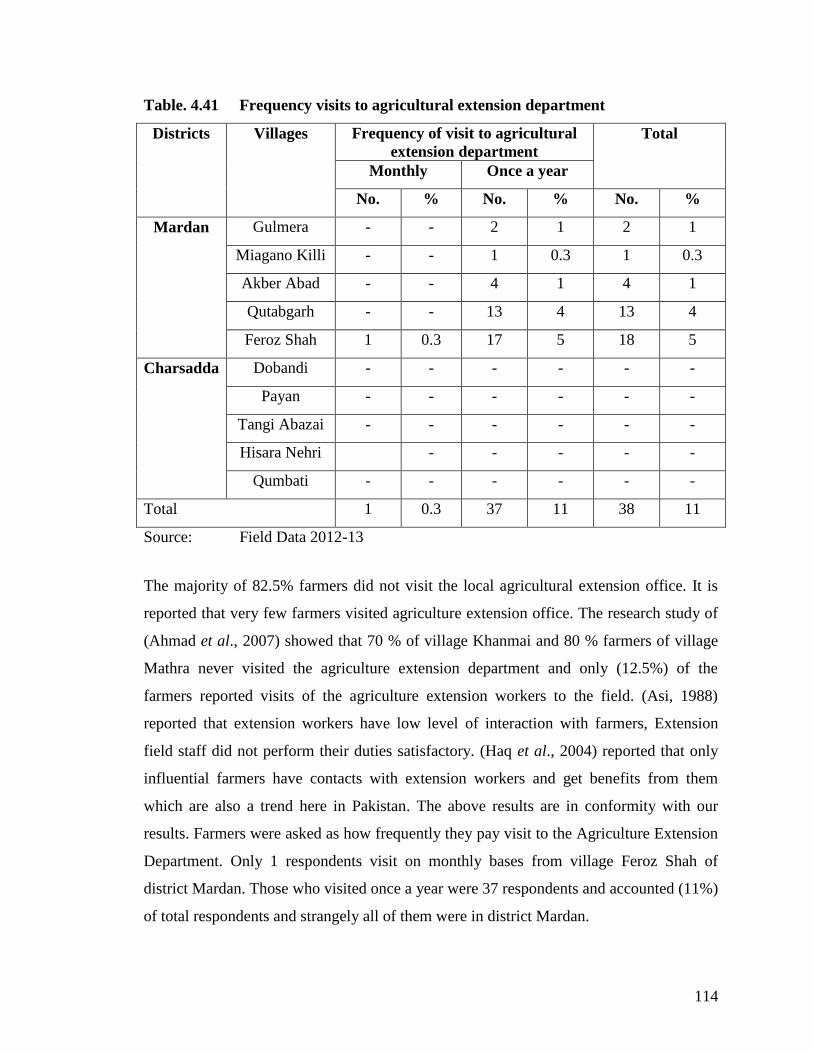
114
Table. 4.41 Frequency visits to agricultural extension department
Districts Villages Frequency of visit to agricultural
extension department
Total
Monthly Once a year
No. % No. % No. %
Mardan Gulmera - - 2 1 2 1
Miagano Killi - - 1 0.3 1 0.3
Akber Abad - - 4 1 4 1
Qutabgarh - - 13 4 13 4
Feroz Shah 1 0.3 17 5 18 5
Charsadda Dobandi - - - - - -
Payan - - - - - -
Tangi Abazai - - - - - -
Hisara Nehri - - - - -
Qumbati - - - - - -
Total 1 0.3 37 11 38 11
Source: Field Data 2012-13
The majority of 82.5% farmers did not visit the local agricultural extension office. It is
reported that very few farmers visited agriculture extension office. The research study of
(Ahmad et al., 2007) showed that 70 % of village Khanmai and 80 % farmers of village
Mathra never visited the agriculture extension department and only (12.5%) of the
farmers reported visits of the agriculture extension workers to the field. (Asi, 1988)
reported that extension workers have low level of interaction with farmers, Extension
field staff did not perform their duties satisfactory. (Haq et al., 2004) reported that only
influential farmers have contacts with extension workers and get benefits from them
which are also a trend here in Pakistan. The above results are in conformity with our
results. Farmers were asked as how frequently they pay visit to the Agriculture Extension
Department. Only 1 respondents visit on monthly bases from village Feroz Shah of
district Mardan. Those who visited once a year were 37 respondents and accounted (11%)
of total respondents and strangely all of them were in district Mardan.
115
The results of the research study of (Perviaz, 2009) showed that 70 % out of total
respondents observed occasional visit of extension staff to their field. It is further showed
that none of respondent receives the visit of agricultural field assistant to their field.
These results of the research study confirm the results of the Table 4.41.
Distance of agricultural extension department from respondents residence
The data given in Table 4.42 showed that maximum (61 %) respondents were not aware
about agricultural extension department where 24 % respondents from district Mardan
and 37 % respondents were from district Charsadda. There were 13% respondents who
reported that agricultural extension department was at the distance of less than 5
kilometers from their villages. The 17 % respondents reported the distance of more than
10 kilometers from their locations. However, the remaining 5 % respondents of total
respondents told that agriculture extension department is 10 kilometers away from their
village. The farmer’s responses regarding the distance of Agricultural Extension
Department are present in table No. 4.42.
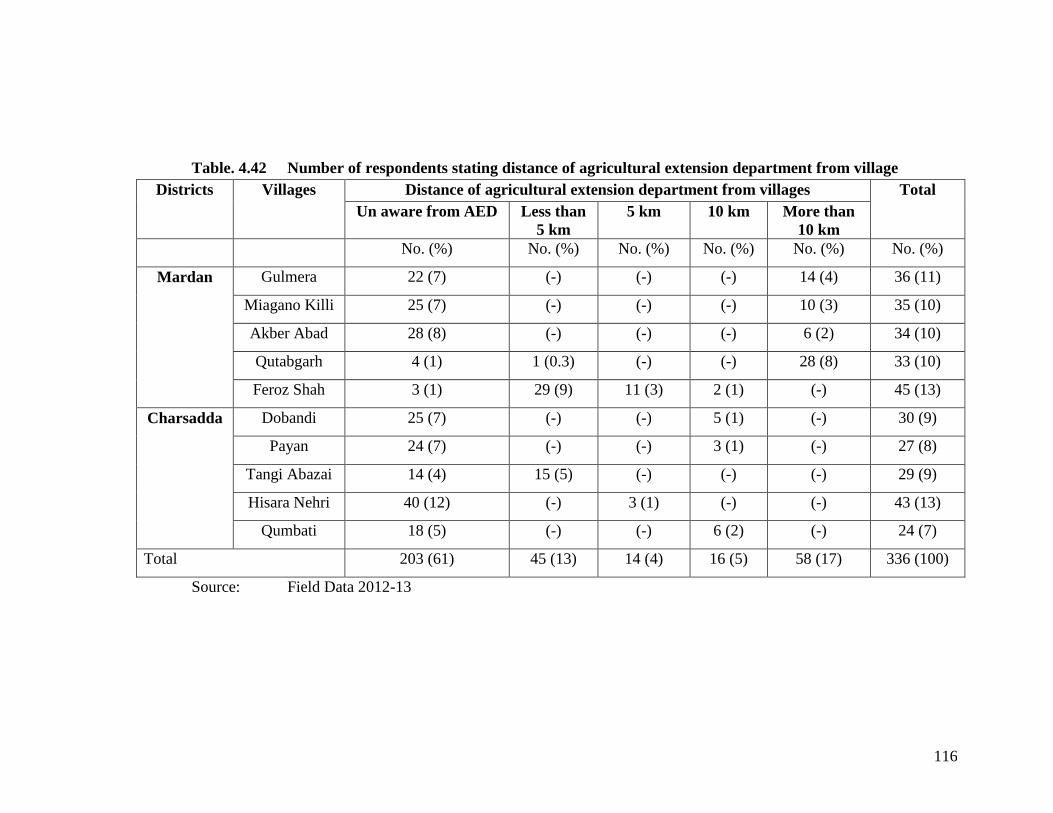
116
Table. 4.42 Number of respondents stating distance of agricultural extension department from village
Districts Villages Distance of agricultural extension department from villages Total
Un aware from AED Less than
5 km
5 km 10 km More than
10 km
No. (%) No. (%) No. (%) No. (%) No. (%) No. (%)
Mardan Gulmera 22 (7) (-) (-) (-) 14 (4) 36 (11)
Miagano Killi 25 (7) (-) (-) (-) 10 (3) 35 (10)
Akber Abad 28 (8) (-) (-) (-) 6 (2) 34 (10)
Qutabgarh 4 (1) 1 (0.3) (-) (-) 28 (8) 33 (10)
Feroz Shah 3 (1) 29 (9) 11 (3) 2 (1) (-) 45 (13)
Charsadda Dobandi 25 (7) (-) (-) 5 (1) (-) 30 (9)
Payan 24 (7) (-) (-) 3 (1) (-) 27 (8)
Tangi Abazai 14 (4) 15 (5) (-) (-) (-) 29 (9)
Hisara Nehri 40 (12) (-) 3 (1) (-) (-) 43 (13)
Qumbati 18 (5) (-) (-) 6 (2) (-) 24 (7)
Total 203 (61) 45 (13) 14 (4) 16 (5) 58 (17) 336 (100)
Source: Field Data 2012-13
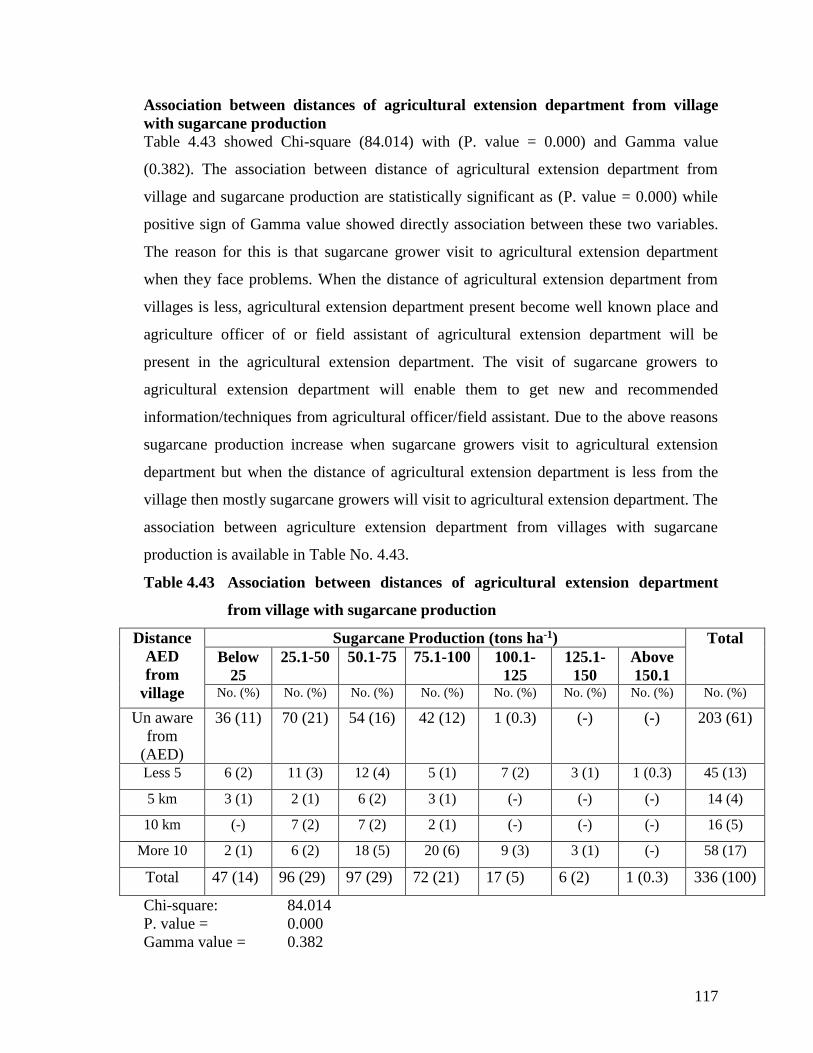
117
Association between distances of agricultural extension department from village
with sugarcane production
Table 4.43 showed Chi-square (84.014) with (P. value = 0.000) and Gamma value
(0.382). The association between distance of agricultural extension department from
village and sugarcane production are statistically significant as (P. value = 0.000) while
positive sign of Gamma value showed directly association between these two variables.
The reason for this is that sugarcane grower visit to agricultural extension department
when they face problems. When the distance of agricultural extension department from
villages is less, agricultural extension department present become well known place and
agriculture officer of or field assistant of agricultural extension department will be
present in the agricultural extension department. The visit of sugarcane growers to
agricultural extension department will enable them to get new and recommended
information/techniques from agricultural officer/field assistant. Due to the above reasons
sugarcane production increase when sugarcane growers visit to agricultural extension
department but when the distance of agricultural extension department is less from the
village then mostly sugarcane growers will visit to agricultural extension department. The
association between agriculture extension department from villages with sugarcane
production is available in Table No. 4.43.
Table 4.43 Association between distances of agricultural extension department
from village with sugarcane production
Distance
AED
from
village
Sugarcane Production (tons ha-1) Total
Below
25
25.1-50 50.1-75 75.1-100 100.1-
125
125.1-
150
Above
150.1 No. (%) No. (%) No. (%) No. (%) No. (%) No. (%) No. (%) No. (%)
Un aware
from
(AED)
36 (11) 70 (21) 54 (16) 42 (12) 1 (0.3) (-) (-) 203 (61)
Less 5 6 (2) 11 (3) 12 (4) 5 (1) 7 (2) 3 (1) 1 (0.3) 45 (13)
5 km 3 (1) 2 (1) 6 (2) 3 (1) (-) (-) (-) 14 (4)
10 km (-) 7 (2) 7 (2) 2 (1) (-) (-) (-) 16 (5)
More 10 2 (1) 6 (2) 18 (5) 20 (6) 9 (3) 3 (1) (-) 58 (17)
Total 47 (14) 96 (29) 97 (29) 72 (21) 17 (5) 6 (2) 1 (0.3) 336 (100)
Chi-square: 84.014
P. value = 0.000
Gamma value = 0.382
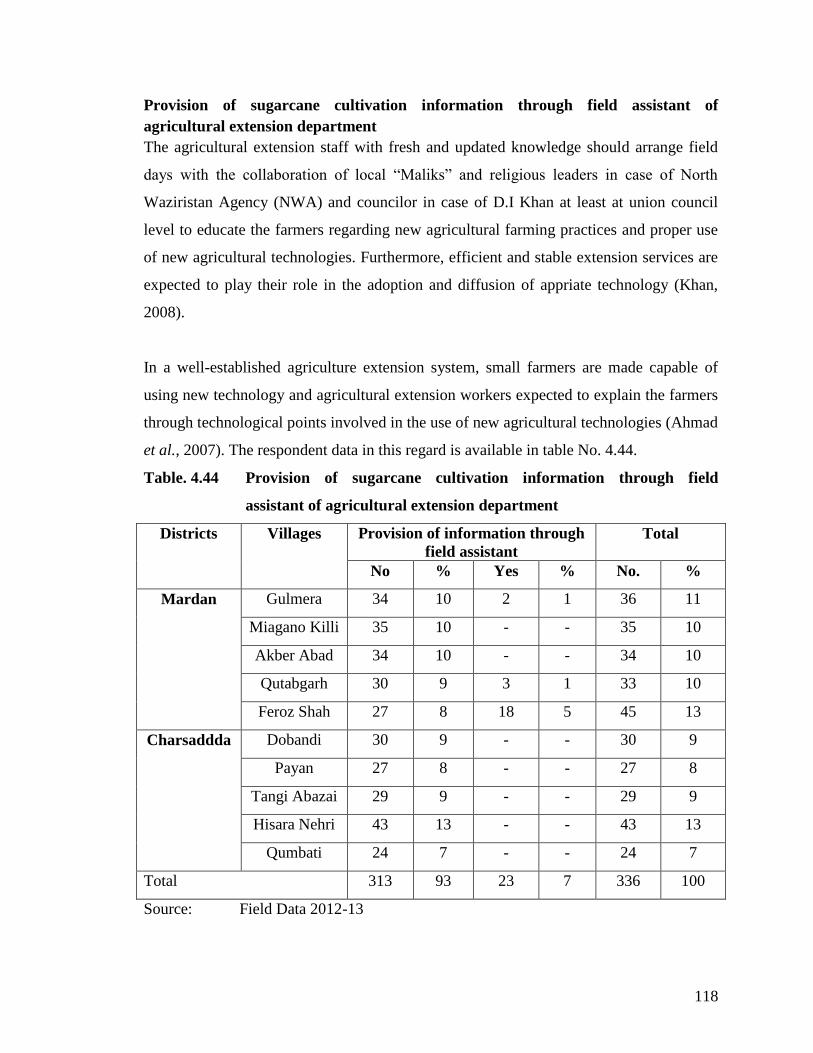
118
Provision of sugarcane cultivation information through field assistant of
agricultural extension department
The agricultural extension staff with fresh and updated knowledge should arrange field
days with the collaboration of local “Maliks” and religious leaders in case of North
Waziristan Agency (NWA) and councilor in case of D.I Khan at least at union council
level to educate the farmers regarding new agricultural farming practices and proper use
of new agricultural technologies. Furthermore, efficient and stable extension services are
expected to play their role in the adoption and diffusion of appriate technology (Khan,
2008).
In a well-established agriculture extension system, small farmers are made capable of
using new technology and agricultural extension workers expected to explain the farmers
through technological points involved in the use of new agricultural technologies (Ahmad
et al., 2007). The respondent data in this regard is available in table No. 4.44.
Table. 4.44 Provision of sugarcane cultivation information through field
assistant of agricultural extension department
Districts Villages Provision of information through
field assistant
Total
No % Yes % No. %
Mardan Gulmera 34 10 2 1 36 11
Miagano Killi 35 10 - - 35 10
Akber Abad 34 10 - - 34 10
Qutabgarh 30 9 3 1 33 10
Feroz Shah 27 8 18 5 45 13
Charsaddda Dobandi 30 9 - - 30 9
Payan 27 8 - - 27 8
Tangi Abazai 29 9 - - 29 9
Hisara Nehri 43 13 - - 43 13
Qumbati 24 7 - - 24 7
Total 313 93 23 7 336 100
Source: Field Data 2012-13
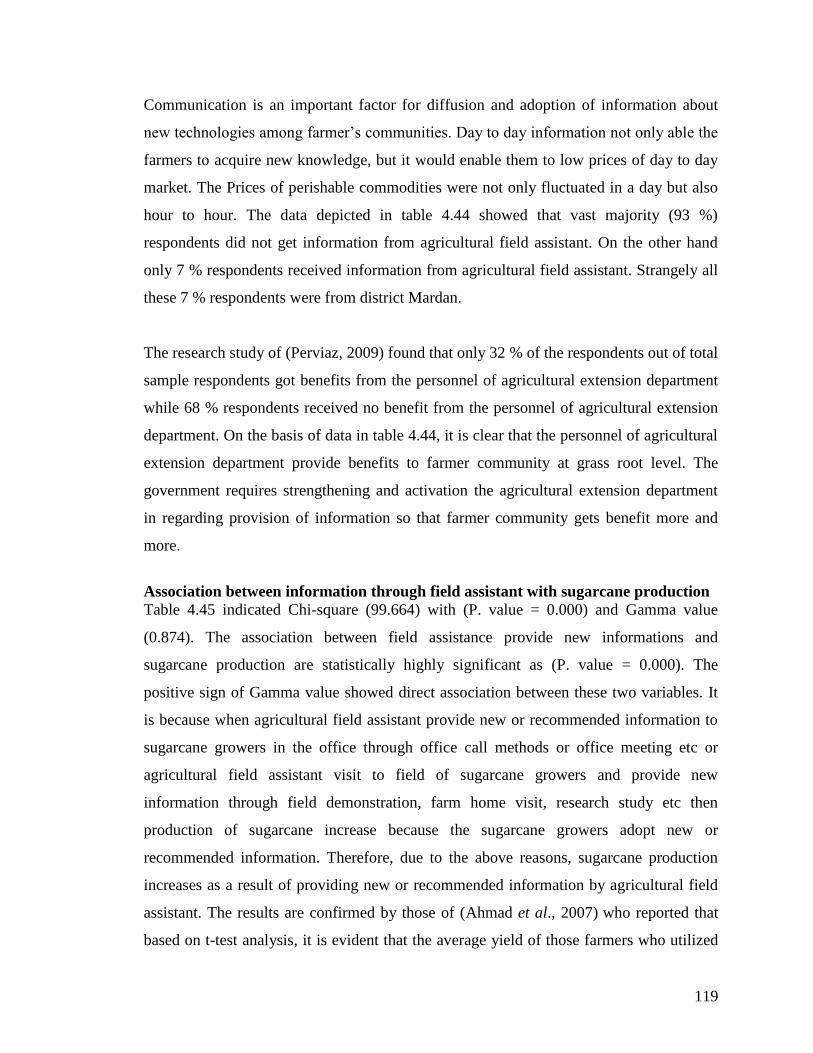
119
Communication is an important factor for diffusion and adoption of information about
new technologies among farmer’s communities. Day to day information not only able the
farmers to acquire new knowledge, but it would enable them to low prices of day to day
market. The Prices of perishable commodities were not only fluctuated in a day but also
hour to hour. The data depicted in table 4.44 showed that vast majority (93 %)
respondents did not get information from agricultural field assistant. On the other hand
only 7 % respondents received information from agricultural field assistant. Strangely all
these 7 % respondents were from district Mardan.
The research study of (Perviaz, 2009) found that only 32 % of the respondents out of total
sample respondents got benefits from the personnel of agricultural extension department
while 68 % respondents received no benefit from the personnel of agricultural extension
department. On the basis of data in table 4.44, it is clear that the personnel of agricultural
extension department provide benefits to farmer community at grass root level. The
government requires strengthening and activation the agricultural extension department
in regarding provision of information so that farmer community gets benefit more and
more.
Association between information through field assistant with sugarcane production
Table 4.45 indicated Chi-square (99.664) with (P. value = 0.000) and Gamma value
(0.874). The association between field assistance provide new informations and
sugarcane production are statistically highly significant as (P. value = 0.000). The
positive sign of Gamma value showed direct association between these two variables. It
is because when agricultural field assistant provide new or recommended information to
sugarcane growers in the office through office call methods or office meeting etc or
agricultural field assistant visit to field of sugarcane growers and provide new
information through field demonstration, farm home visit, research study etc then
production of sugarcane increase because the sugarcane growers adopt new or
recommended information. Therefore, due to the above reasons, sugarcane production
increases as a result of providing new or recommended information by agricultural field
assistant. The results are confirmed by those of (Ahmad et al., 2007) who reported that
based on t-test analysis, it is evident that the average yield of those farmers who utilized
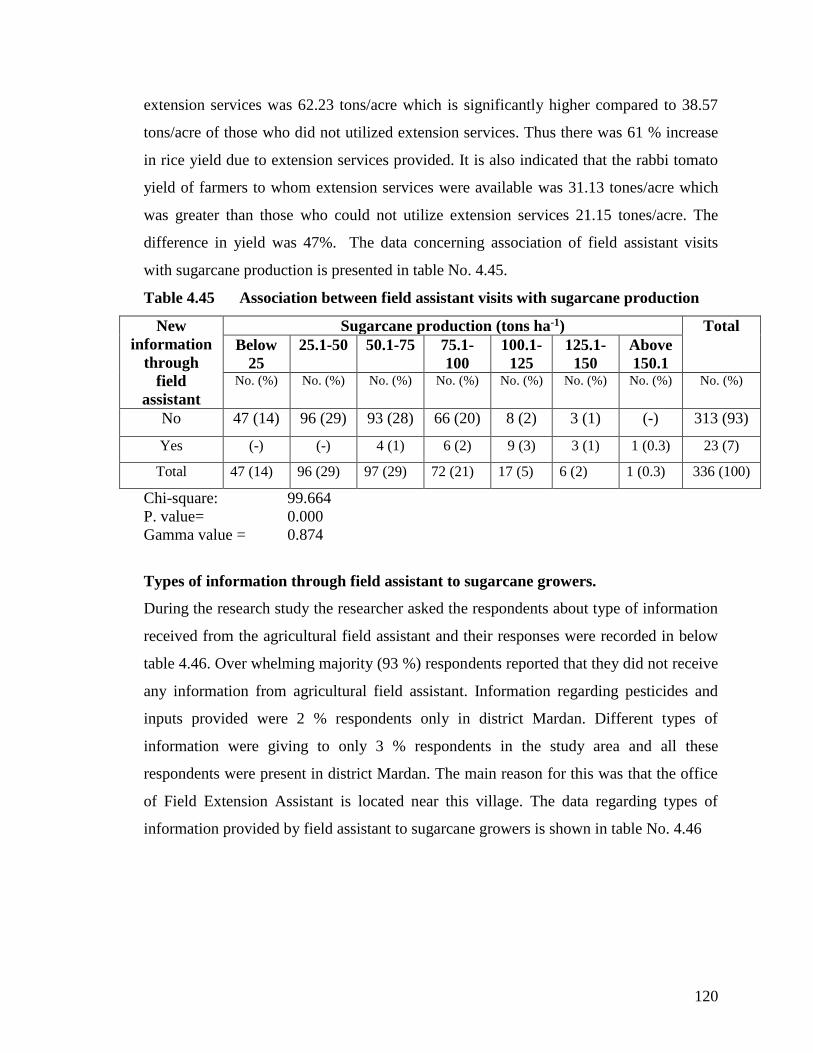
120
extension services was 62.23 tons/acre which is significantly higher compared to 38.57
tons/acre of those who did not utilized extension services. Thus there was 61 % increase
in rice yield due to extension services provided. It is also indicated that the rabbi tomato
yield of farmers to whom extension services were available was 31.13 tones/acre which
was greater than those who could not utilize extension services 21.15 tones/acre. The
difference in yield was 47%. The data concerning association of field assistant visits
with sugarcane production is presented in table No. 4.45.
Table 4.45 Association between field assistant visits with sugarcane production
New
information
through
field
assistant
Sugarcane production (tons ha-1) Total
Below
25
25.1-50 50.1-75 75.1-
100
100.1-
125
125.1-
150
Above
150.1 No. (%) No. (%) No. (%) No. (%) No. (%) No. (%) No. (%) No. (%)
No 47 (14) 96 (29) 93 (28) 66 (20) 8 (2) 3 (1) (-) 313 (93)
Yes (-) (-) 4 (1) 6 (2) 9 (3) 3 (1) 1 (0.3) 23 (7)
Total 47 (14) 96 (29) 97 (29) 72 (21) 17 (5) 6 (2) 1 (0.3) 336 (100)
Chi-square: 99.664
P. value= 0.000
Gamma value = 0.874
Types of information through field assistant to sugarcane growers.
During the research study the researcher asked the respondents about type of information
received from the agricultural field assistant and their responses were recorded in below
table 4.46. Over whelming majority (93 %) respondents reported that they did not receive
any information from agricultural field assistant. Information regarding pesticides and
inputs provided were 2 % respondents only in district Mardan. Different types of
information were giving to only 3 % respondents in the study area and all these
respondents were present in district Mardan. The main reason for this was that the office
of Field Extension Assistant is located near this village. The data regarding types of
information provided by field assistant to sugarcane growers is shown in table No. 4.46
121
Table. 4.46 Types of information through field assistant
Districts Villages Information provide through field
assistant
Total
No
information
About
pesticides
About
input
More
than
one
No. (%) No. (%) No. (%) No.
(%)
No. (%)
Mardan Gulmera 34 (11) (-) (-) (-) 36 (11)
Miagano Killi 35 (10) (-) (-) (-) 35 (10)
Akber Abad 34 (10) (-) (-) (-) 34 (10)
Qutabgarh 30 (9) 3 (1) (-) (-) 33 (10)
Feroz Shah 27 (8) 5 (1) 6 (2) 9 (3) 45 (13)
Charsadda Dobandi 30 (9) (-) (-) (-) 30 (9)
Payan 27 (8) (-) (-) (-) 27 (8)
Tangi Abazai 29 (9) (-) (-) (-) 29 (9)
Hisara Nehri 43 (13) (-) (-) (-) 43 (13)
Qumbati 24 (7) (-) (-) (-) 24 (7)
Total 313 (93) 8 (2) 6 (2) 9 (3) 336 (100)
Source: Field Data 2012-13
Methods /Techniques of information used by field assistant
The daily casual meetings are beneficial and main source of developing relationship
between extension agents and farmers. Though excess of anything is bad and one proverb
is quoted to support the statement “The constant guest is never welcomed”. Therefore,
farmers are expected to visit agricultural office with a specific objective and at a
convenient time. The data concerning various methods and techniques used by field
assistant to sugarcane growers is available in table No. 4.47.
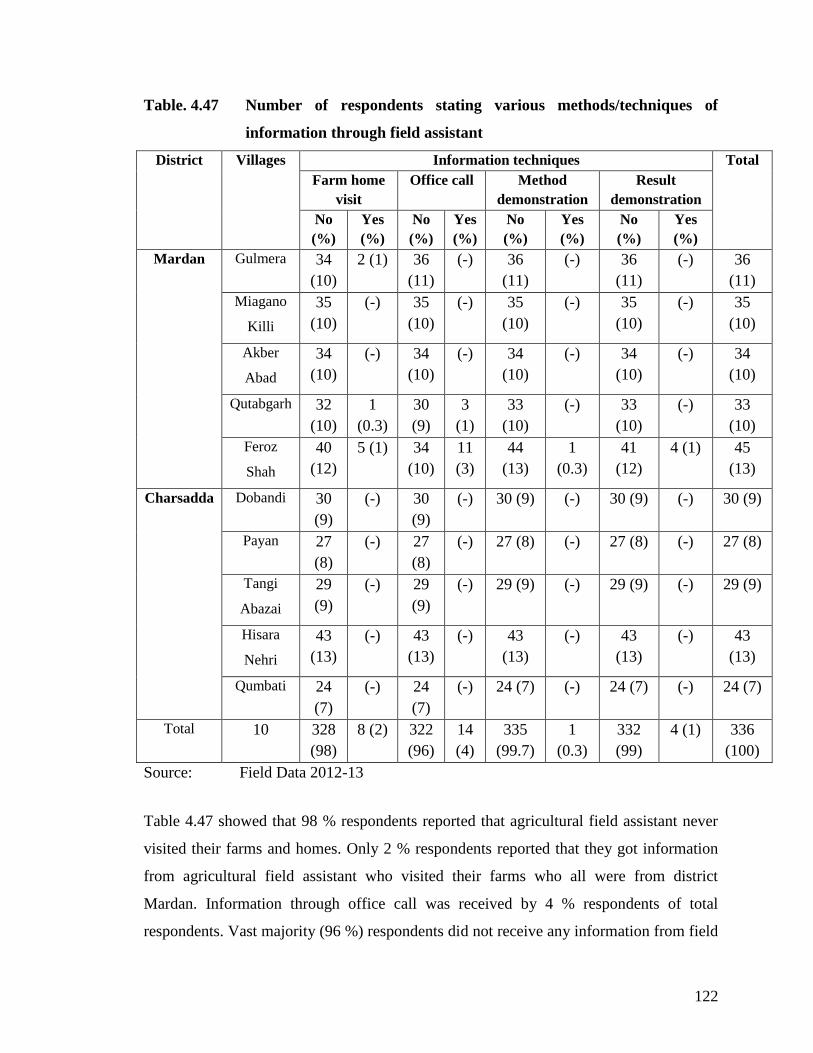
122
Table. 4.47 Number of respondents stating various methods/techniques of
information through field assistant
District Villages Information techniques Total
Farm home
visit
Office call Method
demonstration
Result
demonstration
No
(%)
Yes
(%)
No
(%)
Yes
(%)
No
(%)
Yes
(%)
No
(%)
Yes
(%)
Mardan Gulmera 34
(10)
2 (1) 36
(11)
(-) 36
(11)
(-) 36
(11)
(-) 36
(11)
Miagano
Killi
35
(10)
(-) 35
(10)
(-) 35
(10)
(-) 35
(10)
(-) 35
(10)
Akber
Abad
34
(10)
(-) 34
(10)
(-) 34
(10)
(-) 34
(10)
(-) 34
(10)
Qutabgarh 32
(10)
1
(0.3)
30
(9)
3
(1)
33
(10)
(-) 33
(10)
(-) 33
(10)
Feroz
Shah
40
(12)
5 (1) 34
(10)
11
(3)
44
(13)
1
(0.3)
41
(12)
4 (1) 45
(13)
Charsadda Dobandi 30
(9)
(-) 30
(9)
(-) 30 (9) (-) 30 (9) (-) 30 (9)
Payan 27
(8)
(-) 27
(8)
(-) 27 (8) (-) 27 (8) (-) 27 (8)
Tangi
Abazai
29
(9)
(-) 29
(9)
(-) 29 (9) (-) 29 (9) (-) 29 (9)
Hisara
Nehri
43
(13)
(-) 43
(13)
(-) 43
(13)
(-) 43
(13)
(-) 43
(13)
Qumbati 24
(7)
(-) 24
(7)
(-) 24 (7) (-) 24 (7) (-) 24 (7)
Total 10 328
(98)
8 (2) 322
(96)
14
(4)
335
(99.7)
1
(0.3)
332
(99)
4 (1) 336
(100)
Source: Field Data 2012-13
Table 4.47 showed that 98 % respondents reported that agricultural field assistant never
visited their farms and homes. Only 2 % respondents reported that they got information
from agricultural field assistant who visited their farms who all were from district
Mardan. Information through office call was received by 4 % respondents of total
respondents. Vast majority (96 %) respondents did not receive any information from field
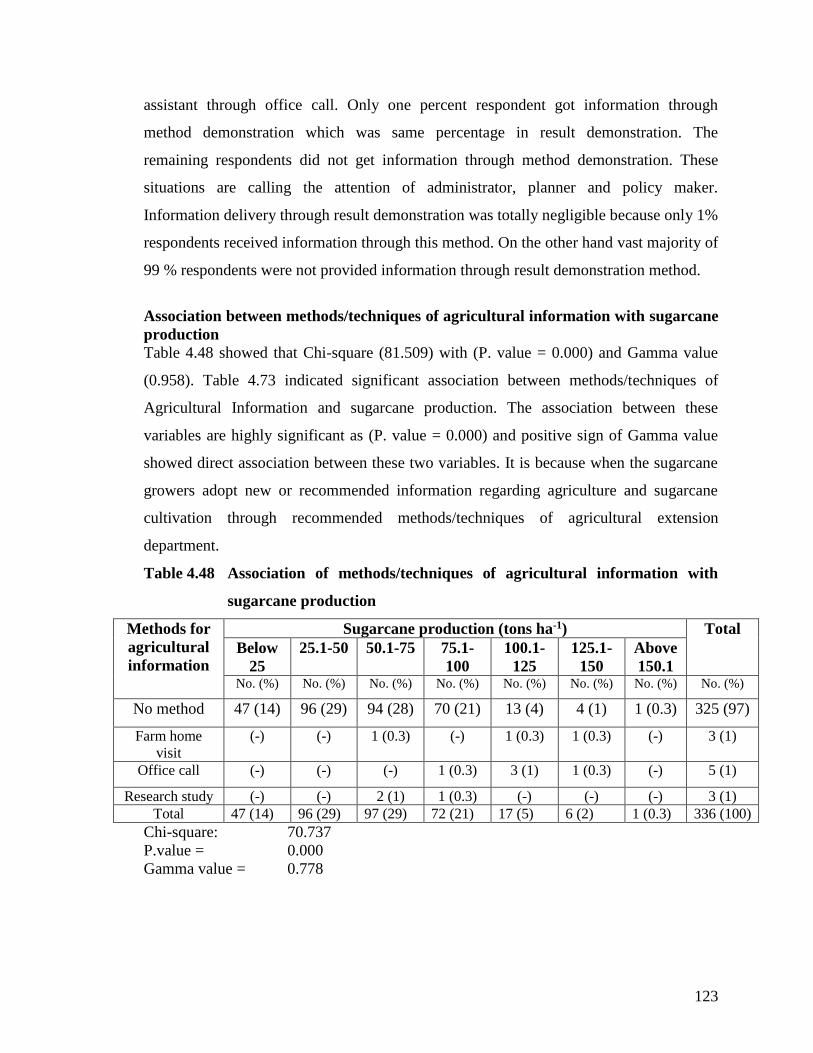
123
assistant through office call. Only one percent respondent got information through
method demonstration which was same percentage in result demonstration. The
remaining respondents did not get information through method demonstration. These
situations are calling the attention of administrator, planner and policy maker.
Information delivery through result demonstration was totally negligible because only 1%
respondents received information through this method. On the other hand vast majority of
99 % respondents were not provided information through result demonstration method.
Association between methods/techniques of agricultural information with sugarcane
production
Table 4.48 showed that Chi-square (81.509) with (P. value = 0.000) and Gamma value
(0.958). Table 4.73 indicated significant association between methods/techniques of
Agricultural Information and sugarcane production. The association between these
variables are highly significant as (P. value = 0.000) and positive sign of Gamma value
showed direct association between these two variables. It is because when the sugarcane
growers adopt new or recommended information regarding agriculture and sugarcane
cultivation through recommended methods/techniques of agricultural extension
department.
Table 4.48 Association of methods/techniques of agricultural information with
sugarcane production
Methods for
agricultural
information
Sugarcane production (tons ha-1) Total
Below
25
25.1-50 50.1-75 75.1-
100
100.1-
125
125.1-
150
Above
150.1 No. (%) No. (%) No. (%) No. (%) No. (%) No. (%) No. (%) No. (%)
No method 47 (14) 96 (29) 94 (28) 70 (21) 13 (4) 4 (1) 1 (0.3) 325 (97)
Farm home
visit
(-) (-) 1 (0.3) (-) 1 (0.3) 1 (0.3) (-) 3 (1)
Office call (-) (-) (-) 1 (0.3) 3 (1) 1 (0.3) (-) 5 (1)
Research study (-) (-) 2 (1) 1 (0.3) (-) (-) (-) 3 (1)
Total 47 (14) 96 (29) 97 (29) 72 (21) 17 (5) 6 (2) 1 (0.3) 336 (100)
Chi-square: 70.737
P.value = 0.000
Gamma value = 0.778
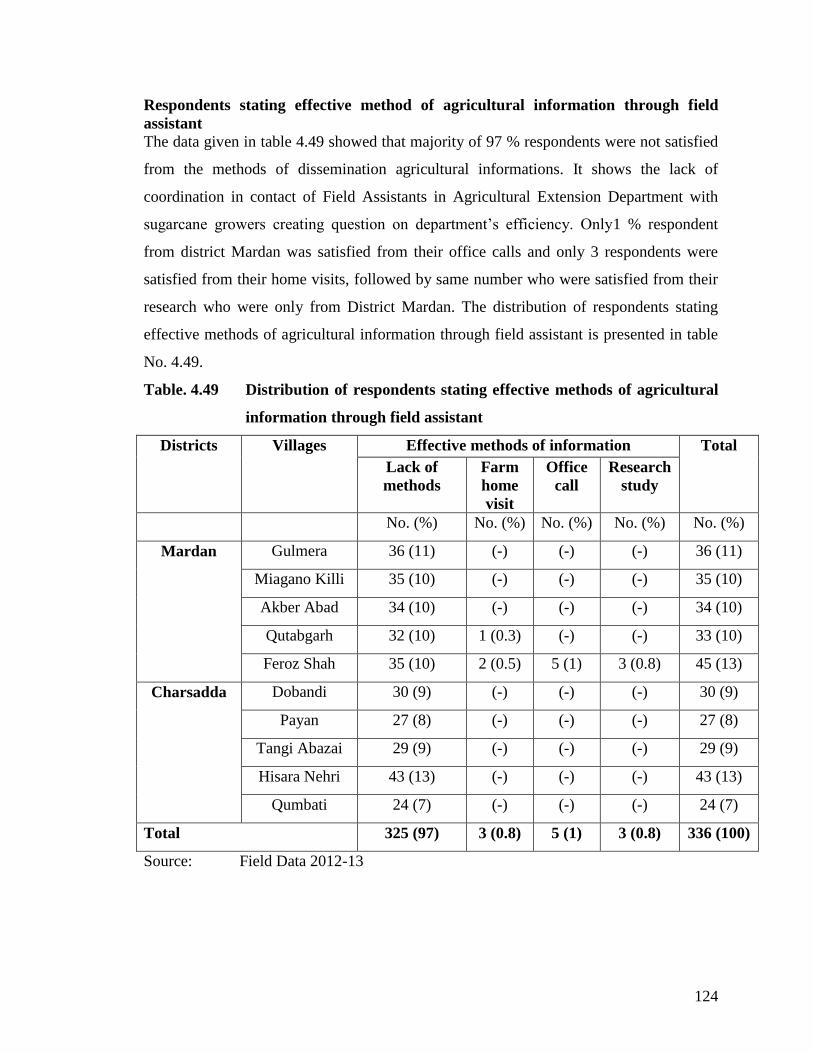
124
Respondents stating effective method of agricultural information through field
assistant
The data given in table 4.49 showed that majority of 97 % respondents were not satisfied
from the methods of dissemination agricultural informations. It shows the lack of
coordination in contact of Field Assistants in Agricultural Extension Department with
sugarcane growers creating question on department’s efficiency. Only1 % respondent
from district Mardan was satisfied from their office calls and only 3 respondents were
satisfied from their home visits, followed by same number who were satisfied from their
research who were only from District Mardan. The distribution of respondents stating
effective methods of agricultural information through field assistant is presented in table
No. 4.49.
Table. 4.49 Distribution of respondents stating effective methods of agricultural
information through field assistant
Districts Villages Effective methods of information Total
Lack of
methods
Farm
home
visit
Office
call
Research
study
No. (%) No. (%) No. (%) No. (%) No. (%)
Mardan Gulmera 36 (11) (-) (-) (-) 36 (11)
Miagano Killi 35 (10) (-) (-) (-) 35 (10)
Akber Abad 34 (10) (-) (-) (-) 34 (10)
Qutabgarh 32 (10) 1 (0.3) (-) (-) 33 (10)
Feroz Shah 35 (10) 2 (0.5) 5 (1) 3 (0.8) 45 (13)
Charsadda Dobandi 30 (9) (-) (-) (-) 30 (9)
Payan 27 (8) (-) (-) (-) 27 (8)
Tangi Abazai 29 (9) (-) (-) (-) 29 (9)
Hisara Nehri 43 (13) (-) (-) (-) 43 (13)
Qumbati 24 (7) (-) (-) (-) 24 (7)
Total 325 (97) 3 (0.8) 5 (1) 3 (0.8) 336 (100)
Source: Field Data 2012-13
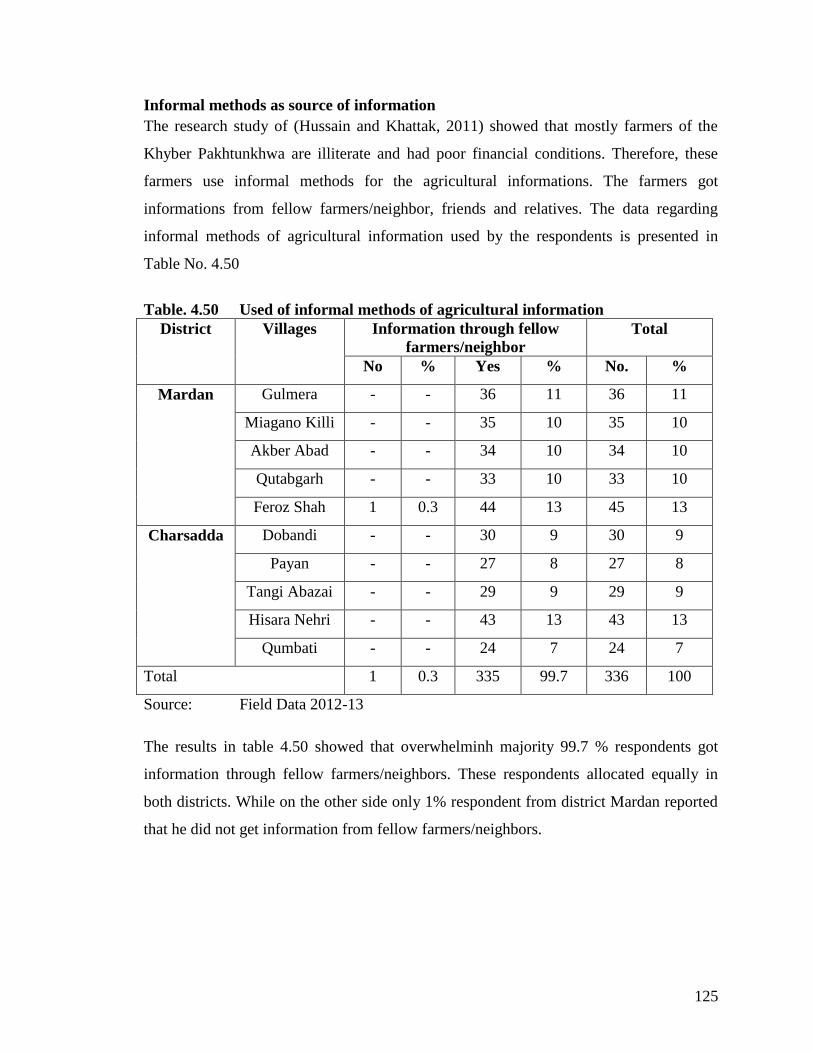
125
Informal methods as source of information
The research study of (Hussain and Khattak, 2011) showed that mostly farmers of the
Khyber Pakhtunkhwa are illiterate and had poor financial conditions. Therefore, these
farmers use informal methods for the agricultural informations. The farmers got
informations from fellow farmers/neighbor, friends and relatives. The data regarding
informal methods of agricultural information used by the respondents is presented in
Table No. 4.50
Table. 4.50 Used of informal methods of agricultural information
District Villages Information through fellow
farmers/neighbor
Total
No % Yes % No. %
Mardan Gulmera - - 36 11 36 11
Miagano Killi - - 35 10 35 10
Akber Abad - - 34 10 34 10
Qutabgarh - - 33 10 33 10
Feroz Shah 1 0.3 44 13 45 13
Charsadda Dobandi - - 30 9 30 9
Payan - - 27 8 27 8
Tangi Abazai - - 29 9 29 9
Hisara Nehri - - 43 13 43 13
Qumbati - - 24 7 24 7
Total 1 0.3 335 99.7 336 100
Source: Field Data 2012-13
The results in table 4.50 showed that overwhelminh majority 99.7 % respondents got
information through fellow farmers/neighbors. These respondents allocated equally in
both districts. While on the other side only 1% respondent from district Mardan reported
that he did not get information from fellow farmers/neighbors.
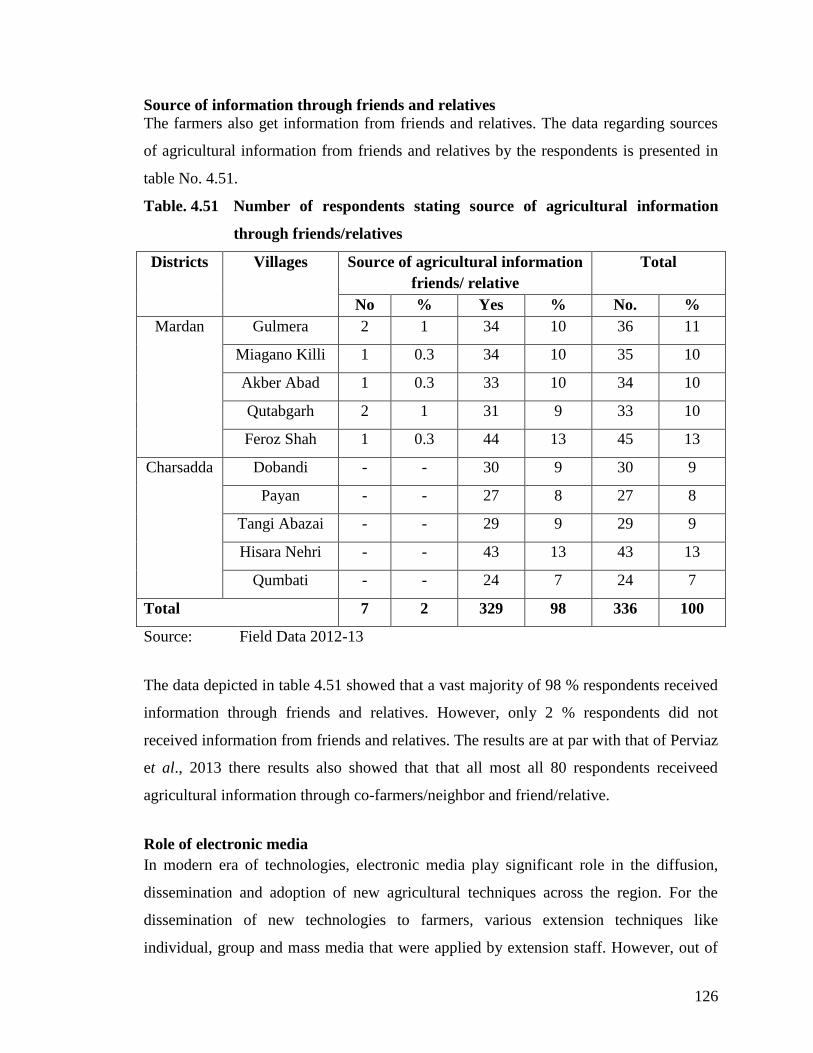
126
Source of information through friends and relatives
The farmers also get information from friends and relatives. The data regarding sources
of agricultural information from friends and relatives by the respondents is presented in
table No. 4.51.
Table. 4.51 Number of respondents stating source of agricultural information
through friends/relatives
Districts Villages Source of agricultural information
friends/ relative
Total
No % Yes % No. %
Mardan Gulmera 2 1 34 10 36 11
Miagano Killi 1 0.3 34 10 35 10
Akber Abad 1 0.3 33 10 34 10
Qutabgarh 2 1 31 9 33 10
Feroz Shah 1 0.3 44 13 45 13
Charsadda Dobandi - - 30 9 30 9
Payan - - 27 8 27 8
Tangi Abazai - - 29 9 29 9
Hisara Nehri - - 43 13 43 13
Qumbati - - 24 7 24 7
Total 7 2 329 98 336 100
Source: Field Data 2012-13
The data depicted in table 4.51 showed that a vast majority of 98 % respondents received
information through friends and relatives. However, only 2 % respondents did not
received information from friends and relatives. The results are at par with that of Perviaz
et al., 2013 there results also showed that that all most all 80 respondents receiveed
agricultural information through co-farmers/neighbor and friend/relative.
Role of electronic media
In modern era of technologies, electronic media play significant role in the diffusion,
dissemination and adoption of new agricultural techniques across the region. For the
dissemination of new technologies to farmers, various extension techniques like
individual, group and mass media that were applied by extension staff. However, out of
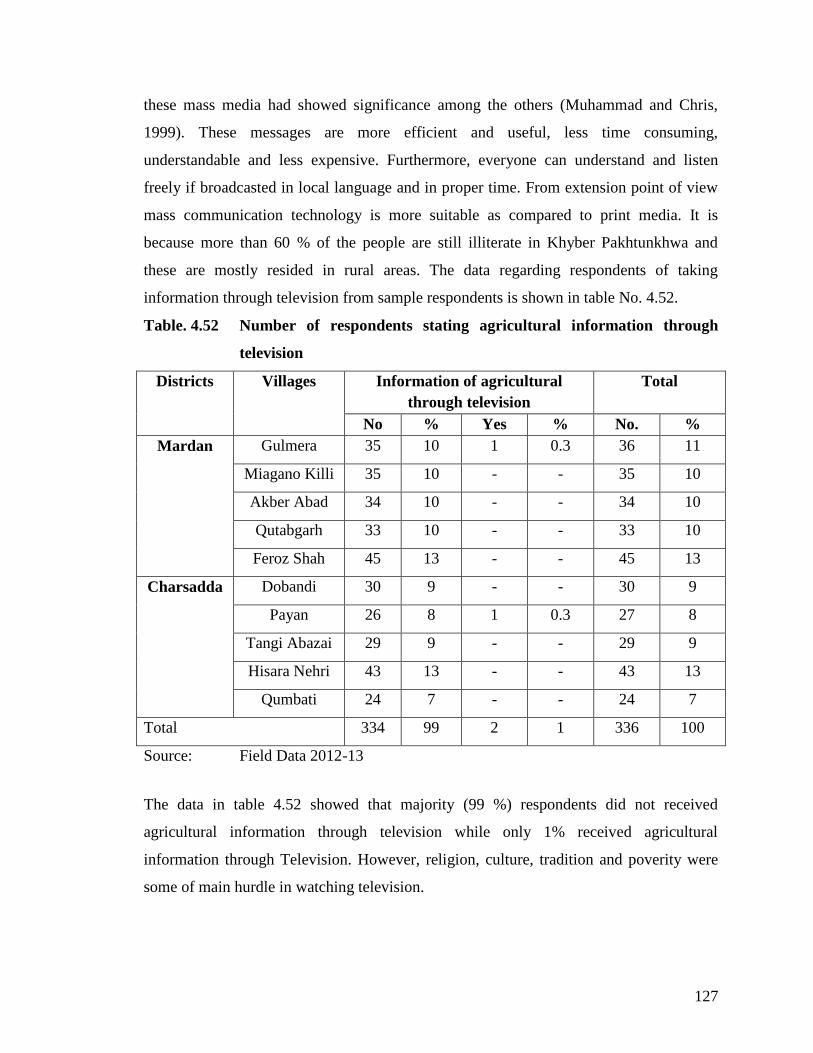
127
these mass media had showed significance among the others (Muhammad and Chris,
1999). These messages are more efficient and useful, less time consuming,
understandable and less expensive. Furthermore, everyone can understand and listen
freely if broadcasted in local language and in proper time. From extension point of view
mass communication technology is more suitable as compared to print media. It is
because more than 60 % of the people are still illiterate in Khyber Pakhtunkhwa and
these are mostly resided in rural areas. The data regarding respondents of taking
information through television from sample respondents is shown in table No. 4.52.
Table. 4.52 Number of respondents stating agricultural information through
television
Districts Villages Information of agricultural
through television
Total
No % Yes % No. %
Mardan Gulmera 35 10 1 0.3 36 11
Miagano Killi 35 10 - - 35 10
Akber Abad 34 10 - - 34 10
Qutabgarh 33 10 - - 33 10
Feroz Shah 45 13 - - 45 13
Charsadda Dobandi 30 9 - - 30 9
Payan 26 8 1 0.3 27 8
Tangi Abazai 29 9 - - 29 9
Hisara Nehri 43 13 - - 43 13
Qumbati 24 7 - - 24 7
Total 334 99 2 1 336 100
Source: Field Data 2012-13
The data in table 4.52 showed that majority (99 %) respondents did not received
agricultural information through television while only 1% received agricultural
information through Television. However, religion, culture, tradition and poverity were
some of main hurdle in watching television.
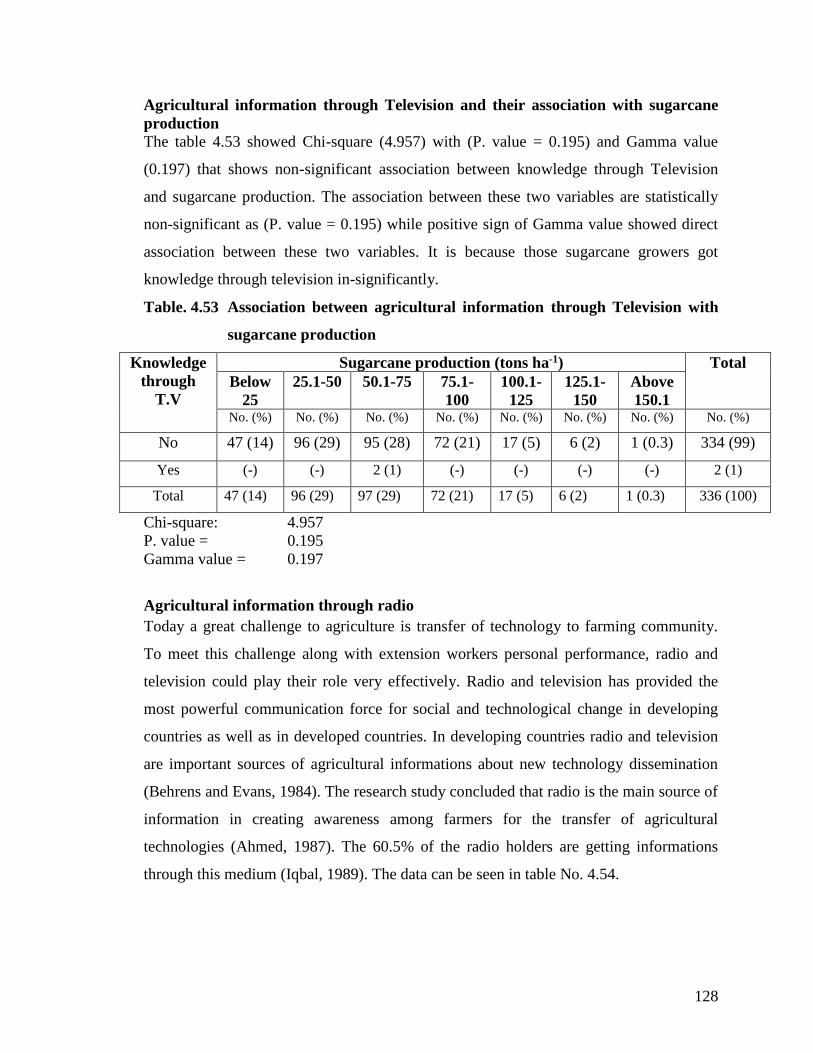
128
Agricultural information through Television and their association with sugarcane
production
The table 4.53 showed Chi-square (4.957) with (P. value = 0.195) and Gamma value
(0.197) that shows non-significant association between knowledge through Television
and sugarcane production. The association between these two variables are statistically
non-significant as (P. value = 0.195) while positive sign of Gamma value showed direct
association between these two variables. It is because those sugarcane growers got
knowledge through television in-significantly.
Table. 4.53 Association between agricultural information through Television with
sugarcane production
Knowledge
through
T.V
Sugarcane production (tons ha-1) Total
Below
25
25.1-50 50.1-75 75.1-
100
100.1-
125
125.1-
150
Above
150.1 No. (%) No. (%) No. (%) No. (%) No. (%) No. (%) No. (%) No. (%)
No 47 (14) 96 (29) 95 (28) 72 (21) 17 (5) 6 (2) 1 (0.3) 334 (99)
Yes (-) (-) 2 (1) (-) (-) (-) (-) 2 (1)
Total 47 (14) 96 (29) 97 (29) 72 (21) 17 (5) 6 (2) 1 (0.3) 336 (100)
Chi-square: 4.957
P. value = 0.195
Gamma value = 0.197
Agricultural information through radio
Today a great challenge to agriculture is transfer of technology to farming community.
To meet this challenge along with extension workers personal performance, radio and
television could play their role very effectively. Radio and television has provided the
most powerful communication force for social and technological change in developing
countries as well as in developed countries. In developing countries radio and television
are important sources of agricultural informations about new technology dissemination
(Behrens and Evans, 1984). The research study concluded that radio is the main source of
information in creating awareness among farmers for the transfer of agricultural
technologies (Ahmed, 1987). The 60.5% of the radio holders are getting informations
through this medium (Iqbal, 1989). The data can be seen in table No. 4.54.
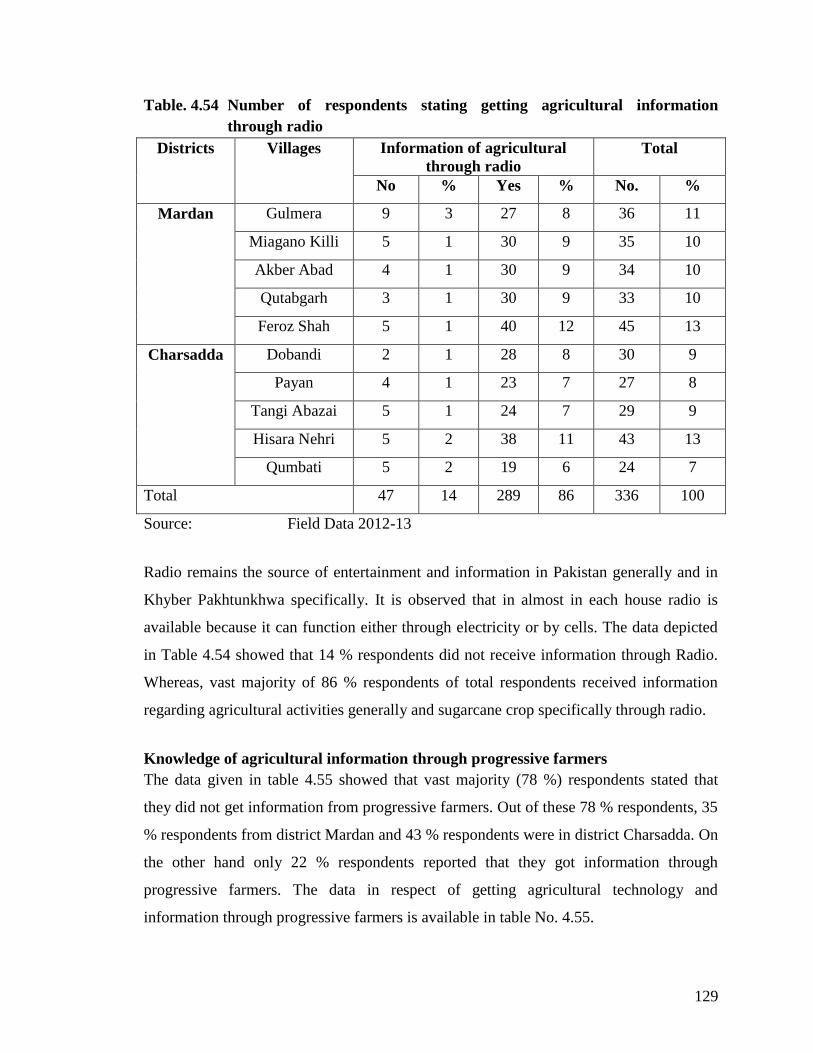
129
Table. 4.54 Number of respondents stating getting agricultural information
through radio
Districts
Villages Information of agricultural
through radio
Total
No % Yes % No. %
Mardan Gulmera 9 3 27 8 36 11
Miagano Killi 5 1 30 9 35 10
Akber Abad 4 1 30 9 34 10
Qutabgarh 3 1 30 9 33 10
Feroz Shah 5 1 40 12 45 13
Charsadda Dobandi 2 1 28 8 30 9
Payan 4 1 23 7 27 8
Tangi Abazai 5 1 24 7 29 9
Hisara Nehri 5 2 38 11 43 13
Qumbati 5 2 19 6 24 7
Total 47 14 289 86 336 100
Source: Field Data 2012-13
Radio remains the source of entertainment and information in Pakistan generally and in
Khyber Pakhtunkhwa specifically. It is observed that in almost in each house radio is
available because it can function either through electricity or by cells. The data depicted
in Table 4.54 showed that 14 % respondents did not receive information through Radio.
Whereas, vast majority of 86 % respondents of total respondents received information
regarding agricultural activities generally and sugarcane crop specifically through radio.
Knowledge of agricultural information through progressive farmers
The data given in table 4.55 showed that vast majority (78 %) respondents stated that
they did not get information from progressive farmers. Out of these 78 % respondents, 35
% respondents from district Mardan and 43 % respondents were in district Charsadda. On
the other hand only 22 % respondents reported that they got information through
progressive farmers. The data in respect of getting agricultural technology and
information through progressive farmers is available in table No. 4.55.
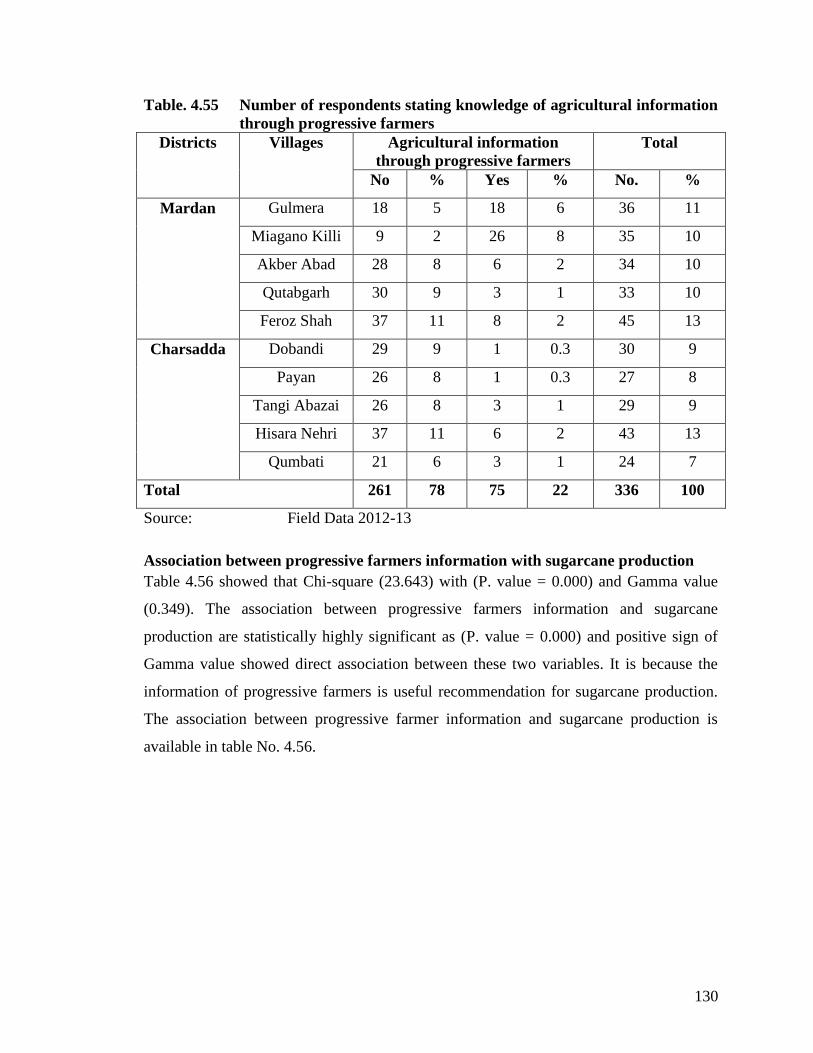
130
Table. 4.55 Number of respondents stating knowledge of agricultural information
through progressive farmers
Districts Villages Agricultural information
through progressive farmers
Total
No % Yes % No. %
Mardan Gulmera 18 5 18 6 36 11
Miagano Killi 9 2 26 8 35 10
Akber Abad 28 8 6 2 34 10
Qutabgarh 30 9 3 1 33 10
Feroz Shah 37 11 8 2 45 13
Charsadda Dobandi 29 9 1 0.3 30 9
Payan 26 8 1 0.3 27 8
Tangi Abazai 26 8 3 1 29 9
Hisara Nehri 37 11 6 2 43 13
Qumbati 21 6 3 1 24 7
Total 261 78 75 22 336 100
Source: Field Data 2012-13
Association between progressive farmers information with sugarcane production
Table 4.56 showed that Chi-square (23.643) with (P. value = 0.000) and Gamma value
(0.349). The association between progressive farmers information and sugarcane
production are statistically highly significant as (P. value = 0.000) and positive sign of
Gamma value showed direct association between these two variables. It is because the
information of progressive farmers is useful recommendation for sugarcane production.
The association between progressive farmer information and sugarcane production is
available in table No. 4.56.
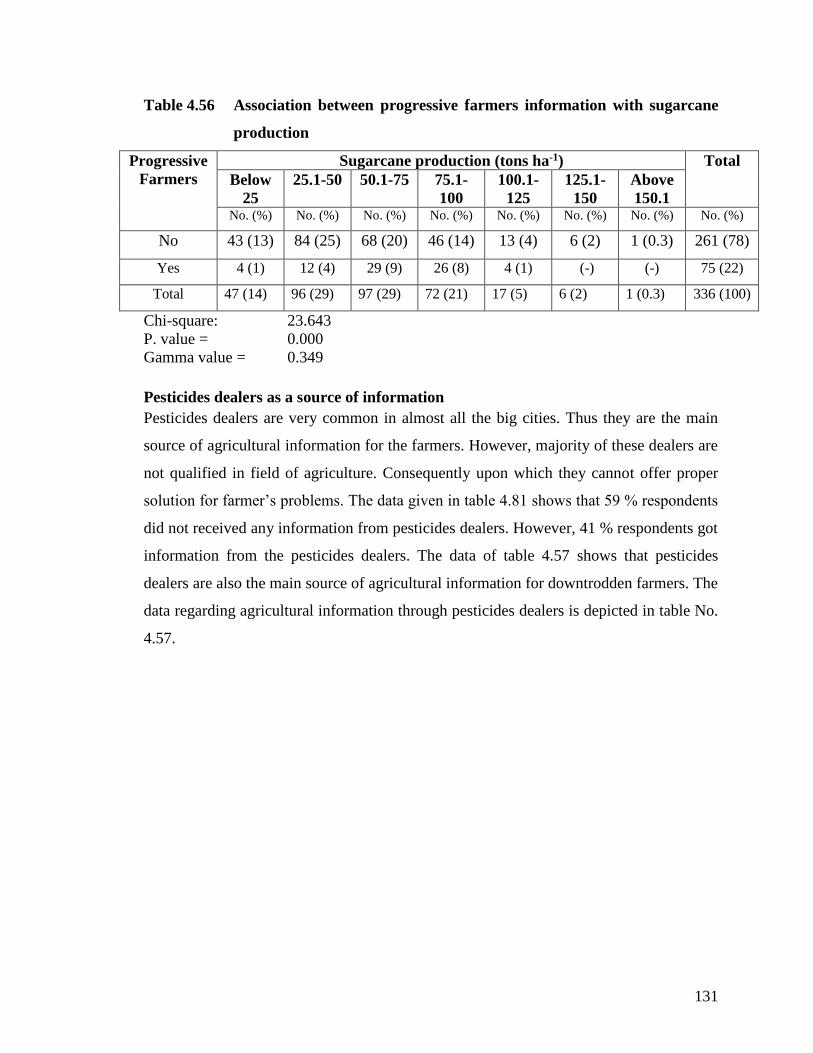
131
Table 4.56 Association between progressive farmers information with sugarcane
production
Progressive
Farmers
Sugarcane production (tons ha-1) Total
Below
25
25.1-50 50.1-75 75.1-
100
100.1-
125
125.1-
150
Above
150.1 No. (%) No. (%) No. (%) No. (%) No. (%) No. (%) No. (%) No. (%)
No 43 (13) 84 (25) 68 (20) 46 (14) 13 (4) 6 (2) 1 (0.3) 261 (78)
Yes 4 (1) 12 (4) 29 (9) 26 (8) 4 (1) (-) (-) 75 (22)
Total 47 (14) 96 (29) 97 (29) 72 (21) 17 (5) 6 (2) 1 (0.3) 336 (100)
Chi-square: 23.643
P. value = 0.000
Gamma value = 0.349
Pesticides dealers as a source of information
Pesticides dealers are very common in almost all the big cities. Thus they are the main
source of agricultural information for the farmers. However, majority of these dealers are
not qualified in field of agriculture. Consequently upon which they cannot offer proper
solution for farmer’s problems. The data given in table 4.81 shows that 59 % respondents
did not received any information from pesticides dealers. However, 41 % respondents got
information from the pesticides dealers. The data of table 4.57 shows that pesticides
dealers are also the main source of agricultural information for downtrodden farmers. The
data regarding agricultural information through pesticides dealers is depicted in table No.
4.57.
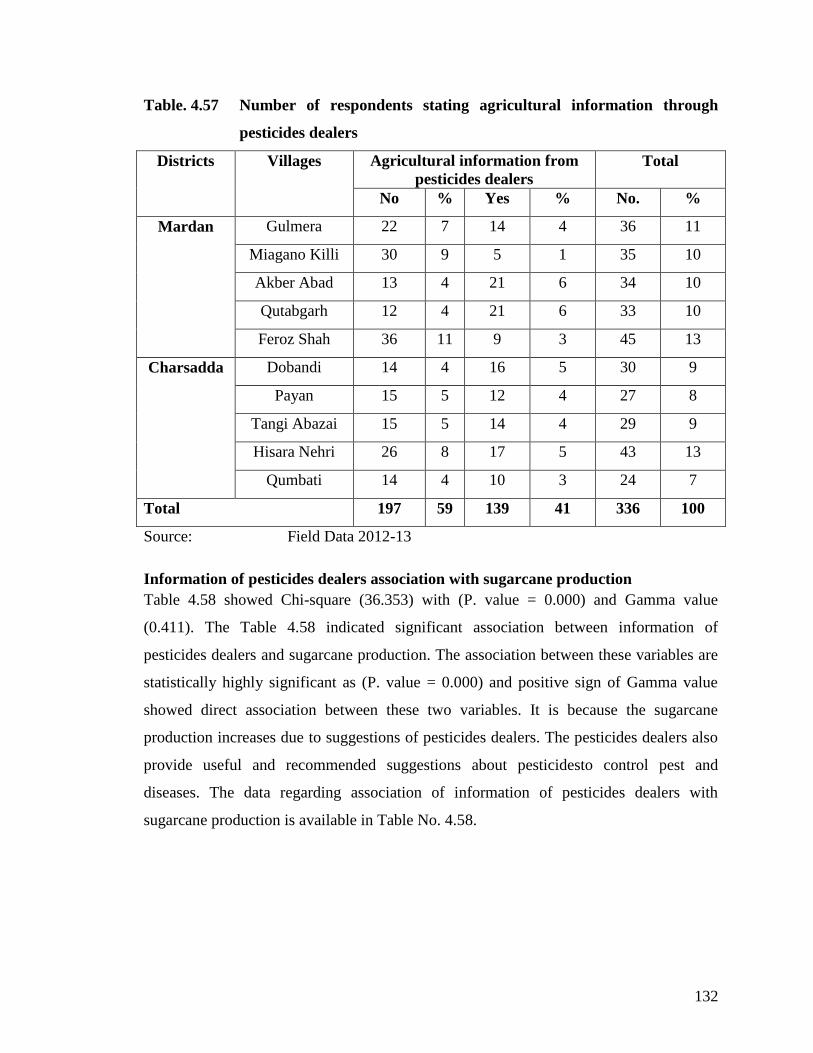
132
Table. 4.57 Number of respondents stating agricultural information through
pesticides dealers
Districts Villages Agricultural information from
pesticides dealers
Total
No % Yes % No. %
Mardan Gulmera 22 7 14 4 36 11
Miagano Killi 30 9 5 1 35 10
Akber Abad 13 4 21 6 34 10
Qutabgarh 12 4 21 6 33 10
Feroz Shah 36 11 9 3 45 13
Charsadda Dobandi 14 4 16 5 30 9
Payan 15 5 12 4 27 8
Tangi Abazai 15 5 14 4 29 9
Hisara Nehri 26 8 17 5 43 13
Qumbati 14 4 10 3 24 7
Total 197 59 139 41 336 100
Source: Field Data 2012-13
Information of pesticides dealers association with sugarcane production
Table 4.58 showed Chi-square (36.353) with (P. value = 0.000) and Gamma value
(0.411). The Table 4.58 indicated significant association between information of
pesticides dealers and sugarcane production. The association between these variables are
statistically highly significant as (P. value = 0.000) and positive sign of Gamma value
showed direct association between these two variables. It is because the sugarcane
production increases due to suggestions of pesticides dealers. The pesticides dealers also
provide useful and recommended suggestions about pesticidesto control pest and
diseases. The data regarding association of information of pesticides dealers with
sugarcane production is available in Table No. 4.58.
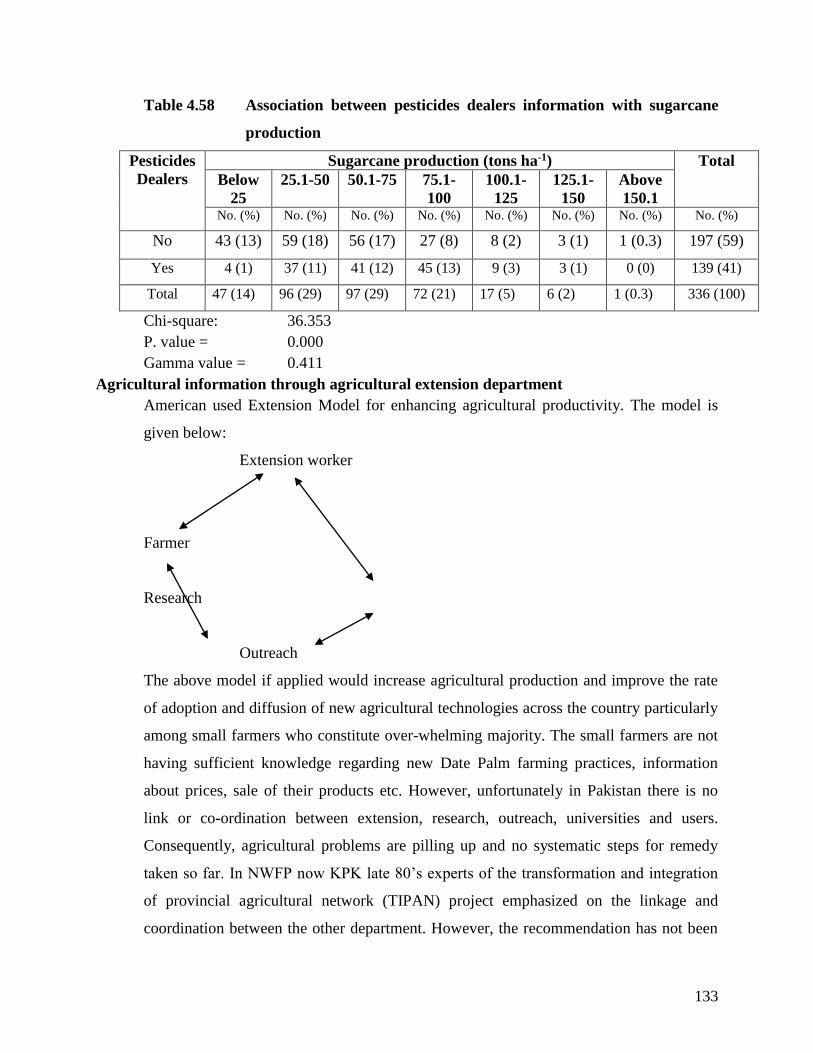
133
Table 4.58 Association between pesticides dealers information with sugarcane
production
Pesticides
Dealers
Sugarcane production (tons ha-1) Total
Below
25
25.1-50 50.1-75 75.1-
100
100.1-
125
125.1-
150
Above
150.1 No. (%) No. (%) No. (%) No. (%) No. (%) No. (%) No. (%) No. (%)
No 43 (13) 59 (18) 56 (17) 27 (8) 8 (2) 3 (1) 1 (0.3) 197 (59)
Yes 4 (1) 37 (11) 41 (12) 45 (13) 9 (3) 3 (1) 0 (0) 139 (41)
Total 47 (14) 96 (29) 97 (29) 72 (21) 17 (5) 6 (2) 1 (0.3) 336 (100)
Chi-square: 36.353
P. value = 0.000
Gamma value = 0.411
Agricultural information through agricultural extension department
American used Extension Model for enhancing agricultural productivity. The model is
given below:
Extension worker
Farmer
Research
Outreach
The above model if applied would increase agricultural production and improve the rate
of adoption and diffusion of new agricultural technologies across the country particularly
among small farmers who constitute over-whelming majority. The small farmers are not
having sufficient knowledge regarding new Date Palm farming practices, information
about prices, sale of their products etc. However, unfortunately in Pakistan there is no
link or co-ordination between extension, research, outreach, universities and users.
Consequently, agricultural problems are pilling up and no systematic steps for remedy
taken so far. In NWFP now KPK late 80’s experts of the transformation and integration
of provincial agricultural network (TIPAN) project emphasized on the linkage and
coordination between the other department. However, the recommendation has not been
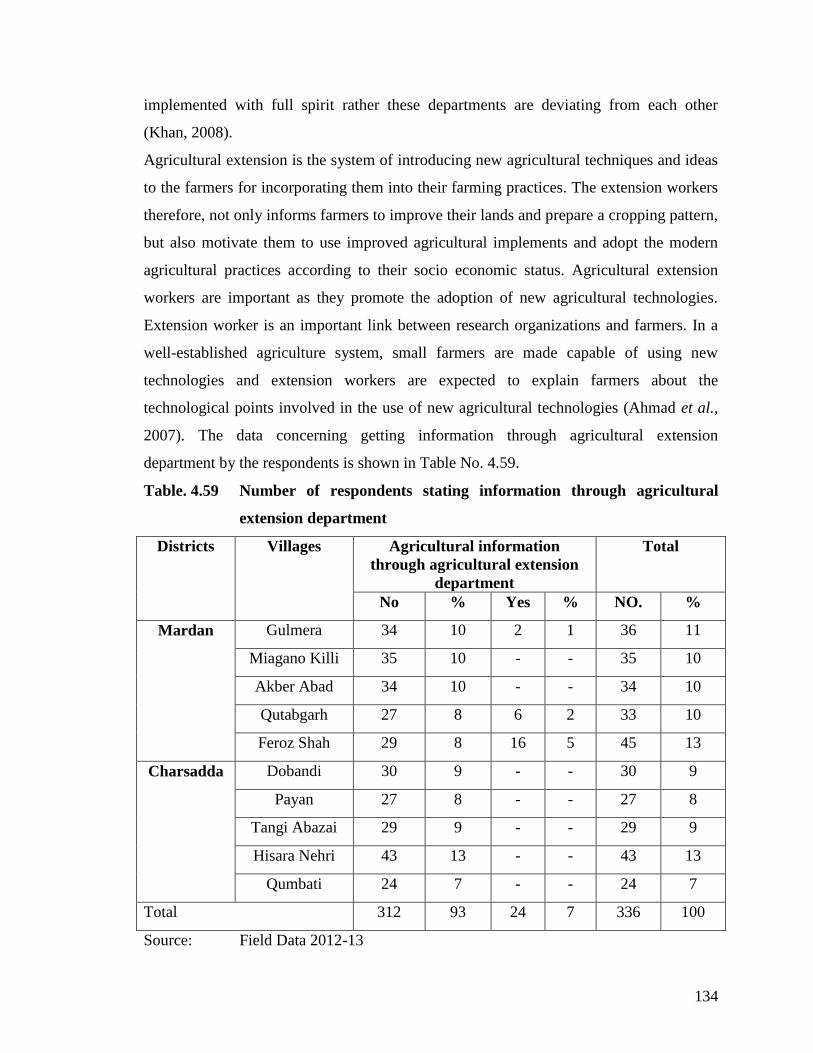
134
implemented with full spirit rather these departments are deviating from each other
(Khan, 2008).
Agricultural extension is the system of introducing new agricultural techniques and ideas
to the farmers for incorporating them into their farming practices. The extension workers
therefore, not only informs farmers to improve their lands and prepare a cropping pattern,
but also motivate them to use improved agricultural implements and adopt the modern
agricultural practices according to their socio economic status. Agricultural extension
workers are important as they promote the adoption of new agricultural technologies.
Extension worker is an important link between research organizations and farmers. In a
well-established agriculture system, small farmers are made capable of using new
technologies and extension workers are expected to explain farmers about the
technological points involved in the use of new agricultural technologies (Ahmad et al.,
2007). The data concerning getting information through agricultural extension
department by the respondents is shown in Table No. 4.59.
Table. 4.59 Number of respondents stating information through agricultural
extension department
Districts Villages Agricultural information
through agricultural extension
department
Total
No % Yes % NO. %
Mardan Gulmera 34 10 2 1 36 11
Miagano Killi 35 10 - - 35 10
Akber Abad 34 10 - - 34 10
Qutabgarh 27 8 6 2 33 10
Feroz Shah 29 8 16 5 45 13
Charsadda Dobandi 30 9 - - 30 9
Payan 27 8 - - 27 8
Tangi Abazai 29 9 - - 29 9
Hisara Nehri 43 13 - - 43 13
Qumbati 24 7 - - 24 7
Total 312 93 24 7 336 100
Source: Field Data 2012-13
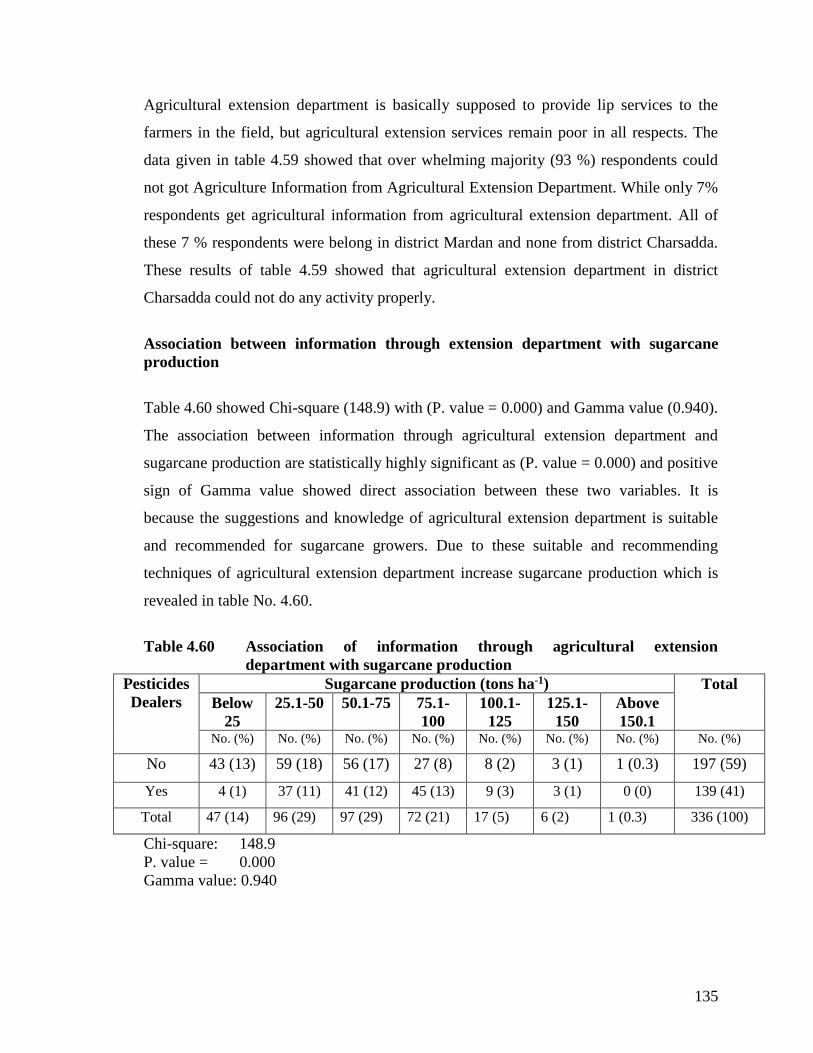
135
Agricultural extension department is basically supposed to provide lip services to the
farmers in the field, but agricultural extension services remain poor in all respects. The
data given in table 4.59 showed that over whelming majority (93 %) respondents could
not got Agriculture Information from Agricultural Extension Department. While only 7%
respondents get agricultural information from agricultural extension department. All of
these 7 % respondents were belong in district Mardan and none from district Charsadda.
These results of table 4.59 showed that agricultural extension department in district
Charsadda could not do any activity properly.
Association between information through extension department with sugarcane
production
Table 4.60 showed Chi-square (148.9) with (P. value = 0.000) and Gamma value (0.940).
The association between information through agricultural extension department and
sugarcane production are statistically highly significant as (P. value = 0.000) and positive
sign of Gamma value showed direct association between these two variables. It is
because the suggestions and knowledge of agricultural extension department is suitable
and recommended for sugarcane growers. Due to these suitable and recommending
techniques of agricultural extension department increase sugarcane production which is
revealed in table No. 4.60.
Table 4.60 Association of information through agricultural extension
department with sugarcane production
Pesticides
Dealers
Sugarcane production (tons ha-1) Total
Below
25
25.1-50 50.1-75 75.1-
100
100.1-
125
125.1-
150
Above
150.1 No. (%) No. (%) No. (%) No. (%) No. (%) No. (%) No. (%) No. (%)
No 43 (13) 59 (18) 56 (17) 27 (8) 8 (2) 3 (1) 1 (0.3) 197 (59)
Yes 4 (1) 37 (11) 41 (12) 45 (13) 9 (3) 3 (1) 0 (0) 139 (41)
Total 47 (14) 96 (29) 97 (29) 72 (21) 17 (5) 6 (2) 1 (0.3) 336 (100)
Chi-square: 148.9
P. value = 0.000
Gamma value: 0.940
136
Main constraints
The demand for sugar and its by-products is increasing; sugarcane cultivation is facing
many problems. Cane cultivation has become uneconomical to farmers due to rising costs
of cultivation, improper cultivation practices, growing water scarcities, unavailability of
good quality seed material, increased pest/pathogen pressure, unpredictable climatic
aberrations and non-remunerative price due to regulations by the government (Goud,
2011).
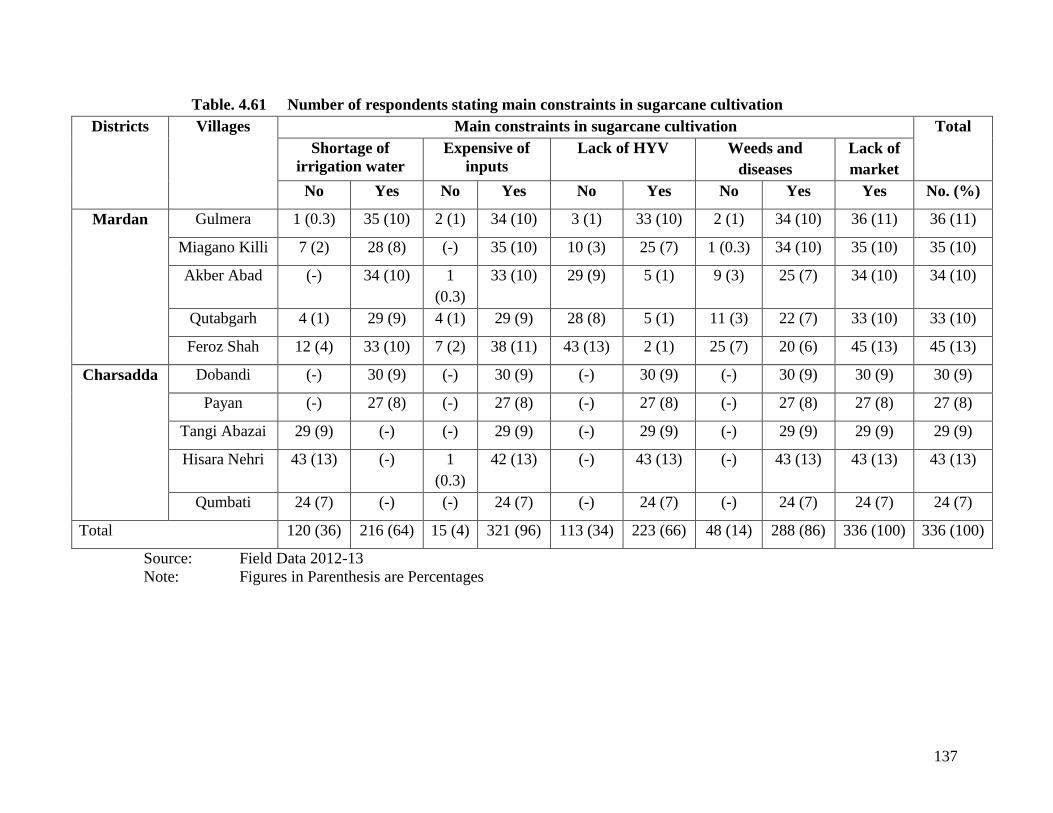
137
Table. 4.61 Number of respondents stating main constraints in sugarcane cultivation
Districts Villages Main constraints in sugarcane cultivation Total
Shortage of
irrigation water
Expensive of
inputs
Lack of HYV Weeds and
diseases
Lack of
market
No Yes No Yes No Yes No Yes Yes No. (%)
Mardan Gulmera 1 (0.3) 35 (10) 2 (1) 34 (10) 3 (1) 33 (10) 2 (1) 34 (10) 36 (11) 36 (11)
Miagano Killi 7 (2) 28 (8) (-) 35 (10) 10 (3) 25 (7) 1 (0.3) 34 (10) 35 (10) 35 (10)
Akber Abad (-) 34 (10) 1
(0.3)
33 (10) 29 (9) 5 (1) 9 (3) 25 (7) 34 (10) 34 (10)
Qutabgarh 4 (1) 29 (9) 4 (1) 29 (9) 28 (8) 5 (1) 11 (3) 22 (7) 33 (10) 33 (10)
Feroz Shah 12 (4) 33 (10) 7 (2) 38 (11) 43 (13) 2 (1) 25 (7) 20 (6) 45 (13) 45 (13)
Charsadda Dobandi (-) 30 (9) (-) 30 (9) (-) 30 (9) (-) 30 (9) 30 (9) 30 (9)
Payan (-) 27 (8) (-) 27 (8) (-) 27 (8) (-) 27 (8) 27 (8) 27 (8)
Tangi Abazai 29 (9) (-) (-) 29 (9) (-) 29 (9) (-) 29 (9) 29 (9) 29 (9)
Hisara Nehri 43 (13) (-) 1
(0.3)
42 (13) (-) 43 (13) (-) 43 (13) 43 (13) 43 (13)
Qumbati 24 (7) (-) (-) 24 (7) (-) 24 (7) (-) 24 (7) 24 (7) 24 (7)
Total 120 (36) 216 (64) 15 (4) 321 (96) 113 (34) 223 (66) 48 (14) 288 (86) 336 (100) 336 (100)
Source: Field Data 2012-13
Note: Figures in Parenthesis are Percentages
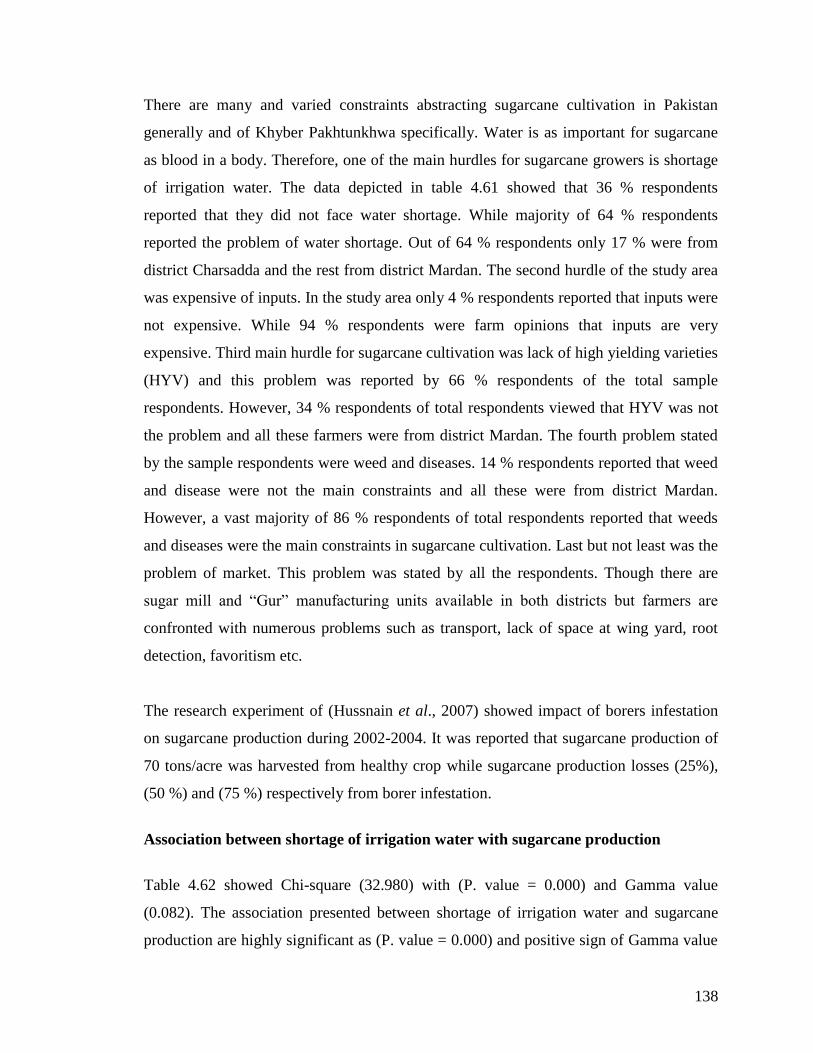
138
There are many and varied constraints abstracting sugarcane cultivation in Pakistan
generally and of Khyber Pakhtunkhwa specifically. Water is as important for sugarcane
as blood in a body. Therefore, one of the main hurdles for sugarcane growers is shortage
of irrigation water. The data depicted in table 4.61 showed that 36 % respondents
reported that they did not face water shortage. While majority of 64 % respondents
reported the problem of water shortage. Out of 64 % respondents only 17 % were from
district Charsadda and the rest from district Mardan. The second hurdle of the study area
was expensive of inputs. In the study area only 4 % respondents reported that inputs were
not expensive. While 94 % respondents were farm opinions that inputs are very
expensive. Third main hurdle for sugarcane cultivation was lack of high yielding varieties
(HYV) and this problem was reported by 66 % respondents of the total sample
respondents. However, 34 % respondents of total respondents viewed that HYV was not
the problem and all these farmers were from district Mardan. The fourth problem stated
by the sample respondents were weed and diseases. 14 % respondents reported that weed
and disease were not the main constraints and all these were from district Mardan.
However, a vast majority of 86 % respondents of total respondents reported that weeds
and diseases were the main constraints in sugarcane cultivation. Last but not least was the
problem of market. This problem was stated by all the respondents. Though there are
sugar mill and “Gur” manufacturing units available in both districts but farmers are
confronted with numerous problems such as transport, lack of space at wing yard, root
detection, favoritism etc.
The research experiment of (Hussnain et al., 2007) showed impact of borers infestation
on sugarcane production during 2002-2004. It was reported that sugarcane production of
70 tons/acre was harvested from healthy crop while sugarcane production losses (25%),
(50 %) and (75 %) respectively from borer infestation.
Association between shortage of irrigation water with sugarcane production
Table 4.62 showed Chi-square (32.980) with (P. value = 0.000) and Gamma value
(0.082). The association presented between shortage of irrigation water and sugarcane
production are highly significant as (P. value = 0.000) and positive sign of Gamma value
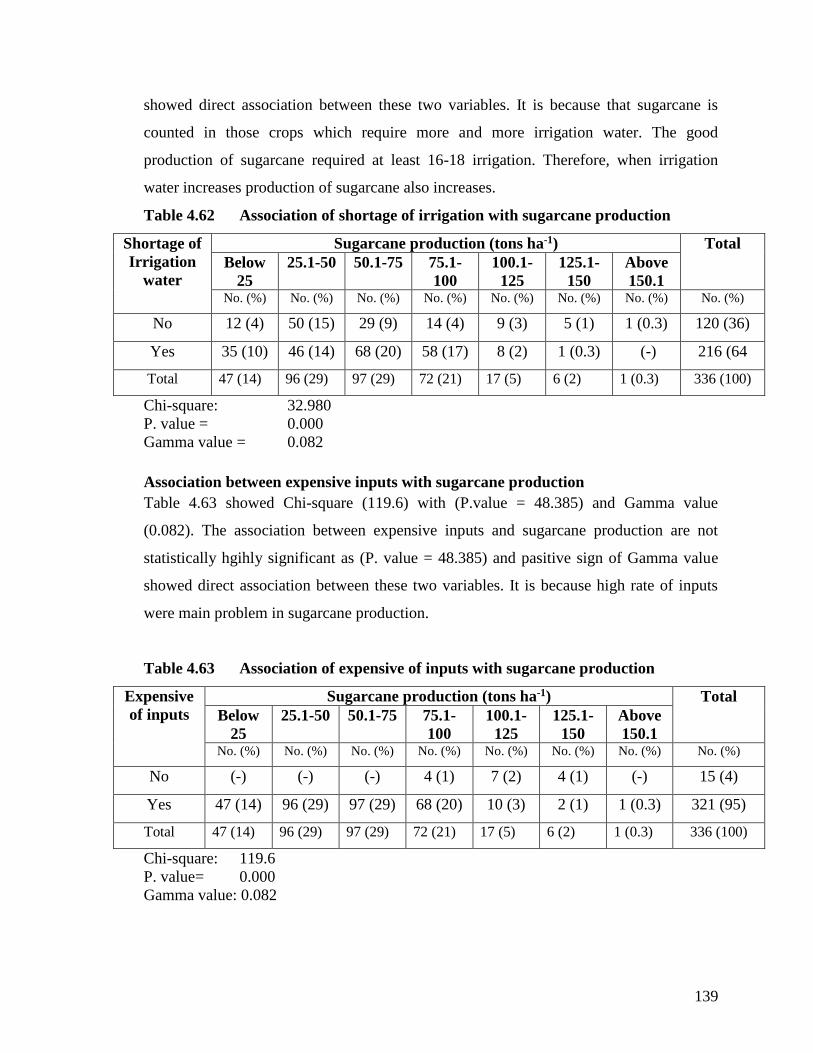
139
showed direct association between these two variables. It is because that sugarcane is
counted in those crops which require more and more irrigation water. The good
production of sugarcane required at least 16-18 irrigation. Therefore, when irrigation
water increases production of sugarcane also increases.
Table 4.62 Association of shortage of irrigation with sugarcane production
Shortage of
Irrigation
water
Sugarcane production (tons ha-1) Total
Below
25
25.1-50 50.1-75 75.1-
100
100.1-
125
125.1-
150
Above
150.1 No. (%) No. (%) No. (%) No. (%) No. (%) No. (%) No. (%) No. (%)
No 12 (4) 50 (15) 29 (9) 14 (4) 9 (3) 5 (1) 1 (0.3) 120 (36)
Yes 35 (10) 46 (14) 68 (20) 58 (17) 8 (2) 1 (0.3) (-) 216 (64
Total 47 (14) 96 (29) 97 (29) 72 (21) 17 (5) 6 (2) 1 (0.3) 336 (100)
Chi-square: 32.980
P. value = 0.000
Gamma value = 0.082
Association between expensive inputs with sugarcane production
Table 4.63 showed Chi-square (119.6) with (P.value = 48.385) and Gamma value
(0.082). The association between expensive inputs and sugarcane production are not
statistically hgihly significant as (P. value = 48.385) and pasitive sign of Gamma value
showed direct association between these two variables. It is because high rate of inputs
were main problem in sugarcane production.
Table 4.63 Association of expensive of inputs with sugarcane production
Expensive
of inputs
Sugarcane production (tons ha-1) Total
Below
25
25.1-50 50.1-75 75.1-
100
100.1-
125
125.1-
150
Above
150.1 No. (%) No. (%) No. (%) No. (%) No. (%) No. (%) No. (%) No. (%)
No (-) (-) (-) 4 (1) 7 (2) 4 (1) (-) 15 (4)
Yes 47 (14) 96 (29) 97 (29) 68 (20) 10 (3) 2 (1) 1 (0.3) 321 (95)
Total 47 (14) 96 (29) 97 (29) 72 (21) 17 (5) 6 (2) 1 (0.3) 336 (100)
Chi-square: 119.6
P. value= 0.000
Gamma value: 0.082
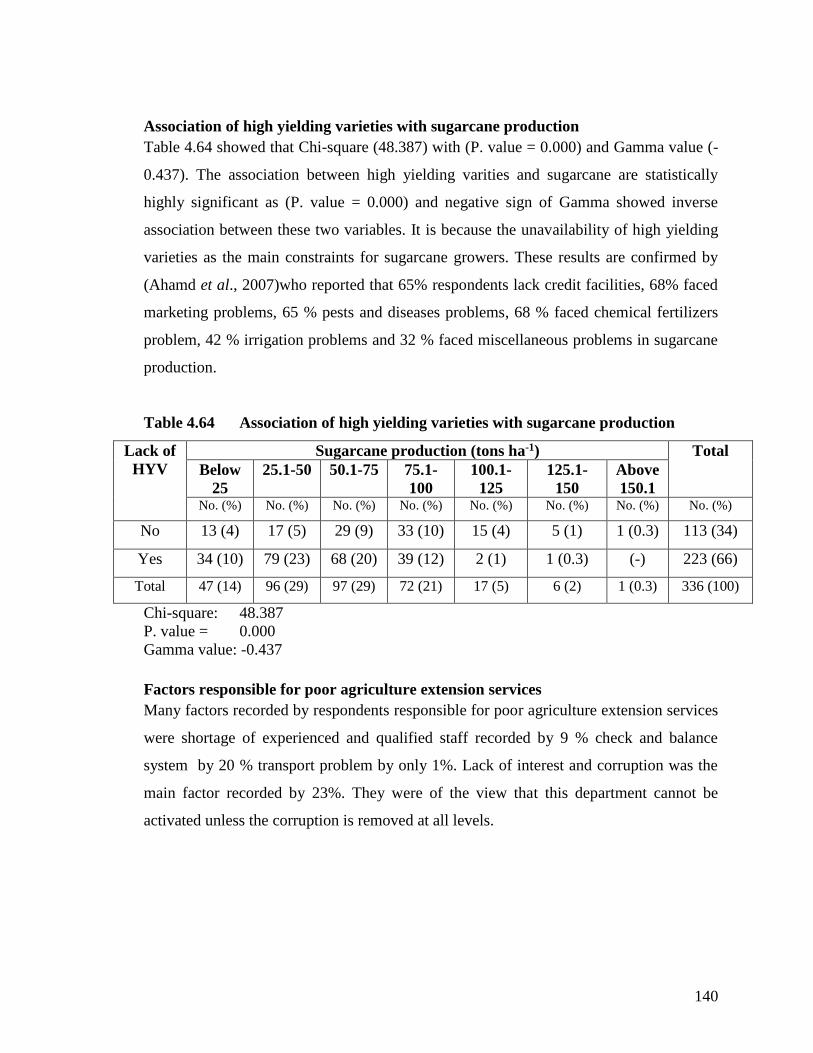
140
Association of high yielding varieties with sugarcane production
Table 4.64 showed that Chi-square (48.387) with (P. value = 0.000) and Gamma value (-
0.437). The association between high yielding varities and sugarcane are statistically
highly significant as (P. value = 0.000) and negative sign of Gamma showed inverse
association between these two variables. It is because the unavailability of high yielding
varieties as the main constraints for sugarcane growers. These results are confirmed by
(Ahamd et al., 2007)who reported that 65% respondents lack credit facilities, 68% faced
marketing problems, 65 % pests and diseases problems, 68 % faced chemical fertilizers
problem, 42 % irrigation problems and 32 % faced miscellaneous problems in sugarcane
production.
Table 4.64 Association of high yielding varieties with sugarcane production
Lack of
HYV
Sugarcane production (tons ha-1) Total
Below
25
25.1-50 50.1-75 75.1-
100
100.1-
125
125.1-
150
Above
150.1 No. (%) No. (%) No. (%) No. (%) No. (%) No. (%) No. (%) No. (%)
No 13 (4) 17 (5) 29 (9) 33 (10) 15 (4) 5 (1) 1 (0.3) 113 (34)
Yes 34 (10) 79 (23) 68 (20) 39 (12) 2 (1) 1 (0.3) (-) 223 (66)
Total 47 (14) 96 (29) 97 (29) 72 (21) 17 (5) 6 (2) 1 (0.3) 336 (100)
Chi-square: 48.387
P. value = 0.000
Gamma value: -0.437
Factors responsible for poor agriculture extension services
Many factors recorded by respondents responsible for poor agriculture extension services
were shortage of experienced and qualified staff recorded by 9 % check and balance
system by 20 % transport problem by only 1%. Lack of interest and corruption was the
main factor recorded by 23%. They were of the view that this department cannot be
activated unless the corruption is removed at all levels.
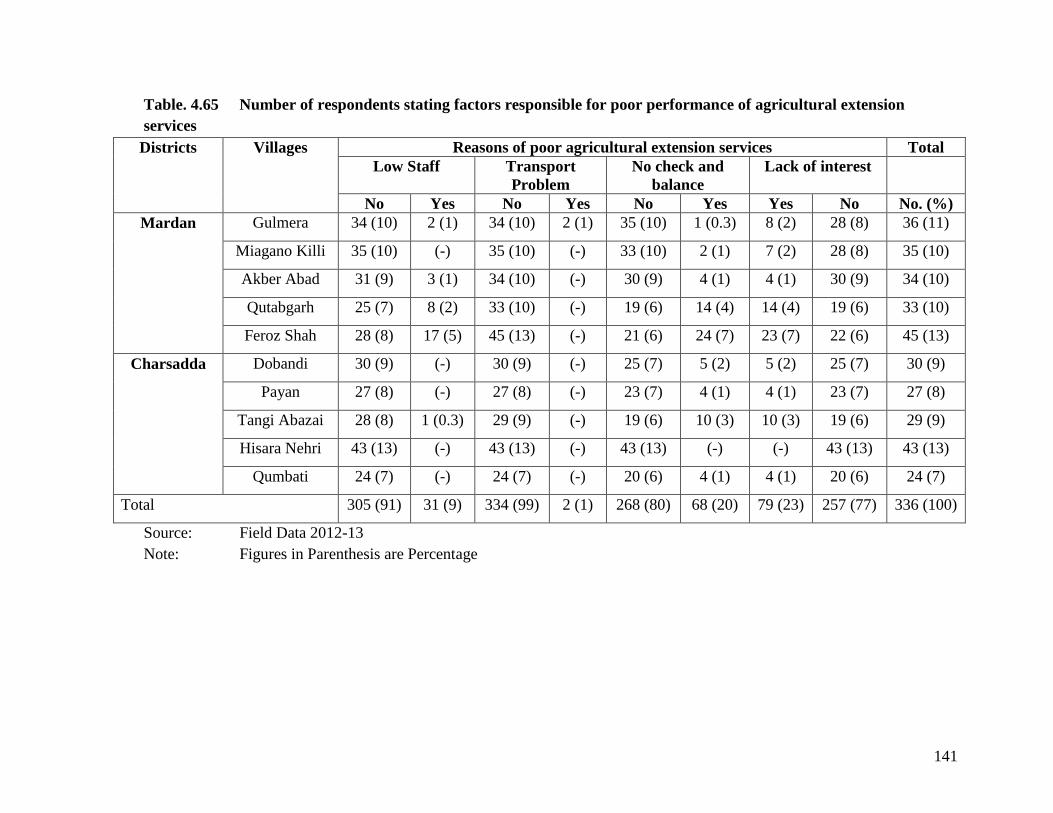
141
Table. 4.65 Number of respondents stating factors responsible for poor performance of agricultural extension
services
Districts Villages Reasons of poor agricultural extension services Total
Low Staff Transport
Problem
No check and
balance
Lack of interest
No Yes No Yes No Yes Yes No No. (%)
Mardan Gulmera 34 (10) 2 (1) 34 (10) 2 (1) 35 (10) 1 (0.3) 8 (2) 28 (8) 36 (11)
Miagano Killi 35 (10) (-) 35 (10) (-) 33 (10) 2 (1) 7 (2) 28 (8) 35 (10)
Akber Abad 31 (9) 3 (1) 34 (10) (-) 30 (9) 4 (1) 4 (1) 30 (9) 34 (10)
Qutabgarh 25 (7) 8 (2) 33 (10) (-) 19 (6) 14 (4) 14 (4) 19 (6) 33 (10)
Feroz Shah 28 (8) 17 (5) 45 (13) (-) 21 (6) 24 (7) 23 (7) 22 (6) 45 (13)
Charsadda Dobandi 30 (9) (-) 30 (9) (-) 25 (7) 5 (2) 5 (2) 25 (7) 30 (9)
Payan 27 (8) (-) 27 (8) (-) 23 (7) 4 (1) 4 (1) 23 (7) 27 (8)
Tangi Abazai 28 (8) 1 (0.3) 29 (9) (-) 19 (6) 10 (3) 10 (3) 19 (6) 29 (9)
Hisara Nehri 43 (13) (-) 43 (13) (-) 43 (13) (-) (-) 43 (13) 43 (13)
Qumbati 24 (7) (-) 24 (7) (-) 20 (6) 4 (1) 4 (1) 20 (6) 24 (7)
Total 305 (91) 31 (9) 334 (99) 2 (1) 268 (80) 68 (20) 79 (23) 257 (77) 336 (100)
Source: Field Data 2012-13
Note: Figures in Parenthesis are Percentage
142
Solution of constraints
Pakistan Agricultural Research Council (PARC) suggests some solution of constraints
such as, increase in area under approved good quality varieties, implementation of quality
control system and payments on sugar content basis at mill gate, establishment of
Sugarcane Breeding Institute at Gharho (Kitti Bandar, the most suitable location for
sugarcane cross breeding in the country) to strengthen sugarcane development program
for desired characteristics i.e high yield, high sugar contents, drought and salt tolerance,
Ban on unapproved and low sugar content varieties such as Co-1148, SPF-238, Disco,
etc. Production and distribution of quality cane seed of approved varieties is desired by
the sugar mills on their own/rented farms, biological insect-pest control labs should be
established by all sugar mills to control Pyrilla and Borers complex, press Mud sale to
the brick kilns should be banned and sold to the farmers only as organic chemical
fertilizer, Pakistan Agricultural Research Council recommended for healthy seeds of
approved varieties of sugarcane, this cane increase cane yield from 20% to 25%.
Sugarcane varieties recommended for Khyber Pakhtunkhwa are CPM-13, CO-1321,
Mardan-93, JN 88-1, ABID-96 and Madan-2005, CP 77-400, MCP 421 and Mardan 92
(Zubair, 2014).
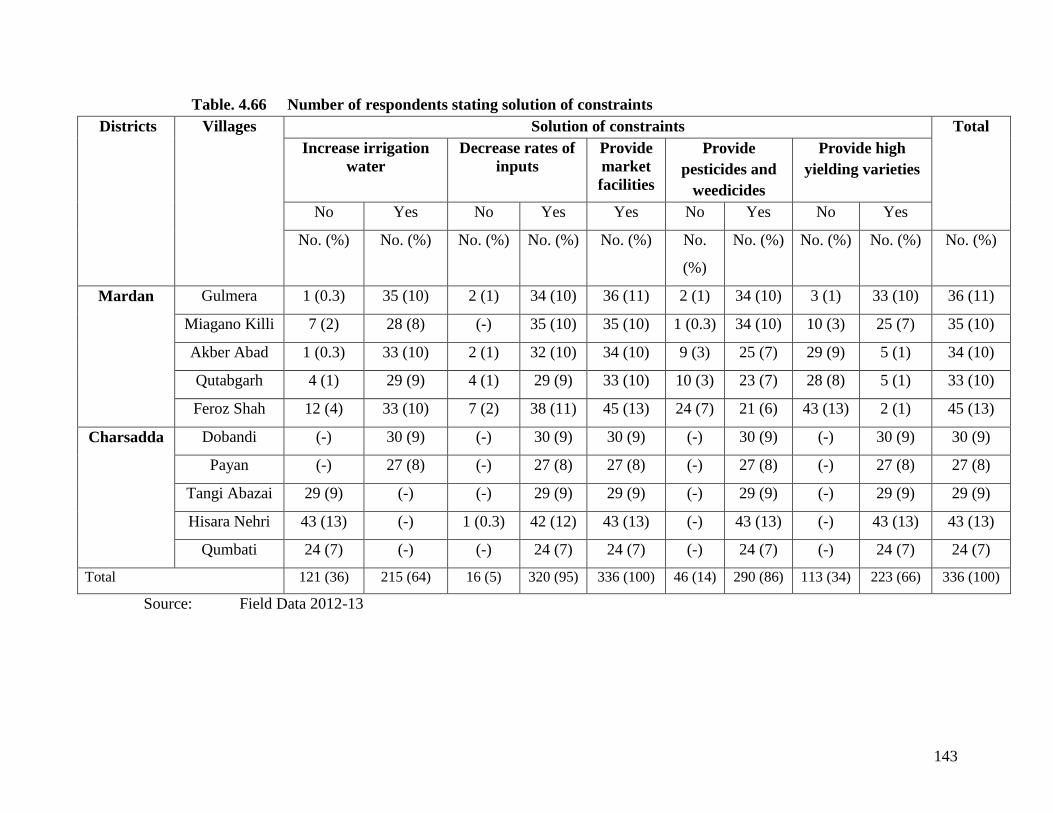
143
Table. 4.66 Number of respondents stating solution of constraints
Districts Villages Solution of constraints Total
Increase irrigation
water
Decrease rates of
inputs
Provide
market
facilities
Provide
pesticides and
weedicides
Provide high
yielding varieties
No Yes No Yes Yes No Yes No Yes
No. (%) No. (%) No. (%) No. (%) No. (%) No.
(%)
No. (%) No. (%) No. (%) No. (%)
Mardan Gulmera 1 (0.3) 35 (10) 2 (1) 34 (10) 36 (11) 2 (1) 34 (10) 3 (1) 33 (10) 36 (11)
Miagano Killi 7 (2) 28 (8) (-) 35 (10) 35 (10) 1 (0.3) 34 (10) 10 (3) 25 (7) 35 (10)
Akber Abad 1 (0.3) 33 (10) 2 (1) 32 (10) 34 (10) 9 (3) 25 (7) 29 (9) 5 (1) 34 (10)
Qutabgarh 4 (1) 29 (9) 4 (1) 29 (9) 33 (10) 10 (3) 23 (7) 28 (8) 5 (1) 33 (10)
Feroz Shah 12 (4) 33 (10) 7 (2) 38 (11) 45 (13) 24 (7) 21 (6) 43 (13) 2 (1) 45 (13)
Charsadda Dobandi (-) 30 (9) (-) 30 (9) 30 (9) (-) 30 (9) (-) 30 (9) 30 (9)
Payan (-) 27 (8) (-) 27 (8) 27 (8) (-) 27 (8) (-) 27 (8) 27 (8)
Tangi Abazai 29 (9) (-) (-) 29 (9) 29 (9) (-) 29 (9) (-) 29 (9) 29 (9)
Hisara Nehri 43 (13) (-) 1 (0.3) 42 (12) 43 (13) (-) 43 (13) (-) 43 (13) 43 (13)
Qumbati 24 (7) (-) (-) 24 (7) 24 (7) (-) 24 (7) (-) 24 (7) 24 (7)
Total 121 (36) 215 (64) 16 (5) 320 (95) 336 (100) 46 (14) 290 (86) 113 (34) 223 (66) 336 (100)
Source: Field Data 2012-13
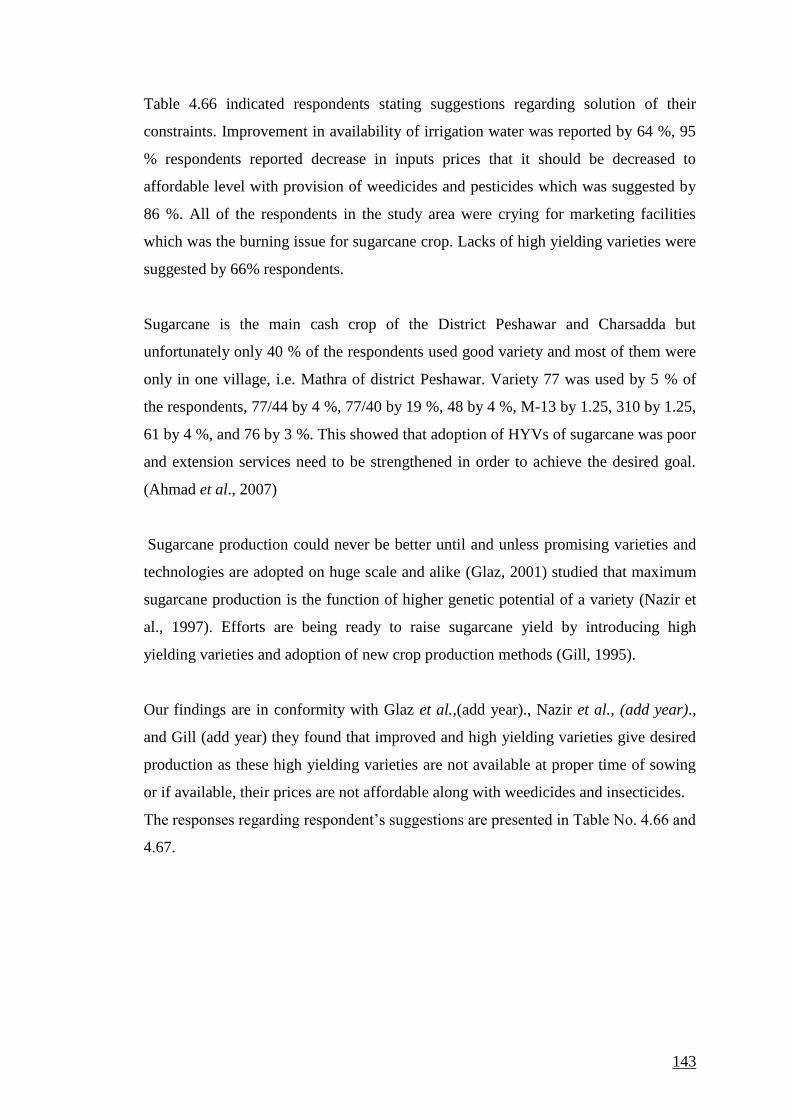
143
Table 4.66 indicated respondents stating suggestions regarding solution of their
constraints. Improvement in availability of irrigation water was reported by 64 %, 95
% respondents reported decrease in inputs prices that it should be decreased to
affordable level with provision of weedicides and pesticides which was suggested by
86 %. All of the respondents in the study area were crying for marketing facilities
which was the burning issue for sugarcane crop. Lacks of high yielding varieties were
suggested by 66% respondents.
Sugarcane is the main cash crop of the District Peshawar and Charsadda but
unfortunately only 40 % of the respondents used good variety and most of them were
only in one village, i.e. Mathra of district Peshawar. Variety 77 was used by 5 % of
the respondents, 77/44 by 4 %, 77/40 by 19 %, 48 by 4 %, M-13 by 1.25, 310 by 1.25,
61 by 4 %, and 76 by 3 %. This showed that adoption of HYVs of sugarcane was poor
and extension services need to be strengthened in order to achieve the desired goal.
(Ahmad et al., 2007)
Sugarcane production could never be better until and unless promising varieties and
technologies are adopted on huge scale and alike (Glaz, 2001) studied that maximum
sugarcane production is the function of higher genetic potential of a variety (Nazir et
al., 1997). Efforts are being ready to raise sugarcane yield by introducing high
yielding varieties and adoption of new crop production methods (Gill, 1995).
Our findings are in conformity with Glaz et al.,(add year)., Nazir et al., (add year).,
and Gill (add year) they found that improved and high yielding varieties give desired
production as these high yielding varieties are not available at proper time of sowing
or if available, their prices are not affordable along with weedicides and insecticides.
The responses regarding respondent’s suggestions are presented in Table No. 4.66 and
4.67.
144
Table. 4.67 Number of respondents stating suggestions to government for
sugarcane cultivator
Districts Villages Suggestion of sugarcane cultivator Total
Program start
for sugarcane
growers
Govt. check
agric. officer
Improve water
channels
No
(%)
Yes.
(%)
No
(%)
Yes.
(%)
No
(%)
Yes.
(%)
No. (%)
Mardan Gulmera (-) 36 (11) (-) 36 (11) 1 (0.3) 35 (10) 36 (11)
Miagano
Killi
(-) 35 (10) (-) 35 (10) 5 (1) 30 (9) 35 (10)
Akber
Abad
(-) 34 (10) (-) 34 (10) 4 (1) 30 (9) 34 (10)
Qutabgarh (-) 33 (10) (-) 33 (10) 18 (5) 15 (4) 33 (10)
Feroz
Shah
(-) 45 (13) 4 (1) 41 (12) 30 (9) 15 (4) 45 (13)
Charsadda Dobandi (-) 30 (9) 26 (8) 4 (1) 15 (5) 15 (4) 30 (9)
Payan (-) 27 (8) 25 (7) 2 (1) 15 (5) 12 (4) 27 (8)
Tangi
Abazai
(-) 29 (9) 13 (4) 16 (5) 29 (9) (-) 29 (9)
Hisara
Nehri
(-) 43 (13) 43
(13)
(-) 43(13) (-) 43 (13)
Qumbati 1
(0.3)
23 (7) 19 (6) 5 (1) 24 (7) (-) 24 (7)
Total 1
(0.3)
335
(99)
130
(39)
206
(61)
184
(55)
152
(45)
336
(100)
Source: Field Data 2012-13
Sugarcane cultivated area and production in Pakistan
Agricultural activities in plain areas of Pakistan are performed in two seasons. Those
crops which are cultivated before the beginning of winter season and harvested in
early summer is known as “Rabi Crops”. It includes wheat, barley, grams, oil seeds,
pulses etc and those crops which are grown in the beginning of summer and their
picking or harvesting takes place in early winter is called “Kharif Crops”. It includes
Rice, Sugarcane, Millets, and Maize etc that are the main crops cultivated in Pakistan.
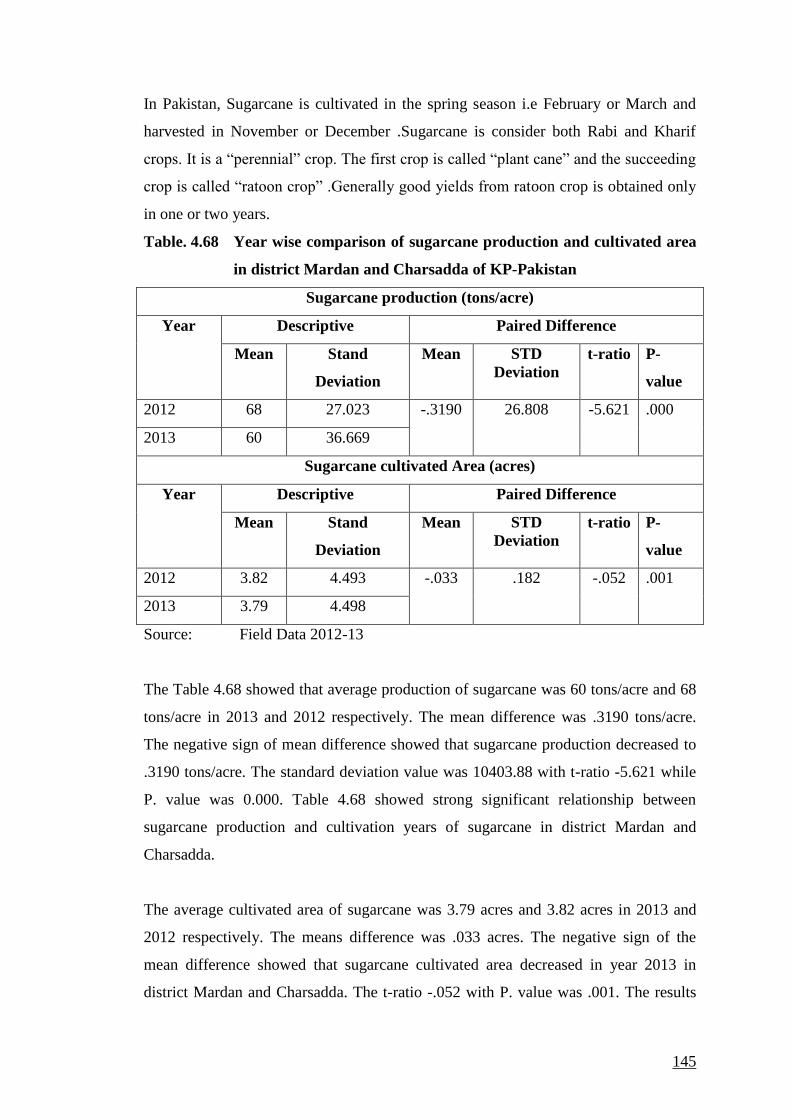
145
In Pakistan, Sugarcane is cultivated in the spring season i.e February or March and
harvested in November or December .Sugarcane is consider both Rabi and Kharif
crops. It is a “perennial” crop. The first crop is called “plant cane” and the succeeding
crop is called “ratoon crop” .Generally good yields from ratoon crop is obtained only
in one or two years.
Table. 4.68 Year wise comparison of sugarcane production and cultivated area
in district Mardan and Charsadda of KP-Pakistan
Sugarcane production (tons/acre)
Year Descriptive Paired Difference
Mean Stand
Deviation
Mean STD
Deviation
t-ratio P-
value
2012 68 27.023 -.3190 26.808 -5.621 .000
2013 60 36.669
Sugarcane cultivated Area (acres)
Year Descriptive Paired Difference
Mean Stand
Deviation
Mean STD
Deviation
t-ratio P-
value
2012 3.82 4.493 -.033 .182 -.052 .001
2013 3.79 4.498
Source: Field Data 2012-13
The Table 4.68 showed that average production of sugarcane was 60 tons/acre and 68
tons/acre in 2013 and 2012 respectively. The mean difference was .3190 tons/acre.
The negative sign of mean difference showed that sugarcane production decreased to
.3190 tons/acre. The standard deviation value was 10403.88 with t-ratio -5.621 while
P. value was 0.000. Table 4.68 showed strong significant relationship between
sugarcane production and cultivation years of sugarcane in district Mardan and
Charsadda.
The average cultivated area of sugarcane was 3.79 acres and 3.82 acres in 2013 and
2012 respectively. The means difference was .033 acres. The negative sign of the
mean difference showed that sugarcane cultivated area decreased in year 2013 in
district Mardan and Charsadda. The t-ratio -.052 with P. value was .001. The results
146
showed strong significant relationship between year and cultivated area of sugarcane
in district Mardan and Charsadda. The main reasons for less production and area were
lack of High Yielding Varieties (HYV), high cost of inputs, in-effective use of
pesticides and weedicides and low quality of pesticides and weedicides, in-sufficient
irrigation water, lack of market facility, poor extension services, no effective and
fruitful program for sugarcane growers, no check and balance system of agricultural
extension department and its activities.
In research study (Pervaiz et al., 2013) pointed out that sugarcane cultivated area and
Production had decreased within five years 2005-10 years in Khyber Pakhtunkhwa-
Pakistan. They recommend that Government should provide required amount of loan
to the farmers for agricultural purpose at soft terms and conditions and low interest
rate. Government should control the prices of all necessary inputs and give subsidy to
farmers. There is a need to direct the attention of concerned authority to activate
agricultural extension services. Agricultural extension activities need to be propagated
through all groups and mass communication.
147
V. SUMMARY, CONCLUSIONS AND RECOMMENDATIONS
5.1 SUMMARY
Sugarcane is widely grown in district Peshawar, Charsadda, Mardan, Swabi, Bannu
and Dera Ismail Khan of Khyber Pakhtunkhwa for sugar and Gur manufacturing
purpose. The opportunity of employment has also been created for local skilled, semi-
skilled and un-skilled peoples. Instead of important cash crop, the area and production
of sugarcane is not increasing significantly. The present study was initiated to identify
the short coming and acute shortage of sugarcane cultivation. The main objectives of
this study were to analyze the role of agricultural extension services in promoting
sugarcane production and factors responsible for poor agricultural extension services
regarding sugarcane production and its low yield/acre.
Majority of the respondents’ i.e 80 % were illiterates while the 20 % were literate.
Age is an important factor to accept new agricultural technologies. The 17 % (young)
of the respondents were in age category 26-35 years, 70 % (middle age) in category
36-45 years and 14 % (old age) were above 45 years.
The sugarcane growers are also categorized as share cropper (42 %), owner
cultivators (37 %,) owner-cum tenant (13 %) and tenants (7 %). They were further
divided on basis of land holding i.e 89 % of the respondents having up to 5 acres, 6 %
having land 6-10 acres. The remaining 2 % of respodents where each having land 11-
12 and 17-21 acres. The 83 % farmers were above 45 years. The 78% respondents
were cultivating sugarcane from last 15 years. The remaining 12 %, 7 % and 3%
respondents of district Mardan cultivating sugarcane more than 15 years, 10 years and
less than 5 years respectively. Either chemical fertilizers are not used due to soil
fertility or due to its non-availability at right time and un-affordable price of DAP as
stated by 70% of respondents. The 13 % of respondents did not use nitrate. The
phosphate was not used by 93 % while only 7 % respondents used less than 2
bags/acre of phosphate. The majority respondents were using Farm Yard Manure
(FYM) in little amount.
Irrigation water and soil types are important factors for cultivation of sugarcane crops.
In research area, sufficient irrigation water was not available at needed time but its
148
positive association with production was due to use of canal irrigation water. The
respondents constituting the percentage of 53, 32, 8 and 7 were having silt loam, clay
loam, sandy loam and waterlogged loam respectively.
Sugarcane was grown in month of February reported by 91 % respondents (most
suitable time) while the remaining 9 % respondents cultivate sugarcane in month of
November. The crops are grown on fallow land by 13% and intercropping 87 % of the
respondents. The use of intercropping decrease production but it is profitable for
sugarcane growers to get more than one crop simultaneously.
Agricultural Machinery implies the use of various power sources and improved
farming tools and equipments with view to reduce drought of human being and
animals. Cultivator was used by majority of the respondents’ i.e 74 % followed by 24
% rotivator and only 2 % used bullock driven rotivator. The sugarcane growers are
getting information from fellow farmers (88 %), extension department (6 %) and the
remaining (6 %) using their own sources. Majority 98 % of the respondents were
satisfied with the use of agricultural machinery by saving their time and is cost
effective and only 2 % were not satisfied by stating their high cost. The cost of
machinery was Rs 2000/- to 3000/- per acre as stated by respondents.
The respondents constituting 38 %, 36 %, 17 % and 3 % used seed rate per acre was
3200 kg/ 2400 kg, 4000 kg and 1600 kg respectively. Again 72 %, 19 % and 5 %
respondents were using CP 77/400, CP 77-78 and 248 varieties respectively. The 80
% of respondents had not cultivated sugarcane for sugar mills.
Weeds were one of the main problems of sugarcane growers and most common weeds
were Convolvulus arvensis, reported by 67 % of the respondents Sorgam helepensis
by 89 %, Siysbrium irrio by 70 %, Parthebium Spp by 74 %, Cirum arvensis by 85 %
and Scandix Spp by 74 %. All respondents tried to control weeds by mechanical,
cultural and chemical method (68%). All the respondents were controlling weeds by
mechanical and cultural methods i.e. physically by cultivation of resistant varieties, by
crop rotation and eradication of the weeds. Chemically weeds are controlled by
respondents 33 %, 32 %, 31 %, 16 % and 4 % by using Ametyern, Atrazin, Azafax
Port and Parvan respectively. The other chemicals were reported by 7% respondents.
The insect pests of sugarcane in research area were causing considerable losses.
Among the use of pesticides reported by respondents 71 %, 33 %, 30 %, 18 % and 1
149
% Insecticides, Termiticides, Regind, Millathian and Puradan respectively. The pest
of sugarcane were rates, borers, pyrilla and termiticids reported by 85 %, 62 %, 62 %
and 47 % respondents respectively.
Infrastructure and roads are playing an important role for all crops in general and
sugarcane in particular to carry the crops from field to market. However, 66 %
respondents reported good road conditions while 34 % reported poor condition of
road. Distance from market and village reported by respondents 64 %, 99 % and 3 %
from 4-6 kilometers, 1-3 kilometers and 7-10 kilometers respectively.
Agricultural extension services are very important for quick adoption and the
diffusion of agricultural technologies. However, vast majority of 87 % of respondents
did not know about agricultural extension agent, who playing the role of front line
worker. Only 7 % of respondents knew them by face while 6 % knew them by name.
The sugarcane production of the familiar respondents with extension workers was
much higher than the rest of the respondents.
The provisions of information to the farmers regarding new agricultural technologies
are the basic responsibilities of agricultural extension workers. However, they were
failed to provide new and needed agricultural information to end users reported by 93
% respondents and only 7 % respondents replied positively. Factors responsible for
poor performance of agricultural extension services as observed by the researcher and
respondents were shortage of experience and qualified staff, lack of interest and
corruption, checks and balance system and transport problem stated by 9 %, 23 %, 2
% and 1 % respondents respectively.
In modern era of technologies electronic media is playing an important role in
diffusion and adoption of new agricultural technologies across the region. Strangely
enough only 1 % got information through television. The radio was the best source of
information reported by 86 % of the respondents.
Receiving of agricultural practices through informal method was reported by 51 %
respondents. Knowledge through progressive farmers on scientific technology
providing to the farmers stated by 22 % respondents and getting useful information
from pesticides dealers were stated by 41 % respondents. The main constraints
regarding sugarcane cultivation and low yield in the study area were shortage of
150
irrigation water, expensive inputs, lack of high yielding varieties, weed and diseases
and lack of market facility was reported by 64 %, 96 %, 66 %, 86 % and 100 %
respondents respectively.
The associationship of various variables i.e the function of field assistant, (p.value
=0.000), the role of agricultural extension department (P. value=0.000), distance of
local market from village (P. value= 0.000), road condition (P. value= 0.000) and
knowledge about agricultural extension department (P. value= 0.000) with sugarcane
production (kg acre-1) is highly significant. The association between visit of
agricultural extension department (P. value= 0.000), distance of agricultural extension
department from village and providing information by field assistant (P. value
=0.000) with sugarcane production (kg acre-1) is highly significant. The study further
showed that the association between methods of agricultural information (P. value=
0.000) and knowledge through television (P. value= 0.195) with sugarcane production
is highly significant. It is the evident from the data that association between
techniques providing by progressive farmers (P. value= 0.000), knowledge from
pesticides dealers (P. value= 0.000), shortage of irrigation water (P. value= 0.000),
expensive inputs (P. value= 0.000) and lack of high yielding varieties (P. value=
0.000) with sugarcane production is highly significant.
151
5.2 CONCLUSIONS
It is concluded from the present study that…
1. Research area had a large number of tenants and share cropper as owner can get
higher production, majority of uneducated farmers as higher production was
observed from educated farmers who were minimum and majority respondents
were from middle aged
2. Majority of the respondents were middle (36-45 years) age. This shows that the
respondents are mature and responsible to make decision.
3. Mostly respondents having small size of landholding up to 5 acres. It shows that
no respondent was without land while, some respondents land is un-cultivable or
under road, under canal, water logging and are not suitable for sugarcane
cultivation.
4. Majority of respondents were not using DAP because of its non-availability at
right time or un-affordable price. Again phosphate was not used by mostly
respondents because of soil fertility while some used it with un-recommended
doses which increased only cost rather than return.
5. Majority of respondents having insufficient irrigation water in the study area.
On the other hand farmers having silt loam, clay loam, sandy loam, water
logged loam soil which mainly determined the needs of water.
6. Majority of the respondents cultivating their crops in month of February (most
suitable time) and mostly sample respondents use intercropping method because
they were in opinion that it is more profitable to get two or more than two crops
which give them more return at the same time.
7. Majority of respondents use cultivator in the study area. They mostly got
information related agricultural machinery from fellow farmers. Surprisingly
majority of respondents were satisfied with the use of agricultural machinery by
saving their time and less cost effective. The sugarcane production per acre was
not reduced only reduced due to unrecommended practices but pest invasion
also plays their role. The major enemies of the crops wereweeds, insects and
pests in the study area. If they are controlled timely and through recommended
methods will automatically increase per acre yield. So the important weeds
reported by the respondents were Convolus arvensis, Sorgam helepensis,
Sisybrium irrio, Parthenium Spp, Siyribrium hervensis and Scandix Spp. They
were controlled by mechanical, cultural and chemical methods. Chemically
152
weeds are controlled by using by Ametryn, Atrazeen, Azafax port and Parvan.
The insects pest of sugarcane was controlled by majority of respondents through
pestcides application in the study area.
8. Due to poor role of extension services, farmers were still using old varieties of
sugarcane.
9. Mostly respondents reported good road condition. Majority of respondents
reported 4-6 kilometers and 1-3 kilometers from villages. Due to high level of
illiteracy and vast majority of the farmers’ confidence on primitive and un-
recommended technology available from fellow farmers adversely affect the
knowledge about extension workers but a small number of respondents knew
them by face and by name. The most and strong media which is playing an
important role in diffusion and adoption of new agricultural technologies in the
absence of agricultural extension agents is electronic media. But majority of
farmers are illiterate and using primitive, un-recommended inputs and their
doses, they are receiving non-technical information from fellow farmers and
they are un-able to read written materials. So their farming is far away from
scientific line.
10. The association of dependant variable (sugarcane production) with independent
various variables (the function of field assistant , the role of agricultural
extension department, distance of local market from village, road condition,
farmers knowledge about agricultural extension department and extension
agents visits to farmers fields, the information getting sources i.e progressive
farmers, pesticides dealers, shortage of irrigation water, expensive inputs and
lack of high yielding varieties) was highly significant.
11. There was lack of cooperation and coordination between Progressive farmers
and farming communities.
153
5.3 RECOMMENDATIONS
Bassed on the research findings following recommendation are formulated
that…
1. Government may provide formal and in-formal education to the farmers that
they should accept the importance of innovations.
2. Government could provide farmers training to the all age people specially
middle age people that they should get maximum knowledge and profit.
3. All decisions made by share croppers, owners and owner- cum tenant may be
ascertained by government that no conflicts occur between farmers.
4. Government could provide facilities to all of the farmers irrespective of their
landholding.
5. It is recommended that agricultural extension department should provide
informations about different chemical fertilizers, their doses and time of
application and proper check and balance system for Extension Personnel may
be there.
6. Government may arrange sufficient water for different types of lands regarding
to the needs and requirements of Sugarcane crops.
7. Agricultural Extension department may advice the respondents for further
improvement by visiting their farms.
8. Agricultural extension services should provide latest cultivation methods,
recommended seed rate and to protect their crops from the loss of weeds and
insect/pests to save their crops.
9. Mobile facilities in shape of vehicles to the extension workers may improve
their farm and home visits to the sugarcane growers by restoring their
confidence to help them in adoption of their recommendations such as, land
preparation, seed rate, protection from different enemies, use of recommended
machinery and other practices, in view to increase the per acre production.
10. Extension services should be enthusiastically activated and equipped with the
latest knowledge of Sugarcane for effective adoption and diffusion of new
Sugarcane technology among the farming community especially to uneducated
farmers in local language by involving small farmers.
11. There should be proper check and balance system in the extension department
specifically and sugar cane growers generally and farmers may be practically
trained especially for Sugarcane cultivation.
154
12. It is recommended that required inputs may be made available in the local
market at reasonable prices when needed by the farmers. An improved
sugarcane package may be developed by the agriculture extension department
and not only publicize it but also distribute it to the farmers on their door steps
in the form of literature to guide them in a perfect sense and also the use of
important methods during demonstration sessions.
155
LTERATURE CITIED
Abbas. M., S. Mohammad., I. Nabi and A. D. Sheikh. 2003. Farmers-Extension
Interaction and the Dissemination of Recommended Sugarcane Production
Technologies in the Central Punjab (Pakistan). International Journal of
Agriculture & Biology. 5(2):134-137.
Achakzai. J. 2013. Impact of agricultural extension services on the use of chemical
fertilizer in Baluchistan province. SJA. 29(2): 317-324
Afghan. S. 1997. Does raw material get necessary development approach for sugar
industry, PSST Proc. of workshop on Agriculture, Karachi-Pakistan. Pp 30-34
Afghan. S. and S. A. Qureshi. 1992. Pakistan with Known Sugarcane Production
Technology Can Obtain Recovery of 10 %. PSST Proc. 27th Annual.
Convention. 1-4 Sept. Lahore.
Agrihunt Report. 2011. Khyber Pakhtunkhwa Sugar Output Set to Decline by 6.6
Percent: Business Recorder on Tuesday, 01/11/2011: available at web cite
http://www.brecorder.com/agriculture-a-
llied/single/624/183:pakistan/1247633:khyber-pakhtun khwa-sugar-output-set-
to-decline-by-66-percent/date=2011-11-01.
Ahmad, M., A. P. Davidson. and T. Ali. 2000. Effectiveness of Public and Private
Sectors Extension: implications for Pakistan farmers; paper presented at 16th
annuals conference of AIAEE held at Arlington VA. Pp 9-12
Ahmad. M. 1999. A Comparative Analysis of the Effectiveness of Agricultural
Extension Work by Public and Private Sectors in Punjab, Pakistan: PhD
Thesis University of New England, Armidale. Pp 53-55
Ahmad. M., M. Akram, R. Rauf, I. A. Khan. and U. Pervez. 2007. Interaction of
Extension Worker with Farmers and Role of Radio and Television as Source
of Information in Technology Transfer: A Case Study of Four Villages of
District Peshawar and Charsadda. SJA. 23 (2): 516-518.
Ahmad. M., R. Rauf, M. Akram, I. A. Khan. and A. Ali. 2007. Adoption of Farm
Machinery; Chemical fertilizer and Soil as Well as Plant Protection Measures.
SJA. 23 (4): 170-172.
Ahmad. S., Jamal, M. Ikramullah. and A. Himayathullah. 2007. Role of extension
services on the farm productivity of district Swat (A Case Study of Two
Villages). SJA. 23 (4): 266-272.
156
Ahmad. S., S. Saleem, M. Zubair, I. A. Khalil, K. Sohail. and Z. Rehman. 2012.
Farmer’s Practices and Yield Response of Sugarcane in Jhang and Sargodha
Districts, Pakistan. SJA. 28(2): 238-354.
Ahmed. A. 1980. The Impact of Land Reforms. SJA 1(2): 87-92.
Ahmed. R. M. 1987. To Study effectiveness of Channels of communication of the
Transfer of Agriculture Technology of Wheat, Sugarcane and Cotton tot the
Farmers in Tehsil Kot Adu of district Muzzafargarh. M. Sc (Hon) un
published Thesis. Deptt. Of Agric. Ext., Univ. of Agric. Faisalabad. Pp 25-28
Anonymous. 2012. Agriculture Economic Research Section, AARI, Faisalabad-
Pakistan. Pp 15-17
Antholt. C. H. 1994. Getting ready for the Twenty First Century: Technical Changes
and Institutional Modernization in Agricultural: World Bank Technical Paper
No. 217. Washington D.C: World Bank. Pp 17-21
Asghar. M. Q and S. Afghan (ed.). 2005. Sugarcane cultivation in Pakistan. Pakistan
Sugar Book. Shakarganj Sugar Research Institute, Jhang: Pp 1-11.
Assefa. Y., J. V. Den. And D. E. Berg. 2008. Farmers Perceptions of Sugarcane Stem
Borers and Farm Management Practices in The Amhara region of Ethiopia.
International Journal of Pest Management 54(3): 219-226.
Asi. A. B (Ed.). 1988. To Study the Effectiveness of Extension Wing of Agricultural
Department as a Source of Information for the Farming community in Tehsil
Okara, district Okara. M.Sc (Hons) un published Thesis. Deptt of Agric. Ext.
Univ. of Agric. Faisalabad. Pp 21-23
Azam. M and M. Khan. 2010. Significance of the Sugarcane Crops with Special
Reference to NWFP. SJA 26(2): 290-295.
Baily. K. D (Ed.). 1982. Methods of Social Research 2nd Ed. New York-Macmillan
Publishing Co., Inc. Pp 41-48.
Bahadar. K., M. Rashid and A.Quddoos. 2012. Response of New Sugar Cane
Genotype in Southern Region of Khbyer Pakhtunkhwa. Pak Sugar J, 1(2):
Pp2-10.
Basant. R. 1988. Indigenous Knowledge and Technologies diffusion: A Case of Agro-
Mechanical Technology in Gujrat. The Gujrat Institute of Area Planning.
Working Paper No. 16 March. Ahmedabad. Pp 1-15.
157
Behrens. J. H and J. F. Evans. 1984. Using mass media for extension teaching. In: B.
E. Swanson (Ed.) Agricultural Extension: a reference manual. 2nd ed. FAO,
United Nation, Rome. Pp. 144-155.
Bilalis. D., N. Sidiras, G. Economous. and C. Vakali. 2003. Effect of different Levels
of Wheat Straw Soil Surface Coverage on Weed Flora in Vicia Faba Crops.
Journal of Agronomy and Crop Science. 189: 233-241.
Birkhaeuser. D., R. Evdnson. and G. Feder. 1991. “The Economic Impact of
Agricultural Extension: a Review”. Economic Development and Cultural
Changes 39(3): 507-521.
Chapman. R., R. Blench, K. Berisavljevic. and G.A. Zakariah. 2003. Rural radio in
agricultural extension: the example of vernacular radio programmes on soil
and water conservation in n. Ghana. Agricultural Research & Extension
Network Paper No.127.
Chauhan. R. S and T. K. Sarivastava. 2002. Influence of Weed Management Practices
on Weed Growth and Yield of Sugarcane. Ind. J of Weed Sci. 34: 318-319.
Cochran. W. G. 1977. Sampling Techniques, 3rd Edition. John Wiley and Sons, New
York. Pp 37-40.
Davidson. A. P., M. Ahmad and T. Ali. 2001. Dilemmas of Agricultural Extension in
Pakistan: Food for Thought ODI Agricultural Research & Extension Network.
Network Paper No. 116. Pp 7-10
Deho. Z. A., S. D. Tunio, Y. J. Minhas and H. I. Majeedano. 2002. Effect of
Mulching Techniques on the Growth and Yield of Sugarcane. Pak. Sug. J. 17:
22-26.
Denevan. W. M. 1995. Prehistoric agricultural methods as models for sustainability.
Adv Plant Pathol 11: 21-43.
Dercon. S., D. O. Gilligan, J. Hoddinott and T. Woldehanna. 2008. The Impact of
Agricultural Extension and Roads on Poverty and Consumption Growth in
Fifteen Ethiopian Villages. International Food Policy Research Institute
(IFPRI) Discussion Paper 00840.
Dhawan. B. D (Ed.). 1989. Studies in Irrigation and Water Management, New Delhi:
Commonwealth Publishers. Pp 51-55
Dinar. A and D. Yaron. 1992. Adoption and abandonment of irrigation technologies.
Journal of Agricultural Economics. 6 (1): 315-332.
158
Dinar. A and D. Zilberman. 1991. The economics of resource-conservation.
Environmental Resource Economics. 3 (1): 260-269.
Dinar. A., M. B. Campbell and D. Zilberman. 1992. Adoption of improved irrigation
and drainage reduction technologies under limiting environmental conditions.
Environmental Resource Economics. 2 (1): 360-373.
Dixon. J., K. Taniguchi, and H. Wattenbach. (eds.). 2003. Approaches to Assessing
the Impact of Globalization on African smallholders: Household and Village
Economy Modeling. Proceedings of a working session on Globalization and
the African Smallholder Study. Rome: Food and Agriculture Organization. Pp
27-31
FAO (Ed.). 1985. Reports of an Experts Consultation on Agricultural Extension and
Research Linkages in the near East, Aman, Jordan. 22-26 July, Rome.Italy. Pp
21-23
Federal Bureau of Statistics. 2011-2012. Annual Report about of Agricultural of
Federal Bureau of Statistic. Page No. 14 and 18. Pp 14-17
Ghafoor. A and M. M. Nayyar. 1987. Strategy of Variety Development and Autumn
Planting in Sugar mills zones of Punjab Province. Proc. Pak. Soc. Sug. Tech.
23: 268-285.
Gilbert. N. W. 1990. A Critical (M.S.U) Rural Development Paper No.(6). Fafling
System Research. Department of Agri. Economic, Michigan University,
U.S.A. Pp. 18-20.
Gilbert. R. A, D. R. Morris, R. E. Perdomo, G. Powell, B. Eiland, and C. R. Rainbolt.
2004. Comparison of Nutrient Sources for Mineral Nutrition of Florida
Sugarcane. Sugarcane Field Station, Florida Crystals Corporation - FL. Pp. 45-
56.
Gill. M. B (eds.). 1995. Physio agronomic studies on flat versus pit plantation of
autumn and spring sugarcane (Saccharum officinarum, L.). Ph.D. Agri. Thesis,
Department of Agronomy, University of Agri. Faisalabad (Pakistan). Pp 49-
89.
Glaz. B. 2001. Sugarcane variety census; Sugar Y. Azucar. Pp 23.
GoP. 1997. Chemical fertilizer Recommendation in Pakistan. (A Pocket guide for
Extension Workers) (P-1). Planning and development Division, National
Chemical fertilizer Development Center, Islamabad. Pp. 14-15.
159
GoP. 1998. Area and Population of Khyber Pakhtunkhwa. For detail information
please visit kpbos.gov.pk. 23-05-2014
GoP. 2005. Economic Survey of Pakistan, Islamabad, Pakistan. Government of
Punjab, Agriculture Department. (n.d) Future Agricultural Extension Strategy.
Lahore, Pakistan. Pp-14-15.
GoP. 2010. Ministry of Food and Agriculture Government of Pakistan. Page No.13
and 18 available at the web site www.finance.gov.pk/survey/chepter-10/02-
Agriculture. pdf. 03-02-2014
GoP. 2011. Economic Survey of Pakistan. Chapter Agriculture. Federal Bureau of
statistic Islamabad-Pakistan. Pp. 18-19.
GoP. 2013. Highlights of Economy of Pakistan. Available at website as: www.
google.com.pk/ agriculture annual report of 2013. Pp. 18-20.
GoP. 2012-13. District Wise Area and Production of Sugarcane in Khyber
Pakhtunkhwa-Pakistan. un-published data of Agricultural Statistical Bureau of
Khyber Pakhtunkhwa. 14-04-2014
Goud. V. V. 2011. Sustainable Sugarcane Initiative, SSI - A Methodology for
Improving Yields. First National Seminar on Sustainable Sugarcane Initiative,
SSI. AgSri, Sugarcane Breeding Institute (SBI) & NRMC (NABARD). Pp. 9-
14
Gujrati. D. N (Ed.). 2004. Basic Econometrics: International Edition 3rd ed., Me
Graw Hill Book Co., New York. Pp 61-66
Gul. F., M. Naeem and Inayatullah. 2008. Effect Of Different Control Methods On
The Infestation Of Borers In Sugarcane Plant And Ratoon Crops. SJA 24 (2):
274-278.
Gul. F., M. Naeem and Inayatullah. 2008. Resistance In Some Promising Varieties of
Sugarcane To different Borers. SJA 24(2): 270-272.
Gul. F., M. Naeem, Inayatullah and R. A. Shah. 2010. Role of Gurdaspur Borer
(Bissetia Steniellus Hampson) in Sugarcane Ratoon Crop Failure and Its
Integrated Control at Mardan. Sarhad J. Agric 26(3): 388-391.
Habib. M., M. Zafarullah, M. Iqbal., K. Nawab and S. Ali (2007). Effect of Farmer
Field Schools on sugarcane Productivity in Malakand Agency. SJA 23 (4):
134-137.
160
Haq. I., M. Ahmad and E. Malik. 2004. The Role of Extension Agent in the
Technology Transfer: A Case Study of Kurram Agency. Sarhad J. Agric. 20
(1): 169-173.
Hassan. 1992. Organizational Properties and Manifestation of Different Models of
Extension Work. Bangladeh Sugar and Food Corporation Dhaka. Bangladesh
Journal of Extension System, 8 (5): 100-120.
Hayat. A (Ed.). 1982. An evaluation of working of the Punjab extension and
agriculture development project in Sargodha District”. Un published Thesis of
M.Sc. (Hons) Agri. Univ. Agri. Faisalabad. Pp 31-35
Hazell. P., C. Poulton, S. Wiggins, and A. Dorward. 2007. The Future of Small Farms
for Poverty Reduction and Growth. International Food Policy Research
Institute (IFPRI) 2020 Discussion Paper 42, May 2007. Washington D.C.:
IFPRI. Pp 12-16
Hu. R., Y. Cai, K. Z. Chen, Y. Cui and J. Huang. 2010. “Effect of Inclusive Public
Agricultural Extension services, Results from a Policy Reform Experiment in
Western China”. International Food Policy Research Institute discussion
(IFPRI) Paper 01037. Pp 7-12
Husain. N (Ed.). 2004. Analysis of the competency levels of extension administration
in the Punjab, Pakistan. Un published PhD thesis, Deptt., Ext. Edu., Univ.
Agric., Faisalabad, Pakistan. Pp 50-59
Hussain. A and N. R. Khattak. 2011. Economic Analysis of Sugarcane Crop in
District Charsadda. J. Agric. Res 49(1): Pp. 153-163.
Hussnain, ul, Z., A. Naheed and S. Rizwana. 2007. Biocontrol Of Insect Pests Of
Sugarcane (Saccharum Sp.).Shakarganj Sugar Research Institute, Jhang,
Pakistan. Pp 34-38
International Weed Science Conference (4th) .2012. "Vegetation Management In 21st
Century" Held In Agricultural University Peshawar. Weed Science Society of
Pakistan. Department of Weed Science. NWFP Agricultural University
Peshawar-Pakistan. Pp 14-17
Iqbal. M (ed.). 2006. Effect of Farmers Field School on Rice, Sugarcane and Tomato
Productivity in District Malakand. Unpublished. M.Sc (Hons). Thesis NWFP
Agricultural University Peshawar. Pp. 56-57.
Iqbal. N (ed.). 1989. Impact of Radio Programme”Ravi Tay Chana” Broadcasted by
Radio Station Faisalabad on Adoption of Agricultural Innovations. Un
161
Published M.Sc (Hons) Thesis. Deptt. Of Agric. Ext., Univ. of Agric.
Faisalabad. Pp 25-28
Jan. O. 1977. Daiky Kia Guzari Hai Ganney Pay Shakkar Honay Tak (Urdu). Mian
Obaidullah Jan, Malkadher Charsadda, N.W.F.P, Pakistan.
Jensen. R. 1982. Adoption and diffusion of an innovation of uncertain profitability.
Journal of Economics. 27 (1): 182-192.
Karim. B. M (ed.). 2005. Cane and Sugar Production. Inter-Cropping. Punjab
Agricultural Research Board. Technologies for prosperities of Agricultural
Stakeholders. Pp 51-55
Karim. B. M. 1990. Sugarcane Production Problems and Research Strategies for
Yield Improvement. Directorate of Agriculture Information Punjab,
Faisalabad-Pakistan. Pp 40-44
Kew. 2014. History of Sugarcane. Available at Website: http://www. Kew.org/plant-
cultures/plants/sugar-cane-history.html. Date (15-06-2014), time: 02:07 pm.
Khalil. I. A. and A. Jan (Ed.). 2002. Cropping Technology. National Book
Foundation, Islamabad. Pp. 126.
Khan, A. (Ed.) 2012. Analysis of Barrier to Communication Regarding Production
Technology among Researchers, Extension Personnel and Farmers in Khyber
Pakhtunkhwa: Pakistan. Unpublished PhD thesis of “The University of
Agriculture, Peshawar-Pakistan”. Pp 40-50.
Khan. D. G., M. Tariq, M. Shah, D. Khan, M. Zubair and Naveedullah. 2008.
Chemical Properties of Salt Affected Soil And Yield Of Sugarcane In Relation
To Water Table Depths In Mardan Scarp Area. SJA 24 (4): 630-634.
Khan. M. A. J (Ed.). 2003. Identification and rank order development of self-
perceived competencies possessed by agriculture extension agents in the
Punjab, Pakistan. Un published PhD Thesis, Department of Agric. Ext., Univ.
Agric. Faisalabad, Pakistan. Pp 61-66
Khan. M. H. 1983. Green Revolution and Redistribution of Rural Incomes: Pakistan's
Experience. The Pakistan Development Review. 22(1): 174-175.
Khan. M. N. 2008 (Ed.). Diffusion of Date Palm Orchards and Their Productivity
with the Perspective of Extension Servicers in Southern Parts of NWFP
Including FATA: Pakistan. Unpublished PhD thesis of The University of
Agriculture Peshawar-Pakistan. Pp 50-55.
162
Kotile. D. G and R. A. Martin. 1998. Farmers Prospective on sustainable Farming
system: A Case Study Proceeding pg the 14 th Annual Conference of the
Association for Internal Agricultural and Extension Education, Tucson,
Arizona. Pp. 361-369.
Kulander. G. and J. Delman. 1993. Getting to the Grassroots: Human Resource
Development for Agricultural Extension in China. Journal of Extension
Systems. 9(2): 65-132.
Kyomugisha. E. 2008. Land tenure and agricultural productivity in Uganda. Uganda
Strategy Support Program (USSP) Brief No. 5. Discussion Paper of
International Food Policy Research Institute (IFPRI). Pp 13-15
Maalouf. W. D., R. Adhikarya and T. Contado. 1991. Extension Coverage and
Resources Problems: The Need for Public- Private Cooperation, in W. M.
Rivera and D. J. Gustafson (Ed.). Agricultural Extension: Worldwide
Institutional Evaluation and Force for Change. Amsterdam: Elsevier Science.
Pp 23-27
Malik. K. B. (Ed.). 1989. Fifty Years of sugarcane Research. Directorate of
Agriculture Information Punjab, Lahore-Pakistan. Pp 41-46
Marinho. M. L., G. A. Cavalcanti, and L. C. Amorim. 1976. The influence of
Nitrogen, Phosphorus and Potassium on the Industrial Yield of the Sugarcane
Plantation in Alagoas. Abstracts on Tropical Agri. 2(8): 106-107.
Mishra. P. J., P. K. Mishra, S. Biswal, S. K. Panda and M. K. Mishera. 2003. Studies
on Integrated Weed Management Practices in Spring Planted Sugarcane of
Coastal Orissa. Indian Sugar. 52: 925-929.
Motavalli. P. P., R. P. Singh and M. M. Anders. 1994. Perception and Management of
Farmyard Manure in the Semiarid Tropics of India. Agr. Syst. 46 (2): 189–
204.
Muhammad. S and G. Chris. 1999. Farmer’s information sources and their relative
effectiveness. International Journal of Agriculture and Biology. 1 (4): 222-
226.
Nawaz. M (Ed.). 1989. Farmers perception of the working of extension field staff in
Jhang district. Un published M.Sc. Agric. Ext. Thesis, Univ. Agric.
Faisalabad. Pp. 69-79.
163
Nayyar. M. M., K. B. Malik, M. N. Kamoka and M. A. Gill. 1987. Economic
Feasibility of Intercropping some Field and Vegetables Crops in Spring and
autumn Crop of Sugarcane. Ibid. 23: 107-122.
Nazir. M. S., H. Ali, M. Saeed, A. Ghafar and M. Tariq. 1997. Juice quality of
different sugarcane genotypes as affected by pure and blend plantation. Pak.
Sugar J. 12(4): 12-14.
NCAER. 1980. Implication of Tractorisation for Farm Employment, Productivity and
Income. National Council of Applied Economic Research, New Delhi. Pp 31-
35.
NIFA. 2013. Annual Report of Nuclear Institute for Food and Agriculture Peshawar,
Pakistan. Page No. 15.
Nulty. N. 1972. The Green Revolution Technology in West Pakistan: implications of
technological change. Preeger Publisher. Pp 81-94.
Obien. S and A. M. Baltezar. 1980. Weed Control in Sugarcane in the Philippines.
Weed Abstract No. 3657. 29(11): 408.
Oladosu. O. I and E. O. Okunade. 2006. Perception of village extension agents in
disseminating agriculture information in Oyo Agricultural zone of Oyo-state.
Jouranl of Social Science. 12 (3): 187-191.
Owen. M. E and M. J. Eweg. 2003. Extension Delivery for Small-Scale Sugarcane
Growers in South Africa: A Public/Private Joint Venture. Proceeding of the
19th Annual conference Raleiga, North Carolina, USA: Pp 496-50.8.
Perera. M., S, C. Sivayoganathan and M. Wijeratne. 2003. Technical Knowledge and
Adoption of Farming Practices to Farmer Level Extension Communication of
Out grower Farmers of Sri Lankan Sugar Industry. Journal of Sugar Tech.
5(3): 121-129.
Pervaiz. U (Ed.). 2009. An Investigation in the Causes of Slow Diffusion of Tube
Well Irrigation Technology in NWFP-Pakistan. Un published Ph.D Thesis.
The University of Agriculture Pewshawar-Pakistan, Department of
Agricultural Extension Education and Communication. Pp 60-70
Pervaiz. U., M. Akram, and H. Ashraf. 2003. Impact of Extension Services on
Agricultural Production: A case study in Malakand Agency. SJA 19 (2): 305-
311.
164
Perviaz. U., F. Khan, D. Jan, Z. Huma and M. Zafarullah. 2013. An Analysis of
Sugarcane Production With Reference to Extension Services in Union Council
Malakandher-Peshawar. SJA 29(1): 37-42.
Prinsley. R., J. Dore, N. Marks, N. M. Gukian and P. Thompson. 1994. The Role of
Private Sector in Extension: A working Paper. Rural Industries Research and
Development Corporation Occasional Paper No. 94/3. Australleya. Pp 7-11
Qasim. M and K. B. Malik. 1985. Coordinated Uniform Variety Yield Trial. PARC
Annual Report: Pp 31.
Qureshi. R. H and E. G. L. Barrett (Ed.). 1998. Saline Agriculture for Irrigated Land
in Pakistan: A handbook. Australleyan Centre for International Agricultural
Research Canberra, Australleya. Pp 41-47
Rainbolt. C. R., J. M. Shine, G. Powell, P. Grose, J. Larsen and R. W. Rice. 2006. Use
of Trinexapac-Ethyl to Improve Seed Quality in Mechanically Planted
Sugarcane in Florida. Florida Crystals Corporation – FL. Pp. 35-41.
Ram. A. N., J. S. Gawander, K. Garan and D. V. Kumar. 2005. Soil loss and
Declining Sugarcane Yields on Sloping land in Fiji. Fiji Sugar Corporation
Limited, Fiji. Pp. 49-56.
Raman. K. R., M. P. Singh, R. O. Singh, U. S. P. Singh. 1996. Long-Term Effects of
Inorganic and Organo-Inorganic Nutrient Supply System on Yield Trends of
Rice-Wheat Cropping System. J. Appl. Biol: 6 (1-2): 56-58.
Rashid. A (Ed.). 2001. Soil Science. National Book Foundation, Islamabad. Pp. 300-
302.
Rasool. A., M. Asad Farooq, M. Zubair, M. Jamil, S. Ahmad and S. Afghan. 2011.
Prospects of Intercropping Rabi Crops in Autumn Planted Sugarcane. Pakistan
Sugar Journal 26(2): 2-5.
Rogers. E. M. (Ed.). 1983. Diffusion of innovations 3rd edition. The Free Press, New
York. Pp 33-36
Rosegrant. W. M and R. E. Evenson. 1995. “Total Factors of Productivity and
Sources of Long Term Growth in Indian Agricultural”. Environment and
Productivity Technology Division. Discussion paper No. 07.
Singels. A. M., V. D. Berg and M. Jones. 2006. Evaluating Production Strategies for
Sugarcane Biomass Using a Crop Model. Sugarcane Research Institute.
Private Bag 02, Mount Edgecombe, 4300, South Africa. Pp 17-21
165
Singh. A., A. S. Svirk, J. Singh, J. Singh, A. Singh, J. Singh. and J. Singh. 2001.
Comparison of pre and post-emergence application of herbicides for the
control of weeds in sugarcane. Sugar Tech. 3:109-112.
Singh. A., A. S. Svirk, J. Singh, J. Singh, A. Singh, and J. Singh. 2001. Efficacy of
new herbicide for the control of weeds in sugarcane. Cooperative Sugar.
33:315- 316.
Singh. A., S. Svirk., J. Singh and J. Singh. 2001. Comparison of Pre and Post-
emergence Application of Herbicides for the Control of Weeds in Sugarcane.
Sugar Tech. 3: 109-112.
Singh. N. P., R. S. Sachan, P. C. Pandey, R. S. Bisht. 1999. Effects of Decade Long
Chemical fertilizer and Manure Application on Soil Fertility and Productivity
of Rice-Wheat System in a Mollisol. J. Indian Soc. Soil Sci: 47 (1): 72-80.
Sivaraman. K. 2011. Intercropping in Sugarcane -Scope, Compatible Crops,
Experiments, Experiences and Results. First National Seminar on Sustainable
Sugarcane Initiative, SSI. AgSri, Sugarcane Breeding Institute (SBI) &
NRMC (NABARD). Pp. 25-29.
Swanson, B. E., R. P, Bentz and A. J. Sofranko (Ed.). 1997. Improving Agricultural
Extension: A Reference Manual Rome: Food and Agricultural Organization.
Pp 41-43
Tahir, A. K. 2011. Improve Farm Extension Services: Sugarcane Research in a
Shambles available at web cite
http://www.dawn.com/2011/08/29/agriculture-and-technology-sugarcane-
research-in-a-shambles.html. 11-09-2013
Tai, S. W (Ed.). 1978. Social Sciences Statistic. It elements and applications.
California Goodyear Publishing company. Pp 61-63
Thanomsub, W. 2004. Responses of Sugarcane to Irrigation Application at Different
Growth Stages on a Clay Soil. Chai Nat Field Crops Research Center, Chai
Nat 17000, Thailand. Pp 71-79.
Tsur. Y., M. Sternberg and E. Hochman. 1990. Dynamic Modeling of Innovation
Process: Adoption with risk aversion and learning. Oxford Economic Papers.
42 (1): 336-355.
Ullah. R., Q. S. Shafi, J. Shah and K. H. Khan. 2011. Comparative Analysis of
Sugarcane on Farm and Research Station in District Mardan. International
Journal of Latest Trends in Agriculture & Food Sciences. 1(1): 6-8.
166
Umali. D. L and L. Schwartz. 1994. Public and Private Agricultural Extension:
Beyond Traditional Frontiers: World Bank Discussion Paper No. 236.
Washington, D.C, World Bank. Pp 8-12
Wikipedia. 2014. List of Extreme Weather Recorded in Pakistan. Available at Web
Cite List of extreme weather records in Pakistan - ikipedia, the free ...
wikipedia.org/wiki/List_of_extreme_weather_records_in_Pakistan. Date (20-
06-2014).
World Bank. 2003. Reaching the rural poor: A Renewed Strategy for Rural
Development. Washington, DC. Pp 19-24.
Zubair. M. 2014. Pakistan Agricultural Research Council (PARC). Sugar Crops
Research Program National Agricultural Research Center (NARC)-Islamabad.
Available at web cit: www. Parc.gov.pk/1subdivisions/narccsi/csi/sugar-html.
08-06-2013.
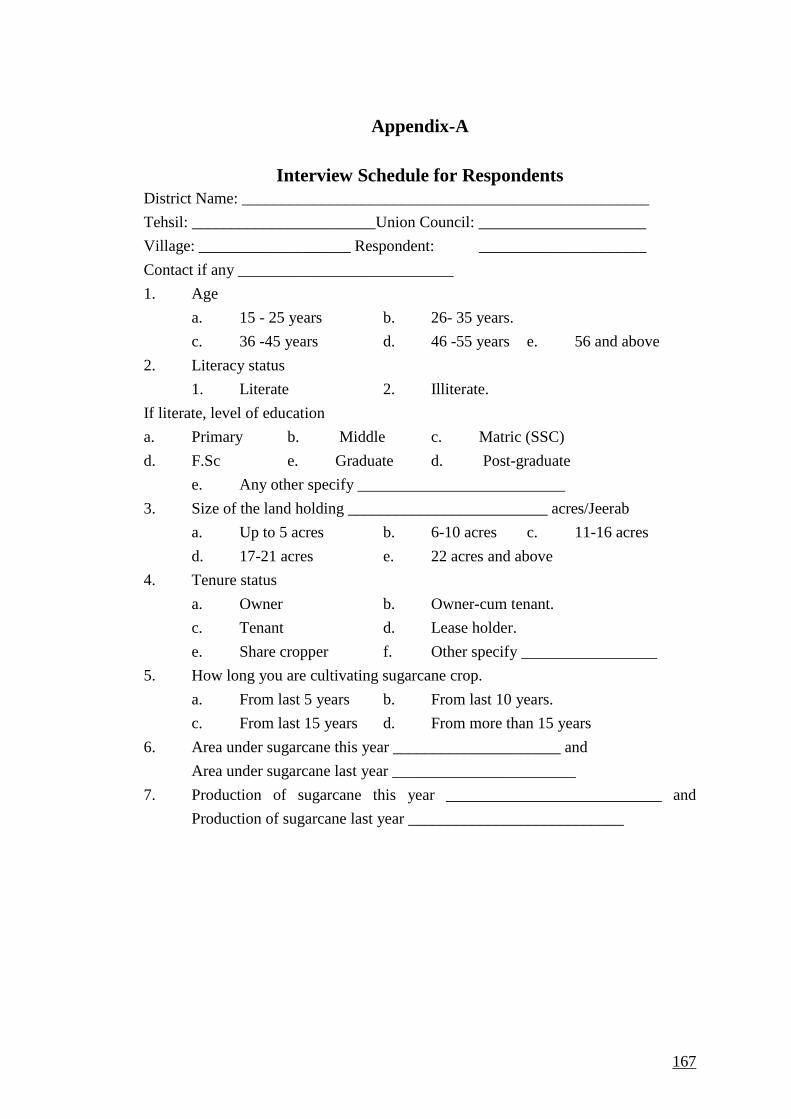
167
Appendix-A
Interview Schedule for Respondents
District Name: ___________________________________________________
Tehsil: _______________________Union Council: _____________________
Village: ___________________ Respondent: _____________________
Contact if any ___________________________
1. Age
a. 15 - 25 years b. 26- 35 years.
c. 36 -45 years d. 46 -55 years e. 56 and above
2. Literacy status
1. Literate 2. Illiterate.
If literate, level of education
a. Primary b. Middle c. Matric (SSC)
d. F.Sc e. Graduate d. Post-graduate
e. Any other specify __________________________
3. Size of the land holding _________________________ acres/Jeerab
a. Up to 5 acres b. 6-10 acres c. 11-16 acres
d. 17-21 acres e. 22 acres and above
4. Tenure status
a. Owner b. Owner-cum tenant.
c. Tenant d. Lease holder.
e. Share cropper f. Other specify _________________
5. How long you are cultivating sugarcane crop.
a. From last 5 years b. From last 10 years.
c. From last 15 years d. From more than 15 years
6. Area under sugarcane this year _____________________ and
Area under sugarcane last year _______________________
7. Production of sugarcane this year ___________________________ and
Production of sugarcane last year ___________________________
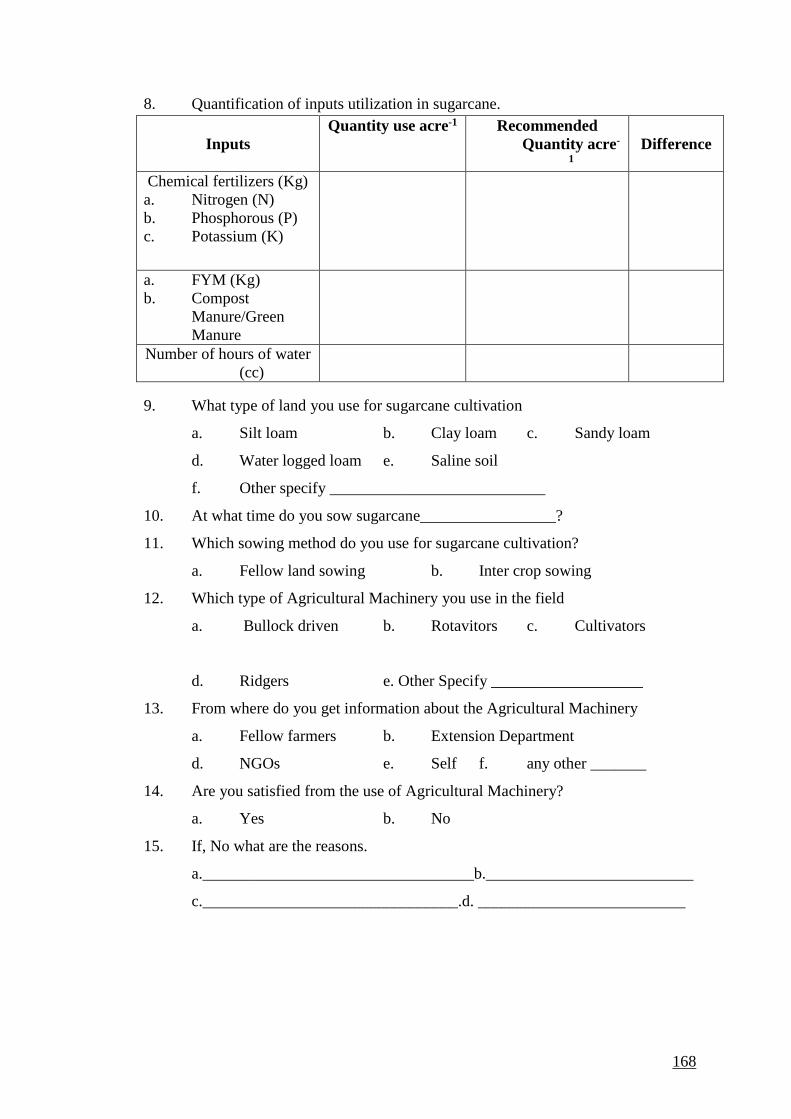
168
8. Quantification of inputs utilization in sugarcane.
Inputs
Quantity use acre-1 Recommended
Quantity acre-
1
Difference
Chemical fertilizers (Kg)
a. Nitrogen (N)
b. Phosphorous (P)
c. Potassium (K)
a. FYM (Kg)
b. Compost
Manure/Green
Manure
Number of hours of water
(cc)
9. What type of land you use for sugarcane cultivation
a. Silt loam b. Clay loam c. Sandy loam
d. Water logged loam e. Saline soil
f. Other specify ___________________________
10. At what time do you sow sugarcane_________________?
11. Which sowing method do you use for sugarcane cultivation?
a. Fellow land sowing b. Inter crop sowing
12. Which type of Agricultural Machinery you use in the field
a. Bullock driven b. Rotavitors c. Cultivators
d. Ridgers e. Other Specify ___________________
13. From where do you get information about the Agricultural Machinery
a. Fellow farmers b. Extension Department
d. NGOs e. Self f. any other _______
14. Are you satisfied from the use of Agricultural Machinery?
a. Yes b. No
15. If, No what are the reasons.
a.__________________________________b.__________________________
c.________________________________.d. __________________________

169
16. What type of techniques is more suitable for sugarcane cultivation?
a. Desi Method b. Modern Method
c. Any other__________________________
17. For how many hours you use Agricultural Machinery per Acre
_____________
18. For how many hours used Agricultural Machinery per day ________________
a. One Hour b. Two
c. Three d. More than Three
19. Is this time sufficient for the Agricultural Machinery?
a. Yes b. No
If no, what you do _____________________________
20. How many labour work with cultivator per acre __________________
21. Which type of labour you use
a. Owner (family members) b. Friends c. Neighbors
d. Hired labour e. Any Other
___________________
22. What is the age of labour ___________________
23. Are you satisfy from the labours
a. Yes b. No
If not satisfied state reasons
a._________________________ b. __________________________
c. __________________________ d. __________________________
24. What is the source of irrigation?
a. Canal (cca) _______________ b. Tube well
_____________
c. Well ____________________ d. Any other source
________
25. Do you get sufficient water for irrigation?
a. Yes b. No
If source of irrigation is canal then which type of canal.
a. Public Canal (cca) b. Private (cca)
If tube well is source of irrigation then which type of tube well is
a. Government Tube well b. Private Tube well
26. How much seed is used per acre/Jareeb _____________________________
170
27. Which type of variety do you use for sugarcane cultivation _____________
28. How much yield of Sugarcane you obtain per acre
_______________________
29. Cost per acre of Sugarcane cultivation
a. Machinery per acre ____________________ Rs
b. Inputs per acre ________________________Rs
c. Labour per acre ________________________Rs
30. For which purpose you cultivate Sugarcane
a. Sugar mills b. Gur
c. other specify_________________________
31. Do you think there is a difference between local variety and improved variety
a. Yes b. No
If, yes how much per acre __________________________
32. Do you think that weeding of sugarcane is necessary?
a. Yes b. No
If yes, which types of weeds are usually found?
a. _________________________________ b. _________________________
c. _________________________________ d. _________________________
e. _________________________________ f. _________________________
33. What methods do you use for weed control?
a. Mechanical b. Chemical c. Biological
d. Cultural e. Other specify __________________________
34. If you use cultural method for weed control
If, yes then specify
a. Cultivation of resistant varieties
b. Destruction of diseased plant.
c. Adoption of crop rotation
d. Control Weeds through Physical methods
d. any other Method please specify._____________________
35. Insects & Pests attack on Sugarcane
a. Yes b. No
171
If, yes what types of Insects:
a. _______________________ b. _______________________
c. ______________________ d. _______________________
which type of Pests
a. ___________________________b. __________________________
c __________________________ d. ___________________________
e __________________________
36. Do you use any Pesticides?
If yes, which type
a. Weedicides b. Insecticides c. Termeticides
d. Fungicides e. Herbicides
a. Which brand of Weediccides used
i.________________________ ii._______________________
iii________________________ iv._______________________
v. ________________________ vi_______________________
b. Which brand of Insecticides used
a. ___________________b. ___________________________
b. ___________________c. ___________________________
c. ___________________d. ___________________________
c. Which brand of Termetoccides used
a. _____________________ b. ___________________________
b. _____________________ c. ___________________________
c. _____________________ d. ___________________________
37. Do you know the field assistant of Agricultural Extension Department of your
area?
a. Yes b. No
If yes, how you know him ___________________________
172
38. Do you know any field assistant other than Agricultural Extension
Department?
a. Yes b. No
If yes then which organization he belongs to
a. Seed dealer b. NGO c. Any other
_____________
39. Distance of village from the local market ______________________
40. How is the road condition of your village ______________________
41. Do you know about the Agricultural Extension Department?
a. Yes b. No
If yes, you ever visit office of Agricultural Extension Department
a. Yes b. No
If yes then how frequently do you meet extension agent.
a. Daily b. Weekly c. Monthly
d. Once a year.
42. In your village did any Program start for the Sugarcane
a. Yes b. No
If, yes which organization started program
a. Agricultural Extension Department b. NGO
c. Research Station d. Any other
_____________
43. Which types of services are provided through the program
a. ________________________ b. _____________________
c. ________________________ d. _____________________
44. Are you satisfied from the Sugarcane program
a. Yes b. No
If No, in which aspects you are not satisfied
a.______________________________ b. _________________________
c. ______________________________ d. _________________________
e. ______________________________
45. How much distance of Agricultural Extension Department from your village
a less than 5 kilometer b. 5 kilometer
c. 10 kilometer d. more than 10 kilometer
173
46. Has Agricultural Extension Department started any program in your village
a. Yes b. No
If yes, which program started by the Agricultural Extension Department ______
47. Is there any effect of extension services on your crop yield
a. Yes b. No
If yes, how much increase is made in sugarcane production on due to extension
service
a. 50 man/jeerab b. 60 man/jeerab
c. 100 man/jeerab d. above 100 man/jeerab
48 Are you satisfy from the Agricultural Extension Department
a. Yes b. No
If, No state reasons
a. ________________________ b. __________________________
c ________________________ d. __________________________
49. Did the field assistant provided new information to the farmers about
sugarcane production in any program
a. Yes b. No
If yes, which types of information do you gets
a. _________________________ b.
______________________
c. _________________________ d.
______________________
e. _________________________ f.
______________________

174
(a) If yes, how do you get information
i) Farm/home visits
ii) Office calls
iii) Method demonstration
iv) Results demonstrations
v) Film shows
vi) Field days
vii) Agricultural Exhibitions
viii) Do not know
(b) Which of the above methods do you think is the most effective?
a. ______________________ b. ________________________
c. _____________________ d. ________________________
50. Through which source of information do you receive most of the knowledge
about agriculture?
(a) Personal
i) Agricultural department functionaries
ii) fellow-farmers/neighbor
iii) Friends/relatives iv) Any other
(b) Impersonal
a. Agricultural department publication
b. T.V
c. Radio
d. Film shows
e. Any others
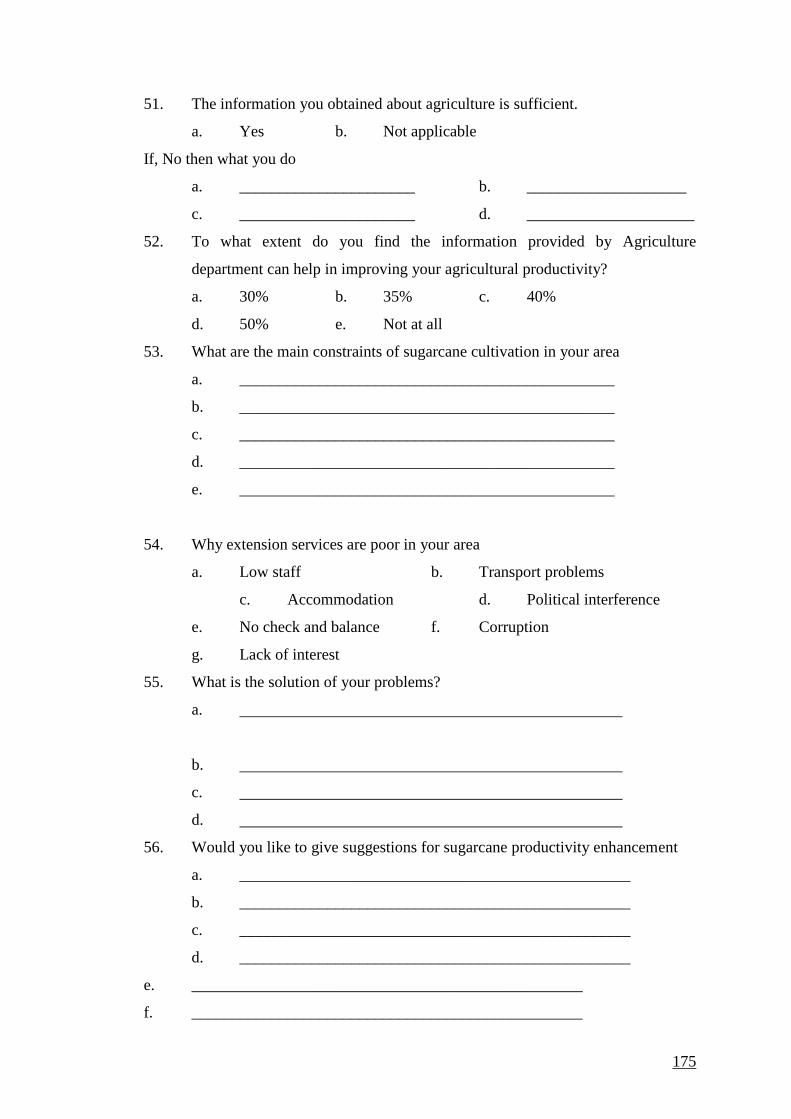
175
51. The information you obtained about agriculture is sufficient.
a. Yes b. Not applicable
If, No then what you do
a. ______________________ b. ____________________
c. ______________________ d. _____________________
52. To what extent do you find the information provided by Agriculture
department can help in improving your agricultural productivity?
a. 30% b. 35% c. 40%
d. 50% e. Not at all
53. What are the main constraints of sugarcane cultivation in your area
a. _______________________________________________
b. _______________________________________________
c. _______________________________________________
d. _______________________________________________
e. _______________________________________________
54. Why extension services are poor in your area
a. Low staff b. Transport problems
c. Accommodation d. Political interference
e. No check and balance f. Corruption
g. Lack of interest
55. What is the solution of your problems?
a.
b.
c.
d.
56. Would you like to give suggestions for sugarcane productivity enhancement
a. _________________________________________________
b. _________________________________________________
c. _________________________________________________
d. _________________________________________________
e. _________________________________________________
f. _________________________________________________
176
APPENDIX-B
General Description of Research Area
District Mardan
Area and Location
After the name of Pir Mardan Shah a name was given to a small area, who was a
famous figure in religion. With passage of time a large area in surrounding was
known as Mardan which is second largest city of Khyber Pakhtunkhwa. District
Mardan was a part of Peshawar valley. In 1937, Mardan was bifurcated from
Peshawar District.
Mardan is situated from 34 degree, 35 to 340 32 North latitudes and 710, 48 to 720 25
East longitudes. It is connected on the North by Buner District and Malakand
protected area, on the East by District Swabi and Buner, on the South by Nowshera
district and on the West by District Charsadda and Malakand protected area with a
total area of 1632 square kilometers.
There are three Tehsils in district Mardan. These Tehsils are Takhtabhai, Mardan and
Katlang having agricultural land. Moreover, the world top irrigation system developed
by British Government during British rules on sub-continent (1857-1947) is also
found in this district (Population Census of Pakistan, 1998).
Climate
Mardan has extremely hot season in summer from May to July and a sharp rise of
temperature is observed. High temperature is recorded in June and July. May and June
dust storms are frequent. In month of June reaches maximum temperature (41C0).
Irrigation and vigorous cultivation make the region humid and oppressive in heat. A
rapid fall of temperature has been recorded in the month of October and onwards
which is coldest in December and January. The month of January is the coldest month
which is 2C0 (mean minimum temperature). The months of maximum rainfall is in
July, August, December and January, where maximum rainfall was recorded in
177
August which was 126 mm. Relative humidity is quite high in the whole year in
which the month of December was maximum 73%.
Economic Scenario
Having fertile agriculture land of district Mardan, majority of the peoples are engaged
in agriculture. Sugarcane, Virginia tobacco and sugar beet are the main cash crops.
Commercial deposits of marble, chromite, granite and other lime stones are found in
Mardan district. Good quality of Topaz veins is the most precious gemstone found in
hill- rocks of Shaheed Jhundai and Shamozi Katlang, Mardan. In spite of agriculture
and mining as major economic activity, this district is also known as three main
clusters, namely light Engineering cluster (Takhtbhai), furniture cluster (Mardan) and
Handi crafts cluster (Mardan) (Population Census of Pakistan, 1998).
Demographic
Mardan district is comprised of total area of 1632 square kilometer, the population of
district is 22 million (Pakistan population census, 2008). Rural literacy rate is 33%
while urban is 48%. Major profession of the people is farming who are directly or
indirectly engaged in agriculture. In different places of district industrial labour has
increased after the establishment of factories. Moreover, some peoples are employed
in government services while some are engaged in business.
Agriculture
District Mardan is famous for largest agricultural area in the whole country. The soil
of Mardan is very apt for sowing of sugarcane as well as Tobacco and therefore called
as sugarcane and Tobacco land. Major crops which are grown in the area include
Jowar, rice, maize, ground nut, wheat, barley, mustard. One of the main possible
sectors of district Mardan is horticultural crop where plum, peach, pear, persimmon
and orange are produced. Moreover, apricot, lemon, leechi and apple are also produce
in this fertile district.
178
District Charsadda
Area and Location
The oldest name of district Charsadda was Pushkalavati, which means "Lotus City". It
was the administrative centre of the Gandhara kingdom. District Charsadda spreads
like apple leaf and is bounded by Nowshera district in the South, Mardan district in
the East, Malakand agency and Mohmand agency in the North and Peshawar and
Mohmand agency in the West. District Charsadda can really know as land of rivers.
River Swat, River Kabul along with the upper & Lower Swat canal, Michini Dalazak
Canal and Doaba feeder Canal are the major sources of irrigation. The District
comprises of tehsil Tangi, tehsil Charsadda and tehsil Shabqadar.
Charsadda is situated in the west of the KPK and is surrounded by Malakand
District on the North. Mardan district on the East, Nowshera and Peshawar districts
on the South and the Mohmand Agency of the Federally Administered Tribal
Areas on the West. The district covers area of 996 square kilometers.
Climate
The climate of Charsadda district is of continental type. It may be separated into three
seasons, viz. winter from December-April; summer from May-September out of
which July-September is the monsoon season, whereas May to June and October to
November is the transitional season. June is very hot and dry when the temperature
increases to more than 40C0. July and August are hot and humid. The water vapor
contents in the atmosphere indicate its most proof in month of August. The humidity
observation indicates conformity with that of rainfall. The spring enters somewhere in
middle of March, which is very nice season of the year.
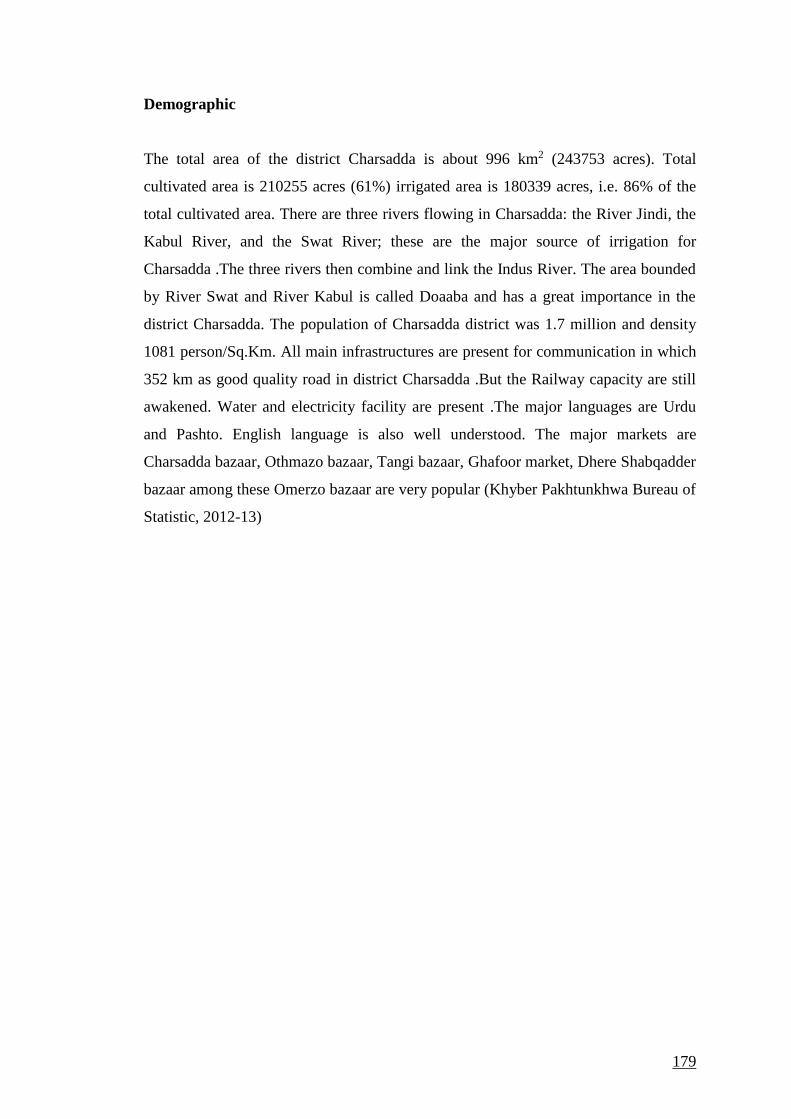
179
Demographic
The total area of the district Charsadda is about 996 km2 (243753 acres). Total
cultivated area is 210255 acres (61%) irrigated area is 180339 acres, i.e. 86% of the
total cultivated area. There are three rivers flowing in Charsadda: the River Jindi, the
Kabul River, and the Swat River; these are the major source of irrigation for
Charsadda .The three rivers then combine and link the Indus River. The area bounded
by River Swat and River Kabul is called Doaaba and has a great importance in the
district Charsadda. The population of Charsadda district was 1.7 million and density
1081 person/Sq.Km. All main infrastructures are present for communication in which
352 km as good quality road in district Charsadda .But the Railway capacity are still
awakened. Water and electricity facility are present .The major languages are Urdu
and Pashto. English language is also well understood. The major markets are
Charsadda bazaar, Othmazo bazaar, Tangi bazaar, Ghafoor market, Dhere Shabqadder
bazaar among these Omerzo bazaar are very popular (Khyber Pakhtunkhwa Bureau of
Statistic, 2012-13)
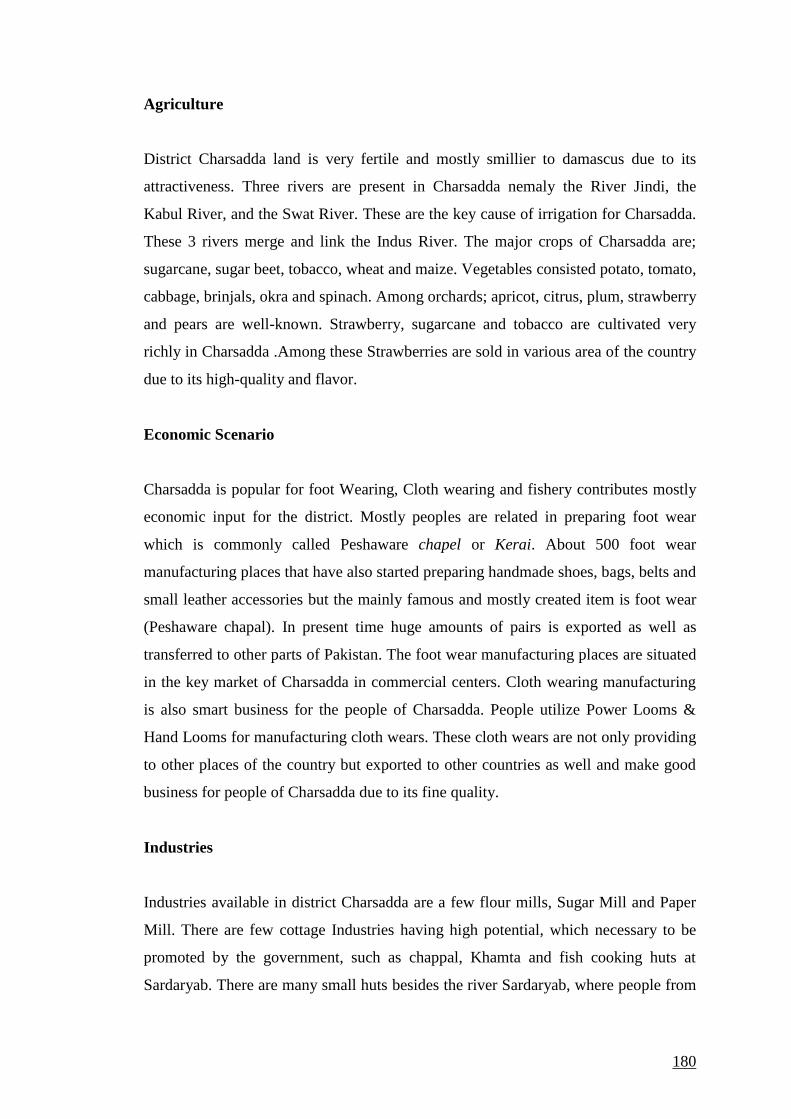
180
Agriculture
District Charsadda land is very fertile and mostly smillier to damascus due to its
attractiveness. Three rivers are present in Charsadda nemaly the River Jindi, the
Kabul River, and the Swat River. These are the key cause of irrigation for Charsadda.
These 3 rivers merge and link the Indus River. The major crops of Charsadda are;
sugarcane, sugar beet, tobacco, wheat and maize. Vegetables consisted potato, tomato,
cabbage, brinjals, okra and spinach. Among orchards; apricot, citrus, plum, strawberry
and pears are well-known. Strawberry, sugarcane and tobacco are cultivated very
richly in Charsadda .Among these Strawberries are sold in various area of the country
due to its high-quality and flavor.
Economic Scenario
Charsadda is popular for foot Wearing, Cloth wearing and fishery contributes mostly
economic input for the district. Mostly peoples are related in preparing foot wear
which is commonly called Peshaware chapel or Kerai. About 500 foot wear
manufacturing places that have also started preparing handmade shoes, bags, belts and
small leather accessories but the mainly famous and mostly created item is foot wear
(Peshaware chapal). In present time huge amounts of pairs is exported as well as
transferred to other parts of Pakistan. The foot wear manufacturing places are situated
in the key market of Charsadda in commercial centers. Cloth wearing manufacturing
is also smart business for the people of Charsadda. People utilize Power Looms &
Hand Looms for manufacturing cloth wears. These cloth wears are not only providing
to other places of the country but exported to other countries as well and make good
business for people of Charsadda due to its fine quality.
Industries
Industries available in district Charsadda are a few flour mills, Sugar Mill and Paper
Mill. There are few cottage Industries having high potential, which necessary to be
promoted by the government, such as chappal, Khamta and fish cooking huts at
Sardaryab. There are many small huts besides the river Sardaryab, where people from

181
various places come to get pleasure from the scenery as well as the tasty fish of the
Charsadda.
The major crop of this area is sugarcane, which is processed in ghani (Gur making
machine). Gur is also exported to Afghanistan, Russia, Uzbekistan, Tajikistan, etc.
particulars of industries and factories present in Charsadda district are Sugar
industries, flour mills, vermicelli’s industry, Charsadda ice factory, cigarettes/tobacco
(leaves processing), footwear industry, craft paper industry, detergent powder factory,
cement bas and marble industry.
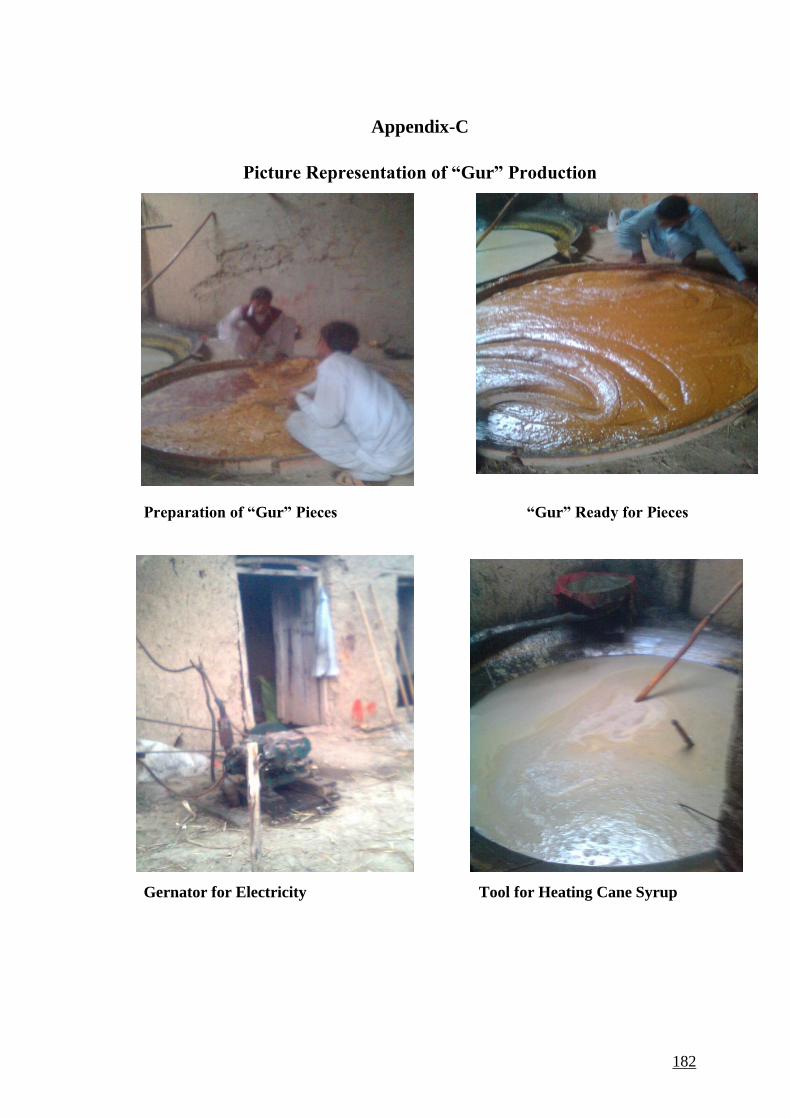
182
Appendix-C
Picture Representation of “Gur” Production
Preparation of “Gur” Pieces “Gur” Ready for Pieces
Gernator for Electricity Tool for Heating Cane Syrup
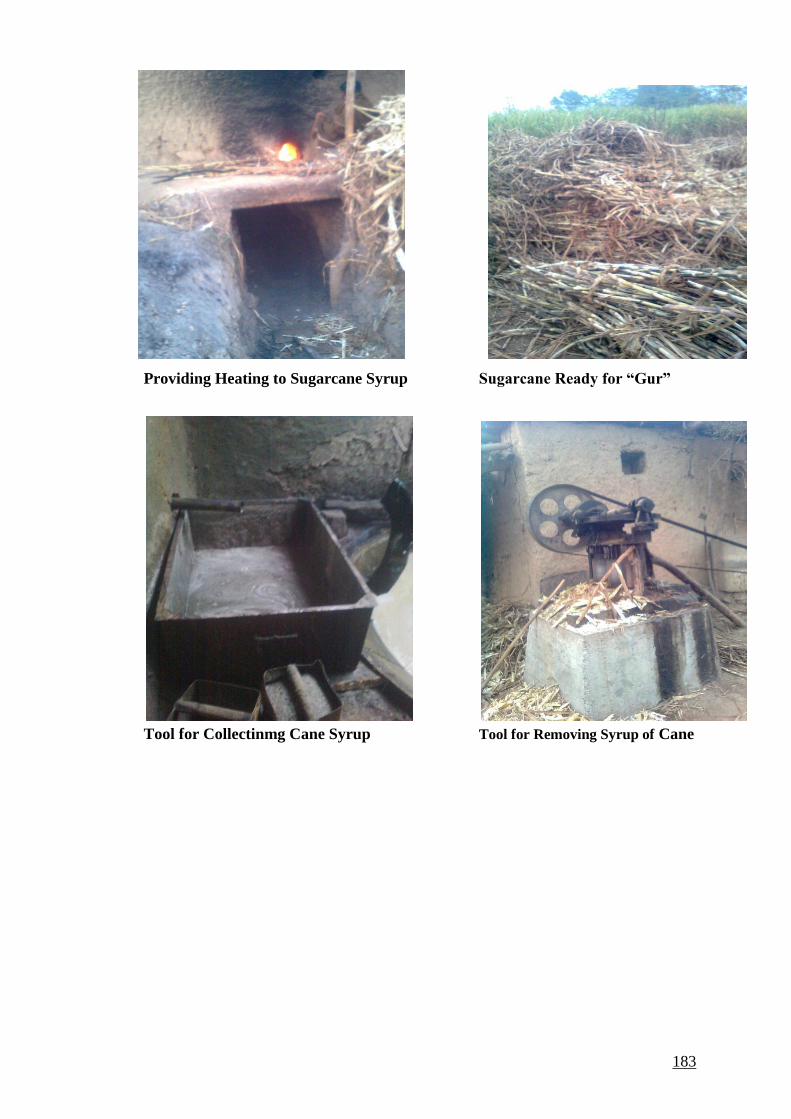
183
Providing Heating to Sugarcane Syrup Sugarcane Ready for “Gur”
Tool for Collectinmg Cane Syrup Tool for Removing Syrup of Cane