Embed Size (px)
Citation preview
Kb
FKDa
Pb
c
d
e
f
a
ARRAA
KBMIAHS
1
tastemrtdhiei
0d
Journal of Hazardous Materials 183 (2010) 482–489
Contents lists available at ScienceDirect
Journal of Hazardous Materials
journa l homepage: www.e lsev ier .com/ locate / jhazmat
inetic analysis and modeling of oleate and ethanol stimulated uranium (VI)io-reduction in contaminated sediments under sulfate reduction conditions
an Zhanga,∗,1, Wei-Min Wub,1, Jack C. Parkerc, Tonia Mehlhornd, Shelly D. Kellye,enneth M. Kemnere, Gengxin Zhanga, Christopher Schadtd, Scott C. Brooksd, Craig S. Criddleb,avid B. Watsond, Philip M. Jardinef
Key Laboratory of Tibetan Environment Changes and Land Surface Processes, Institute of Tibetan Plateau Research, Chinese Academy of Sciences,.O. Box 2871, Beijing 100085, ChinaDepartment of Civil and Environmental Engineering, Stanford University, Stanford, CA 94305, USADepartment of Civil and Environmental Engineering, University of Tennessee, Knoxville, TN 37996, USAEnvironmental Sciences Division, Oak Ridge National Laboratory, Oak Ridge, TN 37831, USABiosciences Division, Argonne National Laboratory, Argonne, IL 60439, USABiosystems Engineering and Soil Science Department, University of Tennessee, Knoxville, TN 37996, USA
r t i c l e i n f o
rticle history:eceived 8 February 2010eceived in revised form 29 May 2010ccepted 12 July 2010vailable online 21 July 2010
a b s t r a c t
Microcosm tests with uranium contaminated sediments were performed to explore the feasibility of usingoleate as a slow-release electron donor for U(VI) reduction in comparison to ethanol. Oleate degradationproceeded more slowly than ethanol with acetate produced as an intermediate for both electron donorsunder a range of initial sulfate concentrations. A kinetic microbial reduction model was developed andimplemented to describe and compare the reduction of sulfate and U(VI) with oleate or ethanol. The
eywords:io-stimulationicrobial reduction
ntermediate productscetate
reaction path model considers detailed oleate/ethanol degradation and the production and consumptionof intermediates, acetate and hydrogen. Although significant assumptions are made, the model trackedthe major trend of sulfate and U(VI) reduction and describes the successive production and consumptionof acetate, concurrent with microbial reduction of aqueous sulfate and U(VI) species. The model resultsimply that the overall rate of U(VI) bioreduction is influenced by both the degradation rate of organic
ion ra
ydrogenimulatesubstrates and consumpt
. Introduction
In situ anaerobic bioremediation has been used for the remedia-ion of a variety of subsurface contaminants including chlorinatedliphatic hydrocarbons, perchlorate, chromate and radionuclidesuch as uranium [1,2]. Microbial reduction of soluble uranium (VI)o sparingly soluble and immobile U(IV) is one promising strat-gy to limit subsurface uranium migration [3]. The process is oftenediated by iron-reducing bacteria (FeRB), sulfate-reducing bacte-
ia (SRB), and a diverse range of other bacteria able to convert U(VI)o U(IV) species or uraninite or UO2(s) in the presence of electrononor sources [4]. Various fast-degrading electron donor sources
ave been tested for U(VI) reduction in contaminated sedimentsn situ, including ethanol, acetate and glucose [5–8]. Using weeklythanol injection, uranium concentrations below US EPA drink-ng water standard (<0.03 mg/l) were achieved and maintained
∗ Corresponding author. Tel.: +86 10 62849383; fax: +86 10 62849886.E-mail address: [email protected] (F. Zhang).
1 Fan Zhang and Wei-Min Wu contributed equally to this work.
304-3894/$ – see front matter © 2010 Elsevier B.V. All rights reserved.oi:10.1016/j.jhazmat.2010.07.049
te of intermediate products.© 2010 Elsevier B.V. All rights reserved.
in a highly contaminated area at the US DOE Oak Ridge site [7].Relatively rapid U(VI) attenuation was observed associated withethanol degradation and acetate accumulation:
C2H6O + H2O → C2H3O2− + 2H2 + H+ (1)
To maintain anaerobic, reducing conditions, frequent ethanoldelivery is required. Field experience with bioremediation of chlo-rinated solvents has demonstrated that the delivery of a readilymetabolized substrate can result in clogging due to over-growth ofmicrobes near the injection port that limits efficient distribution ofelectron donor into the contaminated area.
Slow-release electron donor sources (such as oleate and edibleoil) that have a relatively high energy density have been consideredas alternative electron donor sources for bioreduction of chlori-nated solvents [9,10]. The slow degradation of substrates can allowhigh penetration into the subsurface. Oleic acid is a monounsat-
urated omega-9 fatty acid found in various animal and vegetableoil sources and also a major long-chain fatty acid (FA) in wastew-aters as the product of lipid hydrolysis [11]. Because oleate is amajor long-chain FA in vegetable oil, it will be produced as the oilis hydrolyzed during biodegradation. In the presence of Ca2+ ions,
rdous
o
2
cmaf(o
C
foowRptddbf
inipOatat(sfUtfio[
pfufttriwPaalc
wcwrettt
F. Zhang et al. / Journal of Haza
leate forms calcium–oleate precipitates:
C18H33O2− + Ca2+ → Ca(C18H33O2)2↓ (2)
If oleic acid were delivered to subsurface, the precipitatedalcium–oleate could be trapped or attached to subsurface sedi-ent and serve as a long-term energy source for microbial growth
nd bioreduction. The anaerobic degradation of oleate can be per-ormed by syntrophic consortia composed of butyrate-degraderse.g. Syntrophomonas spp.) together with H2-utilizing methanogensr SRB, with acetate as an intermediate [12,13]:
18H33O2− + 16H2O → 9C2H3O2
− + 15H2 + 8H+ (3)
In this reaction, hydrogen must be maintained at a low level (aew Pa or lower partial pressure) via consumption by methanogensr SRB for the reaction to be thermodynamically favorable. Duringleate degradation, acetate was accumulated as a major product,hile other FAs were not found as degradation products [13].ecently, we found that the degradation of oleate can also beerformed by sulfate-reducing Desulforegula conservatrix – like bac-eria, which degrades other long-chain FAs [14]. Oleate and itsegradation product acetate and hydrogen could serve as electrononor source for U(VI) reduction. To date, however, no report haseen published about the use of oleate as an electron donor sourceor U(VI) reduction.
In field settings, groundwater geochemistry may significantlynfluence bioremediation results. At US DOE uranium contami-ated sites, sulfate is presented in groundwater and U(VI) reduction
s likely performed under sulfate-reducing condition with H2-roducing substrate like ethanol [15,16]. The pilot field study at theak Ridge site indicated that SRB were abundant [6]. SRB use sulfates an electron acceptor for the dissimilation of various organic mat-ers and hydrogen to support their metabolic activity [17,18]. SRBre also capable of reducing various inorganic ions in aqueous solu-ion such as iron (III), manganese (IV), uranium (VI), and technetiumVII), etc [18]. Under sulfate-reducing conditions, accelerated dis-olution of the iron oxides may be due to redox-reactions betweenerric iron and sulfides [19]. The impact of sulfate on field scale(VI) reduction has been studied previously [20,21]. In addition,
he end products of sulfate reduction, hydrogen sulfide and sul-de (as FeS), also abiotically reduce U(VI) to U(IV) but the presencef bicarbonate and neutral or high pH may inhibit the reduction22,23].
Understanding bioreduction processes is crucial to successfullyredict long-term fate of environmental uranium [24]. Modelsor the reduction of metals and radionuclides by SRB can besed to develop and design treatment systems employing SRBor bioremediation [18]. Modeling U(VI) bioreduction requireshe consideration of uranium aqueous chemistry, uranium sorp-ion/desorption, and bioreactive kinetics [25]. Microbial U(VI)eduction have been described by several investigators using var-ous formulations, such as first-order kinetics [18,26], and more
idely used Michaelis–Menten or Monod kinetics [18,25,27,28].revious modeling efforts have made a variety of simplifyingssumptions, for example, not including aqueous complexationnd sorption reaction of uranium [18,27]. Other investigators haveumped bioreduction kinetics without considering production andonsumption of intermediates [25].
In this study, we used microcosms to study U(VI) reductionith oleate in comparison to ethanol at different initial sulfate
oncentrations. Kinetic microbial reduction model incorporatedith equilibrium aqueous complexation and surface complexation
eactions was developed to describe the degradation of oleate orthanol associated with U(VI) reduction to U(IV). Construction ofhe reaction path model and simulation of the tests provided insighto the bioreduction processes and identified the rate limiting fac-ors.
Materials 183 (2010) 482–489 483
2. Materials and methods
2.1. Microcosm test
Microcosms were established in 158 ml serum bottles usinggroundwater and sediment from Area 2 of OR-IFRC site(Fig. S1 supplementary data) and incubated at ambient tempera-ture (22–24 ◦C). Groundwater from well FW231-2 was used andhad the following composition: pH 6.73; nitrate, 1.37 mM; sul-fate, 1.14 mM; Ca, 2.60 mM; U(VI), 4.87 �M; COD and nitrite, 0.Sediment samples from sampling cores FB107 and FB109 weremixed for use in the microcosms. Soil-saprolite material in thesamples exhibited a particle size ranging from 0.15 to 1.0 mmand contained 0.649 mg/g U(VI); 49 mg/g HCl extractable iron thatincludes 18.28 mg/g Fe(II); and 18.6 mg/g COD. Microcosms wereestablished in an anaerobic glovebag by mixing 8.51 g (dry weight)sediment with 130 ml amended groundwater (Table 1). The micro-cosms were then sealed with butyl rubber stoppers and aluminumcaps for 5 weeks.
Experimental replicates contained either sodium oleate orethanol as electron donor plus various levels of sulfate (fromNa2SO4) amendment. Negative controls received neither electrondonor nor sulfate. Oleate or ethanol was added to the microcosmto achieve electron donor level of 720 mg COD/l (0.92 mM of oleateor 9 mM of ethanol) for a theoretical hydrogen yield of 1.794 and2.34 mmole per bottle for oleate and ethanol, respectively (Eqs.(1) and (3)). Microcosms were mixed by shaking and allowed tosettle for 12 h before sampling the aqueous phase at time zero.Subsequently, the microcosms were incubated without shaking tosimulate conditions influenced only by diffusivity. Samples (about1.5 ml each time) were withdrawn periodically for the quantifica-tion of U(VI), pH, COD, acetate and sulfate in the aqueous phase. Thechange of volume of aqueous phase was recorded based on weightchange of each microcosm before and after sampling. At the end ofthe test, headspace gas composition was analyzed and sulfide, Fe(II)and alkalinity in aqueous phase were measured. Sediment sampleswere also withdrawn for the analysis of U speciation and iron (II)content.
2.2. Analytical methods
The source and quality of chemicals used and analytical meth-ods have been described in detail previously [6,7]. Uranium(VI)in aqueous phase was measured using a kinetic phosphorescenceKPA-11analyzer (Chemchek Instruments, Richland,WA). Anions(acetate, NO3
−, Cl−, and SO42−) were analyzed with an ion chro-
matograph equipped with an IonPac AS-14 analytical column andan AG-14 guard column (Dionex DX-120, Sunnyvale, CA). Cations(Ca, Fe, Mn, Mg, U, K, Na, etc.) were determined using an inductivelycoupled plasma mass spectrometer (ICPMS) (Perkin Elmer ELAN6100). The oxidation state of U in sediments was determined by UL3-edge XANES [29,30]. The Fe(II) and Fe contents in the solid phasewas determined by extraction of sediment sample (30–50 mg dryweight) using 1.5 ml of HCl (6N) for 24 h. Aqueous Fe(II), total Fe,sulfide and COD was measured colorimetrically using a HACH DR2000 spectrophotometer (Hach Chemical, Loveland, CO). Methaneand hydrogen in gas phase was measured by gas chromatographyas described by Spalding and Watson (2006).
2.3. Electron balance estimation
At the end of the test, electron balance was estimated based onavailable electrons from complete oxidation of oleate or ethanol,electrons required for electron acceptor consumption and electronsin intermediates of oleate or ethanol degradation. The half reac-tions for electron transfer are based on those published previously
484 F. Zhang et al. / Journal of Hazardous Materials 183 (2010) 482–489
Table 1Chemical composition in aqueous phase before bioreduction with oletate or ethanol.
Microcosm Control Oleate Ethanol
A1 A2 A3 B1 B2
Substrate No Oleate Oleate Oleate Ethanol EthanolConcentration, mMa no 0.92 0.92 0.92 9.0 9.0Added SO4
2− , mM no no 3.85 7.70 no 3.85pH 7.13 6.89 7.00 7.04 6.85 6.92HCO3
− , mM 6.60 6.60 6.60 6.60 6.60 6.60SO4
2− , mM 1.09 1.09 4.92 8.58 1.07 4.89U, �M 14.9 14.5 23.5 27.3 14.9 22.8Fe, mM 0.0041 0.0034 0.0047 0.0035 0.0040 0.0039Na+, mM 0.51 0.61 7.81 15 0.51 8.03K+, mM 0.16 0.15 0.12 0.13 0.11 0.13Ca2+, mM 2.80 2.80 2.88 3.03 2.83 2.88Mg2+, mM 0.76 0.76 0.77 0.81 0.77 0.78Mn2+, mM 0.029 0.030 0.032 0.032 0.027 0.029CaUO2(CO3)3
2− in U, %b 19.7 19.7 19.3 18.6 19.7 19.3b
mmol
[tBoaFt
2
cbcTwwni
2
mobtcp
S
Ca2UO2(CO3)3 in U, % 80.0 80.0H2 source available (mmole)b No 1.794
a The COD concentration of ethanol or oleate was 720 mg/l (COD/electron = 8 mg/b Calculated.
2,31,32] at pH 7.0 (Table 2). The half reactions include oleate oxida-ion, ethanol oxidation, acetate oxidation and hydrogen oxidation.oth hydrogen and acetate are considered as intermediates ofleate or ethanol degradation. Major reactions involved in electroncceptor consumption include nitrate reduction, sulfate reduction,e(III) reduction, CO2 reduction (methanogenesis) and U(VI) reduc-ion to U(IV).
.4. Modeling tools
The computer code HydroGeoChem v5.0 (HGC5) [33,34] is aomprehensive model for water flow and reactive transport. Theiogeochemical reactive transport module of HGC5 was used to cal-ulate concentration changes and distributions of various species.he program is designed for generic biogeochemical reaction net-orks, which may include both equilibrium and kinetic reactionsith user specified formulations [35]. HGC5 was coupled with theonlinear inversion code PEST [36] to automate calibration of spec-
fied model coefficients from measured data.
.5. Basic geochemistry model
At the OR-IFRC site, uranium in contaminated sediment isainly present as uranyl which is predominantly bound to mon-
dentate phosphorus and bidentate carbon ligands [29]. Theasic geochemistry model includes uranium aqueous complexa-ion reactions [37–39] (Table S1 of supplementary data) and surface
omplexation reactions for uranium sorption [40] (Table S2 of sup-lementary data):(OH)2 + UO22+ Ke1
↽ ⇀SO2UO2 + 2H+ (4)
Table 2Half reactions for electron transfer associated with bioreduction with ol
No. Processes
1 Oleate oxidation2 Ethanol oxidation3 Acetate oxidation4 Hydrogen oxidation5 Denitrification of nitrate6 Sulfate reduction7 Fe(III) reduction8 Methanogenesis (CO2 reduction)9 U(VI) reduction to U(IV)
80.4 81.1 80.0 80.41.794 1.794 2.34 2.34
e).
W(OH)2 + UO22+ Ke2
↽ ⇀WO2UO2 + 2H+ (5)
S(OH)2 + UO22+ + CO3
2− Ke3↽ ⇀SO2UO2CO3
2− + 2H+ (6)
W(OH)2 + UO22+CO3
2− Ke4↽ ⇀WO2UO2CO3
2− + 2H+ (7)
where UO22+ is a uranyl species in aqueous phase, S and W denote
strong and weak surface binding sites, respectively, and Ke1, Ke2,Ke3, and Ke4 are equilibrium coefficients for the individual reactions.Previously, we determined the values for log Ke1, log Ke2, log Ke3,and log Ke4 to be −2.64, −6.84, −13.68, −17.28, respectively, andstrong and weak sorbing site densities to be 0.0018 mole sites/moleFe(III) and 0.8732 mole sites/mole Fe(III), respectively, for the sedi-ment from the studied site [41]. In addition, a surface complexationmodel describing sulfate sorption [42] was introduced to model.
XOH + H++SO42− Ke5
↽ ⇀XSO4− + H2O (8)
where X denotes both strong and weak surface binding sites andlog Ke5 is equilibrium coefficient that was calibrated from initialaqueous composition data (Table 1).
A previous study showed that at low pH, U(VI) sorption is mainlydue to cation exchange involving the U(VI) species representedby UO22+, while at higher pH, sorption of U(VI) is dominated byanionic uranyl–carbonate species [16]. Therefore, cation exchangeof U(VI) is omitted in this study for microcosm tests performedunder pH ∼ 7.
2.6. Reaction pathway model
A kinetic microbial reduction model incorporated with the basicgeochemistry model were developed to describe the sulfate and
etate or ethanol.
Half reactions for electron transfer
C18H33O2− + 43H2O → 9CO2 + 9HCO3
− + 110H+ + 102e−
C2H6O + 3H2O → 2CO2 + 12H+ + 12e−
CH3CO2− + 3H2O → CO2 + HCO3
− + 8H+ + 8e−
H2 → 2H+ + 2e−
NO3− + 6H+ + 5e− → 0.5N2 + 3H2O
SO42− + 9.5H+ + 8e− → 0.5H2S + 0.5HS− + 4H2O
Fe3+ + e− → Fe2+
CO2 + 8H+ + 8e− → CH4 + 2H2OUO2(CO3)3
4− + 3H+ + 2e− → UO2(s) + 3HCO3−
rdous Materials 183 (2010) 482–489 485
uppggpkd
C
o
C
wtRradoss[[a
3
3
fbCtdiidpAOUd
Table 3Chemical composition at the end of test and relative electron recoveries for majorreactions (as %).
Microcosm Oleate Ethanol
A1 A2 A3 B1 B2
Substrate Oleate Oleate Oleate Ethanol EthanolInitial SO4
2− , mM 1.09 4.92 8.58 1.07 4.89pH 7.01 7.14 7.46 7.02 7.40HCO3
− , mM 14.5 17.9 25.4 13.3 15.0U, �M 0.95 1.89 2.33 0.42 2.07S2− , mM 0.0078 0.0039 0.0141 0.0023 0.0102Fe2+, mM 0.290 0.058 0.0095 0.18 0.022U(IV)/total U in solids, % 37 61 65 56 65Fe(II) generated, mmole 1.08 1.64 1.76 1.12 1.58CH4, mmole 0.817 0.539 0.10 0.842 0.425Electron recovery, %CH4 production 75.0 40.25 7.38 75.37 35.02Sulfate reduction 12.01 44.09 76.03 11.49 48.43Fe(II) reduction 12.78 15.38 16.28 12.82 16.30U(IV) reduction 0.21 0.28 0.30 0.31 0.33
F. Zhang et al. / Journal of Haza
ranium reduction stimulated by oleate or ethanol. The reactionath model considers detailed oleate/ethanol degradation and theroduction and consumption of intermediates, acetate and hydro-en. Ammonium was considered as a nitrogen source for microbialrowth. In addition to the aqueous complexation and surface com-lexation reactions specified in the basic geochemistry model, sixinetic bioreactions are included in the model. First, oleate degra-ation
18H33O2−+16H2O → 9C2H3O2
− + 15H2 + 8H+, R1 = K1Coleate
(9)
r ethanol degradation
2H6O2 + H2O → C2H3O2− + 2H2 + H+, R1 = K1Cethanol (10)
Second, sulfate reduction by acetate
0.125C2H3O2−+0.1125SO4
2−+0.00435NH4++0.16875H+ → 0.00435C5H7O2N+
0.05625H2S + 0.05625HS− + 0.1033CO2 + 0.125HCO3− + 0.1098H2O
R2 = K2 · Cacetate
Kacetate + Cacetate· CSO4
KSO4 + CSO4
(11)
Third, sulfate reduction by hydrogen
0.5H2 + 0.1125SO42− + 0.00435NH4
+ + 0.16875H+ + 0.02174CO2 →0.00435C5H7O2N + 0.05625H2S + 0.05625HS− + 0.4848H2O
R3 = K3 · CH2
KH2 + CH2
· CSO4
KSO4 + CSO4
(12)
Fourth, U(VI) reduction by acetate
0.125C2H3O2− + 0.45UO2(CO3)3
4− + 0.00435NH4+ + 0.45H+ + 0.3402H2O →
0.00435C5H7O2N + 0.45UO2(s) + 0.1033CO2 + 1.475HCO3−
R4 = K4 · Cacetate
Kacetate + Cacetate· CU(VI)
KU(VI) + CU(VI)
(13)
Fifth, U(VI) reduction by hydrogen
0.5H2 + 0.45UO2(CO3)34− + 0.00435NH4
+ + 0.45H+ + 0.02174CO2 →0.03478H2O + 0.00435C5H7O2N + 0.45UO2(s) + 1.35HCO3
−
R5 = K5 · CH2
KH2 + CH2
· CU(VI)
KU(VI) + CU(VI)
(14)
here R1 is degradation rate of oleate for oleate amended sys-em or degradation rate of acetate for acetate amended system;2 and R3 are rate of sulfate reduction by acetate and hydrogen,espectively; and R4 and R5 are rate of U(VI) reduction by acetatend hydrogen, respectively. R2 through R5 are formulated by aual Monod rate law. K1 is the rate constant for degradation ofleate or acetate; K2 and K3 are the maximum specific rate ofubstrate utilization for sulfate; and K4 and K5 are the maximumpecific rate of substrate utilization for U(VI), Kacetate = 0.07 mM43], KH2 = 141 pa [44], KSO4 = 0.01 mM [25] and KU(VI) = 0.5 mM25] are half saturation coefficient for acetate, hydrogen, sulfatend U(VI), respectively.
. Results and discussion
.1. Initial aqueous composition simulation
Nitrate was not detected in all microcosms in the samplesrom all microcosms at time zero. It was consumed due to micro-ial activity probably using sediment organic matter (as 18.6 mgOD/g). In contrast, constant sulfate concentration in the con-rol indicated no sulfate reduction in the absence of electrononor amendment (Fig. S2). In the control microcosm after mix-
ng the sediment with groundwater, aqueous U(VI) concentrationncreased gradually from 12.1 to 15.2 �M over the first 5 weeksue to desorption of U(VI) from sediments (Fig. 1 and Fig. S2, sup-
lementary data). Microcosms receiving sulfate supplement (A2,3, and B2) showed increased uranium concentration (Table 1).leate or ethanol was introduced to the tested microcosms after(VI) concentrations reach steady level after 5 weeks at static con-ition. The steady state aqueous composition was simulated usingNote: Sulfate and acetate were not detected in the microcosms except for control atthe end of the test (day 180). U speciation was analyzed by XANES. Fe(II) generatedwas calculated based on the difference between total Fe(II) in the microcosm withamended electron donor and that in control.
the basic geochemistry model including aqueous complexationand surface complexation reactions. The equilibrium coefficient ofthe sulfate surface complexation reaction log Ke5 (Eq. (8)), whichdirectly affects the amount of sulfate sorption and indirectly affectsthe amount of competing uranium and carbonate sorption, wascalibrated to be 8.08 ± 0.24 to achieve the best fit of the aqueoussulfate and uranium concentrations and alkalinity. The amount oftotal carbonate and sulfate in the systems of mixed sediments andgroundwater were not measured and thus estimated together withlog Ke5. Total of dissolved and sorbed carbonate was estimated to be18.7 ± 0.4 mM. The total sulfate including dissolved and sorbed wasestimated to be 1.44 ± 0.22 mM. The simulated sulfate concentra-tions are close to those measured in microcosms when desorptionof the sorbed fraction is taken into account (Table 1). The dominantaqueous U(VI) species was the calcium–uranyl–carbonate complex,Ca2UO2(CO3)3 (Table 1).
3.2. Electron balance
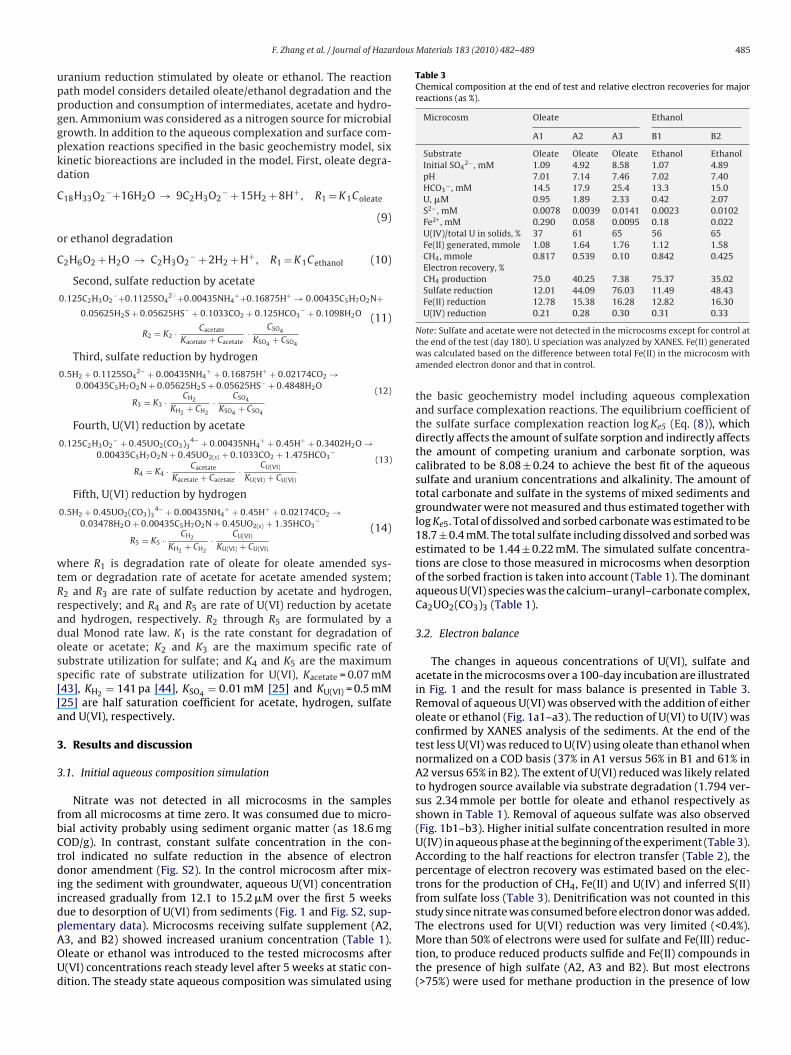
The changes in aqueous concentrations of U(VI), sulfate andacetate in the microcosms over a 100-day incubation are illustratedin Fig. 1 and the result for mass balance is presented in Table 3.Removal of aqueous U(VI) was observed with the addition of eitheroleate or ethanol (Fig. 1a1–a3). The reduction of U(VI) to U(IV) wasconfirmed by XANES analysis of the sediments. At the end of thetest less U(VI) was reduced to U(IV) using oleate than ethanol whennormalized on a COD basis (37% in A1 versus 56% in B1 and 61% inA2 versus 65% in B2). The extent of U(VI) reduced was likely relatedto hydrogen source available via substrate degradation (1.794 ver-sus 2.34 mmole per bottle for oleate and ethanol respectively asshown in Table 1). Removal of aqueous sulfate was also observed(Fig. 1b1–b3). Higher initial sulfate concentration resulted in moreU(IV) in aqueous phase at the beginning of the experiment (Table 3).According to the half reactions for electron transfer (Table 2), thepercentage of electron recovery was estimated based on the elec-trons for the production of CH4, Fe(II) and U(IV) and inferred S(II)from sulfate loss (Table 3). Denitrification was not counted in thisstudy since nitrate was consumed before electron donor was added.
The electrons used for U(VI) reduction was very limited (<0.4%).More than 50% of electrons were used for sulfate and Fe(III) reduc-tion, to produce reduced products sulfide and Fe(II) compounds inthe presence of high sulfate (A2, A3 and B2). But most electrons(>75%) were used for methane production in the presence of low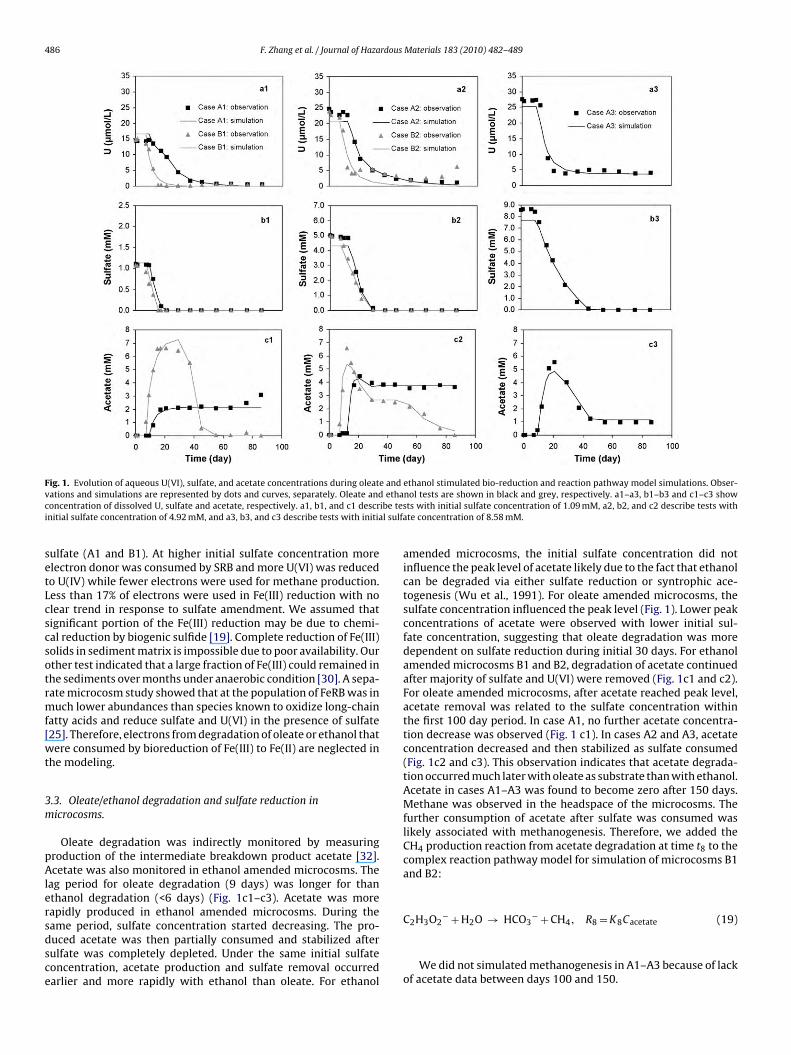
486 F. Zhang et al. / Journal of Hazardous Materials 183 (2010) 482–489
Fig. 1. Evolution of aqueous U(VI), sulfate, and acetate concentrations during oleate and ethanol stimulated bio-reduction and reaction pathway model simulations. Obser-v ethac ibe tesi l sulfa
setLcscsotrmf[wt
3m
pAlersdsce
ations and simulations are represented by dots and curves, separately. Oleate andoncentration of dissolved U, sulfate and acetate, respectively. a1, b1, and c1 descrnitial sulfate concentration of 4.92 mM, and a3, b3, and c3 describe tests with initia
ulfate (A1 and B1). At higher initial sulfate concentration morelectron donor was consumed by SRB and more U(VI) was reducedo U(IV) while fewer electrons were used for methane production.ess than 17% of electrons were used in Fe(III) reduction with nolear trend in response to sulfate amendment. We assumed thatignificant portion of the Fe(III) reduction may be due to chemi-al reduction by biogenic sulfide [19]. Complete reduction of Fe(III)olids in sediment matrix is impossible due to poor availability. Ourther test indicated that a large fraction of Fe(III) could remained inhe sediments over months under anaerobic condition [30]. A sepa-ate microcosm study showed that at the population of FeRB was inuch lower abundances than species known to oxidize long-chain
atty acids and reduce sulfate and U(VI) in the presence of sulfate25]. Therefore, electrons from degradation of oleate or ethanol thatere consumed by bioreduction of Fe(III) to Fe(II) are neglected in
he modeling.
.3. Oleate/ethanol degradation and sulfate reduction inicrocosms.
Oleate degradation was indirectly monitored by measuringroduction of the intermediate breakdown product acetate [32].cetate was also monitored in ethanol amended microcosms. The
ag period for oleate degradation (9 days) was longer for thanthanol degradation (<6 days) (Fig. 1c1–c3). Acetate was moreapidly produced in ethanol amended microcosms. During the
ame period, sulfate concentration started decreasing. The pro-uced acetate was then partially consumed and stabilized afterulfate was completely depleted. Under the same initial sulfateoncentration, acetate production and sulfate removal occurredarlier and more rapidly with ethanol than oleate. For ethanolnol tests are shown in black and grey, respectively. a1–a3, b1–b3 and c1–c3 showts with initial sulfate concentration of 1.09 mM, a2, b2, and c2 describe tests withte concentration of 8.58 mM.
amended microcosms, the initial sulfate concentration did notinfluence the peak level of acetate likely due to the fact that ethanolcan be degraded via either sulfate reduction or syntrophic ace-togenesis (Wu et al., 1991). For oleate amended microcosms, thesulfate concentration influenced the peak level (Fig. 1). Lower peakconcentrations of acetate were observed with lower initial sul-fate concentration, suggesting that oleate degradation was moredependent on sulfate reduction during initial 30 days. For ethanolamended microcosms B1 and B2, degradation of acetate continuedafter majority of sulfate and U(VI) were removed (Fig. 1c1 and c2).For oleate amended microcosms, after acetate reached peak level,acetate removal was related to the sulfate concentration withinthe first 100 day period. In case A1, no further acetate concentra-tion decrease was observed (Fig. 1 c1). In cases A2 and A3, acetateconcentration decreased and then stabilized as sulfate consumed(Fig. 1c2 and c3). This observation indicates that acetate degrada-tion occurred much later with oleate as substrate than with ethanol.Acetate in cases A1–A3 was found to become zero after 150 days.Methane was observed in the headspace of the microcosms. Thefurther consumption of acetate after sulfate was consumed waslikely associated with methanogenesis. Therefore, we added theCH4 production reaction from acetate degradation at time t8 to thecomplex reaction pathway model for simulation of microcosms B1and B2:
− −
C2H3O2 + H2O → HCO3 + CH4, R8 = K8Cacetate (19)We did not simulated methanogenesis in A1–A3 because of lackof acetate data between days 100 and 150.
F. Zhang et al. / Journal of Hazardous Materials 183 (2010) 482–489 487
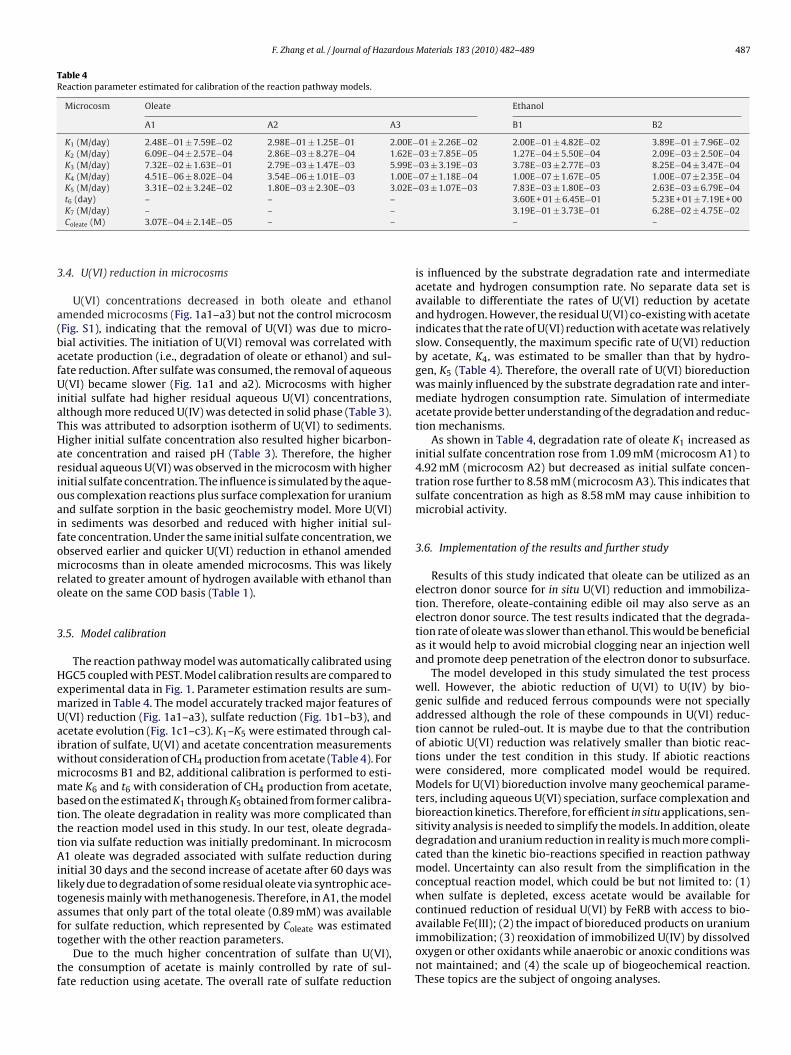
Table 4Reaction parameter estimated for calibration of the reaction pathway models.
Microcosm Oleate Ethanol
A1 A2 A3 B1 B2
K1 (M/day) 2.48E−01 ± 7.59E−02 2.98E−01 ± 1.25E−01 2.00E−01 ± 2.26E−02 2.00E−01 ± 4.82E−02 3.89E−01 ± 7.96E−02K2 (M/day) 6.09E−04 ± 2.57E−04 2.86E−03 ± 8.27E−04 1.62E−03 ± 7.85E−05 1.27E−04 ± 5.50E−04 2.09E−03 ± 2.50E−04K3 (M/day) 7.32E−02 ± 1.63E−01 2.79E−03 ± 1.47E−03 5.99E−03 ± 3.19E−03 3.78E−03 ± 2.77E−03 8.25E−04 ± 3.47E−04K4 (M/day) 4.51E−06 ± 8.02E−04 3.54E−06 ± 1.01E−03 1.00E−07 ± 1.18E−04 1.00E−07 ± 1.67E−05 1.00E−07 ± 2.35E−04K5 (M/day) 3.31E−02 ± 3.24E−02 1.80E−03 ± 2.30E−03 3.02E−03 ± 1.07E−03 7.83E−03 ± 1.80E−03 2.63E−03 ± 6.79E−04t6 (day) – – – 3.60E + 01 ± 6.45E−01 5.23E + 01 ± 7.19E + 00
3
a(bafUiaTHarioaifomro
3
HemUaiwmmbtttAiltaft
tf
K7 (M/day) – – –Coleate (M) 3.07E−04 ± 2.14E−05 – –
.4. U(VI) reduction in microcosms
U(VI) concentrations decreased in both oleate and ethanolmended microcosms (Fig. 1a1–a3) but not the control microcosmFig. S1), indicating that the removal of U(VI) was due to micro-ial activities. The initiation of U(VI) removal was correlated withcetate production (i.e., degradation of oleate or ethanol) and sul-ate reduction. After sulfate was consumed, the removal of aqueous(VI) became slower (Fig. 1a1 and a2). Microcosms with higher
nitial sulfate had higher residual aqueous U(VI) concentrations,lthough more reduced U(IV) was detected in solid phase (Table 3).his was attributed to adsorption isotherm of U(VI) to sediments.igher initial sulfate concentration also resulted higher bicarbon-te concentration and raised pH (Table 3). Therefore, the higheresidual aqueous U(VI) was observed in the microcosm with highernitial sulfate concentration. The influence is simulated by the aque-us complexation reactions plus surface complexation for uraniumnd sulfate sorption in the basic geochemistry model. More U(VI)n sediments was desorbed and reduced with higher initial sul-ate concentration. Under the same initial sulfate concentration, webserved earlier and quicker U(VI) reduction in ethanol amendedicrocosms than in oleate amended microcosms. This was likely
elated to greater amount of hydrogen available with ethanol thanleate on the same COD basis (Table 1).
.5. Model calibration
The reaction pathway model was automatically calibrated usingGC5 coupled with PEST. Model calibration results are compared toxperimental data in Fig. 1. Parameter estimation results are sum-arized in Table 4. The model accurately tracked major features of(VI) reduction (Fig. 1a1–a3), sulfate reduction (Fig. 1b1–b3), andcetate evolution (Fig. 1c1–c3). K1–K5 were estimated through cal-bration of sulfate, U(VI) and acetate concentration measurements
ithout consideration of CH4 production from acetate (Table 4). Foricrocosms B1 and B2, additional calibration is performed to esti-ate K6 and t6 with consideration of CH4 production from acetate,
ased on the estimated K1 through K5 obtained from former calibra-ion. The oleate degradation in reality was more complicated thanhe reaction model used in this study. In our test, oleate degrada-ion via sulfate reduction was initially predominant. In microcosm1 oleate was degraded associated with sulfate reduction during
nitial 30 days and the second increase of acetate after 60 days wasikely due to degradation of some residual oleate via syntrophic ace-ogenesis mainly with methanogenesis. Therefore, in A1, the modelssumes that only part of the total oleate (0.89 mM) was available
or sulfate reduction, which represented by Coleate was estimatedogether with the other reaction parameters.Due to the much higher concentration of sulfate than U(VI),he consumption of acetate is mainly controlled by rate of sul-ate reduction using acetate. The overall rate of sulfate reduction
3.19E−01 ± 3.73E−01 6.28E−02 ± 4.75E−02– –
is influenced by the substrate degradation rate and intermediateacetate and hydrogen consumption rate. No separate data set isavailable to differentiate the rates of U(VI) reduction by acetateand hydrogen. However, the residual U(VI) co-existing with acetateindicates that the rate of U(VI) reduction with acetate was relativelyslow. Consequently, the maximum specific rate of U(VI) reductionby acetate, K4, was estimated to be smaller than that by hydro-gen, K5 (Table 4). Therefore, the overall rate of U(VI) bioreductionwas mainly influenced by the substrate degradation rate and inter-mediate hydrogen consumption rate. Simulation of intermediateacetate provide better understanding of the degradation and reduc-tion mechanisms.
As shown in Table 4, degradation rate of oleate K1 increased asinitial sulfate concentration rose from 1.09 mM (microcosm A1) to4.92 mM (microcosm A2) but decreased as initial sulfate concen-tration rose further to 8.58 mM (microcosm A3). This indicates thatsulfate concentration as high as 8.58 mM may cause inhibition tomicrobial activity.
3.6. Implementation of the results and further study
Results of this study indicated that oleate can be utilized as anelectron donor source for in situ U(VI) reduction and immobiliza-tion. Therefore, oleate-containing edible oil may also serve as anelectron donor source. The test results indicated that the degrada-tion rate of oleate was slower than ethanol. This would be beneficialas it would help to avoid microbial clogging near an injection welland promote deep penetration of the electron donor to subsurface.
The model developed in this study simulated the test processwell. However, the abiotic reduction of U(VI) to U(IV) by bio-genic sulfide and reduced ferrous compounds were not speciallyaddressed although the role of these compounds in U(VI) reduc-tion cannot be ruled-out. It is maybe due to that the contributionof abiotic U(VI) reduction was relatively smaller than biotic reac-tions under the test condition in this study. If abiotic reactionswere considered, more complicated model would be required.Models for U(VI) bioreduction involve many geochemical parame-ters, including aqueous U(VI) speciation, surface complexation andbioreaction kinetics. Therefore, for efficient in situ applications, sen-sitivity analysis is needed to simplify the models. In addition, oleatedegradation and uranium reduction in reality is much more compli-cated than the kinetic bio-reactions specified in reaction pathwaymodel. Uncertainty can also result from the simplification in theconceptual reaction model, which could be but not limited to: (1)when sulfate is depleted, excess acetate would be available forcontinued reduction of residual U(VI) by FeRB with access to bio-
available Fe(III); (2) the impact of bioreduced products on uraniumimmobilization; (3) reoxidation of immobilized U(IV) by dissolvedoxygen or other oxidants while anaerobic or anoxic conditions wasnot maintained; and (4) the scale up of biogeochemical reaction.These topics are the subject of ongoing analyses.
4 rdous
4
iiffsoctCsrAaC
tUloacaatuiwcett
gsttwmiaotBevtr
bbefoggbmbosdas
[
[
[
[
[
88 F. Zhang et al. / Journal of Haza
. Conclusion
This research mainly focused on the biogeochemical model-ng of U(VI) reduction with two distinct electron donor sources,.e., oleate and ethanol. Our study confirmed that long-chainatty acids like oleate can serve as electron donor sourceor U(VI) reduction. The results of microcosm tests demon-trated that U(VI) reduction can be achieved using eitherleate or ethanol as electron donor under different sulfateoncentrations. Higher sulfate concentrations caused desorp-ion of U(VI) and higher initial aqueous U(VI) concentration.ompetitive sorption of U(VI) and sulfate can be accuratelyimulated by a basic geochemistry model that includes equilib-ium aqueous complexation and surface complexation reactions.ccording to the aqueous speciation calculations, the dominantqueous U(VI) species was calcium–uranyl–carbonate complex,a2UO2(CO3)3.
Degradation of oleate in the sediments proceeded more slowlyhan ethanol. On the same COD basis, less U(VI) was reduced to(IV) using oleate than ethanol presumably because oleate has
ess hydrogen available via substrate degradation. The removalf U(VI) from the aqueous phase was mainly correlated withcetate production and sulfate reduction. Higher initial sulfateoncentration led to more bicarbonate production and raised pH;nd resulted in more U(VI) reduction in sediments. In oleatemended microcosms, the sulfate concentration also influencedhe peak concentrations of the intermediate breakdown prod-ct acetate. Lower peak concentration was observed with lower
nitial sulfate concentration suggesting that oleate degradationas more dependent on sulfate reduction. Mass balance cal-
ulation shows that with increased sulfate amendment morelectron donor was consumed by SRB and more U(VI) was reducedo U(IV) while less electrons were used for methane produc-ion.
A kinetic microbial reduction model incorporated with the basiceochemistry model was developed to describe the reduction ofulfate and U(VI) stimulated by oleate or ethanol. Both models trackhe major trend of sulfate and U(VI) reduction. The model describeshe successive production and consumption of acetate, concurrentith the bioreduction of aqueous sulfate and U(VI) species. Theodel results imply that (1) the overall rate of sulfate reduction
s influenced by the substrate degradation rate and intermediatecetate and hydrogen consumption rate and (2) the overall ratef U(VI) bioreduction is mainly influenced by both the degrada-ion rate of organic substrates and consumption rate of hydrogen.oth mass balance calculation and model calibration show that thextent of U(VI) reduced was likely related to hydrogen availableia substrate degradation. Simulation of intermediate acetate usinghe model provides better understanding of the degradation andeduction processes.
The kinetic microbial reduction model may be further improvedy simulating biomass production and tying reaction rates toiomass rather than using a lumped rate constant. Methanogen-sis could be inhibited by sulfate-reducing bacteria competingor transferred hydrogen (Abram and Nedwell, 1978). The lagf acetate degradation by methanogens maybe also due to slowrowth of acetate-utilizing methanogens. It is therefore sug-ested that future studies consider measurement of hydrogen andiomass, and analysis of bacterial type to enable the develop-ent and testing of more comprehensive models with competition
etween sulfate-reducing bacteria and methanogens and growth
f respective biomass. In addition, to apply oleate and otherlow-release substrates to the subsurface for in situ bioreme-iation, substrate delivery strategies need to be developed tovoid well clogging and ensure efficient amendment disper-al.[
[
Materials 183 (2010) 482–489
Supplementary data
Supplementary data associated with this article includesdescription of sample location at Oak Ridge site, sulfate and U con-centrations in control microcosm, and tables containing aqueouscomplexation reactions and surface complexation reactions con-sidered in the model.
Acknowledgements
This research was funded by the U.S. Department of Energy,Office of Science, Office of the Biological and EnvironmentalResearch. Oak Ridge National Laboratory is managed by UT-Battelle,LLC, for the U.S. Department of Energy under Contract DE-AC05-00OR22725. The authors thank Kenneth Lowe and Xiangping Yinfor analytical help.
Appendix A. Supplementary data
Supplementary data associated with this article can be found, inthe online version, at doi:10.1016/j.jhazmat.2010.07.049.
References
[1] H.H. Tabak, P. Lens, E.D. van Hullebusch, W. Dejonghe, Developments in biore-mediation of soils and sediments polluted with metals and radionuclides: 1.Microbial processes and mechanisms affecting bioremediation of metal con-tamination and influencing metal toxicity and transport, Rev. Environ. Sci.Biotechnol. 4 (2005) 115–156.
[2] B.E. Rittmann, P.L. McCarty, Environmental Biotechnology: Principles andApplications, McGraw- Hill, New York, 2001.
[3] D.R. Lovley, E.J.P. Phillips, Y.A. Gorby, E.R. Landa, Microbial reduction of ura-nium, Nature 350 (1991) 413–416.
[4] T.C. Hazen, H.H. Tabak, Developments in bioremediation of soils and sedimentspolluted with metals and radionuclides: 2. Field research on bioremedia-tion of metals and radionuclides, Rev. Environ. Sci. Biotechnol. 4 (2005) 157–183.
[5] J.D. Istok, J.M. Senko, L.R. Krumholz, D.B. Watson, M.A. Bogle, A. Peacock, Y.J.Chang, D.C. White, In situ bioreduction of technetium and uranium in a nitrate-contaminated aquifer, Environ. Sci. Technol. 38 (2004) 468–475.
[6] W.-M. Wu, J. Carley, T. Gentry, M.A. Ginder-Vogel, M. Fienen, T. Mehlhorn, H.Yan, S. Carroll, J. Nyman, J. Luo, M.E. Gentile, M.W. Fields, R.F. Hickey, D.B. Wat-son, O.A. Cirpka, S. Fendorf, J. Zhou, P.K. Kitanidis, P.M. Jardine, C.S. Criddle,Pilot-scale in situ bioremediation of uranium in a highly contaminated aquifer:2. U(VI) reduction and geochemical control of U(VI) bioavailability, Environ. Sci.Technol. 40 (2006) 3986–3995.
[7] W.-M. Wu, J. Carley, J. Luo, M.A. Ginder-vogel, E. Cardenas, M.B. Leigh, C. Hwang,S.D. Kelly, C. Ruan, L. Wu, J.V. Norstrand, T. Gentry, K. Lowe, T. Mehlhorn, S.Carroll, W. Luo, M.W. Fields, B. Gu, D. Watson, K.M. Kemner, T. Marsh, J. Tiedje,J. Zhou, S. Fendorf, P.K. Kitanidis, P.M. Jardine, C.S. Criddle, In situ bioreductionof uranium (VI) to submicromolar levels and reoxidation by dissolved oxygen,Environ. Sci. Technol. 41 (2007) 5716–5723.
[8] R.T. Anderson, H.A. Vrionis, I. Ortiz-Bernad, C.T. Resch, P.E. Long, R. Dayvault, K.Karp, S. Marutzky, D.R. Metzler, A. Peacock, D.C. White, M. Lowe, D.R. Lovley,Stimulating the in situ activity of Geobacter species to remove uranium fromthe groundwater of a uranium-contaminated aquifer, Appl. Environ. Microbiol.69 (2003) 5884–5891.
[9] R.C. Borden, Concurrent bioremediation of perchlorate and 1,1,1-trichloroethene in an emulsified oil barrier, J. Contam. Hydrol. 94 (2007)13–33.
10] Y. Yang, P.L. McCarty, Comparison between donor substrates for biologi-cally enhanced tetrachloroethene DNAPL dissolution, Environ. Sci. Technol. 36(2002) 3400–3404.
11] M. Quemeneur, Y. Marty, Fatty-acids and sterols in domestic wastewaters,Water Res. 28 (1994) 1217–1226.
12] F. Roy, G. Albagnac, E. Samain, Influence of calcium addition on growth of highlypurified syntrophic cultures degrading long-chain fatty acids, Appl. Environ.Microbiol. 49 (1985) 702–705.
13] D.Z. Sousa, M.A. Pereira, A.J.M. Stams, M.M. Alves, H. Smidt, Microbial commu-nities involved in anaerobic degradation of unsaturated or saturated long-chainfatty acids, Appl. Environ. Microbiol. 73 (2007) 1054–1064.
14] G.N. Rees, B.K.C. Patel, Desulforegula conservatrix gen. nov., sp. nov., a long-chain fatty acid-oxidizing, sulfate-reducing bacterium isolated from sediments
of a freshwater lake, Int. J. Syst. Evol. Microbiol. 51 (2001) 1911–1916.15] Y. Suzuki, S.D. Kelly, K.M. Kemner, J.F. Banfield, Microbial Populations Stim-ulated for Hexavalent Uranium Reduction in Uranium Mine Sediment, Appl.Environ. Microbiol. 69 (2003) 1337–1346.
16] F. Zhang, W. Luo, J.C. Parker, B.P. Spalding, S.C. Brooks, D.B. Watson, P.M. Jardine,B. Gu, Geochemical modeling of reactions and partitioning of trace metals and
rdous
[
[
[
[
[
[
[
[
[
[
[
[
[
[
[
[
[
[
[
[
[
[
[
[
[
[
[43] K. Ingvorsen, A.J.B. Zehnder, B.B. Jørgensen, Kinetics of sulfate and acetateuptake by Desulfobacter postgatei, Appl. Environ. Microbiol. 47 (1984)403–408.
F. Zhang et al. / Journal of Haza
radionuclides during titration of contaminated acidic sediments, Environ. Sci.Technol. 42 (2008) 8007–8013.
17] S.H. Harris, J.D. Istok, J.M. Suflita, Changes in organic matter biodegradabilityinfluencing sulfate reduction in an aquifer contaminated by landfill leachate,Microb. Ecol. 51 (2006) 535–542.
18] J.R. Spear, L.A. Figueroa, B.D. Honeyman, Modeling reduction of uranium U(VI)under variable sulfate concentrations by sulfate-reducing bacteria, Am. Soc.Microbiol. 66 (2000) 3711–3721.
19] Y.L. Li, H. Vali, J. Yang, T.J. Phelps, C.L. Zhang, Reduction of iron oxides enhancedby a sulfate-reducing bacterium and biogenic H2S, Geomicrobiol. J. 23 (2006)103–117.
20] W. Luo, W.-M. Wu, T. Yan, C.S. Criddle, P.M. Jardine, J. Zhou, B. Gu, Influenceof bicarbonate, sulfate, and electron donors on biological reduction of uraniumand microbial community composition, Appl. Microbiol. Biotechnol. 77 (2007)713–721.
21] J.L. Druhan, M.E. Conrad, K.H. Williams, L. N’Guessan, P.E. Long, S.S. Hubbard,Sulfur isotopes as indicators of amended bacterial sulfate reduction processesinfluencing field scale uranium bioremediation, Environ. Sci. Technol. 42 (2008)7842–7849.
22] B. Hua, B. Deng, Reductive immobilization of uranium (VI) by amorphous ironsulfide, Environ. Sci. Technol. 42 (2008) 8703–8708.
23] B. Hua, H. Xu, J. Terry, B. Deng, Kinetics of uranium (VI) reduction by hydrogensulfide in anoxic aqueous systems, Environ. Sci. Technol. 40 (2006) 4666–4671.
24] J. Komlos, H.S. Moon, P.R. Jaffé, Effect of sulfate on the simultaneous bioreduc-tion of iron and uranium, J. Environ. Qual. 37 (2008) 2058–2062.
25] J. Luo, F.-A. Weber, O.A. Cirpka, W.-M. Wu, J.L. Nyman, J. Carley, P.M. Jardine, C.S.Criddle, P.K. Kitanidis, Modeling in-situ uranium (VI) bioreduction by sulfate-reducing bacteria, J. Contam. Hydrol. 92 (2007) 129–148.
26] J. Luo, W.-M. Wu, J. Carley, M.N. Fienen, H. Cheng, D. Watson, C.S. Criddle,P.M. Jardine, P.K. Kitanidis, Estimating first-order reaction rate coefficient fortransport with nonequilibrium linear mass transfer in heterogeneous media, J.Contam. Hydrol. 98 (2008) 50–60.
27] J.R. Spear, L.A. Figueroa, B.D. Honeyman, Modeling the removal of uranium U(VI)from aqueous solutions in the presence of sulfate reducing bacteria, Environ.Sci. Technol. 33 (1999) 2667–2675.
28] S. Yabusaki, Y. Fang, P. Long, C. Resch, A. Peacock, J. Komlos, P. Jaffe, S. Morrison,R. Dayvault, D. White, R. Anderson, Uranium removal from groundwater via insitu biostimulation: field-scale modeling of transport and biological processes,J. Contam. Hydrol. 93 (2007) 216–235.
29] S.D. Kelly, K.M. Kemner, J. Carley, C. Criddle, P.M. Jardine, T.L. Marsh, D. Phillips,
D. Watson, W.-M. Wu, Speciation of uranium in sediments before and after insitu biostimulation, Environ. Sci. Technol. 42 (2008) 1558–1564.30] S.D. Kelly, W.-M. Wu, F. Yang|, C. Criddle, T.L. Marsh, E.J. O’Loughlin, B. Rave,D. Watson, P.M. Jardine, K.M. Kemner, Monitoring uranium transformations instatic microcosms, Environ. Sci. Technol. (2009) (published online, December2, 2009).
[
Materials 183 (2010) 482–489 489
31] S.C. Brooks, J.K. Fredrickson, S.L. Carroll, D.W. Kennedy, J.M. Zachara, A.E. Ply-male, S.D. Kelly, K.M. Kemner, S. Fendorf, Inhihition of bacterial U(VI) reductionby calcium, Environ. Sci. Technol. 37 (2003) 1850–1858.
32] D.Z. Sousa, H. Smidt, M.M. Alves, A.J.M. Stams, Syntrophomonas zehnderi spnov., an anaerobe that degrades long-chain fatty acids in co-culture withMethanobacterium formicicum, Int. J. Syst. Evol. Microbiol. 57 (2007) 609–615.
33] G.T. Yeh, J.T. Sun, P.M. Jardine, W.D. Burger, Y.L. Fang, M.H. Li, M.D. Siegel,HydroGeoChem 5.0: a three-dimensional model of coupled fluid flow, thermaltransport, and hydrogeochem transport through variable saturatedconditions– version 5. 0., Oak Ridge National Laboratory, Oak Ridge, TN, 2004.
34] G.-T. Yeh, Y. Fang, F. Zhang, J.T. Sun, Y. Li, M.-H. Li, M.D. Siegel, Numerical mod-eling of coupled fluid flow and thermal and reactive biogeochemical transportin porous and fractured media, Comput. Geosci. 14 (2010) 49–170.
35] F. Zhang, G.T. Yeh, J.C. Parker, S.C. Brooks, M.N. Pace, Y.-J. Kim, P.M. Jardine, D.B.Watson, A reaction-based paradigm to model reactive chemical transport ingroundwater with general kinetic and equilibrium reactions, J. Contam. Hydrol.92 (2007) 10–32.
36] J.P.E.S.T. Doherty, Model Independent Parameter Estimation, WatermarkNumerical Comput. (2002).
37] W. Dong, S.C. Brooks, Determination of the formation constants of ternarycomplexes of uranyl and carbonate with alkaline earth metals (Mg2+, Ca2+,Sr2+, and Ba2+) using anion exchange method, Environ. Sci. Technol. 40 (2006)4689–4695.
38] R. Guillaumont, T. Fanghanel, V. Neck, J. Fuger, D.A. Palmer, I. Grenthe, M.H.Rand (Eds.), Update on the Chemical Thermodynamics of Uranium, Neptunium,Plutonium, Americium, and Technetium, Elsevier, 2003, p. 918.
39] W. Stumm, J.J. Morgan, Aquatic Chemistry, 3rd ed., John Wiley and Sons, NewYork, 1996, p. 1003.
40] T.D. Waite, J.A. Davis, T.E. Payne, G.A. Waychunas, N. Xu, Uranium (VI) adsorp-tion to ferrihydrite: application of a surface complexation model, Geochim.Cosmochim. Acta 58 (1994) 5465–5478.
41] F. Zhang, J.C. Parker, S.C. Brooks, Y.-J. Kim, P.M. Jardine, D.B. Watson, Comparisonof approaches to calibrate a surface complexation model for U(VI) sorption toweathered saprolite, Transp. Porous Med. 78 (2009) 185–197.
42] Z.S. Kooner, P.M. Jardine, S. Feldman, Competitive surface complexation reac-tions of sulfate and natural organic carbon on soil, J. Environ. Qual. 24 (1995)656–662.
44] D.R. Lovley, D.F. Dwyer, M.J. Klug, Kinetic analysis of competition betweensulfate reducers and methanogens for hydrogen in sediments, Appl. Environ.Microbiol. 43 (1982) 1373–1379.


