Embed Size (px)
Citation preview
Topical delivery of clofazimine, artemisone and decoquinate utilizing vesicles as carrier system
L van Zyl
orcid.org/ 0000-0002-9775-0347
Thesis submitted in partial fulfilment of the requirements for the degree Doctor of Philosophy in Pharmaceutics at the
Potchefstroom Campus of the North-West University
Promoter: Prof J du Plessis Co-Promoter: Dr J Viljoen
Graduation May 2018 Student number: 20855125

The financial assistance of the National Research Foundation (NRF) towards this research is hereby acknowledged. Opinions expressed and conclusions arrived at, are those of the author and are not necessarily to be attributed to the NRF.

If we knew what we were
doing, it would not be called
research, would it?
-Albert Einstein
i
Table of contents
TABLE OF CONTENTS i
TABLE OF TABLES xi
TABLE OF FIGURES xv
ACKNOWLEDGEMENTS xxiii
ABSTRACT xxiv
References xxvi
UITTREKSEL xxvii
Bronnelys xxix
PREFACE
CHAPTER 1 Introduction and problem statement
1.1. Introduction and problem statement 2
1.2. Research aim and objectives 3
References 4
CHAPTER 2 Review article published in Tuberculosis
1. Introduction 8
2. Classification of cutaneous tuberculosis 9
2.1. Inoculation of tuberculosis from an exogenous source 9
2.2. Tuberculosis from an endogenous source 9
2.2.1. Haematogenous tuberculosis 10
1
ii
2.2.1.1. Tuberculids 11
3. Atypical mycobacterium infections of the skin 12
4. Current treatment regimens of cutaneous tuberculosis 13
4.1. True cutaneous tuberculosis and tuberculids 14
4.2. Atypical mycobacterium infections 14
5. Summary 15
Acknowledgements 15
Funding 15
Competing interests 15
Ethical approval 15
References 15
CHAPTER 3 Article on the validation of the analytical method accepted for publication in
DIEPharmazie
Abstract 19
1. Introduction 19
2. Investigations, results and discussion 20
3. Experimental 21
Acknowledgements 22
Disclaimer 22
References 22
iii
CHAPTER 4 Manuscript to be submitted to the Journal of Pharmaceutical and Biomedical Analysis on the topical delivery of artemisone, clofazimine and decoquinate
encapsulated in vesicles and their in vitro efficacy against a tuberculosis cell line
Abstract 29
Keywords 29
Highlights 30
1. Introduction 31
2. Materials and methods 32
2.1. Materials 32
2.2. Methods 32
2.2.1. Preparation of vesicles 32
2.2.2. Pre-formulation and characterisation 33
2.2.2.1. Isothermal calorimetry 33
2.2.2.2. Encapsulation efficiency 33
2.2.2.3. Zeta-potential, size distribution and vesicle size 33
2.2.2.4. pH and viscosity 33
2.2.3. Topical delivery 34
2.2.3.1. Skin preparation 34
2.2.3.2. Skin diffusion studies 34
2.2.3.3. Tape stripping 34
2.2.4. Efficacy against tuberculosis 35
3. Results and discussion 35
3.1. Pre-formulation and characterisation 35
3.1.1. Isothermal calorimetry 35
iv
3.1.2. Encapsulation efficiency 37
3.1.3. Zeta-potential, size distribution and vesicle size 37
3.1.4. pH and viscosity 39
3.2. Skin diffusion studies 40
3.3. Efficacy against tuberculosis 41
4. Conclusions 41
Acknowledgements 43
References 44
CHAPTER 5 Final conclusion and future prospects
5.1. Final conclusion 47
5.2. Future prospects 50
References 51
ANNEXURE A Analytical method validation for the concurrent determination of decoquinate,
artemisone and clofazimine by means of HPLC
A.1. Introduction 53
A.2. High performance liquid chromatography method validation for
decoquinate, artemisone and clofazimine 53
A.2.1. Chromatographic conditions 53
A.2.2. Reference standard and sample preparation 54
A.2.3. Analytical validation of test procedure and acceptance criteria 55
A.2.3.1. Linearity 55
A.2.3.2. Limit of detection and quantitation 59
A.2.3.3. Accuracy 60
v
A.2.3.4. Precision 62
A.2.3.4.1. Repeatability (Intra-day assay variation) 63
A.2.3.4.2. Intermediate precision (Inter-day assay variation) 65
A.2.3.4.3. Reproducibility 67
A.2.3.5. Ruggedness (Stability) 70
A.2.3.6. System suitability 74
A.2.3.7. Conclusion 76
References 77
ANNEXURE B Full compatibility report of clofazimine, artemisone and decoquinate with vesicle
components
1. Introduction 79
2. Method of analysis for compatibility 79
3. Results 80
3.1. Combination of artemisone, clofazimine and decoquinate 80
3.2. Artemisone in combination with phosphatidylcholine 81
3.3. Clofazimine and phosphatidylcholine 82
3.4. Decoquinate and phosphatidylcholine 82
3.5. Artemisone, clofazimine and decoquinate in combination with
phosphatidylcholine 83
3.6. Artemisone in combination with cholesterol 84
3.7. Clofazimine in combination with cholesterol 85
3.8. Decoquinate and cholesterol 86
3.9. Artemisone, decoquinate and clofazimine in combination with
cholesterol 87
vi
3.10. Phosphatidylcholine and cholesterol 87
3.11. Artemisone and Tween®20 88
3.12. Clofazimine and Tween®20 89
3.13. Decoquinate and Tween®20 89
3.14. Phosphatidylcholine and Tween®20 90
3.15. Combination of Tween®20 and cholesterol 91
3.16. Decoquinate, artemisone and Tween®20 91
3.17. Decoquinate, clofazimine and Tween®20 92
3.18. Artemisone, clofazimine and Tween®20 93
3.19. Artemisone, clofazimine, decoquinate and Tween®20 94
3.20. Liposomes containing artemisone 94
3.21. Liposomes containing clofazimine 95
3.22. Liposomes containing decoquinate 96
3.23. Liposomes containing artemisone, decoquinate and clofazimine 97
3.24. Transferosomes containing artemisone 98
3.25. Transferosomes containing clofazimine 99
3.26. Transferosomes containing decoquinate 100
3.27. Transferosomes containing artemisone, decoquinate and clofazimine 101
3.28. Niosomes containing artemisone 102
3.29. Niosomes containing clofazimine 103
3.30. Niosomes containing decoquinate 104
3.31. Niosomes containing artemisone, clofazimine and decoquinate 105
3.32. Conclusion 106
vii
ANNEXURE C Liposomes, niosomes and transferosomes utilised for topical drug delivery
C.1. Introduction 107
C.2. Background 107
C.2.1. Liposomes 108
C.2.2. Niosomes 110
C.2.3. Transferosomes 111
C.3. Preparation of vesicles 112
C.3.1. Materials 112
C.3.2. Method of preparation 112
C.4. Pre-formulation of vesicles 116
C.4.1. Differential scanning calorimetry 116
C.4.2. Isothermal calorimetry 117
C.4.3. Hot stage microscopy 120
C.5. Characterisation 123
C.5.1. Transmission electron microscopy 123
C.5.2. Encapsulation efficiency 125
C.5.3. Zeta-potential, size and size distribution 127
C.5.4. pH 144
C.5.5. Viscosity 146
C.6. Efficacy against tuberculosis 149
C.6.1. Effect of empty vesicles on tuberculosis cells 151
C.6.2. Effectivity of a combination of APIs against tuberculosis 151
viii
C.6.3. Effect of the type of vesicle used to encapsulate the APIs on
tuberculosis cells 151
C.7. Summary 152
References 154
ANNEXURE D Transdermal diffusion studies of different vesicle dispersions
D.1. Introduction 158
D.2. Methods and materials 159
D.2.1. Preparation of phosphate buffer solution 159
D.2.2. Skin preparation 159
D.2.3. Skin diffusion studies 161
D.2.4. Tape stripping 162
D.2.5. HPLC analysis 162
D.3. Results and discussion 162
D.3.1. Skin diffusion studies and tape stripping 162
D.4. Conclusion 169
References 170
ANNEXURE E Author’s guide for DIEPharmazie
E.1. Aim 171
E.2. Conditions 171
E.3. Ethical considerations 172
E.3.1. Conflicts of interest 173
E.3.2. Informed consent 173
E.3.3. Human and animal rights 173
ix
E.4. Preparation of manuscripts 173
ANNEXURE F Author’s guide to the Journal of Pharmaceutical and Biomedical Analysis
F.1. Introduction 177
F.1.1. Types of paper 178
F.1.2. Submission checklist 178
F.2. Before you begin 179
F.2.1. Ethics in publishing 179
F.2.2. Declaration of interest 179
F.2.3. Submission declaration and verification 179
F.2.4. Changes to authorship 180
F.2.5. Copyright 180
F.2.6. Role of the funding source 181
F.2.7. Open access 181
F.2.8. Submission 183
F.3. Preparation 183
F.3.1. Peer review 183
F.3.2. Article structure 184
F.3.3. Essential title page information 185
F.3.4. Abstract 186
F.3.5. Keywords 186
F.3.6. Artwork 188
F.3.7. Tables 189
F.3.8. References 189
x
F.3.9. Video 192
F.3.10. Supplementary material 193
F.3.11. AudioSlides 194
F.3.12. Interactive plots 194
F.4. After acceptance 194
F.4.1. Online proof correction 194
F.4.2. Offprints 195
F.5. Author inquiries 195
ANNEXURE G Certificate of language editing
197
xi
TABLE OF TABLES
CHAPTER 1 Introduction and problem statement
Table 1.1: Physicochemical properties of the three chosen APIs 2
CHAPTER 2 Review article published in Tuberculosis
Table 1: Atypical mycobacterium species responsible for cutaneous infections 9
Table 2: The classification of established leprosy 14
CHAPTER 3 Article on the validation of the analytical method accepted for publication in
DIEPharmazie
Table 1: Solubility (µg/ml) (37°C) determined for artemisone, clofazimine
and decoquinate in nine different solvents 24
Table 2: Obtained validation parameters for the three compounds 24
Table 3: Precision data for artemisone, clofazimine and decoquinate 24
CHAPTER 4 Manuscript to be submitted to the Journal of Pharmaceutical and Biomedical Analysis on the topical delivery of artemisone, clofazimine and decoquinate
encapsulated in vesicles and their in vitro efficacy against a tuberculosis cell line
Table 1: Encapsulation efficiency (%) of vesicle dispersions containing
1% API(s) 37
Table 2: Zeta-potential, size and size distribution (PDI) of the different
dispersions 38
Table 3: The pH and viscosity of 1% API dispersions at 25±1.0°C 39
xii
Table 4: Growth inhibition (%) of the APIs in solid form, as well as in, the
different dispersions 41
ANNEXURE A Analytical method validation for the concurrent determination of decoquinate,
artemisone and clofazimine by means of HPLC
Table A.1: Linear regression data obtained for artemisone 56
Table A.2: Linearity data for clofazimine 57
Table A.3: Linearity data obtained for decoquinate 58
Table A.4: Limit of detection (LOD) determined for artemisone, clofazimine
and decoquinate 59
Table A.5: Accuracy of artemisone 60
Table A.6: Accuracy of clofazimine 61
Table A.7: Accuracy of decoquinate 62
Table A.8: Artemisone repeatability 63
Table A.9: Clofazimine repeatability 64
Table A.10: Decoquinate repeatability 64
Table A.11: Intermediate precision of artemisone 65
Table A.12: Intermediate precision of clofazimine 66
Table A.13: Intermediate precision of decoquinate 66
Table A.14: Reproducibility of artemisone 67
Table A.15: Reproducibility of clofazimine 68
Table A.16: Reproducibility of decoquinate 68
Table A.17: Precision of artemisone between three days 69
Table A.18: Precision of clofazimine between three days 69
Table A.19: Precision of decoquinate between three days 70
xiii
Table A.20: Stability of artemisone 71
Table A.21: Stability of clofazimine 72
Table A.22: Stability of decoquinate 73
Table A.23: System suitability for artemisone 74
Table A.24: System suitability for clofazimine 75
Table A.25: System suitability for decoquinate 75
ANNEXURE C Liposomes, niosomes and transferosomes utilised for topical drug delivery
Table C.1: Liposome vesicles (5%) 115
Table C.2: Transferosome vesicles (5%) 116
Table C.3: Niosome vesicles (5%) 116
Table C.4: Compatibility report of different ingredients used for vesicle preparation 119
Table C.5: Encapsulation efficiency (%EE) of the vesicles in the different
dispersions 126
Table C.6: Amount (mg) of API entrapped in the vesicles for the different
dispersions with the initial amount added to dispersion in brackets 127
Table C.7: The average zeta-potentials for the different dispersions 128
Table C.8: Average sizes (n=3) of the niosomes with 0.2% API and 4 min
sonication 129
Table C.9: Average sizes (n=3) of the vesicles of different dispersions 131
Table C.10: Average pH measurements (n=3) of the different dispersions at room
temperature (25±1.0°C) 145
Table C.11: The average viscosity (mPa.s, n=12) for the different dispersions
at 25±1.0°C 148
Table C.12: Dispersions prepared for efficacy against tuberculosis 149
Table C.13: Efficacy against Mycobacterium tuberculosis H37Rv 150
xiv
Table C.14: Percentage inhibition of the three APIs, combination of the APIs and
also when encapsulated into selected vesicles 151
xv
TABLE OF FIGURES
CHAPTER 2 Review article published in Tuberculosis
Figure 1: Inoculation tuberculosis in a child 9
Figure 2: Tuberculosis verrucosa cutis 9
Figure 3: Scrofuloderma 10
Figure 4: Scrofuloderma in a male patient showing lymph gland involvement 10
Figure 5: Orifacial tuberculosis 10
Figure 6: Tuberculous gamma on the dorsum of the right foot of an eight-year
old boy 10
Figure 7: Lupus vulgaris plaque of the face, neck and chest 11
Figure 8: Deforming, ulcerative lupus vulgaris in a caucasian male 11
Figure 9: Cutaneous miliary TB before rupture of papules and crust formation 11
Figure 10: Lichen scrofulosorum of the forearm and abdomen 11
Figure 11: Papulonecrotic tuberculid 12
Figure 12: Erythema induratum of Bazin showing prevalence in the lower
extremities 12
Figure 13: Infection with Mycobacterium marinum in the upper extremities 12
Figure 14: Buruli ulcer in an eleven-year old boy from Australia 12
Figure 15: Cervicofacial Mycobacterium haemophilum lymphadenitis in a
child, A: presenting as a red swelling of the skin, B: after skin
breakdown, and C: ulcerating open wound 13
Figure 16: A fresh tattoo infected with Mycobacterium chelonae 13
xvi
Figure 17: Lesions caused by Mycobacterium abscessus 13
Figure 18: Established leprosy in order from A: tuberculoid leprosy, B: borderline
leprosy, to C: lepromatous leprosy 14
CHAPTER 3 Article on the validation of the analytical method accepted for publication in
DIEPharmazie
Fig. 1: Molecular structures of A) clofazimine, B) artemisone and
C) decoquinate. 25
Fig. 2: Chromatographs of a standard solution containing clofazimine,
artemisone and decoquinate, respectively. The top chromatogram
signifying detection obtained at 284 nm and the bottom chromatogram
showing detection at 210 nm. 25
Fig. 3: Chromatographs obtained with a solution containing typical excipients
used in formulation of solid oral dosage forms, observing clofazimine,
artemisone and decoquinate, respectively. The top chromatogram
signifying detection obtained at 284 nm and the bottom chromatogram
showing detection at 210 nm. 26
Fig. 4: Chromatographs of excipient solution for transdermal/topical delivery
systems showing clofazimine, artemisone, and decoquinate,
respectively. The top chromatogram signifying detection obtained at
284 nm and the bottom chromatogram showing detection at 210 nm. 26
CHAPTER 4 Manuscript to be submitted to the Journal of Pharmaceutical and Biomedical Analysis on the topical delivery of artemisone, clofazimine and decoquinate
encapsulated in vesicles and their in vitro efficacy against a tuberculosis cell line
Figure 1: Heat flow versus time graph obtained for a combination of ART,
CLF and DQ 36
Figure 2: Heat flow data obtained for ART, CLF, DQ and Tween®20 36
Figure 3: TEM imaging illustrating: A. Liposomes, B. Niosomes and C.
Transferosomes prepared with pure water 38
xvii
Figure 4: Average concentrations of APIs present in the stratum corneum-
epidermis (SCE) and epidermis-dermis (ED) after tape stripping 40
ANNEXURE A Analytical method validation for the concurrent determination of decoquinate,
artemisone and clofazimine by means of HPLC
Figure A.1: Chromatogram of a reference standard injected into HPLC and the
retention times of the three APIs 55
Figure A.2: Linear regression curve of artemisone 56
Figure A.3: Linear regression curve for clofazimine 57
Figure A.4: Linear regression curve for decoquinate 58
ANNEXURE B Full compatibility report of clofazimine, artemisone and decoquinate with vesicle
components
Figure 1: Heat flow versus time graph obtained for a combination of artemisone,
clofazimine and decoquinate. 80
Figure 2: Graph depicting the heat flow data of artemisone combined with
phosphatidylcholine. 81
Figure 3: Heat flow versus time graph obtained for a combination of clofazimine
and phosphatidylcholine. 82
Figure 4: Heat flow data obtained for decoquinate and phosphatidylcholine. 83
Figure 5: Heat flow data obtained for artemisone, clofazimine, decoquinate and
phosphatidylcholine. 84
Figure 6: Heat flow versus time graph obtained for a combination of artemisone
and cholesterol. 85
Figure 7: Heat flow versus time graph obtained for a combination of clofazimine
and cholesterol. 86
Figure 8: Heat flow data obtained for decoquinate and cholesterol. 86
xviii
Figure 9: Heat flow data obtained for artemisone, decoquinate, clofazimine
and cholesterol. 87
Figure 10: Heat flow data obtained for phosphatidylcholine and cholesterol. 88
Figure 11: Heat flow data obtained for artemisone and Tween® 20. 88
Figure 12: Heat flow data obtained for clofazimine and Tween® 20. 89
Figure 13: Heat flow data obtained for decoquinate and Tween® 20. 90
Figure 14: Heat flow data obtained for phosphatidylcholine and Tween® 20. 90
Figure 15: Heat flow data obtained for Tween®20 and cholesterol. 91
Figure 16: Heat flow data obtained for decoquinate, artemisone and Tween®20. 92
Figure 17: Heat flow data obtained for decoquinate, clofazimine and Tween®20. 93
Figure 18: Heat flow data obtained for artemisone, clofazimine and Tween®20. 93
Figure 19: Heat flow data obtained for artemisone, clofazimine, decoquinate
and Tween®20. 94
Figure 20: Heat flow versus time graph obtained for a combination of artemisone,
phosphatidylcholine and cholesterol. 95
Figure 21: Heat flow versus time graph obtained for a combination of clofazimine,
phosphatidylcholine and cholesterol. 96
Figure 22: Heat flow versus time graph obtained for a combination of decoquinate,
phosphatidylcholine and cholesterol. 97
Figure 23: Heat flow versus time graph obtained for a combination of decoquinate,
phosphatidylcholine and cholesterol when formulated as liposomes. 98
Figure 24: Heat flow data obtained for transferosomes containing artemisone and
phosphatidylcholine. 99
Figure 25: Heat flow data obtained for transferosomes containing clofazimine and
phosphatidylcholine. 100
Figure 26: Heat flow data obtained for transferosomes containing decoquinate and
phosphatidylcholine. 101
xix
Figure 27: Heat flow data obtained for transferosomes containing artemisone,
clofazimine, decoquinate and phosphatidylcholine. 102
Figure 28: Heat flow data obtained for niosomes containing artemisone. 103
Figure 29: Heat flow data obtained for niosomes containing clofazimine. 104
Figure 30: Heat flow data obtained for niosomes containing decoquinate. 105
Figure 31: Heat flow data obtained for niosomes containing artemisone,
clofazimine and decoquinate. 105
ANNEXURE C Liposomes, niosomes and transferosomes utilised for topical drug delivery
Figure C.1: Diagrammatical presentation of a unilamellar vesicle 108
Figure C.2: Labcon® hotplate and stirrer 113
Figure C.3: Transsonic® TS540 ultrasonicator bath 113
Figure C.4: Hielscher® ultrasonic processor UP200St at 200 W and 26 kHz 114
Figure C.5: Lipid film containing clofazimine in a beaker 115
Figure C.6: DSC thermogram of the three APIs and their combination 117
Figure C.7: Hot stage microscopy micrographs of artemisone during continuous
heating 121
Figure C.8: Hot stage microscopy micrograph of clofazimine during continuous
heating 121
Figure C.9: Hot stage microscopy micrograph of decoquinate during continuous
heating 122
Figure C.10: Hot stage microscopy micrograph of artemisone, clofazimine and
decoquinate during continuous heating 123
Figure C.11: TEM imaging illustrating: A. Liposomes, B. Niosomes and C.
Transferosomes prepared with PBS as the aqueous phase 124
Figure C.12: TEM imaging illustrating: A. Liposomes, B. Niosomes and C.
Transferosomes prepared with pure water 124
xx
Figure C.13: Dispersions after centrifugation showing the formation of pellets 125
Figure C.14: Size distribution of niosomes containing 0.2% artemisone (A),
clofazimine (B), decoquinate (C), and a combination of all three
APIs (D), sonicated 4 min 130
Figure C.15: Size distribution of liposomes with no APIs 132
Figure C.16: Size distribution of the liposomes containing 0.2% artemisone (A),
clofazimine (B), decoquinate (C), and all three APIs (D) 133
Figure C.17: Size distribution of the liposomes in the dispersion containing 0.4%
of all three APIs 134
Figure C.18: Size distribution of the liposomes containing 1% artemisone (A),
clofazimine (B), decoquinate (C), and all three APIs (D) 135
Figure C.19: Size distribution of transferosomes in the blank dispersion 136
Figure C.20: Size distribution of the transferosomes containing 0.2% artemisone (A),
clofazimine (B), decoquinate (C), and a combination of all three
APIs (D) 137
Figure C.21: Size distribution of the transferosomes in the dispersion containing
0.4% of all three APIs 138
Figure C.22: Size distribution of the transferosomes containing 1% artemisone (A),
clofazimine (B), decoquinate (C), and a combination of all three
APIs (D) 139
Figure C.23: Size distribution of niosomes in the blank dispersion 140
Figure C.24: Size distribution of the niosomes containing 0.2% artemisone (A),
clofazimine (B), decoquinate (C), and a combination of all three
APIs (D) 141
Figure C.25 Size distribution of the niosomes in the dispersion containing 0.4%
of all three APIs 142
xxi
Figure C.26: Size distribution of the niosomes containing 1% artemisone (A),
clofazimine (B), decoquinate (C), and a combination of all three
APIs (D) 143
Figure C.27: Mettler® Toledo pH meter 144
Figure C.28: A Brookfield® Viscometer used for measuring viscosity 147
ANNEXURE D Transdermal diffusion studies of different vesicle dispersions
Figure D.1: Vertical Franz diffusion cell components and assembly 159
Figure D.2: Full thickness black skin as received from donor 160
Figure D.3: Zimmer® electric dermatome model 8821 160
Figure D.4: A Grant® JB series water bath equipped with a magnetic stirrer plate 161
Figure D.5: Average concentration of clofazimine for the liposome dispersion in
the individual Franz cells 163
Figure D.6: Average concentration of decoquinate for the liposome dispersion in
the individual Franz cells 164
Figure D.7: Average concentration of clofazimine for the transferosome dispersion
in the individual Franz cells 165
Figure D.8: Average concentration of decoquinate for the transferosome dispersion
in the individual Franz cells 165
Figure D.9: Average concentration of clofazimine for the niosome dispersion in
the individual Franz cells 166
Figure D.10: Average concentration of decoquinate for the niosome dispersion in
the individual Franz cells 166
Figure D.11: Average concentration of clofazimine for the no vesicles dispersion in
the individual Franz cells 167
Figure D.12: Average concentration of decoquinate for the no vesicles dispersion in
the individual Franz cells 167
xxii
Figure D.13: Average concentrations APIs present in the SCE and ED for the
different dispersions investigated 168
xxiii
ACKNOWLEDGEMENTS
Glory be to God our Father. Thank you for all the blessings given in abundance, for giving me
this opportunity and each day carrying me through any obstacles I may face.
To Roean, the keeper of my heart, thank you for all your sacrifices, love, encouragement and a
few stern words where needed.
To my family, old and new, for all your support, love, understanding and encouragement.
Prof. Jeanetta du Plessis & Dr. Joe Viljoen: Thank you for all your guidance, patience,
encouragement and all the hours spent reading this thesis to help me deliver the best possible
version of this work.
Prof. Jan du Preez & Dr. Minja Gerber: Thank you for all the help with the HPLC, interpreting
data and writing the validation article.
Prof. Marique Aucamp: Thank you for all the hours spent with TAM, DSC and HSM.
Mrs. Hester de Beer: Thank you for always being willing to help with anything, even if it was just
pointing me to the right person for the task.
Dr. Anine Jordaan: Thank you for bringing my vesicles to life through your help with TEM.
Prof. Schalk Vorster: Thank you for helping with language editing of this thesis.
Thank you to the National Research Foundation (NRF), Medical Research Council (MRC) and the Centre of Excellence for Pharmaceutical Sciences (Pharmacen), North-West University, Potchefstroom Campus for funding this project and making it a possibility.
xxiv
ABSTRACT
Artemisone, clofazimine and decoquinate are part of the MALTBRedox MRC South African
University Flagship Projects, which focus on oxidant-redox drug combinations for the treatment
of tuberculosis and a few other diseases. These active pharmaceutical ingredients (APIs) were
chosen as a possible treatment of cutaneous tuberculosis (CTB), an uncommon and undefined
disease that is often misdiagnosed (Abdelmalek et al., 2013; Baig et al., 2014; Fader et al., 2010).
Currently CTB is only treated with regular oral anti-tuberculous medication, with occasional
invasive procedures such as skin grafts (Yates, 2010).
Artemisone, clofazimine and decoquinate have a log P of 2.49, 7.7 and 7.8, respectively
(Biamonte et al., 2013; Dunay et al., 2009; Nagelschmitz et al., 2008; Steyn et al., 2011). A high
log P-value indicates that the API is highly lipophilic and therefore a delivery system, namely
vesicles, was chosen to improve skin permeation. Many vesicles are currently being investigated
all over the world as carriers for APIs in topical delivery, though for this study liposomes, niosomes
and transferosomes were selected.
Dispersions containing a single API, a combination of all three APIs, as well as no API, were
prepared for all three types of vesicles. Characterisation of dispersions containing 0.2%, 0.4%
and 1% API was performed. Isothermal calorimetry indicated that no incompatibility occurred in
the 1% API combination dispersions, except the niosome dispersion, which indicated a probable
incompatibility. Encapsulation efficiency was above 85% for all 1% API dispersions. The empty
vesicles depicted an average size of 154 nm, 167.5 nm and 106.3 nm for liposomes, niosomes
and transferosomes, respectively. Vesicle sizes increased with increase in API concentration,
whereas stability decreased. Clofazimine was found to have the most significant impact on
vesicle size and stability when added as 1%, increasing the average niosome size to 2 461 nm.
Viscosity was below 2 mPa.s for all 1% API dispersions, ensuring even spreadability when applied
to the skin. The pH of all the dispersions were between 5–6, thus limiting skin irritation.
In vitro transdermal diffusion studies were conducted on black skin, using dispersions containing
1% of all three APIs. No APIs could be detected in the receptor phase. Artemisone was not
detected in the skin by means of HPLC analysis, which might be due to the fact that the
concentration was below the limit of detection (LOD). The LOD for artemisone was determined
at 4.42 µg/ml, whereas it was 0.042 µg/ml for clofazimine and 0.703 µg/ml for decoquinate.
Higher API concentrations were present in the stratum corneum-epidermis (SCE), compared to
in the epidermis-dermis (ED) for all the dispersions. Transferosomes delivered the highest
xxv
concentration clofazimine into the SCE and ED, as well as the highest concentration decoquinate
into the ED. The highest concentration decoquinate in the SCE, however, was obtained by the
niosome dispersion.
Efficacy against tuberculosis of the APIs (1%) encapsulated in vesicles was tested on strain
H37Rv. All dispersions were found to be effective to some degree against the tuberculosis strain
tested, with clofazimine in niosomes being the most effective with 52% growth inhibition. The
least effective was decoquinate in niosomes, with only 8% inhibition. The combination
dispersions delivered inhibitions of 42%, 38% and 12% for liposomes, niosomes and
transferosomes, respectively. Surprisingly, it was found that the vesicle dispersions containing
no APIs also presented some efficacy against the tuberculosis strain tested.
New knowledge contributed to pharmaceutics by this study includes encapsulating the three APIs
in liposomes, niosomes and transferosomes and successfully delivering them into the skin as
proved by transdermal diffusion studies. Developing an HPLC method for the concurrent analysis
of the three APIs and determining the activity of the vesicle dispersion against the specific
tuberculosis strain tested also contributed new knowledge. Results indicated that decoquinate,
an API never before considered for tuberculosis, does have anti-tuberculous activity. No
significant increase in efficacy against the tuberculosis strain was noted when combining the three
APIs in a vesicle dispersion, compared to when the APIs were incorporated separately into the
vesicles, though the blank vesicles had surprisingly high activity against the specific tuberculosis
strain tested.
Keywords: Clofazimine, artemisone, decoquinate, liposomes, niosomes, transferosomes,
transdermal

xxvi
REFERENCES ABDELMALEK, R., MEBAZAA, A., BERRICHE, A., KILANI, B., OSMAN, A.B., MOKNI, M. &
BENAISSA, H.T. 2013. Cutaneous tuberculosis in Tunisia. Médecine et maladies infectieuses,
43(9):374-378.
BAIG, I.A., MOON, J.Y., KIM, M.S., KOO, B.S. & YOON, M.Y. 2014. Structural and functional
significance of the highly-conserved residues in Mycobacterium tuberculosis acetohydroxyacid
synthase. Enzyme and microbial technology, 58-59:52-59.
BIAMONTE, M.A., WANNER, J. & LE ROCH, K.G. 2013. Recent advances in malaria drug
discovery. Bioorganic & medicinal chemistry letters, 23(10):2829-2843.
DUNAY, I.R., CHI CHAN, W., HAYNES, R.K. & SIBLEY, L.D. 2009. Artemisone and artemiside
control acute and reactivated toxoplasmosis in a murine model. Journal of antimicrobial agents
and chemotherapy, 53(10):4450-4456.
FADER, T., PARKS, J., KHAN, N.U., MANNING, R., STOKES, S. & NASIR, N.A. 2010.
Extrapulmonary tuberculosis in Kabul, Afghanistan: a hospital-based retrospective review.
International journal of infectious diseases, 14(2):e102-e110.
NAGELSCHMITZ, J., VOITH, B., WENSING, G., ROEMER, A., FUGMANN, B., HAYNES, R.K.,
KOTECKA, B.M., RIECKMANN, K.H. & EDSTEIN, M.D. 2008. First assessment in humans of
the safety, tolerability, pharmacokinetics, and ex vivo pharmacodynamics antimalarial activity of
the new artemisinin derivative artemisone. Antimicrobial agents and chemotherapy, 52(9):3085-
3091.
STEYN, J.D., WIESNER, L., DU PLESSIS, L.H., GROBLER, A.F., SMITH, P.J., CHAN, W.C.,
HAYNES, R.K. & KOTZÉ, A.F. 2011. Absorption of the novel artemisinin derivatives artemisone
and artemiside: potential application of Pheroid™ technology. International journal of
pharmaceutics, 414(1-2):260-266.
YATES, V.M. 2010. Mycobacterial infections. (In Burns, T., Breathnach, S., Cox, N. & Griffiths,
C., eds. Rook’s textbook of dermatology. 8th ed. Vol 2. West Sussex, United Kingdom: Blackwell
Publishing Ltd. p. 31.1-31.41.)
xxvii
UITTREKSEL
Artemisoon, klofasimien en dekokwinaat is deel van die MALTBRedox MRC Suid-Afrikaanse
Universiteit Flagship Projekte wat fokus op oksidasie-reduksie geneesmiddelkombinasies vir die
behandeling van tuberkulose en ʼn paar ander siektes. Hierdie geneesmiddels is gekies vir
moontlike behandeling van kutaneuse tuberkulose (KTB), ʼn ongewone en ongedefinieerde siekte
wat dikwels verkeerd gediagnoseer word (Abdelmalek et al., 2013; Baig et al., 2014; Fader et al.,
2010). Tans word KTB slegs behandel met gewone orale anti-tuberkulose-medisyne, en soms
met indringende prosedures soos veloorplantings (Yates, 210).
Artemisoon, klofasimien en dekokwinaat besit ʼn log P van 2.49, 7.7 en 7.8, onderskeidelik
(Biamonte et al., 2013; Dunay et al., 2009; Nagelschmitz et al., 2008; Steyn et al., 2011). ‘n Hoë
log P dui op ʼn sterk lipofiliese geneesmiddel en om hierdie rede is ‘n afleweringsisteem, naamlik
vesikels, gekies om veldeurlaatbaarheid te verbeter. Baie vesikels word tans reg oor die wêreld
ondersoek as draers van geneesmiddels vir topikale aflewering, maar vir hierdie studie is
liposome, niosome en transferosome geselekteer.
Dispersies met ʼn enkele geneesmiddel, ʼn kombinasie van al drie geneesmiddels, sowel as geen
geneesmiddel, is voorberei vir al drie tipes vesikels. Karakterisering van dispersies wat 0.2%,
0.4% en 1% geneesmiddel bevat, is uitgevoer. Isotermiese kalorimetrie-resultate het aangetoon
dat geen onverenigbaarhede voorkom in die 1% geneemiddeldispersie nie. Resultate verkry
vanaf die niosoomdispersie het egter op ʼn moontlikheid van onverenigbaarheid gedui.
Enkapsuleringeffektiwiteit was bo 85% vir alle 1% geneesmiddeldispersies. Die leë vesikels het
ʼn gemiddelde grootte van 154 nm, 167.5 nm en 106.3 nm gehad vir liposome, niosome en
transferosomes, onderskeidelik. Vesikelgrootte het toegeneem met ʼn toename in
geneesmiddelkonsentrasie, terwyl stabiliteit afgeneem het. Dit is gevind dat klofasimien die
grootste impak gehad het op vesikelgrootte en stabiliteit wanneer dit bygevoeg is in ʼn 1%
konsentrasie, met ʼn gemiddelde vesikelvergroting tot 2 461 nm. Viskositeit was onder 2 mPa.s
vir alle 1% geneesmiddeldispersies, wat eweredige spreibaarheid sal verseker tydens
aanwending op die vel. Die pH van al die dispersies was tussen 5–6, wat vel-irritasie beperk.
In vitro transdermale-afleweringstudies is uitgevoer op swart vel, deur van dispersies gebruik te
maak wat 1% van al drie geneesmiddels bevat. Geen geneesmiddel is waargeneem in die
reseptorfase nie. Artemisoon kon nie in die vel opgespoor word met behulp van die HPLC-
metode nie, wat moontlik verduidelik kan word deur die feit dat die konsentrasie onder die
opsporingslimiet was. Die opsporingslimiet van artemisoon is bepaal as 4.42 µg/ml, terwyl dit
xxviii
0.042 µg/ml vir klofasimien en 0.703 µg/ml vir dekokwinaat is. Hoër konsentrasies van die
geneesmiddels was wel teenwoordig in die stratum korneum-epidermis (SKE) in vergelyking met
die epidermis-dermis (ED) vir alle dispersies. Transferosome het die hoogste konsentrasie
klofasimien afgelewer in die SKE en ED, sowel as die hoogste konsentrasie dekokwinaat in die
ED. Die hoogste konsentrasie dekokwinaat in die SKE is egter verkry deur die niosoomdispersie.
Effektiwiteit van die geneesmiddels (1%) ingesluit in vesikels is getoets teen die spesifieke
bakteriële stam van tuberkulose teen die H37RV variasie. Daar is gevind dat al die dispersies
effektiwiteit toon, hoewel in ʼn klein mate; met klofasimien in niosome die effektiefste met 52%
groei-onderdrukking. Die laagste effektiwiteit teen die spesifieke tuberkulose-stam is getoon deur
dekokwinaat in niosome met 8% onderdrukking. Die kombinasie-dispersies het onderdrukkings
van 42%, 38% en 12% gelewer vir liposome, niosome en transferosomes, onderskeidelik.
Verbasend is daar gevind dat die vesikeldispersies wat geen geneesmiddels bevat het nie, ook
ʼn mate van effektiwiteit getoon het.
Nuwe kennis wat bydra tot Farmaseutika deur hierdie studie, sluit in die enkapsulering van die
drie geneesmiddels in liposome, niosome en transferosome, asook die suksesvolle aflewering
daarvan in die vel soos bepaal deur transdermale afleweringsstudies. Ontwikkeling van ʼn HPLC-
metode vir die gesamentlike analise van die drie geneesmiddels, asook die getoetste aktiwiteit
van die vesikeldispersies teen die spesifieke tuberkulose-stam, dra ook by tot nuwe kennis.
Resultate het aangedui dat dekokwinaat, ʼn geneesmiddel wat nooit voorheen oorweeg is teen
tuberkulose nie, wel anti-tuberkulose-aktiwiteit besit. Geen merkwaardige toename in effektiwiteit
teen tuberkulose is waargeneem wanneer die drie geneesmiddels gekombineer is in ʼn
vesikeldispersie, teenoor wanneer die geneesmiddels apart ingesluit is in die vesikels nie,
alhoewel die blanko-vesikels verbasend hoë aktiwiteit teen die spesifieke tuberkulose-stam
getoon het.
Sleutelwoorde: Klofasimien, artemisoon, dekokwinaat, liposome, niosome, transferosome,
transdermaal
xxix
BRONNELYS ABDELMALEK, R., MEBAZAA, A., BERRICHE, A., KILANI, B., OSMAN, A.B., MOKNI, M. &
BENAISSA, H.T. 2013. Cutaneous tuberculosis in Tunisia. Médecine et maladies infectieuses,
43(9):374-378.
BAIG, I.A., MOON, J.Y., KIM, M.S., KOO, B.S. & YOON, M.Y. 2014. Structural and functional
significance of the highly-conserved residues in Mycobacterium tuberculosis acetohydroxyacid
synthase. Enzyme and microbial technology, 58-59:52-59.
BIAMONTE, M.A., WANNER, J. & LE ROCH, K.G. 2013. Recent advances in malaria drug
discovery. Bioorganic & medicinal chemistry letters, 23(10):2829-2843.
DUNAY, I.R., CHI CHAN, W., HAYNES, R.K. & SIBLEY, L.D. 2009. Artemisone and artemiside
control acute and reactivated toxoplasmosis in a murine model. Journal of antimicrobial agents
and chemotherapy, 53(10):4450-4456.
FADER, T., PARKS, J., KHAN, N.U., MANNING, R., STOKES, S. & NASIR, N.A. 2010.
Extrapulmonary tuberculosis in Kabul, Afghanistan: a hospital-based retrospective review.
International journal of infectious diseases, 14(2):e102-e110.
NAGELSCHMITZ, J., VOITH, B., WENSING, G., ROEMER, A., FUGMANN, B., HAYNES, R.K.,
KOTECKA, B.M., RIECKMANN, K.H. & EDSTEIN, M.D. 2008. First assessment in humans of
the safety, tolerability, pharmacokinetics, and ex vivo pharmacodynamics antimalarial activity of
the new artemisinin derivative artemisone. Antimicrobial agents and chemotherapy, 52(9):3085-
3091.
STEYN, J.D., WIESNER, L., DU PLESSIS, L.H., GROBLER, A.F., SMITH, P.J., CHAN, W.C.,
HAYNES, R.K. & KOTZÉ, A.F. 2011. Absorption of the novel artemisinin derivatives artemisone
and artemiside: potential application of Pheroid™ technology. International journal of
pharmaceutics, 414(1-2):260-266.
YATES, V.M. 2010. Mycobacterial infections. (In Burns, T., Breathnach, S., Cox, N. & Griffiths,
C., eds. Rook’s textbook of dermatology. 8th ed. Vol 2. West Sussex, United Kingdom: Blackwell
Publishing Ltd. p. 31.1-31.41.)
1
PREFACE
This thesis is submitted in an article format and written according to the requirements of the
North-West University manual for postgraduate studies and conforms to the requirements
preferred by the appropriate journals. The thesis is written according to UK English spelling,
with the article chapters written according to each journal’s Guide to Authors.
Chapter 2:
Article 1: Cutaneous tuberculosis overview and current treatment regimens
Article published in Tuberculosis.
This review publication was written in order to fulfil the requirement of the NWU that a complete
literature overview should be included. No separate literature overview was thus included in
this thesis as this review was seen as fulfilment of the above requirement.
Chapter 3:
Article 2: Development and validation of the simultaneous determination of artemisone,
clofazimine and decoquinate with HPLC
Article accepted for publication in DIEPharmazie.
Chapter 4:
Article 3: Topical delivery of artemisone, clofazimine and decoquinate encapsulated in
vesicles and their in vitro efficacy against Mycobacterium tuberculosis H37Rv
strain
Article for submission to the Journal of Pharmaceutical and Biomedical Analysis.
2
Chapter 1
INTRODUCTION AND PROBLEM STATEMENT
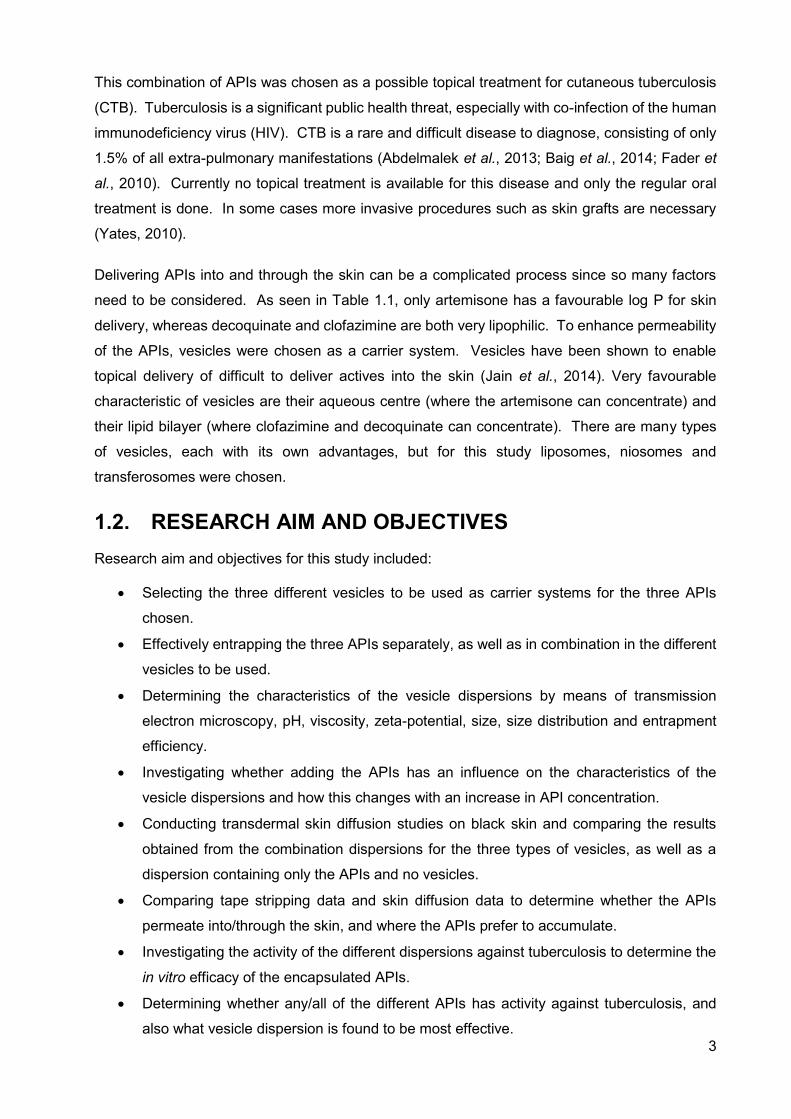
1.1 INTRODUCTION AND PROBLEM STATEMENT Human skin consists mainly of two layers, of which the epidermis is of most importance for this
study. The epidermis can be divided into mainly four layers, of which the stratum corneum is the
outermost layer. The stratum corneum regulates skin transport and is responsible for the skin’s
barrier function (Barry, 1983; Barry, 2001; Hadgraft, 2001; Suhonen et al., 1999; Venus et al.,
2010; Williams, 2003).
Topical delivery of an active pharmaceutical ingredient (API) is subjected to various specifications
due to the complicated structure of the skin and its excellent barrier function. For an API to be
delivered into the skin it has to have both hydrophilic and lipophilic properties. The optimal
partition coefficient (log P) range is between 1–3 and the optimal molecular weight is 500 g/mol
or less (Karande & Mitragotri, 2009; Moser et al., 2001; Niak et al., 2000; Swart et al., 2005).
The APIs chosen for this study are artemisone, clofazimine and decoquinate. These APIs were
part of the MALTBRedox MRC South African University Flagship Projects, which focus on
oxidant-redox drug combinations for the treatment of malaria, TB and related diseases. This
study formed part of the topical and transdermal delivery of actives with the ultimate aim to treat
dermal tuberculosis. The physicochemical properties of these APIs can be seen in Table 1.1.
Table 1.1: Physicochemical properties of the three chosen APIs
Property Artemisone Clofazimine Decoquinate Aqueous solubility (mg/L) 89 10 No data in literature
Molecular weight (g/mol) 401.5 473.4 417.5
Log P 2.49 7.6 7.8
pKa No data 8.51 10.76
Half-life (h) 2.8 8 Only animal tested
Melting point 199.26 210-212 219.89
Peak plasma concentration (h) 0.875 8-12 Only animal tested
[References: Biamonte et al., 2013; Bolla & Nangia, 2012; Brittain & Florey, 1992; Cholo et al.,
2011; Dunay et al., 2009; Holdiness, 1989; Iglesias et al., 2014; Nagelschmitz et al., 2008; Nam
et al., 2011; Pharmacopeia online, 2014; Srikanth et al., 2014; Steyn et al., 2011]
3
This combination of APIs was chosen as a possible topical treatment for cutaneous tuberculosis
(CTB). Tuberculosis is a significant public health threat, especially with co-infection of the human
immunodeficiency virus (HIV). CTB is a rare and difficult disease to diagnose, consisting of only
1.5% of all extra-pulmonary manifestations (Abdelmalek et al., 2013; Baig et al., 2014; Fader et
al., 2010). Currently no topical treatment is available for this disease and only the regular oral
treatment is done. In some cases more invasive procedures such as skin grafts are necessary
(Yates, 2010).
Delivering APIs into and through the skin can be a complicated process since so many factors
need to be considered. As seen in Table 1.1, only artemisone has a favourable log P for skin
delivery, whereas decoquinate and clofazimine are both very lipophilic. To enhance permeability
of the APIs, vesicles were chosen as a carrier system. Vesicles have been shown to enable
topical delivery of difficult to deliver actives into the skin (Jain et al., 2014). Very favourable
characteristic of vesicles are their aqueous centre (where the artemisone can concentrate) and
their lipid bilayer (where clofazimine and decoquinate can concentrate). There are many types
of vesicles, each with its own advantages, but for this study liposomes, niosomes and
transferosomes were chosen.
1.2. RESEARCH AIM AND OBJECTIVES Research aim and objectives for this study included:
Selecting the three different vesicles to be used as carrier systems for the three APIs
chosen.
Effectively entrapping the three APIs separately, as well as in combination in the different
vesicles to be used.
Determining the characteristics of the vesicle dispersions by means of transmission
electron microscopy, pH, viscosity, zeta-potential, size, size distribution and entrapment
efficiency.
Investigating whether adding the APIs has an influence on the characteristics of the
vesicle dispersions and how this changes with an increase in API concentration.
Conducting transdermal skin diffusion studies on black skin and comparing the results
obtained from the combination dispersions for the three types of vesicles, as well as a
dispersion containing only the APIs and no vesicles.
Comparing tape stripping data and skin diffusion data to determine whether the APIs
permeate into/through the skin, and where the APIs prefer to accumulate.
Investigating the activity of the different dispersions against tuberculosis to determine the
in vitro efficacy of the encapsulated APIs.
Determining whether any/all of the different APIs has activity against tuberculosis, and
also what vesicle dispersion is found to be most effective.
4
REFERENCES ABDELMALEK, R., MEBAZAA, A., BERRICHE, A., KILANI, B., OSMAN, A.B., MOKNI, M., et al.
2013. Cutaneous tuberculosis in Tunisia. Médecine et maladies infectieuses, 43(9):374-378.
BAIG, I.A., MOON, J.Y., KIM, M.S., KOO, B.S. & YOON, M.Y. 2014. Structural and functional
significance of the highly-conserved residues in Mycobacterium tuberculosis acetohydroxyacid
synthase. Enzyme and microbial technology, 58-59:52-59.
BARRY, B.W. 1983. Dermatological Formulations: Percutaneous Absorption. Drugs and the
pharmaceutical sciences. Vol. 18. New York: Marcel Dekker. 480p.
BARRY, B.W. 2001. Novel mechanisms and devices to enable successful transdermal drug
delivery. European journal of pharmaceutical sciences, 14(2):101-114.
BIAMONTE, M.A., WANNER, J. & LE ROCH, K.G. 2013. Recent advances in malaria drug
discovery. Bioorganic & medicinal chemistry letters, 23(10):2829-2843.
BOLLA, G. & NANGIA, A. 2012. Clofazimine Mesylate: A high solubility stable salt. Crystal
growth and design, 12(12):6250-6259.
BRITTAIN, H.G. & FLOREY, K. 1992. Profiles of drug substances, excipients and related
methodology. Vol 21. London: Academic Press Ltd. 696p.
CHOLO, M.C., STEEL, H.C., FOURIE, P.B., GERMISHUIZEN, W.A. & ANDERSON, R. 2011.
Clofazimine: current status and future prospects. Journal of antimicrobial chemotherapy,
67(2):290-298.
DUNAY, I.R., CHI CHAN, W., HAYNES, R.K. & SIBLEY, L.D. 2009. Artemisone and artemiside
control acute and reactivated toxoplasmosis in a murine model. Journal of antimicrobial agents
and chemotherapy, 53(10):4450-4456.
FADER, T., PARKS, J., KHAN, N.U., MANNING, R., STOKES, S. & NASIR, N.A. 2010.
Extrapulmonary tuberculosis in Kabul, Afghanistan: a hospital-based retrospective review.
International journal of infectious diseases, 14(2):e102-e110.
HADGRAFT, J. 2001. Skin, the final frontier. International journal of pharmaceutics,
224(1-2):1-18.
HOLDINESS, M.R. 1989. Clinical pharmacokinetics of clofazimine: a review. Clinical
pharmacokinetics, 16(2):74-85.
5
IGLESIAS, A., NEBOT, C., VÁZQUEZ, B.I., MIRANDA, J.M., ABUÍN, C.M.F. & CEPEDA, A.
2014. Detection of veterinary drug residues in surface waters collected nearby farming areas in
Galicia, North of Spain. Environmental science and pollution research, 21(3):2367-2377.
JAIN, S., JAIN, V. & MAHAJAN, S.C. 2014. Lipid based vesicular delivery systems. Advances
in pharmaceutics, 2014:1-12.
KARANDE, P. & MITRAGOTRI, S. 2009. Enhancement of transdermal drug delivery via
synergistic action of chemicals. Biochimica et biophysica acta (BBA) – Biomembranes,
1788(11):2362-2373.
MOSER, K., KRIWET, K., NAIK, A., KALIA, Y.N. & GUY, R.H. 2001. Passive skin penetration
enhancement and its quantification in vitro. European journal of pharmaceutics and
biopharmaceutics, 52(2):103-112.
NAGELSCHMITZ, J., VOITH, B., WENSING, G., ROEMER, A., FUGMANN, B., HAYNES, R.K.,
KOTECKA, B.M., RIECKMANN, K.H. & EDSTEIN, M.D. 2008. First assessment in humans of
the safety, tolerability, pharmacokinetics, and ex vivo pharmacodynamics antimalarial activity of
the new artemisinin derivative artemisone. Antimicrobial agents and chemotherapy, 52(9):3085-
3091.
NAIK, A., KALIA, Y.N. & GUY, R.H. 2000. Transdermal drug delivery: overcoming the skin’s
barrier function. Pharmaceutical science & technology today, 3(9):318-326.
NAM, T., McNAMARA, C.W., BOPP, S., DHARIA, N.V., MEISTER, S., BONAMY, G.M.C.,
PLOUFFE, D.M., KATO, N., McCORMACK, S., BURSULAYA, B., KE, H., VAIDYA, A.B.,
SCHULTZ, P.G. & WINZELER, E.A. 2011. A chemical genomic analysis of decoquinate, a
Plasmodium falciparum cytochrome b inhibitor. ACS chemical biology, 6(11):1214-1222.
PHARMACOPEIA ONLINE. 2014. http://www.uspbpep.com/usp29/v29240/
usp29nf245O_m22310.html Date of access: 19 May 2014.
SRIKANTH, C.H., JOSHI, P., BIKKASANI, A.K., PORWAL, K. & GAYEN, J.R. 2014. Bone
distribution study of anti leprotic drug clofazimine in rat bone marrow cells by a sensitive reverse
phase liquid chromatography method. Journal of chromatography B, 960:82-86.
STEYN, J.D., WIESNER, L., DU PLESSIS, L.H., GROBLER, A.F., SMITH, P.J., CHAN, W.C.,
HAYNES, R.K. & KOTZÉ, A.F. 2011. Absorption of the novel artemisinin derivatives artemisone
and artemiside: potential application of Pheroid™ technology. International journal of
pharmaceutics, 414(1-2):260-266.
6
SUHONEN, M.T., BOUWSTRA, J.A. & URTTI, A. 1999. Chemical enhancement of percutaneous
absorption in relation to stratum corneum structural alterations. Journal of controlled release,
59(2):149-161.
SWART, H., BREYTENBACH, J.C., HADGRAFT, J. & DU PLESSIS, J. 2005. Synthesis and
transdermal penetration of NSAID glycoside esters. International journal of pharmaceutics,
301:71-79.
VENUS, M., WATERMAN, J. & McNAB, I. 2010. Basic physiology of the skin. Surgery (Oxford),
28(10):469-472.
WILLIAMS, A.C. 2003. Transdermal and Topical Drug Delivery. 1st ed. London: Pharmaceutical
Press. 242p.
YATES, V.M. 2010. Mycobacterial infections. (In Burns, T., Breathnach, S., Cox, N. & Griffiths,
C., eds. Rook’s textbook of dermatology. 8th ed. Vol 2. West Sussex, United Kingdom: Blackwell
Publishing Ltd. p. 31.1-31.41.)
7
Chapter 2
REVIEW ARTICLE PUBLISHED IN
TUBERCULOSIS
This chapter contains the literature background for this study and is presented in article format as
published in the journal Tuberculosis in 2015. This review publication was written in order to fulfil
the requirement of the NWU that a complete literature overview should be included. No separate
literature overview was thus included in this thesis as this review was seen as fulfilment of the
above requirement.
REVIEW
Cutaneous tuberculosis overview and current treatment regimens
Lindi van Zyl, Jeanetta du Plessis*, Joe ViljoenCentre of Excellence for Pharmaceutical Sciences, North-West University, Private Bag X6001, Potchefstroom, 2520, South Africa
a r t i c l e i n f o
Article history:Received 22 July 2014Accepted 17 December 2014
Keywords:CutaneousTuberculosisDermalTreatmentClassification
s u m m a r y
Tuberculosis is one of the oldest diseases known to humankind and it is currently a worldwide threatwith 8e9 million new active disease being reported every year. Among patients with co-infection of thehuman immunodeficiency virus (HIV), tuberculosis is ultimately responsible for the most deaths.Cutaneous tuberculosis (CTB) is uncommon, comprising 1e1.5% of all extra-pulmonary tuberculosismanifestations, which manifests only in 8.4e13.7% of all tuberculosis cases.
A more accurate classification of CTB includes inoculation tuberculosis, tuberculosis from an endog-enous source and haematogenous tuberculosis. There is furthermore a definite distinction between trueCTB caused byMycobacterium tuberculosis and CTB caused by atypicalmycobacterium species. The lesionscaused by mycobacterium species vary from small papules (e.g. primary inoculation tuberculosis) andwarty lesions (e.g. tuberculosis verrucosa cutis) to massive ulcers (e.g. Buruli ulcer) and plaques (e.g.lupus vulgaris) that can be highly deformative.
Treatment options for CTB are currently limited to conventional oral therapy and occasional surgicalintervention in cases that require it. True CTB is treated with a combination of rifampicin, ethambutol,pyrazinamide, isoniazid and streptomycin that is tailored to individual needs. Atypical mycobacteriuminfections are mostly resistant to anti-tuberculous drugs and only respond to certain antibiotics. As in thecase of pulmonary TB, various and relatively wide-ranging treatment regimens are available, althoughpatient compliance is poor. The development of multi-drug and extremely drug-resistant strains has alsothreatened treatment outcomes. To date, no topical therapy for CTB has been identified and althoughconventional therapy has mostly shown positive results, there is a lack of other treatment regimens.
© 2015 Elsevier Ltd. All rights reserved.
1. Introduction
Tuberculosis (TB) is one the oldest diseases of humankind. Ashumanity populated the earth, so did this disease spread as well.Typical tuberculous lesions, containing acid-fast bacilli (AFB), havebeen identified in Egyptian mummies [1e4]. The prevalence of TBincreased dramatically during the seventeenth and eighteenthcenturies, after which it declined over the next two-hundred years[5]. Later in the nineteenth century, TB again became amajor healthconcern, although improved hygiene and immunisation caused thedisease to wane again [6e8].
TB today continues to pose a significant public health threat. TheWorld Health Organisation (WHO) estimates that approximately20e40% of the world's population are affected, with 8e9 millionnew cases of active disease being reported every year [9e16]. TB is
ultimately responsible for most deaths among patients infectedwith the human immunodeficiency virus (HIV) [8,17,18,19,20].
Despite TB being such a widespread disease, especially indeveloping countries, it manifests only as an extra-pulmonarydisease in 8.4e13.7% of cases. The difference in data and the lowvalues may also indicate how uncommon and undefined this dis-ease truly is. This increases with co-infection of HIV. Cutaneoustuberculosis (CTB) is relatively uncommon and not a well defineddisease, comprising only 1e1.5% of all extra-pulmonary manifes-tations [21e25,12,26,8,27e29,20,30]. Th�eophile Laennec [8], in-ventor of the stethoscope, described the first example of CTB in1826. CTB is prevalent among women, mostly young adults. Themost common site of CTB infection is the face, although it oftenappears on the neck and torso as well [31].
CTB has many different manifestations, which complicatesdiagnosis. The increase in multi-drug resistant TB has also resultedin an increase in the occurrence of CTB. Skin manifestations of in-fections caused by Mycobacterium tuberculosis are known as trueCTB, but some of the other species of the Mycobacterium genus arealso responsible for cutaneous manifestations, as summarised in
* Corresponding author. Tel.: þ27 18 299 2274; fax: þ27 87 231 5432.E-mail addresses: [email protected] (L. van Zyl), [email protected].
za (J. du Plessis), [email protected] (J. Viljoen).
Contents lists available at ScienceDirect
Tuberculosis
journal homepage: http : / / int l .e lsevierhealth.com/journals / tube
http://dx.doi.org/10.1016/j.tube.2014.12.0061472-9792/© 2015 Elsevier Ltd. All rights reserved.
Tuberculosis 95 (2015) 629e638
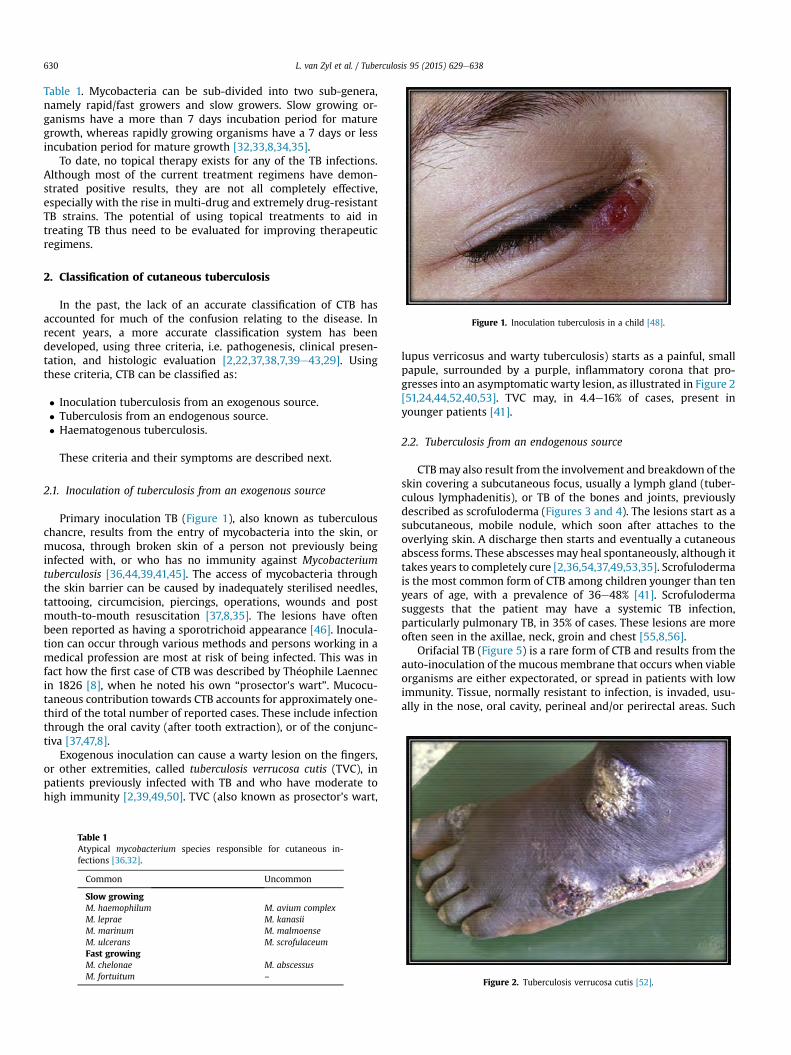
Table 1. Mycobacteria can be sub-divided into two sub-genera,namely rapid/fast growers and slow growers. Slow growing or-ganisms have a more than 7 days incubation period for maturegrowth, whereas rapidly growing organisms have a 7 days or lessincubation period for mature growth [32,33,8,34,35].
To date, no topical therapy exists for any of the TB infections.Although most of the current treatment regimens have demon-strated positive results, they are not all completely effective,especially with the rise in multi-drug and extremely drug-resistantTB strains. The potential of using topical treatments to aid intreating TB thus need to be evaluated for improving therapeuticregimens.
2. Classification of cutaneous tuberculosis
In the past, the lack of an accurate classification of CTB hasaccounted for much of the confusion relating to the disease. Inrecent years, a more accurate classification system has beendeveloped, using three criteria, i.e. pathogenesis, clinical presen-tation, and histologic evaluation [2,22,37,38,7,39e43,29]. Usingthese criteria, CTB can be classified as:
� Inoculation tuberculosis from an exogenous source.� Tuberculosis from an endogenous source.� Haematogenous tuberculosis.
These criteria and their symptoms are described next.
2.1. Inoculation of tuberculosis from an exogenous source
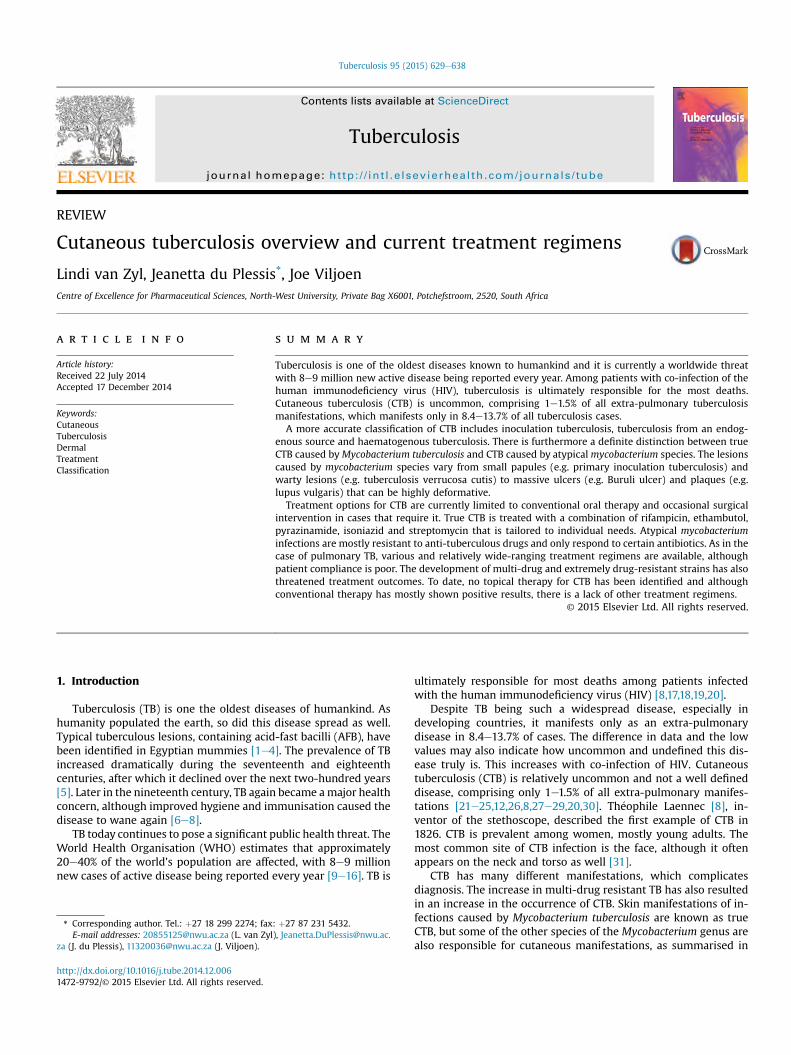
Primary inoculation TB (Figure 1), also known as tuberculouschancre, results from the entry of mycobacteria into the skin, ormucosa, through broken skin of a person not previously beinginfected with, or who has no immunity against Mycobacteriumtuberculosis [36,44,39,41,45]. The access of mycobacteria throughthe skin barrier can be caused by inadequately sterilised needles,tattooing, circumcision, piercings, operations, wounds and postmouth-to-mouth resuscitation [37,8,35]. The lesions have oftenbeen reported as having a sporotrichoid appearance [46]. Inocula-tion can occur through various methods and persons working in amedical profession are most at risk of being infected. This was infact how the first case of CTB was described by Th�eophile Laennecin 1826 [8], when he noted his own “prosector's wart”. Mucocu-taneous contribution towards CTB accounts for approximately one-third of the total number of reported cases. These include infectionthrough the oral cavity (after tooth extraction), or of the conjunc-tiva [37,47,8].
Exogenous inoculation can cause a warty lesion on the fingers,or other extremities, called tuberculosis verrucosa cutis (TVC), inpatients previously infected with TB and who have moderate tohigh immunity [2,39,49,50]. TVC (also known as prosector's wart,
lupus verricosus and warty tuberculosis) starts as a painful, smallpapule, surrounded by a purple, inflammatory corona that pro-gresses into an asymptomatic warty lesion, as illustrated in Figure 2[51,24,44,52,40,53]. TVC may, in 4.4e16% of cases, present inyounger patients [41].
2.2. Tuberculosis from an endogenous source
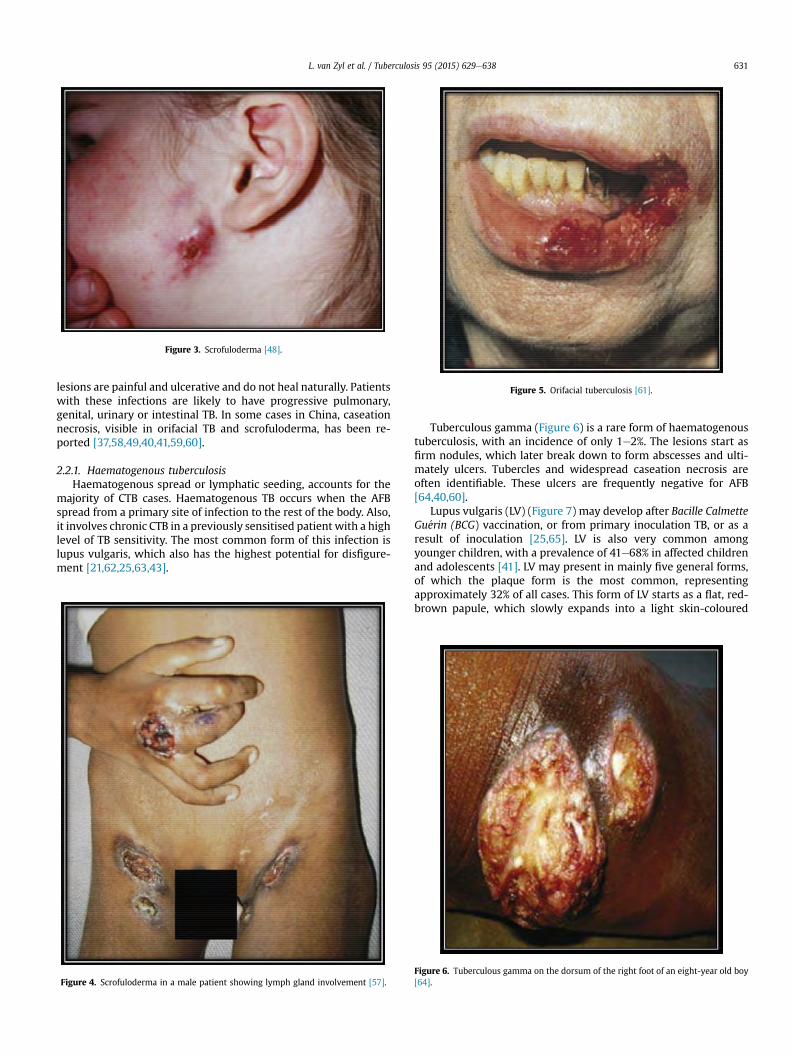
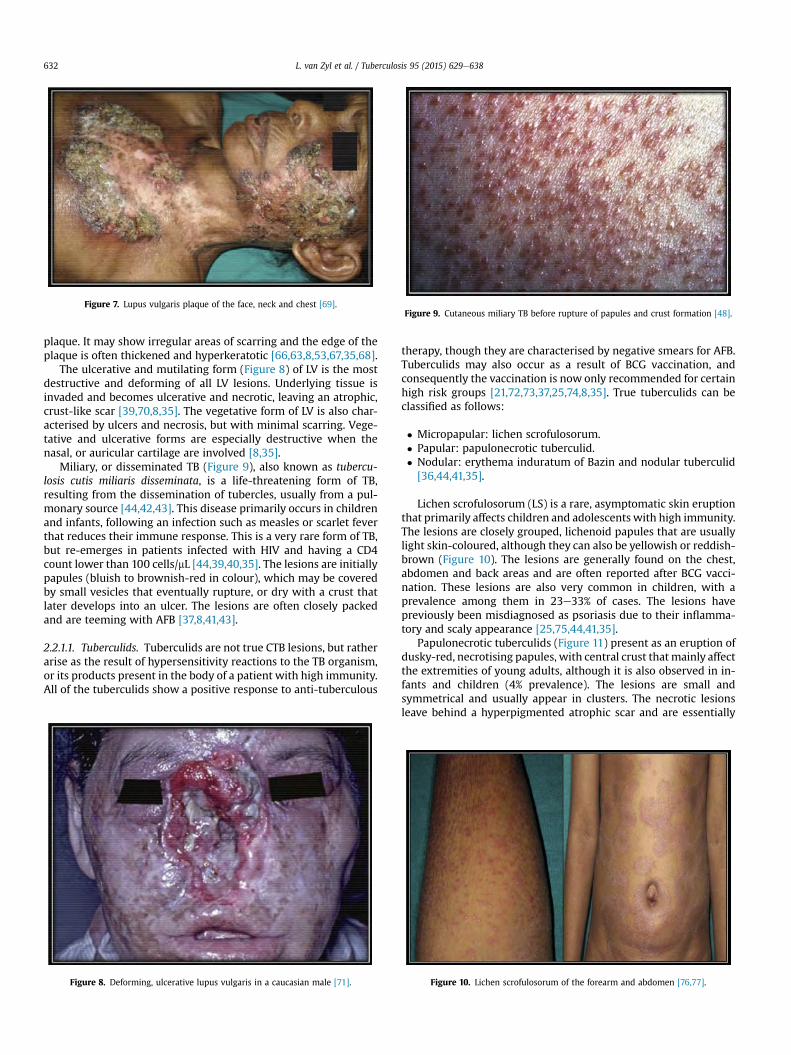
CTBmay also result from the involvement and breakdown of theskin covering a subcutaneous focus, usually a lymph gland (tuber-culous lymphadenitis), or TB of the bones and joints, previouslydescribed as scrofuloderma (Figures 3 and 4). The lesions start as asubcutaneous, mobile nodule, which soon after attaches to theoverlying skin. A discharge then starts and eventually a cutaneousabscess forms. These abscesses may heal spontaneously, although ittakes years to completely cure [2,36,54,37,49,53,35]. Scrofulodermais the most common form of CTB among children younger than tenyears of age, with a prevalence of 36e48% [41]. Scrofulodermasuggests that the patient may have a systemic TB infection,particularly pulmonary TB, in 35% of cases. These lesions are moreoften seen in the axillae, neck, groin and chest [55,8,56].
Orifacial TB (Figure 5) is a rare form of CTB and results from theauto-inoculation of the mucous membrane that occurs when viableorganisms are either expectorated, or spread in patients with lowimmunity. Tissue, normally resistant to infection, is invaded, usu-ally in the nose, oral cavity, perineal and/or perirectal areas. Such
Table 1Atypical mycobacterium species responsible for cutaneous in-fections [36,32].
Common Uncommon
Slow growingM. haemophilum M. avium complexM. leprae M. kanasiiM. marinum M. malmoenseM. ulcerans M. scrofulaceumFast growingM. chelonae M. abscessusM. fortuitum –
Figure 1. Inoculation tuberculosis in a child [48].
Figure 2. Tuberculosis verrucosa cutis [52].
L. van Zyl et al. / Tuberculosis 95 (2015) 629e638630
lesions are painful and ulcerative and do not heal naturally. Patientswith these infections are likely to have progressive pulmonary,genital, urinary or intestinal TB. In some cases in China, caseationnecrosis, visible in orifacial TB and scrofuloderma, has been re-ported [37,58,49,40,41,59,60].
2.2.1. Haematogenous tuberculosisHaematogenous spread or lymphatic seeding, accounts for the
majority of CTB cases. Haematogenous TB occurs when the AFBspread from a primary site of infection to the rest of the body. Also,it involves chronic CTB in a previously sensitised patient with a highlevel of TB sensitivity. The most common form of this infection islupus vulgaris, which also has the highest potential for disfigure-ment [21,62,25,63,43].
Tuberculous gamma (Figure 6) is a rare form of haematogenoustuberculosis, with an incidence of only 1e2%. The lesions start asfirm nodules, which later break down to form abscesses and ulti-mately ulcers. Tubercles and widespread caseation necrosis areoften identifiable. These ulcers are frequently negative for AFB[64,40,60].
Lupus vulgaris (LV) (Figure 7) may develop after Bacille CalmetteGu�erin (BCG) vaccination, or from primary inoculation TB, or as aresult of inoculation [25,65]. LV is also very common amongyounger children, with a prevalence of 41e68% in affected childrenand adolescents [41]. LV may present in mainly five general forms,of which the plaque form is the most common, representingapproximately 32% of all cases. This form of LV starts as a flat, red-brown papule, which slowly expands into a light skin-coloured
Figure 3. Scrofuloderma [48].
Figure 4. Scrofuloderma in a male patient showing lymph gland involvement [57].
Figure 5. Orifacial tuberculosis [61].
Figure 6. Tuberculous gamma on the dorsum of the right foot of an eight-year old boy[64].
L. van Zyl et al. / Tuberculosis 95 (2015) 629e638 631
plaque. It may show irregular areas of scarring and the edge of theplaque is often thickened and hyperkeratotic [66,63,8,53,67,35,68].
The ulcerative and mutilating form (Figure 8) of LV is the mostdestructive and deforming of all LV lesions. Underlying tissue isinvaded and becomes ulcerative and necrotic, leaving an atrophic,crust-like scar [39,70,8,35]. The vegetative form of LV is also char-acterised by ulcers and necrosis, but with minimal scarring. Vege-tative and ulcerative forms are especially destructive when thenasal, or auricular cartilage are involved [8,35].
Miliary, or disseminated TB (Figure 9), also known as tubercu-losis cutis miliaris disseminata, is a life-threatening form of TB,resulting from the dissemination of tubercles, usually from a pul-monary source [44,42,43]. This disease primarily occurs in childrenand infants, following an infection such as measles or scarlet feverthat reduces their immune response. This is a very rare form of TB,but re-emerges in patients infected with HIV and having a CD4count lower than 100 cells/mL [44,39,40,35]. The lesions are initiallypapules (bluish to brownish-red in colour), which may be coveredby small vesicles that eventually rupture, or dry with a crust thatlater develops into an ulcer. The lesions are often closely packedand are teeming with AFB [37,8,41,43].
2.2.1.1. Tuberculids. Tuberculids are not true CTB lesions, but ratherarise as the result of hypersensitivity reactions to the TB organism,or its products present in the body of a patient with high immunity.All of the tuberculids show a positive response to anti-tuberculous
therapy, though they are characterised by negative smears for AFB.Tuberculids may also occur as a result of BCG vaccination, andconsequently the vaccination is now only recommended for certainhigh risk groups [21,72,73,37,25,74,8,35]. True tuberculids can beclassified as follows:
� Micropapular: lichen scrofulosorum.� Papular: papulonecrotic tuberculid.� Nodular: erythema induratum of Bazin and nodular tuberculid[36,44,41,35].
Lichen scrofulosorum (LS) is a rare, asymptomatic skin eruptionthat primarily affects children and adolescents with high immunity.The lesions are closely grouped, lichenoid papules that are usuallylight skin-coloured, although they can also be yellowish or reddish-brown (Figure 10). The lesions are generally found on the chest,abdomen and back areas and are often reported after BCG vacci-nation. These lesions are also very common in children, with aprevalence among them in 23e33% of cases. The lesions havepreviously been misdiagnosed as psoriasis due to their inflamma-tory and scaly appearance [25,75,44,41,35].
Papulonecrotic tuberculids (Figure 11) present as an eruption ofdusky-red, necrotising papules, with central crust that mainly affectthe extremities of young adults, although it is also observed in in-fants and children (4% prevalence). The lesions are small andsymmetrical and usually appear in clusters. The necrotic lesionsleave behind a hyperpigmented atrophic scar and are essentially
Figure 7. Lupus vulgaris plaque of the face, neck and chest [69].
Figure 8. Deforming, ulcerative lupus vulgaris in a caucasian male [71].
Figure 9. Cutaneous miliary TB before rupture of papules and crust formation [48].
Figure 10. Lichen scrofulosorum of the forearm and abdomen [76,77].
L. van Zyl et al. / Tuberculosis 95 (2015) 629e638632
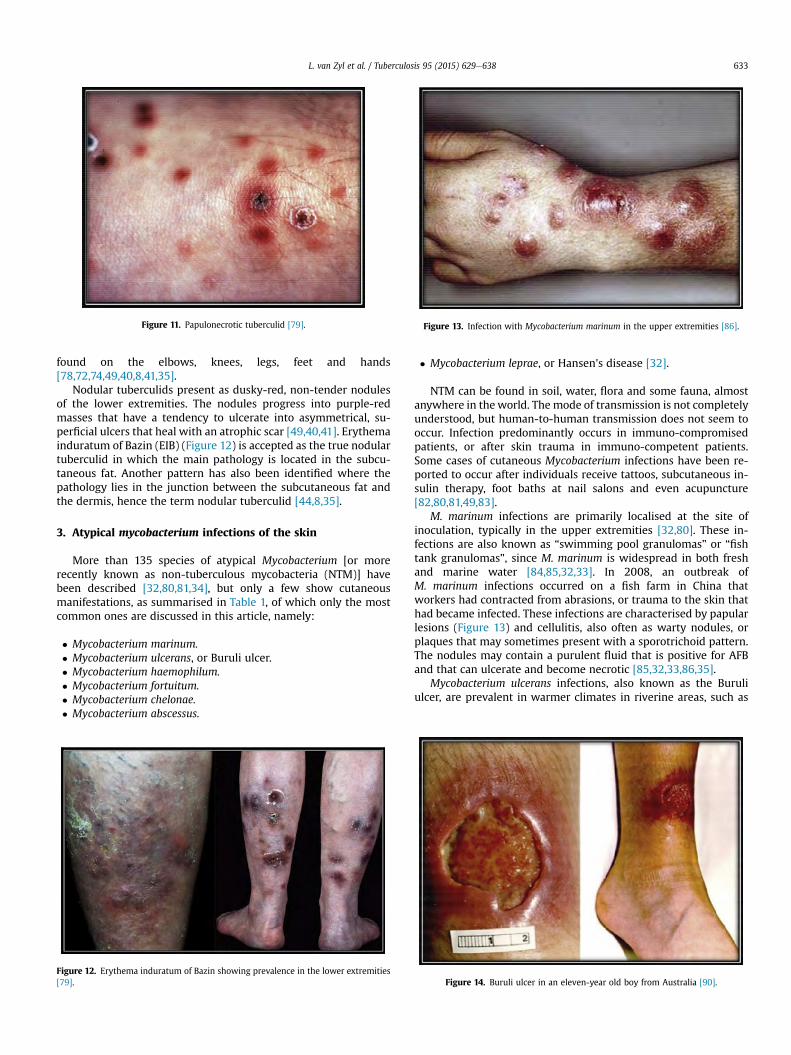
found on the elbows, knees, legs, feet and hands[78,72,74,49,40,8,41,35].
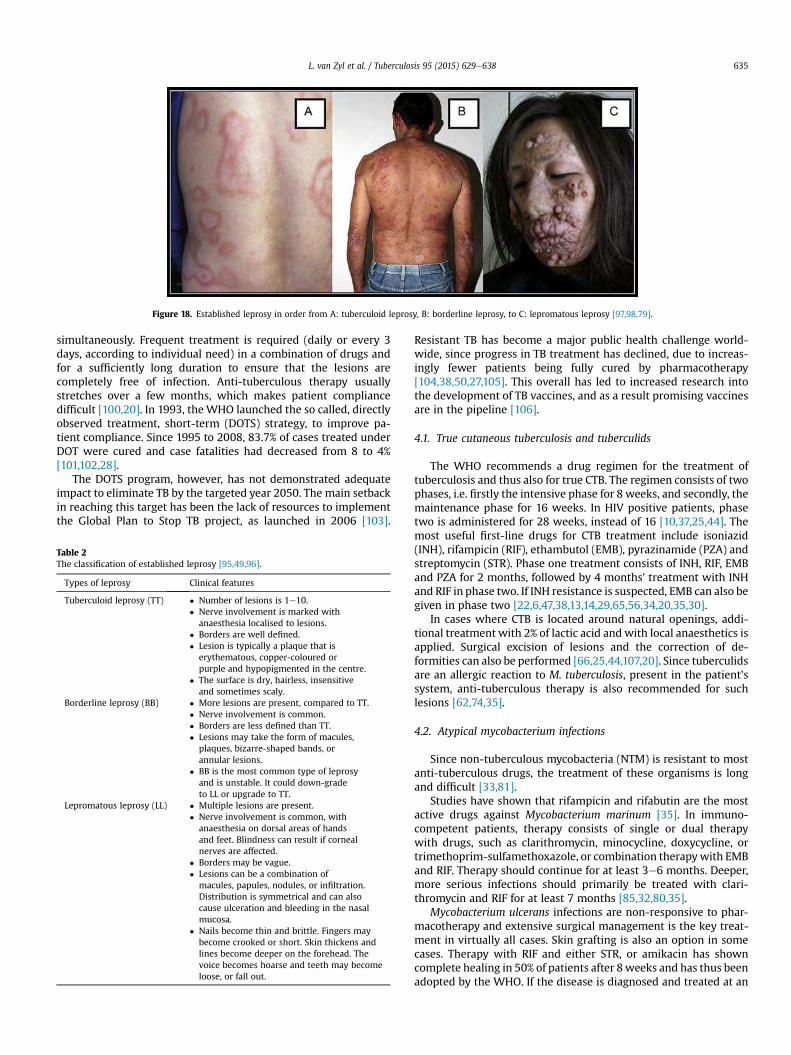
Nodular tuberculids present as dusky-red, non-tender nodulesof the lower extremities. The nodules progress into purple-redmasses that have a tendency to ulcerate into asymmetrical, su-perficial ulcers that heal with an atrophic scar [49,40,41]. Erythemainduratum of Bazin (EIB) (Figure 12) is accepted as the true nodulartuberculid in which the main pathology is located in the subcu-taneous fat. Another pattern has also been identified where thepathology lies in the junction between the subcutaneous fat andthe dermis, hence the term nodular tuberculid [44,8,35].
3. Atypical mycobacterium infections of the skin
More than 135 species of atypical Mycobacterium [or morerecently known as non-tuberculous mycobacteria (NTM)] havebeen described [32,80,81,34], but only a few show cutaneousmanifestations, as summarised in Table 1, of which only the mostcommon ones are discussed in this article, namely:
� Mycobacterium marinum.� Mycobacterium ulcerans, or Buruli ulcer.� Mycobacterium haemophilum.� Mycobacterium fortuitum.� Mycobacterium chelonae.� Mycobacterium abscessus.
� Mycobacterium leprae, or Hansen's disease [32].
NTM can be found in soil, water, flora and some fauna, almostanywhere in the world. The mode of transmission is not completelyunderstood, but human-to-human transmission does not seem tooccur. Infection predominantly occurs in immuno-compromisedpatients, or after skin trauma in immuno-competent patients.Some cases of cutaneous Mycobacterium infections have been re-ported to occur after individuals receive tattoos, subcutaneous in-sulin therapy, foot baths at nail salons and even acupuncture[82,80,81,49,83].
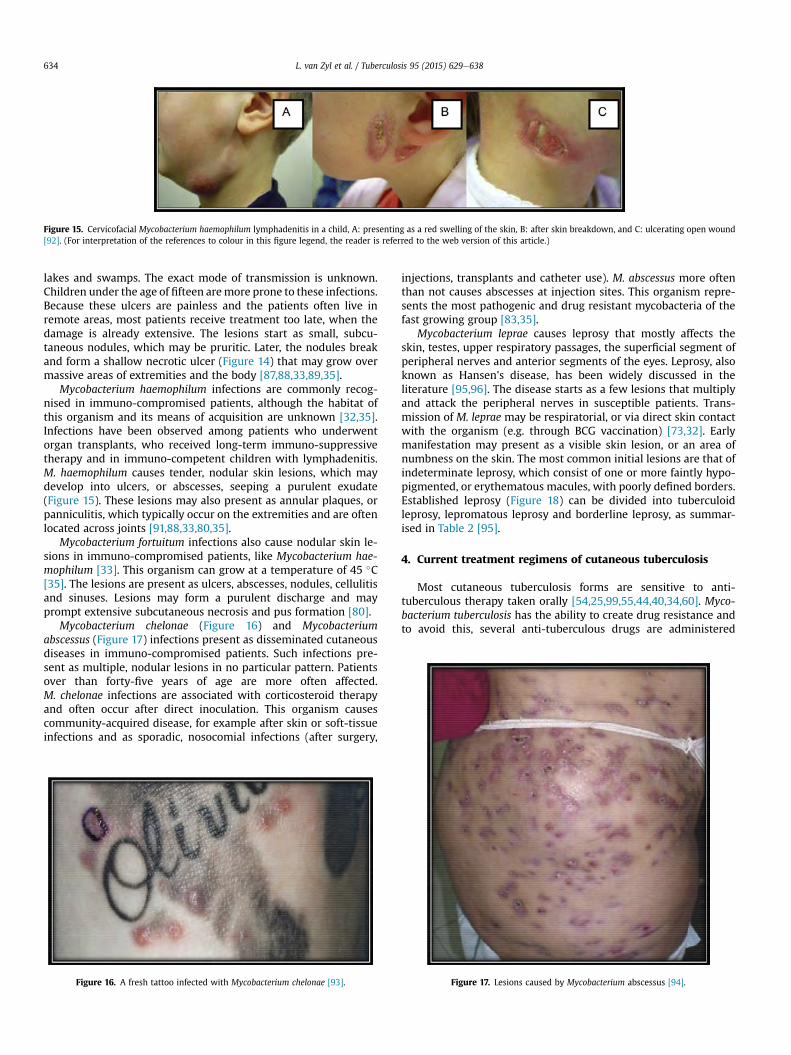
M. marinum infections are primarily localised at the site ofinoculation, typically in the upper extremities [32,80]. These in-fections are also known as “swimming pool granulomas” or “fishtank granulomas”, since M. marinum is widespread in both freshand marine water [84,85,32,33]. In 2008, an outbreak ofM. marinum infections occurred on a fish farm in China thatworkers had contracted from abrasions, or trauma to the skin thathad became infected. These infections are characterised by papularlesions (Figure 13) and cellulitis, also often as warty nodules, orplaques that may sometimes present with a sporotrichoid pattern.The nodules may contain a purulent fluid that is positive for AFBand that can ulcerate and become necrotic [85,32,33,86,35].
Mycobacterium ulcerans infections, also known as the Buruliulcer, are prevalent in warmer climates in riverine areas, such as
Figure 11. Papulonecrotic tuberculid [79].
Figure 12. Erythema induratum of Bazin showing prevalence in the lower extremities[79].
Figure 13. Infection with Mycobacterium marinum in the upper extremities [86].
Figure 14. Buruli ulcer in an eleven-year old boy from Australia [90].
L. van Zyl et al. / Tuberculosis 95 (2015) 629e638 633
lakes and swamps. The exact mode of transmission is unknown.Children under the age of fifteen aremore prone to these infections.Because these ulcers are painless and the patients often live inremote areas, most patients receive treatment too late, when thedamage is already extensive. The lesions start as small, subcu-taneous nodules, which may be pruritic. Later, the nodules breakand form a shallow necrotic ulcer (Figure 14) that may grow overmassive areas of extremities and the body [87,88,33,89,35].
Mycobacterium haemophilum infections are commonly recog-nised in immuno-compromised patients, although the habitat ofthis organism and its means of acquisition are unknown [32,35].Infections have been observed among patients who underwentorgan transplants, who received long-term immuno-suppressivetherapy and in immuno-competent children with lymphadenitis.M. haemophilum causes tender, nodular skin lesions, which maydevelop into ulcers, or abscesses, seeping a purulent exudate(Figure 15). These lesions may also present as annular plaques, orpanniculitis, which typically occur on the extremities and are oftenlocated across joints [91,88,33,80,35].
Mycobacterium fortuitum infections also cause nodular skin le-sions in immuno-compromised patients, like Mycobacterium hae-mophilum [33]. This organism can grow at a temperature of 45 �C[35]. The lesions are present as ulcers, abscesses, nodules, cellulitisand sinuses. Lesions may form a purulent discharge and mayprompt extensive subcutaneous necrosis and pus formation [80].
Mycobacterium chelonae (Figure 16) and Mycobacteriumabscessus (Figure 17) infections present as disseminated cutaneousdiseases in immuno-compromised patients. Such infections pre-sent as multiple, nodular lesions in no particular pattern. Patientsover than forty-five years of age are more often affected.M. chelonae infections are associated with corticosteroid therapyand often occur after direct inoculation. This organism causescommunity-acquired disease, for example after skin or soft-tissueinfections and as sporadic, nosocomial infections (after surgery,
injections, transplants and catheter use). M. abscessus more oftenthan not causes abscesses at injection sites. This organism repre-sents the most pathogenic and drug resistant mycobacteria of thefast growing group [83,35].
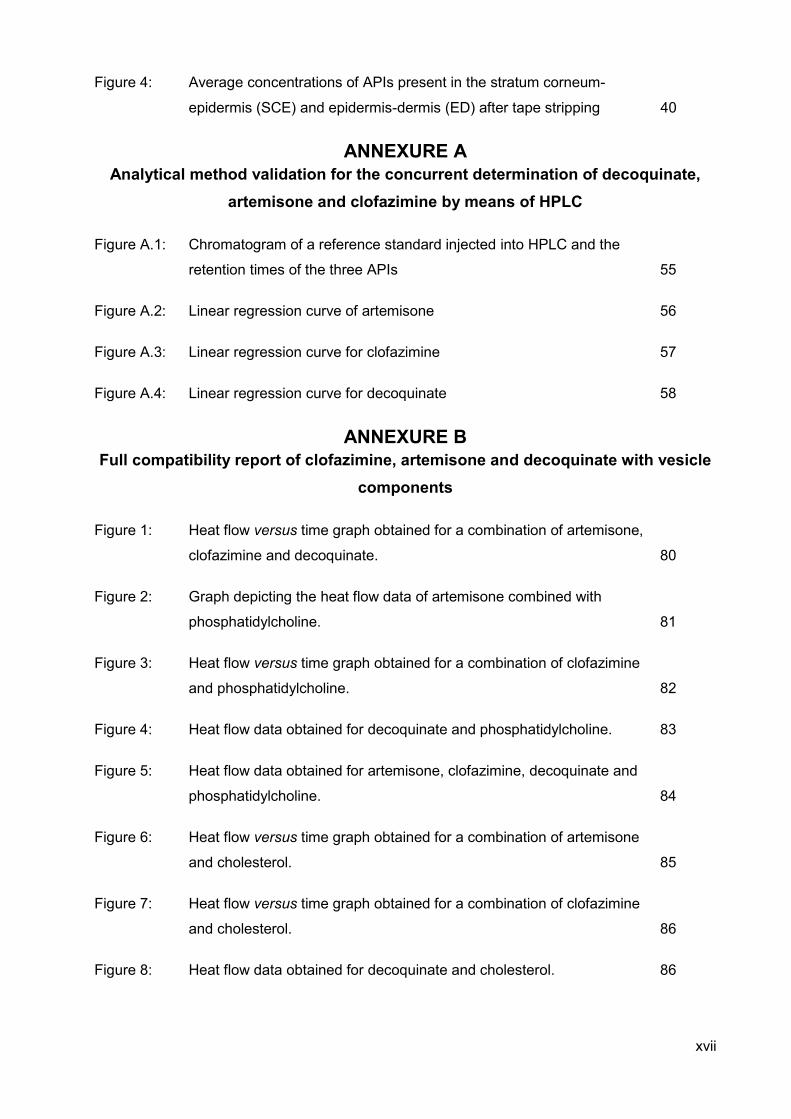
Mycobacterium leprae causes leprosy that mostly affects theskin, testes, upper respiratory passages, the superficial segment ofperipheral nerves and anterior segments of the eyes. Leprosy, alsoknown as Hansen's disease, has been widely discussed in theliterature [95,96]. The disease starts as a few lesions that multiplyand attack the peripheral nerves in susceptible patients. Trans-mission of M. leprae may be respiratorial, or via direct skin contactwith the organism (e.g. through BCG vaccination) [73,32]. Earlymanifestation may present as a visible skin lesion, or an area ofnumbness on the skin. The most common initial lesions are that ofindeterminate leprosy, which consist of one or more faintly hypo-pigmented, or erythematous macules, with poorly defined borders.Established leprosy (Figure 18) can be divided into tuberculoidleprosy, lepromatous leprosy and borderline leprosy, as summar-ised in Table 2 [95].
4. Current treatment regimens of cutaneous tuberculosis
Most cutaneous tuberculosis forms are sensitive to anti-tuberculous therapy taken orally [54,25,99,55,44,40,34,60]. Myco-bacterium tuberculosis has the ability to create drug resistance andto avoid this, several anti-tuberculous drugs are administered
Figure 15. Cervicofacial Mycobacterium haemophilum lymphadenitis in a child, A: presenting as a red swelling of the skin, B: after skin breakdown, and C: ulcerating open wound[92]. (For interpretation of the references to colour in this figure legend, the reader is referred to the web version of this article.)
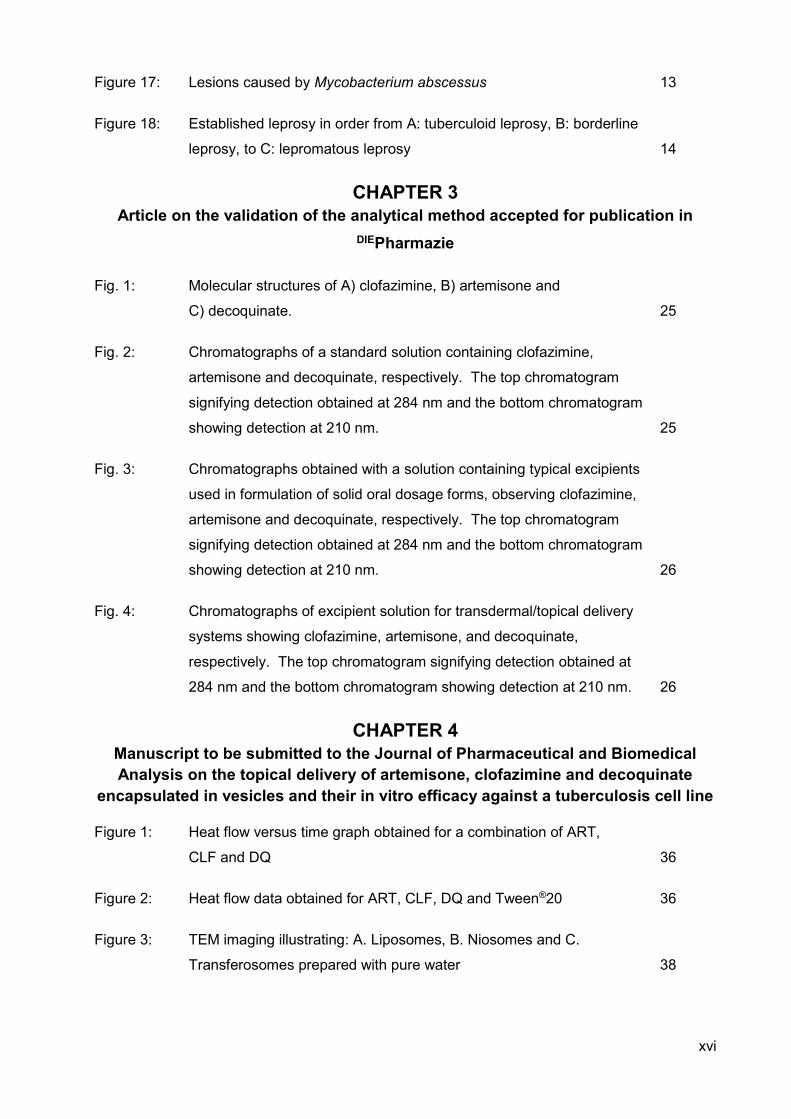
Figure 16. A fresh tattoo infected with Mycobacterium chelonae [93]. Figure 17. Lesions caused by Mycobacterium abscessus [94].
L. van Zyl et al. / Tuberculosis 95 (2015) 629e638634
simultaneously. Frequent treatment is required (daily or every 3days, according to individual need) in a combination of drugs andfor a sufficiently long duration to ensure that the lesions arecompletely free of infection. Anti-tuberculous therapy usuallystretches over a few months, which makes patient compliancedifficult [100,20]. In 1993, the WHO launched the so called, directlyobserved treatment, short-term (DOTS) strategy, to improve pa-tient compliance. Since 1995 to 2008, 83.7% of cases treated underDOT were cured and case fatalities had decreased from 8 to 4%[101,102,28].
The DOTS program, however, has not demonstrated adequateimpact to eliminate TB by the targeted year 2050. The main setbackin reaching this target has been the lack of resources to implementthe Global Plan to Stop TB project, as launched in 2006 [103].
Resistant TB has become a major public health challenge world-wide, since progress in TB treatment has declined, due to increas-ingly fewer patients being fully cured by pharmacotherapy[104,38,50,27,105]. This overall has led to increased research intothe development of TB vaccines, and as a result promising vaccinesare in the pipeline [106].
4.1. True cutaneous tuberculosis and tuberculids
The WHO recommends a drug regimen for the treatment oftuberculosis and thus also for true CTB. The regimen consists of twophases, i.e. firstly the intensive phase for 8 weeks, and secondly, themaintenance phase for 16 weeks. In HIV positive patients, phasetwo is administered for 28 weeks, instead of 16 [10,37,25,44]. Themost useful first-line drugs for CTB treatment include isoniazid(INH), rifampicin (RIF), ethambutol (EMB), pyrazinamide (PZA) andstreptomycin (STR). Phase one treatment consists of INH, RIF, EMBand PZA for 2 months, followed by 4 months' treatment with INHand RIF in phase two. If INH resistance is suspected, EMB can also begiven in phase two [22,6,47,38,13,14,29,65,56,34,20,35,30].
In cases where CTB is located around natural openings, addi-tional treatment with 2% of lactic acid and with local anaesthetics isapplied. Surgical excision of lesions and the correction of de-formities can also be performed [66,25,44,107,20]. Since tuberculidsare an allergic reaction to M. tuberculosis, present in the patient'ssystem, anti-tuberculous therapy is also recommended for suchlesions [62,74,35].
4.2. Atypical mycobacterium infections
Since non-tuberculous mycobacteria (NTM) is resistant to mostanti-tuberculous drugs, the treatment of these organisms is longand difficult [33,81].
Studies have shown that rifampicin and rifabutin are the mostactive drugs against Mycobacterium marinum [35]. In immuno-competent patients, therapy consists of single or dual therapywith drugs, such as clarithromycin, minocycline, doxycycline, ortrimethoprim-sulfamethoxazole, or combination therapywith EMBand RIF. Therapy should continue for at least 3e6 months. Deeper,more serious infections should primarily be treated with clari-thromycin and RIF for at least 7 months [85,32,80,35].
Mycobacterium ulcerans infections are non-responsive to phar-macotherapy and extensive surgical management is the key treat-ment in virtually all cases. Skin grafting is also an option in somecases. Therapy with RIF and either STR, or amikacin has showncomplete healing in 50% of patients after 8 weeks and has thus beenadopted by the WHO. If the disease is diagnosed and treated at an
Figure 18. Established leprosy in order from A: tuberculoid leprosy, B: borderline leprosy, to C: lepromatous leprosy [97,98,79].
Table 2The classification of established leprosy [95,49,96].
Types of leprosy Clinical features
Tuberculoid leprosy (TT) � Number of lesions is 1e10.� Nerve involvement is marked with
anaesthesia localised to lesions.� Borders are well defined.� Lesion is typically a plaque that is
erythematous, copper-coloured orpurple and hypopigmented in the centre.
� The surface is dry, hairless, insensitiveand sometimes scaly.
Borderline leprosy (BB) � More lesions are present, compared to TT.� Nerve involvement is common.� Borders are less defined than TT.� Lesions may take the form of macules,
plaques, bizarre-shaped bands, orannular lesions.
� BB is the most common type of leprosyand is unstable. It could down-gradeto LL or upgrade to TT.
Lepromatous leprosy (LL) � Multiple lesions are present.� Nerve involvement is common, with
anaesthesia on dorsal areas of handsand feet. Blindness can result if cornealnerves are affected.
� Borders may be vague.� Lesions can be a combination of
macules, papules, nodules, or infiltration.Distribution is symmetrical and can alsocause ulceration and bleeding in the nasalmucosa.
� Nails become thin and brittle. Fingers maybecome crooked or short. Skin thickens andlines become deeper on the forehead. Thevoice becomes hoarse and teeth may becomeloose, or fall out.
L. van Zyl et al. / Tuberculosis 95 (2015) 629e638 635
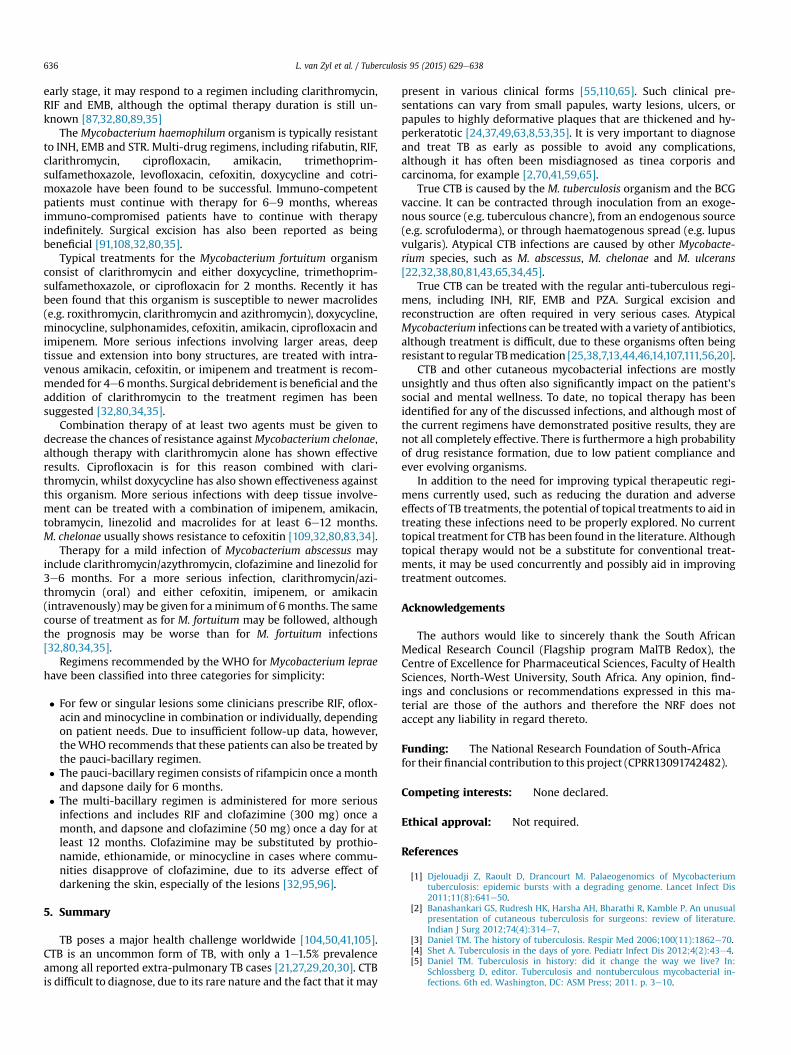
early stage, it may respond to a regimen including clarithromycin,RIF and EMB, although the optimal therapy duration is still un-known [87,32,80,89,35]
The Mycobacterium haemophilum organism is typically resistantto INH, EMB and STR. Multi-drug regimens, including rifabutin, RIF,clarithromycin, ciprofloxacin, amikacin, trimethoprim-sulfamethoxazole, levofloxacin, cefoxitin, doxycycline and cotri-moxazole have been found to be successful. Immuno-competentpatients must continue with therapy for 6e9 months, whereasimmuno-compromised patients have to continue with therapyindefinitely. Surgical excision has also been reported as beingbeneficial [91,108,32,80,35].
Typical treatments for the Mycobacterium fortuitum organismconsist of clarithromycin and either doxycycline, trimethoprim-sulfamethoxazole, or ciprofloxacin for 2 months. Recently it hasbeen found that this organism is susceptible to newer macrolides(e.g. roxithromycin, clarithromycin and azithromycin), doxycycline,minocycline, sulphonamides, cefoxitin, amikacin, ciprofloxacin andimipenem. More serious infections involving larger areas, deeptissue and extension into bony structures, are treated with intra-venous amikacin, cefoxitin, or imipenem and treatment is recom-mended for 4e6months. Surgical debridement is beneficial and theaddition of clarithromycin to the treatment regimen has beensuggested [32,80,34,35].
Combination therapy of at least two agents must be given todecrease the chances of resistance againstMycobacterium chelonae,although therapy with clarithromycin alone has shown effectiveresults. Ciprofloxacin is for this reason combined with clari-thromycin, whilst doxycycline has also shown effectiveness againstthis organism. More serious infections with deep tissue involve-ment can be treated with a combination of imipenem, amikacin,tobramycin, linezolid and macrolides for at least 6e12 months.M. chelonae usually shows resistance to cefoxitin [109,32,80,83,34].
Therapy for a mild infection of Mycobacterium abscessus mayinclude clarithromycin/azythromycin, clofazimine and linezolid for3e6 months. For a more serious infection, clarithromycin/azi-thromycin (oral) and either cefoxitin, imipenem, or amikacin(intravenously) may be given for aminimum of 6months. The samecourse of treatment as for M. fortuitum may be followed, althoughthe prognosis may be worse than for M. fortuitum infections[32,80,34,35].
Regimens recommended by the WHO for Mycobacterium lepraehave been classified into three categories for simplicity:
� For few or singular lesions some clinicians prescribe RIF, oflox-acin and minocycline in combination or individually, dependingon patient needs. Due to insufficient follow-up data, however,theWHO recommends that these patients can also be treated bythe pauci-bacillary regimen.
� The pauci-bacillary regimen consists of rifampicin once a monthand dapsone daily for 6 months.
� The multi-bacillary regimen is administered for more seriousinfections and includes RIF and clofazimine (300 mg) once amonth, and dapsone and clofazimine (50 mg) once a day for atleast 12 months. Clofazimine may be substituted by prothio-namide, ethionamide, or minocycline in cases where commu-nities disapprove of clofazimine, due to its adverse effect ofdarkening the skin, especially of the lesions [32,95,96].
5. Summary
TB poses a major health challenge worldwide [104,50,41,105].CTB is an uncommon form of TB, with only a 1e1.5% prevalenceamong all reported extra-pulmonary TB cases [21,27,29,20,30]. CTBis difficult to diagnose, due to its rare nature and the fact that it may
present in various clinical forms [55,110,65]. Such clinical pre-sentations can vary from small papules, warty lesions, ulcers, orpapules to highly deformative plaques that are thickened and hy-perkeratotic [24,37,49,63,8,53,35]. It is very important to diagnoseand treat TB as early as possible to avoid any complications,although it has often been misdiagnosed as tinea corporis andcarcinoma, for example [2,70,41,59,65].
True CTB is caused by the M. tuberculosis organism and the BCGvaccine. It can be contracted through inoculation from an exoge-nous source (e.g. tuberculous chancre), from an endogenous source(e.g. scrofuloderma), or through haematogenous spread (e.g. lupusvulgaris). Atypical CTB infections are caused by other Mycobacte-rium species, such as M. abscessus, M. chelonae and M. ulcerans[22,32,38,80,81,43,65,34,45].
True CTB can be treated with the regular anti-tuberculous regi-mens, including INH, RIF, EMB and PZA. Surgical excision andreconstruction are often required in very serious cases. AtypicalMycobacterium infections can be treatedwith a variety of antibiotics,although treatment is difficult, due to these organisms often beingresistant to regular TBmedication [25,38,7,13,44,46,14,107,111,56,20].
CTB and other cutaneous mycobacterial infections are mostlyunsightly and thus often also significantly impact on the patient'ssocial and mental wellness. To date, no topical therapy has beenidentified for any of the discussed infections, and although most ofthe current regimens have demonstrated positive results, they arenot all completely effective. There is furthermore a high probabilityof drug resistance formation, due to low patient compliance andever evolving organisms.
In addition to the need for improving typical therapeutic regi-mens currently used, such as reducing the duration and adverseeffects of TB treatments, the potential of topical treatments to aid intreating these infections need to be properly explored. No currenttopical treatment for CTB has been found in the literature. Althoughtopical therapy would not be a substitute for conventional treat-ments, it may be used concurrently and possibly aid in improvingtreatment outcomes.
Acknowledgements
The authors would like to sincerely thank the South AfricanMedical Research Council (Flagship program MalTB Redox), theCentre of Excellence for Pharmaceutical Sciences, Faculty of HealthSciences, North-West University, South Africa. Any opinion, find-ings and conclusions or recommendations expressed in this ma-terial are those of the authors and therefore the NRF does notaccept any liability in regard thereto.
Funding: The National Research Foundation of South-Africafor their financial contribution to this project (CPRR13091742482).
Competing interests: None declared.
Ethical approval: Not required.
References
[1] Djelouadji Z, Raoult D, Drancourt M. Palaeogenomics of Mycobacteriumtuberculosis: epidemic bursts with a degrading genome. Lancet Infect Dis2011;11(8):641e50.
[2] Banashankari GS, Rudresh HK, Harsha AH, Bharathi R, Kamble P. An unusualpresentation of cutaneous tuberculosis for surgeons: review of literature.Indian J Surg 2012;74(4):314e7.
[3] Daniel TM. The history of tuberculosis. Respir Med 2006;100(11):1862e70.[4] Shet A. Tuberculosis in the days of yore. Pediatr Infect Dis 2012;4(2):43e4.[5] Daniel TM. Tuberculosis in history: did it change the way we live? In:
Schlossberg D, editor. Tuberculosis and nontuberculous mycobacterial in-fections. 6th ed. Washington, DC: ASM Press; 2011. p. 3e10.
L. van Zyl et al. / Tuberculosis 95 (2015) 629e638636
[6] Dandewate P, Vemuri K, Khan EM, Sritharan M, Padhye S. Synthesis, char-acterization and anti-tubercular activity of ferrocenylhydrazones and theirß-cyclodextrin conjugates. Carbohydr Polym 2014;108(1):135e44.
[7] Kar S, Krishnan A, Gangane N, Preetha K. Scrofuloderma: a case series fromrural India. Indian J Tuberc 2011;58(4):189e95.
[8] Rull�an J, Seijo-Montes RE, Vaillant A, S�anchez NP. Cutaneous manifestationsof pulmonary disease. In: S�anchez NP, editor. Atlas of dermatology in internalmedicine. 14th ed. San Juan, Puerto Rico: Springer; 2012. p. 17e30.
[9] Carman AS, Patel AG. Science with societal implications: detectingMycobacterium tuberculosis in Africa. Clin Microbiol Newsl 2014;36(10):73e7.
[10] Hernandez C, Cetner AS, Jordan JE, Puangsuvan SN, Robinson JK. Tuberculosisin the age of biologic therapy. J Am Acad Dermatol 2008;59(3):363e80.
[11] Galagan JE. Genomic insights into tuberculosis. Nat Rev Genet 2014;15(5):307e20.
[12] Ilgazli A, Boyaci H, Basyigit I, Yildiz F. Extrapulmonary tuberculosis: clinicaland epidemiologic spectrum of 636 cases. Arch Med Res 2004;35(5):435e41.
[13] Kaur IP, Singh H. Nanostructured drug delivery for better management oftuberculosis. J Control Release 2014;184(1):36e50.
[14] Petkova Z, Valcheva V, Momekov G, Petrov P, Dimitrov V, Doytchinova I, et al.Antimycobacterial activity of chiral aminoalcohols with camphene scaffold.Eur J Med Chem 2014;81:150e7.
[15] Singhal S, Jaiswa P. Presentation of tuberculosis in TB-HIV co-infection pa-tients and the treatment outcome with directly observed short coursetherapy. Asian Pac J Trop Biomed 2011;1(2):S266e7.
[16] Ugarte-Gil C, Ponce M, Zamudio C, Canaza L, Samalvides F, Seas C. Knowledgeabout HIV prevention and transmission among recently diagnosed tuber-culosis patients: a cross sectional study. BMC Public Health 2013;13:1237e46.
[17] Baig IA, Moon JY, Kim MS, Koo BS, Yoon MY. Structural and functional sig-nificance of the highly-conserved residues in Mycobacterium tuberculosisacetohydroxyacid synthase. Enzym Microb Technol 2014;58e59:52e9.
[18] Hanifa Y, Fielding KL, Charalambous S, Variava E, Luke B, Churchyard GJ, et al.Tuberculosis among adults starting antiretroviral therapy in South Africa:the need for routine case finding. Int J Tuberc Lung Dis 2012;16(9):1252e9.
[19] Saxena S, Karkhanis V, Joshi JM. Tuberculosis prevention: an enigma worthunravelling. Indian J Tuberc 2012;59(2):65e7.
[20] Wyrzykowska N, Wyrzykowski M, Zaba R, Silny W. Treatment of cutaneousinfections caused by Mycobacterium tuberculosis. Adv Dermatol Allergol2012;29(4):293e8.
[21] Abdelmalek R, Mebazaa A, Berriche A, Kilani B, Osman AB, Mokni M, et al.Cutaneous tuberculosis in Tunisia. M�ed Mal Infect 2013;43(9):374e8.
[22] Bravo FG, Gotuzzo E. Cutaneous tuberculosis. Clin Dermatol 2007;25(2):173e80.
[23] Fader T, Parks J, Khan NU, Manning R, Stokes S, Nasir NA. Extrapulmonarytuberculosis in Kabul, Afghanistan: a hospital-based retrospective review. IntJ Infect Dis 2010;14(2):e102e10.
[24] Ghosh S, Aggarwal K, Jain VK, Chaudhuri S, Ghosh E, Arshdeep. Tuberculosisverrucosa cutis presenting as diffuse plantar keratoderma: an unusual sight.Indian J Dermatol 2014;59(1):80e1.
[25] Ho SCK. Cutaneous tuberculosis: clinical features, diagnosis and manage-ment. Hong Kong J Dermatol Venereol Bull 2003;11:130e8.
[26] Puri N. A clinical and histopathological profile of patients with cutaneoustuberculosis. Indian J Dermatol 2011;56(5):550e2.
[27] Sankar MM, Singh J, Diana SCA, Singh S. Molecular characterization ofMycobacteium tuberculosis isolates from Indian patients with extrapulmo-nary tuberculosis. Tuberculosis 2013;93:75e83.
[28] Sevgi DY, Derin O, Alpay AS, Gündüz A, Konuklar AS, Bayraktar B, et al.Extrapulmonary tuberculosis: 7 year-experience of a tertiary center inIstanbul. Eur J Intern Med 2013;24:864e7.
[29] Stockamp NW, Paul S, Sharma S, Libke RD, Boswell JS, Nassar NN. Cutaneoustuberculosis of the penis in an HIV-infected adult. Int J STD AIDS 2013;24:57e8.
[30] Zouhair K, Akhdari N, Nejjam F, Ouazzani T, Lakhdar H. Cutaneous tuber-culosis in Morocco. Int J Infect Dis 2007;11(3):209e12.
[31] Solis AH, Gonz�alez NEH, Cazarez F, P�erez PM, Diaz HO, Escobar-Gutierrez A,et al. Skin biopsy: a pillar in the identification of cutaneous Mycobacteriumtuberculosis infection. J Infect Dev Ctries 2012;6(8):626e31.
[32] Gentry, C.A. http://www.accp.com/docs/bookstore/psap/p5b6sample02.pdf[accessed 18.03.14].
[33] Jones-Lopez EC, Ellner JJ. Tuberculosis and atypical mycobacterial infections.In: Guerrant RL, Walker DH, Weller PF, editors. Tropical infectious diseases.3rd ed. London: Elsevier Inc.; 2011. p. 228e47.
[34] Walter N, Daley CL. Tuberculosis and nontuberculous mycobacterial in-fections. In: Spiro SG, Silvestri GA, Agustí A, editors. Clinical respiratorymedicine. 4th ed. Philadelphia: Elsevier Ltd.; 2012. p. 383e405.
[35] Yates VM. Mycobacterial infections. In: Burns T, Breathnach S, Cox N,Griffiths C, editors. Rook's textbook of dermatology. 8th ed., vol. 2. WestSussex, United Kingdom: Blackwell Publishing Ltd; 2010. 31.1e31.41.
[36] Cardoso JC, Calonje E. Cutaneous infections presenting with granulomatousinfiltrates: a review of histopathological patterns. Pathol Infect Dis2013;19(2):54e61.
[37] Hill MK, Sanders CV. Cutaneous tuberculosis. In: Schlossberg D, editor.Tuberculosis and nontuberculous mycobacterial infections. 6th ed. Wash-ington, DC: ASM Press; 2011. p. 409e14.
[38] Kansal HM, Goel S. Cutaneous manifestations in cases of pulmonary tuber-culosis: a clinical profile. J Indian Acad Clin Med 2013;14(3e4):284e6.
[39] Macgregor RR. Cutaneous tuberculosis. Clin Dermatol 1995;13(3):245e55.[40] Ramarao S, Greene JN, Casanas BC, Carrington ML, Rice J, Kass J. Cutaneous
manifestations of tuberculosis. Infect Dis Clin Pract 2012;20(6):376e83.[41] Sethuraman G, Ramesh V. Cutaneous tuberculosis in children. Pediatr Der-
matol 2013;30(1):7e16.[42] Sharma SK, Mohan A, Sharma A, Mitra DK. Miliary tuberculosis: new insights
into an old disease. Lancet Infect Dis 2005;5(7):415e30.[43] Steger JW, Barrett TL. Cutaneous tuberculosis. In: James WD, editor. The
textbook of military medicine: military dermatology, vol. 4. Fort SamHouston, Texas: Borden Institute; 1994. p. 355e89.
[44] Lai-Cheong LE, Perez A, Tang V, Martinez A, Hill V, Menag�e HDUP. Cutaneousmanifestations of tuberculosis. Clin Exp Dermatol 2007;32(4):461e6.
[45] Zadbuke S, Khan N, Set R, Shastri J. Primary inoculation tuberculosisfollowing a vehicular accident. Indian J Med Microbiol 2011;30(1):98e100.
[46] Nakamura S, Hashimoto Y, Nishi K, Takahashi H, Takeda K, Mizumoto T, et al.Cutaneous tuberculosis simulating lymphocutaneous sporotrichosis. Aus-tralas J Dermatol 2012;53(4):136e7.
[47] Huang D, Yin H. Primary inoculation tuberculosis after accidental scalpelinjury. Infect 2013;41(4):841e4.
[48] Ngan, V. http://www.dermnetnz.org/bacterial/tuberculosis.html [accessed25.03.14].
[49] Paller AS, Mancini AJ. Hurwitz clinical pediatric dermatology: a textbook ofskin disorders of childhood and adolescence. 3rd ed. Philadelphia: ElsevierInc.; 2006. p. 737.
[50] Sahoo SP, Misra J, Subudhi BSK, Panda AK. Tuberculous lesion of the footpresenting as epithelioma. Singap Med J 2013;54(3):e59e61.
[51] Fukamachi S, Kawakami C, Kabashima R, Sawada Y, Sugita K, Nakamura M,et al. Tuberculosis verrucosa cutis with elevation of circulating T-helper 1and 17 cells and their reductions after successful treatment. J Dermatol2011;39(5):507e9.
[52] Rajan J, Mathai AT, Prasad PK, Kaviarasan PK. Multifocal tuberculosis ver-rucosa cutis. Indian J Dermatol 2011;56(3):332e4.
[53] Shimizu H. Shimizu's textbook of dermatology. 1st ed. Hokkaido UniversityPress; 2005. p. 528.
[54] Das CK, Mahapatra A, Das MM, Sahoo D, Chayani N. Coexistence of cutaneoustuberculosis (scrofuloderma) and Hanseniasis: a rare presentation. J ClinDiagn Res 2014;8(2):141e2.
[55] Kim GW, Park JH, Kim HS, Kim SH, Ko HC, Kim BS, et al. Delayed diagnosis ofscrofuloderma misdiagnosed as a bacterial abscess. Ann Dermatol2012;24(1):70e3.
[56] Verma S, Thakur BK, Gupta A. Multifocal childhood cutaneous tuberculosis:report of two interesting cases from Sikkim, India. Pediatr Dermatol2013;30(3):e1e4.
[57] Singal, A. & Sonthalia, S. http://www.ijdvl.com/text.asp?2010/76/5/494/69060 [accessed 25.03.14].
[58] Mehta PK, Raj A, Singh N, Khuller GK. Diagnosis of extrapulmonary tuber-culosis by PCR. FEMS Immunol Med Microbiol 2012;66(1):20e36.
[59] Sun WL, Xu KL, Chen LL, Yu ZS. Tuberculosis cutis orificialis with bothgingival involvement and underlying pulmonary tuberculosis. Aust Dent J2011;56(2):216e20.
[60] Wang H, Wu Q, Lin L, Cui P. Cutaneous tuberculosis: a diagnostic and ther-apeutic study of 20 cases. J Dermatol Treat 2011;22(6):310e4.
[61] Wolf, K. http://mizzouderm.com/misc-bacteria.html [accessed 25.03.14]..[62] Arora S, Arora G, Kakkar S. Cutaneous tuberculosis: a clinic-morphological
study. Med J Armed Forces India 2006;62(4):344e7.[63] Rhodes J, Caccetta TP, Tait C. Lupus vulgaris: difficulties in diagnosis. Aust J
Dermatol 2013;54:e53e5.[64] Dash M, Sarangi R, Panda M. Generalized tuberculous gamma. Indian Pediatr
2012;49(9):773.[65] Tutanc M, Arica V, Basarslan F, Dogramaci AC, Ozgur T, Akcora B. The
youngest patient of lupus vulgaris: a cutaneous tuberculosis case report. PakJ Med Sci 2012;28(3):533e5.
[66] Ezzedine K, Simonart T, Malvy D, Bourgoin C, Noel JC. Cutaneous verrucouscarcinoma arising in lupus vulgaris. J Dermatol 2011;39(5):505e7.
[67] Turan E, Yurt N, Yesilova Y, Celik OI. Lupus vulgaris diagnosed after 37 years:a case of delayed diagnosis. Dermatol Online J 2012;18(5):13.
[68] Zaki SA, Sami SA, Sami LB. Cutaneous tuberculosis. Lung India 2011;28(3):229e30.
[69] Thakur BK, Verma S, Hazarika D. A clinicopathological study of cutaneoustuberculosis at Dibrugarh district, Assam. Indian J Dermatol 2012;57(1):63e5.
[70] Rahman MH, Ansari NP, Hadiuzzaman M, Nipa NI, Islam S, Mumu SA, et al.Lupus vulgaris on the buttock mimicking tinea corporis. J Pak Assoc Der-matol 2011;21(4):295e7.
[71] Derm-IS team. http://www.dermis.net/dermisroot/en/10368/image.htm[accessed 26.03.14].
[72] Dongre AM, Sanghavi SA, Khopkar US. Papulonecrotic tuberculid at the siteof tuberculin test in a patient with concomitant erythema induratum andpapulonecrotic tuberculid. Indian J Dermatol Venereol Leprol 2013;78(2):248e51.
[73] Gantzer A, Neven B, Picard C, Brousse N, Lortholary O, Fischer A, et al. Severecutaneous bacillus Calmette-Gu�erin infection in immunocompromised chil-dren: the relevance of skin biopsy. J Cutan Pathol 2012;40(1):30e7.
L. van Zyl et al. / Tuberculosis 95 (2015) 629e638 637
[74] Kim GW, Park HJ, Kim HS, Chin HW, Kim SH, Ko HC, et al. Simultaneousoccurrence of papulonecrotic tuberculid and erythema induratum in a pa-tient with pulmonary tuberculosis. Pediatr Dermatol 2013;30(2):256e9.
[75] Kumar U, Sethuraman G, Verma P, Das P, Sharma VK. Psriasiform type oflichen scrofulosorum: clue to disseminated tuberculosis. Pediatr Dermatol2011;28(5):532e4.
[76] Dandale, A., Gupta, N., Dhurat, R. & Ghate, S. http://www.ijdvl.com/text.asp?2013/79/3/436/110797 [accessed 27.03.14].
[77] Singhal, P., Patel, P.H. & Marfatia, Y.S. https://www.scienceopen.com/document/vid/4f2a39ce-172d-4047-983f-5d6e3f86c730;jsessionid¼DUzhMU8RAVXFsCr8dpd3CUnN.master:so-app1-prd [accessed27.03.14].
[78] Brinca A, Andrade P, Vieira R, Figueiredo A. Papulonecrotic tuberculid: reportof a clinical case. Dermatol Rep 2011;3(e29):66e7.
[79] Jehad. http://dermaamin.com/site/atlas-of-dermatology.html [accessed27.03.14]..
[80] Khan, F.A. & Khakoo, R. http://www.cutis.com/fileadmin/qhi-archive/ArticlePDF/CT/088040194.pdf [accessed 31.03.14].
[81] Kullavanijaya P. Atypical mycobacterial cutaneous infection. Clin Dermatol1999;17(2):153e8.
[82] Juhas E, English JC. Tattoo-associated complications. J Pediatr AdolescGynecol 2013;26(2):125e9.
[83] Shaaban HS, Bishop SL, Menon L, Slim J. Mycobacterium chelonae infection ofthe parotid gland. J Glob Infect Dis 2012;4(1):79e81.
[84] Broutin V, Ba~nuls AL, Aubry A, Keck N, Choisy M, Bernardet JF, et al. Geneticdiversity and population structure of Mycobacterium marinum: new insightsinto host and environmental specificities. J Clin Microbiol 2012;50(11):3627e34.
[85] Feng Y, Xu H, Wang H, Zhang C, Zong W, Wu Q. Outbreak of cutaneousMycobacterium marinum infection in Jiangsu Haian, China. Diagn MicrobiolInfect Dis 2011;71(3):267e72.
[86] Nguyen, C. http://www.nejm.org/doi/full/10.1056/ENEJMicm000083[accessed 01.04.14].
[87] Bratschi MW, Tabah EN, Bolz M, Stucki D, Borrell S, Gagneux S, et al. A case ofcutaneous tuberculosis in a Buruli ulcer-endemic area. PLOS Negl Trop Dis2012;6(8):1e3.
[88] Groves R. Unusual cutaneous mycobacterial diseases. Clin Dermatol1995;13(3):257e63.
[89] Meyers WM, Walsh DS, Portaels F. Mycobacterium ulcerans infection (Buruliulcer). In: Guerrant RL, Walker DH, Weller PF, editors. Tropical infectiousdiseases. 3rd ed. London: Elsevier Inc.; 2011. p. 248e52.
[90] Johnson, P.D.R., Stinear, T., Small, P.L.C., Pluschke, G., Merritt, R.W., Portaels, F.,et al. http://www.plosmedicine.org/article/info%3Adoi%2F10.1371%2Fjournal.pmed.0020108 [accessed 01.04.14].
[91] Aslam A, Green RL, Motta L, Ghrew M, Griffiths CEM, Warren RB. CutaneousMycobacterium haemophilum infection in a patient receiving infliximab forpsoriasis. Br J Dermatol 2012;168(2):446e7.
[92] Lindeboom, J.A., BruijnesteijnVanCoppenraet, L.E.S, VanSoolingen,D., Prins, J.M.& Kuijper, E.J. http://cmr.asm.org/content/24/4/701.full [accessed 01.04.14].
[93] Welsh, J. http://www.businessinsider.com.au/mysterious-tattoo-infections-outbreak-running-rampant-2012-8 [accessed 01.04.14].
[94] Jardin, O., Hern�andez-P�erez, R., Corrales, H., Cardoso-Leao, S. & De Waard,J.H. http://zl.elsevier.es/es/revista/enfermedades-infecciosas-microbiologia-clinica-28/seguimiento-un-brote-infeccion-tejido-blando-causado-13184022-originales-2010 [accessed 01.04.14]..
[95] Lockwood DNJ. Leprosy. In: Burns T, Breathnach S, Cox N, Griffiths C, editors.Rook's textbook of dermatology. 8th ed., vol. 2. West Sussex, UnitedKingdom: Blackwell Publishing Ltd; 2010. 32.1e32.20.
[96] Walsh DS, Meyers WM. Leprosy. In: Guerrant RL, Walker DH, Weller PF,editors. Tropical infectious diseases. 3rd ed. London: Elsevier Inc.; 2011.p. 253e60.
[97] Brayer, T. http://healthwise-everythinghealth.blogspot.com/2012/04/lepromatous-leprosy.html [accessed 02.04.14].
[98] Esfandbod, M. http://www.nejm.org/doi/pdf/10.1056/NEJMicm1011992[accessed 02.04.14].
[99] Jean M, Masse V, Carlier R, Perronne C, Cr�emieux AC. Isolated subcutaneoustuberculous abscesses of the lumbar wall. J Travel Med 2012;19(5):329e30.
[100] Fern�andez GP. Tuberculosis infections of the head and neck. Acta Otorrino-laringol Esp 2009;60(1):59e66.
[101] Arora VK, Jaiswal AK, Jain V. Changing trends of cutaneous tuberculosis inthe era of DOTS strategy. Indian J Tuberc 2012;59(2):116e8.
[102] Martins F, Santos S, Ventura C, Elvas-Leit~ao R, Santos L, Vitorino S, et al.Design, synthesis and biological evaluation of novel isoniazid derivativeswith potent antitubercular activity. Eur J Med Chem 2014;81:119e38.
[103] Lawn SD, Zumla AI. Tuberculosis. Lancet 2011;378:57e72.[104] Abubakar I, Zignol M, Falzon D, Raviglione M, Ditiu L, Masham S, et al. Drug-
resistant tuberculosis: time for visionary political leadership. Lancet InfectDis 2013;13(6):529e39.
[105] Zignol M, Dara M, Sean AD, Falzon D, Dadu A, Kremer K, et al. Drug-resistanttuberculosis in the WHO European region: an analysis of surveillance data.Drug Resist Updat 2013;16:108e15.
[106] Gr€oschel MI, Prabowo SA, Cardona PJ, Stanford JL, Van Der Werf TS. Thera-peutic vaccines for tuberculosis: a systemic review. Vaccine 2014;32(26):3162e8.
[107] Ramesh V. Cutaneous tuberculosis and esthiomene. Int J Gynecol Obstet2011;114(3):293e4.
[108] Cameselle D, Hern�andez J, Franc�es A, Montenegro T, Ca~nas F, Borrego L.Sporotrichoid cutaneous infection by Mycobacterium haemophilum in anAIDS patient. Actas Dermo-sifiliogr 2007;98(3):188e93.
[109] Curc�o, N. http://www.actasdermo.org/en/cutaneous-infection-in-tattoo-due/articulo/90167655/?pubmed¼true [accessed 31.03.14].
[110] Sultana A, Bhuiyan MSI, Haque A, Bashar A, Islam MT, Rahman MM. Patternof cutaneous tuberculosis among children and adolescents. Bangladesh MedRes Counc Bull 2012;38:94e7.
[111] Sattinger E, Meyer S, Costard-J€ackle A. Cutaneous tuberculosis mimickingerysipelas of the lower leg in a heart transplant recipient. Transpl Int2011;24(6):e51e3.
L. van Zyl et al. / Tuberculosis 95 (2015) 629e638638
18
Chapter 3
ARTICLE ON THE VALIDATION OF THE
ANALYTICAL METHOD ACCEPTED FOR
PUBLICATION IN DIEPHARMAZIE
This chapter is written in article format as requested by the DIEPharmazie and was accepted for
publication.
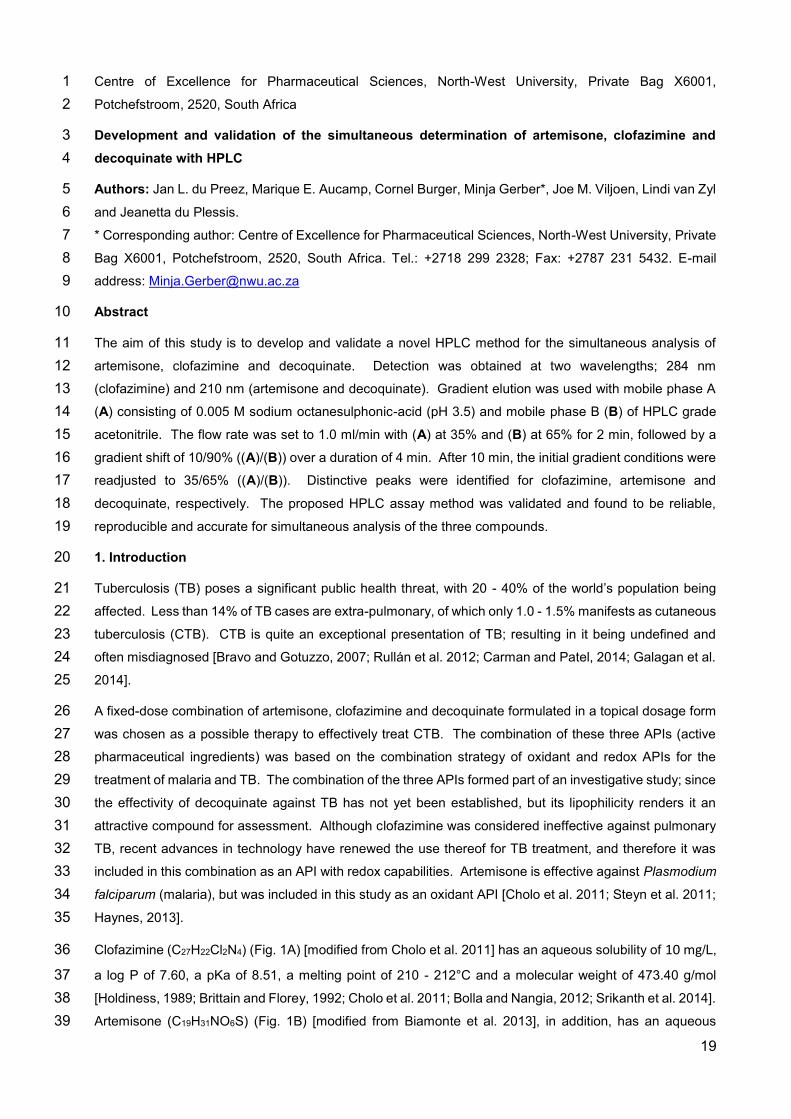
19
Centre of Excellence for Pharmaceutical Sciences, North-West University, Private Bag X6001, 1 Potchefstroom, 2520, South Africa 2
Development and validation of the simultaneous determination of artemisone, clofazimine and 3 decoquinate with HPLC 4
Authors: Jan L. du Preez, Marique E. Aucamp, Cornel Burger, Minja Gerber*, Joe M. Viljoen, Lindi van Zyl 5 and Jeanetta du Plessis. 6 * Corresponding author: Centre of Excellence for Pharmaceutical Sciences, North-West University, Private 7 Bag X6001, Potchefstroom, 2520, South Africa. Tel.: +2718 299 2328; Fax: +2787 231 5432. E-mail 8 address: [email protected] 9
Abstract 10
The aim of this study is to develop and validate a novel HPLC method for the simultaneous analysis of 11 artemisone, clofazimine and decoquinate. Detection was obtained at two wavelengths; 284 nm 12 (clofazimine) and 210 nm (artemisone and decoquinate). Gradient elution was used with mobile phase A 13 (A) consisting of 0.005 M sodium octanesulphonic-acid (pH 3.5) and mobile phase B (B) of HPLC grade 14 acetonitrile. The flow rate was set to 1.0 ml/min with (A) at 35% and (B) at 65% for 2 min, followed by a 15 gradient shift of 10/90% ((A)/(B)) over a duration of 4 min. After 10 min, the initial gradient conditions were 16 readjusted to 35/65% ((A)/(B)). Distinctive peaks were identified for clofazimine, artemisone and 17 decoquinate, respectively. The proposed HPLC assay method was validated and found to be reliable, 18 reproducible and accurate for simultaneous analysis of the three compounds. 19
1. Introduction 20
Tuberculosis (TB) poses a significant public health threat, with 20 - 40% of the world’s population being 21 affected. Less than 14% of TB cases are extra-pulmonary, of which only 1.0 - 1.5% manifests as cutaneous 22 tuberculosis (CTB). CTB is quite an exceptional presentation of TB; resulting in it being undefined and 23 often misdiagnosed [Bravo and Gotuzzo, 2007; Rullán et al. 2012; Carman and Patel, 2014; Galagan et al. 24 2014]. 25
A fixed-dose combination of artemisone, clofazimine and decoquinate formulated in a topical dosage form 26 was chosen as a possible therapy to effectively treat CTB. The combination of these three APIs (active 27 pharmaceutical ingredients) was based on the combination strategy of oxidant and redox APIs for the 28 treatment of malaria and TB. The combination of the three APIs formed part of an investigative study; since 29 the effectivity of decoquinate against TB has not yet been established, but its lipophilicity renders it an 30 attractive compound for assessment. Although clofazimine was considered ineffective against pulmonary 31 TB, recent advances in technology have renewed the use thereof for TB treatment, and therefore it was 32 included in this combination as an API with redox capabilities. Artemisone is effective against Plasmodium 33 falciparum (malaria), but was included in this study as an oxidant API [Cholo et al. 2011; Steyn et al. 2011; 34 Haynes, 2013]. 35
Clofazimine (C27H22Cl2N4) (Fig. 1A) [modified from Cholo et al. 2011] has an aqueous solubility of 10 mg/L, 36
a log P of 7.60, a pKa of 8.51, a melting point of 210 - 212°C and a molecular weight of 473.40 g/mol 37 [Holdiness, 1989; Brittain and Florey, 1992; Cholo et al. 2011; Bolla and Nangia, 2012; Srikanth et al. 2014]. 38 Artemisone (C19H31NO6S) (Fig. 1B) [modified from Biamonte et al. 2013], in addition, has an aqueous 39
20
solubility of 89 mg/L (pH 7.2, water), a log P of 2.49, a melting point of ≈199°C and a molecular weight of 40 401.52 g/mol [Nagelschmitz et al. 2008; Dunay et al. 2011; Steyn et al. 2011]. Very little information is 41 available for decoquinate; since it has mainly been used as a veterinary API. Decoquinate (C24H36NO5) 42 (Fig. 1C) [modified from Biamonte et al. 2013] has a log P of 7.80, a pKa of 10.76, a melting point of ≈219°C 43 and a molecular weight of 417.54 g/mol [Nam et al. 2011; Iglesias et al. 2014]. Currently, no HPLC method 44 for the simultaneous determination of these three compounds is available in literature. Therefore, this 45 method was developed and validated to determine the concentration assays of the three compounds 46 simultaneously for different routes of administration such as solid oral dosage forms or transdermal 47 formulations. This method was developed and validated based on the International Conference on 48 Harmonisation (ICH) and current Good Manufacturing Practice (cGMP) guidelines and parameters [ICH, 49 2005; FDA, 2011]. 50
2. Investigations, results and discussion 51
The proposed method was validated in terms of linearity, accuracy, precision, limit of detection (LOD), limit 52 of quantitation (LOQ), system suitability and robustness. Thereafter the solubility of all three APIs was 53 determined in different solvents (Table 1). The solubility of decoquinate, when compared to the other two 54 APIs, was the lowest in all investigated solvents, consequently the solubility thereof was used as the 55 deciding parameter during the method development steps. The solubility of decoquinate in tetrahydrofuran 56 (THF) was the highest, however, since it is considered a toxic solvent; it will not be the solvent of choice 57 during pre-formulation, dosage form development or API release testing from either solid or semi-solid 58 formulations. Hence, ethanol was chosen as the main solvent. 59
The linearity was determined by constructing a regression plot of API concentration versus peak area 60 response, allowing the calculation of a regression equation for each API. The resulting equations are listed 61 in Table 2. The correlation coefficient (r2) was also determined, where the strongest linear relationship is 62 indicated by a correlation coefficient of 1 [Krause, 2003; UNODC, 2009]. The accuracy of the three 63 compounds can be seen in Table 2. The mean recovery percentages were all between 98 - 102% (%RSD 64 < 15%), thus complying with validation requirements for accuracy parameters. 65
Precision was conducted during a three-day period at three concentration levels (Table 2). All the 66 parameters mentioned adhered to the specifications and thus the method was found to be accurate and 67 precise. The stability of artemisone, clofazimine and decoquinate was evaluated, and no significant 68 instability was observed for at least 24 h (Table 2). None of the API concentrations deviated with more 69 than 15% and were consequently found to be stable for at least 24 h after preparation. System suitability 70 was determined with the injection precision for retention times and peak areas as depicted in Table 2. 71 System suitability was determined from six replicate injections. The obtained peaks were analysed in terms 72 of peak area and retention times. All %RSD values were less than 2% (Table 2) and as a result the method 73 was found to be suitable for the HPLC system. 74
The LOQ is the lowest concentration of API that can be quantitatively ascertained, above which analysis is 75 possible with the specified degree of accuracy and precision. LOQ is used particularly for determining 76 impurities and/or degradation products [ICH, 2005; VICH, 2015]. To ensure whether LOQ is accurate, the 77 API should be injected at the calculated LOQ concentration (n = 6) and the %RSD should be calculated for 78 each concentration. %RSD variation should not exceed 20 [Krause, 2003; ICH, 2005; Westgard, 2008; 79
21
Huber, 2010; VICH, 2015; González et al. 2014]. The LOD, on the other hand, can be determined according 80 to several methods, though the method used in this study is based on the standard deviation of the 81 regression line or the y-intercept and the slope of the calibration curve. The calculated LOD was 1.98 µg/ml 82 for artemisone, 3.11 µg/ml for clofazimine and 2.29 µg/ml for decoquinate. Confirmation of the LOD 83 required injecting the samples at the calculated concentration six times. The experimental LOD obtained 84 was thus 4.42 µg/ml (%RSD 19.68), 0.042 µg/ml (%RSD 17.73) and 0.703 µg/ml (%RSD 17.79) for 85 artemisone, clofazimine and decoquinate, respectively. LOQ was subsequently determined as 13.39 µg/ml 86 for artemisone, 0.13 µg/ml for clofazimine and 2.13 µg/ml for decoquinate. The experimentally determined 87 LOD and LOQ values corresponded well; whereas the calculated LOD did not correlate with the 88 experimental values. In our experience the calculated LOD rarely correlates with experimentally 89 determined values and is of limited use. 90
Since there is currently no dosage form containing this combination of compounds available on the market, 91 it was decided to make two solutions containing possible excipients that is normally included in a solid oral 92 dosage form and a transdermal/topical delivery system, in order to test the sensitivity and selectivity of the 93 method. The solution for solid oral dosage form contained the three APIs, talc, microcrystalline cellulose, 94 polyvinylpyrrolidone (PVP 30), lactose, magnesium stearate, vinylpyrrolidone-vinyl acetate copolymer 95 (Kollidon® VA64) and Pluronic® F-127 dissolved in absolute ethanol in unspecified concentrations. The 96 solution prepared for transdermal/topical delivery contained the three APIs, polysorbate 20 (Tween® 20), 97 polysorbate 80 (Tween® 80), sorbitan monostearate (Span® 60), phosphatidylcholine, cholesterol, safflower 98 oil and olive oil dissolved in absolute ethanol in unspecified concentrations. As observed from Fig. 2 - 4 99 the three compounds delivered peaks at the determined retention times with little to no interference from 100 the different excipients, which can possibly be used during formulation of solid oral dosage forms and 101 transdermal/topical delivery systems. In addition to the novelty for the simultaneous quantification of 102 artemisone, clofazimine and decoquinate the method is reliable and sensitive which complies with the ICH 103 guidelines for method validation. Validation parameters such as linearity, limit of detection and quantitation, 104 accuracy, precision, sample stability and system suitability were established. The reproducible method 105 was also used to determine sensitivity of the method when applying it to an excipient mixture for a possible 106 solid oral dosage form and for a transdermal/topical delivery system. The method was found to be adequate 107 in quantifying the three APIs with virtually no interference. 108
3. Experimental 109
An Agilent® 1100 Series HPLC which was used during this study consisted of an Agilent® 1100 pump, diode 110 array detector, and an autosampler injector module, and ChemStation Rev. A.10.02 software was utilised 111 for data acquisition and analysis (Agilent Technologies, Palo Alto, CA). A Restek Ultra C18 fully endcapped 112 reversed phase column (250 x 4.6 mm, 5 µm) was used with 100 Å pores, a 20% carbon load (Restek 113 corporation, Bellefonte, US), a pH range of 2.5 – 8.0 and a temperature limit of 80°C. Gradient elution was 114 used with mobile phase A (A) consisting of 0.005 M sodium octanesulphonic-acid (pH 3.5) and mobile 115 phase B (B) comprising of HPLC grade acetonitrile. The flow rate was set to 1.0 ml/min with (A) at 35% 116 and (B) at 65% for 2 min, followed by a gradient shift of 10/90% ((A)/(B)) over a duration of 4 min. After 10 117 min the initial gradient conditions were readjusted to 35/65% ((A)/(B)). An injection volume of 20 µl was 118 used and the UV detection was set at 210 and 284 nm. Retention times were approximately 6.4 min, 7.5 119
22
min and 10.2 min for clofazimine, artemisone and decoquinate, respectively and the run time was set to 15 120 min. Ethanol absolute (99.7%) was used as the solvent throughout the method validation. 121
Acknowledgements 122
This work was carried out with the financial support of the South African National Research Foundation 123 (NRF) (Grants no. IFRR81178 and CPRR13091742482); the South African Medical Research Council 124 (MRC) for the Flagship Project MALTB-Redox; and the Centre of Excellence for Pharmaceutical Sciences 125 (Pharmacen) of the North-West University, Potchefstroom Campus, South Africa. 126
Disclaimer 127
Any opinions, findings and conclusions, or recommendations expressed in this material are those of the 128 authors and therefore the NRF does not accept any liability in regard thereto. 129
References 130
Biamonte MA, Wanner J, Le Roch KG (2013) Recent advances in malaria drug discovery. Bioorg Med 131 Chem Lett 23: 2829 - 2843. 132
Bolla G, Nangia A (2012) Clofazimine Mesylate: A high solubility stable salt. Cryst Growth Des 12: 6250 - 133 6259. 134
Bravo FG, Gotuzzo E (2007) Cutaneous tuberculosis. Clin Dermatol 25: 173 - 180. 135
Brittain HG, Florey K (1992) Profiles of drug substances, excipients and related methodology. In: Brittain H 136 (ed.) 1st ed., London, 696p. 137
Carman AS, Patel AG (2014) Science with societal implications: detecting Mycobacterium tuberculosis in 138 Africa. Clin Microbiol Newsl 36: 73 - 77. 139
FDA (2011) Current good manufacturing process Guidance for Industry. Process validation: General 140 principles and practices .CGMP [online]. Available from: https://www.fda.gov/ohrms/dockets/98fr/fda-141
2008-d-0559-gdl.pdf [Accessed 20 July 2016] 142
Cholo MC, Steel HC, Fourie PB, Germishuizen WA, Anderson R (2011) Clofazimine: current status and 143 future prospects. J Antimicrob Chemother 67: 290 - 298. 144
Dunay IR, Chi Chan W, Haynes RK, Sibley LD (2009) Artemisone and artemiside control acute and 145 reactivated toxoplasmosis in a murine model. Int J Antimicrob Agents 53: 4450 - 4456. 146
Galagan JE (2014) Genomic insights into tuberculosis. Nat Rev Genet 15: 307e20. 147
González O, Blanco ME, Iriarte G, Bartolomé L, Maguregui MI, Alonso RM (2014) Bioanalytical 148 chromatographic method validation according to current regulations, with special focus on the non-well 149 defined parameters limit of quantification, robustness and matrix effect. J Chromatogr A 1353: 10 - 27. 150
Haynes, R.K. (2013) MRC South African University Flagship Projects: Project Proposal. Development to 151 the clinical phase of oxidant and redox drug combinations for treatment of malaria. TB and related 152 diseases [online]. Available from: http://www-153 chem.ust.hk/Seminars/2016/201610/Haynes%20Abstract%20Chem%20Dep%20HKUST%20041016.pdf 154 [Accessed 20 April 2017] 155
23
Holdiness MR (1989) Clinical pharmacokinetics of clofazimine: a review. Clin Pharmacokinet 16: 74 - 85. 156
Huber l (2010) Validation of Analytical Methods. A Primer, Agilent Technologies, Germany, (Publ. No. 157
5990-5140EN). 158
ICH (2005) International conference on harmonisation of technical requirements for registration of 159 pharmaceuticals for human use Validation of analytical procedures: Text and methodology Q2(R1). 160 [online]. Available from: 161 https://www.ich.org/fileadmin/Public_Web_Site/ICH_Products/Guidelines/Quality/Q2_R1/Step4/Q2_R1__162 Guideline.pdf [Accessed 20 April 2017] 163
Iglesias A, Nebot C, Vázquez BI, Miranda JM, Abuín CMF, Cepeda A (2014) Detection of veterinary drug 164 residues in surface waters collected nearby farming areas in Galicia, North of Spain. Environ Sci Pollut Res 165 21: 2367 - 2377. 166
Krause SO (2003) Good analytical method validation practice: Deriving acceptance criteria for the AMV 167 protocol – Part II. J Val Tech 9: 162 - 178. 168
Nagelschmitz J, Voith B, Wensing G, Roemer A, Fugmann B, Haynes RK, Kotecka BM, Rieckmann KH, 169 Edstein MD (2008) First assessment in humans of the safety, tolerability, pharmacokinetics, and ex vivo 170 pharmacodynamics antimalarial activity of the new artemisinin derivative artemisone. Antimicrob Agents 171 Chemother 52: 3085 - 3091. 172
Nam T, McNamara CW, Bopp S, Dharia NV, Meister S, Bonamy GMC, Plouffe DM, Kato N, McCormack 173 S, Bursulaya B, Ke H, Vaidya AB, Schultz PG, Winzeler EA (2011) A chemical genomic analysis of 174 decoquinate, a Plasmodium falciparum cytochrome b inhibitor. ACS Chem Biol 6: 1214 - 1222. 175
Rullán J, Seijo-Montes RE, Vaillant A, Sánchez NP. Cutaneous manifestations of pulmonary disease. In: 176 Sánchez NP (ed.) Atlas of dermatology in internal medicine. 14th ed., San Juan, Puerto Rico, p. 17 - 30. 177
Srikanth CH, Joshi P, Bikkasani AK, Porwal K, Gayen JR (2014) Bone distribution study of antileprotic drug 178 clofazimine in rat bone marrow cells by a sensitive reverse phase liquid chromatography method. J 179 Chromatogr B 960: 82 - 86. 180
Steyn JD, Wiesner L, Du Plessis LH, Grobler AF, Smith PJ, Chan WC, Haynes RK, Kotzé AF (2011) 181 Absorption of the novel artemisinin derivatives artemisone and artemiside: potential application of 182 Pheroid™ technology. Int J Pharm 414: 260 - 266. 183
VICH: International cooperation on harmonisation of technical requirements for registration of veterinary 184 medicinal products (2015) Guidance for industry. Studies to evaluate the metabolism and residue kinetics 185 of veterinary drugs in food-producing animals: Validation of analytical methods used in residue depletion 186 studies (VICH GL49(R)). 23p. 187
Westgard JO (2008) Basic Method Validation: training in analytical quality management for healthcare 188 laboratories. In: Westgard WI (ed.) 3rd ed. Madison QC, 320 pp. 189
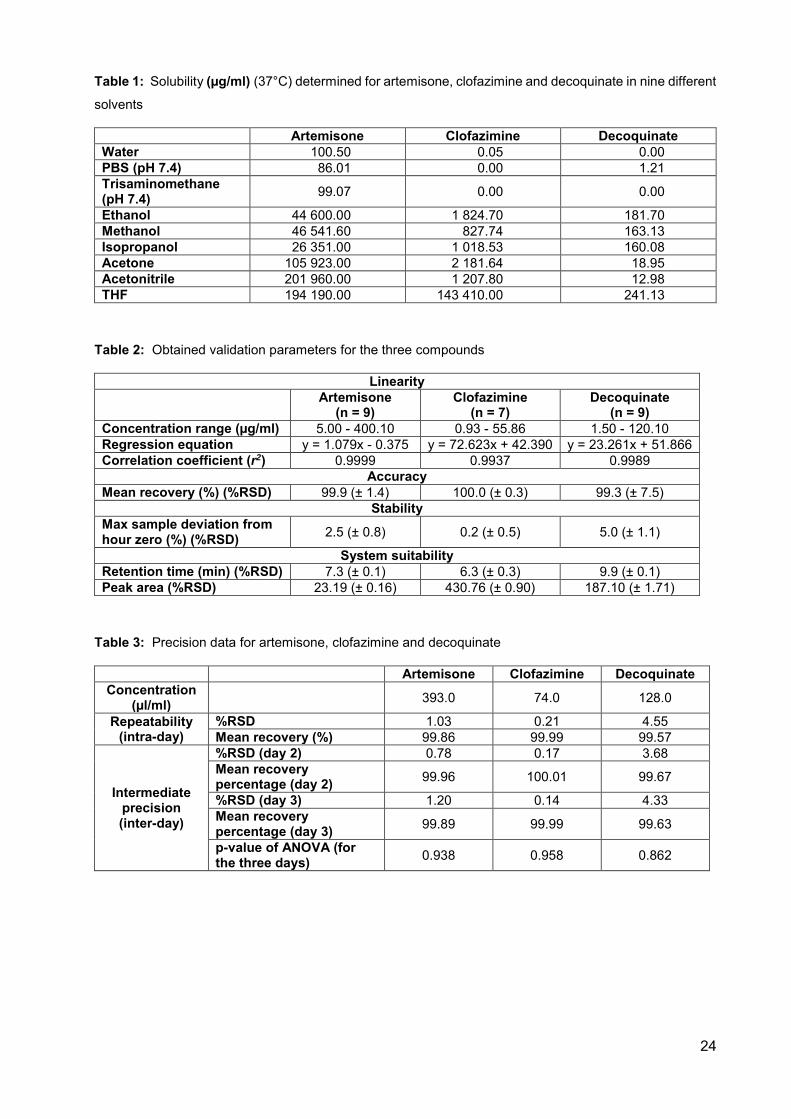
24
Table 1: Solubility (µg/ml) (37°C) determined for artemisone, clofazimine and decoquinate in nine different
solvents
Artemisone Clofazimine Decoquinate Water 100.50 0.05 0.00 PBS (pH 7.4) 86.01 0.00 1.21 Trisaminomethane (pH 7.4) 99.07 0.00 0.00
Ethanol 44 600.00 1 824.70 181.70 Methanol 46 541.60 827.74 163.13 Isopropanol 26 351.00 1 018.53 160.08 Acetone 105 923.00 2 181.64 18.95 Acetonitrile 201 960.00 1 207.80 12.98 THF 194 190.00 143 410.00 241.13
Table 2: Obtained validation parameters for the three compounds
Linearity
Artemisone (n = 9)
Clofazimine (n = 7)
Decoquinate (n = 9)
Concentration range (µg/ml) 5.00 - 400.10 0.93 - 55.86 1.50 - 120.10 Regression equation y = 1.079x - 0.375 y = 72.623x + 42.390 y = 23.261x + 51.866 Correlation coefficient (r2) 0.9999 0.9937 0.9989
Accuracy Mean recovery (%) (%RSD) 99.9 (± 1.4) 100.0 (± 0.3) 99.3 (± 7.5)
Stability Max sample deviation from hour zero (%) (%RSD) 2.5 (± 0.8) 0.2 (± 0.5) 5.0 (± 1.1)
System suitability Retention time (min) (%RSD) 7.3 (± 0.1) 6.3 (± 0.3) 9.9 (± 0.1) Peak area (%RSD) 23.19 (± 0.16) 430.76 (± 0.90) 187.10 (± 1.71)
Table 3: Precision data for artemisone, clofazimine and decoquinate
Artemisone Clofazimine Decoquinate Concentration
(µl/ml) 393.0 74.0 128.0
Repeatability (intra-day)
%RSD 1.03 0.21 4.55 Mean recovery (%) 99.86 99.99 99.57
Intermediate precision (inter-day)
%RSD (day 2) 0.78 0.17 3.68 Mean recovery percentage (day 2) 99.96 100.01 99.67
%RSD (day 3) 1.20 0.14 4.33 Mean recovery percentage (day 3) 99.89 99.99 99.63
p-value of ANOVA (for the three days) 0.938 0.958 0.862
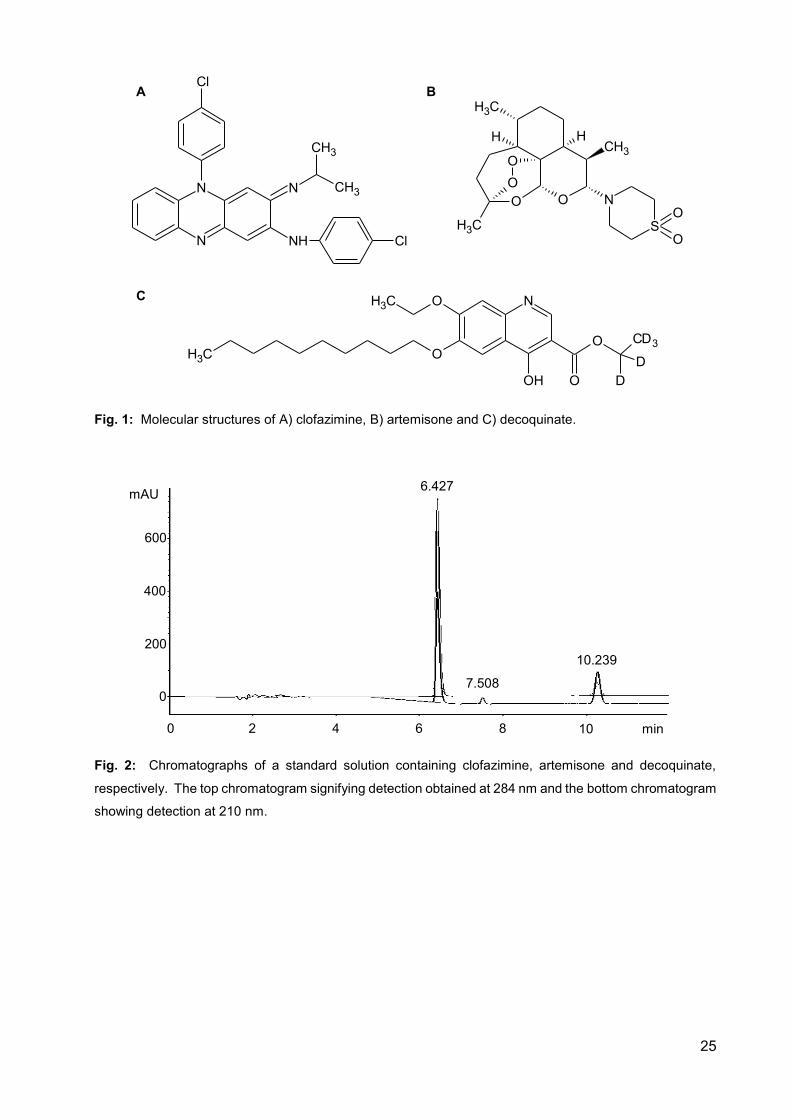
25
Fig. 1: Molecular structures of A) clofazimine, B) artemisone and C) decoquinate.
Fig. 2: Chromatographs of a standard solution containing clofazimine, artemisone and decoquinate,
respectively. The top chromatogram signifying detection obtained at 284 nm and the bottom chromatogram
showing detection at 210 nm.
7.508
10.239
6.427
0
200
400
600
mAU
2
6
4
0
8
10
min
O
CH3
OOO
CH3
H HCH3
N
SO
O
N
N
Cl
NH
N
CH3
CH3
Cl
NOCH3
OCH3
OH O
O
DD
CD3
B
C
A
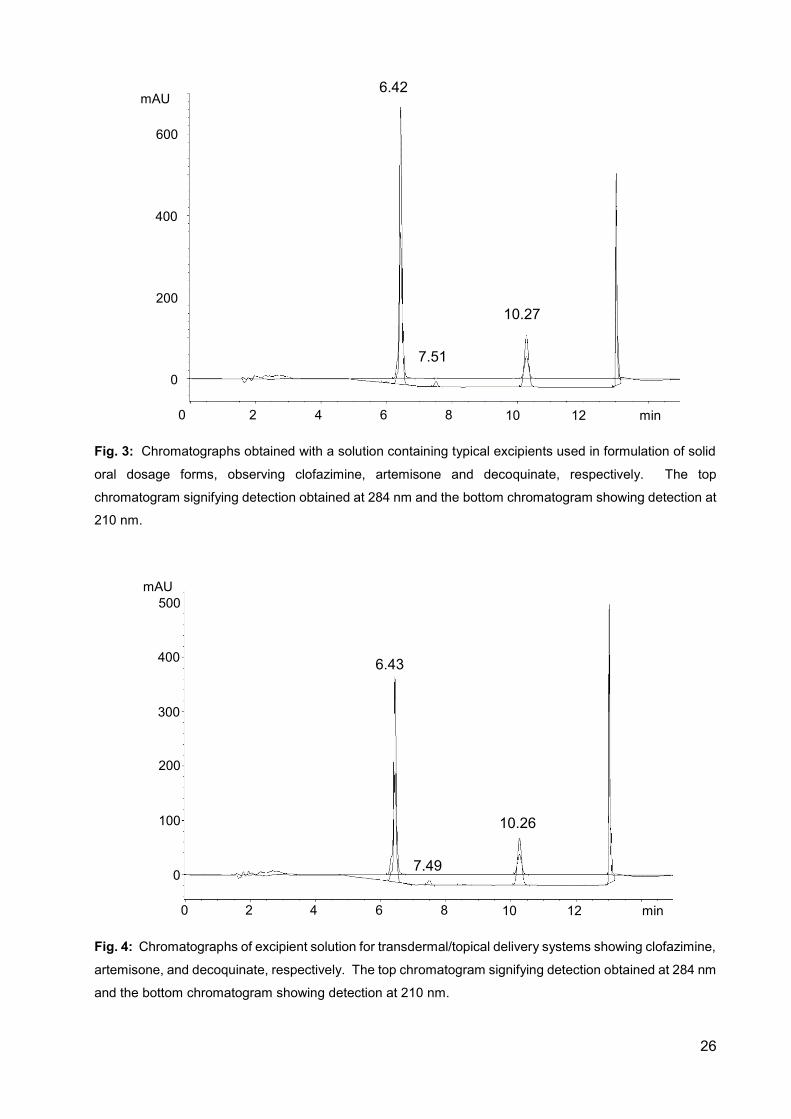
26
Fig. 3: Chromatographs obtained with a solution containing typical excipients used in formulation of solid
oral dosage forms, observing clofazimine, artemisone and decoquinate, respectively. The top
chromatogram signifying detection obtained at 284 nm and the bottom chromatogram showing detection at
210 nm.
Fig. 4: Chromatographs of excipient solution for transdermal/topical delivery systems showing clofazimine,
artemisone, and decoquinate, respectively. The top chromatogram signifying detection obtained at 284 nm
and the bottom chromatogram showing detection at 210 nm.
6.42
10.27
7.51 0
200
400
600
mAU
2
6
4
0
8
10
min
12
2
6
4
0
8
10
min
12
0
200
400
500 mAU
300
100
6.43
10.26
7.49
27
Chapter 4
MANUSCRIPT TO BE SUBMITTED TO THE
JOURNAL OF PHARMACEUTICAL AND
BIOMEDICAL ANALYSIS ON THE TOPICAL
DELIVERY OF ARTEMISONE, CLOFAZIMINE
AND DECOQUINATE ENCAPSULATED IN
VESICLES AND THEIR IN VITRO EFFICACY
AGAINST A TUBERCULOSIS CELL LINE
This chapter is written in article format as stipulated by the Journal of pharmaceutical and
biomedical analysis according to the Guide to Authors in Annexure F.
28
Topical delivery of artemisone, clofazimine and decoquinate encapsulated in vesicles and their in vitro efficacy against Mycobacterium tuberculosis H37Rv strain
Lindi van Zyla, Joe Viljoenb, Richard K. Haynesc, Marique Aucampd, Andile H. Ngwanee, Jeanetta
du Plessis*f.
a. Centre of Excellence for Pharmaceutical Sciences, North-West University, Private Bag X6001, Potchefstroom, 2520, South Africa. [email protected] (Miss. L. van Zyl)
b. Centre of Excellence for Pharmaceutical Sciences, North-West University, Private Bag X6001, Potchefstroom, 2520, South Africa. [email protected] (Dr. J.M. Viljoen).
c. Centre of Excellence for Pharmaceutical Sciences, North-West University, Private Bag X6001, Potchefstroom, 2520, South Africa. [email protected] (Prof. R.K. Haynes).
d. Centre of Excellence for Pharmaceutical Sciences, North-West University, Private Bag X6001, Potchefstroom, 2520, South Africa. [email protected] (Prof. M. Aucamp).
e. DST/NRF Centre of Excellence for Biomedical Tuberculosis Research, Faculty of Medicine and Health Sciences, Stellenbosch University, Tygerberg 7505, South Africa. [email protected]. (Dr. A.H. Ngwane).
f. Centre of Excellence for Pharmaceutical Sciences, North-West University, Private Bag X6001, Potchefstroom, 2520, South Africa. [email protected] (Prof. J. Du Plessis).
* Corresponding author. Tel.: +2718 299 2274; Fax: +2787 231 5432. E-mail address:
[email protected] (Prof. J du Plessis)
29
Abstract 1
Vesicles are widely investigated as carrier systems for active pharmaceutical ingredients (APIs). 2
For topical delivery they are especially effective since they create a “depot-effect” thereby 3
concentrating the APIs in the skin. Artemisone, clofazimine and decoquinate were selected as a 4
combination therapy for the topical treatment of cutaneous tuberculosis. Delivering APIs into the 5
skin presents various challenges; however, utilising niosomes, liposomes and transferosomes as 6
carrier systems may circumvent these challenges. 7
Vesicles containing 1% of each of the three selected APIs were prepared using the thin-film 8
hydration method. Isothermal calorimetry, differential scanning calorimetry and hot-stage 9
microscopy indicated no to minimal incompatibility between the APIs and the vesicle components. 10
Encapsulation efficiency was higher than 85% for all vesicle dispersions. Vesicle stability 11
decreased and size increased with an increase in API concentration. Niosomes were found to 12
be most unstable. 13
Skin diffusion studies were conducted for 12 h on black human female skin utilising vertical Franz 14
diffusion cells. Transferosomes and niosomes delivered the highest average concentrations of 15
clofazimine and decoquinate into the skin, whereas artemisone was not detected. No APIs were 16
present in the receptor phase. 17
Efficacy for antituberculosis was tested against Mycobacterium tuberculosis H37Rv laboratory 18
strain. All the dispersions depicted some activity, surprisingly even the blank vesicles as well. 19
The highest percentage inhibition (52%) against TB was obtained with niosomes containing 1% 20
clofazimine. 21
Keywords 22
Vesicles, Artemisone, Clofazimine, Decoquinate, Tuberculosis, Topical delivery 23
30
Highlights 24
Vesicle size increased and stability decreased with an increase in API concentration. 25
Clofazimine had the largest impact on zeta-potential and vesicle size. 26
Decoquinate and clofazimine were delivered topically in vesicle dispersions. 27
Higher API concentrations were present in the stratum corneum compared to the 28
concentrations in the epidermis-dermis. 29
All of the dispersions displayed efficacy against tuberculosis, even vesicles containing no API. 30
31
1. Introduction 31
Delivery of active pharmaceutical ingredients (APIs) into the skin is a challenging endeavour that 32
is mainly attributed to the barrier function of the stratum corneum [1, 2]. Vesicles, however, have 33
been investigated as a delivery system to increase topical delivery of numerous APIs [3]. Vesicles 34
were used in this study due to their unique ability to encapsulate both hydrophilic and lipophilic 35
APIs, which is especially helpful when formulating a combination of artemisone (ART), 36
clofazimine (CLF) and decoquinate (DQ) [4, 5]. Vesicles have the tendency to create a “depot-37
effect”, concentrating the APIs in the skin, which is where cutaneous tuberculosis (CTB) normally 38
resides [6, 7]. Focus was placed on liposomes, niosomes and transferosomes as topical carrier 39
systems for the combination of ART, DQ and CLF. The combination of these three APIs was 40
selected from a list of approved APIs supplied by the MALTBRedox MRC South African University 41
Flagship Projects, for their redox-oxidant drug working mechanism to determine activity against 42
tuberculosis when applied topically. The rationale behind this mechanism is explained by looking 43
at each API closely and determining its purpose. 44
CLF is a lipophilic API which enables it to accumulate in the skin, whereas its anti-inflammatory 45
action helps control harmful inflammation, supporting its efficacy in the treatment of leprosy. CLF 46
is considered ineffective against pulmonary tuberculosis, though recent advances in technology 47
and the rise in API resistance have renewed interest in the API as an anti-tuberculous agent. CLF 48
has mainly two mechanisms of antimicrobial action, but for the benefit of the Flagship Project, the 49
focus will be on the redox cycling. The outer membrane of the organism is the primary site of 50
action. When CLF is added to the membrane of the organism in the presence of potassium 51
cyanide [(KCN), terminal cytochrome (CYP) respiratory chain inhibitor] and the oxidisable cofactor 52
reduced nicotinamide adenine dinucleotide (NADH), reduction and oxidation of CLF occur with 53
the production of superoxides and H2O2 (hydrogen peroxide), also known as antimicrobial reactive 54
oxygen species (ROS). The ROS interfere with the ATP (adenosine triphosphate) production 55
which leads to bacterial death [8]. 56
ART is a new derivative of artemisinin, which is active against all red blood cell stages of 57
Plasmodium falciparum. There is limited resistance to this group of APIs and due to their short 58
half-life it is recommended that they be administered in combination with other APIs [9]. ART is 59
a 10-alkylaminoartemisinin developed as a highly effective antimalarial with very low or no neuro- 60
and cytotoxicity due to its low log P value [10, 11, 12]. ART is metabolised primarily in the liver 61
by CYP3A4 and bio-transformed into three main metabolites. These three metabolites (M1, M2, 62
M3) possess intrinsic antimalarial activity [11]. The artemisinins are thought to generate toxic 63
oxygen radicals through cleavage of the peroxide bond by Fe(II) (iron) found in heme proteins. 64
This oxidant activity is of importance to the Flagship Project. The artemisinins will enhance the 65
activity of CFZ against tuberculosis through acceleration of the cycling of the redox API [13]. 66
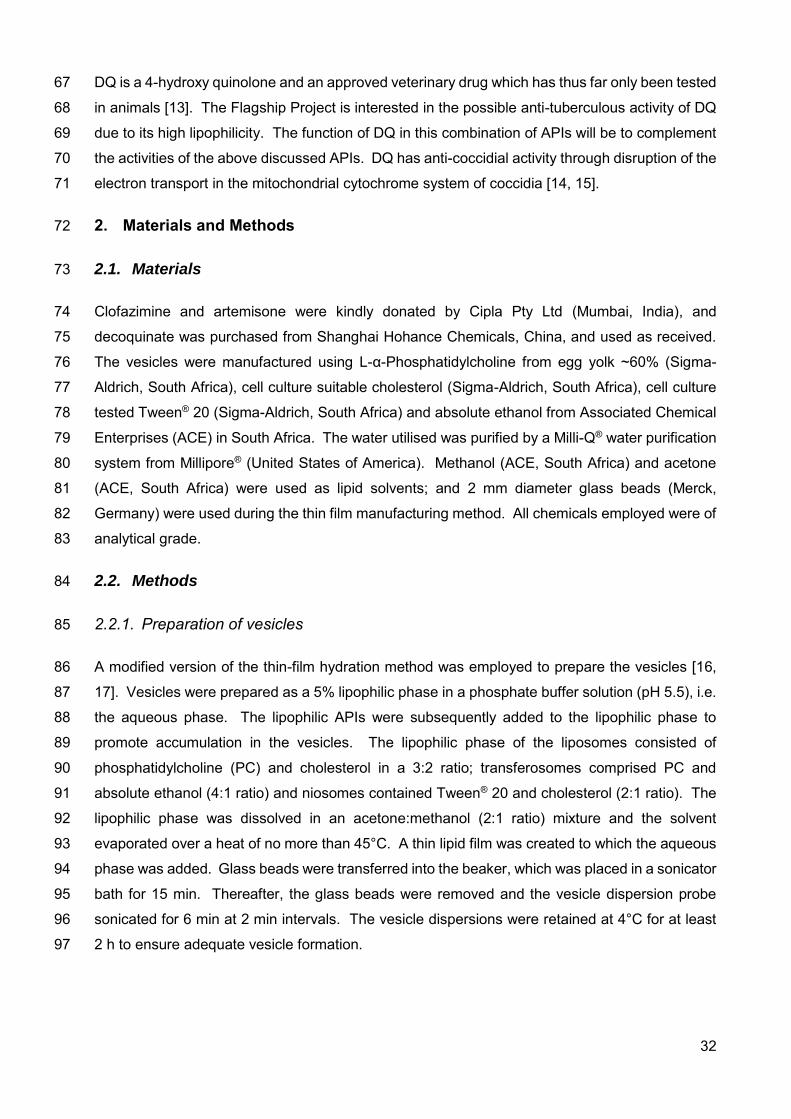
32
DQ is a 4-hydroxy quinolone and an approved veterinary drug which has thus far only been tested 67
in animals [13]. The Flagship Project is interested in the possible anti-tuberculous activity of DQ 68
due to its high lipophilicity. The function of DQ in this combination of APIs will be to complement 69
the activities of the above discussed APIs. DQ has anti-coccidial activity through disruption of the 70
electron transport in the mitochondrial cytochrome system of coccidia [14, 15]. 71
2. Materials and Methods 72
2.1. Materials 73
Clofazimine and artemisone were kindly donated by Cipla Pty Ltd (Mumbai, India), and 74
decoquinate was purchased from Shanghai Hohance Chemicals, China, and used as received. 75
The vesicles were manufactured using L-α-Phosphatidylcholine from egg yolk ~60% (Sigma-76
Aldrich, South Africa), cell culture suitable cholesterol (Sigma-Aldrich, South Africa), cell culture 77
tested Tween® 20 (Sigma-Aldrich, South Africa) and absolute ethanol from Associated Chemical 78
Enterprises (ACE) in South Africa. The water utilised was purified by a Milli-Q® water purification 79
system from Millipore® (United States of America). Methanol (ACE, South Africa) and acetone 80
(ACE, South Africa) were used as lipid solvents; and 2 mm diameter glass beads (Merck, 81
Germany) were used during the thin film manufacturing method. All chemicals employed were of 82
analytical grade. 83
2.2. Methods 84
2.2.1. Preparation of vesicles 85
A modified version of the thin-film hydration method was employed to prepare the vesicles [16, 86
17]. Vesicles were prepared as a 5% lipophilic phase in a phosphate buffer solution (pH 5.5), i.e. 87
the aqueous phase. The lipophilic APIs were subsequently added to the lipophilic phase to 88
promote accumulation in the vesicles. The lipophilic phase of the liposomes consisted of 89
phosphatidylcholine (PC) and cholesterol in a 3:2 ratio; transferosomes comprised PC and 90
absolute ethanol (4:1 ratio) and niosomes contained Tween® 20 and cholesterol (2:1 ratio). The 91
lipophilic phase was dissolved in an acetone:methanol (2:1 ratio) mixture and the solvent 92
evaporated over a heat of no more than 45°C. A thin lipid film was created to which the aqueous 93
phase was added. Glass beads were transferred into the beaker, which was placed in a sonicator 94
bath for 15 min. Thereafter, the glass beads were removed and the vesicle dispersion probe 95
sonicated for 6 min at 2 min intervals. The vesicle dispersions were retained at 4°C for at least 96
2 h to ensure adequate vesicle formation. 97
33
2.2.2. Pre-formulation and characterisation 98
2.2.2.1. Isothermal calorimetry 99
Compatibility between the three APIs and the vesicle components was established with a 100
2277 Thermal Activity Monitor (TAMIII; TA Instruments, United States of America), equipped with 101
an oil bath with a stability of ± 100 µK over 24 h. The calorimeter’s temperature was maintained 102
at 40°C. During the compatibility studies the heat flow was measured for the single components, 103
as well as for the mixtures, since it is a powerful tool for detecting incompatibilities and instabilities 104
between APIs and/or excipients. 105
2.2.2.2. Encapsulation efficiency 106
To determine the encapsulation efficiency, the centrifugation separation method was used. The 107
selected dispersions were centrifuged at 2,000 g for 20 min for the unentrapped API to form a 108
pellet in the tube [18]. An Eppendorf® 5804 R centrifuge equipped with an A-4-44 rotor was used. 109
To determine entrapment efficiency, the unentrapped API was subtracted from the initial added 110
API and a percentage calculated. 111
2.2.2.3. Zeta-potential, size distribution and vesicle size 112
Zeta-potential, as well as vesicle size and distribution of the vesicles, was determined by means 113
of dynamic light scattering using a Zetasizer Nano® ZS (Malvern® Instruments Ltd., 114
Worcestershire, United Kingdom) at 25°C. Zeta-potential is the electrostatic potential at 115
interfaces and determines the electrostatic repulsion between particles in a system. The higher 116
the zeta-potential, the stronger the repulsion and the more stable the colloidal system becomes 117
[19]. 118
The size and size distribution for these dispersions were also determined utilising the Zetasizer 119
Nano® ZS. The different vesicles were also imaged and their sizes measured using the FEI 120
Tecnai G2 20S-Twin TEM at 120 kV. A transmission electron microscope equipped with a Gatan® 121
bottom mount camera using DigitalMicrograph® software for imaging and measuring vesicle size 122
was employed. 123
2.2.2.4. pH and viscosity 124
The pH was determined for each of the selected dispersions using a Mettler® Toledo pH meter 125
(Mettler® Toledo International Inc., United States of America) with a Mettler® Toledo Inlab® 410 126
NTC electrode 9823. 127
34
Viscosity was measured using a Brookfield® Viscometer model DV2T™ (Stoughton, United States 128
of America) connected to a circulating water bath with a Brookfield® temperature controller to 129
maintain the temperature in the water jacket at 25±1.0°C. A SC4-18 spindle was employed at 130
100 rpm, where the torque was approximately 20%. 131
2.2.3. Topical delivery 132
2.2.3.1. Skin preparation 133
Black skin, donated by anonymous female patients who underwent abdominoplastic surgery, was 134
obtained for transdermal diffusion studies [NWU-00114-11-A5]. The donated skin was frozen at 135
-20°C for no longer than 6 months. Prior to conducting the studies, the skin was left to thaw and 136
visually inspected for defects such as stretch marks and/or holes/large hair follicles. The skin 137
was cut into pieces of approximately 2 cm x 4 cm and 400 µm thick with a Zimmer® electric 138
dermatome model 8821. The skin pieces were placed on Whatman® filter paper, cut in circles 139
and covered in aluminium foil prior to storage in a freezer at -20°C until the studies were 140
conducted (within 24 h). 141
2.2.3.2. Skin diffusion studies 142
In vitro skin diffusion studies were conducted utilising ten vertical Franz diffusion cells over 12 h 143
[20]. Skin circles were mounted between a receptor and a donor compartment. The receptor 144
phase consisted of phosphate buffer solution (pH 7.4) and a magnetic stirrer, whereas the donor 145
compartment contained the vesicle dispersion. The Franz cells were placed in a water bath 146
maintained at 37°C. 147
2.2.3.3. Tape stripping 148
After the 12 h diffusion studies, the skin circles were removed from the Franz cells and fixed onto 149
a board with Whatman® filter paper. All excess dispersion was dabbed from the skin surface. For 150
the tape stripping, fifteen strips of clear 3M Scotch® tape were used and an extra two strips for 151
cleaning. The strips were used to remove the stratum corneum-epidermis, which was then put 152
into a polytop containing 5 ml absolute ethanol and placed in the refrigerator for approximately 153
8 h. The remaining dermis of the diffusion area (circular imprint of the donor phase is indicative 154
of this area) was cut into small pieces, to increase the surface area, and also transferred into a 155
polytop with 5 ml absolute ethanol and stored between 2-8°C for approximately 8 h. Thereafter, 156
the ethanol was filtered, using a 45 µm filter, and analysed by means of HPLC. 157
35
2.2.4. Efficacy against tuberculosis 158
Mycobacterium tuberculosis (M. tb) H37Rv was inoculated in a 1:10 dilution from stock cultures 159
in a 25 cm3 tissue flask for 4 days until the optical density at 600 nm (OD600) reached 0.6. These 160
cultures were sub-cultured at 1:5 dilutions into a 75 cm3 tissue flask until OD600 reached 0.3 for 161
the experiment. Aliquots of 10 ml from this culture were transferred into 25 cm3 tissue flasks. The 162
concentrations that showed 50% or less M. tb growth inhibition of CLF, ART and DQ ranged from 163
12.5, 10.5 and 11.9 µM, respectively, were used. Therefore the dispersions containing a single 164
API were tested at 12.5 µM, correspondingly. During the experiment, CLF was the most active 165
API of the selected APIs and thus its concentration [21] was utilised as a benchmark for the other 166
APIs. Each culture flask was treated with the desired amount of API for 24 hrs as well as one 167
control flask with no API. 168
After 24 h post-inoculation and incubation at 37°C, 200 µl samples from each culture flask were 169
centrifuged, resuspended, washed twice in 7H9 broth and plated on 7H11 agar. After 12–15 days 170
of incubation at 37°C the CFUs were enumerated and the percentage inhibition was calculated 171
relative to the untreated control. 172
3. Results and discussion 173
3.1. Pre-formulation and characterisation 174
3.1.1. Isothermal calorimetry 175
It was established that ART, CLF and DQ were compatible (Figure 1) in the solid-state form. ART, 176
CLF and the combination of all three APIs in combination with PC showed incompatibility. All 177
three APIs in combination with Tween® 20 indicated incompatibility (Figure 2). Incompatibilities 178
were seen when a difference between the measured heat flow and the theoretically calculated 179
heat flow was observed. All other combinations tested were compatible. 180
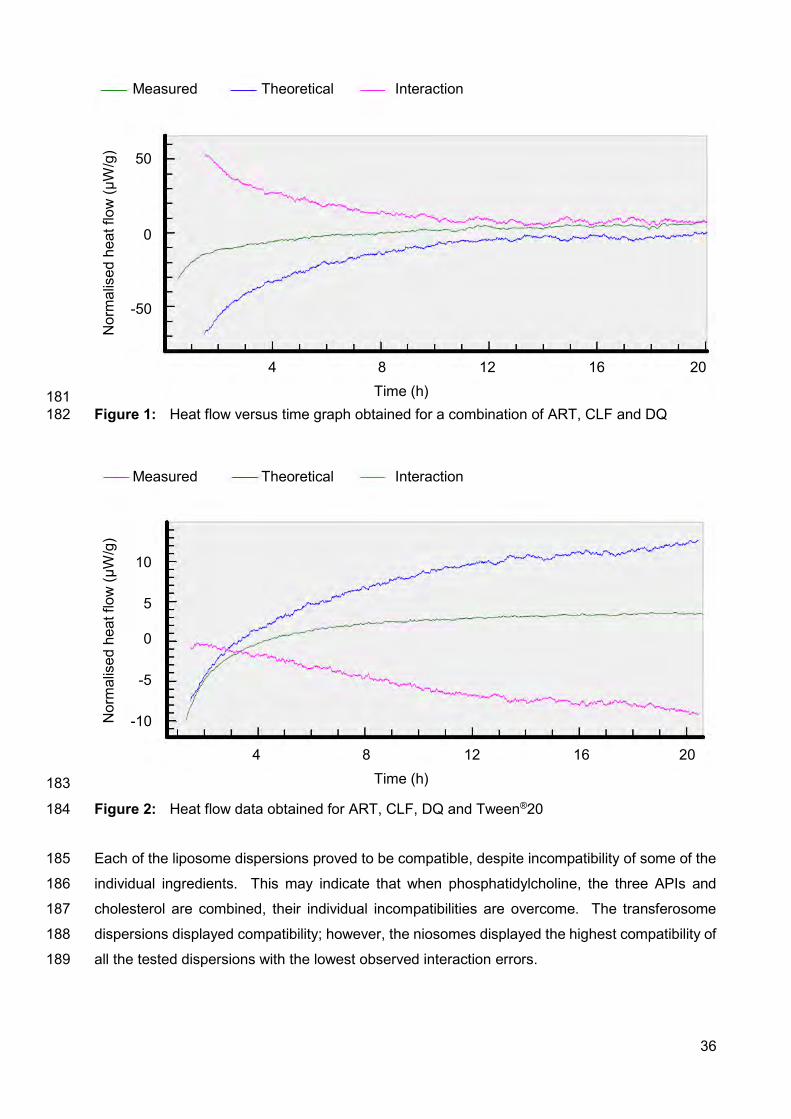
36
181 Figure 1: Heat flow versus time graph obtained for a combination of ART, CLF and DQ 182
183
Figure 2: Heat flow data obtained for ART, CLF, DQ and Tween®20 184
Each of the liposome dispersions proved to be compatible, despite incompatibility of some of the 185
individual ingredients. This may indicate that when phosphatidylcholine, the three APIs and 186
cholesterol are combined, their individual incompatibilities are overcome. The transferosome 187
dispersions displayed compatibility; however, the niosomes displayed the highest compatibility of 188
all the tested dispersions with the lowest observed interaction errors. 189
Measured Theoretical Interaction
Time (h) 4 8 12 16 20
Nor
mal
ised
hea
t flo
w (µ
W/g
) 50
0
-50
Measured Theoretical Interaction
Time (h) 4 8 12 16 20
Nor
mal
ised
hea
t flo
w (µ
W/g
)
10
5
0
-5
-10
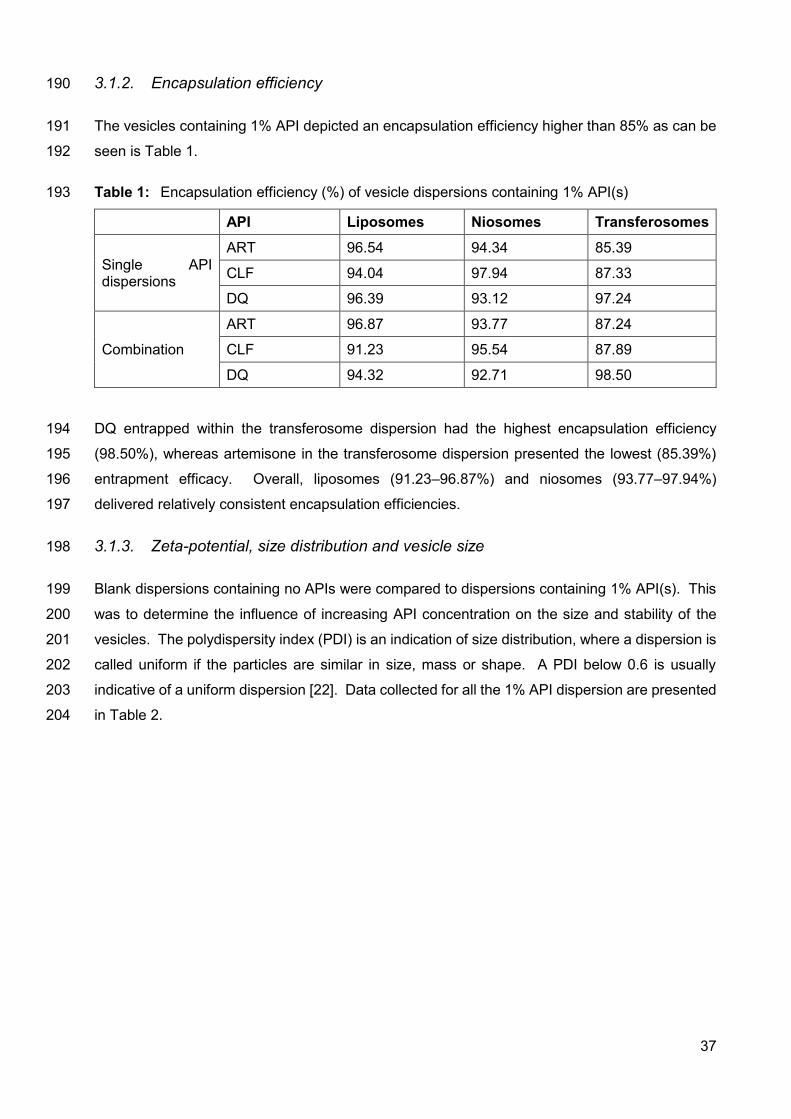
37
3.1.2. Encapsulation efficiency 190
The vesicles containing 1% API depicted an encapsulation efficiency higher than 85% as can be 191
seen is Table 1. 192
Table 1: Encapsulation efficiency (%) of vesicle dispersions containing 1% API(s) 193
API Liposomes Niosomes Transferosomes
Single API dispersions
ART 96.54 94.34 85.39
CLF 94.04 97.94 87.33
DQ 96.39 93.12 97.24
Combination
ART 96.87 93.77 87.24
CLF 91.23 95.54 87.89
DQ 94.32 92.71 98.50
DQ entrapped within the transferosome dispersion had the highest encapsulation efficiency 194
(98.50%), whereas artemisone in the transferosome dispersion presented the lowest (85.39%) 195
entrapment efficacy. Overall, liposomes (91.23–96.87%) and niosomes (93.77–97.94%) 196
delivered relatively consistent encapsulation efficiencies. 197
3.1.3. Zeta-potential, size distribution and vesicle size 198
Blank dispersions containing no APIs were compared to dispersions containing 1% API(s). This 199
was to determine the influence of increasing API concentration on the size and stability of the 200
vesicles. The polydispersity index (PDI) is an indication of size distribution, where a dispersion is 201
called uniform if the particles are similar in size, mass or shape. A PDI below 0.6 is usually 202
indicative of a uniform dispersion [22]. Data collected for all the 1% API dispersion are presented 203
in Table 2. 204
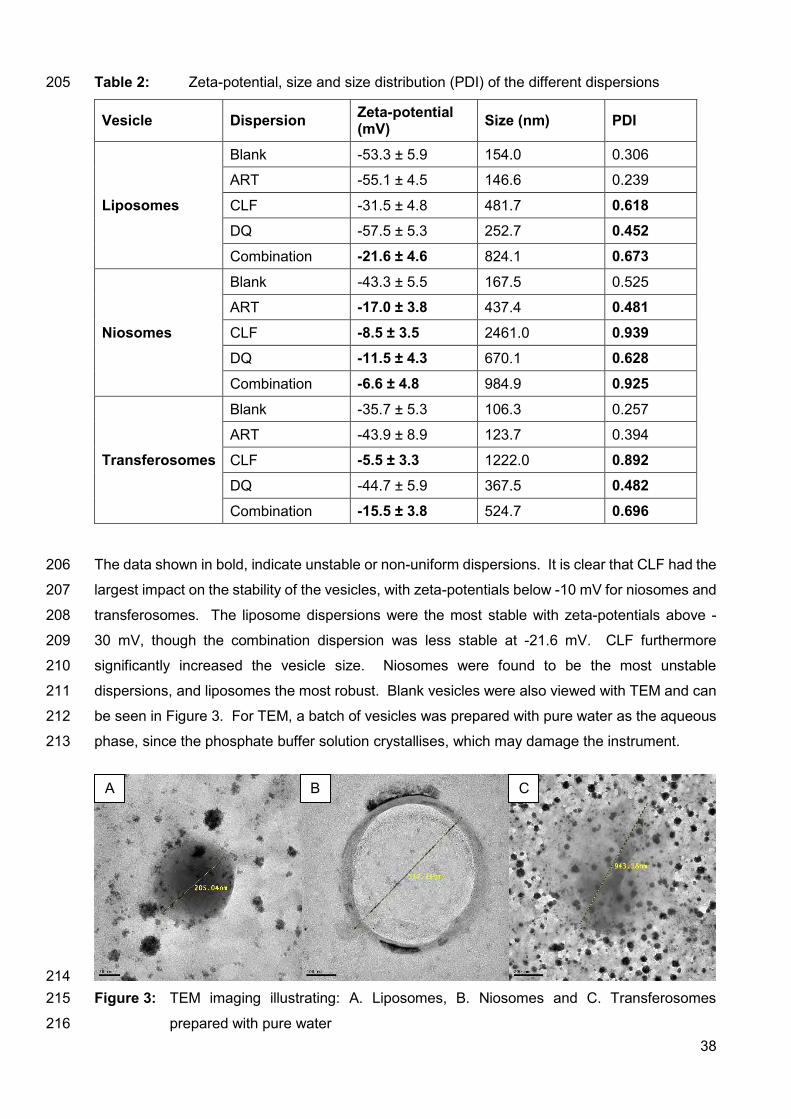
38
Table 2: Zeta-potential, size and size distribution (PDI) of the different dispersions 205
Vesicle Dispersion Zeta-potential (mV) Size (nm) PDI
Liposomes
Blank -53.3 ± 5.9 154.0 0.306
ART -55.1 ± 4.5 146.6 0.239
CLF -31.5 ± 4.8 481.7 0.618 DQ -57.5 ± 5.3 252.7 0.452
Combination -21.6 ± 4.6 824.1 0.673
Niosomes
Blank -43.3 ± 5.5 167.5 0.525
ART -17.0 ± 3.8 437.4 0.481
CLF -8.5 ± 3.5 2461.0 0.939 DQ -11.5 ± 4.3 670.1 0.628
Combination -6.6 ± 4.8 984.9 0.925
Transferosomes
Blank -35.7 ± 5.3 106.3 0.257
ART -43.9 ± 8.9 123.7 0.394
CLF -5.5 ± 3.3 1222.0 0.892 DQ -44.7 ± 5.9 367.5 0.482
Combination -15.5 ± 3.8 524.7 0.696
The data shown in bold, indicate unstable or non-uniform dispersions. It is clear that CLF had the 206
largest impact on the stability of the vesicles, with zeta-potentials below -10 mV for niosomes and 207
transferosomes. The liposome dispersions were the most stable with zeta-potentials above -208
30 mV, though the combination dispersion was less stable at -21.6 mV. CLF furthermore 209
significantly increased the vesicle size. Niosomes were found to be the most unstable 210
dispersions, and liposomes the most robust. Blank vesicles were also viewed with TEM and can 211
be seen in Figure 3. For TEM, a batch of vesicles was prepared with pure water as the aqueous 212
phase, since the phosphate buffer solution crystallises, which may damage the instrument. 213
214 Figure 3: TEM imaging illustrating: A. Liposomes, B. Niosomes and C. Transferosomes 215
prepared with pure water 216
A B C
39
3.1.4. pH and viscosity 217
The buffer used to formulate the vesicles was prepared at 1.5 standard strength, since a pilot 218
study indicated that artemisone in liposomes lowers the pH to as low as 3.17 at 25°C. The 219
dispersions were produced to be applied topically, thus the pH needs to be buffered between 4–220
9 in order to avoid skin irritation [23]. Viscosity readings were taken at 10 s intervals. Generally, 221
it is assumed that more viscous formulations will inhibit or eliminate the skin partitioning and 222
absorption of molecules within a formulation, partly due to poor skin distribution. This may not 223
always be the case, since it was also found that thin layers of a more viscous formulation may 224
enhance skin permeation due to the formation of an occlusive layer [24]. The viscosities of the 225
dispersions were measured and the values obtained were relatively similar to that of water, which 226
has a viscosity of 1 mPa.s at 20°C or 0.89 mPa.s at 25°C [25]. Data collected for the pH and 227
viscosity of the dispersions are shown in Table 3. 228
Table 3: The pH and viscosity of 1% API dispersions at 25±1.0°C 229
Vesicle Dispersion pH Viscosity (mPa.s)
Liposomes
Blank 5.50 1.88
ART 5.51 1.89
CLF 5.49 2.44
DQ 5.51 1.87
Combination 5.44 2.89
Niosomes
Blank 5.19 1.71
ART 5.11 1.71
CLF 5.24 1.66
DQ 5.06 1.69
Combination 5.75 1.99
Transferosomes
Blank 5.37 1.41
ART 5.36 1.45
CLF 5.53 1.54
DQ 5.34 1.47
Combination 5.43 1.78
The pH was kept above 5 and below 6, which is ideal for topical application. The dispersions 230
were slightly more viscous than water, though not too viscous to form an occlusive layer; good 231
spreadability was however still ensured. 232
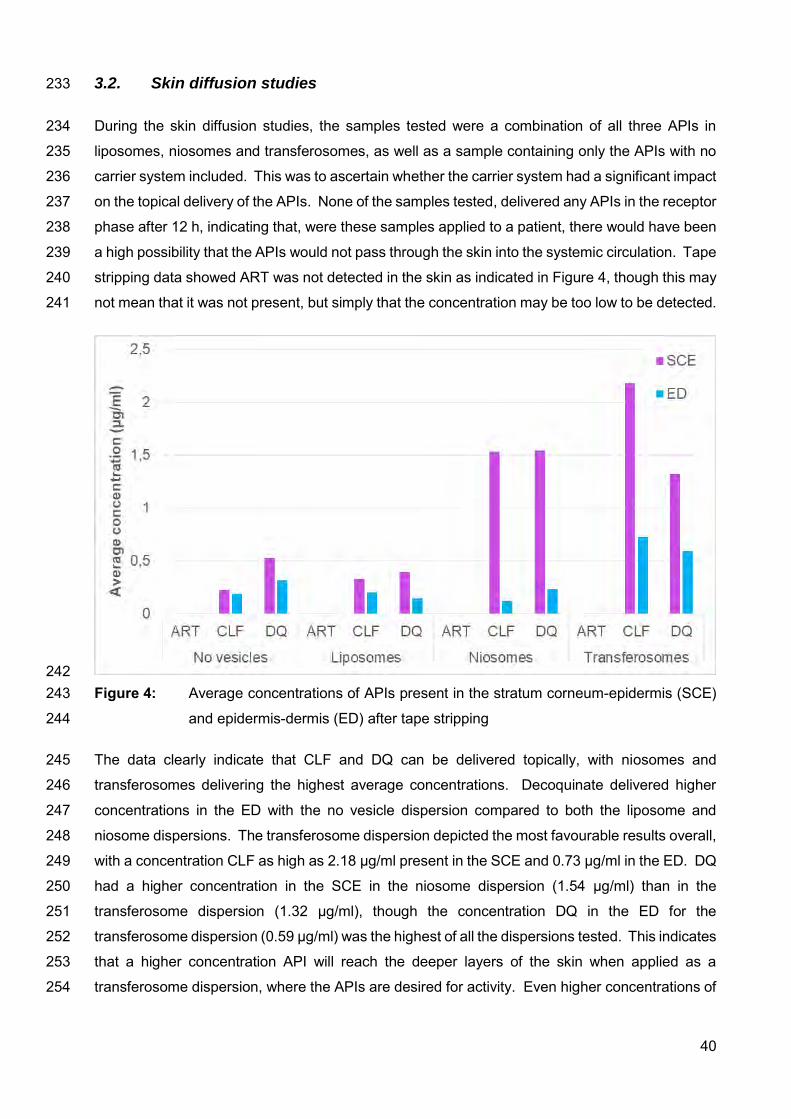
40
3.2. Skin diffusion studies 233
During the skin diffusion studies, the samples tested were a combination of all three APIs in 234
liposomes, niosomes and transferosomes, as well as a sample containing only the APIs with no 235
carrier system included. This was to ascertain whether the carrier system had a significant impact 236
on the topical delivery of the APIs. None of the samples tested, delivered any APIs in the receptor 237
phase after 12 h, indicating that, were these samples applied to a patient, there would have been 238
a high possibility that the APIs would not pass through the skin into the systemic circulation. Tape 239
stripping data showed ART was not detected in the skin as indicated in Figure 4, though this may 240
not mean that it was not present, but simply that the concentration may be too low to be detected. 241
242 Figure 4: Average concentrations of APIs present in the stratum corneum-epidermis (SCE) 243
and epidermis-dermis (ED) after tape stripping 244
The data clearly indicate that CLF and DQ can be delivered topically, with niosomes and 245
transferosomes delivering the highest average concentrations. Decoquinate delivered higher 246
concentrations in the ED with the no vesicle dispersion compared to both the liposome and 247
niosome dispersions. The transferosome dispersion depicted the most favourable results overall, 248
with a concentration CLF as high as 2.18 µg/ml present in the SCE and 0.73 µg/ml in the ED. DQ 249
had a higher concentration in the SCE in the niosome dispersion (1.54 µg/ml) than in the 250
transferosome dispersion (1.32 µg/ml), though the concentration DQ in the ED for the 251
transferosome dispersion (0.59 µg/ml) was the highest of all the dispersions tested. This indicates 252
that a higher concentration API will reach the deeper layers of the skin when applied as a 253
transferosome dispersion, where the APIs are desired for activity. Even higher concentrations of 254
41
the APIs will possibly be delivered into the skin of a patient with CTB, since CTB is a disease that 255
damages the skin and the stratum corneum will not be intact. 256
3.3. Efficacy against tuberculosis 257
A control culture was used as the positive control at 0% inhibition and isoniazid as the negative 258
control (83% inhibition) since it is a known API against tuberculosis. Table 4 presents the data 259
obtained from efficacy studies against tuberculosis for the 1% API dispersions evaluated. 260
Table 4: Growth inhibition (%) of the APIs in solid form, as well as in, the different 261
dispersions 262
API Liposomes Niosomes Transferosomes ART 28 31 20 38
CLF 42 42 52 38
DQ 28 29 8 35
Combination - 42 38 12
Blank - 12 36 42
All the dispersions and APIs tested depicted some activity against tuberculosis. Of the three 263
APIs, CLF was the most active (42%). Comparing the single API dispersions, CLF in niosomes 264
was the most active (52%) and DQ in niosomes the least active (8%). Of the combination 265
dispersion, liposomes showed the highest activity against tuberculosis (42%) and transferosomes 266
were least active (12%). Interestingly, even the empty vesicles displayed some activity against 267
tuberculosis. This may be indicative that one or more of the vesicle components may have some 268
degree of activity against tuberculosis. Transferosomes depicted the highest activity of the blank 269
vesicles, which was similar to the CLF powder activity (42%). Transferosomes consist mainly of 270
PC, though Acton [26] stipulated that PC was found to have no activity against tuberculosis. This 271
is interesting and may indicate that either the combination of the buffer and the PC or the shape 272
and size of the transferosomes have some activity against tuberculosis. Further investigation into 273
the activity of blank transferosomes against tuberculosis will definitely be beneficial. Activity of 274
the empty vesicles may also be caused by an occlusion effect caused by the vesicles over the 275
tuberculosis cells, which may lead to cell death. 276
4. Conclusions 277
Liposomes, niosomes and transferosomes were prepared containing ART, DQ and CLF. It was 278
established that an increase in API concentration had a definite influence on vesicles stability and 279
size. The higher the concentration API in the vesicles, the higher the amount of API entrapped 280
in the vesicle and thus an increase in size was obtained. This phenomenon, however, decreases 281
42
stability of the vesicle system. Size distribution and the zeta-potential indicated that CLF caused 282
the most instabilities in the vesicles, with the biggest increase in size and the most unfavourable 283
zeta-potential. Overall, niosomes were found to be most unstable and liposomes most robust. 284
In vitro skin diffusion studies indicated that DQ and CLF could be delivered into the skin, though 285
no API was present in the receptor phase, which would represent the systemic circulation. Tape 286
stripping data showed that transferosomes delivered the highest average concentration CLF and 287
DQ into the skin. Transferosomes contain no cholesterol, unlike the niosomes and liposomes. 288
This may suggest that transferosomes are less lipophilic, and thus, these highly lipophilic APIs 289
are less likely to remain in the vesicles and would rather be inclined to penetrate more freely into 290
the skin. 291
Though no definite conclusions can be made from the efficacy against tuberculosis data, further 292
investigation into clofazimine would be beneficial, since clofazimine powder and clofazimine in 293
the different vesicles, delivered the highest percentage inhibition. CLF is a documented anti-294
tuberculous API that was investigated in the 1990s, but which caused skin pigmentation due to 295
ceroid lipofuscinosis [27, 28]. Further investigation is required of methods to deliver CLF locally, 296
other than by means of vesicles, since CLF had the most influence on vesicle instabilities, while 297
limiting the severe skin pigmentation might be advantageous for cutaneous tuberculosis. Further 298
investigation into the reason why blank transferosomes also had such high anti-tuberculous 299
activity, might produce some new insight into the way to combat tuberculosis and its ever 300
increasing resistance. 301
43
Acknowledgements 302
The authors would like to sincerely thank the South African Medical Research Council (Flagship 303
program MALTBRedox), the Centre of Excellence for Pharmaceutical Sciences, Faculty of Health 304
Sciences, North-West University, South Africa and the National Research Foundation of South-305
Africa for their financial contribution to this project [grant number CPRR13091742482]. Any 306
opinion, findings and conclusions or recommendations expressed in this material are those of the 307
authors and therefore the NRF does not accept any liability in regard thereto. 308
44
References 309
[1] Gillet, A., Lecomte, F., Hubert, P., Ducat, E., Evrard, B. & Piel, G, Skin penetration 310
behaviour of liposomes as a function of their composition, Eur. J. Pharm. Biopharm. 79 311
(2011) 43-53. 312
[2] Tavano, L., Gentile, L., Rossi, C.O. & Muzzalupo, R, Novel gel-niosomes formulations 313
as multicomponent systems for transdermal drug delivery, Colloids. Surf. B: 314
Biointerfaces. 110 (2013) 281-288. 315
[3] El Maghraby, G.M.M., Williams, A.C. & Barry, B.W, Oestradiol skin delivery from 316
ultradeformable liposomes: refinement of surfactant concentration, Int. J. Pharm. 196 317
(2000) 63-74. 318
[4] Dragicevic-Curic, N. & Maibach, H.I, Percutaneous penetration enhancers - Chemical 319
methods in penetration enhancement: Drug manipulation strategies and vehicle effects, 320
first ed., New York, Springer, 2015. 321
[5] Mahale, N.B., Thakkar, P.D., Mali, R.G., Walunj, D.R. & Chaudhari, S.R, Niosomes: 322
novel sustained release nonionic stable vesicular systems – an overview, Adv. Colloid. 323
Interface. Sci. 183-184 (2012) 46-54. 324
[6] Jain, S., Jain, V. & Mahajan, S.C, Lipid based vesicular drug delivery systems, Adv. 325
Pharm. 2014 (2014) 1-12. 326
[7] Kaur, I.P. & Singh, H, Nanostructured drug delivery for better management of 327
tuberculosis, J. Control. Release. 18 (2014) 36-50. 328
[8] Cholo, M.C., Steel, H.C., Fourie, P.B., Germishuizen, W.A. & Anderson, R, Clofazimine: 329
current status and future prospects, J. Atimicrob. Chemother. 67(2011):290-298. 330
[9] Steyn, J.D., Wiesner, L., du Plessis, L.H., Grobler, A.F., Smith, P.J., Chan, W.C., 331
Haynes, R.K. & Kotzé, A.F, Absorption of the novel artemisinin derivatives artemisone 332
and artemiside: potential application of Pheroid™ technology, Int. J. Pharm. 333
414(2011):260-266. 334
[10] Dunay, I.R., Chi Chan, W., Haynes, R.K. & Sibley, L.D, Artemisone and artemiside 335
control acute and reactivated toxoplasmosis in a murine model, J. Antimicrob. Agents. 336
Chemother. 53(2009):4450-4456. 337
[11] Nagelschmitz, J., Voith B., Wensing, G., Roemer, A., Fugmann, B., Haynes, R.K., 338
Kotecka, B.M., Rieckmann, K.H. & Edstein, M.D, First assessment in humans of the 339
45
safety, tolerability, pharmacokinetics, and ex vivo pharmacodynamics antimalarial 340
activity of the new artemisinin derivative artemisone, Antimicrob. Agents. Chemother. 341
52(2008):3085-3091. 342
[12] Vivas, L., Rattray, L., Stewart, L.B., Robinson, B.L., Fugmann B., Haynes, R.K., Peters, 343
W. & Croft, S.L, Antimalarial efficacy and drug interactions of the novel semi-synthetic 344
endoperoxide artemisone in vitro and in vivo, J. Antimicrob. Chemother. 59(2007):658-345
665. 346
[13] Biamonte, M.A., Wanner, J. & le Roch, K.G, Recent advances in malaria drug discovery, 347
Bioorganic Med. Chem. Lett. 23(2013):2829-2843. 348
[14] Mikota, S.K. & Plumb, D.C, Elephant formulary. 349
http://elephantcare.org/resources/formulary/drug-index/decoquinate/, 2017 (accessed 350
11 October 2017). 351
[15] Williams, R.B, The mode of action of anticoccidial quinolones (6-decyloxy-4-352
hydroxyquinoline-3-carboxylates) in chickens, Int. J. Parasitol. 27(1997):101-111. 353
[16] Agarwal, R., Katare, O.P. & Vyas, S.P, Preparation and in vitro evaluation of 354
liposomal/niosomal delivery systems for antipsoriatic drug dithranol, Int. J. Pharm. 288 355
(2001) 43-52. 356
[17] Shaji, J. & Lal, M, Preparation, optimization and evaluation of transferosomal formulation 357
for enhanced transdermal delivery of a COX-2 inhibitor, Int. J. Pharm. Pharm. Sci. 6 358
(2014) 467-477. 359
[18] New, R.R.C, Liposomes: a practical approach, first ed., New York, Oxford university 360
press,1990. 361
[19] Zhao, C., Tong, K., Tan, J., Liu, Q., Wu, T. & Sun, D, Colloidal properties of 362
montmorillonite suspensions modified with polyetheramine, Colloids. Surf. A: 363
Physicochem. Eng. Asp. 457 (2014) 8-15. 364
[20] Van Zyl, L., du Preez, J., Gerber, M., du Plessis, J. & Viljoen, J, Essential fatty acids as 365
transdermal penetration enhancers, J. Pharm. Sci. 105(2016):188-193. 366
[21] Lechartier, B. & Cole, S.T, Mode of action of clofazimine and combination therapy with 367
benzothiazinones against Mycobacterium tuberculosis, Antimicrob. Agents. Chemother., 368
59 (2015) 4457-4463. 369
46
[22] Malvern instruments Ltd, Zetasizer nano series: User manual (MAN0317; Issue 1.1), 370
Malvern Instruments Ltd., England, 2004. 371
[23] Paudel, K.S., Milewski, M., Swadley, C.L., Brogden, N.K., Ghosh, P. & Stinchcomb, A, 372
Challenges and opportunities in dermal/transdermal delivery, Ther. Deliv. 1 (2010) 109-373
131. 374
[24] Leite-Silva, V.R., De Almeida, M.M., Fradin, A., Grice, J.E. & Roberts, M.S, Delivery of 375
drugs applied topically to the skin: Advanced formulation. 376
http://www.medscape.org/viewarticle/771038_3 , 2012 (accessed 18 May 2016). 377
[25] Crittenden, J.C., Trussel, R.R., Hand, D.W., Howe, K.J. & Tchobanoglous, G, MWH’s 378
water treatment: Principles and design, third ed., New Jersey, John Wiley & Sons, Inc., 379
2012. 380
[26] Acton, A, Tuberculosis: New insights for the Healthcare Professional: 2011 Edition. 381
https://books.google.co.za/books?id=Hjllcl5deFUC&pg=PT115&lpg=PT115&dq=phosp382
hatidylcholine+against+tuberculosis&source=bl&ots=0JoLR8YpCS&sig=OzipfIV7NY4c383
h0WKTsMs4f8MTeQ&hl=en&sa=X&ved=0ahUKEwiymNK9h4bWAhUDD8AKHVIiDO8384
Q6AEISjAE#v=onepage&q=phosphatidylcholine%20against%20tuberculosis&f=false, 385
2012 (accessed 2 September 2017). 386
[27] Job, C.K., Yoder, L., Jackobson, R.R. & Hastings, R.C, Skin pigmentation from 387
clofazimine therapy in leprosy patients: A reappraisal, J. Am. Acad. Dermatol. 23 (1990) 388
236-241. 389
[28] Smith, M., Accinelli, A., Tejada, F.R. & Kharel, M.K, Chapter 28 – Drugs used in 390
Tuberculosis and leprosy. Side. Effect. Drug. Annual. 38 (2016) 283-293. 391
47
Chapter 5
FINAL CONCLUSION AND FUTURE PROSPECTS
5.1. FINAL CONCLUSION Artemisone, clofazimine and decoquinate were chosen as APIs for this study as part of the
MALTBRedox MRC South African University Flagship Projects, which focus on oxidant-redox
drug combinations for the possible treatment of malaria, tuberculosis and related diseases. These
three APIs were chosen for this study for topical delivery by means of vesicles and effectivity
against tuberculosis.
Cutaneous tuberculosis (CTB) is an uncommon disease, which manifests in only 1.5% of all extra-
pulmonary cases; furthermore, this disease manifests in different forms, impeding diagnosis
(Bravo & Gotuzzo, 2007; Fader et al., 2010; Sankar et al., 2013). Currently, the accepted oral
anti-tuberculous therapy is employed for the treatment of CTB, but the duration of the treatment
is long, resistance to the APIs occurs and patient compliance is unsatisfactory (Das et al., 2014;
Jean et al., 2012; Ramarao et al., 2012). The treatment is not completely effective and with these
unsightly lesions, topical treatment might (concurrently with oral treatment) enhance treatment
outcomes and possibly shorten treatment duration.
For topical delivery of APIs they have to adhere to certain criteria, since the skin has a remarkable
barrier function (Hadgraft, 2001). The optimal partition coefficient (log P) is 1–3, with which only
artemisone (log P 2.49) complies. Decoquinate (log P 7.8) and clofazimine (log P 7.6) are highly
lipophilic APIs, rendering penetration of these APIs into the skin significantly more difficult as
some form of hydrophilicity is necessary for skin permeation (Biamonte et al., 2013; Dunay et al.,
2009; Nagelschmitz et al., 2008; Steyn et al., 2011). For this reason, different vesicle systems
were chosen as delivery vehicles, since they can encapsulate both hydrophilic and lipophilic APIs,
and they mostly create a “depot-effect”, increasing API concentrations at target organs
(Dragicevic-Curic & Maibach, 2015; Jain et al., 2014).
Currently, a variety of vesicles are employed as vehicles for topical delivery. For this study
liposomes, niosomes and transferosomes were selected, and each system contained a final
concentration of 1% API. The influence of API concentration on the vesicles was determined
beforehand by preparing vesicles containing 0.2%, 0.4% and 1% API. The total vesicle
concentration in phosphate buffer solution (10 ml as the aqueous phase) was retained at 5%. As
part of the pre-formulation process, we used isothermal calorimetry in order to determine that
none to minimal incompatibility existed between the APIs and vesicle components.
48
Encapsulation efficacy of the different 1% dispersions for all the vesicles was above 85%. At
0.2% API, the zeta-potentials for the formulations indicated mostly stable formulations, though an
increase in API concentration increased vesicle size and the zeta-potential was below optimal.
Zeta-potential and size distribution indicated complete instability of the vesicles from the 0.4%
API concentration and higher. Thus, vesicles containing 0.6% and 0.8% API were not tested
further. Niosomes were found to be most unstable with increasing vesicle size up to 2 461 nm in
the 1% clofazimine formulation. Transferosomes delivered smaller vesicles (99.3 nm in the 0.2%
combination API formulation) compared to liposomes (167.4 nm). Viscosity and pH were deemed
acceptable for all formulations to ensure even spreadability and no skin irritation.
Skin diffusion studies were conducted on black skin using the 1% combination API dispersions
as well as a dispersion containing no vesicles. For all four of the dispersions tested on skin, no
APIs were present in the receptor fluid (representing human blood) and no artemisone were
present in the epidermis-dermis (ED) or stratum corneum-epidermis (SCE). No APIs present in
the receptor fluid were considered optimal, since the APIs should ideally be concentrated in the
skin for local effectivity against CTB. However, as stated, artemisone was not detected in the
skin and this finding is undesirable. This finding by no means suggests that no artemisone
permeated the skin, it may simply be that the concentration of artemisone that did permeate the
skin was below the minimum level of quantification, and this should be researched further. Tape
stripping data depicted that the average concentrations of the APIs were higher in the SCE than
in the ED. Decoquinate concentrations were higher than clofazimine in the no vesicle, liposome
and niosome formulations, whereas the concentration of clofazimine in the transferosome
formulation was higher than that of decoquinate. The transferosomes also delivered the highest
average API concentrations in the skin.
Fifteen formulations, all containing 1% API, were sent to Stellenbosch University to be studied for
activity against Mycobacterium tuberculosis (strain H37Rv). The empty vesicles presented with
very low percentage inhibition, with the empty transferosomes (42%) displaying the highest
percentage inhibition. Of the single API formulations, clofazimine in niosomes (52%) overall
displayed the highest percentage inhibition. Between the combination API formulations, the
transferosome formulation depicted the lowest (12%) and the liposome formulation the highest
(42%) percentage inhibition. Clofazimine is a documented anti-tuberculous API (Smith et al.,
2016), though artemisone and decoquinate are not. The data showed that artemisone and
decoquinate as APIs alone did have some activity against tuberculosis, though not significant.
Niosomes and transferosomes containing no API demonstrated activity almost as high as pure
clofazimine; this might possibly be explained by their ingredients, which mostly consisted of
cholesterol and phosphatidylcholine (PC). Cholesterol and PC may possibly have some activity
against TB, though according literature PC had no activity (Acton, 2012).
49
This study contributed to new knowledge in pharmaceutics, in that:
Artemisone, clofazimine and decoquinate were successfully encapsulated in liposomes,
niosomes and transferosomes.
The influence of an increase in the APIs’ concentration, as well as the effect of each API
on the physical properties of the vesicles was determined as defined by measurement of
the zeta-potential, size of the vesicles, size distribution, pH and viscosity.
An HPLC method was developed for the concurrent determination of artemisone,
clofazimine and decoquinate.
Decoquinate and clofazimine were successfully delivered into the skin when utilising
liposomes, niosomes and transferosomes as carrier system. When a suspension of APIs
in phosphate buffer solution (no vesicles incorporated) was applied, clofazimine and
decoquinate were detected in the skin.
Results indicated that decoquinate had activity against tuberculosis, an API never before
considered for tuberculosis.
There was no significant increase in efficacy against tuberculosis when combining the
three APIs in a vesicle dispersion, compared to the efficacy when the APIs were separately
incorporated into the vesicles.
Transferosomes and liposomes enhanced the activity of artemisone and decoquinate,
whereas niosomes were found to enhance the activity of clofazimine. Niosomes, however,
drastically decreased the activity of decoquinate.
A combination of the APIs in transferosomes had significantly lower activity against
tuberculosis when compared to the individual APIs in transferosomes, though the blank
transferosomes were found to be most active against tuberculosis.
50
5.2. FUTURE PROSPECTS Future prospects for additional investigations and aspects that need to be considered include:
Efficacy against malaria, leprosy and relevant diseases.
Different vesicles to enhance transdermal delivery.
Different combinations of APIs, or substituting one or two of the APIs for another from the
list of APIs investigated by the MALTBRedox MRC South African University Flagship
Projects for activity against tuberculosis.
Investigating the activity of the components of the vesicles used against tuberculosis.
Exploring whether the 0.2% API formulations (depicting optimal characteristics and better
stability) do have less activity against tuberculosis.
Studying whether the 0.2% API formulations provided lower skin diffusion, since the 1%
API formulation had a considerable amount of excess API that was not encapsulated, and
which formed a sediment on the skin.
51
REFERENCES ACTON, A. 2012. Tuberculosis: New insights for the Healthcare Professional: 2011 Edition.
https://books.google.co.za/books?id=Hjllcl5deFUC&pg=PT115&lpg=PT115&dq=phosphatidylch
oline+against+tuberculosis&source=bl&ots=0JoLR8YpCS&sig=OzipfIV7NY4ch0WKTsMs4f8MT
eQ&hl=en&sa=X&ved=0ahUKEwiymNK9h4bWAhUDD8AKHVIiDO8Q6AEISjAE#v=onepage&q
=phosphatidylcholine%20against%20tuberculosis&f=false Date of access: 2 September 2017.
BIAMONTE, M.A., WANNER, J. & LE ROCH, K.G. 2013. Recent advances in malaria drug
discovery. Bioorganic & medicinal chemistry letters, 23(10):2829-2843.
BRAVO, F.G. & GOTUZZO, E. 2007. Cutaneous tuberculosis. Clinical dermatology, 25(2):173-
180.
DAS, C.K., MAHAPATRA, A., DAS, M.M., SAHOO, D. & CHAYANI, N. 2014. Coexistence of
cutaneous tuberculosis (scrofuloderma) and Hanseniasis: a rare presentation. Journal of clinical
and diagnostic research, 8(2):141-2.
DRAGICEVIC-CURIC, N. & MAIBACH, H.I., eds. 2015. Percutaneous penetration enhancers -
Chemical methods in penetration enhancement: Drug manipulation strategies and vehicle effects.
1st ed. New York: Springer. 341p.
DUNAY, I.R., CHI CHAN, W., HAYNES, R.K. & SIBLEY, L.D. 2009. Artemisone and artemiside
control acute and reactivated toxoplasmosis in a murine model. Journal of antimicrobial agents
and chemotherapy, 53(10):4450-4456.
FADER, T., PARKS, J., KHAN, N.U., MANNING, R., STOKES, S. & NASIR, N.A. 2010.
Extrapulmonary tuberculosis in Kabul, Afghanistan: a hospital-based retrospective review.
International journal of infectious diseases, 14(2):e102-e110.
HADGRAFT, J. 2004. Skin deep. European journal of pharmaceutics and. biopharmaceutics,
58(2):291-299.
JAIN, S., JAIN, V. & MAHAJAN, S.C. 2014. Lipid based vesicular drug delivery systems.
Advances in pharmaceutics, 2014:1-12.
JEAN, M., MASSE, V., CARLIER, R., PERRONNE, C. & CRÉMIEUX, A.C. 2012. Isolated
subcutaneous tuberculous abscesses of the lumbar wall. Journal of travel medicine, 19(5):329-
330.
NAGELSCHMITZ, J., VOITH, B., WENSING, G., ROEMER, A., FUGMANN, B., HAYNES, R.K.,
KOTECKA, B.M., RIECKMANN, K.H. & EDSTEIN, M.D. 2008. First assessment in humans of
52
the safety, tolerability, pharmacokinetics, and ex vivo pharmacodynamics antimalarial activity of
the new artemisinin derivative artemisone. Antimicrobial agents and chemotherapy, 52(9):3085-
3091.
RAMARAO, S., GREENE, J.N., CASANAS, B.C., CARRINGTON, M.L., RICE, J. & KASS, J.
2012. Cutaneous manifestations of tuberculosis. Infectious diseases in clinical practice,
20(6):376-383.
SANKAR, M.M., SINGH, J., DIANA, S.C.A. & SINGH, S. 2013. Molecular characterization of
Mycobacteium tuberculosis isolates from Indian patients with extrapulmonary tuberculosis.
Tuberculosis, 93:75-83.
SMITH, M., ACCINELLI, A., TEJADA, F.R. & KHAREL, M.K. 2016. Chapter 28 – Drugs used in
Tuberculosis and leprosy. Side effects of drugs annual, 38:283-293.
STEYN, J.D., WIESNER, L., DU PLESSIS, L.H., GROBLER, A.F., SMITH, P.J., CHAN, W.C.,
HAYNES, R.K. & KOTZÉ, A.F. 2011. Absorption of the novel artemisinin derivatives artemisone
and artemiside: potential application of Pheroid™ technology. International journal of
pharmaceutics, 414(1-2):260-266.
53
Annexure A
ANALYTICAL METHOD VALIDATION FOR THE
CONCURRENT DETERMINATION OF DECOQUINATE,
ARTEMISONE AND CLOFAZIMINE BY MEANS OF
HPLC
A.1. INTRODUCTION Analytical method validation is an important on-going, regulatory requirement in pharmaceutical
analysis. It provides documented, objective evidence which verifies that a method being used is
adequate in measuring a performance parameter (BPCC, 2001; ICH, 2005; Shabir, 2004; Singh,
2013). The validation of a method is the process by which it is tested for accuracy, reliability,
reproducibility, specificity, sensitivity and preciseness for its intended purpose (Ermer & Miller,
2005; McPolin, 2009; CGMP, 2011). Validation also establishes the performance limits of the
measurement of a parameter; data is validated according to specific guidelines, though these are
only recommendations (CGMP, 2011; Singh, 2013).
The scope and relevancy of an analytical method should be defined before the validation process
is started. There are a few different types of validation, though only the most significant ones will
be discussed in this annexure (Singh, 2013).
A.2. HIGH PERFORMANCE LIQUID CHROMATOGRAPHY METHOD VALIDATION FOR DECOQUINATE, ARTEMI-SONE AND CLOFAZIMINE
A.2.1. CHROMATOGRAPHIC CONDITIONS
Analytical instrument: The analysis of artemisone, decoquinate and clofazimine was
performed using an Agilent® 1100 Series HPLC system in a controlled
environment (25°C). The instrument consisted of an Agilent® 1100
pump, diode array detector, autosampler injection mechanism and
Chemstation Rev. A.10.02 software for data acquisition and analysis
(Agilent Technologies, Palo Alto, CA).
Column: A Restek Ultra C18 fully endcapped reversed phase column with a 5 μm
particle size; 250 x 4.60 mm was used (Restek corporation, Bellefonte,
US).
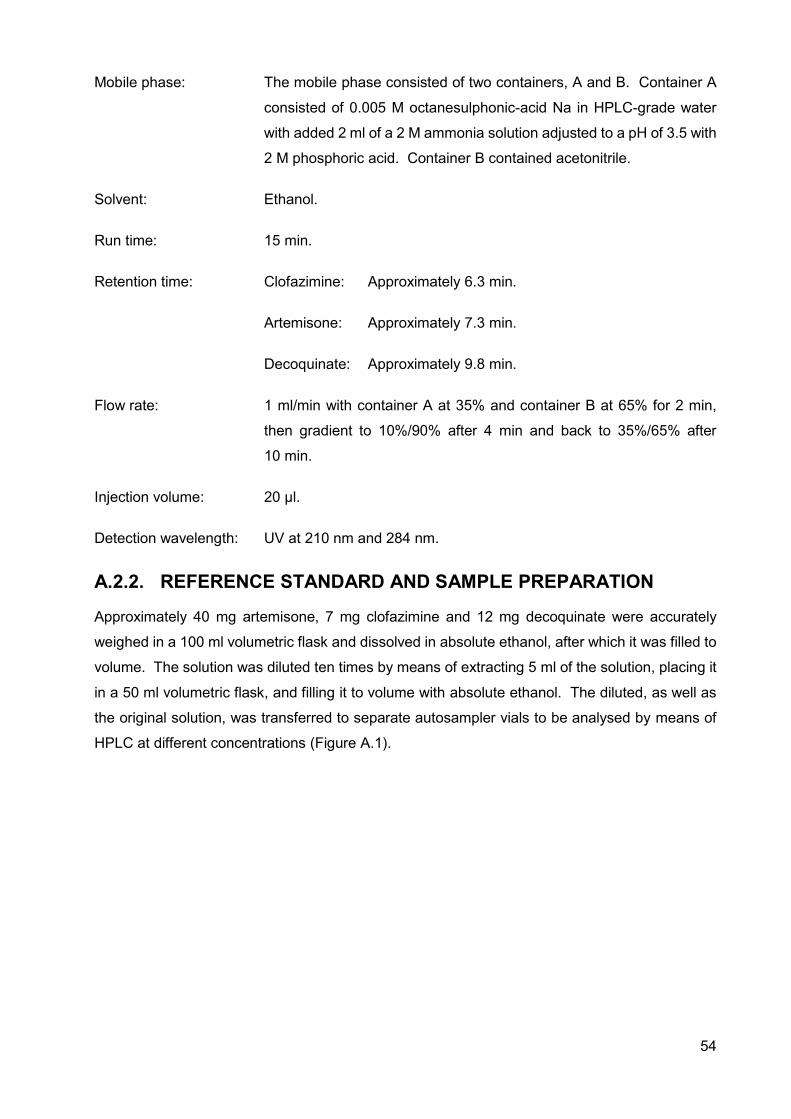
54
Mobile phase: The mobile phase consisted of two containers, A and B. Container A
consisted of 0.005 M octanesulphonic-acid Na in HPLC-grade water
with added 2 ml of a 2 M ammonia solution adjusted to a pH of 3.5 with
2 M phosphoric acid. Container B contained acetonitrile.
Solvent: Ethanol.
Run time: 15 min.
Retention time: Clofazimine: Approximately 6.3 min.
Artemisone: Approximately 7.3 min.
Decoquinate: Approximately 9.8 min.
Flow rate: 1 ml/min with container A at 35% and container B at 65% for 2 min,
then gradient to 10%/90% after 4 min and back to 35%/65% after
10 min.
Injection volume: 20 µl.
Detection wavelength: UV at 210 nm and 284 nm.
A.2.2. REFERENCE STANDARD AND SAMPLE PREPARATION
Approximately 40 mg artemisone, 7 mg clofazimine and 12 mg decoquinate were accurately
weighed in a 100 ml volumetric flask and dissolved in absolute ethanol, after which it was filled to
volume. The solution was diluted ten times by means of extracting 5 ml of the solution, placing it
in a 50 ml volumetric flask, and filling it to volume with absolute ethanol. The diluted, as well as
the original solution, was transferred to separate autosampler vials to be analysed by means of
HPLC at different concentrations (Figure A.1).
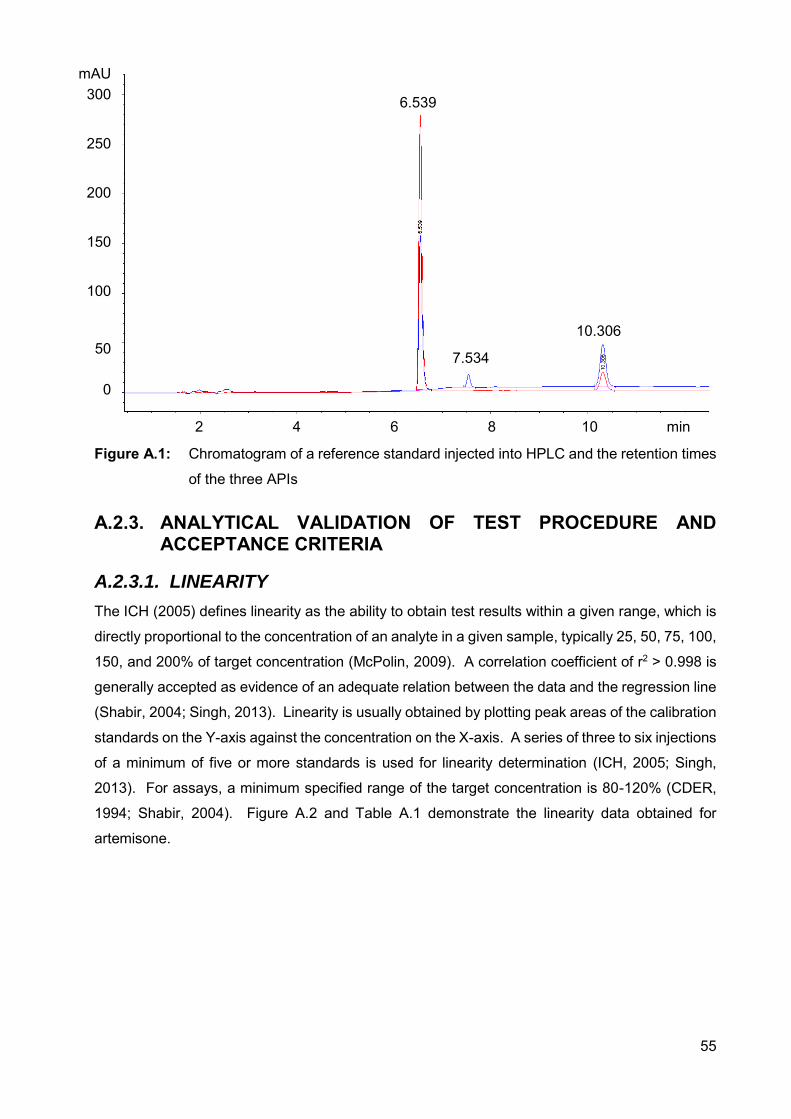
55
Figure A.1: Chromatogram of a reference standard injected into HPLC and the retention times
of the three APIs
A.2.3. ANALYTICAL VALIDATION OF TEST PROCEDURE AND ACCEPTANCE CRITERIA
A.2.3.1. LINEARITY
The ICH (2005) defines linearity as the ability to obtain test results within a given range, which is
directly proportional to the concentration of an analyte in a given sample, typically 25, 50, 75, 100,
150, and 200% of target concentration (McPolin, 2009). A correlation coefficient of r2 > 0.998 is
generally accepted as evidence of an adequate relation between the data and the regression line
(Shabir, 2004; Singh, 2013). Linearity is usually obtained by plotting peak areas of the calibration
standards on the Y-axis against the concentration on the X-axis. A series of three to six injections
of a minimum of five or more standards is used for linearity determination (ICH, 2005; Singh,
2013). For assays, a minimum specified range of the target concentration is 80-120% (CDER,
1994; Shabir, 2004). Figure A.2 and Table A.1 demonstrate the linearity data obtained for
artemisone.
mAU 300
250
200
150
100
50
0
2 4 6 8 10 min
6.539
7.534
10.306
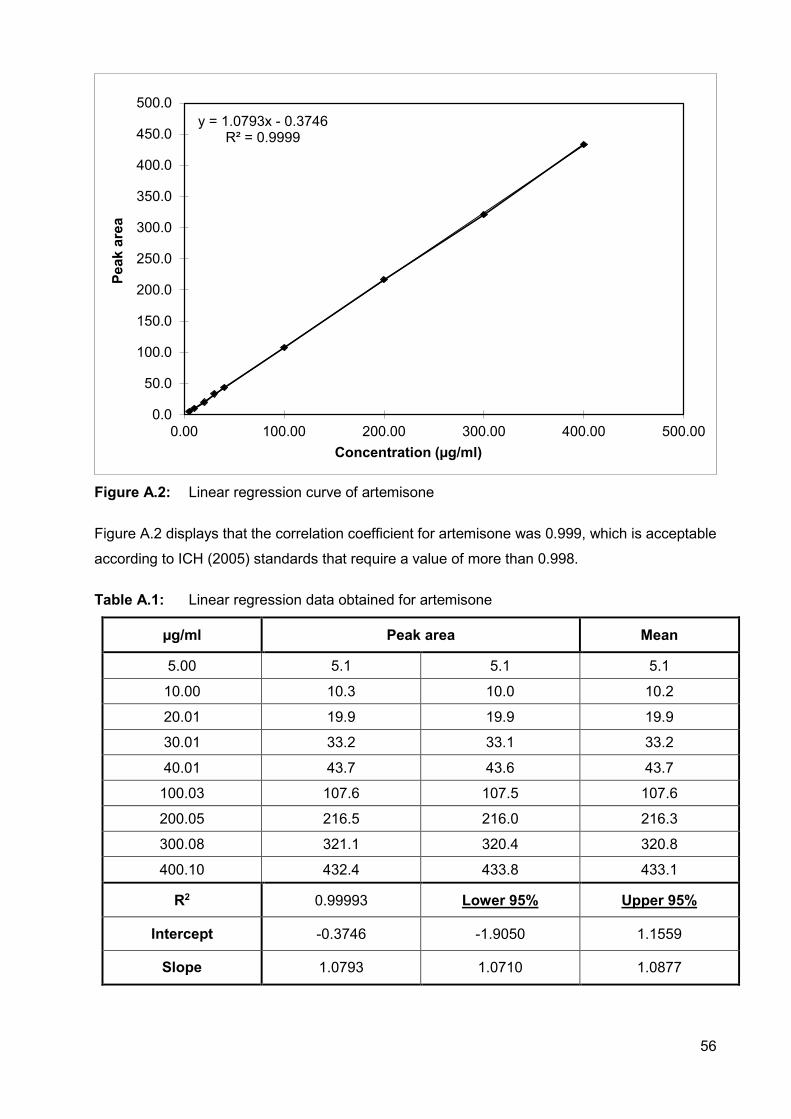
56
Figure A.2: Linear regression curve of artemisone
Figure A.2 displays that the correlation coefficient for artemisone was 0.999, which is acceptable
according to ICH (2005) standards that require a value of more than 0.998.
Table A.1: Linear regression data obtained for artemisone
µg/ml Peak area Mean
5.00 5.1 5.1 5.1
10.00 10.3 10.0 10.2
20.01 19.9 19.9 19.9
30.01 33.2 33.1 33.2
40.01 43.7 43.6 43.7
100.03 107.6 107.5 107.6
200.05 216.5 216.0 216.3
300.08 321.1 320.4 320.8
400.10 432.4 433.8 433.1
R2 0.99993 Lower 95% Upper 95%
Intercept -0.3746 -1.9050 1.1559
Slope 1.0793 1.0710 1.0877
y = 1.0793x - 0.3746R² = 0.9999
0.0
50.0
100.0
150.0
200.0
250.0
300.0
350.0
400.0
450.0
500.0
0.00 100.00 200.00 300.00 400.00 500.00
Peak
are
a
Concentration (µg/ml)
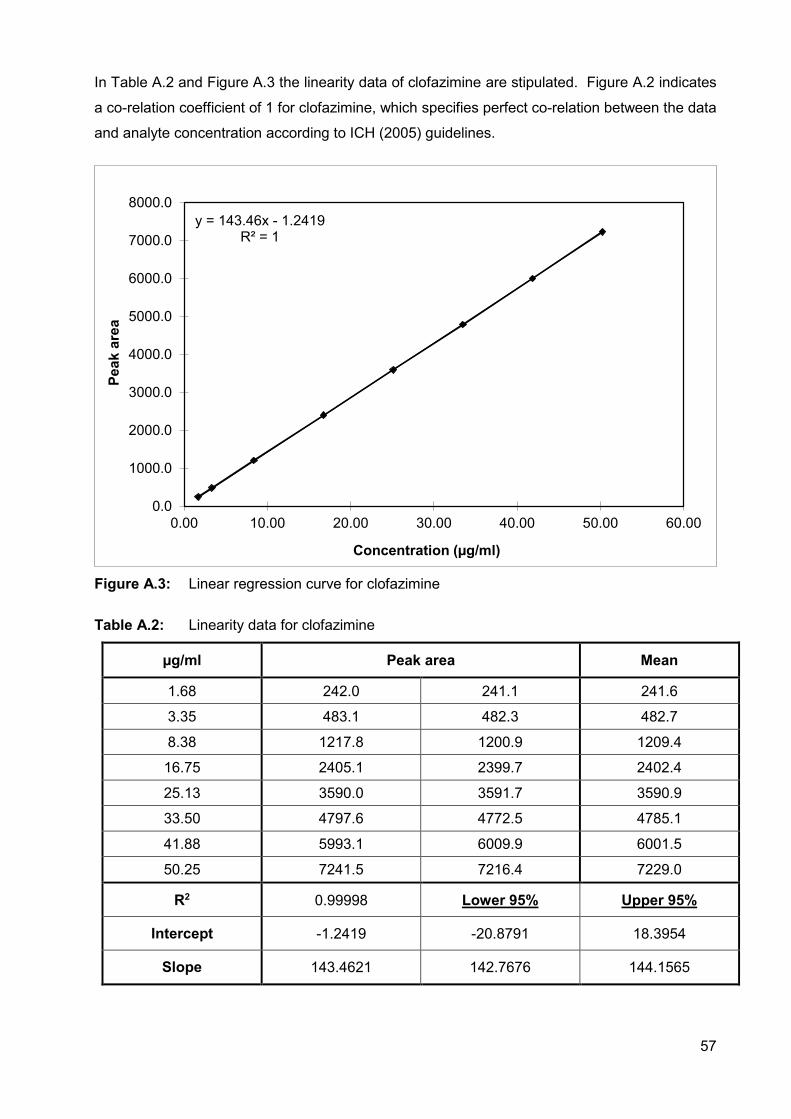
57
In Table A.2 and Figure A.3 the linearity data of clofazimine are stipulated. Figure A.2 indicates
a co-relation coefficient of 1 for clofazimine, which specifies perfect co-relation between the data
and analyte concentration according to ICH (2005) guidelines.
Figure A.3: Linear regression curve for clofazimine
Table A.2: Linearity data for clofazimine
µg/ml Peak area Mean
1.68 242.0 241.1 241.6
3.35 483.1 482.3 482.7
8.38 1217.8 1200.9 1209.4
16.75 2405.1 2399.7 2402.4
25.13 3590.0 3591.7 3590.9
33.50 4797.6 4772.5 4785.1
41.88 5993.1 6009.9 6001.5
50.25 7241.5 7216.4 7229.0
R2 0.99998 Lower 95% Upper 95%
Intercept -1.2419 -20.8791 18.3954
Slope 143.4621 142.7676 144.1565
y = 143.46x - 1.2419R² = 1
0.0
1000.0
2000.0
3000.0
4000.0
5000.0
6000.0
7000.0
8000.0
0.00 10.00 20.00 30.00 40.00 50.00 60.00
Peak
are
a
Concentration (µg/ml)
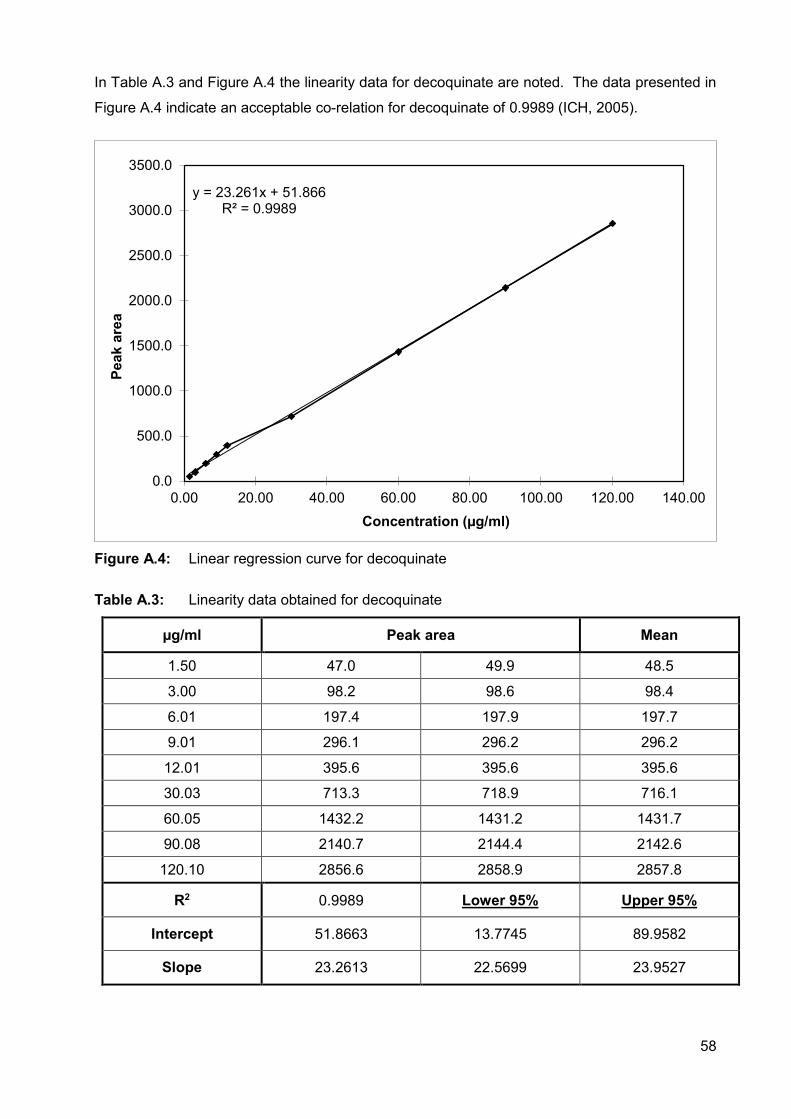
58
In Table A.3 and Figure A.4 the linearity data for decoquinate are noted. The data presented in
Figure A.4 indicate an acceptable co-relation for decoquinate of 0.9989 (ICH, 2005).
Figure A.4: Linear regression curve for decoquinate
Table A.3: Linearity data obtained for decoquinate
µg/ml Peak area Mean
1.50 47.0 49.9 48.5
3.00 98.2 98.6 98.4
6.01 197.4 197.9 197.7
9.01 296.1 296.2 296.2
12.01 395.6 395.6 395.6
30.03 713.3 718.9 716.1
60.05 1432.2 1431.2 1431.7
90.08 2140.7 2144.4 2142.6
120.10 2856.6 2858.9 2857.8
R2 0.9989 Lower 95% Upper 95%
Intercept 51.8663 13.7745 89.9582
Slope 23.2613 22.5699 23.9527
y = 23.261x + 51.866R² = 0.9989
0.0
500.0
1000.0
1500.0
2000.0
2500.0
3000.0
3500.0
0.00 20.00 40.00 60.00 80.00 100.00 120.00 140.00
Peak
are
a
Concentration (µg/ml)
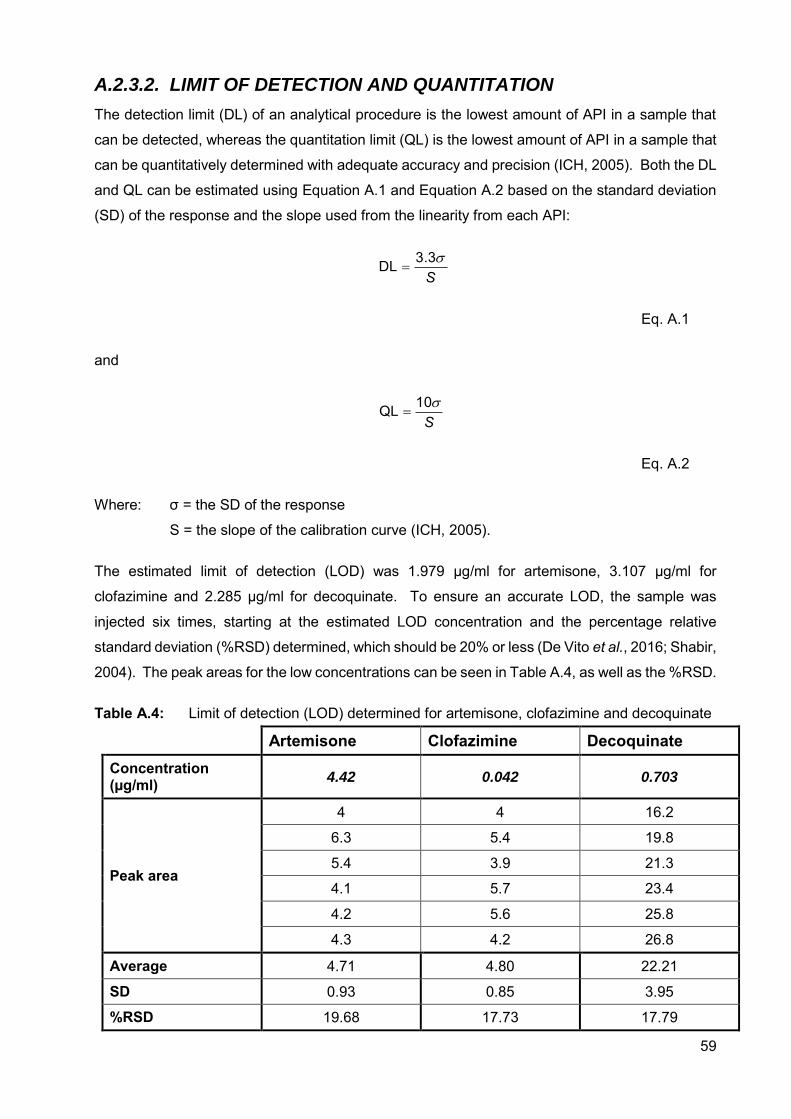
59
A.2.3.2. LIMIT OF DETECTION AND QUANTITATION
The detection limit (DL) of an analytical procedure is the lowest amount of API in a sample that
can be detected, whereas the quantitation limit (QL) is the lowest amount of API in a sample that
can be quantitatively determined with adequate accuracy and precision (ICH, 2005). Both the DL
and QL can be estimated using Equation A.1 and Equation A.2 based on the standard deviation
(SD) of the response and the slope used from the linearity from each API:
S3.3DL
Eq. A.1
and
S10QL
Eq. A.2
Where: σ = the SD of the response
S = the slope of the calibration curve (ICH, 2005).
The estimated limit of detection (LOD) was 1.979 µg/ml for artemisone, 3.107 µg/ml for
clofazimine and 2.285 µg/ml for decoquinate. To ensure an accurate LOD, the sample was
injected six times, starting at the estimated LOD concentration and the percentage relative
standard deviation (%RSD) determined, which should be 20% or less (De Vito et al., 2016; Shabir,
2004). The peak areas for the low concentrations can be seen in Table A.4, as well as the %RSD.
Table A.4: Limit of detection (LOD) determined for artemisone, clofazimine and decoquinate
Artemisone Clofazimine Decoquinate Concentration (µg/ml) 4.42 0.042 0.703
Peak area
4 4 16.2
6.3 5.4 19.8
5.4 3.9 21.3
4.1 5.7 23.4
4.2 5.6 25.8
4.3 4.2 26.8
Average 4.71 4.80 22.21
SD 0.93 0.85 3.95
%RSD 19.68 17.73 17.79
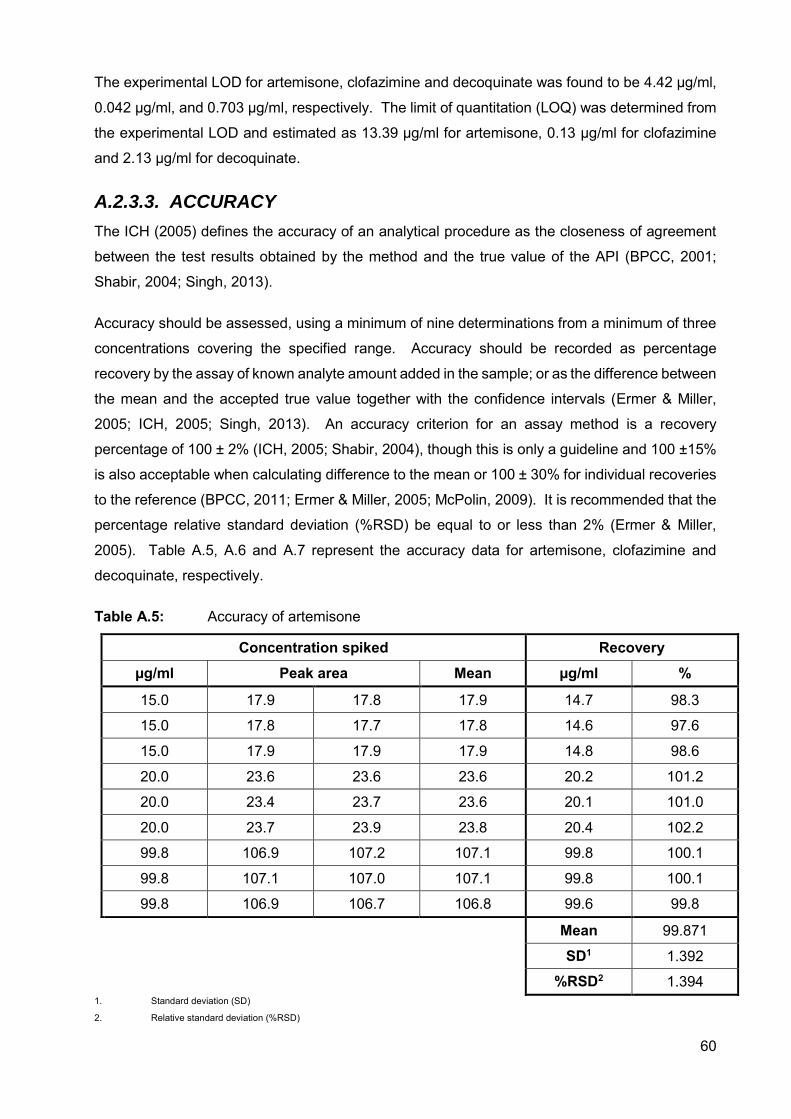
60
The experimental LOD for artemisone, clofazimine and decoquinate was found to be 4.42 µg/ml,
0.042 µg/ml, and 0.703 µg/ml, respectively. The limit of quantitation (LOQ) was determined from
the experimental LOD and estimated as 13.39 µg/ml for artemisone, 0.13 µg/ml for clofazimine
and 2.13 µg/ml for decoquinate.
A.2.3.3. ACCURACY
The ICH (2005) defines the accuracy of an analytical procedure as the closeness of agreement
between the test results obtained by the method and the true value of the API (BPCC, 2001;
Shabir, 2004; Singh, 2013).
Accuracy should be assessed, using a minimum of nine determinations from a minimum of three
concentrations covering the specified range. Accuracy should be recorded as percentage
recovery by the assay of known analyte amount added in the sample; or as the difference between
the mean and the accepted true value together with the confidence intervals (Ermer & Miller,
2005; ICH, 2005; Singh, 2013). An accuracy criterion for an assay method is a recovery
percentage of 100 ± 2% (ICH, 2005; Shabir, 2004), though this is only a guideline and 100 ±15%
is also acceptable when calculating difference to the mean or 100 ± 30% for individual recoveries
to the reference (BPCC, 2011; Ermer & Miller, 2005; McPolin, 2009). It is recommended that the
percentage relative standard deviation (%RSD) be equal to or less than 2% (Ermer & Miller,
2005). Table A.5, A.6 and A.7 represent the accuracy data for artemisone, clofazimine and
decoquinate, respectively.
Table A.5: Accuracy of artemisone
Concentration spiked Recovery µg/ml Peak area Mean µg/ml %
15.0 17.9 17.8 17.9 14.7 98.3
15.0 17.8 17.7 17.8 14.6 97.6
15.0 17.9 17.9 17.9 14.8 98.6
20.0 23.6 23.6 23.6 20.2 101.2
20.0 23.4 23.7 23.6 20.1 101.0
20.0 23.7 23.9 23.8 20.4 102.2
99.8 106.9 107.2 107.1 99.8 100.1
99.8 107.1 107.0 107.1 99.8 100.1
99.8 106.9 106.7 106.8 99.6 99.8
Mean 99.871
SD1 1.392
%RSD2 1.394 1. Standard deviation (SD)
2. Relative standard deviation (%RSD)
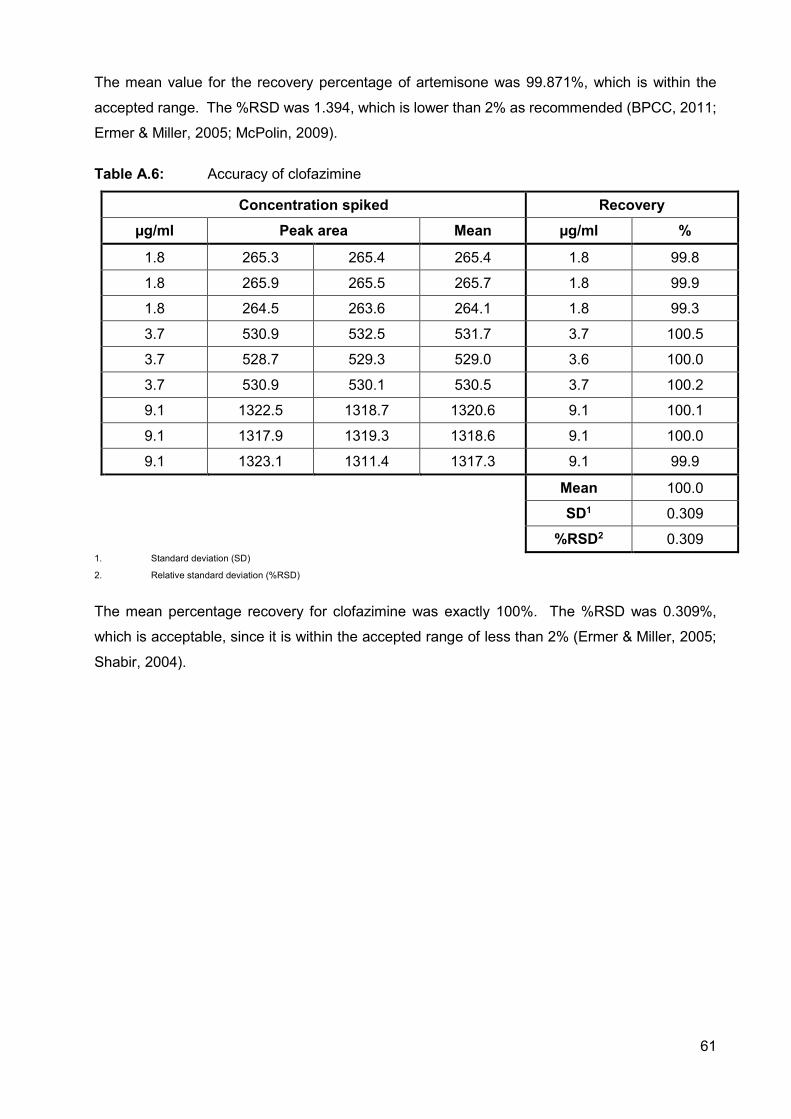
61
The mean value for the recovery percentage of artemisone was 99.871%, which is within the
accepted range. The %RSD was 1.394, which is lower than 2% as recommended (BPCC, 2011;
Ermer & Miller, 2005; McPolin, 2009).
Table A.6: Accuracy of clofazimine
Concentration spiked Recovery µg/ml Peak area Mean µg/ml %
1.8 265.3 265.4 265.4 1.8 99.8
1.8 265.9 265.5 265.7 1.8 99.9
1.8 264.5 263.6 264.1 1.8 99.3
3.7 530.9 532.5 531.7 3.7 100.5
3.7 528.7 529.3 529.0 3.6 100.0
3.7 530.9 530.1 530.5 3.7 100.2
9.1 1322.5 1318.7 1320.6 9.1 100.1
9.1 1317.9 1319.3 1318.6 9.1 100.0
9.1 1323.1 1311.4 1317.3 9.1 99.9
Mean 100.0
SD1 0.309
%RSD2 0.309 1. Standard deviation (SD)
2. Relative standard deviation (%RSD)
The mean percentage recovery for clofazimine was exactly 100%. The %RSD was 0.309%,
which is acceptable, since it is within the accepted range of less than 2% (Ermer & Miller, 2005;
Shabir, 2004).
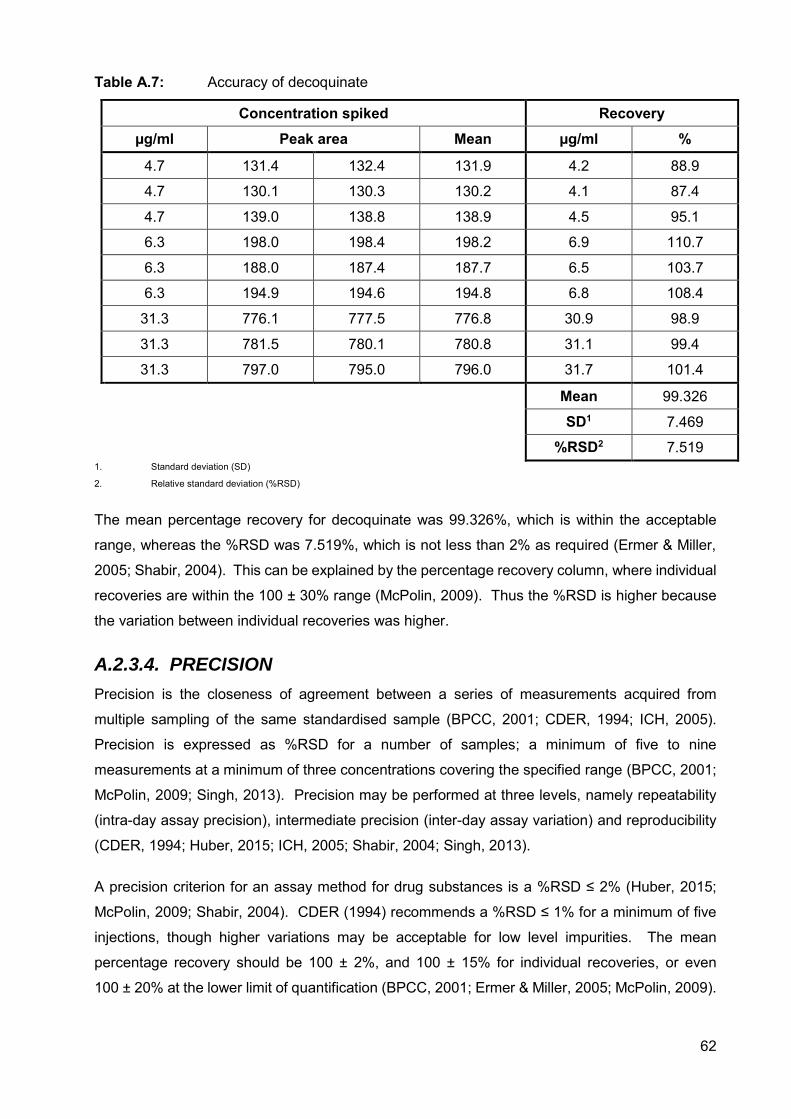
62
Table A.7: Accuracy of decoquinate
Concentration spiked Recovery µg/ml Peak area Mean µg/ml %
4.7 131.4 132.4 131.9 4.2 88.9
4.7 130.1 130.3 130.2 4.1 87.4
4.7 139.0 138.8 138.9 4.5 95.1
6.3 198.0 198.4 198.2 6.9 110.7
6.3 188.0 187.4 187.7 6.5 103.7
6.3 194.9 194.6 194.8 6.8 108.4
31.3 776.1 777.5 776.8 30.9 98.9
31.3 781.5 780.1 780.8 31.1 99.4
31.3 797.0 795.0 796.0 31.7 101.4
Mean 99.326
SD1 7.469
%RSD2 7.519 1. Standard deviation (SD)
2. Relative standard deviation (%RSD)
The mean percentage recovery for decoquinate was 99.326%, which is within the acceptable
range, whereas the %RSD was 7.519%, which is not less than 2% as required (Ermer & Miller,
2005; Shabir, 2004). This can be explained by the percentage recovery column, where individual
recoveries are within the 100 ± 30% range (McPolin, 2009). Thus the %RSD is higher because
the variation between individual recoveries was higher.
A.2.3.4. PRECISION
Precision is the closeness of agreement between a series of measurements acquired from
multiple sampling of the same standardised sample (BPCC, 2001; CDER, 1994; ICH, 2005).
Precision is expressed as %RSD for a number of samples; a minimum of five to nine
measurements at a minimum of three concentrations covering the specified range (BPCC, 2001;
McPolin, 2009; Singh, 2013). Precision may be performed at three levels, namely repeatability
(intra-day assay precision), intermediate precision (inter-day assay variation) and reproducibility
(CDER, 1994; Huber, 2015; ICH, 2005; Shabir, 2004; Singh, 2013).
A precision criterion for an assay method for drug substances is a %RSD ≤ 2% (Huber, 2015;
McPolin, 2009; Shabir, 2004). CDER (1994) recommends a %RSD ≤ 1% for a minimum of five
injections, though higher variations may be acceptable for low level impurities. The mean
percentage recovery should be 100 ± 2%, and 100 ± 15% for individual recoveries, or even
100 ± 20% at the lower limit of quantification (BPCC, 2001; Ermer & Miller, 2005; McPolin, 2009).
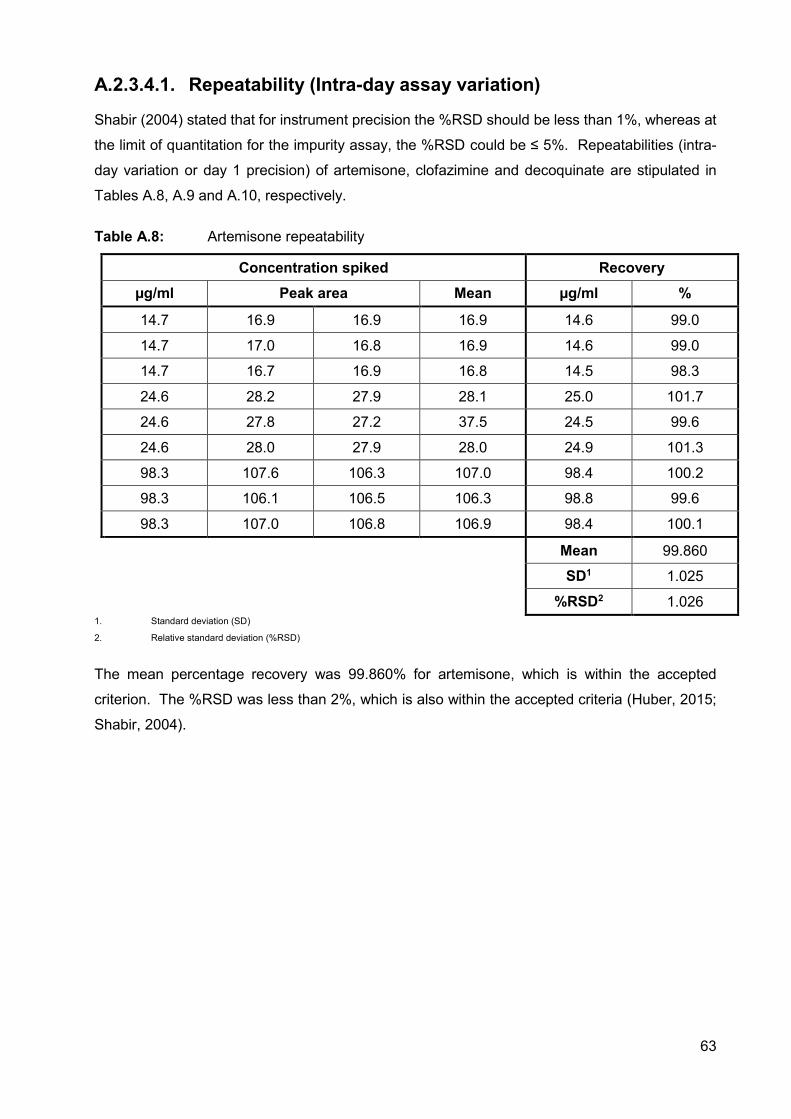
63
A.2.3.4.1. Repeatability (Intra-day assay variation)
Shabir (2004) stated that for instrument precision the %RSD should be less than 1%, whereas at
the limit of quantitation for the impurity assay, the %RSD could be ≤ 5%. Repeatabilities (intra-
day variation or day 1 precision) of artemisone, clofazimine and decoquinate are stipulated in
Tables A.8, A.9 and A.10, respectively.
Table A.8: Artemisone repeatability
Concentration spiked Recovery µg/ml Peak area Mean µg/ml %
14.7 16.9 16.9 16.9 14.6 99.0
14.7 17.0 16.8 16.9 14.6 99.0
14.7 16.7 16.9 16.8 14.5 98.3
24.6 28.2 27.9 28.1 25.0 101.7
24.6 27.8 27.2 37.5 24.5 99.6
24.6 28.0 27.9 28.0 24.9 101.3
98.3 107.6 106.3 107.0 98.4 100.2
98.3 106.1 106.5 106.3 98.8 99.6
98.3 107.0 106.8 106.9 98.4 100.1
Mean 99.860
SD1 1.025
%RSD2 1.026 1. Standard deviation (SD)
2. Relative standard deviation (%RSD)
The mean percentage recovery was 99.860% for artemisone, which is within the accepted
criterion. The %RSD was less than 2%, which is also within the accepted criteria (Huber, 2015;
Shabir, 2004).
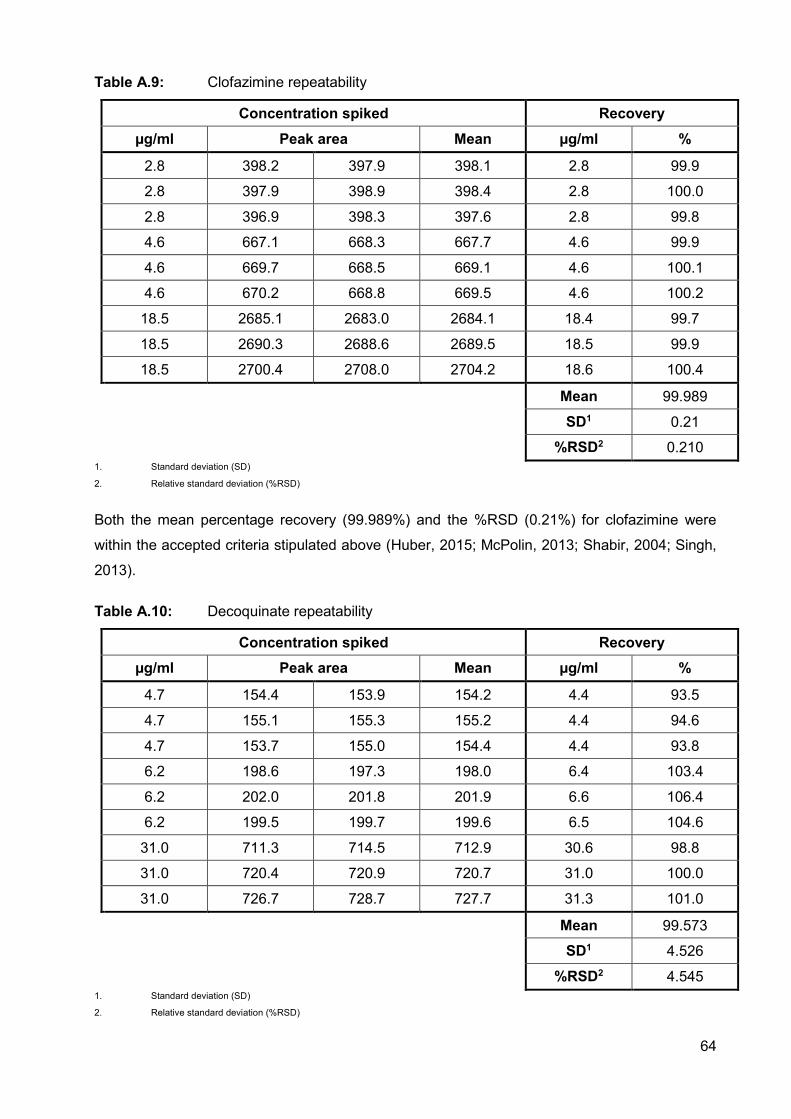
64
Table A.9: Clofazimine repeatability
Concentration spiked Recovery µg/ml Peak area Mean µg/ml %
2.8 398.2 397.9 398.1 2.8 99.9
2.8 397.9 398.9 398.4 2.8 100.0
2.8 396.9 398.3 397.6 2.8 99.8
4.6 667.1 668.3 667.7 4.6 99.9
4.6 669.7 668.5 669.1 4.6 100.1
4.6 670.2 668.8 669.5 4.6 100.2
18.5 2685.1 2683.0 2684.1 18.4 99.7
18.5 2690.3 2688.6 2689.5 18.5 99.9
18.5 2700.4 2708.0 2704.2 18.6 100.4
Mean 99.989
SD1 0.21
%RSD2 0.210 1. Standard deviation (SD)
2. Relative standard deviation (%RSD)
Both the mean percentage recovery (99.989%) and the %RSD (0.21%) for clofazimine were
within the accepted criteria stipulated above (Huber, 2015; McPolin, 2013; Shabir, 2004; Singh,
2013).
Table A.10: Decoquinate repeatability
Concentration spiked Recovery µg/ml Peak area Mean µg/ml %
4.7 154.4 153.9 154.2 4.4 93.5
4.7 155.1 155.3 155.2 4.4 94.6
4.7 153.7 155.0 154.4 4.4 93.8
6.2 198.6 197.3 198.0 6.4 103.4
6.2 202.0 201.8 201.9 6.6 106.4
6.2 199.5 199.7 199.6 6.5 104.6
31.0 711.3 714.5 712.9 30.6 98.8
31.0 720.4 720.9 720.7 31.0 100.0
31.0 726.7 728.7 727.7 31.3 101.0
Mean 99.573
SD1 4.526
%RSD2 4.545 1. Standard deviation (SD)
2. Relative standard deviation (%RSD)
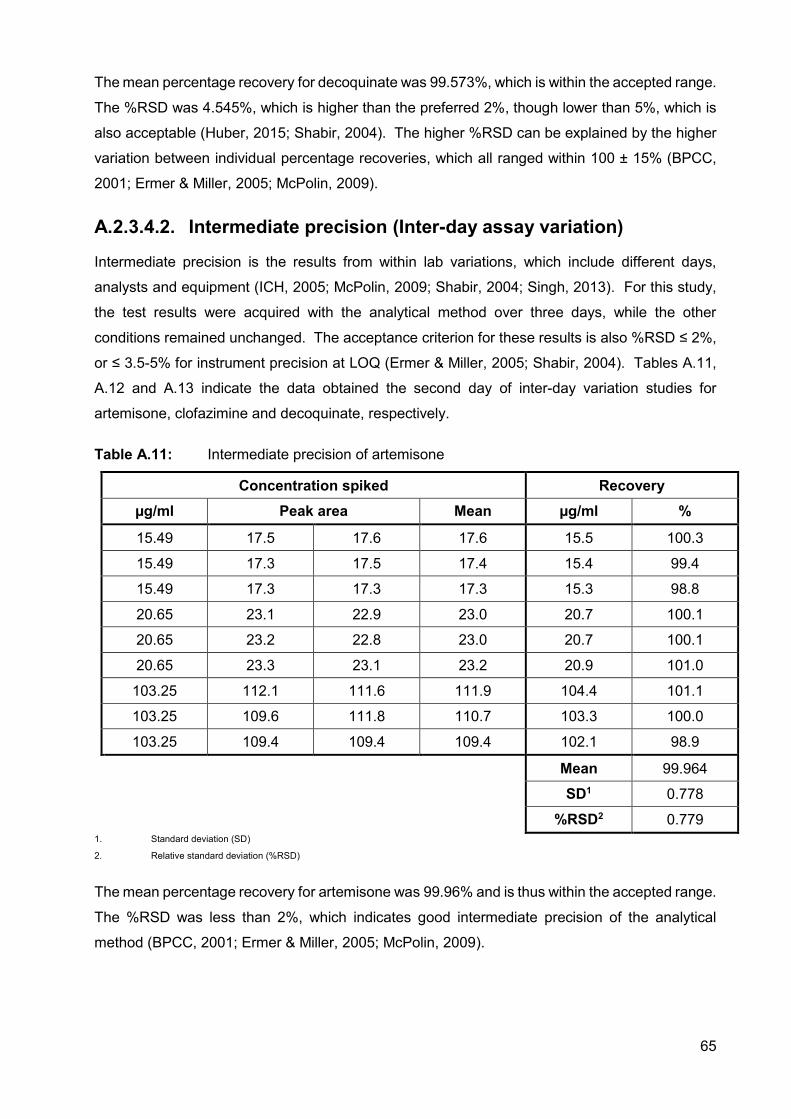
65
The mean percentage recovery for decoquinate was 99.573%, which is within the accepted range.
The %RSD was 4.545%, which is higher than the preferred 2%, though lower than 5%, which is
also acceptable (Huber, 2015; Shabir, 2004). The higher %RSD can be explained by the higher
variation between individual percentage recoveries, which all ranged within 100 ± 15% (BPCC,
2001; Ermer & Miller, 2005; McPolin, 2009).
A.2.3.4.2. Intermediate precision (Inter-day assay variation)
Intermediate precision is the results from within lab variations, which include different days,
analysts and equipment (ICH, 2005; McPolin, 2009; Shabir, 2004; Singh, 2013). For this study,
the test results were acquired with the analytical method over three days, while the other
conditions remained unchanged. The acceptance criterion for these results is also %RSD ≤ 2%,
or ≤ 3.5-5% for instrument precision at LOQ (Ermer & Miller, 2005; Shabir, 2004). Tables A.11,
A.12 and A.13 indicate the data obtained the second day of inter-day variation studies for
artemisone, clofazimine and decoquinate, respectively.
Table A.11: Intermediate precision of artemisone
Concentration spiked Recovery µg/ml Peak area Mean µg/ml %
15.49 17.5 17.6 17.6 15.5 100.3
15.49 17.3 17.5 17.4 15.4 99.4
15.49 17.3 17.3 17.3 15.3 98.8
20.65 23.1 22.9 23.0 20.7 100.1
20.65 23.2 22.8 23.0 20.7 100.1
20.65 23.3 23.1 23.2 20.9 101.0
103.25 112.1 111.6 111.9 104.4 101.1
103.25 109.6 111.8 110.7 103.3 100.0
103.25 109.4 109.4 109.4 102.1 98.9
Mean 99.964
SD1 0.778
%RSD2 0.779 1. Standard deviation (SD)
2. Relative standard deviation (%RSD)
The mean percentage recovery for artemisone was 99.96% and is thus within the accepted range.
The %RSD was less than 2%, which indicates good intermediate precision of the analytical
method (BPCC, 2001; Ermer & Miller, 2005; McPolin, 2009).
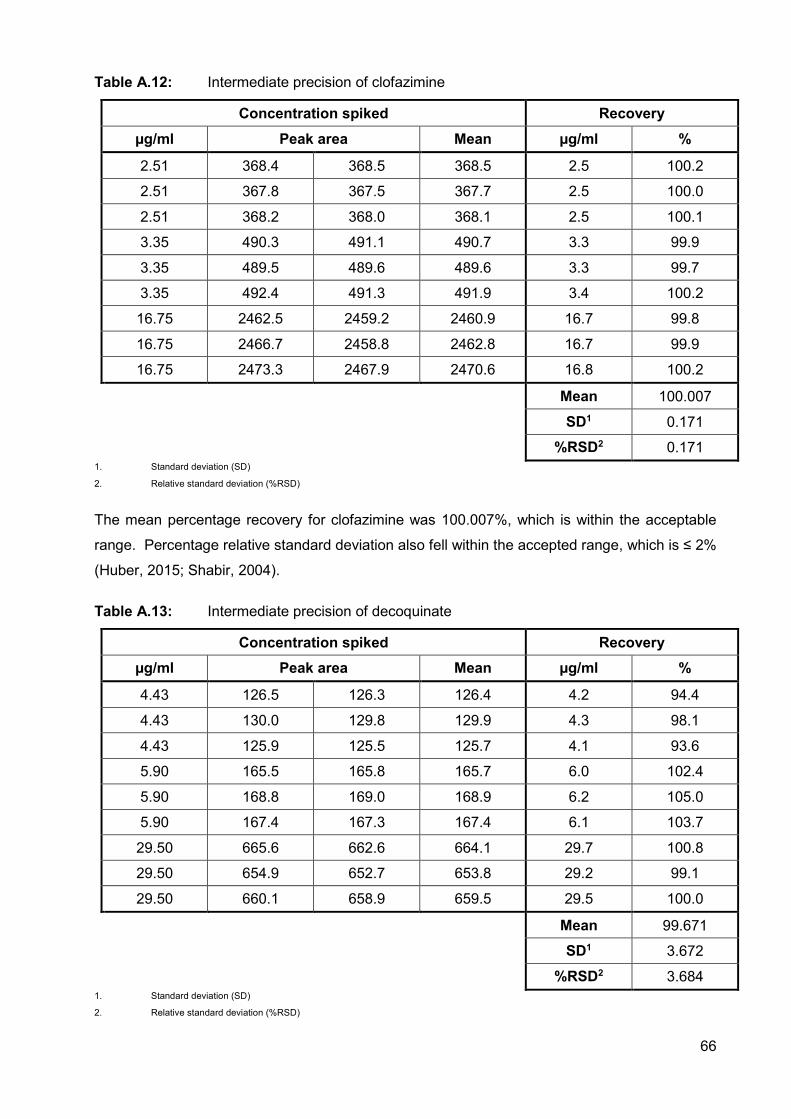
66
Table A.12: Intermediate precision of clofazimine
Concentration spiked Recovery µg/ml Peak area Mean µg/ml %
2.51 368.4 368.5 368.5 2.5 100.2
2.51 367.8 367.5 367.7 2.5 100.0
2.51 368.2 368.0 368.1 2.5 100.1
3.35 490.3 491.1 490.7 3.3 99.9
3.35 489.5 489.6 489.6 3.3 99.7
3.35 492.4 491.3 491.9 3.4 100.2
16.75 2462.5 2459.2 2460.9 16.7 99.8
16.75 2466.7 2458.8 2462.8 16.7 99.9
16.75 2473.3 2467.9 2470.6 16.8 100.2
Mean 100.007
SD1 0.171
%RSD2 0.171 1. Standard deviation (SD)
2. Relative standard deviation (%RSD)
The mean percentage recovery for clofazimine was 100.007%, which is within the acceptable
range. Percentage relative standard deviation also fell within the accepted range, which is ≤ 2%
(Huber, 2015; Shabir, 2004).
Table A.13: Intermediate precision of decoquinate
Concentration spiked Recovery µg/ml Peak area Mean µg/ml %
4.43 126.5 126.3 126.4 4.2 94.4
4.43 130.0 129.8 129.9 4.3 98.1
4.43 125.9 125.5 125.7 4.1 93.6
5.90 165.5 165.8 165.7 6.0 102.4
5.90 168.8 169.0 168.9 6.2 105.0
5.90 167.4 167.3 167.4 6.1 103.7
29.50 665.6 662.6 664.1 29.7 100.8
29.50 654.9 652.7 653.8 29.2 99.1
29.50 660.1 658.9 659.5 29.5 100.0
Mean 99.671
SD1 3.672
%RSD2 3.684 1. Standard deviation (SD)
2. Relative standard deviation (%RSD)
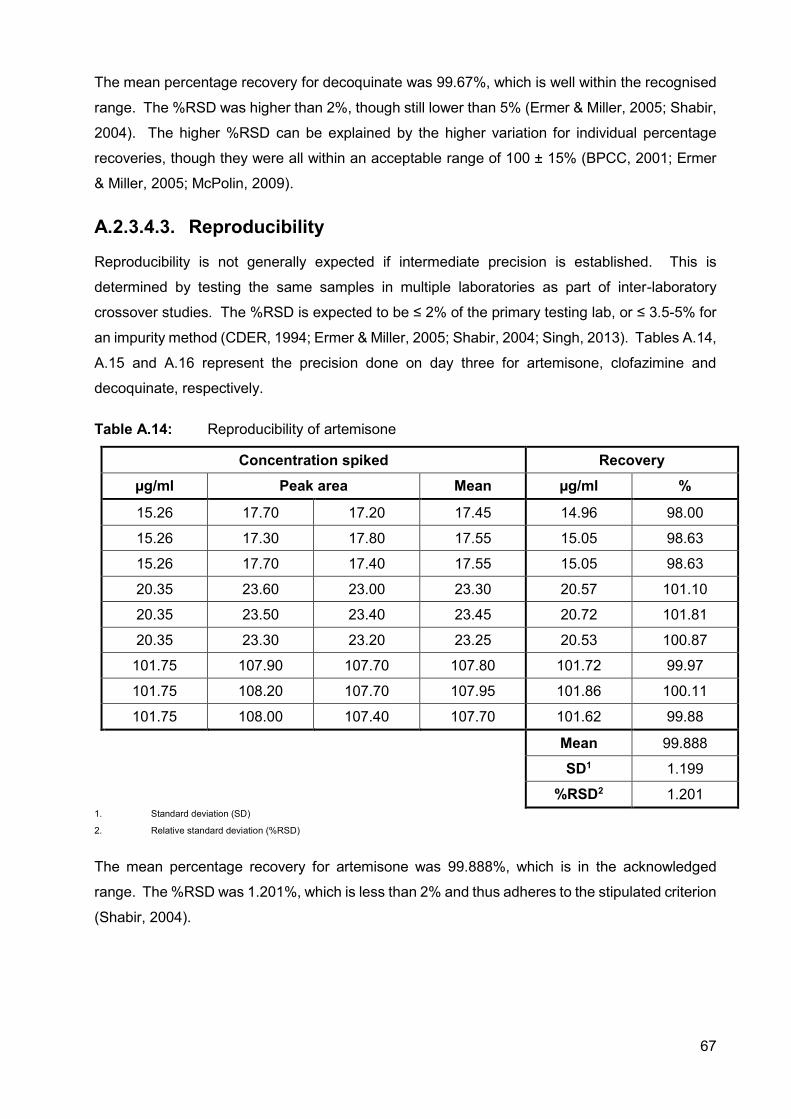
67
The mean percentage recovery for decoquinate was 99.67%, which is well within the recognised
range. The %RSD was higher than 2%, though still lower than 5% (Ermer & Miller, 2005; Shabir,
2004). The higher %RSD can be explained by the higher variation for individual percentage
recoveries, though they were all within an acceptable range of 100 ± 15% (BPCC, 2001; Ermer
& Miller, 2005; McPolin, 2009).
A.2.3.4.3. Reproducibility
Reproducibility is not generally expected if intermediate precision is established. This is
determined by testing the same samples in multiple laboratories as part of inter-laboratory
crossover studies. The %RSD is expected to be ≤ 2% of the primary testing lab, or ≤ 3.5-5% for
an impurity method (CDER, 1994; Ermer & Miller, 2005; Shabir, 2004; Singh, 2013). Tables A.14,
A.15 and A.16 represent the precision done on day three for artemisone, clofazimine and
decoquinate, respectively.
Table A.14: Reproducibility of artemisone
Concentration spiked Recovery µg/ml Peak area Mean µg/ml %
15.26 17.70 17.20 17.45 14.96 98.00
15.26 17.30 17.80 17.55 15.05 98.63
15.26 17.70 17.40 17.55 15.05 98.63
20.35 23.60 23.00 23.30 20.57 101.10
20.35 23.50 23.40 23.45 20.72 101.81
20.35 23.30 23.20 23.25 20.53 100.87
101.75 107.90 107.70 107.80 101.72 99.97
101.75 108.20 107.70 107.95 101.86 100.11
101.75 108.00 107.40 107.70 101.62 99.88
Mean 99.888
SD1 1.199
%RSD2 1.201 1. Standard deviation (SD)
2. Relative standard deviation (%RSD)
The mean percentage recovery for artemisone was 99.888%, which is in the acknowledged
range. The %RSD was 1.201%, which is less than 2% and thus adheres to the stipulated criterion
(Shabir, 2004).
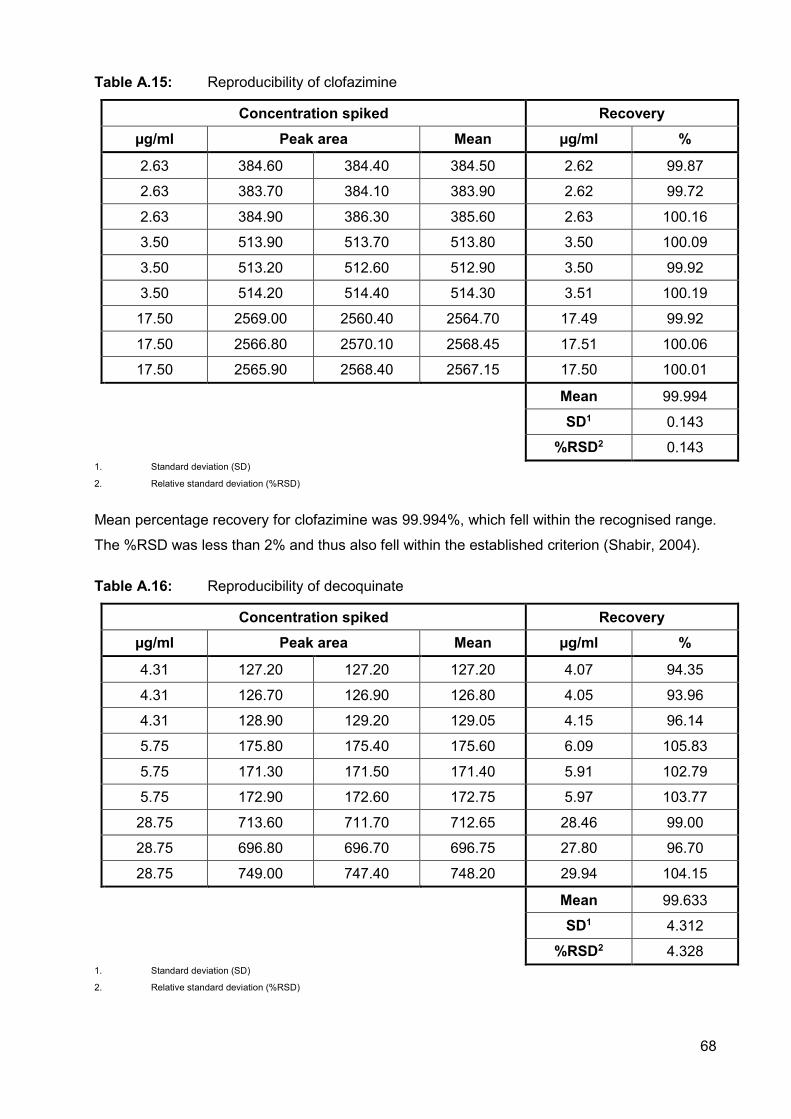
68
Table A.15: Reproducibility of clofazimine
Concentration spiked Recovery µg/ml Peak area Mean µg/ml %
2.63 384.60 384.40 384.50 2.62 99.87
2.63 383.70 384.10 383.90 2.62 99.72
2.63 384.90 386.30 385.60 2.63 100.16
3.50 513.90 513.70 513.80 3.50 100.09
3.50 513.20 512.60 512.90 3.50 99.92
3.50 514.20 514.40 514.30 3.51 100.19
17.50 2569.00 2560.40 2564.70 17.49 99.92
17.50 2566.80 2570.10 2568.45 17.51 100.06
17.50 2565.90 2568.40 2567.15 17.50 100.01
Mean 99.994
SD1 0.143
%RSD2 0.143 1. Standard deviation (SD)
2. Relative standard deviation (%RSD)
Mean percentage recovery for clofazimine was 99.994%, which fell within the recognised range.
The %RSD was less than 2% and thus also fell within the established criterion (Shabir, 2004).
Table A.16: Reproducibility of decoquinate
Concentration spiked Recovery µg/ml Peak area Mean µg/ml %
4.31 127.20 127.20 127.20 4.07 94.35
4.31 126.70 126.90 126.80 4.05 93.96
4.31 128.90 129.20 129.05 4.15 96.14
5.75 175.80 175.40 175.60 6.09 105.83
5.75 171.30 171.50 171.40 5.91 102.79
5.75 172.90 172.60 172.75 5.97 103.77
28.75 713.60 711.70 712.65 28.46 99.00
28.75 696.80 696.70 696.75 27.80 96.70
28.75 749.00 747.40 748.20 29.94 104.15
Mean 99.633
SD1 4.312
%RSD2 4.328 1. Standard deviation (SD)
2. Relative standard deviation (%RSD)
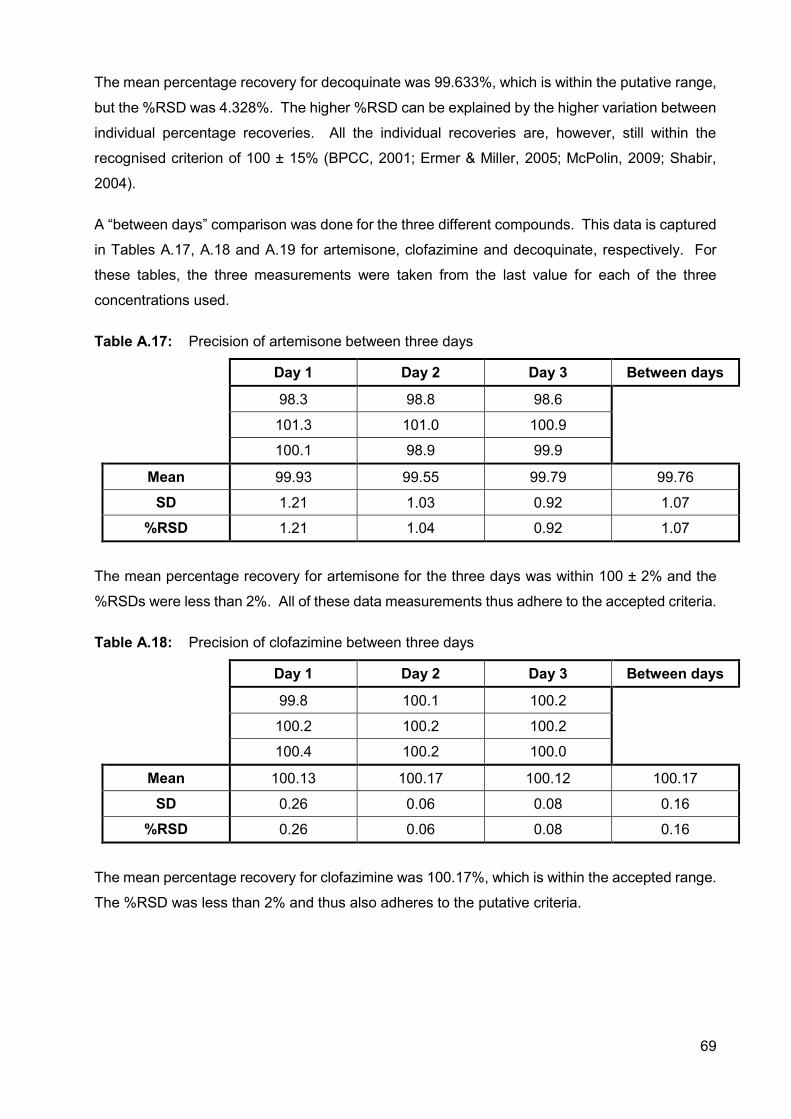
69
The mean percentage recovery for decoquinate was 99.633%, which is within the putative range,
but the %RSD was 4.328%. The higher %RSD can be explained by the higher variation between
individual percentage recoveries. All the individual recoveries are, however, still within the
recognised criterion of 100 ± 15% (BPCC, 2001; Ermer & Miller, 2005; McPolin, 2009; Shabir,
2004).
A “between days” comparison was done for the three different compounds. This data is captured
in Tables A.17, A.18 and A.19 for artemisone, clofazimine and decoquinate, respectively. For
these tables, the three measurements were taken from the last value for each of the three
concentrations used.
Table A.17: Precision of artemisone between three days
Day 1 Day 2 Day 3 Between days
98.3 98.8 98.6 101.3 101.0 100.9
100.1 98.9 99.9
Mean 99.93 99.55 99.79 99.76
SD 1.21 1.03 0.92 1.07
%RSD 1.21 1.04 0.92 1.07
The mean percentage recovery for artemisone for the three days was within 100 ± 2% and the
%RSDs were less than 2%. All of these data measurements thus adhere to the accepted criteria.
Table A.18: Precision of clofazimine between three days
Day 1 Day 2 Day 3 Between days
99.8 100.1 100.2
100.2 100.2 100.2
100.4 100.2 100.0
Mean 100.13 100.17 100.12 100.17
SD 0.26 0.06 0.08 0.16
%RSD 0.26 0.06 0.08 0.16
The mean percentage recovery for clofazimine was 100.17%, which is within the accepted range.
The %RSD was less than 2% and thus also adheres to the putative criteria.
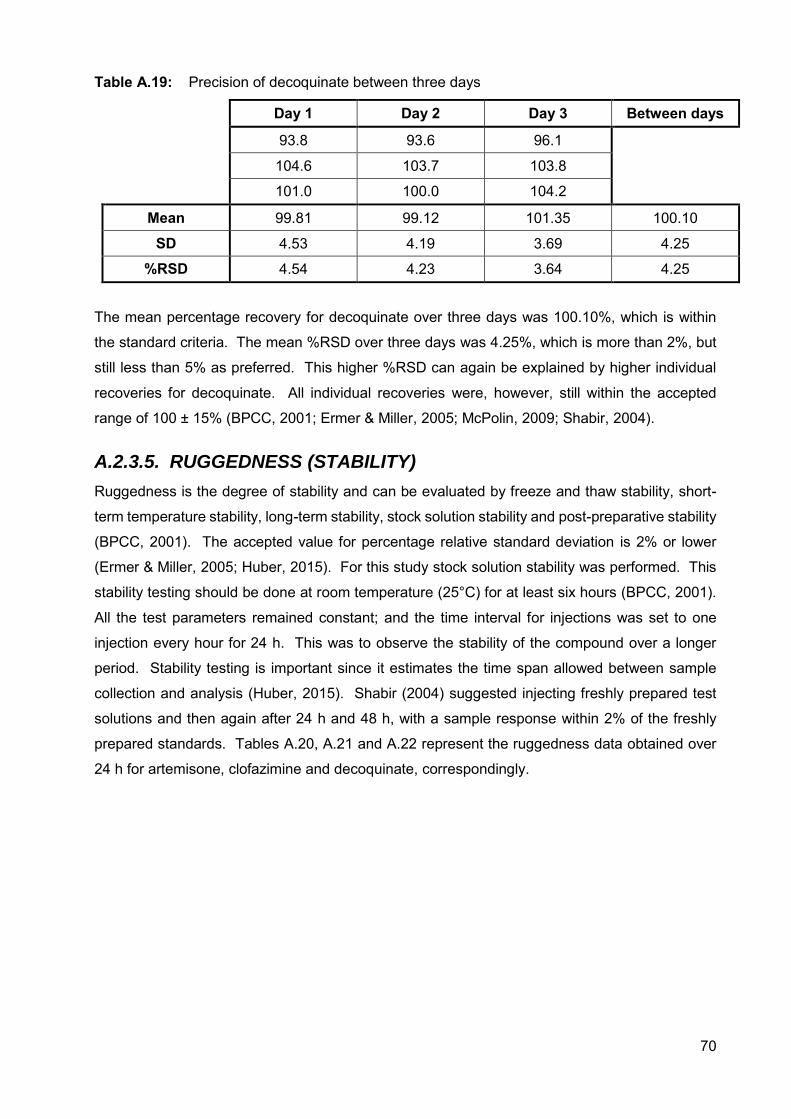
70
Table A.19: Precision of decoquinate between three days
Day 1 Day 2 Day 3 Between days
93.8 93.6 96.1
104.6 103.7 103.8
101.0 100.0 104.2
Mean 99.81 99.12 101.35 100.10
SD 4.53 4.19 3.69 4.25
%RSD 4.54 4.23 3.64 4.25
The mean percentage recovery for decoquinate over three days was 100.10%, which is within
the standard criteria. The mean %RSD over three days was 4.25%, which is more than 2%, but
still less than 5% as preferred. This higher %RSD can again be explained by higher individual
recoveries for decoquinate. All individual recoveries were, however, still within the accepted
range of 100 ± 15% (BPCC, 2001; Ermer & Miller, 2005; McPolin, 2009; Shabir, 2004).
A.2.3.5. RUGGEDNESS (STABILITY)
Ruggedness is the degree of stability and can be evaluated by freeze and thaw stability, short-
term temperature stability, long-term stability, stock solution stability and post-preparative stability
(BPCC, 2001). The accepted value for percentage relative standard deviation is 2% or lower
(Ermer & Miller, 2005; Huber, 2015). For this study stock solution stability was performed. This
stability testing should be done at room temperature (25°C) for at least six hours (BPCC, 2001).
All the test parameters remained constant; and the time interval for injections was set to one
injection every hour for 24 h. This was to observe the stability of the compound over a longer
period. Stability testing is important since it estimates the time span allowed between sample
collection and analysis (Huber, 2015). Shabir (2004) suggested injecting freshly prepared test
solutions and then again after 24 h and 48 h, with a sample response within 2% of the freshly
prepared standards. Tables A.20, A.21 and A.22 represent the ruggedness data obtained over
24 h for artemisone, clofazimine and decoquinate, correspondingly.
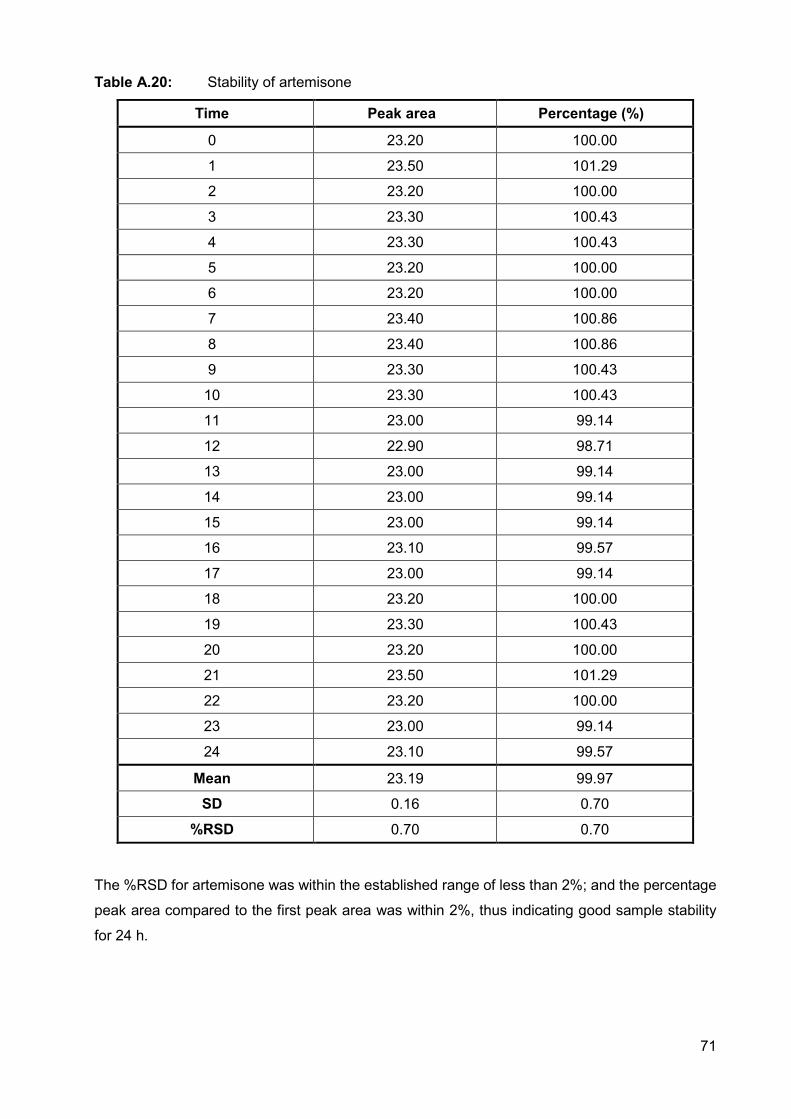
71
Table A.20: Stability of artemisone
Time Peak area Percentage (%)
0 23.20 100.00
1 23.50 101.29
2 23.20 100.00
3 23.30 100.43
4 23.30 100.43
5 23.20 100.00
6 23.20 100.00
7 23.40 100.86
8 23.40 100.86
9 23.30 100.43
10 23.30 100.43
11 23.00 99.14
12 22.90 98.71
13 23.00 99.14
14 23.00 99.14
15 23.00 99.14
16 23.10 99.57
17 23.00 99.14
18 23.20 100.00
19 23.30 100.43
20 23.20 100.00
21 23.50 101.29
22 23.20 100.00
23 23.00 99.14
24 23.10 99.57
Mean 23.19 99.97
SD 0.16 0.70
%RSD 0.70 0.70
The %RSD for artemisone was within the established range of less than 2%; and the percentage
peak area compared to the first peak area was within 2%, thus indicating good sample stability
for 24 h.
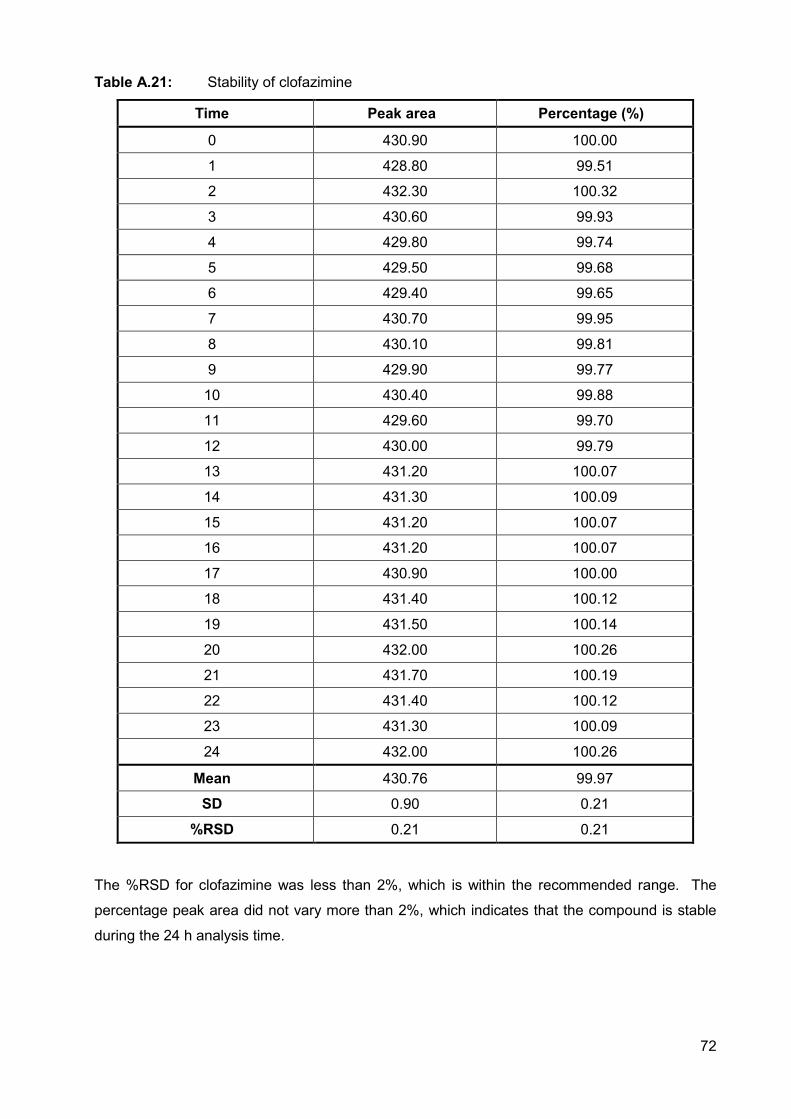
72
Table A.21: Stability of clofazimine
Time Peak area Percentage (%)
0 430.90 100.00
1 428.80 99.51
2 432.30 100.32
3 430.60 99.93
4 429.80 99.74
5 429.50 99.68
6 429.40 99.65
7 430.70 99.95
8 430.10 99.81
9 429.90 99.77
10 430.40 99.88
11 429.60 99.70
12 430.00 99.79
13 431.20 100.07
14 431.30 100.09
15 431.20 100.07
16 431.20 100.07
17 430.90 100.00
18 431.40 100.12
19 431.50 100.14
20 432.00 100.26
21 431.70 100.19
22 431.40 100.12
23 431.30 100.09
24 432.00 100.26
Mean 430.76 99.97
SD 0.90 0.21
%RSD 0.21 0.21
The %RSD for clofazimine was less than 2%, which is within the recommended range. The
percentage peak area did not vary more than 2%, which indicates that the compound is stable
during the 24 h analysis time.
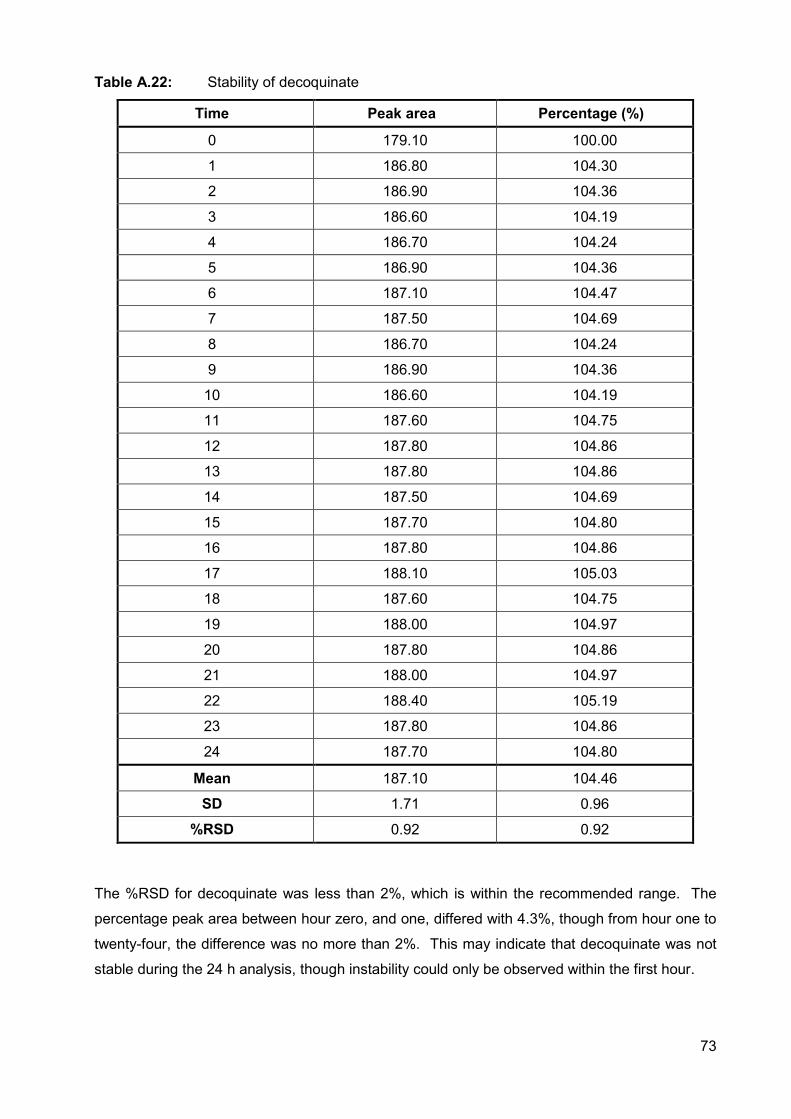
73
Table A.22: Stability of decoquinate
Time Peak area Percentage (%)
0 179.10 100.00
1 186.80 104.30
2 186.90 104.36
3 186.60 104.19
4 186.70 104.24
5 186.90 104.36
6 187.10 104.47
7 187.50 104.69
8 186.70 104.24
9 186.90 104.36
10 186.60 104.19
11 187.60 104.75
12 187.80 104.86
13 187.80 104.86
14 187.50 104.69
15 187.70 104.80
16 187.80 104.86
17 188.10 105.03
18 187.60 104.75
19 188.00 104.97
20 187.80 104.86
21 188.00 104.97
22 188.40 105.19
23 187.80 104.86
24 187.70 104.80
Mean 187.10 104.46
SD 1.71 0.96
%RSD 0.92 0.92
The %RSD for decoquinate was less than 2%, which is within the recommended range. The
percentage peak area between hour zero, and one, differed with 4.3%, though from hour one to
twenty-four, the difference was no more than 2%. This may indicate that decoquinate was not
stable during the 24 h analysis, though instability could only be observed within the first hour.
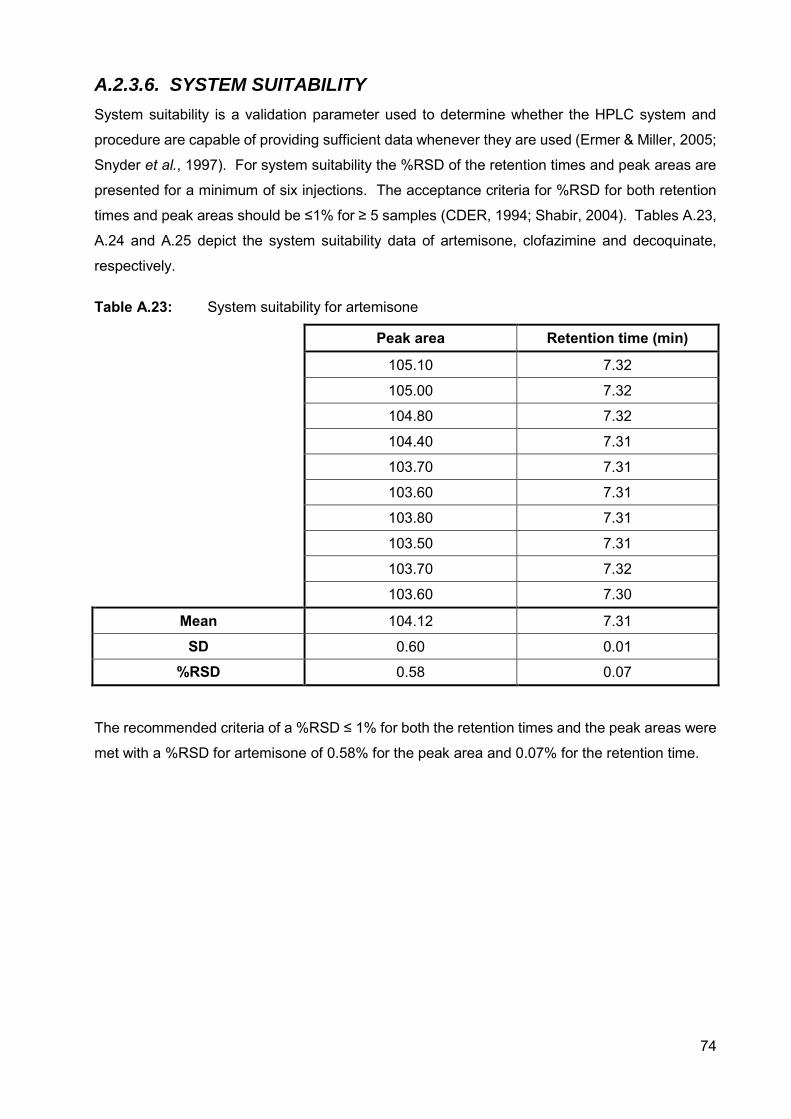
74
A.2.3.6. SYSTEM SUITABILITY
System suitability is a validation parameter used to determine whether the HPLC system and
procedure are capable of providing sufficient data whenever they are used (Ermer & Miller, 2005;
Snyder et al., 1997). For system suitability the %RSD of the retention times and peak areas are
presented for a minimum of six injections. The acceptance criteria for %RSD for both retention
times and peak areas should be ≤1% for ≥ 5 samples (CDER, 1994; Shabir, 2004). Tables A.23,
A.24 and A.25 depict the system suitability data of artemisone, clofazimine and decoquinate,
respectively.
Table A.23: System suitability for artemisone
Peak area Retention time (min)
105.10 7.32
105.00 7.32
104.80 7.32
104.40 7.31
103.70 7.31
103.60 7.31
103.80 7.31
103.50 7.31
103.70 7.32
103.60 7.30
Mean 104.12 7.31
SD 0.60 0.01
%RSD 0.58 0.07
The recommended criteria of a %RSD ≤ 1% for both the retention times and the peak areas were
met with a %RSD for artemisone of 0.58% for the peak area and 0.07% for the retention time.
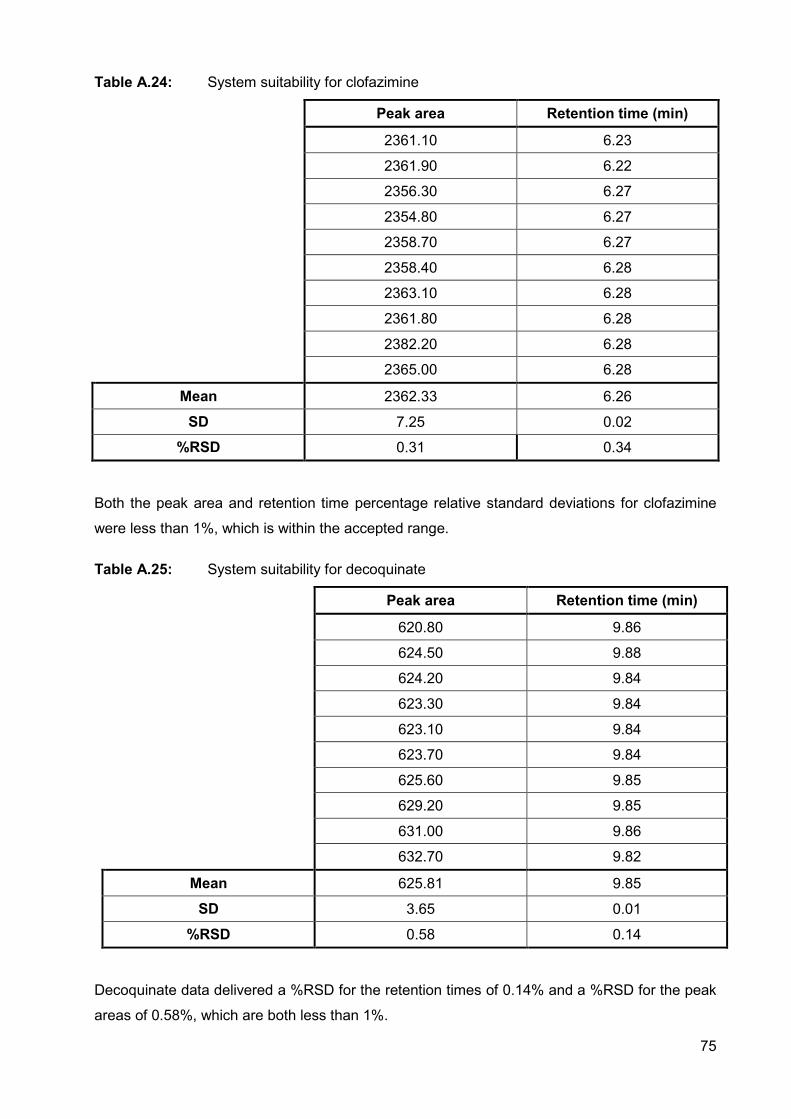
75
Table A.24: System suitability for clofazimine
Peak area Retention time (min)
2361.10 6.23
2361.90 6.22
2356.30 6.27
2354.80 6.27
2358.70 6.27
2358.40 6.28
2363.10 6.28
2361.80 6.28
2382.20 6.28
2365.00 6.28
Mean 2362.33 6.26
SD 7.25 0.02
%RSD 0.31 0.34
Both the peak area and retention time percentage relative standard deviations for clofazimine
were less than 1%, which is within the accepted range.
Table A.25: System suitability for decoquinate
Peak area Retention time (min)
620.80 9.86
624.50 9.88
624.20 9.84
623.30 9.84
623.10 9.84
623.70 9.84
625.60 9.85
629.20 9.85
631.00 9.86
632.70 9.82
Mean 625.81 9.85
SD 3.65 0.01
%RSD 0.58 0.14
Decoquinate data delivered a %RSD for the retention times of 0.14% and a %RSD for the peak
areas of 0.58%, which are both less than 1%.
76
A.2.3.7. CONCLUSION
The HPLC method for the simultaneous analysis of artemisone, clofazimine and decoquinate was
validated and it was found that this method is reliable and sensitive in determining the different
concentrations of the APIs. Tables A.1 to A.25 show the validation parameters determined for
the APIs. It was concluded that clofazimine, artemisone and decoquinate can be analysed by
this method with all the acceptance criteria met. Decoquinate, however, displayed a little
instability while conducting 24 h stability testing as seen in Table A.22. Decoquinate was also the
compound with the most data variance when observing the accuracy and precision studies
performed (Tables A.7; A.10; A.13 and A.16).
77
REFERENCES BIOPHARMACEUTICS COORDINATING COMMITTEE (BPCC). 2001. Guidance for Industry.
Bioanalytical method validation. 22p.
CENTER FOR DRUG EVALUATION AND RESEARCH (CDER). 1994. Reviewer guidance:
Validation of chromatographic methods. 30p.
CURRENT GOOD MANUFACTURING PRACTICE (CGMP). 2011. Guidance for Industry.
Process validation: General principles and practices. 19p.
DE VITO, V., SABA, A., LEE, H., OWEN, H., POAPOLATHEP, A. & GIORGI, M. 2016. Detection
and quantification of the selective EP4 receptor antagonist CJ-023423 (grapiprant) in canine
plasma by HPLC with spectrofluorimetric detection. Journal of pharmaceutical and biomedical
analysis, 118:251-258.
ERMER, J. & MILLER, J.H., eds. 2005. Method validation in pharmaceutical analysis: A guide
to best practice. Weinheim: Wiley-VCH Verlag. 403p.
HUBER, L. 2015. Validation of analytical methods. Agilent Technologies.
http://www.fws.gov/aah/PDF/QI-Terms%20and%20Defs.pdf Date of access: 20 May 2015.
INTERNATIONAL CONFERENCE ON HARMONISATION (ICH) of technical requirements for
registration of pharmaceuticals for human use. 2005. Validation of analytical procedures: Text
and methodology Q2(R1). 17p.
McPOLIN, O. 2009. Validation of analytical methods for pharmaceutical analysis. Warren Point,
UK: Mourne training services. 141p.
SHABIR, G.A. 2004. A practical approach to validation of HPLC methods under current good
manufacturing practices. Journal of validation technology, 10:210-218.
SINGH, R. 2013. HPLC method development and validation – an overview. Journal of
pharmaceutical education and research, 4(1):26-33.
SNYDER, L.R., KIRKLAND, J.J. & GLAJCH, J.L. 1997. Practical HPLC method development.
2nd ed. New York: Wiley -Interscience. p. 643-713.
78
Annexure B
FULL COMPATIBILITY REPORT OF
CLOFAZIMINE, ARTEMISONE AND
DECOQUINATE WITH VESICLE COMPONENTS
This chapter contains the full isothermal calorimetry report, conducted through thermal activity
monitor (TAM) as received by Prof M. Aucamp. A compacted version of this data is reflected in
Annexure C.
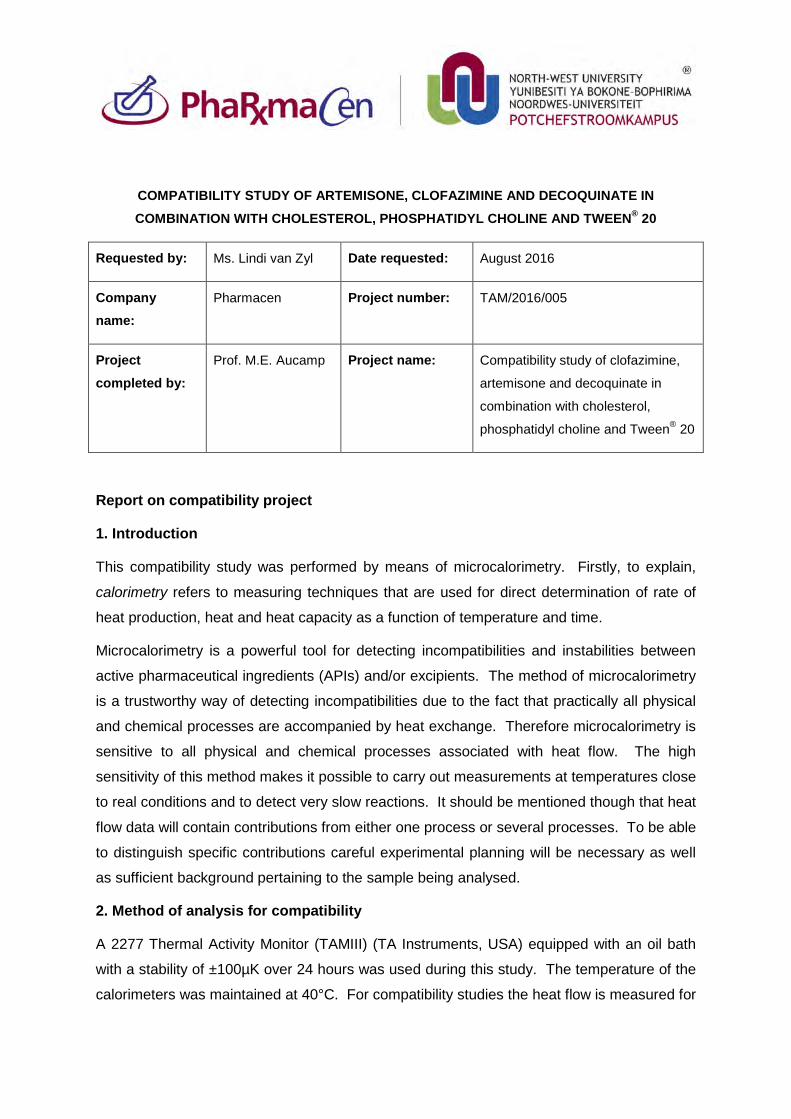
COMPATIBILITY STUDY OF ARTEMISONE, CLOFAZIMINE AND DECOQUINATE IN COMBINATION WITH CHOLESTEROL, PHOSPHATIDYL CHOLINE AND TWEEN® 20
Requested by: Ms. Lindi van Zyl Date requested: August 2016
Company name:
Pharmacen Project number: TAM/2016/005
Project completed by:
Prof. M.E. Aucamp Project name: Compatibility study of clofazimine,
artemisone and decoquinate in
combination with cholesterol,
phosphatidyl choline and Tween® 20
Report on compatibility project
1. Introduction
This compatibility study was performed by means of microcalorimetry. Firstly, to explain,
calorimetry refers to measuring techniques that are used for direct determination of rate of
heat production, heat and heat capacity as a function of temperature and time.
Microcalorimetry is a powerful tool for detecting incompatibilities and instabilities between
active pharmaceutical ingredients (APIs) and/or excipients. The method of microcalorimetry
is a trustworthy way of detecting incompatibilities due to the fact that practically all physical
and chemical processes are accompanied by heat exchange. Therefore microcalorimetry is
sensitive to all physical and chemical processes associated with heat flow. The high
sensitivity of this method makes it possible to carry out measurements at temperatures close
to real conditions and to detect very slow reactions. It should be mentioned though that heat
flow data will contain contributions from either one process or several processes. To be able
to distinguish specific contributions careful experimental planning will be necessary as well
as sufficient background pertaining to the sample being analysed.
2. Method of analysis for compatibility
A 2277 Thermal Activity Monitor (TAMIII) (TA Instruments, USA) equipped with an oil bath
with a stability of ±100µK over 24 hours was used during this study. The temperature of the
calorimeters was maintained at 40°C. For compatibility studies the heat flow is measured for
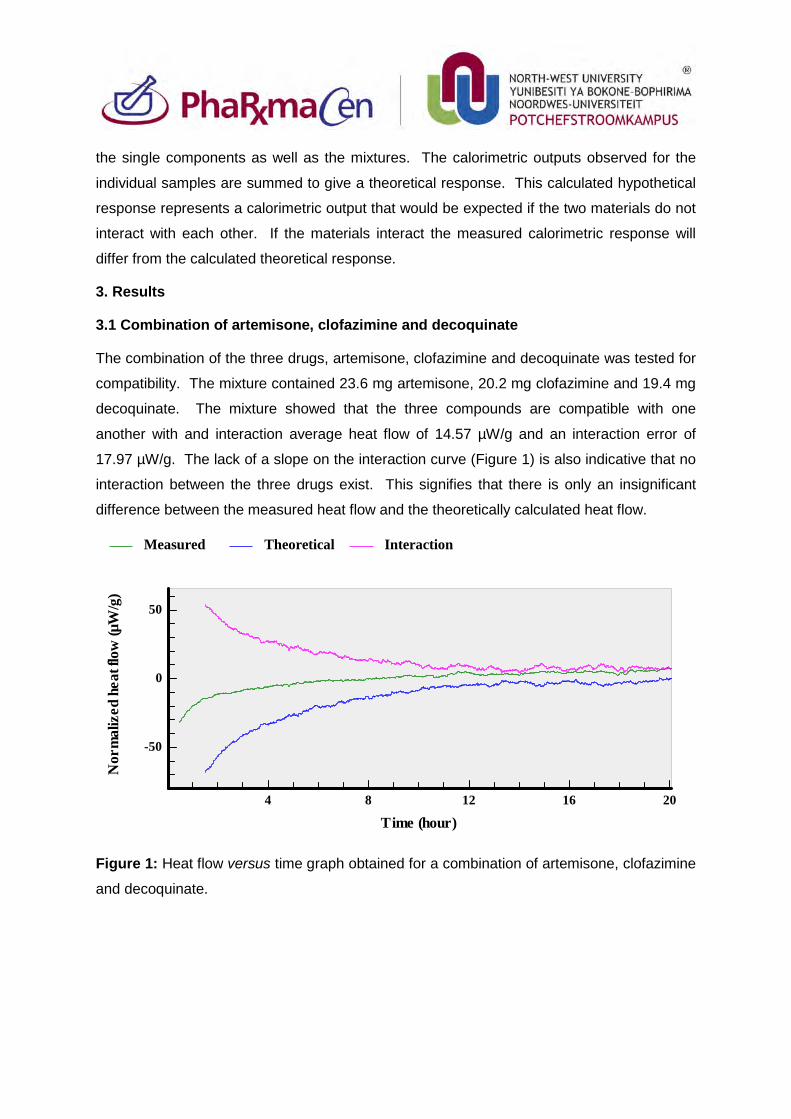
the single components as well as the mixtures. The calorimetric outputs observed for the
individual samples are summed to give a theoretical response. This calculated hypothetical
response represents a calorimetric output that would be expected if the two materials do not
interact with each other. If the materials interact the measured calorimetric response will
differ from the calculated theoretical response.
3. Results
3.1 Combination of artemisone, clofazimine and decoquinate
The combination of the three drugs, artemisone, clofazimine and decoquinate was tested for
compatibility. The mixture contained 23.6 mg artemisone, 20.2 mg clofazimine and 19.4 mg
decoquinate. The mixture showed that the three compounds are compatible with one
another with and interaction average heat flow of 14.57 µW/g and an interaction error of
17.97 µW/g. The lack of a slope on the interaction curve (Figure 1) is also indicative that no
interaction between the three drugs exist. This signifies that there is only an insignificant
difference between the measured heat flow and the theoretically calculated heat flow.
Figure 1: Heat flow versus time graph obtained for a combination of artemisone, clofazimine
and decoquinate.
Measured Theoretical Interaction
Nor
mal
ized
hea
t flo
w (µ
W/g
)
Time (hour)4 8 12 16 20
-50
0
50
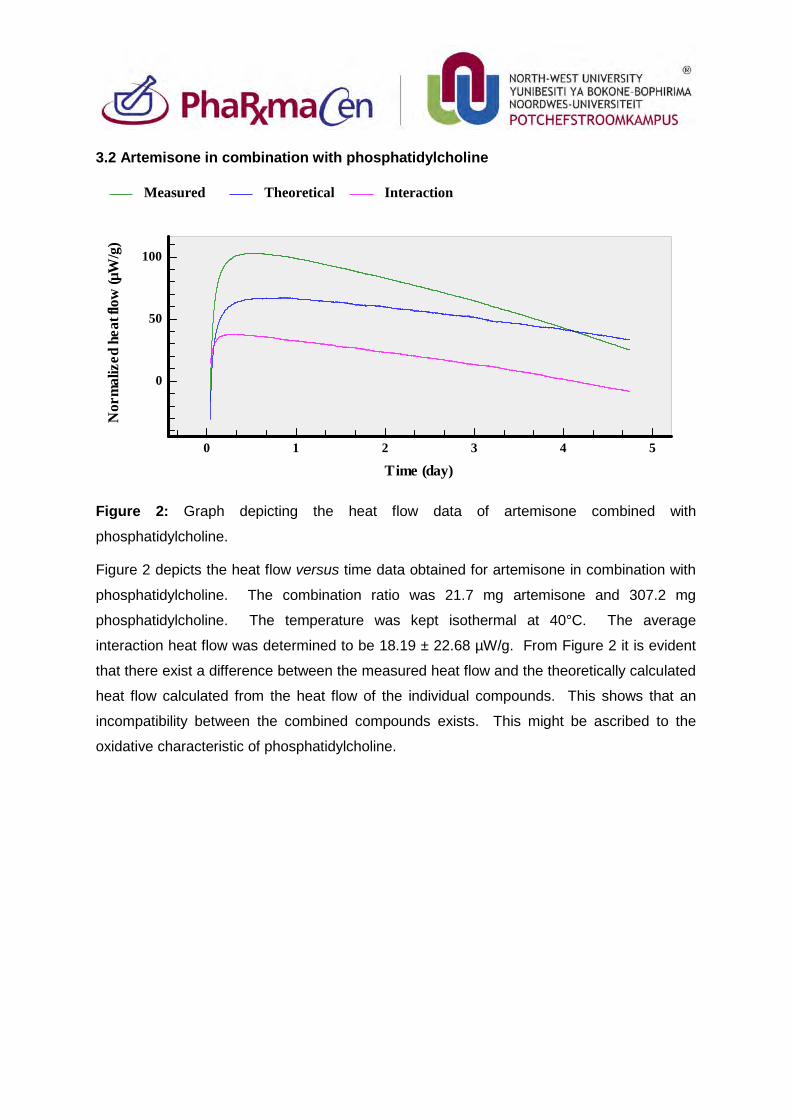
3.2 Artemisone in combination with phosphatidylcholine
Figure 2: Graph depicting the heat flow data of artemisone combined with
phosphatidylcholine.
Figure 2 depicts the heat flow versus time data obtained for artemisone in combination with
phosphatidylcholine. The combination ratio was 21.7 mg artemisone and 307.2 mg
phosphatidylcholine. The temperature was kept isothermal at 40°C. The average
interaction heat flow was determined to be 18.19 ± 22.68 µW/g. From Figure 2 it is evident
that there exist a difference between the measured heat flow and the theoretically calculated
heat flow calculated from the heat flow of the individual compounds. This shows that an
incompatibility between the combined compounds exists. This might be ascribed to the
oxidative characteristic of phosphatidylcholine.
Measured Theoretical Interaction
Nor
mal
ized
hea
t flo
w (µ
W/g
)
Time (day)0 1 2 3 4 5
0
50
100
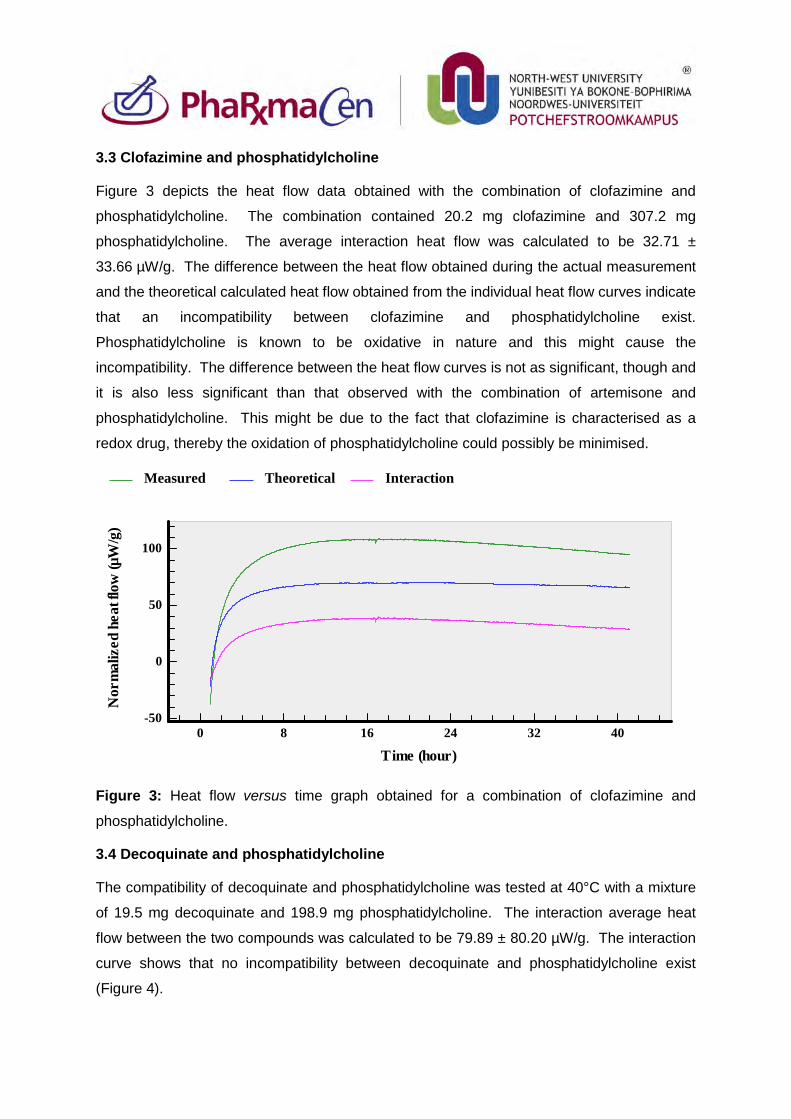
3.3 Clofazimine and phosphatidylcholine
Figure 3 depicts the heat flow data obtained with the combination of clofazimine and
phosphatidylcholine. The combination contained 20.2 mg clofazimine and 307.2 mg
phosphatidylcholine. The average interaction heat flow was calculated to be 32.71 ±
33.66 µW/g. The difference between the heat flow obtained during the actual measurement
and the theoretical calculated heat flow obtained from the individual heat flow curves indicate
that an incompatibility between clofazimine and phosphatidylcholine exist.
Phosphatidylcholine is known to be oxidative in nature and this might cause the
incompatibility. The difference between the heat flow curves is not as significant, though and
it is also less significant than that observed with the combination of artemisone and
phosphatidylcholine. This might be due to the fact that clofazimine is characterised as a
redox drug, thereby the oxidation of phosphatidylcholine could possibly be minimised.
Figure 3: Heat flow versus time graph obtained for a combination of clofazimine and
phosphatidylcholine.
3.4 Decoquinate and phosphatidylcholine
The compatibility of decoquinate and phosphatidylcholine was tested at 40°C with a mixture
of 19.5 mg decoquinate and 198.9 mg phosphatidylcholine. The interaction average heat
flow between the two compounds was calculated to be 79.89 ± 80.20 µW/g. The interaction
curve shows that no incompatibility between decoquinate and phosphatidylcholine exist
(Figure 4).
Measured Theoretical Interaction
Nor
mal
ized
hea
t flo
w (µ
W/g
)
Time (hour)0 8 16 24 32 40
-50
0
50
100
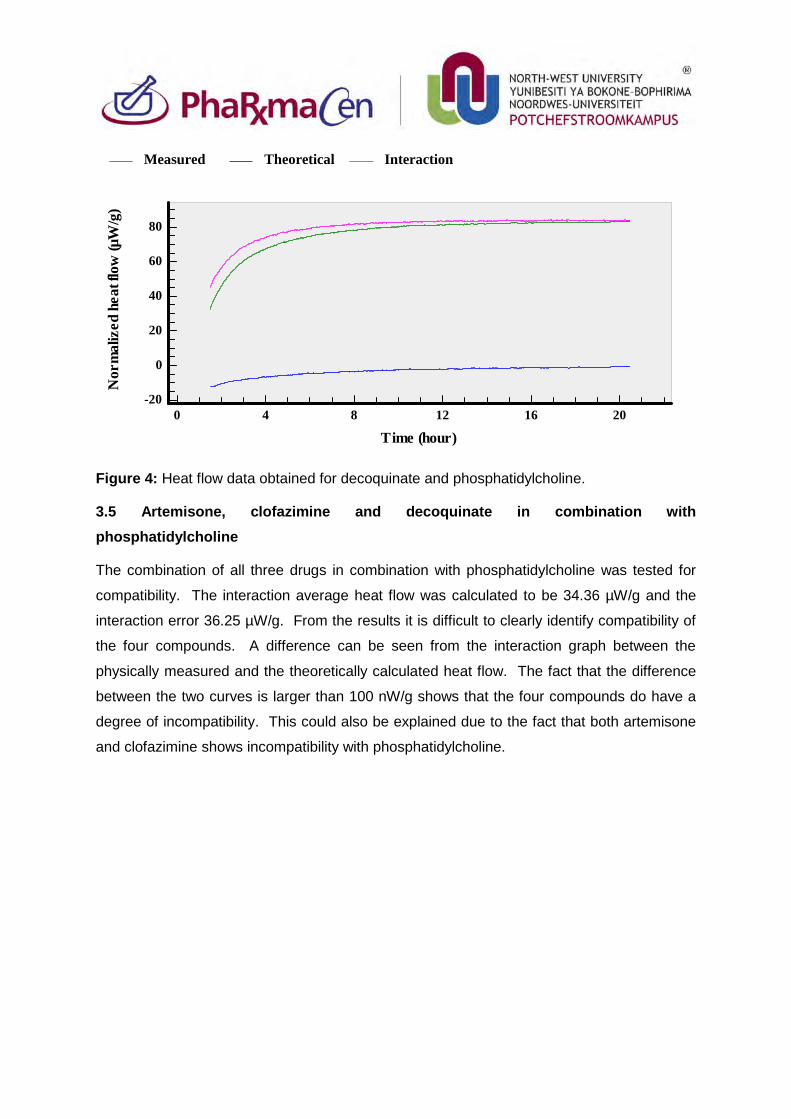
Figure 4: Heat flow data obtained for decoquinate and phosphatidylcholine.
3.5 Artemisone, clofazimine and decoquinate in combination with phosphatidylcholine
The combination of all three drugs in combination with phosphatidylcholine was tested for
compatibility. The interaction average heat flow was calculated to be 34.36 µW/g and the
interaction error 36.25 µW/g. From the results it is difficult to clearly identify compatibility of
the four compounds. A difference can be seen from the interaction graph between the
physically measured and the theoretically calculated heat flow. The fact that the difference
between the two curves is larger than 100 nW/g shows that the four compounds do have a
degree of incompatibility. This could also be explained due to the fact that both artemisone
and clofazimine shows incompatibility with phosphatidylcholine.
Measured Theoretical Interaction
Nor
mal
ized
hea
t flo
w (µ
W/g
)
Time (hour)0 4 8 12 16 20
-20
0
20
40
60
80
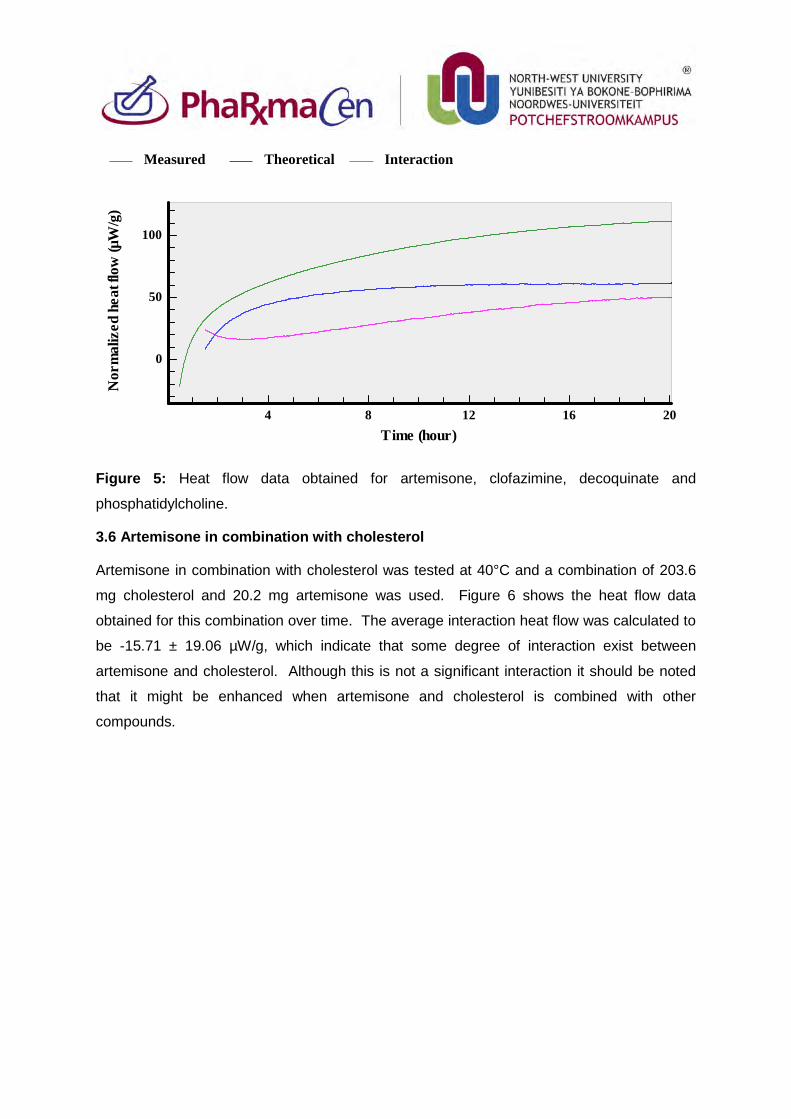
Figure 5: Heat flow data obtained for artemisone, clofazimine, decoquinate and
phosphatidylcholine.
3.6 Artemisone in combination with cholesterol
Artemisone in combination with cholesterol was tested at 40°C and a combination of 203.6
mg cholesterol and 20.2 mg artemisone was used. Figure 6 shows the heat flow data
obtained for this combination over time. The average interaction heat flow was calculated to
be -15.71 ± 19.06 µW/g, which indicate that some degree of interaction exist between
artemisone and cholesterol. Although this is not a significant interaction it should be noted
that it might be enhanced when artemisone and cholesterol is combined with other
compounds.
Measured Theoretical Interaction
Nor
mal
ized
hea
t flo
w (µ
W/g
)
Time (hour)4 8 12 16 20
0
50
100
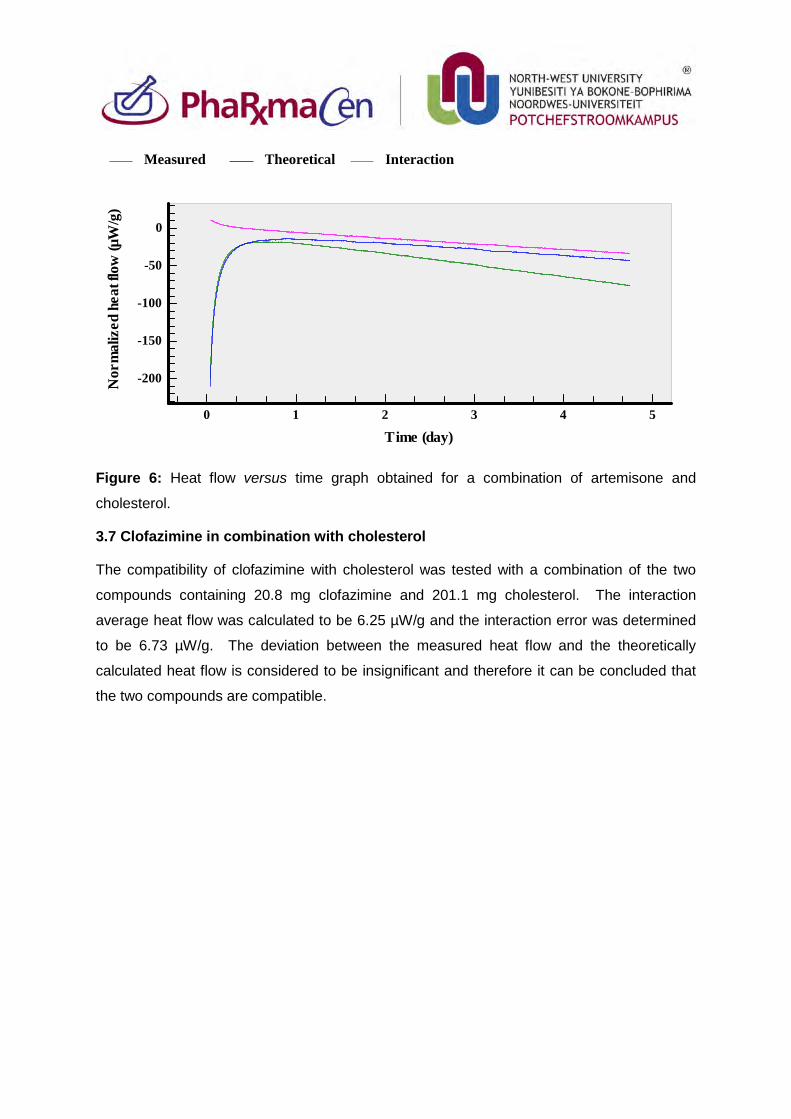
Figure 6: Heat flow versus time graph obtained for a combination of artemisone and
cholesterol.
3.7 Clofazimine in combination with cholesterol
The compatibility of clofazimine with cholesterol was tested with a combination of the two
compounds containing 20.8 mg clofazimine and 201.1 mg cholesterol. The interaction
average heat flow was calculated to be 6.25 µW/g and the interaction error was determined
to be 6.73 µW/g. The deviation between the measured heat flow and the theoretically
calculated heat flow is considered to be insignificant and therefore it can be concluded that
the two compounds are compatible.
Measured Theoretical Interaction
Nor
mal
ized
hea
t flo
w (µ
W/g
)
Time (day)0 1 2 3 4 5
-200
-150
-100
-50
0
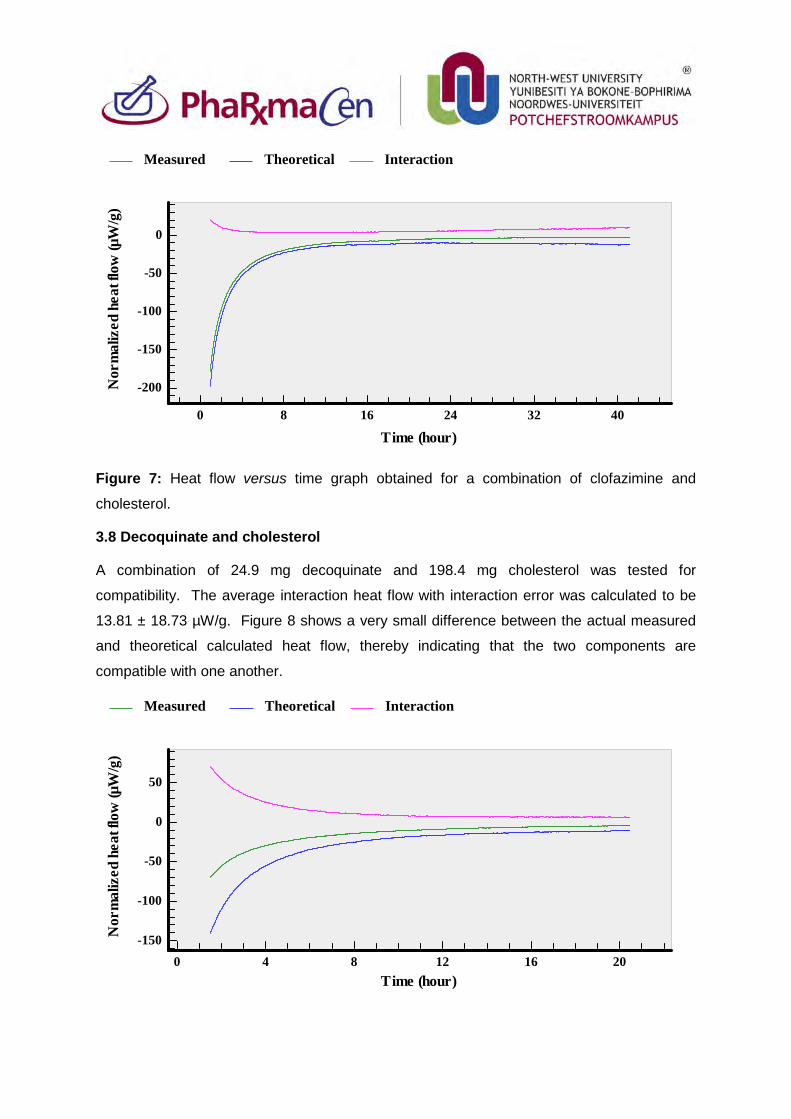
Figure 7: Heat flow versus time graph obtained for a combination of clofazimine and
cholesterol.
3.8 Decoquinate and cholesterol
A combination of 24.9 mg decoquinate and 198.4 mg cholesterol was tested for
compatibility. The average interaction heat flow with interaction error was calculated to be
13.81 ± 18.73 µW/g. Figure 8 shows a very small difference between the actual measured
and theoretical calculated heat flow, thereby indicating that the two components are
compatible with one another.
Measured Theoretical Interaction
Nor
mal
ized
hea
t flo
w (µ
W/g
)
Time (hour)0 8 16 24 32 40
-200
-150
-100
-50
0
Measured Theoretical Interaction
Nor
mal
ized
hea
t flo
w (µ
W/g
)
Time (hour)0 4 8 12 16 20
-150
-100
-50
0
50
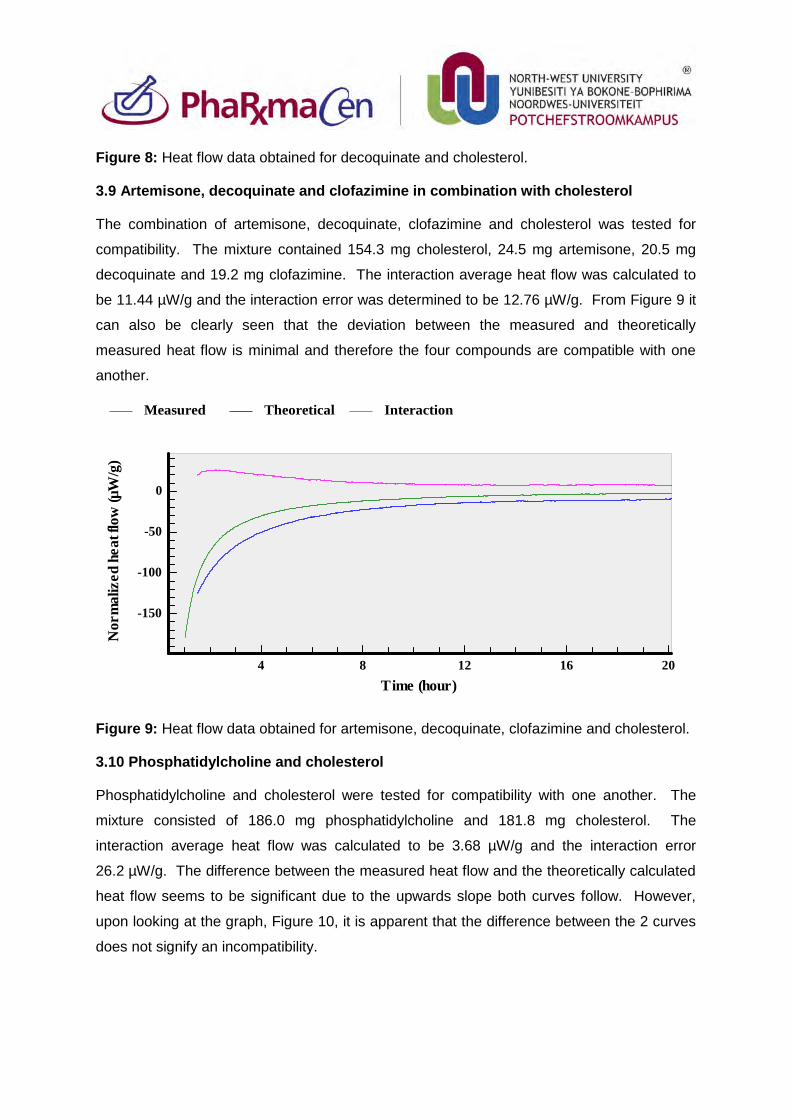
Figure 8: Heat flow data obtained for decoquinate and cholesterol.
3.9 Artemisone, decoquinate and clofazimine in combination with cholesterol
The combination of artemisone, decoquinate, clofazimine and cholesterol was tested for
compatibility. The mixture contained 154.3 mg cholesterol, 24.5 mg artemisone, 20.5 mg
decoquinate and 19.2 mg clofazimine. The interaction average heat flow was calculated to
be 11.44 µW/g and the interaction error was determined to be 12.76 µW/g. From Figure 9 it
can also be clearly seen that the deviation between the measured and theoretically
measured heat flow is minimal and therefore the four compounds are compatible with one
another.
Figure 9: Heat flow data obtained for artemisone, decoquinate, clofazimine and cholesterol.
3.10 Phosphatidylcholine and cholesterol
Phosphatidylcholine and cholesterol were tested for compatibility with one another. The
mixture consisted of 186.0 mg phosphatidylcholine and 181.8 mg cholesterol. The
interaction average heat flow was calculated to be 3.68 µW/g and the interaction error
26.2 µW/g. The difference between the measured heat flow and the theoretically calculated
heat flow seems to be significant due to the upwards slope both curves follow. However,
upon looking at the graph, Figure 10, it is apparent that the difference between the 2 curves
does not signify an incompatibility.
Measured Theoretical Interaction
Nor
mal
ized
hea
t flo
w (µ
W/g
)
Time (hour)4 8 12 16 20
-150
-100
-50
0
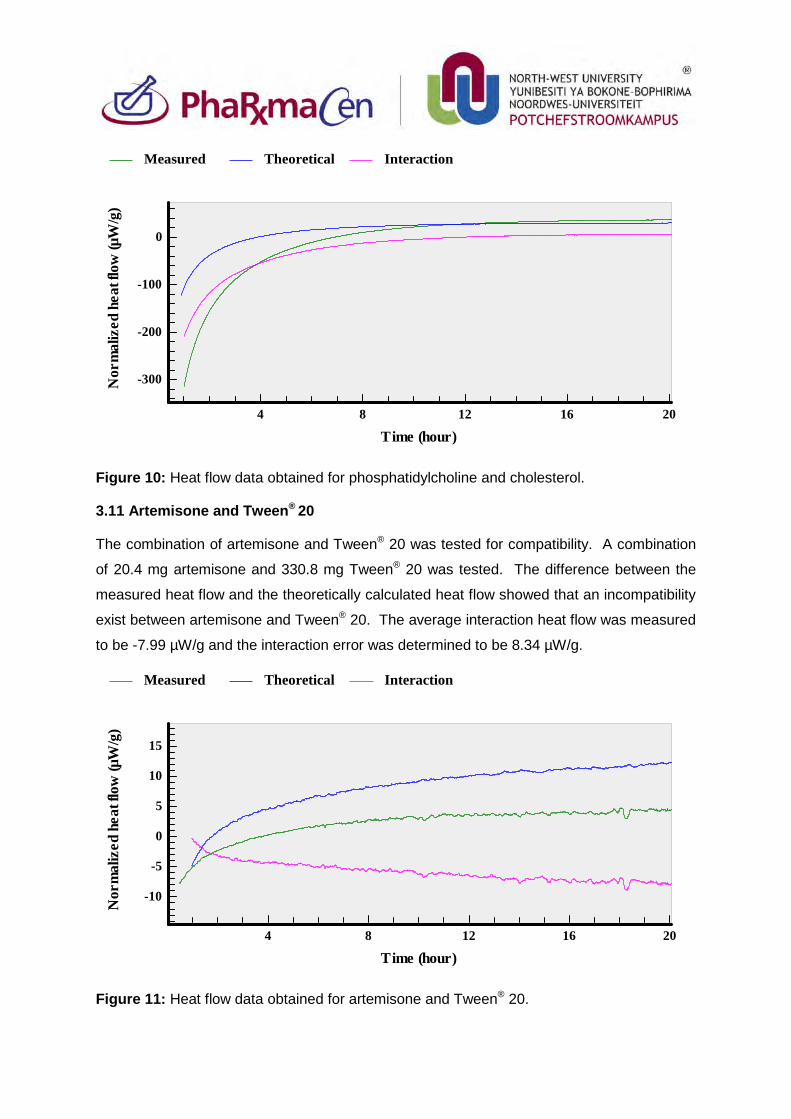
Figure 10: Heat flow data obtained for phosphatidylcholine and cholesterol.
3.11 Artemisone and Tween® 20
The combination of artemisone and Tween® 20 was tested for compatibility. A combination
of 20.4 mg artemisone and 330.8 mg Tween® 20 was tested. The difference between the
measured heat flow and the theoretically calculated heat flow showed that an incompatibility
exist between artemisone and Tween® 20. The average interaction heat flow was measured
to be -7.99 µW/g and the interaction error was determined to be 8.34 µW/g.
Figure 11: Heat flow data obtained for artemisone and Tween® 20.
Measured Theoretical Interaction
Nor
mal
ized
hea
t flo
w (µ
W/g
)
Time (hour)4 8 12 16 20
-300
-200
-100
0
Measured Theoretical Interaction
Nor
mal
ized
hea
t flo
w (µ
W/g
)
Time (hour)4 8 12 16 20
-10
-5
0
5
10
15
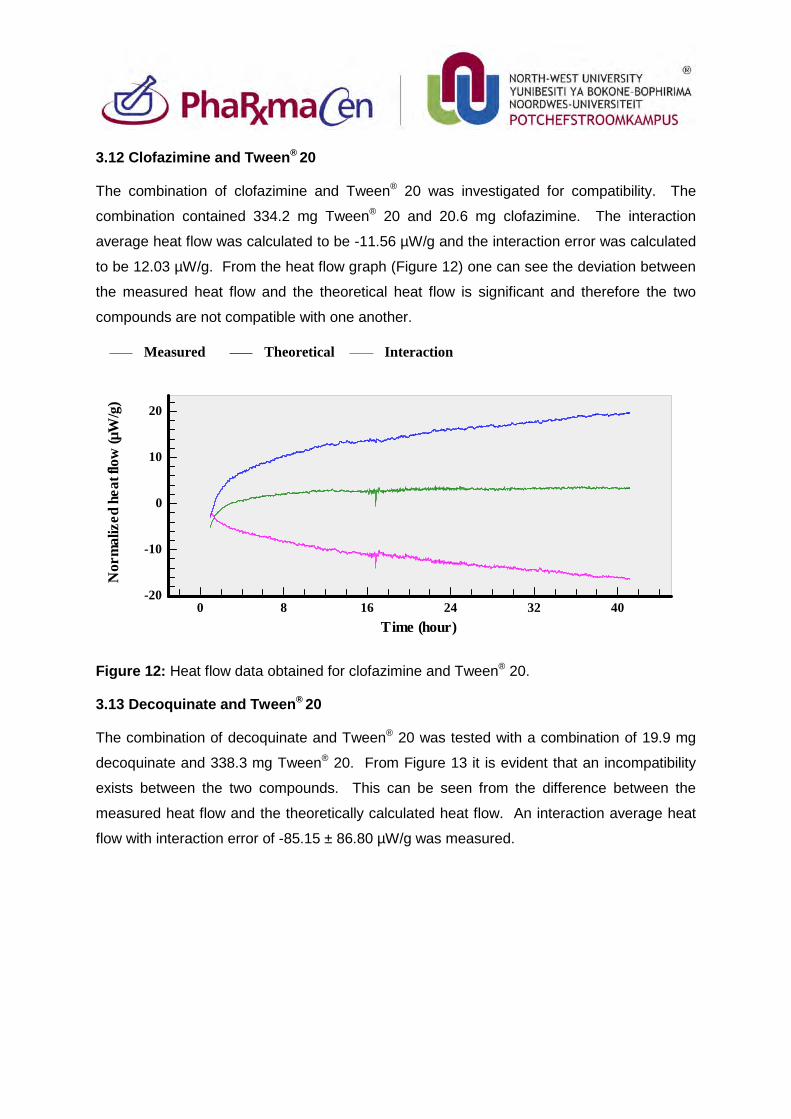
3.12 Clofazimine and Tween® 20
The combination of clofazimine and Tween® 20 was investigated for compatibility. The
combination contained 334.2 mg Tween® 20 and 20.6 mg clofazimine. The interaction
average heat flow was calculated to be -11.56 µW/g and the interaction error was calculated
to be 12.03 µW/g. From the heat flow graph (Figure 12) one can see the deviation between
the measured heat flow and the theoretical heat flow is significant and therefore the two
compounds are not compatible with one another.
Figure 12: Heat flow data obtained for clofazimine and Tween® 20.
3.13 Decoquinate and Tween® 20
The combination of decoquinate and Tween® 20 was tested with a combination of 19.9 mg
decoquinate and 338.3 mg Tween® 20. From Figure 13 it is evident that an incompatibility
exists between the two compounds. This can be seen from the difference between the
measured heat flow and the theoretically calculated heat flow. An interaction average heat
flow with interaction error of -85.15 ± 86.80 µW/g was measured.
Measured Theoretical Interaction
Nor
mal
ized
hea
t flo
w (µ
W/g
)
Time (hour)0 8 16 24 32 40
-20
-10
0
10
20
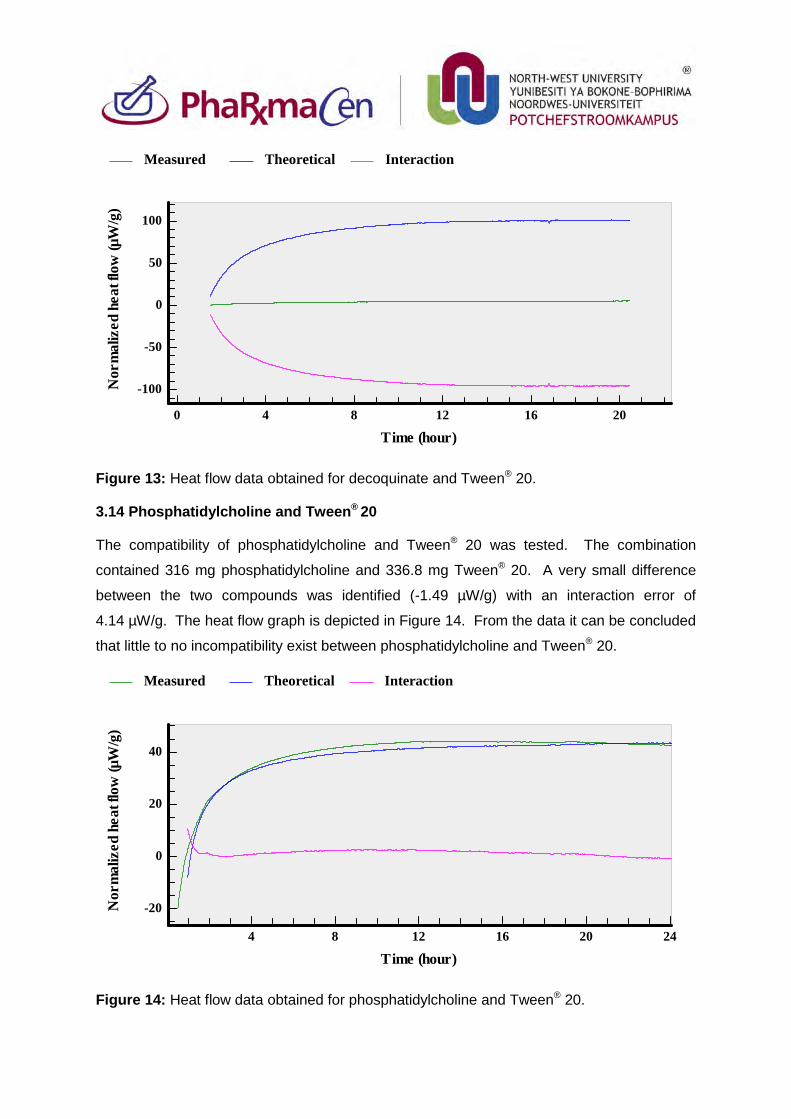
Figure 13: Heat flow data obtained for decoquinate and Tween® 20.
3.14 Phosphatidylcholine and Tween® 20
The compatibility of phosphatidylcholine and Tween® 20 was tested. The combination
contained 316 mg phosphatidylcholine and 336.8 mg Tween® 20. A very small difference
between the two compounds was identified (-1.49 µW/g) with an interaction error of
4.14 µW/g. The heat flow graph is depicted in Figure 14. From the data it can be concluded
that little to no incompatibility exist between phosphatidylcholine and Tween® 20.
Figure 14: Heat flow data obtained for phosphatidylcholine and Tween® 20.
Measured Theoretical Interaction
Nor
mal
ized
hea
t flo
w (µ
W/g
)
Time (hour)0 4 8 12 16 20
-100
-50
0
50
100
Measured Theoretical Interaction
Nor
mal
ized
hea
t flo
w (µ
W/g
)
Time (hour)4 8 12 16 20 24
-20
0
20
40
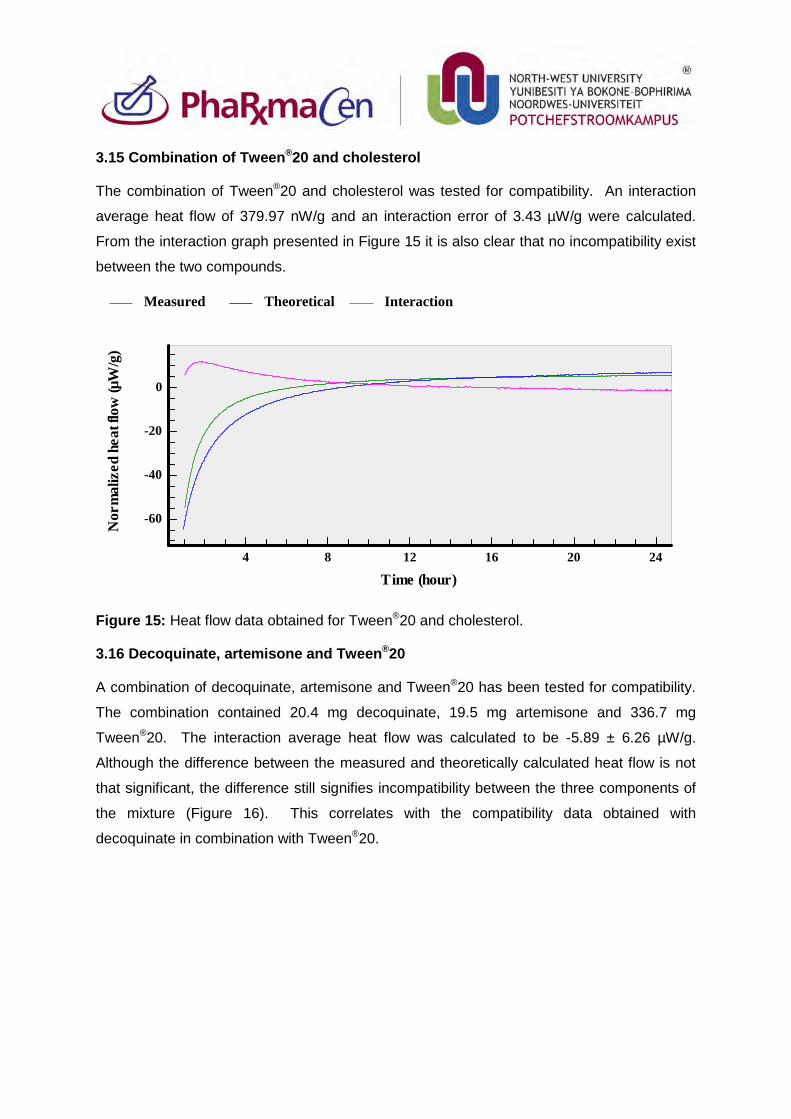
3.15 Combination of Tween®20 and cholesterol
The combination of Tween®20 and cholesterol was tested for compatibility. An interaction
average heat flow of 379.97 nW/g and an interaction error of 3.43 µW/g were calculated.
From the interaction graph presented in Figure 15 it is also clear that no incompatibility exist
between the two compounds.
Figure 15: Heat flow data obtained for Tween®20 and cholesterol.
3.16 Decoquinate, artemisone and Tween®20
A combination of decoquinate, artemisone and Tween®20 has been tested for compatibility.
The combination contained 20.4 mg decoquinate, 19.5 mg artemisone and 336.7 mg
Tween®20. The interaction average heat flow was calculated to be -5.89 ± 6.26 µW/g.
Although the difference between the measured and theoretically calculated heat flow is not
that significant, the difference still signifies incompatibility between the three components of
the mixture (Figure 16). This correlates with the compatibility data obtained with
decoquinate in combination with Tween®20.
Measured Theoretical Interaction
Nor
mal
ized
hea
t flo
w (µ
W/g
)
Time (hour)4 8 12 16 20 24
-60
-40
-20
0
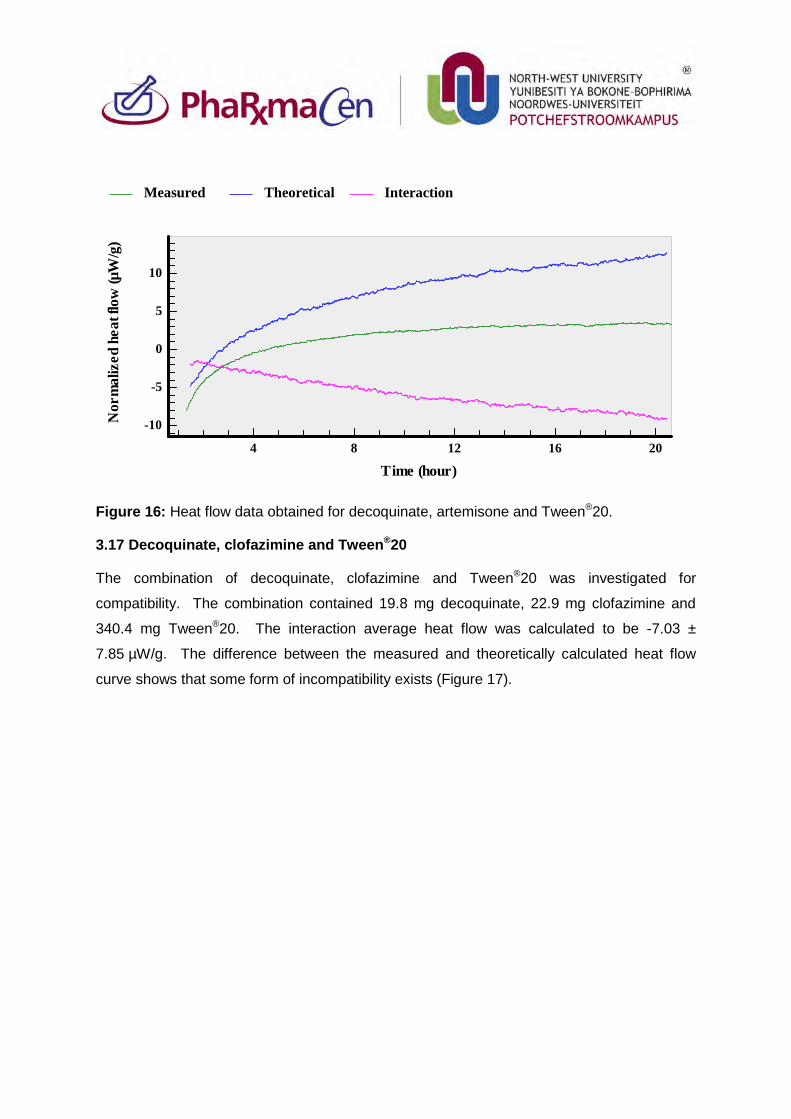
Figure 16: Heat flow data obtained for decoquinate, artemisone and Tween®20.
3.17 Decoquinate, clofazimine and Tween®20
The combination of decoquinate, clofazimine and Tween®20 was investigated for
compatibility. The combination contained 19.8 mg decoquinate, 22.9 mg clofazimine and
340.4 mg Tween®20. The interaction average heat flow was calculated to be -7.03 ±
7.85 µW/g. The difference between the measured and theoretically calculated heat flow
curve shows that some form of incompatibility exists (Figure 17).
Measured Theoretical Interaction
Nor
mal
ized
hea
t flo
w (µ
W/g
)
Time (hour)4 8 12 16 20
-10
-5
0
5
10
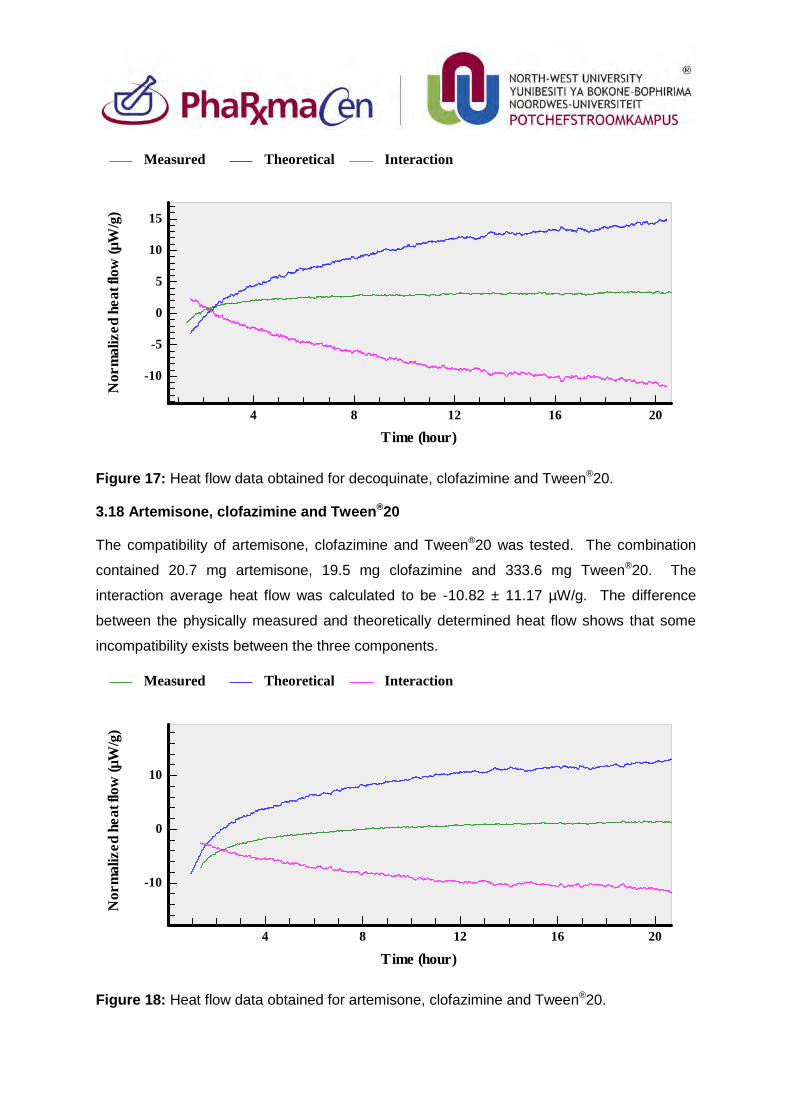
Figure 17: Heat flow data obtained for decoquinate, clofazimine and Tween®20.
3.18 Artemisone, clofazimine and Tween®20
The compatibility of artemisone, clofazimine and Tween®20 was tested. The combination
contained 20.7 mg artemisone, 19.5 mg clofazimine and 333.6 mg Tween®20. The
interaction average heat flow was calculated to be -10.82 ± 11.17 µW/g. The difference
between the physically measured and theoretically determined heat flow shows that some
incompatibility exists between the three components.
Figure 18: Heat flow data obtained for artemisone, clofazimine and Tween®20.
Measured Theoretical Interaction
Nor
mal
ized
hea
t flo
w (µ
W/g
)
Time (hour)4 8 12 16 20
-10
-5
0
5
10
15
Measured Theoretical Interaction
Nor
mal
ized
hea
t flo
w (µ
W/g
)
Time (hour)4 8 12 16 20
-10
0
10
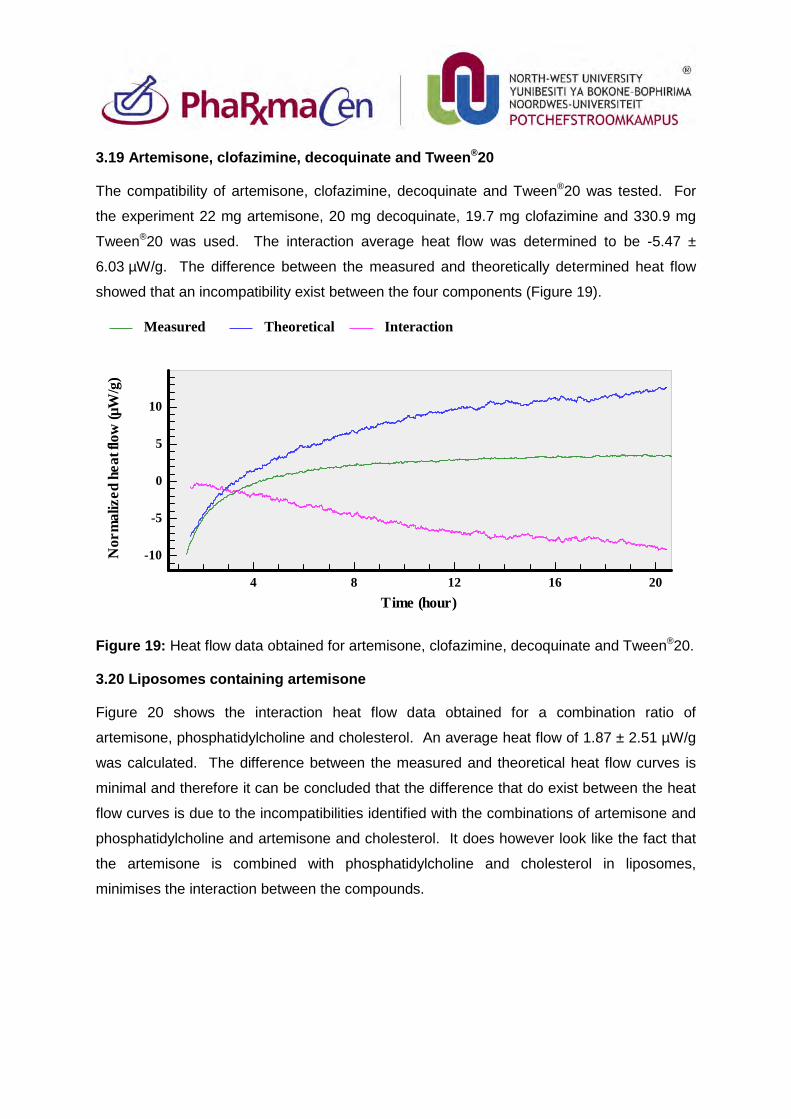
3.19 Artemisone, clofazimine, decoquinate and Tween®20
The compatibility of artemisone, clofazimine, decoquinate and Tween®20 was tested. For
the experiment 22 mg artemisone, 20 mg decoquinate, 19.7 mg clofazimine and 330.9 mg
Tween®20 was used. The interaction average heat flow was determined to be -5.47 ±
6.03 µW/g. The difference between the measured and theoretically determined heat flow
showed that an incompatibility exist between the four components (Figure 19).
Figure 19: Heat flow data obtained for artemisone, clofazimine, decoquinate and Tween®20.
3.20 Liposomes containing artemisone
Figure 20 shows the interaction heat flow data obtained for a combination ratio of
artemisone, phosphatidylcholine and cholesterol. An average heat flow of 1.87 ± 2.51 µW/g
was calculated. The difference between the measured and theoretical heat flow curves is
minimal and therefore it can be concluded that the difference that do exist between the heat
flow curves is due to the incompatibilities identified with the combinations of artemisone and
phosphatidylcholine and artemisone and cholesterol. It does however look like the fact that
the artemisone is combined with phosphatidylcholine and cholesterol in liposomes,
minimises the interaction between the compounds.
Measured Theoretical Interaction
Nor
mal
ized
hea
t flo
w (µ
W/g
)
Time (hour)4 8 12 16 20
-10
-5
0
5
10
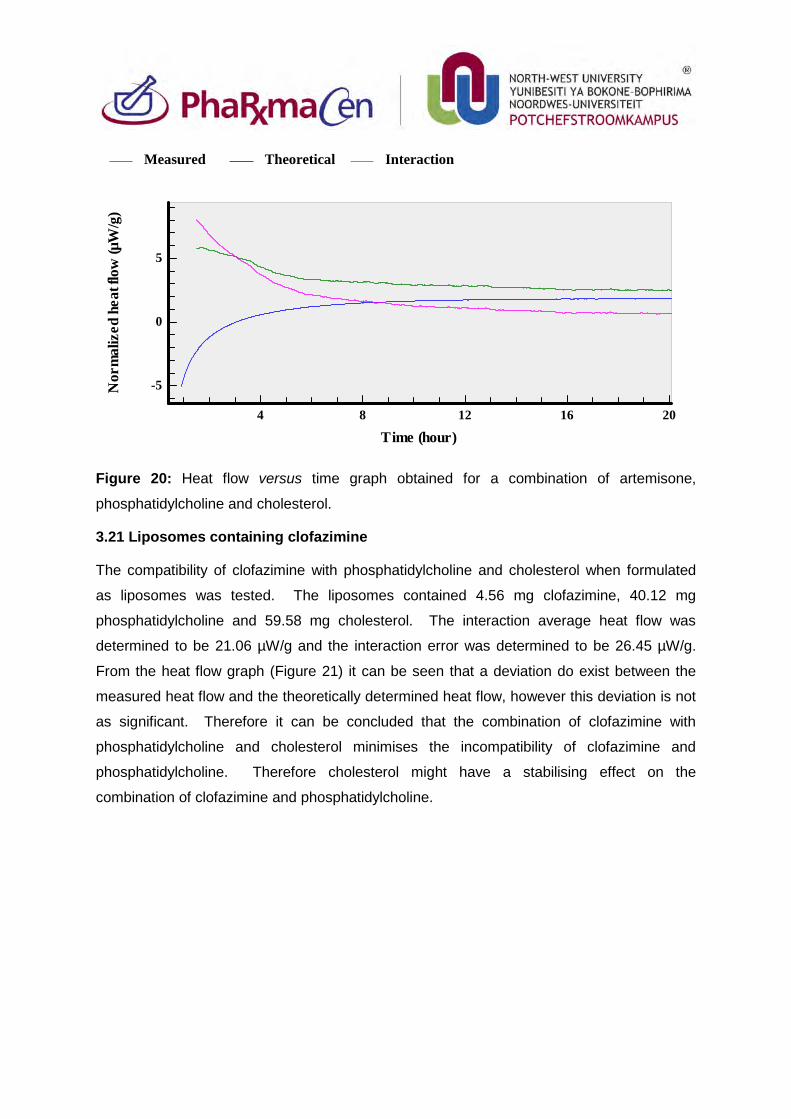
Figure 20: Heat flow versus time graph obtained for a combination of artemisone,
phosphatidylcholine and cholesterol.
3.21 Liposomes containing clofazimine
The compatibility of clofazimine with phosphatidylcholine and cholesterol when formulated
as liposomes was tested. The liposomes contained 4.56 mg clofazimine, 40.12 mg
phosphatidylcholine and 59.58 mg cholesterol. The interaction average heat flow was
determined to be 21.06 µW/g and the interaction error was determined to be 26.45 µW/g.
From the heat flow graph (Figure 21) it can be seen that a deviation do exist between the
measured heat flow and the theoretically determined heat flow, however this deviation is not
as significant. Therefore it can be concluded that the combination of clofazimine with
phosphatidylcholine and cholesterol minimises the incompatibility of clofazimine and
phosphatidylcholine. Therefore cholesterol might have a stabilising effect on the
combination of clofazimine and phosphatidylcholine.
Measured Theoretical Interaction
Nor
mal
ized
hea
t flo
w (µ
W/g
)
Time (hour)4 8 12 16 20
-5
0
5
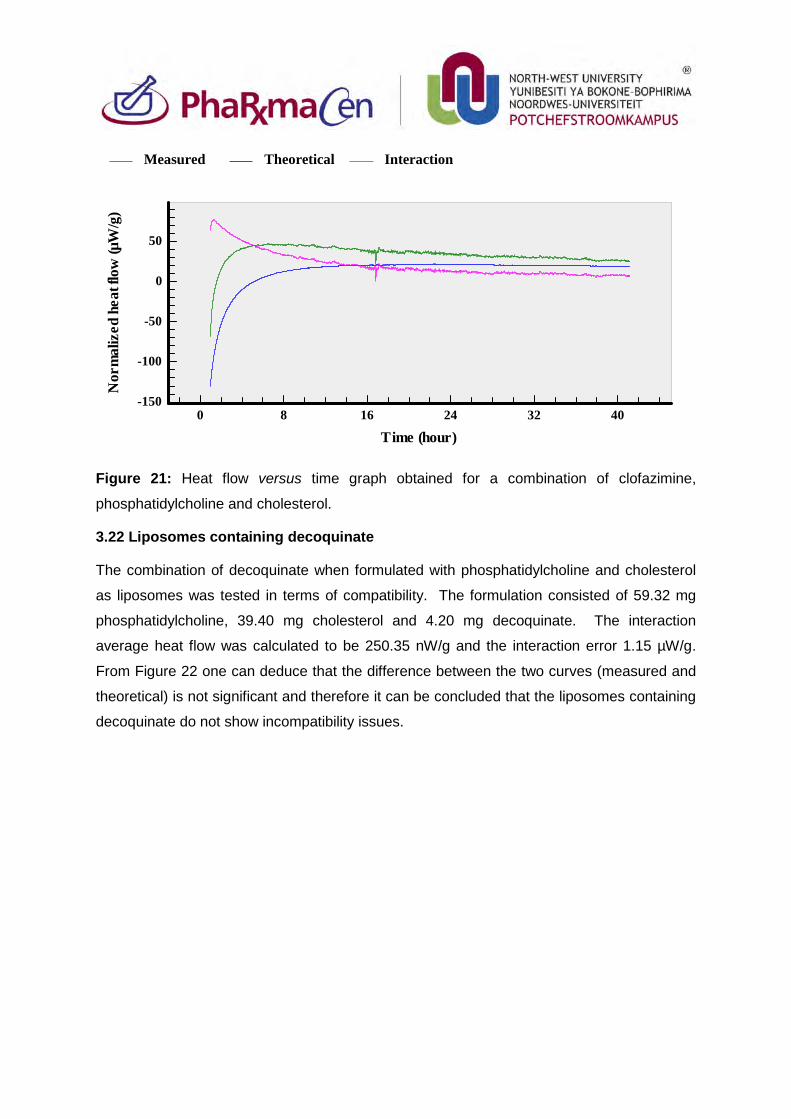
Figure 21: Heat flow versus time graph obtained for a combination of clofazimine,
phosphatidylcholine and cholesterol.
3.22 Liposomes containing decoquinate
The combination of decoquinate when formulated with phosphatidylcholine and cholesterol
as liposomes was tested in terms of compatibility. The formulation consisted of 59.32 mg
phosphatidylcholine, 39.40 mg cholesterol and 4.20 mg decoquinate. The interaction
average heat flow was calculated to be 250.35 nW/g and the interaction error 1.15 µW/g.
From Figure 22 one can deduce that the difference between the two curves (measured and
theoretical) is not significant and therefore it can be concluded that the liposomes containing
decoquinate do not show incompatibility issues.
Measured Theoretical Interaction
Nor
mal
ized
hea
t flo
w (µ
W/g
)
Time (hour)0 8 16 24 32 40
-150
-100
-50
0
50
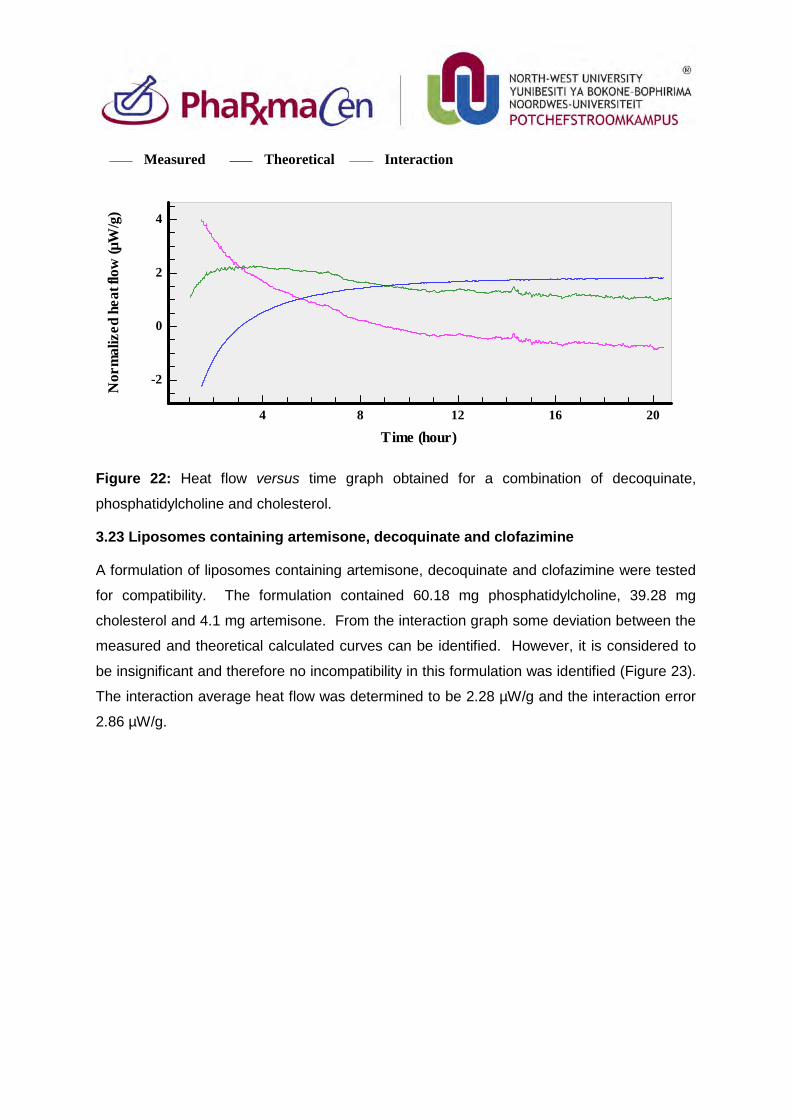
Figure 22: Heat flow versus time graph obtained for a combination of decoquinate,
phosphatidylcholine and cholesterol.
3.23 Liposomes containing artemisone, decoquinate and clofazimine
A formulation of liposomes containing artemisone, decoquinate and clofazimine were tested
for compatibility. The formulation contained 60.18 mg phosphatidylcholine, 39.28 mg
cholesterol and 4.1 mg artemisone. From the interaction graph some deviation between the
measured and theoretical calculated curves can be identified. However, it is considered to
be insignificant and therefore no incompatibility in this formulation was identified (Figure 23).
The interaction average heat flow was determined to be 2.28 µW/g and the interaction error
2.86 µW/g.
Measured Theoretical Interaction
Nor
mal
ized
hea
t flo
w (µ
W/g
)
Time (hour)4 8 12 16 20
-2
0
2
4
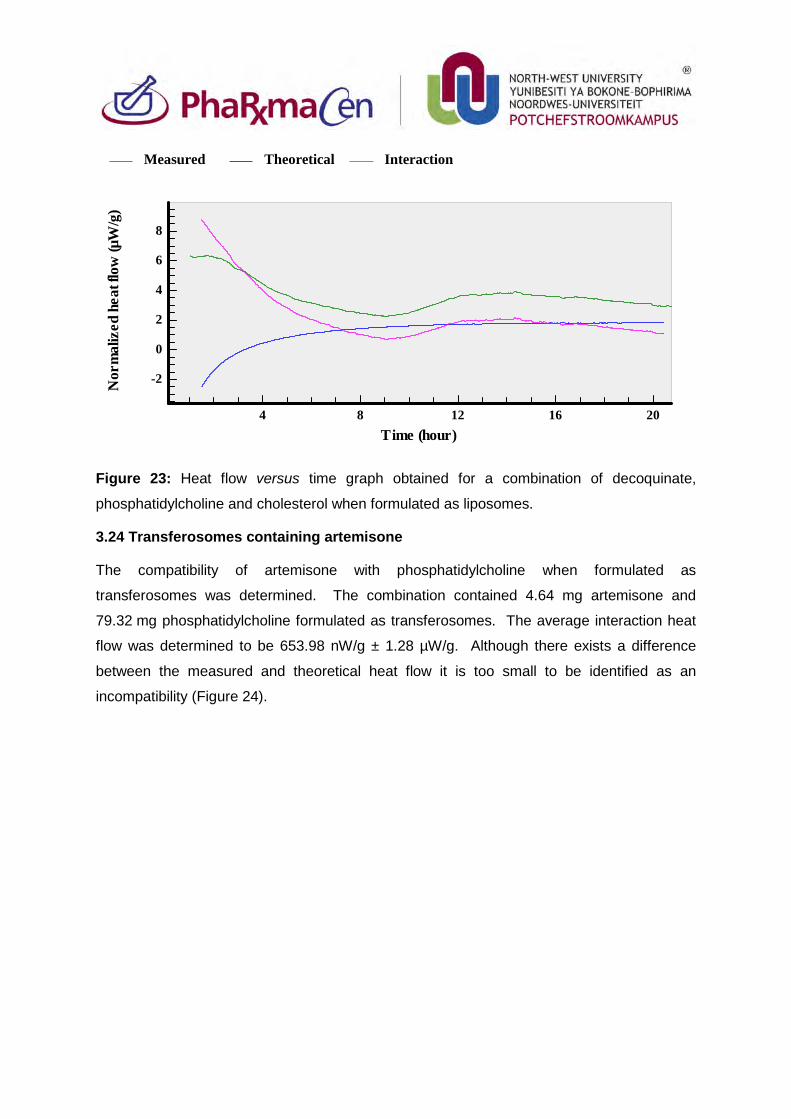
Figure 23: Heat flow versus time graph obtained for a combination of decoquinate,
phosphatidylcholine and cholesterol when formulated as liposomes.
3.24 Transferosomes containing artemisone
The compatibility of artemisone with phosphatidylcholine when formulated as
transferosomes was determined. The combination contained 4.64 mg artemisone and
79.32 mg phosphatidylcholine formulated as transferosomes. The average interaction heat
flow was determined to be 653.98 nW/g ± 1.28 µW/g. Although there exists a difference
between the measured and theoretical heat flow it is too small to be identified as an
incompatibility (Figure 24).
Measured Theoretical Interaction
Nor
mal
ized
hea
t flo
w (µ
W/g
)
Time (hour)4 8 12 16 20
-2
0
2
4
6
8
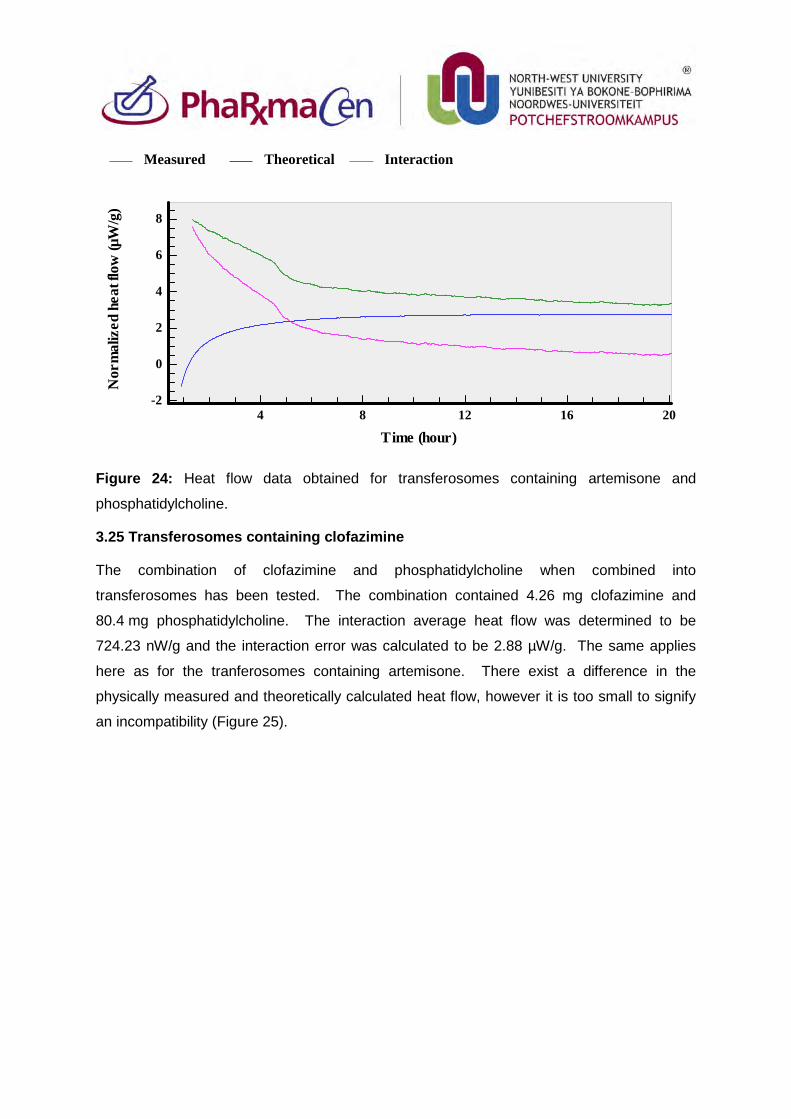
Figure 24: Heat flow data obtained for transferosomes containing artemisone and
phosphatidylcholine.
3.25 Transferosomes containing clofazimine
The combination of clofazimine and phosphatidylcholine when combined into
transferosomes has been tested. The combination contained 4.26 mg clofazimine and
80.4 mg phosphatidylcholine. The interaction average heat flow was determined to be
724.23 nW/g and the interaction error was calculated to be 2.88 µW/g. The same applies
here as for the tranferosomes containing artemisone. There exist a difference in the
physically measured and theoretically calculated heat flow, however it is too small to signify
an incompatibility (Figure 25).
Measured Theoretical Interaction
Nor
mal
ized
hea
t flo
w (µ
W/g
)
Time (hour)4 8 12 16 20
-2
0
2
4
6
8
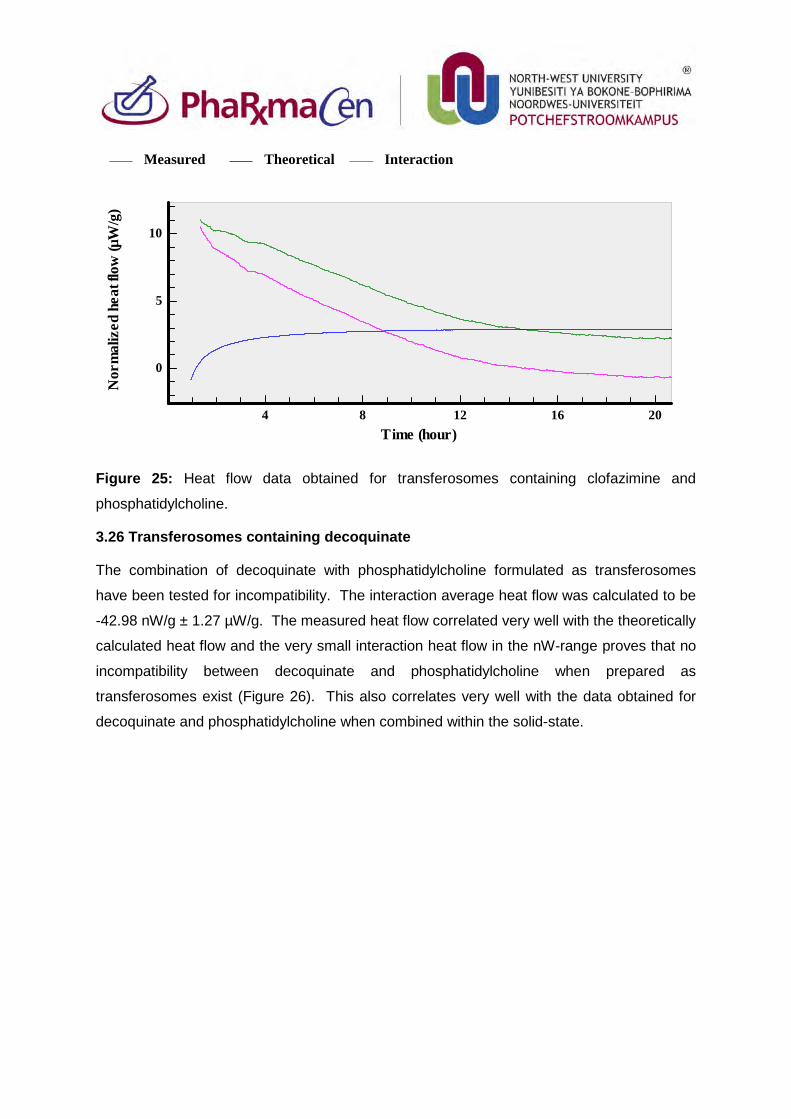
Figure 25: Heat flow data obtained for transferosomes containing clofazimine and
phosphatidylcholine.
3.26 Transferosomes containing decoquinate
The combination of decoquinate with phosphatidylcholine formulated as transferosomes
have been tested for incompatibility. The interaction average heat flow was calculated to be
-42.98 nW/g ± 1.27 µW/g. The measured heat flow correlated very well with the theoretically
calculated heat flow and the very small interaction heat flow in the nW-range proves that no
incompatibility between decoquinate and phosphatidylcholine when prepared as
transferosomes exist (Figure 26). This also correlates very well with the data obtained for
decoquinate and phosphatidylcholine when combined within the solid-state.
Measured Theoretical Interaction
Nor
mal
ized
hea
t flo
w (µ
W/g
)
Time (hour)4 8 12 16 20
0
5
10

Figure 26: Heat flow data obtained for transferosomes containing decoquinate and
phosphatidylcholine.
3.27 Transferosomes containing artemisone, decoquinate and clofazimine
Transferosomes containing artemisone, decoquinate and clofazimine were tested for
compatibility. The formulation contained 79.4 mg phosphatidylcholine, 4.6 mg artemisone,
4.58 mg decoquinate and 4.42 mg clofazimine. Figure 27 shows the heat flow graphs
obtained for this combination. From all the transferosome combinations this combination
showed the greatest difference between the measured and theoretically calculated heat flow
curves. The interaction heat flow was calculated to be 4.0 µW/g and the interaction error
was determined to be 4.5 µW/g. Although a difference was observed between the
measured and theoretical calculated heat flow curves, it was too insignificant to account for
an incompatibility. It was therefore concluded that within the transferosome formulation
containing all three drugs no incompatibility was observed.
Measured Theoretical Interaction
Nor
mal
ized
hea
t flo
w (µ
W/g
)
Time (hour)0 4 8 12 16 20
-10
-5
0
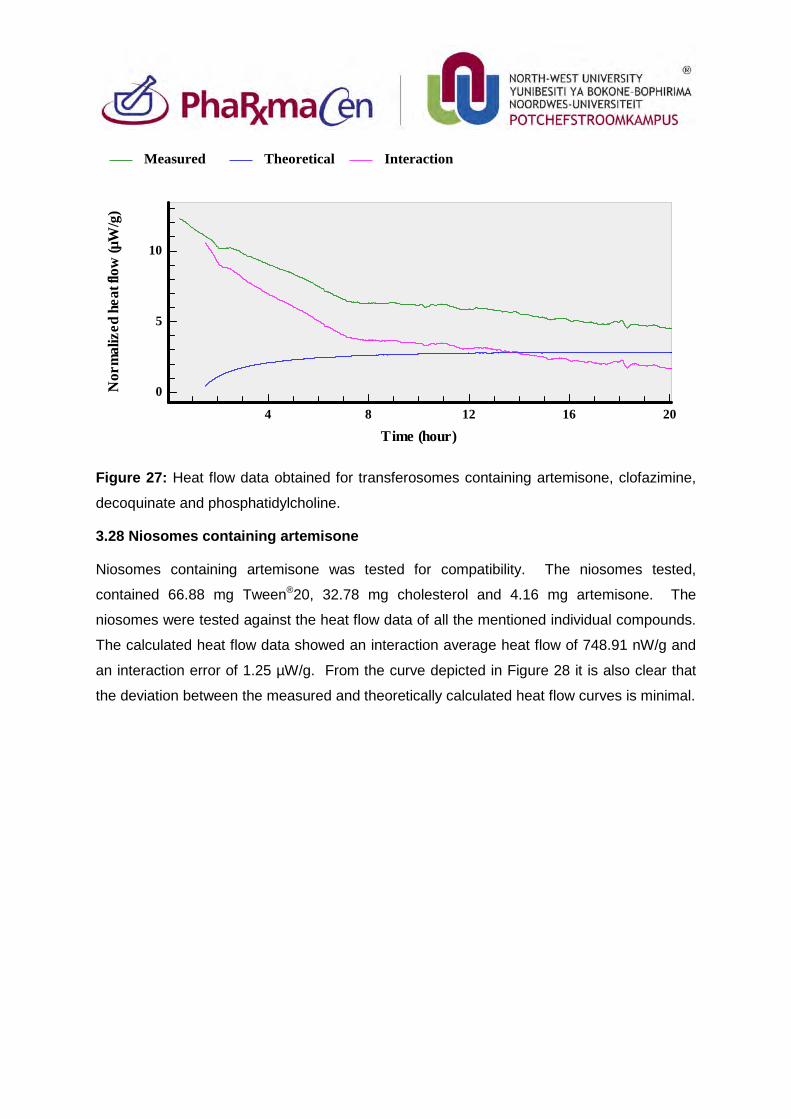
Figure 27: Heat flow data obtained for transferosomes containing artemisone, clofazimine,
decoquinate and phosphatidylcholine.
3.28 Niosomes containing artemisone
Niosomes containing artemisone was tested for compatibility. The niosomes tested,
contained 66.88 mg Tween®20, 32.78 mg cholesterol and 4.16 mg artemisone. The
niosomes were tested against the heat flow data of all the mentioned individual compounds.
The calculated heat flow data showed an interaction average heat flow of 748.91 nW/g and
an interaction error of 1.25 µW/g. From the curve depicted in Figure 28 it is also clear that
the deviation between the measured and theoretically calculated heat flow curves is minimal.
Measured Theoretical Interaction
Nor
mal
ized
hea
t flo
w (µ
W/g
)
Time (hour)4 8 12 16 20
0
5
10
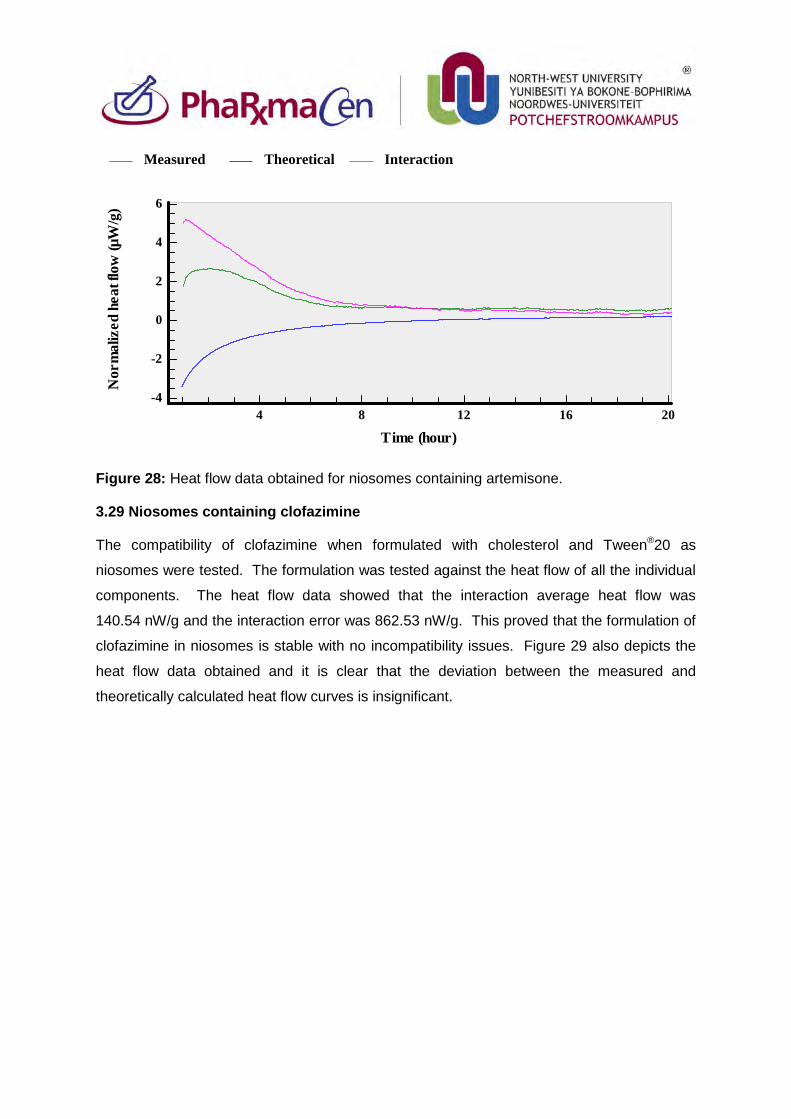
Figure 28: Heat flow data obtained for niosomes containing artemisone.
3.29 Niosomes containing clofazimine
The compatibility of clofazimine when formulated with cholesterol and Tween®20 as
niosomes were tested. The formulation was tested against the heat flow of all the individual
components. The heat flow data showed that the interaction average heat flow was
140.54 nW/g and the interaction error was 862.53 nW/g. This proved that the formulation of
clofazimine in niosomes is stable with no incompatibility issues. Figure 29 also depicts the
heat flow data obtained and it is clear that the deviation between the measured and
theoretically calculated heat flow curves is insignificant.
Measured Theoretical Interaction
Nor
mal
ized
hea
t flo
w (µ
W/g
)
Time (hour)4 8 12 16 20
-4
-2
0
2
4
6
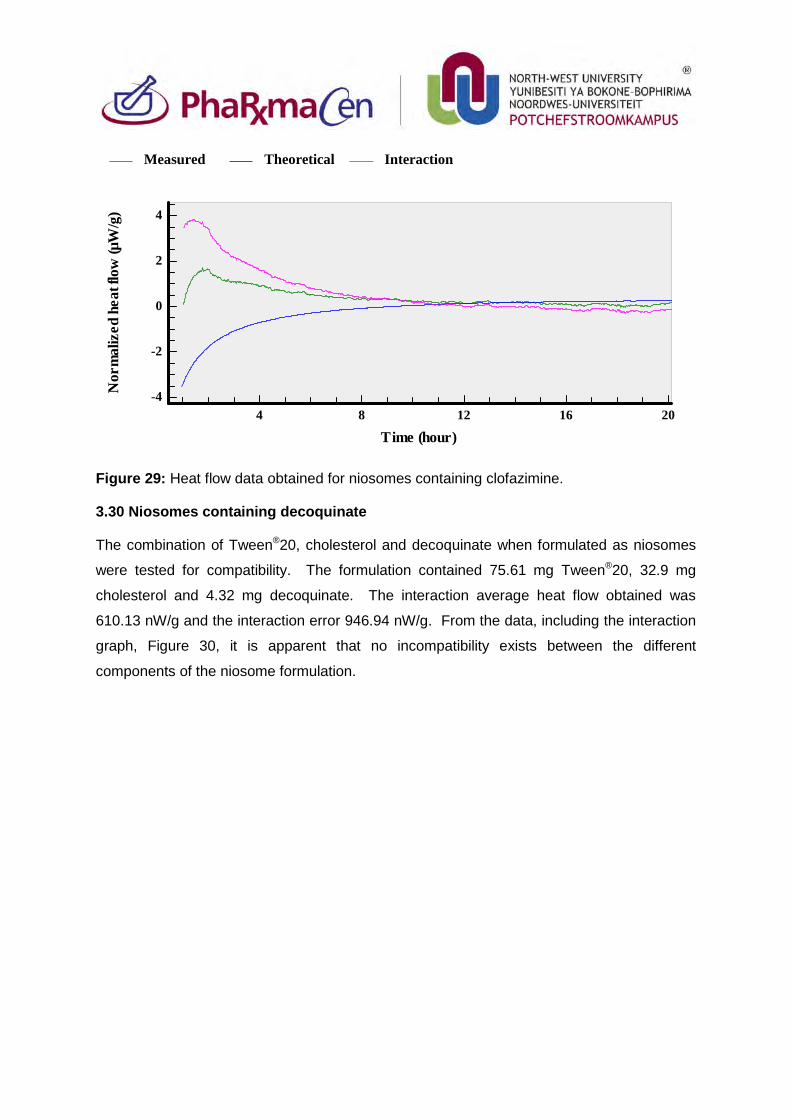
Figure 29: Heat flow data obtained for niosomes containing clofazimine.
3.30 Niosomes containing decoquinate
The combination of Tween®20, cholesterol and decoquinate when formulated as niosomes
were tested for compatibility. The formulation contained 75.61 mg Tween®20, 32.9 mg
cholesterol and 4.32 mg decoquinate. The interaction average heat flow obtained was
610.13 nW/g and the interaction error 946.94 nW/g. From the data, including the interaction
graph, Figure 30, it is apparent that no incompatibility exists between the different
components of the niosome formulation.
Measured Theoretical Interaction
Nor
mal
ized
hea
t flo
w (µ
W/g
)
Time (hour)4 8 12 16 20
-4
-2
0
2
4
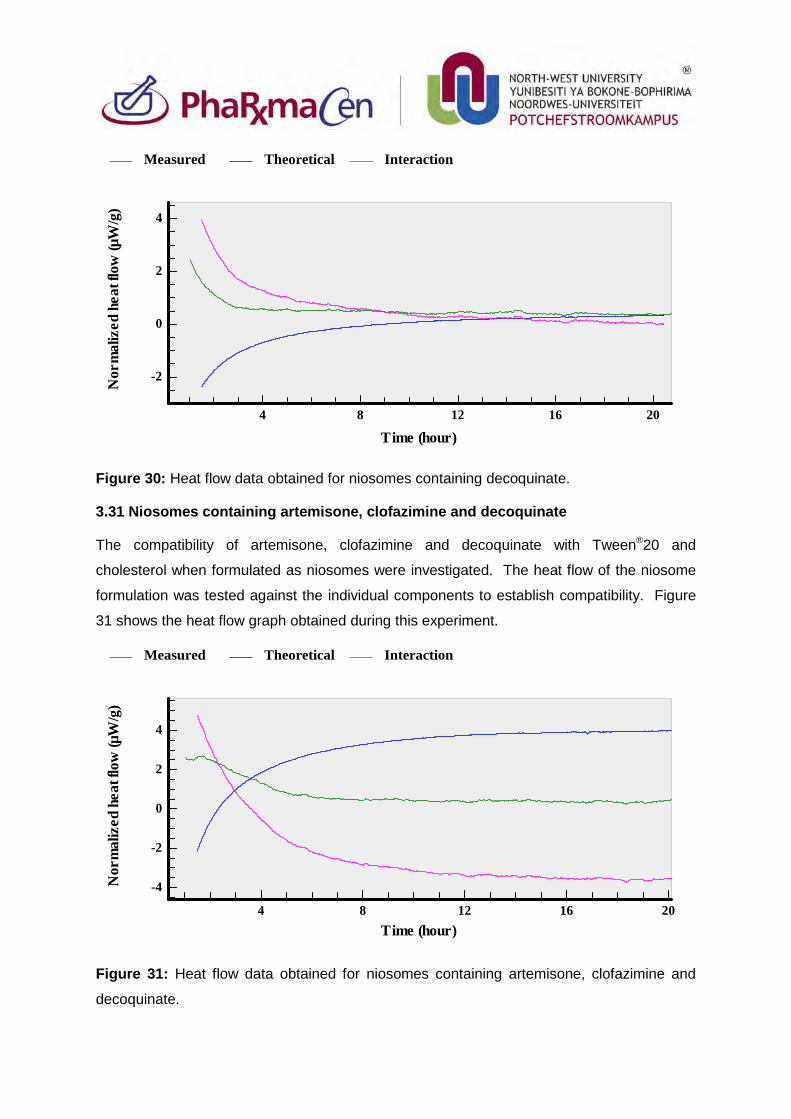
Figure 30: Heat flow data obtained for niosomes containing decoquinate.
3.31 Niosomes containing artemisone, clofazimine and decoquinate
The compatibility of artemisone, clofazimine and decoquinate with Tween®20 and
cholesterol when formulated as niosomes were investigated. The heat flow of the niosome
formulation was tested against the individual components to establish compatibility. Figure
31 shows the heat flow graph obtained during this experiment.
Figure 31: Heat flow data obtained for niosomes containing artemisone, clofazimine and
decoquinate.
Measured Theoretical Interaction
Nor
mal
ized
hea
t flo
w (µ
W/g
)
Time (hour)4 8 12 16 20
-2
0
2
4
Measured Theoretical Interaction
Nor
mal
ized
hea
t flo
w (µ
W/g
)
Time (hour)4 8 12 16 20
-4
-2
0
2
4
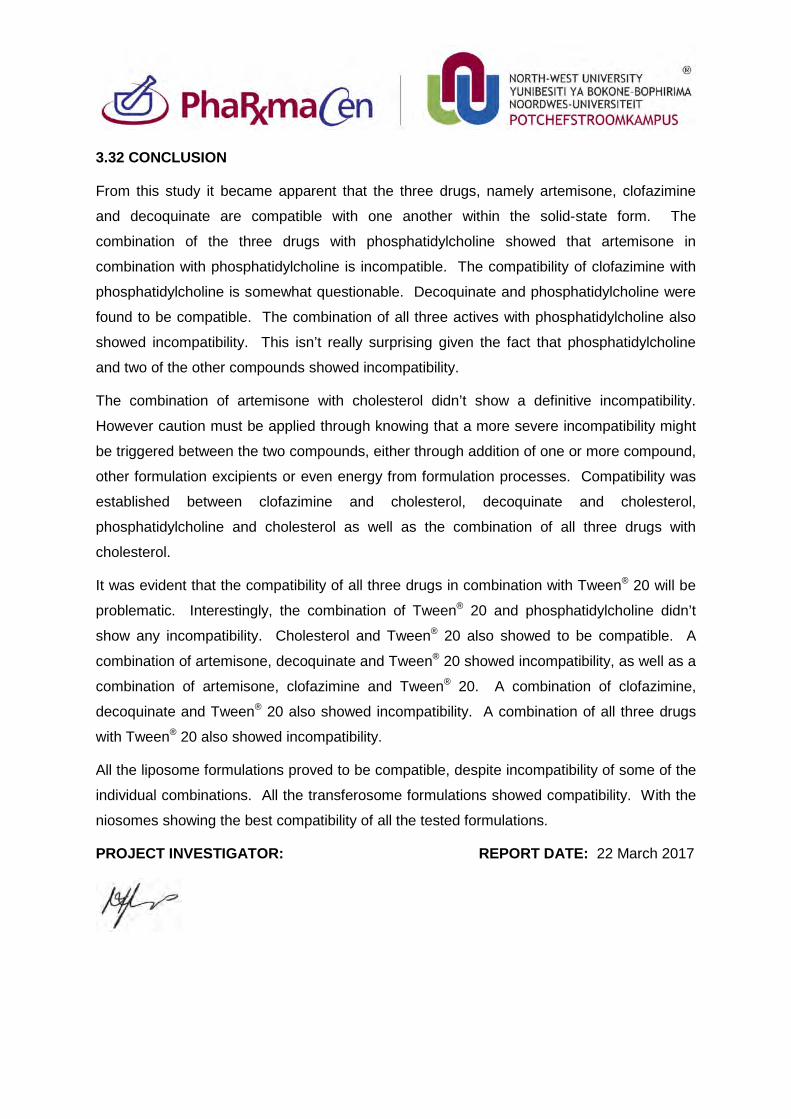
3.32 CONCLUSION
From this study it became apparent that the three drugs, namely artemisone, clofazimine
and decoquinate are compatible with one another within the solid-state form. The
combination of the three drugs with phosphatidylcholine showed that artemisone in
combination with phosphatidylcholine is incompatible. The compatibility of clofazimine with
phosphatidylcholine is somewhat questionable. Decoquinate and phosphatidylcholine were
found to be compatible. The combination of all three actives with phosphatidylcholine also
showed incompatibility. This isn’t really surprising given the fact that phosphatidylcholine
and two of the other compounds showed incompatibility.
The combination of artemisone with cholesterol didn’t show a definitive incompatibility.
However caution must be applied through knowing that a more severe incompatibility might
be triggered between the two compounds, either through addition of one or more compound,
other formulation excipients or even energy from formulation processes. Compatibility was
established between clofazimine and cholesterol, decoquinate and cholesterol,
phosphatidylcholine and cholesterol as well as the combination of all three drugs with
cholesterol.
It was evident that the compatibility of all three drugs in combination with Tween® 20 will be
problematic. Interestingly, the combination of Tween® 20 and phosphatidylcholine didn’t
show any incompatibility. Cholesterol and Tween® 20 also showed to be compatible. A
combination of artemisone, decoquinate and Tween® 20 showed incompatibility, as well as a
combination of artemisone, clofazimine and Tween® 20. A combination of clofazimine,
decoquinate and Tween® 20 also showed incompatibility. A combination of all three drugs
with Tween® 20 also showed incompatibility.
All the liposome formulations proved to be compatible, despite incompatibility of some of the
individual combinations. All the transferosome formulations showed compatibility. With the
niosomes showing the best compatibility of all the tested formulations.
PROJECT INVESTIGATOR: REPORT DATE: 22 March 2017
107
Annexure C
LIPOSOMES, NIOSOMES AND TRANSFEROSOMES
UTILISED FOR TOPICAL DRUG DELIVERY
C.1. INTRODUCTION During the past few decades the skin as delivery route has become increasingly prevalent, mainly
due to the circumvention of the hepatic fist pass effect. Active pharmaceutical ingredients (APIs)
can be delivered either topically and/or transdermally via the skin, depending on the treatment
strategy. There are, however, also a few obstacles to overcome when formulating for topical
application since the skin’s primary function is to create a boundary between the body and the
surrounding environment, being highly selective as to what will pass through it (Dragicevic-Curic
& Maibach, 2015; Tavano et al., 2013). Since skin inhibits the penetration of most compounds,
vesicles have been investigated in more detail to increase delivery of APIs to the skin (El
Maghraby et al., 2000).
C.2. BACKGROUND The skin is a complex organ which can mainly be divided into the epidermis, dermis and
hypodermis. When focussing on topical delivery of an API, the epidermis is of utmost importance.
The stratum corneum (SC) is the outermost layer of the epidermis and is responsible for the
barrier function of the skin (Gillet et al., 2011; Tavano et al., 2013). The SC consists of layers of
corneocytes, which are non-living cells that have a cornified envelope instead of a plasma
membrane. Corneocytes are filled with keratin filaments and are scattered in a lipid-enriched
extracellular matrix also containing protein/peptide components. This extracellular matrix,
ordered into lamellae parallel to the flat surface of the corneocytes, is the only continuous section
in the SC and is therefore likely to be central to the skin’s barrier function (Dragicevic-Curic &
Maibach, 2015).
For delivery to the skin, an API must adhere to two key rules, namely it must have a molecular
mass of less than 500 g/mol and a partition coefficient (log P) of 1–3, though other factors such
as solubility, melting point and molecular volume may also influence skin permeation. Tavano et
al. (2013) established that with vesicles, skin permeation will also be influenced by composition,
API solubility in the matrix and viscosity. This confirms that it will be quite a challenge to deliver
specific compounds into, and through the skin. For this reason the focus has been placed on the
use of delivery systems to promote skin permeation. Delivery systems, such as vesicles
(Figure C.1), were chosen for this study, since they are capable of encapsulating both hydrophilic
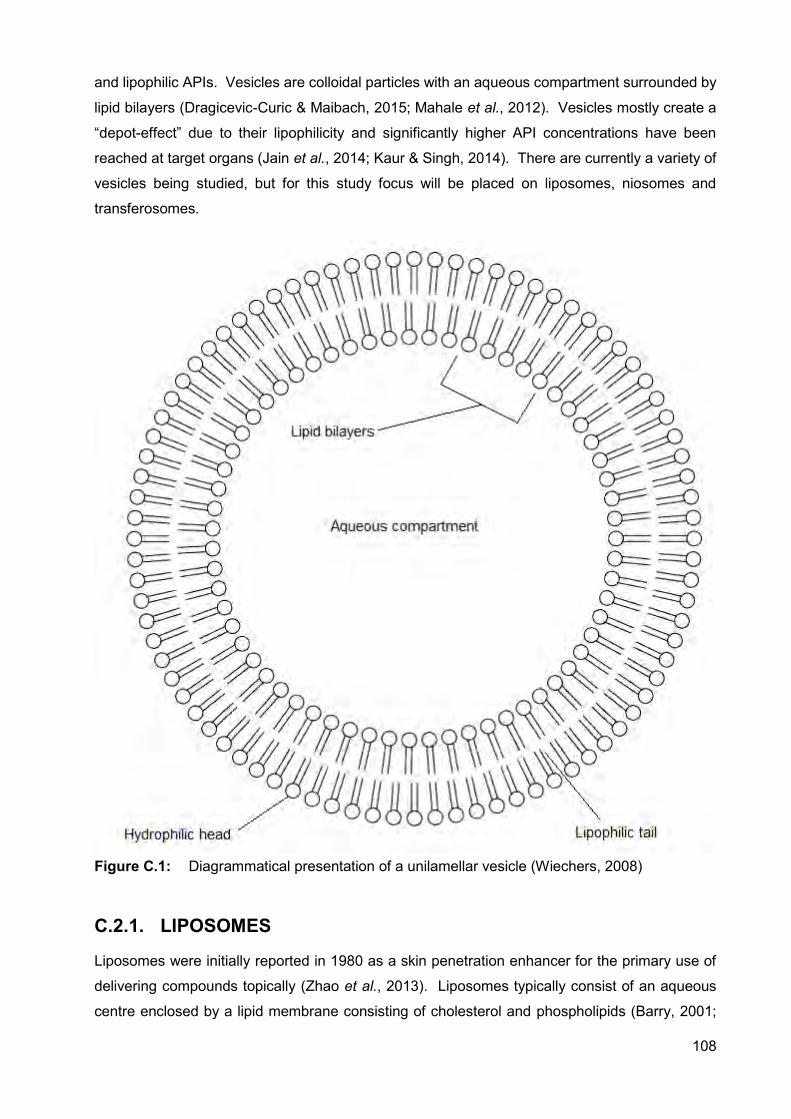
108
and lipophilic APIs. Vesicles are colloidal particles with an aqueous compartment surrounded by
lipid bilayers (Dragicevic-Curic & Maibach, 2015; Mahale et al., 2012). Vesicles mostly create a
“depot-effect” due to their lipophilicity and significantly higher API concentrations have been
reached at target organs (Jain et al., 2014; Kaur & Singh, 2014). There are currently a variety of
vesicles being studied, but for this study focus will be placed on liposomes, niosomes and
transferosomes.
Figure C.1: Diagrammatical presentation of a unilamellar vesicle (Wiechers, 2008)
C.2.1. LIPOSOMES
Liposomes were initially reported in 1980 as a skin penetration enhancer for the primary use of
delivering compounds topically (Zhao et al., 2013). Liposomes typically consist of an aqueous
centre enclosed by a lipid membrane consisting of cholesterol and phospholipids (Barry, 2001;
109
Kaur & Singh, 2014; New, 1990). They can entrap compounds both within the aqueous
compartment, as well as in the lipid membrane, improving the efficacy and lowering toxicity of
some APIs, including clofazimine (Isacchi et al., 2012; Kaur & Singh, 2014; Vanniasinghe et al.,
2009). The liposome membrane is similar to the lipid portion of natural cell membranes and can
be constructed of natural components, rendering liposomes a safe and effective vehicle for
medical applications (New, 1990).
The main components of liposomes are cholesterol and phospholipids. Phospholipids are the
major components of biological membranes. Phosphatidyl choline (PC) molecules, also called
lecithin, are the most common phospholipids, which are amphiphatic molecules with a pair of
hydrophobic hydrocarbon chains linked with a hydrophilic polar head-group (phosphocholine)
through a glycerol bridge. In an aqueous medium the PC molecules align themselves in planar
bilayer sheets to minimise adverse interactions, which are entirely eliminated when these sheets
fold onto themselves to form closed sealed vesicles. PC can be derived from natural and
synthetic sources, though they are more readily extracted from egg yolk and soybeans. It is used
as the main phospholipid in liposomes since it is chemically inert and has lower cost implications
relative to other phospholipids (New, 1990).
Cholesterol, on the other hand, does not form bilayer structures by itself; nonetheless, it can be
incorporated into phospholipid membranes in high concentrations. Cholesterol to PC ratios can
be 1:1 or 2:1, yet ratios in natural membranes vary from 0.1–1. It is an amphiphatic molecule
which attaches to the membrane with its hydroxyl group towards the aqueous surface and the
aliphatic chain aligned parallel to the acyl chains in the centre of the bilayer. Cholesterol has a
minimal effect on the position of the main transition temperature; however, with increasing
concentrations a phase transition is eliminated altogether, thus, reducing the enthalpy of phase
change to zero at a 1:1 ratio. This alters the fluidity of the membrane both above and below the
phase transition temperature. Below this temperature the membrane packing is weakened and
fluidity is increased, whereas above this temperature the membranes are condensed through
reduction in freedom of the acyl chains and fluidity is decreased. In short, higher concentrations
of cholesterol decrease membrane permeability at temperatures higher than the main transition
temperature. Egg yolk lecithin membranes (used in this study) have a transition temperature of -
15°C to -7°C, compared to membranes from mammalian sources that range from 0–40°C (New,
1990).
Liposome membranes are semi-permeable, thus, the rate of diffusion of molecules and ions
across the membrane differs substantially. Molecules, which are highly soluble in organic and
aqueous, media will pass practically unrestricted through the membrane, whereas polar solutes
(e.g. glucose) and compounds with a higher molecular weight will only pass through the
membrane very slowly. As a result of the semi-permeable nature of the phospholipid membrane,
110
a concentration difference of the solute between both sides of the membrane can cause osmotic
pressure which will lead to accumulation of water molecules on one side of the membrane. This
can cause the liposome to swell if higher concentrations of solute are entrapped in the vesicle
surrounded by lower concentrations in the aqueous phase. Swelling of the liposome will increase
the area of the membrane, which in turn will significantly increase the spacing between adjacent
phospholipid molecules, and accelerated leakage through the membrane can subsequently
occur. Furthermore, complete rupturing of the vesicle may sometimes occur, which will cause
total content loss of the liposome into the aqueous phase before the liposome re-seals again
(New, 1990).
Liposomes are classified according to size and shape since they range in size from 25 nm to even
1000 nm or larger (Isacchi et al., 2012; Manconi et al., 2011; Vanniasinghe et al., 2009; Zhao et
al., 2013), and they can be bound by a single bilayer membrane or multiple concentric membrane
lamellae stacked on one another. Multilamellar vesicles (MLVs) range from 100–1000 nm in
diameter and typically comprise five or more concentric lamellae. Small unilamellar vesicles
(SUVs) are defined as liposomes at the lowest limit of size for phospholipid vesicles and are 15–
25 nm in diameter, whereas large unilamellar vesicles (LUVs) have a diameter of approximately
1 000 nm (New, 1990; Vanniasinghe et al., 2009).
Liposomes utilised in the topical/transdermal delivery of APIs have gained significant interest,
since their membrane structure is similar to natural membranes as obtained in the skin, thus
minimising obstruction from the skin. Liposomes are expected however to remain at the surface
of the skin, and dehydrate themselves where after they fuse with the skin lipids and release their
entrapped content (Barry, 2001). Topical delivery is therefore more likely than transdermal
delivery, though some cases of transport processes have been reported depending on the
formulation (El Maghraby et al., 2000).
C.2.2. NIOSOMES
Niosomes, similar to liposomes, have attracted immense interest for API delivery, since they are
biodegradable, non-toxic, amphiphilic and are penetration enhancers effective in modulating API
release properties (Agarwal et al., 2001). Niosomes have been investigated for their ability to
enhance API transport across the SC and improving the retention time of APIs in skin tissues,
thus reducing systemic absorption. They were first introduced as an element of cosmetic
applications developed by L’Oreal (Mahale et al., 2012; Mali et al., 2013). Their size ranges in
diameter from 50–15 000 nm, depending on the production method and composition. Niosomes
can also be classified as unilamellar or multilamellar vesicles (Agarwal et al., 2001; Jain et al.,
2014; Kaur & Singh, 2014; Mali et al., 2013; Sharma et al., 2009; Tavano et al., 2013).
111
Typically, niosomes consist of non-ionic surfactants and may or may not contain cholesterol, while
adding cholesterol results in less leakage from the vesicles and providing rigidity to the bilayers
(Barry, 2001; Kumar & Rajeshwarrao, 2011; Mahale et al., 2012; Varun et al., 2012). Surfactants
that can be used include Pluronic L64 (non-ionic), Aerosol OT (anionic), Spans (non-ionic) and
Tweens (non-ionic), although uncharged molecules are preferred for dermal applications, as
neutral compounds will permeate the skin barrier more readily. It was also found that the charge
of the surfactant influences the size of the vesicles (Tavano et al., 2013). Nanometer sized
niosomes were mainly documented when Span 60, Span 20 and Tween 20 were used as
surfactants (Mali et al., 2013). The non-ionic surfactants contribute most of the desirable
properties of niosomes, which include the ability to maintain pH up to physiological pH as well as
improving the bioavailability of many APIs through inhibiting p-glycoprotein (Mahale et al., 2012).
They can encapsulate lipophilic as well as hydrophilic APIs and protect these APIs against
enzymatic and acidic degradation (Sharma et al., 2009).
Niosomes have a few advantages over liposomes which include the fact that they are structurally
and chemically more stable, have lower production costs and they do not require special
conditions for protection and storage (Kaur & Singh, 2014; Verun et al., 2012). They are
osmotically active and are more flexible in structure (Jain et al, 2014). They also significantly
enhance cutaneous API retention when compared to the commercial formulation RetinA® and
phosphatidylcholine liposomes (Manconi et al., 2011).
C.2.3. TRANSFEROSOMES
Liposomes and niosomes are not suitable for transdermal delivery of APIs due to their poor skin
permeability, as well as their aggregation and fusion tendency in skin tissue. This led to the
production of transferosomes (meaning to carry across), which can reversibly alter their
membrane structure to enable them to penetrate through narrow skin pores (Gillet et al., 2011;
Jain et al., 2014). The first generation transferosomes were introduced in 1992, which can also
be termed highly deformable, elastic liposomes, consisting of phospholipids and a single chain
co-surfactant. The co-surfactant acts as an “edge activator” by destabilising the lipid bilayer and
thus increasing the deformability (Gillet et al., 2011; Kumar & Rajeshwarrao, 2011; Manconi et
al., 2012). Co-surfactants that can be used include sodium cholate, sodium deoxycholate,
Tween 80 and Span 80 (El Maghraby et al., 2000; Jain et al., 2014).
Barry (2001) mentioned that vesicle sizes of 200–300 nm can pass through intact skin due to their
ultra-deformability. The diameter of transferosomes is considerably smaller than that of
conventional liposomes and can vary from 90–340 nm (Gillet et al., 2011; Jain et al., 2014). These
vesicles can be used for topical and transdermal API delivery and can efficiently entrap APIs of
both low and high molecular weight. Encapsulated APIs can be released in a controlled manner,
but transferosomes are chemically unstable and expensive to manufacture (Jain et al., 2014).
112
C.3. PREPARATION OF VESICLES
C.3.1. MATERIALS
Clofazimine (CLF) was kindly donated by Cipla Inc. (Mumbai, India), whereas artemisone (ART)
and decoquinate (DQ) were supplied by the MALTBRedox MRC South African University
Flagship Projects from the Pharmaceutical Chemistry Department of the North-West University
(Potchefstroom, South Africa). The vesicles were manufactured using L-α-Phosphatidylcholine
from egg yolk ~60% (Sigma-Aldrich, South Africa), cell culture suitable cholesterol (Sigma-
Aldrich, South Africa), cell culture tested Tween® 20 (Sigma-Aldrich, South Africa) and absolute
ethanol from Associated Chemical Enterprises (ACE) in South Africa. The water used was
purified by a Milli-Q® water purification system from Millipore® (United States of America).
Methanol (ACE, South Africa) and acetone (ACE, South Africa) were used as lipid solvents and
glass beads with a diameter of 2 mm (Merch, Germany) were used during the thin film
manufacturing method. All chemicals used were of analytical grade.
C.3.2. METHOD OF PREPARATION
The equipment utilised in the preparation of the vesicles are:
Hot plate/stirrer (Figure C.2)
Ultrasonicator bath (Figure C.3)
Hielscher ultrasonic processor UP200St (200 W, 26 kHz, Figure 3.4).
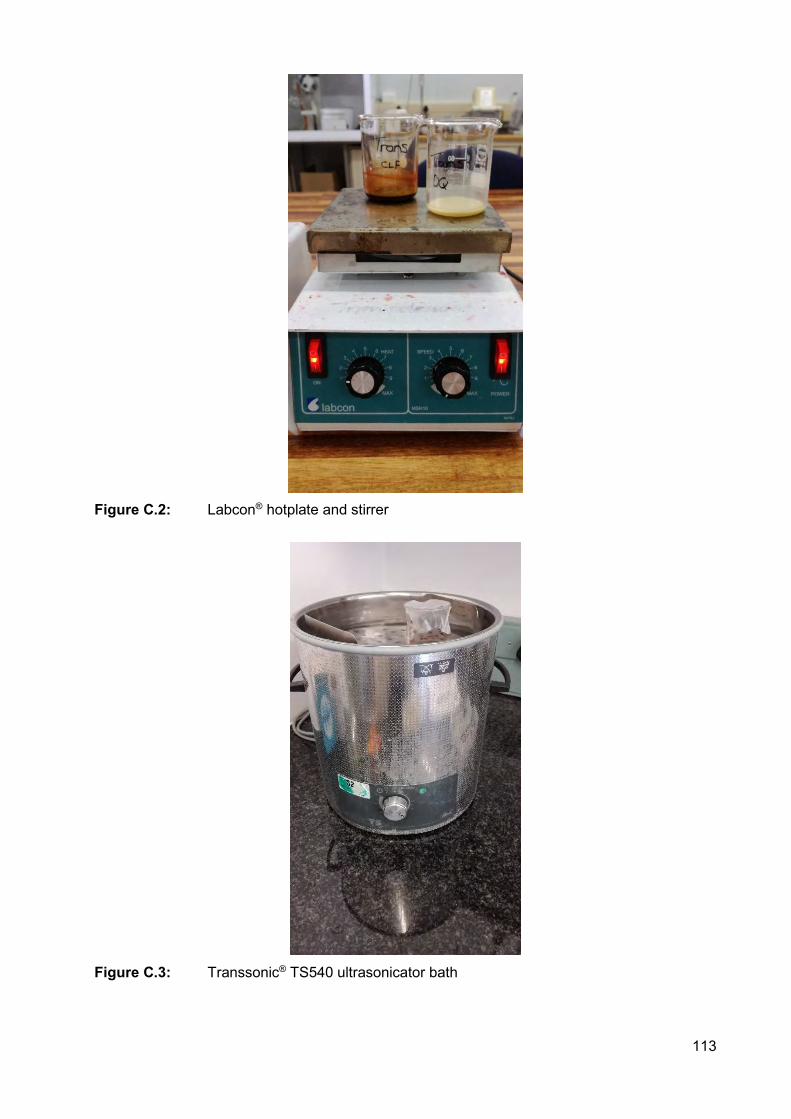
113
Figure C.2: Labcon® hotplate and stirrer
Figure C.3: Transsonic® TS540 ultrasonicator bath
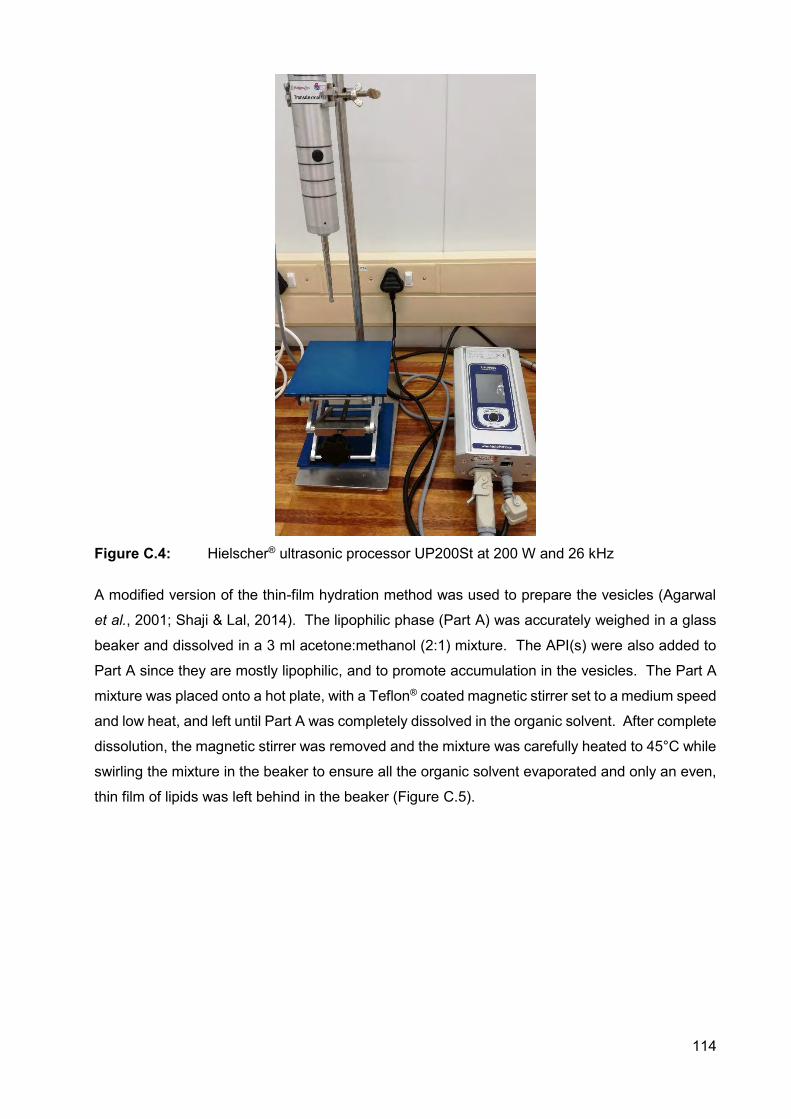
114
Figure C.4: Hielscher® ultrasonic processor UP200St at 200 W and 26 kHz
A modified version of the thin-film hydration method was used to prepare the vesicles (Agarwal
et al., 2001; Shaji & Lal, 2014). The lipophilic phase (Part A) was accurately weighed in a glass
beaker and dissolved in a 3 ml acetone:methanol (2:1) mixture. The API(s) were also added to
Part A since they are mostly lipophilic, and to promote accumulation in the vesicles. The Part A
mixture was placed onto a hot plate, with a Teflon® coated magnetic stirrer set to a medium speed
and low heat, and left until Part A was completely dissolved in the organic solvent. After complete
dissolution, the magnetic stirrer was removed and the mixture was carefully heated to 45°C while
swirling the mixture in the beaker to ensure all the organic solvent evaporated and only an even,
thin film of lipids was left behind in the beaker (Figure C.5).
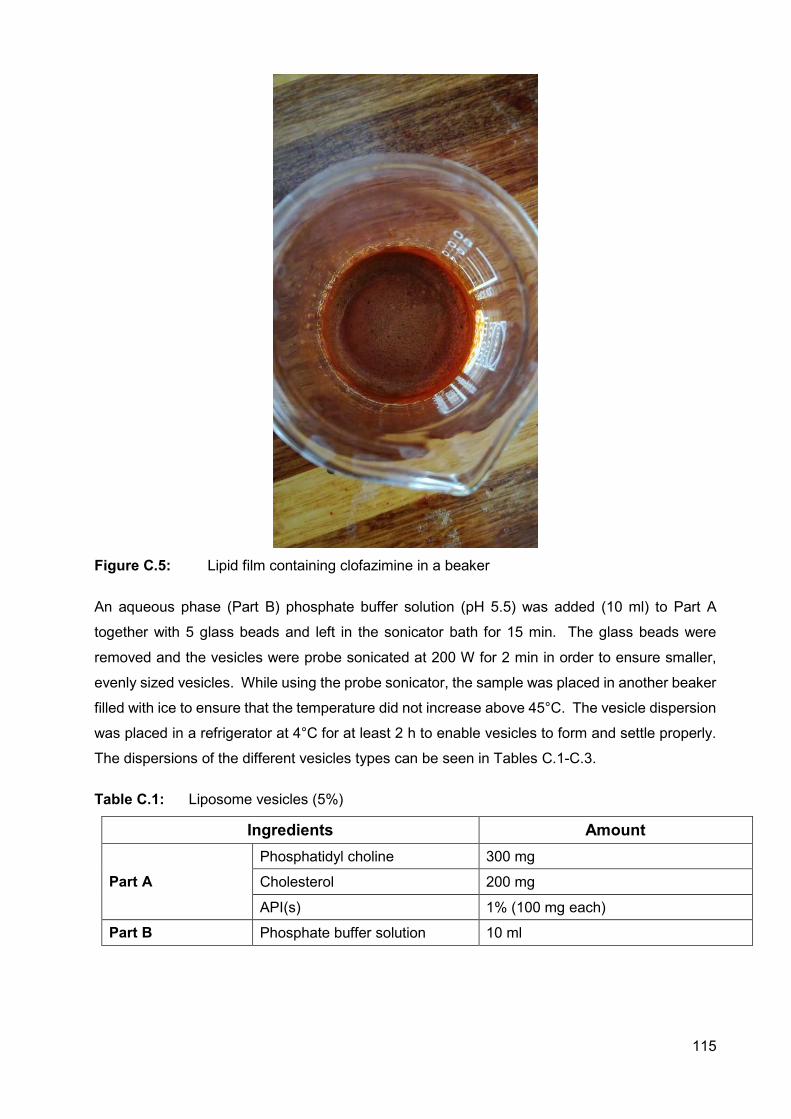
115
Figure C.5: Lipid film containing clofazimine in a beaker
An aqueous phase (Part B) phosphate buffer solution (pH 5.5) was added (10 ml) to Part A
together with 5 glass beads and left in the sonicator bath for 15 min. The glass beads were
removed and the vesicles were probe sonicated at 200 W for 2 min in order to ensure smaller,
evenly sized vesicles. While using the probe sonicator, the sample was placed in another beaker
filled with ice to ensure that the temperature did not increase above 45°C. The vesicle dispersion
was placed in a refrigerator at 4°C for at least 2 h to enable vesicles to form and settle properly.
The dispersions of the different vesicles types can be seen in Tables C.1-C.3.
Table C.1: Liposome vesicles (5%)
Ingredients Amount
Part A Phosphatidyl choline 300 mg
Cholesterol 200 mg
API(s) 1% (100 mg each)
Part B Phosphate buffer solution 10 ml
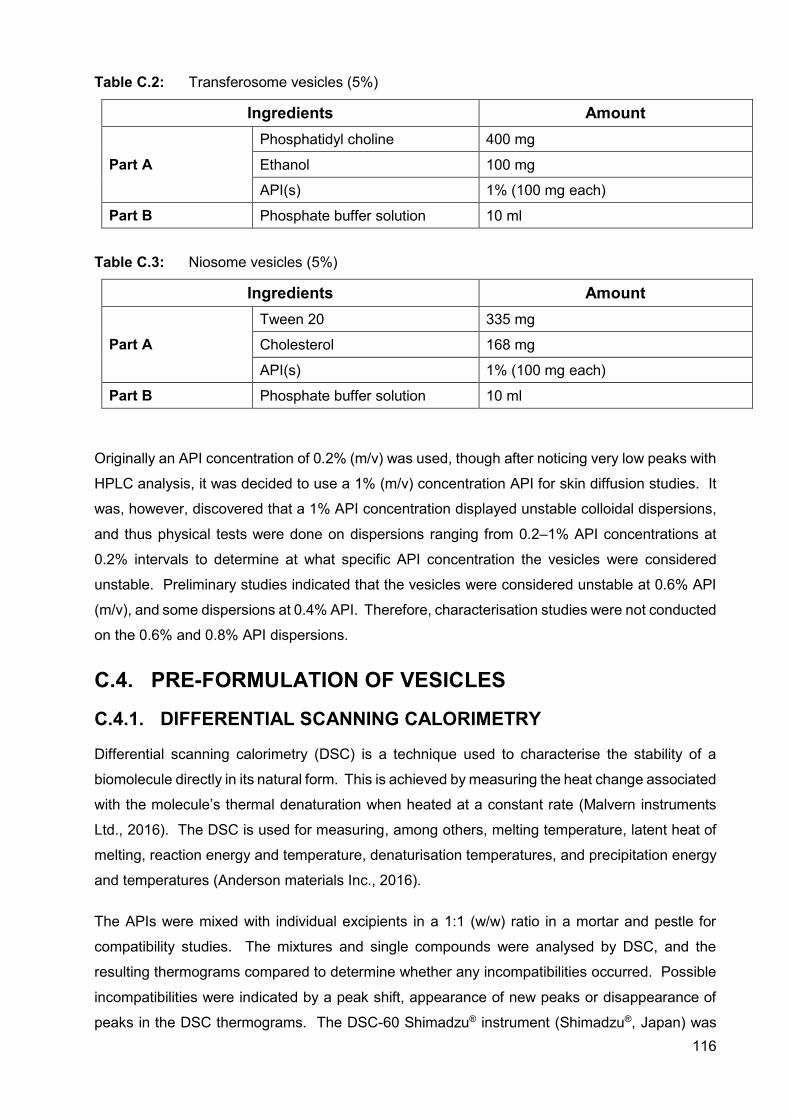
116
Table C.2: Transferosome vesicles (5%)
Ingredients Amount
Part A Phosphatidyl choline 400 mg
Ethanol 100 mg
API(s) 1% (100 mg each)
Part B Phosphate buffer solution 10 ml
Table C.3: Niosome vesicles (5%)
Ingredients Amount
Part A Tween 20 335 mg
Cholesterol 168 mg
API(s) 1% (100 mg each)
Part B Phosphate buffer solution 10 ml
Originally an API concentration of 0.2% (m/v) was used, though after noticing very low peaks with
HPLC analysis, it was decided to use a 1% (m/v) concentration API for skin diffusion studies. It
was, however, discovered that a 1% API concentration displayed unstable colloidal dispersions,
and thus physical tests were done on dispersions ranging from 0.2–1% API concentrations at
0.2% intervals to determine at what specific API concentration the vesicles were considered
unstable. Preliminary studies indicated that the vesicles were considered unstable at 0.6% API
(m/v), and some dispersions at 0.4% API. Therefore, characterisation studies were not conducted
on the 0.6% and 0.8% API dispersions.
C.4. PRE-FORMULATION OF VESICLES
C.4.1. DIFFERENTIAL SCANNING CALORIMETRY
Differential scanning calorimetry (DSC) is a technique used to characterise the stability of a
biomolecule directly in its natural form. This is achieved by measuring the heat change associated
with the molecule’s thermal denaturation when heated at a constant rate (Malvern instruments
Ltd., 2016). The DSC is used for measuring, among others, melting temperature, latent heat of
melting, reaction energy and temperature, denaturisation temperatures, and precipitation energy
and temperatures (Anderson materials Inc., 2016).
The APIs were mixed with individual excipients in a 1:1 (w/w) ratio in a mortar and pestle for
compatibility studies. The mixtures and single compounds were analysed by DSC, and the
resulting thermograms compared to determine whether any incompatibilities occurred. Possible
incompatibilities were indicated by a peak shift, appearance of new peaks or disappearance of
peaks in the DSC thermograms. The DSC-60 Shimadzu® instrument (Shimadzu®, Japan) was
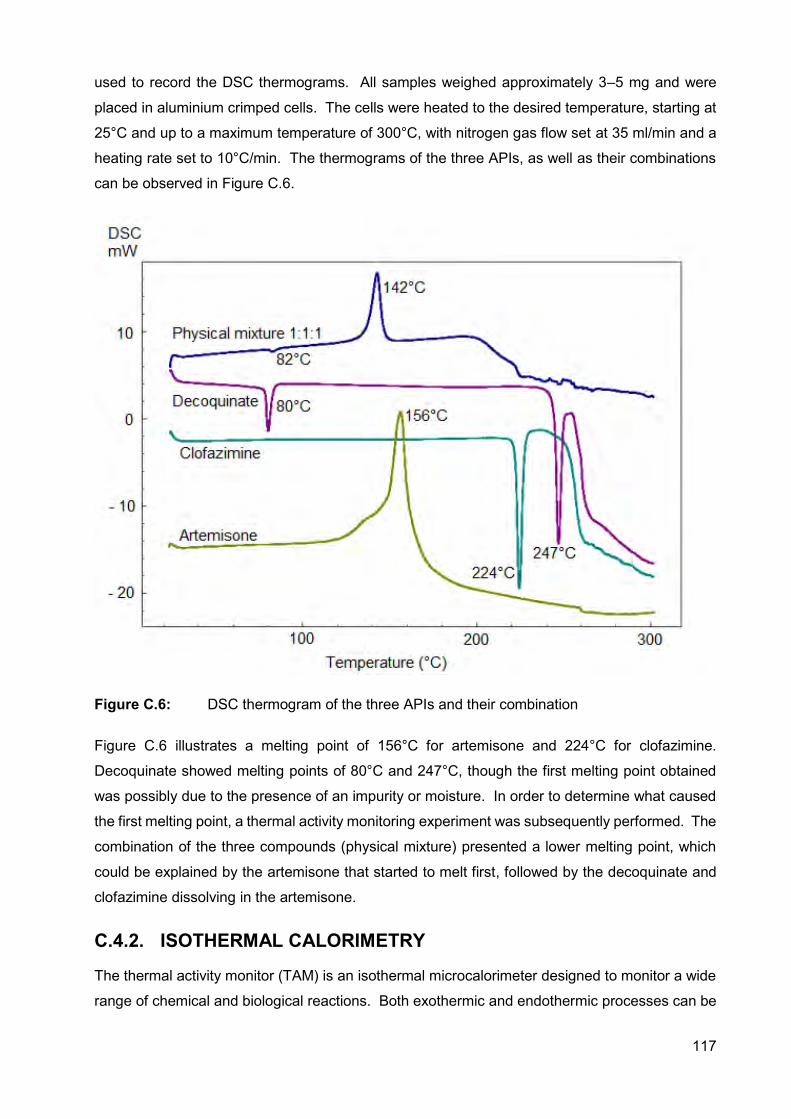
117
used to record the DSC thermograms. All samples weighed approximately 3–5 mg and were
placed in aluminium crimped cells. The cells were heated to the desired temperature, starting at
25°C and up to a maximum temperature of 300°C, with nitrogen gas flow set at 35 ml/min and a
heating rate set to 10°C/min. The thermograms of the three APIs, as well as their combinations
can be observed in Figure C.6.
Figure C.6: DSC thermogram of the three APIs and their combination
Figure C.6 illustrates a melting point of 156°C for artemisone and 224°C for clofazimine.
Decoquinate showed melting points of 80°C and 247°C, though the first melting point obtained
was possibly due to the presence of an impurity or moisture. In order to determine what caused
the first melting point, a thermal activity monitoring experiment was subsequently performed. The
combination of the three compounds (physical mixture) presented a lower melting point, which
could be explained by the artemisone that started to melt first, followed by the decoquinate and
clofazimine dissolving in the artemisone.
C.4.2. ISOTHERMAL CALORIMETRY
The thermal activity monitor (TAM) is an isothermal microcalorimeter designed to monitor a wide
range of chemical and biological reactions. Both exothermic and endothermic processes can be
118
quantified. The TAM is often used for its sensitivity and to study reactions that traditional
calorimeters such as the DSC cannot facilitate (Fauske & Associates, 2016).
Compatibility testing was conducted using a 2277 Thermal Activity Monitor (TAMIII) (TA
Instruments, United States of America), equipped with an oil bath with a stability of ± 100 µK over
24 h. The calorimeters’ temperature was maintained at 40°C. During the compatibility studies
the heat flow was measured for the single components, as well as for the mixtures. Calorimetric
outputs observed for the individual samples were summed to provide a theoretical response. This
calculated hypothetical response represents a calorimetric output that would be expected if the
two materials do not interact with each other. If the materials interact, the measured calorimetric
response will differ from the calculated theoretical response (TA Instruments, 2017).
Compatibility of different combinations of clofazimine (CLF), artemisone (ART), decoquinate
(DQ), Tween® 20, cholesterol, phosphatidylcholine (PC), niosomes, transferosomes and
liposomes were analysed. The results can be seen in Table.C.4 below.
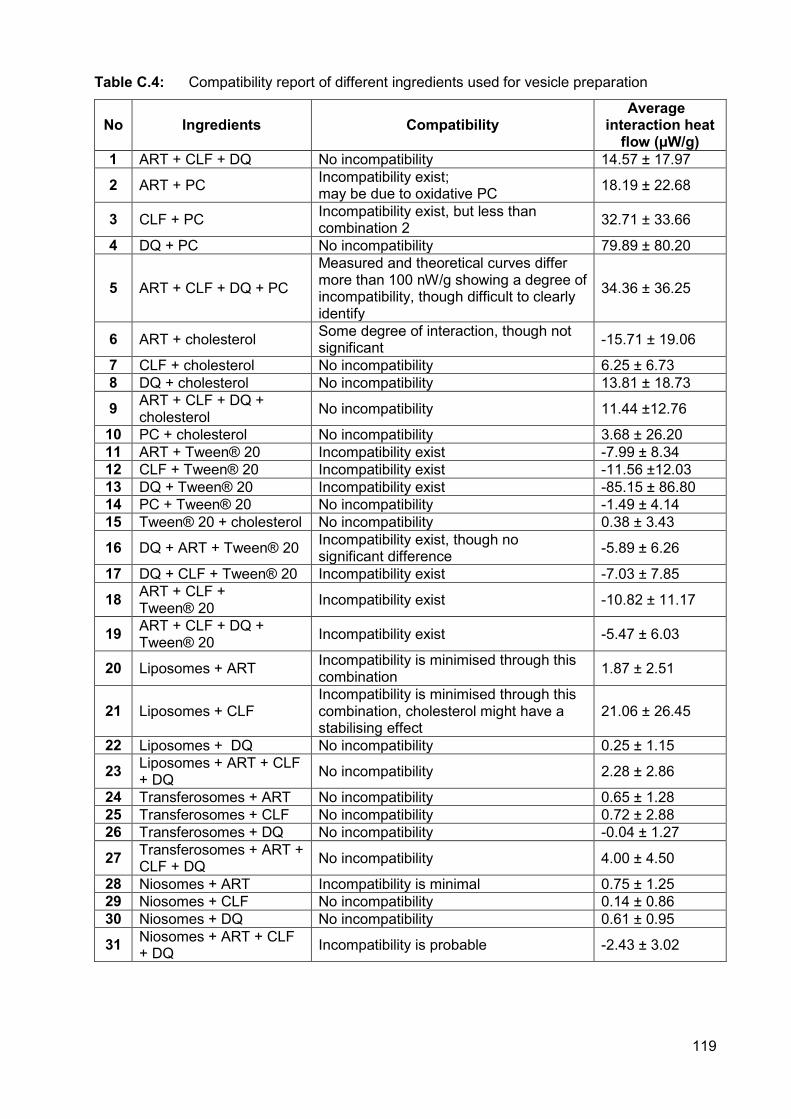
119
Table C.4: Compatibility report of different ingredients used for vesicle preparation
No Ingredients Compatibility Average
interaction heat flow (µW/g)
1 ART + CLF + DQ No incompatibility 14.57 ± 17.97
2 ART + PC Incompatibility exist; may be due to oxidative PC 18.19 ± 22.68
3 CLF + PC Incompatibility exist, but less than combination 2 32.71 ± 33.66
4 DQ + PC No incompatibility 79.89 ± 80.20
5 ART + CLF + DQ + PC
Measured and theoretical curves differ more than 100 nW/g showing a degree of incompatibility, though difficult to clearly identify
34.36 ± 36.25
6 ART + cholesterol Some degree of interaction, though not significant -15.71 ± 19.06
7 CLF + cholesterol No incompatibility 6.25 ± 6.73 8 DQ + cholesterol No incompatibility 13.81 ± 18.73
9 ART + CLF + DQ + cholesterol No incompatibility 11.44 ±12.76
10 PC + cholesterol No incompatibility 3.68 ± 26.20 11 ART + Tween® 20 Incompatibility exist -7.99 ± 8.34 12 CLF + Tween® 20 Incompatibility exist -11.56 ±12.03 13 DQ + Tween® 20 Incompatibility exist -85.15 ± 86.80 14 PC + Tween® 20 No incompatibility -1.49 ± 4.14 15 Tween® 20 + cholesterol No incompatibility 0.38 ± 3.43
16 DQ + ART + Tween® 20 Incompatibility exist, though no significant difference -5.89 ± 6.26
17 DQ + CLF + Tween® 20 Incompatibility exist -7.03 ± 7.85
18 ART + CLF + Tween® 20 Incompatibility exist -10.82 ± 11.17
19 ART + CLF + DQ + Tween® 20 Incompatibility exist -5.47 ± 6.03
20 Liposomes + ART Incompatibility is minimised through this combination 1.87 ± 2.51
21 Liposomes + CLF Incompatibility is minimised through this combination, cholesterol might have a stabilising effect
21.06 ± 26.45
22 Liposomes + DQ No incompatibility 0.25 ± 1.15
23 Liposomes + ART + CLF + DQ No incompatibility 2.28 ± 2.86
24 Transferosomes + ART No incompatibility 0.65 ± 1.28 25 Transferosomes + CLF No incompatibility 0.72 ± 2.88 26 Transferosomes + DQ No incompatibility -0.04 ± 1.27
27 Transferosomes + ART + CLF + DQ No incompatibility 4.00 ± 4.50
28 Niosomes + ART Incompatibility is minimal 0.75 ± 1.25 29 Niosomes + CLF No incompatibility 0.14 ± 0.86 30 Niosomes + DQ No incompatibility 0.61 ± 0.95
31 Niosomes + ART + CLF + DQ Incompatibility is probable -2.43 ± 3.02
120
From this study it became apparent that the three APIs, artemisone, clofazimine and decoquinate
are compatible with one another within the solid-state form. The combinations of the three APIs
with PC showed artemisone in combination with PC to be incompatible. The incompatibility of
clofazimine with PC is slightly less than artemisone and PC, whereas decoquinate and PC were
found to be compatible. The combination of all three actives with PC also showed incompatibility.
This was not surprising given the fact that PC and two of the other compounds showed
incompatibility.
The artemisone/cholesterol combination did not show a definitive incompatibility. However,
caution must be exercised, as it is known that a more severe incompatibility might be triggered
between the two compounds, either through addition of one or more compounds, other
dispersion excipients or even energy from production processes. Compatibility was established
between clofazimine and cholesterol, decoquinate and cholesterol, PC and cholesterol, as well
as the combination of all three APIs together with cholesterol.
It was evident that the incompatibility of all three APIs in combination with Tween® 20 would be
problematic. Interestingly, the combination of Tween® 20 and PC did not show any
incompatibility, as was the case with cholesterol and Tween® 20. The
artemisone/decoquinate/Tween® 20 combination, the artemisone/clofazimine/Tween® 20
combination, as well as clofazimine/decoquinate/Tween® 20 exhibited clear incompatibilities. A
combination of all three APIs with Tween® 20 also showed incompatibility.
All the liposome dispersions proved to be compatible, despite incompatibility of some of the
individual combinations. All the transferosome dispersions displayed compatibility, with the
niosomes showing the best compatibility of all the dispersions tested.
C.4.3. HOT-STAGE MICROSCOPY
Hot-stage microscopy (HSM) combines thermal analysis and microscopy to characterise the
physical properties of materials as a function of temperature. HSM is used in the pharmaceutical
industry in various ways to confirm transitions observed using other techniques (Vitez et al.,
1998).
A small amount of API was placed on a microscope slide with either a cover slide only, or the API
first covered with silicon oil (Fluka Chemica, Switzerland) and then a cover slide (in the case of
solvates). A Nikon® Eclipse E400 thermo-microscope (Tokyo, Japan), equipped with a Leitz 350
heating unit (Wetzlar, Germany) and a Metratherm 1200d thermostat were used for the HSM
experiments. A Nikon® Simple Polarising Attachment (Tokyo, Japan) was fixed on the same
microscope for the polarising optical microscopy. Images were taken using a Nikon® Coolpix
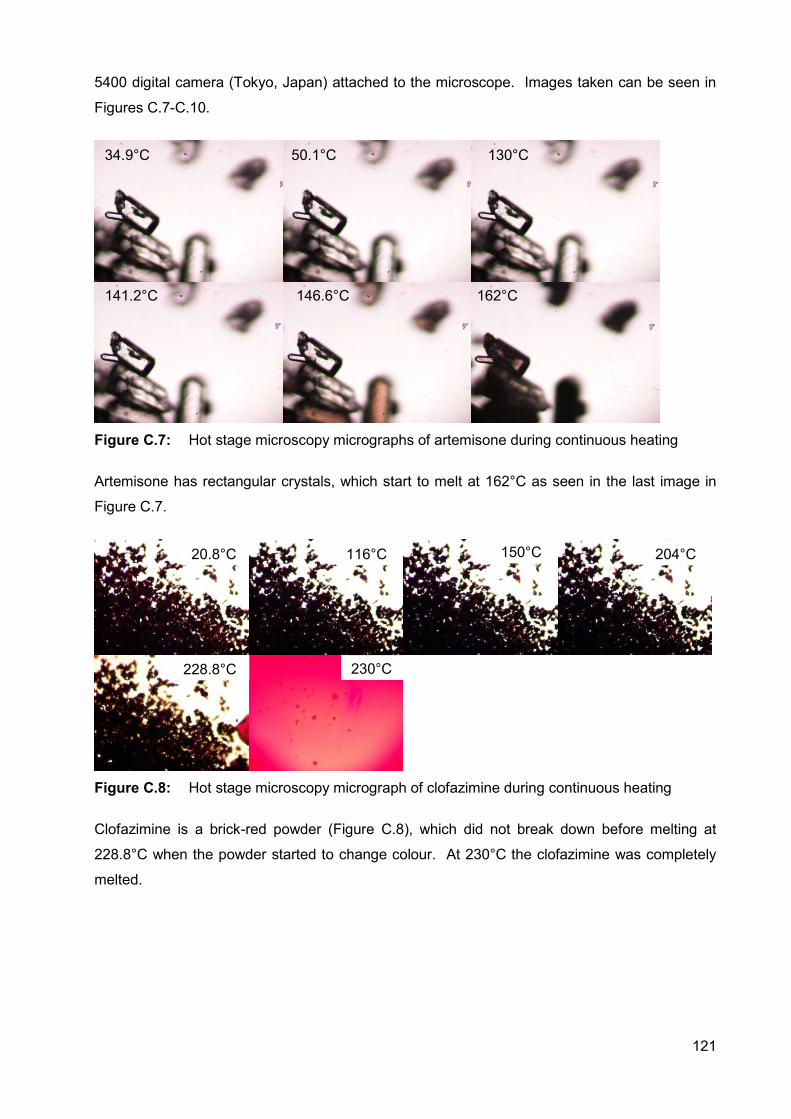
121
5400 digital camera (Tokyo, Japan) attached to the microscope. Images taken can be seen in
Figures C.7-C.10.
Figure C.7: Hot stage microscopy micrographs of artemisone during continuous heating
Artemisone has rectangular crystals, which start to melt at 162°C as seen in the last image in
Figure C.7.
Figure C.8: Hot stage microscopy micrograph of clofazimine during continuous heating
Clofazimine is a brick-red powder (Figure C.8), which did not break down before melting at
228.8°C when the powder started to change colour. At 230°C the clofazimine was completely
melted.
20.8°C 116°C 150°C 204°C
228.8°C
34.9°C 50.1°C 130°C
141.2°C 146.6°C 162°C
230°C
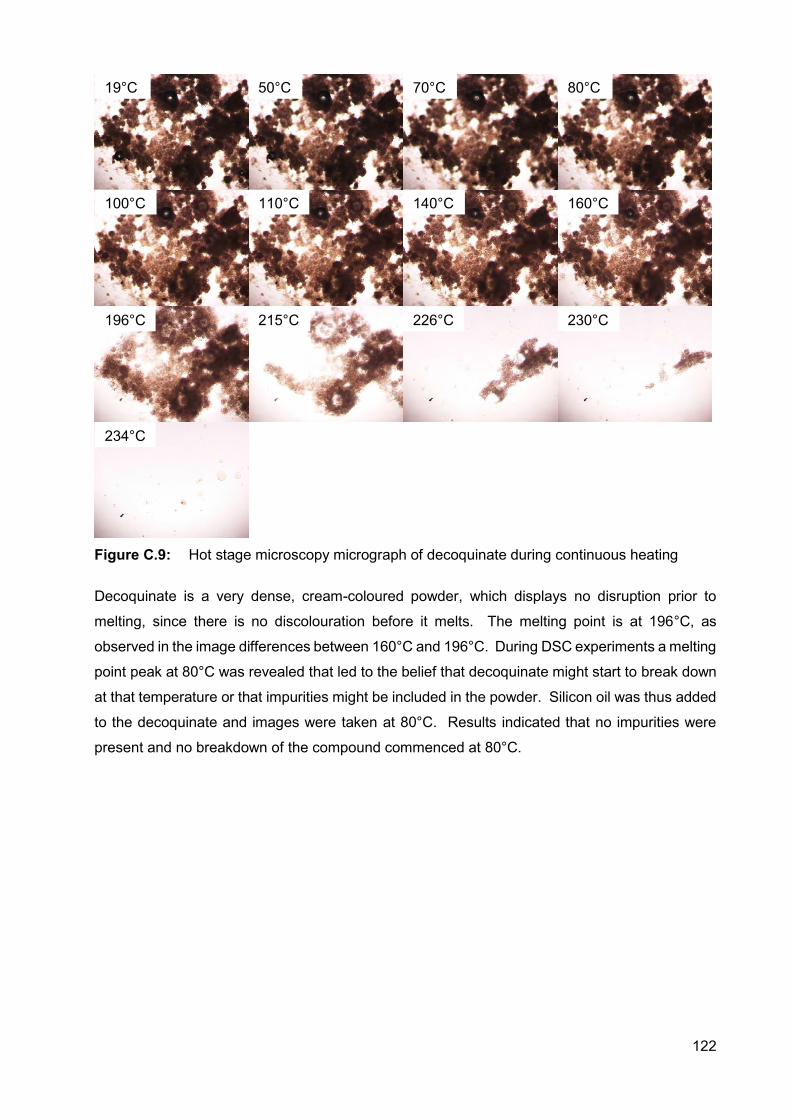
122
Figure C.9: Hot stage microscopy micrograph of decoquinate during continuous heating
Decoquinate is a very dense, cream-coloured powder, which displays no disruption prior to
melting, since there is no discolouration before it melts. The melting point is at 196°C, as
observed in the image differences between 160°C and 196°C. During DSC experiments a melting
point peak at 80°C was revealed that led to the belief that decoquinate might start to break down
at that temperature or that impurities might be included in the powder. Silicon oil was thus added
to the decoquinate and images were taken at 80°C. Results indicated that no impurities were
present and no breakdown of the compound commenced at 80°C.
19°C 50°C 70°C 80°C
100°C 110°C 140°C 160°C
196°C 215°C 226°C 230°C
234°C
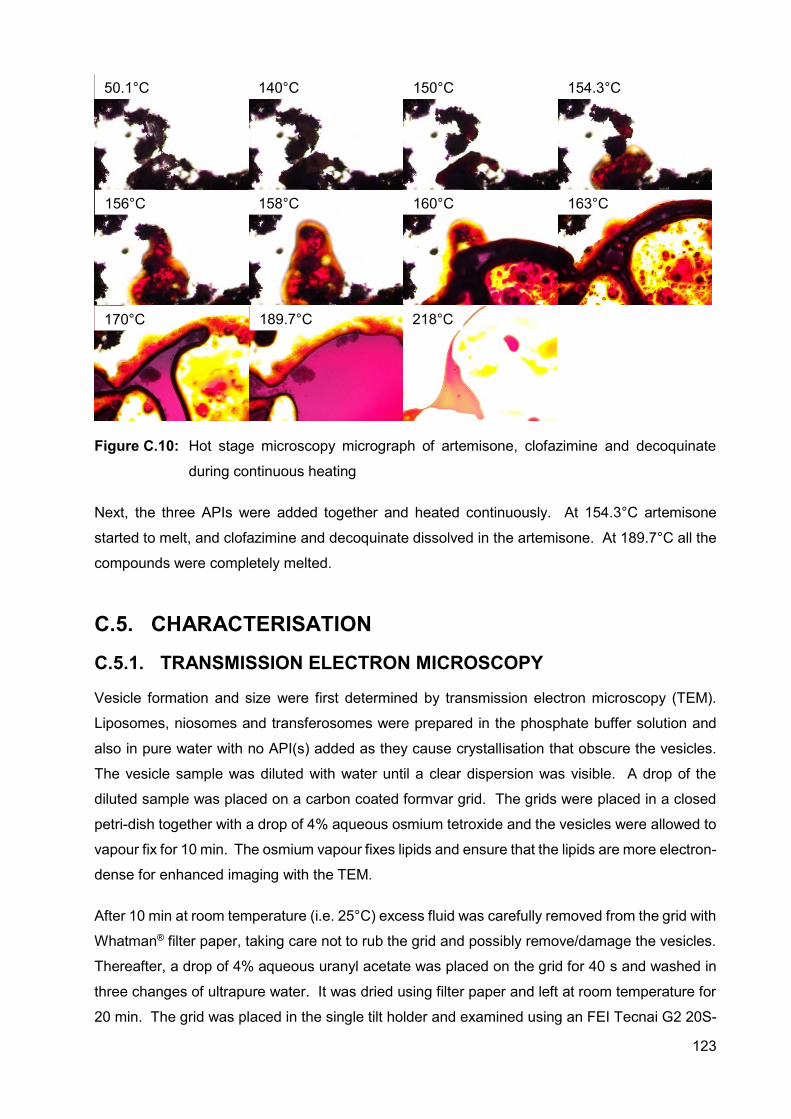
123
Figure C.10: Hot stage microscopy micrograph of artemisone, clofazimine and decoquinate
during continuous heating
Next, the three APIs were added together and heated continuously. At 154.3°C artemisone
started to melt, and clofazimine and decoquinate dissolved in the artemisone. At 189.7°C all the
compounds were completely melted.
C.5. CHARACTERISATION
C.5.1. TRANSMISSION ELECTRON MICROSCOPY
Vesicle formation and size were first determined by transmission electron microscopy (TEM).
Liposomes, niosomes and transferosomes were prepared in the phosphate buffer solution and
also in pure water with no API(s) added as they cause crystallisation that obscure the vesicles.
The vesicle sample was diluted with water until a clear dispersion was visible. A drop of the
diluted sample was placed on a carbon coated formvar grid. The grids were placed in a closed
petri-dish together with a drop of 4% aqueous osmium tetroxide and the vesicles were allowed to
vapour fix for 10 min. The osmium vapour fixes lipids and ensure that the lipids are more electron-
dense for enhanced imaging with the TEM.
After 10 min at room temperature (i.e. 25°C) excess fluid was carefully removed from the grid with
Whatman® filter paper, taking care not to rub the grid and possibly remove/damage the vesicles.
Thereafter, a drop of 4% aqueous uranyl acetate was placed on the grid for 40 s and washed in
three changes of ultrapure water. It was dried using filter paper and left at room temperature for
20 min. The grid was placed in the single tilt holder and examined using an FEI Tecnai G2 20S-
50.1°C 140°C 150°C 154.3°C
156°C 158°C 160°C 163°C
170°C 189.7°C 218°C
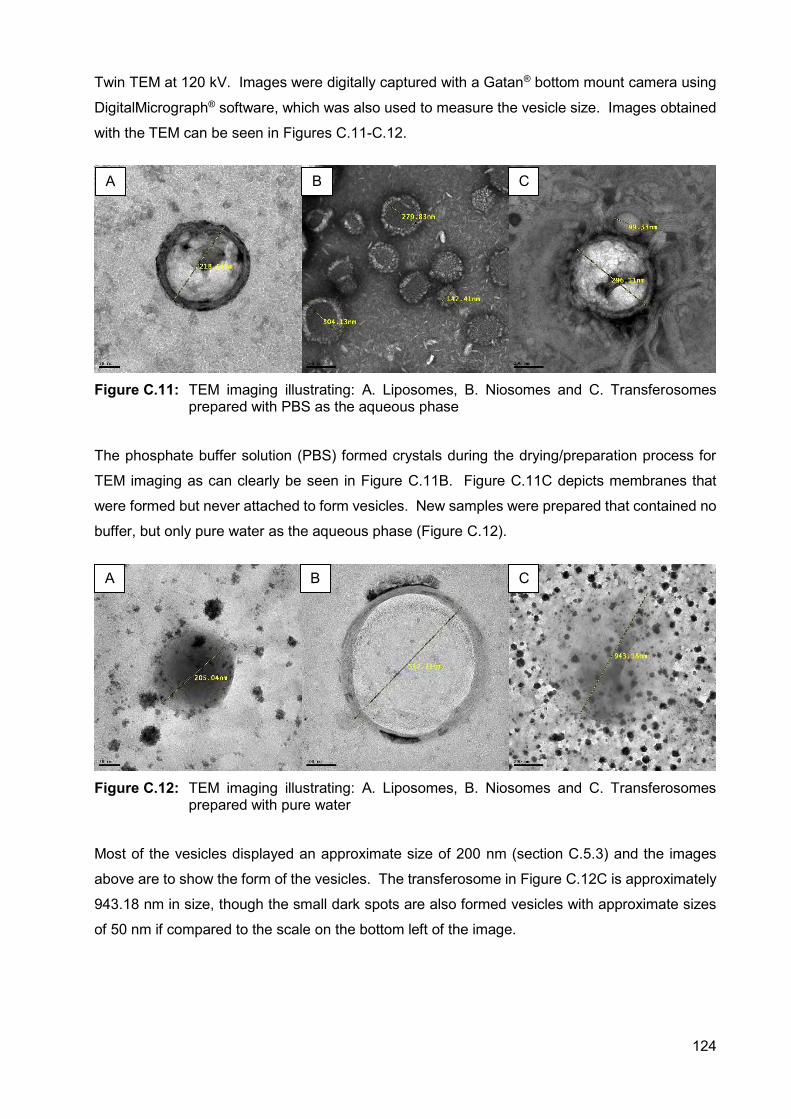
124
Twin TEM at 120 kV. Images were digitally captured with a Gatan® bottom mount camera using
DigitalMicrograph® software, which was also used to measure the vesicle size. Images obtained
with the TEM can be seen in Figures C.11-C.12.
Figure C.11: TEM imaging illustrating: A. Liposomes, B. Niosomes and C. Transferosomes
prepared with PBS as the aqueous phase
The phosphate buffer solution (PBS) formed crystals during the drying/preparation process for
TEM imaging as can clearly be seen in Figure C.11B. Figure C.11C depicts membranes that
were formed but never attached to form vesicles. New samples were prepared that contained no
buffer, but only pure water as the aqueous phase (Figure C.12).
Figure C.12: TEM imaging illustrating: A. Liposomes, B. Niosomes and C. Transferosomes
prepared with pure water
Most of the vesicles displayed an approximate size of 200 nm (section C.5.3) and the images
above are to show the form of the vesicles. The transferosome in Figure C.12C is approximately
943.18 nm in size, though the small dark spots are also formed vesicles with approximate sizes
of 50 nm if compared to the scale on the bottom left of the image.
A B C
A B C
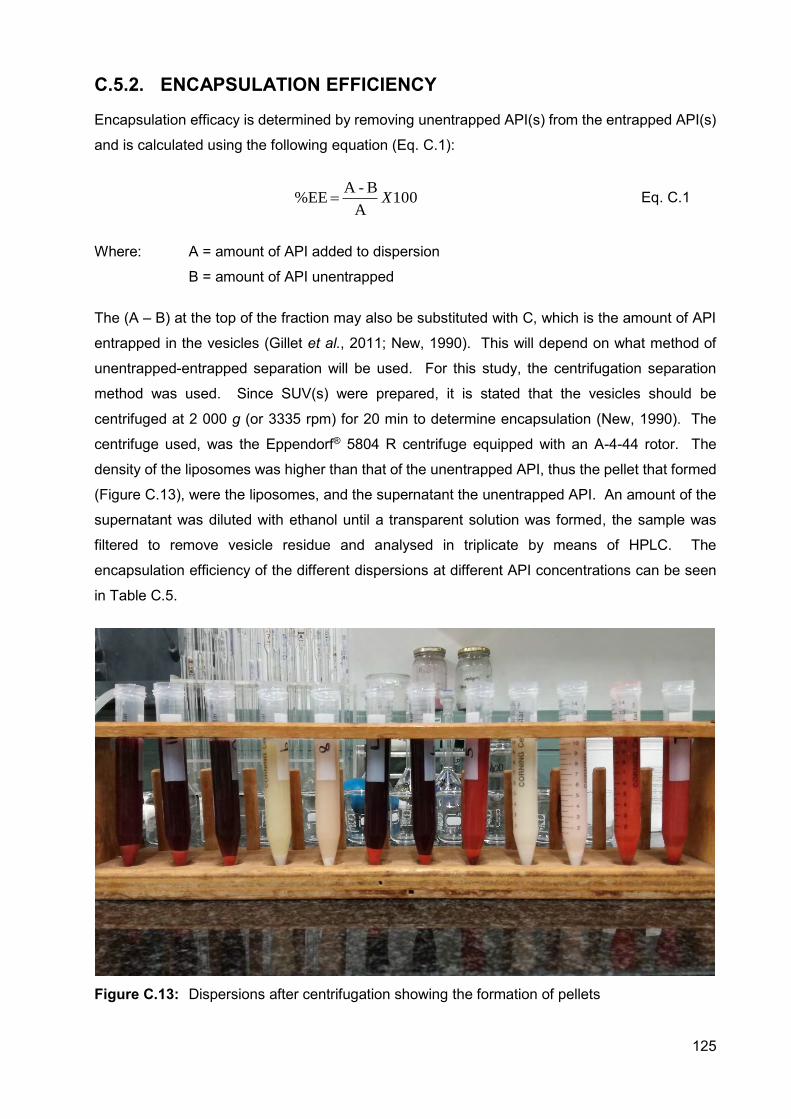
125
C.5.2. ENCAPSULATION EFFICIENCY
Encapsulation efficacy is determined by removing unentrapped API(s) from the entrapped API(s)
and is calculated using the following equation (Eq. C.1):
100A
B-A %EE X Eq. C.1
Where: A = amount of API added to dispersion
B = amount of API unentrapped
The (A – B) at the top of the fraction may also be substituted with C, which is the amount of API
entrapped in the vesicles (Gillet et al., 2011; New, 1990). This will depend on what method of
unentrapped-entrapped separation will be used. For this study, the centrifugation separation
method was used. Since SUV(s) were prepared, it is stated that the vesicles should be
centrifuged at 2 000 g (or 3335 rpm) for 20 min to determine encapsulation (New, 1990). The
centrifuge used, was the Eppendorf® 5804 R centrifuge equipped with an A-4-44 rotor. The
density of the liposomes was higher than that of the unentrapped API, thus the pellet that formed
(Figure C.13), were the liposomes, and the supernatant the unentrapped API. An amount of the
supernatant was diluted with ethanol until a transparent solution was formed, the sample was
filtered to remove vesicle residue and analysed in triplicate by means of HPLC. The
encapsulation efficiency of the different dispersions at different API concentrations can be seen
in Table C.5.
Figure C.13: Dispersions after centrifugation showing the formation of pellets
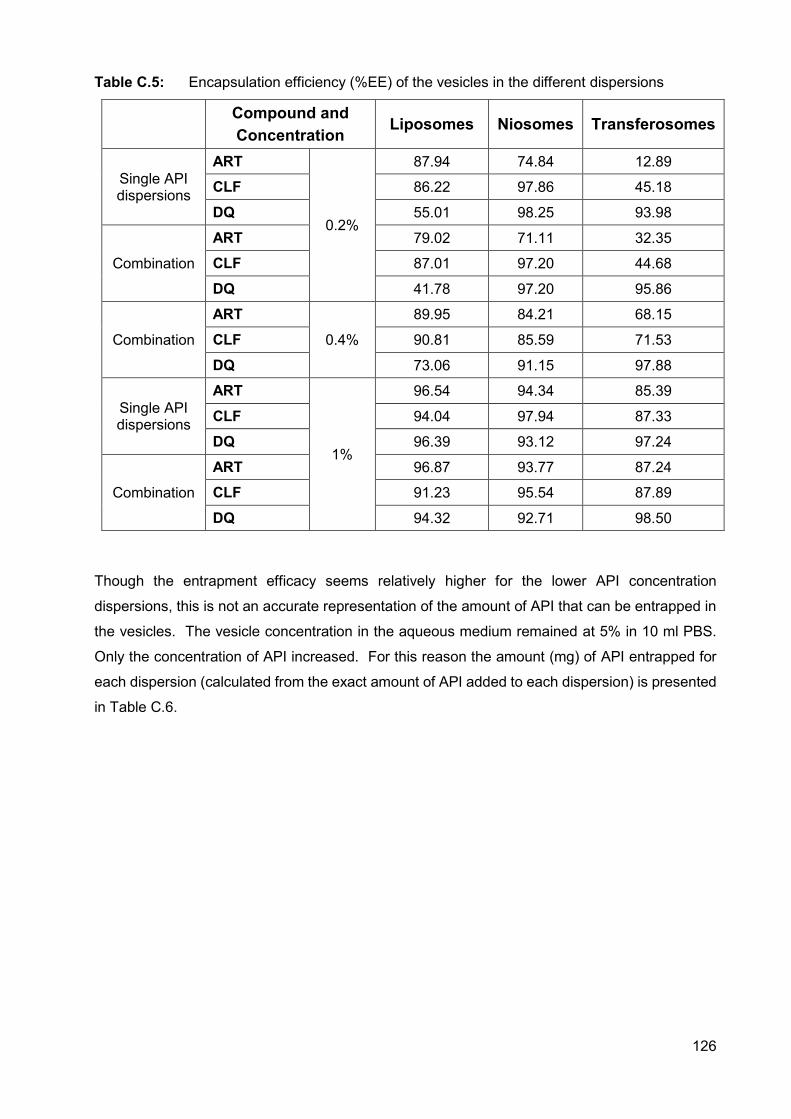
126
Table C.5: Encapsulation efficiency (%EE) of the vesicles in the different dispersions
Compound and Concentration
Liposomes Niosomes Transferosomes
Single API dispersions
ART
0.2%
87.94 74.84 12.89
CLF 86.22 97.86 45.18
DQ 55.01 98.25 93.98
Combination
ART 79.02 71.11 32.35
CLF 87.01 97.20 44.68
DQ 41.78 97.20 95.86
Combination
ART
0.4%
89.95 84.21 68.15
CLF 90.81 85.59 71.53
DQ 73.06 91.15 97.88
Single API dispersions
ART
1%
96.54 94.34 85.39
CLF 94.04 97.94 87.33
DQ 96.39 93.12 97.24
Combination
ART 96.87 93.77 87.24
CLF 91.23 95.54 87.89
DQ 94.32 92.71 98.50
Though the entrapment efficacy seems relatively higher for the lower API concentration
dispersions, this is not an accurate representation of the amount of API that can be entrapped in
the vesicles. The vesicle concentration in the aqueous medium remained at 5% in 10 ml PBS.
Only the concentration of API increased. For this reason the amount (mg) of API entrapped for
each dispersion (calculated from the exact amount of API added to each dispersion) is presented
in Table C.6.
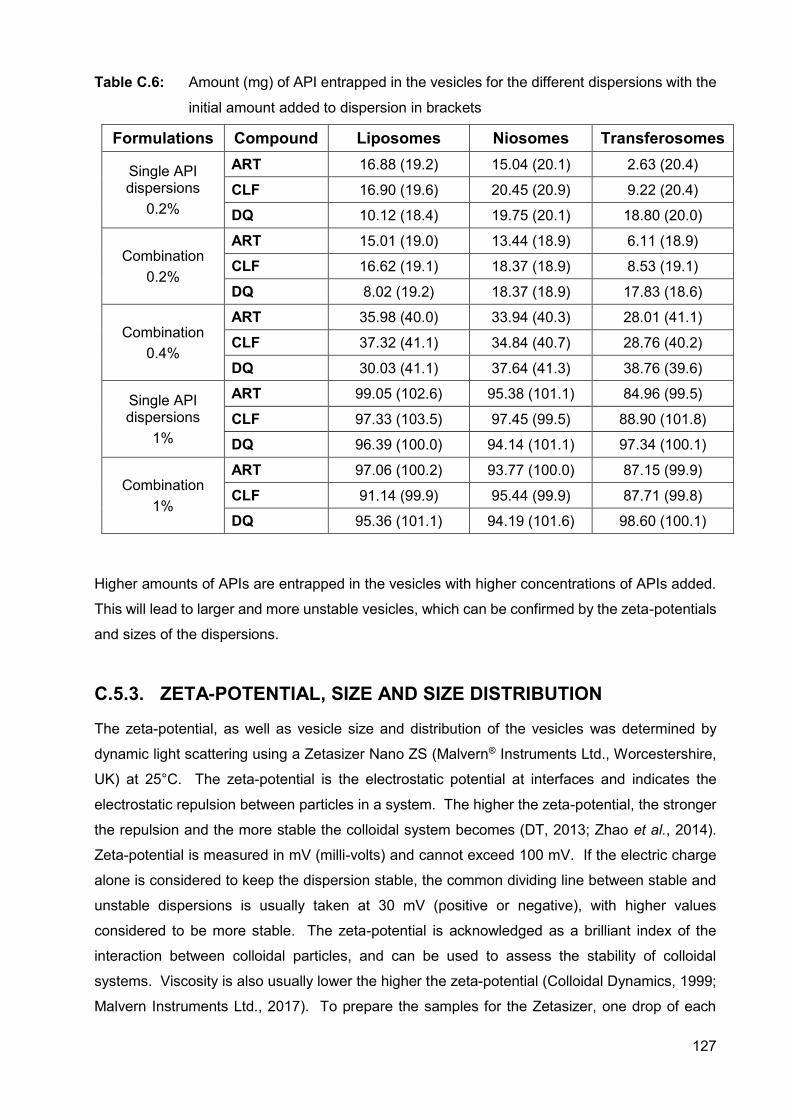
127
Table C.6: Amount (mg) of API entrapped in the vesicles for the different dispersions with the
initial amount added to dispersion in brackets
Formulations Compound Liposomes Niosomes Transferosomes
Single API dispersions
0.2%
ART 16.88 (19.2) 15.04 (20.1) 2.63 (20.4)
CLF 16.90 (19.6) 20.45 (20.9) 9.22 (20.4)
DQ 10.12 (18.4) 19.75 (20.1) 18.80 (20.0)
Combination 0.2%
ART 15.01 (19.0) 13.44 (18.9) 6.11 (18.9)
CLF 16.62 (19.1) 18.37 (18.9) 8.53 (19.1)
DQ 8.02 (19.2) 18.37 (18.9) 17.83 (18.6)
Combination 0.4%
ART 35.98 (40.0) 33.94 (40.3) 28.01 (41.1)
CLF 37.32 (41.1) 34.84 (40.7) 28.76 (40.2)
DQ 30.03 (41.1) 37.64 (41.3) 38.76 (39.6)
Single API dispersions
1%
ART 99.05 (102.6) 95.38 (101.1) 84.96 (99.5)
CLF 97.33 (103.5) 97.45 (99.5) 88.90 (101.8)
DQ 96.39 (100.0) 94.14 (101.1) 97.34 (100.1)
Combination 1%
ART 97.06 (100.2) 93.77 (100.0) 87.15 (99.9)
CLF 91.14 (99.9) 95.44 (99.9) 87.71 (99.8)
DQ 95.36 (101.1) 94.19 (101.6) 98.60 (100.1)
Higher amounts of APIs are entrapped in the vesicles with higher concentrations of APIs added.
This will lead to larger and more unstable vesicles, which can be confirmed by the zeta-potentials
and sizes of the dispersions.
C.5.3. ZETA-POTENTIAL, SIZE AND SIZE DISTRIBUTION
The zeta-potential, as well as vesicle size and distribution of the vesicles was determined by
dynamic light scattering using a Zetasizer Nano ZS (Malvern® Instruments Ltd., Worcestershire,
UK) at 25°C. The zeta-potential is the electrostatic potential at interfaces and indicates the
electrostatic repulsion between particles in a system. The higher the zeta-potential, the stronger
the repulsion and the more stable the colloidal system becomes (DT, 2013; Zhao et al., 2014).
Zeta-potential is measured in mV (milli-volts) and cannot exceed 100 mV. If the electric charge
alone is considered to keep the dispersion stable, the common dividing line between stable and
unstable dispersions is usually taken at 30 mV (positive or negative), with higher values
considered to be more stable. The zeta-potential is acknowledged as a brilliant index of the
interaction between colloidal particles, and can be used to assess the stability of colloidal
systems. Viscosity is also usually lower the higher the zeta-potential (Colloidal Dynamics, 1999;
Malvern Instruments Ltd., 2017). To prepare the samples for the Zetasizer, one drop of each
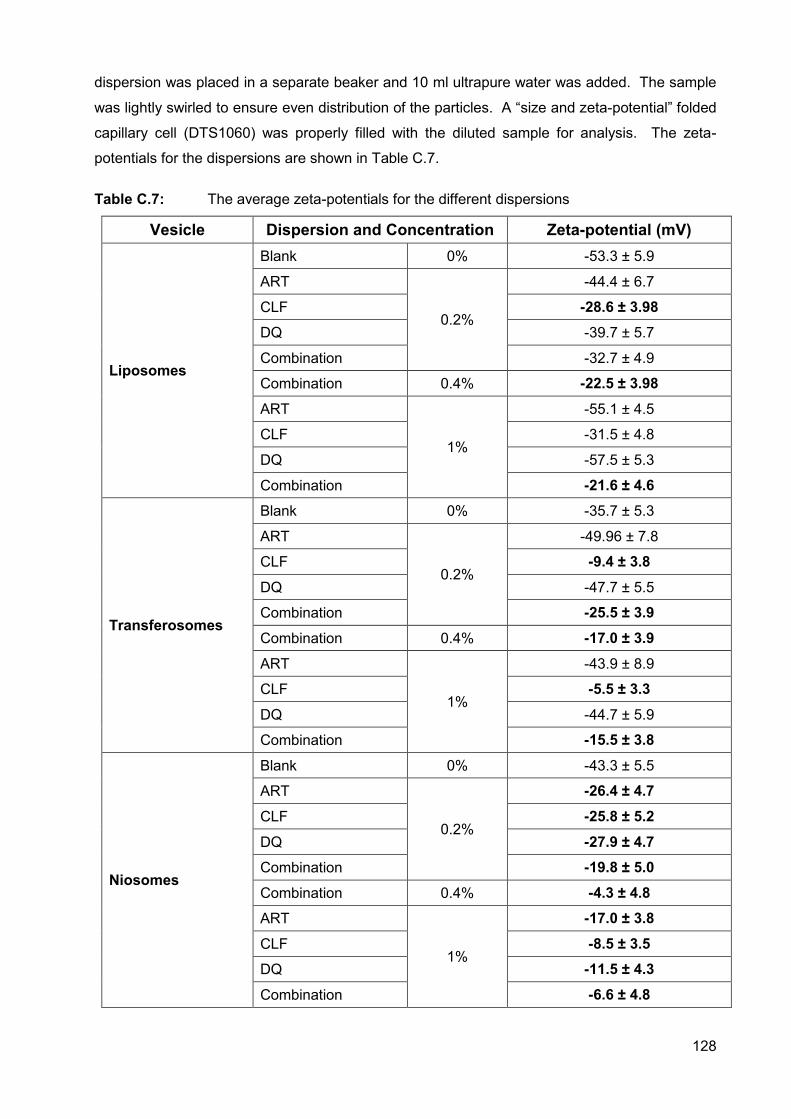
128
dispersion was placed in a separate beaker and 10 ml ultrapure water was added. The sample
was lightly swirled to ensure even distribution of the particles. A “size and zeta-potential” folded
capillary cell (DTS1060) was properly filled with the diluted sample for analysis. The zeta-
potentials for the dispersions are shown in Table C.7.
Table C.7: The average zeta-potentials for the different dispersions
Vesicle Dispersion and Concentration Zeta-potential (mV)
Liposomes
Blank 0% -53.3 ± 5.9
ART
0.2%
-44.4 ± 6.7
CLF -28.6 ± 3.98 DQ -39.7 ± 5.7
Combination -32.7 ± 4.9
Combination 0.4% -22.5 ± 3.98
ART
1%
-55.1 ± 4.5
CLF -31.5 ± 4.8
DQ -57.5 ± 5.3
Combination -21.6 ± 4.6
Transferosomes
Blank 0% -35.7 ± 5.3
ART
0.2%
-49.96 ± 7.8
CLF -9.4 ± 3.8
DQ -47.7 ± 5.5
Combination -25.5 ± 3.9
Combination 0.4% -17.0 ± 3.9
ART
1%
-43.9 ± 8.9
CLF -5.5 ± 3.3
DQ -44.7 ± 5.9
Combination -15.5 ± 3.8
Niosomes
Blank 0% -43.3 ± 5.5
ART
0.2%
-26.4 ± 4.7
CLF -25.8 ± 5.2
DQ -27.9 ± 4.7 Combination -19.8 ± 5.0
Combination 0.4% -4.3 ± 4.8 ART
1%
-17.0 ± 3.8
CLF -8.5 ± 3.5 DQ -11.5 ± 4.3
Combination -6.6 ± 4.8
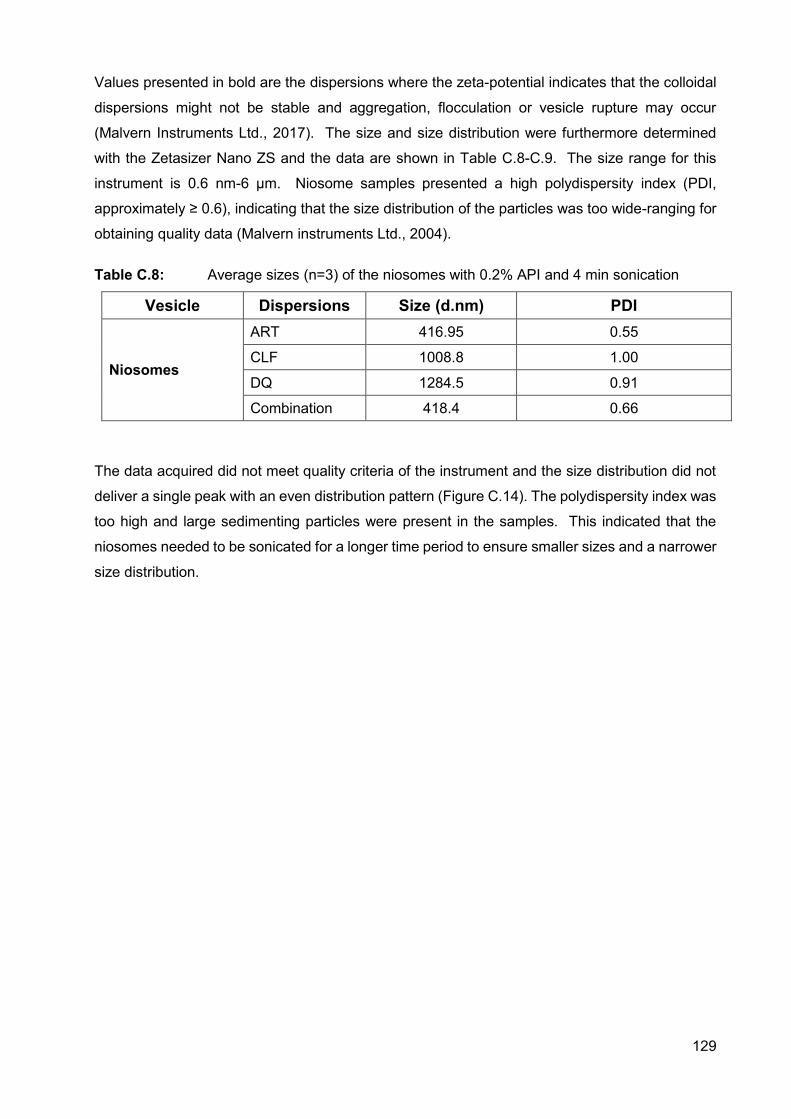
129
Values presented in bold are the dispersions where the zeta-potential indicates that the colloidal
dispersions might not be stable and aggregation, flocculation or vesicle rupture may occur
(Malvern Instruments Ltd., 2017). The size and size distribution were furthermore determined
with the Zetasizer Nano ZS and the data are shown in Table C.8-C.9. The size range for this
instrument is 0.6 nm-6 µm. Niosome samples presented a high polydispersity index (PDI,
approximately ≥ 0.6), indicating that the size distribution of the particles was too wide-ranging for
obtaining quality data (Malvern instruments Ltd., 2004).
Table C.8: Average sizes (n=3) of the niosomes with 0.2% API and 4 min sonication
Vesicle Dispersions Size (d.nm) PDI
Niosomes
ART 416.95 0.55
CLF 1008.8 1.00
DQ 1284.5 0.91
Combination 418.4 0.66
The data acquired did not meet quality criteria of the instrument and the size distribution did not
deliver a single peak with an even distribution pattern (Figure C.14). The polydispersity index was
too high and large sedimenting particles were present in the samples. This indicated that the
niosomes needed to be sonicated for a longer time period to ensure smaller sizes and a narrower
size distribution.
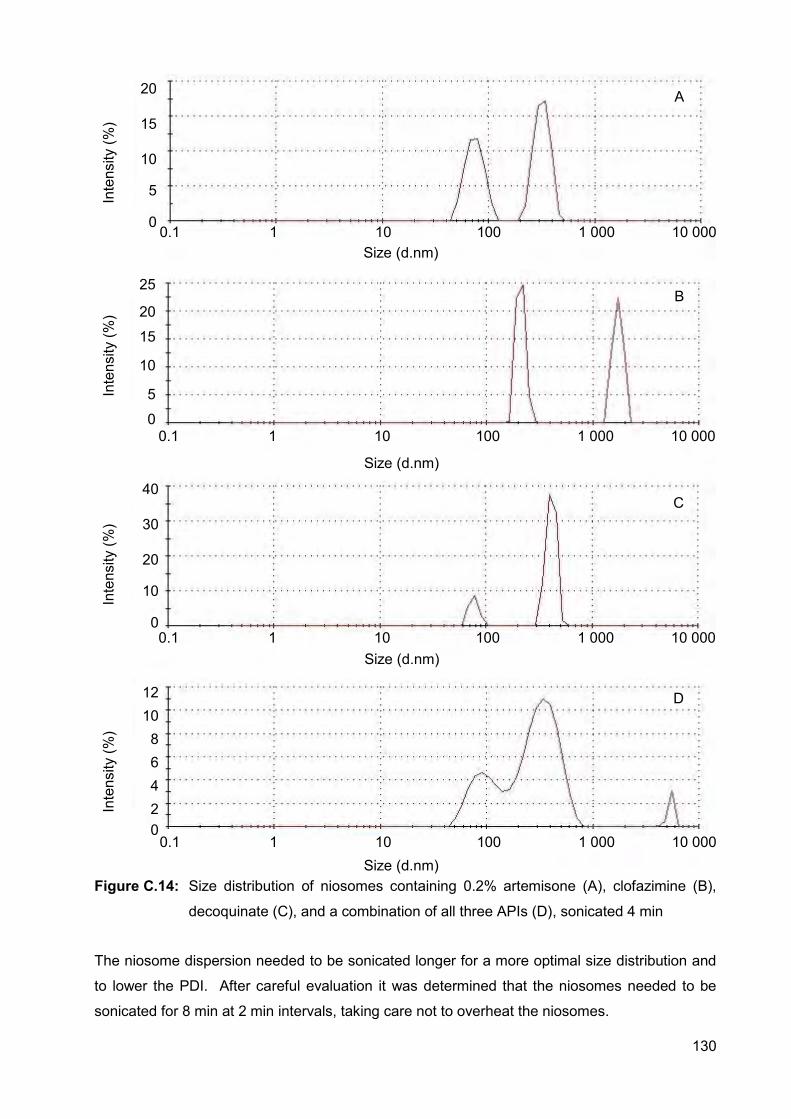
130
Figure C.14: Size distribution of niosomes containing 0.2% artemisone (A), clofazimine (B),
decoquinate (C), and a combination of all three APIs (D), sonicated 4 min
The niosome dispersion needed to be sonicated longer for a more optimal size distribution and
to lower the PDI. After careful evaluation it was determined that the niosomes needed to be
sonicated for 8 min at 2 min intervals, taking care not to overheat the niosomes.
Size (d.nm)
Size (d.nm)
Size (d.nm)
Inte
nsity
(%)
0.1 1 10 100 1 000 10 000
20
15
10
5
0
Size (d.nm)
Inte
nsity
(%)
0.1 1 10 100 1 000 10 000
25
20
15
10
5
0
Inte
nsity
(%)
0.1 1 10 100 1 000 10 000
40
30
20
10
0
Inte
nsity
(%)
0.1 1 10 100 1 000 10 000
12 10 8 6 4 2 0
A
B
C
D
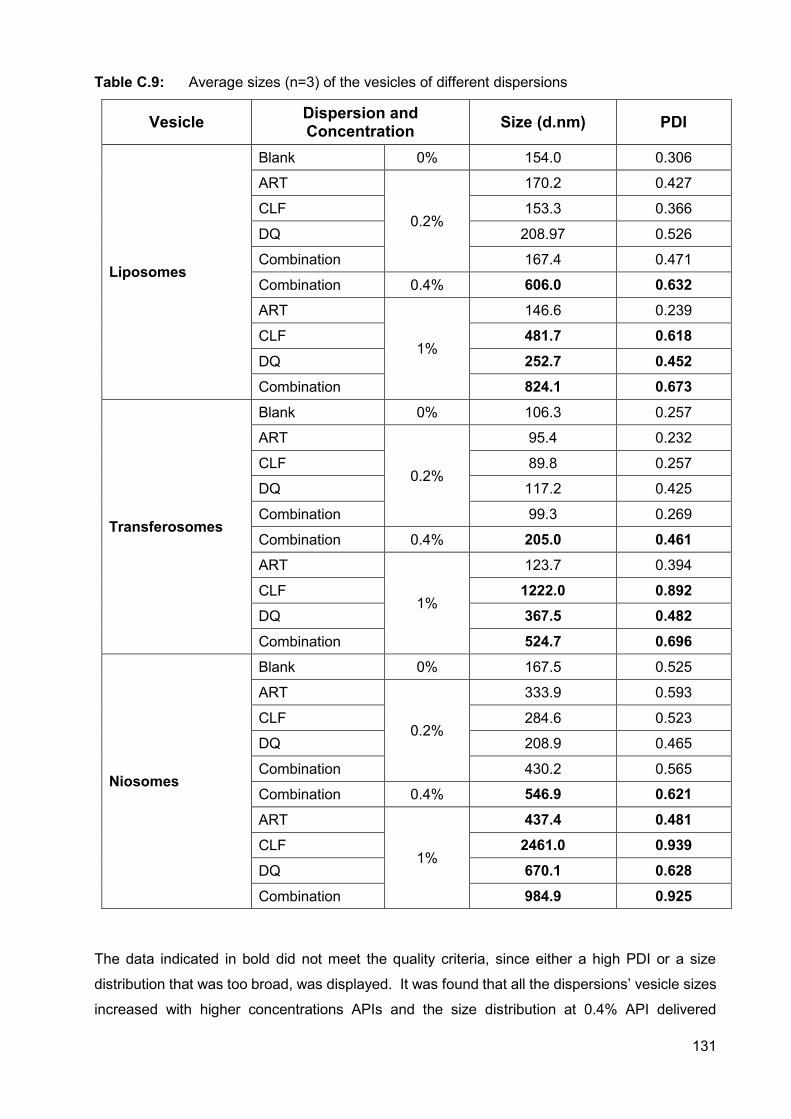
131
Table C.9: Average sizes (n=3) of the vesicles of different dispersions
Vesicle Dispersion and Concentration Size (d.nm) PDI
Liposomes
Blank 0% 154.0 0.306
ART
0.2%
170.2 0.427
CLF 153.3 0.366
DQ 208.97 0.526
Combination 167.4 0.471
Combination 0.4% 606.0 0.632 ART
1%
146.6 0.239
CLF 481.7 0.618
DQ 252.7 0.452 Combination 824.1 0.673
Transferosomes
Blank 0% 106.3 0.257
ART
0.2%
95.4 0.232
CLF 89.8 0.257
DQ 117.2 0.425
Combination 99.3 0.269
Combination 0.4% 205.0 0.461 ART
1%
123.7 0.394
CLF 1222.0 0.892 DQ 367.5 0.482
Combination 524.7 0.696
Niosomes
Blank 0% 167.5 0.525
ART
0.2%
333.9 0.593
CLF 284.6 0.523
DQ 208.9 0.465
Combination 430.2 0.565
Combination 0.4% 546.9 0.621
ART
1%
437.4 0.481 CLF 2461.0 0.939
DQ 670.1 0.628
Combination 984.9 0.925
The data indicated in bold did not meet the quality criteria, since either a high PDI or a size
distribution that was too broad, was displayed. It was found that all the dispersions’ vesicle sizes
increased with higher concentrations APIs and the size distribution at 0.4% API delivered
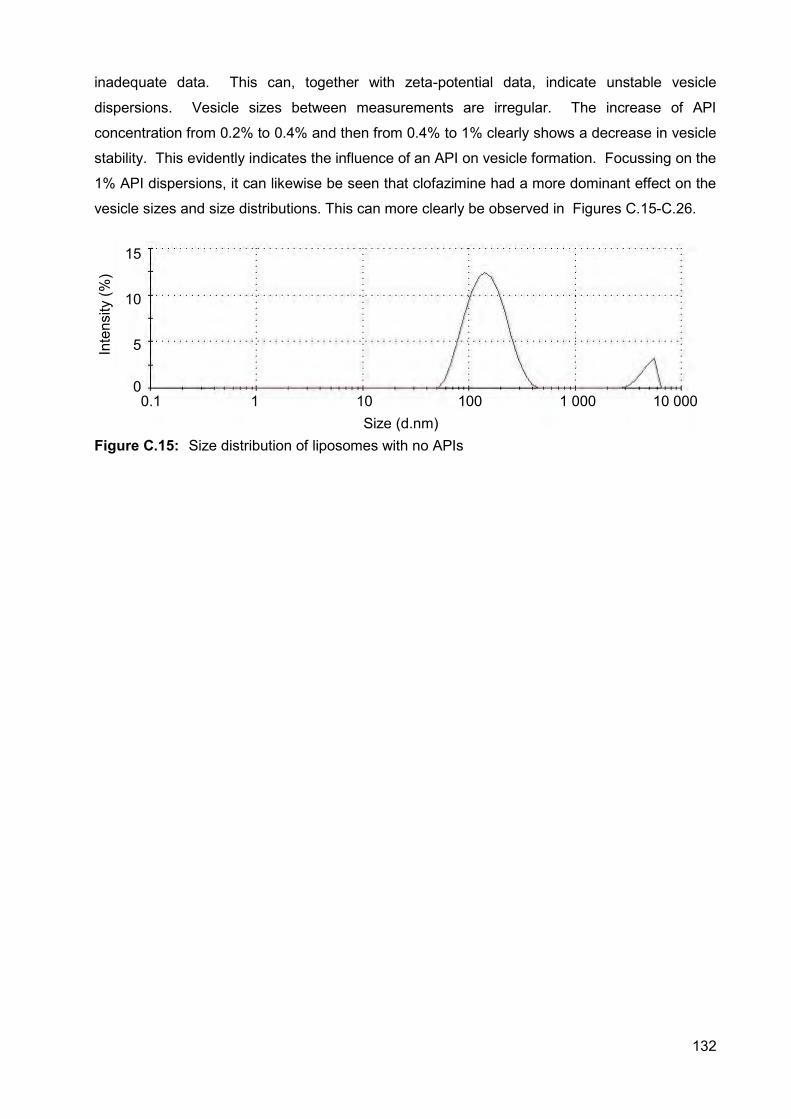
132
inadequate data. This can, together with zeta-potential data, indicate unstable vesicle
dispersions. Vesicle sizes between measurements are irregular. The increase of API
concentration from 0.2% to 0.4% and then from 0.4% to 1% clearly shows a decrease in vesicle
stability. This evidently indicates the influence of an API on vesicle formation. Focussing on the
1% API dispersions, it can likewise be seen that clofazimine had a more dominant effect on the
vesicle sizes and size distributions. This can more clearly be observed in Figures C.15-C.26.
Figure C.15: Size distribution of liposomes with no APIs
0.1 1 10 100 1 000 10 000 Size (d.nm)
Inte
nsity
(%)
15
10
5
0
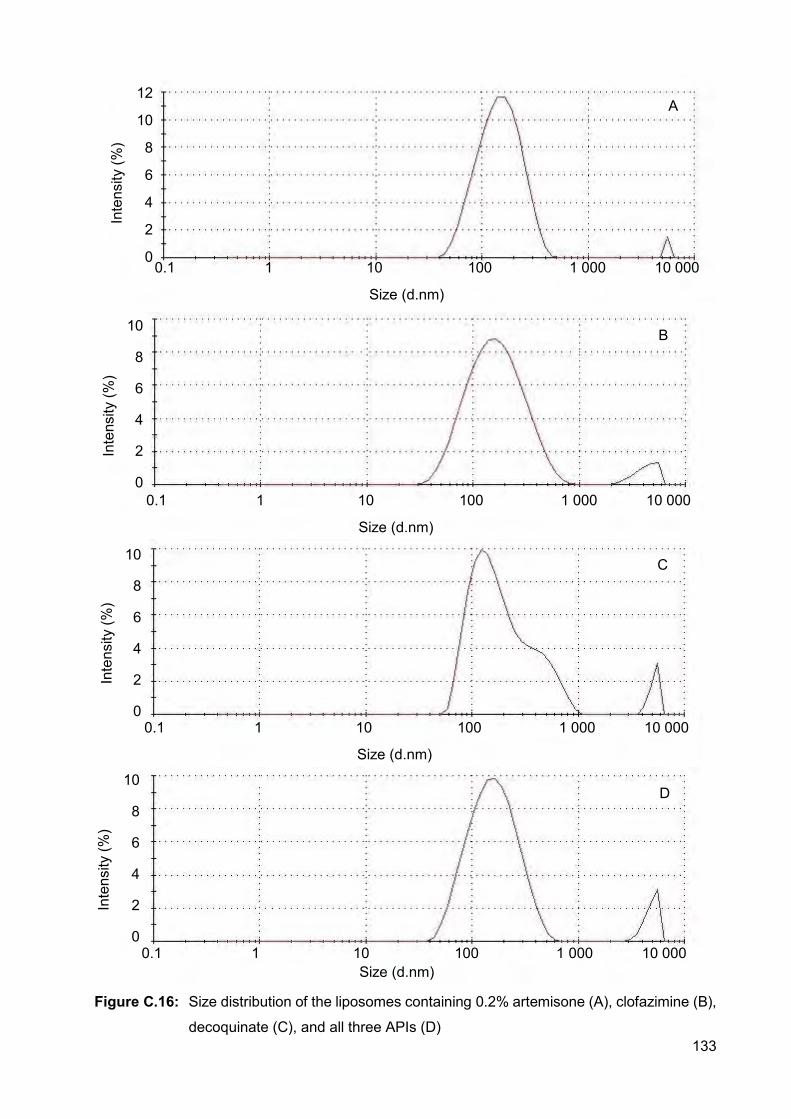
133
Figure C.16: Size distribution of the liposomes containing 0.2% artemisone (A), clofazimine (B),
decoquinate (C), and all three APIs (D)
0.1 1 10 100 1 000 10 000
Size (d.nm)
Inte
nsity
(%)
12
10
8
6
4
2
0
0.1 1 10 100 1 000 10 000
Size (d.nm)
Inte
nsity
(%)
10
8
6
4
2
0
0.1 1 10 100 1 000 10 000
Size (d.nm)
Inte
nsity
(%)
10
8
6
4
2
0
0.1 1 10 100 1 000 10 000 Size (d.nm)
Inte
nsity
(%)
10
8
6
4
2
0
A
B
C
D
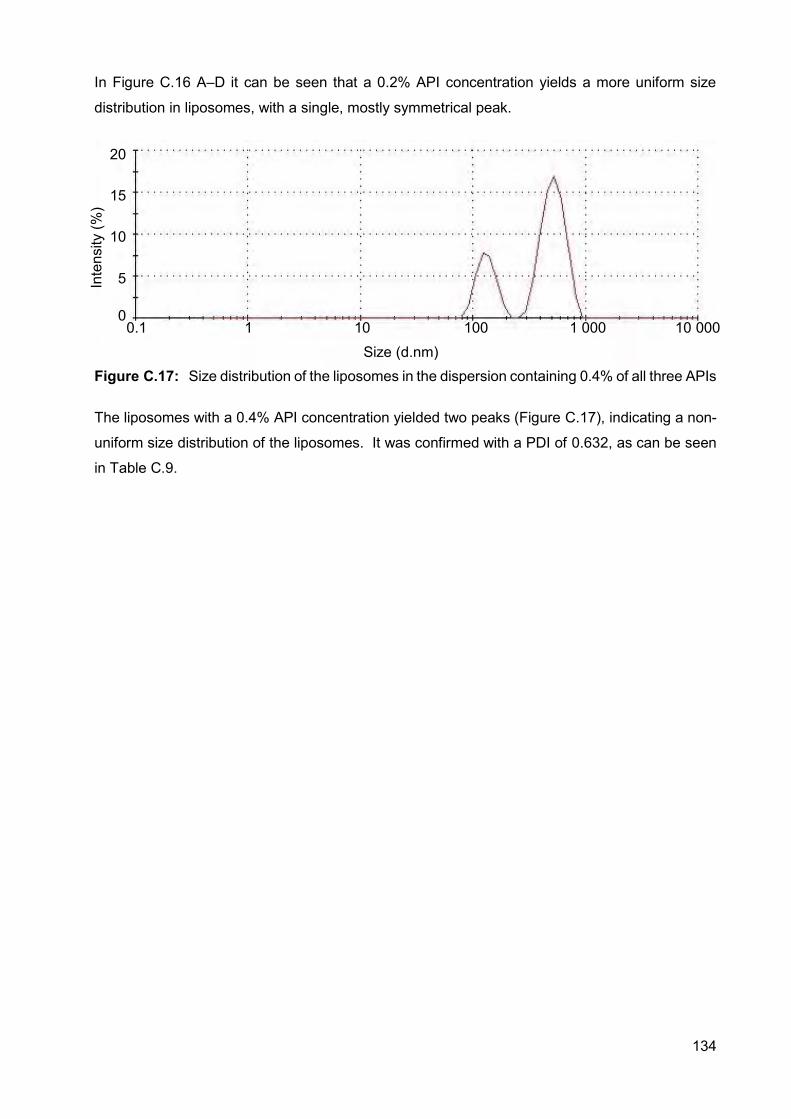
134
In Figure C.16 A–D it can be seen that a 0.2% API concentration yields a more uniform size
distribution in liposomes, with a single, mostly symmetrical peak.
Figure C.17: Size distribution of the liposomes in the dispersion containing 0.4% of all three APIs
The liposomes with a 0.4% API concentration yielded two peaks (Figure C.17), indicating a non-
uniform size distribution of the liposomes. It was confirmed with a PDI of 0.632, as can be seen
in Table C.9.
0.1 1 10 100 1 000 10 000 Size (d.nm)
Inte
nsity
(%)
20
15
10
5
0
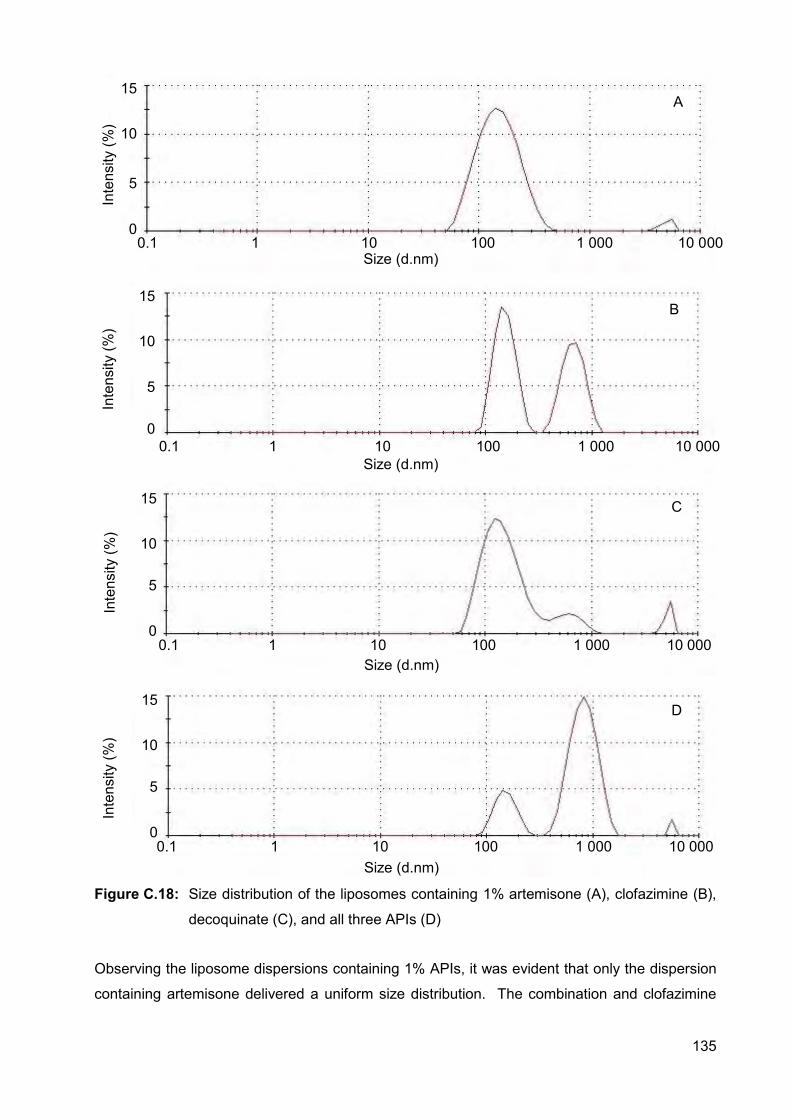
135
Figure C.18: Size distribution of the liposomes containing 1% artemisone (A), clofazimine (B),
decoquinate (C), and all three APIs (D)
Observing the liposome dispersions containing 1% APIs, it was evident that only the dispersion
containing artemisone delivered a uniform size distribution. The combination and clofazimine
Size (d.nm) 0.1 1 10 100 1 000 10 000
15
10
5
0
Inte
nsity
(%)
Inte
nsity
(%)
0.1 1 10 100 1 000 10 000 Size (d.nm)
15
10
5
0
Size (d.nm)
15
10
5
0
Inte
nsity
(%)
0.1 1 10 100 1 000 10 000
0.1 1 10 100 1 000 10 000 Size (d.nm)
Inte
nsity
(%)
15
10
5
0
A
B
C
D
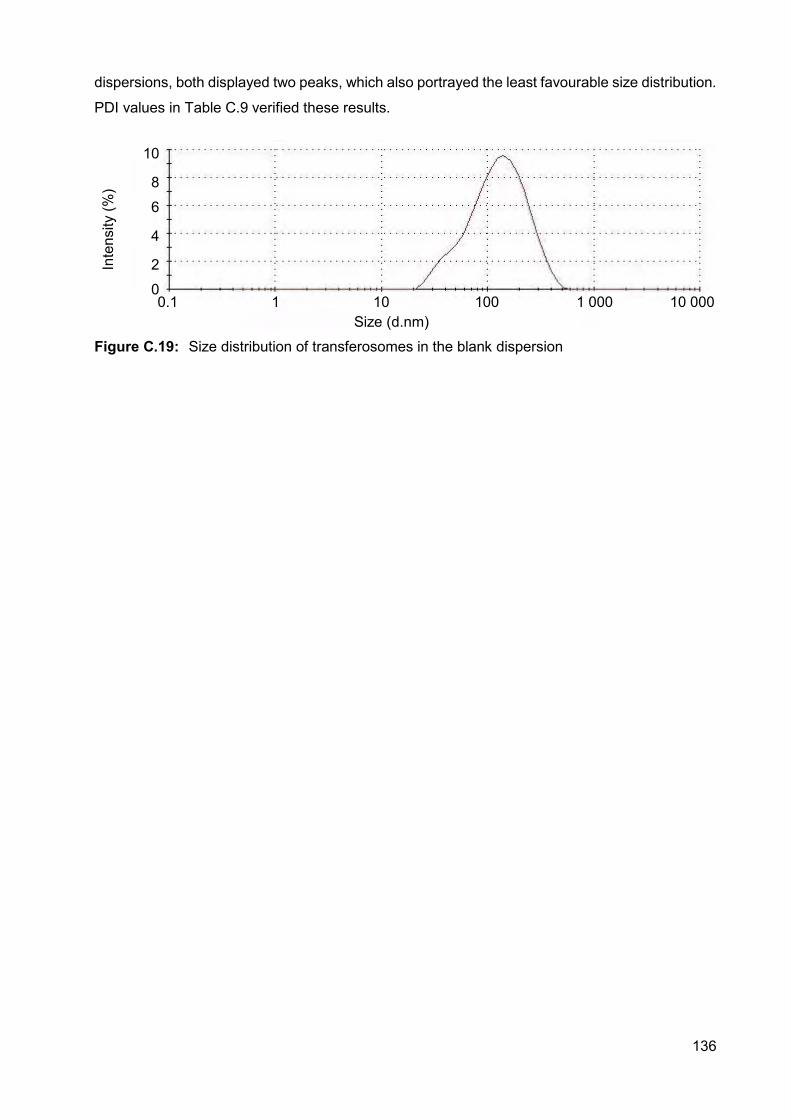
136
dispersions, both displayed two peaks, which also portrayed the least favourable size distribution.
PDI values in Table C.9 verified these results.
Figure C.19: Size distribution of transferosomes in the blank dispersion
Size (d.nm) 0.1 1 10 100 1 000 10 000
Inte
nsity
(%)
10
8
6
4
2
0
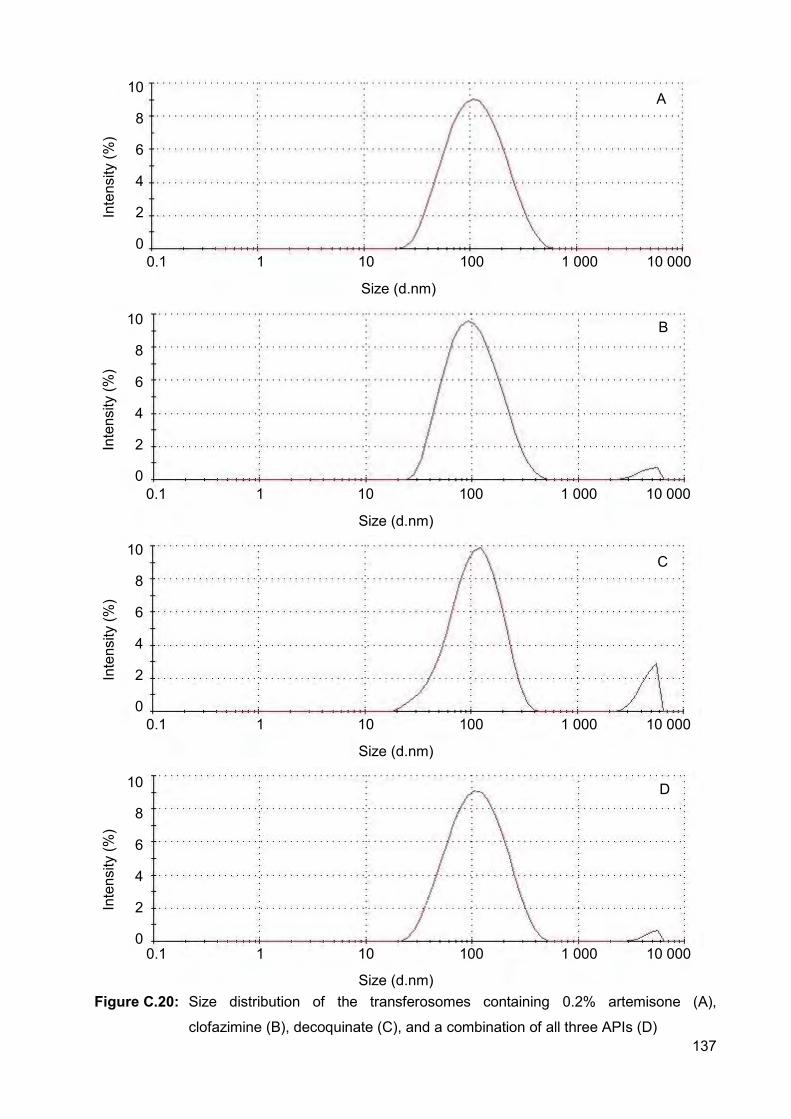
137
Figure C.20: Size distribution of the transferosomes containing 0.2% artemisone (A),
clofazimine (B), decoquinate (C), and a combination of all three APIs (D)
0.1 1 10 100 1 000 10 000
Size (d.nm)
Inte
nsity
(%)
10
8
6
4
2
0
0.1 1 10 100 1 000 10 000
Size (d.nm)
Inte
nsity
(%)
10
8
6
4
2
0
0.1 1 10 100 1 000 10 000
Size (d.nm)
Inte
nsity
(%)
10
8
6
4
2
0
0.1 1 10 100 1 000 10 000
Size (d.nm)
Inte
nsity
(%)
10
8
6
4
2
0
A
B
C
D
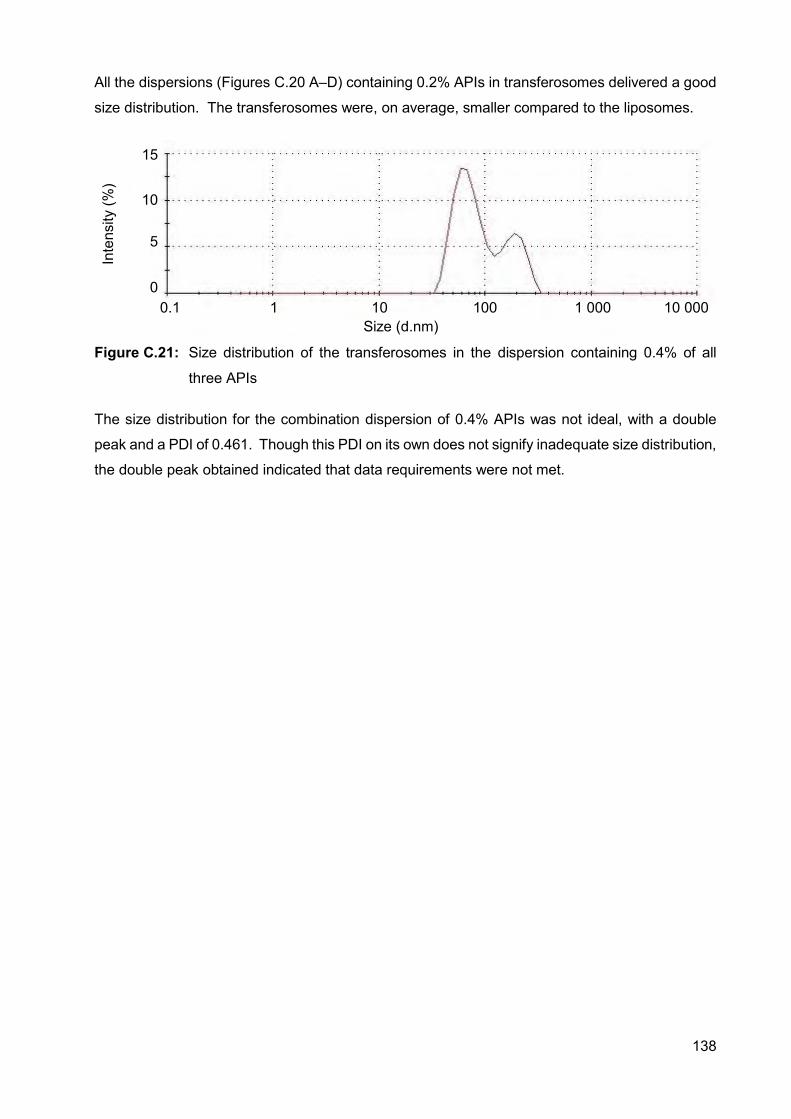
138
All the dispersions (Figures C.20 A–D) containing 0.2% APIs in transferosomes delivered a good
size distribution. The transferosomes were, on average, smaller compared to the liposomes.
Figure C.21: Size distribution of the transferosomes in the dispersion containing 0.4% of all
three APIs
The size distribution for the combination dispersion of 0.4% APIs was not ideal, with a double
peak and a PDI of 0.461. Though this PDI on its own does not signify inadequate size distribution,
the double peak obtained indicated that data requirements were not met.
15
10
5
0 0.1 1 10 100 1 000 10 000
Size (d.nm)
Inte
nsity
(%)
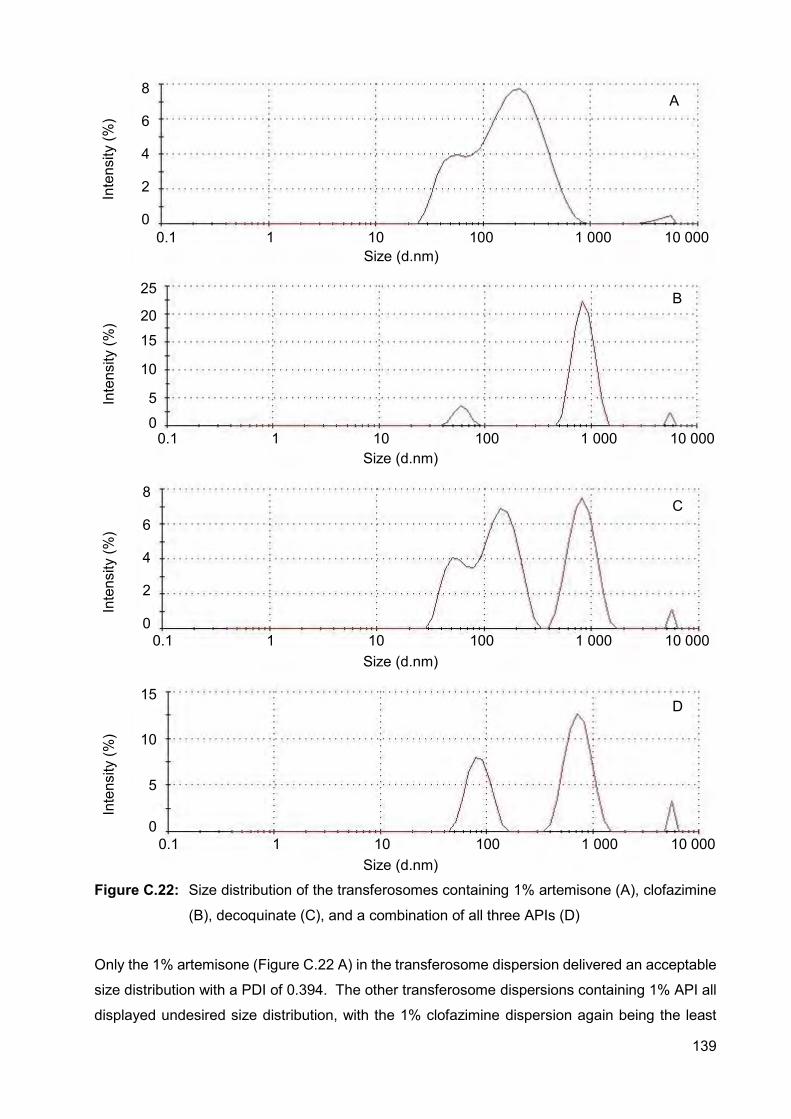
139
Figure C.22: Size distribution of the transferosomes containing 1% artemisone (A), clofazimine
(B), decoquinate (C), and a combination of all three APIs (D)
Only the 1% artemisone (Figure C.22 A) in the transferosome dispersion delivered an acceptable
size distribution with a PDI of 0.394. The other transferosome dispersions containing 1% API all
displayed undesired size distribution, with the 1% clofazimine dispersion again being the least
8
6
4
2
0
Size (d.nm) 0.1 1 10 100 1 000 10 000
Inte
nsity
(%)
0.1 1 10 100 1 000 10 000 Size (d.nm)
Inte
nsity
(%)
25
20
15
10
5
0
0.1 1 10 100 1 000 10 000 Size (d.nm)
Inte
nsity
(%)
8
6
4
2
0
Size (d.nm) 0.1 1 10 100 1 000 10 000
Inte
nsity
(%)
15
10
5
0
A
B
C
D
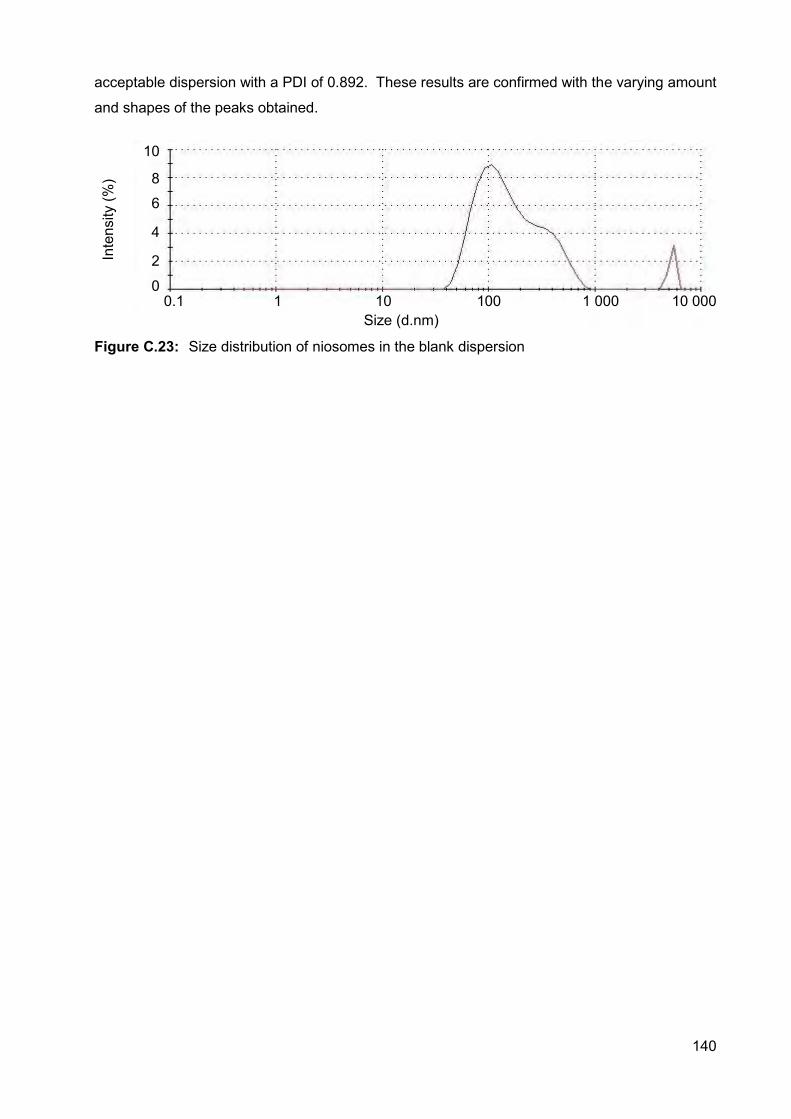
140
acceptable dispersion with a PDI of 0.892. These results are confirmed with the varying amount
and shapes of the peaks obtained.
Figure C.23: Size distribution of niosomes in the blank dispersion
Size (d.nm) 0.1 1 10 100 1 000 10 000
Inte
nsity
(%)
10
8
6
4
2
0
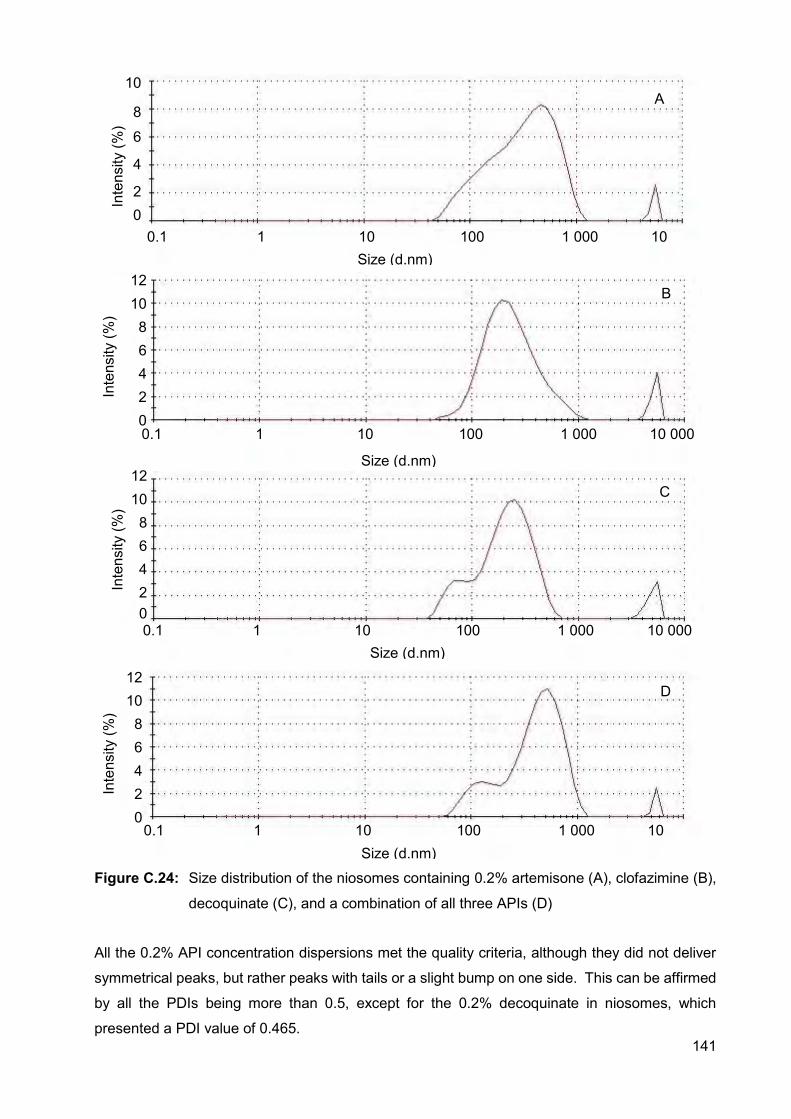
141
Figure C.24: Size distribution of the niosomes containing 0.2% artemisone (A), clofazimine (B),
decoquinate (C), and a combination of all three APIs (D)
All the 0.2% API concentration dispersions met the quality criteria, although they did not deliver
symmetrical peaks, but rather peaks with tails or a slight bump on one side. This can be affirmed
by all the PDIs being more than 0.5, except for the 0.2% decoquinate in niosomes, which
presented a PDI value of 0.465.
0.1 1 10 100 1 000 10 000
Size (d.nm)
Inte
nsity
(%)
12 10 8 6 4 2 0
0.1 1 10 100 1 000 10 Size (d.nm)
Inte
nsity
(%)
10
8
6
4
2 0
0.1 1 10 100 1 000 10 000 Size (d.nm)
Inte
nsity
(%)
12 10 8 6 4 2 0
0.1 1 10 100 1 000 10 Size (d.nm)
Inte
nsity
(%)
12 10 8 6 4 2 0
A
B
C
D
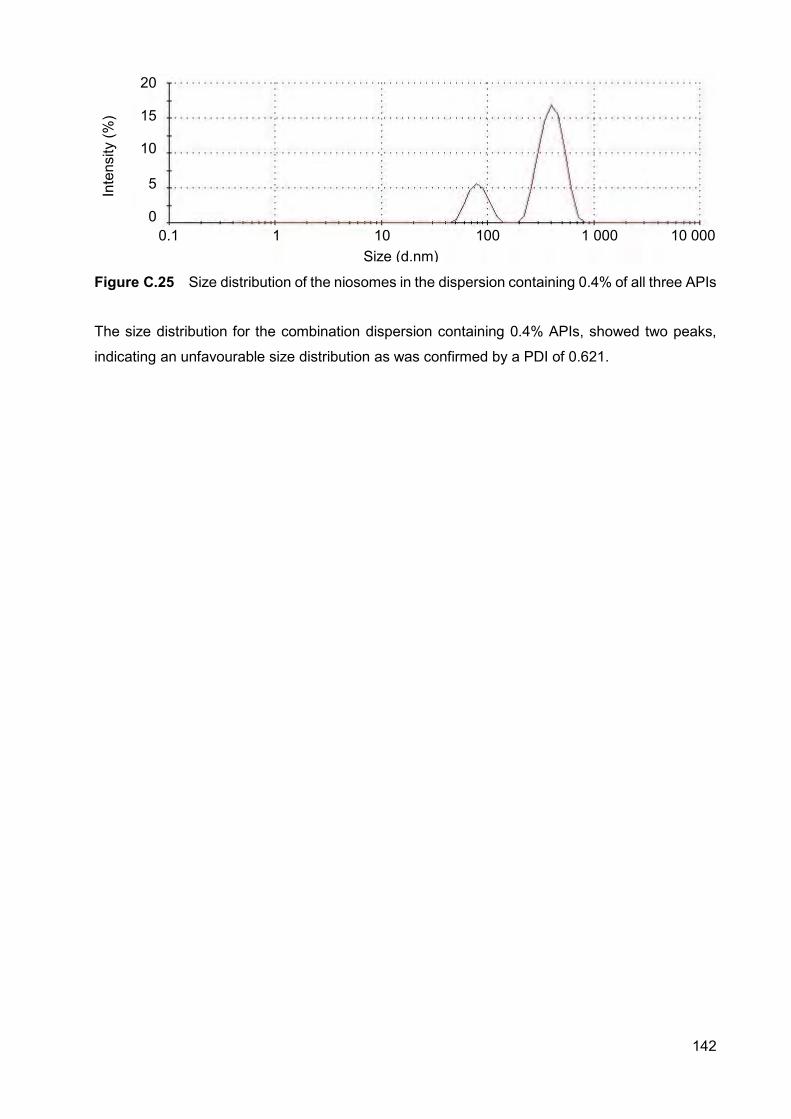
142
Figure C.25 Size distribution of the niosomes in the dispersion containing 0.4% of all three APIs
The size distribution for the combination dispersion containing 0.4% APIs, showed two peaks,
indicating an unfavourable size distribution as was confirmed by a PDI of 0.621.
20
15
10
5
0 0.1 1 10 100 1 000 10 000
Size (d.nm)
Inte
nsity
(%)
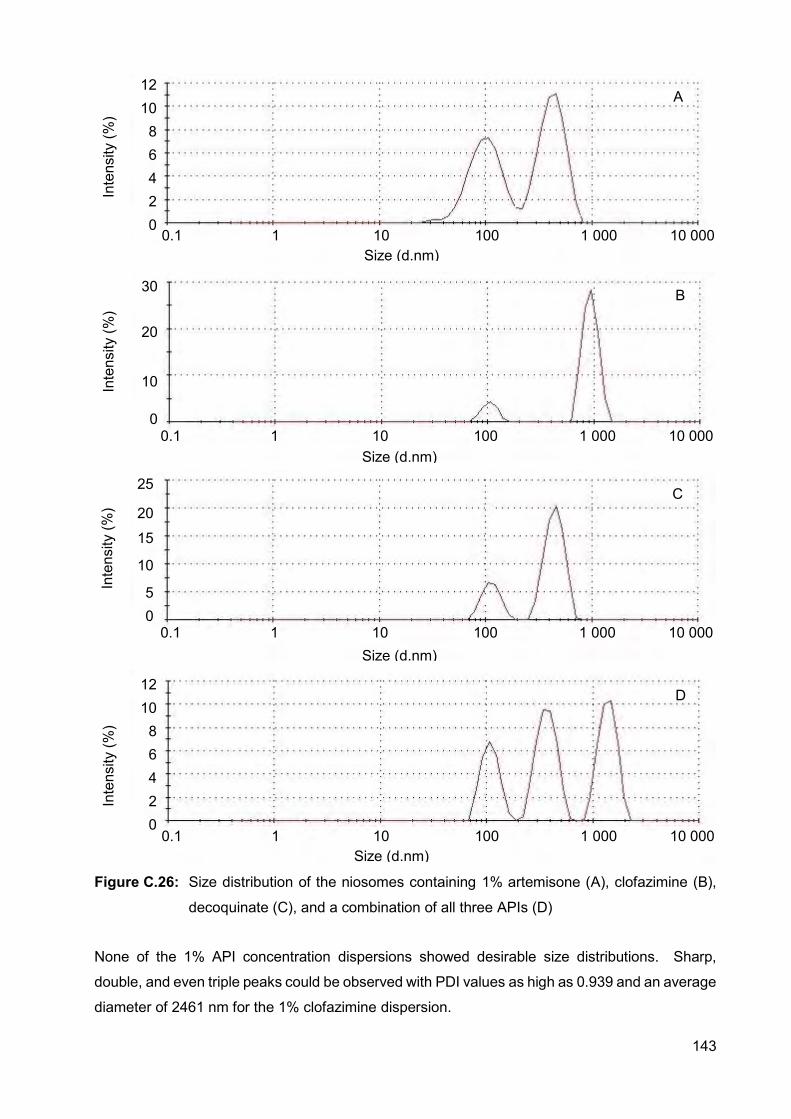
143
Figure C.26: Size distribution of the niosomes containing 1% artemisone (A), clofazimine (B),
decoquinate (C), and a combination of all three APIs (D)
None of the 1% API concentration dispersions showed desirable size distributions. Sharp,
double, and even triple peaks could be observed with PDI values as high as 0.939 and an average
diameter of 2461 nm for the 1% clofazimine dispersion.
12 10 8 6 4 2 0
0.1 1 10 100 1 000 10 000 Size (d.nm)
Inte
nsity
(%)
0.1 1 10 100 1 000 10 000 Size (d.nm)
Inte
nsity
(%)
25
20
15
10
5 0
0.1 1 10 100 1 000 10 000 Size (d.nm)
Inte
nsity
(%)
30
20
10
0
0.1 1 10 100 1 000 10 000 Size (d.nm)
Inte
nsity
(%)
12 10 8 6 4 2 0
A
B
C
D
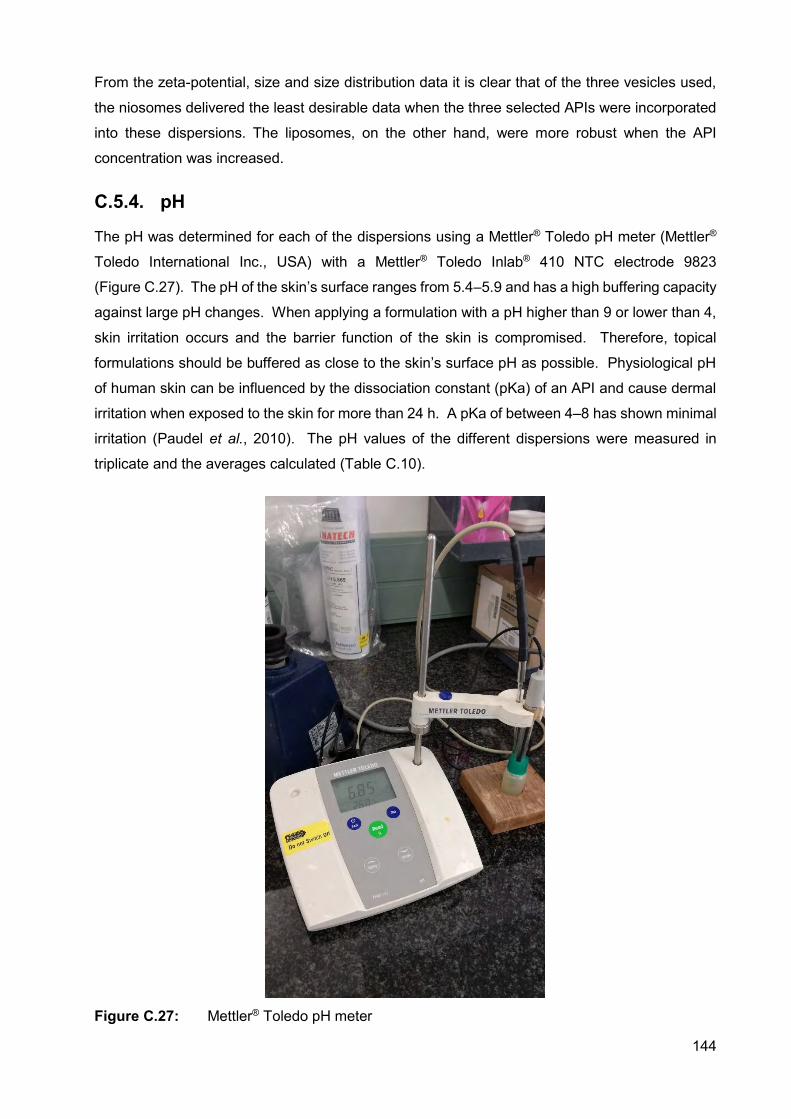
144
From the zeta-potential, size and size distribution data it is clear that of the three vesicles used,
the niosomes delivered the least desirable data when the three selected APIs were incorporated
into these dispersions. The liposomes, on the other hand, were more robust when the API
concentration was increased.
C.5.4. pH
The pH was determined for each of the dispersions using a Mettler® Toledo pH meter (Mettler®
Toledo International Inc., USA) with a Mettler® Toledo Inlab® 410 NTC electrode 9823
(Figure C.27). The pH of the skin’s surface ranges from 5.4–5.9 and has a high buffering capacity
against large pH changes. When applying a formulation with a pH higher than 9 or lower than 4,
skin irritation occurs and the barrier function of the skin is compromised. Therefore, topical
formulations should be buffered as close to the skin’s surface pH as possible. Physiological pH
of human skin can be influenced by the dissociation constant (pKa) of an API and cause dermal
irritation when exposed to the skin for more than 24 h. A pKa of between 4–8 has shown minimal
irritation (Paudel et al., 2010). The pH values of the different dispersions were measured in
triplicate and the averages calculated (Table C.10).
Figure C.27: Mettler® Toledo pH meter
145
Table C.10: Average pH measurements (n=3) of the different dispersions at room temperature (25±1.0°C)
Vesicle Dispersions and concentration API pH
Liposomes
Blank 0% 5.50 ART
0.2%
5.67 CLF 5.37 DQ 5.72
Combination 5.22 Combination 0.4% 5.32
ART
1%
5.51 CLF 5.49 DQ 5.51
Combination 5.44
Transferosomes
Blank 0% 5.37 ART
0.2%
5.58 CLF 5.26 DQ 5.60
Combination 5.06 Combination 0.4% 5.44
ART
1%
5.36 CLF 5.53 DQ 5.34
Combination 5.43
Niosomes
Blank 0% 5.19 ART
0.2%
4.95 CLF 5.17 DQ 4.99
Combination 5.53 Combination 0.4% 5.29
ART
1%
5.11 CLF 5.24 DQ 5.06
Combination 5.75
No vesicles
ART
0.2%
5.63 CLF 5.69 DQ 5.69
Combination 5.78 Combination 0.4% 5.89
ART
1%
5.68 CLF 5.70 DQ 5.67
Combination 5.48
146
All the pH values collected were between 4 and 9 as preferred for topical application. Most of the
values acquired were even between 5.4-5.9, the same as the skin pH, which are ideal.
C.5.5. VISCOSITY
The viscosity of the dispersions was measured using a Brookfield® Viscometer model DV2T™
(Stoughton, USA, Figure C.28) connected to a circulating water bath with a Brookfield®
temperature controller to maintain the temperature in the water jacket at 25±1.0°C. A SC4-18
spindle was used for this study and set to 100 rpm, where the torque is approximately 20%. The
spindle was immersed in the dispersion without causing a disturbance. Viscosity readings were
taken every 10 s for 1 min. The experiment was performed in triplicate and the average viscosity
for each dispersion was determined (Table C.11). Generally, it is assumed that more viscous
formulations will inhibit or eliminate the skin partitioning and absorption of molecules within a
formulation, partly due to poor skin distribution. This may not always be the case, since it was
also found that thin layers of a more viscous formulation may enhance skin permeation due to the
formation of an occlusive layer. Careful analysis of results is thus necessary to avoid false
interpretations (Leite-Silva et al., 2012). The viscosities of the dispersions were found to be very
close to that of water, which has a viscosity of 1 cP (or mPa.s in SI units) at 20°C and 0.89 mPa.s
at 25°C (Crittenden et al., 2012).
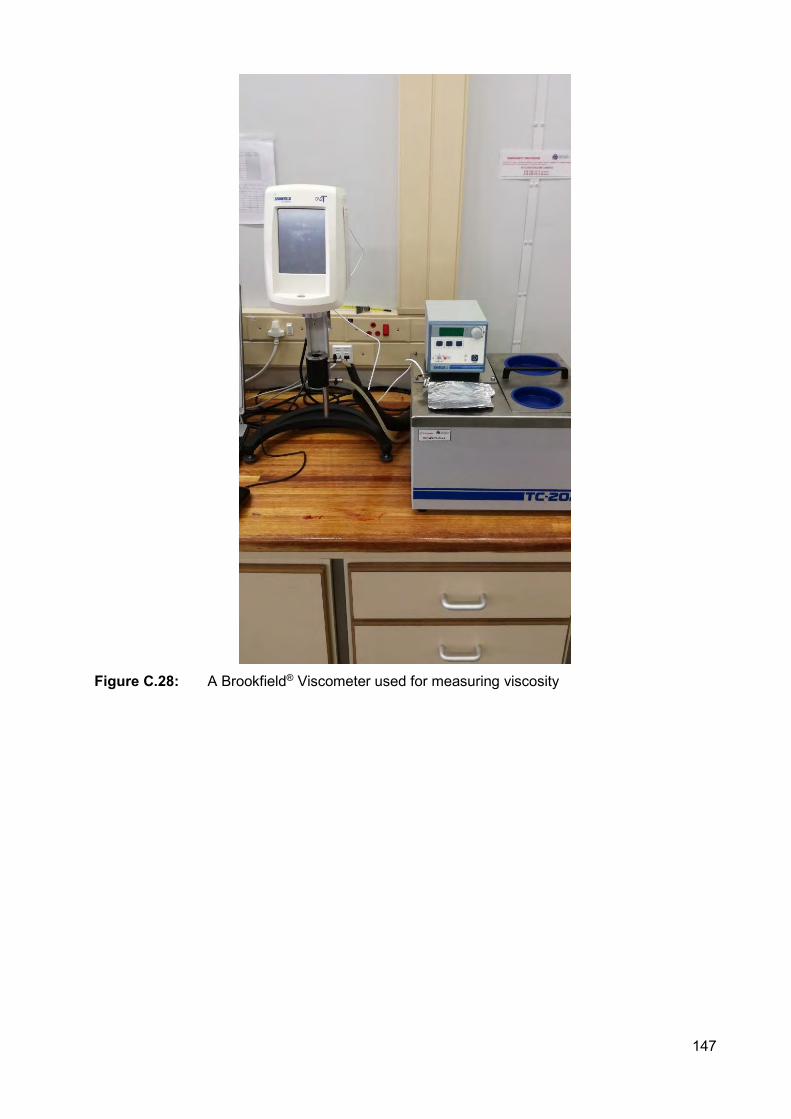
147
Figure C.28: A Brookfield® Viscometer used for measuring viscosity
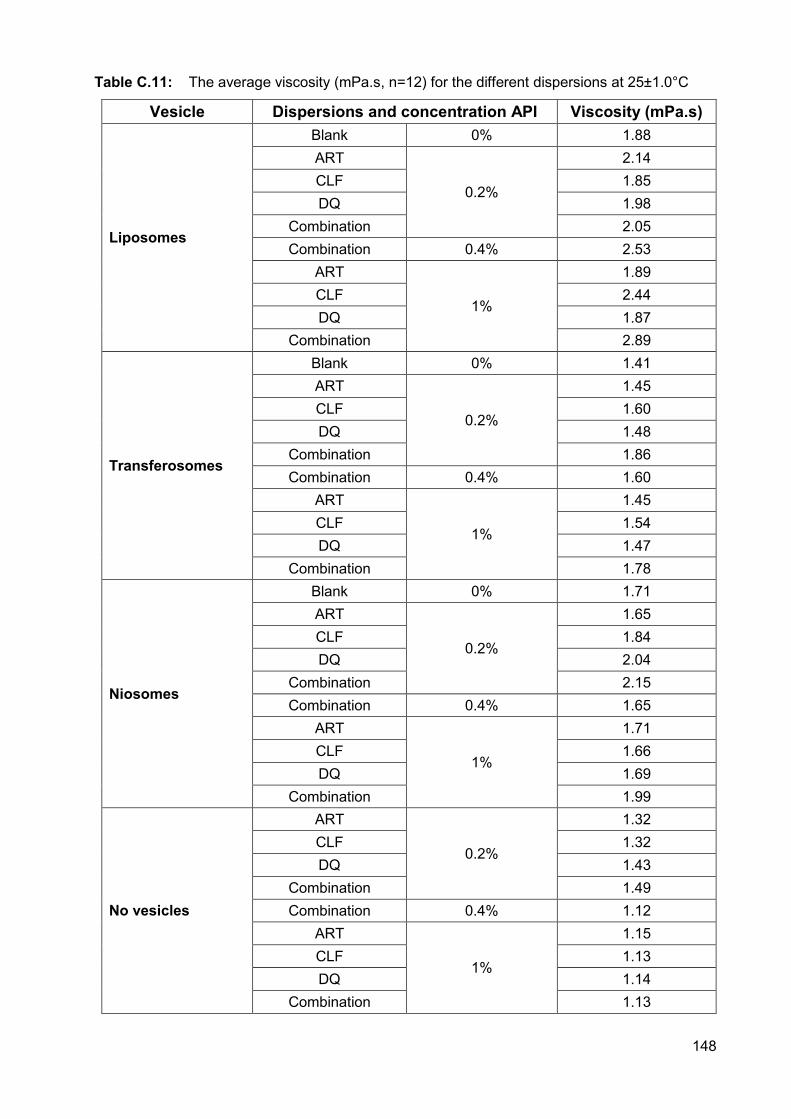
148
Table C.11: The average viscosity (mPa.s, n=12) for the different dispersions at 25±1.0°C
Vesicle Dispersions and concentration API Viscosity (mPa.s)
Liposomes
Blank 0% 1.88 ART
0.2%
2.14 CLF 1.85 DQ 1.98
Combination 2.05 Combination 0.4% 2.53
ART
1%
1.89 CLF 2.44 DQ 1.87
Combination 2.89
Transferosomes
Blank 0% 1.41 ART
0.2%
1.45 CLF 1.60 DQ 1.48
Combination 1.86 Combination 0.4% 1.60
ART
1%
1.45 CLF 1.54 DQ 1.47
Combination 1.78
Niosomes
Blank 0% 1.71 ART
0.2%
1.65 CLF 1.84 DQ 2.04
Combination 2.15 Combination 0.4% 1.65
ART
1%
1.71 CLF 1.66 DQ 1.69
Combination 1.99
No vesicles
ART
0.2%
1.32 CLF 1.32 DQ 1.43
Combination 1.49 Combination 0.4% 1.12
ART
1%
1.15 CLF 1.13 DQ 1.14
Combination 1.13
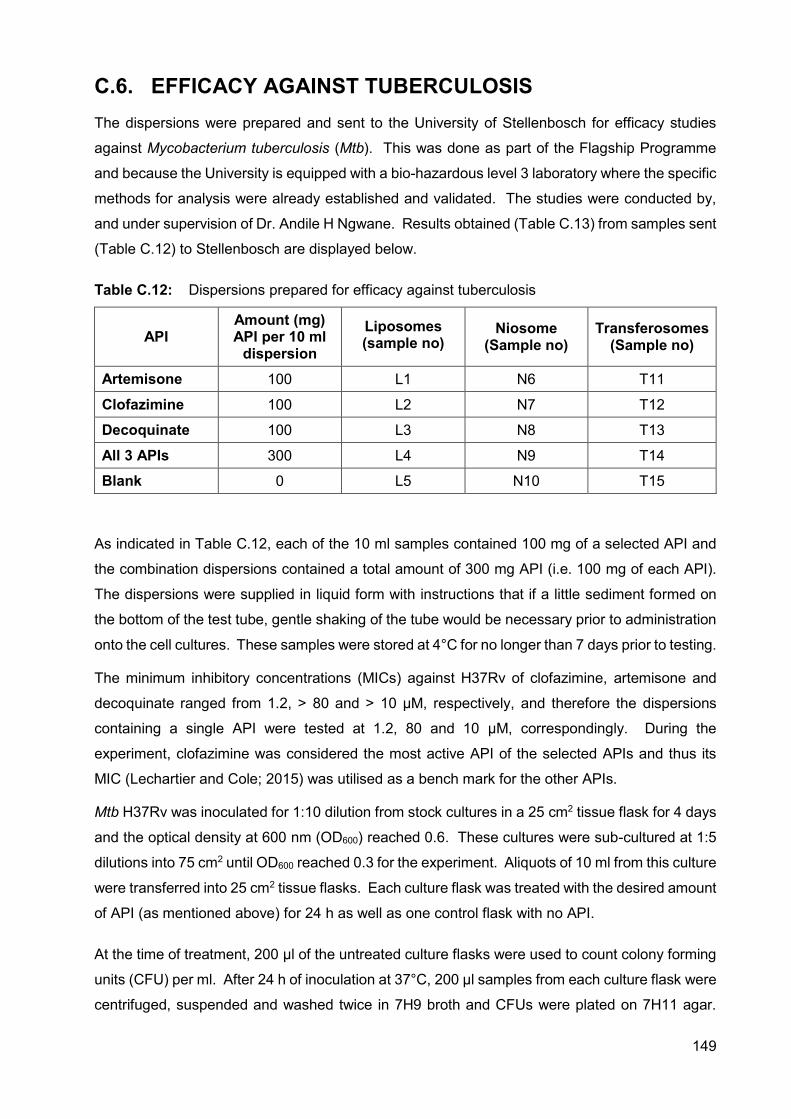
149
C.6. EFFICACY AGAINST TUBERCULOSIS The dispersions were prepared and sent to the University of Stellenbosch for efficacy studies
against Mycobacterium tuberculosis (Mtb). This was done as part of the Flagship Programme
and because the University is equipped with a bio-hazardous level 3 laboratory where the specific
methods for analysis were already established and validated. The studies were conducted by,
and under supervision of Dr. Andile H Ngwane. Results obtained (Table C.13) from samples sent
(Table C.12) to Stellenbosch are displayed below.
Table C.12: Dispersions prepared for efficacy against tuberculosis
API Amount (mg) API per 10 ml
dispersion
Liposomes (sample no)
Niosome (Sample no)
Transferosomes (Sample no)
Artemisone 100 L1 N6 T11
Clofazimine 100 L2 N7 T12
Decoquinate 100 L3 N8 T13
All 3 APIs 300 L4 N9 T14
Blank 0 L5 N10 T15
As indicated in Table C.12, each of the 10 ml samples contained 100 mg of a selected API and
the combination dispersions contained a total amount of 300 mg API (i.e. 100 mg of each API).
The dispersions were supplied in liquid form with instructions that if a little sediment formed on
the bottom of the test tube, gentle shaking of the tube would be necessary prior to administration
onto the cell cultures. These samples were stored at 4°C for no longer than 7 days prior to testing.
The minimum inhibitory concentrations (MICs) against H37Rv of clofazimine, artemisone and
decoquinate ranged from 1.2, > 80 and > 10 µM, respectively, and therefore the dispersions
containing a single API were tested at 1.2, 80 and 10 µM, correspondingly. During the
experiment, clofazimine was considered the most active API of the selected APIs and thus its
MIC (Lechartier and Cole; 2015) was utilised as a bench mark for the other APIs.
Mtb H37Rv was inoculated for 1:10 dilution from stock cultures in a 25 cm2 tissue flask for 4 days
and the optical density at 600 nm (OD600) reached 0.6. These cultures were sub-cultured at 1:5
dilutions into 75 cm2 until OD600 reached 0.3 for the experiment. Aliquots of 10 ml from this culture
were transferred into 25 cm2 tissue flasks. Each culture flask was treated with the desired amount
of API (as mentioned above) for 24 h as well as one control flask with no API.
At the time of treatment, 200 µl of the untreated culture flasks were used to count colony forming
units (CFU) per ml. After 24 h of inoculation at 37°C, 200 µl samples from each culture flask were
centrifuged, suspended and washed twice in 7H9 broth and CFUs were plated on 7H11 agar.
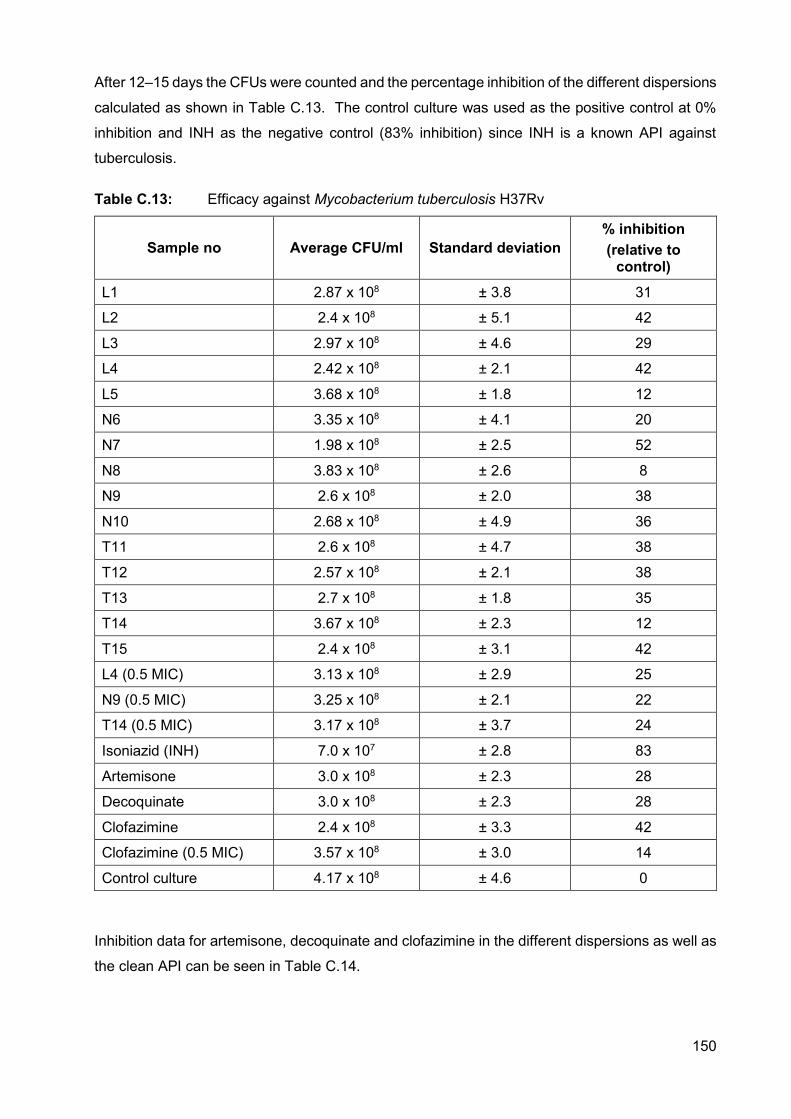
150
After 12–15 days the CFUs were counted and the percentage inhibition of the different dispersions
calculated as shown in Table C.13. The control culture was used as the positive control at 0%
inhibition and INH as the negative control (83% inhibition) since INH is a known API against
tuberculosis.
Table C.13: Efficacy against Mycobacterium tuberculosis H37Rv
Sample no Average CFU/ml Standard deviation % inhibition (relative to
control)
L1 2.87 x 10⁸ ± 3.8 31
L2 2.4 x 10⁸ ± 5.1 42
L3 2.97 x 10⁸ ± 4.6 29
L4 2.42 x 10⁸ ± 2.1 42
L5 3.68 x 10⁸ ± 1.8 12
N6 3.35 x 10⁸ ± 4.1 20
N7 1.98 x 10⁸ ± 2.5 52
N8 3.83 x 10⁸ ± 2.6 8
N9 2.6 x 10⁸ ± 2.0 38
N10 2.68 x 10⁸ ± 4.9 36
T11 2.6 x 10⁸ ± 4.7 38
T12 2.57 x 10⁸ ± 2.1 38
T13 2.7 x 10⁸ ± 1.8 35
T14 3.67 x 10⁸ ± 2.3 12
T15 2.4 x 10⁸ ± 3.1 42
L4 (0.5 MIC) 3.13 x 10⁸ ± 2.9 25
N9 (0.5 MIC) 3.25 x 10⁸ ± 2.1 22
T14 (0.5 MIC) 3.17 x 10⁸ ± 3.7 24
Isoniazid (INH) 7.0 x 10⁷ ± 2.8 83
Artemisone 3.0 x 10⁸ ± 2.3 28
Decoquinate 3.0 x 10⁸ ± 2.3 28
Clofazimine 2.4 x 10⁸ ± 3.3 42
Clofazimine (0.5 MIC) 3.57 x 10⁸ ± 3.0 14
Control culture 4.17 x 10⁸ ± 4.6 0
Inhibition data for artemisone, decoquinate and clofazimine in the different dispersions as well as
the clean API can be seen in Table C.14.
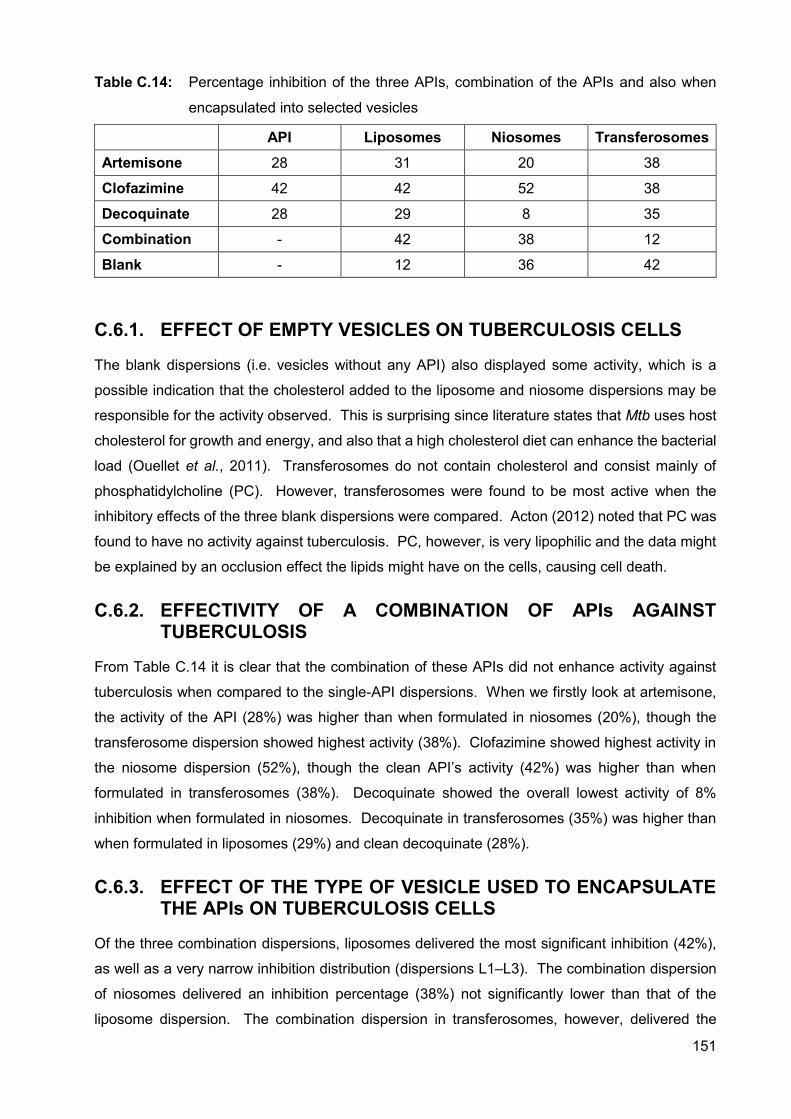
151
Table C.14: Percentage inhibition of the three APIs, combination of the APIs and also when
encapsulated into selected vesicles
API Liposomes Niosomes Transferosomes Artemisone 28 31 20 38
Clofazimine 42 42 52 38
Decoquinate 28 29 8 35
Combination - 42 38 12
Blank - 12 36 42
C.6.1. EFFECT OF EMPTY VESICLES ON TUBERCULOSIS CELLS
The blank dispersions (i.e. vesicles without any API) also displayed some activity, which is a
possible indication that the cholesterol added to the liposome and niosome dispersions may be
responsible for the activity observed. This is surprising since literature states that Mtb uses host
cholesterol for growth and energy, and also that a high cholesterol diet can enhance the bacterial
load (Ouellet et al., 2011). Transferosomes do not contain cholesterol and consist mainly of
phosphatidylcholine (PC). However, transferosomes were found to be most active when the
inhibitory effects of the three blank dispersions were compared. Acton (2012) noted that PC was
found to have no activity against tuberculosis. PC, however, is very lipophilic and the data might
be explained by an occlusion effect the lipids might have on the cells, causing cell death.
C.6.2. EFFECTIVITY OF A COMBINATION OF APIs AGAINST TUBERCULOSIS
From Table C.14 it is clear that the combination of these APIs did not enhance activity against
tuberculosis when compared to the single-API dispersions. When we firstly look at artemisone,
the activity of the API (28%) was higher than when formulated in niosomes (20%), though the
transferosome dispersion showed highest activity (38%). Clofazimine showed highest activity in
the niosome dispersion (52%), though the clean API’s activity (42%) was higher than when
formulated in transferosomes (38%). Decoquinate showed the overall lowest activity of 8%
inhibition when formulated in niosomes. Decoquinate in transferosomes (35%) was higher than
when formulated in liposomes (29%) and clean decoquinate (28%).
C.6.3. EFFECT OF THE TYPE OF VESICLE USED TO ENCAPSULATE THE APIs ON TUBERCULOSIS CELLS
Of the three combination dispersions, liposomes delivered the most significant inhibition (42%),
as well as a very narrow inhibition distribution (dispersions L1–L3). The combination dispersion
of niosomes delivered an inhibition percentage (38%) not significantly lower than that of the
liposome dispersion. The combination dispersion in transferosomes, however, delivered the
152
lowest percentage inhibition (12%). Though no definite conclusions can be made from this data,
further investigation into clofazimine would be beneficial, since clofazimine powder and
clofazimine in the different vesicles delivered the highest percentage inhibition. Clofazimine is a
documented anti-tuberculous API that was investigated in the 1990s, but which caused skin
pigmentation due to ceroid lipofuscinosis (Job et al., 1990; Smith et al., 2016). Further
investigation into methods to deliver it locally, while limiting the severe skin pigmentation might
be advantageous for CTB. There is a definite difference between data from the three vesicles,
and since vesicles are ideal for carrying APIs with non-ideal properties through/into skin, further
investigation into vesicles would be beneficial.
C.7. SUMMARY Liposomes, transferosomes and niosomes were successfully prepared and viewed with TEM.
Size and size distribution were conducted with the Zetasizer Nano ZS and results showed that
the vesicle sizes were within the limits stated by literature. The transferosome dispersions
displayed the smallest vesicles that were, furthermore, confirmed by literature. These results are
an indication that transdermal delivery through this dosage form may be further improved.
Liposomes delivered good size distribution and sizes only slightly larger than transferosomes. On
the other hand, the prepared niosomes showed the largest vesicles, which will possibly improve
topical delivery. Niosome sizes, however, were more broadly distributed and presented a high
PDI (> 0.6), indicating that the method of production may need some alteration. The time
sonicated was subsequently lengthened, which in turn caused a more favourable size distribution.
The zeta-potential values for the dispersions were more than -30 mV, with a few exceptions,
which may indicate that those dispersions are unstable and vesicles may aggregate or leak API
after some time.
The dispersions were manufactured to have a pH-value of no less than five since this is the lowest
pH at which dispersions can be topically applied to avoid skin irritation. The pKa values of the
APIs were used to calculate at which pH they would be mostly unionised as unionised particles
pass more readily across lipid membranes. The proportion of unionised API determines the
effective membrane gradient for diffusion, although ionised particles may also diffuse across the
stratum corneum to a limited extent (Barry, 2002; Vaidyanathan et al., 1985). A pH approximately
5.5 was attained by preparing a 1.5 strength phosphate buffer solution. It was determined that a
lower pH would produce higher concentrations unionised particles, but the pH had to be kept
above 5.
Viscosity was subsequently determined for each dispersion in order to later interpret skin diffusion
data, since viscosity influences spreadability of a formulation and the formulation may cause an
occlusion effect if the viscosity is high. The viscosity measured for the dispersions was close to
that of water, which ensured easy and even spreadability.
153
When tested against tuberculosis, activity was found for all of the dispersions, with clofazimine in
niosomes being the highest and decoquinate in niosomes the lowest. Combination of the APIs
did not increase activity compared to the single-API dispersions. Surprisingly, the blank
dispersions also showed some activity, which cannot be fully explained in the case of the
transferosomes. When omitting the combination dispersions, transferosomes and liposomes
delivered narrowly distributed data with the transferosomes being slightly higher.
154
REFERENCES ACTON, A. 2012. Tuberculosis: New insights for the Healthcare Professional: 2011 Edition.
https://books.google.co.za/books?id=Hjllcl5deFUC&pg=PT115&lpg=PT115&dq=phosphatidylch
oline+against+tuberculosis&source=bl&ots=0JoLR8YpCS&sig=OzipfIV7NY4ch0WKTsMs4f8MT
eQ&hl=en&sa=X&ved=0ahUKEwiymNK9h4bWAhUDD8AKHVIiDO8Q6AEISjAE#v=onepage&q
=phosphatidylcholine%20against%20tuberculosis&f=false Date of access: 2 September 2017.
AGARWAL, R., KATARE, O.P. & VYAS, S.P. 2001. Preparation and in vitro evaluation of
liposomal/niosomal delivery systems for antipsoriatic drug dithranol. International journal of
pharmacceutics., 288:43-52.
ANDERSON MATERIALS INC. 2016. Differential scanning calorimetry (DSC) thermal analysis.
http://www.andersonmaterials.com/dsc.html Date of access: 21 July 2016.
BARRY, B. 2002. Transdermal drug delivery. (In Aulton, M. E., ed. Pharmaceutics: The science
of dosage form design. 2nd ed. New York: Churchill Livingstone. p. 499-533.)
BARRY, B.W. 2001. Novel mechanisms and devices to enable successful transdermal drug
delivery. Eur. J. Pharm. Sci., 14:101-114.
COLLOIDAL DYNAMICS: Leaders in colloid measurement. 1999. Electroacoustics tutorials: The
zeta potential. 4p.
CRITTENDEN, J.C., TRUSSEL, R.R., HAND, D.W., HOWE, K.J. & TCHOBANOGLOUS, G., eds.
2012. MWH’s water treatment: Principles and design. 3rd ed. New Jersey: John Wiley & Sons,
Inc. 1901p.
DRAGICEVIC-CURIC, N. & MAIBACH, H.I., eds. 2015. Percutaneous penetration enhancers -
Chemical methods in penetration enhancement: Drug manipulation strategies and vehicle effects.
1st ed. New York: Springer. 341p.
DT: DISPERSION TECHNOLOGY INC. 2013. Zeta potential, short tutorial.
http://www.dispersion.com/zeta-potential-short-tutorial Date of access: 17 May 2016.
EL MAGHRABY, G.M.M., WILLIAMS, A.C. & BARRY, B.W. 2000. Oestradiol skin delivery from
ultradeformable liposomes: refinement of surfactant concentration. International journal of
pharmaceutis, 196:63-74.
FAUSKE & ASSOCIATES, LLC. 2016. Thermal stability. http://www.fauske.com/chemical-
industrial/thermal-stability Date of access: 21 July 2016.
155
GILLET, A., LECOMTE, F., HUBERT, P., DUCAT, E., EVRARD, B. & PIEL, G. 2011. Skin
penetration behaviour of liposomes as a function of their composition. European journal of
pharmaceutics and biopharmaceutics, 79:43-53.
ISACCHI, B., BERGONZI, M.C., GRAZIOSO, M., RIGHESCHI, C., PIETRETTI, A., SEVERINI,
C. & BILIA, A.R. 2012. Artemisinin and artemisinin plus curcumin liposomal formulations:
enhanced antimalarial efficacy against Plasmodium berghei-infected mice. European journal of
pharmaceutics and biopharmaceutics, 80:528-534.
JAIN, S., JAIN, V. & MAHAJAN, S.C. 2014. Lipid based vesicular drug delivery systems.
Advances in pharmaceutics, 2014:1-12.
JOB, C.K., YODER, L., JACKOBSON, R.R. & HASTINGS, R.C. 1990. Skin pigmentation from
clofazimine therapy in leprosy patients: A reappraisal. Journal of the American academy of
dermatology, 23(2):236-241.
KAUR, I.P. & SINGH, H. 2014. Nanostructured drug delivery for better management of
tuberculosis. Journal of controlled release, 18:36-50.
KUMAR, G.P. & RAJESHWARRAO, P. 2011. Nonionic surfactant vesicular systems for effective
drug delivery – an overview. Acta pharmaceutica sinica B, 1(4):208-219.
LECHARTIER, B. & COLE, S.T. 2015. Mode of action of clofazimine and combination therapy
with benzothiazinones against Mycobacterium tuberculosis. Antimicrobial agents and
chemotherapy, 59(8):4457-4463.
LEITE-SILVA, V.R., DE ALMEIDA, M.M., FRADIN, A., GRICE, J.E. & ROBERTS, M.S. 2012.
Delivery of drugs applied topically to the skin: Advanced formulation.
http://www.medscape.org/viewarticle/771038_3 Date of access: 18 May 2016.
MAHALE, N.B., THAKKAR, P.D., MALI, R.G., WALUNJ, D.R. & CHAUDHARI, S.R. 2012.
Niosomes: novel sustained release nonionic stable vesicular systems – an overview. Advances
in colloid and interface science, 183-184:46-54.
MALI, N., DARANDALE, S. & VAVIA, P. 2013. Niosomes as a vesicular carrier for topical
administration of minoxidil: formulation and in vitro assessment. Drug delivery and translational
research, 3:587-592.
MALVERN INSTRUMENTS LTD. 2004. Zetasizer nano series: User manual (MAN0317; Issue
1.1). Malvern Instruments Ltd.: England. 270p.
156
MALVERN INSTRUMENTS LTD. 2016. Differential scanning calorimetry: confident
characterisation of protein stability. http://www.malvern.com/en/products/technology/differential-
scanning-calorimetry/ Date of access: 21 July 2016.
MALVERN INSTRUMENTS LTD. 2017. An introduction to zeta-potential.
https://www2.warwick.ac.uk/fac/cross_fac/sciencecity/programmes/internal/themes/am2/bookin
g/particlesize/mrk654-01_an_introduction_to_zeta_potential_v3.pdf Date of access: 23 May
2017.
MANCONI, M., SINICO, C., CADDEO, C., VILA, A.O., VALENTI, D. & FADDA, A.M. 2011.
Penetration enhancer containing vesicles as carriers for dermal delivery of tretinoin. International
journal of pharmaceutics, 412:37-46.
MANCONI, M., CADDEO, C., SINICO, C., VALENTI, D., MOSTALLINO, M.C., LAMPIS, S.,
MONDUZZI, M. & FADDA, A.M. 2012. Penetration enhancer-containing vesicles: composition
dependence of structural features and skin penetration ability. European journal of
pharmaceutics and biopharmaceutics, 82:352-359.
NEW, R.R.C, ed. 1990. Liposomes: a practical approach. 1st ed. New York: Oxford university
press. 301p.
OUELLET, H., JOHNSTON, J.B. & ORTIZ DE MONTELLANO, P.R. 2011. Cholesterol
catabolism as a therapeutic target in Mycobacterium tuberculosis. Trends in microbiology,
19(11):530-539.
PAUDEL, K.S., MILEWSKI, M., SWADLEY, C.L., BROGDEN, N.K., GHOSH, P. &
STINCHCOMB, A. 2010. Challenges and opportunities in dermal/transdermal delivery.
Therapeutic delivery, 1(1): 109-131.
SHAJI, J. & LAL, M. 2014. Preparation, optimization and evaluation of transferosomal
formulation for enhanced transdermal delivery of a COX-2 inhibitor. International journal of
pharmaceutics and pharmaceutical sciences, 6(1):467-477.
SHARMA, S.K., CHAUHAN, M. & ANILKUMAR, N. 2009. Span-60 niosomal oral suspension of
fluconazole formulation and in vitro evaluation. Journal of pharmaceutical research and health
care, 1(2):142-156.
SMITH, M., ACCINELLI, A., TEJADA, F.R. & KHAREL, M.K. 2016. Chapter 28 – Drugs used in
Tuberculosis and leprosy. Side effects of drugs annual, 38:283-293.
TA INSTRUMENTS. 2017. Microcalorimetry. http://www.tainstruments.com/pdf/brochure/
MicrocalorimetryBrochure.pdf Date of access: 29 August 2017.
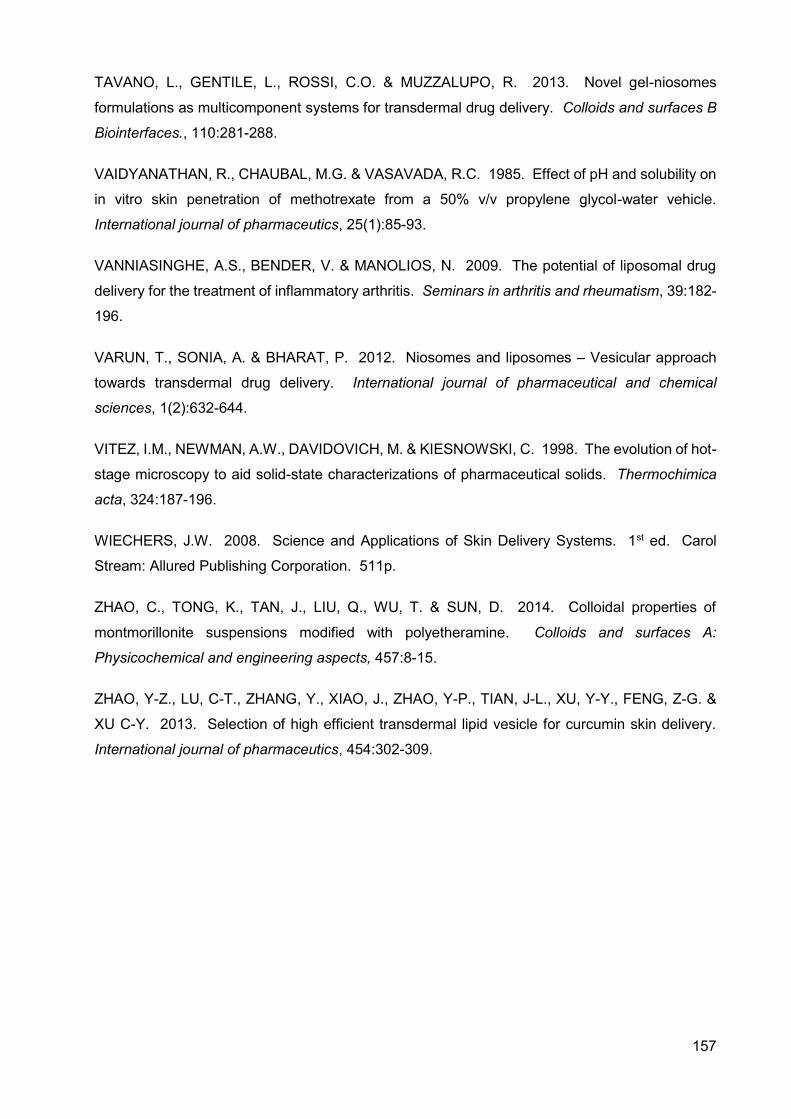
157
TAVANO, L., GENTILE, L., ROSSI, C.O. & MUZZALUPO, R. 2013. Novel gel-niosomes
formulations as multicomponent systems for transdermal drug delivery. Colloids and surfaces B
Biointerfaces., 110:281-288.
VAIDYANATHAN, R., CHAUBAL, M.G. & VASAVADA, R.C. 1985. Effect of pH and solubility on
in vitro skin penetration of methotrexate from a 50% v/v propylene glycol-water vehicle.
International journal of pharmaceutics, 25(1):85-93.
VANNIASINGHE, A.S., BENDER, V. & MANOLIOS, N. 2009. The potential of liposomal drug
delivery for the treatment of inflammatory arthritis. Seminars in arthritis and rheumatism, 39:182-
196.
VARUN, T., SONIA, A. & BHARAT, P. 2012. Niosomes and liposomes – Vesicular approach
towards transdermal drug delivery. International journal of pharmaceutical and chemical
sciences, 1(2):632-644.
VITEZ, I.M., NEWMAN, A.W., DAVIDOVICH, M. & KIESNOWSKI, C. 1998. The evolution of hot-
stage microscopy to aid solid-state characterizations of pharmaceutical solids. Thermochimica
acta, 324:187-196.
WIECHERS, J.W. 2008. Science and Applications of Skin Delivery Systems. 1st ed. Carol
Stream: Allured Publishing Corporation. 511p.
ZHAO, C., TONG, K., TAN, J., LIU, Q., WU, T. & SUN, D. 2014. Colloidal properties of
montmorillonite suspensions modified with polyetheramine. Colloids and surfaces A:
Physicochemical and engineering aspects, 457:8-15.
ZHAO, Y-Z., LU, C-T., ZHANG, Y., XIAO, J., ZHAO, Y-P., TIAN, J-L., XU, Y-Y., FENG, Z-G. &
XU C-Y. 2013. Selection of high efficient transdermal lipid vesicle for curcumin skin delivery.
International journal of pharmaceutics, 454:302-309.
158
Annexure D
TRANSDERMAL DIFFUSION STUDIES OF DIFFERENT
VESICLE DISPERSIONS
D.1. INTRODUCTION Transdermal delivery of APIs across the skin into the systemic circulation, or topical delivery into
the skin has been found a convenient route of administration (Dwivedi et al. 2016; Luo & Lane,
2015). This route has many advantages, such as enhanced patient compliance, reduced dosing
and avoiding the hepatic first-pass effect, to name only a few. This route, however, comes with
many challenges as well. For example, only a limited amount of APIs can be delivered through
this route due to the formidable barrier function of the stratum corneum (Ahad et al., 2017; Haine
et al., 2017). APIs have to be both lipophilic and hydrophilic to pass into/through the skin, they
have to be potent enough to pass this layer in therapeutic amounts, and the molecules should be
small in size and have no charge (Malinovskaja-Gomez et al., 2017).
To improve the permeability of non-ideal APIs, many penetration enhancers have been
investigated (Ashtikar et al., 2016). For this study the use of vesicles has been applied for the
topical delivery of artemisone, clofazimine and decoquinate. Vertical Franz diffusion cells
(Figure B.1) were used in studying in vitro transdermal delivery, which was done to determine
permeation of the APIs through dermatomed black female skin over a period of 12 h. A Franz
cell consists of a donor compartment (top) and a receptor compartment (bottom). The receptor
compartment is filled with phosphate buffer solution (pH 7.4) which represents human blood and
the donor compartment is filled with a specific formulation to be tested. The skin, on which the
formulations are tested, is subsequently clamped between the two compartments.
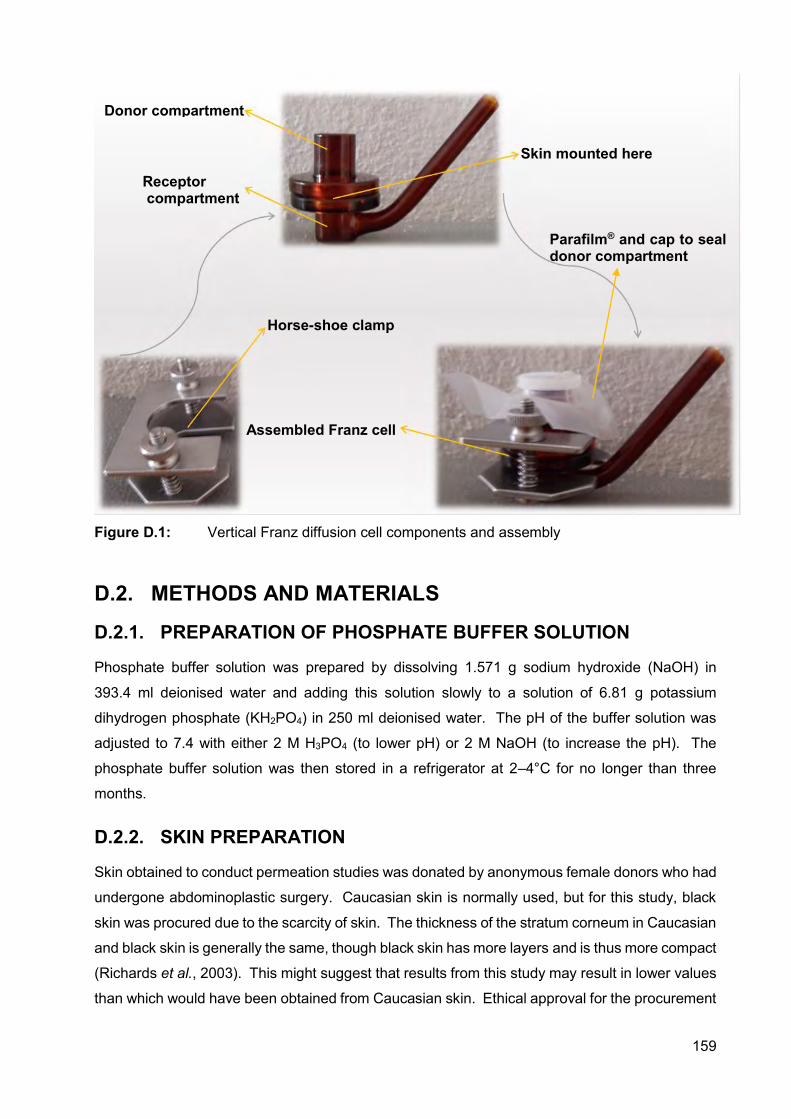
159
Figure D.1: Vertical Franz diffusion cell components and assembly
D.2. METHODS AND MATERIALS
D.2.1. PREPARATION OF PHOSPHATE BUFFER SOLUTION
Phosphate buffer solution was prepared by dissolving 1.571 g sodium hydroxide (NaOH) in
393.4 ml deionised water and adding this solution slowly to a solution of 6.81 g potassium
dihydrogen phosphate (KH2PO4) in 250 ml deionised water. The pH of the buffer solution was
adjusted to 7.4 with either 2 M H3PO4 (to lower pH) or 2 M NaOH (to increase the pH). The
phosphate buffer solution was then stored in a refrigerator at 2–4°C for no longer than three
months.
D.2.2. SKIN PREPARATION
Skin obtained to conduct permeation studies was donated by anonymous female donors who had
undergone abdominoplastic surgery. Caucasian skin is normally used, but for this study, black
skin was procured due to the scarcity of skin. The thickness of the stratum corneum in Caucasian
and black skin is generally the same, though black skin has more layers and is thus more compact
(Richards et al., 2003). This might suggest that results from this study may result in lower values
than which would have been obtained from Caucasian skin. Ethical approval for the procurement
Horse-shoe clamp
Donor compartment
Assembled Franz cell
Skin mounted here
Receptor compartment
Parafilm® and cap to seal donor compartment
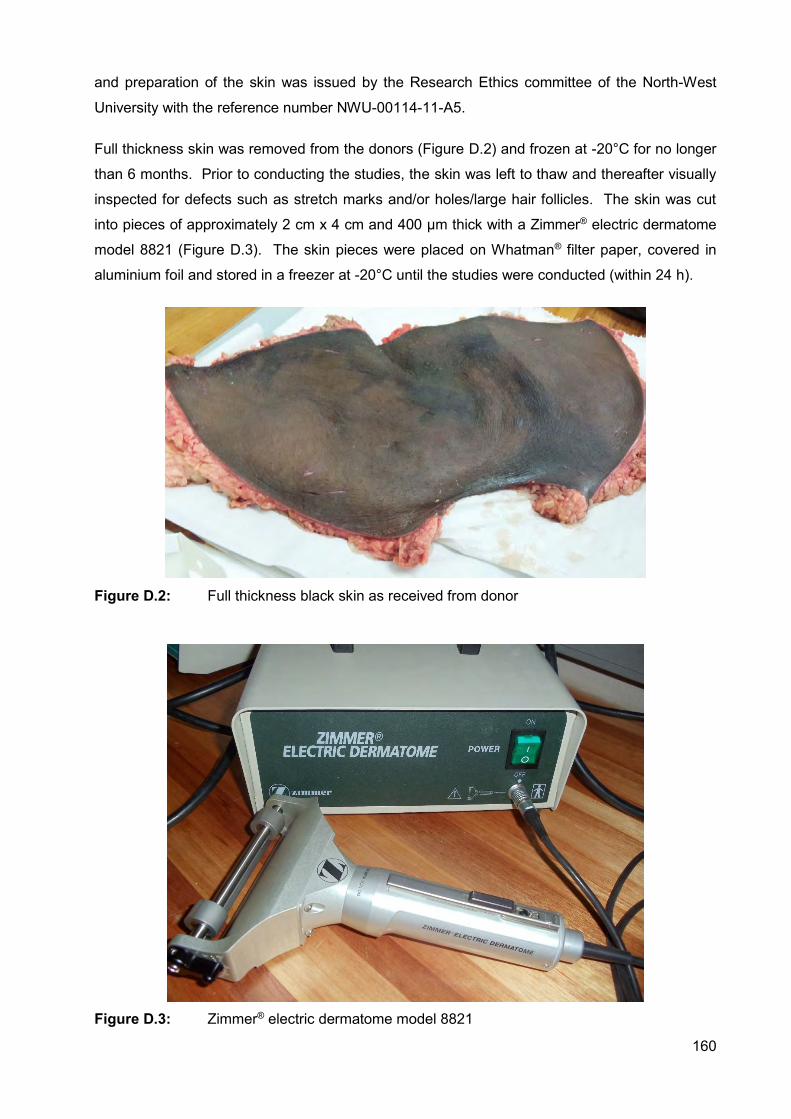
160
and preparation of the skin was issued by the Research Ethics committee of the North-West
University with the reference number NWU-00114-11-A5.
Full thickness skin was removed from the donors (Figure D.2) and frozen at -20°C for no longer
than 6 months. Prior to conducting the studies, the skin was left to thaw and thereafter visually
inspected for defects such as stretch marks and/or holes/large hair follicles. The skin was cut
into pieces of approximately 2 cm x 4 cm and 400 µm thick with a Zimmer® electric dermatome
model 8821 (Figure D.3). The skin pieces were placed on Whatman® filter paper, covered in
aluminium foil and stored in a freezer at -20°C until the studies were conducted (within 24 h).
Figure D.2: Full thickness black skin as received from donor
Figure D.3: Zimmer® electric dermatome model 8821
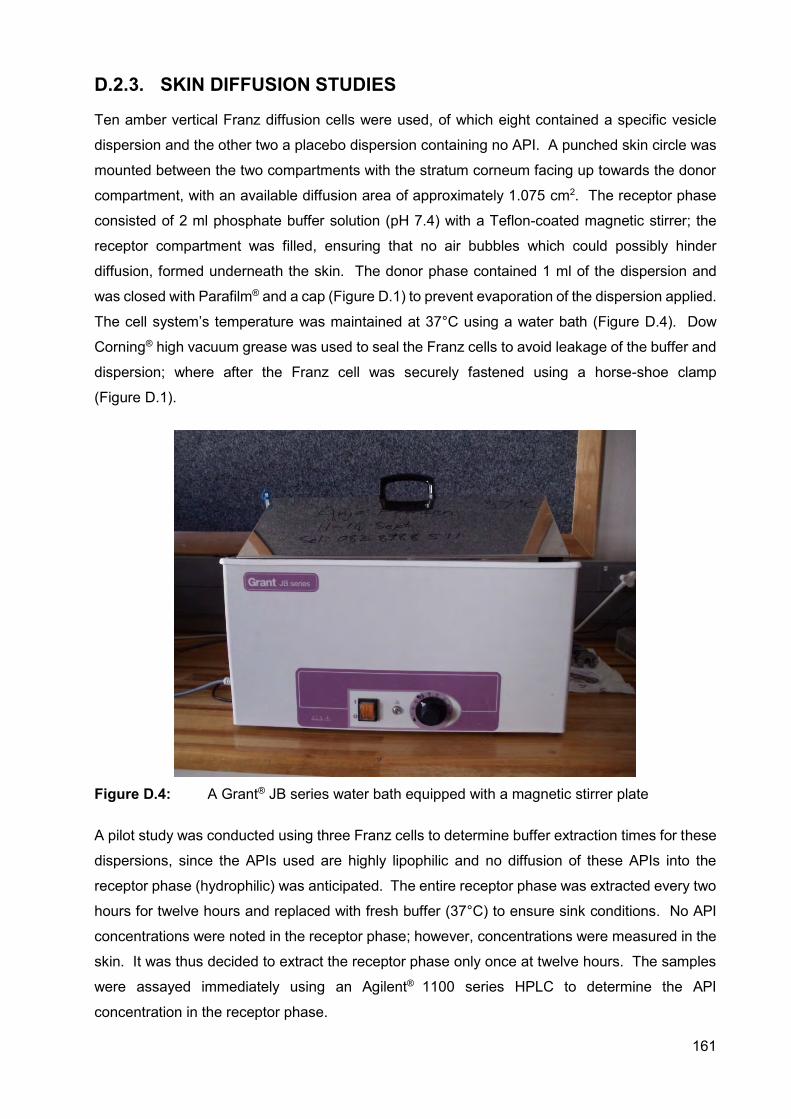
161
D.2.3. SKIN DIFFUSION STUDIES
Ten amber vertical Franz diffusion cells were used, of which eight contained a specific vesicle
dispersion and the other two a placebo dispersion containing no API. A punched skin circle was
mounted between the two compartments with the stratum corneum facing up towards the donor
compartment, with an available diffusion area of approximately 1.075 cm2. The receptor phase
consisted of 2 ml phosphate buffer solution (pH 7.4) with a Teflon-coated magnetic stirrer; the
receptor compartment was filled, ensuring that no air bubbles which could possibly hinder
diffusion, formed underneath the skin. The donor phase contained 1 ml of the dispersion and
was closed with Parafilm® and a cap (Figure D.1) to prevent evaporation of the dispersion applied.
The cell system’s temperature was maintained at 37°C using a water bath (Figure D.4). Dow
Corning® high vacuum grease was used to seal the Franz cells to avoid leakage of the buffer and
dispersion; where after the Franz cell was securely fastened using a horse-shoe clamp
(Figure D.1).
Figure D.4: A Grant® JB series water bath equipped with a magnetic stirrer plate
A pilot study was conducted using three Franz cells to determine buffer extraction times for these
dispersions, since the APIs used are highly lipophilic and no diffusion of these APIs into the
receptor phase (hydrophilic) was anticipated. The entire receptor phase was extracted every two
hours for twelve hours and replaced with fresh buffer (37°C) to ensure sink conditions. No API
concentrations were noted in the receptor phase; however, concentrations were measured in the
skin. It was thus decided to extract the receptor phase only once at twelve hours. The samples
were assayed immediately using an Agilent® 1100 series HPLC to determine the API
concentration in the receptor phase.
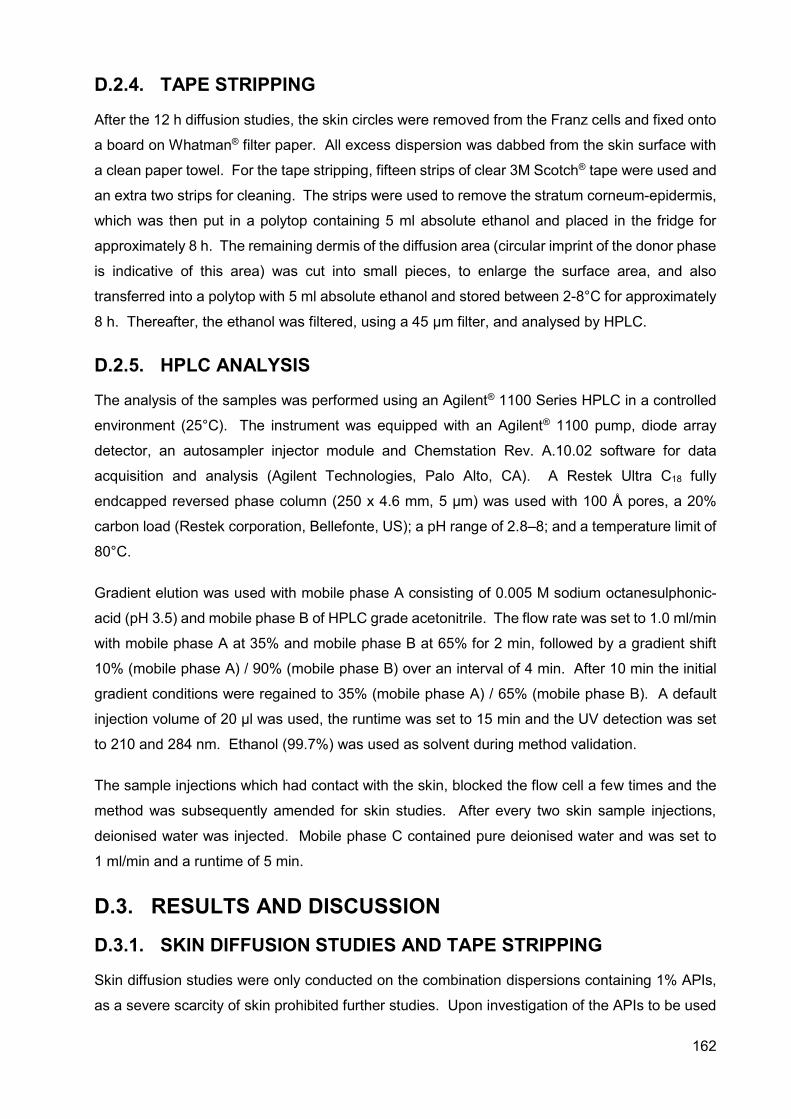
162
D.2.4. TAPE STRIPPING
After the 12 h diffusion studies, the skin circles were removed from the Franz cells and fixed onto
a board on Whatman® filter paper. All excess dispersion was dabbed from the skin surface with
a clean paper towel. For the tape stripping, fifteen strips of clear 3M Scotch® tape were used and
an extra two strips for cleaning. The strips were used to remove the stratum corneum-epidermis,
which was then put in a polytop containing 5 ml absolute ethanol and placed in the fridge for
approximately 8 h. The remaining dermis of the diffusion area (circular imprint of the donor phase
is indicative of this area) was cut into small pieces, to enlarge the surface area, and also
transferred into a polytop with 5 ml absolute ethanol and stored between 2-8°C for approximately
8 h. Thereafter, the ethanol was filtered, using a 45 µm filter, and analysed by HPLC.
D.2.5. HPLC ANALYSIS
The analysis of the samples was performed using an Agilent® 1100 Series HPLC in a controlled
environment (25°C). The instrument was equipped with an Agilent® 1100 pump, diode array
detector, an autosampler injector module and Chemstation Rev. A.10.02 software for data
acquisition and analysis (Agilent Technologies, Palo Alto, CA). A Restek Ultra C18 fully
endcapped reversed phase column (250 x 4.6 mm, 5 µm) was used with 100 Å pores, a 20%
carbon load (Restek corporation, Bellefonte, US); a pH range of 2.8–8; and a temperature limit of
80°C.
Gradient elution was used with mobile phase A consisting of 0.005 M sodium octanesulphonic-
acid (pH 3.5) and mobile phase B of HPLC grade acetonitrile. The flow rate was set to 1.0 ml/min
with mobile phase A at 35% and mobile phase B at 65% for 2 min, followed by a gradient shift
10% (mobile phase A) / 90% (mobile phase B) over an interval of 4 min. After 10 min the initial
gradient conditions were regained to 35% (mobile phase A) / 65% (mobile phase B). A default
injection volume of 20 µl was used, the runtime was set to 15 min and the UV detection was set
to 210 and 284 nm. Ethanol (99.7%) was used as solvent during method validation.
The sample injections which had contact with the skin, blocked the flow cell a few times and the
method was subsequently amended for skin studies. After every two skin sample injections,
deionised water was injected. Mobile phase C contained pure deionised water and was set to
1 ml/min and a runtime of 5 min.
D.3. RESULTS AND DISCUSSION
D.3.1. SKIN DIFFUSION STUDIES AND TAPE STRIPPING
Skin diffusion studies were only conducted on the combination dispersions containing 1% APIs,
as a severe scarcity of skin prohibited further studies. Upon investigation of the APIs to be used
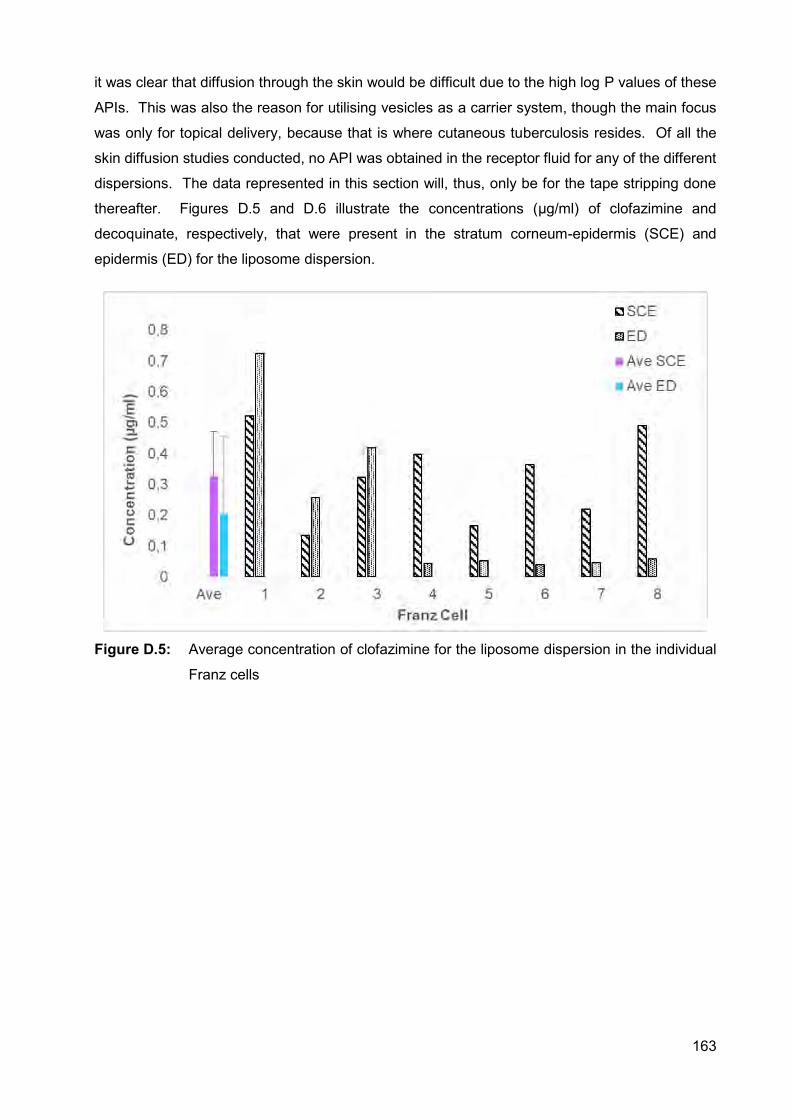
163
it was clear that diffusion through the skin would be difficult due to the high log P values of these
APIs. This was also the reason for utilising vesicles as a carrier system, though the main focus
was only for topical delivery, because that is where cutaneous tuberculosis resides. Of all the
skin diffusion studies conducted, no API was obtained in the receptor fluid for any of the different
dispersions. The data represented in this section will, thus, only be for the tape stripping done
thereafter. Figures D.5 and D.6 illustrate the concentrations (µg/ml) of clofazimine and
decoquinate, respectively, that were present in the stratum corneum-epidermis (SCE) and
epidermis (ED) for the liposome dispersion.
Figure D.5: Average concentration of clofazimine for the liposome dispersion in the individual
Franz cells
164
Figure D.6: Average concentration of decoquinate for the liposome dispersion in the individual
Franz cells
The average decoquinate concentration in the SCE (0.396 µg/ml) was higher than the clofazimine
concentration (0.328 µg/ml). Overall, the API concentrations in the SCE were higher compared
to the concentrations present in the ED. This may be partly explained by the fact that the 1%
dispersions created significant sediment on the skin during skin diffusion studies, which was
extremely difficult to clean, and more than the designated one tape-strip for cleaning was
suggested. The concentration of clofazimine present in the ED (0.205 µg/ml) was higher than the
concentration of decoquinate in the ED (0.1497 µg/ml). Figures D.7 and D.8 illustrate the data
obtained from the transferosome dispersion.
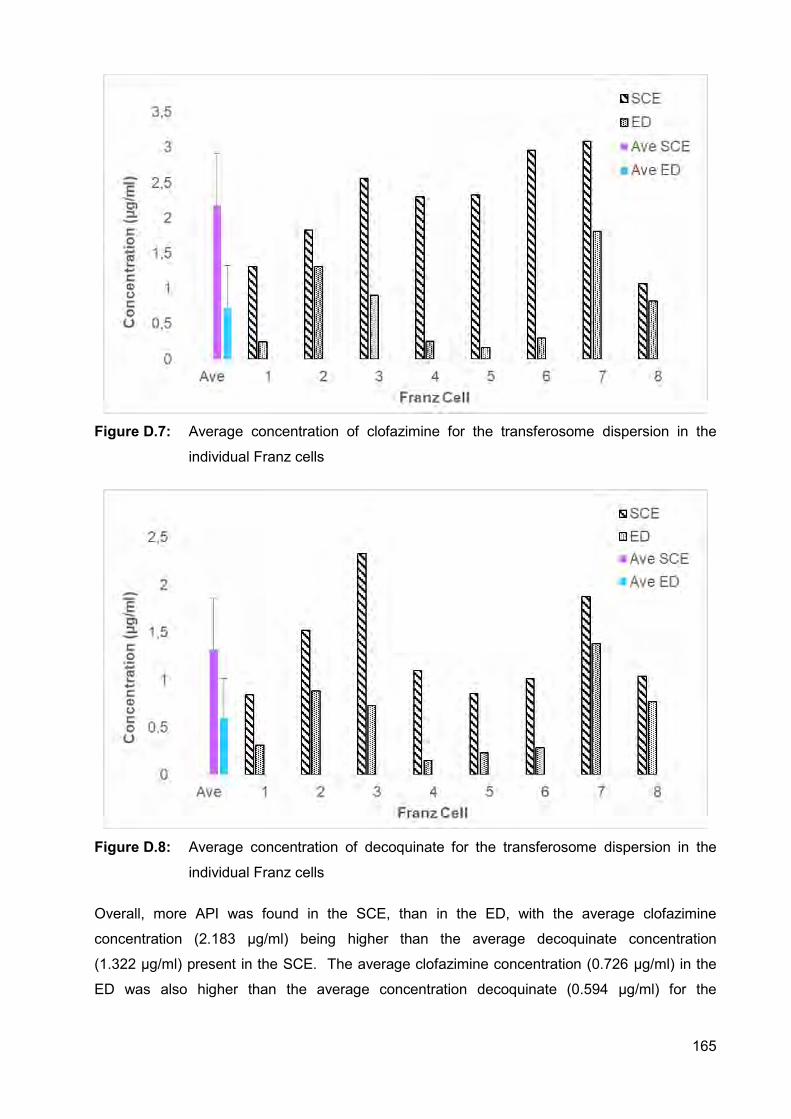
165
Figure D.7: Average concentration of clofazimine for the transferosome dispersion in the
individual Franz cells
Figure D.8: Average concentration of decoquinate for the transferosome dispersion in the
individual Franz cells
Overall, more API was found in the SCE, than in the ED, with the average clofazimine
concentration (2.183 µg/ml) being higher than the average decoquinate concentration
(1.322 µg/ml) present in the SCE. The average clofazimine concentration (0.726 µg/ml) in the
ED was also higher than the average concentration decoquinate (0.594 µg/ml) for the
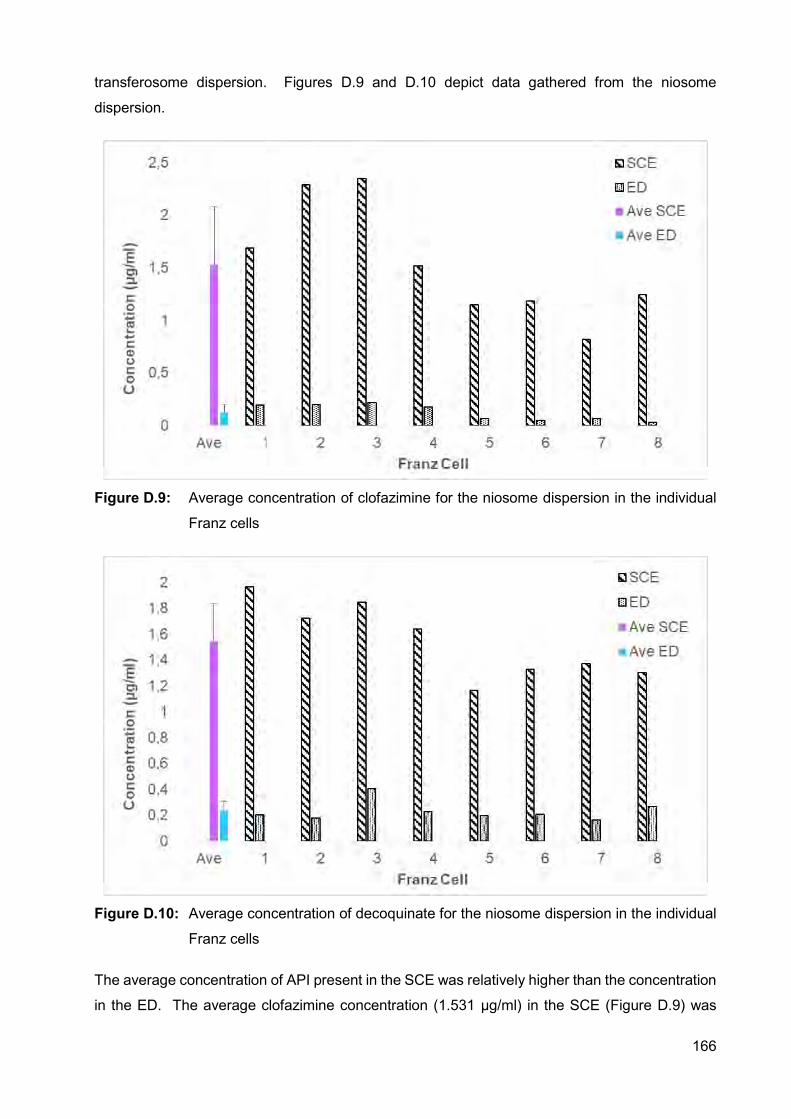
166
transferosome dispersion. Figures D.9 and D.10 depict data gathered from the niosome
dispersion.
Figure D.9: Average concentration of clofazimine for the niosome dispersion in the individual
Franz cells
Figure D.10: Average concentration of decoquinate for the niosome dispersion in the individual
Franz cells
The average concentration of API present in the SCE was relatively higher than the concentration
in the ED. The average clofazimine concentration (1.531 µg/ml) in the SCE (Figure D.9) was
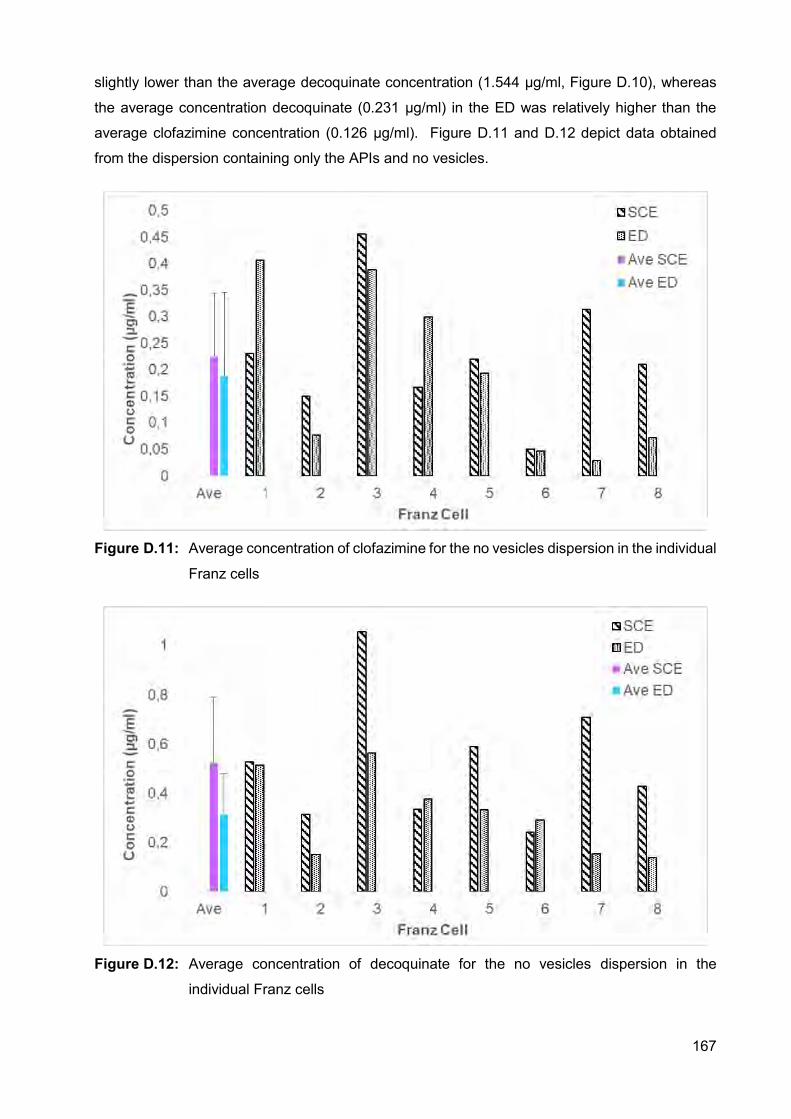
167
slightly lower than the average decoquinate concentration (1.544 µg/ml, Figure D.10), whereas
the average concentration decoquinate (0.231 µg/ml) in the ED was relatively higher than the
average clofazimine concentration (0.126 µg/ml). Figure D.11 and D.12 depict data obtained
from the dispersion containing only the APIs and no vesicles.
Figure D.11: Average concentration of clofazimine for the no vesicles dispersion in the individual
Franz cells
Figure D.12: Average concentration of decoquinate for the no vesicles dispersion in the
individual Franz cells
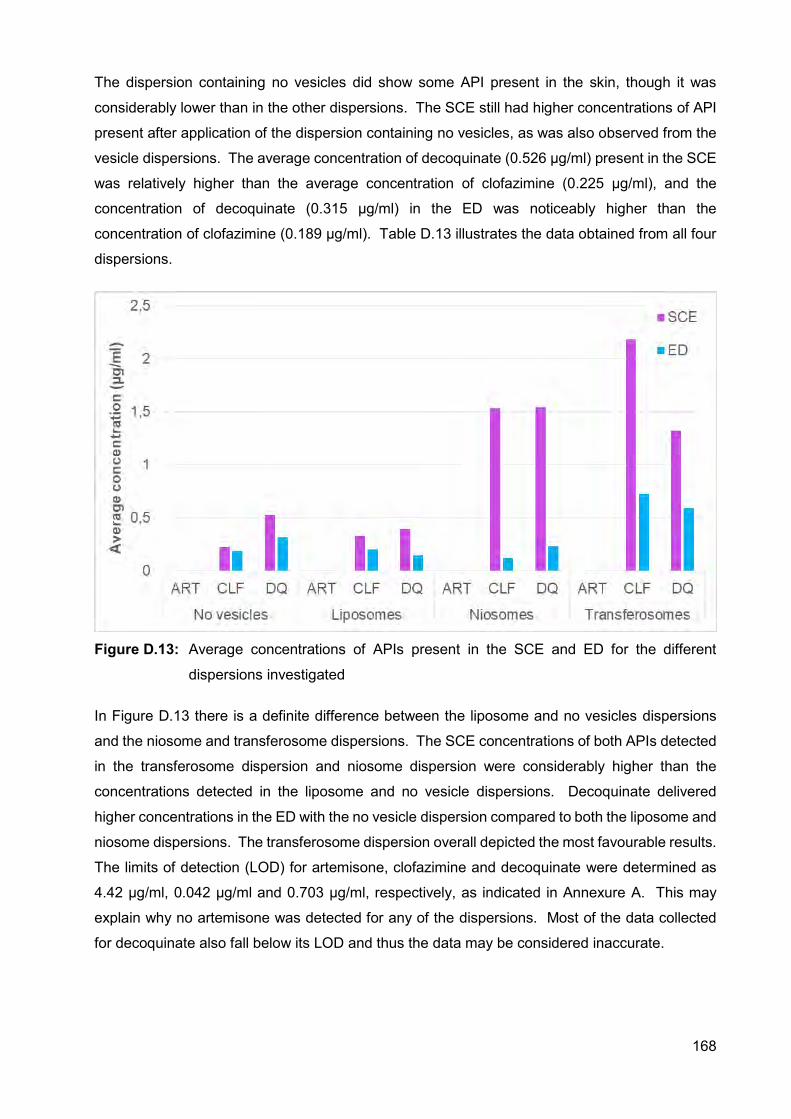
168
The dispersion containing no vesicles did show some API present in the skin, though it was
considerably lower than in the other dispersions. The SCE still had higher concentrations of API
present after application of the dispersion containing no vesicles, as was also observed from the
vesicle dispersions. The average concentration of decoquinate (0.526 µg/ml) present in the SCE
was relatively higher than the average concentration of clofazimine (0.225 µg/ml), and the
concentration of decoquinate (0.315 µg/ml) in the ED was noticeably higher than the
concentration of clofazimine (0.189 µg/ml). Table D.13 illustrates the data obtained from all four
dispersions.
Figure D.13: Average concentrations of APIs present in the SCE and ED for the different
dispersions investigated
In Figure D.13 there is a definite difference between the liposome and no vesicles dispersions
and the niosome and transferosome dispersions. The SCE concentrations of both APIs detected
in the transferosome dispersion and niosome dispersion were considerably higher than the
concentrations detected in the liposome and no vesicle dispersions. Decoquinate delivered
higher concentrations in the ED with the no vesicle dispersion compared to both the liposome and
niosome dispersions. The transferosome dispersion overall depicted the most favourable results.
The limits of detection (LOD) for artemisone, clofazimine and decoquinate were determined as
4.42 µg/ml, 0.042 µg/ml and 0.703 µg/ml, respectively, as indicated in Annexure A. This may
explain why no artemisone was detected for any of the dispersions. Most of the data collected
for decoquinate also fall below its LOD and thus the data may be considered inaccurate.
169
D.4. CONCLUSION The data collected are promising since no studies have been performed on this combination of
APIs and this study indicated that it is possible to deliver decoquinate and clofazimine into the
skin. Artemisone was not measured in the skin, but it does not necessarily mean that it was not
present. It might be that the concentration present was below the limit of quantitation. The
transferosome dispersion displayed the highest concentrations decoquinate and clofazimine
present in the skin, making it the most promising dispersion. Transferosomes contain no
cholesterol, unlike the niosomes and liposomes. This may suggest that transferosomes are less
lipophilic, and thus, these highly lipophilic APIs are less likely to remain in the vesicles and would
rather be inclined to penetrate more freely into the skin. This could have been confirmed by
conducting membrane studies, but since these APIs are so lipophilic the receptor phase would
have had to consist of mostly ethanol to produce any results, which is unrealistic since the
receptor phase should represent human blood.
Though the concentration of APIs was 1%, the concentration of vesicles in the aqueous phase
was 5% (preparation of vesicles, Annexure C). If the concentration of vesicles in the aqueous
phase can be increased from the 5% used, entrapment of the APIs may be increased; and higher
concentrations of APIs may be present in the skin. This may promote the presence of artemisone.
Ideally, the concentrations of the APIs present in the skin should be increased to above their LOD
for accurate data acquisition. Moreover, it is advisable that other penetration enhancers and
delivery systems should also be investigated for the delivery of these APIs.
170
REFERENCES AHAD, A., AL-SALEH, A.A., AL-MOHIZEA, A.M., AL-JENOOBI, F.I., RAISH, M., YASSIN. A.E.B.
& ALAM, M.A. 2017. Formulation and characterization of novel soft nanovesicles for enhanced
transdermal delivery of eprosartan mesylate. Saudi pharmaceutical journal, article in press:
http://dx.doi.org/10.1016/j.jsps.2017.01.006
ASHTIKAR, M., NAGARSEKAR, K. & FAHR, A. 2016. Transdermal delivery from liposomal
formulations – Evolution of the technology over the last three decades. Journal of controlled
release., 242: 126-140.
DWIVEDI, A., MAZUMDER, A., FOX, L.T., BRÜMMER, A., GERBER, M., DU PREEZ, J.L.,
HAYNES, R.K. & DU PLESSIS, J. 2016. In vitro skin permeation of artemisone and its nano-
vesicular formulations. International journal of pharmaceutics, 503:1-7.
HAINE, A.T., KOGA, Y., HASHIMOTO, Y., HIGASHI, T., MOTOYAMA, K., ARIMA, H. &
NIIDOME, T. 2017. Enhancement of transdermal protein delivery by photothermal effect of gold
nanorods coated on polysaccharide-based hydrogel. European journal of pharmaceutics and
biopharmaceutics, 119: 91-95.
LUO, L. & LANE, M.E. 2015. Topical and transdermal delivery of caffeine. International journal
of pharmaceutics, 490: 155-164.
MALINOVSKAJA-GOMEZ, K., ESPUELAS, S., GARRIDO, M.J., HIRVONEN, J. & LAAKSONEN,
T. 2017. Comparison of liposomal drug formulations for transdermal iontophoretic drug delivery.
European journal of pharmaceutical sciences, 106: 294-301.
RICHARDS, G.M., ORESAJO, C.O. & HALDER, R.M. 2003. Structure and function of ethnic
skin and hair. Dermatologic clinics, 21:595-600.
171
Annexure E
AUTHOR’S GUIDE FOR DIEPHARMAZIE
INSTRUCTIONS FOR AUTHORS
E.1. AIM The journal DiePharmazie publishes reviews, experimental studies, letters to the editor, as well as
book reviews.
The following fields of pharmacy are covered: Pharmaceutical and medicinal chemistry,
pharmaceutical analysis and drug control, pharmaceutical technology, biopharmacy
(biopharmaceutics, pharmacokinetics, and biotransformation), experimental and clinical
pharmacology, pharmaceutical biology (pharmacognosy), clinical pharmacy, history of pharmacy.
Articles are published in English and are classified as:
Reviews
A summarizing presentation encompassing the current state of our knowledge and providing
comprehensive interpretation with citation of the literature.
Original articles Publications from all fields mentioned above.
Short communications
Brief publications about the fields mentioned above (see Preparation of manuscripts)
Letters to the editor
E.2. CONDITIONS For submitted manuscripts, it is the responsibility of the author(s) to demonstrate novelty or a new
approach taken in his research. The references should reflect the most recent relevant articles,
and the discussion should compare the author’s findings with the results of former investigations.
For an experimental work, the data have to be determined and classified in a suitable way,
problems must be formulated in view of the data, hypotheses should be suggested an/or the
author should give possible explanations for any inconsistencies.
172
If possible, the author(s) should perform mathematical or statistical calculations, fit the curves
appropriate, and carry out the experiments under controlled conditions. Studies involving animals
or human volunteers must include details of ethical approval.
Authors are requested to submit all manuscripts online. Paper copy submissions are no longer
acceptable. Articles are considered for publication depending on their value and pharmaceutical
relevance and with the understanding that they have not been published previously and are
submitted exclusively to the journal DiePharmazie.
All manuscripts are subject to experts review. Additional corrections may be done by the editors.
A PDF-file of the article is delivered free of charge after the paper has been published in the
journal. Please note that, by copyright reasons, this is for personal use of the authors only and
must not be made available, e.g. by posting on a freely accessible website.
Processing charges: Publication fees for publication in DiePharmazie are 250 € per manuscript (+
19%VAT), regardless of type and length. Authors will receive an invoice right after acceptance.
Papers will neither be copy-edited nor typeset before the fee has been paid.
Delivery of a PDF-file of the article is included in the publication fee. Please note that, by copyright
reasons, this is for personal use of the authors only and must not be made available, e.g. by
posting on a freely accessible website.
The quotation of registered names, trade names, trademarks, etc. in this journal does not imply,
even in the absence of a specific statement, that such names are exempt from the relevant laws
and regulations and therefore free for general use.
As the journal is publishing exclusively original research, significant changes in authorship after
submission will lead to manuscript rejection. Processing charges will not be refunded in these
cases.
E.3. ETHICAL CONSIDERATIONS Editors of PHARMAZIE fully support internationally accepted high ethical standards in publication,
as particularly outlined by the Committee on Publication Ethics (COPE; publicationethics.org), the
International Committee of Medical Journal Editors (ICMJE; www.icmje.org), the Council of
Scientific Editors (CSE; www.councilscienceditors.org), and the European Association of Science
Editors (http://www.ease.org.uk/wp-content/uploads/ease_toolkit_seven_sins.pdf). Authors are
requested to inform themselves from these publications.
Most important aspects are presented here in brief:
173
E.3.1. CONFLICTS OF INTEREST
All authors must disclose any financial and personal relationships with other people or
organizations that could inappropriately influence (bias) their work. Examples of potential
conflicts of interest include employment, consultancies, stock ownership, honoraria, paid expert
testimony, patent applications/registrations, and grants or other funding. If there are no conflicts
of interest then please state this: 'Conflicts of interest: none declared'. Submission of manuscripts
is not possible without a conflict of interest declaration.
E.3.2. INFORMED CONSENT
Patients have a right to privacy that should not be violated without informed consent. Identifying
information, including names, initials, or hospital numbers, should not be published in written
descriptions, photographs, or pedigrees unless the information is essential for scientific purposes
and the patient (or parent or guardian) gives written informed consent for publication. Informed
consent for this purpose requires that an identifiable patient be shown the manuscript to be
published. Authors should disclose to these patients whether any potential identifiable material
might be available via the Internet as well as in print after publication. Authors need to provide
the journal with a written statement that attests that they have received and archived written
patient consent.
E.3.3. HUMAN AND ANIMAL RIGHTS
If the work involves the use of human subjects, the author should ensure that the work described
has been carried out in accordance with The Code of Ethics of the World Medical Association
(Declaration of Helsinki) for experiments involving humans. This has to be stated in the
manuscript. Authors should also include a statement in the manuscript that informed consent
was obtained for experimentation with human subjects. The privacy rights of human subjects
must always be observed. All animal experiments should comply with the ARRIVE guidelines
(http://www.nc3rs.org.uk/arrive-guidelines), the EU Directive 2010/63/EU for animal experiments
(http://ec.europa.eu/environment/chemicals/lab_animals/legislation_en.htm) or similar
regulations. The authors should clearly indicate in the manuscript that such guidelines have been
followed.
E.4. PREPARATION OF MANUSCRIPTS In order to achieve uniform presentation and to avoid unnecessary delays because of further
inquiries, all authors are requested to observe the following guidelines:
Below the title, the surname(s) of the author(s) with initials should be given without academic and
professional degrees. The full address of the author for correspondence should appear below
174
author names. Details on the institution where the work was done are requested and should be
given above the title.
Each manuscript should start with an abstract, containing the most essential results of the study.
Papers should be subdivided into chapters and subchapters according to the decimal system
(e.g. 2.1.3.).
To achieve clarity and brevity of the presentation, original contributions should be subdivided after
the abstract (see 2.) as follows:
1. Introduction: This should indicate the question under investigation which is generally
based on a brief interpretation of the literature considering the current state of knowledge
in the subfield and explaining the necessary theoretical foundations.
2. Investigations and results: Methods should only be described generally (see
"Experimental"), referring to previous or analogous studies. The presentation of results
should be precise, with necessary formulas (numbered in sequence with Arabic
numerals), diagrams, tables and figures added separately (together with the legend) to
the manuscripts. Numerical values of results should generally be presented either in tables
or curves (please mark statistical limits).
3. Discussion (unless covered by 2. as Investigations, results and discussion): It should not
repeat results already given, but should state the conclusions drawn from the results or
provide a theoretical debate and comparison with literature citations.
4. Experimental: This part describes briefly the detailed experimental conditions. Unless
directions taken from literature have been modified, it suffices to refer to the original
source. In the case of well-known inorganic or organic compounds chemical formulae or
common abbreviations may be used (e.g. NaCI, H2SO4, CH3OH, C6H6: Ac, Eth, Me,
Phe, DMSO) under "Experimental". In other parts of the paper this is not desirable.
Results of elemental analyses can be omitted if it is stated that all the results were in an
acceptable error range.
Short communications are limited to 100 lines (including short summary; subdivisions are not
required; the "Experimental" - if there is one - should be marked), up to 15 citations of literature
and a maximum of 2 supplementary materials (schemes, figures, tables) are allowed.
Only the surnames of authors are given in the text. When there are more than two authors, only
the name of the first one is used, followed by et al.
References in the text have to be cited by author and year, if there are three or more authors, use
et al. (Miller 1997; Miller and Smith 2000; Miller et al. 2001). If the year is the same for several
references identify these with a, b, c etc (Smith 1998a; Smith 1998b etc.) both in the text and in
the reference list. At the end of the paper, references are listed in alphabetical order under the
175
first author’s surname. All authors should be given here. If there are several references to items
with the same first author, arrange these chronologically regardless the alphabetical order of the
co-authors ("alphabetic-chronological" order).
Journal names should be abbreviated according to "Index Medicus" (Medline) or "Chemical
Abstracts Service Source Index".
Quotations have to follow the following style:
Journal articles:
Lee J (2002) Formulation development of epidermal growth factor. Pharmazie 57: 787 -
790.
Lee EB, Shin KH, Woo WS (1984) Pharmacological study on piperine. Arch Pharm Res 7:
127 - 132.
Books/Book chapters
Krishan K, Andersen ME (1994) physiologically based pharmacokinetic modelling in
toxicology. In: Hayes W (ed.) Principles and methods of toxicology, 3rd ed., New York, p.
149 – 187
For the identification of pharmaceutical substances, the International Non-proprietary Names
(INN) proposed or recommended by the WHO should be used. Registered Trade Marks (usually
indicated with R; in an article this sign should only be used when it is first mentioned or used in
the summary), trivial names and chemical nomenclature can be added.
Nomenclature and spelling should conform to the directions given by IUPAC and IUB. Units of
measurement are determined by the directions of the International Units System SI as symbols;
M instead of mol/l or mol * l-1 is allowed.
Botanical names (species, genus) should be marked in italics.
The following abbreviations should be used consequently (except in the title and all subtitles). All
other abbreviations have to be explained in the manuscript at first usage, if aforementioned
directions are not applicable. Abs. = absolute: anh. = anhydrous; b.p.; b.r. = boiling point, -range;
calcd. = calculated; CC = column chromatography; conc. = concentrated; dec. = decomposition,
eq. = equation; Fig. = figure; GC = gas chromatography, - chromatogram, HPLC = high
performance liquid chromatography, -chromatogram; i.m. = intramuscular; i.p. = intraperitoneal;
IR = infrared; i.v. = intravenous; m.p.; m.r. = melting point, -range; MS = mass spectrometry, mass
spectrum; NMR = nuclear magnetic resonance spectrum; PC = paper chromatography, -
176
chromatogram, % = per cent, percentage, p.o. = peroral; s.c. = subcutaneous; TLC = thin layer
chromatography, - chromatogram; UV = ultraviolet.
Footnotes must be numbered consecutively and are to be added separately to the manuscript.
They are printed following the "Experimental".
Dedications (e.g., on the occasion of the 60th or higher birthday) should be inserted between
author(s) and summary.
Additions to legends of table should be marked by *, **, *** or a, b, c, d etc.
Figures have to be of sufficient quality for reproduction process. Even after size reduction the
figures' key has to be easy to read. Manuscripts containing figures of insufficient quality cannot
be accepted.
177
ANNEXURE F
AUTHOR’S GUIDE TO THE JOURNAL OF
PHARMACEUTICAL AND BIOMEDICAL ANALYSIS
GUIDE FOR AUTHORS
.
F.1. INTRODUCTION
This journal is an international medium directed towards the needs of academic, clinical,
government and industrial analysis by publishing original research reports and critical reviews on
pharmaceutical and biomedical analysis. It covers the interdisciplinary aspects of analysis in the
pharmaceutical, biomedical and clinical sciences, including developments in analytical
methodology, instrumentation, computation and interpretation. Submissions on novel analytical
methods focusing on drug purity and stability studies, pharmacokinetics, therapeutic monitoring,
metabolic profiling; drug-related aspects of analytical biochemistry and forensic toxicology; quality
assurance in the pharmaceutical industry are also welcome.
Studies from areas of well established and poorly selective methods, such as UVVIS
spectrophotometry (including derivative and multi-wavelength measurements), basic
electroanalytical (potentiometric, polarographic and voltammetric) methods, fluorimetry,
flowinjection analysis, etc. are accepted for publication in exceptional cases only, if a unique and
substantial advantage over presently known systems is demonstrated. Similarly, assays of simple
drug formulations by any methods, as well as, the determination of drugs in biological samples
based merely on spiked samples are not acceptable. Drug purity/stability studies should contain
information on the structure elucidation of the impurities/degradants. Papers dealing with the
analytical aspects of traditional folk medicines are acceptable if the results are expected to attract
the interest of readers also outside the area of origin. Bioanalytical papers (pharmacokinetic,
bioequivalence, protein and DNA binding studies) are accepted if the focus is on innovative
analytical methodology. Bioanalysis of new investigational drugs that are currently in the
preclinical phase are only acceptable if their pharmacological activity is well documented in an
international medium.
In determining the suitability of submitted articles for publication, particular scrutiny will be placed
on the degree of novelty and significance of the research and the extent to which it adds to existing
knowledge in pharmaceutical and biomedical analysis. In all submissions to the journal, authors
178
must address the question of how their proposed methodology compares with previously reported
methods. A substantial body of work cannot be fractionated into different shorter papers.
F.1.1. Types of Paper
The following types of papers will be considered for publication:
Reviews: Authors wishing to submit a review should send a short synopsis to one of the editors
before starting detailed work on a manuscript. The structure and presentation of a review article
will normally be at the author’s discretion. Reviews may be relatively short, i.e. dealing with a
limited subject, or longer and more general in nature.
Full Length Research Papers: These papers should describe in detail original and important
pieces of work in the fields covered by the Journal.
Short Communications: These should describe complete and original pieces of research whose
length and/or importance do not justify a full-length paper. The format is the same as that for a
full-length Research Paper, except that the total number of figures and/or tables should not
normally exceed six. This approximate length of the manuscript should be 10 pages excluding
Tables and Figures, Keywords are essential. The Editors reserve the right to publish as a Short
Communication a paper originally submitted as a full-length Research Paper.
F.1.2. Submission checklist
You can use this list to carry out a final check of your submission before you send it to the journal
for review. Please check the relevant section in this Guide for Authors for more details.
Ensure that the following items are present:
One author has been designated as the corresponding author with contact details:
• E-mail address
• Full postal address
All necessary files have been uploaded:
Manuscript:
• Include keywords
• All figures (include relevant captions)
• All tables (including titles, description, footnotes)
• Ensure all figure and table citations in the text match the files provided
• Indicate clearly if color should be used for any figures in print
179
Graphical Abstracts / Highlights files (where applicable)
Supplemental files (where applicable)
Further considerations
• Manuscript has been ‘spell checked’ and ‘grammar checked’
• All references mentioned in the Reference List are cited in the text, and vice versa
• Permission has been obtained for use of copyrighted material from other sources
(including the Internet)
• A competing interests statement is provided, even if the authors have no competing
interests to declare
• Journal policies detailed in this guide have been reviewed
• Referee suggestions and contact details provided, based on journal requirements
For further information, visit our Support Center.
F.2. BEFORE YOU BEGIN
F.2.1 Ethics in publishing
Please see our information pages on Ethics in publishing and Ethical guidelines for journal
publication.
F.2.2. Declaration of interest
All authors must disclose any financial and personal relationships with other people or
organizations that could inappropriately influence (bias) their work. Examples of potential conflicts
of interest include employment, consultancies, stock ownership, honoraria, paid expert testimony,
patent applications/registrations, and grants or other funding. If there are no conflicts of interest
then please state this: 'Conflicts of interest: none'. More information.
F.2.3. Submission declaration and verification
Submission of an article implies that the work described has not been published previously
(except in the form of an abstract or as part of a published lecture or academic thesis or as an
electronic preprint, see 'Multiple, redundant or concurrent publication' section of our ethics policy
for more information), that it is not under consideration for publication elsewhere, that its
publication is approved by all authors and tacitly or explicitly by the responsible authorities where
the work was carried out, and that, if accepted, it will not be published elsewhere in the same
form, in English or in any other language, including electronically without the written consent of
180
the copyright-holder. To verify originality, your article may be checked by the originality detection
service CrossCheck.
F.2.4. Changes to authorship
Authors are expected to consider carefully the list and order of authors before submitting their
manuscript and provide the definitive list of authors at the time of the original submission. Any
addition, deletion or rearrangement of author names in the authorship list should be made only
before the manuscript has been accepted and only if approved by the journal Editor. To request
such a change, the Editor must receive the following from the corresponding author: (a) the
reason for the change in author list and (b) written confirmation (e-mail, letter) from all authors
that they agree with the addition, removal or rearrangement. In the case of addition or removal of
authors, this includes confirmation from the author being added or removed.
Only in exceptional circumstances will the Editor consider the addition, deletion or rearrangement
of authors after the manuscript has been accepted. While the Editor considers the request,
publication of the manuscript will be suspended. If the manuscript has already been published in
an online issue, any requests approved by the Editor will result in a corrigendum.
F.2.5. Copyright
Upon acceptance of an article, authors will be asked to complete a 'Journal Publishing Agreement'
(see more information on this). An e-mail will be sent to the corresponding author confirming
receipt of the manuscript together with a 'Journal Publishing Agreement' form or a link to the
online version of this agreement.
Subscribers may reproduce tables of contents or prepare lists of articles including abstracts for
internal circulation within their institutions. Permission of the Publisher is required for resale or
distribution outside the institution and for all other derivative works, including compilations and
translations. If excerpts from other copyrighted works are included, the author(s) must obtain
written permission from the copyright owners and credit the source(s) in the article. Elsevier has
preprinted forms for use by authors in these cases.
For open access articles: Upon acceptance of an article, authors will be asked to complete an
'Exclusive License Agreement' (more information). Permitted third party reuse of open access
articles is determined by the author's choice of user license.
Author rights
As an author you (or your employer or institution) have certain rights to reuse your work. More
information.
181
Elsevier supports responsible sharing
Find out how you can share your research published in Elsevier journals.
F.2.6. Role of the funding source
You are requested to identify who provided financial support for the conduct of the research and/or
preparation of the article and to briefly describe the role of the sponsor(s), if any, in study design;
in the collection, analysis and interpretation of data; in the writing of the report; and in the decision
to submit the article for publication. If the funding source(s) had no such involvement then this
should be stated.
Funding body agreements and policies
Elsevier has established a number of agreements with funding bodies which allow authors to
comply with their funder's open access policies. Some funding bodies will reimburse the author
for the Open Access Publication Fee. Details of existing agreements are available online.
F.2.7. Open access
This journal offers authors a choice in publishing their research:
Subscription
• Articles are made available to subscribers as well as developing countries and patient
groups through our universal access programs.
• No open access publication fee payable by authors.
Open access
• Articles are freely available to both subscribers and the wider public with permitted reuse.
• An open access publication fee is payable by authors or on their behalf, e.g. by their
research funder or institution.
Regardless of how you choose to publish your article, the journal will apply the same peer review
criteria and acceptance standards. For open access articles, permitted third party (re)use is
defined by the following Creative Commons user licenses:
Creative Commons Attribution (CC BY)
Lets others distribute and copy the article, create extracts, abstracts, and other revised versions,
adaptations or derivative works of or from an article (such as a translation), include in a collective
work (such as an anthology), text or data mine the article, even for commercial purposes, as long
182
as they credit the author(s), do not represent the author as endorsing their adaptation of the
article, and do not modify the article in such a way as to damage the author's honor or reputation.
Creative Commons Attribution-NonCommercial-NoDerivs (CC BY-NC-ND)
For non-commercial purposes, lets others distribute and copy the article, and to include in a
collective work (such as an anthology), as long as they credit the author(s) and provided they do
not alter or modify the article.
The open access publication fee for this journal is USD 3050, excluding taxes. Learn more about
Elsevier's pricing policy: https://www.elsevier.com/openaccesspricing.
Green open access
Authors can share their research in a variety of different ways and Elsevier has a number of green
open access options available. We recommend authors see our green open access page for
further information. Authors can also self-archive their manuscripts immediately and enable public
access from their institution's repository after an embargo period. This is the version that has been
accepted for publication and which typically includes author-incorporated changes suggested
during submission, peer review and in editor-author communications. Embargo period: For
subscription articles, an appropriate amount of time is needed for journals to deliver value to
subscribing customers before an article becomes freely available to the public. This is the
embargo period and it begins from the date the article is formally published online in its final and
fully citable form. Find out more. This journal has an embargo period of 24 months.
Elsevier Publishing Campus
The Elsevier Publishing Campus (www.publishingcampus.com) is an online platform offering free
lectures, interactive training and professional advice to support you in publishing your research.
The College of Skills training offers modules on how to prepare, write and structure your article
and explains how editors will look at your paper when it is submitted for publication. Use these
resources, and more, to ensure that your submission will be the best that you can make it.
Language (usage and editing services)
Please write your text in good English (American or British usage is accepted, but not a mixture
of these). Authors who feel their English language manuscript may require editing to eliminate
possible grammatical or spelling errors and to conform to correct scientific English may wish to
use the English Language Editing service available from Elsevier's WebShop.
183
F.2.8. Submission
Our online submission system guides you stepwise through the process of entering your article
details and uploading your files. The system converts your article files to a single PDF file used
in the peer-review process. Editable files (e.g., Word, LaTeX) are required to typeset your article
for final publication. All correspondence, including notification of the Editor’s decision and
requests for revision, is sent by e-mail. Please submit your article via
http://www.elsevier.com/locate/jpba
Referees
Please submit the names and institutional e-mail addresses of several potential referees. For
more details, visit our Support site. Note that the editor retains the sole right to decide whether or
not the suggested reviewers are used.
All manuscripts will be assessed by two independent Reviewers. Reviews will be assessed by
one Reviewer. Authors will be informed of the Reviewers’ comments. Authors are required to
ensure that each line of their manuscript is numbered consecutively.
F.3. PREPARATION
F.3.1. Peer review
This journal operates a single blind review process. All contributions will be initially assessed by
the editor for suitability for the journal. Papers deemed suitable are then typically sent to a
minimum of two independent expert reviewers to assess the scientific quality of the paper. The
Editor is responsible for the final decision regarding acceptance or rejection of articles. The
Editor’s decision is final. More information on types of peer review.
Use of word processing software
It is important that the file be saved in the native format of the word processor used. The text
should be in single-column format. Keep the layout of the text as simple as possible. Most
formatting codes will be removed and replaced on processing the article. In particular, do not use
the word processor’s options to justify text or to hyphenate words. However, do use bold face,
italics, subscripts, superscripts etc. When preparing tables, if you are using a table grid, use only
one grid for each individual table and not a grid for each row. If no grid is used, use tabs, not
spaces, to align columns.
The electronic text should be prepared in a way very similar to that of conventional manuscripts
(see also the Guide to Publishing with Elsevier). Note that source files of figures, tables and text
184
graphics will be required whether or not you embed your figures in the text. See also the section
on Electronic artwork.
To avoid unnecessary errors you are strongly advised to use the ‘spell-check’ and ‘grammar-
check’ functions of your word processor.
F.3.2. Article structure
Page and line numbers
Add page and line numbers. This is useful for reviewers, who need to refer to specific pages and
lines in your manuscript.
Subdivision – numbered sections
Divide your article into clearly defined and numbered sections. Subsections should be numbered
1.1 (then 1.1.1, 1.1.2, ...), 1.2, etc. (the abstract is not included in section numbering). Use this
numbering also for internal cross-referencing: do not just refer to ‘the text’. Any subsection may
be given a brief heading. Each heading should appear on its own separate line.
Introduction
State the objectives of the work and provide an adequate background, avoiding a detailed
literature survey or a summary of the results.
Material and methods
Provide sufficient detail to allow the work to be reproduced. Methods already published should be
indicated by a reference: only relevant modifications should be described. When describing mixed
solvents for chromatography, extraction or other purposes, the following convention must be
adopted: solvent A-solvent B-solvent C (a:b:c, v/v/v) or (a:b:c, w/w/w) where a:b:c are the
proportions (by volume or weight as appropriate) of the components A, B and C, respectively.
The method of preparation of buffers should be clearly expressed, with the pH value and molarity
stated in parentheses, e.g. sodium acetate (pH 4.7; 0.1 M). For mixed solvent systems, it should
be clearly stated whether the pH value quoted is the pH of the original aqueous component or the
apparent pH (i.e. pH*) of the mixed solvent system. Typical examples of mobile phases employed
in liquid chromatography might be:acetonitrile-sodium octylsulphate (10 mM)-sodium acetate (pH
4.7;0.1 M) (25:25:50, v/v/v), and acetonitrile-sodium octylsulphate (10 mM)-sodium acetate (0.1
M)(25:25:50, v/v/v )(pH* 4.7). Discussion of the optimisation procedure for the proposed method
/ assay should be given in detail.
185
Theory/calculation
A Theory section should extend, not repeat, the background to the article already dealt with in the
Introduction and lay the foundation for further work. In contrast, a Calculation section represents
a practical development from a theoretical basis.
Results
Results should be clear and concise.
Discussion
This should explore the significance of the results of the work, not repeat them. A combined
Results and Discussion section is often appropriate. Avoid extensive citations and discussion of
published literature.
Conclusions
The main conclusions of the study may be presented in a short Conclusions section, which may
stand alone or form a subsection of a Discussion or Results and Discussion section.
Appendices
If there is more than one appendix, they should be identified as A, B, etc. Formulae and equations
in appendices should be given separate numbering: Eq. (A.1), Eq. (A.2), etc.; in a subsequent
appendix, Eq. (B.1) and so on. Similarly for tables and figures: Table A.1; Fig. A.1, etc.
F.3.3. Essential title page information
• Title. Concise and informative. Titles are often used in information-retrieval systems.
Avoid abbreviations and formulae where possible.
• Author names and affiliations. Please clearly indicate the given name(s) and family
name(s) of each author and check that all names are accurately spelled. Present the
authors’ affiliation addresses (where the actual work was done) below the names. Indicate
all affiliations with a lower case superscript letter immediately after the author’s name and
in front of the appropriate address. Provide the full postal address of each affiliation,
including the country name and, if available, the e-mail address of each author.
• Corresponding author. Clearly indicate who will handle correspondence at all stages of
refereeing and publication, also post-publication. Ensure that the e-mail address is given and that contact details are kept up to date by the corresponding author.
• Present/permanent address. If an author has moved since the work described in the
article was done, or was visiting at the time, a ‘Present address’ (or ‘Permanent address’)
186
may be indicated as a footnote to that author’s name. The address at which the author
actually did the work must be retained as the main, affiliation address. Superscript Arabic
numerals are used for such footnotes.
F.3.4. Abstract
A concise and factual abstract is required. The abstract should state briefly the purpose of the
research, the principal results and major conclusions. An abstract is often presented separately
from the article, so it must be able to stand alone. For this reason, References should be avoided,
but if essential, then cite the author(s) and year(s). Also, non-standard or uncommon
abbreviations should be avoided, but if essential they must be defined at their first mention in the
abstract itself.
Graphical abstract
Although a graphical abstract is optional, its use is encouraged as it draws more attention to the
online article. The graphical abstract should summarize the contents of the article in a concise,
pictorial form designed to capture the attention of a wide readership. Graphical abstracts should
be submitted as a separate file in the online submission system. Image size: Please provide an
image with a minimum of 531 × 1328 pixels (h × w) or proportionally more. The image should be
readable at a size of 5 × 13 cm using a regular screen resolution of 96 dpi. Preferred file types:
TIFF, EPS, PDF or MS Office files. You can view Example Graphical Abstracts on our information
site. Authors can make use of Elsevier’s Illustration Services to ensure the best presentation of
their images and in accordance with all technical requirements.
Highlights
Highlights are mandatory for this journal. They consist of a short collection of bullet points that
convey the core findings of the article and should be submitted in a separate editable file in the
online submission system. Please use ‘Highlights’ in the file name and include 3 to 5 bullet points
(maximum 85 characters, including spaces, per bullet point). You can view example Highlights
on our information site.
F.3.5. Keywords
Immediately after the abstract, provide a maximum of 6 keywords, using American spelling and
avoiding general and plural terms and multiple concepts (avoid, for example, ‘and’, ‘of’). Be
sparing with abbreviations: only abbreviations firmly established in the field may be eligible. These
keywords will be used for indexing purposes.
187
Abbreviations
Define abbreviations that are not standard in this field in a footnote to be placed on the first page
of the article. Such abbreviations that are unavoidable in the abstract must be defined at their first
mention there, as well as in the footnote. Ensure consistency of abbreviations throughout the
article.
List of Journal of Pharmaceutical and Biomedical Analysis abbreviations.
Acknowledgements
Collate acknowledgements in a separate section at the end of the article before the references
and do not, therefore, include them on the title page, as a footnote to the title or otherwise. List
here those individuals who provided help during the research (e.g., providing language help,
writing assistance or proof reading the article, etc.).
Formatting of funding sources
List funding sources in this standard way to facilitate compliance to funder’s requirements:
Funding: This work was supported by the National Institutes of Health [grant numbers xxxx, yyyy];
the Bill & Melinda Gates Foundation, Seattle, WA [grant number zzzz]; and the United States
Institutes of Peace [grant number aaaa].
It is not necessary to include detailed descriptions on the program or type of grants and awards.
When funding is from a block grant or other resources available to a university, college, or other
research institution, submit the name of the institute or organization that provided the funding. If
no funding has been provided for the research, please include the following sentence: This
research did not receive any specific grant from funding agencies in the public, commercial, or
not-for-profit sectors.
Math formulae
Please submit math equations as editable text and not as images. Present simple formulae in line
with normal text where possible and use the solidus (/) instead of a horizontal line for small
fractional terms, e.g., X/Y. In principle, variables are to be presented in italics. Powers of e are
often more conveniently denoted by exp. Number consecutively any equations that have to be
displayed separately from the text (if referred to explicitly in the text).
Footnotes
Footnotes should be used sparingly. Number them consecutively throughout the article. Many
word processors can build footnotes into the text, and this feature may be used. Otherwise, please
188
indicate the position of footnotes in the text and list the footnotes themselves separately at the
end of the article. Do not include footnotes in the Reference list.
F.3.6. Artwork
Electronic artwork
General points
• Make sure you use uniform lettering and sizing of your original artwork.
• Embed the used fonts if the application provides that option.
• Aim to use the following fonts in your illustrations: Arial, Courier, Times New Roman,
Symbol, or use fonts that look similar.
• Number the illustrations according to their sequence in the text.
• Use a logical naming convention for your artwork files.
• Provide captions to illustrations separately.
• Size the illustrations close to the desired dimensions of the published version.
• Submit each illustration as a separate file.
A detailed guide on electronic artwork is available.
You are urged to visit this site; some excerpts from the detailed information are given here.
Formats
If your electronic artwork is created in a Microsoft Office application (Word, PowerPoint, Excel)
then please supply ‘as is’ in the native document format. Regardless of the application used other
than Microsoft Office, when your electronic artwork is finalized, please ‘Save as’ or convert the
images to one of the following formats (note the resolution requirements for line drawings,
halftones, and line/halftone combinations given below):
EPS (or PDF): Vector drawings, embed all used fonts.
TIFF (or JPEG): Color or grayscale photographs (halftones), keep to a minimum of 300 dpi.
TIFF (or JPEG): Bitmapped (pure black & white pixels) line drawings, keep to a minimum of 1000
dpi.
TIFF (or JPEG): Combinations bitmapped line/half-tone (color or grayscale), keep to a minimum
of 500 dpi.
189
Please do not:
• Supply files that are optimized for screen use (e.g., GIF, BMP, PICT, WPG); these typically
have a low number of pixels and limited set of colors;
• Supply files that are too low in resolution;
• Submit graphics that are disproportionately large for the content.
Color artwork
Please make sure that artwork files are in an acceptable format (TIFF (or JPEG), EPS (or PDF),
or MS Office files) and with the correct resolution. If, together with your accepted article, you
submit usable color figures then Elsevier will ensure, at no additional charge, that these figures
will appear in color online (e.g., ScienceDirect and other sites) regardless of whether or not these
illustrations are reproduced in color in the printed version. For color reproduction in print, you will receive information regarding the costs from Elsevier after receipt of your accepted article. Please indicate your preference for color: in print or online only. Further information on
the preparation of electronic artwork.
Figure captions
Ensure that each illustration has a caption. Supply captions separately, not attached to the figure.
A caption should comprise a brief title (not on the figure itself) and a description of the illustration.
Keep text in the illustrations themselves to a minimum but explain all symbols and abbreviations
used.
F.3.7. Tables
Please submit tables as editable text and not as images. Tables can be placed either next to the
relevant text in the article, or on separate page(s) at the end. Number tables consecutively in
accordance with their appearance in the text and place any table notes below the table body. Be
sparing in the use of tables and ensure that the data presented in them do not duplicate results
described elsewhere in the article. Please avoid using vertical rules and shading in table cells.
F.3.8. References
Citation in text
Please ensure that every reference cited in the text is also present in the reference list (and vice
versa). Any references cited in the abstract must be given in full. Unpublished results and personal
communications are not recommended in the reference list, but may be mentioned in the text. If
these references are included in the reference list they should follow the standard reference style
of the journal and should include a substitution of the publication date with either 'Unpublished
190
results' or 'Personal communication'. Citation of a reference as 'in press' implies that the item has
been accepted for publication.
Reference links
Increased discoverability of research and high quality peer review are ensured by online links to
the sources cited. In order to allow us to create links to abstracting and indexing services, such
as Scopus, CrossRef and PubMed, please ensure that data provided in the references are
correct. Please note that incorrect surnames, journal/book titles, publication year and pagination
may prevent link creation. When copying references, please be careful as they may already
contain errors. Use of the DOI is encouraged.
A DOI can be used to cite and link to electronic articles where an article is in-press and full citation
details are not yet known, but the article is available online. A DOI is guaranteed never to change,
so you can use it as a permanent link to any electronic article. An example of a citation using DOI
for an article not yet in an issue is: VanDecar J.C., Russo R.M., James D.E., Ambeh W.B., Franke
M. (2003). Aseismic continuation of the Lesser Antilles slab beneath northeastern Venezuela.
Journal of Geophysical Research, https://doi.org/10.1029/2001JB000884. Please note the format
of such citations should be in the same style as all other references in the paper.
Web references
As a minimum, the full URL should be given and the date when the reference was last accessed.
Any further information, if known (DOI, author names, dates, reference to a source publication,
etc.), should also be given. Web references can be listed separately (e.g., after the reference list)
under a different heading if desired, or can be included in the reference list.
Data references
This journal encourages you to cite underlying or relevant datasets in your manuscript by citing
them in your text and including a data reference in your Reference List. Data references should
include the following elements: author name(s), dataset title, data repository, version (where
available), year, and global persistent identifier. Add [dataset] immediately before the reference
so we can properly identify it as a data reference. The [dataset] identifier will not appear in your
published article.
References in a special issue
Please ensure that the words 'this issue' are added to any references in the list (and any citations
in the text) to other articles in the same Special Issue.
191
Reference management software
Most Elsevier journals have their reference template available in many of the most popular
reference management software products. These include all products that support Citation Style
Language styles, such as Mendeley and Zotero, as well as EndNote. Using the word processor
plug-ins from these products, authors only need to select the appropriate journal template when
preparing their article, after which citations and bibliographies will be automatically formatted in
the journal's style. If no template is yet available for this journal, please follow the format of the
sample references and citations as shown in this Guide. Users of Mendeley Desktop can easily
install the reference style for this journal by clicking the following link:
http://open.mendeley.com/use-citation-style/journal-of-pharmaceutical-and-biomedical-analysis
When preparing your manuscript, you will then be able to select this style using the Mendeley
plugins for Microsoft Word or LibreOffice.
Reference formatting
There are no strict requirements on reference formatting at submission. References can be in any
style or format as long as the style is consistent. Where applicable, author(s) name(s), journal
title/book title, chapter title/article title, year of publication, volume number/book chapter and the
pagination must be present. Use of DOI is highly encouraged. The reference style used by the
journal will be applied to the accepted article by Elsevier at the proof stage. Note that missing
data will be highlighted at proof stage for the author to correct. If you do wish to format the
references yourself they should be arranged according to the following examples:
Reference style
Text: Indicate references by number(s) in square brackets in line with the text. The actual authors
can be referred to, but the reference number(s) must always be given. Example: '..... as
demonstrated [3,6]. Barnaby and Jones [8] obtained a different result ....'
List: Number the references (numbers in square brackets) in the list in the order in which they
appear in the text.
Examples:
Reference to a journal publication:
[1] J. van der Geer, J.A.J. Hanraads, R.A. Lupton, The art of writing a scientific article, J. Sci.
Commun. 163 (2010) 51–59.
192
Reference to a book:
[2] W. Strunk Jr., E.B. White, The Elements of Style, fourth ed., Longman, New York, 2000.
Reference to a chapter in an edited book:
[3] G.R. Mettam, L.B. Adams, How to prepare an electronic version of your article, in: B.S. Jones,
R.Z. Smith (Eds.), Introduction to the Electronic Age, E-Publishing Inc., New York, 2009, pp. 281–
304.
Reference to a website:
[4] Cancer Research UK, Cancer statistics reports for the UK. http://www.cancerresearchuk.org/
aboutcancer/statistics/cancerstatsreport/, 2003 (accessed 13 March 2003).
Reference to a dataset:
[dataset] [5] M. Oguro, S. Imahiro, S. Saito, T. Nakashizuka, Mortality data for Japanese oak wilt
disease and surrounding forest compositions, Mendeley Data, v1, 2015. https://doi.org/10.17632/
xwj98nb39r.1.
Journal abbreviations source
Journal names should be abbreviated according to the List of Title Word Abbreviations.
F.3.9. Video
Elsevier accepts video material and animation sequences to support and enhance your scientific
research. Authors who have video or animation files that they wish to submit with their article are
strongly encouraged to include links to these within the body of the article. This can be done in
the same way as a figure or table by referring to the video or animation content and noting in the
body text where it should be placed. All submitted files should be properly labelled so that they
directly relate to the video file’s content. In order to ensure that your video or animation material
is directly usable, please provide the files in one of our recommended file formats with a preferred
maximum size of 150 MB in total. Any single file should not exceed 50 MB. Video and animation
files supplied will be published online in the electronic version of your article in Elsevier Web
products, including ScienceDirect. Please supply ‘stills’ with your files: you can choose any frame
from the video or animation or make a separate image. These will be used instead of standard
icons and will personalize the link to your video data. For more detailed instructions please visit
our video instruction pages.
193
Note: since video and animation cannot be embedded in the print version of the journal, please
provide text for both the electronic and the print version for the portions of the article that refer to
this content.
F.3.10. Supplementary material
Supplementary material such as applications, images and sound clips, can be published with your
article to enhance it. Submitted supplementary items are published exactly as they are received
(Excel or PowerPoint files will appear as such online). Please submit your material together with
the article and supply a concise, descriptive caption for each supplementary file. If you wish to
make changes to supplementary material during any stage of the process, please make sure to
provide an updated file. Do not annotate any corrections on a previous version. Please switch off
the ‘Track Changes’ option in Microsoft Office files as these will appear in the published version.
RESEARCH DATA
This journal encourages and enables you to share data that supports your research publication
where appropriate, and enables you to interlink the data with your published articles. Research
data refers to the results of observations or experimentation that validate research findings. To
facilitate reproducibility and data reuse, this journal also encourages you to share your software,
code, models, algorithms, protocols, methods and other useful materials related to the project.
Below are a number of ways in which you can associate data with your article or make a statement
about the availability of your data when submitting your manuscript. If you are sharing data in one
of these ways, you are encouraged to cite the data in your manuscript and reference list. Please
refer to the "References" section for more information about data citation. For more information
on depositing, sharing and using research data and other relevant research materials, visit the
research data page.
Data linking
If you have made your research data available in a data repository, you can link your article
directly to the dataset. Elsevier collaborates with a number of repositories to link articles on
ScienceDirect with relevant repositories, giving readers access to underlying data that gives them
a better understanding of the research described. There are different ways to link your datasets
to your article. When available, you can directly link your dataset to your article by providing the
relevant information in the submission system. For more information, visit the database linking
page.
For supported data repositories a repository banner will automatically appear next to your
published article on ScienceDirect. In addition, you can link to relevant data or entities through
194
identifiers within the text of your manuscript, using the following format: Database: xxxx (e.g.,
TAIR: AT1G01020; CCDC: 734053; PDB: 1XFN).
Mendeley Data
This journal supports Mendeley Data, enabling you to deposit any research data (including raw
and processed data, video, code, software, algorithms, protocols, and methods) associated with
your manuscript in a free-to-use, open access repository. During the submission process, after
uploading your manuscript, you will have the opportunity to upload your relevant datasets directly
to Mendeley Data. The datasets will be listed and directly accessible to readers next to your
published article online. For more information, visit the Mendeley Data for journals page.
Data statement
To foster transparency, we encourage you to state the availability of your data in your submission.
This may be a requirement of your funding body or institution. If your data is unavailable to access
or unsuitable to post, you will have the opportunity to indicate why during the submission process,
for example by stating that the research data is confidential. The statement will appear with your
published article on ScienceDirect. For more information, visit the Data Statement page.
F.3.11. AudioSlides
The journal encourages authors to create an AudioSlides presentation with their published article.
AudioSlides are brief, webinar-style presentations that are shown next to the online article on
ScienceDirect. This gives authors the opportunity to summarize their research in their own words
and to help readers understand what the paper is about. More information and examples are
available. Authors of this journal will automatically receive an invitation e-mail to create an
AudioSlides presentation after acceptance of their paper.
F.3.12. Interactive plots
This journal enables you to show an Interactive Plot with your article by simply submitting a data
file. Full instructions.
F.4. AFTER ACCEPTANCE
F.4.1. Online proof correction
Corresponding authors will receive an e-mail with a link to our online proofing system, allowing
annotation and correction of proofs online. The environment is similar to MS Word: in addition to
editing text, you can also comment on figures/tables and answer questions from the Copy Editor.
Web-based proofing provides a faster and less error-prone process by allowing you to directly
195
type your corrections, eliminating the potential introduction of errors. If preferred, you can still
choose to annotate and upload your edits on the PDF version. All instructions for proofing will be
given in the e-mail we send to authors, including alternative methods to the online version and
PDF.
We will do everything possible to get your article published quickly and accurately. Please use
this proof only for checking the typesetting, editing, completeness and correctness of the text,
tables and figures. Significant changes to the article as accepted for publication will only be
considered at this stage with permission from the Editor. It is important to ensure that all
corrections are sent back to us in one communication. Please check carefully before replying, as
inclusion of any subsequent corrections cannot be guaranteed. Proofreading is solely your
responsibility.
F.4.2. Offprints
The corresponding author will, at no cost, receive a customized Share Link providing 50 days free
access to the final published version of the article on ScienceDirect. The Share Link can be used
for sharing the article via any communication channel, including email and social media. For an
extra charge, paper offprints can be ordered via the offprint order form which is sent once the
article is accepted for publication. Both corresponding and co-authors may order offprints at any
time via Elsevier’s Webshop. Corresponding authors who have published their article open
access do not receive a Share Link as their final published version of the article is available open
access on ScienceDirect and can be shared through the article DOI link.
F.5. AUTHOR INQUIRIES
Visit the Elsevier Support Center to find the answers you need. Here you will find everything from
Frequently Asked Questions to ways to get in touch. You can also check the status of your
submitted article or find out when your accepted article will be published.
196
Annexure G
CERTIFICATE OF LANGUAGE EDITING
This annexure contains a certificate as proof of language editing performed by Prof S Vorster on
chapters 1, 4, and 5 as well as annexures A, C, and D. Chapters 2 and 3 were already submitted
and/or accepted for publication and thus edited beforehand. Annexure B is a report included as
received by Prof Aucamp and annexures E and F are author guidelines supplied by the respective
journals.
197
Certificate of Editing
This document certifies that the Thesis:
“Topical delivery of clofazimine, artemisone and decoquinate utilising vesicles as carrier system”
by
Lindi van Zyl
has been edited by me for proper English language usage.
Cell 072 719 7025
Date: 27 October 2017
Prof SW Vorster BA (Hons), MMet, MSc (Eng), PhD
Accredited Member No. 1000923 South African Translators’ Institute