Embed Size (px)
Citation preview
Talanta 47 (1998) 203–212
LA-ICP-MS, IC and DPASV-DPCSV determination of metallicimpurities in solar-grade silicon
Pier Luigi Buldini a,*, Anna Mevoli b, Jawahar Lal Sharma c
a C.N.R.-Lamel, Via P. Gobetti n. 101, 40129, Bologna, Italyb PASTIS SCpA, S.S. 7, km. 7,300, 72100, Brindisi, Italyc K.M. College, Uni6ersity of Delhi, Delhi, 110007, India
Received 2 October 1997; received in revised form 11 February 1998; accepted 11 February 1998
Abstract
Stringent specifications are laid down for the silicon used for solar cells. The present work deals with theapplication of different techniques to the simultaneous determination of most common metallic impurities like iron,copper, nickel, zinc, lead and cadmium, in industrial process control. Laser ablation inductively coupled plasma massspectrometry is quite expensive in apparatus, but it directly performs the analysis of solid silicon with very goodsensitivity, even if coupled to considerable standard deviation, probably due to the material defects. Both ionchromatography and voltammetry need sample pre-treatment, but they are characterized by cheap and simpleapparatus, suitable detection limits, good sensitivity and small standard deviation. © 1998 Elsevier Science B.V. Allrights reserved.
Keywords: Solar-grade silicon; Metallic impurities; Laser ablation inductively coupled plasma mass spectrometry; Ionchromatography; Voltammetry
1. Introduction
In the current decade, photovoltaic industry hasestablished its own identity as a result of theincreasing relevance of alternative energies. Theactual trend is to produce silicon ingots or rib-bons suitable for fabricating large area (\100cm2) and thin (B150 mm) photovoltaic cells,thereby reducing the cost factor, without affectingtheir efficiency. Solar-grade silicon is character-
ized by an intermediate level of quality in respectof semiconductor-grade and most of the metallicimpurities that can be present, cause a consider-able reduction in minority carrier lifetime if over-coming the low ppm range. The most favourableresult is achieved when a tolerable impurity con-tent is counter balanced by the low cost of thestarting material coupled with the minimum ma-nipulations resulting from the crystal growth tech-nique and the melt replenishment strategy.
In electronic-grade materials, the content ofmetallic impurities is generally monitored by spec-trography [1], spark source mass spectrometry
* Corresponding author. Tel.: +39 051 6399203; fax: +39051 6399216, +39 054 720267.
0039-9140/98/$19.00 © 1998 Elsevier Science B.V. All rights reserved.
PII S0039-9140(98)00065-4
P. Luigi Buldini et al. / Talanta 47 (1998) 203–212204
(SSMS) [2], secondary ions mass spectrometry(SIMS) [3] or neutron activation analysis (NAA)[4] which, coupled with radiochemical separationand measurements, provide the lowest detectionlimits. These techniques, however, are very expen-sive and relatively long time is required for analy-sis, in addition their use in industrial process isunusual.
The permissible limits of metallic impurities insolar-grade silicon, made it possible the use oftechniques much more cheap and easy to manage,for process control, like flameless atomic absorp-tion spectrometry (FAAS) [5], polarography [6],ion chromatography (IC) [7] or inductively cou-pled plasma mass spectrometry (ICP-MS) [8].These techniques are very attractive for traceanalysis owing to their ease of operation andsatisfactory sensitivity in process control coupledwith the advantage of simultaneousdeterminations.
In the present work, laser ablation inductivelycoupled plasma mass spectrometry (LA-ICP-MS),ion chromatography (IC) and pulsed voltam-metries (DPASV-DPCSV) are applied to thesimultaneous determination of iron, copper,nickel, zinc, lead, cadmium, and cobalt in solar-grade silicon.
LA-ICP-MS requires only minimal samplepreparation: silicon ingots or ribbons must be cutand the wafer is ablated by laser pulses and ionsanalyzed in inductively coupled plasma.
IC and DPASV-DPCSV require pieces orcoarse powder dissolution in a mixture of hy-drofluoric and nitric acids, that are successivelyvolatilized at the same time of the silicon matrix(as hexafluorosilicic acid). The residue is thendissolved in water and analyzed.
2. Experimental
2.1. Reagents and standards
Sodium hydrogencarbonate, sodium acetate,oxalic acid, lithium hydroxide, 2-dimethy-laminoethanol, 4-(2-pyridylazo)-resorcinolmonosodium salt (PAR) and pyridine-2,6-dicar-boxylic acid (PDCA) were chromatographic grade
(Novachimica, Milan, Italy), ammonium hydrox-ide (30%), glacial acetic acid, hydrofluoric acid(50%), nitric acid (70%), trichloroethylene, ace-tone and methanol were Erbatron electronic grade(Carlo Erba Reagenti, Milan, Italy), while ammo-nium acetate, catechol, dimethylglyoxime andethyl alcohol (95°) were ACS reagent grade. 2 Mammonium acetate (pH=5.5) was chelationgrade (Dionex, Sunnyvale, CA). Ultrapure waterwith conductivity B0.1 mS (DI water) was ob-tained from a MILLI-Q system (Millipore, Bed-ford, MA). Working standards for use in analysisby IC and DPASV-DPCSV were prepared dailyby diluting Carlo Erba Reagenti Normex atomicabsorption standards (1.000 g l−1), while for ICPuse, AccuStandard solutions (1.000 g l−1) wereused.
Polytetrafluoroethylene (PTFE) labware wascleaned by refluxing in hot and concentrated nitricacid, then carefully washed with DI water andfinally dried with filtered air in a clean atmo-sphere. Details of cleaning procedures and ap-paratus are reported in the standard texts.Normal precautions for trace analysis were ob-served throughout. Reagents, standards and sam-ple solutions were prepared and stored influorinated ethylene propylene labware.Polypropylene calibrated equipment was used
Table 1Laser and inductively coupled plasma mass spectrometric con-ditions
Q switchedLaser mode850 VLaser power
Focus Sample surfaceLaser energy (J shot−1) 0.2Repetition rate (Hz) 4Raster 7×7Aerosol gas path length (m) 2.5Aerosol Ar gas flow rate (l min−1) 0.98Auxiliary Ar gas flow rate (l min−1) 0.40Coolant Ar gas flow rate (l min−1) 13.0Inductively coupled plasma power (W) 1200Multichannel analyzer (channels) 4096Dwell time (ms) 160Sweeps per acquisition 100
120Pre-ablation time (s)Ablation time (s) 180
60Acquisition time (s)
P. Luigi Buldini et al. / Talanta 47 (1998) 203–212 205
Table 2Ion chromatographic conditions
Dionex IonPac CG5+CS5Column6 mM PDCA +50 mM CH3COOHEluent 1 [Fe3+,+50 mM CH3COONa (pH=4.6)Cu2+, Ni2+,
Zn2+]50 mM (COOH)2 +95 mM LiOHEluent 2 [Pb2+,(pH=4.8)Cd2+, Co2+]
Eluent flow rate 1.0 ml min−1
Injection volume 150 mlVisible absorbanceDetection0.3 mM PAR in 1 M 2-dimethy-Post columnlaminoethanol +0.5 M NH4OH +0.5reagentM NaHCO3
0.5 ml min−1PCR flow rate520 nmWavelength
2.4. Instrumentation
For ion chromatographic and voltammetricanalyses, a laboratory mill (Spex, Edison, NJ)fitted with an agate cell, was the standard appara-tus used to prepare the samples. Then they weremicrowaving digested in a MLS 1200 system(Milestone, Sorisole, Italy) equipped with a FAM40 acid scrubber module. Dissolution was per-formed using 40% power and programming tem-peratures as a function of the values dictated bythe factorial design.
Mass spectrometric analyses were performed ona VG PlasmaQuadII+ (VG Elemental, ThermoInstruments, Winsford, UK) inductively coupledplasma mass spectrometer equipped with a finefocused LaserProbe ablation module. The Laser-Probe is based on a 500 mJ pulsed Nd:YAG laseroperating at a wavelength of 1064 nm. The finefocus optics facilitate the production of lasercraters of about 100 mm in the Q-switched modefor silicon. A full description of the laser andICP-MS instrumentation and analysis methodol-ogy is reported in the standard texts [9]. 29Si isused as the internal standard isotope. Most instru-mental functions are controlled by an 80386 basedcomputer (Epson, Sesto S. Giovanni, Italy) withVG PlasmaQuad software.
All the mass spectrometric conditions are listedin Table 1.
Chromatographic analyses were performed on ametal-free Dionex DX-300 ion chromatographequipped with: an AGP gradient pump, a Post-column Pneumatic Controller for post-columnreagent addition and a DSA UV-Vis multiple-wavelength detector.
All the chromatographic conditions are listed inTable 2.
All measurements were made at room tempera-ture and in all cases, injection of the sample wasdone at least in triplicate. All the samples werefiltered through 0.45 mm filter.
Data manipulation and the operation of allcomponents in the system were controlled by AI-450 Dionex chromatographic software interfacedvia an ACI-2 Advanced Computer Interface to an80386 based computer (Epson, Sesto S. Giovanni,Italy).
throughout in order to prevent leaching and/oradsorption effects. Manipulations were done on alaminar-flow clean bench to avoid fortuitouspollution.
2.2. Voltammetric complexing solutions
For the determination of iron(III), a 0.1 Mcatechol solution was used as complexant. It wasprepared by dissolving 2.750 g of pyrocatechol inultrapure water under a nitrogen flow in a darkbottle. The solution was stored under nitrogenatmosphere to prevent its oxidation, which other-wise causes the shift and decrease of the iron peakthereby influencing the response linearity.
For the determination of nickel(II) andcobalt(II), a 0.043 M dimethylglyoxime solutionwas prepared in ethyl alcohol (95°).
2.3. Chromatographic eluent and post-columnreagent solutions
A mixture of 6 mM PDCA, 50 mM acetic acidand 50 mM sodium acetate (pH=4.6) was em-ployed for the determination of iron(III), cop-per(II), nickel(II), and zinc(II). For the analysis oflead(II), cadmium(II), and cobalt(II) a mixture of50 mM oxalic acid and 95 mM lithium hydroxide(pH=4.8) was used as the eluent. The post-column reagent used with both eluents was 0.3mM PAR dissolved in 1 M 2-dimethy-laminoethanol, 0.5 M ammonium hydroxide and0.5 M sodium hydrogencarbonate.
P. Luigi Buldini et al. / Talanta 47 (1998) 203–212206
Table 3Voltammetric conditions
MME operated as HMDE, Hg drop size 0.60 mm2.Electrode type1920 rpmElectrode stirring speed (during
deposition time)Zn(II), Cd(II), Pb(II), Cu(II) Deposition (at −1.450 V) 120 s, quiet time before potential scan 20 s, DPASV from
−1.450 to −0.100 V, pulse amplitude 60 mV, potential scan rate 10 mV s−1.Deposition (at −0.650 V) 60 s, quiet time before potential scan 20 s, CSV from −0.650Fe(III)to −1.100 V, potential scan rate 60 mV s−1.Deposition (at −1.100 V) 35 s, quiet time before potential scan 30 s, DPCSV fromNi(II), Co(II)−1.100 to −1.450 V, pulse amplitude −40 mV, potential scan rate 10 mV s−1.
Voltammetric measurements were performedon a Metrohm (Herisau, Switzerland) 646 VAprocessor equipped with a 647 VA stand, a 675VA sample changer, a 677 drive unit and Dosimat665 automatic addition burettes. A conventionalthree-electrode arrangement consisting of a multi-mode electrode (MME) working electrode, an Ag/AgCl [3 M KNO3] reference electrode and a 6.5cm long platinum wire auxiliary electrode wasused.
All the voltammetric conditions are listed inTable 3.
2.5. Mass spectrometric working conditions
LA-ICP-MS requires only minimal samplepreparation: (a) the slicing of a flat piece off thesilicon ingot or the cutting of a ribbon piece thatfits inside the laser cell and is no more than 5 mmabove the motorized X–Y sample stage, (b) thedegreasing of the sample, such as usually per-formed on semiconductor wafers, in order to re-move any residue of the cutting process and (c)the pre-ablation of the sample site for removingany surface contamination caused by the handlingof the slice in order to insure that impurities resultfrom the silicon ablation. A pre-ablation step twominutes long proved to be sufficient to removeany surface contaminant. Then ablation is carriedout for 3 min, because this time was sufficient toinsure the generation of a stable aerosol densityprior to acquisition time (last 60 s), long enoughtto provide an high intense spectrum when scan-ning in the m/z 20–210 range. Any sample is atleast ablated at three different sites in order toreject spurious data and to ensure better preci-
sion. Particularly important is to analyze siliconsamples without variations in the characteristicsof the physical matrix because of variations involatilized sample mass, so causing apparent vari-ation of the analytes concentration. Due to theabsence of silicon wafers standards, LA-ICP-MSoperating parameters were optimized by usingNIST SRM 610 and 614 glass wafers as the mostsimilar standard matrix possible. Once optimiza-tion was achieved, in-house reference silicon sam-ples were used in order to insure dataintercomparability on short and long term.
2.6. Ion chromatographic working conditions
Silicon pieces or coarse powder is dissolvedwith an hydrofluoric–nitric acid mixture beforethe injection on to the chromatographic column.Effectively, cations can be determined by simplyreducing acid concentration in the sample solu-tion, but its plain dilution is not desirable becauseof the low amount of metallic impurities usuallypresent in solar-grade silicon. It is therefore highlyrecommended to remove mineral acid excess, thatis necessary for the complete dissolution of thesample, through its volatilization.
In addition, the volatilization process is notonly quite effective for the removal of the reagentexcess, but also for eliminating the matrix withoutaffecting most of the metallic ions. Silicon isremoved as hexafluorosilicic acid, which distils asan azeotrope with water and hydrofluoric acid atabout 110°C. The residue is then dissolved in thesame chromatographic eluent, filtered andinjected.
P. Luigi Buldini et al. / Talanta 47 (1998) 203–212 207
Tab
le4
Ion
chro
mat
ogra
phic
reco
very
ofm
etal
stan
dard
sad
ded
tose
mic
ondu
ctor
silic
on,
diss
olut
ion
inH
F–
HN
O3
mix
ture
and
vola
tiliz
atio
nto
dryn
ess
at13
0°C
Fe(
III)
mgkg
−1
SiC
u(II
)mg
kg−
1Si
Ni(
II)
mgkg
−1
SiZ
n(II
)mg
kg−
1Si
Pb(
II)
mgkg
−1
SiC
d(II
)mg
kg−
1Si
Co(
II)
mgkg
−1
Si
8080
150
8080
8080
Add
eda
829
2819
215
09
3F
ound
a809
2799
2799
1809
210
210
210
010
099
Rec
.(%
)99
100
200
200
500
200
200
200
200
Add
eda
1999
320
29
249
59
8F
ound
a20
19
419
99
220
09
419
89
399
Rec
.(%
)10
199
101
9910
099
5050
100
5050
L.O
.D.b
5050
aM
ean
valu
eca
lcul
ated
onte
nsa
mpl
es9
s-tr
iplic
ate
inje
ctio
nea
ch.
Chr
omat
ogra
phic
cond
itio
nsas
repo
rted
inT
able
4.b
Lim
itof
dete
ctio
nca
lcul
ated
as3s
+av
erag
eno
ise.
P. Luigi Buldini et al. / Talanta 47 (1998) 203–212208
Tab
le5
Vol
tam
met
ric
reco
very
ofm
etal
stan
dard
sad
ded
tose
mic
ondu
ctor
silic
on,
diss
olut
ion
inH
F–
HN
O3
mix
ture
and
vola
tiliz
atio
nto
dryn
ess
at13
0°C
Cu(
II)
mgkg
−1
SiP
b(II
)mg
kg−
1Si
Cd(
II)
mgkg
−1
SiZ
n(II
)mg
kg−
1Si
Fe(
III)
mgkg
−1
SiN
i(II
)mg
kg−
1Si
Co(
II)
mgkg
−1
Si
150
8080
150
150
150
80A
dded
a
1529
4809
1809
1F
ound
a14
89
415
69
715
09
4799
110
210
010
099
104
Rec
.(%
)10
099
500
200
200
500
500
200
200
Add
eda
5079
1019
99
219
99
2F
ound
a49
09
1050
99
1520
09
519
69
310
2R
ec.
(%)
100
100
9810
210
098
100
5050
100
100
L.O
.D.b
100
50
aM
ean
valu
eca
lcul
ated
onte
nsa
mpl
es9
s.V
olta
mm
etri
cco
ndit
ions
asre
port
edin
Tab
le5.
bL
imit
ofde
tect
ion
calc
ulat
edas
3s+
aver
age
nois
e.
P. Luigi Buldini et al. / Talanta 47 (1998) 203–212 209
Table 6Metallic impurities determined in NBS SRM 57a silicon metal and in solar-grade silicon of different origin
Analytical Technique NBS SRM 57a SamplesImpurity
DbCbCertified valuea Foundb Ab Bb
2509344096 17092Fe 1100914IC 50009100 49909571120923 448910 25597 17293CSV 50009100 5020985
16891724792610959100LA-ICP-MS 44094250009100 —c
8192 5391 9.090.2 B0.05Cu IC 40910 41915491 9.090.2DPASV 40910 4093 8093 B0.1
B0.019.5917998LA-ICP-MS 539440910 —c
8192 B0.1Ni IC 80920 7992 20093 B0.1B0.1B0.1809320095DPASV 80920 8294
198920 7998 B0.01 B0.01LA-ICP-MS 80920 —c
B0.05B0.05B0.05Zn 8.290.2IC (B10) B0.05B0.1 B0.1DPASV (B10) B0.1 8.390.2 B0.1
B0.01 B0.01LA-ICP-MS (B10) —c 8.591.0 B0.01
B0.05 B0.05 B0.05Pb 5.690.2IC B10 B0.05B0.05 B0.05DPASV B10 B0.05 5.590.2 B0.05
B0.01B0.015.590.5LA-ICP-MS B0.01B10 —c
5.290.1 B0.05 B0.05 B0.05Cd IC — B0.05B0.05B0.05B0.055.190.1DPASV — B0.05
B0.01 B0.01LA-ICP-MS — —c 5.090.6 B0.01
B0.05B0.05 B0.05Co 3.290.1IC — B0.053.190.1 B0.05 B0.05 B0.05DPCSV — B0.053.090.3 B0.01 B0.01LA-ICP-MS — B0.01—c
a Values in mg g−1 Si.b Values in mg g−1 Si. Mean value calculated over ten samples 9s.c NBS SRM 57a is in the form of a fine powder and laser ablation is unreliable.
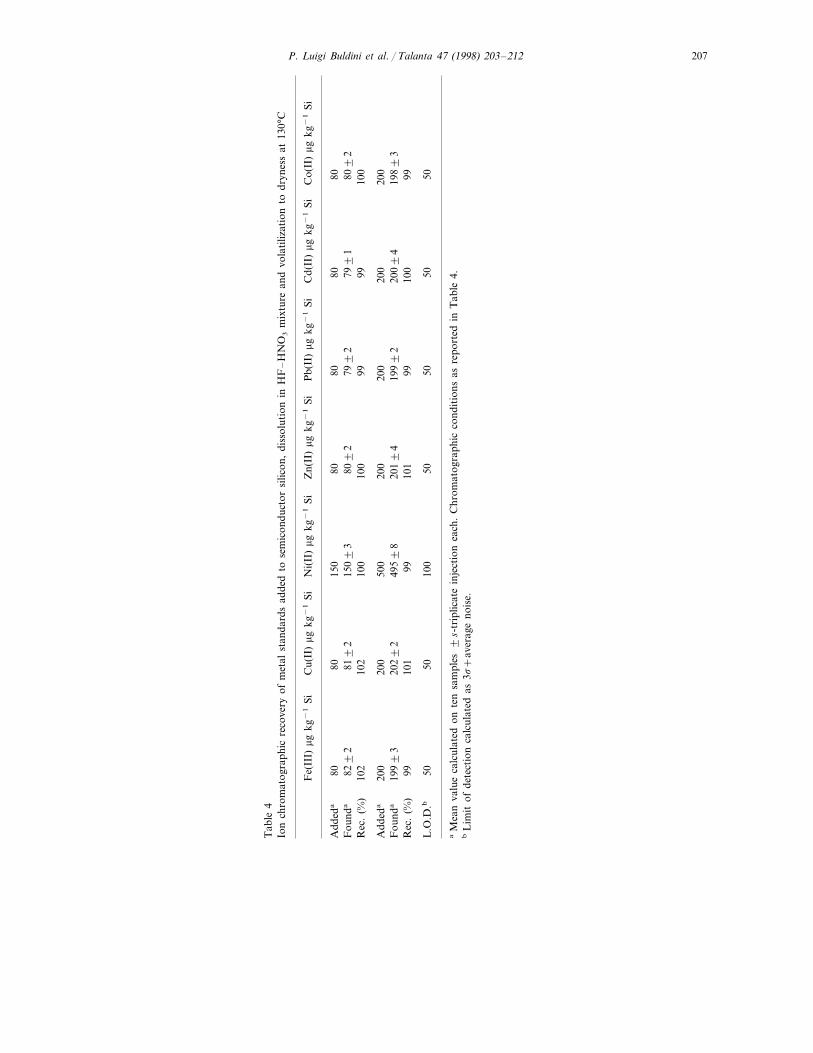
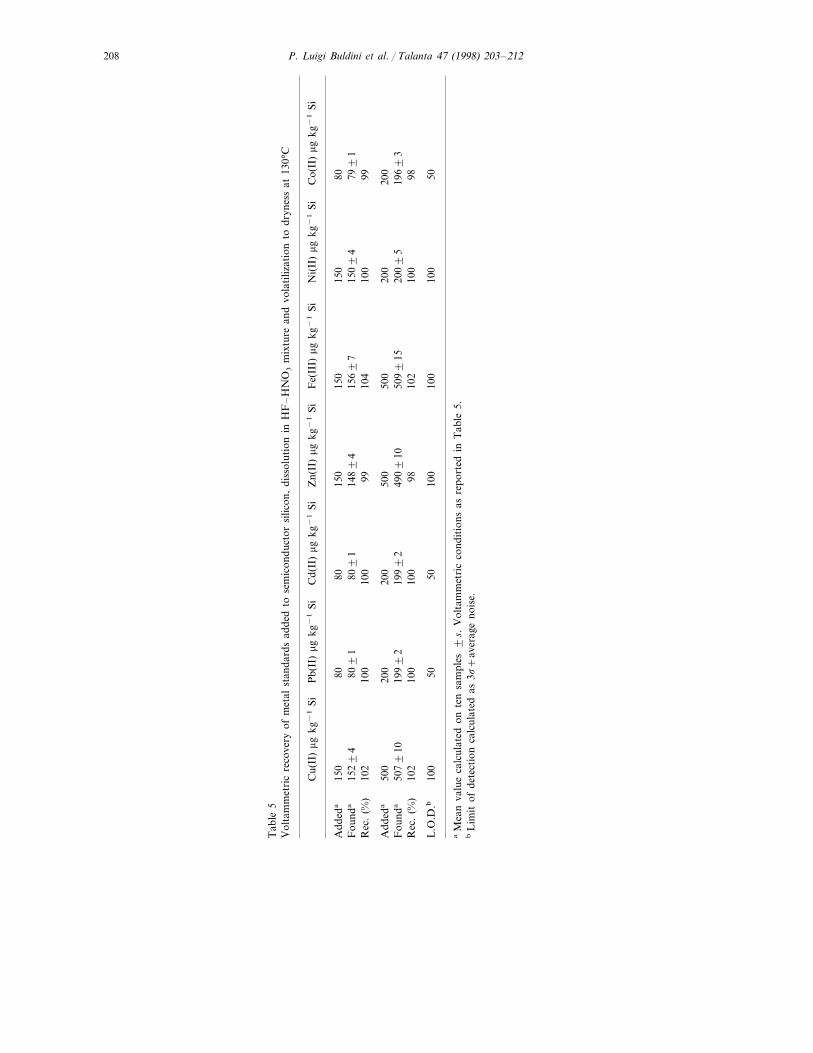
As shown in Tables 4 and 5, it was found thatiron(III), copper(II), nickel(II), zinc(II), lead(II),cadmium(II), and cobalt(II) are not affected byacids and matrix volatilization at 130°C and theirrecovery results in the 98–102% range.
2.7. Voltammetric working conditions
The same dissolution procedure used for theion chromatographic analysis proved to be suit-able for the voltammetric one, too, because it wellsucceeds in the complete removal of the reagentexcess. Hydrofluoric acid traces are particularlydangerous owing to the use of glass mercury dropelectrodes in voltammetry. In this case the residue
is dissolved in DI water and the solution is trans-ferred to the electrolytic cell.
The best voltammetric conditions for the simul-taneous determination of zinc, cadmium, lead,copper, iron, nickel and cobalt were experimentallyestablished [10]. The procedure consists of threesteps at different pH. First of all, the determinationof zinc, cadmium, lead and copper by differentialpulse anodic stripping voltammetry (DPASV) isperformed at pH 5.5 (acetate buffer), then thedetermination of iron by cathodic stripping voltam-metry (CSV) of its catechol complex follows at pH9.5 (ammonia–ammonium acetate buffer) and atthe same pH nickel and cobalt are determined bydifferential pulse cathodic stripping voltammetry(DPCSV) of their dimethylglyoxime complexes.
P. Luigi Buldini et al. / Talanta 47 (1998) 203–212210
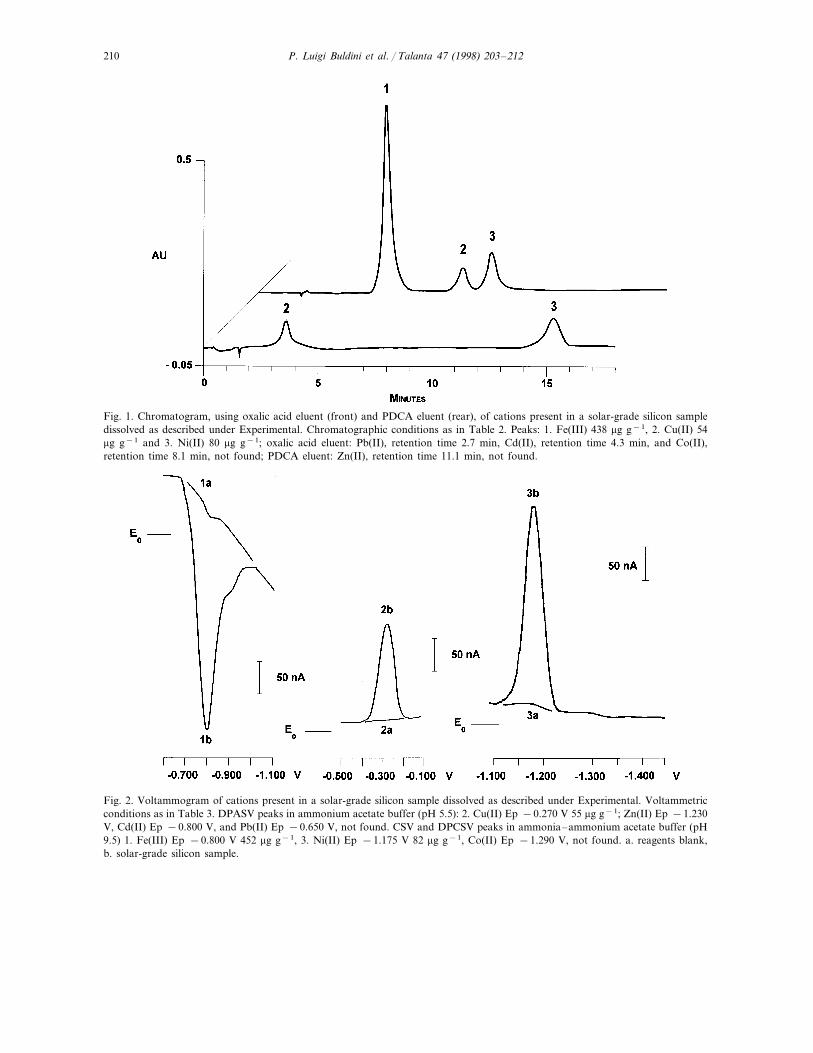
Fig. 1. Chromatogram, using oxalic acid eluent (front) and PDCA eluent (rear), of cations present in a solar-grade silicon sampledissolved as described under Experimental. Chromatographic conditions as in Table 2. Peaks: 1. Fe(III) 438 mg g−1, 2. Cu(II) 54mg g−1 and 3. Ni(II) 80 mg g−1; oxalic acid eluent: Pb(II), retention time 2.7 min, Cd(II), retention time 4.3 min, and Co(II),retention time 8.1 min, not found; PDCA eluent: Zn(II), retention time 11.1 min, not found.
Fig. 2. Voltammogram of cations present in a solar-grade silicon sample dissolved as described under Experimental. Voltammetricconditions as in Table 3. DPASV peaks in ammonium acetate buffer (pH 5.5): 2. Cu(II) Ep −0.270 V 55 mg g−1; Zn(II) Ep −1.230V, Cd(II) Ep −0.800 V, and Pb(II) Ep −0.650 V, not found. CSV and DPCSV peaks in ammonia–ammonium acetate buffer (pH9.5) 1. Fe(III) Ep −0.800 V 452 mg g−1, 3. Ni(II) Ep −1.175 V 82 mg g−1, Co(II) Ep −1.290 V, not found. a. reagents blank,b. solar-grade silicon sample.
P. Luigi Buldini et al. / Talanta 47 (1998) 203–212 211
pH value and ligand concentration were opti-mized to ensure a complete and fast cation com-plexation and a reproducible complex depositiononto the hanging mercury drop electrode(HMDE), during the pre-electrolysis step. Theblank observed in iron and nickel/cobalt deter-minations is essentially due to the fact that bothcatechol and dimethylglyoxime are electroactivein the same potential range in which the respec-tive complexes with iron(III) and nickel(II) arereduced back.
2.8. Procedure
Silicon ingots and ribbons are properly cutand slices are cleaned by ultrasonic washing anddegreased with trichloroethylene, acetone andmethanol [11]. After rapid etching with 1+1hydrofluoric–nitric acid mixture at room tem-perature in order to remove the surface layer,the slices are washed in DI running water anddried in pure nitrogen flow.
The sample is directly inserted in the laserchamber, if LA-ICP-MS is used, or it is ground,in a mill fitted with an agate cell, for the succes-sive acid dissolution, when ion chromatographyor voltammetry are performed. Then, in a PTFEvessel, 10–100 mg of sample are added with 2ml of 12 M HNO3 and 3 ml of 28 M HF andheated to 110°C for 5–10 min, then the temper-ature is raised to 130°C and acidic fumes arecompletely scrubbed off (20 min).
The small residue is dissolved in: (a) 5 ml ofeluent and directly injected on to the ion chro-matograph fitted with on line filter or (b) 10 mlof DI water and transferred to the electrolyticcell.
For voltammetric analysis, the equipment op-erations consist of a 300 ml addition of 2 Mammonium acetate buffer (pH 5.5) followed bythe determination of zinc, lead, cadmium andcopper, a further addition of 300 ml of 5 Mammonia–ammonium acetate buffer (pH 9.5)and 50 ml of 0.1 M catechol for iron determina-tion and, at last, 50 ml of 0.043 M dimethylgly-oxime for the determination of nickel andcobalt.
3. Results and discussion
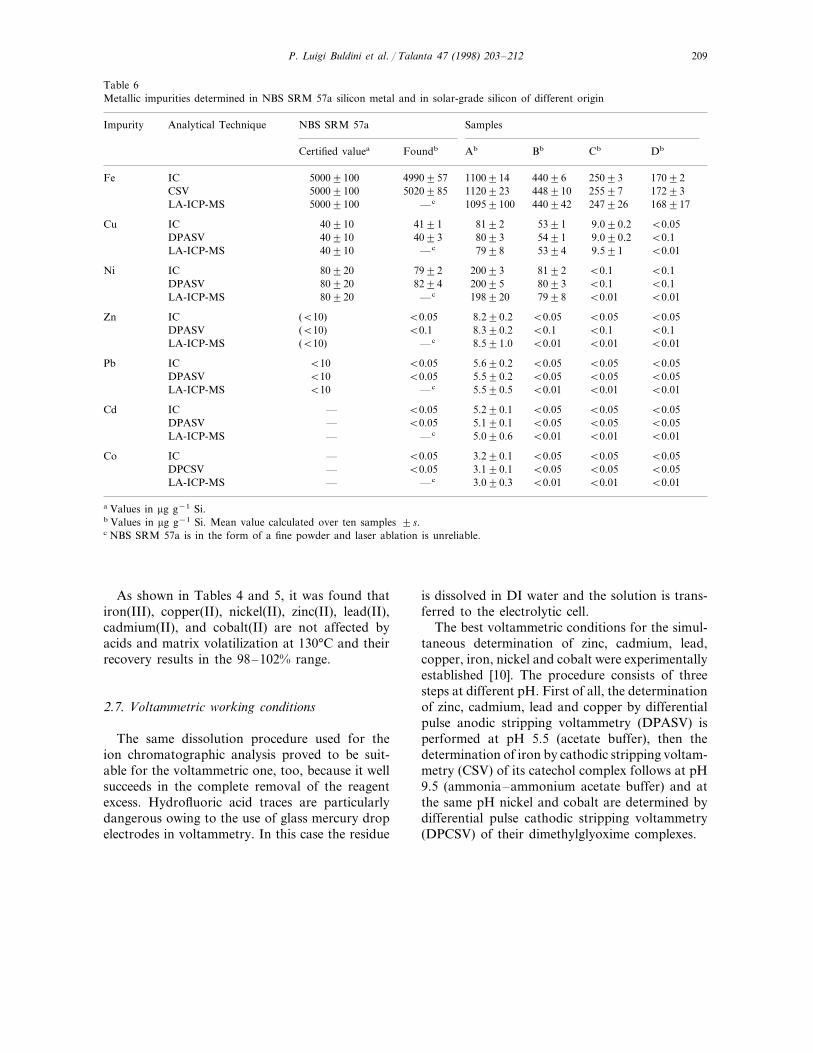
Because no solar-grade silicon standards werefound, NBS SRM silicon metal was analyzed (seeTable 6) and the detection limits and linear rangeswere determined by spiking ultrapure semicon-ductor silicon with various amounts of the deter-mined species, subjecting them to microwavedigestion and then analyzing them by means ofthe proposed procedures. Some data are summa-rized in Tables 4 and 5, while in Fig. 1 theirchromatographic behavior and in Fig. 2 theirvoltammetric behavior is reported.
Some results obtained on solar-grade siliconingots fused in a tentative run of refining rawmaterial are summarized in Table 6, too.
In absence of standards, the results obtained bythe three considered techniques were comparedeach other and they were found in goodagreement.
No interference of the impurities usually foundin silicon was found, the only drawbacks beingthe heat dissolution treatment over volatile spe-cies, like arsenic and antimony [12], thus makingimpossible their quantitation.
4. Conclusions
All of the selected analytical techniques re-vealed suitable for the determination of metallicimpurities in solar-grade silicon process control.
LA-ICP-MS is quite expensive in apparatus,but it permits the direct analysis of solid siliconcoupled with very good sensitivity even if con-nected to considerable standard deviation, proba-bly due to the polysilicon defects. It requires onlyminimal sample preparation and the single stan-dard calibration technique used, enables the deter-mination of trace to major element contentwithout reference to matrix matched standards.The principal component of the matrix is used asthe internal standard isotope (29Si).
Both IC and DPASV-DPCSV need sample pre-treatment, but cheap and simple apparatus, suit-able detection limits and small standard deviationcharacterize them. In both cases run time is about1/2 h, plus the sample pre-treatment. It is neces-
P. Luigi Buldini et al. / Talanta 47 (1998) 203–212212
sary to match sample results with standards.Voltammetry reveals a bit complicated if com-pared to ion chromatography.
Acknowledgements
One of the authors (J.L.S.) acknowledges finan-cial support from the International Center forTheoretical Physics (Trieste, Italy).
References
[1] V.G. Protasov, Spectrographic analysis of technical andused silicon, Zavod. Lab. 55 (1989) 54–55.
[2] I.U.P.A.C. Analytical Chemistry Division, General as-pects of trace analytical methods. VI. Trace analysis ofsemiconductor materials, A. Bulk analysis, Pure Appl.Chem. 57 (1985) 1133–1152.
[3] A.B. Tolstogouzov, T.I. Kitaeva, S.S. Volkov, SIMSimaging: apparatus and applications, Mikrochim. Acta114-115 (1994) 505–510.
[4] E.L. Lakomaa, P. Manninen, R.J. Rosenberg, R. Zillia-cus, Neutron-activation analysis of semiconductor materi-
als, J. Radioanal. Nucl. Chem. 168 (1993) 357–366.[5] D.A. Stewart, D.C. Newton, Determination of iron in
semiconductor-grade silicon by furnace atomic-absorp-tion spectrometry, Analyst 108 (1983) 1450–1458.
[6] P.L. Buldini, A. Toponi, Q. Zini, Polarographic determi-nation of metallic impurities on lapped silicon wafers,Microchem. J. 38 (1988) 241–245.
[7] P.L. Buldini, S. Cavalli, A. Mevoli, E. Milella, Applica-tion of ion chromatography to the analysis of high-purityCdTe, J. Chromatogr. 739 (1996) 131–137.
[8] W. Hub, H. Amphlett, Application of ETC-ICP-MS insemiconductor process control, Fresenius J. Anal. Chem.350 (1994) 587–592.
[9] W.T. Perkins, N.J.G. Pearce, in: P.J. Potts, J.F.W.Bowles, S.J.B. Reed, M.R. Cave (Eds.), MicroanalyticalTechniques in the Geosciences, Chapman and Hall, Lon-don, 1995, pp. 291–325.
[10] P.L. Buldini, D. Ferri, D. Nobili, Determination of tran-sition metals in natural waters by microprocessor-con-trolled voltammetry in comparison with graphite furnaceatomic absorption spectrometry, Electroanalysis 3 (1991)559–566.
[11] P.L. Buldini, Q. Zini, D. Ferri, Anodic oxidation ofpolysilicon, J. Electrochem. Soc. 128 (1981) 1062–1064.
[12] S. Niese, K. Icker, D. Birnstein, J. Dubnack, M.L. Boett-ger, Semiconductor silicon samples for inter-laboratorycomparison, Isotopenpraxis 25 (1989) 237–239.
.


