Embed Size (px)
Citation preview
Doctoral Thesis in Materials Science and Engineering
Characterization of Impurities in Different Ferroalloys and Their Effects on the Inclusion Characteristics of SteelsYONG WANG
Stockholm, Sweden 2021
kth royal institute of technology
Characterization of Impurities in Different Ferroalloys and Their Effects on the Inclusion Characteristics of SteelsYONG WANG
Doctoral Thesis in Materials Science and Engineering KTH Royal Institute of TechnologyStockholm, Sweden 2021
Academic Dissertation which, with due permission of the KTH Royal Institute of Technology, is submitted for public defence for the Degree of Doctor of Philosophy on Thursday, 3rd June, 2021, at 10:00 a.m. in Green Room, Osquars backe 31, Södra tornet, plan 4, Stocklholm.

© Yong Wang ISBN: 978-91-7873-895-3TRITA-ITM-AVL 2021:26 Printed by: Universitetsservice US-AB, Sweden 2021

To my beloved family
送给我挚爱的家人

I
Abstract
Ferroalloys have become increasingly important due to their indispensable role in
steelmaking. As the performance requirements of steel materials increase, it is necessary to
have a better understanding of the impact of impurities in ferroalloys on the steel cleanliness.
The quality of the ferroalloy will directly affect the quality of the steel. This is especially
important when ferroalloys are added during the late stage of the ladle metallurgy process.
The goal of the present work is to gain knowledge about various ferroalloy impurities added
in the steel production process and to study the influence of ferroalloy impurities on
inclusions in the steel. The research work is divided into four main parts. `
In the first part, previous works on impurities present in different ferroalloys as well as
how these impurities can influence the steel cleanliness have been reviewed. The applications
of different ferroalloys and their production trends were discussed. The possible harmful
inclusions in different ferroalloys were identified. The results showed that: 1) MnO, MnS
and MnO-SiO2-MnS inclusions from FeMn and SiMn alloys have a temporary influence on
the steel quality; 2) The effect of trace elements, such as Al, Ca contents, should be
considered before the addition of FeSi alloys to steel. Also, Al2O3 inclusions and relatively
high Al contents are commonly found in FeTi, FeNb and FeV alloys due to their production
process. This information should be paid more attention to when these ferroalloys are added
to steel; and 3) specific alloys containing REM oxides, Cr(C,N), Cr-Mn-O, Al2O3, Al-Ti-O,
TiS and Ti(C,N) have not been studied enough to enable a judgement on their influence on
the steel cleanliness. Moreover, the effect of large size SiO2 inclusions in FeSi and FeMo
alloys on the steel cleanliness is not fully understood.
In the second part, the impurity assessment of 10 different ferroalloys (FeSi, FeCr, FeMo,
FeV, FeTi, FeNb, FeW, FeB, MnN, FeCrN) was carried out by using various characterization
techniques. The inclusions obtained in these ferroalloys were mostly silica or alumina; and
or the oxides of the base elements. Also, the main elemental impurities and inclusions were
closely related to their manufacturing route. The advantages and disadvantages of different
methods were compared, and the detection technology of ferroalloy inclusions was optimized.
The results showed that the traditional two-dimensional method on a polished surface can
not always be applied for the investigation of inclusions in some specific ferroalloys.
Moreover, the investigations of inclusions on metal surface after electrolytic extraction
showed a big potential to use to detect larger sized inclusions. The results on both the film
filter and metal surface should be grouped together to obtain more comprehensive
information on the inclusion characteristics. Among these ferroalloys, FeCr and FeNb were
found to be relatively less studied ferroalloys. Thus, they were selected for further studies.
In the third part, the early melting behaviours of FeNb, HCFeCr and LCFeCr alloys
during additions in liquid iron was studied. The experiments were carried out by using the
"liquid metal suction" technique. Here, the ferroalloy was contacted with liquid iron for a
predetermined time and then quenched. The obtained samples were further studied to
determine the microstructure and the formation of inclusions. It was found that the mutual
diffusion between solid ferroalloy and liquid iron formed a reaction zone. Also, the initial
dissolution mechanism of FeNbs alloy in liquid iron was proposed, and the mechanism was
II
controlled by diffusion. The TiOx inclusions in FeNb alloy will partially or completely be
reduced due to a reaction with Nb in the reaction zone. The original stable inclusions, such
as Al2O3 in FeNb alloys and MnCr2O4 inclusions in LCFeCr alloys can move in this zone
and keep their original forms without experiencing any changes. Under the same conditions,
the melting speed of LCFeCr alloy is faster than that of HCFeCr alloy. The addition of FeNb
and FeCr alloys in steel certainly introduces inclusions to steel.
In the fourth part, the influence of the addition of LCFeCr alloys on the inclusions in Ti-
containing ferritic stainless steel was studied on a laboratory scale. It was found that the
MnCr2O4 inclusions in the LCFeCr alloy would react with TiN and dissolved Ti in the Ti-
containing steel to form TiOx-Cr2O3 system inclusions. In addition, the removal effect of slag
on such inclusions was also studied. The results found that the slag addition can modify the
TiOx-rich inclusions, but that the Ti content in the steel was significantly reduced. Therefore,
a proper amount of TiO2 content should be added into the slag to get a low Ti loss in the steel
melt, which should be studied further. Therefore, the composition of the steel directly affects
the behaviour of the inclusions from ferroalloys in steel.
Key words: ferroalloys, electrolytic extraction, metal surface, non-metallic inclusions, steel
cleanliness, computational thermodynamics.
III
Sammanfattning
Ferrolegeringar har blivit allt viktigare på grund av deras oumbärliga roll i
ståltillverkning. När prestandakraven för stålmaterial ökar är det nödvändigt att ha en större
förståelse för effekterna av föroreningar i ferrolegeringar på stålets renhet. Ferrolegeringens
kvalitet kommer att direkt påverka stålets kvalitet. Detta är särskilt viktigt när ferrolegeringar
tillsätts i slutet av skänkmetallurgiprocessen. Målet med det här arbetet är att få kunskap om
olika orenheter i ferrolegeringar som tillsätts i stålproduktionsprocessen och att studera hur
orenheter i ferrolegeringar påverkar inneslutningar i stålet. Arbetet är indelat i fyra delar.
I den första delen har tidigare forskning om orenheter som finns i olika järnlegeringar
samt hur dessa orenheter kan påverka stålets renhet granskats. Tillämpningarna av olika
ferrolegeringar och trender i deras produktion diskuterades. De möjliga skadliga
inneslutningarna i olika ferrolegeringar identifierades. Resultaten visade att: 1) MnO-, MnS-
och MnO-SiO2-MnS-inneslutningar från FeMn- och SiMn-legeringar har en tillfällig
inverkan på stålkvaliteten; 2) Effekten av spårämnen, såsom Al, Ca-innehåll, bör tas hänsyn
till innan FeSi-legeringar tillsätts. Dessutom förekommer Al2O3-inneslutningar med ett
relativt högt Al-innehåll vanligen i FeTi, FeNb och FeV-legeringar på grund av deras
produktionsprocesser. Denna information bör utnyttjas i högre grad åt när dessa
ferrolegeringar tillsätts till stål; och 3) specifika legeringar innehållande REM-oxider,
Cr(C,N), Cr-Mn-O, Al2O3, Al-Ti-O, TiS och Ti(C,N) har inte studerats tillräckligt för att
deras inflytande på stålets renhet ska kunna bedömas. Effekten av stora SiO2-inneslutningar
i FeSi och FeMo-legeringar på stålets renhet är inte helt klarlagd.
I den andra delen utfördes bedömningar av förekomsten av föroreningar i 10 olika
ferrolegeringar (FeSi, FeCr, FeMo, FeV, FeTi, FeNb, FeW, FeB, MnN, FeCrN) med hjälp
av olika karakteriseringstekniker. Inneslutningarna i dessa ferrolegeringar bestod mestadels
av kiseldioxid eller aluminiumoxid; och/eller oxider av basämnena. Dessutom konstaterades
att, de största ämnesföroreningarna och inneslutningarna var nära relaterade till
tillverkningsvägen. Fördelarna och nackdelarna med olika metoder jämfördes och
detekteringstekniken för inneslutningar av ferrolegeringar optimerades. Resultaten visade att
den traditionella tvådimensionella metoden på en polerad yta inte alltid kan tillämpas för
undersökning av inneslutningar i vissa specifika ferrolegeringar. Vidare visade sig
undersökningarna av inneslutningar på metallytan efter elektrolytisk extraktion vara
fördelaktiga för upptäckt av större inneslutningar. Resultaten på både filmfiltret och
metallytan bör grupperas för att erhålla en mer omfattande information om inneslutningarnas
egenskaper. Bland dessa ferrolegeringar så konstaterades att FeCr och FeNb vara studerade
i relativt mindre omfattning. Således, de valdes för vidare studier.
I den tredje delen studerades det tidiga smältbeteendet av FeNb-, HCFeCr- och LCFeCr
legeringar vid tillsats i flytande järn. Experimenten utfördes med hjälp av "flytande
metallsugningstekniken", i vilken ferrolegeringen sattes i kontakt med flytande järn under en
bestämd tid innan provet släcktes. Därefter undersöktes mikrostrukturen och bildandet av
inneslutningar i de erhållna proverna. Resultaten visade att den inbördes diffusionen mellan
en fast ferrolegering och flytande järn bildade en reaktionszon. Den ursprungliga
upplösningsmekanismen för en FeNb-legering i flytande järn föreslogs och det konstaterades
IV
att mekanismen styrdes genom diffusion. TiOx-inneslutningarna i FeNb-legering reduceras
delvis eller fullständigt genom att reagera med Nb i reaktionszonen. De ursprungliga stabila
inneslutningarna, såsom Al2O3 i FeNb-legeringar och MnCr2O4-inneslutningar i LCFeCr-
legeringar, kan röra sig i denna zon och behålla sina ursprungliga former att utan förändras.
Under samma förhållanden är smältningshastigheten för LCFeCr-legeringen snabbare än för
HCFeCr-legeringen. Tillsatsen av FeNb och FeCr-legeringar i stål introducerar med
säkerthet inneslutningar i stål.
I den fjärde delen studerades inverkan av tillsatser av LCFeCr-legeringar på
inneslutningarna i Ti-innehållande ferritiska rostfritt stål i laboratorieskala. Det visade sig att
MnCr2O4-inneslutningarna i LCFeCr-legeringen kan reagera med TiN och upplöst Ti i Ti-
innehållande stål under bildandetav inneslutningar i TiOx-Cr2O3-systemet. Dessutom
studerades hur slagg avlägsnar sådana inneslutningar. Resultaten visar att en tillsats av slagg
kan modifiera de TiOx-rika inneslutningarna, men att Ti-halten i stålet minskade märkbart.
Därför bör en lämplig mängd TiO2 tillsättas i slaggen för att få en låg Ti-förlust i stålsmältan,
vilket bör studeras vidare. Därmed påverkar stålets sammansättning direkt beteendet hos
inneslutningarna från ferrolegeringar i stål.
Nyckelord: ferrolegering, elektrolytisk extraktion, metallyta, icke-metalliska inneslutningar,
stålrenhet, beräkningstermodynamik.
V
Acknowledgements
First of all, I would like to express my deepest acknowledge to my two greatest supervisors
Docent Andrey Karasev and Professor Pär Jönsson, for your valuable guidance and endless
support during my whole study period. Moreover, your scientific discussion, professional
knowledge, positive and optimistic attitude, endless support are very helpful for me during
my study and growth at KTH. You have helped me a lot on how to carry out research and
make scientific and professional expressions when facing problems. Thank you so much for
the time spent on me sharing knowledge about research as well as life. I appreciate the warm
care and encouragement from you which benefit greatly on my life. Thanks for providing
such a graceful chance to me to work in your group and I have truly learned a lot from you.
Special thanks to Professor Joo Hyun Park at the Department of Materials Science and
Chemical Engineering, Hanyang University for your innovative ideas, patient guidance,
experiment support, helpful and delightful discussions. Your rigorous academic attitude and
approachable personality will become my inexhaustible wealth. Thank you very much for
taking care of me when I was in Korea. I would also give my thanks to members in the HITP2
lab at Hanyang University for helping me with my experiment works and made me feel
welcome in Korea.
I would like to thank Dr. Wangzhong Mu for giving me lots of valuable advance and
motivational discussions for my work whenever my research got stuck. I appreciate Associate
Professor Anders Tilliander for helping me with the ferroalloy samples from companies. I
also would like to thank Wenli Long, who has helped me a lot with the technical problem at
the KTH lab.
Thanks to all my dedicated colleagues in the unit of process at the MSE Department. I had a
lot of fun in the sport time to play “Innebandy” each Thursday afternoon and table tennis. I
cherish the unforgettable experience and happy time we spent together throughout the whole
PhD period. Thanks to all my friends in Stockholm, there are many good memories with you
all. With your company, the dark winter in Stockholm becomes much brighter.
I would like to acknowledge China Scholarship Council (CSC) for the financial support for
my study at KTH. Jernkontoret and Walfrid Pettersons Minnesfond are also acknowledged
for the financial support of my study in Korea and my attendance at the conference.
Finally, I would like to express my greatest gratitude to my parents for their endless support.
Last but not least, without the constant love and support from my wife Kun Bai, my study
would be impossible to accomplish. Nothing can be compared with them in the world.
Yong Wang
Stockholm, April, 2021
VI
Supplements
The present thesis is based on the following supplements:
Supplement I: Non-metallic Inclusions in Different Ferroalloys and their Effect on the Steel
Quality-A Review
Yong Wang, Andrey Karasev, Joo Hyun Park and Pär G. Jönsson, under
review in Metallurgical and Materials Transaction B, 2021.
Supplement II: An Investigation of Non-Metallic Inclusions in Different Ferroalloys using
Electrolytic Extraction
Yong Wang, Andrey Karasev and Pär G. Jönsson, Metals, 2019, 9(6), 687.
Supplement III: Characterization of Non-metallic Inclusions in Different Ferroalloys used
in the Steelmaking Process
Yong Wang, Andrey Karasev and Pär G. Jönsson, under review in Steel
Research International, 2021.
Supplement IV: Comparison of Non-metallic Inclusion Characteristics in Metal Samples
Using 2D and 3D Methods
Yong Wang, Andrey Karasev and Pär G. Jönsson, Steel Research
International, 2020, 1900669.
Supplement Ⅴ: Interfacial Reactions and Inclusion Formations at an Early Stage of FeNb
Alloy Additions to Molten Iron
Yong Wang, Andrey Karasev, Joo Hyun Park and Pär G. Jönsson, ISIJ
International, 2021, 61(1), 209-218.
Supplement Ⅵ: Interfacial Phenomena and Inclusion Formation Behavior at Early Melting
Stages of HCFeCr and LCFeCr Alloys in Liquid Iron
Yong Wang, Andrey Karasev, Joo Hyun Park, Wangzhong Mu and Pär G.
Jönsson, accepted in Metallurgical and Materials Transaction B, 2021.
Supplement Ⅶ: Effect of LCFeCr Alloy Additions on the Non-metallic Inclusion
Characteristics in Ti-containing Ferritic Stainless Steel
Yong Wang, Min Kyo Oh, Tea-Sung Kim, Andrey Karasev, Wangzhong
Mu, Joo Hyun Park and Pär G. Jönsson, under review in Metallurgical
and Materials Transaction B, 2021.
VII
Supplement Ⅷ: Evolution of the Non-Metallic Inclusions Influenced by Slag-Metal
Reactions in Ti-containing Ferritic Stainless Steel
Yong Wang, Jin Hyung Cho, Tae-Su Jeong, Andrey Karasev,
Wangzhong Mu, Joo Hyun Park and Pär G. Jönsson, under review in
Metallurgical and Materials Transaction B, 2021.
The contributions by the author to the supplements of this thesis:
Supplement I. Literature survey, major part of writing.
Supplement II-Ⅷ. Literature survey, experimental work, observations and analyses,
thermodynamic calculations and major part of writing.
Part of the work presented at the conferences:
[1] Yong Wang, Andrey Karasev, Pär G. Jönsson. Evaluation of inclusions in ferroalloys
using electrolytic extraction. EOSC 2018–8th European Oxygen Steelmaking Conference,
Taranto, Italy, October 10-12, 2018.
[2] Yong Wang, Andrey Karasev, Pär G. Jönsson. Assessment of Non-metallic Inclusions
in Different Ferroalloys and Their Influence on the Steel Cleanliness. The 11th International
Conference on Molten Slags, Fluxes and Salts, Seoul, Korea, February 21-25, 2021.
VIII
Contents
Abstract .................................................................................................................................. Ⅰ
Sammanfattning ................................................................................................................. Ⅲ
Acknowledgements .............................................................................................................. Ⅴ
Supplements ....................................................................................................................... Ⅵ
Chapter 1. Introduction ....................................................................................................... 1
1.1 Background ................................................................................................................... 1
1.2 Inclusions in Ferroalloys ............................................................................................... 2
1.3 Early Melting Stage of FeNb and FeCr Alloys Additions to Molten Iron .................... 5
1.4 Effect of FeCr Alloy Additions on the Inclusions in Stainless Steel ............................ 7
1.5 Objectives and Overview of the Work .......................................................................... 8
Chapter 2. Methodology ..................................................................................................... 11
2.1 Preparation of the Samples .......................................................................................... 11
2.2 Analysis and Characterization ..................................................................................... 13
Chapter 3. Results and Discussions ................................................................................... 15
3.1 Inclusion Characteristics in Different Ferroalloys ...................................................... 15
3.1.1 Inclusions in FeSi alloys ....................................................................................... 15
3.1.2 Inclusions in FeCr alloys ...................................................................................... 16
3.1.3 Inclusions in FeMo alloys .................................................................................... 17
3.1.4 Inclusions in FeV alloys ....................................................................................... 19
3.1.5 Inclusions in FeTi alloys....................................................................................... 20
3.1.6 Inclusions in FeNb alloys ..................................................................................... 21
3.1.7 Inclusions in FeW alloys ...................................................................................... 22
3.1.8 Inclusions in FeB alloys ....................................................................................... 23
3.1.9 Inclusions in MnN and FeCrN alloys ................................................................... 24
3.2 Comparison of Inclusion Characteristics in Metal Samples Using 2D and 3D Methods
........................................................................................................................................... 26
3.2.1 Investigation of inclusion morphology ................................................................. 26
3.2.2 Determination of inclusion compositions ............................................................. 28
3.2.3 Determination of inclusion sizes and numbers ..................................................... 29
3.2.4 Geometrical consideration of inclusions by using the 2D and EE methods ......... 32
3.3 Interfacial Reactions and Inclusion Formations at an Early Stage of FeNb Alloy
Additions to Molten Iron ................................................................................................... 36
IX
3.3.1 Overview of the dissolution phenomenon of FeNb alloy ..................................... 36
3.3.2 Inclusions in the diffusion zone ............................................................................ 38
3.3.3 Mechanism of the inclusion transformation ......................................................... 39
3.4 Interfacial Phenomena and Inclusion Formation Behavior at Early Melting Stages of
HCFeCr and LCFeCr Alloys in Liquid Iron ..................................................................... 41
3.4.1 Overview of the dissolution phenomenon of HCFeCr and LCFeCr alloys .......... 41
3.4.2 Fe-HCFeCr interactions ........................................................................................ 42
3.4.3 Fe-LCFeCr interactions ........................................................................................ 44
3.4.4 Dissolution mechanism of FeCr alloys ................................................................. 45
3.5 Effect of FeCr Alloys and Slag Additions on the Inclusions in 430 Stainless Steel ... 46
3.5.1 Composition changes of steel and slag samples after FeCr alloy and slag
additions ........................................................................................................................ 46
3.5.2 Inclusion characteristics in the steel melt after FeCr and slag additions .............. 47
3.5.3 Evolution mechanism of the inclusions in steel ................................................... 52
Chapter 4. Concluding Discussion .................................................................................... 55
Chapter 5. Conclusions ....................................................................................................... 57
Chapter 6. Sustainability and Recommendations for Future Work .............................. 60
6.1 Sustainability Considerations ...................................................................................... 60
6.2 Recommendations for Future Work ............................................................................ 60
References ................................................................................................................... 62

X
1
Chapter 1. Introduction
1.1 Background
The demand for high-quality steel is consistently on the rise. This result in increasing
requirements on the material properties of the steel. For steelmakers, it has been challenging to
make the steelmaking process more efficient and environmentally friendly without
compromising the quality and the productivity of steel. To obtain a satisfactory cleanliness of
steel, it is necessary to control and improve a wide range of operating practices throughout the
steelmaking processes such as deoxidant and alloy additions, secondary metallurgy treatments,
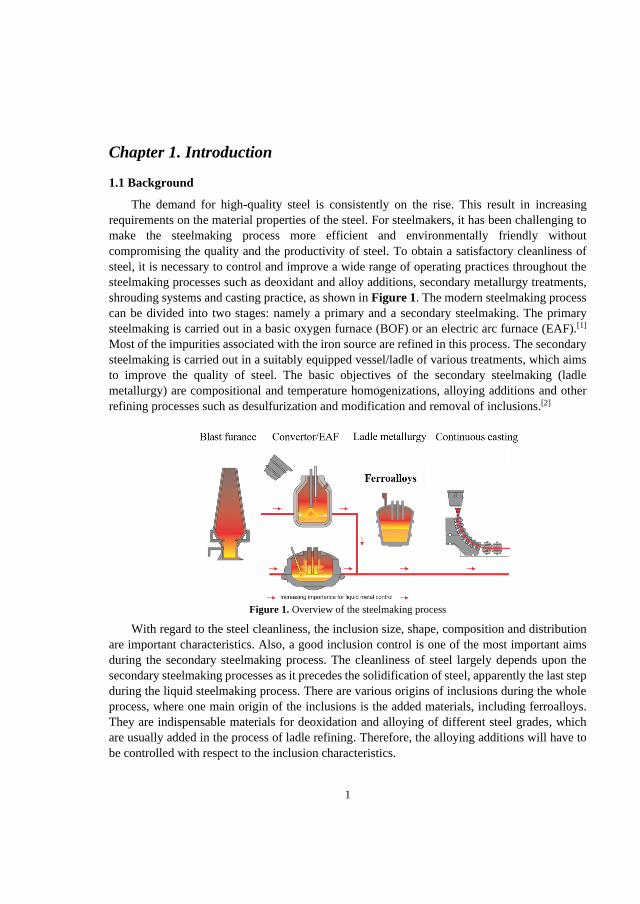
shrouding systems and casting practice, as shown in Figure 1. The modern steelmaking process
can be divided into two stages: namely a primary and a secondary steelmaking. The primary
steelmaking is carried out in a basic oxygen furnace (BOF) or an electric arc furnace (EAF).[1]
Most of the impurities associated with the iron source are refined in this process. The secondary
steelmaking is carried out in a suitably equipped vessel/ladle of various treatments, which aims
to improve the quality of steel. The basic objectives of the secondary steelmaking (ladle
metallurgy) are compositional and temperature homogenizations, alloying additions and other
refining processes such as desulfurization and modification and removal of inclusions.[2]
Figure 1. Overview of the steelmaking process
With regard to the steel cleanliness, the inclusion size, shape, composition and distribution
are important characteristics. Also, a good inclusion control is one of the most important aims
during the secondary steelmaking process. The cleanliness of steel largely depends upon the
secondary steelmaking processes as it precedes the solidification of steel, apparently the last step
during the liquid steelmaking process. There are various origins of inclusions during the whole
process, where one main origin of the inclusions is the added materials, including ferroalloys.
They are indispensable materials for deoxidation and alloying of different steel grades, which
are usually added in the process of ladle refining. Therefore, the alloying additions will have to
be controlled with respect to the inclusion characteristics.
2
Regarding the ferroalloy production processes, it is known[3] that impurities such as Ca, S,
Al, and O are inevitable in ferroalloys. As a result, these impurities can form new endogenous
inclusions as a result of chemical reactions between elements in the ferroalloys and the liquid
steels. Furthermore, it is possible that the existing inclusions present in ferroalloys, which are
not removed during secondary steelmaking, can be inherited to the final steel products. This is
especially important in those cases when ferroalloys are added late in the ladle metallurgy
process, where there is not enough time to remove the additional inclusions that are added to the
steel.[4] Another important development of new ferroalloy qualities is the high purity ferroalloys
that are used for late additions in the tundish or mold or the ingot during casting.[4] In this case,
high-purity ferroalloys need to meet the composition requirements without increasing the
refining time. Based on these hypotheses, the role of ferroalloy impurities on steel cleanliness is
studied in the present research work.
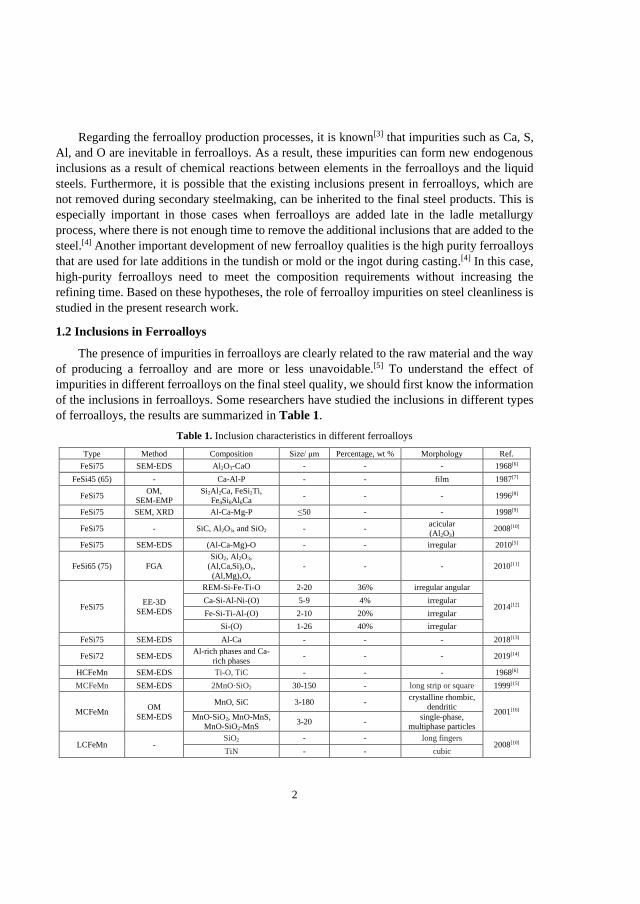
1.2 Inclusions in Ferroalloys
The presence of impurities in ferroalloys are clearly related to the raw material and the way
of producing a ferroalloy and are more or less unavoidable.[5] To understand the effect of
impurities in different ferroalloys on the final steel quality, we should first know the information
of the inclusions in ferroalloys. Some researchers have studied the inclusions in different types
of ferroalloys, the results are summarized in Table 1.
Table 1. Inclusion characteristics in different ferroalloys
Type Method Composition Size/ μm Percentage, wt % Morphology Ref.
FeSi75 SEM-EDS Al2O3-CaO - - - 1968[6]
FeSi45 (65) - Ca-Al-P - - film 1987[7]
FeSi75 OM,
SEM-EMP Si2Al2Ca, FeSi2Ti,
Fe4Si8Al6Ca - - - 1996[8]
FeSi75 SEM, XRD Al-Ca-Mg-P ≤50 - - 1998[9]
FeSi75 - SiC, Al2O3, and SiO2 - - acicular (Al2O3)
2008[10]
FeSi75 SEM-EDS (Al-Ca-Mg)-O - - irregular 2010[5]
FeSi65 (75) FGA
SiO2, Al2O3,
(Al,Ca,Si)xOy,
(Al,Mg)xOy
- - - 2010[11]
FeSi75 EE-3D
SEM-EDS
REM-Si-Fe-Ti-O 2-20 36% irregular angular
2014[12] Ca-Si-Al-Ni-(O) 5-9 4% irregular
Fe-Si-Ti-Al-(O) 2-10 20% irregular
Si-(O) 1-26 40% irregular
FeSi75 SEM-EDS Al-Ca - - - 2018[13]
FeSi72 SEM-EDS Al-rich phases and Ca-
rich phases - - - 2019[14]
HCFeMn SEM-EDS Ti-O, TiC - - - 1968[6]
MCFeMn SEM-EDS 2MnO·SiO2 30-150 - long strip or square 1999[15]
MCFeMn OM
SEM-EDS
MnO, SiC 3-180 - crystalline rhombic,
dendritic 2001[16]
MnO-SiO2, MnO-MnS, MnO-SiO2-MnS
3-20 - single-phase,
multiphase particles
LCFeMn - SiO2 - - long fingers
2008[10] TiN - - cubic
3
HCFeMn
LCFeMn
AC-3D
SEM-EDS
C - 0.3-0.5% (weight)
powder
2010[5] C, Si/SiO2, MnO-SiO2-
MnS -
0.2-0.25%
(weight) powder
FeMn OM TiS-MnS, TiS-MnS-TiC,
TiS-TiC,
Ti(C, N)
1-8 - crystalline, dendritic,
and irregular 2010[17]
MCFeMn EE-3D,
SEM-EDS Mn-Si-S-O 30-150 - irregular 2014[18]
SiMn SEM-EDS Mn5Si3, Mn3Si-Mn
eutectic, TiC - - - 1968[6]
SiMn EE-3D
SEM-EDS
REM-Si-Mn-O 1-26 56% clusters
2014[12]
Al-O 2-5 2% irregular
Si-Ca-Mg-O 6-12 6% irregular
Si-Mn-O 1-8 8% spherical
Mn-Si-Fe-O 3-16 28% ellipsoid
FeTi35 SEM-EDS Al2O3, TiN,
Al4TiO8 ≤20 - - 2009[19]
FeTi35 SEM-EDS TiOx - - irregular
2013[20] Al2O3 10-90 - irregular
FeTi70 SEM-EDS
Ca-(Ti-Si)-O 20-130 3.71/cm-2 irregular
2016[21] Ca-Ti-Si-O 60-260 5.88/cm-2 irregular
Si-Ca-Ti-O 40-100 3.28/cm-2 irregular
FeTi70 SEM-EDS Al-O, Al-Ti-O, Ca-Al-O - - - 2013[20]
FeTi70 AC-3D
SEM-EDS
Si/SiO2, Al-Ti-O, Fe-Al-Ti-O
1-20 1-1.5% (weight) faceted 2010[5]
FeTi35 Si/SiO2, Al-Ti-O 1-50 9-9.5% (weight) irregular
FeTi70 SEM-EDS α-Al2O3,
Fe-Ti-Al2O3 - - - 2011[22]
FeTi70 EE-3D
SEM-EDS
Ti-Fe 6-25 9% faceted
2014[12] Ti-Fe 1-8 75% flower-like
Ti-(Fe-Al-O) 3-15 10% cluster
REM-Si-Cr-Al-O 1-21 6% cluster
LC FeCr (65) SEM-EDS CaSi, Cr-Si-O, Cr-Mn-Si-O
3-100 - spherical 1978[23]
HC FeCr (65) SEM-EDS (CrMnFeTi)S,
Cr5S6, 4-40 - polygonal 1998[24]
HC&LP FeCr (65)
SEM-EDS (Cr, Ti) (C, N),
MnS, Al2O3 2-60 - polygonal 2003[25]
FeCr - chromiumspinel, Cr-O,
silicate - - dendrites 2008[10]
FeCr SEM-EDS FeO⋅(Cr, Al)2O3,CrS,
(Cr, Mn)S, CrO-SiO2 - - - 2011[22]
LCFeCr EE-3D
SEM-EDS
Si-Cr-Mn-O-N 2-16
34% spherical
2014[26]
4-36 rod-like
Cr-Fe-O 6-30 6.5% faceted
Cr-Fe-Mn-O-N 3-77 50% dendrites
20-50 2% irregular
Cr-Si-Fe-Mn-O 8-45 7.5% irregular
HCFeCr EE-3D
SEM-EDS
Cr-Mn-S-O
2-5
57%
globular
4-10 rod-like
6-14 irregular
Cr-C-N 2-14 10% irregular
Si-Al-Ca-Mg-O 3-28 7% irregular
Ca-O-P 2-26 26% clusters
4
FeMo - MgAl2O4, CaMo2O4,
SiO2 - - - 2008[10]
FeMo AC-3D
SEM-EDS Si/SiO2, Al2O3 10-50
0.5-0.9%
(weight)
spherical,
irregular 2010[5]
FeMo SEM-EDS Si-Al-O, Ca-Si-Al-O - - - 2011[22]
FeNb EE-3D
SEM-EDS
Al-O 2-12 20% irregular
2014[12] 5-27 4% clusters
Ti-Nb-S-O 1-14 17% irregular
Nb-Ti-O 2-21 59% irregular
FeV SEM-EDS carbides V4C3 - - - 2008[10]
FeP AC-3D
SEM-EDS (Fe, P, Mn, Ti)O 10–80
0.30–0.4%
(weight) angular 2010[5]
HC, high carbon; LC, low carbon; MC, medium carbon; SEM, scanning electron microscope; EDS, energy dispersive
spectroscopy; OM, optical microscope; FGA, fractional gas analysis; EMP, electron microprobe; XRD, X-ray diffraction; EE,
electrolytic extraction; MS-EE, metal surface after electrolytic extraction; AC, acid chemical extraction; 2D, two-dimensional,
3D, three-dimensional
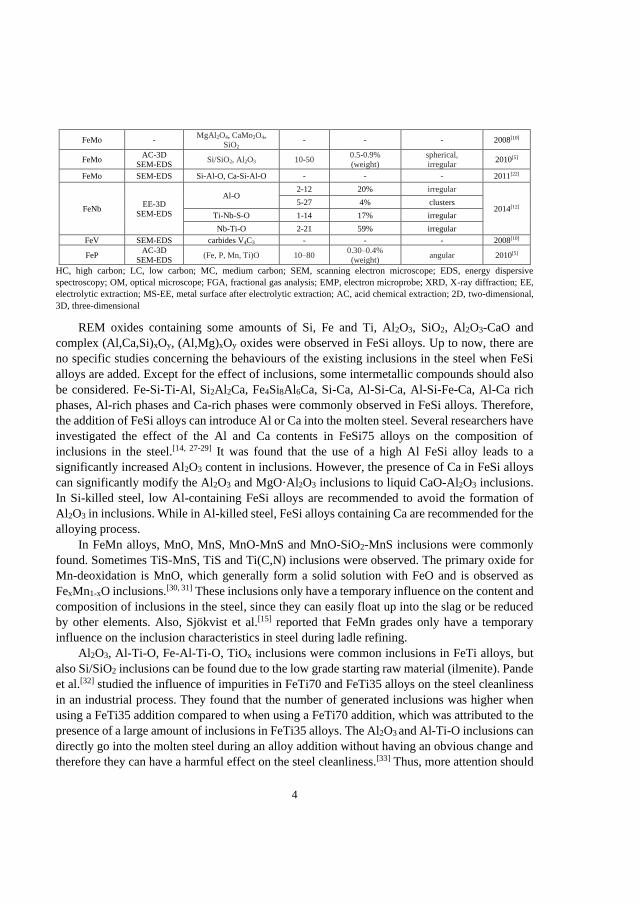
REM oxides containing some amounts of Si, Fe and Ti, Al2O3, SiO2, Al2O3-CaO and
complex (Al,Ca,Si)xOy, (Al,Mg)xOy oxides were observed in FeSi alloys. Up to now, there are
no specific studies concerning the behaviours of the existing inclusions in the steel when FeSi
alloys are added. Except for the effect of inclusions, some intermetallic compounds should also
be considered. Fe-Si-Ti-Al, Si2Al2Ca, Fe4Si8Al6Ca, Si-Ca, Al-Si-Ca, Al-Si-Fe-Ca, Al-Ca rich
phases, Al-rich phases and Ca-rich phases were commonly observed in FeSi alloys. Therefore,
the addition of FeSi alloys can introduce Al or Ca into the molten steel. Several researchers have
investigated the effect of the Al and Ca contents in FeSi75 alloys on the composition of
inclusions in the steel.[14, 27-29] It was found that the use of a high Al FeSi alloy leads to a
significantly increased Al2O3 content in inclusions. However, the presence of Ca in FeSi alloys
can significantly modify the Al2O3 and MgO·Al2O3 inclusions to liquid CaO-Al2O3 inclusions.
In Si-killed steel, low Al-containing FeSi alloys are recommended to avoid the formation of
Al2O3 in inclusions. While in Al-killed steel, FeSi alloys containing Ca are recommended for the
alloying process.
In FeMn alloys, MnO, MnS, MnO-MnS and MnO-SiO2-MnS inclusions were commonly
found. Sometimes TiS-MnS, TiS and Ti(C,N) inclusions were observed. The primary oxide for
Mn-deoxidation is MnO, which generally form a solid solution with FeO and is observed as
FexMn1-xO inclusions.[30, 31] These inclusions only have a temporary influence on the content and
composition of inclusions in the steel, since they can easily float up into the slag or be reduced
by other elements. Also, Sjökvist et al.[15] reported that FeMn grades only have a temporary
influence on the inclusion characteristics in steel during ladle refining.
Al2O3, Al-Ti-O, Fe-Al-Ti-O, TiOx inclusions were common inclusions in FeTi alloys, but
also Si/SiO2 inclusions can be found due to the low grade starting raw material (ilmenite). Pande
et al.[32] studied the influence of impurities in FeTi70 and FeTi35 alloys on the steel cleanliness
in an industrial process. They found that the number of generated inclusions was higher when
using a FeTi35 addition compared to when using a FeTi70 addition, which was attributed to the
presence of a large amount of inclusions in FeTi35 alloys. The Al2O3 and Al-Ti-O inclusions can
directly go into the molten steel during an alloy addition without having an obvious change and
therefore they can have a harmful effect on the steel cleanliness.[33] Thus, more attention should
5
be paid to the cleanliness of FeTi alloys and additional adjustments can be made if we clearly
know the quality of FeTi alloys.
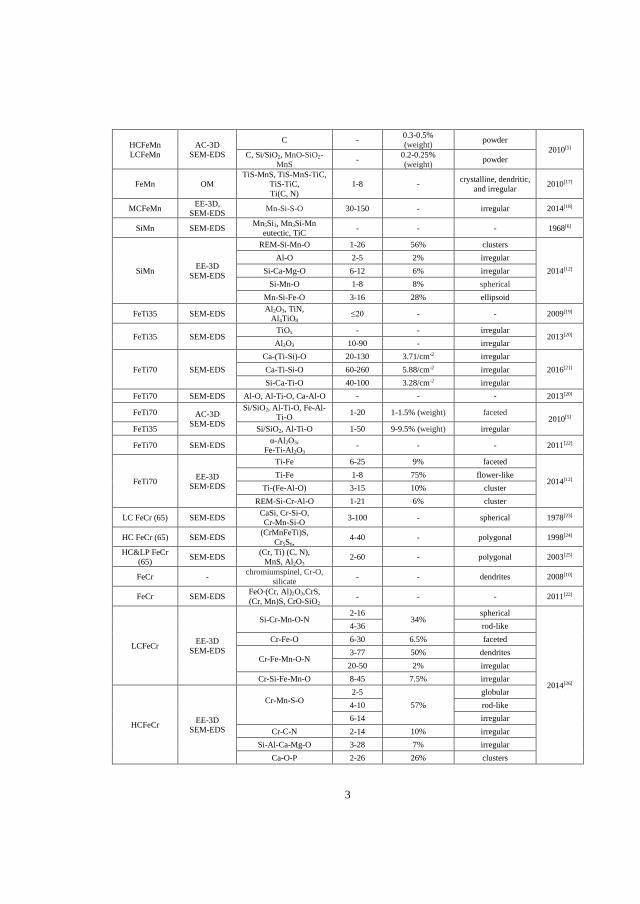
Si-Cr-Mn-O, Cr-O, Cr-Si-O, Si-Al-Ca-Mg-O and Ca-O-P inclusions were found in LCFeCr
alloys. (Cr,Ti)(C,N), Cr(C,N), CrS, MnCr2S3, MnS, Al2O3 inclusions were usually observed in
HCFeCr alloys. Sjökvist et al.[25] studied the effect of adding HCFeCr alloys on the inclusion
characteristics in steels. They reported that MnS and (Cr,Ti)(C, N) inclusions from FeCr alloys
were dissolved together with the alloys. It should be pointed out that the impurities in HCFeCr
alloys might have enough time to be removed from the steel since HCFeCr alloys are generally
added in the EAF process and/or at a very early stage of the refining process. Compared to the
HCFeCr alloys, LCFeCr alloys are added into the furnace during the very last stage of refining
to fine-tune the chemical composition of specific steel grades. Thus, more attention should be
paid to the purity of these alloys. In addition, the presence of inclusions in SiMn, FeMo, FeNb,
FeV and FeP alloys have also been studied.
The majority of studies have been done by using two dimensional (2D) investigations, which
usually can not reflect the whole information of the inclusion characteristics. Then, Pande et al.[5,
34] started to apply the acid extraction method to investigate the inclusions in three dimensions
(3D). It should be mentioned that the acid extraction is not suitable to use for a FeSi alloy due to
that Si is not directly soluble in acids. Later Bi et al.[35] applied the electrolytic extraction method
in the investigation of inclusions in different ferroalloys. They found that this method was more
suitable to use than the acid extraction method since some impurities might dissolve during the
acid extraction. Therefore, the electrolytic extraction method was selected for the investigation
of inclusions in the present study. In addition, the inclusions on the metal surfaces after extraction
were also investigated. To get fully information of the cleanliness of ferroalloys, inclusions in a
variety of ferroalloys were investigated and compared to previous results.
1.3 Early Melting Stage of FeNb and FeCr Alloys Additions to Molten Iron
Alloying elements are usually added into the steel in the form of ferroalloys. In most cases,
the ferroalloys are typically added to steel during the tapping operations or ladle treatments,
aiming to take advantage of favourable hydrodynamic and thermal conditions for their rapid
melting and dispersion into the melt. This is particularly the case of a cold solid alloy that is
brought into contact with a hot liquid metal, which results in a solid melting and complex
interactions at the mutual interface. In general, the dissolution or melting process of ferroalloys
in liquid steel is revealed to be of great complexity, since it is a dynamic process consisting of
mechanical, heat and mass transfer, and chemical phenomena containing phase transformations
and complex multiphase interactions between solid, liquid, and gaseous phases.[36, 37] Several
parameters such as the superheat of the steel melt, addition method and location and physical
properties of the ferroalloys (melting point, density, thermal conductivity, etc.) can affect these
processes.[38-42]
In recent years, there has been a growing interest concerning the kinetics and mechanism of
alloy melting and dissolution in liquid metals.[20, 21, 43-47] Pande et al.[20] studied the dissolution
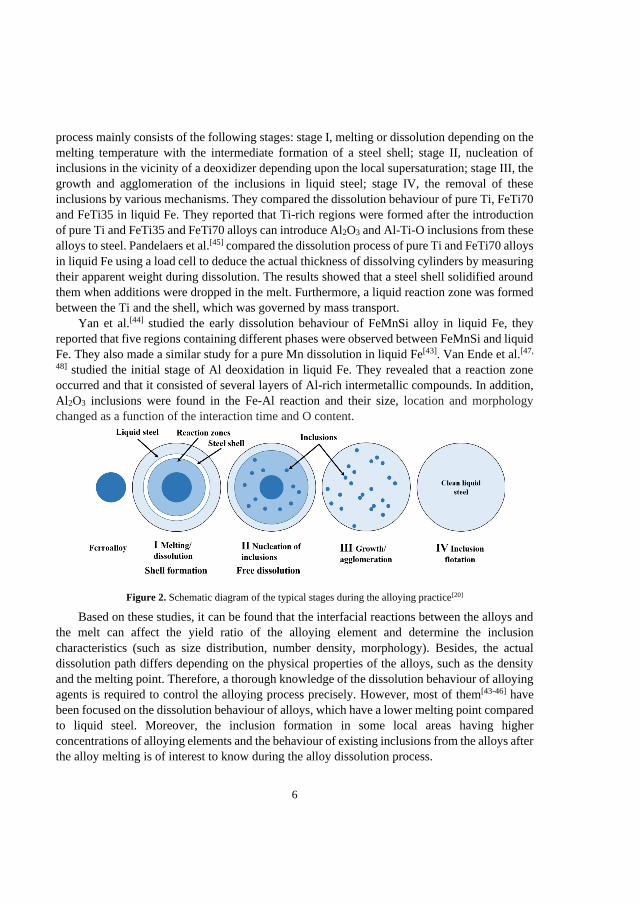
behaviour of FeTi alloy in the melt, which is schematically shown in Figure 2. The dissolution
6
process mainly consists of the following stages: stage I, melting or dissolution depending on the
melting temperature with the intermediate formation of a steel shell; stage II, nucleation of
inclusions in the vicinity of a deoxidizer depending upon the local supersaturation; stage III, the
growth and agglomeration of the inclusions in liquid steel; stage IV, the removal of these
inclusions by various mechanisms. They compared the dissolution behaviour of pure Ti, FeTi70
and FeTi35 in liquid Fe. They reported that Ti-rich regions were formed after the introduction
of pure Ti and FeTi35 and FeTi70 alloys can introduce Al2O3 and Al-Ti-O inclusions from these
alloys to steel. Pandelaers et al.[45] compared the dissolution process of pure Ti and FeTi70 alloys
in liquid Fe using a load cell to deduce the actual thickness of dissolving cylinders by measuring
their apparent weight during dissolution. The results showed that a steel shell solidified around
them when additions were dropped in the melt. Furthermore, a liquid reaction zone was formed
between the Ti and the shell, which was governed by mass transport.
Yan et al.[44] studied the early dissolution behaviour of FeMnSi alloy in liquid Fe, they
reported that five regions containing different phases were observed between FeMnSi and liquid
Fe. They also made a similar study for a pure Mn dissolution in liquid Fe[43]. Van Ende et al.[47,
48] studied the initial stage of Al deoxidation in liquid Fe. They revealed that a reaction zone
occurred and that it consisted of several layers of Al-rich intermetallic compounds. In addition,
Al2O3 inclusions were found in the Fe-Al reaction and their size, location and morphology
changed as a function of the interaction time and O content.
Figure 2. Schematic diagram of the typical stages during the alloying practice[20]
Based on these studies, it can be found that the interfacial reactions between the alloys and
the melt can affect the yield ratio of the alloying element and determine the inclusion
characteristics (such as size distribution, number density, morphology). Besides, the actual
dissolution path differs depending on the physical properties of the alloys, such as the density
and the melting point. Therefore, a thorough knowledge of the dissolution behaviour of alloying
agents is required to control the alloying process precisely. However, most of them[43-46] have
been focused on the dissolution behaviour of alloys, which have a lower melting point compared
to liquid steel. Moreover, the inclusion formation in some local areas having higher
concentrations of alloying elements and the behaviour of existing inclusions from the alloys after
the alloy melting is of interest to know during the alloy dissolution process.
7
Due to the high melting temperature of FeNb, it does not immediately melt but rather
sluggishly dissolves when being added to liquid steel.[49] In addition, different grades of FeCr
alloys are selected for the alloying process according to the carbon content requirement of the
final product. These FeCr grades differ not only with respect to their C content but also impurities
and physical properties, which greatly affect the dissolution process. However, not enough
attention has been paid to the interfacial processes between FeNb, FeCr alloys and liquid Fe and
steel so far. Therefore, the interactions between FeNb and Fe shortly after the alloy addition were
investigated based on quenched samples using the liquid-metal suction method. Furthermore,
similar studies were made for HCFeCr and LCFeCr alloys. The aim was to understand the early
dissolution phenomenon of FeNb, HCFeCr and LCFeCr alloys in liquid Fe as well as the
behaviour of inclusion formations.
1.4 Effect of FeCr Alloy Additions on the Inclusions in Stainless Steel
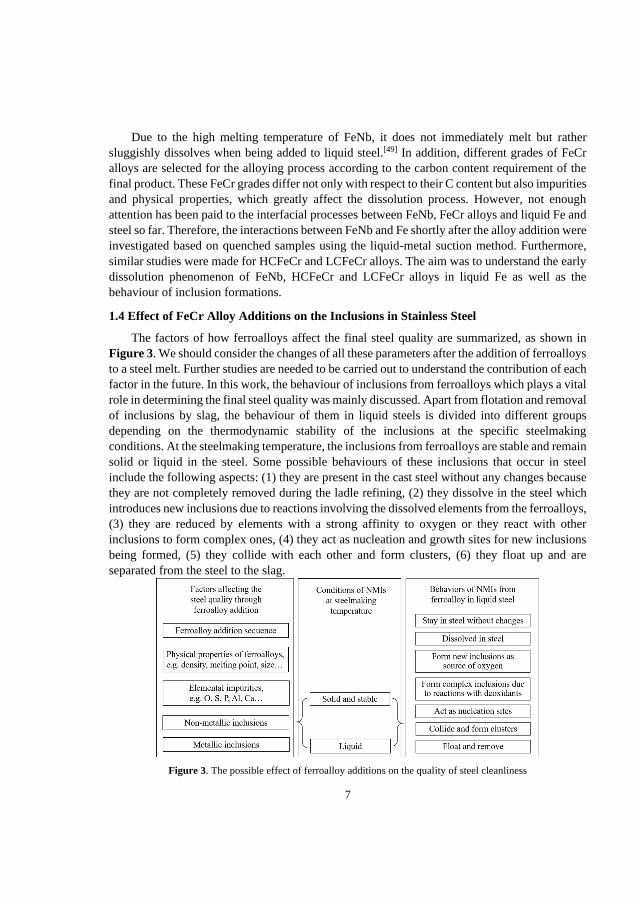
The factors of how ferroalloys affect the final steel quality are summarized, as shown in
Figure 3. We should consider the changes of all these parameters after the addition of ferroalloys
to a steel melt. Further studies are needed to be carried out to understand the contribution of each
factor in the future. In this work, the behaviour of inclusions from ferroalloys which plays a vital
role in determining the final steel quality was mainly discussed. Apart from flotation and removal
of inclusions by slag, the behaviour of them in liquid steels is divided into different groups
depending on the thermodynamic stability of the inclusions at the specific steelmaking
conditions. At the steelmaking temperature, the inclusions from ferroalloys are stable and remain
solid or liquid in the steel. Some possible behaviours of these inclusions that occur in steel
include the following aspects: (1) they are present in the cast steel without any changes because
they are not completely removed during the ladle refining, (2) they dissolve in the steel which
introduces new inclusions due to reactions involving the dissolved elements from the ferroalloys,
(3) they are reduced by elements with a strong affinity to oxygen or they react with other
inclusions to form complex ones, (4) they act as nucleation and growth sites for new inclusions
being formed, (5) they collide with each other and form clusters, (6) they float up and are
separated from the steel to the slag.
Figure 3. The possible effect of ferroalloy additions on the quality of steel cleanliness
8
Many studies have focused on the inclusion characteristic changes during different stages
of the steel production process.[27, 30, 31, 50, 51] Ferroalloys are added during and at the end of the
secondary metallurgy process and this defines the refining time for the impurities/inclusions
introduced to the liquid steel through ferroalloy additions. The additions of ferroalloys can not
only increase the content of the alloying element but can also have an unintentional effect on the
inclusion content in the steel melt. This is an area that has not been widely explored.
Wijk and Brabie[8] performed laboratory experiments to study the influence of FeSi alloy
(standard, granulated, high purity) additions on the inclusion characteristics in steel melts. They
reported that the addition of a high purity FeSi alloy resulted in fewer inclusions compared to
when using a standard FeSi alloy. In addition, the effect of Al and Ca in FeSi alloys on the
composition evolution of inclusions in different steel melt have been well investigated by several
researchers.[27, 28, 52, 53] They reported that the high Al containing FeSi alloys can significantly
increase the formation of pure Al2O3 inclusions and the Al2O3 in inclusions in the liquid steel.
The high Ca containing FeSi alloys can modify solid inclusions into liquid inclusions. Sjökvist
et al.[4] investigated the effect of FeMn additions on the inclusion characteristics in steel. They
proposed that FeMn grades only have a temporary influence on the inclusion characteristics in
steel during ladle refining. Pande et al.[5, 20] revealed that FeTi can act as a potential source of
oxygen, which leads to the formation of new inclusions during the dissolution of the alloy in
steel melt. They also studied the influence of impurities in FeTi70 and FeTi35 alloys on the steel
cleanliness in an industrial process. Their results showed that the number of the generated
inclusions was higher when using a FeTi35 addition compared to when using a FeTi70 addition,
which was attributed to the presence of larger impurities in the FeTi35 alloys.[54] Also, Dorrer et
al.[55, 56] reported that the FeTi75 additions can cause the formation of a new population of Ti-
containing alumina inclusions which increased the clogging sensitivity. However, very little
information is available in the literature concerning the effect of the impurities present in FeCr
and FeNb alloys on the steel quality.rtanr
In this study, the laboratory alloying experiments were carried out using ferritic stainless
steel (430) as experimental materials. The aim is to investigate the effects of FeCr alloy additions
on the inclusion characteristics in steel.
1.5 Objectives and Overview of the Work
The main objective of this research was to obtain knowledge concerning the various
ferroalloys and their impurities and to study the influence of ferroalloy impurities on inclusion
characteristics in liquid steel on a laboratory scale. The findings of this work would be helpful
for ferroalloy producers to improve their ferroalloy qualities and steelmakers to use low quality
ferroalloys to enable a sustainable steelmaking. A schematic diagram of the main work in this
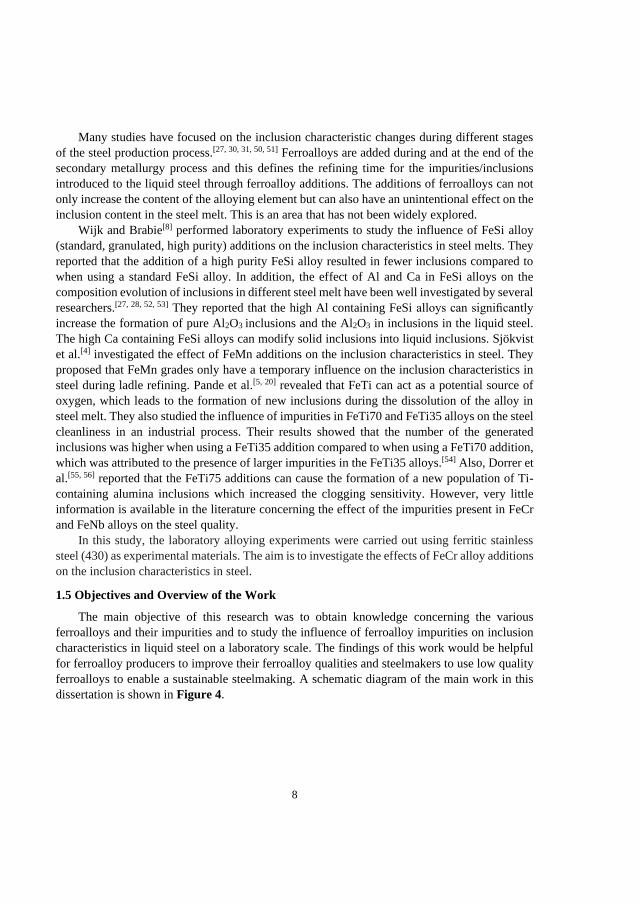
dissertation is shown in Figure 4.
9
Figure 4. Schematic diagram of the main work in this thesis
In supplement I, the information of the main trace elements and inclusions in various
ferroalloys (FeSi, FeMn, SiMn, FeTi, FeCr, FeMo, FeNb, FeV, FeB, FeP, some complex
ferroalloys) and their behaviours after the additions of ferroalloys in steel melt was extensively
reviewed from a large number of previous studies. Some suggestions were made for future
research work for each ferroalloy grade. Also, it gives some options and meaningful research
directions.
In supplement Ⅱ and Ⅲ, three-dimensional investigations of inclusion characteristics were
studied for 10 types of ferroalloys: FeSi, FeCr, FeMo, FeV, FeTi, FeNb, FeW, FeB, MnN and
FeCrN. The possible origins of the inclusions were discussed and the possible harmful inclusions
were identified for each type of ferroalloy. Some results were compared to results from previous
studies. This would help in better understanding the cleanliness of various ferroalloys. On the
basis of this knowledge, impure ferroalloys, FeCr and FeNb alloys were selected for further
studies.
In supplement Ⅳ, the inclusion characteristics (such as morphology, composition, size,
and number) of various shapes of inclusions, including spherical, octahedral, elongated, bar-like,
plate-like, polyhedral, and irregular inclusions, were observed in different steels and ferroalloys
using the 2D, EE and MS methods. The advantages and limitations of different methods for
investigations of different shaped inclusions were discussed. This work will help readers choose
more suitable experimental methods to analyze inclusions.
In supplement Ⅴ and Ⅵ, the initial dissolution and melting phenomenons of FeNb and
FeCr (HC- and LC-) alloys in liquid Fe as well as the behaviour of inclusion formations were
investigated using a liquid-metal-suction method. The dissolution mechanism of these alloys was
proposed. This would help in better understanding the nature of inclusions present in FeNb,
HCFeCr and LCFeCr alloys and how they dissolve or melt in steel melt.

10
In supplement Ⅶ and Ⅷ, the effect of FeCr alloys and slag additions on the inclusion
characteristics in Ti-containing 430 ferritic stainless steel were investigated. The evolutions and
transformation mechanisms of the existing inclusions from FeCr alloys in steel melt were
discussed. Moreover, the steel and slag composition changes and inclusion composition changes
caused by slag-steel reactions were discussed.
11
Chapter 2. Methodology
2.1 Preparation of the Samples
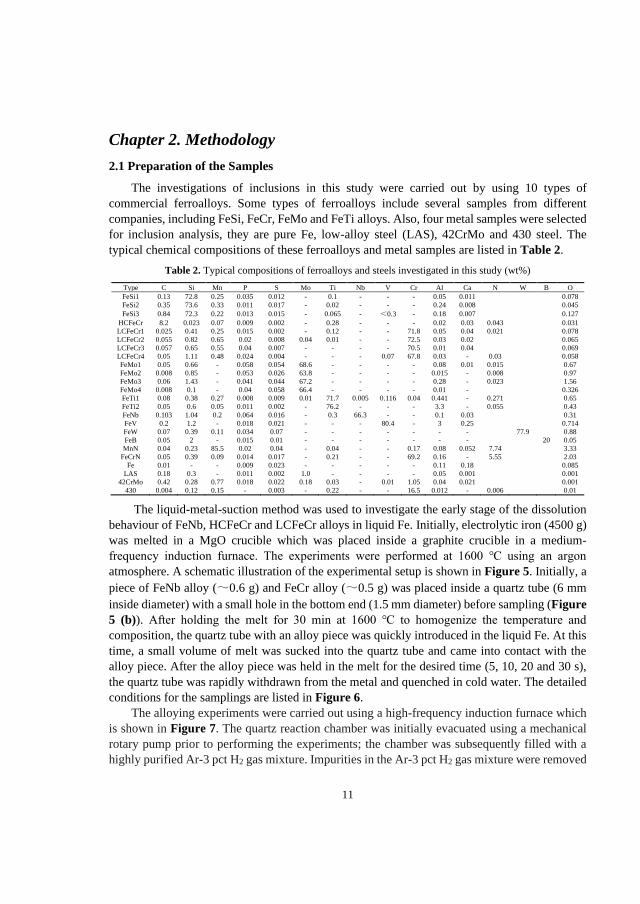
The investigations of inclusions in this study were carried out by using 10 types of
commercial ferroalloys. Some types of ferroalloys include several samples from different
companies, including FeSi, FeCr, FeMo and FeTi alloys. Also, four metal samples were selected
for inclusion analysis, they are pure Fe, low-alloy steel (LAS), 42CrMo and 430 steel. The
typical chemical compositions of these ferroalloys and metal samples are listed in Table 2.
Table 2. Typical compositions of ferroalloys and steels investigated in this study (wt%)
Type C Si Mn P S Mo Ti Nb V Cr Al Ca N W B O
FeSi1 0.13 72.8 0.25 0.035 0.012 - 0.1 - - - 0.05 0.011 0.078
FeSi2 0.35 73.6 0.33 0.011 0.017 - 0.02 - - - 0.24 0.008 0.045
FeSi3 0.84 72.3 0.22 0.013 0.015 - 0.065 - <0.3 - 0.18 0.007 0.127
HCFeCr 8.2 0.023 0.07 0.009 0.002 - 0.28 - - - 0.02 0.03 0.043 0.031
LCFeCr1 0.025 0.41 0.25 0.015 0.002 - 0.12 - - 71.8 0.05 0.04 0.021 0.078
LCFeCr2 0.055 0.82 0.65 0.02 0.008 0.04 0.01 - - 72.5 0.03 0.02 0.065
LCFeCr3 0.057 0.65 0.55 0.04 0.007 - - - - 70.5 0.01 0.04 0.069
LCFeCr4 0.05 1.11 0.48 0.024 0.004 - - - 0.07 67.8 0.03 - 0.03 0.058
FeMo1 0.05 0.66 - 0.058 0.054 68.6 - - - - 0.08 0.01 0.015 0.67
FeMo2 0.008 0.85 - 0.053 0.026 63.8 - - - - 0.015 - 0.008 0.97
FeMo3 0.06 1.43 - 0.041 0.044 67.2 - - - - 0.28 - 0.023 1.56
FeMo4 0.008 0.1 - 0.04 0.058 66.4 - - - - 0.01 - 0.326
FeTi1 0.08 0.38 0.27 0.008 0.009 0.01 71.7 0.005 0.116 0.04 0.441 - 0.271 0.65
FeTi2 0.05 0.6 0.05 0.011 0.002 - 76.2 - - - 3.3 - 0.055 0.43
FeNb 0.103 1.04 0.2 0.064 0.016 - 0.3 66.3 - - 0.1 0.03 0.31
FeV 0.2 1.2 - 0.018 0.021 - - - 80.4 - 3 0.25 0.714
FeW 0.07 0.39 0.11 0.034 0.07 - - - - - - - 77.9 0.88
FeB 0.05 2 - 0.015 0.01 - - - - - - - 20 0.05
MnN 0.04 0.23 85.5 0.02 0.04 - 0.04 - - 0.17 0.08 0.052 7.74 3.33
FeCrN 0.05 0.39 0.09 0.014 0.017 - 0.21 - - 69.2 0.16 - 5.55 2.03
Fe 0.01 - - 0.009 0.023 - - - - - 0.11 0.18 0.085
LAS 0.18 0.3 - 0.011 0.002 1.0 - - - - 0.05 0.001 0.001
42CrMo 0.42 0.28 0.77 0.018 0.022 0.18 0.03 - 0.01 1.05 0.04 0.021 0.001
430 0.004 0.12 0.15 - 0.003 - 0.22 - - 16.5 0.012 - 0.006 0.01
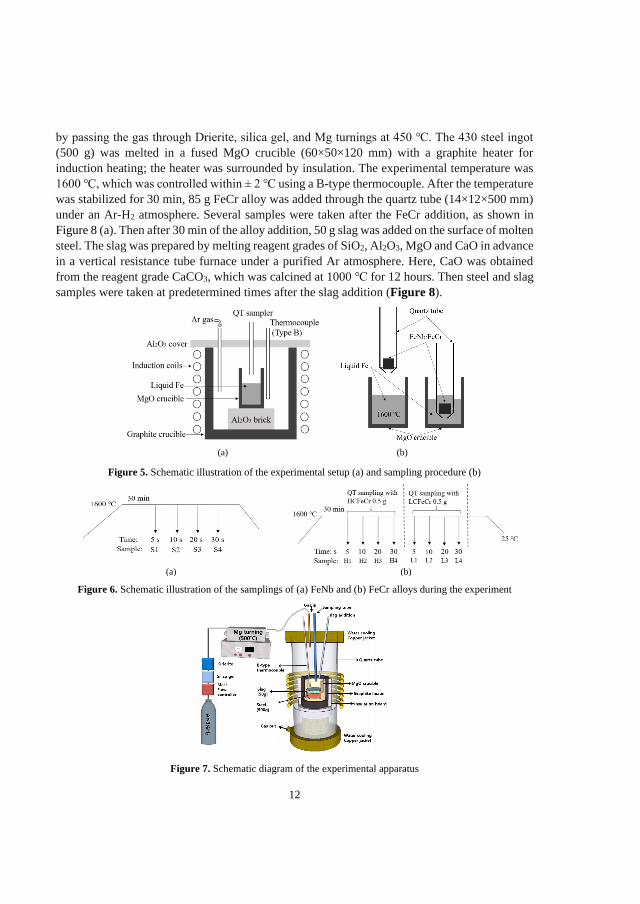
The liquid-metal-suction method was used to investigate the early stage of the dissolution
behaviour of FeNb, HCFeCr and LCFeCr alloys in liquid Fe. Initially, electrolytic iron (4500 g)
was melted in a MgO crucible which was placed inside a graphite crucible in a medium-
frequency induction furnace. The experiments were performed at 1600 ℃ using an argon
atmosphere. A schematic illustration of the experimental setup is shown in Figure 5. Initially, a
piece of FeNb alloy (~0.6 g) and FeCr alloy (~0.5 g) was placed inside a quartz tube (6 mm
inside diameter) with a small hole in the bottom end (1.5 mm diameter) before sampling (Figure
5 (b)). After holding the melt for 30 min at 1600 ℃ to homogenize the temperature and
composition, the quartz tube with an alloy piece was quickly introduced in the liquid Fe. At this
time, a small volume of melt was sucked into the quartz tube and came into contact with the
alloy piece. After the alloy piece was held in the melt for the desired time (5, 10, 20 and 30 s),
the quartz tube was rapidly withdrawn from the metal and quenched in cold water. The detailed
conditions for the samplings are listed in Figure 6.
The alloying experiments were carried out using a high-frequency induction furnace which
is shown in Figure 7. The quartz reaction chamber was initially evacuated using a mechanical
rotary pump prior to performing the experiments; the chamber was subsequently filled with a
highly purified Ar-3 pct H2 gas mixture. Impurities in the Ar-3 pct H2 gas mixture were removed
12
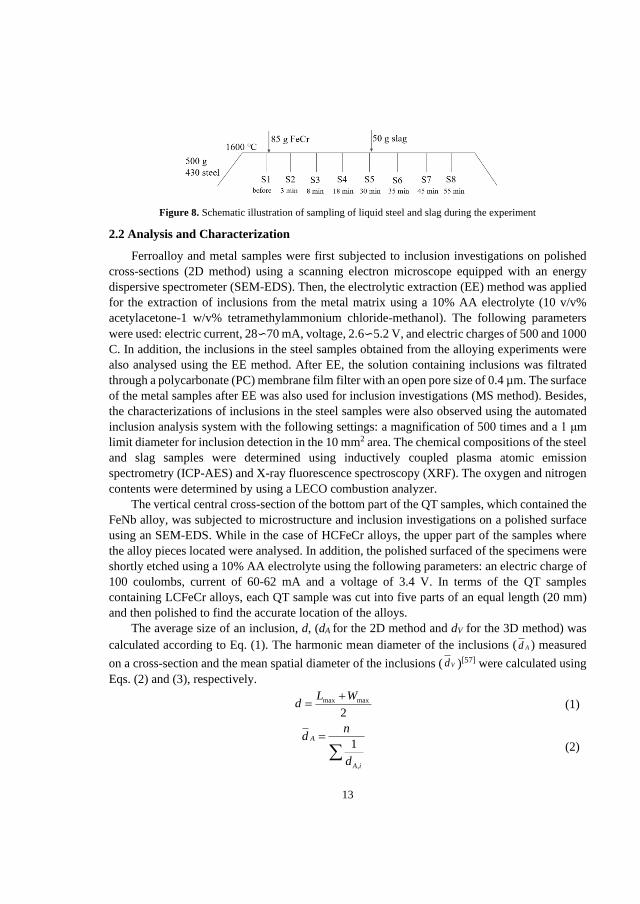
by passing the gas through Drierite, silica gel, and Mg turnings at 450 ℃. The 430 steel ingot
(500 g) was melted in a fused MgO crucible (60×50×120 mm) with a graphite heater for
induction heating; the heater was surrounded by insulation. The experimental temperature was
1600 ℃, which was controlled within ± 2 ℃ using a B-type thermocouple. After the temperature
was stabilized for 30 min, 85 g FeCr alloy was added through the quartz tube (14×12×500 mm)
under an Ar-H2 atmosphere. Several samples were taken after the FeCr addition, as shown in
Figure 8 (a). Then after 30 min of the alloy addition, 50 g slag was added on the surface of molten
steel. The slag was prepared by melting reagent grades of SiO2, Al2O3, MgO and CaO in advance
in a vertical resistance tube furnace under a purified Ar atmosphere. Here, CaO was obtained
from the reagent grade CaCO3, which was calcined at 1000 ℃ for 12 hours. Then steel and slag
samples were taken at predetermined times after the slag addition (Figure 8).
(a) (b)
Figure 5. Schematic illustration of the experimental setup (a) and sampling procedure (b)
(a) (b)
Figure 6. Schematic illustration of the samplings of (a) FeNb and (b) FeCr alloys during the experiment
Figure 7. Schematic diagram of the experimental apparatus
13
Figure 8. Schematic illustration of sampling of liquid steel and slag during the experiment
2.2 Analysis and Characterization
Ferroalloy and metal samples were first subjected to inclusion investigations on polished
cross-sections (2D method) using a scanning electron microscope equipped with an energy
dispersive spectrometer (SEM-EDS). Then, the electrolytic extraction (EE) method was applied
for the extraction of inclusions from the metal matrix using a 10% AA electrolyte (10 v/v%
acetylacetone-1 w/v% tetramethylammonium chloride-methanol). The following parameters
were used: electric current, 28∽70 mA, voltage, 2.6∽5.2 V, and electric charges of 500 and 1000
C. In addition, the inclusions in the steel samples obtained from the alloying experiments were
also analysed using the EE method. After EE, the solution containing inclusions was filtrated
through a polycarbonate (PC) membrane film filter with an open pore size of 0.4 µm. The surface
of the metal samples after EE was also used for inclusion investigations (MS method). Besides,
the characterizations of inclusions in the steel samples were also observed using the automated
inclusion analysis system with the following settings: a magnification of 500 times and a 1 μm
limit diameter for inclusion detection in the 10 mm2 area. The chemical compositions of the steel
and slag samples were determined using inductively coupled plasma atomic emission
spectrometry (ICP-AES) and X-ray fluorescence spectroscopy (XRF). The oxygen and nitrogen
contents were determined by using a LECO combustion analyzer.
The vertical central cross-section of the bottom part of the QT samples, which contained the
FeNb alloy, was subjected to microstructure and inclusion investigations on a polished surface
using an SEM-EDS. While in the case of HCFeCr alloys, the upper part of the samples where
the alloy pieces located were analysed. In addition, the polished surfaced of the specimens were
shortly etched using a 10% AA electrolyte using the following parameters: an electric charge of
100 coulombs, current of 60-62 mA and a voltage of 3.4 V. In terms of the QT samples
containing LCFeCr alloys, each QT sample was cut into five parts of an equal length (20 mm)
and then polished to find the accurate location of the alloys.
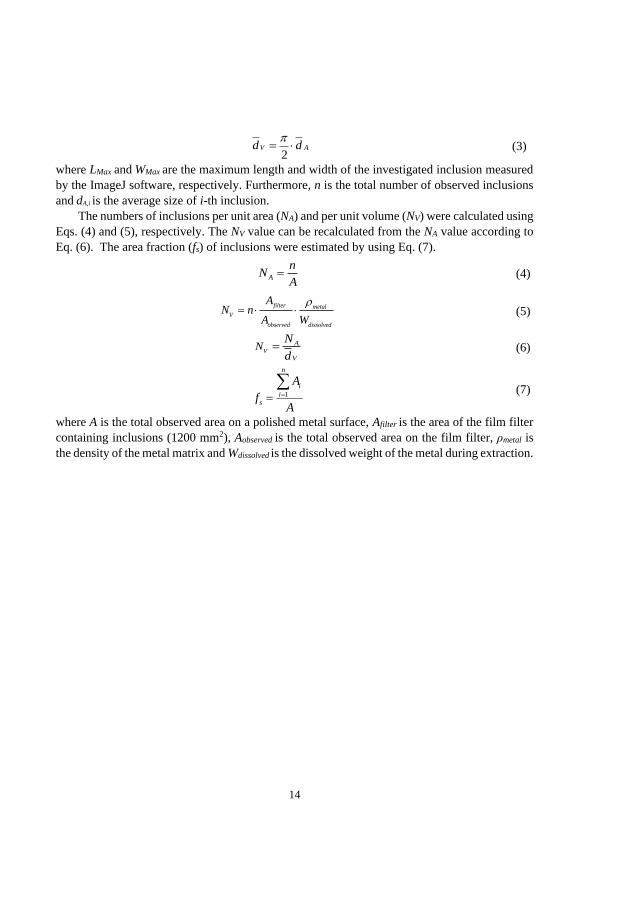
The average size of an inclusion, d, (dA for the 2D method and dV for the 3D method) was
calculated according to Eq. (1). The harmonic mean diameter of the inclusions ( ) measured
on a cross-section and the mean spatial diameter of the inclusions ( )[57] were calculated using
Eqs. (2) and (3), respectively.
max max
2
L Wd
+= (1)
(2)
Ad
Vd
,
1A
A i
nd
d
=
14
(3)
where LMax and
WMax are the maximum length and width of the investigated inclusion measured
by the ImageJ software, respectively. Furthermore, n is the total number of observed inclusions
and dA,i is the average size of i-th inclusion. The numbers of inclusions per unit area (NA) and per unit volume (NV) were calculated using
Eqs. (4) and (5), respectively. The NV value can be recalculated from the NA value according to
Eq. (6). The area fraction (fs) of inclusions were estimated by using Eq. (7).
A
nN
A= (4)
(5)
(6)
(7)
where A is the total observed area on a polished metal surface, Afilter is the area of the film filter
containing inclusions (1200 mm2), Aobserved is the total observed area on the film filter, ρmetal is
the density of the metal matrix and Wdissolved is the dissolved weight of the metal during extraction.
2V Ad d
=
filter metal
V
observed dissolved
AN n
A W
=
V
A
V
NN
d=
1
n
i
is
A
fA
==
15
Chapter 3. Results and Discussion
3.1 Inclusion Characteristics in Different Ferroalloys
3.1.1 Inclusions in FeSi alloys
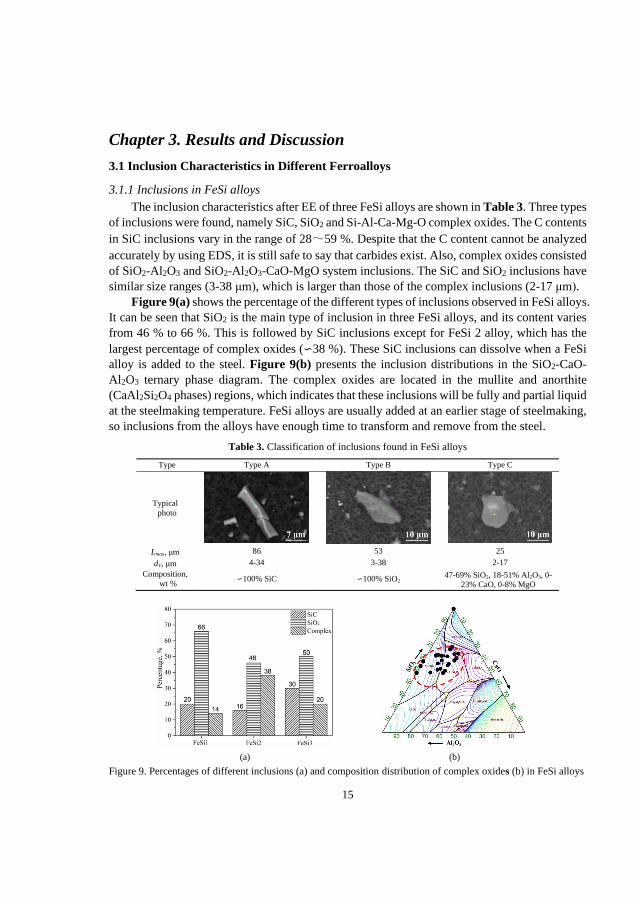
The inclusion characteristics after EE of three FeSi alloys are shown in Table 3. Three types
of inclusions were found, namely SiC, SiO2 and Si-Al-Ca-Mg-O complex oxides. The C contents
in SiC inclusions vary in the range of 28~59 %. Despite that the C content cannot be analyzed
accurately by using EDS, it is still safe to say that carbides exist. Also, complex oxides consisted
of SiO2-Al2O3 and SiO2-Al2O3-CaO-MgO system inclusions. The SiC and SiO2 inclusions have
similar size ranges (3-38 μm), which is larger than those of the complex inclusions (2-17 μm).
Figure 9(a) shows the percentage of the different types of inclusions observed in FeSi alloys.
It can be seen that SiO2 is the main type of inclusion in three FeSi alloys, and its content varies
from 46 % to 66 %. This is followed by SiC inclusions except for FeSi 2 alloy, which has the
largest percentage of complex oxides (∽38 %). These SiC inclusions can dissolve when a FeSi
alloy is added to the steel. Figure 9(b) presents the inclusion distributions in the SiO2-CaO-
Al2O3 ternary phase diagram. The complex oxides are located in the mullite and anorthite
(CaAl2Si2O4 phases) regions, which indicates that these inclusions will be fully and partial liquid
at the steelmaking temperature. FeSi alloys are usually added at an earlier stage of steelmaking,
so inclusions from the alloys have enough time to transform and remove from the steel.
Table 3. Classification of inclusions found in FeSi alloys
Type Type A Type B Type C
Typical
photo
Lmax, μm 86 53 25
dV, μm 4-34 3-38 2-17
Composition,
wt % ∽100% SiC ∽100% SiO2
47-69% SiO2, 18-51% Al2O3, 0-23% CaO, 0-8% MgO
(a) (b)
Figure 9. Percentages of different inclusions (a) and composition distribution of complex oxides (b) in FeSi alloys
16
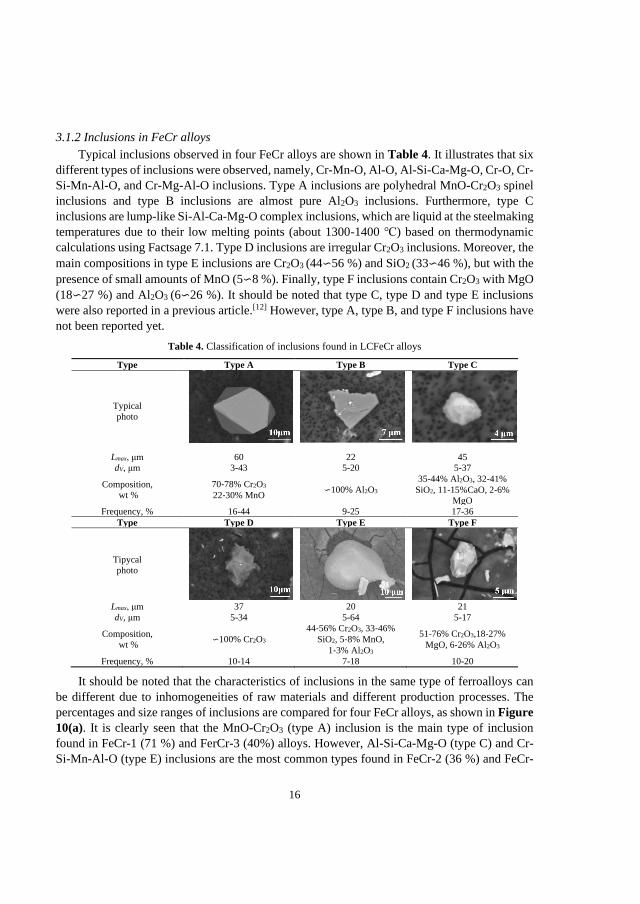
3.1.2 Inclusions in FeCr alloys
Typical inclusions observed in four FeCr alloys are shown in Table 4. It illustrates that six
different types of inclusions were observed, namely, Cr-Mn-O, Al-O, Al-Si-Ca-Mg-O, Cr-O, Cr-
Si-Mn-Al-O, and Cr-Mg-Al-O inclusions. Type A inclusions are polyhedral MnO-Cr2O3 spinel
inclusions and type B inclusions are almost pure Al2O3 inclusions. Furthermore, type C
inclusions are lump-like Si-Al-Ca-Mg-O complex inclusions, which are liquid at the steelmaking
temperatures due to their low melting points (about 1300-1400 ℃) based on thermodynamic
calculations using Factsage 7.1. Type D inclusions are irregular Cr2O3 inclusions. Moreover, the
main compositions in type E inclusions are Cr2O3 (44∽56 %) and SiO2 (33∽46 %), but with the
presence of small amounts of MnO (5∽8 %). Finally, type F inclusions contain Cr2O3 with MgO
(18∽27 %) and Al2O3 (6∽26 %). It should be noted that type C, type D and type E inclusions
were also reported in a previous article.[12] However, type A, type B, and type F inclusions have
not been reported yet.
Table 4. Classification of inclusions found in LCFeCr alloys
Type Type A Type B Type C
Typical
photo
Lmax, μm 60 22 45
dV, μm 3-43 5-20 5-37
Composition,
wt %
70-78% Cr2O3
22-30% MnO ∽100% Al2O3
35-44% Al2O3, 32-41%
SiO2, 11-15%CaO, 2-6%
MgO
Frequency, % 16-44 9-25 17-36
Type Type D Type E Type F
Tipycal
photo
Lmax, μm 37 20 21
dV, μm 5-34 5-64 5-17
Composition,
wt % ∽100% Cr2O3
44-56% Cr2O3, 33-46%
SiO2, 5-8% MnO,
1-3% Al2O3
51-76% Cr2O3,18-27%
MgO, 6-26% Al2O3
Frequency, % 10-14 7-18 10-20
It should be noted that the characteristics of inclusions in the same type of ferroalloys can
be different due to inhomogeneities of raw materials and different production processes. The
percentages and size ranges of inclusions are compared for four FeCr alloys, as shown in Figure
10(a). It is clearly seen that the MnO-Cr2O3 (type A) inclusion is the main type of inclusion
found in FeCr-1 (71 %) and FerCr-3 (40%) alloys. However, Al-Si-Ca-Mg-O (type C) and Cr-
Si-Mn-Al-O (type E) inclusions are the most common types found in FeCr-2 (36 %) and FeCr-
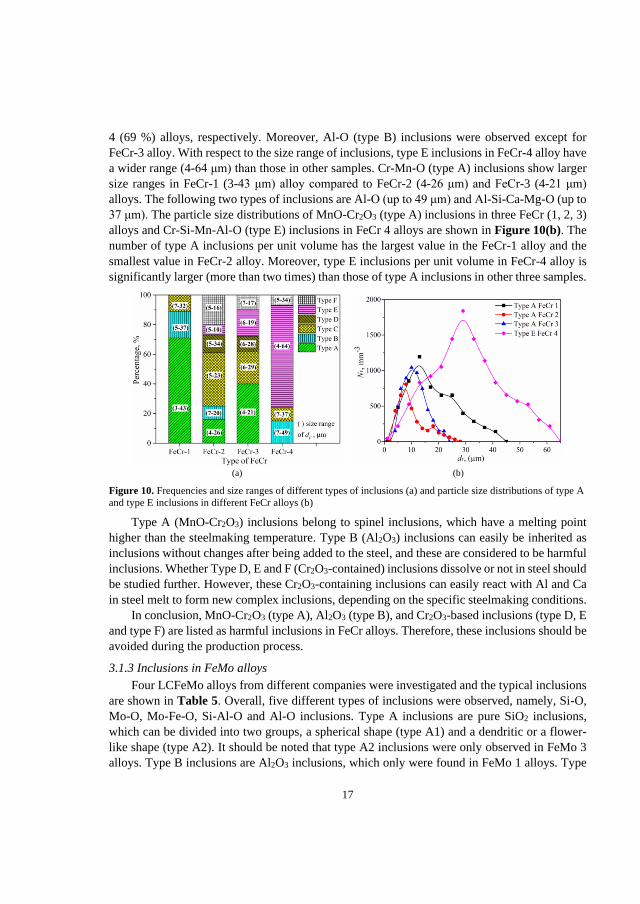
17
4 (69 %) alloys, respectively. Moreover, Al-O (type B) inclusions were observed except for
FeCr-3 alloy. With respect to the size range of inclusions, type E inclusions in FeCr-4 alloy have
a wider range (4-64 μm) than those in other samples. Cr-Mn-O (type A) inclusions show larger
size ranges in FeCr-1 (3-43 μm) alloy compared to FeCr-2 (4-26 μm) and FeCr-3 (4-21 μm)
alloys. The following two types of inclusions are Al-O (up to 49 μm) and Al-Si-Ca-Mg-O (up to
37 μm). The particle size distributions of MnO-Cr2O3 (type A) inclusions in three FeCr (1, 2, 3)
alloys and Cr-Si-Mn-Al-O (type E) inclusions in FeCr 4 alloys are shown in Figure 10(b). The
number of type A inclusions per unit volume has the largest value in the FeCr-1 alloy and the
smallest value in FeCr-2 alloy. Moreover, type E inclusions per unit volume in FeCr-4 alloy is
significantly larger (more than two times) than those of type A inclusions in other three samples.
(a) (b)
Figure 10. Frequencies and size ranges of different types of inclusions (a) and particle size distributions of type A
and type E inclusions in different FeCr alloys (b)
Type A (MnO-Cr2O3) inclusions belong to spinel inclusions, which have a melting point
higher than the steelmaking temperature. Type B (Al2O3) inclusions can easily be inherited as
inclusions without changes after being added to the steel, and these are considered to be harmful
inclusions. Whether Type D, E and F (Cr2O3-contained) inclusions dissolve or not in steel should
be studied further. However, these Cr2O3-containing inclusions can easily react with Al and Ca
in steel melt to form new complex inclusions, depending on the specific steelmaking conditions.
In conclusion, MnO-Cr2O3 (type A), Al2O3 (type B), and Cr2O3-based inclusions (type D, E
and type F) are listed as harmful inclusions in FeCr alloys. Therefore, these inclusions should be
avoided during the production process.
3.1.3 Inclusions in FeMo alloys
Four LCFeMo alloys from different companies were investigated and the typical inclusions
are shown in Table 5. Overall, five different types of inclusions were observed, namely, Si-O,
Mo-O, Mo-Fe-O, Si-Al-O and Al-O inclusions. Type A inclusions are pure SiO2 inclusions,
which can be divided into two groups, a spherical shape (type A1) and a dendritic or a flower-
like shape (type A2). It should be noted that type A2 inclusions were only observed in FeMo 3
alloys. Type B inclusions are Al2O3 inclusions, which only were found in FeMo 1 alloys. Type
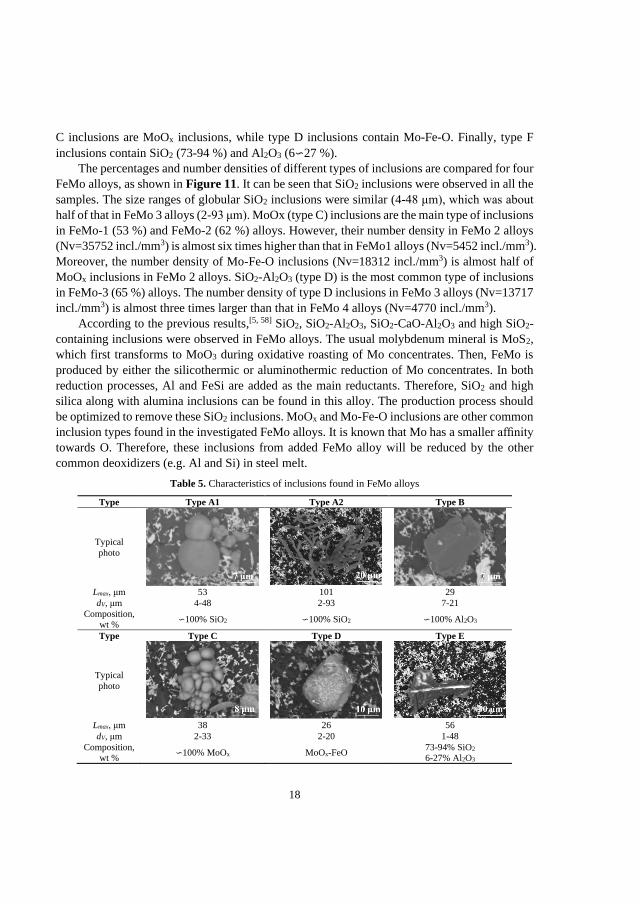
18
C inclusions are MoOx inclusions, while type D inclusions contain Mo-Fe-O. Finally, type F
inclusions contain SiO2 (73-94 %) and Al2O3 (6∽27 %).
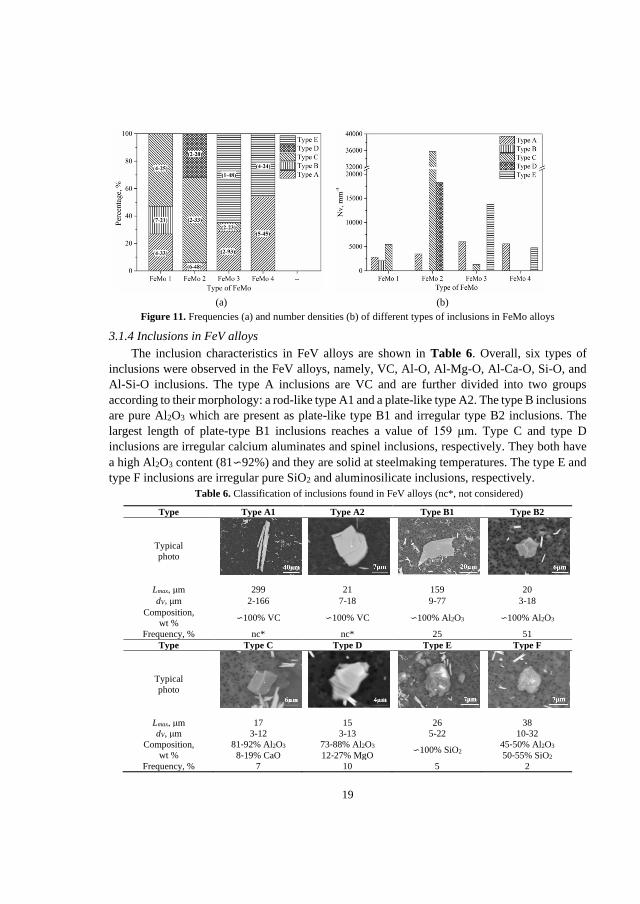
The percentages and number densities of different types of inclusions are compared for four
FeMo alloys, as shown in Figure 11. It can be seen that SiO2 inclusions were observed in all the
samples. The size ranges of globular SiO2 inclusions were similar (4-48 μm), which was about
half of that in FeMo 3 alloys (2-93 μm). MoOx (type C) inclusions are the main type of inclusions
in FeMo-1 (53 %) and FeMo-2 (62 %) alloys. However, their number density in FeMo 2 alloys
(Nv=35752 incl./mm3) is almost six times higher than that in FeMo1 alloys (Nv=5452 incl./mm3).
Moreover, the number density of Mo-Fe-O inclusions (Nv=18312 incl./mm3) is almost half of
MoOx inclusions in FeMo 2 alloys. SiO2-Al2O3 (type D) is the most common type of inclusions
in FeMo-3 (65 %) alloys. The number density of type D inclusions in FeMo 3 alloys (Nv=13717
incl./mm3) is almost three times larger than that in FeMo 4 alloys (Nv=4770 incl./mm3).
According to the previous results,[5, 58] SiO2, SiO2-Al2O3, SiO2-CaO-Al2O3 and high SiO2-
containing inclusions were observed in FeMo alloys. The usual molybdenum mineral is MoS2,
which first transforms to MoO3 during oxidative roasting of Mo concentrates. Then, FeMo is
produced by either the silicothermic or aluminothermic reduction of Mo concentrates. In both
reduction processes, Al and FeSi are added as the main reductants. Therefore, SiO2 and high
silica along with alumina inclusions can be found in this alloy. The production process should
be optimized to remove these SiO2 inclusions. MoOx and Mo-Fe-O inclusions are other common
inclusion types found in the investigated FeMo alloys. It is known that Mo has a smaller affinity
towards O. Therefore, these inclusions from added FeMo alloy will be reduced by the other
common deoxidizers (e.g. Al and Si) in steel melt.
Table 5. Characteristics of inclusions found in FeMo alloys
Type Type A1 Type A2 Type B
Typical
photo
Lmax, μm 53 101 29
dV, μm 4-48 2-93 7-21
Composition,
wt % ∽100% SiO2 ∽100% SiO2 ∽100% Al2O3
Type Type C Type D Type E
Typical
photo
Lmax, μm 38 26 56
dV, μm 2-33 2-20 1-48
Composition,
wt % ∽100% MoOx MoOx-FeO
73-94% SiO2
6-27% Al2O3
19
(a) (b)
Figure 11. Frequencies (a) and number densities (b) of different types of inclusions in FeMo alloys
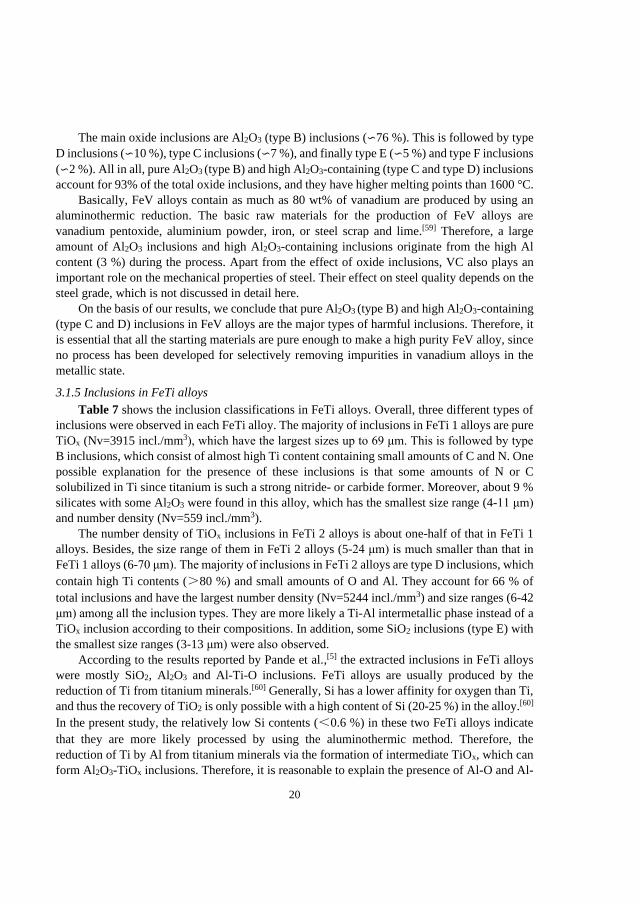
3.1.4 Inclusions in FeV alloys
The inclusion characteristics in FeV alloys are shown in Table 6. Overall, six types of
inclusions were observed in the FeV alloys, namely, VC, Al-O, Al-Mg-O, Al-Ca-O, Si-O, and
Al-Si-O inclusions. The type A inclusions are VC and are further divided into two groups
according to their morphology: a rod-like type A1 and a plate-like type A2. The type B inclusions
are pure Al2O3 which are present as plate-like type B1 and irregular type B2 inclusions. The
largest length of plate-type B1 inclusions reaches a value of 159 μm. Type C and type D
inclusions are irregular calcium aluminates and spinel inclusions, respectively. They both have
a high Al2O3 content (81∽92%) and they are solid at steelmaking temperatures. The type E and
type F inclusions are irregular pure SiO2 and aluminosilicate inclusions, respectively.
Table 6. Classification of inclusions found in FeV alloys (nc*, not considered)
Type Type A1 Type A2 Type B1 Type B2
Typical
photo
Lmax, μm 299 21 159 20
dV,μm 2-166 7-18 9-77 3-18
Composition,
wt % ∽100% VC ∽100% VC ∽100% Al2O3 ∽100% Al2O3
Frequency, % nc* nc* 25 51
Type Type C Type D Type E Type F
Typical
photo
Lmax, μm 17 15 26 38
dV, μm 3-12 3-13 5-22 10-32
Composition,
wt %
81-92% Al2O3
8-19% CaO
73-88% Al2O3
12-27% MgO ∽100% SiO2
45-50% Al2O3
50-55% SiO2
Frequency, % 7 10 5 2
20
The main oxide inclusions are Al2O3 (type B) inclusions (∽76 %). This is followed by type
D inclusions (∽10 %), type C inclusions (∽7 %), and finally type E (∽5 %) and type F inclusions
(∽2 %). All in all, pure Al2O3 (type B) and high Al2O3-containing (type C and type D) inclusions
account for 93% of the total oxide inclusions, and they have higher melting points than 1600 °C.
Basically, FeV alloys contain as much as 80 wt% of vanadium are produced by using an
aluminothermic reduction. The basic raw materials for the production of FeV alloys are
vanadium pentoxide, aluminium powder, iron, or steel scrap and lime.[59] Therefore, a large
amount of Al2O3 inclusions and high Al2O3-containing inclusions originate from the high Al
content (3 %) during the process. Apart from the effect of oxide inclusions, VC also plays an
important role on the mechanical properties of steel. Their effect on steel quality depends on the
steel grade, which is not discussed in detail here.
On the basis of our results, we conclude that pure Al2O3 (type B) and high Al2O3-containing
(type C and D) inclusions in FeV alloys are the major types of harmful inclusions. Therefore, it
is essential that all the starting materials are pure enough to make a high purity FeV alloy, since
no process has been developed for selectively removing impurities in vanadium alloys in the
metallic state.
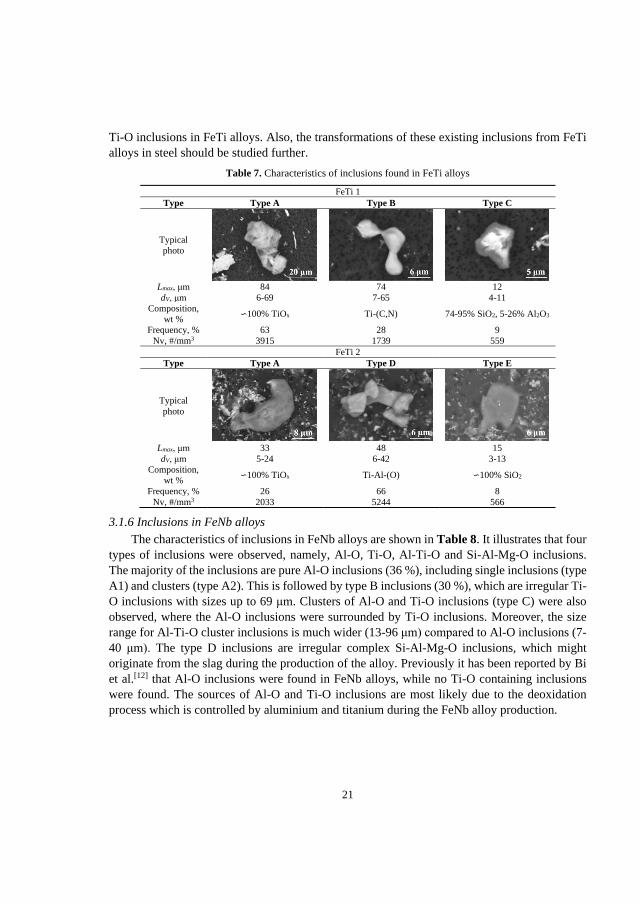
3.1.5 Inclusions in FeTi alloys
Table 7 shows the inclusion classifications in FeTi alloys. Overall, three different types of
inclusions were observed in each FeTi alloy. The majority of inclusions in FeTi 1 alloys are pure
TiOx (Nv=3915 incl./mm3), which have the largest sizes up to 69 μm. This is followed by type
B inclusions, which consist of almost high Ti content containing small amounts of C and N. One
possible explanation for the presence of these inclusions is that some amounts of N or C
solubilized in Ti since titanium is such a strong nitride- or carbide former. Moreover, about 9 %
silicates with some Al2O3 were found in this alloy, which has the smallest size range (4-11 μm)
and number density (Nv=559 incl./mm3).
The number density of TiOx inclusions in FeTi 2 alloys is about one-half of that in FeTi 1
alloys. Besides, the size range of them in FeTi 2 alloys (5-24 μm) is much smaller than that in
FeTi 1 alloys (6-70 μm). The majority of inclusions in FeTi 2 alloys are type D inclusions, which
contain high Ti contents (>80 %) and small amounts of O and Al. They account for 66 % of
total inclusions and have the largest number density (Nv=5244 incl./mm3) and size ranges (6-42
μm) among all the inclusion types. They are more likely a Ti-Al intermetallic phase instead of a
TiOx inclusion according to their compositions. In addition, some SiO2 inclusions (type E) with
the smallest size ranges (3-13 μm) were also observed.
According to the results reported by Pande et al.,[5] the extracted inclusions in FeTi alloys
were mostly SiO2, Al2O3 and Al-Ti-O inclusions. FeTi alloys are usually produced by the
reduction of Ti from titanium minerals.[60] Generally, Si has a lower affinity for oxygen than Ti,
and thus the recovery of TiO2 is only possible with a high content of Si (20-25 %) in the alloy.[60]
In the present study, the relatively low Si contents (<0.6 %) in these two FeTi alloys indicate
that they are more likely processed by using the aluminothermic method. Therefore, the
reduction of Ti by Al from titanium minerals via the formation of intermediate TiOx, which can
form Al2O3-TiOx inclusions. Therefore, it is reasonable to explain the presence of Al-O and Al-
21
Ti-O inclusions in FeTi alloys. Also, the transformations of these existing inclusions from FeTi
alloys in steel should be studied further.
Table 7. Characteristics of inclusions found in FeTi alloys
FeTi 1
Type Type A Type B Type C
Typical
photo
Lmax, μm 84 74 12
dV, μm 6-69 7-65 4-11
Composition,
wt % ∽100% TiOx Ti-(C,N) 74-95% SiO2, 5-26% Al2O3
Frequency, % 63 28 9
Nv, #/mm3 3915 1739 559
FeTi 2
Type Type A Type D Type E
Typical
photo
Lmax, μm 33 48 15
dV, μm 5-24 6-42 3-13
Composition,
wt % ∽100% TiOx Ti-Al-(O) ∽100% SiO2
Frequency, % 26 66 8
Nv, #/mm3 2033 5244 566
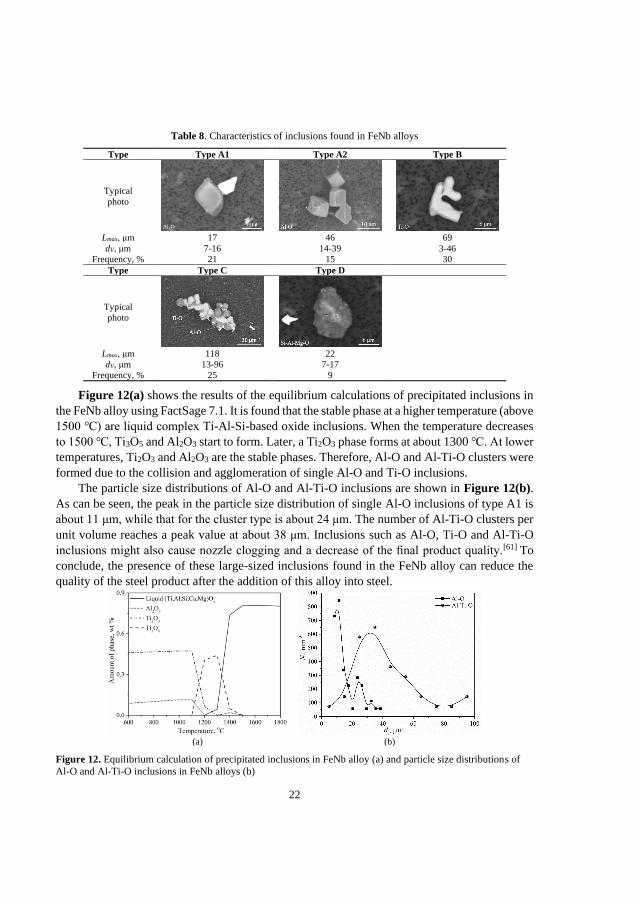
3.1.6 Inclusions in FeNb alloys
The characteristics of inclusions in FeNb alloys are shown in Table 8. It illustrates that four
types of inclusions were observed, namely, Al-O, Ti-O, Al-Ti-O and Si-Al-Mg-O inclusions.
The majority of the inclusions are pure Al-O inclusions (36 %), including single inclusions (type
A1) and clusters (type A2). This is followed by type B inclusions (30 %), which are irregular Ti-
O inclusions with sizes up to 69 μm. Clusters of Al-O and Ti-O inclusions (type C) were also
observed, where the Al-O inclusions were surrounded by Ti-O inclusions. Moreover, the size
range for Al-Ti-O cluster inclusions is much wider (13-96 μm) compared to Al-O inclusions (7-
40 μm). The type D inclusions are irregular complex Si-Al-Mg-O inclusions, which might
originate from the slag during the production of the alloy. Previously it has been reported by Bi
et al.[12] that Al-O inclusions were found in FeNb alloys, while no Ti-O containing inclusions
were found. The sources of Al-O and Ti-O inclusions are most likely due to the deoxidation
process which is controlled by aluminium and titanium during the FeNb alloy production.
22
Table 8. Characteristics of inclusions found in FeNb alloys
Type Type A1 Type A2 Type B
Typical
photo
Lmax, μm 17 46 69
dV, μm 7-16 14-39 3-46
Frequency, % 21 15 30
Type Type C Type D
Typical
photo
Lmax, μm 118 22
dV, μm 13-96 7-17
Frequency, % 25 9
Figure 12(a) shows the results of the equilibrium calculations of precipitated inclusions in
the FeNb alloy using FactSage 7.1. It is found that the stable phase at a higher temperature (above
1500 ℃) are liquid complex Ti-Al-Si-based oxide inclusions. When the temperature decreases
to 1500 ℃, Ti3O5 and Al2O3 start to form. Later, a Ti2O3 phase forms at about 1300 ℃. At lower
temperatures, Ti2O3 and Al2O3 are the stable phases. Therefore, Al-O and Al-Ti-O clusters were
formed due to the collision and agglomeration of single Al-O and Ti-O inclusions.
The particle size distributions of Al-O and Al-Ti-O inclusions are shown in Figure 12(b).
As can be seen, the peak in the particle size distribution of single Al-O inclusions of type A1 is
about 11 μm, while that for the cluster type is about 24 μm. The number of Al-Ti-O clusters per
unit volume reaches a peak value at about 38 μm. Inclusions such as Al-O, Ti-O and Al-Ti-O
inclusions might also cause nozzle clogging and a decrease of the final product quality.[61] To
conclude, the presence of these large-sized inclusions found in the FeNb alloy can reduce the
quality of the steel product after the addition of this alloy into steel.
(a) (b)
Figure 12. Equilibrium calculation of precipitated inclusions in FeNb alloy (a) and particle size distributions of
Al-O and Al-Ti-O inclusions in FeNb alloys (b)
23
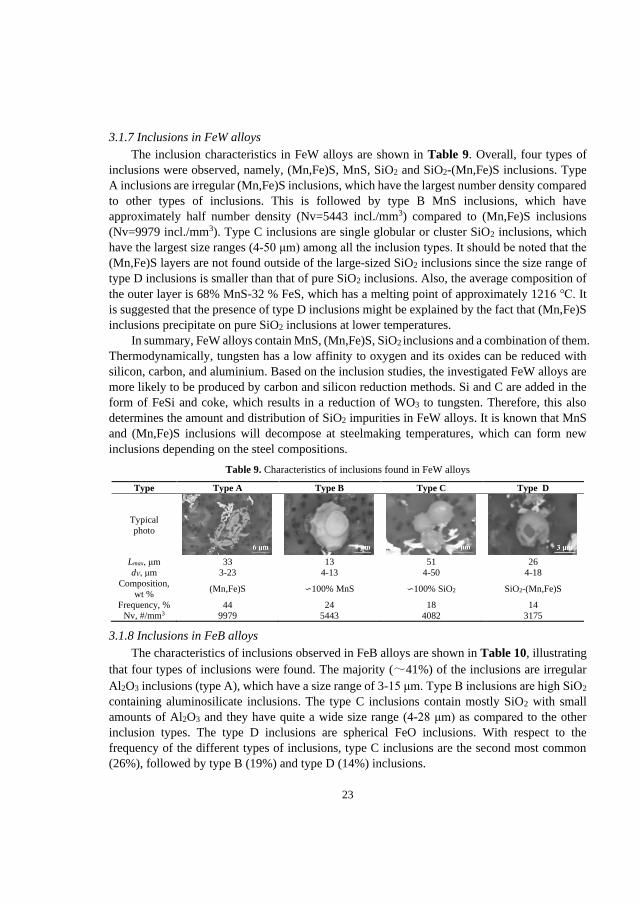
3.1.7 Inclusions in FeW alloys
The inclusion characteristics in FeW alloys are shown in Table 9. Overall, four types of
inclusions were observed, namely, (Mn,Fe)S, MnS, SiO2 and SiO2-(Mn,Fe)S inclusions. Type
A inclusions are irregular (Mn,Fe)S inclusions, which have the largest number density compared
to other types of inclusions. This is followed by type B MnS inclusions, which have
approximately half number density (Nv=5443 incl./mm3) compared to (Mn,Fe)S inclusions
(Nv=9979 incl./mm3). Type C inclusions are single globular or cluster SiO2 inclusions, which
have the largest size ranges (4-50 μm) among all the inclusion types. It should be noted that the
(Mn,Fe)S layers are not found outside of the large-sized SiO2 inclusions since the size range of
type D inclusions is smaller than that of pure SiO2 inclusions. Also, the average composition of
the outer layer is 68% MnS-32 % FeS, which has a melting point of approximately 1216 ℃. It
is suggested that the presence of type D inclusions might be explained by the fact that (Mn,Fe)S
inclusions precipitate on pure SiO2 inclusions at lower temperatures.
In summary, FeW alloys contain MnS, (Mn,Fe)S, SiO2 inclusions and a combination of them.
Thermodynamically, tungsten has a low affinity to oxygen and its oxides can be reduced with
silicon, carbon, and aluminium. Based on the inclusion studies, the investigated FeW alloys are
more likely to be produced by carbon and silicon reduction methods. Si and C are added in the
form of FeSi and coke, which results in a reduction of WO3 to tungsten. Therefore, this also
determines the amount and distribution of SiO2 impurities in FeW alloys. It is known that MnS
and (Mn,Fe)S inclusions will decompose at steelmaking temperatures, which can form new
inclusions depending on the steel compositions.
Table 9. Characteristics of inclusions found in FeW alloys
Type Type A Type B Type C Type D
Typical
photo
Lmax, μm 33 13 51 26 dV, μm 3-23 4-13 4-50 4-18
Composition,
wt % (Mn,Fe)S ∽100% MnS ∽100% SiO2 SiO2-(Mn,Fe)S
Frequency, % 44 24 18 14 Nv, #/mm3 9979 5443 4082 3175
3.1.8 Inclusions in FeB alloys
The characteristics of inclusions observed in FeB alloys are shown in Table 10, illustrating
that four types of inclusions were found. The majority (~41%) of the inclusions are irregular
Al2O3 inclusions (type A), which have a size range of 3-15 μm. Type B inclusions are high SiO2
containing aluminosilicate inclusions. The type C inclusions contain mostly SiO2 with small
amounts of Al2O3 and they have quite a wide size range (4-28 μm) as compared to the other
inclusion types. The type D inclusions are spherical FeO inclusions. With respect to the
frequency of the different types of inclusions, type C inclusions are the second most common
(26%), followed by type B (19%) and type D (14%) inclusions.
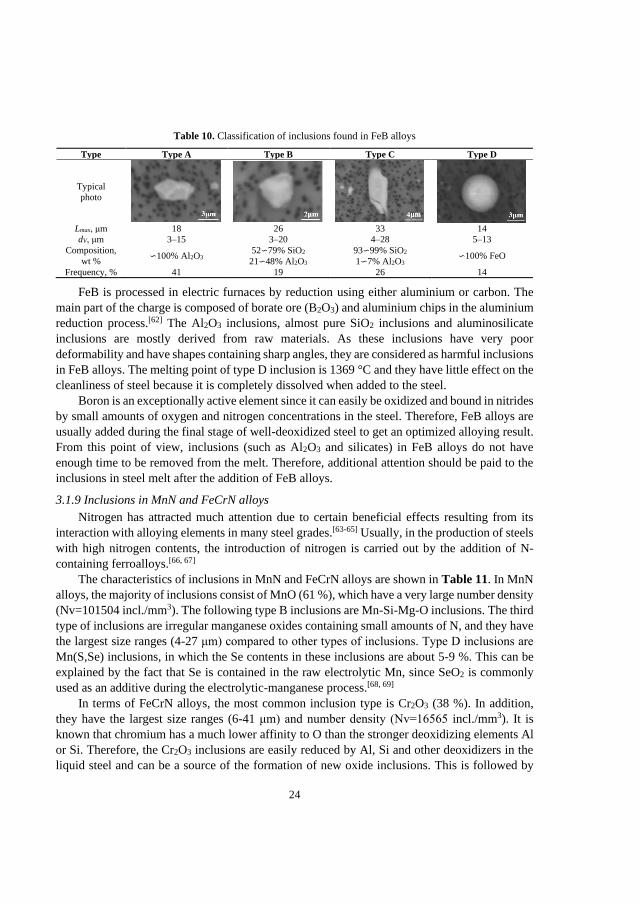
24
Table 10. Classification of inclusions found in FeB alloys
Type Type A Type B Type C Type D
Typical
photo
Lmax, μm 18 26 33 14 dV, μm 3–15 3–20 4–28 5–13
Composition,
wt % ∽100% Al2O3
52∽79% SiO2
21∽48% Al2O3 93∽99% SiO2
1∽7% Al2O3 ∽100% FeO
Frequency, % 41 19 26 14
FeB is processed in electric furnaces by reduction using either aluminium or carbon. The
main part of the charge is composed of borate ore (B2O3) and aluminium chips in the aluminium
reduction process.[62] The Al2O3 inclusions, almost pure SiO2 inclusions and aluminosilicate
inclusions are mostly derived from raw materials. As these inclusions have very poor
deformability and have shapes containing sharp angles, they are considered as harmful inclusions
in FeB alloys. The melting point of type D inclusion is 1369 °C and they have little effect on the
cleanliness of steel because it is completely dissolved when added to the steel.
Boron is an exceptionally active element since it can easily be oxidized and bound in nitrides
by small amounts of oxygen and nitrogen concentrations in the steel. Therefore, FeB alloys are
usually added during the final stage of well-deoxidized steel to get an optimized alloying result.
From this point of view, inclusions (such as Al2O3 and silicates) in FeB alloys do not have
enough time to be removed from the melt. Therefore, additional attention should be paid to the
inclusions in steel melt after the addition of FeB alloys.
3.1.9 Inclusions in MnN and FeCrN alloys
Nitrogen has attracted much attention due to certain beneficial effects resulting from its
interaction with alloying elements in many steel grades.[63-65] Usually, in the production of steels
with high nitrogen contents, the introduction of nitrogen is carried out by the addition of N-
containing ferroalloys.[66, 67]
The characteristics of inclusions in MnN and FeCrN alloys are shown in Table 11. In MnN
alloys, the majority of inclusions consist of MnO (61 %), which have a very large number density
(Nv=101504 incl./mm3). The following type B inclusions are Mn-Si-Mg-O inclusions. The third
type of inclusions are irregular manganese oxides containing small amounts of N, and they have
the largest size ranges (4-27 μm) compared to other types of inclusions. Type D inclusions are
Mn(S,Se) inclusions, in which the Se contents in these inclusions are about 5-9 %. This can be
explained by the fact that Se is contained in the raw electrolytic Mn, since SeO2 is commonly
used as an additive during the electrolytic-manganese process.[68, 69]
In terms of FeCrN alloys, the most common inclusion type is Cr2O3 (38 %). In addition,
they have the largest size ranges (6-41 μm) and number density (Nv=16565 incl./mm3). It is
known that chromium has a much lower affinity to O than the stronger deoxidizing elements Al
or Si. Therefore, the Cr2O3 inclusions are easily reduced by Al, Si and other deoxidizers in the
liquid steel and can be a source of the formation of new oxide inclusions. This is followed by
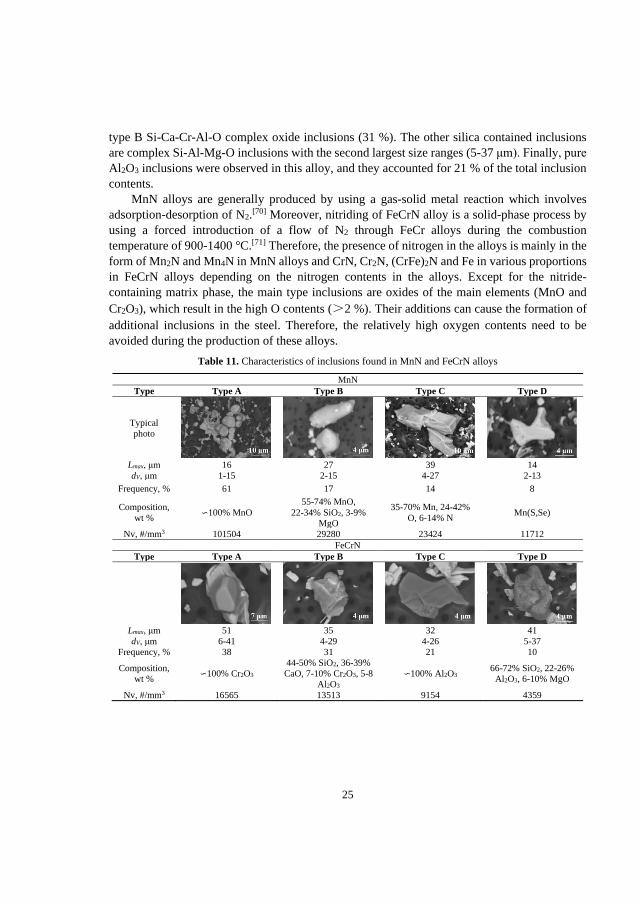
25
type B Si-Ca-Cr-Al-O complex oxide inclusions (31 %). The other silica contained inclusions
are complex Si-Al-Mg-O inclusions with the second largest size ranges (5-37 μm). Finally, pure
Al2O3 inclusions were observed in this alloy, and they accounted for 21 % of the total inclusion
contents.
MnN alloys are generally produced by using a gas-solid metal reaction which involves
adsorption-desorption of N2.[70] Moreover, nitriding of FeCrN alloy is a solid-phase process by
using a forced introduction of a flow of N2 through FeCr alloys during the combustion
temperature of 900-1400 °C.[71] Therefore, the presence of nitrogen in the alloys is mainly in the
form of Mn2N and Mn4N in MnN alloys and CrN, Cr2N, (CrFe)2N and Fe in various proportions
in FeCrN alloys depending on the nitrogen contents in the alloys. Except for the nitride-
containing matrix phase, the main type inclusions are oxides of the main elements (MnO and
Cr2O3), which result in the high O contents (>2 %). Their additions can cause the formation of
additional inclusions in the steel. Therefore, the relatively high oxygen contents need to be
avoided during the production of these alloys.
Table 11. Characteristics of inclusions found in MnN and FeCrN alloys
MnN
Type Type A Type B Type C Type D
Typical
photo
Lmax, μm 16 27 39 14 dV, μm 1-15 2-15 4-27 2-13
Frequency, % 61 17 14 8
Composition,
wt % ∽100% MnO
55-74% MnO,
22-34% SiO2, 3-9%
MgO
35-70% Mn, 24-42%
O, 6-14% N Mn(S,Se)
Nv, #/mm3 101504 29280 23424 11712 FeCrN
Type Type A Type B Type C Type D
Lmax, μm 51 35 32 41 dV, μm 6-41 4-29 4-26 5-37
Frequency, % 38 31 21 10
Composition,
wt % ∽100% Cr2O3
44-50% SiO2, 36-39%
CaO, 7-10% Cr2O3, 5-8
Al2O3 ∽100% Al2O3
66-72% SiO2, 22-26%
Al2O3, 6-10% MgO
Nv, #/mm3 16565 13513 9154 4359
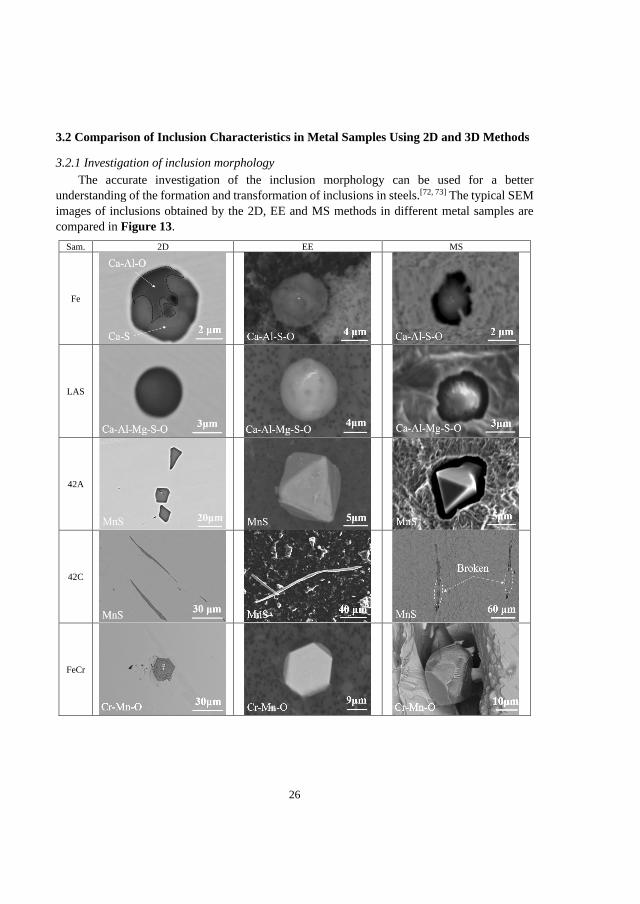
26
3.2 Comparison of Inclusion Characteristics in Metal Samples Using 2D and 3D Methods
3.2.1 Investigation of inclusion morphology
The accurate investigation of the inclusion morphology can be used for a better
understanding of the formation and transformation of inclusions in steels.[72, 73] The typical SEM
images of inclusions obtained by the 2D, EE and MS methods in different metal samples are
compared in Figure 13.
Sam. 2D EE MS
Fe
LAS
42A
42C
FeCr
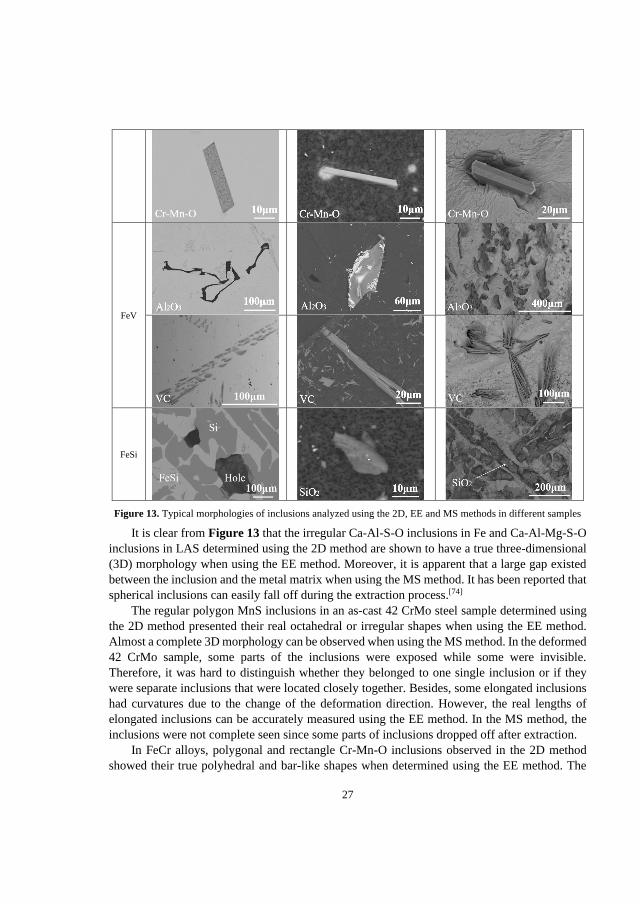
27
FeV
FeSi
Figure 13. Typical morphologies of inclusions analyzed using the 2D, EE and MS methods in different samples
It is clear from Figure 13 that the irregular Ca-Al-S-O inclusions in Fe and Ca-Al-Mg-S-O
inclusions in LAS determined using the 2D method are shown to have a true three-dimensional
(3D) morphology when using the EE method. Moreover, it is apparent that a large gap existed
between the inclusion and the metal matrix when using the MS method. It has been reported that
spherical inclusions can easily fall off during the extraction process.[74]
The regular polygon MnS inclusions in an as-cast 42 CrMo steel sample determined using
the 2D method presented their real octahedral or irregular shapes when using the EE method.
Almost a complete 3D morphology can be observed when using the MS method. In the deformed
42 CrMo sample, some parts of the inclusions were exposed while some were invisible.
Therefore, it was hard to distinguish whether they belonged to one single inclusion or if they
were separate inclusions that were located closely together. Besides, some elongated inclusions
had curvatures due to the change of the deformation direction. However, the real lengths of
elongated inclusions can be accurately measured using the EE method. In the MS method, the
inclusions were not complete seen since some parts of inclusions dropped off after extraction.
In FeCr alloys, polygonal and rectangle Cr-Mn-O inclusions observed in the 2D method
showed their true polyhedral and bar-like shapes when determined using the EE method. The
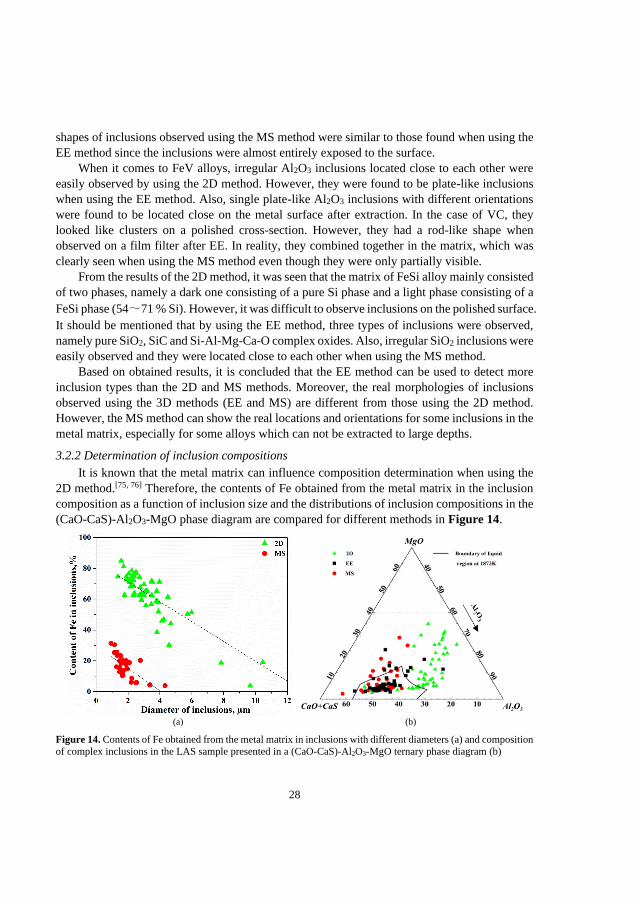
28
shapes of inclusions observed using the MS method were similar to those found when using the
EE method since the inclusions were almost entirely exposed to the surface.
When it comes to FeV alloys, irregular Al2O3 inclusions located close to each other were
easily observed by using the 2D method. However, they were found to be plate-like inclusions
when using the EE method. Also, single plate-like Al2O3 inclusions with different orientations
were found to be located close on the metal surface after extraction. In the case of VC, they
looked like clusters on a polished cross-section. However, they had a rod-like shape when
observed on a film filter after EE. In reality, they combined together in the matrix, which was
clearly seen when using the MS method even though they were only partially visible.
From the results of the 2D method, it was seen that the matrix of FeSi alloy mainly consisted
of two phases, namely a dark one consisting of a pure Si phase and a light phase consisting of a
FeSi phase (54~71 % Si). However, it was difficult to observe inclusions on the polished surface.
It should be mentioned that by using the EE method, three types of inclusions were observed,
namely pure SiO2, SiC and Si-Al-Mg-Ca-O complex oxides. Also, irregular SiO2 inclusions were
easily observed and they were located close to each other when using the MS method.
Based on obtained results, it is concluded that the EE method can be used to detect more
inclusion types than the 2D and MS methods. Moreover, the real morphologies of inclusions
observed using the 3D methods (EE and MS) are different from those using the 2D method.
However, the MS method can show the real locations and orientations for some inclusions in the
metal matrix, especially for some alloys which can not be extracted to large depths.
3.2.2 Determination of inclusion compositions
It is known that the metal matrix can influence composition determination when using the
2D method.[75, 76] Therefore, the contents of Fe obtained from the metal matrix in the inclusion
composition as a function of inclusion size and the distributions of inclusion compositions in the
(CaO-CaS)-Al2O3-MgO phase diagram are compared for different methods in Figure 14.
(a) (b)
Figure 14. Contents of Fe obtained from the metal matrix in inclusions with different diameters (a) and composition
of complex inclusions in the LAS sample presented in a (CaO-CaS)-Al2O3-MgO ternary phase diagram (b)
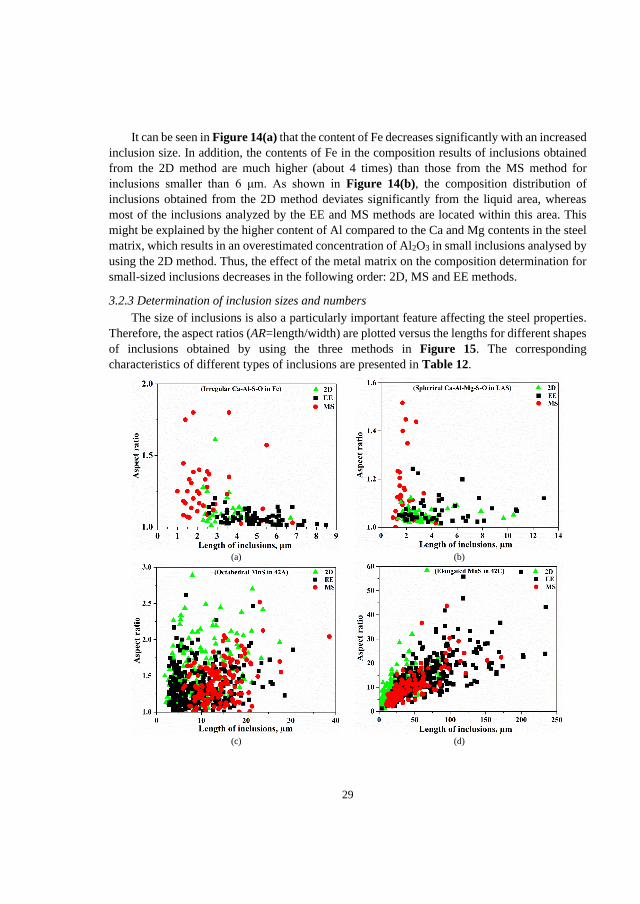
29
It can be seen in Figure 14(a) that the content of Fe decreases significantly with an increased
inclusion size. In addition, the contents of Fe in the composition results of inclusions obtained
from the 2D method are much higher (about 4 times) than those from the MS method for
inclusions smaller than 6 μm. As shown in Figure 14(b), the composition distribution of
inclusions obtained from the 2D method deviates significantly from the liquid area, whereas
most of the inclusions analyzed by the EE and MS methods are located within this area. This
might be explained by the higher content of Al compared to the Ca and Mg contents in the steel
matrix, which results in an overestimated concentration of Al2O3 in small inclusions analysed by
using the 2D method. Thus, the effect of the metal matrix on the composition determination for
small-sized inclusions decreases in the following order: 2D, MS and EE methods.
3.2.3 Determination of inclusion sizes and numbers
The size of inclusions is also a particularly important feature affecting the steel properties.
Therefore, the aspect ratios (AR=length/width) are plotted versus the lengths for different shapes
of inclusions obtained by using the three methods in Figure 15. The corresponding
characteristics of different types of inclusions are presented in Table 12.
(a) (b)
(c) (d)
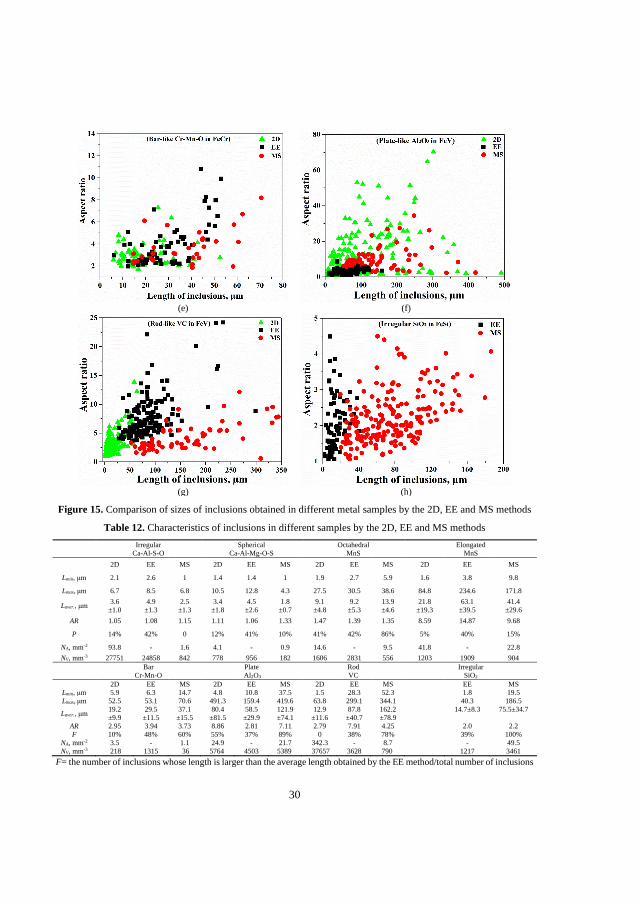
30
(e) (f)
(g) (h)
Figure 15. Comparison of sizes of inclusions obtained in different metal samples by the 2D, EE and MS methods
Table 12. Characteristics of inclusions in different samples by the 2D, EE and MS methods
Irregular
Ca-Al-S-O
Spherical
Ca-Al-Mg-O-S
Octahedral
MnS
Elongated
MnS
2D EE MS 2D EE MS 2D EE MS 2D EE MS
Lmin, μm 2.1 2.6 1 1.4 1.4 1 1.9 2.7 5.9 1.6 3.8 9.8
Lmax, μm 6.7 8.5 6.8 10.5 12.8 4.3 27.5 30.5 38.6 84.8 234.6 171.8
Laver., μm 3.6
±1.0
4.9
±1.3
2.5
±1.3
3.4
±1.8
4.5
±2.6
1.8
±0.7
9.1
±4.8
9.2
±5.3
13.9
±4.6
21.8
±19.3
63.1
±39.5
41.4
±29.6
AR 1.05 1.08 1.15 1.11 1.06 1.33 1.47 1.39 1.35 8.59 14.87 9.68
P 14% 42% 0 12% 41% 10% 41% 42% 86% 5% 40% 15%
NA, mm-2 93.8 - 1.6 4.1 - 0.9 14.6 - 9.5 41.8 - 22.8
NV, mm-3 27751 24858 842 778 956 182 1606 2831 556 1203 1909 904
Bar
Cr-Mn-O
Plate
Al2O3
Rod
VC
Irregular
SiO2
2D EE MS 2D EE MS 2D EE MS EE MS
Lmin, μm 5.9 6.3 14.7 4.8 10.8 37.5 1.5 28.3 52.3 1.8 19.5
Lmax, μm 52.5 53.1 70.6 491.3 159.4 419.6 63.8 299.1 344.1 40.3 186.5
Laver., μm 19.2
±9.9
29.5
±11.5
37.1
±15.5
80.4
±81.5
58.5
±29.9
121.9
±74.1
12.9
±11.6
87.8
±40.7
162.2
±78.9
14.7±8.3 75.5±34.7
AR 2.95 3.94 3.73 8.86 2.81 7.11 2.79 7.91 4.25 2.0 2.2
F 10% 48% 60% 55% 37% 89% 0 38% 78% 39% 100%
NA, mm-2 3.5 - 1.1 24.9 - 21.7 342.3 - 8.7 - 49.5
NV, mm-3 218 1315 36 5764 4503 5389 37657 3628 790 1217 3461
F= the number of inclusions whose length is larger than the average length obtained by the EE method/total number of inclusions
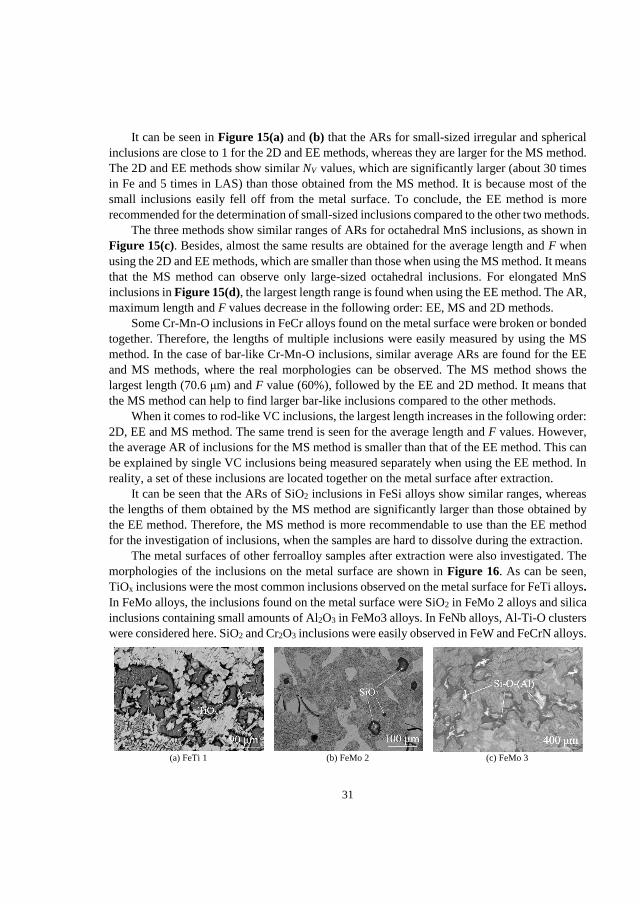
31
It can be seen in Figure 15(a) and (b) that the ARs for small-sized irregular and spherical
inclusions are close to 1 for the 2D and EE methods, whereas they are larger for the MS method.
The 2D and EE methods show similar NV values, which are significantly larger (about 30 times
in Fe and 5 times in LAS) than those obtained from the MS method. It is because most of the
small inclusions easily fell off from the metal surface. To conclude, the EE method is more
recommended for the determination of small-sized inclusions compared to the other two methods.
The three methods show similar ranges of ARs for octahedral MnS inclusions, as shown in
Figure 15(c). Besides, almost the same results are obtained for the average length and F when
using the 2D and EE methods, which are smaller than those when using the MS method. It means
that the MS method can observe only large-sized octahedral inclusions. For elongated MnS
inclusions in Figure 15(d), the largest length range is found when using the EE method. The AR,
maximum length and F values decrease in the following order: EE, MS and 2D methods.
Some Cr-Mn-O inclusions in FeCr alloys found on the metal surface were broken or bonded
together. Therefore, the lengths of multiple inclusions were easily measured by using the MS
method. In the case of bar-like Cr-Mn-O inclusions, similar average ARs are found for the EE
and MS methods, where the real morphologies can be observed. The MS method shows the
largest length (70.6 μm) and F value (60%), followed by the EE and 2D method. It means that
the MS method can help to find larger bar-like inclusions compared to the other methods.
When it comes to rod-like VC inclusions, the largest length increases in the following order:
2D, EE and MS method. The same trend is seen for the average length and F values. However,
the average AR of inclusions for the MS method is smaller than that of the EE method. This can
be explained by single VC inclusions being measured separately when using the EE method. In
reality, a set of these inclusions are located together on the metal surface after extraction.
It can be seen that the ARs of SiO2 inclusions in FeSi alloys show similar ranges, whereas
the lengths of them obtained by the MS method are significantly larger than those obtained by
the EE method. Therefore, the MS method is more recommendable to use than the EE method
for the investigation of inclusions, when the samples are hard to dissolve during the extraction.
The metal surfaces of other ferroalloy samples after extraction were also investigated. The
morphologies of the inclusions on the metal surface are shown in Figure 16. As can be seen,
TiOx inclusions were the most common inclusions observed on the metal surface for FeTi alloys.
In FeMo alloys, the inclusions found on the metal surface were SiO2 in FeMo 2 alloys and silica
inclusions containing small amounts of Al2O3 in FeMo3 alloys. In FeNb alloys, Al-Ti-O clusters
were considered here. SiO2 and Cr2O3 inclusions were easily observed in FeW and FeCrN alloys.
(a) FeTi 1 (b) FeMo 2 (c) FeMo 3
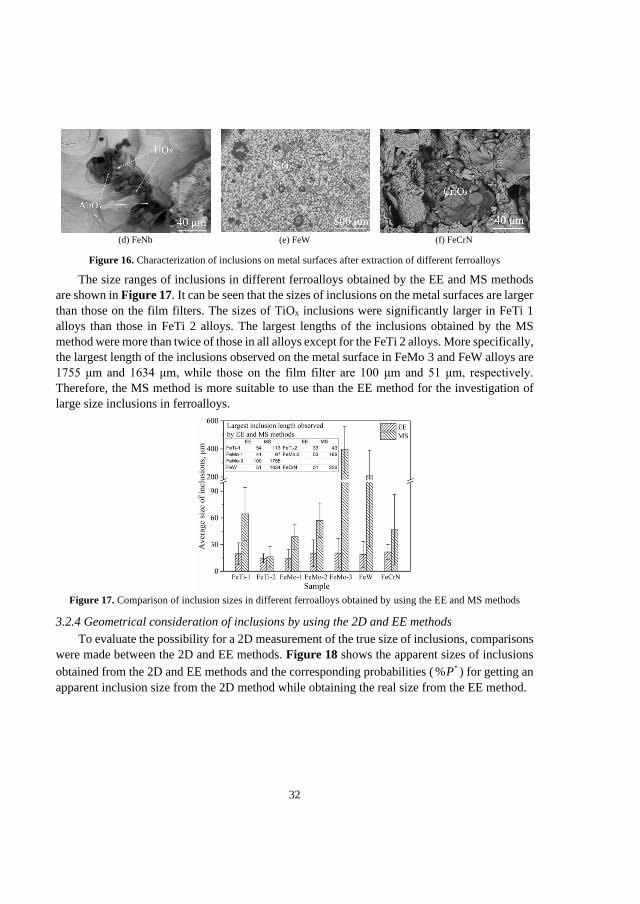
32
(d) FeNb (e) FeW (f) FeCrN
Figure 16. Characterization of inclusions on metal surfaces after extraction of different ferroalloys
The size ranges of inclusions in different ferroalloys obtained by the EE and MS methods
are shown in Figure 17. It can be seen that the sizes of inclusions on the metal surfaces are larger
than those on the film filters. The sizes of TiOx inclusions were significantly larger in FeTi 1
alloys than those in FeTi 2 alloys. The largest lengths of the inclusions obtained by the MS
method were more than twice of those in all alloys except for the FeTi 2 alloys. More specifically,
the largest length of the inclusions observed on the metal surface in FeMo 3 and FeW alloys are
1755 μm and 1634 μm, while those on the film filter are 100 μm and 51 μm, respectively.
Therefore, the MS method is more suitable to use than the EE method for the investigation of
large size inclusions in ferroalloys.
Figure 17. Comparison of inclusion sizes in different ferroalloys obtained by using the EE and MS methods
3.2.4 Geometrical consideration of inclusions by using the 2D and EE methods
To evaluate the possibility for a 2D measurement of the true size of inclusions, comparisons
were made between the 2D and EE methods. Figure 18 shows the apparent sizes of inclusions
obtained from the 2D and EE methods and the corresponding probabilities ( *%P ) for getting an
apparent inclusion size from the 2D method while obtaining the real size from the EE method.

33
(a) (b)
(c) (d)
(e) (f)
(g)
Figure 18. Schematic illustrations of 2D and EE measurements for different shaped inclusions and probabilities for
2D measurement of inclusions with a given ratio of dCS/dEE
It can be seen in Figure 18(a) that the dCS value (=2[BC]) decreases with an increased
distance between the cross-section and the center of an inclusion ([OC]). In this case, the
probability ( % sphereP ) of getting the apparent inclusion size on the cross-section in the given range
of a dCS/dEE ratio can be calculated based on the ratio between the [OC] length and [OD] length
(0.5·dEE), in which the [OC] length can be obtained by using Eq. (8). The % sphereP value for the
given value of k=dCS/dEE ratio can be determined by using Eq. (9).
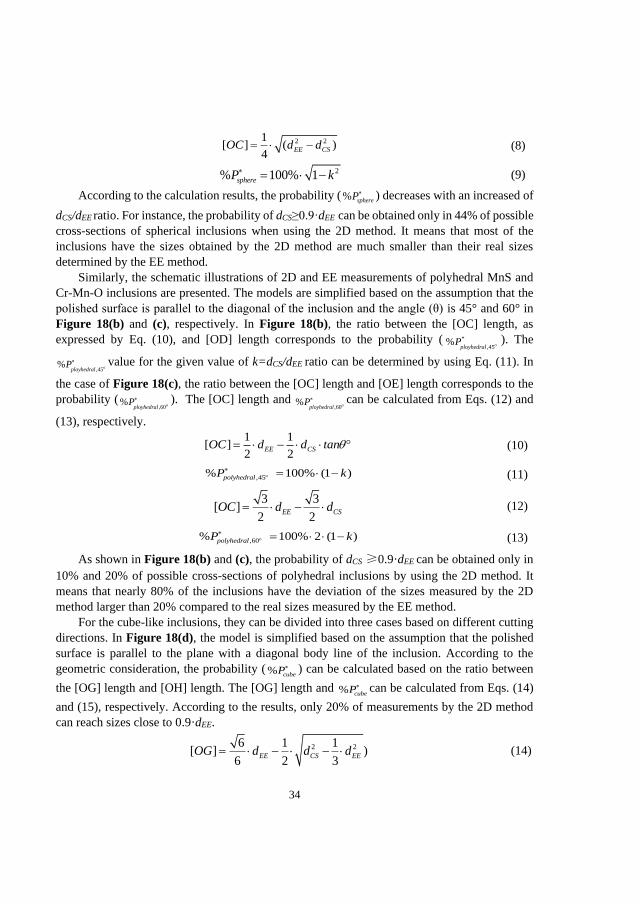
34
2 21[ ] ( )
4EE CSOC d d= − (8)
2% 100% 1sphereP k = − (9)
According to the calculation results, the probability ( ) decreases with an increased of
dCS/dEE ratio. For instance, the probability of dCS≥0.9·dEE can be obtained only in 44% of possible
cross-sections of spherical inclusions when using the 2D method. It means that most of the
inclusions have the sizes obtained by the 2D method are much smaller than their real sizes
determined by the EE method.
Similarly, the schematic illustrations of 2D and EE measurements of polyhedral MnS and
Cr-Mn-O inclusions are presented. The models are simplified based on the assumption that the
polished surface is parallel to the diagonal of the inclusion and the angle (θ) is 45° and 60° in
Figure 18(b) and (c), respectively. In Figure 18(b), the ratio between the [OC] length, as
expressed by Eq. (10), and [OD] length corresponds to the probability ( *
,45% oployhedral
P ). The
,45% oployhedral
P value for the given value of k=dCS/dEE ratio can be determined by using Eq. (11). In
the case of Figure 18(c), the ratio between the [OC] length and [OE] length corresponds to the
probability (,60
% oployhedralP ). The [OC] length and
,60% oployhedral
P can be calculated from Eqs. (12) and
(13), respectively.
1 1[ ]
2 2EE CSd d tC aO n= − (10)
,45% 100% (1 )polyhedralP k
= − (11)
3 3[ ]
2 2EE CSOC d d= −
(12)
,60% 100% 2 (1 )polyhedralP k
= − (13)
As shown in Figure 18(b) and (c), the probability of dCS ≥0.9·dEE can be obtained only in
10% and 20% of possible cross-sections of polyhedral inclusions by using the 2D method. It
means that nearly 80% of the inclusions have the deviation of the sizes measured by the 2D
method larger than 20% compared to the real sizes measured by the EE method.
For the cube-like inclusions, they can be divided into three cases based on different cutting
directions. In Figure 18(d), the model is simplified based on the assumption that the polished
surface is parallel to the plane with a diagonal body line of the inclusion. According to the
geometric consideration, the probability ( % cubeP ) can be calculated based on the ratio between
the [OG] length and [OH] length. The [OG] length and % cubeP can be calculated from Eqs. (14)
and (15), respectively. According to the results, only 20% of measurements by the 2D method
can reach sizes close to 0.9·dEE.
2 26 1 1[ ] )
6 2 3CS EEEEOG d dd= − − (14)
% sphereP
35
26 1% 100% (1 1 )
2 3cubeP k = − − (15)
In the case of Figure 18(e), the dCS value, calculated by using Eq. (16), increases with an
increased cutting angle. The value of k=dCS/dEE ratio can be determined by using Eq. (17), where
three values of α were selected as a simplification. As can be seen, the k ratio increases
dramatically with an increased cutting angle, which depends on the change of the dCS value. The
deviation of the sizes measured by the 2D method from that by the EE method decreases with a
decreased α value. In addition, the ratio is always larger than 0.5 when the α value is smaller
than 60°.
cos
sin
EECS
dd
= (16)
cos
sink
= (17)
In the case of Figure 18(f), it is assumed that the polished surface is parallel to any surface
of the cube. Thus the value of the k=dCS/dEE ratio is fixed, which equals to cos . It means that
the dCS value is always smaller than the dEE value.
A schematic illustration of a cross-section of bar-like inclusion and the dependence of
dCS/dEE ratio on the original length and width (wEE) of inclusion is shown in Figure 18(g). The
dCS value can be determined by using Eq. (18).
sin
EECS
wd
= (18)
The width of inclusion is fixed at a value of 8 μm according to the average width obtained
by using the EE method. Moreover, a 30 μm average length and a 70 μm largest length are chosen
for the calculation. It can be seen that the value of the dCS/dEE ratio remains almost constant at
the beginning and then sharply decreases with an increased cutting angle. The dCS value
determined by using the 2D method can be 80% of the dEE value when the cutting angle less than
20°. This shows good agreement with our experimental results.
When it comes to elongated inclusions, Kanbe et al.[77] made a comprehensive discussion.
They reported that the dCS/dEE ratio decreased with an increased cutting angle. Moreover, the
inclusions with a dEE /wEE value of 10 required to be cut when the cutting angle is smaller than
6° in relation to the rolling direction to measure almost the actual maximum length (dCS/dEE
≥95%) when using the 2D method.
In accordance with the obtained results, the applications of three methods with respect to
different types of inclusions are summarized in Table 13. It can be seen that the EE method is
the most preferred method to use for the determination of inclusion morphology, which is
followed by the MS method in most cases. For the size measurement of small inclusions, the EE
method is the most recommended, while the MS method is almost unusable. In addition, the EE
method can successfully be applied for the investigation of elongated inclusions. From the
perspective of detecting the large-sized and maximum size of inclusions, the MS method is
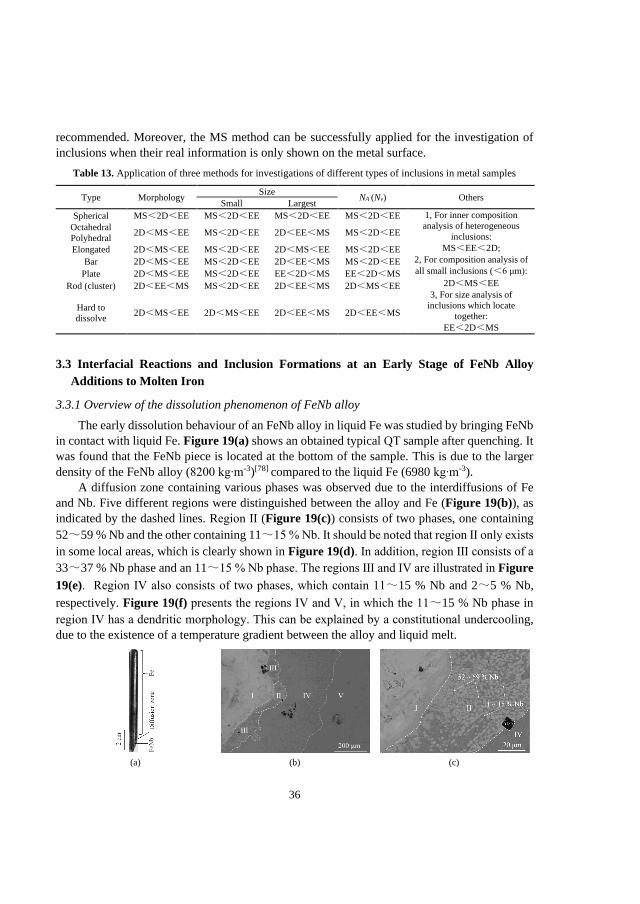
36
recommended. Moreover, the MS method can be successfully applied for the investigation of
inclusions when their real information is only shown on the metal surface.
Table 13. Application of three methods for investigations of different types of inclusions in metal samples
Type Morphology Size
NA (Nv) Others Small Largest
Spherical MS<2D<EE MS<2D<EE MS<2D<EE MS<2D<EE 1, For inner composition
analysis of heterogeneous
inclusions:
MS<EE<2D;
2, For composition analysis of
all small inclusions (<6 μm):
2D<MS<EE
3, For size analysis of
inclusions which locate
together:
EE<2D<MS
Octahedral
Polyhedral 2D<MS<EE MS<2D<EE 2D<EE<MS MS<2D<EE
Elongated 2D<MS<EE MS<2D<EE 2D<MS<EE MS<2D<EE
Bar 2D<MS<EE MS<2D<EE 2D<EE<MS MS<2D<EE
Plate 2D<MS<EE MS<2D<EE EE<2D<MS EE<2D<MS
Rod (cluster) 2D<EE<MS MS<2D<EE 2D<EE<MS 2D<MS<EE
Hard to
dissolve 2D<MS<EE 2D<MS<EE 2D<EE<MS 2D<EE<MS
3.3 Interfacial Reactions and Inclusion Formations at an Early Stage of FeNb Alloy
Additions to Molten Iron
3.3.1 Overview of the dissolution phenomenon of FeNb alloy
The early dissolution behaviour of an FeNb alloy in liquid Fe was studied by bringing FeNb
in contact with liquid Fe. Figure 19(a) shows an obtained typical QT sample after quenching. It
was found that the FeNb piece is located at the bottom of the sample. This is due to the larger
density of the FeNb alloy (8200 kg∙m-3)[78] compared to the liquid Fe (6980 kg∙m-3).
A diffusion zone containing various phases was observed due to the interdiffusions of Fe
and Nb. Five different regions were distinguished between the alloy and Fe (Figure 19(b)), as
indicated by the dashed lines. Region Ⅱ (Figure 19(c)) consists of two phases, one containing
52~59 % Nb and the other containing 11~15 % Nb. It should be noted that region Ⅱ only exists
in some local areas, which is clearly shown in Figure 19(d). In addition, region Ⅲ consists of a
33~37 % Nb phase and an 11~15 % Nb phase. The regions Ⅲ and Ⅳ are illustrated in Figure
19(e). Region Ⅳ also consists of two phases, which contain 11~15 % Nb and 2~5 % Nb,
respectively. Figure 19(f) presents the regions Ⅳ and Ⅴ, in which the 11~15 % Nb phase in
region Ⅳ has a dendritic morphology. This can be explained by a constitutional undercooling,
due to the existence of a temperature gradient between the alloy and liquid melt.
(a) (b) (c)
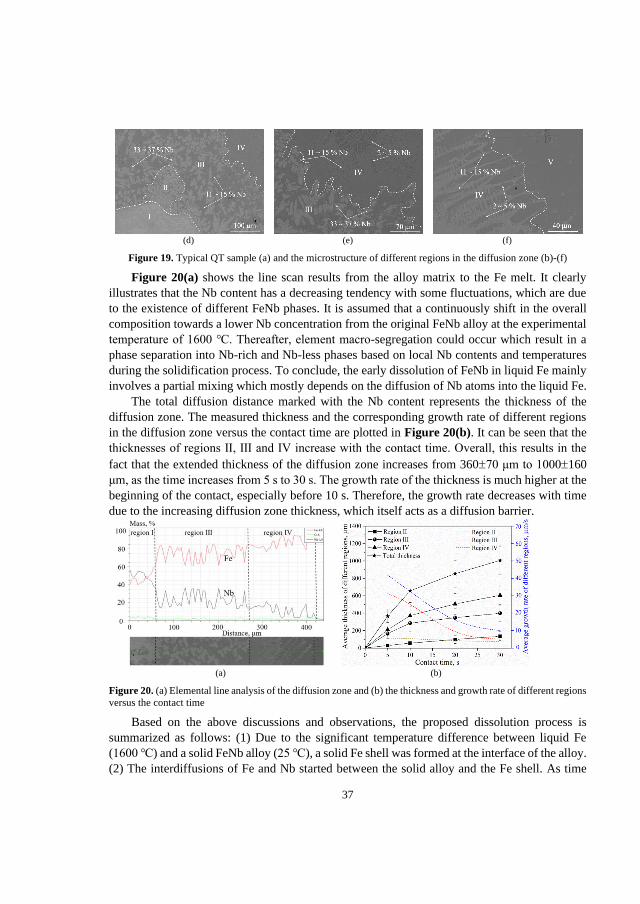
37
(d) (e) (f)
Figure 19. Typical QT sample (a) and the microstructure of different regions in the diffusion zone (b)-(f)
Figure 20(a) shows the line scan results from the alloy matrix to the Fe melt. It clearly
illustrates that the Nb content has a decreasing tendency with some fluctuations, which are due
to the existence of different FeNb phases. It is assumed that a continuously shift in the overall
composition towards a lower Nb concentration from the original FeNb alloy at the experimental
temperature of 1600 ℃. Thereafter, element macro-segregation could occur which result in a
phase separation into Nb-rich and Nb-less phases based on local Nb contents and temperatures
during the solidification process. To conclude, the early dissolution of FeNb in liquid Fe mainly
involves a partial mixing which mostly depends on the diffusion of Nb atoms into the liquid Fe.
The total diffusion distance marked with the Nb content represents the thickness of the
diffusion zone. The measured thickness and the corresponding growth rate of different regions
in the diffusion zone versus the contact time are plotted in Figure 20(b). It can be seen that the
thicknesses of regions Ⅱ, Ⅲ and Ⅳ increase with the contact time. Overall, this results in the
fact that the extended thickness of the diffusion zone increases from 36070 μm to 1000160
μm, as the time increases from 5 s to 30 s. The growth rate of the thickness is much higher at the
beginning of the contact, especially before 10 s. Therefore, the growth rate decreases with time
due to the increasing diffusion zone thickness, which itself acts as a diffusion barrier.
(a) (b)
Figure 20. (a) Elemental line analysis of the diffusion zone and (b) the thickness and growth rate of different regions
versus the contact time
Based on the above discussions and observations, the proposed dissolution process is
summarized as follows: (1) Due to the significant temperature difference between liquid Fe
(1600 ℃) and a solid FeNb alloy (25 ℃), a solid Fe shell was formed at the interface of the alloy.
(2) The interdiffusions of Fe and Nb started between the solid alloy and the Fe shell. As time
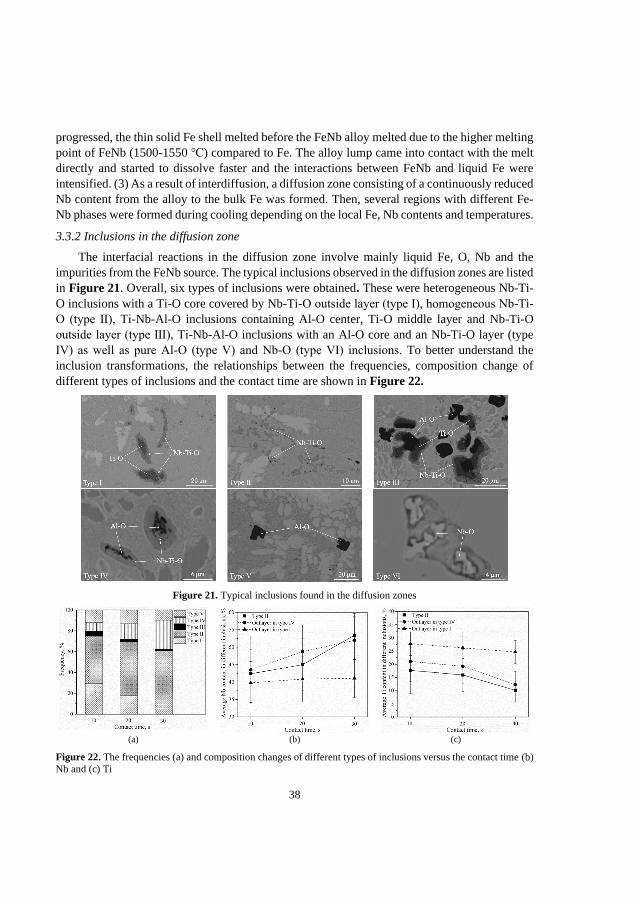
38
progressed, the thin solid Fe shell melted before the FeNb alloy melted due to the higher melting
point of FeNb (1500-1550 ℃) compared to Fe. The alloy lump came into contact with the melt
directly and started to dissolve faster and the interactions between FeNb and liquid Fe were
intensified. (3) As a result of interdiffusion, a diffusion zone consisting of a continuously reduced
Nb content from the alloy to the bulk Fe was formed. Then, several regions with different Fe-
Nb phases were formed during cooling depending on the local Fe, Nb contents and temperatures.
3.3.2 Inclusions in the diffusion zone
The interfacial reactions in the diffusion zone involve mainly liquid Fe, O, Nb and the
impurities from the FeNb source. The typical inclusions observed in the diffusion zones are listed
in Figure 21. Overall, six types of inclusions were obtained. These were heterogeneous Nb-Ti-
O inclusions with a Ti-O core covered by Nb-Ti-O outside layer (type Ⅰ), homogeneous Nb-Ti-
O (type Ⅱ), Ti-Nb-Al-O inclusions containing Al-O center, Ti-O middle layer and Nb-Ti-O
outside layer (type Ⅲ), Ti-Nb-Al-O inclusions with an Al-O core and an Nb-Ti-O layer (type
Ⅳ) as well as pure Al-O (type Ⅴ) and Nb-O (type Ⅵ) inclusions. To better understand the
inclusion transformations, the relationships between the frequencies, composition change of
different types of inclusions and the contact time are shown in Figure 22.
Figure 21. Typical inclusions found in the diffusion zones
(a) (b) (c)
Figure 22. The frequencies (a) and composition changes of different types of inclusions versus the contact time (b)
Nb and (c) Ti
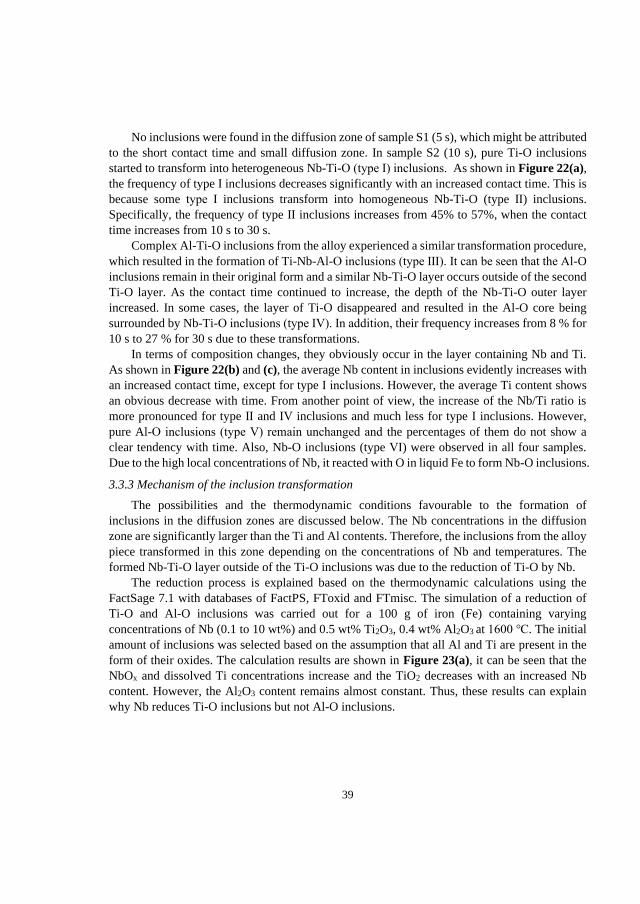
39
No inclusions were found in the diffusion zone of sample S1 (5 s), which might be attributed
to the short contact time and small diffusion zone. In sample S2 (10 s), pure Ti-O inclusions
started to transform into heterogeneous Nb-Ti-O (type Ⅰ) inclusions. As shown in Figure 22(a),
the frequency of type Ⅰ inclusions decreases significantly with an increased contact time. This is
because some type Ⅰ inclusions transform into homogeneous Nb-Ti-O (type Ⅱ) inclusions.
Specifically, the frequency of type Ⅱ inclusions increases from 45% to 57%, when the contact
time increases from 10 s to 30 s.
Complex Al-Ti-O inclusions from the alloy experienced a similar transformation procedure,
which resulted in the formation of Ti-Nb-Al-O inclusions (type Ⅲ). It can be seen that the Al-O
inclusions remain in their original form and a similar Nb-Ti-O layer occurs outside of the second
Ti-O layer. As the contact time continued to increase, the depth of the Nb-Ti-O outer layer
increased. In some cases, the layer of Ti-O disappeared and resulted in the Al-O core being
surrounded by Nb-Ti-O inclusions (type Ⅳ). In addition, their frequency increases from 8 % for
10 s to 27 % for 30 s due to these transformations.
In terms of composition changes, they obviously occur in the layer containing Nb and Ti.
As shown in Figure 22(b) and (c), the average Nb content in inclusions evidently increases with
an increased contact time, except for type Ⅰ inclusions. However, the average Ti content shows
an obvious decrease with time. From another point of view, the increase of the Nb/Ti ratio is
more pronounced for type Ⅱ and Ⅳ inclusions and much less for type Ⅰ inclusions. However,
pure Al-O inclusions (type Ⅴ) remain unchanged and the percentages of them do not show a
clear tendency with time. Also, Nb-O inclusions (type Ⅵ) were observed in all four samples.
Due to the high local concentrations of Nb, it reacted with O in liquid Fe to form Nb-O inclusions.
3.3.3 Mechanism of the inclusion transformation
The possibilities and the thermodynamic conditions favourable to the formation of
inclusions in the diffusion zones are discussed below. The Nb concentrations in the diffusion
zone are significantly larger than the Ti and Al contents. Therefore, the inclusions from the alloy
piece transformed in this zone depending on the concentrations of Nb and temperatures. The
formed Nb-Ti-O layer outside of the Ti-O inclusions was due to the reduction of Ti-O by Nb.
The reduction process is explained based on the thermodynamic calculations using the
FactSage 7.1 with databases of FactPS, FToxid and FTmisc. The simulation of a reduction of
Ti-O and Al-O inclusions was carried out for a 100 g of iron (Fe) containing varying
concentrations of Nb (0.1 to 10 wt%) and 0.5 wt% Ti2O3, 0.4 wt% Al2O3 at 1600 ℃. The initial
amount of inclusions was selected based on the assumption that all Al and Ti are present in the
form of their oxides. The calculation results are shown in Figure 23(a), it can be seen that the
NbOx and dissolved Ti concentrations increase and the TiO2 decreases with an increased Nb
content. However, the Al2O3 content remains almost constant. Thus, these results can explain
why Nb reduces Ti-O inclusions but not Al-O inclusions.
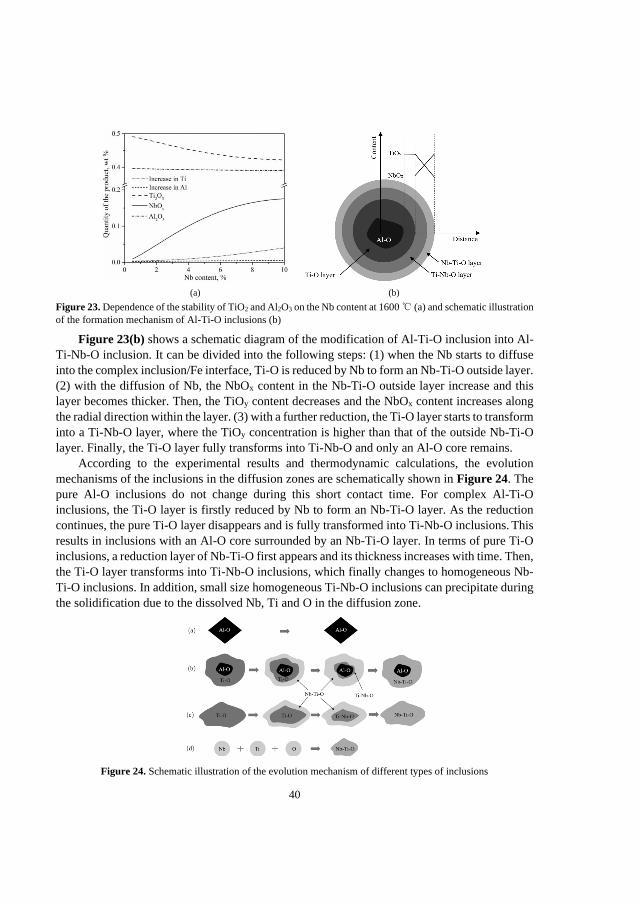
40
(a) (b)
Figure 23. Dependence of the stability of TiO2 and Al2O3 on the Nb content at 1600 ℃ (a) and schematic illustration
of the formation mechanism of Al-Ti-O inclusions (b)
Figure 23(b) shows a schematic diagram of the modification of Al-Ti-O inclusion into Al-
Ti-Nb-O inclusion. It can be divided into the following steps: (1) when the Nb starts to diffuse
into the complex inclusion/Fe interface, Ti-O is reduced by Nb to form an Nb-Ti-O outside layer.
(2) with the diffusion of Nb, the NbOx content in the Nb-Ti-O outside layer increase and this
layer becomes thicker. Then, the TiOy content decreases and the NbOx content increases along
the radial direction within the layer. (3) with a further reduction, the Ti-O layer starts to transform
into a Ti-Nb-O layer, where the TiOy concentration is higher than that of the outside Nb-Ti-O
layer. Finally, the Ti-O layer fully transforms into Ti-Nb-O and only an Al-O core remains.
According to the experimental results and thermodynamic calculations, the evolution
mechanisms of the inclusions in the diffusion zones are schematically shown in Figure 24. The
pure Al-O inclusions do not change during this short contact time. For complex Al-Ti-O
inclusions, the Ti-O layer is firstly reduced by Nb to form an Nb-Ti-O layer. As the reduction
continues, the pure Ti-O layer disappears and is fully transformed into Ti-Nb-O inclusions. This
results in inclusions with an Al-O core surrounded by an Nb-Ti-O layer. In terms of pure Ti-O
inclusions, a reduction layer of Nb-Ti-O first appears and its thickness increases with time. Then,
the Ti-O layer transforms into Ti-Nb-O inclusions, which finally changes to homogeneous Nb-
Ti-O inclusions. In addition, small size homogeneous Ti-Nb-O inclusions can precipitate during
the solidification due to the dissolved Nb, Ti and O in the diffusion zone.
Figure 24. Schematic illustration of the evolution mechanism of different types of inclusions
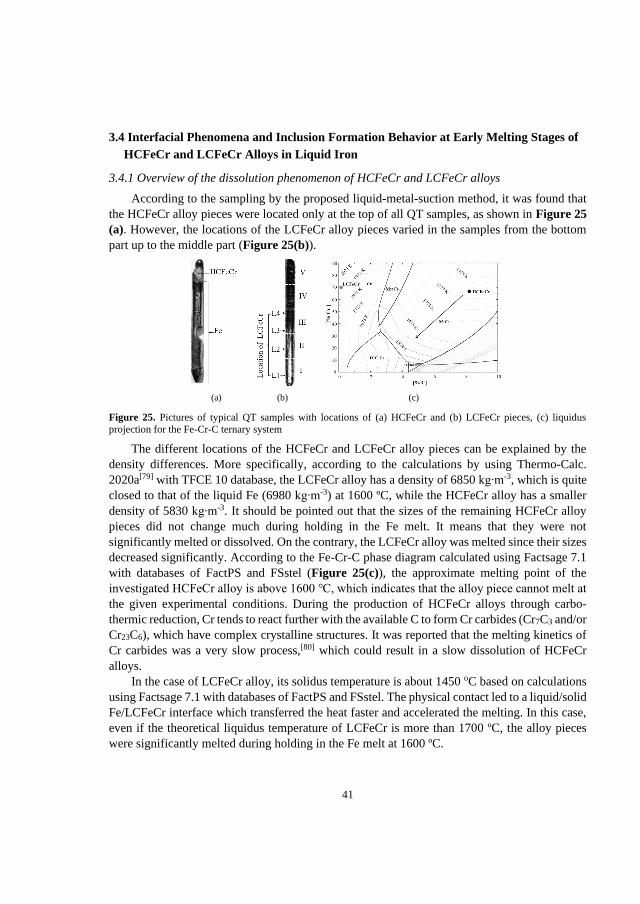
41
3.4 Interfacial Phenomena and Inclusion Formation Behavior at Early Melting Stages of
HCFeCr and LCFeCr Alloys in Liquid Iron
3.4.1 Overview of the dissolution phenomenon of HCFeCr and LCFeCr alloys
According to the sampling by the proposed liquid-metal-suction method, it was found that
the HCFeCr alloy pieces were located only at the top of all QT samples, as shown in Figure 25
(a). However, the locations of the LCFeCr alloy pieces varied in the samples from the bottom
part up to the middle part (Figure 25(b)).
(a) (b) (c)
Figure 25. Pictures of typical QT samples with locations of (a) HCFeCr and (b) LCFeCr pieces, (c) liquidus
projection for the Fe-Cr-C ternary system
The different locations of the HCFeCr and LCFeCr alloy pieces can be explained by the
density differences. More specifically, according to the calculations by using Thermo-Calc.
2020a[79] with TFCE 10 database, the LCFeCr alloy has a density of 6850 kg∙m-3, which is quite
closed to that of the liquid Fe (6980 kg∙m-3) at 1600 ºC, while the HCFeCr alloy has a smaller
density of 5830 kg∙m-3. It should be pointed out that the sizes of the remaining HCFeCr alloy
pieces did not change much during holding in the Fe melt. It means that they were not
significantly melted or dissolved. On the contrary, the LCFeCr alloy was melted since their sizes
decreased significantly. According to the Fe-Cr-C phase diagram calculated using Factsage 7.1
with databases of FactPS and FSstel (Figure 25(c)), the approximate melting point of the
investigated HCFeCr alloy is above 1600 ℃, which indicates that the alloy piece cannot melt at
the given experimental conditions. During the production of HCFeCr alloys through carbo-
thermic reduction, Cr tends to react further with the available C to form Cr carbides (Cr7C3 and/or
Cr23C6), which have complex crystalline structures. It was reported that the melting kinetics of
Cr carbides was a very slow process,[80] which could result in a slow dissolution of HCFeCr
alloys.
In the case of LCFeCr alloy, its solidus temperature is about 1450 oC based on calculations
using Factsage 7.1 with databases of FactPS and FSstel. The physical contact led to a liquid/solid
Fe/LCFeCr interface which transferred the heat faster and accelerated the melting. In this case,
even if the theoretical liquidus temperature of LCFeCr is more than 1700 ºC, the alloy pieces
were significantly melted during holding in the Fe melt at 1600 ºC.
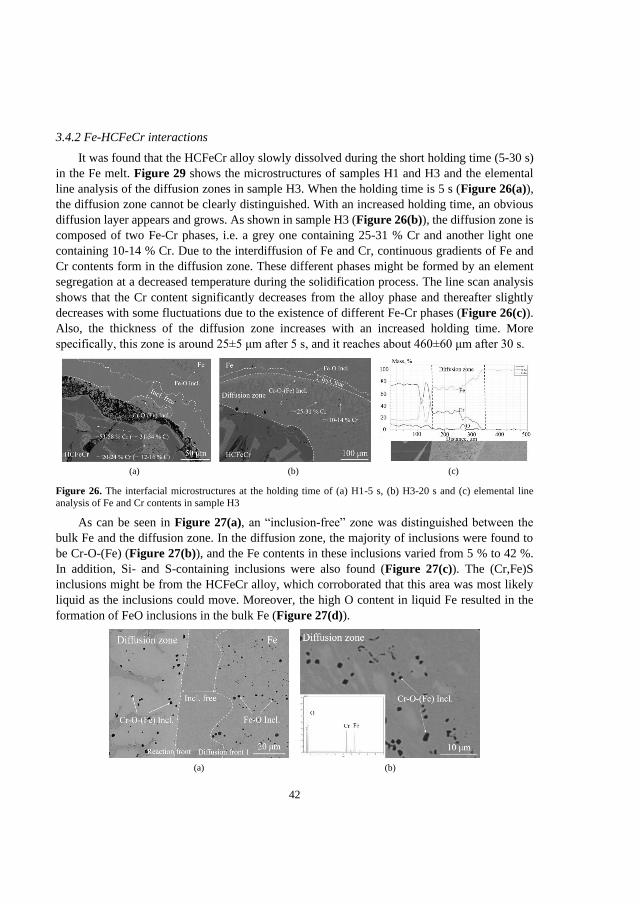
42
3.4.2 Fe-HCFeCr interactions
It was found that the HCFeCr alloy slowly dissolved during the short holding time (5-30 s)
in the Fe melt. Figure 29 shows the microstructures of samples H1 and H3 and the elemental
line analysis of the diffusion zones in sample H3. When the holding time is 5 s (Figure 26(a)),
the diffusion zone cannot be clearly distinguished. With an increased holding time, an obvious
diffusion layer appears and grows. As shown in sample H3 (Figure 26(b)), the diffusion zone is
composed of two Fe-Cr phases, i.e. a grey one containing 25-31 % Cr and another light one
containing 10-14 % Cr. Due to the interdiffusion of Fe and Cr, continuous gradients of Fe and
Cr contents form in the diffusion zone. These different phases might be formed by an element
segregation at a decreased temperature during the solidification process. The line scan analysis
shows that the Cr content significantly decreases from the alloy phase and thereafter slightly
decreases with some fluctuations due to the existence of different Fe-Cr phases (Figure 26(c)).
Also, the thickness of the diffusion zone increases with an increased holding time. More
specifically, this zone is around 25±5 μm after 5 s, and it reaches about 460±60 μm after 30 s.
(a) (b) (c)
Figure 26. The interfacial microstructures at the holding time of (a) H1-5 s, (b) H3-20 s and (c) elemental line
analysis of Fe and Cr contents in sample H3
As can be seen in Figure 27(a), an “inclusion-free” zone was distinguished between the
bulk Fe and the diffusion zone. In the diffusion zone, the majority of inclusions were found to
be Cr-O-(Fe) (Figure 27(b)), and the Fe contents in these inclusions varied from 5 % to 42 %.
In addition, Si- and S-containing inclusions were also found (Figure 27(c)). The (Cr,Fe)S
inclusions might be from the HCFeCr alloy, which corroborated that this area was most likely
liquid as the inclusions could move. Moreover, the high O content in liquid Fe resulted in the
formation of FeO inclusions in the bulk Fe (Figure 27(d)).
(a) (b)
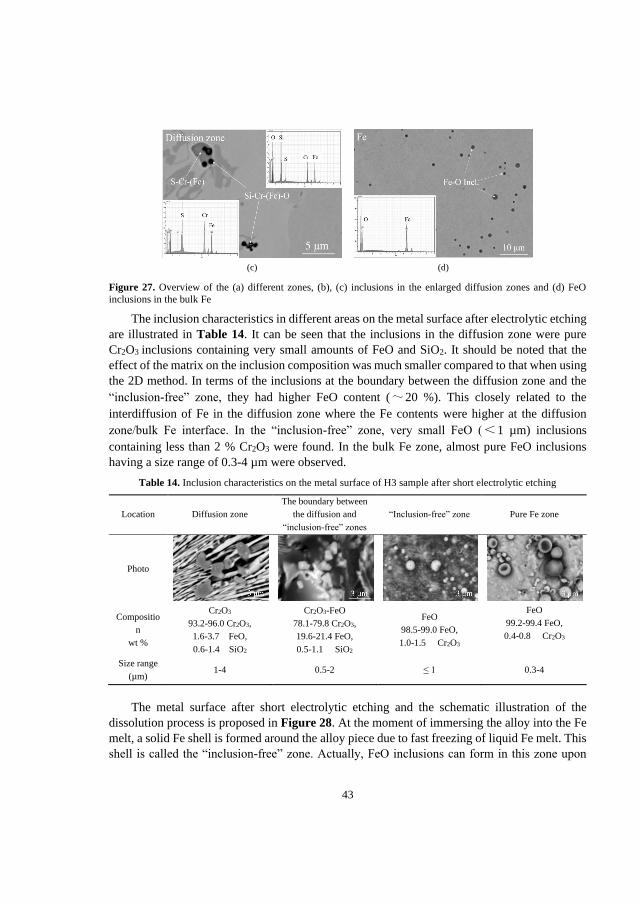
43
(c) (d)
Figure 27. Overview of the (a) different zones, (b), (c) inclusions in the enlarged diffusion zones and (d) FeO
inclusions in the bulk Fe
The inclusion characteristics in different areas on the metal surface after electrolytic etching
are illustrated in Table 14. It can be seen that the inclusions in the diffusion zone were pure
Cr2O3 inclusions containing very small amounts of FeO and SiO2. It should be noted that the
effect of the matrix on the inclusion composition was much smaller compared to that when using
the 2D method. In terms of the inclusions at the boundary between the diffusion zone and the
“inclusion-free” zone, they had higher FeO content (~20 %). This closely related to the
interdiffusion of Fe in the diffusion zone where the Fe contents were higher at the diffusion
zone/bulk Fe interface. In the “inclusion-free” zone, very small FeO (<1 µm) inclusions
containing less than 2 % Cr2O3 were found. In the bulk Fe zone, almost pure FeO inclusions
having a size range of 0.3-4 µm were observed.
Table 14. Inclusion characteristics on the metal surface of H3 sample after short electrolytic etching
Location Diffusion zone
The boundary between
the diffusion and
“inclusion-free” zones
“Inclusion-free” zone Pure Fe zone
Photo
Compositio
n
wt %
Cr2O3
93.2-96.0 Cr2O3,
1.6-3.7 FeO,
0.6-1.4 SiO2
Cr2O3-FeO
78.1-79.8 Cr2O3,
19.6-21.4 FeO,
0.5-1.1 SiO2
FeO
98.5-99.0 FeO,
1.0-1.5 Cr2O3
FeO
99.2-99.4 FeO,
0.4-0.8 Cr2O3
Size range
(µm) 1-4 0.5-2 ≤ 1 0.3-4
The metal surface after short electrolytic etching and the schematic illustration of the
dissolution process is proposed in Figure 28. At the moment of immersing the alloy into the Fe
melt, a solid Fe shell is formed around the alloy piece due to fast freezing of liquid Fe melt. This
shell is called the “inclusion-free” zone. Actually, FeO inclusions can form in this zone upon
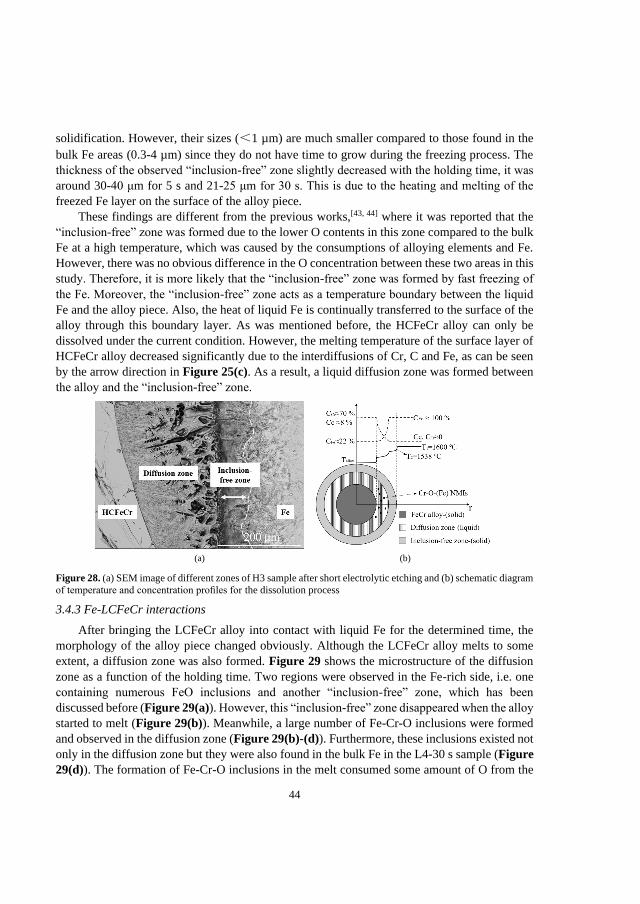
44
solidification. However, their sizes (<1 µm) are much smaller compared to those found in the
bulk Fe areas (0.3-4 µm) since they do not have time to grow during the freezing process. The
thickness of the observed “inclusion-free” zone slightly decreased with the holding time, it was
around 30-40 μm for 5 s and 21-25 μm for 30 s. This is due to the heating and melting of the
freezed Fe layer on the surface of the alloy piece.
These findings are different from the previous works,[43, 44] where it was reported that the
“inclusion-free” zone was formed due to the lower O contents in this zone compared to the bulk
Fe at a high temperature, which was caused by the consumptions of alloying elements and Fe.
However, there was no obvious difference in the O concentration between these two areas in this
study. Therefore, it is more likely that the “inclusion-free” zone was formed by fast freezing of
the Fe. Moreover, the “inclusion-free” zone acts as a temperature boundary between the liquid
Fe and the alloy piece. Also, the heat of liquid Fe is continually transferred to the surface of the
alloy through this boundary layer. As was mentioned before, the HCFeCr alloy can only be
dissolved under the current condition. However, the melting temperature of the surface layer of
HCFeCr alloy decreased significantly due to the interdiffusions of Cr, C and Fe, as can be seen
by the arrow direction in Figure 25(c). As a result, a liquid diffusion zone was formed between
the alloy and the “inclusion-free” zone.
(a) (b)
Figure 28. (a) SEM image of different zones of H3 sample after short electrolytic etching and (b) schematic diagram
of temperature and concentration profiles for the dissolution process
3.4.3 Fe-LCFeCr interactions
After bringing the LCFeCr alloy into contact with liquid Fe for the determined time, the
morphology of the alloy piece changed obviously. Although the LCFeCr alloy melts to some
extent, a diffusion zone was also formed. Figure 29 shows the microstructure of the diffusion
zone as a function of the holding time. Two regions were observed in the Fe-rich side, i.e. one
containing numerous FeO inclusions and another “inclusion-free” zone, which has been
discussed before (Figure 29(a)). However, this “inclusion-free” zone disappeared when the alloy
started to melt (Figure 29(b)). Meanwhile, a large number of Fe-Cr-O inclusions were formed
and observed in the diffusion zone (Figure 29(b)-(d)). Furthermore, these inclusions existed not
only in the diffusion zone but they were also found in the bulk Fe in the L4-30 s sample (Figure
29(d)). The formation of Fe-Cr-O inclusions in the melt consumed some amount of O from the
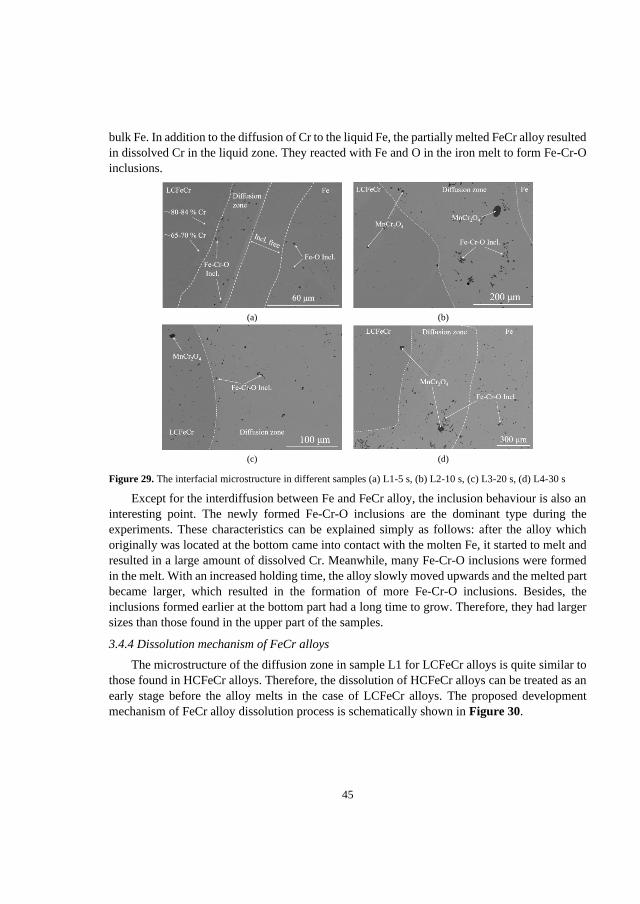
45
bulk Fe. In addition to the diffusion of Cr to the liquid Fe, the partially melted FeCr alloy resulted
in dissolved Cr in the liquid zone. They reacted with Fe and O in the iron melt to form Fe-Cr-O
inclusions.
(a) (b)
(c) (d)
Figure 29. The interfacial microstructure in different samples (a) L1-5 s, (b) L2-10 s, (c) L3-20 s, (d) L4-30 s
Except for the interdiffusion between Fe and FeCr alloy, the inclusion behaviour is also an
interesting point. The newly formed Fe-Cr-O inclusions are the dominant type during the
experiments. These characteristics can be explained simply as follows: after the alloy which
originally was located at the bottom came into contact with the molten Fe, it started to melt and
resulted in a large amount of dissolved Cr. Meanwhile, many Fe-Cr-O inclusions were formed
in the melt. With an increased holding time, the alloy slowly moved upwards and the melted part
became larger, which resulted in the formation of more Fe-Cr-O inclusions. Besides, the
inclusions formed earlier at the bottom part had a long time to grow. Therefore, they had larger
sizes than those found in the upper part of the samples.
3.4.4 Dissolution mechanism of FeCr alloys
The microstructure of the diffusion zone in sample L1 for LCFeCr alloys is quite similar to
those found in HCFeCr alloys. Therefore, the dissolution of HCFeCr alloys can be treated as an
early stage before the alloy melts in the case of LCFeCr alloys. The proposed development
mechanism of FeCr alloy dissolution process is schematically shown in Figure 30.
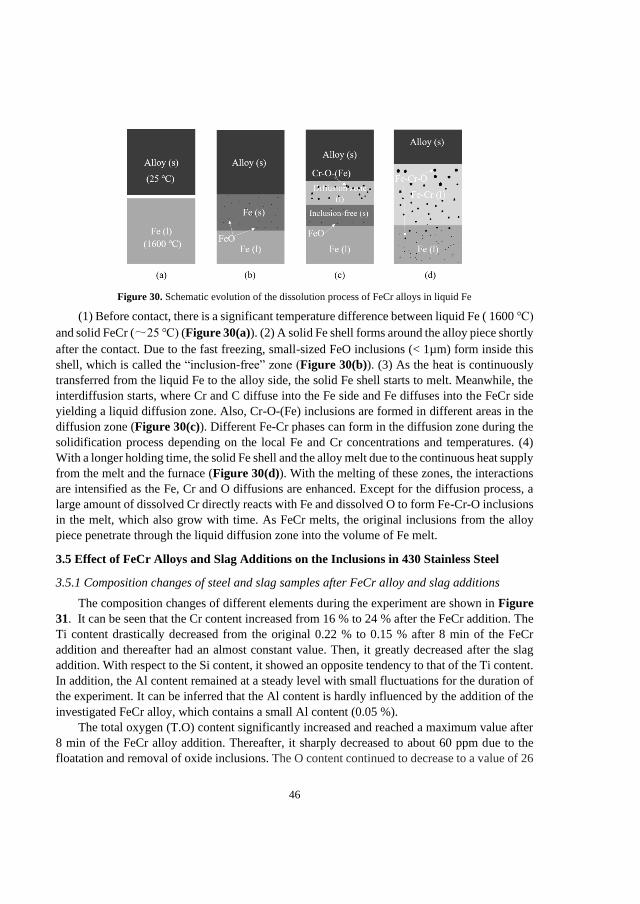
46
Figure 30. Schematic evolution of the dissolution process of FeCr alloys in liquid Fe
(1) Before contact, there is a significant temperature difference between liquid Fe ( 1600 ℃)
and solid FeCr (~25 ℃) (Figure 30(a)). (2) A solid Fe shell forms around the alloy piece shortly
after the contact. Due to the fast freezing, small-sized FeO inclusions (< 1µm) form inside this
shell, which is called the “inclusion-free” zone (Figure 30(b)). (3) As the heat is continuously
transferred from the liquid Fe to the alloy side, the solid Fe shell starts to melt. Meanwhile, the
interdiffusion starts, where Cr and C diffuse into the Fe side and Fe diffuses into the FeCr side
yielding a liquid diffusion zone. Also, Cr-O-(Fe) inclusions are formed in different areas in the
diffusion zone (Figure 30(c)). Different Fe-Cr phases can form in the diffusion zone during the
solidification process depending on the local Fe and Cr concentrations and temperatures. (4)
With a longer holding time, the solid Fe shell and the alloy melt due to the continuous heat supply
from the melt and the furnace (Figure 30(d)). With the melting of these zones, the interactions
are intensified as the Fe, Cr and O diffusions are enhanced. Except for the diffusion process, a
large amount of dissolved Cr directly reacts with Fe and dissolved O to form Fe-Cr-O inclusions
in the melt, which also grow with time. As FeCr melts, the original inclusions from the alloy
piece penetrate through the liquid diffusion zone into the volume of Fe melt.
3.5 Effect of FeCr Alloys and Slag Additions on the Inclusions in 430 Stainless Steel
3.5.1 Composition changes of steel and slag samples after FeCr alloy and slag additions
The composition changes of different elements during the experiment are shown in Figure
31. It can be seen that the Cr content increased from 16 % to 24 % after the FeCr addition. The
Ti content drastically decreased from the original 0.22 % to 0.15 % after 8 min of the FeCr
addition and thereafter had an almost constant value. Then, it greatly decreased after the slag
addition. With respect to the Si content, it showed an opposite tendency to that of the Ti content.
In addition, the Al content remained at a steady level with small fluctuations for the duration of
the experiment. It can be inferred that the Al content is hardly influenced by the addition of the
investigated FeCr alloy, which contains a small Al content (0.05 %).
The total oxygen (T.O) content significantly increased and reached a maximum value after
8 min of the FeCr alloy addition. Thereafter, it sharply decreased to about 60 ppm due to the
floatation and removal of oxide inclusions. The O content continued to decrease to a value of 26
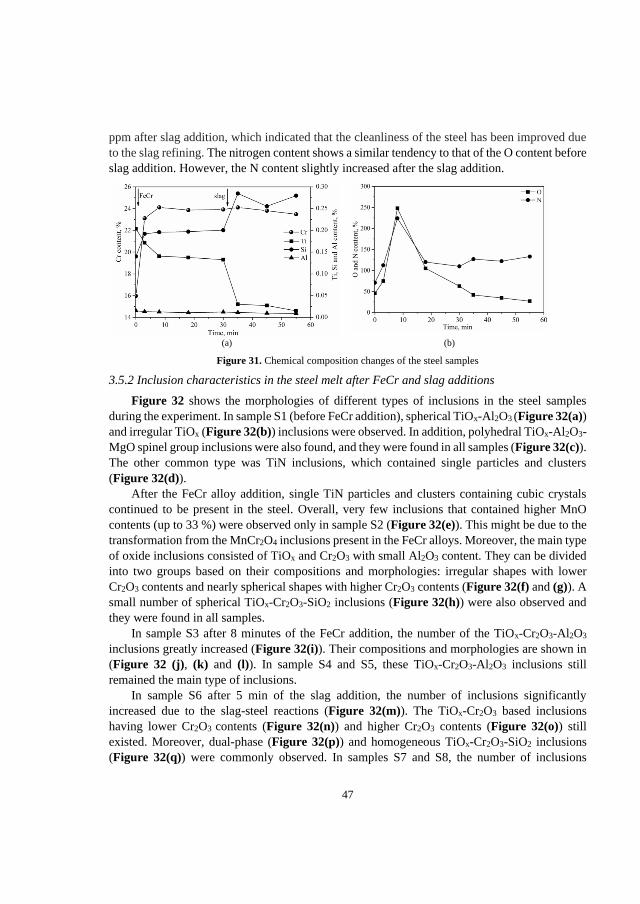
47
ppm after slag addition, which indicated that the cleanliness of the steel has been improved due
to the slag refining. The nitrogen content shows a similar tendency to that of the O content before
slag addition. However, the N content slightly increased after the slag addition.
(a) (b)
Figure 31. Chemical composition changes of the steel samples
3.5.2 Inclusion characteristics in the steel melt after FeCr and slag additions
Figure 32 shows the morphologies of different types of inclusions in the steel samples
during the experiment. In sample S1 (before FeCr addition), spherical TiOx-Al2O3 (Figure 32(a))
and irregular TiOx (Figure 32(b)) inclusions were observed. In addition, polyhedral TiOx-Al2O3-
MgO spinel group inclusions were also found, and they were found in all samples (Figure 32(c)).
The other common type was TiN inclusions, which contained single particles and clusters
(Figure 32(d)).
After the FeCr alloy addition, single TiN particles and clusters containing cubic crystals
continued to be present in the steel. Overall, very few inclusions that contained higher MnO
contents (up to 33 %) were observed only in sample S2 (Figure 32(e)). This might be due to the
transformation from the MnCr2O4 inclusions present in the FeCr alloys. Moreover, the main type
of oxide inclusions consisted of TiOx and Cr2O3 with small Al2O3 content. They can be divided
into two groups based on their compositions and morphologies: irregular shapes with lower
Cr2O3 contents and nearly spherical shapes with higher Cr2O3 contents (Figure 32(f) and (g)). A
small number of spherical TiOx-Cr2O3-SiO2 inclusions (Figure 32(h)) were also observed and
they were found in all samples.
In sample S3 after 8 minutes of the FeCr addition, the number of the TiOx-Cr2O3-Al2O3
inclusions greatly increased (Figure 32(i)). Their compositions and morphologies are shown in
(Figure 32 (j), (k) and (l)). In sample S4 and S5, these TiOx-Cr2O3-Al2O3 inclusions still
remained the main type of inclusions.
In sample S6 after 5 min of the slag addition, the number of inclusions significantly
increased due to the slag-steel reactions (Figure 32(m)). The TiOx-Cr2O3 based inclusions
having lower Cr2O3 contents (Figure 32(n)) and higher Cr2O3 contents (Figure 32(o)) still
existed. Moreover, dual-phase (Figure 32(p)) and homogeneous TiOx-Cr2O3-SiO2 inclusions
(Figure 32(q)) were commonly observed. In samples S7 and S8, the number of inclusions
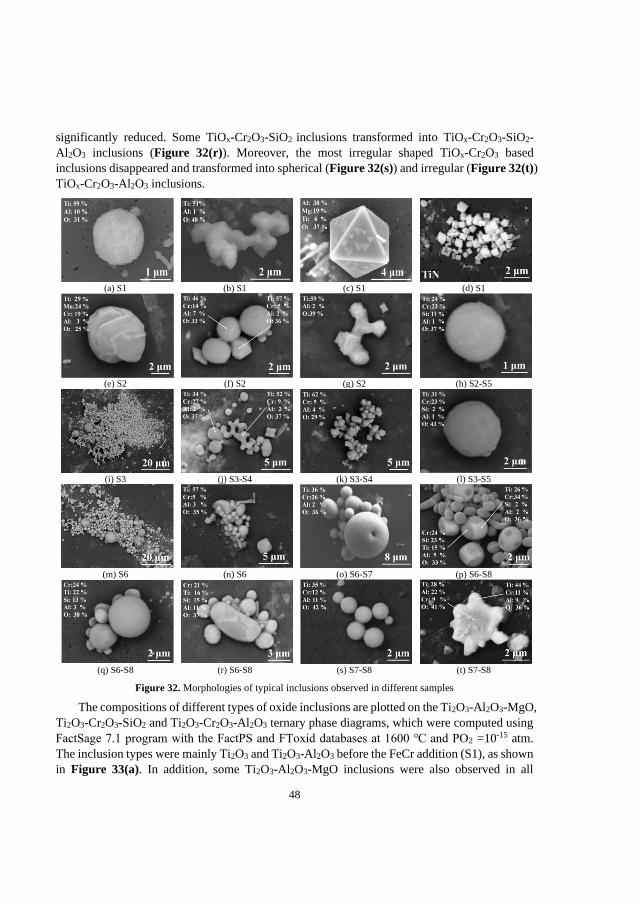
48
significantly reduced. Some TiOx-Cr2O3-SiO2 inclusions transformed into TiOx-Cr2O3-SiO2-
Al2O3 inclusions (Figure 32(r)). Moreover, the most irregular shaped TiOx-Cr2O3 based
inclusions disappeared and transformed into spherical (Figure 32(s)) and irregular (Figure 32(t))
TiOx-Cr2O3-Al2O3 inclusions.
(a) S1 (b) S1 (c) S1 (d) S1
(e) S2 (f) S2 (g) S2 (h) S2-S5
(i) S3 (j) S3-S4 (k) S3-S4 (l) S3-S5
(m) S6 (n) S6 (o) S6-S7 (p) S6-S8
(q) S6-S8 (r) S6-S8 (s) S7-S8 (t) S7-S8
Figure 32. Morphologies of typical inclusions observed in different samples
The compositions of different types of oxide inclusions are plotted on the Ti2O3-Al2O3-MgO,
Ti2O3-Cr2O3-SiO2 and Ti2O3-Cr2O3-Al2O3 ternary phase diagrams, which were computed using
FactSage 7.1 program with the FactPS and FToxid databases at 1600 ℃ and PO2 =10-15 atm.
The inclusion types were mainly Ti2O3 and Ti2O3-Al2O3 before the FeCr addition (S1), as shown
in Figure 33(a). In addition, some Ti2O3-Al2O3-MgO inclusions were also observed in all
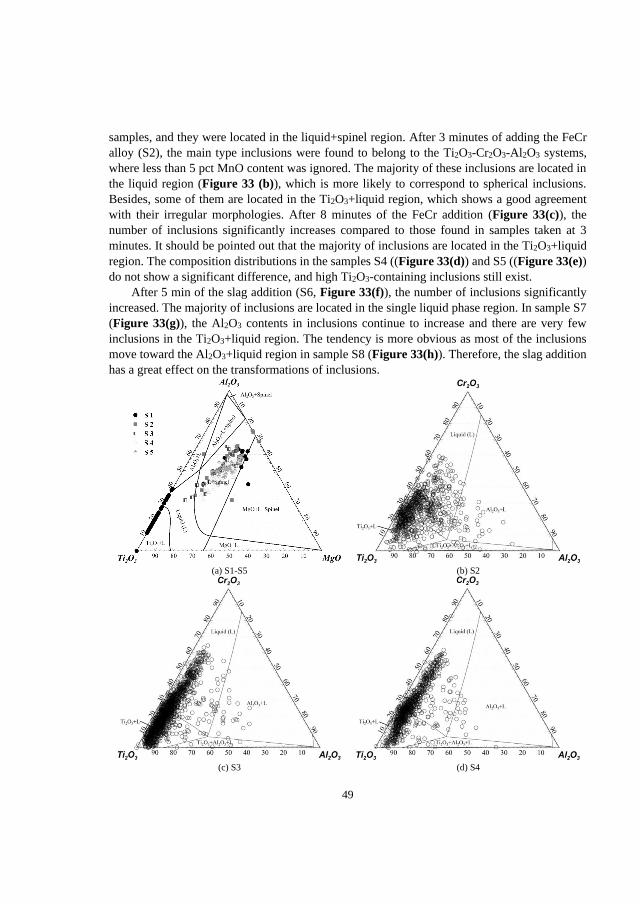
49
samples, and they were located in the liquid+spinel region. After 3 minutes of adding the FeCr
alloy (S2), the main type inclusions were found to belong to the Ti2O3-Cr2O3-Al2O3 systems,
where less than 5 pct MnO content was ignored. The majority of these inclusions are located in
the liquid region (Figure 33 (b)), which is more likely to correspond to spherical inclusions.
Besides, some of them are located in the Ti2O3+liquid region, which shows a good agreement
with their irregular morphologies. After 8 minutes of the FeCr addition (Figure 33(c)), the
number of inclusions significantly increases compared to those found in samples taken at 3
minutes. It should be pointed out that the majority of inclusions are located in the Ti2O3+liquid
region. The composition distributions in the samples S4 ((Figure 33(d)) and S5 ((Figure 33(e))
do not show a significant difference, and high Ti2O3-containing inclusions still exist.
After 5 min of the slag addition (S6, Figure 33(f)), the number of inclusions significantly
increased. The majority of inclusions are located in the single liquid phase region. In sample S7
(Figure 33(g)), the Al2O3 contents in inclusions continue to increase and there are very few
inclusions in the Ti2O3+liquid region. The tendency is more obvious as most of the inclusions
move toward the Al2O3+liquid region in sample S8 (Figure 33(h)). Therefore, the slag addition
has a great effect on the transformations of inclusions.
(a) S1-S5 (b) S2
(c) S3 (d) S4
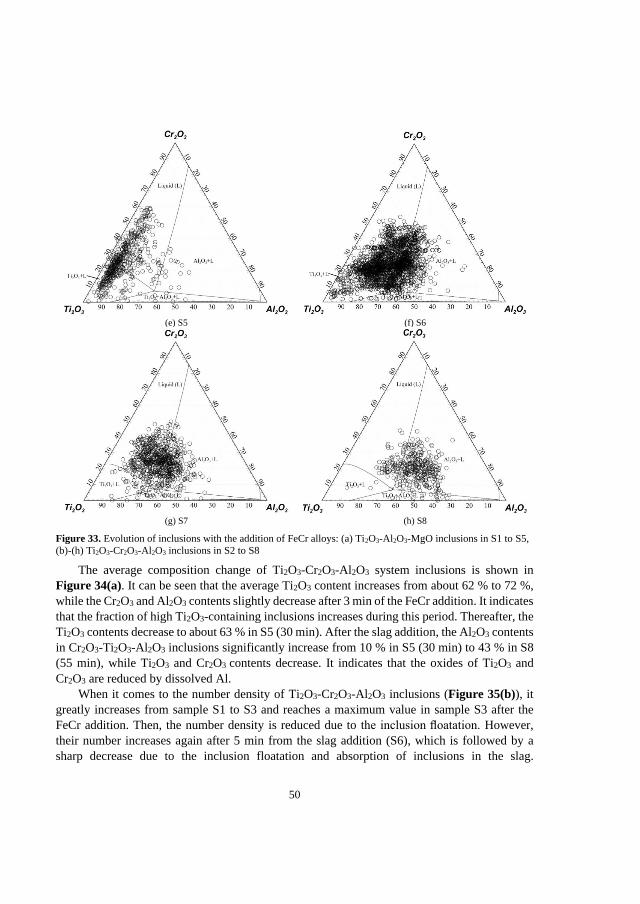
50
(e) S5 (f) S6
(g) S7 (h) S8
Figure 33. Evolution of inclusions with the addition of FeCr alloys: (a) Ti2O3-Al2O3-MgO inclusions in S1 to S5,
(b)-(h) Ti2O3-Cr2O3-Al2O3 inclusions in S2 to S8
The average composition change of Ti2O3-Cr2O3-Al2O3 system inclusions is shown in
Figure 34(a). It can be seen that the average Ti2O3 content increases from about 62 % to 72 %,
while the Cr2O3 and Al2O3 contents slightly decrease after 3 min of the FeCr addition. It indicates
that the fraction of high Ti2O3-containing inclusions increases during this period. Thereafter, the
Ti2O3 contents decrease to about 63 % in S5 (30 min). After the slag addition, the Al2O3 contents
in Cr2O3-Ti2O3-Al2O3 inclusions significantly increase from 10 % in S5 (30 min) to 43 % in S8
(55 min), while Ti2O3 and Cr2O3 contents decrease. It indicates that the oxides of Ti2O3 and
Cr2O3 are reduced by dissolved Al.
When it comes to the number density of Ti2O3-Cr2O3-Al2O3 inclusions (Figure 35(b)), it
greatly increases from sample S1 to S3 and reaches a maximum value in sample S3 after the
FeCr addition. Then, the number density is reduced due to the inclusion floatation. However,
their number increases again after 5 min from the slag addition (S6), which is followed by a
sharp decrease due to the inclusion floatation and absorption of inclusions in the slag.
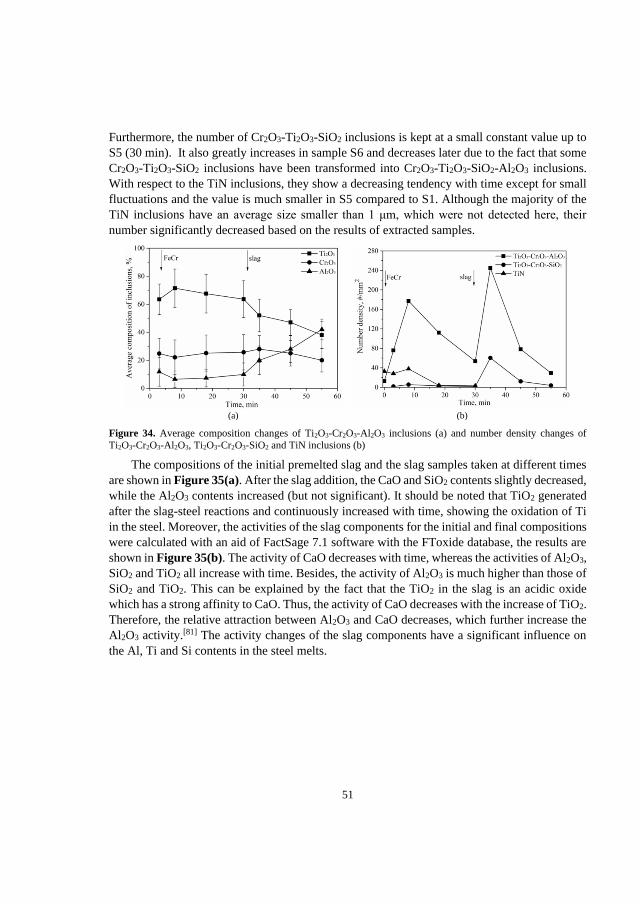
51
Furthermore, the number of Cr2O3-Ti2O3-SiO2 inclusions is kept at a small constant value up to
S5 (30 min). It also greatly increases in sample S6 and decreases later due to the fact that some
Cr2O3-Ti2O3-SiO2 inclusions have been transformed into Cr2O3-Ti2O3-SiO2-Al2O3 inclusions.
With respect to the TiN inclusions, they show a decreasing tendency with time except for small
fluctuations and the value is much smaller in S5 compared to S1. Although the majority of the
TiN inclusions have an average size smaller than 1 μm, which were not detected here, their
number significantly decreased based on the results of extracted samples.
(a) (b)
Figure 34. Average composition changes of Ti2O3-Cr2O3-Al2O3 inclusions (a) and number density changes of
Ti2O3-Cr2O3-Al2O3, Ti2O3-Cr2O3-SiO2 and TiN inclusions (b)
The compositions of the initial premelted slag and the slag samples taken at different times
are shown in Figure 35(a). After the slag addition, the CaO and SiO2 contents slightly decreased,
while the Al2O3 contents increased (but not significant). It should be noted that TiO2 generated
after the slag-steel reactions and continuously increased with time, showing the oxidation of Ti
in the steel. Moreover, the activities of the slag components for the initial and final compositions
were calculated with an aid of FactSage 7.1 software with the FToxide database, the results are
shown in Figure 35(b). The activity of CaO decreases with time, whereas the activities of Al2O3,
SiO2 and TiO2 all increase with time. Besides, the activity of Al2O3 is much higher than those of
SiO2 and TiO2. This can be explained by the fact that the TiO2 in the slag is an acidic oxide
which has a strong affinity to CaO. Thus, the activity of CaO decreases with the increase of TiO2.
Therefore, the relative attraction between Al2O3 and CaO decreases, which further increase the
Al2O3 activity.[81] The activity changes of the slag components have a significant influence on
the Al, Ti and Si contents in the steel melts.
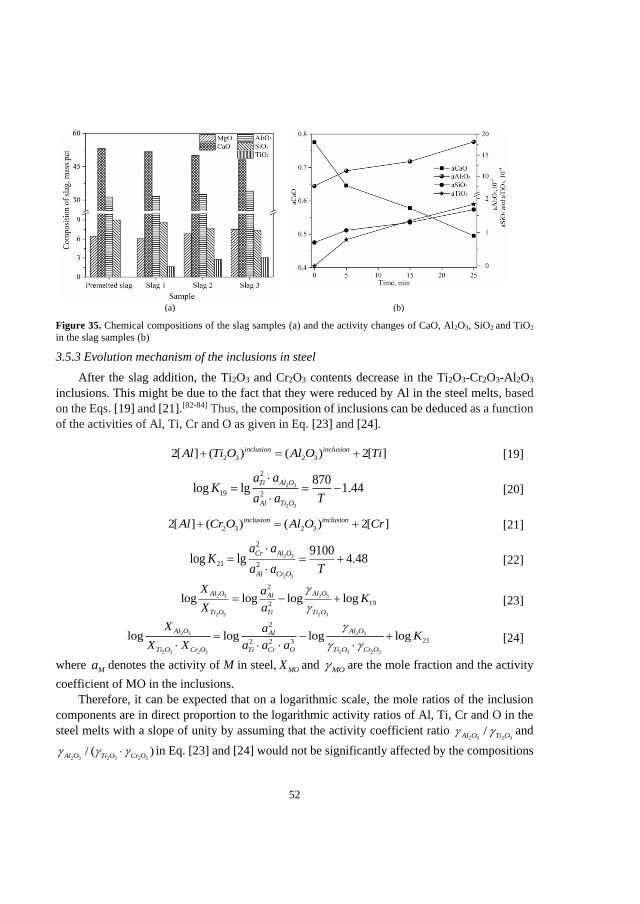
52
(a) (b)
Figure 35. Chemical compositions of the slag samples (a) and the activity changes of CaO, Al2O3, SiO2 and TiO2
in the slag samples (b)
3.5.3 Evolution mechanism of the inclusions in steel
After the slag addition, the Ti2O3 and Cr2O3 contents decrease in the Ti2O3-Cr2O3-Al2O3
inclusions. This might be due to the fact that they were reduced by Al in the steel melts, based
on the Eqs. [19] and [21].[82-84] Thus, the composition of inclusions can be deduced as a function
of the activities of Al, Ti, Cr and O as given in Eq. [23] and [24].
2 3 2 32[ ] ( ) ( ) 2[ ]inclusion inclusionAl Ti O Al O Ti+ = + [19]
2 3
2 3
2
19 2
870log lg 1.44
Ti Al O
Al Ti O
a aK
a a T
= = −
[20]
2 3 2 32[ ] ( ) ( ) 2[ ]inclusion inclusionAl Cr O Al O Cr+ = + [21]
2 3
2 3
2
21 2
9100log lg 4.48
Cr Al O
Al Cr O
a aK
a a T
= = +
[22]
2 3 2 3
2 3 2 3
2
192log log log log
Al O Al OAl
Ti O Ti Ti O
X aK
X a
= − + [23]
2 3 2 3
2 3 2 3 2 3 2 3
2
212 2 3log log log log
Al O Al OAl
Ti O Cr O Ti Cr O Ti O Cr O
X aK
X X a a a
= − +
[24]
where Ma denotes the activity of M in steel,
MOX and MO are the mole fraction and the activity
coefficient of MO in the inclusions.
Therefore, it can be expected that on a logarithmic scale, the mole ratios of the inclusion
components are in direct proportion to the logarithmic activity ratios of Al, Ti, Cr and O in the
steel melts with a slope of unity by assuming that the activity coefficient ratio 2 3 2 3
/Al O Ti O and
2 3 2 3 2 3/ ( )Al O Ti O Cr O in Eq. [23] and [24] would not be significantly affected by the compositions
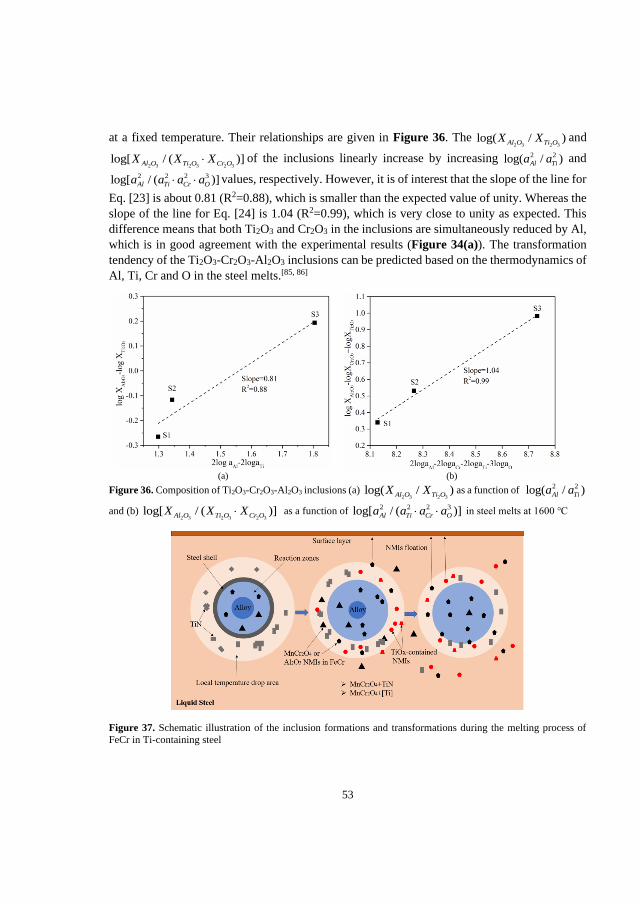
53
at a fixed temperature. Their relationships are given in Figure 36. The 2 3 2 3
log( / )Al O Ti OX X and
2 3 2 3 2 3log[ / ( )]Al O Ti O Cr OX X X of the inclusions linearly increase by increasing 2 2log( / )Al Tia a and
2 2 2 3log[ / ( )]Al Ti Cr Oa a a a values, respectively. However, it is of interest that the slope of the line for
Eq. [23] is about 0.81 (R2=0.88), which is smaller than the expected value of unity. Whereas the
slope of the line for Eq. [24] is 1.04 (R2=0.99), which is very close to unity as expected. This
difference means that both Ti2O3 and Cr2O3 in the inclusions are simultaneously reduced by Al,
which is in good agreement with the experimental results (Figure 34(a)). The transformation
tendency of the Ti2O3-Cr2O3-Al2O3 inclusions can be predicted based on the thermodynamics of
Al, Ti, Cr and O in the steel melts.[85, 86]
(a) (b)
Figure 36. Composition of Ti2O3-Cr2O3-Al2O3 inclusions (a) 2 3 2 3
log( / )Al O Ti OX X as a function of 2 2log( / )Al Tia a
and (b) 2 3 2 3 2 3
log[ / ( )]Al O Ti O Cr OX X X as a function of 2 2 2 3log[ / ( )]Al Ti Cr Oa a a a in steel melts at 1600 ℃
Figure 37. Schematic illustration of the inclusion formations and transformations during the melting process of
FeCr in Ti-containing steel
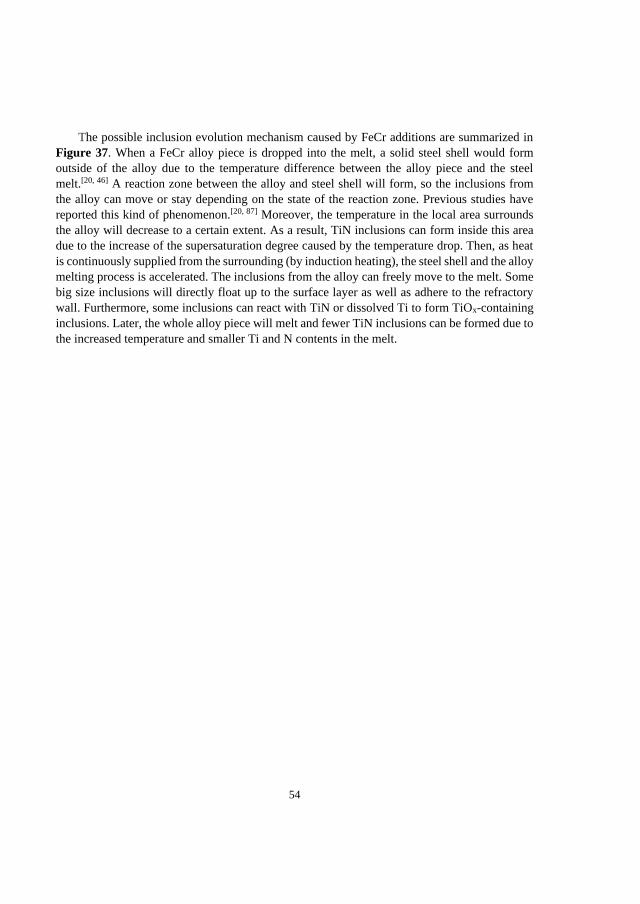
54
The possible inclusion evolution mechanism caused by FeCr additions are summarized in
Figure 37. When a FeCr alloy piece is dropped into the melt, a solid steel shell would form
outside of the alloy due to the temperature difference between the alloy piece and the steel
melt.[20, 46] A reaction zone between the alloy and steel shell will form, so the inclusions from
the alloy can move or stay depending on the state of the reaction zone. Previous studies have
reported this kind of phenomenon.[20, 87] Moreover, the temperature in the local area surrounds
the alloy will decrease to a certain extent. As a result, TiN inclusions can form inside this area
due to the increase of the supersaturation degree caused by the temperature drop. Then, as heat
is continuously supplied from the surrounding (by induction heating), the steel shell and the alloy
melting process is accelerated. The inclusions from the alloy can freely move to the melt. Some
big size inclusions will directly float up to the surface layer as well as adhere to the refractory
wall. Furthermore, some inclusions can react with TiN or dissolved Ti to form TiOx-containing
inclusions. Later, the whole alloy piece will melt and fewer TiN inclusions can be formed due to
the increased temperature and smaller Ti and N contents in the melt.
55
Chapter 4. Concluding Discussion
This study was carried out to evaluate the impurities in different ferroalloys and their effect
on steel cleanliness. The present work is mainly divided into four parts: (1) review work
regarding the ferroalloy cleanliness; (2) investigation of impurities in commercial used
ferroalloys during secondary steelmaking and the selection of impure ferroalloys for further
studies; (3) determination of the interfacial phenomena and inclusion formations at an early
melting stage for the selected ferroalloys and (4) investigation of the influence of the impurities
on the selected steel grades based on a laboratory-scale experiment. The goals of this study were
achieved by accomplishing the different tasks in three main parts.
1. Review work of the inclusions in different ferroalloys
Nowadays, the steelmakers only know the compositions of the ferroalloys provided by the
suppliers and lack the exact information about the main elemental impurities and inclusions
present in ferroalloys. Previous works on the inclusions in different ferroalloys and their
behaviours in steel have been reviewed in supplement Ⅰ. The possible harmful inclusions and
their origins in ferroalloys were discussed. Some suggestions were made for future research work
for each studied ferroalloy grade.
2. Investigation of the impurities in different ferroalloys
The present study leads to a better understanding of the impurities in the commercial
ferroalloys during the secondary steelmaking processes. The ferroalloys chosen for this study
were FeSi, HCFeCr, LCFeCr, FeMo, FeV, FeTi, FeNb, FeW, FeB, MnN and FeCrN (supplement
Ⅱ and Ⅲ). These ferroalloys were investigated using a combination of the polished two-
dimensional method and the three-dimensional electrolytic extraction method on both film filters
and metal surfaces.
The inclusions obtained in these ferroalloys were mostly silica or alumina; and or
the oxides of the base elements. The main elemental impurities and inclusions were closely
related to their manufacturing routes, such as SiO2 in FeMo and FeW alloys caused by the
silicothermic reduction method. Moreover, the presence of Al2O3 inclusions in FeTi, FeV and
FeNb alloys is caused by the aluminothermic method. Therefore, the ferroalloy manufacturers
should carefully select suitable raw materials and optimize their production process according to
the quality requirements of the steel industry. Moreover, the traditional 2D polished method can
not always be applied for the investigation of inclusions in some specific ferroalloys, such as
FeSi and FeTi. The investigations of inclusions on the film filters can show some advantages
compared to the acid extraction method due to the fact that some inclusions can easily be
dissolved in acid. Furthermore, the investigations of inclusions on metal surface after electrolytic
extraction showed a big advantage in detecting larger sized inclusions (supplement Ⅳ).
Considering the complexity of the steelmaking process, the direct evidence of the influence
of the ferroalloy impurities on steel cleanliness may not be evident on the basis of the
characterization of ferroalloys alone. However, this investigation leads to a conclusion that there
is a possibility of impairing the steel cleanliness if some harmful inclusions cannot be removed
during the secondary steelmaking process, especially for some late addition stages. The obtained
56
knowledge about the impurities in different ferroalloys can help steelmakers to use the
ferroalloys in an improved way.
3. Investigation of the interfacial phenomena at the early melting stages of ferroalloys
In the laboratory study, the reaction zone of three different ferroalloys (FeNb, HCFeCr and
LCFeCr) on introduction to the liquid iron was studied (supplement Ⅴ and Ⅵ). The reaction
zone was obtained by suctioning a small quantity of liquid iron into a silica tube, where the
ferroalloy piece was placed. This reaction zone was formed due to the interdiffusion of the alloy
element and liquid iron, where their thickness increased with the contact time. The original stable
inclusions, such as Al2O3 in FeNb alloys and MnCr2O4 inclusions in LCFeCr alloys can move
in this zone and keep their original forms without changes. Some inclusions can transform in this
zone depending on the local high concentrations of the alloy elements surrounding the inclusions
and the temperature. Also, some new inclusions can form in the reaction zone when alloy melted
depending on the different O contents in the steel melt. It was observed that the dissolution
behaviour in addition to the base composition of ferroalloy, also depend on the nature of
impurities and matrix phases. It was concluded that the addition of FeNb and FeCr alloys in steel
certainly will lead to an introduction of inclusions to steel.
4. Investigation of the influence of impurities in FeCr alloys on the steel cleanliness
Steelmaking is a complex process that involves a variety of additions and contacts with
various fluxes and refractories at high temperatures. Therefore, laboratory-scale experiments
were made to investigate the influence of the ferroalloy impurities on steel cleanliness. It was
found that the MnCr2O4 inclusions from FeCr alloys can react with TiN inclusions or dissolved
Ti in Ti-containing steel to form TiOx-Cr2O3 liquid and high TiOx-containing inclusions.
Therefore, the effect of impurities in ferroalloys on steel cleanliness is greatly dependent on the
inclusions in steel and the steel composition (supplement Ⅶ). Moreover, the effect of slag
additions on the inclusion characteristics after the FeCr addition in Ti-containing steel was
evaluated (supplement Ⅷ). It was found that the slag can modify high TiOx-containing
inclusions into TiOx-Al2O3 system liquid inclusions and Al2O3-rich solid inclusions. In addition,
the Ti content greatly decreased after the slag addition. Therefore, a proper amount of TiO2
content should be added into the slag to get a low Ti loss in the steel melt.
The overall conclusion from this study is that: there is indeed an influence of ferroalloy
quality on the steel cleanliness. Therefore, there is scope for improving the steel quality with an
improved knowledge of ferroalloy additions or making the steelmaking process cost-effective
with the use of low-quality ferroalloys. A close communication between ferroalloy producers
and steelmakers will make ferroalloy producers aware of the specific requirements of the steel
industry, in turn, can make effective use of ferroalloys with the prior knowledge of the ferroalloy
impurities provided by the suppliers.
57
Chapter 5. Conclusions
This study has evaluated the impurities in different ferroalloys and also applied different
methods for inclusion determinations in ferroalloys. The early melting behaviours of FeNb and
FeCr alloys in liquid iron were investigated. Also, the effect of impurities in ferroalloys in
different steel grades was studied. Based on the results obtained in this study, several specific
conclusions from each supplement can be summarized as follows:
1. Non-metallic inclusions in Different Ferroalloys and Their Effect on the Steel Quality-A
Review (Supplement Ⅰ)
(1) The inclusions in steel after the additions of FeSi, FeMn and FeTi alloys have been more
studied than other types of ferroalloys. The effect of the Al, Ca contents on inclusions should be
considered before the addition of FeSi alloys. In Si-killed steel, the low Al and Ca containing
FeSi alloy is recommended to avoid the formation of Al2O3 and CaO in inclusions. In Al-killed
steel, FeSi containing Ca is recommended for the alloying process. MnO, MnS and MnO-SiO2-
MnS inclusions from FeMn and SiMn alloys have a temporary influence on the steel quality.
The addition of FeTi alloys can introduce Al2O3, Al-Ti-O and Ti-O inclusions in steel.
(2) Except for the inclusions in FeTi, FeNb and FeV alloys, the Ti-rich, Nb-rich, V-rich
carbides and nitrides, which have important effects on the steel properties should be studied
further. Specific alloys containing REM oxides, Cr(C,N), Cr-Mn-O, Al-Ti-O, TiS and Ti(C,N)
have not been studied enough to enable a judgement on their influence on the steel cleanliness.
2. Inclusion Characteristics in Different Ferroalloys (Supplement Ⅱ and Ⅲ)
(1) The existing inclusions in different ferroalloys were closely related to their
manufacturing routes, where the main inclusions were more likely the oxidization products of
the reductant and some unreduced ore during the production process, such as SiO2 in FeMo and
FeW alloys, TiOx in FeTi and MoOx in FeMo alloys.
(2) Pure Al2O3 and high Al2O3-containing inclusions were commonly found in FeV, FeNb,
FeCr and FeB alloys, and TiOx were observed in FeTi and FeNb alloys. Cr2O3-MnO and Cr2O3-
SiO2 based inclusions were commonly found in LCFeCr alloy. The main type of oxide inclusions
in N-contained ferroalloys were the oxides of the main elements. The characteristics of the
inclusions in ferroalloys should be known before their additions to the liquid steel, for a better
control of the inclusion characteristics during the steelmaking process.
3. Comparison of Nonmetallic Inclusion Characteristics in Metal Samples Using 2D and
3D Methods (Supplement Ⅳ)
(1) The 2D method is less accurate to detect the real morphology, size and number of
inclusions. The EE method is more recommendable to use to determine the number and accurate
morphology of inclusions and the accurate size of small-sized spherical inclusions and elongated
inclusions.
(2) A partial or full three-dimensional morphology of the inclusions can be observed when
using the MS method depending on the specific conditions. This method is more advantageous
58
to use when the aim is to detect the largest inclusions. Also, sometimes the real locations or
existence form of inclusions can only be obtained by using the MS method.
(3) In general, the EE method can show the complete types of inclusions in a sample, while
the MS method can only detect inclusions that are relatively large in size and number. Overall,
the results obtained by the EE method and the MS method should be combined together to get
more accurate information of the inclusion characteristics.
4. Interfacial Reactions and Inclusion Formations at an Early Stage of FeNb Alloy
Additions to Molten Iron (Supplement V)
(1) The early dissolution mechanism of the FeNb alloy in liquid Fe was proposed, which
was controlled by diffusion. A diffusion zone consisting of a continuously reduced Nb content
from the alloy to the bulk Fe was observed between the alloy and liquid iron, which was
attributed to the interdiffusion of liquid Fe and solid FeNb alloy. The thickness of the diffusion
zone increased with the contact time and the growth rate of the thickness was much higher at the
beginning of the contact.
(2) The Ti-O inclusions first transformed to heterogeneous inclusions with a Ti-O core
covered by an Nb-Ti-O outside layer and then changed to homogeneous Ti-Nb-O inclusions, due
to a reduction which was caused by a high Nb concentration surrounding the inclusions. The Ti-
O in the Ti-Al-O inclusions experienced the same transformation way and finally formed the
inclusions with the Al-O core surrounded by an Nb-Ti-O outside layer. However, pure Al-O
inclusions remained their original forms without changes. The addition of FeNb alloys in steel
certainly introduces Al-O and Al-Ti-Nb-O inclusions.
5. Interfacial Processes at Early Stages of HCFeCr and LCFeCr Alloys Additions into
Liquid Iron (Supplement Ⅵ)
(1) Interdiffusion between solid FeCr alloy and liquid Fe resulted in a diffusion zone, which
consisted of different Fe-Cr phases. In addition, the thickness of the diffusion zone increased
with the holding time. The LCFeCr alloys melt faster than HCFeCr alloys under the same
conditions. An “inclusion free” zone was observed in the Fe-rich side matrix, which was due to
the fast freezing of the Fe shell on the alloy surface.
(2) In the early dissolution of HCFeCr alloys, large numbers of Cr-O-(Fe) inclusions were
formed in the liquid diffusion zone and FeO inclusions formed in the bulk Fe only during
solidification of metal samples. While in the case of LCFeCr alloys, plenty of Fe-Cr-O inclusions
were found not only in the diffusion zone but also in the bulk Fe when the alloy started to melt.
Their characteristics were closely related to the dissolution and melting behaviour of the LCFeCr
alloy. In addition, inclusions originated from LCFeCr alloys were also found without obvious
changes in the diffusion zone and bulk Fe.
6. Effect of FeCr Alloys and Slag Additions on the Inclusions in 430 Stainless Steel
(Supplement Ⅶ and Ⅷ)
(1) After the FeCr additions, Ti2O3-Cr2O3 based inclusions with a small amount of Al2O3 (8
wt%) are located in the single liquid region and Ti2O3+liquid region. Their number density
59
greatly increased and reached a maximum value at 8 min after the FeCr addition. High melting
point Ti2O3-rich inclusions still existed in the final samples before the slag addition. Moreover,
the number density of TiN inclusions first increased and then significantly decreased to a much
smaller level compared with that before the FeCr addition.
(2) The critical N and Ti contents needed to form TiN inclusions increase with the increase
of Cr content in liquid steel. The MnCr2O4 inclusions from FeCr alloys can react with TiN
inclusions or dissolved Ti in Ti-containing steel to form TiOx-Cr2O3 liquid and high TiOx
contained inclusions. The dissolved Ti and Al in the melt can reduce MnCr2O4 inclusions,
however, the specific reaction mechanisms depend on the ratio of Ti/Al in the steel.
(3) High TiOx-containing inclusions transformed to Ti2O3-Cr2O3-Al2O3 and Ti2O3-Cr2O3-
SiO2 two system inclusions after the slag addition. The Al2O3 contents in the inclusions increased
with time while the Ti2O3 and Cr2O3 contents decreased. The 2 3 2 3 2 3
log[ / ( )]Al O Ti O Cr OX X X of the
inclusions was expressed as a linear function of 2 2 2 3log[ / ( )]Al Ti Cr Oa a a a of the steel melts with a
slope of unity theoretically expected.
60
Chapter 6. Sustainability and Recommendations for Future Work
6.1 Sustainability Considerations
From the viewpoint of sustainable steelmaking, the future of steelmaking involves many
challenges. The cleanliness of steels largely depends on the cleanliness of ferroalloys. The
steelmaking industry is the largest consumer of ferroalloys, so the developments in the steel
industry have a direct impact on the progress of the ferroalloy industry. This thesis contributes
to a more sustainable and high efficient steelmaking process by using suitable raw materials,
such as ferroalloys. The production process of ferroalloys can be improved after understanding
the importance of impurities in ferroalloys. Therefore, some expensive but clean quality
ferroalloy can be used to produce a particular steel grade without affecting the steel cleanliness.
Moreover, the demand for a cheap but low-quality ferroalloys can be used if the impurities can
be removed during the steelmaking process without any additional treatments. This will make
the ferroalloy manufacturing process energy-efficient and economical, because no separate
refining process is needed during the ferroalloy production. Also, the customer requirement is
focused on the mechanical properties of the steel grade, the steelmakers can select a particular
combination of ferroalloys considering the cost and the quality of the incoming ferroalloy to
bring consistent recovery results. Hence, it is possible to control the steel chemistry within close
tolerances to decrease the consumption of expensive ferroalloys. Understanding the dissolution
of different ferroalloys can help to increase the alloy recovery and to reach an optimum melting
and mixing time in steel. Overall, the ferroalloy quality does not seem to be an independent
subject. Any improvement in the ferroalloy industry can make the steelmaking process more
economical and energy-efficient. The implementation of the results of this thesis contributes to
the following United Nations goals: goal 12 Responsible Consumption and Production.[88]
6.2 Recommendations for Future Work
So far, it is clear that to evaluate the influence of ferroalloy impurities on steel cleanliness,
in addition to the ferroalloys’ compositional details, some more factors such as their physical
properties, nature of impurities and the addition time need to be taken into account. Based on the
finding of the present study, the following aspects are recommended to study more in-depth:
1. More refined ferroalloys can be developed through the controlled production process
based on the impurities found in different ferroalloys. The ferroalloy manufacturers can carefully
select suitable raw materials according to the quality requirements of the steel industry. Also,
they can adopt a reasonable process route and technical means to refine the ferroalloy products
to ensure that the desired quality of the ferroalloy products is obtained.
2. Investigate the use of low-cost ferroalloys instead of refined ferroalloys. The cleaner the
ferroalloy, the higher will be the cost of its manufacture. A planned study is needed for a
particular steel grade to which a significant amount of certain ferroalloy grade is required. The
scope for the replacement of the expensive high-quality ferroalloy by a low-cost impure
ferroalloy will depend on whether the impurities from ferroalloys can not be inherited in steel.

61
3. Investigate the effect of different kinds of ferroalloy additions on the inclusion
characteristics in specific steel grades on a laboratory scale. The thermodynamic and kinetic
models of the evolution of inclusions from the alloy to the steel can be established with respect
to the presence of different inclusions in ferroalloys.
4. Systematically investigate the effect of ferroalloy additions on steel cleanliness at the final
stage of ladle treatment on an industrial scale and improve the technologies of late additions of
ferroalloys in steel.
5. Investigate the kinetics and mechanism of different ferroalloys with respect to the melting
and dissolution in liquid steel. Laboratory and simulation works should be performed to
investigate the effect of different factors (such as size, density, melting point, superheat of steel,
thermal conductivity, surface tension etc.) on the melting behaviour of ferroalloys.
62
References
1. K. Lange: Int. Mater. Rev., 1988, vol. 33, pp. 53-89.
2. R. Kiessling and N. Lange, 1968.
3. F. Habashi: Handbook of extractive metallurgy. Wiley-VCH, 1998.
4. T. Sjökvist, M. Göransson, P. Jönsson and P. Cowx: Ironmak. Steelmak., 2003, vol. 30, pp. 73-80.
5. M. Pande, M. Guo, X. Guo, D. Geysen, S. Devisscher, B. Blanpain and P. Wollants: Ironmak. Steelmak.,
2010, vol. 37, pp. 502-511.
6. G. Franklin, G. Rule and R. Widdowson: 5th International Congress on X-Ray Optics and Microanalysis,
Springer, 1969, pp. 474-480.
7. V. Povolotskii, T. Komissarova and V. Minaev: Chern. Metall, 1987, vol. 8, pp. 31-35.
8. O. Wijk and V. Brabie: ISIJ Int., 1996, vol. 36, pp. S132-S135.
9. Q.C. Horn, R.W. Heckel and C.L. Nassaralla: Metall. Mater. Trans. B, 1998, vol. 29, pp. 325-329.
10. Y.P. Vorob’ev: Steel Transl., 2008, vol. 38, pp. 69-76.
11. K. Grigorovich, S. Shibaev and I. Kostenko: 12th International Ferroalloys Congress, Helsinki, Finland,
2010.
12. Y. Bi, A. Karasev and P.G. Jönsson: Steel Res. Int., 2014, vol. 85, pp. 659-669.
13. M. Li, S. Li, Y. Ren, W. Yang and L. Zhang: Ironmak. Steelmak., 2020, vol. 47, pp 6-12.
14. W. Li, Y. Ren and L. Zhang: Ironmak. Steelmak., 2020, vol. 47, pp 40-46.
15. T. Sjöqvist and P.G. Jönsson, 57th Electric Furnace Conference, Pittsburgh, USA, 1999, pp 383-392.
16. T. Sjöqvist, P.G. Jönsson and O. Grong: Metall. Mater. Trans. A, 2001, vol. 32, pp. 1049-1056.
17. V. Sharapova: Steel Transl., 2010, vol. 40, pp. 1092-1094.
18. P.W. Han, S.J. Chu, P. Mei and Y.F. Lin: J. Iron Steel Res. Int., 2014, vol. 21, pp. 23-27.
19. P. Kaushik, H. Pielet and H. Yin: Ironmak. Steelmak., 2009, vol. 36, pp. 561-571.
20. M.M. Pande, M. Guo and B. Blanpain: ISIJ Int., 2013, vol. 53, pp. 629-638.
21. H.E. Kellner, A.V. Karasev, A. Memarpour and P.G. Jönsson: Steel Res. Int., 2016, vol. 87, pp. 1461-1468.
22. M. Gasik, A. Panchenko and A. Salnikov: Metall. Min. Ind., 2011, vol. 3, pp. 1-9.
23. W. Tiekink, A. Overbosch, P. Broersen, R. Kooter, M. Rijnders and L. Alders: Stahl Eisen, 2013, vol. 133,
pp. 59-64.
24. B. Metcalfe and D. Slatter: Ironmak. Steelmak., 1978, vol. 5, pp. 103-106.
25. T. Sjokvist, PhD thesis, KTH Royal Institute of Technology, 2003.
26. Y. Bi, A. Karasev and P.G. Jonsson: Ironmak. Steelmak., 2014, vol. 41, pp. 756-762.
27. M. Li, S. Li, Y. Ren, W. Yang and L. Zhang: Ironmak. Steelmak., 2020, vol. 47, pp. 6-12.
28. J.H. Park and Y.B. Kang: Metall. Mater. Trans. B, 2006, vol. 37, pp. 791-797.
29. K. Mizuno, H. Todoroki, M. Noda and T. Tohge: Iron Steelmak., 2001, vol. 28, pp. 93-101.
30. V. Thapliyal, A. Kumar, D. Robertson and J. Smith: Ironmak. Steelmak., 2015, vol. 42, pp. 382-394.
31. F. Li, H. Li, S. Zheng, J. You, K. Han and Q. Zhai: Materials, 2017, vol. 10, pp. 1206.
32. M.M. Pande, M. Guo, S. Devisscher and B. Blanpain: Ironmak. Steelmak., 2012, vol. 39, pp. 519-529.
33. P. Dorrer, S.K. Michelic, C. Bernhard, A. Penz and R. Rössler: Steel Res. Int., 2019, pp. 1800635.
34. M.M. Pande, PhD thesis, KU Leuven, 2012.
35. Y. Bi, PhD thesis, KTH Royal Institute of Technology, 2014.
36. L. Zhang and F. Oeters: Steel Res., 1999, vol. 70, pp. 126-126.
37. H. Duan, L. Zhang, B.G. Thomas and A.N. Conejo: Metall. Mater. Trans. B, 2018, vol. 49, pp. 2722-2743.
38. L. Pandelaers, PhD thesis, KU Leuven, 2011.
63
39. S.A. Argyropoulos and R.I. Guthrie: Metall.Trans. B, 1984, vol. 15, pp. 47-58.
40. S.J.A. Shah, PhD thesis, University of Alberta, 2015.
41. D.S. Webber, PhD thesis, Missouri University of Science and Technology, 2011.
42. H. Duan, L. Zhang and B.G. Thomas: Steel Res. Int., 2019, vol. 90, pp. 1800288.
43. P. Yan, L. Pandelaers, M. Guo and B. Blanpain: ISIJ Int., 2014, vol. 54, pp. 1209-1217.
44. P. Yan, L. Pandelaers, L. Zheng, B. Blanpain and M. Guo: ISIJ Int., 2015, vol. 55, pp. 1661-1668.
45. L. Pandelaers, D. Barrier, P. Gardin, P. Wollants and B. Blanpain: Metall. Mater. Trans. B, 2013, vol. 44,
pp. 561-570.
46. L. Pandelaers, F. Verhaeghe, B. Blanpain, P. Wollants and P. Gardin: Metall. Mater. Trans. B, 2009, vol.
40, pp. 676-684.
47. M.A. Van Ende, M. Guo, J. Proost, B. Blanpain and P. Wollants: ISIJ Int., 2010, vol. 50, pp. 1552-1559.
48. M.A. Van Ende, M. Guo, J. Proost, B. Blanpain and P. Wollants: ISIJ Int., 2011, vol. 51, pp. 27-34.
49. S.A. Argyropoulos and P.G. Sismanis: Metall. Trans. B, 1991, vol. 22, pp. 417-427.
50. X. Yin, Y. Sun, Y. Yang, X. Deng, M. Barati and A. McLean: Ironmak. Steelmak., 2017, vol. 44, pp. 152-
158.
51. X. Li, Z. Jiang, X. Geng, M. Chen and L. Peng: ISIJ Int., 2019, vol. 59, pp. 1552-1561.
52. W. Li, Y. Ren and L. Zhang: Ironmak. Steelmak., 2020, vol. 47, pp. 40-46.
53. J.F. Xu, K.P. Wang, Y. Wang, Z.D. Qu and X.K. Tu: J. Iron Steel Res. Int., 2020, vol. 27, PP. 1011-1017.
54. M. Pande, M. Guo, S. Devisscher and B. Blanpain: Ironmak. Steelmak., 2012, vol. 39, pp. 519-529.
55. P. Dorrer, S.K. Michelic, C. Bernhard, A. Penz and R. Rössler: Steel Res. Int., 2019, vol. 90, pp. 1800635.
56. C. Bernhard, P. Dorrer, S. Michelic and R. Rössler: BHM Berg-und Hüttenmännische Monatshefte, 2019,
vol. 164, pp. 475-478.
57. R. Inoue, S. Ueda, T. Ariyama and H. Suito: ISIJ Int., 2011, vol. 51, pp. 2050-2055.
58. Y. Wang, A. Karasev and P.G. Jönsson: Metals, 2019, vol. 9, p. 687.
59. M. Gasik, In Handbook of Ferroalloys, Elsevier, 2013, pp 397-409.
60. M. Gasik: Handbook of ferroalloys: theory and technology, Butterworth-Heinemann, 2013.
61. D.C. Park, I.H. Jung, P.C. Rhee and H.G. Lee: ISIJ Int., 2004, vol. 44, pp. 1669-1678.
62. O. Polyakov, In Handbook of Ferroalloys, Elsevier, 2013, pp 449-457.
63. O. Bannykh: Met. Sci. Heat Treat., 2005, vol. 47, pp. 261-265.
64. T.V. Rashev, A. Eliseev, L.T. Zhekova and P. Bogev: Steel Transl., 2019, vol. 49, pp. 433-439.
65. H. Vashishtha, R.V. Taiwade, S. Sharma and A.P. Patil: J. Manuf. Process., 2017, vol. 25, pp. 49-59.
66. H.B. Li, Z.H. Jiang, M.H. Shen and X.M. You: J. Iron Steel Res. Int., 2007, vol. 14, pp. 63-68.
67. L. Smirnov, O. Zayakin, V. Zhuchkov, A. Oryshchenko, G.Y. Kalinin and D. Shul’min: Metallurgist, 2019,
vol. 63, pp. 785-791.
68. X. Fan, S. Xi, D. Sun, Z. Liu, J. Du and C. Tao: Hydrometallurgy, 2012, vol. 127, pp. 24-29.
69. F. Yang, L. Jiang, X. Yu, Y. Lai and J. Li: Hydrometallurgy, 2020, vol. 192, pp. 105285.
70. A. Ahmed, T. Mattar, A. Fathy, H. El-Faramawy and M. Eissa: Can. Metall. Quart., 2006, vol. 45, pp.
493-497.
71. D. Krastev, 6th International Metallurgical Congress, Ohrid. Macedonia, 2014, pp 1-6.
72. J.B. Xie, D. Zhang, Q.K. Yang, J.M. An, Z.Z. Huang and J.X. Fu: Ironmak. Steelmak., 2019, vol. 46, pp.
564-573.
73. J. Guo, K. Fang, H. Guo, Y. Luo, S. Duan, X. Shi and W. Yang: Metals, 2018, vol. 8, pp. 68.
74. D. Zhang, P. Shen, J.B. Xie, J.B. An, Z.B. Huang and J.X. Fu: J. Iron Steel Res. Int., 2019, vol. 26, pp.
275-284.
75. H. Doostmohammadi, A. Karasev and P.G. Jönsson: Steel Res. Int., 2010, vol. 81, pp. 398-406.
64
76. D. Janis, R. Inoue, A. Karasev and P.G. Jönsson: Adv. Mater. Sci. Eng., 2014, vol. 2014.
77. Y. Kanbe, A. Karasev, H. Todoroki and P.G. Jönsson: Steel Res. Int., 2011, vol. 82, pp. 313-322.
78. B. Bhardwaj and F. Chrome: NIIR Project Consultancy Services, 2014, pp. 387.
79. J.O. Andersson, T. Helander, L. Höglund, P. Shi and B. Sundman: Calphad, 2002, vol. 26, pp. 273-312.
80. F. Su, W. Liu, H. Wang and Z. Wen: Heat Transfer-Asian Research, 2020, vol. 49, pp. 249-257.
81. G.Y. Qian, F. Jiang, G.G. Cheng and C.S. Wang: Metall. Res. Tech., 2014, vol. 111, pp. 229-237.
82. J.J. Pak, J.O. Jo, S.I. Kim, W.Y. Kim, T.I. Chung, S.M. Seo, J.H. Park and D.S. Kim: ISIJ Int., 2007, vol.
47, pp. 16-24.
83. T. Itoh, T. Nagasaka and M. Hino: ISIJ Int., 2000, vol. 40, pp. 1051-1058.
84. M. Hino and K. Ito: 19th Committee on Steelmaking, Tohoku University Press, Sendai, 2010.
85. J.H. Park and D.S. Kim: Metall. Mater. Trans. B, 2005, vol. 36, pp. 495-502.
86. J.H. Park, S.-B. Lee and D.S. Kim: Metall. Mater. Trans. B, 2005, vol. 36, pp. 67-73.
87. Y. Wang, A. Karasev, J.H. Park and P.G. Jönsson: ISIJ Int., 2021, vol. 61, pp. 209-218.
88. United Nations-sustainable development goals. https://www.globalgoals.org/12-responsible-consumption-
and-production.


![Elastic response of [111]-tunnelling impurities](https://img.pdfslide.net/doc/110x75/6344c9f138eecfb33a063ffe/elastic-response-of-111-tunnelling-impurities.jpg)