Embed Size (px)
Citation preview

This article was downloaded by: [196.46.245.55]On: 09 September 2013, At: 08:46Publisher: Taylor & FrancisInforma Ltd Registered in England and Wales Registered Number: 1072954 Registeredoffice: Mortimer House, 37-41 Mortimer Street, London W1T 3JH, UK
Energy Sources, Part A: Recovery,Utilization, and Environmental EffectsPublication details, including instructions for authors andsubscription information:http://www.tandfonline.com/loi/ueso20
Laboratory Scale Preparation of Biogasfrom Cassava Tubers, Cassava Peels, andPalm Kernel Oil ResiduesS. O. Jekayinfa a & V. Scholz ba Department of Agricultural Engineering , Ladoke AkintolaUniversity of Technology , Ogbomoso , Oyo State , Nigeriab Post Harvest Technology, Leibniz-Institute for AgriculturalEngineering (ATB) , Potsdam , GermanyPublished online: 05 Sep 2013.
To cite this article: S. O. Jekayinfa & V. Scholz (2013) Laboratory Scale Preparation of Biogas fromCassava Tubers, Cassava Peels, and Palm Kernel Oil Residues, Energy Sources, Part A: Recovery,Utilization, and Environmental Effects, 35:21, 2022-2032, DOI: 10.1080/15567036.2010.532190
To link to this article: http://dx.doi.org/10.1080/15567036.2010.532190
PLEASE SCROLL DOWN FOR ARTICLE
Taylor & Francis makes every effort to ensure the accuracy of all the information (the“Content”) contained in the publications on our platform. However, Taylor & Francis,our agents, and our licensors make no representations or warranties whatsoever as tothe accuracy, completeness, or suitability for any purpose of the Content. Any opinionsand views expressed in this publication are the opinions and views of the authors,and are not the views of or endorsed by Taylor & Francis. The accuracy of the Contentshould not be relied upon and should be independently verified with primary sourcesof information. Taylor and Francis shall not be liable for any losses, actions, claims,proceedings, demands, costs, expenses, damages, and other liabilities whatsoever orhowsoever caused arising directly or indirectly in connection with, in relation to or arisingout of the use of the Content.
This article may be used for research, teaching, and private study purposes. Anysubstantial or systematic reproduction, redistribution, reselling, loan, sub-licensing,systematic supply, or distribution in any form to anyone is expressly forbidden. Terms &Conditions of access and use can be found at http://www.tandfonline.com/page/terms-and-conditions
Energy Sources, Part A, 35:2022–2032, 2013
Copyright © Taylor & Francis Group, LLC
ISSN: 1556-7036 print/1556-7230 online
DOI: 10.1080/15567036.2010.532190
Laboratory Scale Preparation of Biogas from Cassava
Tubers, Cassava Peels, and Palm Kernel Oil Residues
S. O. Jekayinfa1 and V. Scholz2
1Department of Agricultural Engineering, Ladoke Akintola University of Technology,
Ogbomoso, Oyo State, Nigeria2Post Harvest Technology, Leibniz-Institute for Agricultural Engineering (ATB),
Potsdam, Germany
The feasibility of utilizing cassava tuber, cassava peels, palm kernel cake, and palm kernel shells
in methane production through anaerobic digestion was evaluated in this work. The production of
biogas from cassava tuber, cassava peels, palm kernel shell, and palm kernel cake was investigated in
laboratory scale using the simple single-state digesters of 2 liter working volume. The digester was
fed on a batch-basis with the slurry of cassava tuber, cassava peels, palm kernel shell, and palm kernel
cake containing average moisture content of 18% and operated at a temperature of 35ıC for 30 days.
Measured biogas yields for cassava tuber, cassava peels, palm kernel cake, and palm kernel shell were
0.66, 0.66, 0.58, and 0.08 m3/(kg VS), respectively, after 30 days digestion time. Methane production
from cassava tuber, cassava peels, palm kernel cake, and palm kernel shell was 0.31, 0.28, 0.32, and
0.05 m3/(kg VS), respectively. From this laboratory scale study, it can be concluded that cassava
tuber, cassava peels, and palm kernel cake can be used in an ecologically sound way as substrates for
anaerobic digestion.
Keywords: biogas, cassava residues, laboratory scale, Nigeria, palm kernel residues
1. INTRODUCTION
1.1. Biogas Production from Crop Residues
Production of methane-rich biogas through anaerobic digestion of organic materials provides aversatile carrier of renewable energy, as methane can be used in replacement for fossil fuels
in both heat and power generation and as a vehicle fuel, thus contributing to cutting down
the emissions of greenhouse gases and slowing down the climate change. Biogas as a renew-
able energy source could be a relative means of solving the problems of rising energy prices,waste treatment/management, and creating sustainable development. Generally, the production of
this gas involves a complex biochemical reaction that takes place under anaerobic conditions
in the presence of highly pH-sensitive microbiological catalysts that are mainly bacteria. The
major products of this reaction are methane (CH4) and carbon dioxide (CO2) (Hashimoto et al.,1980).
Address correspondence to Dr. Simeon Jekayinfa, Department of Agricultural Engineering, Ladoke Akintola University
of Technology, P.M.B. 4000, Ogbomoso, Oyo State 201001, Nigeria. E-mail: [email protected]
2022
Dow
nloa
ded
by [
196.
46.2
45.5
5] a
t 08:
46 0
9 Se
ptem
ber
2013
PREPARATION OF BIOGAS 2023
1.2. Energy and Agricultural Situation in Nigeria
Nigeria has a land area of 98.3 million hectares. At present, about 34 million hectares or 35%
are under cultivation. Because of the vast area of uncultivated land coupled with the natural
fertility of its soil, Nigeria has great agricultural potential. Agriculture remains the largest sector
of the economy in Nigeria. It generates employment for about 70% of Nigeria’s population andcontributes about 40% to the gross domestic product (GDP) with crops accounting for 80%,
livestock 13%, forestry 3%, and fishery 4% (Akinbami, 2001). It plays significant roles in the
nation’s economic development. Nigeria is rich in both fossil fuels, such as crude oil; natural gas;
coal; and renewable energy resources, including solar, wind, biomass, biogas, etc. The nationalenergy supply in Nigeria is at present almost dependent on fossil fuels and firewood, which are
depleting fast. The energy supply mix in the country (Chendo, 2001) shows that the share of
natural gas was 25%, hydroelectricity was 13%, tar sands was 28%, coal and lignite was 13%,
and the crude oil share was 21%.Energetically, the Nigerian economy can be disaggregated into industry, transport, commercial,
household, and agricultural sectors. The household sector has consistently accounted for over
half of Nigeria’s total domestic energy consumption. According to Akinbami (2001), the energyconsuming activities in this sector are cooking, lighting, and operation of electrical appliances.
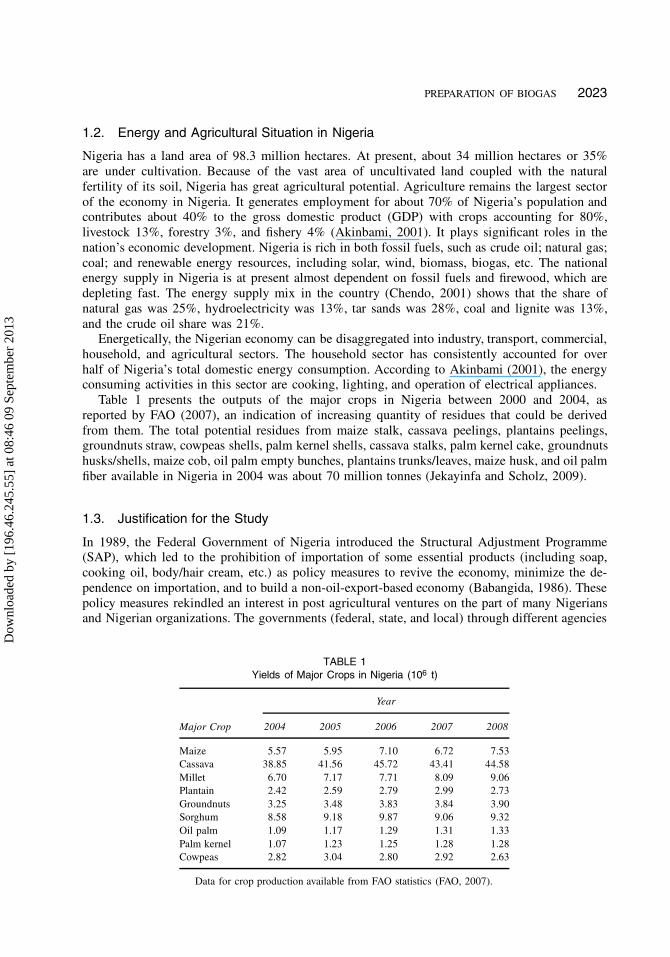
Table 1 presents the outputs of the major crops in Nigeria between 2000 and 2004, as
reported by FAO (2007), an indication of increasing quantity of residues that could be derived
from them. The total potential residues from maize stalk, cassava peelings, plantains peelings,groundnuts straw, cowpeas shells, palm kernel shells, cassava stalks, palm kernel cake, groundnuts
husks/shells, maize cob, oil palm empty bunches, plantains trunks/leaves, maize husk, and oil palm
fiber available in Nigeria in 2004 was about 70 million tonnes (Jekayinfa and Scholz, 2009).
1.3. Justification for the Study
In 1989, the Federal Government of Nigeria introduced the Structural Adjustment Programme(SAP), which led to the prohibition of importation of some essential products (including soap,
cooking oil, body/hair cream, etc.) as policy measures to revive the economy, minimize the de-
pendence on importation, and to build a non-oil-export-based economy (Babangida, 1986). These
policy measures rekindled an interest in post agricultural ventures on the part of many Nigeriansand Nigerian organizations. The governments (federal, state, and local) through different agencies
TABLE 1
Yields of Major Crops in Nigeria (106 t)
Year
Major Crop 2004 2005 2006 2007 2008
Maize 5.57 5.95 7.10 6.72 7.53
Cassava 38.85 41.56 45.72 43.41 44.58
Millet 6.70 7.17 7.71 8.09 9.06
Plantain 2.42 2.59 2.79 2.99 2.73
Groundnuts 3.25 3.48 3.83 3.84 3.90
Sorghum 8.58 9.18 9.87 9.06 9.32
Oil palm 1.09 1.17 1.29 1.31 1.33
Palm kernel 1.07 1.23 1.25 1.28 1.28
Cowpeas 2.82 3.04 2.80 2.92 2.63
Data for crop production available from FAO statistics (FAO, 2007).
Dow
nloa
ded
by [
196.
46.2
45.5
5] a
t 08:
46 0
9 Se
ptem
ber
2013
2024 S. O. JEKAYINFA AND V. SCHOLZ
TABLE 2
Physical Properties of the Palm Kernel Shells
Property Value
Bulk density, Mg/m3 0.74
Dry density, Mg/m3 0.65
Void ratio 0.40
Porosity, % 28
Water content, % 9
Water absorption, % 14
Specific gravity 1.62
Impact value, % 4.5
made efforts to increase local production of these essential commodities through incentives given
to farmers and agro-based organizations. These led to the establishment of some cottage industries
like those producing soap, cooking oil, and body/hair cream (Aina, 2002; Olajide and Oyelade,2002). These industries make use of palm kernel oil (PKO) as the basic raw material. As a
result, demands for PKO have been on the increase without any appreciable profit-margin to the
producers owing to high input energy. This has resulted in the dwindling production of PKO in
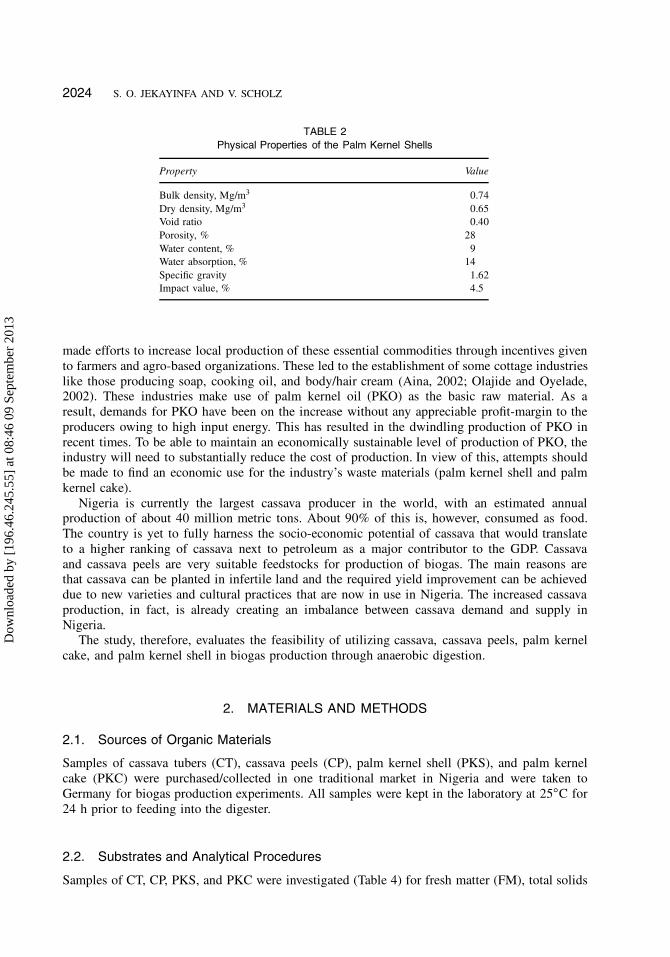
recent times. To be able to maintain an economically sustainable level of production of PKO, theindustry will need to substantially reduce the cost of production. In view of this, attempts should
be made to find an economic use for the industry’s waste materials (palm kernel shell and palm
kernel cake).
Nigeria is currently the largest cassava producer in the world, with an estimated annualproduction of about 40 million metric tons. About 90% of this is, however, consumed as food.
The country is yet to fully harness the socio-economic potential of cassava that would translate
to a higher ranking of cassava next to petroleum as a major contributor to the GDP. Cassava
and cassava peels are very suitable feedstocks for production of biogas. The main reasons arethat cassava can be planted in infertile land and the required yield improvement can be achieved
due to new varieties and cultural practices that are now in use in Nigeria. The increased cassava
production, in fact, is already creating an imbalance between cassava demand and supply in
Nigeria.The study, therefore, evaluates the feasibility of utilizing cassava, cassava peels, palm kernel
cake, and palm kernel shell in biogas production through anaerobic digestion.
2. MATERIALS AND METHODS
2.1. Sources of Organic Materials
Samples of cassava tubers (CT), cassava peels (CP), palm kernel shell (PKS), and palm kernel
cake (PKC) were purchased/collected in one traditional market in Nigeria and were taken to
Germany for biogas production experiments. All samples were kept in the laboratory at 25ıC for
24 h prior to feeding into the digester.
2.2. Substrates and Analytical Procedures
Samples of CT, CP, PKS, and PKC were investigated (Table 4) for fresh matter (FM), total solids
Dow
nloa
ded
by [
196.
46.2
45.5
5] a
t 08:
46 0
9 Se
ptem
ber
2013
PREPARATION OF BIOGAS 2025
TABLE 3
Typical Chemical Compositions and Energy
Content of Palm Kernel Cake
Constituents Composition
Dry matter1, % 91
Proximate chemical composition (as % of cakes)a
Crude protein .N � 6:25/ 14
Ether extract 8
Crude fiber 23
Total ash 6
N-free extracts (by difference) 49
Mineral nutrientsb
Calcium, % 0.29
Phosphorous, % 0.79
Magnesium, % 0.27
Iron, mg kg�1 4.05
Copper, mg kg�1 28.5
Zinc, mg kg�1 77.0
Manganese, mg kg�1 225.0
Energy contentb
Metabolizable energy, MJ kg�1 6.2
Metabolizable energy, Kcal kg�1 1,480.0
True metabolizable energy, MJ kg�1 7.4
True metabolizable energy, Kcal kg�1 1,760.0
Sources: aExtracted from Mustaffa et al. (1991); bExtracted from Yeong
et al. (1983).
(TS), volatile solids (VS), volatile fatty acids (VFA), pH, NH4-N, conductivity (LF), and organicdry matter in % of fresh mass (oTS). The inoculum for the batch anaerobic digestion tests was
specified by analyzing the parameter’s dry matter, organic dry matter, pH, organic acids, and
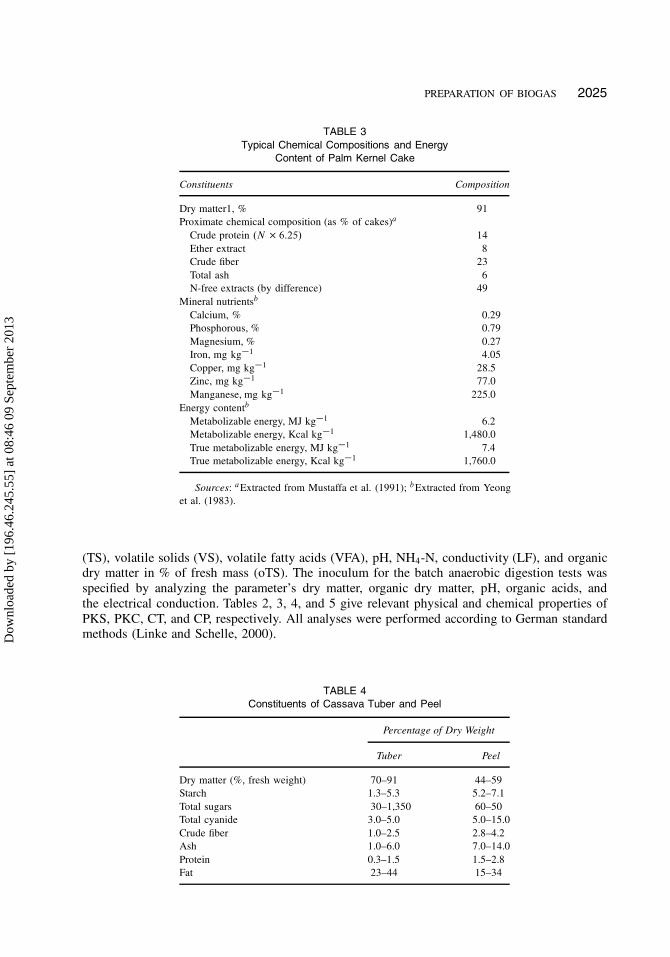
the electrical conduction. Tables 2, 3, 4, and 5 give relevant physical and chemical properties of
PKS, PKC, CT, and CP, respectively. All analyses were performed according to German standardmethods (Linke and Schelle, 2000).
TABLE 4
Constituents of Cassava Tuber and Peel
Percentage of Dry Weight
Tuber Peel
Dry matter (%, fresh weight) 70–91 44–59
Starch 1.3–5.3 5.2–7.1
Total sugars 30–1,350 60–50
Total cyanide 3.0–5.0 5.0–15.0
Crude fiber 1.0–2.5 2.8–4.2
Ash 1.0–6.0 7.0–14.0
Protein 0.3–1.5 1.5–2.8
Fat 23–44 15–34
Dow
nloa
ded
by [
196.
46.2
45.5
5] a
t 08:
46 0
9 Se
ptem
ber
2013
2026 S. O. JEKAYINFA AND V. SCHOLZ
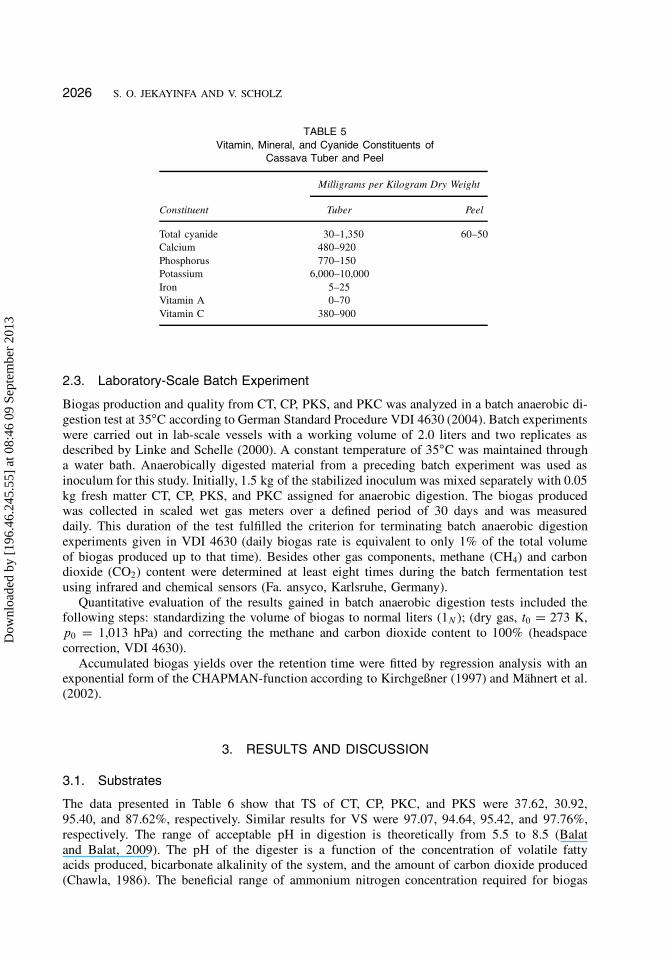
TABLE 5
Vitamin, Mineral, and Cyanide Constituents of
Cassava Tuber and Peel
Milligrams per Kilogram Dry Weight
Constituent Tuber Peel
Total cyanide 30–1,350 60–50
Calcium 480–920
Phosphorus 770–150
Potassium 6,000–10,000
Iron 5–25
Vitamin A 0–70
Vitamin C 380–900
2.3. Laboratory-Scale Batch Experiment
Biogas production and quality from CT, CP, PKS, and PKC was analyzed in a batch anaerobic di-
gestion test at 35ıC according to German Standard Procedure VDI 4630 (2004). Batch experiments
were carried out in lab-scale vessels with a working volume of 2.0 liters and two replicates asdescribed by Linke and Schelle (2000). A constant temperature of 35ıC was maintained through
a water bath. Anaerobically digested material from a preceding batch experiment was used as
inoculum for this study. Initially, 1.5 kg of the stabilized inoculum was mixed separately with 0.05
kg fresh matter CT, CP, PKS, and PKC assigned for anaerobic digestion. The biogas producedwas collected in scaled wet gas meters over a defined period of 30 days and was measured
daily. This duration of the test fulfilled the criterion for terminating batch anaerobic digestion
experiments given in VDI 4630 (daily biogas rate is equivalent to only 1% of the total volume
of biogas produced up to that time). Besides other gas components, methane (CH4) and carbondioxide (CO2) content were determined at least eight times during the batch fermentation test
using infrared and chemical sensors (Fa. ansyco, Karlsruhe, Germany).
Quantitative evaluation of the results gained in batch anaerobic digestion tests included thefollowing steps: standardizing the volume of biogas to normal liters (1N ); (dry gas, t0 D 273 K,
p0 D 1,013 hPa) and correcting the methane and carbon dioxide content to 100% (headspace
correction, VDI 4630).
Accumulated biogas yields over the retention time were fitted by regression analysis with anexponential form of the CHAPMAN-function according to Kirchgeßner (1997) and Mähnert et al.
(2002).
3. RESULTS AND DISCUSSION
3.1. Substrates
The data presented in Table 6 show that TS of CT, CP, PKC, and PKS were 37.62, 30.92,
95.40, and 87.62%, respectively. Similar results for VS were 97.07, 94.64, 95.42, and 97.76%,
respectively. The range of acceptable pH in digestion is theoretically from 5.5 to 8.5 (Balat
and Balat, 2009). The pH of the digester is a function of the concentration of volatile fattyacids produced, bicarbonate alkalinity of the system, and the amount of carbon dioxide produced
(Chawla, 1986). The beneficial range of ammonium nitrogen concentration required for biogas
Dow
nloa
ded
by [
196.
46.2
45.5
5] a
t 08:
46 0
9 Se
ptem
ber
2013
PREPARATION OF BIOGAS 2027
TABLE 6
Characterization of Applied Substrates as Total Solids (TS), Volatile Solids (VS), Volatile Fatty Acids (VFA),
pH, NH4-N, Conductivity (LF), Organic Dry Matter in % of Fresh Mass (oTS)
Substrates
TS,
%
VS,
% TS
VFA,
g/kg FMa
pH,
[-]
NH4-N,
g/kg FMa
LF,
mS/cm
oTS,
% FMa
Cassava tuber 37.62 97.07 0.43 5.86 0.057 0.96 36.52
Palm cake 95.40 95.42 1.48 5.60 0.075 1.22 91.03
Palm shell 87.62 97.76 0.30 5.63 0.006 0.21 85.65
Cassava peels 30.92 94.64 0.95 5.13 0.085 1.13 29.27
aFM: Fresh matter.
production is 50–200 mg/l (Larry and Clifford, 1980). The values obtained in the present studyfor these parameters fall within these quoted figures.
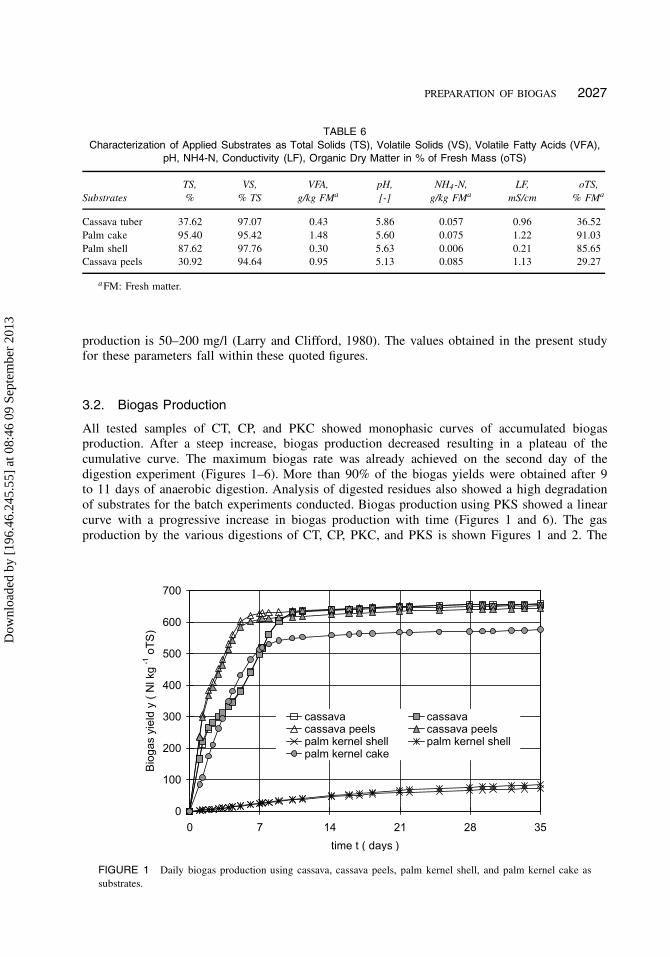
3.2. Biogas Production
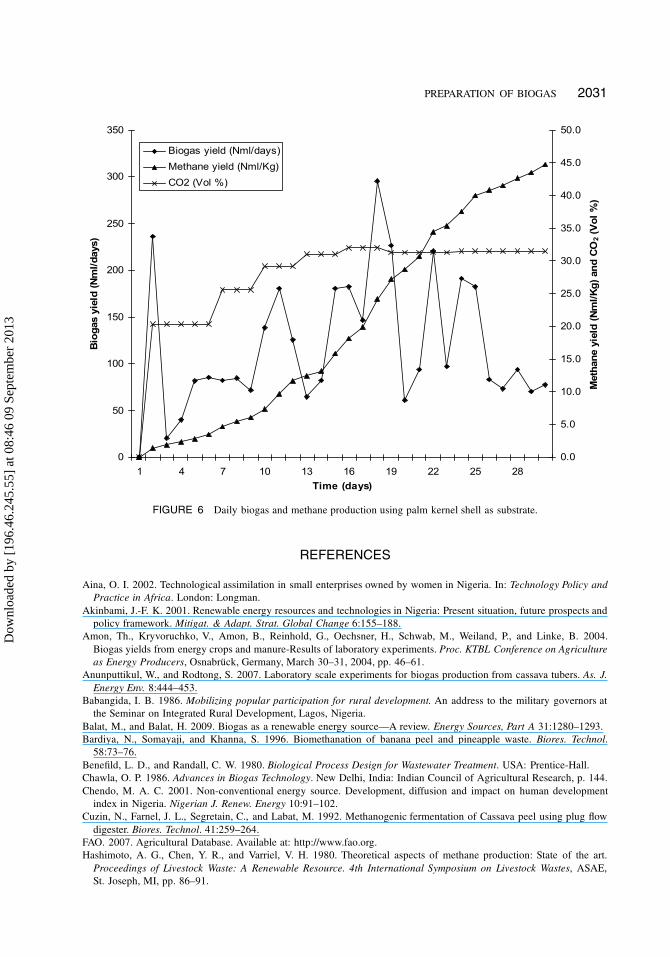
All tested samples of CT, CP, and PKC showed monophasic curves of accumulated biogasproduction. After a steep increase, biogas production decreased resulting in a plateau of the
cumulative curve. The maximum biogas rate was already achieved on the second day of the
digestion experiment (Figures 1–6). More than 90% of the biogas yields were obtained after 9to 11 days of anaerobic digestion. Analysis of digested residues also showed a high degradation
of substrates for the batch experiments conducted. Biogas production using PKS showed a linear
curve with a progressive increase in biogas production with time (Figures 1 and 6). The gas
production by the various digestions of CT, CP, PKC, and PKS is shown Figures 1 and 2. The
FIGURE 1 Daily biogas production using cassava, cassava peels, palm kernel shell, and palm kernel cake as
substrates.
Dow
nloa
ded
by [
196.
46.2
45.5
5] a
t 08:
46 0
9 Se
ptem
ber
2013
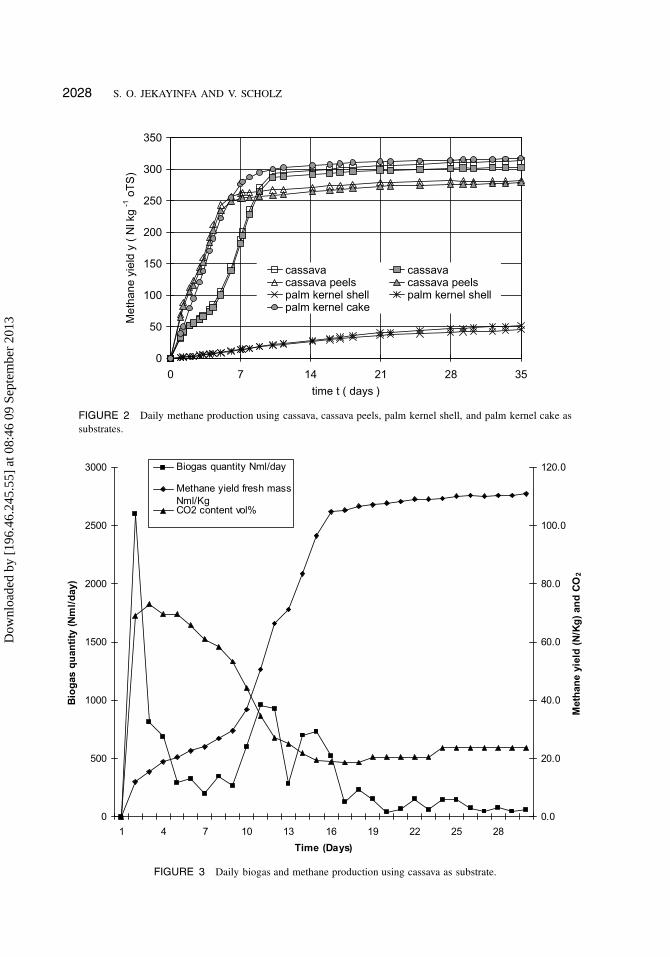
2028 S. O. JEKAYINFA AND V. SCHOLZ
FIGURE 2 Daily methane production using cassava, cassava peels, palm kernel shell, and palm kernel cake as
substrates.
FIGURE 3 Daily biogas and methane production using cassava as substrate.
Dow
nloa
ded
by [
196.
46.2
45.5
5] a
t 08:
46 0
9 Se
ptem
ber
2013
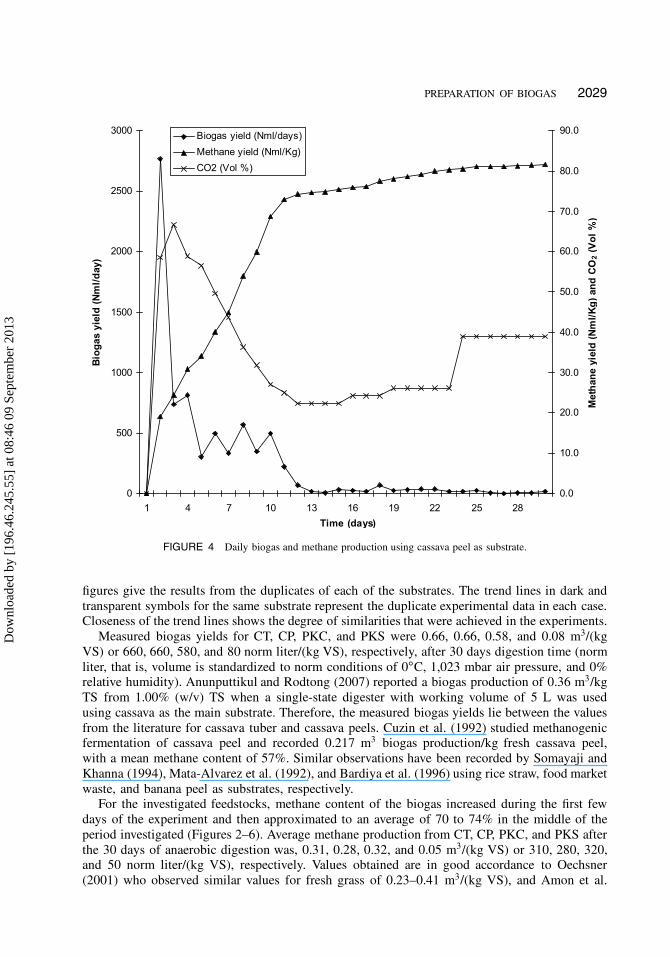
PREPARATION OF BIOGAS 2029
FIGURE 4 Daily biogas and methane production using cassava peel as substrate.
figures give the results from the duplicates of each of the substrates. The trend lines in dark and
transparent symbols for the same substrate represent the duplicate experimental data in each case.Closeness of the trend lines shows the degree of similarities that were achieved in the experiments.
Measured biogas yields for CT, CP, PKC, and PKS were 0.66, 0.66, 0.58, and 0.08 m3/(kg
VS) or 660, 660, 580, and 80 norm liter/(kg VS), respectively, after 30 days digestion time (norm
liter, that is, volume is standardized to norm conditions of 0ıC, 1,023 mbar air pressure, and 0%relative humidity). Anunputtikul and Rodtong (2007) reported a biogas production of 0.36 m3/kg
TS from 1.00% (w/v) TS when a single-state digester with working volume of 5 L was used
using cassava as the main substrate. Therefore, the measured biogas yields lie between the values
from the literature for cassava tuber and cassava peels. Cuzin et al. (1992) studied methanogenicfermentation of cassava peel and recorded 0.217 m3 biogas production/kg fresh cassava peel,
with a mean methane content of 57%. Similar observations have been recorded by Somayaji and
Khanna (1994), Mata-Alvarez et al. (1992), and Bardiya et al. (1996) using rice straw, food market
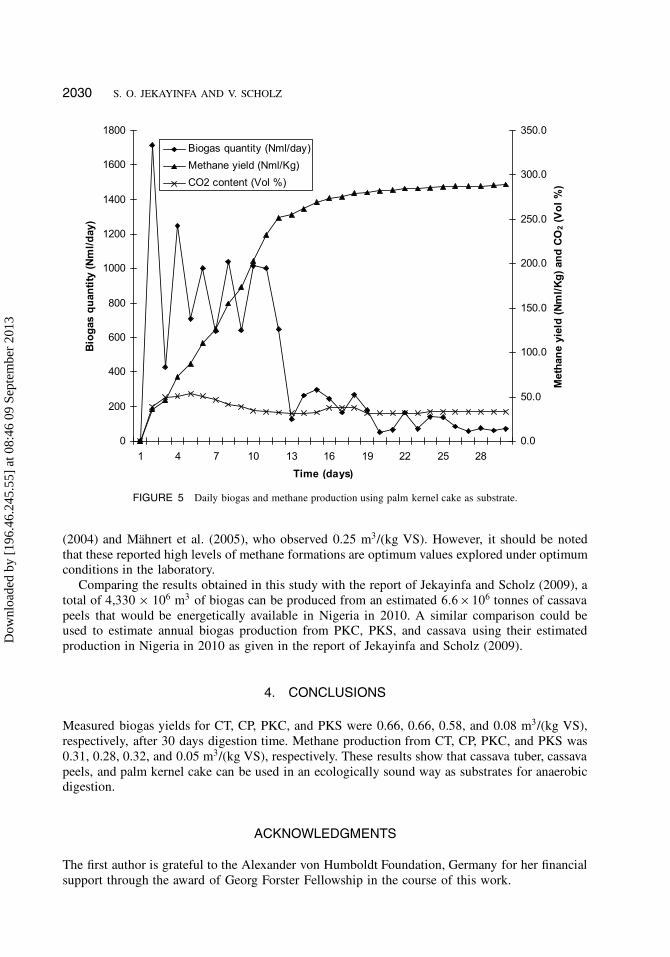
waste, and banana peel as substrates, respectively.For the investigated feedstocks, methane content of the biogas increased during the first few
days of the experiment and then approximated to an average of 70 to 74% in the middle of the
period investigated (Figures 2–6). Average methane production from CT, CP, PKC, and PKS after
the 30 days of anaerobic digestion was, 0.31, 0.28, 0.32, and 0.05 m3/(kg VS) or 310, 280, 320,and 50 norm liter/(kg VS), respectively. Values obtained are in good accordance to Oechsner
(2001) who observed similar values for fresh grass of 0.23–0.41 m3/(kg VS), and Amon et al.
Dow
nloa
ded
by [
196.
46.2
45.5
5] a
t 08:
46 0
9 Se
ptem
ber
2013
2030 S. O. JEKAYINFA AND V. SCHOLZ
FIGURE 5 Daily biogas and methane production using palm kernel cake as substrate.
(2004) and Mähnert et al. (2005), who observed 0.25 m3/(kg VS). However, it should be noted
that these reported high levels of methane formations are optimum values explored under optimumconditions in the laboratory.
Comparing the results obtained in this study with the report of Jekayinfa and Scholz (2009), a
total of 4,330 � 106 m3 of biogas can be produced from an estimated 6:6 � 106 tonnes of cassava
peels that would be energetically available in Nigeria in 2010. A similar comparison could beused to estimate annual biogas production from PKC, PKS, and cassava using their estimated
production in Nigeria in 2010 as given in the report of Jekayinfa and Scholz (2009).
4. CONCLUSIONS
Measured biogas yields for CT, CP, PKC, and PKS were 0.66, 0.66, 0.58, and 0.08 m3/(kg VS),
respectively, after 30 days digestion time. Methane production from CT, CP, PKC, and PKS was
0.31, 0.28, 0.32, and 0.05 m3/(kg VS), respectively. These results show that cassava tuber, cassava
peels, and palm kernel cake can be used in an ecologically sound way as substrates for anaerobicdigestion.
ACKNOWLEDGMENTS
The first author is grateful to the Alexander von Humboldt Foundation, Germany for her financial
support through the award of Georg Forster Fellowship in the course of this work.
Dow
nloa
ded
by [
196.
46.2
45.5
5] a
t 08:
46 0
9 Se
ptem
ber
2013
PREPARATION OF BIOGAS 2031
FIGURE 6 Daily biogas and methane production using palm kernel shell as substrate.
REFERENCES
Aina, O. I. 2002. Technological assimilation in small enterprises owned by women in Nigeria. In: Technology Policy and
Practice in Africa. London: Longman.
Akinbami, J.-F. K. 2001. Renewable energy resources and technologies in Nigeria: Present situation, future prospects and
policy framework. Mitigat. & Adapt. Strat. Global Change 6:155–188.
Amon, Th., Kryvoruchko, V., Amon, B., Reinhold, G., Oechsner, H., Schwab, M., Weiland, P., and Linke, B. 2004.
Biogas yields from energy crops and manure-Results of laboratory experiments. Proc. KTBL Conference on Agriculture
as Energy Producers, Osnabrück, Germany, March 30–31, 2004, pp. 46–61.
Anunputtikul, W., and Rodtong, S. 2007. Laboratory scale experiments for biogas production from cassava tubers. As. J.
Energy Env. 8:444–453.
Babangida, I. B. 1986. Mobilizing popular participation for rural development. An address to the military governors at
the Seminar on Integrated Rural Development, Lagos, Nigeria.
Balat, M., and Balat, H. 2009. Biogas as a renewable energy source—A review. Energy Sources, Part A 31:1280–1293.
Bardiya, N., Somayaji, and Khanna, S. 1996. Biomethanation of banana peel and pineapple waste. Biores. Technol.
58:73–76.
Benefild, L. D., and Randall, C. W. 1980. Biological Process Design for Wastewater Treatment. USA: Prentice-Hall.
Chawla, O. P. 1986. Advances in Biogas Technology. New Delhi, India: Indian Council of Agricultural Research, p. 144.
Chendo, M. A. C. 2001. Non-conventional energy source. Development, diffusion and impact on human development
index in Nigeria. Nigerian J. Renew. Energy 10:91–102.
Cuzin, N., Farnel, J. L., Segretain, C., and Labat, M. 1992. Methanogenic fermentation of Cassava peel using plug flow
digester. Biores. Technol. 41:259–264.
FAO. 2007. Agricultural Database. Available at: http://www.fao.org.
Hashimoto, A. G., Chen, Y. R., and Varriel, V. H. 1980. Theoretical aspects of methane production: State of the art.
Proceedings of Livestock Waste: A Renewable Resource. 4th International Symposium on Livestock Wastes, ASAE,
St. Joseph, MI, pp. 86–91.
Dow
nloa
ded
by [
196.
46.2
45.5
5] a
t 08:
46 0
9 Se
ptem
ber
2013
2032 S. O. JEKAYINFA AND V. SCHOLZ
Jekayinfa, S. O., and Scholz, V. 2009. Potential availability of energetically usable crop residues in Nigeria. Energy Sources
31:687–697.
Kirchgeßner, M. 1997. Tierernährung [Animal Nutrition], 10th Edition, Frankfurt, Germany: Verlags Union Agrar.
Linke, B., and Schelle, H. 2000. Solid state anaerobic digestion of organic wastes. Agricultural engineering into the third
millenium. Paper No. 00-AP-025. AgEng Warwick 2000 Coventry, UK, July 2–7, pp. 101–102.
Mähnert, P., Heiermann, M., and Linke, B. 2005. Batch- and semi-continuous biogas production from different grass
species. Manuscript EE 05 010. Agricultural Engineering International: The CIGR E Journal. Vol. VII.
Mähnert, P., Heiermann, M., Pöchl, M., Schelle, H., and Linke, B. 2002. Alternative use for grassland cuts—Forage grasses
as biogas co-substrates. Landtechnik 5:260–261.
Mata-Alvarez, J., Liabres, P., Cecchi, F., and Pavan, P. 1992. Anaerobic digestion of the Barcelona food market organic
waste: Experimental study. Biores. Technol. 39:39–48.
Mustaffa, B., Zairi, S., and Hawari, H. 1991. Palm kernel cake in cattle feedlotting. ASEAN Food J. 6:102–103.
Oechsner, H. 2001. Biogas—Stand der technik. Proc. 3. Graskraft-Seminar, Stuttgart-Hohenheim, May 18, pp. 11–20.
Olajide, J. O., and Oyelade, O. J. 2002. Performance evaluation of the strategic grain reserve storage programme (SGRSP)
in Nigeria. Technovation 22:463–468.
Somayaji, D., and Khanna, S. 1994. Biomethanation of rice and wheat straw. World J. Microbiol. Biotechnol. 10:521–523.
VDI 4630 Entwurf. 2004. Green paper: Fermentation of organic materials. D-10772. Berlin, Germany: Beuth Verlag
GmbH.
Yeong, S. W., Mukherjee, T. K., and Hutagulung, R. I. 1983. The nutritive value of palm kernel cake as a feedstuff for
poultry. Proceedings of the National Workshop on Oil Palm By-products Utilization Kuala Lumpur, Malaysia, December
14, pp. 100–107.
Dow
nloa
ded
by [
196.
46.2
45.5
5] a
t 08:
46 0
9 Se
ptem
ber
2013