Embed Size (px)
Citation preview

ORIGINAL ARTICLE
Diversity, Distribution and Effects on Cassava Cultivars ofCassava Brown Streak Viruses in MalawiWillard Mbewe1,2*, P. Lava Kumar2, Wisdom Changadeya1, Pheneas Ntawuruhunga3† and James Legg4
1 University of Malawi, Chancellor College, P. O. Box 280, Zomba, Malawi
2 International Institute of Tropical Agriculture (IITA), Ibadan PMB 5320, Nigeria
3 IITA-Malawi, Chitedze Station, P. O. Box 30258, Lilongwe, Malawi
4 IITA-Tanzania, P.O. Box 34441, Dar es Salaam, Tanzania
Keywords
brown streak disease, cassava, Malawi, virus
diversity, whitefly
Correspondence
J. Legg, IITA-Tanzania, Dar es Salaam,
Tanzania.
E-mail: [email protected]
*Present address: Bvumbwe Agricultural
Research Station, P. O. Box 5748, Limbe,
Malawi
†Present address: IITA-Zambia, 32 Poplar
Road, Lusaka, Zambia
Received: April 22, 2014; accepted: Septem-
ber 26, 2014.
doi: 10.1111/jph.12339
Abstract
Cassava brown streak disease (CBSD) has emerged as a major threat to
cassava (Manihot esculenta) in eastern and southern Africa. CBSD was
first reported in Malawi in the 1950s, but little data on the distribution
and epidemiology of the disease are available. A diagnostic survey was
therefore conducted in Malawi to determine the distribution, incidence
and diversity of viruses causing the disease, and to characterize its effects
on local cassava cultivars. Diagnostic tests confirmed the presence of cas-
sava brown streak viruses (CBSVs) in 90% of leaf samples from symp-
tomatic plants. Average CBSD foliar severity was 2.5, although this
varied significantly between districts. Both Cassava brown streak virus
(CBSV) and Ugandan cassava brown streak virus (UCBSV) (genus Ipomovi-
rus, family Potyviridae) were detected from sampled plants. UCBSV was
widespread, whereas CBSV was detected only in the two most northerly
districts. The average abundance of the whitefly vector (Bemisia tabaci)
was 0.4 per plant, a low value that was partly attributable to the fact that
the survey was conducted during the cool part of the year known to be
unfavourable for B. tabaci whiteflies. Spearman’s correlation analyses
showed a positive correlation between CBSD foliar incidence and CBSD
severity and between CBSD severity and CBSD stem incidence. Of the
31 cassava varieties encountered, 20–20 was most severely affected,
whilst Mtutumusi was completely unaffected. Although data from this
study do not indicate a significant CBSD deterioration in Malawi,
strengthened management efforts are required to reduce the current
impact of the disease.
Introduction
Cassava in Malawi is produced on 149 400 ha with a
production of 3.42 million tons, making it the most
important root crop in Malawi (Sauti 1981; FAOSTAT
2012). The crop is the source of dietary energy for
over 30% of the population and is the second most
important staple in the country after maize (Benesi
2005; FAOSTAT 2012). However, high incidences of
cassava brown streak disease (CBSD) threaten the
sustainable production of the crop in Malawi with an
estimated yield loss of 70%, based on studies compar-
ing infected and healthy experimental plots (Shaba
et al. 2003; Benesi 2005). The other major viral dis-
ease in Africa, cassava mosaic disease (CMD) also
occurs widely in Malawi, although the threat is cur-
rently perceived to be lower than that of CBSD as
large numbers of strongly CMD-resistant varieties
have been developed in recent years (Dixon et al.
2003; Ntawuruhunga et al. 2013).
CBSD was first reported in Tanzania by Storey
(1936) and later in Malawi (Nichols 1950). The
� 2014 Blackwell Verlag GmbH 1
J Phytopathol
disease was subsequently shown to occur widely
through the low altitude areas of east and central
Africa – from southern Kenya, through Tanzania to
Mozambique (Legg and Raya 1998; Hillocks et al.
2002; Benesi 2005). Although, it was first believed
that the disease was restricted to coastal lowlands and
the lakeshore areas of Malawi, new outbreaks have
recently been reported in Uganda (Alicai et al. 2007),
western Kenya (Ntawuruhunga and Legg 2007; Obi-
ero et al., unpublished data), the Lake (Victoria) Zone
of Tanzania (Jeremiah and Legg 2008; Legg et al.
2011), Burundi (Bigirimana et al. 2011) and eastern
Democratic Republic of Congo (Mulimbi et al. 2012).
CBSD is caused by two distinct viruses: Cassava
brown streak virus (CBSV) and Ugandan cassava brown
streak virus (UCBSV) (Family Potyviridae; Genus Ipomo-
virus) (Mbanzibwa et al. 2009a,b; Monger et al. 2010;
Winter et al. 2010), collectively referred as cassava
brown streak viruses (CBSVs). The CBSVs are propa-
gated through infected stem cuttings (Storey 1936)
and they are also transmitted by the whitefly, Bemisia
tabaci (Genn.) in a semi-persistent manner (Maruthi
et al. 2005). CBSD symptoms in cassava are charac-
terized by feathery chlorosis on leaves, brown streaks
on stems as well as stem die-back in cases of severe
infection (Nichols 1950). The most economically
important effect of the disease is the dry corky necro-
tic rot in the tuberous roots of infected plants, which
typically becomes more severe as the plant matures
(Nichols 1950).
Although CBSD has been recognized as one of the
major constraints to sustainable cassava production in
Malawi, precise knowledge on disease distribution
and severity, economic losses, varietal reaction and
farmers’ knowledge is limited. After the first report of
CBSD in Malawi (Nichols 1950), the disease was
rediscovered in 1993 (J.M. Thresh and H. Rossel,
unpublished). Previous surveys showed that CBSD
was widespread in the major cassava producing
regions of the country (Gondwe et al. 2003), and that
the incidence and severity were highest along the
shores of Lake Malawi. These included parts of the
districts of Karonga, Rumphi, Nkhatabay, Nkhotakota,
Salima and Mangochi. More recently, both virus spe-
cies associated with CBSD were identified from
Malawi, and whilst CBSV was found to be localized in
northern lakeshore areas, UCBSV was shown to occur
more widely through lakeshore areas of Malawi
(Mbanzibwa et al. 2011).
Currently, there are efforts by the Department of
Agricultural Research Services (DARS) to develop sus-
tainable solutions for the management of the disease
through selection and conventional breeding for
resistance (I. Benesi, personal communication). How-
ever, it is essential to have precise and up-to-date
knowledge on the distribution of the disease and asso-
ciated viruses, and to determine the effect of the dis-
ease on the most widely grown cassava cultivars.
Therefore, this study was carried out to provide an in-
depth assessment of the current status of CBSD and
the response of local cultivars to it under epiphytotic
conditions.
Materials and Methods
Survey area, sampling procedure and data collection
Surveys were conducted in 2010 in twelve districts
that represent the most important cassava-growing
areas of the country, viz., Chitipa, Chiradzulu, Karo-
nga, Kasungu, Mulanje, Mzimba, Nkhatabay, Nkhota-
kota, Salima, Rumphi, Thyolo and Zomba. A total of
ninety fields were assessed, selected at intervals of
10 km along motorable roads. Thirty plants of the
predominant variety in each field were sampled fol-
lowing an ‘X’ transect (Sseruwagi et al. 2004). Inci-
dence of CBSD was recorded as the percentage of
symptomatic plants amongst the 30 assessed. The total
number of B. tabaci whitefly adults was recorded on
the top five leaves of one shoot per sampled plant,
and the average per plant was calculated for each
sampled field. Severity was considered as the degree
of chlorotic symptom expression on symptomatic
leaves (mainly occurring on the lower portion of the
plant) assessed using a scale of 1–5 (Table 1), where 1
represents no symptoms and 5 represents the most
severe symptoms (Rwegasira et al. 2011). Symptoms
on the stems were also assessed using the same scale.
Plants that were 3–6 months old were targeted for
symptom assessment, whitefly counts and sampling
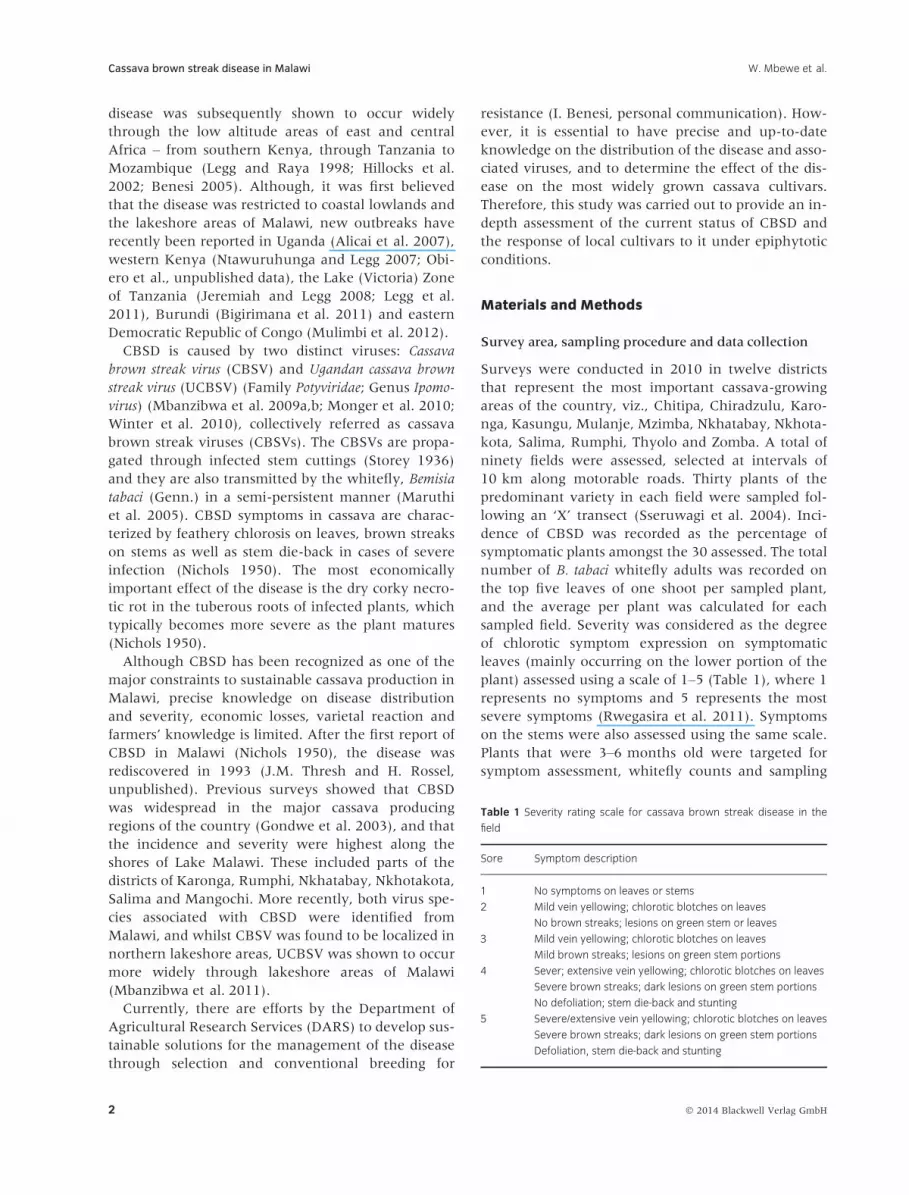
Table 1 Severity rating scale for cassava brown streak disease in the
field
Sore Symptom description
1 No symptoms on leaves or stems
2 Mild vein yellowing; chlorotic blotches on leaves
No brown streaks; lesions on green stem or leaves
3 Mild vein yellowing; chlorotic blotches on leaves
Mild brown streaks; lesions on green stem portions
4 Sever; extensive vein yellowing; chlorotic blotches on leaves
Severe brown streaks; dark lesions on green stem portions
No defoliation; stem die-back and stunting
5 Severe/extensive vein yellowing; chlorotic blotches on leaves
Severe brown streaks; dark lesions on green stem portions
Defoliation, stem die-back and stunting
� 2014 Blackwell Verlag GmbH2
Cassava brown streak disease in Malawi W. Mbewe et al.
for virus testing. Plants at this growth stage typically
express CBSD symptoms if infected, host peak white-
fly populations and provide a good source of young
actively-growing leaflets for virus testing. In every
cassava field surveyed, at least one leaf sample was
collected from a CBSD symptomatic plant and a sec-
ond sample from an asymptomatic plant for virus test-
ing in the laboratory. Altogether 429 samples were
collected in this survey for virus testing, which were
pressed between paper sheets in a herbarium press
and allowed to dry. They were stored at room temper-
ature prior to laboratory testing for CBSVs.
Detection of cassava brown streak viruses
Total nucleic acids were extracted from about 50 mg
of dried leaf sample using a modified Cetyl trimethy-
lammonium bromide (CTAB) protocol as detailed in
Abarshi et al. (2010). Nucleic acids were quantified
using a NanodropTM (Wilmington, DE, USA) spectro-
photometer, and about 20 ng/lL nucleic acid was
used for virus detection by Reverse Transcription –Polymerase Chain Reaction (RT-PCR) as detailed in
Abarshi et al. (2012). Two sets of primers were used
for the amplification: CBSV-F3 (50 GGARCCRATG-
TAYAAATTTGC 30) and CBSV-R3 (50 AG-
GAGCWGCTARWGCAAA 30) (Abarshi et al. 2012)
which amplify a c. 283 bp fragment corresponding to
the 30 end of the coat protein encoding gene; and
CBSV-10 (50 ATCAGAATAGTGTGACTGCTG 30) and
CBSV-11 (50 CCACATTATTATCGTCACCAGG 30)(Monger et al. 2001) which amplify a c. 231 bp frag-
ment also from the 30 end of the coat protein encoding
region of the CBSV. RT-PCR reactions were per-
formed in a GeneAmp 9700 PCR� thermal cycler
(Applied Biosystems, Foster City, CA, USA) set with
the following conditions: 42°C for 30 min for reverse
transcription, followed by heat denaturation at 94°Cfor 5 min; and then 35 cycles of amplification com-
prising the following: denaturation at 94°C for 1 min,
annealing at 52°C for 1 min, extension at 72°C for
1 min, followed by a single cycle of final extension at
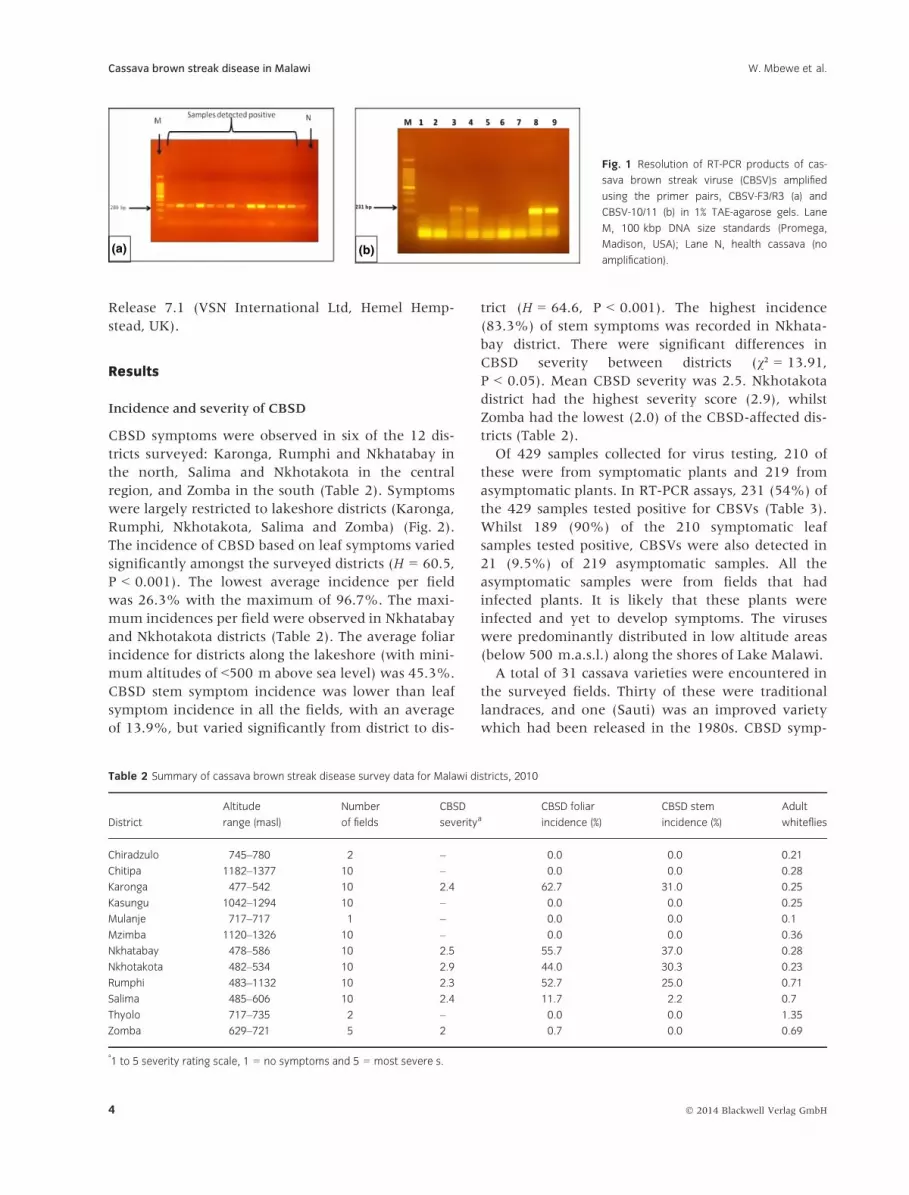
72°C for 10 min. The RT-PCR products were resolved
with a 1% agarose gel using TAE buffer and DNA
bands were visualized by ethidium bromide staining
(Abarshi et al. 2010) (Fig. 1). Samples were scored for
presence (CBSVs positive) or absence (CBSVs nega-
tive) of amplified products. Samples that failed to pro-
duce any PCR products were tested for the presence
of host nucleic acids by the amplification of a house
keeping gene, ribulose bisphosphate carboxylase oxy-
genase (RubiscoL) using the primer pair: RBCL-F535
(50 CTTTCCAAGGCCC
GCCTCA 30) and RBCL-R705 (50 CATCATCTTTGGTAAAATCAAGTCCA 30) specific to the large subunit of
RubiscoL. These primers amplify a fragment of c. 171 bp
(Alabi et al. 2008).
Nucleotide sequencing and phylogenetic analysis
The phylogenetic relationship of various isolates of
CBSVs from wide geographic regions was analysed
to determine the relationships of isolates analysed
in this study and also to compare them with other
isolates reported recently from Malawi (Mbanzibwa
et al. 2011). For this purpose, a selection of RT-
PCR products produced by the primer sets CBSV-
F3/R3 and CBSV-10/11 were sequenced. In all
cases, cloned sequences were sequenced in both
orientations and in duplicate. Nucleotide sequences
of each isolate were edited and compared with each
other using the bioinformatics software programmes
– VECTOR NTI ADVANCE (Invitrogen Corp., Carlsbad,
CA, USA) and BIOEDIT SEQUENCE ALIGNMENT EDITOR Ver.
7.0.5.3. A consensus sequence was obtained for
each isolate, and the sequences were verified by
BLASTN searches (http://blast.ncbi.nlm.nih.gov/Blast.
cgi). The ‘Translate a DNA Sequence’ option of Bio-
Edit was used to ascertain that the sequences were
in the correct translation frame prior to using them
for further analyses.
Thirty-three unique sequences were obtained
which represented isolates from 20 locations encom-
passing all the districts in which CBSD was detected in
this study (Tables S1–S3). Multiple sequence align-
ments were generated by ClustalW using nucleotides
of RT-PCR amplicons (about 230 to 283 bases) of the
33 isolates analysed in this study along with
sequences of 18 CBSVs previously reported from
Malawi, one reference sequence each of UCBSV and
CBSV and an outgroup sequence of Sweet potato mild
mottle virus (SPMMV, genus Ipomovirus, family Potyviri-
dae) available in NCBI’s GenBank (see Supplementary
Data S1 for alignments). Phylogenetic relationships
were inferred using the Neighbour-Joining method
(Tamura et al. 2007).
Data analysis
The CBSD incidence data were analysed using the
Kruskal–Wallis test for nonparametric data. Symptom
severity data from different cassava-growing regions
were compared by Chi-square tests. Associations
between variables were examined using the Spear-
man rank correlation coefficient. Statistical proce-
dures were all performed using Genstat for Windows
� 2014 Blackwell Verlag GmbH 3
W. Mbewe et al. Cassava brown streak disease in Malawi
Release 7.1 (VSN International Ltd, Hemel Hemp-
stead, UK).
Results
Incidence and severity of CBSD
CBSD symptoms were observed in six of the 12 dis-
tricts surveyed: Karonga, Rumphi and Nkhatabay in
the north, Salima and Nkhotakota in the central
region, and Zomba in the south (Table 2). Symptoms
were largely restricted to lakeshore districts (Karonga,
Rumphi, Nkhotakota, Salima and Zomba) (Fig. 2).
The incidence of CBSD based on leaf symptoms varied
significantly amongst the surveyed districts (H = 60.5,
P < 0.001). The lowest average incidence per field
was 26.3% with the maximum of 96.7%. The maxi-
mum incidences per field were observed in Nkhatabay
and Nkhotakota districts (Table 2). The average foliar
incidence for districts along the lakeshore (with mini-
mum altitudes of <500 m above sea level) was 45.3%.
CBSD stem symptom incidence was lower than leaf
symptom incidence in all the fields, with an average
of 13.9%, but varied significantly from district to dis-
trict (H = 64.6, P < 0.001). The highest incidence
(83.3%) of stem symptoms was recorded in Nkhata-
bay district. There were significant differences in
CBSD severity between districts (v² = 13.91,
P < 0.05). Mean CBSD severity was 2.5. Nkhotakota
district had the highest severity score (2.9), whilst
Zomba had the lowest (2.0) of the CBSD-affected dis-
tricts (Table 2).
Of 429 samples collected for virus testing, 210 of
these were from symptomatic plants and 219 from
asymptomatic plants. In RT-PCR assays, 231 (54%) of
the 429 samples tested positive for CBSVs (Table 3).
Whilst 189 (90%) of the 210 symptomatic leaf
samples tested positive, CBSVs were also detected in
21 (9.5%) of 219 asymptomatic samples. All the
asymptomatic samples were from fields that had
infected plants. It is likely that these plants were
infected and yet to develop symptoms. The viruses
were predominantly distributed in low altitude areas
(below 500 m.a.s.l.) along the shores of Lake Malawi.
A total of 31 cassava varieties were encountered in
the surveyed fields. Thirty of these were traditional
landraces, and one (Sauti) was an improved variety
which had been released in the 1980s. CBSD symp-
Table 2 Summary of cassava brown streak disease survey data for Malawi districts, 2010
District
Altitude
range (masl)
Number
of fields
CBSD
severityaCBSD foliar
incidence (%)
CBSD stem
incidence (%)
Adult
whiteflies
Chiradzulo 745–780 2 – 0.0 0.0 0.21
Chitipa 1182–1377 10 – 0.0 0.0 0.28
Karonga 477–542 10 2.4 62.7 31.0 0.25
Kasungu 1042–1294 10 – 0.0 0.0 0.25
Mulanje 717–717 1 – 0.0 0.0 0.1
Mzimba 1120–1326 10 – 0.0 0.0 0.36
Nkhatabay 478–586 10 2.5 55.7 37.0 0.28
Nkhotakota 482–534 10 2.9 44.0 30.3 0.23
Rumphi 483–1132 10 2.3 52.7 25.0 0.71
Salima 485–606 10 2.4 11.7 2.2 0.7
Thyolo 717–735 2 – 0.0 0.0 1.35
Zomba 629–721 5 2 0.7 0.0 0.69
a
1 to 5 severity rating scale, 1 = no symptoms and 5 = most severe s.
(a) (b)
Fig. 1 Resolution of RT-PCR products of cas-
sava brown streak viruse (CBSV)s amplified
using the primer pairs, CBSV-F3/R3 (a) and
CBSV-10/11 (b) in 1% TAE-agarose gels. Lane
M, 100 kbp DNA size standards (Promega,
Madison, USA); Lane N, health cassava (no
amplification).
� 2014 Blackwell Verlag GmbH4
Cassava brown streak disease in Malawi W. Mbewe et al.

toms were observed on 24 of these varieties (Table 4).
CBSD incidence exceeded 80% in varieties Abiti-
Mdala, Chakuwawa, Mushombe and Unknown-2,
whilst symptoms were not observed on seven varie-
ties (Bushman, Chinsalanzo, Chithekere, Koloweka,
Masangwi, Mtutumusi and one unknown variety)
(Table 4). Eight of the ten fields planted with these
seven varieties were encountered in districts in which
CBSD was absent. Of the five most widely grown vari-
eties [Manyokola (= Mbundumali), Mtutumusi,
20–20, Sauti and Thipula], Manyokola and Mtutumu-
si had the lowest incidences of CBSD, whilst 20–20had a high CBSD incidence. There was no correlation
between CBSD incidence and severity, as some of the
varieties with low incidences had high severity scores
(var. Thundulu), and others with high incidence had
low severity (var. Matakolembwende and Nyajogwa).
Adult whitefly population
Bemisia tabaci adults were observed in all the cassava-
growing regions of the country, averaging 0.4 insects
per plant (Table 2), but their numbers did not differ
significantly between districts. The maximum number
of whiteflies was observed in Rumphi district (5.8/
plant). Karonga, Chitipa and Mzimba districts had the
fewest whiteflies (averaging 0.9/plant). Variety Nya-
jogwa had the highest number of adult whiteflies with
an average of 2.9 per plant whilst varieties Chitemb-
were and Koloweka had the least (0.03).
Correlation analyses
Spearman’s rank correlation coefficient tests showed
a positive correlation between CBSD foliar incidence
and CBSD severity (r = 0.90, P < 0.05) (Table 5).
However, there was no correlation between abun-
dance of whiteflies and CBSD incidence (r = 0.16,
P = 0.30). There was a negative correlation between
altitude and CBSD foliar incidence (r = �5.0,
P = 0.00) (Table 5).
Molecular diversity of cassava brown streak viruses
The phylogenetic analysis of the 33 sequences of
CBSVs from this study together with selected refer-
ence sequences revealed a clear partitioning into three
Table 3 Symptomatic and asymptomatic cassava leaf samples analysed
for cassava brown streak viruses by RT-PCR
District
Total samples
Symptomatic
samples
Asymptomatic
samples
Tested
Positive
to
CBSVsa Tested
Positive
to
CBSVs Tested
Positive
to
CBSVs
Chiradzulo 4 0 (0) 0 0 (0) 4 0 (0)
Chitipa 22 0 (0) 0 0 (0) 22 0 (0)
Karonga 78 65 (83) 56 55 (98) 22 9 (41)
Kasungu 20 0 (0) 0 0 (0) 20 0 (0)
Mulanje 2 0 (0) 0 0 (0) 2 0 (0)
Mzimba 21 0 (0) 0 0 (0) 21 0 (0)
Nkhatabay 85 58 (68) 52 48 (92) 33 6 (18)
Nkhotakota 79 54 (68) 53 46 (87) 26 1 (4)
Rumphi 37 23 (62) 21 19 (90) 16 2 (13)
Salima 59 24 (41) 22 15 (68) 37 2 (5)
Thyolo 3 0 (0) 0 0 (0) 3 0 (0)
Zomba 19 7 (37) 6 6 (100) 13 1 (8)
Total 429 231 (54) 210 189 (90) 219 21 (10)
a
Per cent positive samples presented in parenthesis.
Table 4 Predominant cultivars, incidence and severity of cassava
brown streak disease, and mean adult whitefly abundance in Malawi,
2010
Variety Name
Number
of fields
observed
CBSD
severity
CBSD foliar
incidence (%)
Mean adult
whiteflies
per plant
20–20 4 2.6 76.7 0.24
Abiti-Mdala 1 2.5 86.7 0.23
Bitilisi 2 2.9 46.7 0.12
Bushman 1 – 0.0 0.07
Chakuwawa 1 2.8 96.7 0.10
Chinsalanzo 1 – 0.0 0.17
Chitembwere 2 2 15.0 0.03
Chithekere 1 – 0.0 0.13
Gomani 2 3.2 36.7 0.45
Gomani Mutuwa 1 2.7 66.7 0.27
Koloweka 1 – 0.0 0.03
Manyokola 23 2.3 3.0 0.58
Masangwi 1 – 0.0 0.10
Maso’azungu 2 2 6.7 0.32
Matakolembwende 2 2.3 63.4 0.40
Mbawala 3 3.1 55.6 0.47
Mbundumali 14 2.9 4.3 0.41
Mchilingano 2 2 1.7 0.57
Mpapa 1 2.6 73.3 0.20
Mpuma 2 2.5 45.0 0.27
Mtutumusi 4 – 0.0 0.46
Mushombe 1 2.6 83.3 0.20
Nyajogwa 2 2.1 70.0 2.92
Nyakayera 1 2.5 63.3 0.13
Nyaukandawire 1 2.7 10.0 0.27
Nyautonga 1 2 30.0 0.47
Sauti 5 2.3 57.3 0.16
Thipula 5 2.5 44.0 0.09
Thundulu 1 3 10.0 0.30
Unknown 1 1 – 0.0 0.06
Unknown 2 1 2.5 83.3 0.03
Total/Mean 90 2.5 36.4 0.34
� 2014 Blackwell Verlag GmbH 5
W. Mbewe et al. Cassava brown streak disease in Malawi

clusters (Fig. 3). This included one cluster each for
isolates of UCBSV and CBSV – in agreement with pre-
vious studies (Mbanzibwa et al. 2011). Nucleotide
sequence divergence between Malawian isolates
obtained through this study was 0.1–5.2% for the
CBSV cluster and 0.4–9.8% for the UCBSV cluster. In
addition, a group of five isolates formed an intermedi-
ate cluster not aligning with either UCBSV or CBSV
(see cluster 3 in Fig. 3). Nucleotide sequence diver-
gence between isolates in this intermediate cluster
was 3.4–11.7%, but there were much greater
differences with sequences of UCBSV (11.3–22.5%)
and CBSV (19.3–23.2%). Surprisingly, translated
amino acid sequences of these isolates were similar to
the most closely related sequences of CBSV (88%
identity) and UCBSV (95% identity). In spite of these
close relationships, this group of five isolates is novel
as it appears to be intermediate between CBSV and
UCBSV. Full genome sequences would reveal addi-
tional novel features and allow the proper classifica-
tion of these isolates to either CBSV, UCBSV or as a
unique species. However, as all five isolates have a
relatively high homology with UCBSV, the provi-
sional conclusion from this study is that they should
be considered as a strain of UCBSV.
An analysis of the geographical distribution of
sequenced isolates revealed that UCBSV was present
in all surveyed areas were CBSD was encountered. By
contrast, CBSV was only detected in the northern dis-
tricts of Karonga and Rumphi. Isolates of the distinct
strain of UCBSV were present both in the far south
(Zomba and Salima) and north (Karonga and Rum-
phi) of the sampled area.
Discussion
Understanding disease ecology and accurate pathogen
diagnosis are essential prerequisites for the develop-
ment of sound management strategies. As CBSD con-
tinues to threaten subsistence cassava production in
east, central and southern Africa, there is a need to
gather new information on the distribution of the dis-
ease, as well as the performance of cultivars being
Table 5 Correlation analysis for cassava brown streak disease inci-
dence, altitude and adult whiteflies based on data for 90 sites
Parameter 1 Parameter 2 Coefficient Significance
CBSD incidence B. tabaci 0.16 ns
CBSD incidence Altitude �0.50 **
CBSD incidence CBSD foliar severity 0.90 **
ns, not significant.
**Significant at P < 0.01 level.
Fig. 2 Incidence and distribution of cassava brown streak disease in
Malawi, 2010.
Fig. 3 Phylogenetic relationships amongst 33 isolates of cassava brown streak viruse (CBSV)s from Malawi and 20 isolates from NCBI GenBank (indi-
cated in italics) inferred from the ClustalW alignment of about 230–280 bp portion of the 30 terminus of the coat protein gene of CBSV or Ugandan
cassava brown streak virus, inferred by the Neighbour-Joining method (1000 replications) using MEGA4 software. Percentage bootstrap values are
shown at the branch points. Branches corresponding to partitions reproduced in <50% bootstrap replicates were collapsed. The evolutionary dis-
tances were computed using the Maximum Composite Likelihood method and are in the units of the number of base substitutions per site. All posi-
tions containing gaps and missing data were eliminated from the data set (Complete deletion option). There were a total of 162 positions in the final
data set. Isolate grouped together are labelled as cluster 1, 2 and 3. Sweet potato mild mottle virus (SPMMV, genus Potyvirus, family Potyviridae) was
included as an out-group. Details of isolates and sequence alignments are available in the supplementary data files.
� 2014 Blackwell Verlag GmbH6
Cassava brown streak disease in Malawi W. Mbewe et al.

� 2014 Blackwell Verlag GmbH 7
W. Mbewe et al. Cassava brown streak disease in Malawi

grown by farmers. Effective surveillance of this dis-
ease is particularly important in view of the rapid new
spread that has been reported from the Great Lakes
region of East Africa (Alicai et al. 2007; Legg et al.
2011).
This study has reconfirmed the presence of CBSD in
Malawi along northern, central and southern lake-
shore areas of Lake Malawi as reported previously
(Nichols 1950; Gondwe et al. 2003; Shaba et al. 2003;
Mbanzibwa et al. 2010, 2011). Previous surveys
reported a CBSD incidence of 40% (Gondwe et al.
2003) compared to the overall average of 26.3%
reported here. However, the 40% described by Gon-
dwe et al. (2003) was the average incidence in lake-
shore districts in 2000–2001, when the surveys were
conducted. In the current study, mean foliar inci-
dence for these districts was 45.3%, suggesting that
there has in fact been a small increase in CBSD in this
most heavily affected part of the country. It is signifi-
cant, however, that the general distribution of CBSD
has not changed greatly in Malawi during the decade
that has separated these two surveys: in both cases,
Nkhatabay, Karonga, and Nkhotakota districts were
shown to be the most severely affected areas. Signifi-
cantly, these three districts account for nearly 50% of
total cassava production in Malawi (Ministry of Agri-
culture, 2009). Possible reasons for the high level of
disease in these three districts include the relatively
high density of cassava cultivation, which makes virus
spread between crops easier, and the low altitude and
associated higher average temperatures favouring
whitefly vector populations (Hillocks et al. 1999).
Although whitefly abundance was generally low in
the survey, highest populations were recorded in
lakeshore areas.
Previous survey data have demonstrated that nei-
ther farmers nor extension workers are aware of the
cause of CBSD (Gondwe et al. 2003). The farmers and
extension workers thought that CBSD symptoms
were due to heavy rainfall or water logging, whilst
others attributed this to old age. On the contrary,
farmers were fully aware of the other main cassava
virus disease in Malawi, cassava mosaic disease
(CMD) and were already using CMD-free materials
when planting (Gondwe et al. 2003). This is not alto-
gether surprising, as foliar symptoms of CMD are
much more obvious than those of CBSD.
The study showed a strong association between
CBSD incidence and severity, as well as an inverse
relationship between CBSD incidence and altitude.
Although the correlation with whitefly abundance
was not significant, these other significant associa-
tions nevertheless provide a strong indirect indication
that CBSD is most prevalent in agro-ecologies favour-
able for whitefly population increase. It is important
to note that the current survey was carried out at the
start of the dry season, a period of low temperature
that is known from experience elsewhere to be unfa-
vourable for whitefly population increase (Dengel
1981; Fargette et al. 1993).
The virtual absence of CBSD from higher altitude
parts of Malawi confirms that the disease is still
behaving in the manner established during the early
years of CBSD research, in which it was noted that
CBSD was not a problem at higher elevations (Nichols
1950). At that time, it was hypothesized that this was
due to the lack of transmission of the causal virus (es)
at higher altitudes. Studies in Tanzania linked
decreasing abundance of the whitefly vector with
increasing altitude (Legg and Raya 1998; Hillocks
et al. 1999). Recent outbreaks of CBSD in mid-alti-
tude areas of the Great Lakes region of East and Cen-
tral Africa (Alicai et al. 2007; Mbanzibwa et al. 2011)
have demonstrated that there is no intrinsic barrier to
the spread of the CBSD-causing viruses at elevations
above 1000 m.a.s.l. Moreover, it has been shown that
changes in abundance of the B. tabaci vector can read-
ily account for the change in CBSD dynamics at mid-
altitude elevations (Legg et al. 2011). Although such
vector changes seem to have occurred widely in many
parts of East and Central Africa (Legg et al. 2006),
data presented here suggest that this is not yet the
case in Malawi. The fact that neighbouring countries
have experienced such changes, however, emphasizes
the importance of regular surveillance exercises in
Malawi, particularly during periods favourable for
whitefly populations.
The detection of CBSVs in 90% of the symptomatic
samples reconfirms previous reports (Monger et al.
2001; Mbanzibwa et al. 2010) which proved RT-PCR
to be a powerful diagnostic tool for the detection of
CBSVs. Although diagnosis based on visual symptoms
seems to have missed approximately 10% of infec-
tions detected by RT-PCR, this relatively high detec-
tion rate suggests that visual assessments may be
appropriate for many routine surveillance applica-
tions. PCR-based diagnostics will be essential, how-
ever, where detection of early stage infections or
species-level determinations is required. Although the
reasons for the apparent undiagnosed infections were
not investigated in this study, the most probable rea-
sons are either that the plants were incorrectly
labelled as symptomatic (CBSD symptoms are widely
considered to be difficult to recognize) or that
sequence variability of infecting CBSVs led to primers
failing to amplify target sequences. It was notable that
� 2014 Blackwell Verlag GmbH8
Cassava brown streak disease in Malawi W. Mbewe et al.
primers CBSV10/11 detected a relatively small pro-
portion of symptomatic samples compared to CBSV-
F3/R3. This was as anticipated, as the CBSV10/11
primers were first developed in 2001 (Monger et al.
2001) at a time when there was little knowledge of
the diversity of CBSVs. By contrast, CBSV-F3/R3
(Abarshi et al., 2010) was produced much more
recently and was developed to be broadly reactive to a
wide diversity of CBSVs. In this respect, the Malawian
isolates reported here were highly diverse.
Both of these results highlight the variability within
and between species of CBSVs and indicate a high
likelihood that a proportion of CBSD-causing viruses
may not be detected by existing primer sets. The prim-
ers used were able, however, to detect a previously
undescribed strain of UCBSV, which could be further
resolved into two groups, one of which occurred in
the far south of the sampled zone (Salima and Zom-
ba), whilst the other occurred in the north (Karonga
and Rumphi). Although further studies will be
required incorporating full genome sequencing, this
does raise the intriguing possibility of the occurrence
of viruses that are intermediate between the two main
CBSV and UCBSV species groupings.
Sequence analysis indicated that there is greater
genetic variability amongst UCBSV than CBSV iso-
lates. This fact, coupled with the much wider distribu-
tion of UCBSV than CBSV suggests that UCBSV is
likely to be the endemic species that has been associ-
ated with cassava in Malawi since the earliest records
of CBSD in the country (Nichols 1950). Substantial
within country movements of cassava planting mate-
rials, which occur both informally from farmer to
farmer and officially through large-scale governmen-
tal or NGO operations, lead to the ready dispersal of
cassava-infecting virus species over relatively short
periods of time. CBSV would therefore seem to be a
relatively recent introduction from a neighbouring
country, most likely Tanzania where CBSV is the pre-
dominant species (Mbanzibwa et al. 2010; Rwegasira
et al. 2011). Comparisons of full genome sequences of
Malawian CBSVs with those of CBSVs obtained from
CBSD-affected areas of neighbouring countries (Tan-
zania and Mozambique) would likely clarify questions
about the origins of CBSVs currently occurring in
Malawi.
The study has documented the existing threat that
CBSD poses to sustainable cassava production in
Malawi. Both CMD and CBSD continue to be wide-
spread and negatively impact cassava yields, particu-
larly in the lowland zone along the shores of Lake
Malawi. This highlights the need for the development
and implementation of effective management
strategies. Sources of resistance to CMD are already
available that provide virtual immunity to infection,
and these have been widely deployed throughout East
and Central Africa to combat the CMD pandemic
(Dixon et al. 2003). By contrast, there has been less
success in developing resistance to CBSVs, although
farmer-grown varieties do differ considerably in their
response to CBSD, as highlighted in this study. Sev-
eral national and international research institutions
are seeking to develop novel conventional as well as
transgenic approaches to enhancing the resistance of
cassava to CBSVs (Munga 2008; Yadav et al. 2011). In
the interim, much could be achieved immediately
through the systematic promotion of phytosanitation
measures that would include the development of
‘clean’ virus-tested sources of planting material, isola-
tion of planting material multiplication sites and the
selection by farmers of disease-free stems when estab-
lishing a new crop. Of the 31 cassava varieties
encountered in this survey, only one was an
officially-released improved variety (Sauti). This
highlights a need to strengthen Malawi’s cassava
variety development and dissemination programme.
Amongst the local varieties, all being grown in
CBSD-affected districts were infected, albeit to
varying degrees. Significantly, the most widely grown
local variety [Manyokola (=Mbundumali)] had one of
the lowest incidences of CBSD, suggesting that this is
an important factor driving its popularity. Future
breeding efforts should aim to identify and utilize pos-
sible sources of resistance in this and other varieties
that are relatively less affected by CBSD. In the short
term, however, the health status of cassava planting
material in Malawi could be enhanced by incorporat-
ing this and similar varieties into the kinds of phyto-
sanitation schemes described above.
Although whitefly vector abundance was very
low at the time the study was conducted this is not
necessarily an indication that this is the case
throughout the year. Work elsewhere has high-
lighted the high degree of seasonal variability that
characterizes B. tabaci abundance (Fishpool et al.
1995), and populations are typically lowest during
the cool dry season. Cassava virus infection is sus-
tained through the activity of whitefly vector, and
the fact that the viruses causing both CBSD and
CMD are transmitted by B. tabaci makes it an obvi-
ous target for control. Future cassava disease control
efforts should therefore have a more specific focus
on managing populations of the vector.
Management of vector-borne plant pathogens has
been an enormous challenge due to the complex
dynamics and interactions of host plants, vectors and
� 2014 Blackwell Verlag GmbH 9
W. Mbewe et al. Cassava brown streak disease in Malawi

viruses within a variable environment (Castle et al.
1998). With respect to CBSD, there is a clear need to
understand such factors thoroughly and to use this
knowledge to determine how they affect incidences
and severities of CBSD. This will certainly help in
implementing both proactive and reactive measures
to mitigate the disease in Malawi and elsewhere.
Acknowledgements
We are grateful to USAID for financial support to this
work received as part of the USAID administered WB
grant, no. Eem-g-00-04-00013-00, food security and
crisis mitigation programme, with CGIAR as trustee.
Many thanks to Mr. Chris Moyo and Mr. Kalenga–Maliro of the International Institute of Tropical
Agriculture (IITA, Malawi), for assisting with the diag-
nostic surveys.
References
Abarshi MM, Mohammed IU, Wasswa P, Hillocks RJ, Holt
J, Legg JP, Seal SE, Maruthi MN. (2010) Optimization of
diagnostic RT-PCR protocols and sampling procedures
for the reliable and cost-effective detection of Cassava
brown streak virus. J Virol Methods 163:353–359.
Abarshi MM, Mohammed IU, Jeremiah SC, Legg JP,
Kumar PL, Hillocks RJ, Maruthi MN. (2012) Multiplex
RT-PCR assays for the simultaneous detection of both
RNA and DNA viruses infecting cassava and the com-
mon occurrence of mixed infections by two cassava
brown streak viruses in East Africa. J Virol Methods
179:176–184.
Alabi OJ, Kumar PL, Naidu RA. (2008) Multiplex PCR for
the detection of African cassava mosaic virus and East
African cassava mosaic Cameroon virus in cassava. J
Virol Methods 154:111–120.
Alicai T, Omongo CA, Maruthi MN, Hillocks RJ, Baguma
Y, Kawuki R, Bua A, Otim-Nape GW, Colvin J. (2007)
Re-emergence of cassava brown streak disease in
Uganda. Plant Dis 91:24–29.
Benesi IRM. (2005) Characterisation of Malawian Cassava
germplasm for diversity, starch extraction and its native
and modified properties. PhD thesis. University of the
Free State Bloemfontein, South Africa. 199 pp.
Bigirimana S, Barumbanze P, Ndayihanzamaso P, Shirima
R, Legg JP. (2011) First report of cassava brown streak
disease and associated Ugandan cassava brown streak virus
in Burundi. New Dis Rep 24:26. [http://dx.doi.org/10.
5197/j.2044-0588.2011.024.026]
Castle SJ, Mowry TM, Berger PH. (1998) Differential set-
tling by Myzus persicae (Homoptera: Aphididae) on
various virus infected host plants. Ann Entomol Soc Am
91:661–667.
Dengel HJ. (1981) Untersuchengen €uber das Auftreten der
Imagines von Bemisia tabaci (Genn.) auf verschiedenen
Manoksorten. Z Pflanzenkr Pflanzenpathol Pflanzens-
chutz 88:355–366.
Dixon AGO, Bandyopadhyay R, Coyne D et al. (2003)
Cassava: from a poor farmer’s crop to a pacesetter of
African rural development. Chron Hort 43:8–14.
FAOSTAT. (2012) FAO database. Food and Agriculture
Organisation of the United Nations, Rome, Italy. Avail-
able at http://faostat.fao.org/site/567/default.aspx.
Accessed December 10, 2012.
Fargette D, Jeger M, Fauquet C, Fishpool LDC. (1993)
Analysis of temporal disease progress of African cassava
mosaic virus. Phytopathology 84:91–98.
Fishpool LDC, Fauquet C, Thouvenel JC, Burban C, Colvin
J. (1995) The phenology of Bemisia tabaci populations
(Homoptera: Aleyrodidae) on cassava in southern Cote
d’Ivoire. Bull Entomol Res 85:197–207.
Gondwe FMT, Mahungu NM, Hillocks RJ, Raya MD, Moyo
CC, Soko MM, Chipungu F, Benesi IRM. (2003) Eco-
nomic losses experienced by small-scale farmers in
Malawi due to cassava brown streak virus disease. In:
Legg JP, Hillocks RJ. (eds) Cassava Brown Streak Virus
Disease: Past, Present and Future. Proc. Int. Workshop,
Mombasa, Kenya, 27–30 October 2002. Aylesford, UK,
Natural Resources International Limited, pp. 28–35
Hillocks RJ, Raya MD, Thresh JM. (1999) Factors affecting
the distribution, spread and symptom expression of cas-
sava brown streak disease in Tanzania. Afr J Root Tuber
Crops 3:57–61.
Hillocks RJ, Thresh JM, Tomas J, Botao M, Macia R, Zavier
R. (2002) Cassava brown streak in northern Mozam-
bique. Int J Pest Manag 48:179–182.
Jeremiah SC, Legg JP. (2008) Cassava brown streak virus.
Available on: http://www.youtube.com/watch?
v=nCJdws9CnUw. Uploaded: October 25, 2008.
Legg JP, Raya M. (1998) Survey of cassava virus diseases
in Tanzania. Int J Pest Manag 44:17–23.
Legg JP, Owor B, Sseruwagi P, Ndunguru J. (2006) Cas-
sava mosaic virus disease in East and Central Africa: epi-
demiology and management of a regional pandemic.
Adv Virus Res 67:355–418.
Legg JP, Jeremiah SC, Obiero HM et al. (2011) Comparing
the regional epidemiology of the cassava mosaic and cas-
sava brown streak pandemics in Africa. Virus Res
159:161–170.
Maruthi MN, Hillocks RJ, Mtunda K, Raya MD, Muhanna
M, Kiozia H, Rekha AR, Colvin J, Thresh JM. (2005)
Transmission of Cassava brown streak virus by Bemisia
tabaci (Gennadius). J Phytopathol 153:307–312.
Mbanzibwa DR, Tian Y, Mukasa SB, Valkonen JPT.
(2009a) Cassava Brown Streak Virus (Potyviridae) encodes
a putative Maf/HAM1 pyrophosphatase implicated in
reduction of mutations and a P1 proteinase that sup-
� 2014 Blackwell Verlag GmbH10
Cassava brown streak disease in Malawi W. Mbewe et al.

presses RNA silencing but contain no HC-Pro’. J Virol
83:6934–6940.
Mbanzibwa DR, Tian YP, Tugume AK, Mukasa SB, Tairo F,
Kyamanywa S, Kullaya A, Valkonen JPT. (2009b)
Genetically distinct strains of cassava brown streak virus in
the Lake Victoria basin and the Indian Ocean coastal
area of East Africa. Arch Virol 154:353–359.
Mbanzibwa DR, Tian YP, Tugume AK, Mukasa SB, Tairo F,
Kyamanywa S, Kullaya A, Valkonen JPT. (2010) Simul-
taneous virus-specific detection of the two cassava
brown streak-associated viruses by RT-PCR reveals wide
distribution in East Africa, mixed infections and infec-
tions inManihot glaziovii. J Virol Methods 171:394–400.
Mbanzibwa DR, Tian Y, Tugume AK et al. (2011) Evolu-
tion of cassava brown streak disease – associated viruses.
J Gen Virol 92:974–987.
Ministry of Agriculture. (2009) Annual Report on crop
estimates. Lilongwe, Malawi.
Monger WA, Seal S, Isaac AM, Foster GD. (2001) Molecu-
lar characterisation of Cassava brown streak virus coat pro-
tein. Plant Pathol 50:527–534.
Monger WA, Alicai T, Ndunguru J et al. (2010) The com-
plete genome sequence of the Tanzanian strain of Cas-
sava brown streak virus and comparison with the Ugandan
strain sequence. Arch Virol 155:429–433.
Mulimbi W, Phemba X, Assumani B et al. (2012) First
report of Ugandan cassava brown streak virus on cassava
in Democratic Republic of Congo. New Dis Rep 26:11.
[http://dx.doi.org/10.5197/j.2044-0588.2012.026.011]
Munga TL. (2008) Breeding for cassava brown streak dis-
ease resistance in coastal Kenya. PhD Thesis. University
of KwaZulu-Natal, Pietermaritzburg, South Africa.
Nichols RFJ. (1950) The brown streak disease of cassava:
distribution, climatic effects and diagnostic symptoms.
East Afr Agric J 15:154–160.
Ntawuruhunga P, Legg JP. (2007) New spread of cassava
brown streak virus disease and its implications for the
movement of cassava germplasm in the East and Central
African region, pp. 1–6. Available at: http://c3project.
iita.org/Doc/A25-CBSDbriefMay6.pdf. Accessed on 24
April, 2013.
Ntawuruhunga P, Dixon AGO, Kanju E et al. (2013) Suc-
cessful innovations and lessons learnt in cassava
improvement and deployment by IITA in the Eastern
African Region. AJRTC 10:41–54.
Rwegasira GM, Momanyi G, Rey MEC, Kahwa G, Legg JP.
(2011) Widespread occurrence and diversity of cassava
brown streak virus (Potyviridae: Ipomovirus) in Tanza-
nia. J Phytopathol 101:1159–1167.
Sauti RFN. (1981) Problems of Cassava Production in
Malawi. Tropical Root Crops. Research Strategies for the
1980s. Otawa, Canada, IDRC, pp.104–106.
Shaba ER, Chipungu F, Mazuma EDL. (2003) Cassava
Brown Streak Virus Disease in Malawi. In: Legg JP, Hill-
ocks RJ. (eds) Cassava Brown Streak Virus Disease: Past,
Present and Future. Proceedings of an International
Workshop, Mombasa, Kenya, 27–30 October 2002.
Aylesford, UK, Natural Resources International Limited,
pp 18–19.
Sseruwagi P, Sserubombwe WS, Legg JP, Ndunguru J,
Thresh JM. (2004) Methods of surveying the incidence
and severity of cassava mosaic disease and whitefly vec-
tor populations on cassava in Africa: a review. Virus Res
100:129–142.
Storey HH. (1936) Virus diseases of East African plants.
VI-A progress report on studies of the disease of cassava.
East Afr Agric J 2:34–39.
Tamura K, Dudley J, Nei M, Kumar S. (2007)
MEGA4: molecular evolutionary genetics analysis
(MEGA) software version 4.0. Mol Biol Evol
24:1596–1599.
Winter S, Koerbler M, Stein B, Pietruszka A, Butgereitt A.
(2010) Analysis of cassava brown streak viruses reveals
the presence of distinct virus species causing cassava
brown streak disease in East Africa. J Gen Virol
83:6934–6940.
Yadav JS, Ogwok E, Wagaba H, Patil BL, Bagewadi B, Ali-
cai T, Gaitan-Solis E, Taylor NJ, Fauquet CM. (2011)
RNAi-mediated resistance to Cassava brown streak Uganda
virus in transgenic cassava. Mol Plant Pathol 12:677–687.
Supporting Information
Additional Supporting Information may be found in
the online version of this article:
Table S1. Locational details of samples taken for
sequencing.
Table S2. Details of CBSV and UCBSV isolates used
for phylogenetic analysis.
Table S3. Summary of CBSVs isolates sequenced
during the survey.
Data S1. ClustalW allignment of CBSV & UCBSV
sequences.
� 2014 Blackwell Verlag GmbH 11
W. Mbewe et al. Cassava brown streak disease in Malawi