Embed Size (px)
Citation preview
v i s i t u s a t s c a g . c a . g o v
LAST-MILE FREIGHT DELIVERY STUDY
October 2020
v i s i t u s a t s c a g . c a . g o v
ABOUT SCAGSCAG is the nation’s largest metropolitan planning organization (MPO), representing six counties, 191 cities and more than 19 million residents. SCAG undertakes a variety of planning and policy initiatives to encourage a more sustainable Southern California now and in the future.
MISSION STATEMENTTo foster innovative regional solutions that improve the lives of Southern Californians through inclusive collaboration, visionary planning, regional advocacy, information sharing, and promoting best practices.
LAST-MILE FREIGHT DELIVERY STUDYOctober 2020
In partnership with Pat Smith, ASLA
The consultant team was led by
ACKNOWLEDGEMENTS
SCAG would like to thank staff of the Los Angeles Department of Transportation, Los Angeles Department of City Planning, and members of the Project Advisory Committee.
Last Mile Freight Delivery Study | Table of Contents
Table of Contents
Executive Summary .......................................................................................................................... ES-1
Chapter 1: Last-Mile Delivery Problem Statement ...............................................................................1-1
Chapter 2: Definitions and Terminology ..............................................................................................2-1
Chapter 3: Stakeholder Involvement...................................................................................................3-1
Chapter 4: Policy Review ....................................................................................................................4-1
Chapter 5: Citywide Data Collection and Analysis ...............................................................................5-1
Chapter 6: Field Data Collection ..........................................................................................................6-1
Chapter 7: Best Practices Literature Review ........................................................................................7-1
Chapter 8: Case Studies in the City of Los Angeles ...............................................................................8-1
Chapter 9: Recommended Actions and Pilot Projects ..........................................................................9-1
Toolbox of Strategies ......................................................................................................................... S-1
Last Mile Freight Delivery Study | Executive Summary
ES - 1 | P a g e
Executive Summary This Study The purpose of the Last-Mile Freight Delivery Study is to increase understanding of last-mile delivery issues for the Southern California Association of Governments (SCAG) and its member Cities by examining the relationship between last-mile access conditions, the delivery of goods, and the role of last-mile delivery in the overall transportation system.
The study serves as a foundational approach and assesses the use of curb areas for deliveries, and the magnitude of other curb uses competing for curb space in the study area of the City of Los Angeles. It provides stakeholder and analytical findings and recommendations for blocks in case study areas, City of Los Angeles pilot project concepts, policy considerations and a Toolbox of Strategies for cities throughout the SCAG region to utilize when faced with their own unique delivery challenges.
Planning for efficient last-mile delivery is an ongoing and rapidly evolving activity. Key trends impacting last-mile deliveries include the continued expansion of e-commerce and increasing usage of transportation network companies (TNCs). As technologies change and delivery operations, logistics and consumer needs and desires adjust, so too must the public agencies tools and solutions. The combination of sustained e-commerce growth and higher frequencies of faster deliveries indicate that delivery activity and techniques will continue to proliferate. Government agencies, SCAG and its member cities will benefit from assessing and improving the underlying conditions and factors in the accommodation of last-mile freight rather than simply addressing its symptoms on an ad hoc basis.
The phases of the study are summarized in the following chapters within this report:
1. Chapter 1: Last-Mile Delivery Problem Statement 2. Chapter 2: Definitions and Terminology establishes a
common lexicon for the project 3. Chapter 3: Stakeholder Involvement describes the
outreach effort central to identifying issues and solutions while interpreting the data to better understand curbside interactions.
4. Chapter 4: Policy Review describes the context of delivery issues.
5. Chapter 5: Citywide Data Collection and Analysis describes the methodology and findings of the GIS analysis to identify areas where delivery issues are focused and select case study areas.
6. Chapter 6: Field Data Collection, the methodology and overall observations for the case study block field data collection
7. Chapter 7: Best Practices Literature Review is a summary of last-mile best practices
8. Chapter 8: Case Studies in the City of Los Angeles: includes data and recommendations for each specific case study area
9. Chapter 9: Recommended Actions and Pilot Project Concepts is a collection of pilot project concepts recommended for the City of Los Angeles beyond block-level interventions as described in Chapter 8.
10. The Toolbox of Strategies is a listing of last-mile improvement strategies.
Last Mile Freight Delivery Study | Executive Summary
ES - 2 | P a g e
COVID-19 Update While most of the data collection and analysis for this study was performed in 2018, there has been tremendous impacts to last-mile deliveries stemming from COVID-19. This has included:
• Accelerated home-based orders and deliveries beginning in March 2020, with exponential increases from prior year in some product categories.
• Increased public safety measures, including delivery drivers use of gloves and masks, and expanded use of order online and pick-up at store omni-channel options.
• Improved resiliency of supply chains through businesses adapting and adjusting to higher e-commerce-based consumer orders.
What is Last Mile Delivery? Last-mile delivery represents the final leg of the supply chain as goods are delivered from production to consumption—generally at building loading docks, driveways or curbside. Bringing goods to markets for their distribution is an important driver of cities’ economies as businesses spend upwards of $1.5 trillion on transportation and logistics services annually in the U.S. Therefore, the delivery of goods, is an essential component of urban life.
Last-Mile Delivery Issues Affect the Transportation System Last-mile deliveries happen in complex environments: they involve the interaction among several elements, including producer operations, delivery company services, consumers,
buildings, delivery space, streets, and vehicles. Because of this, last-mile deliveries deal with congestion issues in transit, as well as compete for limited space as their vehicles park and are received.
Key observations from this study are:
• Receivers, not delivery companies, drive deliveries. • Deliveries occur everywhere and concentrate where
land use activity concentrates. • Deliveries generally occur during business hours. • Curb space is uniform; land use is not. • Curb space and land use regulation are cities’ primary
role in the logistics supply chain. • Businesses demand deliveries adapt to more
challenging conditions. • The delivery industry is highly innovative. • Delivery demand is expected to increase as stores are
adopting new delivery strategies. • Demand on the curb is multimodal.
Last-Mile Delivery Issues Last-mile delivery challenges are of two basic types:
• Delivering goods on time, intact, efficiently, and safely. • Minimizing disruption and external costs to the
community and the environment,
Last Mile Freight Delivery Study | Executive Summary
ES - 3 | P a g e
However, major delivery industry challenges and trends are exacerbating these issues:
• Smaller, more frequent shipments for business customers.
• “Densification” of commercial and industrial space. • Trucking industry issues of driver shortage, hours of
service, driver retention, electronic logging mandates, and truck parking.
• Urban congestion affecting deliveries. • E-commerce increasing the frequency of small
deliveries, and rapid delivery through fulfillment systems.
• Alternate systems and modes such as drones, robots, 3D printing, cargo bikes, and autonomous vehicles.
• “Uberization” and “gig economy” participants.
Solutions in the Last Mile The complexity of goods movement and deliveries combined with the constant innovation of various actors in the industry necessitates unique strategies involving multidisciplinary approaches to core issues rather than reactive measures towards impacts.
This report was prepared for SCAG and its member agencies to define local and regional opportunities, and to bring solutions to last-mile freight issues while facilitating efforts which may need public/private partnership with public agencies, private industry or other stakeholders.
The data, stakeholder outreach, and literature review for this study has reinforced those issues with last-mile freight delivery based on the following perspectives:
• Many see inefficient use of space.
• Others see opportunities to avoid conflicts. • Others prefer to operate in areas where enforcement
of regulation is limited. • Some accept conditions as they are and continue
striving to improve delivery conditions wherever possible.
The strategies proposed in this study are meant to be a range of options to be considered for the specific delivery issues at the block, district, or city level. Nearly every strategy brings costs to various parties. The key is understanding the benefits of these costs so that they can be factored into decision making through pilots and testing and addressed early within the implementation process to ensure expectations are aligned and met.
Project Advisory Committee The Project Advisory Committee (PAC) was composed of key stakeholders that participated directly in meetings, interviews, and other discussions to help guide the study approach and review project deliverables. Key strengths of the PAC included knowledge, expertise and insights into the problem, approaches and methodology, access to contacts and data, validation of the applicability of solutions, and serving as liaisons to promote study recommendations.
Definitions and Terminology For this study, any vehicle delivering or picking up a commercial good was defined as a “delivery vehicle” by its role in transporting a delivery rather than it being any specific type of vehicle.
Last Mile Freight Delivery Study | Executive Summary
ES - 4 | P a g e
The actions of all vehicles, whether involved in a delivery, passenger loading or parking were tabulated in the field data collection along with the type of vehicle and its location along the study block. This provided a comprehensive data set to enable delivery conditions to be analyzed within the context of all curb activity.
All other types of curb activity were also tabulated as part of the block-by-block field data collection in order to understand the interactions among the various curb uses and provide a comprehensive picture of delivery conditions to assess specific issues and develop the toolbox of strategies.
Last Mile Freight Delivery Study | Executive Summary
ES - 5 | P a g e
Stakeholder Findings The outreach to last-mile freight stakeholders provided insights into both the usage and challenges of the street system for last-mile deliveries.
Stakeholder Receiver Perspective Receivers dictate delivery requirements and carriers, suppliers, and drivers make their best efforts to meet those requirements. The study team contacted both delivery receivers (those who actually receive the goods) and building managers (those that manage facilities that receive tenants’ deliveries, for example).
From the receivers’ point of view there were a few common challenges:
• Receiving the goods when needed or desired. • Receiving the goods when employees are available to
accept them. • Receiving the goods where desired (e.g. inside vs. on
the sidewalk). • Receiving the goods in manageable units, and in good
condition. • Maintaining security of the goods, the facility, and the
personnel.
Both building managers and receivers noted limitations of building design and their impacts on last-mile access. As a general point, building designs that lack input from tenants or eventual owners often lead to legacy access problems, impacting access for delivery vehicles. Active transportation needs—specifically bicycle access and storage—can conflict with delivery access when bicycles
obstruct loading doors and docks or compete to use ramps and doors.
The difficulties experienced by receivers can extend to commercial, office, and even residential locations with the expansion of e-commerce delivery. Office buildings that previously received supplies from a small number of local vendors now also receive e-commerce deliveries in a myriad of personal and commercial vehicles, as well as personal deliveries for people who work in the building. Apartment managers must cope with far more parcel volume than was ever anticipated in building designs. Residential customers find valuable deliveries left on front porches and driveways, increasing the risk of theft.
For tenants of large office or commercial buildings, scheduling access to common loading docks and freight elevators can be a problem if adequate loading dock space or hours of operation are not in place. Stakeholders noted this problem in connection with large deliveries of furniture, equipment, or building/remodeling materials.
Stakeholder Deliverer Perspective In most cases carriers are responding to customer (receiver) requirements and preferences. The need for last-mile deliveries, like freight transportation in general, is a derived demand: the customers want the goods, and delivery service is how to acquire them. While this study addresses the issues associated with the delivery trip, the receiver is simply concerned with having the good and not necessarily the means by which it arrives.
There is a key difference between the patterns of commercial delivery operators such as the United States Postal Service (USPS), United Parcel Service (UPS), FedEx, and on-call or
Last Mile Freight Delivery Study | Executive Summary
ES - 6 | P a g e
shipment-specific services such as food or beverage deliverers. The major delivery carriers have set routes and driver assignments, with a workload that varies by day but is relatively stable over the long-run. Pick-up and delivery times rarely vary within a daily window unless there are special customer requirements. Some package-delivery drivers, for example, typically:
• Make commercial deliveries in the mornings, when customers want their goods.
• Make residential deliveries and commercial pick-ups in the afternoon, when commercial customers are ready to ship.
The commercial pattern of receiving goods in the morning or early afternoon, and shipping goods in the late afternoon is common, and deeply ingrained. Carriers tend to receive and process orders during the day and ship the accumulated orders in the late afternoon. As a result, many commercial establishments may be served twice daily if they ship and receive goods.
Stakeholder outreach verified preference of delivering to locations with off-street parking versus delivering from the street across the sidewalk. The latter is viewed as less convenient because of availability, safety and security concerns.
Delivery drivers commonly find loading docks and loading zones occupied, either by another legitimate delivery vehicle or by a private vehicle. With the increased use of private vehicles without commercial plates for on-demand delivery and use of rented vehicles, it can be difficult for delivery drivers, store owners, or parking enforcement officers to determine what is and is not legitimate use.
Stakeholders noted routine planning and management steps can facilitate such deliveries and mitigate last-mile issues:
• Arranging for temporary parking restrictions to create workable access.
• Planning for the route of large trucks. • Ensuring that the required personnel and equipment
are available to unload (or load) the vehicle promptly. • Scheduling large or unusual deliveries for night or
weekend hours, where possible.
Night and Off-hour Deliveries Most stakeholders contacted recognize the potential efficiencies of night or off-hour deliveries, and would like to expand their night and off-hour operations. The benefits include less traffic congestion, better access to sidewalks and loading zones, and less interference with routine business operations.
The barriers to night and off-hour deliveries include:
• Receiver business hours and staffing. • Availability of drivers willing to work nights, and extra
cost. • Security of unattended goods. • Laws and regulations limiting liquor deliveries at night. • Community concerns over nighttime lights and noise. • Ensuring a critical mass of customers to make off-hours
delivery viable to cover the costs of drivers and vehicles.
Stakeholder enthusiasm for night and off-hour deliveries suggests that it may be productive to reduce or mitigate these barriers where possible.
Last Mile Freight Delivery Study | Executive Summary
ES - 7 | P a g e
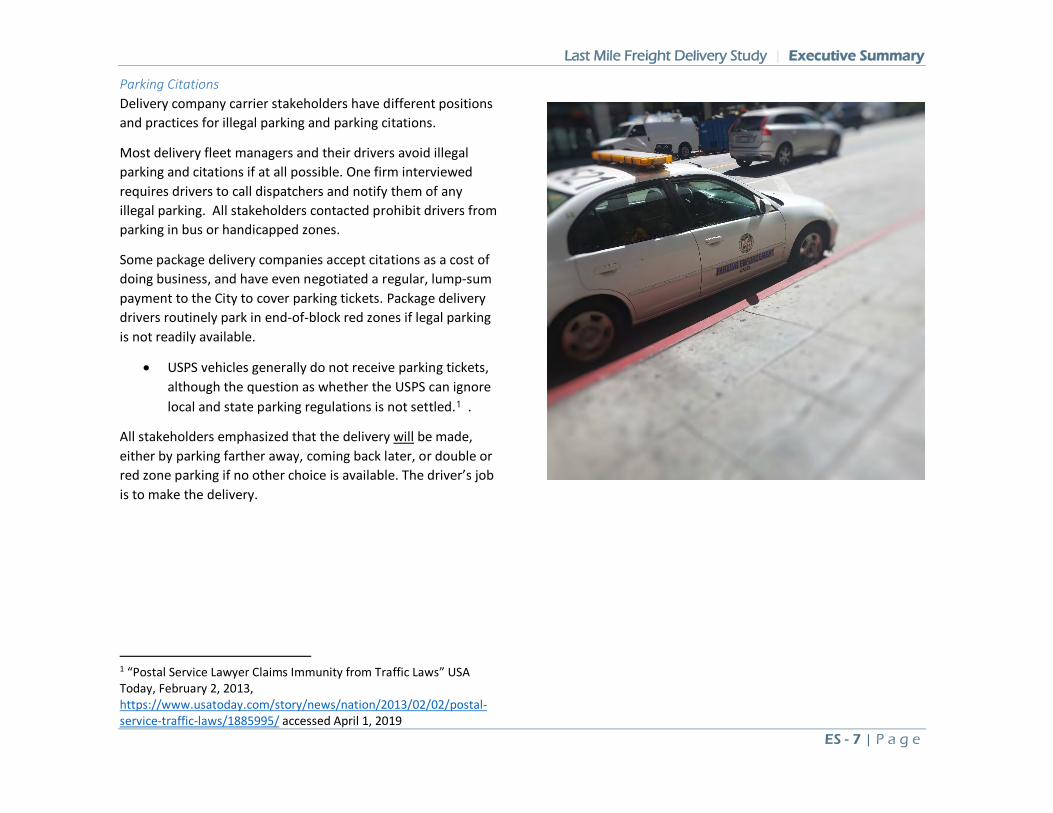
Parking Citations Delivery company carrier stakeholders have different positions and practices for illegal parking and parking citations.
Most delivery fleet managers and their drivers avoid illegal parking and citations if at all possible. One firm interviewed requires drivers to call dispatchers and notify them of any illegal parking. All stakeholders contacted prohibit drivers from parking in bus or handicapped zones.
Some package delivery companies accept citations as a cost of doing business, and have even negotiated a regular, lump-sum payment to the City to cover parking tickets. Package delivery drivers routinely park in end-of-block red zones if legal parking is not readily available.
• USPS vehicles generally do not receive parking tickets, although the question as whether the USPS can ignore local and state parking regulations is not settled.1 .
All stakeholders emphasized that the delivery will be made, either by parking farther away, coming back later, or double or red zone parking if no other choice is available. The driver’s job is to make the delivery.
1 “Postal Service Lawyer Claims Immunity from Traffic Laws” USA Today, February 2, 2013, https://www.usatoday.com/story/news/nation/2013/02/02/postal-service-traffic-laws/1885995/ accessed April 1, 2019
Last Mile Freight Delivery Study | Executive Summary
ES - 8 | P a g e
Analysis Findings
The Citywide data collected and analyzed for the project was categorized as land use, street, and activity data, and was used to identify:
• Common delivery conditions for different types of blocks typologies.
• High-delivery areas for further investigation in case study field review and stakeholder outreach.
• Block outliers (efficient and inefficient deliveries) to investigate delivery issues.
• Trends and relationships of various data related to deliveries.
The data sets used to identify key indicators of blocks that may experience delivery issues were: truck parking citations, truck-related collisions and delivery frequency.
Truck Parking Citation Data Truck parking citation data for calendar year 2014 was obtained from Xerox. The data included the location, date, and type of citation. The data set showed clear trends in terms of the types of citations given and their frequency and distribution in the city. Citations were concentrated in downtown Los Angeles, along major commercial corridors, and by government buildings and hospitals. This data proved helpful as a proxy for locating blocks with high delivery demand and potential for identifying areas with inadequate loading space.
2 Southern California Association of Governments, Firm based InfoGroup 2016 data
Truck Related Collisions Truck-related collision data was collected from the Statewide Integrated Traffic Records System (SWITRS). The data was not able to distinguish trip purpose (e.g. if vehicles were making deliveries). ‘Party’ data did indicate the type and make of the vehicle and its movement prior to the collision. Collisions occurred at a relatively low frequency therefore the low sample size made it difficult to make clear correlations to actual issues in the physical location the collision occurred. However, locations with four or more collisions in the data set were used to identify potential block issues.
Delivery Frequency The project team used parcel-level employment or building area to estimate delivery trip generation. SCAG provided employment data2 for Los Angeles County in geographic information system (GIS) form. This data has the employment by number of employees and North America Industry Classification System (NAICS) code of business. Using the recent National Cooperative Freight Research Project (NCFRP) 25: Freight Trip Generation and Land Use3, freight trip generation and parcel trip generation was calculated for each business in the City of Los Angeles. The NCFRP report has tables which use the NAICS code of the business, the number of employees, and observed freight and delivery trip rates, which were used in the New York City region to calculate trip generation which was summed at the block level.
Block Typologies The study developed block typologies to describe the most common type of delivery locations and to serve as the basis for consolidating other data attributes of blocks as they related to
3 Freight Trip Generation and Land Use, National Cooperative Freight Research Program 25, Transportation Research Board.
Last Mile Freight Delivery Study | Executive Summary
ES - 9 | P a g e
delivery conditions. The block typologies were the primary organizing level for GIS data attributes of land use, street, and activities and was refined with PAC and stakeholder input.
Block typologies defined blocks based on land use and street classification. Measures of delivery activity were used to indicate outliers within those typologies for further case study investigation.
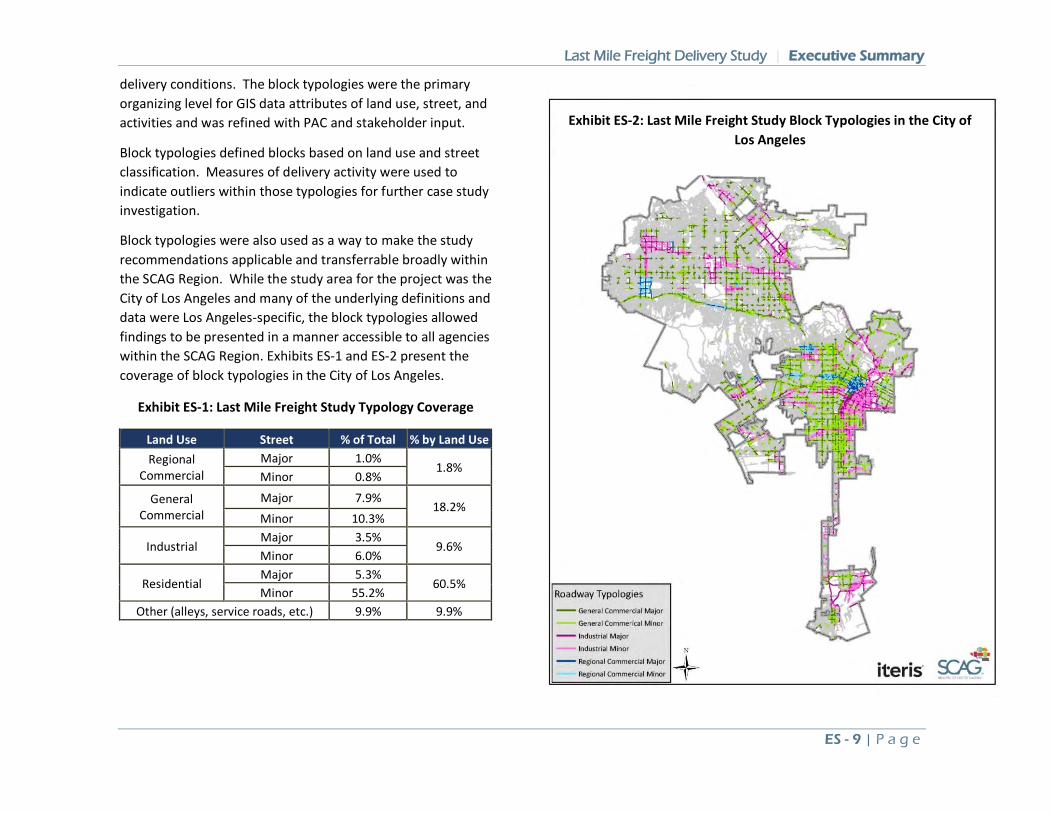
Block typologies were also used as a way to make the study recommendations applicable and transferrable broadly within the SCAG Region. While the study area for the project was the City of Los Angeles and many of the underlying definitions and data were Los Angeles-specific, the block typologies allowed findings to be presented in a manner accessible to all agencies within the SCAG Region. Exhibits ES-1 and ES-2 present the coverage of block typologies in the City of Los Angeles.
Exhibit ES-1: Last Mile Freight Study Typology Coverage
Land Use Street % of Total % by Land Use Regional
Commercial Major 1.0%
1.8% Minor 0.8%
General Commercial
Major 7.9% 18.2%
Minor 10.3%
Industrial Major 3.5%
9.6% Minor 6.0%
Residential Major 5.3%
60.5% Minor 55.2%
Other (alleys, service roads, etc.) 9.9% 9.9%
Exhibit ES-2: Last Mile Freight Study Block Typologies in the City of Los Angeles
Last Mile Freight Delivery Study | Executive Summary
ES - 10 | P a g e
Best Practices Literature Review For the study, an extensive literature review of delivery issues, assessments, techniques and strategies was undertaken. The literature review provides a broad understanding and provides a list and resource for detailed study of elements of last-mile freight delivery. Additional materials were also referenced for a deeper understanding of Last Mile Delivery problems, the changing context of last mile delivery and e-commerce and methodologies relevant to this study.
Peer city last-mile improvement implementation was focused on their authority to designate curbside loading areas, to restrict truck parking, to prohibit trucks from certain roads, and to designate specific truck routes. Physical characteristics of city roads can also limit truck movements such as height limits imposed by bridges and overpasses, the width of roadways, and turning radii at intersections. The most common last-mile delivery practices by cities are:
• Limiting truck parking to certain locations • Prohibiting standing by trucks except for loading and
unloading • Limiting trailer parking • Make zoning or building requirements for off-street loading
areas and mail rooms • Setting pricing for the use of curb space • Identifying specific truck routes within the city • Developing a pilot off-hour truck delivery program that
restricts truck deliveries to certain hours with low traffic • Setting weight and size limits on streets • Limitations on noise
The best practice scan demonstrated more innovate practices of:
• Off-peak delivery programs • Combination use lanes • Low emission zones • Urban consolidation centers • Commercial loading zone permits and meter payments • Delivery and service plans • Cargo bicycles • Electric delivery fleets • Common carrier lockers
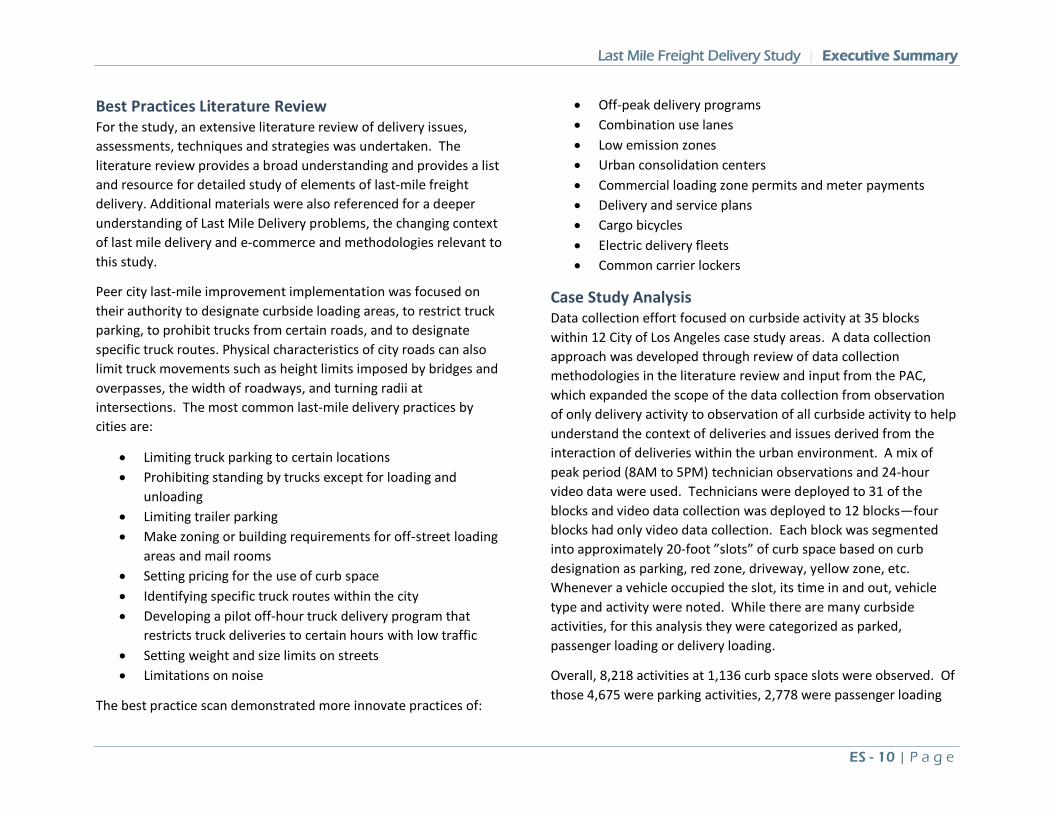
Case Study Analysis Data collection effort focused on curbside activity at 35 blocks within 12 City of Los Angeles case study areas. A data collection approach was developed through review of data collection methodologies in the literature review and input from the PAC, which expanded the scope of the data collection from observation of only delivery activity to observation of all curbside activity to help understand the context of deliveries and issues derived from the interaction of deliveries within the urban environment. A mix of peak period (8AM to 5PM) technician observations and 24-hour video data were used. Technicians were deployed to 31 of the blocks and video data collection was deployed to 12 blocks—four blocks had only video data collection. Each block was segmented into approximately 20-foot ”slots” of curb space based on curb designation as parking, red zone, driveway, yellow zone, etc. Whenever a vehicle occupied the slot, its time in and out, vehicle type and activity were noted. While there are many curbside activities, for this analysis they were categorized as parked, passenger loading or delivery loading.
Overall, 8,218 activities at 1,136 curb space slots were observed. Of those 4,675 were parking activities, 2,778 were passenger loading
Last Mile Freight Delivery Study | Executive Summary
ES - 11 | P a g e
activities and 765 were delivery loading. The freight deliveries lasted an average of 30 minutes.
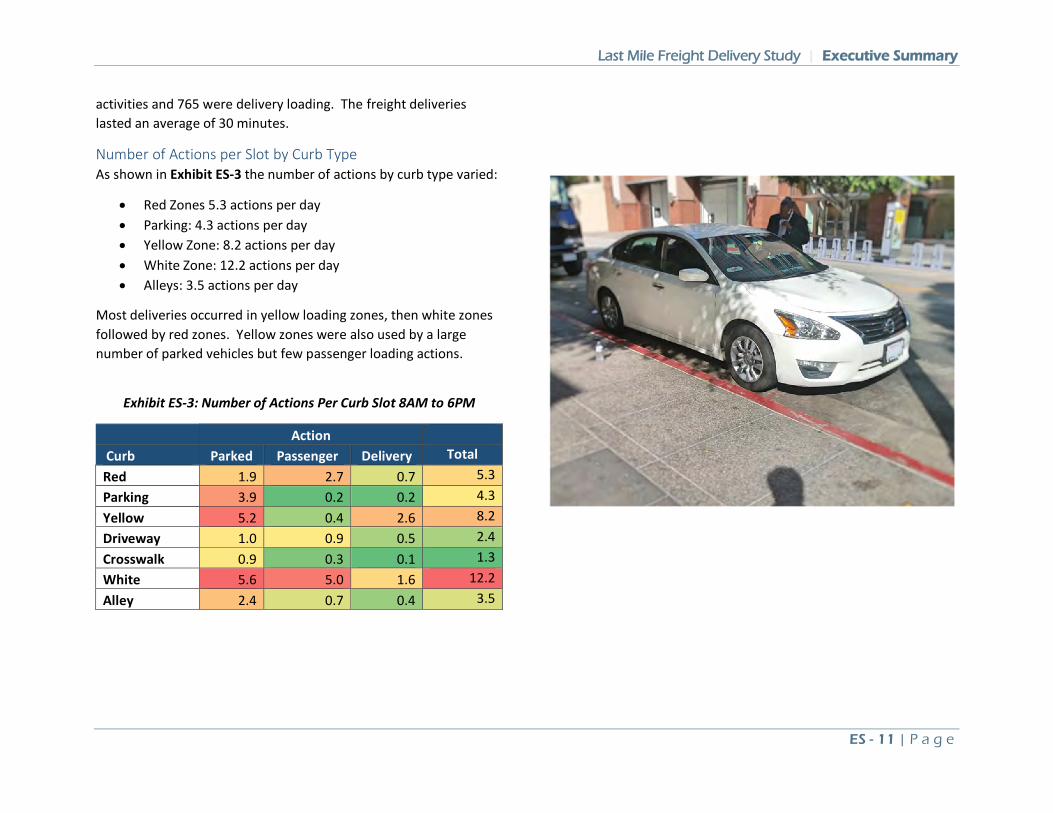
Number of Actions per Slot by Curb Type As shown in Exhibit ES-3 the number of actions by curb type varied:
• Red Zones 5.3 actions per day • Parking: 4.3 actions per day • Yellow Zone: 8.2 actions per day • White Zone: 12.2 actions per day • Alleys: 3.5 actions per day
Most deliveries occurred in yellow loading zones, then white zones followed by red zones. Yellow zones were also used by a large number of parked vehicles but few passenger loading actions.
Exhibit ES-3: Number of Actions Per Curb Slot 8AM to 6PM
Action Curb Parked Passenger Delivery Total Red 1.9 2.7 0.7 5.3 Parking 3.9 0.2 0.2 4.3 Yellow 5.2 0.4 2.6 8.2 Driveway 1.0 0.9 0.5 2.4 Crosswalk 0.9 0.3 0.1 1.3 White 5.6 5.0 1.6 12.2 Alley 2.4 0.7 0.4 3.5
Last Mile Freight Delivery Study | Executive Summary
ES - 12 | P a g e
0
5
10
15
20
25
30
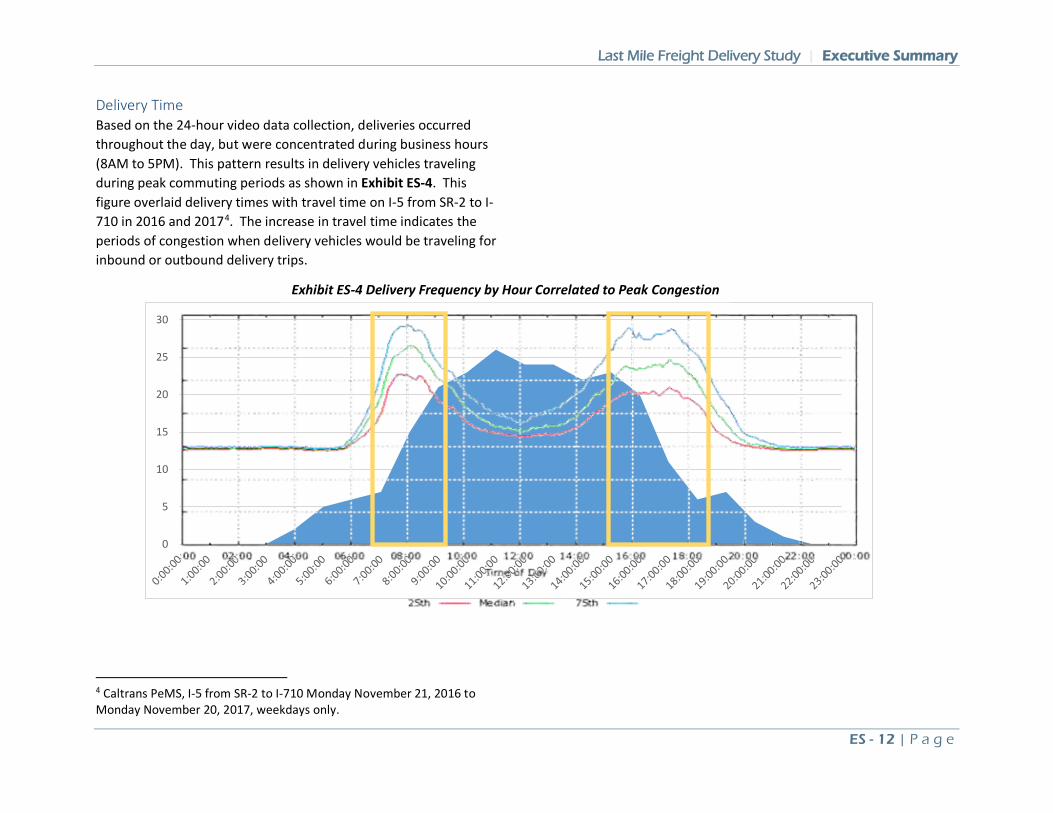
Delivery Time Based on the 24-hour video data collection, deliveries occurred throughout the day, but were concentrated during business hours (8AM to 5PM). This pattern results in delivery vehicles traveling during peak commuting periods as shown in Exhibit ES-4. This figure overlaid delivery times with travel time on I-5 from SR-2 to I-710 in 2016 and 20174. The increase in travel time indicates the periods of congestion when delivery vehicles would be traveling for inbound or outbound delivery trips.
4 Caltrans PeMS, I-5 from SR-2 to I-710 Monday November 21, 2016 to Monday November 20, 2017, weekdays only.
Exhibit ES-4 Delivery Frequency by Hour Correlated to Peak Congestion
Last Mile Freight Delivery Study | Executive Summary
ES - 13 | P a g e
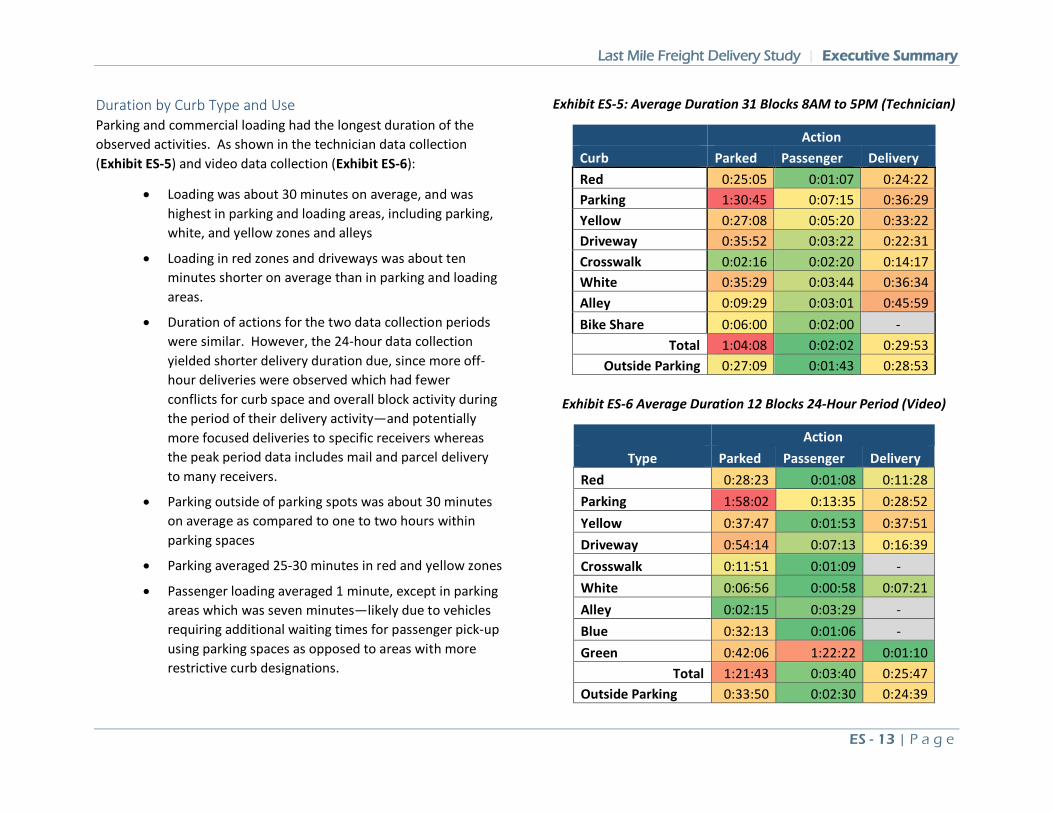
Duration by Curb Type and Use Parking and commercial loading had the longest duration of the observed activities. As shown in the technician data collection (Exhibit ES-5) and video data collection (Exhibit ES-6):
• Loading was about 30 minutes on average, and was highest in parking and loading areas, including parking, white, and yellow zones and alleys
• Loading in red zones and driveways was about ten minutes shorter on average than in parking and loading areas.
• Duration of actions for the two data collection periods were similar. However, the 24-hour data collection yielded shorter delivery duration due, since more off-hour deliveries were observed which had fewer conflicts for curb space and overall block activity during the period of their delivery activity—and potentially more focused deliveries to specific receivers whereas the peak period data includes mail and parcel delivery to many receivers.
• Parking outside of parking spots was about 30 minutes on average as compared to one to two hours within parking spaces
• Parking averaged 25-30 minutes in red and yellow zones
• Passenger loading averaged 1 minute, except in parking areas which was seven minutes—likely due to vehicles requiring additional waiting times for passenger pick-up using parking spaces as opposed to areas with more restrictive curb designations.
Exhibit ES-5: Average Duration 31 Blocks 8AM to 5PM (Technician)
Action Curb Parked Passenger Delivery Red 0:25:05 0:01:07 0:24:22 Parking 1:30:45 0:07:15 0:36:29 Yellow 0:27:08 0:05:20 0:33:22 Driveway 0:35:52 0:03:22 0:22:31 Crosswalk 0:02:16 0:02:20 0:14:17 White 0:35:29 0:03:44 0:36:34 Alley 0:09:29 0:03:01 0:45:59 Bike Share 0:06:00 0:02:00 -
Total 1:04:08 0:02:02 0:29:53 Outside Parking 0:27:09 0:01:43 0:28:53
Exhibit ES-6 Average Duration 12 Blocks 24-Hour Period (Video)
Action Type Parked Passenger Delivery
Red 0:28:23 0:01:08 0:11:28 Parking 1:58:02 0:13:35 0:28:52 Yellow 0:37:47 0:01:53 0:37:51 Driveway 0:54:14 0:07:13 0:16:39 Crosswalk 0:11:51 0:01:09 - White 0:06:56 0:00:58 0:07:21 Alley 0:02:15 0:03:29 - Blue 0:32:13 0:01:06 - Green 0:42:06 1:22:22 0:01:10
Total 1:21:43 0:03:40 0:25:47 Outside Parking 0:33:50 0:02:30 0:24:39
Last Mile Freight Delivery Study | Executive Summary
ES - 14 | P a g e
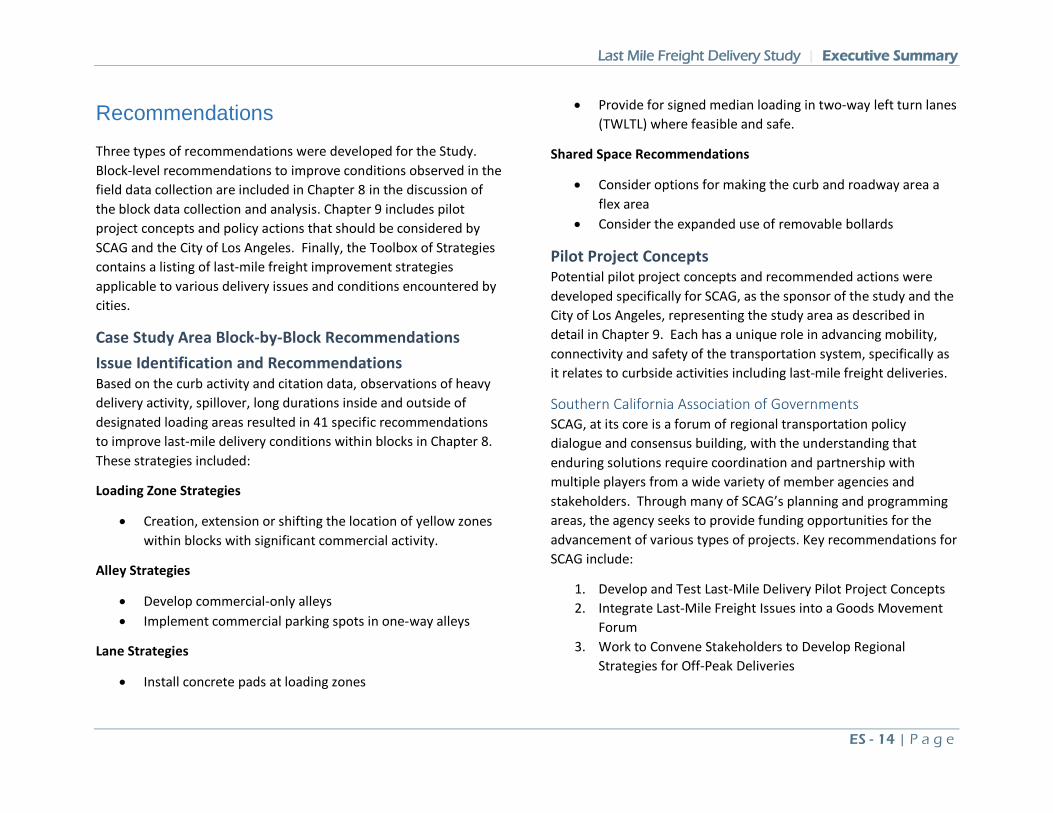
Recommendations Three types of recommendations were developed for the Study. Block-level recommendations to improve conditions observed in the field data collection are included in Chapter 8 in the discussion of the block data collection and analysis. Chapter 9 includes pilot project concepts and policy actions that should be considered by SCAG and the City of Los Angeles. Finally, the Toolbox of Strategies contains a listing of last-mile freight improvement strategies applicable to various delivery issues and conditions encountered by cities.
Case Study Area Block-by-Block Recommendations Issue Identification and Recommendations Based on the curb activity and citation data, observations of heavy delivery activity, spillover, long durations inside and outside of designated loading areas resulted in 41 specific recommendations to improve last-mile delivery conditions within blocks in Chapter 8. These strategies included:
Loading Zone Strategies
• Creation, extension or shifting the location of yellow zones within blocks with significant commercial activity.
Alley Strategies
• Develop commercial-only alleys • Implement commercial parking spots in one-way alleys
Lane Strategies
• Install concrete pads at loading zones
• Provide for signed median loading in two-way left turn lanes (TWLTL) where feasible and safe.
Shared Space Recommendations
• Consider options for making the curb and roadway area a flex area
• Consider the expanded use of removable bollards
Pilot Project Concepts Potential pilot project concepts and recommended actions were developed specifically for SCAG, as the sponsor of the study and the City of Los Angeles, representing the study area as described in detail in Chapter 9. Each has a unique role in advancing mobility, connectivity and safety of the transportation system, specifically as it relates to curbside activities including last-mile freight deliveries.
Southern California Association of Governments SCAG, at its core is a forum of regional transportation policy dialogue and consensus building, with the understanding that enduring solutions require coordination and partnership with multiple players from a wide variety of member agencies and stakeholders. Through many of SCAG’s planning and programming areas, the agency seeks to provide funding opportunities for the advancement of various types of projects. Key recommendations for SCAG include:
1. Develop and Test Last-Mile Delivery Pilot Project Concepts 2. Integrate Last-Mile Freight Issues into a Goods Movement
Forum 3. Work to Convene Stakeholders to Develop Regional
Strategies for Off-Peak Deliveries
Last Mile Freight Delivery Study | Executive Summary
ES - 15 | P a g e
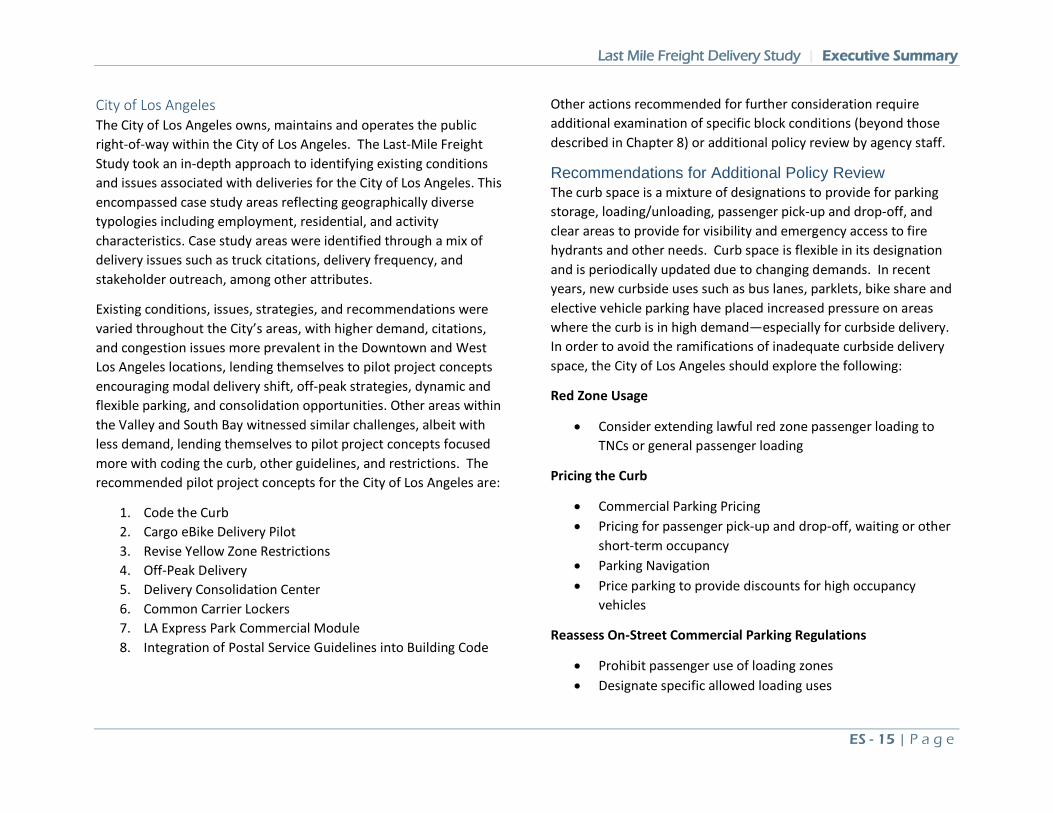
City of Los Angeles The City of Los Angeles owns, maintains and operates the public right-of-way within the City of Los Angeles. The Last-Mile Freight Study took an in-depth approach to identifying existing conditions and issues associated with deliveries for the City of Los Angeles. This encompassed case study areas reflecting geographically diverse typologies including employment, residential, and activity characteristics. Case study areas were identified through a mix of delivery issues such as truck citations, delivery frequency, and stakeholder outreach, among other attributes.
Existing conditions, issues, strategies, and recommendations were varied throughout the City’s areas, with higher demand, citations, and congestion issues more prevalent in the Downtown and West Los Angeles locations, lending themselves to pilot project concepts encouraging modal delivery shift, off-peak strategies, dynamic and flexible parking, and consolidation opportunities. Other areas within the Valley and South Bay witnessed similar challenges, albeit with less demand, lending themselves to pilot project concepts focused more with coding the curb, other guidelines, and restrictions. The recommended pilot project concepts for the City of Los Angeles are:
1. Code the Curb 2. Cargo eBike Delivery Pilot 3. Revise Yellow Zone Restrictions 4. Off-Peak Delivery 5. Delivery Consolidation Center 6. Common Carrier Lockers 7. LA Express Park Commercial Module 8. Integration of Postal Service Guidelines into Building Code
Other actions recommended for further consideration require additional examination of specific block conditions (beyond those described in Chapter 8) or additional policy review by agency staff.
Recommendations for Additional Policy Review The curb space is a mixture of designations to provide for parking storage, loading/unloading, passenger pick-up and drop-off, and clear areas to provide for visibility and emergency access to fire hydrants and other needs. Curb space is flexible in its designation and is periodically updated due to changing demands. In recent years, new curbside uses such as bus lanes, parklets, bike share and elective vehicle parking have placed increased pressure on areas where the curb is in high demand—especially for curbside delivery. In order to avoid the ramifications of inadequate curbside delivery space, the City of Los Angeles should explore the following:
Red Zone Usage
• Consider extending lawful red zone passenger loading to TNCs or general passenger loading
Pricing the Curb
• Commercial Parking Pricing • Pricing for passenger pick-up and drop-off, waiting or other
short-term occupancy • Parking Navigation • Price parking to provide discounts for high occupancy
vehicles
Reassess On-Street Commercial Parking Regulations
• Prohibit passenger use of loading zones • Designate specific allowed loading uses
Last Mile Freight Delivery Study | Executive Summary
ES - 16 | P a g e
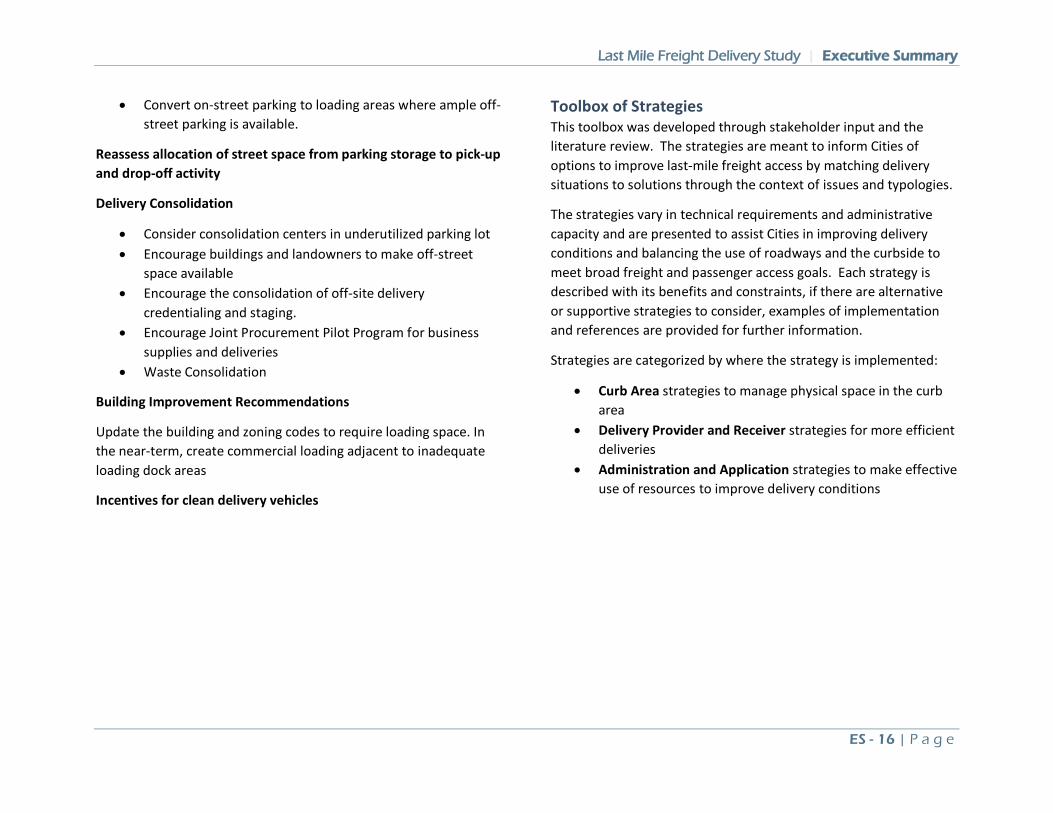
• Convert on-street parking to loading areas where ample off-street parking is available.
Reassess allocation of street space from parking storage to pick-up and drop-off activity
Delivery Consolidation
• Consider consolidation centers in underutilized parking lot • Encourage buildings and landowners to make off-street
space available • Encourage the consolidation of off-site delivery
credentialing and staging. • Encourage Joint Procurement Pilot Program for business
supplies and deliveries • Waste Consolidation
Building Improvement Recommendations
Update the building and zoning codes to require loading space. In the near-term, create commercial loading adjacent to inadequate loading dock areas
Incentives for clean delivery vehicles
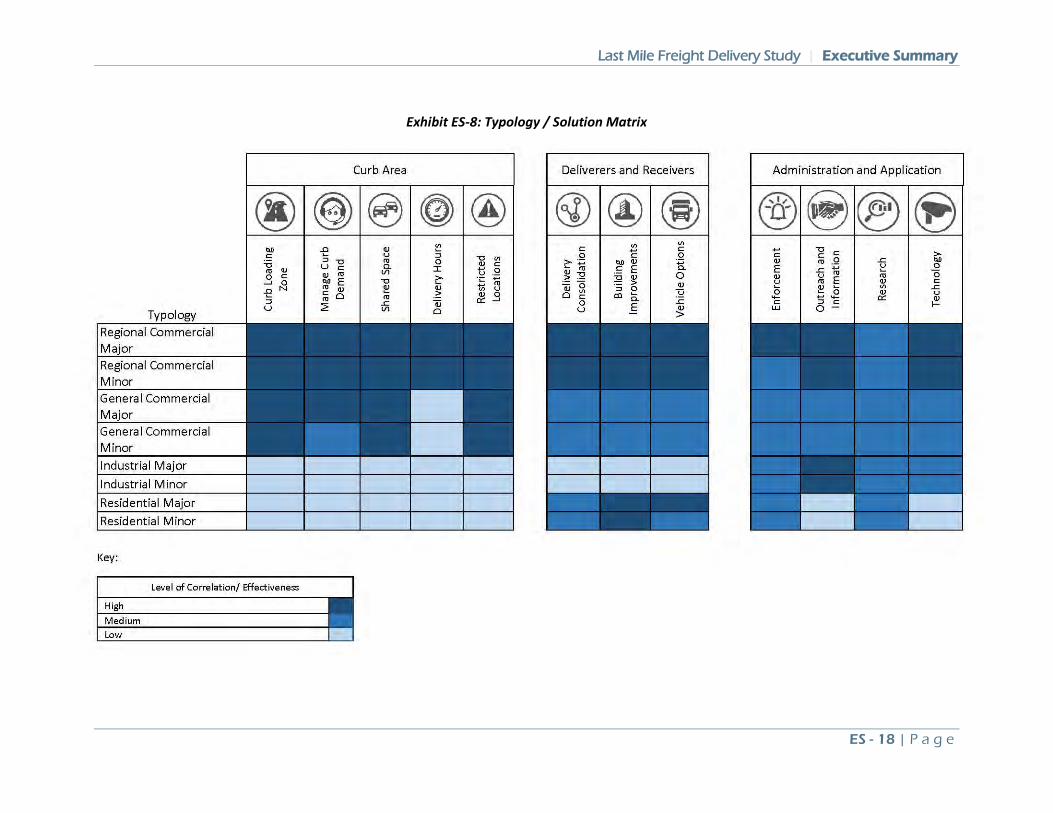
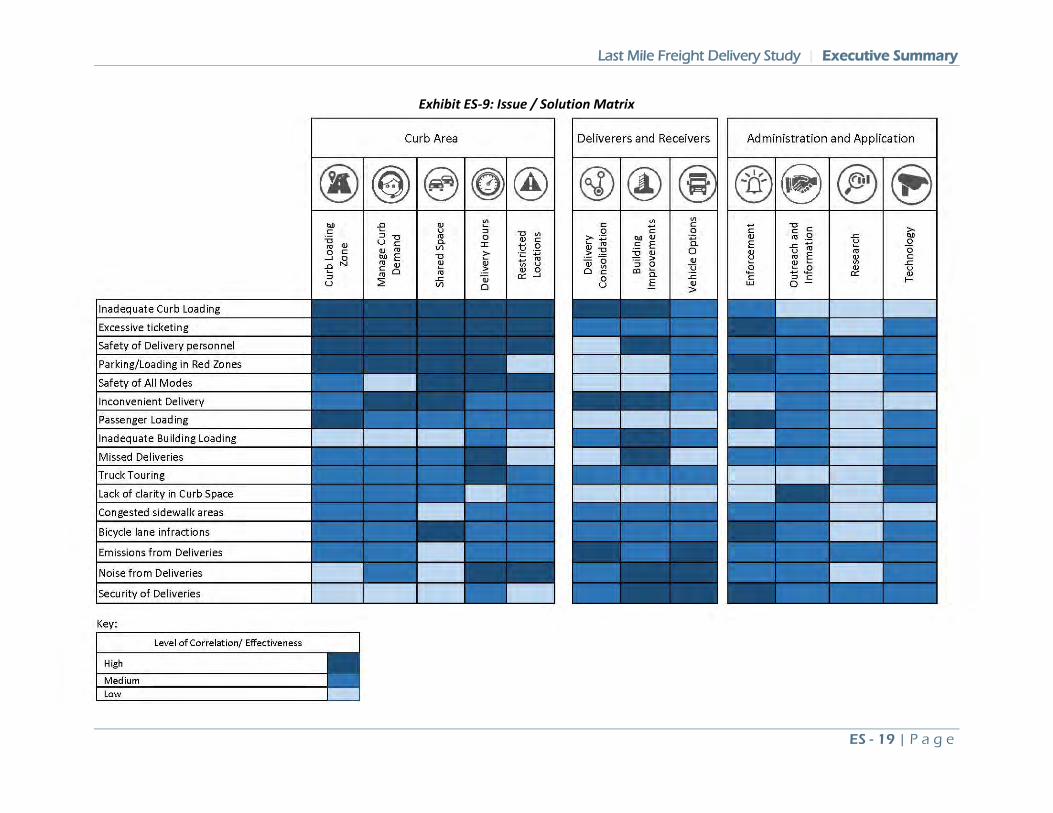
Toolbox of Strategies This toolbox was developed through stakeholder input and the literature review. The strategies are meant to inform Cities of options to improve last-mile freight access by matching delivery situations to solutions through the context of issues and typologies.
The strategies vary in technical requirements and administrative capacity and are presented to assist Cities in improving delivery conditions and balancing the use of roadways and the curbside to meet broad freight and passenger access goals. Each strategy is described with its benefits and constraints, if there are alternative or supportive strategies to consider, examples of implementation and references are provided for further information.
Strategies are categorized by where the strategy is implemented:
• Curb Area strategies to manage physical space in the curb area
• Delivery Provider and Receiver strategies for more efficient deliveries
• Administration and Application strategies to make effective use of resources to improve delivery conditions
Last Mile Freight Delivery Study | Executive Summary
ES - 17 | P a g e
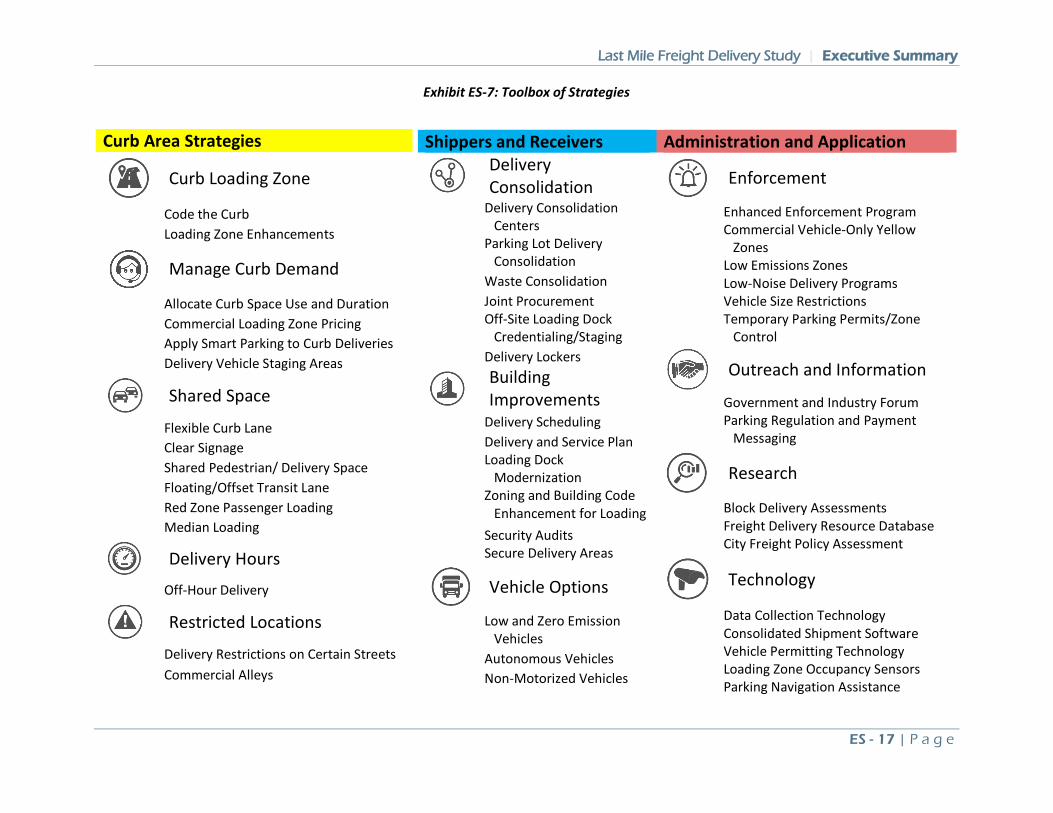
Exhibit ES-7: Toolbox of Strategies
Curb Area Strategies
Curb Loading Zone
Code the Curb
Loading Zone Enhancements
Manage Curb Demand
Allocate Curb Space Use and Duration
Commercial Loading Zone Pricing
Apply Smart Parking to Curb Deliveries
Delivery Vehicle Staging Areas
Shared Space
Flexible Curb Lane
Clear Signage
Shared Pedestrian/ Delivery Space
Floating/Offset Transit Lane
Red Zone Passenger Loading
Median Loading
Delivery Hours Off-Hour Delivery
Restricted Locations
Delivery Restrictions on Certain Streets
Commercial Alleys
Shippers and Receivers
Delivery Consolidation
Delivery Consolidation
Centers
Parking Lot Delivery
Consolidation
Waste Consolidation
Joint Procurement
Off-Site Loading Dock
Credentialing/Staging
Delivery Lockers
Building Improvements
Delivery Scheduling
Delivery and Service Plan
Loading Dock
Modernization
Zoning and Building Code
Enhancement for Loading
Security Audits Secure Delivery Areas
Vehicle Options
Low and Zero Emission
Vehicles
Autonomous Vehicles
Non-Motorized Vehicles
Administration and Application
Enforcement
Enhanced Enforcement Program
Commercial Vehicle-Only Yellow
Zones Low Emissions Zones Low-Noise Delivery Programs Vehicle Size Restrictions
Temporary Parking Permits/Zone
Control
Outreach and Information
Government and Industry Forum
Parking Regulation and Payment
Messaging
Research
Block Delivery Assessments Freight Delivery Resource Database City Freight Policy Assessment
Technology
Data Collection Technology Consolidated Shipment Software Vehicle Permitting Technology Loading Zone Occupancy Sensors Parking Navigation Assistance
Last Mile Freight Delivery Study | Executive Summary
ES - 18 | P a g e
Exhibit ES-8: Typology / Solution Matrix
Last Mile Freight Delivery Study | Executive Summary
ES - 19 | P a g e
Exhibit ES-9: Issue / Solution Matrix
Last Mile Freight Delivery Study | Chapter 1: Last-Mile Delivery Problem Statement
1 - 1 | P a g e
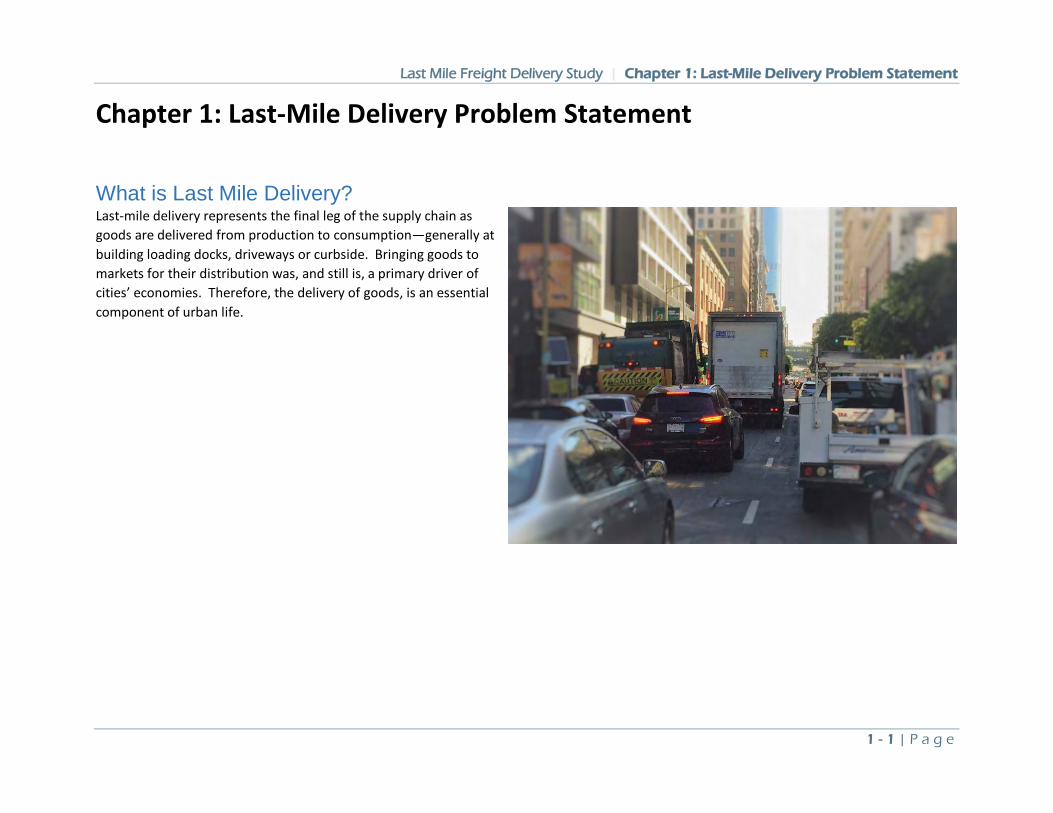
Chapter 1: Last-Mile Delivery Problem Statement
What is Last Mile Delivery? Last-mile delivery represents the final leg of the supply chain as goods are delivered from production to consumption—generally at building loading docks, driveways or curbside. Bringing goods to markets for their distribution was, and still is, a primary driver of cities’ economies. Therefore, the delivery of goods, is an essential component of urban life.
Last Mile Freight Delivery Study | Chapter 1: Last-Mile Delivery Problem Statement
1 - 2 | P a g e
Last-Mile Delivery Issues Affect the Transportation System Last-mile deliveries happen in complex environments: they involve the interaction among several elements, including producers, delivery providers, consumers, buildings, delivery space, streets, and vehicles. Because of this, last-mile deliveries deal with congestion issues in transit, as well as compete for limited space as their vehicles park and are received.
Despite their essential role in the economy and urban life, last-mile deliveries are often not prioritized in transportation and land use policymaking, planning, or building. Transportation infrastructure is often intended to accommodate mobility goals including through trips. Each of those trips have a beginning and an end, and without careful consideration of the trade-offs of sacrificing last-mile elements for through trips, a lack of the last-mile elements will begin to encroach into the space dedicated for through trips.
Loss of on-street loading spaces, access to off-street facilities and limits to flexible space used for deliveries will not reduce or eliminate deliveries, they will simply push delivery loading to curb space designated for other uses or travel lanes.
Furthermore, growth and concentration of commercial activity, e-commerce deliveries, reallocation of “complete street” curb space, and consumer expectations for delivery service are all contributing to an increase in competition and conflicts for space used for deliveries.
True balance in the transportation system requires a role for delivery access and space. This study offers best practice strategies to tip the balance to accommodate last-mile delivery needs to not
only improve delivery efficiency, but to reduce the externalities of a necessary societal function on the transportation system
Last-Mile Delivery Issues Last-mile delivery challenges are of two basic types:
• Delivering goods on time, intact, efficiently, and safely. • Minimizing disruption and external costs to the community
and the environment.
The growing number of goods deliveries and the intense competition for limited street options for delivery, parking, and curb space leads to problems familiar in any urban area:
• Blocked driveways and double-parking. • Lack of curb access, and misuse of loading and no-parking
zones. • Sidewalks blocked with goods and equipment. • Competition for the use of sidewalks, ramps, and elevators.
These problems are often exacerbated when urban land use densifies. The street and sidewalk rarely expand as larger buildings replace smaller ones, while the demand for deliveries increases. New buildings seldom devote enough space to accommodate the needs of tenants or residents, impacting deliveries further.
There has been a dramatic increase in small shipments, deliveries, and related returns from e-commerce. This increase has added to the delivery volume of existing carriers such as the United States Postal Service (USPS), United Parcel Service (UPS), and FedEx, also bringing new carriers and independent contractors and other participants into the last-mile delivery business. This trend has thus increased both the volume and complexity of last-mile delivery.
Last Mile Freight Delivery Study | Chapter 1: Last-Mile Delivery Problem Statement
1 - 3 | P a g e
The increase in e-commerce has greatly expanded deliveries to individual residences and apartment buildings, as well as impacted business-to-business (B2B) shipment and delivery patterns. For single-family residences the external issues are primarily additional vehicle miles travelled (VMT) and shipment security. Urban apartment buildings, however, have limited parking and limited access, as few were designed to receive more than the occasional deliveries.
These problems raise the cost of deliveries and reduce reliability for delivery providers and receivers. These problems also increase urban VMT, emissions, and greenhouse gases; inconveniencing neighboring land uses; and adding to urban street and sidewalk congestion.
Technological “solutions” such as three-dimensional (3D) printing, drone delivery, autonomous vehicles and robots, and the “urbanization of freight” have received extensive positive media and trade press coverage. An objective assessment, however, indicates that these technologies will have a potentially marginal impact, and cannot be relied upon to completely solve last-mile freight delivery problems in Los Angeles.
To sustain and/or improve last-mile delivery efficiency and mitigate its impacts, Los Angeles planners and officials need a detailed understanding of the issues, and a toolbox of effective solutions, so that pilot project and other implementation opportunities can be pursued.
Major Delivery Industry Issues and Trends Affecting Last-Mile Conditions
Smaller, more frequent shipments As noted previously, the demand for freight delivery is derived from the underlying consumer demand for the goods themselves. Customers want to receive their shipments when they want them, in good condition, and at the minimum cost. The catch phrase “better, faster, cheaper” effectively summarizes customer expectations for the delivery of goods. Delivery companies, chiefly commercial carriers and private fleet operators also respond to efficiency trends within the industry, environmental regulations, and legal mandates related to licensing labor, and safety. These customer, industry, and governmental factors together drive change in the trucking and delivery industries.
One major customer-driven change is the trend toward smaller, more frequent shipments. Products have become smaller, most notably in the electronics sector. Efforts to reduce inventory holding costs have led to more frequent replenishment of smaller stocks, necessitating more frequent but smaller deliveries. The unprecedented convenience of e-commerce, particularly with free shipping, has led to proliferation of small packages and parcels. Direct shipment to the customer is a key factor; instead of delivering 50 pairs of shoes to a shoe store, the industry is now delivering 50 pairs of shoes to 50 homes, apartments, and offices.
Carriers have shifted to a more diverse vehicle fleet, adding smaller vehicles such as minivans to a mix once dominated by larger cargo vans, step vans, and box trucks. UPS and FedEx have shifted from attempting to standardize on one delivery vehicle to a mixed fleet
Last Mile Freight Delivery Study | Chapter 1: Last-Mile Delivery Problem Statement
1 - 4 | P a g e
of vehicle types that can be matched with the territories and markets they serve, with the USPS following suit.
“Densification” of Commercial and Industrial Space The progressive “densification” of urban industrial, commercial, retail, and residential development is also changing delivery requirements.
In contrast to longstanding trends toward sprawling one-story factories and distribution centers, multi-story facilities are becoming more common – particularly in urban areas with scarce and costly development space.
Higher floor area ratios (FARs) tend to squeeze delivery parking out of private property and into the street. For retail, office, and residential developments, loading docks, doors, and ramps are often considered “non-revenue” space and minimized. Many smaller stores or mini malls may be built without rear doors or access.
These shifts can leave drivers with more deliveries to make for a given footprint, and less access. It is common for drivers serving large office buildings or retail complexes to spend more time within the buildings than driving. Package delivery companies have reported that some drivers travel as little as ten miles per day on the road, spending most of their time moving both horizontally and vertically in the buildings. The greater time spent at each stop increases the time the vehicle will be stopped in each location. In these instances, fifteen or thirty minutes in a loading zone may no longer be enough.
Trucking Industry Concerns From the trucking industry point of view, the main challenges of last mile delivery include minimizing cost, ensuring transparency,
increasing efficiency, making delivery frictionless and improving infrastructure. This is generally accomplished through a focus on a company’s operations, since long-term transportation system or land use changes are out of the control of the delivery companies.
Each year the American Transportation Research Institute (ATRI, the research arm of the American Trucking Associations) conducts an industry survey to identify the most vital concerns. The top five 2018 industry concerns were:
1. Driver Shortage. With rising demand and an aging workforce, the industry continues to have trouble recruiting drivers.
2. Hours of Service (HOS Rules. Recent changes in roles differences between Federal and California rules, and stricter enforcement via electronic logging devices combine to make Hours of Service regulations a major concern.
3. Driver Retention. Motor carriers have difficulty retaining drivers once recruited, with 100% annual turnover not uncommon.
4. ELD Mandate. The requirement for trucks traveling over 100 miles to use an electronic logging device (ELD) has been implemented nationwide, but the industry has not yet fully adjusted. Local delivery drivers may be exempt under the Short Haul provision, as may drivers of smaller “non-commercial” trucks that do not require CDLs or travel more than 150 from base.
5. Truck Parking. Although associated primarily with the need for truck drivers to stop for rest breaks, etc., this issue also reflects last-mile delivery barriers.
Last Mile Freight Delivery Study | Chapter 1: Last-Mile Delivery Problem Statement
1 - 5 | P a g e
It is notable that the top five industry concerns all focus on drivers and rules affecting drivers. Issues such as fuel costs or environmental regulation are farther down the list.
These issues have mixed implications for last-mile freight delivery. The driver shortage and driver retention problems, for example, are traceable in part to lifestyle issues for long-haul truckers (that do not often affect urban delivery) and in part to working conditions (that are an issue for urban delivery). HOS Rules are likewise applicable equally to long-haul drivers and many delivery drivers, including mandatory rest stops. The ELD mandate may not affect most local delivery drivers but will affect some. The truck parking issue is common to all sectors. As last-mile delivery becomes slower and more difficult, delivery fleets and services will need more drivers, which may be more challenging as drivers are harder to recruit and retain.
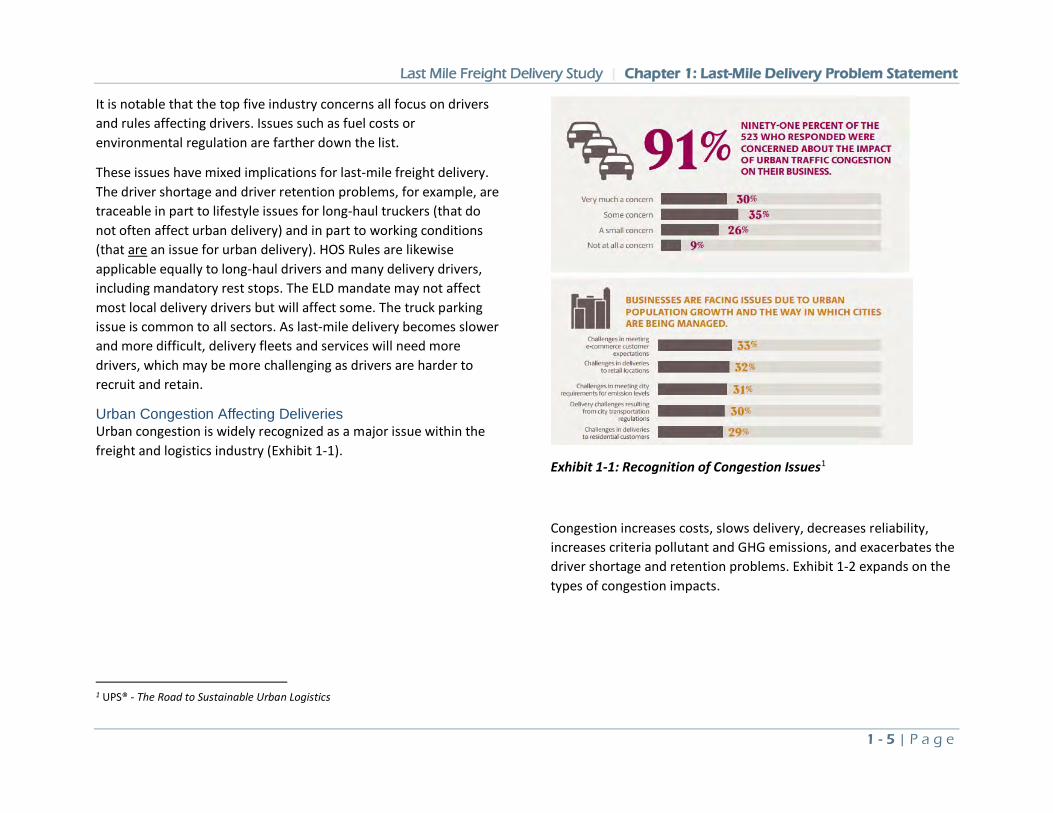
Urban Congestion Affecting Deliveries Urban congestion is widely recognized as a major issue within the freight and logistics industry (Exhibit 1-1).
1 UPS® - The Road to Sustainable Urban Logistics
Exhibit 1-1: Recognition of Congestion Issues1
Congestion increases costs, slows delivery, decreases reliability, increases criteria pollutant and GHG emissions, and exacerbates the driver shortage and retention problems. Exhibit 1-2 expands on the types of congestion impacts.
Last Mile Freight Delivery Study | Chapter 1: Last-Mile Delivery Problem Statement
1 - 6 | P a g e
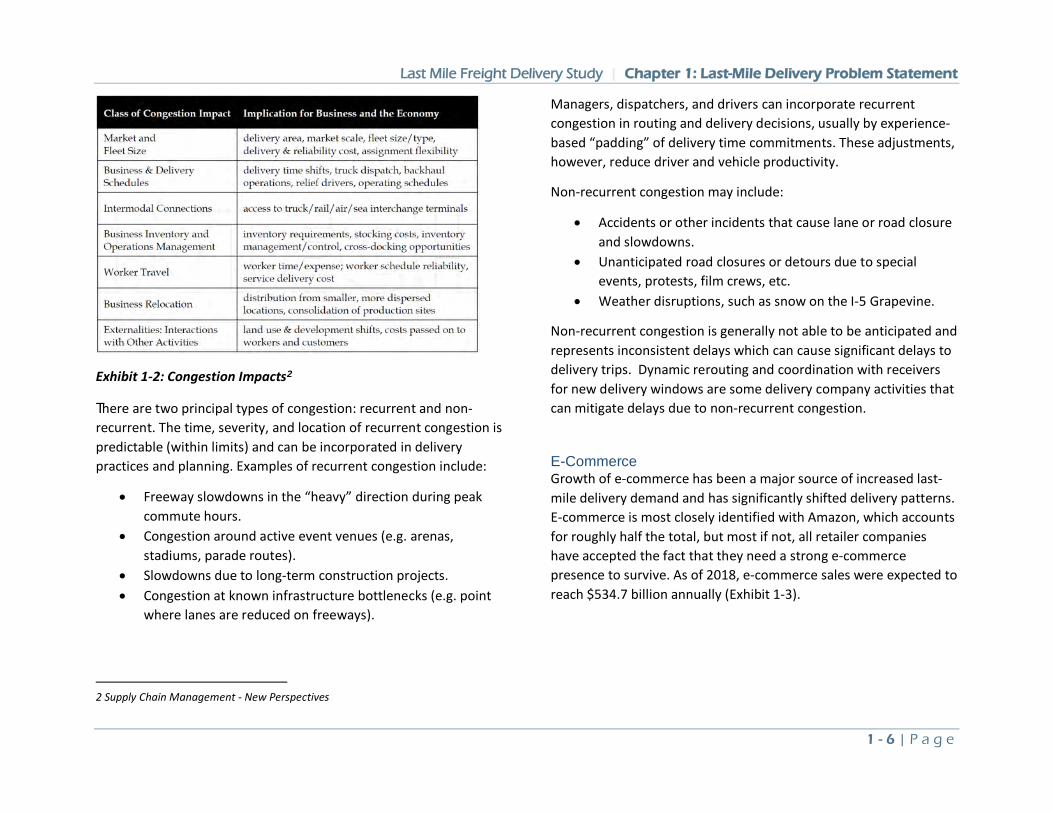
Exhibit 1-2: Congestion Impacts2
There are two principal types of congestion: recurrent and non-recurrent. The time, severity, and location of recurrent congestion is predictable (within limits) and can be incorporated in delivery practices and planning. Examples of recurrent congestion include:
• Freeway slowdowns in the “heavy” direction during peak commute hours.
• Congestion around active event venues (e.g. arenas, stadiums, parade routes).
• Slowdowns due to long-term construction projects. • Congestion at known infrastructure bottlenecks (e.g. point
where lanes are reduced on freeways).
2 Supply Chain Management - New Perspectives
Managers, dispatchers, and drivers can incorporate recurrent congestion in routing and delivery decisions, usually by experience-based “padding” of delivery time commitments. These adjustments, however, reduce driver and vehicle productivity.
Non-recurrent congestion may include:
• Accidents or other incidents that cause lane or road closure and slowdowns.
• Unanticipated road closures or detours due to special events, protests, film crews, etc.
• Weather disruptions, such as snow on the I-5 Grapevine.
Non-recurrent congestion is generally not able to be anticipated and represents inconsistent delays which can cause significant delays to delivery trips. Dynamic rerouting and coordination with receivers for new delivery windows are some delivery company activities that can mitigate delays due to non-recurrent congestion.
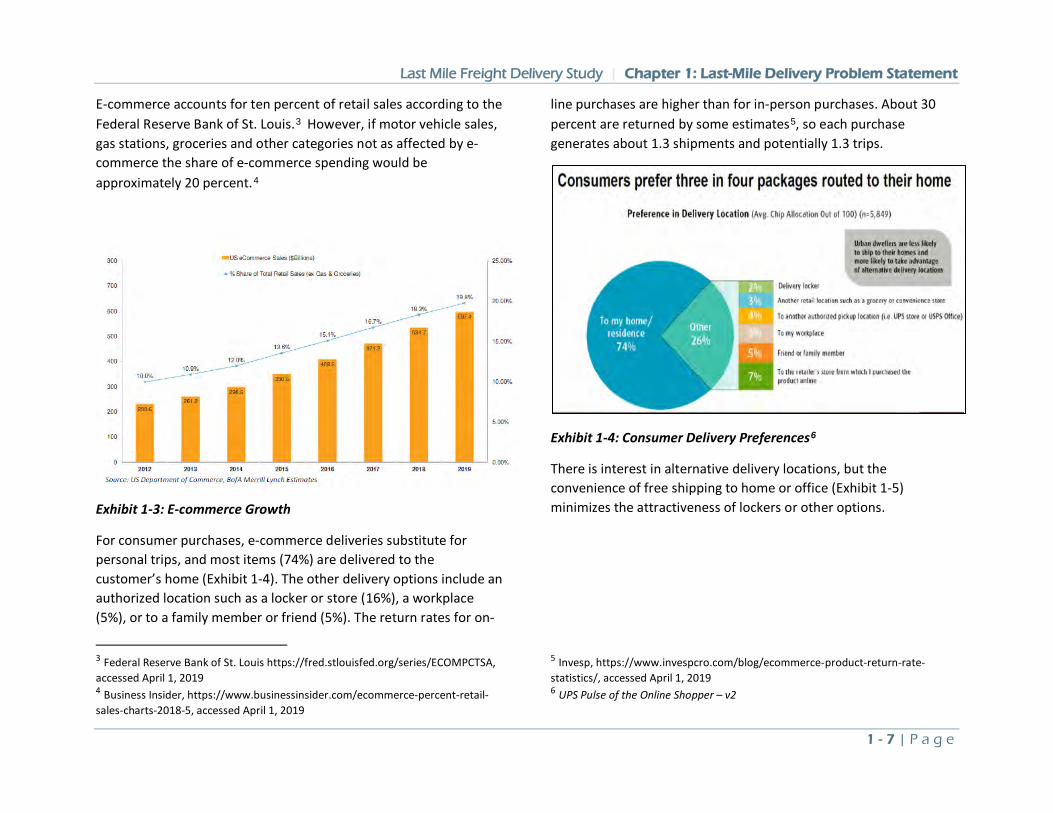
E-Commerce Growth of e-commerce has been a major source of increased last-mile delivery demand and has significantly shifted delivery patterns. E-commerce is most closely identified with Amazon, which accounts for roughly half the total, but most if not, all retailer companies have accepted the fact that they need a strong e-commerce presence to survive. As of 2018, e-commerce sales were expected to reach $534.7 billion annually (Exhibit 1-3).
Last Mile Freight Delivery Study | Chapter 1: Last-Mile Delivery Problem Statement
1 - 7 | P a g e
E-commerce accounts for ten percent of retail sales according to the Federal Reserve Bank of St. Louis.3 However, if motor vehicle sales, gas stations, groceries and other categories not as affected by e-commerce the share of e-commerce spending would be approximately 20 percent.4
Exhibit 1-3: E-commerce Growth
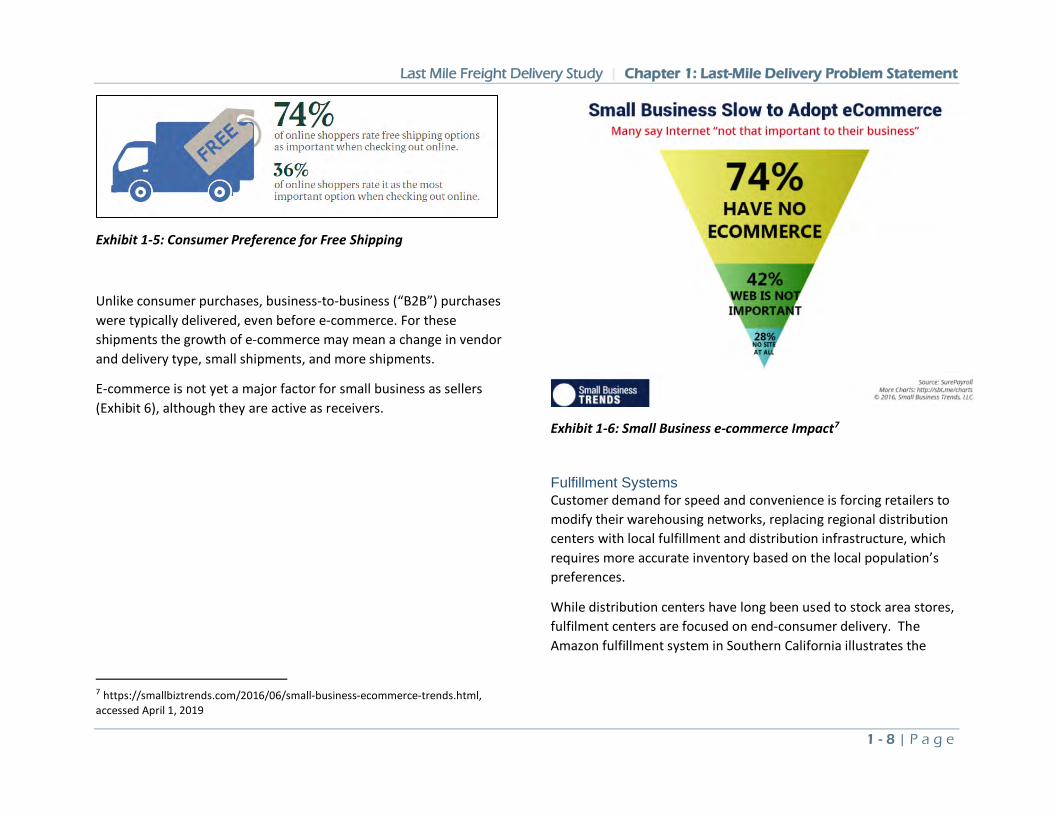
For consumer purchases, e-commerce deliveries substitute for personal trips, and most items (74%) are delivered to the customer’s home (Exhibit 1-4). The other delivery options include an authorized location such as a locker or store (16%), a workplace (5%), or to a family member or friend (5%). The return rates for on-
3 Federal Reserve Bank of St. Louis https://fred.stlouisfed.org/series/ECOMPCTSA, accessed April 1, 2019 4 Business Insider, https://www.businessinsider.com/ecommerce-percent-retail-sales-charts-2018-5, accessed April 1, 2019
line purchases are higher than for in-person purchases. About 30 percent are returned by some estimates5, so each purchase generates about 1.3 shipments and potentially 1.3 trips.
Exhibit 1-4: Consumer Delivery Preferences6
There is interest in alternative delivery locations, but the convenience of free shipping to home or office (Exhibit 1-5) minimizes the attractiveness of lockers or other options.
5 Invesp, https://www.invespcro.com/blog/ecommerce-product-return-rate-statistics/, accessed April 1, 2019 6 UPS Pulse of the Online Shopper – v2
Last Mile Freight Delivery Study | Chapter 1: Last-Mile Delivery Problem Statement
1 - 8 | P a g e
Exhibit 1-5: Consumer Preference for Free Shipping
Unlike consumer purchases, business-to-business (“B2B”) purchases were typically delivered, even before e-commerce. For these shipments the growth of e-commerce may mean a change in vendor and delivery type, small shipments, and more shipments.
E-commerce is not yet a major factor for small business as sellers (Exhibit 6), although they are active as receivers.
7 https://smallbiztrends.com/2016/06/small-business-ecommerce-trends.html, accessed April 1, 2019
Exhibit 1-6: Small Business e-commerce Impact7
Fulfillment Systems Customer demand for speed and convenience is forcing retailers to modify their warehousing networks, replacing regional distribution centers with local fulfillment and distribution infrastructure, which requires more accurate inventory based on the local population’s preferences.
While distribution centers have long been used to stock area stores, fulfilment centers are focused on end-consumer delivery. The Amazon fulfillment system in Southern California illustrates the
Last Mile Freight Delivery Study | Chapter 1: Last-Mile Delivery Problem Statement
1 - 9 | P a g e
emerging pattern for major e-commerce firms and their impact on last mile freight. Amazon has six types of facilities in Southern California8:
• Regional Fulfillment Centers – supplier loads in and consolidated loads out
o Small Sortable o Large Non-sortable o Specialized
• Pantry & Fresh DCs – food Fulfillment Centers • Inbound Cross-dock (IXD) – import containers in, trucks out
to Fulfillment Centers • Regional sort centers – sort from Fulfillment Centers to local
metro area • Delivery Stations – sort for last-mile delivery • Prime Now hubs – same day courier to last mile
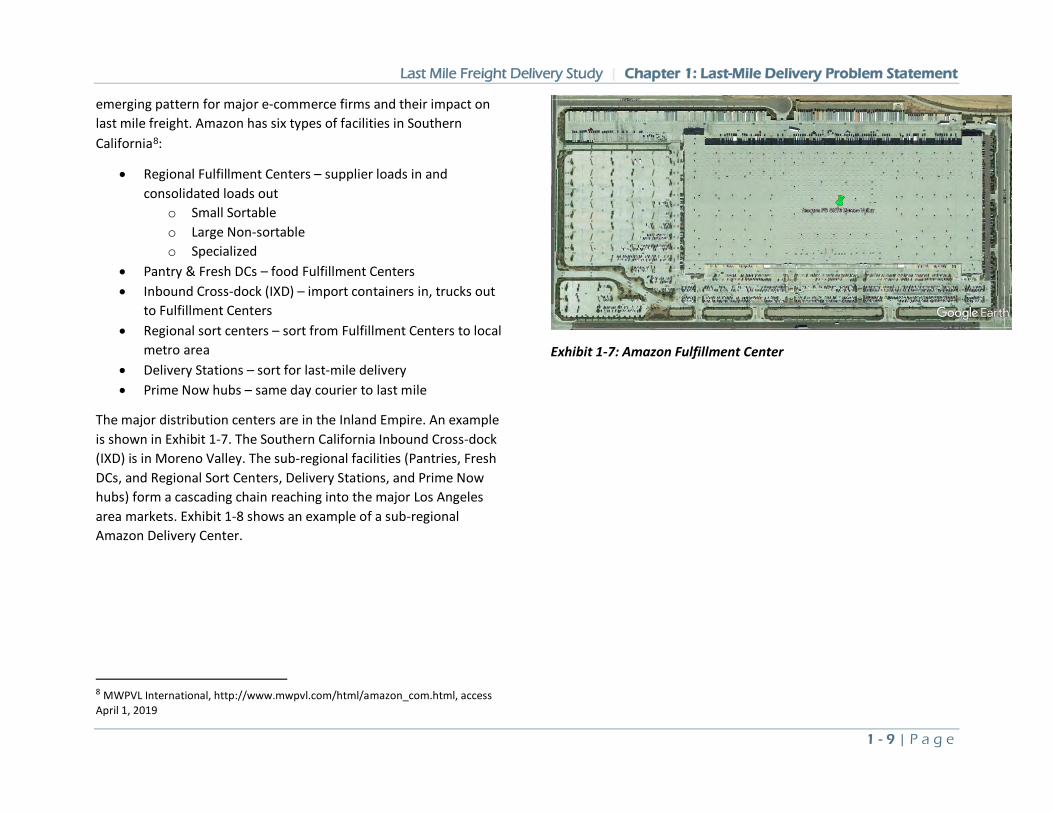
The major distribution centers are in the Inland Empire. An example is shown in Exhibit 1-7. The Southern California Inbound Cross-dock (IXD) is in Moreno Valley. The sub-regional facilities (Pantries, Fresh DCs, and Regional Sort Centers, Delivery Stations, and Prime Now hubs) form a cascading chain reaching into the major Los Angeles area markets. Exhibit 1-8 shows an example of a sub-regional Amazon Delivery Center.
8 MWPVL International, http://www.mwpvl.com/html/amazon_com.html, access April 1, 2019
Exhibit 1-7: Amazon Fulfillment Center
Last Mile Freight Delivery Study | Chapter 1: Last-Mile Delivery Problem Statement
1 - 10 | P a g e
Exhibit 1-8: Amazon Delivery Center
Alternate Systems and Modes Much attention has been paid in the public and trade media to alternative modes such as drones, 3D printing, cargo bikes, and autonomous vehicles, including delivery robots. None of these have yet been implemented on a large scale, and the potential impact on last-mile freight is currently unknown.
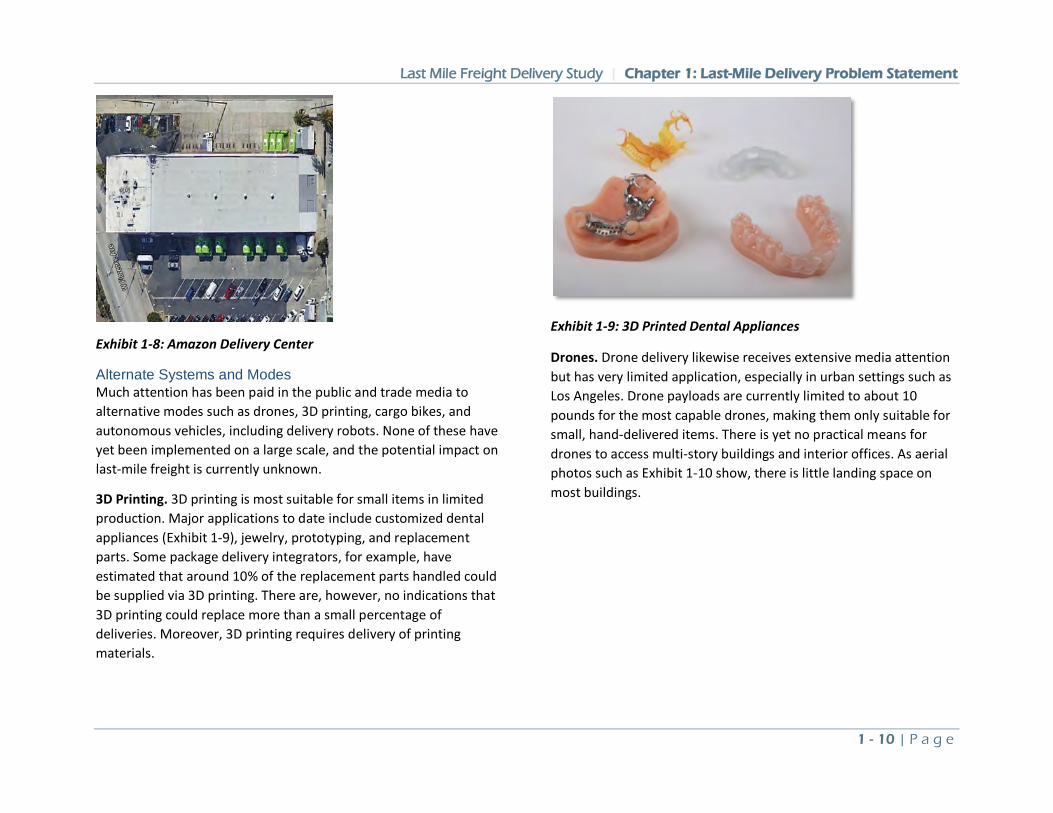
3D Printing. 3D printing is most suitable for small items in limited production. Major applications to date include customized dental appliances (Exhibit 1-9), jewelry, prototyping, and replacement parts. Some package delivery integrators, for example, have estimated that around 10% of the replacement parts handled could be supplied via 3D printing. There are, however, no indications that 3D printing could replace more than a small percentage of deliveries. Moreover, 3D printing requires delivery of printing materials.
Exhibit 1-9: 3D Printed Dental Appliances
Drones. Drone delivery likewise receives extensive media attention but has very limited application, especially in urban settings such as Los Angeles. Drone payloads are currently limited to about 10 pounds for the most capable drones, making them only suitable for small, hand-delivered items. There is yet no practical means for drones to access multi-story buildings and interior offices. As aerial photos such as Exhibit 1-10 show, there is little landing space on most buildings.
Last Mile Freight Delivery Study | Chapter 1: Last-Mile Delivery Problem Statement
1 - 11 | P a g e
Exhibit 1-10: Aerial Photo, Downtown Los Angeles
A typical UPS or FedEx truck may hold 200–300 deliveries; replacing even a small portion of those trips would require thousands of simultaneous drone flights across the urban landscape. Package delivery companies view drones as an option for extending the reach of drivers in suburban rural areas (Exhibit 1-11), not as an option for urban last-mile freight.
Exhibit 1-11: Aerial Photo, Suburban Homes9
9 Source: Google Earth
Drones have been used successfully for emergency medical supplies, vital replacement parts, and access to difficult or remote locations, and will likely continue to have value in those applications. Some companies in Europe and China have begun commercial operations in rural environments.
"Uberization" The term “Uberization” is loosely used to refer to the increased presence of “transportation network companies” (TNCs) such as Uber and Lyft in small deliveries. Examples include Uber, Uber Eats, GrubHub, Door Dash, and many others. By using personal vehicles these services add new delivery capacity to be used as substitutes for personal trips or for new trips. Most such shipments deliver to homes, apartments, or offices for individuals. Business use of TNCs remains uncommon. One serious limiting factor is that personal vehicles usually lack commercial license plates, and would be nominally ineligible to use commercial loading zones.
There is also discussion of the “Uberization” of freight transportation. “Uber Freight” is a truck brokerage system launched by Uber. Unlike the TNCs using personal vehicles, Uber Freight does not bring significant new capacity into the system and competes with hundreds of existing truck brokers and systems. While the Uber Freight system may have innovative technology features, it performs a similar function as existing systems by offering shipments to carriers with available capacity.
Autonomous Vehicles The phrase “autonomous vehicles” (AV) covers a wide range of types and technologies, including self-driving trucks and sidewalk
Last Mile Freight Delivery Study | Chapter 1: Last-Mile Delivery Problem Statement
1 - 12 | P a g e
delivery robots. (Truck platooning and connected vehicle technologies are often discussed with autonomous vehicles, but those technologies are primarily suited for rural highways rather than last-mile deliveries.)
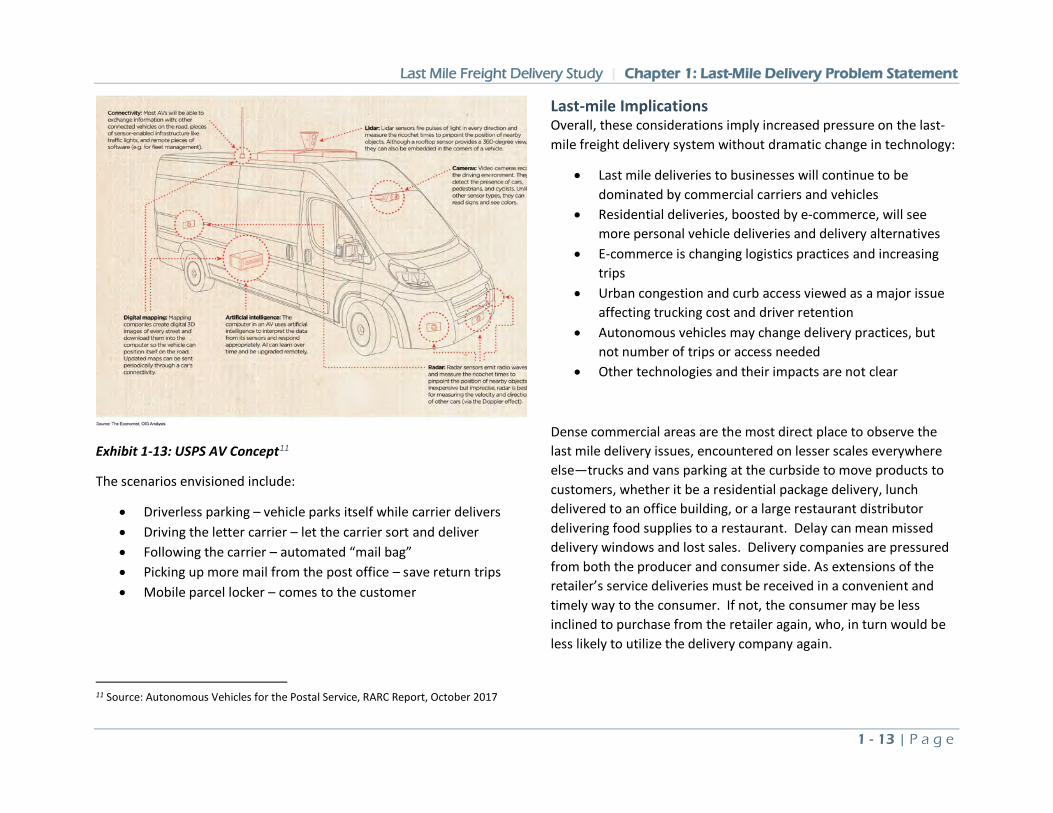
As Exhibit 1-12 shows, there are several well-defined stages in vehicle automation, from minimal driver assistance (Level 1) to fully autonomous vehicles with no driver options (Level 5). The development of autonomous freight vehicles lags that of passenger vehicles, with only a few test trips to date. But the pace of testing is increasing as more states adjust their regulatory environment.
Exhibit 1-12: Vehicle Automation Levels10
The eventual adoption of autonomous, driverless vehicles may not change the number of last-mile delivery trips or the access requirements, since those are determined by the number and nature of customer orders and supplier shipments.
Autonomous vehicles could, however, change the nature of deliveries. Instead of a driver unloading the vehicle and hand-delivering packages, the receiver would have to unload the vehicle or otherwise retrieve the shipment. The change could result in longer stops when receiver personnel are not immediately available or do not immediately recognize the arrival.
A second major difference is that AVs would not ordinarily break rules or laws. A human delivery driver can choose to double park, violate a parking restriction, briefly block a driveway, or otherwise “bend the rules” to accomplish a delivery. The main premise of
10 Source: SAE International, OIG Analysis
machine learning and algorithm technology is that over time, the AV would learn how to adjust and be flexible within its environment. There could be limits on how well an AV could be equipped, programmed, or otherwise enabled to exercise the same options or judgement. But this could conceivably lead to an AV making a “judgment call”, for example, regarding parking in a red zone for a shorter than 2-minute delivery.
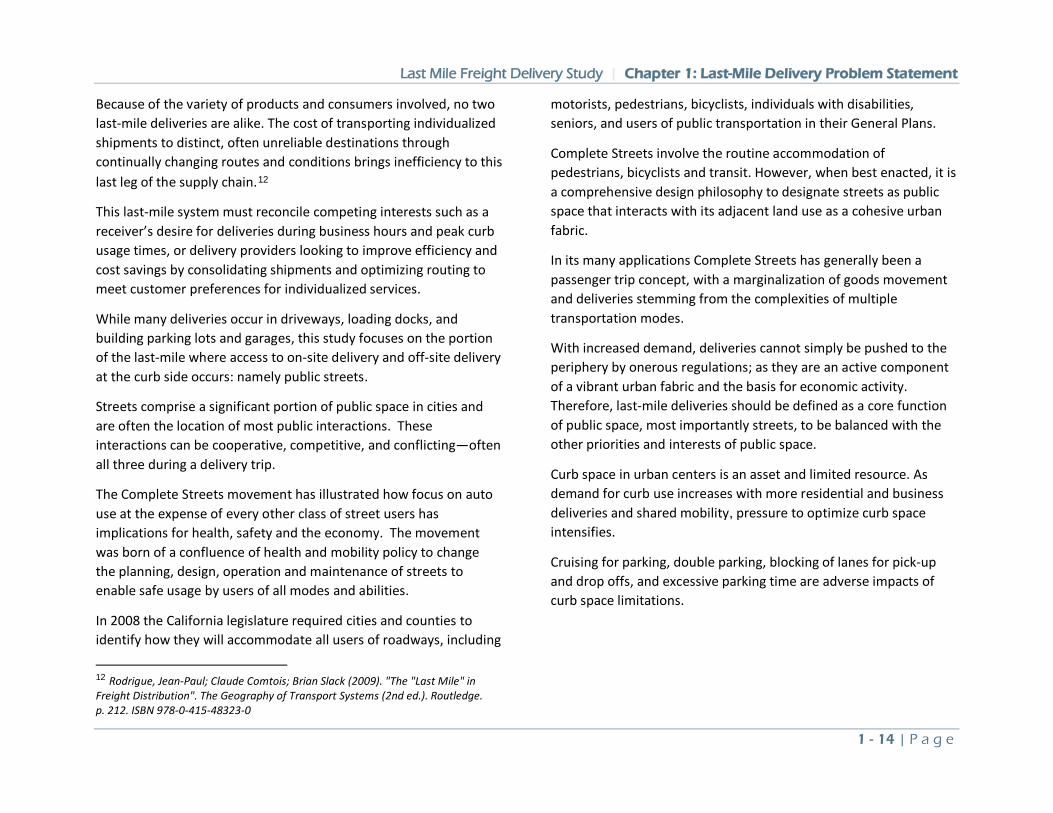
USPS AV Scenarios One of the most thorough assessments of AV use in last-mile delivery was prepared for the USPS. Exhibit 13 shows a concept for an AV postal vehicle.
Last Mile Freight Delivery Study | Chapter 1: Last-Mile Delivery Problem Statement
1 - 13 | P a g e
Exhibit 1-13: USPS AV Concept11
The scenarios envisioned include:
• Driverless parking – vehicle parks itself while carrier delivers • Driving the letter carrier – let the carrier sort and deliver • Following the carrier – automated “mail bag” • Picking up more mail from the post office – save return trips • Mobile parcel locker – comes to the customer
11 Source: Autonomous Vehicles for the Postal Service, RARC Report, October 2017
Last-mile Implications Overall, these considerations imply increased pressure on the last-mile freight delivery system without dramatic change in technology:
• Last mile deliveries to businesses will continue to be dominated by commercial carriers and vehicles
• Residential deliveries, boosted by e-commerce, will see more personal vehicle deliveries and delivery alternatives
• E-commerce is changing logistics practices and increasing trips
• Urban congestion and curb access viewed as a major issue affecting trucking cost and driver retention
• Autonomous vehicles may change delivery practices, but not number of trips or access needed
• Other technologies and their impacts are not clear
Dense commercial areas are the most direct place to observe the last mile delivery issues, encountered on lesser scales everywhere else—trucks and vans parking at the curbside to move products to customers, whether it be a residential package delivery, lunch delivered to an office building, or a large restaurant distributor delivering food supplies to a restaurant. Delay can mean missed delivery windows and lost sales. Delivery companies are pressured from both the producer and consumer side. As extensions of the retailer’s service deliveries must be received in a convenient and timely way to the consumer. If not, the consumer may be less inclined to purchase from the retailer again, who, in turn would be less likely to utilize the delivery company again.
Last Mile Freight Delivery Study | Chapter 1: Last-Mile Delivery Problem Statement
1 - 14 | P a g e
Because of the variety of products and consumers involved, no two last-mile deliveries are alike. The cost of transporting individualized shipments to distinct, often unreliable destinations through continually changing routes and conditions brings inefficiency to this last leg of the supply chain.12
This last-mile system must reconcile competing interests such as a receiver’s desire for deliveries during business hours and peak curb usage times, or delivery providers looking to improve efficiency and cost savings by consolidating shipments and optimizing routing to meet customer preferences for individualized services.
While many deliveries occur in driveways, loading docks, and building parking lots and garages, this study focuses on the portion of the last-mile where access to on-site delivery and off-site delivery at the curb side occurs: namely public streets.
Streets comprise a significant portion of public space in cities and are often the location of most public interactions. These interactions can be cooperative, competitive, and conflicting—often all three during a delivery trip.
The Complete Streets movement has illustrated how focus on auto use at the expense of every other class of street users has implications for health, safety and the economy. The movement was born of a confluence of health and mobility policy to change the planning, design, operation and maintenance of streets to enable safe usage by users of all modes and abilities.
In 2008 the California legislature required cities and counties to identify how they will accommodate all users of roadways, including
12 Rodrigue, Jean-Paul; Claude Comtois; Brian Slack (2009). "The "Last Mile" in Freight Distribution". The Geography of Transport Systems (2nd ed.). Routledge. p. 212. ISBN 978-0-415-48323-0
motorists, pedestrians, bicyclists, individuals with disabilities, seniors, and users of public transportation in their General Plans.
Complete Streets involve the routine accommodation of pedestrians, bicyclists and transit. However, when best enacted, it is a comprehensive design philosophy to designate streets as public space that interacts with its adjacent land use as a cohesive urban fabric.
In its many applications Complete Streets has generally been a passenger trip concept, with a marginalization of goods movement and deliveries stemming from the complexities of multiple transportation modes.
With increased demand, deliveries cannot simply be pushed to the periphery by onerous regulations; as they are an active component of a vibrant urban fabric and the basis for economic activity. Therefore, last-mile deliveries should be defined as a core function of public space, most importantly streets, to be balanced with the other priorities and interests of public space.
Curb space in urban centers is an asset and limited resource. As demand for curb use increases with more residential and business deliveries and shared mobility, pressure to optimize curb space intensifies.
Cruising for parking, double parking, blocking of lanes for pick-up and drop offs, and excessive parking time are adverse impacts of curb space limitations.
Last Mile Freight Delivery Study | Chapter 1: Last-Mile Delivery Problem Statement
1 - 15 | P a g e
As one explores issues of last-mile delivery, broader and interrelated curbside issues become apparent. There is thus a need to look for the underlying issues rather than the symptoms.
Key observations from this study are:
Receivers, Not Delivery providers, Drive Deliveries The questions of what, where, and when deliveries occur is generally under the control of receivers. Delivery companies serve the receivers and therefore try to accommodate the receivers’ needs to the degree possible. The “how”, or in what type of vehicle, a delivery is made is generally the only choice made by delivery providers.
Deliveries Occur Everywhere, and Concentrate where Land Use Activity Concentrates Every active land use can receive deliveries from mail, packages, or merchandise. Deliveries are generally proportional to the level of activity or people in a building. Retailers and other commercial activity areas involve larger and more frequent deliveries because they represent direct points of distribution to consumers themselves. Therefore, the denser and most commercially active areas receive the most deliveries.
Deliveries Generally Occur During Business Hours Few receivers request deliveries outside of normal business hours. Receivers prefer to reduce the cost of having employees work extra hours to receive shipments. However, larger scale companies and food-related businesses tend to have staff stock items prior to and/or after business hours.
Curb Space is Fairly Uniform; Land Use is Not City blocks are generally 300 to 500 feet long with curb space on each side. Therefore, each block generally has 600–1000 feet of curb space. However, the buildings that front those curbs can vary
from a few less dense residences to office towers—leading to far different uses of the curb space.
Curb Space and Land Use Regulation Are Cities’ Primary Role in the Logistics Supply Chain Cities primarily regulate deliveries to the sites and buildings planned and approved through land use policies, zoning, and building codes. Therefore, a city’s biggest impact in improving delivery conditions is in the last-mile.
Business Demands Deliveries Adapt to More Challenging Conditions Many delivery sites have challenges. These issues are often longstanding as a legacy from a different era or from the prioritization of site space without delivery access and accommodation in mind. However, these conditions are generally mitigated by experienced drivers and pressure from a competitive delivery service marketplace that ensures goods are delivered on-site and on-time.
The Delivery Industry is Highly Innovative The logistics industry and last-mile consumer deliveries are innovating at a rapid pace, with many new investments by traditional companies and new companies competing for a rapidly expanding market. Because of this, improvement in last-mile freight conditions will need to be through a sustained effort of outreach to include new delivery providers and receivers and flexible in the application of last-mile strategies.
New Trends in Delivery Significantly Affect Last-Mile Delivery • Next-Day and Same-Day Fulfillment – Narrow logistics
windows - Examples include pharmaceuticals and food delivery.
Last Mile Freight Delivery Study | Chapter 1: Last-Mile Delivery Problem Statement
1 - 16 | P a g e
• Gig economy/crowdsourcing applications use independent drivers or bike couriers.
• Transparency and track-ability for in-transit and proof of delivery tracking
• USPS parcel delivery with decline of mail delivery- Adding a parcel to a home delivery is only an incremental cost to the USPS, since the carrier is going to the house anyway. It is more expensive for UPS or FedEx to make that same delivery, since it’s an independent stop.
• Insourcing of last-mile deliveries – Retailers such as Amazon and Wayfair are expanding the use of their own fleets and equipment for last mile deliveries. Many contract carriers companies like XPO Logistics, J.B. Hunt Transport, and Schneider National now have their own local delivery services as well. They have their own vehicles and drivers on payroll for local deliveries to residences and other businesses, in addition to their traditional long-haul shipments.
• Use of third-party last mile delivery companies – Target, Wal-Mart, and Costco have expanded partnerships with third-party last mile delivery companies including Shipt and Instacart, as well as Wal-Mart’s crowdsourced program.
• City warehouses such as Amazon Prime Now which will deliver within two hours.
• Sales from delivery carriers based on prior or similar spending habits.
• Smart Technology and sensors for parking
Solutions in the Last Mile “Last-mile” is a network distribution concept used to describe telecommunications, electricity, transit riders or goods deliveries. In each of these cases, the last leg of the chain is the least efficient
because it involves distribution to a wide variety of destinations. Each of those destinations require individual trips subjected to recurrent and non-recurrent congestion and reliance on receiver availability. Efficiencies in the last-mile from the delivery providers’ perspective is to make the shortest and fastest routing of their delivery vehicles to make the maximum amount of deliveries in a day.
The USPS has been perfecting its delivery routing process for centuries; and UPS and FedEx for decades. In the Internet age, last-mile delivery has resulted from the proliferation of smartphones and the impacts on retailers' e-commerce business, notably Amazon. This has led to a desire to perfect fast, free or low-cost, and return deliveries, all the while working with and competing against legacy carriers and a host of new start-ups eager to gain market share.
The complexity of goods movement and deliveries combined with the constant innovation of various actors in the industry necessitates tailored and nuanced strategies involving multidisciplinary approaches to core issues rather than superficial addressing of negative externalities.
This report was prepared for SCAG and its component agencies to define their opportunities to bring solutions to last-mile freight issues while facilitating efforts which may need partnership with other agencies, private industry or other stakeholders.
The data, stakeholder outreach, and literature review for this study has reinforced those issues with last-mile freight delivery based on the following perspectives:
• Many see inefficient use of space • Others see opportunities to avoid conflicts
Last Mile Freight Delivery Study | Chapter 1: Last-Mile Delivery Problem Statement
1 - 17 | P a g e
• Others prefer to operate in a gray area of regulation • Some are too busy to be concerned with the details of
delivery conditions and simply accept conditions as they are
The strategies proposed in this study are meant to be a range of options to be considered for the specific delivery issues at the block, district, or city level. Nearly every strategy brings costs to various parties. The key is understanding the benefits of these costs so that they can be factored into decision making, piloted and addressed early within the implementation process to ensure improvements meet expectations rather than being a penalty or inconvenience.
Planning for efficient last-mile delivery is an ongoing and sustained activity. As land uses change and delivery operations, logistics and consumer needs and desires adjust, so to must the solutions. Delivery activity and techniques will continue to proliferate, and government agencies, SCAG and its member cities are better served improving the underlying conditions and factors in the accommodation of last-mile freight rather than simply addressing its symptoms on an ad hoc basis.
This Study The purpose of the study is to increase understanding of last-mile delivery issues for the Southern California of Governments (SCAG) and its member Cities by examining the relationship between last-mile access conditions, the delivery of goods, and the role of last-mile delivery in the overall transportation system.
The study assesses the use of curb areas for deliveries, and the magnitude of other curb uses competing for limited curb space, at the Citywide and case study block level to provide recommendations in the case study areas, City of Los Angeles pilot projects and a Toolbox of Strategies for cities throughout the SCAG
region to utilize when faced with their own unique delivery challenges.
The phases of the study are summarized in the following chapters within this report:
1. Chapter 1: Last-Mile Delivery Problem Statement—this chapter
2. Chapter 2: Definitions and Terminology establishes a common lexicon for the project
3. Chapter 3: Project Advisory Committee (PAC) 4. Chapter 4: Stakeholder Involvement describes the outreach
effort central to identifying issues and solutions while interpreting the data to better understand curbside interactions.
5. Chapter 5: Policy Review describes the context of delivery issues.
6. Chapter 6: Citywide Data Collection and Analysis describes the methodology and findings of the GIS analysis to identify areas where delivery issues are focused and select case study areas.
7. Chapter 7: Field Data Collection, the methodology and overall observation for the field data collection are summarized in Chapter 7,
8. Chapter 8: Best Practices Literature Review is a summary of last-mile best practices
9. Chapter 9: Case Studies in the City of Los Angeles: includes data and recommendations for each specific case study area
10. Chapter 10: Recommended Actions and Pilot Projects is a collection of pilot projects recommended for the City of Los Angeles beyond block-level interventions as described in Chapter 9.
Last Mile Freight Delivery Study | Chapter 1: Last-Mile Delivery Problem Statement
1 - 18 | P a g e
11. The Toolbox of Strategies is a listing of last-mile improvement strategies.
The study area for the project was the City of Los Angeles, and to a large degree areas around downtown Los Angeles were used for field data collection. This is not to say that the strategies recommended by the report are limited to downtown areas. These areas have high densities and more limited space, therefore the negative externalities of density in terms of freight delivery are exacerbated and make for good illustrative cases. Lower density commercial areas and residential areas must also accommodate deliveries through on-street loading areas, alleys and in-building receiving space to avoid. The Toolbox of Strategies is intended to be applicable throughout the region to address the range of last mile delivery issues.
Last Mile Freight Delivery Study | Chapter 2: Definitions and Terminology
2 - 1 | P a g e
Chapter 2: Definitions and Terminology
A common language was developed for this study to communicate last-mile delivery issues. This chapter presents the glossary of terminology which consolidated freight industry, transportation planning and parking terminology for use in this study. It is followed by a primer on how deliveries are commonly made.
Last Mile Freight Delivery Study | Chapter 2: Definitions and Terminology
2 - 2 | P a g e
Glossary Complete Streets – a design and operating philosophy of streets of safe use of streets for all users regardless of mode of transportation or ability. Due to many years of focus on automobile throughput, complete street projects generally are designed a part of an overall community context to support pedestrians, bicyclists and transit and include parking considerations, land uses and population characteristics.
Curb space – the outside lane of a street adjacent to a curb face. The curbs space is programed for short- and long-term parking, passenger loading, deliveries, or through travel. These programmed uses can vary during the course of the day (i.e. peak hour travel lanes)
Delivery Provider/Deliverer – a vehicle or person making a delivery, can work for a delivery company or be an individual making a delivery of goods or otherwise unloading goods.
Delivery - the transfer of a good from delivery provider to a receiver or from a producer/retailer to a delivery provider, regardless of vehicle mode or type of good. This project focused on the use of curb space and therefore is inclusive of all types of loading activities. In this report delivery is used interchangeably for drop-off and pick-up deliveries.
Delivery Company – a company specializing in the delivery of goods.
Delivery Vehicle – Any vehicle used for a delivery. Vehicles are most often trucks, however vans, personal cars, cargo bicycles and hand carts are also vehicles used for delivery.
Dispatching – the process of scheduling and managing pickup and delivery by a delivery company.
Last Mile – the last stage in the delivery or pick-up. This project focuses on the final block of a delivery as a vehicle approaches, parks, dwells during delivery and then departs a block.
Loading – The act of dropping-off or picking up a good as a delivery. Loading occurs when a deliverer parks to remove or place a good in the delivery vehicle. Loading is the period of time from when a vehicle stops to unload or load and make a delivery to when the driver departs after delivery to the receiver. Note: the project did not distinguish a failed delivery from a successful delivery.
Logistics – the coordination among the various actors in a supply chain to complete a delivery. The components relevant to this study are delivery company dispatching, operation of loading areas and loading docks, and the coordination between deliverers and receivers regarding the time, location and staffing for deliveries.
Off-street parking – parking of vehicles anywhere but on the streets—usually in private lots, garages and driveways. Off-street parking can be indoors in parking structures or under buildings or outdoors in surface lots.
On-street parking – parking designated along a street. Generally placed at the curbside, but may also be adjacent to curb side transit lanes or bicycle lanes. Meters or parking permits may be required and restrictions on the time of day and duration of parking are often in place.
Package - Any physical piece of cargo in relation to transport consisting of the contents and its packing for the purpose of ease of handling by manual or mechanical means.
Last Mile Freight Delivery Study | Chapter 2: Definitions and Terminology
2 - 3 | P a g e
Pallet - a platform on which a number of packages or pieces may be loaded to facilitate handling by a lift truck.
Parcel – a small package for delivery of a consumer good to a receiver.
Parking –the dwelling of a vehicle while the driver
Passenger Loading – the pick-up or drop-off of passengers by a vehicle. This includes public transportation, transportation network companies (TNCs), taxis, or private vehicles.
Producer – A firm or individual that produces a good for consumption off-site, requiring a delivery trip. Producers also may act as receivers of raw materials for their production into goods.
Receiver – an individual or business that receives a delivery of goods. Generally, for consumption on site, but receivers could also be retail establishments replenishing their stock or manufacturers receiving raw materials.
Standing – See Waiting, a vehicle parked for a period of time without the driver leaving the vehicle
Supply Chain – the process by which a good produced and transferred to a consumer. The supply chain is usually a network of different companies and individuals involved in producing and transporting a good.
Unloading - Taking goods from a vehicle freight off of a trailer and onto the dock floor.
Waiting – The parking of a vehicle where the driver does not exit the vehicle, also called ‘standing’
How Last Mile Delivery is Made This section summarizes the most common means of last-mile delivery.
Hand Carry/Small Package A substantial majority of deliveries are hand-carried, although there are no readily available data on the exact breakdown from those which are not. USPS, UPS, and FedEx deliveries are commonly hand-delivered to the final recipient, even if a hand truck or cart are used to reach the building or office. Most e-commerce deliveries are likewise hand-carried, including personal service such as meal delivery. The increased use of personal vehicles for deliveries, particularly passenger autos, is only practical for hand-delivered items. Hand-delivery can be a substitute for a personal trip, most obviously in a meal delivery or an e-commerce delivery that replaces a shopping errand.
Delivery personnel can walk farther from their vehicle than those needing equipment such as hand trucks, giving them more flexibility in finding parking spaces. Hand-delivery items are the only class suitable for delivery using motor bikes, scooters, or cargo bikes, as well as newer technologies like robots.
Hand-delivery can also be much quicker, again easing parking requirements.
• Near-universal access • Massive growth in home and office delivery due to e-
commerce • Substitute for personal customer trip • Personal services (e.g. Errand Runners, Über Eats) • Use of personal vehicles
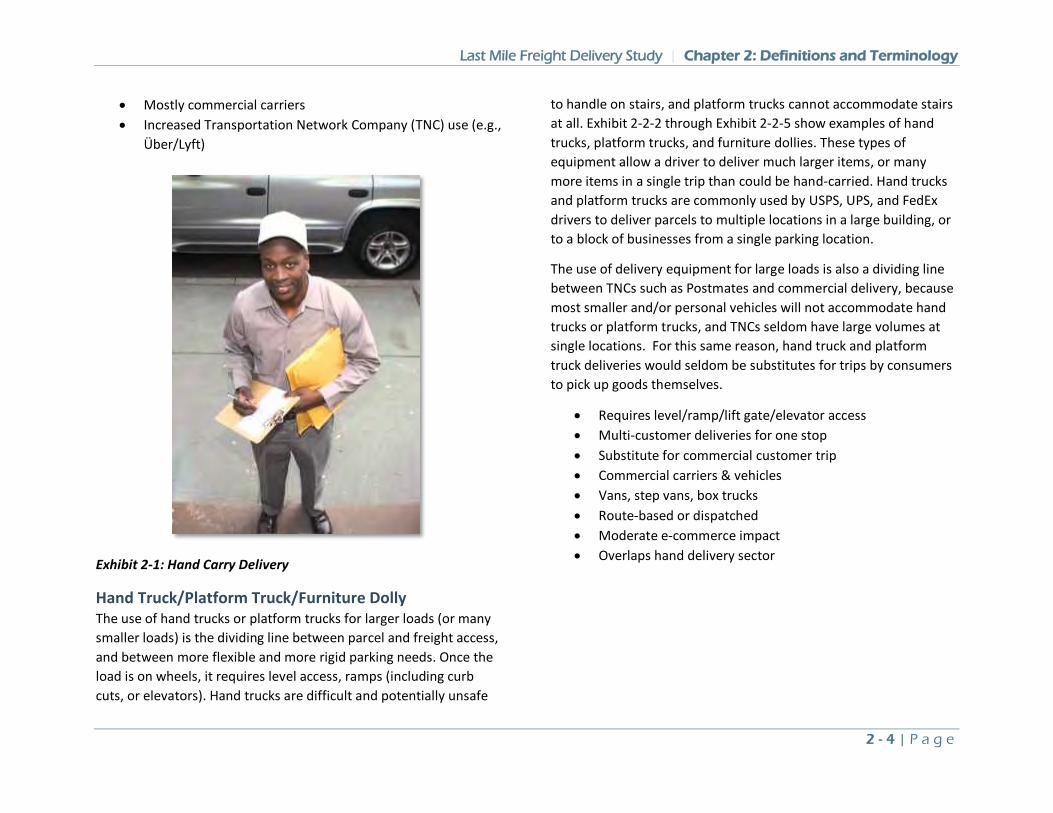
Last Mile Freight Delivery Study | Chapter 2: Definitions and Terminology
2 - 4 | P a g e
• Mostly commercial carriers • Increased Transportation Network Company (TNC) use (e.g.,
Über/Lyft)
Exhibit 2-1: Hand Carry Delivery
Hand Truck/Platform Truck/Furniture Dolly The use of hand trucks or platform trucks for larger loads (or many smaller loads) is the dividing line between parcel and freight access, and between more flexible and more rigid parking needs. Once the load is on wheels, it requires level access, ramps (including curb cuts, or elevators). Hand trucks are difficult and potentially unsafe
to handle on stairs, and platform trucks cannot accommodate stairs at all. Exhibit 2-2-2 through Exhibit 2-2-5 show examples of hand trucks, platform trucks, and furniture dollies. These types of equipment allow a driver to deliver much larger items, or many more items in a single trip than could be hand-carried. Hand trucks and platform trucks are commonly used by USPS, UPS, and FedEx drivers to deliver parcels to multiple locations in a large building, or to a block of businesses from a single parking location.
The use of delivery equipment for large loads is also a dividing line between TNCs such as Postmates and commercial delivery, because most smaller and/or personal vehicles will not accommodate hand trucks or platform trucks, and TNCs seldom have large volumes at single locations. For this same reason, hand truck and platform truck deliveries would seldom be substitutes for trips by consumers to pick up goods themselves.
• Requires level/ramp/lift gate/elevator access • Multi-customer deliveries for one stop • Substitute for commercial customer trip • Commercial carriers & vehicles • Vans, step vans, box trucks • Route-based or dispatched • Moderate e-commerce impact • Overlaps hand delivery sector
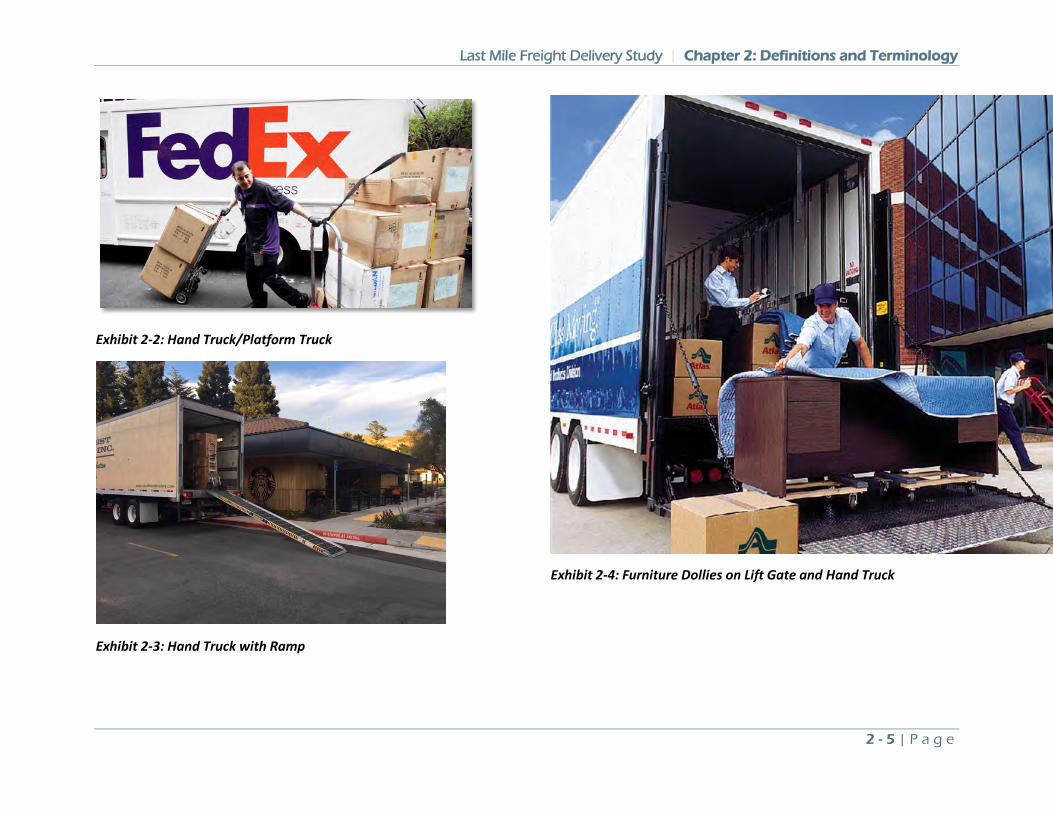
Last Mile Freight Delivery Study | Chapter 2: Definitions and Terminology
2 - 5 | P a g e
Exhibit 2-2: Hand Truck/Platform Truck
Exhibit 2-3: Hand Truck with Ramp
Exhibit 2-4: Furniture Dollies on Lift Gate and Hand Truck
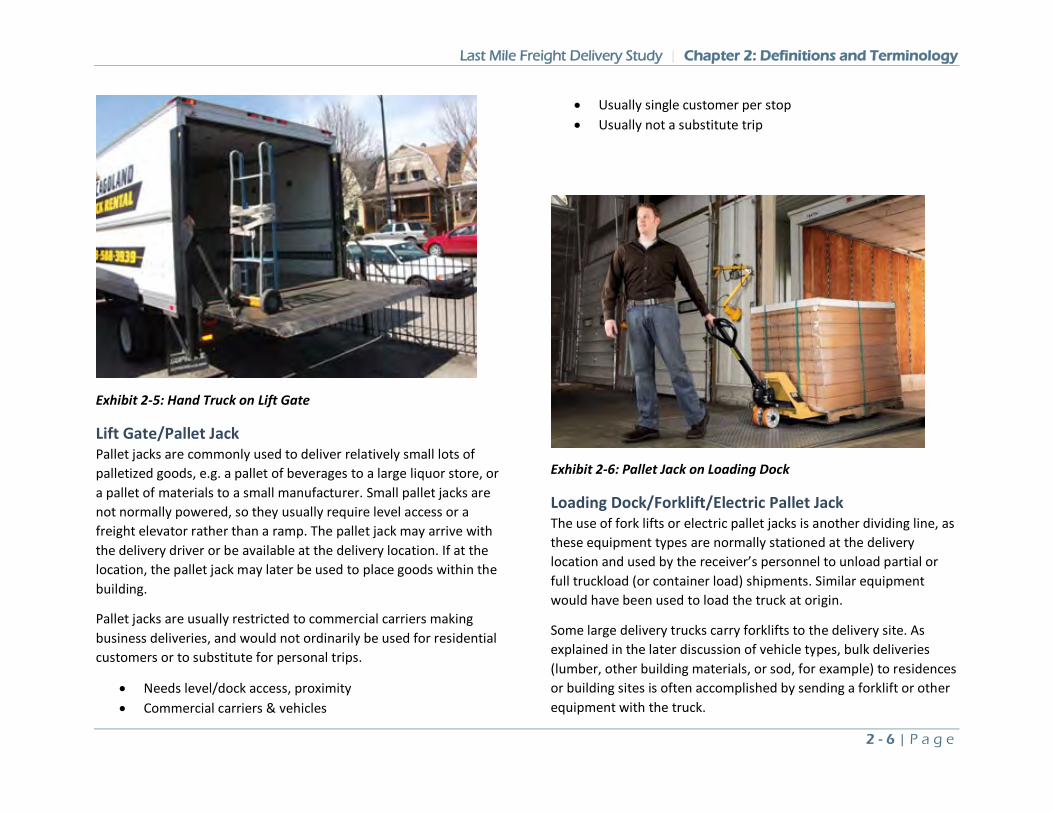
Last Mile Freight Delivery Study | Chapter 2: Definitions and Terminology
2 - 6 | P a g e
Exhibit 2-5: Hand Truck on Lift Gate
Lift Gate/Pallet Jack Pallet jacks are commonly used to deliver relatively small lots of palletized goods, e.g. a pallet of beverages to a large liquor store, or a pallet of materials to a small manufacturer. Small pallet jacks are not normally powered, so they usually require level access or a freight elevator rather than a ramp. The pallet jack may arrive with the delivery driver or be available at the delivery location. If at the location, the pallet jack may later be used to place goods within the building.
Pallet jacks are usually restricted to commercial carriers making business deliveries, and would not ordinarily be used for residential customers or to substitute for personal trips.
• Needs level/dock access, proximity • Commercial carriers & vehicles
• Usually single customer per stop • Usually not a substitute trip
Exhibit 2-6: Pallet Jack on Loading Dock
Loading Dock/Forklift/Electric Pallet Jack The use of fork lifts or electric pallet jacks is another dividing line, as these equipment types are normally stationed at the delivery location and used by the receiver’s personnel to unload partial or full truckload (or container load) shipments. Similar equipment would have been used to load the truck at origin.
Some large delivery trucks carry forklifts to the delivery site. As explained in the later discussion of vehicle types, bulk deliveries (lumber, other building materials, or sod, for example) to residences or building sites is often accomplished by sending a forklift or other equipment with the truck.
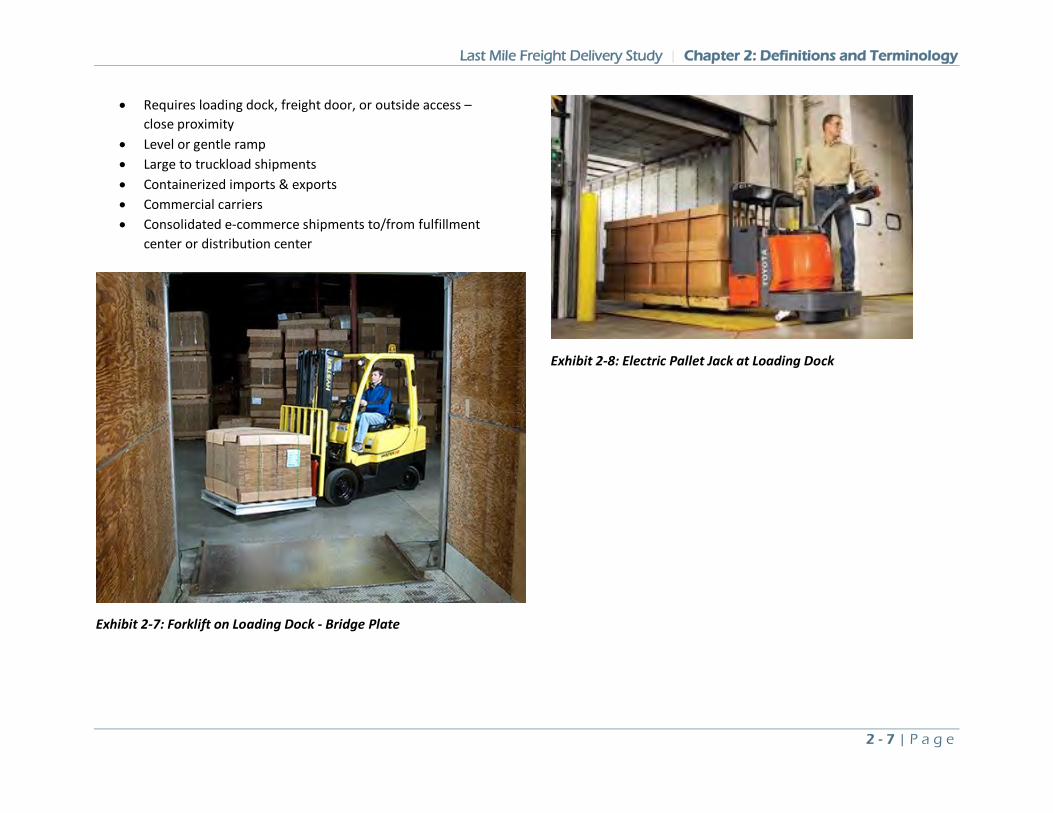
Last Mile Freight Delivery Study | Chapter 2: Definitions and Terminology
2 - 7 | P a g e
• Requires loading dock, freight door, or outside access – close proximity
• Level or gentle ramp • Large to truckload shipments • Containerized imports & exports • Commercial carriers • Consolidated e-commerce shipments to/from fulfillment
center or distribution center
Exhibit 2-7: Forklift on Loading Dock - Bridge Plate
Exhibit 2-8: Electric Pallet Jack at Loading Dock
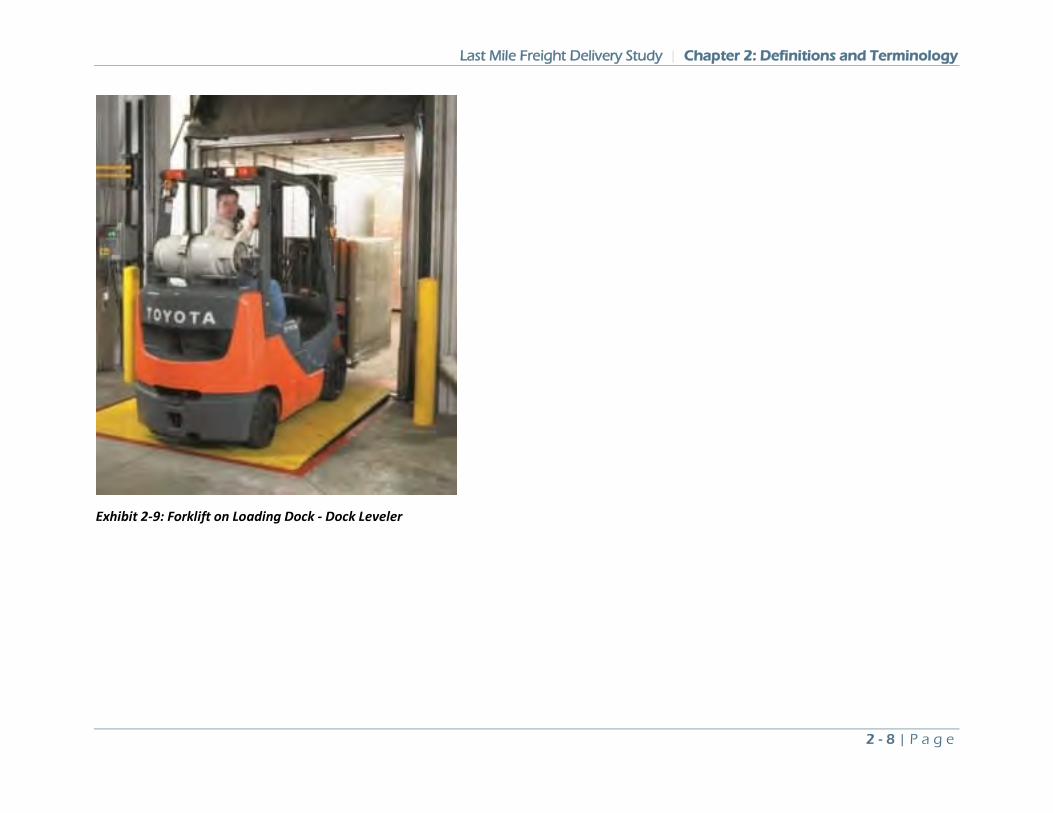
Last Mile Freight Delivery Study | Chapter 2: Definitions and Terminology
2 - 8 | P a g e
Exhibit 2-9: Forklift on Loading Dock - Dock Leveler
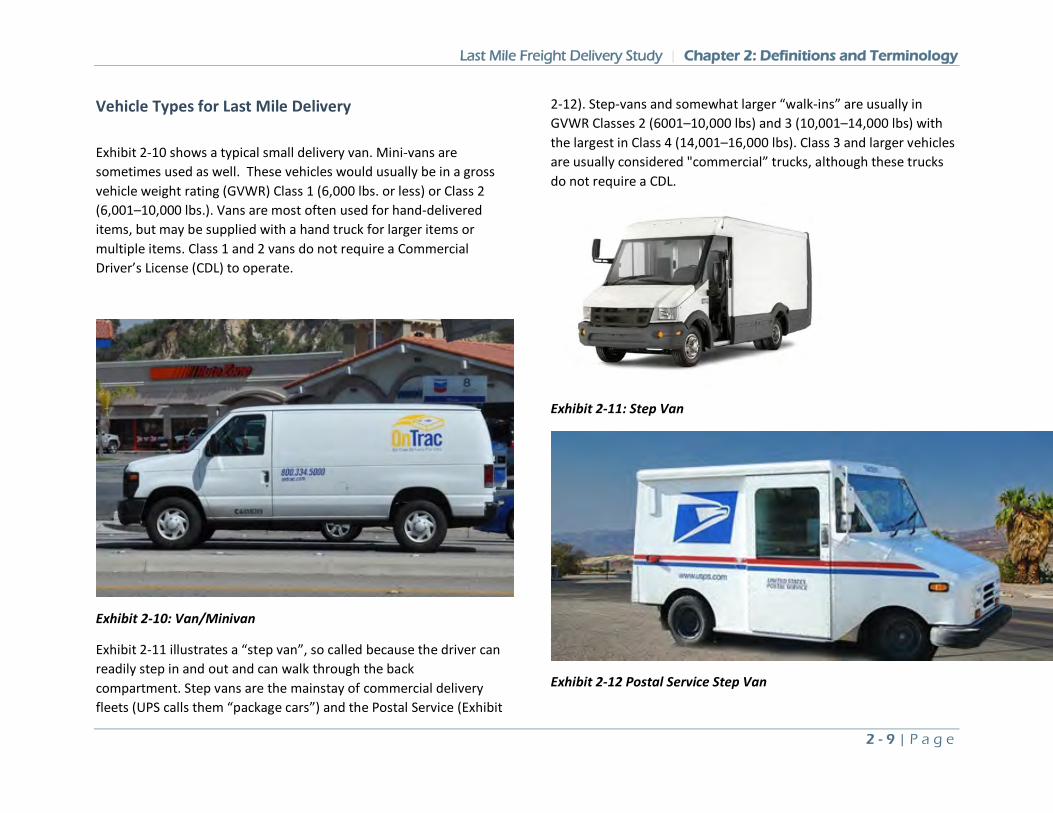
Last Mile Freight Delivery Study | Chapter 2: Definitions and Terminology
2 - 9 | P a g e
Vehicle Types for Last Mile Delivery Exhibit 2-10 shows a typical small delivery van. Mini-vans are sometimes used as well. These vehicles would usually be in a gross vehicle weight rating (GVWR) Class 1 (6,000 lbs. or less) or Class 2 (6,001–10,000 lbs.). Vans are most often used for hand-delivered items, but may be supplied with a hand truck for larger items or multiple items. Class 1 and 2 vans do not require a Commercial Driver’s License (CDL) to operate.
Exhibit 2-10: Van/Minivan
Exhibit 2-11 illustrates a “step van”, so called because the driver can readily step in and out and can walk through the back compartment. Step vans are the mainstay of commercial delivery fleets (UPS calls them “package cars”) and the Postal Service (Exhibit
2-12). Step-vans and somewhat larger “walk-ins” are usually in GVWR Classes 2 (6001–10,000 lbs) and 3 (10,001–14,000 lbs) with the largest in Class 4 (14,001–16,000 lbs). Class 3 and larger vehicles are usually considered "commercial” trucks, although these trucks do not require a CDL.
Exhibit 2-11: Step Van
Exhibit 2-12 Postal Service Step Van
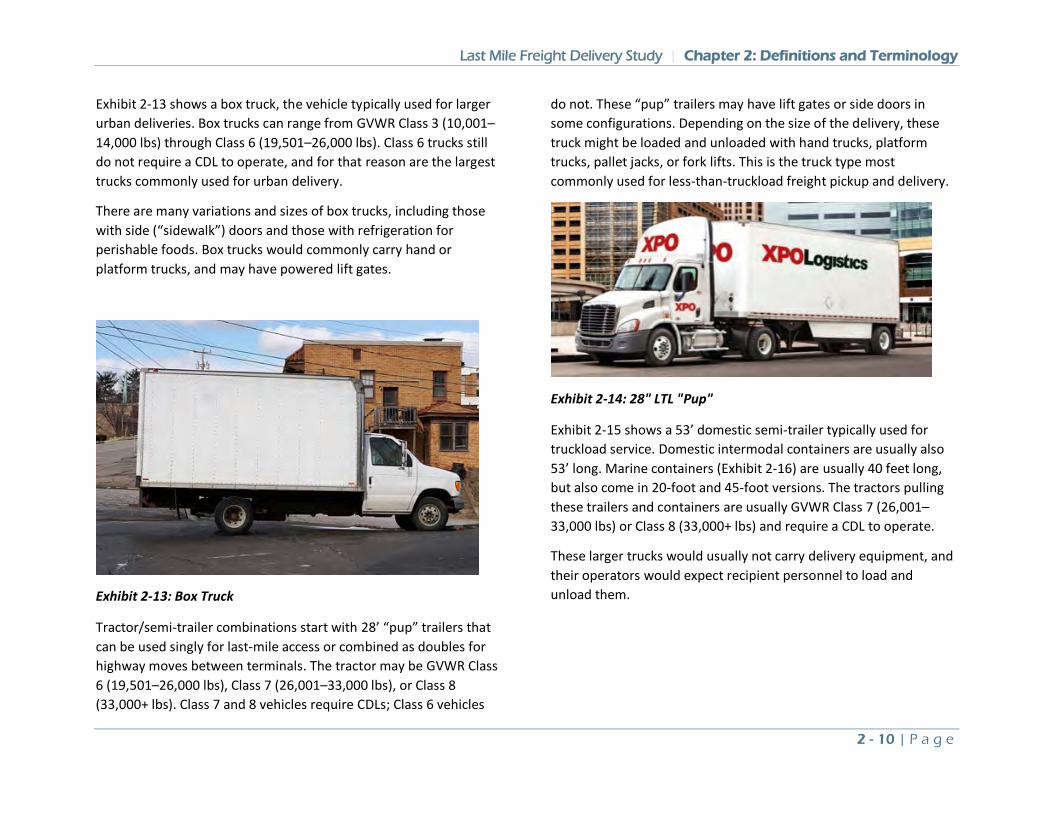
Last Mile Freight Delivery Study | Chapter 2: Definitions and Terminology
2 - 10 | P a g e
Exhibit 2-13 shows a box truck, the vehicle typically used for larger urban deliveries. Box trucks can range from GVWR Class 3 (10,001–14,000 lbs) through Class 6 (19,501–26,000 lbs). Class 6 trucks still do not require a CDL to operate, and for that reason are the largest trucks commonly used for urban delivery.
There are many variations and sizes of box trucks, including those with side (“sidewalk”) doors and those with refrigeration for perishable foods. Box trucks would commonly carry hand or platform trucks, and may have powered lift gates.
Exhibit 2-13: Box Truck
Tractor/semi-trailer combinations start with 28’ “pup” trailers that can be used singly for last-mile access or combined as doubles for highway moves between terminals. The tractor may be GVWR Class 6 (19,501–26,000 lbs), Class 7 (26,001–33,000 lbs), or Class 8 (33,000+ lbs). Class 7 and 8 vehicles require CDLs; Class 6 vehicles
do not. These “pup” trailers may have lift gates or side doors in some configurations. Depending on the size of the delivery, these truck might be loaded and unloaded with hand trucks, platform trucks, pallet jacks, or fork lifts. This is the truck type most commonly used for less-than-truckload freight pickup and delivery.
Exhibit 2-14: 28" LTL "Pup"
Exhibit 2-15 shows a 53’ domestic semi-trailer typically used for truckload service. Domestic intermodal containers are usually also 53’ long. Marine containers (Exhibit 2-16) are usually 40 feet long, but also come in 20-foot and 45-foot versions. The tractors pulling these trailers and containers are usually GVWR Class 7 (26,001–33,000 lbs) or Class 8 (33,000+ lbs) and require a CDL to operate.
These larger trucks would usually not carry delivery equipment, and their operators would expect recipient personnel to load and unload them.
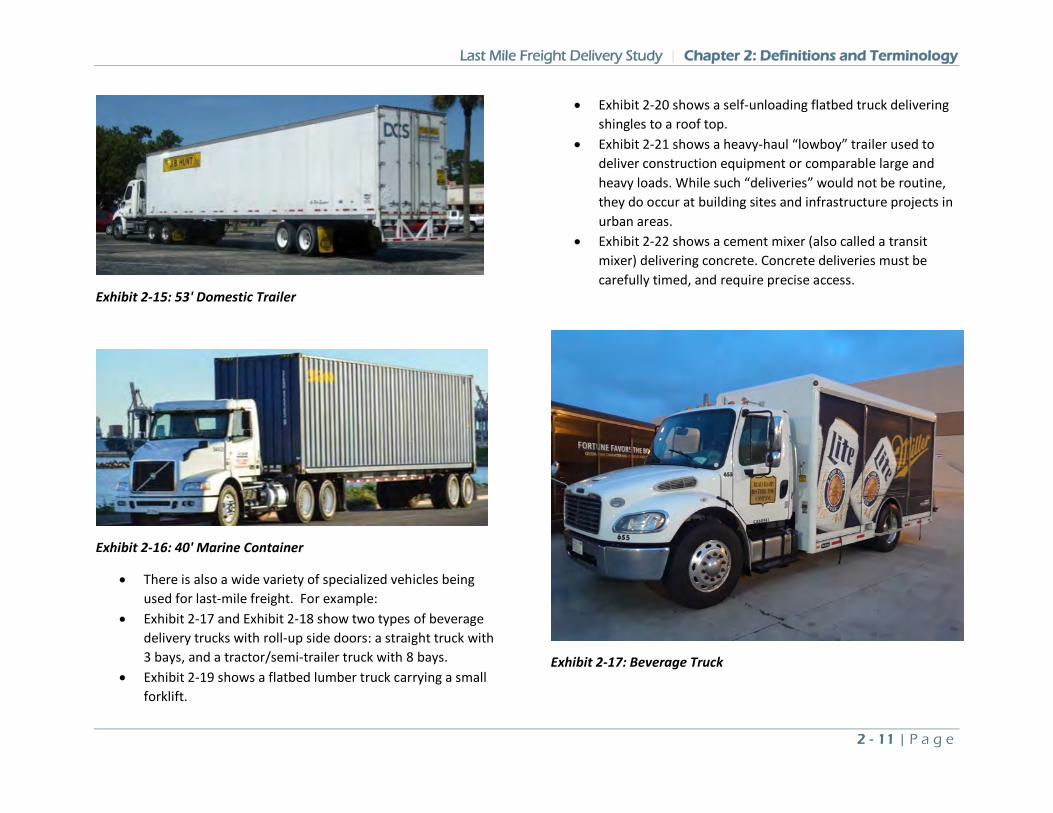
Last Mile Freight Delivery Study | Chapter 2: Definitions and Terminology
2 - 11 | P a g e
Exhibit 2-15: 53' Domestic Trailer
Exhibit 2-16: 40' Marine Container
• There is also a wide variety of specialized vehicles being used for last-mile freight. For example:
• Exhibit 2-17 and Exhibit 2-18 show two types of beverage delivery trucks with roll-up side doors: a straight truck with 3 bays, and a tractor/semi-trailer truck with 8 bays.
• Exhibit 2-19 shows a flatbed lumber truck carrying a small forklift.
• Exhibit 2-20 shows a self-unloading flatbed truck delivering shingles to a roof top.
• Exhibit 2-21 shows a heavy-haul “lowboy” trailer used to deliver construction equipment or comparable large and heavy loads. While such “deliveries” would not be routine, they do occur at building sites and infrastructure projects in urban areas.
• Exhibit 2-22 shows a cement mixer (also called a transit mixer) delivering concrete. Concrete deliveries must be carefully timed, and require precise access.
Exhibit 2-17: Beverage Truck
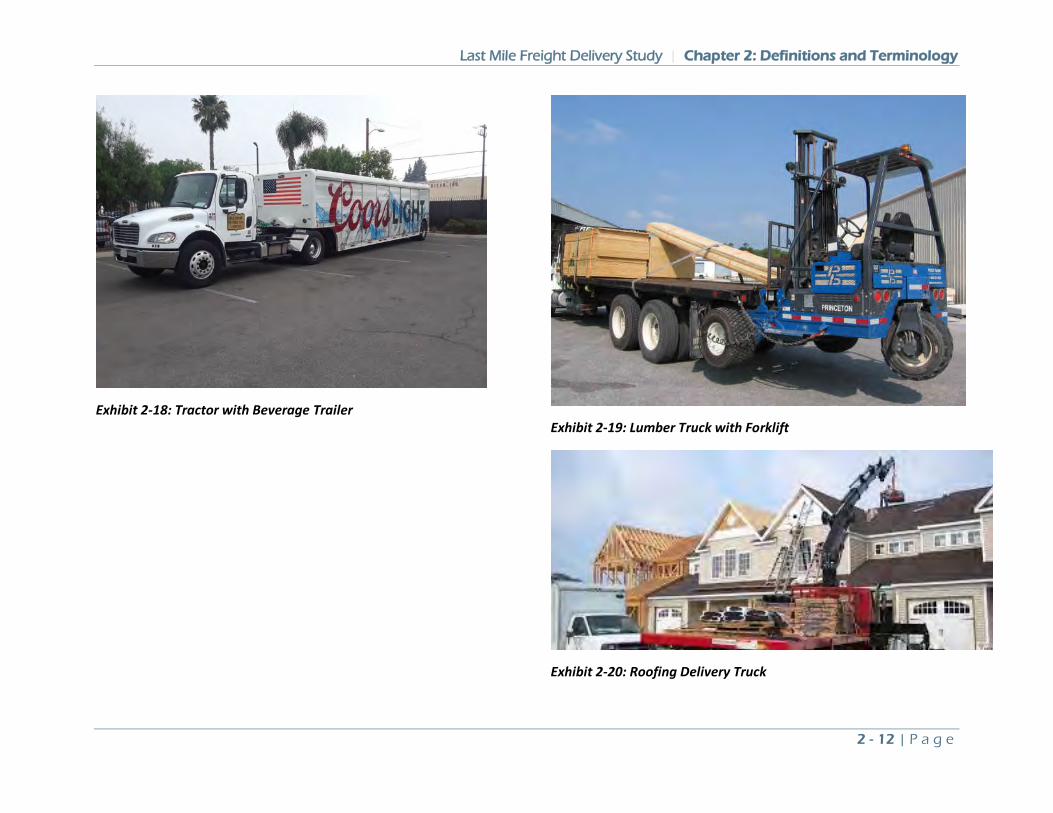
Last Mile Freight Delivery Study | Chapter 2: Definitions and Terminology
2 - 12 | P a g e
Exhibit 2-18: Tractor with Beverage Trailer
Exhibit 2-19: Lumber Truck with Forklift
Exhibit 2-20: Roofing Delivery Truck
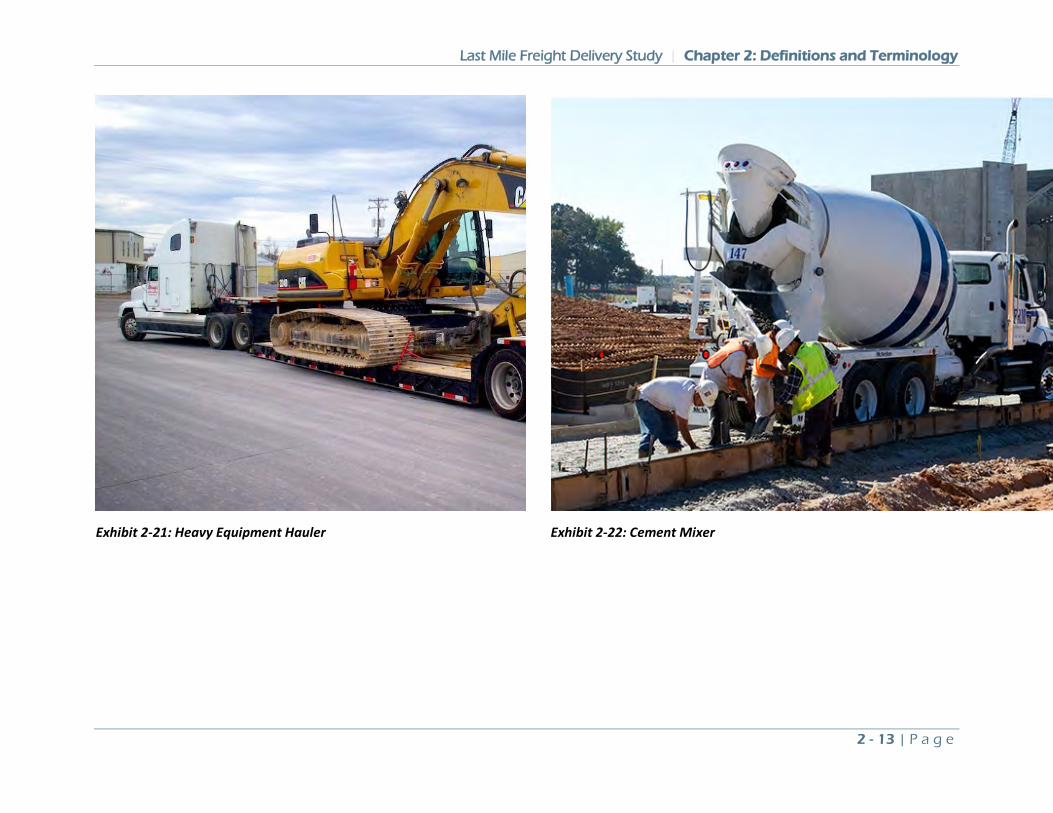
Last Mile Freight Delivery Study | Chapter 2: Definitions and Terminology
2 - 13 | P a g e
Exhibit 2-21: Heavy Equipment Hauler
Exhibit 2-22: Cement Mixer
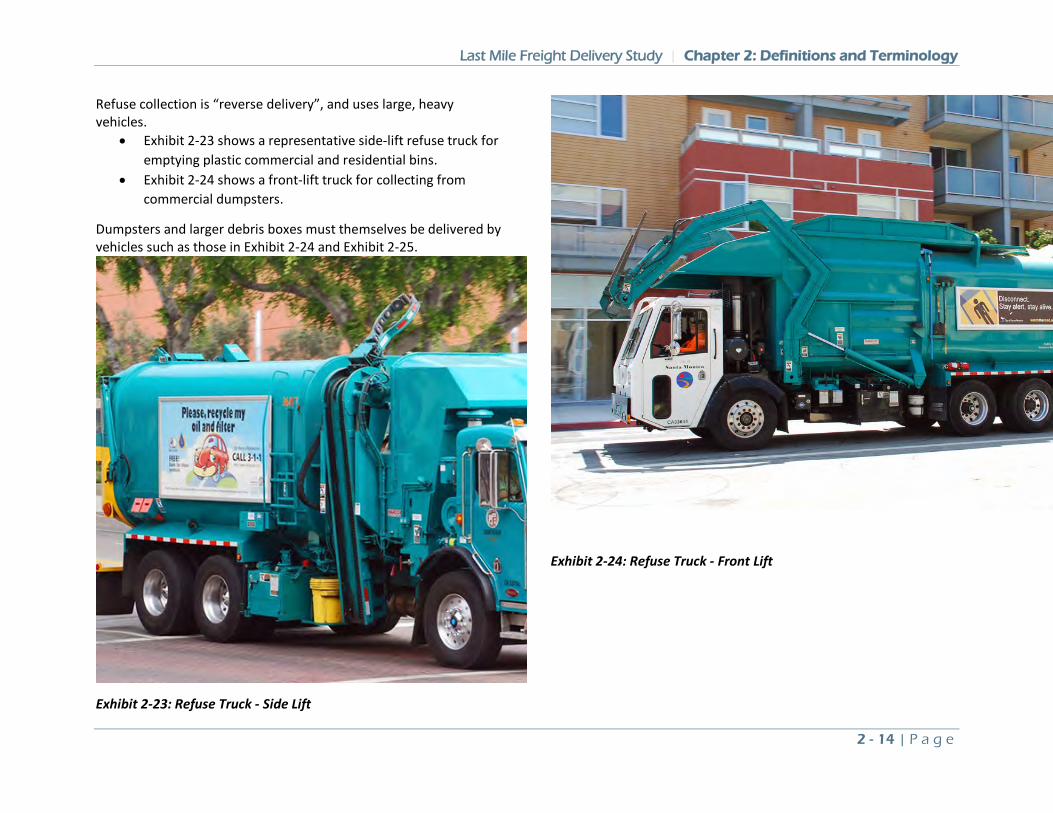
Last Mile Freight Delivery Study | Chapter 2: Definitions and Terminology
2 - 14 | P a g e
Refuse collection is “reverse delivery”, and uses large, heavy vehicles.
• Exhibit 2-23 shows a representative side-lift refuse truck for emptying plastic commercial and residential bins.
• Exhibit 2-24 shows a front-lift truck for collecting from commercial dumpsters.
Dumpsters and larger debris boxes must themselves be delivered by vehicles such as those in Exhibit 2-24 and Exhibit 2-25.
Exhibit 2-23: Refuse Truck - Side Lift
Exhibit 2-24: Refuse Truck - Front Lift
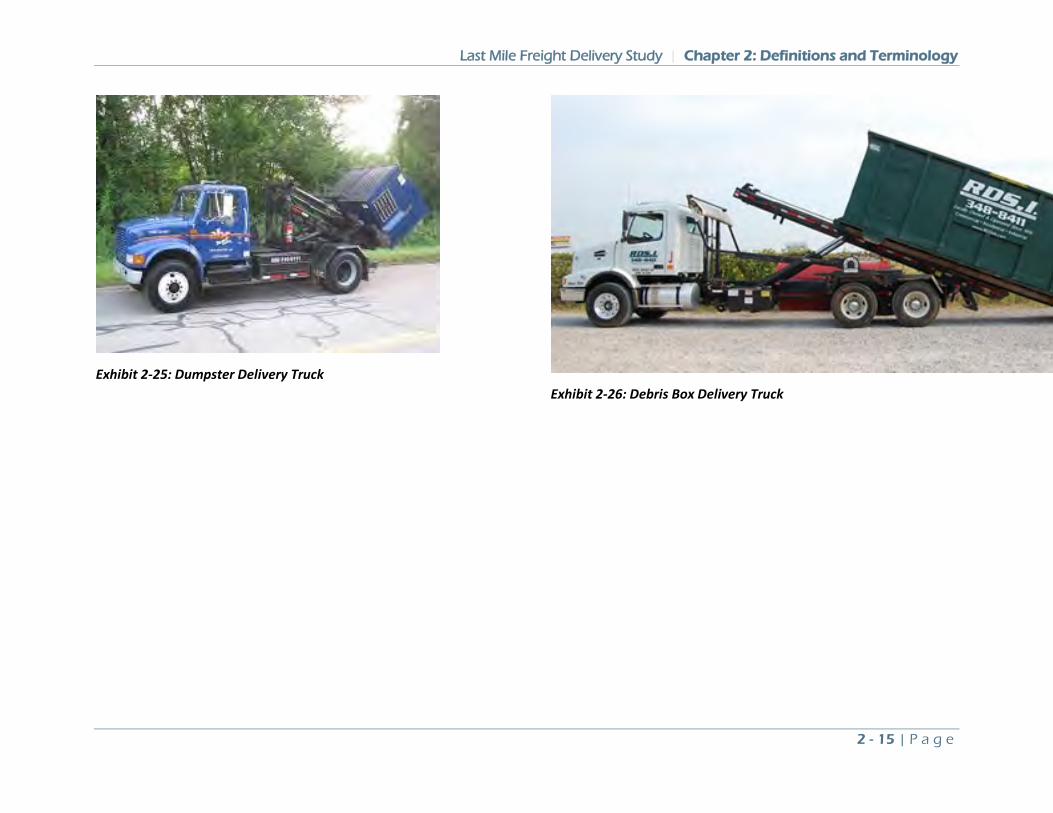
Last Mile Freight Delivery Study | Chapter 2: Definitions and Terminology
2 - 15 | P a g e
Exhibit 2-25: Dumpster Delivery Truck
Exhibit 2-26: Debris Box Delivery Truck
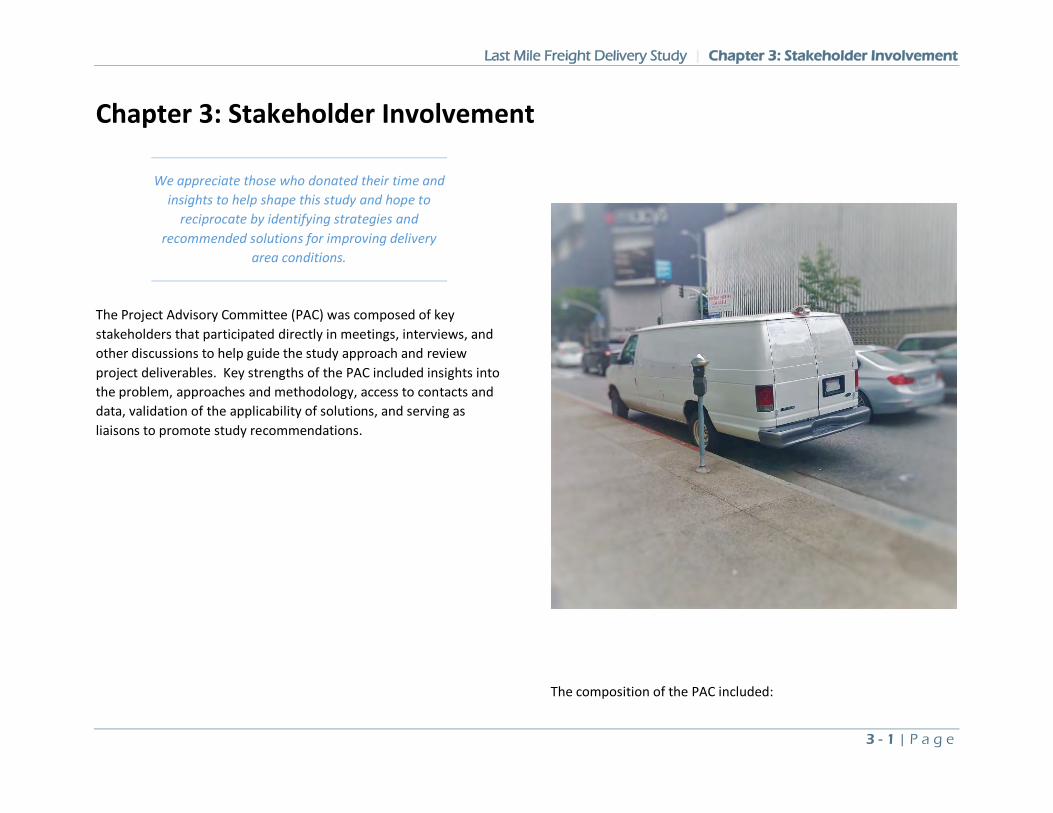
Last Mile Freight Delivery Study | Chapter 3: Stakeholder Involvement
3 - 1 | P a g e
Chapter 3: Stakeholder Involvement
We appreciate those who donated their time and insights to help shape this study and hope to
reciprocate by identifying strategies and recommended solutions for improving delivery
area conditions.
The Project Advisory Committee (PAC) was composed of key stakeholders that participated directly in meetings, interviews, and other discussions to help guide the study approach and review project deliverables. Key strengths of the PAC included insights into the problem, approaches and methodology, access to contacts and data, validation of the applicability of solutions, and serving as liaisons to promote study recommendations.
The composition of the PAC included:
Last Mile Freight Delivery Study | Chapter 3: Stakeholder Involvement
3 - 2 | P a g e
• Industry
o FedEx o Sysco: o California Trucking Association (CTA) o United Parcel Service (UPS) o Amazon o Los Angeles Chamber of Commerce o United States Postal Service (USPS) o Building Owners and Managers Association of
Greater Los Angeles (BOMA) • Academia
o California State Polytechnic University, Pomona o Rensselaer Polytechnic Institute o USC METRANS Transportation Center
• Government
o Caltrans District 7 Regional Planning o LA Metro Parking & Share Mobility Management o City of Los Angeles Department of Transportation
(LADOT) o City of Los Angeles Department of City Planning
(LADCP) o City of Los Angeles Bureau of Engineering (LABE)
While not all PAC members were able to attend each meeting, the materials were sent to each member via email.
Stakeholders reviewed and provided guidance on the work plan approach, delivery issues, data collection methods, locations representative of specific issues, and recommendations for best practice strategies. The structure for stakeholder involvement was
flexible to integrate other input beyond work plan elements that strengthened project outcomes and informed project activities.
Goals for project stakeholder involvement were:
• Clarify the purpose, process and outcomes of the study • Involvement across sectors – those who deliver goods,
those who sell goods, and those who use goods. • Involvement throughout the study process. • Enhance data-driven analysis and deliverables. • Balancing interests by embracing collaboration and
collaborative decision-making • Improve the regional understanding of delivery issues and
facilitating improvement projects through a pilot program or supporting the City in enacting improvements or policies.
Key Findings The outreach to Last-Mile Freight stakeholders provided insights into both the usage and challenges of the street system for last-mile deliveries.
Receiver Perspective A receiver can include a major manufacturer or producer of products (receiving raw materials, components, or other deliveries), or a retail or service business (receiving finished products for inventory or other deliveries). Ultimately, receivers dictate delivery requirements and carriers, suppliers, and drivers make their best efforts to meet those requirements. The study team contacted both delivery receivers (those who receive the goods) and building managers (those that manage facilities that receive tenants’ deliveries, for example). Their perspectives both overlapped and complemented each other.
Last Mile Freight Delivery Study | Chapter 3: Stakeholder Involvement
3 - 3 | P a g e
From the receivers’ point of view there are a few common challenges:
• Receiving the goods when needed or desired. • Receiving the goods when employees are available to
accept them. • Receiving the goods where desired (e.g. inside vs. on the
sidewalk). • Receiving the goods in manageable units, and in good
condition. • Maintaining security of the goods, the facility, and the
personnel.
Both building managers and receivers noted limitations of building design and their impacts on last-mile access. As a general point, building designs that lack input from tenants or eventual owners often create legacy access problems, such as:
• Parking lot clearances under 7 feet, which hamper delivery trucks.
• Lack of rear doors or access, forcing delivery drivers to work from a shared parking lot or the sidewalk.
• Narrow entry doors that do not accommodate standard delivery units. For instance, liquor store doors too narrow for a pallet, forcing manual transfer from truck/sidewalk to store.
• Unattended or secured loading docks or doors that create security risks.
• Insufficient loading dock or door capacity for the size of building and volume of freight.
Although Los Angeles is not typically thought of as an “old” city, many problems are endemic to older, legacy buildings:
• Loading dock bays that are too short for modern trucks, leaving the truck projecting into the street.
• Loading docks or doors that are often too low for modern vehicles.
• Legacy loading docks or doors that have been blocked or converted to other uses.
• Difficult-to-negotiate doors, ramps, and stairs. • Steep access ramps at loading docks that may make the
docks difficult or unsafe to use.
Loading and access facilities are, from the perspective of a developer or building owner, non-revenue space to be minimized. Industrial and commercial developers often seek to maximize Floor Area Ratios (FARs) that govern how much of a given parcel can be covered by structures with usable space. One way to maximize FARs is to minimize parking and vehicle access.
Active transportation needs—specifically bicycle access and storage—can conflict with delivery access when bicycles obstruct loading doors and docks or compete to use ramps and doors.
The difficulties experienced by receivers can extend to commercial, office, and even residential locations with the expansion of e-commerce delivery. Office buildings that previously received supplies from a small number of local vendors now also receive e-commerce deliveries in a myriad of personal and commercial vehicles, as well as personal deliveries for people who work in the building. Apartment managers must cope with far more parcel volume than was ever anticipated in building designs. Residential customers find valuable deliveries left on front porches and driveways, increasing the risk of theft.
Last Mile Freight Delivery Study | Chapter 3: Stakeholder Involvement
3 - 4 | P a g e
For tenants of large office or commercial buildings, scheduling access to common loading docks and freight elevators can be a problem if adequate loading dock space or hours of operation are in place. Stakeholders noted this problem in connection with large deliveries of furniture, equipment, or building/remodeling materials.
Although beyond the scope of this study, the massive increase in parcel deliveries to buildings never designed for them creates internal delivery issues – especially when multistory buildings lack elevators. In some cases, most of the time spent making the delivery is within the building.
The proliferation of delivery services – which may now include part-time drivers working as independent contractors and using their personal autos – causes problems for receivers and buildings with specific access procedures and requirements. Buildings or receivers may specify hours, access codes, phone numbers for reservations, sign-in procedures, etc. that are familiar to regular delivery drivers (e.g. USPS, FedEx, UPS, coffee service, bottled water companies) but become obstacles to others.
Deliverer Perspective Stakeholders in this group included:
• Major delivery and service carriers, including USPS, UPS, FedEx, and Sysco.
• Local and national trucking firms. • Retail chains and product vendors operating their own
delivery fleets.
As the individual contact interviews in the next section reveal, these stakeholders have much in common:
• In most cases carriers are responding to customer (receiver) requirements and preferences.
• The need for last-mile deliveries, like freight transportation in general, is a derived demand: the customers want the goods, and delivery service is how to acquire them. While this study addresses the issues associated with the delivery trip; the receiver is simply concerned with having the good not necessarily the means by which it arrives.
• The value of delivery service is a function of ‘place utility” – the value of a good is determined by its location. Therefore, goods in the delivery process have no value to receivers until delivered.
There is a key difference between the patterns of commercial delivery operators such as USPS, UPS, Fed Ex, and on-call or shipment-specific services such as food or beverage deliverers. The major delivery carriers have set routes and driver assignments, with a workload that varies by day but is relatively stable over the long run. Pick-up and delivery times vary within a daily window unless there are special customer requirements. Some package-delivery drivers, for example, typically:
• Make commercial deliveries in the mornings, when customers want their goods.
• Make residential deliveries and commercial pick-ups in the afternoon, when commercial customers are ready to ship.
The commercial pattern of receiving goods in the morning or early afternoon, and shipping goods in the late afternoon is common, and deeply ingrained. Shippers tend to receive and process orders during the day and ship the accumulated orders in the late afternoon. As a result, many commercial establishments may be served twice daily if they are shippers as well as receivers.
Last Mile Freight Delivery Study | Chapter 3: Stakeholder Involvement
3 - 5 | P a g e
As one stakeholder put it: “Clients are as flexible as a 2x4 when it comes to delivery time”. Ideally, delivery times would:
• Match the availability of customer personnel to receive, and perhaps load or unload the goods.
• Avoid peak commute hours. • Require minimal dwell or occupancy time at congested
locations. • Use the smallest possible vehicle.
In practice, delivery companies and receivers must continually negotiate compromises and tradeoffs among these objectives.
Delivery services with regular routes may plan those routes in detail, including the streets taken, the turns made, and the order of stops. Examples of this are beer and soda distributers or deliveries to stock retail stores.
Many deliveries directly to consumers must alter their daily routes based on the location of the receivers. Many of the package delivery companies have systems to optimize routing to save time, fuel, and cost.
However, both regularly schedule deliveries and on-demand deliveries are disrupted by traffic congestion and lack of or inefficient loading space.
Stakeholder outreach verified preference of delivering to locations with off-street parking versus delivering from the street across the sidewalk. The latter is viewed as less convenient because of availability, safety and security concerns. The availability of off-street parking is most often a function of customer type and size. For example:
• Beer and beverage distributors interviewed distinguished large, free-standing stores (often part of a chain) with off-street parking from small, neighborhood stores (often on corners) that must be served from the street.
• Deliveries to major retailers seldom have delivery problems because the stores usually have parking lots and rear access.
• Some package delivery drivers, in contrast, routinely park in red zones at the end of blocks because so few of their customers have off-street parking or available loading zones.
Deliveries range from small, hand-carried parcels to full 53-foot trailer loads of heavy equipment or construction materials. The access requirements rise as delivery size increases, as do the consequences of not meeting those requirements.
The physical aspect of last-mile access involves both the adequacy of the infrastructure – loading zones, docks, doors, ramps, etc. – and its availability. In dense commercial and industrial zones, particularly in older areas, there are intense, conflicting demands for the infrastructure. Delivery drivers commonly find loading docks and loading zones occupied, either by another legitimate delivery vehicle or by a private vehicle. With the increased use of private vehicles without commercial plates for on-demand delivery and use of rented vehicles, it can be difficult for delivery drivers, store owners, or parking enforcement officers to determine what is and is not legitimate use.
There has been a shift in delivery vehicles and sizes that is causing a mismatch between loading dock and loading zone infrastructure.
There are several different truck types in use for deliveries with a range of floor heights. Loading docks are typically 48 to 52 inches
Last Mile Freight Delivery Study | Chapter 3: Stakeholder Involvement
3 - 6 | P a g e
high, creating the possibility of mismatches between the truck types expected when the loading dock was built and the trucks now in use. Modern, well-planned loading docks can include hydraulic ‘dock levelers” to allow safe, efficient transfers (critical when using forklifts), but older facilities may “make do” with bridge plates or temporary solutions.
There is also a potential mismatch between outside loading dock dimensions and modern truck and trailer dimensions, making some legacy loading docks (or freight doors) unusable. “Just use smaller trucks” is not a viable option for standardized fleets or fleets that only occasionally serve sub-standard facilities.
A final issue with loading dock access has to do with the combination of truck height, truck length, and approach ramp slope. It is possible for a tall truck on a sloping ramp may strike the building wall or an overhead structure and simultaneously be held away from the loading dock apron. The problem occurs when taller trucks try to use older facilities; when ramp slopes are too steep; or when longer trucks occupy larger, sloping approaches that were not needed by older, shorter trucks.
Besides getting taller and wider, trucks used for delivery have gotten longer. One critical outcome is that trucks may be too long for legacy loading zones, or what was once a multi-vehicle zone can now accommodate one less vehicle. Carrier stakeholders expressed frustration when painted loading zones are a foot shorter than the truck itself, exposing the driver to citations from a strict enforcer.
Semi-tractor trailer combinations have also gotten much longer. Much of the commercial and industrial infrastructure in Los Angeles was built in the 1950s and before, when trailer lengths were not standardized, and 35-foot trailers were common. Forty-foot trailers were legalized and common in the 1960s. Forty-eight-foot trailers
were introduced with the Surface Transportation Assistance Act (STAA) in 1982. Since 1989 the common length has been 53 feet, with 57 feet the legal limit in most places. Common trailer lengths have thus increased by 18 feet since the 1950s, and 13 feet since the 1960s and 1970s – the equivalent of 1 to 1.5 street travel lanes. A loading dock that could barely accept a 40’ trailer in 1970 would leave a 53’ trailer blocking a full lane of traffic today. A sidewalk loading zone that could accommodate the largest truck expected in 1970 would be seriously inadequate today.
Large, infrequent deliveries of equipment, vehicles, furniture, building materials, or other goods beyond routine merchandise or supplies can cause special problems as they:
• Typically require larger trucks. • May also require special handling or special handling
equipment. • Take longer, perhaps hours rather than minutes.
Stakeholders described the potential for street blockage, congestion, citations, etc. as the possible outcomes.
Stakeholders also noted that routine planning and management steps can facilitate such deliveries and mitigate impacts.
• Arranging for temporary parking restrictions to create workable access.
• Planning for the route of large trucks. • Ensuring that the required personnel and equipment are
available to unload (or load) the vehicle promptly. • Scheduling large or unusual deliveries for night or weekend
hours, where possible.
Last Mile Freight Delivery Study | Chapter 3: Stakeholder Involvement
3 - 7 | P a g e
Night and Off-hour Deliveries Most stakeholders contacted recognize the potential efficiencies of night or off-hour deliveries and would like to expand their night and off-hour operations. The benefits include less traffic congestion, better access to sidewalks and loading zones, and less interference with routine business operations.
The barriers to night and off-hour deliveries include:
• Receiver business hours and staffing. • Availability of drivers willing to work nights, and extra cost. • Security of unattended goods. • Laws and regulations limiting liquor deliveries at night. • Community concerns over nighttime lights and noise. • Ensuring a critical mass of customers to make off-hours
delivery viable to cover the costs of drivers and vehicles.
Stakeholder enthusiasm for night and off-hour deliveries suggests that it may be productive to reduce or mitigate these barriers where possible.
Parking Citations Carrier and shipper stakeholders have different positions and practices for illegal parking and parking citations.
Most delivery fleet managers and their drivers avoid illegal parking and citations if possible. One firm interviewed requires drivers to call dispatchers and notify them of any illegal parking.
1 “Postal Service Lawyer Claims Immunity from Traffic Laws” USA Today, February 2, 2013, https://www.usatoday.com/story/news/nation/2013/02/02/postal-service-traffic-laws/1885995/ accessed April 1, 2019
All stakeholders contacted prohibit drivers from parking in bus or handicapped zones.
Some package delivery companies accept citations as a cost of doing business, and have even negotiated a regular, lump-sum payment to the City to cover parking tickets. Package delivery drivers routinely park in end-of-block red zones if legal parking is not readily available.
• USPS vehicles generally do not receive parking tickets, although the question as whether the USPS can ignore local and state parking regulations is not settled.1 .
All stakeholders emphasized that the delivery will be made, either by parking farther away, coming back later, or double or red zone parking if no other choice is available. The driver’s job is to make the delivery.
Stakeholder Outreach Methodology Because of the invaluable insights and expertise from freight and delivery stakeholders, the first step of the project’s development was a Stakeholder Coordination plan to identify the methodology for soliciting, responding to, and documenting stakeholder inputs. The intent of engaging stakeholders was to integrate input and accommodate diverse and possibly conflicting priorities throughout the study process. An additional purpose was to ensure solutions
Last Mile Freight Delivery Study | Chapter 3: Stakeholder Involvement
3 - 8 | P a g e
developed were palatable and potentially implementable by the City of Los Angeles and other stakeholders.
Through development of the plan, stakeholder involvement had clear statements of project purpose, tasks, and objectives for an audience with less familiarity of planning processes. Three key messages were used to introduce and describe the project to potential stakeholders, in order to explain the need for the project, its purpose and its benefits. Key themes were also tailored to different types of stakeholders to demonstrate how the outcomes of the project could help their goals—such as ensuring adequate curb space for loading. Key messages of the project were as follows:
Key Message 1: Freight and parcel deliveries are an essential part of everyday life, and the volume of deliveries is increasing
• Nearly everything that surrounds you was delivered at one point.
• The parcel market in the United States is expected to double by 2025,
• Same-day and instant delivery is less than one percent of current deliveries but will account for around 20 percent of standard parcel revenue by 2025.
• Time is money: the last mile can exceed 50 percent of the total delivery cost.2
Key Message 2: Deliveries increasingly occur on streets, at the curbside, and across sidewalks
• Deliveries compete for space with other vehicles, bicycles, and pedestrians.
2 (Singer Ogg UPS.pdf)
• Street congestion adds uncertainty and delay to delivery times.
• Last mile freight delivery challenges are increasing in an era of Complete Streets, where limited curb space is being asked to accommodate more and different types of users,
• Delivery occurs both in separate and overlapping shared loading and standing zones.
• Safety design and practices will become more important for delivery vehicles and personnel as conflicts with vehicles, bicycles and pedestrians increase,
Key Message 3: This Study will provide last mile freight strategies for areas of limited street space based on issues encountered in Los Angeles
• The study will focus on delivery strategies that balance and support community goals of predictable and efficient delivery and accommodation of delivery vehicles within a multimodal transportation system.
• Major delivery issues involve loading zones, street geometrics and turning radii, loading dock requirements and placement, vehicle choices, delivery times, and enforcement.
• Stakeholder involvement will guide the study and identify feasible best practices.
• On the ground conditions and community priorities differ throughout Los Angeles, so the study will identify context specific strategies.
Last Mile Freight Delivery Study | Chapter 3: Stakeholder Involvement
3 - 9 | P a g e
Stakeholder Roles Based on the level of involvement in the project, stakeholders were categorized as:
o PAC Member –asked to attend PAC meetings and be asked to be interviewed as stakeholders.
o Stakeholder – interviews for data collection and analysis focused on identifying issues and specific case study area data collection focused on solutions and implementation
o Case Study Stakeholder Questions - in conjunction with case study data collection focused on case study area-specific issues
o Data Resource Questions –to provide data or clarifications of data
o General Awareness Questions –to informed on general delivery issues and potential recommendations
Stakeholder Interviewee Stakeholders interviewed/surveyed for the study were engaged in a formalized process as documented in a stakeholder log of meeting summaries. Questionnaires were prepared for each meeting—tailored to the specific market segment or area of interest of the interviewee. Most interviews were conducted as phone interviews out of convenience; however some in-person interviews were conducted.
First, stakeholders were presented with the project, its goals, work plan, and schedule. They were then asked a series of standardized questions developed for deliverers and receivers. These questions were intended to gather insight on major issues facing deliveries as
well as specific areas in the City that work well or do not work well for last-mile freight delivery.
Case Study Area Stakeholders Once Case Study locations were identified, area stakeholders such as businesses were identified for survey interview. The survey was developed to identify key issues and recommendations by area stakeholders to provide qualitative data to partner with the quantitative data. This strengthened the data analysis, providing the best assessment of area issues while establishing a framework for recommendations that could be implemented in a real-world situation.
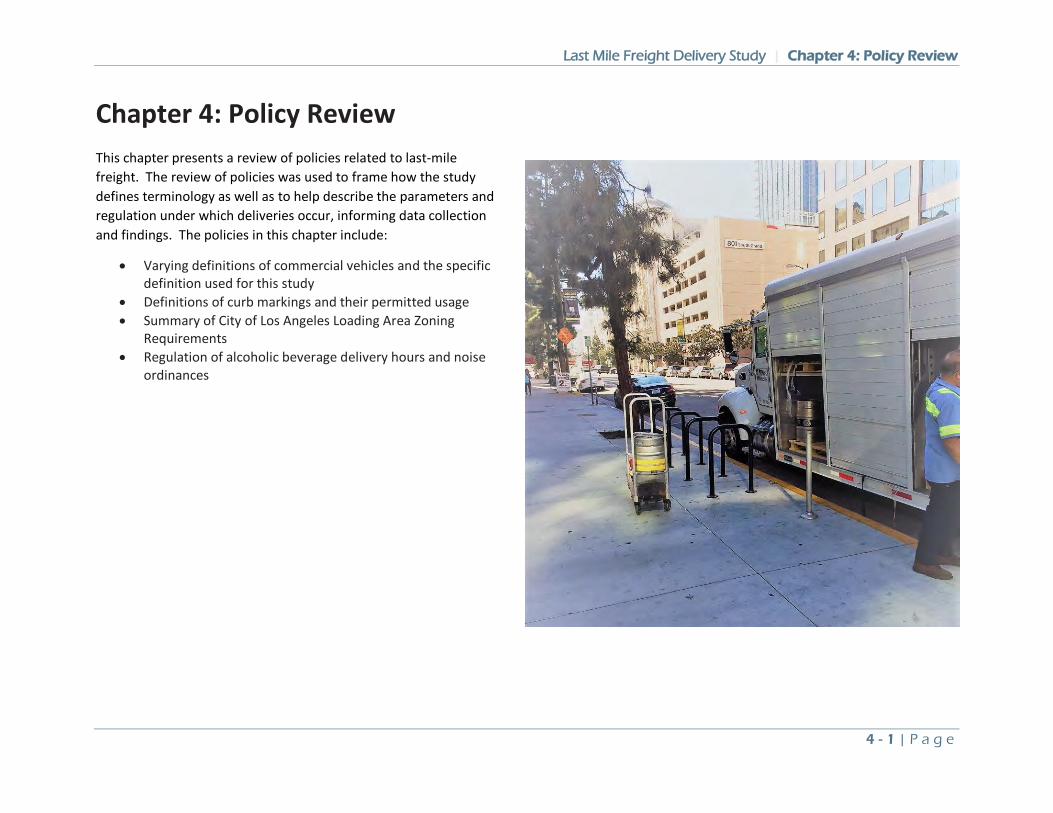
Last Mile Freight Delivery Study | Chapter 4: Policy Review
4 - 1 | P a g e
Chapter 4: Policy Review This chapter presents a review of policies related to last-mile freight. The review of policies was used to frame how the study defines terminology as well as to help describe the parameters and regulation under which deliveries occur, informing data collection and findings. The policies in this chapter include:
• Varying definitions of commercial vehicles and the specific definition used for this study
• Definitions of curb markings and their permitted usage • Summary of City of Los Angeles Loading Area Zoning
Requirements • Regulation of alcoholic beverage delivery hours and noise
ordinances
Last Mile Freight Delivery Study | Chapter 4: Policy Review
4 - 2 | P a g e
Delivery Vehicle Definitions In order to determine a working definition of delivery vehicles applicable to this study, definitions used by a variety of agencies were investigated. As detailed in the following sections, agencies define commercial and delivery vehicles based on the perspective or purposes of the agency. While many vehicles that match the specific standards or regulatory requirements of a commercial vehicle (e.g., having commercial license plates) may be involved in the last-mile delivery of goods, they are often engaged in a far wider variety of activities than just delivery. Similarly, many small businesses – and more frequently e-commerce companies - rely on personal vehicles for what is effectively the delivery of commercial goods.
Therefore, for this study, the purpose as a delivery vehicle rather than type of vehicle was used to define delivery vehicles. Any vehicle delivering or picking up a commercial good was defined as a “delivery vehicle” by its role in transporting a delivery rather than it being any specific type of vehicle.
The actions of vehicles, whether involved in a delivery, passenger loading or parking were tabulated in the field data collection along with the type of vehicle and its location along the study block. This provided a comprehensive data set to enable delivery conditions to be analyzed within the context of all curb activity.
1 https://www.dmv.ca.gov/portal/wcm/connect/f93f514b-ffa6-46cd-9da7-939ef851e288/ch13_comml_vehs.pdf?MOD=AJPERES&CVID=
State of California Department of Motor Vehicles The California Department of Motor Vehicles (DMV) defines commercial vehicles by the activity performed by the vehicle. Based on the vehicle codes these definitions include many non-delivery vehicles.
California Vehicle Code Division 1, section 260 (a) defines a "commercial vehicle" as a vehicle which is used or maintained for the transportation of persons for hire, compensation, or profit or designed, used, or maintained primarily for the transportation of property. The DMV further defines these in the Vehicle Industry Registration Procedures (2014) as1:
• Bus • For Hire Passenger Vehicle • Motor Truck • Multipurpose Vehicle • Pickup • Station Wagon • Tow Truck • Truck Tractor • Water-Well Drilling Rigs • Yard Truck
California Vehicle Code Chapter 9. Stopping, Standing, and Parking section 22502. provides that all vehicles must be right-hand parallel parked unless: 1) they are commercial vehicles, 2) it is reasonably necessary for them to accomplish loading or unloading of merchandise, and 3) while anything connected with loading, or
Accessed 8/26/18
Last Mile Freight Delivery Study | Chapter 4: Policy Review
4 - 3 | P a g e
unloading, is being executed.2 This provision allows additional flexibility for large commercial vehicles to park while loading and unloading, as opposed to private vehicles.
City of Los Angeles The City of Los Angeles defines commercial vehicles by type of vehicle:
“Commercial vehicle” shall mean:
(1) a truck tractor; or (2) a motor vehicle with commercial license plate; and
(A) Exceeding 22 feet total length including bumpers, or (B) 22 feet or less in length with the name of a business enterprise or establishment or a sign advertising a product or service painted, attached, or otherwise affixed on or to the exterior thereof.
Commercial vehicles (those 22 feet or more in length) are only allowed to park for three hours, however there is an exception if they need more time to complete their task. The City of Los Angeles does not issue any licenses for commercial vehicles.
By designating a specific size or a specific requirement for business signage on the vehicle, this definition misses other types of vehicles that are still involved in commercial activities or deliveries. This is relevant for our study because our definition of delivery vehicle used in the study is more includes inclusive of different vehicle
2 http://leginfo.legislature.ca.gov/faces/codes_displayText.xhtml?lawCode=VEH&division=11.&title=&part=&chapter=9.&article= Accessed 8/26/18
types than the commercial vehicle definition used by the City of Los Angeles.
SEC. PARKING - COMMERCIAL VEHICLES. (Amended by Ord. No. 168,782, Eff. 7/12/93.) No person shall park or leave standing any commercial vehicle or any other vehicle exceeding 22 feet in length as measured from bumper to bumper, other than a house car, on any public street where a majority of the buildings situated on the property contiguous thereto is used for residential purposes, whether as single-family dwellings or as multi-family dwellings, nor shall any person park or leave standing any commercial vehicle for more than three (3) hours on any other public street, except that any vehicle regulated herein may park notwithstanding such prohibition or in excess of such time limitation:
(1) While loading or unloading property, and additional time is necessary to complete such work; or
(2) When such vehicle is parked in connection with, and in aid of, the performance of a service to or on a property in the block in which such vehicle is parked, and additional time is necessary and reasonable to complete such service.
The provisions of this section shall not apply to trailers and semitrailers regulated by the provisions of Section 80.69.1 of this Code.
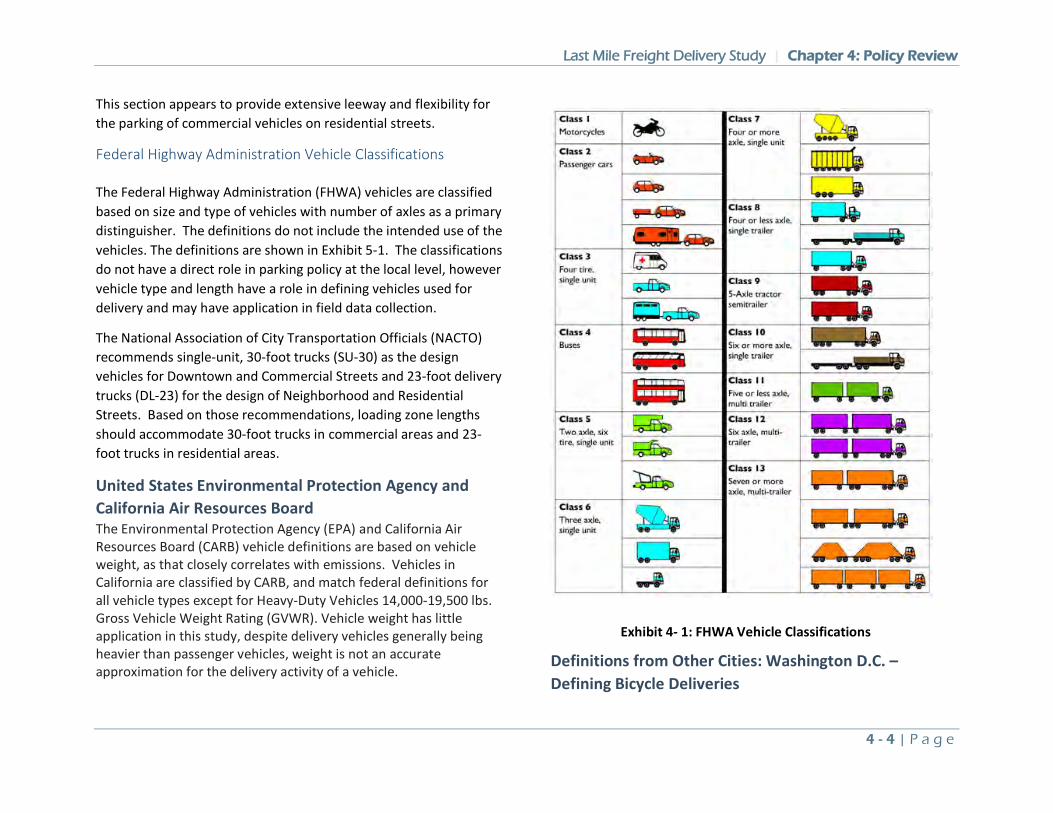
Last Mile Freight Delivery Study | Chapter 4: Policy Review
4 - 4 | P a g e
This section appears to provide extensive leeway and flexibility for the parking of commercial vehicles on residential streets.
Federal Highway Administration Vehicle Classifications The Federal Highway Administration (FHWA) vehicles are classified based on size and type of vehicles with number of axles as a primary distinguisher. The definitions do not include the intended use of the vehicles. The definitions are shown in Exhibit 5-1. The classifications do not have a direct role in parking policy at the local level, however vehicle type and length have a role in defining vehicles used for delivery and may have application in field data collection.
The National Association of City Transportation Officials (NACTO) recommends single-unit, 30-foot trucks (SU-30) as the design vehicles for Downtown and Commercial Streets and 23-foot delivery trucks (DL-23) for the design of Neighborhood and Residential Streets. Based on those recommendations, loading zone lengths should accommodate 30-foot trucks in commercial areas and 23-foot trucks in residential areas.
United States Environmental Protection Agency and California Air Resources Board The Environmental Protection Agency (EPA) and California Air Resources Board (CARB) vehicle definitions are based on vehicle weight, as that closely correlates with emissions. Vehicles in California are classified by CARB, and match federal definitions for all vehicle types except for Heavy-Duty Vehicles 14,000-19,500 lbs. Gross Vehicle Weight Rating (GVWR). Vehicle weight has little application in this study, despite delivery vehicles generally being heavier than passenger vehicles, weight is not an accurate approximation for the delivery activity of a vehicle.
Definitions from Other Cities: Washington D.C. – Defining Bicycle Deliveries
Exhibit 4- 1: FHWA Vehicle Classifications
Last Mile Freight Delivery Study | Chapter 4: Policy Review
4 - 5 | P a g e
Washington D.C. also defines a commercial vehicle as one greater than 22 feet in length or is used for transporting freight, however the city also specifically defines commercial bicycle and courier services, there is no equivalent defining of these activities in the City of Los Angeles. Non-motorized definitions of commercial vehicles could include push or hand carts, sidewalk vending or cargo bicycle.3 Washington D.C.’s commercial bicycle regulations are:
• “Commercial bicycle operator” means an individual at least 16 years of age who receives financial compensation for the delivery or pick-up of goods or services by bicycle as a substantial part of his or her business or earnings, as defined by the Mayor in rules developed pursuant to S 50- 1632(d)(3).
• “Courier company” means any firm, partnership, company, corporation, or organization operating within the District of Columbia that employs, compensates, utilizes, or contracts with a commercial bicycle operator.
Definitions from Other Cities: Chicago Defines Likely Commercial Vehicles The City of Chicago defines commercial vehicles by those most likely to be engaged in commercial activity by defining them as vehicles that are not public passenger vehicles and either: (1) carry permits issued under 9-64-160(d); or (2) bear commercial vehicle license plates; or (3) are emblazoned with the name, logo or other identifier of a business affixed either permanently (e.g. stenciled or painted) or temporarily (e.g. a magnetic sticker, or a sign attached
3 https://beta.code.dccouncil.us/dc/council/code/titles/50/chapters/16/subchapters/II/
to the antenna or placed in a clear sleeve) to the vehicle in a manner identifiable from at least twenty-five feet away. Temporary, unaffixed identification (e.g. a sheet of paper or cardboard on the dashboard or rear window deck) is not sufficient to label a vehicle a commercial vehicle.
Transportation Network Companies California was the first state to regulate transportation network company (TNC) ridesharing services. TNCs provide prearranged transportation services for compensation using an online-enabled application or platform (such as smart phone apps) to connect drivers using their personal vehicles with passengers.4 TNC platforms are also used to deliver food and items with personal vehicles. TNC goods delivery services include:
• Restaurant meals delivered to commercial and residential customers (Door Dash, Grubhub, Post Mates, Uber Eats).
• Small parcel and ecommerce delivery (Amazon Express, Uber Rush).
• On-call delivery of furniture, appliances, party supplies, dry cleaning, etc. (Takl, Errand Runners).
These services are expanding rapidly in scope, number of companies, and usage. Such operations present multiple regulatory challenges to the City of Los Angeles and urban areas in general. Given the growth and parking issues raised by these operations, it is critical that any definition of commercial vehicle include goods delivered by TNCs.
4 California Public Utilities Commission, http://www.cpuc.ca.gov/tncinfo/, Accessed April 1, 2019
Last Mile Freight Delivery Study | Chapter 4: Policy Review
4 - 6 | P a g e
Conclusions of Delivery Vehicle Definitions In reviewing multiple documents and policies from the Federal to local level, it was rare to see the distinction between a commercial vehicle and a delivery vehicle made. However, this distinction is important when considering future strategies to address last-mile deliveries—as the data collection displayed that around 30-percent of deliveries were made without the use of a traditional commercial vehicle, including the rise of Transportation Network Companies (TNCs), personal vehicles being used for delivery trips.
Therefore, trip purpose rather than type of vehicle was used to define delivery vehicles. Any vehicle delivering or picking up a commercial good was defined as a “delivery vehicle” by its role in transporting a delivery rather than it being any specific type of vehicle. This included professional moving vans to hand carts and everything in between—as long as it was making a delivery or otherwise loading and unloading goods. The vehicle or activity does not need to be commercially registered or motorized for the purposes of this study. As part of the field data collection, several personal vehicles were observed making deliveries to small businesses, especially in the Garment District and Jewelry District. We hypothesize that many small businesses that trade in relatively small but expensive items may use personal vehicles operated by family or co-workers to make deliveries and were considered deliveries as part of this study.
All other types of curb activity were also tabulated as part of the field data collection in order to understand the interactions among the various curb uses.
Vehicles used for loading and unloading of passengers will be considered a “passenger loading vehicle” and while not the target of
the study, were analyzed in relation to delivery vehicles. This included TNCs like Lyft and Uber, as well as taxis and tour buses.
Parked and waiting by vehicles was also observed and tabulated in the data collection.
The two other major elements of the data collection were the duration of the delivery, passenger loading or parking actions (time in and time out) and where the action occurred whether it was at one of the various curb designations or in travel or bicycle lanes.
Using the definitions above, data collection looked at all types of vehicles and their actions on a block-by-block basis in the case study data collection. The defining of vehicle actions (parking, delivery, passenger loading) rather than types of vehicles allowed the data collection to have as comprehensive a picture of delivery conditions to assess specific issues and develop the toolbox of strategies.
These definitions were presented to, and reviewed by the Project Advisory Committee (PAC) which concurred with the approach of emphasizing data collection that was inclusive of all curb actions and vehicles.
Last Mile Freight Delivery Study | Chapter 4: Policy Review
4 - 7 | P a g e
Curb Markings
Curb lanes provide a variety of uses: as travel lanes, parking, loading for passengers and deliveries and other types of activities such as bikeshare, car share and parklets. To assist in defining the usage of curb space, curbs are colored (often painted) different colors based on its permitted or intended use along with signage.
Cities enact flexible usage of curb lanes to meet time-specific demands such as rush hour lanes, early morning delivery zones, nighttime passenger loading zones, or overnight-only street parking. However, the cost of managing and enforcing rotating curb lane usage means that this is generally reserved only for those locations with the highest curb space demand.
State of California There are no national curb color standards; however, states generally follow similar guidelines. In California, the color of curb markings shall conform to CVC 21458 quoted below5:
(a) Whenever local authorities enact local parking regulations and indicate them by the use of paint upon curbs, the following colors only shall be used, and the colors indicate as follows:
• Red indicates no stopping, standing, or parking, whether the vehicle is attended or unattended, except that a bus may stop in a red zone marked or sign posted as a bus loading zone.
• Yellow indicates stopping only for the purpose of loading or unloading passengers or freight for the time as may be specified by local ordinance.
5 http://www.dot.ca.gov/trafficops/camutcd/docs/TMChapter6.pdf
• White indicates stopping for either of the following purposes:
o Loading or unloading of passengers for the time as may be specified by local ordinance.
o Depositing mail in an adjacent mailbox. • Green indicates time limit parking specified by local
ordinance. • Blue indicates parking limited exclusively to the vehicles of
disabled persons and disabled veterans.
City of Los Angeles In the City of Los Angeles, posed sign regulations apply regardless of curb color. Curb zones may be delineated by either signs or paint with six exceptions, as follows: 1) No Parking Zones are shown only by signs; 2) School Bus Zones are shown only by signs; 3) Tour Bus Zones are shown only by signs; 4) Disabled Person Parking Zones shall be shown by both blue curb and signs; 5) where the use of the zone is shared during different hours of the day and therefore can only be shown by signing; and 6) where the applicable days or hours are different than as shown for conventional painted curb markings, in which case signing shall be used. For new installations, special parking zone signs are not to be installed atop parking meter posts.
When a curb zone is painted, the following colors of paint indicate restricted or allowed uses:
Red Curbs
• General regulation: no stopping, parking or standing. a No Stopping Zone prohibits the momentary stopping of vehicles at the right edge of the roadway
Last Mile Freight Delivery Study | Chapter 4: Policy Review
4 - 8 | P a g e
• Applies whether or not vehicle is attended • 24 hours, 7 days a week • Placed at intersection approaches (50 feet nonsignalized, 30
feet signalized) and departures (30 feet), transit bus zones (with stenciling “No Stopping Bus Zone”)
• At least 15 feet upstream and downstream of a fire hydrant • At driveways and alleys (within six feet of an alley or
driveway within a parking meter zone). Not all driveways and alleys in the City have associated red curb painting.
No Parking Zones (signed only)
• No Parking Zones are shown only by signs (no red curbs. A No Parking Zone prohibits the continued standing of an occupied or unoccupied vehicle, but allows momentary stopping, commercial loading and passenger loading. The City of Los Angeles Manual of Policies and Procedures Section 343 specifically states:
“A No Parking Zone may be used on arterial streets instead of a No Stopping Zone only in rare cases only where it is necessary to accommodate momentary stopping during non-peak periods. A No Parking Zone may also be used instead of a designated Commercial Loading Zone where the restriction extends beyond 100 feet.”
Yellow Curbs
• General regulation: commercial loading only • Vehicles with a commercial license plate are allowed to park
in yellow zones, only if they are actively loading or unloading freight, for a maximum of 30 minutes
• Yellow curb zone restrictions are in effect Monday through Saturday 7:00 a.m. to 6:00 p.m. unless otherwise posted on signs; all other parking regulations are in effect outside hours noted
• Vehicles without a commercial license plate may load and unload passengers or baggage in these zones, but only for a maximum of 5 minutes
• Commercial loading zones are justified by: o Inadequate On-Street Parking: On-street parking
within 200 feet of the site proposed to be served by a Commercial Loading Zone location frequently is occupied, or the material handled is so heavy or bulky that loading at the immediate location is required. The City encourages evaluation of time-limited (e.g. 30 minute or one hour) parking as a possible alternative to a Commercial Loading Zone due to its more permissive use.
o Frequent Usage: The site proposed to be served has at least five uses by commercial vehicles daily. Where there are more than 10 uses per day by commercial vehicles, or where the usage is primarily by large trucks an extended zone length may be authorized.
o Lack of Alternative Facilities: Off-street facilities, adjacent loading zones, or alleys are not available, or the volume of loading exceeds the capacity of those facilities by at least five uses per day.
• Commercial loading zones are intended to be monitored to determine continued need and removed if no longer justified. Older commercial areas, such as Chinatown have many legacy loading zones fronting parcels where former
Last Mile Freight Delivery Study | Chapter 4: Policy Review
4 - 9 | P a g e
buildings were demolished and are now used for surface parking.
White Curbs
• General regulation: Passenger Loading Zone permits stopping only for the purpose of loading and unloading passengers and their personal baggage and then only for the time necessary, but in no event for more than five minutes.
• Part-time Passenger Loading Zones with specific hours posted on signs may be combined with other parking zones in order to allow dual use of the curb during various periods of the day. Locations for Passenger Loading Zones should be coordinated with City-approved valet parking operations.
• Vehicles loading or unloading passengers may stop for a maximum of 5 minutes
• The installation of passenger loading zones is justified by adjacent meeting halls, restaurants and night clubs, and schools and other facilities where on-street parking within 200 feet is frequently occupied.
• Taxicab zones are authorized by the bureau responsible for Franchise Regulations. They are determined based on a demonstrated need and a commitment from taxicab operators to use them.
• Mailbox and Book Deposit Zones are special types of Passenger Loading Zones and may be installed for mailboxes or book deposit boxes that are adjacent to curbs.
Green Curbs
• General Regulation: short-term parking • As posted, generally 15 minutes or 30 minutes
• Green curb zone restrictions are in effect Monday through Saturday 8:00 a.m. to 6:00 p.m. unless otherwise posted on signs; all other parking regulations are in effect outside hours noted
• The establishment of a Short-Time Parking Zone (including a single space) is justified where: a need for such parking has been demonstrated after a trial with time-limit parking; the nature of the retail businesses is such that patrons who park conduct their transactions in a short period; and there is inadequate off-street parking. Since they are restrictive zones and deny usage as time-limit parking they should be carefully considered before authorizing. Generally, they are installed with one or two spaces. When justified, Short-Time Parking Zones should be installed at the ends of blocks, whenever possible, to ensure clarity of regulation. However, nursery schools and child care facilities requiring children to be dropped off and picked up inside the facility by a responsible adult may justify a mid-block, Short-Time Parking Zone. Any other requests for a mid-block zone must demonstrate an over-riding need or safety consideration.
• Utilization of any newly installed Short-Time Parking Zone shall be monitored for not less than three months to determine if it is providing the anticipated improved access and/or more equitable distribution of curb space. Demonstrated underutilization will be cause for reversion of the Short-Time Parking Zone (space) to the restriction in place for the balance of the block.
Blue Curbs
• On January 24, 2017, the Los Angeles City Council adopted the Phase 1 Program for Accessible Parking Zone's (APZ's). The Phase 1 Program generally restricts the placement of
Last Mile Freight Delivery Study | Chapter 4: Policy Review
4 - 10 | P a g e
APZ’s to corner locations to serve the entire block. Any necessary improvements to the selected corner will be included in the City’s Sidewalk Repair Program for design and construction.
• Businesses may submit a request for an APZ. The City conducts an investigation to determine need. Generally, corner locations are prioritized though it is possible to petition for APZ zones in non-corner locations. The following adjacent land uses are prioritized for APZs:
o Government buildings serving the public such as administration buildings, public employment offices, post offices, public libraries, police stations, etc.
o Rehabilitation facilities. o Vocational Training facilities. o Public recreation facilities including but not
necessarily limited to municipal swimming pools, recreation halls, and museums.
o Attractions of cultural interest. o Community service facilities, such as senior citizen
service centers. o Hospitals and convalescent homes, medical facilities
and doctors’ offices. o Employment offices of enterprises employing more
than 200 persons. o Commercial and/or office buildings with an
aggregate of more than 50,000 square feet of usable floor space.
o Businesses that specialize in sales and/or services to the disabled.
• Residential requirements also apply for applications
Important takeaways for last mile freight delivery in reviewing the City of Los Angeles curb designations are:
• Commercial deliveries are permitted in No Parking Zones (signed only)
• Passenger loading and unloading is permitted in commercial loading zones
• Commercial Loading Zones are in effect from 7AM to 6PM
• Commercial Loading is not intended to take longer than 30 minutes
• A Commercial Loading Zone can be justified through inadequate parking within 200 feet of a site served by at least five daily commercial deliveries, or by inadequate alternative facilities (loading areas and alleys) or if the volume of loading exceeds the capacity of those facilities by at least five uses per day.
• Ten uses by commercial vehicles per day or use by large tucks can justify extended commercial zone length.
Last Mile Freight Delivery Study | Chapter 4: Policy Review
4 - 11 | P a g e
City of Los Angeles Zoning Requirements for Loading The City of Los Angeles zoning requirements for loading areas include driveway width requirements (different for predominately residential zones and predominately commercial or industrial zones). Significantly, and perhaps uniquely, a loading area is required for all buildings in the C or M zones. Despite this requirement, observations show that delivery vehicles prefer curbside deliveries meaning there is either not effective implementation of the loading space requirement or the access to loading spaces or the needs of deliverers do not align with the loading space requirements. The earliest sections of the zoning code loading requirements were effective in 1965 and therefore much of the building stock in older areas of the City were not subject to these requirements.
The requirements are listed below:
(f) Driveway Width. (Amended by Ord. No. 184,802, Eff. 3/17/17.) Every access driveway shall be at least 9 feet in width in the A, RE, RS, R1, RU, RZ, R2, RMP and RW Zones, and 10 feet in width in the RD, R3, RAS3, R4, RAS4, R5, P, PB, C and M Zones [i.e. wider driveways are required in “commercially” zoned areas than in primarily residential areas]; provided, however, every access driveway serving a parking area or garage having a capacity of more than 25 automobiles or trucks shall be at least 19 feet in width, or in lieu thereof, there shall be two access driveways, each of which is at least 10 feet in width; provided, further, however, that an access driveway serving an apartment house erected in the R2 Zone shall be at least 10 feet in width…
6. Loading Space.
(a) A loading space shall be provided and maintained on the same lot with every hospital, hotel, or institution building. A loading space shall be provided and maintained on the same lot with every building in the C or M Zones where the lot on which said building is located abuts an alley, provided that when the lot is occupied by a use, such as a service station or a drive-in business, in which the building covers less than the total buildable area, a suitable loading space must be provided, but it need not comply with all the provisions of this section if its location, size and means of access are approved by the Department of Building and Safety. (Amended by Ord. No. 174,769, Eff. 9/26/02.)
EXCEPTION: No loading space shall be required on a lot that abuts an alley in the C Zone when all the buildings are erected, structurally altered, enlarged or maintained and used solely as dwellings or apartment houses. (Amended by Ord. No. 174,769, Eff. 9/26/02.)
(b) Every required loading space shall be so located and arranged that delivery vehicles may be driven upon or into said space from the alley. Such loading space shall have a minimum height of 14 feet and shall be directly accessible through a usable door not less than three feet in width and not less than six feet six inches in height opening from the building it is to serve. (Amended by Ord. No. 138,685, Eff. 7/10/69.)
(c) Every required loading space shall have a minimum area of 400 square feet, a minimum width of 20 feet measured along the alley line, and a minimum depth of ten feet measured perpendicularly to the alley line except as hereafter provided in this Subsection. Such loading space may be furnished within a building where said building is designed and arranged to include accessible loading space equivalent to that required by this subdivision.
Last Mile Freight Delivery Study | Chapter 4: Policy Review
4 - 12 | P a g e
(d) The required loading space shall have a minimum area of 600 square feet where the gross floor area of all buildings on the lot exceeds 50,000 square feet, but not more than 100,000 square feet, a minimum area of 800 square feet where the gross floor area of all buildings is between 100,000 and 200,000 square feet, and shall be increased by an additional 200 square feet for each additional 200,000 square feet or fraction thereof of gross floor area in the building.
(e) The required loading space, on lots less 40 feet in width, shall extend across the full width of the lot at the alley line, but need not exceed 10 feet in depth.
(f) No loading space shall be required on a lot on which a building, other than a residential building, is to be erected, structurally altered, or enlarged, and on which there is an existing separate building being lawfully maintained adjacent to the alley in such manner as to prevent the establishment of the loading space required by the provisions of this subdivision. (Amended by Ord. No. 130,952, Eff. 11/8/65.)
(g) No loading space shall be required on unusually shaped lots, oddly located lots, or on hillside lots, when waived by the Department of Building and Safety as provided for in Sec. 12.26-B.
(h) Any loading space being maintained in connection with an existing main building shall be maintained so long as the building remains, provided, however, that this regulation shall not require the maintenance of more loading space than is herein required for a
6 http://leginfo.legislature.ca.gov/faces/codes_displayText.xhtml?lawCode=BPC&division=9.&title=&part=&chapter=16.&article=2. Accessed 8/26/18
new building, nor the maintenance of such space in any other zone or for any other buildings than those specified herein.
Alcoholic Beverage Delivery The State of California bans the delivery of alcoholic beverages between the hours of 8 p.m. and 3 a.m. in the Business and Professions Code Division 9: Alcoholic Beverages, Chapter 16: Regulatory Provisions Article 2, Hours and Sale and Delivery of Alcoholic Beverages section 25631.
Except as otherwise provided in this section, no person licensed as a manufacturer, winegrower, distilled spirits manufacturer’s agent, rectifier, or wholesaler of any alcoholic beverage shall deliver or cause to be delivered any alcoholic beverage to or for any person holding an on-sale or off-sale license on Sunday or except between the hours of 3 a.m. and 8 p.m. of any day other than Sunday. Any alcoholic beverage may be delivered at the platform of the manufacturing, producing, or distributing plant at any time. Nothing contained in this section prohibits the transportation or the carriage and delivery in transit at any time of any alcoholic beverage between the premises of a manufacturer, winegrower, wholesaler, distiller, importer, or any of them. Every person violating the provisions of this section is guilty of a misdemeanor. 6
Last Mile Freight Delivery Study | Chapter 4: Policy Review
4 - 13 | P a g e
Since that time period is prime off-hour delivery time and establishments that serve alcohol could potentially be staffed to accept deliveries during those hours, the regulation limits the potential effectiveness of an off-hours delivery program.
Noise Ordinances Loading operations have the potential of creating noise levels in excess of state and local law—especially in the evening and early morning.
The public policy in California enabling local ordinances regulating the level of noise emitted is the Health and Safety Code 46000 (f): “All Californians are entitled to a peaceful and quiet environment without the intrusion of noise which may be hazardous to their health or welfare. (g) It is the policy of the state to provide an environment for all Californians.
Cities and counties have established various local laws to provide some protection for their citizens from excessive or untimely noise. Most local ordinances include "quiet times." A typical ordinance prohibits loud noises between 11 p.m. and 7 or 8 a.m. on weekdays and 11 p.m. or midnight until 8 to 10 a.m. on Sundays and holidays.
The City of Los Angeles Noise Regulations are codified in its noise ordinance (Los Angeles Municipal Code Section 111 et seq.) 7 establishes sound measurement and criteria, minimum ambient noise levels for different land use zoning classifications, sound emission levels for specific uses, hours of operation for certain uses (construction activity, rubbish collection, etc.), standards for
7 City of Los Angeles Municipal Code Chapter XI, Noise Regulation, http://library.amlegal.com/nxt/gateway.dll/California/lamc/municipalcode
determining noise deemed a disturbance of the peace, and legal remedies for violations.
Specific to the loading and unloading of vehicles, Section 114.03 states:
(a) It shall be unlawful for any person, between the hours of 10:00 p.m. and 7:00 a.m. of the following day, to load or unload any vehicle, or operate any dollies, carts, forklifts, or other wheeled equipment, which causes any impulsive sound, raucous or unnecessary noise within 200 feet of any residential building.
(b) Irrespective of the provisions of Subsection (a), loading or unloading of vehicles of the type of activity referred to in Subsection (a) may occur between the hours of 6:00 a.m. to 11:00 p.m. of the same day pursuant to a permit issued by the Department of Transportation in accordance with a business program as defined by said department. This permit program would be limited to the area bounded by Western Avenue, Santa Monica Freeway, Central Avenue, and the San Diego Freeway, within the limits of the City of Los Angeles. Such permits will not be issued to high-noise businesses such as trash pickup.
Several components of Section 114.03 are directly relevant to last-mile delivery strategies. First, given the vague definition of “any impulsive sound, raucous or unnecessary noise” within 200 feet of any residential building is broad enough to discourage vehicle loading and unloading of any kind between 10:00 p.m. and 7 a.m. in residential areas and potentially in mixed-use areas such as Downtown Los Angeles—which has seen a large influx of housing units since the drafting of the noise ordinance. The origins of the
?f=templates$fn=default.htm$3.0$vid=amlegal:losangeles_ca_mc, accessed April 1, 2019.
Last Mile Freight Delivery Study | Chapter 4: Policy Review
4 - 14 | P a g e
business program clause identifying Crenshaw and Leimert Park neighborhoods for a “business program” were not investigated as part of this report. However, it is clear that any off-hour delivery must include a noise reduction or elimination component to avoid running afoul of local noise ordinances within the City of Los Angeles and in other jurisdictions as well.
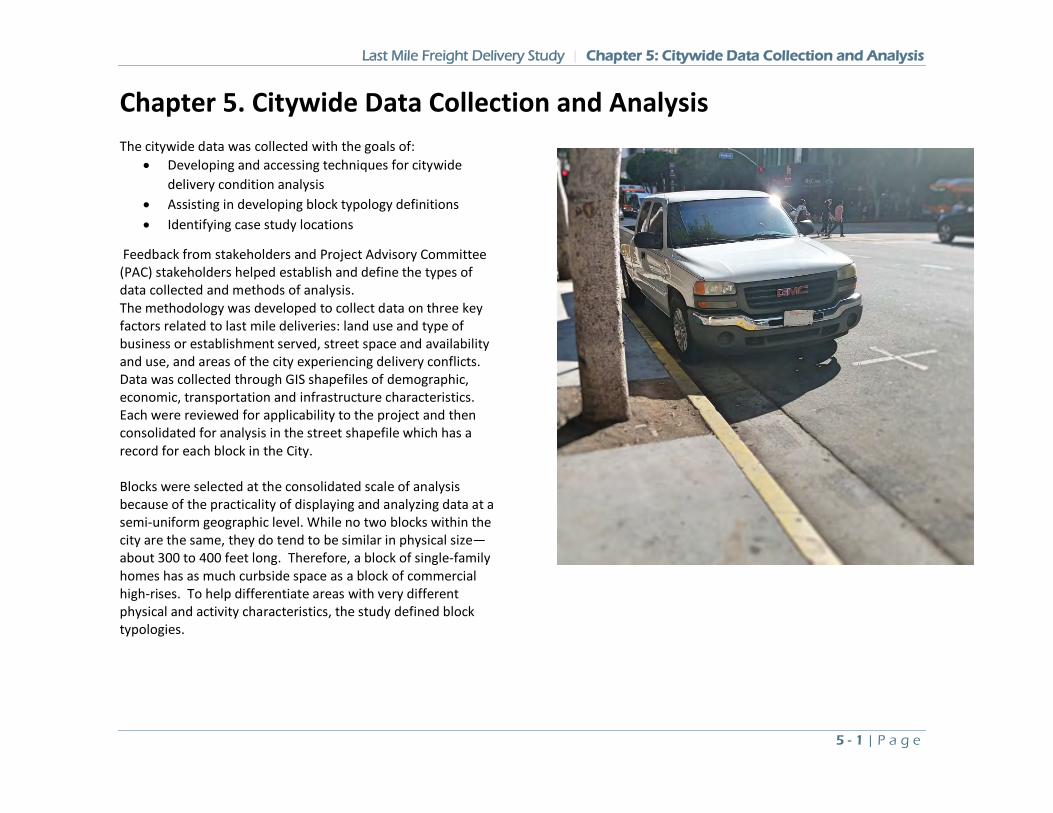
Last Mile Freight Delivery Study | Chapter 5: Citywide Data Collection and Analysis
5 - 1 | P a g e
Chapter 5. Citywide Data Collection and Analysis The citywide data was collected with the goals of:
• Developing and accessing techniques for citywide delivery condition analysis
• Assisting in developing block typology definitions • Identifying case study locations
Feedback from stakeholders and Project Advisory Committee (PAC) stakeholders helped establish and define the types of data collected and methods of analysis. The methodology was developed to collect data on three key factors related to last mile deliveries: land use and type of business or establishment served, street space and availability and use, and areas of the city experiencing delivery conflicts. Data was collected through GIS shapefiles of demographic, economic, transportation and infrastructure characteristics. Each were reviewed for applicability to the project and then consolidated for analysis in the street shapefile which has a record for each block in the City. Blocks were selected at the consolidated scale of analysis because of the practicality of displaying and analyzing data at a semi-uniform geographic level. While no two blocks within the city are the same, they do tend to be similar in physical size—about 300 to 400 feet long. Therefore, a block of single-family homes has as much curbside space as a block of commercial high-rises. To help differentiate areas with very different physical and activity characteristics, the study defined block typologies.
Last Mile Freight Delivery Study | Chapter 5: Citywide Data Collection and Analysis
5 - 2 | P a g e
Data Collected and Analyzed The Citywide data collected and analyzed for the project was categorized as land use, street, and activity data, and was used to identify:
• Common delivery conditions for different types of blocks typologies
• High-delivery areas for further investigation in case study field review and stakeholder outreach
• Block outliers (efficient and inefficient deliveries) to investigate delivery issues
• Trends and relationships of various data related to deliveries
The land use data layers identified the places where freight delivery trips are generated:
• Land use (City of Los Angeles and SCAG definitions) • Zoning • Active businesses • Parcels • Surface parking lots • Post offices • UPS and FedEx locations
Data of street described how and where freight delivery trips were conducted:
• Street characteristics • Parking meter locations • Defined truck routes • Street furniture • Bus stops – the location of Metro bus stops was included • Truck parking tickets indicated potential issues of
deliveries occurring outside of loading areas • Locations of other initiatives such as bike and car share,
electric car share, transit lanes and bicycle lanes, parklets, etc.
Activity data described the level and type of actions involved in freight delivery:
• Truck parking citations • Truck-involved collisions • High quality transit areas / transit priority areas • Walkability Index Score (2012) • Average daily traffic / Average daily truck traffic • Estimated delivery trip generation
Key Data Sets These data were overlain and reviewed for their applicability to the project, particularly those that were major indicators of freight delivery activity. In review of the data, truck parking citations, truck-related collisions and delivery frequency were identified as the key indicators of blocks that may experience delivery issues. Truck Parking Citations Truck parking citation data for calendar year 2014 was obtained from Xerox. The data included the location, date, and type of citation. The data set showed clear trends in terms of the types of citations given and their frequency and distribution in the city. Citations were concentrated in downtown Los Angeles, along major commercial corridors, and by government buildings and hospitals. Citation data was not representative of all violations. Los Angeles Department of Transportation (LADOT) parking enforcement does not have unlimited resources to cover the entire city uniformly. It is likely enforcement resources were allocated to high need areas and therefore, while not uniform, the data was likely indicative of areas with
Last Mile Freight Delivery Study | Chapter 5: Citywide Data Collection and Analysis
5 - 3 | P a g e
conflicts/complaints/or the need for enforcement. However, parking enforcement staff were not interviewed for this project. A parking violation during a delivery in a low-activity area, such as parking in a red zone during a residential delivery, is not as disruptive to the transportation system as one in a higher activity area due to more potential for blocking travel lanes, conflicts with bicycles and pedestrians and safety conflicts during parking maneuvers and when entering traffic. In addition, the lower density, and therefore number of deliveries made, reduces the amount of time a delivery vehicle would be in violation and reduce the time it could be observed by enforcement. This data has proven helpful as a proxy for locating blocks with high delivery demand and potential for identifying areas with inadequate loading space. One potential use of the data not explored in this study is the identification of blocks with similar physical characteristics and delivery demand with relatively fewer citations to potentially indicate better potential delivery conditions such as clearly defined curb loading or adequate off-street loading. This data was compared to violations for passenger vehicles in terms of distribution of citations, which upon cursory comparison did not have the same overall patterns of occurrence. Parking citations for all vehicles were more evenly distributed across the City as compared to truck citations, which indicate that truck citation data probably is indicative of 1) where truck parking has higher competition for parking and/or 2) where issues or limits to parking for trucks occur.
1 Freight Trip Generation and Land Use, National Cooperative Freight Research Program 25, Transportation Research Board.
Truck Related Collisions Truck-related collision data was collected from the Statewide Integrated Traffic Records System (SWITRS). The data was not able to distinguish trip purpose (e.g. if vehicles were making deliveries). ‘Party’ data did indicate the type and make of the vehicle and its movement prior to the collision. Collisions occur at a relatively low frequency therefore the low sample size may make it difficult to make clear correlations to actual issues in the physical location the collision occurred. However, locations with four or more collisions in the data set were used to identify potential block issues. Delivery Frequency There was no single comprehensive source for delivery frequency to identify high activity areas. Individual delivery companies may have proprietary data; however, we were not able to obtain it for purposes of this study. Therefore, the project team used parcel-level employment or building area to estimate delivery trip generation using the methodology described in the National Cooperative Freight Research Project (NCFRP) 25: Freight Trip Generation and Land Use1 and NCFRP Research Report 37: Using Commodity Flow Survey Microdata and Other Establishment Data to Estimate the Generation of Freight, Freight Trips and Service Trips, and MetroFreight Study Residential Parcel Deliveries: Evidence from a Large Apartment Complex. SCAG provided employment data2 for Los Angeles County in geographic information system (GIS) form. This data has the employment by number of employees and North America Industry Classification System (NAICS) code of business. Using
2 Southern California Association of Governments, Firm based InfoGroup 2016 data
Last Mile Freight Delivery Study | Chapter 5: Citywide Data Collection and Analysis
5 - 4 | P a g e
the NCFRP report tables correlating types of businesses and number of employees3, freight trip generation and parcel trip generation was calculated for each business in the City of Los Angeles. The Info16 data is organized by employer location, NAICS six-digit code. Rates for Service Trip Generation (Table 14 of the NCFRP 37 Report) and Freight Trip Generation (Table 13 of the report) are linear factors organized by two or three-digit NAICS codes and by number of employees. There is a single factor for service truck trip generation and graduated factors for freight trip generation based on the number of employees (1 to 10, 11 to 40, 41 to 149, 150 to 999 and 1000+). To account for U.S. Postal Service trips, one trip per day was added to each business. This data was joined to the block data by the latitude and longitude in the NAICS data. To estimate daily residential parcel deliveries, residential units as listed in the Los Angeles County Assessor’s parcel data had one US. Postal Service trip per day plus a factor of 0.3 for parcel deliveries. The parcel delivery factor was based on the first phase of research analyzing parcel delivery data collected from a large apartment complex in which each apartment unit generated about 1.5 parcel deliveries per week4. Those 1.5 deliveries per week were divided by 5 weekdays to obtain the factor of 0.3. The resulting point data was aggregated to the adjacent block to integrate into this study’s block level analysis, with the final block level data including both business and residential deliveries.
Data Gaps Data gaps in the GIS screening indicated the limits of the Citywide analysis, however the field data collection during the case study phase of the project provided the opportunity to collect this data at the block level. Key data gaps identified were:
• Curb Designation (Painting) – there is currently no publicly available GIS shapefile of the location of red, white, yellow and blue curb painting in the City of Los Angeles. As an alternative, field data on curb painting was obtained during the case study phase of the study and was analyzed at the block-level.
• Off-street loading docks/areas – No comprehensive data source for the location, access points or size of off-street loading areas in the City of Los Angeles was found. Generally, all sites zoned for commercial or manufacturing are required to have loading areas under the zoning ordinance, however compliance was not verifiable.
3 Freight Trip Generation and Land Use, National Cooperative Freight Research Program 25, Transportation Research Board.
4 Rodrigue, J., (2017) Residential Parcel Deliveries: Evidence from a Large Apartment Complex, MetroFreight Center of Excellence
Last Mile Freight Delivery Study | Chapter 5: Citywide Data Collection and Analysis
5 - 5 | P a g e
Block Typologies The study developed block typologies to describe the most common type of delivery locations and be the basis for consolidating other data attributes of blocks as they related to delivery conditions. The block typologies were the primary organizing level for GIS data attributes of land use, street, and activities and was refined with Project Advisory Committee (PAC) and stakeholder input. Block typologies defined blocks based on land use and street classification. These typologies were intended to define areas with similar delivery demand and street area. Measures of delivery activity were used to indicate outliers within those typologies for further case study investigation. Block typologies were also used to make the study recommendations applicable and transferrable broadly within the SCAG Region. While the study area for the project was the City of Los Angeles and many of the underlying definitions and data were Los Angeles-specific, the block typologies allowed findings to be presented in a manner accessible to all agencies within the SCAG Region.
Scale and Application of Typologies Data was consolidated at the block level for this analysis; however, the scale of typologies was flexible to account for individual blocks, groupings of adjacent blocks, or districts of a city. This was done to observe deliveries and conditions within the practical delivery radius of several adjacent blocks from the parking space in order to assess alternatives to the curb in front of an individual business. Since parking policy is generally set around clusters of similar land uses in districts, the case
study analysis also looked at the district level—a grouping of similar or complementary typologies such as commercial business districts.
Block Typologies The block typologies defined in this study describe blocks based on land use and street classification:
• General Commercial – Major Street • General Commercial – Minor Street • Regional Commercial – Major Street • Regional Commercial – Minor Street • Industrial – Major Street • Industrial – Minor Street • Residential – Major Street • Residential – Minor Street • Institutional - Major Street • Institutional - Minor Street
These typologies are further explained as follows: Land Use Land use categories were consolidated from the City of Los Angeles Land Use definitions for commercial, industrial and residential land uses with an overlay typology of institutional land use (government offices, hospitals, etc.) from SCAG land use definitions. Exhibit 6-1 presents the name and example types of draft block typology land use.
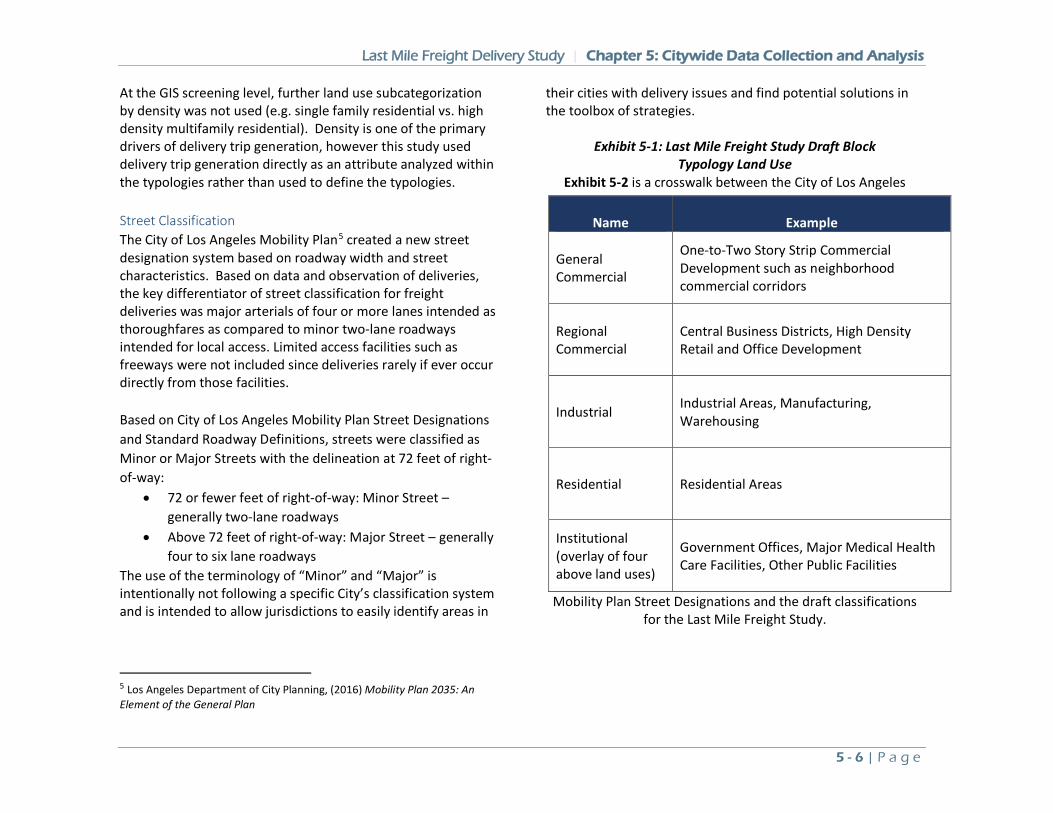
Last Mile Freight Delivery Study | Chapter 5: Citywide Data Collection and Analysis
5 - 6 | P a g e
At the GIS screening level, further land use subcategorization by density was not used (e.g. single family residential vs. high density multifamily residential). Density is one of the primary drivers of delivery trip generation, however this study used delivery trip generation directly as an attribute analyzed within the typologies rather than used to define the typologies. Street Classification The City of Los Angeles Mobility Plan5 created a new street designation system based on roadway width and street characteristics. Based on data and observation of deliveries, the key differentiator of street classification for freight deliveries was major arterials of four or more lanes intended as thoroughfares as compared to minor two-lane roadways intended for local access. Limited access facilities such as freeways were not included since deliveries rarely if ever occur directly from those facilities. Based on City of Los Angeles Mobility Plan Street Designations and Standard Roadway Definitions, streets were classified as Minor or Major Streets with the delineation at 72 feet of right-of-way:
• 72 or fewer feet of right-of-way: Minor Street – generally two-lane roadways
• Above 72 feet of right-of-way: Major Street – generally four to six lane roadways
The use of the terminology of “Minor” and “Major” is intentionally not following a specific City’s classification system and is intended to allow jurisdictions to easily identify areas in
5 Los Angeles Department of City Planning, (2016) Mobility Plan 2035: An Element of the General Plan
their cities with delivery issues and find potential solutions in the toolbox of strategies.
Exhibit 5-1: Last Mile Freight Study Draft Block Typology Land Use
Exhibit 5-2 is a crosswalk between the City of Los Angeles
Mobility Plan Street Designations and the draft classifications for the Last Mile Freight Study.
Name Example
General Commercial
One-to-Two Story Strip Commercial Development such as neighborhood commercial corridors
Regional Commercial
Central Business Districts, High Density Retail and Office Development
Industrial Industrial Areas, Manufacturing, Warehousing
Residential Residential Areas
Institutional (overlay of four above land uses)
Government Offices, Major Medical Health Care Facilities, Other Public Facilities
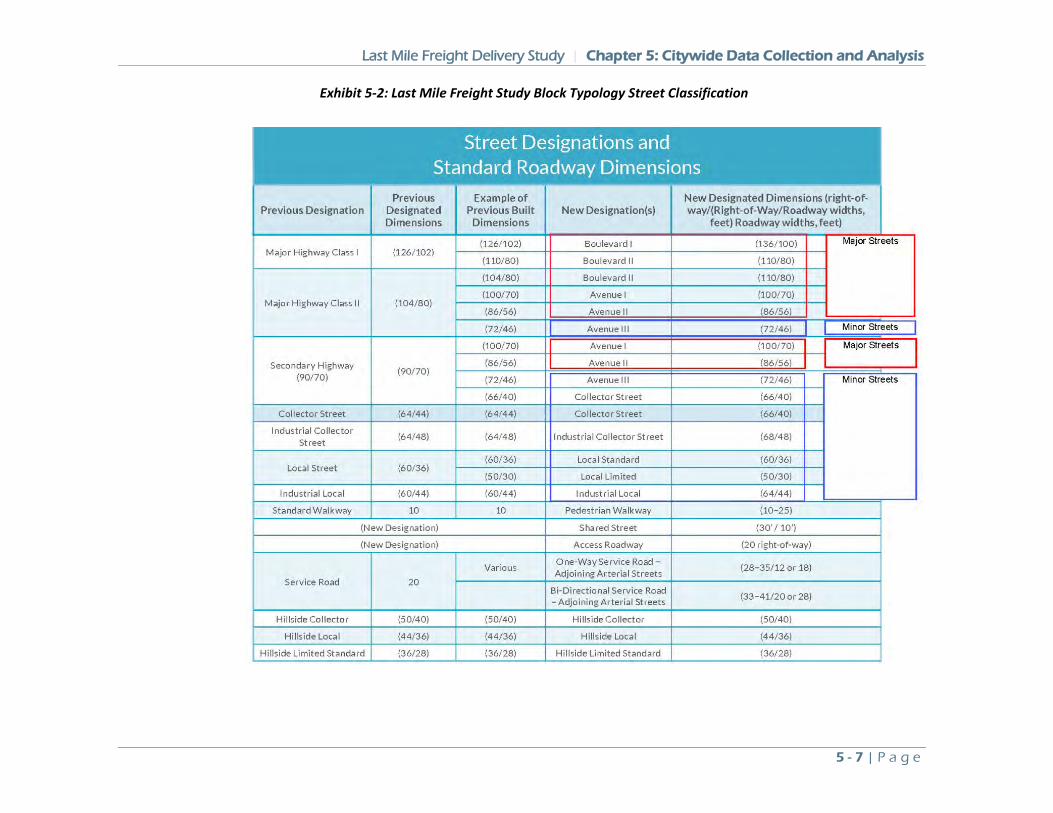
Last Mile Freight Delivery Study | Chapter 5: Citywide Data Collection and Analysis
5 - 7 | P a g e
Exhibit 5-2: Last Mile Freight Study Block Typology Street Classification
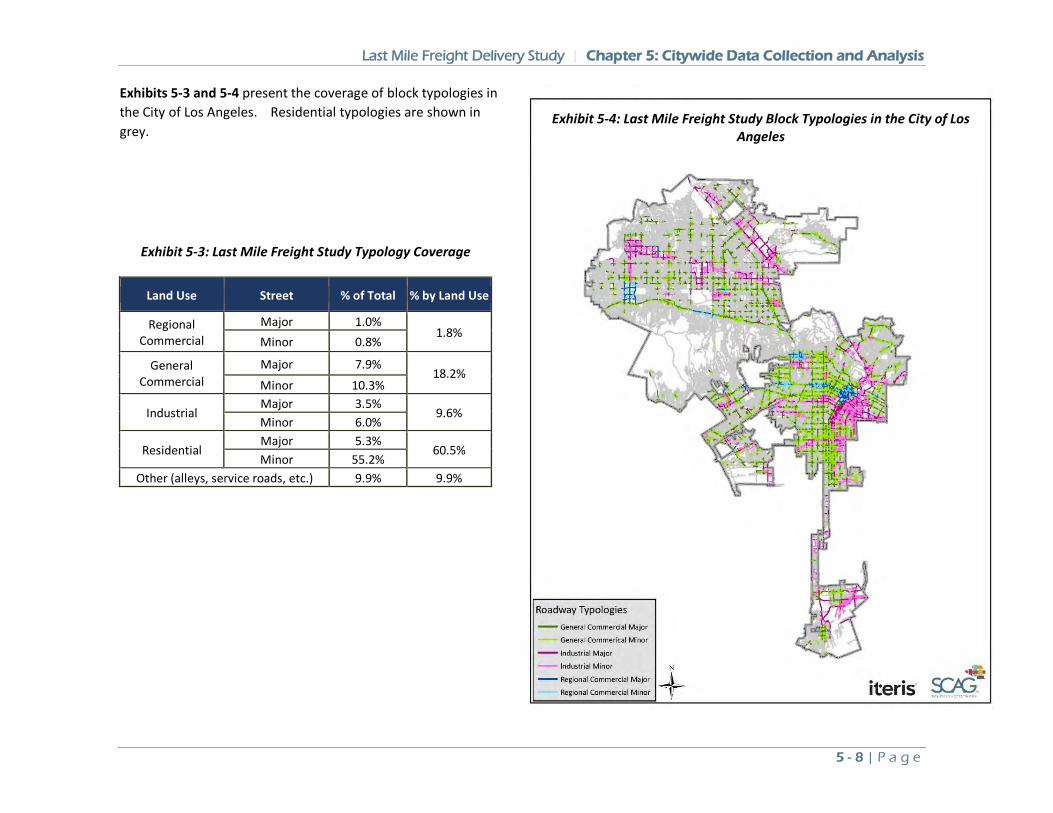
Last Mile Freight Delivery Study | Chapter 5: Citywide Data Collection and Analysis
5 - 8 | P a g e
Exhibits 5-3 and 5-4 present the coverage of block typologies in the City of Los Angeles. Residential typologies are shown in grey.
Exhibit 5-3: Last Mile Freight Study Typology Coverage
Land Use Street % of Total % by Land Use
Regional Commercial
Major 1.0% 1.8%
Minor 0.8%
General Commercial
Major 7.9% 18.2%
Minor 10.3%
Industrial Major 3.5%
9.6% Minor 6.0%
Residential Major 5.3%
60.5% Minor 55.2%
Other (alleys, service roads, etc.) 9.9% 9.9%
Exhibit 5-4: Last Mile Freight Study Block Typologies in the City of Los Angeles
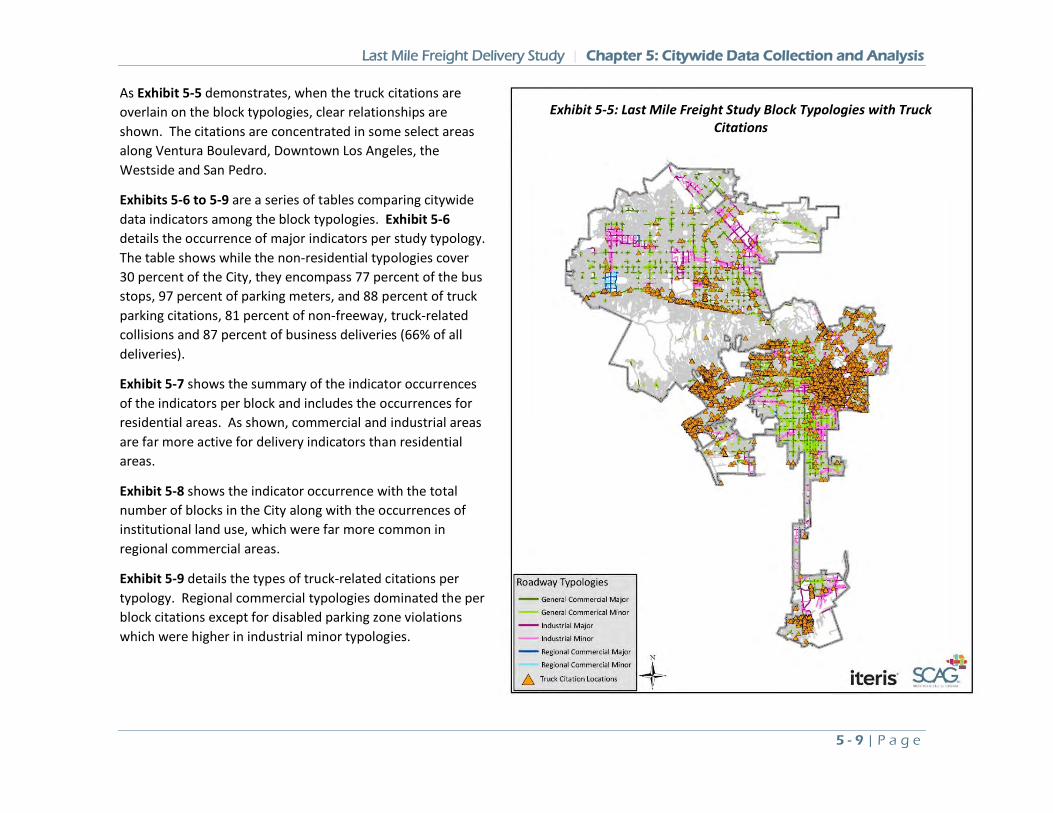
Last Mile Freight Delivery Study | Chapter 5: Citywide Data Collection and Analysis
5 - 9 | P a g e
As Exhibit 5-5 demonstrates, when the truck citations are overlain on the block typologies, clear relationships are shown. The citations are concentrated in some select areas along Ventura Boulevard, Downtown Los Angeles, the Westside and San Pedro.
Exhibits 5-6 to 5-9 are a series of tables comparing citywide data indicators among the block typologies. Exhibit 5-6 details the occurrence of major indicators per study typology. The table shows while the non-residential typologies cover 30 percent of the City, they encompass 77 percent of the bus stops, 97 percent of parking meters, and 88 percent of truck parking citations, 81 percent of non-freeway, truck-related collisions and 87 percent of business deliveries (66% of all deliveries).
Exhibit 5-7 shows the summary of the indicator occurrences of the indicators per block and includes the occurrences for residential areas. As shown, commercial and industrial areas are far more active for delivery indicators than residential areas.
Exhibit 5-8 shows the indicator occurrence with the total number of blocks in the City along with the occurrences of institutional land use, which were far more common in regional commercial areas.
Exhibit 5-9 details the types of truck-related citations per typology. Regional commercial typologies dominated the per block citations except for disabled parking zone violations which were higher in industrial minor typologies.
Exhibit 5-5: Last Mile Freight Study Block Typologies with Truck Citations
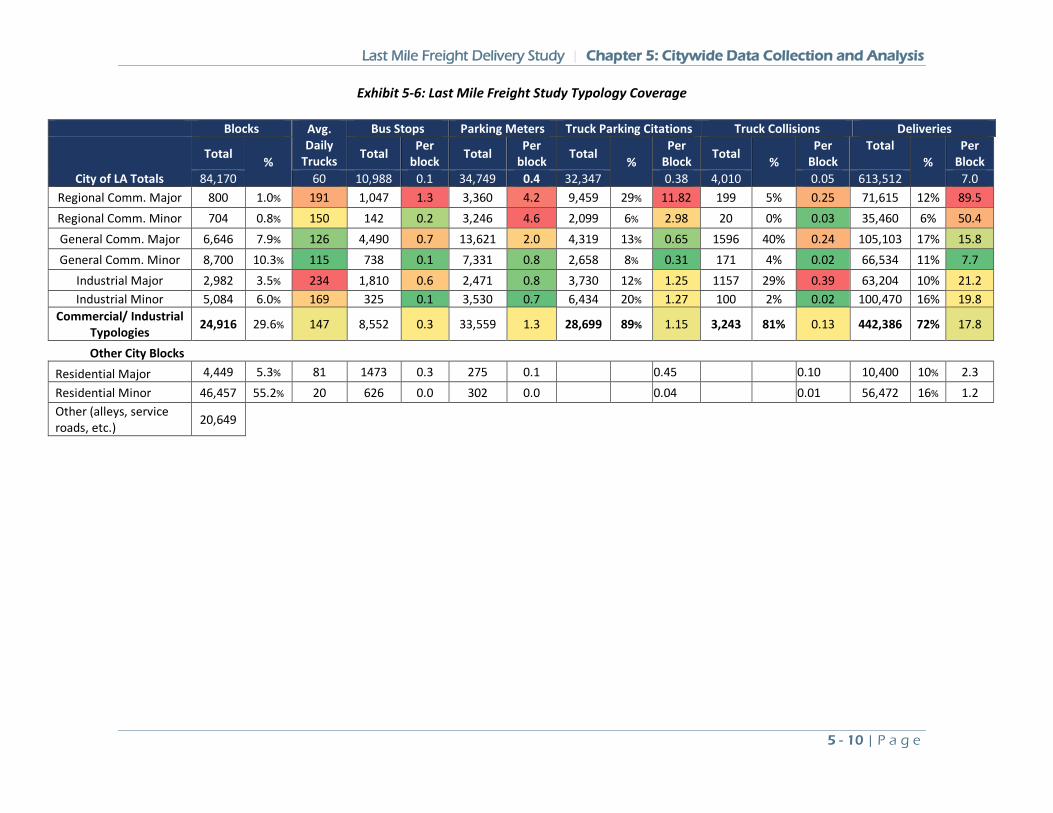
Last Mile Freight Delivery Study | Chapter 5: Citywide Data Collection and Analysis
5 - 10 | P a g e
Exhibit 5-6: Last Mile Freight Study Typology Coverage
Blocks Avg. Daily
Trucks
Bus Stops Parking Meters Truck Parking Citations Truck Collisions Deliveries
City of LA Totals
Total %
Total Per block Total Per
block Total %
Per Block Total
% Per
Block Total
% Per
Block 84,170 60 10,988 0.1 34,749 0.4 32,347 0.38 4,010 0.05 613,512 7.0
Regional Comm. Major 800 1.0% 191 1,047 1.3 3,360 4.2 9,459 29% 11.82 199 5% 0.25 71,615 12% 89.5 Regional Comm. Minor 704 0.8% 150 142 0.2 3,246 4.6 2,099 6% 2.98 20 0% 0.03 35,460 6% 50.4 General Comm. Major 6,646 7.9% 126 4,490 0.7 13,621 2.0 4,319 13% 0.65 1596 40% 0.24 105,103 17% 15.8 General Comm. Minor 8,700 10.3% 115 738 0.1 7,331 0.8 2,658 8% 0.31 171 4% 0.02 66,534 11% 7.7
Industrial Major 2,982 3.5% 234 1,810 0.6 2,471 0.8 3,730 12% 1.25 1157 29% 0.39 63,204 10% 21.2 Industrial Minor 5,084 6.0% 169 325 0.1 3,530 0.7 6,434 20% 1.27 100 2% 0.02 100,470 16% 19.8
Commercial/ Industrial Typologies 24,916 29.6% 147 8,552 0.3 33,559 1.3 28,699 89% 1.15 3,243 81% 0.13 442,386 72% 17.8
Other City Blocks
Residential Major 4,449 5.3% 81 1473 0.3 275 0.1 0.45 0.10 10,400 10% 2.3 Residential Minor 46,457 55.2% 20 626 0.0 302 0.0 0.04 0.01 56,472 16% 1.2 Other (alleys, service roads, etc.) 20,649
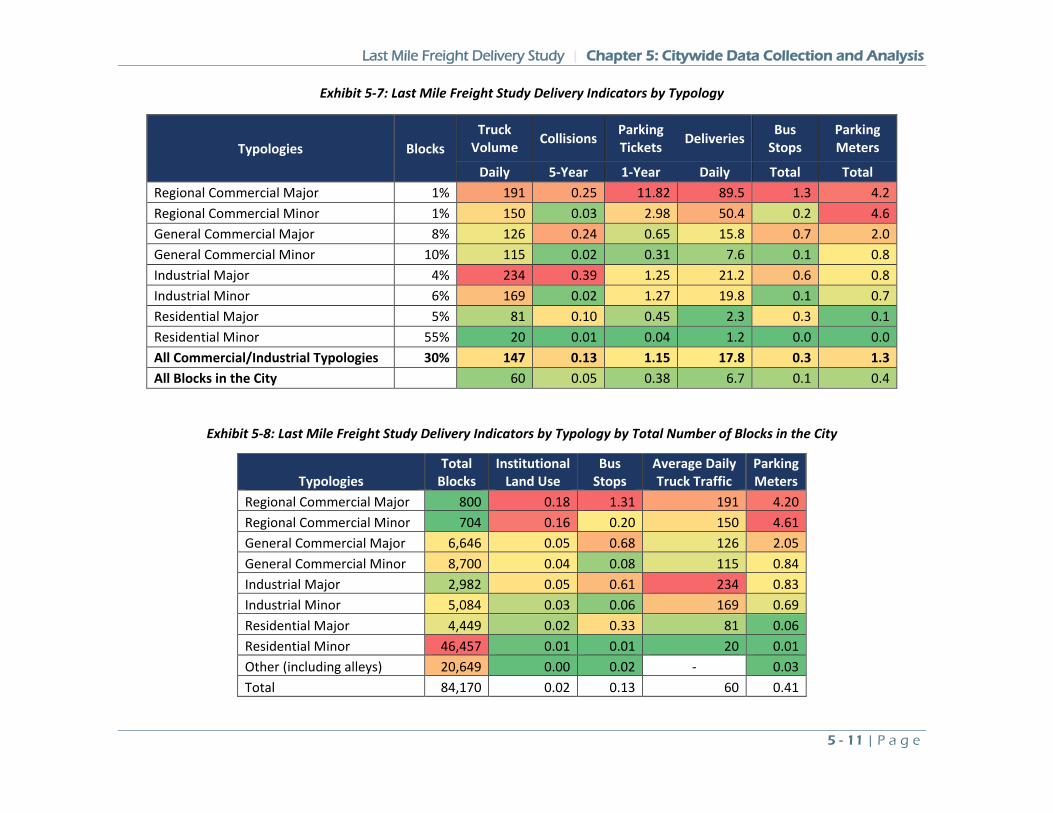
Last Mile Freight Delivery Study | Chapter 5: Citywide Data Collection and Analysis
5 - 11 | P a g e
Exhibit 5-7: Last Mile Freight Study Delivery Indicators by Typology
Typologies Blocks Truck
Volume Collisions Parking Tickets Deliveries Bus
Stops Parking Meters
Daily 5-Year 1-Year Daily Total Total Regional Commercial Major 1% 191 0.25 11.82 89.5 1.3 4.2 Regional Commercial Minor 1% 150 0.03 2.98 50.4 0.2 4.6 General Commercial Major 8% 126 0.24 0.65 15.8 0.7 2.0 General Commercial Minor 10% 115 0.02 0.31 7.6 0.1 0.8 Industrial Major 4% 234 0.39 1.25 21.2 0.6 0.8 Industrial Minor 6% 169 0.02 1.27 19.8 0.1 0.7 Residential Major 5% 81 0.10 0.45 2.3 0.3 0.1 Residential Minor 55% 20 0.01 0.04 1.2 0.0 0.0 All Commercial/Industrial Typologies 30% 147 0.13 1.15 17.8 0.3 1.3 All Blocks in the City 60 0.05 0.38 6.7 0.1 0.4
Exhibit 5-8: Last Mile Freight Study Delivery Indicators by Typology by Total Number of Blocks in the City
Typologies Total
Blocks Institutional
Land Use Bus
Stops Average Daily Truck Traffic
Parking Meters
Regional Commercial Major 800 0.18 1.31 191 4.20 Regional Commercial Minor 704 0.16 0.20 150 4.61 General Commercial Major 6,646 0.05 0.68 126 2.05 General Commercial Minor 8,700 0.04 0.08 115 0.84 Industrial Major 2,982 0.05 0.61 234 0.83 Industrial Minor 5,084 0.03 0.06 169 0.69 Residential Major 4,449 0.02 0.33 81 0.06 Residential Minor 46,457 0.01 0.01 20 0.01 Other (including alleys) 20,649 0.00 0.02 - 0.03 Total 84,170 0.02 0.13 60 0.41
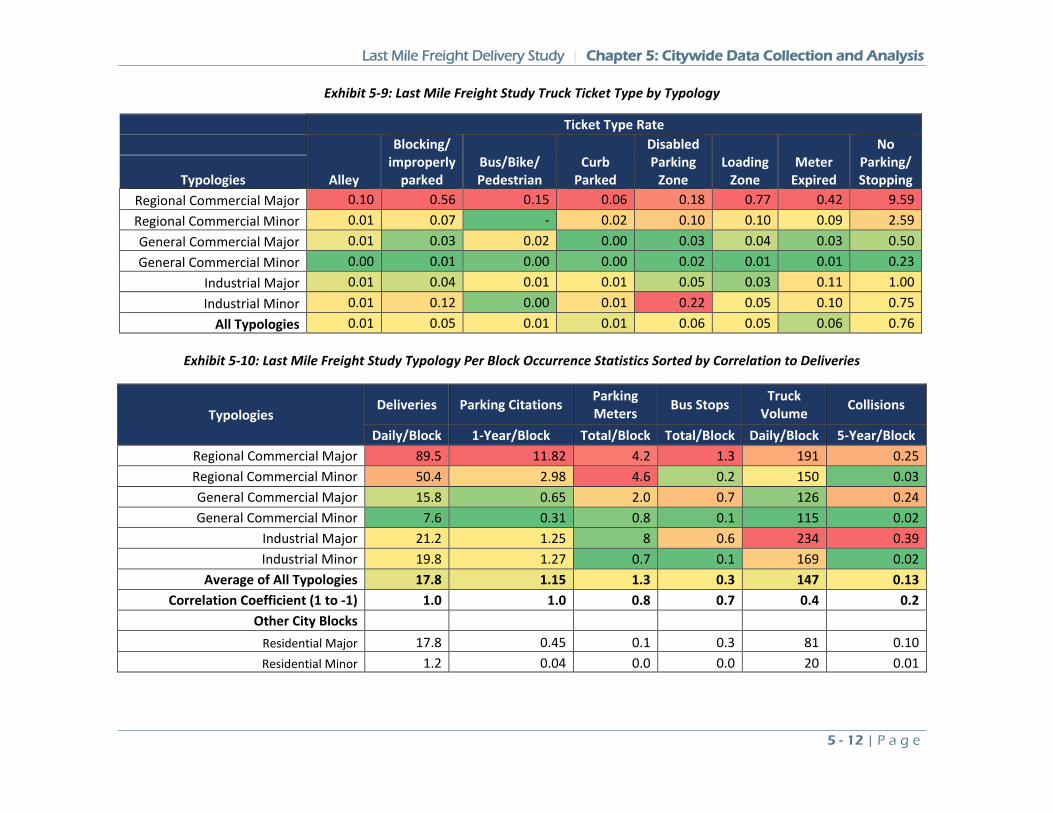
Last Mile Freight Delivery Study | Chapter 5: Citywide Data Collection and Analysis
5 - 12 | P a g e
Exhibit 5-9: Last Mile Freight Study Truck Ticket Type by Typology
Ticket Type Rate
Alley
Blocking/ improperly
parked Bus/Bike/ Pedestrian
Curb Parked
Disabled Parking
Zone Loading
Zone Meter
Expired
No Parking/ Stopping Typologies
Regional Commercial Major 0.10 0.56 0.15 0.06 0.18 0.77 0.42 9.59 Regional Commercial Minor 0.01 0.07 - 0.02 0.10 0.10 0.09 2.59 General Commercial Major 0.01 0.03 0.02 0.00 0.03 0.04 0.03 0.50 General Commercial Minor 0.00 0.01 0.00 0.00 0.02 0.01 0.01 0.23
Industrial Major 0.01 0.04 0.01 0.01 0.05 0.03 0.11 1.00 Industrial Minor 0.01 0.12 0.00 0.01 0.22 0.05 0.10 0.75
All Typologies 0.01 0.05 0.01 0.01 0.06 0.05 0.06 0.76
Exhibit 5-10: Last Mile Freight Study Typology Per Block Occurrence Statistics Sorted by Correlation to Deliveries
Typologies Deliveries Parking Citations Parking
Meters Bus Stops Truck Volume Collisions
Daily/Block 1-Year/Block Total/Block Total/Block Daily/Block 5-Year/Block Regional Commercial Major 89.5 11.82 4.2 1.3 191 0.25 Regional Commercial Minor 50.4 2.98 4.6 0.2 150 0.03 General Commercial Major 15.8 0.65 2.0 0.7 126 0.24 General Commercial Minor 7.6 0.31 0.8 0.1 115 0.02
Industrial Major 21.2 1.25 8 0.6 234 0.39 Industrial Minor 19.8 1.27 0.7 0.1 169 0.02
Average of All Typologies 17.8 1.15 1.3 0.3 147 0.13 Correlation Coefficient (1 to -1) 1.0 1.0 0.8 0.7 0.4 0.2
Other City Blocks Residential Major 17.8 0.45 0.1 0.3 81 0.10 Residential Minor 1.2 0.04 0.0 0.0 20 0.01
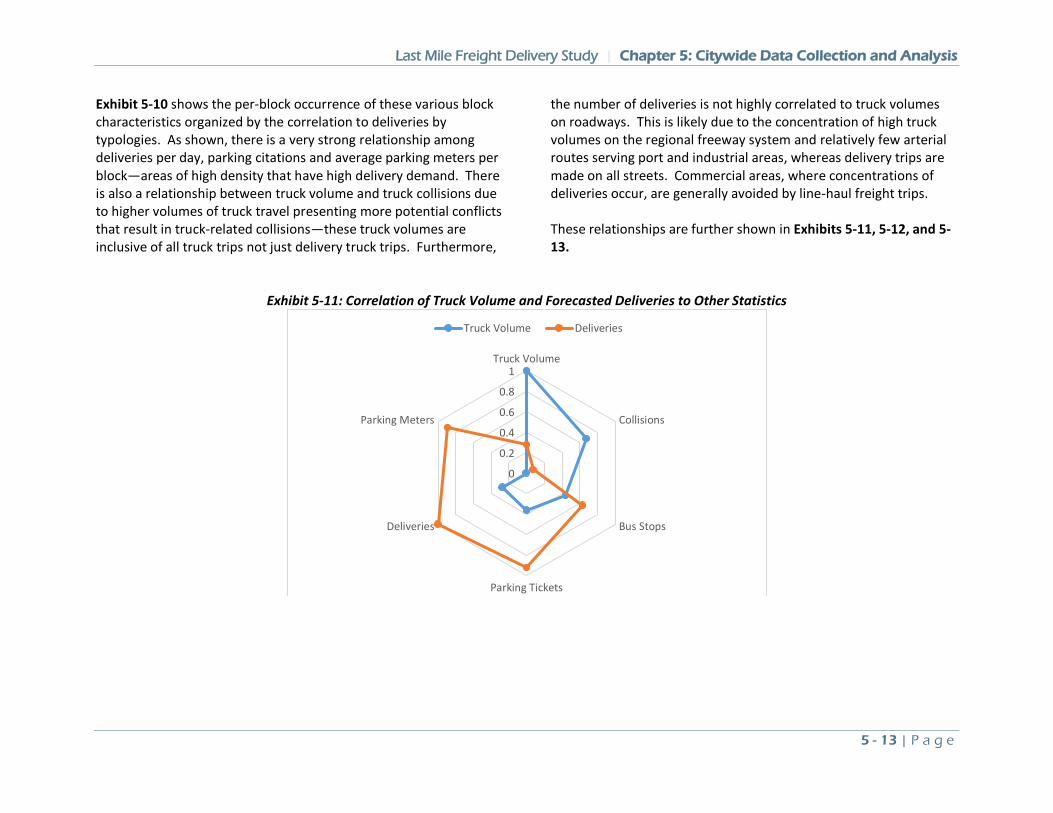
Last Mile Freight Delivery Study | Chapter 5: Citywide Data Collection and Analysis
5 - 13 | P a g e
Exhibit 5-10 shows the per-block occurrence of these various block characteristics organized by the correlation to deliveries by typologies. As shown, there is a very strong relationship among deliveries per day, parking citations and average parking meters per block—areas of high density that have high delivery demand. There is also a relationship between truck volume and truck collisions due to higher volumes of truck travel presenting more potential conflicts that result in truck-related collisions—these truck volumes are inclusive of all truck trips not just delivery truck trips. Furthermore,
the number of deliveries is not highly correlated to truck volumes on roadways. This is likely due to the concentration of high truck volumes on the regional freeway system and relatively few arterial routes serving port and industrial areas, whereas delivery trips are made on all streets. Commercial areas, where concentrations of deliveries occur, are generally avoided by line-haul freight trips. These relationships are further shown in Exhibits 5-11, 5-12, and 5-13.
Exhibit 5-11: Correlation of Truck Volume and Forecasted Deliveries to Other Statistics
0
0.2
0.4
0.6
0.8
1Truck Volume
Collisions
Bus Stops
Parking Tickets
Deliveries
Parking Meters
Truck Volume Deliveries
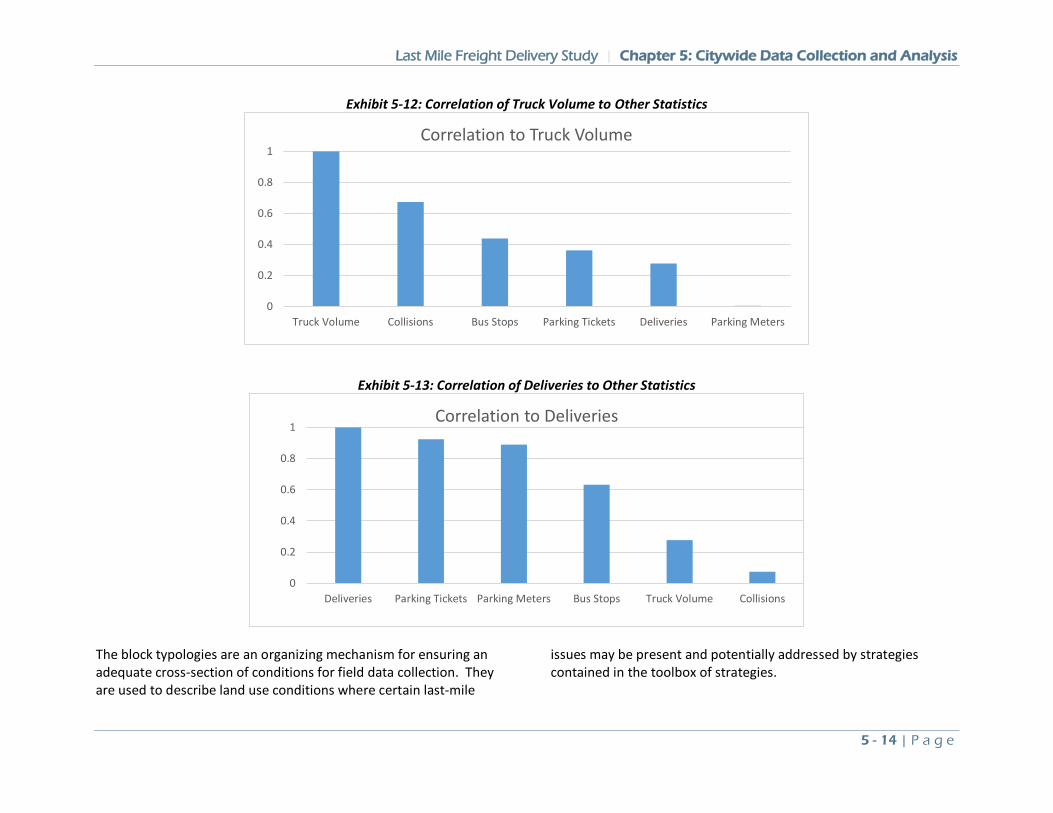
Last Mile Freight Delivery Study | Chapter 5: Citywide Data Collection and Analysis
5 - 14 | P a g e
Exhibit 5-12: Correlation of Truck Volume to Other Statistics
Exhibit 5-13: Correlation of Deliveries to Other Statistics
The block typologies are an organizing mechanism for ensuring an adequate cross-section of conditions for field data collection. They are used to describe land use conditions where certain last-mile
issues may be present and potentially addressed by strategies contained in the toolbox of strategies.
0
0.2
0.4
0.6
0.8
1
Truck Volume Collisions Bus Stops Parking Tickets Deliveries Parking Meters
Correlation to Truck Volume
0
0.2
0.4
0.6
0.8
1
Deliveries Parking Tickets Parking Meters Bus Stops Truck Volume Collisions
Correlation to Deliveries
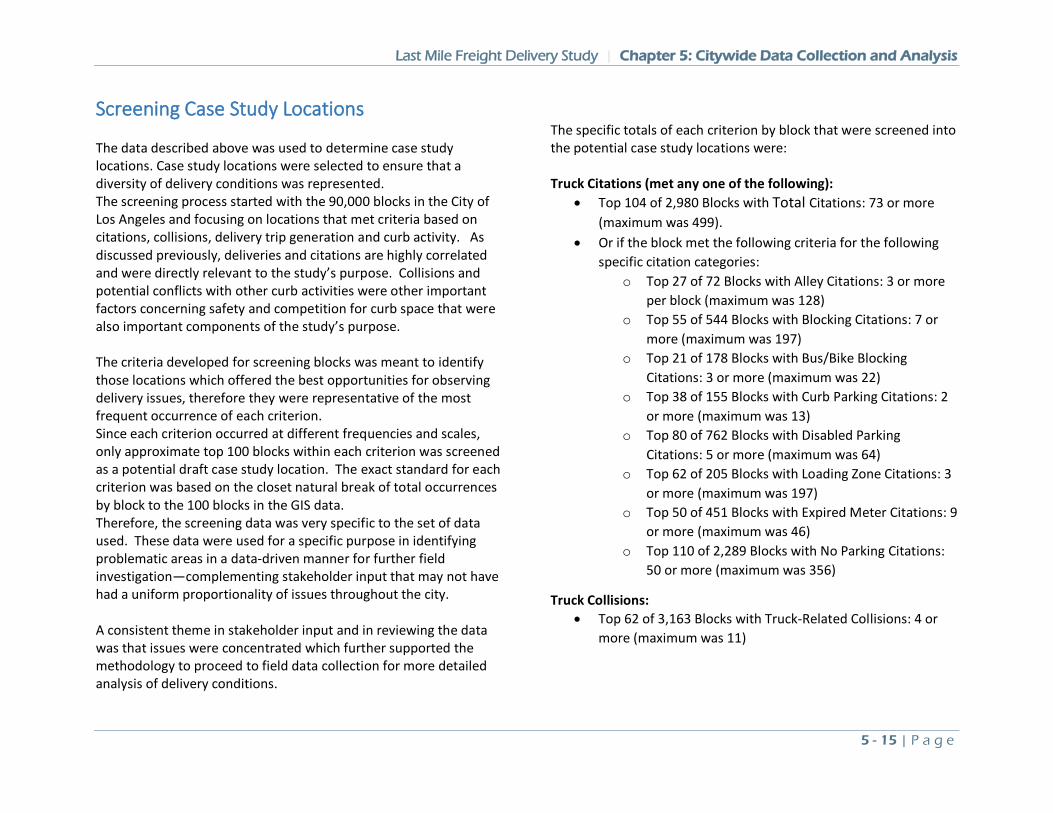
Last Mile Freight Delivery Study | Chapter 5: Citywide Data Collection and Analysis
5 - 15 | P a g e
Screening Case Study Locations The data described above was used to determine case study locations. Case study locations were selected to ensure that a diversity of delivery conditions was represented. The screening process started with the 90,000 blocks in the City of Los Angeles and focusing on locations that met criteria based on citations, collisions, delivery trip generation and curb activity. As discussed previously, deliveries and citations are highly correlated and were directly relevant to the study’s purpose. Collisions and potential conflicts with other curb activities were other important factors concerning safety and competition for curb space that were also important components of the study’s purpose. The criteria developed for screening blocks was meant to identify those locations which offered the best opportunities for observing delivery issues, therefore they were representative of the most frequent occurrence of each criterion. Since each criterion occurred at different frequencies and scales, only approximate top 100 blocks within each criterion was screened as a potential draft case study location. The exact standard for each criterion was based on the closet natural break of total occurrences by block to the 100 blocks in the GIS data. Therefore, the screening data was very specific to the set of data used. These data were used for a specific purpose in identifying problematic areas in a data-driven manner for further field investigation—complementing stakeholder input that may not have had a uniform proportionality of issues throughout the city. A consistent theme in stakeholder input and in reviewing the data was that issues were concentrated which further supported the methodology to proceed to field data collection for more detailed analysis of delivery conditions.
The specific totals of each criterion by block that were screened into the potential case study locations were: Truck Citations (met any one of the following):
• Top 104 of 2,980 Blocks with Total Citations: 73 or more (maximum was 499).
• Or if the block met the following criteria for the following specific citation categories:
o Top 27 of 72 Blocks with Alley Citations: 3 or more per block (maximum was 128)
o Top 55 of 544 Blocks with Blocking Citations: 7 or more (maximum was 197)
o Top 21 of 178 Blocks with Bus/Bike Blocking Citations: 3 or more (maximum was 22)
o Top 38 of 155 Blocks with Curb Parking Citations: 2 or more (maximum was 13)
o Top 80 of 762 Blocks with Disabled Parking Citations: 5 or more (maximum was 64)
o Top 62 of 205 Blocks with Loading Zone Citations: 3 or more (maximum was 197)
o Top 50 of 451 Blocks with Expired Meter Citations: 9 or more (maximum was 46)
o Top 110 of 2,289 Blocks with No Parking Citations: 50 or more (maximum was 356)
Truck Collisions: • Top 62 of 3,163 Blocks with Truck-Related Collisions: 4 or
more (maximum was 11)
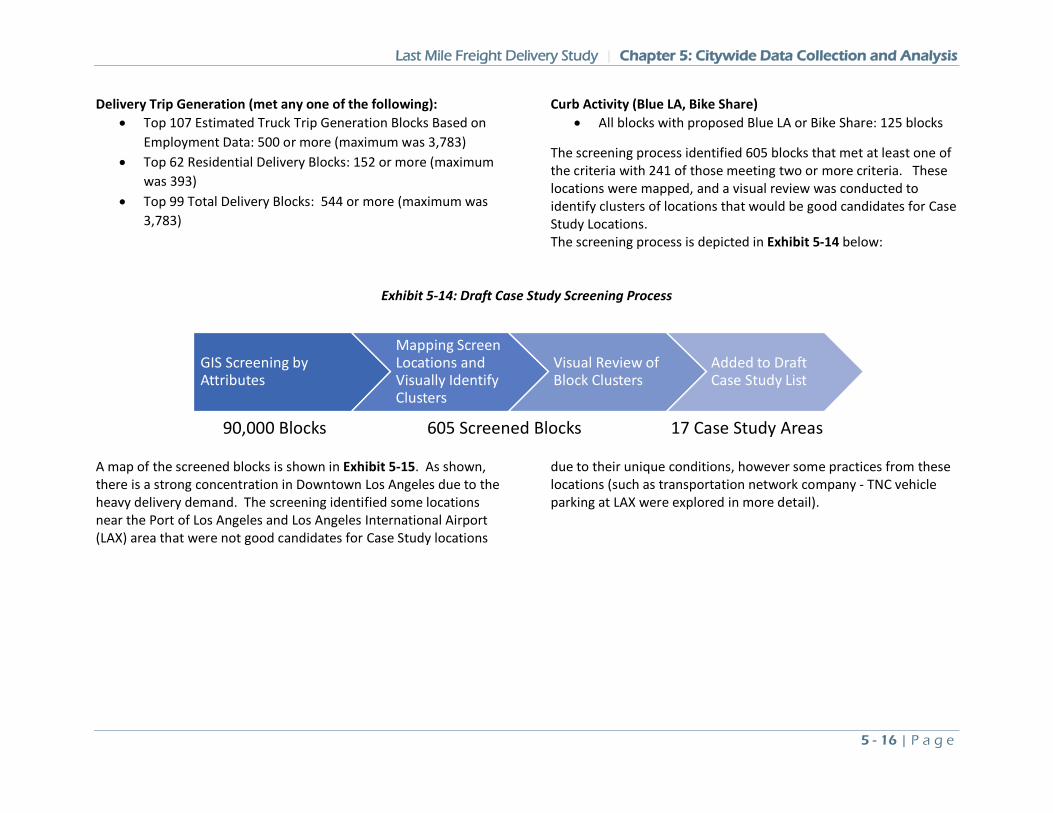
Last Mile Freight Delivery Study | Chapter 5: Citywide Data Collection and Analysis
5 - 16 | P a g e
Delivery Trip Generation (met any one of the following): • Top 107 Estimated Truck Trip Generation Blocks Based on
Employment Data: 500 or more (maximum was 3,783) • Top 62 Residential Delivery Blocks: 152 or more (maximum
was 393) • Top 99 Total Delivery Blocks: 544 or more (maximum was
3,783)
Curb Activity (Blue LA, Bike Share) • All blocks with proposed Blue LA or Bike Share: 125 blocks
The screening process identified 605 blocks that met at least one of the criteria with 241 of those meeting two or more criteria. These locations were mapped, and a visual review was conducted to identify clusters of locations that would be good candidates for Case Study Locations. The screening process is depicted in Exhibit 5-14 below:
Exhibit 5-14: Draft Case Study Screening Process
A map of the screened blocks is shown in Exhibit 5-15. As shown, there is a strong concentration in Downtown Los Angeles due to the heavy delivery demand. The screening identified some locations near the Port of Los Angeles and Los Angeles International Airport (LAX) area that were not good candidates for Case Study locations
due to their unique conditions, however some practices from these locations (such as transportation network company - TNC vehicle parking at LAX were explored in more detail).
GIS Screening by Attributes
Mapping Screen Locations and Visually Identify Clusters
Visual Review of Block Clusters
Added to Draft Case Study List
90,000 Blocks 605 Screened Blocks 17 Case Study Areas
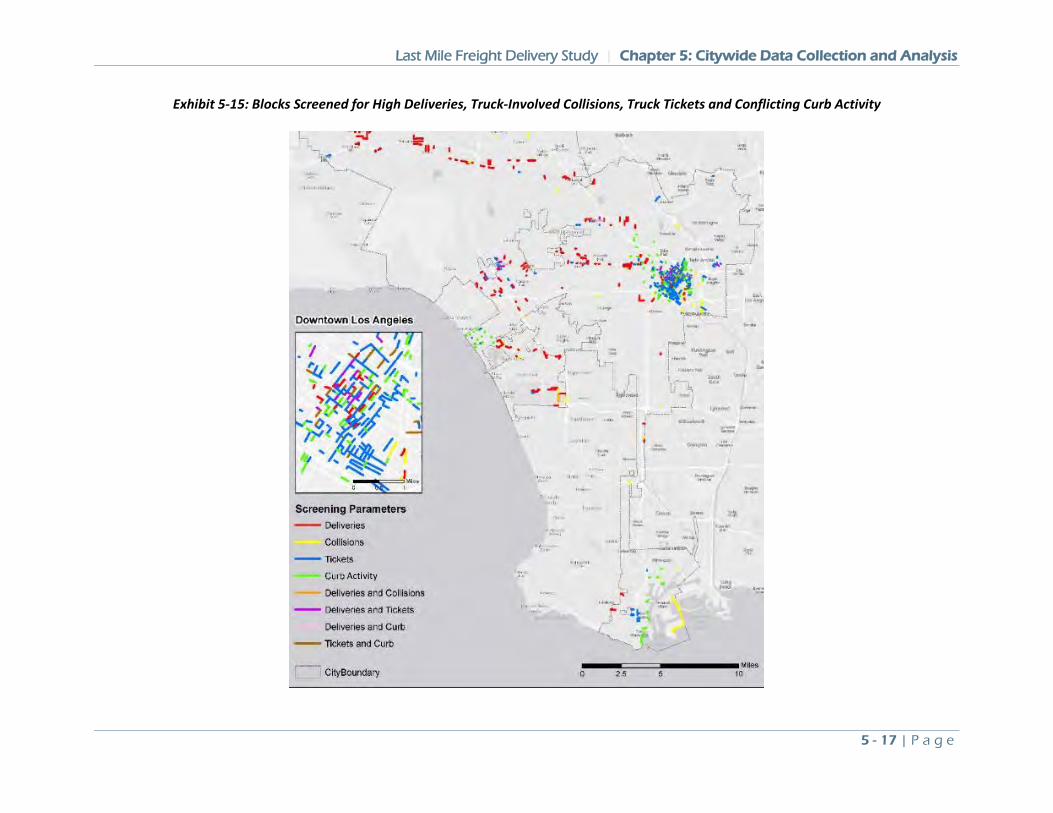
Last Mile Freight Delivery Study | Chapter 5: Citywide Data Collection and Analysis
5 - 17 | P a g e
Exhibit 5-15: Blocks Screened for High Deliveries, Truck-Involved Collisions, Truck Tickets and Conflicting Curb Activity
Activity
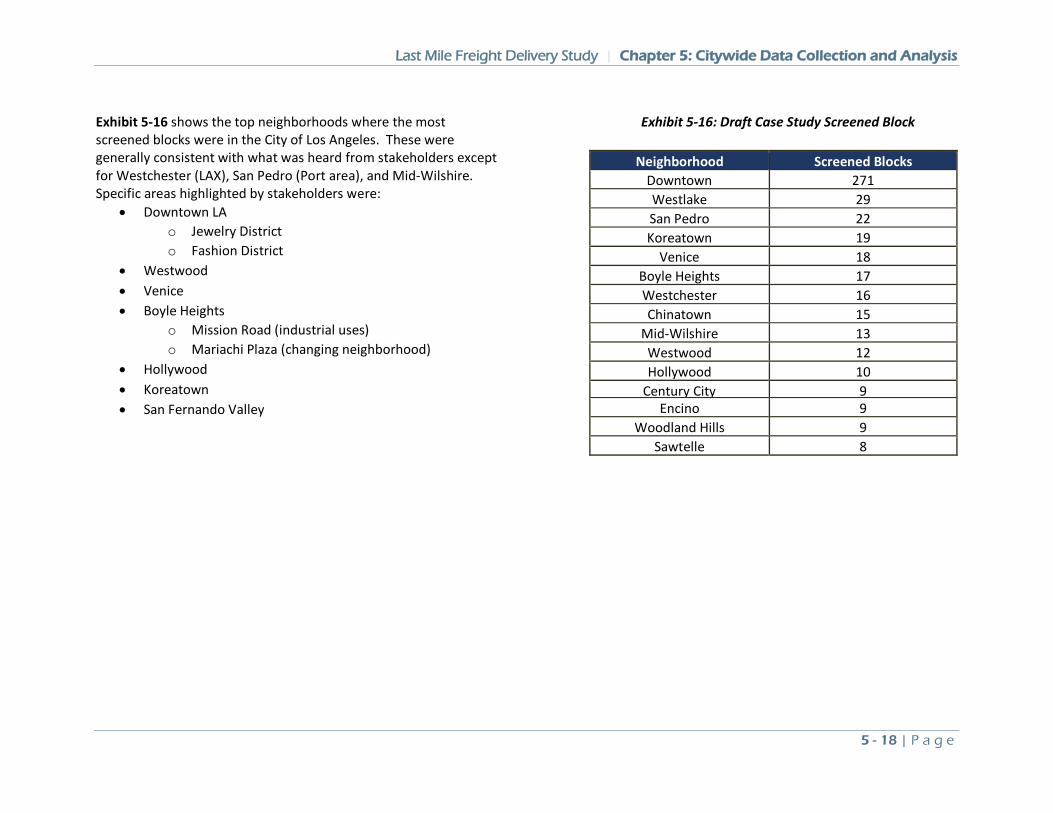
Last Mile Freight Delivery Study | Chapter 5: Citywide Data Collection and Analysis
5 - 18 | P a g e
Exhibit 5-16 shows the top neighborhoods where the most screened blocks were in the City of Los Angeles. These were generally consistent with what was heard from stakeholders except for Westchester (LAX), San Pedro (Port area), and Mid-Wilshire. Specific areas highlighted by stakeholders were:
• Downtown LA o Jewelry District o Fashion District
• Westwood • Venice • Boyle Heights
o Mission Road (industrial uses) o Mariachi Plaza (changing neighborhood)
• Hollywood • Koreatown • San Fernando Valley
Exhibit 5-16: Draft Case Study Screened Block
Neighborhood Screened Blocks Downtown 271 Westlake 29 San Pedro 22 Koreatown 19
Venice 18 Boyle Heights 17 Westchester 16 Chinatown 15
Mid-Wilshire 13 Westwood 12 Hollywood 10
Century City 9 Encino 9
Woodland Hills 9 Sawtelle 8
Last Mile Freight Delivery Study | Chapter 5: Citywide Data Collection and Analysis
5 - 19 | P a g e
Based on a visual review of the screened blocks and PAC input, 17 clusters of screened blocks were identified for their potential as case study locations based on their potential to provide a high frequency of deliveries and issues to observe. The clusters of screened blocks, numbered for identification but not ‘ranked’ by any measure:
#1 Wilshire Boulevard, Bixel Street, Lucas Avenue – Westlake #2: 6th-8th, Grand, Hope and Olive -Downtown #3: Ventura Boulevard – Encino #4: Van Nuys Boulevard – Van Nuys #5: Grand Avenue, 6th, 11th, 14th Streets - San Pedro #6: Westwood Boulevard, Galey, La Conte, Midvale – Westwood #7: Traction Avenue/2nd St. - Downtown – Arts District #8: North Spring/North Broadway – Chinatown #9: Cesar Chavez Avenue - Boyle Heights #10: USC Medical Center - Boyle Heights #12: Wilshire Boulevard and side streets - Koreatown #11: Los Feliz Boulevard - Atwater Village #13: Hill Street - Downtown – Jewelry District
#14: Whitley Street - Hollywood #15: Santee Street - Downtown – Garment District #16:: Crocker Street - Downtown – Skid Row #17: Main Street and Broadway – Venice
A summary of the average daily deliveries and annual truck citations by cluster is provided in Exhibit 6-17. These two metrics indicate the potential number of observations of delivery activity and issues to observe in field data collection. A section of Hill Street in the Jewelry District was chosen as a pilot site to test data collection techniques before the data collection was expanded to the other case study areas as shown in Exhibits 5-17 and 5-18. These case study areas were reviewed by the project team, the PAC and City of Los Angeles staff to refine locations to be part of the field data collection. Originally only five to ten case study areas were to be analyzed, however the project team expanded data collection to obtain a greater range of delivery conditions. Twelve case study locations were selected, and one to six blocks were selected per case study area for a total of 35 blocks to be included in the data collection.
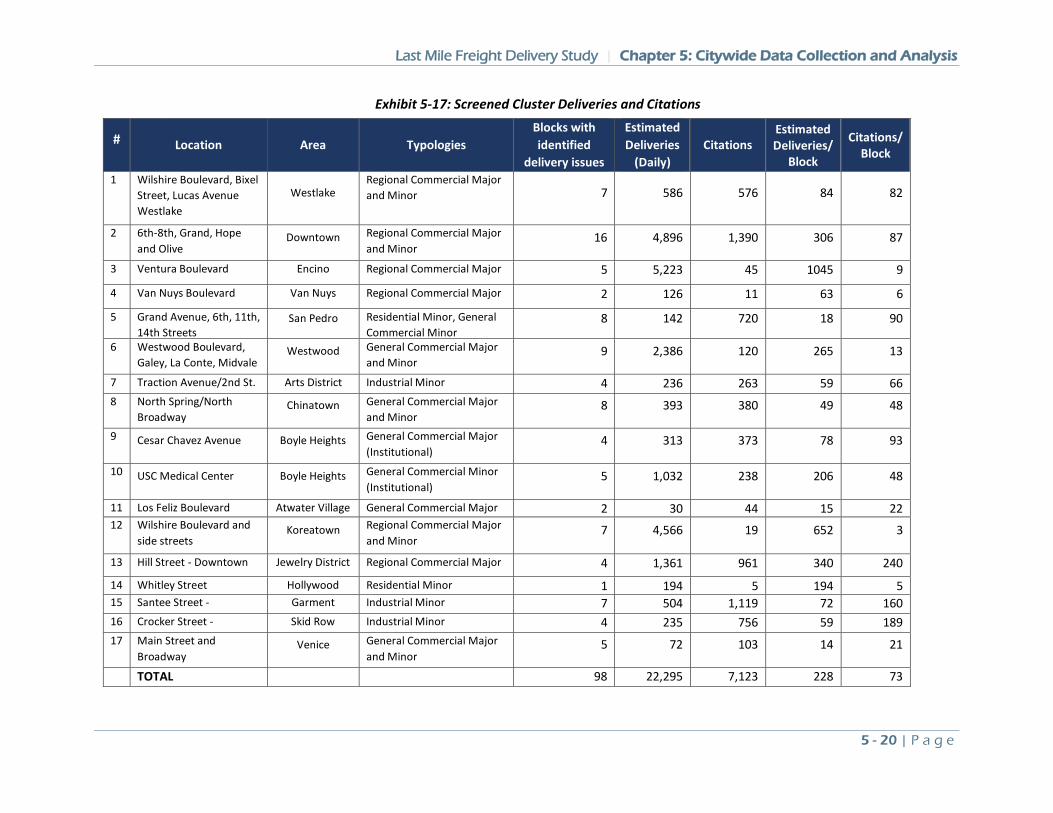
Last Mile Freight Delivery Study | Chapter 5: Citywide Data Collection and Analysis
5 - 20 | P a g e
Exhibit 5-17: Screened Cluster Deliveries and Citations
# Location Area Typologies Blocks with identified
delivery issues
Estimated Deliveries
(Daily) Citations
Estimated Deliveries/
Block
Citations/ Block
1 Wilshire Boulevard, Bixel Street, Lucas Avenue Westlake
Westlake Regional Commercial Major and Minor 7 586 576 84 82
2 6th-8th, Grand, Hope and Olive
Downtown Regional Commercial Major and Minor
16 4,896 1,390 306 87
3 Ventura Boulevard Encino Regional Commercial Major 5 5,223 45 1045 9
4 Van Nuys Boulevard Van Nuys Regional Commercial Major 2 126 11 63 6
5 Grand Avenue, 6th, 11th, 14th Streets
San Pedro Residential Minor, General Commercial Minor
8 142 720 18 90
6 Westwood Boulevard, Galey, La Conte, Midvale
Westwood General Commercial Major and Minor
9 2,386 120 265 13
7 Traction Avenue/2nd St.
Arts District Industrial Minor 4 236 263 59 66 8 North Spring/North
Broadway Chinatown General Commercial Major
and Minor 8 393 380 49 48
9 Cesar Chavez Avenue Boyle Heights General Commercial Major (Institutional)
4 313 373 78 93
10 USC Medical Center Boyle Heights General Commercial Minor (Institutional)
5 1,032 238 206 48
11 Los Feliz Boulevard Atwater Village General Commercial Major 2 30 44 15 22 12 Wilshire Boulevard and
side streets Koreatown Regional Commercial Major
and Minor 7 4,566 19 652 3
13 Hill Street - Downtown Jewelry District Regional Commercial Major 4 1,361 961 340 240
14 Whitley Street Hollywood Residential Minor 1 194 5 194 5 15 Santee Street -
Garment
Industrial Minor 7 504 1,119 72 160
16 Crocker Street -
Skid Row Industrial Minor 4 235 756 59 189 17 Main Street and
Broadway Venice General Commercial Major
and Minor 5 72 103 14 21
TOTAL 98 22,295 7,123 228 73
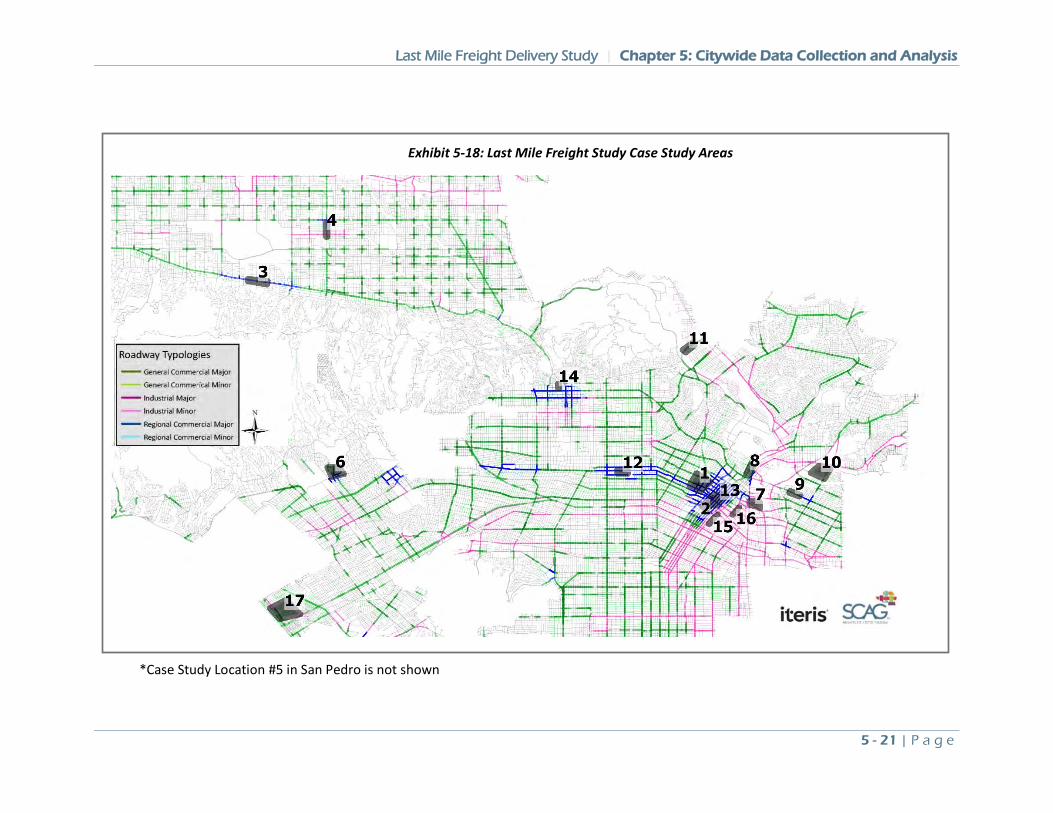
Last Mile Freight Delivery Study | Chapter 5: Citywide Data Collection and Analysis
5 - 21 | P a g e
Exhibit 5-18: Last Mile Freight Study Case Study Areas
*Case Study Location #5 in San Pedro is not shown
Last Mile Freight Delivery Study | Chapter 6: Field Data Collection
6 - 1 | P a g e
Chapter 6: Field Data Collection
The field data collection for the Last-Mile Freight Delivery Study built upon information gathered from the Project Advisory Committee (PAC), direct stakeholder outreach, and other technical sources, to refine locations and methods of obtaining field data. This information was used to support analysis and draw conclusions for the final recommendations and strategies.
This chapter contains overall findings and observations from the field data collection, while Chapter 9 details each case study block with recommendations to changes to curb designations or restrictions as applicable.
Data collection effort focused on curbside activity at 35 blocks within 12 City of Los Angeles case study areas. A data collection approach was developed through review of data collection methodologies in the literature review and input from the PAC, which expanded the scope of the data collection from observation of only delivery activity to observation of all curbside activity to help understand the context of deliveries and issues derived from the interaction of deliveries within the urban environment. A mix of peak period (8AM to 5PM) technician observations and 24-hour video data were used. Technicians were deployed to 31 of the blocks and video data collection was deployed to 12 blocks—four blocks had only video data collection. Each block was segmented into approximately 20-foot” slots of curb space based on curb designation as parking, red zone, driveway, yellow zone, etc. Whenever a vehicle occupied the slot, its time in and out, vehicle type and activity were noted. While there are many curbside
activities, for this analysis they were categorized as parked, passenger loading or delivery loading.
Overall, 8,218 activities at 1,136 curb space slots were observed. Of those 4,675 were parking activities, 2,778 were passenger loading activities and 765 were delivery loading. The freight deliveries lasted an average of 30 minutes.
Data Collection Process The Geographic Information System (GIS) analysis of City of Los Angeles data described in Chapter 6 identified clusters of blocks with a concentration of delivery-related issues existed. To further understand these issues, these clusters of blocks with delivery issues were grouped by neighborhood into case study areas. From these case study areas, specific blocks were selected for field data collection.
The project team, through data collection and stakeholder interviews, and PAC refinement identified 17 potential case study locations in the project study area—the City of Los Angeles. Based on refinement with the PAC, 11 of the 17 case study areas were selected as field collection sites and the project team defined specific blocks within each case study area for data collection. Hill Street was selected as the initial data collection site due to the volume and diversity of delivery conditions in the Jewelry District, which was used to refine the data collection techniques such as the strengths and weakness of video vs. in-person data collection. Based on the initial site data collection, methods to observe and record curbside activity were adjusted with practical improvements
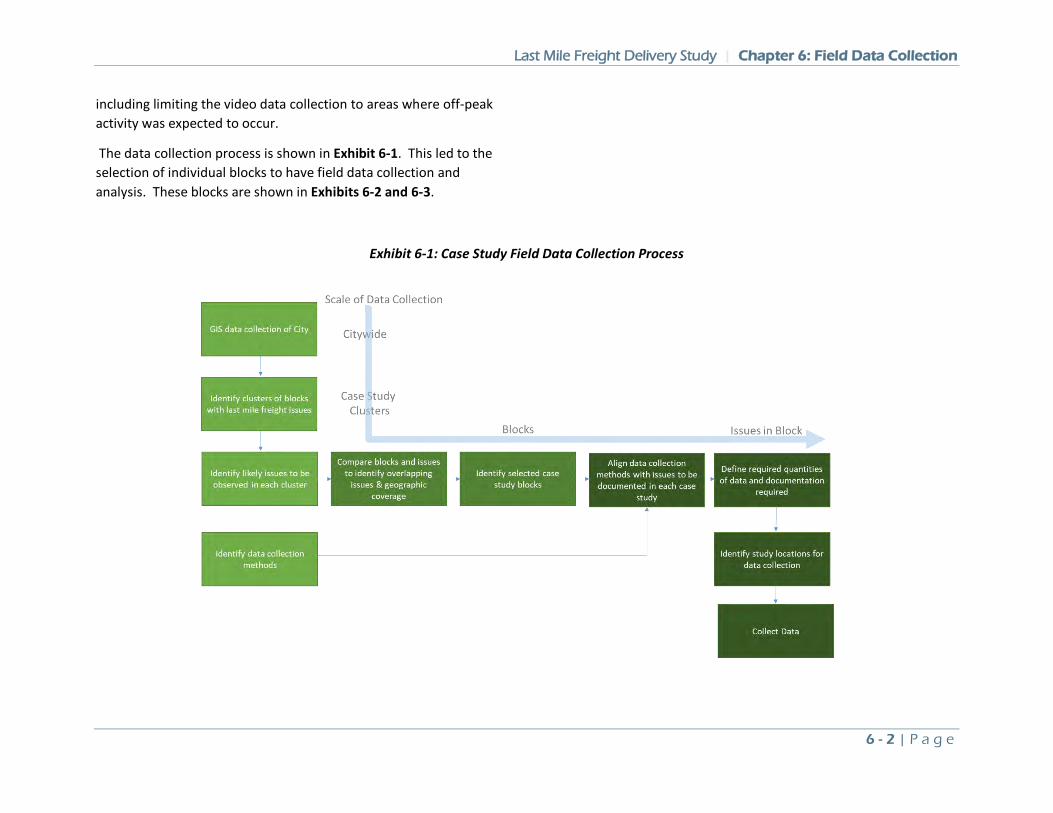
Last Mile Freight Delivery Study | Chapter 6: Field Data Collection
6 - 2 | P a g e
including limiting the video data collection to areas where off-peak activity was expected to occur.
The data collection process is shown in Exhibit 6-1. This led to the selection of individual blocks to have field data collection and analysis. These blocks are shown in Exhibits 6-2 and 6-3.
Exhibit 6-1: Case Study Field Data Collection Process
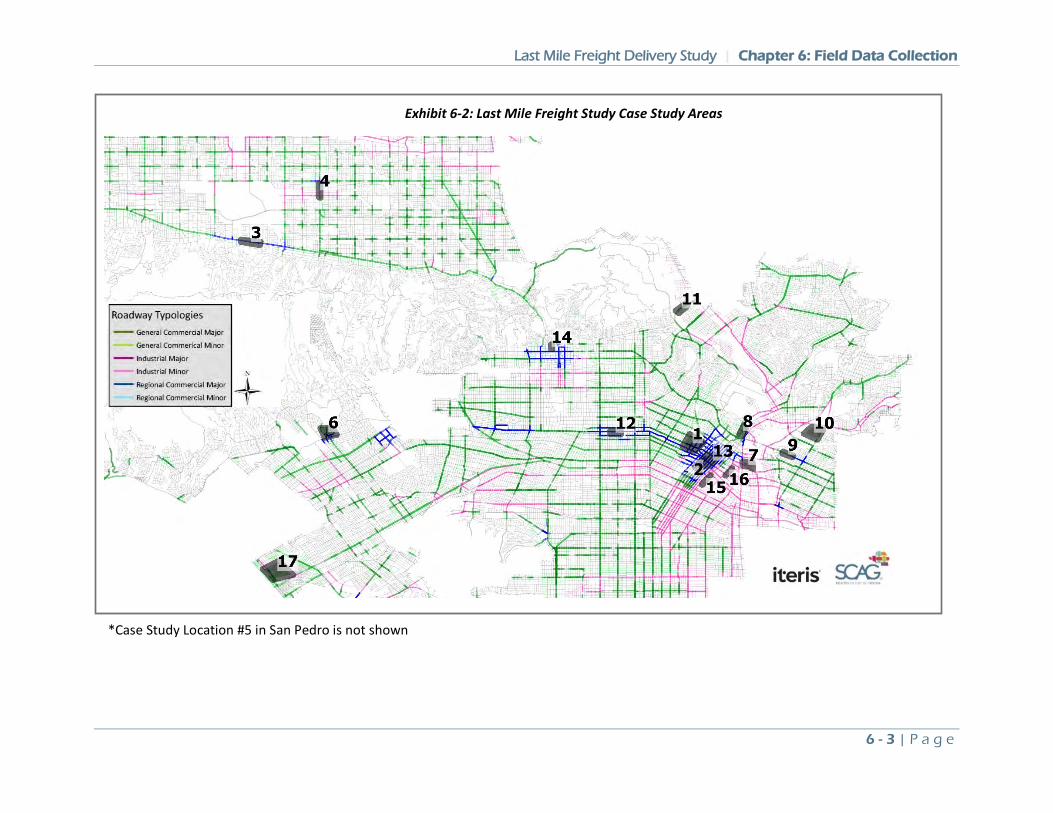
Last Mile Freight Delivery Study | Chapter 6: Field Data Collection
6 - 3 | P a g e
Exhibit 6-2: Last Mile Freight Study Case Study Areas
*Case Study Location #5 in San Pedro is not shown
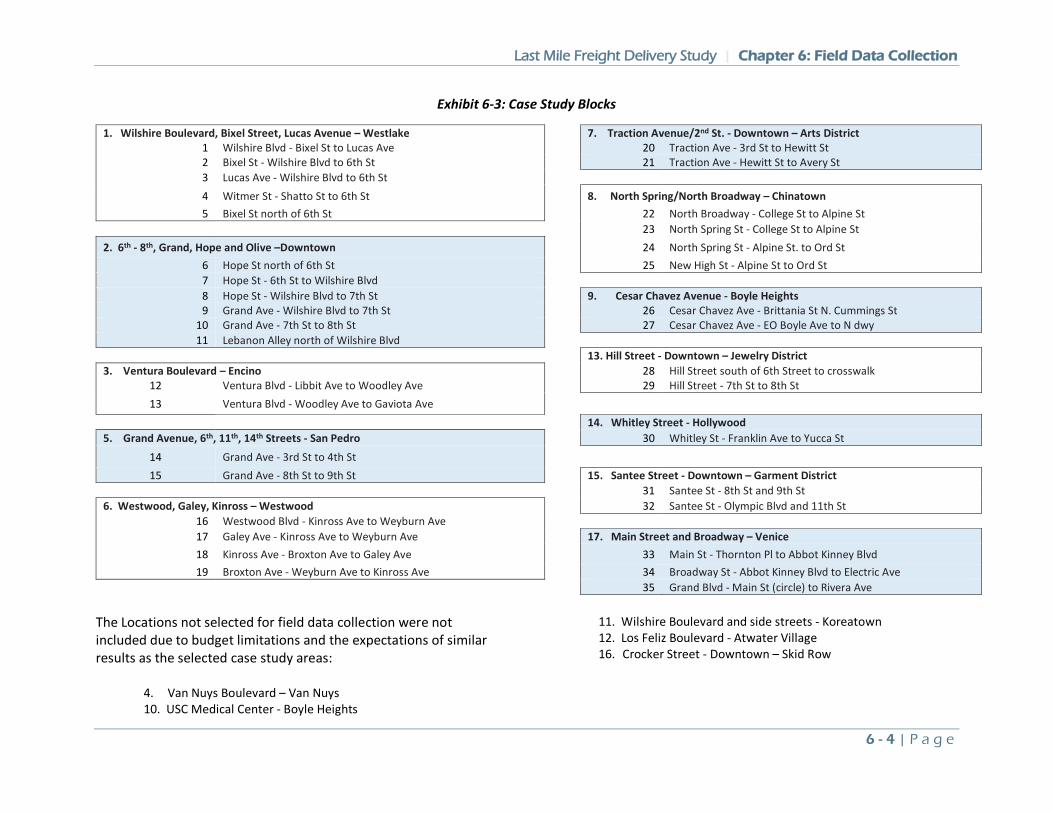
Last Mile Freight Delivery Study | Chapter 6: Field Data Collection
6 - 4 | P a g e
Exhibit 6-3: Case Study Blocks
1. Wilshire Boulevard, Bixel Street, Lucas Avenue – Westlake 7. Traction Avenue/2nd St. - Downtown – Arts District 1 Wilshire Blvd - Bixel St to Lucas Ave 20 Traction Ave - 3rd St to Hewitt St 2 Bixel St - Wilshire Blvd to 6th St 21 Traction Ave - Hewitt St to Avery St 3 Lucas Ave - Wilshire Blvd to 6th St
4 Witmer St - Shatto St to 6th St 8. North Spring/North Broadway – Chinatown 5 Bixel St north of 6th St 22 North Broadway - College St to Alpine St
23 North Spring St - College St to Alpine St 2. 6th - 8th, Grand, Hope and Olive –Downtown 24 North Spring St - Alpine St. to Ord St
6 Hope St north of 6th St 25 New High St - Alpine St to Ord St 7 Hope St - 6th St to Wilshire Blvd 8 Hope St - Wilshire Blvd to 7th St 9. Cesar Chavez Avenue - Boyle Heights 9 Grand Ave - Wilshire Blvd to 7th St 26 Cesar Chavez Ave - Brittania St N. Cummings St
10 Grand Ave - 7th St to 8th St 27 Cesar Chavez Ave - EO Boyle Ave to N dwy 11 Lebanon Alley north of Wilshire Blvd
13. Hill Street - Downtown – Jewelry District 3. Ventura Boulevard – Encino 28 Hill Street south of 6th Street to crosswalk
12 Ventura Blvd - Libbit Ave to Woodley Ave 29 Hill Street - 7th St to 8th St 13 Ventura Blvd - Woodley Ave to Gaviota Ave 14. Whitley Street - Hollywood
5. Grand Avenue, 6th, 11th, 14th Streets - San Pedro 30 Whitley St - Franklin Ave to Yucca St 14 Grand Ave - 3rd St to 4th St
15 Grand Ave - 8th St to 9th St 15. Santee Street - Downtown – Garment District 31 Santee St - 8th St and 9th St
6. Westwood, Galey, Kinross – Westwood 32 Santee St - Olympic Blvd and 11th St 16 Westwood Blvd - Kinross Ave to Weyburn Ave 17 Galey Ave - Kinross Ave to Weyburn Ave 17. Main Street and Broadway – Venice 18 Kinross Ave - Broxton Ave to Galey Ave 33 Main St - Thornton Pl to Abbot Kinney Blvd 19 Broxton Ave - Weyburn Ave to Kinross Ave 34 Broadway St - Abbot Kinney Blvd to Electric Ave
35 Grand Blvd - Main St (circle) to Rivera Ave
The Locations not selected for field data collection were not included due to budget limitations and the expectations of similar results as the selected case study areas:
4. Van Nuys Boulevard – Van Nuys 10. USC Medical Center - Boyle Heights
11. Wilshire Boulevard and side streets - Koreatown 12. Los Feliz Boulevard - Atwater Village 16. Crocker Street - Downtown – Skid Row
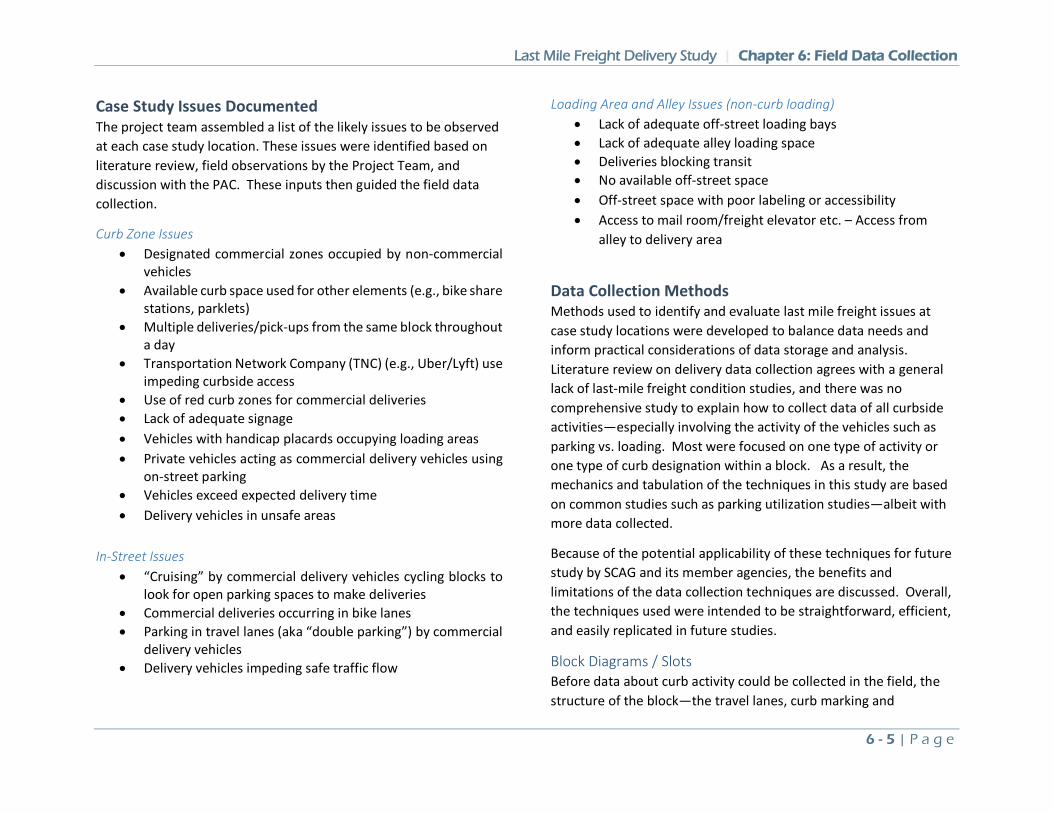
Last Mile Freight Delivery Study | Chapter 6: Field Data Collection
6 - 5 | P a g e
Case Study Issues Documented The project team assembled a list of the likely issues to be observed at each case study location. These issues were identified based on literature review, field observations by the Project Team, and discussion with the PAC. These inputs then guided the field data collection.
Curb Zone Issues • Designated commercial zones occupied by non-commercial
vehicles • Available curb space used for other elements (e.g., bike share
stations, parklets) • Multiple deliveries/pick-ups from the same block throughout
a day • Transportation Network Company (TNC) (e.g., Uber/Lyft) use
impeding curbside access • Use of red curb zones for commercial deliveries • Lack of adequate signage • Vehicles with handicap placards occupying loading areas • Private vehicles acting as commercial delivery vehicles using
on-street parking • Vehicles exceed expected delivery time • Delivery vehicles in unsafe areas
In-Street Issues
• “Cruising” by commercial delivery vehicles cycling blocks to look for open parking spaces to make deliveries
• Commercial deliveries occurring in bike lanes • Parking in travel lanes (aka “double parking”) by commercial
delivery vehicles • Delivery vehicles impeding safe traffic flow
Loading Area and Alley Issues (non-curb loading) • Lack of adequate off-street loading bays • Lack of adequate alley loading space • Deliveries blocking transit • No available off-street space • Off-street space with poor labeling or accessibility • Access to mail room/freight elevator etc. – Access from
alley to delivery area
Data Collection Methods Methods used to identify and evaluate last mile freight issues at case study locations were developed to balance data needs and inform practical considerations of data storage and analysis. Literature review on delivery data collection agrees with a general lack of last-mile freight condition studies, and there was no comprehensive study to explain how to collect data of all curbside activities—especially involving the activity of the vehicles such as parking vs. loading. Most were focused on one type of activity or one type of curb designation within a block. As a result, the mechanics and tabulation of the techniques in this study are based on common studies such as parking utilization studies—albeit with more data collected.
Because of the potential applicability of these techniques for future study by SCAG and its member agencies, the benefits and limitations of the data collection techniques are discussed. Overall, the techniques used were intended to be straightforward, efficient, and easily replicated in future studies.
Block Diagrams / Slots Before data about curb activity could be collected in the field, the structure of the block—the travel lanes, curb marking and
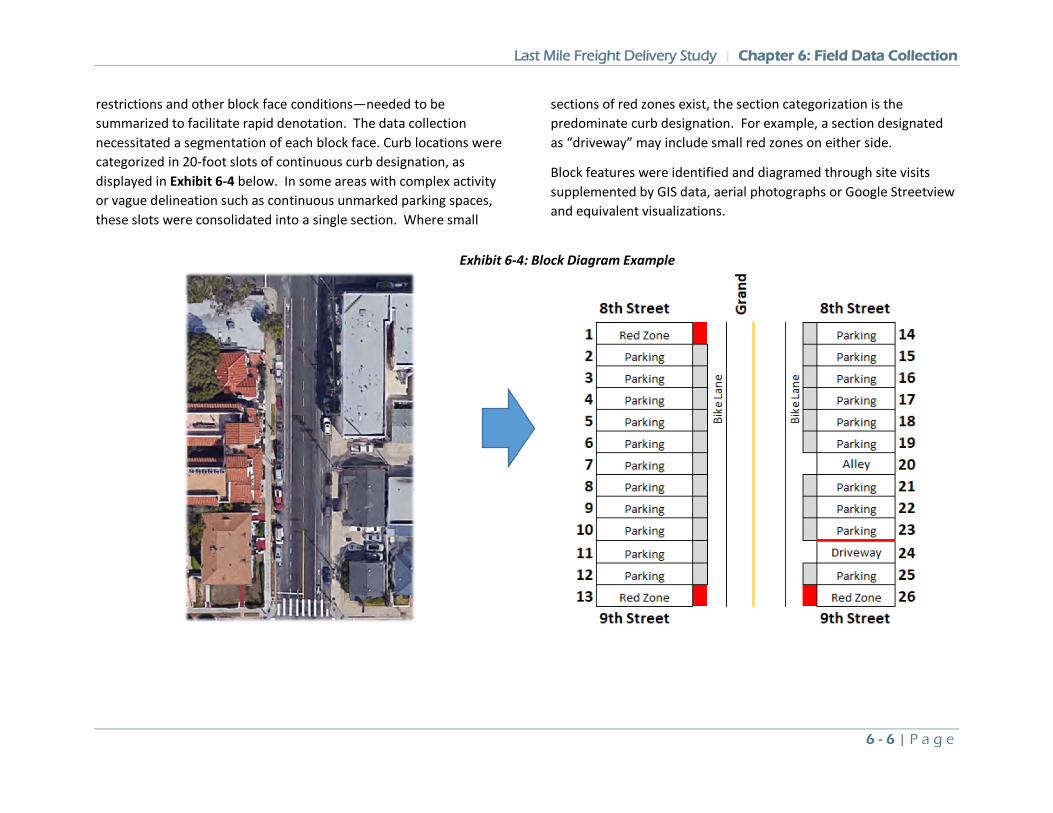
Last Mile Freight Delivery Study | Chapter 6: Field Data Collection
6 - 6 | P a g e
restrictions and other block face conditions—needed to be summarized to facilitate rapid denotation. The data collection necessitated a segmentation of each block face. Curb locations were categorized in 20-foot slots of continuous curb designation, as displayed in Exhibit 6-4 below. In some areas with complex activity or vague delineation such as continuous unmarked parking spaces, these slots were consolidated into a single section. Where small
sections of red zones exist, the section categorization is the predominate curb designation. For example, a section designated as “driveway” may include small red zones on either side.
Block features were identified and diagramed through site visits supplemented by GIS data, aerial photographs or Google Streetview and equivalent visualizations.
Exhibit 6-4: Block Diagram Example
Last Mile Freight Delivery Study | Chapter 6: Field Data Collection
6 - 7 | P a g e
The items noted in the block diagrams are:
Curb Designation • Parking - unmetered and metered • Yellow Zone • Red Zone • White Zone • Green zone • Blue Zone • Parklet • Carshare space • Bike Share station • Bike corral • Driveway/curb cut
Outside Lane • Travel Lane • Bike Lane • Transit Lane
Sidewalk • Driveway • Crosswalk
Curb Utilization In the field, curbside activity was documented with vehicle time in and time out to indicate duration. The data was used to assess overall delivery and loading conditions and use of different curb zones for deliveries and other purposes. This required the technicians or video reviewers to denote each vehicle, first identifying the vehicle, then its location, duration, and activity. Since all curb areas in the block face were observed, this included improper or unintended use of space.
Vehicle types were standardized to the degree possible. However, variation among technicians resulted in the need to review and “clean” the data. Initially an it was thought an expansive and exhaustive list would make for easier data collection and analysis. While flexibility to denote field activity was useful, when analysis was conducted the consolidation of vehicle types and activities into fewer categories was helpful in the interpretation of data.
Vehicle Type • Car/Personal Vehicle • TNC (Uber/Lyft) • Taxi • Delivery Truck • Large Truck (18-wheeler) • Postal Truck • Service Truck/Van • Food Truck • Other Truck/Van • Bus • Bicycle • Motorcycle/Motorized Scooter
If the vehicle was a delivery vehicle, technicians were asked to note the company name (if visible). This information was valuable in validating and further distinguishing between industries such as parcel/package delivery, foodservice, medical, construction, etc.
Duration • Determined by inbound (time in) and outbound (time out)
time for each vehicle. The duration was as little as 10 seconds for passenger drop-offs or as long as multiple hours for parked vehicles. Duration was important for both identifying the number of vehicles over a time period, as
Last Mile Freight Delivery Study | Chapter 6: Field Data Collection
6 - 8 | P a g e
well as providing average metrics in total, by vehicle types, as well as by case study locations.
Location A second location identifier code was used to collect data on vehicles stopped in the block but not at curbside. These included:
• In Driveway (blocking/on side) • In Driveway to parking or loading area • On Curb • In Travel Lane • In Bike Lane • In Bus Lane • Alley • Other
Activity The most important attribute of each action, and the most challenging data point to collect was the vehicle and driver activity. It was found the in-person data collection was more effective in determining curbside activity due to issues with visibility and the ability to discern actions outside the view of the camera footage. Curbside activity is complex, and many different types of actions occur. This study’s focus was on deliveries regardless of vehicle. However, data were also collected on other types of activity.
• Parked (unoccupied) • Waiting (occupied) • Loading Passengers
• Parcel Deliveries • Collecting Mail • Other pick-up • Other Deliveries (e.g. linen) • Bulk Food Delivery • Food Delivery to individual • Utility Service • Other
Given the large amount of data collected, these categories were further consolidated for analysis as parked, passenger or delivery. The groupings were used to simplify the interpretation of the data into broad, but relevant categories to assess delivery conditions.
• Parked: Parked and waiting (driver does not exit the vehicle) • Passenger: passenger pick-up or drop-off • Delivery: commercial loading, personal vehicle goods
loading and utility vehicles.
However, the raw data collection was left intact to allow for more granular analysis later as needed. While altering the raw data collection into consolidated categories was an option, the analysis of the data could have led to the need to look at more refined issues such as analysis of the activity of specific types of vehicles or delivery companies.
Data Collection Method This study used both in-person field technicians and video data collection (reviewed later by a technician) to collect case study data.
-peak analysis, there was a limited field of view leading to less accuracy than the field technician observed collection. As discussed, Video data collection has a short practical viewing distance that necessitates deployment of approximately four to six
cameras per block—each requiring review, tabulation, and elimination of any duplicate actions. In addition, some items, such as identification of TNC vehicles, was not possible with the video collection technique resulting from an inability to accurately identify
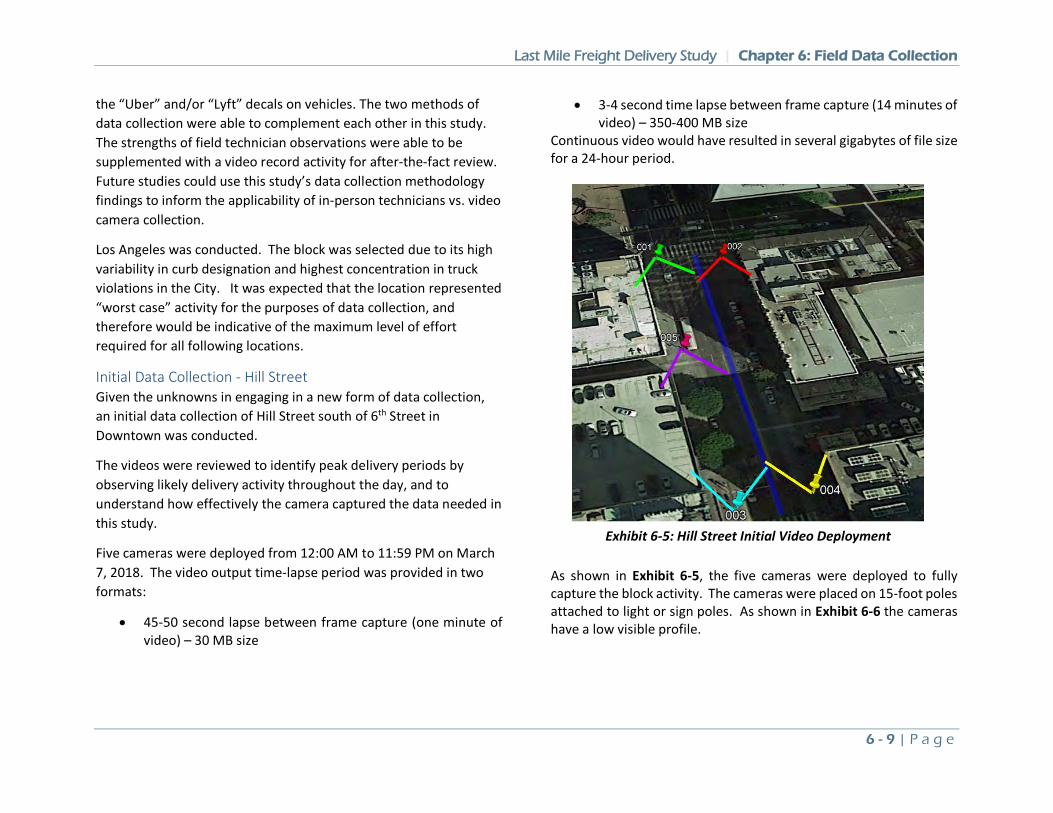
Last Mile Freight Delivery Study | Chapter 6: Field Data Collection
6 - 9 | P a g e
the “Uber” and/or “Lyft” decals on vehicles. The two methods of data collection were able to complement each other in this study. The strengths of field technician observations were able to be supplemented with a video record activity for after-the-fact review. Future studies could use this study’s data collection methodology findings to inform the applicability of in-person technicians vs. video camera collection.
Los Angeles was conducted. The block was selected due to its high variability in curb designation and highest concentration in truck violations in the City. It was expected that the location represented “worst case” activity for the purposes of data collection, and therefore would be indicative of the maximum level of effort required for all following locations.
Initial Data Collection - Hill Street Given the unknowns in engaging in a new form of data collection, an initial data collection of Hill Street south of 6th Street in Downtown was conducted.
The videos were reviewed to identify peak delivery periods by observing likely delivery activity throughout the day, and to understand how effectively the camera captured the data needed in this study.
Five cameras were deployed from 12:00 AM to 11:59 PM on March 7, 2018. The video output time-lapse period was provided in two formats:
• 45-50 second lapse between frame capture (one minute of video) – 30 MB size
• 3-4 second time lapse between frame capture (14 minutes of video) – 350-400 MB size
Continuous video would have resulted in several gigabytes of file size for a 24-hour period.
As shown in Exhibit 6-5, the five cameras were deployed to fully capture the block activity. The cameras were placed on 15-foot poles attached to light or sign poles. As shown in Exhibit 6-6 the cameras have a low visible profile.
Exhibit 6-5: Hill Street Initial Video Deployment
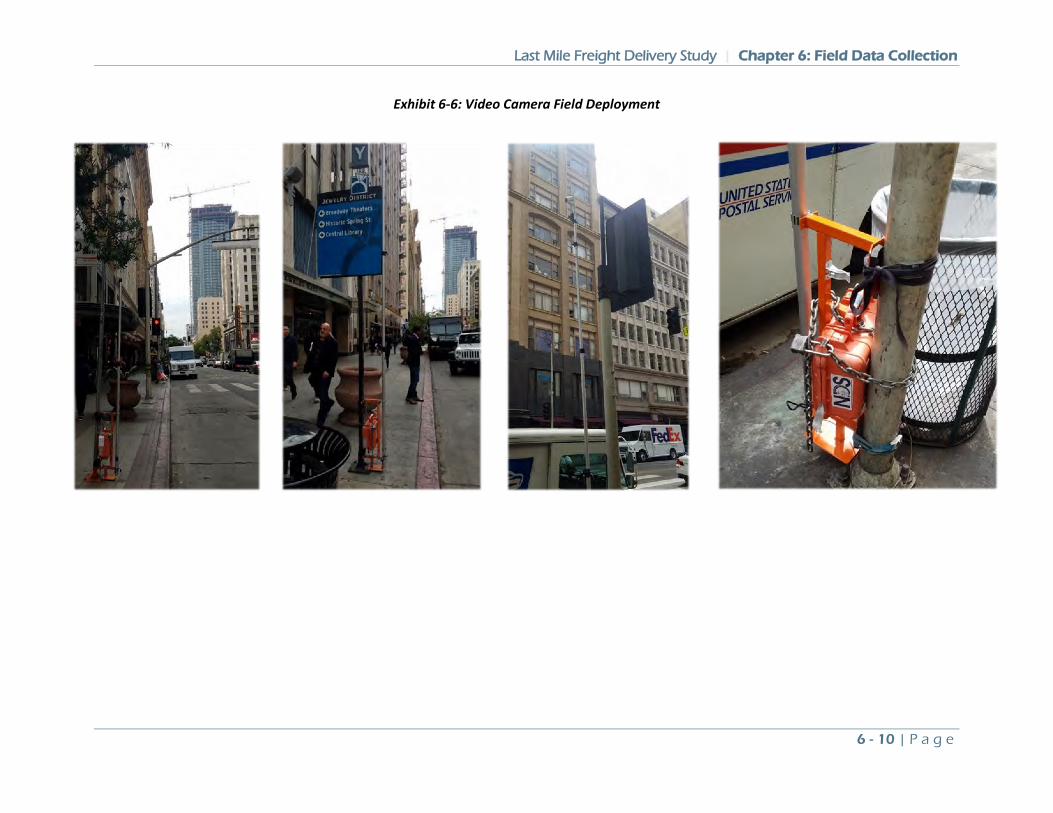
Last Mile Freight Delivery Study | Chapter 6: Field Data Collection
6 - 10 | P a g e
Exhibit 6-6: Video Camera Field Deployment
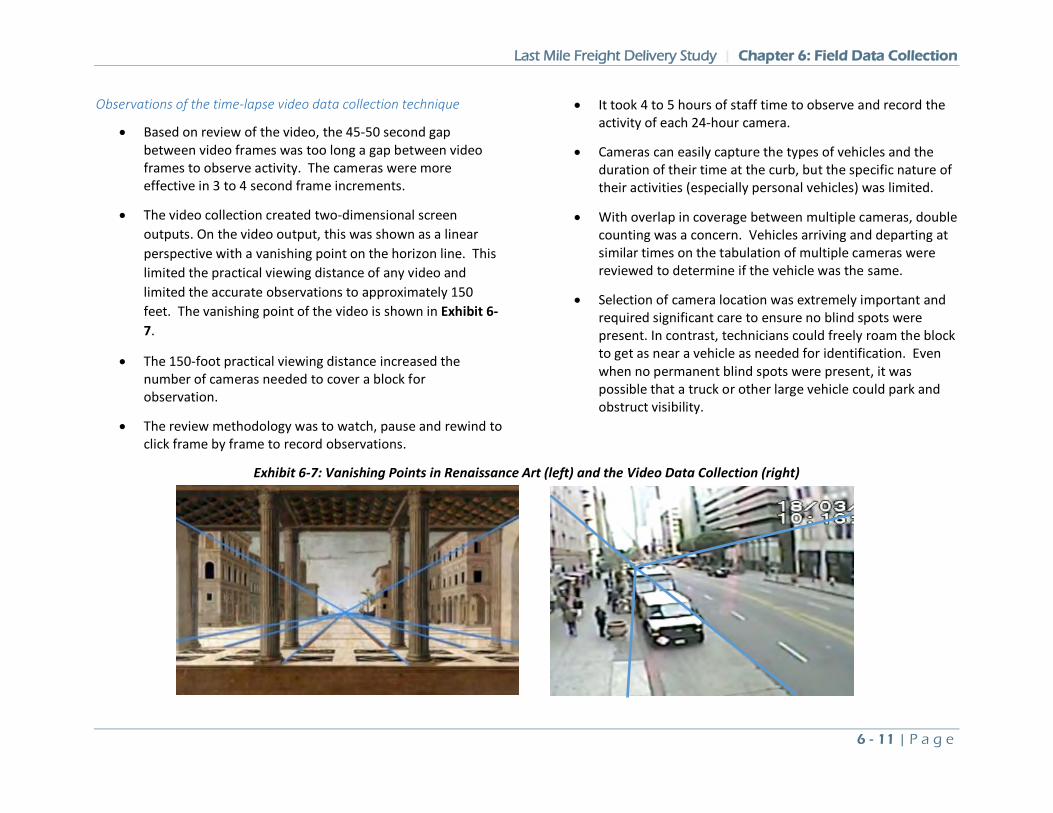
Last Mile Freight Delivery Study | Chapter 6: Field Data Collection
6 - 11 | P a g e
Observations of the time-lapse video data collection technique
• Based on review of the video, the 45-50 second gap between video frames was too long a gap between video frames to observe activity. The cameras were more effective in 3 to 4 second frame increments.
• The video collection created two-dimensional screen outputs. On the video output, this was shown as a linear perspective with a vanishing point on the horizon line. This limited the practical viewing distance of any video and limited the accurate observations to approximately 150 feet. The vanishing point of the video is shown in Exhibit 6-7.
• The 150-foot practical viewing distance increased the number of cameras needed to cover a block for observation.
• The review methodology was to watch, pause and rewind to click frame by frame to record observations.
• It took 4 to 5 hours of staff time to observe and record the activity of each 24-hour camera.
• Cameras can easily capture the types of vehicles and the duration of their time at the curb, but the specific nature of their activities (especially personal vehicles) was limited.
• With overlap in coverage between multiple cameras, double counting was a concern. Vehicles arriving and departing at similar times on the tabulation of multiple cameras were reviewed to determine if the vehicle was the same.
• Selection of camera location was extremely important and required significant care to ensure no blind spots were present. In contrast, technicians could freely roam the block to get as near a vehicle as needed for identification. Even when no permanent blind spots were present, it was possible that a truck or other large vehicle could park and obstruct visibility.
Exhibit 6-7: Vanishing Points in Renaissance Art (left) and the Video Data Collection (right)
Last Mile Freight Delivery Study | Chapter 6: Field Data Collection
6 - 12 | P a g e
Observations of Activity in the Video
• Delivery vehicles seemed to park for long periods in this block and drivers used hand carts as the primary delivery mechanism.
• Of the 442 observed activities, only 34 were deliveries by delivery vehicles.
• There may have been more personal vehicle deliveries in this block than could be observed from the camera, particularly those that occurred in alleys or driveways.
• 29 out of 32 deliveries occurred during business hours, the first peak is 11:00 AM to 1:00 PM with a second peak from 3:00 PM to 5:00 PM (pick-ups).
• Curb space was mostly used was for passenger drop-off and pick-up (176 instances). Many passenger transfers took about 10 seconds and occurred in the red zones.
• All delivery trucks parked in or around yellow zones or in alleys, except for some use of red zones.
• The side of alleys were used as "loading areas".
• The deliverers seemed to be very experienced and conscious of their choice of parking space. They likely have developed strategies on a block-by-block basis to park in locations for the most efficient deliveries even if they are not designated yellow zones.
• Non-peak times had very little curb delivery activity or conflicts.
• There was a considerable amount of hand cart activity to and from the Los Angeles Jewelry Mart.
• Buses were not included in the curb activity of the video review for time savings. They were only noted when a vehicle impeded or blocked a transit bus.
The tabulation of the data was the first cut at more simplified categories was developed to show types of vehicles and types of activities. Vehicles were classified as commercial, personal, or government and the activities included utility/construction, delivery, waiting, passenger pick-up and drop-off, parked, and unknown. These categories were further simplified in the tabulation of the subsequent blocks to delivery, parked and passenger loading as they were a better representation of the different utilization patterns on a block.
As shown in Exhibit 6-8, passenger pick-up and drop off was the most common curb activity. Deliveries were the second fewest after utilities. Activities classified as unknown were parked or waiting vehicles with an unclear activity in the video.
Exhibit 6-9 shows the average duration of each activity. Passenger pick up and drop off was the shortest duration activity followed by waiting. Deliveries had some of the longest durations after parked vehicles indicating that the use of loading zones was for relatively long periods of time.
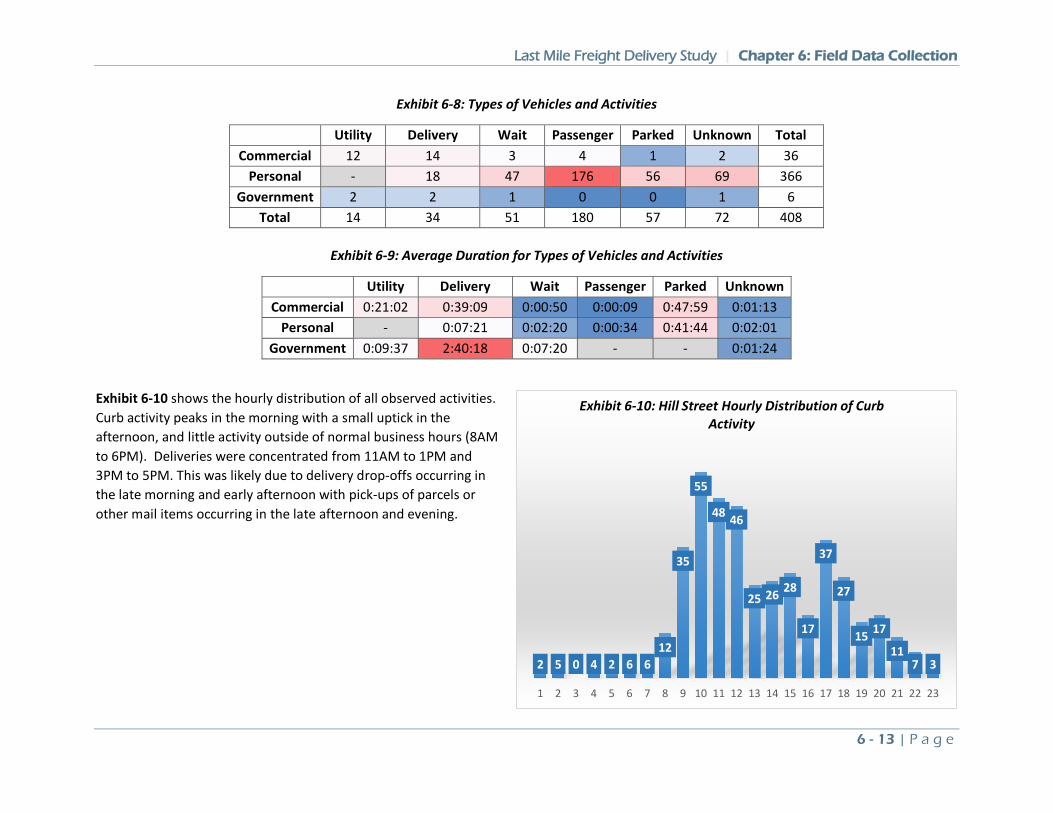
Last Mile Freight Delivery Study | Chapter 6: Field Data Collection
6 - 13 | P a g e
Exhibit 6-8: Types of Vehicles and Activities
Utility Delivery Wait Passenger Parked Unknown Total Commercial 12 14 3 4 1 2 36
Personal - 18 47 176 56 69 366 Government 2 2 1 0 0 1 6
Total 14 34 51 180 57 72 408
Exhibit 6-9: Average Duration for Types of Vehicles and Activities
Utility Delivery Wait Passenger Parked Unknown Commercial 0:21:02 0:39:09 0:00:50 0:00:09 0:47:59 0:01:13
Personal - 0:07:21 0:02:20 0:00:34 0:41:44 0:02:01 Government 0:09:37 2:40:18 0:07:20 - - 0:01:24
Exhibit 6-10 shows the hourly distribution of all observed activities. Curb activity peaks in the morning with a small uptick in the afternoon, and little activity outside of normal business hours (8AM to 6PM). Deliveries were concentrated from 11AM to 1PM and 3PM to 5PM. This was likely due to delivery drop-offs occurring in the late morning and early afternoon with pick-ups of parcels or other mail items occurring in the late afternoon and evening.
2 5 0 4 2 6 6
12
35
55
48 46
25 26 28
17
37
27
15 17
117 3
1 2 3 4 5 6 7 8 9 10 11 12 13 14 15 16 17 18 19 20 21 22 23
Exhibit 6-10: Hill Street Hourly Distribution of Curb Activity
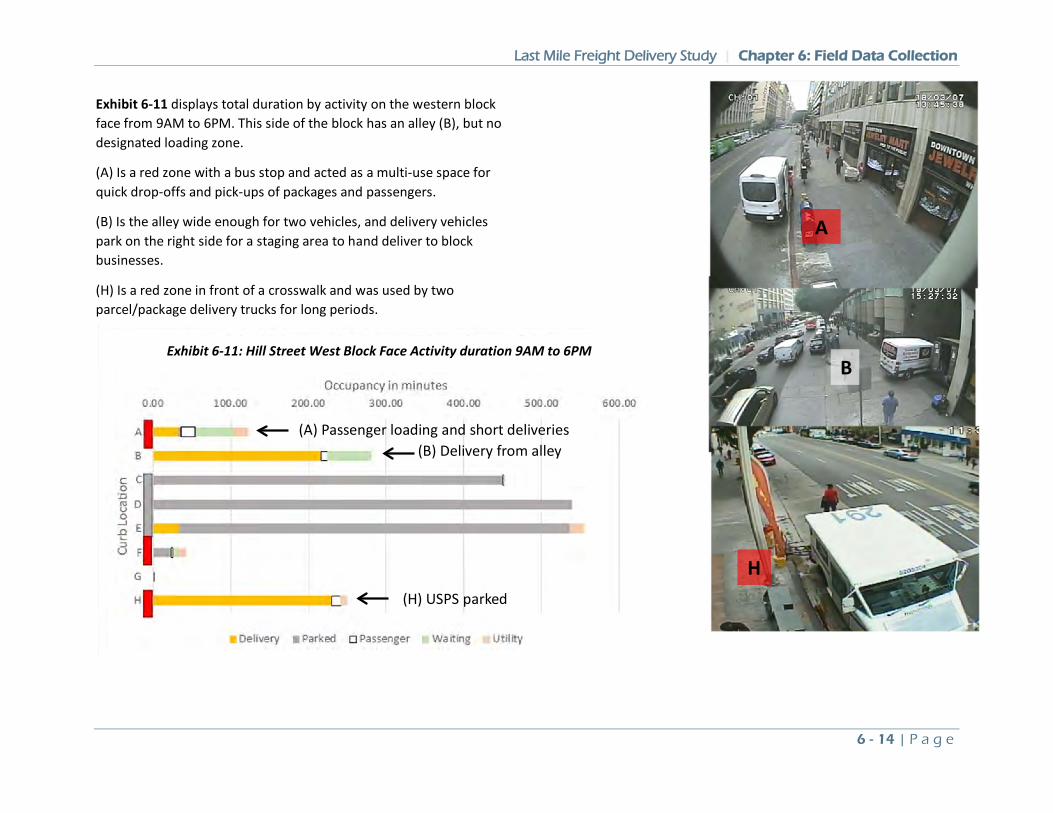
Last Mile Freight Delivery Study | Chapter 6: Field Data Collection
6 - 14 | P a g e
Exhibit 6-11 displays total duration by activity on the western block face from 9AM to 6PM. This side of the block has an alley (B), but no designated loading zone.
(A) Is a red zone with a bus stop and acted as a multi-use space for quick drop-offs and pick-ups of packages and passengers.
(B) Is the alley wide enough for two vehicles, and delivery vehicles park on the right side for a staging area to hand deliver to block businesses.
(H) Is a red zone in front of a crosswalk and was used by two parcel/package delivery trucks for long periods.
(A) Passenger loading and short deliveries (B) Delivery from alley
(H) USPS parked
A
B
H
Exhibit 6-11: Hill Street West Block Face Activity duration 9AM to 6PM
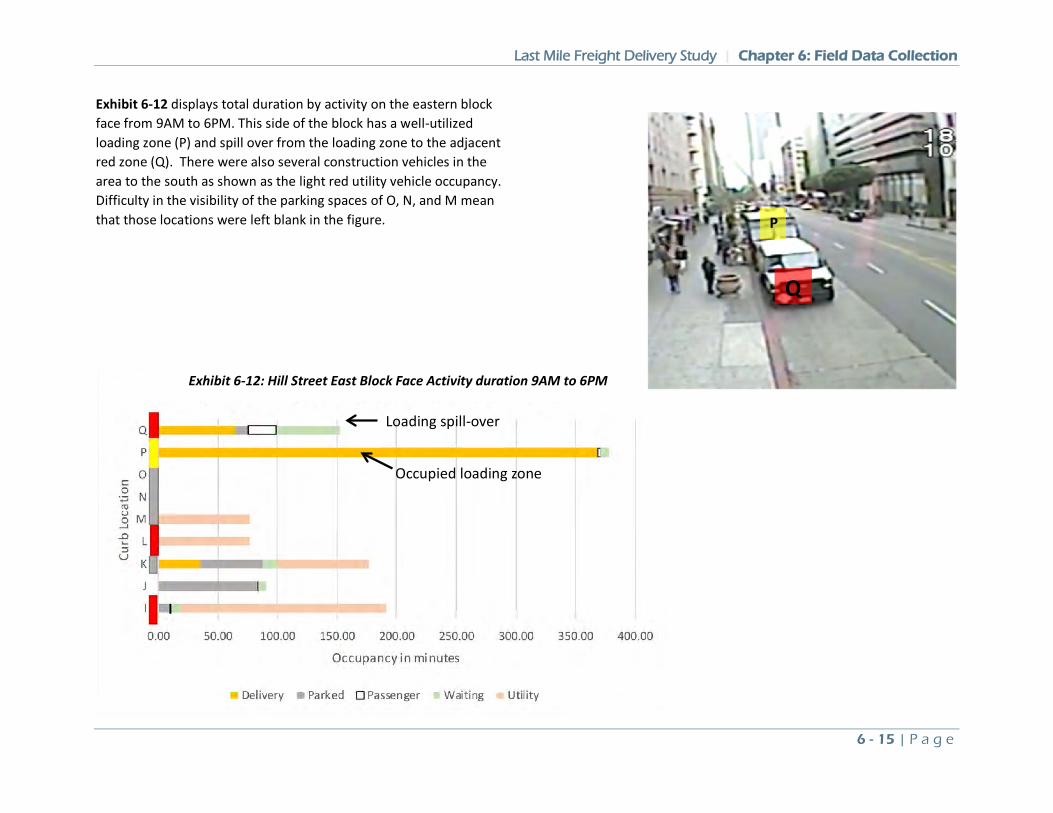
Last Mile Freight Delivery Study | Chapter 6: Field Data Collection
6 - 15 | P a g e
Exhibit 6-12 displays total duration by activity on the eastern block face from 9AM to 6PM. This side of the block has a well-utilized loading zone (P) and spill over from the loading zone to the adjacent red zone (Q). There were also several construction vehicles in the area to the south as shown as the light red utility vehicle occupancy. Difficulty in the visibility of the parking spaces of O, N, and M mean that those locations were left blank in the figure.
Loading spill-over
Occupied loading zone
Q
P
Exhibit 6-12: Hill Street East Block Face Activity duration 9AM to 6PM
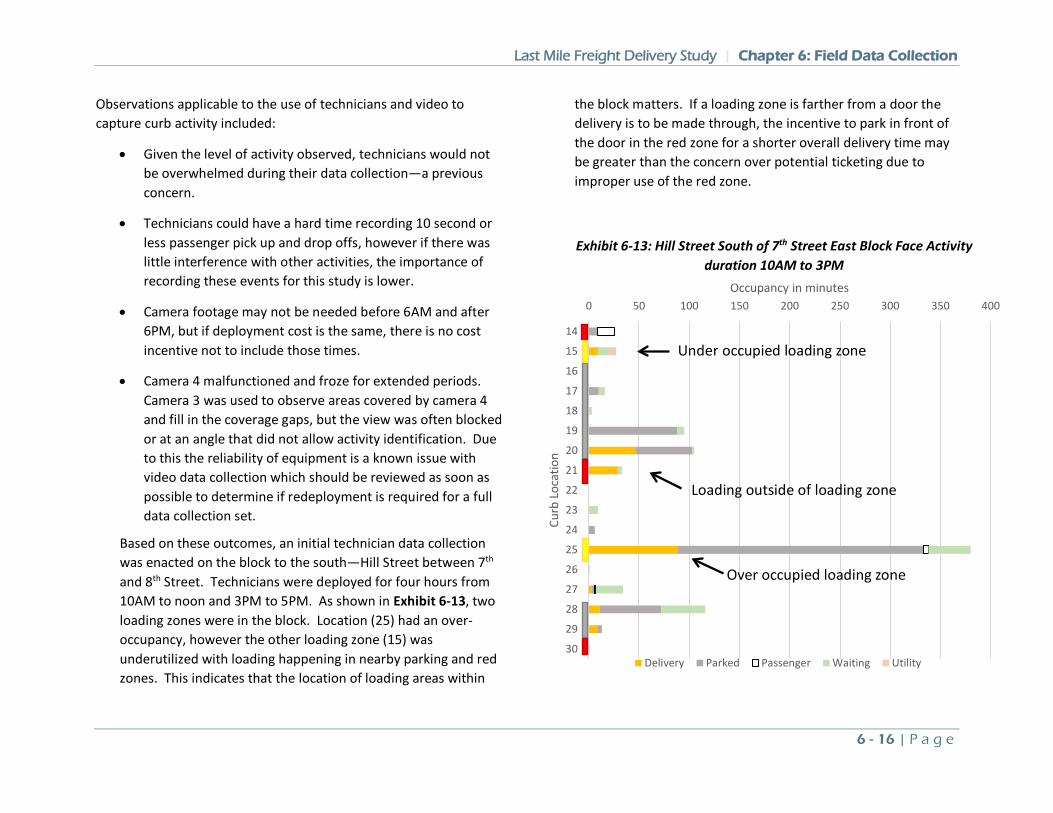
Last Mile Freight Delivery Study | Chapter 6: Field Data Collection
6 - 16 | P a g e
Observations applicable to the use of technicians and video to capture curb activity included:
• Given the level of activity observed, technicians would not be overwhelmed during their data collection—a previous concern.
• Technicians could have a hard time recording 10 second or less passenger pick up and drop offs, however if there was little interference with other activities, the importance of recording these events for this study is lower.
• Camera footage may not be needed before 6AM and after 6PM, but if deployment cost is the same, there is no cost incentive not to include those times.
• Camera 4 malfunctioned and froze for extended periods. Camera 3 was used to observe areas covered by camera 4 and fill in the coverage gaps, but the view was often blocked or at an angle that did not allow activity identification. Due to this the reliability of equipment is a known issue with video data collection which should be reviewed as soon as possible to determine if redeployment is required for a full data collection set.
Based on these outcomes, an initial technician data collection was enacted on the block to the south—Hill Street between 7th and 8th Street. Technicians were deployed for four hours from 10AM to noon and 3PM to 5PM. As shown in Exhibit 6-13, two loading zones were in the block. Location (25) had an over-occupancy, however the other loading zone (15) was underutilized with loading happening in nearby parking and red zones. This indicates that the location of loading areas within
the block matters. If a loading zone is farther from a door the delivery is to be made through, the incentive to park in front of the door in the red zone for a shorter overall delivery time may be greater than the concern over potential ticketing due to improper use of the red zone.
0 50 100 150 200 250 300 350 400
14
15
16
17
18
19
20
21
22
23
24
25
26
27
28
29
30
Occupancy in minutes
Curb
Loc
atio
n
East Curb Occupancy by Activity - 10 am - 3 pm
Delivery Parked Passenger Waiting Utility
Over occupied loading zone
Loading outside of loading zone
Under occupied loading zone
Exhibit 6-13: Hill Street South of 7th Street East Block Face Activity duration 10AM to 3PM
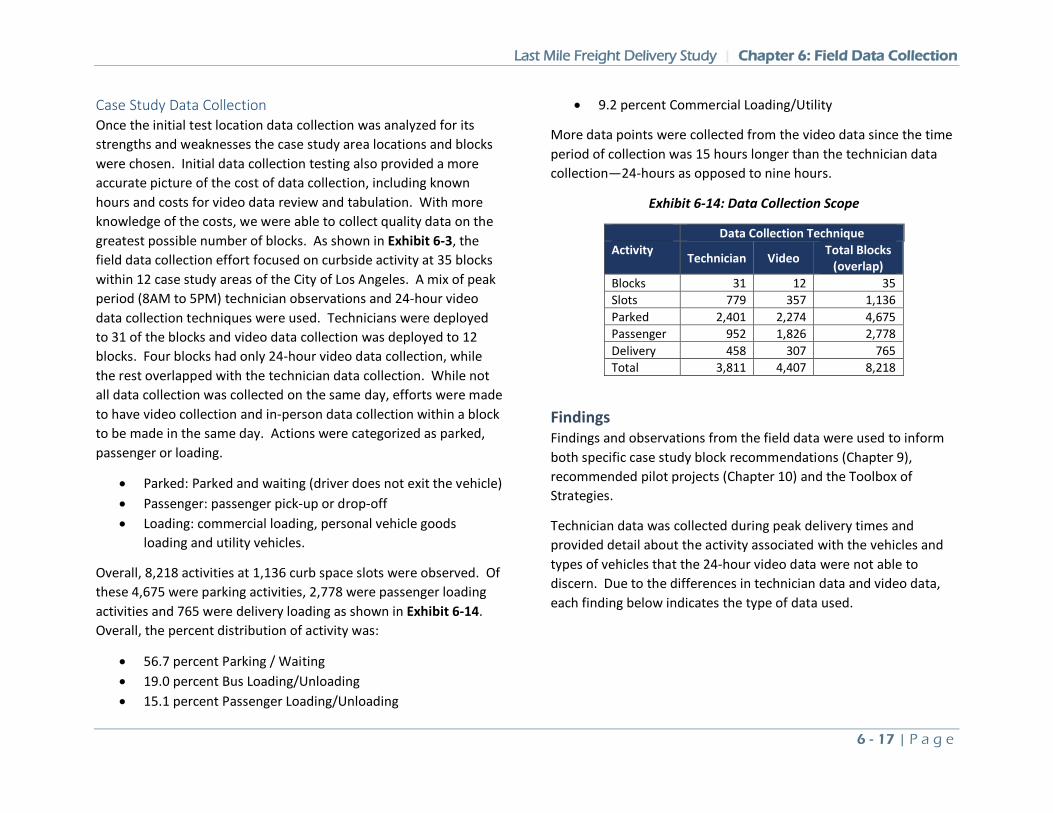
Last Mile Freight Delivery Study | Chapter 6: Field Data Collection
6 - 17 | P a g e
Case Study Data Collection Once the initial test location data collection was analyzed for its strengths and weaknesses the case study area locations and blocks were chosen. Initial data collection testing also provided a more accurate picture of the cost of data collection, including known hours and costs for video data review and tabulation. With more knowledge of the costs, we were able to collect quality data on the greatest possible number of blocks. As shown in Exhibit 6-3, the field data collection effort focused on curbside activity at 35 blocks within 12 case study areas of the City of Los Angeles. A mix of peak period (8AM to 5PM) technician observations and 24-hour video data collection techniques were used. Technicians were deployed to 31 of the blocks and video data collection was deployed to 12 blocks. Four blocks had only 24-hour video data collection, while the rest overlapped with the technician data collection. While not all data collection was collected on the same day, efforts were made to have video collection and in-person data collection within a block to be made in the same day. Actions were categorized as parked, passenger or loading.
• Parked: Parked and waiting (driver does not exit the vehicle) • Passenger: passenger pick-up or drop-off • Loading: commercial loading, personal vehicle goods
loading and utility vehicles.
Overall, 8,218 activities at 1,136 curb space slots were observed. Of these 4,675 were parking activities, 2,778 were passenger loading activities and 765 were delivery loading as shown in Exhibit 6-14. Overall, the percent distribution of activity was:
• 56.7 percent Parking / Waiting • 19.0 percent Bus Loading/Unloading • 15.1 percent Passenger Loading/Unloading
• 9.2 percent Commercial Loading/Utility
More data points were collected from the video data since the time period of collection was 15 hours longer than the technician data collection—24-hours as opposed to nine hours.
Exhibit 6-14: Data Collection Scope
Data Collection Technique Activity Technician Video Total Blocks
(overlap) Blocks 31 12 35 Slots 779 357 1,136 Parked 2,401 2,274 4,675 Passenger 952 1,826 2,778 Delivery 458 307 765 Total 3,811 4,407 8,218
Findings Findings and observations from the field data were used to inform both specific case study block recommendations (Chapter 9), recommended pilot projects (Chapter 10) and the Toolbox of Strategies.
Technician data was collected during peak delivery times and provided detail about the activity associated with the vehicles and types of vehicles that the 24-hour video data were not able to discern. Due to the differences in technician data and video data, each finding below indicates the type of data used.
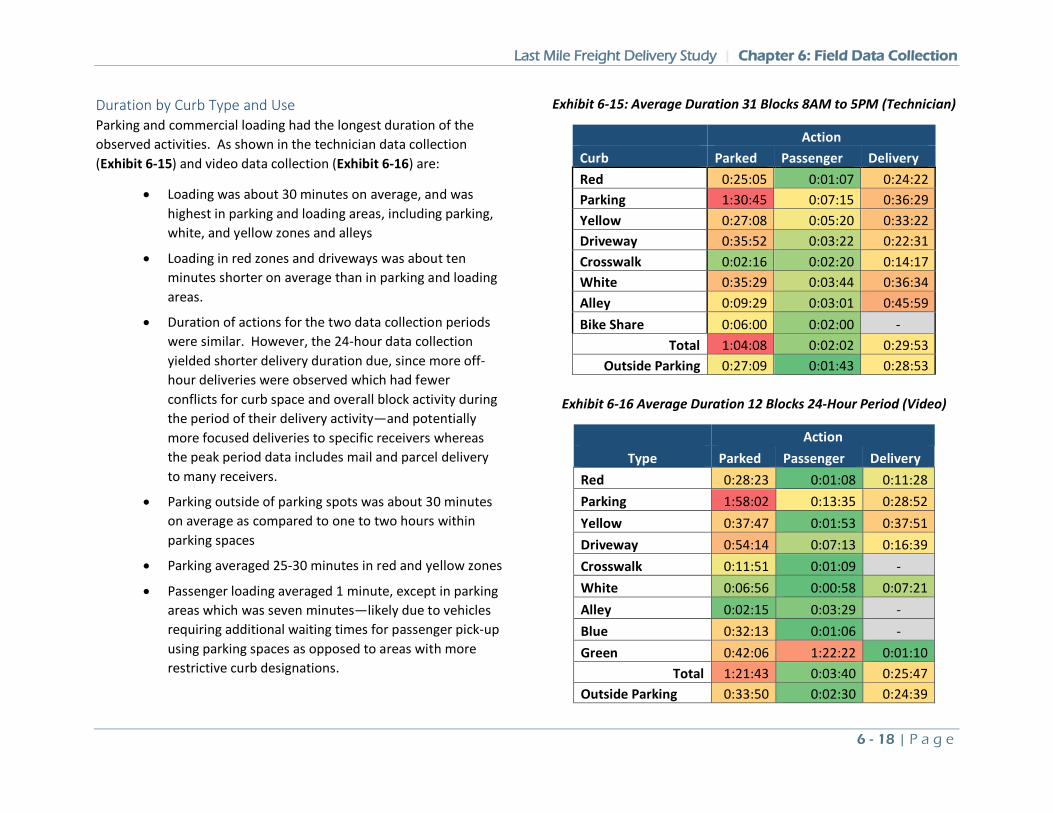
Last Mile Freight Delivery Study | Chapter 6: Field Data Collection
6 - 18 | P a g e
Duration by Curb Type and Use Parking and commercial loading had the longest duration of the observed activities. As shown in the technician data collection (Exhibit 6-15) and video data collection (Exhibit 6-16) are:
• Loading was about 30 minutes on average, and was highest in parking and loading areas, including parking, white, and yellow zones and alleys
• Loading in red zones and driveways was about ten minutes shorter on average than in parking and loading areas.
• Duration of actions for the two data collection periods were similar. However, the 24-hour data collection yielded shorter delivery duration due, since more off-hour deliveries were observed which had fewer conflicts for curb space and overall block activity during the period of their delivery activity—and potentially more focused deliveries to specific receivers whereas the peak period data includes mail and parcel delivery to many receivers.
• Parking outside of parking spots was about 30 minutes on average as compared to one to two hours within parking spaces
• Parking averaged 25-30 minutes in red and yellow zones
• Passenger loading averaged 1 minute, except in parking areas which was seven minutes—likely due to vehicles requiring additional waiting times for passenger pick-up using parking spaces as opposed to areas with more restrictive curb designations.
Exhibit 6-15: Average Duration 31 Blocks 8AM to 5PM (Technician)
Action Curb Parked Passenger Delivery Red 0:25:05 0:01:07 0:24:22 Parking 1:30:45 0:07:15 0:36:29 Yellow 0:27:08 0:05:20 0:33:22 Driveway 0:35:52 0:03:22 0:22:31 Crosswalk 0:02:16 0:02:20 0:14:17 White 0:35:29 0:03:44 0:36:34 Alley 0:09:29 0:03:01 0:45:59 Bike Share 0:06:00 0:02:00 -
Total 1:04:08 0:02:02 0:29:53 Outside Parking 0:27:09 0:01:43 0:28:53
Exhibit 6-16 Average Duration 12 Blocks 24-Hour Period (Video)
Action Type Parked Passenger Delivery
Red 0:28:23 0:01:08 0:11:28 Parking 1:58:02 0:13:35 0:28:52 Yellow 0:37:47 0:01:53 0:37:51 Driveway 0:54:14 0:07:13 0:16:39 Crosswalk 0:11:51 0:01:09 - White 0:06:56 0:00:58 0:07:21 Alley 0:02:15 0:03:29 - Blue 0:32:13 0:01:06 - Green 0:42:06 1:22:22 0:01:10
Total 1:21:43 0:03:40 0:25:47 Outside Parking 0:33:50 0:02:30 0:24:39
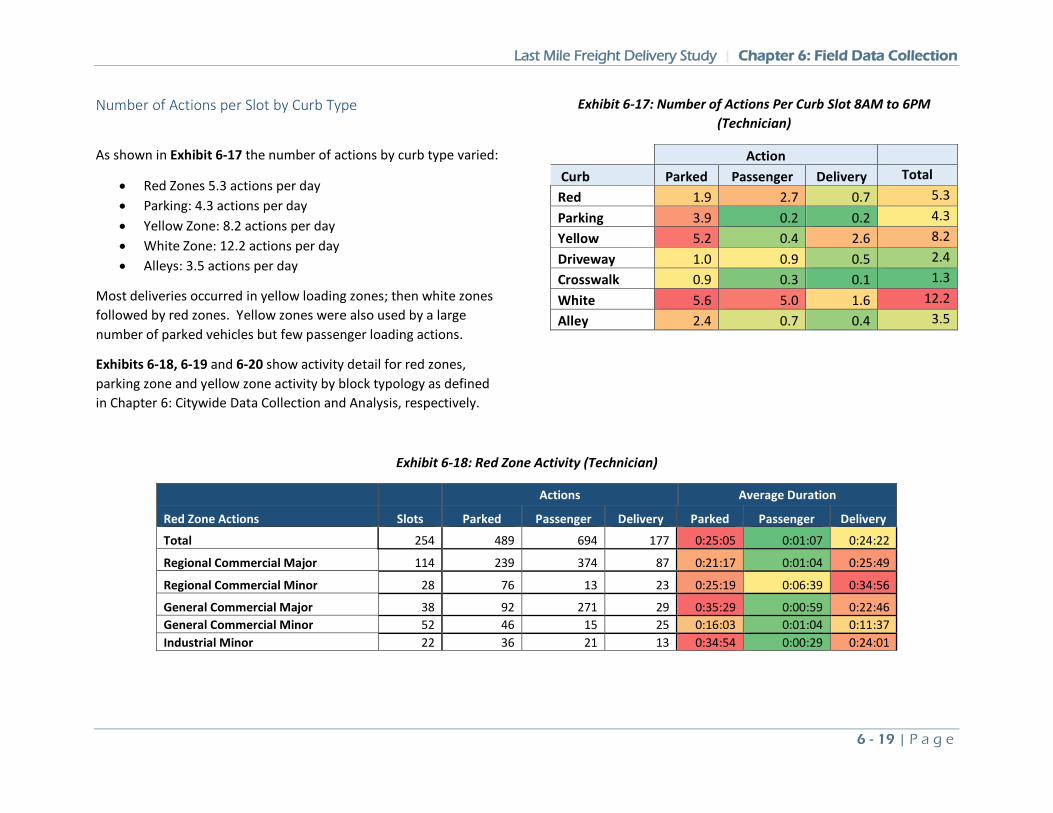
Last Mile Freight Delivery Study | Chapter 6: Field Data Collection
6 - 19 | P a g e
Number of Actions per Slot by Curb Type
As shown in Exhibit 6-17 the number of actions by curb type varied:
• Red Zones 5.3 actions per day • Parking: 4.3 actions per day • Yellow Zone: 8.2 actions per day • White Zone: 12.2 actions per day • Alleys: 3.5 actions per day
Most deliveries occurred in yellow loading zones; then white zones followed by red zones. Yellow zones were also used by a large number of parked vehicles but few passenger loading actions.
Exhibits 6-18, 6-19 and 6-20 show activity detail for red zones, parking zone and yellow zone activity by block typology as defined in Chapter 6: Citywide Data Collection and Analysis, respectively.
Exhibit 6-17: Number of Actions Per Curb Slot 8AM to 6PM (Technician)
Action Curb Parked Passenger Delivery Total Red 1.9 2.7 0.7 5.3 Parking 3.9 0.2 0.2 4.3 Yellow 5.2 0.4 2.6 8.2 Driveway 1.0 0.9 0.5 2.4 Crosswalk 0.9 0.3 0.1 1.3 White 5.6 5.0 1.6 12.2 Alley 2.4 0.7 0.4 3.5
Exhibit 6-18: Red Zone Activity (Technician)
Actions Average Duration
Red Zone Actions Slots Parked Passenger Delivery Parked Passenger Delivery
Total 254 489 694 177 0:25:05 0:01:07 0:24:22
Regional Commercial Major 114 239 374 87 0:21:17 0:01:04 0:25:49
Regional Commercial Minor 28 76 13 23 0:25:19 0:06:39 0:34:56
General Commercial Major 38 92 271 29 0:35:29 0:00:59 0:22:46 General Commercial Minor 52 46 15 25 0:16:03 0:01:04 0:11:37 Industrial Minor 22 36 21 13 0:34:54 0:00:29 0:24:01
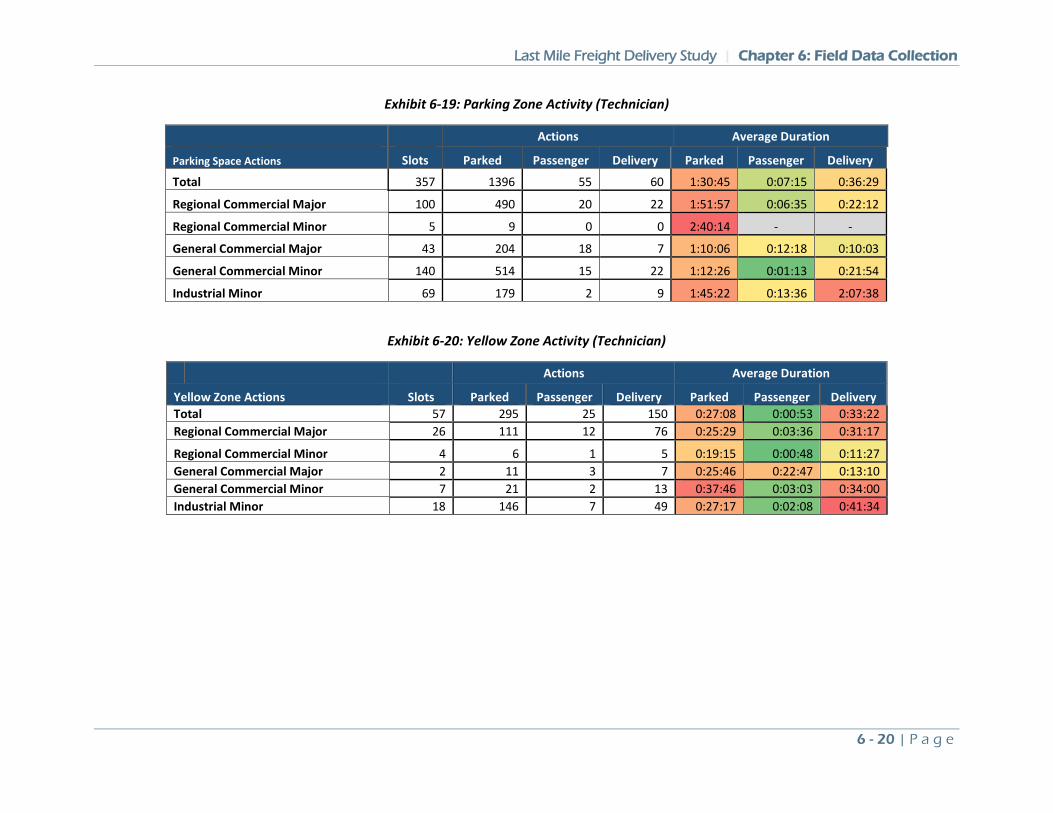
Last Mile Freight Delivery Study | Chapter 6: Field Data Collection
6 - 20 | P a g e
Exhibit 6-19: Parking Zone Activity (Technician)
Actions Average Duration
Parking Space Actions Slots Parked Passenger Delivery Parked Passenger Delivery
Total 357 1396 55 60 1:30:45 0:07:15 0:36:29
Regional Commercial Major 100 490 20 22 1:51:57 0:06:35 0:22:12
Regional Commercial Minor 5 9 0 0 2:40:14 - -
General Commercial Major 43 204 18 7 1:10:06 0:12:18 0:10:03
General Commercial Minor 140 514 15 22 1:12:26 0:01:13 0:21:54
Industrial Minor 69 179 2 9 1:45:22 0:13:36 2:07:38
Exhibit 6-20: Yellow Zone Activity (Technician)
Actions Average Duration
Yellow Zone Actions Slots Parked Passenger Delivery Parked Passenger Delivery Total 57 295 25 150 0:27:08 0:00:53 0:33:22 Regional Commercial Major 26 111 12 76 0:25:29 0:03:36 0:31:17
Regional Commercial Minor 4 6 1 5 0:19:15 0:00:48 0:11:27 General Commercial Major 2 11 3 7 0:25:46 0:22:47 0:13:10 General Commercial Minor 7 21 2 13 0:37:46 0:03:03 0:34:00 Industrial Minor 18 146 7 49 0:27:17 0:02:08 0:41:34
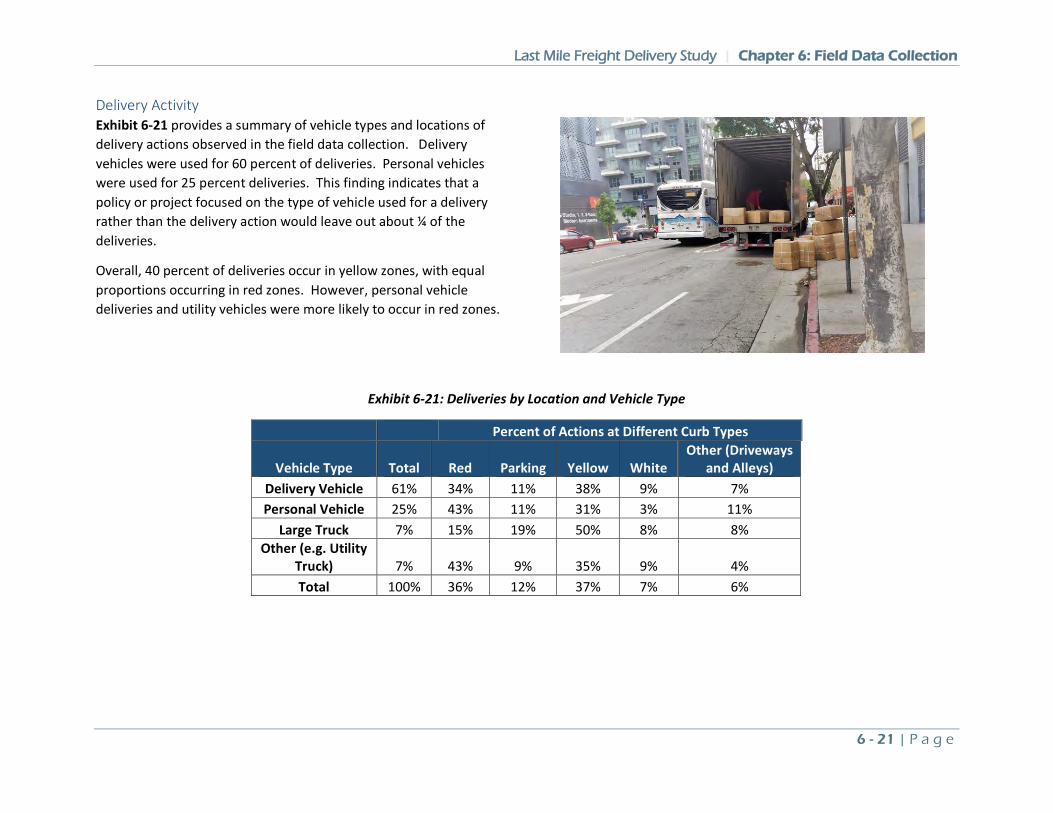
Last Mile Freight Delivery Study | Chapter 6: Field Data Collection
6 - 21 | P a g e
Delivery Activity Exhibit 6-21 provides a summary of vehicle types and locations of delivery actions observed in the field data collection. Delivery vehicles were used for 60 percent of deliveries. Personal vehicles were used for 25 percent deliveries. This finding indicates that a policy or project focused on the type of vehicle used for a delivery rather than the delivery action would leave out about ¼ of the deliveries.
Overall, 40 percent of deliveries occur in yellow zones, with equal proportions occurring in red zones. However, personal vehicle deliveries and utility vehicles were more likely to occur in red zones.
Exhibit 6-21: Deliveries by Location and Vehicle Type
Percent of Actions at Different Curb Types
Vehicle Type Total Red Parking Yellow White Other (Driveways
and Alleys) Delivery Vehicle 61% 34% 11% 38% 9% 7% Personal Vehicle 25% 43% 11% 31% 3% 11%
Large Truck 7% 15% 19% 50% 8% 8% Other (e.g. Utility
Truck) 7% 43% 9% 35% 9% 4% Total 100% 36% 12% 37% 7% 6%
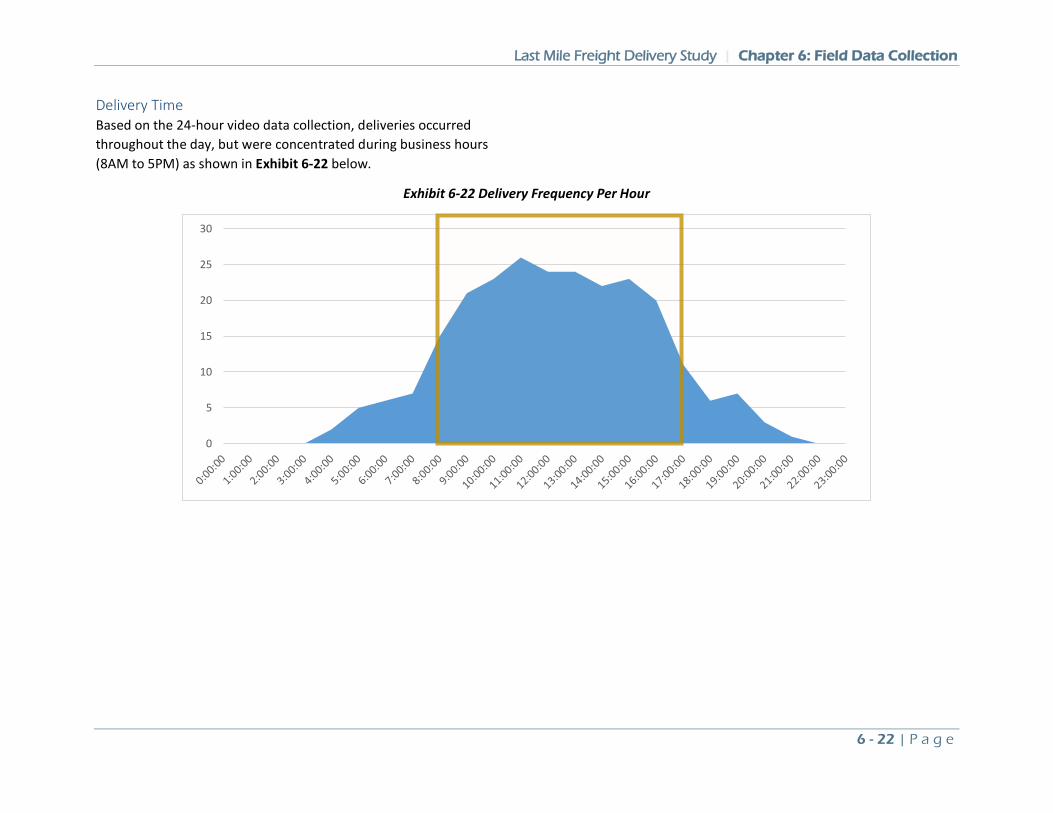
Last Mile Freight Delivery Study | Chapter 6: Field Data Collection
6 - 22 | P a g e
Delivery Time Based on the 24-hour video data collection, deliveries occurred throughout the day, but were concentrated during business hours (8AM to 5PM) as shown in Exhibit 6-22 below.
Exhibit 6-22 Delivery Frequency Per Hour
0
5
10
15
20
25
30
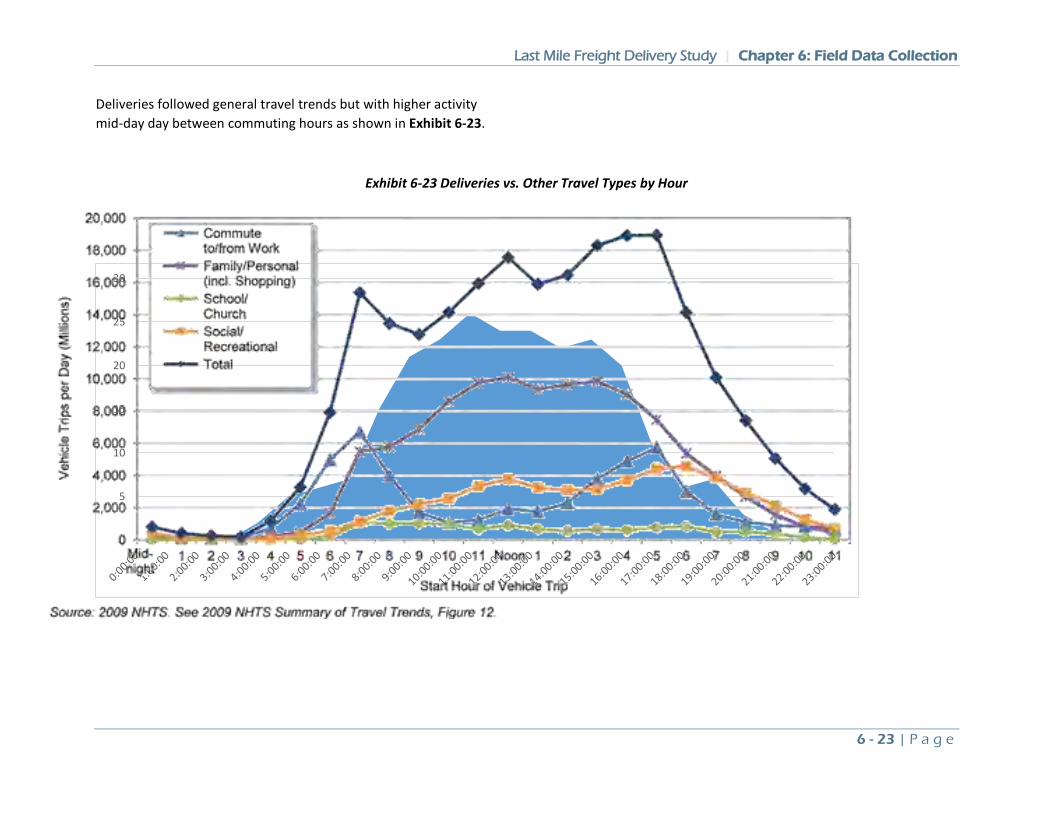
Last Mile Freight Delivery Study | Chapter 6: Field Data Collection
6 - 23 | P a g e
Deliveries followed general travel trends but with higher activity mid-day day between commuting hours as shown in Exhibit 6-23.
Exhibit 6-23 Deliveries vs. Other Travel Types by Hour
0
5
10
15
20
25
30
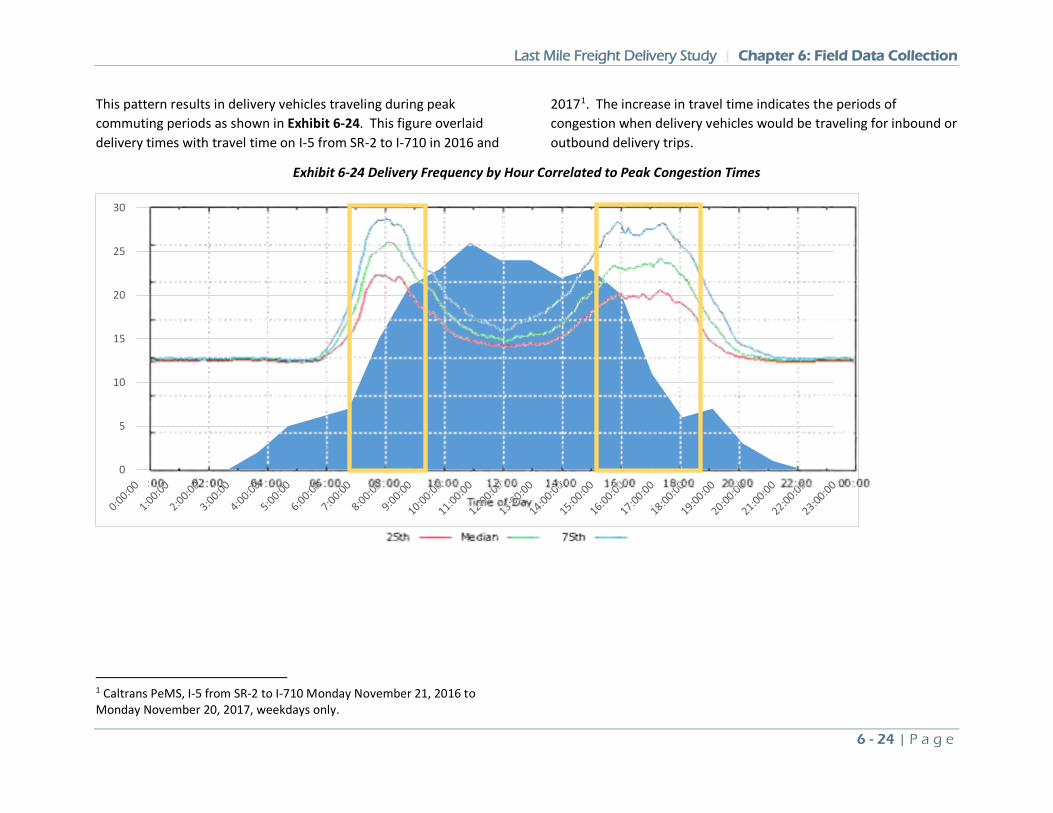
Last Mile Freight Delivery Study | Chapter 6: Field Data Collection
6 - 24 | P a g e
This pattern results in delivery vehicles traveling during peak commuting periods as shown in Exhibit 6-24. This figure overlaid delivery times with travel time on I-5 from SR-2 to I-710 in 2016 and
20171. The increase in travel time indicates the periods of congestion when delivery vehicles would be traveling for inbound or outbound delivery trips.
Exhibit 6-24 Delivery Frequency by Hour Correlated to Peak Congestion Times
1 Caltrans PeMS, I-5 from SR-2 to I-710 Monday November 21, 2016 to Monday November 20, 2017, weekdays only.
0
5
10
15
20
25
30
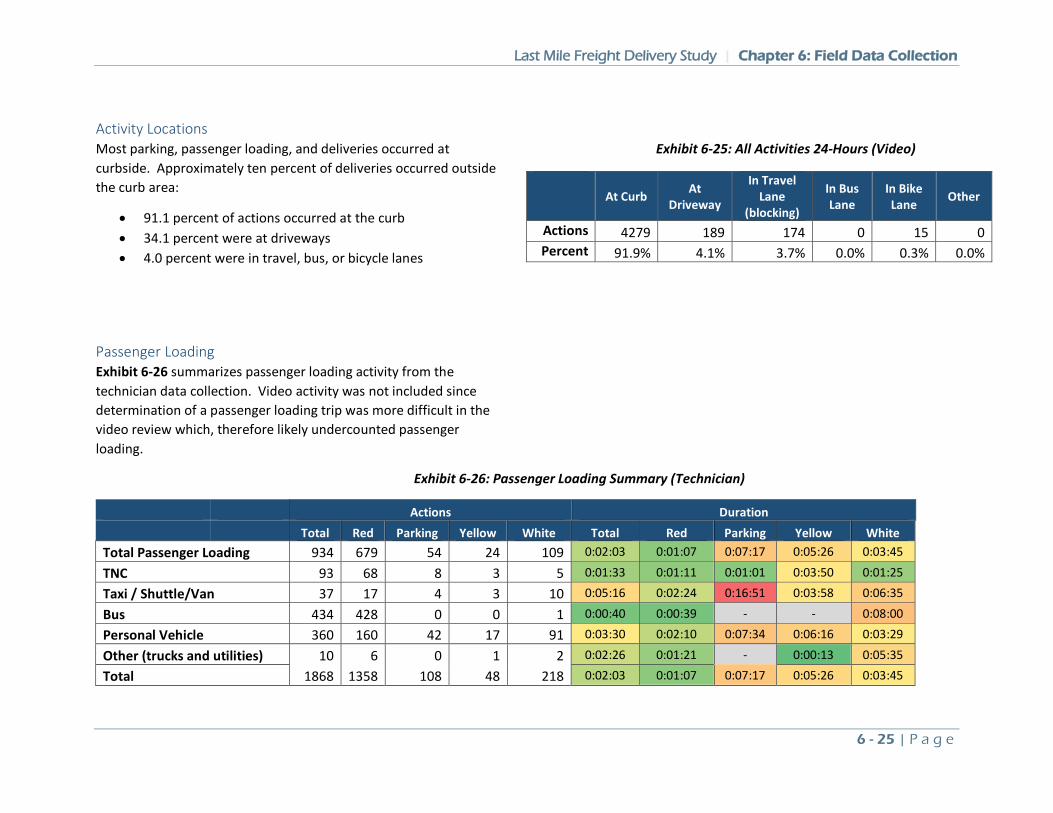
Last Mile Freight Delivery Study | Chapter 6: Field Data Collection
6 - 25 | P a g e
Activity Locations Most parking, passenger loading, and deliveries occurred at curbside. Approximately ten percent of deliveries occurred outside the curb area:
• 91.1 percent of actions occurred at the curb • 34.1 percent were at driveways • 4.0 percent were in travel, bus, or bicycle lanes
Exhibit 6-25: All Activities 24-Hours (Video)
Passenger Loading Exhibit 6-26 summarizes passenger loading activity from the technician data collection. Video activity was not included since determination of a passenger loading trip was more difficult in the video review which, therefore likely undercounted passenger loading.
Exhibit 6-26: Passenger Loading Summary (Technician)
Actions Duration
Total Red Parking Yellow White Total Red Parking Yellow White Total Passenger Loading 934 679 54 24 109 0:02:03 0:01:07 0:07:17 0:05:26 0:03:45
TNC 93 68 8 3 5 0:01:33 0:01:11 0:01:01 0:03:50 0:01:25
Taxi / Shuttle/Van 37 17 4 3 10 0:05:16 0:02:24 0:16:51 0:03:58 0:06:35
Bus 434 428 0 0 1 0:00:40 0:00:39 - - 0:08:00
Personal Vehicle 360 160 42 17 91 0:03:30 0:02:10 0:07:34 0:06:16 0:03:29
Other (trucks and utilities) 10 6 0 1 2 0:02:26 0:01:21 - 0:00:13 0:05:35
Total 1868 1358 108 48 218 0:02:03 0:01:07 0:07:17 0:05:26 0:03:45
At Curb At
Driveway
In Travel Lane
(blocking)
In Bus Lane
In Bike Lane Other
Actions 4279 189 174 0 15 0 Percent 91.9% 4.1% 3.7% 0.0% 0.3% 0.0%
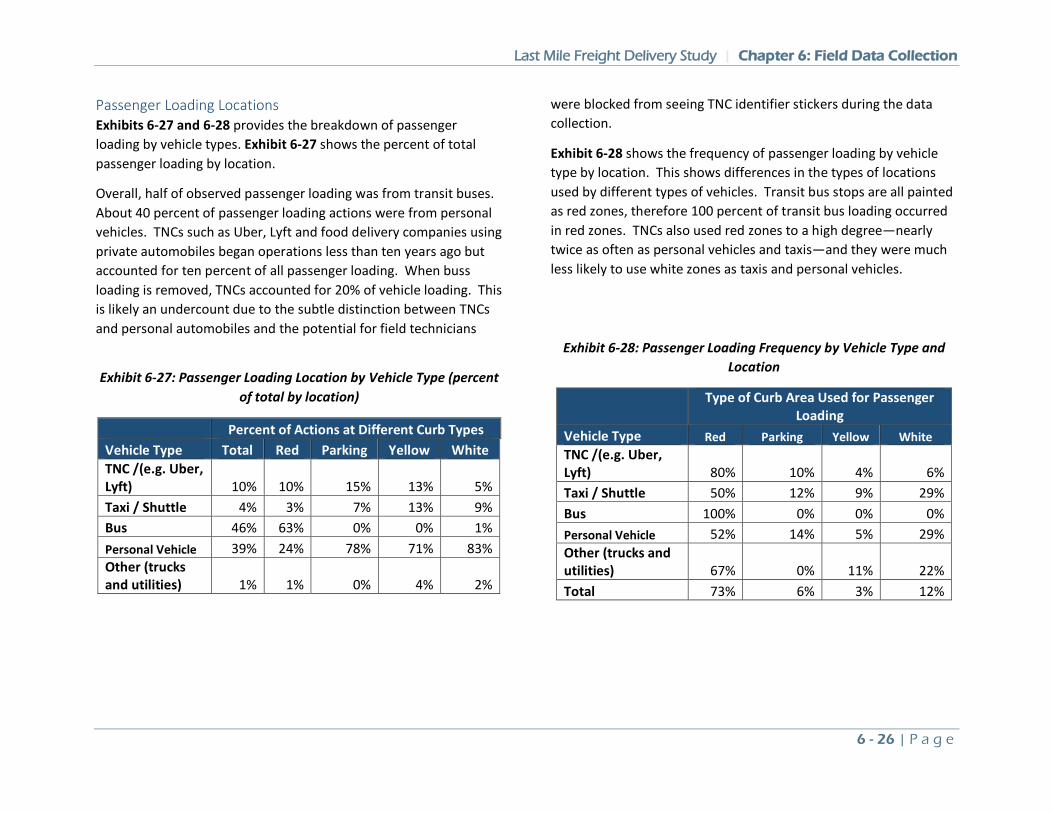
Last Mile Freight Delivery Study | Chapter 6: Field Data Collection
6 - 26 | P a g e
Passenger Loading Locations Exhibits 6-27 and 6-28 provides the breakdown of passenger loading by vehicle types. Exhibit 6-27 shows the percent of total passenger loading by location.
Overall, half of observed passenger loading was from transit buses. About 40 percent of passenger loading actions were from personal vehicles. TNCs such as Uber, Lyft and food delivery companies using private automobiles began operations less than ten years ago but accounted for ten percent of all passenger loading. When buss loading is removed, TNCs accounted for 20% of vehicle loading. This is likely an undercount due to the subtle distinction between TNCs and personal automobiles and the potential for field technicians
were blocked from seeing TNC identifier stickers during the data collection.
Exhibit 6-28 shows the frequency of passenger loading by vehicle type by location. This shows differences in the types of locations used by different types of vehicles. Transit bus stops are all painted as red zones, therefore 100 percent of transit bus loading occurred in red zones. TNCs also used red zones to a high degree—nearly twice as often as personal vehicles and taxis—and they were much less likely to use white zones as taxis and personal vehicles.
Exhibit 6-27: Passenger Loading Location by Vehicle Type (percent of total by location)
Percent of Actions at Different Curb Types Vehicle Type Total Red Parking Yellow White TNC /(e.g. Uber, Lyft) 10% 10% 15% 13% 5% Taxi / Shuttle 4% 3% 7% 13% 9% Bus 46% 63% 0% 0% 1% Personal Vehicle 39% 24% 78% 71% 83% Other (trucks and utilities) 1% 1% 0% 4% 2%
Exhibit 6-28: Passenger Loading Frequency by Vehicle Type and Location
Type of Curb Area Used for Passenger
Loading Vehicle Type Red Parking Yellow White TNC /(e.g. Uber, Lyft) 80% 10% 4% 6% Taxi / Shuttle 50% 12% 9% 29% Bus 100% 0% 0% 0% Personal Vehicle 52% 14% 5% 29% Other (trucks and utilities) 67% 0% 11% 22% Total 73% 6% 3% 12%
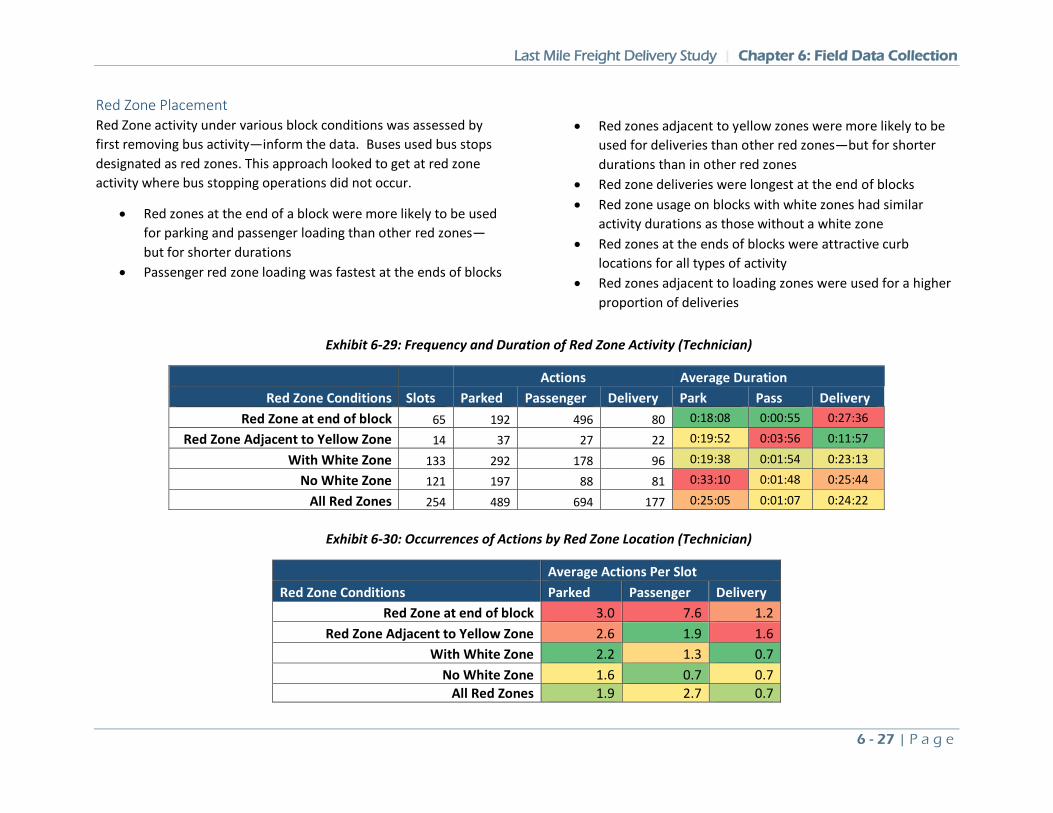
Last Mile Freight Delivery Study | Chapter 6: Field Data Collection
6 - 27 | P a g e
Red Zone Placement Red Zone activity under various block conditions was assessed by first removing bus activity—inform the data. Buses used bus stops designated as red zones. This approach looked to get at red zone activity where bus stopping operations did not occur.
• Red zones at the end of a block were more likely to be used for parking and passenger loading than other red zones—but for shorter durations
• Passenger red zone loading was fastest at the ends of blocks
• Red zones adjacent to yellow zones were more likely to be used for deliveries than other red zones—but for shorter durations than in other red zones
• Red zone deliveries were longest at the end of blocks • Red zone usage on blocks with white zones had similar
activity durations as those without a white zone • Red zones at the ends of blocks were attractive curb
locations for all types of activity • Red zones adjacent to loading zones were used for a higher
proportion of deliveries
Exhibit 6-29: Frequency and Duration of Red Zone Activity (Technician)
Actions Average Duration Red Zone Conditions Slots Parked Passenger Delivery Park Pass Delivery
Red Zone at end of block 65 192 496 80 0:18:08 0:00:55 0:27:36
Red Zone Adjacent to Yellow Zone 14 37 27 22 0:19:52 0:03:56 0:11:57
With White Zone 133 292 178 96 0:19:38 0:01:54 0:23:13
No White Zone 121 197 88 81 0:33:10 0:01:48 0:25:44
All Red Zones 254 489 694 177 0:25:05 0:01:07 0:24:22
Exhibit 6-30: Occurrences of Actions by Red Zone Location (Technician)
Average Actions Per Slot Red Zone Conditions Parked Passenger Delivery
Red Zone at end of block 3.0 7.6 1.2 Red Zone Adjacent to Yellow Zone 2.6 1.9 1.6
With White Zone 2.2 1.3 0.7 No White Zone 1.6 0.7 0.7
All Red Zones 1.9 2.7 0.7
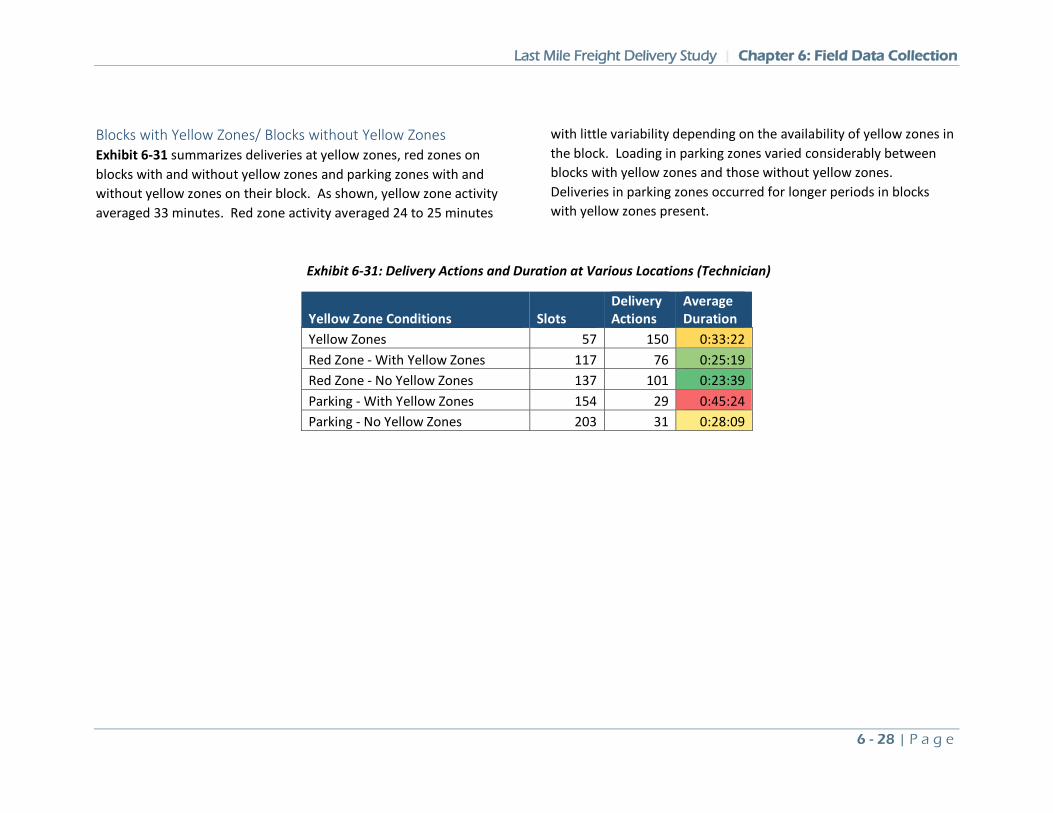
Last Mile Freight Delivery Study | Chapter 6: Field Data Collection
6 - 28 | P a g e
Blocks with Yellow Zones/ Blocks without Yellow Zones Exhibit 6-31 summarizes deliveries at yellow zones, red zones on blocks with and without yellow zones and parking zones with and without yellow zones on their block. As shown, yellow zone activity averaged 33 minutes. Red zone activity averaged 24 to 25 minutes
with little variability depending on the availability of yellow zones in the block. Loading in parking zones varied considerably between blocks with yellow zones and those without yellow zones. Deliveries in parking zones occurred for longer periods in blocks with yellow zones present.
Exhibit 6-31: Delivery Actions and Duration at Various Locations (Technician)
Yellow Zone Conditions Slots Delivery Actions
Average Duration
Yellow Zones 57 150 0:33:22 Red Zone - With Yellow Zones 117 76 0:25:19 Red Zone - No Yellow Zones 137 101 0:23:39 Parking - With Yellow Zones 154 29 0:45:24 Parking - No Yellow Zones 203 31 0:28:09
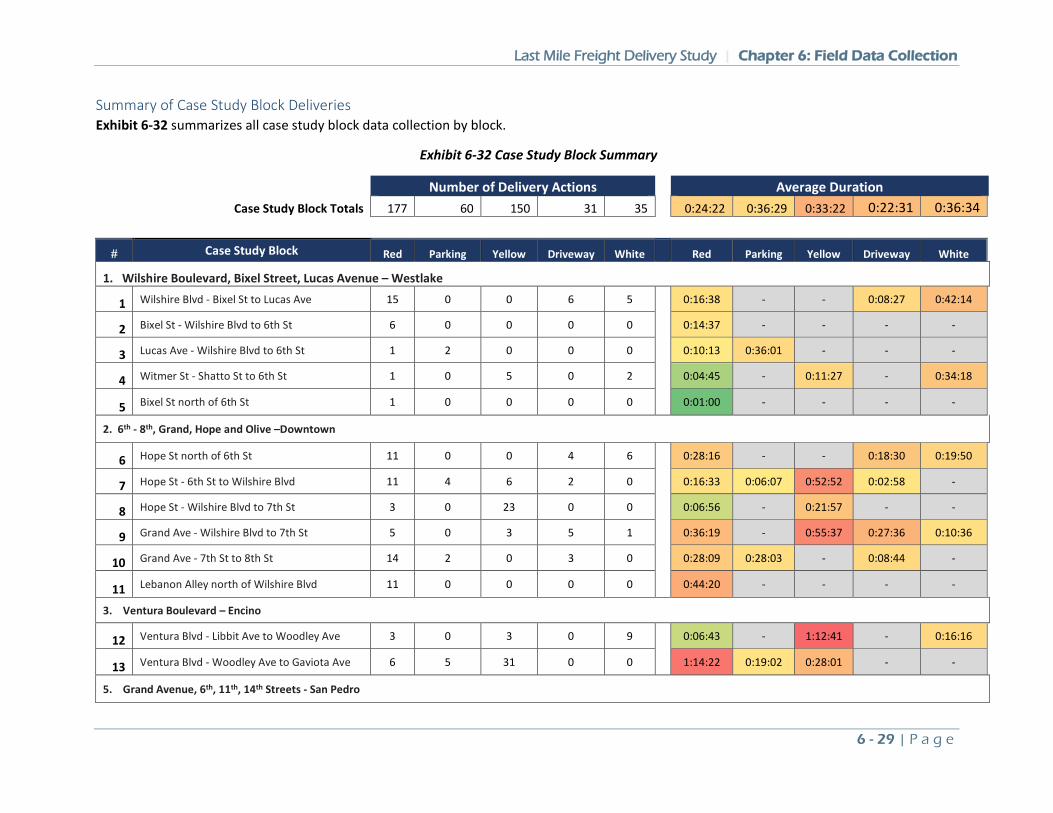
Last Mile Freight Delivery Study | Chapter 6: Field Data Collection
6 - 29 | P a g e
Summary of Case Study Block Deliveries Exhibit 6-32 summarizes all case study block data collection by block.
Exhibit 6-32 Case Study Block Summary
Number of Delivery Actions Average Duration
Case Study Block Totals 177 60 150 31 35 0:24:22 0:36:29 0:33:22 0:22:31 0:36:34
# Case Study Block Red Parking Yellow Driveway White Red Parking Yellow Driveway White
1. Wilshire Boulevard, Bixel Street, Lucas Avenue – Westlake
1 Wilshire Blvd - Bixel St to Lucas Ave 15 0 0 6 5 0:16:38 - - 0:08:27 0:42:14
2 Bixel St - Wilshire Blvd to 6th St 6 0 0 0 0 0:14:37 - - - -
3 Lucas Ave - Wilshire Blvd to 6th St 1 2 0 0 0 0:10:13 0:36:01 - - -
4 Witmer St - Shatto St to 6th St 1 0 5 0 2 0:04:45 - 0:11:27 - 0:34:18
5 Bixel St north of 6th St 1 0 0 0 0 0:01:00 - - - -
2. 6th - 8th, Grand, Hope and Olive –Downtown
6 Hope St north of 6th St 11 0 0 4 6 0:28:16 - - 0:18:30 0:19:50
7 Hope St - 6th St to Wilshire Blvd 11 4 6 2 0 0:16:33 0:06:07 0:52:52 0:02:58 -
8 Hope St - Wilshire Blvd to 7th St 3 0 23 0 0 0:06:56 - 0:21:57 - -
9 Grand Ave - Wilshire Blvd to 7th St 5 0 3 5 1 0:36:19 - 0:55:37 0:27:36 0:10:36
10 Grand Ave - 7th St to 8th St 14 2 0 3 0 0:28:09 0:28:03 - 0:08:44 -
11 Lebanon Alley north of Wilshire Blvd 11 0 0 0 0 0:44:20 - - - -
3. Ventura Boulevard – Encino
12 Ventura Blvd - Libbit Ave to Woodley Ave 3 0 3 0 9 0:06:43 - 1:12:41 - 0:16:16
13 Ventura Blvd - Woodley Ave to Gaviota Ave 6 5 31 0 0 1:14:22 0:19:02 0:28:01 - -
5. Grand Avenue, 6th, 11th, 14th Streets - San Pedro
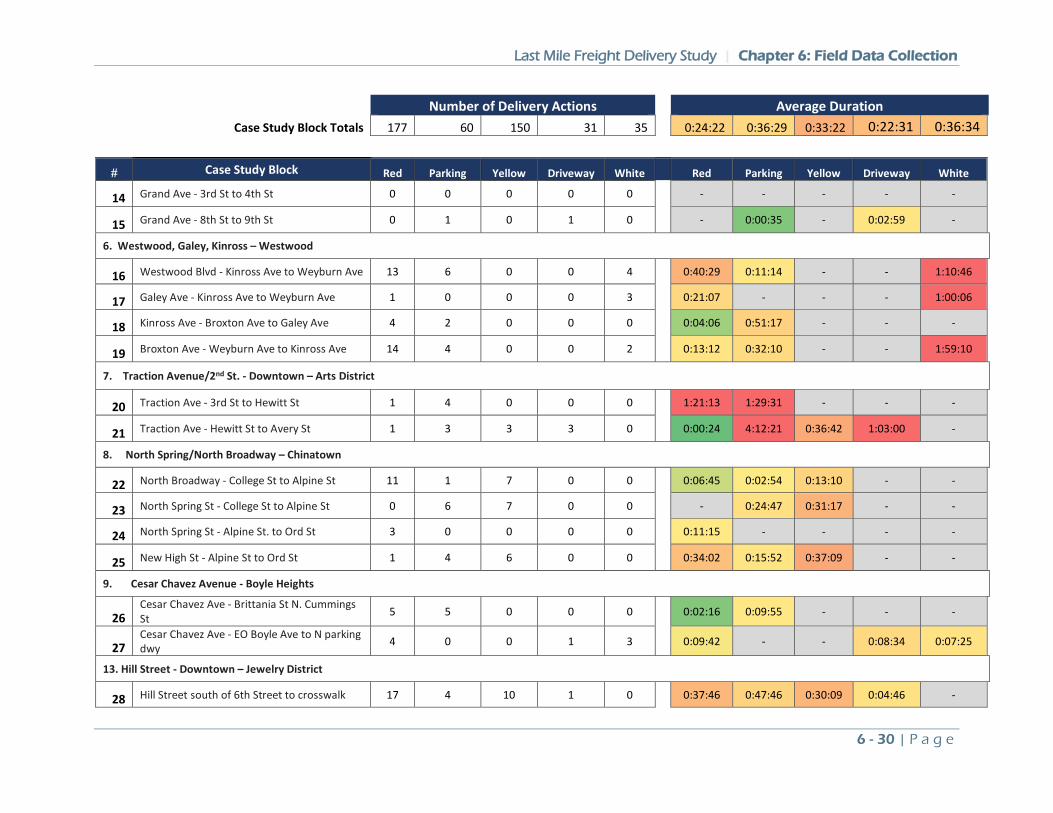
Last Mile Freight Delivery Study | Chapter 6: Field Data Collection
6 - 30 | P a g e
Number of Delivery Actions Average Duration
Case Study Block Totals 177 60 150 31 35 0:24:22 0:36:29 0:33:22 0:22:31 0:36:34
# Case Study Block Red Parking Yellow Driveway White Red Parking Yellow Driveway White
14 Grand Ave - 3rd St to 4th St 0 0 0 0 0 - - - - -
15 Grand Ave - 8th St to 9th St 0 1 0 1 0 - 0:00:35 - 0:02:59 -
6. Westwood, Galey, Kinross – Westwood
16 Westwood Blvd - Kinross Ave to Weyburn Ave 13 6 0 0 4 0:40:29 0:11:14 - - 1:10:46
17 Galey Ave - Kinross Ave to Weyburn Ave 1 0 0 0 3 0:21:07 - - - 1:00:06
18 Kinross Ave - Broxton Ave to Galey Ave 4 2 0 0 0 0:04:06 0:51:17 - - -
19 Broxton Ave - Weyburn Ave to Kinross Ave 14 4 0 0 2 0:13:12 0:32:10 - - 1:59:10
7. Traction Avenue/2nd St. - Downtown – Arts District
20 Traction Ave - 3rd St to Hewitt St 1 4 0 0 0 1:21:13 1:29:31 - - -
21 Traction Ave - Hewitt St to Avery St 1 3 3 3 0 0:00:24 4:12:21 0:36:42 1:03:00 -
8. North Spring/North Broadway – Chinatown
22 North Broadway - College St to Alpine St 11 1 7 0 0 0:06:45 0:02:54 0:13:10 - -
23 North Spring St - College St to Alpine St 0 6 7 0 0 - 0:24:47 0:31:17 - -
24 North Spring St - Alpine St. to Ord St 3 0 0 0 0 0:11:15 - - - -
25 New High St - Alpine St to Ord St 1 4 6 0 0 0:34:02 0:15:52 0:37:09 - -
9. Cesar Chavez Avenue - Boyle Heights
26 Cesar Chavez Ave - Brittania St N. Cummings St 5 5 0 0 0 0:02:16 0:09:55 - - -
27 Cesar Chavez Ave - EO Boyle Ave to N parking dwy 4 0 0 1 3 0:09:42 - - 0:08:34 0:07:25
13. Hill Street - Downtown – Jewelry District
28 Hill Street south of 6th Street to crosswalk 17 4 10 1 0 0:37:46 0:47:46 0:30:09 0:04:46 -
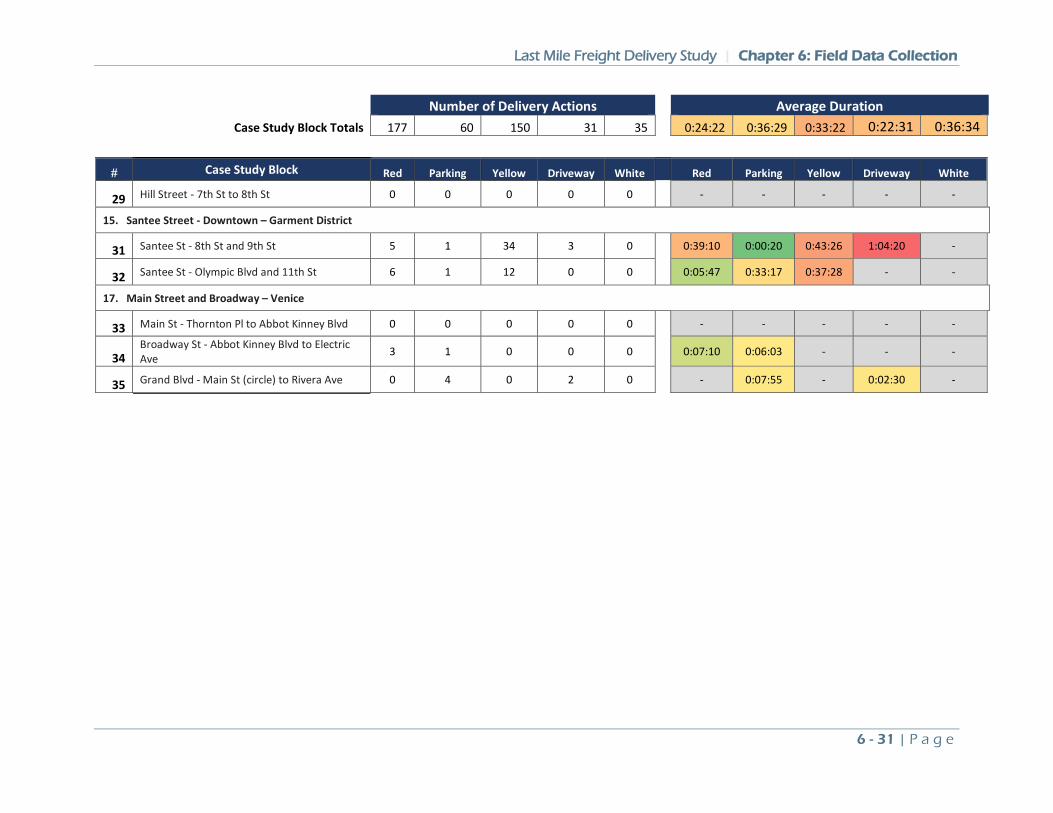
Last Mile Freight Delivery Study | Chapter 6: Field Data Collection
6 - 31 | P a g e
Number of Delivery Actions Average Duration
Case Study Block Totals 177 60 150 31 35 0:24:22 0:36:29 0:33:22 0:22:31 0:36:34
# Case Study Block Red Parking Yellow Driveway White Red Parking Yellow Driveway White
29 Hill Street - 7th St to 8th St 0 0 0 0 0 - - - - -
15. Santee Street - Downtown – Garment District
31 Santee St - 8th St and 9th St 5 1 34 3 0 0:39:10 0:00:20 0:43:26 1:04:20 -
32 Santee St - Olympic Blvd and 11th St 6 1 12 0 0 0:05:47 0:33:17 0:37:28 - -
17. Main Street and Broadway – Venice
33 Main St - Thornton Pl to Abbot Kinney Blvd 0 0 0 0 0 - - - - -
34 Broadway St - Abbot Kinney Blvd to Electric Ave 3 1 0 0 0 0:07:10 0:06:03 - - -
35 Grand Blvd - Main St (circle) to Rivera Ave 0 4 0 2 0 - 0:07:55 - 0:02:30 -
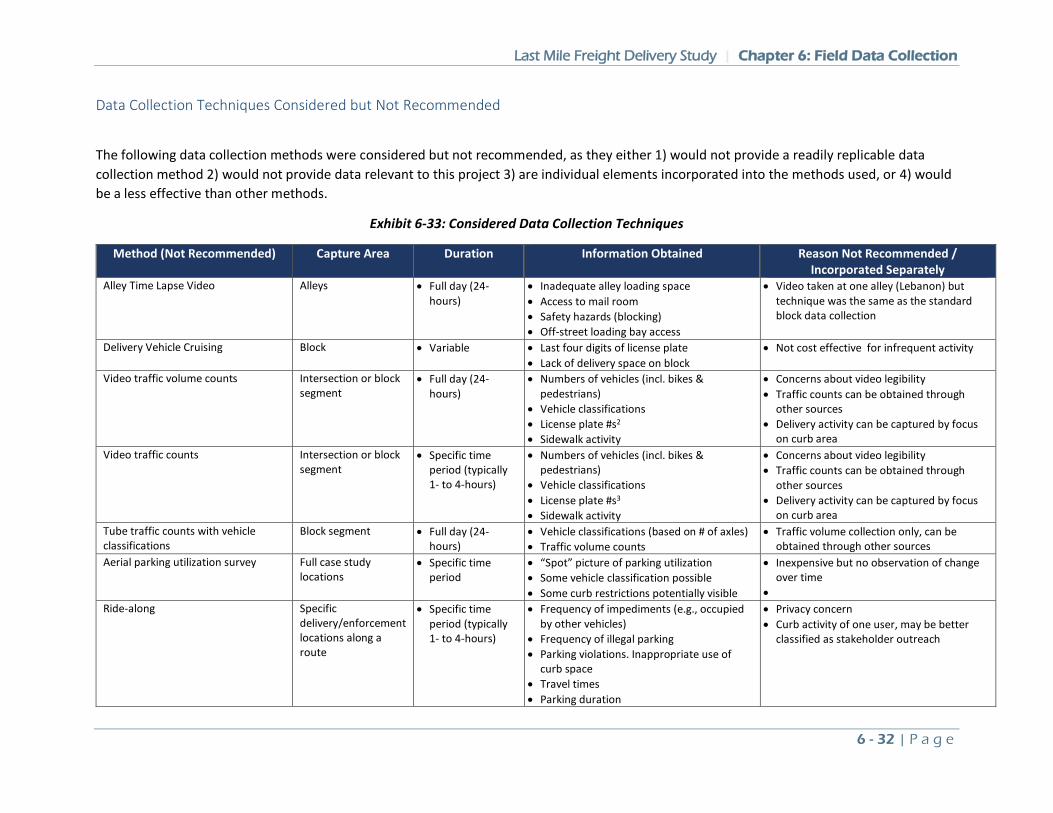
Last Mile Freight Delivery Study | Chapter 6: Field Data Collection
6 - 32 | P a g e
Data Collection Techniques Considered but Not Recommended
The following data collection methods were considered but not recommended, as they either 1) would not provide a readily replicable data collection method 2) would not provide data relevant to this project 3) are individual elements incorporated into the methods used, or 4) would be a less effective than other methods.
Exhibit 6-33: Considered Data Collection Techniques
Method (Not Recommended) Capture Area Duration Information Obtained Reason Not Recommended / Incorporated Separately
Alley Time Lapse Video Alleys • Full day (24-hours)
• Inadequate alley loading space • Access to mail room • Safety hazards (blocking) • Off-street loading bay access
• Video taken at one alley (Lebanon) but technique was the same as the standard block data collection
Delivery Vehicle Cruising Block • Variable • Last four digits of license plate • Lack of delivery space on block
• Not cost effective for infrequent activity
Video traffic volume counts Intersection or block segment
• Full day (24-hours)
• Numbers of vehicles (incl. bikes & pedestrians)
• Vehicle classifications • License plate #s2 • Sidewalk activity
• Concerns about video legibility • Traffic counts can be obtained through
other sources • Delivery activity can be captured by focus
on curb area Video traffic counts Intersection or block
segment • Specific time
period (typically 1- to 4-hours)
• Numbers of vehicles (incl. bikes & pedestrians)
• Vehicle classifications • License plate #s3 • Sidewalk activity
• Concerns about video legibility • Traffic counts can be obtained through
other sources • Delivery activity can be captured by focus
on curb area Tube traffic counts with vehicle classifications
Block segment • Full day (24-hours)
• Vehicle classifications (based on # of axles) • Traffic volume counts
• Traffic volume collection only, can be obtained through other sources
Aerial parking utilization survey Full case study locations
• Specific time period
• “Spot” picture of parking utilization • Some vehicle classification possible • Some curb restrictions potentially visible
• Inexpensive but no observation of change over time
• Ride-along Specific
delivery/enforcement locations along a route
• Specific time period (typically 1- to 4-hours)
• Frequency of impediments (e.g., occupied by other vehicles)
• Frequency of illegal parking • Parking violations. Inappropriate use of
curb space • Travel times • Parking duration
• Privacy concern • Curb activity of one user, may be better
classified as stakeholder outreach
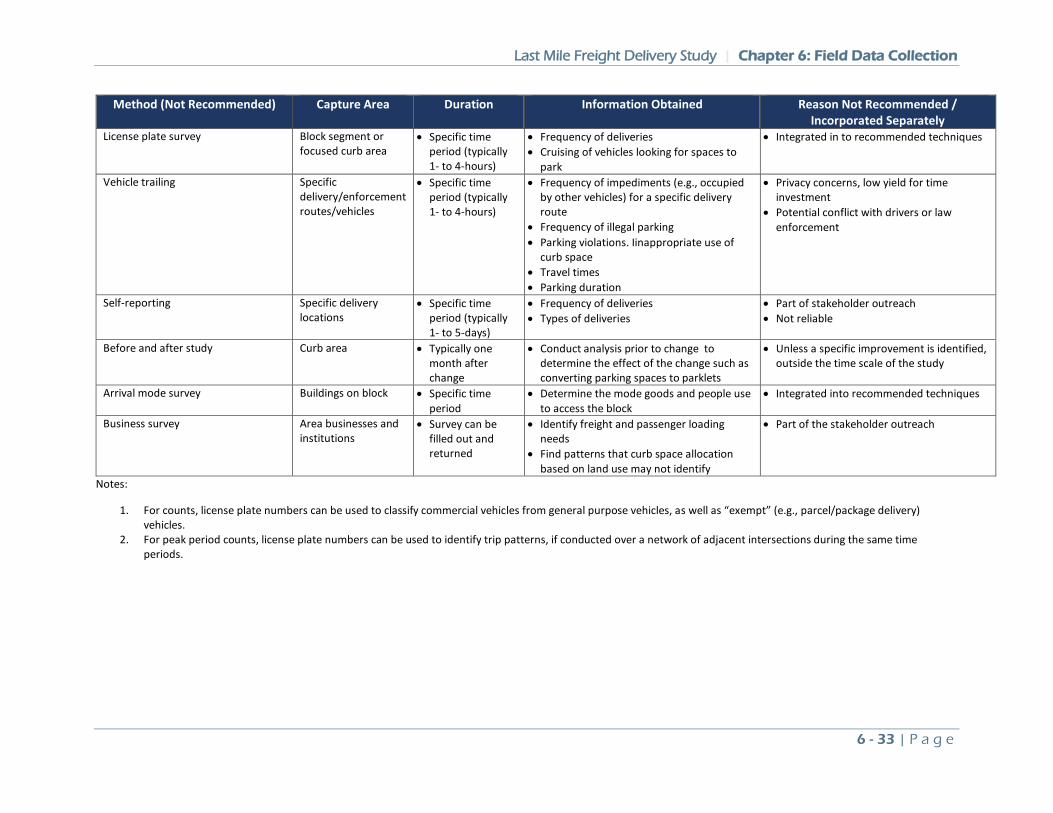
Last Mile Freight Delivery Study | Chapter 6: Field Data Collection
6 - 33 | P a g e
Method (Not Recommended) Capture Area Duration Information Obtained Reason Not Recommended / Incorporated Separately
License plate survey Block segment or focused curb area
• Specific time period (typically 1- to 4-hours)
• Frequency of deliveries • Cruising of vehicles looking for spaces to
park
• Integrated in to recommended techniques
Vehicle trailing Specific delivery/enforcement routes/vehicles
• Specific time period (typically 1- to 4-hours)
• Frequency of impediments (e.g., occupied by other vehicles) for a specific delivery route
• Frequency of illegal parking • Parking violations. Iinappropriate use of
curb space • Travel times • Parking duration
• Privacy concerns, low yield for time investment
• Potential conflict with drivers or law enforcement
Self-reporting Specific delivery locations
• Specific time period (typically 1- to 5-days)
• Frequency of deliveries • Types of deliveries
• Part of stakeholder outreach • Not reliable
Before and after study Curb area • Typically one month after change
• Conduct analysis prior to change to determine the effect of the change such as converting parking spaces to parklets
• Unless a specific improvement is identified, outside the time scale of the study
Arrival mode survey Buildings on block • Specific time period
• Determine the mode goods and people use to access the block
• Integrated into recommended techniques
Business survey Area businesses and institutions
• Survey can be filled out and returned
• Identify freight and passenger loading needs
• Find patterns that curb space allocation based on land use may not identify
• Part of the stakeholder outreach
Notes:
1. For counts, license plate numbers can be used to classify commercial vehicles from general purpose vehicles, as well as “exempt” (e.g., parcel/package delivery) vehicles.
2. For peak period counts, license plate numbers can be used to identify trip patterns, if conducted over a network of adjacent intersections during the same time periods.
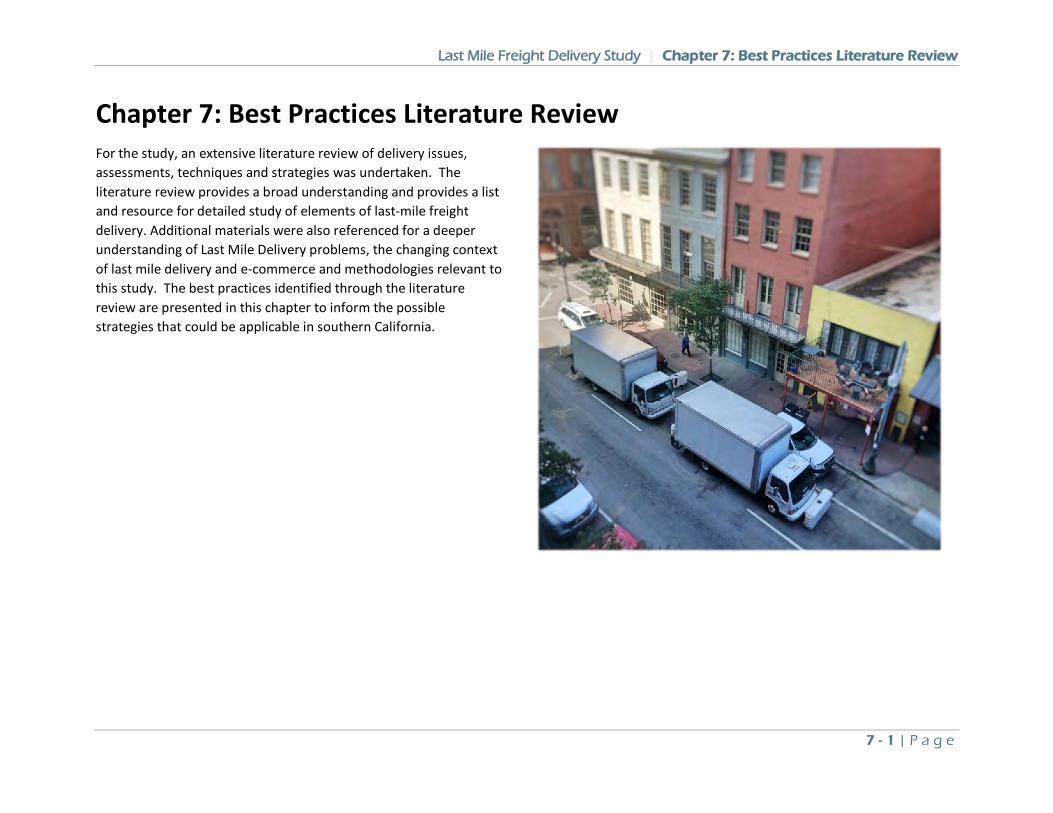
Last Mile Freight Delivery Study | Chapter 7: Best Practices Literature Review
7 - 1 | P a g e
Chapter 7: Best Practices Literature Review For the study, an extensive literature review of delivery issues, assessments, techniques and strategies was undertaken. The literature review provides a broad understanding and provides a list and resource for detailed study of elements of last-mile freight delivery. Additional materials were also referenced for a deeper understanding of Last Mile Delivery problems, the changing context of last mile delivery and e-commerce and methodologies relevant to this study. The best practices identified through the literature review are presented in this chapter to inform the possible strategies that could be applicable in southern California.
Last Mile Freight Delivery Study | Chapter 7: Best Practices Literature Review
7 - 2 | P a g e
The literature review involved the collection of relevant articles, scholarly papers, reports and studies into an electronic database in PDF format. Items in the literature review were numbered in the order they were reviewed—there is no prioritization inferred by the numbering. Sources file names, reference and summaries of their topics were compiled in a literature review file. Key topics searched in the literature review were:
• Delivery issues facing the City of Los Angeles and other peer cities
• Data collection methods • Strategies to improve delivery conditions
Overall, 206 documents were collected, reviewed and catalogued as part of the literature review. These included 104 documents with guidelines, research or overview papers to inform general last-mile delivery issues and 102 with specific policies and strategies to improve delivery conditions. Strategies were organized based on the broad categories of the Curb Area, Deliverer and Receiver and Administration and Application strategies and then further organized by more specific types of strategies under those categories.
These topical categories were then used to coalesce specific best practice policies and strategies from the literature review sources. Below are the literature review best practice categories along with the number of sources collected in each topic in parentheses. Some sources covered multiple best practice areas.
• Curb Area Strategies o Curb Loading Areas (39 sources) o Manage Curb Demand (35 sources) o Shared Space (24 sources)
o Operating Hours (39 sources) o Restricted Locations (14 sources)
• Deliverer and Receiver Strategies o Delivery Consolidation (21 sources) o Building/ Parking Improvements (19 sources) o Vehicle Options (24 sources)
• Administration and Application Strategies o Enforcement (26 sources) o Education and Outreach (26 sources) o Research and Analysis (40 sources) o Technology (38 sources)
The collection and analysis of the literature review was shared with the Project Advisory Committee (PAC) and refined into actionable strategies as described in the Toolbox of Strategies. The toolbox is structured as a resource to assist Cities in identifying solutions for improving delivery conditions and balancing the use of roadways and the curbside, in order to meet broad freight and passenger access goals.
This chapter contains a summary of selected implementation examples of best practice innovative solutions for last-mile freight delivery issues.
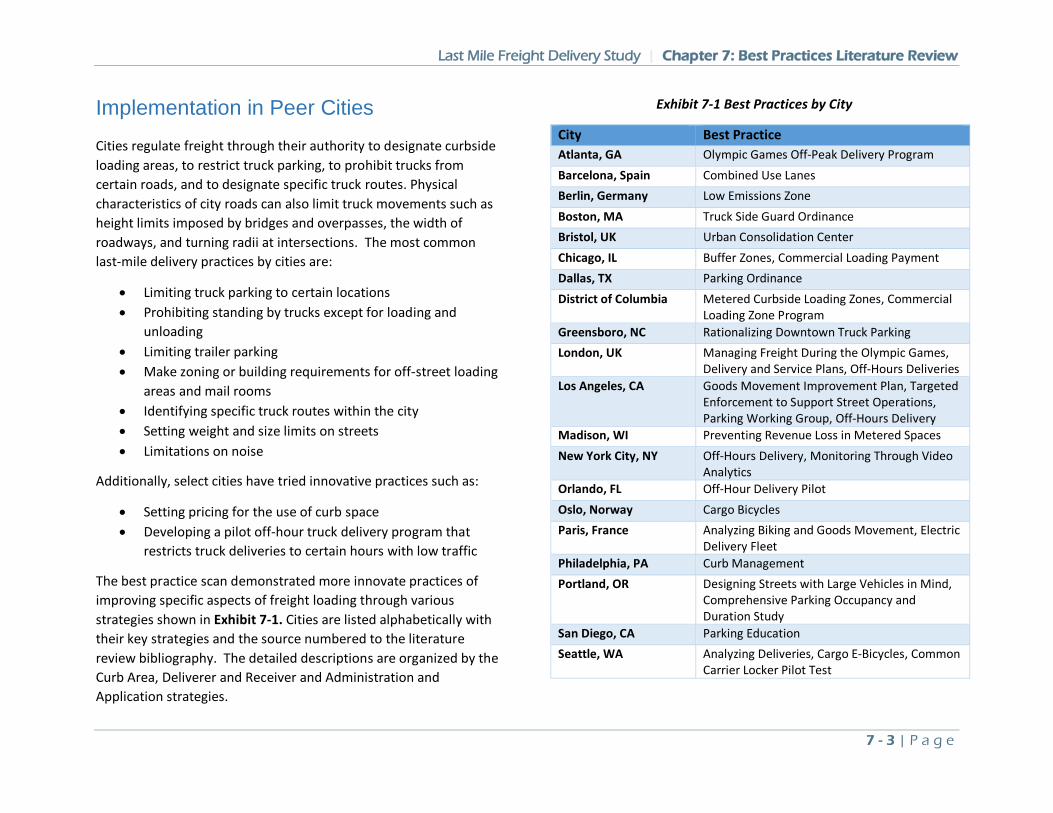
Last Mile Freight Delivery Study | Chapter 7: Best Practices Literature Review
7 - 3 | P a g e
Implementation in Peer Cities Cities regulate freight through their authority to designate curbside loading areas, to restrict truck parking, to prohibit trucks from certain roads, and to designate specific truck routes. Physical characteristics of city roads can also limit truck movements such as height limits imposed by bridges and overpasses, the width of roadways, and turning radii at intersections. The most common last-mile delivery practices by cities are:
• Limiting truck parking to certain locations • Prohibiting standing by trucks except for loading and
unloading • Limiting trailer parking • Make zoning or building requirements for off-street loading
areas and mail rooms • Identifying specific truck routes within the city • Setting weight and size limits on streets • Limitations on noise
Additionally, select cities have tried innovative practices such as:
• Setting pricing for the use of curb space • Developing a pilot off-hour truck delivery program that
restricts truck deliveries to certain hours with low traffic
The best practice scan demonstrated more innovate practices of improving specific aspects of freight loading through various strategies shown in Exhibit 7-1. Cities are listed alphabetically with their key strategies and the source numbered to the literature review bibliography. The detailed descriptions are organized by the Curb Area, Deliverer and Receiver and Administration and Application strategies.
Exhibit 7-1 Best Practices by City
City Best Practice Atlanta, GA Olympic Games Off-Peak Delivery Program Barcelona, Spain Combined Use Lanes Berlin, Germany Low Emissions Zone Boston, MA Truck Side Guard Ordinance Bristol, UK Urban Consolidation Center Chicago, IL Buffer Zones, Commercial Loading Payment Dallas, TX Parking Ordinance District of Columbia Metered Curbside Loading Zones, Commercial
Loading Zone Program Greensboro, NC Rationalizing Downtown Truck Parking London, UK Managing Freight During the Olympic Games,
Delivery and Service Plans, Off-Hours Deliveries Los Angeles, CA Goods Movement Improvement Plan, Targeted
Enforcement to Support Street Operations, Parking Working Group, Off-Hours Delivery
Madison, WI Preventing Revenue Loss in Metered Spaces New York City, NY Off-Hours Delivery, Monitoring Through Video
Analytics Orlando, FL Off-Hour Delivery Pilot Oslo, Norway Cargo Bicycles Paris, France Analyzing Biking and Goods Movement, Electric
Delivery Fleet Philadelphia, PA Curb Management Portland, OR Designing Streets with Large Vehicles in Mind,
Comprehensive Parking Occupancy and Duration Study
San Diego, CA Parking Education Seattle, WA Analyzing Deliveries, Cargo E-Bicycles, Common
Carrier Locker Pilot Test
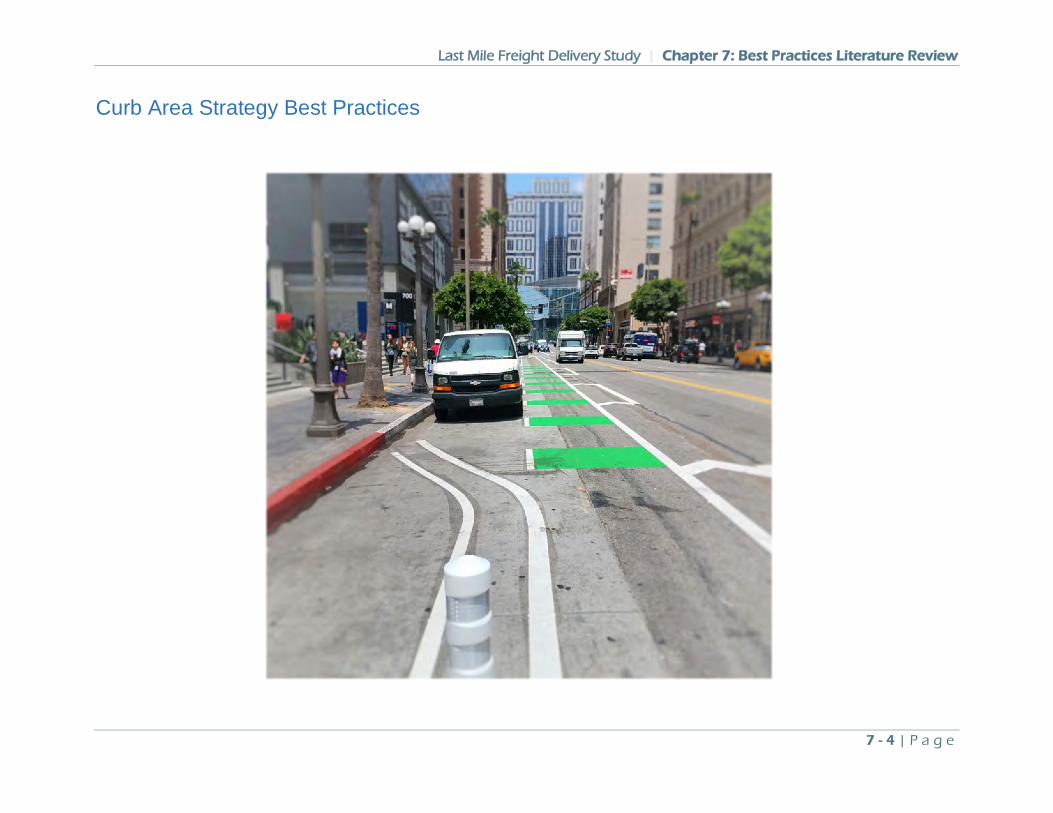
Last Mile Freight Delivery Study | Chapter 7: Best Practices Literature Review
7 - 4 | P a g e
Curb Area Strategy Best Practices
Last Mile Freight Delivery Study | Chapter 7: Best Practices Literature Review
7 - 5 | P a g e
Atlanta, GA Olympic Games Off-Peak Delivery Program The 1996 Olympic Games in Atlanta created a major and sudden influx of traffic and congestion. Furthermore, urban freight demand was expected to rise with additional needs for deliveries to restaurants, hotels and tourist spots, which would raise freight demand and the need for additional trucks, add to congestion and decrease productivity.
The region strongly encouraged off-peak delivery for all commercial vehicle-based pick-up and delivery services during the Olympics. An outreach campaign was conducted to encourage commercial vehicles to shift to off-peak hours or otherwise consolidate their deliveries. The shift to nighttime delivery was one aspect of regional transportation control measures.
During the daytime delivery ban, many regional carriers used the same equipment during the day to support night-time inter-city or interstate (over-the-road) operations between other markets. Therefore, many changes had to be made to workforce scheduling and equipment utilization outside the region and even the state. In addition, transit times between cities were affected, which disrupted supply chains. However, carriers responded to the changes in local and over-the-road operations by adopting temporary standards and changes in the supply chain. UPS and FedEx changed their flight arrival and departure times to comply with delivery time of day restrictions.
Companies such as Coca Cola, with headquarters in Atlanta, realized productivity gains during the temporary off-peak delivery program when they found greater numbers of receivers and shippers available during hours with less congestion. The Atlanta Regional Mobility Plan (2008) noted that more than 60 percent of food
distributors interviewed were willing to move to night deliveries “under the right circumstances.”
Source: LaBelle, J. (2015), Off-Peak Delivery: A Pilot Project for the Chicago Region, Urban Transportation Center, University of Illinois Chicago
Barcelona, Spain Combined Use Lanes Barcelona uses variable message signs to indicate different permitted uses at different times of day on the Balmes Street (Carrer de Balmes) arterial. During peak periods use of the street for through traffic is allowed, the mid-day is for temporary truck loading stops, and at night and on weekends on-street parking is permitted which provides for a flexible use of the road space based on changes to mobility demands.
Source: Seattle Urban Mobility Plan (2008), Chapter 10 Best Practices in Freight Movement
Berlin, Germany Low Emissions Zone Berlin established the “Urban Freight Laboratory” to pilot innovative delivery schemes. One such effort established a low-emissions zone (LEZ) that restricted vehicle access to environmentally sensitive areas to reduce pollution levels. Low emissions zones are relatively popular in Europe and have spread to other parts of the world such as Mexico City.
To enter LEZs, every vehicle irrespective of its weight must have a sticker issued on the basis of a registration certificate that represents a pollution standard by color. The three colors of red, orange and green correspond to European particulate matter
Last Mile Freight Delivery Study | Chapter 7: Best Practices Literature Review
7 - 6 | P a g e
standards. While only green stickers are generally allowed in LEZs, Berlin needed to grant several exceptions on a case-by-case basis—most often due to a trucking firm’s financial hardship of obtaining new vehicles. While pollution in LEZs has decreased, the economic impacts were analyzed through surveys in Berlin.
Berlin saw the development of new logistics hubs outside the boundaries of the LEZ. These terminals would be used to transfer from polluting vehicles to cleaner (primarily natural gas and biogas) vehicles to make final deliveries.
During the three-year period after the introduction of its LEZ, Berlin saw a significant drop in the number of transport and logistics firms and a loss of 15,000 related jobs. It should be noted that this three-year period was 2008-2011 when the brunt of the economic recession was occurring. It was difficult for smaller businesses to maintain a sufficient level of business activity due to limited resources for new vehicles and/or an ability to make changes in business practices, keeping in line with the delivery sector’s labor laws and safety standards.
London experienced a similar decline. This indicates that public gains in lower emissions must be offset with programs to maintain the financial viability of delivery services for a balanced approach.
Sources: Holquin-Veras, J. (2015) Improving Freight System Performance in Metropolitan Areas: A Planning Guide, National Cooperative Freight Research Program Report 33, Transportation Research Board.
Dablanc, L. (2014) Impacts of Environmental Access Restrictions on Delivery Activities, the Example of Low Emissions Zones in Europe, Project number 14-2.2a, MetroFreight Volvo Center of Excellence
Chicago, IL Buffer Zones The Chicago Department of Transportation uses buffer zones when implementing complete streets concepts to ensure the safe operation of loading and unloading of trucks. Buffers between narrowed travel lanes and bicycle lanes ensure trucks can operate without conflict with bicyclists while other treatments help avoid conflicts between drivers and bicyclists during unloading.
Source: United States Department of Transportation, Federal Highway Administration, Urban Freight Movement presented to Downtown Delivery Symposium, Delaware Valley Regional Planning Commission, July 15, 2015
Greensboro, NC Rationalizing Downtown Truck Parking The City has a policy to reconfigure downtown parking spaces to maximize customer parking. It established two types of truck zones. A "truck only" 70- to 80-foot loading zones for commercial licensed vehicles is for over 15,000 pounds or heavier for 60 minutes maximum. A "delivery or drop off/pick up zone" provides one or two 30-foot spaces on each block with a maximum 30-minute time limit.
Source: (2009) Improving Freight Movement in Delaware Central Business Districts, Institute from Public Administration College of Education and Public Policy, University of Delaware
Last Mile Freight Delivery Study | Chapter 7: Best Practices Literature Review
7 - 7 | P a g e
London, UK Off-Hours Deliveries
A trial of off hours deliveries (OHD) performed in the London borough of Wandsworth at the Sainsbury supermarket chain found:
• The average delivery vehicle roundtrip journey times were reduced by 60 minutes from the distribution time;
• OHD produced a saving in drivers’ time of 2 hours per day, equal to 700 hours or £16,000 per year; and
• OHD removed 700 vehicle journeys from the road annually (2 per day during the congested period), which is equivalent to a 68-ton reduction in CO2, and a 700-liter per year savings in fuel.
Source: Dowling, R. (2014) Incorporating Truck Analysis into the Highway Capacity Manual, National Cooperative Freight Research Program Report 31, Transportation Research Board.
Los Angeles, CA Off-Hours Delivery The 1984 Olympics provided an opportunity for the City of Los Angeles to innovate in its transportation system to accommodate a temporary change in traffic patterns due to the housing of the Olympic Games.
Caltrans worked with more than 50 governmental agencies and private transportation planners to implement the traffic management plan. The California Highway Patrol and Caltrans concentrated on freeway flow management strategies which included strict monitoring of access to freeways; closure of certain on-ramps; instant towing of disabled vehicles; bus-only on-ramps; motorist advisories; traffic signal system management; intense
surveillance using helicopters and closed- circuit television; encouragement to commute in off-peak times or work from home; and encouraging a voluntary reduction in peak period truck deliveries. The California Highway Patrol and the California Trucking Association negotiated a five-week labor contract waiver with the Teamsters Union. This allowed truckers in Southern California to switch their deliveries to the off-peak hours.
The state of California enacted laws to allow off-peak delivery of certain commodities and implemented a public information campaign to educate the trucking industry on the necessity of altering delivery routes and activities. In addition, some businesses increased their inventory to reduce the need for deliveries during peak periods.
As a result of the numerous transportation control measures, congestion was reduced by approximately 60 percent and truck traffic decreased by 16 percent during peak periods. In addition, there was a 42 percent reduction in truck-related collisions during the Olympic period. Much of the success was attributed to the high degree of public awareness surrounding the traffic plan and the transportation system being in a state of readiness.
In 2005, the Ports of Los Angeles and Long Beach implemented the “PierPASS OffPeak” program to create incentives to shift traffic to off-peak hours. Under the OffPeak program, all international container terminals in the two adjacent ports established five new shifts per week (Monday through Thursday from 6:00 PM to 3:00 AM and Saturday from 8:00 AM to 6:00 PM). As an incentive to use the new night-time and week-end shifts, a Traffic Mitigation Fee (TMF) is now required for most cargo movement during peak hours (Monday through Friday, 3:00 AM to 6:00 PM). The TMF is a financial assessment administered through PierPASS to finance the
Last Mile Freight Delivery Study | Chapter 7: Best Practices Literature Review
7 - 8 | P a g e
labor and operational costs of the additional night-time gates. Between 30 percent and 45 percent of a typical day’s container cargo at the ports has shifted to the off-peak hours since the start of the program. The Off-Peak program was restructured in November 2018 using appointments rather than the daytime only TMF used in the original Off-Peak program.
Sources: Seattle Urban Mobility Plan (2008), Chapter 10 Best Practices in Freight Movement
LaBelle, J. (2015), Off-Peak Delivery: A Pilot Project for the Chicago Region, Urban Transportation Center, University of Illinois Chicago
New York City, NY New York City faces several challenges for last-mile delivery: off-street freight requirements have changed minimally since 1952, while commercial property deliveries have increased 300 percent in 30 years.
The New York City Department of Transportation Office of Freight Mobility has several key projects and deliverables to meet its mission of reducing the impacts of trucks on communities and infrastructure while also supporting the City’s economic competitiveness. These include development of a Smart Truck Management Plan, ensure truck route compliance, a weight-in-motion (WIM) program, a low noise monitoring program and three pilot programs highlighted here: an off-hour deliveries program, monitoring of truck loading activity through video analytics and a study of green loading zones.
Off-Hour Delivery In 2002 the Council of Logistics Management asked the New York State Department of Transportation (NYSDOT) to study how to foster off-peak delivery in New York City. From 2003 to 2005 the
NYSDOT funded off-peak delivery research focused on Manhattan and later expanded the scope to Brooklyn. Since 2007, the USDOT’s Commercial Remote Sensing and Spatial Technology program has funded an off-peak delivery pilot, which took place in 2009, as well as a current design and implementation phase. The NYCDOT considers off-peak deliveries as those taking place between 10PM and 6AM.
In 2009, NYCDOT worked with the Rensselaer Polytechnic Institute (RPI) and a group of stakeholders and research partners to implement an off-hour truck delivery pilot program (ODP) in New York. The pilot included 35 receivers and 20 trucks/vendors. Participating companies included Foot Locker (ten stores), Whole Foods (four stores), and Sysco (twenty-one stores). Half of the participants staffed ODP and the other half had unassisted ODP where the store provided the driver with a key or passcode. Receivers were given a financial incentive of $2,000 for participation and carriers were given $300 per truck participating in the pilot.
• Travel time savings to all highway users were estimated at approximately 3-5 minutes per trip due to the shift in deliveries to off-hours
• Off-Peak Delivery is estimated to be 30-40 percent cheaper for carriers than regular daytime deliveries.
• Carriers that switch to off-hours would save about 48 minutes in travel time per delivery tour and one to three hours in total service time per delivery tour.
• The main reason cited by receivers for continuing with off-peak delivery was its increased reliability
• Almost all the receivers using unassisted (no receiver staff present) ODP remained in the off-hours because of its reliability, without any additional incentives. However, when the pilot ended all the receivers with staffed ODP
Last Mile Freight Delivery Study | Chapter 7: Best Practices Literature Review
7 - 9 | P a g e
reverted to regular daytime deliveries even though they were satisfied with their experience in the pilot.
• With unassisted ODP, liability issues decrease when receivers provide the driver with keys for the first set of double doors or install a virtual cage, which restricts drivers to an area marked off by sensors.
• The more deliveries an establishment receives, the less likely they are to participate in unassisted off-peak deliveries.
The 2nd phase of the New York ODP project focused on the findings of the funded research efforts. Unassisted ODP behavioral research found the key financial determinants in ODP participation are one-time incentives and discounts from vendors. Vendor discounts include carriers providing shipping discounts when more vendors sign up for off-peak deliveries. The RPI research suggested the public sector should provide incentives for shippers and receivers.
For shippers, the use of shipping discounts and a “Trusted Vendor” program were key lessons learned. Trusted vendor corresponds to characteristics of the receiver concerning whether they currently provide access to a vendor to do unattended off-hour deliveries. For receivers, research pointed to initiate a program with signature chains to be the leaders in ODP programs. Once there is a clear plan with developed incentives, it is important to engage community stakeholders. If several key chain companies are on board and a business case is well defined, then it will be possible to win over residents concerned about noise issues and small businesses who could be potential participants. All the of the evidence pointed to the engagement of receivers as the most necessary component of an off-hours delivery program.
Source: LaBelle, J. (2015), Off-Peak Delivery: A Pilot Project for the Chicago Region, Urban Transportation Center, University of Illinois Chicago
Orlando, FL Off-Hour Delivery Pilot The Florida Department of Transportation and Orlando Health Campus received an FHWA grant to study the costs and benefits of moving freight deliveries occurring during peak traffic periods to off-hours. The goals of the program were to improve air quality, lessen congestion, and foster walkability on the campus and in the neighborhood.
Orlando Health served as the Project Champion, receiver, and one of the carriers. Though significant effort was made on the part of the project team and Orlando Health, of the 13 carriers that access the SODO campus, two carriers with seven total trucks participated in the study. Through project implementation, the study team was able to demonstrate marked environmental and economic benefits from utilizing the off-peak logistics model.
The final report project report estimated the total economic benefit over the 30-year analysis period of the off-peak deliveries for the seven daily trips is estimated at $263,746. Of this total amount, $255,486 is due to travel time savings for trucks with emissions reductions amounting to $8,260. These benefits are directly tied to travel time savings, productivity increases, and pollution reductions. By moving deliveries from the peak to the off-peak period, drivers are estimated to save over 7,600 vehicle-hours over a 30-year analysis period. The traffic analysis shows that participating trucks would experience a 35 percent travel time reduction by 2040.
Last Mile Freight Delivery Study | Chapter 7: Best Practices Literature Review
7 - 10 | P a g e
Based on a conservative estimate of a broader adoption of off-hour deliveries for 500 potential daily off-peak deliveries for the Orlando urban area, the resulting economic benefit would be approximately $19 million over the 30-year period and $630,000 per year.
Sources: LaBelle, J. (2015), Off-Peak Delivery: A Pilot Project for the Chicago Region, Urban Transportation Center, University of Illinois Chicago
Orlando Florida Department of Transportation, (2017) Off-Peak Freight Delivery Pilot Project Final Report
Philadelphia, PA Curb Management The Philadelphia Parking Authority has focused on improving downtown delivery where there is multiple demand on curb space. They balance conflicting demands by establishing special purpose zones, set aside specific hours for specific purposes, regulating length of stay and set rates for public parking to encourage turnover. The City updated their meter equipment, developed a pay-by-phone and updated parking rates to increase parking space vacancy rates and vehicle turnover. For truck loading, in order to reduce illegal truck parking, open parking on major retail streets and facilitate deliveries, the City established new truck loading zones. The 55 new truck loading zones were located off major retailed streets and away from retail fronts. Truck loading was allowed only from 6:00AM to 10:00AM Monday to Friday with no truck parking after 10:00AM. The City also established package delivery zones, located separately from the truck loading zones, in places where multiple deliveries could be served from a central location. The updated parking program was preceded by an extensive education campaign and was followed by a grace period for ticketing and towing.
Source: Presentation: Dickson, R. Downtown Delivery, Philadelphia Parking Authority.
Portland, OR Designing Streets with Large Vehicles in Mind As Part of its Freight Master Plan, Portland developed street guidelines for truck movements. The design guide included a discussion of truck operating requirements, and a tool kit of potential design solutions. Issues associated with truck movements were presented in two categories:
• “Design for”–design concepts that fully accommodate within prescribed travel lanes the physical requirement of truck movements
• “Accommodate”–design concepts, or operational and/or demand management strategies that accommodate truck movements in relatively tight street environments.
Source: City of Portland Office of Transportation (2008), Designing for Truck Movements and Other Large Vehicles in Portland Final Draft
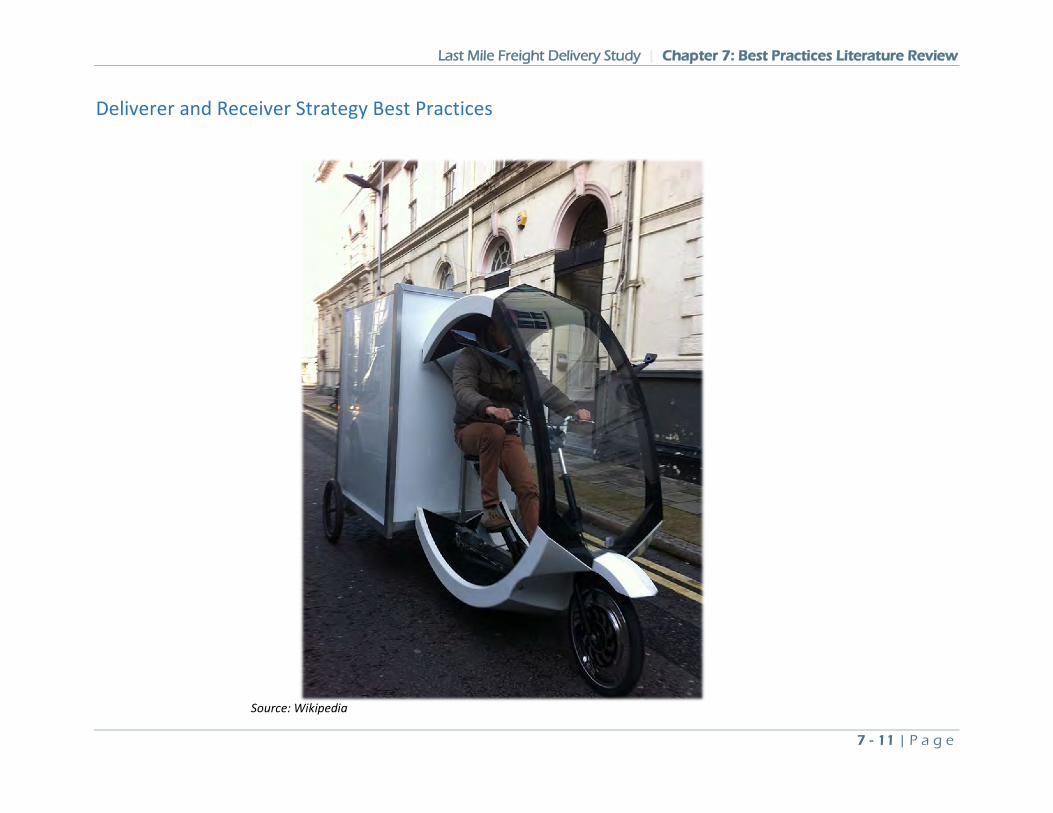
Last Mile Freight Delivery Study | Chapter 7: Best Practices Literature Review
7 - 11 | P a g e
Deliverer and Receiver Strategy Best Practices
Source: Wikipedia
Last Mile Freight Delivery Study | Chapter 7: Best Practices Literature Review
7 - 12 | P a g e
Bristol, UK Urban Consolidation Center The Bristol Freight Quality Partnership (BFQP) was established in 2003 as a joint effort of the Bristol City Council, three other public agencies, and 17 private entities. The BFQP developed a strategic plan to reduce truck delivery trips to Broadmead, the core retail area including approximately 325 stores. The BFQP established a freight consolidation center in an industrial park on the urban fringe, with access to the local road network and approximately 25 minutes away from Broadmead. During the initial trial phase, the center served 17 retailers using one truck. Over time, a second, larger truck was added, and participation has increased to 46 retailers. For participating retailers, the consolidation resulted in a 73 percent reduction in delivery movements; vehicle mileage was reduced by 65 percent. By collecting the goods destined to the target area and consolidating deliveries into one large delivery made by high-load vehicles, urban consolidation centers can relieve congestion and improve air quality. Significant benefits also accrue to the participating retailers from improved staff productivity and safety, the provision of services such as recycling of packaging.
The pilot phase of the service was provided to retailers at no cost, with funding provided by European Community funding. In 2011, the consolidation center was expanded to serve the City of Bath and use of electric vehicles was implemented.
Oslo, Norway Cargo Bicycles DHL Express conducted a cargo bicycle pilot project in Oslo, Norway. Overall, the findings indicate what has been challenging for DHL during the start-up period to reach their target of an average of 90 deliveries with 2-3 cargo bicycles. The main reasons for this were
the design of the cargo bicycle and difficulties in recruiting cyclists. In addition, it was difficult for DHL and the local authorities to identify a suitable location for an urban logistics staging area or micro hub in the city center.
Source: Norwegian Centre for Transport Research
Paris, France Analyzing Biking and Goods Movement A MetroFreight study comparing bicycle delivery in Paris from 2001 to 2014 showed the most benefits of increased bicycle deliveries came from reduced usage of vans, followed by motorcycles. Very few trucks were replaced by bicycles or cargo bicycles.
Source: Koning, M. (2014), The Goods Impacts of Biking for Goods: Lessons from Paris City, MetroFreight, Volvo Center of Excellence
Electric Delivery Fleet Private parcel delivery firms operate fleets of 100 percent battery electric vehicles. One firm, Green Link started operations in 2009 and by 2013 was making 2,500 deliveries per day with 80 employees using electric cargo bikes and small electric vehicles. They operate from three urban delivery hubs which are supplied early in the morning. Parcels are consolidated in the hub before optimized routes are chosen for delivery. The company estimates a 10 percent reduction in CO2 emissions, a 16 percent reduction in delivery failures, and a 20 percent reduction in distribution costs due to tour optimization, use of bicycle lanes to bypass traffic, no fuel costs and the combining of delivery and pick-ups.
Source: Presentation: Darchambeau, M., Sustainable City Logistics, The Green Link
Last Mile Freight Delivery Study | Chapter 7: Best Practices Literature Review
7 - 13 | P a g e
Portland, OR Cargo Bicycle Pilot Program Building on a fleet of traditional bicycles during the peak holiday delivery season in Portland, UPS introduced a pilot program using electric bikes year-round. The eBike is equipped with battery-powered electric motors that makes it possible to cover further distances, carry substantial loads, and navigate hills and other terrain.
Source: Oregonlive.com
Seattle, WA Cargo E-Bicycles UPS partnered with the Seattle Department of Transportation and University of Washington to make deliveries using electric-assist cargo bikes in downtown Seattle. The purpose is to allow UPS to make deliveries to areas conventional delivery trucks cannot access directly and currently require that trucks be parked on the periphery for long periods of time.
UPS has pilot-tested its e-bike delivery systems with the first test taking place in Hamburg, Germany, in 2012, and the first U.S. test in Portland, Oregon, in 2016. In those tests, UPS used an electrically assisted tricycle with a wagon over the back two wheels to hold packages. During the year-long pilot, UPS will deliver packages in Pike Place Market and the surrounding neighborhood using the bikes. UPS worked with Silver Eagle Manufacturing to develop the e-bikes, which carry trailers packed with modular, detachable cargo containers. UPS has tested e-bike delivery in other cities, but the Seattle pilot is the first in which wagons with detachable containers will be used. The cargo bikes can hold up to 400 pounds. Couriers drive on sidewalks and designated bike lanes to make their
deliveries. Two key issues for cargo bicycles are right sized density to make cargo bike loads to be competitive with truck deliveries and the need for a staging area to transfer freight to the cargo bikes. Amazon previously tested a cargo bike program for Prime Now deliveries with 40 couriers and no City involvement. However, the program was stopped in 2016.
Source: University of Washington Urban Freight Lab, Geekwire.com June 2, 2016
Common Carrier Locker Pilot Test Part of the Final 50 Feet Research Program, the University of Washington Urban Freight Lab secured funding and partners for a pilot of a common carrier locker system in the Seattle Municipal Tower. Common carrier lockers are open to all delivery and retail firms. The pilot tested the ability of new mini-distribution centers such as smart lockers to create delivery density and reduce the time delivering within large buildings.
The Urban Freight Lab collected before and after data to evaluate the pilot’s premise: that use of a mini-distribution node would create delivery density and decrease delivery time. Lab members UPS and the U.S. Postal Service participated in this pilot, so any package they delivered to the building went into the locker system. This pilot reduced the average amount of time parcel delivery personnel spent doing their work in the 62-floor office tower by 78 percent, when compared with going floor-to-floor, door-to-door in the tower. This pilot provided evidence that the common carrier locker system strategy can achieve a significant reduction in delivery time.
Source: University of Washington Urban Freight Lab
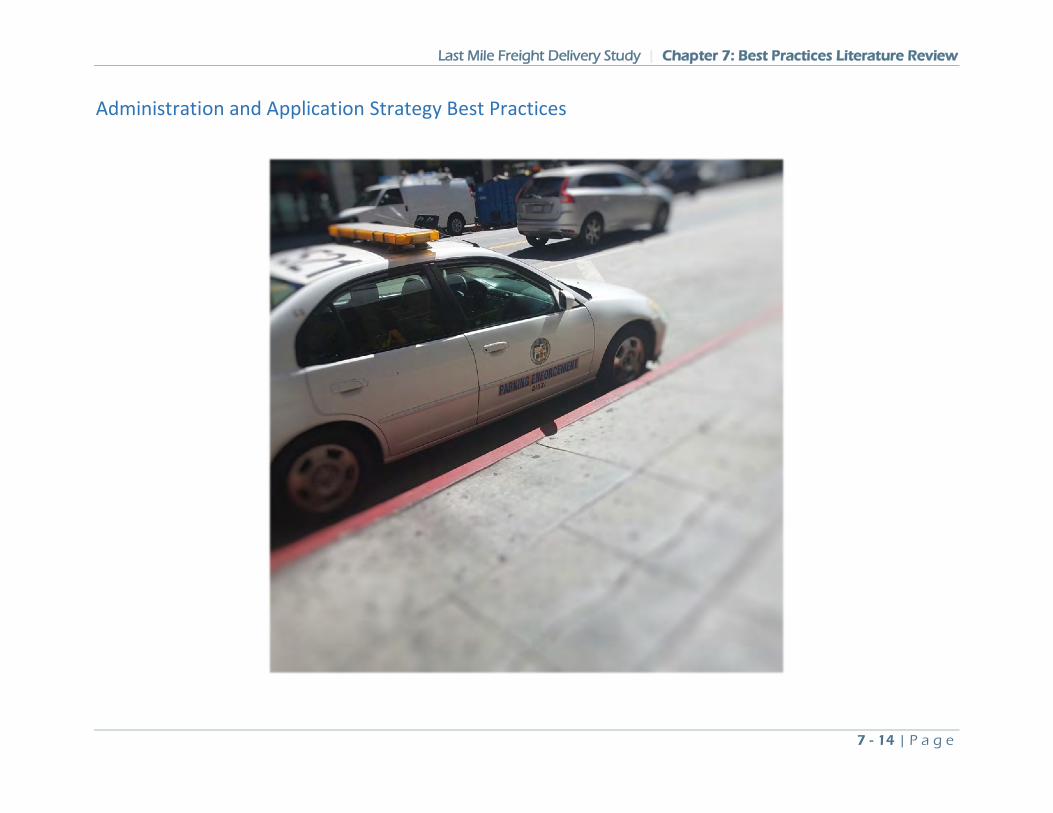
Last Mile Freight Delivery Study | Chapter 7: Best Practices Literature Review
7 - 14 | P a g e
Administration and Application Strategy Best Practices
Last Mile Freight Delivery Study | Chapter 7: Best Practices Literature Review
7 - 15 | P a g e
Boston, MA Truck Side Guard Ordinance Boston was the first U.S. city to require side guards—an enhanced safety measure designed to prevent fatalities and further reduce the risk of a collision with pedestrians and bicyclists. A City ordinance mandates all large City-contracted vehicles to be equipped with side guards, convex mirrors, and blind-spot awareness decals to improve safety.
Source: United States Department of Transportation, Federal Highway Administration, Urban Freight Movement presented to Downtown Delivery Symposium, Delaware Valley Regional Planning Commission, July 15, 2015
Commercial Loading Payment Chicago Parking Meters, LLC operates the third-largest metered parking system in the United States and the largest system privately operated under a concession agreement. It operates ParkChicago, a mobile payment option for street parking in Chicago, as well as the operation, management and maintenance of Chicago’s metered parking system. Since 2009, electronic pay boxes were installed at all of the approximately 36,000 metered spaces in the city’s downtown and neighborhood areas.
Chicago Parking Meters engaged Chicago-based creative agency, Futureman Digital, to design and develop all aspects of the ParkChicago brand including street signs, website, videos, and application screens.
The ParkChicago mobile application and website are a portal to pay for standard street parking as well as commercial loading zone
parking. Signage indicates a zone code for users to pay for parking on their phone.
Source: Park Chicago
Dallas, TX Parking Ordinance City policy requires new development within CBDs to provide off-street facilities or a payment in lieu of such a facility to be used to finance common off-street facilities. There are City ordinances for the number of off-street loading docks, berths, and size of dock dimensions based on development specifications.
Source: (2009) Improving Freight Movement in Delaware Central Business Districts, Institute from Public Administration College of Education and Public Policy, University of Delaware
District of Columbia Metered Curbside Loading Zones In 2007, the District implemented metered loading zones as part of the Downtown Congestion Task Force’s recommendation to reduce congestion, reduce double-parking, and create turnover of parking spaces in the District’s downtown core. Drivers of commercial vehicles can pay at smart meters that accept credit cards, debit cards, and coin payments. Following the adoption of the metered-loading-zone regulation, the Washington, D.C., government established a commercial loading zone program.
Source: (2009) Improving Freight Movement in Delaware Central Business Districts, Institute from Public Administration College of Education and Public Policy, University of Delaware
Last Mile Freight Delivery Study | Chapter 7: Best Practices Literature Review
7 - 16 | P a g e
Commercial Loading Zone Program Washington DC developed a commercial loading zone program (CLZ) to incorporate loading zones as part of the transportation network by improving data with right-sizing loading zone space via modeling effort, providing information for freight carriers, payment options with pay-by-phone to provide managers with visibility and control, and more efficient use of curb space to decrease congestion and encourage compliance. The District enacted a process of outreach and data collection, a regulation and rulemaking process, implementation of the program and then evaluation of the program.
Outreach to stakeholders included business improvement districts, freight stakeholders and other business interests. The data collection included identification of loading zones, a freight stakeholder survey and focus groups with interested parties such as FedEx, UPS, Guernsey Products, Association of Beverage Alcohol Wholesalers, and the American Trucking Association. The biggest survey issues were lack of loading zones and occupied loading zones, with traffic congestion and infrastructure issues following. Most deliveries occurred from 6:00AM to 6:00PM with the peak from 10:00AM to 2:00PM. The land use composition of blocks featuring loading zones showed that the most common types of businesses on blocks with loading zones were Food and Drink Establishments (64 percent) followed by Personal Services (47 percent), Business Services (42 percent), Miscellaneous Retail (41 percent) and Food Stores (30 percent).
The City passed a Commercial Curbside Loading Zone Act that:
• Establish loading zone meter fees • Determine space for loading zones
• Develop a payment process which includes pay-by-phone • Implement enforcement plan
An annual and day pass for commercial loading zones was created. One permit issued per company with each vehicle listed on the permit. The permit allows parking for up to two hours and allows carriers to park in private vehicle metered parking between 10:00AM and 2:00PM if the vehicle is less than 40 feet in length. The permit fee was used in lieu of paying at the meter during those hours.
Performance measures were developed to analyze delivery patterns and its effect on corridor travel time. These performance measures are:
• Occupancy rate of loading zones • Violations for double parking and overstaying • Amount of time each vehicle uses loading zone • Reductions in delivery times for carriers • Reduction in travel time along corridor
The district implemented a transportation online permitting system to purchase permits and allow the public to see where permitting was given on a map. From the data collected from the online permitting system, a CLZ analysis model was developed which integrates a freight trip generation model (based on SIC category) to estimate the delivery needs for business establishments at a block face level. Analytics of CLZ usage enabled the District to establish freight considerations into building and plan permits, construction permits and public space permits. During the update to the District’s zoning code, changes to loading requirements include 30-foot loading berths, required internal access, alley access if an improved alley of 15-feet or more exists and platform specifications
Last Mile Freight Delivery Study | Chapter 7: Best Practices Literature Review
7 - 17 | P a g e
and requirements. CLZ data was also used when a new streetcar was implemented. Loading zones along the streetcar route were shifted to side streets based on coordination with the freight industry, community and business.
Source: Cleckley, E. District Department of Transportation, Commercial Loading Zone Program Fact Sheet
London, UK Managing Freight During the Olympic Games Transportation initiatives for the Olympic Games included curbside controls, such as parking, waiting, and loading restrictions, which meant that delivery drivers were unable to deliver goods as they normally would. Transport for London established a code of practice to direct carriers how to make off-hour deliveries during the 2012 Olympic Games. The purpose of the code, created in partnership with the Freight Transport Association and the Noise Abatement Society, was to help businesses and operators reduce disturbance for local residents. Transport for London provided general guidance including using newer and quieter equipment, ensuring all staff were briefed and trained, providing copies of the code to all suppliers and receivers, and liaising with the local borough. The code includes extensive directions for how the driver should minimize noise during deliveries.
Source: LaBelle, J. (2015), Off-Peak Delivery: A Pilot Project for the Chicago Region, Urban Transportation Center, University of Illinois Chicago
Delivery and Service Plans Transport for London also uses Delivery and Service Plans (DSPs) for businesses to rationalize their delivery practices. The DSP covers all aspects of freight and servicing operations, from promoting
efficiency in the procurement process to minimizing duplication of supplier trips including consolidation where possible, to the safe and practical access for vehicles serving the site. Efficiencies are built upon the ‘4 R’s’ of:
a) Reduce – taking steps to minimize the number of delivery and servicing trips to a site, this may include consolidation of deliveries through procurement or use of a consolidation Centre.
b) Re-time – ensuring deliveries take place outside peak hours (i.e. avoiding deliveries between 7am-7pm Monday to Friday, with a focus on delivering later in the evening or at weekends where noise and other considerations allow).
c) Revise Mode – moving away from using petrol or diesel vehicles for deliveries, considering foot, cycle or zero emission delivery vehicles, and requiring a high level of vehicle and driver safety.
d) Re-routing – taking steps to route deliveries more efficiently and reduce road danger.
Los Angeles, CA Goods Movement Improvement Plan FHWA conducted extensive review of freight-related projects and strategies, site visits, and interviews with organizations involved in project implementation, namely the Goods Movement Improvement Plan and the Tiger Teams Curbside Management Program.
In 1999, LADOT produced a Goods Movement Improvement Plan that identified study areas, routes used, and freight trip generators/attractors by compiling truck count data and other info to visually display trouble spots. The Plan addressed issues such as turning problems at intersections, trucks blocking road while
Last Mile Freight Delivery Study | Chapter 7: Best Practices Literature Review
7 - 18 | P a g e
backing into docking facilities or while loading/unloading on street, long queues at railroad crossing gates, delays at traffic signals; slowing of through truck traffic, severe truck bottlenecks, delivery trucks parked illegally, deteriorated streets surfaces and faded lane markings.
The study defined deficiencies in system such as inadequate curb return radii (<25 feet), inadequate lane width (<10 feet), inadequate arterial street access to freeway ramps, insufficient length of staging areas for off-street loading, limited availability of truck staging/loading areas, signal operations and timing not optimized for trucks, on-street parking restricting truck access, lack of curb-side loading zones.
Potential solutions were placed in four categories: 1) operational improvement measures, 2) engineering improvement measures, 3) capital improvement measures, 4) programmatic and policy measures.
Source: United States Department of Transportation (2009) Urban Freight Case Studies: Los Angeles
Targeted Enforcement to Support Street Operations In the early 2000s, as the percentage of just-in-time deliveries and the overall amount of goods delivered has risen, the demand for curb space in urban centers also has increased, leading to congestion on downtown Los Angeles streets. The City of Los Angeles could not meet the increased demand for curb space while maintaining street operations, LADOT initiated an enhanced enforcement program called Tiger Teams.
The targeted enforcement program deployed 15 uniformed traffic control officials and 10 tow trucks during the peak hours to monitor
designated corridors in search of parking violations, and this has led to a drastic decrease in the number of violators.
To better understand the problems facing truck drivers and couriers, LADOT set up interviews with repeat offenders. From these discussions, LADOT received input that helped identify and establish loading zones in areas where they were most needed.
After addressing the inadequate loading and unloading space issue, the City introduced the Tiger Teams to enforce curb-space regulations. Before officers were sent out, an extensive marketing campaign was launched to inform the public of the new enforcement program.
The program was ended in 2008 due to budget reductions in the wake of the financial crisis.
Source: FHWA Urban Freight Case Studies
Parking Working Group In 2014, the Mayor of Los Angeles established the Los Angeles Parking Reform Working Group (LAPRWG) and invited representatives from several stakeholder groups to participate: businesses, residents, advocacy organizations, a research center, and the City of Los Angeles. The Mayor's Office hosted LAPRWG meetings and coordinated city staff participation. To begin work, LAPRWG split into two different subcommittee groups to focus on two broad areas of parking, Management & Administration and Policy & Strategy.
The LAPRWG has begun to re-examine Los Angeles’s parking policies by adopting shared principles and goals for parking policies. The group has also conducted its own research to inform its recommendations and has actively sought information and advice
Last Mile Freight Delivery Study | Chapter 7: Best Practices Literature Review
7 - 19 | P a g e
from other cities that have reformed their own parking policies and management.
In 2015, the group produced recommendations of
1. Expand Performance-Based Pricing 2. Adopt a Freight Parking Program 3. Re-evaluate the Street Cleaning Program 4. Re-evaluate Preferential Parking Districts 5. Experiment with Information and Communication
Technology 6. Segregate Parking Revenue for Management and
Reinvestment purposes
Most of the recommendations have not yet been implemented. The detailed recommendations in #2 to revise freight parking policy were:
Short-Term Solutions (one year or less)
• LADOT should work with its vendor to identify the 20 streets in DTLA where the largest number of parking citations are issued to participants of the Fleet Operator and Rental Agency Program;
• Council District 14 and LADOT staff should assemble and lead a DTLA Freight Parking Task Force to:
o Evaluate existing curbside management on the 20 most cited streets, including its impact on freight deliveries (i.e., new and larger spaces, extended parking restrictions, etc.);
o Outreach to businesses and residents and begin a petition process should a new commercial loading
zone need to be added or existing metered space or red curb replaced;
o Task Force should include representatives from freight delivery companies participating in the City’s Fleet Operator and Rental Agency Program, DTLA Neighborhood Council, Central City Association, Downtown Business Improvement Districts, L.A. Chamber of Commerce, and homeowner and property manager associations.
• Sponsor enabling legislation at the state level that would permit cities to create “freight loading only” spaces
• Create new signage for “freight loading only” spaces (see Exhibit 1 in Appendix for sample sign) and submit an experimentation permit with the California Traffic Control Devices Committee to expedite its implementation.
• Explore metering commercial loading zones as an alternative to a permit program
Longer-term solutions (two to three years)
• Convert commercial loading spaces on 20 most cited streets to “freight loading only” (short-term parking and white curb spaces to be maintained)
• Develop a Freight Parking Permit (fee TBD by City) that would allow vehicles registered in the Fleet Operator and Rental Agency Program to:
o Park in “freight loading only” spaces; o Use GPS payment technology for metered spaces
that the City is piloting for car-share companies; o Pay pre-set, reduced fines for non-safety parking
violations in the pilot area (See Exhibit 2: Sample
Last Mile Freight Delivery Study | Chapter 7: Best Practices Literature Review
7 - 20 | P a g e
Reduced Fine Schedule) in exchange for not contesting tickets.
• Provide LADOT with adequate funding needed to create and administer the program
o Freight Parking Permit could be structured to offset the cost of creating and administering the Pilot Program.
• LADOT should create an online marketing, education and reporting campaign for the Pilot Program prior to its launch.
• LADOT should only issue warnings to “freight loading only” violators in the first month of implementing the program to raise awareness of and encourage participation in the Pilot.
o LADOT should create and attach a small 1-page brochure with information on the Pilot Program as a leave-behind when issuing a warning or ticket to a “freight loading only” violator.
• Evaluate the Pilot program and explore replicating it in other problem areas of the City
Source: Los Angeles Parking Reform Working Group (2015), Proposals for Parking Reform in the City of Los Angeles Final Report
Madison, WI Preventing Revenue Loss in Metered Spaces The City requires hangtag parking permits to contractors who need to park in metered spaces. Hashtags can be purchased in advance, used in any metered space, and enable the space to revert to revenue-generating once the work is completed. Madison, WI policy distinguishes "freight loading" for anyone engaged in loading/unloading and "truck loading" for only vehicles with truck plates.
Source: Scott, M. (2009) Improving Freight Movement in Delaware Central Business Districts, Institute from Public Administration College of Education and Public Policy, University of Delaware
New York City, NY Monitoring Through Video Analytics In order to develop a quantitative approach to forecast freight demand, the Office of Freight Mobility tested a pilot video analytics program for data collection, planning analysis and policy development. This analysis will also be used to validate a prototype formula for forecasting off-street loading and unloading capacity. The formula determined the total number of loading berths required per hour and then compared on- and off-street capacity and usage to determine the amount of unused or needed loading capacity.
The data metrics are:
• Through traffic volume by classification • Parking utilization by classification(on-street) • Parking utilization by classification(off-street) • Loading dock utilization off-street • Double Parking by classification • Freight trips generated by store based on trajectory to/from
truck
Quantified data was collected from video cameras set up in the block. They learned that the analytics need to run at the camera location (as opposed to being sent remotely), a dedicated technical vendor staff to help troubleshoot cameras was needed, and there needs to be block-level customization given the uniqueness of each location.
Last Mile Freight Delivery Study | Chapter 7: Best Practices Literature Review
7 - 21 | P a g e
Source: Presentation: Approaches to Monitor Truck Loading Activity in New York City Using Video Analytics, New York Department of Transportation, TRB Innovations in Freight Data Workshop, Irvine, CA, May 18, 2017
Portland, OR Comprehensive Parking Occupancy and Duration Study In 2014 the City of Portland conducted a detailed analysis of parking occupancy and stay durations in the Central City. The study comprised 293 black faces divided into nine subareas representing potential routes that one may travel while looking for parking. Observations for each route were conducted on a Tuesday, Wednesday or Thursday between 7:00AM and 10:00PM with each block face along the route observed once per hour. Additionally, two routes with numerous nightlife destinations were observed on a Friday night from 4:00PM to 12:00AM.
Occupancy rates were generally observed to fluctuate between 60% and 90% for the bulk of the day, with two distinct ‘peaks’ observed: an afternoon peak occurring during the 12:00 or 1:00 PM hours, and an evening peak occurring during the 6:00 or 7:00 PM hours. The peak loading/unloading activity for loading zones was found to occur during the 10:00 AM hour., and loading zone occupancy was generally light over the course of the day. Short stay stalls, allowing for maximum stays of 5 to 15 minutes, were generally observed to be at approximately 50% occupancy over the course of the day. Carpool slots were heavily utilized. Disabled spaces, hotel zones, and other similar slots were utilized to various extents, but generally did not have significant numbers of unauthorized users.
Source: Lancaster Engineering (2015), Central City Parking Occupancy and Turnover Analysis Report of Findings
San Diego, CA Parking Education The City of San Diego produced a pamphlet, Parking 101: Parking Basics in the City of San Diego, distributed to city residents. It described the City’s parking regulations and purpose for the regulations, namely, to help maximize available parking, maintain traffic flow and enhance public safety. The various types of parking zones were described along with their restrictions, directions on using parking meters and pre-paid parking cards and additional tips for parking.
Source: City of San Diego Department of Community and Economic Development, (2003) Parking 101: Parking Basics in the City of San Diego
Seattle, WA Analyzing Deliveries The City of Seattle partnered with the University of Washington Urban Freight Lab to initiate several studies and pilot programs to improve freight delivery—especially in the downtown Seattle area.
The Final 50 Feet Research Program looked at curb occupancy, surveyed building loading bays, and developed a toolkit. Key findings of the curb occupancy study were:
• Commercial and passenger vehicle drivers use loading and parking zones fluidly: commercial vehicles use parking zones and passenger vehicles are parking in commercial zones.
• Most commercial vehicle demand is for short-term parking: 15 or 30 minutes.
• Thirty-six percent of the total commercial vehicles parked along the curb were service vehicles.
Last Mile Freight Delivery Study | Chapter 7: Best Practices Literature Review
7 - 22 | P a g e
• Forty-one percent of commercial vehicles parked in unauthorized locations. But a much higher percentage parked in unauthorized areas near retail centers (55 percent – 65 percent) when compared to the predominantly office and residential areas (27 percent – 30 percent). The research team found that curb parking behavior is associated with granular, building-level urban land use. This occurred even as other factors such as the total number, length and ratio of loading zones versus parking zones varied widely across the five study areas.
Sources: Presentation: From Curb Space to Flex Space, Krawczyk, T. Policy and Planning Director, Seattle Department of Transportation, October 30, 2017
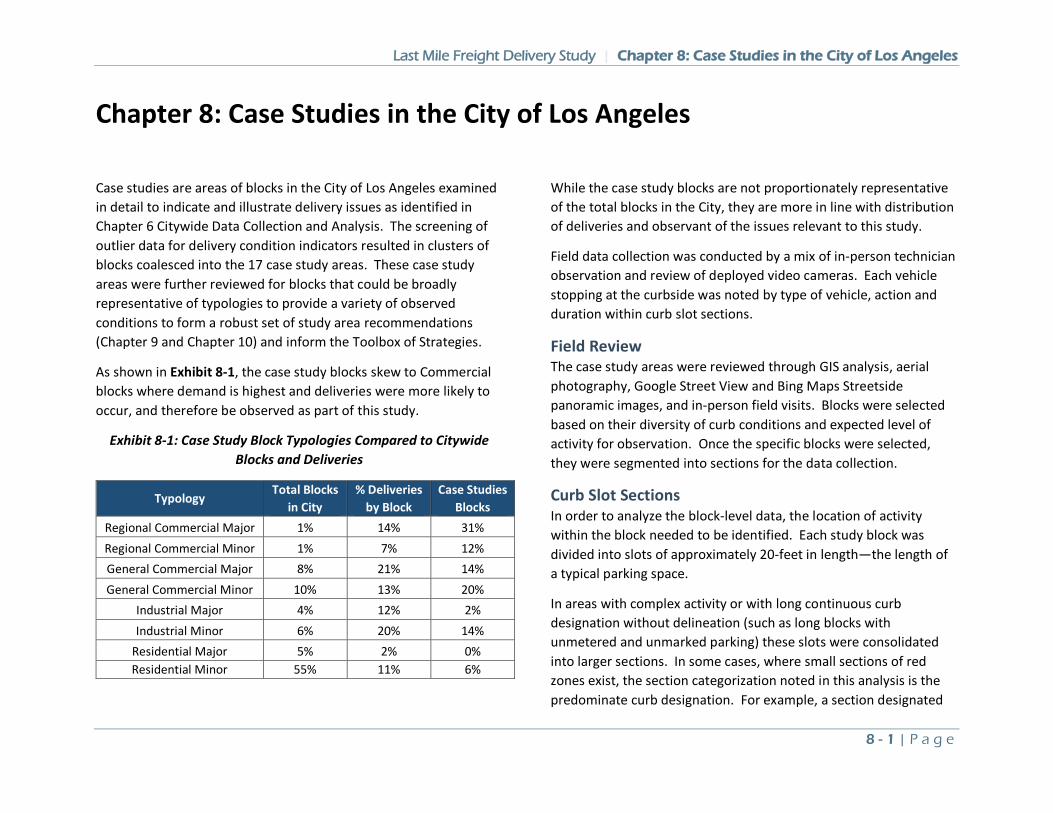
Last Mile Freight Delivery Study | Chapter 8: Case Studies in the City of Los Angeles
8 - 1 | P a g e
Chapter 8: Case Studies in the City of Los Angeles
Case studies are areas of blocks in the City of Los Angeles examined in detail to indicate and illustrate delivery issues as identified in Chapter 6 Citywide Data Collection and Analysis. The screening of outlier data for delivery condition indicators resulted in clusters of blocks coalesced into the 17 case study areas. These case study areas were further reviewed for blocks that could be broadly representative of typologies to provide a variety of observed conditions to form a robust set of study area recommendations (Chapter 9 and Chapter 10) and inform the Toolbox of Strategies.
As shown in Exhibit 8-1, the case study blocks skew to Commercial blocks where demand is highest and deliveries were more likely to occur, and therefore be observed as part of this study.
Exhibit 8-1: Case Study Block Typologies Compared to Citywide Blocks and Deliveries
While the case study blocks are not proportionately representative of the total blocks in the City, they are more in line with distribution of deliveries and observant of the issues relevant to this study.
Field data collection was conducted by a mix of in-person technician observation and review of deployed video cameras. Each vehicle stopping at the curbside was noted by type of vehicle, action and duration within curb slot sections.
Field Review The case study areas were reviewed through GIS analysis, aerial photography, Google Street View and Bing Maps Streetside panoramic images, and in-person field visits. Blocks were selected based on their diversity of curb conditions and expected level of activity for observation. Once the specific blocks were selected, they were segmented into sections for the data collection.
Curb Slot Sections In order to analyze the block-level data, the location of activity within the block needed to be identified. Each study block was divided into slots of approximately 20-feet in length—the length of a typical parking space.
In areas with complex activity or with long continuous curb designation without delineation (such as long blocks with unmetered and unmarked parking) these slots were consolidated into larger sections. In some cases, where small sections of red zones exist, the section categorization noted in this analysis is the predominate curb designation. For example, a section designated
Typology Total Blocks
in City % Deliveries
by Block Case Studies
Blocks Regional Commercial Major 1% 14% 31% Regional Commercial Minor 1% 7% 12% General Commercial Major 8% 21% 14% General Commercial Minor 10% 13% 20%
Industrial Major 4% 12% 2% Industrial Minor 6% 20% 14%
Residential Major 5% 2% 0% Residential Minor 55% 11% 6%
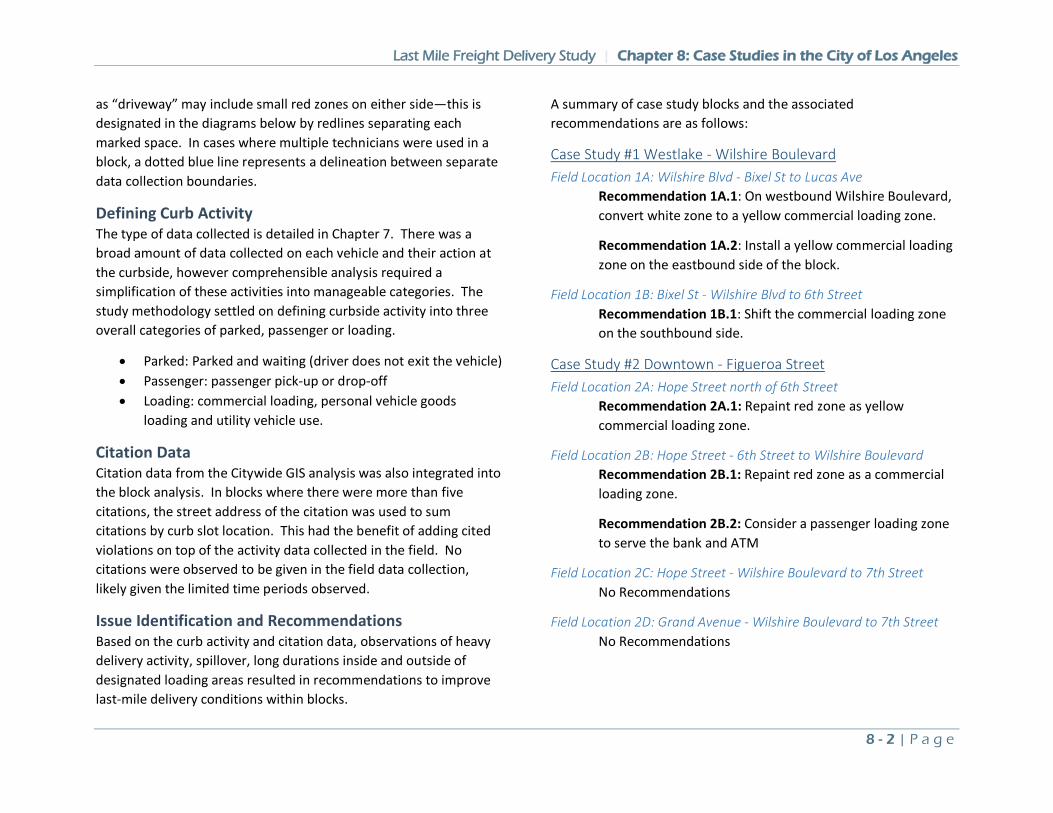
Last Mile Freight Delivery Study | Chapter 8: Case Studies in the City of Los Angeles
8 - 2 | P a g e
as “driveway” may include small red zones on either side—this is designated in the diagrams below by redlines separating each marked space. In cases where multiple technicians were used in a block, a dotted blue line represents a delineation between separate data collection boundaries.
Defining Curb Activity The type of data collected is detailed in Chapter 7. There was a broad amount of data collected on each vehicle and their action at the curbside, however comprehensible analysis required a simplification of these activities into manageable categories. The study methodology settled on defining curbside activity into three overall categories of parked, passenger or loading.
• Parked: Parked and waiting (driver does not exit the vehicle) • Passenger: passenger pick-up or drop-off • Loading: commercial loading, personal vehicle goods
loading and utility vehicle use.
Citation Data Citation data from the Citywide GIS analysis was also integrated into the block analysis. In blocks where there were more than five citations, the street address of the citation was used to sum citations by curb slot location. This had the benefit of adding cited violations on top of the activity data collected in the field. No citations were observed to be given in the field data collection, likely given the limited time periods observed.
Issue Identification and Recommendations Based on the curb activity and citation data, observations of heavy delivery activity, spillover, long durations inside and outside of designated loading areas resulted in recommendations to improve last-mile delivery conditions within blocks.
A summary of case study blocks and the associated recommendations are as follows:
Case Study #1 Westlake - Wilshire Boulevard Field Location 1A: Wilshire Blvd - Bixel St to Lucas Ave
Recommendation 1A.1: On westbound Wilshire Boulevard, convert white zone to a yellow commercial loading zone.
Recommendation 1A.2: Install a yellow commercial loading zone on the eastbound side of the block.
Field Location 1B: Bixel St - Wilshire Blvd to 6th Street Recommendation 1B.1: Shift the commercial loading zone on the southbound side.
Case Study #2 Downtown - Figueroa Street Field Location 2A: Hope Street north of 6th Street
Recommendation 2A.1: Repaint red zone as yellow commercial loading zone.
Field Location 2B: Hope Street - 6th Street to Wilshire Boulevard Recommendation 2B.1: Repaint red zone as a commercial loading zone.
Recommendation 2B.2: Consider a passenger loading zone to serve the bank and ATM
Field Location 2C: Hope Street - Wilshire Boulevard to 7th Street No Recommendations
Field Location 2D: Grand Avenue - Wilshire Boulevard to 7th Street No Recommendations
Last Mile Freight Delivery Study | Chapter 8: Case Studies in the City of Los Angeles
8 - 3 | P a g e
Field Location 2E: Grand Avenue - 7th Street to 8th Street Recommendation 2E.1: Install yellow commercial loading on the west side of the roadway
Recommendation 2E.2: Install yellow commercial loading zone on the east side of the roadway
Field Location 2F: Lebanon Alley North of Wilshire Boulevard Recommendation 2F.1: Analyze Lebanon Alley for possible legal commercial loading.
Field Location 2G: Hope Place Recommendation 2G.1: Allowable median loading should be considered.
Case Study #3: Encino - Ventura Boulevard Field Location 3A: Ventura Boulevard – Libbit Avenue to Woodley Avenue No Recommendations
Field Location 3B: Ventura Boulevard - Woodley Avenue to Gaviota Avenue
Recommendation 3B.1: Convert the yellow commercial loading zone to a white passenger loading zone
Recommendation 3B.2: Lengthen the yellow commercial loading zone
Recommendation 3B.3: Replace one metered parking with yellow commercial loading zone
Case Study #4: Van Nuys – Van Nuys Boulevard Recommendation 4.1: Work with the auto dealership to better accommodate loading, either in the median or on the side of the roadway.
Case Study #5: San Pedro – Grand Avenue Field Location 5A: Grand Avenue – 3rd Street to 4th Street No Recommendations
Field Location 5B: Grand Avenue – 8th Street to 9th Street No Recommendations
Case Study #6: Westwood – Westwood Boulevard and Galey Avenue Field Location 6A: Westwood Boulevard - Kinross Avenue to Weyburn Avenue
Recommendation 6A.1: Create a yellow commercial loading zone
Field Location 6B: Gayley Avenue – Kinross Avenue to Weyburn Avenue No Recommendations
Field Location 6C: Kinross Avenue – Broxton Avenue to Gayley Avenue Recommendation 6C.1: Consider conversion 15-minute parking spaces to a white passenger loading zone.
Recommendation 6C.2: Convert the two 2-hour parking spaces at section F to a white loading zone.
Field Location 6D: Broxton Avenue – Weyburn Avenue to Kinross Avenue
Recommendation 6D.1: Convert the white zone to a yellow commercial loading zone.
Case Study #7: Arts District – Traction Avenue Field Location 7A: Traction Avenue – 3rd Street to Hewitt Street
Recommendation 7A.1: Install parking meters for the parking spaces to encourage vehicle turn-over.
Last Mile Freight Delivery Study | Chapter 8: Case Studies in the City of Los Angeles
8 - 4 | P a g e
Field Location 7B: Traction Avenue – Hewitt Street to Avery Street Recommendation 7B.1: Convert the parking spaces to a white or yellow loading zone based on further study.
Case Study #8: Chinatown – North Spring/North Broadway Field Location 8A: Broadway – College Street to Alpine Street
Recommendation 8A.1: Insert a bioswale at the end of north end of section P to provide a visual cue of the shifting travel lanes
Field Location 8B: North Spring Street - College Street to Alpine Street No Recommendations
Field Location 8C: North Spring Street - Alpine Street to Ord Street No Recommendations
Field Location 8D: New High Street – Alpine Street to Ord Street No Recommendations
Case Study #9: Boyle Heights – Cesar Chavez Avenue Field Location 9A: Cesar Chavez Avenue - Brittania Street N. Cummings Street
Recommendation 9A.1: Lengthen the westernmost parking space to accommodate food trucks (approximately 25 feet). Consider designating the space for food truck parking.
Field Location 9B: Cesar Chavez Avenue – East of Boyle Avenue to Parking Lot Driveway
Recommendation 9B.1: Work with the White Memorial Medical Plaza to install signage directing to the patient drop-off area in the parking lot on the westbound side of the street.
Recommendation 9B.2: Convert the westernmost 30 feet of the white zone to a yellow commercial loading zone to meet loading demand in the block.
Recommendation 9B.3: Consider converting the 15-minute parking green zone to white passenger loading zones.
Case Study #10: Boyle Heights - USC Medical Center No Recommendations
Case Study #11: Koreatown – Wilshire Boulevard Recommendation 11.1: Consider a floating (off-set) bus lane on Wilshire Boulevard to enable curbside access.
Recommendation 11.2: Convert a section of the red zone on the west side of Wilshire Place to a white zone to accommodate passenger pick-up and drop-off for the Southwestern Law School.
Case Study #12: Atwater Village – Los Feliz Boulevard No Recommendations
Case Study #13: Jewelry District – Hill Street Recommendation 13.1: Convert Lindley Place alley to a commercial only alley.
Field Location 13A: Hill Street – 6th Street South to Crosswalk Recommendation 13A.1: Convert alley south of 6th street between S. Hill Street and S. Olive Street to a commercial only or provide commercial parking.
Recommendation 13A.2: Convert parking space to a white passenger loading zone.
Recommendation 13A.3: Lengthen the yellow commercial loading zone.
Last Mile Freight Delivery Study | Chapter 8: Case Studies in the City of Los Angeles
8 - 5 | P a g e
Field Location 13B: Hill Street – 7th Street to 8th Street Recommendation 13B.1: Paint and extend loading zone to accommodate 30-foot delivery vehicles.
Recommendation 13B.2: Extend loading zone to accommodate 30-foot delivery vehicles.
Case Study #14: Hollywood – Whitley Street
Field Location 14A: Whitley Street - Franklin Avenue to Yucca Street Recommendation 14A.1: Move yellow commercial loading zone north. Convert existing yellow commercial loading zone to parking.
Case Study #15: Garment District - Santee Street Field Location 15A: Santee Street – 8th Street to 9th Street
Recommendation 15A.1: Reconfigure the curb space in front of the Cooper Building to allow for more efficient delivery space.
Recommendation 15A.2: Investigate the use of the southern section of the surface parking lot as a staging or loading area for the block.
Recommendation 15A.3: Extend yellow zone to accommodate larger delivery vehicles that have to unload in the red zone
Field Location 15B: Santee Street – Olympic Boulevard and 11th Street
Recommendation 15B.1: Extend loading zone by eliminating the red curbs between parking spaces.
Case Study #16: Venice – Main Street, Broadway, Grand Avenue Field Location 16A: Main Street - Thornton Place to Abbot Kinney Boulevard
Recommendation 16A.1: Add loading zone. The hours of the loading zone could be confined to 10AM to 4PM to minimize impact on the residential parking access as it would allow overnight parking.
Field Location 16B: Broadway - Abbot Kinney Boulevard to Electric Avenue
Recommendation 16B.1: Add loading zone. The hours of the loading zone could be confined to 10AM to 4PM to minimize impact on the residential parking access as it would allow overnight parking.
Field Location 16C: Grand Boulevard – Main Street (Circle) to Rivera Avenue
Recommendation 16C.1: Add loading zone. The hours of the loading zone could be confined to 10AM to 4PM to minimize impact on the residential parking access as it would allow overnight parking.
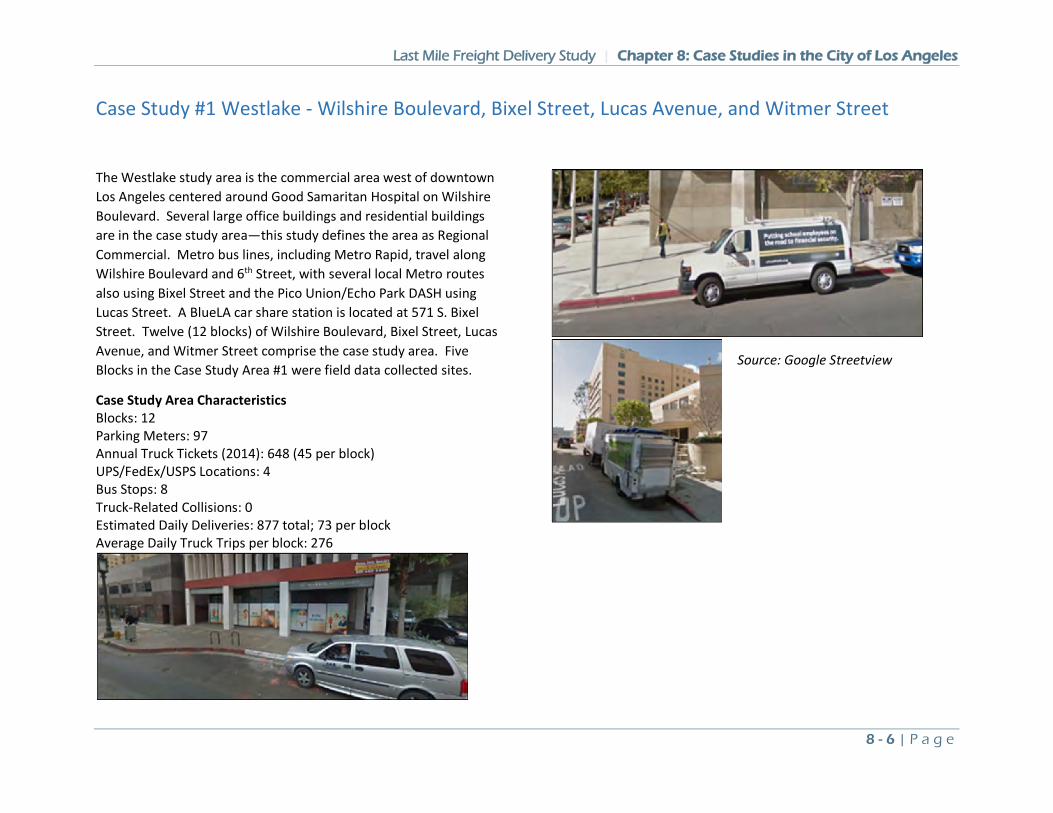
Last Mile Freight Delivery Study | Chapter 8: Case Studies in the City of Los Angeles
8 - 6 | P a g e
Case Study #1 Westlake - Wilshire Boulevard, Bixel Street, Lucas Avenue, and Witmer Street
The Westlake study area is the commercial area west of downtown Los Angeles centered around Good Samaritan Hospital on Wilshire Boulevard. Several large office buildings and residential buildings are in the case study area—this study defines the area as Regional Commercial. Metro bus lines, including Metro Rapid, travel along Wilshire Boulevard and 6th Street, with several local Metro routes also using Bixel Street and the Pico Union/Echo Park DASH using Lucas Street. A BlueLA car share station is located at 571 S. Bixel Street. Twelve (12 blocks) of Wilshire Boulevard, Bixel Street, Lucas Avenue, and Witmer Street comprise the case study area. Five Blocks in the Case Study Area #1 were field data collected sites.
Case Study Area Characteristics Blocks: 12 Parking Meters: 97 Annual Truck Tickets (2014): 648 (45 per block) UPS/FedEx/USPS Locations: 4 Bus Stops: 8 Truck-Related Collisions: 0 Estimated Daily Deliveries: 877 total; 73 per block Average Daily Truck Trips per block: 276
Source: Google Streetview
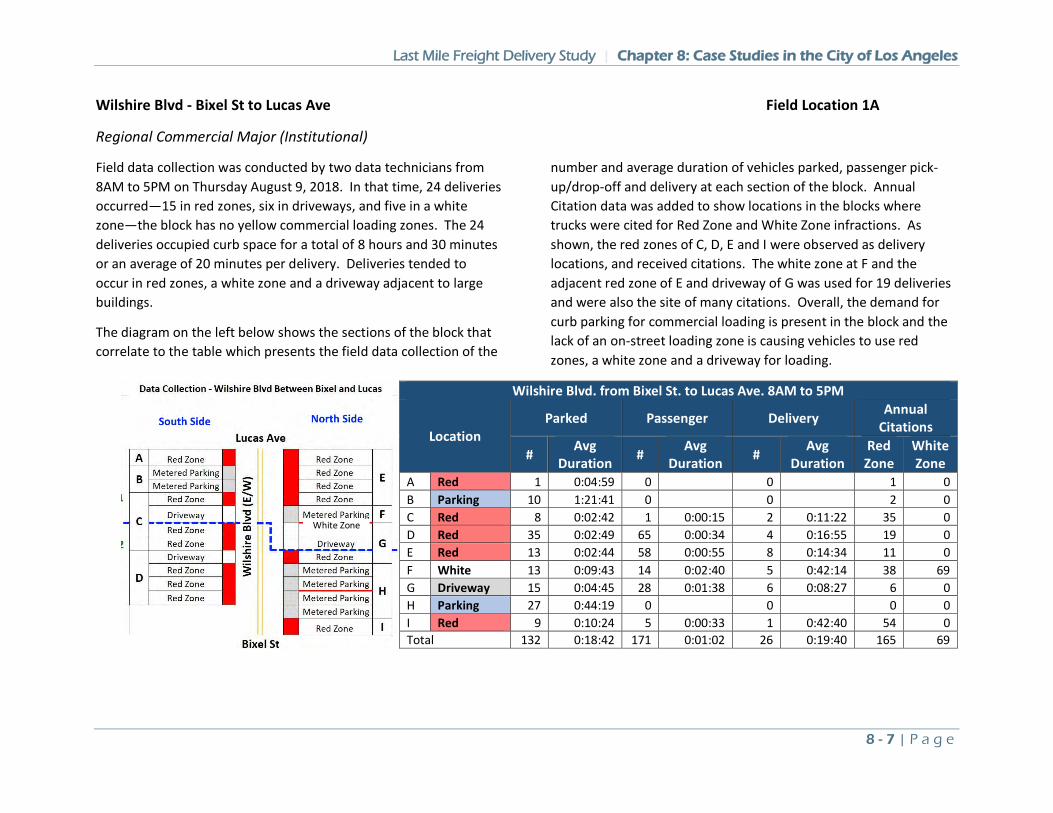
Last Mile Freight Delivery Study | Chapter 8: Case Studies in the City of Los Angeles
8 - 7 | P a g e
Wilshire Blvd - Bixel St to Lucas Ave Field Location 1A
Regional Commercial Major (Institutional)
Field data collection was conducted by two data technicians from 8AM to 5PM on Thursday August 9, 2018. In that time, 24 deliveries occurred—15 in red zones, six in driveways, and five in a white zone—the block has no yellow commercial loading zones. The 24 deliveries occupied curb space for a total of 8 hours and 30 minutes or an average of 20 minutes per delivery. Deliveries tended to occur in red zones, a white zone and a driveway adjacent to large buildings.
The diagram on the left below shows the sections of the block that correlate to the table which presents the field data collection of the
number and average duration of vehicles parked, passenger pick-up/drop-off and delivery at each section of the block. Annual Citation data was added to show locations in the blocks where trucks were cited for Red Zone and White Zone infractions. As shown, the red zones of C, D, E and I were observed as delivery locations, and received citations. The white zone at F and the adjacent red zone of E and driveway of G was used for 19 deliveries and were also the site of many citations. Overall, the demand for curb parking for commercial loading is present in the block and the lack of an on-street loading zone is causing vehicles to use red zones, a white zone and a driveway for loading.
Wilshire Blvd. from Bixel St. to Lucas Ave. 8AM to 5PM
Location Parked Passenger Delivery Annual
Citations
# Avg Duration # Avg
Duration # Avg Duration
Red Zone
White Zone
A Red 1 0:04:59 0 0 1 0 B Parking 10 1:21:41 0 0 2 0 C Red 8 0:02:42 1 0:00:15 2 0:11:22 35 0 D Red 35 0:02:49 65 0:00:34 4 0:16:55 19 0 E Red 13 0:02:44 58 0:00:55 8 0:14:34 11 0 F White 13 0:09:43 14 0:02:40 5 0:42:14 38 69 G Driveway 15 0:04:45 28 0:01:38 6 0:08:27 6 0 H Parking 27 0:44:19 0 0 0 0 I Red 9 0:10:24 5 0:00:33 1 0:42:40 54 0 Total 132 0:18:42 171 0:01:02 26 0:19:40 165 69
White Zone
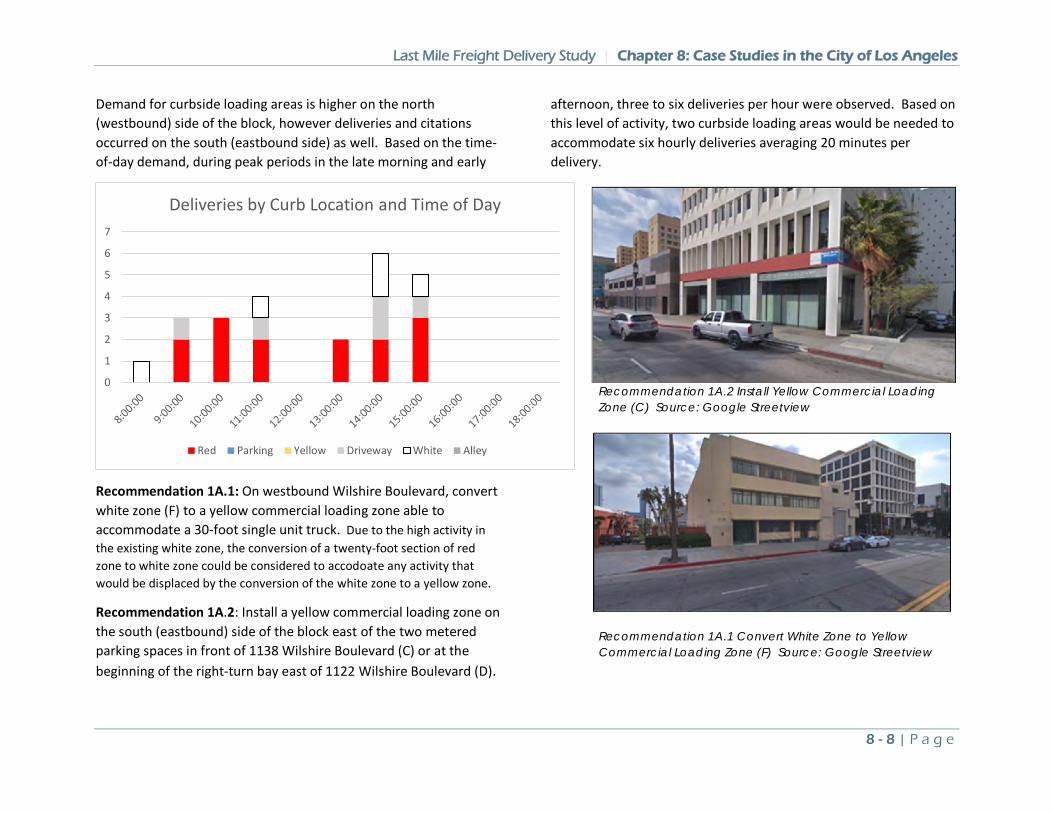
Last Mile Freight Delivery Study | Chapter 8: Case Studies in the City of Los Angeles
8 - 8 | P a g e
Demand for curbside loading areas is higher on the north (westbound) side of the block, however deliveries and citations occurred on the south (eastbound side) as well. Based on the time-of-day demand, during peak periods in the late morning and early
afternoon, three to six deliveries per hour were observed. Based on this level of activity, two curbside loading areas would be needed to accommodate six hourly deliveries averaging 20 minutes per delivery.
Recommendation 1A.1: On westbound Wilshire Boulevard, convert white zone (F) to a yellow commercial loading zone able to accommodate a 30-foot single unit truck. Due to the high activity in the existing white zone, the conversion of a twenty-foot section of red zone to white zone could be considered to accodoate any activity that would be displaced by the conversion of the white zone to a yellow zone.
Recommendation 1A.2: Install a yellow commercial loading zone on the south (eastbound) side of the block east of the two metered parking spaces in front of 1138 Wilshire Boulevard (C) or at the beginning of the right-turn bay east of 1122 Wilshire Boulevard (D).
0
1
2
3
4
5
6
7
Deliveries by Curb Location and Time of Day
Red Parking Yellow Driveway White Alley
Recommendation 1A.1 Convert White Zone to Yellow Commercial Loading Zone (F) Source: Google Streetview
Recommendation 1A.2 Install Yellow Commercial Loading Zone (C) Source: Google Streetview
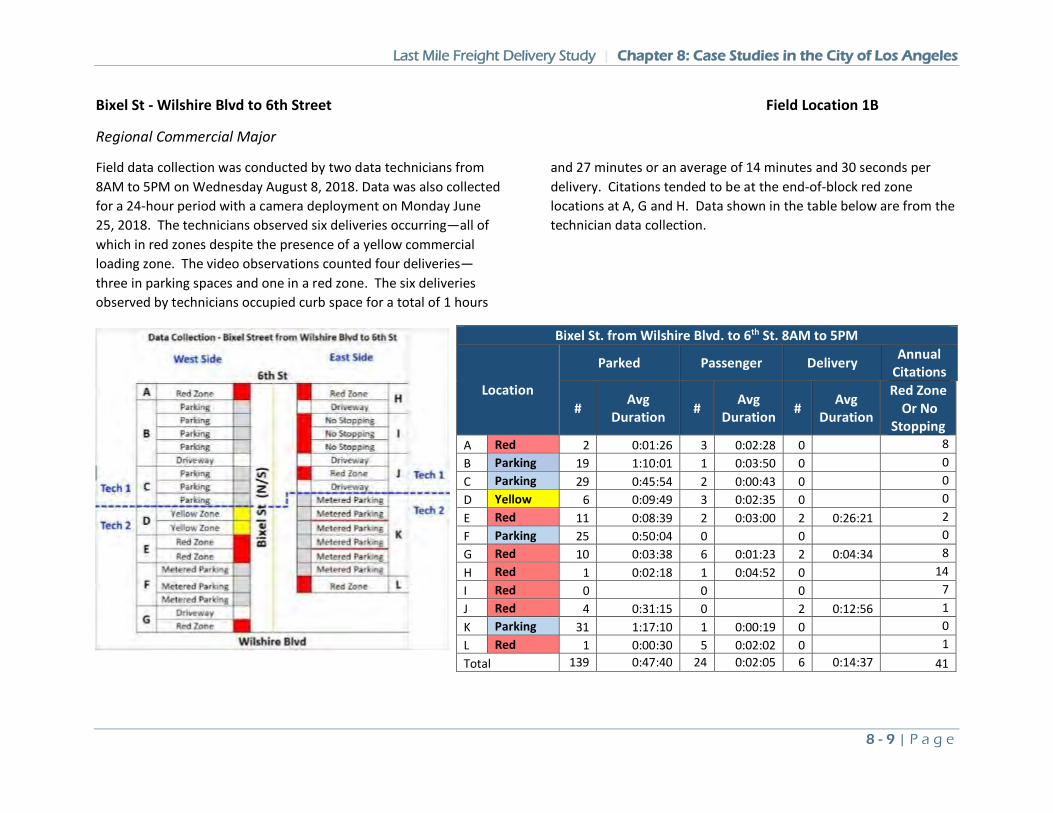
Last Mile Freight Delivery Study | Chapter 8: Case Studies in the City of Los Angeles
8 - 9 | P a g e
Bixel St - Wilshire Blvd to 6th Street Field Location 1B
Regional Commercial Major
Field data collection was conducted by two data technicians from 8AM to 5PM on Wednesday August 8, 2018. Data was also collected for a 24-hour period with a camera deployment on Monday June 25, 2018. The technicians observed six deliveries occurring—all of which in red zones despite the presence of a yellow commercial loading zone. The video observations counted four deliveries—three in parking spaces and one in a red zone. The six deliveries observed by technicians occupied curb space for a total of 1 hours
and 27 minutes or an average of 14 minutes and 30 seconds per delivery. Citations tended to be at the end-of-block red zone locations at A, G and H. Data shown in the table below are from the technician data collection.
Bixel St. from Wilshire Blvd. to 6th St. 8AM to 5PM
Location
Parked Passenger Delivery Annual Citations
# Avg Duration # Avg
Duration # Avg Duration
Red Zone Or No
Stopping A Red 2 0:01:26 3 0:02:28 0 8 B Parking 19 1:10:01 1 0:03:50 0 0 C Parking 29 0:45:54 2 0:00:43 0 0 D Yellow 6 0:09:49 3 0:02:35 0 0 E Red 11 0:08:39 2 0:03:00 2 0:26:21 2 F Parking 25 0:50:04 0 0 0 G Red 10 0:03:38 6 0:01:23 2 0:04:34 8 H Red 1 0:02:18 1 0:04:52 0 14 I Red 0 0 0 7 J Red 4 0:31:15 0 2 0:12:56 1 K Parking 31 1:17:10 1 0:00:19 0 0 L Red 1 0:00:30 5 0:02:02 0 1 Total 139 0:47:40 24 0:02:05 6 0:14:37 41
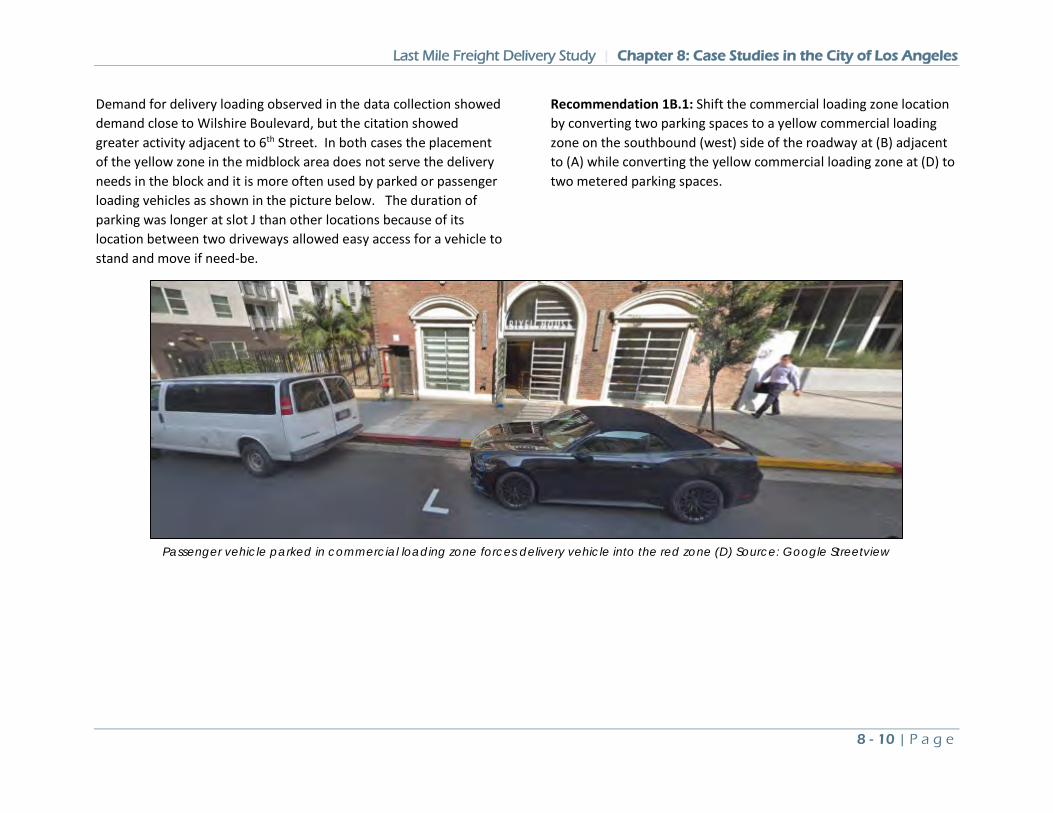
Last Mile Freight Delivery Study | Chapter 8: Case Studies in the City of Los Angeles
8 - 10 | P a g e
Demand for delivery loading observed in the data collection showed demand close to Wilshire Boulevard, but the citation showed greater activity adjacent to 6th Street. In both cases the placement of the yellow zone in the midblock area does not serve the delivery needs in the block and it is more often used by parked or passenger loading vehicles as shown in the picture below. The duration of parking was longer at slot J than other locations because of its location between two driveways allowed easy access for a vehicle to stand and move if need-be.
Recommendation 1B.1: Shift the commercial loading zone location by converting two parking spaces to a yellow commercial loading zone on the southbound (west) side of the roadway at (B) adjacent to (A) while converting the yellow commercial loading zone at (D) to two metered parking spaces.
Passenger vehicle parked in commercial loading zone forces delivery vehicle into the red zone (D) Source: Google Streetview
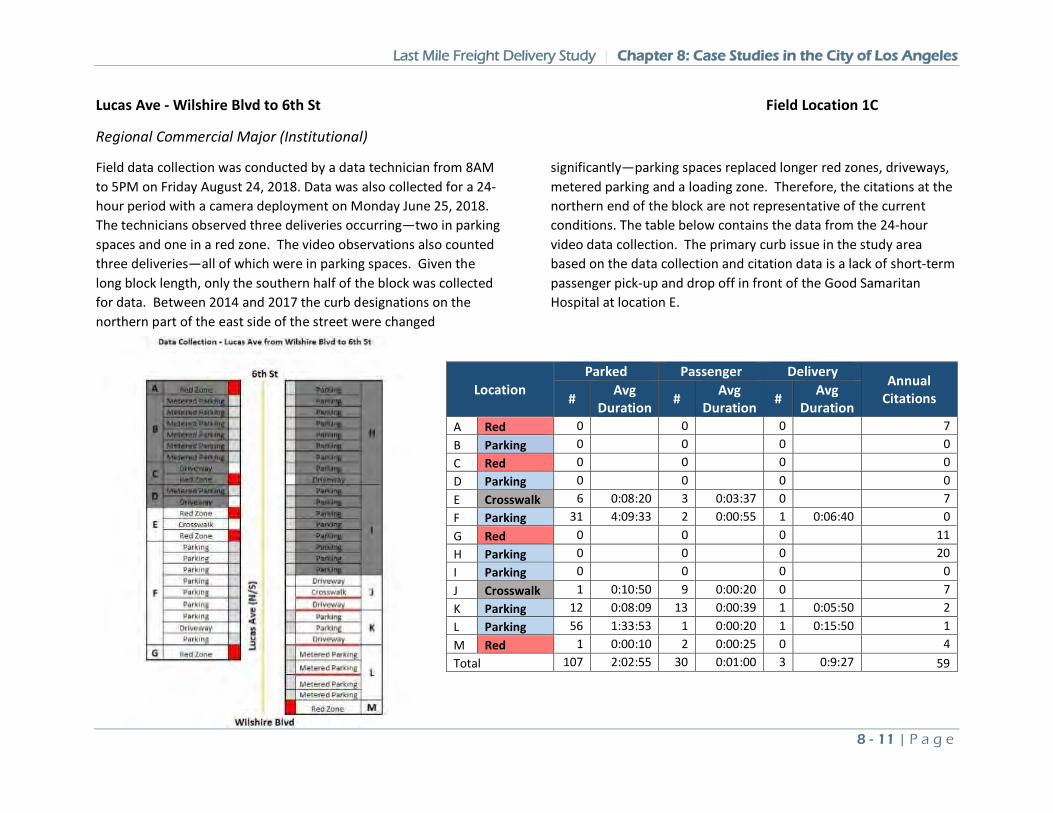
Last Mile Freight Delivery Study | Chapter 8: Case Studies in the City of Los Angeles
8 - 11 | P a g e
Lucas Ave - Wilshire Blvd to 6th St Field Location 1C
Regional Commercial Major (Institutional)
Field data collection was conducted by a data technician from 8AM to 5PM on Friday August 24, 2018. Data was also collected for a 24-hour period with a camera deployment on Monday June 25, 2018. The technicians observed three deliveries occurring—two in parking spaces and one in a red zone. The video observations also counted three deliveries—all of which were in parking spaces. Given the long block length, only the southern half of the block was collected for data. Between 2014 and 2017 the curb designations on the northern part of the east side of the street were changed
significantly—parking spaces replaced longer red zones, driveways, metered parking and a loading zone. Therefore, the citations at the northern end of the block are not representative of the current conditions. The table below contains the data from the 24-hour video data collection. The primary curb issue in the study area based on the data collection and citation data is a lack of short-term passenger pick-up and drop off in front of the Good Samaritan Hospital at location E.
Location Parked Passenger Delivery
Annual Citations # Avg
Duration # Avg Duration # Avg
Duration A Red 0 0 0 7 B Parking 0 0 0 0 C Red 0 0 0 0 D Parking 0 0 0 0 E Crosswalk 6 0:08:20 3 0:03:37 0 7 F Parking 31 4:09:33 2 0:00:55 1 0:06:40 0 G Red 0 0 0 11 H Parking 0 0 0 20 I Parking 0 0 0 0 J Crosswalk 1 0:10:50 9 0:00:20 0 7 K Parking 12 0:08:09 13 0:00:39 1 0:05:50 2 L Parking 56 1:33:53 1 0:00:20 1 0:15:50 1 M Red 1 0:00:10 2 0:00:25 0 4 Total 107 2:02:55 30 0:01:00 3 0:9:27 59
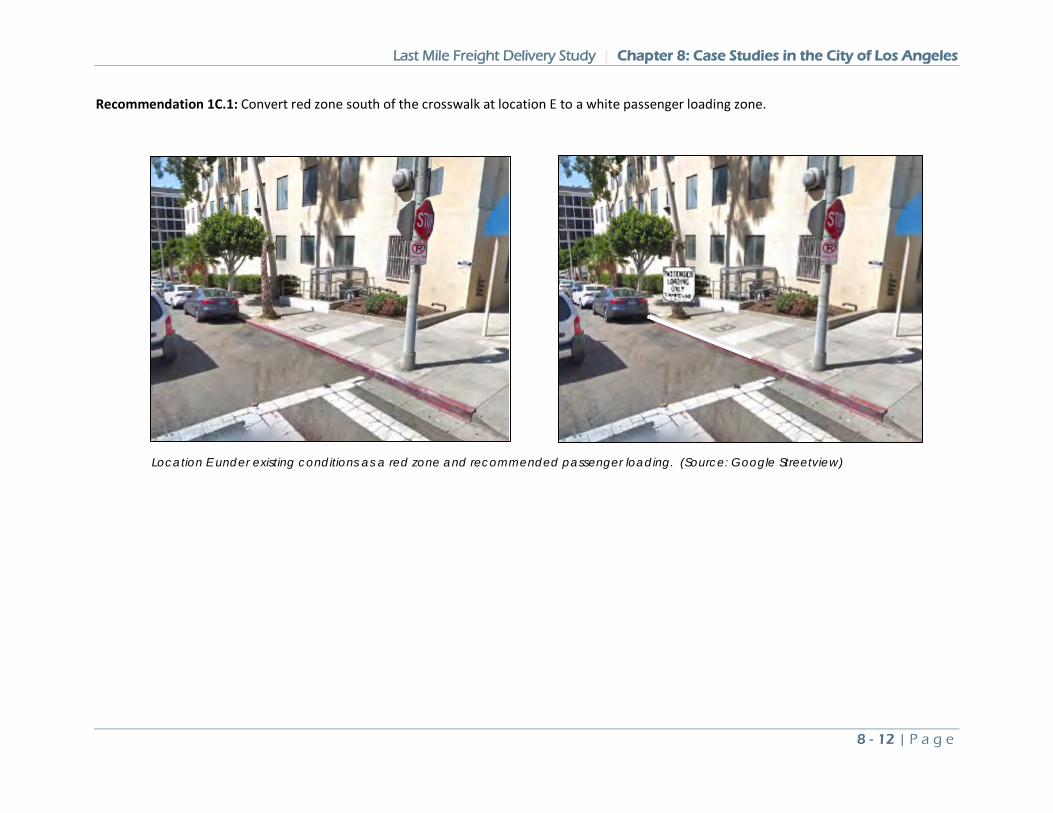
Last Mile Freight Delivery Study | Chapter 8: Case Studies in the City of Los Angeles
8 - 12 | P a g e
Recommendation 1C.1: Convert red zone south of the crosswalk at location E to a white passenger loading zone.
Location E under existing conditions as a red zone and recommended passenger loading. (Source: Google Streetview)
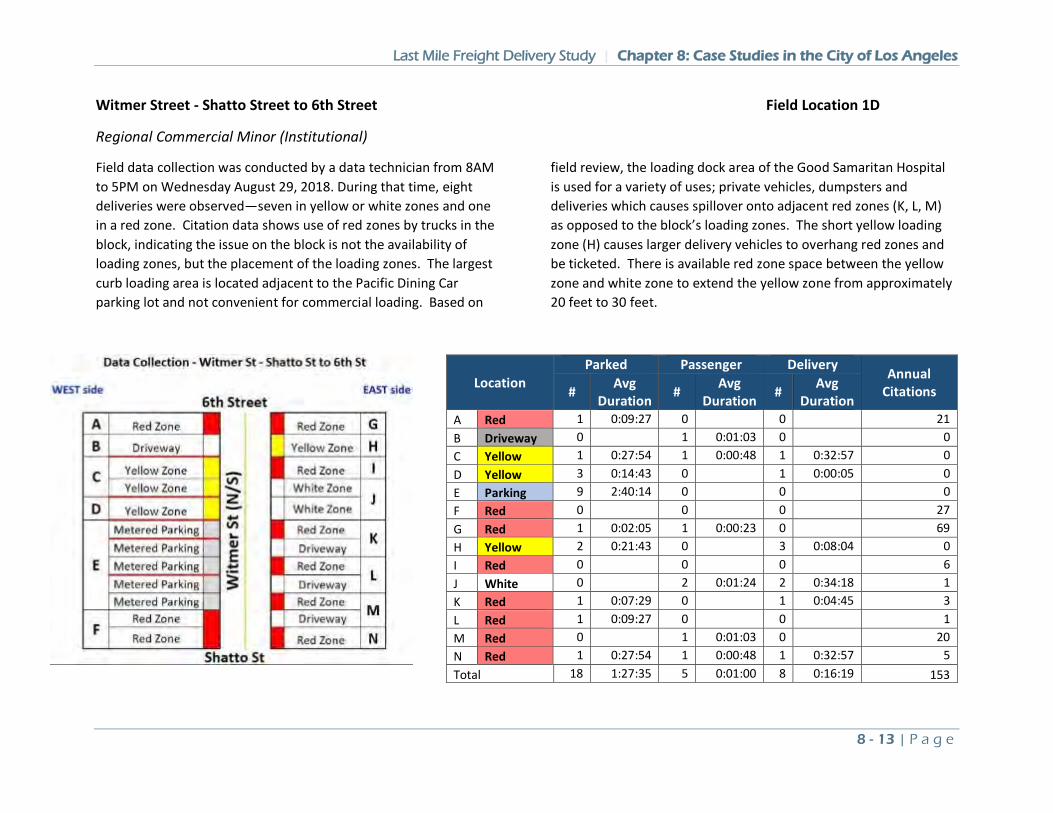
Last Mile Freight Delivery Study | Chapter 8: Case Studies in the City of Los Angeles
8 - 13 | P a g e
Witmer Street - Shatto Street to 6th Street Field Location 1D
Regional Commercial Minor (Institutional)
Field data collection was conducted by a data technician from 8AM to 5PM on Wednesday August 29, 2018. During that time, eight deliveries were observed—seven in yellow or white zones and one in a red zone. Citation data shows use of red zones by trucks in the block, indicating the issue on the block is not the availability of loading zones, but the placement of the loading zones. The largest curb loading area is located adjacent to the Pacific Dining Car parking lot and not convenient for commercial loading. Based on
field review, the loading dock area of the Good Samaritan Hospital is used for a variety of uses; private vehicles, dumpsters and deliveries which causes spillover onto adjacent red zones (K, L, M) as opposed to the block’s loading zones. The short yellow loading zone (H) causes larger delivery vehicles to overhang red zones and be ticketed. There is available red zone space between the yellow zone and white zone to extend the yellow zone from approximately 20 feet to 30 feet.
Location Parked Passenger Delivery
Annual Citations # Avg
Duration # Avg Duration # Avg
Duration A Red 1 0:09:27 0 0 21 B Driveway 0 1 0:01:03 0 0 C Yellow 1 0:27:54 1 0:00:48 1 0:32:57 0 D Yellow 3 0:14:43 0 1 0:00:05 0 E Parking 9 2:40:14 0 0 0 F Red 0 0 0 27 G Red 1 0:02:05 1 0:00:23 0 69 H Yellow 2 0:21:43 0 3 0:08:04 0 I Red 0 0 0 6 J White 0 2 0:01:24 2 0:34:18 1 K Red 1 0:07:29 0 1 0:04:45 3 L Red 1 0:09:27 0 0 1 M Red 0 1 0:01:03 0 20 N Red 1 0:27:54 1 0:00:48 1 0:32:57 5 Total 18 1:27:35 5 0:01:00 8 0:16:19 153
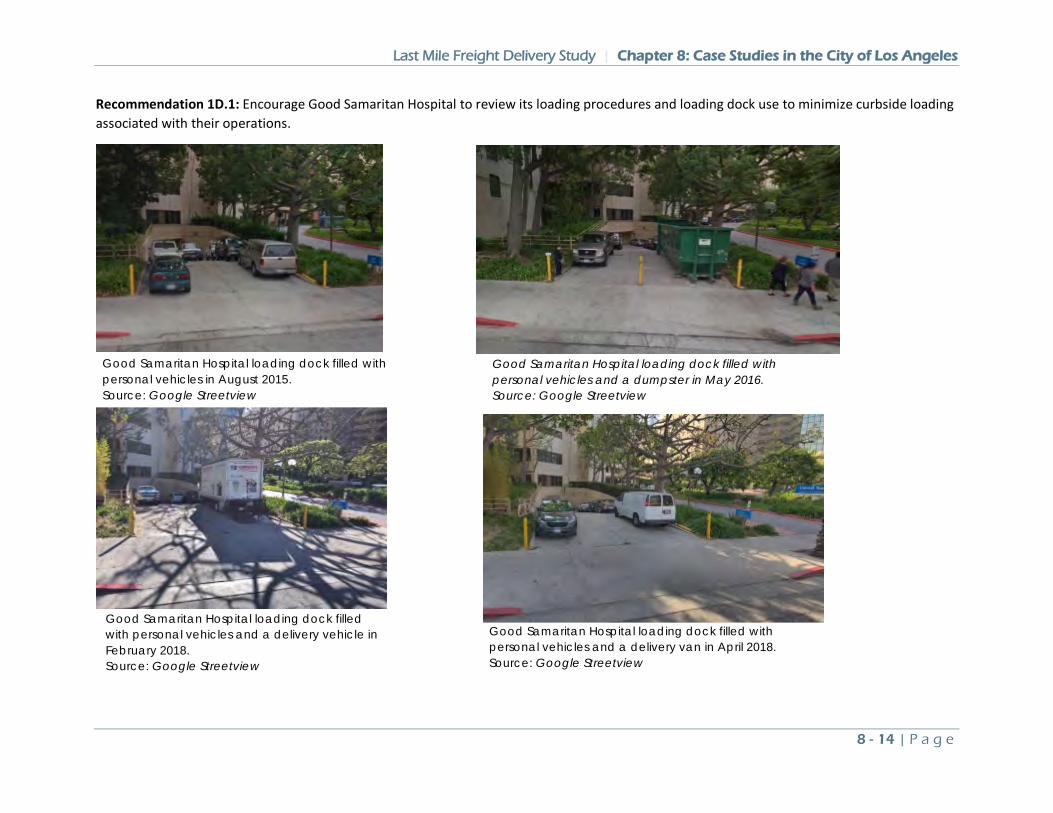
Last Mile Freight Delivery Study | Chapter 8: Case Studies in the City of Los Angeles
8 - 14 | P a g e
Recommendation 1D.1: Encourage Good Samaritan Hospital to review its loading procedures and loading dock use to minimize curbside loading associated with their operations.
Good Samaritan Hospital loading dock filled with personal vehicles and a dumpster in May 2016. Source: Google Streetview
Good Samaritan Hospital loading dock filled with personal vehicles in August 2015. Source: Google Streetview
Good Samaritan Hospital loading dock filled with personal vehicles and a delivery vehicle in February 2018. Source: Google Streetview
Good Samaritan Hospital loading dock filled with personal vehicles and a delivery van in April 2018. Source: Google Streetview
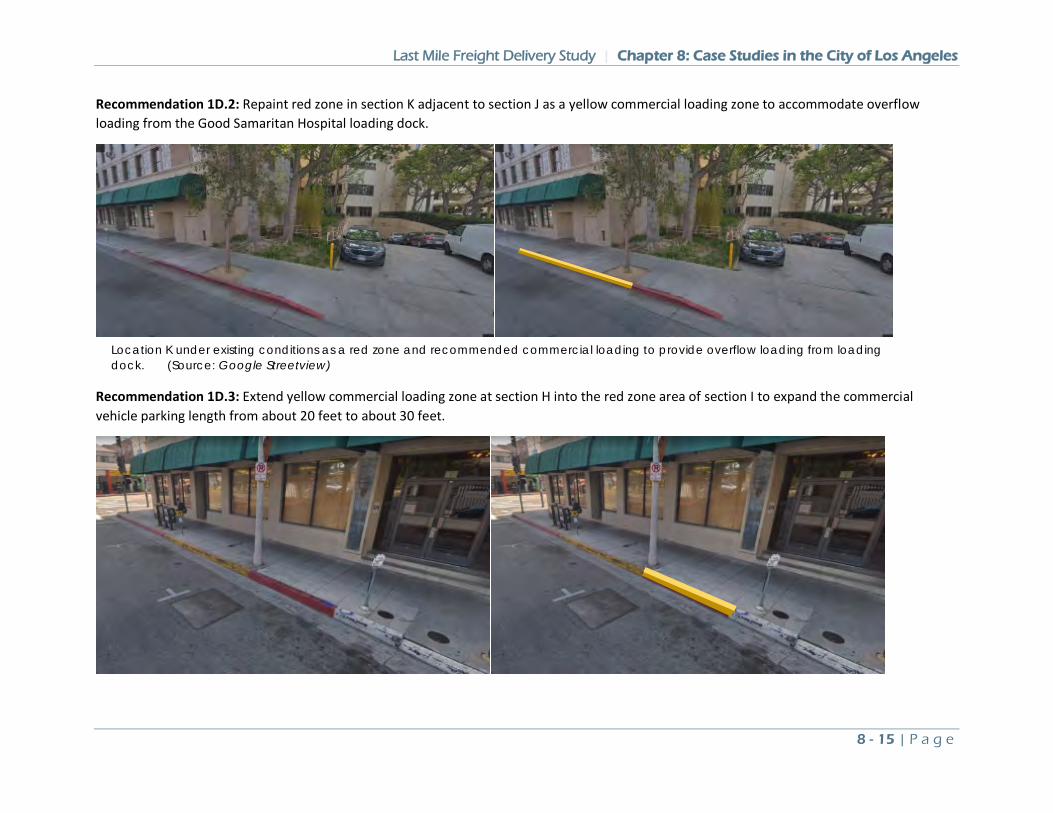
Last Mile Freight Delivery Study | Chapter 8: Case Studies in the City of Los Angeles
8 - 15 | P a g e
Recommendation 1D.2: Repaint red zone in section K adjacent to section J as a yellow commercial loading zone to accommodate overflow loading from the Good Samaritan Hospital loading dock.
Recommendation 1D.3: Extend yellow commercial loading zone at section H into the red zone area of section I to expand the commercial vehicle parking length from about 20 feet to about 30 feet.
Location K under existing conditions as a red zone and recommended commercial loading to provide overflow loading from loading dock. (Source: Google Streetview)
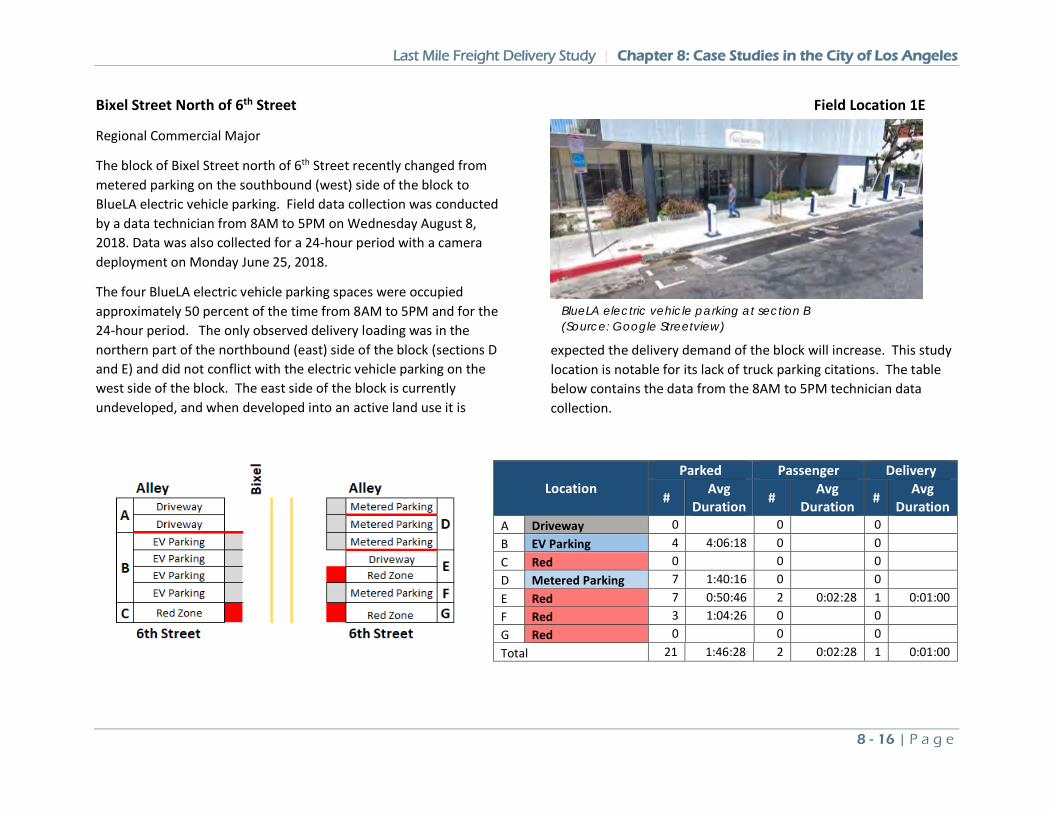
Last Mile Freight Delivery Study | Chapter 8: Case Studies in the City of Los Angeles
8 - 16 | P a g e
Bixel Street North of 6th Street Field Location 1E
Regional Commercial Major
The block of Bixel Street north of 6th Street recently changed from metered parking on the southbound (west) side of the block to BlueLA electric vehicle parking. Field data collection was conducted by a data technician from 8AM to 5PM on Wednesday August 8, 2018. Data was also collected for a 24-hour period with a camera deployment on Monday June 25, 2018.
The four BlueLA electric vehicle parking spaces were occupied approximately 50 percent of the time from 8AM to 5PM and for the 24-hour period. The only observed delivery loading was in the northern part of the northbound (east) side of the block (sections D and E) and did not conflict with the electric vehicle parking on the west side of the block. The east side of the block is currently undeveloped, and when developed into an active land use it is
expected the delivery demand of the block will increase. This study location is notable for its lack of truck parking citations. The table below contains the data from the 8AM to 5PM technician data collection.
Location Parked Passenger Delivery
# Avg Duration # Avg
Duration # Avg Duration
A Driveway 0 0 0 B EV Parking 4 4:06:18 0 0 C Red 0 0 0 D Metered Parking 7 1:40:16 0 0 E Red 7 0:50:46 2 0:02:28 1 0:01:00 F Red 3 1:04:26 0 0 G Red 0 0 0 Total 21 1:46:28 2 0:02:28 1 0:01:00
BlueLA electric vehicle parking at section B (Source: Google Streetview)
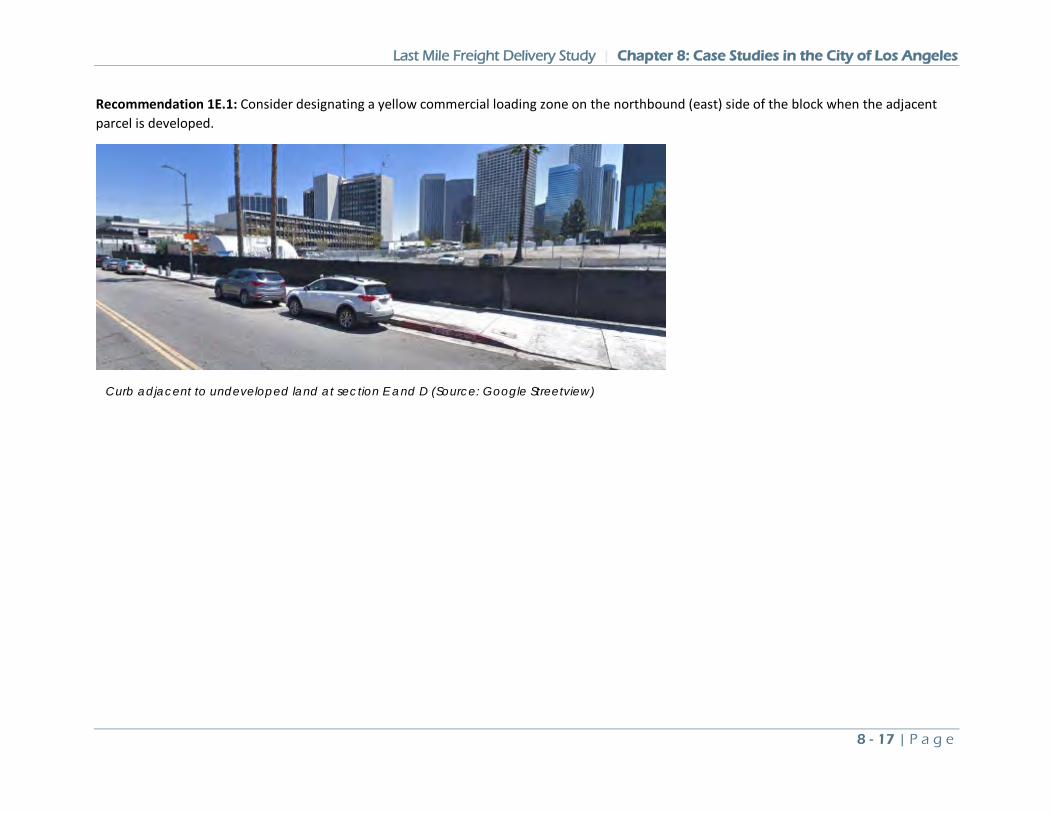
Last Mile Freight Delivery Study | Chapter 8: Case Studies in the City of Los Angeles
8 - 17 | P a g e
Recommendation 1E.1: Consider designating a yellow commercial loading zone on the northbound (east) side of the block when the adjacent parcel is developed.
Curb adjacent to undeveloped land at section E and D (Source: Google Streetview)
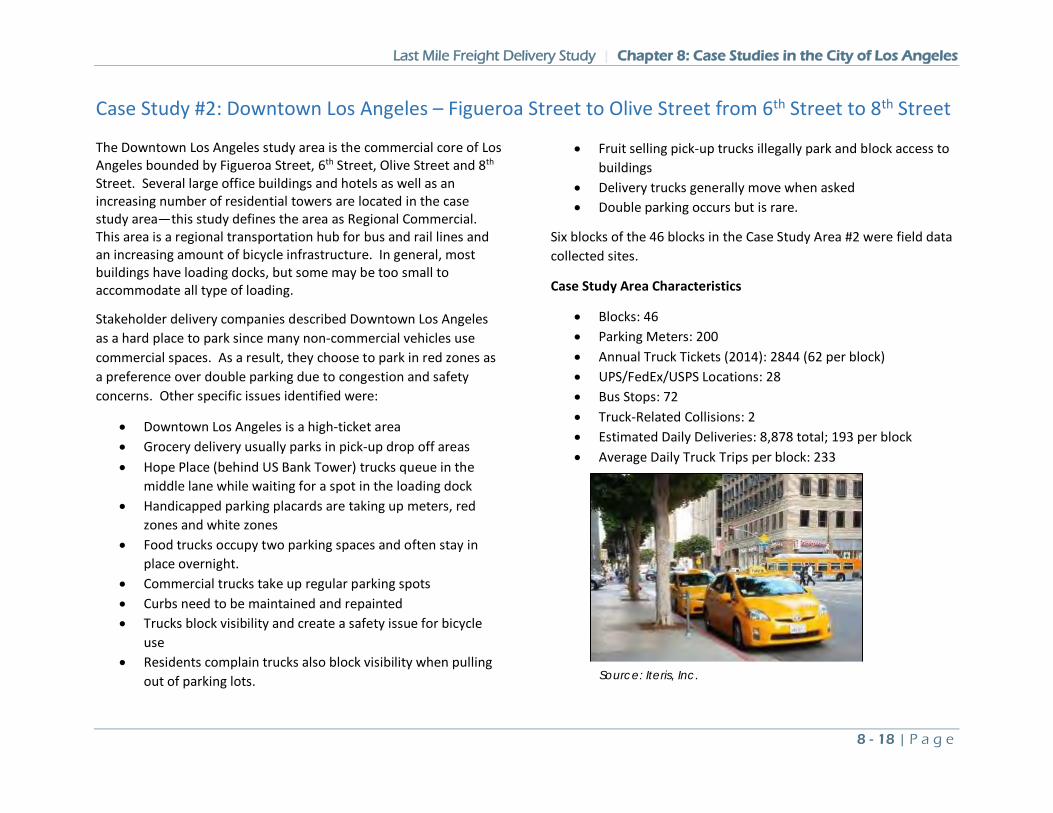
Last Mile Freight Delivery Study | Chapter 8: Case Studies in the City of Los Angeles
8 - 18 | P a g e
Case Study #2: Downtown Los Angeles – Figueroa Street to Olive Street from 6th Street to 8th Street
The Downtown Los Angeles study area is the commercial core of Los Angeles bounded by Figueroa Street, 6th Street, Olive Street and 8th Street. Several large office buildings and hotels as well as an increasing number of residential towers are located in the case study area—this study defines the area as Regional Commercial. This area is a regional transportation hub for bus and rail lines and an increasing amount of bicycle infrastructure. In general, most buildings have loading docks, but some may be too small to accommodate all type of loading.
Stakeholder delivery companies described Downtown Los Angeles as a hard place to park since many non-commercial vehicles use commercial spaces. As a result, they choose to park in red zones as a preference over double parking due to congestion and safety concerns. Other specific issues identified were:
• Downtown Los Angeles is a high-ticket area • Grocery delivery usually parks in pick-up drop off areas • Hope Place (behind US Bank Tower) trucks queue in the
middle lane while waiting for a spot in the loading dock • Handicapped parking placards are taking up meters, red
zones and white zones • Food trucks occupy two parking spaces and often stay in
place overnight. • Commercial trucks take up regular parking spots • Curbs need to be maintained and repainted • Trucks block visibility and create a safety issue for bicycle
use • Residents complain trucks also block visibility when pulling
out of parking lots.
• Fruit selling pick-up trucks illegally park and block access to buildings
• Delivery trucks generally move when asked • Double parking occurs but is rare.
Six blocks of the 46 blocks in the Case Study Area #2 were field data collected sites.
Case Study Area Characteristics
• Blocks: 46 • Parking Meters: 200 • Annual Truck Tickets (2014): 2844 (62 per block) • UPS/FedEx/USPS Locations: 28 • Bus Stops: 72 • Truck-Related Collisions: 2 • Estimated Daily Deliveries: 8,878 total; 193 per block • Average Daily Truck Trips per block: 233
Source: Iteris, Inc.
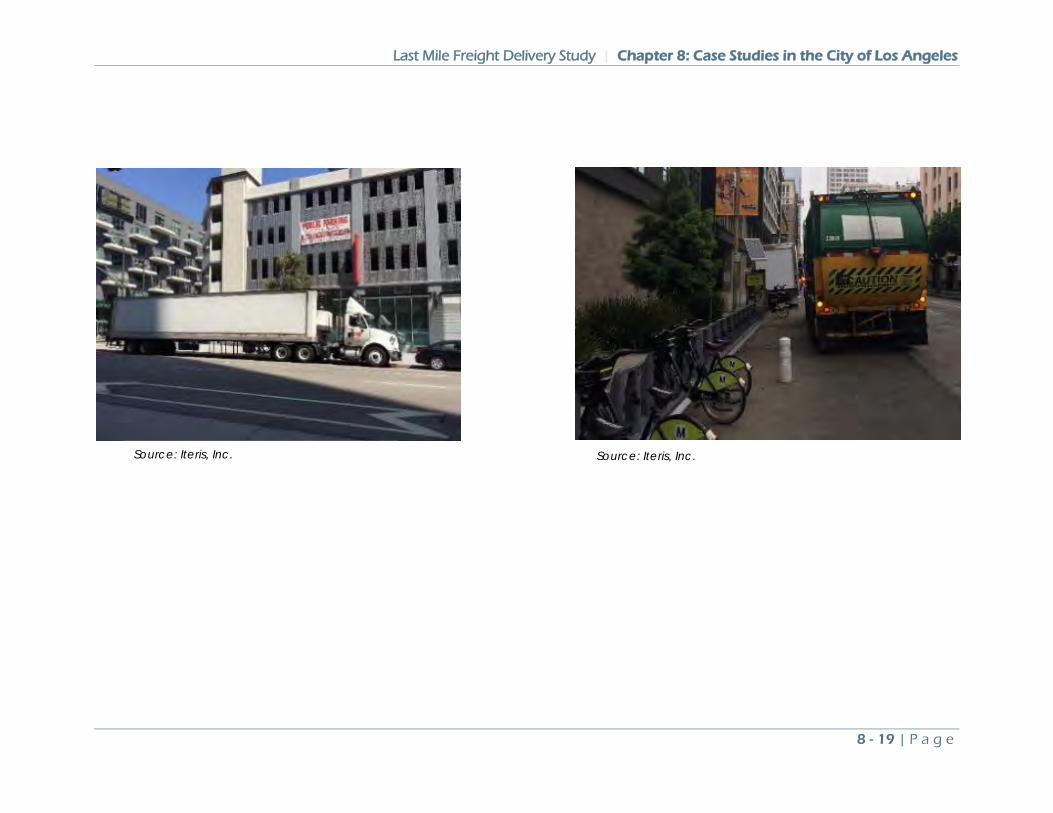
Last Mile Freight Delivery Study | Chapter 8: Case Studies in the City of Los Angeles
8 - 19 | P a g e
Source: Iteris, Inc.
Source: Iteris, Inc.
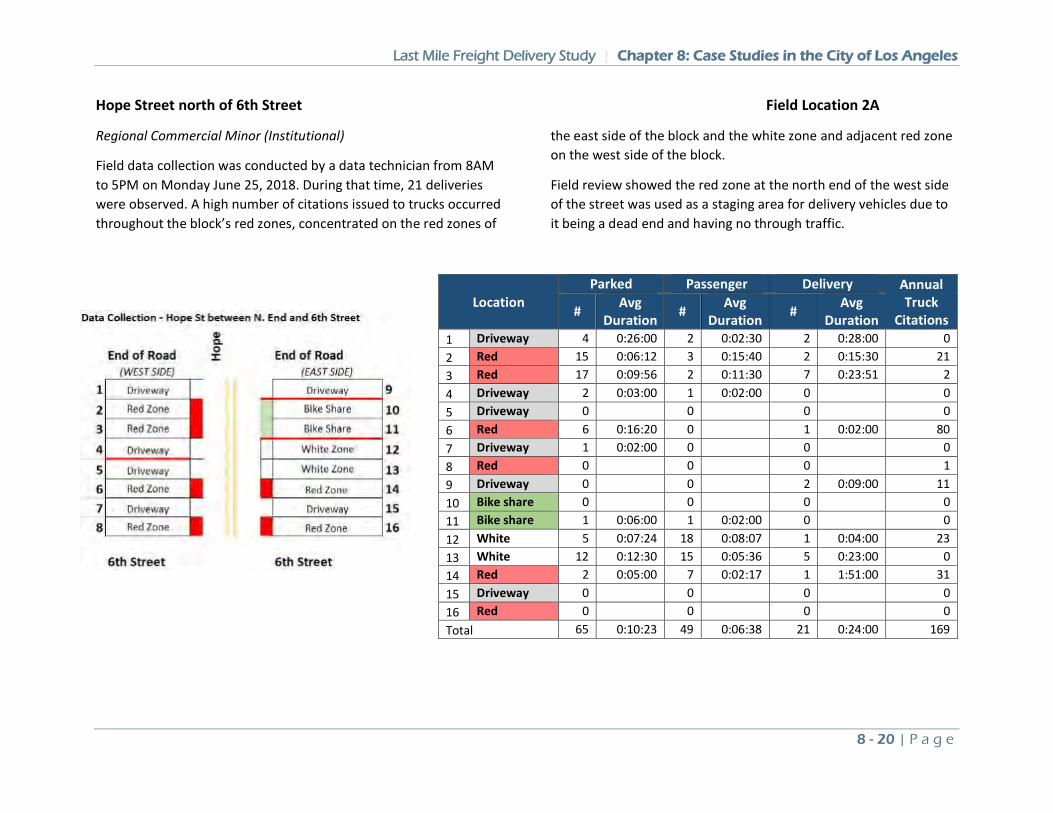
Last Mile Freight Delivery Study | Chapter 8: Case Studies in the City of Los Angeles
8 - 20 | P a g e
Hope Street north of 6th Street Field Location 2A
Regional Commercial Minor (Institutional)
Field data collection was conducted by a data technician from 8AM to 5PM on Monday June 25, 2018. During that time, 21 deliveries were observed. A high number of citations issued to trucks occurred throughout the block’s red zones, concentrated on the red zones of
the east side of the block and the white zone and adjacent red zone on the west side of the block.
Field review showed the red zone at the north end of the west side of the street was used as a staging area for delivery vehicles due to it being a dead end and having no through traffic.
Location Parked Passenger Delivery Annual
Truck Citations # Avg
Duration # Avg Duration # Avg
Duration 1 Driveway 4 0:26:00 2 0:02:30 2 0:28:00 0 2 Red 15 0:06:12 3 0:15:40 2 0:15:30 21 3 Red 17 0:09:56 2 0:11:30 7 0:23:51 2 4 Driveway 2 0:03:00 1 0:02:00 0 0 5 Driveway 0 0 0 0 6 Red 6 0:16:20 0 1 0:02:00 80 7 Driveway 1 0:02:00 0 0 0 8 Red 0 0 0 1 9 Driveway 0 0 2 0:09:00 11 10 Bike share 0 0 0 0 11 Bike share 1 0:06:00 1 0:02:00 0 0 12 White 5 0:07:24 18 0:08:07 1 0:04:00 23 13 White 12 0:12:30 15 0:05:36 5 0:23:00 0 14 Red 2 0:05:00 7 0:02:17 1 1:51:00 31 15 Driveway 0 0 0 0 16 Red 0 0 0 0 Total 65 0:10:23 49 0:06:38 21 0:24:00 169
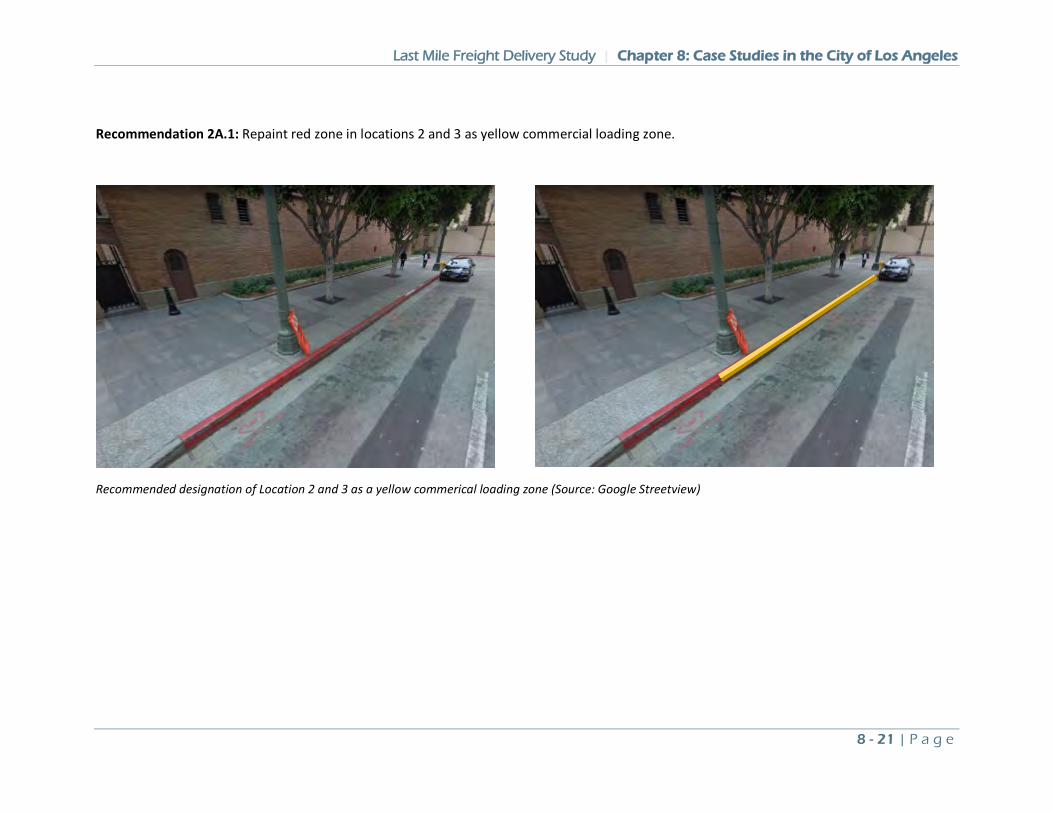
Last Mile Freight Delivery Study | Chapter 8: Case Studies in the City of Los Angeles
8 - 21 | P a g e
Recommendation 2A.1: Repaint red zone in locations 2 and 3 as yellow commercial loading zone.
Recommended designation of Location 2 and 3 as a yellow commerical loading zone (Source: Google Streetview)
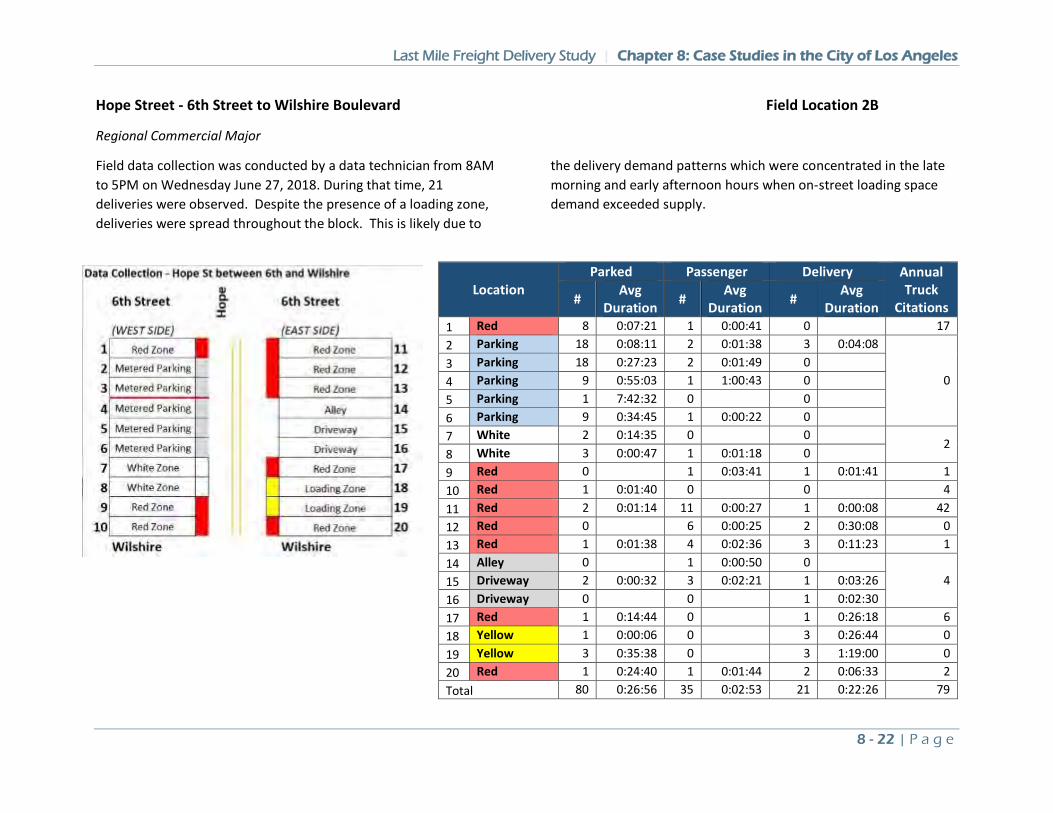
Last Mile Freight Delivery Study | Chapter 8: Case Studies in the City of Los Angeles
8 - 22 | P a g e
Hope Street - 6th Street to Wilshire Boulevard Field Location 2B
Regional Commercial Major
Field data collection was conducted by a data technician from 8AM to 5PM on Wednesday June 27, 2018. During that time, 21 deliveries were observed. Despite the presence of a loading zone, deliveries were spread throughout the block. This is likely due to
the delivery demand patterns which were concentrated in the late morning and early afternoon hours when on-street loading space demand exceeded supply.
Location Parked Passenger Delivery Annual
Truck Citations # Avg
Duration # Avg Duration # Avg
Duration 1 Red 8 0:07:21 1 0:00:41 0 17 2 Parking 18 0:08:11 2 0:01:38 3 0:04:08
0 3 Parking 18 0:27:23 2 0:01:49 0 4 Parking 9 0:55:03 1 1:00:43 0 5 Parking 1 7:42:32 0 0 6 Parking 9 0:34:45 1 0:00:22 0 7 White 2 0:14:35 0 0
2 8 White 3 0:00:47 1 0:01:18 0 9 Red 0 1 0:03:41 1 0:01:41 1 10 Red 1 0:01:40 0 0 4 11 Red 2 0:01:14 11 0:00:27 1 0:00:08 42 12 Red 0 6 0:00:25 2 0:30:08 0 13 Red 1 0:01:38 4 0:02:36 3 0:11:23 1 14 Alley 0 1 0:00:50 0
4 15 Driveway 2 0:00:32 3 0:02:21 1 0:03:26 16 Driveway 0 0 1 0:02:30 17 Red 1 0:14:44 0 1 0:26:18 6 18 Yellow 1 0:00:06 0 3 0:26:44 0 19 Yellow 3 0:35:38 0 3 1:19:00 0 20 Red 1 0:24:40 1 0:01:44 2 0:06:33 2 Total 80 0:26:56 35 0:02:53 21 0:22:26 79
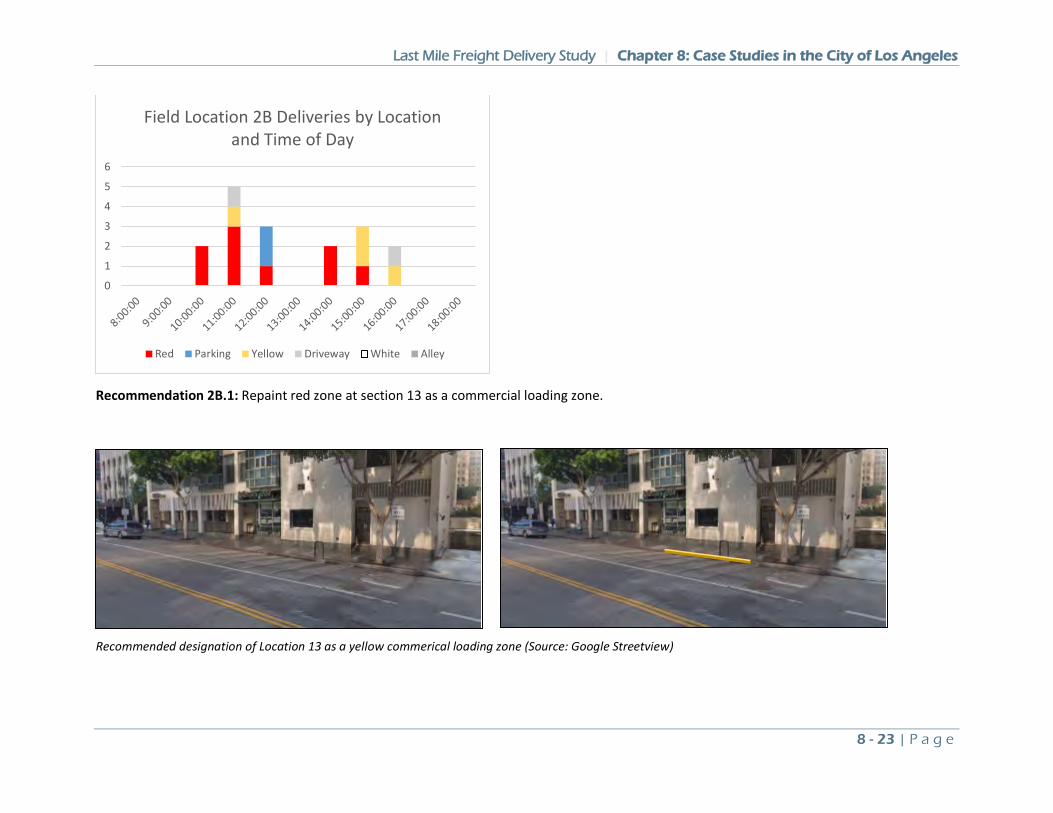
Last Mile Freight Delivery Study | Chapter 8: Case Studies in the City of Los Angeles
8 - 23 | P a g e
Recommendation 2B.1: Repaint red zone at section 13 as a commercial loading zone.
Recommended designation of Location 13 as a yellow commerical loading zone (Source: Google Streetview)
0
1
2
3
4
5
6
Field Location 2B Deliveries by Location and Time of Day
Red Parking Yellow Driveway White Alley
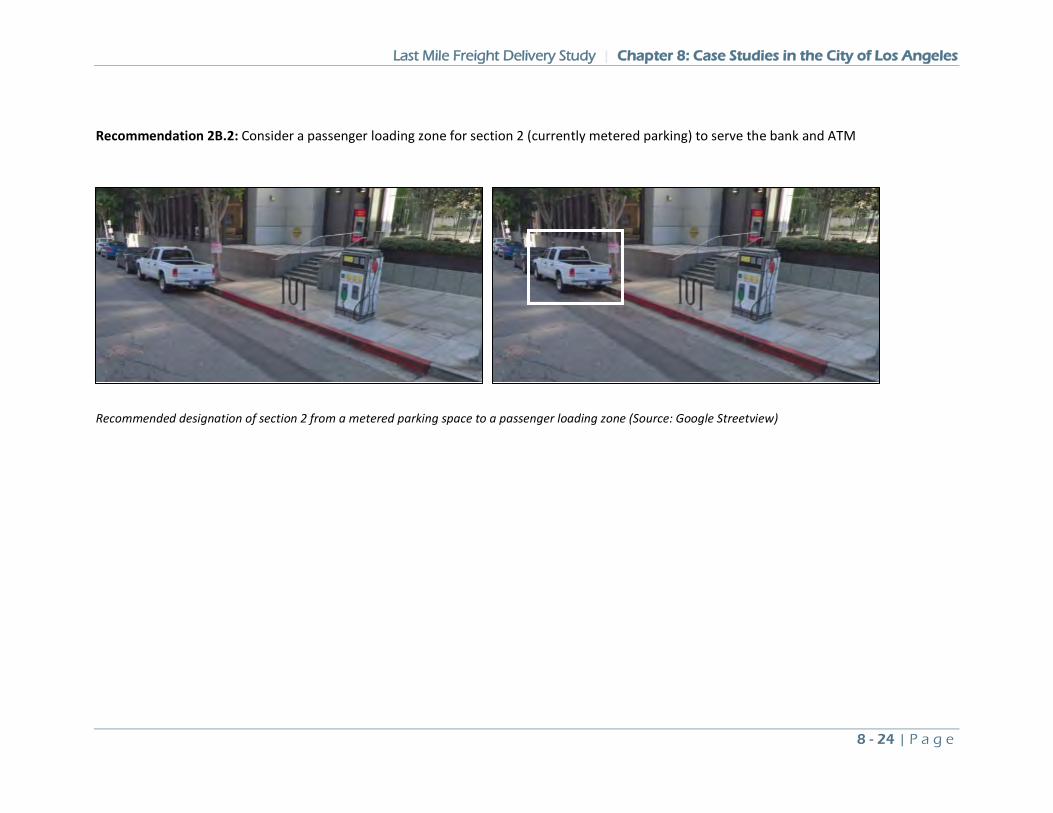
Last Mile Freight Delivery Study | Chapter 8: Case Studies in the City of Los Angeles
8 - 24 | P a g e
Recommendation 2B.2: Consider a passenger loading zone for section 2 (currently metered parking) to serve the bank and ATM
Recommended designation of section 2 from a metered parking space to a passenger loading zone (Source: Google Streetview)
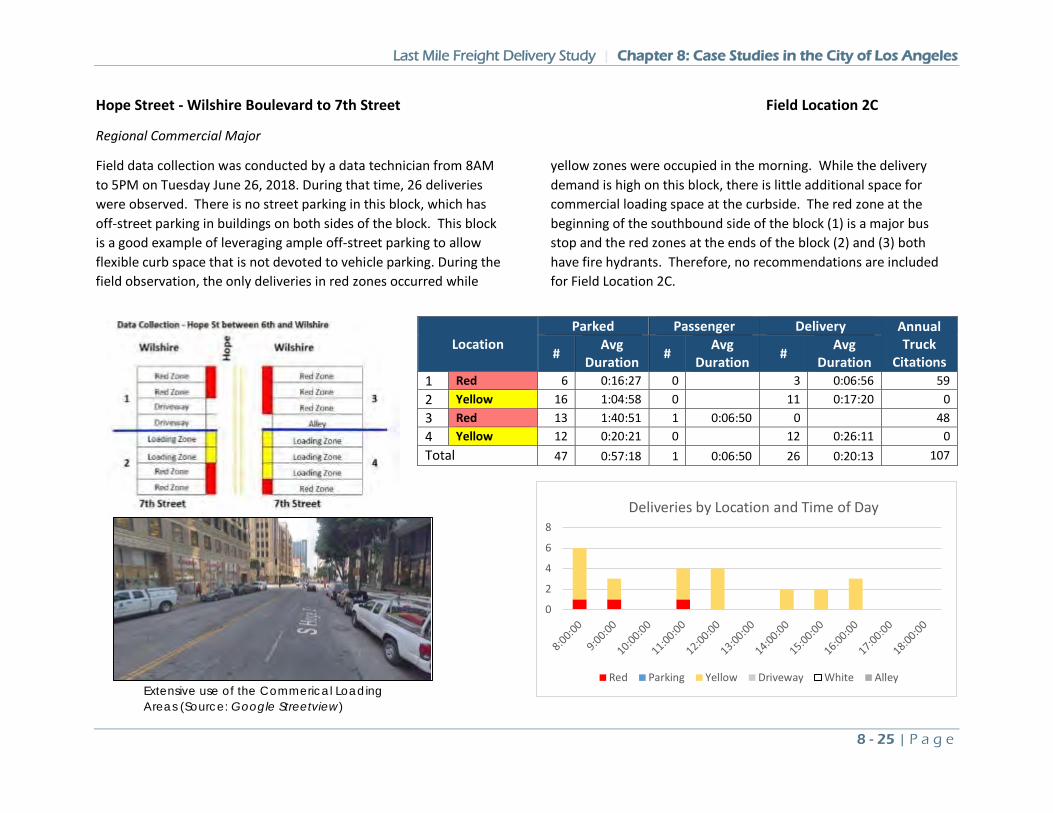
Last Mile Freight Delivery Study | Chapter 8: Case Studies in the City of Los Angeles
8 - 25 | P a g e
Hope Street - Wilshire Boulevard to 7th Street Field Location 2C
Regional Commercial Major
Field data collection was conducted by a data technician from 8AM to 5PM on Tuesday June 26, 2018. During that time, 26 deliveries were observed. There is no street parking in this block, which has off-street parking in buildings on both sides of the block. This block is a good example of leveraging ample off-street parking to allow flexible curb space that is not devoted to vehicle parking. During the field observation, the only deliveries in red zones occurred while
yellow zones were occupied in the morning. While the delivery demand is high on this block, there is little additional space for commercial loading space at the curbside. The red zone at the beginning of the southbound side of the block (1) is a major bus stop and the red zones at the ends of the block (2) and (3) both have fire hydrants. Therefore, no recommendations are included for Field Location 2C.
Location Parked Passenger Delivery Annual
Truck Citations # Avg
Duration # Avg Duration # Avg
Duration 1 Red 6 0:16:27 0 3 0:06:56 59 2 Yellow 16 1:04:58 0 11 0:17:20 0 3 Red 13 1:40:51 1 0:06:50 0 48 4 Yellow 12 0:20:21 0 12 0:26:11 0 Total 47 0:57:18 1 0:06:50 26 0:20:13 107
0
2
4
6
8Deliveries by Location and Time of Day
Red Parking Yellow Driveway White AlleyExtensive use of the Commerical Loading Areas (Source: Google Streetview)
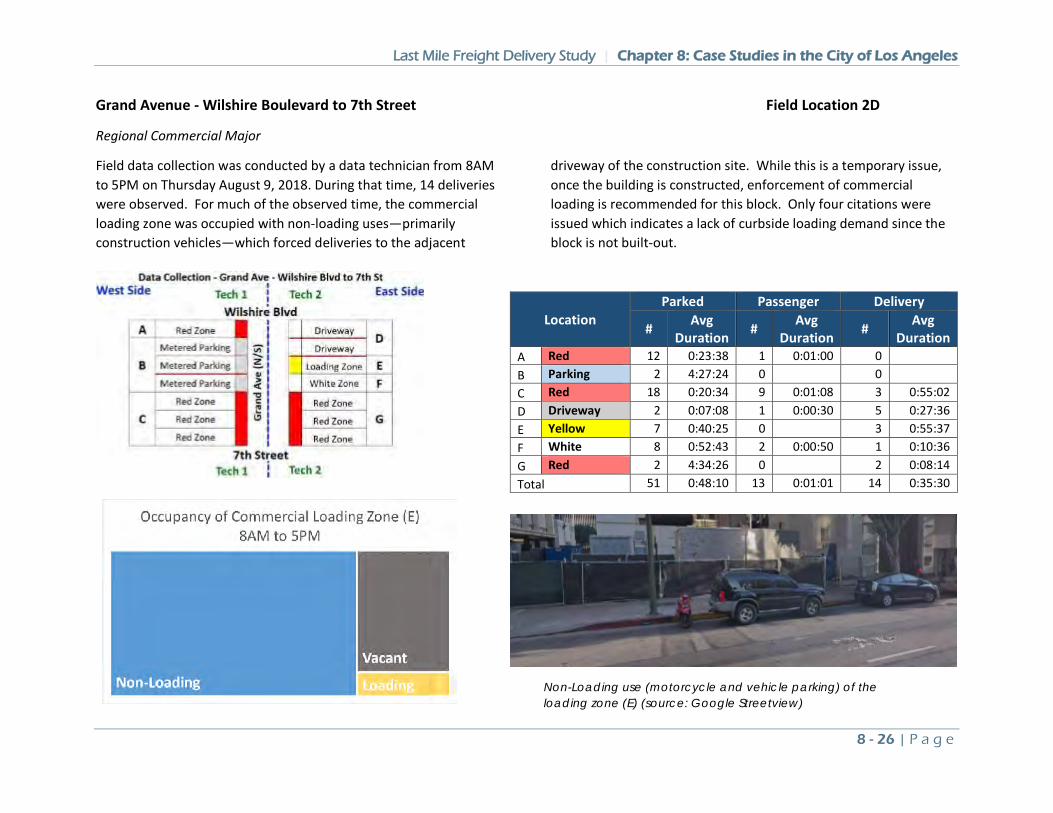
Last Mile Freight Delivery Study | Chapter 8: Case Studies in the City of Los Angeles
8 - 26 | P a g e
Grand Avenue - Wilshire Boulevard to 7th Street Field Location 2D
Regional Commercial Major
Field data collection was conducted by a data technician from 8AM to 5PM on Thursday August 9, 2018. During that time, 14 deliveries were observed. For much of the observed time, the commercial loading zone was occupied with non-loading uses—primarily construction vehicles—which forced deliveries to the adjacent
driveway of the construction site. While this is a temporary issue, once the building is constructed, enforcement of commercial loading is recommended for this block. Only four citations were issued which indicates a lack of curbside loading demand since the block is not built-out.
Location Parked Passenger Delivery
# Avg Duration # Avg
Duration # Avg Duration
A Red 12 0:23:38 1 0:01:00 0 B Parking 2 4:27:24 0 0 C Red 18 0:20:34 9 0:01:08 3 0:55:02 D Driveway 2 0:07:08 1 0:00:30 5 0:27:36 E Yellow 7 0:40:25 0 3 0:55:37 F White 8 0:52:43 2 0:00:50 1 0:10:36 G Red 2 4:34:26 0 2 0:08:14 Total 51 0:48:10 13 0:01:01 14 0:35:30
Non-Loading use (motorcycle and vehicle parking) of the loading zone (E) (source: Google Streetview)
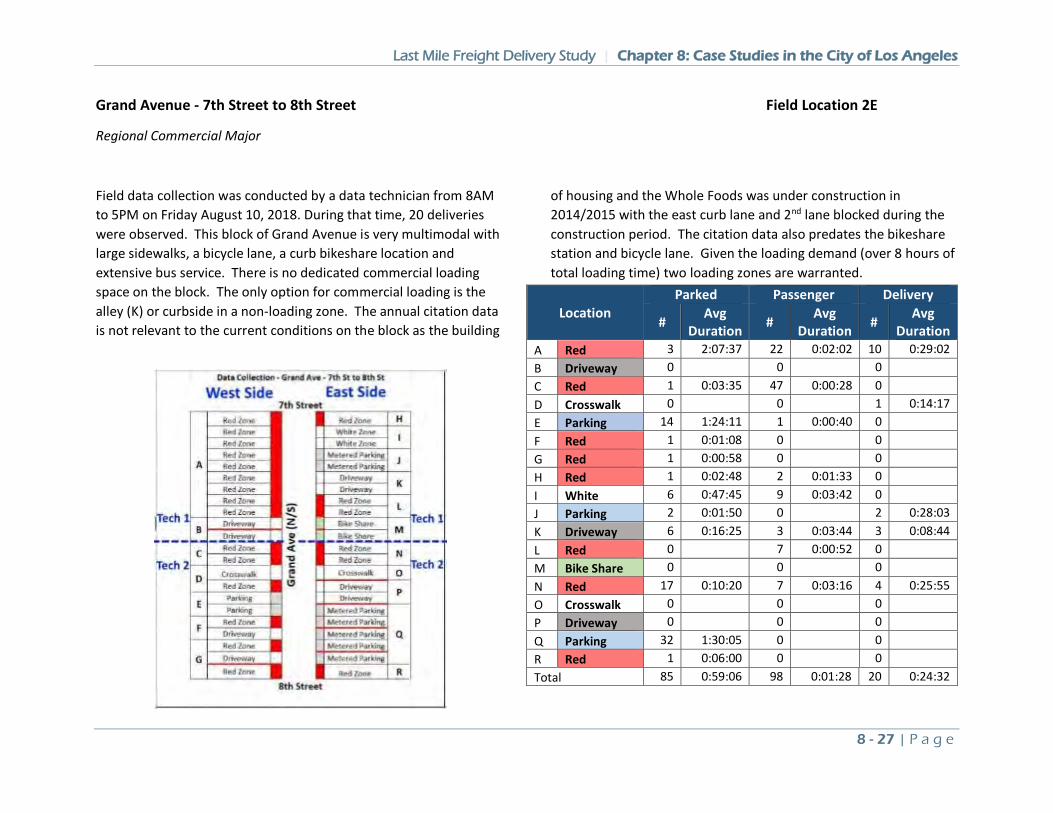
Last Mile Freight Delivery Study | Chapter 8: Case Studies in the City of Los Angeles
8 - 27 | P a g e
Grand Avenue - 7th Street to 8th Street Field Location 2E
Regional Commercial Major
Field data collection was conducted by a data technician from 8AM to 5PM on Friday August 10, 2018. During that time, 20 deliveries were observed. This block of Grand Avenue is very multimodal with large sidewalks, a bicycle lane, a curb bikeshare location and extensive bus service. There is no dedicated commercial loading space on the block. The only option for commercial loading is the alley (K) or curbside in a non-loading zone. The annual citation data is not relevant to the current conditions on the block as the building
of housing and the Whole Foods was under construction in 2014/2015 with the east curb lane and 2nd lane blocked during the construction period. The citation data also predates the bikeshare station and bicycle lane. Given the loading demand (over 8 hours of total loading time) two loading zones are warranted.
Location Parked Passenger Delivery
# Avg Duration # Avg
Duration # Avg Duration
A Red 3 2:07:37 22 0:02:02 10 0:29:02 B Driveway 0 0 0 C Red 1 0:03:35 47 0:00:28 0 D Crosswalk 0 0 1 0:14:17 E Parking 14 1:24:11 1 0:00:40 0 F Red 1 0:01:08 0 0 G Red 1 0:00:58 0 0 H Red 1 0:02:48 2 0:01:33 0 I White 6 0:47:45 9 0:03:42 0 J Parking 2 0:01:50 0 2 0:28:03 K Driveway 6 0:16:25 3 0:03:44 3 0:08:44 L Red 0 7 0:00:52 0 M Bike Share 0 0 0 N Red 17 0:10:20 7 0:03:16 4 0:25:55 O Crosswalk 0 0 0 P Driveway 0 0 0 Q Parking 32 1:30:05 0 0 R Red 1 0:06:00 0 0 Total 85 0:59:06 98 0:01:28 20 0:24:32
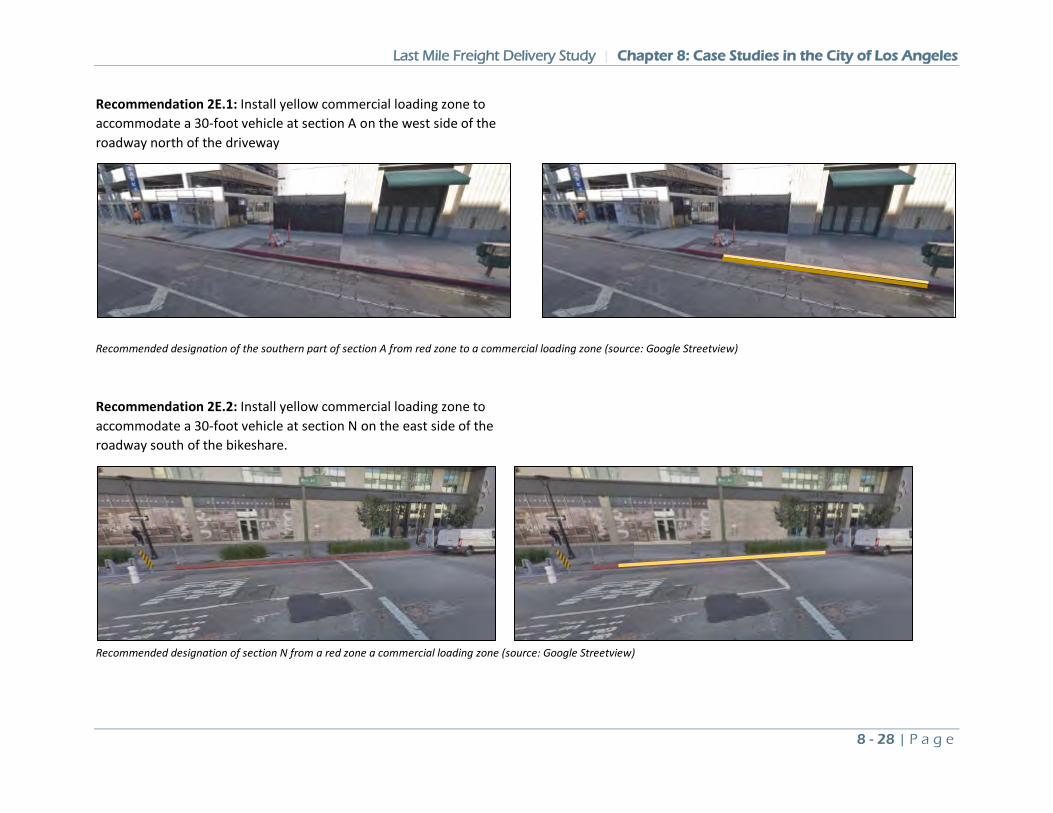
Last Mile Freight Delivery Study | Chapter 8: Case Studies in the City of Los Angeles
8 - 28 | P a g e
Recommendation 2E.1: Install yellow commercial loading zone to accommodate a 30-foot vehicle at section A on the west side of the roadway north of the driveway
Recommended designation of the southern part of section A from red zone to a commercial loading zone (source: Google Streetview)
Recommendation 2E.2: Install yellow commercial loading zone to accommodate a 30-foot vehicle at section N on the east side of the roadway south of the bikeshare.
Recommended designation of section N from a red zone a commercial loading zone (source: Google Streetview)
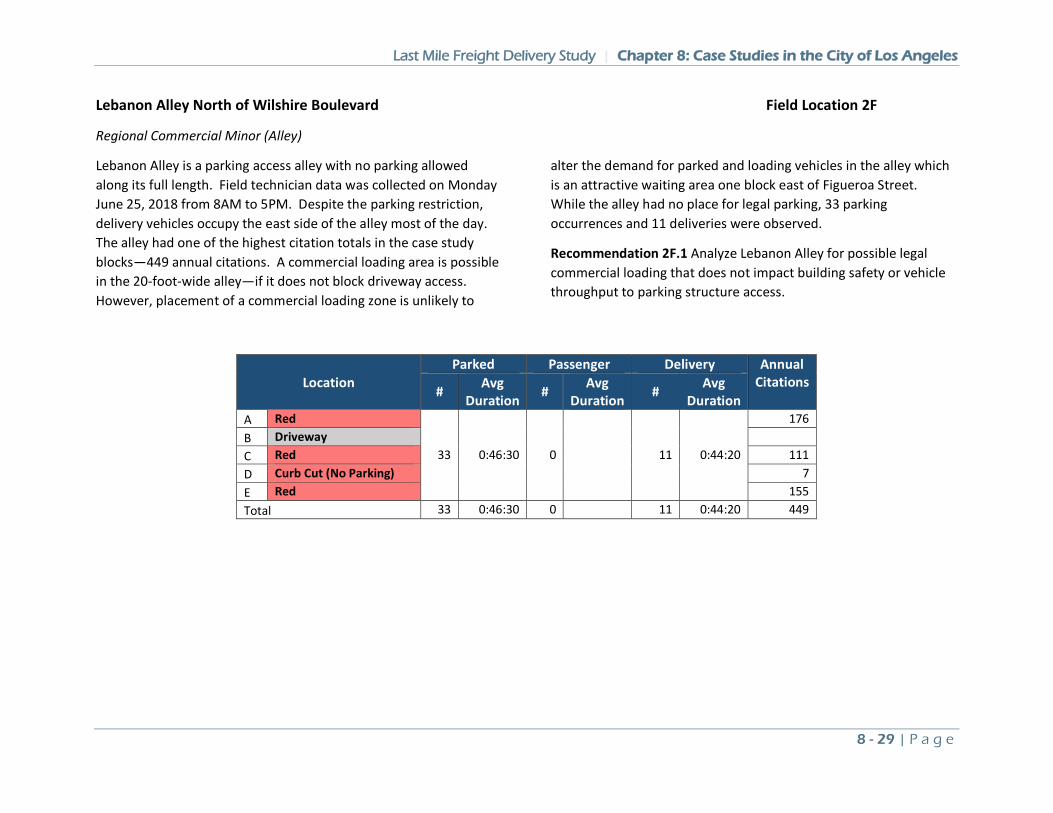
Last Mile Freight Delivery Study | Chapter 8: Case Studies in the City of Los Angeles
8 - 29 | P a g e
Lebanon Alley North of Wilshire Boulevard Field Location 2F
Regional Commercial Minor (Alley)
Lebanon Alley is a parking access alley with no parking allowed along its full length. Field technician data was collected on Monday June 25, 2018 from 8AM to 5PM. Despite the parking restriction, delivery vehicles occupy the east side of the alley most of the day. The alley had one of the highest citation totals in the case study blocks—449 annual citations. A commercial loading area is possible in the 20-foot-wide alley—if it does not block driveway access. However, placement of a commercial loading zone is unlikely to
alter the demand for parked and loading vehicles in the alley which is an attractive waiting area one block east of Figueroa Street. While the alley had no place for legal parking, 33 parking occurrences and 11 deliveries were observed.
Recommendation 2F.1 Analyze Lebanon Alley for possible legal commercial loading that does not impact building safety or vehicle throughput to parking structure access.
Location Parked Passenger Delivery Annual
Citations # Avg
Duration # Avg Duration # Avg
Duration A Red
33 0:46:30 0 11 0:44:20
176 B Driveway C Red 111 D Curb Cut (No Parking) 7 E Red 155 Total 33 0:46:30 0 11 0:44:20 449
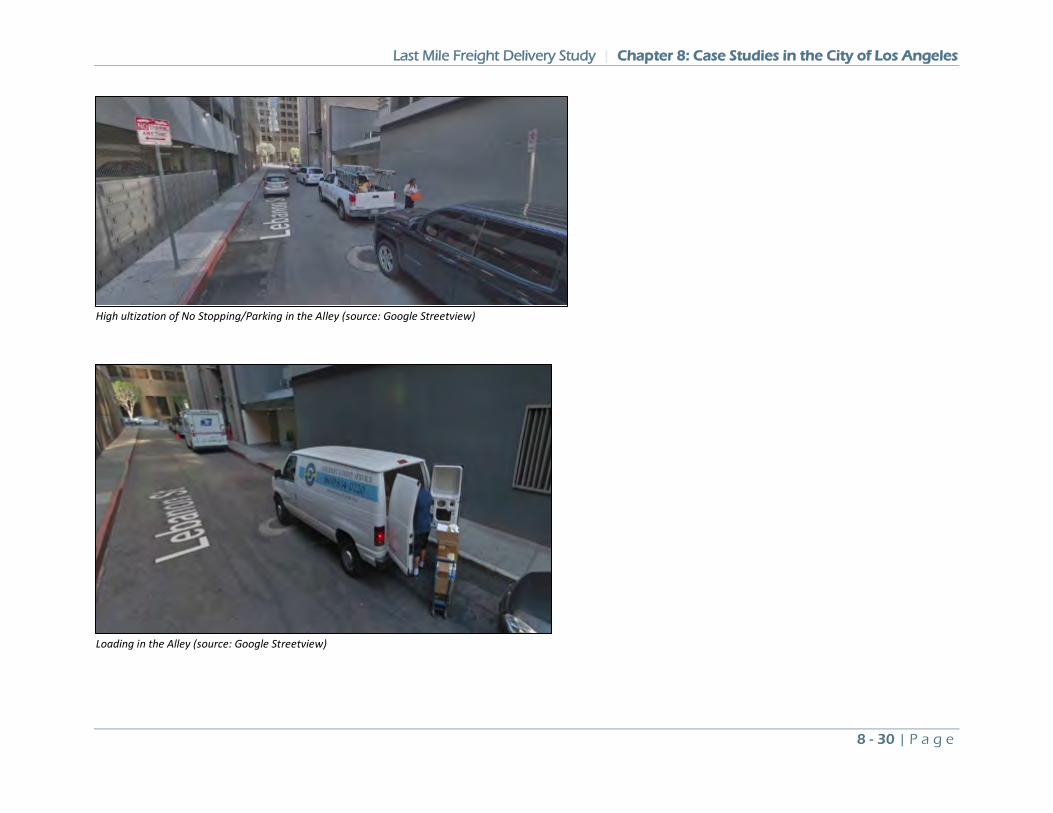
Last Mile Freight Delivery Study | Chapter 8: Case Studies in the City of Los Angeles
8 - 30 | P a g e
High ultization of No Stopping/Parking in the Alley (source: Google Streetview)
Loading in the Alley (source: Google Streetview)
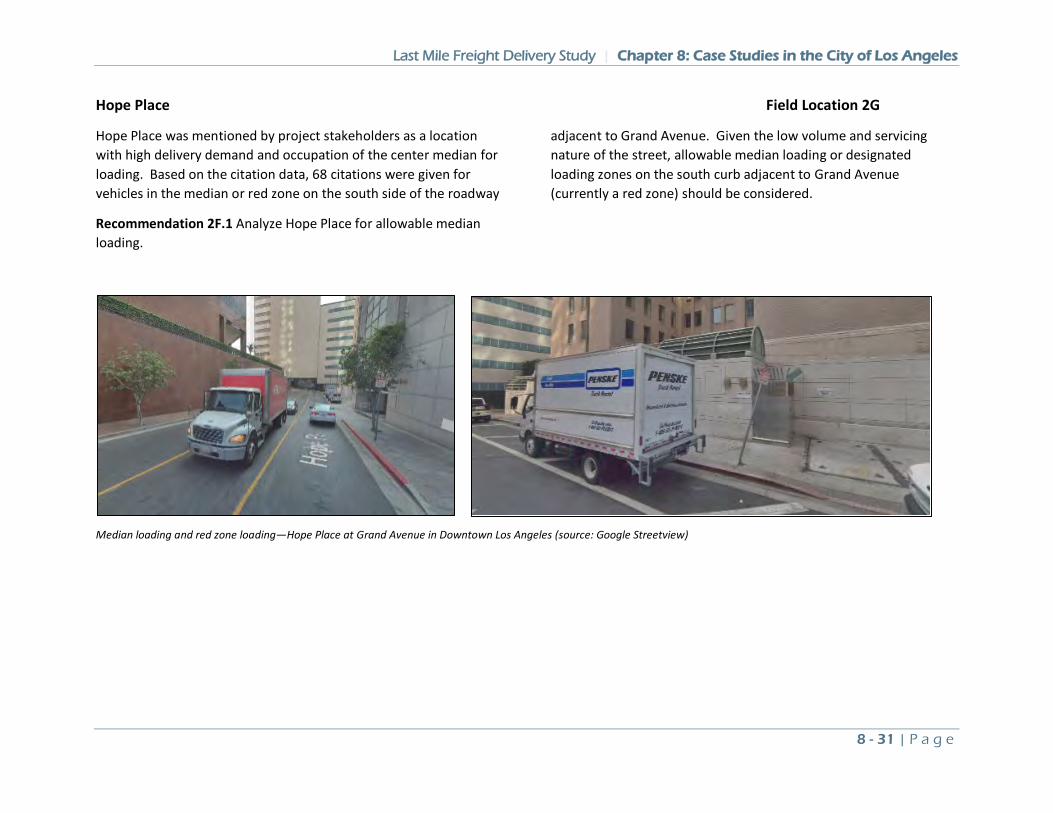
Last Mile Freight Delivery Study | Chapter 8: Case Studies in the City of Los Angeles
8 - 31 | P a g e
Hope Place Field Location 2G
Hope Place was mentioned by project stakeholders as a location with high delivery demand and occupation of the center median for loading. Based on the citation data, 68 citations were given for vehicles in the median or red zone on the south side of the roadway
adjacent to Grand Avenue. Given the low volume and servicing nature of the street, allowable median loading or designated loading zones on the south curb adjacent to Grand Avenue (currently a red zone) should be considered.
Recommendation 2F.1 Analyze Hope Place for allowable median loading.
Median loading and red zone loading—Hope Place at Grand Avenue in Downtown Los Angeles (source: Google Streetview)
Last Mile Freight Delivery Study | Chapter 8: Case Studies in the City of Los Angeles
8 - 32 | P a g e
Case Study #3: Encino – Ventura Boulevard
The Encino study area is along the high-volume corridor of Ventura Boulevard which is fronted by several large businesses—banks, restaurants and office buildings. This study defines Ventura Boulevard as a Regional Commercial Major roadway. Four Metro bus lines run along Ventura Boulevard, two of which are Metro Rapid lines. The two-block study area of Ventura Boulevard is from Libbit Avenue to Gaviota Avenue. Both blocks were field data collected sites.
Case Study Area Characteristics
• Blocks: 2 • Parking Meters: 67 • Annual Truck Tickets (2014): 26 (13 per block) • UPS/FedEx/USPS Locations: 15 • Bus Stops: 7 • Truck-Related Collisions: 0 • Estimated Daily Deliveries: 2,849 total; 1,424 per block • Average Daily Truck Trips per block: N/A
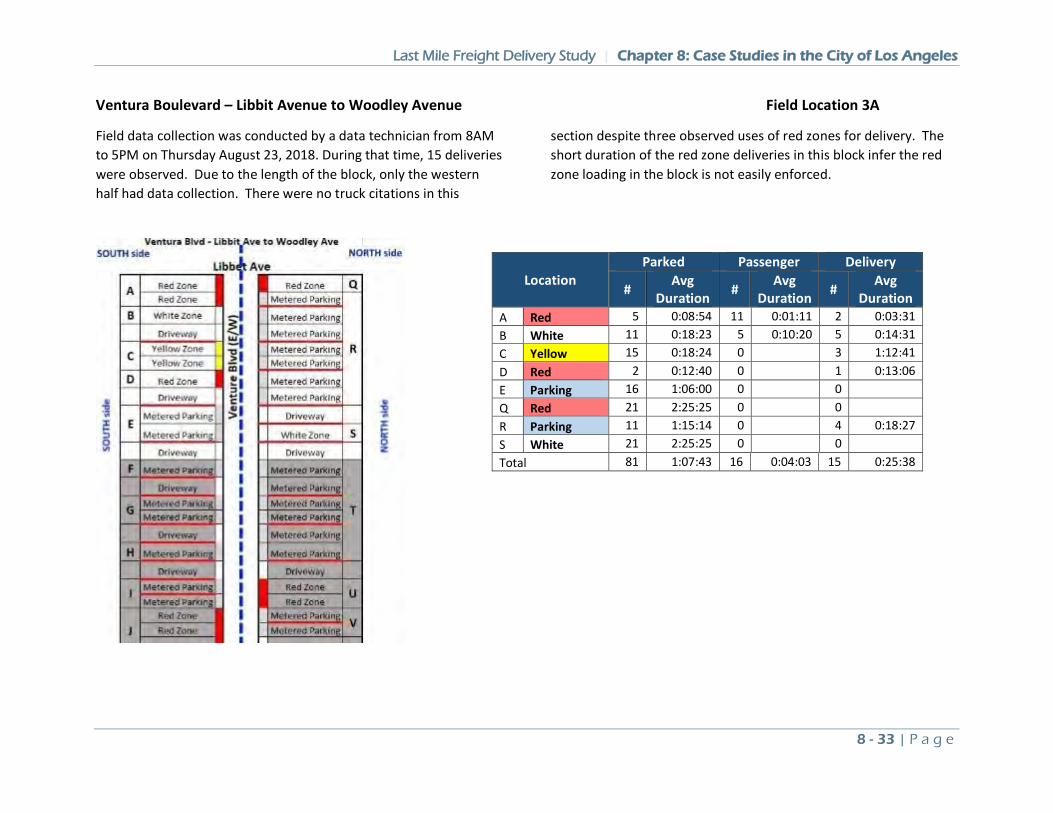
Last Mile Freight Delivery Study | Chapter 8: Case Studies in the City of Los Angeles
8 - 33 | P a g e
Ventura Boulevard – Libbit Avenue to Woodley Avenue Field Location 3A
Field data collection was conducted by a data technician from 8AM to 5PM on Thursday August 23, 2018. During that time, 15 deliveries were observed. Due to the length of the block, only the western half had data collection. There were no truck citations in this
section despite three observed uses of red zones for delivery. The short duration of the red zone deliveries in this block infer the red zone loading in the block is not easily enforced.
Location Parked Passenger Delivery
# Avg Duration # Avg
Duration # Avg Duration
A Red 5 0:08:54 11 0:01:11 2 0:03:31 B White 11 0:18:23 5 0:10:20 5 0:14:31 C Yellow 15 0:18:24 0 3 1:12:41 D Red 2 0:12:40 0 1 0:13:06 E Parking 16 1:06:00 0 0 Q Red 21 2:25:25 0 0 R Parking 11 1:15:14 0 4 0:18:27 S White 21 2:25:25 0 0 Total 81 1:07:43 16 0:04:03 15 0:25:38
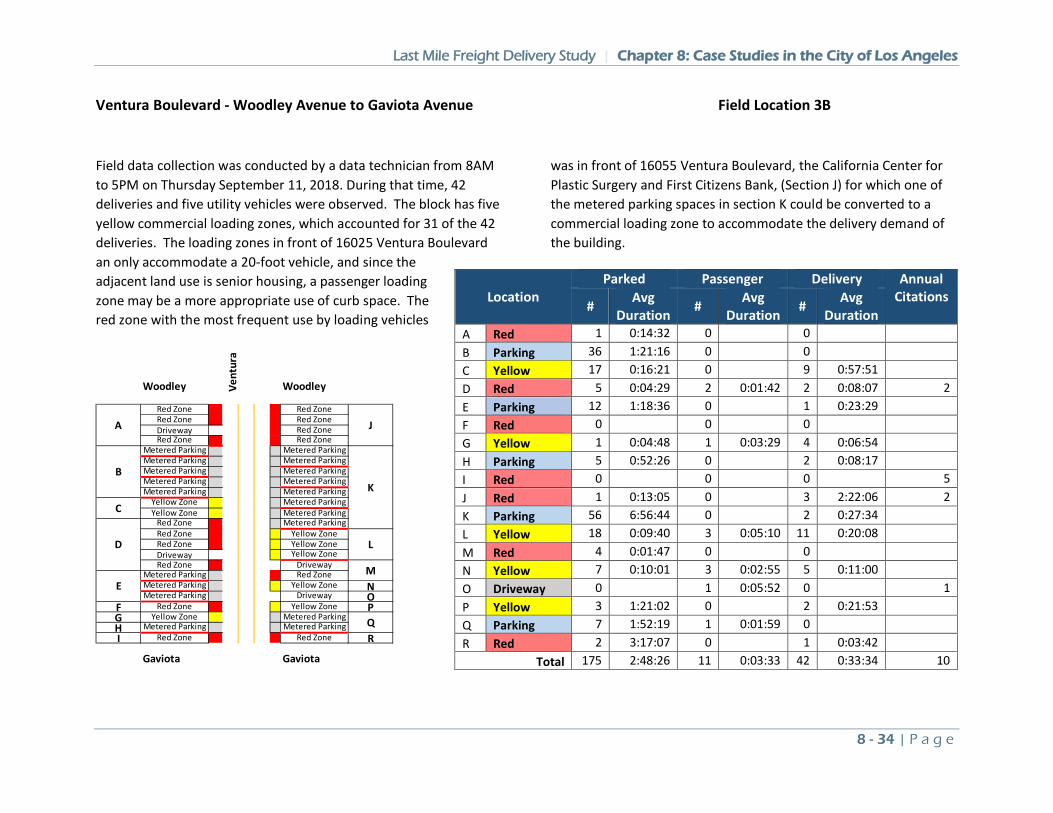
Last Mile Freight Delivery Study | Chapter 8: Case Studies in the City of Los Angeles
8 - 34 | P a g e
Ventura Boulevard - Woodley Avenue to Gaviota Avenue Field Location 3B
Field data collection was conducted by a data technician from 8AM to 5PM on Thursday September 11, 2018. During that time, 42 deliveries and five utility vehicles were observed. The block has five yellow commercial loading zones, which accounted for 31 of the 42 deliveries. The loading zones in front of 16025 Ventura Boulevard an only accommodate a 20-foot vehicle, and since the adjacent land use is senior housing, a passenger loading zone may be a more appropriate use of curb space. The red zone with the most frequent use by loading vehicles
was in front of 16055 Ventura Boulevard, the California Center for Plastic Surgery and First Citizens Bank, (Section J) for which one of the metered parking spaces in section K could be converted to a commercial loading zone to accommodate the delivery demand of the building.
Location Parked Passenger Delivery Annual
Citations # Avg
Duration # Avg Duration # Avg
Duration A Red 1 0:14:32 0 0 B Parking 36 1:21:16 0 0 C Yellow 17 0:16:21 0 9 0:57:51 D Red 5 0:04:29 2 0:01:42 2 0:08:07 2 E Parking 12 1:18:36 0 1 0:23:29 F Red 0 0 0 G Yellow 1 0:04:48 1 0:03:29 4 0:06:54 H Parking 5 0:52:26 0 2 0:08:17 I Red 0 0 0 5 J Red 1 0:13:05 0 3 2:22:06 2 K Parking 56 6:56:44 0 2 0:27:34 L Yellow 18 0:09:40 3 0:05:10 11 0:20:08 M Red 4 0:01:47 0 0 N Yellow 7 0:10:01 3 0:02:55 5 0:11:00 O Driveway 0 1 0:05:52 0 1 P Yellow 3 1:21:02 0 2 0:21:53 Q Parking 7 1:52:19 1 0:01:59 0 R Red 2 3:17:07 0 1 0:03:42
Total 175 2:48:26 11 0:03:33 42 0:33:34 10
Woodley Vent
ura
Woodley
Red Zone Red ZoneRed Zone Red ZoneDriveway Red ZoneRed Zone Red Zone
Metered Parking Metered ParkingMetered Parking Metered ParkingMetered Parking Metered ParkingMetered Parking Metered ParkingMetered Parking Metered Parking
Yellow Zone Metered ParkingYellow Zone Metered Parking
Red Zone Metered ParkingRed Zone Yellow ZoneRed Zone Yellow ZoneDriveway Yellow ZoneRed Zone Driveway
Metered Parking Red ZoneMetered Parking Yellow Zone NMetered Parking Driveway O
F Red Zone Yellow Zone PG Yellow Zone Metered ParkingH Metered Parking Metered ParkingI Red Zone Red Zone R
Gaviota Gaviota
Q
J
BK
C
D L
ME
A
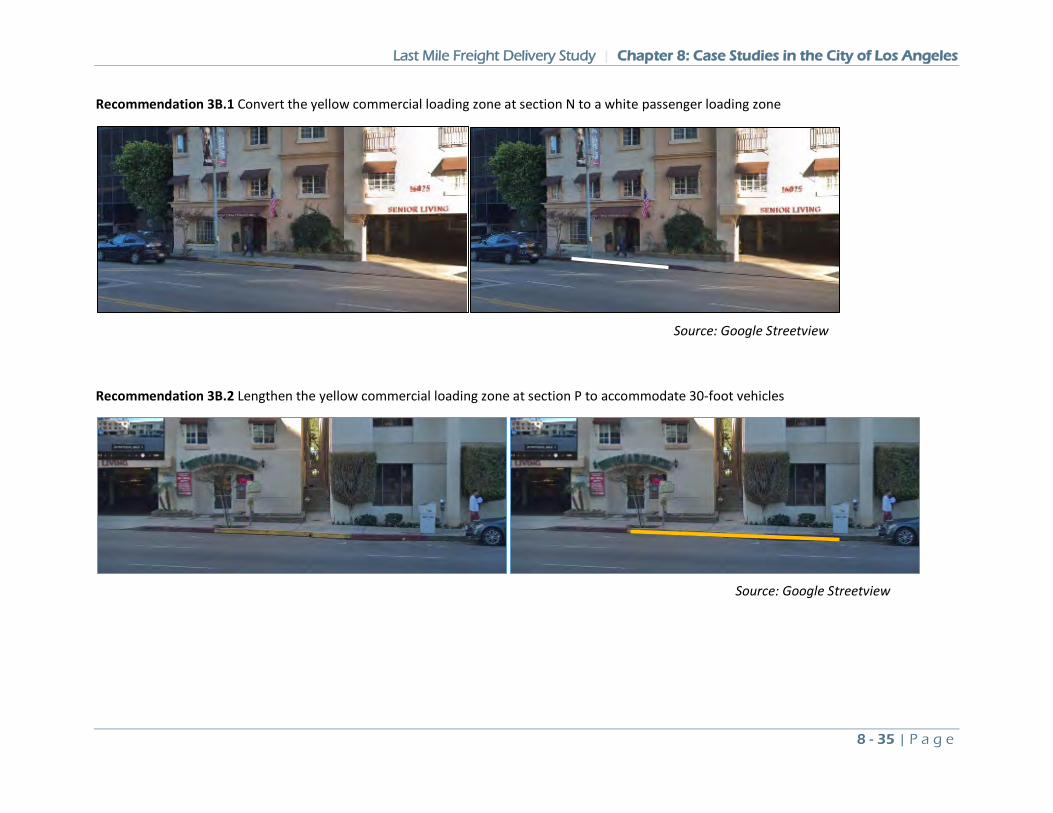
Last Mile Freight Delivery Study | Chapter 8: Case Studies in the City of Los Angeles
8 - 35 | P a g e
Recommendation 3B.1 Convert the yellow commercial loading zone at section N to a white passenger loading zone
Recommendation 3B.2 Lengthen the yellow commercial loading zone at section P to accommodate 30-foot vehicles
Source: Google Streetview
Source: Google Streetview
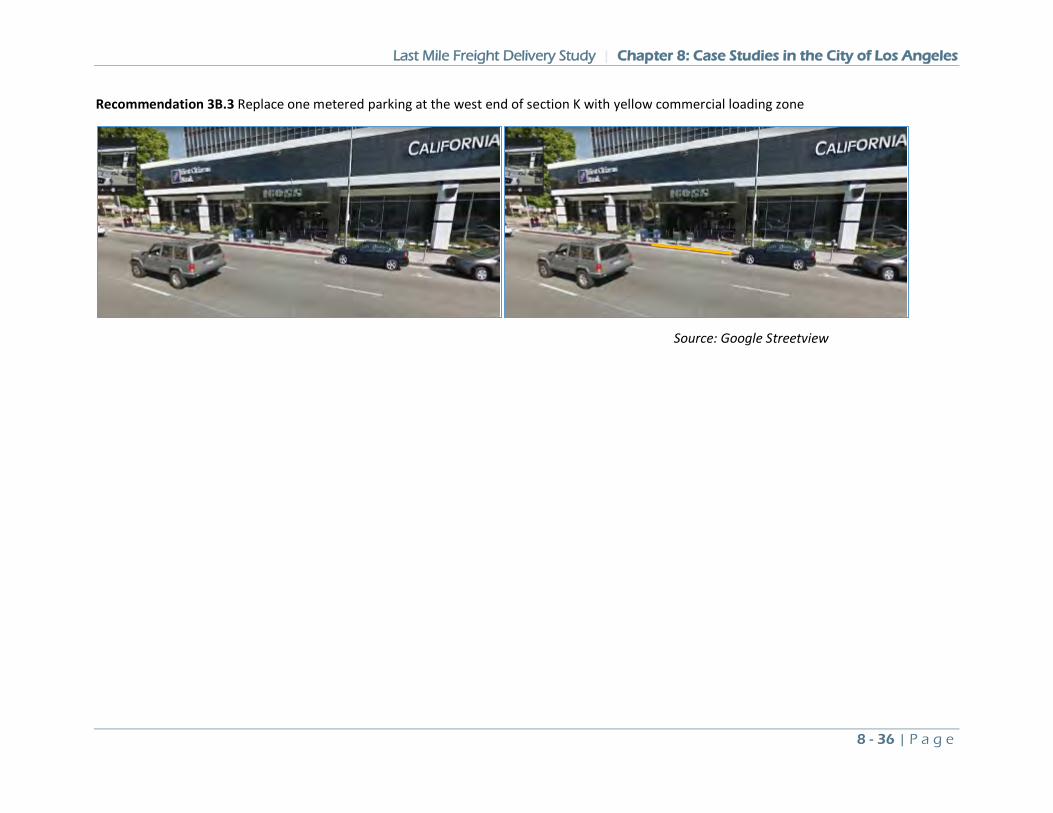
Last Mile Freight Delivery Study | Chapter 8: Case Studies in the City of Los Angeles
8 - 36 | P a g e
Recommendation 3B.3 Replace one metered parking at the west end of section K with yellow commercial loading zone
Source: Google Streetview
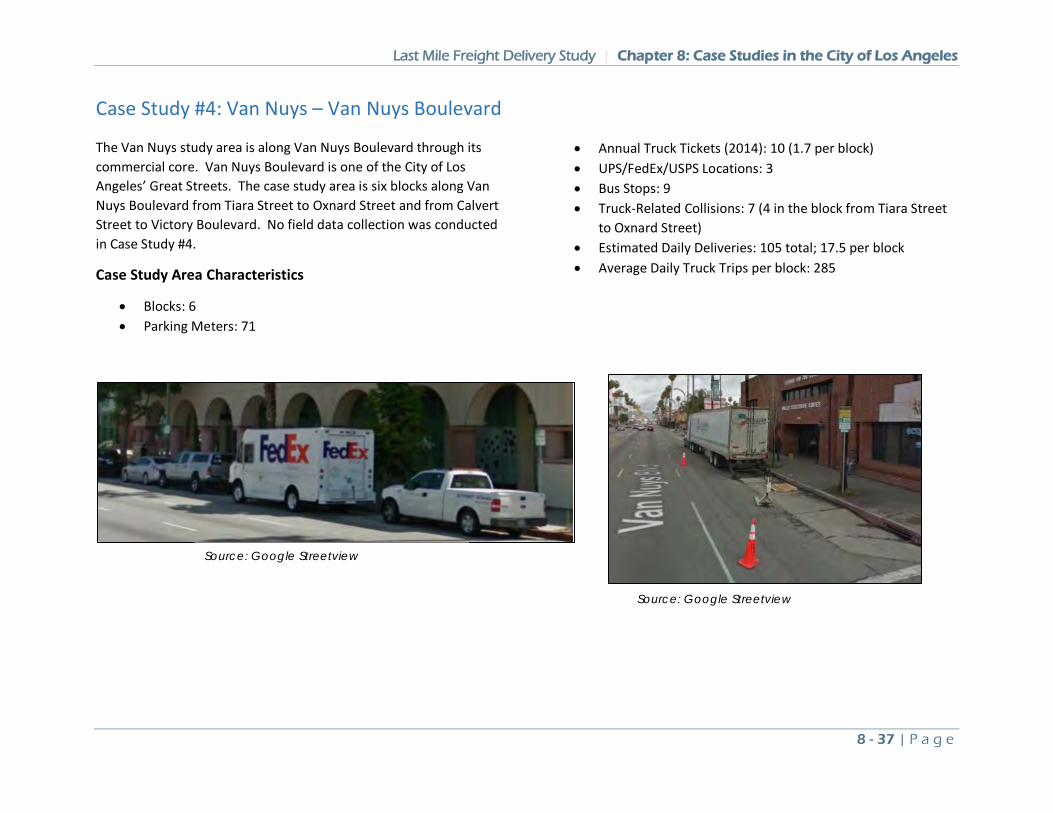
Last Mile Freight Delivery Study | Chapter 8: Case Studies in the City of Los Angeles
8 - 37 | P a g e
Case Study #4: Van Nuys – Van Nuys Boulevard
The Van Nuys study area is along Van Nuys Boulevard through its commercial core. Van Nuys Boulevard is one of the City of Los Angeles’ Great Streets. The case study area is six blocks along Van Nuys Boulevard from Tiara Street to Oxnard Street and from Calvert Street to Victory Boulevard. No field data collection was conducted in Case Study #4.
Case Study Area Characteristics
• Blocks: 6 • Parking Meters: 71
• Annual Truck Tickets (2014): 10 (1.7 per block) • UPS/FedEx/USPS Locations: 3 • Bus Stops: 9 • Truck-Related Collisions: 7 (4 in the block from Tiara Street
to Oxnard Street) • Estimated Daily Deliveries: 105 total; 17.5 per block • Average Daily Truck Trips per block: 285
Source: Google Streetview
Source: Google Streetview
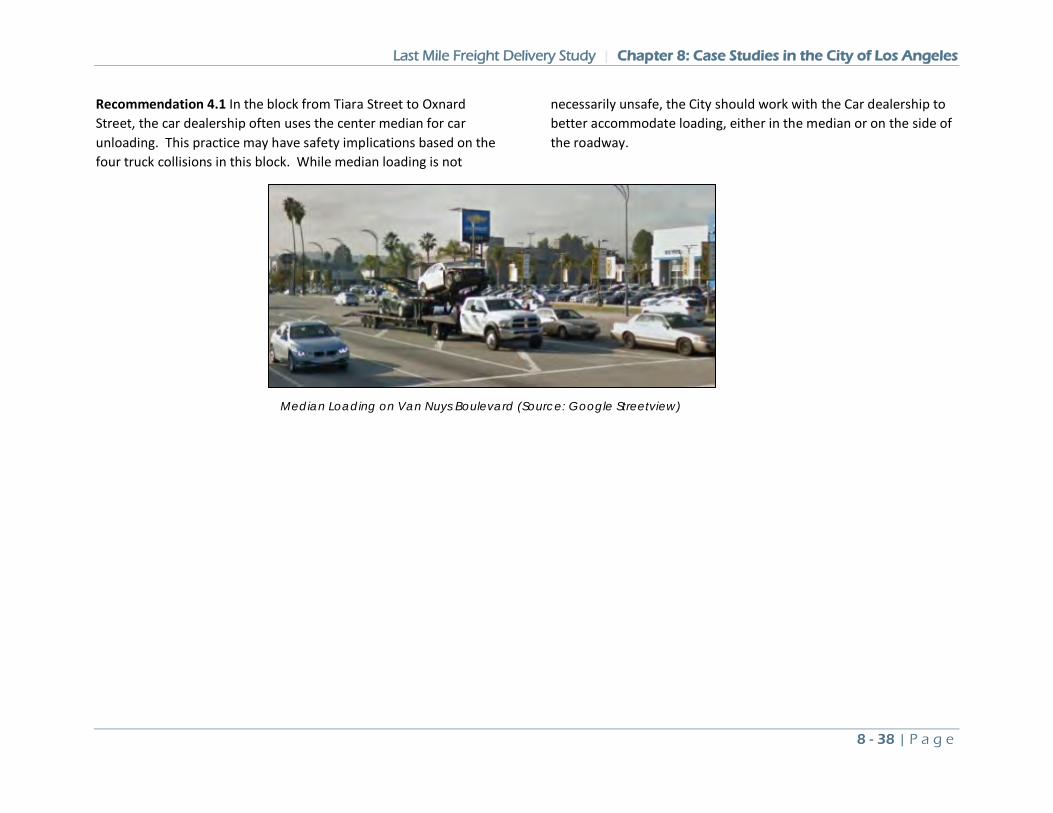
Last Mile Freight Delivery Study | Chapter 8: Case Studies in the City of Los Angeles
8 - 38 | P a g e
Recommendation 4.1 In the block from Tiara Street to Oxnard Street, the car dealership often uses the center median for car unloading. This practice may have safety implications based on the four truck collisions in this block. While median loading is not
necessarily unsafe, the City should work with the Car dealership to better accommodate loading, either in the median or on the side of the roadway.
Median Loading on Van Nuys Boulevard (Source: Google Streetview)
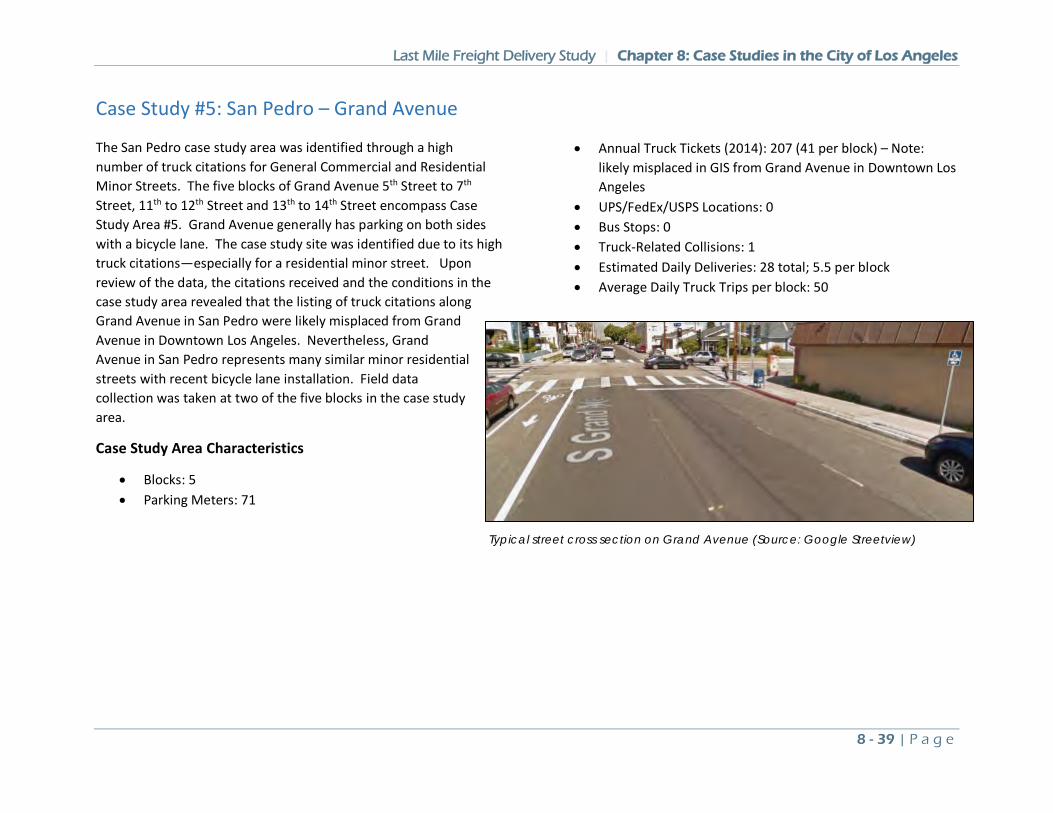
Last Mile Freight Delivery Study | Chapter 8: Case Studies in the City of Los Angeles
8 - 39 | P a g e
Case Study #5: San Pedro – Grand Avenue
The San Pedro case study area was identified through a high number of truck citations for General Commercial and Residential Minor Streets. The five blocks of Grand Avenue 5th Street to 7th Street, 11th to 12th Street and 13th to 14th Street encompass Case Study Area #5. Grand Avenue generally has parking on both sides with a bicycle lane. The case study site was identified due to its high truck citations—especially for a residential minor street. Upon review of the data, the citations received and the conditions in the case study area revealed that the listing of truck citations along Grand Avenue in San Pedro were likely misplaced from Grand Avenue in Downtown Los Angeles. Nevertheless, Grand Avenue in San Pedro represents many similar minor residential streets with recent bicycle lane installation. Field data collection was taken at two of the five blocks in the case study area.
Case Study Area Characteristics
• Blocks: 5 • Parking Meters: 71
• Annual Truck Tickets (2014): 207 (41 per block) – Note: likely misplaced in GIS from Grand Avenue in Downtown Los Angeles
• UPS/FedEx/USPS Locations: 0 • Bus Stops: 0 • Truck-Related Collisions: 1 • Estimated Daily Deliveries: 28 total; 5.5 per block • Average Daily Truck Trips per block: 50
Typical street cross section on Grand Avenue (Source: Google Streetview)
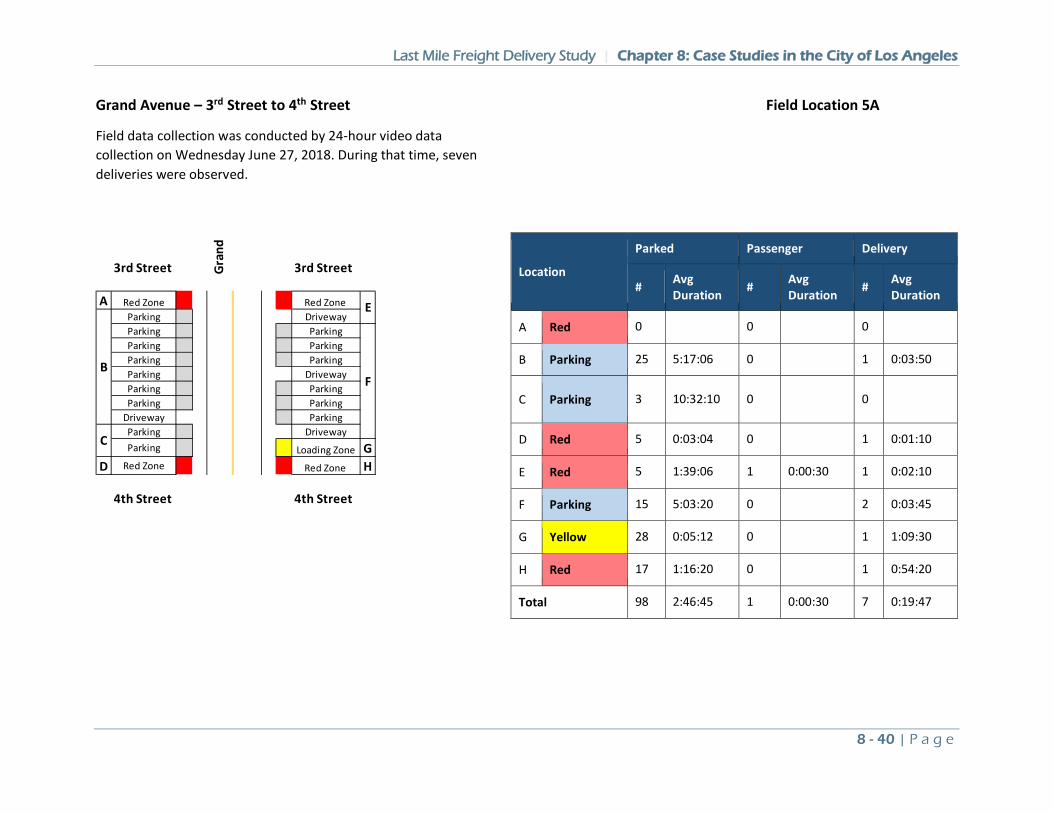
Last Mile Freight Delivery Study | Chapter 8: Case Studies in the City of Los Angeles
8 - 40 | P a g e
Grand Avenue – 3rd Street to 4th Street Field Location 5A
Field data collection was conducted by 24-hour video data collection on Wednesday June 27, 2018. During that time, seven deliveries were observed.
Location
Parked Passenger Delivery
# Avg Duration # Avg
Duration # Avg Duration
A Red 0 0 0
B Parking 25 5:17:06 0 1 0:03:50
C Parking 3 10:32:10 0 0
D Red 5 0:03:04 0 1 0:01:10
E Red 5 1:39:06 1 0:00:30 1 0:02:10
F Parking 15 5:03:20 0 2 0:03:45
G Yellow 28 0:05:12 0 1 1:09:30
H Red 17 1:16:20 0 1 0:54:20
Total 98 2:46:45 1 0:00:30 7 0:19:47
3rd Street Gran
d
3rd Street
A Red Zone Red Zone Parking DrivewayParking ParkingParking ParkingParking ParkingParking DrivewayParking ParkingParking Parking
Driveway ParkingParking DrivewayParking Loading Zone G
D Red Zone Red Zone H
4th Street 4th Street
E
BF
C
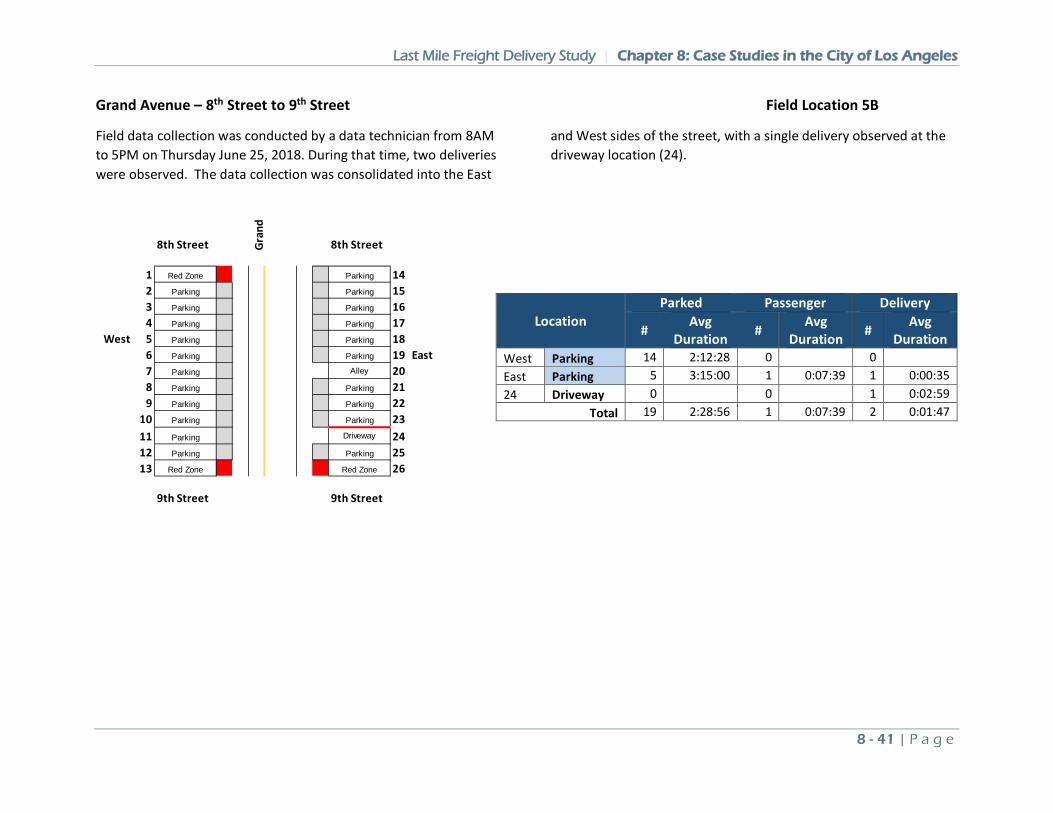
Last Mile Freight Delivery Study | Chapter 8: Case Studies in the City of Los Angeles
8 - 41 | P a g e
Grand Avenue – 8th Street to 9th Street Field Location 5B
Field data collection was conducted by a data technician from 8AM to 5PM on Thursday June 25, 2018. During that time, two deliveries were observed. The data collection was consolidated into the East
and West sides of the street, with a single delivery observed at the driveway location (24).
Location
Parked Passenger Delivery
# Avg Duration # Avg
Duration # Avg Duration
West Parking 14 2:12:28 0 0 East Parking 5 3:15:00 1 0:07:39 1 0:00:35 24 Driveway 0 0 1 0:02:59
Total 19 2:28:56 1 0:07:39 2 0:01:47
8th Street Gran
d8th Street
1 Red Zone Parking 142 Parking Parking 153 Parking Parking 164 Parking Parking 17
West 5 Parking Parking 186 Parking Parking 19 East7 Parking Alley 208 Parking Parking 219 Parking Parking 22
10 Parking Parking 2311 Parking Driveway 2412 Parking Parking 2513 Red Zone Red Zone 26
9th Street 9th Street
Last Mile Freight Delivery Study | Chapter 8: Case Studies in the City of Los Angeles
8 - 42 | P a g e
Case Study #6: Westwood – Westwood Boulevard and Galey Avenue
The Westwood case study area encompassed the eleven blocks of:
• Westwood Boulevard from Lindbrook to Le Conte • Weyburn from Westwood Boulevard and Gayley Avenue • Gayley Avenue from Weyburn to Lindbrook • Kinross from Westwood Boulevard to Gayley Ave • Broxton from Weyburn to Kinross
This busy, primarily retail, commercial area has heavy bicycle and pedestrian activity. Curbside parking is in high demand; however off-street public lots are available. Field data collection was taken at four of the eleven blocks in the case study area. While Westwood has several alleys, curbside delivery is common.
Westwood is one of the pilot locations for the Los Angeles Department of Transportation’s (LADOT) Express Park program. The meters generated roughly $1.75 million in 2016-2017. The money goes to the City of Los Angeles, but the City is looking into options
for the Westwood Business Improvement District (BID) to retain some of the revenue under a potential Parking Benefit District. The inappropriate use of expired or invalid handicapped placards make effective parking management difficult. Cars with a placard are exempt from meter fees and the Westwood BID determined that 40 percent of meters were occupied by placard vehicles.
Case Study Area Characteristics
• Blocks: 11 • Parking Meters: 173 • Annual Truck Tickets (2014): 184 (17 per block) • UPS/FedEx/USPS Locations: 6 • Bus Stops: 6 • Truck-Related Collisions: 1 • Estimated Daily Deliveries: 324 total; 29.5 per block • Average Daily Truck Trips per block: 55
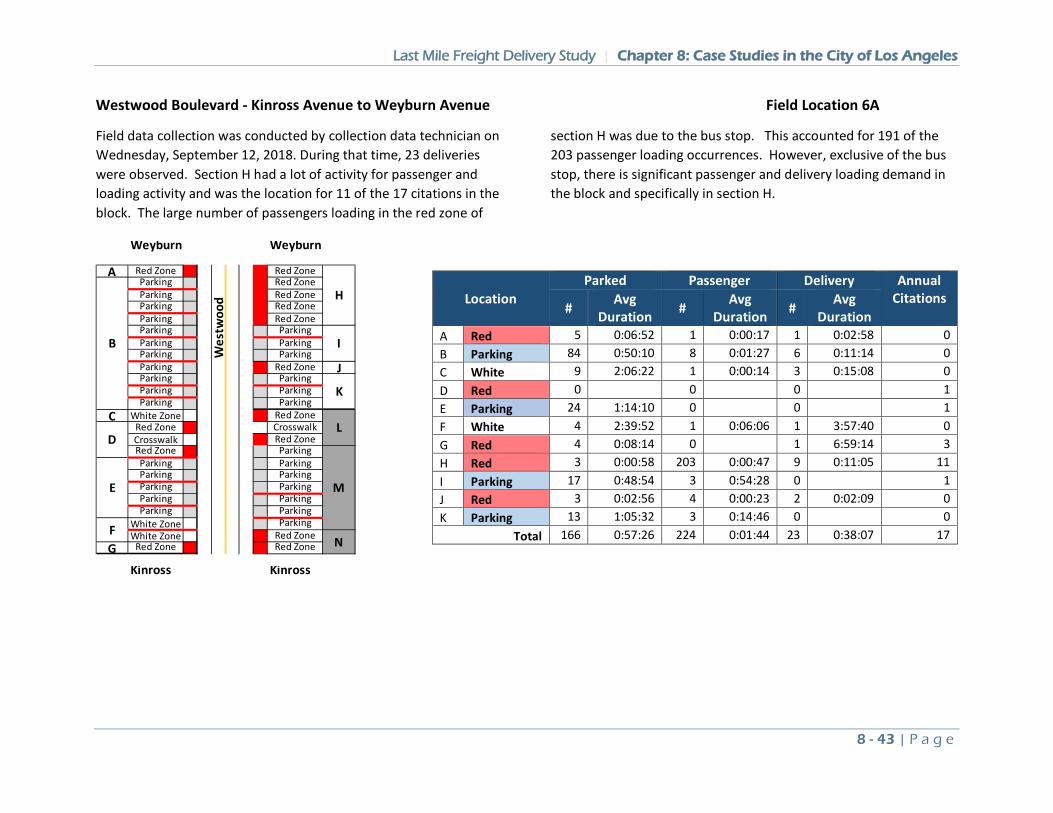
Last Mile Freight Delivery Study | Chapter 8: Case Studies in the City of Los Angeles
8 - 43 | P a g e
Westwood Boulevard - Kinross Avenue to Weyburn Avenue Field Location 6A
Field data collection was conducted by collection data technician on Wednesday, September 12, 2018. During that time, 23 deliveries were observed. Section H had a lot of activity for passenger and loading activity and was the location for 11 of the 17 citations in the block. The large number of passengers loading in the red zone of
section H was due to the bus stop. This accounted for 191 of the 203 passenger loading occurrences. However, exclusive of the bus stop, there is significant passenger and delivery loading demand in the block and specifically in section H.
Location Parked Passenger Delivery Annual
Citations # Avg
Duration # Avg Duration # Avg
Duration A Red 5 0:06:52 1 0:00:17 1 0:02:58 0 B Parking 84 0:50:10 8 0:01:27 6 0:11:14 0 C White 9 2:06:22 1 0:00:14 3 0:15:08 0 D Red 0 0 0 1 E Parking 24 1:14:10 0 0 1 F White 4 2:39:52 1 0:06:06 1 3:57:40 0 G Red 4 0:08:14 0 1 6:59:14 3 H Red 3 0:00:58 203 0:00:47 9 0:11:05 11 I Parking 17 0:48:54 3 0:54:28 0 1 J Red 3 0:02:56 4 0:00:23 2 0:02:09 0 K Parking 13 1:05:32 3 0:14:46 0 0
Total 166 0:57:26 224 0:01:44 23 0:38:07 17
Weyburn Weyburn
A Red Zone Red ZoneParking Red ZoneParking Red ZoneParking Red ZoneParking Red ZoneParking ParkingParking ParkingParking ParkingParking Red Zone JParking ParkingParking ParkingParking Parking
C White Zone Red ZoneRed Zone CrosswalkCrosswalk Red ZoneRed Zone ParkingParking ParkingParking ParkingParking ParkingParking ParkingParking Parking
White Zone ParkingWhite Zone Red Zone
G Red Zone Red Zone
Kinross Kinross
Wes
twoo
d H
B I
K
LD
ME
FN
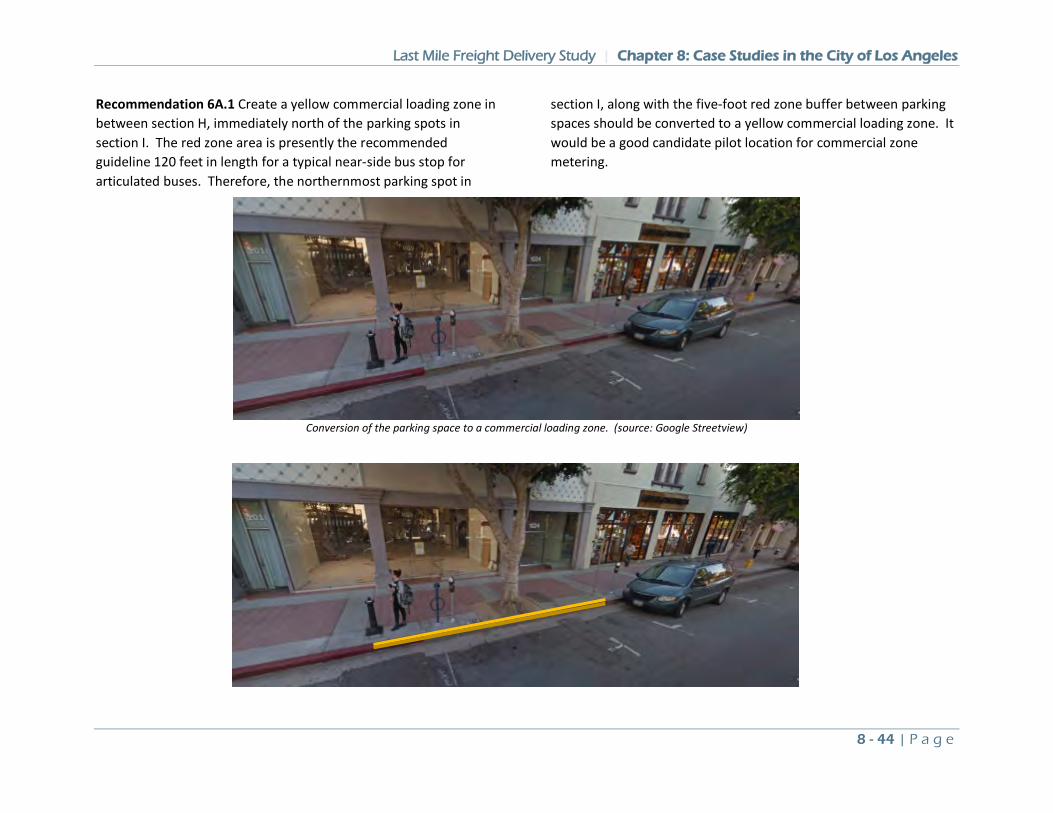
Last Mile Freight Delivery Study | Chapter 8: Case Studies in the City of Los Angeles
8 - 44 | P a g e
Recommendation 6A.1 Create a yellow commercial loading zone in between section H, immediately north of the parking spots in section I. The red zone area is presently the recommended guideline 120 feet in length for a typical near-side bus stop for articulated buses. Therefore, the northernmost parking spot in
section I, along with the five-foot red zone buffer between parking spaces should be converted to a yellow commercial loading zone. It would be a good candidate pilot location for commercial zone metering.
Conversion of the parking space to a commercial loading zone. (source: Google Streetview)
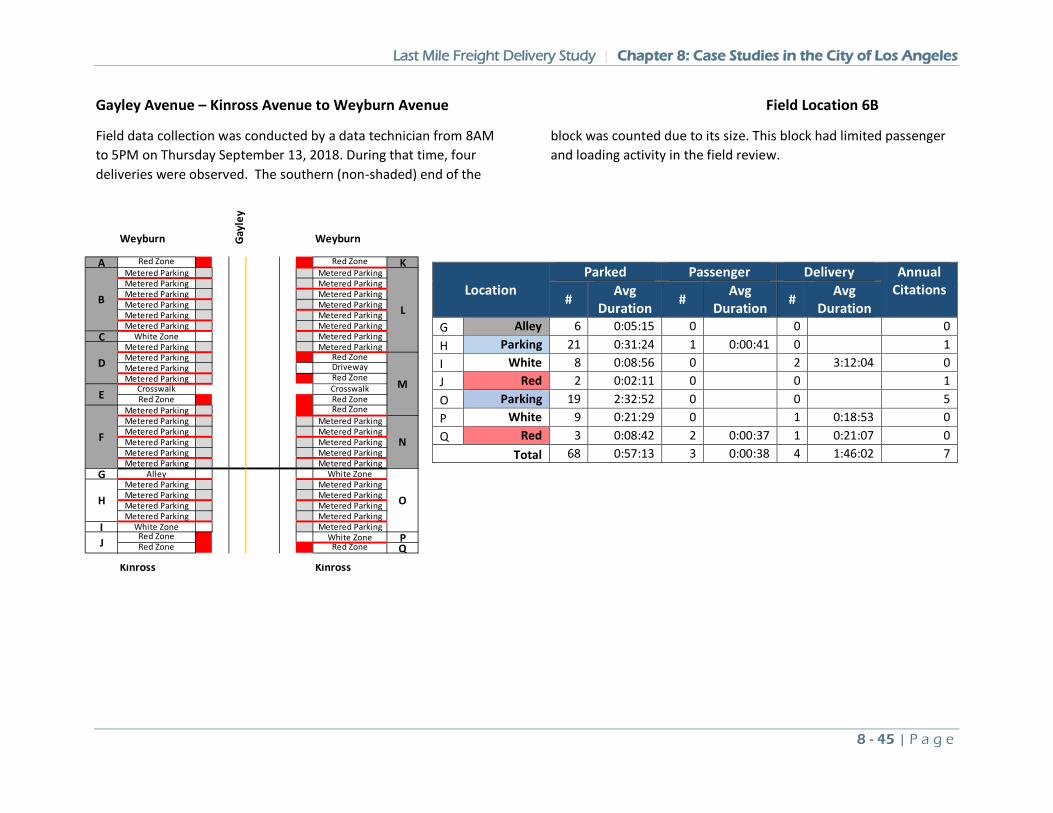
Last Mile Freight Delivery Study | Chapter 8: Case Studies in the City of Los Angeles
8 - 45 | P a g e
Gayley Avenue – Kinross Avenue to Weyburn Avenue Field Location 6B
Field data collection was conducted by a data technician from 8AM to 5PM on Thursday September 13, 2018. During that time, four deliveries were observed. The southern (non-shaded) end of the
block was counted due to its size. This block had limited passenger and loading activity in the field review.
Location Parked Passenger Delivery Annual
Citations # Avg
Duration # Avg Duration # Avg
Duration G Alley 6 0:05:15 0 0 0 H Parking 21 0:31:24 1 0:00:41 0 1 I White 8 0:08:56 0 2 3:12:04 0 J Red 2 0:02:11 0 0 1 O Parking 19 2:32:52 0 0 5 P White 9 0:21:29 0 1 0:18:53 0 Q Red 3 0:08:42 2 0:00:37 1 0:21:07 0
Total 68 0:57:13 3 0:00:38 4 1:46:02 7
Weyburn Gayl
eyWeyburn
A Red Zone Red Zone KMetered Parking Metered ParkingMetered Parking Metered ParkingMetered Parking Metered ParkingMetered Parking Metered ParkingMetered Parking Metered ParkingMetered Parking Metered Parking
C White Zone Metered ParkingMetered Parking Metered ParkingMetered Parking Red ZoneMetered Parking DrivewayMetered Parking Red Zone
Crosswalk CrosswalkRed Zone Red Zone
Metered Parking Red ZoneMetered Parking Metered ParkingMetered Parking Metered ParkingMetered Parking Metered ParkingMetered Parking Metered ParkingMetered Parking Metered Parking
G Alley White ZoneMetered Parking Metered ParkingMetered Parking Metered ParkingMetered Parking Metered ParkingMetered Parking Metered Parking
I White Zone Metered ParkingRed Zone White Zone PRed Zone Red Zone Q
Kinross Kinross
OH
J
L
D
ME
F N
B
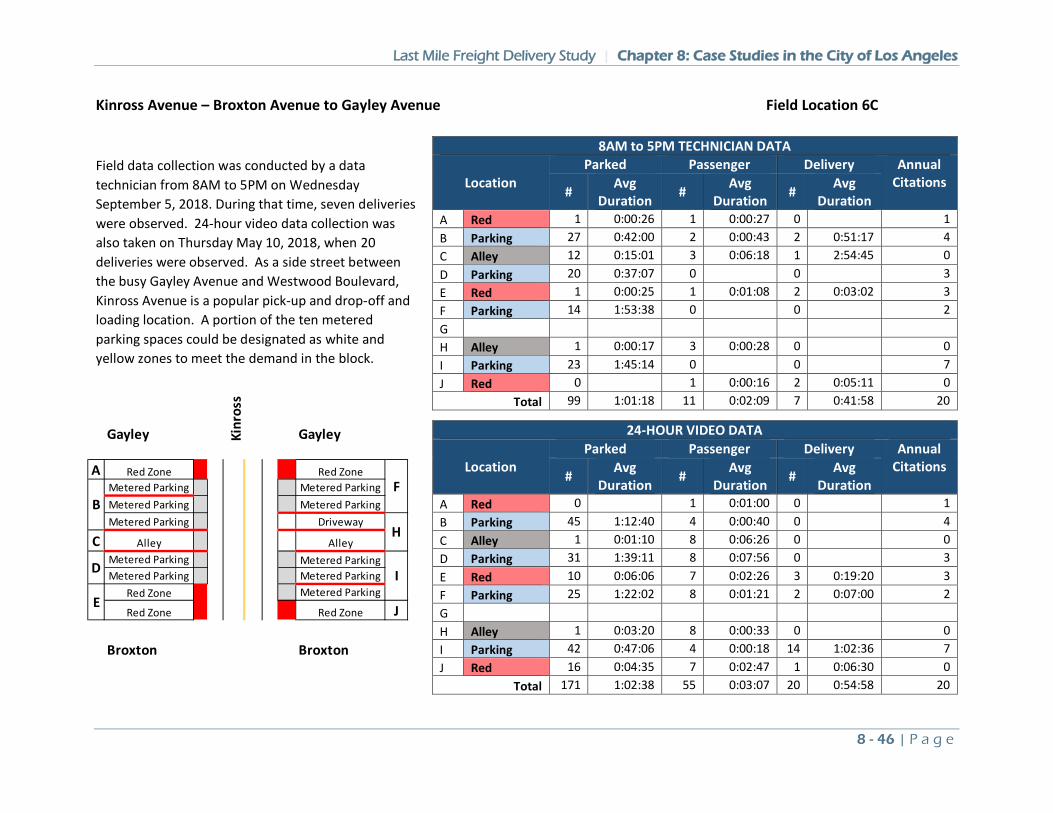
Last Mile Freight Delivery Study | Chapter 8: Case Studies in the City of Los Angeles
8 - 46 | P a g e
Kinross Avenue – Broxton Avenue to Gayley Avenue Field Location 6C
Field data collection was conducted by a data technician from 8AM to 5PM on Wednesday September 5, 2018. During that time, seven deliveries were observed. 24-hour video data collection was also taken on Thursday May 10, 2018, when 20 deliveries were observed. As a side street between the busy Gayley Avenue and Westwood Boulevard, Kinross Avenue is a popular pick-up and drop-off and loading location. A portion of the ten metered parking spaces could be designated as white and yellow zones to meet the demand in the block.
8AM to 5PM TECHNICIAN DATA
Location Parked Passenger Delivery Annual
Citations # Avg
Duration # Avg Duration # Avg
Duration A Red 1 0:00:26 1 0:00:27 0 1 B Parking 27 0:42:00 2 0:00:43 2 0:51:17 4 C Alley 12 0:15:01 3 0:06:18 1 2:54:45 0 D Parking 20 0:37:07 0 0 3 E Red 1 0:00:25 1 0:01:08 2 0:03:02 3 F Parking 14 1:53:38 0 0 2 G H Alley 1 0:00:17 3 0:00:28 0 0 I Parking 23 1:45:14 0 0 7 J Red 0 1 0:00:16 2 0:05:11 0
Total 99 1:01:18 11 0:02:09 7 0:41:58 20
24-HOUR VIDEO DATA
Location Parked Passenger Delivery Annual
Citations # Avg
Duration # Avg Duration # Avg
Duration A Red 0 1 0:01:00 0 1 B Parking 45 1:12:40 4 0:00:40 0 4 C Alley 1 0:01:10 8 0:06:26 0 0 D Parking 31 1:39:11 8 0:07:56 0 3 E Red 10 0:06:06 7 0:02:26 3 0:19:20 3 F Parking 25 1:22:02 8 0:01:21 2 0:07:00 2 G H Alley 1 0:03:20 8 0:00:33 0 0 I Parking 42 0:47:06 4 0:00:18 14 1:02:36 7 J Red 16 0:04:35 7 0:02:47 1 0:06:30 0
Total 171 1:02:38 55 0:03:07 20 0:54:58 20
Gayley Kinr
oss
Gayley
A Red Zone Red ZoneMetered Parking Metered ParkingMetered Parking Metered ParkingMetered Parking Driveway
C Alley AlleyMetered Parking Metered ParkingMetered Parking Metered Parking
Red Zone Metered Parking
Red Zone Red Zone J
Broxton Broxton
FB
H
D I
E
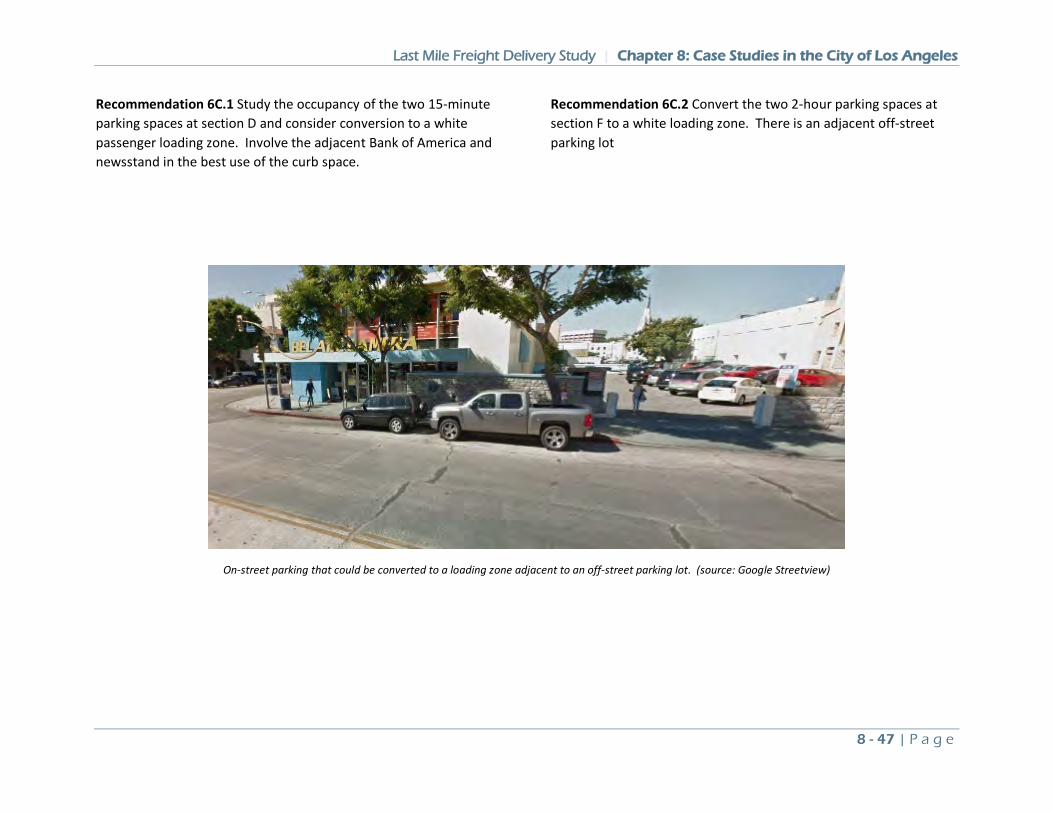
Last Mile Freight Delivery Study | Chapter 8: Case Studies in the City of Los Angeles
8 - 47 | P a g e
Recommendation 6C.1 Study the occupancy of the two 15-minute parking spaces at section D and consider conversion to a white passenger loading zone. Involve the adjacent Bank of America and newsstand in the best use of the curb space.
Recommendation 6C.2 Convert the two 2-hour parking spaces at section F to a white loading zone. There is an adjacent off-street parking lot
On-street parking that could be converted to a loading zone adjacent to an off-street parking lot. (source: Google Streetview)
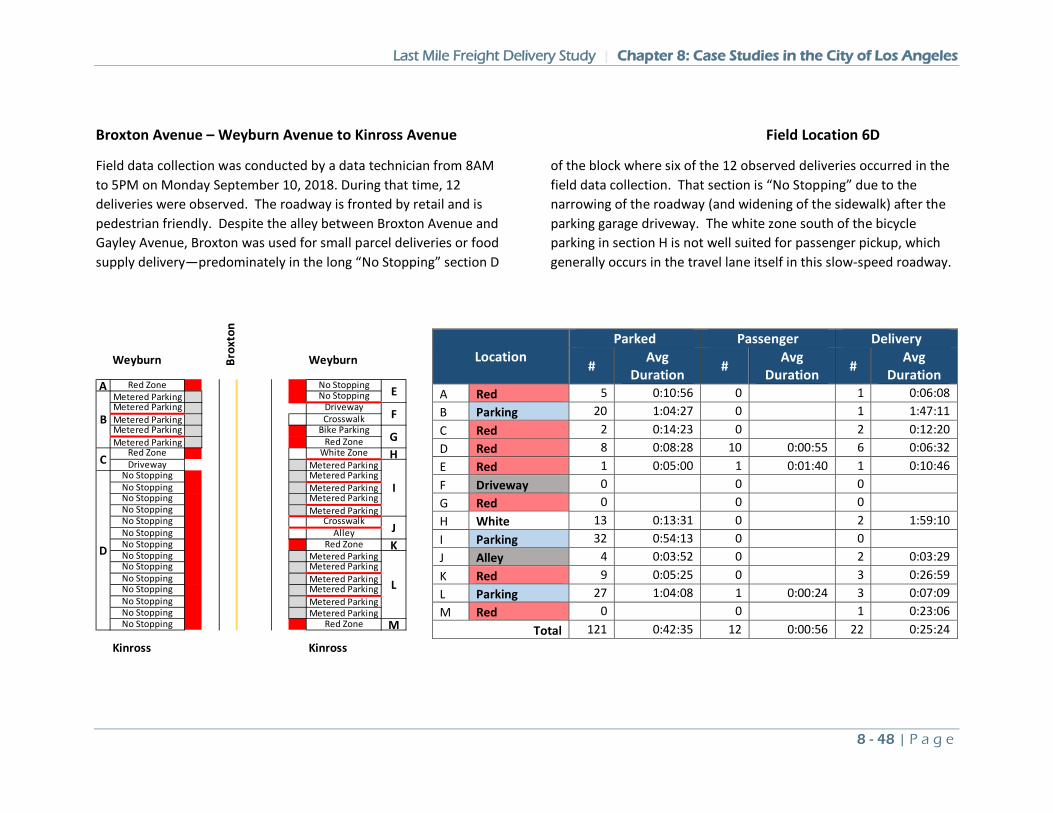
Last Mile Freight Delivery Study | Chapter 8: Case Studies in the City of Los Angeles
8 - 48 | P a g e
Broxton Avenue – Weyburn Avenue to Kinross Avenue Field Location 6D
Field data collection was conducted by a data technician from 8AM to 5PM on Monday September 10, 2018. During that time, 12 deliveries were observed. The roadway is fronted by retail and is pedestrian friendly. Despite the alley between Broxton Avenue and Gayley Avenue, Broxton was used for small parcel deliveries or food supply delivery—predominately in the long “No Stopping” section D
of the block where six of the 12 observed deliveries occurred in the field data collection. That section is “No Stopping” due to the narrowing of the roadway (and widening of the sidewalk) after the parking garage driveway. The white zone south of the bicycle parking in section H is not well suited for passenger pickup, which generally occurs in the travel lane itself in this slow-speed roadway.
Location Parked Passenger Delivery
# Avg Duration # Avg
Duration # Avg Duration
A Red 5 0:10:56 0 1 0:06:08 B Parking 20 1:04:27 0 1 1:47:11 C Red 2 0:14:23 0 2 0:12:20 D Red 8 0:08:28 10 0:00:55 6 0:06:32 E Red 1 0:05:00 1 0:01:40 1 0:10:46 F Driveway 0 0 0 G Red 0 0 0 H White 13 0:13:31 0 2 1:59:10 I Parking 32 0:54:13 0 0 J Alley 4 0:03:52 0 2 0:03:29 K Red 9 0:05:25 0 3 0:26:59 L Parking 27 1:04:08 1 0:00:24 3 0:07:09 M Red 0 0 1 0:23:06
Total 121 0:42:35 12 0:00:56 22 0:25:24
Weyburn Brox
ton
Weyburn
A Red Zone No StoppingMetered Parking No StoppingMetered Parking DrivewayMetered Parking CrosswalkMetered Parking Bike ParkingMetered Parking Red Zone
Red Zone White Zone HDriveway Metered Parking
No Stopping Metered ParkingNo Stopping Metered ParkingNo Stopping Metered ParkingNo Stopping Metered ParkingNo Stopping CrosswalkNo Stopping AlleyNo Stopping Red Zone KNo Stopping Metered ParkingNo Stopping Metered ParkingNo Stopping Metered ParkingNo Stopping Metered ParkingNo Stopping Metered ParkingNo Stopping Metered ParkingNo Stopping Red Zone M
Kinross Kinross
E
B F
G
C
I
D
J
L
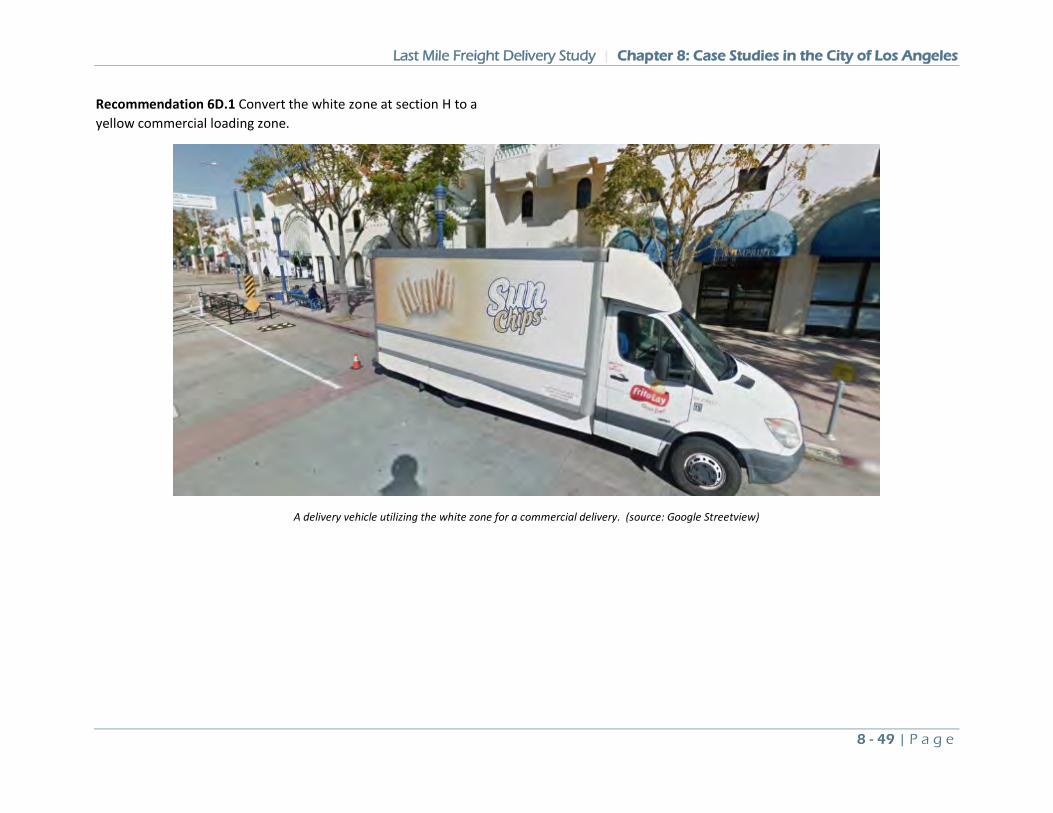
Last Mile Freight Delivery Study | Chapter 8: Case Studies in the City of Los Angeles
8 - 49 | P a g e
Recommendation 6D.1 Convert the white zone at section H to a yellow commercial loading zone.
A delivery vehicle utilizing the white zone for a commercial delivery. (source: Google Streetview)
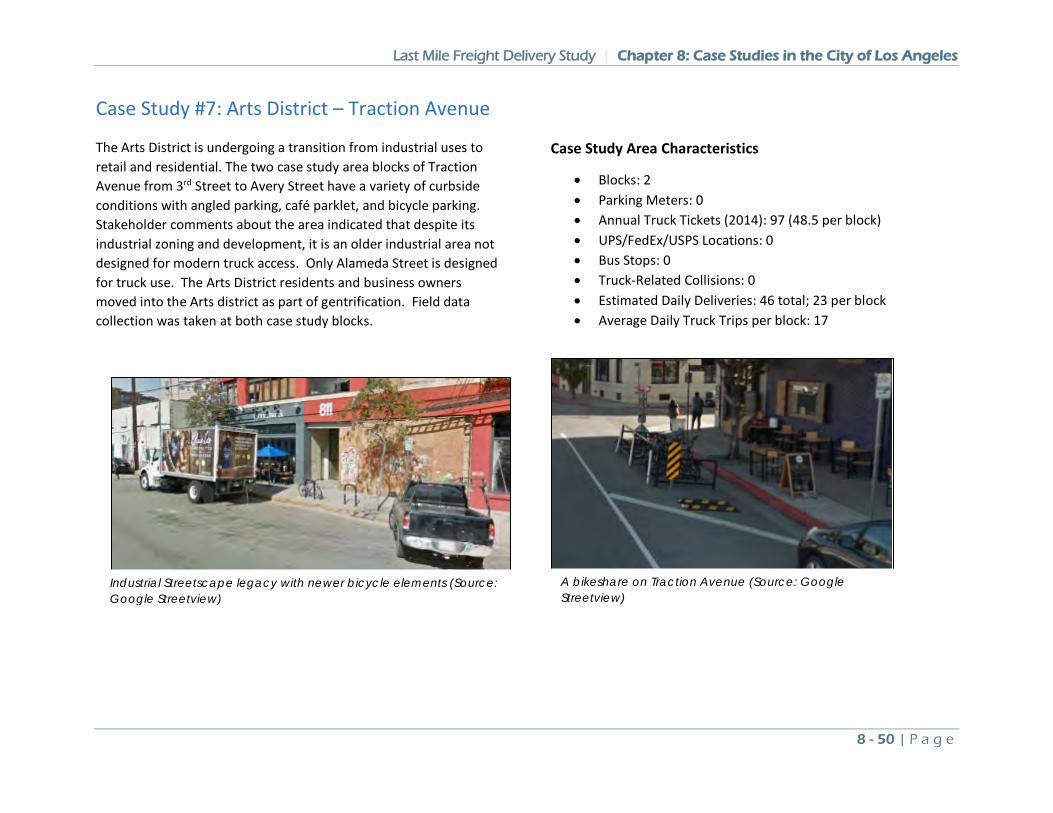
Last Mile Freight Delivery Study | Chapter 8: Case Studies in the City of Los Angeles
8 - 50 | P a g e
Case Study #7: Arts District – Traction Avenue
The Arts District is undergoing a transition from industrial uses to retail and residential. The two case study area blocks of Traction Avenue from 3rd Street to Avery Street have a variety of curbside conditions with angled parking, café parklet, and bicycle parking. Stakeholder comments about the area indicated that despite its industrial zoning and development, it is an older industrial area not designed for modern truck access. Only Alameda Street is designed for truck use. The Arts District residents and business owners moved into the Arts district as part of gentrification. Field data collection was taken at both case study blocks.
Case Study Area Characteristics
• Blocks: 2 • Parking Meters: 0 • Annual Truck Tickets (2014): 97 (48.5 per block) • UPS/FedEx/USPS Locations: 0 • Bus Stops: 0 • Truck-Related Collisions: 0 • Estimated Daily Deliveries: 46 total; 23 per block • Average Daily Truck Trips per block: 17
A bikeshare on Traction Avenue (Source: Google Streetview)
Industrial Streetscape legacy with newer bicycle elements (Source: Google Streetview)
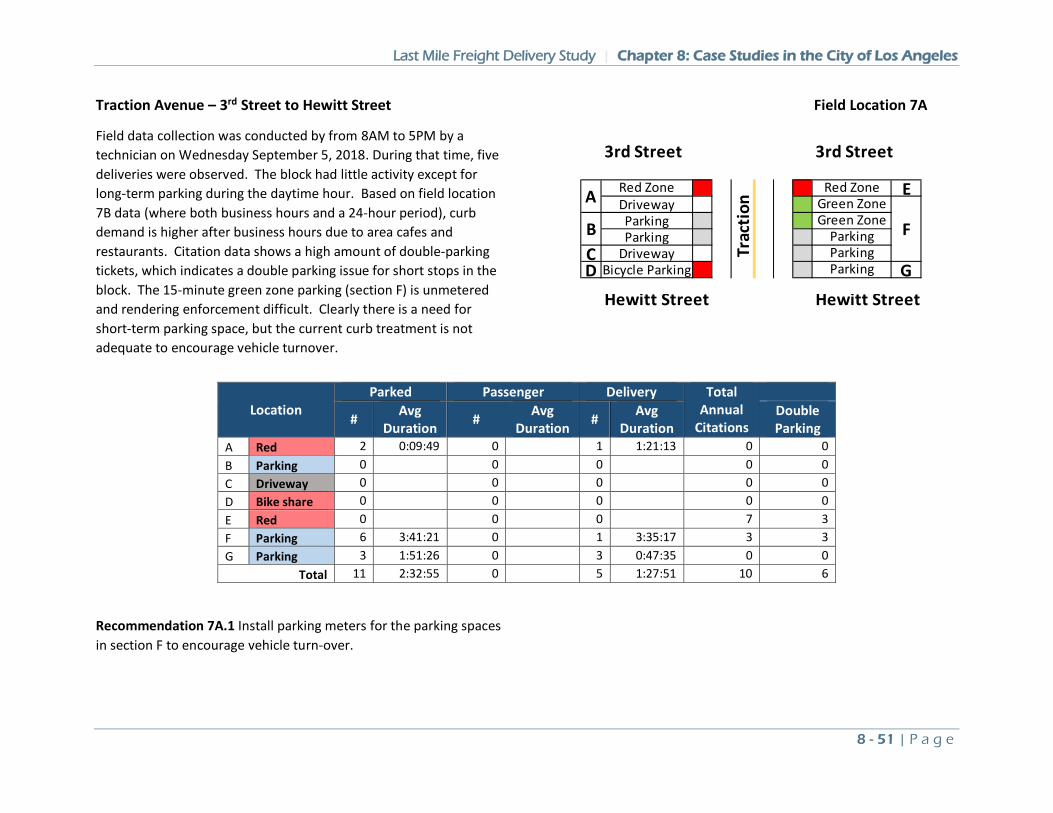
Last Mile Freight Delivery Study | Chapter 8: Case Studies in the City of Los Angeles
8 - 51 | P a g e
Traction Avenue – 3rd Street to Hewitt Street Field Location 7A
Field data collection was conducted by from 8AM to 5PM by a technician on Wednesday September 5, 2018. During that time, five deliveries were observed. The block had little activity except for long-term parking during the daytime hour. Based on field location 7B data (where both business hours and a 24-hour period), curb demand is higher after business hours due to area cafes and restaurants. Citation data shows a high amount of double-parking tickets, which indicates a double parking issue for short stops in the block. The 15-minute green zone parking (section F) is unmetered and rendering enforcement difficult. Clearly there is a need for short-term parking space, but the current curb treatment is not adequate to encourage vehicle turnover.
Recommendation 7A.1 Install parking meters for the parking spaces in section F to encourage vehicle turn-over.
Location Parked Passenger Delivery Total
Annual Citations
# Avg Duration # Avg
Duration # Avg Duration
Double Parking
A Red 2 0:09:49 0 1 1:21:13 0 0 B Parking 0 0 0 0 0 C Driveway 0 0 0 0 0 D Bike share 0 0 0 0 0 E Red 0 0 0 7 3 F Parking 6 3:41:21 0 1 3:35:17 3 3 G Parking 3 1:51:26 0 3 0:47:35 0 0
Total 11 2:32:55 0 5 1:27:51 10 6
3rd Street 3rd Street
Red Zone Red Zone EDriveway Green ZoneParking Green ZoneParking Parking
C Driveway ParkingD Bicycle Parking Parking G
Hewitt Street Hewitt Street
FB
A
Trac
tion
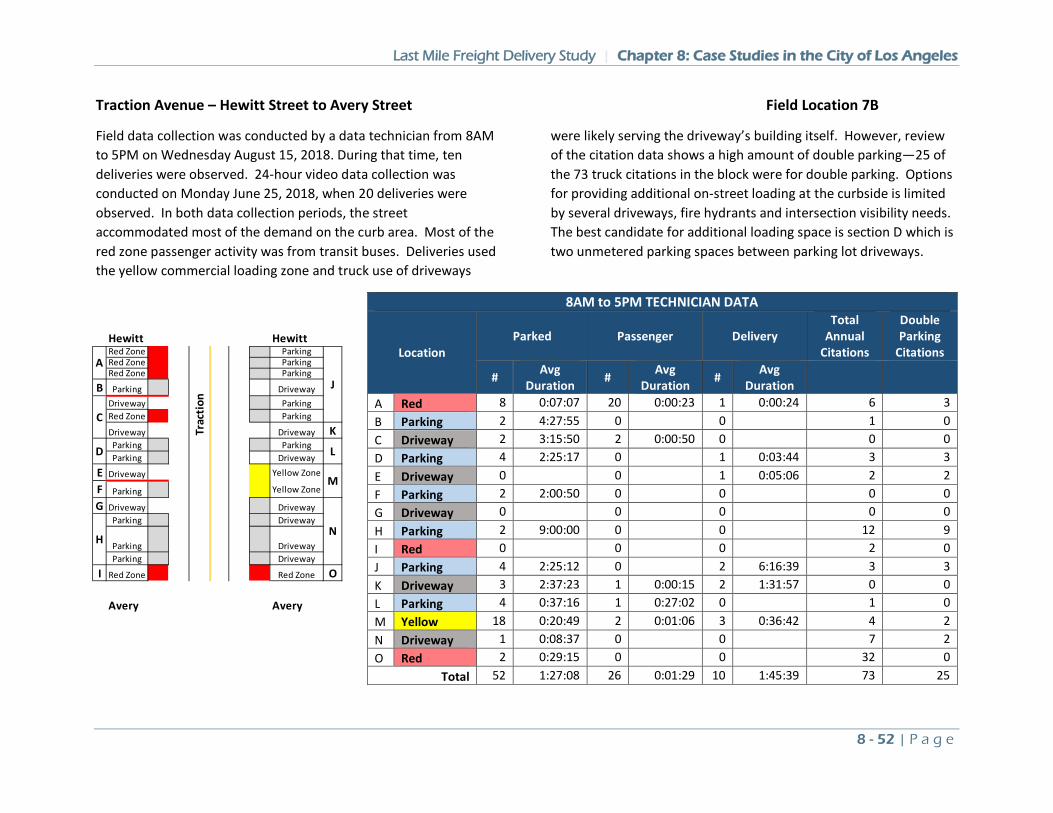
Last Mile Freight Delivery Study | Chapter 8: Case Studies in the City of Los Angeles
8 - 52 | P a g e
Traction Avenue – Hewitt Street to Avery Street Field Location 7B
Field data collection was conducted by a data technician from 8AM to 5PM on Wednesday August 15, 2018. During that time, ten deliveries were observed. 24-hour video data collection was conducted on Monday June 25, 2018, when 20 deliveries were observed. In both data collection periods, the street accommodated most of the demand on the curb area. Most of the red zone passenger activity was from transit buses. Deliveries used the yellow commercial loading zone and truck use of driveways
were likely serving the driveway’s building itself. However, review of the citation data shows a high amount of double parking—25 of the 73 truck citations in the block were for double parking. Options for providing additional on-street loading at the curbside is limited by several driveways, fire hydrants and intersection visibility needs. The best candidate for additional loading space is section D which is two unmetered parking spaces between parking lot driveways.
8AM to 5PM TECHNICIAN DATA
Location Parked Passenger Delivery
Total Annual
Citations
Double Parking
Citations
# Avg Duration # Avg
Duration # Avg Duration
A Red 8 0:07:07 20 0:00:23 1 0:00:24 6 3 B Parking 2 4:27:55 0 0 1 0 C Driveway 2 3:15:50 2 0:00:50 0 0 0 D Parking 4 2:25:17 0 1 0:03:44 3 3 E Driveway 0 0 1 0:05:06 2 2 F Parking 2 2:00:50 0 0 0 0 G Driveway 0 0 0 0 0 H Parking 2 9:00:00 0 0 12 9 I Red 0 0 0 2 0 J Parking 4 2:25:12 0 2 6:16:39 3 3 K Driveway 3 2:37:23 1 0:00:15 2 1:31:57 0 0 L Parking 4 0:37:16 1 0:27:02 0 1 0 M Yellow 18 0:20:49 2 0:01:06 3 0:36:42 4 2 N Driveway 1 0:08:37 0 0 7 2 O Red 2 0:29:15 0 0 32 0
Total 52 1:27:08 26 0:01:29 10 1:45:39 73 25
Hewitt HewittRed Zone ParkingRed Zone ParkingRed Zone Parking
B Parking DrivewayDriveway ParkingRed Zone Parking
Driveway Driveway KParking ParkingParking Driveway
E Driveway Yellow Zone
F Parking Yellow Zone
G Driveway DrivewayParking Driveway
Parking DrivewayParking Driveway
I Red Zone Red Zone O
Avery Avery
M
NH
A
J
C
D L
Trac
tion
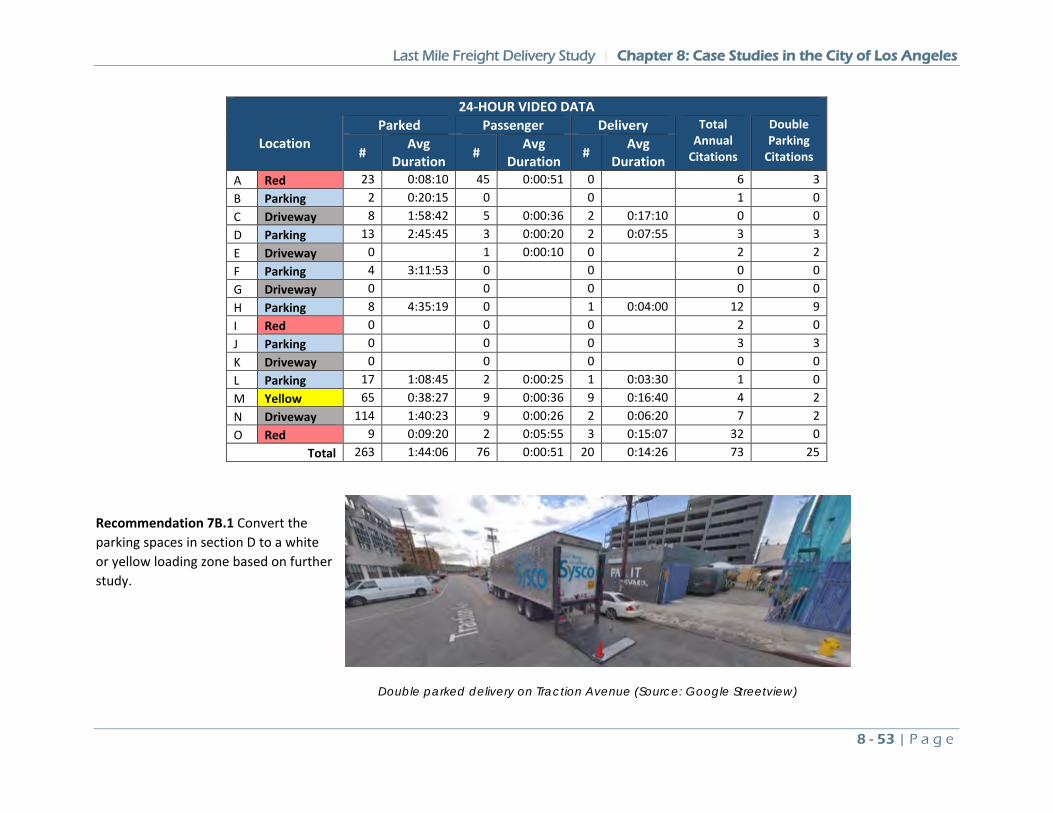
Last Mile Freight Delivery Study | Chapter 8: Case Studies in the City of Los Angeles
8 - 53 | P a g e
Recommendation 7B.1 Convert the parking spaces in section D to a white or yellow loading zone based on further study.
24-HOUR VIDEO DATA
Location Parked Passenger Delivery Total
Annual Citations
Double Parking
Citations # Avg Duration # Avg
Duration # Avg Duration
A Red 23 0:08:10 45 0:00:51 0 6 3 B Parking 2 0:20:15 0 0 1 0 C Driveway 8 1:58:42 5 0:00:36 2 0:17:10 0 0 D Parking 13 2:45:45 3 0:00:20 2 0:07:55 3 3 E Driveway 0 1 0:00:10 0 2 2 F Parking 4 3:11:53 0 0 0 0 G Driveway 0 0 0 0 0 H Parking 8 4:35:19 0 1 0:04:00 12 9 I Red 0 0 0 2 0 J Parking 0 0 0 3 3 K Driveway 0 0 0 0 0 L Parking 17 1:08:45 2 0:00:25 1 0:03:30 1 0 M Yellow 65 0:38:27 9 0:00:36 9 0:16:40 4 2 N Driveway 114 1:40:23 9 0:00:26 2 0:06:20 7 2 O Red 9 0:09:20 2 0:05:55 3 0:15:07 32 0
Total 263 1:44:06 76 0:00:51 20 0:14:26 73 25
Double parked delivery on Traction Avenue (Source: Google Streetview)
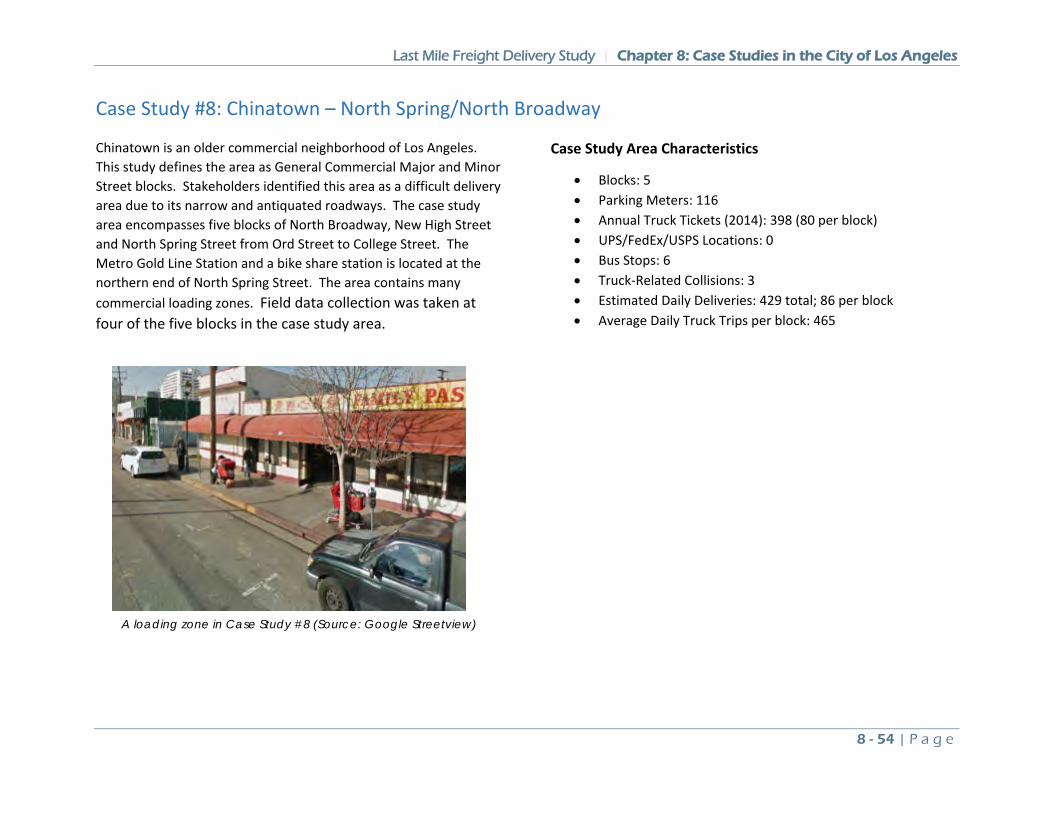
Last Mile Freight Delivery Study | Chapter 8: Case Studies in the City of Los Angeles
8 - 54 | P a g e
Case Study #8: Chinatown – North Spring/North Broadway
Chinatown is an older commercial neighborhood of Los Angeles. This study defines the area as General Commercial Major and Minor Street blocks. Stakeholders identified this area as a difficult delivery area due to its narrow and antiquated roadways. The case study area encompasses five blocks of North Broadway, New High Street and North Spring Street from Ord Street to College Street. The Metro Gold Line Station and a bike share station is located at the northern end of North Spring Street. The area contains many commercial loading zones. Field data collection was taken at four of the five blocks in the case study area.
Case Study Area Characteristics
• Blocks: 5 • Parking Meters: 116 • Annual Truck Tickets (2014): 398 (80 per block) • UPS/FedEx/USPS Locations: 0 • Bus Stops: 6 • Truck-Related Collisions: 3 • Estimated Daily Deliveries: 429 total; 86 per block • Average Daily Truck Trips per block: 465
A loading zone in Case Study #8 (Source: Google Streetview)
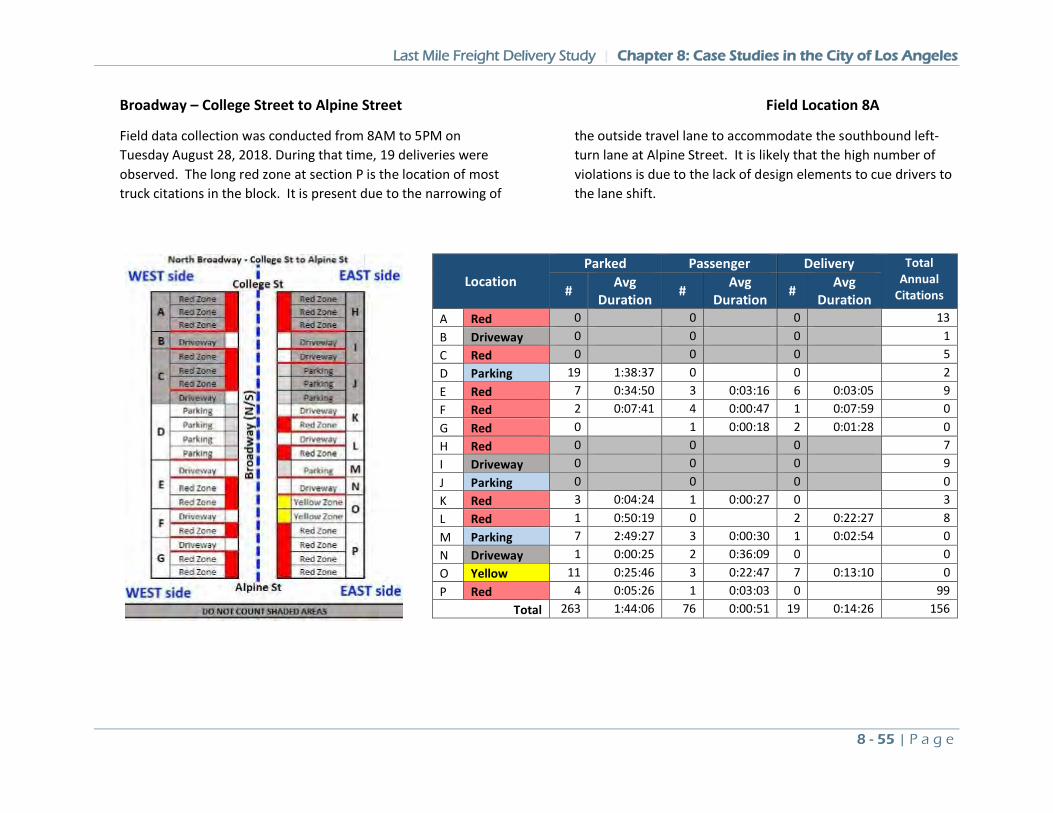
Last Mile Freight Delivery Study | Chapter 8: Case Studies in the City of Los Angeles
8 - 55 | P a g e
Broadway – College Street to Alpine Street Field Location 8A
Field data collection was conducted from 8AM to 5PM on Tuesday August 28, 2018. During that time, 19 deliveries were observed. The long red zone at section P is the location of most truck citations in the block. It is present due to the narrowing of
the outside travel lane to accommodate the southbound left-turn lane at Alpine Street. It is likely that the high number of violations is due to the lack of design elements to cue drivers to the lane shift.
Location Parked Passenger Delivery Total
Annual Citations # Avg
Duration # Avg Duration # Avg
Duration A Red 0 0 0 13 B Driveway 0 0 0 1 C Red 0 0 0 5 D Parking 19 1:38:37 0 0 2 E Red 7 0:34:50 3 0:03:16 6 0:03:05 9 F Red 2 0:07:41 4 0:00:47 1 0:07:59 0 G Red 0 1 0:00:18 2 0:01:28 0 H Red 0 0 0 7 I Driveway 0 0 0 9 J Parking 0 0 0 0 K Red 3 0:04:24 1 0:00:27 0 3 L Red 1 0:50:19 0 2 0:22:27 8 M Parking 7 2:49:27 3 0:00:30 1 0:02:54 0 N Driveway 1 0:00:25 2 0:36:09 0 0 O Yellow 11 0:25:46 3 0:22:47 7 0:13:10 0 P Red 4 0:05:26 1 0:03:03 0 99
Total 263 1:44:06 76 0:00:51 19 0:14:26 156
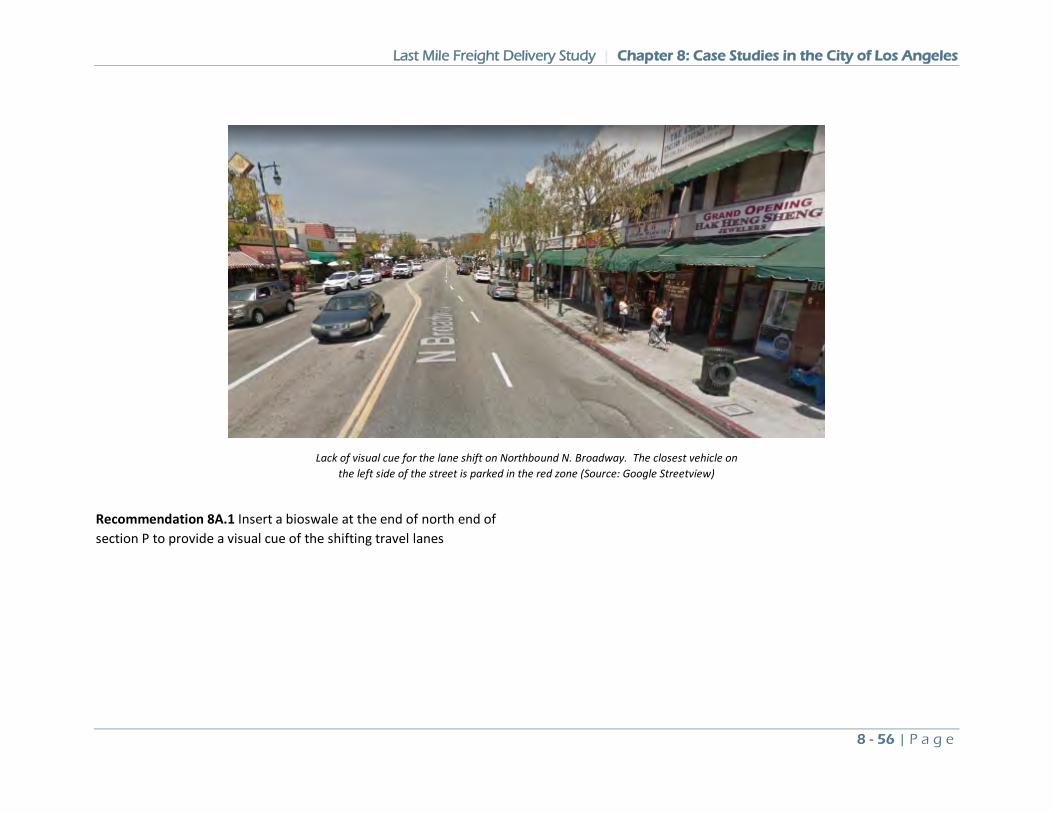
Last Mile Freight Delivery Study | Chapter 8: Case Studies in the City of Los Angeles
8 - 56 | P a g e
Lack of visual cue for the lane shift on Northbound N. Broadway. The closest vehicle on the left side of the street is parked in the red zone (Source: Google Streetview)
Recommendation 8A.1 Insert a bioswale at the end of north end of section P to provide a visual cue of the shifting travel lanes
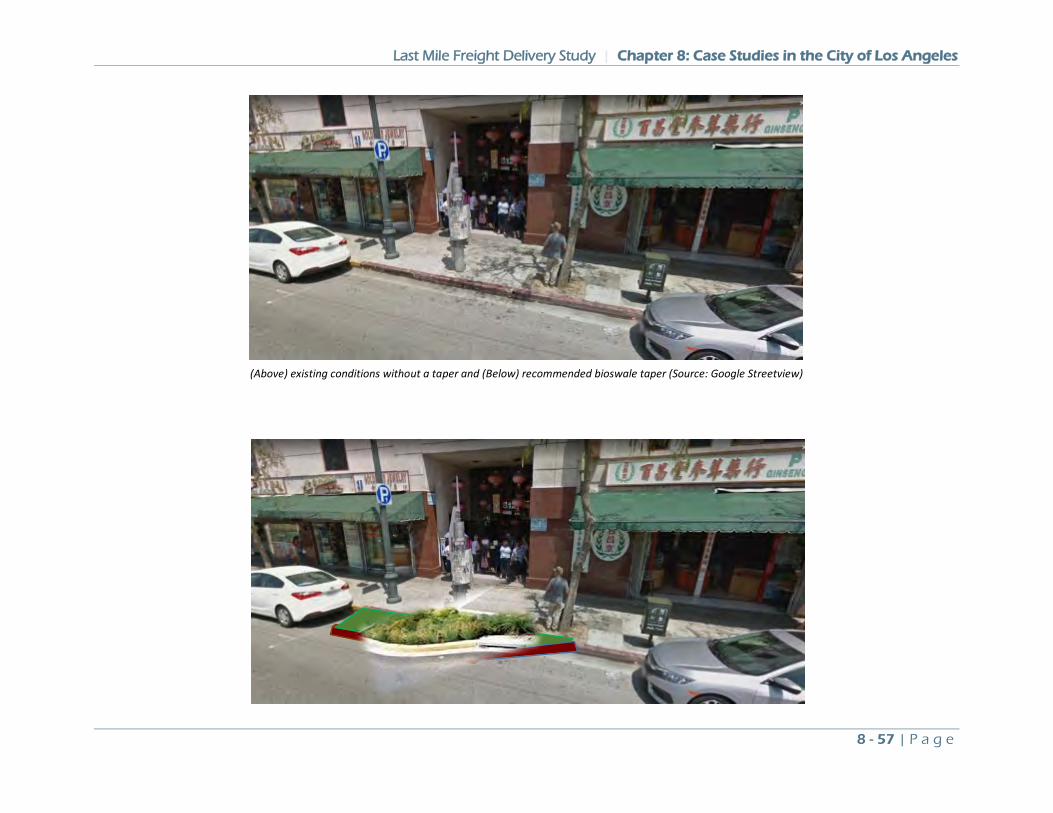
Last Mile Freight Delivery Study | Chapter 8: Case Studies in the City of Los Angeles
8 - 57 | P a g e
(Above) existing conditions without a taper and (Below) recommended bioswale taper (Source: Google Streetview)
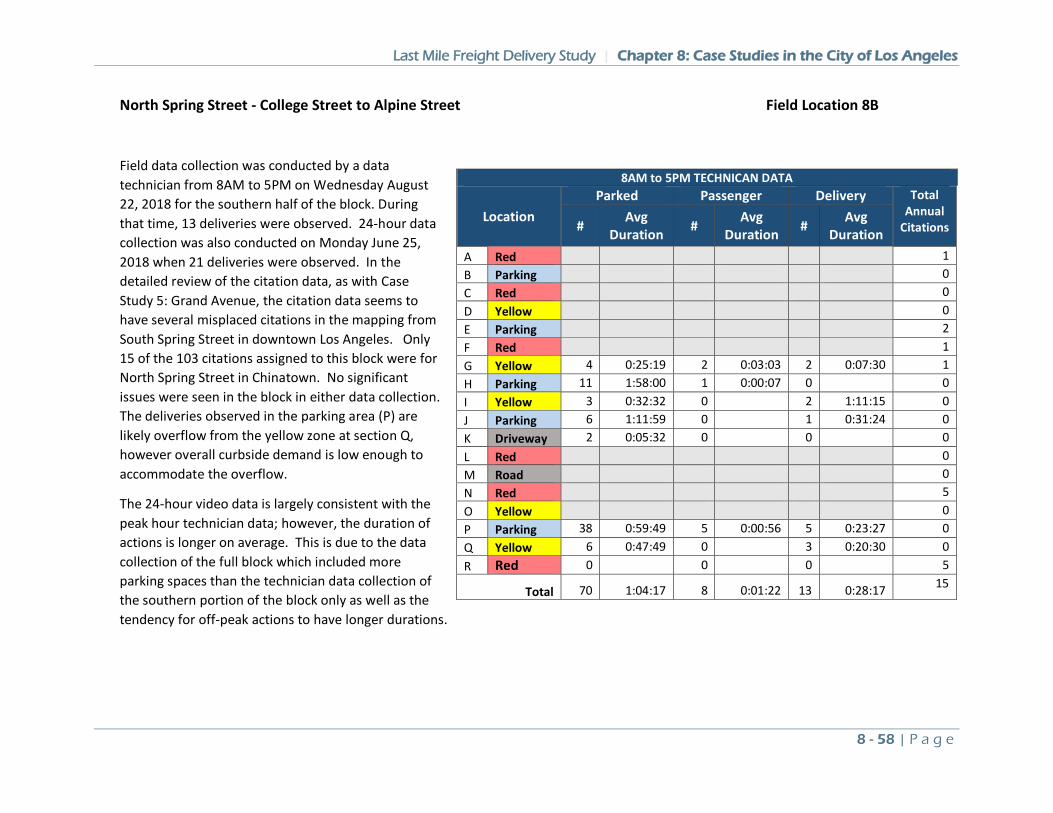
Last Mile Freight Delivery Study | Chapter 8: Case Studies in the City of Los Angeles
8 - 58 | P a g e
North Spring Street - College Street to Alpine Street Field Location 8B
Field data collection was conducted by a data technician from 8AM to 5PM on Wednesday August 22, 2018 for the southern half of the block. During that time, 13 deliveries were observed. 24-hour data collection was also conducted on Monday June 25, 2018 when 21 deliveries were observed. In the detailed review of the citation data, as with Case Study 5: Grand Avenue, the citation data seems to have several misplaced citations in the mapping from South Spring Street in downtown Los Angeles. Only 15 of the 103 citations assigned to this block were for North Spring Street in Chinatown. No significant issues were seen in the block in either data collection. The deliveries observed in the parking area (P) are likely overflow from the yellow zone at section Q, however overall curbside demand is low enough to accommodate the overflow.
The 24-hour video data is largely consistent with the peak hour technician data; however, the duration of actions is longer on average. This is due to the data collection of the full block which included more parking spaces than the technician data collection of the southern portion of the block only as well as the tendency for off-peak actions to have longer durations.
8AM to 5PM TECHNICAN DATA
Location Parked Passenger Delivery Total
Annual Citations # Avg
Duration # Avg Duration # Avg
Duration A Red 1 B Parking 0 C Red 0 D Yellow 0 E Parking 2 F Red 1 G Yellow 4 0:25:19 2 0:03:03 2 0:07:30 1 H Parking 11 1:58:00 1 0:00:07 0 0 I Yellow 3 0:32:32 0 2 1:11:15 0 J Parking 6 1:11:59 0 1 0:31:24 0 K Driveway 2 0:05:32 0 0 0 L Red 0 M Road 0 N Red 5 O Yellow 0 P Parking 38 0:59:49 5 0:00:56 5 0:23:27 0 Q Yellow 6 0:47:49 0 3 0:20:30 0 R Red 0 0 0 5
Total 70 1:04:17 8 0:01:22 13 0:28:17 15
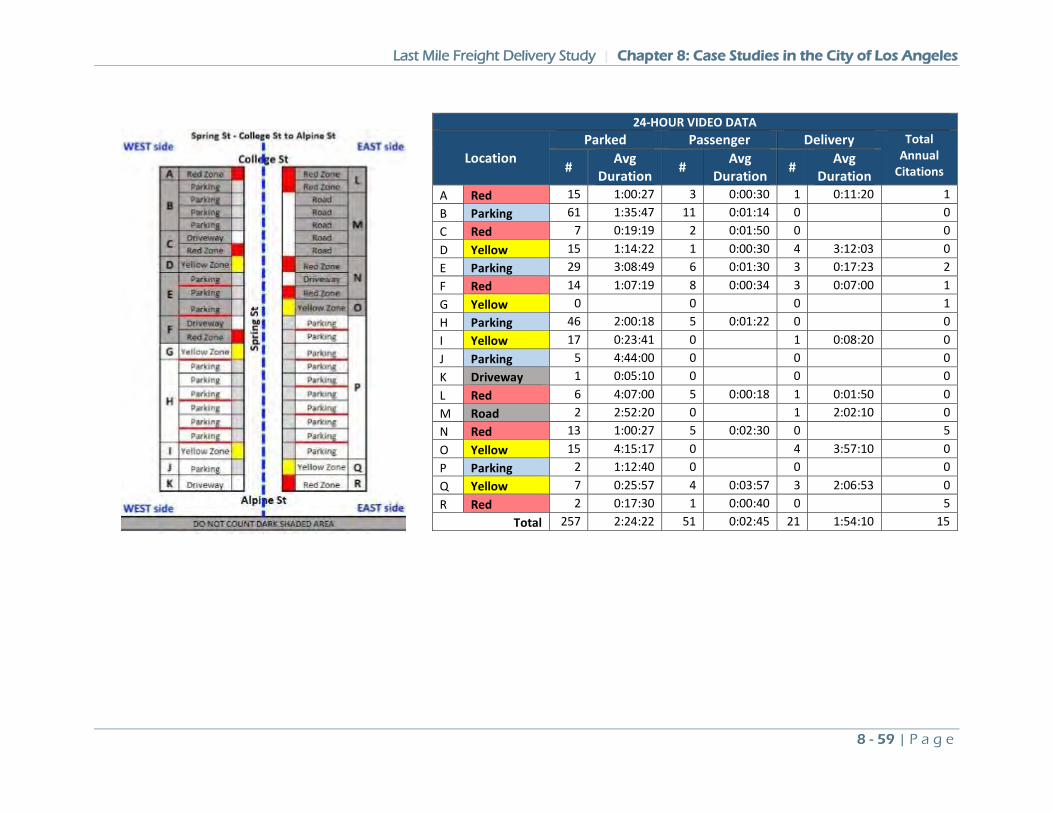
Last Mile Freight Delivery Study | Chapter 8: Case Studies in the City of Los Angeles
8 - 59 | P a g e
24-HOUR VIDEO DATA
Location Parked Passenger Delivery Total
Annual Citations # Avg
Duration # Avg Duration # Avg
Duration A Red 15 1:00:27 3 0:00:30 1 0:11:20 1 B Parking 61 1:35:47 11 0:01:14 0 0 C Red 7 0:19:19 2 0:01:50 0 0 D Yellow 15 1:14:22 1 0:00:30 4 3:12:03 0 E Parking 29 3:08:49 6 0:01:30 3 0:17:23 2 F Red 14 1:07:19 8 0:00:34 3 0:07:00 1 G Yellow 0 0 0 1 H Parking 46 2:00:18 5 0:01:22 0 0 I Yellow 17 0:23:41 0 1 0:08:20 0 J Parking 5 4:44:00 0 0 0 K Driveway 1 0:05:10 0 0 0 L Red 6 4:07:00 5 0:00:18 1 0:01:50 0 M Road 2 2:52:20 0 1 2:02:10 0 N Red 13 1:00:27 5 0:02:30 0 5 O Yellow 15 4:15:17 0 4 3:57:10 0 P Parking 2 1:12:40 0 0 0 Q Yellow 7 0:25:57 4 0:03:57 3 2:06:53 0 R Red 2 0:17:30 1 0:00:40 0 5
Total 257 2:24:22 51 0:02:45 21 1:54:10 15
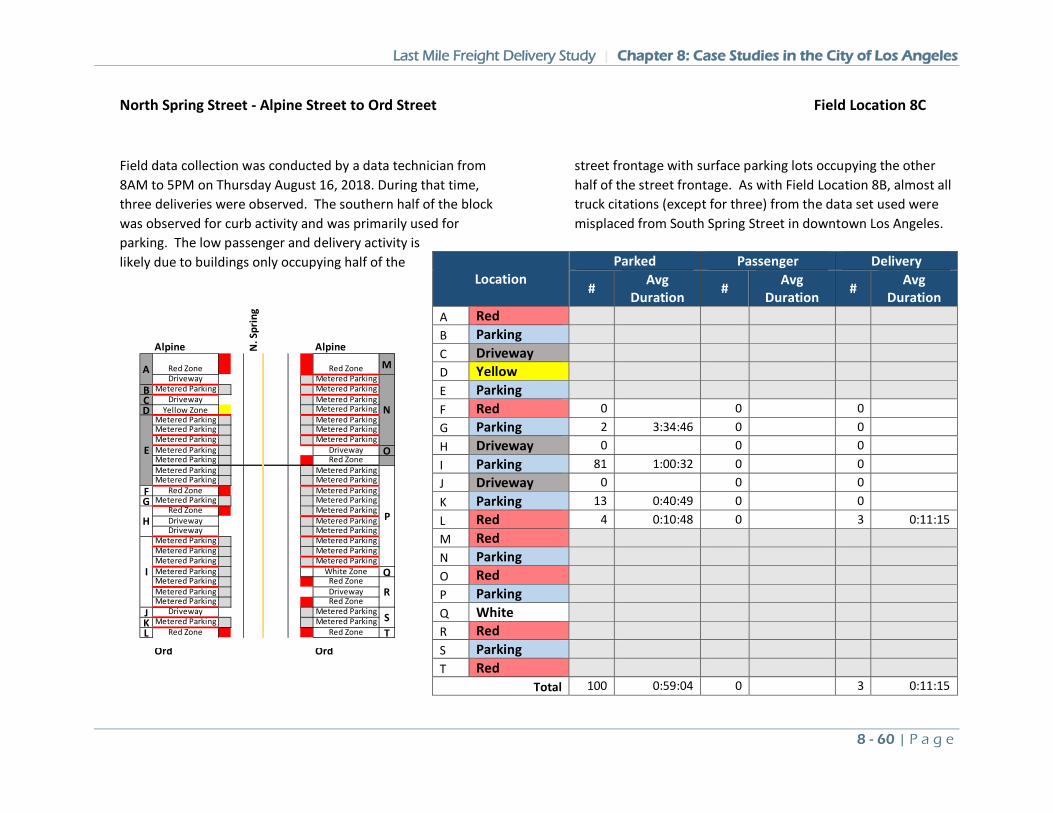
Last Mile Freight Delivery Study | Chapter 8: Case Studies in the City of Los Angeles
8 - 60 | P a g e
North Spring Street - Alpine Street to Ord Street Field Location 8C
Field data collection was conducted by a data technician from 8AM to 5PM on Thursday August 16, 2018. During that time, three deliveries were observed. The southern half of the block was observed for curb activity and was primarily used for parking. The low passenger and delivery activity is likely due to buildings only occupying half of the
street frontage with surface parking lots occupying the other half of the street frontage. As with Field Location 8B, almost all truck citations (except for three) from the data set used were misplaced from South Spring Street in downtown Los Angeles.
Location Parked Passenger Delivery
# Avg Duration # Avg
Duration # Avg Duration
A Red B Parking C Driveway D Yellow E Parking F Red 0 0 0 G Parking 2 3:34:46 0 0 H Driveway 0 0 0 I Parking 81 1:00:32 0 0 J Driveway 0 0 0 K Parking 13 0:40:49 0 0 L Red 4 0:10:48 0 3 0:11:15 M Red N Parking O Red P Parking Q White R Red S Parking T Red
Total 100 0:59:04 0 3 0:11:15
Alpine N. S
prin
g
Alpine
Red Zone Red Zone MDriveway Metered Parking
B Metered Parking Metered ParkingC Driveway Metered ParkingD Yellow Zone Metered Parking
Metered Parking Metered ParkingMetered Parking Metered ParkingMetered Parking Metered ParkingMetered Parking Driveway OMetered Parking Red ZoneMetered Parking Metered ParkingMetered Parking Metered Parking
F Red Zone Metered ParkingG Metered Parking Metered Parking
Red Zone Metered ParkingDriveway Metered ParkingDriveway Metered Parking
Metered Parking Metered ParkingMetered Parking Metered ParkingMetered Parking Metered ParkingMetered Parking White Zone QMetered Parking Red ZoneMetered Parking DrivewayMetered Parking Red Zone
J Driveway Metered ParkingK Metered Parking Metered ParkingL Red Zone Red Zone T
Ord Ord
N
P
S
R
I
H
A
E
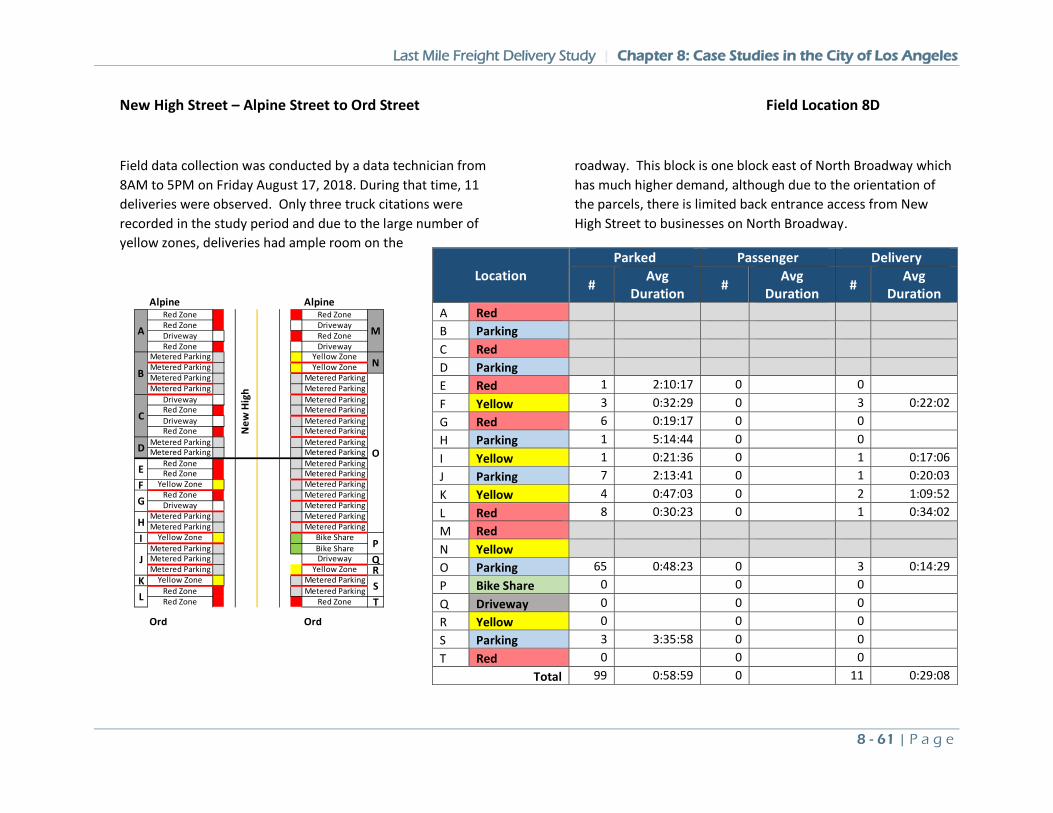
Last Mile Freight Delivery Study | Chapter 8: Case Studies in the City of Los Angeles
8 - 61 | P a g e
New High Street – Alpine Street to Ord Street Field Location 8D
Field data collection was conducted by a data technician from 8AM to 5PM on Friday August 17, 2018. During that time, 11 deliveries were observed. Only three truck citations were recorded in the study period and due to the large number of yellow zones, deliveries had ample room on the
roadway. This block is one block east of North Broadway which has much higher demand, although due to the orientation of the parcels, there is limited back entrance access from New High Street to businesses on North Broadway.
Location Parked Passenger Delivery
# Avg Duration # Avg
Duration # Avg Duration
A Red B Parking C Red D Parking E Red 1 2:10:17 0 0 F Yellow 3 0:32:29 0 3 0:22:02 G Red 6 0:19:17 0 0 H Parking 1 5:14:44 0 0 I Yellow 1 0:21:36 0 1 0:17:06 J Parking 7 2:13:41 0 1 0:20:03 K Yellow 4 0:47:03 0 2 1:09:52 L Red 8 0:30:23 0 1 0:34:02 M Red N Yellow O Parking 65 0:48:23 0 3 0:14:29 P Bike Share 0 0 0 Q Driveway 0 0 0 R Yellow 0 0 0 S Parking 3 3:35:58 0 0 T Red 0 0 0
Total 99 0:58:59 0 11 0:29:08
Alpine AlpineRed Zone Red ZoneRed Zone DrivewayDriveway Red ZoneRed Zone Driveway
Metered Parking Yellow ZoneMetered Parking Yellow ZoneMetered Parking Metered ParkingMetered Parking Metered Parking
Driveway Metered ParkingRed Zone Metered ParkingDriveway Metered ParkingRed Zone Metered Parking
Metered Parking Metered ParkingMetered Parking Metered Parking
Red Zone Metered ParkingRed Zone Metered Parking
F Yellow Zone Metered ParkingRed Zone Metered ParkingDriveway Metered Parking
Metered Parking Metered ParkingMetered Parking Metered Parking
I Yellow Zone Bike ShareMetered Parking Bike ShareMetered Parking Driveway QMetered Parking Yellow Zone R
K Yellow Zone Metered ParkingRed Zone Metered ParkingRed Zone Red Zone T
Ord Ord
PJ
SL
A M
BN
O
C
D
E
G
H
New
Hig
h
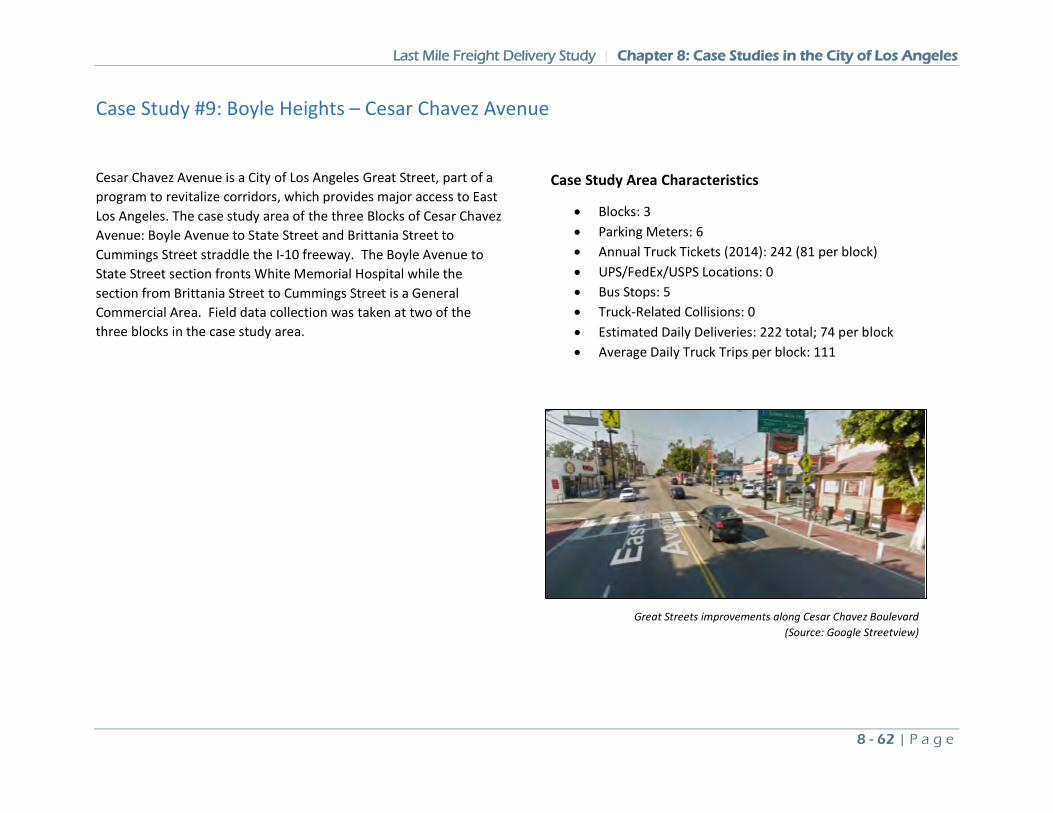
Last Mile Freight Delivery Study | Chapter 8: Case Studies in the City of Los Angeles
8 - 62 | P a g e
Case Study #9: Boyle Heights – Cesar Chavez Avenue
Cesar Chavez Avenue is a City of Los Angeles Great Street, part of a program to revitalize corridors, which provides major access to East Los Angeles. The case study area of the three Blocks of Cesar Chavez Avenue: Boyle Avenue to State Street and Brittania Street to Cummings Street straddle the I-10 freeway. The Boyle Avenue to State Street section fronts White Memorial Hospital while the section from Brittania Street to Cummings Street is a General Commercial Area. Field data collection was taken at two of the three blocks in the case study area.
Case Study Area Characteristics
• Blocks: 3 • Parking Meters: 6 • Annual Truck Tickets (2014): 242 (81 per block) • UPS/FedEx/USPS Locations: 0 • Bus Stops: 5 • Truck-Related Collisions: 0 • Estimated Daily Deliveries: 222 total; 74 per block • Average Daily Truck Trips per block: 111
Great Streets improvements along Cesar Chavez Boulevard (Source: Google Streetview)
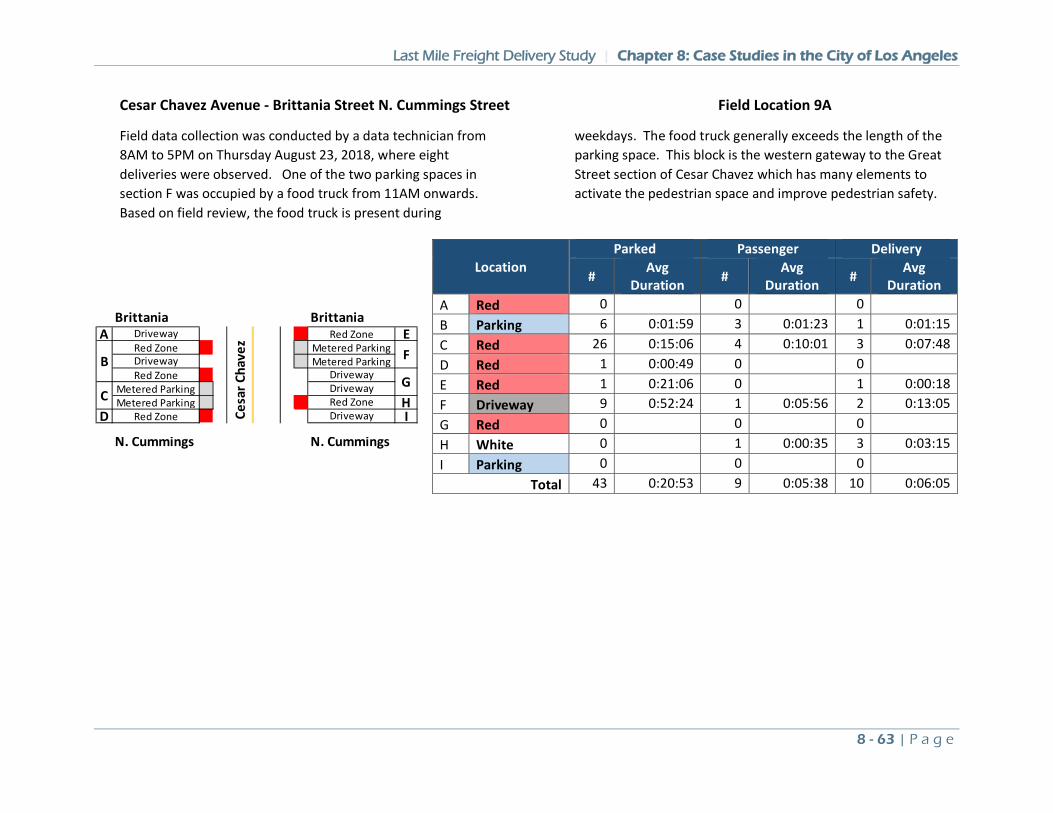
Last Mile Freight Delivery Study | Chapter 8: Case Studies in the City of Los Angeles
8 - 63 | P a g e
Cesar Chavez Avenue - Brittania Street N. Cummings Street Field Location 9A
Field data collection was conducted by a data technician from 8AM to 5PM on Thursday August 23, 2018, where eight deliveries were observed. One of the two parking spaces in section F was occupied by a food truck from 11AM onwards. Based on field review, the food truck is present during
weekdays. The food truck generally exceeds the length of the parking space. This block is the western gateway to the Great Street section of Cesar Chavez which has many elements to activate the pedestrian space and improve pedestrian safety.
Location Parked Passenger Delivery
# Avg Duration # Avg
Duration # Avg Duration
A Red 0 0 0 B Parking 6 0:01:59 3 0:01:23 1 0:01:15 C Red 26 0:15:06 4 0:10:01 3 0:07:48 D Red 1 0:00:49 0 0 E Red 1 0:21:06 0 1 0:00:18 F Driveway 9 0:52:24 1 0:05:56 2 0:13:05 G Red 0 0 0 H White 0 1 0:00:35 3 0:03:15 I Parking 0 0 0
Total 43 0:20:53 9 0:05:38 10 0:06:05
Brittania BrittaniaA Driveway Red Zone E
Red Zone Metered ParkingDriveway Metered ParkingRed Zone Driveway
Metered Parking DrivewayMetered Parking Red Zone H
D Red Zone Driveway I
N. Cummings N. Cummings
B F
GC
Cesa
r Cha
vez
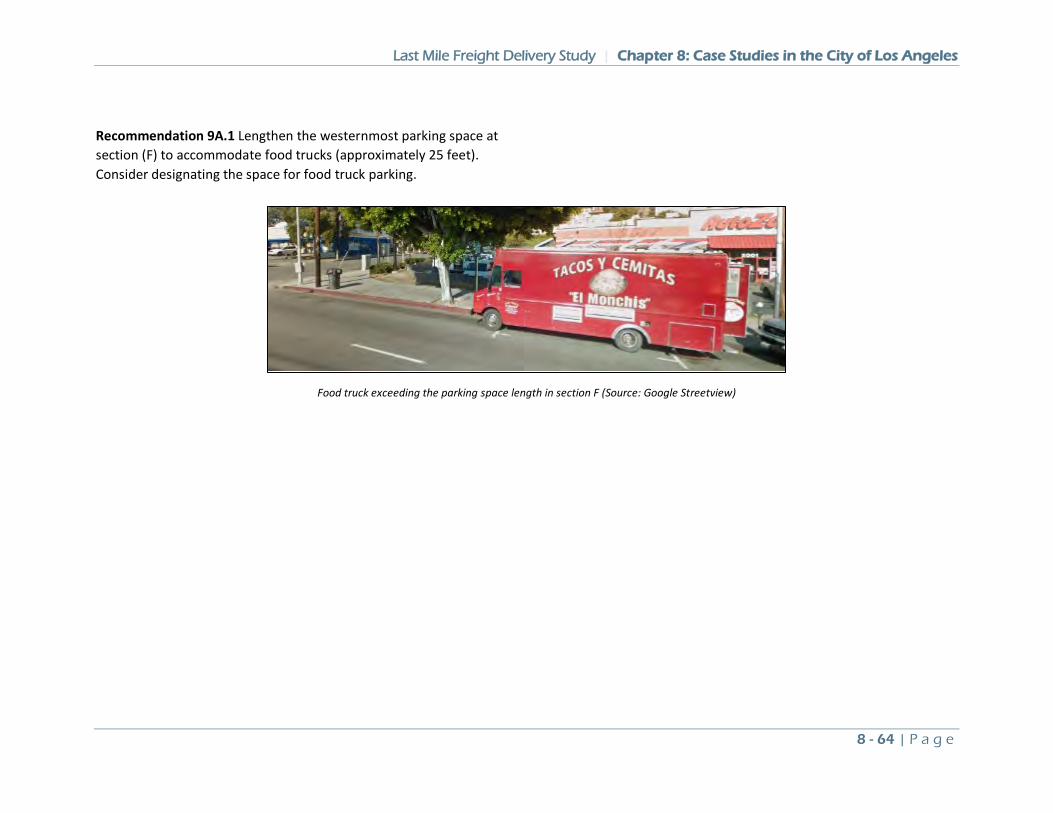
Last Mile Freight Delivery Study | Chapter 8: Case Studies in the City of Los Angeles
8 - 64 | P a g e
Recommendation 9A.1 Lengthen the westernmost parking space at section (F) to accommodate food trucks (approximately 25 feet). Consider designating the space for food truck parking.
Food truck exceeding the parking space length in section F (Source: Google Streetview)
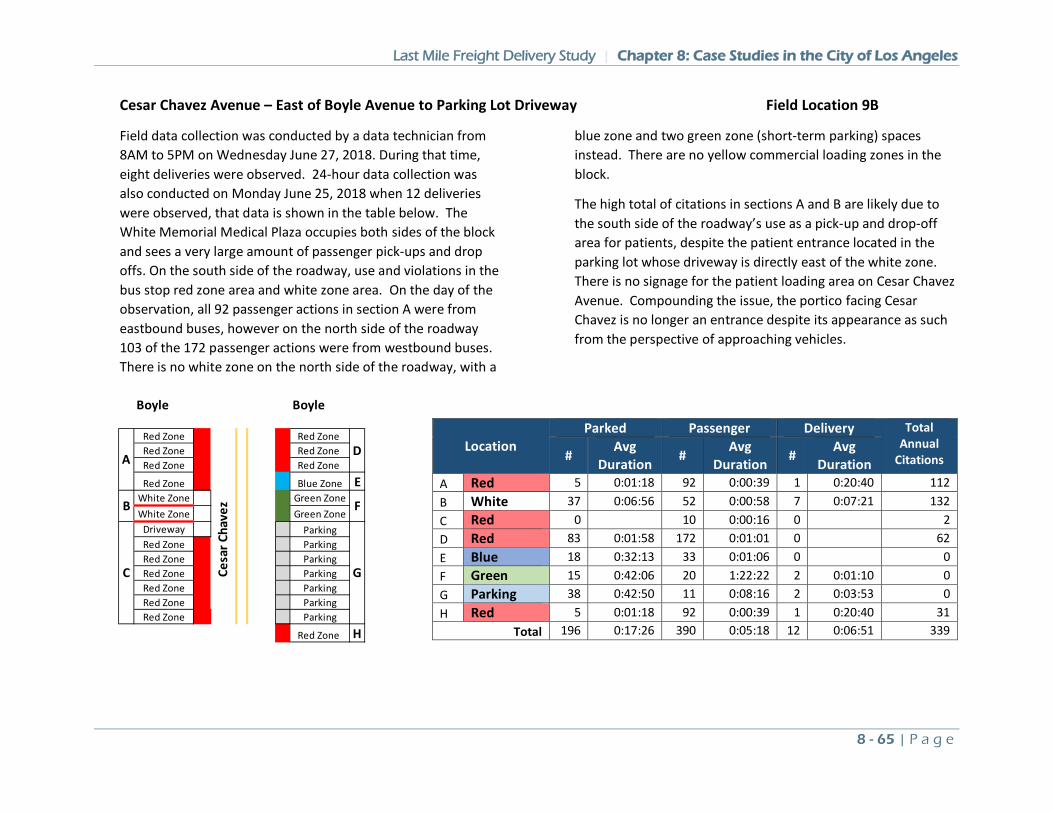
Last Mile Freight Delivery Study | Chapter 8: Case Studies in the City of Los Angeles
8 - 65 | P a g e
Cesar Chavez Avenue – East of Boyle Avenue to Parking Lot Driveway Field Location 9B
Field data collection was conducted by a data technician from 8AM to 5PM on Wednesday June 27, 2018. During that time, eight deliveries were observed. 24-hour data collection was also conducted on Monday June 25, 2018 when 12 deliveries were observed, that data is shown in the table below. The White Memorial Medical Plaza occupies both sides of the block and sees a very large amount of passenger pick-ups and drop offs. On the south side of the roadway, use and violations in the bus stop red zone area and white zone area. On the day of the observation, all 92 passenger actions in section A were from eastbound buses, however on the north side of the roadway 103 of the 172 passenger actions were from westbound buses. There is no white zone on the north side of the roadway, with a
blue zone and two green zone (short-term parking) spaces instead. There are no yellow commercial loading zones in the block.
The high total of citations in sections A and B are likely due to the south side of the roadway’s use as a pick-up and drop-off area for patients, despite the patient entrance located in the parking lot whose driveway is directly east of the white zone. There is no signage for the patient loading area on Cesar Chavez Avenue. Compounding the issue, the portico facing Cesar Chavez is no longer an entrance despite its appearance as such from the perspective of approaching vehicles.
Location Parked Passenger Delivery Total
Annual Citations # Avg
Duration # Avg Duration # Avg
Duration A Red 5 0:01:18 92 0:00:39 1 0:20:40 112 B White 37 0:06:56 52 0:00:58 7 0:07:21 132 C Red 0 10 0:00:16 0 2 D Red 83 0:01:58 172 0:01:01 0 62 E Blue 18 0:32:13 33 0:01:06 0 0 F Green 15 0:42:06 20 1:22:22 2 0:01:10 0 G Parking 38 0:42:50 11 0:08:16 2 0:03:53 0 H Red 5 0:01:18 92 0:00:39 1 0:20:40 31
Total 196 0:17:26 390 0:05:18 12 0:06:51 339
Boyle Boyle
Red Zone Red Zone Red Zone Red Zone Red Zone Red Zone
Red Zone Blue Zone EWhite Zone Green ZoneWhite Zone Green Zone
Driveway ParkingRed Zone ParkingRed Zone ParkingRed Zone ParkingRed Zone ParkingRed Zone ParkingRed Zone Parking
Red Zone H
A D
B F
C GCesa
r Cha
vez
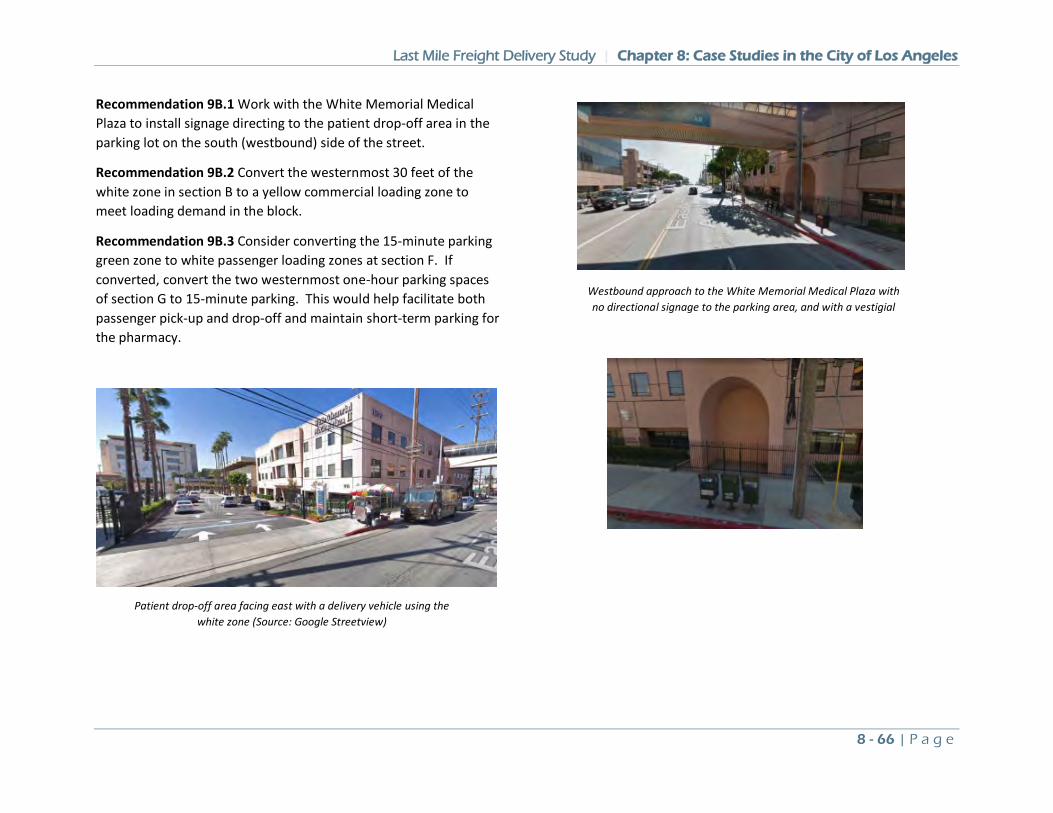
Last Mile Freight Delivery Study | Chapter 8: Case Studies in the City of Los Angeles
8 - 66 | P a g e
Recommendation 9B.1 Work with the White Memorial Medical Plaza to install signage directing to the patient drop-off area in the parking lot on the south (westbound) side of the street.
Recommendation 9B.2 Convert the westernmost 30 feet of the white zone in section B to a yellow commercial loading zone to meet loading demand in the block.
Recommendation 9B.3 Consider converting the 15-minute parking green zone to white passenger loading zones at section F. If converted, convert the two westernmost one-hour parking spaces of section G to 15-minute parking. This would help facilitate both passenger pick-up and drop-off and maintain short-term parking for the pharmacy.
Westbound approach to the White Memorial Medical Plaza with no directional signage to the parking area, and with a vestigial
Patient drop-off area facing east with a delivery vehicle using the white zone (Source: Google Streetview)
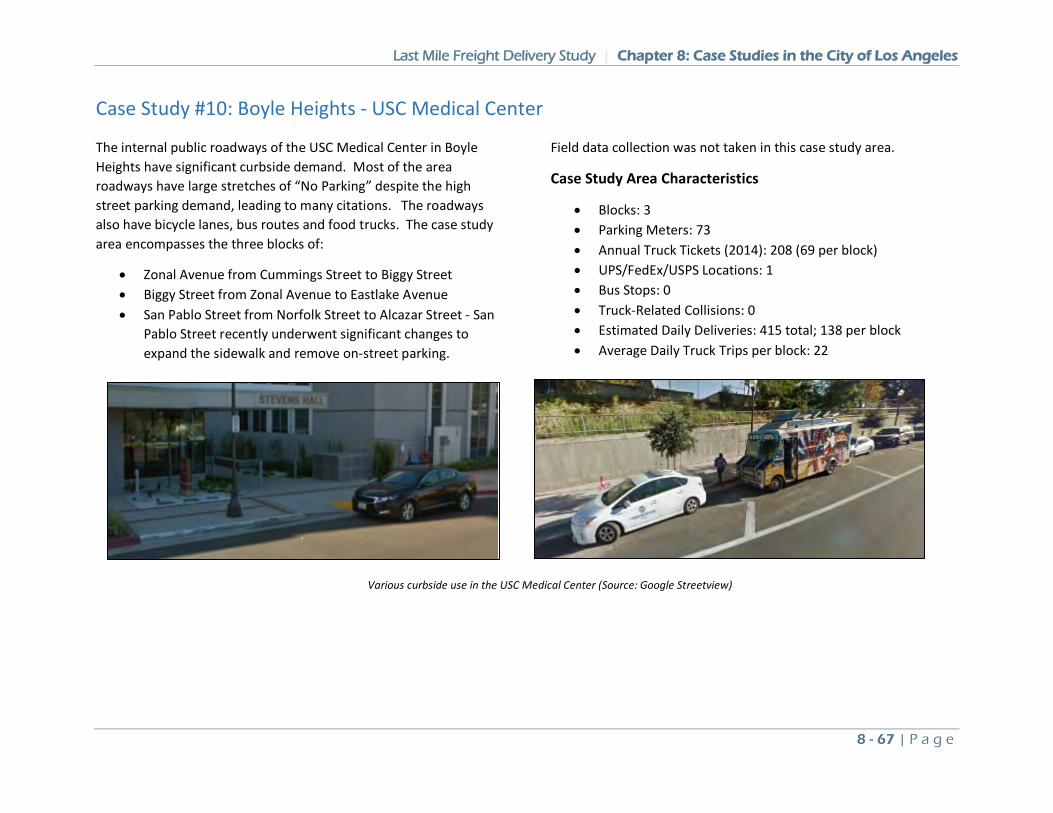
Last Mile Freight Delivery Study | Chapter 8: Case Studies in the City of Los Angeles
8 - 67 | P a g e
Case Study #10: Boyle Heights - USC Medical Center
The internal public roadways of the USC Medical Center in Boyle Heights have significant curbside demand. Most of the area roadways have large stretches of “No Parking” despite the high street parking demand, leading to many citations. The roadways also have bicycle lanes, bus routes and food trucks. The case study area encompasses the three blocks of:
• Zonal Avenue from Cummings Street to Biggy Street • Biggy Street from Zonal Avenue to Eastlake Avenue • San Pablo Street from Norfolk Street to Alcazar Street - San
Pablo Street recently underwent significant changes to expand the sidewalk and remove on-street parking.
Field data collection was not taken in this case study area.
Case Study Area Characteristics
• Blocks: 3 • Parking Meters: 73 • Annual Truck Tickets (2014): 208 (69 per block) • UPS/FedEx/USPS Locations: 1 • Bus Stops: 0 • Truck-Related Collisions: 0 • Estimated Daily Deliveries: 415 total; 138 per block • Average Daily Truck Trips per block: 22
Various curbside use in the USC Medical Center (Source: Google Streetview)
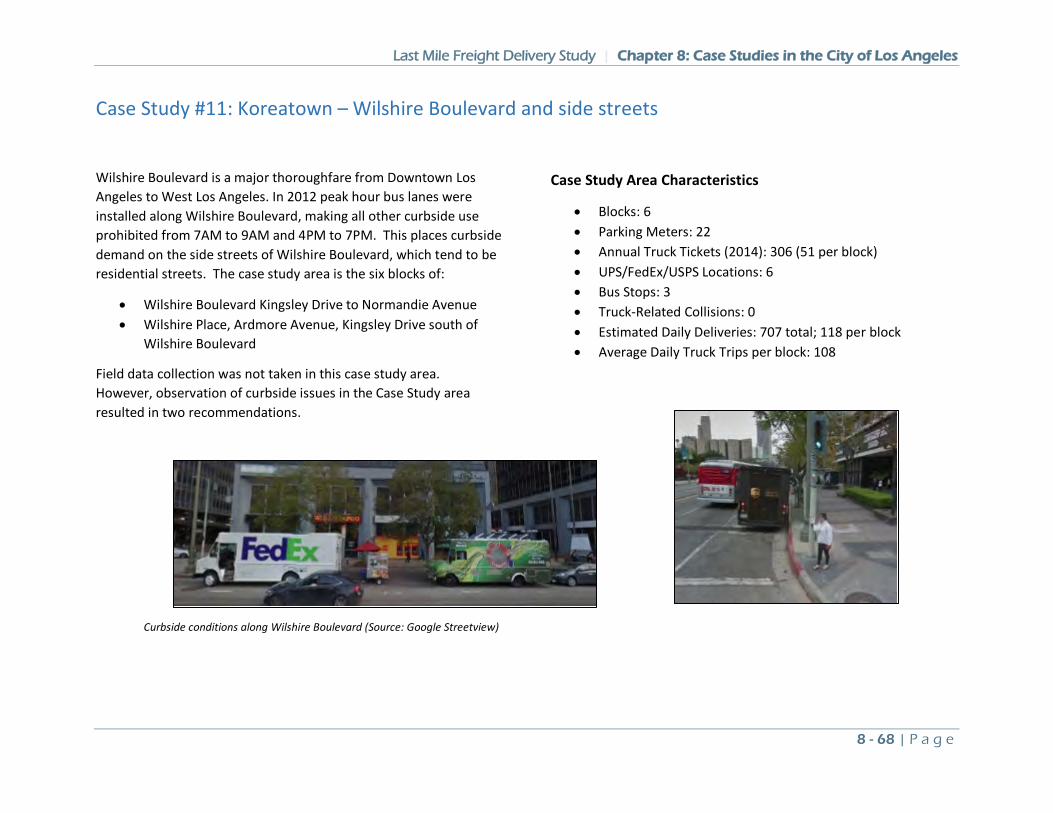
Last Mile Freight Delivery Study | Chapter 8: Case Studies in the City of Los Angeles
8 - 68 | P a g e
Case Study #11: Koreatown – Wilshire Boulevard and side streets
Wilshire Boulevard is a major thoroughfare from Downtown Los Angeles to West Los Angeles. In 2012 peak hour bus lanes were installed along Wilshire Boulevard, making all other curbside use prohibited from 7AM to 9AM and 4PM to 7PM. This places curbside demand on the side streets of Wilshire Boulevard, which tend to be residential streets. The case study area is the six blocks of:
• Wilshire Boulevard Kingsley Drive to Normandie Avenue • Wilshire Place, Ardmore Avenue, Kingsley Drive south of
Wilshire Boulevard
Field data collection was not taken in this case study area. However, observation of curbside issues in the Case Study area resulted in two recommendations.
Case Study Area Characteristics
• Blocks: 6 • Parking Meters: 22 • Annual Truck Tickets (2014): 306 (51 per block) • UPS/FedEx/USPS Locations: 6 • Bus Stops: 3 • Truck-Related Collisions: 0 • Estimated Daily Deliveries: 707 total; 118 per block • Average Daily Truck Trips per block: 108
Curbside conditions along Wilshire Boulevard (Source: Google Streetview)
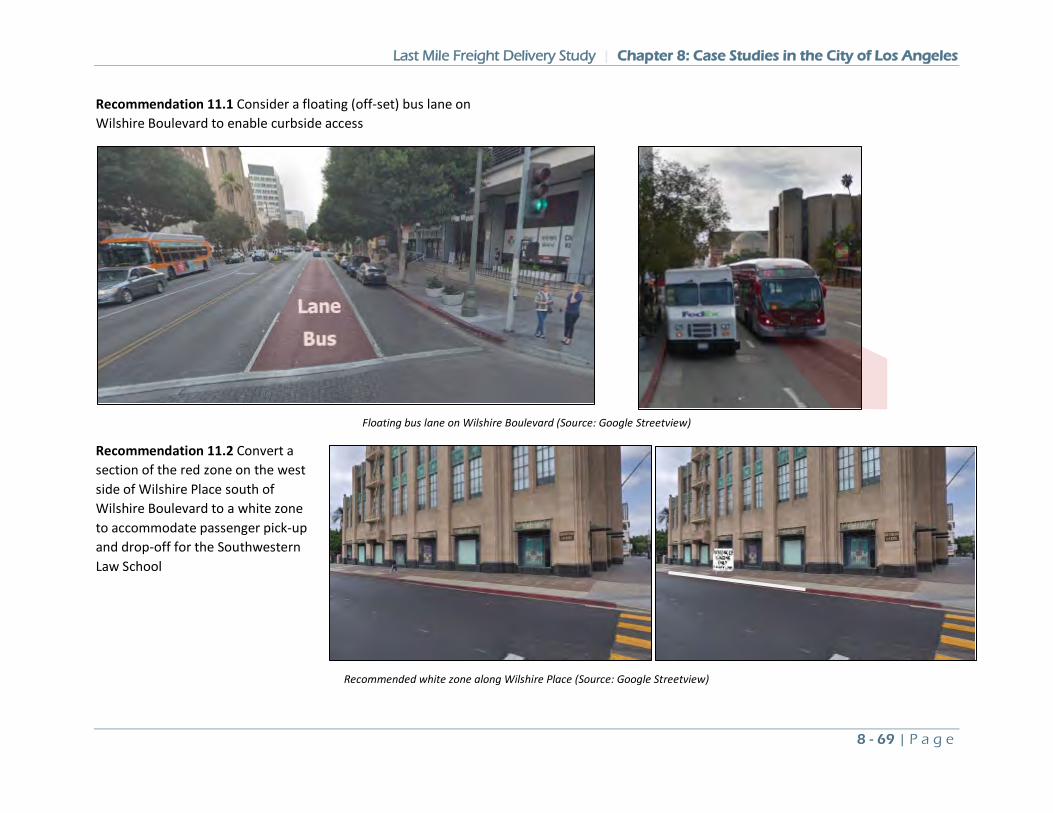
Last Mile Freight Delivery Study | Chapter 8: Case Studies in the City of Los Angeles
8 - 69 | P a g e
Recommendation 11.1 Consider a floating (off-set) bus lane on Wilshire Boulevard to enable curbside access
Floating bus lane on Wilshire Boulevard (Source: Google Streetview) Recommendation 11.2 Convert a section of the red zone on the west side of Wilshire Place south of Wilshire Boulevard to a white zone to accommodate passenger pick-up and drop-off for the Southwestern Law School
Recommended white zone along Wilshire Place (Source: Google Streetview)
Last Mile Freight Delivery Study | Chapter 8: Case Studies in the City of Los Angeles
8 - 70 | P a g e
Case Study #12: Atwater Village – Los Feliz Boulevard
Los Feliz Boulevard is the backbone of the Atwater Village neighborhood. The two case study area blocks of Los Feliz Boulevard from Glenfeliz Boulevard to Edenhurst Avenue have bus service, bicycle parking, loading zones and metered parking. Field data collection was not taken in this case study area.
Case Study Area Characteristics
• Blocks: 2 • Parking Meters: 31 • Annual Truck Tickets (2014): 46 (23 per block) • UPS/FedEx/USPS Locations: 0 • Bus Stops: 2 • Truck-Related Collisions: 0 • Estimated Daily Deliveries: 18 total; 9 per block • Average Daily Truck Trips per block: N/A
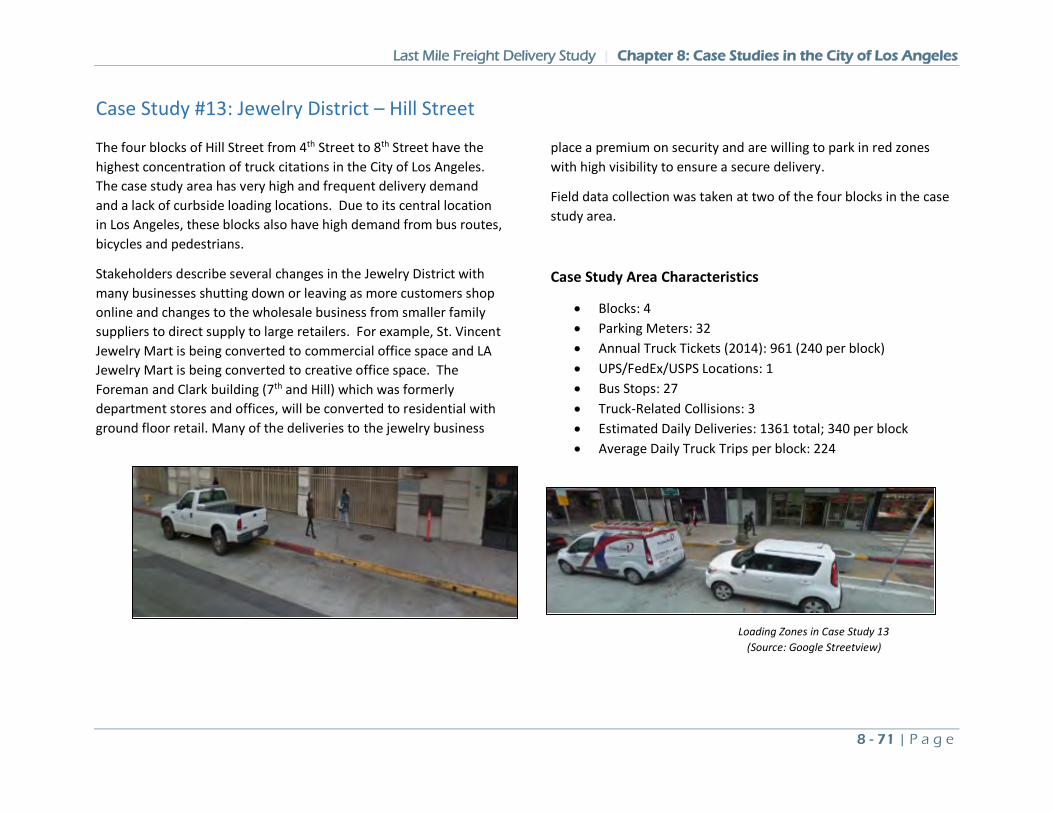
Last Mile Freight Delivery Study | Chapter 8: Case Studies in the City of Los Angeles
8 - 71 | P a g e
Case Study #13: Jewelry District – Hill Street
The four blocks of Hill Street from 4th Street to 8th Street have the highest concentration of truck citations in the City of Los Angeles. The case study area has very high and frequent delivery demand and a lack of curbside loading locations. Due to its central location in Los Angeles, these blocks also have high demand from bus routes, bicycles and pedestrians.
Stakeholders describe several changes in the Jewelry District with many businesses shutting down or leaving as more customers shop online and changes to the wholesale business from smaller family suppliers to direct supply to large retailers. For example, St. Vincent Jewelry Mart is being converted to commercial office space and LA Jewelry Mart is being converted to creative office space. The Foreman and Clark building (7th and Hill) which was formerly department stores and offices, will be converted to residential with ground floor retail. Many of the deliveries to the jewelry business
place a premium on security and are willing to park in red zones with high visibility to ensure a secure delivery.
Field data collection was taken at two of the four blocks in the case study area.
Case Study Area Characteristics
• Blocks: 4 • Parking Meters: 32 • Annual Truck Tickets (2014): 961 (240 per block) • UPS/FedEx/USPS Locations: 1 • Bus Stops: 27 • Truck-Related Collisions: 3 • Estimated Daily Deliveries: 1361 total; 340 per block • Average Daily Truck Trips per block: 224
Loading Zones in Case Study 13
(Source: Google Streetview)
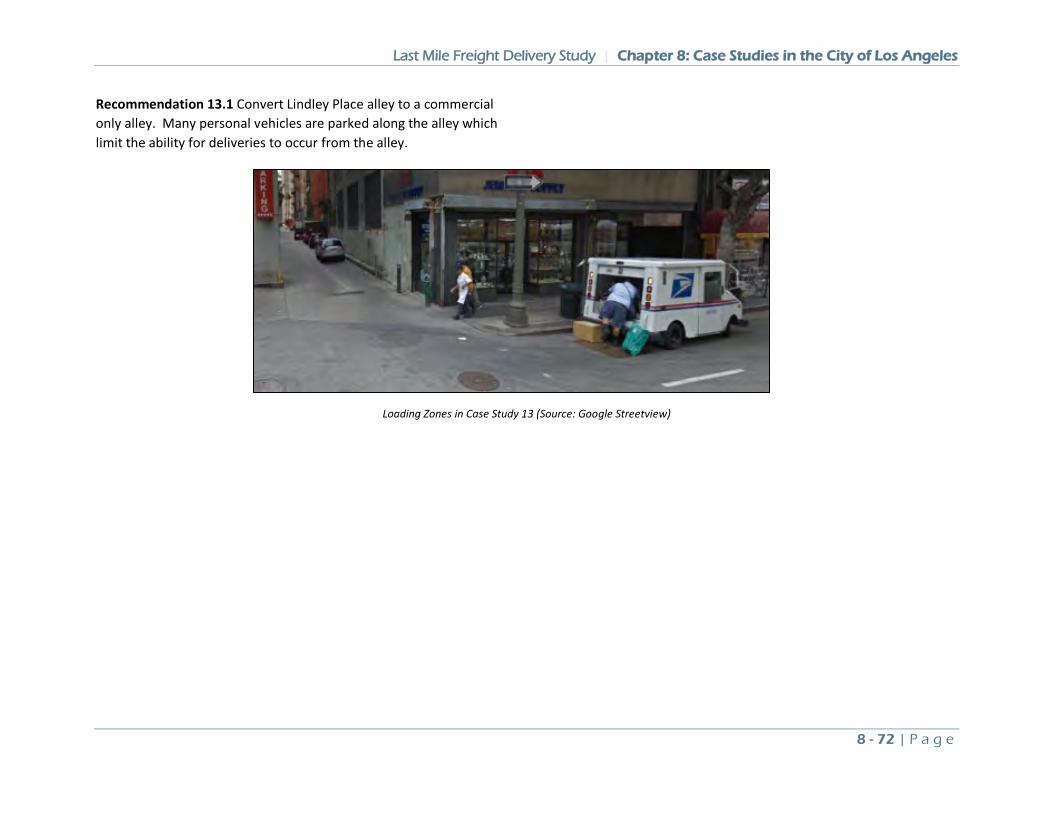
Last Mile Freight Delivery Study | Chapter 8: Case Studies in the City of Los Angeles
8 - 72 | P a g e
Recommendation 13.1 Convert Lindley Place alley to a commercial only alley. Many personal vehicles are parked along the alley which limit the ability for deliveries to occur from the alley.
Loading Zones in Case Study 13 (Source: Google Streetview)
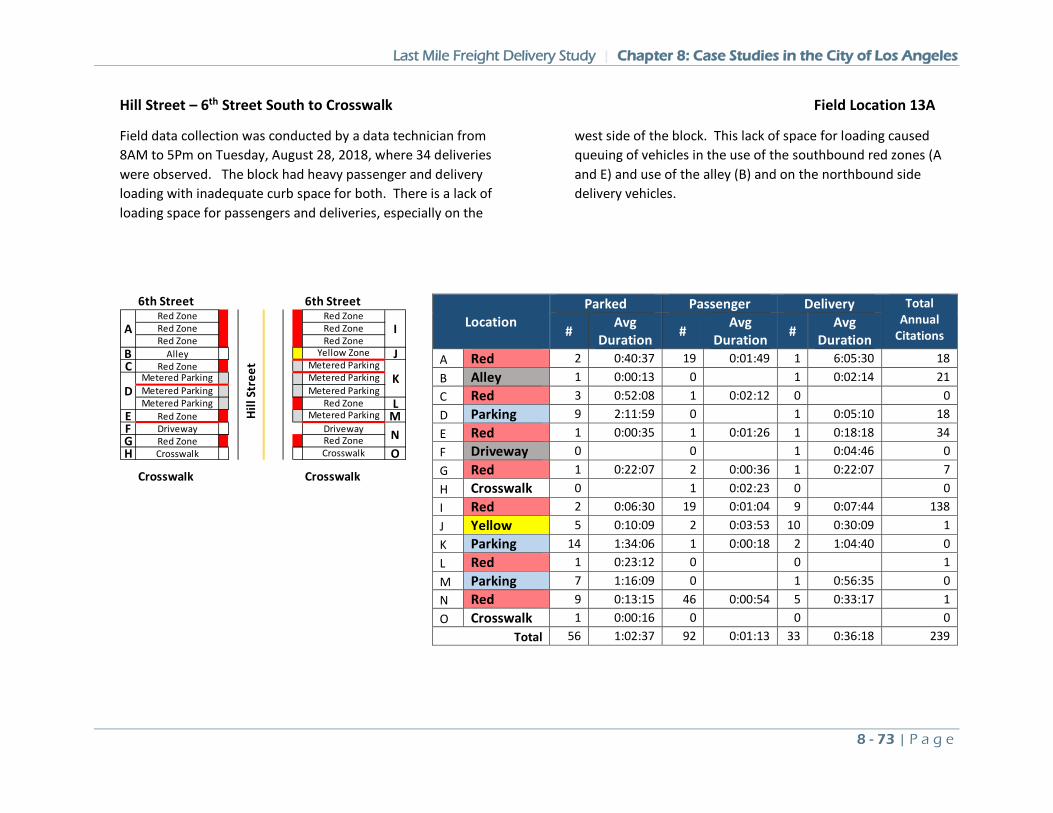
Last Mile Freight Delivery Study | Chapter 8: Case Studies in the City of Los Angeles
8 - 73 | P a g e
Hill Street – 6th Street South to Crosswalk Field Location 13A
Field data collection was conducted by a data technician from 8AM to 5Pm on Tuesday, August 28, 2018, where 34 deliveries were observed. The block had heavy passenger and delivery loading with inadequate curb space for both. There is a lack of loading space for passengers and deliveries, especially on the
west side of the block. This lack of space for loading caused queuing of vehicles in the use of the southbound red zones (A and E) and use of the alley (B) and on the northbound side delivery vehicles.
Location Parked Passenger Delivery Total
Annual Citations # Avg
Duration # Avg Duration # Avg
Duration A Red 2 0:40:37 19 0:01:49 1 6:05:30 18 B Alley 1 0:00:13 0 1 0:02:14 21 C Red 3 0:52:08 1 0:02:12 0 0 D Parking 9 2:11:59 0 1 0:05:10 18 E Red 1 0:00:35 1 0:01:26 1 0:18:18 34 F Driveway 0 0 1 0:04:46 0 G Red 1 0:22:07 2 0:00:36 1 0:22:07 7 H Crosswalk 0 1 0:02:23 0 0 I Red 2 0:06:30 19 0:01:04 9 0:07:44 138 J Yellow 5 0:10:09 2 0:03:53 10 0:30:09 1 K Parking 14 1:34:06 1 0:00:18 2 1:04:40 0 L Red 1 0:23:12 0 0 1 M Parking 7 1:16:09 0 1 0:56:35 0 N Red 9 0:13:15 46 0:00:54 5 0:33:17 1 O Crosswalk 1 0:00:16 0 0 0
Total 56 1:02:37 92 0:01:13 33 0:36:18 239
6th Street 6th StreetRed Zone Red ZoneRed Zone Red ZoneRed Zone Red Zone
B Alley Yellow Zone JC Red Zone Metered Parking
Metered Parking Metered ParkingMetered Parking Metered ParkingMetered Parking Red Zone L
E Red Zone Metered Parking MF Driveway DrivewayG Red Zone Red ZoneH Crosswalk Crosswalk O
Crosswalk Crosswalk
A I
KD
N
Hill
Str
eet
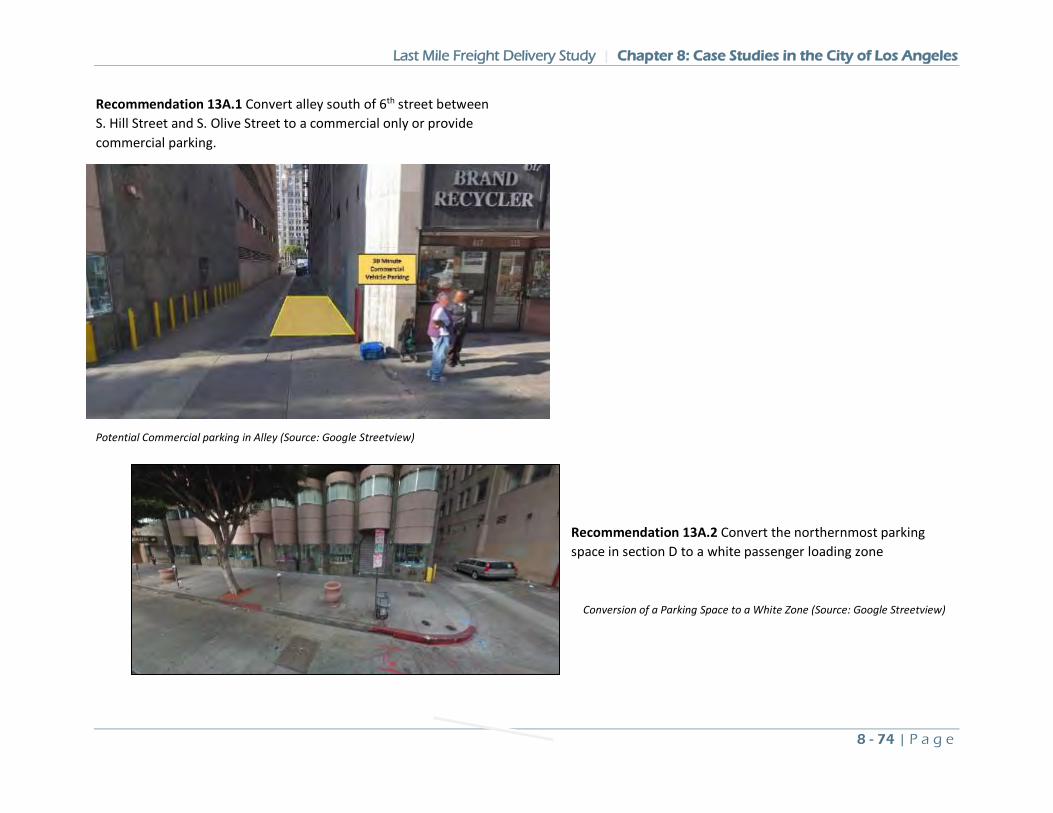
Last Mile Freight Delivery Study | Chapter 8: Case Studies in the City of Los Angeles
8 - 74 | P a g e
Recommendation 13A.1 Convert alley south of 6th street between S. Hill Street and S. Olive Street to a commercial only or provide commercial parking.
Potential Commercial parking in Alley (Source: Google Streetview)
Recommendation 13A.2 Convert the northernmost parking space in section D to a white passenger loading zone
Conversion of a Parking Space to a White Zone (Source: Google Streetview)
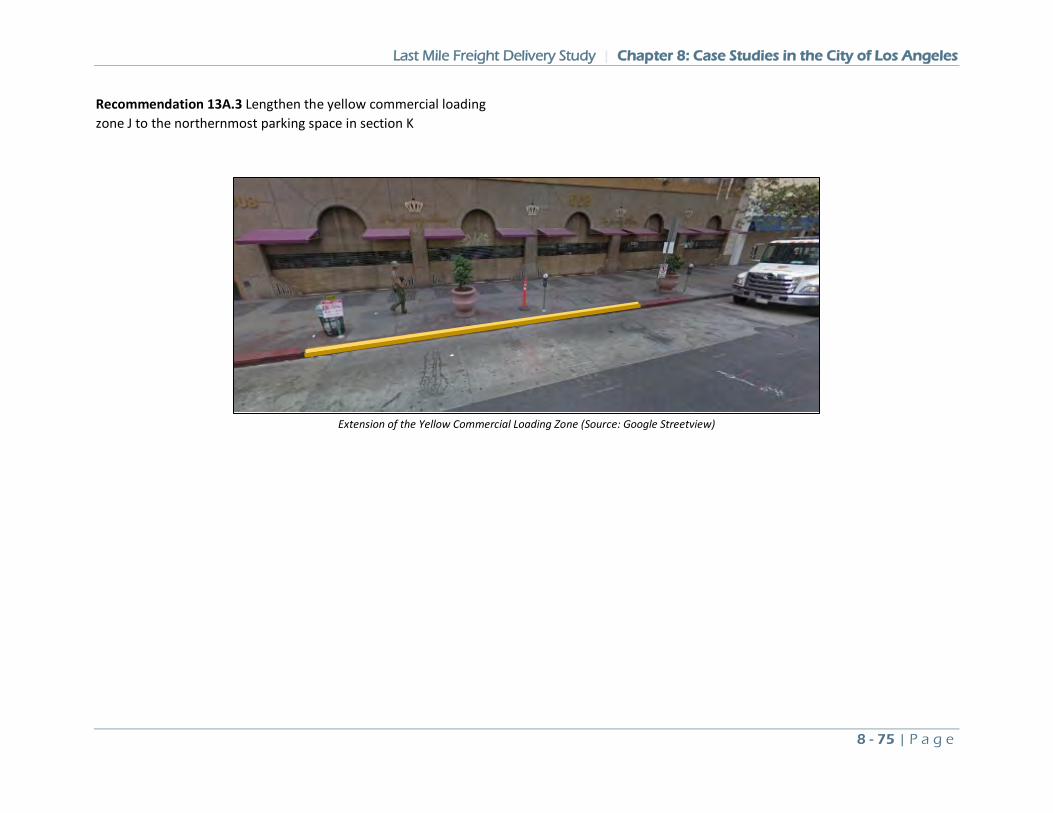
Last Mile Freight Delivery Study | Chapter 8: Case Studies in the City of Los Angeles
8 - 75 | P a g e
Recommendation 13A.3 Lengthen the yellow commercial loading zone J to the northernmost parking space in section K
Extension of the Yellow Commercial Loading Zone (Source: Google Streetview)
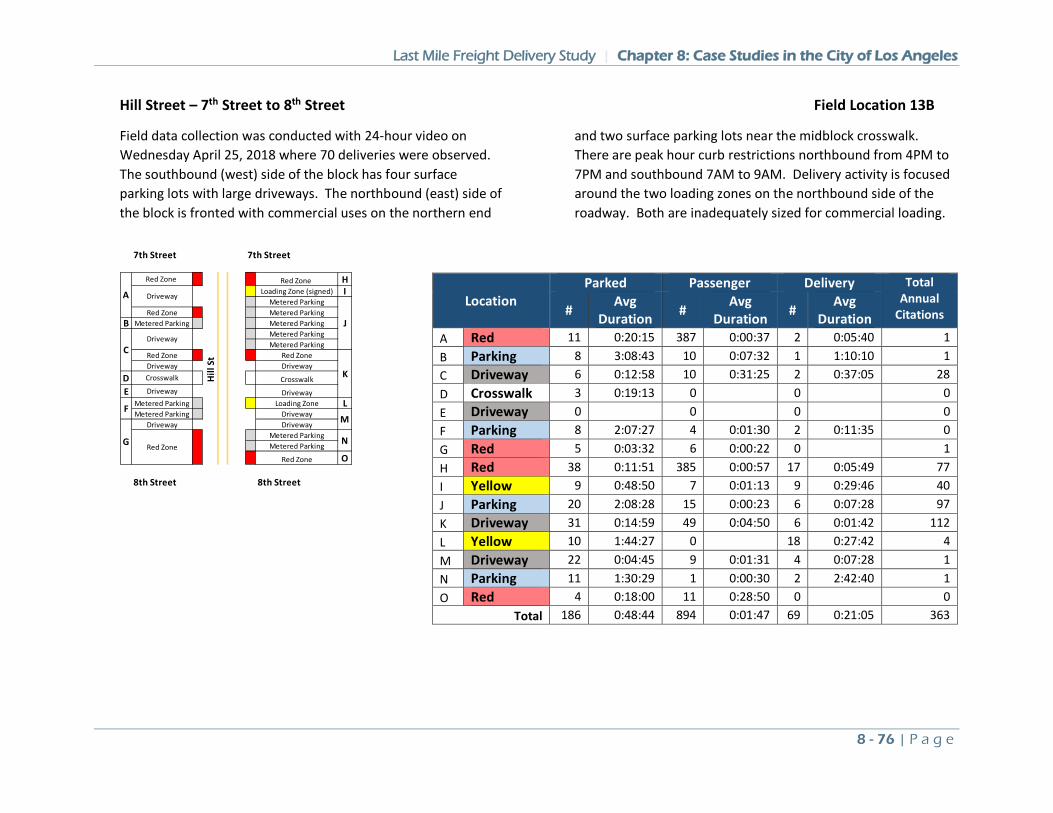
Last Mile Freight Delivery Study | Chapter 8: Case Studies in the City of Los Angeles
8 - 76 | P a g e
Hill Street – 7th Street to 8th Street Field Location 13B
Field data collection was conducted with 24-hour video on Wednesday April 25, 2018 where 70 deliveries were observed. The southbound (west) side of the block has four surface parking lots with large driveways. The northbound (east) side of the block is fronted with commercial uses on the northern end
and two surface parking lots near the midblock crosswalk. There are peak hour curb restrictions northbound from 4PM to 7PM and southbound 7AM to 9AM. Delivery activity is focused around the two loading zones on the northbound side of the roadway. Both are inadequately sized for commercial loading.
Location Parked Passenger Delivery Total
Annual Citations # Avg
Duration # Avg Duration # Avg
Duration A Red 11 0:20:15 387 0:00:37 2 0:05:40 1 B Parking 8 3:08:43 10 0:07:32 1 1:10:10 1 C Driveway 6 0:12:58 10 0:31:25 2 0:37:05 28 D Crosswalk 3 0:19:13 0 0 0 E Driveway 0 0 0 0 F Parking 8 2:07:27 4 0:01:30 2 0:11:35 0 G Red 5 0:03:32 6 0:00:22 0 1 H Red 38 0:11:51 385 0:00:57 17 0:05:49 77 I Yellow 9 0:48:50 7 0:01:13 9 0:29:46 40 J Parking 20 2:08:28 15 0:00:23 6 0:07:28 97 K Driveway 31 0:14:59 49 0:04:50 6 0:01:42 112 L Yellow 10 1:44:27 0 18 0:27:42 4 M Driveway 22 0:04:45 9 0:01:31 4 0:07:28 1 N Parking 11 1:30:29 1 0:00:30 2 2:42:40 1 O Red 4 0:18:00 11 0:28:50 0 0
Total 186 0:48:44 894 0:01:47 69 0:21:05 363
7th Street 7th Street
Red Zone Red Zone HLoading Zone (signed) I
Metered ParkingRed Zone Metered Parking
B Metered Parking Metered ParkingMetered ParkingMetered Parking
Red Zone Red ZoneDriveway Driveway
D Crosswalk Crosswalk
E Driveway DrivewayMetered Parking Loading Zone LMetered Parking Driveway
Driveway DrivewayMetered ParkingMetered Parking
Red Zone O
8th Street 8th Street
FM
G Red ZoneN
A Driveway
J
CDriveway
KHill
St
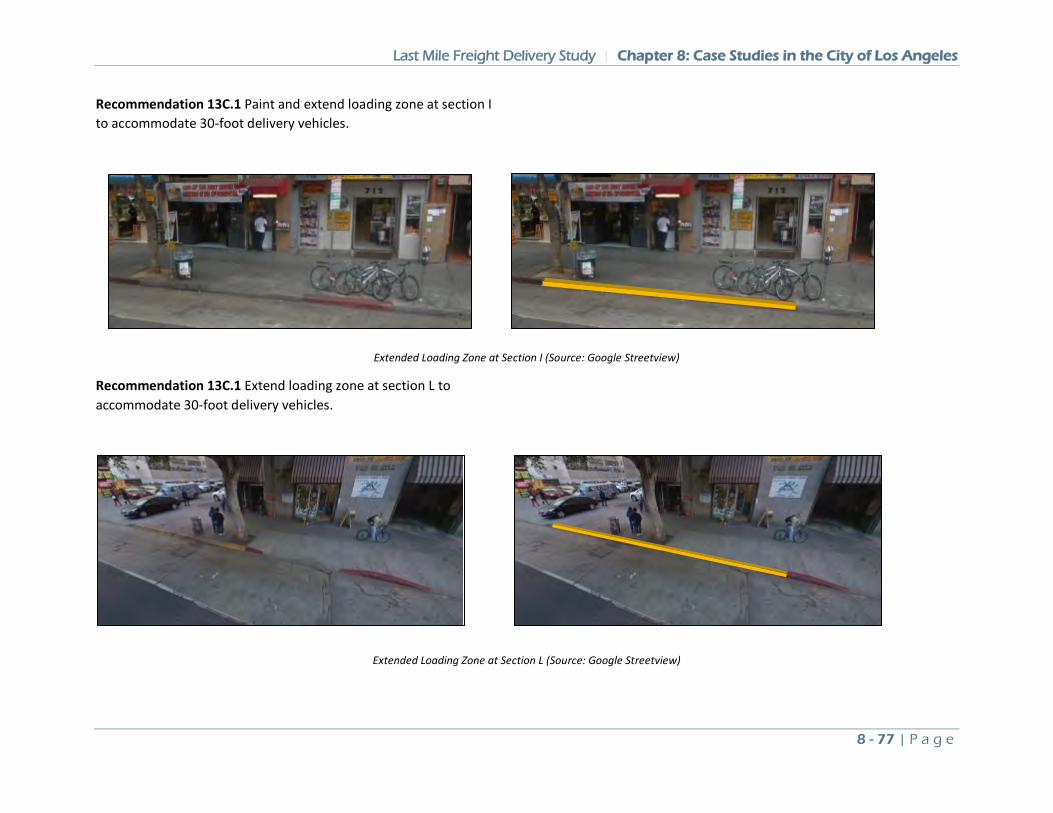
Last Mile Freight Delivery Study | Chapter 8: Case Studies in the City of Los Angeles
8 - 77 | P a g e
Recommendation 13C.1 Paint and extend loading zone at section I to accommodate 30-foot delivery vehicles.
Extended Loading Zone at Section I (Source: Google Streetview)
Recommendation 13C.1 Extend loading zone at section L to accommodate 30-foot delivery vehicles.
Extended Loading Zone at Section L (Source: Google Streetview)
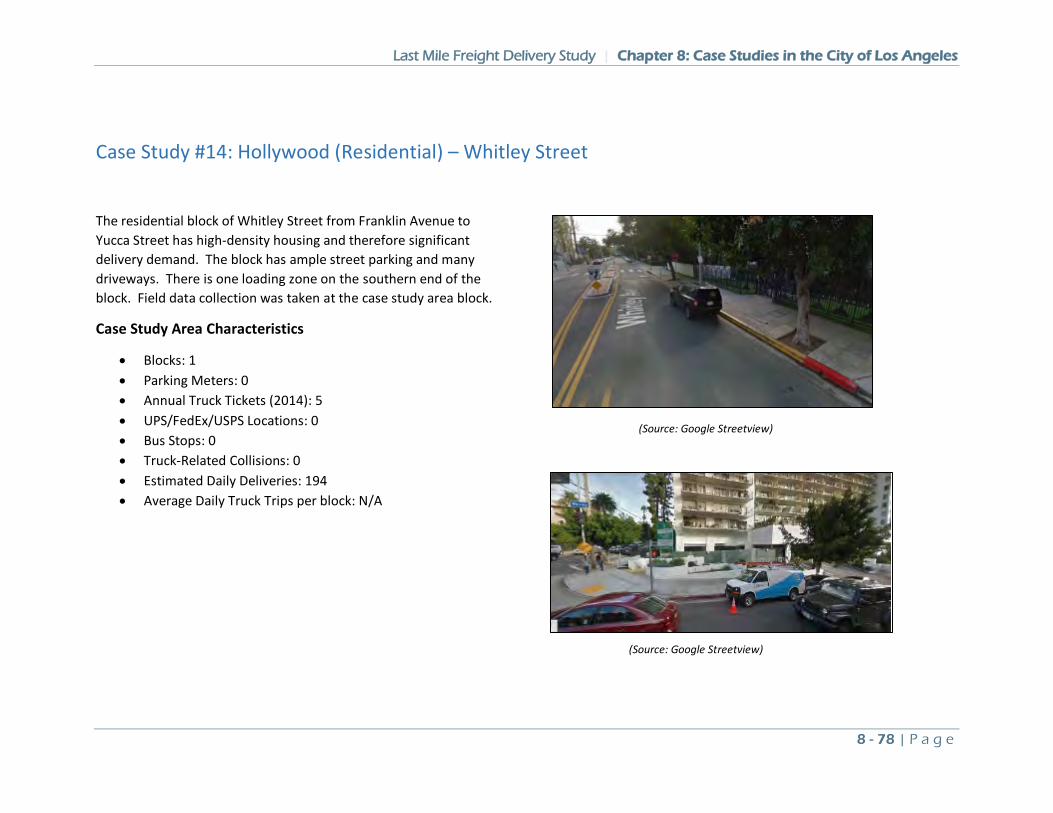
Last Mile Freight Delivery Study | Chapter 8: Case Studies in the City of Los Angeles
8 - 78 | P a g e
Case Study #14: Hollywood (Residential) – Whitley Street
The residential block of Whitley Street from Franklin Avenue to Yucca Street has high-density housing and therefore significant delivery demand. The block has ample street parking and many driveways. There is one loading zone on the southern end of the block. Field data collection was taken at the case study area block.
Case Study Area Characteristics
• Blocks: 1 • Parking Meters: 0 • Annual Truck Tickets (2014): 5 • UPS/FedEx/USPS Locations: 0 • Bus Stops: 0 • Truck-Related Collisions: 0 • Estimated Daily Deliveries: 194 • Average Daily Truck Trips per block: N/A
(Source: Google Streetview)
(Source: Google Streetview)
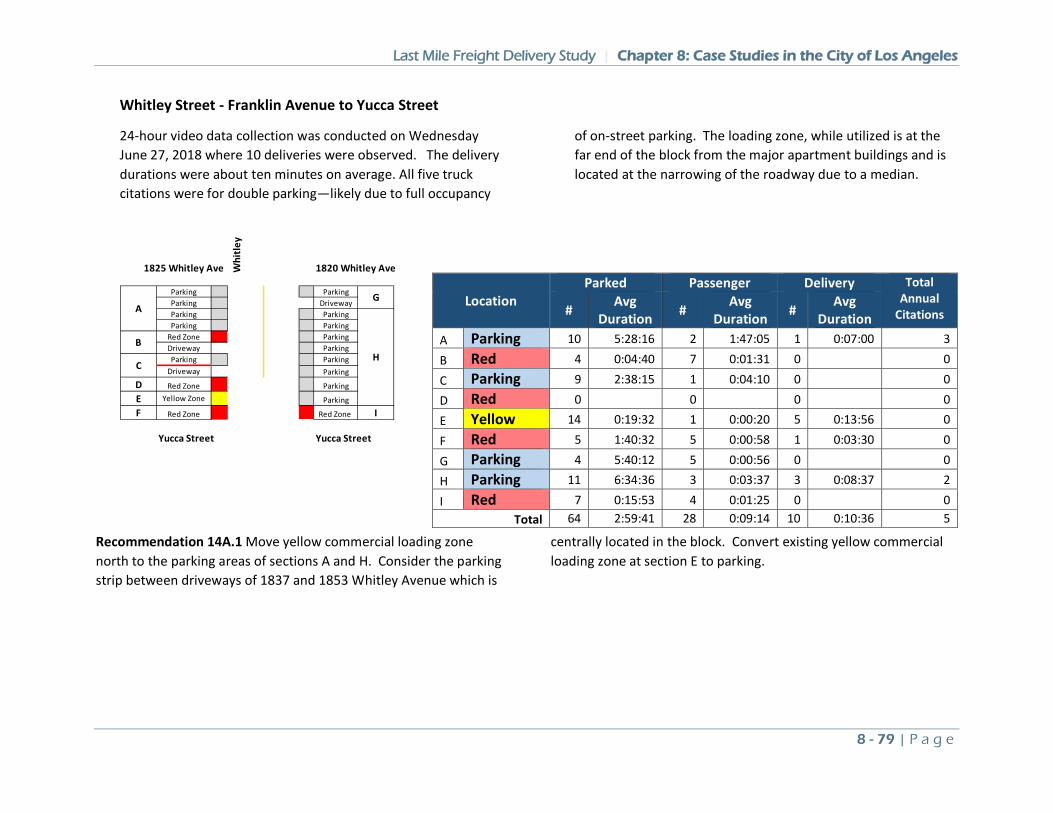
Last Mile Freight Delivery Study | Chapter 8: Case Studies in the City of Los Angeles
8 - 79 | P a g e
Whitley Street - Franklin Avenue to Yucca Street
24-hour video data collection was conducted on Wednesday June 27, 2018 where 10 deliveries were observed. The delivery durations were about ten minutes on average. All five truck citations were for double parking—likely due to full occupancy
of on-street parking. The loading zone, while utilized is at the far end of the block from the major apartment buildings and is located at the narrowing of the roadway due to a median.
Recommendation 14A.1 Move yellow commercial loading zone north to the parking areas of sections A and H. Consider the parking strip between driveways of 1837 and 1853 Whitley Avenue which is
centrally located in the block. Convert existing yellow commercial loading zone at section E to parking.
Location Parked Passenger Delivery Total
Annual Citations # Avg
Duration # Avg Duration # Avg
Duration A Parking 10 5:28:16 2 1:47:05 1 0:07:00 3
B Red 4 0:04:40 7 0:01:31 0 0
C Parking 9 2:38:15 1 0:04:10 0 0
D Red 0 0 0 0
E Yellow 14 0:19:32 1 0:00:20 5 0:13:56 0
F Red 5 1:40:32 5 0:00:58 1 0:03:30 0
G Parking 4 5:40:12 5 0:00:56 0 0
H Parking 11 6:34:36 3 0:03:37 3 0:08:37 2
I Red 7 0:15:53 4 0:01:25 0 0 Total 64 2:59:41 28 0:09:14 10 0:10:36 5
1825 Whitley Ave Whi
tley
1820 Whitley Ave
Parking ParkingParking DrivewayParking ParkingParking Parking
Red Zone ParkingDriveway ParkingParking Parking
Driveway Parking
D Red Zone Parking
E Yellow Zone Parking
F Red Zone Red Zone I
Yucca Street Yucca Street
AG
HB
C
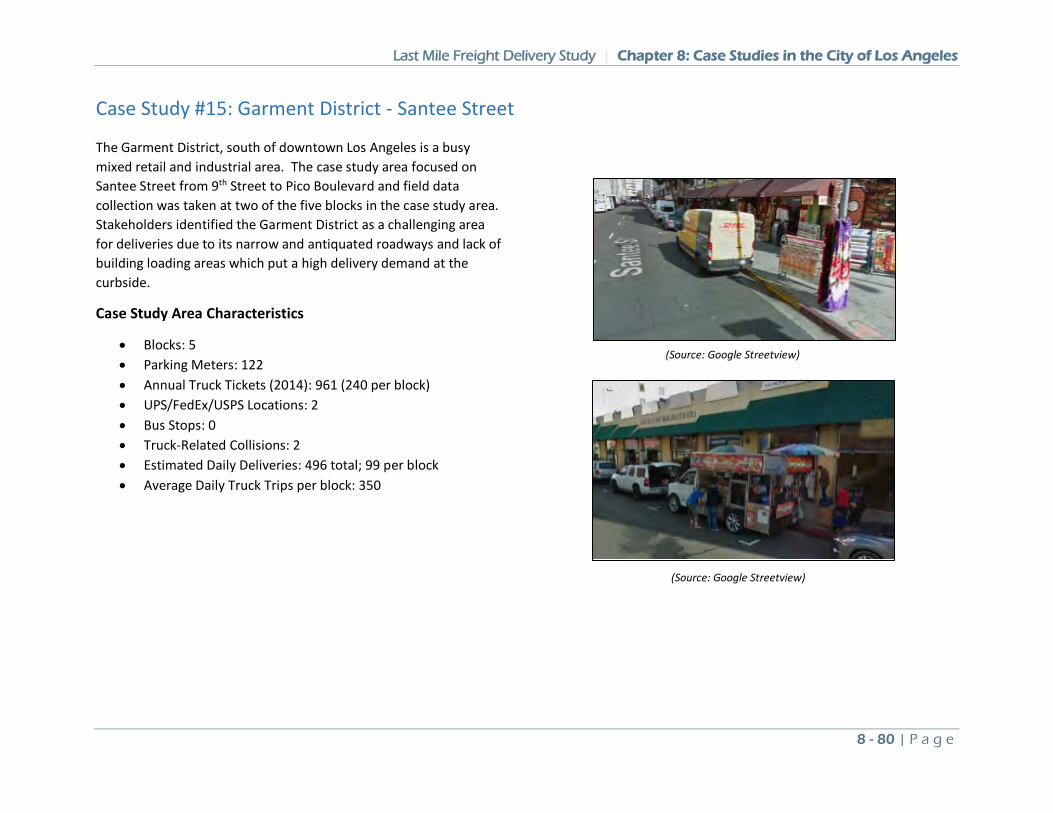
Last Mile Freight Delivery Study | Chapter 8: Case Studies in the City of Los Angeles
8 - 80 | P a g e
Case Study #15: Garment District - Santee Street
The Garment District, south of downtown Los Angeles is a busy mixed retail and industrial area. The case study area focused on Santee Street from 9th Street to Pico Boulevard and field data collection was taken at two of the five blocks in the case study area. Stakeholders identified the Garment District as a challenging area for deliveries due to its narrow and antiquated roadways and lack of building loading areas which put a high delivery demand at the curbside.
Case Study Area Characteristics
• Blocks: 5 • Parking Meters: 122 • Annual Truck Tickets (2014): 961 (240 per block) • UPS/FedEx/USPS Locations: 2 • Bus Stops: 0 • Truck-Related Collisions: 2 • Estimated Daily Deliveries: 496 total; 99 per block • Average Daily Truck Trips per block: 350
(Source: Google Streetview)
(Source: Google Streetview)
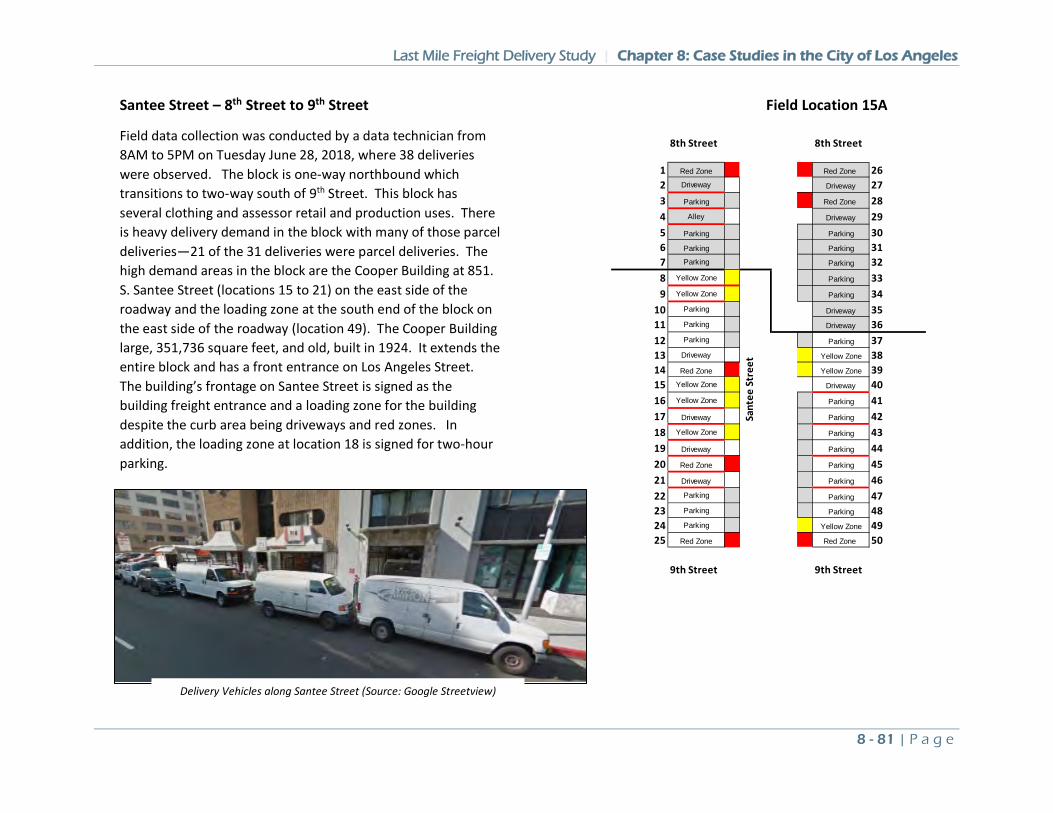
Last Mile Freight Delivery Study | Chapter 8: Case Studies in the City of Los Angeles
8 - 81 | P a g e
Santee Street – 8th Street to 9th Street Field Location 15A
Field data collection was conducted by a data technician from 8AM to 5PM on Tuesday June 28, 2018, where 38 deliveries were observed. The block is one-way northbound which transitions to two-way south of 9th Street. This block has several clothing and assessor retail and production uses. There is heavy delivery demand in the block with many of those parcel deliveries—21 of the 31 deliveries were parcel deliveries. The high demand areas in the block are the Cooper Building at 851. S. Santee Street (locations 15 to 21) on the east side of the roadway and the loading zone at the south end of the block on the east side of the roadway (location 49). The Cooper Building large, 351,736 square feet, and old, built in 1924. It extends the entire block and has a front entrance on Los Angeles Street. The building’s frontage on Santee Street is signed as the building freight entrance and a loading zone for the building despite the curb area being driveways and red zones. In addition, the loading zone at location 18 is signed for two-hour parking.
8th Street 8th Street
1 Red Zone Red Zone 262 Driveway Driveway 273 Parking Red Zone 284 Alley Driveway 295 Parking Parking 306 Parking Parking 317 Parking Parking 328 Yellow Zone Parking 339 Yellow Zone Parking 34
10 Parking Driveway 3511 Parking Driveway 3612 Parking Parking 3713 Driveway Yellow Zone 3814 Red Zone Yellow Zone 3915 Yellow Zone Driveway 4016 Yellow Zone Parking 4117 Driveway Parking 4218 Yellow Zone Parking 4319 Driveway Parking 4420 Red Zone Parking 4521 Driveway Parking 4622 Parking Parking 4723 Parking Parking 4824 Parking Yellow Zone 4925 Red Zone Red Zone 50
9th Street 9th Street
Sant
ee S
tree
t
Delivery Vehicles along Santee Street (Source: Google Streetview)
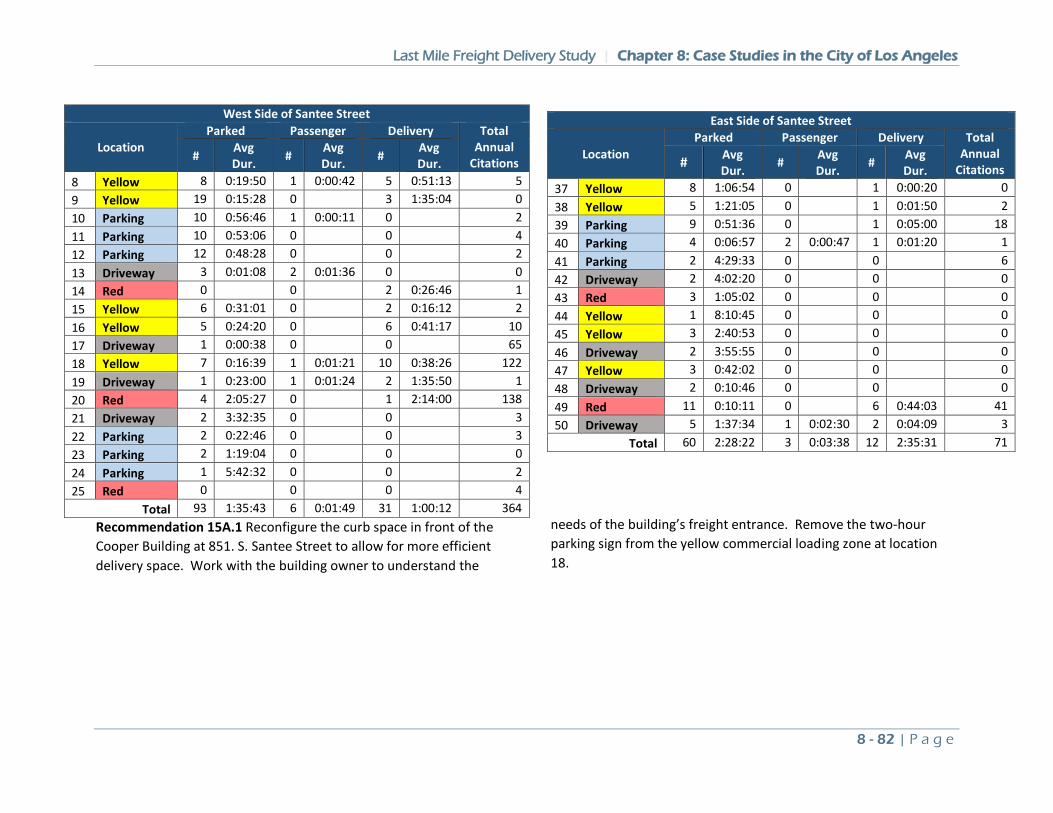
Last Mile Freight Delivery Study | Chapter 8: Case Studies in the City of Los Angeles
8 - 82 | P a g e
Recommendation 15A.1 Reconfigure the curb space in front of the Cooper Building at 851. S. Santee Street to allow for more efficient delivery space. Work with the building owner to understand the
needs of the building’s freight entrance. Remove the two-hour parking sign from the yellow commercial loading zone at location 18.
West Side of Santee Street
Location Parked Passenger Delivery Total
Annual Citations # Avg
Dur. # Avg Dur. # Avg
Dur. 8 Yellow 8 0:19:50 1 0:00:42 5 0:51:13 5 9 Yellow 19 0:15:28 0 3 1:35:04 0 10 Parking 10 0:56:46 1 0:00:11 0 2 11 Parking 10 0:53:06 0 0 4 12 Parking 12 0:48:28 0 0 2 13 Driveway 3 0:01:08 2 0:01:36 0 0 14 Red 0 0 2 0:26:46 1 15 Yellow 6 0:31:01 0 2 0:16:12 2 16 Yellow 5 0:24:20 0 6 0:41:17 10 17 Driveway 1 0:00:38 0 0 65 18 Yellow 7 0:16:39 1 0:01:21 10 0:38:26 122 19 Driveway 1 0:23:00 1 0:01:24 2 1:35:50 1 20 Red 4 2:05:27 0 1 2:14:00 138 21 Driveway 2 3:32:35 0 0 3 22 Parking 2 0:22:46 0 0 3 23 Parking 2 1:19:04 0 0 0 24 Parking 1 5:42:32 0 0 2 25 Red 0 0 0 4
Total 93 1:35:43 6 0:01:49 31 1:00:12 364
East Side of Santee Street
Location Parked Passenger Delivery Total
Annual Citations # Avg
Dur. # Avg Dur. # Avg
Dur. 37 Yellow 8 1:06:54 0 1 0:00:20 0 38 Yellow 5 1:21:05 0 1 0:01:50 2 39 Parking 9 0:51:36 0 1 0:05:00 18 40 Parking 4 0:06:57 2 0:00:47 1 0:01:20 1 41 Parking 2 4:29:33 0 0 6 42 Driveway 2 4:02:20 0 0 0 43 Red 3 1:05:02 0 0 0 44 Yellow 1 8:10:45 0 0 0 45 Yellow 3 2:40:53 0 0 0 46 Driveway 2 3:55:55 0 0 0 47 Yellow 3 0:42:02 0 0 0 48 Driveway 2 0:10:46 0 0 0 49 Red 11 0:10:11 0 6 0:44:03 41 50 Driveway 5 1:37:34 1 0:02:30 2 0:04:09 3
Total 60 2:28:22 3 0:03:38 12 2:35:31 71
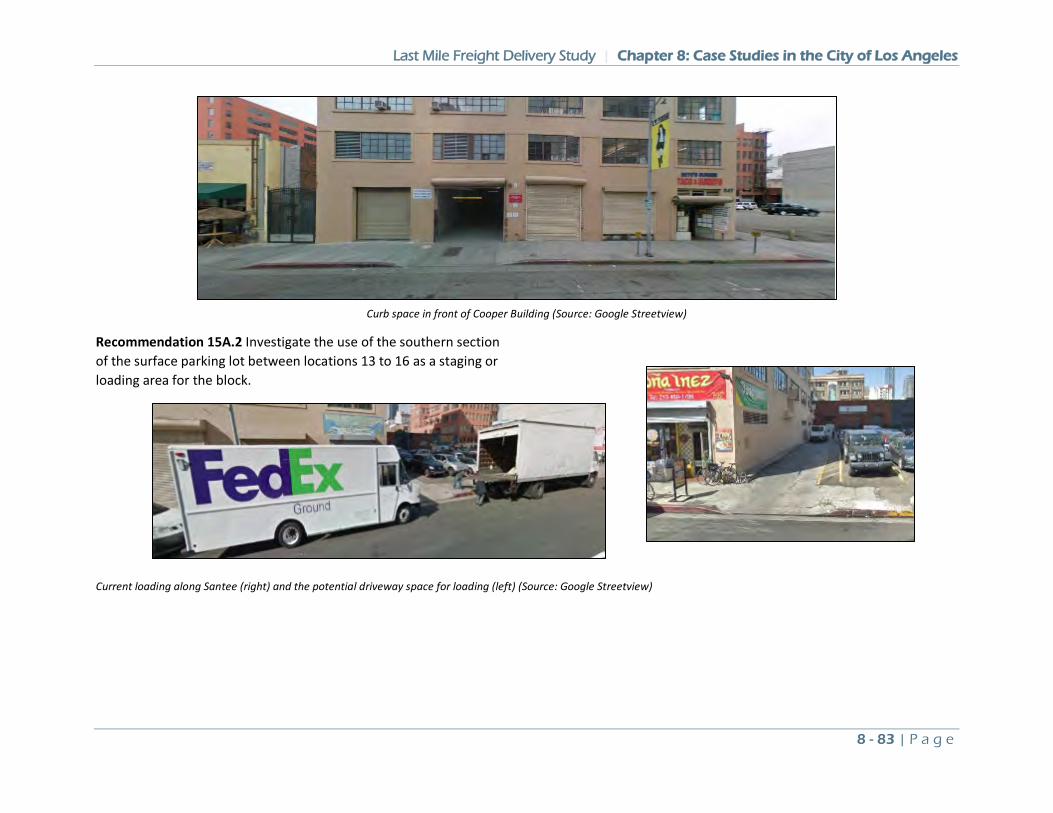
Last Mile Freight Delivery Study | Chapter 8: Case Studies in the City of Los Angeles
8 - 83 | P a g e
Curb space in front of Cooper Building (Source: Google Streetview) Recommendation 15A.2 Investigate the use of the southern section of the surface parking lot between locations 13 to 16 as a staging or loading area for the block.
Current loading along Santee (right) and the potential driveway space for loading (left) (Source: Google Streetview)
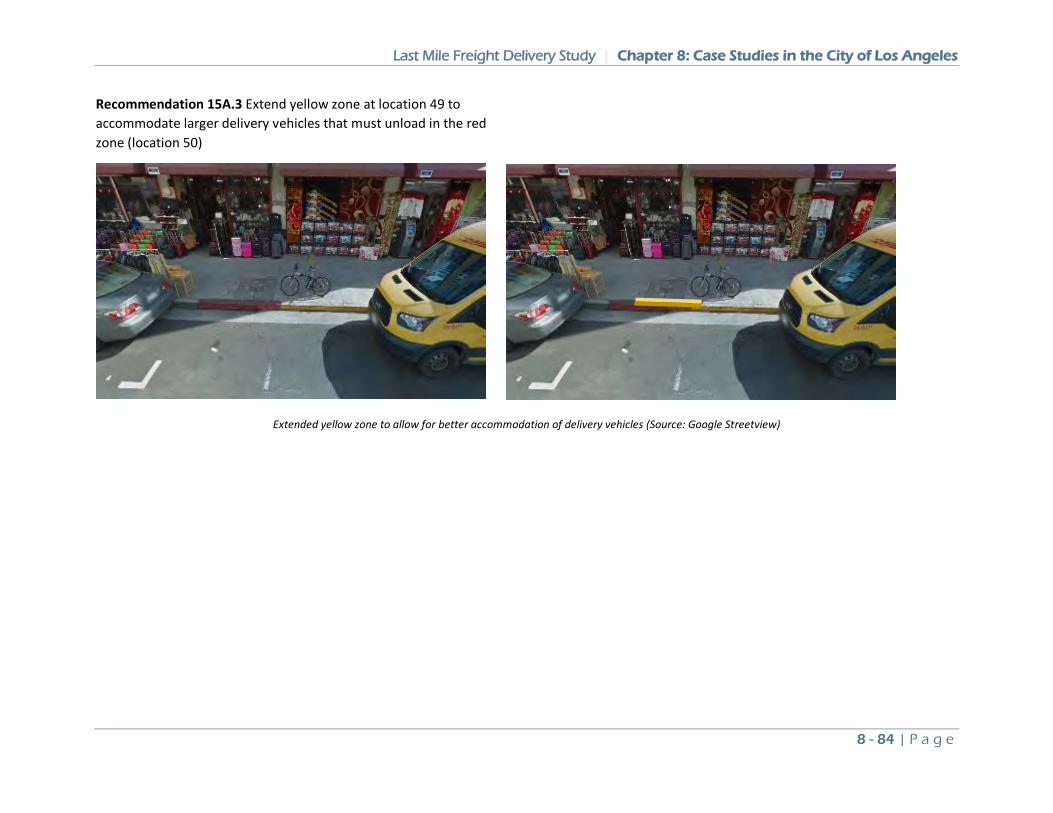
Last Mile Freight Delivery Study | Chapter 8: Case Studies in the City of Los Angeles
8 - 84 | P a g e
Recommendation 15A.3 Extend yellow zone at location 49 to accommodate larger delivery vehicles that must unload in the red zone (location 50)
Extended yellow zone to allow for better accommodation of delivery vehicles (Source: Google Streetview)
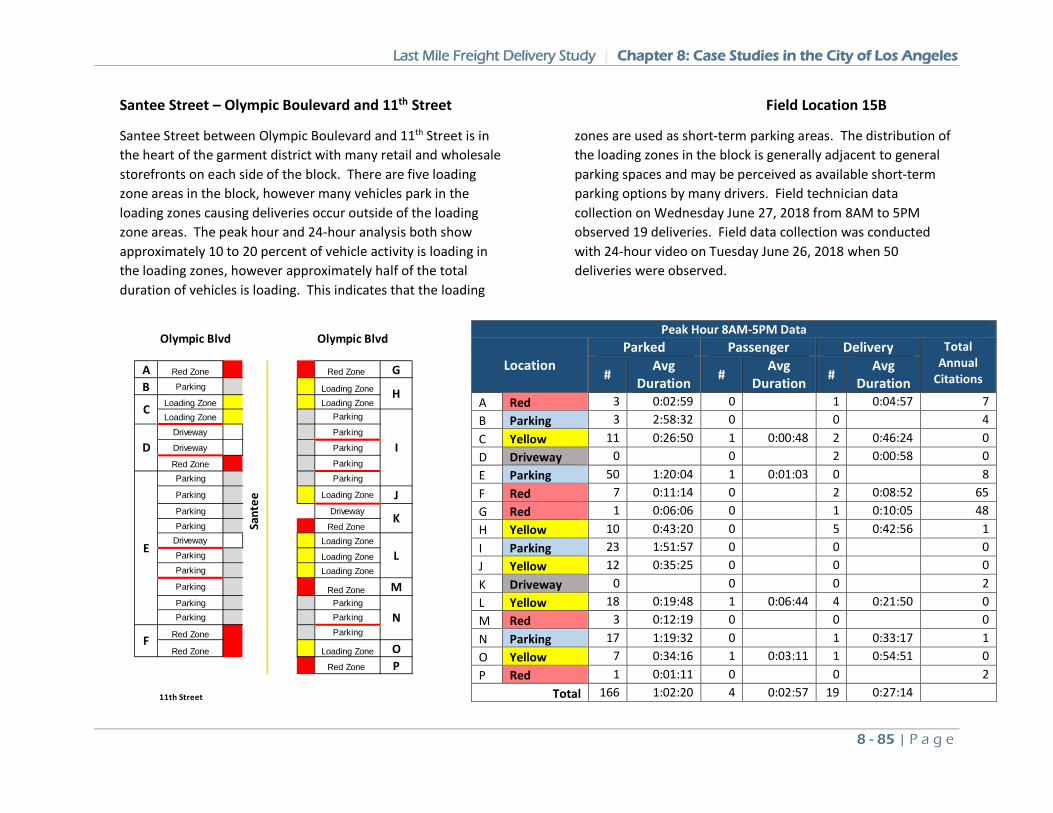
Last Mile Freight Delivery Study | Chapter 8: Case Studies in the City of Los Angeles
8 - 85 | P a g e
Santee Street – Olympic Boulevard and 11th Street Field Location 15B
Santee Street between Olympic Boulevard and 11th Street is in the heart of the garment district with many retail and wholesale storefronts on each side of the block. There are five loading zone areas in the block, however many vehicles park in the loading zones causing deliveries occur outside of the loading zone areas. The peak hour and 24-hour analysis both show approximately 10 to 20 percent of vehicle activity is loading in the loading zones, however approximately half of the total duration of vehicles is loading. This indicates that the loading
zones are used as short-term parking areas. The distribution of the loading zones in the block is generally adjacent to general parking spaces and may be perceived as available short-term parking options by many drivers. Field technician data collection on Wednesday June 27, 2018 from 8AM to 5PM observed 19 deliveries. Field data collection was conducted with 24-hour video on Tuesday June 26, 2018 when 50 deliveries were observed.
Peak Hour 8AM-5PM Data
Location Parked Passenger Delivery Total
Annual Citations # Avg
Duration # Avg Duration # Avg
Duration A Red 3 0:02:59 0 1 0:04:57 7 B Parking 3 2:58:32 0 0 4 C Yellow 11 0:26:50 1 0:00:48 2 0:46:24 0 D Driveway 0 0 2 0:00:58 0 E Parking 50 1:20:04 1 0:01:03 0 8 F Red 7 0:11:14 0 2 0:08:52 65 G Red 1 0:06:06 0 1 0:10:05 48 H Yellow 10 0:43:20 0 5 0:42:56 1 I Parking 23 1:51:57 0 0 0 J Yellow 12 0:35:25 0 0 0 K Driveway 0 0 0 2 L Yellow 18 0:19:48 1 0:06:44 4 0:21:50 0 M Red 3 0:12:19 0 0 0 N Parking 17 1:19:32 0 1 0:33:17 1 O Yellow 7 0:34:16 1 0:03:11 1 0:54:51 0 P Red 1 0:01:11 0 0 2
Total 166 1:02:20 4 0:02:57 19 0:27:14
Olympic Blvd Olympic Blvd
A Red Zone Red Zone GB Parking Loading Zone
Loading Zone Loading ZoneLoading Zone Parking
Driveway Parking
Driveway Parking
Red Zone ParkingParking Parking
Parking Loading Zone JParking DrivewayParking Red Zone
Driveway Loading ZoneParking Loading ZoneParking Loading Zone
Parking Red Zone MParking ParkingParking Parking
Red Zone Parking
Red Zone Loading Zone ORed Zone P
11th Street
H
I
K
L
N
Sant
ee
C
D
E
F
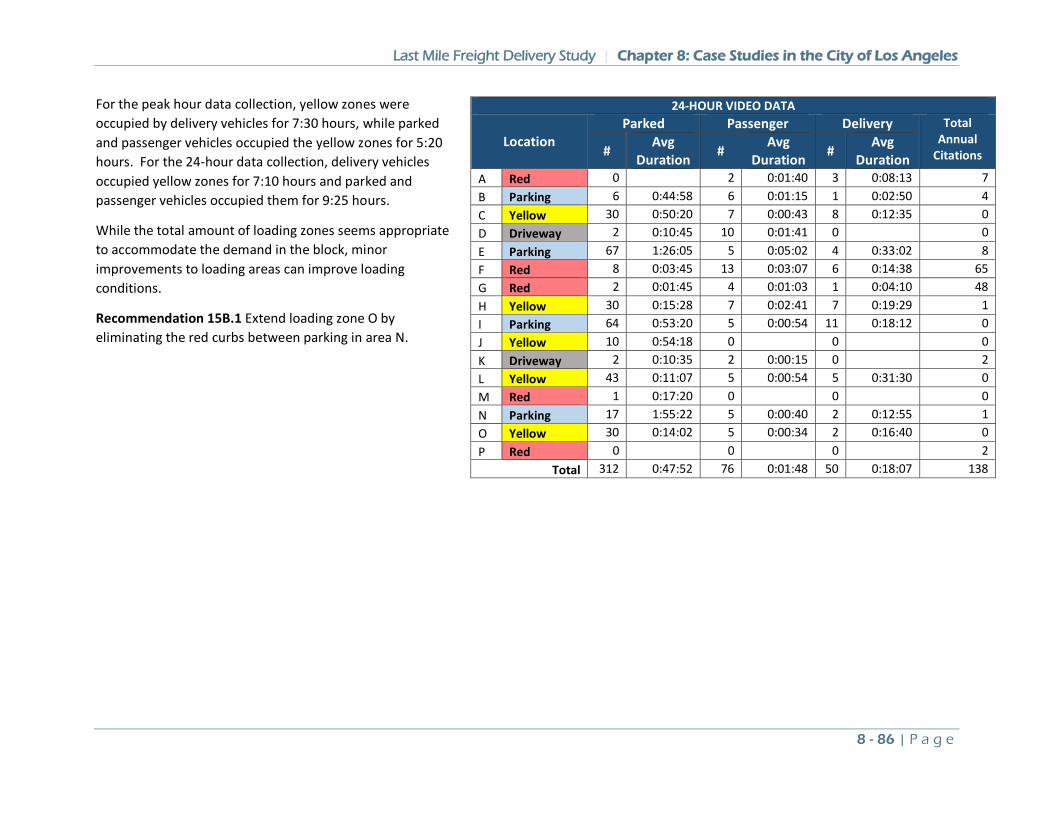
Last Mile Freight Delivery Study | Chapter 8: Case Studies in the City of Los Angeles
8 - 86 | P a g e
For the peak hour data collection, yellow zones were occupied by delivery vehicles for 7:30 hours, while parked and passenger vehicles occupied the yellow zones for 5:20 hours. For the 24-hour data collection, delivery vehicles occupied yellow zones for 7:10 hours and parked and passenger vehicles occupied them for 9:25 hours.
While the total amount of loading zones seems appropriate to accommodate the demand in the block, minor improvements to loading areas can improve loading conditions.
Recommendation 15B.1 Extend loading zone O by eliminating the red curbs between parking in area N.
24-HOUR VIDEO DATA
Location Parked Passenger Delivery Total
Annual Citations # Avg
Duration # Avg Duration # Avg
Duration A Red 0 2 0:01:40 3 0:08:13 7 B Parking 6 0:44:58 6 0:01:15 1 0:02:50 4 C Yellow 30 0:50:20 7 0:00:43 8 0:12:35 0 D Driveway 2 0:10:45 10 0:01:41 0 0 E Parking 67 1:26:05 5 0:05:02 4 0:33:02 8 F Red 8 0:03:45 13 0:03:07 6 0:14:38 65 G Red 2 0:01:45 4 0:01:03 1 0:04:10 48 H Yellow 30 0:15:28 7 0:02:41 7 0:19:29 1 I Parking 64 0:53:20 5 0:00:54 11 0:18:12 0 J Yellow 10 0:54:18 0 0 0 K Driveway 2 0:10:35 2 0:00:15 0 2 L Yellow 43 0:11:07 5 0:00:54 5 0:31:30 0 M Red 1 0:17:20 0 0 0 N Parking 17 1:55:22 5 0:00:40 2 0:12:55 1 O Yellow 30 0:14:02 5 0:00:34 2 0:16:40 0 P Red 0 0 0 2
Total 312 0:47:52 76 0:01:48 50 0:18:07 138
Last Mile Freight Delivery Study | Chapter 8: Case Studies in the City of Los Angeles
8 - 87 | P a g e
Case Study #16: Venice – Main Street, Broadway, Grand Avenue
The Venice case study area encompasses five blocks of Main Street from Thornton Place to Abbot Kinney Boulevard, Broadway from Abbot Kinney Boulevard to Electric Avenue, and Grand Boulevard from Main Street to Riviera Avenue. Stakeholders identified the narrow streets of Venice as a major challenge to deliveries and curb access in general. Off-hour deliveries would be limited in Venice due to the increase in noise in the predominately residential area. Field data collection was taken at three of the six blocks in the case study area.
Case Study Area Characteristics
• Blocks: 6 • Parking Meters: 0 • Annual Truck Tickets (2014): 79 (13 per block) • UPS/FedEx/USPS Locations: 0 • Bus Stops: 2 • Truck-Related Collisions: 0 • Estimated Daily Deliveries: 66 total; 11 per block • Average Daily Truck Trips per block: 25
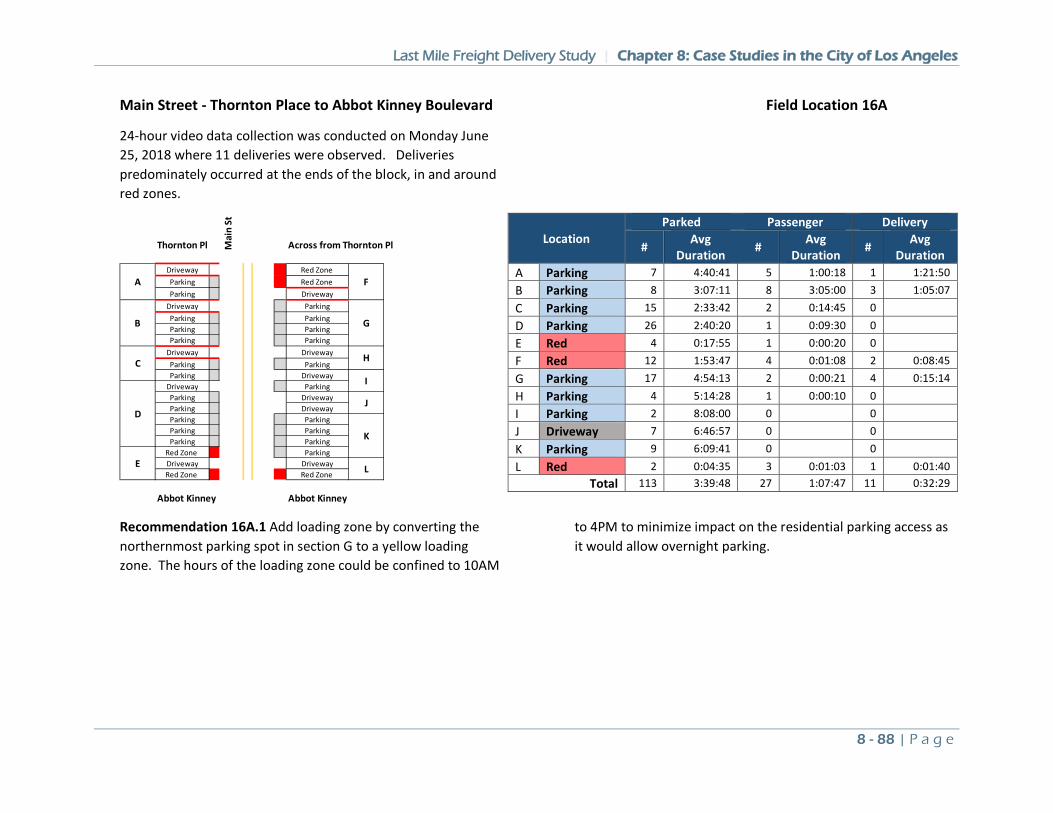
Last Mile Freight Delivery Study | Chapter 8: Case Studies in the City of Los Angeles
8 - 88 | P a g e
Main Street - Thornton Place to Abbot Kinney Boulevard Field Location 16A
24-hour video data collection was conducted on Monday June 25, 2018 where 11 deliveries were observed. Deliveries predominately occurred at the ends of the block, in and around red zones.
Recommendation 16A.1 Add loading zone by converting the northernmost parking spot in section G to a yellow loading zone. The hours of the loading zone could be confined to 10AM
to 4PM to minimize impact on the residential parking access as it would allow overnight parking.
Thornton Pl Mai
n St
Across from Thornton Pl
Driveway Red Zone Parking Red Zone Parking Driveway
Driveway ParkingParking ParkingParking ParkingParking Parking
Driveway DrivewayParking ParkingParking Driveway
Driveway ParkingParking DrivewayParking DrivewayParking ParkingParking ParkingParking Parking
Red Zone ParkingDriveway DrivewayRed Zone Red Zone
Abbot Kinney Abbot Kinney
A F
B G
C H
I
DJ
K
E L
Location Parked Passenger Delivery
# Avg Duration # Avg
Duration # Avg Duration
A Parking 7 4:40:41 5 1:00:18 1 1:21:50 B Parking 8 3:07:11 8 3:05:00 3 1:05:07 C Parking 15 2:33:42 2 0:14:45 0 D Parking 26 2:40:20 1 0:09:30 0 E Red 4 0:17:55 1 0:00:20 0 F Red 12 1:53:47 4 0:01:08 2 0:08:45 G Parking 17 4:54:13 2 0:00:21 4 0:15:14 H Parking 4 5:14:28 1 0:00:10 0 I Parking 2 8:08:00 0 0 J Driveway 7 6:46:57 0 0 K Parking 9 6:09:41 0 0 L Red 2 0:04:35 3 0:01:03 1 0:01:40
Total 113 3:39:48 27 1:07:47 11 0:32:29
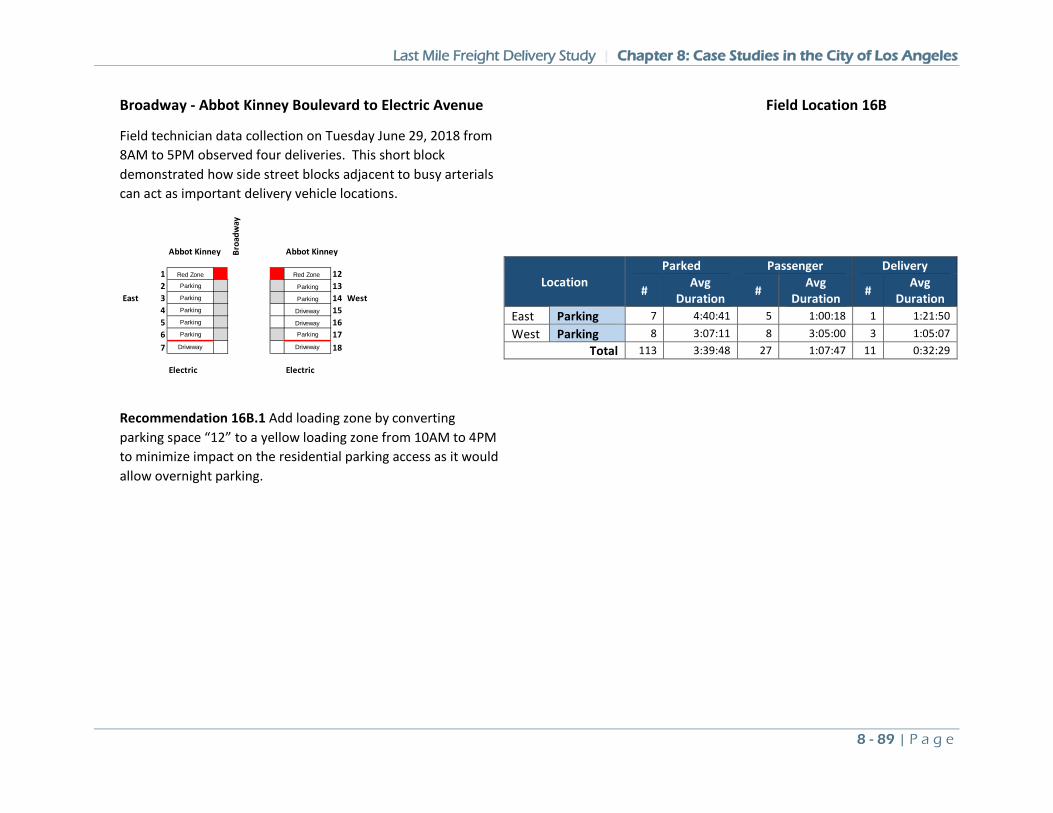
Last Mile Freight Delivery Study | Chapter 8: Case Studies in the City of Los Angeles
8 - 89 | P a g e
Broadway - Abbot Kinney Boulevard to Electric Avenue Field Location 16B
Field technician data collection on Tuesday June 29, 2018 from 8AM to 5PM observed four deliveries. This short block demonstrated how side street blocks adjacent to busy arterials can act as important delivery vehicle locations.
Recommendation 16B.1 Add loading zone by converting parking space “12” to a yellow loading zone from 10AM to 4PM to minimize impact on the residential parking access as it would allow overnight parking.
Abbot Kinney Broa
dway
Abbot Kinney
1 Red Zone Red Zone 122 Parking Parking 13
East 3 Parking Parking 14 West4 Parking Driveway 155 Parking Driveway 166 Parking Parking 177 Driveway Driveway 18
Electric Electric
Location Parked Passenger Delivery
# Avg Duration # Avg
Duration # Avg Duration
East Parking 7 4:40:41 5 1:00:18 1 1:21:50 West Parking 8 3:07:11 8 3:05:00 3 1:05:07
Total 113 3:39:48 27 1:07:47 11 0:32:29
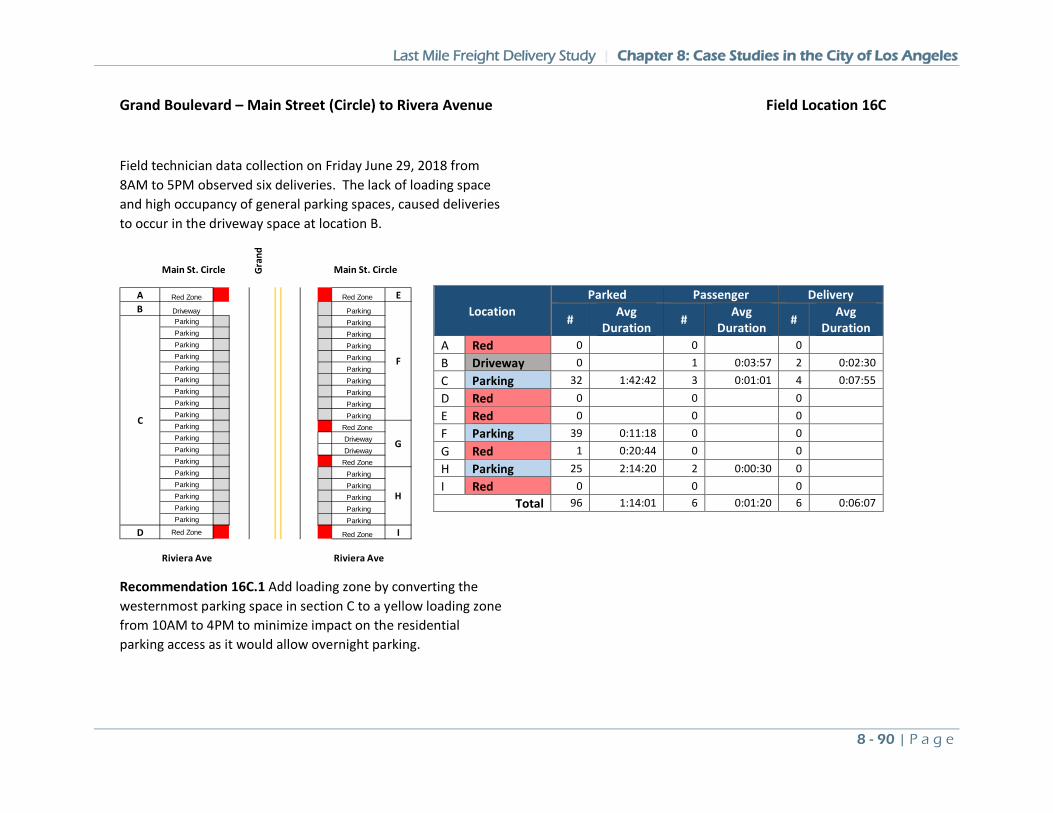
Last Mile Freight Delivery Study | Chapter 8: Case Studies in the City of Los Angeles
8 - 90 | P a g e
Grand Boulevard – Main Street (Circle) to Rivera Avenue Field Location 16C
Field technician data collection on Friday June 29, 2018 from 8AM to 5PM observed six deliveries. The lack of loading space and high occupancy of general parking spaces, caused deliveries to occur in the driveway space at location B.
Recommendation 16C.1 Add loading zone by converting the westernmost parking space in section C to a yellow loading zone from 10AM to 4PM to minimize impact on the residential parking access as it would allow overnight parking.
Main St. Circle Gran
dMain St. Circle
A Red Zone Red Zone EB Driveway Parking
Parking ParkingParking ParkingParking ParkingParking ParkingParking ParkingParking ParkingParking ParkingParking ParkingParking ParkingParking Red Zone Parking DrivewayParking DrivewayParking Red Zone Parking ParkingParking ParkingParking ParkingParking ParkingParking Parking
D Red Zone Red Zone I
Riviera Ave Riviera Ave
F
C
G
H
Location Parked Passenger Delivery
# Avg Duration # Avg
Duration # Avg Duration
A Red 0 0 0 B Driveway 0 1 0:03:57 2 0:02:30 C Parking 32 1:42:42 3 0:01:01 4 0:07:55 D Red 0 0 0 E Red 0 0 0 F Parking 39 0:11:18 0 0 G Red 1 0:20:44 0 0 H Parking 25 2:14:20 2 0:00:30 0 I Red 0 0 0
Total 96 1:14:01 6 0:01:20 6 0:06:07
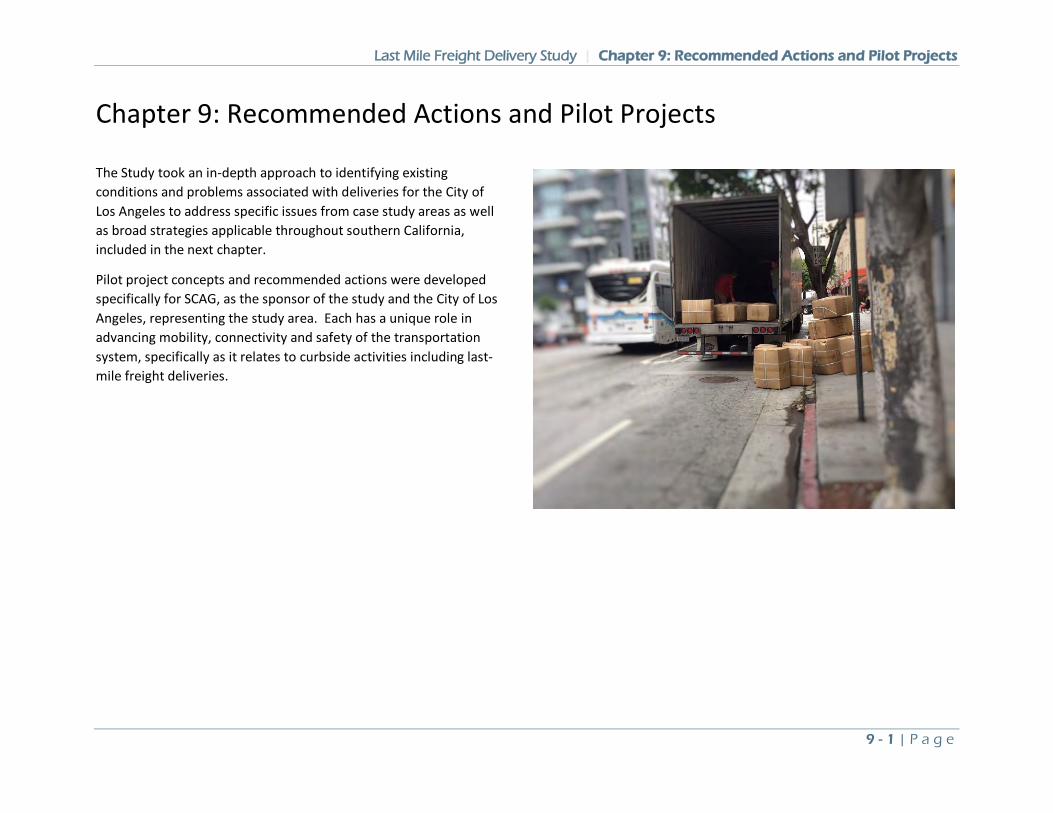
Last Mile Freight Delivery Study | Chapter 9: Recommended Actions and Pilot Projects
9 - 1 | P a g e
Chapter 9: Recommended Actions and Pilot Projects
The Study took an in-depth approach to identifying existing conditions and problems associated with deliveries for the City of Los Angeles to address specific issues from case study areas as well as broad strategies applicable throughout southern California, included in the next chapter.
Pilot project concepts and recommended actions were developed specifically for SCAG, as the sponsor of the study and the City of Los Angeles, representing the study area. Each has a unique role in advancing mobility, connectivity and safety of the transportation system, specifically as it relates to curbside activities including last-mile freight deliveries.
Last Mile Freight Delivery Study | Chapter 9: Recommended Actions and Pilot Projects
9 - 2 | P a g e
Southern California Association of Governments SCAG, at its core is a forum of regional transportation policy dialogue and consensus building, with the understanding that enduring solutions require coordination and partnership with multiple players from a wide variety of member agencies and stakeholders. Through many of SCAG’s planning and programming areas, the agency seeks to identify and provide funding opportunities for the advancement of various types of projects.
1. Develop and Test Last-Mile Delivery Pilot Projects Coordination and collaboration with the Los Angeles Department of Transportation (LADOT) and Los Angeles Department of City Planning (LADCP) as well as other public agencies and key freight stakeholders to develop suitable pilot locations and balancing local government opportunities and constraints with business operating needs and expectations. Based on preliminary discussions with public agencies, revision of yellow zones and signage, a cargo e-bike pilot and support of a Code the Curb effort are key last-mile strategies applicable for the near term.
2. Integrate Last-Mile Freight Issues into Goods Movement Forum Incorporate study analysis from data collection, pilot project concept information, and key area-based issues and strategies into SCAG’s Goods Movement Forum. This forum will help further work for last-mile deliveries, and could also inform SCAG’s role as a member of the California Freight Advisory Committee (CFAC).
3. Work to Facilitate Off-Peak Delivery Assess and determine appropriate relationships for the Los Angeles and SCAG region, from previous study findings including delivery company and receiver participation interest, ideal types of delivery company and receiver companies to consider based on foodservice and consumer sectors, incentive potential, and security issues.
Develop an initial framework to include an approach involving industry leaders to recruit delivery companies and receivers to participate, focus on the retail, food, beverage, restaurant industries and their carriers, initiate and secure incentive funding, develop a monitoring system including data collection and analysis, coordinate with public agencies to ensure off-peak delivery placement is optimal.
Support Efforts to Revise Business and Professions Code Division 9: Alcoholic Beverages, Chapter 16: Regulatory Provisions Article 2, Hours and Sale and Delivery of Alcoholic Beverages section 25631 to allow delivery of alcoholic beverage between the hours of 8 p.m. and 3 a.m. to support off-hours delivery. A successful off-hours delivery program is targeted to shippers who deliver in bulk and receivers who are available in the off hours. Alcoholic beverage delivery meets both those criteria, however, are currently prohibited under California State law.
Last Mile Freight Delivery Study | Chapter 9: Recommended Actions and Pilot Projects
9 - 3 | P a g e
City of Los Angeles The City of Los Angeles owns, maintains and operates the public right-of-way within the City. The Last-Mile Freight Study took an in-depth approach to identifying existing conditions and issues associated with deliveries for the City of Los Angeles. This encompassed case study areas reflecting geographical diverse typologies including employment, residential, and activity characteristics. Case study areas were identified through a mix of delivery issues such as truck citations, delivery frequency, and stakeholder outreach, among other attributes.
Existing conditions, issues, strategies, and recommendations were varied throughout the City’s areas, with higher demand, citations, and congestion issues more prevalent in the Downtown and West Los Angeles locations, lending themselves to pilot project concepts encouraging modal delivery shift, off-peak strategies, dynamic and flexible parking, and consolidation opportunities. Other areas within the Valley and South Bay witnessed similar challenges, albeit with less demand, lending themselves to pilot projects focused more with coding the curb, other guidelines, and restrictions.
1. Code the Curb Objectives: Coding the curb is the foundational step in more effective curb regulation, management, information, and pricing. It would also look to support connected and automated vehicle development.
Description: Cities manage a huge network of public curbside assets, parking signs, lane striping, fire hydrants, street trees and curb painting. Ideally a city would know the exact location and condition of each asset. This is nearly impossible without a full digital inventory. While costly, a digital inventory allows for more
efficient curb space designation, faster and smarter planning of streets, public transparency, and more information for funding.
Coding the curb area into a digital inventory for dynamic use and update is a foundational step in measuring, assessing and managing the curb space of a city. The City of Los Angeles began a Code the Curb effort, but completion requires additional resources to finalize the inventory, maintain the database, and build applications of the curb inventory.
Coding the Curb is the foundational step in active management of curb space which is becoming increasingly necessary to address high curbside demand in downtown areas and the accommodation of new mobility innovations such as vehicle navigation, bike share, transportation network companies (TNCs) and connected/automated vehicles.
Coding the Curb has the potential to facilitate active management of the curb space to maximize its utility as a public space by providing data to “right-size” curb designations to meet demand, enable dynamic pricing based on type of use and vehicle, and payment for passenger curbside pickup and automated vehicle use.
While this study can provide few insights to the City of Los Angeles that they have not learned from starting a Code the Curb effort, one item of interest is in the prioritization of streets to code. The blocks with the highest curb demand placed on them—the Regional Commercial blocks as defined in this study, are only two percent of the total blocks in the City. General Commercial roadways are 18 percent of the total blocks in the City—taken together the Regional and General Commercial are 20 percent of City of Los Angeles blocks. Therefore, by using the typology methodology of this study, those blocks with the most activity and demand placed on the
Last Mile Freight Delivery Study | Chapter 9: Recommended Actions and Pilot Projects
9 - 4 | P a g e
curbside could be prioritized for digitizing, starting to bring the benefits of coding the curb in the areas with the highest need.
Location(s): Citywide but could focus initially on non-residential streets.
Scalability: Project could be prioritized for commercial streets (20 percent of total) initially with industrial (10 percent), residential (60 percent) and other (10 percent) prioritized subsequently.
Status: The total cost estimate is anticipated to be approximately $5.5 million. The 2018-2019 City of Los Angeles Budget lists approximately $1.1 million for the Code the Curb Project in 2017-2018 from the Special Parking Revenue Fund (parking meter and lot revenue).
Cost Expectations: $4.5 to $5.5 million estimate for initial survey along with ongoing maintenance of database.
Challenges: Coding the Curb is a very large effort with many challenges:
• Data Standardization – on a basic level, the curbside is a good candidate for digitation—most curbs are similar in length and height, they begin and end at intersections, and they do not intersect other curbs. However, driveways, curb cuts, and a high variation of curb use and occupation mean data collection needs to account for the many variable conditions at the curb.
• High variability in curb rules – there is a high variability in curb rules, which may be delineated by either curb paint or signage.
• Temporary conditions – construction, filming permits, and temporary tow-away can provide challenges.
• Technical challenges of integrating curb data with other city information to provide occupancy, pricing, navigation and temporary conditions.
• Code the Curb will need to be continually updated for all changes to conditions and therefore will need annual allocated resources for maintenance.
Application: Code the Curb data can be integrated into other City databases such as:
• Zone Information and Map Access System (ZIMAS) • https://data.lacity.org/ • MyLA requests • GeoHub
The most promising use of Code the Curb is to support real-time use for parking pricing, flexible space and connected and automated vehicles. Dynamic integration with LA Express Park™ could integrate demand and pricing information to provide active management of curb space and provide information directly to vehicles through connected and automated vehicle technology. However, pricing is not a prerequisite for the management of the curb. SCAG can assist the City in funding a program of Coding the Curb and developing techniques and methodologies which can be applied in other Cities in the region. Additional data collection (such as a loading dock inventory or parking inventory) can be coupled with the Code the Curb effort to leverage delivery opportunities through other programs.
Implementation Examples: Washington DC
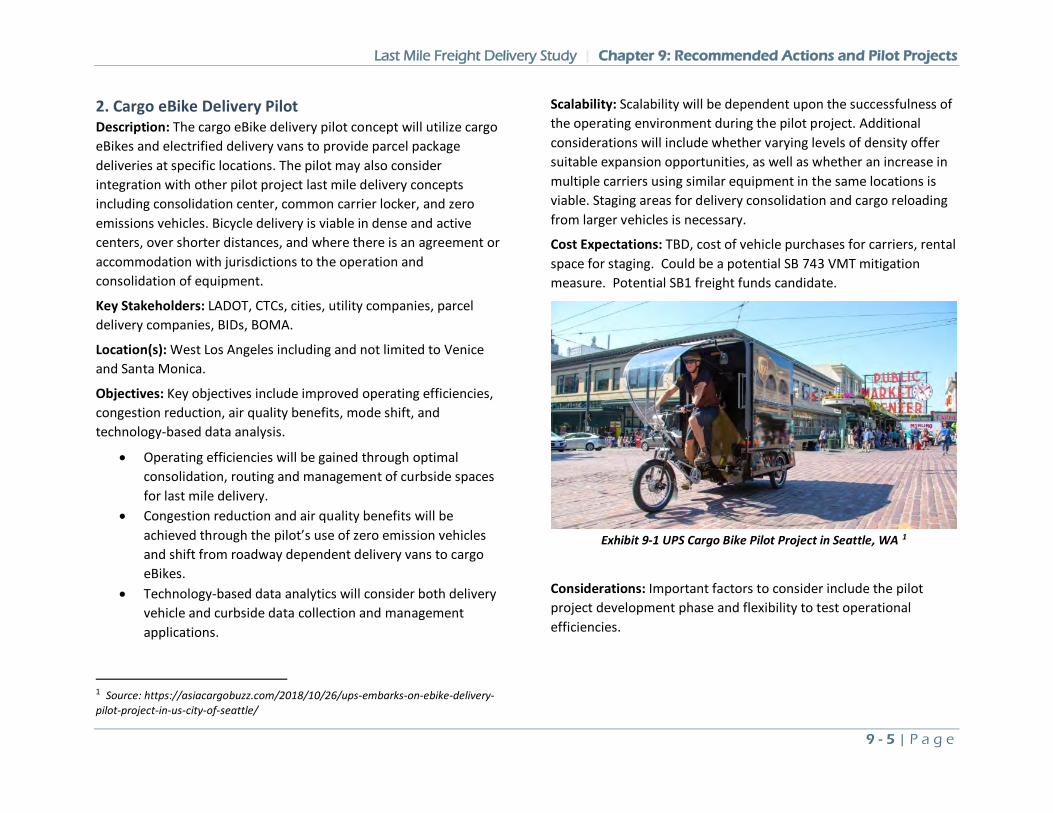
Last Mile Freight Delivery Study | Chapter 9: Recommended Actions and Pilot Projects
9 - 5 | P a g e
2. Cargo eBike Delivery Pilot Description: The cargo eBike delivery pilot concept will utilize cargo eBikes and electrified delivery vans to provide parcel package deliveries at specific locations. The pilot may also consider integration with other pilot project last mile delivery concepts including consolidation center, common carrier locker, and zero emissions vehicles. Bicycle delivery is viable in dense and active centers, over shorter distances, and where there is an agreement or accommodation with jurisdictions to the operation and consolidation of equipment.
Key Stakeholders: LADOT, CTCs, cities, utility companies, parcel delivery companies, BIDs, BOMA.
Location(s): West Los Angeles including and not limited to Venice and Santa Monica.
Objectives: Key objectives include improved operating efficiencies, congestion reduction, air quality benefits, mode shift, and technology-based data analysis.
• Operating efficiencies will be gained through optimal consolidation, routing and management of curbside spaces for last mile delivery.
• Congestion reduction and air quality benefits will be achieved through the pilot’s use of zero emission vehicles and shift from roadway dependent delivery vans to cargo eBikes.
• Technology-based data analytics will consider both delivery vehicle and curbside data collection and management applications.
1 Source: https://asiacargobuzz.com/2018/10/26/ups-embarks-on-ebike-delivery-pilot-project-in-us-city-of-seattle/
Scalability: Scalability will be dependent upon the successfulness of the operating environment during the pilot project. Additional considerations will include whether varying levels of density offer suitable expansion opportunities, as well as whether an increase in multiple carriers using similar equipment in the same locations is viable. Staging areas for delivery consolidation and cargo reloading from larger vehicles is necessary.
Cost Expectations: TBD, cost of vehicle purchases for carriers, rental space for staging. Could be a potential SB 743 VMT mitigation measure. Potential SB1 freight funds candidate.
Exhibit 9-1 UPS Cargo Bike Pilot Project in Seattle, WA 1
Considerations: Important factors to consider include the pilot project development phase and flexibility to test operational efficiencies.
Last Mile Freight Delivery Study | Chapter 9: Recommended Actions and Pilot Projects
9 - 6 | P a g e
• The pilot project development phase will necessitate identifying a comprehensive approach for the launch of a pilot project to be tested. Decisions will need to be made as to specific operations, such as consolidation needs, whether deliveries will target common carrier locations, and the extent of potential use for zero emission vehicles up through the supply chain process (warehouse to receiver).
• It will be very important to work with delivery companies to understand the requirements to meet expected operating efficiency targets in order to successfully deploy the pilot project. This may include, but not be limited to temporary physical roadway and/or curbside changes such as restriping, adding/removing signage, vendor equipment for delivery consolidation, routing needs of the pilot project, and/or data collection and analysis.
Potential Location: Venice was identified as a strong candidate for a cargo e-bike pilot program. Allocation of space at LADOT Lot 731 (2108 Pacific Avenue) at Venice Blvd./Pacific Ave. or LADOT Lot 740 (S. 301 Main St) at Main St./Rose Ave. could have space allocated to cargo bike staging. LADOT Lot 740 is particularly attractive due to its triangular shape resulting in an approximate 20-foot by 20-foot space at the southern end of the lot currently not able to be used for other purposes.
Implementation Examples: DHL cargo cycles in Netherlands and Germany. UPS Cargo e-bike in Seattle (Partnership with Seattle DOT and UW). FedEx electric bike delivery in Washington DC.
3. Revise Yellow Zone Restrictions Objective: To increase commercial loading space at times when on-street parking demand is low and provide flexible use of the curb space.
Description: Yellow curb zone restrictions are in effect Monday through Saturday 7:00 a.m. to 6:00 p.m. unless otherwise posted on signs; all other parking regulations are in effect outside hours noted. Generally, the lack of additional signage means that loading zone restrictions from 7:00 a.m. to 6:00 p.m. do not overlap with peak delivery times of 10:00 a.m. to 4:00 p.m. Furthermore, non-freight use of yellow zones is rarely prohibited by signage as non-commercial vehicles may load and unload passengers in yellow zones for up to 5 minutes. Based on the data collection of this study this leads to two times as much non-commercial activity than commercial activity in yellow zones. It is very difficult to enforce commercial loading areas if non-commercial uses are permitted—even for limited activities.
Key Stakeholders: LADOT.
Location(s): Case study areas.
Scalability: Yellow zone alterations could be made across the City, but most effective at a district level with good signage and outreach to ensure understanding of the shift in commercial parking time.
Cost Expectations: Staff cost of review, signage and painting.
Considerations: Outreach campaign for deliverers and receivers.
Implementation Examples: San Francisco and Carson are examples of California cities that further limit use of yellow zones.
4. Off-Peak Delivery Objectives: Key objectives include reduced vehicle miles traveled (VMT) and congestion, improved air quality benefits, greater operating efficiencies, and technology-based data analysis
Last Mile Freight Delivery Study | Chapter 9: Recommended Actions and Pilot Projects
9 - 7 | P a g e
• Congestion reduction and air quality benefits will be achieved through the pilot’s shifting of delivery vehicles from congested time periods to off-peak operations. This will reduce VMT, specifically by the amount of time it takes to locate parking, park, and perform deliveries.
• Key performance measures include travel speeds and service times, or dwell times. Previous pilot projects have found that substantial improvement in travel speeds combined with a reduction in service times result from off-peak deliveries, greatly improving a company’s operating efficiencies.
• Technology-based data analytics will consider both delivery vehicle and curbside data collection and management applications.
Description: The off-peak last mile freight pilot project will seek to improve peak period and business hour congestion, safety, and air quality issues, by shifting deliveries during these times to off-peak periods. Off-hour delivery programs involve incentives for shippers and receivers to make deliveries in off-hours when there is little conflicting demand at the curb. However, it should be noted that not all businesses are willing to extend employment hours due to increased labor costs and the nature of their delivery needs.
A targeted, voluntary off-hours delivery pilot program can be developed for high-demand areas of the City of Los Angeles. As experienced in the off-hours programs in New York City, Chicago, and Orlando, financial incentives are needed to offset labor and operational costs of off-hours delivery.
2 Holquin-Veras, J. (2010) Integrative Freight Demand Management in the New York City Metropolitan Area, Final Report, submitted to United States
Specific to the experience from the City of New York, the following aspects were described in the project’s final report2 as important for a successful off-hour delivery program:
• Receiver participation increases with the amount of incentive provided with different industry segments being more sensitive to incentives.
• Conducting off-hour deliveries is about 30 percent cheaper for the deliverer than delivering in regular hours.
• The carriers most inclined to participate are those that have delivery tours with fewer delivery stops.
• The best candidate for participation in off-hours deliveries are the food and consumer goods sector. In the New York City Off-Hours pilot program, the analysis estimated that financial incentives of $5,000 to $10,000 per receiver could shift 7 to 15 percent of delivery trips to off-hours.
• Unassisted deliveries provide a good alternative to the provision of financial incentives (key deliveries, delivery lockers, or two-stage deliveries to a secure area near the final receiver).
The City of Los Angeles implemented an off-hours delivery program called Operation Breezeway during the 1984 Olympic Games. In partnership with the California Highway Patrol and California Trucking Association, the program involved extensive outreach. Operation Breezeway offers a
Department of Transportation, Cooperative Agreement #DTOS59-07-H-0002
Last Mile Freight Delivery Study | Chapter 9: Recommended Actions and Pilot Projects
9 - 8 | P a g e
precedent that off-hours deliveries can be accepted in Los Angeles.
Several steps can be taken to develop a similar pilot project including:
a. Identify and approach industry leaders to recruit shippers and receivers to participate.
b. Target representatives of the retail, food, beverage, restaurant and their carriers.
c. Lobby to remove the ban on the delivery of alcoholic beverages between the hours of 8 p.m. and 3 a.m. in the Business and Professions Code Division 9: Alcoholic Beverages, Chapter 16: Regulatory Provisions Article 2, Hours and Sale and Delivery of Alcoholic Beverages section 25631. Alcoholic beverage delivery is a key off-hours delivery market.
d. Secure and develop financial incentives for off-hours deliveries for shippers and receivers.
e. Create a monitoring system for before and after assessments through traffic data, GPS units, and interviews of participants.
f. Be cognizant off-hours delivery zone placement in terms of noise and lighting.
Other strategies such as consolidation centers, common carrier lockers, and zero emission vehicles may be considered as part of the pilot project.
Key Stakeholders: SCAG, CTCs, cities, delivery companies, BOMA, receivers.
Location(s): Downtown and West Los Angeles, and multiple locations throughout the City.
Scalability: There is a need to make connections between receivers and delivery companies best suited to perform off-peak deliveries. Previous pilot project results have indicated that certain industries including consumer and food service businesses are most likely to receive off-peak deliveries. This reflects a broad geographic opportunity.
Cost Expectations: TBD.
Considerations: Important factors to consider include the pilot project development phase and scalability with respect to an incentive-based program.
• SCAG has been active with identified companies which have participated in previous pilot projects, yielding strong opportunities. Regardless, it will be highly important during the development phase to work in a complimentary fashion with receivers and the companies directly supplying shipments to them. The most critical part of this pilot is buy-in from receiver businesses as they drive the shipping and receiving schedule.
• Previous pilot projects have included financial incentives for both receivers and delivery companies, to offset increased labor costs for off-peak deliveries. From a scalability perspective, a tangible incentive will need to be identified that can be applied across a much broader receiver/carrier spectrum in order to achieve increasing benefits for a City or region. This is an important policy decision to consider, as there may need to be an examination of incentive structures to determine whether there is long-term viability.
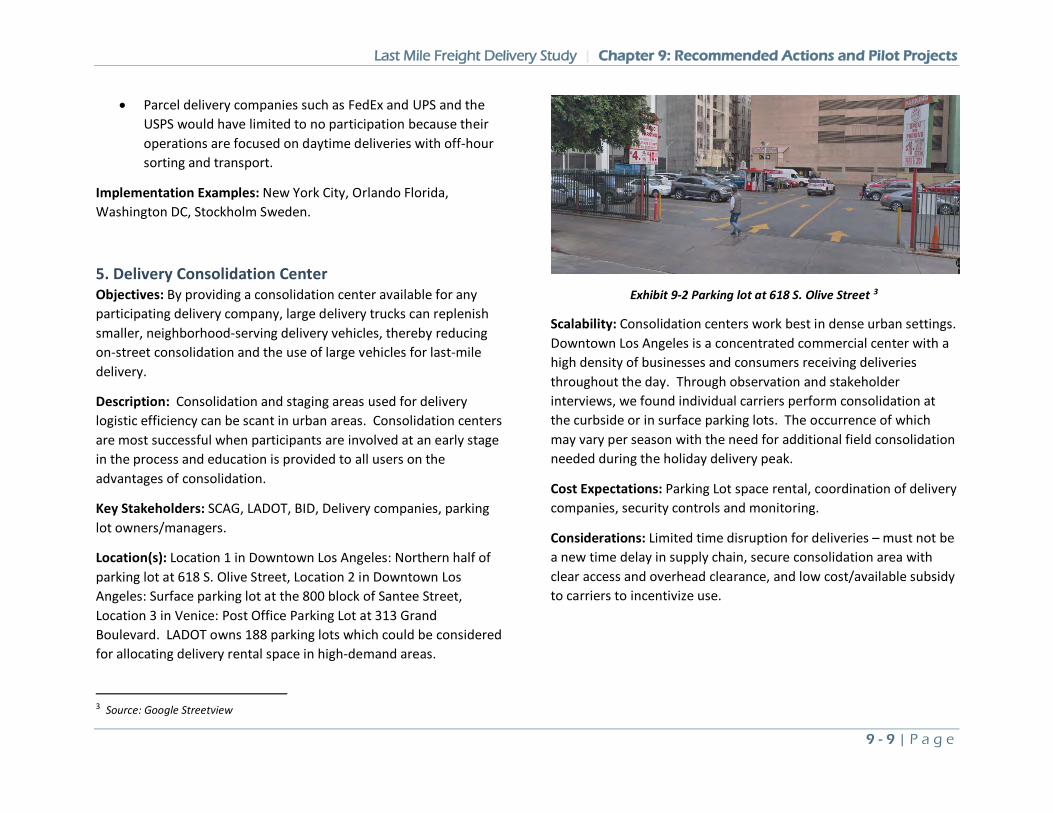
Last Mile Freight Delivery Study | Chapter 9: Recommended Actions and Pilot Projects
9 - 9 | P a g e
• Parcel delivery companies such as FedEx and UPS and the USPS would have limited to no participation because their operations are focused on daytime deliveries with off-hour sorting and transport.
Implementation Examples: New York City, Orlando Florida, Washington DC, Stockholm Sweden.
5. Delivery Consolidation Center Objectives: By providing a consolidation center available for any participating delivery company, large delivery trucks can replenish smaller, neighborhood-serving delivery vehicles, thereby reducing on-street consolidation and the use of large vehicles for last-mile delivery.
Description: Consolidation and staging areas used for delivery logistic efficiency can be scant in urban areas. Consolidation centers are most successful when participants are involved at an early stage in the process and education is provided to all users on the advantages of consolidation.
Key Stakeholders: SCAG, LADOT, BID, Delivery companies, parking lot owners/managers.
Location(s): Location 1 in Downtown Los Angeles: Northern half of parking lot at 618 S. Olive Street, Location 2 in Downtown Los Angeles: Surface parking lot at the 800 block of Santee Street, Location 3 in Venice: Post Office Parking Lot at 313 Grand Boulevard. LADOT owns 188 parking lots which could be considered for allocating delivery rental space in high-demand areas.
3 Source: Google Streetview
Exhibit 9-2 Parking lot at 618 S. Olive Street 3
Scalability: Consolidation centers work best in dense urban settings. Downtown Los Angeles is a concentrated commercial center with a high density of businesses and consumers receiving deliveries throughout the day. Through observation and stakeholder interviews, we found individual carriers perform consolidation at the curbside or in surface parking lots. The occurrence of which may vary per season with the need for additional field consolidation needed during the holiday delivery peak.
Cost Expectations: Parking Lot space rental, coordination of delivery companies, security controls and monitoring.
Considerations: Limited time disruption for deliveries – must not be a new time delay in supply chain, secure consolidation area with clear access and overhead clearance, and low cost/available subsidy to carriers to incentivize use.
Last Mile Freight Delivery Study | Chapter 9: Recommended Actions and Pilot Projects
9 - 10 | P a g e
Implementation Examples: Monaco, La Rochelle, France Venice, Italy, Nuernberg and Cologne Germany. Amazon Prime Now (single retailer) on San Fernando Road in Atwater Village.
6. Common Carrier Lockers Objectives: Provide centralized deliver locations to facilitate shorter delivery times for large buildings or busy areas. The increased efficiency for package drop-off could mean that receivers have access to their parcels faster than an office or home delivery.
Description: Delivery lockers enable secure deliveries in the absence of a receiving person, while concentrating the delivery location for parcels in central locations to lower the total time for delivery trips. They reduce unsuccessful deliveries and can be supportive of off-hour deliveries. Viable locations include mail centers, office buildings, residential buildings, neighborhood entrances, retail stores, universities and institutions. Many delivery lockers are located inside of buildings for climate and security purposes, however they could be located in activity centers such as transit stops or other public spaces. The pilot could include technology to enable anyone to sign up and receive deliveries at lockers, increasing their appeal.
Key Stakeholders: SCAG/LADOT/BID/BOMA and Metro, Building owners and managers, public space owners and managers (such as malls, transit area locations and other high-volume areas), and delivery companies.
Location(s): In-Building Lockers at mail centers, office buildings, residential buildings, neighborhood entrances, retail stores, universities and institutions. Public Area Lockers can be placed at high-ridership locations in the Metro system. The highest ridership locations are located in Downtown Los Angeles, however more
desirable locations at transfer stations or park and ride locations would be more desirable for customers as lockers would be more effective closer to the point of residence rather than commercial activity. The following locations are recommended due to their position in the Metro system or if the station’s park and ride lot exceeded 200 parking spaces.
*Recommended pilot locations
• Orange Line - North Hollywood Red Line/Orange Line*, Van Nuys*, Sepulveda*, Balboa, Reseda, Pierce College, Canoga, Chatsworth*
• Gold Line - East LA Civic Center • Green Line - Crenshaw, Willowbrook/Rosa Parks,
Hawthorne/Lennox, Aviation/LAX, Redondo Beach, Harbor Freeway, Lakewood, Long Beach Bl, Norwalk*
• Red/Purple Line - Westlake/Macarthur Park, Hollywood/Highland*, Universal City/Studio City*, North Hollywood* (repeat)
• Expo Line - Expo/Crenshaw, La Cienega/Jefferson*, Expo/Sepulveda
• Blue Line - Willowbrook/Rosa Parks (repeat), Artesia*,Del Amo, Willow Street*, Downtown Long Beach
• Silver line - El Monte Station, Harbor Freeway (repeat), Manchester Rosecrans, Harbor Gateway Transit Center*
• Other - CSUN Transit Center (Rapid 744, 239, 240), Van Nuys/San Fernando Road (Rapid 794, Rapid 744, 94, 224, 233), Sherman Oaks at Sepulveda (Rapid 744, Rapid 788, Rapid 734), Inglewood Transit Center (Rapid 740, 442, 40), Westwood at Wilshire (Rapid 720, Rapid 734, 20)
Scalability: Delivery lockers can be scaled easily—the benefits of common carrier delivery locations are proportional to their
Last Mile Freight Delivery Study | Chapter 9: Recommended Actions and Pilot Projects
9 - 11 | P a g e
installation and use—even a single site would provide the benefit of shorter delivery times.
Cost Expectations: Locker installation and coordination with delivery companies.
Considerations: Location, hours of operation, security, protocols for delivery and pickup.
Implementation Examples: Amazon Lockers, Parcel Pending, American Locker, Packstation, USPS gopost®.
7. LA Express Park Commercial Module Objectives: To provide online and mobile commercial parking space reservations and bring transparency to commercial parking demand for both the City and commercial deliverers.
Description: Currently pricing is not used to encourage turnover of commercial loading zones in Los Angeles. A pricing program for commercial loading zones would encourage turnover, facilitate better enforcement, and allow reserving of space in preparation for deliveries. The performance-based LA Express Park parking pricing program could be expanded to contain a module for commercial loading zone reservations. Approximately 6,300 curb parking spaces in Downtown Los Angeles, 500 spaces in Westwood and 900 spaces in Hollywood are under the LA Express Park program. Adding commercial spaces would entail about 10 to 15 percent more spaces added to manage the use of commercial loading zones.
Key Stakeholders: LADOT, app developers (ParkMe, Parker, ParkMobile).
Location(s): Downtown Los Angeles, Westwood, and Hollywood.
Scalability: LA Express Park is currently operating in Downtown Los Angeles, Westwood, and Hollywood and could be scaled along with the expansion of LA Express Park to other parts of the City.
Cost Expectations: Sensor installation, website design and integration, administration of commercial module.
Considerations: The level of pricing and allocation of delivery space will need to be developed through survey of current uses and forecasted demand. This will likely require adjustment once implemented. Enforcement of non-compliance would require additional enforcement resources.
Implementation Examples: Washington DC online freight permits. Chicago has separate payment for street parking and loading zone parking. San Francisco yellow zone meters and permits.
8. Integration of Postal Service Guidelines into Building Code Objectives: To review:
• Front door to mailbox distance (general less than 25 feet), with exceptions for big lobbies.
• Loading zones in front of buildings, potential for designated delivery onsite parking or loading dock access when necessary.
• Integrate new height clearances required for trucks in new buildings.
Description: The purpose of the Los Angeles Building Code is to safeguard life, limb, health, property and public welfare by regulating and controlling the design, construction, quality of materials, use and occupancy, location and maintenance of all buildings and structures erected or to be erected within the city,
Last Mile Freight Delivery Study | Chapter 9: Recommended Actions and Pilot Projects
9 - 12 | P a g e
and by regulating certain grading operations. The City of Los Angeles Building Code is codified in the Los Angeles Municipal Code, Chapter IX, Article I.
Upon cursory review there is no direction to how mailrooms or parcel lockers should be placed. The US Postal Service National Delivery Planning Standards: A Guide for Builders and Developers could be integrated as appropriate into the building code or representatives from USPS could be integrated into the building plan check process. Non-City agencies are consulted in the plan check process such as AQMD, LAUSD, the California Department of Conservation Division of Oil, Gas, and Geothermal Resources and Cal OSHA.
Key Stakeholders: Department of Building and Safety, Department of City Planning, USPS.
Location(s): Building Permits.
Scalability: Based on USPS Staff availability.
Cost Expectations: Staff cost and cost of involving another layer of building permit review.
Considerations: Role of USPS in building permit process, type of projects to review, review standards and protocols.
Other Recommendations for Further Consideration Other actions recommended for further consideration require additional examination of specific block conditions (beyond those described in Chapter 9) or additional policy review by agency staff.
Recommendations to be Considered Under Specific Block Conditions Chapter 9: Case Studies in the City of Los Angeles includes specific recommendations about revising loading conditions at the specific blocks analyzed in the study. The types of recommendations could be extended to other parts of the City based on conditions in other blocks identified as having delivery condition issues.
Alley Strategies • Develop commercial-only alleys to act as extended loading
area) – require review of safety access (proposed for Lindley Place)
• Implement commercial parking spots in one-way alleys in areas with limited curbside space for loading (proposed for alley between Hill Street and Mercury Court south of 6th Street).
Lane Strategies • Consider Floating/Offset transit lane on Wilshire
Boulevard to move the peak hour Metro Rapid lane from the curb area in locations where curb access is a priority over vehicle throughput.
• Install concrete pads at loading zones – for roadway maintenance and loading zone delineation
• Provide for signed median loading in two-way left turn lanes (TWLTL) where feasible and safe.
Shared Space Recommendations Consider options for making the curb and roadway area a flex area which can be used for different activities at different times and conditions. Slow-speed or low volume areas hold promise in developing shared space activities.
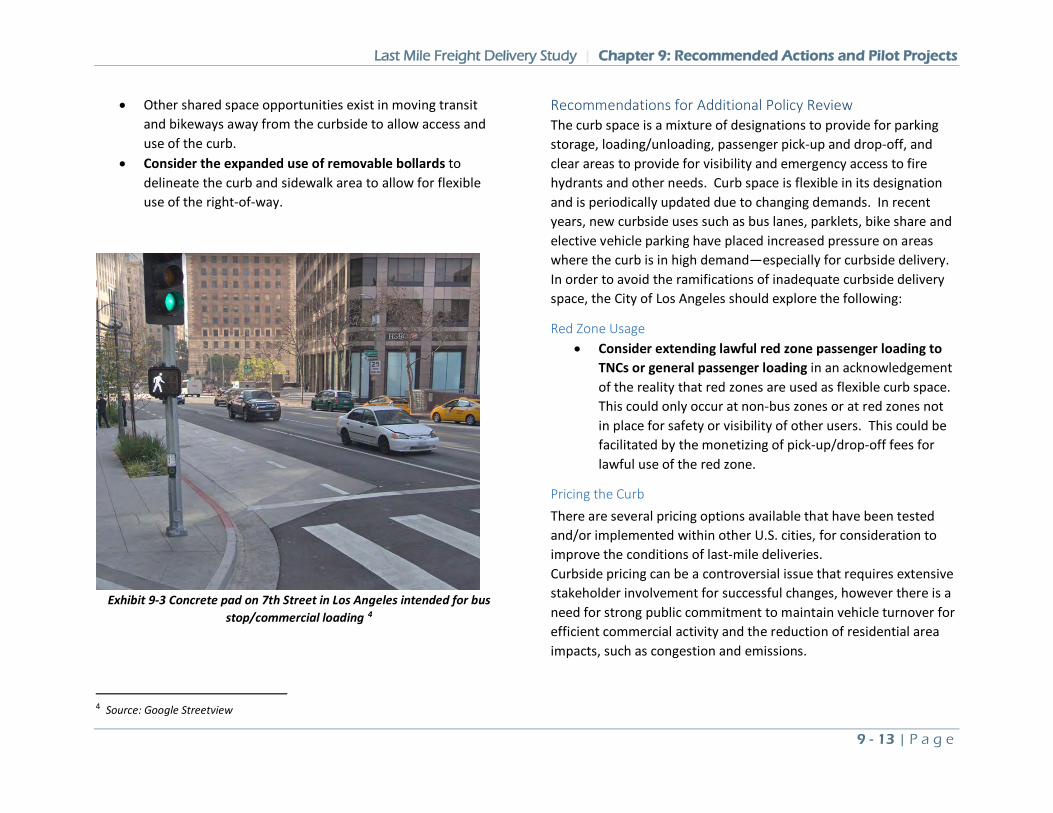
Last Mile Freight Delivery Study | Chapter 9: Recommended Actions and Pilot Projects
9 - 13 | P a g e
• Other shared space opportunities exist in moving transit and bikeways away from the curbside to allow access and use of the curb.
• Consider the expanded use of removable bollards to delineate the curb and sidewalk area to allow for flexible use of the right-of-way.
Exhibit 9-3 Concrete pad on 7th Street in Los Angeles intended for bus
stop/commercial loading 4
4 Source: Google Streetview
Recommendations for Additional Policy Review The curb space is a mixture of designations to provide for parking storage, loading/unloading, passenger pick-up and drop-off, and clear areas to provide for visibility and emergency access to fire hydrants and other needs. Curb space is flexible in its designation and is periodically updated due to changing demands. In recent years, new curbside uses such as bus lanes, parklets, bike share and elective vehicle parking have placed increased pressure on areas where the curb is in high demand—especially for curbside delivery. In order to avoid the ramifications of inadequate curbside delivery space, the City of Los Angeles should explore the following:
Red Zone Usage • Consider extending lawful red zone passenger loading to
TNCs or general passenger loading in an acknowledgement of the reality that red zones are used as flexible curb space. This could only occur at non-bus zones or at red zones not in place for safety or visibility of other users. This could be facilitated by the monetizing of pick-up/drop-off fees for lawful use of the red zone.
Pricing the Curb There are several pricing options available that have been tested and/or implemented within other U.S. cities, for consideration to improve the conditions of last-mile deliveries. Curbside pricing can be a controversial issue that requires extensive stakeholder involvement for successful changes, however there is a need for strong public commitment to maintain vehicle turnover for efficient commercial activity and the reduction of residential area impacts, such as congestion and emissions.
Last Mile Freight Delivery Study | Chapter 9: Recommended Actions and Pilot Projects
9 - 14 | P a g e
Presently the curb is priced at metered locations to encourage vehicle turnover and through permits for preferential parking districts, overnight parking and oversized vehicles to reduce impacts on neighborhoods. Pricing strategies hold promise in increasing the efficiency of curb use, by encouraging delivery and person-throughput rather than vehicle storage and supporting greater access and near-term technology automation. In terms of municipal on-street parking management, the City of Los Angeles is at the forefront with LA Express Park™ which recently expanded from Downtown Los Angeles to Hollywood and Westwood. It is used in areas with the highest on-street demand, yet is only currently focused on personal vehicle parking, and not on deliveries, passenger pick-up/drop-off, or the allocation of curb space in general. However, it is a platform from which the City could expand curb pricing in the following ways:
• Commercial Parking Pricing – currently unpriced, commercial loading zones could have pricing through permit (daily, monthly, and annual) or by meter or pay-by-phone to help discourage non-loading use and vehicle turn-over. Peer Cities with commercial zone pricing are Washington DC and Chicago, IL.
• Pricing for passenger pick-up and drop-off, waiting or other short-term occupancy based on time used rather than pre-paid in order to encourage vehicle turn-over.
• Parking Navigation - Digital navigation tools could use digitized curb information to direct drivers to real-time parking options and display restrictions and pricing to allow for better individual parking decisions.
• Price parking to provide discounts for high occupancy vehicles in locations where carpooling should be encouraged. This concept is used within parking lots
(generally through a Travel Demand Management Ordinance), however the concept could be applied at the curb.
Reassess On-Street Commercial Parking Regulations Cities can specify the duration and use of their commercial loading zones and enforce it through sensors, video, or in-person enforcement. Currently the City of Los Angeles has very permissive use of commercial loading zones that allows for general parking during non-business hours and non-commercial loading at all hours. Strengthening the restrictions can discourage non-delivery use such as:
• Prohibit passenger use of loading zones. • Designate specific allowed loading uses such as parcel
delivery or freight delivery. • Convert on-street parking to loading areas where ample
off-street parking is available. Revenue loss of parking meters could be offset by commercial parking permitting, metering or another comprehensive pricing program.
Reassess allocation of street space from parking storage to pick-up and drop-off activity Comprehensive assessment of all available parking (public and private, on-street and off-street) supply and demand to determine the amount of parking space required to meet demand. If adequate parking supply is provided off-street, this could allow for the reallocation of curb space from long-term parking to short-term uses such as delivery or passenger loading or through movement of vehicles or bicycles.
Last Mile Freight Delivery Study | Chapter 9: Recommended Actions and Pilot Projects
9 - 15 | P a g e
Delivery Consolidation Consolidation and staging areas used for delivery logistic efficiency can be scant in urban areas. Consolidation centers are most successful when participants are involved at an early stage in the process and education is provided to all users on the advantages of consolidation. Identifying and targeting industry segments that would benefit the most from consolidation centers is the first step in the program.
Several strategy options for high density areas can be employed to make for more efficient last-mile conditions:
• Consider consolidation centers in underutilized parking lot included as recommended pilot project #5 as previously presented.
• Encourage buildings and landowners to make off-street space available for vehicle staging when loading docks are occupied to reduce double parking or parking in red zones while awaiting loading dock availability.
• Encourage the consolidation of off-site delivery credentialing and staging- In downtown areas where loading dock space and security is at a premium, off-site delivery credentialing and staging, possibly combined with consolidation centers, can reduce loading area congestion.
• Encourage Joint Procurement Pilot Program for business supplies and deliveries – in partnership with a BID and business-to-business supplier.
• Waste Consolidation at the block or district level to reduce overall waste trips and leverage recycling and waste diversion. Potential funding through stateCap and Trade funds (CalRecycle).
One possible source of pushback in the implementation of consolidation is the is the loss of face-to-face contact between supplier and receiver. In some cases, such as restaurant delivery, consolidation strategies may not be suitable. Foodservice and other service company delivery drivers are often involved in sales and work to maintain relationships with their customers. Delivery consolidation is not an appropriate mechanism for such companies as there is minimal benefit versus risking loss of sales if the delivery contact relationship is not established and maintained.
Building Improvement Recommendations Inefficient building space/protocols for deliveries are a major source of time spent during deliveries. The City could provide incentives for the inclusion of postal/parcel lockers in commercial and residential buildings to consolidate delivery locations. The City of Los Angeles Design Studio has stressed the importance of mailroom/parcel locker room location within new developments as well as limiting curb conflicts. However, loading space is only required for buildings when commercial space is present.
• Update the building and zoning codes to require loading space more than the current 400 square feet plus greater amounts for buildings of 50,000 square feet or more to specify:
a. Provide design controls/approvals specifically for delivery access and passenger loading.
b. Increase minimum clearance for garages to allow for freight vehicles.
• In the near-term, create commercial loading adjacent to inadequate loading dock areas to alleviate inadequate on-site loading areas.
Last Mile Freight Delivery Study | Chapter 9: Recommended Actions and Pilot Projects
9 - 16 | P a g e
Clean Fuel Vehicle Incentives The City can play an important role in partnering with shippers to secure grant funding for alternative vehicle procurement and to provide infrastructure to support these vehicles which include low- and zero-emissions, connected and autonomous, and non-motorized vehicles. Each could be supported at the curbside such as BlueLA charging stations or in off-street consolidation areas.
There are several challenges to the increased use of electric vehicles. There is not enough capacity in the infrastructure supply side to serve electric vehicle fleets. This is especially true for electric trucks which need long charging periods and power in excess of what currently serves warehouses and distribution centers. Curbside charging would not be applicable to large vehicle charging due to the rate of turnover and short dwell durations. Off-street charging locations may be viable in areas with high density of deliveries such as retail/urban areas such as malls, big-box retail locations, and downtown locations.
• Incentives for clean delivery vehicles – facilitate applications for Low Carbon Transportation (LCT) Cap and Trade funds (CARB administered) and other partnering opportunities to encourage alternative delivery vehicles such as cargo bicycles.
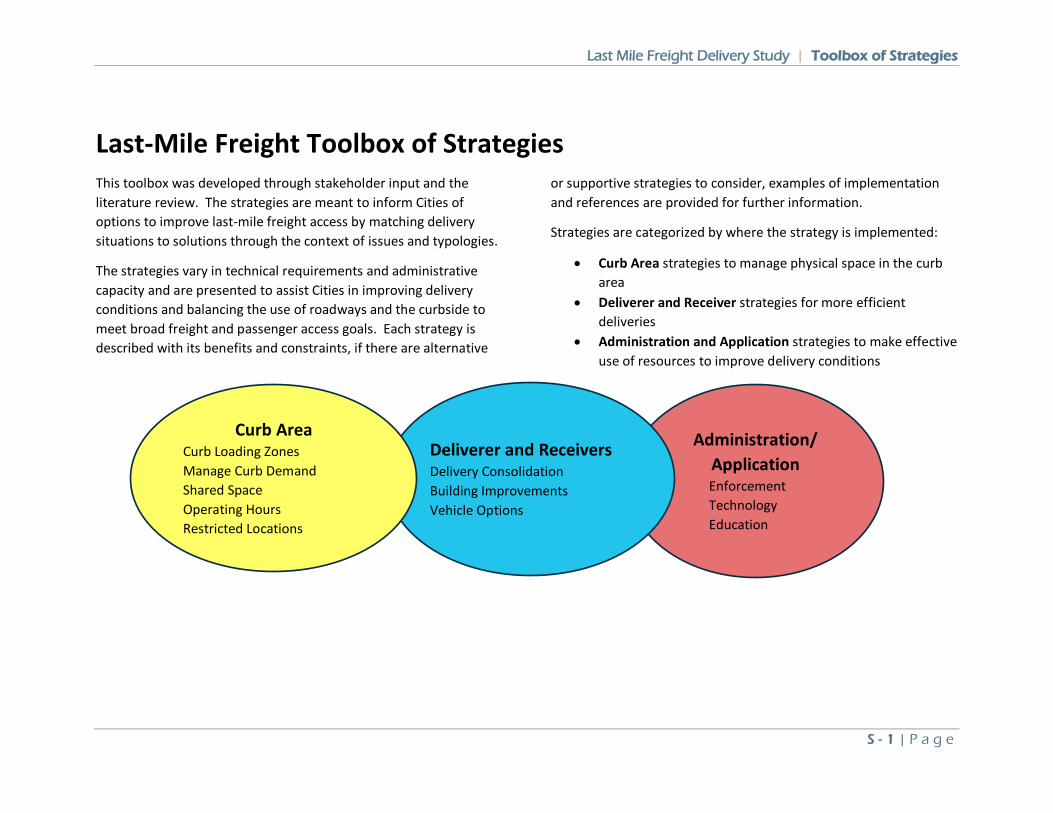
Last Mile Freight Delivery Study | Toolbox of Strategies
S - 1 | P a g e
Last-Mile Freight Toolbox of Strategies
This toolbox was developed through stakeholder input and the literature review. The strategies are meant to inform Cities of options to improve last-mile freight access by matching delivery situations to solutions through the context of issues and typologies.
The strategies vary in technical requirements and administrative capacity and are presented to assist Cities in improving delivery conditions and balancing the use of roadways and the curbside to meet broad freight and passenger access goals. Each strategy is described with its benefits and constraints, if there are alternative
or supportive strategies to consider, examples of implementation and references are provided for further information.
Strategies are categorized by where the strategy is implemented:
• Curb Area strategies to manage physical space in the curb area
• Deliverer and Receiver strategies for more efficient deliveries
• Administration and Application strategies to make effective use of resources to improve delivery conditions
Administration/ Application Enforcement Technology Education
Deliverer and Receivers Delivery Consolidation Building Improvements Vehicle Options
Curb Area Curb Loading Zones Manage Curb Demand Shared Space Operating Hours Restricted Locations
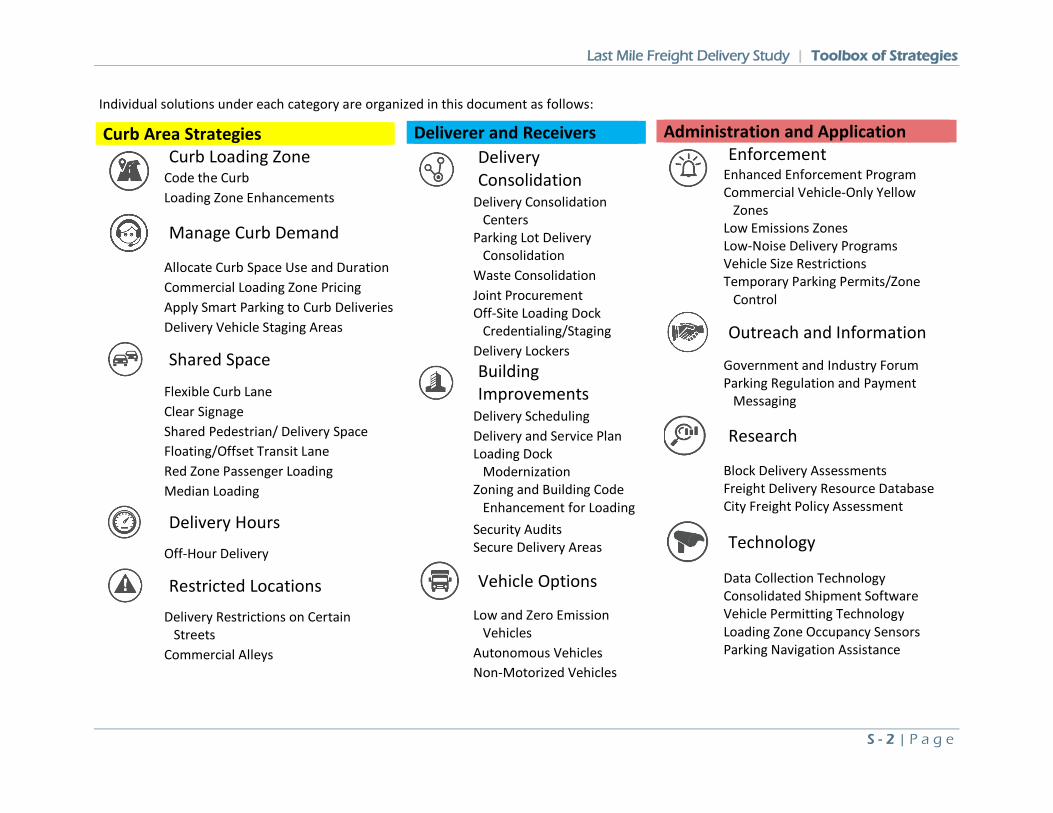
Last Mile Freight Delivery Study | Toolbox of Strategies
S - 2 | P a g e
Individual solutions under each category are organized in this document as follows: Deliverer and Receivers
Delivery Consolidation
Delivery Consolidation
Centers
Parking Lot Delivery
Consolidation
Waste Consolidation
Joint Procurement
Off-Site Loading Dock
Credentialing/Staging
Delivery Lockers
Building Improvements
Delivery Scheduling
Delivery and Service Plan
Loading Dock
Modernization
Zoning and Building Code
Enhancement for Loading
Security Audits Secure Delivery Areas
Vehicle Options
Low and Zero Emission
Vehicles
Autonomous Vehicles
Non-Motorized Vehicles
Administration and Application
Enforcement
Enhanced Enforcement Program
Commercial Vehicle-Only Yellow
Zones Low Emissions Zones Low-Noise Delivery Programs Vehicle Size Restrictions
Temporary Parking Permits/Zone
Control
Outreach and Information
Government and Industry Forum
Parking Regulation and Payment
Messaging
Research
Block Delivery Assessments Freight Delivery Resource Database City Freight Policy Assessment
Technology
Data Collection Technology Consolidated Shipment Software Vehicle Permitting Technology Loading Zone Occupancy Sensors Parking Navigation Assistance
Curb Area Strategies
Curb Loading Zone Code the Curb
Loading Zone Enhancements
Manage Curb Demand
Allocate Curb Space Use and Duration
Commercial Loading Zone Pricing
Apply Smart Parking to Curb Deliveries
Delivery Vehicle Staging Areas
Shared Space
Flexible Curb Lane
Clear Signage
Shared Pedestrian/ Delivery Space
Floating/Offset Transit Lane
Red Zone Passenger Loading
Median Loading
Delivery Hours Off-Hour Delivery
Restricted Locations
Delivery Restrictions on Certain
Streets
Commercial Alleys
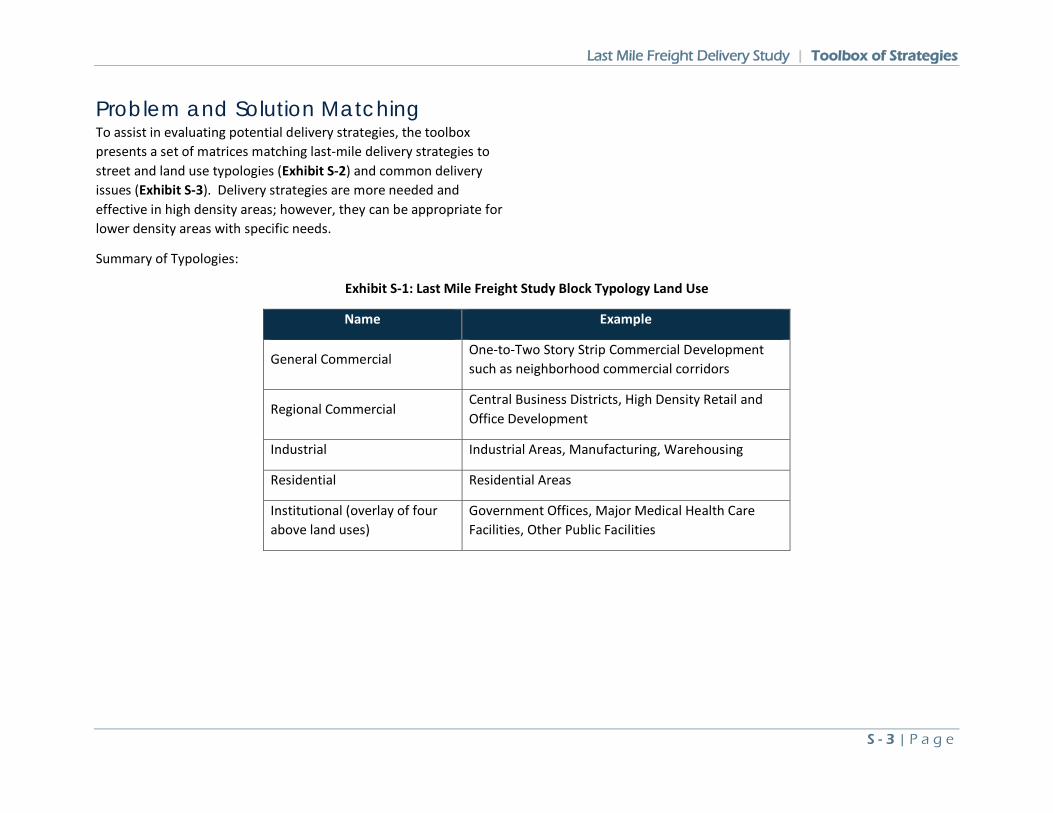
Last Mile Freight Delivery Study | Toolbox of Strategies
S - 3 | P a g e
Problem and Solution Matching To assist in evaluating potential delivery strategies, the toolbox presents a set of matrices matching last-mile delivery strategies to street and land use typologies (Exhibit S-2) and common delivery issues (Exhibit S-3). Delivery strategies are more needed and effective in high density areas; however, they can be appropriate for lower density areas with specific needs.
Summary of Typologies:
Exhibit S-1: Last Mile Freight Study Block Typology Land Use
Name Example
General Commercial One-to-Two Story Strip Commercial Development such as neighborhood commercial corridors
Regional Commercial Central Business Districts, High Density Retail and Office Development
Industrial Industrial Areas, Manufacturing, Warehousing
Residential Residential Areas
Institutional (overlay of four above land uses)
Government Offices, Major Medical Health Care Facilities, Other Public Facilities
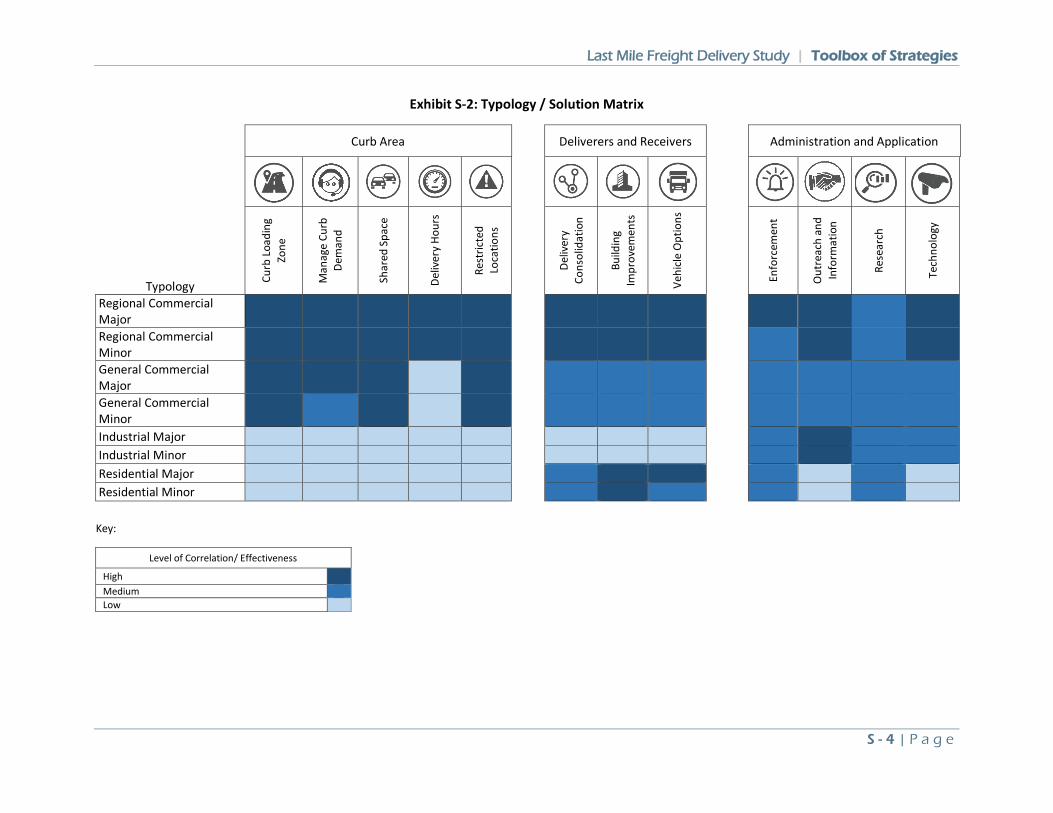
Last Mile Freight Delivery Study | Toolbox of Strategies
S - 4 | P a g e
Exhibit S-2: Typology / Solution Matrix
Curb Area
Deliverers and Receivers
Administration and Application
Typology Curb
Loa
ding
Zo
ne
Man
age
Curb
De
man
d
Shar
ed S
pace
Deliv
ery
Hour
s
Rest
ricte
d Lo
catio
ns
Deliv
ery
Cons
olid
atio
n
Build
ing
Impr
ovem
ents
Vehi
cle
Opt
ions
Enfo
rcem
ent
Out
reac
h an
d In
form
atio
n
Rese
arch
Tech
nolo
gy
Regional Commercial Major Regional Commercial Minor General Commercial Major General Commercial Minor Industrial Major Industrial Minor Residential Major Residential Minor
Key:
Level of Correlation/ Effectiveness
High Medium Low
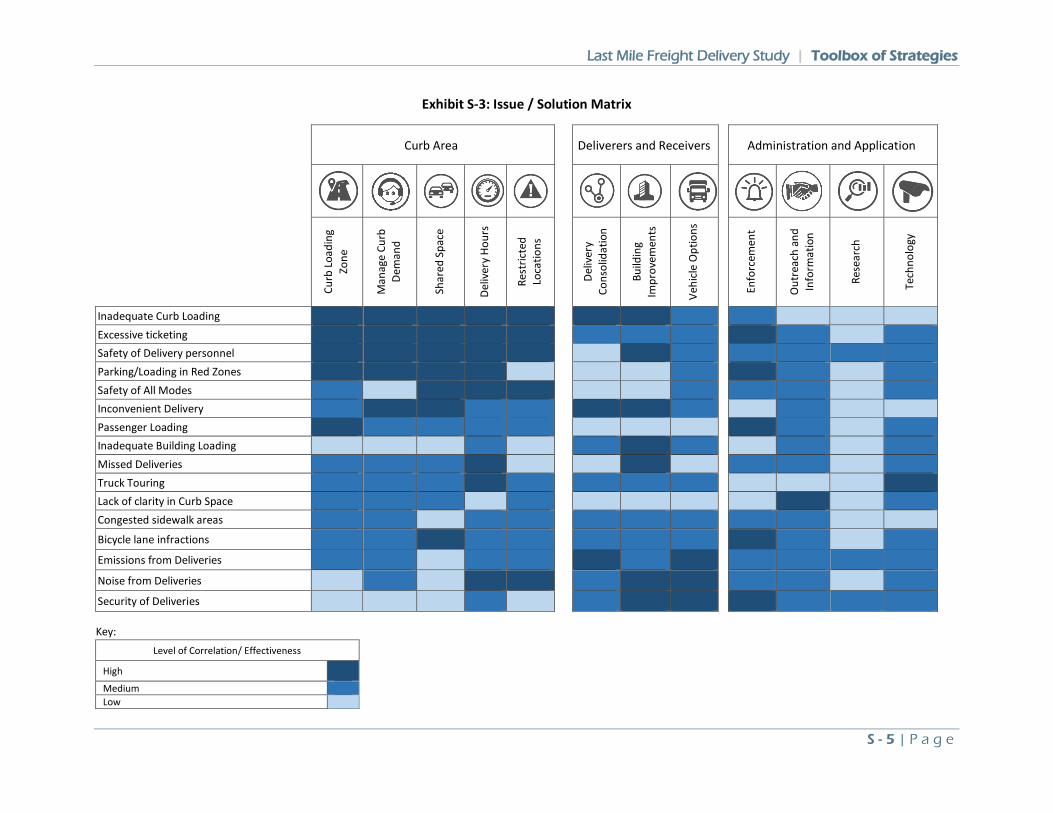
Last Mile Freight Delivery Study | Toolbox of Strategies
S - 5 | P a g e
Exhibit S-3: Issue / Solution Matrix
Curb Area
Deliverers and Receivers
Administration and Application
Curb
Loa
ding
Zo
ne
Man
age
Curb
De
man
d
Shar
ed S
pace
Deliv
ery
Hour
s
Rest
ricte
d Lo
catio
ns
Deliv
ery
Cons
olid
atio
n
Build
ing
Impr
ovem
ents
Vehi
cle
Opt
ions
Enfo
rcem
ent
Out
reac
h an
d In
form
atio
n
Rese
arch
Tech
nolo
gy
Inadequate Curb Loading Excessive ticketing Safety of Delivery personnel Parking/Loading in Red Zones Safety of All Modes Inconvenient Delivery Passenger Loading Inadequate Building Loading Missed Deliveries Truck Touring Lack of clarity in Curb Space Congested sidewalk areas Bicycle lane infractions Emissions from Deliveries Noise from Deliveries Security of Deliveries
Key: Level of Correlation/ Effectiveness
High Medium Low
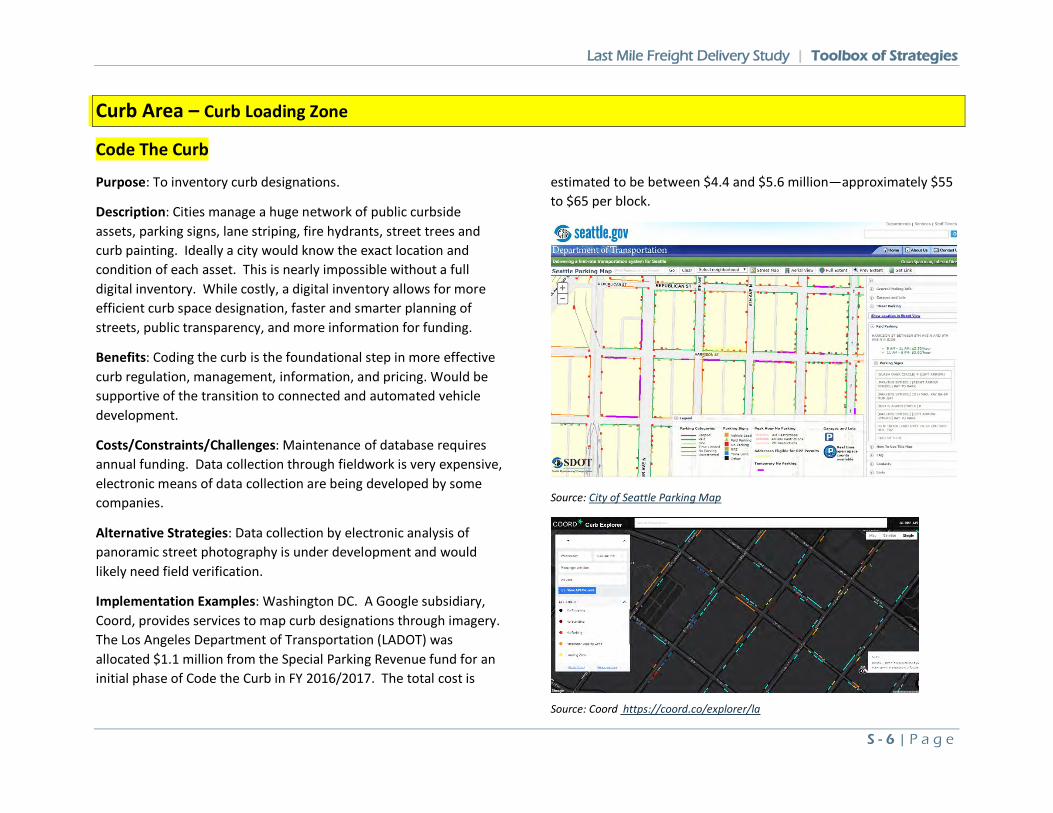
Last Mile Freight Delivery Study | Toolbox of Strategies
S - 6 | P a g e
Curb Area – Curb Loading Zone
Code The Curb
Purpose: To inventory curb designations.
Description: Cities manage a huge network of public curbside assets, parking signs, lane striping, fire hydrants, street trees and curb painting. Ideally a city would know the exact location and condition of each asset. This is nearly impossible without a full digital inventory. While costly, a digital inventory allows for more efficient curb space designation, faster and smarter planning of streets, public transparency, and more information for funding.
Benefits: Coding the curb is the foundational step in more effective curb regulation, management, information, and pricing. Would be supportive of the transition to connected and automated vehicle development.
Costs/Constraints/Challenges: Maintenance of database requires annual funding. Data collection through fieldwork is very expensive, electronic means of data collection are being developed by some companies.
Alternative Strategies: Data collection by electronic analysis of panoramic street photography is under development and would likely need field verification.
Implementation Examples: Washington DC. A Google subsidiary, Coord, provides services to map curb designations through imagery. The Los Angeles Department of Transportation (LADOT) was allocated $1.1 million from the Special Parking Revenue fund for an initial phase of Code the Curb in FY 2016/2017. The total cost is
estimated to be between $4.4 and $5.6 million—approximately $55 to $65 per block.
Source: City of Seattle Parking Map
Source: Coord https://coord.co/explorer/la
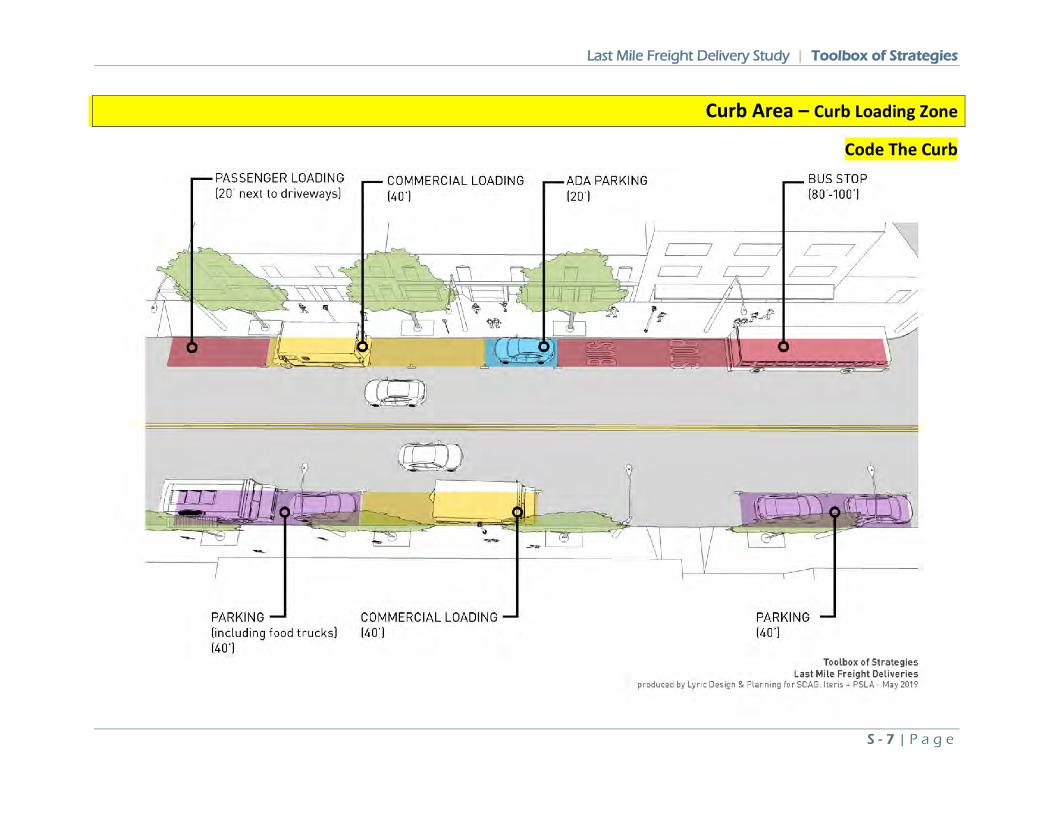
Last Mile Freight Delivery Study | Toolbox of Strategies
S - 7 | P a g e
Curb Area – Curb Loading Zone
Code The Curb
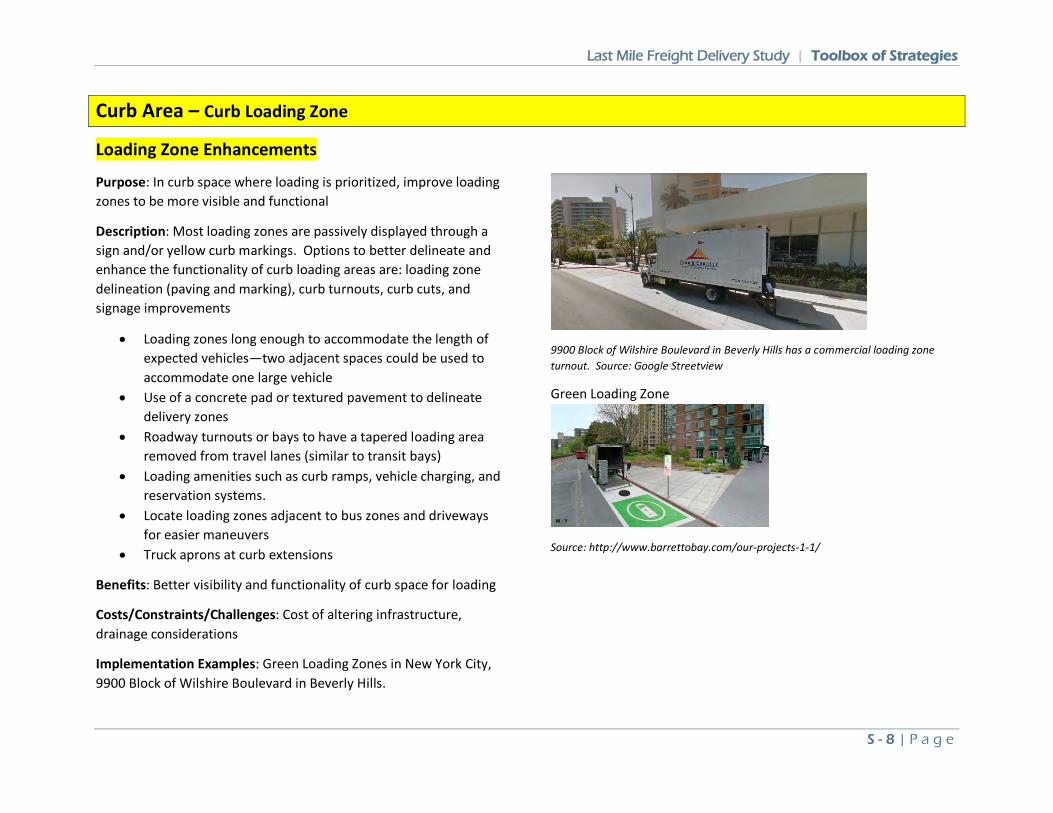
Last Mile Freight Delivery Study | Toolbox of Strategies
S - 8 | P a g e
Curb Area – Curb Loading Zone
Loading Zone Enhancements
Purpose: In curb space where loading is prioritized, improve loading zones to be more visible and functional
Description: Most loading zones are passively displayed through a sign and/or yellow curb markings. Options to better delineate and enhance the functionality of curb loading areas are: loading zone delineation (paving and marking), curb turnouts, curb cuts, and signage improvements
• Loading zones long enough to accommodate the length of expected vehicles—two adjacent spaces could be used to accommodate one large vehicle
• Use of a concrete pad or textured pavement to delineate delivery zones
• Roadway turnouts or bays to have a tapered loading area removed from travel lanes (similar to transit bays)
• Loading amenities such as curb ramps, vehicle charging, and reservation systems.
• Locate loading zones adjacent to bus zones and driveways for easier maneuvers
• Truck aprons at curb extensions
Benefits: Better visibility and functionality of curb space for loading
Costs/Constraints/Challenges: Cost of altering infrastructure, drainage considerations
Implementation Examples: Green Loading Zones in New York City, 9900 Block of Wilshire Boulevard in Beverly Hills.
9900 Block of Wilshire Boulevard in Beverly Hills has a commercial loading zone turnout. Source: Google Streetview
Green Loading Zone
Source: http://www.barrettobay.com/our-projects-1-1/
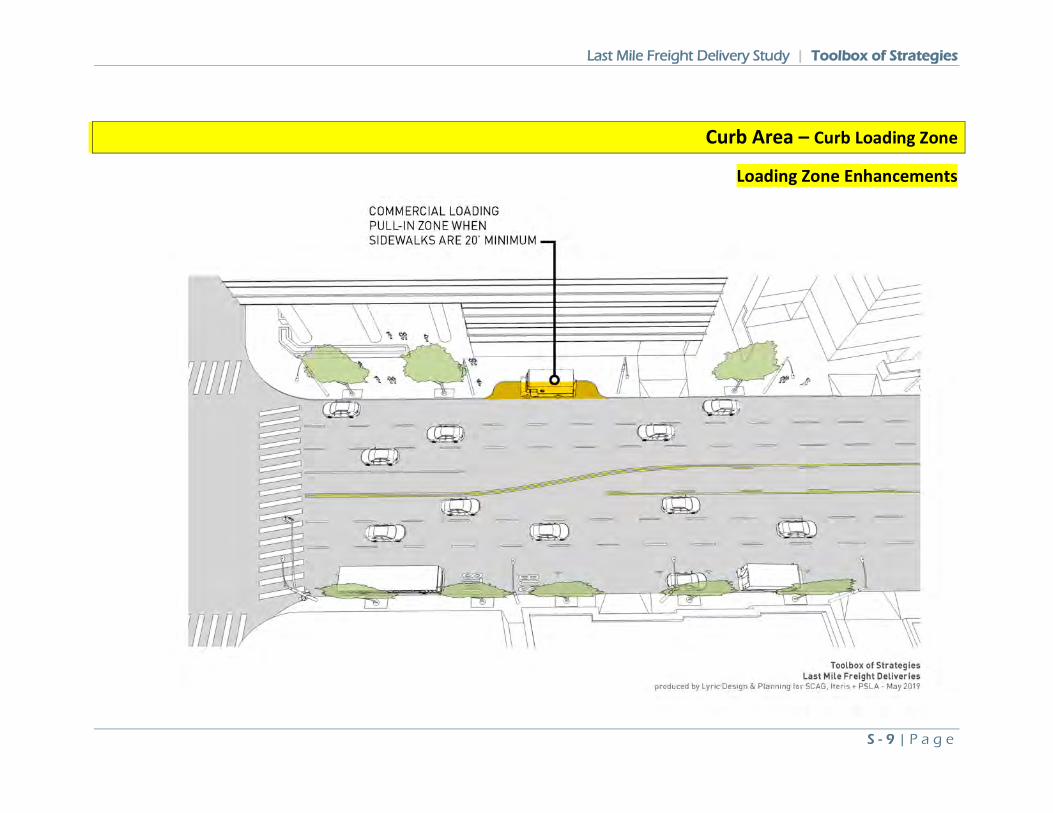
Last Mile Freight Delivery Study | Toolbox of Strategies
S - 9 | P a g e
Curb Area – Curb Loading Zone
Loading Zone Enhancements
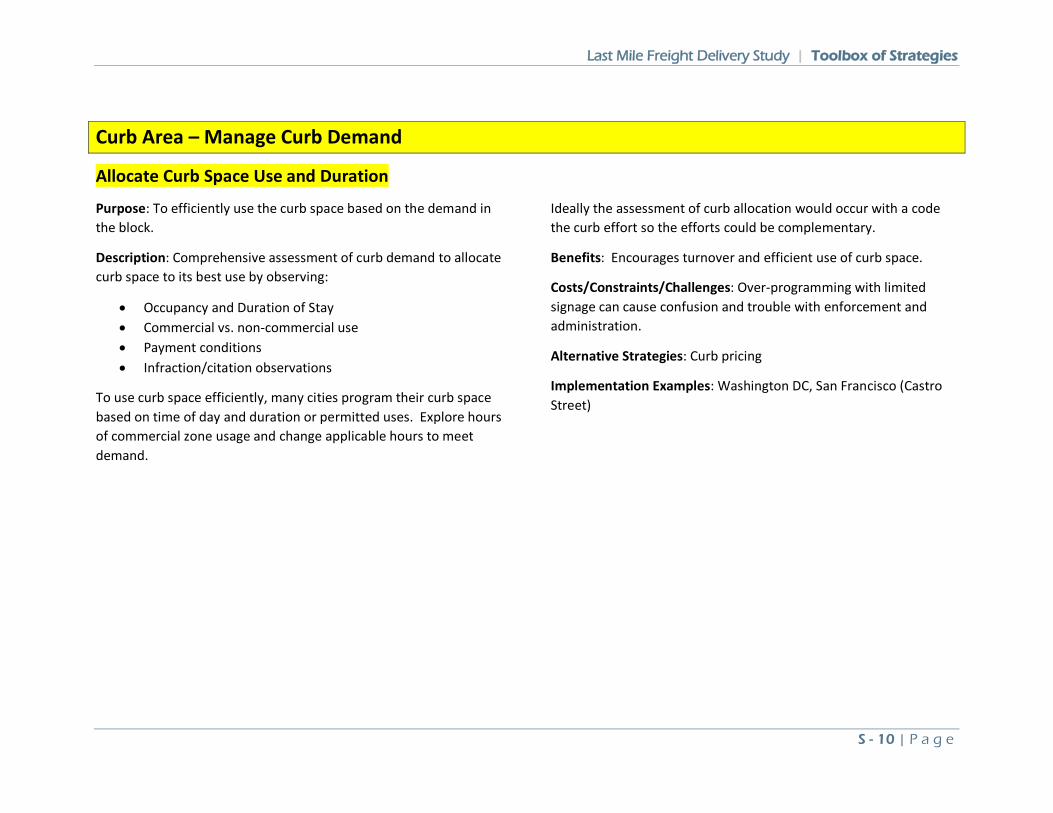
Last Mile Freight Delivery Study | Toolbox of Strategies
S - 10 | P a g e
Curb Area – Manage Curb Demand
Allocate Curb Space Use and Duration
Purpose: To efficiently use the curb space based on the demand in the block.
Description: Comprehensive assessment of curb demand to allocate curb space to its best use by observing:
• Occupancy and Duration of Stay • Commercial vs. non-commercial use • Payment conditions • Infraction/citation observations
To use curb space efficiently, many cities program their curb space based on time of day and duration or permitted uses. Explore hours of commercial zone usage and change applicable hours to meet demand.
Ideally the assessment of curb allocation would occur with a code the curb effort so the efforts could be complementary.
Benefits: Encourages turnover and efficient use of curb space.
Costs/Constraints/Challenges: Over-programming with limited signage can cause confusion and trouble with enforcement and administration.
Alternative Strategies: Curb pricing
Implementation Examples: Washington DC, San Francisco (Castro Street)
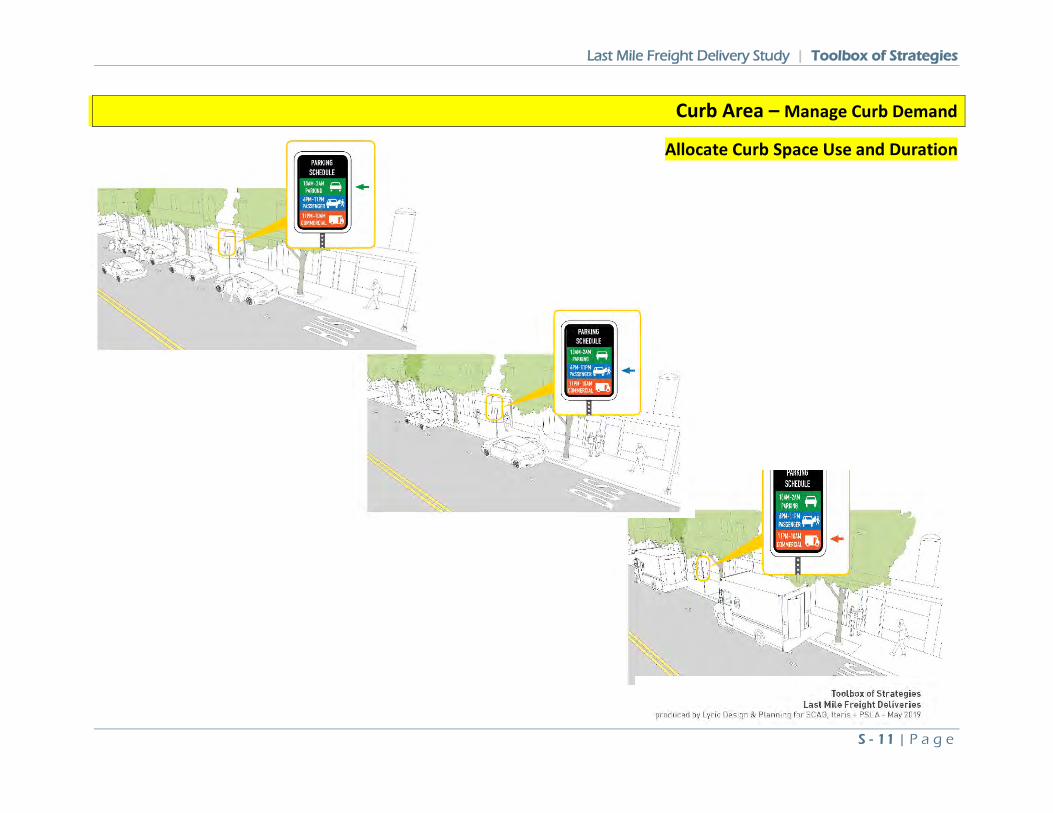
Last Mile Freight Delivery Study | Toolbox of Strategies
S - 11 | P a g e
Curb Area – Manage Curb Demand
Allocate Curb Space Use and Duration
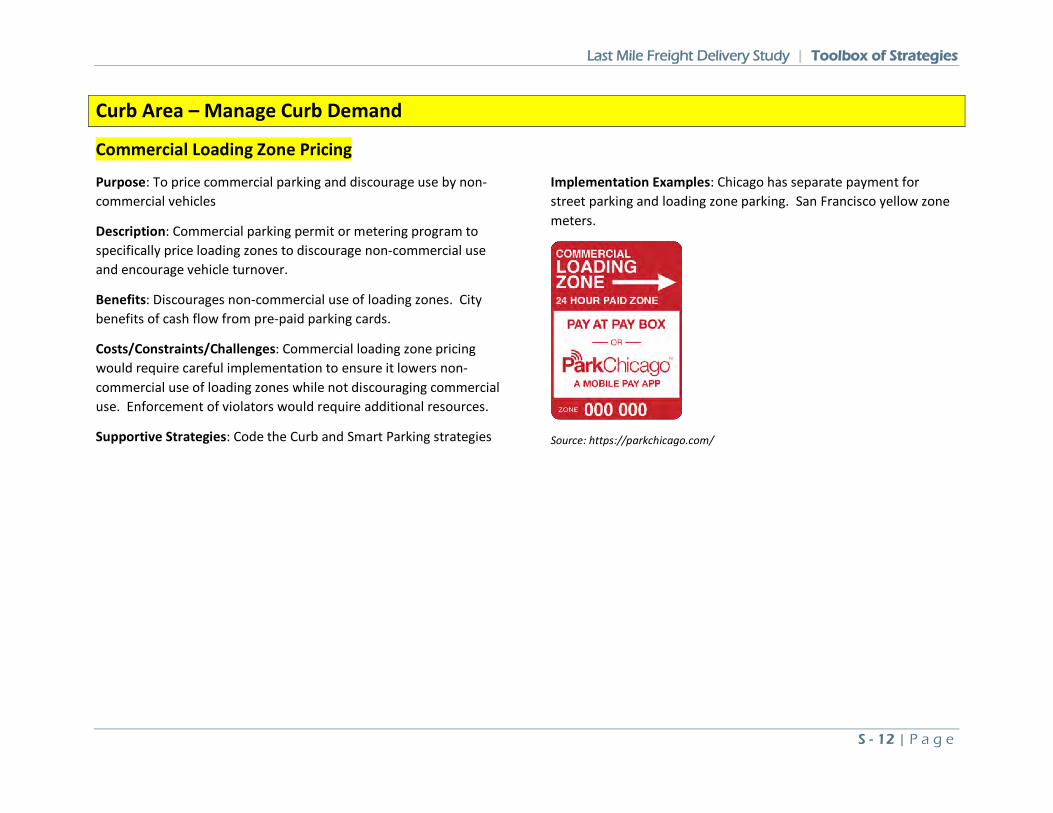
Last Mile Freight Delivery Study | Toolbox of Strategies
S - 12 | P a g e
Curb Area – Manage Curb Demand
Commercial Loading Zone Pricing
Purpose: To price commercial parking and discourage use by non-commercial vehicles
Description: Commercial parking permit or metering program to specifically price loading zones to discourage non-commercial use and encourage vehicle turnover.
Benefits: Discourages non-commercial use of loading zones. City benefits of cash flow from pre-paid parking cards.
Costs/Constraints/Challenges: Commercial loading zone pricing would require careful implementation to ensure it lowers non-commercial use of loading zones while not discouraging commercial use. Enforcement of violators would require additional resources.
Supportive Strategies: Code the Curb and Smart Parking strategies
Implementation Examples: Chicago has separate payment for street parking and loading zone parking. San Francisco yellow zone meters.
Source: https://parkchicago.com/
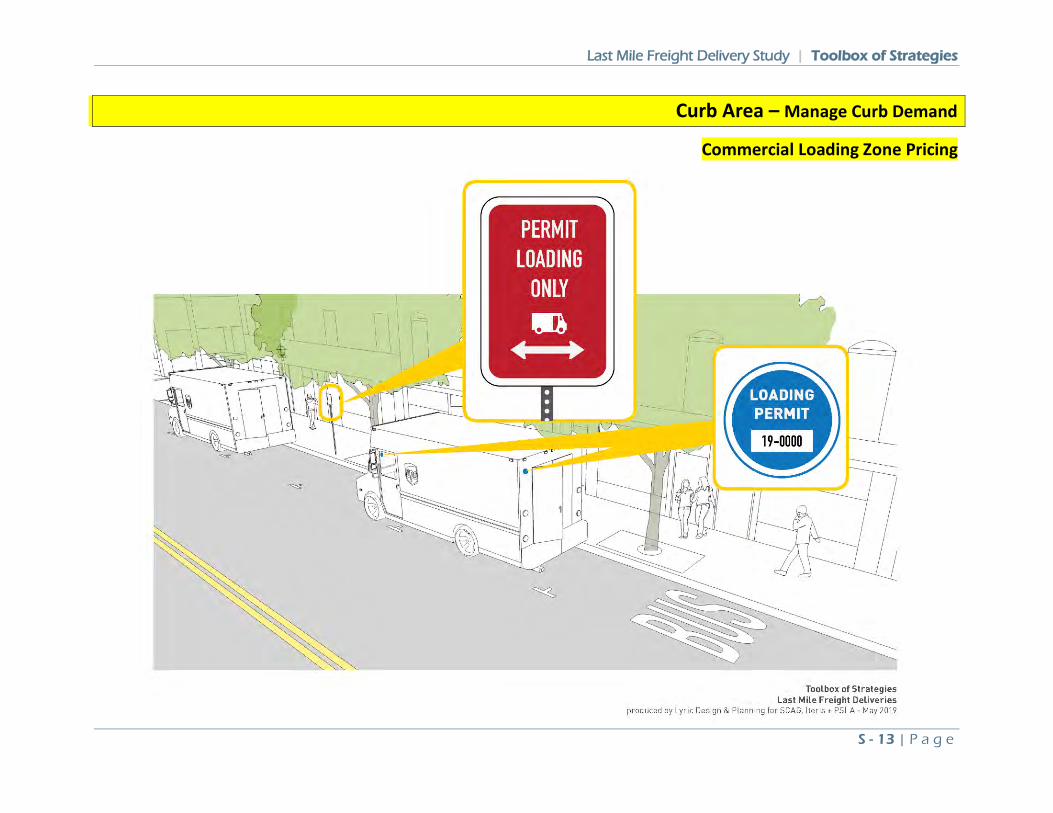
Last Mile Freight Delivery Study | Toolbox of Strategies
S - 13 | P a g e
Curb Area – Manage Curb Demand
Commercial Loading Zone Pricing
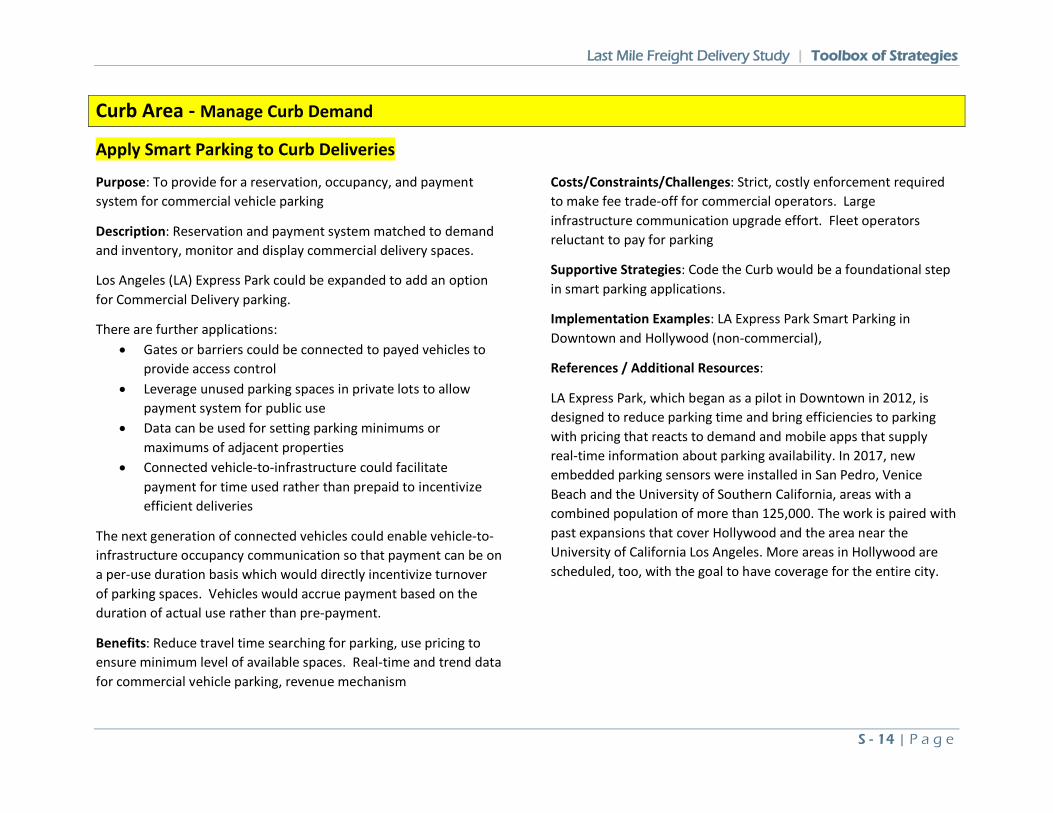
Last Mile Freight Delivery Study | Toolbox of Strategies
S - 14 | P a g e
Curb Area - Manage Curb Demand
Apply Smart Parking to Curb Deliveries
Purpose: To provide for a reservation, occupancy, and payment system for commercial vehicle parking
Description: Reservation and payment system matched to demand and inventory, monitor and display commercial delivery spaces.
Los Angeles (LA) Express Park could be expanded to add an option for Commercial Delivery parking.
There are further applications: • Gates or barriers could be connected to payed vehicles to
provide access control • Leverage unused parking spaces in private lots to allow
payment system for public use • Data can be used for setting parking minimums or
maximums of adjacent properties • Connected vehicle-to-infrastructure could facilitate
payment for time used rather than prepaid to incentivize efficient deliveries
The next generation of connected vehicles could enable vehicle-to-infrastructure occupancy communication so that payment can be on a per-use duration basis which would directly incentivize turnover of parking spaces. Vehicles would accrue payment based on the duration of actual use rather than pre-payment.
Benefits: Reduce travel time searching for parking, use pricing to ensure minimum level of available spaces. Real-time and trend data for commercial vehicle parking, revenue mechanism
Costs/Constraints/Challenges: Strict, costly enforcement required to make fee trade-off for commercial operators. Large infrastructure communication upgrade effort. Fleet operators reluctant to pay for parking
Supportive Strategies: Code the Curb would be a foundational step in smart parking applications.
Implementation Examples: LA Express Park Smart Parking in Downtown and Hollywood (non-commercial),
References / Additional Resources:
LA Express Park, which began as a pilot in Downtown in 2012, is designed to reduce parking time and bring efficiencies to parking with pricing that reacts to demand and mobile apps that supply real-time information about parking availability. In 2017, new embedded parking sensors were installed in San Pedro, Venice Beach and the University of Southern California, areas with a combined population of more than 125,000. The work is paired with past expansions that cover Hollywood and the area near the University of California Los Angeles. More areas in Hollywood are scheduled, too, with the goal to have coverage for the entire city.
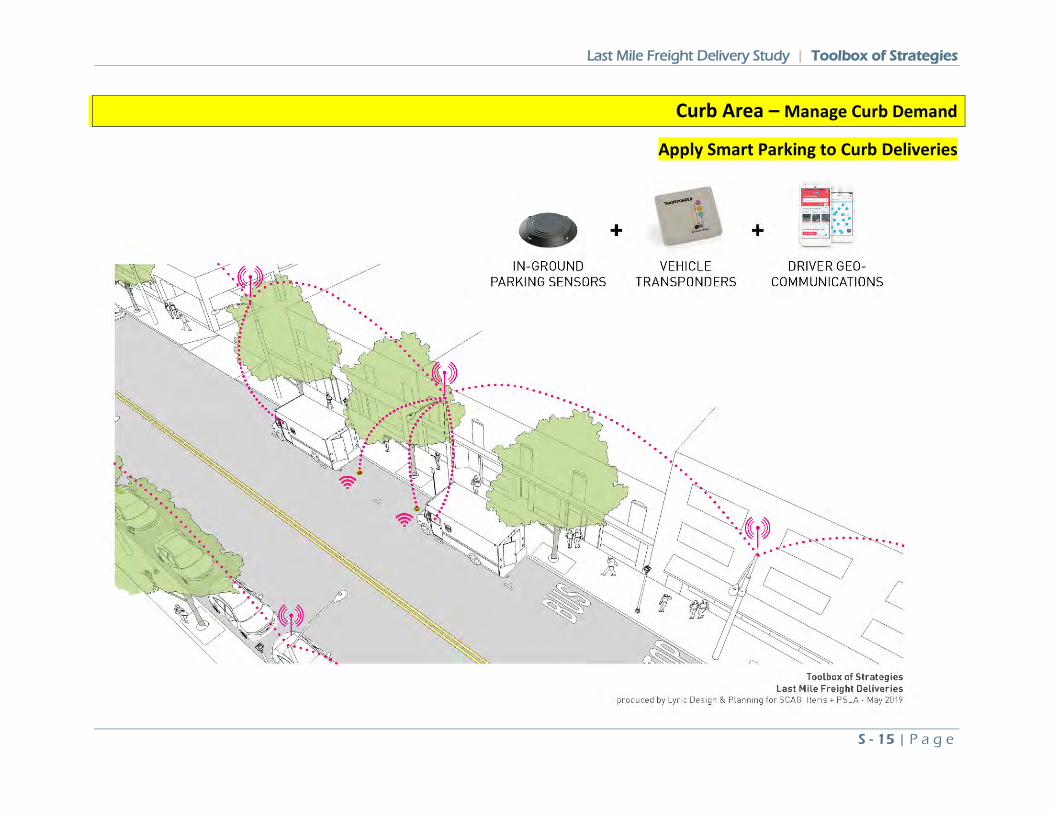
Last Mile Freight Delivery Study | Toolbox of Strategies
S - 15 | P a g e
Curb Area – Manage Curb Demand
Apply Smart Parking to Curb Deliveries
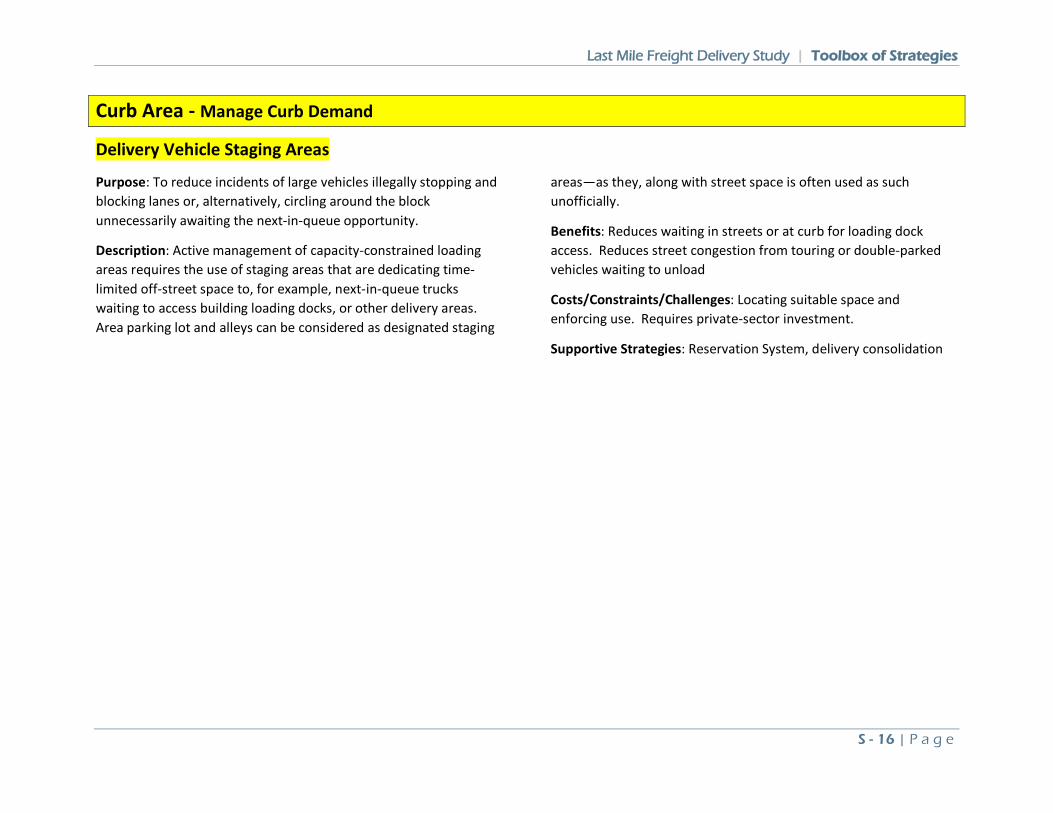
Last Mile Freight Delivery Study | Toolbox of Strategies
S - 16 | P a g e
Curb Area - Manage Curb Demand
Delivery Vehicle Staging Areas
Purpose: To reduce incidents of large vehicles illegally stopping and blocking lanes or, alternatively, circling around the block unnecessarily awaiting the next-in-queue opportunity.
Description: Active management of capacity-constrained loading areas requires the use of staging areas that are dedicating time-limited off-street space to, for example, next-in-queue trucks waiting to access building loading docks, or other delivery areas. Area parking lot and alleys can be considered as designated staging
areas—as they, along with street space is often used as such unofficially.
Benefits: Reduces waiting in streets or at curb for loading dock access. Reduces street congestion from touring or double-parked vehicles waiting to unload
Costs/Constraints/Challenges: Locating suitable space and enforcing use. Requires private-sector investment.
Supportive Strategies: Reservation System, delivery consolidation
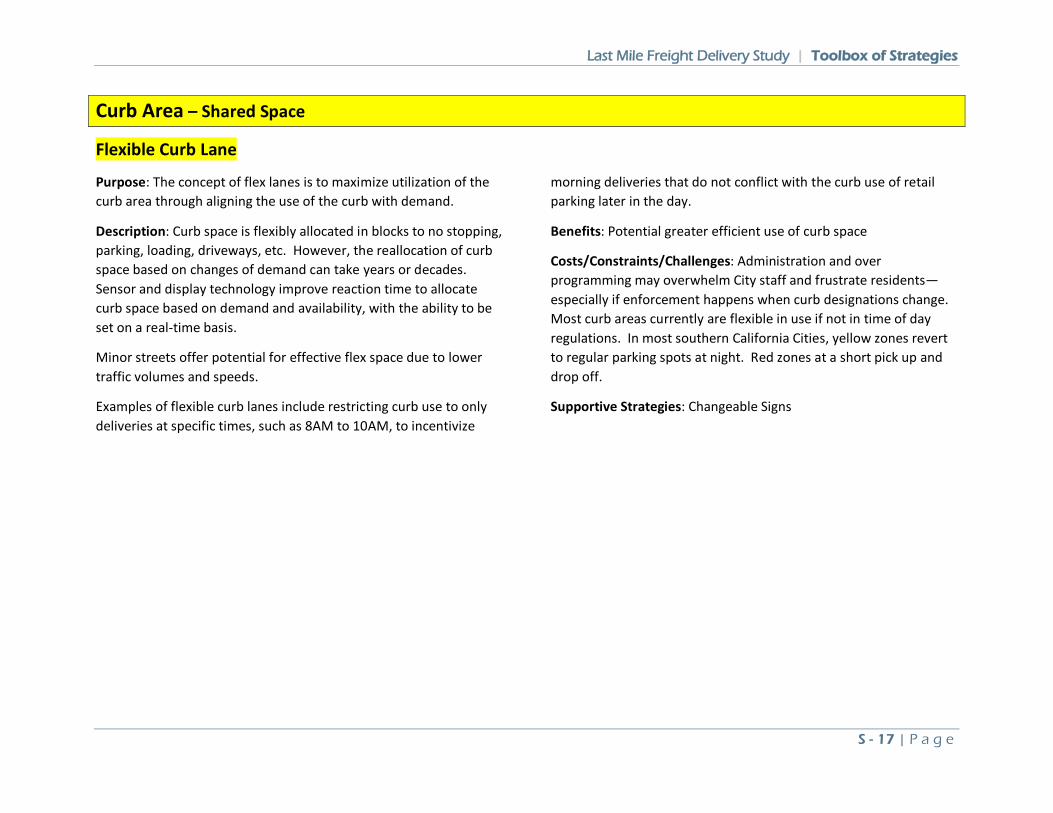
Last Mile Freight Delivery Study | Toolbox of Strategies
S - 17 | P a g e
Curb Area – Shared Space
Flexible Curb Lane
Purpose: The concept of flex lanes is to maximize utilization of the curb area through aligning the use of the curb with demand.
Description: Curb space is flexibly allocated in blocks to no stopping, parking, loading, driveways, etc. However, the reallocation of curb space based on changes of demand can take years or decades. Sensor and display technology improve reaction time to allocate curb space based on demand and availability, with the ability to be set on a real-time basis.
Minor streets offer potential for effective flex space due to lower traffic volumes and speeds.
Examples of flexible curb lanes include restricting curb use to only deliveries at specific times, such as 8AM to 10AM, to incentivize
morning deliveries that do not conflict with the curb use of retail parking later in the day.
Benefits: Potential greater efficient use of curb space
Costs/Constraints/Challenges: Administration and over programming may overwhelm City staff and frustrate residents—especially if enforcement happens when curb designations change. Most curb areas currently are flexible in use if not in time of day regulations. In most southern California Cities, yellow zones revert to regular parking spots at night. Red zones at a short pick up and drop off.
Supportive Strategies: Changeable Signs
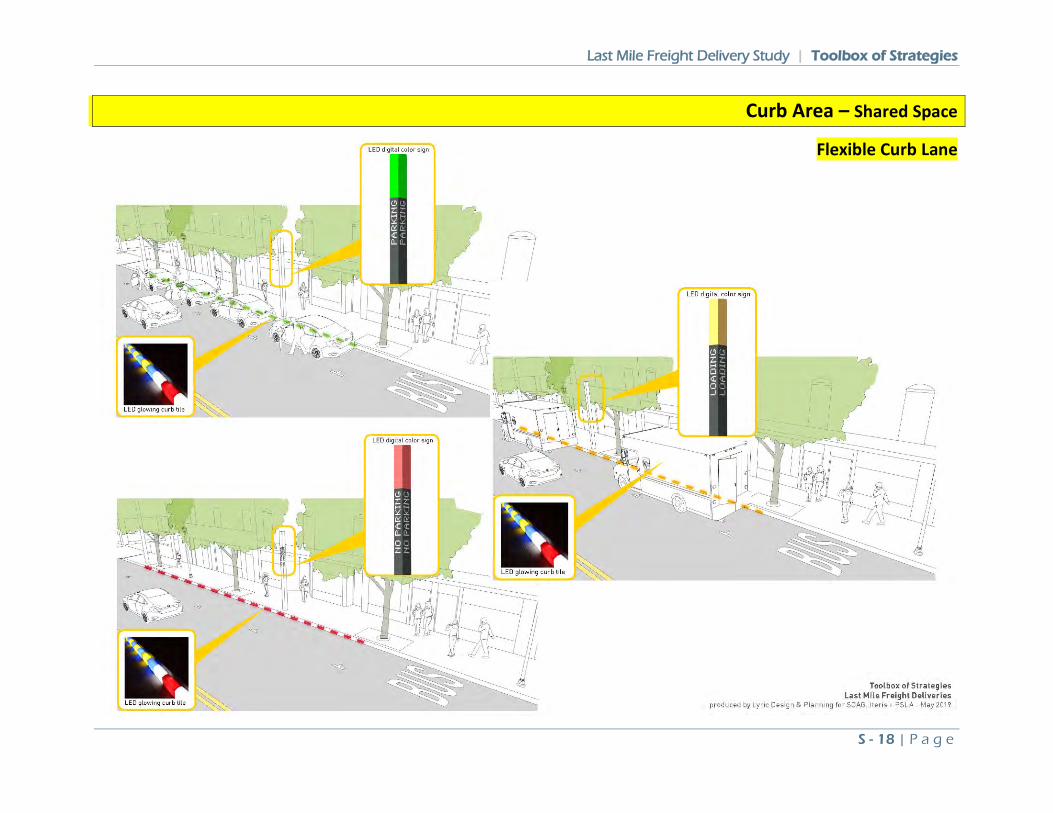
Last Mile Freight Delivery Study | Toolbox of Strategies
S - 18 | P a g e
Curb Area – Shared Space
Flexible Curb Lane
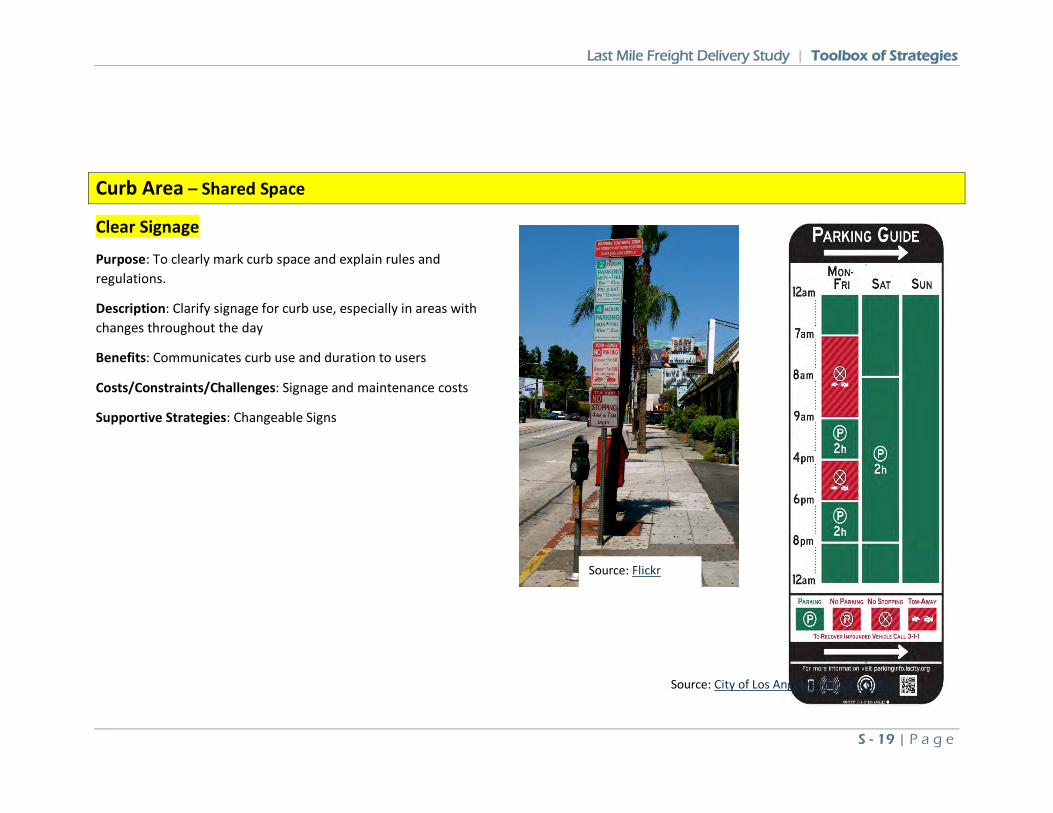
Last Mile Freight Delivery Study | Toolbox of Strategies
S - 19 | P a g e
Curb Area – Shared Space
Clear Signage
Purpose: To clearly mark curb space and explain rules and regulations.
Description: Clarify signage for curb use, especially in areas with changes throughout the day
Benefits: Communicates curb use and duration to users
Costs/Constraints/Challenges: Signage and maintenance costs
Supportive Strategies: Changeable Signs
Source: Flickr
Source: City of Los Angeles Mayor’s Office
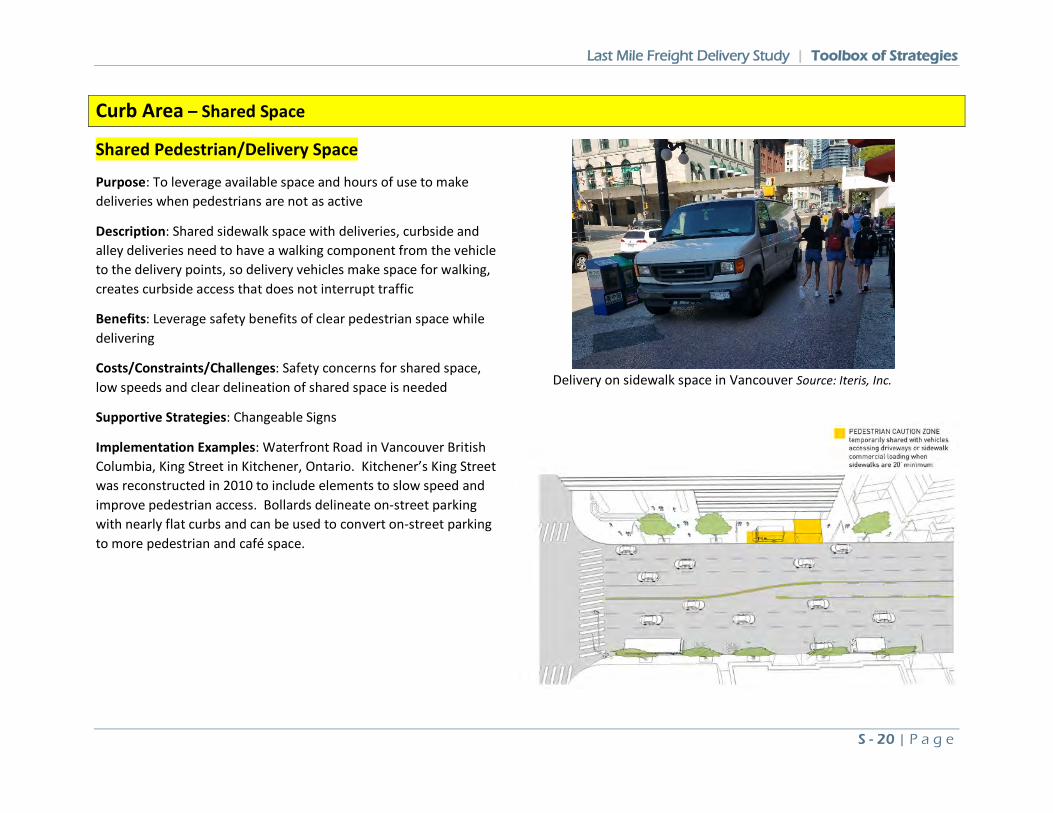
Last Mile Freight Delivery Study | Toolbox of Strategies
S - 20 | P a g e
Curb Area – Shared Space
Shared Pedestrian/Delivery Space
Purpose: To leverage available space and hours of use to make deliveries when pedestrians are not as active
Description: Shared sidewalk space with deliveries, curbside and alley deliveries need to have a walking component from the vehicle to the delivery points, so delivery vehicles make space for walking, creates curbside access that does not interrupt traffic
Benefits: Leverage safety benefits of clear pedestrian space while delivering
Costs/Constraints/Challenges: Safety concerns for shared space, low speeds and clear delineation of shared space is needed
Supportive Strategies: Changeable Signs
Implementation Examples: Waterfront Road in Vancouver British Columbia, King Street in Kitchener, Ontario. Kitchener’s King Street was reconstructed in 2010 to include elements to slow speed and improve pedestrian access. Bollards delineate on-street parking with nearly flat curbs and can be used to convert on-street parking to more pedestrian and café space.
Delivery on sidewalk space in Vancouver Source: Iteris, Inc.
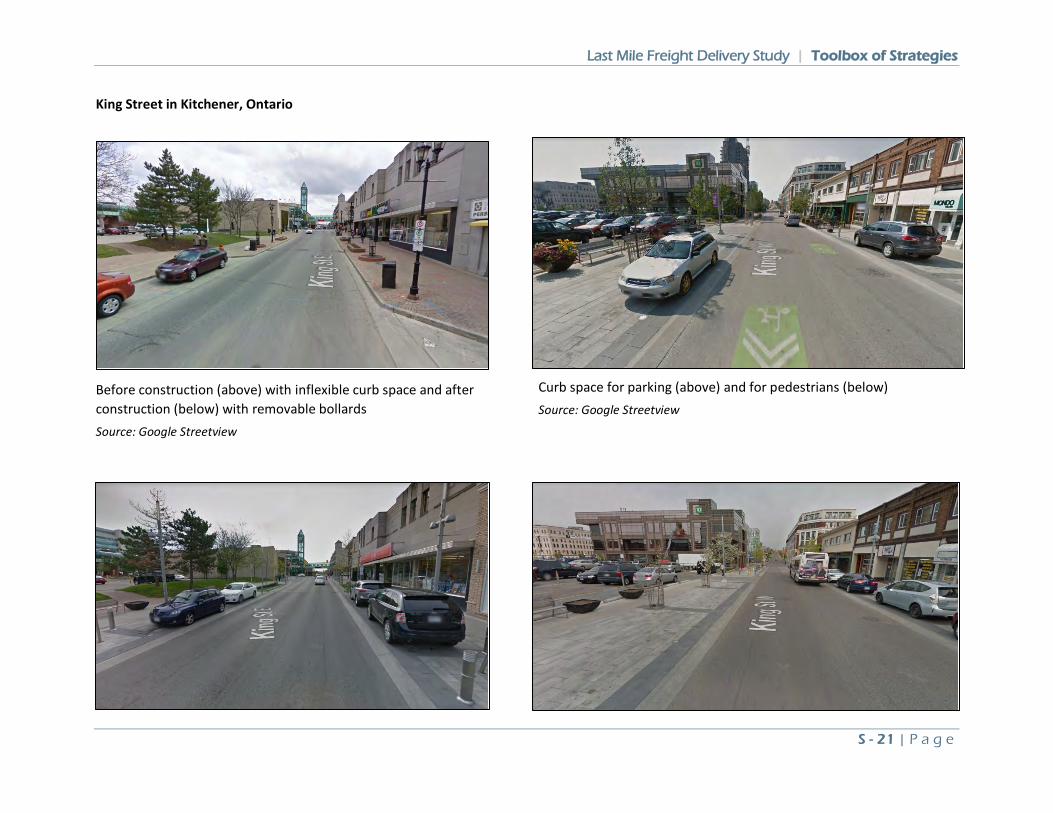
Last Mile Freight Delivery Study | Toolbox of Strategies
S - 21 | P a g e
King Street in Kitchener, Ontario
Before construction (above) with inflexible curb space and after construction (below) with removable bollards Source: Google Streetview
Curb space for parking (above) and for pedestrians (below) Source: Google Streetview
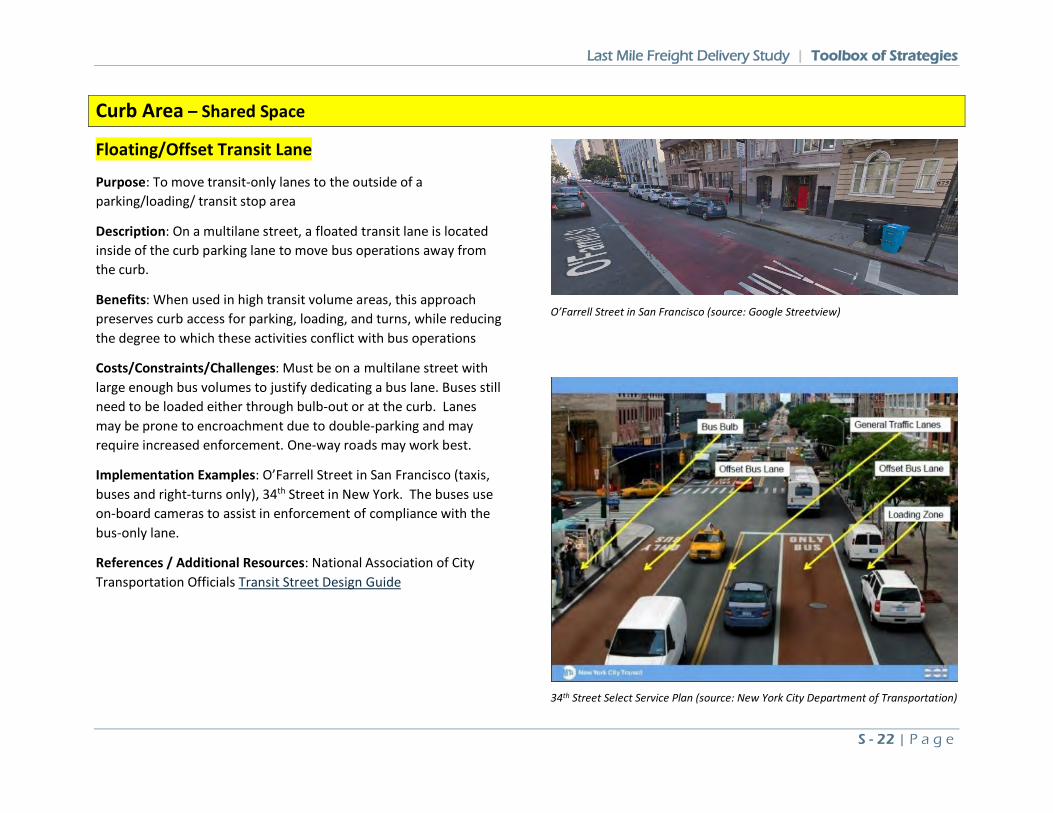
Last Mile Freight Delivery Study | Toolbox of Strategies
S - 22 | P a g e
Curb Area – Shared Space
Floating/Offset Transit Lane
Purpose: To move transit-only lanes to the outside of a parking/loading/ transit stop area
Description: On a multilane street, a floated transit lane is located inside of the curb parking lane to move bus operations away from the curb.
Benefits: When used in high transit volume areas, this approach preserves curb access for parking, loading, and turns, while reducing the degree to which these activities conflict with bus operations
Costs/Constraints/Challenges: Must be on a multilane street with large enough bus volumes to justify dedicating a bus lane. Buses still need to be loaded either through bulb-out or at the curb. Lanes may be prone to encroachment due to double-parking and may require increased enforcement. One-way roads may work best.
Implementation Examples: O’Farrell Street in San Francisco (taxis, buses and right-turns only), 34th Street in New York. The buses use on-board cameras to assist in enforcement of compliance with the bus-only lane.
References / Additional Resources: National Association of City Transportation Officials Transit Street Design Guide
O’Farrell Street in San Francisco (source: Google Streetview)
34th Street Select Service Plan (source: New York City Department of Transportation)
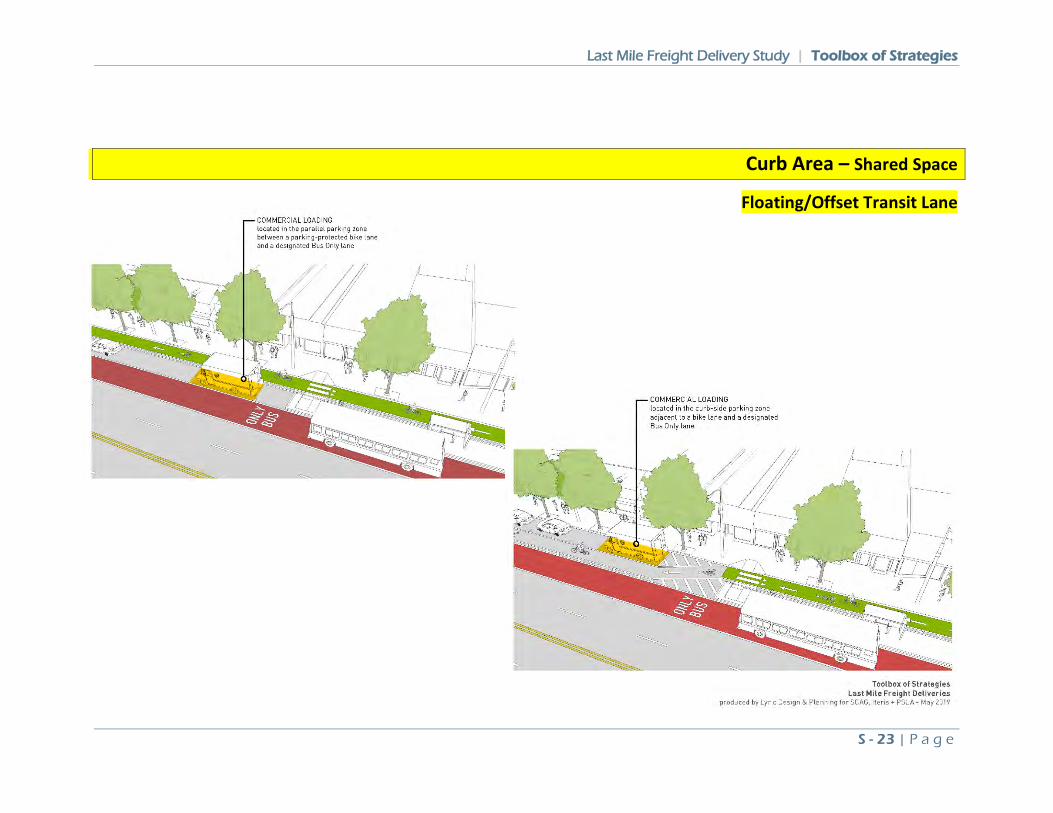
Last Mile Freight Delivery Study | Toolbox of Strategies
S - 23 | P a g e
Curb Area – Shared Space
Floating/Offset Transit Lane
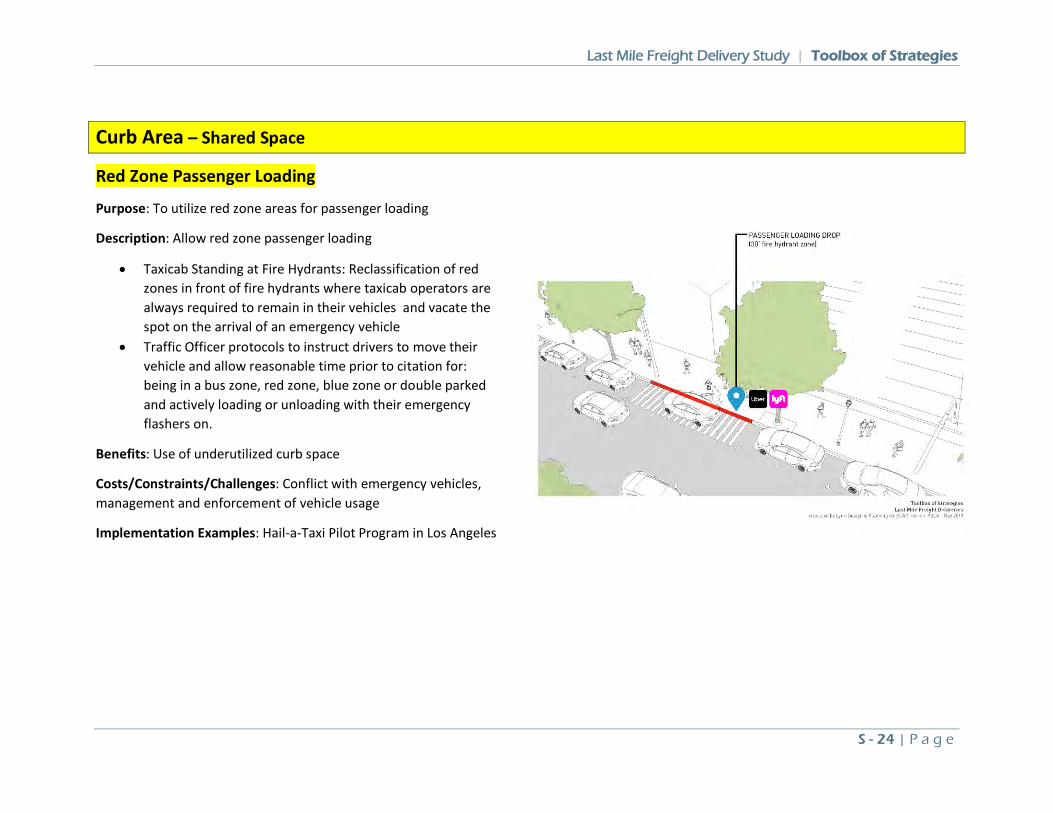
Last Mile Freight Delivery Study | Toolbox of Strategies
S - 24 | P a g e
Curb Area – Shared Space
Red Zone Passenger Loading
Purpose: To utilize red zone areas for passenger loading
Description: Allow red zone passenger loading
• Taxicab Standing at Fire Hydrants: Reclassification of red zones in front of fire hydrants where taxicab operators are always required to remain in their vehicles and vacate the spot on the arrival of an emergency vehicle
• Traffic Officer protocols to instruct drivers to move their vehicle and allow reasonable time prior to citation for: being in a bus zone, red zone, blue zone or double parked and actively loading or unloading with their emergency flashers on.
Benefits: Use of underutilized curb space
Costs/Constraints/Challenges: Conflict with emergency vehicles, management and enforcement of vehicle usage
Implementation Examples: Hail-a-Taxi Pilot Program in Los Angeles
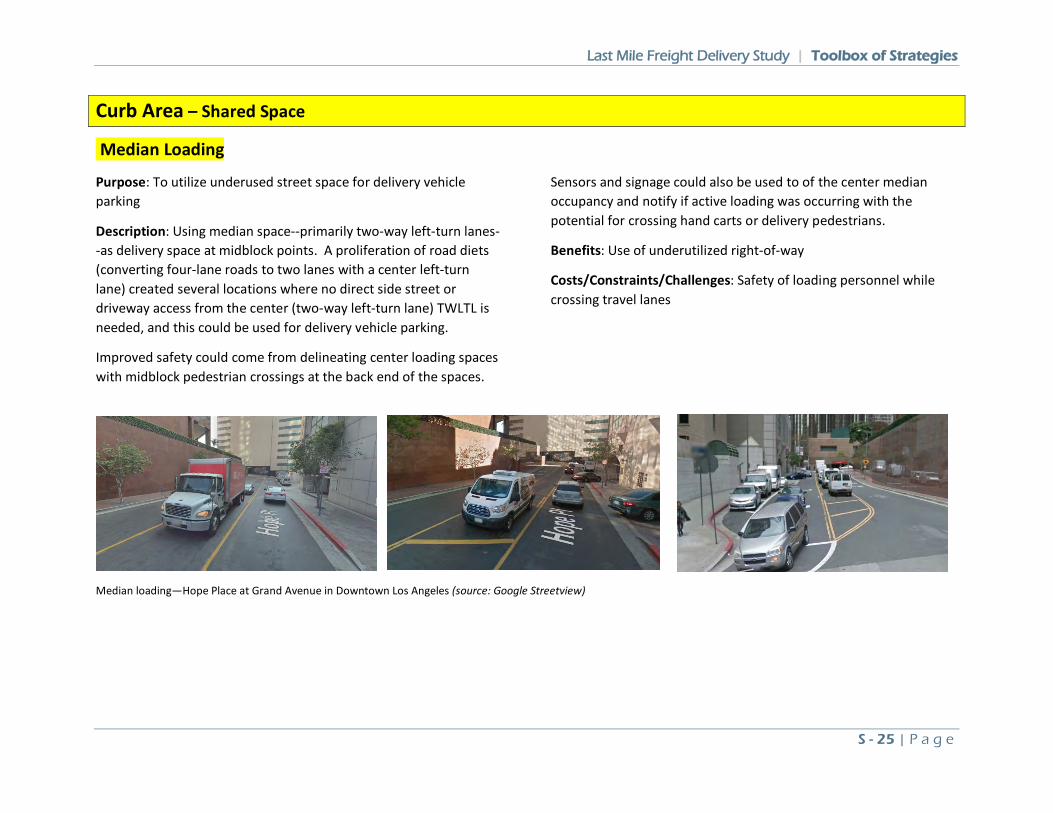
Last Mile Freight Delivery Study | Toolbox of Strategies
S - 25 | P a g e
Curb Area – Shared Space
Median Loading
Purpose: To utilize underused street space for delivery vehicle parking
Description: Using median space--primarily two-way left-turn lanes--as delivery space at midblock points. A proliferation of road diets (converting four-lane roads to two lanes with a center left-turn lane) created several locations where no direct side street or driveway access from the center (two-way left-turn lane) TWLTL is needed, and this could be used for delivery vehicle parking.
Improved safety could come from delineating center loading spaces with midblock pedestrian crossings at the back end of the spaces.
Sensors and signage could also be used to of the center median occupancy and notify if active loading was occurring with the potential for crossing hand carts or delivery pedestrians.
Benefits: Use of underutilized right-of-way
Costs/Constraints/Challenges: Safety of loading personnel while crossing travel lanes
Median loading—Hope Place at Grand Avenue in Downtown Los Angeles (source: Google Streetview)
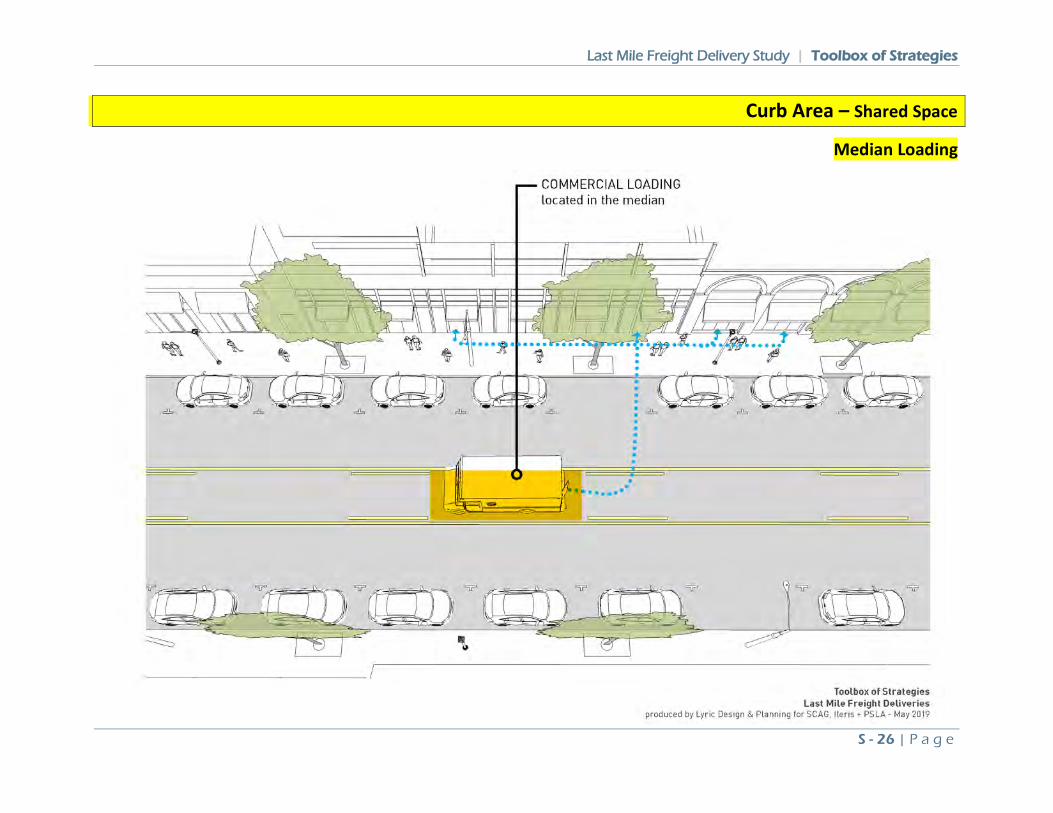
Last Mile Freight Delivery Study | Toolbox of Strategies
S - 26 | P a g e
Curb Area – Shared Space
Median Loading
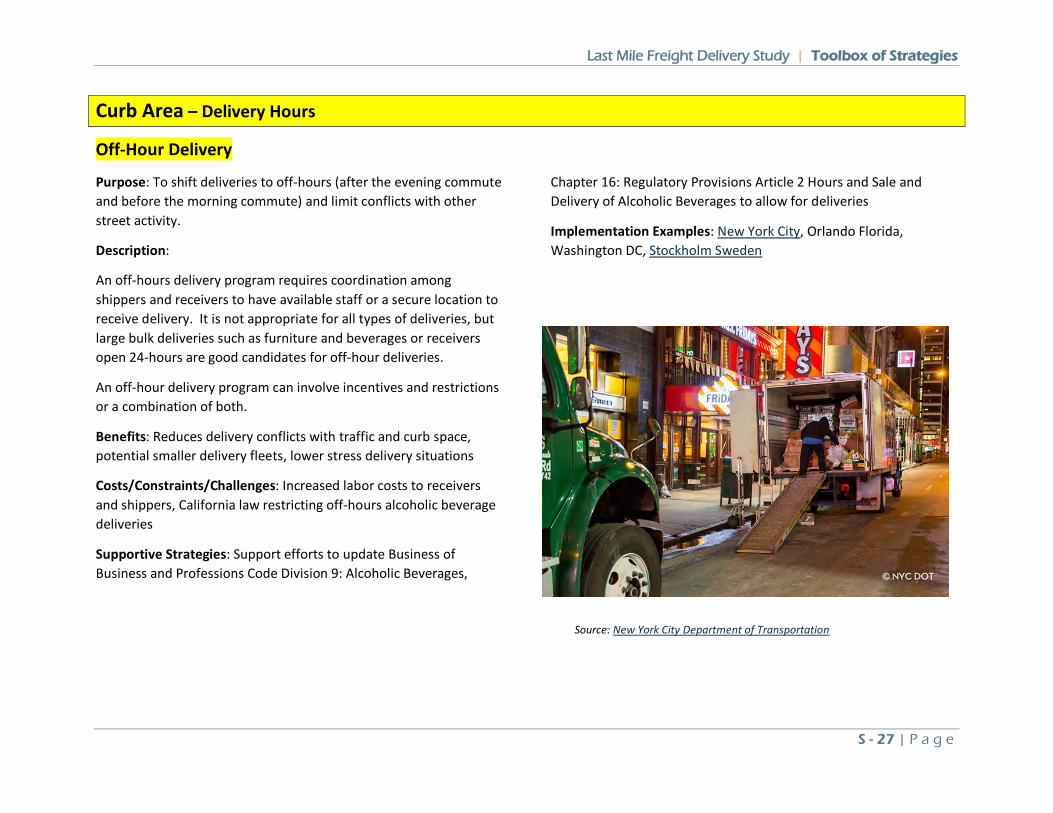
Last Mile Freight Delivery Study | Toolbox of Strategies
S - 27 | P a g e
Curb Area – Delivery Hours
Off-Hour Delivery
Purpose: To shift deliveries to off-hours (after the evening commute and before the morning commute) and limit conflicts with other street activity.
Description:
An off-hours delivery program requires coordination among shippers and receivers to have available staff or a secure location to receive delivery. It is not appropriate for all types of deliveries, but large bulk deliveries such as furniture and beverages or receivers open 24-hours are good candidates for off-hour deliveries.
An off-hour delivery program can involve incentives and restrictions or a combination of both.
Benefits: Reduces delivery conflicts with traffic and curb space, potential smaller delivery fleets, lower stress delivery situations
Costs/Constraints/Challenges: Increased labor costs to receivers and shippers, California law restricting off-hours alcoholic beverage deliveries
Supportive Strategies: Support efforts to update Business of Business and Professions Code Division 9: Alcoholic Beverages,
Chapter 16: Regulatory Provisions Article 2 Hours and Sale and Delivery of Alcoholic Beverages to allow for deliveries
Implementation Examples: New York City, Orlando Florida, Washington DC, Stockholm Sweden
Source: New York City Department of Transportation
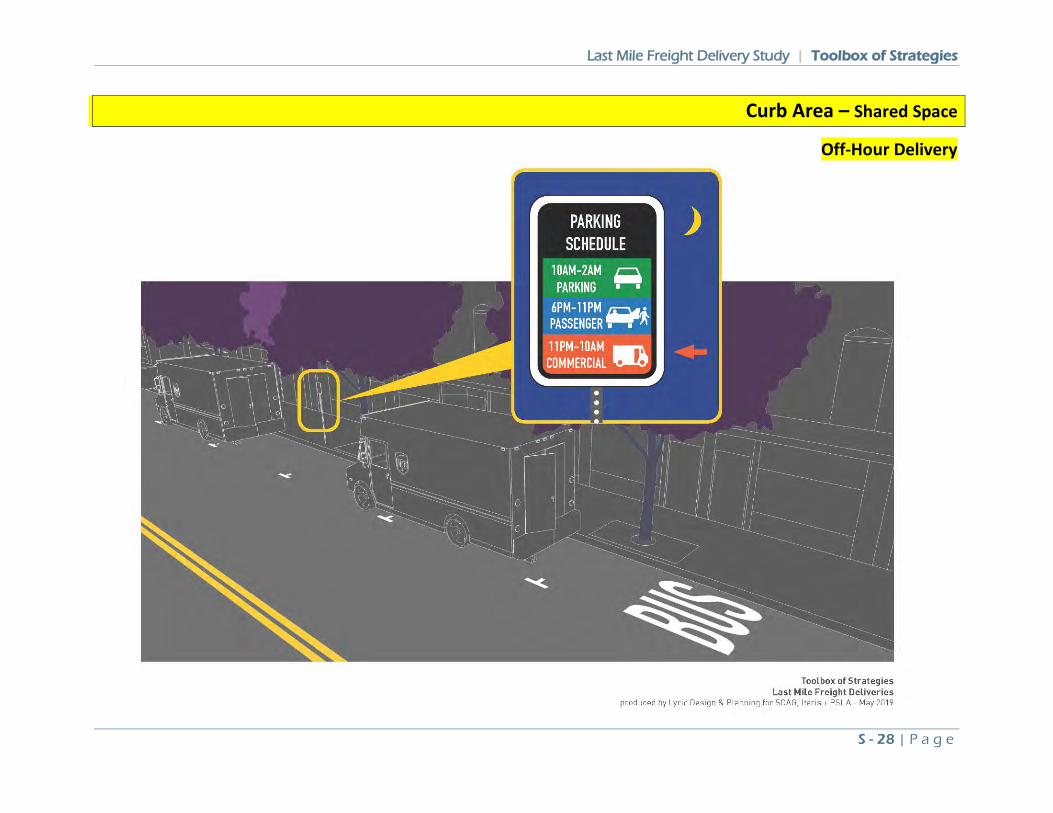
Last Mile Freight Delivery Study | Toolbox of Strategies
S - 28 | P a g e
Curb Area – Shared Space
Off-Hour Delivery
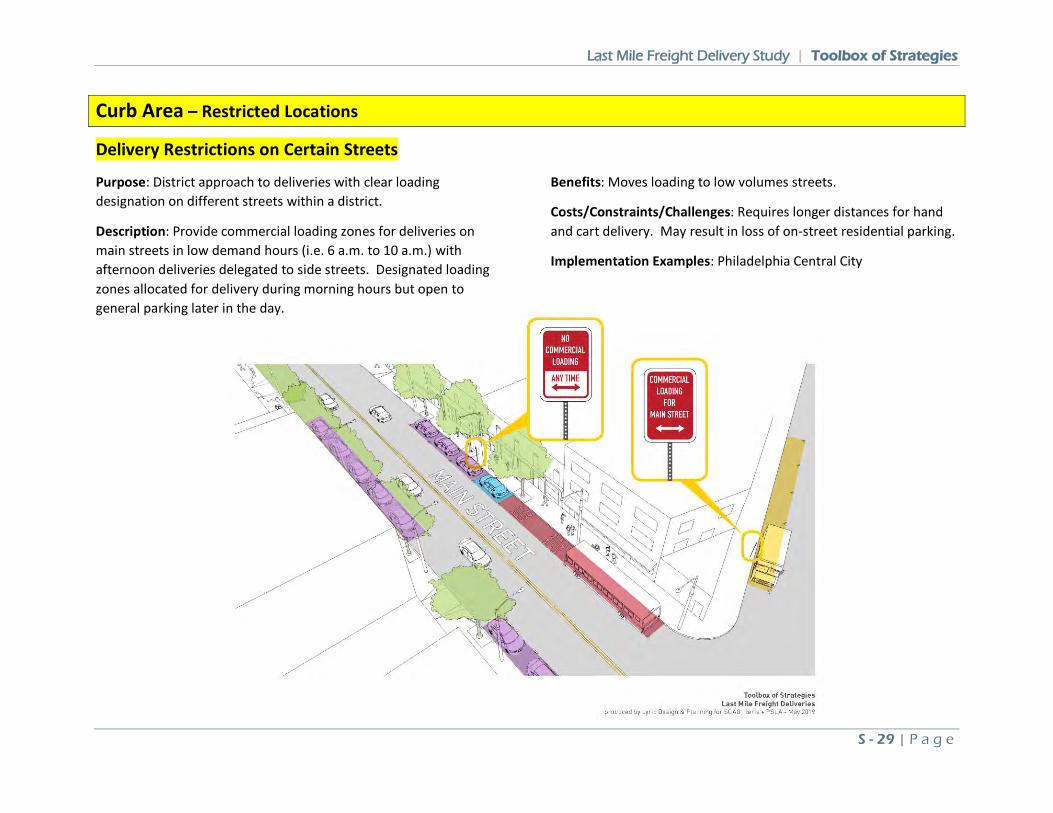
Last Mile Freight Delivery Study | Toolbox of Strategies
S - 29 | P a g e
Curb Area – Restricted Locations
Delivery Restrictions on Certain Streets
Purpose: District approach to deliveries with clear loading designation on different streets within a district.
Description: Provide commercial loading zones for deliveries on main streets in low demand hours (i.e. 6 a.m. to 10 a.m.) with afternoon deliveries delegated to side streets. Designated loading zones allocated for delivery during morning hours but open to general parking later in the day.
Benefits: Moves loading to low volumes streets.
Costs/Constraints/Challenges: Requires longer distances for hand and cart delivery. May result in loss of on-street residential parking.
Implementation Examples: Philadelphia Central City
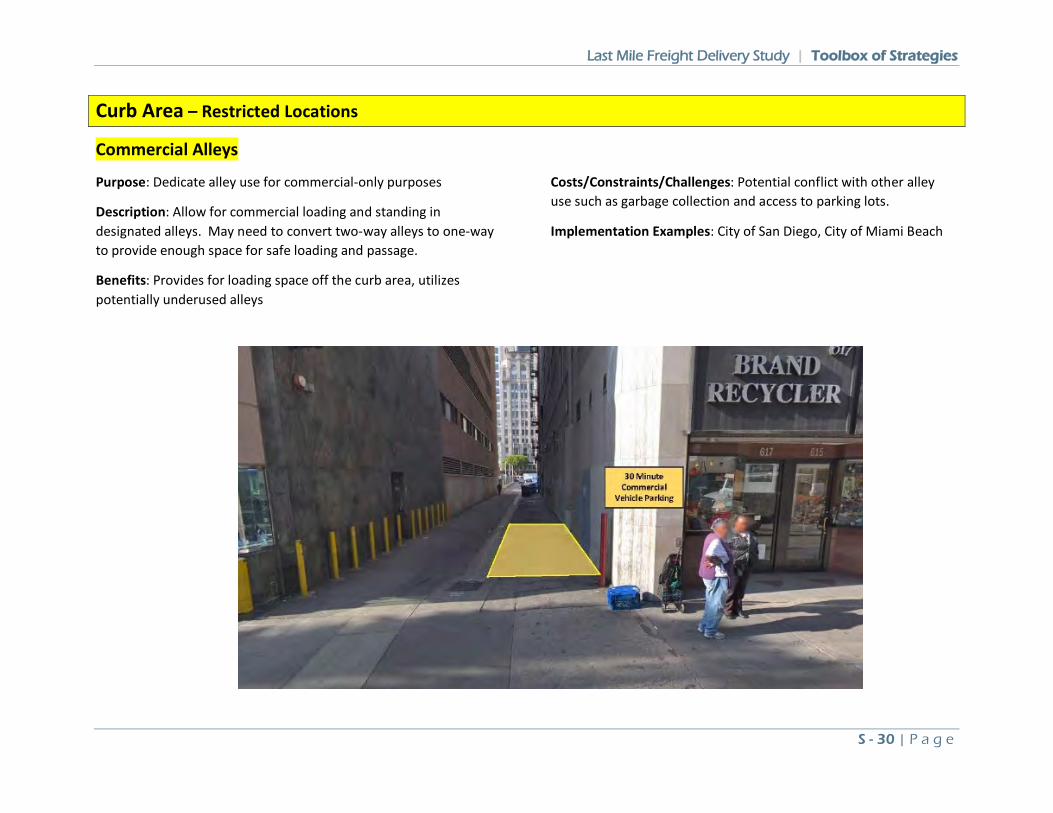
Last Mile Freight Delivery Study | Toolbox of Strategies
S - 30 | P a g e
Curb Area – Restricted Locations
Commercial Alleys
Purpose: Dedicate alley use for commercial-only purposes
Description: Allow for commercial loading and standing in designated alleys. May need to convert two-way alleys to one-way to provide enough space for safe loading and passage.
Benefits: Provides for loading space off the curb area, utilizes potentially underused alleys
Costs/Constraints/Challenges: Potential conflict with other alley use such as garbage collection and access to parking lots.
Implementation Examples: City of San Diego, City of Miami Beach
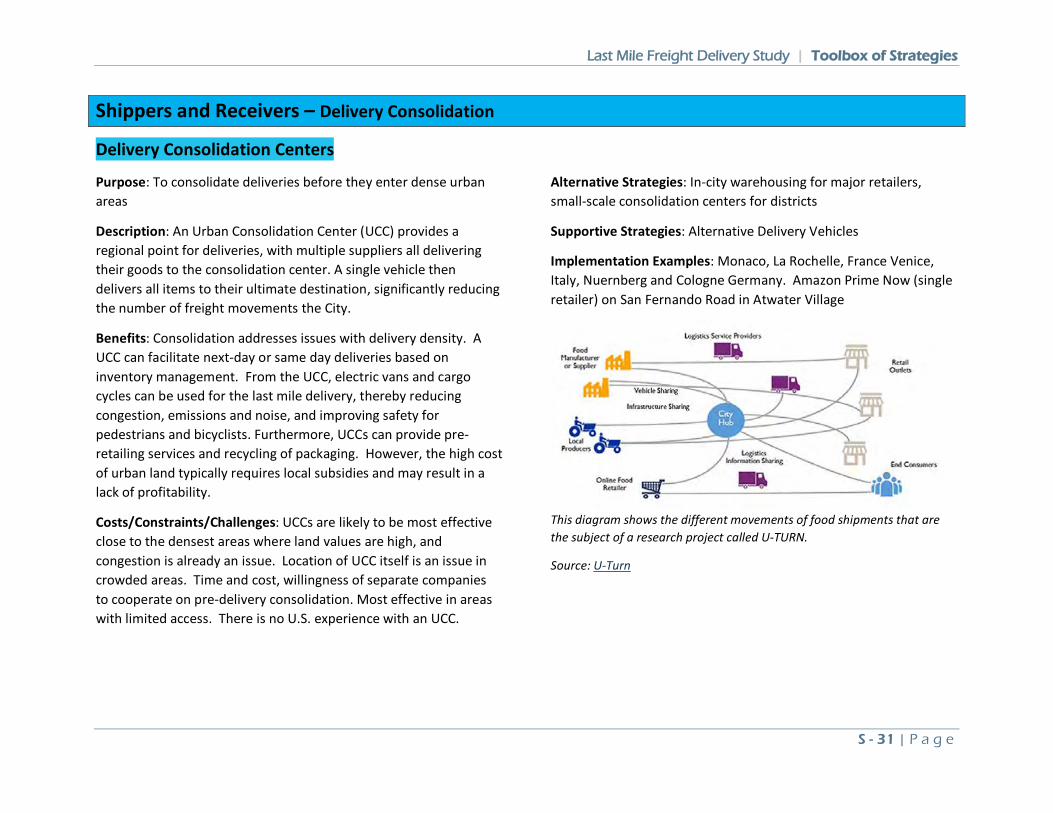
Last Mile Freight Delivery Study | Toolbox of Strategies
S - 31 | P a g e
Shippers and Receivers – Delivery Consolidation
Delivery Consolidation Centers
Purpose: To consolidate deliveries before they enter dense urban areas
Description: An Urban Consolidation Center (UCC) provides a regional point for deliveries, with multiple suppliers all delivering their goods to the consolidation center. A single vehicle then delivers all items to their ultimate destination, significantly reducing the number of freight movements the City.
Benefits: Consolidation addresses issues with delivery density. A UCC can facilitate next-day or same day deliveries based on inventory management. From the UCC, electric vans and cargo cycles can be used for the last mile delivery, thereby reducing congestion, emissions and noise, and improving safety for pedestrians and bicyclists. Furthermore, UCCs can provide pre-retailing services and recycling of packaging. However, the high cost of urban land typically requires local subsidies and may result in a lack of profitability.
Costs/Constraints/Challenges: UCCs are likely to be most effective close to the densest areas where land values are high, and congestion is already an issue. Location of UCC itself is an issue in crowded areas. Time and cost, willingness of separate companies to cooperate on pre-delivery consolidation. Most effective in areas with limited access. There is no U.S. experience with an UCC.
Alternative Strategies: In-city warehousing for major retailers, small-scale consolidation centers for districts
Supportive Strategies: Alternative Delivery Vehicles
Implementation Examples: Monaco, La Rochelle, France Venice, Italy, Nuernberg and Cologne Germany. Amazon Prime Now (single retailer) on San Fernando Road in Atwater Village
This diagram shows the different movements of food shipments that are the subject of a research project called U-TURN.
Source: U-Turn
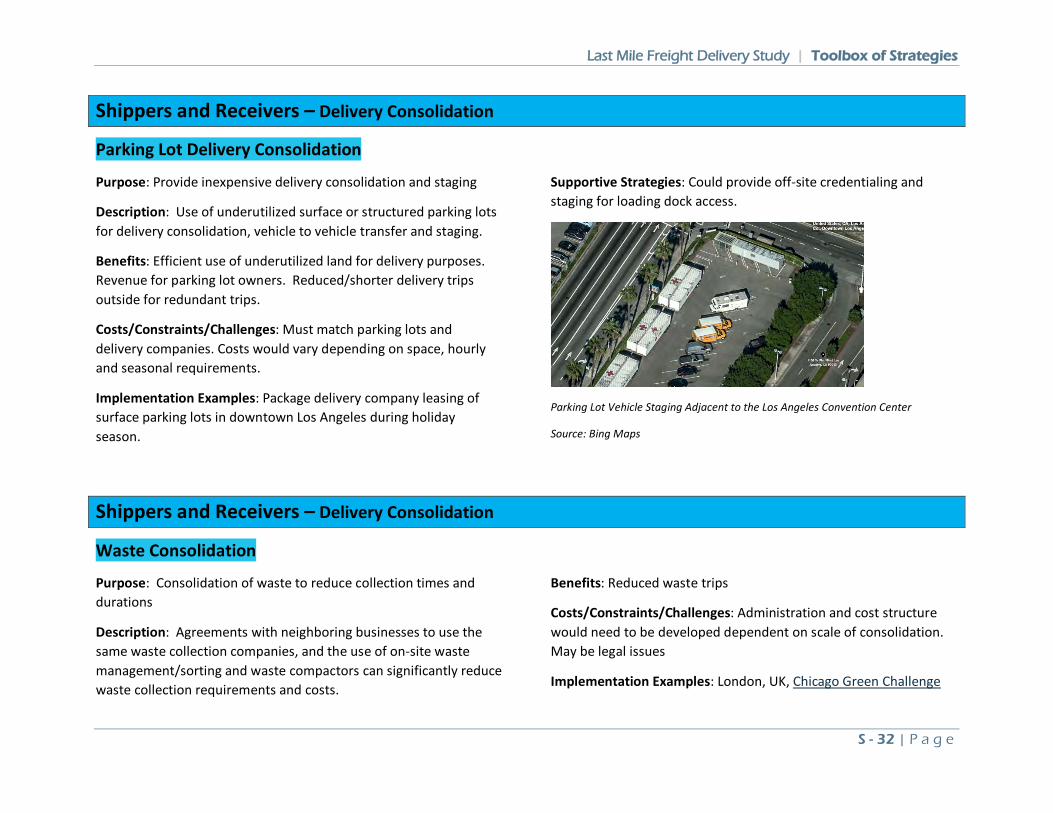
Last Mile Freight Delivery Study | Toolbox of Strategies
S - 32 | P a g e
Shippers and Receivers – Delivery Consolidation
Parking Lot Delivery Consolidation
Purpose: Provide inexpensive delivery consolidation and staging
Description: Use of underutilized surface or structured parking lots for delivery consolidation, vehicle to vehicle transfer and staging.
Benefits: Efficient use of underutilized land for delivery purposes. Revenue for parking lot owners. Reduced/shorter delivery trips outside for redundant trips.
Costs/Constraints/Challenges: Must match parking lots and delivery companies. Costs would vary depending on space, hourly and seasonal requirements.
Implementation Examples: Package delivery company leasing of surface parking lots in downtown Los Angeles during holiday season.
Supportive Strategies: Could provide off-site credentialing and staging for loading dock access.
Parking Lot Vehicle Staging Adjacent to the Los Angeles Convention Center
Source: Bing Maps
Shippers and Receivers – Delivery Consolidation
Waste Consolidation
Purpose: Consolidation of waste to reduce collection times and durations
Description: Agreements with neighboring businesses to use the same waste collection companies, and the use of on-site waste management/sorting and waste compactors can significantly reduce waste collection requirements and costs.
Benefits: Reduced waste trips
Costs/Constraints/Challenges: Administration and cost structure would need to be developed dependent on scale of consolidation. May be legal issues
Implementation Examples: London, UK, Chicago Green Challenge
Last Mile Freight Delivery Study | Toolbox of Strategies
S - 33 | P a g e
Shippers and Receivers – Delivery Consolidation
Joint Procurement
Purpose: To reduce multiple delivery trip making to deliver to the same area.
Description: Co-ordination of procurement between departments or with neighboring organizations can significantly reduce the number of deliveries and may result in cost savings through being able to place larger orders. It is like Supply Chain Pooling where individual logistics operations are shared between a group of collaborators.
Benefits: Joint procurement initiatives between tenants, as well as common logistics operations in the loading bay with shared staff able to receive goods on behalf of all tenants, have the potential to reduce the number of suppliers used and thus vehicle deliveries.
Costs/Constraints/Challenges: Requires coordination among building or block participants. Costs dependent on scale.
Implementation Examples: Jermyn Street London, UK: Anglo and Doodle Parcel Services
Shippers and Receivers – Delivery Consolidation
Off-Site Loading Dock Credentialing / Staging
Purpose: Move credentialing and staging from street and loading dock area to off-site location.
Description: Have an off-site loading dock credentialing and staging location for consolidation purposes—it would likely be a large parking area with processing gate, potentially a consolidation center.
Benefits: Prevent non-credentialed vehicles from entering loading area or building. Supports reservation system. Stages vehicles while loading dock is occupied to lower the amount of on-street congestion due to loading dock.
Costs/Constraints/Challenges: Proper location of a credentialing location and consideration of delivery company routing operations.
Alternative Strategies: Depending on security could have post at beginning of driveway to prevent non-credentialed vehicles from accessing the loading dock area.
Supportive Strategies: Urban consolidation centers, parking lot consolidation centers
Implementation Examples: World Trade Center, New York.
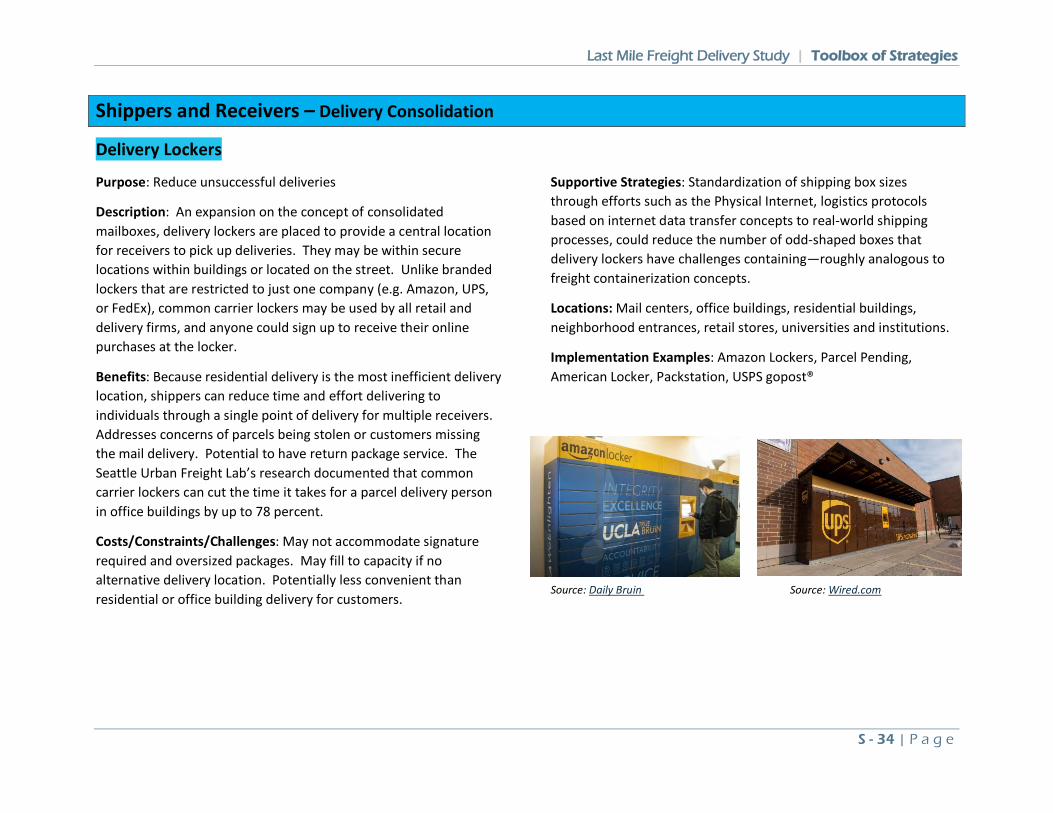
Last Mile Freight Delivery Study | Toolbox of Strategies
S - 34 | P a g e
Shippers and Receivers – Delivery Consolidation
Delivery Lockers
Purpose: Reduce unsuccessful deliveries
Description: An expansion on the concept of consolidated mailboxes, delivery lockers are placed to provide a central location for receivers to pick up deliveries. They may be within secure locations within buildings or located on the street. Unlike branded lockers that are restricted to just one company (e.g. Amazon, UPS, or FedEx), common carrier lockers may be used by all retail and delivery firms, and anyone could sign up to receive their online purchases at the locker.
Benefits: Because residential delivery is the most inefficient delivery location, shippers can reduce time and effort delivering to individuals through a single point of delivery for multiple receivers. Addresses concerns of parcels being stolen or customers missing the mail delivery. Potential to have return package service. The Seattle Urban Freight Lab’s research documented that common carrier lockers can cut the time it takes for a parcel delivery person in office buildings by up to 78 percent.
Costs/Constraints/Challenges: May not accommodate signature required and oversized packages. May fill to capacity if no alternative delivery location. Potentially less convenient than residential or office building delivery for customers.
Supportive Strategies: Standardization of shipping box sizes through efforts such as the Physical Internet, logistics protocols based on internet data transfer concepts to real-world shipping processes, could reduce the number of odd-shaped boxes that delivery lockers have challenges containing—roughly analogous to freight containerization concepts.
Locations: Mail centers, office buildings, residential buildings, neighborhood entrances, retail stores, universities and institutions.
Implementation Examples: Amazon Lockers, Parcel Pending, American Locker, Packstation, USPS gopost®
Source: Daily Bruin Source: Wired.com
Last Mile Freight Delivery Study | Toolbox of Strategies
S - 35 | P a g e
Shippers and Receivers – Building Improvements
Delivery Scheduling
Purpose: To prevent congested loading dock areas
Description: Using a delivery booking system is strongly advised and is a requirement of some delivery schedule plans. As loading bay space is likely to be constrained, it is essential that bookings are used to ensure that capacity is not exceeded.
Benefits: Benefits include reductions in congestion and pollution, improved turnaround times, and transparency for all actors in the
supply chain. Such systems are particularly important in dense urban areas, including shopping centers, markets, sports arenas, tourism/cultural sites, and residential towers.
Costs/Constraints/Challenges: Requires administration of delivery times, and may have large non-compliance which would diminish its effectiveness
Implementation Examples: AppointmentPlus, Doodle Parcels
Shippers and Receivers – Building Improvements
Delivery and Service Plan
Purpose: To organize how a business, building or block would accommodate deliveries and service vehicles.
Description: A Delivery and Servicing Plan (DSP) is a document setting out how freight and servicing vehicle movements to and from a site will be managed.
Benefits: Delivery and Servicing Plans designed to manage the deliveries for an entire building can reduce the negative effects of
urban freight deliveries. Most effective when done at time of building design, however review of historical operations and identification of inefficiencies is effective as well.
Costs/Constraints/Challenges: Would need to be required as a condition of lease or by the City. Enforcement of plan.
Implementation Examples: Transport for London
Last Mile Freight Delivery Study | Toolbox of Strategies
S - 36 | P a g e
Shippers and Receivers – Building Improvements
Loading Dock Modernization
Purpose: Retrofit outdated loading areas and loading docks
Description: Loading docks should be designed for function, durability, safety and security. However, over time specifications for those elements change requiring physical retrofit in older commercial and industrial areas that were not designed for large vehicles or the high frequency of modern deliveries. Elements to consider for Loading areas from the Whole Building Design Guide include:
• Adjacency to other functions • Accommodation of vehicles • Lighting • Edge guards and bumpers • Exterior doors • Noise exposure mitigation • Flooring • Stormwater management • Weather protection
• Monitoring of ingress and egress • Emergency egress • Monitoring of deliveries and shipments • HVAC adjacency • Accident prevention
Benefits: Removes delivery vehicles from curb area, provides for safer and more secure deliveries
Costs/Constraints/Challenges: Costs and constrains depend on the format of the loading area and the type of demand placed upon it. In-building loading areas present the largest challenges as additional space is unlikely to be available.
Alternative Strategies: Adjacent surface parking areas should be investigated for possible lease/designation for delivery. Delivery scheduling systems to minimize bottlenecks in loading docks
Implementation Examples: Dock to ground ramps such as Dockzilla
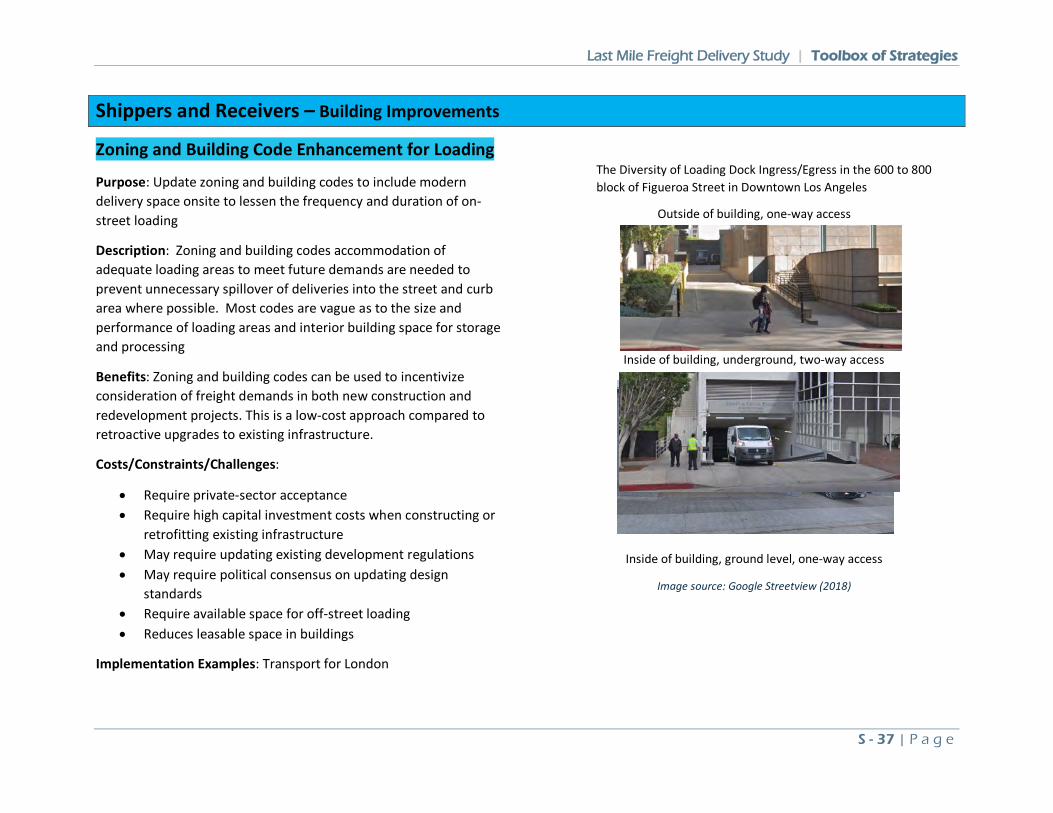
Last Mile Freight Delivery Study | Toolbox of Strategies
S - 37 | P a g e
Shippers and Receivers – Building Improvements
Zoning and Building Code Enhancement for Loading
Purpose: Update zoning and building codes to include modern delivery space onsite to lessen the frequency and duration of on-street loading
Description: Zoning and building codes accommodation of adequate loading areas to meet future demands are needed to prevent unnecessary spillover of deliveries into the street and curb area where possible. Most codes are vague as to the size and performance of loading areas and interior building space for storage and processing
Benefits: Zoning and building codes can be used to incentivize consideration of freight demands in both new construction and redevelopment projects. This is a low-cost approach compared to retroactive upgrades to existing infrastructure.
Costs/Constraints/Challenges:
• Require private-sector acceptance • Require high capital investment costs when constructing or
retrofitting existing infrastructure • May require updating existing development regulations • May require political consensus on updating design
standards • Require available space for off-street loading • Reduces leasable space in buildings
Implementation Examples: Transport for London
Outside of building, one-way access
Inside of building, underground, two-way access
Inside of building, ground level, one-way access
Image source: Google Streetview (2018)
The Diversity of Loading Dock Ingress/Egress in the 600 to 800 block of Figueroa Street in Downtown Los Angeles
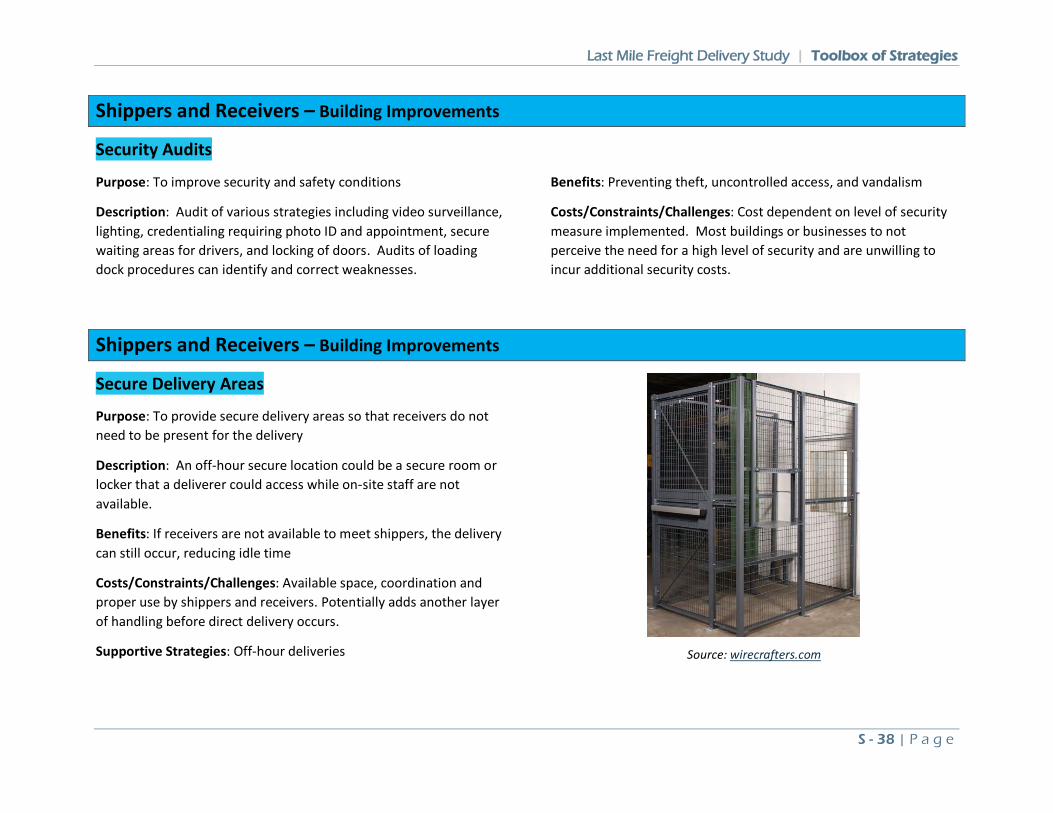
Last Mile Freight Delivery Study | Toolbox of Strategies
S - 38 | P a g e
Shippers and Receivers – Building Improvements
Security Audits
Purpose: To improve security and safety conditions
Description: Audit of various strategies including video surveillance, lighting, credentialing requiring photo ID and appointment, secure waiting areas for drivers, and locking of doors. Audits of loading dock procedures can identify and correct weaknesses.
Benefits: Preventing theft, uncontrolled access, and vandalism
Costs/Constraints/Challenges: Cost dependent on level of security measure implemented. Most buildings or businesses to not perceive the need for a high level of security and are unwilling to incur additional security costs.
Shippers and Receivers – Building Improvements
Secure Delivery Areas
Purpose: To provide secure delivery areas so that receivers do not need to be present for the delivery
Description: An off-hour secure location could be a secure room or locker that a deliverer could access while on-site staff are not available.
Benefits: If receivers are not available to meet shippers, the delivery can still occur, reducing idle time
Costs/Constraints/Challenges: Available space, coordination and proper use by shippers and receivers. Potentially adds another layer of handling before direct delivery occurs.
Supportive Strategies: Off-hour deliveries
Source: wirecrafters.com
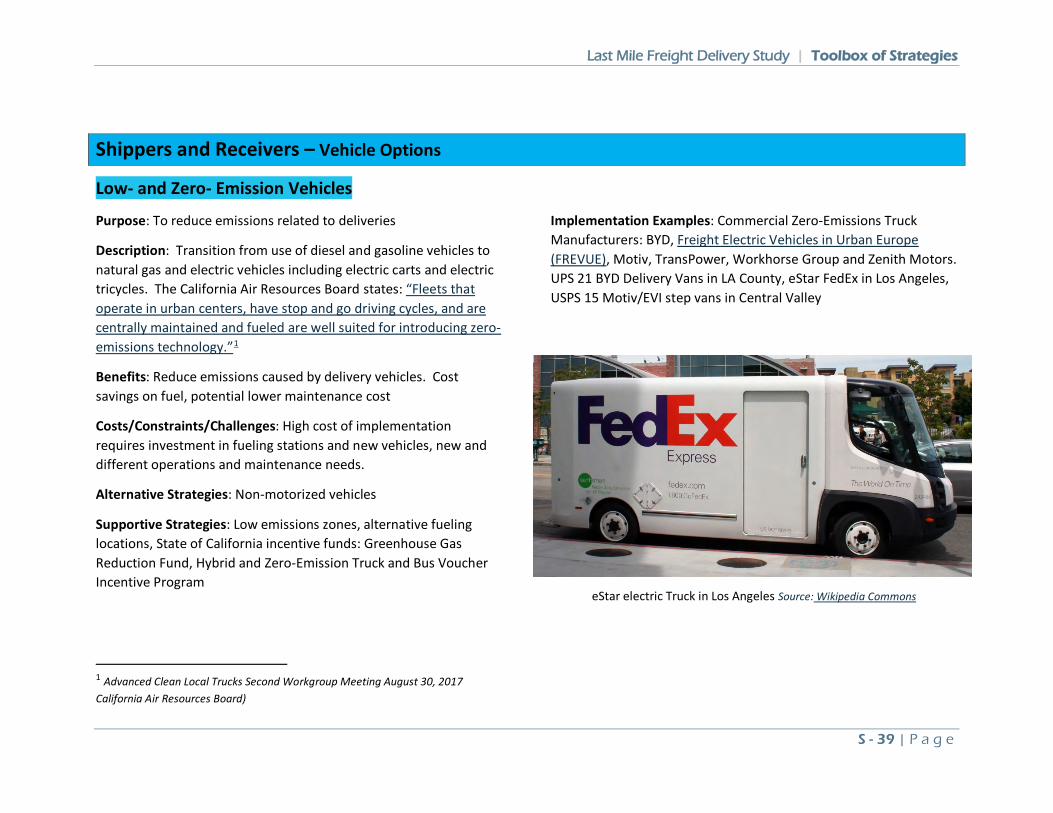
Last Mile Freight Delivery Study | Toolbox of Strategies
S - 39 | P a g e
Shippers and Receivers – Vehicle Options
Low- and Zero- Emission Vehicles
Purpose: To reduce emissions related to deliveries
Description: Transition from use of diesel and gasoline vehicles to natural gas and electric vehicles including electric carts and electric tricycles. The California Air Resources Board states: “Fleets that operate in urban centers, have stop and go driving cycles, and are centrally maintained and fueled are well suited for introducing zero-emissions technology.”1
Benefits: Reduce emissions caused by delivery vehicles. Cost savings on fuel, potential lower maintenance cost
Costs/Constraints/Challenges: High cost of implementation requires investment in fueling stations and new vehicles, new and different operations and maintenance needs.
Alternative Strategies: Non-motorized vehicles
Supportive Strategies: Low emissions zones, alternative fueling locations, State of California incentive funds: Greenhouse Gas Reduction Fund, Hybrid and Zero-Emission Truck and Bus Voucher Incentive Program
1 Advanced Clean Local Trucks Second Workgroup Meeting August 30, 2017 California Air Resources Board)
Implementation Examples: Commercial Zero-Emissions Truck Manufacturers: BYD, Freight Electric Vehicles in Urban Europe (FREVUE), Motiv, TransPower, Workhorse Group and Zenith Motors. UPS 21 BYD Delivery Vans in LA County, eStar FedEx in Los Angeles, USPS 15 Motiv/EVI step vans in Central Valley
eStar electric Truck in Los Angeles Source: Wikipedia Commons
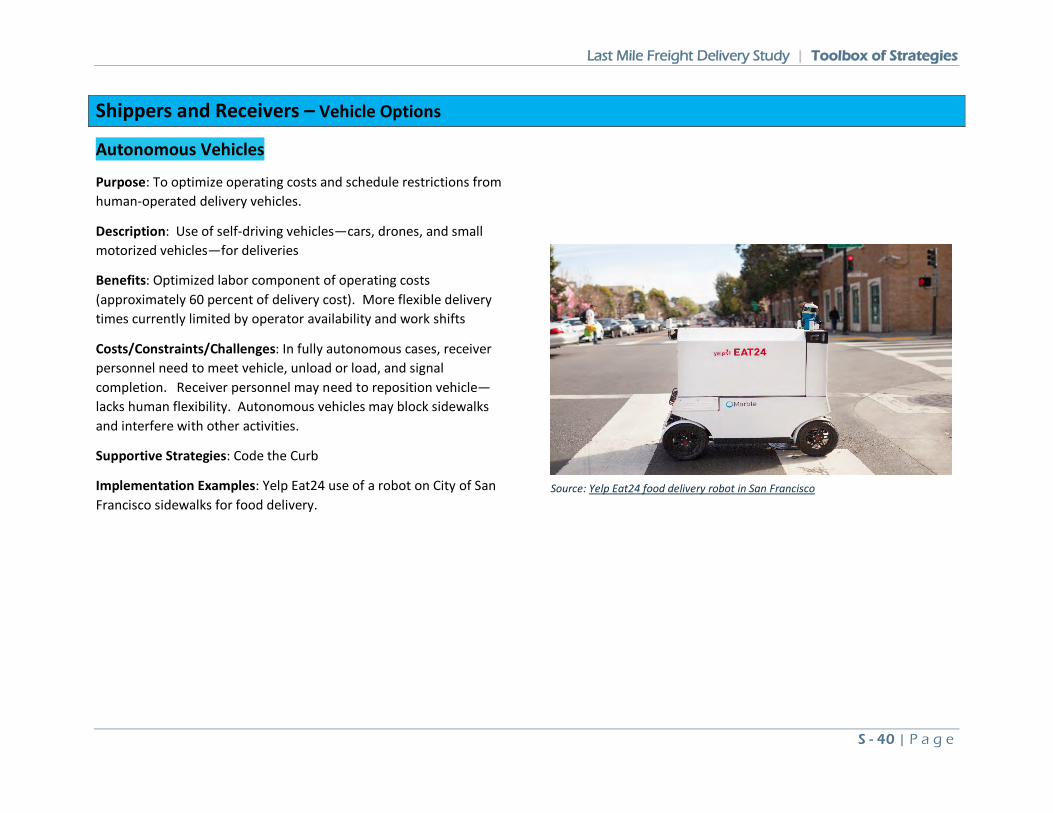
Last Mile Freight Delivery Study | Toolbox of Strategies
S - 40 | P a g e
Shippers and Receivers – Vehicle Options
Autonomous Vehicles
Purpose: To optimize operating costs and schedule restrictions from human-operated delivery vehicles.
Description: Use of self-driving vehicles—cars, drones, and small motorized vehicles—for deliveries
Benefits: Optimized labor component of operating costs (approximately 60 percent of delivery cost). More flexible delivery times currently limited by operator availability and work shifts
Costs/Constraints/Challenges: In fully autonomous cases, receiver personnel need to meet vehicle, unload or load, and signal completion. Receiver personnel may need to reposition vehicle—lacks human flexibility. Autonomous vehicles may block sidewalks and interfere with other activities.
Supportive Strategies: Code the Curb
Implementation Examples: Yelp Eat24 use of a robot on City of San Francisco sidewalks for food delivery.
Source: Yelp Eat24 food delivery robot in San Francisco
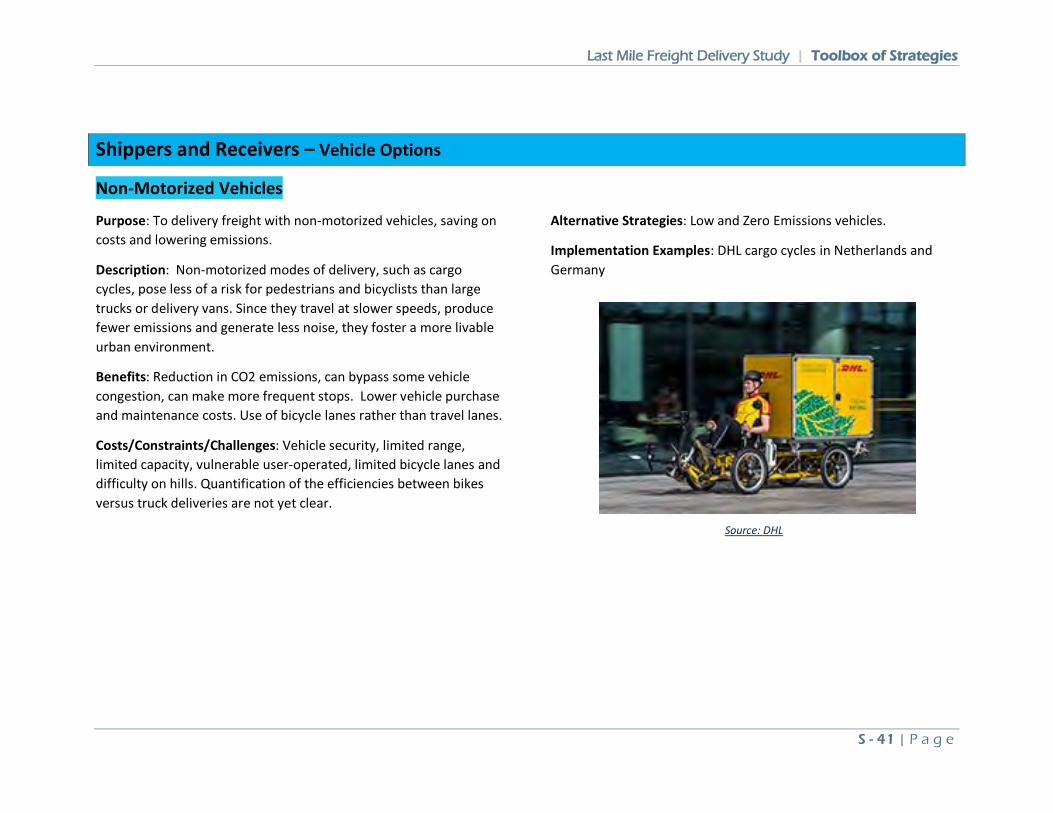
Last Mile Freight Delivery Study | Toolbox of Strategies
S - 41 | P a g e
Shippers and Receivers – Vehicle Options
Non-Motorized Vehicles
Purpose: To delivery freight with non-motorized vehicles, saving on costs and lowering emissions.
Description: Non-motorized modes of delivery, such as cargo cycles, pose less of a risk for pedestrians and bicyclists than large trucks or delivery vans. Since they travel at slower speeds, produce fewer emissions and generate less noise, they foster a more livable urban environment.
Benefits: Reduction in CO2 emissions, can bypass some vehicle congestion, can make more frequent stops. Lower vehicle purchase and maintenance costs. Use of bicycle lanes rather than travel lanes.
Costs/Constraints/Challenges: Vehicle security, limited range, limited capacity, vulnerable user-operated, limited bicycle lanes and difficulty on hills. Quantification of the efficiencies between bikes versus truck deliveries are not yet clear.
Alternative Strategies: Low and Zero Emissions vehicles.
Implementation Examples: DHL cargo cycles in Netherlands and Germany
Source: DHL
Last Mile Freight Delivery Study | Toolbox of Strategies
S - 42 | P a g e
Administration and Application – Enforcement
Enhanced Enforcement Program for Delivery Restrictions
Purpose: To ensure loading space turnover or reduce dwell time
Description: Enforcement of commercial loading zone occupancy and time limits
Benefits: Reduce violations in loading zones to allow for more efficient use for deliveries.
Costs/Constraints/Challenges: Cost of enforcement personnel to specifically patrol loading zones. Difficulty in verifying legitimate use. Need commercial vehicle permit system.
Alternative Strategies: Delivery permitting system,
Supportive Strategies: Commercial delivery-only designation (to avoid confusion with 5-minute passenger loading use of yellow zones). Commercial vehicle permit system.
References / Additional Resources: City of Los Angeles Controller Parking Ticket Information and Recommendations.
Administration and Application – Enforcement
Commercial Vehicle-Only Yellow Zones
Purpose: Limit yellow zone usage to commercial vehicles only.
Description: Many cities allow other uses of yellow zones in off-hours (6PM to 6 or 7AM) or for short-term (5 minute) loading and unloading of non-commercial vehicles. The duration and type of loading is set by local ordinance. California Vehicle Code Division 11 Chapter 2 section 21458 states “Yellow indicates stopping only for the purpose of loading or unloading passenger or freight for the time as may be specified by local ordinance.”
Benefits: Provide clarity in yellow zone enforcement and lower the amount of conflicting uses.
Costs/Constraints/Challenges: Cost of updated regulations such as updated signage, outreach and legislative action. How to identify commercial vehicles and deal with personal vehicles used for commercial delivery (e.g. Amazon Express, Postmates)
Alternative Strategies: Could be implemented in high-demand areas only
Implementation Examples: Many cities restrict yellow zone usage to just commercial vehicles including Beverly Hills.
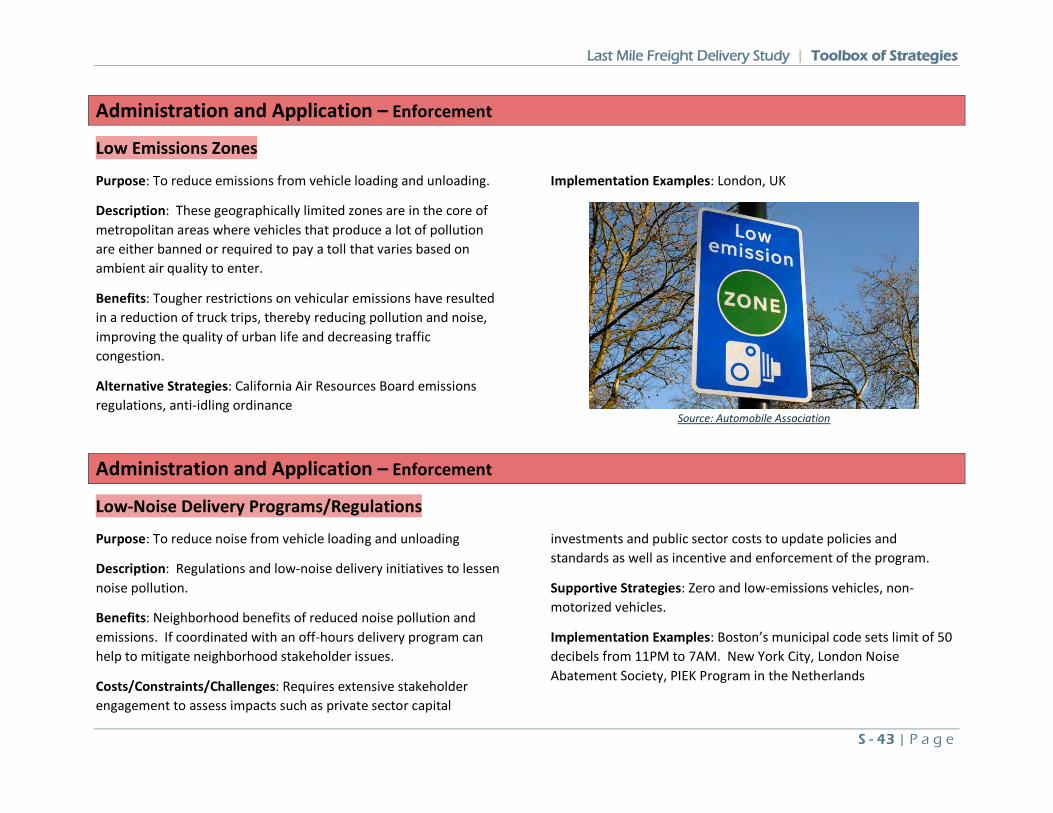
Last Mile Freight Delivery Study | Toolbox of Strategies
S - 43 | P a g e
Administration and Application – Enforcement
Low Emissions Zones
Purpose: To reduce emissions from vehicle loading and unloading.
Description: These geographically limited zones are in the core of metropolitan areas where vehicles that produce a lot of pollution are either banned or required to pay a toll that varies based on ambient air quality to enter.
Benefits: Tougher restrictions on vehicular emissions have resulted in a reduction of truck trips, thereby reducing pollution and noise, improving the quality of urban life and decreasing traffic congestion.
Alternative Strategies: California Air Resources Board emissions regulations, anti-idling ordinance
Implementation Examples: London, UK
Source: Automobile Association
Administration and Application – Enforcement
Low-Noise Delivery Programs/Regulations
Purpose: To reduce noise from vehicle loading and unloading
Description: Regulations and low-noise delivery initiatives to lessen noise pollution.
Benefits: Neighborhood benefits of reduced noise pollution and emissions. If coordinated with an off-hours delivery program can help to mitigate neighborhood stakeholder issues.
Costs/Constraints/Challenges: Requires extensive stakeholder engagement to assess impacts such as private sector capital
investments and public sector costs to update policies and standards as well as incentive and enforcement of the program.
Supportive Strategies: Zero and low-emissions vehicles, non-motorized vehicles.
Implementation Examples: Boston’s municipal code sets limit of 50 decibels from 11PM to 7AM. New York City, London Noise Abatement Society, PIEK Program in the Netherlands
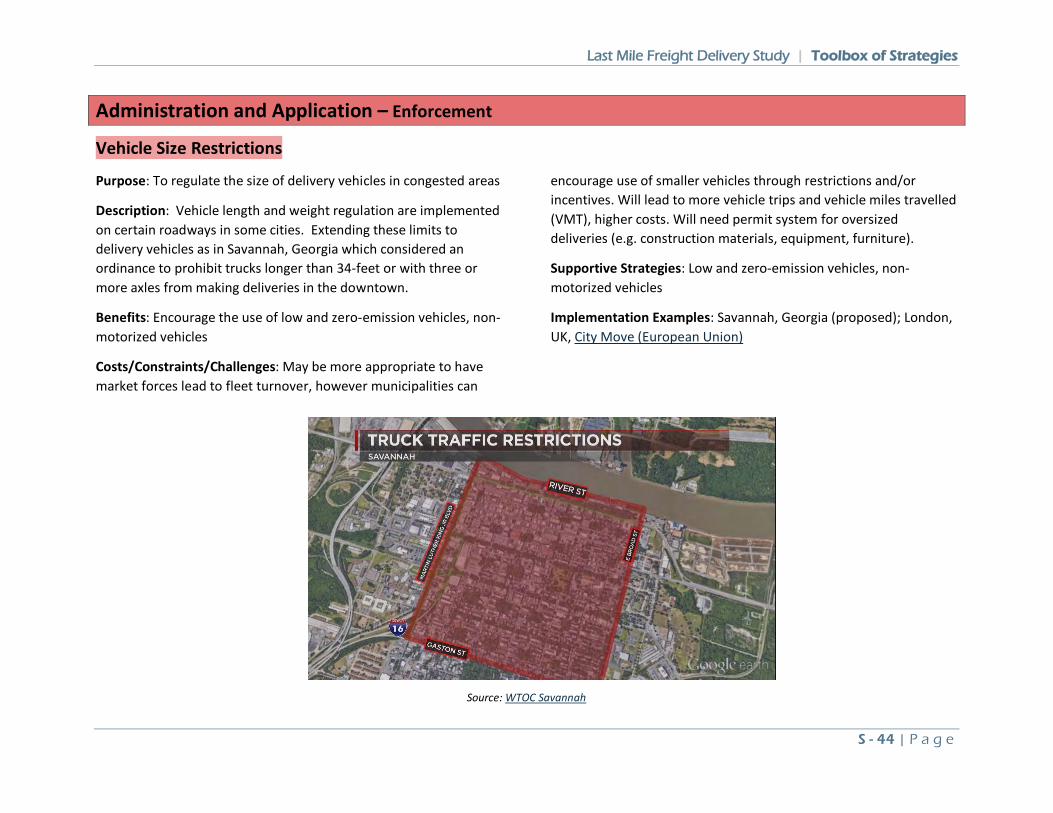
Last Mile Freight Delivery Study | Toolbox of Strategies
S - 44 | P a g e
Administration and Application – Enforcement
Vehicle Size Restrictions
Purpose: To regulate the size of delivery vehicles in congested areas
Description: Vehicle length and weight regulation are implemented on certain roadways in some cities. Extending these limits to delivery vehicles as in Savannah, Georgia which considered an ordinance to prohibit trucks longer than 34-feet or with three or more axles from making deliveries in the downtown.
Benefits: Encourage the use of low and zero-emission vehicles, non-motorized vehicles
Costs/Constraints/Challenges: May be more appropriate to have market forces lead to fleet turnover, however municipalities can
encourage use of smaller vehicles through restrictions and/or incentives. Will lead to more vehicle trips and vehicle miles travelled (VMT), higher costs. Will need permit system for oversized deliveries (e.g. construction materials, equipment, furniture).
Supportive Strategies: Low and zero-emission vehicles, non-motorized vehicles
Implementation Examples: Savannah, Georgia (proposed); London, UK, City Move (European Union)
Source: WTOC Savannah
Last Mile Freight Delivery Study | Toolbox of Strategies
S - 45 | P a g e
Administration and Application – Enforcement
Temporary Parking Permits/Zone Control
Purpose: Create opportunities for safe & efficient delivery of construction materials, equipment, etc.
Description: Increase awareness of temporary loading/parking permits for periodic needs, streamline permitting process. Proactively contact construction sites and other potential users.
Benefits: Reduced congestion, incidents, and violations at construction sites and other locations.
Costs/Constraints/Challenges: Making permit process easy and accessible, improving awareness among receivers.
Supportive Strategies: Commercial vehicle permitting, curb inventory
Implementation Examples: City of San Francisco permitting
Administration and Application – Outreach and Information
Government and Industry Forum for Delivery Issues
Purpose: To create opportunity to consider the various perspectives of stake-holders and thereby identify possible solutions
Description: A forum of industry and government stakeholders for presentations and discussions on freight and delivery issues.
Benefits: A freight delivery-based forum would provide an opportunity to identify issues, coordinate with appropriate stakeholders, and have consistent dialog, leading to the potential to increase productivity and reduce externalities of deliveries and build consensus for actions. Outcomes are not limited to physical projects; relationships and knowledge exchange between participants provide a foundation for further improving urban freight delivery.
Costs/Constraints/Challenges: Requires high/moderate coordination among multiple stakeholders/jurisdictions with limited resources to donate time
Supportive Strategies: Since its successful implementation requires the commitment of all the agents involved, it is more effective when suppliers for the same receiver are located in close proximity to each other.
Implementation Examples: Tenjin, a central business district in Fukuoka, Japan (Nemoto 1997), Delivery Service Plans, London, England (Transport for London 2013a), Greater New York City, Atlanta , Washington DC
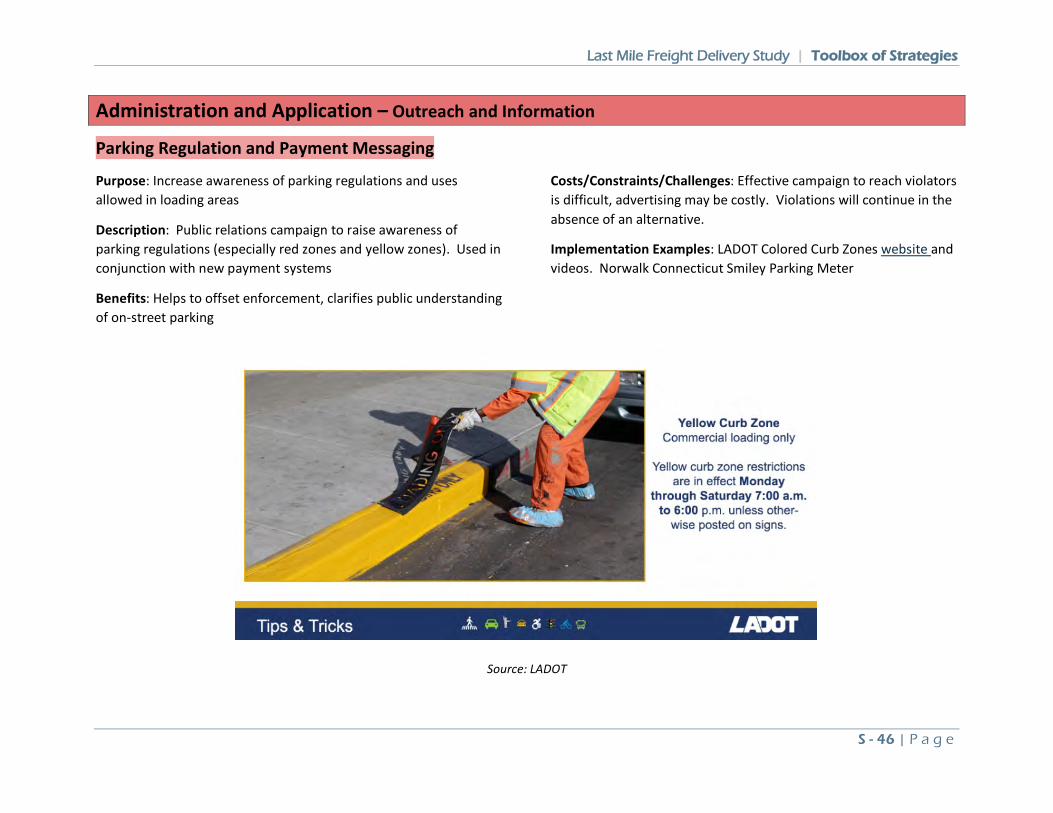
Last Mile Freight Delivery Study | Toolbox of Strategies
S - 46 | P a g e
Administration and Application – Outreach and Information
Parking Regulation and Payment Messaging
Purpose: Increase awareness of parking regulations and uses allowed in loading areas
Description: Public relations campaign to raise awareness of parking regulations (especially red zones and yellow zones). Used in conjunction with new payment systems
Benefits: Helps to offset enforcement, clarifies public understanding of on-street parking
Costs/Constraints/Challenges: Effective campaign to reach violators is difficult, advertising may be costly. Violations will continue in the absence of an alternative.
Implementation Examples: LADOT Colored Curb Zones website and videos. Norwalk Connecticut Smiley Parking Meter
Source: LADOT
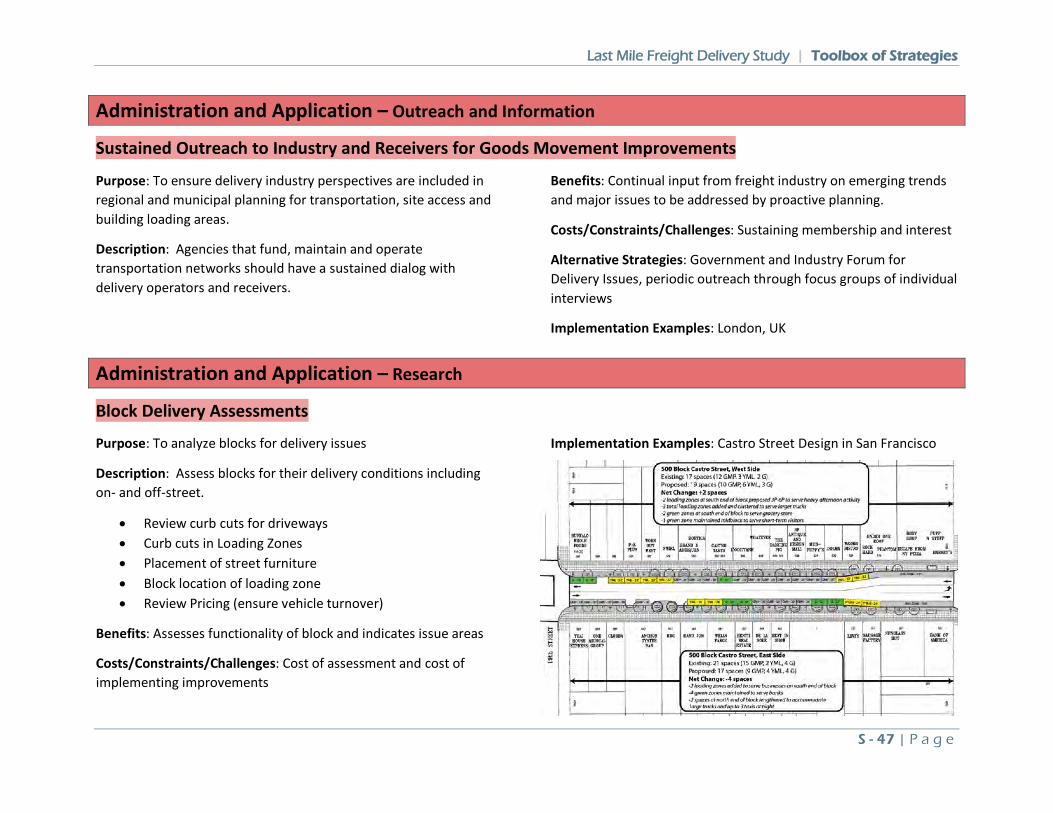
Last Mile Freight Delivery Study | Toolbox of Strategies
S - 47 | P a g e
Administration and Application – Outreach and Information
Sustained Outreach to Industry and Receivers for Goods Movement Improvements
Purpose: To ensure delivery industry perspectives are included in regional and municipal planning for transportation, site access and building loading areas.
Description: Agencies that fund, maintain and operate transportation networks should have a sustained dialog with delivery operators and receivers.
Benefits: Continual input from freight industry on emerging trends and major issues to be addressed by proactive planning.
Costs/Constraints/Challenges: Sustaining membership and interest
Alternative Strategies: Government and Industry Forum for Delivery Issues, periodic outreach through focus groups of individual interviews
Implementation Examples: London, UK
Administration and Application – Research
Block Delivery Assessments
Purpose: To analyze blocks for delivery issues
Description: Assess blocks for their delivery conditions including on- and off-street.
• Review curb cuts for driveways • Curb cuts in Loading Zones • Placement of street furniture • Block location of loading zone • Review Pricing (ensure vehicle turnover)
Benefits: Assesses functionality of block and indicates issue areas
Costs/Constraints/Challenges: Cost of assessment and cost of implementing improvements
Implementation Examples: Castro Street Design in San Francisco
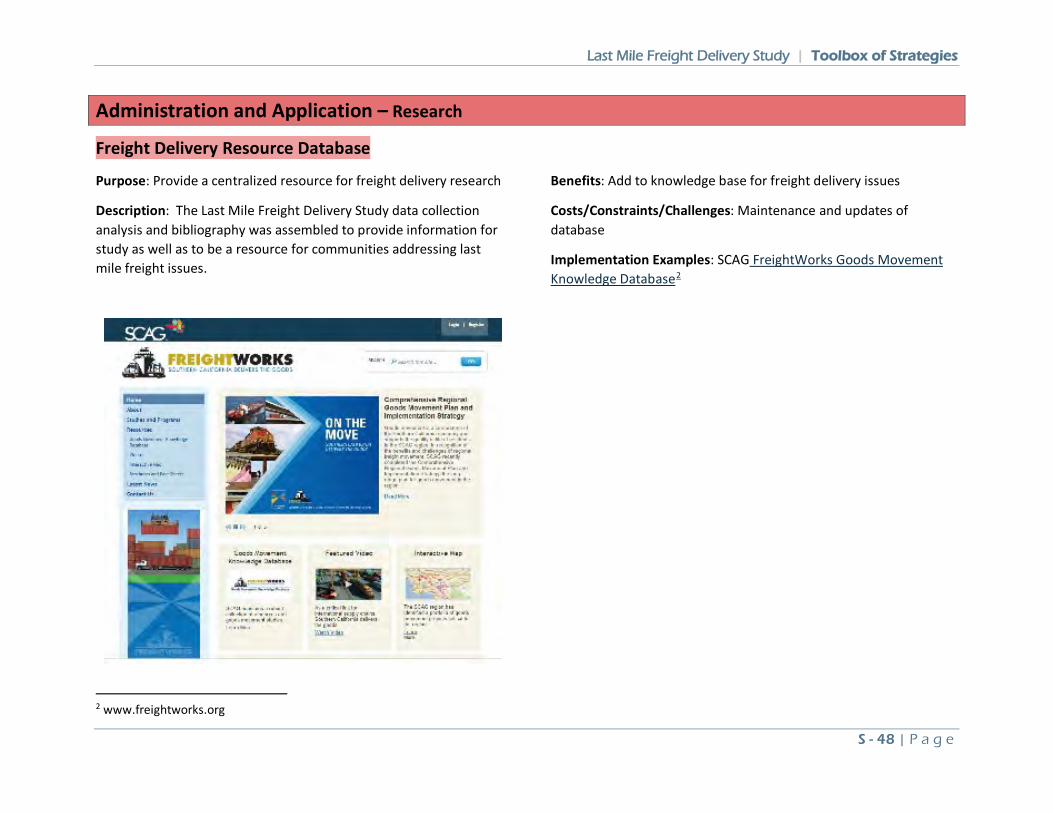
Last Mile Freight Delivery Study | Toolbox of Strategies
S - 48 | P a g e
Administration and Application – Research
Freight Delivery Resource Database
Purpose: Provide a centralized resource for freight delivery research
Description: The Last Mile Freight Delivery Study data collection analysis and bibliography was assembled to provide information for study as well as to be a resource for communities addressing last mile freight issues.
Benefits: Add to knowledge base for freight delivery issues
Costs/Constraints/Challenges: Maintenance and updates of database
Implementation Examples: SCAG FreightWorks Goods Movement Knowledge Database2
2 www.freightworks.org
Last Mile Freight Delivery Study | Toolbox of Strategies
S - 49 | P a g e
Administration and Application – Research
City Freight Policy Assessment
Purpose: Ensure freight policies are state-of-practice and practical to be implemented at the departmental level.
Description: Review freight policies, ordinances and regulations for continual improvement and refinement through ongoing cooperative process.
Benefits: Ensure best practices are aligned with City goals and policies for deliveries.
Costs/Constraints/Challenges: Implementation cost of policy assessment.
Administration and Application – Technology
Data Collection Technology
Purpose: To better understand freight and delivery movements
Description: Use of Global Positioning Systems (GPS), web-based surveys, camera and loop technology, machine learning, etc., to understand freight and delivery conditions.
Benefits: Allocate curb resources to delivery demand
Costs/Constraints/Challenges: Cost dependent on technology applied.
Supportive Strategies: Smart Parking, Code the Curb
Implementation Examples: Truck counts, SCAG/Metro travel demand model truck volume data, ParkerData Availability
Last Mile Freight Delivery Study | Toolbox of Strategies
S - 50 | P a g e
Administration and Application – Technology
Consolidated Shipment Software
Purpose: To reduce delivery trips by consolidating deliveries.
Description: By openly sharing data and holding application design competitions emerging applications have enabled on-demand requests for larger scale shipments. These types of consolidation activities would be an industry-led initiative.
Benefits: Fewer trips per delivery
Costs/Constraints/Challenges: Requires high level of coordination and software infrastructure to implement. Many institutional barriers to wide adoption.
Implementation Examples: Cargomatic, a truck brokerage system, matches shippers to carriers with available space on a truck, improving truck load utilization factors and reducing extra miles travelled and empty trips. However, it is not a full consolidation system which would need broader industry participation.
Administration and Application – Technology
Vehicle Permitting Technology
Purpose: Verify eligibility to use loading zone or dock.
Description: Electronic credentialing through radio-frequency identification (RFID).
Benefits: Ensures user identity for security purposes. May assist in identification of violators for enforcement.
Costs/Constraints/Challenges: Very high implementation cost for vehicles and receivers, high institutional barriers. California Motor
Carrier Permits require the number to be displayed on both sides of each vehicle, however the standards for display can have a wide range of contrast, size, shape and color as long as it is legible from 50 feet away in daylight—this could make automated reading of the number difficult.
Alternative Strategies: Vehicle windshield stickers or license plate identification. Use of motor carrier permit number on the sides of the truck may be used.
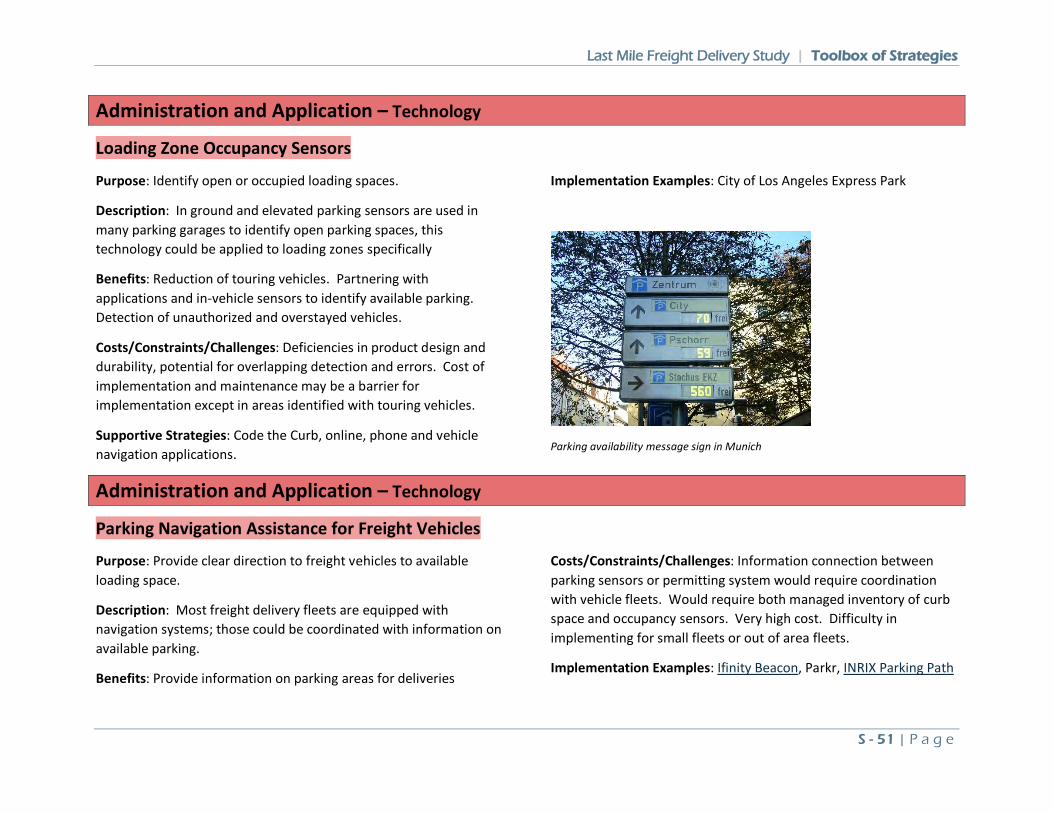
Last Mile Freight Delivery Study | Toolbox of Strategies
S - 51 | P a g e
Administration and Application – Technology
Loading Zone Occupancy Sensors
Purpose: Identify open or occupied loading spaces.
Description: In ground and elevated parking sensors are used in many parking garages to identify open parking spaces, this technology could be applied to loading zones specifically
Benefits: Reduction of touring vehicles. Partnering with applications and in-vehicle sensors to identify available parking. Detection of unauthorized and overstayed vehicles.
Costs/Constraints/Challenges: Deficiencies in product design and durability, potential for overlapping detection and errors. Cost of implementation and maintenance may be a barrier for implementation except in areas identified with touring vehicles.
Supportive Strategies: Code the Curb, online, phone and vehicle navigation applications.
Implementation Examples: City of Los Angeles Express Park
Parking availability message sign in Munich
Administration and Application – Technology
Parking Navigation Assistance for Freight Vehicles
Purpose: Provide clear direction to freight vehicles to available loading space.
Description: Most freight delivery fleets are equipped with navigation systems; those could be coordinated with information on available parking.
Benefits: Provide information on parking areas for deliveries
Costs/Constraints/Challenges: Information connection between parking sensors or permitting system would require coordination with vehicle fleets. Would require both managed inventory of curb space and occupancy sensors. Very high cost. Difficulty in implementing for small fleets or out of area fleets.
Implementation Examples: Ifinity Beacon, Parkr, INRIX Parking Path
plea
se re
cycl
e |
#29
58.2
020.
10.13
MAIN OFFICE900 Wilshire Blvd., Ste. 1700,Los Angeles, CA 90017 Tel: (213) 236-1800
REGIONAL OFFICES
IMPERIAL COUNTY1503 North Imperial Ave., Ste. 104 El Centro, CA 92243Tel: (213) 236-1967
ORANGE COUNTYOCTA Building 600 South Main St., Ste. 741 Orange, CA 92868 Tel: (213) 236-1997
RIVERSIDE COUNTY3403 10th St., Ste. 805 Riverside, CA 92501 Tel: (951) 784-1513
SAN BERNARDINO COUNTY1170 West 3rd St., Ste. 140 San Bernardino, CA 92410 Tel: (213) 236-1925
VENTURA COUNTY4001 Mission Oaks Blvd., Ste. L Camarillo, CA 93012Tel: (213) 236-1960
SCAG.CA.GOV
LAST-MILE FREIGHT DELIVERY STUDYOctober 2020