Embed Size (px)
Citation preview

Title
Lean and Obese Zucker Rats Exhibit Different Patterns of p70S6kinase Regulation
in the Tibialis Anterior Muscle in Response to High Force Muscle Contraction
By Anjaiah Katta
A thesis submitted to the
Graduate faculty of the Department of Biology at
Marshall University In partial fulfillment of the requirements for the degree
of Master of Science
Committee: _____________________________ Dr. Eric R Blough, Thesis adviser _____________________________ Dr. David Mallory, Committee member _____________________________ Dr. Charles Somerville, Committee member Date: 08/02/2007 Summer 2007 Marshall University West Virginia

Abstract
Increased muscle loading results in phosphorylation of the 70 kDa ribosomal S6 kinase
(p70s6k) signaling pathway and this event strongly correlates with degree of muscle
adaptation following resistance exercise. Here, we compared the basal and contraction-
induced phosphorylation of p70s6k, Akt and mTOR in tibialis anterior muscles of lean
and obese Zucker rats. Immunoblotting demonstrated differences in level of basal p70S6k
phosphorylation (Thr 389) in the normal and diabetic TA. HFES had an increase in
p70S6k (Thr389) phosphorylation at 0-, 1- and 3-hr in lean TA and only at 3-hr in obese
TA. mTOR (Ser 2448) Phosphorylation was elevated in lean TA immediately after HFES
and remains unaltered in obese TA. HFES increased activity of both Akt (Thr 308) and
Akt (Ser 473) in lean TA. These results suggest that diabetes is associated with
alterations in the muscle content and ability to activate p70s6k signaling following an
acute bout of exercise.
Key words: type 2 diabetes; skeletal muscle; p70S6k; mTOR; Akt; HFES

iii
Acknowledgements
I would like to thank Dr. Eric Blough, my mentor for his help in my transition to
Marshall. Thank you Eric for providing me with ideal work environment; for setting high
standards in my professional and personal education; for your never ending support,
enthusiasm, generosity and availability; for inspiring me, supporting me and always
believing me. Working under your direction has been an honor and privilege, one that I
am very thankful for. I would like to thank Dr. Mallory and Dr.Somerville for their
valuable comment and suggestion on the thesis. I also thank all friends and colleagues in
our research group for the wonderful discussions we had on research in particular and life
in general; for creating a warm and inspiring environment at the laboratory; for always
being so helpful and nice; Kevin Rice, Devashish Desai, Sunil Kumar Kakarla, Shinichi
Asano, Sarath Meduru and Mupparaju Sriram, working side by side with each of you
made the experiments an enjoyable experience. My parents and friends at home, in India
for their continuous support. This study was supported by National Institute on Aging
Grant AG-027103-1 and WV-NASA to Eric Blough.

iv
ABBREVIATIONS
ADA American Diabetes Association
ANOVA One-way analysis of variance on ranks
BSA Bovine serum albumin
DM Diabetes Mellitus
ECL Enhanced chemiluminiscence
GLUT4 Glucose transporter 4
HFES High Frequency Electrical Stimulation
IOD Integrated Optical Densities
LZ Lean Zucker
mTOR mammalian Target of Rapamycin
NHANES National Health and Nutrition Examination Survey
NHIS National Health Interview Survey
NIA National Institute of Aging
OZ Obese Zucker
PBS Phosphate buffered saline
PBST Phosphate buffered saline with 0.5% tween
PKB Protein kinase B
PRT Progressive Resistance Training
p70S6k 70 kDa ribosomal S6 kinase
SEM Standard Error Mean
SDS-PAGE Sodium Dodecyl Sulfate-Polyacrylamide Gel Electrophoresis
TA Tibialis Anterior
TBS Tris buffered saline
TBST Tris buffered saline with 0.5% tween
T 2 DM Type 2 diabetes mellitus

v
LIST OF TABLES AND FIGURES
Table 1. Body weight and muscle mass of lean and obese (fa/fa) Zucker rats....... .. 31
Figure 1. Diabetes is associated with alterations in skeletal muscle p70S6k and its
pathway related proteins expression ........................................................ ...32
Figure 2. Contraction-induced p70S6k phosphorylation is altered with diabetes... ...33
Figure 3. Contraction-induced mTOR phosphorylation is altered with diabetes ... .. 34
Figure 4. Contraction-induced Akt phosphorylation is altered with diabetes ........ .. 35

vi
Table of contents
ACKNOWLEDGEMENTS.................................................................................. iii ABBREVIATIONS .............................................................................................. iv LIST OF TABLES AND FIGURES ..................................................................... v CHAPTER 1 ........................................................................................................... 1
INTRODUCTION.................................................................................................... 1 PURPOSE ........................................................................................................ 3 Specific Aim #1: To determine if the expression and basal phosphorylation level of Akt/mTOR/p70S6k pathway proteins are altered in the Tibialis Anterior (TA) muscles of lean and obese Zucker rats with type 2 diabetes................................................................................... 4 Specific Aim # 2: To determine if the contraction induced activation/phosphorylation of Akt/mTOR/p70S6k pathway proteins are altered in the Tibialis Anterior (TA) muscles of lean and obese Zucker rats with type 2 diabetes................................................................................... 4
CHAPTER 2 ........................................................................................................... 5 REVIEW OF LITERATURE .................................................................................... 5
p70S6k pathway related proteins and regulation of their activity in skeletal muscle ................................................................................................. 5 The obese Zucker strain as a model for type 2 diabetes investigation .......... 11
CHAPTER 3 ......................................................................................................... 15 ABSTRACT ...................................................................................................... 16 KEY WORDS: TYPE 2 DIABETES; SKELETAL MUSCLE; P70S6K; MTOR; AKT HFES ................................................................................................................. 16 INTRODUCTION............................................................................................. 17
MATERIALS AND METHODS ......................................................................... 19 ANIMALS ............................................................................................................ 19 MATERIALS ........................................................................................................ 19 CONTRACTILE STIMULATION OF SKELETAL MUSCLES ......................................... 20 PREPARATION OF PROTEIN ISOLATES AND IMMUNOBLOTTING............................. 20 STATISTICAL ANALYSIS ...................................................................................... 21
RESULTS ............................................................................................................. 22 SYNDROME-X AND MUSCLE MASS ...................................................................... 22

vii
P70S6K PATHWAY RELATED PROTEIN LEVELS AND PHOSPHORYLATION STATUS ARE ALTERED IN THE DIABETIC TA MUSCLE........................................... 22 THE CONTRACTION-INDUCED PHOSPHORYLATION OF P70S6K IS ALTERED IN THE OBESE-ZUCKER RAT..................................................................................... 22 THE CONTRACTION-INDUCED PHOSPHORYLATION OF POTENTIAL P70S6K REGULATORS IS ALTERED IN OBESE-ZUCKER RAT. .............................................. 23
DISCUSSION....................................................................................................... 25 APPENDIX........................................................................................................... 29
APPENDIX A....................................................................................................... 29 APPENDIX B....................................................................................................... 36
CHAPTER 4 ......................................................................................................... 84 CONCLUSIONS ................................................................................................... 84 FUTURE DIRECTIONS ........................................................................................ 84
REFERENCES ..................................................................................................... 87 CURRICULUM VITAE....................................................................................... 93

- 1 -
Chapter 1
Introduction
It has been estimated that 171 million people worldwide have diabetes and it is estimated
that this will increase to 366 million by 2030 [1]. An estimated 20.8 million people in the United
States, about 7.0 percent of the population have diabetes. Diabetes mellitus (DM) is a serious,
lifelong condition that is characterized high levels of blood glucose resulting from defects in
insulin production, insulin action, or both. The obese Zucker (fa/fa) rat exhibits
hyperinsulinemia, hyperlipidemia and hyperglycemia along with central adiposity. Since
individuals with type 2 diabetes typically exhibit characteristics of metabolic syndrome, the
genetically obese Zucker rat (fa/fa) is thought to be an appropriate model for diabetes related
studies.
Exercise has long been recognized to have important health benefits for people with
type 2 diabetes. The molecular events underlying exercise-induced adaptations in diabetic
muscle remain to be unraveled. It is thought that beneficial effects of exercise on structural and
functional adaptations of muscle are mediated through the activation of various signaling
molecules. These signaling molecules, in turn, activate signaling cascades involved in regulating
gene expression, glucose uptake, glycogen synthesis and protein synthesis. Similar to that seen
with aerobic exercise modalities [2-4] , recent data suggest that anaerobic exercise may also be
beneficial in the treatment of diabetes [5-12]. For example, progressive resistance training has
been found to improve glycemic control, increase skeletal muscle size and strength, and
positively change body composition by increasing lean body mass and decreasing visceral and
total body fat [13-16]. Whether type 2 diabetes alters exercise-induced signal transduction
- 2 -
processes in muscle is not clear, but the existence of differences, if present, may help to explain
why exercise-induced skeletal muscle adaptations may differ between normal and diabetic
populations.
It is well established that strenuous exercise increases the rates of muscle protein
synthesis [17]. This increase in protein synthesis is thought to be regulated, at least in part, by the
phosphorylation of the p70 ribosomal protein S6 kinase (p70S6k) [18]. The activation of p70S6k
has been proposed to promote increased translation of messages that have a polypyrimide motif
just downstream of the 5’ cap [19]. It is thought that p70S6k activity is regulated by the
mammalian target of rapamycin (mTOR) which functions as a growth factor and nutrient-sensing
signaling molecule in mammalian cells [20]. How mTOR activity is modulated is not clear;
however, recent evidence suggests that mTOR is controlled by protein kinase B (PKB) / Akt
which is activated in response to phospholipid products of the phosphatidylinositol 3-kinase
reaction. It is likely that PKB/Akt increases mTOR activity by phosphorylating mTOR at
Ser2448 and it has been hypothesized that this event is a critical point of control in the regulation
of protein synthesis [21]. Further, recent data suggests that p70S6k signaling may be particularly
important in mediating muscle adaptation as the phosphorylation of this molecule following an
exercise bout has been found to be strongly associated with the increase in muscle weight after 6
wk of chronic stimulation [22]. To our knowledge, whether differences exist between normal and
diabetic muscle in this exercise induced activation of p70S6k has not been investigated.

- 3 -
PURPOSE
Our long term goal is to elucidate the contraction-induced intracellular signaling
mechanisms thought to be involved in regulating skeletal muscle hypertrophy in diabetic skeletal
muscle. The purpose of the present study was to determine whether type 2 diabetes alters
Akt/mTOR/p70S6k pathway signaling after an acute episode of contractile activity.
SPECIFIC AIMS
Diabetes is the sixth leading cause of death in the US. The economic burden posed by
diabetes is daunting with the total cost of diabetes in the U.S. in 2002 at an estimated $132
billion [23]. As such, it is clear that the scientific community must continue to search for the
most effective methods for the treatment and prevention of this disease. Recent data have
suggested that increased muscle loading regulates the rate of muscle protein synthesis and
hypertrophy [17]. This increase in protein synthesis, at least in part, is thought to be regulated by
the activation of the Akt/mTOR/p70S6k pathway [19-21]. No research has examined the
response to a single contractile stimulus comparing normal and diabetic muscle. The working
hypothesis of this study is that differences exist between normal and diabetic muscle in the
maximal contraction induced activation of p70S6k pathway. To test this hypothesis and
accomplish the purpose of this study the following specific aims are proposed;

- 4 -
Specific Aim #1: To determine if the expression and basal phosphorylation level of
Akt/mTOR/p70S6k pathway proteins are altered in the Tibialis Anterior (TA) muscles of lean
and obese Zucker rats with type 2 diabetes.
Hypothesis: Type 2 diabetes will be associated with alterations in the expression and basal
phosphorylation level of Akt/mTOR/p70S6k pathway proteins in the Tibialis Anterior (TA)
muscles.
Specific Aim # 2: To determine if the contraction induced activation/phosphorylation of
Akt/mTOR/p70S6k pathway proteins are altered in the Tibialis Anterior (TA) muscles of lean
and obese Zucker rats with type 2 diabetes.
Hypothesis: Type 2 diabetes will be associated with alterations in the contraction induced
activation/phosphorylation of Akt/mTOR/p70S6k pathway proteins in the Tibialis Anterior (TA)
muscles.

- 5 -
Chapter 2
Review of Literature
Introduction
A review of the pertinent literature concerning the present study will be presented
in the following chapter. The following areas will be addressed: 1.) p70S6k pathway related
proteins and the p70S6k regulation in skeletal muscle, and 2.) the obese syndrome X Zucker rat
strain as an animal model for type 2 diabetes investigation.
p70S6k pathway related proteins and regulation of their activity in skeletal
muscle
`The serine / threonine kinase, p70s6k, is believed to function in the regulation of protein
synthesis [24]. The primary structure of p70s6k consists of four functional domains or modules.
Module I extends from the N-terminus to the beginning of the catalytic domain and confers
rapamycin sensitivity to p70s6k [25-27]. Module II contains the conserved catalytic domain,
including the acute site of mitogen-induced phosphorylation in the activation T-loop [27].
Module III links the catalytic domain with the carboxyl tail, contains two additional sites of acute
phosphorylation, and is conserved in many members of the second messenger family of Ser/Thr
kinases [28]. Finally, Module IV contains the putative auto-inhibitory domain, which has
significant sequence similarity with the substrate region of S6, and four closely clustered

- 6 -
phosphorylation sites [29]. The activation of P70s6k occurs in a hierarcal fashion through the
sequential phosphorylation of each module. It is thought that P70s6k activation accelerates
translation of mRNAs containing a terminal oligopolypyrimidine (TOP) track at the 5’ end. This
is important as the regulation of TOP containing proteins has been postulated to be a rate-
limiting step in protein synthesis [30].
It is well known that exercise causes hypertrophy of the muscle and that a single bout of
resistance exercise increases protein synthesis. Baar and Esser (1999) reported that a single bout
of in situ contraction increased p70S6k activity in rat extensor digitorum longus (EDL) and
tibialis anterior (TA) muscles [22]. In a similar study Hernandez et al., (2000) reported that
resistance exercise causes an increase in the rate of protein synthesis, the rate of glucose uptake
and the activity of p70S6k in rat skeletal muscle [31]. Other studies, using other exercise
protocols, reported comparable results. For example, Nader et al., (2001) using high-frequency
electrical stimulation, low-frequency electrical stimulation, or running exercise showed
significant increase in p70S6k phosphorylation in the tibialis anterior and soleus muscles of rat
[32]. To our knowledge how diabetes affects the exercise-induced regulation of p70S6k has not
been examined.
Using humans, Koopman et al., (2006) reported that resistance exercise is associated with
more pronounced phosphorylation of p70S6k in type II vs. type I muscle fibers [33]. Similarly,
in rats, the phosphorylation of upstream regulators of p70S6k like PKB (or Akt) and mTOR was
more pronounced in muscle tissue containing a greater proportion of type II muscle fibers [34,
35]. Taken together, these findings suggest that contraction may regulate p70S6k in an intensity-
and time-dependent manner, and further that p70S6k stimulation in muscle may be fiber type-
specific.

- 7 -
The Mammalian target of rapamycin (mTOR) functions as a growth factor and nutrient-
sensing signaling molecule in mammalian cells. mTOR resides upstream of p70S6K (p70
ribosomal protein S6 Kinase) and is thought to be involved in regulation of a number of
components of the translational machinery [36]. Insulin and activated Akt have been shown to
induce phosphorylation of mTOR in vivo and in vitro. It is thought that the phosphorylation of
Threonine 2446 and Serine 2448 regulates mTOR activity. Although the exact mechanism of this
regulation is unknown, both in vitro and in vivo experiments have implicated Akt in the
phosphorylation and activity of mTOR [37-39].
mTOR has been implicated in skeletal muscle remodeling using several models of
altered muscle loading. For example, recent data by Bodine and colleagues (2001) demonstrated
that overloading the rat plantaris muscle by synergist muscle ablation, increases mTOR Serine
2448 phosphorylation [21]. In contrast, unloading the gastrocnemius muscle by hind limb
suspension, which promotes atrophy of the muscle, decreased Serine 2448 phosphorylation [37].
Similarly, a single bout of in situ muscle contractile activity in rats showed an increase in
phosphorylation level of mTOR and its downstream target p70S6k [34, 37, 40]. Taken together,
these studies suggest that mTOR phosphorylation is sensitive to muscle activity and may play a
role in the exercise-induced regulation of p70S6k phosphorylation.
Akt (PKB) is the serine/threonine kinase that is required for the activation of mTOR.
Akt plays an important role in executing multiple cellular metabolic pathways such as cell
metabolism, cell survival and cell proliferation. In addition to these homeostatic functions, Akt is
also thought to mediate the mitogenic effects of insulin and insulin-like growth factor-I [41-43].
Akt1 is the predominant isoform in most tissues [44] and, similar to many membrane proteins, it
contains a pleckstrin homology (PH) domain that binds phospholipids [45]. Akt is activated in a

- 8 -
PI3K (Phosphoinositide-3 kinase) -dependent manner and is regulated by phosphorylation on
Thr 308 and Ser 473. It appears that the phosphorylation of Thr 308 is dependent, at least in part,
on the activity of PI3-kinase [41]. The kinase responsible for the phosphorylation on Serine 473
has not been identified. Phosphorylation on Serine 473 appears to be related to PI3-kinase
activity, although PDK1 (3-phosphoinositide-dependent protein kinase 1) may also be involved
[46]. Akt can also be activated by PI3K-independent mechanism, as is observed following
growth hormone treatment [47], or after increases in intracellular calcium or cAMP levels [48,
49]. The mechanism for this PI3K-independent Akt activation is poorly understood.
Akt is thought to regulate skeletal muscle growth and metabolism. In Akt1/ PKBα-
deficient mice, there is conspicuous impairment in organism growth [50] , whereas Akt2-
deficient mice exhibit reduced insulin-stimulated glucose uptake in isolated EDL muscles [51].
In situ electroporation of constitutively active Akt has been examined in mouse skeletal muscle
and recent data has suggested that this molecule plays a critical role in the progession of muscle
hypertrophy [21]. The role of Akt as a signaling mediator in muscle contraction is not well
understood. Using rodent models Lund and colleagues (1998) and Sherwood et al., (1999)
following in situ muscle contraction reported no Akt kinase activation [52, 53]. Similar findings
have been reported in humans. For example, Widegren and co-workers (1998) reported no
activation of Akt following one-leg cycle ergometry at approximately 70% VO2max in human
skeletal muscle [54]. Conversely, Nader et al., (2001) reported different modes of exercise like a
single bout of either a high-frequency electrical stimulation, a low-frequency electrical
stimulation, or a running exercise protocol causes transient increase in Akt phosphorylation in
the tibialis anterior and soleus muscles of rat [32]. Supporting these findings, Turinsky et al.,
(1999) reported that exercise in vivo is associated with activation of Akt1 but not Akt2 or Akt3

- 9 -
in contracting skeletal muscles [55]. The reasons for discrepancies between studies is not entirely
clear however it is possible that differences in the model utilized, methods or time points may be
involved. Taken together, these findings suggest that contraction may regulate Akt in an
intensity- and time-dependent manner, or perhaps that Akt stimulation in muscle may be fiber
type-specific. More research is necessary to clarify the pathway responsible for hypertrophy and
increased protein synthesis rates in skeletal muscle.
Summary
The p70S6 kinase and its upstream regulators mTOR and Akt kinase, are proposed
molecules involved in the contraction-mediated regulation of protein synthesis and hypertrophy
in skeletal muscle. The exact molecular mechanism(s) regulating the activity of these molecules
is/are largely unknown. Few studies have investigated differences in the activation of these
signaling molecules in response to an acute bout of resistance exercise. Elucidating the
differences between normal and diabetic muscle tissue at the molecular level may be beneficial
for exercise and pharmacological interventions designed for the treatment of type 2 diabetes.
Overview of Diabetes Mellitus and Insulin resistance
Diabetes Mellitus
It has been estimated that 171million people worldwide have diabetes and it is estimated
that this will increase to 366 million by 2030 [1]. An estimated 20.8 million people in the United
States or about 7.0 % of the population have diabetes. Of those affliated, 14.6 million have been
diagnosed while 6.2 million have yet to be. Diabetes mellitus (DM) is a group of diseases
marked by high levels of blood glucose resulting from defects in insulin production, insulin
action, or both. Insulin is a polypeptide hormone, secreted by the beta cells of the pancreas that

- 10 -
allows glucose to enter cells from the blood. A deficiency in this hormone, or the inability of
cells to respond to it, causes abnormally high blood glucose levels, which if allowed to proceed
unchecked can lead to numerous complications. The two major types of diabetes are type 1 and
type 2. Type 1 diabetes mellitus can occur at any age and is characterized by the marked inability
of the pancreas to secrete insulin because of autoimmune destruction of the beta cells [56]. This
type of diabetes is typically diagnosed in children and has been referred to as juvenile onset
diabetes or insulin dependent diabetes mellitus. Type 1 accounts for about five to ten percent of
all cases of diabetes [56]. The major type of diabetes is type 2 diabetes mellitus (DM). Type II
(non-insulin dependent) DM is an emerging epidemic in Western cultures that is thought to
afflict 150 million people worldwide [57]. This type of diabetes accounts for ninety to ninety five
percent of all diagnosed diabetic cases [58]. Type 2 diabetes is characterized by peripheral
insulin resistance with an insulin-secretary defect (inability to increase beta-cell production of
insulin) that varies in severity. In the progression from normal glucose tolerance to abnormal
glucose tolerance, postprandial glucose levels first increase which eventually results in fasting
hyperglycemia. Several genetic and environmental factors lead to the development of the disease
in most patients [59]. To our knowledge research examining the signaling events thought to
underlie exercise-induced muscle adaptation in type 2 diabetes has not been performed.
Insulin resistance
Insulin resistance is present when the biological effects of insulin are less than expected
for glucose disposal in skeletal muscle [60]. Mutation of some members of the insulin signaling
cascade (insulin receptor, insulin receptor-substrate) also leads to the manifestation of insulin
resistance. Nevertheless, such mutations constitute a very rare cause of type 2 diabetes [61]. The

- 11 -
mechanism by which skeletal muscle becomes insulin resistant is unclear, but there is a strong
correlation between insulin sensitivity and the levels of plasma free fatty acids and intra-
muscular fatty acid metabolites (long chain acyl-CoA, diacylglycerol and triglycerides).
The obese Zucker strain as a model for type 2 diabetes investigation
Appropriate experimental models are essential tools for understanding the molecular
basis of disease and the actions of therapeutic agents. Diabetic research has widely utilized
animal models for experimentation. Thus far, most experiments have utilized rodent models [59]
because of their short life span, the ability to manipulate animal genetics and economic
considerations. There are numerous rodent models for the different types of diabetes. Similar to
humans, Type 2 diabetes in rodents is a heterogeneous group of disorders characterized by
insulin resistance and impaired insulin secretion. Many of these animal models have been
developed using selective breeding which typically produces specific genetic mutations. Other
methods for developing diabetic rodent models include molecular biology techniques such as
gene targeting and transgenic techniques [59].
The Goto Kakizaki (GK) rat, developed by selective breeding of the Wistar rat, and is an
example of a type 2 diabetic model. The GK rat develops relatively stable hyperglycemia and is
characterized by insulin resistance and impaired insulin secretion. The GK rat, like other animal
models of diabetes, develops some features that can be compared with the complications of
diabetes seen in humans. These include renal lesions, structural changes in peripheral nerves and
abnormalities of the retina. Similar to the GK rat the Kuo Kondo (KK) mouse was developed by
selective breeding. Several different lines have been bred and they vary genetically and
phenotypically [59]. The KK mouse becomes obese as an adult; developing insulin resistance,

- 12 -
islet cell hyperplasia, and mild hyperglycemia [59]. Conversely, the Nagoya-Shibata-Yasuda
(NSY) mouse spontaneously develops diabetes in an age-dependent manner, but is not obese.
This model is useful when studying age-related phenotypes [59]. Psammomys obesus (the Israeli
sand rat) is vegetarian in its natural habitat, but when fed laboratory rat chow, becomes obese,
insulin resistant and hyperglycemic [59]. Perhaps the most widely used is Obese Zucker (fa/fa)
rat. The Obese Zucker is a model of monogenic obesity and diabetes along with the Ob/Ob
mouse and db/db mouse. The db/db mouse and the fa/fa Zucker rat both have mutations in the
hypothalamic receptor for leptin [59]. This mutation causes hyperphagia and is thought to be
responsible for the obesity seen in this model. Animal models of diabetes have provided
extremely valuable insight to the disease. The genetically obese Zucker (fa/fa) rat was selected
for the present investigation as this model is widely used in obesity related diabetes studies.
The obese Zucker is developed through selective breeding and exhibits hyperinsulinemia,
hyperlipidemia and hyperglycemia along with central adiposity. These characteristics are
valuable for studying type 2 DM in the context of metabolic syndrome, and should provide
useful insight to the disease since many type 2 diabetics possess these same conditions. Insulin
resistance in obese Zucker rat is mainly associated with impaired insulin-stimulated GLUT-4
protein translocation [62, 63] and glucose transport activity, [64, 65] but does not appear to be
associated with the amount of GLUT-4 turnover stimulated by insulin [62, 66, 67].
Previous studies have indicated differences in the skeletal muscle tissue between obese
Zucker rats and their lean counterparts in response to exercise. Ardevol and others (1997)
exercised female lean and obese Zucker rats in a short, intense treadmill protocol and oxygen
consumption, carbon dioxide release, lactate and bicarbonate levels in venous and arterial blood
were measured. It was concluded that fatigue appears earlier in obese rats due to loss of

- 13 -
buffering ability caused by massive extra-muscular glycolysis and lactate production triggered
by exercise-induced adrenergic stimulation [68]. This same group studied differential substrate
utilization by exercising and fatigued muscle in lean and obese Zucker rats [69]. It was found
that lean rats managed their glycosyl units more efficiently than obese rats [69]. Taken together,
these data suggest that metabolic differences exist between lean and obese Zucker rat muscle
tissue in response to exercise.
The obese Zucker (fa/fa) rat model has been used in other investigations to demonstrate
the potential benefits of exercise training. Cortez et al., (1991) reported significant increase in
oral glucose tolerance while maintaining significantly lower plasma insulin concentrations in
treadmill exercised female obese Zucker rats compared to sedentary control rats [70]. Similarly,
Ivy et al., (1989) reported increased rates of glucose transport (assessed by measuring the rate of
3-O-methyl-D-glucose (3-OMG) accumulation) in obese Zucker rats after treadmill exercise
[71]. The mechanism(s) underlying these improvements in glucose regulation are not entirely
clear, however Brozinick et al.,(1993) demonstrated that obese Zucker rats, following in vivo
muscle contraction, had significantly higher GLUT-4 protein concentration and citrate synthase
activity than the control obese Zucker rats [71, 72]. Taken together, these studies suggest that
exercise training decreases the skeletal muscle insulin resistance of the obese Zucker rat.
Whether the mechanisms of muscle adaptation differ between normal and obese Zucker rats is
not known. Elucidating the molecular events responsible for exercise induced muscle adaptation
in diabetic muscle may be beneficial for exercise and pharmacological interventions designed for
the treatment of this disease.

- 14 -
Summary
Type 2 diabetes is an emerging epidemic in Western cultures that accounts for ninety to
ninety five percent of all diagnosed diabetic cases. The obese Zucker (fa/fa) rat is an appropriate
animal model for studying diabetes at the molecular level in the context of metabolic syndrome.
Few studies have investigated differences in diabetic and normal skeletal muscle in response to
exercise. Elucidating the molecular events responsible for exercise induced muscle adaptation in
diabetic muscle may be beneficial for exercise and pharmacological interventions designed for
the treatment of this disease.

- 15 -
Chapter 3
Lean and Obese Zucker Rats Exhibit Different Patterns of p70S6kinase Regulation in the Tibialis Anterior Muscle in Response to
High Force Muscle Contraction
Anjaiah Katta1 and Eric R. Blough 1,2
1 Department of Biological Sciences, Marshall University 2 Department of Pharmacology, Physiology and Toxicology, Marshall University, Joan C.
Edwards School of Medicine
Author for correspondence:
Eric Blough, Ph.D. Laboratory of Molecular Physiology Suite 311, Science Building Department of Biological Sciences 1 John Marshall Drive Marshall University Huntington, WV 25755-1090 E-mail: [email protected]
Running Title: Diabetes alters contraction induced p70S6k signaling in skeletal muscle

- 16 -
ABSTRACT
Increased muscle loading results in phosphorylation of the 70 kDa ribosomal S6 kinase (p70s6k)
signaling pathway and this event strongly correlates with the degree of muscle adaptation
following resistance exercise. Whether differences exist between normal and diabetic muscle in
the activation of the p70s6k pathway following a single episode of exercise remains unclear.
Using an in situ high-frequency electrical stimulation (HFES), we examined the exercise-induced
phosphorylation of p70s6k, Akt and mammalian target of rapamycin (mTOR) in the tibialis
anterior (TA) muscles of lean and obese Zucker rats at 0, 1, and 3hr after HFES. Immunoblotting
demonstrated differences in the content (27.9 ± 3.6% lower) and level of basal p70S6k
phosphorylation (Thr 389) (26.1 ± 7.5% lower) in the normal and diabetic TA (P<0.05). p70S6k
(Thr389) phosphorylation increased 33.3 ± 7.2% , 24.0 ± 14.9% and 24.6 ± 11.3% in lean TA at
0-, 1- and 3-hr post-HFES and increased 33.5 ± 8.0% in obese TA at 3-hr post-HFES (P<0.05).
mTOR (Ser 2448) Phosphorylation was elevated in lean TA (96.5 ± 40.3%, P< 0.05)
immediately after HFES and remains unaltered in obese TA with HFES. In lean TA, HFES led to
increased phosphorylation of Akt (Thr 308) (31.8 ± 16.2% and 31.1 ± 8.8%) and Akt (Ser 473)
(47.2 ± 12.1% and 43.7 ± 11.7%) at 0- and 3-hr time points respectively (P<0.05). Taken
together, these data suggests that diabetes is associated with alterations in the muscle content and
ability to activate the p70s6k signaling pathway following an acute bout of exercise. (250 words)
Key words: type 2 diabetes; skeletal muscle; p70S6k; mTOR; Akt; HFES

- 17 -
INTRODUCTION
Type 2 (non-insulin dependent) diabetes mellitus (DM) is an emerging epidemic in
Western cultures that is thought to afflict 150 million people worldwide [57]. A number of
studies employing strength training regimens have been shown to improve glycemic control,
increase skeletal muscle size and strength, and positively change body composition suggesting
that anaerobic exercise may be an effective strategy for the treatment of insulin resistance and
type 2 diabetes [13-16]. Recent reports have suggested that differences exist between normal and
diabetic muscle in their adaptation to an exercise regimen [8, 10, 72-75]. However, the direct
effects of exercise on the phenotype of diabetic muscle have not been widely studied. It is
thought that the beneficial effects of exercise on muscle are mediated through the activation of
various signaling cascades which are involved in regulating changes in gene expression, glucose
uptake, and protein synthesis [76]. Whether type 2 diabetes alters exercise-induced signal
transduction processes in muscle is unknown, but the existence of differences, if present, may
help to explain why exercise-induced skeletal muscle adaptations may differ between normal and
diabetic populations.
It is well established that increased muscle loading increases the rates of muscle protein
synthesis [17]. This increase in protein synthesis, at least in part, is thought to be regulated by the
phosphorylation of the p70 ribosomal protein S6 kinase (p70S6k) [18], whose activation has
been proposed to promote increased translation of messages that have a polypyrimide motif just
downstream of the 5’ cap [19]. It is thought that p70S6k activity is regulated by the mammalian
target of rapamycin (mTOR) which functions as a growth factor and nutrient-sensing signaling
molecule in mammalian cells [20]. How mTOR activity is modulated is not clear; however,
- 18 -
recent evidence suggests that mTOR is controlled by protein kinase B (PKB) / Akt which is
activated in response to phospholipid products of the phosphatidylinositol 3-kinase reaction. It is
likely that PKB/Akt increases mTOR activity by phosphorylating mTOR at Ser 2448 and it has
been hypothesized that this event is a critical point of control in the regulation of protein
synthesis [21]. It has been postulated that p70S6k signaling may be particularly important in
mediating muscle adaptation as the phosphorylation of this molecule following an exercise bout
has been found to be strongly associated with the increase in muscle weight after 6 wk of chronic
stimulation [22].
The purpose of the present study was to determine whether type 2 diabetes alters p70S6k
signaling after an acute episode of contractile activity. We hypothesized that type 2 diabetes
would be associated with differences in how muscle contraction regulates the phosphorylation of
the Akt / mTOR / p70S6k signaling cascade. To test this hypothesis the contraction-mediated
activation of Akt, mTOR and p70S6k was assessed in skeletal muscle from normal and diabetic
rats either immediately after or 1 or 3h after a single bout of sciatic nerve stimulation. Taken
together, the data indicate that diabetes alters contraction-induced p70S6k phosphorylation in
skeletal muscle. These findings are consistent with the possibility that DM alters the way skeletal
muscle “senses and responds” to contractile stimuli.

- 19 -
MATERIALS AND METHODS
Animals
All procedures were performed as outlined in the Guide for the Care and Use of Laboratory
Animals as approved by the Council of the American Physiological Society and the Animal Use
Review Board of Marshall University. Young (10 week, n=12) male lean Zucker and young (10
week, n=12) male obese Zucker rats were obtained from the Charles River Laboratories. Rats
were housed two to a cage in an AAALAC approved vivarium. Housing conditions consisted of
a 12H: 12H dark-light cycle and temperature was maintained at 22° ± 2°C. Animals were
provided food and water ad libitum and allowed to recover from shipment for at least two weeks
before experimentation. During this time, the animals were carefully observed and weighed
weekly to ensure none exhibited signs of failure to thrive, such as precipitous weight loss,
disinterest in the environment, or unexpected gait alterations.
Materials
Anti- p70S6k (#9202), Akt (#9272), mTOR (#2972), phosphorylated Thr389 p70S6K (#9206),
phosphorylated Ser421/Thr424 p70S6K (#9204), phosphorylated Ser2448 mTOR (#2971),
phosphorylated Thr308 Akt (#9275) and phosphorylated Ser473 ( #9271) Akt, Mouse IgG, and Rabbit
IgG antibodies were purchased from Cell Signaling Technology (Beverly, MA). Enhanced
chemiluminescence (ECL) western blotting detection reagent was from Amersham Biosciences
(Piscataway, NJ). Restore western blot stripping buffer was obtained from Pierce (Rockford, IL)
and 3T3 cell lysates were from Santa Cruz Biotechnology (Santa Cruz, CA). All other chemicals
were purchased from Sigma (St. Louis, MO) or Fisher Scientific (Hanover, IL).

- 20 -
Contractile stimulation of skeletal muscles
The high-frequency electrical stimulation (HFES) model has been previously described [77] and
was chosen on the basis of its efficacy in stimulating protein translation and muscle hypertrophy
in vivo [22] . In order to produce maximal contractile stimulus, a voltage of 5-7V was applied to
electrodes and sciatic nerve was stimulated with 1-ms pulses at 100 Hz, where all motor units
(both fast and slow) are recruited. The contractions lasted 3-s and were followed by a 10-s rest.
And after the sixth repetition, there was an additional 50 s of rest. The HFES model used in the
present study produced 10 sets of 6 contractions with an overall protocol time of 22 min. This
protocol results in eccentric contraction of the TA. The TA muscle was chosen for analysis on
the basis of previous studies demonstrating that HFES induces p70S6k phosphorylation and
muscle hypertrophy in the TA muscle [78-81]. Animals were killed by a lethal dose of
pentobarbital sodium at baseline, immediately following, 1h or 3 h after HFES. Once excised,
muscles were blotted dry, trimmed of visible fat and tendon projections, weighed, immediately
frozen in liquid nitrogen, and stored at -80° C.
Preparation of protein isolates and immunoblotting
Muscles were pulverized in liquid nitrogen using a mortar and pestle until a fine powder was
obtained. After washing with ice cold PBS, pellets were lysed on ice for 15 minutes in T-PER (2
mL/1g tissue weight) (Pierce, Rockford, IL) and centrifuged for 10 minutes at 2000 X g to pellet
particulate matter. This process was repeated twice and the supernants combined for protein
concentration determination using the Bradford method (Pierce, Rockford, IL). Samples were
diluted to a concentration of 3 μg/ μl in SDS loading buffer, boiled for 5 minutes, and 60 μg of
protein were separated using 10% SDS-PAGE gels. Transfer of protein onto nitrocellulose

- 21 -
membranes, verification of transfer and determination of equal loading between lanes and
membranes was determined as outlined previously [82]. Protein immuno-detection was
performed as outlined by the antibody manufacturer while immunoreactive bands were
visualized with ECL (Amersham Biosciences). Exposure time was adjusted at all times to keep
the integrated optical densities (IODs) within a linear and non-saturated range, and band signal
intensity was quantified by densitometry using a flatbed scanner (Epson Perfection 3200
PHOTO) and Imaging software (AlphaEaseFC). Molecular weight markers (Cell Signaling)
were used as molecular mass standards and NIH 3T3 cell lysates were included as positive
controls. To allow direct comparisons to be made between the concentration levels of different
signaling molecules, immunoblots were stripped and re-probed with Restore western blot
stripping buffer as detailed by the manufacturer (Pierce, Rockford, IL).
Statistical analysis
Results are presented as mean + SEM. Data were analyzed by using the Sigma Stat 3.0
statistical program. Data were analyzed using a two-way ANOVA followed by the Student-
Newman-Keuls post-hoc testing when appropriate. P <0.05 was considered to be statistically
significant.

- 22 -
RESULTS
Syndrome-X and muscle mass
Average body mass of obese Zucker rats (597 ± 21.7 g) was ~82 % greater than lean
counterparts (328 ± 12.2 g; P< 0.05). Compared to lean animals (651 ± 9 mg), TA muscle mass
was ~35% less in the obese Zucker rats (479 ± 20 mg; P< 0.05) (Table 1).
p70S6k pathway related protein levels and phosphorylation status are altered in the diabetic
TA muscle.
To investigate the diabetic effects on the total amounts of p70S6k, mTOR and Akt, we
performed SDS PAGE and western blot analysis using antibodies which recognize both the
unphosphorylated and phosphorylated forms of these molecules. There were no differences in
mTOR protein content (P< 0.05; Fig. 1). The muscle content of p70S6k, and Akt in the obese
zucker TA was 27.9 ± 3.6% and 28.2 ± 10.1% lower, respectively than that observed in their lean
counterparts (P< 0.05; Fig. 1). Immunoblot analysis using phospho-specific antibodies indicated
that the basal phosphorylation level of p70S6k (Thr 389) was 26.1 ± 7.5% lower in the obese
Zucker TA compared to that observed in lean animals (P<0.05; Fig. 2). No significant
differences were detected across groups in basal phosphorylation levels of p70S6k
(Thr421/Ser424), mTOR (Ser 2448), Akt (Thr 308) and Akt (Ser 473) (Fig. 2, 3 & 4).
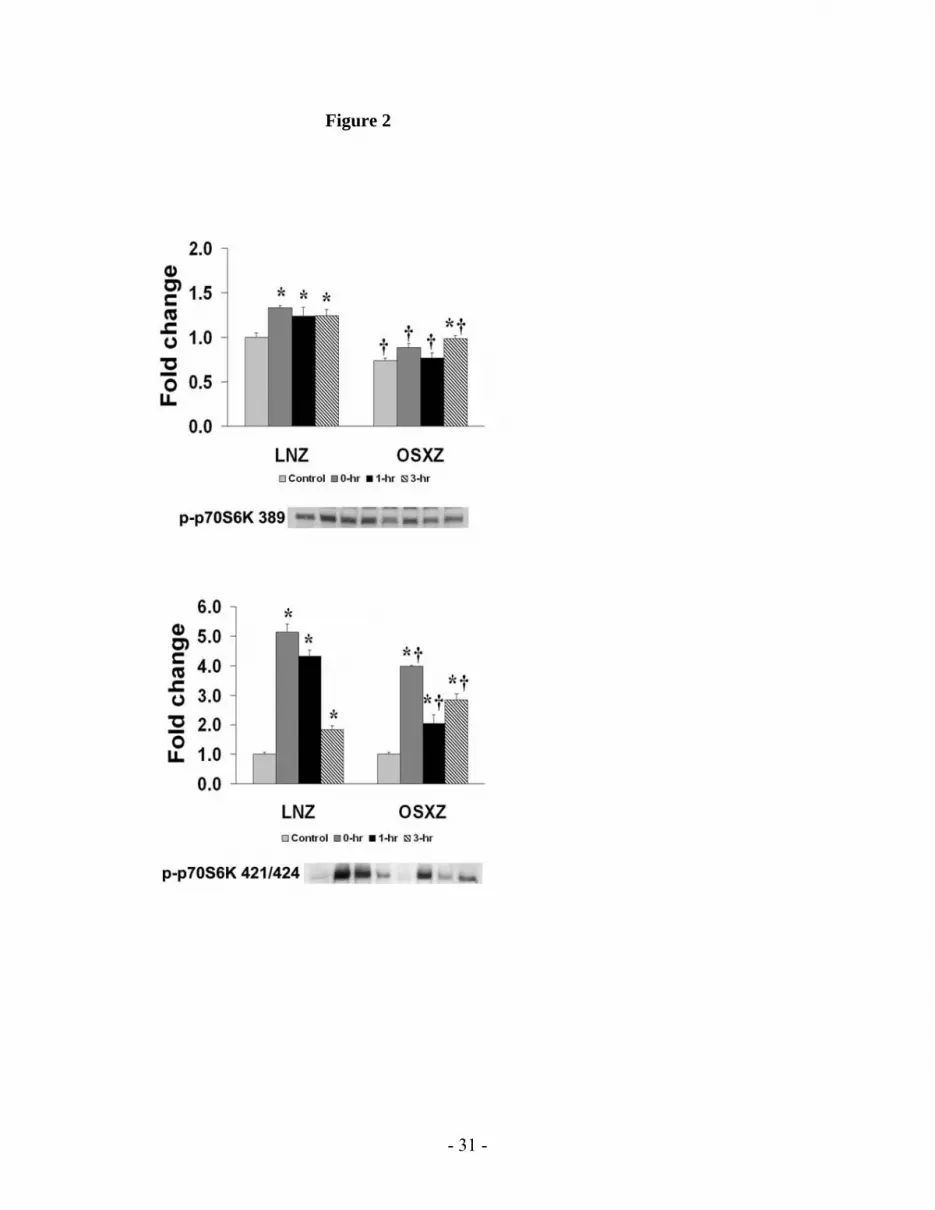
The contraction-induced phosphorylation of p70S6k is altered in the obese-Zucker rat.
Phosphorylation of p70S6k, mTOR and Akt in exercised TA muscles was determined at
0-, 1-, and 3-hours after a bout of HFES and compared to control (unstimulated) muscles.
Exercise induced phosphorylation of these molecules was compared between lean and obese

- 23 -
Zucker rats. In the case of each molecule examined, significant differences existed between lean
and obese Zucker rat models (Fig. 2, 3 & 4). In the lean rat TA, the phosphorylation of p70S6k
(Thr 389) was found to be 33.3 ± 7.2% , 24.0 ± 14.9% and 24.6 ± 11.3% higher than in
unstimulated control muscles at 0-, 1- and 3-hr post-HFES, respectively (P< 0.05) (Fig. 2). This
response appeared to differ in the obese Zucker TA, where the phosphorylation of p70S6k (Thr
389) was 33.5 ± 8.0% higher than control 3 hr post-exercise (P<0.05), but not immediately after
or at the 1 hr post-HFES (Fig. 2). In lean Zucker TA, the Erk1/2-dependent phosphorylation of
p70S6k (Thr 421/Ser 424) was 412.5 ± 37.2% , 331.0 ± 28.1% and 83.0 ± 20.7% higher than
control at 0-, 1- and 3-hr, respectively (P< 0.05) (Fig. 2). Although different in magnitude
compared to lean animals (Fig. 2) p70S6k (Thr 421/Ser 424), phosphorylation in the obese TA
exhibited a similar pattern and was 294.5 ± 9.6% , 103.3 ± 35.5% and 182.0 ± 26.1% higher
than baseline at 0-, 1- and 3-hours, respectively (Fig 2; P< 0.05)
The contraction-induced phosphorylation of potential p70S6k regulators is altered in obese-
Zucker rat.
It is thought that p70S6k phosphorylation is regulated by mTOR and its upstream
regulator Akt [20, 21, 37]. mTOR phosphorylation (Ser 2448) was found to be 96.5 ± 40.3%
higher than baseline immediately after exercise in lean animals (P< 0.05) while it was not
different from baseline at 1 and 3 hr post-HFES (Fig. 3). This response differed in obese animals
with no alteration in mTOR (Ser 2448) phosphorylation levels at any time point after HFES (Fig.
3). In lean Zucker TA, Akt (Thr 308) phosphorylation was 31.8 ± 16.2%, 29.8 ± 7.5% and 31.1 ±
8.8% higher than baseline at 0-, 1- and 3-hr post-HFES, exhibiting a biphasic response (P<0.05;
Fig. 4). An altogether opposite response was observed in the obese Zucker TA, where Akt (Thr

- 24 -
308) phosphorylation was 25.3 ± 6.2%, 44.6 ± 9.0% and 30.4 ± 5.9% lower than baseline at 0-,
1-, and 3-hours, respectively after HFES (P<0.05). In lean rats, the phosphorylation of Akt (Ser
473) appeared to mirror what was seen at the Thr 308 residue with HFES and was 47.2 ± 12.1%
and 43.7 ± 11.7% higher than baseline at 0- and 3-hours, respectively (P< 0.05; Fig. 4). This
pattern of response was essentially opposite in the obese Zucker, where the phosphorylation of
Akt (Ser 473) was 18.7 ± 6.4%, 46.3 ± 5.5% and 32.4 ± 7.3% lower than baseline at 0-, 1-, and
3-hours post-HFES, respectively (P< 0.05; Fig. 4). Taken together these results suggest that the
contraction-induced activation of p70S6k signaling may be altered with diabetes.

- 25 -
DISCUSSION
The obese Zucker rat is insulin resistant and has been used as model of type 2 diabetes
[64, 83]. In this report, we demonstrate that the phosphorylation (activation) of the
Akt/mTOR/p70S6k pathway in response to a maximal contractile stimulus appears to be altered
in diabetic muscle.
Our results suggest that compared to lean animals, the magnitude and time course of the
contraction-induced phosphorylation of p70S6k (Thr 389) and p70S6k (Thr 421 / ser 424) was
significantly different in obese animals (Fig. 2). The p70S6k, is a serine/threonine protein kinase
which plays an important role in regulating protein synthesis. p70S6k modulates protein
synthesis, at least in part, by controlling the translation of numerous messenger RNA transcripts
that encode components of the translational apparatus [84]. Illustrating this fact is the finding
that blockade of p70S6k activity results in a significant inhibition of protein synthesis in multiple
cell systems [85-89]. In skeletal muscle, the contraction induced phosphorylation of p70S6K is
elevated following HFES [22, 34, 77] and is highly correlated with an increase in muscle mass
following a resistance training program [22]. To our knowledge, the influence of diabetes on
p70S6k phosphorylation in response to muscle contraction has not been reported. The
physiological significance of these alterations remains unclear; however, it is interesting to note
that previous reports have suggested that the insulin-stimulated phosphorylation of p70S6k may
be altered in diabetic rats [90-92]. In the light of these studies, our data suggest that diabetes
affect how multiple stimuli regulate the phosphorylation of p70S6k. Future studies employing a
combination of approaches to stimulate p70S6k phosphorylation will certainly be of value in
determining how diabetes may affect the regulation of p70S6k in skeletal muscle.

- 26 -
To further explore how diabetes may be associated with alterations in the contraction-
induced regulation of p70S6k phosphorylation, we assessed the effects of muscle contraction on
mTOR. Like p70S6k, mTOR is thought to be involved in the regulating several components of
the translational machinery and in addition, is thought to be an upstream activator of p70S6k
[36]. Similar to previous studies, increased contractile activity appears to be a strong stimulus to
increase the phosphorylation level of mTOR in non-diabetic muscle [34, 77]. Conversely, in the
diabetic TA, HFES appears unable to alter the degree of mTOR phosphorylation (Fig. 3). This
latter finding is consistent with our data demonstrating that diabetic muscle exhibits a reduced
ability to activate p70S6k following a single bout of exercise. Taken together, these data suggests
that diabetes-associated alterations in p70S6k regulation may be due, at least in part, to defects in
the ability of diabetic muscle to activate mTOR following a contractile stimulus.
mTOR phosphorylation of Ser 2448 is regulated by Akt/PKB [37-39]. Akt is a
serine/threonine kinase which mediates certain types of muscle hypertrophy [21]. Under non-
stimulated conditions Akt is located in the cytoplasm and is thought to translocate to the plasma
membrane upon activation, where it is phosphorylated by phosphinositide-dependent kinases
(PDK) on its two principal regulatory sites Thr308 and Ser 473 [93]. Phosphorylation of both
sites is essential for the activation of Akt. Like p70S6k and mTOR, HFES significantly increased
the amount of Akt (Ser 308) and Akt (Ser 473) phosphorylation in non-diabetic muscle (Fig 4).
Similar findings regarding the effects of contractile activity on Akt phosphorylation in non-
diabetic muscle have been reported previously [32, 55, 94]. In contrast to our findings in the
nondiabetic animals, these events appeared to differ in diabetic muscle, suggesting that diabetes
is associated with alterations in the ability of skeletal muscle to activate Akt signaling following
increased contractile loading (Fig. 4) and this latter finding may be important. Given that Akt is

- 27 -
thought to reside upstream of mTOR, this lack of Akt activation in diabetic muscle may provide
an explanation as to why diabetes may be associated with defects in HFES induced mTOR and
p70S6k phosphoryation. Although this possibility is promising, it should be noted that the
functional role of Akt in regulating p70S6k signaling cannot be accurately assessed in the
absence of further study to evaluate experimental manipulation of this protein. Additional studies
perhaps employing strategies designed to directly inhibit or activate Akt signaling during HFES
may prove to be useful in addressing these possibilities.
The precise influence of diabetes on Akt regulation in muscle contraction remains
unclear. It has been postulated that the degree of Akt activation following contractile activity
may be dependent upon the type of contractile activity, contraction intensity, and / or the
duration of stimulation [77]. Given this contention, it is plausible that reported differences in the
signaling response between models could be related to the time points chosen for evaluation.
Future studies employing other time points may yield different findings. Alternatively, it is
possible that the two groups experienced different amount of tension during the HFES protocol.
Although this possibility exists, we consider it unlikely that differences in contractile intensity, if
present, are solely responsible for the alterations in muscle signaling we observe. Indeed, given
the nature of the HFES model (direct nerve stimulation), the type of contraction this model
produces in the TA (maximal eccentric loading) and the conditions under which the loading
occurred (identical in both groups), we suggest that our data are consistent with the notion that
diabetes is characterized by alterations in contractile signaling. The molecular mechanism(s)
responsible for these differences are largely unknown. Exercise was found to have no effect on
Akt as observed in isolated soleus muscle, but it occurs well in vivo and it is possible that
systemic factors and / or oxidative stress may mediate the activation of Akt by exercise [95].

- 28 -
Supporting this contention, hyperglycemia has been shown to directly decrease insulin-induced
Akt phosphorylation on Ser473 in rat and human skeletal muscle [96, 97]. The factors which
may regulate diminished Akt activation during hyperglycemia will require further
experimentation. Similarly, it is possible that a reduced availability of circulating growth factors,
decreased expression of local growth factors or alterations in cytokine levels may also play a role
regulating Akt signaling [98, 99]. This latter possibility is an intriguing alternative that we are
actively pursuing.
Given the strong correlation between the phosphorylation level of p70S6k and degree of
muscle hypertrophy seen by others, these data could suggest that diabetic muscle may be
incapable of growth following a resistance based exercise program. This is not in agreement with
the findings of Farrell and colleagues [3] who demonstrated that diabetic muscle is fully capable
of undergoing muscle hypertrophy in rats following 8 weeks of resistance training. The reasons
for this apparent discrepancy are not entirely clear, but may lie in the difference in models and
time points between the studies and a more comprehensive examination is needed. Irrespective
of the mechanism, it is likely that diabetes-associated differences in the ability of skeletal muscle
to induce p70S6K signaling could be of clinical importance given the potential role that this
signaling pathway may play in regulating protein synthesis and the adaptation of skeletal muscle
to increased contractile loading. Given the apparent linkage between exercise induced increase in
muscle mass and improvement in glucose disposal, we speculate that the data of the present
study may have implications for the improvement of resistance based programs for the treatment
of diabetes mellitus.

- 29 -
Appendix Appendix A Tables and Figures
Table 1 Body weight and muscle mass of lean and obese (fa/fa) Zucker rats. An asterisk (*)
indicates significant difference (P < 0.05) from the lean Zucker value.
Lean Zucker Obese Zucker
Body mass, g 328 ± 12.2 597 ± 21.7 *
TA mass, mg 651 ± 9 479 ± 20 *

- 30 -
Figure 1
- 31 -
Figure 2

- 32 -
Figure 3

- 33 -
Figure 4

-34-
FIGURE LEGENDS
Fig. 1: Type 2 diabetes is associated with alterations in skeletal muscle p70S6k and
its pathway related proteins. TA muscles from LNZ and obese (fa/fa) Zuckers (OSXZ)
were analyzed by Western blot analysis for diabetes-related changes in total p70S6k,
mTOR and Akt protein expression. Results are expressed as a percent of the normal, LNZ
value. An asterisk (*) indicates significant differences (P< 0.05) from the lean Zucker
value.
Fig. 2: Contraction-induced p70S6k (Thr 389 & Thr 421/Ser 424) phosphorylation
is altered with type 2 diabetes. The basal (control) and contraction-induced
phosphorylation of the p70S6k in TA muscles from lean and diabetic Zucker rats at 0, 1,
and 3 hours after contractile stimulus. p70S6k (Thr 389 & Thr 421/ser 424)
phosphorylation was determined by Western analysis and immunodetection for
phosphorylation on Thr 389 and Thr 421/ser 424. An asterisk (*) indicates significant
difference (P < 0.05) from the control within animal model, and a cross (†) indicates
significant difference (P < 0.05) at corresponding time points across animal models.
Fig. 3: Contraction-induced mTOR (Ser 2448) phosphorylation is altered with type
2 diabetes. The basal (control) and contraction-induced phosphorylation of the mTOR in
TA muscles from lean (LNZ) and obese Zucker (OSXZ) rats at 0-, 1-, and 3-hours after
HFES. Phosphorylation of mTOR was determined by immunodetection of
phosphorylation on Ser 2448. An asterisk (*) indicates significant difference (P < 0.05)

-35-
from the control time point within animal model, and a cross (†) indicates significant
difference (P < 0.05) at corresponding time points across animal models.
Fig. 4: Effects of eccentric, maximal muscle contraction in situ on phosphorylation
of Akt (Thr308 / Ser473). The basal (control) and contraction-induced phosphorylation
of the Akt in TA muscles from lean and diabetic Zucker rats at 0, 1, and 3 hours after
contractile stimulus. Akt phosphorylation was determined by Western analysis and
immunodetection for Akt phosphorylation on Thr308 and Ser473. An asterisk (*)
indicates significant difference (P < 0.05) from the control within animal model, and a
cross (†) indicates significant difference (P < 0.05) at corresponding time points across
animal models.
-36-
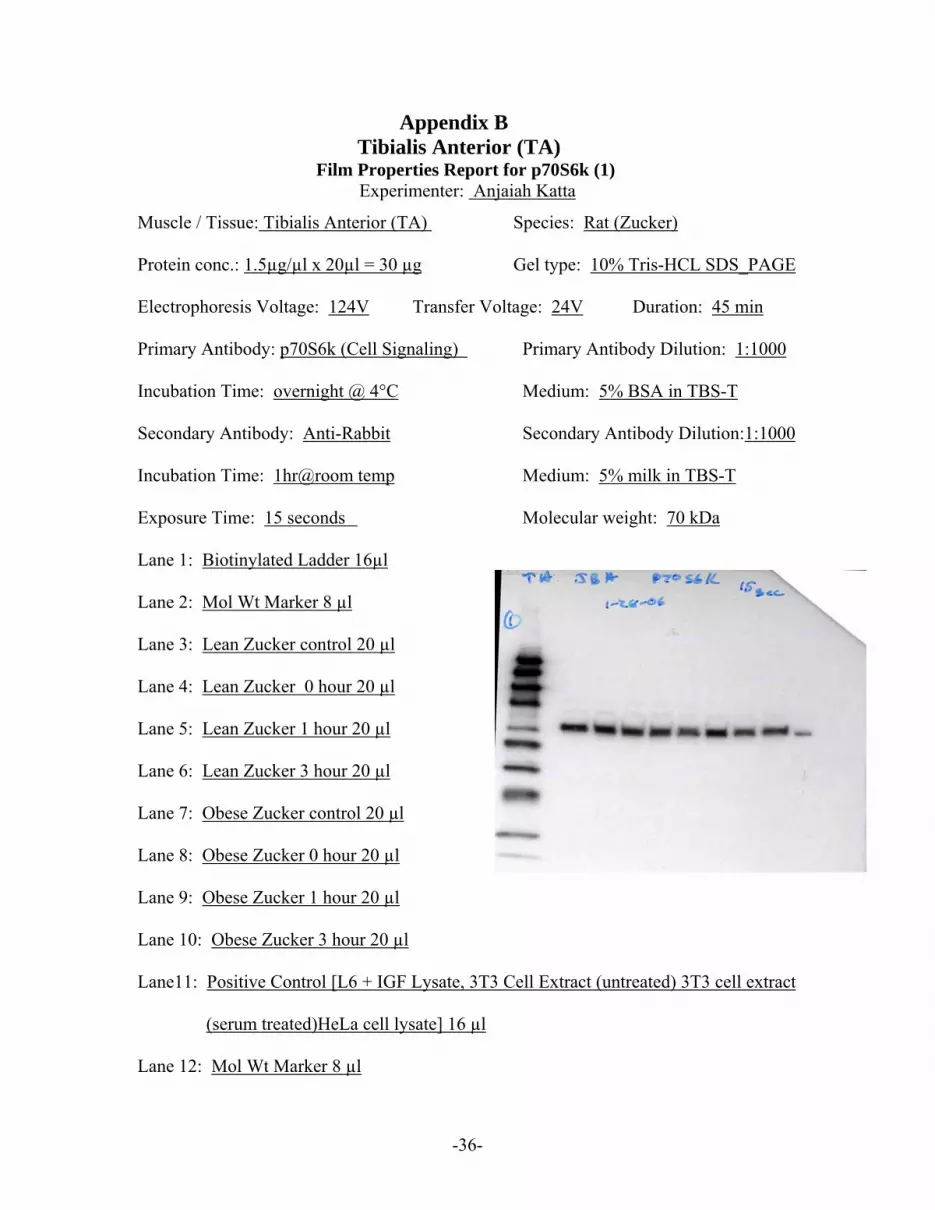
Appendix B Tibialis Anterior (TA) Film Properties Report for p70S6k (1)
Experimenter: Anjaiah Katta
Muscle / Tissue: Tibialis Anterior (TA) Species: Rat (Zucker)
Protein conc.: 1.5µg/µl x 20µl = 30 µg Gel type: 10% Tris-HCL SDS_PAGE
Electrophoresis Voltage: 124V Transfer Voltage: 24V Duration: 45 min
Primary Antibody: p70S6k (Cell Signaling) Primary Antibody Dilution: 1:1000
Incubation Time: overnight @ 4°C Medium: 5% BSA in TBS-T
Secondary Antibody: Anti-Rabbit Secondary Antibody Dilution:1:1000
Incubation Time: 1hr@room temp Medium: 5% milk in TBS-T
Exposure Time: 15 seconds Molecular weight: 70 kDa
Lane 1: Biotinylated Ladder 16µl
Lane 2: Mol Wt Marker 8 µl
Lane 3: Lean Zucker control 20 µl
Lane 4: Lean Zucker 0 hour 20 µl
Lane 5: Lean Zucker 1 hour 20 µl
Lane 6: Lean Zucker 3 hour 20 µl
Lane 7: Obese Zucker control 20 µl
Lane 8: Obese Zucker 0 hour 20 µl
Lane 9: Obese Zucker 1 hour 20 µl
Lane 10: Obese Zucker 3 hour 20 µl
Lane11: Positive Control [L6 + IGF Lysate, 3T3 Cell Extract (untreated) 3T3 cell extract
(serum treated)HeLa cell lysate] 16 µl
Lane 12: Mol Wt Marker 8 µl

-37-
Tibialis Anterior (TA)
Film Properties Report for p70S6k (2)
Experimenter: Anjaiah Katta
Muscle / Tissue: Tibialis Anterior (TA) Species: Rat (Zucker)
Protein conc.: 1.5µg/µl x 20µl = 30 µg Gel type: 10% Tris-HCL SDS_PAGE
Electrophoresis Voltage: 124V Transfer Voltage: 24V Duration: 45 min
Primary Antibody: p70S6k (Cell Signaling) Primary Antibody Dilution: 1:1000
Incubation Time: overnight @ 4°C Medium: 5% BSA in TBS-T
Secondary Antibody: Anti-Rabbit Secondary Antibody Dilution:1:1000
Incubation Time: 1hr@room temp Medium: 5% milk in TBS-T
Exposure Time: 15 seconds Molecular weight: 70 kDa
Lane 1: Biotinylated Ladder 16µl
Lane 2: Mol Wt Marker 8 µl
Lane 3: Lean Zucker control 20 µl
Lane 4: Lean Zucker 0 hour 20 µl
Lane 5: Lean Zucker 1 hour 20 µl
Lane 6: Lean Zucker 3 hour 20 µl
Lane 7: Obese Zucker control 20 µl
Lane 8: Obese Zucker 0 hour 20 µl
Lane 9: Obese Zucker 1 hour 20 µl
Lane 10: Obese Zucker 3 hour 20 µl
Lane11: Positive Control [L6 + IGF Lysate, 3T3 Cell Extract (untreated) 3T3 cell extract
(serum treated)HeLa cell lysate] 16 µl
Lane 12: Mol Wt Marker 8 µl

-38-
Tibialis Anterior (TA)
Film Properties Report for p70S6k (3)
Experimenter: Anjaiah Katta
Muscle / Tissue: Tibialis Anterior (TA) Species: Rat (Zucker)
Protein conc.: 1.5µg/µl x 20µl = 30 µg Gel type: 10% Tris-HCL SDS_PAGE
Electrophoresis Voltage: 124V Transfer Voltage: 24V Duration: 45 min
Primary Antibody: p70S6k (Cell Signaling) Primary Antibody Dilution: 1:1000
Incubation Time: overnight @ 4°C Medium: 5% BSA in TBS-T
Secondary Antibody: Anti-Rabbit Secondary Antibody Dilution:1:1000
Incubation Time: 1hr@room temp Medium: 5% milk in TBS-T
Exposure Time: 15 seconds Molecular weight: 70 kDa
Lane 1: Biotinylated Ladder 16µl
Lane 2: Mol Wt Marker 8 µl
Lane 3: Lean Zucker control 20 µl
Lane 4: Lean Zucker 0 hour 20 µl
Lane 5: Lean Zucker 1 hour 20 µl
Lane 6: Lean Zucker 3 hour 20 µl
Lane 7: Obese Zucker control 20 µl
Lane 8: Obese Zucker 0 hour 20 µl
Lane 9: Obese Zucker 1 hour 20 µl
Lane 10: Obese Zucker 3 hour 20 µl
Lane11: Positive Control [L6 + IGF Lysate, 3T3 Cell Extract (untreated) 3T3 cell extract
(serum treated)HeLa cell lysate] 16 µl
Lane 12: Mol Wt Marker 8 µl

-39-
Tibialis Anterior (TA)
Film Properties Report for p-p70S6k (Thr389) (1)
Experimenter: Anjaiah Katta
Muscle / Tissue: Tibialis Anterior (TA) Species: Rat (Zucker)
Protein conc.: 1.5µg/µl x 20µl = 30 µg Gel type: 10% Tris-HCL SDS_PAGE
Electrophoresis Voltage: 124V Transfer Voltage: 24V Duration: 45 min
Primary Antibody: p-p70S6k (Thr389) Primary Antibody Dilution: 1:1000
Incubation Time: overnight @ 4°C Medium: 5% BSA in TBS-T
Secondary Antibody: Anti-Rabbit Secondary Antibody Dilution:1:1000
Incubation Time: 1hr@room temp Medium: 5% milk in TBS-T
Exposure Time: 5 min Molecular weight: 70 kDa
Lane 1: Biotinylated Ladder 16µl
Lane 2: Mol Wt Marker 8 µl
Lane 3: Lean Zucker control 20 µl
Lane 4: Lean Zucker 0 hour 20 µl
Lane 5: Lean Zucker 1 hour 20 µl
Lane 6: Lean Zucker 3 hour 20 µl
Lane 7: Obese Zucker control 20 µl
Lane 8: Obese Zucker 0 hour 20 µl
Lane 9: Obese Zucker 1 hour 20 µl
Lane 10: Obese Zucker 3 hour 20 µl
Lane11: Positive Control [L6 + IGF Lysate, 3T3 Cell Extract (untreated) 3T3 cell extract
(serum treated)HeLa cell lysate] 16 µl
Lane 12: Mol Wt Marker 8 µl

-40-
Tibialis Anterior (TA)
Film Properties Report for p-p70S6k (Thr389) (2)
Experimenter: Anjaiah Katta
Muscle / Tissue: Tibialis Anterior (TA) Species: Rat (Zucker)
Protein conc.: 1.5µg/µl x 20µl = 30 µg Gel type: 10% Tris-HCL SDS_PAGE
Electrophoresis Voltage: 124V Transfer Voltage: 24V Duration: 45 min
Primary Antibody: p-p70S6k (Thr389) Primary Antibody Dilution: 1:1000
Incubation Time: overnight @ 4°C Medium: 5% BSA in TBS-T
Secondary Antibody: Anti-Rabbit Secondary Antibody Dilution:1:1000
Incubation Time: 1hr@room temp Medium: 5% milk in TBS-T
Exposure Time: 5 min Molecular weight: 70 kDa
Lane 1: Biotinylated Ladder 16µl
Lane 2: Mol Wt Marker 8 µl
Lane 3: Lean Zucker control 20 µl
Lane 4: Lean Zucker 0 hour 20 µl
Lane 5: Lean Zucker 1 hour 20 µl
Lane 6: Lean Zucker 3 hour 20 µl
Lane 7: Obese Zucker control 20 µl
Lane 8: Obese Zucker 0 hour 20 µl
Lane 9: Obese Zucker 1 hour 20 µl
Lane 10: Obese Zucker 3 hour 20 µl
Lane11: Positive Control [L6 + IGF Lysate, 3T3 Cell Extract (untreated) 3T3 cell extract
(serum treated)HeLa cell lysate] 16 µl
Lane 12: Mol Wt Marker 8 µl

-41-
Tibialis Anterior (TA)
Film Properties Report for p-p70S6k (Thr389) (3)
Experimenter: Anjaiah Katta
Muscle / Tissue: Tibialis Anterior (TA) Species: Rat (Zucker)
Protein conc.: 1.5µg/µl x 20µl = 30 µg Gel type: 10% Tris-HCL SDS_PAGE
Electrophoresis Voltage: 124V Transfer Voltage: 24V Duration: 45 min
Primary Antibody: p-p70S6k (Thr389) Primary Antibody Dilution: 1:1000
Incubation Time: overnight @ 4°C Medium: 5% BSA in TBS-T
Secondary Antibody: Anti-Rabbit Secondary Antibody Dilution:1:1000
Incubation Time: 1hr@room temp Medium: 5% milk in TBS-T
Exposure Time: 5 min Molecular weight: 70 kDa
Lane 1: Biotinylated Ladder 16µl
Lane 2: Mol Wt Marker 8 µl
Lane 3: Lean Zucker control 20 µl
Lane 4: Lean Zucker 0 hour 20 µl
Lane 5: Lean Zucker 1 hour 20 µl
Lane 6: Lean Zucker 3 hour 20 µl
Lane 7: Obese Zucker control 20 µl
Lane 8: Obese Zucker 0 hour 20 µl
Lane 9: Obese Zucker 1 hour 20 µl
Lane 10: Obese Zucker 3 hour 20 µl
Lane11: Positive Control [L6 + IGF Lysate, 3T3 Cell Extract (untreated) 3T3 cell extract
(serum treated)HeLa cell lysate] 16 µl
Lane 12: Mol Wt Marker 8 µl

-42-
Tibialis Anterior (TA)
Film Properties Report for p-p70S6k 421/424 (1)
Experimenter: Anjaiah Katta
Muscle / Tissue: Tibialis Anterior (TA) Species: Rat (Zucker)
Protein conc.: 1.5µg/µl x 20µl = 30 µg Gel type: 10% Tris-HCL SDS_PAGE
Electrophoresis Voltage: 124V Transfer Voltage: 24V Duration: 45 min
Primary Antibody: p-p70S6k 421/424 Primary Antibody Dilution: 1:1000
Incubation Time: overnight @ 4°C Medium: 5% BSA in TBS-T
Secondary Antibody: Anti-Rabbit Secondary Antibody Dilution:1:1000
Incubation Time: 1hr@room temp Medium: 5% milk in TBS-T
Exposure Time: 5 min Molecular weight: 70 kDa
Lane 1: Biotinylated Ladder 16µl
Lane 2: Mol Wt Marker 8 µl
Lane 3: Lean Zucker control 20 µl
Lane 4: Lean Zucker 0 hour 20 µl
Lane 5: Lean Zucker 1 hour 20 µl
Lane 6: Lean Zucker 3 hour 20 µl
Lane 7: Obese Zucker control 20 µl
Lane 8: Obese Zucker 0 hour 20 µl
Lane 9: Obese Zucker 1 hour 20 µl
Lane 10: Obese Zucker 3 hour 20 µl
Lane11: Positive Control [L6 + IGF Lysate, 3T3 Cell Extract (untreated) 3T3 cell extract
(serum treated)HeLa cell lysate] 16 µl
Lane 12: Mol Wt Marker 8 µl

-43-
Tibialis Anterior (TA)
Film Properties Report for p-p70S6k 421/424 (2)
Experimenter: Anjaiah Katta
Muscle / Tissue: Tibialis Anterior (TA) Species: Rat (Zucker)
Protein conc.: 1.5µg/µl x 20µl = 30 µg Gel type: 10% Tris-HCL SDS_PAGE
Electrophoresis Voltage: 124V Transfer Voltage: 24V Duration: 45 min
Primary Antibody: p-p70S6k 421/424 Primary Antibody Dilution: 1:1000
Incubation Time: overnight @ 4°C Medium: 5% BSA in TBS-T
Secondary Antibody: Anti-Rabbit Secondary Antibody Dilution:1:1000
Incubation Time: 1hr@room temp Medium: 5% milk in TBS-T
Exposure Time: 5 min Molecular weight: 70 kDa
Lane 1: Biotinylated Ladder 16µl
Lane 2: Mol Wt Marker 8 µl
Lane 3: Lean Zucker control 20 µl
Lane 4: Lean Zucker 0 hour 20 µl
Lane 5: Lean Zucker 1 hour 20 µl
Lane 6: Lean Zucker 3 hour 20 µl
Lane 7: Obese Zucker control 20 µl
Lane 8: Obese Zucker 0 hour 20 µl
Lane 9: Obese Zucker 1 hour 20 µl
Lane 10: Obese Zucker 3 hour 20 µl
Lane11: Positive Control [L6 + IGF Lysate, 3T3 Cell Extract (untreated) 3T3 cell extract
(serum treated)HeLa cell lysate] 16 µl
Lane 12: Mol Wt Marker 8 µl

-44-
Tibialis Anterior (TA)
Film Properties Report for p-p70S6k 421/424 (3)
Experimenter: Anjaiah Katta
Muscle / Tissue: Tibialis Anterior (TA) Species: Rat (Zucker)
Protein conc.: 1.5µg/µl x 20µl = 30 µg Gel type: 10% Tris-HCL SDS_PAGE
Electrophoresis Voltage: 124V Transfer Voltage: 24V Duration: 45 min
Primary Antibody: p-p70S6k 421/424 Primary Antibody Dilution: 1:1000
Incubation Time: overnight @ 4°C Medium: 5% BSA in TBS-T
Secondary Antibody: Anti-Rabbit Secondary Antibody Dilution:1:1000
Incubation Time: 1hr@room temp Medium: 5% milk in TBS-T
Exposure Time: 5 min Molecular weight: 70 kDa
Lane 1: Biotinylated Ladder 16µl
Lane 2: Mol Wt Marker 8 µl
Lane 3: Lean Zucker control 20 µl
Lane 4: Lean Zucker 0 hour 20 µl
Lane 5: Lean Zucker 1 hour 20 µl
Lane 6: Lean Zucker 3 hour 20 µl
Lane 7: Obese Zucker control 20 µl
Lane 8: Obese Zucker 0 hour 20 µl
Lane 9: Obese Zucker 1 hour 20 µl
Lane 10: Obese Zucker 3 hour 20 µl
Lane11: Positive Control [L6 + IGF Lysate, 3T3 Cell Extract (untreated) 3T3 cell extract
(serum treated)HeLa cell lysate] 16 µl
Lane 12: Mol Wt Marker 8 µl

-45-
Tibialis Anterior (TA)
Film Properties Report for mTOR (1)
Experimenter: Anjaiah Katta
Muscle / Tissue: Tibialis Anterior (TA) Species: Rat (Zucker)
Protein conc.: 1.5µg/µl x 20µl = 30 µg Gel type: 10% Tris-HCL SDS_PAGE
Electrophoresis Voltage: 124V Transfer Voltage: 24V Duration: 45 min
Primary Antibody: mTOR (Cell Signaling) Primary Antibody Dilution: 1:1000
Incubation Time: overnight @ 4°C Medium: 5% BSA in TBS-T
Secondary Antibody: Anti-Rabbit Secondary Antibody Dilution:1:1000
Incubation Time: 1hr@room temp Medium: 5% milk in TBS-T
Exposure Time: 2 min Molecular weight: 289 kDa
Lane 1: Biotinylated Ladder 16µl
Lane 2: Mol Wt Marker 8 µl
Lane 3: Lean Zucker control 20 µl
Lane 4: Lean Zucker 0 hour 20 µl
Lane 5: Lean Zucker 1 hour 20 µl
Lane 6: Lean Zucker 3 hour 20 µl
Lane 7: Obese Zucker control 20 µl
Lane 8: Obese Zucker 0 hour 20 µl
Lane 9: Obese Zucker 1 hour 20 µl
Lane 10: Obese Zucker 3 hour 20 µl
Lane11: Positive Control [L6 + IGF Lysate, 3T3 Cell Extract (untreated) 3T3 cell extract
(serum treated)HeLa cell lysate] 16 µl
Lane 12: Mol Wt Marker 8 µl

-46-
Tibialis Anterior (TA)
Film Properties Report for mTOR (2)
Experimenter: Anjaiah Katta
Muscle / Tissue: Tibialis Anterior (TA) Species: Rat (Zucker)
Protein conc.: 1.5µg/µl x 20µl = 30 µg Gel type: 10% Tris-HCL SDS_PAGE
Electrophoresis Voltage: 124V Transfer Voltage: 24V Duration: 45 min
Primary Antibody: mTOR (Cell Signaling) Primary Antibody Dilution: 1:1000
Incubation Time: overnight @ 4°C Medium: 5% BSA in TBS-T
Secondary Antibody: Anti-Rabbit Secondary Antibody Dilution:1:1000
Incubation Time: 1hr@room temp Medium: 5% milk in TBS-T
Exposure Time: 1min Molecular weight: 289 kDa
Lane 1: Biotinylated Ladder 16µl
Lane 2: Mol Wt Marker 8 µl
Lane 3: Lean Zucker control 20 µl
Lane 4: Lean Zucker 0 hour 20 µl
Lane 5: Lean Zucker 1 hour 20 µl
Lane 6: Lean Zucker 3 hour 20 µl
Lane 7: Obese Zucker control 20 µl
Lane 8: Obese Zucker 0 hour 20 µl
Lane 9: Obese Zucker 1 hour 20 µl
Lane 10: Obese Zucker 3 hour 20 µl
Lane11: Positive Control [L6 + IGF Lysate, 3T3 Cell Extract (untreated) 3T3 cell extract
(serum treated)HeLa cell lysate] 16 µl
Lane 12: Mol Wt Marker 8 µl

-47-
Tibialis Anterior (TA)
Film Properties Report for mTOR (3)
Experimenter: Anjaiah Katta
Muscle / Tissue: Tibialis Anterior (TA) Species: Rat (Zucker)
Protein conc.: 1.5µg/µl x 20µl = 30 µg Gel type: 10% Tris-HCL SDS_PAGE
Electrophoresis Voltage: 124V Transfer Voltage: 24V Duration: 45 min
Primary Antibody: mTOR (Cell Signaling) Primary Antibody Dilution: 1:1000
Incubation Time: overnight @ 4°C Medium: 5% BSA in TBS-T
Secondary Antibody: Anti-Rabbit Secondary Antibody Dilution:1:1000
Incubation Time: 1hr@room temp Medium: 5% milk in TBS-T
Exposure Time: 2 min Molecular weight: 289 kDa
Lane 1: Biotinylated Ladder 16µl
Lane 2: Mol Wt Marker 8 µl
Lane 3: Lean Zucker control 20 µl
Lane 4: Lean Zucker 0 hour 20 µl
Lane 5: Lean Zucker 1 hour 20 µl
Lane 6: Lean Zucker 3 hour 20 µl
Lane 7: Obese Zucker control 20 µl
Lane 8: Obese Zucker 0 hour 20 µl
Lane 9: Obese Zucker 1 hour 20 µl
Lane 10: Obese Zucker 3 hour 20 µl
Lane11: Positive Control [L6 + IGF Lysate, 3T3 Cell Extract (untreated) 3T3 cell extract
(serum treated)HeLa cell lysate] 16 µl
Lane 12: Mol Wt Marker 8 µl

-48-
Tibialis Anterior (TA)
Film Properties Report for p-mTOR (1)
Experimenter: Anjaiah Katta
Muscle / Tissue: Tibialis Anterior (TA) Species: Rat (Zucker)
Protein conc.: 1.5µg/µl x 20µl = 30 µg Gel type: 10% Tris-HCL SDS_PAGE
Electrophoresis Voltage: 124V Transfer Voltage: 24V Duration: 45 min
Primary Antibody: p-mTOR (Cell Signaling) Primary Antibody Dilution: 1:1000
Incubation Time: overnight @ 4°C Medium: 5% BSA in TBS-T
Secondary Antibody: Anti-Rabbit Secondary Antibody Dilution:1:1000
Incubation Time: 1hr@room temp Medium: 5% milk in TBS-T
Exposure Time: 5 min Molecular weight: 289 kDa
Lane 1: Biotinylated Ladder 16µl
Lane 2: Mol Wt Marker 8 µl
Lane 3: Lean Zucker control 20 µl
Lane 4: Lean Zucker 0 hour 20 µl
Lane 5: Lean Zucker 1 hour 20 µl
Lane 6: Lean Zucker 3 hour 20 µl
Lane 7: Obese Zucker control 20 µl
Lane 8: Obese Zucker 0 hour 20 µl
Lane 9: Obese Zucker 1 hour 20 µl
Lane 10: Obese Zucker 3 hour 20 µl
Lane11: Positive Control [L6 + IGF Lysate, 3T3 Cell Extract (untreated) 3T3 cell extract
(serum treated)HeLa cell lysate] 16 µl
Lane 12: Mol Wt Marker 8 µl
-49-
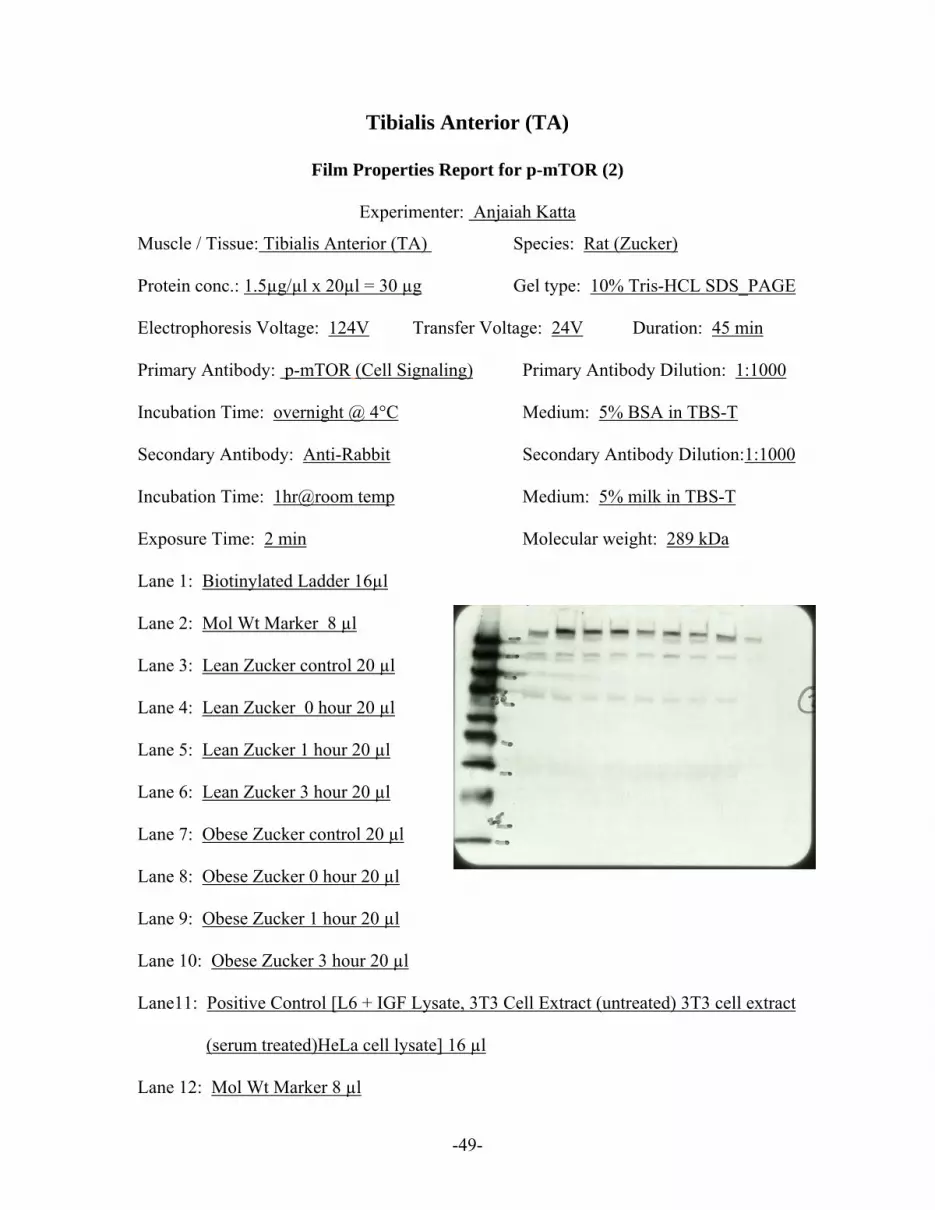
Tibialis Anterior (TA)
Film Properties Report for p-mTOR (2)
Experimenter: Anjaiah Katta
Muscle / Tissue: Tibialis Anterior (TA) Species: Rat (Zucker)
Protein conc.: 1.5µg/µl x 20µl = 30 µg Gel type: 10% Tris-HCL SDS_PAGE
Electrophoresis Voltage: 124V Transfer Voltage: 24V Duration: 45 min
Primary Antibody: p-mTOR (Cell Signaling) Primary Antibody Dilution: 1:1000
Incubation Time: overnight @ 4°C Medium: 5% BSA in TBS-T
Secondary Antibody: Anti-Rabbit Secondary Antibody Dilution:1:1000
Incubation Time: 1hr@room temp Medium: 5% milk in TBS-T
Exposure Time: 2 min Molecular weight: 289 kDa
Lane 1: Biotinylated Ladder 16µl
Lane 2: Mol Wt Marker 8 µl
Lane 3: Lean Zucker control 20 µl
Lane 4: Lean Zucker 0 hour 20 µl
Lane 5: Lean Zucker 1 hour 20 µl
Lane 6: Lean Zucker 3 hour 20 µl
Lane 7: Obese Zucker control 20 µl
Lane 8: Obese Zucker 0 hour 20 µl
Lane 9: Obese Zucker 1 hour 20 µl
Lane 10: Obese Zucker 3 hour 20 µl
Lane11: Positive Control [L6 + IGF Lysate, 3T3 Cell Extract (untreated) 3T3 cell extract
(serum treated)HeLa cell lysate] 16 µl
Lane 12: Mol Wt Marker 8 µl

-50-
Tibialis Anterior (TA)
Film Properties Report for p-mTOR (3)
Experimenter: Anjaiah Katta
Muscle / Tissue: Tibialis Anterior (TA) Species: Rat (Zucker)
Protein conc.: 1.5µg/µl x 20µl = 30 µg Gel type: 10% Tris-HCL SDS_PAGE
Electrophoresis Voltage: 124V Transfer Voltage: 24V Duration: 45 min
Primary Antibody: p-mTOR (Cell Signaling) Primary Antibody Dilution: 1:1000
Incubation Time: overnight @ 4°C Medium: 5% BSA in TBS-T
Secondary Antibody: Anti-Rabbit Secondary Antibody Dilution:1:1000
Incubation Time: 1hr@room temp Medium: 5% milk in TBS-T
Exposure Time: 2 min Molecular weight: 289 kDa
Lane 1: Biotinylated Ladder 16µl
Lane 2: Mol Wt Marker 8 µl
Lane 3: Lean Zucker control 20 µl
Lane 4: Lean Zucker 0 hour 20 µl
Lane 5: Lean Zucker 1 hour 20 µl
Lane 6: Lean Zucker 3 hour 20 µl
Lane 7: Obese Zucker control 20 µl
Lane 8: Obese Zucker 0 hour 20 µl
Lane 9: Obese Zucker 1 hour 20 µl
Lane 10: Obese Zucker 3 hour 20 µl
Lane11: Positive Control [L6 + IGF Lysate, 3T3 Cell Extract (untreated) 3T3 cell extract
(serum treated)HeLa cell lysate] 16 µl
Lane 12: Mol Wt Marker 8 µl

-51-
Tibialis Anterior (TA)
Film Properties Report for Akt (1)
Experimenter: Anjaiah Katta
Muscle / Tissue: Tibialis Anterior (TA) Species: Rat (Zucker)
Protein conc.: 1.5µg/µl x 20µl = 30 µg Gel type: 10% Tris-HCL SDS_PAGE
Electrophoresis Voltage: 124V Transfer Voltage: 24V Duration: 45 min
Primary Antibody: Akt (Cell Signaling) Primary Antibody Dilution: 1:1000
Incubation Time: overnight @ 4°C Medium: 5% BSA in TBS-T
Secondary Antibody: Anti-Rabbit Secondary Antibody Dilution:1:1000
Incubation Time: 1hr@room temp Medium: 5% milk in TBS-T
Exposure Time: 5 seconds Molecular weight: 60 kDa
Lane 1: Biotinylated Ladder 16µl
Lane 2: Mol Wt Marker 8 µl
Lane 3: Lean Zucker control 20 µl
Lane 4: Lean Zucker 0 hour 20 µl
Lane 5: Lean Zucker 1 hour 20 µl
Lane 6: Lean Zucker 3 hour 20 µl
Lane 7: Obese Zucker control 20 µl
Lane 8: Obese Zucker 0 hour 20 µl
Lane 9: Obese Zucker 1 hour 20 µl
Lane 10: Obese Zucker 3 hour 20 µl
Lane11: Positive Control [L6 + IGF Lysate, 3T3 Cell Extract (untreated) 3T3 cell extract
(serum treated)HeLa cell lysate] 16 µl
Lane 12: Mol Wt Marker 8 µl

-52-
Tibialis Anterior (TA)
Film Properties Report for Akt (2)
Experimenter: Anjaiah Katta
Muscle / Tissue: Tibialis Anterior (TA) Species: Rat (Zucker)
Protein conc.: 1.5µg/µl x 20µl = 30 µg Gel type: 10% Tris-HCL SDS_PAGE
Electrophoresis Voltage: 124V Transfer Voltage: 24V Duration: 45 min
Primary Antibody: Akt (Cell Signaling) Primary Antibody Dilution: 1:1000
Incubation Time: overnight @ 4°C Medium: 5% BSA in TBS-T
Secondary Antibody: Anti-Rabbit Secondary Antibody Dilution:1:1000
Incubation Time: 1hr@room temp Medium: 5% milk in TBS-T
Exposure Time: 5 seconds Molecular weight: 60 kDa
Lane 1: Biotinylated Ladder 16µl
Lane 2: Mol Wt Marker 8 µl
Lane 3: Lean Zucker control 20 µl
Lane 4: Lean Zucker 0 hour 20 µl
Lane 5: Lean Zucker 1 hour 20 µl
Lane 6: Lean Zucker 3 hour 20 µl
Lane 7: Obese Zucker control 20 µl
Lane 8: Obese Zucker 0 hour 20 µl
Lane 9: Obese Zucker 1 hour 20 µl
Lane 10: Obese Zucker 3 hour 20 µl
Lane11: Positive Control [L6 + IGF Lysate, 3T3 Cell Extract (untreated) 3T3 cell extract
(serum treated)HeLa cell lysate] 16 µl
Lane 12: Mol Wt Marker 8 µl

-53-
Tibialis Anterior (TA)
Film Properties Report for Akt (3)
Experimenter: Anjaiah Katta
Muscle / Tissue: Tibialis Anterior (TA) Species: Rat (Zucker)
Protein conc.: 1.5µg/µl x 20µl = 30 µg Gel type: 10% Tris-HCL SDS_PAGE
Electrophoresis Voltage: 124V Transfer Voltage: 24V Duration: 45 min
Primary Antibody: Akt (Cell Signaling) Primary Antibody Dilution: 1:1000
Incubation Time: overnight @ 4°C Medium: 5% BSA in TBS-T
Secondary Antibody: Anti-Rabbit Secondary Antibody Dilution:1:1000
Incubation Time: 1hr@room temp Medium: 5% milk in TBS-T
Exposure Time: 5 seconds Molecular weight: 60 kDa
Lane 1: Biotinylated Ladder 16µl
Lane 2: Mol Wt Marker 8 µl
Lane 3: Lean Zucker control 20 µl
Lane 4: Lean Zucker 0 hour 20 µl
Lane 5: Lean Zucker 1 hour 20 µl
Lane 6: Lean Zucker 3 hour 20 µl
Lane 7: Obese Zucker control 20 µl
Lane 8: Obese Zucker 0 hour 20 µl
Lane 9: Obese Zucker 1 hour 20 µl
Lane 10: Obese Zucker 3 hour 20 µl
Lane11: Positive Control [L6 + IGF Lysate, 3T3 Cell Extract (untreated) 3T3 cell extract
(serum treated)HeLa cell lysate] 16 µl
Lane 12: Mol Wt Marker 8 µl

-54-
Tibialis Anterior (TA)
Film Properties Report for p-Akt 308 (1)
Experimenter: Anjaiah Katta
Muscle / Tissue: Tibialis Anterior (TA) Species: Rat (Zucker)
Protein conc.: 1.5µg/µl x 20µl = 30 µg Gel type: 10% Tris-HCL SDS_PAGE
Electrophoresis Voltage: 124V Transfer Voltage: 24V Duration: 45 min
Primary Antibody: p-Akt 308 Primary Antibody Dilution: 1:1000
Incubation Time: overnight @ 4°C Medium: 5% BSA in TBS-T
Secondary Antibody: Anti-Rabbit Secondary Antibody Dilution:1:1000
Incubation Time: 1hr@room temp Medium: 5% milk in TBS-T
Exposure Time: 5 min Molecular weight: 60 kDa
Lane 1: Biotinylated Ladder 16µl
Lane 2: Mol Wt Marker 8 µl
Lane 3: Lean Zucker control 20 µl
Lane 4: Lean Zucker 0 hour 20 µl
Lane 5: Lean Zucker 1 hour 20 µl
Lane 6: Lean Zucker 3 hour 20 µl
Lane 7: Obese Zucker control 20 µl
Lane 8: Obese Zucker 0 hour 20 µl
Lane 9: Obese Zucker 1 hour 20 µl
Lane 10: Obese Zucker 3 hour 20 µl
Lane11: Positive Control [L6 + IGF Lysate, 3T3 Cell Extract (untreated) 3T3 cell extract
(serum treated)HeLa cell lysate] 16 µl
Lane 12: Mol Wt Marker 8 µl

-55-
Tibialis Anterior (TA)
Film Properties Report for p-Akt 308 (2)
Experimenter: Anjaiah Katta
Muscle / Tissue: Tibialis Anterior (TA) Species: Rat (Zucker)
Protein conc.: 1.5µg/µl x 20µl = 30 µg Gel type: 10% Tris-HCL SDS_PAGE
Electrophoresis Voltage: 124V Transfer Voltage: 24V Duration: 45 min
Primary Antibody: p-Akt 308 Primary Antibody Dilution: 1:1000
Incubation Time: overnight @ 4°C Medium: 5% BSA in TBS-T
Secondary Antibody: Anti-Rabbit Secondary Antibody Dilution:1:1000
Incubation Time: 1hr@room temp Medium: 5% milk in TBS-T
Exposure Time: 5 min Molecular weight: 60 kDa
Lane 1: Biotinylated Ladder 16µl
Lane 2: Mol Wt Marker 8 µl
Lane 3: Lean Zucker control 20 µl
Lane 4: Lean Zucker 0 hour 20 µl
Lane 5: Lean Zucker 1 hour 20 µl
Lane 6: Lean Zucker 3 hour 20 µl
Lane 7: Obese Zucker control 20 µl
Lane 8: Obese Zucker 0 hour 20 µl
Lane 9: Obese Zucker 1 hour 20 µl
Lane 10: Obese Zucker 3 hour 20 µl
Lane11: Positive Control [L6 + IGF Lysate, 3T3 Cell Extract (untreated) 3T3 cell extract
(serum treated)HeLa cell lysate] 16 µl
Lane 12: Mol Wt Marker 8 µl

-56-
Tibialis Anterior (TA)
Film Properties Report for p-Akt 308 (3)
Experimenter: Anjaiah Katta
Muscle / Tissue: Tibialis Anterior (TA) Species: Rat (Zucker)
Protein conc.: 1.5µg/µl x 20µl = 30 µg Gel type: 10% Tris-HCL SDS_PAGE
Electrophoresis Voltage: 124V Transfer Voltage: 24V Duration: 45 min
Primary Antibody: p-Akt 308 Primary Antibody Dilution: 1:1000
Incubation Time: overnight @ 4°C Medium: 5% BSA in TBS-T
Secondary Antibody: Anti-Rabbit Secondary Antibody Dilution:1:1000
Incubation Time: 1hr@room temp Medium: 5% milk in TBS-T
Exposure Time: 2 min Molecular weight: 60 kDa
Lane 1: Biotinylated Ladder 16µl
Lane 2: Mol Wt Marker 8 µl
Lane 3: Lean Zucker control 20 µl
Lane 4: Lean Zucker 0 hour 20 µl
Lane 5: Lean Zucker 1 hour 20 µl
Lane 6: Lean Zucker 3 hour 20 µl
Lane 7: Obese Zucker control 20 µl
Lane 8: Obese Zucker 0 hour 20 µl
Lane 9: Obese Zucker 1 hour 20 µl
Lane 10: Obese Zucker 3 hour 20 µl
Lane11: Positive Control [L6 + IGF Lysate, 3T3 Cell Extract (untreated) 3T3 cell extract
(serum treated)HeLa cell lysate] 16 µl
Lane 12: Mol Wt Marker 8 µl

-57-
Tibialis Anterior (TA)
Film Properties Report for p-Akt 473 (1)
Experimenter: Anjaiah Katta
Muscle / Tissue: Tibialis Anterior (TA) Species: Rat (Zucker)
Protein conc.: 1.5µg/µl x 20µl = 30 µg Gel type: 10% Tris-HCL SDS_PAGE
Electrophoresis Voltage: 124V Transfer Voltage: 24V Duration: 45 min
Primary Antibody: p-Akt 473 Primary Antibody Dilution: 1:1000
Incubation Time: overnight @ 4°C Medium: 5% BSA in TBS-T
Secondary Antibody: Anti-Rabbit Secondary Antibody Dilution:1:1000
Incubation Time: 1hr@room temp Medium: 5% milk in TBS-T
Exposure Time: 1min Molecular weight: 60 kDa
Lane 1: Biotinylated Ladder 16µl
Lane 2: Mol Wt Marker 8 µl
Lane 3: Lean Zucker control 20 µl
Lane 4: Lean Zucker 0 hour 20 µl
Lane 5: Lean Zucker 1 hour 20 µl
Lane 6: Lean Zucker 3 hour 20 µl
Lane 7: Obese Zucker control 20 µl
Lane 8: Obese Zucker 0 hour 20 µl
Lane 9: Obese Zucker 1 hour 20 µl
Lane 10: Obese Zucker 3 hour 20 µl
Lane11: Positive Control [L6 + IGF Lysate, 3T3 Cell Extract (untreated) 3T3 cell extract
(serum treated)HeLa cell lysate] 16 µl
Lane 12: Mol Wt Marker 8 µl
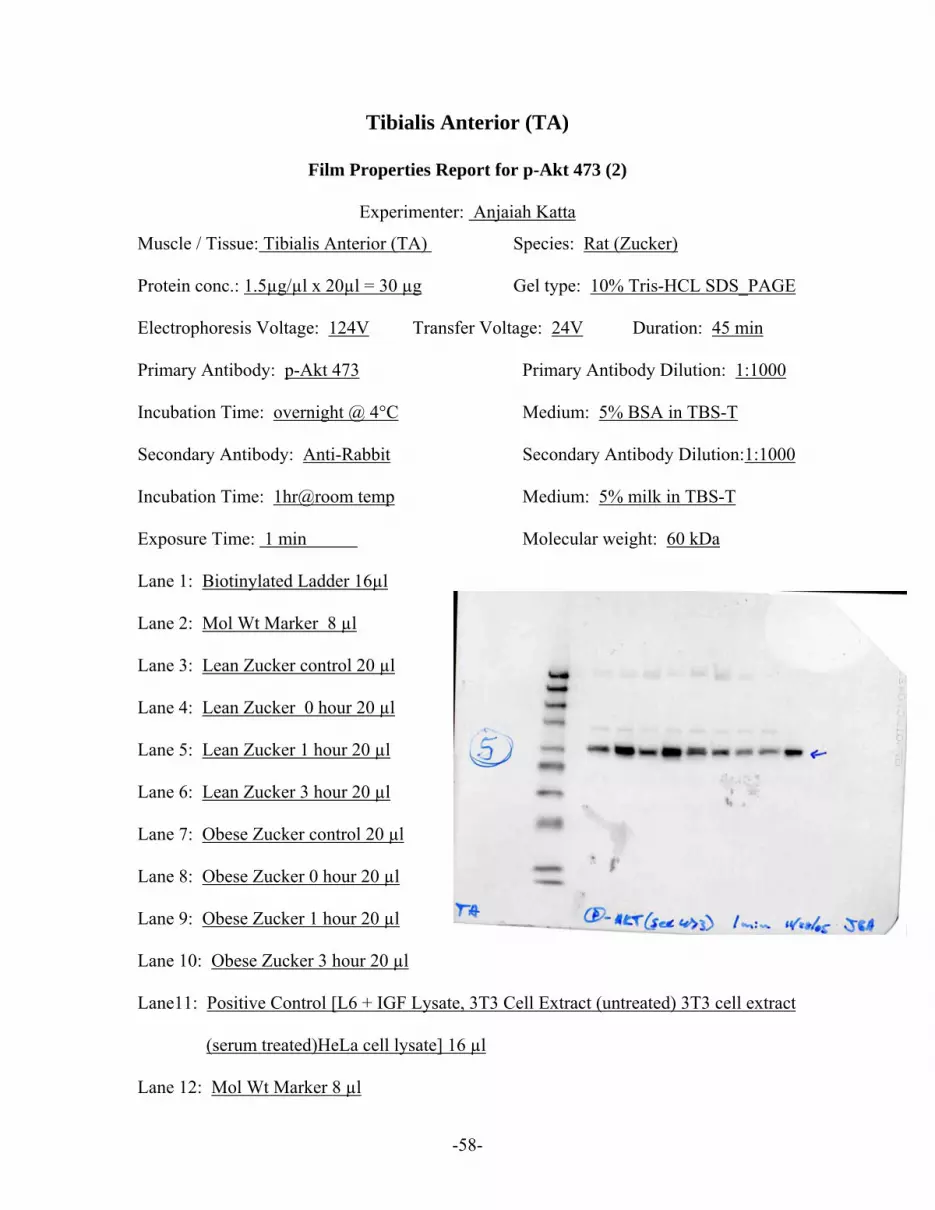
-58-
Tibialis Anterior (TA)
Film Properties Report for p-Akt 473 (2)
Experimenter: Anjaiah Katta
Muscle / Tissue: Tibialis Anterior (TA) Species: Rat (Zucker)
Protein conc.: 1.5µg/µl x 20µl = 30 µg Gel type: 10% Tris-HCL SDS_PAGE
Electrophoresis Voltage: 124V Transfer Voltage: 24V Duration: 45 min
Primary Antibody: p-Akt 473 Primary Antibody Dilution: 1:1000
Incubation Time: overnight @ 4°C Medium: 5% BSA in TBS-T
Secondary Antibody: Anti-Rabbit Secondary Antibody Dilution:1:1000
Incubation Time: 1hr@room temp Medium: 5% milk in TBS-T
Exposure Time: 1 min Molecular weight: 60 kDa
Lane 1: Biotinylated Ladder 16µl
Lane 2: Mol Wt Marker 8 µl
Lane 3: Lean Zucker control 20 µl
Lane 4: Lean Zucker 0 hour 20 µl
Lane 5: Lean Zucker 1 hour 20 µl
Lane 6: Lean Zucker 3 hour 20 µl
Lane 7: Obese Zucker control 20 µl
Lane 8: Obese Zucker 0 hour 20 µl
Lane 9: Obese Zucker 1 hour 20 µl
Lane 10: Obese Zucker 3 hour 20 µl
Lane11: Positive Control [L6 + IGF Lysate, 3T3 Cell Extract (untreated) 3T3 cell extract
(serum treated)HeLa cell lysate] 16 µl
Lane 12: Mol Wt Marker 8 µl

-59-
Tibialis Anterior (TA)
Film Properties Report for p-Akt 473 (3)
Experimenter: Anjaiah Katta
Muscle / Tissue: Tibialis Anterior (TA) Species: Rat (Zucker)
Protein conc.: 1.5µg/µl x 20µl = 30 µg Gel type: 10% Tris-HCL SDS_PAGE
Electrophoresis Voltage: 124V Transfer Voltage: 24V Duration: 45 min
Primary Antibody: p-Akt 473 Primary Antibody Dilution: 1:1000
Incubation Time: overnight @ 4°C Medium: 5% BSA in TBS-T
Secondary Antibody: Anti-Rabbit Secondary Antibody Dilution:1:1000
Incubation Time: 1hr@room temp Medium: 5% milk in TBS-T
Exposure Time: 5 min Molecular weight: 60 kDa
Lane 1: Biotinylated Ladder 16µl
Lane 2: Mol Wt Marker 8 µl
Lane 3: Lean Zucker control 20 µl
Lane 4: Lean Zucker 0 hour 20 µl
Lane 5: Lean Zucker 1 hour 20 µl
Lane 6: Lean Zucker 3 hour 20 µl
Lane 7: Obese Zucker control 20 µl
Lane 8: Obese Zucker 0 hour 20 µl
Lane 9: Obese Zucker 1 hour 20 µl
Lane 10: Obese Zucker 3 hour 20 µl
Lane11: Positive Control [L6 + IGF Lysate, 3T3 Cell Extract (untreated) 3T3 cell extract
(serum treated)HeLa cell lysate] 16 µl
Lane 12: Mol Wt Marker 8 µl

-60-
Subsection B (Raw data)
This section represents the raw data tables produced from spot densitometry of the
immunoblot films.
p70S6k data set
Total p70S6k IDV Values
Lean control Lean 0 Lean 1 Lean 3
Obese conrtol
Obese 0
Obese 1
Obese 3
%C 15.2 13.9 12.8 12.4 10.6 13.3 10.1 11.7%C 15 13.6 13.6 12.3 10.5 13 10.1 11.9%C 15.6 14.3 13.9 12.8 10.5 11.7 9.9 11.4%C 15.4 14.7 13.8 12.8 10.2 11.5 10.2 11.5%C 15.1 13.1 11 13.2 11.5 12.1 11.5 12.5%C 14.5 13.2 10.8 12.8 11.9 12.5 11.9 12.5 N 6 6 6 6 6 6 6 6
Mean 15.133
33 13.8 12.6512.716
6710.866
67 12.35 10.616
67 11.916
67Strandard Deviation
0.377712
0.626099
1.411028
0.325064
0.671317
0.714843
0.854205
0.483391
Standard Error of the mean
0.168918 0.28
0.631031
0.145373
0.300222
0.319687
0.382012
0.216179
Lean control Lean 0 Lean 1 Lean 3
Obese conrtol
Obese 0
Obese 1
Obese 3
Relative Expression Level 1
0.911894
0.835903
0.840308
0.718062
0.816079
0.701542
0.787445
Standard error of the mean
0.011162
0.018502
0.041698
0.009606
0.019838
0.021125
0.025243
0.014285
Lean control Lean 0 Lean 1 Lean 3
Obese conrtol
Obese 0
Obese 1
Obese 3
% RE 100 91.189
4383.590
3184.030
8471.806
1781.607
93 70.154
19 78.744
49
SE 1.1161
99 1.8502
24.1698
080.9606
151.9838
472.1124
71 2.5243
1 1.4284
95

-61-
p-p70S6k Thr389 IDV Values
Lean control Lean 0 Lean 1 Lean 3
Obese conrtol
Obese 0
Obese 1
Obese 3
%C 13.1 16.2 13.5 13.7 9.5 12.5 9.8 11.6%C 12.6 16.2 13.6 13.8 9.8 11.8 10 12.2%C 13.2 15.6 13.2 14.4 9.3 10.7 10.7 13%C 13.2 15.6 13.2 14.4 9.3 10.7 10.7 13%C 10.2 17.3 19.1 17.5 8.2 9.3 7.5 10.8%C 10.9 16.7 18.2 17.4 8 9.4 7.7 11.6 N 6 6 6 6 6 6 6 6
Mean 12.2 16.266
6715.133
33 15.29.0166
6710.733
33 9.4 12.033
33Strandard Deviation
1.316055
0.656252
2.743477
1.767484
0.73598
1.272268
1.442221
0.871015
Standard Error of the mean
0.588558
0.293485
1.22692
0.790443
0.32914
0.568976
0.644981
0.38953
Lean control Lean 0 Lean 1 Lean 3
Obese conrtol
Obese 0
Obese 1
Obese 3
Relative Expression Level 1
1.333333
1.240437
1.245902
0.739071
0.879781
0.770492
0.986339
Standard error of the mean
0.048242
0.024056
0.100567
0.06479
0.026979
0.046637
0.052867
0.031929
Lean control Lean 0 Lean 1 Lean 3
Obese conrtol
Obese 0
Obese 1
Obese 3
% RE 100 133.33
33124.04
37124.59
0273.907
187.978
14 77.049
18 98.633
88
SE 4.8242
42 2.4056
1310.056
726.4790
42.6978
714.6637
35 5.2867
26 3.1928
66

-62-
p-p70S6k 421/424 IDV Values
Lean control Lean 0 Lean 1 Lean 3
Obese conrtol
Obese 0
Obese 1
Obese 3
%C 4.3 19.2 16.7 9.8 4.4 17.9 13.3 14.2%C 4.1 19.4 17 9.7 4 18.3 12.9 14.6%C 5.5 24.8 21.7 8.3 4.2 17.8 7.8 10%C 5.4 24.3 20.9 8.4 4.1 18.5 8 10.4%C 4 25.4 20.3 7 5.4 17.5 6.6 13.9%C 3.8 25.8 20.2 6.5 5.2 17.7 6.9 13.9 N 6 6 6 6 6 6 6 6
Mean 4.5166
67 23.1519.466
678.2833
33 4.55 17.95 9.25 12.833
33Strandard Deviation
0.741395
3.026384
2.098253
1.352652
0.599166
0.378153
3.031006
2.059773
Standard Error of the mean
0.331562
1.35344
0.938367
0.604924
0.267955
0.169115
1.355507
0.921159
Lean control Lean 0 Lean 1 Lean 3
Obese conrtol
Obese 0
Obese 1
Obese 3
Relative Expression Level 1
5.125461
4.309963
1.833948
1.00738
3.97417
2.04797
2.841328
Standard error of the mean
0.073409
0.299655
0.207757
0.133932
0.059326
0.037443
0.300112
0.203947
Lean control Lean 0 Lean 1 Lean 3
Obese conrtol
Obese 0
Obese 1
Obese 3
% RE 100 512.54
61430.99
63183.39
48100.73
8397.41
7 204.79
7 284.13
28
SE 7.3408
55 29.965
4620.775
6613.393
165.9325
883.7442
51 30.011
23 20.394
66

-63-
mTOR data set
Total mTOR IDV Values
Lean control Lean 0 Lean 1 Lean 3
Obese conrtol
Obese 0
Obese 1
Obese 3
%C 11.2 12.8 11.8 16.6 12.3 11.2 9.9 14.2%C 10.8 12.6 11 17.1 12.6 10.5 10.7 14.7%C 13 13.7 12.6 14.5 12.3 10 10 13.9%C 12.8 13.6 12.6 13.8 12.2 11.3 10.6 13.2%C 10.4 18.2 20.3 12.1 7.8 12.1 10.8 8.2%C 9.4 17.2 19.7 12.4 9 12.9 11.6 7.7 N 6 6 6 6 6 6 6 6
Mean 11.266
67 14.683
3314.666
6714.416
6711.033
3311.333
33 10.6 11.983
33Strandard Deviation
1.400952
2.397012
4.177878
2.087502
2.079102
1.051982
0.616441
3.165702
Standard Error of the mean
0.626525
1.071976
1.868404
0.933559
0.929803
0.470461
0.275681
1.415745
Lean control Lean 0 Lean 1 Lean 3
Obese conrtol
Obese 0
Obese 1
Obese 3
Relative Expression Level 1
1.303254
1.301775
1.279586
0.97929
1.005917
0.940828
1.063609
Standard error of the mean
0.055609
0.095146
0.165835
0.08286
0.082527
0.041757
0.024469
0.125658
Lean control Lean 0 Lean 1 Lean 3
Obese conrtol
Obese 0
Obese 1
Obese 3
% RE 100 130.32
54130.17
75127.95
8697.928
99100.59
17 94.082
84 106.36
09
SE 5.5608
71 9.5145
8316.583
478.2860
318.2526
884.1756
87 2.4468
73 12.565
78

-64-
p-mTOR IDV Values
Lean control Lean 0 Lean 1 Lean 3
Obese conrtol
Obese 0
Obese 1
Obese 3
%C 7.1 28.8 19.1 10.2 4.6 15.5 9.7 5.1%C 7.3 28.3 19.1 10.2 5 15.4 9.2 5.5%C 10.8 19.7 14.8 14.2 9.5 11.3 9.3 10.4%C 11.2 19.2 14.6 14.2 9.6 11.4 9.2 10.5%C 13.2 13.6 10.9 14.5 10.7 9.7 11.6 15.9%C 13.1 13.6 10.4 15.2 10.1 9.9 11.5 16.3 N 6 6 6 6 6 6 6 6
Mean 10.45 20.533
3314.816
6713.083
33 8.25 12.2 10.083
33 10.616
67Strandard Deviation
2.698703
6.742008
3.783869
2.26311
2.709059
2.612279
1.151376
4.835046
Standard Error of the mean
1.206897
3.015117
1.692198
1.012094
1.211528
1.168247
0.514911
2.162298
Lean control Lean 0 Lean 1 Lean 3
Obese conrtol
Obese 0
Obese 1
Obese 3
Relative Expression Level 1
1.964912
1.417863
1.251994
0.789474
1.167464
0.964912
1.015949
Standard error of the mean
0.115493
0.288528
0.161933
0.096851
0.115936
0.111794
0.049274
0.206918
Lean control Lean 0 Lean 1 Lean 3
Obese conrtol
Obese 0
Obese 1
Obese 3
% RE 100 196.49
12141.78
63125.19
9478.947
37116.74
64 96.491
23 101.59
49
SE 11.549
25 28.852
816.193
289.6851
0611.593
5711.179
39 4.9273
78 20.691
85

-65-
Akt data set
Total Akt IDV Values
Lean control Lean 0 Lean 1 Lean 3
Obese conrtol
Obese 0
Obese 1
Obese 3
%C 15.2 13 14.1 14.6 11.3 10.6 9.4 11.9%C 15.1 12.6 14.2 14.5 11.5 10.4 10.1 11.6%C 15.8 13.5 17.2 15 11.5 9.5 7.8 9.8%C 14.9 13.3 16.5 15.1 12 9.9 8.2 10.1%C 15.3 14.2 14.9 15.6 10.4 10.9 9.2 9.5%C 16.4 14.2 14.4 15.3 10.2 10.8 9.1 9.6 N 6 6 6 6 6 6 6 6
Mean 15.45 13.466
6715.216
6715.016
67 11.15 10.35 8.9666
67 10.416
67Strandard Deviation
0.554076
0.643946
1.313646
0.416733
0.700714
0.546809
0.835863
1.057198
Standard Error of the mean
0.24779
0.287981
0.58748
0.186369
0.313369
0.24454
0.373809
0.472793
Lean control Lean 0 Lean 1 Lean 3
Obese conrtol
Obese 0
Obese 1
Obese 3
Relative Expression Level 1
0.871629
0.984898
0.971953
0.721683
0.669903
0.580367
0.674218
Standard error of the mean
0.016038
0.01864
0.038025
0.012063
0.020283
0.015828
0.024195
0.030601
Lean control Lean 0 Lean 1 Lean 3
Obese conrtol
Obese 0
Obese 1
Obese 3
% RE 100 87.162
8998.489
7597.195
2572.168
2866.990
29 58.036
68 67.421
79
SE 1.6038
2 1.8639
583.8024
631.2062
712.0282
771.5827
86 2.4194
77 3.0601
5

-66-
p-Akt 308 IDV Values
Lean control Lean 0 Lean 1 Lean 3
Obese conrtol
Obese 0
Obese 1
Obese 3
%C 13.3 22.7 9.3 16.9 11.1 9.8 7.1 9.8%C 14.1 23.2 8.2 16.4 12.7 9.1 7.7 8.6%C 12.8 16.5 10 19.1 13 10.6 9.1 8.7%C 12.2 17.1 10.3 18.6 13.6 10.5 8.5 9.1%C 15.3 15.3 10.7 19.5 14.5 9.6 5.8 9.3%C 15.9 15.4 10.2 19.1 14.4 9.7 5.7 9.7 N 6 6 6 6 6 6 6 6
Mean 13.933
33 18.366
679.7833
3318.266
6713.216
679.8833
33 7.3166
67 9.2Strandard Deviation
1.445914
3.61755
0.902035
1.294089
1.263988
0.570672
1.392001
0.497996
Standard Error of the mean
0.646632
1.617817
0.403402
0.578734
0.565273
0.255212
0.622522
0.222711
Lean control Lean 0 Lean 1 Lean 3
Obese conrtol
Obese 0
Obese 1
Obese 3
Relative Expression Level 1
1.318182
0.702153
1.311005
0.948565
0.70933
0.52512
0.660287
Standard error of the mean
0.046409
0.116111
0.028952
0.041536
0.04057
0.018317
0.044679
0.015984
Lean control Lean 0 Lean 1 Lean 3
Obese conrtol
Obese 0
Obese 1
Obese 3
% RE 100 131.81
8270.215
31131.10
0594.856
4670.933
01 52.511
96 66.028
71
SE 4.6409
02 11.611
132.8952
314.1535
954.0569
821.8316
67 4.4678
59 1.5984
01

-67-
p-Akt 473 IDV Values
Lean control Lean 0 Lean 1 Lean 3
Obese conrtol
Obese 0
Obese 1
Obese 3
%C 11.7 16.6 11.7 15.3 14 12.7 8.2 9.8%C 11.3 17.5 11.6 15.9 13.7 12.1 8.3 9.6%C 10.9 20.1 11.6 19.9 13 10.4 7 7.2%C 10.7 19.8 12.7 18.8 12.3 10.9 7.5 7.2%C 13.5 15.6 13.4 16.9 13.7 10.2 6.4 10.3%C 14 16.5 12.8 16.8 14.1 9.4 5.9 10.5 N 6 6 6 6 6 6 6 6
Mean 12.016
67 17.683
33 12.317.266
6713.466
67 10.95 7.2166
67 9.1Strandard Deviation
1.394872
1.858404
0.769415
1.753473
0.688961
1.237336
0.966264
1.507315
Standard Error of the mean
0.623806
0.831104
0.344093
0.784177
0.308113
0.553353
0.432127
0.674092
Lean control Lean 0 Lean 1 Lean 3
Obese conrtol
Obese 0
Obese 1
Obese 3
Relative Expression Level 1
1.471567
1.023578
1.436893
1.120666
0.911234
0.600555
0.757282
Standard error of the mean
0.051912
0.069163
0.028635
0.065257
0.02564
0.046049
0.035961
0.056096
Lean control Lean 0 Lean 1 Lean 3
Obese conrtol
Obese 0
Obese 1
Obese 3
% RE 100 147.15
67102.35
78143.68
93112.06
6691.123
44 60.055
48 75.728
16
SE 5.1911
69 6.9162
582.8634
656.5257
442.5640
434.6048
83 3.5960
6 5.6096
42

-68-
Subsection C (Statistics)
Total p70S6k
t-test Data source: raw data in TA totals p70paper Normality Test: Passed (P > 0.050) Equal Variance Test: Passed (P = 0.438) Group Name N Missing Mean Std Dev SEM p70 lz 6 0 15.133 0.378 0.154 p70 oz 6 0 10.867 0.671 0.274 Difference 4.267 t = 13.568 with 10 degrees of freedom. (P = <0.001) 95 percent confidence interval for difference of means: 3.566 to 4.967 The difference in the mean values of the two groups is greater than would be expected by chance; there is a statistically significant difference between the input groups (P = <0.001). Power of performed test with alpha = 0.050: 1.000
Total mTOR
t-test Data source: raw data in TA totals p70paper Normality Test: Failed (P = 0.045) Test execution ended by user request, Rank Sum Test begun Mann-Whitney Rank Sum Test Data source: raw data in TA totals p70paper Group N Missing Median 25% 75% mTOR lz 6 0 11.000 10.400 12.800
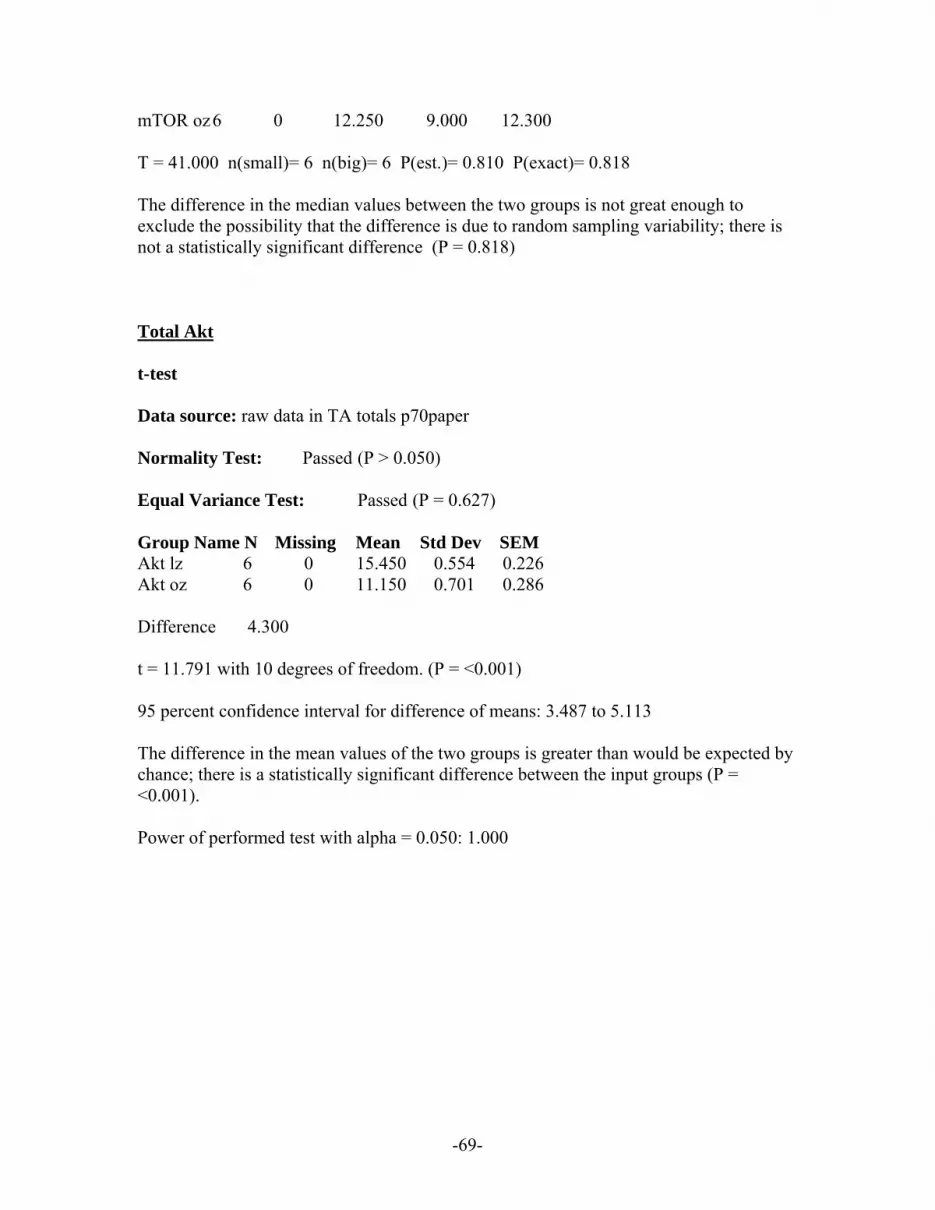
-69-
mTOR oz 6 0 12.250 9.000 12.300 T = 41.000 n(small)= 6 n(big)= 6 P(est.)= 0.810 P(exact)= 0.818 The difference in the median values between the two groups is not great enough to exclude the possibility that the difference is due to random sampling variability; there is not a statistically significant difference (P = 0.818)
Total Akt
t-test Data source: raw data in TA totals p70paper Normality Test: Passed (P > 0.050) Equal Variance Test: Passed (P = 0.627) Group Name N Missing Mean Std Dev SEM Akt lz 6 0 15.450 0.554 0.226 Akt oz 6 0 11.150 0.701 0.286 Difference 4.300 t = 11.791 with 10 degrees of freedom. (P = <0.001) 95 percent confidence interval for difference of means: 3.487 to 5.113 The difference in the mean values of the two groups is greater than would be expected by chance; there is a statistically significant difference between the input groups (P = <0.001). Power of performed test with alpha = 0.050: 1.000

-70-
p-p70S6k Thr389
Two Way Analysis of Variance Data source: raw data TA in p70 pathway Balanced Design Dependent Variable: p p70 389 Normality Test: Failed (P < 0.050) Equal Variance Test: Failed (P < 0.050) Source of Variation DF SS MS F P model 1 41.255 41.255 5.209 0.028 time 3 465.562 155.187 19.595 <0.001 model x time 3 95.996 31.999 4.040 0.013 Residual 40 316.795 7.920 Total 47 919.608 19.566 Main effects cannot be properly interpreted if significant interaction is determined. This is because the size of a factor's effect depends upon the level of the other factor. The effect of different levels of model depends on what level of time is present. There is a statistically significant interaction between model and time. (P = 0.013) Power of performed test with alpha = 0.0500: for model : 0.508 Power of performed test with alpha = 0.0500: for time : 1.000 Power of performed test with alpha = 0.0500: for model x time : 0.669 Least square means for model : Group Mean Obese 11.579 lean 13.433 Std Err of LS Mean = 0.574 Least square means for time : Group Mean control 7.717 zero hr 12.308 one hr 13.700 three hr 16.300 Std Err of LS Mean = 0.812 Least square means for model x time :

-71-
Group Mean Obese x control 8.617 Obese x zero hr 10.483 Obese x one hr 11.000 Obese x three hr 16.217 lean x control 6.817 lean x zero hr 14.133 lean x one hr 16.400 lean x three hr 16.383 Std Err of LS Mean = 1.149 All Pairwise Multiple Comparison Procedures (Student-Newman-Keuls Method) : Comparisons for factor: model Comparison Diff of Means p q P P<0.050 lean vs. Obese 1.854 2 3.228 0.028 Yes Comparisons for factor: time Comparison Diff of Means p q P P<0.050 three hr vs. control 8.583 4 10.565 <0.001 Yes three hr vs. zero hr 3.992 3 4.913 0.004 Yes three hr vs. one hr 2.600 2 3.200 0.029 Yes one hr vs. control 5.983 3 7.365 <0.001 Yes one hr vs. zero hr 1.392 2 1.713 0.233 No zero hr vs. control 4.592 2 5.652 <0.001 Yes Comparisons for factor: time within Obese Comparison Diff of Means p q P P<0.05 three hr vs. control 7.600 4 6.615 <0.001 Yes three hr vs. zero hr 5.733 3 4.990 0.003 Yes three hr vs. one hr 5.217 2 4.541 0.003 Yes one hr vs. control 2.383 3 2.074 0.318 No one hr vs. zero hr 0.517 2 0.450 0.752 Do Not Test zero hr vs. control 1.867 2 1.625 0.258 Do Not Test Comparisons for factor: time within lean Comparison Diff of Means p q P P<0.05 one hr vs. control 9.583 4 8.341 <0.001 Yes one hr vs. zero hr 2.267 3 1.973 0.353 No one hr vs. three hr 0.0167 2 0.0145 0.992 Do Not Test three hr vs. control 9.567 3 8.327 <0.001 Yes three hr vs. zero hr 2.250 2 1.958 0.174 Do Not Test

-72-
zero hr vs. control 7.317 2 6.368 <0.001 Yes Comparisons for factor: model within control Comparison Diff of Means p q P P<0.05 Obese vs. lean 1.800 2 1.567 0.275 No Comparisons for factor: model within zero hr Comparison Diff of Means p q P P<0.05 lean vs. Obese 3.650 2 3.177 0.030 Yes Comparisons for factor: model within one hr Comparison Diff of Means p q P P<0.05 lean vs. Obese 5.400 2 4.700 0.002 Yes Comparisons for factor: model within three hr Comparison Diff of Means p q P P<0.05 lean vs. Obese 0.167 2 0.145 0.919 No A result of "Do Not Test" occurs for a comparison when no significant difference is found between two means that enclose that comparison. For example, if you had four means sorted in order, and found no difference between means 4 vs. 2, then you would not test 4 vs. 3 and 3 vs. 2, but still test 4 vs. 1 and 3 vs. 1 (4 vs. 3 and 3 vs. 2 are enclosed by 4 vs. 2: 4 3 2 1). Note that not testing the enclosed means is a procedural rule, and a result of Do Not Test should be treated as if there is no significant difference between the means, even though one may appear to exist.
p-p70S6k 421/424
Two Way Analysis of Variance Data source: raw data TA in p70 pathway Balanced Design Dependent Variable: p p70421-424 Normality Test: Passed (P = 0.097) Equal Variance Test: Passed (P = 0.220)

-73-
Source of Variation DF SS MS F P model 1 88.021 88.021 23.572 <0.001 time 3 1625.925 541.975 145.143 <0.001 model x time 3 368.351 122.784 32.882 <0.001 Residual 40 149.363 3.734 Total 47 2231.660 47.482 Main effects cannot be properly interpreted if significant interaction is determined. This is because the size of a factor's effect depends upon the level of the other factor. The effect of different levels of model depends on what level of time is present. There is a statistically significant interaction between model and time. (P = <0.001) Power of performed test with alpha = 0.0500: for model : 0.999 Power of performed test with alpha = 0.0500: for time : 1.000 Power of performed test with alpha = 0.0500: for model x time : 1.000 Least square means for model : Group Mean Obese 11.146 lean 13.854 Std Err of LS Mean = 0.394 Least square means for time : Group Mean control 4.533 zero hr 20.550 one hr 14.358 three hr 10.558 Std Err of LS Mean = 0.558 Least square means for model x time : Group Mean Obese x control 4.550 Obese x zero hr 17.950 Obese x one hr 9.250 Obese x three hr 12.833 lean x control 4.517 lean x zero hr 23.150 lean x one hr 19.467 lean x three hr 8.283 Std Err of LS Mean = 0.789 All Pairwise Multiple Comparison Procedures (Student-Newman-Keuls Method) :

-74-
Comparisons for factor: model Comparison Diff of Means p q P P<0.050 lean vs. Obese 2.708 2 6.866 <0.001 Yes Comparisons for factor: time Comparison Diff of Means p q P P<0.050 zero hr vs. control 16.017 4 28.712 <0.001 Yes zero hr vs. three hr 9.992 3 17.912 <0.001 Yes zero hr vs. one hr 6.192 2 11.100 <0.001 Yes one hr vs. control 9.825 3 17.613 <0.001 Yes one hr vs. three hr 3.800 2 6.812 <0.001 Yes three hr vs. control 6.025 2 10.801 <0.001 Yes Comparisons for factor: time within Obese Comparison Diff of Means p q P P<0.05 zero hr vs. control 13.400 4 16.986 <0.001 Yes zero hr vs. one hr 8.700 3 11.028 <0.001 Yes zero hr vs. three hr 5.117 2 6.486 <0.001 Yes three hr vs. control 8.283 3 10.500 <0.001 Yes three hr vs. one hr 3.583 2 4.542 0.003 Yes one hr vs. control 4.700 2 5.958 <0.001 Yes Comparisons for factor: time within lean Comparison Diff of Means p q P P<0.05 zero hr vs. control 18.633 4 23.620 <0.001 Yes zero hr vs. three hr 14.867 3 18.845 <0.001 Yes zero hr vs. one hr 3.683 2 4.669 0.002 Yes one hr vs. control 14.950 3 18.951 <0.001 Yes one hr vs. three hr 11.183 2 14.176 <0.001 Yes three hr vs. control 3.767 2 4.775 0.002 Yes Comparisons for factor: model within control Comparison Diff of Means p q P P<0.05 Obese vs. lean 0.0333 2 0.0423 0.976 No Comparisons for factor: model within zero hr Comparison Diff of Means p q P P<0.05 lean vs. Obese 5.200 2 6.592 <0.001 Yes

-75-
Comparisons for factor: model within one hr Comparison Diff of Means p q P P<0.05 lean vs. Obese 10.217 2 12.951 <0.001 Yes Comparisons for factor: model within three hr Comparison Diff of Means p q P P<0.05 Obese vs. lean 4.550 2 5.768 <0.001 Yes
p-mTOR
Two Way Analysis of Variance Data source: raw data TA in p70 pathway Balanced Design Dependent Variable: p mTOR Normality Test: Passed (P = 0.373) Equal Variance Test: Passed (P = 0.087) Source of Variation DF SS MS F P model 1 235.853 235.853 16.992 <0.001 time 3 303.582 101.194 7.290 <0.001 model x time 3 72.467 24.156 1.740 0.174 Residual 40 555.217 13.880 Total 47 1167.119 24.832 The difference in the mean values among the different levels of model is greater than would be expected by chance after allowing for effects of differences in time. There is a statistically significant difference (P = <0.001). To isolate which group(s) differ from the others use a multiple comparison procedure. The difference in the mean values among the different levels of time is greater than would be expected by chance after allowing for effects of differences in model. There is a statistically significant difference (P = <0.001). To isolate which group(s) differ from the others use a multiple comparison procedure. The effect of different levels of model does not depend on what level of time is present. There is not a statistically significant interaction between model and time. (P = 0.174) Power of performed test with alpha = 0.0500: for model : 0.984

-76-
Power of performed test with alpha = 0.0500: for time : 0.958 Power of performed test with alpha = 0.0500: for model x time : 0.188 Least square means for model : Group Mean Obese 10.288 lean 14.721 Std Err of LS Mean = 0.760 Least square means for time : Group Mean control 9.350 zero hr 16.367 one hr 12.450 three hr 11.850 Std Err of LS Mean = 1.076 Least square means for model x time : Group Mean Obese x control 8.250 Obese x zero hr 12.200 Obese x one hr 10.083 Obese x three hr 10.617 lean x control 10.450 lean x zero hr 20.533 lean x one hr 14.817 lean x three hr 13.083 Std Err of LS Mean = 1.521 All Pairwise Multiple Comparison Procedures (Student-Newman-Keuls Method) : Comparisons for factor: model Comparison Diff of Means p q P P<0.050 lean vs. Obese 4.433 2 5.830 <0.001 Yes Comparisons for factor: time Comparison Diff of Means p q P P<0.050 zero hr vs. control 7.017 4 6.524 <0.001 Yes zero hr vs. three hr 4.517 3 4.200 0.014 Yes zero hr vs. one hr 3.917 2 3.642 0.014 Yes one hr vs. control 3.100 3 2.882 0.116 No one hr vs. three hr 0.600 2 0.558 0.695 Do Not Test three hr vs. control 2.500 2 2.324 0.108 Do Not Test

-77-
Comparisons for factor: time within Obese Comparison Diff of Means p q P P<0.05 zero hr vs. control 3.950 4 2.597 0.272 No zero hr vs. one hr 2.117 3 1.392 0.591 Do Not Test zero hr vs. three hr 1.583 2 1.041 0.466 Do Not Test three hr vs. control 2.367 3 1.556 0.520 Do Not Test three hr vs. one hr 0.533 2 0.351 0.806 Do Not Test one hr vs. control 1.833 2 1.205 0.399 Do Not Test Comparisons for factor: time within lean Comparison Diff of Means p q P P<0.05 zero hr vs. control 10.083 4 6.629 <0.001 Yes zero hr vs. three hr 7.450 3 4.898 0.004 Yes zero hr vs. one hr 5.717 2 3.759 0.011 Yes one hr vs. control 4.367 3 2.871 0.118 No one hr vs. three hr 1.733 2 1.140 0.425 Do Not Test three hr vs. control 2.633 2 1.731 0.228 Do Not Test Comparisons for factor: model within control Comparison Diff of Means p q P P<0.05 lean vs. Obese 2.200 2 1.446 0.313 No Comparisons for factor: model within zero hr Comparison Diff of Means p q P P<0.05 lean vs. Obese 8.333 2 5.479 <0.001 Yes Comparisons for factor: model within one hr Comparison Diff of Means p q P P<0.05 lean vs. Obese 4.733 2 3.112 0.034 Yes Comparisons for factor: model within three hr Comparison Diff of Means p q P P<0.05 lean vs. Obese 2.467 2 1.622 0.258 No A result of "Do Not Test" occurs for a comparison when no significant difference is found between two means that enclose that comparison. For example, if you had four means sorted in order, and found no difference between means 4 vs. 2, then you would not test 4 vs. 3 and 3 vs. 2, but still test 4 vs. 1 and 3 vs. 1 (4 vs. 3 and 3 vs. 2 are enclosed by 4 vs. 2: 4 3 2 1). Note that not testing the enclosed means is a procedural

-78-
rule, and a result of Do Not Test should be treated as if there is no significant difference between the means, even though one may appear to exist. p-Akt 308 Two Way Analysis of Variance Data source: raw data TA in p70 pathway Balanced Design Dependent Variable: p-Akt 308 Normality Test: Passed (P = 0.079) Equal Variance Test: Passed (P = 0.050) Source of Variation DF SS MS F P model 1 322.403 322.403 118.451 <0.001 time 3 251.038 83.679 30.744 <0.001 model x time 3 159.905 53.302 19.583 <0.001 Residual 40 108.873 2.722 Total 47 842.219 17.920 Main effects cannot be properly interpreted if significant interaction is determined. This is because the size of a factor's effect depends upon the level of the other factor. The effect of different levels of model depends on what level of time is present. There is a statistically significant interaction between model and time. (P = <0.001) Power of performed test with alpha = 0.0500: for model : 1.000 Power of performed test with alpha = 0.0500: for time : 1.000 Power of performed test with alpha = 0.0500: for model x time : 1.000 Least square means for model : Group Mean Obese 9.904 lean 15.088 Std Err of LS Mean = 0.337 Least square means for time : Group Mean control 13.575 zero hr 14.125 one hr 8.550

-79-
three hr 13.733 Std Err of LS Mean = 0.476 Least square means for model x time : Group Mean Obese x control 13.217 Obese x zero hr 9.883 Obese x one hr 7.317 Obese x three hr 9.200 lean x control 13.933 lean x zero hr 18.367 lean x one hr 9.783 lean x three hr 18.267 Std Err of LS Mean = 0.674 All Pairwise Multiple Comparison Procedures (Student-Newman-Keuls Method) : Comparisons for factor: model Comparison Diff of Means p q P P<0.050 lean vs. Obese 5.183 2 15.392 <0.001 Yes Comparisons for factor: time Comparison Diff of Means p q P P<0.050 zero hr vs. one hr 5.575 4 11.706 <0.001 Yes zero hr vs. control 0.550 3 1.155 0.695 No zero hr vs. three hr 0.392 2 0.822 0.564 Do Not Test three hr vs. one hr 5.183 3 10.884 <0.001 Yes three hr vs. control 0.158 2 0.332 0.815 Do Not Test control vs. one hr 5.025 2 10.551 <0.001 Yes Comparisons for factor: time within Obese Comparison Diff of Means p q P P<0.05 control vs. one hr 5.900 4 8.760 <0.001 Yes control vs. three hr 4.017 3 5.964 <0.001 Yes control vs. zero hr 3.333 2 4.949 0.001 Yes zero hr vs. one hr 2.567 3 3.811 0.027 Yes zero hr vs. three hr 0.683 2 1.015 0.477 No three hr vs. one hr 1.883 2 2.796 0.055 No Comparisons for factor: time within lean Comparison Diff of Means p q P P<0.05 zero hr vs. one hr 8.583 4 12.744 <0.001 Yes

-80-
zero hr vs. control 4.433 3 6.582 <0.001 Yes zero hr vs. three hr 0.100 2 0.148 0.917 No three hr vs. one hr 8.483 3 12.595 <0.001 Yes three hr vs. control 4.333 2 6.434 <0.001 Yes control vs. one hr 4.150 2 6.162 <0.001 Yes Comparisons for factor: model within control Comparison Diff of Means p q P P<0.05 lean vs. Obese 0.717 2 1.064 0.456 No Comparisons for factor: model within zero hr Comparison Diff of Means p q P P<0.05 lean vs. Obese 8.483 2 12.595 <0.001 Yes Comparisons for factor: model within one hr Comparison Diff of Means p q P P<0.05 lean vs. Obese 2.467 2 3.662 0.013 Yes Comparisons for factor: model within three hr Comparison Diff of Means p q P P<0.05 lean vs. Obese 9.067 2 13.461 <0.001 Yes A result of "Do Not Test" occurs for a comparison when no significant difference is found between two means that enclose that comparison. For example, if you had four means sorted in order, and found no difference between means 4 vs. 2, then you would not test 4 vs. 3 and 3 vs. 2, but still test 4 vs. 1 and 3 vs. 1 (4 vs. 3 and 3 vs. 2 are enclosed by 4 vs. 2: 4 3 2 1). Note that not testing the enclosed means is a procedural rule, and a result of Do Not Test should be treated as if there is no significant difference between the means, even though one may appear to exist.

-81-
p-Akt 473
Two Way Analysis of Variance Data source: raw data TA in p70 pathway Balanced Design Dependent Variable: p akt473 Normality Test: Passed (P = 0.650) Equal Variance Test: Passed (P = 0.580) Source of Variation DF SS MS F P model 1 257.613 257.613 144.348 <0.001 time 3 136.108 45.369 25.422 <0.001 model x time 3 162.312 54.104 30.316 <0.001 Residual 40 71.387 1.785 Total 47 627.420 13.349 Main effects cannot be properly interpreted if significant interaction is determined. This is because the size of a factor's effect depends upon the level of the other factor. The effect of different levels of model depends on what level of time is present. There is a statistically significant interaction between model and time. (P = <0.001) Power of performed test with alpha = 0.0500: for model : 1.000 Power of performed test with alpha = 0.0500: for time : 1.000 Power of performed test with alpha = 0.0500: for model x time : 1.000 Least square means for model : Group Mean Obese 10.183 lean 14.817 Std Err of LS Mean = 0.273 Least square means for time : Group Mean control 12.742 zero hr 14.317 one hr 9.758 three hr 13.183 Std Err of LS Mean = 0.386 Least square means for model x time :

-82-
Group Mean Obese x control 13.467 Obese x zero hr 10.950 Obese x one hr 7.217 Obese x three hr 9.100 lean x control 12.017 lean x zero hr 17.683 lean x one hr 12.300 lean x three hr 17.267 Std Err of LS Mean = 0.545 All Pairwise Multiple Comparison Procedures (Student-Newman-Keuls Method): Comparisons for factor: model Comparison Diff of Means p q P P<0.050 lean vs. Obese 4.633 2 16.991 <0.001 Yes Comparisons for factor: time Comparison Diff of Means p q P P<0.050 zero hr vs. one hr 4.558 4 11.820 <0.001 Yes zero hr vs. control 1.575 3 4.084 0.017 Yes zero hr vs. three hr 1.133 2 2.939 0.044 Yes three hr vs. one hr 3.425 3 8.881 <0.001 Yes three hr vs. control 0.442 2 1.145 0.423 No control vs. one hr 2.983 2 7.736 <0.001 Yes Comparisons for factor: time within Obese Comparison Diff of Means p q P P<0.05 control vs. one hr 6.250 4 11.460 <0.001 Yes control vs. three hr 4.367 3 8.007 <0.001 Yes control vs. zero hr 2.517 2 4.614 0.002 Yes zero hr vs. one hr 3.733 3 6.845 <0.001 Yes zero hr vs. three hr 1.850 2 3.392 0.021 Yes three hr vs. one hr 1.883 2 3.453 0.019 Yes Comparisons for factor: time within lean Comparison Diff of Means p q P P<0.05 zero hr vs. control 5.667 4 10.390 <0.001 Yes zero hr vs. one hr 5.383 3 9.871 <0.001 Yes zero hr vs. three hr 0.417 2 0.764 0.592 No three hr vs. control 5.250 3 9.626 <0.001 Yes three hr vs. one hr 4.967 2 9.107 <0.001 Yes

-83-
one hr vs. control 0.283 2 0.520 0.715 No Comparisons for factor: model within control Comparison Diff of Means p q P P<0.05 Obese vs. lean 1.450 2 2.659 0.068 No Comparisons for factor: model within zero hr Comparison Diff of Means p q P P<0.05 lean vs. Obese 6.733 2 12.346 <0.001 Yes Comparisons for factor: model within one hr Comparison Diff of Means p q P P<0.05 lean vs. Obese 5.083 2 9.321 <0.001 Yes Comparisons for factor: model within three hr Comparison Diff of Means p q P P<0.05 lean vs. Obese 8.167 2 14.974 <0.001 Yes

-84-
Chapter 4
Conclusions
1. Type 2 diabetes was found to significantly alter expression of p70S6k and Akt in the
tibialis anterior muscle.
2. Type 2 diabetes was found to significantly alter the basal phosphorylation of p70S6k
(Thr 389) in the tibialis anterior muscle.
3. Type 2 diabetes was found to significantly alter contraction- induced activation of
Akt/mTOR/p70S6k pathway proteins. These diabetes-associated alterations in
Akt/mTOR/p70S6k pathway regulation may be due, at least in part, to defects in the
ability of diabetic muscle to activate this pathway following a contractile stimulus.
The upstream molecules responsible for these alterations remain to be determined.
Future Directions
Future research based on this study should focus on mechanisms associated with
differences in contraction induced activation of Akt/mTOR/p70S6k pathway in type 2
diabetic skeletal muscle. In the past several years, considerable progress has been made
to elucidate intracellular signaling mechanisms in the regulation of protein synthesis and
skeletal muscle mass in contracting skeletal muscle. It is now apparent that the
Akt/mTOR/p70S6k pathway plays a critical role in the regulation of protein synthesis.
Our data suggest that the magnitude and time course of the contraction-induced
activation of Akt/mTOR/p70S6k pathway proteins are significantly altered with type 2
diabetes. The molecular mechanism(s) responsible for these differences with diabetes are

-85-
largely unknown. Additional studies, perhaps employing strategies designed to directly
inhibit or activate specific signaling proteins of pathway during HFES may prove to be
useful in addressing these possibilities. Further elucidating the molecular mechanisms for
differences in the ability of skeletal muscle to activate Akt/mTOR/p70S6k pathway could
be of clinical importance and may have implications for the improvement of resistance
based programs for the treatment of diabetes mellitus.
Our data suggest that the in situ high-frequency electrical stimulation (HFES)
induced activation of Akt/mTOR/p70S6k pathway proteins is significantly altered in type
2 diabetes. Nader et al., (2001) using different modes of exercise like high-frequency
electrical stimulation, low-frequency electrical stimulation, or running exercise showed
activation of p70S6k pathway in the tibialis anterior and soleus muscles of rat [32].
Experiments comparing normal and diabetic animals with different modes of exercise
and also using different time points can help provide a better understanding of how
diabetes may be associated with differences in how skeletal muscle “sense” and
“respond” to different stimuli.
The results of present study have shown that contraction-induced regulation of
p70S6k signaling may be altered in the skeletal muscles of the obese Zucker (fa/fa) rat
model. Whether similar findings would be observed in other diabetic model or other
types of diabetes (e.g. type I) remains to be determined. In future experiments, it will be
challenging and informative to determine how p70S6k signaling is regulated in other
models.
Koopman et al., (2006) reported that resistance exercise is associated with more
pronounced phosphorylation of p70S6k in type II vs. type I muscle fibers [33]. Similarly,

-86-
in rats, the phosphorylation of upstream regulators of p70S6k like PKB (or Akt) and
mTOR was more pronounced in muscle tissue containing a greater proportion of type II
muscle fibers [34, 35]. Oberbach et al., (2006) have recently found that the slow oxidative
fiber fraction was reduced by 16% with diabetes, and the fast glycolytic fiber fraction
was increased by 49% in vastus lateralis muscles of human subjects with type 2 diabetes
[100]. This variation in fiber fraction should invariably result in differences in oxidative
and glycolytic enzyme content and activity. This could lead to variations in the ratio of
fat and carbohydrate used in muscle during contraction. Taken together, these studies
suggest that regulation of p70S6k pathway proteins may differ between fiber types and it
is possible that fiber type transitions associated with diabetes may be involved. Further
contractile studies using different muscles (the predominantly slow twitch soleus and the
predominantly fast twitch EDL) may give better understanding of altered regulation of
these proteins with diabetes.

-87-
REFERENCES
1. Wild, S., et al., Global prevalence of diabetes: estimates for the year 2000 and projections for 2030. Diabetes Care, 2004. 27(5): p. 1047-53.
2. Broderick, T.L., P. Poirier, and M. Gillis, Exercise training restores abnormal myocardial glucose utilization and cardiac function in diabetes. Diabetes Metab Res Rev, 2005. 21(1): p. 44-50.
3. Farrell, P.A., et al., Hypertrophy of skeletal muscle in diabetic rats in response to chronic resistance exercise. J Appl Physiol, 1999. 87(3): p. 1075-82.
4. Wegner, J.A., et al., Select cardiovascular and metabolic responses of diabetic rats to moderate exercise training. Med Sci Sports Exerc, 1987. 19(5): p. 497-503.
5. Baldi, J.C. and N. Snowling, Resistance training improves glycaemic control in obese type 2 diabetic men. Int J Sports Med, 2003. 24(6): p. 419-23.
6. Eriksson, J.G., Exercise and the treatment of type 2 diabetes mellitus. An update. Sports Med, 1999. 27(6): p. 381-91.
7. Henriksen, E.J., Invited review: Effects of acute exercise and exercise training on insulin resistance. J Appl Physiol, 2002. 93(2): p. 788-96.
8. Holten, M.K., et al., Strength training increases insulin-mediated glucose uptake, GLUT4 content, and insulin signaling in skeletal muscle in patients with type 2 diabetes. Diabetes, 2004. 53(2): p. 294-305.
9. Honkola, A., T. Forsen, and J. Eriksson, Resistance training improves the metabolic profile in individuals with type 2 diabetes. Acta Diabetol, 1997. 34(4): p. 245-8.
10. Juel, C., M.K. Holten, and F. Dela, Effects of strength training on muscle lactate release and MCT1 and MCT4 content in healthy and type 2 diabetic humans. J Physiol, 2004. 556(Pt 1): p. 297-304.
11. Tudor-Locke, C.E., R.C. Bell, and A.M. Meyers, Revisiting the role of physical activity and exercise in the treatment of type 2 diabetes. Can J Appl Physiol, 2000. 25(6): p. 466-92.
12. Willey, K.A. and M.A. Singh, Battling insulin resistance in elderly obese people with type 2 diabetes: bring on the heavy weights. Diabetes Care, 2003. 26(5): p. 1580-8.
13. Bruce, C.R., et al., Disassociation of muscle triglyceride content and insulin sensitivity after exercise training in patients with Type 2 diabetes. Diabetologia, 2004. 47(1): p. 23-30.
14. Cauza, E., et al., The relative benefits of endurance and strength training on the metabolic factors and muscle function of people with type 2 diabetes mellitus. Arch Phys Med Rehabil, 2005. 86(8): p. 1527-33.

-88-
15. Tokmakidis, S.P., et al., The effects of a combined strength and aerobic exercise program on glucose control and insulin action in women with type 2 diabetes. Eur J Appl Physiol, 2004. 92(4-5): p. 437-42.
16. Venojarvi, M., et al., Role of skeletal muscle-fibre type in regulation of glucose metabolism in middle-aged subjects with impaired glucose tolerance during a long-term exercise and dietary intervention. Diabetes Obes Metab, 2005. 7(6): p. 745-54.
17. Laurent, G.J. and D.J. Millward, Protein turnover during skeletal muscle hypertrophy. Fed Proc, 1980. 39(1): p. 42-7.
18. Kimball, S.R., R.L. Horetsky, and L.S. Jefferson, Signal transduction pathways involved in the regulation of protein synthesis by insulin in L6 myoblasts. Am J Physiol, 1998. 274(1 Pt 1): p. C221-8.
19. Shah, O.J., S.R. Kimball, and L.S. Jefferson, Glucocorticoids abate p70(S6k) and eIF4E function in L6 skeletal myoblasts. Am J Physiol Endocrinol Metab, 2000. 279(1): p. E74-82.
20. Pullen, N. and G. Thomas, The modular phosphorylation and activation of p70s6k. FEBS Lett, 1997. 410(1): p. 78-82.
21. Bodine, S.C., et al., Akt/mTOR pathway is a crucial regulator of skeletal muscle hypertrophy and can prevent muscle atrophy in vivo. Nat Cell Biol, 2001. 3(11): p. 1014-9.
22. Baar, K. and K. Esser, Phosphorylation of p70(S6k) correlates with increased skeletal muscle mass following resistance exercise. Am J Physiol, 1999. 276(1 Pt 1): p. C120-7.
23. Hogan, P., T. Dall, and P. Nikolov, Economic costs of diabetes in the US in 2002. Diabetes Care, 2003. 26(3): p. 917-32.
24. Brown, E.J. and S.L. Schreiber, A signaling pathway to translational control. Cell, 1996. 86(4): p. 517-20.
25. Chang, P.Y., et al., Insulin stimulation of mitogen-activated protein kinase, p90rsk, and p70 S6 kinase in skeletal muscle of normal and insulin-resistant mice. Implications for the regulation of glycogen synthase. J Biol Chem, 1995. 270(50): p. 29928-35.
26. Dennis, P.B., et al., The principal rapamycin-sensitive p70(s6k) phosphorylation sites, T-229 and T-389, are differentially regulated by rapamycin-insensitive kinase kinases. Mol Cell Biol, 1996. 16(11): p. 6242-51.
27. Weng, Q.P., et al., Multiple independent inputs are required for activation of the p70 S6 kinase. Mol Cell Biol, 1995. 15(5): p. 2333-40.
28. Pearson, R.B., et al., The principal target of rapamycin-induced p70s6k inactivation is a novel phosphorylation site within a conserved hydrophobic domain. Embo J, 1995. 14(21): p. 5279-87.
29. Ferrari, S., et al., Activation of p70s6k is associated with phosphorylation of four clustered sites displaying Ser/Thr-Pro motifs. Proc Natl Acad Sci U S A, 1992. 89(15): p. 7282-6.
30. Pause, A., et al., Insulin-dependent stimulation of protein synthesis by phosphorylation of a regulator of 5'-cap function. Nature, 1994. 371(6500): p. 762-7.

-89-
31. Hernandez, J.M., M.J. Fedele, and P.A. Farrell, Time course evaluation of protein synthesis and glucose uptake after acute resistance exercise in rats. J Appl Physiol, 2000. 88(3): p. 1142-9.
32. Nader, G.A. and K.A. Esser, Intracellular signaling specificity in skeletal muscle in response to different modes of exercise. J Appl Physiol, 2001. 90(5): p. 1936-42.
33. Koopman, R., et al., Increase in S6K1 phosphorylation in human skeletal muscle following resistance exercise occurs mainly in type II muscle fibers. Am J Physiol Endocrinol Metab, 2006. 290(6): p. E1245-52.
34. Parkington, J.D., et al., Contraction-mediated mTOR, p70S6k, and ERK1/2 phosphorylation in aged skeletal muscle. J Appl Physiol, 2004. 97(1): p. 243-8.
35. Sakamoto, K., et al., Akt signaling in skeletal muscle: regulation by exercise and passive stretch. Am J Physiol Endocrinol Metab, 2003. 285(5): p. E1081-8.
36. Gingras, A.C., B. Raught, and N. Sonenberg, Regulation of translation initiation by FRAP/mTOR. Genes Dev, 2001. 15(7): p. 807-26.
37. Reynolds, T.H.t., S.C. Bodine, and J.C. Lawrence, Jr., Control of Ser2448 phosphorylation in the mammalian target of rapamycin by insulin and skeletal muscle load. J Biol Chem, 2002. 277(20): p. 17657-62.
38. Scott, P.H. and J.C. Lawrence, Jr., Attenuation of mammalian target of rapamycin activity by increased cAMP in 3T3-L1 adipocytes. J Biol Chem, 1998. 273(51): p. 34496-501.
39. Sekulic, A., et al., A direct linkage between the phosphoinositide 3-kinase-AKT signaling pathway and the mammalian target of rapamycin in mitogen-stimulated and transformed cells. Cancer Res, 2000. 60(13): p. 3504-13.
40. Bolster, D.R., et al., Immediate response of mammalian target of rapamycin (mTOR)-mediated signalling following acute resistance exercise in rat skeletal muscle. J Physiol, 2003. 553(Pt 1): p. 213-20.
41. Alessi, D.R., et al., Mechanism of activation of protein kinase B by insulin and IGF-1. Embo J, 1996. 15(23): p. 6541-51.
42. Guo, S., et al., Phosphorylation of serine 256 by protein kinase B disrupts transactivation by FKHR and mediates effects of insulin on insulin-like growth factor-binding protein-1 promoter activity through a conserved insulin response sequence. J Biol Chem, 1999. 274(24): p. 17184-92.
43. Proud, C.G. and R.M. Denton, Molecular mechanisms for the control of translation by insulin. Biochem J, 1997. 328 (Pt 2): p. 329-41.
44. Chen, W.S., et al., Growth retardation and increased apoptosis in mice with homozygous disruption of the Akt1 gene. Genes Dev, 2001. 15(17): p. 2203-8.
45. Walker, K.S., et al., Activation of protein kinase B beta and gamma isoforms by insulin in vivo and by 3-phosphoinositide-dependent protein kinase-1 in vitro: comparison with protein kinase B alpha. Biochem J, 1998. 331 (Pt 1): p. 299-308.
46. Williams, M.R., et al., The role of 3-phosphoinositide-dependent protein kinase 1 in activating AGC kinases defined in embryonic stem cells. Curr Biol, 2000. 10(8): p. 439-48.
47. Sakaue, H., et al., Phosphoinositide 3-kinase is required for insulin-induced but not for growth hormone- or hyperosmolarity-induced glucose uptake in 3T3-L1 adipocytes. Mol Endocrinol, 1997. 11(10): p. 1552-62.

-90-
48. Sable, C.L., et al., cAMP stimulates protein kinase B in a Wortmannin-insensitive manner. FEBS Lett, 1997. 409(2): p. 253-7.
49. Yano, S., H. Tokumitsu, and T.R. Soderling, Calcium promotes cell survival through CaM-K kinase activation of the protein-kinase-B pathway. Nature, 1998. 396(6711): p. 584-7.
50. Cho, H., et al., Akt1/PKBalpha is required for normal growth but dispensable for maintenance of glucose homeostasis in mice. J Biol Chem, 2001. 276(42): p. 38349-52.
51. Cho, H., et al., Insulin resistance and a diabetes mellitus-like syndrome in mice lacking the protein kinase Akt2 (PKB beta). Science, 2001. 292(5522): p. 1728-31.
52. Lund, S., et al., Evidence against protein kinase B as a mediator of contraction-induced glucose transport and GLUT4 translocation in rat skeletal muscle. FEBS Lett, 1998. 425(3): p. 472-4.
53. Sherwood, D.J., et al., Differential regulation of MAP kinase, p70(S6K), and Akt by contraction and insulin in rat skeletal muscle. Am J Physiol, 1999. 276(5 Pt 1): p. E870-8.
54. Widegren, U., et al., Divergent effects of exercise on metabolic and mitogenic signaling pathways in human skeletal muscle. Faseb J, 1998. 12(13): p. 1379-89.
55. Turinsky, J. and A. Damrau-Abney, Akt kinases and 2-deoxyglucose uptake in rat skeletal muscles in vivo: study with insulin and exercise. Am J Physiol, 1999. 276(1 Pt 2): p. R277-82.
56. Berdanier, C.D., Diet, autoimmunity, and insulin-dependent diabetes mellitus: a controversy. Proc Soc Exp Biol Med, 1995. 209(3): p. 223-30.
57. Diamond, J., The double puzzle of diabetes. Nature, 2003. 423(6940): p. 599-602. 58. Zimmet, P., et al., The metabolic syndrome: a global public health problem and a
new definition. J Atheroscler Thromb, 2005. 12(6): p. 295-300. 59. Rees, D.A. and J.C. Alcolado, Animal models of diabetes mellitus. Diabet Med,
2005. 22(4): p. 359-70. 60. Dinneen, S., J. Gerich, and R. Rizza, Carbohydrate metabolism in non-insulin-
dependent diabetes mellitus. N Engl J Med, 1992. 327(10): p. 707-13. 61. Kahn, B.B., Type 2 diabetes: when insulin secretion fails to compensate for
insulin resistance. Cell, 1998. 92(5): p. 593-6. 62. Etgen, G.J., Jr., et al., Glucose transport and cell surface GLUT-4 protein in
skeletal muscle of the obese Zucker rat. Am J Physiol, 1996. 271(2 Pt 1): p. E294-301.
63. King, P.A., et al., Insulin resistance in obese Zucker rat (fa/fa) skeletal muscle is associated with a failure of glucose transporter translocation. J Clin Invest, 1992. 90(4): p. 1568-75.
64. Crettaz, M., et al., Insulin resistance in soleus muscle from obese Zucker rats. Involvement of several defective sites. Biochem J, 1980. 186(2): p. 525-34.
65. Henriksen, E.J. and S. Jacob, Effects of captopril on glucose transport activity in skeletal muscle of obese Zucker rats. Metabolism, 1995. 44(2): p. 267-72.
66. Friedman, J.E., et al., Exercise training increases glucose transporter protein GLUT-4 in skeletal muscle of obese Zucker (fa/fa) rats. FEBS Lett, 1990. 268(1): p. 13-6.

-91-
67. Jacob, S., et al., The antioxidant alpha-lipoic acid enhances insulin-stimulated glucose metabolism in insulin-resistant rat skeletal muscle. Diabetes, 1996. 45(8): p. 1024-9.
68. Ardevol, A., et al., Lactate-bicarbonate interrelationship during exercise and recovery in lean and obese Zucker rats. Int J Obes Relat Metab Disord, 1997. 21(5): p. 333-9.
69. Ardevol, A., et al., Carbohydrate handling in exercising muscle of obese Zucker rats. Int J Obes Relat Metab Disord, 1997. 21(3): p. 239-49.
70. Cortez, M.Y., et al., Insulin resistance of obese Zucker rats exercise trained at two different intensities. Am J Physiol, 1991. 261(5 Pt 1): p. E613-9.
71. Ivy, J.L., et al., Skeletal muscle glucose transport in obese Zucker rats after exercise training. J Appl Physiol, 1989. 66(6): p. 2635-41.
72. Brozinick, J.T., Jr., et al., Effects of exercise training on muscle GLUT-4 protein content and translocation in obese Zucker rats. Am J Physiol, 1993. 265(3 Pt 1): p. E419-27.
73. Christ, C.Y., et al., Exercise training improves muscle insulin resistance but not insulin receptor signaling in obese Zucker rats. J Appl Physiol, 2002. 92(2): p. 736-44.
74. Treadway, J.L., et al., Effect of exercise on insulin receptor binding and kinase activity in skeletal muscle. Am J Physiol, 1989. 256(1 Pt 1): p. E138-44.
75. Stickland, N.C., et al., Inability of muscles in the obese mouse (ob/ob) to respond to changes in body weight and activity. J Anat, 1994. 184 (Pt 3): p. 527-33.
76. Bassel-Duby, R. and E.N. Olson, Signaling pathways in skeletal muscle remodeling. Annu Rev Biochem, 2006. 75: p. 19-37.
77. Parkington, J.D., et al., Differential activation of mTOR signaling by contractile activity in skeletal muscle. Am J Physiol Regul Integr Comp Physiol, 2003. 285(5): p. R1086-90.
78. Geiger, P.C., et al., Activation of p38 MAP kinase enhances sensitivity of muscle glucose transport to insulin. Am J Physiol Endocrinol Metab, 2005. 288(4): p. E782-8.
79. Martineau, L.C. and P.F. Gardiner, Insight into skeletal muscle mechanotransduction: MAPK activation is quantitatively related to tension. J Appl Physiol, 2001. 91(2): p. 693-702.
80. Somwar, R., et al., Activation of p38 mitogen-activated protein kinase alpha and beta by insulin and contraction in rat skeletal muscle: potential role in the stimulation of glucose transport. Diabetes, 2000. 49(11): p. 1794-800.
81. Wretman, C., et al., Effects of concentric and eccentric contractions on phosphorylation of MAPK(erk1/2) and MAPK(p38) in isolated rat skeletal muscle. J Physiol, 2001. 535(Pt 1): p. 155-64.
82. Mylabathula, D.B., et al., Age-associated changes in MAPK activation in fast- and slow-twitch skeletal muscle of the F344/NNiaHSD X Brown Norway/BiNia rat model. Exp Gerontol, 2006. 41(2): p. 205-14.
83. Ionescu, E., J.F. Sauter, and B. Jeanrenaud, Abnormal oral glucose tolerance in genetically obese (fa/fa) rats. Am J Physiol, 1985. 248(5 Pt 1): p. E500-6.
84. Pearson, R.B. and G. Thomas, Regulation of p70s6k/p85s6k and its role in the cell cycle. Prog Cell Cycle Res, 1995. 1: p. 21-32.

-92-
85. Dufner, A. and G. Thomas, Ribosomal S6 kinase signaling and the control of translation. Exp Cell Res, 1999. 253(1): p. 100-9.
86. Jefferies, H.B., et al., Rapamycin suppresses 5'TOP mRNA translation through inhibition of p70s6k. Embo J, 1997. 16(12): p. 3693-704.
87. Coutant, A., et al., PI3K-FRAP/mTOR pathway is critical for hepatocyte proliferation whereas MEK/ERK supports both proliferation and survival. Hepatology, 2002. 36(5): p. 1079-88.
88. Mourani, P.M., et al., Unique, highly proliferative growth phenotype expressed by embryonic and neointimal smooth muscle cells is driven by constitutive Akt, mTOR, and p70S6K signaling and is actively repressed by PTEN. Circulation, 2004. 109(10): p. 1299-306.
89. Wu, X., et al., Insulin promotes rat retinal neuronal cell survival in a p70S6K-dependent manner. J Biol Chem, 2004. 279(10): p. 9167-75.
90. Hei, Y.J., et al., Skeletal muscle mitogen-activated protein kinases and ribosomal S6 kinases. Suppression in chronic diabetic rats and reversal by vanadium. Diabetes, 1995. 44(10): p. 1147-55.
91. Fluckey, J.D., et al., Insulin stimulation of muscle protein synthesis in obese Zucker rats is not via a rapamycin-sensitive pathway. Am J Physiol Endocrinol Metab, 2000. 279(1): p. E182-7.
92. Markuns, J.F., et al., Effects of streptozocin-induced diabetes and islet cell transplantation on insulin signaling in rat skeletal muscle. Endocrinology, 1999. 140(1): p. 106-11.
93. Vanhaesebroeck, B. and D.R. Alessi, The PI3K-PDK1 connection: more than just a road to PKB. Biochem J, 2000. 346 Pt 3: p. 561-76.
94. Sakamoto, K., et al., Contraction regulation of Akt in rat skeletal muscle. J Biol Chem, 2002. 277(14): p. 11910-7.
95. Shaw, M., P. Cohen, and D.R. Alessi, The activation of protein kinase B by H2O2 or heat shock is mediated by phosphoinositide 3-kinase and not by mitogen-activated protein kinase-activated protein kinase-2. Biochem J, 1998. 336 (Pt 1): p. 241-6.
96. Gosmanov, A.R., et al., Impaired expression and insulin-stimulated phosphorylation of Akt-2 in muscle of obese patients with atypical diabetes. Am J Physiol Endocrinol Metab, 2004. 287(1): p. E8-E15.
97. Oku, A., et al., Inhibitory effect of hyperglycemia on insulin-induced Akt/protein kinase B activation in skeletal muscle. Am J Physiol Endocrinol Metab, 2001. 280(5): p. E816-24.
98. Melian, E., et al., Tissue-specific response of IGF-I mRNA expression to obesity-associated GH decline in the male Zucker fatty rat. J Endocrinol, 1999. 160(1): p. 49-56.
99. Valerio, A., et al., TNF-alpha downregulates eNOS expression and mitochondrial biogenesis in fat and muscle of obese rodents. J Clin Invest, 2006. 116(10): p. 2791-8.
100. Oberbach, A., et al., Altered fiber distribution and fiber-specific glycolytic and oxidative enzyme activity in skeletal muscle of patients with type 2 diabetes. Diabetes Care, 2006. 29(4): p. 895-900.

-93-
Curriculum Vitae
Anjaiah Katta
work: Biotech Building 217, [email protected] College of Science, Work: (304)696-3267 1 John Marshall Drive, cell: (251)786-3806 Huntington, WV 25755
Home: 3363, RT 60 E, #B 6, Huntington, WV 25705
EDUCATION: M.S. in Biology: College of Science, Marshall University, Huntington, WV (Graduating, Aug- 2007).
Concentrations: Molecular Biology, Physiology Thesis title: Lean and Obese Zucker Rats Exhibit Different Patterns of p70S6kinase Regulation in the Tibialis Anterior Muscle in Response to High Force Muscle Contraction Advisor: Dr. Eric R. Blough M.V.Sc in Clinical Veterinary Medicine: College of Veterinary Science, Acharya N. G. Ranga Agricultural University, Tirupati, A.P, India. B.V.Sc & A.H (Bachelor of Veterinary Science and Animal Husbandry, Equivalent of D.V.M): College of Veterinary Science, Acharya N. G. Ranga Agricultural University, Tirupati, A.P, India.
PROFESSIONAL EXPERIENCE: Research Assistant: From Jan 2002 to Nov- 2003. In laboratory of veterinary clinical Medicine, college of veterinary sciences, Tirupathi. Veterinary Assistant Surgeon: From Nov 2003 to Aug 2005. Animal Husbandry Department, Government of A. P, India. Research Assistant: Spring 2006 to till now. Dr. Eric Blough, in Laboratory of Molecular Physiology, COS, Marshall University.
PUBLICATIONS:
- Effects of Diabetes on pressure induced MAPKs signaling in the inferior vena cava of diabetic and non-diabetic Zucker Rats; K. M. Rice1,D.H.Desai2,Sunil K.Kakarla1 , Anjaiah Katta1 and E. R. Blough1,2 ; 1 Department of Biological Sciences, Marshall University, 2 Department of

-94-
Physiology, Marshall University, Joan C. Edwards School of Medicine; Cardiovascular Diabetology August 2006.
- Aging influences multiple indices of oxidative stress in the heart of the Fischer 344/NNia x Brown Norway/BiNia rat. Shinichi Asano1, Kevin M. Rice1, Sunil K. Karkarla1, Anjaiah Katta1 and Eric R Blough1,2: 1Department of Biological Sciences, Marshall University, 2 Department of Physiology, Marshall University, Joan C. Edwards School of Medicine. Redox report Vol4 issue 12 2007
SUBMITTED:
- High force contraction-induced mitogen activated protein kinase (MAPK) signaling in the rat skeletal muscle is altered in diabetes. Anjaiah Katta1, Sunil K. Kakarla1, and 1,2Eric R Blough: 1 Department of Biological Sciences, Marshall University, 2 Department of Physiology, Marshall University, Joan C. Edwards School of Medicine (In review).
- Lean and obese Zucker rats exhibit different patterns of p70S6kinaser
Regulation in the Tibialis Anterior muscle in response to high force muscle contraction. Anjaiah Katta1, Sunil K. Kakarla1, and 1,2Eric R Blough: 1 Department of Biological Sciences, Marshall University, 2 Department of Physiology, Marshall University, Joan C. Edwards School of Medicine (In review).
IN PREPARATION: - Altered dystrophin-glycoprotein complex composition in the aging rat heart. Sunil K. Karkarla1, Anjaiah Katta1 ,Kevin M. Rice1, Devashich H. Desai2, and Eric R Blough1,2: Department of Biological Sciences, Marshall University, 2 Department of Physiology, Marshall University, Joan C. Edwards School of Medicine (In preparation) - Aging alters the NFκ-B signaling in F1 skeletal muscle; K. M. Rice1, Sunil K.Kakarla1 ,Anjaiah Katta1,and E. R. Blough1,2 ; 1 Department of Biological Sciences, Marshall University, 2 Department of Physiology, Marshall University, Joan C. Edwards School of Medicine (In preparation) - Sheer stress induces MAPK and p70s6k signaling in A7r5 smooth muscle cells; K. M. Rice1 , Sunil K.Kakarla1, Anjaiah Katta1 and E. R. Blough1,2 ; 1 Department of Biological Sciences, Marshall University, 2 Department of Physiology, Marshall University, Joan C. Edwards School of Medicine (In preparation) - Diabetes alters the DGC complex and ROS in Cardiac Muscle; K. M. Rice1 , Anjaiah Katta1, Sunil K.Kakarla1 and E. R. Blough1,2 ; 1 Department of Biological Sciences, Marshall University, 2 Department of Physiology, Marshall University, Joan C. Edwards School of Medicine (In preparation)

-95-
PAPERS PRESENTED AT CONFERENCES: Pressure –induced regulation of mitogen activated protein kinases in the rat inferior vena cave. Devashish H. Desai, Kevin M. Rice, Sunil K. Karkarla, Anjaiah Katta, Deborah L. Preston, Ernest M. Walker Jr., Paulette S. Wehner, and Eric R Blough: Presented at the ACSM Conference on Integrative Physiology of Exercise: Discovery and Application of Cardiovascular-Pulmonary and Metabolic Science, Indianapolis, IN, 2006 High force contraction-induced mitogen activated protein kinase (MAPK) signaling in the rat skeletal muscle is altered in diabetes. Anjaiah Katta, Kevin M. Rice, Deborah L. Preston, Sunil K. Kakarla, Elli Yokochi, J. Brandon Armstrong, and Eric R Blough: Presented at the ACSM Conference on Integrative Physiology of Exercise: Discovery and Application of Cardiovascular-Pulmonary and Metabolic Science, Indianapolis, IN, 2006 HSPs are altered with age associated increase in oxidative strew in the heart of the Fischer 344/Nnia X Brown Norway/Binia rat. Shinichi Asano, Kevin M. Rice, Sunil K. Karkarla, Anjaiah Katta, Paulette S. Wehner, Ernest M. Walker Jr., and Eric R Blough: Presented at the ACSM Conference on Integrative Physiology of Exercise: Discovery and Application of Cardiovascular-Pulmonary and Metabolic Science, Indianapolis, IN, 2006
PROFESSIONAL MEMBERSHIPS: Member of Indian Veterinary Council Eligibility to practice veterinary medicine in India. Member of Andhra Pradesh Veterinary Association License to practice veterinary medicine in the state of Andhra Pradesh, India.
American College of Sport Medicine (ACSM)
RESEARCH SKILLS: • Protein Identification by MALDI- TOF Mass Spectrometry. • Identification of Post-translational modification of proteins. • Protein and peptide characterization by LC-TOF. • Immunohistochemistry. • Flourescent and Confocal Microscopy. • Different staining procedures. • Protein expression and purification. • Immunoblotting, Immunoprecipitation and Westerns. • High Performance Liquid Chromatography. • DNA and Protein gel electrophoresis. • Operation of laser-based scanners and imaging equipment. • Cell and tissue culture.

-96-
• Robotic sample preparation for proteomics. • Handling of Laboratory animals and small animal surgery.
REFERENCES:
Dr. Eric R. Blough, Assosciate Professor
Department of Biology Director, Laboratory of Molecular physiology Marshall University, Huntington, WV (304)696-3267 Dr. Charles Somerville, Professor Department of Biology Marshall University, Huntington, WV (304)696-2424 Dr. David Mallory, Professor Department of Biology Marshall University, Huntington, WV (304)696-2353


