Embed Size (px)
Citation preview

LEISURE TRIPS OF SENIOR CITIZENS:DETERMINANTS OF MODAL CHOICE
TIM SCHWANEN,* MARTIN DIJST** & FRANS M. DIELEMAN***
Urban Research Centre Utrecht (URU), and members of the Netherlands Graduate School of Housingand Urban Research (NETHUR), Faculty of Geographical Sciences, Utrecht University, PO Box 80.115,3508 TC Utrecht, The Netherlands.E-mails: *[email protected], **[email protected], ***[email protected]
Received: February 2000; revised September 2000
ABSTRACTThe use of the passenger car is a major cause of environmental degradation and increasingcongestion on traffic arteries. Policy-makers therefore seek ways to curtail this form of privatetransport. Scientific research can help them attain this goal by identifying factors that influencetravel behaviour. This paper examines the mobility of senior citizens with respect to variousleisure activities, an area that has remained under-exposed. The analysis shows that older peopleprefer to take the car for trips in their leisure time. If they own a vehicle, they tend to use itfrequently, irrespective of where they live. Characteristics of the residential environment mainlyinfluence the modal choice of seniors who do not have a car of their own. Public transport isprimarily used as a substitute for walking and cycling; public transport does not offer seniors areal alternative to the car.
Key words: Senior citizens, modal split, leisure activities, residential environment, multinomiallogistic regression, the Netherlands
INTRODUCTION
Since the mid 1980s, policy-makers havestepped up efforts to discourage the use ofthe passenger car. Their intervention is aresponse to ongoing environmental degrada-tion, growing traffic congestion, and increas-ing social pressure (Hart 1992). Since then,more and more research has been focused onways to influence people’s travel behaviour.
To date, mobility studies have largelyignored the travel patterns of senior citizens.This oversight is unfortunate; at present,Europe has over 100 m elderly people. Thesheer size of this population, which willincrease further in the future, means thattheir travel behaviour will have a strongimpact on the overall pattern of mobility.But there are two other reasons to study themodal choice of the senior population.
The first is that at least half of the elderlypopulation in Europe has no access to aprivate car (EC 1996). Burkhardt et al. (1999a)expect a major increase in the use of the caramong senior men and women in the USA; ofcourse, driving is much more common amongolder people in the USA than in Europe. Itis important to recognise that driving will notbe an option for every senior in the future.Low-income households cannot afford a car,and poor health may force elderly persons togive up driving. In Europe, public transportis expected to serve an important functionfor elderly people (EC 1996, 1999). Still, theexpectation seems to be warranted that theuse of the private car will increase amongsenior citizens.
A second reason to analyse the mobility be-haviour of the elderly is that the meaning ofcapability and coupling constraints (Hagerstrand
Tijdschrift voor Economische en Sociale Geografie – 2001, Vol. 92, No. 3, pp. 347–360.# 2001 by the Royal Dutch Geographical Society KNAGPublished by Blackwell Publishers, 108 Cowley Road, Oxford OX4 1JF, UK and 350 Main Street, Malden MA 02148, USA

1970) change as people get older. The majorityof seniors no longer commute to work. Theirtrips are mostly for leisure activities; these aremuch more diffuse in time and space thancommuting or shopping trips. Unfortunately,the international literature devotes little atten-tion to the mobility behaviour for leisureactivities among senior citizens. The questionis, how is this mobility structured for seniors indiverse residential environments? And to whatextent do people prefer walking, cycling, orpublic transport for leisure trips when theyretire, as they become older, or if they live inan urban environment?
This paper focuses on how the seniorpopulation of the Netherlands uses variousmeans of transport in their leisure time. Theoutcomes are largely based on a study con-ducted by Schwanen (1999). The choice oftravel mode is linked to three sets of factors:
1. Personal characteristics, such as edu-cational attainment, age, and householdcomposition.
2. Car ownership.3. Characteristics of the residential environ-
ment.
The current international literature revealsa growing interest in this last topic, namelythe link between travel behaviour and urbanform. The aim of this paper is to extend theresearch on the relationship between urbanform and mobility to cover the leisure-relatedtravel behaviour of the senior population.To flesh out this relationship, it is necessaryto include the personal characteristics ofthe seniors as well as their differential accessto private cars. The source of data for theNetherlands on which this paper is basedoffers this option.
THE LITERATURE
People’s participation in daily activities isconstrained in time and space. However,people differ in the nature and degree ofthe constraints they encounter. For example,compared to younger people, senior citizensexperience both less and more constraintsthat influence their travel opportunities andthereby affect their modal choice (Figure 1).
Coupling constraints (Hagerstrand 1970) willhave less impact on seniors. Most of them areretired or work only part time. As a conse-
Figure 1. Potential changes in the capabilities and constraints of seniors and travel behaviour.
Labour
Income
Health
Periods of
free time
Transport
modes
Leisure
activities
Modal
choice
Determinants Opportunities Behaviour
TIM SCHWANEN, MARTIN DIJST & FRANS M. DIELEMAN348
# 2001 by the Royal Dutch Geographical Society KNAG

quence, the workplace is no longer – or onlyto some extent – a peg around which theordering of other activities is arranged andshuffled. Instead of many brief periods ofspare time, seniors have fewer but longerperiods of time to spend on leisure activitiesfurther away from home (Dijst 1995). Thesechanges in the time-space constraints ofseniors may show up in their specific modalchoices.
On the other hand, getting older canincrease the impact of capability constraints(Hagerstrand 1970). The physical and psycho-logical condition of the individual is im-portant in this respect. Empirical research(Mollenkopf & Flaschentrager 1997; Ruopila& Suutama 1997) shows that the number oftrips is negatively correlated with the state ofhealth of seniors. Health problems can alsodecrease a person’s ability to walk, bike, ordrive a car ( Jette & Branch 1992; Leinbachet al. 1994).
The ability of people to travel may also beconstrained by a drop in income after retire-ment. Instead of their accustomed salary,seniors receive a lower pension, which maydiscourage them from maintaining a car ordriving (Gardiner & Hill 1996; Leinbach et al.1994). Thus, although it is likely that carownership will rise in the future (Burkhardtet al. 1999a), driving will not necessarily be anoption for every senior. What other transportmodes are available for this car-free category?
As Burkhardt et al. (1999b) point out, elderlypeople who do not drive or no longer havea car of their own prefer to be driven byrelatives, friends or neighbours. Althoughconvenient, this arrangement has some dis-advantages: it makes seniors dependent uponothers; it calls for considerable pre-trip plan-ning, and it obliges them to offer somethingin return. In other words, this arrangementwill increase seniors’ coupling constraints.
As second choice, seniors prefer walking,especially to make use of daily services(Marcellini et al. 1997). Public transport iscertainly not popular, especially not amongprevious car owners (Burkhardt et al. 1999a;Carp 1988; Traenkle et al. 1993). They do notlike its inherent inconvenience, they do notfeel safe, and they object to the sporadicservice at many locations and at some times of
the day and the week. For many, the distancefrom home to the nearest stop is too long towalk; this is certainly true for those who arephysically impaired. Some of the major draw-backs to public transport are the physicalobstacles of getting onto buses or trains andhaving to stand in moving vehicles when thereare not enough seats.
Paratransit services have been developed assupplementary modes of transport, especiallyfor the elderly and the handicapped. Thesefacilities are not very popular, however. Notonly do they require prior reservation but theyare not always available. Moreover, somepeople feel that there is a stigma attached totaking these rides. Coughlin and Lacombe(1997) draw attention to the limited spatialavailability of paratransit services in the USA.The networks are often radial, and many sub-urban areas are not covered. These authorsalso mention the problem of trying to run theservice on a limited budget; such facilitiesassign leisure trips lower priority than travelfor other purposes (Coughlin & Lacombe1997). Therefore, paratransit services prove tobe of limited significance in the analysespresented below.
Travel opportunities and travel choices arenot only dependent on the available transportmodes. They are also dependent on theopportunities in various residential environ-ments. The international literature on themobility of senior citizens hardly mentionsdifferences in the modal split among residen-tial environments. At best, any reference tothis topic is limited to the observation thatprivate vehicles are used more widely in ruralareas than in urban areas (Chu 1994; Traenkleet al. 1993). Rosenbloom (1995) compares themodal split of seniors in central cities and insuburbs of US metropolitan areas. She showsthat suburban residents use the private carmore often than urban residents of the sameage cohort. But elderly people living in thesuburbs also walk to their destinations rela-tively often. Dutch research in the metropoli-tan area of Amsterdam has shown that seniorswho no longer work and live in the city centretend to walk more often than their counter-parts who live at the edge of the city or in oneof the growth centres. Yet, seniors living in thecentre of Amsterdam make relatively long
LEISURE TRIPS OF SENIOR CITIZENS: DETERMINANTS OF MODAL CHOICE 349
# 2001 by the Royal Dutch Geographical Society KNAG

trips by car or public transport for their leisureactivities outside the city (Vijgen & VanEngelsdorp Gastelaars 1992).
THE RESEARCH DESIGN
Given the expected rise in car ownershipamong seniors and the uneven distribution ofcars among seniors in the future, this paperexamines the differences in leisure trips andmodal choice between seniors with and with-out a private car living in specific residentialenvironments. The data is taken from theDutch National Travel Survey (in Dutch:Onderzoek VerplaatsingsGedrag OVG), whichgoes back to 1978. Since 1995, each monthmore than 7,000 households in the Nether-lands have been included in the survey.All members of these households are askedto complete a trip diary for an entire day.Every year, over 150,000 individuals (includingchildren) participate in this survey (CBS1996a). The analyses reported in this paperare based on the OVG for 1996. From thatsource, we selected 28,419 seniors, defined aspeople aged 50 or over living independently,either alone or in a two-person household.The relevant personal characteristics of theseindividuals were established on an individualbasis and used accordingly in the analysis. Carownership was measured at the householdlevel. To make distinctions in car accessibilityamong seniors within households, having acurrent driver’s licence was used in the multi-variate analysis in addition to household carownership.
Leisure trips were defined as travel for anyof the following activities: social visits, includ-ing overnight stays; recreation or participationin sports; touring or walking; and recreationalshopping (that is, trips to retail stores furtherthan 3 km away from the residence).
The effect that the characteristics of theirresidential environment had on seniors’ travelbehaviour was analysed at the level of themunicipality where they were living. The OVGprovides no information at the intra-municipallevel. Yet, we are aware of the existence ofdifferences in residential environments withinmunicipalities. For example, city centres andsuburbs can be distinguished within the threebiggest cities. Despite this intra-municipal
heterogeneity, the large differences foundbetween the municipalities make the resultsof our analysis significant.
Before municipalities were classified, adistinction was made between the RandstadHolland and the rest of the Netherlands. TheRandstad is the most intensely urbanised partof the country. Public transport facilities inthe Randstad Holland are much better thanin other parts of the Netherlands (Van denHeuvel 1997), while nature areas are relativelyscarce ( Jokovi & Schone 1998). We definedthe Randstad Holland as the provinces ofNorth Holland, South Holland and Utrechtand the municipality of Almere (compareFigure 2).
The classification of residential environ-ments is based on a typology of Dutchmunicipalities designed by the Directorate-General of Housing, which resorts under theMinistry of Housing, Spatial Planning andthe Environment (VROM). This typology wasslightly modified for our investigation.1 Withinthe Randstad, four residential environmentsare distinguished (Figure 2):
1. The three biggest cities (Amsterdam, Rot-terdam, The Hague).
2. The medium-sized cities.3. The growth centres.4. The suburban and rural municipalities.
The growth centres include the new towns –developed to accommodate the overspill ofpopulation from the big cities as the centre-piece of the national spatial planning policy ofthe 1970s – as well as the new town of Almere.All other municipalities in the Randstad,comprising the major part of the so-calledGreen Heart in the centre of this ring of cities,constitute the category of suburban and ruralareas. The other nine provinces are combinedas the rest of the Netherlands. Within thiscategory, a distinction has been made betweenmunicipalities with a more urban and thosewith a less urban character (Figure 2).
The following section begins with a dis-cussion of the degree to which senior citizensengage in various leisure activities. The dis-cussion revolves around the question, what de-termines the outcome of the choice betweenspending leisure time at home versus goingelsewhere to take part in various activities?
TIM SCHWANEN, MARTIN DIJST & FRANS M. DIELEMAN350
# 2001 by the Royal Dutch Geographical Society KNAG

Figure 2. Typology of residential environments in the Netherlands.
Randstad three big cities
Randstad medium-sized cities
Randstad growth centres
Randstad suburban
Rest Netherlands, more urbanised
Rest Netherlands, less urbanised
LEISURE TRIPS OF SENIOR CITIZENS: DETERMINANTS OF MODAL CHOICE 351
# 2001 by the Royal Dutch Geographical Society KNAG
The answer is couched in a discussion ofmodal split and modal choice. Several tablesand figures are presented to visualise therelationships between personal characteristics,car ownership and residential environments,and the modal split. This provides the foun-dation for a more detailed analysis of therelationship between modal choice and resi-dential environment by multivariate analysis.The model used for this analysis is the multi-nomial logistic regression model.
MAJOR LEISURE ACTIVITIES ANDMOBILITY LEVEL
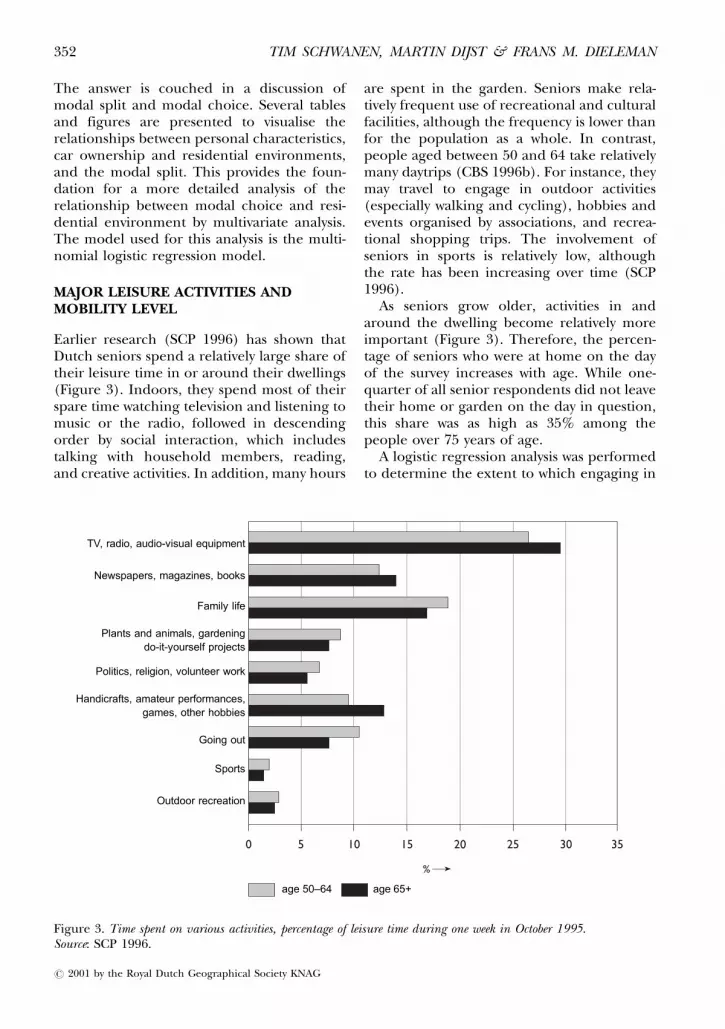
Earlier research (SCP 1996) has shown thatDutch seniors spend a relatively large share oftheir leisure time in or around their dwellings(Figure 3). Indoors, they spend most of theirspare time watching television and listening tomusic or the radio, followed in descendingorder by social interaction, which includestalking with household members, reading,and creative activities. In addition, many hours
are spent in the garden. Seniors make rela-tively frequent use of recreational and culturalfacilities, although the frequency is lower thanfor the population as a whole. In contrast,people aged between 50 and 64 take relativelymany daytrips (CBS 1996b). For instance, theymay travel to engage in outdoor activities(especially walking and cycling), hobbies andevents organised by associations, and recrea-tional shopping trips. The involvement ofseniors in sports is relatively low, althoughthe rate has been increasing over time (SCP1996).
As seniors grow older, activities in andaround the dwelling become relatively moreimportant (Figure 3). Therefore, the percen-tage of seniors who were at home on the dayof the survey increases with age. While one-quarter of all senior respondents did not leavetheir home or garden on the day in question,this share was as high as 35% among thepeople over 75 years of age.
A logistic regression analysis was performedto determine the extent to which engaging in
Figure 3. Time spent on various activities, percentage of leisure time during one week in October 1995.Source: SCP 1996.
TV, radio, audio-visual equipment
Newspapers, magazines, books
Family life
Plants and animals, gardening
do-it-yourself projects
Politics, religion, volunteer work
Handicrafts, amateur performances,
games, other hobbies
Going out
Sports
Outdoor recreation
age 50–64 age 65+
TIM SCHWANEN, MARTIN DIJST & FRANS M. DIELEMAN352
# 2001 by the Royal Dutch Geographical Society KNAG

out-of-home activities is a function of personaland household characteristics and the resi-dential environment of senior citizens (Table 1).For each independent variable, the followingparameters are given: the unstandardised para-meter estimate (B), the standard error of theparameter estimate (SE), and the standardisedcoefficient (R). Coefficients for categorical vari-ables are always relative to a reference category– for instance, seniors who are 50–59 years oldin the case of age.
All variables entered into the model are sig-nificantly associated with the decision to stayhome or not. Educational attainment is moststrongly related to engagement in out-of-homeactivities. The association is positive: all elsebeing equal, seniors with the highest level ofeducation are 2.6 times as likely to leave home
as seniors with the lowest educational attain-ment. Owning a car and having a driver’slicence proved to be an inducement to gettingout more. This may be interpreted to meanthat having easy access to private means oftransport reduces seniors’ resistance to travel.As expected, seniors without jobs are lessmobile than those who are still in the labourforce. Among the economically active seg-ment, seniors who work fewer than 30 hours aweek stay at home less than full-time employ-ees. This might be related to the higher rate ofleisure mobility found for those with part-timejobs (Schwanen 1999). They might spreadtheir mobility in their leisure time more evenlyover the week, implying that immobility onthe day of the survey is less likely. Housewivesalso prove to stay home less than people who
Table 1. Logistic regression model for senior citizens who made at least one trip on the day of the survey.
Reference category = No trips B SE R
Age (50–59 years = 0) ** 0.0760–64 years 70.12 * 0.05 70.0165–74 years 70.34 ** 0.04 70.04�75 years 70.65 ** 0.05 70.07Gender (female = 1) 70.13 ** 0.04 70.02Household size (single = 1) 0.18 ** 0.04 0.02Car ownership (yes = 1) 0.21 ** 0.05 0.03Driver’s licence (yes = 1) 0.16 ** 0.04 0.02Economic activities (not gainfully employed = 0) ** 0.06
Part-time work 0.69 ** 0.08 0.05Full-time work 0.52 ** 0.06 0.05Housewives 0.11 * 0.04 0.01
Educational attainment (no education = 0) ** 0.11Primary education 0.39 ** 0.04 0.06Secondary education 0.70 ** 0.05 0.09Higher education 0.95 ** 0.06 0.10
Residential environment ** 0.02(Randstad three big cities = 0)
Randstad medium-sized cities 70.16 0.09 70.01Randstad suburban 70.15 0.08 70.01Randstad growth centres 70.05 0.06 0.00Rest Netherlands, more urbanised 70.17 ** 0.06 70.01Rest Netherlands, less urbanised 70.22 ** 0.06 70.02
Constant 0.80 ** 0.08
Initial 72 log likelihood 29,694.9Model improvement 1,623.2 **
* significant for a = 0.05; ** significant for a = 0.01;N = 28,419 people.
Source: CBS 1996.
LEISURE TRIPS OF SENIOR CITIZENS: DETERMINANTS OF MODAL CHOICE 353
# 2001 by the Royal Dutch Geographical Society KNAG

are no longer employed, presumably becausethey run frequent errands in the course oftheir daily activities, for instance to get groceries.
As mentioned above, the incidence ofstaying at home is positively correlated withage. The very old prove to be the least mobilegroup. In addition, men seem to engage inout-of-home activities more frequently thanwomen do. All else being equal, seniors inone-person households tend to stay home less.This may be due to the fact that single peopleneed to meet with other people for socialinteraction, since they have no opportunity tosocialise with household members.
People’s propensity to be at home on theday of the survey differs by type of residentialenvironment. Seniors in Amsterdam, Rotter-dam and The Hague tend to stay home lessthan seniors elsewhere. Outside the Randstad,the likelihood of engaging in out-of-homeactivities turns out to be somewhat lower.Although the estimated differences are rathersmall, the results suggest that it is easier forseniors to take part in out-of-home activities ifthey live in highly urbanised environments.
It has already been pointed out that seniorstend to stay at home more as they grow older,irrespective of owning a car. Nevertheless,having a car at their disposal does influencethe pattern of activities of seniors (Table 2).Seniors without a car show a sharper declinein average number of daily trips per personwith advancing age than car owners, both forleisure and non-leisure activities. This suggeststhat the presence of a car in the householdhas a positive effect on the mobility and socialinvolvement of older seniors.
MODAL SPLIT FOR LEISURE ACTIVITIES
The OVG data shows a decline in the rate ofcar ownership as people age. Of the youngestseniors, 89% live in a household where at leastone car is available. This percentage drops to76% for seniors in the age group of 65–74years and 57% for the elderly aged 75 andolder. The incidence of car ownership amongthe senior population also varies by residentialenvironment. Whereas 65% of seniors in thethree big cities and 71% of the seniors livingin the medium-sized cities in the Randstadown a car, this percentage runs up to 84% insuburban and rural municipalities outside theRandstad. In the other residential environ-ments, approximately 80% of the seniors livein households with a car.
Car ownership and age lead to major differ-ences in car use for leisure trips. Not surpris-ingly, Figure 4 indicates that the use of a caris much higher for car-owning seniors anddecreases with age. Since age and car owner-ship are correlated with each other, differ-ences in car use between seniors with andwithout a car become larger as people age.
Seniors under 75 without a car compensatethe lower proportion of car trips primarily bya higher rate of bicycle trips. Persons over 75without a car make more frequent use of publictransport and walk more than car owners ofthe same age. This implies that if we want toexamine seniors’ choice of travel mode ingreater depth, the data will have to distinguishwalking from cycling and public transport.
Car owners over 60 take the car more oftenfor leisure trips as they get older (Figure 4).
Table 2. Average number of trips by senior citizens per person per day, by trip purpose, car ownership and age.
Leisure activities Other activities All activities
Carowner
Non-carowner
Total Carowner
Non-carowner
Total Carowner
Non-carowner
Total
50–59 years 1.55 1.29 1.52 1.83 1.56 1.80 3.38 2.85 3.3260–64 years 1.68 1.45 1.64 1.42 1.05 1.36 3.10 2.50 3.0165–74 years 1.58 1.19 1.48 1.20 0.96 1.15 2.78 2.15 2.6375 years and older 1.29 0.89 1.12 0.97 0.80 0.90 2.26 1.69 2.01Total 1.56 1.16 1.48 1.48 1.04 1.39 3.04 2.21 2.87
Source: CBS 1996.
TIM SCHWANEN, MARTIN DIJST & FRANS M. DIELEMAN354
# 2001 by the Royal Dutch Geographical Society KNAG

This pattern is observed for all four leisure-time activities, although it is most pronouncedfor social visits and recreational shopping.Moreover, it is noteworthy that the share oftrips taken as a driver rather than as apassenger increases with a person’s age. Thissuggests that car owners continue to drive asthey reach advanced age, rather than beingdriven by a son or daughter or someone else.For seniors without a car, however, the highpercentages of riding in a car as a passengerindicate that many leisure trips are under-taken together with persons who do notbelong to the senior’s household.
There are substantial differences in themodal split for leisure activities among thesix residential environments. The share ac-counted for by public transport especiallydiffers: seniors in Amsterdam, Rotterdamand The Hague make eight times as manytrips by train, bus, tram or metro than seniorsin the least urbanised environments outsidethe Randstad. The higher use of publictransport in more urbanised environmentsmay be attributed to the fact that the quality ofservice (in time and space) improves as thedegree of urbanisation increases (Van denHeuvel 1997). In contrast, there is much lessvariation in car use among residential environ-ments: the effect of the spatial structure onthe use of cars is approximately 20%.
The residential environment seems to affectmodal choice most strongly among seniors
without a car (Figure 5). For that group, theeffect of the spatial structure on using a car isnearly 35%. However, the large share of publictransport trips recorded for seniors without acar in the three big cities coincides first andforemost with fewer bicycle trips. A betterprovision of public transport obviously doesnot lead to a reduction in the use of cars;rather, it tends to get people off their bicycles.Therefore, environmentally friendly modes oftransport seem to compete more with eachother than with the private car. This outcomeconfirms the results of an investigation byVidakovic (1985) in the metropolitan area ofAmsterdam.
Across all residential environments, carowners use their vehicle for 65% of theirleisure trips. When seniors own a car, they useit, irrespective of where they live. Althoughpublic transport is of less interest to carowners, the data presented for this group inFigure 5 suggests that better public transportdoes affect their behaviour. For them too, itmainly results in a reduction of the slowmodes of transport.
DETERMINANTS OF MODAL CHOICEFOR LEISURE ACTIVITIES
A multinomial logit model is used to assessthe effects of seniors’ personal characteristicsand their residential environment on theirchoice of travel mode for leisure activities. The
Figure 4. Modal split for leisure activities of senior citizens by car ownership and age.
Car owners Non-car owners
Other
Walking
Cycling
Publictransport
Car passenger
Car driver
50–59 60–64 65–74 �75 50–59 60–64 65–74 �75
LEISURE TRIPS OF SENIOR CITIZENS: DETERMINANTS OF MODAL CHOICE 355
# 2001 by the Royal Dutch Geographical Society KNAG

dependent variable ‘main travel mode’ con-sists of four categories: car, public transport,bicycle and walking. When the same referencecategory is used, only three models need to begenerated; all coefficients in those models arerelative to the reference category (Wrigley1985). By changing the transport mode thatserves as a reference category, comparisonscan be made across transport modes. In themodels presented in Table 3, public transportserves as the reference category; all coeffi-cients are thus relative to choosing publictransport. Models with other reference cate-gories are not covered in this paper, for lack ofspace (available from authors on request).Where relevant, however, the coefficients aregiven in the text. The models presented hereare primarily intended to clarify the effects ofpersonal/household and environmental vari-ables while controlling other factors. Thismeans that variables that yield no significantresults are still included in the models.
Table 3 reveals that the variable ‘car owner-ship’ exerts the greatest influence on seniors’modal choice. Owning a car has a strongpositive relationship with using a car forleisure activities. The likelihood of using anyof the other modes of transport declines if
there is a vehicle in a senior’s household. Thisis particularly true for public transport: asTable 3 shows, car ownership has an R value of0.41. In contrast, in models with walking andcycling as reference categories, the R coeffi-cients amount to 0.19 and 0.23 respectively.The results seem to support the conclusionthat among seniors in car-owning households,public transport is not a popular travel mode(Burkhardt et al. 1999b; Carp 1988; Traenkleet al. 1993). Having a driver’s licence has asimilar effect as owning a car, though themagnitude of the effect is smaller.
The likelihood of using public transportincreases with advancing age. The propensityto walk or cycle declines with age and this isespecially true of cycling. Age does not have asignificant effect on the choice between publictransport and the car. This indicates thatseniors become more dependent on motor-ised travel modes as they grow older. Indeed,relative to both walking and cycling, thelikelihood of using a car tends to increasewith age. Thus, as seniors grow older, both thecar and public transport become more im-portant when they travel for leisure purposes.These results suggest that age can serve as areasonably good proxy variable for physical
Figure 5. Modal split for leisure activities of senior citizens by car ownership and residential environment.
Car owners Non-car owners
Other
Walking
Cycling
Publictransport
Car passenger
Car driver
A Randstad, three big cities D Randstad, growth centres
B Randstad, medium-sized cities E Rest Netherlands, more urbanised
C Randstad, suburban F Rest Netherlands, less urbanised
TIM SCHWANEN, MARTIN DIJST & FRANS M. DIELEMAN356
# 2001 by the Royal Dutch Geographical Society KNAG

well-being. In addition, they indicate thatcapability constraints tend to impinge moreseverely on the travel behaviour of seniors, asthey grow older.
The models indicate that women are farmore dependent on public transport thanmen. Compared with men, they use both thecar and the bicycle less frequently than publictransport. After controlling for other factors,the effect of household size is relatively small.Table 3 indicates that single seniors tend touse public transport modes more frequently,whereas seniors with a partner are more likelyto cycle.
Educational attainment is positively cor-related with the chance of choosing publictransport for leisure travel. In particular,higher-educated people tend to take publictransport more frequently than the car or thebicycle. Since income is not included in themodel, educational attainment may also act asa proxy for income. An explanation for therelatively high likelihood of using publictransport for people with a high score oneducational attainment may be the habits theydeveloped when still working full-time. Onaverage, highly educated people commutelarger distances than lower-educated persons.
Table 3. Multinomial logistic regression model for modal choice of senior citizens for leisure trips.
Reference category = Publictransportation
Car Cycling Walking
B SE R B SE R B SE R
Age (50–59 years = 0) 0.00 ** 0.11 ** 0.0560–64 years 70.01 0.10 0.00 70.04 0.09 0.00 70.09 0.09 0.0065–74 years 70.04 0.09 0.00 70.46 ** 0.08 70.06 70.38 ** 0.08 70.0575 years and older 0.11 0.11 0.00 70.96 ** 0.11 70.10 70.41 ** 0.10 70.04
Gender (female = 1) 70.21 ** 0.08 70.02 70.63 ** 0.08 70.09 70.52 ** 0.08 70.07Household size (single = 1) 0.03 0.08 0.00 70.14 * 0.07 70.02 0.07 0.07 0.00Car ownership (yes = 1) 3.17 ** 0.08 0.41 0.89 ** 0.08 0.13 1.34 ** 0.08 0.19Driver’s licence (yes = 1) 0.91 ** 0.08 0.12 0.47 ** 0.08 0.06 0.35 ** 0.08 0.05Economic activities 0.00 * 0.02 * 0.02(not gainfully employed = 0)Part-time work 70.06 0.14 0.00 70.12 0.14 0.00 70.23 0.14 70.01Full-time work 0.22 0.12 0.01 70.22 0.13 70.01 70.15 0.13 0.00Housewives 0.11 0.08 0.00 70.19 * 0.08 0.02 0.16 * 0.08 0.02
Educational attainment ** 0.07 ** 0.09 ** 0.04(no education = 0)Primary education 70.26 ** 0.09 70.03 70.23 ** 0.08 70.03 70.22 ** 0.08 70.03Secondary education 70.34 ** 0.10 70.03 70.53 ** 0.09 70.06 70.28 ** 0.09 70.03Higher education 70.75 ** 0.11 70.07 70.86 ** 0.10 70.09 70.41 ** 0.10 70.04
Residential environment ** 0.22 ** 0.26 ** 0.21(Randstad three big cities = 0)Randstad medium-sized cities 0.73 ** 0.13 0.06 1.01 ** 0.12 0.09 0.45 ** 0.12 0.04Randstad suburban 1.19 ** 0.14 0.09 1.39 ** 0.13 0.11 1.04 ** 0.13 0.09Randstad growth centres 1.11 ** 0.09 0.13 1.45 ** 0.09 0.17 0.90 ** 0.09 0.11Rest Netherlands, more urbanised 1.42 ** 0.09 0.17 1.78 ** 0.09 0.21 1.31 ** 0.08 0.17Rest Netherlands, less urbanised 2.12 ** 0.11 0.20 2.36 ** 0.11 0.24 1.78 ** 0.10 0.19
Constant 71.30 ** 0.14 0.24 ** 0.13 0.01 0.13
Initial –2 log likelihood 13,861.7 10,027.5 9,502.9Model improvement 5,039.1** 1,827.9** 1,631.7**
* significant for a = 0.05; ** a = 0.01;N = 41,800 leisure trips.
Source: CBS 1996.
LEISURE TRIPS OF SENIOR CITIZENS: DETERMINANTS OF MODAL CHOICE 357
# 2001 by the Royal Dutch Geographical Society KNAG

Therefore, those with more education seemto make more use of public transport beforetheir retirement (Dijst & Rosenboom 1991;Rouwendaal & Rietveld 1994).
After controlling for other factors, theeffects of having a job prove to be relativelysmall. Although not always significant, thecoefficients indicate that working seniors tendto use both the car and public transport moreoften, while retired people tend to walk andcycle more often. There are relatively fewdifferences between seniors who work parttime and those working full time. The lattermerely tend to use the car more often thanpublic transport. The higher chance thatworking seniors will take fast modes of trans-port may reflect differences in time pressure.Obviously, working people have less sparetime. Therefore, they may be less willing toselect travel modes for their leisure activitiesthat extend the duration of the trip. Fastermodes of transport may then be an option.
The variable ‘residential environment’ isimportant in all three models, as its highcoefficients demonstrate. The results showthat the likelihood of using public transportfor a leisure trip increases along with thedegree of urbanisation. The R coefficientsshow once more that the substitution effectsbetween public transport and cycling aregreater than those between public transportand the car. In a model in which car use andwalking are compared with each other, theenvironment in which seniors live is a lessimportant determinant of the mode choicefor leisure activities (R = 0.01). Thus, the resi-dential environment mainly affects the choicebetween taking public transport, riding abicycle or using a car.
To summarise, the selected personal char-acteristics have considerable effects on themodal choice of seniors. Car ownership and,to a lesser degree, residential environment arethe most important determinants of theseniors’ choice of travel mode for leisureactivities.
CONCLUSIONS AND DISCUSSION
This analysis of seniors’ leisure mobility wasconceived against the background of a grow-ing desire to discourage the use of the private
car. Until now, investigations of mobility be-haviour have largely ignored the role of seniors.This is unfortunate, because this demographiccategory accounts for a substantial and grow-ing proportion of the population of Europe.Moreover, older people frequently use privatecars, also in their leisure time. Hence, seniorsmake a significant contribution to the totaluse of cars.
Our investigation shows that seniors spendrelatively much time in and around theirdwellings. The tendency to stay at homeincreases with age. Nevertheless, large num-bers of seniors take trips until they are quiteadvanced in age. This paper links the choiceof travel mode for leisure trips to three sets offactors, namely personal characteristics, carownership and residential environment. Own-ing a car proves to be crucial to the choice oftravel mode. If seniors own a car, they use it,whether or not they live in a city. And theolder they are, the more they select the privatecar as their mode of transport. Other personalcharacteristics, such as gender, also play a role.Characteristics of the residential environmenthave a substantial influence on modal choice,even when controlling for personal character-istics. Indeed, the residential environment is asignificant factor in the choice of travel mode,especially for those who do not own a privatecar. Public transport is used much more in thebig and medium-sized cities than elsewhere,obviously because service in the cities is muchbetter than in the suburbs and in rural areas.However, public transport seems to competemainly with riding a bicycle and walking ratherthan with driving.
The use of the car by seniors is likely toincrease further in the future. Primarily, this isbecause the number of seniors is rising, but itis also because more and more older seniorshave a driver’s licence and own a car. Thesenumbers are rising most rapidly amongwomen and single people. It is generallyassumed that people tend to hold on to oldhabits as they age. If so, it is likely that leisureactivities away from home and the diversity ofsuch activities will be even more prominentfor future cohorts of seniors. This implies thatseniors will make more trips in the future thanthey do now. In view of the higher rate of carownership, it may also be expected that many
TIM SCHWANEN, MARTIN DIJST & FRANS M. DIELEMAN358
# 2001 by the Royal Dutch Geographical Society KNAG

more of these trips will be made by private car.From our analysis, it should be clear that othermodes of transport can hardly compete withthe car.
Nevertheless, there will always be someelderly people who depend on public trans-port because of their low income and/or poorhealth. More and more of those seniors will beliving in suburban areas, where the distancesto facilities and services may be substantial. Inthat light, public transport should remainavailable for seniors in such places. It is alsoimportant that those facilities can be reachedsafely, also by individuals who are less mobile.In addition, new concepts for public transport– like door-to-door service – should be intro-duced. In order to reduce the financialburden of public transport, these new trans-port facilities should be attuned to and sharedwith the wider population.
Furthermore, due attention should be givento the opportunities opening up to seniorswith the proliferation of ICT. Although thebenefits of these new technologies are notundisputed (Graham & Marvin 1996), suchnew communication channels offer the im-mobile elderly the option to remain involvedwith their social setting. In addition, theopportunity of ‘virtual’ contact might offsetsome of the environmental impact of thegrowing mobility of the elderly.
Notes
1. The most important modification is that theregions North, East and South have beencombined as the rest of the country; this regionincludes the province of Flevoland, except forthe municipality of Almere.
REFERENCES
BURKHARDT, J.E., A. BERGER, M.A. CREEDON & A.T.MCGAVOCK (1999a), Tomorrow’s Older Drivers: Who?
How Many? What Impacts? Paper presented at the78th Annual Meeting of the TransportationResearch Board. Washington, DC.
BURKHARDT, J.E., A. BERGER, M.A. CREEDON & A.T.MCGAVOCK (1999b), Mobility Changes for Elderly
Who Reduce or Cease Driving. Paper presented atthe 78th Annual Meeting of the TransportationResearch Board. Washington, DC.
CARP, F.M. (1988), Significance of Mobility for the Well-
Being of the Elderly. (Transportation in an AgingSociety, Vol. II, Technical Papers). Washington,DC: Transportation Research Board.
CENTRAAL BUREAU VOOR DE STATISTIEK (1996a),Onderzoek verplaatsingsgedrag, 1996. Documentatie
set. Voorburg/Heerlen: Centraal Bureau voor deStatistiek.
CENTRAAL BUREAU VOOR DE STATISTIEK (1996b),Dagrecreatie 1995/96. Voorburg/Heerlen: Cen-traal Bureau voor de Statistiek.
CHU, X. (1994), The Effects of Age on the Driving Habits
of the Elderly. Evidence from the 1990 National
Personal Transportation Study. Washington, DC:US Department of Transportation (DOT-T-95-12).
COUGHLIN, J.F. & A. LACOMBE (1997), Ten MythsAbout Transportation for the Elderly. Transporta-
tion Quarterly 51, pp. 91–100.DIJST, M. (1995), Het elliptisch leven: actieruimte als
integrale maat voor bereik en mobiliteit – modelontwik-
keling met als voorbeeld tweeverdieners met kinderen in
Houten en Utrecht. PhD thesis. Utrecht/Delft:Koninklijk Nederlands Aardrijkskundig Genoot-schap/Technische Universiteit Delft.
DIJST, M. & H. ROSENBOOM (1991), Milieu, econ-omie en emancipatie: een moeizame vervoer-en verkeerrelatie. Tijdschrift Vervoerwetenschap 27,pp. 469–484.
EUROPEAN COMMISSION (1996), The Citizens’ Network:
Fulfilling the Potential of Public Passenger Transport
in Europe. Brussels: European Commission GreenPaper.
EUROPEAN COMMISSION (1999), Developing the Citi-
zens’ Network. Brussels: EC, DG VII.GARDINER, C. & R. HILL (1996), Analysis of Access to
Cars from the 1991 UK Anonymised Records: ACase Study of Elderly Population in Sheffield.Urban Studies 33, pp. 269–281.
GRAHAM, S. & S. MARVIN (1996), Telecommunications
and the City: Electronic Spaces, Urban Places. Lon-don: Routledge.
HART, T. (1992), Transport, the Urban Pattern andRegional Change, 1960–2010. Urban Studies 29,pp. 483–503.
HAGERSTRAND, T. (1970), What About People inRegional Science? Regional Science Association
Papers XXIV, pp. 7–21.JETTE, A.M. & L.G. BRANCH (1992), A Ten-Year
Follow-Up of Driving Patterns Among theCommunity-Dwelling Elderly. Human Factors 34,pp. 25–31.
LEISURE TRIPS OF SENIOR CITIZENS: DETERMINANTS OF MODAL CHOICE 359
# 2001 by the Royal Dutch Geographical Society KNAG

JOKOVI, E.M. & M.B. SCHONE (1998), Wensen voor
recreatie. Inventarisatie van recreatieve wensen en
gedrag in Nederland met behulp van recreatiebeelden.Wageningen: DLO – Staring Centrum.
LEINBACH, T., J. WATKINS & N. STAMATIADIS (1994),Transportation Services, Utilization and the Needs of
the Elderly in Non-Urban Areas: Patterns in Two
Kentucky Communities. Washington, DC: US De-partment of Transportation.
MARCELLINI, F., C. GAGLIARDI, L. SPAZZAFUMO &F. LEONARDI (1997), Keeping the Elderly Mobile –a Comparative Research Project: Findings fromItaly. In: H. MOLLENKOPF & F. MARCELLINI, eds.,The Outdoor Mobility of Older People – Technological
Support and Future Possibilities, pp. 21–30. Luxem-bourg: Office for Official Publications of theEuropean Communities.
MOLLENKOPF, H. & P. FLASCHENTRAGER (1997),Keeping the Elderly Mobile – a ComparativeResearch Project: Findings from Germany. In:H. MOLLENKOPF & F. MARCELLINI, eds., The Out-
door Mobility of Older People – Technological Support
and Future Possibilities, pp. 45–64. Luxembourg:Office for Official Publications of the EuropeanCommunities.
ROSENBLOOM, S. (1995), Travel by the Elderly. 1990NPTS Report Series. Washington, DC: US Depart-ment of Transportation
ROUWENDAAL, J. & P. RIETVELD (1994), Changes inCommuting Distances of Dutch Households.Urban Studies 31, pp. 1545–1557.
RUOPILA, I. & T. SUUTAMA (1997), Keeping theElderly Mobile – a Comparative Research Projectfrom Finland: The Self-Rated Mobility in Relation
to PADL, Use of Services, Interest-Based Activitiesand Social Participation Among Finnish PeopleAged 55+ Years. In: H. MOLLENKOPF & F. MARCEL-
LINI, eds., The Outdoor Mobility of Older People – Tech-
nological Support and Future Possibilities, pp. 31–43.Luxembourg: Office for Official Publications ofthe European Communities.
SCHWANEN, T. (1999), Met de auto op weg naar de
toekomst? Het verplaatsingsgedrag van senioren in hun
vrije tijd. Utrecht: Faculty of GeographicalSciences, Utrecht University.
SOCIAAL EN CULTUREEL PLANBUREAU (1996), Sociaal
en cultureel rapport 1996. Rijswijk: Sociaal enCultureel Planbureau.
TRAENKLE, U., C. GELAU & T. METKER (1993),Mobility Needs of Elderly Drivers. In: I. VAN
DEN OEVER & J. GRAAFMANS, eds., Perceived Needs
of the Elderly About Mobility, pp. 95–104. Eind-hoven: Akontes Publishing.
VAN DEN HEUVEL, M.G. (1997), Openbaar Vervoer in
de Randstad. Een systematische aanpak. PhD thesis.Amsterdam: Thesis Publishers.
VIDAKOVIC, V. (1985), Amsterdammers onderweg. Am-sterdam: Dienst Ruimtelijke Ordening, Ge-meente Amsterdam.
VIJGEN, J. & R. VAN ENGELSDORP GASTELAARS (1992),Centrum, stadsrand, groeikern. Bewonersprofielen en
leefpatronen in drie woonmilieus binnen het gewest
Amsterdam. Amsterdam: Centrum voor Grootste-delijk Onderzoek, Universiteit van Amsterdam(Stedelijke Netwerken Werkstukken 40).
WRIGLEY, N. (1985), Categorical Data Analysis for
Geographers and Environmental Scientists. London/New York: Longman.
TIM SCHWANEN, MARTIN DIJST & FRANS M. DIELEMAN360
# 2001 by the Royal Dutch Geographical Society KNAG


