Embed Size (px)
Citation preview
Local Affine Multidimensional Projection
Paulo Joia, Fernando V. Paulovich, Danilo Coimbra, José Alberto Cuminato, Luis Gustavo Nonato
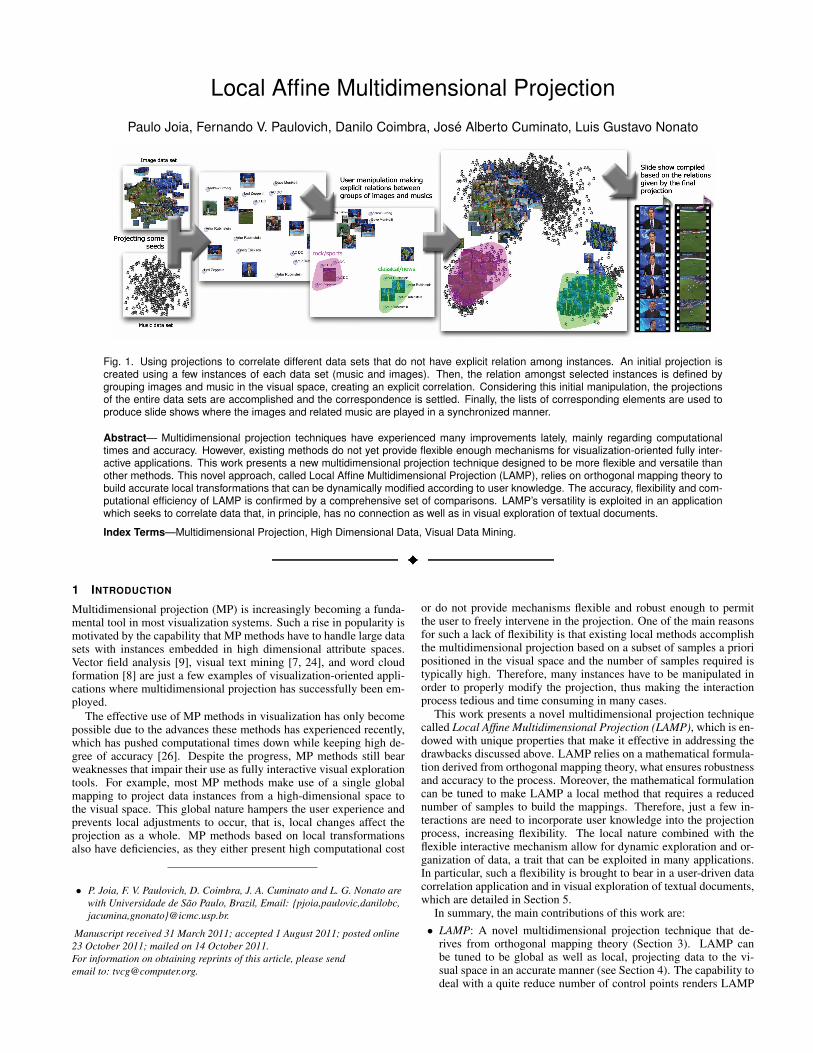
Fig. 1. Using projections to correlate different data sets that do not have explicit relation among instances. An initial projection iscreated using a few instances of each data set (music and images). Then, the relation amongst selected instances is defined bygrouping images and music in the visual space, creating an explicit correlation. Considering this initial manipulation, the projectionsof the entire data sets are accomplished and the correspondence is settled. Finally, the lists of corresponding elements are used toproduce slide shows where the images and related music are played in a synchronized manner.
Abstract— Multidimensional projection techniques have experienced many improvements lately, mainly regarding computationaltimes and accuracy. However, existing methods do not yet provide flexible enough mechanisms for visualization-oriented fully inter-active applications. This work presents a new multidimensional projection technique designed to be more flexible and versatile thanother methods. This novel approach, called Local Affine Multidimensional Projection (LAMP), relies on orthogonal mapping theory tobuild accurate local transformations that can be dynamically modified according to user knowledge. The accuracy, flexibility and com-putational efficiency of LAMP is confirmed by a comprehensive set of comparisons. LAMP’s versatility is exploited in an applicationwhich seeks to correlate data that, in principle, has no connection as well as in visual exploration of textual documents.
Index Terms—Multidimensional Projection, High Dimensional Data, Visual Data Mining.
1 INTRODUCTION
Multidimensional projection (MP) is increasingly becoming a funda-mental tool in most visualization systems. Such a rise in popularity ismotivated by the capability that MP methods have to handle large datasets with instances embedded in high dimensional attribute spaces.Vector field analysis [9], visual text mining [7, 24], and word cloudformation [8] are just a few examples of visualization-oriented appli-cations where multidimensional projection has successfully been em-ployed.
The effective use of MP methods in visualization has only becomepossible due to the advances these methods has experienced recently,which has pushed computational times down while keeping high de-gree of accuracy [26]. Despite the progress, MP methods still bearweaknesses that impair their use as fully interactive visual explorationtools. For example, most MP methods make use of a single globalmapping to project data instances from a high-dimensional space tothe visual space. This global nature hampers the user experience andprevents local adjustments to occur, that is, local changes affect theprojection as a whole. MP methods based on local transformationsalso have deficiencies, as they either present high computational cost
• P. Joia, F. V. Paulovich, D. Coimbra, J. A. Cuminato and L. G. Nonato arewith Universidade de São Paulo, Brazil, Email: {pjoia,paulovic,danilobc,jacumina,gnonato}@icmc.usp.br.
Manuscript received 31 March 2011; accepted 1 August 2011; posted online23 October 2011; mailed on 14 October 2011.For information on obtaining reprints of this article, please sendemail to: [email protected].
or do not provide mechanisms flexible and robust enough to permitthe user to freely intervene in the projection. One of the main reasonsfor such a lack of flexibility is that existing local methods accomplishthe multidimensional projection based on a subset of samples a prioripositioned in the visual space and the number of samples required istypically high. Therefore, many instances have to be manipulated inorder to properly modify the projection, thus making the interactionprocess tedious and time consuming in many cases.
This work presents a novel multidimensional projection techniquecalled Local Affine Multidimensional Projection (LAMP), which is en-dowed with unique properties that make it effective in addressing thedrawbacks discussed above. LAMP relies on a mathematical formula-tion derived from orthogonal mapping theory, what ensures robustnessand accuracy to the process. Moreover, the mathematical formulationcan be tuned to make LAMP a local method that requires a reducednumber of samples to build the mappings. Therefore, just a few in-teractions are need to incorporate user knowledge into the projectionprocess, increasing flexibility. The local nature combined with theflexible interactive mechanism allow for dynamic exploration and or-ganization of data, a trait that can be exploited in many applications.In particular, such a flexibility is brought to bear in a user-driven datacorrelation application and in visual exploration of textual documents,which are detailed in Section 5.
In summary, the main contributions of this work are:• LAMP: A novel multidimensional projection technique that de-
rives from orthogonal mapping theory (Section 3). LAMP canbe tuned to be global as well as local, projecting data to the vi-sual space in an accurate manner (see Section 4). The capability todeal with a quite reduce number of control points renders LAMP
suitable for interactive applications.• Data Correlation: The LAMP’s flexibility and effectiveness is ex-
ploited in a new visualization-based data correlation application(Section 5) that relates data from distinct data sets by only manip-ulating control points.
To the best of our knowledge, orthogonal mapping theory has neverbeen used in the context of multidimensional projection. Furthermore,this is the first time that multidimensional projection is explicitly em-ployed to interactively correlate instances from data sets that have noconnection.
2 RELATED WORK
Multidimensional projection methods aim at mapping instances froma high dimensional space to the visual space so as to preserve distancesas much as possible. Most MP methods derive from the multidimen-sional scaling (MDS) theory, a family of techniques that consider onlydistance information between pairs of instances to perform dimension-ality reduction, thus making Cartesian coordinates for the original dataunnecessary.
In order to better contextualize our approach and highlight itsparticularities we organize the existing MP methods into two maingroups, global and local.
Global methods map data from a high-dimensional space to the vi-sual space using a single transformation. Good examples of globalmethods are techniques based on spectral decomposition, which com-pute the embedding coordinates for each data instance from eigenvec-tors of a transformation applied to a dissimilarity matrix (symmetricmatrix containing the distance between each pair of instances) [34].Aiming at reducing the high computation costs (typically O(n3),where n is the number of instances to be projected) associated withthe eigendecomposition Roweis and Saul [28] proposed an O(n2) al-gorithm that combines local fitting and global linear mapping. Sampleinstances were exploited by Brandes and Pich [3] and de Silva andTenenbaum [11], achieving an O(k3 + kn) algorithm, where k is thenumber of samples used to build the mapping. Subset of samples hasbeen further exploited by Faloutsos and Lin [12] so as to obtain anO(n) dimensionality reduction scheme. Tenenbaum et al. [33] pro-posed an O(n) algorithm using a geometric framework. Multiscalematrix representation was employed by Belkin and Niyogii [1] andKoren et al. [20] towards reducing the computational burden, how-ever, the lack of flexibility to enable user interaction hamper the effec-tive use of spectral decomposition methods in visualization-orientedinteractive applications.
First proposed by Kruskal [21], nonlinear-optimization-based tech-niques comprise the class of global methods that accomplish the map-ping to visual space by finding a minimum for an energy function,usually called stress function. Optimization methods tend to be com-putationally expensive (O(n2)), even when using efficient numericalsolvers [5]. In order to reduce computational costs, Pekalska et al. [27]proposed a technique that first embeds a subset of samples in the visualspace by optimizing a stress function and then places the remaininginstances using a global linear mapping, resulting in an O(k3 +kn) al-gorithm. Although more efficient than other optimization-based meth-ods, Pekalska’s approach is not flexible enough to support interactiveapplications while still requiring a minimum number of sample pointsequivalent to the dimension of the data.
Least Squares Projection [25] (LSP) is a two-step global techniquethat also uses a non-linear scheme to first position a subset of the sam-ples in the visual space, mapping the remaining instances through aLaplacian-like operator, resulting an O(k2+n2) algorithm. LSP makesuse of a global neighborhood graph from which a large sparse linearsystem is derived. LSP allows for modifying the projection by manip-ulating the position of samples in the visual space, however, LSP’sglobal nature limits the amount a projection can be changed. Thesame limitation can be observed in the recent linear mapping calledPLMP [26] (whose complexity is linear), which also makes use of asubset of samples to define a global linear map. Likewise Pekalska’sapproach, PLMP also requires a minimum number of samples in order
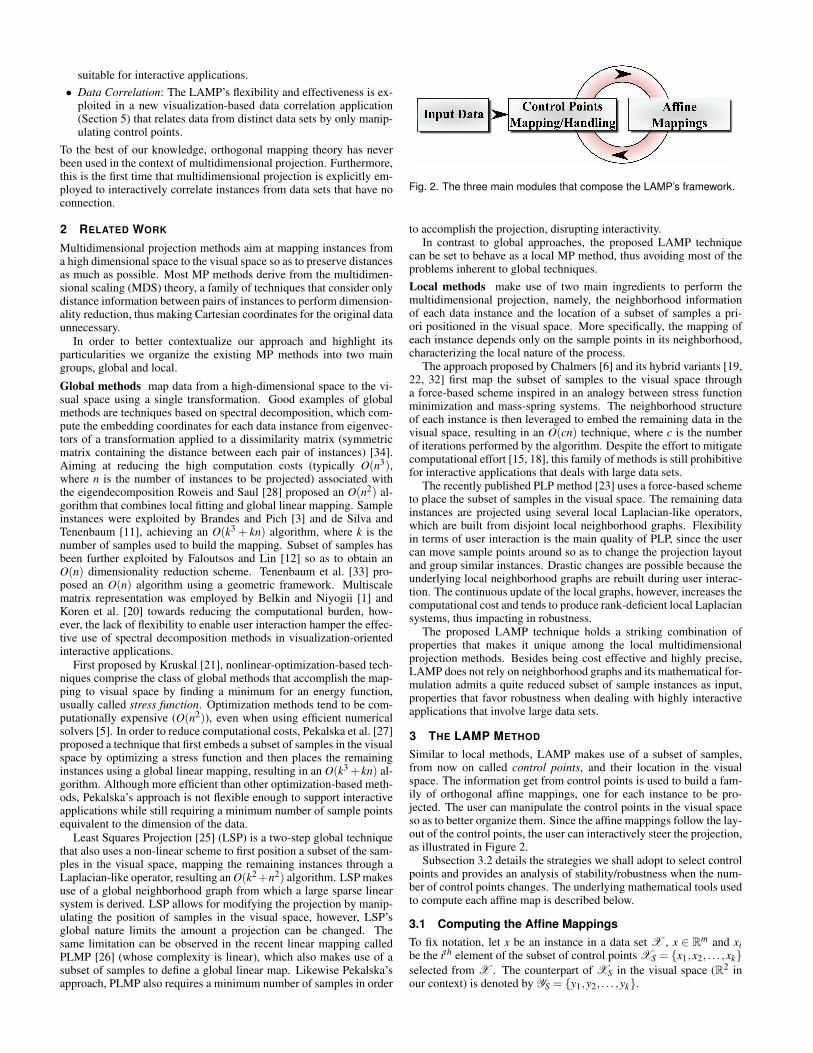
Fig. 2. The three main modules that compose the LAMP’s framework.
to accomplish the projection, disrupting interactivity.In contrast to global approaches, the proposed LAMP technique
can be set to behave as a local MP method, thus avoiding most of theproblems inherent to global techniques.Local methods make use of two main ingredients to perform themultidimensional projection, namely, the neighborhood informationof each data instance and the location of a subset of samples a pri-ori positioned in the visual space. More specifically, the mapping ofeach instance depends only on the sample points in its neighborhood,characterizing the local nature of the process.
The approach proposed by Chalmers [6] and its hybrid variants [19,22, 32] first map the subset of samples to the visual space througha force-based scheme inspired in an analogy between stress functionminimization and mass-spring systems. The neighborhood structureof each instance is then leveraged to embed the remaining data in thevisual space, resulting in an O(cn) technique, where c is the numberof iterations performed by the algorithm. Despite the effort to mitigatecomputational effort [15, 18], this family of methods is still prohibitivefor interactive applications that deals with large data sets.
The recently published PLP method [23] uses a force-based schemeto place the subset of samples in the visual space. The remaining datainstances are projected using several local Laplacian-like operators,which are built from disjoint local neighborhood graphs. Flexibilityin terms of user interaction is the main quality of PLP, since the usercan move sample points around so as to change the projection layoutand group similar instances. Drastic changes are possible because theunderlying local neighborhood graphs are rebuilt during user interac-tion. The continuous update of the local graphs, however, increases thecomputational cost and tends to produce rank-deficient local Laplaciansystems, thus impacting in robustness.
The proposed LAMP technique holds a striking combination ofproperties that makes it unique among the local multidimensionalprojection methods. Besides being cost effective and highly precise,LAMP does not rely on neighborhood graphs and its mathematical for-mulation admits a quite reduced subset of sample instances as input,properties that favor robustness when dealing with highly interactiveapplications that involve large data sets.
3 THE LAMP METHOD
Similar to local methods, LAMP makes use of a subset of samples,from now on called control points, and their location in the visualspace. The information get from control points is used to build a fam-ily of orthogonal affine mappings, one for each instance to be pro-jected. The user can manipulate the control points in the visual spaceso as to better organize them. Since the affine mappings follow the lay-out of the control points, the user can interactively steer the projection,as illustrated in Figure 2.
Subsection 3.2 details the strategies we shall adopt to select controlpoints and provides an analysis of stability/robustness when the num-ber of control points changes. The underlying mathematical tools usedto compute each affine map is described below.
3.1 Computing the Affine MappingsTo fix notation, let x be an instance in a data set X , x ∈ Rm and xibe the ith element of the subset of control points XS = {x1,x2, . . . ,xk}selected from X . The counterpart of XS in the visual space (R2 inour context) is denoted by YS = {y1,y2, . . . ,yk}.
Given an instance x, the Local Affine Multidimensional Projectiontechnique maps x to the visual space by finding the best affine trans-formation fx(p) = pM+ t that minimizes
∑i
αi‖ fx(xi)− yi‖2, subject to MT M = I (1)
where matrix M and vector t are the unknowns, I is the identity matrix,and αi are scalar weights defined as:
αi =1
‖xi− x‖2 (2)
The minimization problem (1) is similar to that employed in “as-rigid-as-possible” image deformation [30]. However, in contrast toimage deformation applications, where the affine transformations arefrom R2 to R2, we look for affine maps taking points from Rm toR2. Therefore, the explicit formulas used in image deformation donot apply in our context, which requires a more general minimizationscheme.
Before deriving the mathematical tools used to solve (1), lets dis-cuss some relevant aspects involved in such a minimization problem.The restriction MT M = I ensures that the resulting affine transforma-tion behaves like a rigid transformation, that is, data can only be ro-tated and translated during the mapping process, avoiding scaling andshear effects. This behavior goes right back to what we need, namely,to preserve distances as much as possible during the multidimensionalprojection. If no constraint is enforced, the minimizer for the sum-mation in (1) can be found through a conventional least square fittingprocedure. However, in this case, errors in the positioning of con-trol points are propagated by the local affine mappings, resulting inpoorer quality projections. The orthogonality constraint ensures thaterrors introduced during the positioning of control points are not dras-tically propagated during the projection step. In other words, distor-tions are inevitable, the orthogonality constraint just keeps them assmall as possible. We refer the interested reader to the book by Gowerand Dijksterhuis [17], which provides a detailed discussion on how or-thogonality and other more general constraints affect the outcome ofminimization problems as the one stated in (1).
Another aspect to be observed is that the weights αi depend on thepoint of evaluation, therefore, a distinct affine transformation is ob-tained for each instance x. Finally, in contrast to “as-rigid-as-possible”image deformation applications, we do not need to ensure continuityfor the overall transformation, on the contrary, discontinuities may behighly desirable to better keep apart uncorrelated data instances dur-ing projection. This flexibility allows us to restrict the summation in(1) to take into account only control points in a neighborhood of x,rendering the process truly local. In fact, the larger the number ofsamples considered in the summation the less local is the projection ofx. This fact will be exploited in our formulation and better discussedin Sections 3.2 and 4.
By taking partial derivatives with respect to t equal to zero, one canwrite t in terms of M as
t = y− xM, x =∑i αixi
α, y =
∑i αiyi
α(3)
where α = ∑i αi. Therefore, the minimization problem (1) can berewritten as
∑i
αi‖xiM− yi‖2, subject to MT M = I (4)
where xi = xi− x and yi = yi− y.The minimization problem (4) can be expressed in matricial form
‖AM−B‖F , subject to MT M = I (5)
where ‖ · ‖F denotes the Frobenius norm and matrices A and B aregiven by
A =
√
α1x1√α2x2...√
αk xk
, B =
√
α1y1√α2y2...√
αk yk
(6)
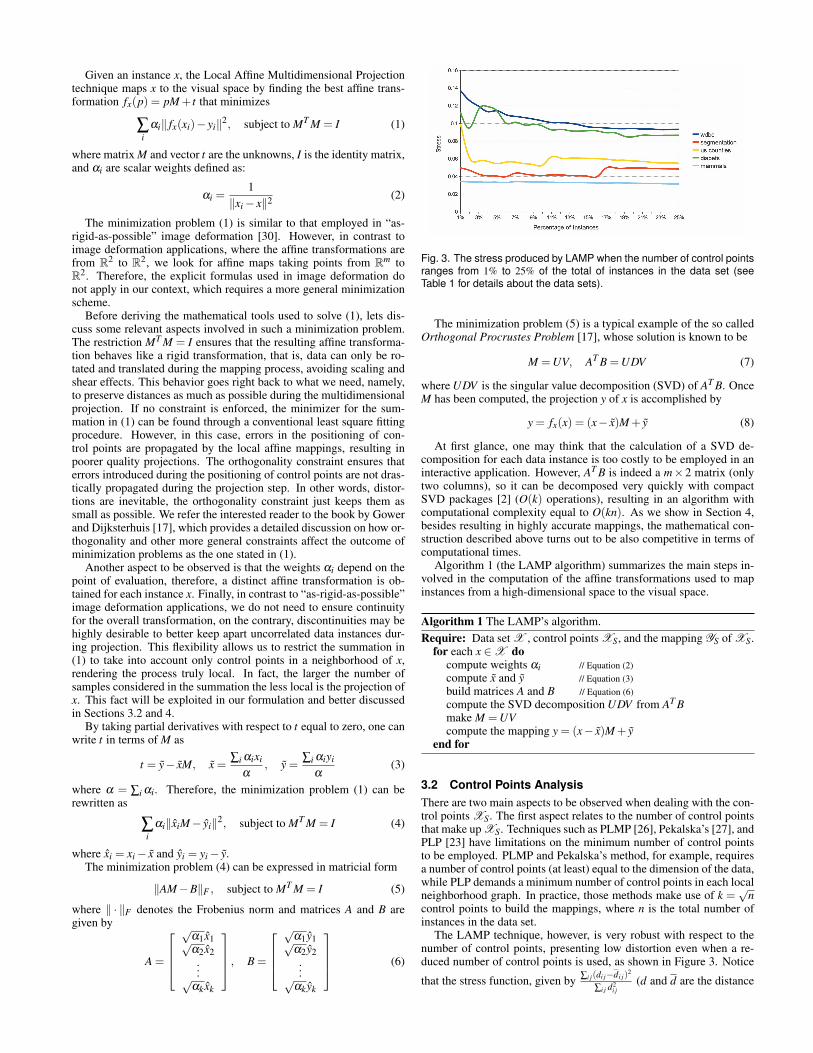
Fig. 3. The stress produced by LAMP when the number of control pointsranges from 1% to 25% of the total of instances in the data set (seeTable 1 for details about the data sets).
The minimization problem (5) is a typical example of the so calledOrthogonal Procrustes Problem [17], whose solution is known to be
M =UV, AT B =UDV (7)
where UDV is the singular value decomposition (SVD) of AT B. OnceM has been computed, the projection y of x is accomplished by
y = fx(x) = (x− x)M+ y (8)
At first glance, one may think that the calculation of a SVD de-composition for each data instance is too costly to be employed in aninteractive application. However, AT B is indeed a m×2 matrix (onlytwo columns), so it can be decomposed very quickly with compactSVD packages [2] (O(k) operations), resulting in an algorithm withcomputational complexity equal to O(kn). As we show in Section 4,besides resulting in highly accurate mappings, the mathematical con-struction described above turns out to be also competitive in terms ofcomputational times.
Algorithm 1 (the LAMP algorithm) summarizes the main steps in-volved in the computation of the affine transformations used to mapinstances from a high-dimensional space to the visual space.
Algorithm 1 The LAMP’s algorithm.Require: Data set X , control points XS, and the mapping YS of XS.
for each x ∈X docompute weights αi // Equation (2)compute x and y // Equation (3)build matrices A and B // Equation (6)compute the SVD decomposition UDV from AT Bmake M =UVcompute the mapping y = (x− x)M+ y
end for
3.2 Control Points AnalysisThere are two main aspects to be observed when dealing with the con-trol points XS. The first aspect relates to the number of control pointsthat make up XS. Techniques such as PLMP [26], Pekalska’s [27], andPLP [23] have limitations on the minimum number of control pointsto be employed. PLMP and Pekalska’s method, for example, requiresa number of control points (at least) equal to the dimension of the data,while PLP demands a minimum number of control points in each localneighborhood graph. In practice, those methods make use of k =
√n
control points to build the mappings, where n is the total number ofinstances in the data set.
The LAMP technique, however, is very robust with respect to thenumber of control points, presenting low distortion even when a re-duced number of control points is used, as shown in Figure 3. Notice
that the stress function, given by ∑i j(di j−di j)2
∑i j d2i j
(d and d are the distance
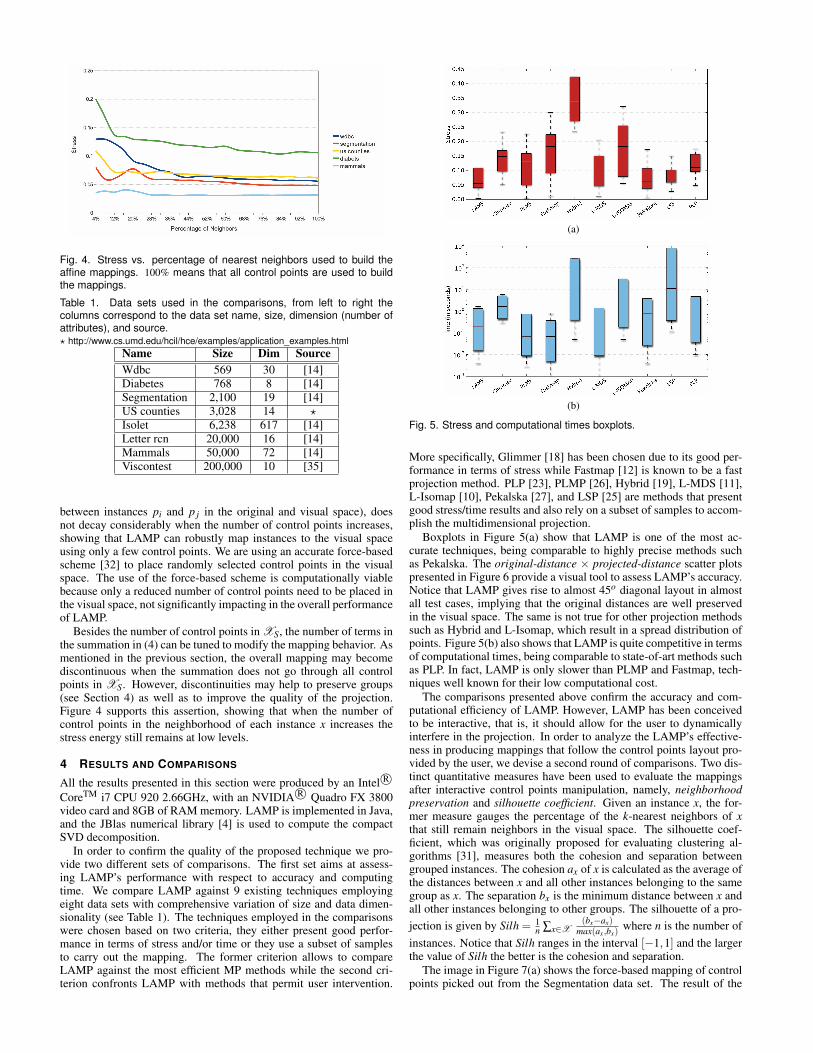
Fig. 4. Stress vs. percentage of nearest neighbors used to build theaffine mappings. 100% means that all control points are used to buildthe mappings.
Table 1. Data sets used in the comparisons, from left to right thecolumns correspond to the data set name, size, dimension (number ofattributes), and source.? http://www.cs.umd.edu/hcil/hce/examples/application_examples.html
Name Size Dim SourceWdbc 569 30 [14]Diabetes 768 8 [14]Segmentation 2,100 19 [14]US counties 3,028 14 ?Isolet 6,238 617 [14]Letter rcn 20,000 16 [14]Mammals 50,000 72 [14]Viscontest 200,000 10 [35]
between instances pi and p j in the original and visual space), doesnot decay considerably when the number of control points increases,showing that LAMP can robustly map instances to the visual spaceusing only a few control points. We are using an accurate force-basedscheme [32] to place randomly selected control points in the visualspace. The use of the force-based scheme is computationally viablebecause only a reduced number of control points need to be placed inthe visual space, not significantly impacting in the overall performanceof LAMP.
Besides the number of control points in XS, the number of terms inthe summation in (4) can be tuned to modify the mapping behavior. Asmentioned in the previous section, the overall mapping may becomediscontinuous when the summation does not go through all controlpoints in XS. However, discontinuities may help to preserve groups(see Section 4) as well as to improve the quality of the projection.Figure 4 supports this assertion, showing that when the number ofcontrol points in the neighborhood of each instance x increases thestress energy still remains at low levels.
4 RESULTS AND COMPARISONS
All the results presented in this section were produced by an Intel R©CoreTM i7 CPU 920 2.66GHz, with an NVIDIA R© Quadro FX 3800video card and 8GB of RAM memory. LAMP is implemented in Java,and the JBlas numerical library [4] is used to compute the compactSVD decomposition.
In order to confirm the quality of the proposed technique we pro-vide two different sets of comparisons. The first set aims at assess-ing LAMP’s performance with respect to accuracy and computingtime. We compare LAMP against 9 existing techniques employingeight data sets with comprehensive variation of size and data dimen-sionality (see Table 1). The techniques employed in the comparisonswere chosen based on two criteria, they either present good perfor-mance in terms of stress and/or time or they use a subset of samplesto carry out the mapping. The former criterion allows to compareLAMP against the most efficient MP methods while the second cri-terion confronts LAMP with methods that permit user intervention.
(a)
(b)
Fig. 5. Stress and computational times boxplots.
More specifically, Glimmer [18] has been chosen due to its good per-formance in terms of stress while Fastmap [12] is known to be a fastprojection method. PLP [23], PLMP [26], Hybrid [19], L-MDS [11],L-Isomap [10], Pekalska [27], and LSP [25] are methods that presentgood stress/time results and also rely on a subset of samples to accom-plish the multidimensional projection.
Boxplots in Figure 5(a) show that LAMP is one of the most ac-curate techniques, being comparable to highly precise methods suchas Pekalska. The original-distance × projected-distance scatter plotspresented in Figure 6 provide a visual tool to assess LAMP’s accuracy.Notice that LAMP gives rise to almost 45o diagonal layout in almostall test cases, implying that the original distances are well preservedin the visual space. The same is not true for other projection methodssuch as Hybrid and L-Isomap, which result in a spread distribution ofpoints. Figure 5(b) also shows that LAMP is quite competitive in termsof computational times, being comparable to state-of-art methods suchas PLP. In fact, LAMP is only slower than PLMP and Fastmap, tech-niques well known for their low computational cost.
The comparisons presented above confirm the accuracy and com-putational efficiency of LAMP. However, LAMP has been conceivedto be interactive, that is, it should allow for the user to dynamicallyinterfere in the projection. In order to analyze the LAMP’s effective-ness in producing mappings that follow the control points layout pro-vided by the user, we devise a second round of comparisons. Two dis-tinct quantitative measures have been used to evaluate the mappingsafter interactive control points manipulation, namely, neighborhoodpreservation and silhouette coefficient. Given an instance x, the for-mer measure gauges the percentage of the k-nearest neighbors of xthat still remain neighbors in the visual space. The silhouette coef-ficient, which was originally proposed for evaluating clustering al-gorithms [31], measures both the cohesion and separation betweengrouped instances. The cohesion ax of x is calculated as the average ofthe distances between x and all other instances belonging to the samegroup as x. The separation bx is the minimum distance between x andall other instances belonging to other groups. The silhouette of a pro-jection is given by Silh = 1
n ∑x∈X(bx−ax)
max(ax,bx)where n is the number of
instances. Notice that Silh ranges in the interval [−1,1] and the largerthe value of Silh the better is the cohesion and separation.
The image in Figure 7(a) shows the force-based mapping of controlpoints picked out from the Segmentation data set. The result of the
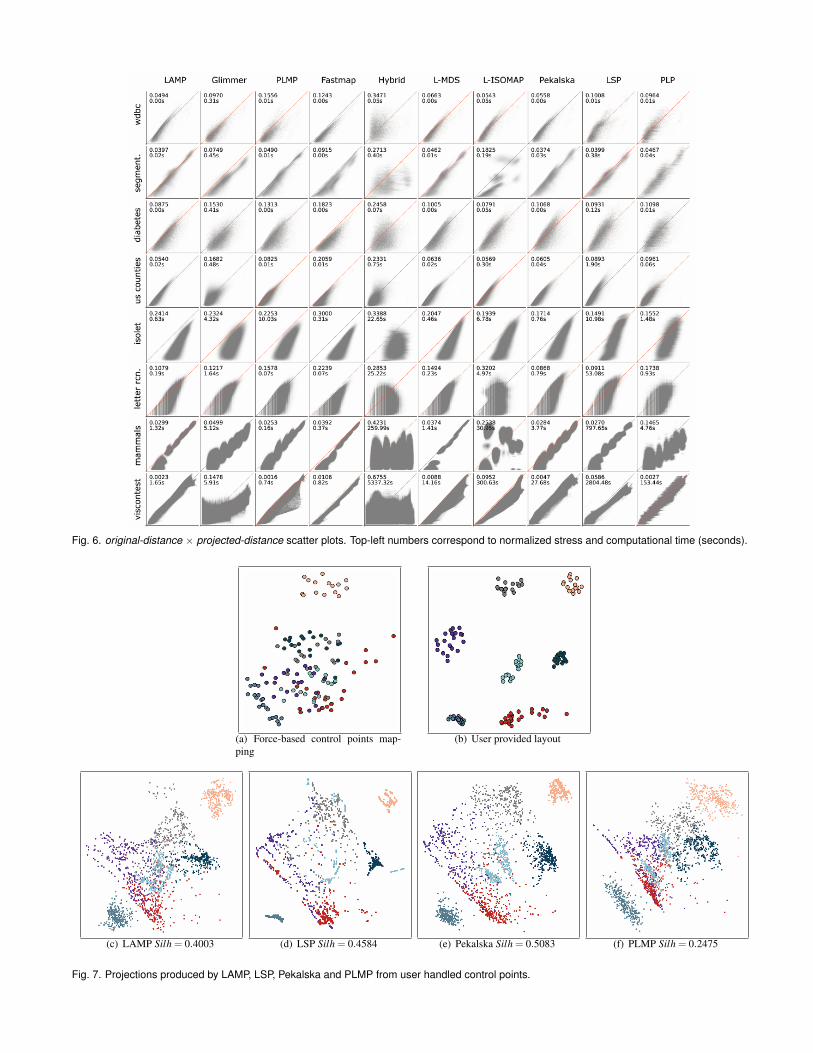
Fig. 6. original-distance × projected-distance scatter plots. Top-left numbers correspond to normalized stress and computational time (seconds).
(a) Force-based control points map-ping
(b) User provided layout
(c) LAMP Silh = 0.4003 (d) LSP Silh = 0.4584 (e) Pekalska Silh = 0.5083 (f) PLMP Silh = 0.2475
Fig. 7. Projections produced by LAMP, LSP, Pekalska and PLMP from user handled control points.
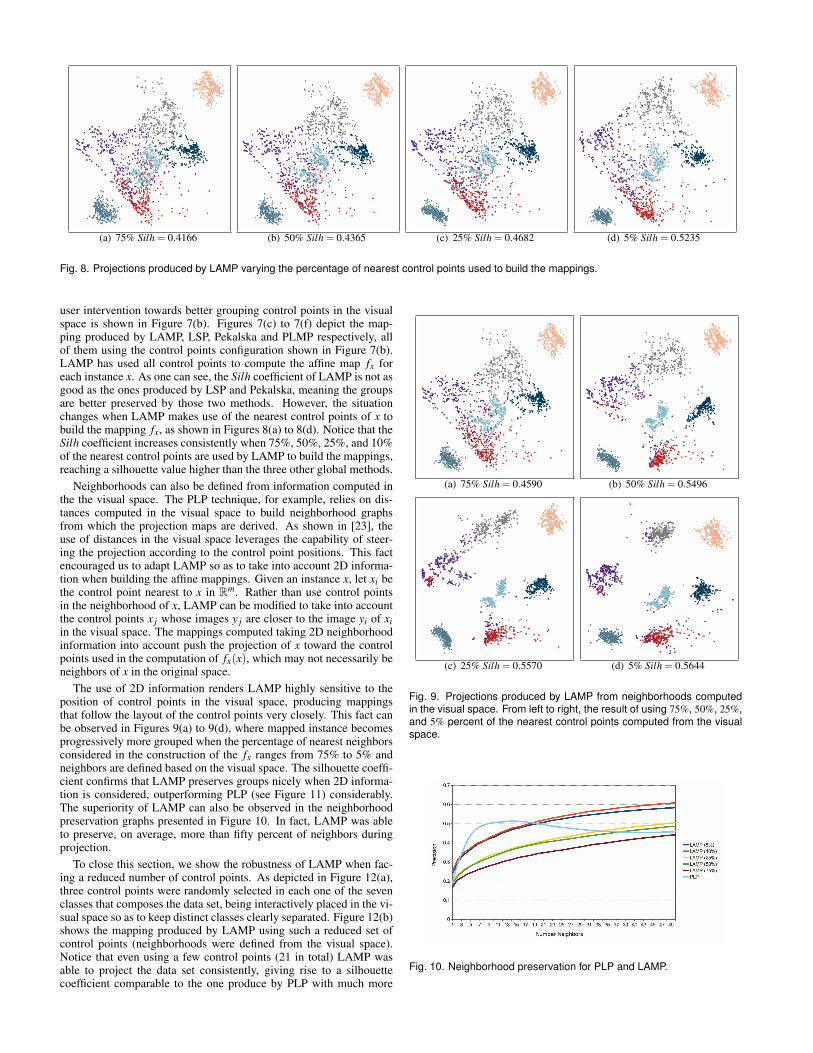
(a) 75% Silh = 0.4166 (b) 50% Silh = 0.4365 (c) 25% Silh = 0.4682 (d) 5% Silh = 0.5235
Fig. 8. Projections produced by LAMP varying the percentage of nearest control points used to build the mappings.
user intervention towards better grouping control points in the visualspace is shown in Figure 7(b). Figures 7(c) to 7(f) depict the map-ping produced by LAMP, LSP, Pekalska and PLMP respectively, allof them using the control points configuration shown in Figure 7(b).LAMP has used all control points to compute the affine map fx foreach instance x. As one can see, the Silh coefficient of LAMP is not asgood as the ones produced by LSP and Pekalska, meaning the groupsare better preserved by those two methods. However, the situationchanges when LAMP makes use of the nearest control points of x tobuild the mapping fx, as shown in Figures 8(a) to 8(d). Notice that theSilh coefficient increases consistently when 75%, 50%, 25%, and 10%of the nearest control points are used by LAMP to build the mappings,reaching a silhouette value higher than the three other global methods.
Neighborhoods can also be defined from information computed inthe the visual space. The PLP technique, for example, relies on dis-tances computed in the visual space to build neighborhood graphsfrom which the projection maps are derived. As shown in [23], theuse of distances in the visual space leverages the capability of steer-ing the projection according to the control point positions. This factencouraged us to adapt LAMP so as to take into account 2D informa-tion when building the affine mappings. Given an instance x, let xi bethe control point nearest to x in Rm. Rather than use control pointsin the neighborhood of x, LAMP can be modified to take into accountthe control points x j whose images y j are closer to the image yi of xiin the visual space. The mappings computed taking 2D neighborhoodinformation into account push the projection of x toward the controlpoints used in the computation of fx(x), which may not necessarily beneighbors of x in the original space.
The use of 2D information renders LAMP highly sensitive to theposition of control points in the visual space, producing mappingsthat follow the layout of the control points very closely. This fact canbe observed in Figures 9(a) to 9(d), where mapped instance becomesprogressively more grouped when the percentage of nearest neighborsconsidered in the construction of the fx ranges from 75% to 5% andneighbors are defined based on the visual space. The silhouette coeffi-cient confirms that LAMP preserves groups nicely when 2D informa-tion is considered, outperforming PLP (see Figure 11) considerably.The superiority of LAMP can also be observed in the neighborhoodpreservation graphs presented in Figure 10. In fact, LAMP was ableto preserve, on average, more than fifty percent of neighbors duringprojection.
To close this section, we show the robustness of LAMP when fac-ing a reduced number of control points. As depicted in Figure 12(a),three control points were randomly selected in each one of the sevenclasses that composes the data set, being interactively placed in the vi-sual space so as to keep distinct classes clearly separated. Figure 12(b)shows the mapping produced by LAMP using such a reduced set ofcontrol points (neighborhoods were defined from the visual space).Notice that even using a few control points (21 in total) LAMP wasable to project the data set consistently, giving rise to a silhouettecoefficient comparable to the one produce by PLP with much more
(a) 75% Silh = 0.4590 (b) 50% Silh = 0.5496
(c) 25% Silh = 0.5570 (d) 5% Silh = 0.5644
Fig. 9. Projections produced by LAMP from neighborhoods computedin the visual space. From left to right, the result of using 75%, 50%, 25%,and 5% percent of the nearest control points computed from the visualspace.
Fig. 10. Neighborhood preservation for PLP and LAMP.
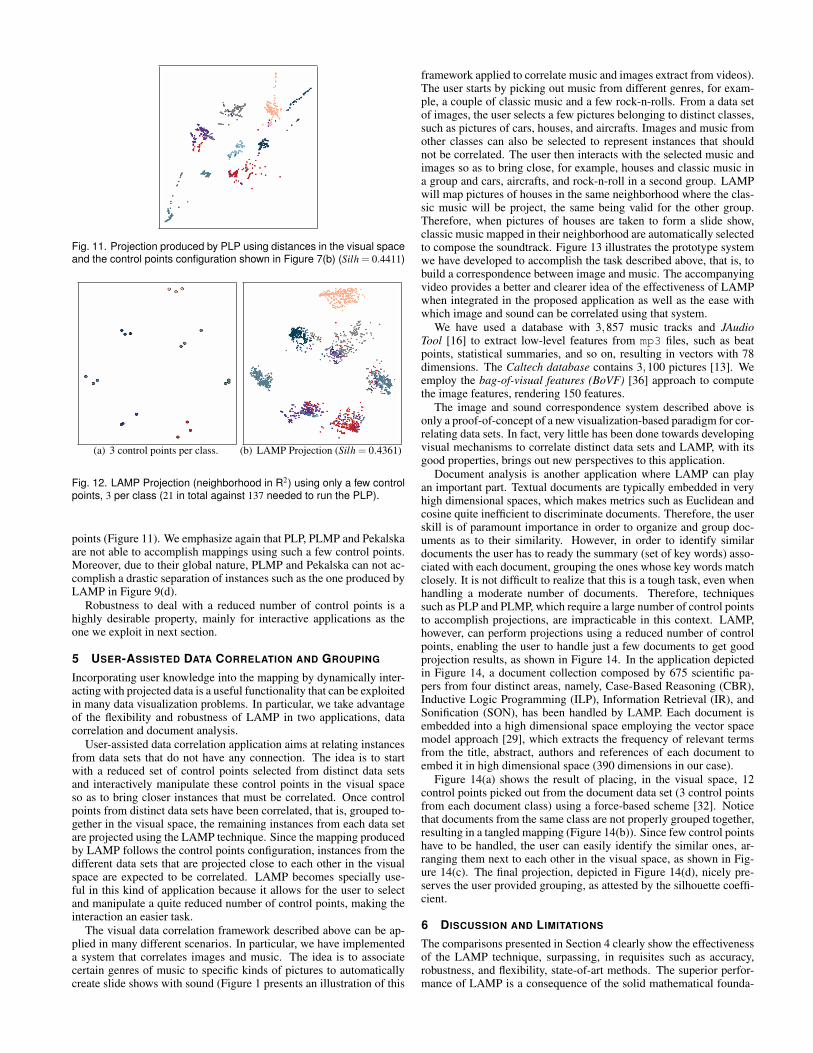
Fig. 11. Projection produced by PLP using distances in the visual spaceand the control points configuration shown in Figure 7(b) (Silh = 0.4411)
(a) 3 control points per class. (b) LAMP Projection (Silh = 0.4361)
Fig. 12. LAMP Projection (neighborhood in R2) using only a few controlpoints, 3 per class (21 in total against 137 needed to run the PLP).
points (Figure 11). We emphasize again that PLP, PLMP and Pekalskaare not able to accomplish mappings using such a few control points.Moreover, due to their global nature, PLMP and Pekalska can not ac-complish a drastic separation of instances such as the one produced byLAMP in Figure 9(d).
Robustness to deal with a reduced number of control points is ahighly desirable property, mainly for interactive applications as theone we exploit in next section.
5 USER-ASSISTED DATA CORRELATION AND GROUPING
Incorporating user knowledge into the mapping by dynamically inter-acting with projected data is a useful functionality that can be exploitedin many data visualization problems. In particular, we take advantageof the flexibility and robustness of LAMP in two applications, datacorrelation and document analysis.
User-assisted data correlation application aims at relating instancesfrom data sets that do not have any connection. The idea is to startwith a reduced set of control points selected from distinct data setsand interactively manipulate these control points in the visual spaceso as to bring closer instances that must be correlated. Once controlpoints from distinct data sets have been correlated, that is, grouped to-gether in the visual space, the remaining instances from each data setare projected using the LAMP technique. Since the mapping producedby LAMP follows the control points configuration, instances from thedifferent data sets that are projected close to each other in the visualspace are expected to be correlated. LAMP becomes specially use-ful in this kind of application because it allows for the user to selectand manipulate a quite reduced number of control points, making theinteraction an easier task.
The visual data correlation framework described above can be ap-plied in many different scenarios. In particular, we have implementeda system that correlates images and music. The idea is to associatecertain genres of music to specific kinds of pictures to automaticallycreate slide shows with sound (Figure 1 presents an illustration of this
framework applied to correlate music and images extract from videos).The user starts by picking out music from different genres, for exam-ple, a couple of classic music and a few rock-n-rolls. From a data setof images, the user selects a few pictures belonging to distinct classes,such as pictures of cars, houses, and aircrafts. Images and music fromother classes can also be selected to represent instances that shouldnot be correlated. The user then interacts with the selected music andimages so as to bring close, for example, houses and classic music ina group and cars, aircrafts, and rock-n-roll in a second group. LAMPwill map pictures of houses in the same neighborhood where the clas-sic music will be project, the same being valid for the other group.Therefore, when pictures of houses are taken to form a slide show,classic music mapped in their neighborhood are automatically selectedto compose the soundtrack. Figure 13 illustrates the prototype systemwe have developed to accomplish the task described above, that is, tobuild a correspondence between image and music. The accompanyingvideo provides a better and clearer idea of the effectiveness of LAMPwhen integrated in the proposed application as well as the ease withwhich image and sound can be correlated using that system.
We have used a database with 3,857 music tracks and JAudioTool [16] to extract low-level features from mp3 files, such as beatpoints, statistical summaries, and so on, resulting in vectors with 78dimensions. The Caltech database contains 3,100 pictures [13]. Weemploy the bag-of-visual features (BoVF) [36] approach to computethe image features, rendering 150 features.
The image and sound correspondence system described above isonly a proof-of-concept of a new visualization-based paradigm for cor-relating data sets. In fact, very little has been done towards developingvisual mechanisms to correlate distinct data sets and LAMP, with itsgood properties, brings out new perspectives to this application.
Document analysis is another application where LAMP can playan important part. Textual documents are typically embedded in veryhigh dimensional spaces, which makes metrics such as Euclidean andcosine quite inefficient to discriminate documents. Therefore, the userskill is of paramount importance in order to organize and group doc-uments as to their similarity. However, in order to identify similardocuments the user has to ready the summary (set of key words) asso-ciated with each document, grouping the ones whose key words matchclosely. It is not difficult to realize that this is a tough task, even whenhandling a moderate number of documents. Therefore, techniquessuch as PLP and PLMP, which require a large number of control pointsto accomplish projections, are impracticable in this context. LAMP,however, can perform projections using a reduced number of controlpoints, enabling the user to handle just a few documents to get goodprojection results, as shown in Figure 14. In the application depictedin Figure 14, a document collection composed by 675 scientific pa-pers from four distinct areas, namely, Case-Based Reasoning (CBR),Inductive Logic Programming (ILP), Information Retrieval (IR), andSonification (SON), has been handled by LAMP. Each document isembedded into a high dimensional space employing the vector spacemodel approach [29], which extracts the frequency of relevant termsfrom the title, abstract, authors and references of each document toembed it in high dimensional space (390 dimensions in our case).
Figure 14(a) shows the result of placing, in the visual space, 12control points picked out from the document data set (3 control pointsfrom each document class) using a force-based scheme [32]. Noticethat documents from the same class are not properly grouped together,resulting in a tangled mapping (Figure 14(b)). Since few control pointshave to be handled, the user can easily identify the similar ones, ar-ranging them next to each other in the visual space, as shown in Fig-ure 14(c). The final projection, depicted in Figure 14(d), nicely pre-serves the user provided grouping, as attested by the silhouette coeffi-cient.
6 DISCUSSION AND LIMITATIONS
The comparisons presented in Section 4 clearly show the effectivenessof the LAMP technique, surpassing, in requisites such as accuracy,robustness, and flexibility, state-of-art methods. The superior perfor-mance of LAMP is a consequence of the solid mathematical founda-
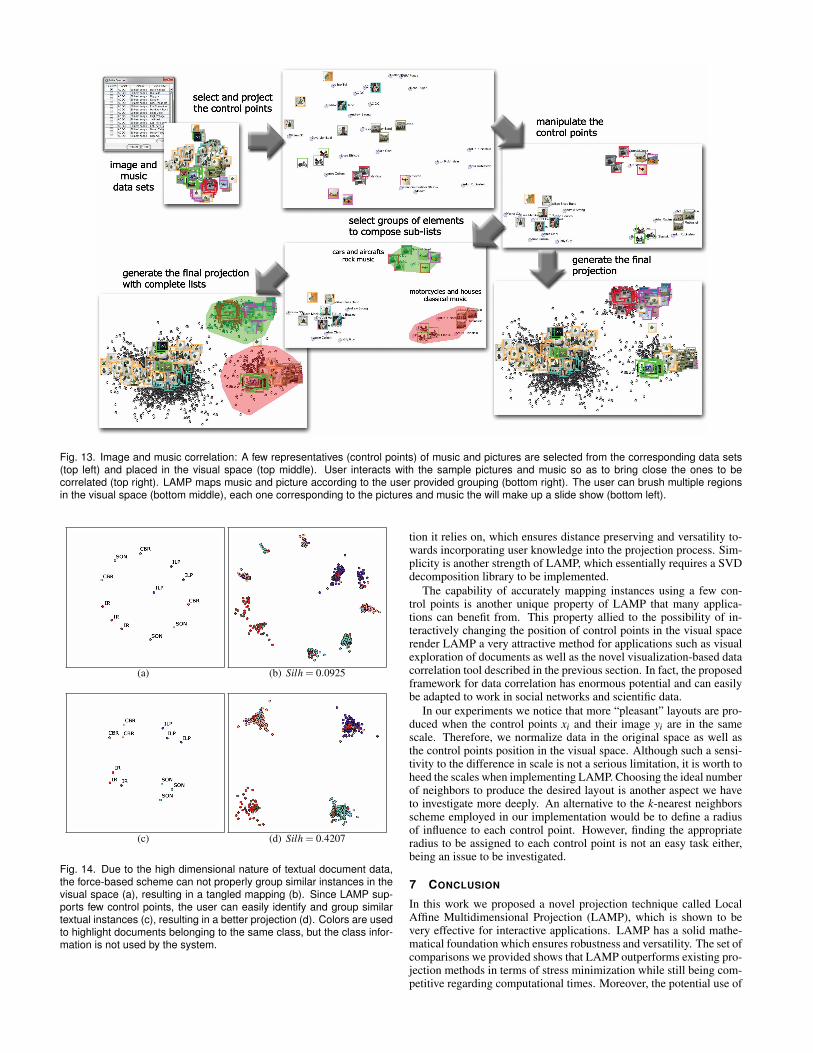
Fig. 13. Image and music correlation: A few representatives (control points) of music and pictures are selected from the corresponding data sets(top left) and placed in the visual space (top middle). User interacts with the sample pictures and music so as to bring close the ones to becorrelated (top right). LAMP maps music and picture according to the user provided grouping (bottom right). The user can brush multiple regionsin the visual space (bottom middle), each one corresponding to the pictures and music the will make up a slide show (bottom left).
(a) (b) Silh = 0.0925
(c) (d) Silh = 0.4207
Fig. 14. Due to the high dimensional nature of textual document data,the force-based scheme can not properly group similar instances in thevisual space (a), resulting in a tangled mapping (b). Since LAMP sup-ports few control points, the user can easily identify and group similartextual instances (c), resulting in a better projection (d). Colors are usedto highlight documents belonging to the same class, but the class infor-mation is not used by the system.
tion it relies on, which ensures distance preserving and versatility to-wards incorporating user knowledge into the projection process. Sim-plicity is another strength of LAMP, which essentially requires a SVDdecomposition library to be implemented.
The capability of accurately mapping instances using a few con-trol points is another unique property of LAMP that many applica-tions can benefit from. This property allied to the possibility of in-teractively changing the position of control points in the visual spacerender LAMP a very attractive method for applications such as visualexploration of documents as well as the novel visualization-based datacorrelation tool described in the previous section. In fact, the proposedframework for data correlation has enormous potential and can easilybe adapted to work in social networks and scientific data.
In our experiments we notice that more “pleasant” layouts are pro-duced when the control points xi and their image yi are in the samescale. Therefore, we normalize data in the original space as well asthe control points position in the visual space. Although such a sensi-tivity to the difference in scale is not a serious limitation, it is worth toheed the scales when implementing LAMP. Choosing the ideal numberof neighbors to produce the desired layout is another aspect we haveto investigate more deeply. An alternative to the k-nearest neighborsscheme employed in our implementation would be to define a radiusof influence to each control point. However, finding the appropriateradius to be assigned to each control point is not an easy task either,being an issue to be investigated.
7 CONCLUSION
In this work we proposed a novel projection technique called LocalAffine Multidimensional Projection (LAMP), which is shown to bevery effective for interactive applications. LAMP has a solid mathe-matical foundation which ensures robustness and versatility. The set ofcomparisons we provided shows that LAMP outperforms existing pro-jection methods in terms of stress minimization while still being com-petitive regarding computational times. Moreover, the potential use of
LAMP to support visualization-based data correlation opens new pos-sibilities for applications which could not be efficiently addressed untilnow. Therefore, flexibility, effectiveness, and ease of implementationrender LAMP one of the most attractive multidimensional projectionmethods for handling high-dimensional data. We are currently inves-tigating better mechanisms to assess the impact of user interaction inthe quality of the projection, since stress is not a useful measure afterinteraction.
ACKNOWLEDGMENTS
We would like to thank the anonymous reviewers for their constructivecomments. This research has been funded by Fapesp-Brazil, CNPq-NSF, and CNPq-Brazil.
REFERENCES
[1] M. Belkin and P. Niyogi. Laplacian eigenmaps for dimensionality reduc-tion and data representation. Neural Comput., 15(6):1373–1396, 2003.
[2] L. S. Blackford, J. Demmel, J. Dongarra, I. Duff, S. Hammarling,G. Henry, M. Heroux, L. Kaufman, A. Lumsdaine, A. Petitet, R. Pozo,K. Remington, and R. C. Whaley. An updated set of basic linear algebrasubprograms (BLAS). ACM Trans. Math. Softw., 28:135–151, June 2002.
[3] U. Brandes and C. Pich. Eigensolver methods for progressive multidi-mensional scaling of large data. In M. Kaufmann and D. Wagner, editors,LNCS, volume 4372, pages 42–53. 2007.
[4] M. L. Braun, J. Schaback, M. L. Jugel, and N. Oury. jBlas: Linear algebrafor java, 2011.
[5] M. M. Bronstein, A. M. Bronstein, R. Kimmel, and I. Yavneh. Multigridmultidimensional scaling. Numerical Linear Algebra with Applications,13:149–171, 2006.
[6] M. Chalmers. A linear iteration time layout algorithm for visualisinghigh-dimensional data. In IEEE Visualization, pages 127–ff., 1996.
[7] Y. Chen, L. Wang, M. Dong, and J. Hua. Exemplar-based visualizationof large document corpus. IEEE Trans. Vis. Comput. Graph., 15:1161–1168, 2009.
[8] W. Cui, Y. Wu, S. Liu, F. Wei, M. X. Zhou, and H. Qu. Context-preserving, dynamic word cloud visualization. IEEE Computer Graphicsand Applications, pages 42–53, 2010.
[9] J. Daniels, E. W. Anderson, L. G. Nonato, and C. T. Silva. Interac-tive vector field feature identification. IEEE Trans. Vis. Comput. Graph.,16:1560–1568, 2010.
[10] V. de Silva and J. B. Tenenbaum. Global versus local methods in non-linear dimensionality reduction. In Advances in Neural Information Pro-cessing Systems 15, pages 705–712. MIT Press, 2003.
[11] V. de Silva and J. B. Tenenbaum. Sparse multidimensional scaling usinglandmark points. Technical report, Stanford, 2004.
[12] C. Faloutsos and K. Lin. FastMap: A fast algorithm for indexing,datamining and visualization of traditional and multimedia databases. InACM SIGMOD, pages 163–174, 1995.
[13] R. Fergus, P. Perona, and A. Zisserman. Object class recognition by un-supervised scale-invariant learning. In CVPR, volume 2, pages 264–271,2003.
[14] A. Frank and A. Asuncion. UCI machine learning repository, 2010.[15] Y. Frishman and A. Tal. Multi-level graph layout on the GPU. IEEE
Trans. Vis. Comput. Graph., 13:1310–1319., 2007.[16] I. Fuinaga and D. McEnnis. On-demand metadata extraction network
(OMEN). In ACM/IEEE-CS Joint Conf. on Digital Libraries, pages 346–346, 2006.
[17] J. Gower and G. Dijksterhuis. Procrustes Problems. Oxford UniversityPress, 2004.
[18] S. Ingram, T. Munzner, and M. Olano. Glimmer: Multilevel MDS on theGPU. IEEE Trans. Vis. Comp. Graph., 15(2):249–261, 2009.
[19] F. Jourdan and G. Melançon. Multiscale hybrid MDS. In InformationVisualisation, pages 388–393, 2004.
[20] Y. Koren, L. Carmel, and D. Harel. ACE: A fast multiscale eigenvectorscomputation for drawing huge graphs. In IEEE Information Visualization,pages 137–144, 2002.
[21] J. B. Kruskal. Multidimensional scaling by optimizing goodness of fit toa nonmetric hypothesis. Psychometrika, 29:115–129, 1964.
[22] A. Morrison, G. Ross, and M. Chalmers. A hybrid layout algorithm forsub-quadratic multidimensional scaling. In IEEE Information Visualiza-tion, pages 152–158, 2002.
[23] F. V. Paulovich, D. M. Eler, J. Poco, C. P. Botha, R. Minghim, and L. G.Nonato. Piecewise laplacian-based projection for interactive data ex-ploration and organization. Computer Graphics Forum (EuroVis’2011),30(3):1091–1100, 2011.
[24] F. V. Paulovich, L. G. Nonato, and R. Minghim. Visual mapping of textcollections through a fast high precision projection technique. In Inter-national Conference on Information Visualization, pages 282–290, 2006.
[25] F. V. Paulovich, L. G. Nonato, R. Minghim, and H. Levkowitz. Leastsquare projection: A fast high-precision multidimensional projectiontechnique and its application to document mapping. IEEE Trans. Visual.Comp. Graph., 14(3):564–575, 2008.
[26] F. V. Paulovich, C. T. Silva, and L. G. Nonato. Two-phase mappingfor projecting massive data sets. IEEE Trans. on Vis. Comp. Graph.,16(6):1281–1290, 2010.
[27] E. Pekalska, D. de Ridder, R. P. W. Duin, and M. A. Kraaijveld. A newmethod of generalizing Sammon mapping with application to algorithmspeed-up. In M. Boasson, J. A. Kaandorp, J. F. M. Tonino, and M. G.Vosselman, editors, Annual Conf. Advanced School for Comput. Imag.,pages 221–228, 1999.
[28] S. T. Roweis and L. K. Saul. Nonlinear dimensionality reduction by lo-cally linear embedding. Science, 290(5500):2323–2326, December 2000.
[29] G. Salton. Developments in automatic text retrieval. Science, 253:974–980, 1991.
[30] S. Schaefer, T. McPhail, and J. Warren. Image deformation using movingleast squares. ACM Trans. Graph., 25(3):533–540, 2006.
[31] P. Tan, M. Steinbach, and V. Kumar. Introduction to Data Mining.Addison-Wesley, 2005.
[32] E. Tejada, R. Minghim, and L. G. Nonato. On improved projection tech-niques to support visual exploration of multidimensional data sets. Infor-mation Visualization, 2(4):218–231, 2003.
[33] J. B. Tenenbaum, V. de Silva, and J. C. Langford. A global ge-ometric framework for nonlinear dimensionality reduction. Science,290(5500):2319–2323, December 2000.
[34] W. S. Torgeson. Multidimensional scaling of similarity. Psychometrika,30:379–393, 1965.
[35] D. Whalen and M. L. Norman. Competition data set anddescription. In 2008 IEEE Visualization Design Contest.http://vis.computer.org/VisWeek2008/vis/contests.html, 2008.
[36] J. Yang, Y.-G. Jiang, A. G. Hauptmann, and C.-W. Ngo. Evaluating bag-of-visual-words representations in scene classification. In InternationalWorkshop on Multimedia Information Retrieval, pages 197–206, 2007.