Embed Size (px)
Citation preview
Looking at Near-Duplicate Videos from aHuman-Centric Perspective
RODRIGO DE OLIVEIRA
MAURO CHERUBINI
and
NURIA OLIVER
Telefonica Research, Barcelona
Popular content in video sharing websites (e.g., YouTube) is usually replicated via identical copiesor near-duplicates. These duplicates are usually studied because they pose a threat to site ownersin terms of wasted disk space, or privacy infringements. Furthermore, this content might poten-tially hinder the users’ experience in these websites. The research presented in this paper focusesaround the central argument that there is no agreement on the technical definition of what thesenear-duplicates are, and, more importantly, there is no strong evidence that users of video sharingwebsites would like this content to be removed. Most scholars define near-duplicate video clips(NDVC) by means of non-semantic features (e.g., different image/audio quality), while a few alsoinclude semantic features (i.e., different videos of similar content). However, it is unclear whatfeatures contribute to the human perception of near-duplicate videos. The findings of four largescale online surveys that were carried out in the context of our research confirm the relevance ofboth types of features. Some of our findings confirm the adopted definitions of NDVC whereasother findings are surprising: Near-duplicate videos with different image quality, audio quality, orwith/without overlays were perceived as NDVC. However, the same could not be verified whenvideos differed by more than one of these features at the same time. With respect to semantics,it is yet unclear the exact role that it plays in relation to the features that make videos alike.From a user’s perspective, participants preferred in most cases to see only one of the NDVC in thesearch results of a video search query and they were more tolerant to changes in the audio than inthe video tracks. Based on all these findings, we propose a new user-centric NDVC definition andpresent implications for how duplicate content should be dealt with by video sharing websites.
Categories and Subject Descriptors: H.3.3 [Information Search and Retrieval]: Informationfiltering, Search process, Selection process
General Terms: NDVC, near-duplicate, video sharing
Additional Key Words and Phrases: psychophysical experiment, similarity, user study, YouTube
1. INTRODUCTION & MOTIVATION
Today’s video sharing websites allow their users to freely post multimedia contentwithout typically checking for its uniqueness. As a consequence, it is not unusual tofind in these sites multiple copies of the same or very similar videos. These videosare usually referred to as near-duplicate video clips (NDVC).
Author’s address: R. de Oliveira, Via Augusta 177, 08021, Barcelona - Spain.Telefonica Research participates in the Torres Quevedo subprogram (MICINN), cofinanced by theEuropean Social Fund, for researchers recruitment.Permission to make digital/hard copy of all or part of this material without fee for personalor classroom use provided that the copies are not made or distributed for profit or commercialadvantage, the ACM copyright/server notice, the title of the publication, and its date appear, andnotice is given that copying is by permission of the ACM, Inc. To copy otherwise, to republish,to post on servers, or to redistribute to lists requires prior specific permission and/or a fee.c© 2010 ACM 0000-0000/2010/0000-0111 $5.00
ACM Journal Name, Vol. 2, No. 3, 09 2010, Pages 111–133.
112 · Oliveira et al.
Different research groups have related the presence of NDVC to spam creation[Benevenuto et al. 2008] and copyright infringements [Shen et al. 2007]. For exam-ple, Wu et al. [2007] recommend the identification and removal of this duplicatedcontent in order to increase the efficiency of video information retrieval tasks. Intheir studies, they found an average of 27% of NDVC in the search results of anoriginal video.
Most of the previous work in this area has focused on identifying and removingNDVC. However, we believe that these approaches understate the role played byNDVC, as they are neither necessarily uploaded with malicious intent nor are exactcopies of the original video. In fact, it is not infrequent to find near-duplicatevideo clips that complement the original material with additional information (e.g.,commentary audio or subtitles) and that hence might provide valuable informationto the users of the system. For instance, a popular YouTube videos might containnews about a recent event, such as the last victory of the Conservative party in theUK elections. However, the audio channel of the original news piece might havebeen removed to include an audio commentary of the user. This new content mightoffer the user’s perspective on the event and might be considered useful by otherusers. Hence, it is not clear that all near-duplicate content should automaticallybe removed from video sharing sites.
In addition, there does not seem to be a full agreement on the technical definitionof the features that characterize NDVC.
Therefore, we believe that the multimedia information retrieval community wouldbenefit from additional human-centric research on this topic –gathered via userstudies, for at least three reasons: 1) Little is known about how users are affectedby the presence of NDVC; 2) it is generally unknown what features contribute tothe users’ perception of similarity among multimedia items; and 3) there is a lackof empirical proofs showing that the removal of NDVC from the results set of avideo search task satisfies the users’ needs.
In this paper, we present the results of four large-scale online questionnairesthat were designed to shed light on the human perception of NDVC. We askedrespondents to:
(1) Characterize their common use of video sharing websites;(2) Watch pairs of NDVC and state their degree of similarity (some pairs differed
in only one feature while others differed in more than one feature); and(3) Elicit their preferences –if any– on which duplicate they would like to have in
the search results
The analysis of the answers to the questionnaires led us to a user-centric definitionof NDVC with implications for how duplicated videos should be retrieved in videosharing websites (see Section 6).
2. RELATED WORK
In the last few years, different research groups have tried to understand how videosharing websites are used. A large part of the work has analyzed data fromYouTube1, the largest and most popular video sharing website today. The fo-cus has been on gathering objective measurements of the users’ interactions inthese sites, mainly with two goals in mind: 1) improving the efficacy of the video
1See http://www.youtube.com, lastly retrieved in March 2010.
ACM Journal Name, Vol. 2, No. 3, 09 2010.
Looking at Near-Duplicate Videos from a Human-Centric Perspective · 113
information retrieval task; and 2) fighting malicious behavior such as spam, self-promotion of certain users, and copyright infringements. First, we shall review themost relevant work that analyzes the behavior of users of video sharing sites (par-ticularly YouTube), followed by an overview of the literature in NDVC detectionand removal.
2.1 Analyzing YouTube User Behavior
Benevenuto et al. [2008] conducted a study to understand user behavior on YouTube.In particular, they crawled YouTube and studied how people interact with eachother through video responses by measuring degree distributions in their interac-tions. They found that 60% of YouTube users have an out-degree higher thanin-degree, whereas only 5% of the users have significantly higher in-degree thanout-degree. In other words, a very small number of users act as authorities or hubsof information (those with high in-degree) while the majority of users are low-rankusers, have a small number of views and receive none or very few video responsesfrom the video community. Using the same approach they found consistent evi-dences of anti-social behavior. For example, nodes with very high out-degree mayindicate either very active users or spammers.
Complementary results were obtained by Halvey and Keane [2007] who analyzedsocial interactions on YouTube by crawling user pages and focusing on website-supported methods for social interactions. They found that users tend to watchrather than to add videos (e.g., 966 views vs. 11 uploads on average per user).Furthermore, they found a general failure in exploiting the community facilitiesavailable on the website. These findings are very relevant when designing a per-sonalization or recommendation system for YouTube users, as this passive userbehavior might not be informative enough for generating predictions for a commu-nity of users. Similar results were obtained by Gill et al. [2008] who, following asimilar methodology, found that most users do not upload videos (e.g., 51% of ses-sions did not transfer any videos) and have different browsing patterns dependingon the purpose of their visit. Finally, a finer profiling of YouTube users was de-scribed by Maia et al. [2008] where they collected a large dataset containing manyfeatures of the users’ interactions in the system. They then clustered users into 5user types. Out of their sample, only 23% of the users were identified as contentproducers, i.e., users that constantly access their accounts and have a significantlyhigher than average number of uploads, watches, and channel views.
A common pattern found in these studies is that the greatest part of the usersof video sharing websites consume media instead of sharing it. However, littleresearch has been carried out to date on how users reach the content they watch.This specific point is relevant to understand what population of users is affectedby the problem of near-duplicate videos. Note that users who access videos byfollowing recommended links will not experience the presence of near duplicates.Conversely, users who actively search for video content will be exposed to NDVC intheir search results. Hence, we formulate our first hypothesis as: H1, Video searchis the main method for reaching content on video sharing websites.
2.2 Near-Duplicate Video Clips (NDVC)
Turning now our attention to NDVC, it is important to understand the role thatduplicated clips play on the way people use video sharing websites. In this re-gard, Kruitbosch and Nack [2008] investigated to what extent the videos sharedon YouTube are self/amateur generated content vs. professionally authored con-
ACM Journal Name, Vol. 2, No. 3, 09 2010.
114 · Oliveira et al.
tent. They found that most of the popular content on YouTube was professionallygenerated, even though a random sample showed that there was significantly moreuser-generated content available. In this sense, YouTube seems to be acting as asocial filter, allowing anyone to share content they find interesting, rather than away for creative people to show their abilities to the world. Professionally createdvideos are more likely to be copied than user-generated ones [Kruitbosch and Nack2008]. Given that most of the popular content in video sharing websites has beenfound to be professionally generated, one would expect to find a significant numberof NDVC in these sites.
Cha et al. [2007] conducted several experiments on a large dataset of YouTubevideos. They found that the way content is filtered on YouTube is the likely causefor the lower-than-expected popularity of niche contents, which if leveraged couldincrease the total views by as much as 45%. More specifically, they conductedexperiments to understand the impact of content aliasing. They extracted a sampleof 216 of the top 10.000 videos on YouTube and found that about 85% of them had1 to 4 duplicates. Most of the duplicated videos were uploaded on the same dayas the original video or within a week. In addition, many of them still appeared100 or more days after the original videos were posted. Less dramatic results werereported by Wu et. al. [2007] who conducted a study on the topmost search resultson a sample of 24 popular queries from YouTube, Google Video and Yahoo! Video.They found an average of 27% NDVC of the most popular version of a video inthe search results. These results suggest that the presence of NDVC in the searchresults is a real problem that impacts the way people reach for content on videosharing websites. Note that in all studies NDVC are seen as redundant content.Therefore multimedia information retrieval scholars have proposed in recent yearsapproaches to detect and cluster this content, in order to eliminate NDVC from thesearch results.
The first step when building a NDVC detection system is a working definition ofNDVC. Table I summarizes the most common definitions of NDVC that have beenproposed in the literature. As seen on the Table, the actual definition of NDVC isstill an open research question. We summarize next the most relevant and recentefforts –and associated NDVC definitions– in automatically detecting NDVC froma video search result list.
Table I. Comparison of NDVC definitions.Author NDVC definitionWu etal. [2007]
Identical or approximately identical videos close to the exact duplicate of eachother, but different in file formats, encoding parameters, photometric varia-tions (color, lighting changes), editing operations (caption, logo and borderinsertion), different lenghts, and certain modifications (frames add/remove).
Shen etal. [2007]
Clips that are similar or nearly duplicate of each other, but appear differentlydue to various changes introduced during capturing time (camera viewpointand setting, lighting condition, background, foreground, etc.), transformations(video format, frame rate, resize, shift, crop, gamma, contrast, brightness,saturation, blur, age, sharpen, etc.), and editing operations (frame insertion,deletion, swap and content modification).
Basharat etal. [2008]
Videos of the same scene (e.g., a person riding a bike) varying viewpoints, sizes,appearances, bicycle type, and camera motions. The same semantic conceptcan occur under different illumination, appearance, and scene settings, just toname a few.
ACM Journal Name, Vol. 2, No. 3, 09 2010.
Looking at Near-Duplicate Videos from a Human-Centric Perspective · 115
Wu et al. [2007] tried to identify and remove NDVC using the definition reportedin Table I. They proposed a hierarchical approach to cluster and filter out NDVC,demonstrating that their approach could effectively detect and reduce redundantvideos displayed to the user in the top result set. Shen et al. [2007] extended thedefinition of NDVC by including changes introduced during capturing time, such asa change of camera viewpoint (see Table I). They proposed a detection system calledUQLIPS that comprised two approaches: a bounded coordinate system and a framesymbolization, which takes temporal order of the key-frames into consideration.They found that this system could accurately remove NDVC from a large collectionin real-time. In 2009, they proposed an enhanced version of their system that wastaking advantage of the user interaction with the system [Cheng et al. 2009]. Yetanother definition was employed by Basharat et al. [2008], who included intra-classvariations such as scene settings, different viewpoints, different camera motions, toname a few.
More recently, sophisticated techniques for identifying and removing NDVC fromlarge datasets have been proposed. Cheng and Chia [2010] proposed a method ofidentification and removal of near-duplicates in video search results via matchingstrata of keyframes. Yang and colleagues [2009] introduced a system consisting ofthree major elements: a unified feature to describe both images and videos, a coreindexing structure to assure the most frequent data access occurred in the mainmemory, and a multi-steps verification for queries to best exclude false positivesand to increase the precision. Similarly, Zhou and colleagues [2009] proposed anadaptive frame selection strategy called furthest point Voronoi (FPV) to select theshot frame set according to content and frame distribution. While these previoustechniques looked at low-level features of video clips, Min et al. [2009] proposedan advanced technique based on identifying semantic concepts along the temporalaxis of a particular video sequence, resulting in the construction of a so-calledsemantic video signature. Furthermore, Kim and colleagues [2010] proposed to usethe popular gene sequence alignment algorithm in Biology, i.e., BLAST, to detectnear-duplicate images.
Taking as a starting point all previous work, we devised an experiment to test–from a user-centric perspective– which of the features proposed in the literatureplay a role in the users’ perceptions of NDVC. Therefore, we pose our secondhypothesis as: H2, Identical or approximately identical videos differing in photo-metric features (image quality), audio quality, editing of the content (i.e., few ormore scenes), additional content (i.e., audio and image overlays), or having thesame visual context but different audio (or viceversa) are considered by the users assimilar clips. Finally, we seek to verify our initial argument that users might notwant to have all this duplicated content removed from the search results. Hence,our third hypothesis is: H3, Once the users obtain the result list for a video searchquery and after watching the NDVC in such a list, they have a preference for oneNDVC over the others and therefore would rather only see the preferred NDVC inthe search results.
We believe that the previous work in this area has been extremely valuable, butwould greatly benefit from a user study focused on the needs and perceptions ofusers of video sharing sites.
An underlying challenge in this research is related to the subjectivity of thehuman perception [Rui et al. 1999; Shao et al. 2008]: different users might havedifferent reactions to a particular definition of NDVC and might have different pref-erences on how to treat this content (e.g., hide it vs. cluster it). Also, stating the
ACM Journal Name, Vol. 2, No. 3, 09 2010.
116 · Oliveira et al.
questions in a neutral manner is also important as people tend to focus on differentfeatures when thinking about similarity than when thinking about differences [Tver-sky 1977]. In the field of image retrieval, recent psychophysical experiments havebeen conducted to capture the users’ perceptions and to use them as the groundtruth when evaluating the performance of retrieval algorithms. In all the studies,the retrieval performance was significantly improved by incorporating the humanperception of similarity into the systems [Payne and Stonham 2001; Guyader et al.2002; Celebi and Aslandogan 2005], thus highlighting the importance of extendinguser studies of human perception to video similarity as well.
3. HYPOTHESES AND APPROACH
In summary, the work presented in this paper aims at providing evidence on: 1) howusers of video sharing websites reach the content they intend to watch; 2) whetherdifferent features that are used to characterize NDVC are perceived as potentiallyproducing redundant content; and 3) whether users have preferences on the waythey treat NDVC. The research hypotheses of our work are:
H1 Video search is the main method for reaching content on video sharing websites.H2 Identical or approximately identical videos differing in photometric features
(image quality), audio quality, editing of the content (i.e., few or more scenes),additional content (i.e., audio and image overlays), or having the same visualcontext but different audio (or viceversa) are considered by the users as similarclips.
H3 Once the users obtain the result list for a video search query and after watchingthe NDVC in such a list, they have a preference for one NDVC over the othersand therefore would rather only see the preferred NDVC in the search results.
We believe that the validation of these three hypotheses will be instrumental inthe development of efficient, useful and intuitive search and retrieval systems ofaudiovisual content.
In terms of H1, we investigated the users’ behavior in a video search task from twoperspectives: purpose and proactivity. With respect to purpose, subjects were askedto report the most common tasks that they performed in video sharing websites (seeappendix, section B) such as YouTube: (1) search for specific videos, (2) browsewithout a specific video in mind, or (3) do something else. In terms of proactivity,participants answered if the videos they watch on these systems are usually: (1)found by themselves, (2) suggested by someone else, or (3) found by other means.
Concerning H2, we asked participants to watch seven pairs of NDVC (see anexample in the appendix, section C), where each pair of NDVC differed in onlyone feature, as detailed in Section 4.2 (study 1, or S1). Subjects were asked torate the similarity of the paired videos and to state why they chose a particulardegree of similarity. To study the perception of similarity we removed all possibleconfounding variables and offered the subjects only a video pair at a time, assuggested by psychological research in the field [Tversky 1977]. In a second study,or S2, we edited video pairs that had been considered by the users to be NDVCin such a way that the updated videos would differ in more than one feature, inorder to study the interaction between the different low-level features. Moreover,participants were asked to rate the degree of similarity between the edited videopairs and their preferences between videos (study 2, or S2).
Finally, H3 was addressed by asking participants: 1) whether they had a pref-erence between each of the paired videos; and 2) which of the videos they wouldACM Journal Name, Vol. 2, No. 3, 09 2010.
Looking at Near-Duplicate Videos from a Human-Centric Perspective · 117
like to see in the result set if they were searching for videos using the same query.Answers were limited to: (1) video 1, (2) video 2, (3) both, (4) none, (5) either one,and (6) “I don’t know what to expect from the query associated with the videos”(see the appendix, section C).
4. METHODOLOGY
Any video retrieval system whose end user is a human being would greatly benefitfrom the study of the perception of video content from a psychophysical perspec-tive. In our work, we have conducted a psychophysical experiment2 to measure theperceived similarity of NDVC by collecting a large number of subjective answerson video similarity. We presented pairs of videos to subjects using a techniquesimilar to that used in the past for measuring image similarity [Payne and Ston-ham 2001; Guyader et al. 2002; Celebi and Aslandogan 2005]. We wanted theexperiment to take place in an ecologically valid environment. Thus, we opted foran online questionnaire technique instead of an in-lab study. Note that streamedvideos are usually watched in displays with different sizes, resolutions, and contrastlevels. Therefore, the online setting would allow participants to compare videosusing their usual configuration.
In order to test each of the three hypotheses presented in Section 3, we designed4 large-scale questionnaires (Q1...Q4) organized in two studies: Q1 and Q2 werepart of the first study, S1, and were deployed in the first quarter of 2009. WhileQ1 presented open-ended questions and served as a testbed for the following ques-tionnaires, Q2 presented only multiple-choice questions that were derived from thecoding of the open questions of the first questionnaire. Q3 and Q4 were part of S2and were deployed in the first quarter of 2010. To avoid overwhelming the respon-dents, the sample of S2 was split into Q3 and Q4, which presented complementaryversions of the same questions.
4.1 Procedure
To test our hypotheses, we conducted two studies, each one deploying two large-scale questionnaires on one of the most visited news portals in Spain3. Visitors ofthe portal could see a banner on the front page that advertised our research initia-tive. After clicking on the banner, they were redirected to the online questionnaire.As an incentive, three 100 euro vouchers were raffled among all respondents. Thepresence of the incentive did not have any influence on the results collected asparticipants were informed that they would be included in the lottery mechanismregardless of their specific answers to the questions in the questionnaire. Further-more, the incentive mechanism we designed in relation to the effort they had tomake to complete the questionnaire (i.e., 15 minutes) are standard practices inexperiments involving human subjects. The system that hosted the form registeredthe IP of the respondents and the timestamps at which each respondent started andended answering the questions. This procedure was important to find out whichsubjects answered the same questionnaire more than once and thus eliminate re-dundant data. Some overlap between participants of the first and second studiesmight have happened since we used the same sampling methodology (i.e., recruit-
2This is the analysis of perceptual processes by studying the effect on a subject’s experience orbehavior of systematically varying the properties of a stimulus along one or more physical dimen-sions (Bruce et. al., [1996]).3See http://www.terra.es, lastly retrieved in March 2010.
ACM Journal Name, Vol. 2, No. 3, 09 2010.
118 · Oliveira et al.
ing subjects through a news portal). However, the second study was conducted11 months after the first one, which drastically reduces the influence of residuesbetween them.
In the first study (S1), participants watched near-duplicate videos that differedonly by one feature (e.g., image quality), while participants from the the secondstudy (S2) watched NDVC that differed by more than one feature (e.g., image andaudio quality).
The two questionnaires deployed in S1 (Q1 and Q2) had the primary goal ofcollecting both qualitative and quantitative information from participants whileavoiding potential biases in the answers. With respect to S2, two questionnaires(Q3 and Q4) were deployed as a copy of Q2, but with different videos presentedin each of them. The first questionnaire deployment (Q1) lasted one week andthe questions related to H1 and to the why-component of H2 were left as openquestions. These qualitative answers were manually categorized at the end of theweek and used to define multiple-choice questions in the second deployment ofthe questionnaire (Q2), which was available for two weeks. For example, afterparticipants had defined the similarity between the clips of a particular conditionin Q1, we asked them to elaborate. A typical answer was: “they are differentbecause one has a commentary and the other does not”. In Q2, this was translatedto the choice: “I noted relevant differences between the videos”.
In order to validate H2, we selected NDVC examples from YouTube following theprocedure described in Section 4.2. In S1, the presentation order of the seven videoexamples followed a Latin square design to avoid bias, thus creating seven groups(i.e., ABCDEFG, GABCDEF, FGABCDE, and so forth). Similarly, in S2 thepresentation order also followed a Latin square design for the three video examples(i.e., ADE, EAD and DEA). Each participant was submitted randomly to only onegroup. For each of the seven pairs (conditions) in S1 and the three pairs in S2,participants were required to fully watch both videos at least once, and rate howsimilar they thought these videos were using a 5-point Likert scale. Participantscould watch the videos as many times as they liked. All videos had an associatedaudio track.
4.2 Stimuli
In order to validate H2, we selected the most viewed videos on YouTube from“last month” and “at all times”, excluded those with inappropriate content (e.g.,accidents, pornography, etc.), and created queries to retrieve the remaining videos.
From the result set, we identified five NDVC pairs that exemplified variations ofthe most common non-semantic features [Shen et al. 2007; Wu et al. 2007], and twopairs that illustrated variations of semantic features [Basharat et al. 2008]. Theselected videos were edited such that all NDVC pairs would have about the samelength (x = 37 seconds), except in condition C (see Table II)4. These video pairsdeployed in questionnaires Q1 and Q2 differed by only one feature at a time (e.g.,image quality).
After analyzing data from Q1 and Q2, we edited video pairs that users consideredto be NDVC in such a way that the updated videos differed by two or three featuresat the same time. Therefore, we created Q3 and Q4 as a replica of Q2 but withdifferent sets of video pairs. In the former, we presented videos maximizing differ-
4The clips used in S1 can be viewed at: http://goo.gl/BYhb, while the clips used in S2 can beviewed at: http://goo.gl/9UxC. Last retrieved in June 2010.
ACM Journal Name, Vol. 2, No. 3, 09 2010.
Looking at Near-Duplicate Videos from a Human-Centric Perspective · 119
ences (e.g., video A1Q3 with worse image and audio quality and video A2Q3 withbetter image and audio quality), while in the latter we included videos balancingdifferences (e.g., video A1Q4 with worse image quality and better audio quality, andvideo A2Q4 with better image quality and worse audio quality). Table II providessome information about each video pair presented in S2.
4.3 Participants
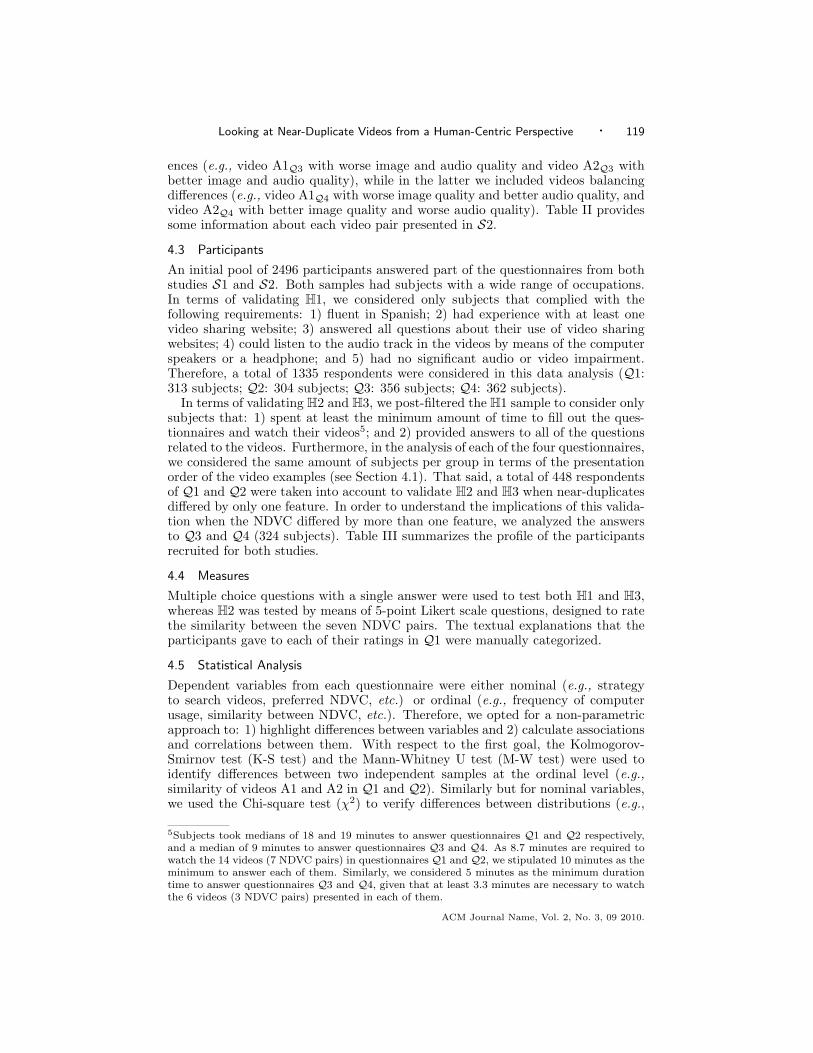
An initial pool of 2496 participants answered part of the questionnaires from bothstudies S1 and S2. Both samples had subjects with a wide range of occupations.In terms of validating H1, we considered only subjects that complied with thefollowing requirements: 1) fluent in Spanish; 2) had experience with at least onevideo sharing website; 3) answered all questions about their use of video sharingwebsites; 4) could listen to the audio track in the videos by means of the computerspeakers or a headphone; and 5) had no significant audio or video impairment.Therefore, a total of 1335 respondents were considered in this data analysis (Q1:313 subjects; Q2: 304 subjects; Q3: 356 subjects; Q4: 362 subjects).
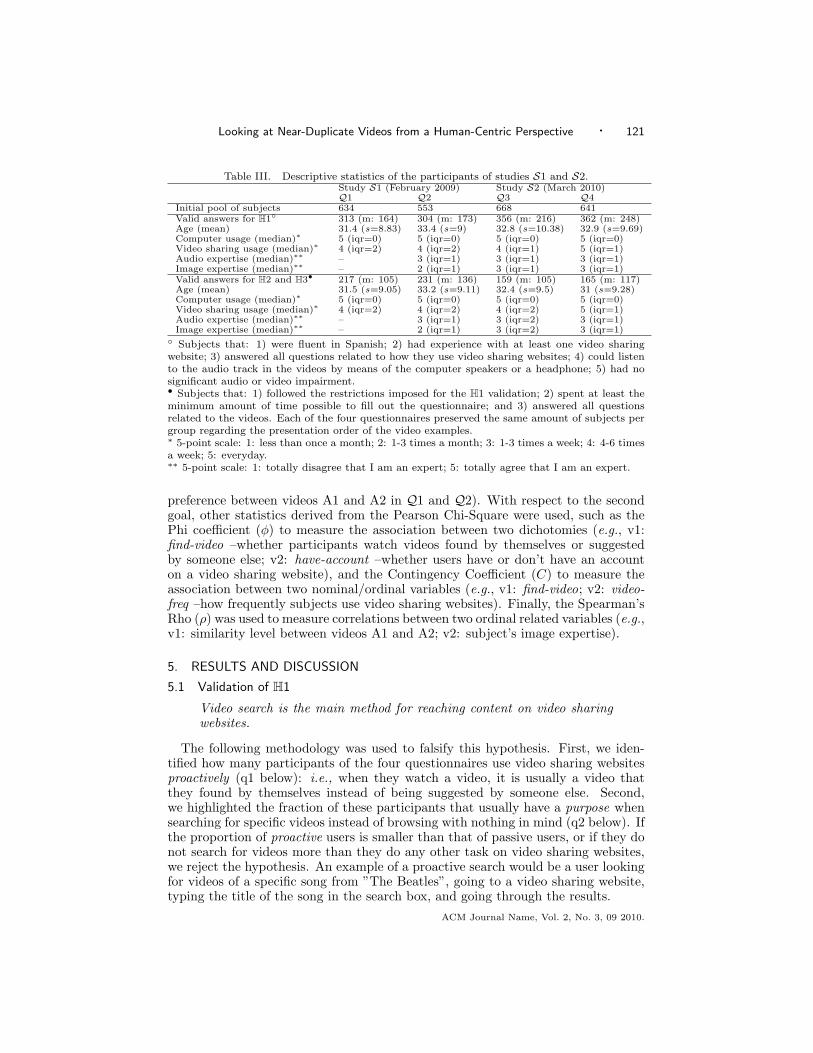
In terms of validating H2 and H3, we post-filtered the H1 sample to consider onlysubjects that: 1) spent at least the minimum amount of time to fill out the ques-tionnaires and watch their videos5; and 2) provided answers to all of the questionsrelated to the videos. Furthermore, in the analysis of each of the four questionnaires,we considered the same amount of subjects per group in terms of the presentationorder of the video examples (see Section 4.1). That said, a total of 448 respondentsof Q1 and Q2 were taken into account to validate H2 and H3 when near-duplicatesdiffered by only one feature. In order to understand the implications of this valida-tion when the NDVC differed by more than one feature, we analyzed the answersto Q3 and Q4 (324 subjects). Table III summarizes the profile of the participantsrecruited for both studies.
4.4 Measures
Multiple choice questions with a single answer were used to test both H1 and H3,whereas H2 was tested by means of 5-point Likert scale questions, designed to ratethe similarity between the seven NDVC pairs. The textual explanations that theparticipants gave to each of their ratings in Q1 were manually categorized.
4.5 Statistical Analysis
Dependent variables from each questionnaire were either nominal (e.g., strategyto search videos, preferred NDVC, etc.) or ordinal (e.g., frequency of computerusage, similarity between NDVC, etc.). Therefore, we opted for a non-parametricapproach to: 1) highlight differences between variables and 2) calculate associationsand correlations between them. With respect to the first goal, the Kolmogorov-Smirnov test (K-S test) and the Mann-Whitney U test (M-W test) were used toidentify differences between two independent samples at the ordinal level (e.g.,similarity of videos A1 and A2 in Q1 and Q2). Similarly but for nominal variables,we used the Chi-square test (χ2) to verify differences between distributions (e.g.,
5Subjects took medians of 18 and 19 minutes to answer questionnaires Q1 and Q2 respectively,and a median of 9 minutes to answer questionnaires Q3 and Q4. As 8.7 minutes are required towatch the 14 videos (7 NDVC pairs) in questionnaires Q1 and Q2, we stipulated 10 minutes as theminimum to answer each of them. Similarly, we considered 5 minutes as the minimum durationtime to answer questionnaires Q3 and Q4, given that at least 3.3 minutes are necessary to watchthe 6 videos (3 NDVC pairs) presented in each of them.
ACM Journal Name, Vol. 2, No. 3, 09 2010.
120 · Oliveira et al.
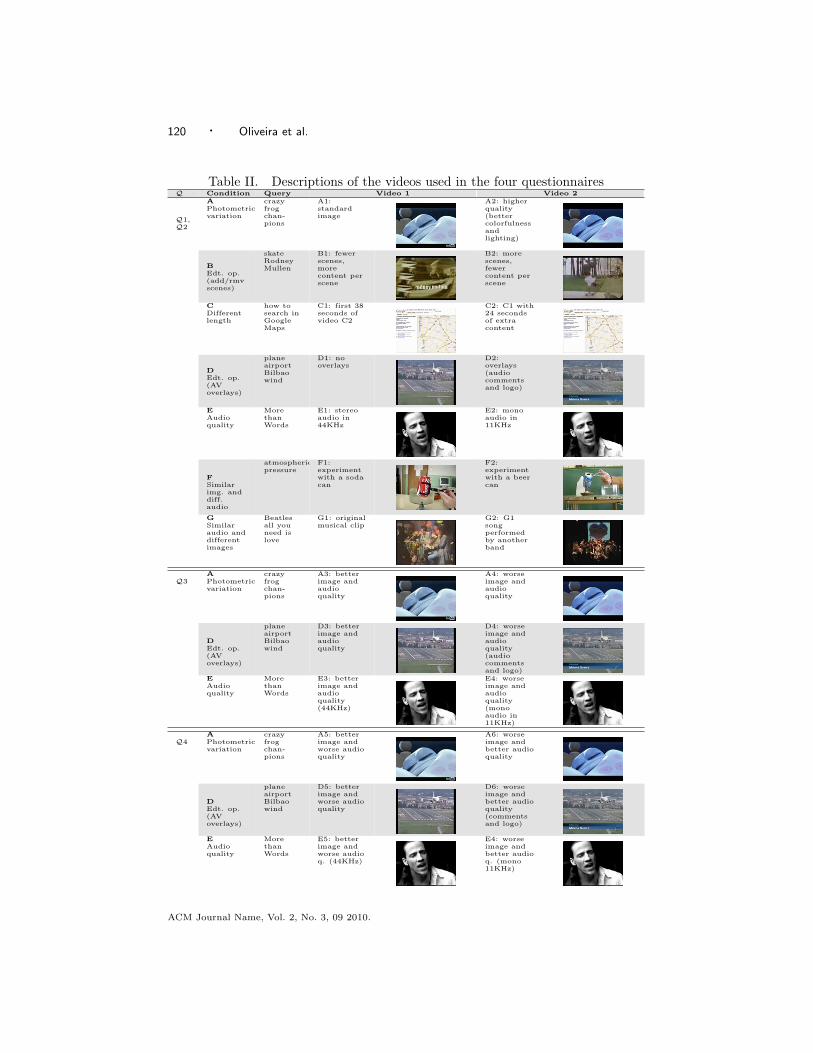
Table II. Descriptions of the videos used in the four questionnairesQ Condition Query Video 1 Video 2
Q1,Q2
APhotometricvariation
crazyfrogchan-pions
A1:standardimage
A2: higherquality(bettercolorfulnessandlighting)
BEdt. op.(add/rmvscenes)
skateRodneyMullen
B1: fewerscenes,morecontent perscene
B2: morescenes,fewercontent perscene
CDifferentlength
how tosearch inGoogleMaps
C1: first 38seconds ofvideo C2
C2: C1 with24 secondsof extracontent
DEdt. op.(AVoverlays)
planeairportBilbaowind
D1: nooverlays
D2:overlays(audiocommentsand logo)
EAudioquality
MorethanWords
E1: stereoaudio in44KHz
E2: monoaudio in11KHz
FSimilarimg. anddiff.audio
atmosphericpressure
F1:experimentwith a sodacan
F2:experimentwith a beercan
GSimilaraudio anddifferentimages
Beatlesall youneed islove
G1: originalmusical clip
G2: G1songperformedby anotherband
Q3APhotometricvariation
crazyfrogchan-pions
A3: betterimage andaudioquality
A4: worseimage andaudioquality
DEdt. op.(AVoverlays)
planeairportBilbaowind
D3: betterimage andaudioquality
D4: worseimage andaudioquality(audiocommentsand logo)
EAudioquality
MorethanWords
E3: betterimage andaudioquality(44KHz)
E4: worseimage andaudioquality(monoaudio in11KHz)
Q4APhotometricvariation
crazyfrogchan-pions
A5: betterimage andworse audioquality
A6: worseimage andbetter audioquality
DEdt. op.(AVoverlays)
planeairportBilbaowind
D5: betterimage andworse audioquality
D6: worseimage andbetter audioquality(commentsand logo)
EAudioquality
MorethanWords
E5: betterimage andworse audioq. (44KHz)
E4: worseimage andbetter audioq. (mono11KHz)
ACM Journal Name, Vol. 2, No. 3, 09 2010.
Looking at Near-Duplicate Videos from a Human-Centric Perspective · 121
Table III. Descriptive statistics of the participants of studies S1 and S2.Study S1 (February 2009) Study S2 (March 2010)Q1 Q2 Q3 Q4
Initial pool of subjects 634 553 668 641Valid answers for H1◦ 313 (m: 164) 304 (m: 173) 356 (m: 216) 362 (m: 248)Age (mean) 31.4 (s=8.83) 33.4 (s=9) 32.8 (s=10.38) 32.9 (s=9.69)Computer usage (median)∗ 5 (iqr=0) 5 (iqr=0) 5 (iqr=0) 5 (iqr=0)Video sharing usage (median)∗ 4 (iqr=2) 4 (iqr=2) 4 (iqr=1) 5 (iqr=1)Audio expertise (median)∗∗ – 3 (iqr=1) 3 (iqr=1) 3 (iqr=1)Image expertise (median)∗∗ – 2 (iqr=1) 3 (iqr=1) 3 (iqr=1)Valid answers for H2 and H3• 217 (m: 105) 231 (m: 136) 159 (m: 105) 165 (m: 117)Age (mean) 31.5 (s=9.05) 33.2 (s=9.11) 32.4 (s=9.5) 31 (s=9.28)Computer usage (median)∗ 5 (iqr=0) 5 (iqr=0) 5 (iqr=0) 5 (iqr=0)Video sharing usage (median)∗ 4 (iqr=2) 4 (iqr=2) 4 (iqr=2) 5 (iqr=1)Audio expertise (median)∗∗ – 3 (iqr=1) 3 (iqr=2) 3 (iqr=1)Image expertise (median)∗∗ – 2 (iqr=1) 3 (iqr=2) 3 (iqr=1)
◦ Subjects that: 1) were fluent in Spanish; 2) had experience with at least one video sharingwebsite; 3) answered all questions related to how they use video sharing websites; 4) could listento the audio track in the videos by means of the computer speakers or a headphone; 5) had nosignificant audio or video impairment.• Subjects that: 1) followed the restrictions imposed for the H1 validation; 2) spent at least theminimum amount of time possible to fill out the questionnaire; and 3) answered all questionsrelated to the videos. Each of the four questionnaires preserved the same amount of subjects pergroup regarding the presentation order of the video examples.∗ 5-point scale: 1: less than once a month; 2: 1-3 times a month; 3: 1-3 times a week; 4: 4-6 timesa week; 5: everyday.∗∗ 5-point scale: 1: totally disagree that I am an expert; 5: totally agree that I am an expert.
preference between videos A1 and A2 in Q1 and Q2). With respect to the secondgoal, other statistics derived from the Pearson Chi-Square were used, such as thePhi coefficient (φ) to measure the association between two dichotomies (e.g., v1:find-video –whether participants watch videos found by themselves or suggestedby someone else; v2: have-account –whether users have or don’t have an accounton a video sharing website), and the Contingency Coefficient (C) to measure theassociation between two nominal/ordinal variables (e.g., v1: find-video; v2: video-freq –how frequently subjects use video sharing websites). Finally, the Spearman’sRho (ρ) was used to measure correlations between two ordinal related variables (e.g.,v1: similarity level between videos A1 and A2; v2: subject’s image expertise).
5. RESULTS AND DISCUSSION
5.1 Validation of H1
Video search is the main method for reaching content on video sharingwebsites.
The following methodology was used to falsify this hypothesis. First, we iden-tified how many participants of the four questionnaires use video sharing websitesproactively (q1 below): i.e., when they watch a video, it is usually a video thatthey found by themselves instead of being suggested by someone else. Second,we highlighted the fraction of these participants that usually have a purpose whensearching for specific videos instead of browsing with nothing in mind (q2 below). Ifthe proportion of proactive users is smaller than that of passive users, or if they donot search for videos more than they do any other task on video sharing websites,we reject the hypothesis. An example of a proactive search would be a user lookingfor videos of a specific song from ”The Beatles”, going to a video sharing website,typing the title of the song in the search box, and going through the results.
ACM Journal Name, Vol. 2, No. 3, 09 2010.
122 · Oliveira et al.
q1. “How many subjects use video sharing websites proactively?” From the1335 participants of the four questionnaires that answered all questions necessaryto validate H1, 786 (59%) reported watching videos found by themselves; 522 (or39%) reported watching videos suggested by someone else via email, blogs, etc.; andthe remaining 27 respondents (2%) expressed that they could not choose betweenthese options because they did both activities without a clear distinction. Theseresults reveal a predominant proactive behavior by users of video sharing websites.
Interestingly, having an account on at least one video sharing website has a weakassociation with the user’s proactive attitude to search videos on these websites(N = 1335, χ = 11.195, φ = −.092, p < .01). Furthermore, having an account doesnot have a significant effect on how frequently users watch videos on these websites(N = 1335, ρ = −.048, p = .08).
q2. “How many subjects search for specific videos instead of browsing withoutanything in mind?” From the 786 proactive users of video sharing websites, 492reported typically searching for specific videos. Additionally, 289 participants outof the 522 passive users stated that although they usually watch videos suggestedby others, when they search for videos, they look for something specific. Therefore,59% of all subjects search for specific videos and are prone to obtain NDVC inthe result set of a video search task. With respect to questionnaires Q2, Q3 andQ4, we also captured how users search for specific videos: (1) typing keywords inthe search box, or (2) using the categories available on the main page of a videosharing website. Results reveal that the majority of subjects (91%) type keywordswhen searching for a specific video. Based on the findings presented in this section,we corroborate H1.
5.2 Validation of H2 (part 1: videos differing by only one feature)
Identical or approximately identical videos differing in photometric fea-tures (image quality), audio quality, editing of the content (i.e., few ormore scenes), additional content (i.e., audio and image overlays), orhaving the same visual context but different audio (or viceversa) areconsidered by the users as similar clips.
Next, we present the results obtained about the participants’ perception of NDVCwhen varying the most common low-level features addressed in the literature (seeSection 4.2). In addition, the implications of our findings for each variation arediscussed with respect to the following variables: (1) differences in image quality,(2) differences in audio quality, (3) differences in visual content, (4) differences inaudio content, (5) differences in audio+visual content, and (6) similar semantics ondifferent videos. Table IV summarizes the results obtained with questionnaires Q1and Q2.
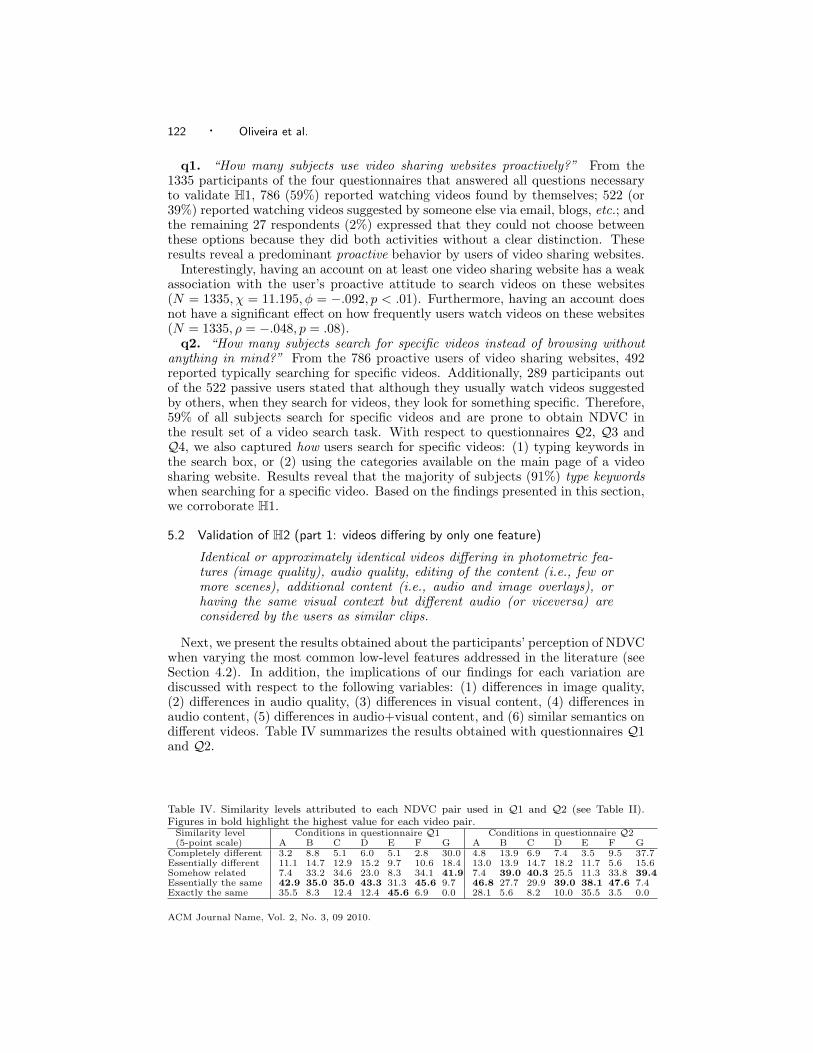
Table IV. Similarity levels attributed to each NDVC pair used in Q1 and Q2 (see Table II).Figures in bold highlight the highest value for each video pair.
Similarity level Conditions in questionnaire Q1 Conditions in questionnaire Q2(5-point scale) A B C D E F G A B C D E F G
Completely different 3.2 8.8 5.1 6.0 5.1 2.8 30.0 4.8 13.9 6.9 7.4 3.5 9.5 37.7Essentially different 11.1 14.7 12.9 15.2 9.7 10.6 18.4 13.0 13.9 14.7 18.2 11.7 5.6 15.6Somehow related 7.4 33.2 34.6 23.0 8.3 34.1 41.9 7.4 39.0 40.3 25.5 11.3 33.8 39.4Essentially the same 42.9 35.0 35.0 43.3 31.3 45.6 9.7 46.8 27.7 29.9 39.0 38.1 47.6 7.4Exactly the same 35.5 8.3 12.4 12.4 45.6 6.9 0.0 28.1 5.6 8.2 10.0 35.5 3.5 0.0
ACM Journal Name, Vol. 2, No. 3, 09 2010.
Looking at Near-Duplicate Videos from a Human-Centric Perspective · 123
Differences in image quality (condition A). According to Table IV, identicalvideos with different image quality were perceived as NDVC by both samples inQ1 and Q2 (a majority of 42.9% and 46.8% respectively stated that videos fromcondition A are “essentially the same”). No significant difference was found betweenthe results fromQ1 andQ2 (p = .10), thus reinforcing the reliability of the samplingmethodology.
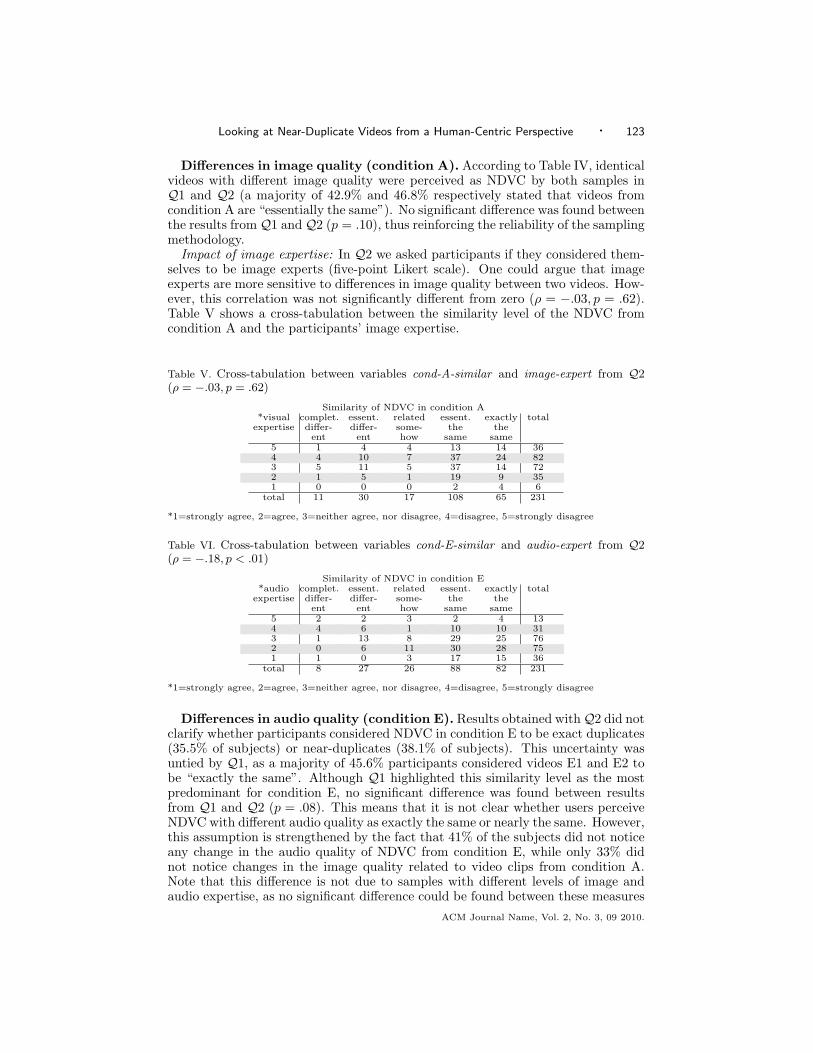
Impact of image expertise: In Q2 we asked participants if they considered them-selves to be image experts (five-point Likert scale). One could argue that imageexperts are more sensitive to differences in image quality between two videos. How-ever, this correlation was not significantly different from zero (ρ = −.03, p = .62).Table V shows a cross-tabulation between the similarity level of the NDVC fromcondition A and the participants’ image expertise.
Table V. Cross-tabulation between variables cond-A-similar and image-expert from Q2(ρ = −.03, p = .62)
Similarity of NDVC in condition A*visual
expertisecomplet.differ-
ent
essent.differ-
ent
relatedsome-how
essent.the
same
exactlythe
same
total
5 1 4 4 13 14 364 4 10 7 37 24 823 5 11 5 37 14 722 1 5 1 19 9 351 0 0 0 2 4 6
total 11 30 17 108 65 231
*1=strongly agree, 2=agree, 3=neither agree, nor disagree, 4=disagree, 5=strongly disagree
Table VI. Cross-tabulation between variables cond-E-similar and audio-expert from Q2(ρ = −.18, p < .01)
Similarity of NDVC in condition E*audio
expertisecomplet.differ-
ent
essent.differ-
ent
relatedsome-how
essent.the
same
exactlythe
same
total
5 2 2 3 2 4 134 4 6 1 10 10 313 1 13 8 29 25 762 0 6 11 30 28 751 1 0 3 17 15 36
total 8 27 26 88 82 231
*1=strongly agree, 2=agree, 3=neither agree, nor disagree, 4=disagree, 5=strongly disagree
Differences in audio quality (condition E). Results obtained withQ2 did notclarify whether participants considered NDVC in condition E to be exact duplicates(35.5% of subjects) or near-duplicates (38.1% of subjects). This uncertainty wasuntied by Q1, as a majority of 45.6% participants considered videos E1 and E2 tobe “exactly the same”. Although Q1 highlighted this similarity level as the mostpredominant for condition E, no significant difference was found between resultsfrom Q1 and Q2 (p = .08). This means that it is not clear whether users perceiveNDVC with different audio quality as exactly the same or nearly the same. However,this assumption is strengthened by the fact that 41% of the subjects did not noticeany change in the audio quality of NDVC from condition E, while only 33% didnot notice changes in the image quality related to video clips from condition A.Note that this difference is not due to samples with different levels of image andaudio expertise, as no significant difference could be found between these measures
ACM Journal Name, Vol. 2, No. 3, 09 2010.
124 · Oliveira et al.
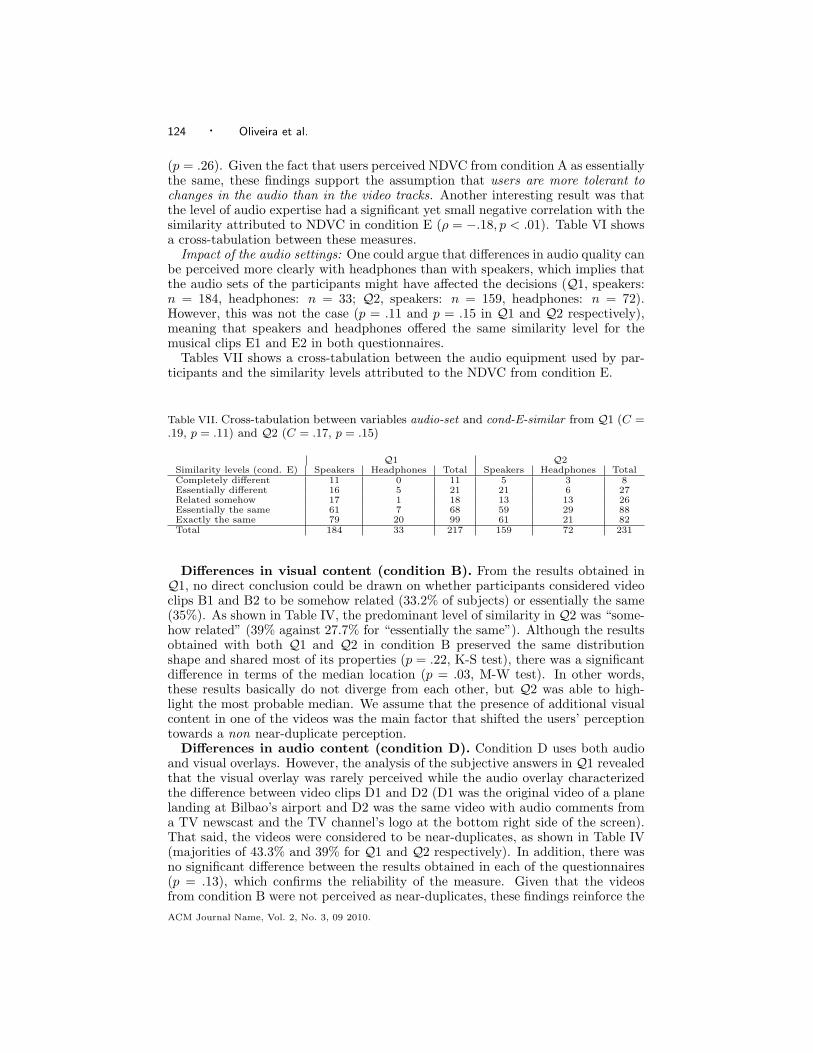
(p = .26). Given the fact that users perceived NDVC from condition A as essentiallythe same, these findings support the assumption that users are more tolerant tochanges in the audio than in the video tracks. Another interesting result was thatthe level of audio expertise had a significant yet small negative correlation with thesimilarity attributed to NDVC in condition E (ρ = −.18, p < .01). Table VI showsa cross-tabulation between these measures.
Impact of the audio settings: One could argue that differences in audio quality canbe perceived more clearly with headphones than with speakers, which implies thatthe audio sets of the participants might have affected the decisions (Q1, speakers:n = 184, headphones: n = 33; Q2, speakers: n = 159, headphones: n = 72).However, this was not the case (p = .11 and p = .15 in Q1 and Q2 respectively),meaning that speakers and headphones offered the same similarity level for themusical clips E1 and E2 in both questionnaires.
Tables VII shows a cross-tabulation between the audio equipment used by par-ticipants and the similarity levels attributed to the NDVC from condition E.
Table VII. Cross-tabulation between variables audio-set and cond-E-similar from Q1 (C =.19, p = .11) and Q2 (C = .17, p = .15)
Q1 Q2Similarity levels (cond. E) Speakers Headphones Total Speakers Headphones TotalCompletely different 11 0 11 5 3 8Essentially different 16 5 21 21 6 27Related somehow 17 1 18 13 13 26Essentially the same 61 7 68 59 29 88Exactly the same 79 20 99 61 21 82Total 184 33 217 159 72 231
Differences in visual content (condition B). From the results obtained inQ1, no direct conclusion could be drawn on whether participants considered videoclips B1 and B2 to be somehow related (33.2% of subjects) or essentially the same(35%). As shown in Table IV, the predominant level of similarity in Q2 was “some-how related” (39% against 27.7% for “essentially the same”). Although the resultsobtained with both Q1 and Q2 in condition B preserved the same distributionshape and shared most of its properties (p = .22, K-S test), there was a significantdifference in terms of the median location (p = .03, M-W test). In other words,these results basically do not diverge from each other, but Q2 was able to high-light the most probable median. We assume that the presence of additional visualcontent in one of the videos was the main factor that shifted the users’ perceptiontowards a non near-duplicate perception.
Differences in audio content (condition D). Condition D uses both audioand visual overlays. However, the analysis of the subjective answers in Q1 revealedthat the visual overlay was rarely perceived while the audio overlay characterizedthe difference between video clips D1 and D2 (D1 was the original video of a planelanding at Bilbao’s airport and D2 was the same video with audio comments froma TV newscast and the TV channel’s logo at the bottom right side of the screen).That said, the videos were considered to be near-duplicates, as shown in Table IV(majorities of 43.3% and 39% for Q1 and Q2 respectively). In addition, there wasno significant difference between the results obtained in each of the questionnaires(p = .13), which confirms the reliability of the measure. Given that the videosfrom condition B were not perceived as near-duplicates, these findings reinforce theACM Journal Name, Vol. 2, No. 3, 09 2010.
Looking at Near-Duplicate Videos from a Human-Centric Perspective · 125
assumption that users are more tolerant to changes in the audio quality than in thevideo quality.
Differences in visual+audio contents (condition C). As in condition B, theNDVC from condition C were labeled as “somehow related” (34.6%) or “essentiallythe same” (35%) in Q1. Once again, the draw was resolved by Q2, where thevideo clips C1 and C2 were clearly not considered to be near-duplicates (40.3%against 29.9%). Note that the results in Q1 and Q2 preserved the same shapeand properties of the distributions (p = .28, K-S test). However, Q2 revealed asignificant difference in their medians (p = .04, M-W test). This means that resultsfrom both questionnaires are consistent, but Q2 highlighted the most probablemedian. Findings from condition C are in agreement with conditions B and D inthe sense that additional visual content in each NDVC is an important factor toshift the users’ perception towards a non near-duplicate evaluation.
Similar semantics on different videos (conditions F and G). With respectto semantics [Basharat et al. 2008], most subjects perceived videos in condition Fas “essentially the same” (45.6% and 47.6% in Q1 and Q2 respectively) and in con-dition G as “somehow related” (41.9% and 39.4% in Q1 and Q2 respectively). Nosignificant difference was found between the results from Q1 and Q2 for conditionsF (p = .36) and G (p = .13), which enhances the reliability of these results. Notethat video clips with different audio and similar visual content (condition F) wereconsidered to be near-duplicates while those with similar audio and different visualcontent were not (condition G). Again, this observation supports the assumptionthat users are more tolerant to changes in the audio than in the video channels.Moreover, the semantics between two different videos in condition F led subjectsto think of them as NDVC while exact duplicates with overlays in condition D didnot. Another interesting result is that only 29% of the subjects considered thechanges between NDVC from condition F to be relevant, which was the smallestproportion among all conditions (A: 39%, B: 50%, C: 72%, D: 62%, E: 36%, G:87%). In other words, two exact duplicates that only differ in their image or audioquality (conditions A and E respectively) are perceived as having more relevant dif-ferences than two different videos –with different audio, people, and scenario– thatare semantically the same (condition F). Therefore, we conclude that the humanperception of NDVC has a semantic component. However, it is not clear from ourstudy the exact role that semantics play on particular instances of videos.
Complementary results. In Q2, after evaluating the similarity level of eachNDVC pair, participants were asked if: (1) they did not notice any differencebetween the videos, (2) they noticed differences but did not care about them, or(3) the differences were relevant. Significant correlations between the answers tothis question and to the similarity level of NDVC pairs could be observed underdifferent levels: weak (B: ρ = −.27), moderate (C: ρ = −.32, D: ρ = −.33, F:ρ = −.41, G: ρ = −.30) and strong (A: ρ = −.53, E: ρ = −.72). This findingreveals a somewhat obvious finding: the more users perceive video pairs as similarvideos, the less significant differences they find between them. This observationreinforces the validity of our experiment and confirms that participants did notrespond to the questionnaire randomly.
Preliminary conclusion for H2. From the results obtained with questionnairesQ1 and Q2, duplicate videos that differ in image quality (condition A), audioquality (condition E) or with/without overlays (condition D) are considered to benear-duplicates (similarity level in conditions A and E: x = 4, q1 = 4, q3 = 5; andD: x = 4, q1 = 3, q3 = 4). Conversely, videos with different audio or visual content
ACM Journal Name, Vol. 2, No. 3, 09 2010.
126 · Oliveira et al.
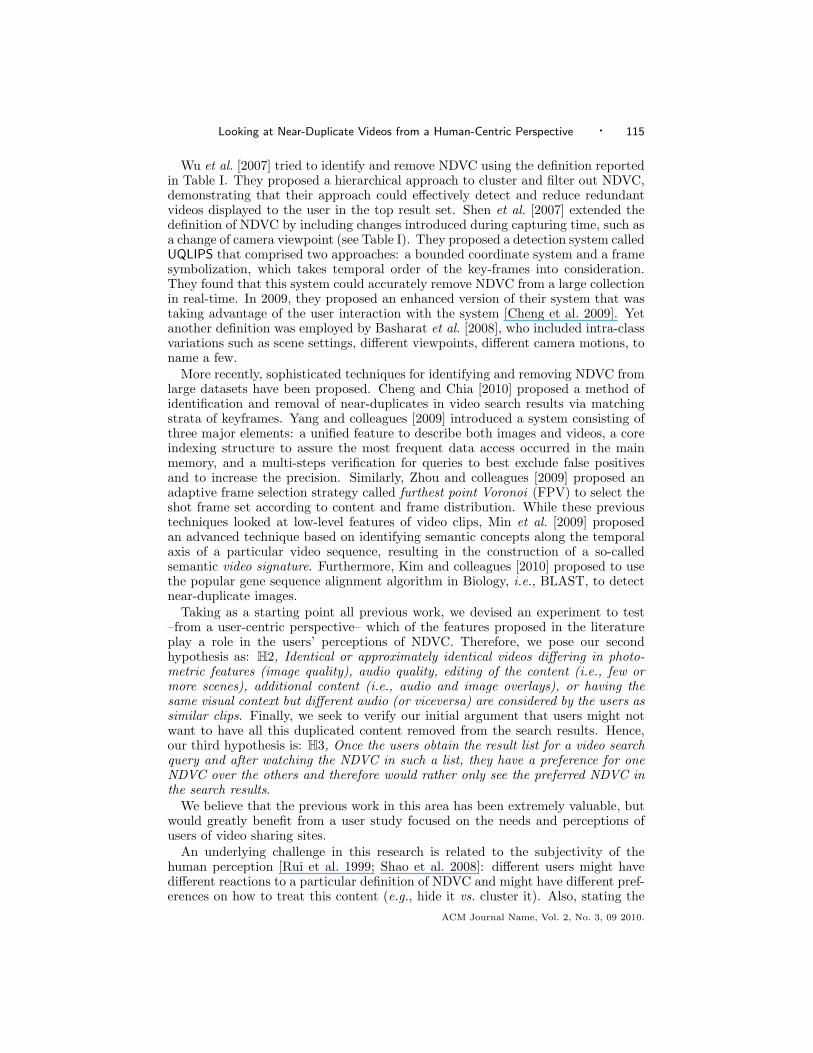
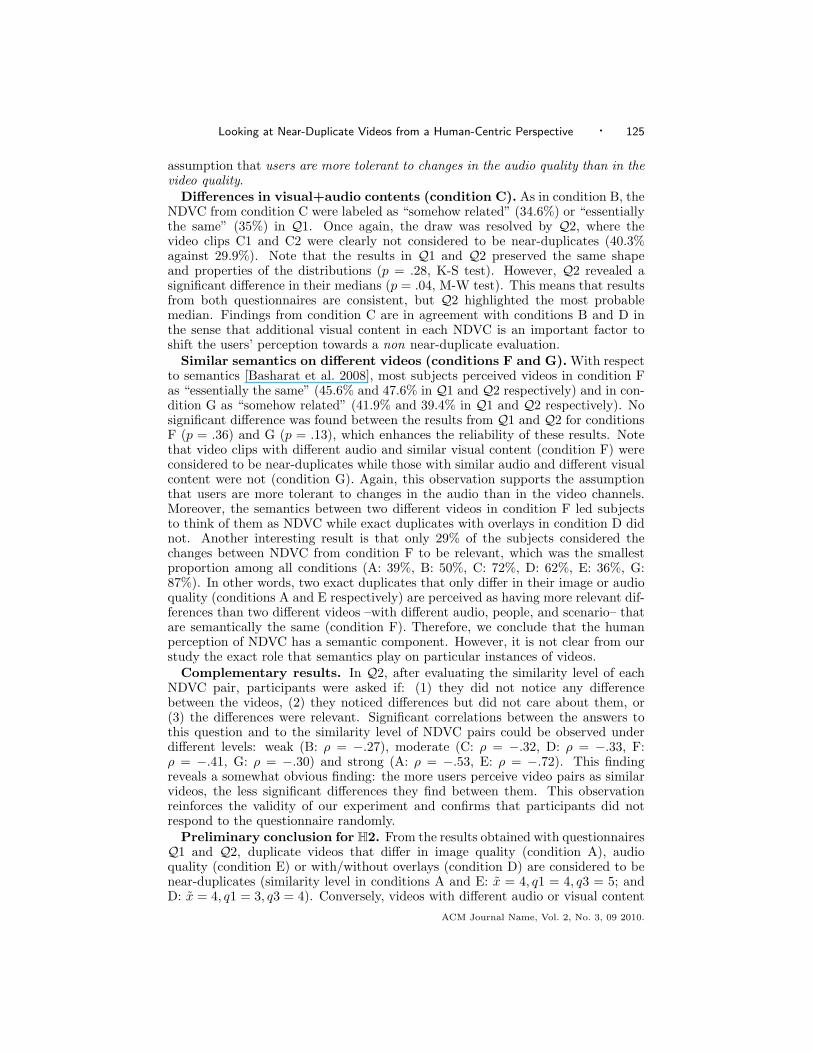
Fig. 1. (left) Boxplot of similarity of video pairs from questionnaires Q1 and Q2. (right) Boxplotof similarity of video pairs from questionnaires Q3 and Q4. Note that the interquartile ranges inall conditions reveal that videos could be considered as essentially different.
were not considered NDVC (similarity level in conditions B: x = 3, q1 = 2, q3 = 4;and C: x = 3, q1 = 3, q3 = 4). Furthermore, completely different videos with thesame semantics seem to be perceived as near-duplicates (similarity level in conditionF: x = 4, q1 = 3, q3 = 4), which is not taken into account by most of the definitionsin the literature. Figure 1 presents this information visually by aggregating theresults from both questionnaires Q1 and Q2.
Although these preliminary results already contradict hypothesis H2, part of theNDVC technical definition remains accurate (i.e., for videos differing in image qual-ity, audio quality, or with/without overlays). Therefore, the following subsectiondiscusses the results of questionnaires Q3 and Q4, in which videos differ by morethan one feature.
5.3 Validation of H2 (part 2: videos differing by more than one feature)
As described in Section 4.2, questionnaires Q3 and Q4 contained the same questionsas those from Q2, but including only three of the original video pairs, i.e., thosefrom conditions A, D and E. These videos were chosen because in study S1 usersconsidered them to be near-duplicates. Therefore, in S2 we wanted to investigatewhether the same perception would be maintained when these videos differed bymore than one feature at a time, as suggested by the NDVC technical definition.
In order to compare data between studies S1 and S2, first we looked for differ-ences between Q1 and Q2, and between Q3 and Q4, regarding similarity betweenvideos from conditions A, D and E. Given that no significant difference was foundin neither case (in S1, A: p = .10; D: p = .13; E: p = .08; and in S2, A: p = .63;D: p = .62; E: p = .45), we could make a straight comparison of similarity betweenthe video pairs in S1 and S2. This comparison revealed that each of the three con-ditions provided a different perception in S2 when compared to S1 (p < .01). Themain outcome of this analysis is that near-duplicate videos differing by more thanone feature are considered to be less similar than near-duplicate videos differing byonly one feature. Moreover, videos differing by more than one feature were actuallynot considered to be near-duplicates, as depicted by Figure 1.
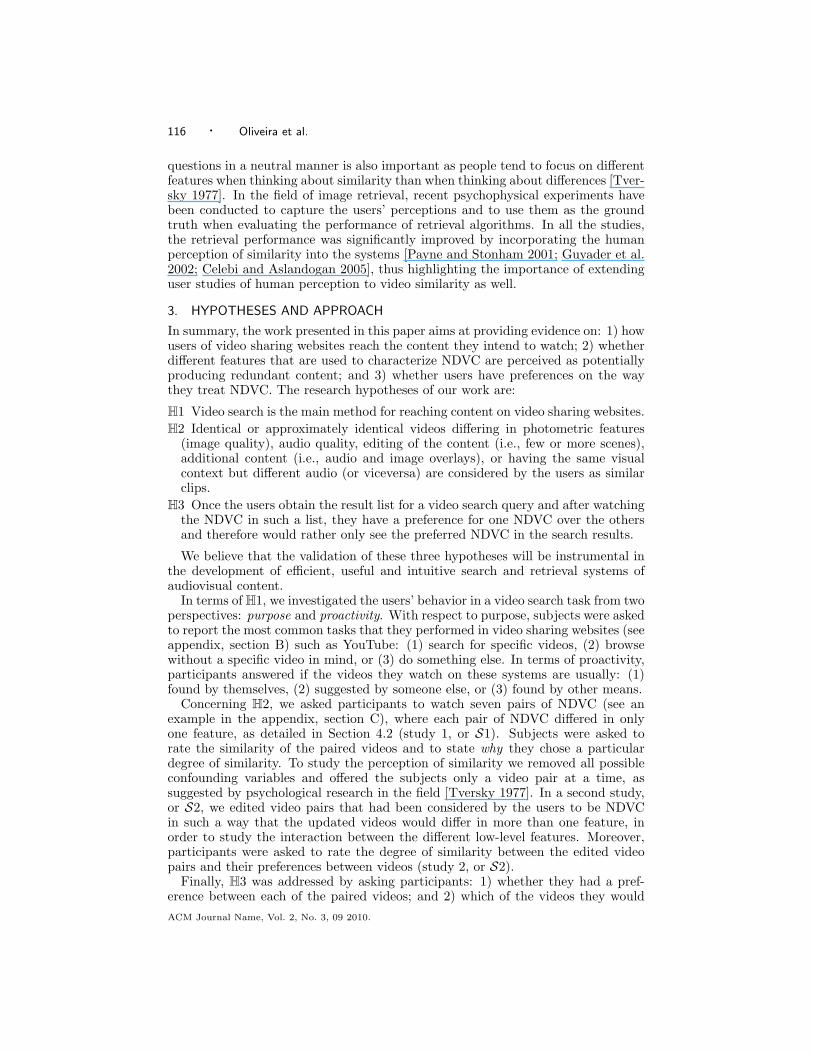
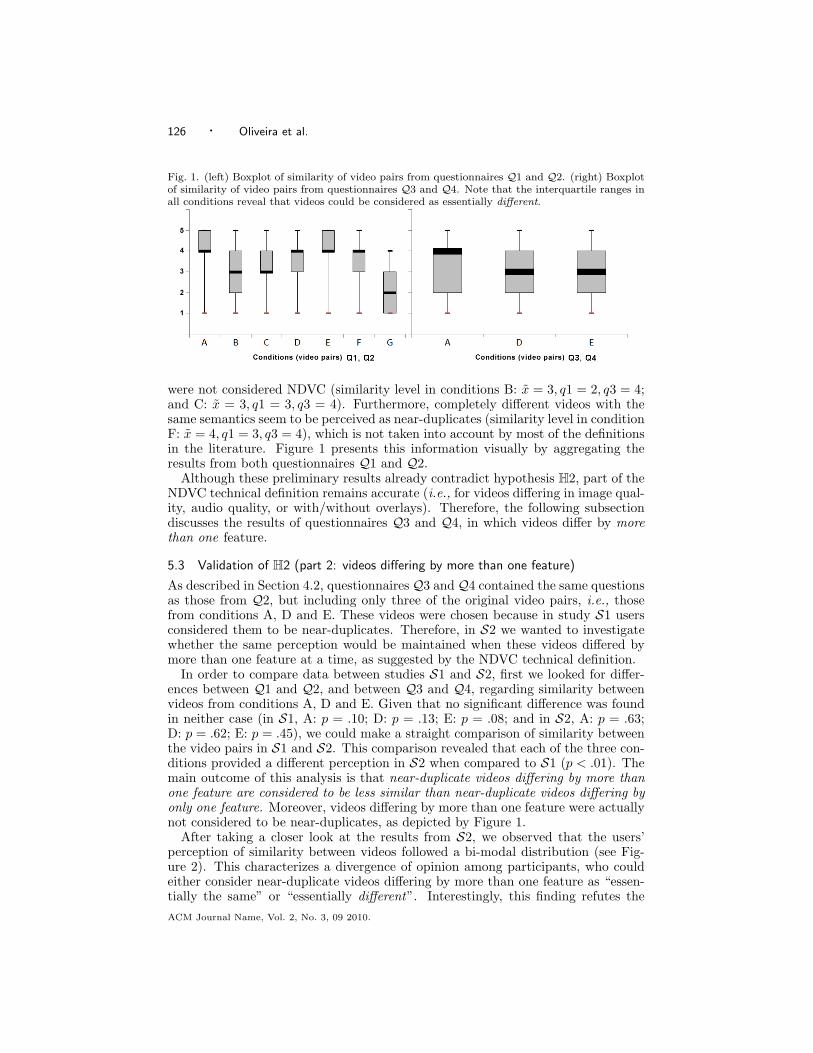
After taking a closer look at the results from S2, we observed that the users’perception of similarity between videos followed a bi-modal distribution (see Fig-ure 2). This characterizes a divergence of opinion among participants, who couldeither consider near-duplicate videos differing by more than one feature as “essen-tially the same” or “essentially different”. Interestingly, this finding refutes theACM Journal Name, Vol. 2, No. 3, 09 2010.
Looking at Near-Duplicate Videos from a Human-Centric Perspective · 127
current technical definition of NDVC.
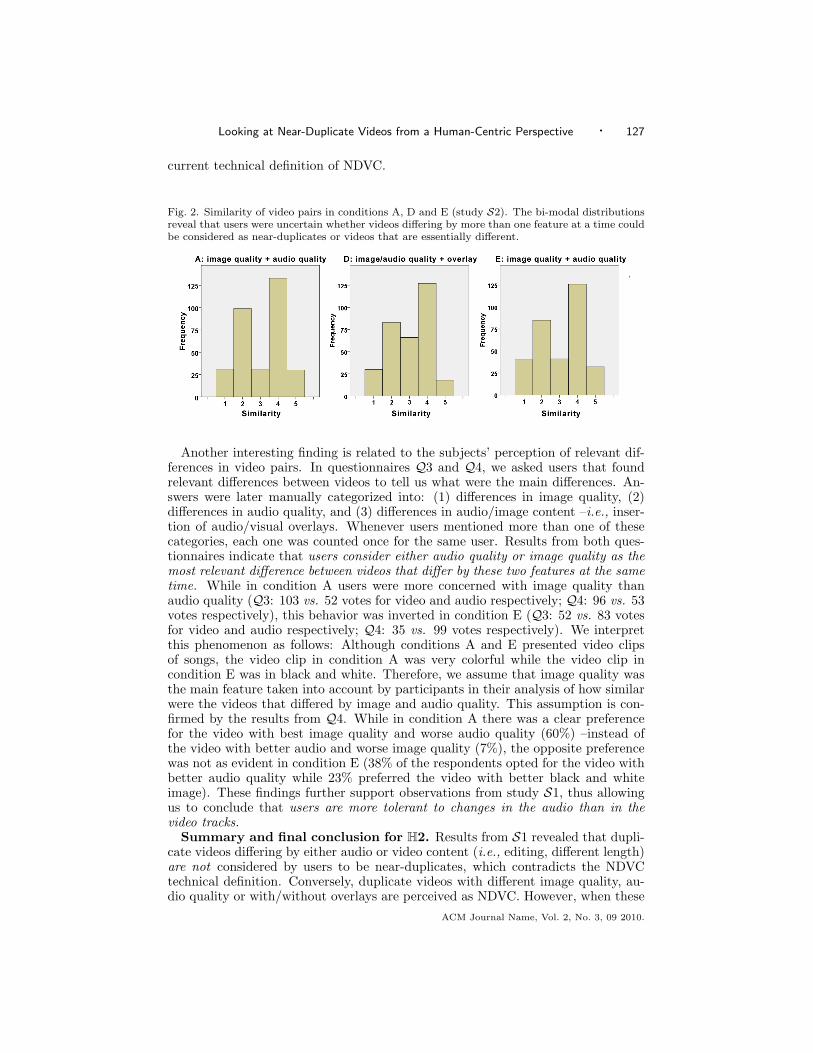
Fig. 2. Similarity of video pairs in conditions A, D and E (study S2). The bi-modal distributionsreveal that users were uncertain whether videos differing by more than one feature at a time couldbe considered as near-duplicates or videos that are essentially different.
Another interesting finding is related to the subjects’ perception of relevant dif-ferences in video pairs. In questionnaires Q3 and Q4, we asked users that foundrelevant differences between videos to tell us what were the main differences. An-swers were later manually categorized into: (1) differences in image quality, (2)differences in audio quality, and (3) differences in audio/image content –i.e., inser-tion of audio/visual overlays. Whenever users mentioned more than one of thesecategories, each one was counted once for the same user. Results from both ques-tionnaires indicate that users consider either audio quality or image quality as themost relevant difference between videos that differ by these two features at the sametime. While in condition A users were more concerned with image quality thanaudio quality (Q3: 103 vs. 52 votes for video and audio respectively; Q4: 96 vs. 53votes respectively), this behavior was inverted in condition E (Q3: 52 vs. 83 votesfor video and audio respectively; Q4: 35 vs. 99 votes respectively). We interpretthis phenomenon as follows: Although conditions A and E presented video clipsof songs, the video clip in condition A was very colorful while the video clip incondition E was in black and white. Therefore, we assume that image quality wasthe main feature taken into account by participants in their analysis of how similarwere the videos that differed by image and audio quality. This assumption is con-firmed by the results from Q4. While in condition A there was a clear preferencefor the video with best image quality and worse audio quality (60%) –instead ofthe video with better audio and worse image quality (7%), the opposite preferencewas not as evident in condition E (38% of the respondents opted for the video withbetter audio quality while 23% preferred the video with better black and whiteimage). These findings further support observations from study S1, thus allowingus to conclude that users are more tolerant to changes in the audio than in thevideo tracks.
Summary and final conclusion for H2. Results from S1 revealed that dupli-cate videos differing by either audio or video content (i.e., editing, different length)are not considered by users to be near-duplicates, which contradicts the NDVCtechnical definition. Conversely, duplicate videos with different image quality, au-dio quality or with/without overlays are perceived as NDVC. However, when these
ACM Journal Name, Vol. 2, No. 3, 09 2010.
128 · Oliveira et al.
videos differed by more than one of these features (study S2), users did not perceivethem as near-duplicates anymore. Actually, a bi-modal distribution was observedin the similarity between video pairs, thus leading to the conclusion that userscan either perceive these videos as NDVC or videos that are essentially different.Therefore and considering results from both S1 and S2, we reject H2.
5.4 Validation of H3
Once the users obtain the result list for a video search query and afterwatching the NDVC in such a list, they have a preference for one NDVCover the others and therefore would rather only see the preferred NDVCin the results
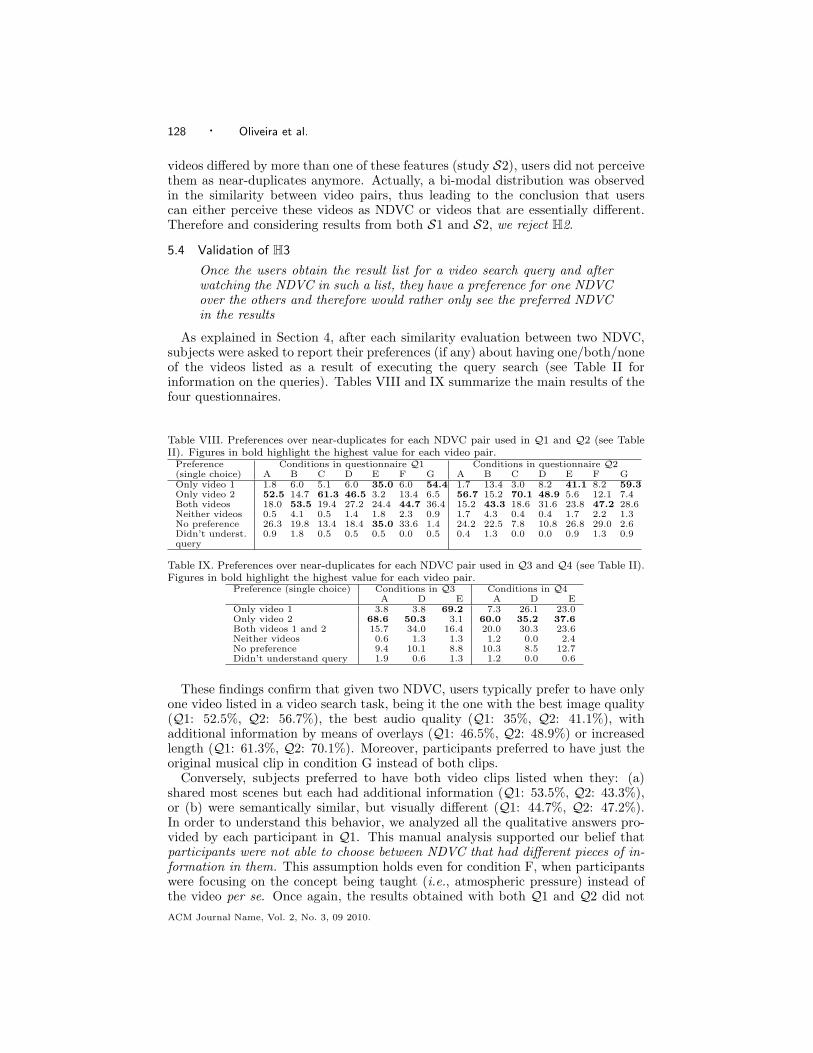
As explained in Section 4, after each similarity evaluation between two NDVC,subjects were asked to report their preferences (if any) about having one/both/noneof the videos listed as a result of executing the query search (see Table II forinformation on the queries). Tables VIII and IX summarize the main results of thefour questionnaires.
Table VIII. Preferences over near-duplicates for each NDVC pair used in Q1 and Q2 (see TableII). Figures in bold highlight the highest value for each video pair.
Preference Conditions in questionnaire Q1 Conditions in questionnaire Q2(single choice) A B C D E F G A B C D E F GOnly video 1 1.8 6.0 5.1 6.0 35.0 6.0 54.4 1.7 13.4 3.0 8.2 41.1 8.2 59.3Only video 2 52.5 14.7 61.3 46.5 3.2 13.4 6.5 56.7 15.2 70.1 48.9 5.6 12.1 7.4Both videos 18.0 53.5 19.4 27.2 24.4 44.7 36.4 15.2 43.3 18.6 31.6 23.8 47.2 28.6Neither videos 0.5 4.1 0.5 1.4 1.8 2.3 0.9 1.7 4.3 0.4 0.4 1.7 2.2 1.3No preference 26.3 19.8 13.4 18.4 35.0 33.6 1.4 24.2 22.5 7.8 10.8 26.8 29.0 2.6Didn’t underst. 0.9 1.8 0.5 0.5 0.5 0.0 0.5 0.4 1.3 0.0 0.0 0.9 1.3 0.9query
Table IX. Preferences over near-duplicates for each NDVC pair used in Q3 and Q4 (see Table II).Figures in bold highlight the highest value for each video pair.
Preference (single choice) Conditions in Q3 Conditions in Q4A D E A D E
Only video 1 3.8 3.8 69.2 7.3 26.1 23.0Only video 2 68.6 50.3 3.1 60.0 35.2 37.6Both videos 1 and 2 15.7 34.0 16.4 20.0 30.3 23.6Neither videos 0.6 1.3 1.3 1.2 0.0 2.4No preference 9.4 10.1 8.8 10.3 8.5 12.7Didn’t understand query 1.9 0.6 1.3 1.2 0.0 0.6
These findings confirm that given two NDVC, users typically prefer to have onlyone video listed in a video search task, being it the one with the best image quality(Q1: 52.5%, Q2: 56.7%), the best audio quality (Q1: 35%, Q2: 41.1%), withadditional information by means of overlays (Q1: 46.5%, Q2: 48.9%) or increasedlength (Q1: 61.3%, Q2: 70.1%). Moreover, participants preferred to have just theoriginal musical clip in condition G instead of both clips.
Conversely, subjects preferred to have both video clips listed when they: (a)shared most scenes but each had additional information (Q1: 53.5%, Q2: 43.3%),or (b) were semantically similar, but visually different (Q1: 44.7%, Q2: 47.2%).In order to understand this behavior, we analyzed all the qualitative answers pro-vided by each participant in Q1. This manual analysis supported our belief thatparticipants were not able to choose between NDVC that had different pieces of in-formation in them. This assumption holds even for condition F, when participantswere focusing on the concept being taught (i.e., atmospheric pressure) instead ofthe video per se. Once again, the results obtained with both Q1 and Q2 did notACM Journal Name, Vol. 2, No. 3, 09 2010.
Looking at Near-Duplicate Videos from a Human-Centric Perspective · 129
reveal a significant difference in any of the seven conditions, which ensures the re-liability of our findings (A: p = .68, B: p = .10, C: p = .23, D: p = .14, E: p = .38,F: p = .46, G: p = .55).
With respect to video pairs that differed by more than one feature, participantsalso preferred to have only one video listed in the video search list, namely the onewith better image and audio quality (AQ3: 68.6%, AQ4: 60%, EQ3: 69.2%, EQ4:37.6%), or with additional information (DQ3: 50.3%, DQ4: 35.2%).
While these preferences are probably video and user dependent, our results cer-tainly give information on how interested people are in having all related video clipslisted after executing a query search. That said and considering the results fromstudies S1 and S2, we corroborate H3.
6. IMPLICATIONS FOR DESIGN
The findings of our study have direct implications on the design of retrieval enginesfor video sharing websites. Particularly, our results suggest that the way duplicatesare treated in the search results should adapt to the feature(s) that make the clipsalike.
Note that in our work we have not considered NDVC that infringe copyrightsor that maliciously harm the system. With this observation in mind, the coreresult of our work is that not all near duplicate videos should be treated the sameand hence not all should a priori be removed from the search result list. From theevidence gathered in our study, we propose three features that would improve –froma user-centric perspective– the way search engines treat NDVC: (a) a user-centricdefinition of NDVC that takes into account semantic similarity, (b) a strategy forclustering the results around the most representative videos, and a recommendationfor (c) adapting the results to the specific features that make the clips alike and tothe user’s video and audio literacy.
6.1 A User-Centric NDVC Definition
Our results suggest that videos that vary in visual content –by overlaying or insert-ing additional information– were not considered to be near-duplicate of the originalvideos. Additionally, our results suggest that users of multimedia repositories mightbenefit from a search engine that takes into account the semantic similarity of themultimedia content. Therefore we propose the following user-centric definition ofNDVC, which restricts the one given by Wu et al. [2007] and includes elements ofBasharat et al. [2008]:
Human perception of similarity between video clips is increasedby proximity of low-level features, and by semantic relatedness.At the same time, perception of similarity is also diminished byinteraction of simultaneous changes in multiple features, andby increased informative value. Furthermore, the perceptionof similarity is a function of the above elements and the contextin which the videos are appraised (i.e., the user’s backgroundand intentions).
In other words, NDVC are approximately identical videos that might differ inencoding parameters, photometric variations (color, lighting changes), editing op-erations (captions, or logo insertion), or audio overlays. However, combinations ofthese variations can reduce similarity between NDVC to the point of being con-sidered to be different videos. The same occurs for identical videos with relevant
ACM Journal Name, Vol. 2, No. 3, 09 2010.
130 · Oliveira et al.
complementary information in any of them (changing clip length or scenes). Fur-thermore, users perceive as near-duplicates videos that are not alike but are visuallysimilar and semantically related. In these videos, the same semantic concept mustbe present without relevant additional information (i.e., the same information ispresented under different scene settings).
It must be noted that a fuller user-centric definition of near-duplicate video clipsmust include more than attributes inherent to a video –or even its semantics, suchas the context of the user and their intention –or lack of one. The bi-modal pic-ture found in Figure 2 argues that in some (many?) cases, the definition of near-duplicates cannot be pinned on the videos themselves, but lies with the user, in-cluding his/her own experiences and personality, and the intent with which (s)heis browsing. In other words, it is a function of video1 + video2 + user + situation,not just video1 + video2. Consider video pair G: one includes the original clip ofthe Beatles singing “All You Need is Love” and the other contains the same songcovered by another band. The audio will be decisive if the user is after the authenticversion, but not so much if s/he simply wants the song in order to learn how toplay it or remember the lyrics. Audio will be irrelevant if users are in fact wantingto have a laugh at some 70’ies hairstyles. In our definition, relevance is defined withrespect to a goal. In the presented study, we did not look at the interplay of theuser’s intention and his/her perception of similarity. However, future work shouldtry to refine the proposed definition to incorporate the user’s goal(s).
The participants of our study identified clips with the same semantic content asbeing essentially the same. This result supports research on algorithms to detectsemantic similarity, such as the work by Basharat et al. [2008]. However, themapping from low-level features onto semantic features is still an open researchproblem. We believe that this is one of the most promising and challenging researchareas in multimedia information retrieval.
6.2 Clustering
The traditional approach to multimedia (images and video) search and retrieval hasleveraged the available metadata (tags, comments, surrounding text) in order tocompute the similarity between the user-submitted textual query and the contentassociated to the metadata. Sophisticated content-based techniques analyze thecontent of the multimedia material in order to assess the similarity between differentitems. This is also the case of the NDVC detection algorithms discussed in Section 2(e.g., [Shen et al. 2007; Wu et al. 2007; Yang et al. 2009; Zhou et al. 2009; Chengand Chia 2010]).
Given two NDVC, the participants of our study preferred to have only one ofthe videos listed in the result list of a video search task. Therefore, we proposeto use NDVC detection algorithms to create clusters of clips that share video,audio, or semantic content, such that: (1) The clusters would be ranked against theuser-submitted query; and (2) only the most representative videos in each clusterwould be shown in the result list (cluster centroid). For example, the video to beshown would be the one with the best image or audio quality, or with additionalinformation using overlays, in relation to the results presented in this paper.
A similar attempt was presented by Hsu and colleagues [2006]. They proposedan approach for re-ranking search results that preserved the maximal mutual in-formation between the search relevance and the high-dimensional low-level visualfeatures of the videos. However, their approach did not take into account all theNDVC features tested in the study presented in this paper.ACM Journal Name, Vol. 2, No. 3, 09 2010.
Looking at Near-Duplicate Videos from a Human-Centric Perspective · 131
How these clusters are visualized and presented to the user is an open researchquestion. An option would consist of displaying only one representative video percluster and allowing users to expand the content of the cluster in order to see allduplicate clips belonging to it.
6.3 Feature and User Adaptation of Search Results
Our final recommendation in the design of video retrieval engines consists of adapt-ing the ranking of the results to the features that make clips alike, and to the abilityof the user to perceive the differences between the clips.
Our findings support boosting the ranking of NDVC that have more content(i.e., condition C), more information such as subtitles of commentary audio (i.e.,condition D), or better video quality (i.e., condition A). In addition, we foundsignificant differences in the perception of NDVC by users with different auditoryskills. Therefore and depending on the user’s auditory skills, a boost in ranking toclips that have better audio quality might be appropriate (i.e., condition E). Also,video sharing websites could apply user modeling techniques in order to dynamicallyupdate the user’s preferences and choose the cluster centroid according to the user’sabilities, task and search query.
Further research is required to understand how simultaneous differences in morethan one feature might interact with the users’ perception of similarity. However,we believe that a flexible weighting scheme that would adjust the search resultsto the specific features of the multimedia content and to the user’s abilities wouldimprove user satisfaction with multimedia search engines.
6.4 Summary: an Improved Social Video Portal Search Engine
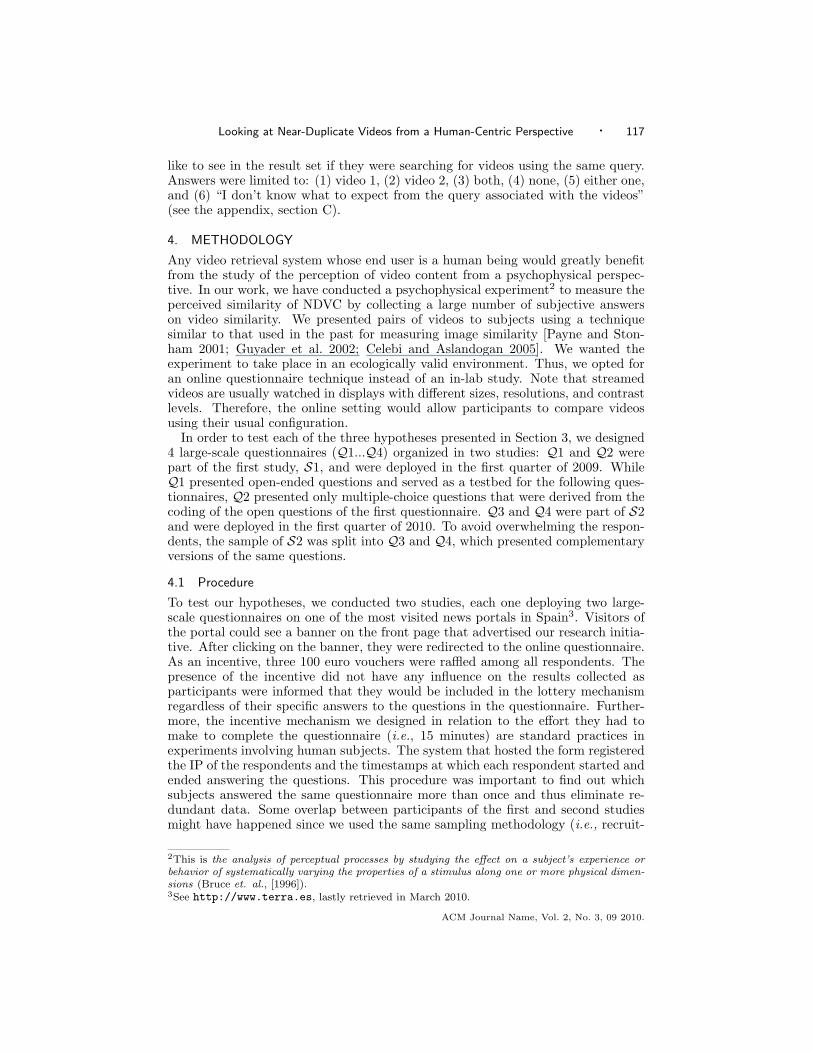
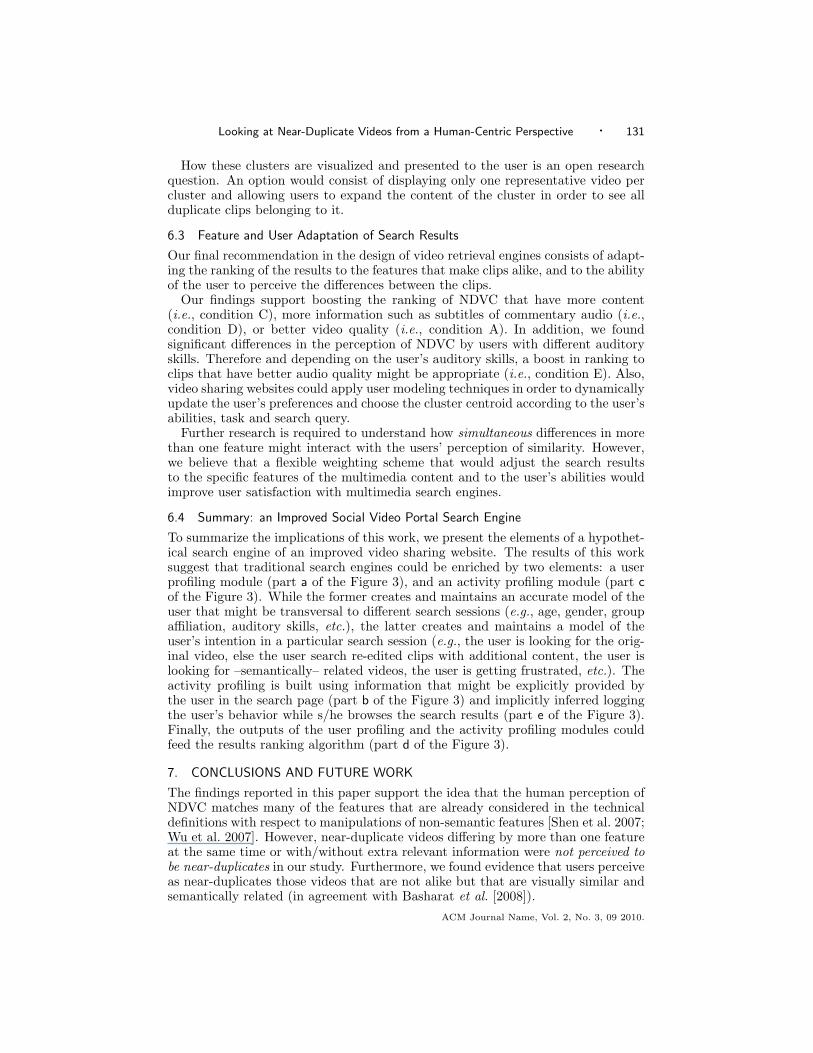
To summarize the implications of this work, we present the elements of a hypothet-ical search engine of an improved video sharing website. The results of this worksuggest that traditional search engines could be enriched by two elements: a userprofiling module (part a of the Figure 3), and an activity profiling module (part cof the Figure 3). While the former creates and maintains an accurate model of theuser that might be transversal to different search sessions (e.g., age, gender, groupaffiliation, auditory skills, etc.), the latter creates and maintains a model of theuser’s intention in a particular search session (e.g., the user is looking for the orig-inal video, else the user search re-edited clips with additional content, the user islooking for –semantically– related videos, the user is getting frustrated, etc.). Theactivity profiling is built using information that might be explicitly provided bythe user in the search page (part b of the Figure 3) and implicitly inferred loggingthe user’s behavior while s/he browses the search results (part e of the Figure 3).Finally, the outputs of the user profiling and the activity profiling modules couldfeed the results ranking algorithm (part d of the Figure 3).
7. CONCLUSIONS AND FUTURE WORK
The findings reported in this paper support the idea that the human perception ofNDVC matches many of the features that are already considered in the technicaldefinitions with respect to manipulations of non-semantic features [Shen et al. 2007;Wu et al. 2007]. However, near-duplicate videos differing by more than one featureat the same time or with/without extra relevant information were not perceived tobe near-duplicates in our study. Furthermore, we found evidence that users perceiveas near-duplicates those videos that are not alike but that are visually similar andsemantically related (in agreement with Basharat et al. [2008]).
ACM Journal Name, Vol. 2, No. 3, 09 2010.
132 · Oliveira et al.
Fig. 3. Interaction flow of an improved social video portal search engine
b. search page d. results ranking e. resultspage
c. activityprofiling
a. user profiling
These findings lead us to propose a user-centric definition of NDVC and a set ofuser-centric guidelines for the design of video sharing websites. More research isneeded to identify low-level features that determine the semantic similarity betweentwo videos. Future work on our side will include research on the relation betweenthe user’s intention and his/her perception of similarity of NDVC. We are currentlydesigning an improved search mechanism for video sharing websites like the onedescribed in Section 6.4 for a major social network portal in Spain6. The challengesrelated to this are related to defining and testing multiple rating schemes that couldcombine the multiplicity of factors described in this article and that could –at thesame time– optimally satisfy the user’s needs.
ACKNOWLEDGMENTS
We would like to thank the reviewers of this paper and all the participants of ourstudy for their valuable feedback. Also, we would like to thank the staff of Terra.esfor providing support to the experiments.
REFERENCES
Basharat, A., Zhai, Y., and Shan, M. 2008. Content based video matching using spatiotemporalvolumes,. Journal of Computer Vision and Image Understanding 110, 3 (June), 360–377.
Benevenuto, F., Duarte, F., Rodrigues, T., Almeida, V. A., Almeida, J. M., and Ross,K. W. 2008. Understanding video interactions in youtube. In MM ’08: Proceeding of the 16thACM international conference on Multimedia. ACM, New York, NY, USA, 761–764.
Bruce, B., Green, P. R., and Georgeson, M. A. 1996. Visual perception. 3rd ed. PsychologyPress.
Celebi, M. E. and Aslandogan, Y. A. 2005. Human perception-driven, similarity-based accessto image databases. In Proceedings of the 18th International Florida Artificial IntelligenceResearch Society Conference, I. Russell and Z. Markov, Eds. Clearwater Beach, Florida, 245–251.
Cha, M., Kwak, H., Rodriguez, P., Ahn, Y.-Y., and Moon, S. 2007. I tube, you tube, ev-erybody tubes: analyzing the world’s largest user generated content video system. In IMC’07: Proceedings of the 7th ACM SIGCOMM conference on Internet measurement. ACM, NewYork, NY, USA, 1–14.
Cheng, R., Huang, Z., Shen, H. T., and Zhou, X. 2009. Interactive near-duplicate videoretrieval and detection. In MM ’09: Proceedings of the 17th ACM international conference onMultimedia. ACM, New York, NY, USA, 1001–1002.
Cheng, X. and Chia, L.-T. 2010. Stratification-based keyframe cliques for removal of near-duplicates in video search results. In MIR ’10: Proceedings of the international conference onMultimedia information retrieval. ACM, New York, NY, USA, 313–322.
6See http://www.keteke.es, last retrieved May 2010.
ACM Journal Name, Vol. 2, No. 3, 09 2010.
Looking at Near-Duplicate Videos from a Human-Centric Perspective · 133
Gill, P., Li, Z., Arlitt, M., and Mahanti, A. 2008. Characterizing users sessions on youtube. InProceedings of SPIE/ACM Conference on Multimedia Computing and Networking (MMCN).San Jose, CA, USA.
Guyader, N., Borgne, H. L., Herault, J., and Guerin-Dugue, A. 2002. Towards the intro-duction of human perception in a natural scene classification system. In Proceedings of NeuralNetworks for Signal Processing. Martigny, Switzerland, 385–394.
Halvey, M. J. and Keane, M. T. 2007. Exploring social dynamics in online media sharing. InWWW ’07: Proceedings of the 16th international conference on World Wide Web. ACM, NewYork, NY, USA, 1273–1274.
Hsu, W. H., Kennedy, L. S., and Chang, S.-F. 2006. Video search reranking via informationbottleneck principle. In MULTIMEDIA ’06: Proceedings of the 14th annual ACM internationalconference on Multimedia. ACM, New York, NY, USA, 35–44.
Kruitbosch, G. and Nack, F. 2008. Broadcast yourself on youtube: really? In HCC ’08:Proceeding of the 3rd ACM international workshop on Human-centered computing. ACM, NewYork, NY, USA, 7–10.
Maia, M., Almeida, J., and Almeida, V. 2008. Identifying user behavior in online social net-works. In SocialNets ’08: Proceedings of the 1st workshop on Social network systems. ACM,New York, NY, USA, 1–6.
Payne, J. S. and Stonham, T. J. 2001. Can texture and image content retrieval methods matchhumanperception? In Proceedings of Intelligent Multimedia, Video and Speech Processing.Hong Kong, China, 154–157.
Rui, Y., Huang, T., and Chang, S. 1999. Image retrieval: current techniques, promising di-rections and open issues. Journal of Visual Communication and Image Representation 10, 4(April), 39–62.
seok Min, H., Choi, J., Neve, W. D., and Ro, Y. M. 2009. Near-duplicate video detection usingtemporal patterns of semantic concepts. Multimedia, International Symposium on 0, 65–71.
Shao, J., Shen, H. T., and Zhou, X. 2008. Challenges and techniques for effective and efficientsimilarity search in large video databases. In Proceedings of the VLDB Endowment. 1, 2,1598–1603.
Shen, H. T., Zhou, X., Huang, Z., Shao, J., and Zhou, X. 2007. Uqlips: a real-time near-duplicate video clip detection system. In VLDB ’07: Proceedings of the 33rd internationalconference on Very large data bases. VLDB Endowment, 1374–1377.
Kim, H.-S., Chang, H.-W., Lee, J., and Lee, D. 2010. Basil: Effective near-duplicate imagedetection using gene sequence alignment.
Tversky, A. 1977. Features of similarity. Psychological Review 84, 4 (July), 327–352.
Wu, X., Hauptmann, A. G., and Ngo, C.-W. 2007. Practical elimination of near-duplicates fromweb video search. In MULTIMEDIA ’07: Proceedings of the 15th international conference onMultimedia. ACM, New York, NY, USA, 218–227.
Yang, X., Zhu, Q., and Cheng, K.-T. 2009. Near-duplicate detection for images and videos.In LS-MMRM ’09: Proceedings of the 1st ACM workshop on Large-scale multimedia retrievaland mining. ACM, New York, NY, USA, 73–80.
Zhou, X., Zhou, X., Chen, L., Bouguettaya, A., Xiao, N., and Taylor, J. A. 2009. An efficientnear-duplicate video shot detection method using shot-based interest points. Transactions onMultimedia. 11, 5, 879–891.
Received March 2010;Accepted June 2010;
ACM Journal Name, Vol. 2, No. 3, 09 2010.
Looking at Near-Duplicate Videos from a Human-Centric Perspective · App–1
This document is the online-only appendix to:
Looking at Near-Duplicate Videos from a Human-Centric Per-spectiveRODRIGO DE OLIVEIRAMAURO CHERUBINIandNURIA OLIVERTelefonica Research, Barcelona
ACM Journal Name, Vol. 2, No. 3, 09 2010, Pages 111–133.
This appendix contains the core questions of Q2. The questionnaire was deployedin Spain and it is here reported in the original language: Castellan.
A. DEMOGRAPHIC QUESTIONS
Cuestionario sobre sitios web donde se comparten videosQuestion #1. ¿Que edad tienes?Question #2. ¿Eres hombre o mujer?Question #3. ¿Eres Espanol?Question #4. ¿Entiendes bien el Castellano?Question #5. ¿En que trabajas?...
B. USAGE OF VIDEO SHARING WEBSITES
¿En que manera utilizas los sitios web para compartir videos?Question #9. Normalmente los videos que miro en YouTube o en sitiossimilares son videos: ...Question #10. Normalmente utilizo sitios donde se comparten videos,como por ejemplo YouTube para: ...Question #11. Cuando busco algo en particular usando Youtube o sim-ilares: ...Question #12. Despues de buscar un vdeo y conseguir varios resultados,elijo los que vere basandome en su: ...Question #13. Este cuestionario incluye videos que se deben escuchar.Elige tu opcion preferida: ...Question #14. Este cuestionario intenta evaluar la manera en que lagente percibe los videos. Por favor, dinos si tienes algun impedimento ala hora de ver o escuchar un video. ...
Permission to make digital/hard copy of all or part of this material without fee for personalor classroom use provided that the copies are not made or distributed for profit or commercialadvantage, the ACM copyright/server notice, the title of the publication, and its date appear, andnotice is given that copying is by permission of the ACM, Inc. To copy otherwise, to republish,to post on servers, or to redistribute to lists requires prior specific permission and/or a fee.c© 2010 ACM 0000-0000/2010/0000-0111 $5.00
ACM Journal Name, Vol. 2, No. 3, 09 2010.
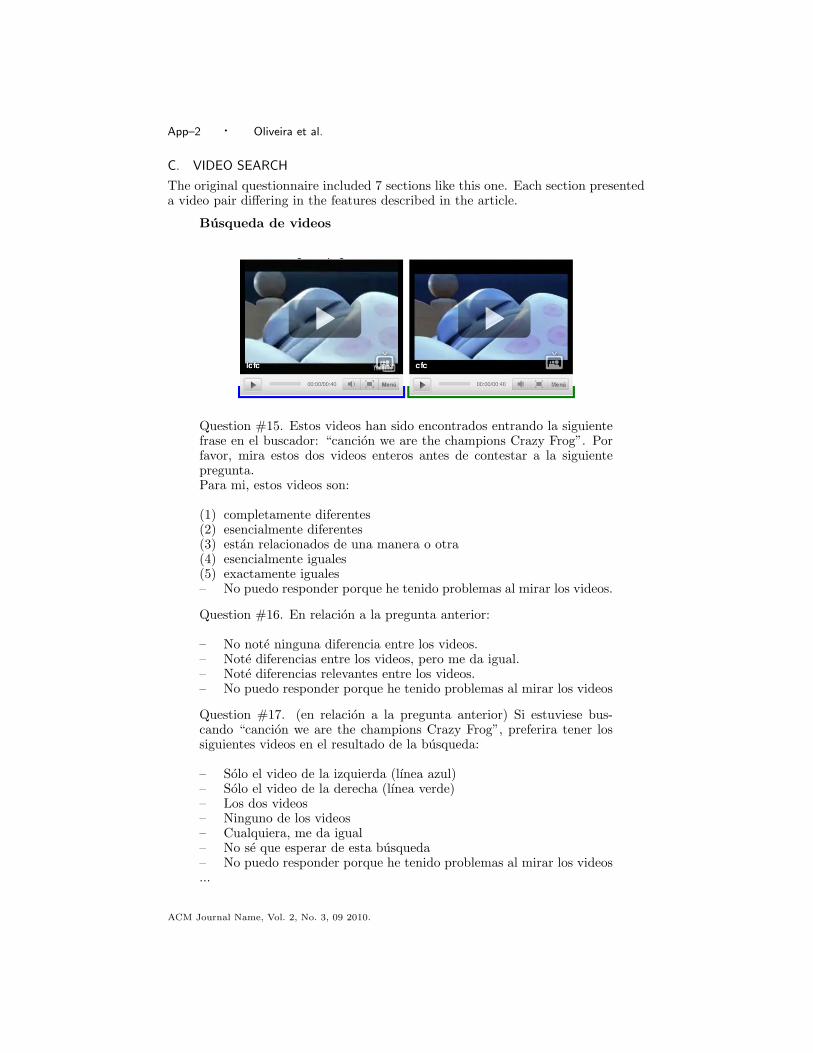
App–2 · Oliveira et al.
C. VIDEO SEARCH
The original questionnaire included 7 sections like this one. Each section presenteda video pair differing in the features described in the article.
Busqueda de videos
Question #15. Estos videos han sido encontrados entrando la siguientefrase en el buscador: “cancion we are the champions Crazy Frog”. Porfavor, mira estos dos videos enteros antes de contestar a la siguientepregunta.Para mi, estos videos son:
(1) completamente diferentes(2) esencialmente diferentes(3) estan relacionados de una manera o otra(4) esencialmente iguales(5) exactamente iguales– No puedo responder porque he tenido problemas al mirar los videos.
Question #16. En relacion a la pregunta anterior:
– No note ninguna diferencia entre los videos.– Note diferencias entre los videos, pero me da igual.– Note diferencias relevantes entre los videos.– No puedo responder porque he tenido problemas al mirar los videos
Question #17. (en relacion a la pregunta anterior) Si estuviese bus-cando “cancion we are the champions Crazy Frog”, preferira tener lossiguientes videos en el resultado de la busqueda:
– Solo el video de la izquierda (lınea azul)– Solo el video de la derecha (lınea verde)– Los dos videos– Ninguno de los videos– Cualquiera, me da igual– No se que esperar de esta busqueda– No puedo responder porque he tenido problemas al mirar los videos...
ACM Journal Name, Vol. 2, No. 3, 09 2010.


