Embed Size (px)
Citation preview

Report No. 14044-MAG
MadagascarPoverty Assessment(In Two Volumes) Volume 11: Main Report, Annexes
June 28, 1996
Population and Human Resources DivisionSouth-Central and Indian Ocean DepartmentAfrica Region
*.4'.. 4
S +A r e C~~~~~ AX
1- 4- -; FX
f , r W x si@e < -,.44,4 4 k
~~ 4 d z 2 X e 4* 3 X{& <'4 , ',- 0a ; t 9
; E tv^s-j-zs i V > w g & i 54"'44
i~~~ 'r sF-"nt. ,b*fF )z_DFi3d
T $ ,,, t t > . ¢ 3 P A 2 t 9 v > e + b 1~~~~~~~~~~~~~~~~~~~~~~~~~~~~~~~~~~k-t ...................~~~~~. 4 . , ' ,,,
4-~~~~ ~ ~ ~ 4' 4 -p .P. %,
Pub
lic D
iscl
osur
e A
utho
rized
Pub
lic D
iscl
osur
e A
utho
rized
Pub
lic D
iscl
osur
e A
utho
rized
Pub
lic D
iscl
osur
e A
utho
rized

CURRENCY EQUIVALENTS
Currency Unit: Malagasy Franc (FMG)Average Exchange Rate
1992: US$1.00 = 1864 FMG1993: US$1.00 = 1914 FMG1994: US$1.00 = 3871 FMG1995: US$1.00 = 4266 FMG
MALAGASY FISCAL YEAR
Januiiary 1 - December 31
WEIGHTS AND MEASURES
Metric Syystem British11US Equivalents
1 meter (m) = 3.28 feetI square meter (sq. m) = 10.76 square feetI kilometer (km) = 0.62 mileI square kilometer (sq. km) = 0.39 square mileI ton (metric) = 2204.6 pounds

TABLE OF CONTENTS
CHAPTER I. INTRODUCTION . ................................................................ I
PART I: UNDERSTANDING POVERTY .................................................................2
CHAPTER 11. ECONOMIC DEVELOPMENT AND POVERTY: 1960-1993 .................................. 2A. Development of the Crisis .................................................................. 2B. Effects of the Crisis on the Poor, 1960-1983 ............................................................. 3C. Poverty Indicators: 1962 and 1980 .................................................................. 4D. Adjustment and its Effects on Poverty, 1983-1990 ...................................................... 6E. Effects of the Political Transition, 1991-1994 ............................................................ 8
CHAPTER III. PROFILE OF POVERTY, 1993/4 ................................................................. 10A. Poverty Profile ................................................................. 11B. Perceptions of the Poor ................................................................. 36C. Poverty and the Environment ................................................................. 38D. Monitoring Poverty in Madagascar ................................................................. 41
PART II: DEVELOPMENT OF A COMPREHENSIVE POVERTY REDUCTIONSTRATEGY ................................................................. 42
CHAPTER IV. DEVELOPING A STRATEGY FOR PROMOTING A PRO-POORPATTERN OF GROWTH ................................................................. 43
A. Pre-conditions for Pro-poor Pattern of Growth ........................................................ 44B. Macroeconomic Policies to Promote Growth and Poverty Reduction ............................... 46C. Agriculture Sector Policies ................................................................. 48D. Development of Off-farm Economic Opportunities .................................................... 53E. Population Growth ................................................................. 56F. Main Conclusions ................................................................. 58
CHAPTER V: IMPROVING THE HUMAN RESOURCES OF THE POOR .................................. 62A. Education ................................................................. 62B. Health ................................................................. 78C. Main Conclusions ................................................................. 91
CHAPTER VI: PROVIDING SAFETY NETS WHERE FEASIBLE ............................................. 94
CHAPTER VII: MATRIX OF ACTIONS ................................................................. 99

FIGURES
FIGURE 3.1: Head Count by Residence .................................................................... 13FIGURE 3.2: Poverty Gap by Residence ................................................................... 14FIGURE 3.3: Severity of Poverty by Residence .......................................................... 14FIGURE 3.4: Distribution of Poverty by Provinces, 1993 ............................................... 16FIGURE 3.5: Distribution of Poverty by Socieconomic Groups ........................................ 20FIGURE 5.1: Per Capita Education Subsidies by Expenditure Quintile ............................... 72FIGURE 5.2: Distribution of Public Eduction Subsidy, All Madagascar ............................. 73FIGURE 5.3: Regional Distribution of Per Capita Education Subsidy ................................ 74FIGURE 5.4: Composition of Average Per Student Household Expenditures for Public
Primary School ......................................................................... 76FIGURE 5.5: Composition of Average Per Student Household Expenditure for Public
Secondary School ......................................................................... 77FIGURE 5.6: Per Capita Public Hospital Subsidy ........................................................ 86FIGURE 5.7: Per Capita Public Basic Health Care Facility Subsidy .................................. 86FIGURE 5.8: Per Capita All Public Health Subsidy ...................................................... 87FIGURE 5.9: Distribution of Public Health Subsidy ..................................................... 88FIGURE 5.10: Per Capita Health Care Subsidy by Region ............................................... 89
TABLES
TABLE 3.1: Distribution of Poverty by Place of Residence .15TABLE 3.2: Distribution of Poverty by Provinces .15TABLE 3.3: Distribution of Poverty by Provinces (Rural and Urban) .17TABLE 3.4: Cost to Eliminate Poverty in Madagascar .19TABLE 3.5: Poverty Groups by Socioeconomic Groups .21TABLE 3.6: Poverty Groups by Socioeconomic Groups .21TABLE 3.7: Gini Index by Residence, Province, and Socioeconomic Groups .22TABLE 3.8: Distribution of Sources of Income by Poverty Groups .23TABLE 3.9: Distribution of Sources of Income by Socioeconomic Groups .24TABLE 3.10: Distribution of Social Indicators by Poverty Groups .................................... 25TABLE 3.11: Nutritional Status, Estimated from Anthropometric Measures, by Socioeconomic
Characteristics and Poverty Group (Children 3 to 60 months) ........................ 27TABLE 3.12: Mean Area Cultivated for All Farmers by Poverty Group and Province ............ 29TABLE 3.13: Distribution of All Farmers by Primary Type of Crops Grown and Poverty Groups
for Each Province ............................................................ 31TABLE 4.1: Effects of Growth on Poverty Reduction .45TABLE 5.1: Trends in Gross Enrollment Rates .63TABLE 5.2: Madagascar: Efficiency Indicators for Primary and Secondary Schools
as Compared with Other African Countries .63TABLE 5.3: Trends in Public Expenditures on Education .65TABLE 5.4: Gross and Net Enrollment Rates .65TABLE 5.5: Private Enrollments as a Share of Total Enrollments by Quintile .66TABLE 5.6: Net and Gross Enrollments by Province .67TABLE 5.7: Per Student Recurrent Expenditures in Current FMG .69TABLE 5.8: Per Student Expenditures by Region .69TABLE 5.9: Average Per Capita Private and Public Expenditures on
Public Education by Quintile .75TABLE 5.10: Average Per Student Household Expenditures on Public Education by Quintile ... 76
TABLE 5.11: Incidence of Public Education Spending on the Poorest and Richest Quintiles,Selected Countries ...................................................................... 78
TABLE 5.12: Proportion of Population Reporting Illness and Seeking Treatment duringTwo Week Recall Period .................................................................... 80
TABLE 5.13: Health Care Facility Utilization Patterns: Where Malagasy Go forOutpatient Treatment, First Visit Only .................................................... 81
TABLE 5.14: Share of Public Hospital Inpatient and Outpatient Visits by Quintile ................. 82TABLE 5.15: Public Health Expenditures as a Share of Total Govemment Expenditures ......... 83TABLE 5.16: Ministry of Health Recurrent Expenditures by Type of Facility ....................... 84TABLE 5.17: Regional Allocation of Public Health Expenditures ..................................... 85TABLE 5.18: Household and Government Spending per Capita on Public Health Care ........... 90TABLE 5.19: Incidence of Public Health Spending on the Poorest and
Richest Quintiles, Selected Countries ...................................................... 91
BOXES
BOX 3.1: A Typical Malagasy Woman 34BOX 3.2: The Arithmetic Of Tavy Agriculture .39BOX 4.1: Strategy For Dynamic And Rapid Growth In Madagascar .46BOX 4.2: Results Of Inaccessibility On Poor Farmers .51BOX 4.3: Monopolies At The Village Level .53BOX 5.1: Reasons Given by the Poor for Low Education Enrollments .68BOX 5.2: Benefit Incidence Analysis of Public Spending .70
ANNEXES
Annex A .... 105Annex B .... 109Annex C .... 140Annex D .... 146
BIBLIOGRAPHY ........... 164
This report was prepared by a team led by Lyine Sherburne-Benz (task manager) and composed of Julia Dayton (humanresources incidence analysis) and Ghislaine Delaine (poverty profile). Other contributors were Armand Randrianarivony, JeanRazafindravonona (poverty profile), Balsama Andriantseheno, Helen Patterson, Roland Ramahatra, Larry Salmen (participatorypoverty assessment), Amolo Ngweno, Rene Rabezandrina (environment), and Helen Patterson (social safety net). FlorenciaCastro-Leal updated the incidence analysis, Elisabeth Huybens provided background on macroeconomic issues, and DanielTommasi provided background on public expenditure issues. Azadeh Moini-Araghi wrote the summary of the participatorypoverty assessment in Annex C. Kalpana Mehra provided invaluable computer analysis. David Sahn, Paul Dorosh and SteveHaggblade of Cornell provided valuable assistance. The report was processed by Precy Lizarondo. Peer reviewers were HelenaRibe and Dominique Van De Walle. Thie Director, Economic Advisor, and Division Chief of the responsible department anddivision are Andrew Rogerson, Roberto Zagha, and David Berk. respectively.


I
CHAPTER 1. INTRODUCTION
1. With a population of 12.4 million, growing at almost 3 percent per year, and aper capita income of US$230 in 1994, Madagascar is among the poorest countries in theworld. The economy is dominated by agriculture. About 79 percent of the population lives inrural areas, on small, mainly subsistence farms and only 2.7 percent of the labor force are innon-agricultural, wage-earning jobs.
2. Despite an incredible potential for growth, a well-trained labor force, andabundant and varied natural resources, Madagascar has experienced a meteoric decline intodeeper and deeper poverty over the last two and a half decades. The countrys real per capitaincome decreased 40 percent between 1971 and 1991 alone1 . The reasons for this disastrouseconomic performance rests primarily on ineffective governmnent policies. From the point ofview of the poor, these dismal statistics are seen to represent an economy that provides few orno opportunities for advancement.
3. The objectives of this report are primarily to: (i) understand this sharp declineinto poverty in hopes that history does not continue to repeat itself, (ii) clarify who the poorare and where they live; (iii) better understand why they are poor; and (iv) explore options forthe development of a sustainable poverty reduction strategy. To achieve this, the report looksat poverty in Madagascar from several perspectives. Chapter II introduces a brief picture ofthe evolution of poverty in Madagascar. Chapter III presents the current profile of poverty.Chapters IV-VI look at government policies and programs to reduce poverty, includinggrowth, human resources, and safety net issues, and proposes strategies for poverty reductionin Madagascar. Chapter VII provides a policy matrix of proposed actions.
IWorld Bank, Madagascar: A Stralegyfor High Growth and Poverty Alleviation. An Economic Strategy Note, June
29, 1994.2 Participatory Poverty Assessmnentfor Madagascar, Ministry of Plan, Madagascar, June 1993.

2
PART I. UNDERSTANDING POVERTY
CHAPTER H. ECONOMIC DEVELOPMENT AND POVERTY: 1960-1993
A. DEVELOPMENT OF THE CRISIS
4. After gaining independence in 1960, the Malagasy economy maintainedrelatively stable prices and an equilibrium in balance of payments and experiencedmoderate growth of almost 3 percent per year between 1960 and 1972. Real per capitaGDP growth was a positive but low 0.4 percent. A change in government in 1972reversed many economic policies of the previous decade to inward-looking policies aimedat self-sufficiency of the economy. To reduce dependence on foreign capital, the newgovernment nationalized foreign-owned firms, limited foreign investment, emphasizedstate control of the economy, and introduced price controls and cumbersomeadministrative regulations. Economnic performance under these new policies wasdisappointing. Real GDP fell at an annual rate of almost one percent between 1972 and1978. In an effort to stimulate growth, the government adopted an "invest-to-the-hilt"program of public sector investment between 1978 and 1980, resulting in a quadrupling ofexternal debt between 1978 and 1980, largely on commercial terms. Unfortunately, thismoney was channeled in large part to a series of economically non-viable investments.The results of this program were a large fiscal deficit,3 an annual inflation rate of 30percent, a rise in public investment and consumption at the expense of the private sector,4
and little economic growth. Real GDP growth for the 1972-80 period as a whole wasminimal (0.6 percent), and on a per capita basis, declined by almost 2 percent a year (seeAnnex Table A-1).
5. The economic crisis reached its peak between 1980 and 1983. With afailure to formulate and imiplement a coordinated and comprehensive austerity programbetween 1980 and 1983, economic conditions continued to deteriorate. In response,stricter economic controls of production and prices were implemented and imports werecompressed through quantitative restrictions and foreign exchange rationing. Import-competing industries received even higher protection, industrial capacity utilizationdeclined, shortages became commonplace, and parallel markets emerged. With inadequateincentives for export crop production and the resulting decline in domestic production, theGovernment's revenue base contracted, further exacerbating both government and balanceof payment deficits, providing even less foreign exchange for imports, and resulting in adownward spiral in production.' With this contraction in revenues, the Government'sability to provide for the functioning and maintenance of economic and social
3The deficit surged from its average lcvel of 2.5 percent of GDP during the 1970s to 18 percent in 1980.4Public investment increased almiost 10 percent a year while private investment declined by 0.3 percent.Correspondingly, public consumption increased alnmost 3 percent a year as private consumption declined by
approximately I percent a year.5 Adverse developments in the terns of trade also aggravated economic problems. Both GDP and the volume ofexports declined, at the same timnc that scheduled external debt service obligations escalated from 4 percent of
exports in 1978 to 17 percent in 1980 and 85 percent in 1983.

3
infrastructure declined, leading to, among other things, considerable deterioration in thecountry's transportation network and setting the stage for a decline in its social services.6
By 1983, real per capita GDP had fallen 30 percent below its 1972 level.
B. EFFECTS OF THE CRISIS ON THE POOR, 1960-1983
6. Agricultural output, which provides the livelihood for the majority of thecountry's poor, stagnated between 1972 and 1980, growing only 0.3 percent a year onaverage. The stagnation in agriculture was primarily the result of government policy toincrease its ownership of productive assets and control over prices, marketing, andprocessing in the agricultural sector. Prices of crops were set by the Government at levelsthat were predominately too low to allow adequate producer incentives. Marketing wasput under the exclusive control of state marketing monopolies that eventually proved to beinefficient, costly, and unreliable. Stagnation in the agricultural sector together withpopulation increases caused per capita agricultural production to decline, and Madagascar,which had been self-sufficient in food and a net exporter of rice, became a heavy importerof this staple.'
7. Government regulation of prices of both manufactured goods andagricultural goods in the 1970s were aimed at benefiting the urban population by keepingconsumer prices low. Although the setting of agricultural prices was also intended toassure farmers a fair price for their produce and protect them from what were consideredto be 'unscrupulous' traders, the prices were set below levels that were profitable andhence necessary in order to stimulate production. Agricultural prices thus remained lowuntil the mid-1970s, resulting in the continuation of declining income levels in rural areas.In 1974 the government tried to lower both regional income disparities and the largevariation of income between different segments of the population. Investments werechanneled into the least favored regions (especially with the creation of regional branchesof the university), the producer price of rice was doubled, and wages of the lower paidurban workers were raised in an effort to protect their living standards.'
8. Between 1974/5 and 1980 both paddy prices and export crop prices(although with a few more exceptions) rose steadily relative to urban wage rates, showinga gradual improvement in the rural/urban income imbalance. Within the agriculturalsector, paddy prices fared better than an index of export prices over this period, favoringthe traditional farmer over the cash crop farmer.9 The government also instituted subsidies
6 Total government expenditure fell froin a h.iglh of 34 percent of GDP in 1979 to 22 percent in 1981, primarily dueto a cut in capital expenditures.7Rice imports peaked at 20 percent of total import value in 1982.8 This latter policy was achieved by increasing minimum wages of the lowest wage categories faster than those inhigher wage categories and by revising the Government's pay scale to favor the lowest paid workers. For furtherdiscussion see Frederic L. Pryor, Incomne Distriblution and Economic Developmnent in Madagascar: Somne HistoricalStatistics, World Bank Discussion Paper No.37, 1988.9For a year by year breakdown in trends in agriculture prices an,d relative prices see Table 2 in Annex I of Povert,
Alleviation in Madagascar. Counlry Assessmnent and Polick, Issues, SDA Unit Report No. 7644-MAG, World Bank,1989.

4
to the urban sector on such basic items as rice, edible oils and condensed milk. Thus,while during the first half of the 1970s the small-holder in agriculture was neglected infavor of a protected import-dependent manufacturing sector, the government attempted toimprove the discrepancy between rural and urban incomes in the mid-1970s. Thesepolicies, however, were only able to slow the decline in real rural incomes. To a largeextent it was a fall in real urban incomes with growing inflation rates, poor industrialperformance, and slow growth in wage rates that slightly narrowed the income gapbetween rural and urban incomes during the 1970s.'
9. Concerning public expenditures, the economic crisis resulted essentially in analmost bankrupt government. Without money, the government had no choice but to cutspending. As a result, there were large cuts to real government expenditures (an average of 13percent a year) between 1980 and 1983. The fall in total real education expenditures (currentand capital) was slightly less than the average (12.3 percent decline a year). Real total healthexpenditures fell considerably (16.3 percent a year on average) with a halving of current realexpenditures on health over this three year period (see Annex Table A-2).
10. Overall, the policies followed by the government during the 1970s and early1980s, despite stated intentions, favored urban areas relative to rural areas where the majorityof the poor lived. Rice subsidies and imports favored urban consumers over poor ruralproducers, while the government's large investment program focused on large industrialprojects that generally supported urban incomes, especially for the nonpoor. Pricing andmarketing controls on export crops also kept real producer prices low for export crop farmers.
C. POVERTY INDICATORS: 1962 AND 1980
11. Most indicators point to an increase in poverty in Madagascar between 1962and 1980 in both rural and urban areas. Pryor" looks at income distribution between the twoyears, finding an increase in overall inequality in income distribution with the gini coefficientincreasing from .40 in 1962 to .47 in 1980.'2 Annex Tables A-3 and A-4 show rough estimatesof income distribution for the period just after independence and the period before adjustmentstarted to be implemented.3
0See Poverty Alleviation in Madagascar for full discussion and tables.
See Frederick L. Pryor, Income Distribution and Ecotonmic Development in AJadagascar: Sonte Historical Statistics.Discussion Paper No.37, Washington, D.C., World Bank, 1988.'2The Gini coefficient is derived from the size distribution of income. A measure of perfect equality of income (witheach decile of the population receiving 10 percent of nationial income) wouild be measured by a Gini coefficient of 0.Likewise perfect inequality would be a Gini coefficient of 1. A Gini coefficient of .5 to .7 is considered to show ahighly unequal distribution of income, while a coefficient of .2 to .35 is considered relatively equitable distribution.See Michael Todero, Economic Development in the Third World, New York, 1982, p. 129 for further information onGini curves.'3This degree of inequality is not uiinusual for low-income couiitries. According to the 1985 and 1988 World BankWorld Development Reports, in 1976 the 20 percent of Kenya's population with the lowest income received only 2.6percent of national income, while the highiest 20 percent received 60.4 percent. For the saine year in Zamnbia, thefigtures were 3.4 and 61.1 percent (vs. Madagascar's 5 percent and 52.4 percent in 1980).

5
12. Pryor also shows that in addition to increasing inequality of the distribution ofincome between the 1960s and 1980, income distribution within rural and urban segments ofthe population changed differently. In 1962 rural areas showed a fairly equitable distribution ofincome, while urban areas had highly unequitable distributions of income. The country as awhole was on the high end of a moderately unequal distribution of income. By 1980,inequality had risen to a level considered highly unequal. The reason for this increase innational inequality was a rise in inequality in rural areas. Income inequality increased in ruralareas with the gini coefficient raising from a moderate level of .30 in 1962 to a highly unequallevel of .47 in 1980. There was a decline in the inequality in the urban sector at the same time,implying that incomes of relatively better off urban households decreased faster than theincomes of poor households (see Annex Table A-4). Possible reasons for this large rise aregovernmental actions which led to the breakdown of traditional rural markets and the ability ofricher farmers to benefit from the small amount of available credit and scarce agricultural inputsand then with the general rise in agricultural prices, the ability of the larger, richer farmers toproduce a marketable surplus and benefit from increased prices.
13. Essama-Nssah'4 takes this analyses further by looking at three dimensions ofpoverty during this period (1962 and 1980) -- the incidence of poverty, its depth, and severity -- for both rural and urban areas. In rural areas, this analysis showed the incidence, the depth,and severity of poverty to have risen over the period.'5 This study also showed an increasinggini index in rural areas, rising from .30 to .42. Analysis of data from urban areas showed anunambiguous increase in urban poverty of all three indicators that occurred in spite of a drop ofabout 4 percentage points in the gini index (from .50 to .46).6
14. To further understand these results, Essama-Nssah decomposes the change inpoverty between its growth and its inequality components for both rural and areas. In urbanareas, increased poverty resulted mainly from lack of growth. In rural areas, the increase inpoverty is seen to have risen primarily because of an increase in inequality in the distribution ofrural incomes. Given the fact that there has not been important land reform or redistribution inMadagascar and that additional analysis shows the gini coefficient for land distribution to havemarginally decreased over the period (from .46 to .435), other factors must have been at work.Government policies were generally pro-rural between 1960 and 1975 and then changed infavor of both the industrial and urban sectors after 1975. State intervention in prices, inputsupply, and marketing proved inefficient and resulted in parallel markets for agriculturalproducts and inputs. Combined with the deterioration of many rural roads and the overvaluedexchange rate, there resulted a shortage of consumer goods and agricultural inputs. It is highly
'4Estimates by B. Essama-Nssah, "hIpact of Growth and Distributioni on Poverty in Madagascar," informal workingpaper, World Bank, draft December 1994.1On the basis of the initial poverty line choseni, dte incidence of poverty was estimated to have declined from 47 to 42 percentbetween 1962 and 1980. Althougl this might lead one to conclude that poverty decreased over the period, the other twvoindicators showed that poverty had increased instead. This suggests that dte two incidence cturves must cross and the first-order dominance test would fail. When re-computinhg the measures uLsing the poverty line proposed by Dorosh et al. ( 1990),this led to an unambiguous increase in rural poverty. The poverty gap rose from 10.5 to 15 and the severity index rose from 3to 7.5 over the pefiod.16This analysis showed the incidence of turbaii poverty increasing from 13 to 18 percent. the poverty gap measture increasingfrom 3 to 7, and the severity index rising from .7 to 3.3.

6
likely that this environment was particularly disabling for poor farmers who may not have hadthe means to deal in the parallel economy, resulting in this increased inequality.
D. ADJUSTMENT AND ITS EFFECTS ON POVERTY, 1983-1990
15. Adjustment efforts. The Government began to complement financialstabilization efforts with structural adjustment measures designed to improve efficiency of theeconomy and set the stage for long-term economic growth. While reforms started slowly, in1987 the government launched a macroeconomic adjustment program to revitalize growththrough a series of supply-side measures to liberalize domestic trade, deregulate prices, devaluethe currency, and liberalize the import system.
16. In the agricultural sector, which is a key area for the reduction of poverty, thegovernment built upon producer price increases in rice between 1983 and 1985, by takingfurther measures to stimulate domestic rice production with the progressive liberalization of therice marketing and distribution systems. Whereas before 1983 all commercial activities in therice sector were reserved for state marketing agencies, this monopoly was partially eliminatedin 1983 by allowing private traders to operate in all areas except in the Government's two largeirrigation schemes at Lac Aloatra and Marovoay. By 1986, market liberalization wascompleted with the opening of these areas to private traders. Producer prices for ricecontinued to be gradually raised and in 1985, the ceiling price was eliminated. In an effort toencourage growth in the export crop sector, export taxes were reduced and internal andexternal trade were fully liberalized for all crops except vanilla. The Government also raisedproducer prices for export crops, although failing to bring them back to profitable levels.'"
17. Effects of Adjtustmtent. Resumed growth and reduced inflation. Among themain goals of the adjustment program and efforts to reduce poverty in Madagascar was first tohalt the deterioration in real income levels and then to produce positive real growth. The firstof these goals was achieved with the financial stabilization that halted the economic decline of1980 to 1982 and set the stage for resumed economic growth. Inflation was reduced from 30percent in the early 1980s to 10 percent in the late 1980s. This reduced the decline inpurchasing power of incomes. Between 1983 and 1986, real GDP growth became positive,averaging 1.6 percent per year, and brought real GDP back to pre-1980 levels. Between 1986and 1990, real GDP growth averaged almost 3.0 percent a year. However, because of therapid 3 percent population growth rate, per capita income in 1986 was approximately 20percent lower than 1980 and 32 percent lower than in 1972. After serious adjustmentmeasures in 1987, real GDP growth averaged almost 3.5 percent a year between 1988 and1990. Private and foreign investment also increased, particularly in export-oriented industries.
18. Reduced government expenditures with some protection of health and adecline in education expenditures. In the first half of this period, between 1983 and 1986
7By 1985/6, the coffee producer price had risen to only 47 percent of its 1970 level (from 42 percent in 1982/3). Theproducer price for vanilla reached 85 percent of its 1970 level (although this increased only marginally from 80 percent in1982/3). The price of cloves contiumed to deteriorate as producer prices were kept low ii line with prospects in worlddemand.

7
before serious adjustment measures were taken in 1987, total real public expenditures remainedfairly constant (falling slightly by 0.1 percent a year). In an attempt to compensate for the largefall in real health expenditures in the early 1980s, positive growth was maintained, averaging2.2 percent growth a year. '8 Education expenditures, on the other hand, continued to plummeteven during this period, falling 7 percent a year on average. As a result of these trends, totalreal expenditure on education in 1986 was almost 20 percent lower than 1983, 30 percentbelow 1981, and 46 percent below the 1980 level. Health fared better with total realexpenditure in 1986 almost 7 percent higher than 1983, 16 percent higher than 1981, but 38percent lower than 1980 (see Annex Table A-2). Due to both the decline in real expendituresin health and education and the poor allocation of expenditure within the sectoral budgets, thequality of services has declined. Between 1988 and 1990, during the serious adjustmentperiod, real expenditures on health rose 44 percent and real expenditures on educationrose 14 percent.
19. Improvements for some of the rural poor. Overall, the agricultural sectorthat provides the majority of the poor with their livelihood, suffered the least fromeconomic decline and gained relatively from the adjustment measures during the 1980s.The net effect of the adjustment measures (exchange rate devaluation, increases in foodcrop and export crop prices, elimination of many government food subsidies, and marketliberalization) considerably changed the terms of trade in favor of the rural sector wherethe vast majority of the country's poor live. During the economic crisis between 1980 and1983, agriculture was the only sector to maintain a positive, although small, real growthrate. The industrial sector experienced a dramatic fall of 12 percent a year on average andservices fell by 3 percent. Between 1983 and 1986, agriculture again grew the strongestaveraging almost 3 percent growth per year, while the industrial sector recovered growth,expanding by 2 percent a year, and services stagnated. Between 1988 and 1990,agriculture grew by 3.2 percent.
20. Within the agricultural sector, however, there have been winners andlosers. While producer prices for rice increased 14 percent in real terms between 1982and 1990, they were highly unstable. Combined with increased paddy production, this, onaverage, translated into increased incomes for rice surplus farmers. Indeed, per capita realincome expenditures seem to have increased significantly in the main paddy producingareas, Lac Aloatra, Morovoay (northwest) and Morandava (midwest).'9 Many rice-deficitfarmers, however, may have seen a decline in their incomes. While the net effect ofincreased rice prices may have reduced incomes for these farmers, this reduction may havebeen offset to some degree by an expansion of production and an increase in the producerprice of other crops they produce, such as potatoes, maize, cassava, wheat and dairyproducts. For farmers on the East Coast who are involved in export crop production, thereforms to date more than likely halted a decline in their incomes, but probably wereunable to improve their incomes. Problems for export crops were compounded by a
18The majority of this growth, however, was in capital expenditures, whichi grew almost 9 percent a year vs. just over1 percent a year for currenit expenditures.'9 Information from Table 21 and 18 from Poverty Alleviation in Madagascar: Country Assessment and Policy
Issues. World Bank. 1989.

8
worsening of international prices for Madagascar's export crops. Since the devaluation ofthe Malagasy franc in 1994, the terms of trade in the rural areas have improvedconsiderably. In spite of serious cyclone damage and the importation of more than150,000 tons of rice, paddy producers in 1994 saw farm gate prices double to between500-600 FMG/kg. This bodes well for production in the coming years.
21. Indeed, for most traditional export crops, the decline in world marketprices and the appreciation of the real exchange rate after 1987 eroded some of thebenefits of the liberalization measures and production stagnated. The share of coffee,cloves and vanilla in total exports dropped from 66 percent in 1985 to 31 percent in1991.' Despite this decline in traditional export crops, the figures also reflect a positiveeffect of liberalization, the expansion of non-traditional agricultural exports such asshrimp, litchis, sisal and to some extent sugar. A large proportion of these non-traditionalexports comes from large-scale industrial enclave sectors that hire labor, often of the poor.Small-scale private fisheries also experienced a six-fold growth in output during the 1980s.Overall however, growth in the agricultural sector, while better than for most sectors haspotential to be much higher. It averaged 2.8 percent per annum between 1983 and 1988,reached 6.3 percent in 1989, but fell back to 2.4 percent in 1990, remaining below thepopulation growth rate in all but one exceptional year.
22. Overall, although still declining on a per capita basis, the agricultural sectorwas much less affected by the economic decline than the mostly urban secondary andtertiary sectors (see Annex Table A-1). In addition, certain segments of the rural sectorbenefited from the adjustment measures through an increase in the price of their output-(especially rice and other food crops). Unfortunately, the rapid deterioration in thecountry's infrastructure has cut-off many communities from participating in new economicopportunities presented by the more open economy. Despite this, however, overall incomelevels remained much lower in rural areas than in urban areas throughout the 1980s.
E. EFFECTS OF THE POLITICAL TRANSITION, 1991-1994
23. The political transition that took place in Madagascar between 1991 and1993, is an important step in the long-term, but this political transition has exacted a,hopefully short-term, heavy economic price. GDP plummeted 7 percent in 1991, beforerising a modest I percent in 1992, 2 percent in 1993, and 1.2 percent in 1994. Overall,between 1990 and 1993, average real GDP fell by 1. 1 percent a year and per capitaincomes fell 4 percent a year on average. The agricultural sector maintained thehighest sectoral growth rate of 1.8 percent a year compared to 0.6 percent a year forindustry and a fall of 1.3 percent a year in services. A modest improvement in overallgrowth was experienced in 1994 with real growth estimated at 1.2 percent. Growth inthe agriculture sector stagnated, growing only at -0.2 percent; industrial growthplummeted -6 percent; and services picked up at 7 percent growth. Overall per capita
20 Madagascar. Privale Sector Assessmnent, World Bank, 1993.
9
incomes have fallen during the first half of the 1990s, eliminating the gains achieved inthe late 1980s.
24. Regarding public expenditures, between 1990 and 1994 real expenditureson health and education have fallen. Total expenditures on education are expected to havebeen maintained at 16 percent of total (non-interest) government expenditures. Recurrenteducation expenditures as a share of total government recurrent expenditure are expectedto have fallen from 30 to 26 percent. Nevertheless, recurrent expenditures for primaryeducation are expected to increase slightly from 43 to 45 percent. Total healthexpenditures were maintained at approximately 6 percent of total (non-interest)government expenditures during the political transition. This was expected to increase to8 percent in the 1994 budget.
10
CHAPTER III. PROFILE OF POVERTY, 1993/4
25. The poverty profile for this poverty assessment is based on several sourcesof information. Results from the recent national household budget survey are used todevelop the quantitative poverty profile in the first section of this chapter. Links betweenpoverty and gender and between poverty and environmental degradation are alsoexplored. To gain a better understanding of the constraints faced by the poor, aparticipatory poverty assessment (PPA) was also carried out and its results are discussedin the second section of this chapter.
26. Previous Poverty Lines. Defining a poverty line that is most appropriatefor a country's circumstances, as well as being replicable for future comparability is often adifficult task, especially in countries with weak information bases, such as Madagascar.Several studies in the past have looked at poverty, although they have all used differentdefinitions of poverty and been based on different types of data. A study by CornellUniversity (Macroeconomic Policies and the Poor) based their poverty line on estimatedhousehold rice consumption because it is the main staple of the Malagasy diet and somedata is available.' On the basis of these rice poverty lines, in 1980 Cornell estimated 34percent of households nationwide (37 percent of rural households and 18 percent of urbanhouseholds in the largest urban centers) were poor. Eighty-eight percent of poorhouseholds lived in rural areas.'22
27. A World Bank study in 1990 gave estimates of food insecurity based onestimated calorie intake that could be related to poverty.2 This study used agriculturalproduction data, an urban income survey, and nutrition data from UNICEF and CatholicRelief Services to model calorie intake. This study classified 35 percent of the populationto face medium food insecurity (34 percent of the rural population and 42 percent of theurban population) and 11 percent to face severe food insecurity (6 percent of the ruralpopulation and 32 percent of the urban population).
28. Other studies have developed poverty lines on the basis of relative povertylines. The development of relative poverty lines is often easiest when only the distributionof household expenditure or incomes are available. Under this methodology, a certainpercentile at the bottom of the income distribution for a country is declared to be poor.
21 The methodology used sets the poverty line as the minimiium income required to meet 50 percent of total calorierequirements from rice. Adjusted for urbani and nrral areas, this resulted in poverty lines of 132,000 FMG and150,000 FMG per vear per hiouselhold.22 The rice poverty line will not be considered fturtlier in this report primarily because rice is not the onily food itemcoisismed by the poor and canunot reflect substitiutioni of other foods for rice in consitmptioni, nor is it an adequaterepresentation of overall basic needs23 Food Security atid Nutrition in Mfadagascar, World Bank, January 1990. The stidy, usinig agrictltuiral productiondata, an urban incoine survey, and periodic infonnationi from UNICEF and Catholic Relief Services, estimated foodsecurity for urban aidniral areas, based on the FAO standard consumption of 2100 calories per day. Rural insecuritywas defined on the basis ot calories constuiied at 3 levels: (i) less thani 90 percent of FAO standards (1890 caloriesper day); (ii) less than 80 percent of FAO standards (1680 calories per day, medium food insecurity); and (iii) lessthan 70 percent of FAO standards (1470 calories per day, severe food insecurity). Urban insectrity was defined asmeeting a certain level of food expendituire as a percent of total expenditture.

11
This methodology was used by B. Essama-Nssah when comparing poverty indicators for1962 and 1980.' Following Pryor's suggestion' based on the fortieth percentile of the1962 distribution of FMG 47,400, he calculates, in real terms an annual income of FMG146,400 in 1980 as a poverty line. This was used to get the best consistency possible inthe comparisons of poverty indicators between 1962 and 1980. This analysis suggested anincrease in poverty and inequality in rural areas over this interval and for urban areas anincrease in poverty with a slight decrease in income inequality.
A. POVERTY PROFILE
29. The analysis in this report utilizes the national household survey, theEnquete permanente aupres des menages (EPM), which was carried out between April1993 and April 1994. This is a nationally representative survey that collected data onexpenditures and living conditions from over 4,500 households representing urban andrural areas in the six Malagasy provinces.26 Because of the data available from this survey,this analysis is able to develop an absolute poverty line that defines poverty as the inabilityto satisfy some set of basic needs.
30. The Poverty Line. Food is the most fundamental need of human beingswithout which we cannot survive. Without adequate food, people do not have the energyrequired to work to their full potential, they are more susceptible to disease, and childrenhave impaired cognitive development. In line with biomedical research, recent academicliterature, and common practice in poverty analysis throughout the world where such datais available, this analysis uses the benchmark per capita calorie requirement of 2,100calories per day. The first part of this poverty line, the food portion, was developed bydefining a "typical" basket of foods reflecting local tastes. To achieve the most realisticbasket of foods for Madagascar, the 42 food items most consumed by households of thethird expenditure quintile -- which on average consumes about 1,750 calories -- wereincluded (see Annex Table B-1).27 The quantities of this reference basket were then valuedtaking into account local variations in the cost of the same food basket on the basis ofrural and urban median prices for each region."
31. The second part of the poverty line estimates essential non-foodrequirements. Families, even if they are unable to meet their food requirements, still haveto purchase non-food items for their survival. Thus, an additional allowance is made in
24 See Essama Nssah, "Impact of Growth and Distributioni on Poverty in Madagascar," World Bank, drafl October1994.25 Pryor, Frederic L. 'Income Distribution and Economic Development in Madagascar: Some Historical Statistics",World Bank Discussion Paper No. 37.26 Annex C provides more information on this survey, other data sources available and used in this poverty profile, aswell as suggestions for future poverty monitorinig.27 Some of these items were already aggregated as group of items, for whiich the average caloric value of the categorywas used. The third quintile was choseni as it most closely represents the basket of foods eaten by the typicalMalagasy. The basket was scaled tip to 2,100 calories and its value estimated accordingly with regional medianprices, urban and rural, of the bottom 60 percent of the sample, from which a nationial bunidle was estimated (seeMethodology Section in Volume 1).3 These deflators can be found in Volume I in the Methodology section.
12
the poverty line for consumption of non-food goods. The methodology for determiningthe consumption of non-foods is different since it is more difficult to determine a 'typical'bundle of non-food items and since prices for such goods are rarely available. Using theapproach proposed by Ravallion (1994), this analysis estimates the allowance for non-foods as the typical non-food spending of those who actually reach the reference level offood spending (for further details see Methodology in Volume I and Ravallion, 1994).
32. Using this approach, which takes into account local differences in prices foreach region, and within each region for urban and rural areas, the national Poverty Line isFMG 248.400 per person per year in Madagascar in 1993 prices. About 70 percent of thepopulation of Madagascar is under this threshold.' A second poverty line is alsocalculated, the extreme poverty line, to determine the number and characteristics of theextreme poor. The extreme poor are defined as those that are just able to purchase thereference 2100 calorie food basket. Because these households in reality also purchaseother non-food essential items, they have to displace some food, thus consuming less thanthe 2100 calories required per day. In this sense, the lower or extreme poverty line couldbe thought of as defining the food poor. This poverty line for the extreme or food poor isFMG 194.460 per person per year. Approximately 59 percent of the population falls underthis threshold and are considered as "food poor" or extremely poor.'
1. Poverty Comparisons
33. Poverty Over Time. Previous studies, such as Essama-Nssah "Impact ofGrowth and Distribution on Poverty in Madagascar" that is mentioned above, point to anincrease in poverty between 1962 and 1980. Because methodologies for defining thepoverty line are different between 1980 and 1993 no meaningful comparisons can bemade. There are other indications, however, that poverty has increased. Very telling is thefact that real per capita national income declined over the period as a whole such that in1993 real per capita GDP was only 75 percent of its 1984 level.3' Enrollment ratios havealso fallen (see Chapter 5).
34. Another indication of change is to look at the change in expenditurepatterns between 1980 and 1993 (see Annex Table B-3). Overall, the percent ofexpenditure allocated to food has increased for the country as a whole from 63 percent in
29 If detailed expenditure data is unavailable relative poverty lines will allow for future comparisons with 1993. Tocalculate relative poverty lines from the 1993 EPM data have been set at two-thirds of mean real per capitaexpenditure (poor) and one-third of mean per capita expenditure (extreme poor). This gives a per capita povertyline for the poor at FMG 162,289 and for the extreme poor a line of FMG 81,144; mean per capita expenditurebeing FMG 243,433. With these lines, 48.8 percent of the total population is poor (55.2 percent of the ruralpopulation and 25.4 percent of the urban population) in 1993. The proportion of extreme poor in the population isestimated to be 14.8 percent (17.5 percent in rural areas and 4.8 percent in urban areas).30 Translated into quintiles, this essentially translate into the bottom three quintiles being extremely poor and half ofthe fourth quintile being poor. See Annex Table B-2.31 Although any conclusions are tenuous at best, if the Essama-Nssah results are compared with the results of the1993 survey, it shows an increase in both the incidence and depth of rural poverty, although the Gini falls from 0.47to 0.40 between 1980 and 1993. In urban areas, the incidence of poverty has increased. Likewise, the Ginicontinued to fall from about 0.7 to 0.46.

13
1980 to 68 percent in 1993/4. This experience is consistent in all regions with theexception in Toliara. This finding might be tied to the large amount of food aid that oftenflows to this drought-prone part of the island. Such a change in the expenditure pattern isusually considered as a sign of impoverishment.
35. Rural and Urban Differences. As shown in Figure 3.1 through 3.3 andTable 3.1, the incidence of poverty is much higher in rural areas than in urban areas.Seventy-seven percent of the rural population is poor compared to 47 percent of the urbanpopulation. With respect to extreme poverty, two-thirds (66 percent) of the ruralpopulation are extremely poor relative to 35 percent of the urban population. As a result,86 percent of the poor reside in rural areas and 88 percent of the extreme poor live in ruralareas. The poverty gap index (which essentially shows the depth of poverty or how farbelow the poverty line the poor are) is also much larger (in fact twice as large) for ruralareas than for urban areas. It is thus clear that government policies to reduce povertymust concentrate on improving living standards in rural areas where the vast majority ofthe country's poor live. Nevertheless, not all rural residents are poor, so in addition topolicies and investments to promote broad-based rural growth, there is also scope fortargeting interventions towards poorer households in rural areas on the basis of othercharacteristics of poor households.
Figure 3.1 Head Count by Residence
65 = L14530-
Capital City Major UIrban Other lUrban Rural
r OPoverty Line | RE,.tremie Poverty Lin.e
40~~~~~~~~~~~~~~~~~~~~~~~~~~~~

14
) gure 3.2 Poverty Gap by Residence
40- .-
35
25
20
CaIta City Mao Ura : : he Urban R u :::::ralN::
36.~ Te proporion of ura poo inceae as th ura area beoe smalle r.EEE
10- _- iER::'#::':'! 1E _ i:E:i:ER? . | _ ~~.:E..... i. ......R E.. ;
For~~~~ty-on pecet:C; of th poplaio in;.0' th capQitaVSl cit of Antnariv are, poo cmae
to sm e . ..rb .. .an a
Capital City Mlajor Urban Other UTrban Rural
0 : Poverty l,ine| Extrerne Poverty Line
,vigure 3.3 Severity of Poverty by Residence
25-
20- 0
1 0 ... .. .. ....,l~~~~~~~~~. .... ..........XtX_1t0 VEEt t'EE 'I 1: ~~~~~~~~~~. ' i:.. EiE ; .g. .... ..'TE l: E-
O I j ! ' i'F' SESE 11111...... . .t ... ...t ' .. X'1: Cnpta .. t Majo ...... .. eUra .......
get pogrssvel w rs ason moesfro teCapital CitymajorrurbananOthters andn then
to smallercn nohrmjr urban areas.(h rvnilcptl thrta h aia iy

15
Table 3.1 Distribution of Poverty by Place of Residence(percent)
Head Count I Poverty Gap | Poverty Severity Share of TotalIndex Contribution I Index Conribution I Index IContributioni Population
Poverty LineZ= 248,400 FMG 70.3 100.0 32.7 100.0 18.8 100.0 100.0Total Urban 47.1 14.3 17.6 11.5 8.7 9.9 21.4Capital City 40.9 5.5 14.7 4.2 7.1 3.6 9.4Major Urban 42.6 3.2 17.3 2.8 9.2 2.6 5.3Other Urban 59.3 5.6 21.9 4.5 10.4 3.8 6.7Rural 76.7 85.8 36.9 88.5 21.5 90.0 78.6Extreme Poverty LineZ= 194,460 FMG 59.2 100.0 23.8 100.0 12.5 100.0 100.0Total Urban 34.8 12.6 11.2 10.1 4.9 8.2 21.4Capital City 30.0 4.8 9.2 3.6 4.0 3.0 9.4Major Urban 31.4 2.8 11.8 2.6 5.7 2.2 5.3Other Urban 44.1 5.0 13.5 3.8 5.7 3.1 6.7Rural 65.9 87.5 27.2 89.9 14.6 91.8 78.6Source: EPM 1993
37. Regional Differences. An analysis of poverty by region shows that Toliarais clearly the poorest province in Madagascar with 80 percent of its population poor and72 percent extremely poor (see Table 3.2). The depth and severity of poverty in thisregion is also the worst in the country. Toamasina and Fianarantsoa (both with aboutthree-quarters of their populations living under the poverty line) are essentially tied forbeing the second worse off in terms of incidence, severity, and depth of poverty.Antananarivo, Antsiranana, and Mahajanga are relatively better off with 64, 66, and 67percent of their population below the poverty line, respectively. Of these three,Mahajanga is a bit worse off with a slightly larger incidence of poor individuals, a largerpoverty gap for the extremely poor, and slightly more severe poverty. While Antananarivohas a slightly lower incidence of poverty, its depth and severity is slightly higher than inAntsiranana.
Table 3.2 Distribution of Poverty by Provinces
Province Head Couint Poverty Gap | Poverty Severity IShare of TotalIndex Contribution I ndex |Contribution| Index ! Contribution Population
Zt FGZ4~0 7.3 : 00 --io.0 --- 32,7: l. 00-0 .S 100.00Antananarivo 64.3 27.5 27.4 25.1 14.5 23.2 30.1Fianarantsoa 73.5 20.3 35.7 21.2 21.1 21.9 19.4Toamasina 74.1 17.2 35.7 17.8 20.5 17.8 16.3Mahajanga 67.3 12.3 27.7 10.8 14.9 10.1 12.8Toliara 80.4 15.4 45.0 18.6 29.5 21.2 13.5Antsiranana 65.7 7.4 26.9 6.5 13.8 5.8 7.9JE;.tree Poveit LinZ .19446D0... 5. :.10.0 - -::: 2. 100.0 . : -12.5 -...0 :. :12-Antananarivo 52.8 26.8 18.9 23.8 8.8 21.1 30.1Fianarantsoa 62.8 20.6 26.5 21.6 14.6 22.5 19.4Toamasina 65.9 18.0 26.2 17.9 13.6 17.7 16.3Mahajanga 50.5 10.9 18.8 10.1 9.4 9.6 12.8Toliara 72.0 16.4 36.3 20.6 22.2 24.0 13.5Antsiranana 53.7 7.2 17.8 5.9 8.1 5.1 7.9Source: EPM 1993

16
38. Nevertheless, because of the large share of the population living inAntananarivo province (30 percent of the island's population) and Fianarantsoa (20percent), these two provinces account for 28 and 20 percent, respectively of the country'spoor population, followed by Toamasina with 17 percent of the island's poor and Toliarawith 15 percent. Antsiranana is home to 7 percent of the island's poor. Numbers for theextreme poor follow similar regional patterns.
Figure 3.4 Distribution of Poverty by Provinces, 1993
90
70 ____l , _
50-
40
30-
20
I 0
0
Antananarivo Fianarantsoa Toamnasina Mahajanga Toliara Antsiranana
L Headcount M Poverty Gap U Poverty Severity
39. The poorest province, Toliara, covers a long arch from the west centralcoast to the east coast and is the driest part of the island. Eighty-four percent of the ruralpopulation and 51 percent of the urban population are poor (see Table 3.3). This provincehas received considerable support from donors, primarily in the area of food aid, becauseof a succession of severe droughts that have brought famine to the isolated ruralpopulations. Somewhat surprisingly, and perhaps because of this aid, global nutritionalstatus of children are relatively better off in most cases in Toliara than the provinces ofAntananarivo, Fianarantsoa, and Toamasina, according to both the 1992 Demographic andHealth (DHS) survey and the EPM survey used in this study.32 Population density is highin the southern districts that are rich in ores, some industrial crops such as sisal, and wherethere are relatively dynamic regional markets in Tolianara and Ambovombe. Despite thetriangular main axes of communication between Ihosy (in Fianarantsoa province), Toliara,and Tolianara, large areas remain marginalized, isolated, and underdeveloped and much ofthe population has fled because of droughts. In part because of this, the incidence of ruralextreme poverty is higher in Toliara than in the other provinces (76 percent compared to71 for Toamasina).
40. Export crop production (coffee, cloves, and pepper) is important in thenarrow coastal plains of Toamasina. It is thus somewhat surprising that the ruralpopulation in this province is the second poorest in the country with an incidence ofpoverty of 79 percent. This has resulted from a history of high taxation on these export
32 See Table 3. 11 on Nutritionial Stattis by poverty grotip and by regioni.

17
crops and very low returns to producers (see, for instance, the results of the participatorypoverty assessment later in this chapter and in Volume I). Unfortunately, these taxes havenot been channeled back into these areas and most traditional export crops have sufferedfrom low productivity. Nonetheless, Toamasina is also home to the country's major port,which handles most of the country's imports and exports. As a result, Toamasina, whilehaving the second poorest rural population in the country, has the lowest incidence ofpoverty in urban areas in the country (35 percent). The province also has a great potentialfor tourism if adequate infrastructure were to be developed.
Table 3.3 Distribution of Poveity by Provinces (Rural and Urban)
Province [ Head Count I Poverty Gap | Poverty Severity Share of TotalIndex Contribution Index IContribulion Index Contribution Populalion
.b ... ,. .,.. U-. .... . . . ............. , ,,,................ . .h ::: :.--. :. : ::R ral :
Z- F GZ4 . 7. -177 10.0 . 36 .9: : .0 21. 100. 100.-Antananarivo 75.9 23.4 33.6 21.5 18.0 19.8 23.6Fianarantsoa 75.9 21.7 37.8 22.5 22.7 23.1 21.9Toamasina 79.0 19.0 38.4 19.1 22.2 19.0 18.4Mahajanga 69.2 11.7 29.6 10.4 16.3 9.9 13.0Toliara 84.2 16.7 47.9 19.7 31.7 22.4 15.2Antsiranana 73.8 7.6 31.0 6.6 15.9 5.8 7.9
EASreuw Poverty Uiw ... ....... ... ...
Antananarivo 63.8 22.8 23.6 20.4 11.1 17.8 23.6Fianarantsoa 66.1 22.0 28.5 22.9 15.9 23.9 21.9Toamasina 70.8 19.8 28.4 19.1 14.8 18.7 18.4Mahajanga 53.4 10.5 20.6 9.8 10.6 9.4 13.0Toliara 75.7 17.5 38.9 21.7 24.1 25.1 15.2Antsiranana 62.0 7.4 20.6 6.0 9.4 5.1 7.9
...... : .- - . .. .-- .. -.... - : ,Po'i'et Lui . ..... .. . . . .
Z----G2.4$,4 -- 47.1 .-. 0. - 17.6 : i.0 8.7 0.Q : 100.0Antananarivo 45.7 52.6 17.6 54.2 8.8 55.1 54.2Fianarantsoa 55.2 12.2 18.7 10.9 8.6 10.2 10.3Toamasina 34.8 6.3 13.8 6.7 6.9 6.7 8.5Mahajanga 59.7 15.2 19.9 13.6 9.0 12.5 12.0Toliara 51.3 7.8 22.7 9.3 12.2 10.2 7.2Antsiranana 35.7 5.9 12.0 5.3 5.7 5.2 7.8
Z=4 G.194 460--3 :- o.o: -1.§ .h ---. ::- W ;-Z=.FMG 194 ~46O . ,t. 100.0 11.2 0. 4.9 :100.0 %0.Antananarivo 35.4 55.1 11.4 55.3 5.1 56.0 54.2Fianarantsoa 36.4 10.8 11.1 10.2 4.6 9.6 10.3Toamasina 26.6 6.5 8.9 6.8 4.0 6.9 8.5Mahajanga 38.9 13.4 11.6 12.5 4.7 11.3 12.0Toliara 43.5 9.0 15.9 10.2 7.6 11.1 7.2Antsiranana 22.9 5.1 7.1 5.0 3.3 5.2 7.8
41. Fianarantsoa, while including intensive rice production in the centralhighlands, also contains large areas of isolated rural communities and relatively isolated

18
small cities. In addition to isolation, the region faces a number of environmental problems.The southwestern part of the province is confronted with periodical droughts, while thesoutheastern part has seen damage to small farms from numerous hurricanes over the pastfive years. Erosion has deteriorated substantial areas of the highlands where immenseareas formally covered with forest and crops have become dry and deserted. As aconsequence of this reduction in arable land due to erosion and high population density,migration has increased towards the already populated lower lands, forcing even higherpopulation density on what is left of the productive lands in the humid valleys and thebottoms of the hills. Resources and income from herding, which has been one of the mostimportant resources of the region, have also been declining with the growing insecuritydue to cattle thefts.33 Reduction in coffee production in the southeastern portions of theregion have also resulted in reduced incomes. The incidence of poverty is high for rural aswell as urban populations (76 and 55 percent, respectively).
42. The three relatively better off provinces are Antananarivo, Antsiranana, andMahajanga with about two-thirds of their respective populations being poor. Of thesethree, Mahajanga is relatively worse off with respect to incidence, severity and depth ofpoverty. Nevertheless, Antananarivo deserves attention from policy makers with respectto poverty reduction efforts because of its contribution to overall poverty in Madagascar.Antananarivo province contains 28 percent of the island's poor due to its large share of theisland's population (30 percent). Antsiranana on the other hand, only contributes 7percent of the island's poor (and about 8 percent of its population). In Antsirananaagricultural activities, encouraged by the tropical and humid climate of the province andthe richness of the soils, have made this region a major producer of export crops likecoffee, cocoa, and vanilla. Eighteen percent of the small farmers grow industrial cropscompared to 4 percent at the national level (see Annex Table B-35). Among these, 48percent are not poor.3 4 Likewise, the abundance of fisheries, in addition to being a growingsource of income, reflects on the nutritional status of the population and raises potentialfor export and industrial food processing economic activities.3 5
43. Robustness of Poverty Rankings. Sensitivity tests on the choice of thepoverty line show that when varying the poverty line over a wide range, the broaderresults are robust (see Annex Table B-4). Rural poverty is always higher and more severethan urban poverty. Among different size urban areas, small cities have a higher incidence,depth, and severity of poverty, followed by major cities, with the capital city beingrelatively better off.36
33 Oflen in conuiection withi illicit export operations rather thani the more customary rites of passage to manhiood.34 Compared to only 29 percent of small export crop producers being not poor for the coiuntry as a %Niole.35 In Antsiranana, 35 percent of childrenl unider five years show signs of stuniting (only 17 percent show extremestunitiig). This is the second best in the counitry afler Mahajaniga (34 and II percent respectively). The nationalaverage is 52 and 30 percent, respectively.36 This holds in 47 of the 48 measurements. In one instance, the severity of poverty for the lowest poverty line ismarginally worse for major cities than for smaller cities -- 4.5 vs. 4.2 (see Annex Table B-4).

19
44. With respect to the regional rankings, it is clear from all indicators --incidence, depth and severity -- that Toliara is always the poorest province. It is also clearthat Toamasina and Fianarantsoa are essentially tied for the second poorest province.Likewise, the relatively better off provinces are consistently Antananarivo, Antsiranana,and Mahajanga. The depth and severity of poverty is consistently the least in Antsiranana.
45. With respect to the incidence of poverty in rural areas, regional rankingsare robust and consistent for all poverty lines. Toliara is the poorest, Toamasina thesecond poorest, followed by Fianarantsoa, Antananarivo, Antsiranana, and Mahajangabeing the richest. With respect to the depth and severity of poverty, again Toliara isconsistently the worst off, while Toamasina and Fianarantsoa are essentially tied forsecond worse off. Antananarivo is consistently in fourth place and Mahajanga andAntsiranana essentially tied for best off
46. In urban areas, Mahajanga, Toliara, and Fianarantsoa are essentially tiedfor the poorest with respect to the incidence of poverty, while Toamasina and Antsirananaare clearly better off. With respect to the depth and severity of poverty in urban areas,Toliara is unambiguously the worst off, and Antsiranana the best off, followed byToamasina as having the second least severity and depth of poverty.
Table 3.4 Cost to Elinminate Poverty in Madagascar
(U$ miillion)Regions Rural tUrban Total
All Madagascar 222.1 28.4 251.0Antananarivo 47.7 15.6 63.3Fianarantsoa 49.8 3.2 53.0Toamasina 42.6 1.9 44.5Mahajanga 23.3 3.9 27.2Toliara 43.9 2.7 46.6Antsiranana 14.8 1.5 16.4Source: World Banik estimates.
47. Estimated Cost of Eliminating Poverty. Table 3.4 shows how much itwould cost in US dollars to eliminate poverty in Madagascar if it is assumed that targetingis both perfect and costless. While it would obviously cost much more in reality toeradicate poverty, this gives a sense of the relative magnitude of the problem in differentareas. Raising the incomes of all of the Malagasy people who currently fall under thepoverty line to the poverty line would cost an estimated $251 million. To bring everyoneup to the lower, or food, poverty line would cost $143 million.7 When these figures arebroken down by rural or urban location, it becomes clear that the lion's share of theexpenditure would be needed in rural areas. In the case of the upper poverty line, thefigures are $222 million (rural) and $28 million (urban), a ratio of 8 to 1, while toeliminate extreme poverty would cost $128 (rural) and $14 million (urban), a ratio of 9 to1. Among the different regions of the country, Antananarivo and Fianarantsoa would
37 These amounts would cover only a costless handing over of the exact amount of cash necessary, on a one timebasis, to each individual below the poverty line.
20
need the largest allocations, while Toliara, the poorest region, would need the third largestallocation because its population is smaller than those of the other two regions. Withineach region, similar urban/rural differences in allocation prevail as at the national level,with the vast majority going to rural areas. Within rural areas, about $50 million would beneeded for Fianarantsoa, $48 million for Antananarivo, and $43 million for each Toliaraand Toamasina. In urban areas, Antananarivo would require the most, $15 million,followed by Mahajanga ($4 million) and Fianarantsoa ($3 million).
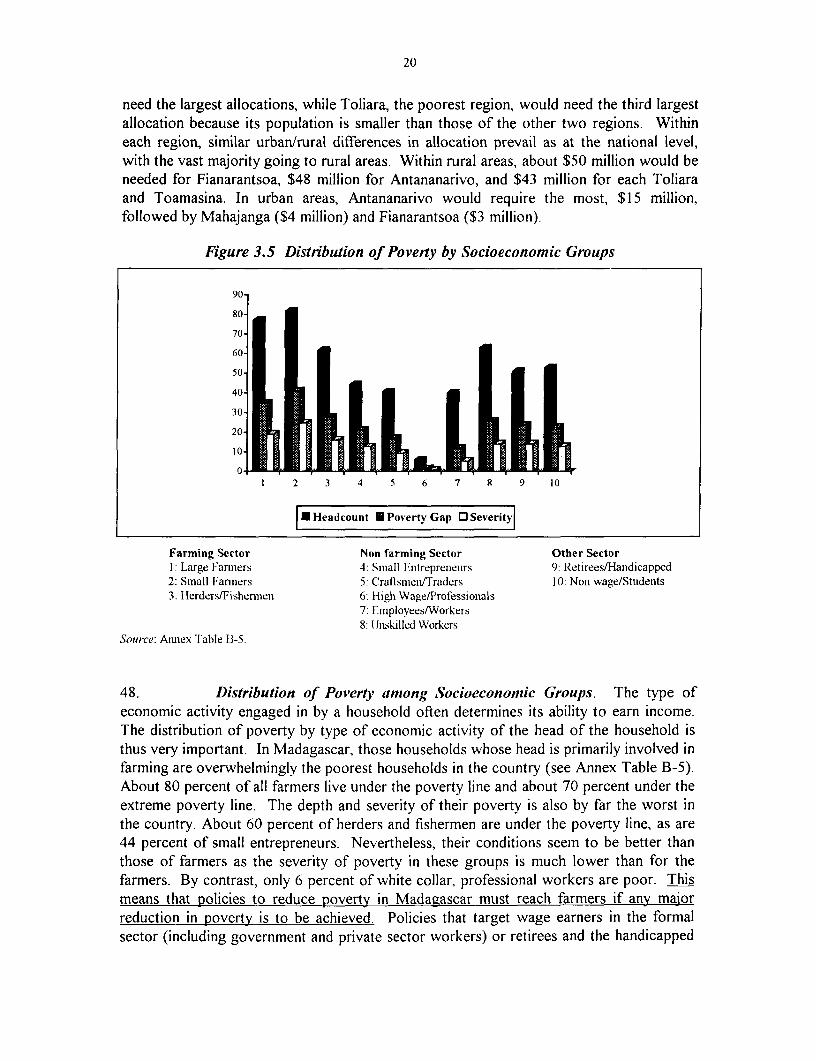
Figure 3.5 Distribution of Poverty by Socioeconomic Groups
90-
80
70-
60-
1 2 3 4 5 6 7 8 9 10
|U HeadJcount Ud Poverty Gap 0 Severity|
Farming Sector Non farming Sector Other Sector1: Large Fanners 4: Small Enltrepreneulrs 9: Retirees/Handicapped2: Small lFarners 5: Craflsmeni/Traders 10: Non wage/Studenits3: Herders/Fishennen 6: Highu Wage/Professionials
7: Employees/Workers8: I Jnskilled Workers
SNoutrce: Aimlex Table B-5.
48. Distribution of PovertH amonga ocioeconomic Croups. The type ofeconomic activity engaged in by a household often determines its ability to earn income.The distribution of poverty by type of economic activity of the head of the household isthus very important. In Madagascar, those households whose head is primarily involved infarming are overwhelmingly the poorest households in the country (see Annex Table 13-5).About 80 percent of all farmers live under the poverty line and about 70 percent under theextreme poverty line. The depth and severity of their poverty is also by far the worst inthe country. About 60 percent of herders and fishermen are under the poverty line, as are44 percent of small entrepreneurs. Nevertheless, their conditions seem to be better thanthose of farmers as the severity of poverty in these groups is much lower than for thefarmers. By contrast, only 6 percent of white collar, professional workers are poor. Thismeans that policies to reduce poverty in Madagascar must reach farmers if any maiorreduction in poverty is to be achieved. Policies that target wage earners in the formalsector (including government and private sector workers) or retirees and the handicapped
21
will reach only a very small portion of the island's poor. Consistently, almost acrosspoverty groups, only 1 percent of the population claims to be unemployed (see AnnexTables B-6 and B-8).
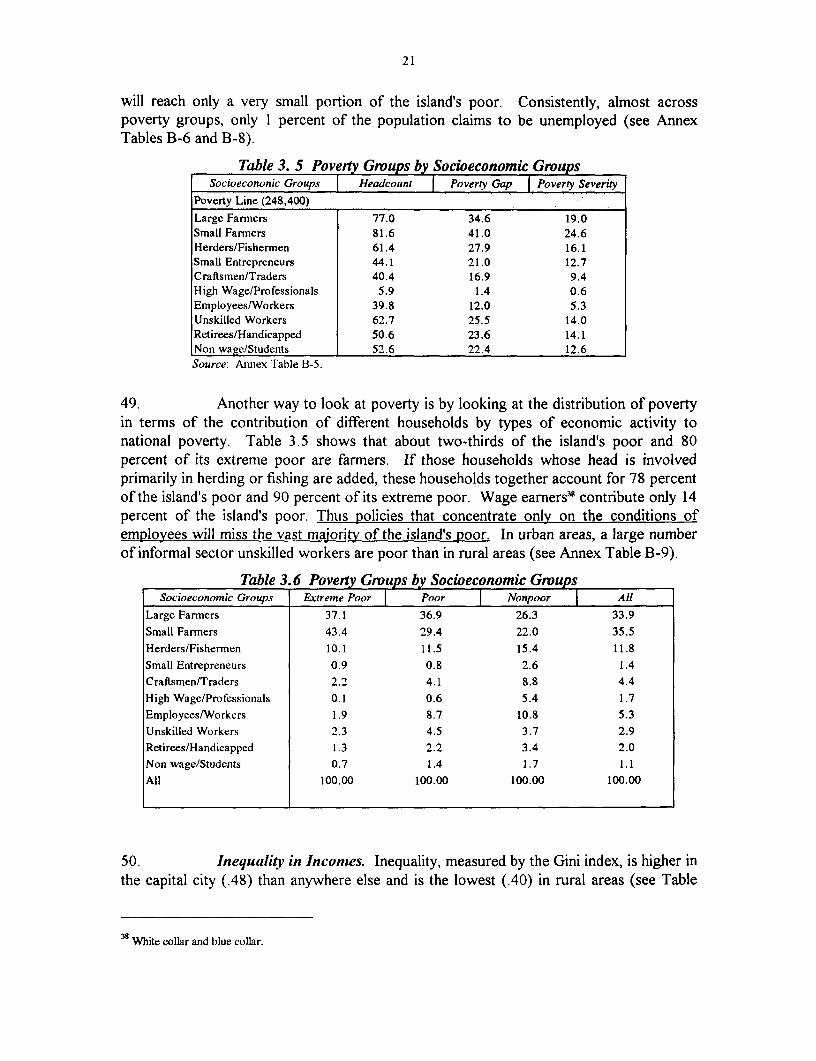
Table 3. 5 Poveily Groups by Socioeconomic GroupsSocioecononic Groups Headcount Poverty Gap rPoverty Severity
Poverty Line (248,400)
Large Farmers 77.0 34.6 19.0Small Farmers 81.6 41.0 24.6Herders/Fishermen 61.4 27.9 16.1Small Entrepreneurs 44.1 21.0 12.7Craftsmen/Traders 40.4 16.9 9.4High Wage/Professionals 5.9 1.4 0.6Employees/Workers 39.8 12.0 5.3Unskilled Workers 62.7 25.5 14.0Retirees/Handicapped 50.6 23.6 14.1Non wage/Students 52.6 22.4 12.6Source: Anunex Table B-5.
49. Another way to look at poverty is by looking at the distribution of povertyin terms of the contribution of different households by types of economic activity tonational poverty. Table 3.5 shows that about two-thirds of the island's poor and 80percent of its extreme poor are farmers. If those households whose head is involvedprimarily in herding or fishing are added, these households together account for 78 percentof the island's poor and 90 percent of its extreme poor. Wage earners38 contribute only 14percent of the island's poor. Thus policies that concentrate only on the conditions ofemployees will miss the vast majority of the island's poor. In urban areas, a large numberof informal sector unskilled workers are poor than in rural areas (see Annex Table B-9).
Table 3.6 Poveiy Groups by Socioeconomic GroupsSocioeconomic Groups Extreme Poor Poor Nonpoor All
Large Farrners 37.1 36.9 26.3 33.9Small Farmners 43.4 29.4 22.0 35.5Herders/Fishermen 10.1 11.5 15.4 11.8Small Entrepreneurs 0.9 0.8 2.6 1.4Craftsmen/Traders 2.2 4.1 8.8 4.4High Wage/Professionals 0.1 0.6 5.4 1.7Employees/Workers 1.9 8.7 10.8 5.3Unskilled Workers 2.3 4.5 3.7 2.9Retirees/Handicapped 1.3 2.2 3.4 2.0Non wage/Students 0.7 1.4 1.7 1.1All 100.00 100.00 100.00 100.00
50. Inequality in Incomes. Inequality, measured by the Gini index, is higher inthe capital city (.48) than anywhere else and is the lowest (.40) in rural areas (see Table
38 White collar and blue collar.

22
3.7). Inequality varies between provinces, but again the differences are not dramatic.Antananarivo province is the highest with a Gini index of .46 and Antsiranana,Fianarantsoa, and Toamasina tie for the lowest at .41.
51. There does not seem to be a convincing pattern between the degree ofinequality and the level of consumption, except when the data is divided by rural and urbanareas at the national level where the higher the average expenditure, the higher the Gini.When divided by province, there is little correlation. For example, while Antananarivo hasthe highest average per capita expenditure and the highest inequality, Toliara has thelowest per capita income and the second highest inequality.
52. There is a tendency for urban areas in each province to have higherinequality than rural areas (with the exception of Mahajanga see Annex Table B-10). Butthere is not always a correlation between high inequality in rural and in urban areas withinthe same province. For instance, Mahajanga has the lowest urban Gini but the highest ruralGini and Antananarivo has the highest urban inequality and close to the lowest urbaninequality.
Table 3. 7 Gini Index by Residence, Province and Socioeconomic GroupResidence/Province Gini Average ExpenditureAll Country .44 243,433Capital .48 471,133Major Cities .44 392,492Other Cities .40 305,550Rural .40 200,906Total Urban .46 399,679ProvincesAntananarivo .46 295,378Fianarantsoa .41 208,643Toainasina .41 215,099Mahajanga .43 267,891Toliara .45 174,752Antsiranana .41 267,066Socioeconomic GroupsLarge farmers .37 204,856Small farmers .38 174,931Herders/Fishermen .41 260,202Small Entrepreneurs .52 435,226Craftsmen/Traders .53 508,205High Wage/Professionals .45 915,998Employees/Workers .36 378,469Unskilled workers .37 251,195Retirees/Handicapped .41 302,348Non wage/Stidents .46 358,746
53. Sources of Income. When looking at the primary sources of householdincome by poverty groups, one feature is how the poor have more concentrated incomesthan nonpoor families. As shown in Table 3.8, almost 60 percent of the extreme poor'sincome and over 55 percent of poor households' income is derived from farm revenuescompared to 40 percent of household income on average for the nonpoor. Having a

23
source of income within the household that is salaried has a strong inverse relationship tothe poverty level of the household. About a third of household income for the nonpoor isderived on average from salaried labor compared to a quarter for the poor and only 16percent for the extreme poor. Transfers play only a small role in total income of allcategories (about 2 percent) and may have been underestimated by the survey.
Table 3.8 Distribution of Sources of Incomes by Poverty GroupsSource of Income Extreme Poor Poor Nonpoor All
Salary 13.4 24.4 33.9 26.4Farrn revenue 58.5 56.3 40.4 47.8Other Non Farrn rev 10.3 7.2 15.0 12.7Transfers 1.7 1.5 2.5 2.1Property 4.0 2.6 2.9 3.2Other 12.1 8.0 5.3 7.8Total 100.0 100.0 100.0 100.0
54. When looking at the sources of income by socioeconomic group someinteresting trends emerge. Large farmers' income is highly concentrated in farm revenue(81 percent), most likely because they are more able to be surplus producers and selloutput on the market to obtain income for the family (see Table 3.9). Small farmers, onthe other hand, are less profitable and must diversify sources of income a bit more (farmrevenue, however, still accounts for almost two-thirds of income on average) to makeends meet. Nevertheless, salaried work accounts for less than 10 percent of income for thevast, vast majority (about 80 percent) of the poor. Herders and fishermen are quitediversified with salaried labor accounting for a third of income on average, farm revenueanother third, and non-farm revenue at almost 20 percent. Small entrepreneurs are alsohighly concentrated with three-quarters of income coming from off-farm revenue (theirenterprises) and 15 percent from salaried labor on average. Craftsmen and traders are abit more diversified on average with 40 percent of income from salaried sources and athird from non-farm activities. Not surprisingly, white collar workers who have relativelysecure income derive the vast majority (84 percent) of household income from salariedsources. They also average 5 percent of household income from farm revenue. Transfers(almost exclusively interhousehold transfers) play an important role as a source of incomefor non-wage earners and students (38 percent). Somewhat surprisingly, they play a muchless important role for retirees and the handicapped who obtain only 8 percent of theirincome from transfers and 43 percent from salaried labor and 25 percent from farmrevenue.

24
Table 3.9 Distribution of Sources of Incomes by Socioeconomic Group
Socioeconomic Groups Salary Farm Non Farm revenue Transfers Property Other Total_____I_ _ revenue I I I I
Large farmners 5.6 81.1 6.5 1.0 1.5 4.3 100Small farmners 9.7 64.4 8.9 1.9 4.0 11.0 100Herders/Fishermen 35.7 36.5 18.1 1.2 2.1 6.5 100Small Entrepreneurs 15.3 3.2 75.5 0.9 1.8 3.2 100Craftsmen/Traders 40.4 8.4 32.7 4.3 7.3 6.8 100High Wage/Professionals 83.6 4.7 2.0 2.2 2.0 5.4 100Employees/Workers 78.1 3.1 4.0 2.2 4.1 8.5 100Unskilled workers 60.5 3.0 5.5 1.5 8.8 20.6 100Retirees/Handicapped 43.0 24.6 9.3 8.4 4.5 10.2 100Non wage/Students 25.0 19.2 -7.3 38.2 4.3 20.5 100All 26.4 47.8 12.7 2.1 3.2 7.8 100
55. Household Characteristics of the Poor While expenditure-based measuresof poverty are a convenient yardstick for measuring the distribution of living standards,they do not fully capture other characteristic of the poor such as literacy, health, housing,or access to clean water. Data on the distribution of social indicators by poverty grouphave not been available in Madagascar before because of the lack of a nationalmultipurpose household survey, such as the EPM, that integrates income or expendituredata and other indicators of household welfare. This section gives a brief overview of thedistribution of selected non-monetary indicators of household living standards using datacollected by the EPM (see Table 3.1 1).3
56. Household Composition. The average Malagasy household contains 4.9members, and not surprisingly, poorer households are larger. Extremely poor householdscontain 5.6 members, while poor households contain 4.8, and the nonpoor have 4.0members on average. Poor households in urban areas tend to have larger household sizethan poor rural households. The extreme poor living in the capital and other major urbancenters average 6.4 household members compared to 5.5 in rural areas.
57. Poor and extremely poor households have higher dependency ratios thando nonpoor households. This results from poor households having a higher averagenumber of children under the age of 14 (2.8 for the extreme poor, 2.1 for the poor, and1.4 for the nonpoor). They also have a higher number of children under 6 years (1.5compared to 1I.1 and 0.7 for the poor and the nonpoor).
39 Expenditure patterns by region, poverty group, quintile, and socioeconomic groups are presented in AnnexTables B-l I to B-15.

25
Table 3.10 Distribution of Social Indicators by Poverty GroupsSocial indicators Extreme Poor Poor Nonpoor All
Household Size (Persons) 5.6 4.8 4.0 4.9Number of Children underthe age of 14 2.8 2.1 1.4 2.2Elderly per Family (age 65+) 0.16 0.18 0.15 0.16Dependency Ratio(ageS20, 65+byage21-64) 2.0 1.6 1.1 1.6Age of Household head (years) 43.2 44.4 41.9 42.8Literacy (percent adults aged 15+) 41.0 48.8 60.0 47.7Completing Secondary School (% Household Heads) 1.3 3.6 10.6 5.0Severe Stunting (percent children 3-60 rn)2 32.4 31.4 25.9 30.3Piped Water (percentusing) 9.1 15.2 30.2 18.6Flushed Toilet (percent using) 0.2 0.6 4.6 1.8Electricity (percent using) 1.7 5.4 20.3 8.9
a. See Table 3.11.
58. Literacy and Schooling. The relationship between education and poverty isalso illustrated in Table 3.10. Forty-one percent of the extreme poor over the age of 15are literate compared to 60 percent for the nonpoor.' With regard to schooling, only 1.3percent of the extreme poor compared to 10.6 percent of nonpoor heads of householdhave completed secondary schooling. Annex Table B-16 shows that the more a head ofhousehold is educated, the less likely he/she will live below the poverty line.4" Amongthose who have only completed Primary school, 37 percent are nonpoor. However, 78percent for those who reached the last three grades or completed secondary level are notpoor and 95 percent of those with a University degree are not poor. Nevertheless,because of lack of growth and economic opportunities, there is still a good chance thatmany with an adequate level of education will remain poor.
59. With regards to schooling, 67 percent of children in extremely poorhouseholds aged 7 to 20 do not attend school, compared to 56 percent for the poor and44 percent for the nonpoor. While these proportions varies slightly to the benefit of themales in the extreme poor group, it varies more significantly by area of residence. Fifty-four percent of the extreme poor children do not attend school in the capital, 49 in themajor cities, and 70 percent in the rural areas. For the nonpoor the proportions are 23 inthe capital, 22 in the major cities, and 57 percent in the rural areas. These numbers reflectlower school attendance for the poor (especially in rural areas).
60. The poor also typically enter the labor force at an earlier age. Theproportions of children aged 7 to 20 active in the labor force is higher for the poor thanfor the nonpoor. Forty-six percent of the extreme poor of this age group are alreadyactive in the labor market compared to 39 of the poor and 29 percent of the nonpoor. Incomparison the proportion of students (as occupation status) are 29, 42 and 55 percent,respectively for the extreme poor, the poor, and the nonpoor. Activity in the labor market
40 The data and analysis on literacy are only preliminary and await final results from corrections in Madagascar. (The1975 census gave a figure of 21 percent illiterates in the country with substantial gender difference of 27 percent ofthe women being illiterate as compared to 20 percent of men. The preliminary results from the 1993 EPM surveygives a gender difference of 36 percent of illiterates with 39 percent for women being illiterate as compared to 30percent of men. This would imply a reduction of literacy in Madagascar.41 Annex Table B-17 presents infornation just for those that did attend school.

26
for female-headed households in this age group is slightly less. Annex Tables B-18, B-19and B-20 also show that children in poor households work more than those in nonpoor.
61. Health, nutrition, and fertility. In 1992 the Demographic and HealthSurvey (DHS) reported that 93 of 1000 children die before reaching their first birthday. Ofa thousand children reaching their first birthday, 77 will not live until their fifth birthday.Infant mortality is much higher in rural areas: 107 per 1000 in rural areas, 75 per 1000 inthe capital city, and 73 per 1000 in other cities. Related to these mortality rates are thepercentage of children vaccinated. The results of EPM show that the proportion ofchildren under 60 months that are vaccinated was 72 percent for the extreme poor, 79percent for the poor, and 82 percent for the nonpoor. The coverage of vaccinations isimproving and will certainly influence the morbidity and mortality rates of young children.
62. Nutritional status, as shown by anthropometric measures, shows thatchildren of poor households generally have higher rates of malnutrition than those ofnonpoor households. Stunting, or low height-for-age, which is usually used as anindicator for chronic malnutrition, is the largest nutritional problem in Madagascar withhalf of children 3 to 60 months stunted and almost a third with severe stunting. Forchildren aged 3 to 60 months, 35 percent in extreme poor households compared to aquarter of those from nonpoor households were severely stunted (3 standard deviationsbelow the norm for the height-for-age indicator) and 55 compared to 47 percent weremoderately stunted (2 standard deviations from the norm).
63. Wasting (weight-for-height) which shows recent malnutrition was lessprevalent, with 6 percent of children from extreme poor households experiencing severewasting (3 standard deviations from the norm) compared to 3 percent for the nonpoor.Seventeen percent of poor compared to 13 percent of the nonpoor children experiencedmoderate wasting. Finally, under nourishment (as shown by the weight-for-age indicator)is moderate for 50 percent of the extreme poor compared to 36 percent of the nonpoorand is severe for 50 percent of the extreme poor but only 10 percent for the nonpoor.
64. Stunting, which seems to be the most serious nutritional problem inMadagascar, is somewhat worse in rural areas than in urban areas and appears to be amore severe problem for children aged 12-23 months (the weaning period).4' By province,Toamasina, Antananarivo and Fianarantsoa generally show the worst nutritional status(using the stunting and undernourishment indicators). Among socioeconomic groups,children of small farmers show the highest incidence of moderate and severe stunting.
42 Durinig the weaning time, chldren start eating solids along vith breast milk. In addition, it is a time X ien clildren arestarting to walk (expending more energy). Complementary food, olleii startinog \ith light rice soup are not nutritively as richas breast miilk and may provoke severe deticienicy if complementary milk or otlier sources of proteins are not mLsed.

27
Table 3.11 Nutritional Status, Esimated from Anthropometnic Measures, bySocioeconomic Characteristics and Poverty Group (Children 3 to 60 months)
Height/Age Weight/Height Weight/AgePoverty Group -3SD -2SD -3SD -2SD -3SD -2SD Number
Extreme Poor 32.4 55.4 5.7 17.4 49.8 49.5 1,821Poor 31.4 46.9 3.7 12.9 14.3 44.3 350Nonpoor 25.9 47.0 3.4 12.8 9.6 35.9 960Age of Children3-6 months 13.9 28.2 7.4 15.9 3.7 17.1 2456-11 months 24.3 43.0 7.4 20.1 14.4 43.0 28412-23 months 36.7 59.3 7.2 21.8 20.9 55.1 67124-35 months 33.2 53.0 4.3 15.6 20.6 49.9 68136-47 months 31.3 54.0 3.0 12.0 12.3 46.2 62648-59 months 28.5 53.9 2.4 9.9 10.1 39.1 624
Sex of ChildrenMale 31.6 53.1 5.8 16.7 15.4 46.1 1,577Female 29.0 50.6 3.8 14.3 14.6 43.8 1,554Residence
Capitale 30.6 50.1 2.9 11.5 7.8 31.1 409Major Cities 25.7 46.7 3.5 12.2 13.3 39.5 377Small Cities 23.4 47.6 5.0 14.9 12.6 40.1 397Urban 26.6 48.2 3.8 12.9 11.2 36.8 1,183Rural 32.6 54.1 5.4 17.1 17.4 49.9 1,948Province
Antananarivo 33.5 58.2 2.8 12.7 13.5 45.7 1,008Fianarantsoa 38.6 57.4 8.0 18.6 18.4 46.5 598Toamasina 35.7 56.5 5.1 17.1 19.8 52.5 474Mahajanga 11.3 33.8 5.9 20.2 10.4 42.1 337Antsiranana 16.9 35.2 3.8 14.4 11.4 39.4 236Toliara 27.8 47.9 4.4 13.2 14.2 38.5 478
Socioeconomic GroupsLarge Farmers 28.2 50.1 5.0 16.8 15.9 47.0 855Small Farmers 32.8 56.1 6.3 17.9 16.8 48.8 930
Herders/Fishermen 32.1 54.7 2.2 14.8 16.4 50.9 446
Small Entrepreneurs 30.7 53.3 4.0 9.3 13.3 45.3 75Craftsmen/Trader 31.8 48.1 1.9 7.0 8.4 29.4 214High Wage/Professional 15.7 35.7 4.3 17.1 5.7 30.0 70Small Wage/Workers 27.6 47.4 4.6 12.4 11.0 35.3 283Unskilled Workers 34.3 49.4 6.0 15.1 18.1 41.6 166Retirees/Handicapped 21.7 45.7 8.7 15.2 10.9 39.1 46Unemployed/Other 28.3 54.4 2.2 17.4 15.2 41.3 46All 30.3 51.9 4.8 16.5 15.0 44.9 3,131
65. Housing and sanitary conditions. Housing conditions are crowded inMadagascar. The average number of people per room among poverty groups shows thatthe extreme poor households generally have one room for 4.3 persons, poor householdshave one room for 3.5 persons, and nonpoor households have 2.7 persons per room. Fifty-

28
six percent of the households live in a single room, 29 percent in two rooms, and 15percent in three or more rooms.
66. Electricity remains a rare source of energy for Malagasy households as only9 percent declare using this source for lighting. In fact, 83 percent of households use oillamps, 3 percent candles, and about 5 percent use non-identified sources (generally noneor the light from a wood fire). The extreme poor have a very limited use of electricity(less than 2 percent), while only 5 percent of the poor declare using it. Twenty percent ofthe nonpoor use electricity, still a small fraction of the population. Since most of thepopulation resides in rural areas, the limited development of the electricity networkexplains why more than 4 in 5 households use an oil lamp for lighting nationally (and 90percent of the rural population; see Annex Table B-2 1).
67. Wood is the main source of fuel for all Malagasy households with morethan 80 percent of them using this source for cooking fuel (see Annex Table B-22).Fourteen percent of all households use charcoal. Electricity, gas, and oil are used by lessthan I percent of the population for cooking fuel. Wood is the almost exclusive source offuel for the extreme poor and the poor (about 95 and 85 percent, respectively). Two-thirds of the nonpoor use wood as their main source of fuel. The second source ofcooking fuel for all households is charcoal. In fact, wood and charcoal account for almost99 percent of the fuel used. While wood is primarily used in rural areas, charcoal is moreimportant in urban areas. In the rural areas 94 percent of households use wood forcooking and 5 percent use charcoal. In urban areas, 44 percent use wood and 50 percentuse charcoal. The implication of such a high level of use of wood for fuel is obvious forthe environment and the high pace of deforestation experienced by the island in the recentyears. One of the solution would be to develop the use of economic stove for cookingand to entice the population in the use of other sources like oil and gas. However, the useof these two kind of fuel may have budgetary implications that are beyond the means ofthe poorest households.
68. The majority of Malagasy households obtain drinking water from sourcesthat can be easily contaminated. Almost 60 percent obtain drinking water from lakes,ponds, and rivers; 20 percent from natural wells (without pumps); and 13 percent frompublic taps. For the extreme poor the figures are 70 percent, 18 percent, and 8 percent,respectively, and for the poor are 57, 25, and 12 percent (see Annex Table B-23). Thenonpoor use more diverse sources of drinking water: about 40 percent from lakes, rivers,and ponds; 20 percent from wells; 20 percent from public taps; and only 6 percent fromindoor plumbing. If all sources of potable water are combined (indoor plumbing, outdoortap, and public tap), 69 percent of households that live in urban areas use potable watercompared to only 32 percent in rural areas.
69. Sanitation equipment for the disposal of sewage and public dumps forgarbage, which is well known to influence health, is in poor supply in Madagascar (seeAnnex Tables B-24 and B-25). Two out of three households have no sanitationequipment, less than a third use latrines, and only 2 percent use flushed toilets. Seventy-five percent of extreme poor households, 63 percent of poor households, and 50 percent

29
of nonpoor households have no access to sanitation equipment. Regarding the use oflatrines, only 24 percent of extreme poor households, 35 of the poor, and 43 percent ofnonpoor households have access. Likewise, only 4 percent use public refuse dumps.Instead, households burn, bury or otherwise dispose of their garbage. The lack of publicor modem sewage is acute even in the urban areas where 27 percent of households do notuse any kind of sewage equipment (compared to 74 percent of rural households). Flushedtoilets are an urban phenomenon and latrines are used by 62 percent of urban and 24percent of rural households. Improving the living conditions of the poor will certainlyimply looking for ways and solutions to improve the provision of safe water and sanitationfor the population as a whole.
2. Farmers and Poverty
70. Since farmers (especially smallholders) are the poorest group in the countryit is important to look more closely at their situation. As shown above, smallholders havethe highest headcount index of poverty (82 percent vs. a 70 percent national average).They also have the most severe level of poverty with the highest poverty gap and severityindex of all socioeconomic groups. While smallholders account for 36 percent of allhouseholds in Madagascar, they account for 43 percent of the extreme poor and 41percent of the poor. The main sources of income for smallfarmers are farm revenue (64percent), salary (10 percent), and non-farm revenue (9 percent). Of expenditures,smallholders spend significantly more, in proportion, on food than the national average (75vs. 68 percent), less on education (0.8 vs. 1.7 percent), and approximately the sameproportion of their consumption on health (2.0 vs. 2.3 percent).43 Their children are alsothe most malnourished.
71. Lan(lhol(lings. The average land area cultivated by different povertygroups is different, but is less striking than one might have expected. The nonpoor onaverage have 40 percent more land than do the extreme poor (2.4 hectares vs. 1.7 hectareson average, respectively). Table 3.12 shows the differences to be particularly striking inthe Antananarivo and Fianarantsoa provinces where the nonpoor have at least twice theamount of land than do the extreme poor. In Mahajanga and Toliara (the poorestprovince), however, the differences in the size of land cultivated is not tremendouslydifferent for the two groups, and in Antsiranana the extreme poor, in fact, own more landon average than do the nonpoor.
Table 3.12 Mean Area Cultivated for All Farmers by Poverty Group and Province(hectares)
Poverty Group Antananarivo Fianarantsoa Toamasina Mahajanga Toliara Antsiranana AllExtreme Poor 1.1 1.0 2.9 1.6 1.5 3.4 1.7Poor 1.3 2.1 2.4 2.5 1.9 2.9 2.1Nonpoor 2.2 2.4 3.8 1.8 1.8 2.7 2.4All 1.4 1.5 3.1 1.8 1.6 3.0 2.0
43 See Annex Table B-15.

30
72. The distribution of farmers by poverty group is amazingly similar withrespect to the area they cultivate (see Annex Table B-26). Whereas 26 percent of theextreme poor cultivate less than half a hectare, 24 percent of the nonpoor cultivate lessthan a half a hectare. Nineteen percent of the extreme poor and 17 percent of the nonpoorcultivate between one half and one hectare of land. Twenty percent of the extreme poorand 17 percent of the nonpoor cultivate between 1.0 and 1.5 hectares, while 36 percentand 42 percent, respectively, cultivate more than 1.5 hectares.'
73. There may also have been a significant change in the average areacultivated over the last decade. Although different methodologies used may account forthe main differences, the results of the survey used in this study show mean area cultivatedto have increased from 1.2 hectares in 1985 (according to the FAO's 1985 AgriculturalCensus) to 2.0 in 1993/4.45 The largest increases in mean area cultivated appear to havebeen in Toamasina (121 percent increase), Antsiranana (100 percent increase) and Toliara(77 percent increase). While cultivated land has in the past accounted for only 3 percentof the country's total land area, further study is warranted to understand the dynamics ofchanges in land use and to see the extent to which expansion has been at the expense offorests and/or other parts of Madagascar's unique environment.
74. Land ownership. Almost two-thirds of farmers own their land and roughlya third use communal lands (see Annex Table B-29). Of those that own their land, onaverage 86 percent of it was inherited and 14 percent was purchased (see Annex Tables B-30 and B-3 1). One-third of farmers who own land have deeds for their property. This isthe case or both extreme poor and nonpoor farmers (see Annex Table B-29). Overall,less than 10 percent of a farmer's cultivated area is either rented or sharecropped land. Forsmall, medium, and large farmers alike, the extreme poor owned more of their land thandid the nonpoor and a somewhat smaller percentage of their cultivated area was oncommunal lands (see Annex Tables B-31, B-32, and B-33 for small farmers divided byresidence and province). This may imply that the poor have less influence in the decisionsof the community as to the allocation of its community land.
75. Primary crops produced. Regarding primary crops produced, Table 3.13shows by province and by poverty group the percentage of small farmers producingprimarily rice, other food crops, or industrial crops. First, it is clear that for bothsmallholders (farmers who cultivate less than a hectare) and larger farmers (those whocultivate more than a hectare), rice and other food crops predominate production patterns,with 96 percent of smallholders producing primarily rice or other food crops, 95 percent
44 Annex Tables B-27 and B-28 present distribution of small farmers by area cultivated, poverty group, residenceand region.45 According to the 1985 agricultuiral census, meaii area cultivated by region (in hectares) was: Antananarivo (1.0),Fianarantsoa (1.1), Toainasina (1.4), Mahajaliga (1.6), Toliara (0.9), Antsiranana (1.5). See World Bank, "PovertyAlleviation in Madagascar: Country Assessment and Policy Issues", June 1989 and Ministry of Agriculture and FAO"Project Recensement National de I'Agricultture et Systeme Pennanient des Statistique Agricoles", Antananarivo,April 1988 for further information.

31
of medium farmers and 86 percent of large farmers (see Annex Tables B-35, B-36, and B-37 for information on small, medium, and large farmers). Nationwide, only 4 percent ofsmallholders produce primarily industrial crops' compared to 14 percent for large farmers.In general, the extreme poor and poor are more dependent on rice production (Toliarabeing the main exception). The reverse is true for other foodcrops. As a farmer gets lesspoor, he has a tendency to diversify out of the main subsistence crop.
Table 3.13 Distribution of All Farmers by Primary Type of CropsGrown and Poverty Groups for Each Province
Province/PovertyGroup Rice Food Crops Industrial Crops All
°/ _ % °/AntananarivoExtreme Poor 47 53 0 100.0Poor 59 41 0 100.0Nonpoor 50 49 1 100.0All 49 50 0 100.0FianarantsoaExtreme Poor 60 30 9 100Poor 62 38 0 100.0Nonpoor 52 38 9 100.0All 58 34 8 100.0ToamasinaExtreme Poor 71 19 10 100.0Poor 61 35 4 100.0Nonpoor 63 32 4 100.0All 68 24 8 100.0MahajangaExtreme Poor 63 27 10 100.0Poor 59 37 4 100.0Nonpoor 51 47 2 100.0All 58 36 6 100.0ToliaraExtreme Poor 32 68 0 100.0Poor 48 52 0 100.0Nonpoor 44 54 1 100.0All 36 63 0 100.0AntsirananaExtreme Poor 41 34 25 100.0Poor 51 21 28 100.0Nonpoor 51 29 19 100.0All 47 30 23 100.0
Total extreme poor 53 40 7 100.0Total poor 58 37 5 100.0Total nonpoor 52 42 6 100.0Total All 53 40 6 100.0
Source: Anuex Table B-34.
46 Industrial crops incitide coffee, vanilla, letchi, cotton, fish, sisal, cloves, cocoa, and rofia.

32
76. There is often an assumption that farmers who primarily produce industrialcrops, which are generally for export purposes, are not poor. In Madagascar this is notthe general rule. For all farmers, 71 percent who produce primarily industrial crops areeither poor or extremely poor farmers (see Annex Table B-34).
77. Several regional findings are noteworthy. In Toliara only approximately athird of all farmers (including the extreme poor and poor) are primarily rice producers.Toamasina province (that includes the Lac Aloatra region) has the highest percentage ofprimarily rice producers (68 percent). Only Antsiranana, Fianarantsoa, Toamasina, andMahajanga provinces have more than 6 percent of small farmers involved primarily inindustrial crop production. In Toamasina and Mahajanga only 15 percent of farmers whoproduce primarily industrial crops are nonpoor compared to about 35 percent inAntsiranana and Fianarantsoa.
3. Women and Poverty
78. Women occupy a relatively favorable position in Madagascar compared tomany other developing countries, but, despite their many advantages, women inMadagascar continue to be confronted by problems that men do not face. They areprotected from discrimination by the constitution, which recognizes the equality of allhuman beings. In some parts of the country, kinship is ambilineal (determined by eithermaternal or paternal links). The law reinforces these traditional rights and extends them tospousal relations. In general, women have some rights to own property (including land),to sue for divorce, and, to a limited extent, to inherit if the partner dies (and the union hasbeen of long duration).
79. However, the legal rights of women are not well known to the generalpublic, and traditional practices that abridge those rights continue. Traditional society inmany parts of Madagascar is based on the principle of the supremacy of the first-born andthe supremacy of the man. Women's roles in the community are typically less prominentthan those of men, which often limits the extent to which their voices are heard in publicdebate. A woman's role is defined mainly in relation to her family and domestic life, so herstatus is enhanced by the birth of children, especially sons. In some areas, especially in thesouth, tradition holds that women may not own land and other immovable goods. Girlchildren may also be excluded from inheritance, and, by custom, the separation of propertyon divorce is frequently in favor of the man, especially if there are no children.
80. Results from the EPM show a lower proportion of poor women in thelabor force are actively working than are poor men as shown in Annex Table B-16. Of theextreme poor, approximately 63 percent of extremely poor women are working(compared to 70 percent of men). Sixty-two percent of poor women work (compared to70 percent of poor men) and 56 percent of the nonpoor women work (compared to 68percent of men). Women in rural areas are more active than women in urban areas. Sixty-five percent of the extreme poor, 66 percent of the poor, and 65 percent of the nonpoorwomen in the labor force in rural areas are currently working compared to 53, 48, and 43percent, respectively, in urban areas.

33
81. Female-headed households are more likely to be poorer than male headedhouseholds. A fifth of all households are headed by women (see Annex Table B-38). In87 percent of cases, female-headed houses are a result of divorces (49 percent) or death ofspouse (38 percent). Only about 5 percent are legally or customarily married or are livingwith a boyfriend. The remaining 7 percent have never been married (Annex Table B-39).Twenty percent of households classified as extremely poor and 18 percent of poor andnonpoor households are headed by women. Within the group of female headed households54 percent are considered as extreme poor (compared to 51 percent for men), 11 percentare poor (compared to 12 percent for men), and 35 percent are nonpoor (compared to 37percent for men).4 '
82. With respect to labor force activity of female-headed households, female-headed houses are less active than male-headed houses, with 84 percent workingcompared to 94 percent of male-headed households (see Annex Table B-43).' Whileequal number are unemployed (less than I percent), 6 percent of female-headedhouseholds (compared to I percent of male-headed households) stay at home and 6percent (vs. 2 percent) say they are unable to work. Information on the socioeconomicgroups by female-headed households can be found in Annex Table B-44.
83. Female household heads are primarily involved in agricultural activities.Forty-three percent are small farmers, 17 percent are large and medium sized farmers, 10percent are herders, 9 percent are in trading and services, and 5 percent are unskilledworkers. Of the extreme poor farmers cultivating rice, 17 percent are female-headed asare 18 percent of poor farmers and 15 percent of nonpoor farmers. Of women operatingmedium and large farms, 52 percent produce primarily rice, 41 percent primarily produceother subsistence crops, and 7 percent produce mainly industrial crops. For all female-headed households who produce primarily rice, 59 percent are extremely poor, 14 percentare poor, and 27 percent are nonpoor. For those who produce other subsistence crops, 67percent are extremely poor, 8 percent are poor, and 25 percent are nonpoor. Finally, forthose who produce industrial crops, 40 percent are extremely poor, 19 are poor, and 41percent are nonpoor.
47 The distribution of female-headed households by poverty group, residence, and region can be found in AnnexTables B-40, B-41 and B-42.48 This paragraph refers to female-headed households while two paragraphs above the discussion is focusing on allwomen.

34
Box 3.1 A Typical Malagasy Woman
A typical Malagasy woman is 15 years old. After completing the fourth grade, she withdraws from school to work onher parents farm, helping her mother to cultivate rice, to look after her younger siblings, and to do housework. Shecomes from a family of 7 children, all of whom have been to school and know how to read and write. In theory, shehas equal civil rights with her brothers and her husband, but under local custom her property (which may be no morethan a couple of domestic animals as her brothers will inherit the family's land) will be transferred over to herhusband on her wedding day. She is unlikely to have much collateral, so if she ever needs to borrow money, she willprobably have to do so from her friends or against her harvest. The family's land seems to retiun less and less eachyear as they use few fertilizers or pesticides and have not had a new stock of seeds in many years. She understandslittle about the village irrigation system, so is unable to prevent the channel leading to her family plot from becomingsilted and blocked or to redirect the water. She has frequently been sick and hungry, having in some seasons only onemeal a day to eat. She can expect at least one of the 4-5 children she is likely to have to die in inifancy. In fact, whileher own life expectancy is close to 60 (if she survives her childbearing years), the life expectancy of a child bomtoday is closer to 50.
84. Girls' enrollment in eduicalionl is virtually the same as boys (see Chapter 5and Annex Tables D-3 and D-9 for more information on female enrollments), but illiteracyremains more common amongst adult women than men, especially in rural areas, and hasbeen estimated at more than a quarter compared with about a fifth in the populationoverall. The EPM (see Annex Table B-45) found that 46 percent of female-headedhouseholds (59 percent of the extreme poor, 43 percent of the poor, and 28 percent of thenonpoor) did not go to school compared to 28 percent of male-headed households (35percent of extreme poor, 28 percent of poor, and 18 percent of nonpoor). Only 17percent completed primary (compared to 28 percent of male-headed households) and 3percent finished secondary (compared to 6 percent of male-headed households).
85. Women's health status in Madagascar is poor, although their lifeexpectancy is higher than for men (53 vs. 50 in 1992, both being the average for Sub-Saharan Africa). Maternal mortality is high, estimated to be about 570 per 100,000 inWHO'S 1993 report on Madagascar. This is largely due to pregnancies coming too soonafter one another and births taking place too early or too late, but it is also associated withpoor prenatal care and the poor nutritional status of the mother. Complications from anabortion are a major cause of maternal mortality (an estimated 20-40 percent) because oflimited access to birth control and because abortions are often performed in unsanitaryconditions and by unqualified practitioners as abortion is against the law. Nearly half ofthe women visiting health clinics in the 1980s did so for reasons relating to abortions.Other causes of illness and death are mainly associated with poverty, and includeinfectious and parasitic illnesses and diseases of the circulatory and respiratory systems aswell as malaria.
86. Credit. There are no legal restrictions on women's access to formal sectorcredit. However, credit from an institution in the formal sector requires collateral such asland titles or ownership of substantial property, which the traditional rules governingfamily property tend to put under the management of the husband. Nevertheless, the EPMfound that of those who requested credit, less than I percent were refused (many, ofcourse, probably never asked because they assumed they would be refused). Women

35
obtained credit in these cases essentially for purchasing consumption goods (58 percent)or for health (10 percent) and celebration and creation or extension of an enterprise (6percent each). The remaining credit was taken for diverse reasons including agriculturalland or inputs, for housing and for education. Extreme poor women borrowed essentiallyfor consumption goods (63 percent), health reasons (8 percent), and agricultural inputs (5percent). Poor women borrowed first for consumption goods (59 percent), health (17percent) and enterprises (10 percent). Nonpoor women borrowed for many reasons, butessentially for consumption goods (53 percent), health (11 percent), and enterprises (8percent).
4. Correlates of Poverty
87. This section looks at the correlates of poverty for rural and urban areas.Using a probit analysis to estimate a number of different probability functions in which thepoverty status of a household is described as a function of many exogenous variablesreveals what variables have an independent association with poverty. It must be notedthat a strong correlation does not necessarily mean causality between variables. Causalitymay, in fact run two ways. The results of the probit can be found in Annex Table B-46.
88. Rural Correlates of Poverty. Variables positively related to being poor inrural areas are: being a farmer (either small or large), having a large number of childrenunder the age of 14 in the household, being a female-headed household and being aproducer of export crops. Variables that are negatively correlated with poverty (andhence reduce the chances of being poor) are: an additional level of schooling;49 being asalaried worker, a small entrepreneur or craftsmen or an unskilled worker in the informalsector; and having more land available per capita to the household.
89. The results presented in Annex Table B-50 show that being a small farmerraises the probability of being poor by 15 percent, while being a large farmer raises onesprobability by 2 percent. An additional child in the household under the age of 14increases the probability of the household being poor by 21 percent. Being a female-headed household raises the probability of being poor by almost 12 percent. On the otherhand, one additional level of education of the head of the household reduces the chancesof being poor by 9 percent. Being a white collar worker reduces ones changes of beingpoor by 80 percent, being a craftsman, working in a small enterprise or being unskilledworker in the informal sector lowers ones changes of being poor by about 15 percent. Anadditional hectare (per capita) reduces ones chances of being poor by only 6 percent. It isimportant to note, however, that while land size is obviously important to the poverty offarmers, there is a tremendous need to relieve other binding constraints (such as decentrural infrastructure, availability of inputs to increase the productivity of land etc.) beforethe full value of land can be realized.
49 The level of schooling is divided as follows: first 3 years of primary, second 3 years of primary, first 3 years ofsecondary, second 3 years of secondary, teacher traininig, special schools, and university.

36
90. Correlates of Urban Poverty. Poverty in urban areas is also positivelycorrelated with being either a small or large farmer, working in the informal sector, andhaving more children under the age of 14. Those variables that reduce ones chances ofbeing poor include additional schooling, a salaried job, working as a craftsman or in asmall enterprise, and being a female-headed household (while being significant, this onlyreduces ones chances of being poor by less than 1 percent).
B. PERCEPTIONS OF THE POOR
91. Where proper economic policies can create the needed opportunities forpoverty reduction, only the poor themselves can act to seize those opportunities. A betterunderstanding of what the poor feel to be their main constraints to escaping from theirpoverty, as well as their priorities, is essential to designing an effective poverty reductionstrategy and is important knowledge when designing programs to motivate the poor tobecome active participants in both creating the opportunities and seizing them when theyappear. To achieve this, a participatory assessment (PPA) of the poor was undertaken infour regions of Madagascar-the southwest portion of the island, Toliara, which is thepoorest province and which experiences periodic droughts; an urban area, the capital cityof Antananarivo; a rice-growing area roughly 150 kilometers to the west of the capital city(Soavinandriana); and the export crop region along the Eastern coast of the country(Sambave and Brickaville). This assessment was undertaken during an eight-month periodin 1993. In this period, 2,582 households were interviewed by Malagasy teams(approximately 650 in each site), as were roughly 100 community leaders, serviceproviders, and government officials. Volume I provides a more detailed summary of thePPA results.
92. Identified Characteristics of Poverty. While poverty in urban areas isoften associated with being unemployed, in rural areas, poverty is more closely related tocultural values, primarily the ability to adhere to local customs and norms. The definitionof the poor at the rural level refers to people who are at or beyond the fringes of the localcommunity. Maintaining dignity and self-respect associated with full membership of thecommunity plays an important role in the definition of the poor in rural areas.Characteristics of a poor person or family often centered around a family's inability to eatthree meals a day, clothing worn, quality of housing, and having to resort to traditionalmedicine rather than using modern medicine. In the South almost half (45 percent) of thehouseholds interviewed eat two meals or less a day, while among the urban poor surveyedin Antananarivo, this figure rises to roughly three-quarters. In all areas the poor wereidentified by the clothes they wear. Many of the poor only own 2 pairs of clothing-onefor everyday usage and one for special events such as church or ceremonies. People in allareas surveyed placed a high value on housing-whether because having a roof providesphysical security in terms of having a place to live, or in export crop regions where thequality of housing owned determines credit eligibility. Of the approximate 600 surveyedin the South, only a little over half (55 percent) were able to take modern medicines,although in almost all regions people highly valued modern medicine over traditionalhealers, believing that in a serious illness, only modern medicine gives hope for a cure.Over half (62 percent) of the children in the households surveyed in the South and roughly

37
50 percent for the other three regions do not attend primary school. The reasons for overhalf of the children of the poor not attending primary school, given in order of importanceto the households interviewed are: (i) lack of financial means, high cost of equipment(uniforms and books); (ii) poor quality of teachers (lack of preparation, absenteeism, lowconcentration, etc.); (iii) irrelevance of curriculum to daily realities of poor; (iv) distanceof school; and (v) lack of teachers; larger size of classes (often 80 students per class).
93. Not surprisingly, low incomes underlie much of the plight of the poor. Itwas the lack of financial resources which was given by 60 percent of the parents asexplaining the non-attendance of their children in school. In the South, householdssurveyed reported that dire poverty had caused almost half (48 percent) of them tomigrate in the five years prior to the survey (1987-92). There is also little access to creditto cover seasonal shortfalls or to support investments. Very few of the poor have accessto formal credit. Banks, in particular, served less than three percent of the poor surveyedin Antananarivo and the agricultural areas and virtually none of those in the South.
94. The Condition of Poverty: Isolation and Powerlessness. The moststriking features of poverty in Madagascar as identified by the poor are isolation andpowerlessness. The poor lack the means of communication with all but their ownimmediate community. Even in Antananarivo (the Capital) only a little over a third (38percent) of the poor interviewed have radios; in the South this figure drops to 6 percent.Television is restricted to a mere 5 per cent in Antananarivo and is nonexistent in thecountryside. Access in and out of poor communities is also hampered by impassable ornon-existent roads. Because of this isolation which limits competition, the bargainingpower of poor producers is diminished. Thus, the money a producer of vanilla receivesfor his product is often only 4 per cent of the export price, and the producer has nonegotiating power to raise the value of his crop. Similarly with litchi and rice crops in theEastern portion of the island and in other isolated areas, the collectors often set the termsof the market, buying at the lowest prices possible and selling at the highest. In somecases, farmers, especially in the export-crop region, described how collectors will go as faras to resort to violence to disrupt or prevent producers from attending meetings of whatgrowers' associations do exist. Collectors have also sabotaged road works into their areasof control to limit competition. Compounding the farmer's lack of power to affect theprices of his produce is his little or no exposure to new technology and information toincrease his productivity.
95. Constraints faced by the Poor. The dominant state of mind among thepoor of Madagascar is one of resentment and distrust. The powerlessness of the smallfarmers, particularly as regards to the collectors, is one clear source of frustration andresentment. In the formal education system the people also see what they feel to be a lackof fair dealing: teachers are sent to school poorly prepared for their classes and receivingsuch low wages that they cannot afford to dress properly. Teachers also often work atother jobs, missing classes as a consequence. The result of this situation is that the parentssee teachers as an "anti-model" for their children. They also see it as another sign that thegovernment does not care for its own people. This feeling of betrayal by and ultimatelyrejection for the institutions of the state pervades interviews in all regions; it is particularly

38
marked in the South, where fully 88 percent of those interviewed said they did not trustthe state and would not collaborate with any programs managed by it. Most of thesecritics of the state laid the cause of their disaffection at perceived corruption and injustice.
96. While the poor have little faith in their public institutions, they are strongadherents of the kind of help they can receive from each other, community self-help(entraide communitaire), or, more broadly, of the potential for supporting state efforts ifthey are participants in their design and execution. Community self-help serves as a kindof informal safety net. In the Eastern, coastal region, over three-quarters of the villagesthat were interviewed are involved in this mutual assistance institution whereby money andgoods are assembled to help one family out in time of need. Ninety-four percent of thoseinvolved in this form of community association said they had improved their income as aresult of this participation. While people in the South appeared to be too poor for eventhis kind of communal undertaking, they did voice enthusiasm for participatory projectsthey knew of and, along with others interviewed in the other regions, they would reactmost favorably to a government that involved them fully in the process of their owndevelopment.
97. The world perceived by the poor of Madagascar is bleak. For the greatmajority of those poor persons interviewed in the four regions of the country covered inthis assessment, this was the first time anyone representing authority had ever listened tothem, had ever sought out their opinion on their own living condition and on what theyfelt should be done to improve it. Not only do the poor lack voice, they areincommunicado, cut off from most contact with the rest of society. Nor do they have themeans to escape their predicament: transport is bad, land is inadequate to meet theirneeds, credit at reasonable rates of interest is non-existent, health services and modemmedication are either absent or priced out of reach of the poor, and education, whichcould give the people the wherewithal to help themselves, is seen as too costly, of poorquality, and largely irrelevant to the needs of the poor. The government is regarded as apredator, facilitating exploitation by the well-off minority of collectors and other ownersof capital. The only institution which is seen as providing positive support is thecommunity where the poor live, and this, while helpful, is constrained by the fact that it ismade up of the poor themselves.
C. POVERTY AND THE ENVIRONMENT5O
Old Malgache proverb: "Mieux vaut mourir demain qu'aujourd'hui."5 '
98. Madagascar's natural environment is a unique source of biodiversity as wellas presenting a rich resource for agricultural, touristic and commercial exploitation. Thecountry has already lost 80 percent of its original forest cover, more than half of which hasbeen lost in the past 40 years. The environment is under severe pressure for reasons thatrelate principally to poverty. The cost of environmental degradation, principally from soil
50 This section largely compiled by Rend Rabezandrina, consultant.51 It's better to die tomorrow thani today.

39
erosion, silting, declining soil fertility, and loss of forests, has been estimated at as high as5-15 percent of GDP annually.52 Environmental degradation is both caused largely bypoverty and is also a cause of poverty. The poor often cause this degradation in search ofland for planting food upon which the survival of many of them is determined. Yet, byreducing overall economic growth this in turn affects the potential for economicopportunities for the poor. The poor also eventually suffer from lower productivity due todeclining soil fertility, silting, and erosion.
99. The traditional forms of itinerant agriculture, which rely on burning ofsavannah and forests, are the chief causes of the precarious situation of Madagascar'sremaining natural habitats and, when combined with increasing population pressure onavailable land, the loss of productive land. The two principal problems are: (i) brush firescultivated on 1-3 million hectares of savannah per year for zebu cattle, which eat the newgrass which grows after the fire; and (ii) tavy agriculture, in which rice is grown on steepslopes where virgin or secondary forests have been burned. About 20,000 Hectares ofprimary forest (about 5 percent of its present area) are burnt each year under tay. Theseforms of farming have become unsustainable as the population has grown, and thedeclining productivity of these forms of agriculture has reduced the potential return toassets (both land and labor). This has tended to exacerbate poverty, which has in turn ledto increasing pressure on the remaining natural resources (see Box 3.2).
Bo.x 3.2 The Arithmetic of Tavy Agriculture
Rene is the pharmacist in the village pharnacy of a small town 40 kilometers from the nearest highway. The roadpeters out about 2 kms. froin his village, but the village is accessible by river, where itinerant traders come to collectthe bananas, cloves, litchi and coffee harvest which make up most of his income. The litchi trees were blown downthree years ago in a hurricanue, but he has replanted them (although they will take several years to bear fruit).
Throughout most of his 60 years Rene has practiced the favy agriculture, burning the hillsides, planting. ice,harvesting for 2-3 years, then burning aniother slope. When he was young, tavy agriculture was profitable, but nowthe cycle is too short and the fields do not have the necessary time to recover. In his youth they would rotate thefields every 12-20 years, but this has fallen to less than 5, a result of population pressures. Rene has six daughtersand sixty grandchildren. He has to divide his land among all of the grandchildren. What else can they do but shortenthe cycle? Thank God he planted coffee forty years ago as a young man - it's the coffee and other trees that keep himgoing today.
When asked if there were family plaining services in the village, the assembled villagers responded "what's that?".After discussion, finally it is agreed that there are no such services. The government nurse (male) does not providethem. Rene does not stock contraceptive supplies in his phannacy. Traditional midwives (both male and female) donot provide contraceptive advice. When asked if he would have wished for fewer children, he responded that hedoesn't see any other way out for the future the way things are going.
100. While in general in Madagascar land rights are well defined, it is less clearin recently-settled areas and rural-urban boundaries, places often inhabited by the poor.Most agricultural land has a communal status but land use rights are attributed to a
52 "The Rich, the Poor and the Wildemness: Can they co-exist?" Alison Jolly, Department of Biology, PrincetonUniversity, 1989

40
specific individual or family and are generally clear. However, officially, communal landbelongs to the state. All natural forests and many other natural habitats are owned by thestate. Government-owned lands are protected to a varying degree. Some are completelyforbidden even to entry while others allow partial exploitation. Taxes and stamp duties onpublicly-owned forests amount to about 12 percent of the retail price, and represent thecost of replanting as well as other charges. It has proved difficult for the government toprevent large-scale encroachment of protected forests in the face of the wide areasaffected and the lack of alternatives. In addition, certain individuals, nationally or verylocally powerful, are able to override these demarcations for commercial exploitation offorests. In other cases, land use rights are unclear (such as in areas of new settlement) orare undefended (as is often the case for state land) and thus the land in question becomes acommons. As nobody owns it, individuals try to assert their rights over it by exploiting it,leading to rapid and severe degradation. In some areas, new "customary law" holds thatsomeone convicted of having cleared state forest land can use his certificate of releasefrom prison as a title of proprietorship over the part he had cleared. He is considered tohave paid for the land by his stay in prison.
101. Urban Areas. The environmental problems in Madagascar's cities are alsoassociated with poverty, particularly to the living conditions of the poor, who live incrowded slums without proper sources of clean water or appropriate services of garbagedisposal. Several hundred people live on the town dumps, which provide a source ofincome through recycling as well as, in the winter, a source of heat as the compostinggarbage is always warm. In addition, several Malgache cities, including the capital,Antananarivo, are plagued by problems of flooding in the rainy and typhoon seasons. It isusually the poor who live close to the floodplains and thus are flooded out of their homesand subject to water-borne diseases.
102. Aware of Madagascar's unique environmental importance, the governmenthas created some natural reserve areas and has been working with international agenciessince the 1960s to protect its environment. Nonetheless, successive policies have notresulted in dramatic improvements in the way land is used. In 1989, Madagascar launchedthe National Environmental Action Plan, the first in Africa, which has received significantsupport from donors.53 This program encourages sustainable development through betternatural resource management, human resources development, and the conservation andmanagement of Madagascar's biodiversity. However, the program has been criticized forfailing to focus on short-term poverty-related issues, which have prevented previous plansfrom attaining their objectives, as the pressing short-term needs of a poor population thatis growing poorer have overshadowed the benefits of the various schemes designed torelieve pressure on natural resources.
5 The first phase focuses on protection and management of biodiversity and ecosystems; soil conservation and ruraldevelopment in priority zones; mapping and GIS; improvements in the land tenure regime; ecological research;establishment of a system of environmenital monitoring.

41
D. MONITORING POVERTY IN MADAGASCAR"
103. The preparation of the poverty profile for this report has highlighted theneed for accurate, comparable data on poverty in Madagascar as a basis for monitoringpoverty trends in the future. The profile was based primarily on a national householdsurvey called the Enquete Permanente aupres des menages (EPM) carried out betweenApril 1993 and April 1994, the results of which were broadly comparable in the areas offertility, infant mortality, and nutritional status, with a Demographic and Health Surveycarried out in 1992. The data have proven to be extremely useful. One lesson learned forfuture operations, however, is the importance of adequate supervision of field and dataentry operations. This can save considerable time in future survey work to get the data inappropriate form for analysis and for the use of policy makers. It will also enhance dataquality.
104. Donors are currently planning a thorough assessment of the country'scapability to produce economic and social statistics and the extent to which it hassufficient staff, skills, equipment, and funding to monitor poverty effectively. At this time,it appears that, while the National Statistics Institute (INSTAT) is fully staffed, the stafflack both the skills and the motivation to carry out its ambitious work program. A specialdepartment within INSTAT is responsible for implementing household surveys, and thestaff of this department have received some training in survey organization and dataprocessing but this training needs to be extended to staff other than the EPM team toenhance the Institute's capacity. Also, except in the EPM unit, INSTAT lacks efficientcomputer equipment and software.
105. INSTAT has been organizing seminars for analyzing and disseminating theresults of the EPM, and two more household survey rounds are scheduled to be fielded in1997 and 1999. The government is also considering supporting the INSTAT in producinga monthly regional urban and rural price index, which would be of prime importance formonitoring living conditions. However, in order to monitor poverty efficiently, it may beinteresting to explore the idea of decentralized "Observatories" of Living Conditions thatwould "take the pulse" of living conditions through out the country (using qualitativesurvey techniques, quickly obtained short-term indicators that have been tested and showearly results of how policies are affecting poverty, as well as periodically carrying outmore complete household surveys of living conditions at appropriate intervals).55 Shorter,topic-specific surveys could also be fielded to answer specific policy questions. It wouldbe useful to designate a central group that would supervise the various activitiesundertaken in the country to monitor poverty, raise funding to support them, anddisseminate the results by means of bulletins, special studies, and workshops and seminarsat both the national and the regional level.
"This draws on information from Annex C.55 One possibility may be to have these observatories staffed by volunteer NGOs as well as regional INSTAT staff.

42
PART II. DEVELOPMENT OF A COMPREHENSIVE POVERTY REDUCTIONSTRATEGY
106. Madagascar is a country with tremendous potential for rapid growth,especially a pattern of growth that raises productivity and economic opportunities for thepoor. It has an abundant, easy to train and low wage labor force that is already a majorsource of attraction for foreign investors in a variety of labor-intensive industries. In 1993labor costs were about two-thirds of those in mainland China and about the same level asin Indonesia. This comparative advantage in labor costs makes Madagascar an attractiveplace for investment in goods that are labor-intensive. Madagascar also has a wide rangeof soils and climates that harbor a potential both for increased production of traditionalfood and export crops and for the diversification into new, high-valued agriculturalexports such as tropical fruits, essential oils and shrimp. It has sizable mineral resourcesthat remain unexploited. With its formidable ecological diversity, including flora andfauna unique to the island as well as unspoiled beaches, Madagascar also has enormouspotential in developing (eco)tourism.
107. To realize this potential and escape from the current spiraling decline intodeeper poverty, a viable vision is needed that the government of Madagascar follows withdetermination and conviction. Experience in East Asia, and even closer in Mauritius, hasshown that rapid economic expansion together with poverty reduction is possible,especially for a country with Madagascar's potential.
108. The essential elements of a strategy to reduce poverty that are addressed inthis section are broad-based growth that includes the poor, improving the human capital ofthe poor, and providing safety nets, where appropriate.

43
CHAPTER IV. DEVELOPING A STRATEGY FOR PROMOTING A PRO-POORPATTERN OF GROWTH
109. This section of the report will concentrate on the elements of a strategythat will promote a pattern of growth that will pro-actively include the poor by raisingtheir productivity and economic opportunities. To achieve a pro-poor pattern of growth,incomes of those below the poverty line need to increase faster than those above thepoverty line. In other words, growth must be accompanied by a decline in inequality.Several findings from the poverty profile provide lessons that are important for the designof such a strategy. These are:
(i) Approximately 70 percent of the population is poor and almost 60 percent areconsidered food poor.
Lesson 1. Any strategy to reduce poverty muJst successfully generate sustainablegrowth.
(ii) The poor are heavily concentrated in rural areas, which contain 86 percent of all thepoor and 88 percent of the extreme poor.
(iii) Farmers alone account for 76 percent of the island's poor. When herders and fishermenare included, these groups account for 88 percent of the island's poor.
Lesson 2. If there are to be major reductions in poverty in Madagascar, a pro-poorgrowth strategy must include efforts to raise the productivity and incomes of ruralfarmers. While it is essential to promote broad-based rural growth, not all ruralresidents are poor and there is some scope for targeting, especially in the poorestprovinces. Developing a strategy for a pro-poor pattern of growth in Madagascar mustthen look at the constraints to broad-based rural growth and raising the productivityand incomes of rural farmers.
(iv) Having a source of income within the household that is salaried has a strong inverserelationship to household poverty.
Lesson 3. Efforts to encourage productive investments that can provide jobs and otheroff-farm employment opportunities should also be an important element in thegovernment's poverty reduction strategy. Because of limited government resources,this will require a growth strategy that includes strong commitment to private sectordevelopment (both domestic and international) and industrial growth to provide non-farm job opportunities.
(v) A central feature of poverty in Madagascar is the feeling of isolation and powerlessnessthat accompanies it. This is largely due to inadequate rural infrastructure, especially ofroads, that limits peoples' access to essential social services, to basic consumer goods,and to markets to sell their produce. As a result, transport costs tend to be high

44
(usually raising costs of consumer goods and lowering producer prices). It also oftenresults in a lack of competition among collectors and traders, resulting in lownegotiating power for producers and hence low producer prices.
Lesson 4. Improvements in rural infrastructure are essential for reducing isolation ofpoor rural populations and providing them with opportunities to raise theirproductivity; improve their access to competition that could reduce their dependenceon the low prices offered by monopolistic or oligopolistic traders; increase their accessto profitable markets and other economic opportunities; and improve their access toessential social services and consumer goods.
A. PRE-CONDITIONS FOR PRO-POOR PATTERN OF GROWTH
110. No country has significantly reduced poverty without considerable andsustained growth. With such wide-spread poverty in Madagascar, setting the conditionsfor such growth are an essential prerequisite to reducing poverty. Madagascar: AStrategy for High Growth and Poverty Alleviation (World Bank 1994) explores therelevance of and potential lessons that can be learned from the successes of othercountries for Madagascar and proposes a potential strategy for breaking the vicious cycle.This strategy is outlined in Box 4. 1.
11. To illustrate just how important growth is to reducing poverty, Table 4.1shows how various rates of per capita growth would affect poverty levels. Assumingdistributionally neutral growth, the incidence of poverty would only decline from itscurrent level of 70 percent of the population to 66 percent of the population after 10 yearsif the economy were to grow at 1 percent a year per capita over the next decade. Evenwith a per capita growth rate of 5 percent a year 45 percent of the population would bepoor after 10 years. Only with an incredible turnaround of policies and performance couldthe country reach a high enough rate of growth to substantially reduce poverty quickly. Ifthe country were able to attain a growth level of 10 percent a year over a 10 year period,poverty would be substantially reduced from 70 percent of the population to 20 percent ofthe population. It is also important to note that the s-lstainability of growth is as crucial asthe rate of growth in the reduction of poverty.
112. The same effect can be seen in the case of the lower (extreme) poverty line.Currently, almost 59 percent of the population have expenditures that fall under this line.A per capita growth rate of I percent over ten years would reduce this figure to 54percent, a drop of less than 10 percent, while 5 percent per capita growth over the sameperiod would cause it to drop by almost a half to 29 percent. As in the case of the upperpoverty line, if the 5 percent per capita growth rate were only sustained for five yearsinstead of ten, the percentage of people living in extreme poverty would only fall by abouta quarter to 45 percent.

45
Table 4.1: Ej ects of Growth on Poverty ReductionCurrent Over 5 years Over 10 years
I % per Capita GrowthPoverty Incidence (%) 70 68 66Poverty Depth 33 31 29
5 % per Capita GrowthPoverty Incidence (%) 70 59 45Poverty Depth 33 24 16
10 % per Capita GrowthPoverty Incidence (%) 70 45 20Poverty Depth 33 16 6
113. Because of Madagascar's own limited resources for developing productivecapacity and the government's weak institutional capacity, promoting private investmentfrom both domestic and international sources will be required if the poverty cycle is to bebroken. Between 1987 and 1992 investment in Madagascar represented only 11.8 percentof GDP, lower than the African average rate of 19 percent. Likewise, private investmentin Madagascar represents only 30 percent of total investment, in comparison to 60 percentin high growth countries. To be able to bring living standards back to where they were in1971 alone would require an annual growth rate of 6 percent by the end of the decade. Toreach this level of growth, investment would have to rise to 20 percent of GDP by the endof the decade, of which private investment would probably need to be on the order oftwo-thirds of total investment. The country's high level of debt also places constraints onachieving this level of growth. If the donor community can be convinced of thegovernment's sincerity and seriousness for creating an environment conducive to rapidgrowth, debt relief will be more easily obtained.
114. It is also important to note that a key element of producing economicgrowth is human capital development. While it is an integral aspect of increasing theproductivity of and opportunities open to the poor as well as their standard of living, it isalso one of the economic foundations of growth. An educated workforce will result inincreased productivity and incomes across all economic sectors, as well as developingfuture managers and entrepreneurs. While human capital development is addressed invarious parts of this chapter, it is the focus of the next chapter.

46
Box 4.1. Strategy for Dynamic and Rapid Growth in Madagascar.
Essential pre-conditions for rapid growth- Adopt a rigorous and stable macroeconomic policy that will control inflation and stimulate domestic.
and foreign confidence in Madagascar and its potential. This implies a low budget deficit, controllinggovernment expenditure and focusing investing in high priority sectors, such as infrastructure andhuman resources; moderate inflation; a realistic exchange rate; viable balance of payments; positiveinterest rates; and liberalization of external trade.
- Establish a legal and regulatory framework conducive to private sector activity, including theindependence and strengthening of the judiciary system, to attract the required investment beyond whatis available in Madagascar.
- Strengthen government's ability to fulfill its essential duty to the people -- guarantee security, institute aregime of sound macroeconomic management, ensure that the legal and regulatory systems function
K properly, and develop human resources and infrastructure. Restoring domestic and internationalconfidence in the commitment and stability of the government and its policies is essential.
Economicfoundationsfor growth- Accumulation of productive capital through increasing domestic savings and direct foreign investment.- Continued diversification of agricultural production and exports, leading to production and export of
labor-intensive manufactured products.- Investment in human capital to improve productivity and income across all economic sectors as well as
to develop future entrepreneurs and managers.- Investment in iiifrastructure for transport, telecommunications, and electric power.
Potential sources of growth- Agricultural sector growth by expanding production for the domestic market, resuming growth of
traditional export crops, and diversifying agriculture for export. This would require increasing yields offood production, making efficient use of irrigation systems, exploiting regional comparative advantages,better organizing production and marketing channels (particularly for quality control and exportpromotion) of traditional export crops and lifting export restrictions and developing nontraditionalexports.
- Industrial sector by establishing an economic climate conducive to both foreign and local investment.- Tourism .by increasing medium- and long-range air access to the island and establishing well-targeted
infrastructure on the most promising sites.
B. MACROECONOMIC POLICIES TO PROMOTE GROWTH AND POVERTYREDUCTION
115. Consistently providing sound macroeconomic policies. The importanceof consistently supporting sound macroeconomic policies as a necessary foundation foreconomic growth is hard to exaggerate. Besides the obvious gains associated with lowinflation, sound macroeconomic policies reduce the likelihood of and need for severestabilization programs that can be costly in terms of foregone output and growth.Achieving sound macroeconomic policies in the case of Madagascar requires first andforemost bringing fiscal imbalances to levels that can be financed without crowding outprivate investment, without excessive recourse to central bank financing, and withoutincreasing the country's external debt to levels inconsistent with export performance.Recent data suggest that this would require the fiscal deficit to decline by about 4percentage points of GDP from current levels.

47
116. Second, fiscal deficit reductions need to be accompanied by healthy publicfinances. This implies the need for taxes that have a low efficiency cost (such as a valueadded tax, which the government introduced in 1995) and public expenditure focused onhigh quality and economically justified programs. After several years of adjustment,Madagascar has considerably reduced the number of inappropriate expenditure programsin its budget. In particular, it eliminated the misguided subsidies (for example, onpetroleum products, flour and retail rice prices) that were introduced in 1994 and that, inthe case of rice, had a detrimental effect on producers who had started to react positivelyto better prices after the float of the exchange rate. The problem that needs to beaddressed now is the insufficiency of public resources currently allocated to crucialdevelopment activities such as rural infrastructure, health, water and sanitation, roads,security, and education. It is clear that the country will need to raise more domesticresources, for example, by improving cost recovery of publicly provided goods andservices, by eliminating tax exemptions that cannot be justified, and improving taxadministration. In addition, it will also be important to take measures that over timereduce the country's quasi-fiscal deficit. For example, at present, the central governmentis responsible for the repayment of the external debt of public enterprises, which is atremendous drain on resources that could otherwise be used for important developmentefforts that would support poverty reduction. Effectively, even though this is not recordedin the budget, this is a government subsidy that is larger than the combined budgets forhealth, education, and rural roads. Similarly, the poor state of the public banks' portfoliois a potential source of significant pressure on the budget.
117. Maintaining a competitive real exchange rate is the third essential elementof a sound macroeconomic framework. There has been some debate in Madagascar as towhether a competitive exchange rate helps the poor or not, and the increases in rice pricesassociated with a more competitive exchange rate have created the impression amongsome that in fact it penalizes the poor. This is a mistaken conclusion, however. There isan ample body of empirical evidence that a competitive exchange rate is generallyassociated with rapid export growth, increased employment opportunities for the poor,and a healthy balance of payments. Studies of the determinants of the high performance ofthe economies of Korea, Malaysia, Thailand and other East Asian countries consistentlyindicate that a competitive exchange rate policy was a key ingredient of these countries'successful development policies. In the case of Madagascar, studies completed by theBank in the early 1 990s suggested that achieving a competitive exchange rate had a strongpositive effect on the incomes of the poor because it raised the prices of the commoditiesthey produce, such as rice. Unfortunately, producers of traditional exports benefited littlefrom the adjustment of the exchange rate in the late 1980s because taxation levels on theseitems remained high.
118. Fourth, it is difficult to see how the country can establish the foundationsfor accelerated growth without addressing the debt overhang problem, which is extremelysevere in Madagascar. The only viable solution is for the government to formulate andstart implementing a stabilization and reform program that is acceptable to the

48
international community. This would enable Madagascar to benefit over time from ParisClub rescheduling or other solutions that may be developed in the future to reduce theburden that the external debt puts on the economy.
119. These policies need to be complemented with a fundamental reorientationof government activities away from areas where it competes with or replaces the privatesector and towards the supply of public goods that the private sector will not provide inareas such as roads, irrigation, water systems, education, and health. In some cases, it maybe appropriate for the government to support the private provision of some publicservices. One area where this is working currently is in a pilot urban works project wherethe government is contracting private firms to rehabilitate urban infrastructure in thecapital city. The local community is directly involved in the planning, the selection ofworks, and the maintenance of the infrastructure. Another interesting and successfulapproach in the education sector is the PRAGAP initiative where the government, localauthorities, and communities are working closely together to reopen primary schools andexpand enrollment.
C. AGRICULTURE SECTOR POLICIES
120. Because agriculture is the primary source of income for the poor, becauseagricultural land and labor are the largest assets of the poor, and because food insecurity isa serious problem among the poor, increasing agricultural productivity and incomes isessential for poverty reduction and any pattern of growth that is to be pro-poor. In thepast, the agriculture sector was heavily taxed, either directly through explicit taxes andstabilization funds, or indirectly through the appreciation of the exchange rate.56 As aresult, average annual agricultural growth was only 0.6 percent between 1970 and 1980,and was as low as -0.1 percent in 1983, which in conjunction with a high populationgrowth rate, led to substantial declines in per capita incomes. With the liberalization,agriculture again grew, almost 3 percent per year between 1983-90. Unfortunately, thisliberalization was partially reversed when in 1992, following a foreign exchange crisis, thegovernment briefly reverted to controlling rice markets and imports.
121. Madagascar has solid potential for accelerated agricultural growth, andhence growth in farmer's incomes, that remains far from being fully exploited. Acomprehensive domestic resource cost (DRC) analysis of the country's comparativeagricultural advantage vis-a-vis the outside world showed both the crops and the regionswhere these comparative advantages exist.57 Given the favorable results, which are evenmore significant following the 1994 devaluation, most poor farmers could benefit from astrategy that exploited these potential advantages. In summary, the analysis shows:
56During the 1970s and early 1980s, prices of the main agriculitiral goods were set by the govermment andmonopolistic marketing boards. Over the 1975-1983 period, producer prices for export crops were only a fraction ofthe export price and for rice was kept below import parity levels, while consuimer prices were kept below borderprices by large subsidies.57 Associates for International Resources and Development, "Regional Specialization and Agricultural Growth inMadagascar," 1992.

49
(a) a strong comparative advantage for nearly all of Madagascar's domesticfood crops, provided a competitive exchange rate is maintained;
(b) an equally strong comparative advantage for a wide range of establishedexport crops (robusta coffee, cocoa, vanilla, pepper, butter beans, and cashew nuts), aswell as a comparative advantage in food and process crops with export potential(peanuts, cotton, cassava, potatoes, and rice);
(c) a comparative advantage for coastal areas in export crops and anadvantage for internal regions such as the Highlands, the Northwest and the Midwest toproduce for home market needs; and
(d) an advantage for the Highland region to diversify into high valuecommodities for both home and export markets, such as specialized fruits andvegetables, and dairy products; the outlying regions in turn would supply the Highlandswith other agricultural commodities: rice, pulses, maize and livestock feed from theMidwest; vegetable oils, cotton and sugar from the coastal areas; and rice fromspecialized areas in the Northwest and Lac Aloatra.5 8
122. The DRC analysis also shows the influence of high transportation costs oncomparative advantage: better internal transport links and lower port or airfreight costswould strongly improve the comparative advantage of non-coastal areas for exports; inturn, inland regions are presently advantaged to serve the home market because of highunloading and internal transportation costs of imported produce. The level of comparativeadvantage is even higher if the exchange rate was not overvalued as it was in 1992 whenthe analysis was done.
123. Growth in virtually all subsectors of the agricultural sector is essential forpoverty reduction. As the poor are farmers of both food crops and agricultural exports,the strategy for both economic and social reasons should be balanced between export andfood crops. There is thus a need to: (a) increase exports for economic growth and toaugment export farmers incomes; and (b) improve the returns to farmers of food crops.Moreover, it has been shown that growth in the small-scale agricultural sector hassubstantial spill over effects by creating demand for services (agricultural processing suchas rice milling, agricultural transport and marketing) and manufacturing goods (farmimplements, clothing, housing), which are provided by small, labor-intensive, ruralnon-farm businesses. 9
58Assuming the rural road infrastructure is improved.WA FMG I increase in paddy output for example generates an estimated increase in GDP of 1.802, while a similarboost in coffee output leads to an increase in GDP of FMG 1.974. Vanilla and cloves will generate FMG 2.041 inadditional GDP following an exogenous FMG I increase in export demand. employment will increase by 2.9, 2.6,and 2.6 jobs, respectively, for each FMG I million increase in output. Dorosh P. and S. Haggblade, 1992,Agricukural Growth Linkages in Madagascar, Cornell Food and Nutrition Policy Program, Working Paper 22.

50
124. Constraints. A number of basic constraints continue to hinder reducingpoverty of Madagascar's poor farmers, and these will have to be removed in order tosubstantially increase rural incomes and reduce poverty. These include dilapidated ruralinfrastructure, low productivity of agricultural production, a deteriorating physicalenvironment, and inconsistent macroeconomic and sectoral policies (as discussed above).
125. Dilapidated Rural Infrastructure. Perhaps the most important bottleneckfor farmers to become part of the market economy and reduce their poverty is theirdifficult access to market. Rural roads are degraded to the point that whole areas are cutoff during most the year and local markets have ceased to function. Of a total roadnetwork of 50,000 kilometers, about 40,000 are classified as rural roads. Of these ruralroads, 90 percent are considered impassable even for small trucks. Good rural roads andmarkets are crucial to both agricultural growth and rising rural incomes. Studies carriedout in South Asia have shown that improving village access to markets raised the use ofcash inputs by 25 percent, the percentage of cash crops marketed by 35 percent, andoverall rural income by 20 percent within three years after completion.
126. The deterioration of rural roads has been reinforced by two factors. First,the Ministry of Public Works has suffered increasingly from lack of funding. Of a "core"road network of 17,000 km that carries about 90 percent of all traffic, public funding issufficient to maintain only 60 percent of it. Funding for rural road maintenance is minimalto nonexistent. Second, most past external donor financing has concentrated onrehabilitation investments rather than addressing the sustainability issues, such as capacitybuilding or resource mobilization for maintenance at the local level.
127. With the decline in rural accessibility, the importance of rural markets hasalso diminished. Primary marketing has shrunk as traders increasingly concentrated onbuying produce from farms with relatively good access, selling it directly on largermarkets. As rural trade contracted, so did market user fees and revenue, making itdifficult for local authorities to maintain market infrastructure or to invest in theirmodernization. As a result, rural markets occur less frequently and more importance isgiven to regional markets in larger towns. The main negative effects of these trends havebeen a lower percentage of farmers with road access and as a result they lack market andprice information; marketing costs are much higher, lowering producer prices and raisingconsumer prices; and farmers are often faced with no traders or only a single trader fortheir produce, thus reducing bargaining power of producers over the prices they receive.This lack of rural accessibility is strongly felt by the poor rural farmers (see Box 4.2) andhas resulted in pervasive market inefficiencies that prevent price signals from reaching thefarmers.

51
Box 4.2. Results of Inaccessibility on Poor Farmers.The people sampled in the PPA saw the areas of credit, land, transport, and markets to be significantconstraintst to reducing their poverty. Credit in the formal credit system was used by only two percent ofthe people. Land was generally felt to be inaccessible to the degree needed for productive purposes; onlyone ftfth (21 percent) of the rural landowners sampled felt they had enough land to grow cropseconomically. The condition of rural roads was seen by many persons to be a major cause of poverty: thebad condition of the roads was seen to favor the middlemen who could afford the more sturdy vehicles totransport crops to the market. Generally, the market situation in which the poor rural producers findthemselves, especially with lack of negotiating power with traders and collectors (often blamed locally onr'economie du rente) due to the lack of effective producers' associations, the aforementioned poortransport, the low level of education, the paucity of credit at reasonable rates of interest, and the near- ortotal monopolies exercised by the collectors, or buyers, all gives the farmners of Madagascar a pervasive.feeling of insecurity and despair.
Remedies seen by the people to the agricultural and transport conditions of Madagascar included: a)facilitate access to land; b) develop methods and teclhniques of soil conservation; c) supervise mnanagers ofrural development projects; d) assure policies which give fair value to agricultural produce; e) encouragethe formation of farmers' associations; f) establish a system of quality control of all roads; g) bringtogether the economic interests benefiting from transport and the people in such a way as to assure thefeeling of insecurity and despair.
128. Low Productivitv. Increases in agricultural production to date haveoccurred primarily through expanding the surface area cultivated, rather than throughincreases in productivity. Nevertheless, there is considerable potential for increasedproductivity in the agricultural sector. Average yields between 1989 and 1991 for mostcrops were significantly below potential and often only one half (corn) to one third(cotton) of African averages. Average fertilizer use is also only one third the Africanaverage. Productivity of rice has the appearance of being adequate (30 times higher thanthe African average), but this masks the fact that current yields are the same today thatthey were in the early 1970s when they were approximately equivalent to those inSoutheast Asia. Paddy yields in Asia, however, have since more than doubled. When twoof the big constraints to rice production are removed in Madagascar (lack of reliable watercontrol and lack of cash input use), as has happened in Lac Aloatra, yields are twice thenational average and close to those of Southeast Asia.
129. Poor farmer support services, including extension, research, and inputsupply, are another reason for low productivity. Until recently, services have beenover centralized in the capital city, have been donor driven and/or concentrated inspecific geographical areas, and lack operating expenditures, among other problems.However, since 1993, the government has embarked upon the definition of a nationalagricultural extension strategy which aims at resolving many of these problems. On thebasis of successful results of a pilot project, the Ministry of Agriculture has launched anational agricultural extension program that aims to rationalize the plethora ofindependent externally funded projects and put in place a well-managed professionalagricultural extension service countrywide by 1998.

52
130. Deteriorating Physical Environment. A major consequence of traditionalfarming practices and the expansion in land cultivation has been an alarming increase inthe degradation of natural resources, which has essentially taken three forms. In thecentral highlands, hillside cultivation using extensive methods has led to soil erosion(with loss of topsoil up to more than 100 tons per year on steep slopes), and extensivedamage to roads, reservoirs, and irrigation structures through siltation. In the driernorthwest to southwest regions, the practice of bush-fires has expanded beyond theregenerative capacity of the plant cover, leading to serious soil cover reductions andfertility losses. Finally, forest destruction is increasing. Deciduous natural forestsalong the West coast are disappearing at the rate of 2.5 percent per year (80 percentover the last 30 years) and humid tropical forests in the Eastern region at the rate of 1.5percent per year (50 percent in the last 30 years), overwhelmingly because of theclearing of new land for cultivation. The effects of this degradation of naturalresources is a significant loss of potential income to the poor in rural areas, throughlower productivity of their land, destruction of essential infrastructure, and lost incomeopportunities from such activities as tourism.
131. Persistence of Public and Private Monopolies. Isolation and poorinfrastructure facilitate the creation and maintenance of private monopolies that reducefarmers' bargaining power and their ability to get 'competitive' prices for their output.Attempts by rural people to increase their incomes by selling cash crops (including ricefor commercial sale) are frustrated by the power of local retailing, marketing,distribution, wholesale, and export monopolies, including those of the State. Thesedepress the returns to producers from potential cash crops such as vanilla and litchis.In addition, these monopolies frequently try to avoid competition by blockinginfrastructure development and lobbying against the liberalization of price policies (seeBox 4.3) One study has shown that when the constraints to real competition areremoved, higher producer prices are paid to farmers, there are lower margins betweenproducer prices and urban market consumer prices, lower output price differentialsbetween geographic areas, and often higher wages for migrant labor.60 Under thenational agricultural extension program referred to above, the appointment ofspecialists in farmers organization has begun, with a view to helping farmers,countrywide, to combat some of the difficulties encountered when operatingindividually.
6mThis study dealt with a policy change that allowed improved competition in the rice market (resulting in morecollectors, transporters, traders, and processors) in Lac Aloatra. With this policy change and despite an attempt bygovernment and established traders in the area to conspire and fix prices paid to rice producers, enough smalltraders came form outside who were willing to pay farmers higher prices to that these agreements on fixed pricesultimately dissolved. For further discussion, see Elliot Berg, Ann McDermott, and Michael Cullen, "The Impact ofEconomic Liberalization on Madagascar's Agricultural Sector and Implications for USAID Strategy." Washington,D.C.: Development Alternatives, Inc., 1990.

53
Box 4.3. Monopolies at the Village Level.
The people in one village in the region of Toamasina describe themselves as subsistence fannersbecause they produce most of their own food. However, they are active players in the monetaryeconomy because, every year before the harvest, they run out of money. The rice collector buys theirharvest in advance and thus provides them with the liquidity to keep going through the plantingseason. After the Tice is harvested, the collector takes it and sells it to markets in larger towns. Whenthe shortage season comes, the people buy rice again from the collector. The price is often three tinesthe price for which they sold it to him.
In the neighboring village, the people have set up a rice cooperative. They buy the rice after theharvest for FMG 4500/daba (15kg), and sell it back in the short season for FMG 7000/daba. Thecompetition forces tbe collector to lower his prices as well. Profits have been used to repay the loanof FMG 1,000,000, which they received from the NGO SAF (a local religious NGO), which allowedthem to start the scbeme.
When the price of coffee is high, most people in the two villages do not plant rice. Instead, they buyit directly from the collector, who imports it from surplus areas. Other profits are used for savings orto set up a little stock of food and other goods that can help them through the next lean times.Although tree crops can be profitable, their prices are very unstable and the interval before bearing canbe long (about 7 years in the case of litchis).
The main cash crops in the area are coffee (FMG 1700/kg in 1993 vs. FMG 700/kg in 1992), cloves(FMG800 in 1993 and 1200 in 1992), and bananas (FMG 30/kg). Transport to the nearest towncenter is on the backs of the village boys, for FMG 15/kg. There is one wholesaler who comes to thevillage with his pickup to buy produce for the national markets. He has been campaigning hardagainst a government plan to fix the road, which would allow other transporters easy access to thevillage.
D. DEVELOPMENT OF OFF-FARM ECONOMIC OPPORTUNITIES
132. Only 2.7 percent of the population are in nonagricultural, wage-earningjobs. In addition to raising productivity and incomes of farmers, the development of off-farm productive opportunities, including salaried employment to absorb the expandinglabor force, is essential. Madagascar's labor force is projected to grow by 3.1 percentannually between 1995 and 2000. This means that approximately 220,000 people, morethan half the total number of existing nonagricultural jobs, will be joining the labor forceeach year.
133. While the development of labor-intensive works where economical, canprovide potential short-term, safety net types of jobs, the government will need to provideincentives for private sector investment to produce the jobs that can absorb much of thislabor. To the extent feasible and economic, stimulating this growth throughout the island,rather than just concentrated in the capital, would benefit more of the poor. To stimulatethis private sector investment, many of the same conditions must be met as those forsustained economic growth (see Box 4.1).

54
134. Encouraging steps towards promoting private sector employment weretaken in the late 1980s. During 1986-91, the government undertook a major program ofreforms, which resulted in fundamental changes in the regulatory environment for theprivate sector6 ' and included the creation of a Free Trade Zone (FTZ) in 1990. As a resultof the reforms, private investment increased fourfold as a share of GDP. The number ofenterprises in the formal sector increased from around 135 a year during 1984-86 to nearly300 in 1988 and nearly 500 in 1990. Also, as part of the FTZ, firms that export 100percent of their products are offered unlimited foreign exchange retention and muchreduced bureaucracy, and so far 90 operations have been approved, while the total numberof jobs created is estimated to be 20,000.62 Most investments in the FTZ are inlabor-intensive sectors such as the garment, food-processing, and jewelry industries, whichrequire mostly unskilled labor and also employs substantial amounts of female labor. Thusexpanding these incentives beyond the current FTZ would increase the potential for jobcreation.
135. Much remains to be done, however. The private sector continues toexperience a number of constraints that prevent it from contributing more to the growth ofthe economy and to job creation. A survey carried out among different categories ofprivate enterprises revealed that several constraints were mentioned by all types of firms.Infrastructure deficiencies were the primary impediment, particularly bottlenecks intelecommunications, transportation, and provision of energy and water services, whichincrease production costs and partially counter Madagascar's attractive low labor costs.Lack of access to and the high costs of bank finance are ranked as the second keyconstraint. Scarcity of foreign exchange, inflation, and political instability were also
63mentioned as major constraints . In general, the constraints facing the private sector canbe categorized as: (i) a distorted incentive framework; (ii) a cumbersome regulatoryframework; (iii) weak judicial system; (iv) a repressed financial sector; (v) weakinfrastructure; and (vi) significant skills gaps.
136. Conistrainits that particularly affect the poor include inadequateinfrastructure that disadvantages small firms, which tend to use labor-intensive productiontechniques,64 restrictive labor market policies and laws, and inadequate savings and loansmechanisms. First, the lack of proper infrastrictu(re, in addition to its importance in therural poverty equation, is the one single constraint mentioned most often by privateentrepreneurs as an impediment to private sector expansion. The principal problem areas
61Over the 1986-1991 period, the government undertook the following major reforms: (i) the exchange rate wasdevalued and the trade and export regime was substantially liberalized; (ii) domestic markets and prices wereliberalized for a range of goods, (iii) a major privatization program was launched, (iv) a financial sectorrestructuring program was undertaken; and (v) initial reforms were made in the investment code and in business lawand regulation. But after 1991, when the country embarked upon a program of political reform, the modest resultsof these economic reforms were eroded. Economic reform stalled, some policy reforms were actually reversed,GDP declined again and by the end of 1993, the Country was facing an emerging payments crisis.62This still represents only 3.4 percent of all job market entrants during the same period.63The survey took place in May 1993, after the OLG had been abandoned, and right after the period of politicalturmoil.4T'able 2.6 and 2.7 of the Private Sector Assessment also show that the newer export-oriented firms are smaller
than the bigger import-substitution firms and are more labor-intensive (hire more labor per unit output).

55
are: (i) a grossly underdeveloped and run down telecommunications system; (ii) aninadequate road transport network; and (iii) an air transport system dominated by a statemonopoly, posing a serious constraint to the development of tourism and export ofhigh-valued products.65 To overcome these constraints, the government will have to: (i)increase the level of investment and recurrent expenditures budgeted for infrastructuredevelopment and maintenance; (ii) liberalize the infrastructure sub-sectors; and (iii)develop a partnership with the private sector through privatization and sub-contracting ofconstruction and maintenance works. With respect to the latter, it is essential from apoverty reduction point of view that sub-contracting procedures be designed in such a waythat they do not bias against the use of small, labor-intensive firms. In view of the successof similar agencies in West-Africa, as well as the preliminary success of the pilotAGETIPA project in Madagascar, the creation of private executing agencies to spearheadcontracting out of road maintenance should be encouraged from both an efficiency andpoverty reduction perspective.
137. Second, the current set of regulations works against small firms. Eventhough the Investment Code offers considerable advantages for small firms, theadministration of the FTZ and especially the Investment Code is complex and highlydiscretionary. Approvals are subject to extensive delays, uncertainty, and to considerablepaperwork requirements, and the red tape involved requires an administrative and financialcapacity that is beyond the means of most small firms. Thus, these regimes are biasedtowards large, well-established, capital-intensive firms, as are government procurementprocedures, particularly in the construction sector. Finally, small firms are at a particulardisadvantage in the current largely discretionary process of foreign exchange allocation.
138. Third, labor market regulations are theoretically restrictive, raising the costof labor to employers and potentially discouraging, rather than encouraging, them to hiremore people. Among the current regulations that could make labor less attractive toemployers include the difficulty for employers to fire unsatisfactory workers or to reducetheir labor force in economic distress. Although these regulations are often not enforcedand employers do not put them high on their list of constraints to expanding economicactivity in practice, they do raise costs to employers and could limit job creation potential.Nevertheless, it is important that the Labor Code promotes an environment conducive tolabor mobility. Given that Madagascar's prospects for growth depend critically on itscompetitive labor position, it is also crucial that minimum wage legislation does not erodelabor competitiveness.
139. Fourth, lack of access to bank finance remains a major constraint both formodem sector private firms, as well as for small farmers. In rural areas, modem creditmarkets are all but non-existent. Only recently has a rural savings and loan grassrootsmovement emerged. From a poverty reduction perspective, it is essential that attention bepaid to developing financial institutions that can effectively cater to small savers andborrowers. The PPA revealed that in rural and urban areas, only 2 percent of the poor
65The government has committed itself to eliminate the state monopoly of the air transport system, but has to datenot implemented its intention to do so.

56
stated that they had access to credit from the formal financial system. The government hasrecently launched a Rural Finance Technical Assistance Project with the objective tostimulate and support the creation of the savings and loan movement at the grass-rootslevel. The government also enacted a law providing a legal and regulatory framework forthe savings and loan associations to fill the legal void in which these grassroots institutionshave operated. So far however, no attempt seems to have been made to support similargrassroots institutions in the urban areas. One way to address this gap may be to study thepotential of the postal savings system, which operates 220 windows in 208 townsthroughout Madagascar. Furthermore, it may be worthwhile to consider the creation of acredit scheme such as those supported by the NGO VITA in various African countries.
140. With a view to fostering growth in small, labor-intensive firms, it seemsimportant that: (i) infrastructure, especially roads, be improved; (ii) administrativeprocedures be streamlined and simplified; (iii) public procurement procedures beredesigned to eliminate biases against labor-intensive firms; (iv) labor laws do not hinderthe creation labor-intensive activities; (v) the government stimulates and supports thecreation of the savings and loan movement at the grass-roots level.
E. POPULATION GROWTH
141. The high population growth rate in Madagascar of 2.8 percent is a seriousthreat to the country's ability to improve living standards for its people. It is also directly apoverty issue. The average household size of the extreme poor is 5.6 compared to 4.0 for
66the nonpoor and 4.9 as the average for the country. Even if the country was able toachieve a rapid decline in fertility rates, the population will double over the next 30 years.Without a decline in fertility rates, the population will double in 20 years. Such rapidgrowth threatens steady economic and social development by negating or severely limitinggains in real per capita income and putting severe strains on the country's natural resourcesand public finances. Unless economic growth rates are attained which are significantlyabove 3 percent and fertility rates decline substantially, population growth will continue tonegate most gains to poverty reduction from economic growth. In addition, the largeincrease in the labor force will require a substantial increase in employment opportunities.If new investiment or capital stock does not increase along with the rise in the labor force,productivity and thus incomes will continue to decline.
142. The large increase in the population will also put severe strains on theprovision of social services. Without a large decline in fertility rates an additional 460,000first graders and 3 million compulsory school students will be added to the educationsystem in 2015, costing an estimated additional US$100 million per year. Furthermore,potential clientele for maternal and child health care services will increase from its current4.6 million to 12.6 million by 2015 (larger than the entire current population),6 7 placingsevere strains on the ability of health services to provide adequate care. With expenditures
6'('his country average differs slightly from the Madagascar Demographic and Health Survey of 1992 statistic of 5.2due to a slightly different definition of the household used by the two surveys.67World Bank, Madagascar Ponulation and Health Sector Review, 1987.
57
unlikely to increase from their current levels in real terms, the quality of social services willcontinue to deteriorate considerably with a rapidly growing population.
143. The high fertility rates also severely threaten Madagascar's food securityposition. Between the mid-1970s and the early 1980s, agricultural production wasinsufficient to meet local demand, resulting in substantial food imports. To feed asubstantially larger population, even with drastic declines in the fertility rate will require adoubling of domestic food production over the next 30 years unless the Governmentresorts to large increases in food imports. To double this production, output would haveto increase by 4 percent a year until the year 2000 and close to 2 percent thereafter. Asagriculture has only grown an average of 2.7 percent a year between 1983 and 1986,considerable advances in agricultural production technology would be needed to increaseyields substantially to attain the required growth in agriculture (even with encouragingsigns of movement towards self-sufficiency in the last few years). With no decline inpopulation growth rates, the situation would be even more untenable, as domesticproduction would have to triple, which if not met would result in even more severeimplications for food security.
144. Total fertility rates are especially high in rural areas where three-quarters ofthe population live. The average number of children per mother is 6.1 for the country as awhole, but 6.7 in rural areas and 3.8 in urban areas. 68 Although public sentiment ingeneral supports family planning, the influence of the church, especially the Catholicchurch, counters this and is supported by many traditional customs. In most areas, themore children a women has, the more she is respected. Many couples would prefer tohave male children rather than female ones; this may increase the number of children perfamily. In 1992, 40 percent of women surveyed by the DHS survey did not want to haveadditional children and for women having four or more children 66 percent wished to haveno more children.'9 However, prevalence rates for modern contraceptive methods are stillonly 5 percent, in part because there are still laws on the books forbidding the promotionof contraception.
145. The education of females, even in Madagascar where enrollments arerelatively equal, is an essential task. While the following statistics from the MadagascarDHS survey (1992) show the tremendous benefits of female education between womenwith a secondary education compared to those with no education, in general, benefits risewith each level of education received by a woman.
(i) Women having completed secondary school (secondaire II) or more hadhalf the fertility rate than those having no schooling (3.2 compared to 6.5)
(ii) Girls without education were much more likely to have early pregnancies(between age 15-19) than average (42 percent vs. the 29 percent average).
6DHS, 1992.9Ibid.

58
(iii) Women having completed secondary school or higher are much morelikely to use modern contraceptives than uneducated girls (19 percent compared to 1percent).
(iv) Children of mothers without education are three times more likely to diebefore the age of 5 than those whose mothers have a secondary education (223 out of a1000 compared to 66 out of a 1000).
(v) Ninety-five percent of women having at least a secondary educationreceive prenatal care compared to 76 percent of those without education.
(vi) More than two-thirds (69 percent) of children whose mothers received atleast a secondary education received all vaccinations vs. 29 percent of mothers withouteducation.
To reduce fertility in Madagascar, three actions are essential: (i) femaleeducation; (ii) strong IEC; and (iii) availability of contraceptives.
F. MAIN CONCLUSIONS
146. Developing a pro-poor pattern of growth obviously requires actions in anumber of areas. First, unlocking constraints to any type of growth are essential inMadagascar. Second, macroeconomic policies that specifically disadvantage the poorshould be addressed. Third, because the vast majority of the poor in Madagascar arerural farmers and because unleashing dynamic growth in Madagascar will requirediversification and increased productivity in rural areas (the two objectives are mutuallyreinforcing), agricultural, private sector, and infrastructural issues must be addressed,to increase productivity of the poor in their agricultural activities and promote off-farmsustainable employment opportunities for the poor. Finally, high population growth,which puts a drag on both overall economic growth and the ability of the poor toescape poverty, must be addressed through the education of girls, IEC and access tocontraceptives.
147. Essential conditions for sustainable growth. As Madagascar embarkson a pro-poor pattern of growth, it is essential that fundamental conditions forsustainable growth are in place. In Madagascar, three elements must be in place.
a. A rigorous and stable macroeconomic framework that will control inflationand stimulate domestic and foreign confidence in Madagascar and its potential isfundamental. This implies a low budget deficit, controlling government expenditure andfocusing investments in high priority areas such as infrastructure and human resources;moderate inflation; a realistic exchange rate; viable balance of payments position; positiveinterest rates; and a liberalized extemal trade regime.

59
b. A legal and regulatory framework that is conducive to private sectoractivity, including the independence and strengthening of the judiciary system, is anotherimportant pillar to any type of sustainable growth.
c. A government that can fulfill its essential duty to its people -- guaranteesecurity, institute a regime of sound macroeconomic management, ensure that the legal andregulatory systems function properly, and support the development of human resources andinfrastructure -- is also essential.
148. Establishing a pro-poor pattern of growth. Establishing a pro-poorpattern of growth requires policies and programs that aim to increase the productivityand incomes of the poor so that they are able to participate in economic growth. InMadagascar, this will require addressing macroeconomic policies that disadvantage thepoor, promoting broad-based rural growth, developing off-farm economic opportunitiesfor the poor, and reducing population rates. The key specific actions and policies ineach of these categories are outlined below.
a. Macroeconomic policies essential for poverty reduction.
(1) A competitive exchange rate that does not become overvalued willneed to be maintained in order to reduce implicit taxation of agricultural products producedby the poor.
(2) Efforts will be needed to eliminate public and private monopoliesthat result in lower producer prices paid to the poor. The development of ruralinfrastructure will be imperative to help eliminate private trader monopolies.
(3) The government will need to remove high export taxation on vanillathat contributes to the low producer prices received by poor vanilla producers.
b. Agricultural and infrastructure sector policies to support poverty reduction.
(1) Because the poor produce both food crops and export crops,agriculture sector policies should be balanced, for both social and economic reasons,between export and food crops. In addition, a large proportion of non-traditional exportscome from large-scale industrial enclave sectors that hire labor of the poor.
(2) Given the comparative advantage enjoyed by Madagascar in nearlyall of its food crops and most traditional and non-traditional agricultural exports, combinedwith the large potential to increase productivity, policies to increase returns to farmers offood crops and to increase exports for both economic growth and increasing export cropfarmers' incomes are essential to poverty reduction. To remove the constraints to exploitingthis potential and to increasing farmer incomes, actions, in addition to the above mentionedmacroeconomic policies, are needed to improve rural infrastructure and farmer services.
60
(a) Improving the dilapidated rural infrastructure, especiallyrural roads and markets is essential for: increasing the proportion of farmers with marketaccess; circulating market and price information; reducing marketing costs; raisingproducer prices and lowering consumer prices to currently isolated farmers; reviving andexpanding markets; and allowing farmers to interact with more than one or two traders,increasing farmer bargaining power. Given limited govemment resources, even if therewere successful reallocations towards such priority sectors as infrastructure and humanresources, improving rural infrastructure, especially roads, will require addressingsustainability issues, such as capacity building and resource mobilization for maintenance atthe local level.
(b) Improving current low levels of productivity would behelped by improved farmer support services (including extension, research and inputsupply), upgrading water control, and increasing use of cash inputs.
c. Policies to Support the Development of Off-farm Economic Opportunities
(1) With limited government resources, there is a need to activelypromote private sector investment in productivity that can provide sustainable jobs to absorbthe island's quickly growing labor force. To stimulate such private sector development, thegovernment will need to meet the essential conditions for sustainable economic growthmentioned above.
(2) Again, development of infrastructure (road transport,telecommunications, air transport) is essential to the development of off-farm economicopportunities. To overcome these constraints, the govemment will have to increase thelevel of investment and recurrent expenditure budgeted for infrastructure development andmaintenance, as well as building capacity and mobilizing resources for maintenance at thelocal level. Additional efforts will need to be made to liberalize the infrastructure sub-sectors and to develop a partnership with the private sector through the privatization andsub-contracting of construction and maintenance works.
(3) Most investments to date in the Free Trade Zone (FTZ) have been inlabor-intensive sectors such as the grament, food-processing, and jewelry industries, whichrequire mostly unskilled labor and also employs substantial amounts of female labor. Thusexpanding the current FTZ would increase the potential for job creation that could benefitthe poor.
(4) Streamlining and simplifying administrative procedures for theimplementation of the Investment Code and the administration of the FTZ (which tend to becomplex and highly discretionary) will facilitate the development of small firms, which tendto use more labor-intensive techniques.
(5) Stimulate and support the creation of savings and loans mechanismsat the grassroots level to support investments by small entrepreneurs and farmers.

61
d. Reducing fertility. Rapid population growth threatens steady economic andsocial development by negating or severely limiting gains in real per capita income andputting severe strains on the country's natural resources, public finances, and the provisionof essential social services. The burden is especially heavy on the poor who have thelargest household size.
(1) The education of females is essential, not only for reducing fertility,but reducing poverty, reducing infant mortality rates, and improving nutritional status.While in Madagascar enrollments in schools are relatively equal at the primary andsecondary level for males and females, secondary school enrollment rates for rural females(where the majority of poverty exists) is only half that of males. As the DHS survey wasable to show the significant difference that secondary schooling of females can make ondeclines in fertility, improving female enrollment should be a priority. (See next section onEducation as well for important steps to improve the quality of education in an effort toencourage families to send their children to school.)
(2) Information, education, and communication campaigns, especially inrural areas, will also be important to increasing female enrollments and reducing bothfertility and poverty.
62
CHAPTER V. IMPROVING THE HUMAN RESOURCES OF THE POOR
149. The poverty profile in Chapter III shows the low levels of human resourcesdevelopment of Madagascar's poor. Social indicators for Madagascar are generallycomparable with those of other Sub-Saharan and low-income countries. Although in the pastliteracy rates were well above averages for Sub-Saharan Africa, school enrollments have beenfalling since the mid-1980s. In health, child malnutrition rates, infant mortality rates and theincidence of TB are all higher than average levels for Sub-Saharan Africa; childimmunization and life expectancy rates are both lower than regional averages.
150. This chapter focuses on government education and health services and theaccess by the poor to these services. The main purpose is to evaluate how effectivelygovernment expenditures reach the poor, to identify constraints to access and use ofservices and to recommend ways in which government social spending could be bettertargeted to the poor. Section A analyzes education expenditures. It provides an overviewof trends in education in Madagascar over the past decade, reviews enrollments rates andpublic expenditures for 1993/4, and then analyses the incidence of public educationspending. Section B addresses the health sector following the same organization. InSection C, conclusions are drawn and recommendations made.
A. EDUCATION
Sector Overview
151. Between independence in 1960 and the early 1980s, the education systemin Madagascar expanded. Reforms were made to provide free education to all studentsand school attendance became mandatory for students between the ages of 6 and 14.Enrollments at all levels increased during this time.70 To achieve this expansion, thegovernment increased the share of total government expenditures allocated to education,which reached 26 percent of the total recurrent budget in 1981.
152. Since the early 1980s, the primary and secondary public education systemhas deteriorated. At the primary level, enrollment rates have been declining. As shown inTable 5.1, the gross enrollment rate7 ' at the primary level dropped from 142 percent in1980 to 83 percent in 1993/4.72 At the lower-secondary level (college), enrollments havealso been declining, although not as sharply, from over 30 percent in 1980 to 23 percent in
70At the primary level, gross enrollments rose from 50 percent at independence and 88 percent in 1975 to well over100 percent in the early 1980s. Secondary enrollments also expanded from 4 percent of scliool-aged children atindependence to 32 percent in 1984. University-level enrollment also increased dramnatically and, in 1977, branchesof the university were established in all provincial capitals.71 The gross enrollment rate is the number of total enrollmenits as a share of total number of school-aged children.72A drop in the gross enrollment rate does not necessarily meani a worsening of the system. It could be the result offewer repetitions or a decrease in the attendance of older (non-school aged) children. However, as shown later in thechapter, in Madagascar it seems to be pointing to a real decline in enrollments.

63
1993/4. One positive sign in enrollments is an apparent increase in the gross enrollmentrate at the upper secondary level, from about 3 percent in 1980 to 12 percent in 1993/4.
153. Madagascar's primary gross enrollment rate is still above the average forSub-Saharan Africa of 66 percent, and the secondary gross enrollment rate is equal to theregional average of 18 percent. At the same time that overall enrollment rates aredeclining, enrollments in private schools are increasing at all levels, showing adissatisfaction with the public system (see Annex Table D. 1. for more details onenrollment trends).
Table 5.1 Trends in Gross Enrollment Rates, Madagascar, 198094(percent)
Sub-Saharan1980 1985 1990 1993/4 Africa
1992Primary 142 117 105 83 67Junior Secondary 30 31 22 23Senior Secondary 2.9 3.4 n.a. 12All Secondary 18 18
Note: Includes public and private school enrollments.Source: 1980-90 from Madagascar: Towards a School Based Strategyfor bnproving Primary and SecondaryEducation, World Bank; 1994 from EPM; Sub-Saharan Africa from World Development Report, 1995.
154. In terms of efficiency, Madagascar compares very poorly with other Sub-Saharan countries and is ranked below most other countries on a range of efficiencyindicators, especially at the primary-school level. As shown in Table 5.2, 36 percent ofprimary students repeated in 1990 and only 38 percent of students stayed in school untilthe final year of primary school.
Table 5.2 Madagascar. Efficiency Indicators for Primary and Secondary Schools asCompared with other African Countries
Sub-Saharan Madagascar'sMadagascar Africa Ranking
Primary:Percent who repeat (1990) 36 21 31 out of 32Percent who arrive in final year (1989) 37.7 67.1 27/29Number of years invested per student completingfirst cycle (1989)2 13.8 n.a. 26/29Secondary:Percent of primary school grads who continue to first
year of general secondary 43 40 9/23Percent who repeat (1990) 20 20 14/28
Madagascar is compared with countries with available data.2 Prescribed duration of first cycle in most countries is six years; in Madagascar, five years.n.a. = not available
Source: Bourdon, Jean, T. Hartnett, F. Orivel, C. Shaw. A Statistical Profile of Education in Sub-Saharan Africa inthe 1980s. Paris: Donors for Africani Education.

64
155. Along with declining enrollments and poor efficiency, public expendituresfor education have been gradually declining since the late-1980s in terms of their share oftotal public spending.73 All education spending (both recurrent and investment) as a shareof total government spending accounted for 16 percent in 1994, as compared with 18percent in 1985 (see Table 5.3). Recurrent education expenditures have declined from 30percent of the total recurrent budget in both 1985 and 1990 to 26 percent in 1994. As ashare of GDP, total education spending accounted for 2.6 percent of GDP in 1991. Thisshare of GDP is low in comparison with the average for Sub-Saharan countries, whichwas 4.3 percent in 1990, and with that of low income countries, which was 3 percent.The modest size of Madagascar's total public budget in relation to GDP explains this lowratio. Within education spending, the share allocated to each level has remained stableover the past decade, with about 45 percent allocated to primary school, 30 percent tosecondary education and 25 percent to tertiary education.
156. The key problems in the education sector in Madagascar are deterioratingaccess, low internal efficiency and quality, and poor learning outcomes. In quantitativeterms, enrollments have declined at all levels between 1980 and the early 1990s. At theprimary level, more than one-third of all students repeat each year, and fewer than 30percent of all those who start school reach the fifth grade. These indicators are amongthe worst in Sub-Saharan Africa.
157. Despite the severe deterioration the system has suffered, slow and steadyimprovements are possible. The most important factors influencing the effectiveness ofprimary schooling in Madagascar have been identified as being: (i) how schools aremanaged by their directors; (ii) the availability of teaching materials, especially teachers'guides and textbooks; (iii) and whether community support is available, especially for theprovision and maintenance of facilities and equipment. These are also the key factors forsecondary schooling, along with the competencies and attitudes of the teachers. Thus, anystrategy for improving the quality and effectiveness of Malagasy education needs to focuson: (i) raising enrollment rates and reducing drop-out rates, especially in rural areas; (ii)improving learning outcomes; (iii) strengthening school management; and (iv) providingmore learning materials. In financial terms, this would involve shifting the government'srecurrent budget allocations towards training more teachers and providing more teachingmaterials, while encouraging communities to support more and better physical facilitiesand equipment. The PRAGAP initiative is a successful example of the government, localauthorities, and communities working together to expand enrollments and improve thequality of education. The government should also ensure that more of its resourcesbenefit the poor by concentrating on basic education and by increasing subsidies for low-income groups. The government should also encourage the development of privateeducation through, for example, regulations, supervision, performance contracts, andincentives.
731nfonnation on educationi expenditures differs amnong the various sources. Depending on the source used, the trendcan change.
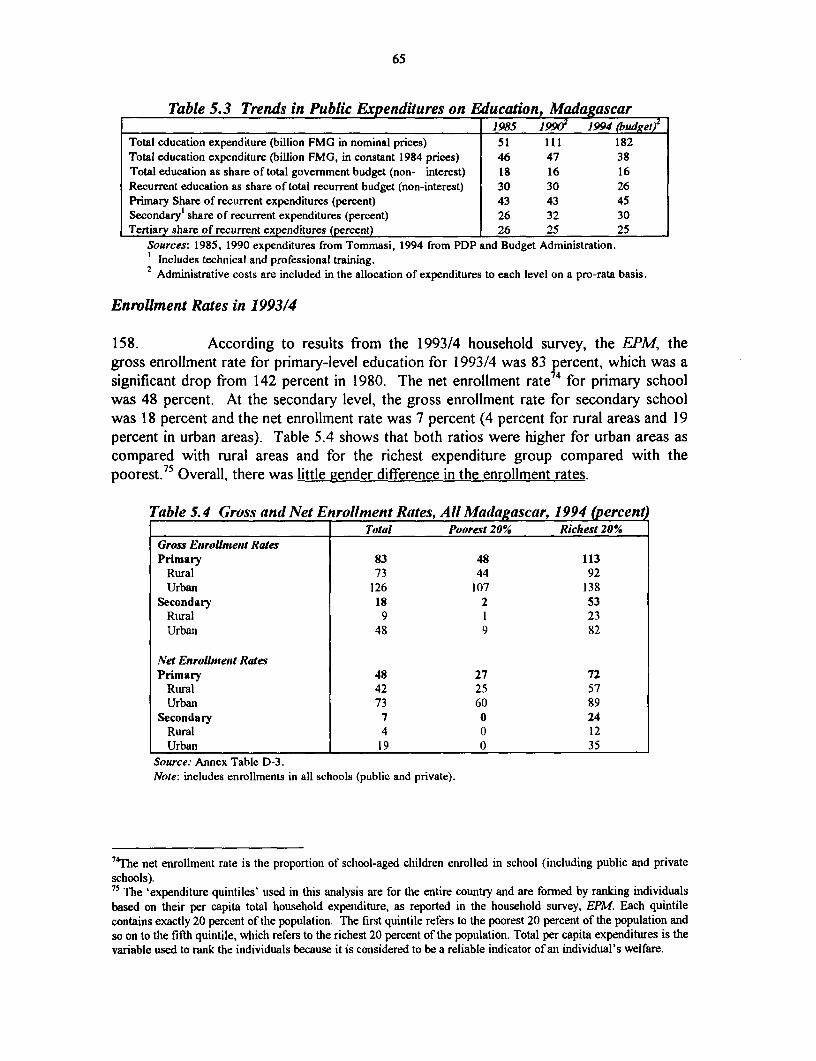
65
Table 5.3 Trends in Public Expenditures on Education, Madagascar1985 19902 1994 (dge)
Total education expenditure (billion FMG in nominal prices) 51 111 182Total education expenditure (billion FMG, in constant 1984 prices) 46 47 38Total education as share of total government budget (non- interest) 18 16 16Recurrent education as share of total recurrent budget (non-interest) 30 30 26Primary Share of recurrent expenditures (percent) 43 43 45Secondaryl share of recurrent expenditures (percent) 26 32 30Tertiary share of recurrent expenditures (percent) 26 25 25
Sources: 1985, 1990 expenditures from Tommasi, 1994 from PDP and Budget Administration.I Includes technical and professional training.2 Administrative costs are included in the allocation of expenditures to each level on a pro-rata basis.
Enrollment Rates in 1993/4
158. According to results from the 1993/4 household survey, the EPM, thegross enrollment rate for primary-level education for 1993/4 was 83 percent, which was asignificant drop from 142 percent in 1980. The net enrollment rate74 for primary schoolwas 48 percent. At the secondary level, the gross enrollment rate for secondary schoolwas 18 percent and the net enrollment rate was 7 percent (4 percent for rural areas and 19percent in urban areas). Table 5.4 shows that both ratios were higher for urban areas ascompared with rural areas and for the richest expenditure group compared with thepoorest.75 Overall, there was little gender difference in the enrollment rates.
Table 5.4 Gross and Net Enrollment Rates, All Madlagascar, 1994 (percent)Total Poorest 20% Richest 20%
Gross EnrolUlent RatesPrimary 83 48 113
Rural 73 44 92Urban 126 107 138
Secondary 18 2 53Riural 9 1 23Urban 48 9 82
Net Enrollmtent RatesPrimary 48 27 72
Rural 42 25 57Urban 73 60 89
Secondary 7 0 24Rural 4 0 12Urban 19 0 35
Source: Annex Table D-3.Note: includes enrollments in all schools (public and private).
'4The net enrollment rate is the proportion of school-aged children enrolled in school (including public and privateschools).75 The 'expenditure quintiles' used in this analysis are for the entire country and are formed by ranking individualsbased on their per capita total household expenditure, as reported in the household survey, EPM. Each quintilecontains exactly 20 percent of the populationi. The first quintile refers to the poorest 20 percent of the population andso on to the fifth quintile, which refers to the richest 20 percent of the population. Total per capita expenditures is thevariable used to rank the individuals because it is considered to be a reliable indicator of an individual's welfare.

66
159. Table 5.5 shows the proportion of students attending private school forprimary and secondary school in each expenditure quintile. Although not surprising thatthe proportion increases with expenditure level, it is interesting to note that 33 percent ofenrollments in secondary school in the poorest quintile are enrolled in private schools. Atboth levels of education, poor students attending private school are mostly attendingreligious schools that charge relatively low fees. Nevertheless, this indicates adissatisfaction with the public system, even among the poorest, who have littlediscretionary income.
Table 5.5 Private Enrollments as a Share of Total Enrollments by Quintile, AllMadagascar, 1993-94
(percent)Quinliles Primary SecondaryPoorest 11 33
2 15 243 18 274 18 29
Richest 42 55
Average 21 43Rural 15 29Urban 35 50Male 20 41
Female 22 44Sources: EPM, 1993/4 and Annex Table D-5.
160. Total university-level enrollments increased by 3.7 percent during the1987-91 period but appeared to be decreasing in the 1990s. According to the EPM, thetotal number of students was 30,866 for the 1993/4 school year, which was equallydivided between the two genders. The Ministry of Higher Education reports a slightlyhigher number: 33,203. In either case, enrollments declined from the 42,000 studentsreported to be enrolled in 1991/2. Although there are provincial branches of the universityin each capital, two-thirds of enrollments are concentrated in Antananarivo.
161. Regional Trendls. Table 5.6 shows enrollment rates by region for 1993/4as compared with 1984/5. Over this period, the primary net enrollment rate declined in allprovinces with the exception of Antananarivo, where it increased from 54 percent in1984/5 to 61 percent in 1993/4. The net enrollment rate dropped the most inMahajanga-from 69 percent in 1984/5 to 48 percent in 1993/4. In 1993/4, both primaryand secondary net and gross enrollment rates were the highest for Antananarivo andAntsiranana and lowest for Fianarantsoa and Toliara, which are two of the poorestregions. Over the same period, enrollments in private school increased at both levels in allprovinces. In 1993/4, Antananarivo (one of the richest regions) had the highest proportionof enrollments in private schools: 38 and 56 percent, in primary and secondaryrespectively, as compared with the national averages of 21 and 43 percent.
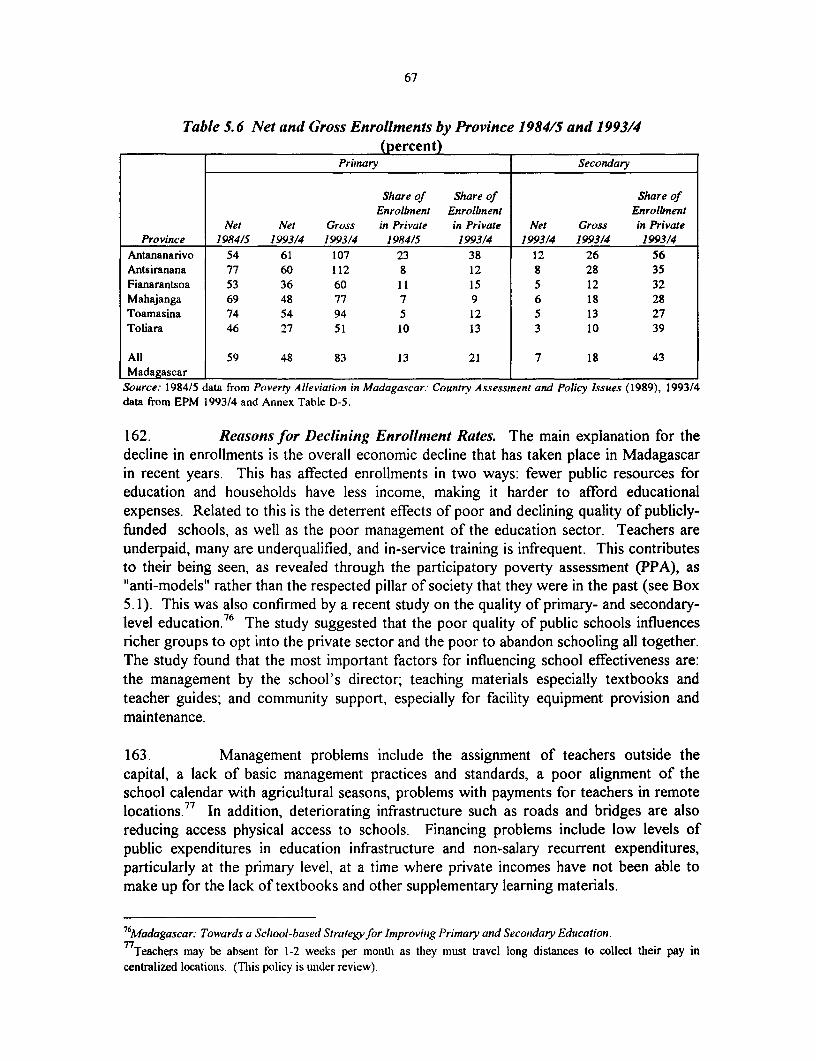
67
Table 5.6 Net and Gross Enrollments by Province 1984/5 and 1993/4(percent)
Primary Secondary
Share of Share of Share ofEnrollnent Enrollment Enrolbnent
Net Net Gross in Privale in Private Net Gross in PrivateProvince 1984/S 1993/4 1993/4 1984/5 1993/4 1993/4 1993/4 1993/4
Antananarivo 54 61 107 23 38 12 26 56Antsiranana 77 60 112 8 12 8 28 35Fianarantsoa 53 36 60 11 15 5 12 32Mahajanga 69 48 77 7 9 6 18 28Toamasina 74 54 94 5 12 5 13 27Toliara 46 27 51 10 13 3 10 39
All 59 48 83 13 21 7 18 43Madagascar __ I
Source. 1984/5 data from Poverty Alleviation in Madagascar: Country Assessment and Policy Issues (1989), 1993/4data from EPM 1993/4 and Annex Table D-5.
162. Reasons for Declining Enrollment Rates. The main explanation for thedecline in enrollments is the overall economic decline that has taken place in Madagascarin recent years. This has affected enrollments in two ways: fewer public resources foreducation and households have less income, making it harder to afford educationalexpenses. Related to this is the deterrent effects of poor and declining quality of publicly-funded schools, as well as the poor management of the education sector. Teachers areunderpaid, many are underqualified, and in-service training is infrequent. This contributesto their being seen, as revealed through the participatory poverty assessment (PPA), as"anti-models" rather than the respected pillar of society that they were in the past (see Box5.1). This was also confirmed by a recent study on the quality of primary- and secondary-level education.7 6 The study suggested that the poor quality of public schools influencesricher groups to opt into the private sector and the poor to abandon schooling all together.The study found that the most important factors for influencing school effectiveness are:the management by the school's director; teaching materials especially textbooks andteacher guides; and community support, especially for facility equipment provision andmaintenance.
163. Management problems include the assignment of teachers outside thecapital, a lack of basic management practices and standards, a poor alignment of theschool calendar with agricultural seasons, problems with payments for teachers in remotelocations.77 In addition, deteriorating infrastructure such as roads and bridges are alsoreducing access physical access to schools. Financing problems include low levels ofpublic expenditures in education infrastructure and non-salary recurrent expenditures,particularly at the primary level, at a time where private incomes have not been able tomake up for the lack of textbooks and other supplementary learning materials.
76 Madagascar: Towards a School-based Strategyfor Improving Primary and Secondary Education.
7Teachers may be absent for 1-2 weeks per moiitlh as they must travel long distances to collect their pay incentralized locationis. (This policy is under review).

68
Box 5.1 Reasons Given by the Poorfor Low Education Enrollments
i''..ot ~mtJwii i -,.-..' d,','s.to the '''"" ~ y of ~Iay4r...f.; () yiic.......t an. t Oft .......
Source: PPA, 1993.
Public Excpenditures in Edulcation, 1988-94
164. During the period 1988-94, per student recurrent expenditures for all levelsof education increased steadily in nominal terms. Table 5.7 shows this increase as well asthe allocation of the spending among levels of education. On average during this period,primary-level education accounted for 44 percent of all recurrent spending, secondary-level education7S (which includes both general and technical training) for 31 percent ofrecurrent spending, and university education accounted for 25 percent of the budget. In1994, the per student expenditure was FMG 50,504 at the primary level, FMG 192,491 atthe secondary level, and FMG 1,104, 000 at the university level. Although it is not usefulto compare the per student expenditure across levels (i.e., a year of university-leveleducation is inherently more expensive than a year of primary-level education), it is helpfulto examine the composition of the expenditure at each level. At the primary level, adesirable target is for $5.00/student to be spent on non-salary expenditures on 'qualityitems' (e.g., books, chalk, teacher supplies, etc.). Of the FMG 50,504, less than 10percent is estimated to be spent on quality non-salary items, which is equivalent to about$2.50. There is, therefore, scope for increasing non-salary recurrent expenditures at theprimary level. At the tertiary level, a recent World Bank mission to Madagascarconcluded that, assuming perfect efficiency, the university system could operate on one-third of its current budget. This suggests that gains in efficiency could significantly reducethe per student expenditure at the university level. The savings from a more efficientuniversity system could be redirected towards the primary-level for needed non-salaryexpenditures.
78twas not possible to disaggregate secondary-level public expenditures between lower- and upper-secondary levelsor between general and technical instruction. Earlier studies have found that per-student spending for techtnicaltruining was significanitly higher that that for general secondary education, but this report does not address that issue.

69
Table 5.7 Per Student Recurrent Expenditures, 1988-941988 1989 1990 1991 1992 1993 1994(thousands of current FMG)
Primary 30 29 31 34 44 n.a. 50Secondary 88 118 135 167 234 n.a. 192Tertiary 546 551 608 902 670 n.a. 1,104
(thousands of current FMG in constant 1984 pricesPrimary 16 14 13 13 15 n.a. 10Secondary 47 56 64 79 111 n.a. 40Tertiary 291 293 324 480 357 n.a. 230
Source: Annex Tables D-6a and D-6b.
165. It was possible to disaggregate public expenditures by geographic region(although not between urban and rural areas). Table 5.8 shows the per studentexpenditure by region for primary- and secondary-level education. Two regions,Fianarantsoa and Toliara, have particularly high per student expenditures at both levels.These are driven mainly by two factors. The first is the larger number of teachers in theseareas in comparison with the number of students, partly because these are very ruralareas,79 and the second is the lower than average enrollments which are likely due to highlevels of poverty in these regions. The primary-level per student expenditure for thecapital, Antananarivo, is about the same as the national average. At the secondary-level, itis well above the national average, which is a result of the large number of teachers (not allof whom are teaching) in the capital.
Table 5.8 Per Student Recurrent Expenditures by Region, 1994(thousands of current FMG)
Region Primary SecondaryAntananarivo 50 227Antsiranana 34 115Fianarantsoa 71 206Mahajanga 46 130Toamasina 39 171Toliara 67 325
All Madagascar 51 192Source: Aiuiex Table D.7.
The Incidence of Public Spending
166. The patterns of enrollments among expenditure quintiles and of publicspending by level of education (and by region) have important implications for thedistribution of these services among economic groups and the degree of targeting to thepoor. From the previous section, we know that enrollment rates are lower among thepoor and increase with per capita expenditure levels. At the same time, per student publicexpenditures are biased towards students at the higher levels of education.
79However, even in provinces withi more teachers per students, most teachers are located in the provincial capital, notin rural areas.

70
167. To determine who benefits from public spending on education, theexpenditure incidence analysis methodology is used.80 The method, which is described inBox 5.2, involves bringing together two types of information: (i) information onenrollments, which is obtained from the EPM household survey; and (ii) per student publicexpenditures, which can be considered an in-kind transfer to the individual (from Table 5.8above).8" The analysis is done by rural and urban location and by region. In this way, thevalue of the in-kind transfer implied in the public provision of education are mapped toindividuals, making it possible to trace how government education spending is distributedto different groups of the population.
Box 5.2. Benefit Incidence Analysis of Public Spending
The Benefit Incidence Analysis methodology is used to analyze the distribution of public spending acrosstdifferent socioeconomic groups. The most important advantage of this technique is to measure how well public..services are targeted to certain groups in the population, for example the poor, particular regions of interest and girls:and women.
The observed patterns of public spending across socioeconomic groups are detenmined by two main factors.First, government spending allocations to and within the sector on each type of public service. Second, householdbehavior regarding utilization rates of public services by socioeconomic groups. The incidence analysis integratestwo sources of information: unitary subsidies by type of public service (e.g. the per student annual subsidyori thesubsidy implicit in each visit to public health care facilities); and infonnation on individual utilization rates of publicservices (e.g. total enrollments by educational level or ainnual visits by health facility type) disaggregated :by...socioeconomic group, region and gender. In this way, the incidence analysis allocates per unit subsidies according toindividual utilization rates of public services usually obtained from household surveys.
In general, govenunent spending will be more equally distributed when a large share is allocated to serices widely used by the population, particularly by the poor. If sectoral public expenditures are largely dedicated toprimary education and basic healthi care, services often used extensively by the poor as well as the nonpoor, the:distribution of sectoral public spending is likely to be more equal. Thus, the incidence of public spending is the:result of a public policy decision, the allocationi of public expenditures to and withiin each sector, and a privatesIdecision, the behavior of households. ......
Source: Sumunary of the methodology used by Van de Walle and Nead (1994), Meerman (1979) and Selowsky
(1979).
168. Per Capita Edlucation Subsidlies. Figure 5.1, presents the results of theincidence analysis by level of education for expenditure quintiles82 and rural/urbanlocation. The figure shows that the education subsidy is not well-targeted to the poor. Theprimary-level subsidy is the most equitably distributed. The average per capita subsidy atthe primary level is FMG 4,931. The poorest quintile receives the smallest per capitasubsidy due to the extremely low enrollments among this group. This is particularly
8This methodology is well established in the literature and the most well-known examples include those by Selowsky(1979) for Colombia, Meerman (1979) for Malaysia, and van de Walle (1994) for Indonesia.O'For each education level, per capita enrollmenits in each region are multiplied by the average per student subsidy inthat region, thereby yielding a per capita subsidy. The per studenit subsidy used in this calculation is the per-studentpublic expenditure for each region, as presented in the previous section. This can be considered an in-kind transfer tothe individual enrolled in public school, as there is no national-level cost recovery program in education. Then, theaverage per capita subsidies for various groups (e.g. expenditure group, region, rurallurban location or gender) arecompared.nSee footnote number 68 for a description of how the expenditure quintiles were created.

71
disturbing because one would expect it to be larger than that received by the richerquintiles for the same reason that the per capita subsidy for the second quintile is high (i.e.,the higher proportion of primary school-aged children in the quintile). At the secondarylevel, the subsidy is biased heavily towards the richest quintiles. The average per capitasubsidy is FMG 3,281, with the richest quintile receiving about ten times the amountreceived by the poorest quintile on a per capita basis. At the tertiary level, the average percapita subsidy is FMG 2,762, although this is absorbed almost entirely by the richestquintile.83 For all levels of education combined, the average subsidy is FMG 10,974 andthe richest quintile receives three times more on a per capita basis than the poorest quintiledoes.
169. There is a large variation in the per capita subsidy for all education betweenurban and rural areas: people in urban areas receive a per capita subsidy that is more thanthree times larger than that for people in rural areas. This is driven by the inequality indistribution of the university-level subsidy and the secondary-level subsidy. The primary-level per capita subsidy is only slightly higher in urban areas as compared with rural areas.The high urban subsidy for university-level education is normal as universities are oftenlocated in urban areas. What is of interest from a poverty perspective is the fact that thesecondary-level per capita subsidy in urban areas is four times as high as that in ruralareas. This suggests that efforts need to be made to expand access and use of secondary-level education in rural areas. This difference in the per capita subsidy is driven entirely bythe patterns of utilization (enrollments) between the two regions, as it was not possible tocalculate a separate per student subsidy for rural and urban areas. It is likely that this is anunderestimation of the real difference between the rural and urban per capita subsidies,since expenditure per secondary student is likely to be higher in urban areas than in ruralareas.
s3 There is an important caveat to the results for university level spending: the survey results for this level are not asreliable as those for primary and secondary education, because attending university is a very rare event (especially inrural areas) and may not have been accurately captured in the survey. (For example, no university-level enrollmentsin the second quintile were reported in survey ). Although we cannot have confidence in the exact amount of thesubsidy allocated to each quintile, the analysis gives an order of magnitude of the bias of the university-level publicexpenditures towards the richest quintile in Madagascar.

72
Figure 5.1 Per Capita Education Subsidies by Expenditure Quintile
30,000 -
25,000
20,000
0 nversity15,000 0 Seco-dar
10o000 U Primary
5 000
0
Quintiles
Source: Annex Table D.9.
170. Although not shown in the figure, the education subsidy is generally evenlydivided between men and women, even at the university-level. This reflects the fact thatgirls have about the same enrollment rates as boys at all levels of education, a situationthat is atypical for an African country.
171. Targeting of the Edlucation Subsidy. How well targeted is the educationsubsidy? This can be assessed in two ways: (i) in relative terms, by comparing thedistribution of the education subsidy with the distribution of per capita total householdexpenditures; and (ii) in absolute terms, by comparing the distribution of the educationsubsidy to the distribution of the population. This is shown in Figure 5.2. The cumulativeshares of individuals in the population, ranked by per capita expenditure, are measured onthe horizontal axis. The vertical axis measures the cumulative shares of expenditures andpublic education subsidies.
172. As shown in the figure, only the curves for primary education and 'alleducation' lie clearly above the Lorenz distribution of per capita total expenditures,indicating that they are distributed in a more pro-poor way than is per capita expenditure.In this sense, the overall education expenditures can be considered relatively pro-poor, inthat the poor receive a larger share of the education subsidy than their share of totalexpenditure. In absolute terms, the figure shows that none of the curves lies above the 45degree diagonal, which means that the richer quintiles receive more of the educationsubsidy than their share in the population. Only the primary-level education subsidy liesnear the diagonal (crossing it at the first quintile), showing that the middle-income groupsbenefit more than the poorest and the richest quintile. Secondary- and university-leveleducation subsidies are not at all pro-poor. The secondary subsidy curve lies almost on

73
top of the Lorenz, indicating that these subsidies are almost as unequally distributed ashousehold expenditures. The university subsidy is strongly pro-rich.
Figure 5.2 Distribution of Public Education Subsidy, All Madagascar
100
, Household
80 so __ expenditures, * Primnary
.60 Secondary
-0--- Universityj 40_ _
- . . . . .All educationj 20 _____t
0
0 20 40 60 80 100
Cumulative Share of Population
Source. Annex Table D.9.
173. Regional Distribution of Edlucation Expenditures. Among the six regionsof Madagascar, the per capita subsidy for all education is about twice as high for aresident of Antananarivo as for a resident in any other region (see Figure 5.3).14 This isthe because the bulk of the university-level subsidy is concentrated in Antananarivo and, toa much lesser degree, because the secondary-level subsidy is also biased toward thecapital. The per capita subsidy at the primary level is on average equally distributed amongregions. These results are consistent with the rural/urban differences in the subsidydiscussed above, as Antananarivo is the most urban region and the others are primarilyrural.
'4 The high subsidy for Antananarivo may not necessarily mean better quality education as it masks the fact that thereis a surplus of teachers (who are on the payrolls, but are usually not teaching).

74
Figure 5.3 Regional Distribution of Per Capita Education Subsidy18,000 .: .............
15 .000 ., ..... i .. .. .. i.::
* 12,000 -' ;;t0--i 9,000- ''~~~. ' _. ....... ,.,, 2L.. .. E h U i -h U SN--n ............. j"
i ... ~~~~~~~~~~~~~~~~~~~~~~~~~~~~~~~~~~~~~~~. 0. . ... . . :_.... .. . . . . . . . . . . . .. . . . . . . . . . . . .rmy6,000- ... . . .2 ;. . ... | .-..;~~~~~~~~~~~~~~~~~~~~~o .......... .. ;--
3 00 0 - .. . -. | | .: .. ... | | -: | | : 0 I -0 | | ...............................- - . . . . ... ......... ....-...
1 '.00 ......''' . . .. : . -. | | ' .:: . .
a~~~~~~~~~~~~~~~~~~~~~~~~~~~~~a~~~~~~~~~~~~~~~~~~~~~~~~~~~~~~~~~~~~~~~~~~~~~~~~~~~~~~~~~~~~~~~~~~~~~~~~~~~~
3c0.. .......
Source:~~~~~~~~~~~~~~~~~~~~~~~~~~~~~~X Annex.Table.D..10Household 12 pndi0e o Education174. Household expend....s....dcao rsontributionaas showni Table a.9.Thepublicsubsidyfoall.primary.and.secondar
are hevie fianca udnoh a oo tan ontennor
c C~~~~~~~~~~~~~~~~~~~~. xXa - a a~~~~~~
contribution as shown in Table 5.9. The public subsidy for all~~~~~ primary.... and Secondaryeducation is on average~~~...... abot.ixtieslage thn.hepivte(huehld. cnriutonttotaleductionexpeditues. or te poresttwo intles,the ubli conriutonatth
primary-level is even more important,~~ ~~~~ accountin for.oretha .90perentof.he.ota.pecapit expeditur at tis leel (he prportins ar almot tht.hig.at.te.secndaryleve
as well). At the same time,~~~~~~~~~~. pe. aiahueol.xedtrso primary.pblic.eduatioar 6 everfnnilbudno0h0po0hno tennor

75
Table 5.9 Average Per Capita Household and Government Expenditureson Public Education, by Quintile, All Madagascar, 1993/4
Primary Secondary All Primary and SecondaryShare of non- Share of non- Share of non-
Expenditure food Expenditure food Expenditure foodQuinliles per capita Expenditures per capita Expenditures per capita Expenditures
Ho sehold ExpenditurePoorest 317 1.9 22 0.1 338 2.02 641 2.0 260 0.8 901 2.93 575 1.4 219 0.5 794 1.94 930 1.3 796 1.1 1,726 2.4Richest 961 0.3 2,040 0.7 3,000 1.0
Average 685 0.6 668 0.6 1,352 1.2Rural 530 0.7 434 0.6 963 1.3Urban 1,254 0.5 1,426 0.5 2,681 1.0
Public ExpenditurePoorest 4,938 30 335 2 4,472 272 6,050 19 2,014 6 8,064 263 5,254 13 2,506 6 7,760 194 5,666 8 4,743 7 10,409 15Richest 3,545 1 6,799 2 10,344 3
Average 4,931 4 3,281 3 8,212 7Rural 4,797 7 1,871 3 6,668 9Urban 5,422 2 8,461 3 13,883 5
Total ExpenditurePoorest 5,255 32 357 2 4,810 292 6,691 21 2,274 7 8,965 293 5,829 14 2,725 7 8,554 214 6,596 9 5,539 8 12,135 17Richest 4,506 1 8,839 3 13,344 4
Average 5,616 5 3,949 4 9,564 9Rural 5,327 7 2,305 3 7,631 11Urban 6,676 3 9,887 4 16,564 6
Source: EPM 1993/94; Annex Table D.9.
175. Table 5.10 shows the average per student household expenditures onpublic primary and secondary education. At the primary level, households pay an averageof FMG 7,012 (about $3.50) per year per student attending public school. This variesconsiderably between rural and urban areas and among expenditure groups. The poorestquintile pays about FMG 3,863 (about US$1.70) per student whereas the richest paysmore than three times that amount - FMG 13,685 (about $5.50). Urban families pay onaverage more than twice per student than rural families do. At the secondary level,average spending per student is significantly higher - FMG 39,166 per student. Thevariations across quintiles are similar to those for primary school, with the poorestquintiles spending only about one-fourth of what the richest quintile spends per student(see Annex Table D.9 for further details).

76
Table 5.10 Average Per Student Household Expenditures on Public Educationby Quintile, All Madagasc r, 1993/4
Primnary Secondary
Quiniiles Expenditure per student Expenditure perStudent
Poorest 3,863 12,576*2 5,352 24,8253 5,531 16,8204 8,286 32,313Richest 13,685 57,746
Average 7,012 39,166Rural 5,579 44,610Urban 11,683 32,449Female 6,867 46,554Male 7,151 32,786
* Sample observations are less than 30.Source: EPM 1993/4.
176. The largest share of household expenditures at both the primary andsecondary level is books and supplies, followed by uniforms, as shown in Figures 5.4 and5.5. These shares are roughly the same among all expenditure groups. Public school feesat the primary level account only for 13 percent of household expenditures on education,and 16 percent at the secondary level.
Figure 5.4 Composition of Average Per Student Household Expendituresfor Public Primary School, 1993/4
others13% school fees
13%
parent assoc5%
mni fonns22%
- | l _ boks &supplies
47%
Source: EPM 1993/4

77
Figure 5.5. Composition of Average Per Student Household Expendituresfor Public Secondary School, 1993/4
school fees
othiers 16%32%
parent assoc. books &1% supplies
37%
uniiforms14%
Source: EPM 1993/4
Cross-Country Comparisons for the Incidence of Public Education Spending
177. If public education spending were equally distributed across populationquintiles, then every income group would receive an exactly equal share of total publiceducation resources.
178. The education sector in Madagascar in 1993 had about the worstdistribution of public resources among all countries in the world where the incidenceanalysis methodology has been used to determine who benefits from public educationspending (see Table 5.11). This is in the large part due to the fact that the children ofthe poor are not enrolled in school and do not capture the benefits of public spendingon education. In comparison with countries in Sub-Saharan Africa, Asia and LatinAmerica, the poor in Madagascar received the smallest share of public educationspending. The poorest quintile in Madagascar received only 8 percent of all publicspending dedicated to education while the richest quintile received 43 percent. Vietnamis the only other country in the sample where the richest quintile received more than inMadagascar, 49 percent, but still targeting of public education resources to the poorwas better in Vietnam than in Madagascar. In Vietnam the poorest quintile receivedalmost twice as much public education resources as the poorest quintile received inMadagascar.

78
Table 5.11 Incidence Of Public Education Spending On The Poorest And RichestQuin tiles, Selected Countries (Percentage Share)
Education spending benefiting:
Country Year the poorest 20% of the the richest 20% of thepopulation (') population (°/)
AFRICACote d'Ivoire 1993 10 38Ghana 1992 16 21Kenya 1992/3 17 21Madagascar 1993 8 41Malawi 1994/5 16 25South Africa 1993 14 40Tanzania 1993 13 23ASIAIndonesia 1989 15 29Lao P.D.R. 1993 l l 35
Vietnam 1993 15 49LATIN AMERICABrazil 1985 14 19Chile 1986 25 17Colombia 1992 23 14Mexico 1992 14 27Uruguay 1989 33 15
Sources: World Baik (1996).Note: If public education spending were equally distributed across population quintiles, then thepoorest and the richest quintiles (every number in the table above) would receive a 20 percentageshare of spending.
B. HEALTH
Sector Overview
179. The health status of the Malagasy population remains at or below thehighly unsatisfactory averages for Sub-Saharan Africa. The infant mortality rate was 116per thousand live births in 1990. This is higher than the average of 107 for Sub-SaharanAfrica and 71 for low-income economies. The under-five mortality rate is estimated to beas at the same as the Sub-Saharan African average for both boys and girls, and lifeexpectancy at birth was 50 years compared to 51 for Sub-Saharan Africa. The vaccinationprogram is less comprehensive than average for Sub-Saharan Africa; only 46 percent ofchildren under the age of 1 receive the third dose of DPT and 33 percent are immunizedagainst measles (relative to 52 percent for both these immunization for Sub-Saharan Africaas a whole). This also compares with 83 and 75 percent, respectively, for Burundi; 89 and89 percent for Rwanda; and 82 and 82 percent for the Central African Republic. Themortality and morbidity data from the public health system point to a predominance ofinfectious and parasitic diseases, which are typically associated with poverty, poorsanitation, and lack of access to safe water. Preventable and treatable diseases such as

79
acute respiratory illness, diarrhea, and malaria are the main causes illness and death.85 Inhospitals, communicable diseases were the leading cause of admissions, accounting for 25percent of the total hospital caseload. Although AIDS has not yet had a significant impacton public health, the high prevalence of (often untreated) sexually-transmitted diseasesindicates that the epidemic could spread rapidly in Madagascar unless a public educationcampaign is started immediately.86 In general, health statistics in Madagascar are of poorquality and require careful interpretation; improving and updating them is a stated goal ofthe Ministry of Health (MOH).
180. The MOH is the major provider of Health services in Madagascar,operating a network of some 1,900 outpatient health facilities. This is supported by ahospital system consisting of 70 first and second level referral hospitals, four regionalhospitals, two national university hospitals, and seven specialized institutions. About 65percent of the population are estimated to live within a five kilometer radius or about onehour's walking distance of a MOH facility, and a primary health facility is located in aboutone out of every eight villages. NGOs are operating around 40 health clinics, 9 hospitalsand 86 family planning clinics. User fees are commonly charged, although typically thefees do not cover the full costs of the services provided. Private and corporate medicalpractices are limited but have been growing in recent years. The number of privatephysicians is estimated at 3,300, most of them being concentrated at the capital and maincities. Self medication and traditional healers continue to have an important following, inpart because of the non-availability, inaccessibility, and high monetary cost of modernmedical care and drugs, especially in the more remote rural areas.
181. In October 1994, the Ministry of Health created 111 health districts,identical to the State districts (Firondronana) in order to transfer resources andmanagement authority to the periphery. The 36 medical regions no longer exist and thesix provincial Directorates have been transformed into regional inspectorates. Starting in1995, the MOH has set up and partially staffed health district management teams anddirectly allocated recurrent budget to the Il1 health districts. A typical health districtincludes 10-15 public health centers and a district hospital (first level referral of care), aswell as a varied number of private health facilities. It is estimated that 80 to 90 percent ofdiseases could be prevented or cured at this primary level of care, provided the requiredservices are of good quality and accessible to the majority of the population.
182. The MOH's Public Expenditure Plan for fiscal years 1993-95 identified therehabilitation of the basic health care system as one of its highest priorities, along withreducing under-five and maternal mortality and achieving 80 percent vaccination coveragefor infants aged up to 11 months and 40 percent coverage for women of childbearing age.However, achieving these aims may require a substantial shift in the way the total health
%5In 1987, the leading causes of death reported to the Ministry of Health (MOH) were: malaria; pen-natal problems;diarrheal diseases; malnutrition; and respiratory diseases (including tuberculosis (TB). The leading causes ofmorbidity reported from outpatienit facilities were: respiratory diseases; malaria; diarrheal diseases; and intestinalparasites. There is unifonnity among the six regions in the leading causes of morbidity and mortality.KTh general, health statistics in Madagascar are of poor quality and require carefuil interpretation; improving andupdating them is a stated goal of the Ministry of Health.

80
care budget is currently allocated. For example, at present, health districts receive only 22percent of the non-salary recurrent health budget which is clearly inadequate for deliveringa package of essential services of good quality.
Utilization of Health Care Facilities: Evidence from EPM.
183. The results from the 1993/4 household survey, the EPM, provideinformation on how often people from different expenditure groups reported being ill,whether they sought treatment and, if so, where they sought treatment. Table 5.12 showsthe proportion of people in each expenditure quintile who reported being ill during the twoweek recall period. On average, 14 percent of the population reported being ill in theprevious two weeks; this varied by expenditure quintile with the poorest quintilesreporting illness less frequently that the richest ones. This is a typical finding for adeveloping country and does not necessarily mean that the poor are healthier, but that theyare less likely to notice/report an illness (and, therefore, less likely to treat it). Urbanwomen reported an illness most often than any other group did, but generally there arevery few difference between the genders.
184. The decision to seek treatment also varies significantly by expenditurequintile. Only 28 percent of the poorest quintile sought treatment when ill, whereas 48percent of those in the richest quintile sought treatment. There were also differences inthe propensity to seek treatment between rural and urban areas-only 34 percent of thoseliving in rural areas sought treatment when ill, whereas 52 percent of urban dwellers did.Of those that sought treatment, the average number of visits per ill person was about 1.7.It was the highest for the poorest quintile (2.0), possibly indicating that they are moreseverely ill when they seek treatment or that the treatment they receive is less effectivethan that received by richer groups.
Table 5.12 Proportion of Population Reporting Illness and Seeking TreatmentDuring Two Week Recall Period, Madagascar, 1993/4
Proportion of Jll SeekingProportion of Pop 11 (percent,) Treatment Average Number of
(percent) Visits/PersonQuintile Rural Ulrban, Total Rural Urban Total Rural Urban Total
Poorest 10 9 10 28 29 28 2.16 1.81 2.132 14 12 14 31 40 33 1.71 1.78 1.723 13 12 13 28 49 31 1.80 1.59 1.754 15 15 15 41 54 44 1.61 1.84 1.67Richest 17 16 17 40 57 48 1.82 1.56 1.68
Average 14 14 14 34 52 38 1.79 1.65 1.74Female 14 16 14 34 53 39 1.84 1.62 1.70Male 14 12 14 33 52 37 1.73 1.69 1.80
Source: EPM 1993/4.

81
185. Two-thirds of those who went for treatment when ill visited a public healthcare facility, and one-third visited a private facility (see Table 5.13). The poorest quintilewas more likely to consult in the public sector (73 percent) than was the richest quintile(60 percent). Within the public sector, about one-third of the outpatient visits are tohospitals (includes General, Specialty and Secondary Hospitals) and about two-thirds areto a basic health care facility (includes all types of basic health care facilities such asprimary health care centers, infirmaries, health posts, maternity posts, and dispensaries).This indicates that the main hospitals are not always used as referral facilities, but are thefirst stop for many outpatients. This is even more true for the poor than the nonpoor.This might be explained by the fact that basic health care facilities are perceived to providelower quality services (they often do not have essential drugs and supplies in stock) and sopeople expect to receive better health care services at a hospital. Within the privatesector, the poor are more likely to consult a traditional healer than to visit a privatedoctor, clinic or pharmacy, whereas this pattern is reversed for the richer groups.
Table 5.13 Health Care Facility Utilization Patterns: Where Malagasy Go ForOutpatient Treatment, First Visit Only, Madagascar, 1993/4
(percent)Quintile
Poorest 2 3 4 Richtest Total
Public FacilitiesHospital' 36 21 14 20 19 21Basic health care facilities2 37 50 55 47 41 46Total Public 73 71 69 67 60 67
Private FacilitiesPrivate clinic, doctor or 10 16 20 24 33 23pharmacyTraditional healer 17 13 11 9 7 10Total Private 27 29 31 33 40 33
Total 100 100 100 100 100 100Source: EPM, 1993/41. Includes General and Specialty Hospitals plus Secondary Hospitals.2. Includes all types of basic health care facilities; primary health care centers, infirmaries, health posts, matemityposts and dispensaries.
186. Most visits to public hospitals, are for outpatient services; only about 5percent of all visits are for inpatient services (see Table 5.14). Twenty-four percent of alloutpatient visits and 28 percent of all inpatient visits are by people in the richest quintile,indicating that the richest group is using hospital services, more than the poorest.

82
Table 5.14 Share of Public Hospital Outpatient and Inpatient Visits_ Quintile, All Madagascar, 1993/4 (percent)
Inpatient Visits as a share ofAnIQuintile All Outpatient Visits All Inpatient Visits Hospital VisitsPoorest 24 12 2
2 16 24 73 9 17 94 27 19 4
Richest 24 28 6Total/Average 100 100 5
Note: Outpatient visits to public hospitals are those reporting General and Specialty Hospitals plus SecondaryHospitals as the place of consultation in the furst visit multiplied by the number of visits in the last twoweeks. Inpatient visits count each hospital stay as one visit, independently of the number of nights spent atthe hospital. Dissaggregated results for inpatient visits by quintiles should be interpreted carefully sinceoverall sample inpatient visits are only 36.Source: EPM 1993/94.
Public Expenditures in Health
187. Public spending on the health sector has steadily increased between 1988-93 in nominal terms (see Table 5.15). As a share of all government recurrentexpenditures, it has increased incrementally - from 5 percent in 1988 to 8 percent in1994. Unfortunately, the budget for drugs and pharmaceutical supplies are very limited.In 1985 the government budget for medicines and pharmaceutical products had declinedto one fifth its 1977 level in real terms and only 10 percent of programmed medicalimports were realized. This low level of expenditures on medicines only allowed theprimary health care centers to cover barely 25 percent of patients' drug requirements.While this problem was partially offset by an increase in the supply of drugs from theprivate sector (whose share of the drug market increased from 63 percent in 1976 to 80percent in 1986), the rise in local supply was of high cost drugs with high mark ups whichwere out of reach of the poor and only marginally improved the overall situation.Because of foreign exchange constraints, the private sector was unable to fulfill thecountry's needs. As a result, the real value of overall drug consumption in Madagascardeclined by 30 percent between 1976 and 1985. At the present, drugs are usually notavailable in public health facilities, especially in remote, basic health care facilities. On ahopeful note, expenditure on drugs are capturing an increasing share of all healthspending, up from 6 percent in 1988 to 11 percent in 1993. This is a positivedevelopment in light of the drug shortages experienced in most public health facilities.

83
Table 5.15 Public Health Expenditures as a Share of Total GovernmentExpenditures, 1988-93
1993 1994(Billions of FMG) 1988 1989 1990 1991 1992 (Budget) (Budget)
(Nominal prices)Total Govt. Exp. (non-interest) (a) 491 695 701 699 894 1,095 1,179
Health(b) 25 42 45 49 58 66 90Recurrent 22 24 30 35 43 47 52Investment 3 18 16 14 15 18 38(b)/(a) 5% 5% 6% 6% 7% 6% 8%
Drugs (c) 2 2 3 4 5 5 n.a.(c)/) 6% 6% 10% 9% 9% 11% n.a.
r.n constant 1984 prices)Total Govt. Exp. (non-interest) (a) 262 330 299 262 297 322 245
Health (b) 13 20 19 18 19 19 19Recurrent 12 11 13 13 14 14 11Investment 2 9 7 5 5 5 8(o)l(a) 5% 5% 6% 6% 7% 6% 8%
Drugs (c) 1 1 1 1 2 1 n.a.(c)/(b) 6% 6% 10% 9% 9% 11% n.a.Sources: Tommasi (1993) and Condau and Damour (1994).
188. The allocation of the 1993 recurrent health budget is shown in Table 5.16.(Trends overtime were not available, except for the non-salary budget shown in AnnexTable D.15). The largest share of the 1993 budget-43 percent-was allocated tohospitals (including principle, general, specialty and secondary hospitals). The secondlargest was spending on basic health care facilities, which includes all levels of serviceprovided by the circoniscriptioni medicales (local hospitals, dispensaries, health posts,infirmaries and basic health centers).87 The rest of the budget was for centraladministration (15 percent) and disease prevention (I percent). When expressed byfunction, personnel expenditures accounted for 54 percent in 1993, drugs for 10 percentand other non-salary expenditures for about 33 percent of expenditures.
87 It was not impossible to disaggregate expenditures in the "basic health care facilities" category, which includesabout eight types of facilities. Central records are not kept at the MOH and visits to four circonscription medicalesdid not yield results that could be generalized to the whole country.

84
Table 5.16 Ministry of Health Recurrent Expenditures by Type of FacilityAU Madagascar, 1993
BasicCentral Health
finfllions Administra- Disease CareFMG) tion Prevention Hospitals Facilities Total
Gcneral,Principle, Sub-totalSpecialty Secondary Hospitals
Administration 764 764Non-salaryRecurrent 6,359 170 3,839 1,372 5,210 3,548 15,287
Personnel 577 441 5,760 5,557 11,317 12,966 25,300Drugs 2,286 1,399 3,685 1,461 5,146
Total 6,936 611 11,885 8,327 20,211 18,738 46,497
(row share) 15% 1% 43% 40% 100%Source: Ministry of Health, 1993.
189. At the regional level, Antananarivo receives 35 percent of publicexpenditures on health, while it accounts for 30 percent of the population (see Table5.17). This is mainly due to the concentration of large and specialized hospitals, asAntananarivo is the capital. One of the poorest regions, Fianarantsoa receives 14 percentof the public health expenditure, although it accounts for 19 percent of the population.The other regions receive a proportion that is more or less equivalent to their share of thepopulation. The table also shows the average recurrent cost per visit to a hospital(including both in- and out-patient visits) or to a basic health care facility for each regionof the country.88 On average, the per visit cost to a hospital is more than twice as high asa visit to a basic health care facility. For hospitals, the high per visit subsidy inAntananarivo is driven by the concentration of expensive, specialized hospitals. At thebasic health care facilities level, Fianarantsoa and Toliara have considerably high per visitcosts eventhough they are among the poorest regions. This is mostly because there arefewer visits to basic health facilities as compared with the other regions.
so The per visit cost is calculated by dividing the total recurrent expenditure for each type of facility (as reported bythe MOH) by the numnber of visits reported in the household survey. At the hospital level, in- and out-patient visitswere treated equally. This is because there is no infornation available on the allocation of public hospitalexpenditures between in- and out-patient services. It was not possible to separate the types of health facilitiesbeyond the two categories (hospitals and basic health care facilities) because the necessary disaggregations of publicexpenditures were not available.

85
Table5.17 Regional AllocaonofPublicHealthExpenditures,1993Share of Share of Cost per Visit (FMG)
Population Public Health Basic Health CareRegion (percent) Expenditurel (percent) Hospital Facility
Antananarivo 30 35 4,406 844Antsiranana 8 9 2,481 2,062Fianarantsoa 19 14 2,132 2,120Mahajanga 13 13 1,072 1,737Toamasina 16 15 1,893 1,158Toliara 14 14 930 1,978
All Madagascar 100 100 2,136 1,4131. Does not include central administration expenditures.Source: Annex Table D.15.
The Incidence of Health Expenditures
190. By bringing together the information on individual utilization rates ofvarious types of public health facilities with the information on cost per visit, it is possibleto identify which groups in the population are receiving the implied government healthsubsidy.89
191. Per Capita Health Subsidlies. Figures 5.6, 5.7 and 5.8 show that, overall,the richer quintiles receive larger per capita subsidies than the poorer quintiles do. Theaverage per capita subsidy for all public health facilities is FMG 3,046. The poorest twoquintiles have the smallest per capita subsidies (FMG 1,851 and FMG 2,826, respectively)and the per capita subsidy then increases with expenditure level, with the richest quintilereceiving FMG 4,514 per capita. The per capita hospital subsidy is larger than that forbasic health care facilities, and it is also less equally distributed among expenditurequintiles.
192. The per capita subsidy is, on average, almost 50 percent higher for urbanareas as compared with rural areas. At the hospital level this discrepancy is considerablylarger than for basic health with the urban per capita subsidy almost three times as large asthe subsidy for rural areas. This is to be expected as hospitals are concentrated in urbanareas. As was the case for the education sector, it was not possible to calculate separateurban and rural per-visit public expenditure subsidy and, therefore, the variation in thesubsidy reflects only the variation in utilization between rural and urban areas. It is likely
89 To calculate the incidence of health spendinig by quintiles and by regions, per capita visits to public health carefacilities in each region are multiplied by the average subsidy per visit in each region. This is done for the two typesof public health care facilities: hospitals and basic health care facilities. The number of visits are limited to curativehealth only. Pre-natal visits and vaccinations were also available from the survey, however, public costs by type ofvisit were not available from the MOH. Il addition, vaccination campaigns are often funded by donors inMadagascar and do not necessarily involve the use of public resources. Preliminary work showed that thedistribution patterns for the use of public health services do not change significantly by adding pre-natal visits andvaccinations since these are a very small fraction of total visits to public health facilities. The per visit subsidies usedin the calculation are the per visit cost for each region (from Table 5.17), which can be considered an in-kind transferto the individual who uses the services (there is no national-level cost recovery program).

86
that this is an underestimation of the real difference in the public subsidy, as one wouldexpect that public expenditures are biased towards urban areas even more so thancaptured in this analysis.
Figure 5.6 Per Capita Public Hospital Subsidy, 1993
4.000-
3,500Rure 300. _ _.
o' 2.500
3 .1 0 0 0 . -. : - . .. . ..............
2*500 .................
3 ,0 0 0 ........ ........ ................... . |............ 2 ............... ...... R u nl..ba
Quintiles
Source: Annex Table D. 16.
2.500 ................ 2 ...........
L 2.000E . ~ ~ ~ ~ ~ . . . . . . . . . . .. . . . . ..... . . . . . ..
500......
0
Quintiles
Sour-ce: Annex Table D. 16.

87
Figure 5.8 Per Capita All Public Health Subsidy, 1993
7.000 -.. .... . ..
Souce:AllexTale .6.00
3,000
relatie term, by Pooprength 2 itibto 3f 4thet halth Ruralie Urhb heLoen
193.t Targeatin ofstheu HealthsSubiidy.yA with the educaative .. s....io..ftion sopubtid, The
is shown in Figure 5.9. The cumulative shares of individuals in the population, ranked byper capita expenditure, are measured on the horizontal axis. The vertical axis measuresthe cumulative shares of expenditures and public health subsidies.
194. When compared with the Lorenz distribution of total expenditures, bothtypes of the health subsidy are relatively pro-poor. This is demonstrated by the fact thatthe curves for the health subsidy lie above the distribution of expenditure. However, all ofthe curves for the health subsidy lie below the 45 degree diagonal, indicating that, inabsolute terms, the health subsidy is biased towards the nonpoor. In other words, thepoor receive less of the public health care subsidy, at any level, than their share in thepopulation. For instance, the poorest 20 percent of the population receives only 12percent of the total health subsidy, whereas the richest 20 percent receives 30 percent ofthe subsidy.
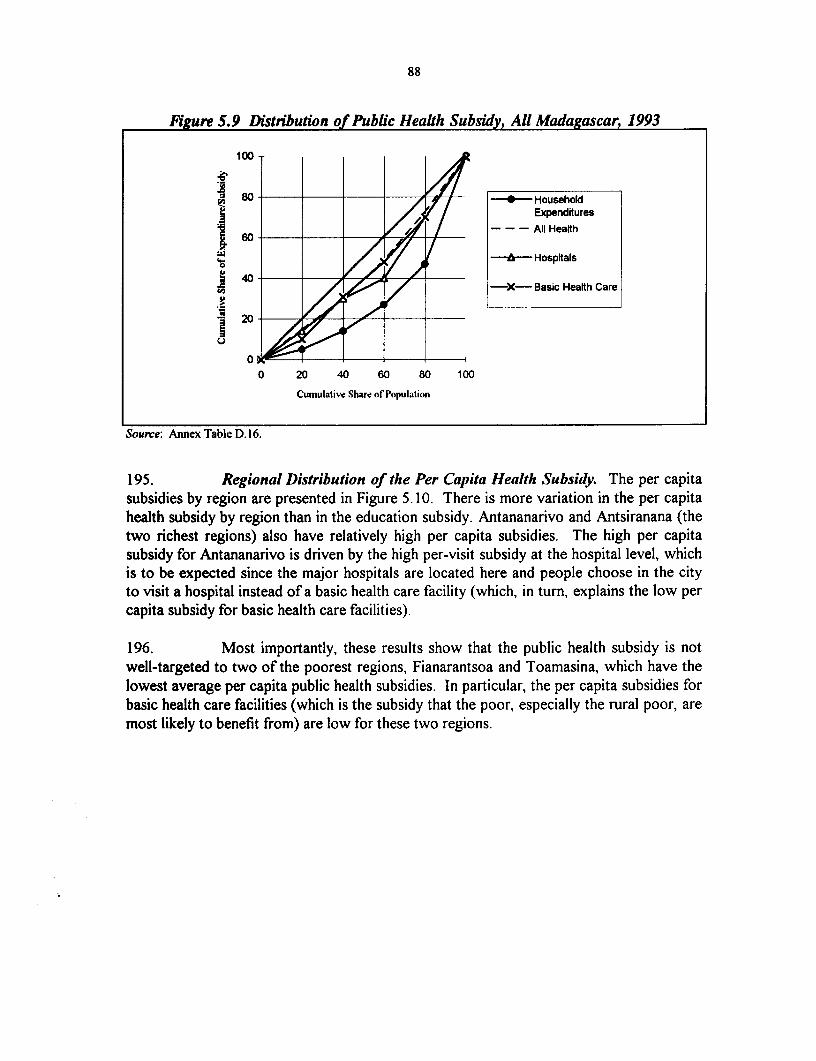
88
Figure 5.9 Distribution of Public Health Subsidy, All Madagascar, 1993
100
so0 -- Household.j /,) / Expenditures
}.~~~~~~~~~~~~~ 60 - 7/--All Heafth
w 40- Hospitals
<! 40 - C S - -X- Basic Health Care
j20__ _
0 -
0 20 40 60 80 100
Cumulative Share of Population
Source: Amiex Table D. 16.
195. Regional Distribution of the Per Capita Health Subsidy. The per capitasubsidies by region are presented in Figure 5. 10. There is more variation in the per capitahealth subsidy by region than in the education subsidy. Antananarivo and Antsiranana (thetwo richest regions) also have relatively high per capita subsidies. The high per capitasubsidy for Antananarivo is driven by the high per-visit subsidy at the hospital level, whichis to be expected since the major hospitals are located here and people choose in the cityto visit a hospital instead of a basic health care facility (which, in turn, explains the low percapita subsidy for basic health care facilities).
196. Most importantly, these results show that the public health subsidy is notwell-targeted to two of the poorest regions, Fianarantsoa and Toamasina, which have thelowest average per capita public health subsidies. In particular, the per capita subsidies forbasic health care facilities (which is the subsidy that the poor, especially the rural poor, aremost likely to benefit from) are low for these two regions.

89
Figure 5.10 Per Capita Public Health Care Subsidy by Region, 1993
3tS~~~~~~~~~~~~~~~~~~~~~~~~~~~~~~~~~~~~~~.. ..... .. .. ......X~~~~~~~~~~~~~~~~~~~~~. .. . .. ..3 w .. c 3,50, ......... .. ..
o~~~~~. .. .. .. .. .... ... . .. . .. .. ......... ..
H ushl E,xpniue on PulcHatBaea oprdwt ubic~1 ~
Expenditures
197. c Table 5.1 ..... .. .. and.government .... on public health
0are. two main messages.emerge . .... the public ................3pOOD .............. .... ............ .p c account for 5 0p
Housichoaldh Expenditrtes nces Pubicneathi Car as Compared with 62 p ublicfrthpors
alre rsaeothnofdexpendituresoftepo(I1prcnfrthpoesquti)
197. Table5.18 sheowsnancialburdenon the household an spending on public health
sevcsi uhgetrfrtepoor than for the richoo. The public subid acutfo50pretfttalms spvendigopubimesalt care for the richest quintile, as pecompared withoo 62xpendtrcen)tha for thepors
arlargersharuine ofpercthe of nonfood expenditures)of.thepoor(11 phereunts f.hepooe qu ile) 5
tanr o thet nonpoorual (2or percent for thvichsits to intlhealhcr.fcltes lhug hr198 ncsecond, y the.. ..nancia burde on .the househol .o spendin d ornpub the
services poisduhgedater forbu the poossry thgsandfrh nsupoore. Thoe burden tisams sugeventimsastiho the poorwolntbestbl qitol (7y peren fofubi noefood sexpienditues than forn thetareowhat individuals preort paying forvisits to im publin ealh crev, facilities. Athouh the
proponents of a cost recovery program argue that the total cost to the individual might belowered with the use of standardized fees, as the amounts currently (informally) being paidcan be quite high.
90 In absolute termns, however, the public subsidy is larger for the richest quintiles.91 The literature on ability and wvilliiigness to pay suggests that househlolds are not able to pay more than five percentof nonfood expenditures on healthl care (see Gertler and van de Gaag, 1990 and World Bank, 1993).

90
Table 5.18. Household and Government Spending Per Capitaon Public Health Care, 1993/4
As a Share of Per CapitaFMYG Nonfood Expenditure j Dercent)
S.are Paid by
PublicQuintiles Household Public Total (percent) Household Public TotalPoorest 1,133 1,851 2,984 62 7 Ii 182 2,528 2,826 5,354 53 8 9 173 2,573 2,066 4,639 45 6 9 114 2,139 3,970 6,109 65 3 6 9Richest 4,581 4,514 9,095 50 1 2 3
Average 2,591 3,046 5,637 54 2 3 5Sources: EPM 1993/4 and Annex Table D-16.
Cross-Country Comparisons for The Incidence of Public Health Spending
199. If public health spending were equally distributed across populationquintiles, then every income group would receive an exactly equal share of total publichealth resources.
200. Public health resources in Madagascar in 1993 are weakly pro-poorbecause their distribution pattern among income groups (or quintiles in this case) ismore equally distributed than the distribution pattern of household expenditures. Across-country comparison of Madagascar with selected countries where the incidenceanalysis methodology has been used to determine who benefits from public healthspending is shown in Table 5.19. In comparison with countries in Sub-Saharan Africa,the poor in Madagascar received about the same share of public health spending as thepoor in Kenya and South Africa. Although Madagascar does not depart from theregional norm, the poorest quintile received less than their population share, 12percent, while the richest quintile received more than their population share, 30percent. In comparison with Asian countries, except Malaysia, the distribution ofhealth spending in Madagascar was more pro-poor but the reverse was true incomparison with Latin American countries, except Brazil.

91
Table 5.19. Incidence of Public Health Spending on the Poorest and RichestQuir tiles, Selected Countries (percentage share)
Health spending benefiting:Country Year the poorest 20% of the the richest 20% of the
population (°/O) population (%/6)AFRICAGhana 1992 12 34Kenya 1992/3 14 24Madagascar 1993 12 30South Afnca 1993 16 17ASIAIndonesia 1989 12 29Malaysia 1989 29 11Vietnam 1993 12 29LATIN AMERICAArgentina 1991 33 6Brazil 1985 17 42Chile 1982 22 11Colombia 1992 27 13Uruguay 1989 37 11Sources: World Bank (1996).Note: If public health spendinig were eqtually distributed across population quintiles, then the poorestand the richest quintiles (every number in the table above) would receive a 20 percentage share ofspeniding.
C. MAIN CONCLUSIONS
201. Based on the incidence analysis, several conclusions can be drawn aboutthe targeting of public social services to the poor. They are summarized in this sectionwith a focus on their implications for social sector policy. In the education sector,education spending is not well-targeted to the poor, and only the primary-level subsidy ismildly pro-poor. The public health subsidy is not well-targeted to the poorest quintiles orto the poorest regions of Madagascar. This can be explained in part by a concentration ofresources in richer (urban) areas as well as by the propensity of the rich to use the morecostly public health services.
Education
202. Enrollments are low, especially among the poor. The evidence from the1993/4 EPM confirms and updates the trend of declining enrollments presented in otherrecent analysis of the sector (namely Madagascar: Towards a School-based Strategy forImproving Primary and Secondary Eduication). The survey results show that enrollmentrates are especially low for the poorest quintiles. The main factor explaining the lowenrollments is the general economic decline that has taken place in Madagascar in recentyears. This has affected the level of public spending on education and has contributed to a

92
decline in the quality of education. As the quality of public education is considered to below, there is less and less motivation for sending children to public schools. At the sametime, incomes have been falling and households are less able to afford the private costs toeducation (including opportunity costs). The nonpoor are opting into the private system,but for the poorer groups, this often means not attending school at all.
203. The main implication for education policy, although not a new one, is thepressing need to improve the quality of schools in order to attract students, especially poorones, back to public schools. Fortunately, work in this area has begun. A pilot schoolimprovement project, which focuses on decentralizing the management of educationexpenditures and involving the community, is underway in Mahajanga and since mid-1995has been extended to pilot districts in all six provinces. The results are encouraging:enrollments have begun to increase in the pilot project area and many schools have beenrefurbished. Also, very importantly, communities have regained confidence in the Ministryof Education. There are plans to replicate this prototype in the rest of Madagascar and theresults presented here endorse a continuation in this effort.
204. The education subsidy is not well-targeted to the poor. Only the primary-level subsidy is mildly pro-poor. Only the primary level subsidy is mildly pro-poor in thatit is more equally distributed that is total expenditure. On a per capita basis, the poorreceive more at the primary level than at any other level. Secondary- and university-levelsubsidies are distributed more unequally than is total expenditure. These findings are theresult of two factors: (i) low enrollment rates among the poor, even at the primary level,and (ii) low per student subsidies for primary education (the level most attended by thepoor), as compared with the higher levels of education, which are used mostly by thenonpoor.
205. As a means of combating poverty, this may point to the need to spendmore public expenditures on primary education (and possibly secondary education) andless on university-level education, where a cost-recovery program could be implementedto cover the high costs of university-level education. This policy recommendation alsofollows from the analysis per-student costs, which indicated that at the primary-level theywere too low (by international standards) and the tertiary level were too high (from anefficiency perspective). The high returns to primary education in developing countries arewell-known and public spending at this level can contribute most towards helping the poormove out of poverty.
206. Second, the evidence points to the need to increase enrollments of poorchildren at the secondary-level. This could be done by improving quality and by helping toreduce the private costs to secondary education to the poor as it is a heavy burden on theirresources. This might involve providing scholarships to poor students to finance thevarious fees and contributions (i.e., to parent associations) required to attend school or in-kind benefits such as free or subsidized books and/or uniforms.

93
207. Public spending is biased towards urban areas. The average per capitasubsidy for all education is three times larger in urban areas than in rural areas. Even if wedo not consider the university subsidy, which is normally concentrated in urban areas, thesubsidy for secondary-level education on a per capita basis is almost four times higher inurban areas as compared with rural areas, pointing to the need to increase rural secondary-level enrollments. This bias towards urban areas is confirmed in the analysis of theregional variation. The average per capita subsidy for all education in Antananarivo (amore urban province) is twice as high as for the other regions, which are mostly rural.
Health
208. The health subsidy is not well-targeted to the poorest two quintiles. Theincidence analysis shows that together the poorest 20 percent (the extreme poor) and thesecond quintile (the moderately poor) receive 31 percent of the total public health subsidy.This suggests that public health expenditures is not reaching the poorest 40 percent of thepopulation (while the richest quintile alone receives 30 percent of the public healthsubsidies). The subsidy for hospitals is more poorly targeted than the subsidy for basichealth care, with only 14 percent of the benefits accruing to the poorest quintile and 16percent to the second quintile, as compared with 30 for the richest quintile. This impliesthat cost recovery policies could be introduced at public hospitals for those able to pay. Inturn, these policies could also support a better budgetary balance towards basic health carefacilities that in Madagascar tend to improve targeting of public resources to the poor.
209. The health subsidy is poorly targeted to two of the poorest regions,Fianarantsoa and Toamasina. The results of the incidence analysis show that the percapita health subsidy is the lowest in these two poor regions of the country, Fianarantsoaand Toamasina. The per capita subsidy is lower in these regions because people use healthservices less in these region (possible because they are poorer and cannot afford the directand indirect costs of seeking treatment).
210. The financial bur(len on the household of spen(ling on public healthservices is much greater for the poor than for the nonpoor. The burden is almost seventimes as high for the poorest quintile, which pays on average 7 percent of nonfoodexpenditures for public health care, than for the richest quintile, which pays an average of1 percent of nonfood expenditures for public health care.
94
CHAPTER VI. PROVIDING SAFETY NETS WHERE FEASIBLE
211. A "Safety Net" is a program designed to provide for those among the poorwho are unlikely to benefit from economic growth or from human resources development.Safety net beneficiaries usually fall into one of the following categories: those who areunable to work because of age or handicap, those who are temporarily affected by naturaldisasters or economic recession, or those who are chronically destitute.
212. While some formal social assistance programs, such as pension and healthbenefits, exist in Madagascar for those in the modern sector, they rarely reach the poor.Given the government's precarious financial situation and weak implementation capacity,the development of permanent, government financed safety nets that meet the needs of thepoor is not plausible in the near future. Nevertheless, there are existing traditional familyand community safety nets, interventions by NGOs and other donors, and severalgovernment programs that act as safety nets, although usually with limited geographiccoverage.
213. Monetary and In-kind Transfers to andfrom Households. The householdbudget consumption survey collected information on transfers to and from households offood and non-food items (see Annex Tables B-47 and B-48). Net transfers accounted for1.4 percent of the poors' expenditures compared to 2.7 percent for the nonpoor. About95 percent of transfers reported as sent from the household were made to other familymembers. The percentage was similar across all expenditure quintiles. Of the transferssent from households, a little less than three-quarters were sent by those in the top 3quintiles. The lowest quintile, however, accounted for 3.8 percent of the value oftransfers sent, almost exclusively to other members of their family.
214. For transfers received by a household, however, over 15 percent wasreceived from non-family members. Interestingly, the percentage of households in therichest quintile that received transfers (43 percent) was not tremendously different fromthe percentage that was received by the lowest quintile (56 percent). The rich were morelikely to receive transfers from non-family members than were the poorest (20 percent oftransfers received by the richest quintile compared to 11 percent for the poorest quintile).Approximately two-thirds of the value of transfers received by households went to the twoupper quintiles (generally the nonpoor).
215. This suggests that while transfers are a somewhat more important sourceof income for the poorer households, it reflects a system where the rich capture themajority of the benefits.
216. Community and Family Safety Nets. A study of safety nets wasundertaken in two sample communities Antananarivo, the capital, and the province ofToliary to obtain an idea of the various kinds of safety nets that exist. Antananarivo is anurban area that includes some chronically destitute and those suffering from economicrecession. Toliary is a province that is prone to cyclical drought and has been hit bynatural disasters, as well as having a high incidence of poverty.

95
economic recession. Toliary is a province that is prone to cyclical drought and hasbeen hit by natural disasters, as well as having a high incidence of poverty.
217. "Fihavanana" (or "Filongoa" in the South) is a philosophy of family andsocietal solidarity and obligations. This solidarity can be formal or informal, but isalways based on reciprocity of services. The risk is that when one abuses or breaks thesolidarity, one may be refused later when one is in need of support. The family ismade up of the ancestors, the "ray amandreny" (the elders of the generation, thegrandparents), the children, and all relatives of the same descendants up to the sixthgeneration. The "ray amandreny" are revered; they are the owners of the family's landand have the last word in settling any disputes. Land is shared with the children of thefamily, and children support their parents when they are no longer able to supportthemselves, a duty that is registered by law.92 Under "Fihavanana", the orphaned,elderly, and handicapped members of the family are taken care of by other familymembers. However, the extent to which this family safety net system is effective isdependent on the economic situation of the household. The drop in purchasing powerhas made it difficult for families to keep up with these obligations, although the lack ofdisaggregated and comparative data makes it difficult to analyze to what extent.
218. Community solidarity is less effective than family solidarity as a basisfor providing permanent assistance to individuals. In general, it operates when there isa death in a family, when labor is required, or when the community needs to beprotected against theft. In the south, 85 percent of the households surveyed take part in"enga" or "give and take," primarily for funerals where families make financialcontributions as an expression of solidarity not only towards the suffering family butalso to the community as a whole. In the region of Sambava in the northeast wherevery few services are available, approximately three-quarters of the communitycontribute 500 FMG per person to a mutual fund in case of emergencies. Otherexamples of community solidarity is the "rima," an exchange of agricultural labor inwhich the beneficiary must provide meals for the laborers, and the "dinampokonolona",which are traditional community courts that can actually pass judgments that contradictthe law of the country. The population often turns towards traditional ways in times ofcrisis. Although this system was found in the PPA to be effective for many, as thetraditional safety nets depend on the family or community being financially healthy, thecurrent economic situation is reducing or eliminating their effectiveness. Thesociological and cultural impact that the breakdown of these systems of solidarity ishaving on the Malagasy population would be an interesting area for further study.
219. NGO, Government, and Donor supported Safety Nets.. NGOs, thegovernment, and donor financed projects all contribute to an informal set of safetynets, although they generally have only limited geographical coverage. The originalintent of this study was to look at the effectiveness of such programs. The goal was tounderstand the extent of interventions, number of beneficiaries, and approximate unit
92 Ordonnance 62-089 of October 1, 1962.
96
cost for providing services. This could have then provided information on the mosteffective and most efficient (as well as cost effective) interventions. Unfortunately,NGOs were unwilling or unable to provide the information, especially on costs. As aresult, this study is unable to effectively evaluate most forms of safety nets.
220. Labor-intensive public works programs. Madagascar is beginning tohave some recent experience with labor-intensive public works programs. TheEconomic Management and Social Action project (EMSAP) contained a labor-intensivepublic works component in the region of Toliara, the poorest region in Madagascar.The implementation of this component got off to a slow start due to a lack of capacityof local firms in implementing labor-intensive technologies, a lack of equipment, andlack of other inputs (including water) in the project area. To overcome theseconstraints, training was provided for some firms on labor-intensive public workstechnologies and equipment was purchased through a Bank-supported transport project.
221. Building on the experiences of the EMSAP, as well as experience insimilar works around the world, the Bank-supported Food Security and Nutritionproject (SECALINE) and the complementary follow-up Social Fund project (FID) areproviding temporary employment programs for the poor. These projects have beenhighly successful, in great part due to the involvement of beneficiaries at all stages,active collaboration with NGOs, strong community involvement in the choice ofactivities, and close collaboration with other donors. In its first full year of operation,the project's social fund has helped create 213,000 person-days of temporaryemployment building essential infrastructure for the poor (including roads, irrigationworks rice land, bridges and crossings, schools and clinics, and markets among otherthings). This project is now being expanded beyond the initial provinces of Toliaryand Antananarivo to the remaining four provinces. It has also been working with theUN's World Food Programme's Food for Work program in the capital. During thelast 3 months of 1994, the Food for Work component created almost 20,000 persondays (62 percent for women) of employment linked to cleaning up poor neighborhoods.
222. Finally, the Bank-supported Urban Works Pilot Project aims todemonstrate the benefits of using a contracting-out approach for the management andmaintenance of infrastructure works, developing small and medium sized enterprises inthe construction and engineering industry, while at the same time improving thedilapidated infrastructure in the capital. This project has also provided employment, inmany cases to the poor. Since its effectiveness, it has provided approximately 14,000person-months of employment.
223. Nutrition programs. Nutrition programs can be extremely important forprotecting children during times of crisis. The SECALINE project is one example ofhow such programs can work successfully in Madagascar, reducing malnutrition intarget communities from 19 percent to 12 percent (a reduction of about 40 percent).The project supports nutrition activities through a community nutrition program and aniodine deficiency disorders program. In addition, IEC activities contribute significantly

97
to improving the nutritional status of the population. The Community NutritionProgram has been successfully addressing malnutrition in target communities by puttingmothers' groups in each community in charge and keeping the focus on communitydevelopment. On the directly nutritional activities, since the program supportsnutritional status monitoring, nutrition education and provides a snack prepared fromlocal materials at a very low cost to malnourished children. The snack is financed bythe World Food Programme, but mainly uses locally available and purchased materials.One of the most interesting aspects of the community nutrition program is the closelink between information, education, and communication (IEC) programs, nutrition,and community development. The IEC messages are developed regionally using resultsfrom local Knowledge, Attitudes, Practices Surveys and beneficiary assessmentsurveys. relevant messages are then developed in accordance with local mores.
224. The iodine deficiency disorders component, which is jointly financedand executed with UNICEF, addresses the high levels of goiter and cretinism due toiodine deficiency. The program has completed it first phase of iodine capsuledistribution and has moved to the phase of iodizing salt. The equipment for saltiodization has now arrived and private sector salt producers have organized themselvesto use this equipment. This should increase the proportion of iodized salt inMadagascar to close to 80 percent of the total salt supply.
225. Other projects that perform the function of limited social safety netsinclude: (i) the 29 Social Assistance Bureaux, which target the aged, the handicapped,and large families going through a crisis; (ii) the Municipal Service for the Protectionof children (or Fivondronana), which makes regular rounds of the capital to find thehomeless and to place them in various social centers; (iii) a Professional ReinsertionProgramme (PRP) supported by the Bank, which retrains ex-employees of stateenterprises for jobs with local enterprises or for self-employment; and (iv) a labor-intensive food-for-work project (mentioned above) in Antananarivo aimed at increasingthe revenues of the poorest households and improving the environment where they live(by, for example, cleaning canals, building embankments, rehabilitating roads, andplanting trees). Weak implementation capacity, however, hinders several of thegovernment programs, resulting in inefficiencies and poor targeting to the intendedbeneficiaries. Nevertheless, many of these programs do provide some measure of atemporary safety nets for their intended beneficiaries.
226. Migration is another form of household strategies for coping withpoverty. In addition to temporary, seasonal migration which often provides animportant supplement to the incomes of the poor, in recent years, many of those hit bynatural disasters or recession have permanently migrated to other areas to find work.In the most impoverished area of the country in the South, the PPA found that almosthalf (48 percent) of the households surveyed had migrated during the five years prior tothe survey (1987-1992). This is a strategy for survival that is proving to be asuccessful way to cope with economic hardship for those among the poor who are fitenough to work and travel. Solidarity among migrants from the same region is an

98
important informal safety net. A study was made of members of a family whomigrated from the Ambositra region to two areas of Antananarivo. The migrants weregiven board and lodging by other members of the family, who also helped them to lookfor work. The salary of the migrants was then handed over to the head of thehousehold where they were staying until the migrants were capable of setting up theirown household. One part of the savings of the migrants would be invested in the cityin real estate and part returned to their village.
227. Main Conclusions. Four main conclusions emerge with regards to theprovision of safety nets in Madagascar.
(i) Given the government's precarious financial situation and weakimplementation capacity, the development of permanent government-financed safety nets is not plausible in the near future.
(ii) Only by following strategies to improve the overall incomes and welfareof households will the traditional community and family safety nets beable to take on an increasing burden of providing the poor withtemporary safety nets in times of duress.
(iii) Supporting and encouraging the development of essential infrastructureusing high intensity labor works where feasible and by using self-targeting mechanisms, such as offering below-market wages, can also bea cost effective and efficient mechanism for transferring income to thepoor in times of need as well as producing the essential infrastructurethat is so crucial to their escape from poverty. Targeting these activitiesto the poorest regions can also be important for reaching the poor.
(iv) Encouraging NGO activities that support safety net operations for poorhouseholds in rural and urban areas is essential.
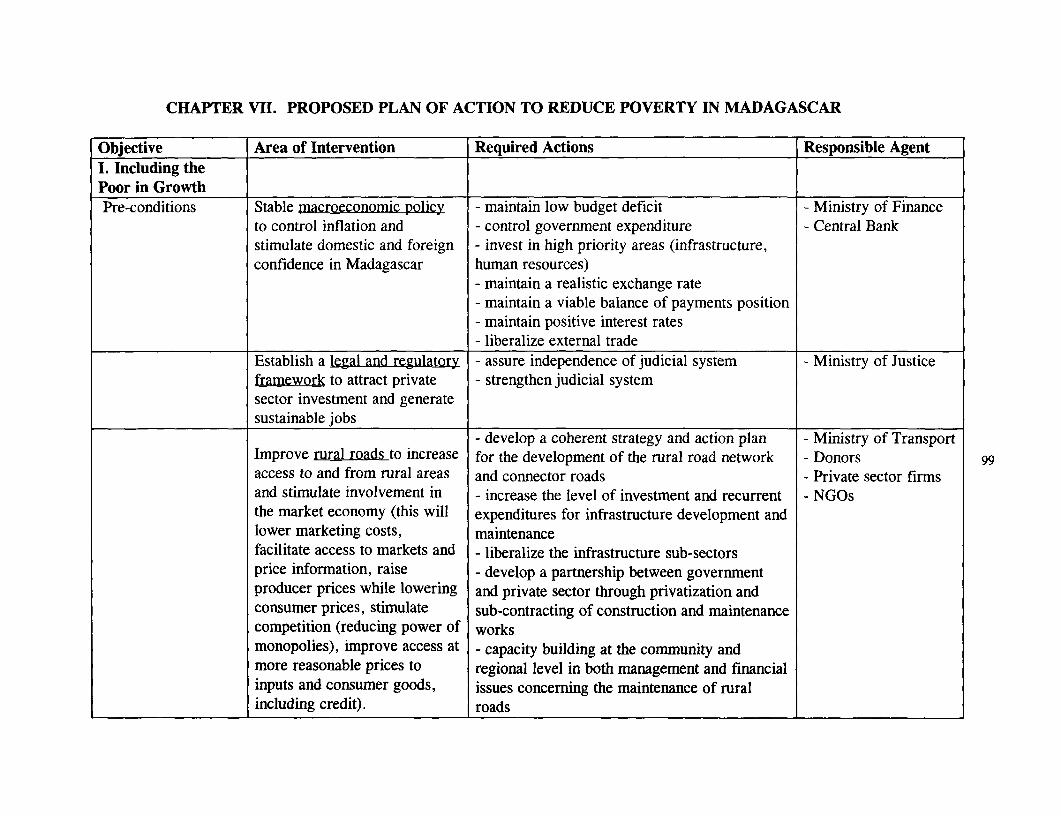
CHAPTER VII. PROPOSED PLAN OF ACTION TO REDUCE POVERTY IN MADAGASCAR
Objective Area of Intervention Required Actions Responsible AgentI. Including thePoor in GrowthPre-conditions Stable macroeconomic policy - maintain low budget deficit - Ministry of Finance
to control inflation and - control government expenditure - Central Bankstimulate domestic and foreign - invest in high priority areas (infrastructure,confidence in Madagascar human resources)
- maintain a realistic exchange rate- maintain a viable balance of payments position- maintain positive interest rates- liberalize external trade
Establish a legal and regulatory - assure independence of judicial system - Ministry of Justiceframework to attract private - strengthen judicial systemsector investment and generatesustainable jobs
- develop a coherent strategy and action plan - Ministry of TransportImprove rural roads to increase for the development of the rural road network - Donors 99access to and from rural areas and connector roads - Private sector firmsand stimulate involvement in - increase the level of investment and recurrent - NGOsthe market economy (this will expenditures for infrastructure development andlower marketing costs, maintenancefacilitate access to markets and - liberalize the infrastructure sub-sectorsprice information, raise - develop a partnership between governmentproducer prices while lowering and private sector through privatization andconsumer prices, stimulate sub-contracting of construction and maintenancecompetition (reducing power of worksmonopolies), improve access at - capacity building at the community andmore reasonable prices to regional level in both management and financialinputs and consumer goods, issues concerning the maintenance of ruralincluding credit). roads

- capacity building at the technical level ofcommunities and private sector enterprisescapable of undertaking rural road works,especially those using labor-intensivetechnologies- resource mobilization at the local level for themaintenance of rural roads
Raise Agricultural Improve rural infrastructure - see above -see aboveIncomes
Improve productivity of both - improve water control - Ministry offood crops and export crops - improve cash input use Agriculture
- improve support services for poor farmers - Ministry of Transport(extension) - FOFIFA- improve research capacity - Entrepreneurs- facilitate private sector supply of inputs- lower transport costs (better roads, betterinternal transport links, lower port andairfreight costs)
Improve natural resource - reduce/eliminate slash and burn agricultural - Ministry of 100management practices Agriculture
- reduce other causes of soil erosion - FOFIFA- reduce bush-fires in NW and SW regions - NGOs- improve yields on existing land to reduce - Donorsforest destruction and improve potential income - Communitiesto the poor of tourism.
Develop farmers organizations - train extension workers in the development of - Ministry offarmers organizations Agriculture- capacity development efforts and support to - NGOsongoing farmers organizations - Donors
Develop the Potential Encourage Private Sector - provide a stable macroeconomic environment - Ministry of Financefor Off-Farm Development in areas outside (see above) - Ministry ofEconomic the capital - expand the Free Trade Zone Commerce

Opportunities - develop infrastructure outside the capital city - Ministry of Transport(roads, telecommunications, water and energy - Central Bankservices) - NGOs- improve efficiency of the Banking sector to - Donorsreduce its costs and improve access to credit - Business associations- encourage the development of grassrootssavings and loans institutions in rural and urbanareas- simplify the investment code, increase thetransparency of its application and reducebureaucratic quagmire and paperwork, all ofwhich disadvantage small, poor firms- redesign public procurement procedures so asnot to have a bias against labor-intensive firms- streamline and simplify administrative.procedures
Reduce the burden of Lower fertility rates - educate girls, increase primary and especially - Ministry oflarge families on the secondary enrollments of girls Educationpoor - develop creative and expansive information, - Ministry of Health 101
education, communication campaigns - Donors- assure accessibility and affordability of -NGOscontraceptives - Communities

II. Improving theHuman Capital ofthe PoorIncrease primary Improve the quality of primary - improve allocation of public expenditures - Ministry ofeducation of the poor education to attract students towards primary education and within primary Education
back to school, especially the education towards instructional needs - Ministry of Financepoor - develop and improve school leadership - Donors
(school directors), especially in the areas of - NGOssupervising teaching, stimulating improvements - Parent associationsin teaching practices, improving their capacity - Communitiesto motivate people- improve the availability of textbooks in theclassroom, as well as teachers' guides- develop community participation
Increase secondary Improve quality of secondary - develop and improve and management of - Ministry ofeducation of the poor schools and the poors' ability school directors Education
to participate - improve school facilities - NGOs- improve competencies and attitudes of - Donors 102teachers - Communities- improve learning materials- improve parental support- provide financial incentives to the poor tosend their children to secondary school(scholarships to cover fees or contributions toparent associations, or in-kind benefits such asfree or subsidized books and/or uniforms)
Increase health status Develop a coherent national - reallocate public expenditures to rural services - Ministry of Financeof the poor health policy and the modalities that reach the poor - Ministry of Health
for implementing it - reallocate medical staff outside the capital and - Communitiesespecially to rural areas - NGOs- develop system to obtain and get medicines - Donors

and other essential medical supplies into poorand rural areas at affordable prices (genericmedicines)- reinforce health districts to plan andcoordinate health activities- improve supervision of the health care that isprovided-support community participation in local healthservices- support ongoing successful NGO programs
103

III. ProvidingSafety Nets for thePoorTemporary Use of labor-intensive public - continue to build upon existing programs, - FIDEmployment works in the poorest regions such as the extension of the SECALINE project - AGETIPASchemes during crisis times and during public works to other poor regions, as well as - WFP
the off-agricultural season the AGETIPA program - NGOs- Ministry of Transport
Nutrition Assistance Target nutrition programs to - support continuation and where appropriate - Ministry of Healthpoor communities expansion of successful community-level - FID
programs, such as SECALINE and other NGO - NGOsprograms - Donors
IV. MonitoringPoverty
Reinforce the capacity of the -develop a program to regularly undertake -INSTATnational statistical institute quantative and qualitative surveys at the -Ministry of(INSTAT) and explore the national, regional, and community level Agriculture 104possibility of creating -regularly collect and publish rural and urban -Ministry of Health"observatories" at the local price indices for each province -Ministry of Educationlevel to monitor the living -regularly collect and publish poverty indicators -Ministry of Laborstandards of the poor and analysis on vulnerable groups -Ministry of Transport
-analyze the available administrative statistics in -Ministry charged withthe relevant ministries (health, education, populationtransport, etc.) -Ministry working with
______________ ~~~~~~~~~~~NGOs

105 Annex A
List of Annex A Tables
Table A-1. Economic Growth ........................................ 106
Table A-2. Real Public Expenditure (Current and Capital) ........................................ 107
Table A-3. Size Distribution of Income, 1962 and 1980 ........................................ 107
Table A-4. Income Inequality Statistics, 1962 and 1980 ........................................ 108

Annex A
Table A-i. Economic Growth.Percent Average Percent Average Percent Average Percent Average Percent Average Percent Average Percent Average Percent Average Percent
GPD Real Gr. GDP Real Gr. GDP Real Gr. GDP Real Gr. GDP Real GDP Real Gr. GDP Real Gr. GDP Real Gr. GDP 19941960 60-72 1972 72-80 1980 80-83 1983 83-86 1986 Gr. 86- 1988 88-90 1990 90-93 1993 1994
88GDP (Mkt 100 2.8 100 0.6 100 -3.6 100 1.6 100 2.2 100 3.5 100 -1.1 100 1.2 100P)Agric. 34.5 1.4 30.8 0.3 36.1 0.6 43.0 2.7 43.0 2.6 32.9 3.2 32.3 1.8 33.9 -0.2 35.3 106Indust. 9.8 8.6 18.7 1.4 18.0 -12.4 15.2 2.1 15.7 3.4 13.0 0.8 14.3 0.6 13.8 -6.1 12.7Service, etc. 55.7 2.2 50.6 0.5 45.9 -3.0 41.8 0.8 41.3 1.6 54.1 4.1 53.4 -1.3 52.3 7.0 52.00
l Figures are in FMG rather than percent of GDP in the relevant columns. They are expressed at market prices in local currency.Source: Ministry of Plan and World Bank documents.

107 Annex A
Table A-2. Real Public Expenditure (Current and Capital)1980 1983 1986 1990 1994
Health 22.6 13.2 14.1 19.3 16.8Education 71.5 48.6 38.9 47.2 36.1
Source: World Bank Public Expenditure Review, 1987, World Baik- and IMF.
Table A-3. Size Distribution of Income, 1962 and 1980Percent of National Income
Cumulative % ofpopulation arranged inorder of iicreasin.g incomes 1962 1980
20 8.1 5.040 18.6 13.760 32.8 27.180 51.0 47.690 64.2 62.995 74.3 73.799 88.9 91.1100 100.0 100.0
Source: Frederic L. Pyor, bncome Distributioni and Economic Development in Madagascar.

108 Annex A
Table A-4. Income Inequality Statistics, 1962 and 1980Group of Families Number of Families ('000) Average Total Income Gini Coefficient
1962Rural 1076.2 60.9 .290Secondary Urban Centers 36.6 153.6 n.a.Largest 6 towns 98.9 199.3 .500Together 1211.7 75.0 .391
1980Rural 1542.9 192.9 .435Secondary Urban Centers 140.5 356.2 .487Largest 6 towns 227.3 462.7 n.a.Together 1910.8 237.0 .489
Source: Frederic L. Pyor, Income Distributioii and Economic Development in Madagascar.

109 Annex B
List of Annex B Tables
Table B-1. Average Calorie Intake Per Commodity .......................... .................. 111Table B-2. Distribution Of Households By Quintiles Of Consumption And
Poverty Group. 112Table B-3. Expenditure Patterns For Basic Needs By Provinces, 1980-1993
(All Country) ....................................................... 112Table B-4. Poverty Rankings At Different Poverty Lines ............... ...................... 113Table B-5. Distribution Of Poverty By Socioeconomic Groups (%) ......................... 114Table B-7. Status Of Employment By Poverty Group (%) .............. ...................... 115Table B-8. Poverty Groups By Status Of Employment (%) ............. ...................... 116Table B-9. Poverty Groups By Socioeconomic Groups (Rural And Urban) ....... ......... 116Table B-10. Gini Index By Province And Socioeconomic Group (Urban And Rural) ...... 117Table B-1 1. Structure Of Food Consumption By Product And Region
(Proportion Of Expenditure) ..................................................... 118Table B-12. Expenditure Pattern By Provinces ................................................... 119Table B-13. Expenditure Patterns By Poverty Group ............................................ 119Table B-14. Expenditure Patterns By Quintiles Of Expenditure ................................ 119Table B-15. Expenditure Patterns By Socioeconomic Groups .................................. 120Table B-16. Distribution Of Head Of Households By Education Level And
Poverty Group ...................................................... 120Table B-17. Distribution Of Head Of Households By Level Of Education And
Poverty Group (For Those Who Attended School) ........... .................... 120Table B-20. Percentage Of Youngsters 7-18 Years Of Age Not Attending School
By Poverty Group And Place Of Residence ........................................ 121Table B-2 1. Distribution Of Households By Poverty Groups And Source Of Energy ...... 122Table B-22. Distribution Of Households By Poverty Group And Type Of Fuel ............. 122Table B-23. Distribution Of Households By Poverty Group And
Source Of Drinking Water ..................................................... 122Table B-24. Distribution Of Households By Poverty Group And
Type Of Garbage Disposal ..................................................... 122Table B-25. Distribution Of Households By Poverty Group And Type Of Sanitation ...... 123Table B-26. Distribution Of All Farmers By Area Cultivated And Poverty Group ......... 123Table B-27. Distribution Of Small Farmers By Area Cultivated,
Poverty Group And Province ...................................................... 124Table B-28. Distribution Of Small Farmers By Area Cultivated, Poverty Group
And Residence ..................................................... 125Table B-29. Distribution Of Farmers By Poverty Group And Status Of Land Ownership. 125Table B-33. Distribution Of Small Farmers By Province, Poverty Group And
Status Of Land Ownership ...................................................... 128Table B-34. Distribution Of All Farmers By Primary Type Of Crops Grown And
Poverty Group For Each Province .................................................. 129Table B-35. Distribution Of Small Farmers By Primary Type Of Crops Grown And
Poverty Groups For Each Province ................................................. 130

110 Annex B
Table B-36. Distribution Of Medium Farmers By Type Of Crops Grown AndPoverty Group For Each Province .................................................. 131
Table B-37. Distribution Of Large Farmers By Type Of Crops Grown AndPoverty Group For Each Province .................................................. 132
Table B-38. Distribution Of Head Of Households By Sex And Poverty Group ....... ...... 132Table B-39. Percent Distribution Of Women Head Of Households
By Current Marital Status And Poverty Group ................ ................... 133Table B-46. Determinants Of Poverty And Probit Analysis For Urban And
Rural Madagascar, 1994 .................................................. 137Table B-47. Monetary And Non-Monetary Transfers To And From Households
(As A Percent Of Households) .................................................. 138Table B-48. Monetary And Non-Monetary Transfers To And From Households
(Percent Of Value) .................................................. 139

III Annex B
Table B-I. Average Calorie Intake per CommodityPC Quantity - Kg/yr
Item no. Item 3RD QUINT Cal/l 00 g PC calories/day
201 Rice 98.8 357 967204 Maize 14.4 357 141211 Manioc, fresh 64.8 91 162212 Manioc, dry 7.7 266 56215 Taro 7.3 102 20216 Potatoes 11.3 82 25217 Sweet potatoes 26.7 87 64221 Kidney beans 2.5 266 18222 Peas 0.2 320 2224 Lentils 0.2 297 2225 Peanuts 0.9 564 14226 Coconuts 0.5 200 3231 Bananas 24.2 62 41232 Apple/pear 0.2 40 0233 Peach/prune 0.6 33 0234 Oranges 2.0 26 1235 Litchi 5.3 36 5236 Mangoes 10.4 60 17237 Avacado 0.8 190 4238 Pineapple 0.7 41 0239 Sugarcane 20.9 62 35251 Tomatoes 1.8 17 0252 Onions/shallots 0.6 36 0254 Beans/peas 0.1 24 0256 Cauliflower 0.2 34 0257 Pepper 0.0 22 0271 Beef 1.9 237 12273 Pork 0.4 418 4277 Chicken 0.9 146 4279 Fresh fish 2.7 103 8280 Crustaceans 0.3 42 0281 Dried fish 0.6 269 4282 Dried shellfish 0.0 329 0291 Eggs 2.0 147 8292 Milk 1.0 66 2301 Peanut oil 0.5 899 12302 Coconut oil 0.2 899 4303 Soya oil 0.0 899 0304 Butter 0.0 737 0305 Animal fat 2.7 891 66306 Margarine 0.0 739 0311 Sugar 2.3 394 25321 Bread 0.8 230 5g14 Non-alcolholic 1.1 40 1gl5 Alcoholic bev 0.7 62 1
1738

112 Annex B
Table B-2. Distribution of Households by Quintiles of Consumption and Poverty GroupPoverty 1 2 3 4 5 Number of
Groups Households
Extreme Poor 100.0 100.0 94.8 10.5 1,300,221Poor 5.2 49.4 286,611Nonpoor 50.6 100.0 914,439
All 100.0 100.0 100.0 100.0 100.0 2,501,271
Table B-3. Expenditure Patterns for Basic Needs by Provinces, 1980-1993 (All Country)1980 Antaiaarivo Fam,arsoa Toamasina Mahajanga Toliara Anisiranana All
Food 52.7 67.0 66.8 61.3 68.5 63.4 62.6
Fuel 6.5 5.4 11.2 6.1 4.5 4.9 5.3
Clothing 6.6 5.5 6.4 7.8 5.1 4.8 6.0
199314Food 68.5 79.0 72.4 71.0 57.9 67.1 69.9
Fuel 3.7 2.6 2.5 3.4 3.2 3.1 3.1
Clothing 6.9 6.2 8.1 8.7 10.3 9.5 7.9
Source: 1980 Budget Survey and EPM.

113 Annex B
Table B-4. Poverty Rankings at Different Poverty LinesZ= FMG 248,400 Z=FMG 223,560 Z=FMG 194,460 Z=FMG 175,014
Head Head Head HeadCount PGI PG2 Count PGI PG2 Count PGI PG2 Count PGI PG2
RegionAntananarivo 64.3 27.4 14.5 59.1 23.7 11.9 52.8 18.9 8.8 47.5 15.4 6.8Fianarantsoa 73.5 35.7 21.1 69.2 31.7 18.2 62.8 26.5 14.6 56.8 22.8 12.3Toamnasina 74.1 35.7 20.5 69.9 31.6 17.4 65.9 26.2 13.6 59.1 22.2 11.1Mahajanga 67.3 27.7 14.9 60.8 23.6 12.3 50.5 18.8 9.4 45.3 15.6 7.6Toliara 80.4 45.0 29.5 76.3 41.3 26.3 72.0 36.3 22.2 68.6 32.5 19.3Antsiranana 65.7 26.9 13.8 61.1 22.9 11.1 53.7 17.8 8.1 46.9 14.1 6.3
ResidenceRural 76.7 36.9 21.5 72.0 32.7 18.4 65.9 27.2 14.6 60.3 23.2 12.1Urban 47.1 17.6 8.7 41.7 14.6 6.9 34.8 11.2 4.9 29.4 8.9 3.7
Capital City 40.9 14.7 7.1 34.7 12.2 5.6 30.0 9.2 4.0 24.9 7.1 0Major Cities 42.6 17.3 9.2 38.2 14.8 7.6 31.4 11.8 5.7 28.0 8 4.5Other Cities 59.3 21.9 10.4 54.4 18.0 8.2 44.1 13.5 5.7 36.7 10.5 4.2Rural 76.7 36.9 23.3 75.2 34.9 20.1 69.3 29.9 16.5 63.5 23.9 13.8
Province/ResidenceRuralAntananarivo 75.9 33.6 18.0 71.0 29.3 14.9 63.3 23.6 11 58.6 19.3 8.7Fianarantsoa 75.9 37.8 22.7 71.8 33.8 19.6 66.1 28.5 15.9 60.1 24.6 13.4Toainasina 79.0 38.4 22.2 74.6 34.2 18.8 70.8 28.4 14.8 63.6 24.0 12.1Mahajanga 69.2 29.6 16.3 62.8 25.5 13.7 53.4 20.6 10.6 48.5 17.2 8.7Toliara 84.2 47.9 31.7 80.0 49.1 28.4 75.7 38.9 24.1 72.5 35.0 21.0Antsiranana 73.8 31.0 15.9 69.4 26.5 12.9 62.0 20.6 9.4 54.4 16.4 7.3
UrbanAntananarivo 45.7 17.6 8.8 40.2 14.8 7.1 35.4 11.4 5.1 29.7 9.1 3.9Fianarantsoa 55.2 18.7 8.6 48.8 15.0 6.6 36.4 11.1 4.6 30.7 8.6 3.3Toamasina 34.8 13.8 6.9 32.4 11.6 5.5 26.6 8.9 4.0 22.8 7.2 3.0Mahajanga 59.7 19.9 9.0 52.6 16.0 6.9 38.9 11.6 4.7 32.6 8.9 3.4Toliara 51.3 22.7 12.2 49.5 19.7 10.1 43.5 15.9 7.6 38.5 13.1 6.0Antsiranana 35.7 12.0 5.7 30.2 9.7 4.5 22.9 7.1 3.3 18.8 5.7 2.5Total 70.3 32.7 18.8 65.5 28.8 15.9 59.2 23.8 12.5 53.7 20.2 10.3

114 Annex B
Table B-S. Distribution of Poverty by Socioeconomic Groups (%)Socioeconomic Groups Head Count Poverty Gap Seve Population
Index Contribut. Index Contribut. Index Contribut. Shares
,S,.,..,.,,,,,...,,,.,,,,,,.............. . .w .w. ... ,...........
Large farmers 77.0 37.1 34.6 35.8 19.0 34.3 33.9Small farmers 81.6 41.2 41.0 44.5 24.6 46.5 35.5Herders/Fishermen 61.4 10.3 27.9 10.1 16.1 10.1 11.8Small Entrepreneurs 44.1 0.9 21.0 0.9 12.7 0.9 1.4Craftsmen/Traders 40.4 2.5 16.9 2.3 9.4 2.2 4.4High Wage/Professionals 5.9 0.1 1.4 0.0 0.6 0.0 1.7Employees/Workers 39.8 3.0 12.0 2.0 5.3 1.5 5.3Unskilled workers 62.7 2.6 25.5 2.3 14.0 2.2 2.9Retirees/Handicapped 50.6 1.4 23.6 1.4 14.1 1.5 2.0Non wage/Students 52.6 0.8 22.4 0.8 12.6 0.7 1.1
+ ,'.,',','',X,~~~~.,'''.'.'....... .. .Large farmers 64.9 37.1 24.4 34.8 12.1 32.6 33.9Small farmers 72.4 43.4 30.9 46.1 17.1 48.3 35.5Herders/Fishermen 50.5 10.1 20.4 10.1 10.8 10.2 11.8Small Entrepreneurs 37.7 0.9 15.6 0.9 9.0 1.0 1.4Craftsmen/Traders 30.0 2.2 11.7 2.2 6.2 2.2 4.4High Wage/Professionals 2.2 0.0 0.7 0.0 0.3 0.0 1.7Employees/Workers 21.8 1.9 6.5 1.4 2.8 1 .2 5.3Unskilled workers 45.9 2.2 17.4 2.1 9.1 2.1 2.9Retirees/Handicapped 38.5 1.3 17.8 1.5 9.8 1.6 2.0Non wage/Students 38.9 0.7 15.8 0.7 8.4 0.7 1.1
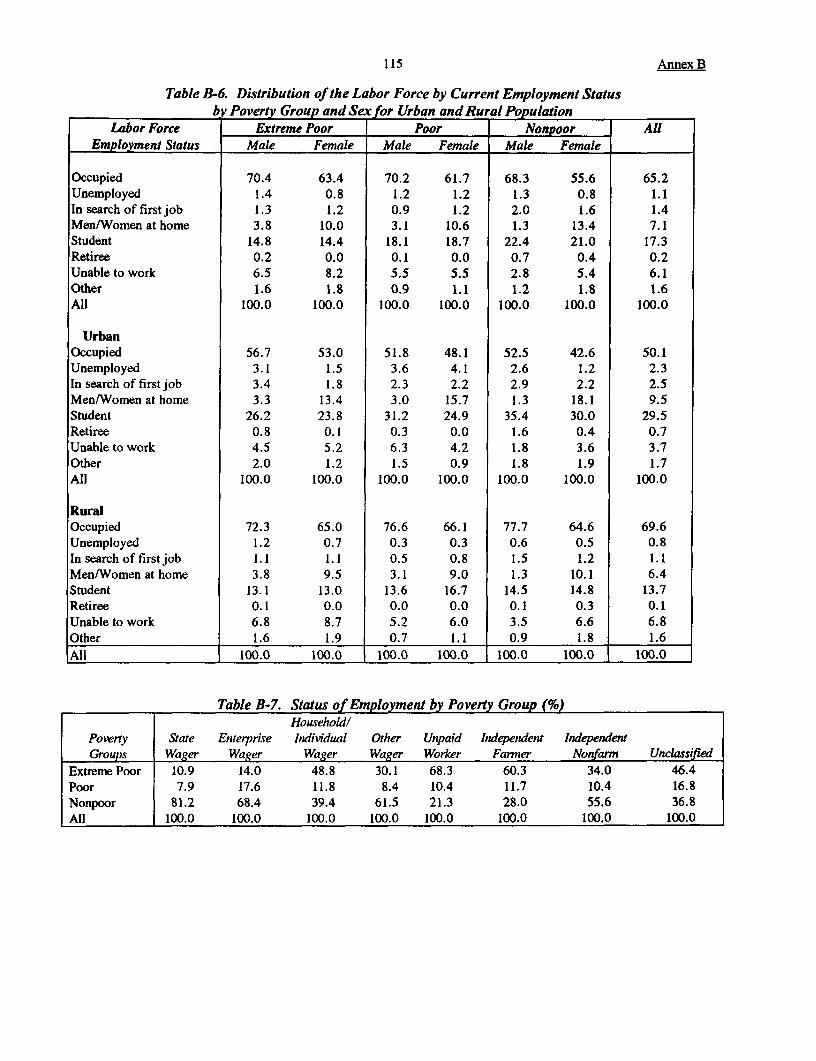
115 Annex B
Table B-6. Distribution of the Labor Force by Current Employment Statusbp Poverty Group and Se for Urban and Rural Population
Labor Force Extreme Poor Poor Nonpoor AllEmployment Status Male Female Male Female Male Female
Occupied 70.4 63.4 70.2 61.7 68.3 55.6 65.2Unemployed 1.4 0.8 1.2 1.2 1.3 0.8 1.1In search of firstjob 1.3 1.2 0.9 1.2 2.0 1.6 1.4Men/Women at home 3.8 10.0 3.1 10.6 1.3 13.4 7.1Student 14.8 14.4 18.1 18.7 22.4 21.0 17.3Retiree 0.2 0.0 0.1 0.0 0.7 0.4 0.2Unable to work 6.5 8.2 5.5 5.5 2.8 5.4 6.1Other 1.6 1.8 0.9 1.1 1.2 1.8 1.6All 100.0 100.0 100.0 100.0 100.0 100.0 100.0
UrbanOccupied 56.7 53.0 51.8 48.1 52.5 42.6 50.1Unemployed 3.1 1.5 3.6 4.1 2.6 1.2 2.3In search of firstjob 3.4 1.8 2.3 2.2 2.9 2.2 2.5Men/Women at home 3.3 13.4 3.0 15.7 1.3 18.1 9.5Student 26.2 23.8 31.2 24.9 35.4 30.0 29.5Retiree 0.8 0.1 0.3 0.0 1.6 0.4 0.7Unable to work 4.5 5.2 6.3 4.2 1.8 3.6 3.7Other 2.0 1.2 1.5 0.9 1.8 1.9 1.7All 100.0 100.0 100.0 100.0 100.0 100.0 100.0
RuralOccupied 72.3 65.0 76.6 66.1 77.7 64.6 69.6Unemployed 1.2 0.7 0.3 0.3 0.6 0.5 0.8In search of first job 1.1 1.1 0.5 0.8 1.5 1.2 1.1Men/Women at home 3.8 9.5 3.1 9.0 1.3 10.1 6.4Student 13.1 13.0 13.6 16.7 14.5 14.8 13.7Retiree 0.1 0.0 0.0 0.0 0.1 0.3 0.1Unable to work 6.8 8.7 5.2 6.0 3.5 6.6 6.8Other 1.6 1.9 0.7 1.1 0.9 1.8 1.6AIII 100.0 100.0 I 100.0 100.0 100.0 100.0 100.0
Table B-7. Status of Employment by Poverty Group (%)Household!
Poverty State Enterprise Ihulividual Other Utpaid Independent IndependentGroups Wager Wager Wager Wager Worker Fanmer Nonfarm Unclassified
Extreme Poor 10.9 14.0 48.8 30.1 68.3 60.3 34.0 46.4Poor 7.9 17.6 11.8 8.4 10.4 11.7 10.4 16.8Nonpoor 81.2 68.4 39.4 61.5 21.3 28.0 55.6 36.8All 100.0 100.0 100.0 100.0 100.0 100.0 100.0 100.0

116 Annex B
Table B-8. Poveily Groups by Staus of Employment (%)Householdl
Poverty .State Enterprise Individual Olher Unpaid Independent IndependentGroups Wager Wager Wager Wqger Worker Farner Nonfann Unclassiied All
ExtrenLe Poor 0.5 1.0 F.0 0.2 43.0 37.2 2.8 0.3 100.0Poor 1.9 6.5 6.3 0.2 42.4 37.7 4.2 0.6 100.0Nonpoor 7.2 9.3 7.8 0.6 32.1 33. 0 9.0 0.5 100.0AlS 2.7 4.1 6.0 0.3 Et4e.r u36.1 4.9 0.4 100.0
Table B-9. Poverty Groups by Socioeconomic Groups (Rural and Urban)Socioecononic / roups sExreme Poor Poor Nonpoor All
Large Fag/ers 40.0 43.0 39.6 40.3Small Farmers 45.7 33.2 31.5 41.0Herders/Fishernen 9.6 10.1 14.0 10.7Small Entrepreneurs 0.6 0.3 1.7 0.8CrgftsmenTraders 1.2 15.1 3.1 1.7High Wage/Professionals 0.0 0.0 1.4 0.3Employees/Workers 0.8 1.3 3.7 2.0Unskilled Workers 0.7 2.6 1.8 1.1Retirees/Handicapped 1.1 2.6 2.5 1.6Non wage/Students 0.4 0.4 0.6 0.5All 100.0 100.0 100.0 100.0.' .'.,. . . . . . '... . . ' . .'.. ' '.'.'.'.'.'.'''.. . . . .
Large Farmers 17.2 I S .8 4.6 . .10.4Smnall Fariners 27.8 17.1 6.7 . .15.3Herders/Fishenmen 13.4 16.0 17.5 . .15.9Small Entrepreneurs 3.1 2.5 4.1 . .3.5Craftsinen/Traders 9.5 10.6 17.9 . .14.1High WagelProfessionals 0.4 2.4 11.7 . .6.6Employees/Workers 9.7 19.6 22.2 . .17.6Unskilled Workers 13.5 10.4 6.8 . .9.6Retirees/Handicapped 2 1.9 1.1 4.8 . .3.7Non wage/Students 2.6 4.5 3.6 . .3.4
All ~~~100.0 100.0 . 100.0 . 100.0

117 Annex B
Table B-10. Gini Index by Province and Socioeconomic Group (Urban and Rural)Urban Rural
Average AverageProvince Gini Expenditure Gini Expenditure
Antananarivo 48.3 428,954 37.6 211,775Fianarantsoa 42.0 337,193 39.3 192,177Toamasina 41.8 422,480 37.8 189,198Mahajanga 40.4 319,582 42.7 254,889Toliara 44.0 331,376 42.2 154,465Antsiranana 40.7 441,152 36.1 220,394
.Socioeconomic GroupsLarge farmers 39.6 254,445 36.8 201,381Small farmers 35.8 217,362 37.6 170,614Herders/Fishermen 35.6 350,012 41.5 223,750Small Entrepreneurs 54.1 525,569 46.0 328,132Craftsmen/Traders 47.3 510,630 64.6 502,805High Wage/Professionals 47.1 966.669 20.8 649,423Employees/Workers 35.8 420,881 30.9 276,387Unskilled workers 38.6 265,895 32.3 217,334Retirees/Handicapped 40.6 430,070 33.4 221,331Non wage/Students 43.6 436,231 38.7 207,370

118 Annex B
Table B-il. Structure of Food Consumption by Product and Region(Propoilion of Expenditure)
Product Antananarivo Fianarantsoa Toamasina Mahajanga Toliara Antsiranana TotalRice-polished 34.0 41.2 41.0 45.7 30.5 45.1 38.6Rice-paddy 1.2 0.5 2.0 2.3 0.8 2.1 1.4Rice flour 0.3 0.0 0.0 0.1 0.0 0.2 0.1Maize 2.2 1.2 1.0 1.9 5.6 0.7 2.0Maize flour 0.1 0.1 0.1 0.1 0.0 0.0 0.1Other cereal/flour 0.1 0.0 0.0 0.0 0.0 0.0 0.0Total - Cereals 37.9 43.0 44.1 50.1 36.9 48.1 42.2Manioc 4.8 17.9 4.8 4.6 13.5 1.5 7.5Yam 0.0 0.1 1.0 0.2 0.4 0.7 0.3Taro 1.1 0.9 1.1 0.2 0.0 0.5 0.8Potatoes 2.0 0.6 0.4 0.4 0.2 0.2 1.0Sweet potatoes 2.2 4.1 0.9 0.5 4.7 0.4 2.2Other tubers 0.1 0.0 0.0 0.0 0.4 0.1 0.1Total-Tubers 10.2 23.6 8.2 5.9 19.2 3.4 11.9Legumes 2.5 1.8 2.1 1.4 1.9 1.1 2.0Peanuts 0.5 0.4 0.5 0.7 0.9 0.1 0.5Other legunies 0.1 0.0 0.4 0.4 0.5 1.3 0.3Total-Legumes 3.1 2.2 3.0 2.5 3.3 2.5 2.8Total-Fruits 2.7 9.3 6.3 3.2 4.7 6.3 4.9Total-Vegetables 5.1 3.0 5.7 4.0 3.8 4.7 4.5Beef 6.0 2.4 4.0 4.3 3.8 6.1 4.7Mutton/Goat 0.0 0.0 0.0 0.0 0.5 0.0 0.1Pork 2.9 1.3 1.4 1.0 0.8 0.8 1.7Meat products 2.0 0.3 0.6 0.6 0.4 0.4 1.0Total - Meat 10.9 4.0 6.0 5.9 5.5 7.3 7.5Chicken 1.6 1.1 2.5 1.4 0.8 4.1 1.8Other poultry 0.3 0.1 0.8 0.8 0.2 0.4 0.4Total-Poultry 1.9 1.2 3.3 2.2 1.0 4.5 2.2Fresh fish 1.6 1.2 3.0 5.1 3.9 3.0 2.6Fresh crustaceans 0.1 0.2 0.6 0.4 0.2 0.2 0.3Other seafood 1.3 0.5 1.1 1.5 0.6 1.6 1.1Total-seafood 3.0 1.9 4.7 7.0 4.7 4.8 4.0Eggs 0.9 0.3 0.7 0.4 0.4 0.5 0.6Milk 1.1 0.5 0.3 0.8 2.1 1.4 1.0Milk products 0.7 0.0 0.2 0.1 0.2 0.1 0.3Honey,other 0.1 0.0 0.2 0.2 0.2 0.2 0.1Total - animal prod 2.8 0.8 1.4 1.5 2.9 2.2 2.0Oils 2.2 1.1 2.7 2.3 2.1 2.3 2.1Butter/margarine 0.7 0.1 0.2 0.1 0.2 0.1 0.3Other fats 0.0 0.1 0.0 0.0 0.2 0.0 0.0Totals-oils & fats 2.9 1.3 2.9 2.4 2.5 2.4 2.4Sugar & confections 3.3 2.3 2.8 3.3 2.8 2.4 2.9Tea/coffee/cocoa 1.8 1.2 1.5 1.8 1.5 0.3 1.5Baked Goods 3.8 0.9 1.6 2.1 2.1 2.5 2.5Conserves 0.4 0.1 0.2 0.2 0.2 0.5 0.3Prepared foods 1.9 0.3 0.8 0.5 1.1 1.0 1.1Salt/condiments 0.8 1.2 1.7 1.2 0.7 1.1 1.1Non-alcoholic 1.0 0.2 0.5 0.7 1.2 0.6 0.7beveragesAlcoholic beverages 1.4 0.9 1.9 1.9 1.8 1.5 1.5Tobacco 5.1 2.6 3.4 3.5 4.2 3.8 4.0
Total 100 100 100 100 100 100 100

119 Annex B
Table B-12. Expenditure Pattern by ProvincesExpenditure Antananarivo Fianarantsoa Toamasina Mahajanga Toliara Antsiranana AllFood 68.5 79.0 72.4 71.0 57.9 67.1 69.9Clothing 6.9 6.2 8.1 8.7 10.3 9.5 7.9Transport 2.4 0.6 1.3 1.3 1.1 1.9 1.5Health 2.0 1.1 2.0 2.3 6.2 3.1 2.5Education 1.7 0.8 0.8 1.0 0.7 1.2 1.1Leisure 1.1 0.5 1.4 0.9 0.7 1.7 1.0Housing 4.7 2.8 3.1 4.4 3.8 4.2 3.9Utilities 2.4 0.5 0.9 1.1 0.6 1.2 1.3Other 10.3 8.5 10.0 9.3 18.7 10.1 10.9Total 100.0 100.0 100.0 100.0 100.0 100.0 100.0
Table B-13. Expenditure Patterns by Poverty GroupExremely
Expenditure poor Poor Nonpoor AllFood 73.5 71.1 64.3 69.9Clothing 8.2 7.6 7.6 7.9Transport 0.7 1.3 2.7 1.5Health 2.2 2.6 3.0 2.5Education 1.0 1.0 1.4 1.1Leisure 0.4 0.7 1.9 1.0Housing 3.3 4.0 4.6 3.9Utilities 0.5 0.9 2.5 1.3Other 10.2 10.8 12.0 10.9Total 100.0 100.0 100.0 100.0
Table B-14. Expenditure Patterns by Quintiles of ExpenditureEJxpenditure Quintiles
Expenditure Poorest 2 3 4 Richest AllFood 73.2 72.7 74.4 70.8 61.8 69.9Clothing 9.1 8.0 7.7 7.2 7.8 7.9Transport 0.4 0.8 0.8 1.6 3.1 1.5Health 1.9 2.5 2.1 2.6 3.2 2.5Education 0.9 1.1 0.8 1.1 1.5 1.1Leisure 0.2 0.5 0.5 1.0 2.3 1.0Housing 3.7 3.3 3.0 4.0 4.9 3.9Utilities 0.2 0.4 0.8 1.2 3.0 1.3Other 10.4 10.7 9.9 10.5 12.4 10.9Total 100.0 100.0 100.0 100.0 100.0 100.0

120 Annex B
Table B-15. Expenditure Patterns by Socioeconomic GroupsSocioeconomic Groups Food Clothing Transport Health Educauion Leisure Housing Utilities Other Total
LArge farmers 70.4 9.3 1.2 3.0 0.8 1.0 2.7 0.6 11.0 100.0Small farnmrs 74.4 7.3 0.8 2.3 0.6 0.4 3.0 0.5 10.7 100.0Horders/Fishermen 68.4 8.1 1.8 2.4 1.1 1.7 3.8 1.5 11.2 100.0Small entrepreneurs 64.6 5.7 2.9 1.4 1.6 1.1 6.0 3.0 13.7 100.0Craftsmenfraders 60.2 7.1 3.6 2.1 2.2 1.7 7.1 3.9 12.1 100.0High wageIProfessionals 48.7 7.9 6.8 2.1 4.8 3.5 7.3 6.0 12.9 100.0Employees/Workers 58.9 7.6 3.5 2.8 2.8 2.1 7.1 3.8 11.4 100.0Unskilled workers 65.5 5.7 2.1 1.7 2.1 1.2 7.8 3.7 10.2 100.0Retiru/slHandicapped 66.9 5.9 2.4 3.4 1.4 0.7 7.6 1.6 10.1 100.0Non wage/Students 64.3 6.7 1.9 2.7 3.4 1.6 7.8 3.2 8.4 100.0AU 69.9 7.9 1.5 2.5 1.1 1.0 3.9 1.3 10.9 100.0
Table B-16. Distribution of Head o Households by Education Level and Poverty GroupPoverty Group/ Extreme Poor Poor r Nonpoor All
Education Level No. % No. % No. % No. %
Did not go to School 509,799 39.2 88,705 30.9 180,155 19.7 778,659 31.1
Completed Primary12gradetoT2 356,916 27.4 71,088 24.8 175,267 19.2 603,271 24.1
T3 to T5 333,923 25.7 76,457 26.7 238,625 26.1 649,005 25.9
Completed SecondaryT6toT9 81,688 6.3 37,689 13.2 169,786 18.6 289,161 11.6
TIO to T12 16,407 1.3 10,440 3.6 96,865 10.6 123,712 5.0
TertiaryTeacher Training 0 0.0 1,145 0.4 3,591 0.4 4,736 0.2Special School 196 0.0 193 0.1 5,512 0.6 5,705 0.2
University 1,488 0.1 894 0.3 44,640 4.9 47,022 1.9
All 1,300,221 100.0 286,611 100.0 914,439 100.0 2,501,271 100.0
Table B-17. Distribution of Head of Households by Level of Education and Poverty Group(for those who attended school)
Primary SecondaryCompleted I Completed | Tertiary All
Poverty Groups Level12th- 72 T3-753 T6-79 Ti0-TI2 f School University
I Sup Extreme Poor 45.2 42.2 10.3 2.1 0.0 0.2 790,422Poor 35.9 38.6 19.0 5.3 0.7 0.4 197,905Nonpoor 23.9 32.5 23.1 13.2 1.2 6.1 734,284

121 Annex B
Table B-18. Distribution of Youngsters 7-18 years old by Occupation Status and Poverty GroupIn Search of Unable to
Poverty Group Occupied Unemployed First Job At Home Student Work OthersExtreme Poor 41.9 1.7 2.4 8.7 32.2 10.4 2.7Poor 36.4 0.2 1.9 6.3 46.9 7.4 0.9Nonpoor 24.1 0.8 2.5 4.9 60.2 4.9 2.6All 36.8 1.3 2.4 7.5 40.9 8.7 2.5
MaleExtreme Poor 45.7 1.9 2.4 6.4 31.1 9.7 2.7Poor 40.4 0.1 0.9 5.3 43.2 9.1 0.9Nonpoor 25.9 0.7 2.9 2.2 62.5 4.0 1.8All 40.2 1.4 2.4 5.3 40.1 8.3 2.3
FemaleExtreme Poor 37.9 1.5 2.3 11.1 33.3 11.1 2.7Poor 31.9 0.3 3.0 7.3 50.9 5.6 1.0Nonpoor 22.4 0.8 2.1 2.2 58.1 5.7 3.3All 33.2 1.2 2.3 9.8 41.7 9.1 2.7
Table B-19. Percentage of Youngsters 7-18 Years of Age Not Attending School by Poverty GroupPoverty Group 7-12 Years 13-18 Years
________________ All Male Female All Male FemaleExtreme Poor 51.6 54.0 49.1 78.8 77.5 80.2Poor 31.6 37.9 24.9 70.3 70.1 70.6Nonpoor 25.1 24.5 25.6 51.0 47.8 54.2All 43.3 45.6 40.8 70.2 68.7 71.8
Table B-20. Percentage of Youngsters 7-18 Years of Age Not Attending School by Poverty_Group and Place of Reside ce
I______________ 1 7-12 Years 13-18 YearsMajor Other Major Other
Poverty Group Capital Cities Urban Rural Capital Cities Urban RuralTotal
Extreme Poor 32.8 28.6 31.6 54.7 72.8 59.6 55.0 81.7Poor 8.6 7.4 30.7 37.7 50.7 41.5 68.0 76.0Nonpoor 7.8 9.6 9.9 35.5 27.8 23.3 33.8 69.1All 17.0 15.8 24.1 49.6 44.6 38.0 48.5 78.5
MaleExtreme Poor 22.3 25.9 35.1 57.5 73.5 57.0 59.8 79.8Poor 12.1 4.8 47.8 45.3 48.5 39.1 63.5 76.7Nonpoor 6.7 6.4 10.7 35.9 20.2 23.3 28.0 66.0All 13.0 12.1 29.5 52.8 40.9 38.7 47.1 76.7
FemaleExtreme Poor 42.8 30.9 27.9 51.5 72.2 63.3 51.5 83.6Poor 1.9 10.5 7.5 30.5 54.8 42.8 72.8 75.2Nonpoor 8.8 13.6 9.2 35.1 34.6 23.2 39.4 72.2All 21.2 19.8 18.6 46.3 48.3 37.3 49.8 80.4

122 Annex B
Table B-21. Distribution of Households by Poverty Groups and Source of Energy
Source of Energy Extreme Poor Poor Nonpoor AllElectricity 1.7 5.4 20.3 8.9Generator 0.5 0.0 0.3 0.4Oil Lamp 90.8 88.3 69.8 82.9Candles 0.6 4.1 6.7 3.3Other 0.3 2.1 2.9 4.5All 100.0 100.0 100.0 100.0
Table B-22. Distribution of Households by Poverty Group and Type of Fuel
Type of Fuel Extreme Poor Poor Nonpoor AllWood 94.4 85.2 68.3 83.8Charcoal 5.0 13.4 29.2 14.8Gas 0.1 0.2 0.8 0.4Electricity 0.1 0.5 0.9 0.5Oil 0.0 0.0 0.3 0.1Other 0.4 0.7 0.5 0.4All 100.0 100.0 100.0 100.0
Table B-23. Distrib ution of Households by Poverty Group and Source of Drinking Water
Source of Driniking Water Extreme Poor Poor Nonpoor AllIndoor Plumbing 0.0 0.2 3.0 1.0Indoor Tap 0.3 1.2 5.8 2.4Water Seller 0.2 0.4 0.7 0.4Rain Water 0.2 0.0 0.0 0.1Other Household 0.1 0.2 0.5 0.3Outdoor Tap 0.9 1.7 3.6 2.0Public Tap 7.8 11.9 20.5 12.9Equipped Well 0.8 1.3 2.8 1.6Well 18.0 25.1 21.3 20.0River, Lake, Spring, 70.8 57.5 41.4 58.5PondOther 0.9 0.6 0.6 0.8All 100.0 100.0 100.0 100.0
Table B-24. Distributon of Households by Poverty Group and Type of Garbage DisposalType of Garbage Disposal Extreme Poor Poor Nonpoor AllPublic Refuse Dump 1.1 2.3 7.6 3.6Dump by Household 68.3 61.9 59.0 64.2Burnt by Household 19.5 22.1 19.6 19.8Buried by Household 11.0 13.7 13.9 12.4All 100.0 100.0 100.0 100.0

123 Annex B
Table B-25. Distribution of Households by Pove)it Group and Type of Sanitation7ype of Sanitation Extreme Poor Poor Nonpoor All
Flushed Toilet 0.2 0.6 4.6 1.8Latrines 23.5 35.1 42.8 31.9Tub 1.1 1.2 1.4 1.2None 75.3 63.1 50.2 65.1All 100.0 100.0 100.0 100.0
Table B-26. Distribution of All Farmers by Area Cultivated and Poverty GroupArea Cultivated (hectares)
Poverty Group <.5 .5-.99 1.0-1.49 > 1.5 TotalN % N % N % N X N %
Extreme Poor 311,057 25.6 229,646 18.9 236,722 19.5 436,978 36.0 1,214,403 100.0Poor 60,318 25.0 38,885 16.1 46,555 19.3 95,139 39.5 240,897 100.0Nonpoor 152,110 24.2 104,525 16.6 106,932 17.0 265,958 42.2 629,525 100.0All 523,485 25.1 373,056 17.9 390,209 18.7 798,075 38.3 2,084,825 100.0

124 Annex B
Table B-27. Distribution of Small Farmers by Area Cultivated,Poverty Group and Province
(hectares)Province/Poverty (.05 .05-.49 .5-1.0 Total
Group % % % N %AntananarivoExtreme Poor 7.6 53.3 39.1 191,045 100.0Poor 12.4 54.6 33.0 39,609 100.0Nonpoor 16.3 57.9 25.8 79,903 100.0All 10.4 54.7 34.9 310,557 100.0
FianarantsoaExtreme Poor 10.2 67.4 22.3 158,542 100.0Poor 13.0 52.1 34.9 28,058 100.0Nonpoor 9.0 60.4 30.6 66,346 100.0All 10.2 63.9 25.9 252,791 100.0
ToamasinaExtreme Poor 5.6 49.2 45.2 57,163 100.0Poor 1.9 74.9 23.2 10,313 100.0Nonpoor 16.7 47.5 35.8 26,638 100.0All 8.3 51.5 40.2 94,114 100.0
MahajangaExtreme Poor 11.1 29.9 59.0 41,467 100.0Poor 0.0 45.6 54.4 10,678 100.0Nonpoor 10.7 25.9 64.4 35,672 100.0All 9.6 29.8 60.6 87,817 100.0
ToliaraExtreme Poor 3.1 17.3 79.6 68,537 100.0Poor 33.0 20.7 46.3 3,868 100.0Nonpoor 0.0 17.2 82.8 19,373 100.0All 3.7 17.4 78.9 91,778 100.0
AntsirananaExtreme Poor 4.7 33.9 61.4 23,949 100.0Poor 6.4 3.2 40.4 6,677 100.0Nonpoor 19.8 27.7 52.5 28,703 100.0All 12.2 27.5 60.3 59,329 100.0
Total 9.5 48.9 41.6 896,541 100.0

125 Annex B
Table B-28. Distribution of Small Fanners by Area Cultivated, Poverty Group and ResidenceResidencel Area Cultivated (hectares)
Poverny Groups <.05 .05-.49 .5-1.0 Total% % % N - %
UrbanExtreme Poor 18.3 57.6 24.1 55,115 100.0Poor 19.6 49.7 30.7 17,298 100.0Nonpoor 24.3 56.9 18.8 59,137 100.0Sub-Total 21.2 56.2 22.6 131,550 100.0RuralExtreme Poor 6.5 48.9 44.6 485,583 100.0Poor 8.7 50.3 41.0 81,905 100.0Nonpoor 9.4 43.3 47.3 197,498 100.0Sub-Total 7.5 47.6 44.9 764,991 100.0Total 9.5 48.9 41.6 896,541 100.0
Table B-29. Distribution of Farmers by Poverty Group and Status of LandOwnership
Land Owner Not Owning LandPoverty Group Deeds No Deeds
N % N % N %
Small FarmersExtreme Poor 137,458 64.9 219,446 61.4 183,519 56.1Poor 26,293 12.4 34,902 9.8 38,008 11.6Nonpoor 48,054 22.7 102,733 28.8 105,848 32.3All 211,805 100.0 357,081 100.0 327,375 100.0
Mediumn FarrnersExtreme Poor 105,331 59.4 256,601 62.1 134,401 59.3Poor 15,030 8.5 50,828 12.3 26,466 11.7Nonpoor 57,003 32.1 105,839 25.6 65,864 29.0All 177,364 100.0 413,268 100.0 226,731 100.0
Large FarmersExtreme Poor 39,784 44.6 88,701 50.3 48,637 46.4Poor 7,733 8.7 25,976 14.8 15,661 14.9Nonpoor 41,700 46.7 61,573 34.9 40,647 38.7All 89,217 100.0 176,250 100.0 104,945 100.0
All FarmersExtreme Poor 282,573 59.1 564,768 59.7 366,557 55.6Poor 49,056 10.2 111,705 11.8 80,135 12.2Nonpoor 146,757 30.7 270,145 28.5 212,359 32.2All 478,386 100.0 946,618 100.0 659,051 100.0

126 Annex B
Table B-30. Distribution of All Farmers by Poverty Group and Type of LandownershipPurchased Rented Sharecropping Nofees Communal Inheritance Households Total
Small HoldingExtreme Poor 5.7 2.6 4.9 21.8 8.7 56.3 540,703 100.0Poor 6.3 5.0 3.4 25.4 7.9 52.0 99,203 100.0Nonpoor 7.5 6.3 7.6 22.4 12.5 43.8 256,635 100.0All 6.3 3.9 5.5 22.4 9.7 52.2 896,541 100.0Medium HoldingExtreme Poor 8.5 4.0 4.9 19.8 9.2 53.4 496,333 100.0Poor 11.2 4.2 2.3 15.8 17.2 49.3 92,324 100.0Nonpoor 9.1 5.2 3.2 19.1 11.6 51.8 228,970 100.0All 9.0 4.3 4.1 19.2 10.8 52.6 817,627 100.0Large HoldingExtreme Poor 10.3 1.8 4.5 15.9 9.9 57.7 177,367 100.0Poor 8.7 7.1 4.0 20.4 15.7 44.1 49,370 100.0Nonpoor 13.1 5.5 2.1 17.9 13.7 47.7 143,920 100.0All 11.2 3.9 3.5 17.3 12.1 52.0 370,657 100.0
All FarmersExtreme Poor 7.5 3.0 4.8 20.1 9.1 55.4 1,214,403 100.0Poor 8.7 5.1 3.1 20.7 13.0 49.4 240,897 100.0Nonpoor 9.4 5.7 4.8 20.2 12.4 47.6 629,545 100.0All 8.2 4.1 4.6 20.2 10.5 52.3 2,084,825 100.0
Table B-31. Distribution of Farmers by Poverty Group and Type of LandownershipOwned Rent-share Conlinunal Households Total
Small HoldingExtreme Poor 62.1 7.4 30.5 540.703 100.0Poor 58.3 8.4 33.3 99,203 100.0Nonpoor 51.3 13.9 34.8 256,635 100.0All 58.6 9.4 32.0 896,541 100.0Medium HoldingExtreme Poor 62.1 8.9 29.0 496,333 100.0Poor 60.5 6.5 33.0 92,324 100.0Nonpoor 60.9 8.4 30.7 228.970 100.0All 61.6 8.4 30.0 817,627 100.0Large HoldingExtreme Poor 67.9 6.3 25.8 177.367 100.0Poor 52.8 11.1 36.1 49.370 100.0Nonpoor 60.8 7.6 31.6 143.920 100.0All 63.2 7.4 29.4 370,657 100.0

127 Annex B
Table B-32. Distribution of Small Farmers by Residence, Poverty Groupand Status of Land Ownership
Residence/ Land Owners with Not Owning LandPoverty Group Deeds No Deeds
N % N % N %Urban
Extreme Poor 12,364 36.1 13,978 47.0 28,773 42.6Poor 4,366 12.8 3,081 10.3 9,851 14.6Nonpoor 17,479 51.1 12,706 42.7 28,952 42.8
Rural
Extreme Poor 125,094 70.4 205,488 62.8 154,746 59.6Poor 21,927 12.4 31,821 9.7 28.157 10.8Nonpoor 30,575 17.2 90.027 27.5 76,896 29.6

128 Annex B
Table B-33. Distribution of Small Farmers by Province, Poverty Groupand Status of Land Ownership
Land Owner Not Owning LandProvince Deeds No Deeds
AntananarivoExtreme Poor 65.1 59.2 60.0Poor 13.0 12.0 13.2Nonpoor 21.9 28.8 26.8N 103,558 90,263 116,446FianarantsoaExtreme Poor 71.0 63.0 53.4Poor 8.6 10.5 14.7Nonpoor 20.4 26.5 31.9N 68,805 118,369 65,772ToainasinaExtreme Poor 58.7 64.1 55.6Poor 21.8 4.5 17.7Nonpoor 19.5 31.5 26.7N 13,456 52,110 28,548MahajangaExtreme Poor 26.1 53.5 43.5Poor 12.2 11.5 13.0Nonpoor 61.7 35.0 43.5N 6,955 44,737 36,125ToliaraExtreme Poor 91.7 72.7 72.5Poor 3.3 5.2 3.7Nonpoor 5.0 22.0 23.8N 9,989 34,520 47,269AntsirananaExtreme Poor 25.1 53.0 38.0Poor 31.5 13.6 4.6Nonpoor 43.4 33.4 57.4N 9,012 17,102 33,215MadagascarExtreme Poor 64.9 61.5 56.1Poor 12.4 9.7 11.6Nonpoor 22.7 28.8 32.3N 211,805 357,081 327,375

129 Annex B
Table B-34. Distribution of All Farmers b Primary Type of Crops Grown and Poverty Group for Each ProvinceProvince/Poverty
Group Rice Food Crops Industrial Crops AllN Province All Crops N Province All Crops N Province All Crops N %
AntananarivoExtreme poor 141,232 56.8 46.9 159,743 63.0 53.1 0 0.0 0.0 300,975 100.0Poor 36,235 14.6 59.4 24,767 9.8 40.6 0 0.0 0.0 61,002 100.0Nonpoor 71,339 28.7 50.3 69,121 27.3 48.8 1,254 100.0 0.9 141,714 100.0All 248,806 100.0 49.4 253,631 100.0 50.4 1,254 100.0 0.2 503,691 100.0FianarantsoaExtreme poor 150,678 60.2 60.5 75,928 52.3 30.5 22,331 64.2 9.0 248,937 100.0Poor 31,392 12.5 62.1 19,162 13.2 37.9 0 0.0 0.0 50,554 100.0Nonpoor 68,260 27.3 52.2 50,116 34.5 38.3 12,450 35.8 9.5 130,826 100.0All 250,330 100.0 58.2 145,206 100.0 33.7 34,781 100.0 8.1 430,317 100.0ToamnasinaExtreme poor 167,692 66.5 71.5 43,834 49.9 18.7 23,093 79.6 9.8 234,619 100.0Poor 20,688 8.2 61.0 11,807 13.4 34.8 1,444 5.0 4.3 33,939 100.0Nonpoor 63,809 25.3 63.4 32,282 36.7 32.1 4,485 15.5 4.5 100,576 100.0All 252,189 100.0 68.3 87,923 100.0 23.8 29,022 100.0 7.9 369,134 100.0MahajangaExtreme poor 83,617 52.7 63.3 35,337 36.3 26.8 13,139 77.1 9.9 132,093 100.0Poor 22,982 14.5 59.3 14,282 14.7 36.8 1,497 8.8 3.9 38,761 100.0Nonpoor 52,012 32.8 50.9 47,739 49.0 46.7 2,409 14.1 2.4 102,160 100.0All 158,611 100.0 58.1 97,358 100.0 35.7 17,045 100.0 6.2 273,014 100.0ToliaraExtreme poor 67,086 60.3 32.3 140,757 73.0 67.7 0 0.0 0.0 207,843 100.0Poor 13,033 11.7 48.3 13,955 7.2 51.7 0 0.0 0.0 26,988 100.0Nonpoor 31,107 28.0 44.3 38,205 19.8 54.4 923 100.0 1.3 70,235 100.0All 111,226 100.0 36.5 192,917 100.0 63.2 923 100.0 0.3 305,066 100.0AntsirananaExtreme poor 36,907 38.8 41.0 30,584 49.9 34.0 22,445 47.6 25.0 89,936 100.0Poor 15,145 15.9 51.1 6,132 10.0 20.7 8,375 17.8 28.2 29,652 100.0Nonpoor 43,114 45.3 51.3 24,557 40.1 29.2 16,343 34.7 19.5 84,014 100.0All 95,166 100.0 46.7 61,273 100.0 30.1 47,163 100.0 23.2 203,602 100.0
Total extreme poor 647,212 58.0 53.3 486,183 58.0 40.0 81,008 62.2 6.7 1,214,403 100.0Total Poor 139,475 12.5 57.9 90,105 10.7 37.4 11,317 8.7 4.7 240,897 100.0Total Nonpoor 329,641 29.5 52.4 262,020 31.3 41.6 37,864 29.1 6.0 629,525 100.0Total All 1,116,328 100.0 53.5 838,308 100.0 40.2 130,189 100.0 6.2 2,084,825 100.0

130 Annex B
Table B-35. Distribution of Small Farmers by Primary Type of Crops Grownand Poverty upsfor EaCh Province
Province/PovertyGroup Rice Food Crops Industrial Crops All
% % % N | %AntananarivoExtrenme Poor 44.2 55.8 0.0 191,045 100.0Poor 52.5 47.5 0.0 39,609 100.0Nonpoor 49.7 50.3 0.0 79,903 79,903All 46.7 53.3 0.0 310,557 100.0FianarantsoaExtreine Poor 61.8 31.3 6.9 158,542 100.0Poor 60.4 39.6 0.0 28,058 100.0Nonpoor 56.7 36.8 6.5 66,346 100.0All 60.3 33.7 6.0 252,946 100.0ToamasinaExtreme Poor 86.9 11.3 1.8 55,163 100.0Poor 68.6 31.4 0.0 10,313 100.0Nonpoor 68.0 28.6 3.4 26,638 100.0All 79.5 18.4 2.1 94,114 100.0MahajangaExtremne Poor 68.8 22.4 8.9 41,467 100.0Poor 73.1 19.6 7.3 10,678 100.0Nonpoor 53.5 46.5 0.0 35,672 100.0All 63.1 31.8 5.1 87,817 100.0ToliaraExtremne Poor 20.4 79.6 0.0 68,537 100.0Poor 74.4 25.6 0.0 3,868 100.0Nonpoor 50.5 49.5 0.0 19,373 100.0All 29.0 71.0 0.0 91,778 100.0AntsirananaExtrell1e Poor 40.9 46.3 12.8 23,949 100.0Poor 49.8 40.6 9.6 6,677 100.0NoIIpoor 47.7 34.2 17.6 28,703 100.0All 45.2 36.6 18.2 59,329 100.0
TotalExtrel1te Poor 52.6 43.9 3.5 540,703 100.0Poor 59.3 37.2 3.5 99,203 100.0Nonpoor 53.8 42.2 4.0 256,635 100.0All 53.7 42.7 3.6 896,541 100.0

131 Annex B
Table B-36. Distribution of Medium Farmners by Type of Crops Grownand Poverty Group for each Province
Food IndustrialProvince/Poverty Group Rice Crops Crops All
% % % N %
AntananarivoExtreme poor 51.2 48.8 0.0 88,623 100.0Poor 70.7 29.3 0.0 13,993 100.0Nonpoor 51.4 48.6 0.0 30,793 100.0All 53.3 46.7 0.0 133,409 100.0FianarantsoaExtreme poor 58.6 29.3 12.1 76,350 100.0Poor 52.1 37.9 0.0 15,137 100.0Nonpoor 50.9 37.1 12.0 43,518 100.0All 56.5 32.8 10.7 135,005 100.0ToalnasinaExtreme poor 72.9 22.4 4.7 98,748 100.0Poor 55.8 44.2 0.0 14,287 100.0Nonpoor 65.7 33.9 0.4 32,937 100.0All 69.6 27.2 3.3 145,972 100.0MahajangaExtreme poor 62.2 28.8 9.0 74,434 100.0Poor 47.2 48.9 3.9 18,350 100.0Nonpoor 52.0 48.0 0.0 48,102 100.0All 56.7 38.0 5.3 140,885 100.0ToliaraExtreme poor 39.5 50.5 0.0 114,337 100.0Poor 43.4 56.6 0.0 16,307 100.0Nonpoor 41.6 57.8 0.6 36,909 100.0All 40.3 59.5 0.2 167,553 100.0AntsirananaExtreme poor 43.9 31.5 24.6 43,841 100.0Poor 53.8 15.6 30.6 14,250 100.0Nonpoor 66.8 25.7 7.5 36,711 100.0All 54.2 26.9 18.9 94,803 100.0
Total 54.8 39.7 5.5 817,627 100.0

132 Annex B
Table B-37. Distribution of Large Fanners by Type of Crops Grownand Poverty Group for each Province
Rice Food Industrial AllProvince/Poverty Group Crop Crop
N %AntananarivoExtreme poor 53.3 46.7 0.0 21,307 100.0Poor 75.3 24.7 0.0 7,400 100.0Nonpoor 51.0 45.0 4.0 31,018 100.0All 54.8 43.1 2.1 59,725 100.0FianarantsoaExtreme poor 57.0 28.1 14.9 14,045 100.0Poor 68.4 31.6 0.0 7,359 100.0Nonpoor 40.5 45.5 14.0 20,962 100.0All 50.8 37.3 11.9 42,366 100.0ToamasinaExtreme poor 58.5 19.4 22.1 78,708 100.0Poor 60.5 24.0 15.5 9,339 100.0Nonpoor 58.7 32.9 8.4 41,001 100.0All 58.7 24.0 17.3 129,048 100.0MahajangaExtreme poor 54.6 28.4 17.0 16,192 100.0Poor 66.9 33.1 0.0 9,734 100.0Nonpoor 43.2 43.7 13.1 18,386 100.0All 52.6 35.8 11.6 44,312 100.0ToliaraExtreme poor 31.9 68.1 0.0 24,969 100.0Poor 45.3 54.7 0.0 6,813 100.0Nonpoor 42.7 52.2 5.1 13,953 100.0All 37.2 61.3 1.5 45,735 100.0AntsirananaExtreme poor 35.6 25.6 38.8 22,146 100.0Poor 47.5 37.4 15.1 8,725 100.0Nonpoor 26.4 27.8 45.8 18,600 100.0All 34.3 28.5 37.2 49,471 100.0
Total 50.5 35.2 14.3 370,657 100.0
Table B-38. Distribution of Head of Households by Sex and Poverty GroupPoverty Group Male Femnale All Number of Households
Extreme Poor 80.4 19.6 100.0 1,300,221Poor 81.8 18.2 100.0 286,611Nonpoor 81.6 18.4 100.0 914,439All 81.0 19.0 100.0 2,501,271

133 Annex B
Table B-39. Percent Distribution of Women Head of Householdsb Current Marital Status and Poveily Group
Marital Status Extrettme Poor Poor Non Poor AllLegally Married 0.5 0.4 1.9 1.0Customary Married 2.8 0.0 3.7 2.8Living Together 2.0 1.1 3.3 2.3Divorced 51.0 49.2 46.5 49.2Widow 39.2 45.5 33.3 37.8Never Married 4.6 3.9 11.4 6.9
All 100.0 100.0 100.0 100.0
Table B-40. Distribution of Heads of Households by Poverty Group and ProvincePovertv Group Antananarivo Fianaranisoa Toanmasina Alahajanga Toliara Antsiranana Total
FemaleExtrenme Poor 45.5 59.4 53.4 52.2 73.1 40.7 254,410Poor 10.6 14.2 12.6 8.7 6.3 13.9 52,227Nonpoor 43.9 26.4 34.0 39.1 20.6 45.4 168,009All 10(.0 100.0 100.0 100.0 100.0 100.0 474,646
MaleExtreiiePoor 47.1 54.2 60.7 41.2 63.1 40.5 1,045,810Poor 12.1 11.2 8.4 15.8 9.3 13.9 234,384Nonpoor 40.8 34.6 30.9 43.0 27.6 45.6 746,431All 1((,0 100.0 100.0 100.0 100.0 100.0 2,026,624
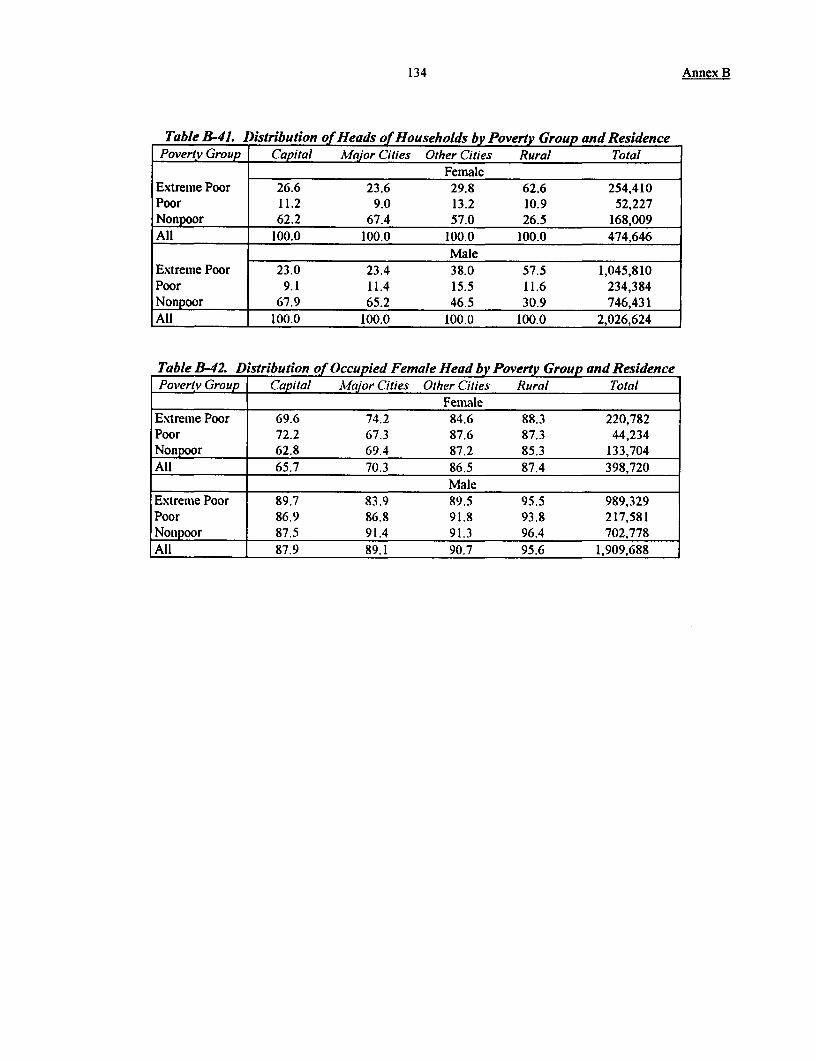
134 Annex B
Table B-41. Distribution of Heads of Households by Poverty Group and ResidencePovertv Group Capital Major Cities Other Cities Rural Total
FemaleExtreme Poor 26.6 23.6 29.8 62.6 254,410Poor 11.2 9.0 13.2 10.9 52,227Nonpoor 62.2 67.4 57.0 26.5 168,009All 100.0 100.0 100.0 100.0 474,646
MaleExtreme Poor 23.0 23.4 38.0 57.5 1,045,810Poor 9.1 11.4 15.5 11.6 234,384Nonpoor 67.9 65.2 46.5 30.9 746,431All 100.0 100.0 100.0 100.0 2,026,624
Table B-42. Distribution of Occupied Female Head by Poverty Group and ResidencePovertv Group Capital Major Cities Other Cities Rural Total
l ____________ _ lFemaleExtreme Poor 69.6 74.2 84.6 88.3 220,782Poor 72.2 67.3 87.6 87.3 44,234Nonpoor 62.8 69.4 87.2 85.3 133,704All 65.7 70.3 86.5 87.4 398,720
MaleExtreme Poor 89.7 83.9 89.5 95.5 989,329Poor 86.9 86.8 91.8 93.8 217,581Nonpoor 87.5 91.4 91.3 96.4 702,778All 87.9 89.1 90.7 95.6 1,909,688

135 Annex B
Table B-43. Distribution of Heads of Households by Occupation Status and Poverty GroupLooking Unable to
Poverty Group Occupied Unemiployed for Job At Homne Student Retiree lWork Other AllFEMALEExtreme Poor 86.8 0.3 0.2 5.8 0.2 0.1 5.4 1.2 100.0Poor 84.7 1.1 0.0 2.3 0.0 0.0 9.4 2.6 100.0Nonpoor 79.6 1.6 1.7 8.1 0.4 1.2 5.8 1.6 100.0All 84.0 0.8 0.7 6.2 0.3 0.5 6.0 1.5 100.0MALEExtreme Poor 94.8 0.3 0.0 1.2 0.1 0.4 2.4 0.7 100.0Poor 92.8 0.8 0.1 1.1 0.2 0.2 3.7 1.0 100.0Nonpoor 94.1 0.8 0.1 0.8 0.5 1.3 2.0 0.3 100.0All 94.3 0.6 0.1 1.0 0.2 0.7 2.4 0.6 100.0
Table B-44. Distribution of Heads of Households b.r Poverty Groups and Socioeconomic GroupsAfedium/
Poverty Large Small Herders; Small Craftsmen High lWage' Employees' Unskilled Retirees/ Non lVage/Group Farmers Farmers Fishennen Entrepreneurs Traders Professionals Workers IWorkers Handicapped Students All
FEMALEExtreme Poor 58.6 67.9 49.1 40.4 29.8 7.5 26.1 37.9 40.3 26.9 254,410Poor 11.0 11.4 8.4 16.2 8.6 5.8 6.1 19.1 11.6 8.5 52,227Nonpoor 30.4 20.7 42.4 43.4 61.6 86.7 67.8 43.0 48.1 67.0 168,009All 100.0 100.0 100.0 100.0 100.0 100.0 100.0 100.0 100.0 100.0 474,646
MALEExtreme Poor 56.6 62.8 44.4 24.7 20.7 1.7 17.7 34.0 39.4 40.0 1,045,810Poor 13.0 10.5 10.7 4.8 11.6 2.6 14.4 16.0 12.5 15.2 234,3841 Nonpoor 30.4 26.7 44.9 70.5 67.7 95.7 67.9 50.0 48.1 44.8 746,431All 100.0 100.0 100.0 100.0 100.0 100.0 100.0 100.0 100.0 100.0 2,026,624

136 Annex B
Table B-45. Distribution of Heads of Household by Level of Education and Poverty GroupDid not Go Lou! Upper LowP LUpper
Povertv Group to School Primnarv Primary Secondary Secondarv Other Prof Ulfiversity Total AllFEMALEExtreme Poor 58.5 23.0 13.6 4.0 0.3 0.0 0.5 100.0 254.410Poor 43.0 25.9 22.1 8.3 0.6 0.0 0.0 100.0 52,227Nonpoor 28.1 24.4 21.2 17.2 6.6 0.2 2.3 100.0 168.009All 46.0 23.9 17.2 9.2 2.6 0.1 1.1 100.0 474.646MALEExtreme Poor 34.5 28.5 28.6 6.8 1.5 0.0 0.0 100.0 1,045,810Poor 28.3 24.5 27.7 14.2 4.3 0.6 0.4 100.0 234,384Nonpoor 17.8 18.0 27.2 18.9 11.5 1.2 5.4 100.0 746,431All 27.6 24.2 28.0 12.1 5.5 0.5 2.1 100.0 2.026,624

137 Annex B
Table B-46. Determinants of Poverty and Probit Analysis for Urban and Rural Madagascar,1994
Variable Coefficient Asymptotic Marginal Coefficient Asymptotic Marginalt-value effect at t-value effect at
mean of x mean of x
Constant 0.19 25.7 0.107 -0.50 -46.1 -0.154Sex of Head 0.23 82.3 0.119 -0.01 -2.2 -0.006(F= l; M=0)Head's Schooling -0.25 -265.7 -0.094 -0.30 -186.7 -0.068(level)Small farmers 0.04 5.3 0.019 0.69 56.5 0.360Large farmers 0.28 38.8 0.152 0.91 80.9 0.507Herders/fishermen 0.00 0.2 0.001 -0.06 -5.3 -0.030Small entpreneurs -0.32 -27.7 -0.158 -0.05 -3.2 -0.024Craftsmen/Traders -0.31 -31.2 -0.152 -0.09 -8.2 -0.047Professionals -1.60 -56.8 -0.796 -0.52 -31.2 -0.252Employee/Workers -0.34 -34.6 -0.168 -0.05 -4.5 -0.026Unskilled workers -0.29 -26.5 -0.147 0.53 45.5 0.278Nonwage/Students -0.50 -33.8 -0.249 0.49 35.1 0.251Children under 14 0.28 424.7 0.205 0.31 246.7 0.229(number)Percapitaland -0.13 -106.0 -0.063(hectares)Gross industrial crops 0.10 23.6 0.051
N= 2557 N= 1943Log-likelihood = -1,017,530.9 Log-likelihood = -29,356.8
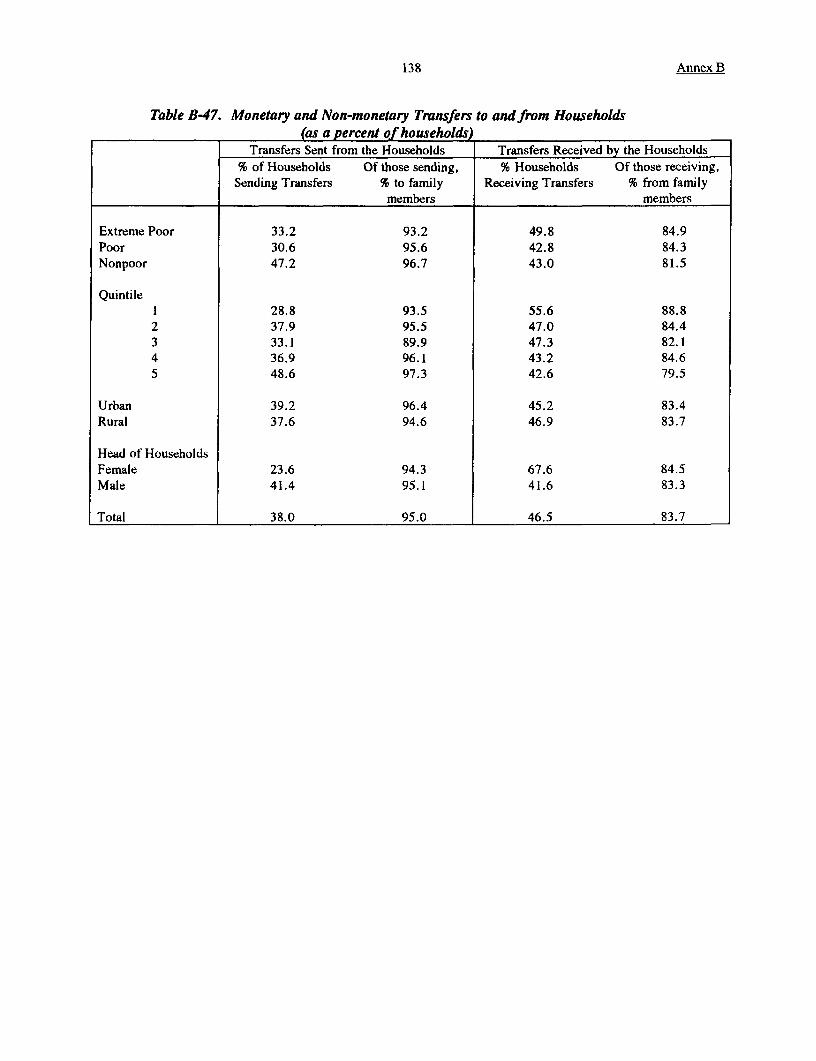
138 Annex B
Table B-47. Monetary and Non-monetary Transfers to and from Households(as a percent of households)
Transfers Sent from the Households Transfers Received by the Households% of Households Of those sending, % Households Of those receiving,
Sending Transfers % to family Receiving Transfers % from familymembers members
Extreme Poor 33.2 93.2 49.8 84.9Poor 30.6 95.6 42.8 84.3Nonpoor 47.2 96.7 43.0 81.5
Quintile1 28.8 93.5 55.6 88.82 37.9 95.5 47.0 84.43 33.1 89.9 47.3 82.14 36.9 96.1 43.2 84.65 48.6 97.3 42.6 79.5
Urban 39.2 96.4 45.2 83.4Rural 37.6 94.6 46.9 83.7
Head of HouseholdsFemale 23.6 94.3 67.6 84.5Male 41.4 95.1 41.6 83.3
Total 38.0 95.0 46.5 83.7

139 Annex B
Table B48. Monetary and Non-monetary Transfers to and from Households(Percent of Value)Sent Received
Cash Food Cash FoodExtreme Poor 38.8 55.1 35.4 54.4Poor 39.2 55.4 41.4 46.2Nonpoor 62.0 29.9 43.4 43.5
Quintilel 28.6 63.7 35.9 52.72 38.7 55.0 35.4 53.53 45.3 50.3 35.4 56.64 49.5 44.2 42.3 46.75 64.7 26.6 43.3 42.0
Urban 67.1 20.9 44.8 38.9Rural 44.5 50.0 37.2 52.7
Head of HouseholdsFemale 42.2 44.4 48.8 37.2Male 50.4 43.6 34.9 54.7
Total 49.4 43.7 38.7 49.9


140 Armex C
Monitoring Poverty
1. The preparation of the Poverty Profile has highlighted the need for accurate dataon poverty in Madagascar. Some years ago, in the framework of the Bank-fundedEconomic Management and Social Action Program (EMSAP), the Government and theWorld Bank had planned the establishment of a monitoring system of living conditions thatwould be implemented by the National Statistics Institute (INSTAT). Of the threehousehold surveys initially planned for the project's four-year life time duration, only onesurvey was executed by INSTAT. Multiple factors resulted in this very poor performance.Because of various origins of funds (three partners, GOM, UNDP and IDA), it took morethan a year to make funds available to the project. Inadequate technical assistance andlaps in both the Bank's and the government's supervision, caused major problems for thequality of the implementation. To learn from this (protracted) experience, a thoroughassessment should be made of the experience with the EPM and other recent householdsurveys. In light of these findings, the current program for poverty monitoring should bereassessed to establish a more efficient system in Madagascar. Some areas that warrantattention in the new system are: timely and regular production of national data on livingconditions, ways to monitor targeted groups and communities; regular dissemination ofoutputs; and integration into policy design.
2. This annex looks at the sources of data that were drawn upon for this povertyanalysis, the national institutional capacity for data gathering and poverty monitoring, andsome potential improvements.
Sources of Data Used in this Poverty Analysis
3. The Poverty Profile of this poverty assessment was mostly based on the results ofthe EPM household survey (1993/4), preliminary results of the 1993 Population Censusand the 1992 Demographic and Health Survey (DHS).
1. Householi Survey - 1993/94
4. The national household survey called Eniqm?.fe Permaniente aupres des menages(EPM) was carried out in the country's six provinces between April 1993 and April 1994.During a full year, 4,508 households were interviewed. The survey methodology wasbased on the method developed by the World Bank as the Social Dimensions ofAdjustment Integrated Survey'. The questionnaire consisted of a household questionnairedivided in thirteen sections covering:
iThe Social Dimensions of Adjustment Integrated Survey, A Survey to Measure Poverty and Understandthe Effects of Policy Change on Households; G. Delaine. L. Demery and Co. SDA Working Paper No.14Surveys and Statistics, The World Bank, 1991

141 Annex C
(1) Household composition and member's background (all individuals,determination of membership);
(2) Education history and costs (members 4 years and over, currentattendance, education history, costs of past 12 months, literacy, parents'education, technical and vocational training);
(3) Health conditions (all members, last two weeks condition, consultationscharacteristics, hospitalization, costs of consultation and hospitalization),Fertility (women 14 to 49 years, global maternity history including lostpregnancies and survival, past 12 months births and infant mortality,prenatal care, contraception prevalence), Immunization (children less than5 years, post natal care, vaccinations status, child care);
(4) Employment, other activities and wages (members 7 years and above,main occupation characteristics and wages, secondary occupationscharacteristics and wages, job search in past 12 months, status ofemployment and job search in past 7 days, employment history,housekeeping);
(5) Migration history (members 15 years and above, recent migration,employment status in previous residence and reason for moving);
(6) Housing characteristics (characteristics, occupancy status, rental costs,mortgage costs, equipment);
(7) Farming activities and revenues (all members operating farm or cattle,identity of holders, agricultural assets, land, cattle and equipment,characteristics and value, harvests disposal and revenues, processing ofproducts, consumption of own produce;
(8) Expenditure (food and non-food, frequency, amount and value);
(9) Non Farm activities and revenues (identity of operator, characteristics,expenditure and revenues, assets, net incomes);
(10) Transfers and other incomes (origin, type, amount and frequency);
(11) Credit, savings and assets (type, identity of account's owner, amount orvalue);
(12) Anthropometrics (children under 5 years); and
(13) Characteristics of Interviews appreciation of cooperation and results.

142 Annex C
5. Sampling was designed on the basis of the survey objectives and organization. Themain objectives were to represent the country's six provinces, the major socio-economicgroups and measure the families' consumption and incomes. The collection of data wasorganized around a division of the year in 10 cycles of 33 days. Sixteen mobile teams ofenumerators composed of two enumerators, one deputy and one supervisor were assigneda specific area within a province to cover in the 10 cycles. The teams also comprised adata entry clerk and a driver. The data entry clerks were usually assigned to the StatisticsRegional Office at the province capital, except in the case of Antsiranana where the teamwas located in a secondary city, Sambava, for part of the cycles because of the poorcondition of the road network in the northern province.
6. At each cycle, the teams visited 32 clusters. Each cluster consisted of 16households in the rural areas and 12 in the urban areas. Expenditure for each householdwas monitored over a different reference period according to the residence. Eachhousehold was visited five times spread over a month in the urban areas and twenty daysin the rural areas. The reference period for the urban households was 30 days and 7 daysfor the rural areas. During these periods diaries were filled up for household expenditure,auto consumption and non farm enterprises expenditure.2
2The Household Diary for Expenditure was open for listing the products purchased by the household.Each household had to report daily, expenses made my each household member, in quantity (localweighting units), and value. The weighting units were registered by the supervisor when coming in alocality and converted into kilograms. Unfortunately, the data from the diaries were not used in thepoverty analysis because of a high percentage of incomplete diaries. Instead, the data from the variousrecall periods in the main questionnaire were used. Information was collected on the basis of thefrequency of the purchase (day, week, month, year) and extrapolated when necessary to a period of 12months. The sampling design was aiming at 4,500 households, questionnaires were completely filled outfor 4,508 households. The sampling was a random and stratified sampling. The Primary Unit, theFokontany were classified as urban and rural on the basis of the definition and classification of theOfficial Geographic Code existing since the 1975 Population Census and sorted by residential standards.The standards were estimated on the basis of the quality of infrastructure in the Fokontany: quality ofaccess road, type and quality of housing, sanitation, etc. For the Secondary Unit, the Fokontany weredivided in segments of 800 to 1200 inhabitants and one segment was selected by Fokontany. Thehouseholds, the final unit of sampling were exhaustively listed in each selected segment and clusters of12 (urban) and 16 (rural) households were drawn from the lists. Three hundred and twenty clusters wereselected, 154 in urban areas and 166 in rural areas. The urban sample was over weighed to ensure a goodrepresentation of the urban socio-economic groups. The distribution of the sample population is thefollowing: (a) urban households, 43 per cent, urban population 43.4 percent; (b) rural households, 56.9percent, rural population 56.6 percent. The 1993 Population Census gives a distribution of the populationwith 21.4 percent urban and 76.4 percent rural, the EPM results were then weighted to reflect the currentdistribution of the population.

143 Annex C
2. Population Census
7. The sampling base consisted of the lists from the 1983 Administrative PopulationCensus annually updated by the Ministry of Internal Affairs. The EPM results wereweighted against the preliminary results of the 1993 Population census. The Census dataare also used for comparison with the EPM results for assessing the quality of the EPMdata.
3. Demographic and Health Survey
8. A Demographic and Health Survey was done in Madagascar in 1992. The resultsof this survey allow useful comparisons with the results of EPM in particular for fertility,infant mortality and nutritional status. The survey covered a national sample of 5,944households and 6,260 women age 15 to 49 years with topics like: demographiccharacteristics of the households members and the women in particular; fertility, familyplanning; nuptiality; preferences for family size; infant mortality (0-5); maternal mortality;mother and children health; breastfeeding practice and nutritional status and; access topublic services for health and family planning.
4. Other (lata
9. Other sources of information were available which may or may not have been usedin the Profile for various reasons, including limitation of coverage or access.
* Demographic Survey, 1966 (National Institute of Statistics and EconomicResearch, INSRE)
* Housing and Population Census, 1975 (INSRE)* Administrative census (yearly up to 1987)* Socio-demographic Survey, 1984 (Ministry of Population, MPCSJS)* Rural Household Budget Survey, 1980 (INSRE)* Urban Household Budget Survey, 1977-78 (INSRE)* Household Budget and Nutrition Survey, 1962 (INSRE)
National Capability of INSTA T and Other Institutions
10. INSTAT has the mandate to carry out national surveys to produce the country'snational economic and demographic indicators. It was responsible for carrying out twopopulation censuses, several household budget surveys, and the EPM. As an exception,the Ministry of Research was responsible for implementing the DHS. However, thesurvey team management was provided by INSTAT's staff. The Ministry of HealthStatistical system is very heavy and relatively inefficient, despite a huge volume ofinformation gathered at all levels, including the level of health units in the smalladministrative divisions such as Fokontany and Fivindronono. The Ministry of Agricultureimplements a regular agricultural census to monitor the production of crops and livestock.

144 Annex C
The survey program is sponsored by FAO and has produced the country's most reliableand regular statistics for the past decade.
11. INSTAT has an unfortunate history of delays in its production. Despite adynamic and ambitious work program, delays have occurred that have tarnished itsreputation and hampered the willingness of donors to support its programs. The Instituteis fully staffed, even though the staff needs skills enhancement and improvement of skillsfor new technicians. Much of the staff lacks motivation as well. Until recently and exceptfor the EPM team, the office lacks efficient computer equipment and software. EPM hasprovided some training for survey organization and data processing, but the number ofstaff trained has not yet reached the critical mass that would make the office moreefficient.
12. The EPM was the first survey of this scope implemented in Madagascar. A rapidassessment of the quality of the data has shown that the demographic information on agestructure, sex distribution, fertility and Anthropometrics are comparable to the Census andthe DHS results. Nevertheless, there have been some problems on the quality of the datagathered on consumption from the diaries. These problems mostly resulted from the lackof serious supervision of the field and data entry operations. Such situations if addressedproperly can be improved and the next round of surveys in INSTAT should benefit fromthe experience provided by EPM.
13. The data have proven to be very useful. They were first used in the PovertyAssessment. They were also used, in the framework of the Food Security Project, for theevaluation of the country's food security situation for each province. A series ofseminars, targeting decisionmakers, have been held to disseminate the survey results.They include an evaluation of the Employment market and the Informal Sector, calculationof Weighting for the Price Index, the building of a Social Accounting Matrix, and theSituation of Women. A seminar is also planned for the poverty assessment.
Improving Poverty Monitoring
14. Donors are currently putting their efforts together for a thorough assessment of thecountry's capability in the production of economic and social sector statistics. It is ofprimary importance that experienced specialists help the government assess the areaswhere the sector lacks capable staff, equipment, skills and funding. It is necessary toprepare an efficient and feasible work program with the various institutions in charge ofgathering information at the national level. The principal institutions to target will beINSTAT and the Ministries in charge of Agriculture, Health, Education and Population.
15. INSTAT has set up a special department for implementing households surveys,around the team of the EPM. The department's main objective is to follow up on theprimary program and continue the surveys for monitoring the trends in living conditions.The current work program include the implementation of regular households surveys tomeasure the trends and changes in the population's conditions at the regional level and to
145 Annex C
monitor vulnerable groups. A core module, including food expenditure in particular andfixed around a core set of key welfare indicators will constitute the monitoring tool. Therest of the questionnaire will change to include specific modules that will be designed onthe basis of the actual priority need for data: health, education, small holders, informalsector, community variables and qualitative modules. The first survey to be implementedin 1997 will focus on households' consumption. The second one planned for 1999 willfocus on employment and social indicators for health and education. In the near future theINSTAT will organize seminars for analyzing and disseminating the results of the EPM:presentation of Main Report and Poverty Assessment; employment and sources ofincomes; informal sector; agricultural activities of the households; women anddevelopment. In addition, weighting for the price index will be calculated from thehousehold expenditure pattern and a Social Accounting Matrix will be build on the basisof the new National Account and using the households' budget from EPM.
16. The Government is also considering putting all necessary support for INSTAT toregularly produce a regional urban and rural price index. This indicator is of primerelevance for monitoring living conditions since monthly indicators can be produced if thesystem of price data collection is made efficient. This will require resources, currently notavailable at INSTAT for daily price data collection at a selected number of various type ofretail markets and shops in urban and rural areas in each province. The periodicalpublication of the monthly regional price indexes will give indication of what is happeningat the meso level and help measuring and anticipate the reaction of the population inmonitoring its purchasing power.
17. However, making poverty monitoring efficient in the country may require theestablishment of an Observatory of Living Conditions. The aim of such a body would beto efficiently monitor activities for gathering and analyzing data related to poverty andliving conditions. The location of this office would be determined based on the need forsuch a body to be in close relation with the Government and to be able to manage fundsfrom different sources.

146 Annex D
List of Annex D Tables
Table D-1. Trends In Education, 1987-94 ..................................................... 147Table D-2. Total Primary And Secondary Enrollments By Region, Madagascar, 1993/4 ................ 148Table D-3. Gross And Net Enrollment Rates, All Madagascar, 1993/4 .......................................... 149Table D-4. Trends In Private School Enrollments As A Share Of All Enrollments Madagascar,
1987/88-1993/94, (Percent)..... 150Table D-5. Private Enrollments As A Share Of All Enrollments, By Region,
1993/4 (Percent) .150Table D-6a. Per Student Public Expenditures By Level Of Education, 1988-94
(Nominal Expenditures) .151Table D-6b. Per Student Public Expenditures By Level Of Education, 1988-94
(Real Expenditures in Constant 1984 Prices) .172Table D-7. Primary And Secondary-Level Public Education: Per Student Expenditures
By Region, 1994 .153Table D-8. Primary And Secondary Education: Regional Shares Of Teachers And
Salary Expenditures (1993/4) And Student/Teacher Ratios By Region .154Table D-9. Distribution Of Education Subsidies Per Capita, By Quintile And Level Of Schooling,
All Madagascar, 1993/4 .175Table D-1O. Regional Distribution Of Educational Subsidy, By Quintile,
Madagascar, 1993/4 ........................................................................... 156Table D-l 1. Madagascar: Regional Health Statistics By Region, 1990 ........................................ 157Table D-12. Nutrition Status Of Children, 1992 ........................................ 157Table D-13. Proportion Of III And III Seeking Treatment ........................................ 158Table D-14. Recurrent Non-Salary Expenditures By Type Of Health Facility,
1988-1993 ..... 1........................................................................... 158Table D-15. Regional Expenditures On Health, Madagascar, 1993 ................................................. 159Table D-16. Per Capita Health Subsidy, Rural And Urban Madagascar .......................................... 160Table D-17. Regional Distribution Of Health Subsidy, Madagascar, 1993/4 .................................... 161
Box D. 1: Cost Recovery In The Ministry Of Health-General Hospital Of Toamasina ............... 162
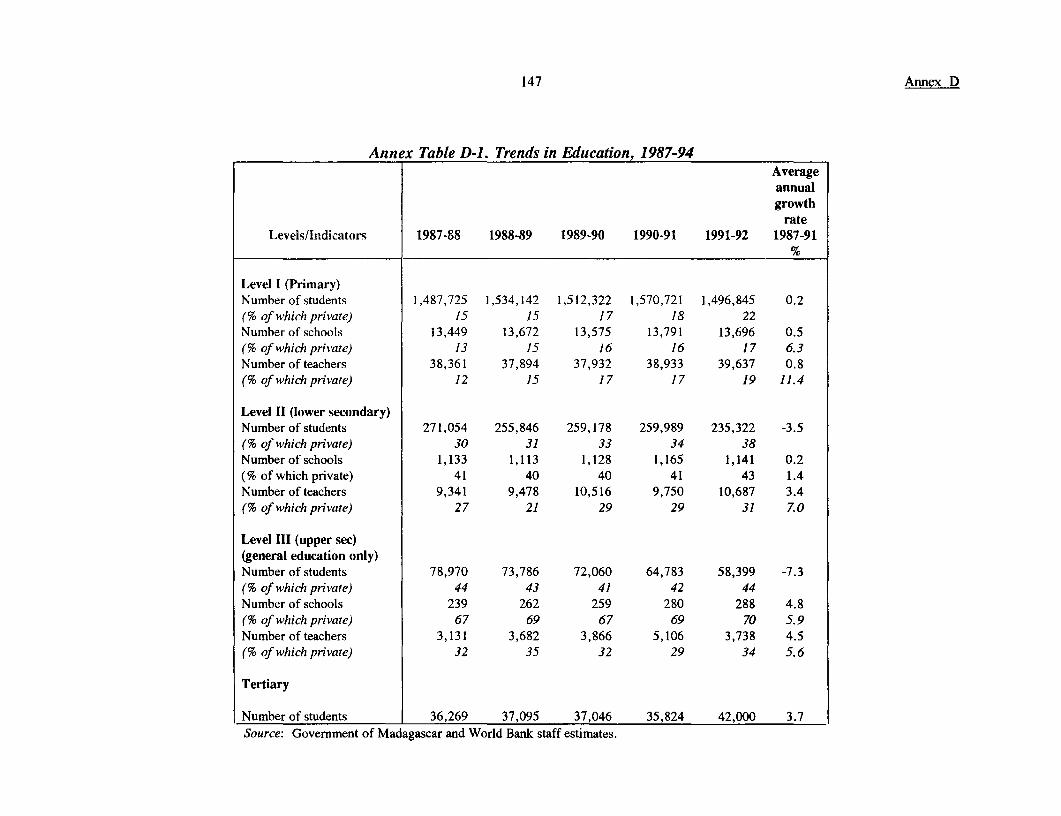
147 Annex D
Annex Table D-1. Trends in Education, 1987-94Averageannualgrowth
rateLevels/Indicators 1987-88 1988-89 1989-90 1990-91 1991-92 1987-91
Level I (Primary)Number of students 1,487,725 1,534,142 1,512,322 1,570,721 1,496,845 0.2(% of which private) 15 15 17 18 22Number of schools 13,449 13,672 13,575 13,791 13,696 0.5(% of which private) 13 15 16 16 17 6.3Number of teachers 38,361 37,894 37,932 38,933 39,637 0.8(% of which private) 12 15 17 17 19 11.4
Level 11 (lower secondary)Number of students 271,054 255,846 259,178 259,989 235,322 -3.5(% of which private) 30 31 33 34 38Numberofschools 1,133 1,113 1,128 1,165 1,141 0.2(% of which private) 41 40 40 41 43 1.4Number of teachers 9,341 9,478 10,516 9,750 10,687 3.4(% of which private) 27 21 29 29 31 7.0
Level III (upper sec)(general education only)Number of students 78,970 73,786 72,060 64,783 58,399 -7.3(% of which private) 44 43 41 42 44Number of schools 239 262 259 280 288 4.8(% of which private) 67 69 67 69 70 5.9Numberofteachers 3,131 3,682 3,866 5,106 3,738 4.5(% of which private) 32 35 32 29 34 5.6
Tertiary
Number of students 36,269 37,095 37,046 35,824 42,000 3.7Source: Government of Madagascar and World Bank staff estimates.

148 Annex D
Annex Table D-2. Total Primary and Secondary Enrollments by Region, Madagascar, 1993/4Public School
(Primary)Quintiles Antananarivo Antsiranana Fianarantsoa Mahajanga Toamasina Toliara TotalPoorest 37,196 17,667 37,861 28,789 50,810 29,746 202,069
2 82,963 29,241 36,512 40,137 62,457 44,610 295,9203 68,072 36,972 44,035 40,159 48,885 18,434 256,5574 95,974 29,492 44,735 32,651 49,993 24,408 277,253
Richest 49,771 22,867 27,734 25,830 39,222 7,990 173,414
Total 333,976 136,239 190,877 167,566 251,367 125,188 1,205,213Public School(Secondary)
Richest 151 0 1,642 1,330 900 264 4,2872 5,682 2,908 3,866 8,297 1,170 3,928 25,8513 9,713 6,428 5,513 4,423 3,955 2,079 32,1114 21,339 7,473 7,529 7,182 12,998 4,370 60,891
Poorest 35,719 10,652 11,149 11,503 13,801 4,432 87,256
Total 72,604 27,461 29,699 32,735 32,824 15,073 210,396
Private School(Primary)
Poorest 15,591 0 2,192 0 1,097 5,532 24,4122 39,714 260 8,253 1,776 2,539 219 52,7613 36,422 1,180 6,342 2,022 9,850 1,770 57,5864 39,219 2,880 6,698 3,768 5,760 2,387 60,712
Richest 70,300 13,395 11,355 8,659 14,636 8,282 126,627
Total 201,246 17,715 34,840 16,225 33,882 18,190 322,098Private School
(Secondary)Poorest 847 0 156 0 0 1,070 2,073
2 5,602 0 1,435 424 120 657 8,2383 6,718 0 2,649 923 982 369 11,6414 16,406 2,527 2,125 1,462 1,649 948 25,117
Richest 63,079 12,240 7,688 9,615 9,562 6,577 108,761
Total 92,652 14,767 14,053 12,424 12,313 9,621 155,830Source: EPM, 1993/94.

149 Annex D
Annex Table D-3. Gross and Net Enrollment Rates, All Madagascar, 1993/4Gross Enrollnent Rates
Primary SecondaryQuintiles: Males Females Total Males Females Total
Poorest 47 49 48 2 1 2Rural 42 47 44 1 0 1Urban 121 90 107 8 10 9
2 88 79 83 9 7 8Rural 86 74 79 7 4 6Urban 103 110 107 20 18 19
3 78 98 87 12 10 11Rural 72 89 79 9 6 7Urban 111 146 127 25 25 25
4 100 108 104 22 23 23Rural 90 102 96 14 16 15Urban 126 130 128 41 40 40
Richest 119 107 113 54 52 53Rural 96 88 92 24 23 23Urban 147 129 138 86 78 82
Total 81 85 83 19 18 18Rural 71 75 73 9 8 9Urban 126 126 126 51 46 48
Net Enrollment Rates
Poorest 26 27 27 0 0 0Rural 23 26 25 0 0 0Urban 69 48 60 0 0 0
2 45 46 45 2 2 2Rural 44 43 43 1 1 1Urban 53 64 59 4 7 6
3 49 54 51 5 5 5Rural 45 51 48 4 3 3Urban 67 69 68 8 13 11
4 53 63 58 8 9 8Rural 48 60 54 5 7 6Urban 67 72 69 14 13 13
Richest 72 72 72 20 28 24Rural 54 60 57 9 16 12Urban 86 92 89 31 39 35
Total 46 50 48 6 8 7Rural 40 44 42 3 4 4Urban 71 76 73 17 21 19
Source: EPM, 1993/94

150 Annex D
Annex Table D-4. Trends in Private School Enrollments as a Share of All Enrollments Madagascar, 1987/88-1993/94, (percent)Year Primary School Junior Secondary Senior Secondary All Secondary
1987/1988 15 30 441990/1991 18 34 42
1993/1994 21 41 45 43Sources: 1985 from World Bank, 1989; 1990/91 from D. Viens; 1993/94 from EPM.
Annex Table D-5. Private Enrollments as a Share of All Enrollments, by Region, 1993/4 (percent)
Quntles Antananarivo Antisiranana Fianarantsoa Mahajanga Toamasina Toliara TotalPoorest 30 0 5 0 0 16 11
2 32 1 18 4 4 0 153 35 13 13 5 5 9 184 29 9 13 10 10 9 18
Richest 59 31 29 25 25 51 42
Total _38 12 15 9 12 13 21
Poorest 85 0 29 0 0 80 332 50 0 27 5 9 14 243 41 0 32 17 20 15 274 43 25 22 17 11 18 29
Richest 64 53 41 46 41 60 55
Total 56 35 32 28 27 39 43Source: EPM, 1993/94.

151 Annex D
Annex Table D-6a. Per Student Public Expenditures by Level of Education, 1988-94:(Nominal Expenditures)
1988 1989 1990 1991 1992 1993 1994(thousands of FMG) (budget) (budget)Primary EducationNon-salary recurrent expenditures 23,000 95,000 1,002,000 100,000 152,000 4,826,000 6,008,453Salary expenditures 31,150,000 28,626,000 28,626,000 33,003,000 36,876,000 39,974,000 37,125,288Pro-rata administrative costs* 6,659,572 8,315,165 9,158,616 10,589,988 15,074,662 14,421,930 17,734,194Total recurrent expenditures 37,832,572 37,036,165 38,786,616 43,692,988 52,102,662 59,221,930 60,867,936Enrollment (number of students) 1,263,044 1,297,106 1,260,005 1,291,909 1,171,266 n.a. 1,205,213Per student expenditure 30 29 31 34 44 50
Secondary EducationNon-salary recurrent expenditures 641,000 756,000 1,834,000 1,849,000 1,665,000 2,718,000 4,017,430Salary expenditures 16,423,000 19,384,000 20,521,000 24,746,000 27,981,000 30,331,000 24,707,706Pro-rata administrative costs* 3,645,428 5,830,835 6,910,384 8,508,012 12,069,338 10,639,070 11,774,106Total recurrent expenditures 20,709,428 25,970,835 29,265,384 35,103,012 41,715,338 43,688,070 40,499,243Enrollment (number of students) 234,355 219,549 216,819 210,299 177,925 n.a. 210,396Per student expenditure 88 118 135 167 234 192
Total -Primarv and Secondary Education 58,542,000 63,007,000 67,920,000 78,646,000 93,819,000 103,060,000 101,367,179
Tertiary EducationNon-salary recurrent expendituresSalary ExpendituresTotal recurrent expenditures 19,821.000 20,430,000 22,539,000 32,313,000 28,128,000 34,002,000 34,107,000Enrollment (number of students) 36,269 37,095 37,046 35,824 42,000 n.a. 30,886Per student expenditure 546 551 608 902 670 1,104
Total Education Recurrent Expenditures 78,363,000 83,437,000 90,459,000 110,959,000 121,947,000 137,062,000 135,474,179
Sources: For Primary and Secondary Education expenditure data: 1988-1993 from Tommasi (1993) and 1994 from MEN 1994 and MINFN.Enrollments for 1988-93 from Viens (1993) and 1994 from EPM, 1993/4.n.a. = not available*Pro-rata administrative costs calculated by allocating administrative costs to the primary and secondary level in proportion to their share of the totalrecurrent expenditure.

152 Annex D
Annex Table D-6b. Per Student Public Expenditures by Level of Education, 1988-94(Real Expenditures in Constant 1984 Prices)
1988 1989 1990 1991 1992 1993 1994(thousands of FMG) (budget) (budget)
Primary EducationNon-salary recurrent expenditures 12,240 45,152 427,292 37,425 50,582 1,421,502 1,249,678Salary expenditures 16,577,967 13,605,513 12,207,249 12,351,422 12,271,547 11,774,374 7,721,564Pro-rata administrative costs* 3,544,211 3,952,075 3,905,593 3,963,319 5,016,526 4,247,991 3,688,476Total recurrent expenditures 20,134,418 17,602,740 16,540,135 16,352,166 17,338,656 17,443,867 12,659,718Enrollment (number of students) 1,263,044 1,297,106 1,260,005 1,291,909 1,171,666 n.a. 1,205,213Per student expenditure 16 14 13 13 15 10
Secondary EducationNon-salary recurrent expenditures 341,139 359,316 782,090 691,991 554,076 800,589 835,572Salary expenditures 8,740,287 9,212,928 8,750,959 9,261,227 9,311,481 8,934,021 5,138,873Pro-rata administrative costs* 1,940,089 2,771,309 2,946,859 3,184,136 4,016,419 3,133,747 2,448,857Total recurrent expenditures 11,021,516 12,343,553 12,479,908 13,137,355 13,881,976 12,868,356 8,423,302Enrollment (number of students) 234,355 219,549 216,819 210,299 177,925 n.a. 210,396Per student expenditure 47 56 58 62 78 40
Total -Primary and Secondary Education 31,155,934 29,946,293 28,963,753 29,433,383 31,220,965 30,356,406 21,083,019
Tertiary EducationNon-salary recurrent expendituresSalary ExpendituresTotal recurrent expenditures 10,548,696 9,710,076 9,611,514 12,093,189 9,369,399 10,015,317 7,093,802Enrollment (number of students) 36,269 37,095 37,046 35,824 42,000 n.a. 30,886Per student expenditure 291 262 259 338 223 230
Total Education Recurrent Expenditures 41,704,630 39,656,369 38,575,266 41,526,572 40,581,364 40,371,723 28,176,820
Sources: For Primary and Secondary Education expenditure data: 1988-1993 from Tommasi (1993) and 1994 from MEN 1994 and MINFIN.Enrollments for 1988-93 from Viens (1993) and 1994 from EPM, 1993/4.n.a. = not available*Pro-rata administrative costs calculated by allocating administrative costs to the primary and secondary level in proportion to their share of the totalrecurrent expenditure.

153 Annex D
Annex Table D-7. Pnimary and Secondary-level Public Education: Per Student Expenditures by Regio , 1994All
Antananarivo Antsiranana Fianarantsoa Mahajanga Toamasina Toliara Madagascar
Primary EducationSalary 10,481,733,696 2,410,776,768 8,576,462,592 4,538,292,864 5,903,277,312 5,214,745,152 37,125,288,384Non-salary 1,373,180,160 899,603,200 1,019,099,440 889,543,680 1,057,410,760 769,615,920 6,008,453,160Pro-rata administrative costs* 4,874,080,001 1,361,043,001 3,945,160,001 2,231,624,000 2,861,847,000 2,460,436,000 17,734,194,000Total 16,728,993,857 4,671,422,969 13,540,722,033 7,659,460,544 9,822,535,072 8,444,797,072 60,867,935,544Enrollments 333,976 136,239 190,877 167,566 251,367 125,188 1,205,213Per Student Subsidy 50,090 34,288 70,940 45,710 39,076 67,457 50,504
Secondary EducationSalary 10,777,059,000 1,780,605,000 3,636,252,000 2,361,645,000 3,355,470,000 2,796,675,000 24,707,706,000Non-salary 887,277,310 464,109,880 694,847,100 662,391,990 634,913,080 673,891,460 4,017,430,820Pro-rata administrative costs* 4,781,078,001 920,083,000 1,775,268,000 1,239,518,000 1,635,612,001 1,422,545,001 11,774,106,000Total 16,445,414,311 3,164,797,880 6,106,367,100 4,263,554,990 5,625,995,081 4,893,111,461 40,499,242,820Enrollments 72,604 27,461 29,699 32,735 32,824 15,073 210,396Per Student Subsidy 226,508 115,247 205,609 130,245 171,399 324,628 192,491
Sources: Salaries totals from PDP, 1994-96 and regional allocation from Ministry of Finance, 1994 (The salary data that came from the MINFIN was checkedfor accuracy by comparing it with numbers of teachers in each region. See Table 9), and PDP, 1994-96; Non-salary expenditures, MEN, 1994 and PDP, 1994-96; Enrollments, EPM, 1993/4.*Pro-rata administrative costs calculated by allocating administrative costs to the primary and secondary levels in proportion to their share of the total recurrentexpenditure.

154 Annex D
Annex Table D-8. Primary and Secondary Education: Regional Shares of Teachers andSalary Erpenditures (1993/4) and Student/teacher Ratios by Region
Antananarivo Antsiranana Fianarantsoa Mahajanga Toamasina Toliara
Primary EducationNumber of Teachers 8,415 1,662 7,986 3,299 5,766 3,493ShareofAllTeachers(%) 27 5 26 11 19 11Regional salary exp. as share 28 6 23 12 16 14
of total salary exp (%)Student/teacher Ratio, 1993/4 40 84 24 51 44 36Student/teacher Ratio, 1984/5 44 67 31 66 39 30
Secondary EducationNumberofTeachers 4,360 1,011 1,951 1,086 1,448 1,136Share of All Teachers(%) 40 9 18 10 13 10Regional salary exp. as share
of total salary exp. (%) 44 7 15 10 14 11Student/teacher Ratio, 1993/4 77 138 98 153 175 111Sources: Number of teachers from MEN PDP 1994-96; Salary expenditures and enrollments from Table 8; 1984/5student/teacher ratio from World Bank, 1989.

155 Annex D
Annex Table D-9. Distrib tion of Education Subsidies per Capita, by Quintile and Level of Schooling, All Madagascar, 1993/4Urban Rural Totals
Male Female Total Male Female Total Male FemaleQuintile column row column row row
share share share share share
Primary-level @ 50,504 FMGper student
I 8,713 5,086 6,825 4,036 3,799 3,917 4,380 17 52 3,900 16 48 4,138 172 8,364 8,368 8,366 5,791 5,596 5,691 6,128 24 49 5,977 25 51 6,050 253 6,835 6,732 6,781 4,997 4,893 4,944 5,298 21 50 5,211 22 50 5,254 214 7,242 5,822 6,514 5,344 5,466 5,404 5,778 23 51 5,553 23 49 5,666 235 3,532 2,981 3,249 3,654 3,942 3,792 3,600 15 51 3,489 14 49 3,545 14
Average 5,833 5,039 5,422 4,817 4,777 4,797 5,029 4,835 4,931
Secondary-level @ 192,491 FMGper student
1 2,637 1,398 1,992 282 115 198 455 3 67 216 1 33 335 22 7,013 4,582 5,728 2,172 747 1,438 2,806 15 67 1,274 9 33 2,014 123 5,397 6,637 6,043 2,208 1,379 1,790 2,730 15 54 2,289 15 46 2,506 154 10,011 8,067 9,015 3,162 3,692 3,422 4,728 27 50 4,758 31 50 4,743 295 11,857 10,104 10,955 3,053 3,641 3,335 6,907 40 51 6,689 44 49 6,799 41
Average 9,193 7,778 8,461 2,061 1,681 1,871 3,547 3,019 3,281
University-level @ 1,104,000 FMGper student
1I0 0 0 0 0 0 0 0 0 0 0 0 0 02 3,517 0 1,657 0 0 0 461 3 100 0 0 0 223 23 1,070 0 513 0 0 0 175 1 100 0 0 0 86 14 3,357 1,879 2,599 1,059 642 854 1,585 11 63 943 7 37 1,266 95 26,988 24,325 25,618 0 2,225 1,068 11,814 84 49 12,647 93 51 12,227 89
Average 12,890 10,696 11,756 210 419 314 2,851 2,675 2,762
All Educationl 11,350 6,484 8,817 4,319 3,915 4,115 4,835 8 54 4,116 8 46 4,472 82 18,893 12,950 15,751 7,963 6,343 7,129 9,394 16 55 7,251 14 45 8,287 153 13,303 13,368 13,337 7,205 6,272 6,734 8,204 14 52 7,499 14 48 7,847 144 20,609 15,768 18,128 9,564 9,800 9,680 12,091 21 52 11,254 21 48 11,675 215 42,376 37,410 39,822 6,707 9,808 8,196 22,322 40 50 22,825 43 50 22,571 41
Average 27,916 23,514 25,639 7,087 6,877 6,982 11,427 10,528 10,974Source: Annex Table D-7 and EPM, 1993/94.

156 Annex D
Annex Table D-10. Regional Distribution of Educational Subsidy, by Quintile, Madagascar, 1993/4Quintile: Antananarivo Antsiranana Fianarantsoa Mahajanga Toamasina Toliara Total
p/capita rowsubsidy share
Pnmary-levelPoorest 3,768 5,906 4,516 5,877 4,753 3,171 4,138 17
2 5,491 5,114 5,942 7,129 5,066 8,789 6,050 253 4,700 5,389 6,334 5,399 4,418 5,184 5,254 214 6,111 4,537 6,571 3,823 5,665 6,762 5,666 23
Richest 2,122 3,558 5,091 3,182 4,616 2,572 3,545 14
Average 4,504 4,780 5,658 4,840 4,890 5,062 4,931
Secondary-levelPoorest 69 0 568 774 369 135 335 2
2 1,700 1,709 1,823 4,199 416 3,724 2,014 123 3,033 3,149 2,298 1,694 1,568 2,813 2,506 154 6,145 3,864 3,205 2,396 6,460 5,826 4,743 29
Richest 8,508 5,570 5,932 4,038 7,124 6,865 6,799 41
Average 4,427 3,239 2,551 2,694 2,801 2,933 3,281
University levelPoorest 0 0 0 0 0 0 0 0
2 392 0 0 983 0 0 223 23 0 0 732 0 0 0 86 14 952 0 2,115 427 3,458 0 1,266 9
Richest 26,628 5,417 697 3,003 5,584 2,197 12,227 89
Average 7,099 1,222 628 969 1,517 276 2,762
Al EducationPoorest 3,831 5,906 5,083 6,650 5,122 3,306 4,472 8
2 7,584 6,823 7,765 12,311 5,482 12,513 8,287 153 7,733 8,537 9,064 7,093 5,986 7,997 7,847 144 13,208 8,401 11,891 6,646 15,584 12,587 11,675 21
Richest 37,757 14,545 11,720 10,224 17,324 11,634 22,571 41
Average 16,030 9,241 8,838 8,503 9,207 8,272 10,974
Source: Annex Table 7 and EPM, 1993/94.

157 Annex D
Annex Table D-11. Madagascar: Regional HealthStatistics by Region, 1990
Region Persons/Doctor Persons/Health CareI Professional
Antananarivo 7,500 1,500Antsiranana 13,600 2,400Fianarantsoa 19,300 2,500Mahajanga 14,100 1,800Toamasina 12,800 1,900Toliara 15,500 2,100Source: UJNDP, 1992
Annex Table D-12. Nutrition Status of Children, 1992Weight-for-
Height-for-age (Stunting) height (Wasting) Weight-for-age1992 1983/84 1992 1983/84
Milda Acuteb Milda Mild Milda AcutebGender:
Male 53 25 5 40 10Female 49 22 4 38 8
Location:Urban 44 19 3 33 7Rural 52 24 5 40 10
Region:Antananarivo 61 28 3 45 9Fianarantsoa 58 31 6 47 15Toamasina 51 24 4 3 36 9
Mahajanga/Antsiranana 33 12 34C 6 3C 28 6Toliara 40 15 4 1 28 6(Antsirabe) (73)
Education of Mother:No education 45 6 34 9Primary 54 5 43 11Lower Secondary 53 3 36 7Upper Secondary 36 2 27 6
All Children: 51 32 5 10 39 9Source: Demographic and Health Survey, 1992, page 125 and Poverty Alleviation in Madagascar,1989.a Less than two standard deviations below the median of the reference population.b Less than three standard deviations below the median of the reference population.c Mahajanga only.

158 Annex D
Annex Table D-13. Proportion of Ill and Ill Seeking Treatment
Quintile Antananarivo Antsiranana Fianarantsoa Mahajanga Toamasina Toliara Total
Poorest 12 19 6 8 13 10 102 12 22 11 12 20 13 143 15 15 11 12 14 10 144 15 21 13 12 22 11 15
Richest 14 23 12 20 24 11 17Total 14 20 11 13 18 11 14.. .. ... .. ... .,.-.,. ... .
Poorest 28 3 19 37 11 54 282 35 30 37 38 28 31 333 32 25 25 42 28 40 314 44 41 35 47 43 65 44
Richest 55 44 33 48 41 70 48Total 41 33 31 44 31 50 38
Source: EPM 1993/94.
Annex Table D-14. Recurrent Non-Salary Expenditures by Type of Health Facility,1988-1993
1988 1989 1990 1991 1992 1993. . NM. . .nal .,. .xp,e,p,ditp,'res : . --
CentralAdministration 2.1 2.9 2.9 10.2 13.0 6.3
(21%) (5%) (32%) (62%) (47%) (31%)Hospitals 2.0 2.6 2.8 2.4 8.4 8.7
(20%) (32%) (31%) (15%) (31%) (42%)Basic Health Care 5.8 2.7 3.2 3.9 6.3 5.5Facilities
(58%) (33%) (37%) (24%) (23%) (27%)Total 9.9 8.2 8.9 16.5 27.7 20.6
................ ..R.i B I xpenditbre
Co'nst1nt9 94
CentralAdministration 1.1 1.4 1.2 3.8 4.3 1.9
(21%) (5%) (32%) (62%) (47%) (31%)Hospitals 1.1 1.2 1.2 0.9 2.8 2.6
(20%) (32%) (31%) (15%) (31%) (42%)Basic Health Care 3.1 1.3 1.4 1.5 2.1 1.6Facilities
(58%) (33 %) (37%) (24%) (23 %) (27%)Total 5.3 3.9 3.8 6.2 9.2 6.1Noles: Includes expenditures on drugs, but does not include expenditures for transmittable disease programs.Source: Ministry of Health, May, 1994 for all figures except drug expenditures for 1992 and 1993, which came fromDamour (1994).

159 Annex D
Annex Table D-15. Regional Expenditures on Health, Madagascar, 1993Basic Health Care
Region Large Hospitals Facilities(000 FMG) General/ share of share of
Principle/Spec. Secondary Total total Total totalAntananarivoSalary 3,279,917 1,873,251 5,153,168 47% 2,593,105 20%Non-salary 2,111,330 291,026 2,402,356 46% 705,598 20%Drugs 1,356,000 657,500 2,013,500 55% 271,000 19%Total 6,747,247 2,821,777 9,569,024 48% 3,569,703 20%Number of Visits 2,171,988 4,230,226Per visit subsidy (FMG) 4,406. 844AntsirananaSalary 238,724 452,383 691,106 6% 1,555,863 12%Non-salary 317,330 160,895 478,225 9 % 418,815 12%Drugs 146,000 130,000 276,000 7% 151,500 10%Total 702,054 743,278 1,445,331 7% 2,126,178 12%Number of Visits 582,608 1,031,082Per visit subsidy (FMG) 2,481 2,062FianarantsoaSalary 568,166 906,720 1,474,886 13% 2,074,484 16%Non-salary 331,752 210,730 542,482 10% 562,286 16%Drugs 212,500 101,000 313,500 9% 231,000 16%Total 1,112,418 1,218,450 2,330,868 12% 2,867,770 16%Number of Visits 1,093,456 1,352,624Per visit subsidy (FMG) 2,132 2,120MahajangaSalary 523,268 702,143 1,225,412 11% 2,074,484 16%Non-salary 323,021 158,948 481,969 9% 577,764 16%Drugs 199,500 109,500 309,000 8% 284,500 19%Total 1,045,789 970,591 2,016,381 10% 2,936,748 16%Number of Visits 1,880,398 1,690,988Per visit subsidy (FMG) 1,072 1,737ToamasinaSalary 428,386 866,420 1,294,806 12% 2,333,795 18%Non-salary 425,146 272,075 697,221 13% 628,987 18%Drugs 199,500 174,500 374,000 10% 224,500 15%Total 1,053,032 1,312,995 2,366,027 12% 3,187,282 18%Number of Visits 1,250,080 2,751,658Per visit subsidy (FMG) 1,893 1,158ToliaraSalary 413,840 755,737 1,169,578 11% 2,333,795 18%Non-salary 330,262 277,913 608,175 12% 654,482 18%Drugs 172.500 226,000 398,500 11% 298,500 20%Total 916,602 1,259,650 2,176,253 11% 3,286,777 18%Number of Visits 2,340,026 1,661,686Per visit subsidy (FMG) 930 1,978All MadagascarTotal Salaries 5,452,301 5,556,654 11,008,955 100% 12,965,526 100%Total Non-Salaries 3,838,841 1,371,587 5,210,428 100% 3,547,932 100%Total Drugs 2,286,000 1,398,500 3,684,500 100% 1,461,000 100%Grand Total 11,577,142 8,326,741 19,903,883 100% 17,974,458 100%Total Number of Visits 9,318.556 12,718,264ALl Madagascar per visitsubsidy (FMG) 2,136 1,413Notes and Sources: Hospital salaries by region were calculated with data from two sources: total expenditures byfacility type came from the MOH (May, 1994) and the shares allocated to each region from the MINFIN (June,1994). For salaries by region for Basic Health Care Facilities, salaries by region were estimated based on the shareof non-salary recurrent expenditures received by that region. Non-salary expenditures from MOH (May, 1994).Drug expenditures from Candau and Damour (1994). No central administrative or disease prevention expendituresare included.

160 Annex D
Annex Table D-16. Per Capita Health Subsidy, Rural and UrbanMadagascar
Quintile Rural Urban Total Columnshare
HospitalPoorest 1,114 1,126 1,115 14%
2 1,102 2,459 1,284 16%3 720 1,238 808 10%4 2,326 2,476 2,350 30%
Richest 1,095 3,949 2,392 30%
Total 1,261 2,810 1,590
Basic Healfth Care FacilityPoorest 732 793 736 10%
2 1,693 570 1,542 21%3 1,237 1,358 1,258 17%4 1,672 1,453 1,620 22%
Richest 2,226 1,998 2,122 29%
Total 1,441 1,512 1,456
All HealthPoorest 1,846 1,919 1,851 12%
2 2,795 3,029 2,826 19%3 1,957 2,596 2,066 14%4 3,998 3,929 3,970 26%
Richest 3,321 5,947 4,514 30%
Total 2,702 4,322 3,046Source: Annex Table 15 and EPM, 1993/94.
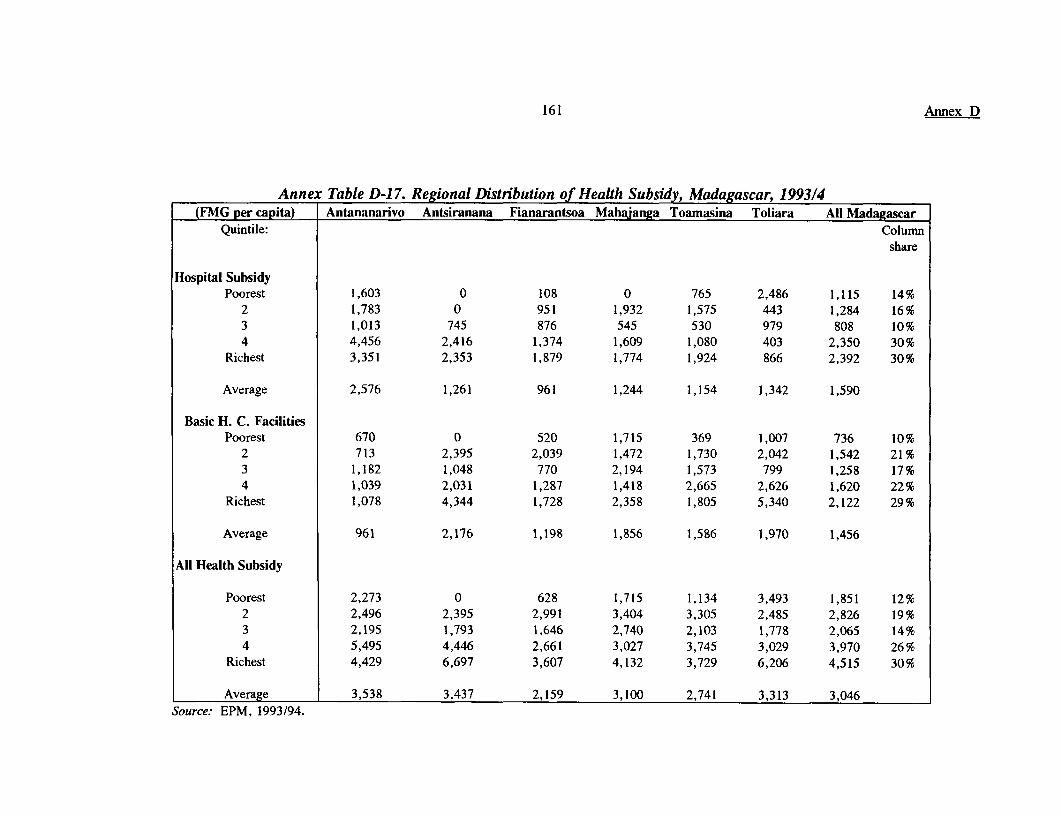
161 Annex D
Annex Table D-17. Regional Distribution of Health Subsidy, Madagascar, 1993/4(FMG per capita) Antananarivo Antsiranana Fianarantsoa Mahajanga Toamnasina Toliara All Madagascar
Quintile: Columnshare
Hospital SubsidyPoorest 1,603 0 108 0 765 2,486 1,115 14%
2 1,783 0 951 1,932 1,575 443 1,284 16%3 1,013 745 876 545 530 979 808 10%4 4,456 2,416 1,374 1,609 1,080 403 2,350 30%
Richest 3,351 2,353 1,879 1,774 1,924 866 2,392 30%
Average 2,576 1,261 961 1,244 1,154 1,342 1,590
Basic H. C. FacilitiesPoorest 670 0 520 1,715 369 1,007 736 10%
2 713 2,395 2,039 1,472 1,730 2,042 1,542 21%3 1,182 1,048 770 2,194 1,573 799 1,258 17%4 1,039 2,031 1,287 1,418 2,665 2,626 1,620 22%
Richest 1,078 4,344 1,728 2,358 1,805 5,340 2,122 29%
Average 961 2,176 1,198 1,856 1,586 1,970 1,456
All Health Subsidy
Poorest 2,273 0 628 1,715 1,134 3,493 1,851 12%2 2,496 2,395 2,991 3,404 3,305 2,485 2,826 19%3 2,195 1,793 1,646 2,740 2,103 1,778 2,065 14%4 5,495 4,446 2,661 3,027 3,745 3,029 3,970 26%
Richest 4,429 6,697 3,607 4,132 3,729 6,206 4,515 30%
Average 3,538 3,437 2,159 3,100 2,741 3,313 3,046Source: EPM, 1993/94.

162 Annex D
Box D.1: Cost Recovery in the Ministry of Health-General Hospital of Toamasina.
In general, the public health care system in Madagascar does not have a cost recovery prograni Theoretically, public health care services arefree, but in reality most patients pay for services. At all levels of health care, patients must pay medical staff (primarily doctors and nurses)for their services and the they usually must provide their own drugs and supplies (which they buy in private pharmacies, usually at highprices).
In late 1992 the Ministry of Health, wNith the aid of the Cooperation Franqaise, started a pilot cost recovery program at the main hospital inthe Toamasina region. This is part of an effort to improve the quality of health sevices and to lower costs for the patient of the services.This hospital was chosen as the pilot program because Toamasina is an important economic center, yet not as much of a political challengeas the capital, Antnanarivo. A second, smaller cost recovery program for the nmain hospital in the Tulear region was begun at the sanmetime. It is expected to be fully implemented by the end of 1994. The Ministfy of Health is currently considering expanding cost recoveryprograms to other regional hospitals.
The cost recovery program at the Toamasina hospital was implemented in two phases. The first phase was started in December 1992 andinstituted fees for laboratory work and sonogranis. The second phase began in January 1994 and consisted of fees for surgery (minor andmajor) and radiology treatment. Importantly, both phases were preceded by improvements in the services provided This includedrenovation of the hospital facilities and the purchase of new equipment and necessary supplies.
The basic principle of the cost recovery program is that health care services are not free and patients should expect to pay for them. Thissaid, the program acknowledges that not everyone is able to pay the full amount. As a result. a sliding scale of payment, according to thepatient's ability to pay, has been put into place. The standard fees are paid by those who can afford them.' Those who cannot afford to paythe full standard fee pay 20% of it. Whether or not a person is able to pay is decided by hospital administrative staff when the patient checksinto the hospital. There is no fonnal criteria for making the decision, only that the person demonstrate that they do not have the means topay. In many cases, the administrative staff tries to verify the person's income in an effort to avoid cheating.2
In addition to the above fees, there are also fees for the hospitalization (per diem bed fees).3 Preliminary inforabtion for 1994 (based on thefirst four mnonths of the year) indicates about one-fifth of hospitalizations are "payant" and the remaining four-fifth are "gratuit". Althoughthese statstics are not available for earlier years. hospital administrators estimate that the ratio has remained stable.The per diem hospitalization fees existed before the cost recovery program and have not been altered. The main difference since theimplementation of cost recovery is the improvement of the quality of the service: all patients, regardless of their hospitalization status. nowreceive free solution and essential drugs4 whereas before cost recovery each patient was responsible for providing their own supply of solutionand drugs. In addition, since the renovation of the hospital facilities, there is little if any difference in the quality of facilities and servicesamong the different levels of hospitalization.
Foreigners, who are generaly considered to have greater purchasing power, pay double the standard fee.2 It would be useful to have a stanudard means for accu,rately identitfing patients who are unable to pay. This is important to make sure that botlh noone is excluded from hospital services aid to dissuade cheating. In the past, there was a system where the poor were identified officially with a"certificate d'indigence." At present no such system exists, but there is the potential for a system to be establislhed where local communities, calledthe "colleclivitNs rdgionale," identify and take responsibility for those in the community who are unable to pay.3There are three per diem prices as well as free facilities. The pay scale is as follows: Level I bed-3,000 FMG/day; Level 2 bed-2,500FMG/day; Level 3 bed-I 500 FMG/dav; and Level 4 that is free. As of May 1994, of the 498 beds, 138 were "payauit" (with fee) and 360 were"gratuit" (free).4 As of May 1994 most of the drigs that are available to hospitalized patients free of charge are donated by NGOs or bilaterals, a result ofincreasing confidence in the improved, transparent management of the hospital. Hospital administrators plan to be able to cover all drug costs inthe near future, as the income from cost recovery increases.

163 Annex D
The current fees for the various hospital services, are set by the hospital administrators based on the amount needed to cover the medicalsumplies, plus a supplement to the medical staff salaries. This mlaiy supplement, which generally equals about half of the staff persodsregular salary, was inouced as part of the cost recovey program to help raly staff support of the cost recovery program and to compensteistalffforearning foregone as a result of the termination of the informal payments that they used to receive from patients. The cost of seicesunder cost recovery is less that the previous cost of medical supplies, let alone the additional fees paid to the medical staff (will also try toillustrate this point with the results from the EPM).
Pre&vuy Results. Although it is still very early in the process, the preliminary indicators are very promising. On the one hand, theincome from cost recovery is increasing. This is allowing the hospital to continue to improve the quality of services. The improvedmanagement and higher quality of services that have resulted from the cost recovery program have prompted the Ministry of Health toincrease its budget allocation for the hospital. Furthermore, the number of patients using the seices has increased (both paying and non-paying, although the trend in the latter is less evident because the statistics were not available before 1993). The fact that the averagehospital stay has deceased over time from an average of 11 days in 1991 to an average of less than 8 for the first four months of 1994 showthat the services are becoming more efficient Finally, the bed occupation rate has increased, but still remains rather low; this will beaddressed in the next phase of reforms.
Remaining chalenges. Despite these positive preliminary indicators, there are several remaining challenges which when attended to willfurther improve the quality and accessibility of the services. The first is the need to change the traditional practice of patients and medicalstaff vis-A-vis the personal side-payments to doctors for services. There continues to be a general fear of doctors that causes the patient to feelobligated to pay the doctors for the services, above and beyond the official payment for the services. The second is the need to revisit the bedoccupation rates and possibly decrease the number of beds that the hospital maintains5. At the same time, it may be necessary to increase theper diem fees currently being charged. It is planned that these issues will be revisited after the end of 1994. Third, the improvement of tbetechnical capacity of both the medical and administrative staff is continuing to take place, mostly with the assistance of the French. Finally,as the cost recovery program generates increased earnings, the hospital will be able to increase the availability of drugs and number of staff,as currently both continue to be undersupplied.
Sorce: Inteewi viith Hospital Administrators, 1994.
5 The number of hospital beds is appropriate in relation to the size of the population served by the hospital. Nevertheless, it is not clear why thebed occupation rate is not higher. Possible explanations include: (I) the fact that many private physicians do not send their patients to the hospitalso as to not loose a client; (ii) the fatalistic mentality that causes some people to accept sickness/death without trying to intercede; and (iii) a lackof confidence in the system due to past comiption. One aspect of this is the sister hospital program, where the Toamasina hospital will be paired with aFrench hospital (St. Denis de la Reunion). This mostly serves as a forum to exchange information on technological and management issues.

164
BIBLIOGRAPHY
Associates for International Resources and Development. Regional Specialization andAgricultural Growth in Madagascar. Boston, 1992.
Berg, Elliot and Ann McDermott, and Michael Cullen. The Impact of EconomicLiberalization on Madagascar's Agricultural Sector and Implications for USAIDStrategy. Washington, D.C.: Development Alternatives, Inc., 1990.
Bourdon, Jean, T. Hartnett, F. Orivel, C. Shaw. A Statistical Profile of Education in Sub-Saharan Africa in the 1980s. Paris: Donors for Afiican Education.
Condau, Danielle and Damour, Damour. Mission d'expertise programme d'appui auxservices de sante. CREDES. Paris. June 1994.
Delaine, Ghislaine, Demery, Lionel and Co. SDA Working Paper No. 14, Surveys andStatistics, Washington, D.C. : World Bank, 1991
Dorosh P. and S. Haggblade, Agricultural Growth Linkages in Madagascar, CornellFood and Nutrition Policy Program, Working Paper 22. 1992.
Enquete Nationale Demographique et Sanitaire 1992. Centre National de Recherches surl'Environnement and Demographic and Health Surveys. Maryland: MacroInternational Inc. February 1994.
Essama-Nssah, B. Impact of Growth and Distribution on Poverty in Madagascar,Informal Working Paper, World Bank, Draft December 1994.
European Union on Health. Health Sector Study Financed by EEC. Cerde. December1995.
Gertler, Paul and van de Gaag, Jacques. The Willingness to Pay for Medical Care:Evidence from Two Developing Countries. Washington, D.C.: World Bank. 1990
Jolly, Alison. The Rich, the Poor and the Wilderness: Can they co-exist?, Department ofBiology, Princeton University, 1989.
Macroeconomic Policies and the Poor in Madagascar. Cornell University. 1993
Madagascar. 1993 Population Census. Madagascar.
Meerman, Jacob. Public Expenditure in Malaysia: Who Benefits and Why? Washington,D.C.: World Bank. 1979

165
Ministry of Plan, Madagascar, Participatory Poverty Assessment for Madagascar. June1993.
Pryor, Frederick L. Income Distribution and Economic Development in Madagascar: SomeHistorical Statistics. World Bank Discussion Paper No.37, Washington, D.C: WorldBank, 1988.
Ravallion, Martin. Poverty Comparisons: A Guide to Concepts andMethods. LSMSWorking Paper No. 88. Washington, D.C.: World Bank. 1992.
Selowsky, Marcelo. Who Benefitsfrom Government Expenditure? A Case Study ofColombia. Washington, D.C.: World Bank. 1979.
Todero, Michael. Economic Development in the Third World, New York, 1982, p.12 9 .
van de Walle, Dominique. The Distribution of Subsidies Through Public Health Servicesin Indonesia, 1978-87. Washington, D.C.: World Bank. 1994.
World Bank. Basic Services for the Poor: Iniforming Public Choice (Draft). July 1996.
. Food Security and Nutrition in Madagascar. January 1990.
. Madagascar: A Strategy for High Growth and Poverty Alleviation: AnEconomic Strategy Note, June 29, 1994.
. Madagascar: Towards a School-based Strategy for Improving Primary andSecondary Education. Report No. 13450-MAG. Population and HumanResources Division, Central Africa and Indian Ocean Department, Africa Region.Washington, D.C.: World Bank, April 7, 1995.
. Private Sector Assessment. Washington, D.C., 1993.
. Poverty Alleviation in Madagascar: Country Assessment and Policy Issues,SDA Unit Report No. 7644-MAG, Washington, D.C., 1989.
.Madagascar Population and Health Sector Review. Washington, D.C.:World Bank, 1987.
_. Tommasi, Daniel. World Bank Estimates. Washington, D.C.1993.
. World Development Reports, Washington, D.C. (1985, 1988, 1995).

IBRD 20035R1:~~~~~~~~~~4 ; a-
-12 12C
MADAGASCAR Antsiranana
Paved road
Rou^teo accessible, sien touts so,,,, NOSY-E AAbil,btNan-permanent roads H -11 -1e i Votrirririno
-Routes -o-soos.-res H -4---- I-I,I Railroad, 6Am n
Cheiein de fer-Ann,
A pusts -.A'7rooos \_-'-' \ A 0 Samha
® N uti a%ltoI Bealonana +'F
F -tiy (pr-- capital AnololavoO O O
Chef-lie Se oFa-t-sy Anteohihy 4 - Andpo_- _ Farilany boundaries ?'t - - :i QAntEalaha
/iiniteo des Fantasy ,,-- '4-efnrin
_ _ Ileernationa, boundaries TRalondrianantetr
ms, es tso, 0 L aMaholanga. Pp,,
Mitsrqo '\ iLBarig Matidritiara
- at-10\- 16- ° t '
'42
Besolompy Maeuatsnana tatEtnana So.ieran. I-ongo NOSYMo-otonoo 0 3ORAf-A
O.Murafanoha r.- \ ~ u>tj (t AmbotondrazajaMainli ratono '-4 N.^
'+ - Anrasozot4e(Anlosorohtol tToamasina
OAioo - ea- Am ohidratrimof
+< TsiraapomandidvX, Miariariao anf sol ln
s e -/ '- Soa,inandr,anab FAn iarndo{olo 4Vtmn
M,sndtivaso - Yooshol Arbatol py nnosibo,iiialBeIo-Tsirihhina)4-- 4F aratn ~ nT 4
2Y~~~~~~~ AntsirabeF f t'lMahanoro 2
Marondava<s-t?hobo 6>Maloimod £'' /~oQdbn ,,
\ Ambotohnondrohono Ambositra Nosutarika
.- \_AnbdimahVsoa
.- d, F t, IfanadZ
Mor,rnbedelu\ 9 Y¶ndaua Barpinao jAobalaoao
'-5,. -~ ~ ~ ~ ~ M..n,
OAnkazoobo hasy, 'F Iahh MonaLora, w Ovohibe jp~~~~Vohipeno OiLOMEiEBS O 50 nro lAY 2YY
Antsir 0''
, : o st ~ ~~~~ MILES 0 50 l00M-nd- SoLoroho ~ \ Vondra,o Parafangana
SakarahaA - inn V,h." bsira 'N.,Vk
t a l ia r y w 4 ,- OhMa V o g oldrn
4 ~ ~ ~ ~ ~ " 0Mdonoy Zo RE TANYAF-. A
/Betiohn -Sod At, me S - h
2* '0 Beiabara / z -o 24- tJ ~ F'~ " COMOFn OS
V-dr.- ~ ~ ~ ~ AM~-'n' &[B
F 0
Mand ntenony -- g. d-
The boundaries. co/rt, F ! / TN I
d nonrnatrons and any Aoaniht - B 'ooron this map do not ' ' 4) Anranana~~~~~O .. m-o [Ri,
thipy on the port of A d A- CMi"W-Id I;d~nbaar,t~, AC IAThe World Bank Group _nTolagnaro -any judgment on the legal a astatus of any tQrritory- AmboaombeJor any endorsement SOUTH N
orf sisach AF FuCAhoondries ! 45 SWAZILAND
DiECEBER 1 994


~~~ __ 7 1~~~~~~~~~~~
;; " 4 r r > r + <~~~~~~~~~~~~~V2
*1~~~~~~~~~ ~ i, 11t{ -? , I * Ist f , n tf *, \
,. Hrf s $ > f r 5 1 2 t X ) s ; rS, v w ; v F _ ,/ tti+<L lyQ
i . A < tl A . >M/' t X t .¢ 4 it t . s nltvi,
J At K L \ Q } tii +6 +w 1 °|l 4 br L f t ) if 6+ R sit j N s) Cr W r V r_4 2 i; , > 9} ( s:e l ^45 t * f t E t 4 i « ' < ni 4 * Jr? ; L1 S' t$ t SS t> g e i
VP" It fir ;1 S.L * ' r #'; * ft
f S n n ~~~~~~~~~~4 4W1fg -$,>_;,-Sr
i F t ( t *!; X > Qf j/4, ,fs kj ?jm sf3j, ; f f ¢~~! d r% l j;sS5~>[
i j < frWs wS 2 w < *iS et ;iPH0 tsZts VLt AoI bLS WoL ; L sS tXyf Xt t,s #, Lst _f ,L 2> } LL,
^ ; X < e B + > i; \ ) d ffi r / r _~~~~~~~~~~~~~~~~~~~~, t 1
z~~~~~~~~~~~~~~~~O 5>t.4 Sd ,t- si 4j >> tr.g;........r
' ' ' ' X K 1 ' ' 1 T ' 4 ~~~~. 1 *e . '. ^
.t. ^ ., 4 z k t t; A = , 5 > I X 4 t g~~~~~~~~~~~~~~~~~~~~~~~~~~~~~~~~~% ; t s ;. Y,9 * _ i S t z ffi t j~~~~~~~~~~~~~~~~~~~~~~~~~~i