Embed Size (px)
Citation preview

Mammography Analysis Using A Soft Perceptual Segmentation Approach
D. Cherifi a,b, A. Beghdadi a, P.Viaris de Lesegno a and A.H. Belbachir b
a L2TI, Institut Galilée – Université Paris 13 - 99, avenue J. B. Clément – 93430, Villetaneuse, France
a,b LAAR, Département de Physique, Faculté des Sciences, Université des Sciences et de la Technologie Mohamed Boudiaf - BP 1505 El M’Nouar Oran, Algérie
Cherifi, beghdadi, [email protected], [email protected]
Abstract—A new mammography image segmentation method based on a perceptual and fuzzy approach is proposed. The main idea is to exploit some properties of the Human Visual System namely the directional and frequency selectivity and the fuzzy sets theory in order to segment the mammography images into meaningful components. A contrast enhancement is used in the case of suspicious cases identified during the segmentation process. The performance of the proposed method is objectively evaluated using the just-noticeable difference measure expressed through a saliency map of the mammography image before and after processing. The obtained results confirm the efficiency of the method in segmenting the images into meaningful regions.
Keywords—Contrast enhancement, just-noticeable difference, mammography, segmentation
1. INTRODUCTION
Digital mammography remains up to now the primary means for an effective imaging modality for detection of the cancer breast. Furthermore, an early detection of the small malignancies as the microcalcification is the best way to reduce a cause of mortality of the women. But in practice, the quality of mammography image is very poor. The low contrast between the normal glandular tissues and the malignant tissues makes the diagnosis ambiguous and difficult. Numerous contrast enhancement methods have been then proposed for mammography image. Some are based on a global analysis of the image [1] and others exploit some local characteristics of the image [2]. However, since the ultimate judge is the observer it would be useful to exploit some characteristics on the human visual system (HVS) such as its frequency and directional selectivity. Thus, several wavelet based methods for contrast enhancement have been proposed [3]-[5]. However, these transforms present some drawbacks such as the lack of rotation and the translation invariance. A new contrast enhancement method combined with a fuzzy-based segmentation process is used for detecting subtle details in low contrasted mammography images. The use of fuzzy logic in the contrast enhancement and segmentation process allows to deal with the difficulties related to vagueness and ambiguity encountered in mammography tissues. The whole
process is performed in a perceptual framework where the just-noticeable difference (JND) is used as an index of details visibility. The obtained results clearly demonstrate the efficiency of the use of fuzzy logic and some perceptual aspects of the HVS in detecting abnormal details in mammography.
This paper is organized as follows: section 2 describes our approach to extract the microcalcifications/masses in the mammography image. A subjective evaluation is proposed in section 3, that evaluate the mammography image before and after both segmentation and enhancement treatment. The results are then discussed in section 4. Finally, a conclusion and some perspectives are given.
2. THE PROPOSED METHOD
The approach proposed here is based on an iterative scheme, consisting of fuzzy based segmentation and contrast enhancement methods. 2.1. Fuzzy segmentation method
Several fuzzy segmentation approaches have been developed [6]-[7] for mammography images. Where, the fuzzy sets represent appropriately the different interrelated tissues present in the digital mammography. A new fuzzy adaptive contrast multi-directional and multiscale segmentation (FACMS) method is proposed. It allows to segment the image into four regions as proposed by Bauer et al. in [8], where the mammography image is decomposed through its morphological characteristics tissues {Homogeneous R1, Edge R2, Raster R3 and aquarelle R4, as presented in Fig.1}. In contrast, in our approach the tissue classification is performed on the basis of biopsy feature {the background R1, healthy tissues R2, suspicious tissues R3 and affected tissues R4}.

Fig. 1: The four segmented regions (left to right): R1, R2, R3 and R4
The different steps of fuzzy segmentation method are defined in the following: 2.1.1. Post-treatment Usually, the gray-level images are observed by the user on a computer screen as luminance. Furthermore, the dynamic range of the mammography image is often unbalanced leading to some loss of visibility of fine details. To cope with this limitation, the gray level image is first stretched to the whole gray-level range [0 255] and then converted into luminance range [Lmin Lmax], as follows:
=γ
255
),(.,max),( maxmin
jiimLLjiL src
src (1)
Where ),( jiimsrc is the gray level of the pixel ),( ji ,
2min Cd/m2.0=L , 2
max Cd/m100=L and 25.0/1=γ are
the commonly used values for our computer screens. 2.1.2. Background substraction The image is first thresholded using a threshold deduced from the gray-level histogram in order to extract the target (breast) from the background. This results in a binary Black and White mask (BW). Then, a morphological opening operation is used to remove spurious points in the background and in the region B. A connected component labeling process [9] is then applied to isolate the different classes so as to extract the region of interest and to remove the radiopaque artifacts that may appear on the top of the mammography images. Note that in the case of the mediolateral-oblique (MLO) mammography, the pectoral muscle is extracted and removed from the image. Indeed, the density of pectoral muscle region is very close to masses/microcalcifications regions within the mammography image and may induce erroneous diagnosis. Fig.2 represents illustrates this post-treatment on a typical mammography image.
The radiopaque artifacts The pectoral muscle
(a) (b) (c) Fig. 2: The mammography image before (a) and after (c) removing the background; radiopaque artifacts and pectoral muscle with the BW mask
extraction (b)
2.1.3. The multidirectional and multiscale luminance contrast There is no universal definition of contrast that is appropriate for all visual stimuli. The well known contrast measures introduced by Weber-Fechner and Michelson are adapted to simple stimuli. For real and complex images, numerous measure definitions of contrast are proposed [10]-[11]. However, these contrast are isotropic and do not take into account the directionality sensitivity of the HVS. In [18] a directional bandlimited contrast has been introduced using Gabor filter decomposition. Here, the local bandlimited directional contrast is computed using the Steerable pyramid transform (SPT) [12]-[14] as alternative to Gabor decomposition. The SPT decomposes the image into high-pass and low-pass components, and then the low-pass component is decomposed intoK oriented sub-bands components and another lower-pass component. The construction of the pyramid is done by repeating recursively the process starting from a down-sampled image of the last lowest-pass component. Therefore, the multidirectional and multiscale contrast ctr is defined as follows:
{ }NnjiL
jiB
jictrn
K
knk
n ,..2,1 ,),(
),(
),( 1 ==∑
= (2)
Where KandN are the number of levels and directions,
respectively. ),(),,( jiLjiB nnk represent the sub-bands and
low SPT luminance components, respectively. 2.1.4. Fuzzy segmentation The fuzzy approach used for segmenting the mammography image is based on the classical fuzzy rules. Starting from three inputs: luminance (Ln), Black-white (BW), contrast ctr and one output s is computed. Four regions are then defined. The shapes of the membership functions of the inputs and the output variable are presented in Fig.3. The corresponding fuzzy rules that cover all possible combinations are:

4
3
2
1
Then target)is and is and is ( If
Then target)is and is and is ( If
Then target)is and is and is ( If
or target)is and is and is ( If
Then ) is and is ( If
s=RBWLowctrHighL
s=RBWLowctrMedL
s=RBWHighctrHighL
BWHighctrMedL
s=RbackgroundBWLowL
n
n
n
n
n
Fig. 3: Membership functions (1), (2), (3) and (4) of
,,, sandctrBWLn respectively
2.2. Fuzzy JND enhancement method
A fuzzy adaptive just-noticeable contrast enhancement (FAJNDE) method is proposed. It enhances locally the segmented regions as obtained in section before according to the JND visibility map. 2.2.1. Just-Noticeable Distortion The just-noticeable distortion JND is a saliency map correlated to the HVS observation. In fact, the HVS is insensitive to the intensity changes around a pixel below the JND threshold due to their spatial sensitivity and masking properties [15]. Here we use the spatial JND model as proposed in [16] and defined as follows:
<+
≥=
),(),( if 3
),(),( if j)(i,),(
jitTjilT
jitTjilTlTjiJND
β (3)
Where, ),(,5.2 jiTl=β represents the visibility
thresholds for the background luminance masking and ),( jiTl denotes the maximum intensity change in the SPT
bands-pass components for a pixel ),( ji as given by:
( )
otherwise 3127),(128
3
127j)(i, if 3127
);(117
j)(i,
+−
≤+
−
=
jiI
IjiI
lT (4)
Where ∑∑= =
+−+−=5
1
5
1
),().3,3(32
1j)(i,
k losrc lkLljkiimI (5) and
),(0 klL is low-pass filter.
( )),(j)(i, max
:1;1jiBtT nk
Kkn === (6)
The JND saliency model highlights the areas which are
more attracted by the HVS. The idea is to use this map in order to enhance adaptively the mammography image. Furthermore, the highly contrasted areas are de-enhanced in order to make them less attractive and to attenuate their masking effect on subtle details. 2.2.2. Fuzzy contrast enhancement rules The FAJNDE method uses two inputs s, JND and delivers an output Q. The shapes of membership functions of the inputs and output variables are presented in Fig.4. The corresponding fuzzy rules are:
44
44
3
33
22
22
11
Then ) is ( If
or Low) is and is ( Ifor High) is and is ( If
Then
Low) is and is ( Ifor High) is and is ( If
Then ) is ( If
or Low) is and is ( Ifor High) is and is ( If
Then High) is and is ( If
eQRs
JNDRsRs
eQ
JNDRsJNDRs
eQRs
JNDRsJNDRs
eQJNDRs
=
=
=
=
Fig. 4: Membership functions (1) and (2) of ,QandJND
respectively
Finally, the transformed luminance Lenh is converted back into gray-level as follows:
γ1
max
),(255),(
=
L
jiLjiim enh
enh (7)
The proposed method starts by segmenting the
mammography image into four fuzzy regions, then we check the number of regions obtained, if the number is only two {the background and the healthy tissues}, the enhancement process would not be applied and the image is classified as a normal mammography image. Otherwise, the segmented
)(JNDµ
Low High 1.0
{ }1 and 4.0,25.0,0=Q
0.0 21 jj
(1) (2)
)( nLµ )(BWµ
Low Medium High background target 1.0 1.0 0.0
4321 llll 0.0 21 cc
(1) (2)
)(ctrµ )(sµ
Low High R1 R2 R3 R4 1.0 1.0 0.0
21 bb 0.0 654321 rrrrrr
(3) (4)
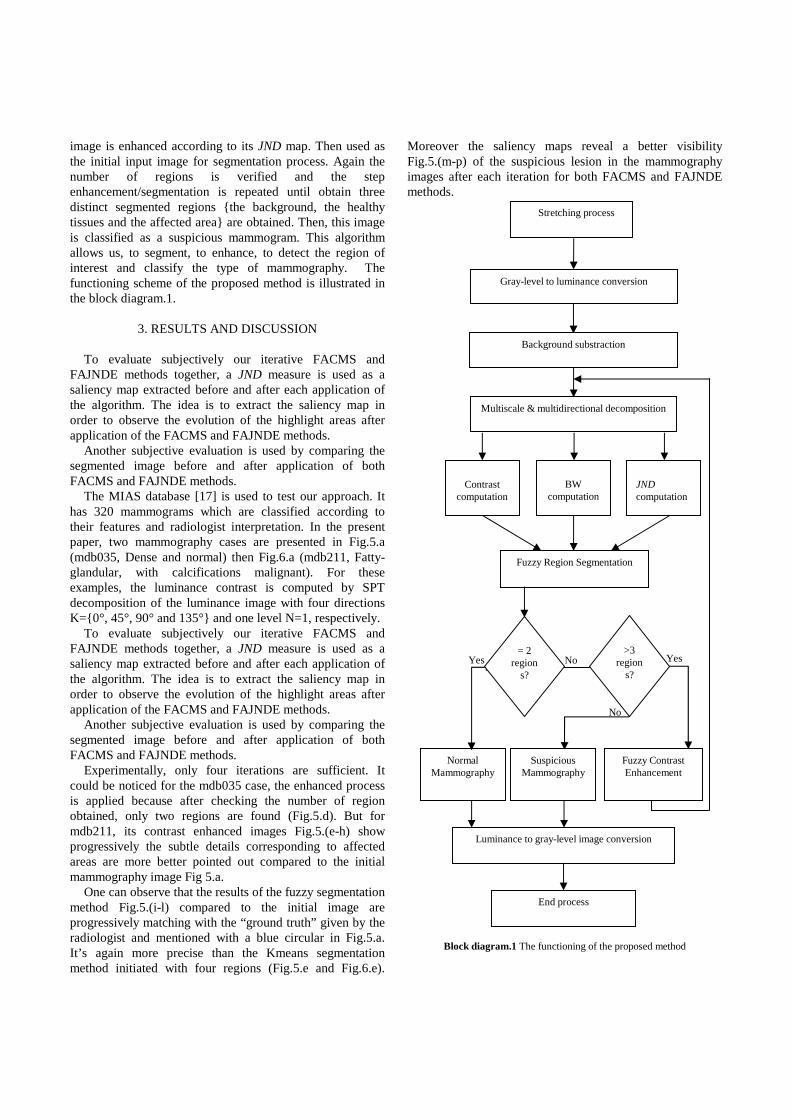
image is enhanced according to its JND map. Then used as the initial input image for segmentation process. Again the number of regions is verified and the step enhancement/segmentation is repeated until obtain three distinct segmented regions {the background, the healthy tissues and the affected area} are obtained. Then, this image is classified as a suspicious mammogram. This algorithm allows us, to segment, to enhance, to detect the region of interest and classify the type of mammography. The functioning scheme of the proposed method is illustrated in the block diagram.1.
3. RESULTS AND DISCUSSION
To evaluate subjectively our iterative FACMS and FAJNDE methods together, a JND measure is used as a saliency map extracted before and after each application of the algorithm. The idea is to extract the saliency map in order to observe the evolution of the highlight areas after application of the FACMS and FAJNDE methods.
Another subjective evaluation is used by comparing the segmented image before and after application of both FACMS and FAJNDE methods.
The MIAS database [17] is used to test our approach. It has 320 mammograms which are classified according to their features and radiologist interpretation. In the present paper, two mammography cases are presented in Fig.5.a (mdb035, Dense and normal) then Fig.6.a (mdb211, Fatty-glandular, with calcifications malignant). For these examples, the luminance contrast is computed by SPT decomposition of the luminance image with four directions K={0°, 45°, 90° and 135°} and one level N=1, respectively.
To evaluate subjectively our iterative FACMS and FAJNDE methods together, a JND measure is used as a saliency map extracted before and after each application of the algorithm. The idea is to extract the saliency map in order to observe the evolution of the highlight areas after application of the FACMS and FAJNDE methods.
Another subjective evaluation is used by comparing the segmented image before and after application of both FACMS and FAJNDE methods.
Experimentally, only four iterations are sufficient. It could be noticed for the mdb035 case, the enhanced process is applied because after checking the number of region obtained, only two regions are found (Fig.5.d). But for mdb211, its contrast enhanced images Fig.5.(e-h) show progressively the subtle details corresponding to affected areas are more better pointed out compared to the initial mammography image Fig 5.a.
One can observe that the results of the fuzzy segmentation method Fig.5.(i-l) compared to the initial image are progressively matching with the “ground truth” given by the radiologist and mentioned with a blue circular in Fig.5.a. It’s again more precise than the Kmeans segmentation method initiated with four regions (Fig.5.e and Fig.6.e).
Moreover the saliency maps reveal a better visibility Fig.5.(m-p) of the suspicious lesion in the mammography images after each iteration for both FACMS and FAJNDE methods.
Block diagram.1 The functioning of the proposed method
No
Yes No Yes
Stretching process
Gray-level to luminance conversion
Background substraction
Multiscale & multidirectional decomposition
Contrast
computation
BW
computation
JND computation
Fuzzy Region Segmentation
Fuzzy Contrast Enhancement
Luminance to gray-level image conversion
End process
>3 region
s?
Suspicious Mammography
Normal Mammography
= 2 region
s?

(a) Original image
(C) The original (a) with the mask (b)
(b) BW of (a)
(d) The segmented of (c)
(e) The segmented of (c) with Kmeans
4. CONCLUSION AND PERSPECTIVES
This approach represents an efficiency treatment where the enhancement process is adjusted for each pixel according to their corresponding segmented region and visibility. This approach allows to enhance and to filter the noise. The obtained results confirm that the proposed algorithm is efficient in enhancing the subtle details and segmenting the mammography image making thus the diagnosis easier.
As perspective, an objective quality metric of mammography images correlated with the subjective assessment of radiologist and doctor will be developed.
5. REFERENCES
[1] R. C. Gonzalez and R. E. Woods, “Ddigital image processing, 1st ed. Reading, MA: Addision-Wesley, 1992. [2] R. Gordon and R .M. Rangayyan, “Feature Enhancement of Film Mammograms using Fixed and Adaptive Neigbourhoods,” Applied Optics, vol. 23, pp. 560-564, 1984. [3] A. F. Laine, S. Schuler, J. Fan, and W. Huda, “Mammographic feature enhancement by multiscale analysis,” IEEE Trans. Med. Imag., vol. 13, pp. 725–740, Apr. 1994. [4] W. Qian, L. P. Clarke, M. Kallergi, H.-D. Li, R. Velthuizen, R. A. Clark, and M. L. Silbiger, “Tree-structured nonlinear filter and wavelet transform for microcalcification segmentation in mammography,” in Proc. SPIE Biomedical Image Processing and Biomedical Visualization, San Jose, CA, vol. 1905, pp. 509–520, 1993. [5] L. Li, W. Qian, and L. P. Clark, “X-ray medical image processing using directional wavelet transform,” in Proc. IEEE Int. Conf. Acoustics, Speech, and Signal Processing, 1996, Atlanta, GA, vol. 4, pp. 2251–2254. [6] I. Gath, A.B. Geva,”Unsupervised optimal fuzzy clustering”, IEEE Trans. Pattern Anal. Mach. Intell, vol. 11(7), pp. 773-781, 1989. [7] Y.W. Lim & S.U. Lee “On The Color Image segmentation Algorithm Based on Thresholding and Fuzzy C-Means Techniques”, Pattern Recognition, vol. 23(9), pp. 935-952, 1990. [8] P. Bauer, U. Boden Hofer, and E. Klement. “A Fuzzy System for Image Pixel Classification and its Genetic Optimization,” In proceedings of European Meeting on Cybernetics and Systems Research, pp. 285-290. 1996. [9] L. Sanz, D. Petkovic, “Machine vision algorithms for automated inspection of thin-film disk heads”, vol. 10, pp. 830-848, 1988. [10] A Beghdadi and A. Le Négrate, "Contrast enhancement technique based on local detection of edges", CVGIP, vol. 46, 1989, pp. 162-174. [11] E. Peli, "Contrast in complex image", J. Opt. Soc. Am. A vol. 7, no. 10, pp. 2032-2040, 1990. [12] W.T. Freeman and E.H. Adelson, “The Design and Use of Steerable Filters,” IEEE Trans, Pattern Anal, Machine Intell, vol. 13, pp. 891-906, 1991. [13] E.P. Simoncelli, W.T. Freeman, E.H. Adelson, and D.J. Heeger, “Shiftable multiscale transform,” IEEE Trans, Information theory, vol. 38(2), pp. 587-607, 1992. [14] E.P. Simoncelli and W.T. Freeman, “The steerable pyramid: a flexible architecture for multiscale derivative computation,” Second international Conf. on Image proc., vol. 3, pp. 444-447, Washington, DC, Oct. 1995. [15] N. Jayant, J. Johnston, R. Safranek, Signal compression based on models of human perception, in: Proceedings of the IEEE, pp. 1385-1422, October 1993. [16] C. H. Chou and Y. C. Li, A perceptually tuned subband image coder based on the measure of just-noticeable-distortion profile, IEEE Trans. Circuits Syst. Video Techno., vol. 5, 467-476, 1995. [17] http://peipa.essex.ac.uk/info/mias.html.
[18] A. Beghdadi, G. Dauphin, A. Bouzerdoum, "Image analysis using local band directional contrast", in Proc. of the International Symposium on Intelligent Multimedia, Video and Speech Processing, ISIMP'04, Hong Kong, October 20-22, 2004
Fig. 5: Simulations results of healty case

(a) Original image
(b) BW of (a)
(c) The original (a) with
the mask (b)
(e) The enhanced of (a)
(f) The enhanced of (b)
(g) The enhanced of (c) (h) The enhanced of (d)
(i) The segmented of (a)
(m) The Vmap of (a)
(j) The segmented of (b)
(n)The Vmap of (b)
(k) The segmented of (c)
(o) The Vmap of (c)
(l) The Segmented of (d) (d) The segmented of (c) with Kmeans
(p) The Vmap of (d)
Fig. 6: Simulations results of affected case


