Embed Size (px)
Citation preview

The American Journal of Medicine

1
Mammography screening among the elderly: A research challenge
Maureen Sanderson PhD a Robert S Levine MD a Mary K Fadden MPH a
Ba
a Depar N 37208
b Divisi L 37232
c Cente
d Depar Knox
e Depar
f Depar Texas
g Moreh A
h Charl 31, USA
Running t
Correspon Meharry M 1-615-321-2
Abstract w Number o Number o Conflict of interest for all authors: None All authors had access to the data and a role in writing the manuscript.

2
Abstract Background: Randomized trials demonstrate clear benefits of mammography screening in
women through age 74 years We explored age- and race-specific rates of mammography
screening
Methods:
Epidemio
Hispanic es
diagnosed
mammog st
cancer mo
Results: A
condition
intervals)
women ag r
biennial m r
biennial m
stratified
Conclusio
selected f ng
women w re
similar am
used for current screening mammography recommendations.
Keywords: Breast cancer screening, mortality, racial disparity, geographic disparities

4
Introduction
Randomized trials demonstrate clear benefits of mammography screening in women up
to age 74 years 1 After age 74 there are no cogent data from randomized trials 1 Data from
minority p
(SEER) p
screening er
mortality ual
or biennia

5
Materials and Methods
Detailed methods of the SEER-Medicare linked file are previously published.2 The SEER
program, comprised of 17 highly qualified cancer registries reflecting 26% of the US population,
includes d
health ins nd
women ag
were succ R
registries S
Census B
A
1995 thro
was chose he
exposure
preceding
irregular m
female, n A
and B cov re
not provid
Hispanics
non-Hisp
Smith-Bin
mammograms.
6
The women were categorized into three mutually exclusive age groups at breast cancer
diagnosis: (Group 1) women ages 69-74 years since the American Cancer Society (ACS)8 and
the United States Preventive Services Task Force (USPSTF)1 recommend regular mammography
for wome
cleanly in d
USPSTF up.
Th
women di
persons w .
Exclusion
diagnoses
diagnosed
Committe
Medicare
(n=17,618
detecting
between t
(n=17,236 7;
Group 3, 7 f
breast can
ages 69-8 r-
years pre-diagnosis while stratifying by race and controlling for confounding factors.9 Cause of
death was available from the SEER file. Survival time was calculated in months from the date of

7
diagnosis to the date of death or the date of last follow-up (December 31, 2010, indicated in the
Medicare file). Cases lost to follow-up, those still alive at the end of the follow-up period, or
those who died of causes other than breast cancer were censored No assumptions were made
about the
Kaplan-M
Si ng
on breast
and AJCC
hazards m as
no eviden
confound sis
year, urba
condition es
made or p
elsewhere
status, we
informati el,
and the pe
separately
radiation
screening
status were retained for confounding adjustment to conform to other analyses.

8
Results
Tables 1 and 2 compare the demographic characteristics of non-Hispanic white and black
women who died of breast cancer with those who were alive or censored at 5 years post
diagnosis er,
have a lat
economic ive
radiation
women. A wn)
did not su
Ta
for 5-year ed
for AJCC
economic
referent g ve
to no/irre s
(Table 3) 43-
0.58), 0.4 e
4) they w -
0.66), 0.4 ar,
biennial, ,
correspon 7
(0.44-0.51) for biennial mammography among whites and 0.36 (0.29-0.44) for annual and 0.47
(0.37-0.58) for biennial mammography among blacks. Tests for trend were again highly
significant.

9
Conclusions
In these data, 69 to 84 year old women receiving regular annual screening mammography
during the four years immediately preceding breast cancer diagnosis had consistently lower five-
year and t
regardles ng
blacks ag
associatio y,
chemothe
Tw s
for screen
that in the r
screening
schedule. d.16
The USPS
adds that CS
and USPS
mammog
mammog
observatio
A s
of ongoin
University of Michigan18 and a six-county mobile van program at the University of California
San Francisco19). Neither is representative of the US. Also, in each study, the end points focused
10
on tumor size at detection,18,19 which may lead to more conservative estimates (i.e.,
underestimates) of benefit.20 In the University of Michigan study,18 a retrospective record review
of women ages 65 years and older (1988 to 1995) the proportion of patients who presented with
a palpable
(48%) tha
proportio p
with the s co
study (19 s
27% smal hy
was assoc re
reduced, a er
biopsy co
annual gr of
tumor cha
attendanc
contrast to
determine ad
been regu
Th ity
of data am
observatio
primary endpoint was breast cancer mortality. Limitations of the predictive models include
reliance on self-reported mammography and national cohorts. Specifically, mammography self-

11
report overestimates use26 and underestimates disparities,26, 27 while the use of national
cohorts23,25 may obscure variations in potential benefit among demographic and geographic sub-
populations For example differences in mortality according to geographical area of residence
and amon
considers
A g to
frequency
biennial s
United Ki r
study33 co
interval fo
screens ov n
contrast, t
biennial s
that study at
greater cl
A
percentag
irregular,
(2002-200
positives)
mammography (2.5%) which would not have occurred with biennial screening. Among blacks,
there were 35 biopsies among the 1,277 women receiving annual mammography (2.7%) which

12
would not have occurred with biennial screening. The net increase for annual screening was
therefore 323 biopsies among the 54,213 women receiving either annual or biennial
mammography (0 6%)
A
data from y
utilization t
for bienni
annual sc
can be us
US, it is u
Linking th a
are also s F1)
as the exp
mammog
Li
underestim e
US. SEER
since 199 in
these data es
such as le
(screening
screening may be healthier and may have a variety of social advantages).16 Further, it has been
estimated that the lag time between the start of screening and onset of mortality benefits may be

13
at least 10 years.17 Nonetheless, the better 10-year survival associated with annual
mammography in these data lessens the probability that observed benefits are solely due to lead
time bias. Similarly the observation of benefits independent from AJCC stage radiation therapy,
and chem at
the time o
independe ue
to the fac
adjustmen
reflect be
which the
status, SE
consisten
promising
In
accounted
believe th in
this popu
reflected od
of greater d
ethnic mi r
2030.3 W
biennial mammography would be hampered by high costs and feasibility issues, this design
strategy would provide the most reliable means to assess the most plausible way to discriminate

14
small to moderate differences. In the interim, the present results highlight the evidentiary
limitations of data used for current screening mammography recommendations.

15
Acknowledgements
This study was supported in part by a grant from the National Institute of Minority Health
and Health Disparities (grant P20 MD000516).

16
References
1. U.S. Preventive Services Task Force. Screening for breast cancer: U.S. Preventive
Services Task Force Recommendation Statement Ann Intern Med 2009 ;151(10) :716-
7
2. W
a
3. U .
U ns:
2
4. E d
R y.
A
5. M
v
U
6. S d to
a
4
7. F
m
8. S 3:
A review of current American Cancer Society guidelines, current issues in cancer

17
screening, and new guidance on cervical cancer screening and lung cancer screening. CA
Cancer J Clin 2013; 63(2): 88-105.
9. Breslow NE Day NE Statistical Methods in Cancer Research Vol 2 The Analysis of
C
10. C y
b er
E
11. C
c
4
12. D
I
13. R
I
4
14. K ng
p
15. K
s sed
m ct.
A
16. Walter LC, Schonberg MA. Screening mammography in older women: A review. JAMA
2014; 311(13): 1336-1347.

18
17. Braithwaite D, Mandelblatt JS, Kerlikowske K. To screen or not to screen older women
for breast cancer: A conundrum. Future Oncol 2013; 9(6): 763-766.
18. Field LR Wilson TE Strawderman M et al Mammographic screening in women more
th 8;
1
19. H
v J
R
20. S
s
1
21. B
B
22. P
c
23. M
s
S
24. B
u
c st
2013; 105(5): 334-341.

19
25. Mandelblatt JS, Cronin KA, Bailey S, et al. Effects of mammography screening under
different screening schedules: Model estimates of potential benefits and harms. Ann
Intern Med 2009; 151(10): 738-747
26. R
h
27. N
w
1
28. C l
m
C
29. B
s ng
C
30. A e
U
31. H
re
H 66.
32. C
C
January 2013. Data are compiled from Compressed Mortality File 1999-2011 Series 20

20
No. 2P, 2013. Accessed at http://wonder.cdc.gov/cmf-icd10.html on May 12, 2014
6:13:22 AM
33. Hennekens CH DeMets D Statistical association and causation: Contributions of
d
34. N
s
35. C
C
fr
1 l
o
36. C
in gy,
a 9;
2
37. H due
e
2

Table 1. Demographic characteristics of white women age 69-74 diagnosed with primary non-metastatic breast cancer who did and did not die from breast cancer by time period Dead (n=2,407) Alive or Censored (n=22,289) Characteristic n % n % Age (years) 66-69 5.9 70-74 4.1 Diagnosis 1995-19 9.3 1998-20 4.9 2001-20 4.1 2004-20 1.7Urban/Rur Big met 1.9 Metro 9.5 Urban/le 8.6 AJCC stag In Situ/I 2.9 II 0.3 III 1.9 Unstage 4.9 Surgery Yes 7.5 No/Unk 2.5 Radiation Yes 7.7 No 9.8 Unknow 2.5Chemothe Yes 7.2 No 8.7 Unknow 4.0 Charlson i 0 8.4 1 7.5 ≥2 7.3 Unknow 6.8 Contextua Quartile 6.3 Quartile 4.8 Quartile 4.7 Quartile 4.2

Table 2. Demographic characteristics of black women ages 69-74 diagnosed with primary non-metastatic breast cancer who did and did not die from breast cancer Dead (n=335) Alive or Censored (n=1,831) Characteristic n % n % Age (years) 66-69 7.1 70-74 2.9 Diagnosis 1995-19 6.0 1998-20 2.2 2001-20 5.9 2004-20 5.9Urban/Rur Big metr 7.3 Metro 2.4 Urban/le 0.3 AJCC stag In Situ/I 4.8 II 2.8 III 3.3 Unstage 9.1 Surgery Yes 5.3 No/Unk 4.7 Radiation Yes 9.7 No 7.4 Unknow 2.9Chemothe Yes 0.2 No 5.3 Unknow 4.5 Charlson i 0 0.3 1 5.7 ≥2 6.9 Unknow 7.1 Contextua Quartile 5.7 Quartile 4.8 Quartile 5.1 Quartile 4.4

Table 3. Hazard ratios of 5-year breast cancer mortality associated with mammography screening among non-Hispanic white women: (a) ages 69-74; (b) ages 75-78; and (c) ages 79-84 years
(a) 69-74 years (Group 1) Dead (n=1,569)
Alive or Censored (n=23,127)
n % N % HRa 95% CIb Mammogr No/Irreg ) Biennial 58) Annual 3) p-value fo
(b) 75
Ib Mammogr No/Irreg ) Biennial 55) Annual 2) p-value fo
(c) 79
Ib Mammogr No/Irreg ) Biennial 45) Annual 3) p-value fo aHazard ra contextual b95% Con
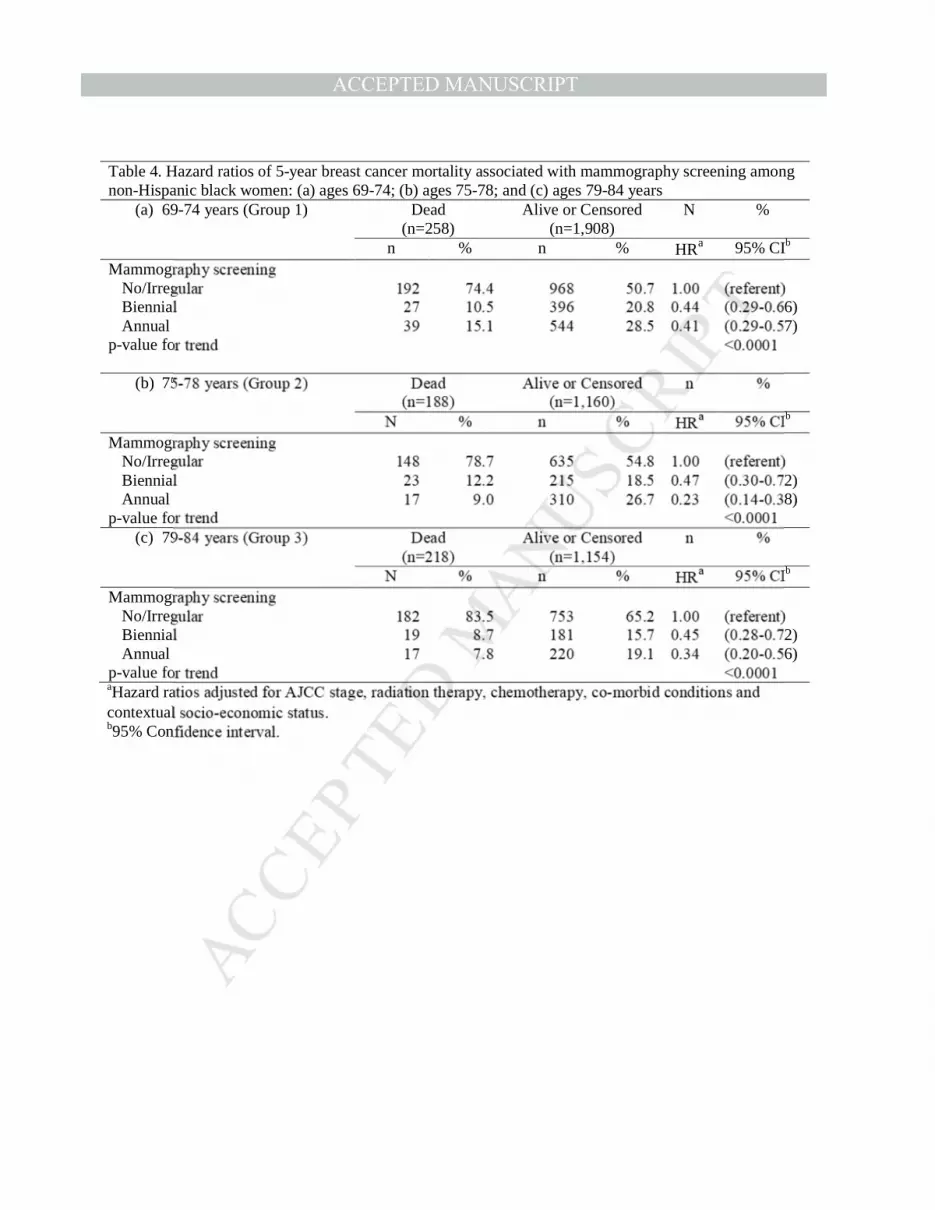
Table 4. Hazard ratios of 5-year breast cancer mortality associated with mammography screening among non-Hispanic black women: (a) ages 69-74; (b) ages 75-78; and (c) ages 79-84 years
(a) 69-74 years (Group 1) Dead (n=258)
Alive or Censored (n=1,908)
N %
n % n % HRa 95% CIb Mammogr No/Irreg ) Biennial 66) Annual 57) p-value fo
(b) 75
Ib
Mammogr No/Irreg ) Biennial 72) Annual 8) p-value fo
(c) 79
Ib Mammogr No/Irreg ) Biennial 72) Annual 56) p-value fo aHazard ra contextual b95% Con

Table 5. Hazard ratios of 10-year breast cancer mortality associated with mammography screening among non-Hispanic white women and black women age 69-84 years
White women
Dead (n=6,303)
Alive or Censored (n=53,195)
n % n % HRa 95% CIb Mammogr No/Irreg ) Biennial 51) Annual 3) p-value fo
Bl
Ib Mammogr No/Irreg ) Biennial 58) Annual 44) p-value fo aHazard ra contextual b95% Con

Clinical Significance
• Black and white women ages 75 to 84 years who had annual mammography had lower ten year breast cancer mortality than corresponding women who had biennial or no


