Embed Size (px)
Citation preview
Office of the EVP and Chief Financial Officer
Direct Lines: 8573-4074 Fax: 8526-3416 Trunk Lines: 8526-3131 to 70/8891-6040 to 70
Locals: 4074,4499
March 19, 2020 MS. JANET A. ENCARNACION HEAD, DISCLOSURE DEPARTMENT Philippine Stock Exchange 6/F PSE Tower 28th Street corner 5th Avenue BGC, Taguig City Dear Ms. Encarnacion: In compliance with the reportorial requirements of Section 17 of the Securities Regulation Code (SRC) and Section 177 of the Revised Corporation Code of the Philippines, we provide you the SEC Form 17-A report of Philippine National Bank as of December 31, 2019. Very truly yours, NELSON C. REYES Executive Vice President & Chief Financial Officer cc: ATTY. MARIE ROSE M. MAGALLEN-LIRIO Head – Issuer Compliance and Disclosure Department (ICCD) Philippine Dealing & Exchange Corporation 37th Floor, Tower 1, The Enterprise Center 6766 Ayala Avenue corner Paseo de Roxas Makati City
1
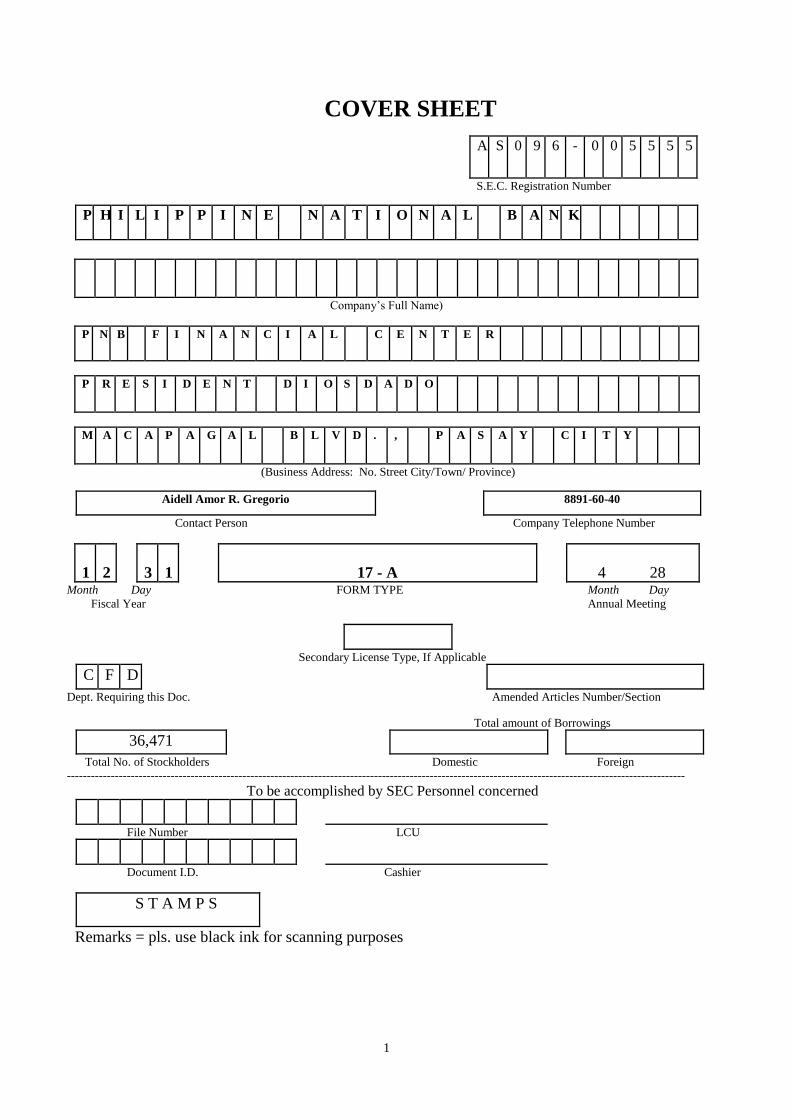
COVER SHEET
A S 0 9 6 - 0 0 5 5 5 5
S.E.C. Registration Number
P H I L I P P I N E N A T I O N A L B A N K
Company’s Full Name)
P N B F I N A N C I A L C E N T E R
P R E S I D E N T D I O S D A D O
M A C A P A G A L B L V D . , P A S A Y C I T Y
(Business Address: No. Street City/Town/ Province)
Aidell Amor R. Gregorio 8891-60-40
Contact Person Company Telephone Number
1
2
3
1
17 - A
4 28 Month Day FORM TYPE Month Day
Fiscal Year Annual Meeting
Secondary License Type, If Applicable
C F D
Dept. Requiring this Doc. Amended Articles Number/Section
Total amount of Borrowings
36,471
Total No. of Stockholders Domestic Foreign
-----------------------------------------------------------------------------------------------------------------------------------------------------------
To be accomplished by SEC Personnel concerned
File Number LCU
Document I.D. Cashier
S T A M P S
Remarks = pls. use black ink for scanning purposes
2
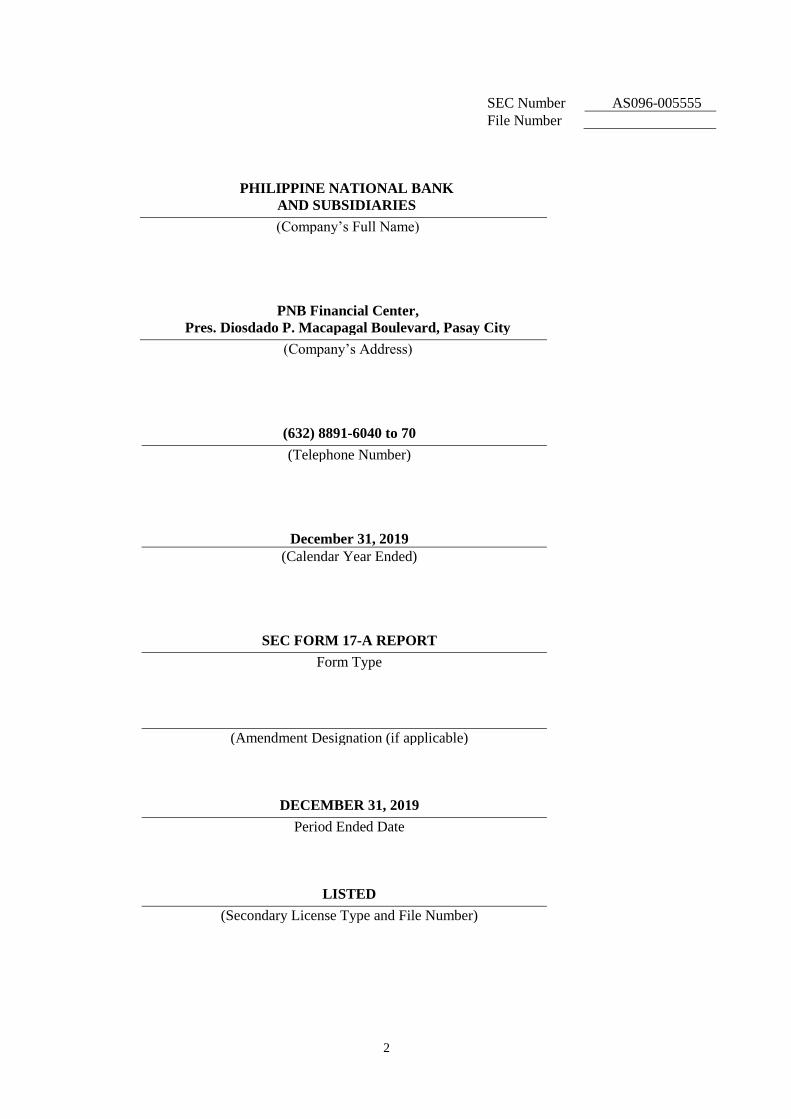
SEC Number AS096-005555
File Number
PHILIPPINE NATIONAL BANK
AND SUBSIDIARIES (Company’s Full Name)
PNB Financial Center,
Pres. Diosdado P. Macapagal Boulevard, Pasay City (Company’s Address)
(632) 8891-6040 to 70 (Telephone Number)
December 31, 2019
(Calendar Year Ended)
SEC FORM 17-A REPORT Form Type
(Amendment Designation (if applicable)
DECEMBER 31, 2019 Period Ended Date
LISTED (Secondary License Type and File Number)
3
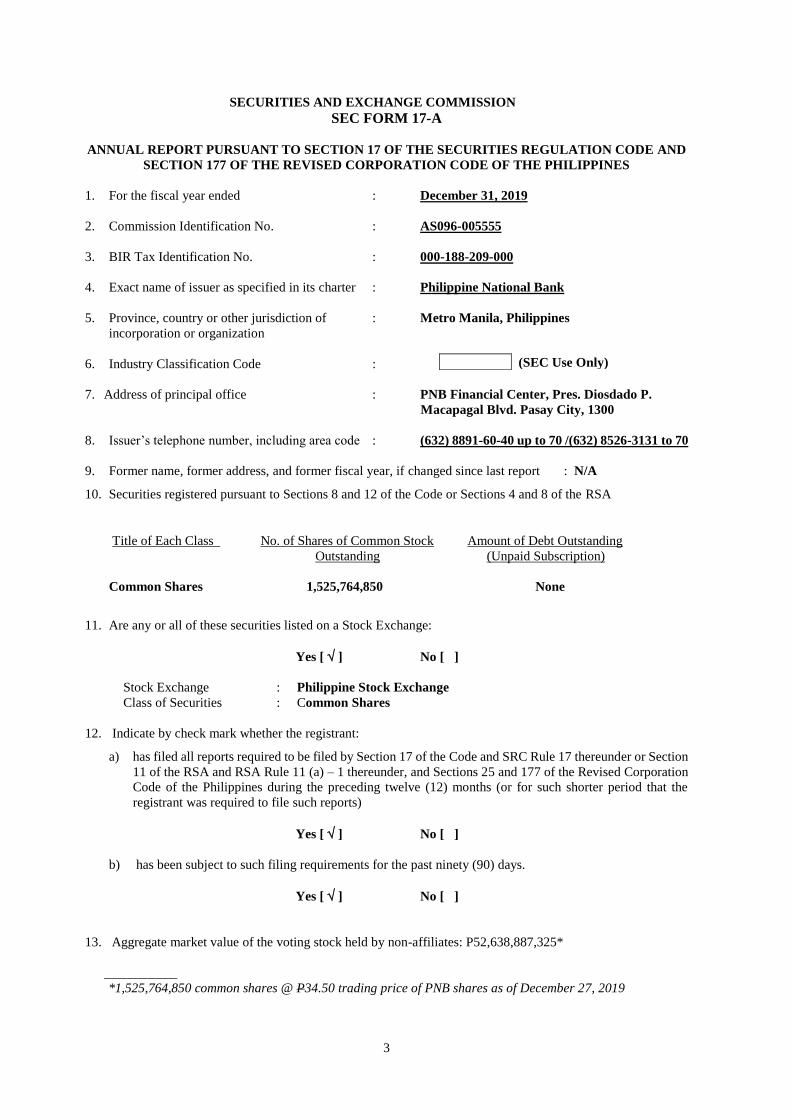
SECURITIES AND EXCHANGE COMMISSION
SEC FORM 17-A
ANNUAL REPORT PURSUANT TO SECTION 17 OF THE SECURITIES REGULATION CODE AND
SECTION 177 OF THE REVISED CORPORATION CODE OF THE PHILIPPINES
1. For the fiscal year ended : December 31, 2019
2. Commission Identification No. : AS096-005555
3. BIR Tax Identification No. : 000-188-209-000
4. Exact name of issuer as specified in its charter : Philippine National Bank
5. Province, country or other jurisdiction of : Metro Manila, Philippines
incorporation or organization
6. Industry Classification Code :
7. Address of principal office : PNB Financial Center, Pres. Diosdado P.
Macapagal Blvd. Pasay City, 1300
8. Issuer’s telephone number, including area code : (632) 8891-60-40 up to 70 /(632) 8526-3131 to 70
9. Former name, former address, and former fiscal year, if changed since last report : N/A
10. Securities registered pursuant to Sections 8 and 12 of the Code or Sections 4 and 8 of the RSA
Title of Each Class No. of Shares of Common Stock Amount of Debt Outstanding
Outstanding (Unpaid Subscription)
Common Shares 1,525,764,850 None
11. Are any or all of these securities listed on a Stock Exchange:
Yes [ ] No [ ]
Stock Exchange : Philippine Stock Exchange
Class of Securities : Common Shares
12. Indicate by check mark whether the registrant:
a) has filed all reports required to be filed by Section 17 of the Code and SRC Rule 17 thereunder or Section
11 of the RSA and RSA Rule 11 (a) – 1 thereunder, and Sections 25 and 177 of the Revised Corporation
Code of the Philippines during the preceding twelve (12) months (or for such shorter period that the
registrant was required to file such reports)
Yes [ ] No [ ]
b) has been subject to such filing requirements for the past ninety (90) days.
Yes [ ] No [ ]
13. Aggregate market value of the voting stock held by non-affiliates: P52,638,887,325*
___________
*1,525,764,850 common shares @ P34.50 trading price of PNB shares as of December 27, 2019
(SEC Use Only)
4
SEC FORM 17-A ANNUAL REPORT
TABLE OF CONTENTS
PART I – BUSINESS AND GENERAL INFORMATION
Item 1 – Business 5
Item 2 – Properties 29
Item 3 – Legal Proceedings 29
Item 4 – Submission of Matters to a Vote of Security Holders 29
PART II – OPERATIONAL AND FINANCIAL INFORMATION
Item 5 – Market for Issuer’s Common Equity and Related Stockholder
Matters
30
Item 6 – Management’s Discussion and Analysis 32
Item 7 – Financial Statements 41
Item 8 – Information on Independent Accountant and Changes
in/disagreements with Accountants on Accounting / Financial
Disclosure
42
PART III – CONTROL AND COMPENSATION INFORMATION
Item 9 – Directors and Executive Officers 44
Item 10 – Executive Compensation 66
Item 10A – Remuneration Policy 67
Item 11 – Security Ownership 69
Item 12 – Certain Relationships and Related Transactions 75
PART IV – EXHIBITS AND REPORTS ON SEC 17-C 76
5
PART I - BUSINESS AND GENERAL INFORMATION
Item 1. Business
A. Business Development
The Philippine National Bank (PNB or the “Bank”), the country’s first universal bank, is the fourth
largest local private commercial bank in terms of assets, net loans and receivables, capital and deposits.
As of December 31, 2019, the Bank has a distribution network of 715 domestic branches and offices
and 1,626 automated teller machines (ATM) in the Philippines. In addition, it has the widest
international footprint among Philippine banks spanning Asia, Europe, the Middle East and North
America with its overseas branches, representative offices, remittance centers and subsidiaries.
In July 2016, PNB celebrated its Centennial Year with the theme, “A Century of Excellence”, signifying
a meaningful milestone for an institution that has served generations of Filipinos here and abroad. For
over 100 years, PNB stands proud as an institution of stability and security for many Filipinos. With its
century of banking history and experience, PNB is poised to move forward to becoming a more dynamic,
innovative and service-focused bank, providing service excellence to Filipinos all over the world.
The Bank was established as a government-owned banking institution on July 22, 1916. As an
instrument of economic development, the Bank led the industry through the years with its agricultural
modernization program and trade finance support for the country’s agricultural exports, pioneering
efforts in the Overseas Filipino Workers’ (OFW) remittance business, as well as the introduction of
many innovations such as “Bank-on-Wheels”, computerized banking, ATM banking, mobile money
changing, domestic traveler’s checks, and electronic filing and payment system for large taxpayers.
PNB has the widest overseas office network and one of the largest domestic branch networks among
local banks.
On February 9, 2013, the Bank concluded its merger with Allied Banking Corporation (ABC) as
approved and confirmed by the Board of Directors (BOD) of PNB and ABC on January 22 and January
23, 2013, respectively. The respective shareholders of PNB and ABC, representing at least two-thirds
of the outstanding capital stock of both banks, approved the terms of the Plan of Merger of the two banks
on March 6, 2012.
To support the Bank’s efforts to diversify its funding sources to meet the financial needs of its clients,
PNB offered Long-Term Negotiable Certificates of Time Deposit (LTNCDs), which extend the maturity
profile of the Bank’s liabilities as part of overall liability management and to raise long-term funds for
general corporate purposes. In October 2016, PNB received the approval from the Bangko Sentral ng
Pilipinas (BSP) to issue up to P20.0 billion worth of LTNCDs in tenors of 5.5 to 10 years in multiple
tranches over a period of one year. Along this line, PNB launched the initial tranche on December 14,
2016 with an offering of P3.0 billion and this was oversubscribed at P5.38 billion. The said offer has a
tenor of 5 years and 6 months and a coupon rate of 3.25%. In 2017, two LTNCD tranches were issued,
viz: a) on April 27, 2017, P3.765 billion at 3.75% coupon rate; and b) on October 26, 2017, P6.35 billion
at 3.875% coupon rate. The last tranche was oversubscribed at more than double the issue size of P3.0
billion. In October 2018, PNB once again received the approval from BSP to issue up to P20.0 billion
worth of LTNCDs. In February 2019, PNB issued the first tranche of 5.5-year LTNCDs totaling P8.2
billion at 5.75% per annum. The original P3.0 billion offering was upsized to meet the 2.7x
oversubscription owing to the strong demand from both retail and institutional investors. On
October 11, 2019, PNB listed the second tranche of LTNCDs totaling P4.6 billion which was double the
announced issue size of P2.0 billion.
As part of the Bank’s efforts to diversify its funding sources and support its strategy on safe aggressive
growth, PNB also tapped the capital markets. In April 2018, PNB successfully issued in Singapore and
Hong Kong its 5-year Fixed Rate Senior Notes worth US$300 million out of its US$1 billion Medium
6
Term Note (MTN) Program. This marked the first time that PNB tapped the international bond market
for medium term dollar funding. Orders for the offering reached approximately $1.2 billion at its peak,
equivalent to 4X oversubscription. The high demand for the initial issue underscores the international
investors’ strong confidence in PNB. In May 2019, the PNB Board of Directors approved the increase
in the amount of the Bank’s MTN Program to US$2 billion. The following month, PNB issued US$750
million in 5.25-year Fixed Rate Senior Notes priced at 99.47% and carried a yield of 3.39% and a coupon
of 3.28%. The transaction was oversubscribed with an orderbook of over US$3.25 billion. The proceeds
of the Notes will be used to support PNB’s loan expansion as the Bank takes advantage of the country’s
sustained economic growth.
In April 2019, PNB acting through its Tokyo branch successfully closed and signed a US$250 million
3-year syndicated term loan facility with a group of international and regional Japanese banks. The
facility was launched originally at US$200 million and attracted total commitments of US$370 million
at close of syndication, representing an oversubscription of about 2.7x with lending commitments
received from 14 Japanese and international banks with operations in Japan. The last syndicated loan
availed by PNB was in 2015. The diversity of the syndicate of lenders is an affirmation of the growing
international market’s appetite for assets from the Philippines. The success of the transaction is a strong
acknowledgment of the capital market’s confidence in the credit strength of the Bank.
In May 2019, PNB listed on the Philippine Dealing and Exchange Corp its maiden offering for fixed
rate Philippine Peso bonds, which reached P13.87 billion, equivalent to an oversubscription of almost
3X the announced issue size of P5 billion.
In July 2019, the Bank successfully issued and listed 276,625,172 common shares priced at P43.38 per
share from its stock rights offering. The net proceeds from the offering amounted to P11.7 billion.
Proceeds from the offering are expected to enhance PNB’s presence in emerging growth areas.
PNB has fully integrated its wholly-owned thrift bank subsidiary, PNB Savings Bank (PNBSB), into
the parent bank through acquisition of its assets and assumption of its liabilities in exchange for cash.
The BODs of PNB and PNBSB approved the integration last September 28 and October 10, 2018,
respectively. Upon integration, PNB will be able to deliver a more efficient banking experience and
serve a wider customer base, while the customers of PNBSB will have access to PNB’s diverse portfolio
of financial solutions. The consumer lending business, currently operated through PNBSB, will also
benefit from PNB’s ability to efficiently raise low cost of funds. PNB secured the Monetary Board
approval last August 29, 2019 for the integration, which was subsequently completed on March 1, 2020.
In a letter to the BSP last March 5, 2020, PNBSB has surrendered its banking license to the BSP.
Recognizing the consistent improvement in PNB’s credit profile, Moody’s upgraded in November 2017
the Bank’s foreign currency and local currency deposit ratings to Baa2/P-2 from Baa3/P-3, two notches
above investment grade. The upgrade reflects the improvement in financial profile since PNB’s merger
with ABC. In December 2017, Fitch Ratings also revised upwards the support rating floor (SRF) of
PNB to ‘BB’ from ‘BB-’, following the upgrade of the Philippine sovereign’s rating to ‘BBB’ from
‘BBB-’.
In affirmation of the Bank’s well-managed operations, PNB received awards from the BSP and other
international award-giving bodies. In the 2017 BSP Stakeholders’ Ceremony, PNB was recognized as
the Outstanding PhilPass REMIT Participant. On July 31, 2018, PNB was also recognized by the
Institute of Corporate Directors (ICD) as among the top performing publicly-listed companies that
ranked high under the ASEAN Corporate Governance Scorecard (ACGS). Out of the 245 companies
assessed, PNB is among the 21 publicly-listed companies that scored 90 points and above. PNB was
also among the top 5 in the financial sector recognized for exemplary corporate governance practices.
In June 2019, PNB was recognized for the second straight year by the ICD for being one of the awardees
of its ACGS Arrow for 2018.

7
As a clear demonstration of the Bank’s commitment in offering competitive financing structures to
clients while contributing to economic development and nation building, PNB and its subsidiaries were
recognized internationally in January 2019 by The Asset Triple A Country Awards 2018 with three
distinctions, viz: a) Best Syndicated Loan awarded to PNB and PNB Savings for the Bloomberry Resorts
and Hotels’ P73.5 billion syndicated term loan facility, b) Best Acquisition Financing awarded to PNB
and PNB Capital and Investment Corp. as lender and lead arranger, respectively, for the Clark Global
Corporation’s US$690 million acquisition project, and c) Most Innovative Deal awarded to PNB Capital
for being one of the lead underwriters and bookrunners for Ayala Land’s P10.0 billion retail bonds.
In recognition of PNB’s innovative products, PNB’s Bank on Wheels was recognized by three (3)
international award-giving bodies: a) the Most Innovative Banking Service - Philippines 2016 award
from the Global Business Outlook Awards; b) the Most Innovative Bank, Philippines 2016 award from
International Finance Magazine Awards; and c) the Most Innovative Banking Product Philippines 2016
from the Global Banking and Finance Review Awards. PNB relaunched the “Bank-on-Wheels” in
December 2015 to meet the evolving needs of its customers and provide them with banking services
when and where they need it most.
Last July 20, 2016, PNB received the “New Consumer Lending Product of the Year Award” for its
Social Security System (SSS) Pension Loan Program in the Asian Banking and Finance Retail Banking
Awards 2016, held in Singapore.
During the SSS Balikat ng Bayan Award Ceremonies last Sept 2, 2016, PNB was awarded as Best OFW
Collecting Partner. At the same time, PNB Savings Bank was awarded as Best Collecting Partner in the
thrift bank category. The Best Collection Partner distinction is awarded to financial institutions that are
consistently among the top with the highest collections; have the biggest volume of transactions and
widest coverage. In September 2019, the SSS recognized the Bank once again as its “Best Paying
Commercial Bank” partner
In September 28, 2017, the PNB-PAL Mabuhay Mastercard won the “Best Co-Brand Program Award
– Philippines” in the Mastercard Innovation Forum 2017 held at Singapore.
PNB received the “Best Brand Initiative award in Philippine Country Awards for 2017” at The Asian
Banker’s Future of Finance in Philippines Awards Program 2017 last October 6, 2017, due to the
following initiatives: a) Launch of “You First” campaign to re-establish PNB in the market; b) The Bank
initiated a series of strategically-designed marketing campaigns; and c) PNB’s “You First” campaign
increased the Bank’s auto and home loans bookings for 2016.
PNB received two awards from the Asian Banking & Finance Retail Banking Awards 2017 i.e. “Digital
Banking Initiative of the Year” for the PNB Mobile Banking App and “New Consumer Lending Product
of the Year” for the PNBSB Smart Salary Loan Program. Last July 12, 2018 PNBSB received two
awards from the Asian Banking & Finance Retail Banking Awards 2017 again, these are “Consumer
Finance Product of the Year – Philippines” for its Smart Personal Loan with Double Coverage product
and “Service Innovation of the Year – Philippines” for its Smart Auto Loan and Home Loan Plus (Value-
added Services). Last October 5, 2018, PNBSB’s Smart Personal Loan once again won the Consumer
Finance Product of the Year, this time from the Asian Banker Philippine Country Awards 2018.
In December 2019, PNB was awarded by the Bureau of Local Government Finance of the Department
of Finance for its timely and complete submission of the quarterly report on LGU indebtedness for the
fiscal year 2018-2019. The Bank was cited for being a strong partner of the government in ensuring the
efficient and responsible borrowing of local government units.
8
The following presents the Bank’s significant subsidiaries:
Domestic Subsidiaries:
PNB Savings Bank
(PNBSB)
A wholly-owned thrift bank subsidiary, formerly known as Allied
Savings Bank. PNBSB is the Bank’s main consumer lending arm that
offers retail deposit products as well as personal, housing, auto and
small business loans.
PNBSB traces its roots from First Malayan Development Bank which
ABC bought in 1986 to reinforce its presence in the countryside. On
January 17, 1996, it was renamed First Allied Savings Bank
following the grant of license to operate as a savings bank. It was in
the same year that the Monetary Board of the BSP granted a foreign
currency deposit license. In 1998, First Allied Savings Bank changed
its name to Allied Savings Bank to further establish its association
with the parent ABC. With the merger of PNB and ABC in 2013,
Allied Savings Bank became a wholly owned subsidiary of PNB. In
November 2014, the Securities and Exchange Commission approved
the change of name of Allied Savings Bank to PNB Savings Bank.
On September 28, 2018, the Parent Company’s BOD approved the
full integration of PNBSB through the acquisition of its assets and
assumption of its liabilities in exchange for cash. On August 29,
2019, the Monetary Board of BSP, through its Resolution No. 1310,
approved the integration of PNBSB with the Parent Company.
PNB Capital and
Investment
Corporation (PNB
Capital)
A wholly-owned subsidiary of the Bank, PNB Capital is licensed by
the SEC to operate as an investment house with a non-quasi-banking
license. It was incorporated on July 30, 1997 and commenced
operations on October 8, 1997.
PNB General Insurers
Co., Inc. (PNB Gen)
A non-life insurance company that offers coverage for Fire and Allied
Perils, Marine, Motor Car, Aviation, Surety, Engineering, Accident
Insurance and other specialized lines, PNB Gen was established in
1991. The Bank directly owns 65.75% of PNB Gen.
On April 26, 2018, the BOD of the Parent Company and PNB
Holdings approved the exchange of all their holdings in PNB Gen for
shares in ABIC. As a result, in 2018, the Group reclassified all the
assets and liabilities as held for sale in 2018.
On September 13, 2019, ABIC submitted a revised offer to purchase
all of the shares of PNB Gen owned by the Parent Company and PNB
Holdings through cash acquisition instead, which the latter parties did
not assent to. On October 1, 2019, ABIC acknowledged the joint
decision of the Parent Company and PNB Holdings, formally closing
the former’s negotiations to purchase the shares of PNB Gen. With
this, the assets and liabilities of PNB Gen were no longer classified
as held for sale.
PNB Securities, Inc.
(PNB Sec)
A wholly-owned subsidiary incorporated in January 18, 1991, PNB
Sec is a member of the Philippine Stock Exchange (PSE). As a
securities dealer, it is engaged in the buying and selling of securities
listed in the PSE either for its own account as dealer or for the account
of its customers as broker.
9
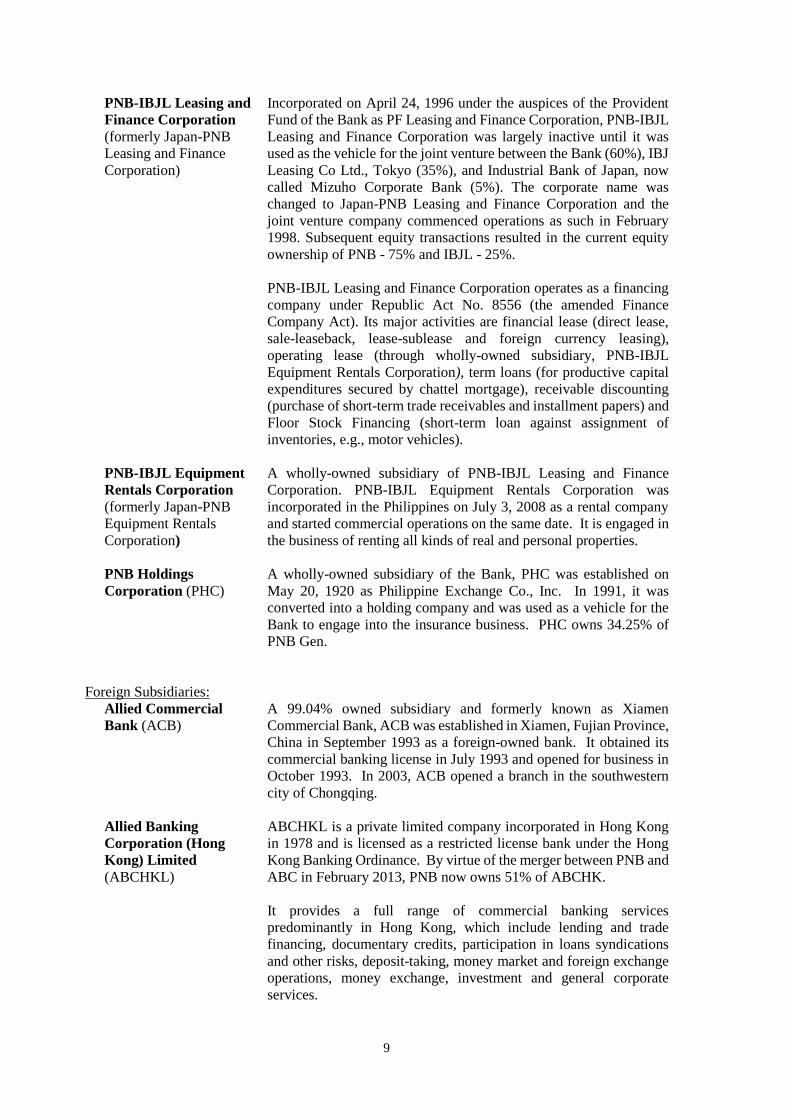
PNB-IBJL Leasing and
Finance Corporation
(formerly Japan-PNB
Leasing and Finance
Corporation)
Incorporated on April 24, 1996 under the auspices of the Provident
Fund of the Bank as PF Leasing and Finance Corporation, PNB-IBJL
Leasing and Finance Corporation was largely inactive until it was
used as the vehicle for the joint venture between the Bank (60%), IBJ
Leasing Co Ltd., Tokyo (35%), and Industrial Bank of Japan, now
called Mizuho Corporate Bank (5%). The corporate name was
changed to Japan-PNB Leasing and Finance Corporation and the
joint venture company commenced operations as such in February
1998. Subsequent equity transactions resulted in the current equity
ownership of PNB - 75% and IBJL - 25%.
PNB-IBJL Leasing and Finance Corporation operates as a financing
company under Republic Act No. 8556 (the amended Finance
Company Act). Its major activities are financial lease (direct lease,
sale-leaseback, lease-sublease and foreign currency leasing),
operating lease (through wholly-owned subsidiary, PNB-IBJL
Equipment Rentals Corporation), term loans (for productive capital
expenditures secured by chattel mortgage), receivable discounting
(purchase of short-term trade receivables and installment papers) and
Floor Stock Financing (short-term loan against assignment of
inventories, e.g., motor vehicles).
PNB-IBJL Equipment
Rentals Corporation
(formerly Japan-PNB
Equipment Rentals
Corporation)
A wholly-owned subsidiary of PNB-IBJL Leasing and Finance
Corporation. PNB-IBJL Equipment Rentals Corporation was
incorporated in the Philippines on July 3, 2008 as a rental company
and started commercial operations on the same date. It is engaged in
the business of renting all kinds of real and personal properties.
PNB Holdings
Corporation (PHC)
A wholly-owned subsidiary of the Bank, PHC was established on
May 20, 1920 as Philippine Exchange Co., Inc. In 1991, it was
converted into a holding company and was used as a vehicle for the
Bank to engage into the insurance business. PHC owns 34.25% of
PNB Gen.
Foreign Subsidiaries:
Allied Commercial
Bank (ACB)
A 99.04% owned subsidiary and formerly known as Xiamen
Commercial Bank, ACB was established in Xiamen, Fujian Province,
China in September 1993 as a foreign-owned bank. It obtained its
commercial banking license in July 1993 and opened for business in
October 1993. In 2003, ACB opened a branch in the southwestern
city of Chongqing.
Allied Banking
Corporation (Hong
Kong) Limited
(ABCHKL)
ABCHKL is a private limited company incorporated in Hong Kong
in 1978 and is licensed as a restricted license bank under the Hong
Kong Banking Ordinance. By virtue of the merger between PNB and
ABC in February 2013, PNB now owns 51% of ABCHK.
It provides a full range of commercial banking services
predominantly in Hong Kong, which include lending and trade
financing, documentary credits, participation in loans syndications
and other risks, deposit-taking, money market and foreign exchange
operations, money exchange, investment and general corporate
services.
10
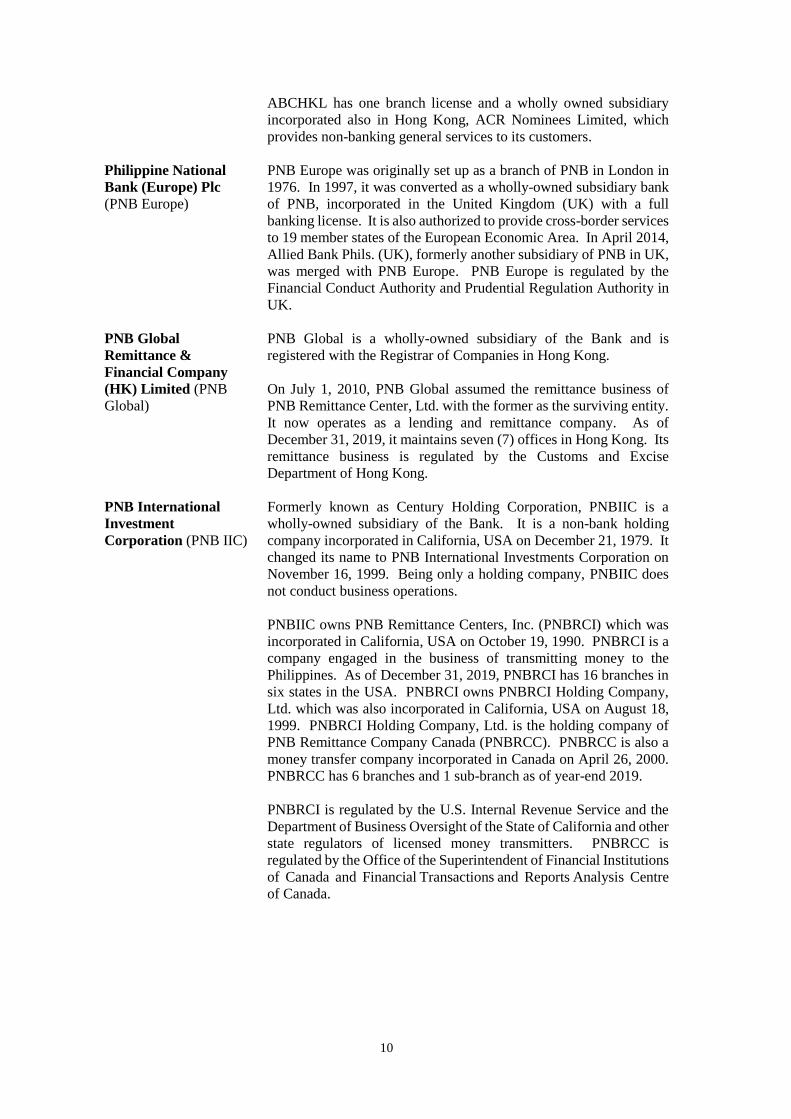
ABCHKL has one branch license and a wholly owned subsidiary
incorporated also in Hong Kong, ACR Nominees Limited, which
provides non-banking general services to its customers.
Philippine National
Bank (Europe) Plc
(PNB Europe)
PNB Europe was originally set up as a branch of PNB in London in
1976. In 1997, it was converted as a wholly-owned subsidiary bank
of PNB, incorporated in the United Kingdom (UK) with a full
banking license. It is also authorized to provide cross-border services
to 19 member states of the European Economic Area. In April 2014,
Allied Bank Phils. (UK), formerly another subsidiary of PNB in UK,
was merged with PNB Europe. PNB Europe is regulated by the
Financial Conduct Authority and Prudential Regulation Authority in
UK.
PNB Global
Remittance &
Financial Company
(HK) Limited (PNB
Global)
PNB Global is a wholly-owned subsidiary of the Bank and is
registered with the Registrar of Companies in Hong Kong.
On July 1, 2010, PNB Global assumed the remittance business of
PNB Remittance Center, Ltd. with the former as the surviving entity.
It now operates as a lending and remittance company. As of
December 31, 2019, it maintains seven (7) offices in Hong Kong. Its
remittance business is regulated by the Customs and Excise
Department of Hong Kong.
PNB International
Investment
Corporation (PNB IIC)
Formerly known as Century Holding Corporation, PNBIIC is a
wholly-owned subsidiary of the Bank. It is a non-bank holding
company incorporated in California, USA on December 21, 1979. It
changed its name to PNB International Investments Corporation on
November 16, 1999. Being only a holding company, PNBIIC does
not conduct business operations.
PNBIIC owns PNB Remittance Centers, Inc. (PNBRCI) which was
incorporated in California, USA on October 19, 1990. PNBRCI is a
company engaged in the business of transmitting money to the
Philippines. As of December 31, 2019, PNBRCI has 16 branches in
six states in the USA. PNBRCI owns PNBRCI Holding Company,
Ltd. which was also incorporated in California, USA on August 18,
1999. PNBRCI Holding Company, Ltd. is the holding company of
PNB Remittance Company Canada (PNBRCC). PNBRCC is also a
money transfer company incorporated in Canada on April 26, 2000.
PNBRCC has 6 branches and 1 sub-branch as of year-end 2019.
PNBRCI is regulated by the U.S. Internal Revenue Service and the
Department of Business Oversight of the State of California and other
state regulators of licensed money transmitters. PNBRCC is
regulated by the Office of the Superintendent of Financial Institutions
of Canada and Financial Transactions and Reports Analysis Centre
of Canada.
11
B. Business Description
1. Products and Services
PNB, through its Head Office and 715 domestic branches/offices and 71 overseas branches,
representative offices, remittance centers and subsidiaries, provides a full range of banking and financial
services to large corporate, middle-market, small and medium enterprises (SMEs) and retail customers,
including OFWs, as well as to the Philippine National Government, national government agencies
(NGAs), local government units (LGUs) and Government Owned and Controlled Corporations (GOCCs)
in the Philippines. PNB’s principal commercial banking activities include deposit-taking, lending, trade
financing, foreign exchange dealings, bills discounting, fund transfers/remittance servicing, asset
management, treasury operations, comprehensive trust services, retail banking and other related
financial services. The Bank and its subsidiaries (the Group) offer a wide range of financial services
predominantly in the Philippines.
Its banking activities are undertaken through the following groups within the Bank, namely:
Retail Banking Sector
The Retail Banking Sector (RBS) principally focuses on retail deposit products (i.e., current accounts,
savings accounts and high cost accounts), cards products, consumer loan products, cash management
solutions and other services. While the main purpose is the generation of lower cost funding for the
Bank’s operations, RBS also concentrates on the cross-selling of trust, fixed income and bancassurance
products to existing customers, and referrals of customers by transforming its domestic and overseas
branch distribution channels into a sales-focused organization.
Retail Lending Group
The Retail Lending Group (RLG) will be the consumer lending arm of the Bank upon the full integration
of its wholly-owned thrift bank subsidiary, PNBSB, into the Parent Bank. RLG is tasked to provide the
Bank’s retail clients with home mortgage loans and car financing.
Institutional Banking Sector
The Institutional Banking Sector (IBS) is responsible for the establishment, expansion and overall
management of banking relationships with large corporates, middle market and SME customers as well
as with Government entities.
Global Banking and Markets Sector
The Global Banking and Markets Sector (GBMS) oversees the management of the Bank’s liquidity and
regulatory reserves as well as the risk positions on interest rates and foreign exchange arising from the
daily inherent operations in deposit-taking and lending, and from proprietary trading. Its functions also
include providing treasury solutions to clients and an oversight on risk positions of the Bank’s foreign
branches and subsidiaries. GBMS is likewise responsible for the establishment and maintenance of
correspondent banking relationship with foreign and local banks and non-bank financial institutions as
well as the acquisition and management of banking relationship with multinational companies.
International Banking & Remittance Group
The International Banking & Remittance Group (IBRG) covers the Bank’s overseas offices across Asia,
Middle East, North America and Europe. It provides convenient and safe remittance services to overseas
Filipino workers (OFWs) as well as full banking services in selected jurisdictions, including overseas
bills payment, deposit account opening, corporate, credit and trade facilities. Through IBRG, the Bank
offers “Own a Philippine Home Loan”, a financing facility for overseas Filipinos and non-Filipinos for
their real estate investments in the Philippines. IBRG is also responsible in forging and maintaining
partnerships with remittance agents to further extend its scope and reach to the OFW market beyond its
brick and mortar overseas offices.
12
Wealth Management Group
The Wealth Management Group (WMG) is responsible for the development of new and non-traditional
products for wealth management and strengthening of business relationship with Wealth Management
clients. WMG’s services include brokering of fixed income securities (e.g., Peso- and USD-
denominated government and corporate securities), selling of pooled funds (Unit Investment Trust
Funds or UITFs), Variable Unit-Linked Funds, and other investment vehicles that potentially offer
higher yields compared to traditional deposit products.
Trust Banking Group
PNB Trust Banking Group (TBG) provides a full range of Trust products and services designed to serve
a broad spectrum of market segments. TBG’s personal trust products and services include personal
management trust, investment management, estate planning, guardianship, life insurance trust, and
escrow. Corporate trust services and products include corporate trusteeship, securitization, portfolio
management, administration of employee benefit plans, pension and retirement plans, and trust
indenture services. Other fiduciary services include such roles as bond registrar, collecting and paying
agent, loan facility agent, escrow agent, share transfer agent, and receiving bank. TBG also manages 13
Philippine Peso- and US dollar-denominated UITFs. These include money market funds, bond funds,
balanced funds, and equity funds.
2. Competition
In the Philippines, the Bank faces competition in all its principal areas of business, from both Philippine
(private and government-owned) and foreign banks, as well as finance companies, mutual funds and
investment banks. The competition that the Bank faces from both domestic and foreign banks was in
part a result of the liberalization of the banking industry with the entry of foreign banks under Republic
Act (R.A.) 7721 in 1994 and R.A. 10641 in 2014, as well as the recent mergers and consolidations in
the banking industry. As of the latest available data from the BSP, there were 46 universal and
commercial banks, of which 17 are private domestic banks, 3 are government banks and 26 are branches
or subsidiaries of foreign banks. Some competitor banks have greater financial resources, wider
networks and greater market share than PNB. Said banks also offer a wider range of commercial
banking services and products; have larger lending limits; and stronger balance sheets than PNB. To
maintain its market position in the industry, the Bank offers diverse products and services, invests in
technology, leverages on the synergies within the Lucio Tan Group of Companies and with its
Government customers, as well as builds on relationships with the Bank’s other key customers.
The Bank also faces competition in its operations overseas. In particular, the Bank’s stronghold in the
remittance business in 17 countries in North America, Europe, the Middle East and Asia is being
challenged by competitor banks and non-banks.
3. Revenue Derived from Foreign Operations
The percentage contributions of the Group’s offices in Asia, Canada and USA, United Kingdom and
Other European Union Countries to the Group’s revenue, for the years 2019, 2018, 2017 are as follows:
2019 2018 2017
Asia (excluding the Philippines)/ Middle East 4% 3% 3%
Canada and USA 2% 1% 2%
United Kingdom & Other European Union
Countries
0.5%
0.3%
0.3%
Please refer to Note 6 of the Audited Financial Statements.
13
4. New Products and Services
The Bank launched the following products and services in 2019:
a. PNB, PPS-EPP, and GCash partnership
Through the PNB Connect initiative, a new business opportunity was created between Palawan
Pawnshop-Palawan Express Pera Padala (PPS-PEPP) and GCash in March 2019. With the newly
forged partnership, GCash transactions will be coursed through PPS-PEPP, while PNB will act as
the settlement bank of the partnership’s transactions. An estimate of over 15 million GCash users
were expected to benefit from this collaboration.
b. ABIC All-in 888 Insurance
ABIC All-in 888 is a personal accident insurance for only P888 with a coverage of P100,000. The
affordable insurance protection not only covers death, disability, and dismemberment but it also
protects the client while travelling including unforeseen contingencies such as cancellation/
interruption and baggage delay.
c. Enhanced ATMSafe Features and Benefits
The ATMSafe is a non-life insurance product that replaces lost money withdrawn from the ATM
due to theft. Effective August 1, 2019, the ATMSafe will also cover replacement of stolen cash
from fraudulent transactions done through over-the-counter withdrawals with passbook savings
accounts and other fraudulent transactions such as ATM tampering, illegal point-of-sale (POS)
transactions and unauthorized electronic banking (e-banking) transactions.
d. PNB Prepaid Mastercard
The PNB Prepaid Mastercard, which allows cardholders to conveniently load and perform online
and POS transactions at any Mastercard merchants worldwide, was launched in October 2019. The
card can be availed instantly without the need to open a bank account.
e. PNB-PAL Mabuhay Miles Prepaid Mastercard
The new PNB-PAL Mabuhay Miles Prepaid Mastercard is a reloadable prepaid card that enables
cardholders to do cashless payments. Launched in October 2019, this card is equipped with a multi-
currency feature that provides hassle-free conversions between 10 currencies, good for travelers
who prefer to spend on their travel destination’s local currency. Cardholders are also entitled to
earn points that can be converted to Mabuhay Miles when they use the card for dining, shopping
and travel.
f. PNB SEA Games Prepaid Mastercard
As the official Bank partner of the 2019 Southeast Asian (SEA) games, PNB launched the 30th SEA
Games Prepaid Card to commemorate the Philippines’ 4th time hosting the biennial event. The card
sports an exclusive design specific to the 30th SEA games and carries the same features as the PNB-
PAL Mabuhay Miles Prepaid Mastercard.
5. Related Party Transactions
(Please refer to Item 12. Certain Relationships and Related Transactions and Note 33 of the audited
financial statements)
14
6. Patents, Trademarks, Licenses, Franchises, Concessions and Royalty Agreements
The Bank’s operations are not dependent on any patents, trademarks, copyrights, franchises, concessions,
and royalty agreements.
7. Government Approval of Principal Products or Services
Generally, e-banking products and services require BSP approval. New deposit products require
notification to the BSP. The Bank has complied with the aforementioned BSP requirements.
8. Estimate of Amount Spent for Research and Development Activities
The Bank provides adequate budget for the development of new products and services which includes
hardware and system development, continuous education and market research. Estimated amount spent
for 2019, 2018 and 2017 totaled P622.3 million, P582.2 million and P416.1million, respectively.
9. Number of Employees
As of December 31, 2019 Total
Officers:
Vice President and up 149
Senior Assistant Vice President to Assistant Manager 4,169
Sub-total 4,318
Rank and File 4,232
Total 8,550
The Bank shall continue to pursue selective and purposive hiring strictly based on business requirements.
The Bank has embarked on a number of initiatives to improve operational efficiency.
With regard to the Collective Bargaining Agreement (CBA), the Bank’s regular rank and file employees
are represented by Philnabank Employees Association (PEMA). The two unions under the merged bank
namely: PNB Employees Union (PNBEU) and PEMA merged effective July 1, 2019, with PEMA as
the surviving union. Existing CBAs are until June 30, 2020.
The Bank has not suffered any strikes, and the Management of the Bank considers its relations with its
employees and the Union as harmonious and mutually beneficial. Industrial peace is continuously being
enjoyed by both Management and the organized Union.
10. Risk Management
As a financial institution with various allied undertakings with an international footprint, PNB continues
to comply with an evolving and regulatory and legislative framework in each of the jurisdictions in
which the Bank operates. The nature and the impact of future changes in laws and regulations are not
always predictable. These changes have implications on the way business is conducted and
corresponding potential impact to capital and liquidity.
Effective risk management is essential to consistent and sustainable performance for all of the Bank’s
stakeholders and is therefore a central part of the financial and operational management of the PNB
15
Group. PNB adds value to clients and therefore the communities in which it operates, generating returns
for shareholders by taking and managing risk.
Through its Risk Management Framework, the Bank manages enterprise-wide risks, with the objective
of maximizing risk-adjusted returns while remaining within its risk appetite. The BOD of the Bank
plays a pivotal role and has the ultimate responsibility in bank governance through their focus on two
factors that will ultimately determine the success of the Bank, viz: (1) responsibility for the Bank’s
strategic objectives; and (2) assurance that such will be executed by choice of talents.
Strong independent oversight has been established at all levels within the Bank. The Bank’s BOD has
delegated specific responsibilities to various Board Committees, which are integral to PNB’s risk
governance framework and allow executive management, through management committees, to evaluate
the risks inherent in the business and to manage them effectively. The following are the eight (8) Board
Committees:
1. Board Audit & Compliance Committee (BACC)
2. Board Information Technology Governance Committee (BITGC)
3. Board Oversight Related Party Transaction Committee (BORC)
4. Board Strategy & Policy Committee (BSPC)
5. Corporate Governance/Nomination/Remuneration and Sustainability (CorGov)
6. Executive Committee (EXCOM)
7. Risk Oversight Committee (ROC)
8. Trust Committee
A sound, robust and effective enterprise risk management (ERM) system coupled with global best
practices were recognized as a necessity and are the prime responsibility of the BOD and senior
management. The approach to risk is founded on strong corporate governance practices that are
intended to strengthen the enterprise risk management of PNB, while positioning PNB Group to manage
the changing regulatory environment in an effective and efficient manner.
The approach to managing risk is outlined in the Bank’s ERM Framework which creates the context for
setting policies and standards, and establishing the right practices throughout the PNB Group. It defines
the risk management processes and sets out the activities, tools, and organizational structure to ensure
material risks are identified, measured, monitored and managed.
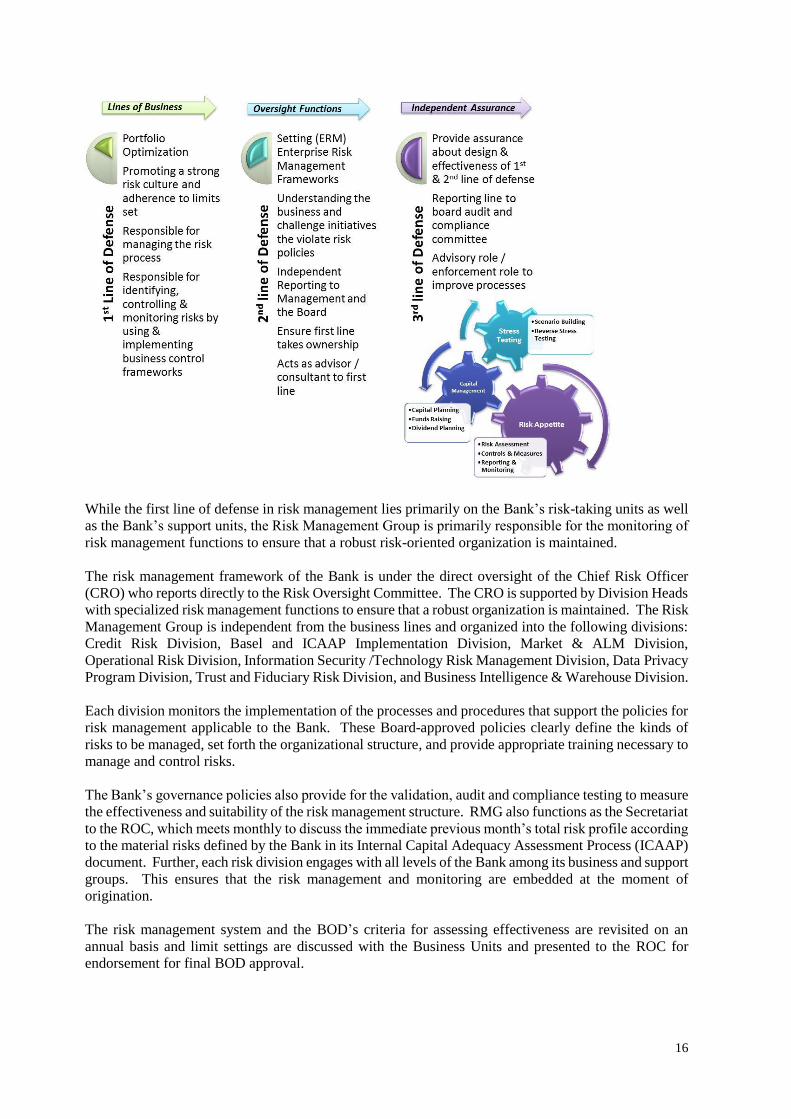
PNB’s ERM Framework, with regular reviews and updates, has served the Bank well and has been
resilient through economic cycles. The PNB Group has placed a strong reliance on this risk governance
framework and the three lines-of-defense model, which are fundamental to PNB’s aspiration to be
world-class at managing risk.
16
While the first line of defense in risk management lies primarily on the Bank’s risk-taking units as well
as the Bank’s support units, the Risk Management Group is primarily responsible for the monitoring of
risk management functions to ensure that a robust risk-oriented organization is maintained.
The risk management framework of the Bank is under the direct oversight of the Chief Risk Officer
(CRO) who reports directly to the Risk Oversight Committee. The CRO is supported by Division Heads
with specialized risk management functions to ensure that a robust organization is maintained. The Risk
Management Group is independent from the business lines and organized into the following divisions:
Credit Risk Division, Basel and ICAAP Implementation Division, Market & ALM Division,
Operational Risk Division, Information Security /Technology Risk Management Division, Data Privacy
Program Division, Trust and Fiduciary Risk Division, and Business Intelligence & Warehouse Division.
Each division monitors the implementation of the processes and procedures that support the policies for
risk management applicable to the Bank. These Board-approved policies clearly define the kinds of
risks to be managed, set forth the organizational structure, and provide appropriate training necessary to
manage and control risks.
The Bank’s governance policies also provide for the validation, audit and compliance testing to measure
the effectiveness and suitability of the risk management structure. RMG also functions as the Secretariat
to the ROC, which meets monthly to discuss the immediate previous month’s total risk profile according
to the material risks defined by the Bank in its Internal Capital Adequacy Assessment Process (ICAAP)
document. Further, each risk division engages with all levels of the Bank among its business and support
groups. This ensures that the risk management and monitoring are embedded at the moment of
origination.
The risk management system and the BOD’s criteria for assessing effectiveness are revisited on an
annual basis and limit settings are discussed with the Business Units and presented to the ROC for
endorsement for final BOD approval.
17
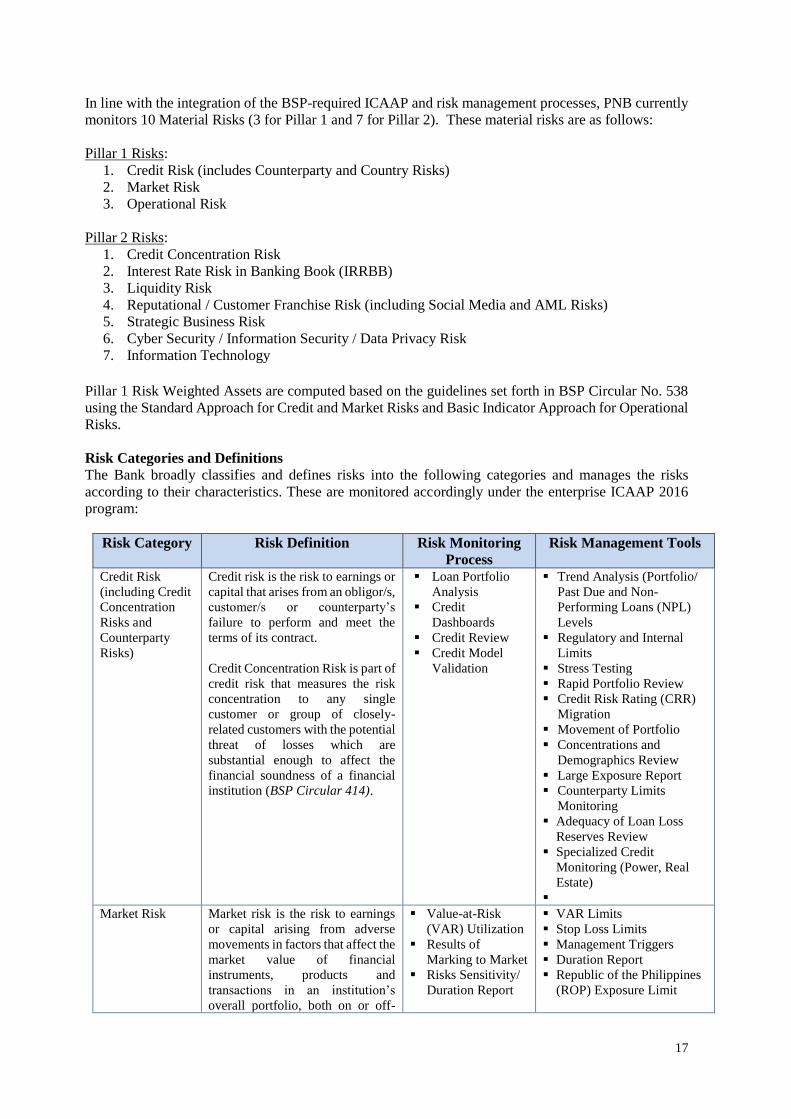
In line with the integration of the BSP-required ICAAP and risk management processes, PNB currently
monitors 10 Material Risks (3 for Pillar 1 and 7 for Pillar 2). These material risks are as follows:
Pillar 1 Risks:
1. Credit Risk (includes Counterparty and Country Risks)
2. Market Risk
3. Operational Risk
Pillar 2 Risks:
1. Credit Concentration Risk
2. Interest Rate Risk in Banking Book (IRRBB)
3. Liquidity Risk
4. Reputational / Customer Franchise Risk (including Social Media and AML Risks)
5. Strategic Business Risk
6. Cyber Security / Information Security / Data Privacy Risk
7. Information Technology
Pillar 1 Risk Weighted Assets are computed based on the guidelines set forth in BSP Circular No. 538
using the Standard Approach for Credit and Market Risks and Basic Indicator Approach for Operational
Risks.
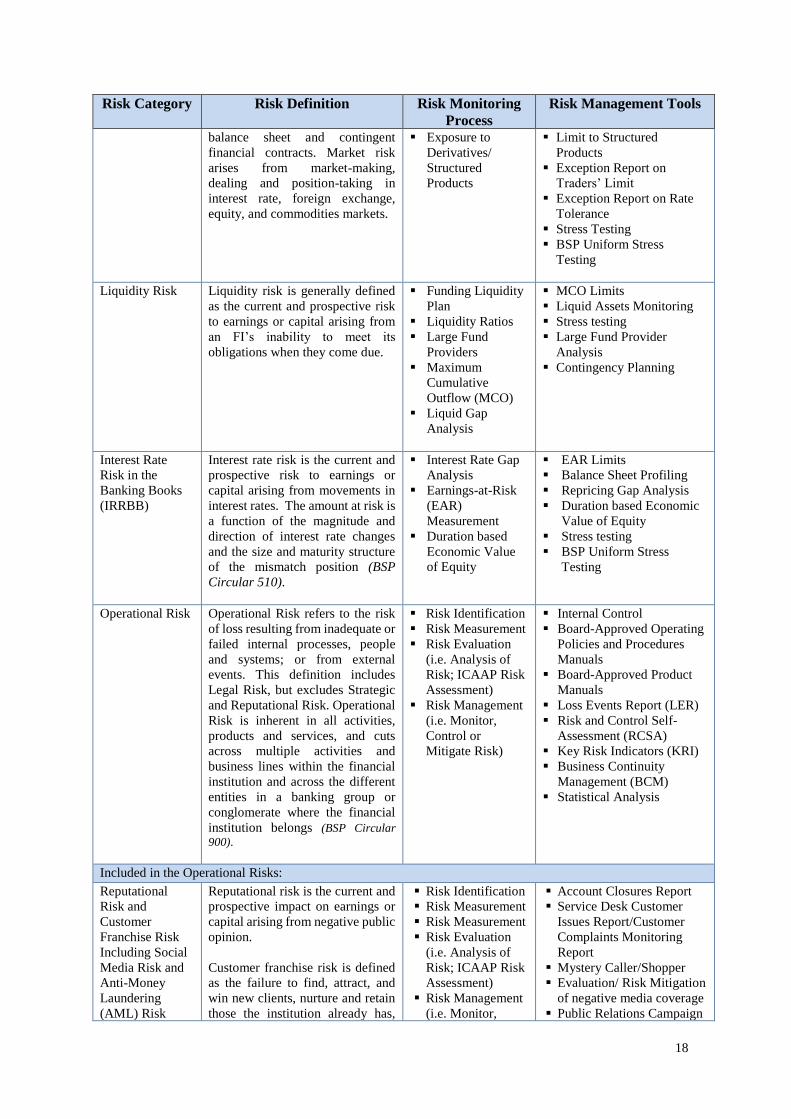
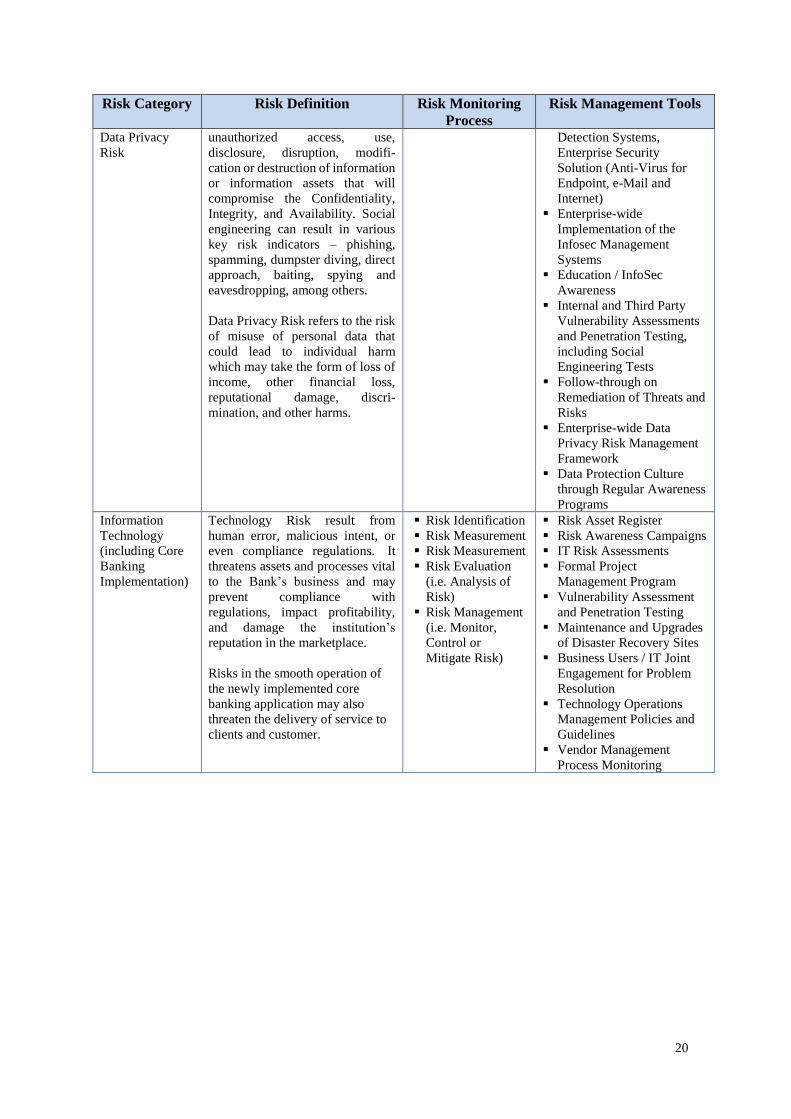
Risk Categories and Definitions
The Bank broadly classifies and defines risks into the following categories and manages the risks
according to their characteristics. These are monitored accordingly under the enterprise ICAAP 2016
program:
Risk Category Risk Definition Risk Monitoring
Process
Risk Management Tools
Credit Risk
(including Credit
Concentration
Risks and
Counterparty
Risks)
Credit risk is the risk to earnings or
capital that arises from an obligor/s,
customer/s or counterparty’s
failure to perform and meet the
terms of its contract.
Credit Concentration Risk is part of
credit risk that measures the risk
concentration to any single
customer or group of closely-
related customers with the potential
threat of losses which are
substantial enough to affect the
financial soundness of a financial
institution (BSP Circular 414).
▪ Loan Portfolio
Analysis
▪ Credit
Dashboards
▪ Credit Review
▪ Credit Model
Validation
▪ Trend Analysis (Portfolio/
Past Due and Non-
Performing Loans (NPL)
Levels
▪ Regulatory and Internal
Limits
▪ Stress Testing
▪ Rapid Portfolio Review
▪ Credit Risk Rating (CRR)
Migration
▪ Movement of Portfolio
▪ Concentrations and
Demographics Review
▪ Large Exposure Report
▪ Counterparty Limits
Monitoring
▪ Adequacy of Loan Loss
Reserves Review
▪ Specialized Credit
Monitoring (Power, Real
Estate)
▪
Market Risk Market risk is the risk to earnings
or capital arising from adverse
movements in factors that affect the
market value of financial
instruments, products and
transactions in an institution’s
overall portfolio, both on or off-
▪ Value-at-Risk
(VAR) Utilization
▪ Results of
Marking to Market
▪ Risks Sensitivity/
Duration Report
▪ VAR Limits
▪ Stop Loss Limits
▪ Management Triggers
▪ Duration Report
▪ Republic of the Philippines
(ROP) Exposure Limit
18
Risk Category Risk Definition Risk Monitoring
Process
Risk Management Tools
balance sheet and contingent
financial contracts. Market risk
arises from market-making,
dealing and position-taking in
interest rate, foreign exchange,
equity, and commodities markets.
▪ Exposure to
Derivatives/
Structured
Products
▪ Limit to Structured
Products
▪ Exception Report on
Traders’ Limit
▪ Exception Report on Rate
Tolerance
▪ Stress Testing
▪ BSP Uniform Stress
Testing
Liquidity Risk Liquidity risk is generally defined
as the current and prospective risk
to earnings or capital arising from
an FI’s inability to meet its
obligations when they come due.
▪ Funding Liquidity
Plan
▪ Liquidity Ratios
▪ Large Fund
Providers
▪ Maximum
Cumulative
Outflow (MCO)
▪ Liquid Gap
Analysis
▪ MCO Limits
▪ Liquid Assets Monitoring
▪ Stress testing
▪ Large Fund Provider
Analysis
▪ Contingency Planning
Interest Rate
Risk in the
Banking Books
(IRRBB)
Interest rate risk is the current and
prospective risk to earnings or
capital arising from movements in
interest rates. The amount at risk is
a function of the magnitude and
direction of interest rate changes
and the size and maturity structure
of the mismatch position (BSP
Circular 510).
▪ Interest Rate Gap
Analysis
▪ Earnings-at-Risk
(EAR)
Measurement
▪ Duration based
Economic Value
of Equity
▪ EAR Limits
▪ Balance Sheet Profiling
▪ Repricing Gap Analysis
▪ Duration based Economic
Value of Equity
▪ Stress testing
▪ BSP Uniform Stress
Testing
Operational Risk Operational Risk refers to the risk
of loss resulting from inadequate or
failed internal processes, people
and systems; or from external
events. This definition includes
Legal Risk, but excludes Strategic
and Reputational Risk. Operational
Risk is inherent in all activities,
products and services, and cuts
across multiple activities and
business lines within the financial
institution and across the different
entities in a banking group or
conglomerate where the financial
institution belongs (BSP Circular
900).
▪ Risk Identification
▪ Risk Measurement
▪ Risk Evaluation
(i.e. Analysis of
Risk; ICAAP Risk
Assessment)
▪ Risk Management
(i.e. Monitor,
Control or
Mitigate Risk)
1.
▪ Internal Control
▪ Board-Approved Operating
Policies and Procedures
Manuals
▪ Board-Approved Product
Manuals
▪ Loss Events Report (LER)
▪ Risk and Control Self-
Assessment (RCSA)
▪ Key Risk Indicators (KRI)
▪ Business Continuity
Management (BCM)
▪ Statistical Analysis
Included in the Operational Risks:
Reputational
Risk and
Customer
Franchise Risk
Including Social
Media Risk and
Anti-Money
Laundering
(AML) Risk
Reputational risk is the current and
prospective impact on earnings or
capital arising from negative public
opinion.
Customer franchise risk is defined
as the failure to find, attract, and
win new clients, nurture and retain
those the institution already has,
▪ Risk Identification
▪ Risk Measurement
▪ Risk Measurement
▪ Risk Evaluation
(i.e. Analysis of
Risk; ICAAP Risk
Assessment)
▪ Risk Management
(i.e. Monitor,
▪ Account Closures Report
▪ Service Desk Customer
Issues Report/Customer
Complaints Monitoring
Report
▪ Mystery Caller/Shopper
▪ Evaluation/ Risk Mitigation
of negative media coverage
▪ Public Relations Campaign

19
Risk Category Risk Definition Risk Monitoring
Process
Risk Management Tools
and entice former clients back into
the fold as well as the failure to
meet client’s expectation in
delivering the institution’s products
and services.
Risks in social media include
susceptibility to account takeover,
malware distribution, brand
bashing, inadvertent disclosure of
sensitive information and privacy
violation, among other possible
threats
Risks relating to AML refers to
transfers or movement of funds that
fall into the following (but not
limited to) categories:
• Terrorist financing
• Unlawful purposes
• Transactions over certain
amounts as defined by the
Ant-Money Laundering
Council
Control or
Mitigate Risk)
Major Factors
considered:
▪ Products
▪ Technology
▪ People
▪ Policies and
Processes
▪ Stakeholders
(including
customer and
regulators)
▪ Review of Stock Price
Performance
▪ Fraud Management
Program
▪ Social Media Management
Framework
▪ Social Media Risk
Management
▪ AML Compliance Review /
Monitoring
▪ Enhanced Due Diligence
Program for Customers
Strategic
Business Risks
Strategic business risk is the
current and prospective impact on
earnings or capital arising from
adverse business decisions,
improper implementation of
decisions, or lack of responsiveness
to industry changes.
▪ Management Profitability
Reports – Budgets vs
Actuals
▪ Benchmarking vis-a-vis
Industry, Peers
▪ Economic Forecasting
▪ Annual Strategic Planning
Exercise
Cyber Security
Risk
Cyber security risk is the current
and prospective impact on
earnings, reputation, customer
franchise, and/or capital arising
from information security threats
of attack on the institution’s digital
footprint through (but not limited
to) the following:
• Breaches in data security
• Sabotage on online (web-
based) activities (distributed-
denial-of-service or DDoS
attacks, ransomware, etc.)
• Common threats (spam,
phishing, malware, spoofing
viruses, etc.)
• Scams and frauds (social
engineering, identify thefts,
email scams, etc.)
▪ Incident Reporting
Management
▪ Information Security Policy
Formulation
▪ Risk Assessment
▪ Information Security
Management System
Implementation
▪ Continuous Information
Security (Infosec) / Cyber
Risk Awareness Campaigns
▪ Network Security
Protection
▪ Limits on Access Privileges
▪ Scanning of Outbound and
Inbound Digital Traffic
Information
Security and
Information Security Risk is the
risk to organizational operations
due to the potential for
▪ Installation of Firewalls,
Intrusion Prevention
Systems / Intrusion
20
Risk Category Risk Definition Risk Monitoring
Process
Risk Management Tools
Data Privacy
Risk
unauthorized access, use,
disclosure, disruption, modifi-
cation or destruction of information
or information assets that will
compromise the Confidentiality,
Integrity, and Availability. Social
engineering can result in various
key risk indicators – phishing,
spamming, dumpster diving, direct
approach, baiting, spying and
eavesdropping, among others.
Data Privacy Risk refers to the risk
of misuse of personal data that
could lead to individual harm
which may take the form of loss of
income, other financial loss,
reputational damage, discri-
mination, and other harms.
Detection Systems,
Enterprise Security
Solution (Anti-Virus for
Endpoint, e-Mail and
Internet)
▪ Enterprise-wide
Implementation of the
Infosec Management
Systems
▪ Education / InfoSec
Awareness
▪ Internal and Third Party
Vulnerability Assessments
and Penetration Testing,
including Social
Engineering Tests
▪ Follow-through on
Remediation of Threats and
Risks
▪ Enterprise-wide Data
Privacy Risk Management
Framework
▪ Data Protection Culture
through Regular Awareness
Programs
Information
Technology
(including Core
Banking
Implementation)
Technology Risk result from
human error, malicious intent, or
even compliance regulations. It
threatens assets and processes vital
to the Bank’s business and may
prevent compliance with
regulations, impact profitability,
and damage the institution’s
reputation in the marketplace.
Risks in the smooth operation of
the newly implemented core
banking application may also
threaten the delivery of service to
clients and customer.
▪ Risk Identification
▪ Risk Measurement
▪ Risk Measurement
▪ Risk Evaluation
(i.e. Analysis of
Risk)
▪ Risk Management
(i.e. Monitor,
Control or
Mitigate Risk)
▪ Risk Asset Register
▪ Risk Awareness Campaigns
▪ IT Risk Assessments
▪ Formal Project
Management Program
▪ Vulnerability Assessment
and Penetration Testing
▪ Maintenance and Upgrades
of Disaster Recovery Sites
▪ Business Users / IT Joint
Engagement for Problem
Resolution
▪ Technology Operations
Management Policies and
Guidelines
▪ Vendor Management
Process Monitoring
21
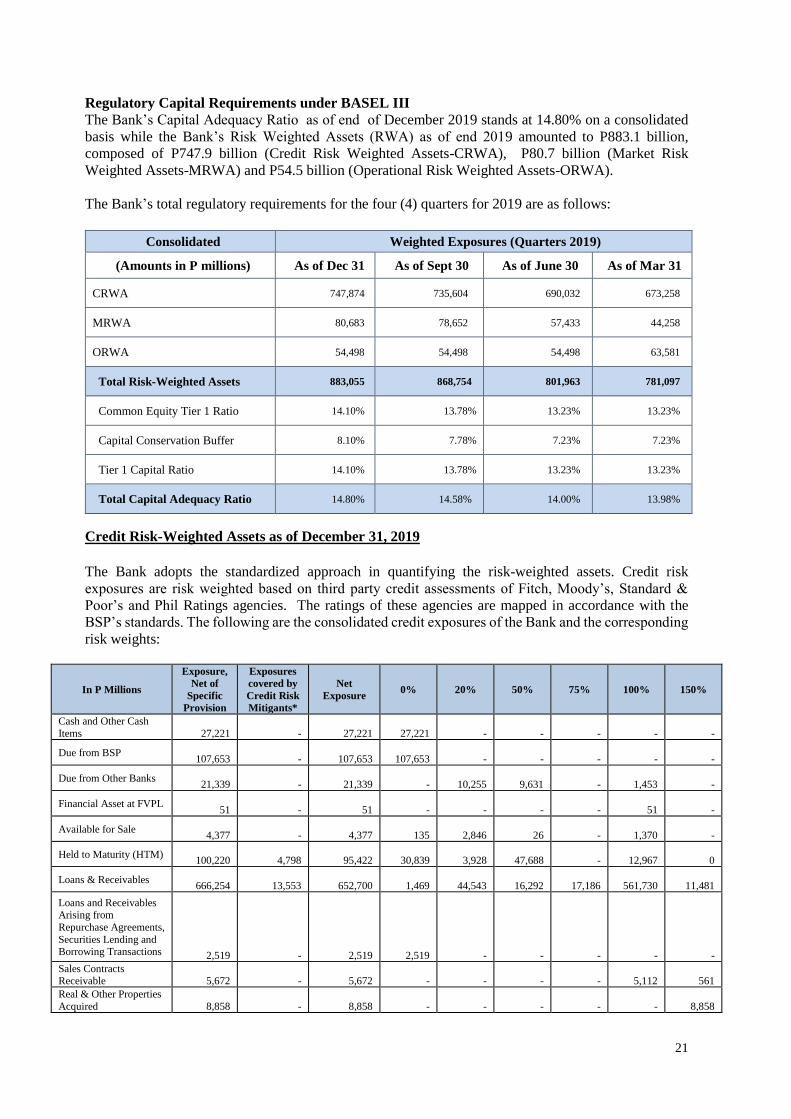
Regulatory Capital Requirements under BASEL III
The Bank’s Capital Adequacy Ratio as of end of December 2019 stands at 14.80% on a consolidated
basis while the Bank’s Risk Weighted Assets (RWA) as of end 2019 amounted to P883.1 billion,
composed of P747.9 billion (Credit Risk Weighted Assets-CRWA), P80.7 billion (Market Risk
Weighted Assets-MRWA) and P54.5 billion (Operational Risk Weighted Assets-ORWA).
The Bank’s total regulatory requirements for the four (4) quarters for 2019 are as follows:
Consolidated Weighted Exposures (Quarters 2019)
(Amounts in P millions) As of Dec 31 As of Sept 30 As of June 30 As of Mar 31
CRWA 747,874 735,604 690,032 673,258
MRWA 80,683 78,652 57,433 44,258
ORWA 54,498 54,498 54,498 63,581
Total Risk-Weighted Assets 883,055 868,754 801,963 781,097
Common Equity Tier 1 Ratio 14.10% 13.78% 13.23% 13.23%
Capital Conservation Buffer 8.10% 7.78% 7.23% 7.23%
Tier 1 Capital Ratio 14.10% 13.78% 13.23% 13.23%
Total Capital Adequacy Ratio 14.80% 14.58% 14.00% 13.98%
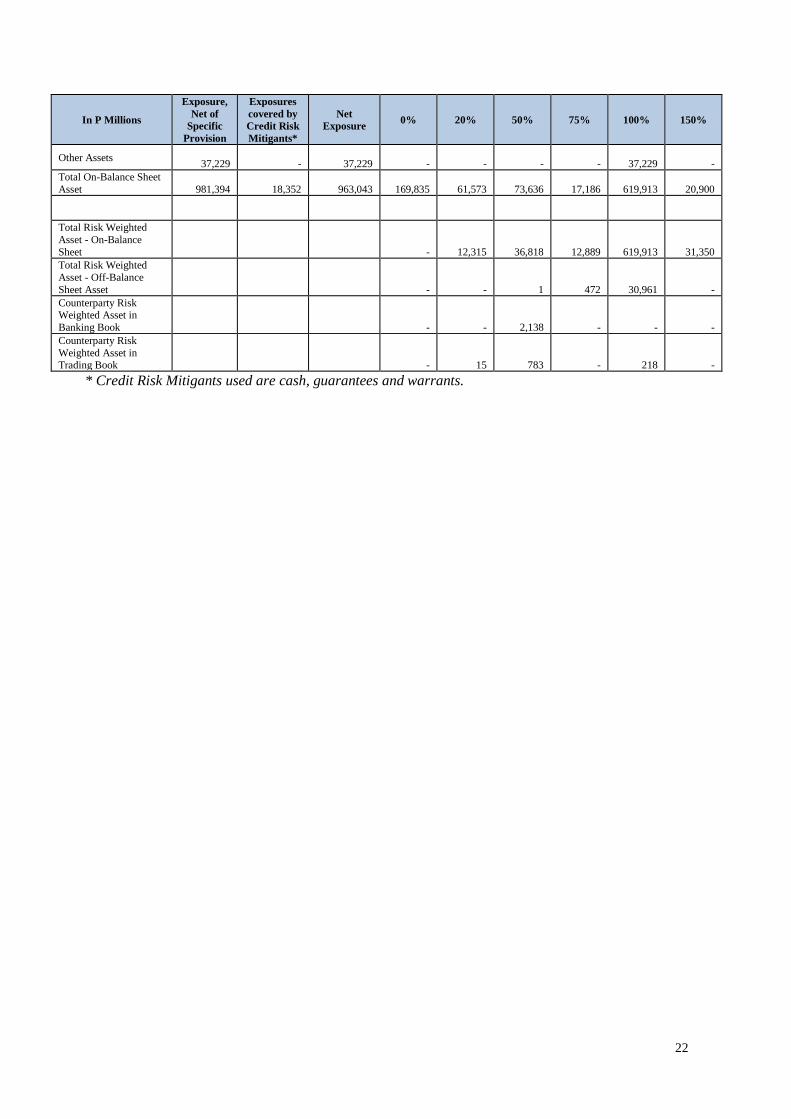
Credit Risk-Weighted Assets as of December 31, 2019
The Bank adopts the standardized approach in quantifying the risk-weighted assets. Credit risk
exposures are risk weighted based on third party credit assessments of Fitch, Moody’s, Standard &
Poor’s and Phil Ratings agencies. The ratings of these agencies are mapped in accordance with the
BSP’s standards. The following are the consolidated credit exposures of the Bank and the corresponding
risk weights:
In P Millions
Exposure,
Net of
Specific
Provision
Exposures
covered by
Credit Risk
Mitigants*
Net
Exposure 0% 20% 50% 75% 100% 150%
Cash and Other Cash
Items 27,221 - 27,221
27,221
-
-
-
-
-
Due from BSP 107,653 - 107,653
107,653
-
-
-
-
-
Due from Other Banks 21,339 - 21,339
-
10,255
9,631
-
1,453
-
Financial Asset at FVPL 51 - 51
-
-
-
-
51
-
Available for Sale 4,377 - 4,377
135
2,846
26
-
1,370
-
Held to Maturity (HTM) 100,220 4,798 95,422 30,839 3,928 47,688 - 12,967 0
Loans & Receivables 666,254 13,553 652,700
1,469
44,543
16,292
17,186
561,730
11,481
Loans and Receivables Arising from
Repurchase Agreements,
Securities Lending and Borrowing Transactions 2,519 - 2,519
2,519
-
-
-
-
-
Sales Contracts Receivable 5,672 - 5,672
-
-
-
-
5,112
561
Real & Other Properties
Acquired 8,858 - 8,858
-
-
-
-
-
8,858
22
In P Millions
Exposure,
Net of
Specific
Provision
Exposures
covered by
Credit Risk
Mitigants*
Net
Exposure 0% 20% 50% 75% 100% 150%
Other Assets 37,229 - 37,229
-
-
-
-
37,229
-
Total On-Balance Sheet
Asset 981,394 18,352 963,043
169,835
61,573
73,636
17,186
619,913
20,900
Total Risk Weighted
Asset - On-Balance
Sheet
-
12,315
36,818
12,889
619,913
31,350
Total Risk Weighted
Asset - Off-Balance
Sheet Asset
-
-
1
472
30,961
-
Counterparty Risk Weighted Asset in
Banking Book
-
- 2,138
-
-
-
Counterparty Risk
Weighted Asset in Trading Book
-
15
783
-
218
-
* Credit Risk Mitigants used are cash, guarantees and warrants.
23
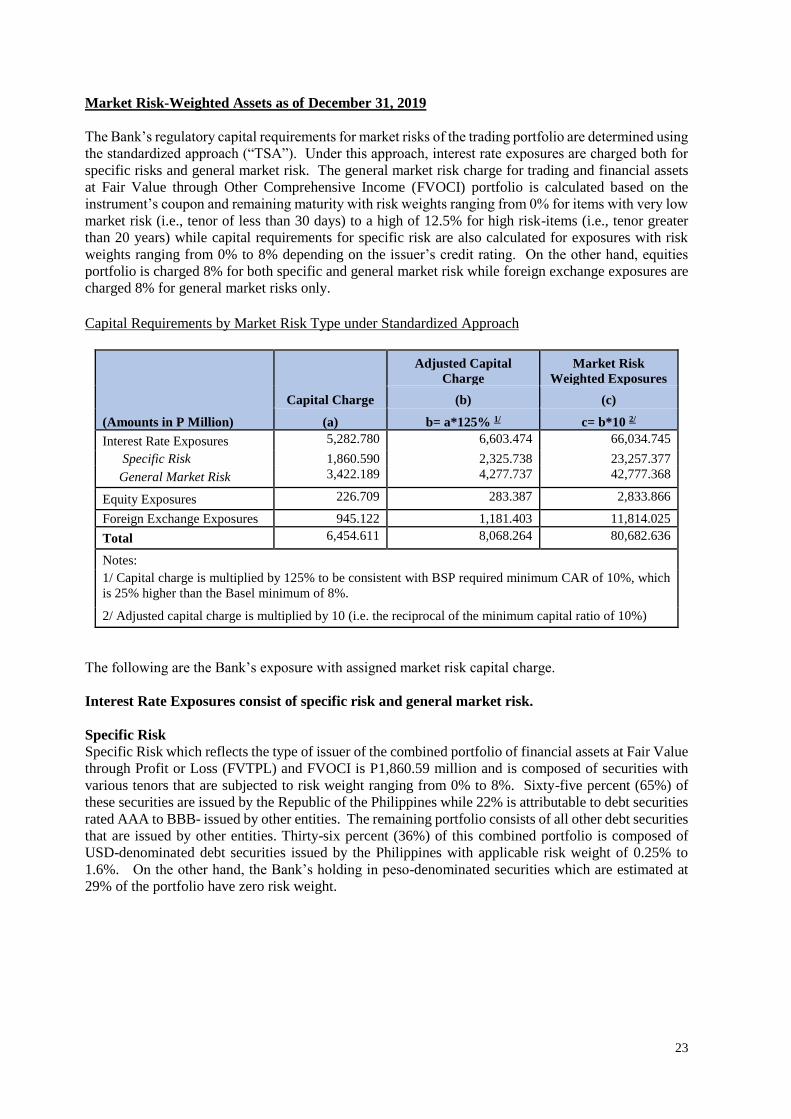
Market Risk-Weighted Assets as of December 31, 2019
The Bank’s regulatory capital requirements for market risks of the trading portfolio are determined using
the standardized approach (“TSA”). Under this approach, interest rate exposures are charged both for
specific risks and general market risk. The general market risk charge for trading and financial assets
at Fair Value through Other Comprehensive Income (FVOCI) portfolio is calculated based on the
instrument’s coupon and remaining maturity with risk weights ranging from 0% for items with very low
market risk (i.e., tenor of less than 30 days) to a high of 12.5% for high risk-items (i.e., tenor greater
than 20 years) while capital requirements for specific risk are also calculated for exposures with risk
weights ranging from 0% to 8% depending on the issuer’s credit rating. On the other hand, equities
portfolio is charged 8% for both specific and general market risk while foreign exchange exposures are
charged 8% for general market risks only.
Capital Requirements by Market Risk Type under Standardized Approach
(Amounts in P Million)
Capital Charge
Adjusted Capital
Charge
Market Risk
Weighted Exposures
(b) (c)
(a) b= a*125% 1/ c= b*10 2/
Interest Rate Exposures 5,282.780 6,603.474 66,034.745
Specific Risk 1,860.590 2,325.738 23,257.377
General Market Risk 3,422.189 4,277.737 42,777.368
Equity Exposures 226.709 283.387 2,833.866
Foreign Exchange Exposures 945.122 1,181.403 11,814.025
Total 6,454.611 8,068.264 80,682.636
Notes:
1/ Capital charge is multiplied by 125% to be consistent with BSP required minimum CAR of 10%, which
is 25% higher than the Basel minimum of 8%.
2/ Adjusted capital charge is multiplied by 10 (i.e. the reciprocal of the minimum capital ratio of 10%)
The following are the Bank’s exposure with assigned market risk capital charge.
Interest Rate Exposures consist of specific risk and general market risk.
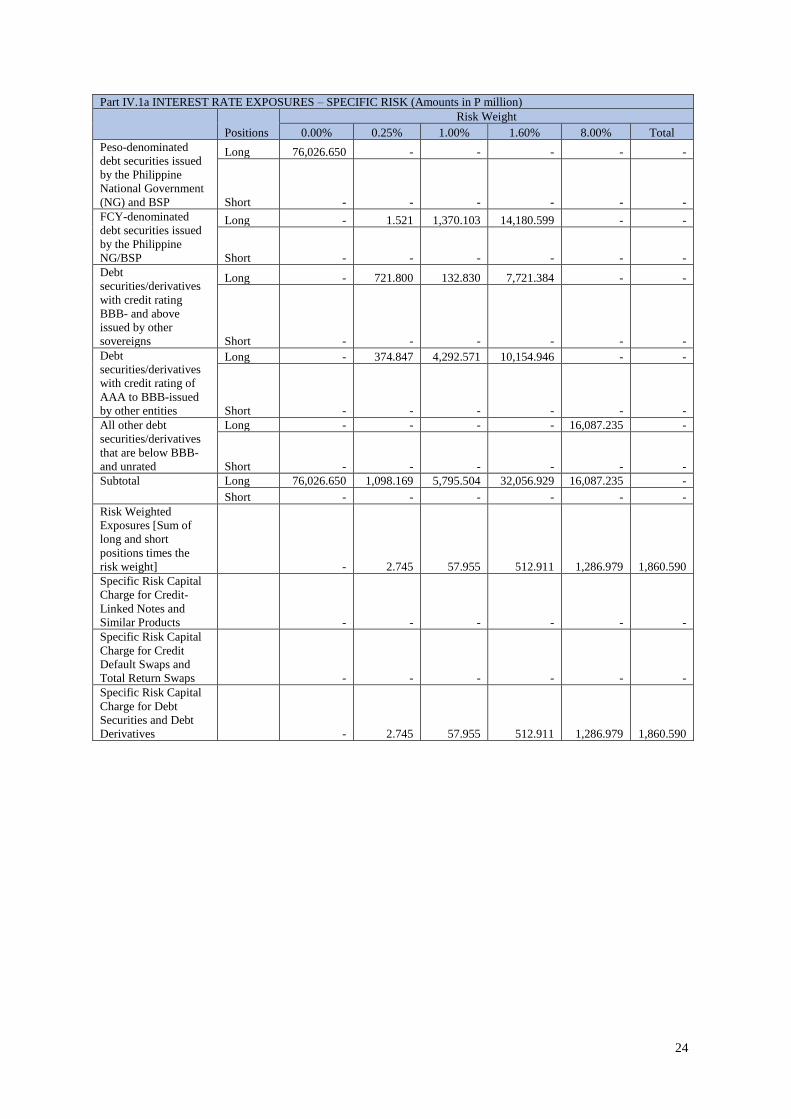
Specific Risk
Specific Risk which reflects the type of issuer of the combined portfolio of financial assets at Fair Value
through Profit or Loss (FVTPL) and FVOCI is P1,860.59 million and is composed of securities with
various tenors that are subjected to risk weight ranging from 0% to 8%. Sixty-five percent (65%) of
these securities are issued by the Republic of the Philippines while 22% is attributable to debt securities
rated AAA to BBB- issued by other entities. The remaining portfolio consists of all other debt securities
that are issued by other entities. Thirty-six percent (36%) of this combined portfolio is composed of
USD-denominated debt securities issued by the Philippines with applicable risk weight of 0.25% to
1.6%. On the other hand, the Bank’s holding in peso-denominated securities which are estimated at
29% of the portfolio have zero risk weight.
24
Part IV.1a INTEREST RATE EXPOSURES – SPECIFIC RISK (Amounts in P million)
Positions
Risk Weight
0.00% 0.25% 1.00% 1.60% 8.00% Total
Peso-denominated
debt securities issued
by the Philippine
National Government
(NG) and BSP
Long 76,026.650 - - - - -
Short - - - - - -
FCY-denominated
debt securities issued
by the Philippine
NG/BSP
Long - 1.521 1,370.103 14,180.599 - -
Short - - - - - -
Debt
securities/derivatives
with credit rating
BBB- and above
issued by other
sovereigns
Long - 721.800 132.830 7,721.384 - -
Short - - - - - -
Debt
securities/derivatives
with credit rating of
AAA to BBB-issued
by other entities
Long - 374.847 4,292.571 10,154.946 - -
Short - - - - - -
All other debt
securities/derivatives
that are below BBB-
and unrated
Long - - - - 16,087.235 -
Short - - - - - -
Subtotal Long 76,026.650 1,098.169 5,795.504 32,056.929 16,087.235 -
Short - - - - - -
Risk Weighted
Exposures [Sum of
long and short
positions times the
risk weight] - 2.745 57.955 512.911 1,286.979 1,860.590
Specific Risk Capital
Charge for Credit-
Linked Notes and
Similar Products - - - - - -
Specific Risk Capital
Charge for Credit
Default Swaps and
Total Return Swaps - - - - - -
Specific Risk Capital
Charge for Debt
Securities and Debt
Derivatives - 2.745 57.955 512.911 1,286.979 1,860.590
25
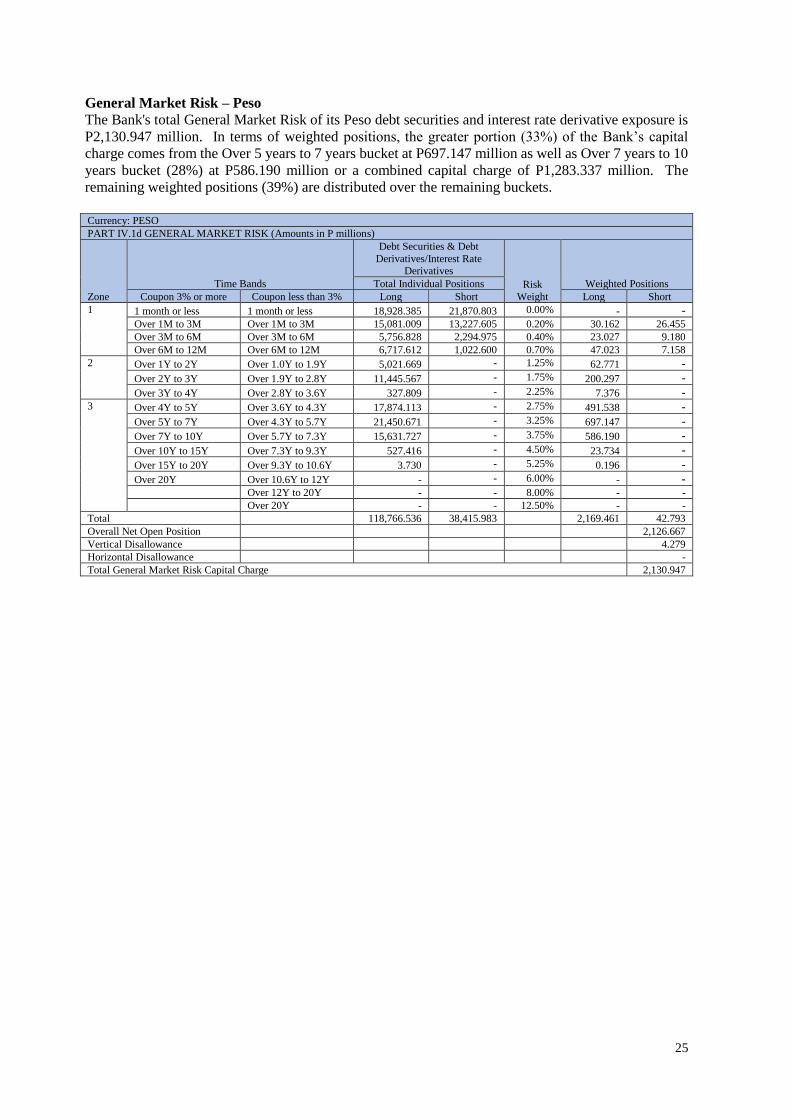
General Market Risk – Peso
The Bank's total General Market Risk of its Peso debt securities and interest rate derivative exposure is
P2,130.947 million. In terms of weighted positions, the greater portion (33%) of the Bank’s capital
charge comes from the Over 5 years to 7 years bucket at P697.147 million as well as Over 7 years to 10
years bucket (28%) at P586.190 million or a combined capital charge of P1,283.337 million. The
remaining weighted positions (39%) are distributed over the remaining buckets.
Currency: PESO
PART IV.1d GENERAL MARKET RISK (Amounts in P millions)
Zone
Time Bands
Debt Securities & Debt
Derivatives/Interest Rate Derivatives
Risk
Weight
Weighted Positions Total Individual Positions
Coupon 3% or more Coupon less than 3% Long Short Long Short
1 1 month or less 1 month or less 18,928.385 21,870.803 0.00% - - Over 1M to 3M Over 1M to 3M 15,081.009 13,227.605 0.20% 30.162 26.455
Over 3M to 6M Over 3M to 6M 5,756.828 2,294.975 0.40% 23.027 9.180
Over 6M to 12M Over 6M to 12M 6,717.612 1,022.600 0.70% 47.023 7.158
2 Over 1Y to 2Y Over 1.0Y to 1.9Y 5,021.669 - 1.25% 62.771 -
Over 2Y to 3Y Over 1.9Y to 2.8Y 11,445.567 - 1.75% 200.297 -
Over 3Y to 4Y Over 2.8Y to 3.6Y 327.809 - 2.25% 7.376 - 3 Over 4Y to 5Y Over 3.6Y to 4.3Y 17,874.113 - 2.75% 491.538 -
Over 5Y to 7Y Over 4.3Y to 5.7Y 21,450.671 - 3.25% 697.147 -
Over 7Y to 10Y Over 5.7Y to 7.3Y 15,631.727 - 3.75% 586.190 -
Over 10Y to 15Y Over 7.3Y to 9.3Y 527.416 - 4.50% 23.734 -
Over 15Y to 20Y Over 9.3Y to 10.6Y 3.730 - 5.25% 0.196 -
Over 20Y Over 10.6Y to 12Y - - 6.00% - - Over 12Y to 20Y - - 8.00% - -
Over 20Y - - 12.50% - -
Total 118,766.536 38,415.983 2,169.461 42.793 Overall Net Open Position 2,126.667
Vertical Disallowance 4.279
Horizontal Disallowance -
Total General Market Risk Capital Charge 2,130.947
26
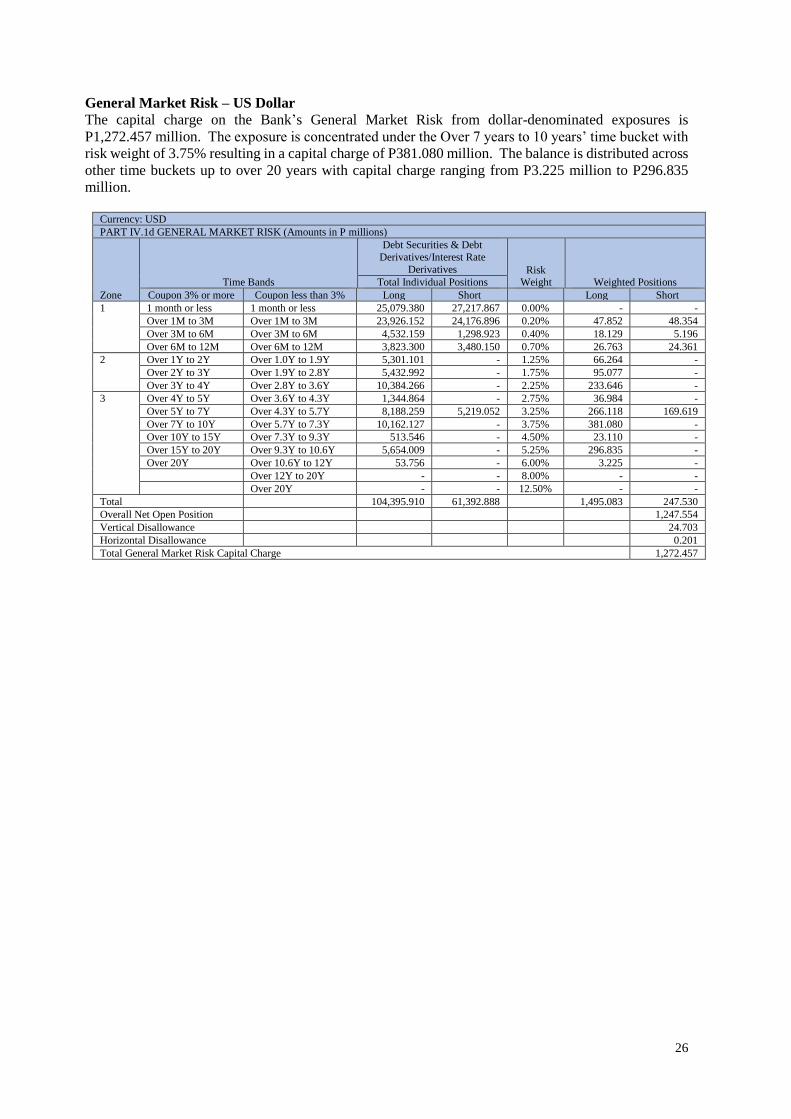
General Market Risk – US Dollar
The capital charge on the Bank’s General Market Risk from dollar-denominated exposures is
P1,272.457 million. The exposure is concentrated under the Over 7 years to 10 years’ time bucket with
risk weight of 3.75% resulting in a capital charge of P381.080 million. The balance is distributed across
other time buckets up to over 20 years with capital charge ranging from P3.225 million to P296.835
million.
Currency: USD
PART IV.1d GENERAL MARKET RISK (Amounts in P millions)
Zone
Time Bands
Debt Securities & Debt
Derivatives/Interest Rate
Derivatives Risk Weight Weighted Positions Total Individual Positions
Coupon 3% or more Coupon less than 3% Long Short Long Short
1 1 month or less 1 month or less 25,079.380 27,217.867 0.00% - -
Over 1M to 3M Over 1M to 3M 23,926.152 24,176.896 0.20% 47.852 48.354
Over 3M to 6M Over 3M to 6M 4,532.159 1,298.923 0.40% 18.129 5.196
Over 6M to 12M Over 6M to 12M 3,823.300 3,480.150 0.70% 26.763 24.361
2 Over 1Y to 2Y Over 1.0Y to 1.9Y 5,301.101 - 1.25% 66.264 -
Over 2Y to 3Y Over 1.9Y to 2.8Y 5,432.992 - 1.75% 95.077 -
Over 3Y to 4Y Over 2.8Y to 3.6Y 10,384.266 - 2.25% 233.646 -
3 Over 4Y to 5Y Over 3.6Y to 4.3Y 1,344.864 - 2.75% 36.984 -
Over 5Y to 7Y Over 4.3Y to 5.7Y 8,188.259 5,219.052 3.25% 266.118 169.619
Over 7Y to 10Y Over 5.7Y to 7.3Y 10,162.127 - 3.75% 381.080 -
Over 10Y to 15Y Over 7.3Y to 9.3Y 513.546 - 4.50% 23.110 -
Over 15Y to 20Y Over 9.3Y to 10.6Y 5,654.009 - 5.25% 296.835 -
Over 20Y Over 10.6Y to 12Y 53.756 - 6.00% 3.225 -
Over 12Y to 20Y - - 8.00% - -
Over 20Y - - 12.50% - -
Total 104,395.910 61,392.888 1,495.083 247.530
Overall Net Open Position 1,247.554
Vertical Disallowance 24.703
Horizontal Disallowance 0.201
Total General Market Risk Capital Charge 1,272.457
27
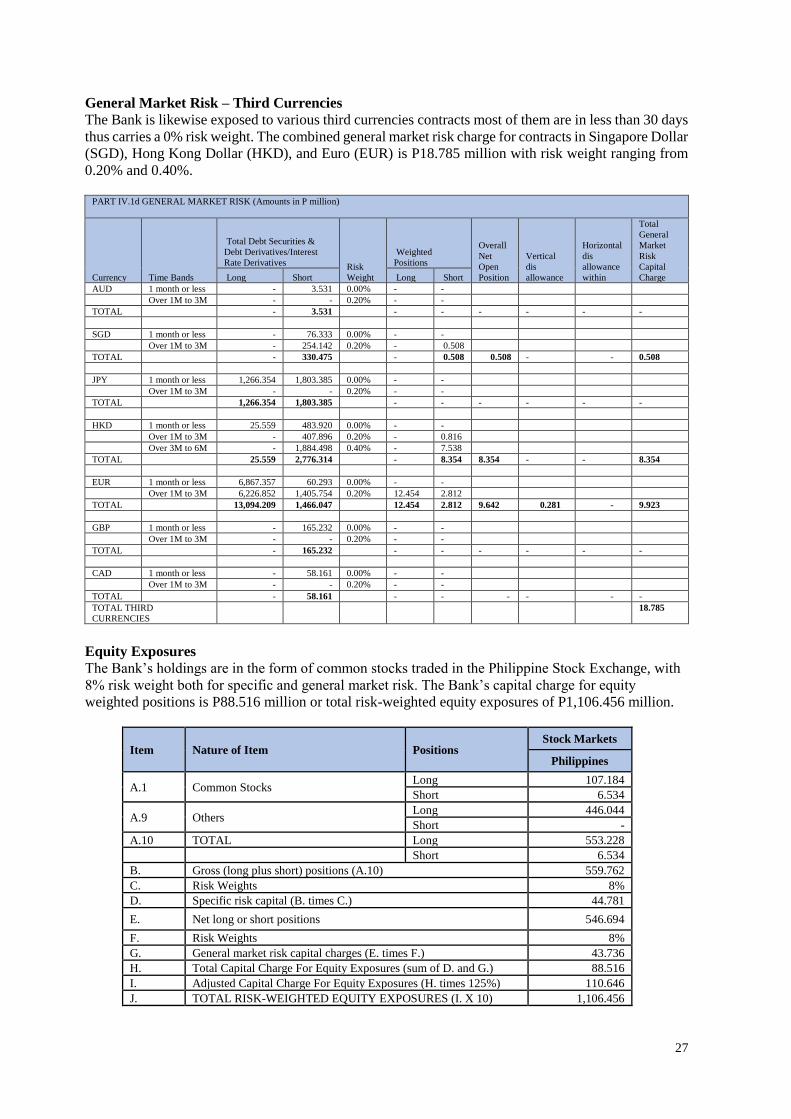
General Market Risk – Third Currencies
The Bank is likewise exposed to various third currencies contracts most of them are in less than 30 days
thus carries a 0% risk weight. The combined general market risk charge for contracts in Singapore Dollar
(SGD), Hong Kong Dollar (HKD), and Euro (EUR) is P18.785 million with risk weight ranging from
0.20% and 0.40%.
PART IV.1d GENERAL MARKET RISK (Amounts in P million)
Currency Time Bands
Total Debt Securities &
Debt Derivatives/Interest
Rate Derivatives Risk
Weight
Weighted
Positions
Overall
Net
Open
Position
Vertical
dis
allowance
Horizontal
dis
allowance
within
Total
General
Market
Risk
Capital
Charge Long Short Long Short
AUD 1 month or less - 3.531 0.00% - -
Over 1M to 3M - - 0.20% - -
TOTAL - 3.531 - - - - - -
SGD 1 month or less - 76.333 0.00% - -
Over 1M to 3M - 254.142 0.20% - 0.508
TOTAL - 330.475 - 0.508 0.508 - - 0.508
JPY 1 month or less 1,266.354 1,803.385 0.00% - -
Over 1M to 3M - - 0.20% - -
TOTAL 1,266.354 1,803.385 - - - - - -
HKD 1 month or less 25.559 483.920 0.00% - -
Over 1M to 3M - 407.896 0.20% - 0.816
Over 3M to 6M - 1,884.498 0.40% - 7.538
TOTAL 25.559 2,776.314 - 8.354 8.354 - - 8.354
EUR 1 month or less 6,867.357 60.293 0.00% - -
Over 1M to 3M 6,226.852 1,405.754 0.20% 12.454 2.812
TOTAL 13,094.209 1,466.047 12.454 2.812 9.642 0.281 - 9.923
GBP 1 month or less - 165.232 0.00% - -
Over 1M to 3M - - 0.20% - -
TOTAL - 165.232 - - - - - -
CAD 1 month or less - 58.161 0.00% - -
Over 1M to 3M - - 0.20% - -
TOTAL - 58.161 - - - - - -
TOTAL THIRD
CURRENCIES
18.785
Equity Exposures
The Bank’s holdings are in the form of common stocks traded in the Philippine Stock Exchange, with
8% risk weight both for specific and general market risk. The Bank’s capital charge for equity
weighted positions is P88.516 million or total risk-weighted equity exposures of P1,106.456 million.
Item Nature of Item Positions Stock Markets
Philippines
A.1 Common Stocks Long 107.184
Short 6.534
A.9 Others Long 446.044
Short -
A.10 TOTAL Long 553.228
Short 6.534
B. Gross (long plus short) positions (A.10) 559.762
C. Risk Weights 8%
D. Specific risk capital (B. times C.) 44.781
E. Net long or short positions 546.694
F. Risk Weights 8%
G. General market risk capital charges (E. times F.) 43.736
H. Total Capital Charge For Equity Exposures (sum of D. and G.) 88.516
I. Adjusted Capital Charge For Equity Exposures (H. times 125%) 110.646
J. TOTAL RISK-WEIGHTED EQUITY EXPOSURES (I. X 10) 1,106.456
28
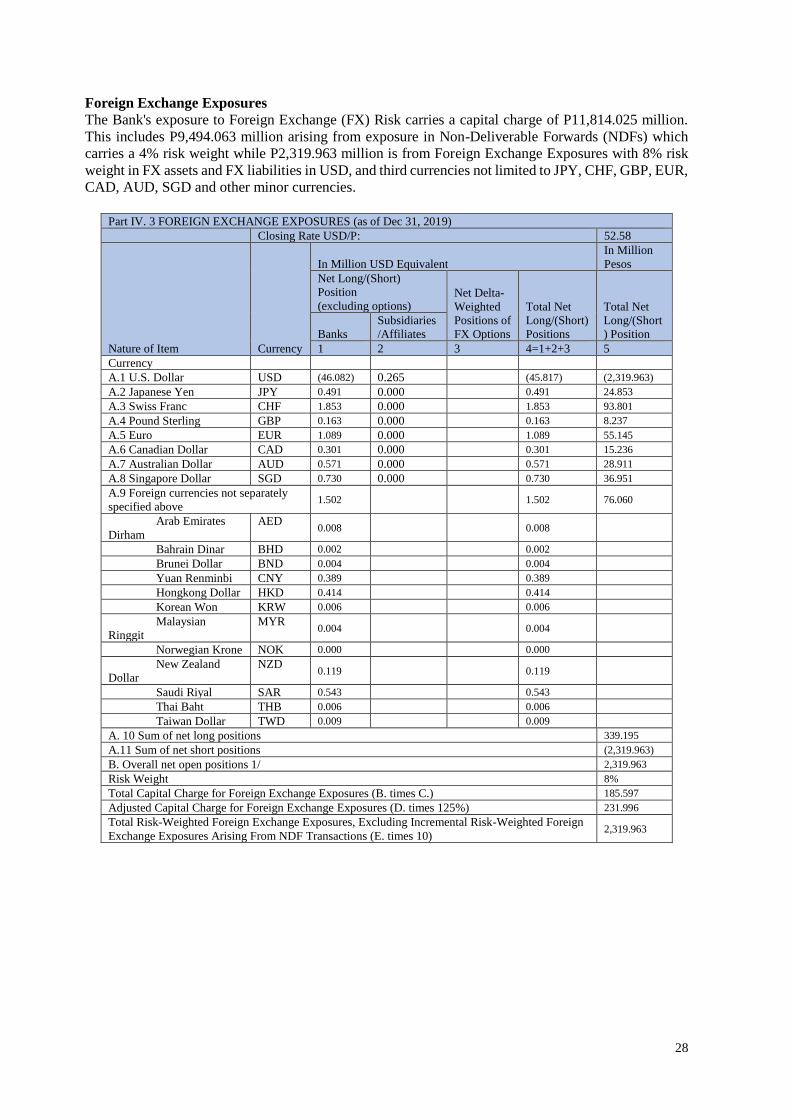
Foreign Exchange Exposures
The Bank's exposure to Foreign Exchange (FX) Risk carries a capital charge of P11,814.025 million.
This includes P9,494.063 million arising from exposure in Non-Deliverable Forwards (NDFs) which
carries a 4% risk weight while P2,319.963 million is from Foreign Exchange Exposures with 8% risk
weight in FX assets and FX liabilities in USD, and third currencies not limited to JPY, CHF, GBP, EUR,
CAD, AUD, SGD and other minor currencies.
Part IV. 3 FOREIGN EXCHANGE EXPOSURES (as of Dec 31, 2019)
Closing Rate USD/P: 52.58
Nature of Item Currency
In Million USD Equivalent
In Million
Pesos
Net Long/(Short)
Position
(excluding options) Net Delta-
Weighted
Positions of
FX Options
Total Net
Long/(Short)
Positions
Total Net
Long/(Short
) Position Banks
Subsidiaries
/Affiliates
1 2 3 4=1+2+3 5
Currency
A.1 U.S. Dollar USD (46.082) 0.265 (45.817) (2,319.963)
A.2 Japanese Yen JPY 0.491 0.000 0.491 24.853
A.3 Swiss Franc CHF 1.853 0.000 1.853 93.801
A.4 Pound Sterling GBP 0.163 0.000 0.163 8.237
A.5 Euro EUR 1.089 0.000 1.089 55.145
A.6 Canadian Dollar CAD 0.301 0.000 0.301 15.236
A.7 Australian Dollar AUD 0.571 0.000 0.571 28.911
A.8 Singapore Dollar SGD 0.730 0.000 0.730 36.951
A.9 Foreign currencies not separately
specified above 1.502 1.502 76.060
Arab Emirates
Dirham
AED 0.008
0.008
Bahrain Dinar BHD 0.002 0.002
Brunei Dollar BND 0.004 0.004
Yuan Renminbi CNY 0.389 0.389
Hongkong Dollar HKD 0.414 0.414
Korean Won KRW 0.006 0.006
Malaysian
Ringgit
MYR 0.004
0.004
Norwegian Krone NOK 0.000 0.000
New Zealand
Dollar
NZD 0.119
0.119
Saudi Riyal SAR 0.543 0.543
Thai Baht THB 0.006 0.006
Taiwan Dollar TWD 0.009 0.009
A. 10 Sum of net long positions 339.195
A.11 Sum of net short positions (2,319.963)
B. Overall net open positions 1/ 2,319.963
Risk Weight 8%
Total Capital Charge for Foreign Exchange Exposures (B. times C.) 185.597
Adjusted Capital Charge for Foreign Exchange Exposures (D. times 125%) 231.996
Total Risk-Weighted Foreign Exchange Exposures, Excluding Incremental Risk-Weighted Foreign
Exchange Exposures Arising From NDF Transactions (E. times 10) 2,319.963
29
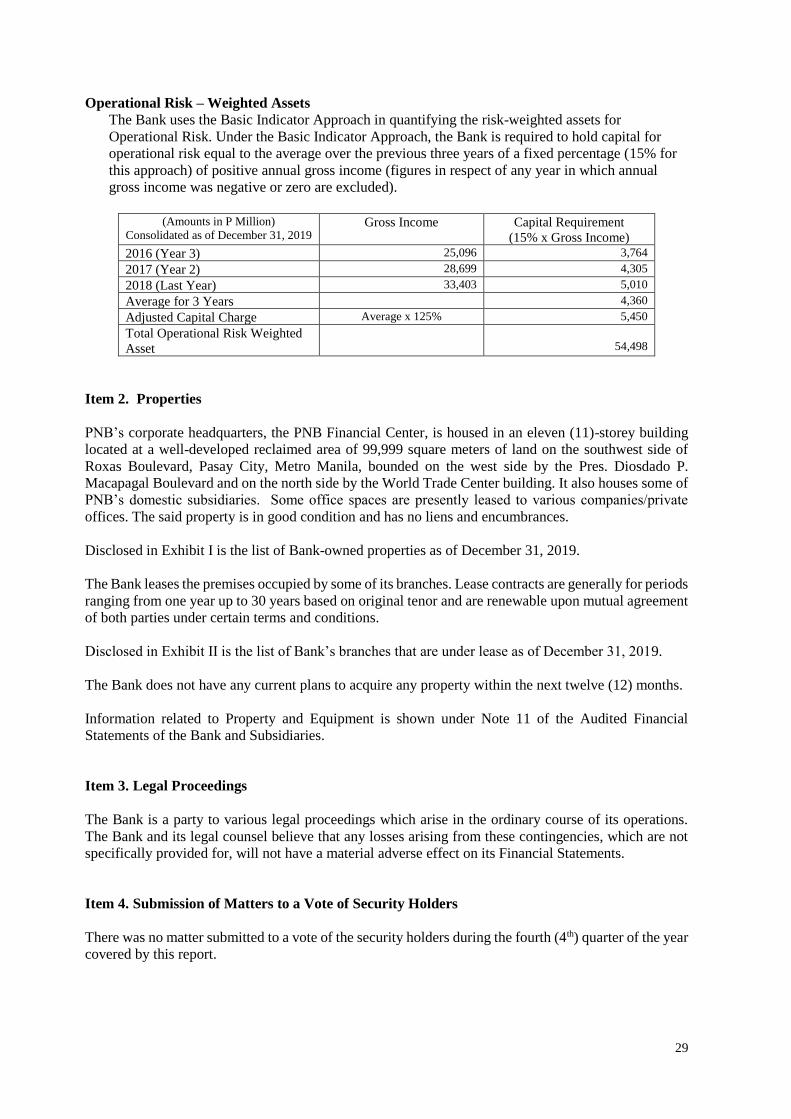
Operational Risk – Weighted Assets
The Bank uses the Basic Indicator Approach in quantifying the risk-weighted assets for
Operational Risk. Under the Basic Indicator Approach, the Bank is required to hold capital for
operational risk equal to the average over the previous three years of a fixed percentage (15% for
this approach) of positive annual gross income (figures in respect of any year in which annual
gross income was negative or zero are excluded).
(Amounts in P Million)
Consolidated as of December 31, 2019 Gross Income Capital Requirement
(15% x Gross Income)
2016 (Year 3) 25,096 3,764
2017 (Year 2) 28,699 4,305
2018 (Last Year) 33,403 5,010
Average for 3 Years 4,360
Adjusted Capital Charge Average x 125% 5,450
Total Operational Risk Weighted
Asset
54,498
Item 2. Properties
PNB’s corporate headquarters, the PNB Financial Center, is housed in an eleven (11)-storey building
located at a well-developed reclaimed area of 99,999 square meters of land on the southwest side of
Roxas Boulevard, Pasay City, Metro Manila, bounded on the west side by the Pres. Diosdado P.
Macapagal Boulevard and on the north side by the World Trade Center building. It also houses some of
PNB’s domestic subsidiaries. Some office spaces are presently leased to various companies/private
offices. The said property is in good condition and has no liens and encumbrances.
Disclosed in Exhibit I is the list of Bank-owned properties as of December 31, 2019.
The Bank leases the premises occupied by some of its branches. Lease contracts are generally for periods
ranging from one year up to 30 years based on original tenor and are renewable upon mutual agreement
of both parties under certain terms and conditions.
Disclosed in Exhibit II is the list of Bank’s branches that are under lease as of December 31, 2019.
The Bank does not have any current plans to acquire any property within the next twelve (12) months.
Information related to Property and Equipment is shown under Note 11 of the Audited Financial
Statements of the Bank and Subsidiaries.
Item 3. Legal Proceedings
The Bank is a party to various legal proceedings which arise in the ordinary course of its operations.
The Bank and its legal counsel believe that any losses arising from these contingencies, which are not
specifically provided for, will not have a material adverse effect on its Financial Statements.
Item 4. Submission of Matters to a Vote of Security Holders
There was no matter submitted to a vote of the security holders during the fourth (4th) quarter of the year
covered by this report.
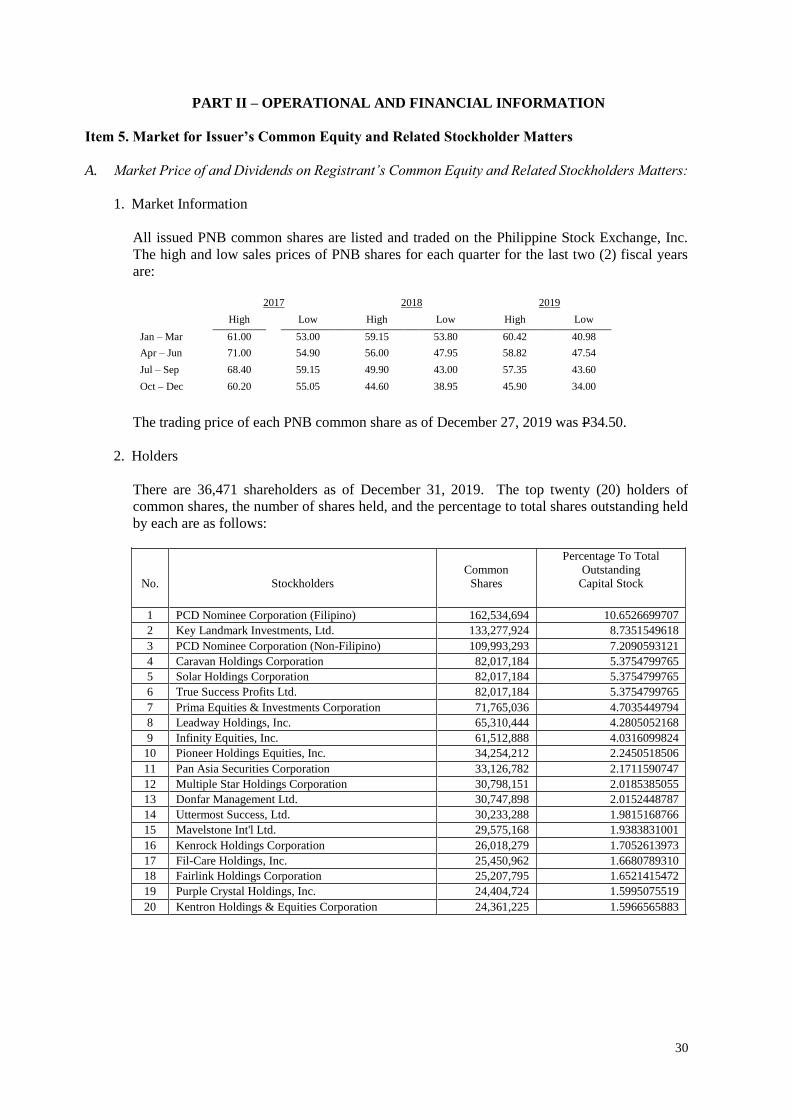
30
PART II – OPERATIONAL AND FINANCIAL INFORMATION
Item 5. Market for Issuer’s Common Equity and Related Stockholder Matters
A. Market Price of and Dividends on Registrant’s Common Equity and Related Stockholders Matters:
1. Market Information
All issued PNB common shares are listed and traded on the Philippine Stock Exchange, Inc.
The high and low sales prices of PNB shares for each quarter for the last two (2) fiscal years
are:
2017 2018 2019
High Low High Low High Low
Jan – Mar 61.00 53.00 59.15 53.80 60.42 40.98
Apr – Jun 71.00 54.90 56.00 47.95 58.82 47.54
Jul – Sep 68.40 59.15 49.90 43.00 57.35 43.60
Oct – Dec 60.20 55.05 44.60 38.95 45.90 34.00
The trading price of each PNB common share as of December 27, 2019 was P34.50.
2. Holders
There are 36,471 shareholders as of December 31, 2019. The top twenty (20) holders of
common shares, the number of shares held, and the percentage to total shares outstanding held
by each are as follows:
No.
Stockholders
Common
Shares
Percentage To Total
Outstanding
Capital Stock
1 PCD Nominee Corporation (Filipino) 162,534,694 10.6526699707
2 Key Landmark Investments, Ltd. 133,277,924 8.7351549618
3 PCD Nominee Corporation (Non-Filipino) 109,993,293 7.2090593121
4 Caravan Holdings Corporation 82,017,184 5.3754799765
5 Solar Holdings Corporation 82,017,184 5.3754799765
6 True Success Profits Ltd. 82,017,184 5.3754799765
7 Prima Equities & Investments Corporation 71,765,036 4.7035449794
8 Leadway Holdings, Inc. 65,310,444 4.2805052168
9 Infinity Equities, Inc. 61,512,888 4.0316099824
10 Pioneer Holdings Equities, Inc. 34,254,212 2.2450518506
11 Pan Asia Securities Corporation 33,126,782 2.1711590747
12 Multiple Star Holdings Corporation 30,798,151 2.0185385055
13 Donfar Management Ltd. 30,747,898 2.0152448787
14 Uttermost Success, Ltd. 30,233,288 1.9815168766
15 Mavelstone Int'l Ltd. 29,575,168 1.9383831001
16 Kenrock Holdings Corporation 26,018,279 1.7052613973
17 Fil-Care Holdings, Inc. 25,450,962 1.6680789310
18 Fairlink Holdings Corporation 25,207,795 1.6521415472
19 Purple Crystal Holdings, Inc. 24,404,724 1.5995075519
20 Kentron Holdings & Equities Corporation 24,361,225 1.5966565883
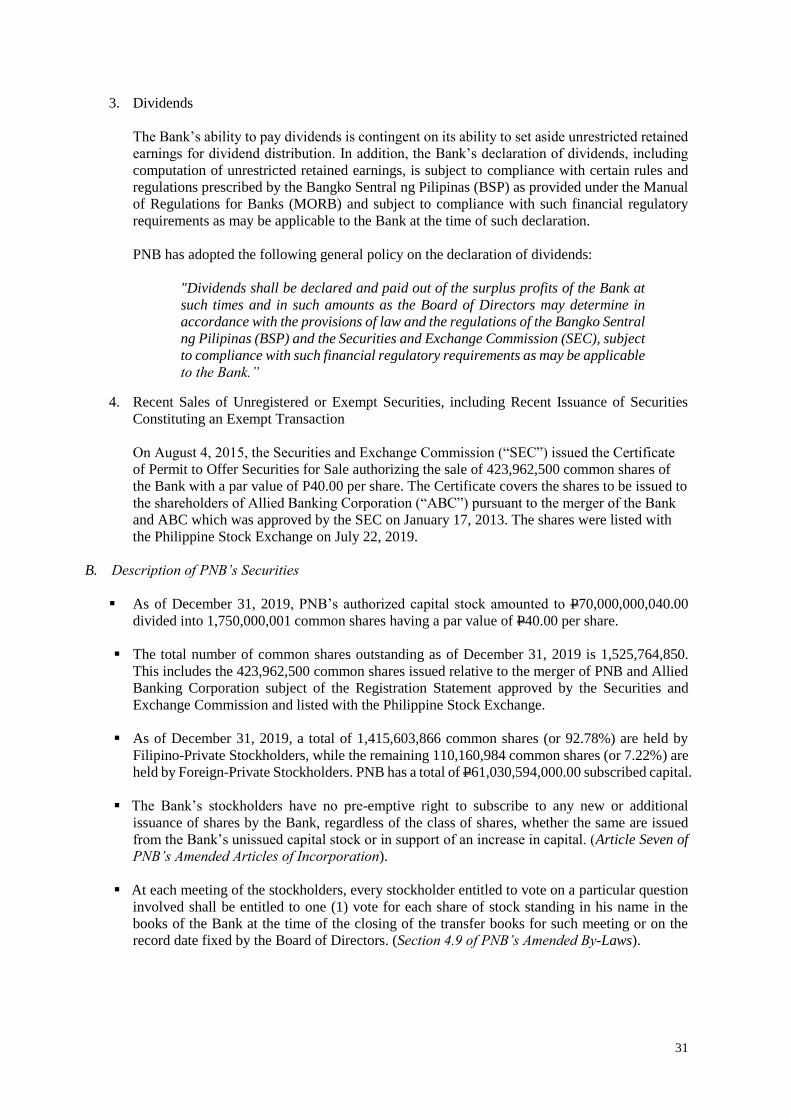
31
3. Dividends
The Bank’s ability to pay dividends is contingent on its ability to set aside unrestricted retained
earnings for dividend distribution. In addition, the Bank’s declaration of dividends, including
computation of unrestricted retained earnings, is subject to compliance with certain rules and
regulations prescribed by the Bangko Sentral ng Pilipinas (BSP) as provided under the Manual
of Regulations for Banks (MORB) and subject to compliance with such financial regulatory
requirements as may be applicable to the Bank at the time of such declaration.
PNB has adopted the following general policy on the declaration of dividends:
"Dividends shall be declared and paid out of the surplus profits of the Bank at
such times and in such amounts as the Board of Directors may determine in
accordance with the provisions of law and the regulations of the Bangko Sentral
ng Pilipinas (BSP) and the Securities and Exchange Commission (SEC), subject
to compliance with such financial regulatory requirements as may be applicable
to the Bank.”
4. Recent Sales of Unregistered or Exempt Securities, including Recent Issuance of Securities
Constituting an Exempt Transaction
On August 4, 2015, the Securities and Exchange Commission (“SEC”) issued the Certificate
of Permit to Offer Securities for Sale authorizing the sale of 423,962,500 common shares of
the Bank with a par value of P40.00 per share. The Certificate covers the shares to be issued to
the shareholders of Allied Banking Corporation (“ABC”) pursuant to the merger of the Bank
and ABC which was approved by the SEC on January 17, 2013. The shares were listed with
the Philippine Stock Exchange on July 22, 2019.
B. Description of PNB’s Securities
▪ As of December 31, 2019, PNB’s authorized capital stock amounted to P70,000,000,040.00
divided into 1,750,000,001 common shares having a par value of P40.00 per share.
▪ The total number of common shares outstanding as of December 31, 2019 is 1,525,764,850.
This includes the 423,962,500 common shares issued relative to the merger of PNB and Allied
Banking Corporation subject of the Registration Statement approved by the Securities and
Exchange Commission and listed with the Philippine Stock Exchange.
▪ As of December 31, 2019, a total of 1,415,603,866 common shares (or 92.78%) are held by
Filipino-Private Stockholders, while the remaining 110,160,984 common shares (or 7.22%) are
held by Foreign-Private Stockholders. PNB has a total of P61,030,594,000.00 subscribed capital.
▪ The Bank’s stockholders have no pre-emptive right to subscribe to any new or additional
issuance of shares by the Bank, regardless of the class of shares, whether the same are issued
from the Bank’s unissued capital stock or in support of an increase in capital. (Article Seven of
PNB’s Amended Articles of Incorporation).
▪ At each meeting of the stockholders, every stockholder entitled to vote on a particular question
involved shall be entitled to one (1) vote for each share of stock standing in his name in the
books of the Bank at the time of the closing of the transfer books for such meeting or on the
record date fixed by the Board of Directors. (Section 4.9 of PNB’s Amended By-Laws).
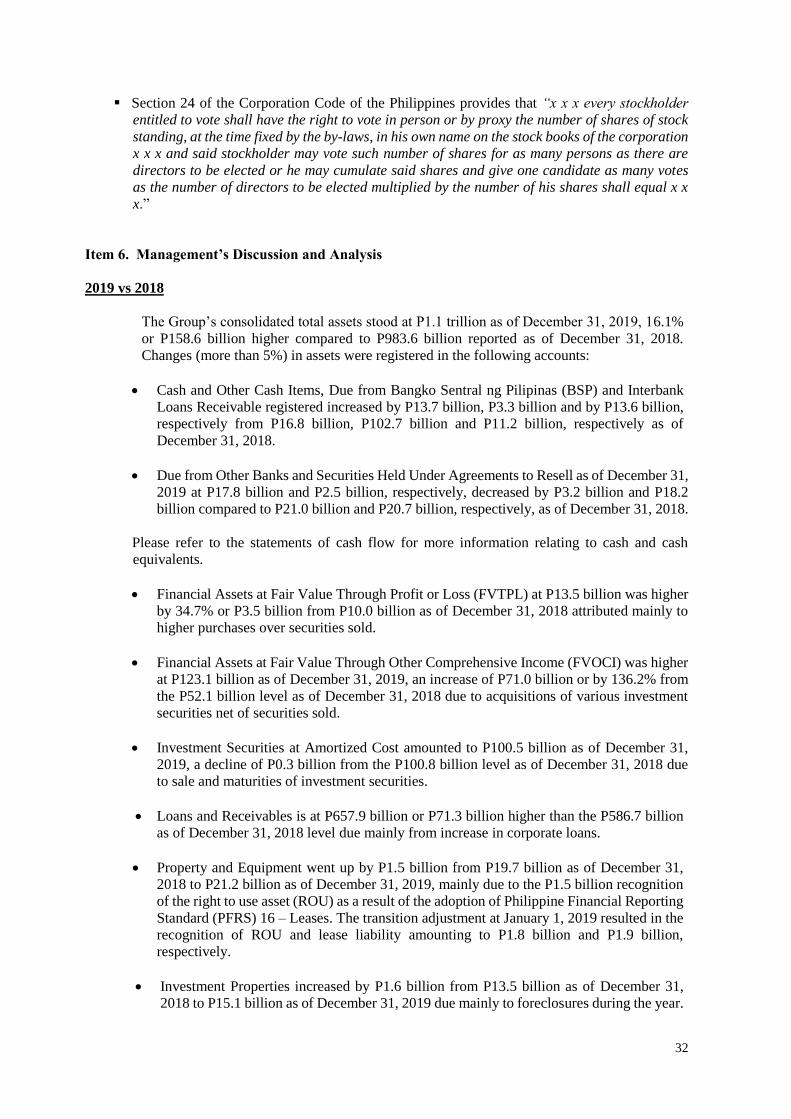
32
▪ Section 24 of the Corporation Code of the Philippines provides that “x x x every stockholder
entitled to vote shall have the right to vote in person or by proxy the number of shares of stock
standing, at the time fixed by the by-laws, in his own name on the stock books of the corporation
x x x and said stockholder may vote such number of shares for as many persons as there are
directors to be elected or he may cumulate said shares and give one candidate as many votes
as the number of directors to be elected multiplied by the number of his shares shall equal x x
x.”
Item 6. Management’s Discussion and Analysis
2019 vs 2018
The Group’s consolidated total assets stood at P1.1 trillion as of December 31, 2019, 16.1%
or P158.6 billion higher compared to P983.6 billion reported as of December 31, 2018.
Changes (more than 5%) in assets were registered in the following accounts:
• Cash and Other Cash Items, Due from Bangko Sentral ng Pilipinas (BSP) and Interbank
Loans Receivable registered increased by P13.7 billion, P3.3 billion and by P13.6 billion,
respectively from P16.8 billion, P102.7 billion and P11.2 billion, respectively as of
December 31, 2018.
• Due from Other Banks and Securities Held Under Agreements to Resell as of December 31,
2019 at P17.8 billion and P2.5 billion, respectively, decreased by P3.2 billion and P18.2
billion compared to P21.0 billion and P20.7 billion, respectively, as of December 31, 2018.
Please refer to the statements of cash flow for more information relating to cash and cash
equivalents.
• Financial Assets at Fair Value Through Profit or Loss (FVTPL) at P13.5 billion was higher
by 34.7% or P3.5 billion from P10.0 billion as of December 31, 2018 attributed mainly to
higher purchases over securities sold.
• Financial Assets at Fair Value Through Other Comprehensive Income (FVOCI) was higher
at P123.1 billion as of December 31, 2019, an increase of P71.0 billion or by 136.2% from
the P52.1 billion level as of December 31, 2018 due to acquisitions of various investment
securities net of securities sold.
• Investment Securities at Amortized Cost amounted to P100.5 billion as of December 31,
2019, a decline of P0.3 billion from the P100.8 billion level as of December 31, 2018 due
to sale and maturities of investment securities.
• Loans and Receivables is at P657.9 billion or P71.3 billion higher than the P586.7 billion
as of December 31, 2018 level due mainly from increase in corporate loans.
• Property and Equipment went up by P1.5 billion from P19.7 billion as of December 31,
2018 to P21.2 billion as of December 31, 2019, mainly due to the P1.5 billion recognition
of the right to use asset (ROU) as a result of the adoption of Philippine Financial Reporting
Standard (PFRS) 16 – Leases. The transition adjustment at January 1, 2019 resulted in the
recognition of ROU and lease liability amounting to P1.8 billion and P1.9 billion,
respectively.
• Investment Properties increased by P1.6 billion from P13.5 billion as of December 31,
2018 to P15.1 billion as of December 31, 2019 due mainly to foreclosures during the year.
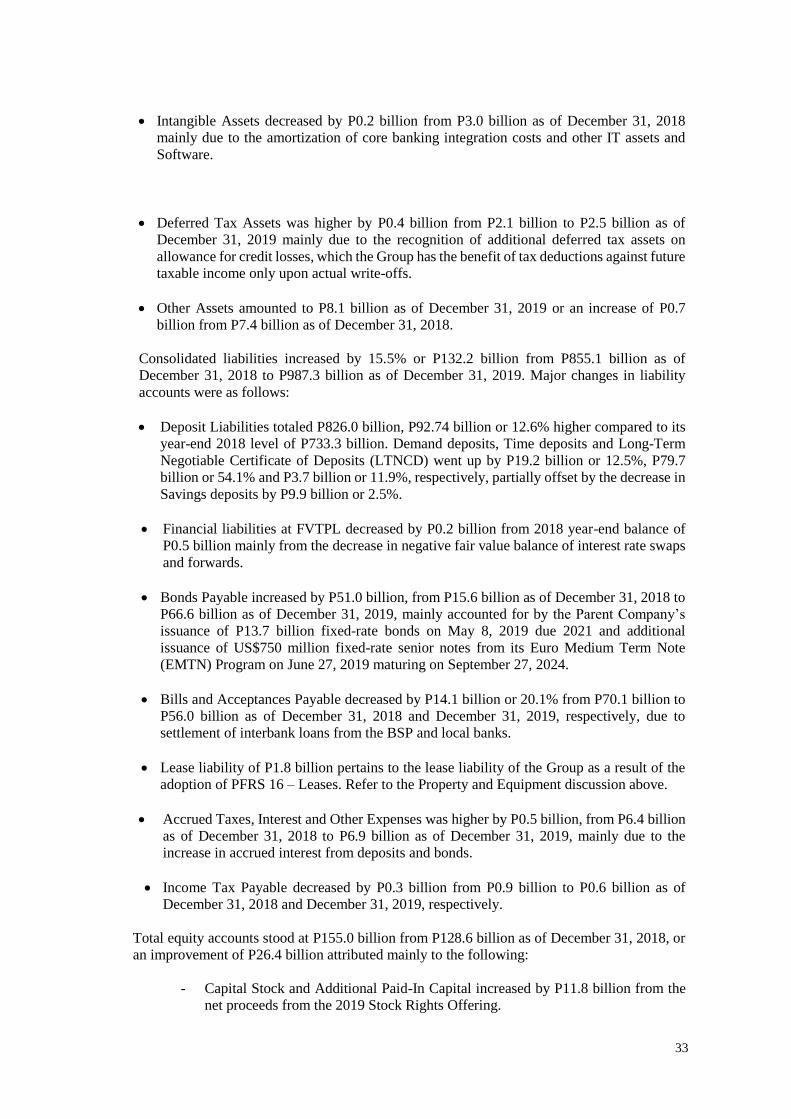
33
• Intangible Assets decreased by P0.2 billion from P3.0 billion as of December 31, 2018
mainly due to the amortization of core banking integration costs and other IT assets and
Software.
• Deferred Tax Assets was higher by P0.4 billion from P2.1 billion to P2.5 billion as of
December 31, 2019 mainly due to the recognition of additional deferred tax assets on
allowance for credit losses, which the Group has the benefit of tax deductions against future
taxable income only upon actual write-offs.
• Other Assets amounted to P8.1 billion as of December 31, 2019 or an increase of P0.7
billion from P7.4 billion as of December 31, 2018.
Consolidated liabilities increased by 15.5% or P132.2 billion from P855.1 billion as of
December 31, 2018 to P987.3 billion as of December 31, 2019. Major changes in liability
accounts were as follows:
• Deposit Liabilities totaled P826.0 billion, P92.74 billion or 12.6% higher compared to its
year-end 2018 level of P733.3 billion. Demand deposits, Time deposits and Long-Term
Negotiable Certificate of Deposits (LTNCD) went up by P19.2 billion or 12.5%, P79.7
billion or 54.1% and P3.7 billion or 11.9%, respectively, partially offset by the decrease in
Savings deposits by P9.9 billion or 2.5%.
• Financial liabilities at FVTPL decreased by P0.2 billion from 2018 year-end balance of
P0.5 billion mainly from the decrease in negative fair value balance of interest rate swaps
and forwards.
• Bonds Payable increased by P51.0 billion, from P15.6 billion as of December 31, 2018 to
P66.6 billion as of December 31, 2019, mainly accounted for by the Parent Company’s
issuance of P13.7 billion fixed-rate bonds on May 8, 2019 due 2021 and additional
issuance of US$750 million fixed-rate senior notes from its Euro Medium Term Note
(EMTN) Program on June 27, 2019 maturing on September 27, 2024.
• Bills and Acceptances Payable decreased by P14.1 billion or 20.1% from P70.1 billion to
P56.0 billion as of December 31, 2018 and December 31, 2019, respectively, due to
settlement of interbank loans from the BSP and local banks.
• Lease liability of P1.8 billion pertains to the lease liability of the Group as a result of the
adoption of PFRS 16 – Leases. Refer to the Property and Equipment discussion above.
• Accrued Taxes, Interest and Other Expenses was higher by P0.5 billion, from P6.4 billion
as of December 31, 2018 to P6.9 billion as of December 31, 2019, mainly due to the
increase in accrued interest from deposits and bonds.
• Income Tax Payable decreased by P0.3 billion from P0.9 billion to P0.6 billion as of
December 31, 2018 and December 31, 2019, respectively.
Total equity accounts stood at P155.0 billion from P128.6 billion as of December 31, 2018, or
an improvement of P26.4 billion attributed mainly to the following:
- Capital Stock and Additional Paid-In Capital increased by P11.8 billion from the
net proceeds from the 2019 Stock Rights Offering.
34
- current period’s net income attributable to Equity Holders of the Parent Company
of P9.7 billion.
- decrease in Accumulated Translation Gain of P0.8 billion.
- Remeasurement loss P0.7 billion
- improvement in Net unrealized gains/(losses) on Financial Assets at FVOCI from
a P3.2 billion loss as of December 31, 2018 to a gain amounting to P3.2 billion as
of December 31, 2019, resulting in an unrealized gain of P6.4 billion for the period.
2018 vs. 2017
The Group’s consolidated total assets stood at P983.7 billion as of December 31, 2018, 17.6%
or P147.5 billion higher compared to P836.2 billion reported as of December 31, 2017.
Changes (more than 5%) in assets were registered in the following accounts:
• Securities Held Under Agreements to Resell as of December 31, 2018 at P20.7 billion,
which represents lending transactions of the Bank with the BSP, was higher by P6.1
billion compared to P14.6 billion as of December 31, 2017.
• Financial Assets at Fair Value Through Profit or Loss at P10.0 billion went up by 246.9%
or P7.1 billion from P2.9 billion attributed mainly to the purchases of various investment
securities, net of sold and matured securities.
• Investment Securities at Amortized Cost was higher at P100.8 billion while Financial Assets
at Fair Value Through Other Comprehensive Income was lower at P52.1 billion as of
December 31, 2018, an increase of P74.0 billion or by 276.1% and a decline of P17.7 billion
or by 25.4% from the P26.8 billion and P69.8 billion level, respectively, as of December 31,
2017 due to purchases of various investment securities, net of disposals and maturities.
• Loans and Receivables registered an increase at P586.7 billion or P84.6 billion higher
than the P502.1 billion as of December 31, 2017 level mainly due to loan releases, net of
pay downs, mainly to various corporate and retail borrowers.
• Investment Properties decreased by P2.1 billion from P15.6 billion as of December 31,
2017 to P13.5 billion as of December 31, 2018, mainly due to disposal of foreclosed
properties.
• Intangible Assets decreased by P0.3 billion from P3.3 billion in December 31, 2017 mainly
due to the decline in capitalization of core banking integration costs and other software
acquisitions.
• Deferred Tax Assets were higher by P0.4 billion from P1.7 billion to P2.1 billion and a
decrease in Other Assets of P1.5 billion from P8.9 billion to P7.4 billion. Decline in Other
Assets was due to decreases in creditable withholding taxes, deferred charges and
outstanding clearing items received as of year-end.
Consolidated liabilities went up by 19.4% or P138.7 billion from P716.4 billion as of
December 31, 2017 to P855.1 billion as of December 31, 2018. Major changes in liability
accounts were as follows:
• Deposit liabilities totaled P733.3 billion, P95.4 billion higher compared to its year-end
2017 level of P637.9 billion due to increases in Demand deposits by P27.5 billion, Savings
deposits by P50.2 billion, Time deposits by P17.6 and LTNCD by P0.1 billion.
35
• Bills and Acceptances Payable increased by P26.2 billion, from P43.9 billion to P70.1
billion, mainly accounted for by borrowings from other banks.
• Accrued Expenses increased by P1.1 billion from P5.3 billion as of December 31, 2017 to
P6.4 billion as of December 31, 2018.
• Financial liabilities at Fair value through profit or loss was higher by P0.1 billion from
2017 year-end balance of P0.4 billion.
• Income Tax Payable decreased by P0.1 billion from P1.0 billion to P0.9 billion, due to the
decline in the income tax provisions for the year.
• Other Liabilities increased by P0.4 billion, from P27.9 billion in December 31, 2017 to
P28.3 billion as of December 31, 2018.
Total equity accounts stood at P128.5 billion from P119.7 billion as of December 31, 2017, or
an improvement of P8.8 billion attributed to current period’s net income of P8.2 billion,
improvement/increase in Net Unrealized Loss on Available-for-Sale Investments,
Accumulated Translation Adjustments and Remeasurement Losses on Retirement Plan.
2017 vs. 2016
The Group’s consolidated assets reached at P836.2 billion as of December 31, 2017, 10.9%
or P82.2 billion higher compared to P754.0 billion reported as of December 31, 2016. Changes
(more than 5%) in assets were registered in the following accounts:
• Interbank Loans Receivable registered an increase as of December 31, 2017, by P5.0
billion from P7.8 billion, and decreases in Due from Bangko Sentral ng Pilipinas and Due
from Other Banks of P18.6 billion and P0.7 billion, respectively, from P127.3 billion and
P22.7 billion, respectively, as of December 31, 2016. On the other hand, Cash and Other
Cash Items increased by P1.4 billion from P11.0 as of December 31, 2016.
• Loans and Receivables registered an increase at P502.1 billion or P73.9 billion higher than
the P428.2 billion as of December 31, 2016 level mainly due to loan releases in the current
year to various corporate borrowers.
• Financial Assets at Fair Value Through Profit or Loss at P2.9 billion as of December 31,
2017 was higher by 52.6% or P1.0 billion from P1.9 billion in 201 attributed mainly due
to the sale of various investment securities.
• Securities Held Under Agreements to Resell as of December 31, 2017 of P14.6 billion
which represents lending transactions of the Bank with the BSP is higher by P12.6 billion
compared to the P2.0 billion as of December 31, 2016.
• Investment Properties decreased by P0.7 billion from P16.3 billion as of December 31,
2016 to P15.6 billion as of December 31, 2017 due to the disposal of foreclosed properties.
• Property and Equipment increased by P0.6 billion from P18.1 billion as of December 31,
2016 to P18.7 billion as of December 31, 2017 mainly due to the additional acquisitions
for the year.
• Intangible Assets, Deferred Tax Assets and Other Assets were higher by P0.7 billion, P0.2
billion and P1.8 billion from P2.6 billion to P3.3 billion, P1.5 billion to P1.7 billion and P7.1
billion to P8.9 billion, respectively.
36
Consolidated liabilities went up by 11.2% or P72.4 billion from P644.0 billion as of December
31, 2016 to P716.4 billion as of December 31, 2017. Major changes in liability accounts were as
follows:
• Deposit liabilities totaled P637.9 billion, P67.4 billion higher compared to its year-end
2016 level of P570.5 billion. Increases were registered in Demand, Time and LTNCD by
P8.2 billion, P69.6 billion and P7.0 billion, respectively, and an offset in Savings of P17.4
billion.
• Bills and Acceptances Payable increased by P8.0 billion, from P35.9 billion to P43.9
billion, mainly accounted for by various borrowings from other banks.
Results of Operations
2019 vs 2018
• For the year ended December 31, 2019, the Group registered a net income of P9.8 billion,
P0.2 billion or 2.1% higher than the P9.6 billion net income for the same period last year.
The Group’s core income comprising primarily of net interest income and net service fees
and commissions recorded substantial improvements in the current period. Net income for
the current period also included increase in net gains from trading and investment securities.
• Net interest income totaled P32.4 billion, higher by 19.9% or P5.4 billion compared to the
same period last year mainly due to the expansion in loan, interbank loans, and trading and
investment securities portfolios which accounted for the P14.5 billion, P9.6 billion, P0.3
billion and P4.2 billion increase in interest income, respectively, partly offset by the decrease
of P0.1 billion in deposits with banks and others. Total interest income increased by 40.3%
or P14.5 billion from P36.1 billion to P50.6 billion. Total interest expense also increased to
P18.1 billion or by P9.1 billion from P9.0 billion for the same period last year primarily due
to growth in deposit liabilities and other borrowings.
• Other income decreased to P4.2 billion compared to P8.4 billion for the same period last
year mainly due to decline in net gains on sale or exchange of assets of P5.1 billion, partly
offset by higher net gains in trading and investment securities by P0.9 billion.
• Net service fees and commission income stood at P4.2 billion, 20.1% or P0.7 billion higher
compared the same period last year driven by growth in deposit and credit card related fees.
• Administrative and other operating expenses amounted to P28.9 billion for the year ended
December 31, 2019, or 12.5% higher compared to the same period last year as strong revenue
growth, particularly in interest income and trading gains, translated to higher business
related taxes.
• Total Comprehensive Income for the year ended December 31, 2019 amounted to P14.6
billion which is P7.2 billion higher than the same period last year due mainly to increase in
net unrealized gains on financial assets at FVOCI.
37
2018 vs 2017
• For the year ended December 31, 2018, the Bank registered a net income of P9.6 billion,
P1.4 billion or 17.2% higher than the P8.2 billion net income for the same period last year
on account of substantial improvements in core income primarily net interest income and
gains from the sale of foreclosed assets.
• Net interest income totaled P27.1 billion, higher by 22.6% or P5.0 billion compared to the
same period last year mainly due to the expansion in the loan and investment securities
portfolio which accounted for the P7.5 billion and P1.5 billion increase in interest income,
respectively. This was partly offset by the decrease in interest income of deposits with banks
and others by P0.6 billion. Total interest income increased by 30.6% or P8.5 billion from
P27.6 billion to P36.1 billion. Total interest expense however, was also higher at P9.0 billion
or by 62.6% or by P3.5 billion from P5.5 billion last year.
• Other income increased significantly to P8.4 billion compared to P7.1 billion for the same
period last year mainly due to higher net gain on sale or exchange of assets by P1.9 billion
and improvement in miscellaneous income by P0.5 billion partly offset by P0.7 billion
decrease in foreign exchange gain and P0.4 billion decline in trading and investment
securities gains.
• Net service fees and commission income stood at P3.5 billion, 12.7% or P0.4 billion higher
compared the same period last year. The minimal growth was attributed to lower levels of
underwriting and investment banking fees.
• Administrative and other operating expenses amounted to P25.7 billion for the year ended
December 31, 2018.
• Total Comprehensive Income for the year ended December 31, 2018 amounted to P8.1
billion.
2017 vs 2016
• For the year ended December 31, 2017, the Bank registered a net income of P8.2 billion,
P1.0 billion higher compared to the P7.2 billion net income for the same period last year.
• Net interest income totaled P22.1 billion, higher by 12.8% or P2.5 billion compared to the
net interest income for the same period last year mainly due to expansion in the loan portfolio
and income from deposits with banks which accounted for P3.0 billion and P0.7 billion
increase in interest income, respectively, partly offset by the decline in interest on investment
securities and interbank loans receivable by P0.1 billion and P0.3 billion. Total interest
income was up by P3.3 billion from P24.3 billion to P27.6 billion. Total interest expense
however, was also higher at P5.5 billion or by P0.7 billion from P4.8 billion last year.
• Other income is higher by P0.1 billion at P7.1 billion compared to P7.0 billion for the same
period last year.
• Net service fees and commission income at P3.1 billion for the year ended December 31,
2017.
• Administrative and other operating expenses amounted to P22.1 billion for the year ended
38
December 31, 2017, lower compared to the same period last year mainly due to decrease in
provision for impairment, credit and other losses by P2.3 billion. This was partly offset by
increases in Compensation and fringe benefits, Taxes and Licenses, Occupancy and
equipment related costs, Depreciation and amortization and miscellaneous expenses by P0.6
billion, P0.3 billion, P0.1 billion, P0.2 billion and P0.2 billion, respectively.
• Reported income from discontinued operations in June 2016 pertains to the income from the
51% ownership interest in PNB Life due to classification as a discontinued operation.
Key Performance Indicators
• Capital Adequacy/Capital Management
The Parent Company’s Capital Management (Sub-Committee of the Asset/Liability Committee)
has been created to specifically handle policies and procedures pertaining to the capital planning
and assessment as well as possible equity investments of the Bank.
The Sub-Committee shall be responsible for the following:
- Determine the appropriate level of capital that will support the attainment of the Bank’s strategic
objectives, meet the minimum regulatory requirements and cover all material risks that the Bank
may encounter in the course of its business
- Periodically monitor and assess the capital ratios of the Bank. Monitoring shall include capital
ratios with and without the regulatory stress test prescribed by the regulators, based on both the
consolidated and solo financial statements of the bank
- Report to the ALCO the Bank’s capital ratio and position based the consolidated and solo
financial statements on a monthly basis and to the Board ICAAP Steering Committee on a
quarterly basis
- Inform the ALCO/ Board ICAAP Steering Committee on possible breach of ICAAP capital
thresholds, particularly during period of stress and activating the Bank’s capital contingency
plan, if needed
➢ The Sub-Committee will evaluate and endorse to the Board the options to improve the
Bank’s capital adequacy as provided for in the Capital Contingency Plan
➢ In case of capital sourcing, the Sub-Committee shall endorse to the Board ICAAP Steering
Committee / Board the manner, the amount and time period for capital raising.
- Ensure that the capital ratios resulting from the three-year strategic business plan under the
Bank’s ICAAP shall meet the minimum regulatory requirement as well as the Bank’s internal
thresholds.
➢ The Sub-Committee shall determine the Bank’s internal thresholds and shall endorse the
same to the Board ICAAP Steering Committee / Board.
- Undertake the optimal allocation of the capital to the different business groups in accordance
with the portfolio diversification policy and subject to the sustainability of earnings, risk weights
of assets, among others.
The Bank and its individual regulatory operations have complied with all externally imposed
capital requirements throughout the period.
39
Regulatory Qualifying Capital
Under existing BSP regulations, the determination of the Parent Company’s compliance with
regulatory requirements and ratios is based on the amount of the Parent Company’s “unimpaired
capital” (regulatory net worth) reported to the BSP, which is determined on the basis of
regulatory policies, which differ from PFRS in some respects.
As required under BSP Circular 781, the risk-based capital ratio of a bank, expressed as a
percentage of qualifying capital to risk-weighted assets, should not be less than 10.00% for both
solo basis (head office and branches) and consolidated basis (parent bank and subsidiaries
engaged in financial allied undertakings but excluding insurance companies). Other minimum
ratios include Common Equity Tier (CET) 1 ratio and Tier 1 capital ratios of 6.0% and 7.5%,
respectively. A conservation buffer of 2.5%, comprised of CET 1 capital is likewise imposed.
Banks and their subsidiaries are subject to the following risk-based capital adequacy ratios
(CARs):
a. Common Equity Tier 1 – must be at least 6.0% of risk weighted assets at all time;
b. Tier 1 capital must be at least 7.5% of risk weighted assets at all times; and
c. Qualifying capital (Tier 1 Capital plus Tier 2 Capital) must be at least 10.0% of risk
weighted assets at all times.
Qualifying capital consists of the sum of the following elements, net of required deductions:
a. Common equity Tier 1 capital consists of 1) paid up common stock that meet the
eligibility criteria, 2) common stock dividends distributable, additional paid in capital
resulting from the issuance of common stock included in CET1 capital, 3) deposits for
common stock subscription, 4) retained earnings, 5) undivided profits, 6) other
comprehensive income (net unrealized gains or losses on AFS and cumulative foreign
currency translation) and minority interest on subsidiary banks which are less than
wholly-owned
b. Additional Tier 1 capital consists of instruments issued by the bank that are not included
in CET 1 capital that meet the criteria for inclusion in additional tier 1 capital, meet the
required loss absorbency features for instrument classified as liabilities and loss
absorbency feature at point of non-viability as defined in the BSP guidelines.
c. Tier 2 capital is composed of 1) instruments issued by the Bank (and are not included in
AT1 capital) that meet criteria for inclusion in Tier 2 and meet the required loss
absorbency feature at point of non-viability as defined in the guidelines, 2) deposits for
subscription of T2 capital, 3) appraisal increment reserves on bank premises as authorized
by the Monetary Board, 4) general loan loss provision, limited to a maximum of 1.00%
of credit risk weighted asset, and minority interest in subsidiaries which are less than
wholly owned as defined in the guidelines.
A capital conservation buffer of 2.5% of risk weighted assets, comprised of CET 1 capital, shall
be required. This buffer is meant to promote the conservation of capital and build-up of
adequate cushion that can be drawn down to absorb losses during period of financial and
economic stress.
The Group’s consolidated capital adequacy ratio for combined credit, market and operational
risks computed based on BSP Circular No. 781 (for 2014) and BSP Circular No. 538 (for 2013
and 2012) were 14.80%, 14.35%, and 15.35% as of December 31, 2019, 2018 and 2017,
respectively, above the minimum 10% required by BSP. For the detailed calculation and
discussion kindly refer to Item 1, no. 10 – Risk Management.
40
• Asset Quality
The Parent Company’s non-performing loans (gross of unearned and other deferred income and
allowance for credit losses) increased to P12.1 billion as of December 31, 2019 compared to P7.8
billion as of December 31, 2018. NPL ratios of the Bank based on BSP guidelines, net of valuation
reserves is better than industry average at 0.68% as at December 31, 2019, compared to 0.34% at
end of 2018. Gross NPL ratio is at 1.99% at end of 2019 and 1.76% at end of 2018.
• Profitability
Years Ended
12/31/19 12/31/18 Return on equity (ROE)1/ 6.89% 7.70%
Return on assets (ROA)2/ 0.92% 1.05%
Net interest margin (NIM)3/ 3.31% 3.24% 1/Net income divided by average total equity for the period indicated
2/Net income divided by average total assets for the period indicated 3/Net interest income divided by average interest-earning assets
• Liquidity
The ratio of liquid assets to total assets as of December 31, 2019 was 26.75% compared to 21.82%
as of December 31, 2018. Ratio of current assets to current liabilities was at 58.82% as of
December 31, 2019 compared to 53.61% as of December 31, 2018.
• Cost Efficiency
The ratio of total operating expenses (excluding provision for impairment, credit and other losses)
to total operating income resulted to 63.17% for the year ended December 2019 compared to
61.47% for the same period last year.
Known trends, demands, commitments, events, and uncertainties
The Bank presently has more than adequate liquid assets to meet known funding requirements and
there are no known trends, demands, commitments, events, or uncertainties that will have a material
impact on the Bank’s liquidity.
Events that will trigger direct or contingent financial obligation
In the normal course of business, the Group makes various commitments and incurs certain
contingent liabilities that are not presented in the financial statements, including several suits and
claims which remain unsettled. No specific disclosures on such unsettled assets and claims are made
because any such disclosures would prejudice the Group’s position with the other parties with whom
it is in dispute. Such exemption from disclosures is allowed under PAS 37, Provisions, Contingent
Liabilities and Contingent Assets. The Group and its legal counsel believe that any losses arising
from these contingencies which are not specifically provided for will not have a material adverse
effect on the financial statements.
Material off-balance sheet transactions, arrangement or obligation
The summary of material off-balance sheet transactions, arrangement or obligations (including
contingent obligations) is discussed in Note 35 (Provisions, Contingent Liabilities and Other
Commitments) of the accompanying audited financial statements of the Group as attached under
Exhibit III.
41
Capital Expenditures
In line with the Bank's digital transformation initiatives and enhancing customer banking experience
strategy, technology upgrades and branch physical infrastructure will account for the bulk of the
Bank‘s capital expenditures for 2019. Capital expenditures will be funded from the proceeds of the
sale of acquired assets and funds generated from the Bank's operations.
Significant Elements of Income or Loss
Significant elements of the Bank’s revenues consist mainly of net interest margin, service fees, net
trading gains and gains from disposal of reacquired properties while the Bank’s expenses consist
mainly of staff cost, depreciation and amortization of assets and provisions for probable losses.
Please refer to the discussions on the results of operations for further details.
Seasonal Aspects
There was no seasonal aspect that had material effect on the Bank’s financial condition or results of
operations.
Item 7. Financial Statements
The Audited Financial Statements (AFS) of the Bank and its Subsidiaries, which comprise the
Statements of Financial Position as of December 31, 2019 and 2018, and the Statements of Income,
Statements of Comprehensive Income, Statements of Changes in Equity and Statements of Cash
Flows for each of the three (3) years in the period ended December 31, 2019, and Notes to the
Financial Statements, including a Summary of Significant Accounting Policies and other
explanatory information, Independent Auditor’s Report and the Statement of Management’s
Responsibility are filed as part of this SEC 17-A report for the year ended December 31, 2019.
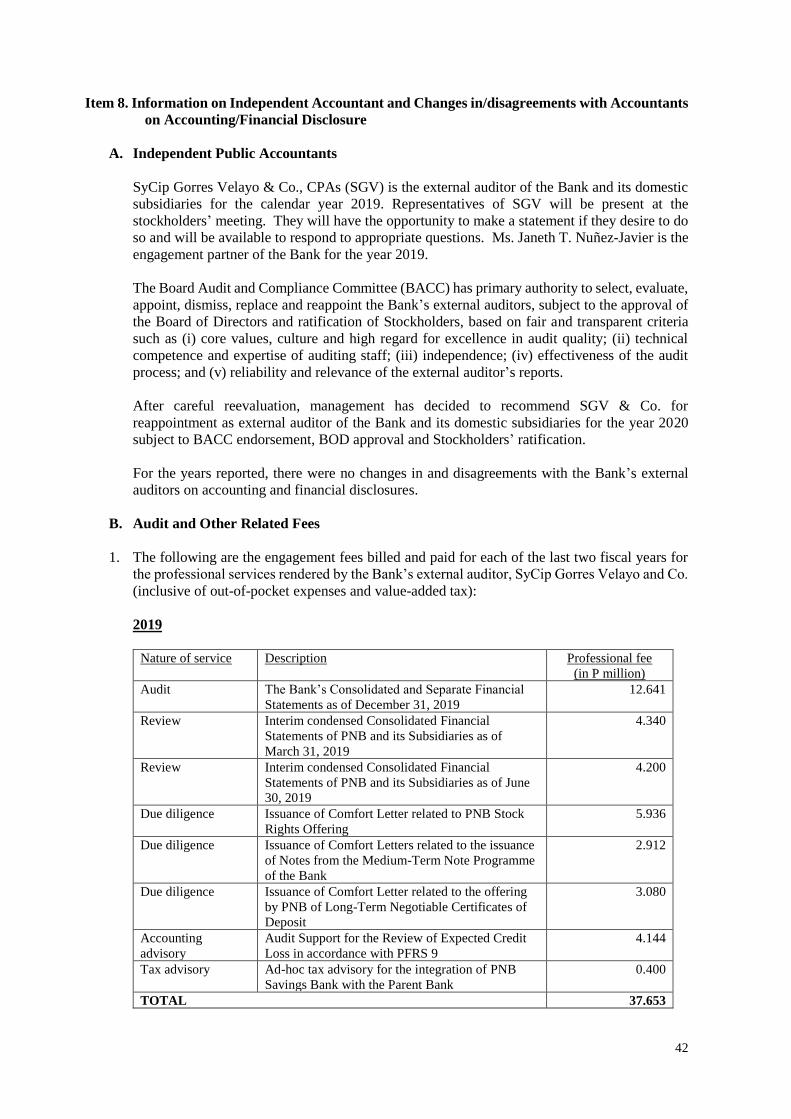
42
Item 8. Information on Independent Accountant and Changes in/disagreements with Accountants
on Accounting/Financial Disclosure
A. Independent Public Accountants
SyCip Gorres Velayo & Co., CPAs (SGV) is the external auditor of the Bank and its domestic
subsidiaries for the calendar year 2019. Representatives of SGV will be present at the
stockholders’ meeting. They will have the opportunity to make a statement if they desire to do
so and will be available to respond to appropriate questions. Ms. Janeth T. Nuñez-Javier is the
engagement partner of the Bank for the year 2019.
The Board Audit and Compliance Committee (BACC) has primary authority to select, evaluate,
appoint, dismiss, replace and reappoint the Bank’s external auditors, subject to the approval of
the Board of Directors and ratification of Stockholders, based on fair and transparent criteria
such as (i) core values, culture and high regard for excellence in audit quality; (ii) technical
competence and expertise of auditing staff; (iii) independence; (iv) effectiveness of the audit
process; and (v) reliability and relevance of the external auditor’s reports.
After careful reevaluation, management has decided to recommend SGV & Co. for
reappointment as external auditor of the Bank and its domestic subsidiaries for the year 2020
subject to BACC endorsement, BOD approval and Stockholders’ ratification.
For the years reported, there were no changes in and disagreements with the Bank’s external
auditors on accounting and financial disclosures.
B. Audit and Other Related Fees
1. The following are the engagement fees billed and paid for each of the last two fiscal years for
the professional services rendered by the Bank’s external auditor, SyCip Gorres Velayo and Co.
(inclusive of out-of-pocket expenses and value-added tax):
2019
Nature of service Description Professional fee
(in P million)
Audit The Bank’s Consolidated and Separate Financial
Statements as of December 31, 2019
12.641
Review Interim condensed Consolidated Financial
Statements of PNB and its Subsidiaries as of
March 31, 2019
4.340
Review Interim condensed Consolidated Financial
Statements of PNB and its Subsidiaries as of June
30, 2019
4.200
Due diligence Issuance of Comfort Letter related to PNB Stock
Rights Offering
5.936
Due diligence Issuance of Comfort Letters related to the issuance
of Notes from the Medium-Term Note Programme
of the Bank
2.912
Due diligence Issuance of Comfort Letter related to the offering
by PNB of Long-Term Negotiable Certificates of
Deposit
3.080
Accounting
advisory
Audit Support for the Review of Expected Credit
Loss in accordance with PFRS 9
4.144
Tax advisory Ad-hoc tax advisory for the integration of PNB
Savings Bank with the Parent Bank
0.400
TOTAL 37.653
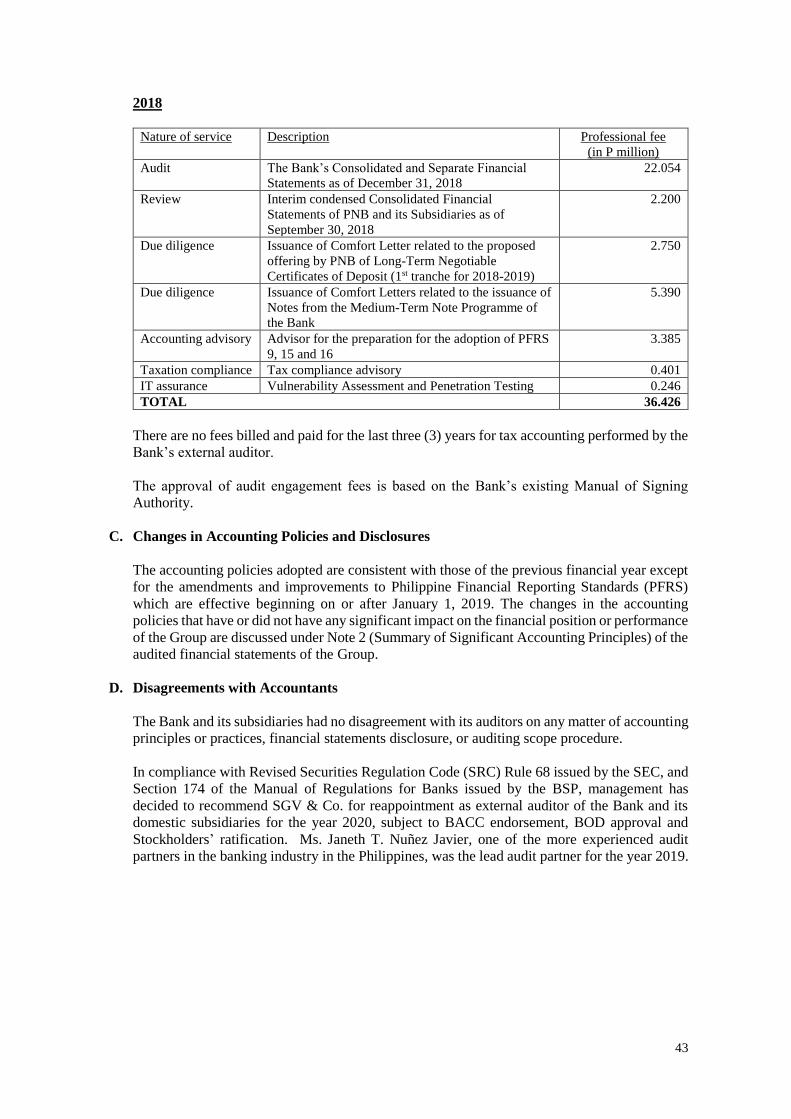
43
2018
Nature of service Description Professional fee
(in P million)
Audit The Bank’s Consolidated and Separate Financial
Statements as of December 31, 2018
22.054
Review Interim condensed Consolidated Financial
Statements of PNB and its Subsidiaries as of
September 30, 2018
2.200
Due diligence Issuance of Comfort Letter related to the proposed
offering by PNB of Long-Term Negotiable
Certificates of Deposit (1st tranche for 2018-2019)
2.750
Due diligence Issuance of Comfort Letters related to the issuance of
Notes from the Medium-Term Note Programme of
the Bank
5.390
Accounting advisory Advisor for the preparation for the adoption of PFRS
9, 15 and 16
3.385
Taxation compliance Tax compliance advisory 0.401
IT assurance Vulnerability Assessment and Penetration Testing 0.246
TOTAL 36.426
There are no fees billed and paid for the last three (3) years for tax accounting performed by the
Bank’s external auditor.
The approval of audit engagement fees is based on the Bank’s existing Manual of Signing
Authority.
C. Changes in Accounting Policies and Disclosures
The accounting policies adopted are consistent with those of the previous financial year except
for the amendments and improvements to Philippine Financial Reporting Standards (PFRS)
which are effective beginning on or after January 1, 2019. The changes in the accounting
policies that have or did not have any significant impact on the financial position or performance
of the Group are discussed under Note 2 (Summary of Significant Accounting Principles) of the
audited financial statements of the Group.
D. Disagreements with Accountants
The Bank and its subsidiaries had no disagreement with its auditors on any matter of accounting
principles or practices, financial statements disclosure, or auditing scope procedure.
In compliance with Revised Securities Regulation Code (SRC) Rule 68 issued by the SEC, and
Section 174 of the Manual of Regulations for Banks issued by the BSP, management has
decided to recommend SGV & Co. for reappointment as external auditor of the Bank and its
domestic subsidiaries for the year 2020, subject to BACC endorsement, BOD approval and
Stockholders’ ratification. Ms. Janeth T. Nuñez Javier, one of the more experienced audit
partners in the banking industry in the Philippines, was the lead audit partner for the year 2019.
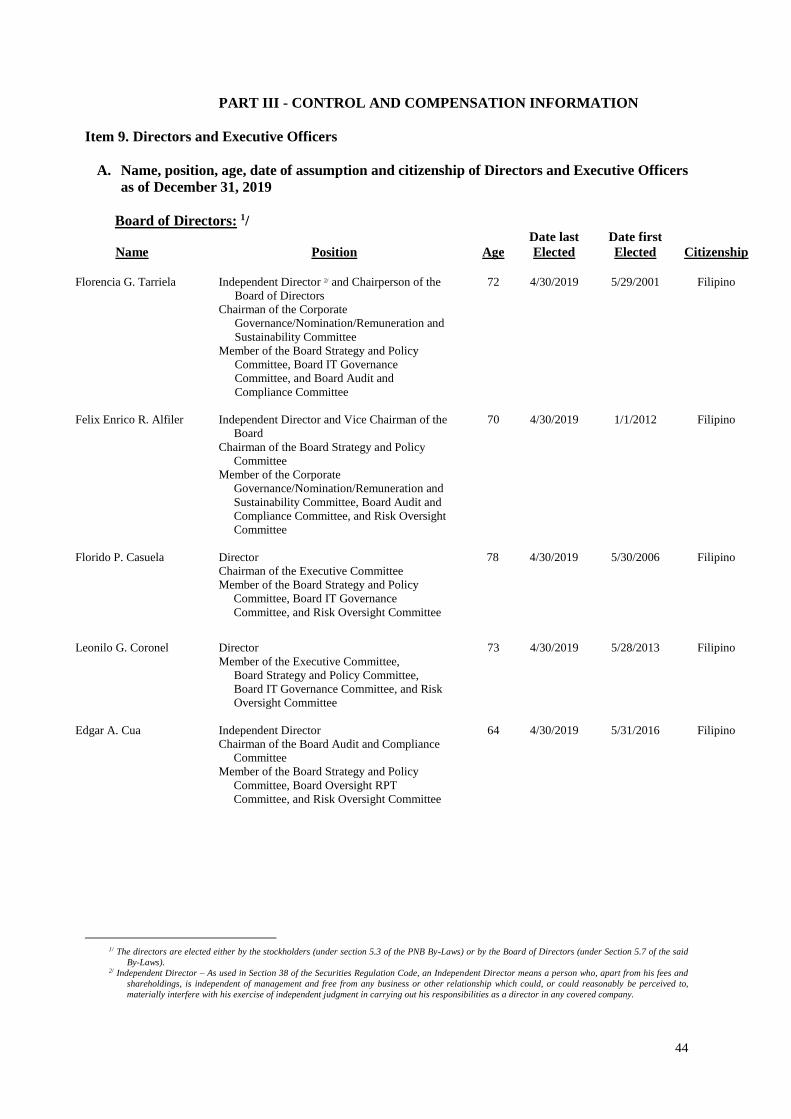
44
PART III - CONTROL AND COMPENSATION INFORMATION
Item 9. Directors and Executive Officers
A. Name, position, age, date of assumption and citizenship of Directors and Executive Officers
as of December 31, 2019
Board of Directors: 1/
Name
Position
Age
Date last
Elected
Date first
Elected
Citizenship
Florencia G. Tarriela Independent Director 2/ and Chairperson of the
Board of Directors
Chairman of the Corporate
Governance/Nomination/Remuneration and
Sustainability Committee
Member of the Board Strategy and Policy
Committee, Board IT Governance
Committee, and Board Audit and
Compliance Committee
72 4/30/2019 5/29/2001 Filipino
Felix Enrico R. Alfiler Independent Director and Vice Chairman of the
Board
Chairman of the Board Strategy and Policy
Committee
Member of the Corporate
Governance/Nomination/Remuneration and
Sustainability Committee, Board Audit and
Compliance Committee, and Risk Oversight
Committee
70 4/30/2019 1/1/2012 Filipino
Florido P. Casuela Director
Chairman of the Executive Committee
Member of the Board Strategy and Policy
Committee, Board IT Governance
Committee, and Risk Oversight Committee
78 4/30/2019 5/30/2006 Filipino
Leonilo G. Coronel
Director
Member of the Executive Committee,
Board Strategy and Policy Committee,
Board IT Governance Committee, and Risk
Oversight Committee
73 4/30/2019 5/28/2013 Filipino
Edgar A. Cua Independent Director
Chairman of the Board Audit and Compliance
Committee
Member of the Board Strategy and Policy
Committee, Board Oversight RPT
Committee, and Risk Oversight Committee
64 4/30/2019 5/31/2016 Filipino
/ The directors are elected either by the stockholders (under section 5.3 of the PNB By-Laws) or by the Board of Directors (under Section 5.7 of the said
By-Laws). 2/ Independent Director – As used in Section 38 of the Securities Regulation Code, an Independent Director means a person who, apart from his fees and
shareholdings, is independent of management and free from any business or other relationship which could, or could reasonably be perceived to,
materially interfere with his exercise of independent judgment in carrying out his responsibilities as a director in any covered company.
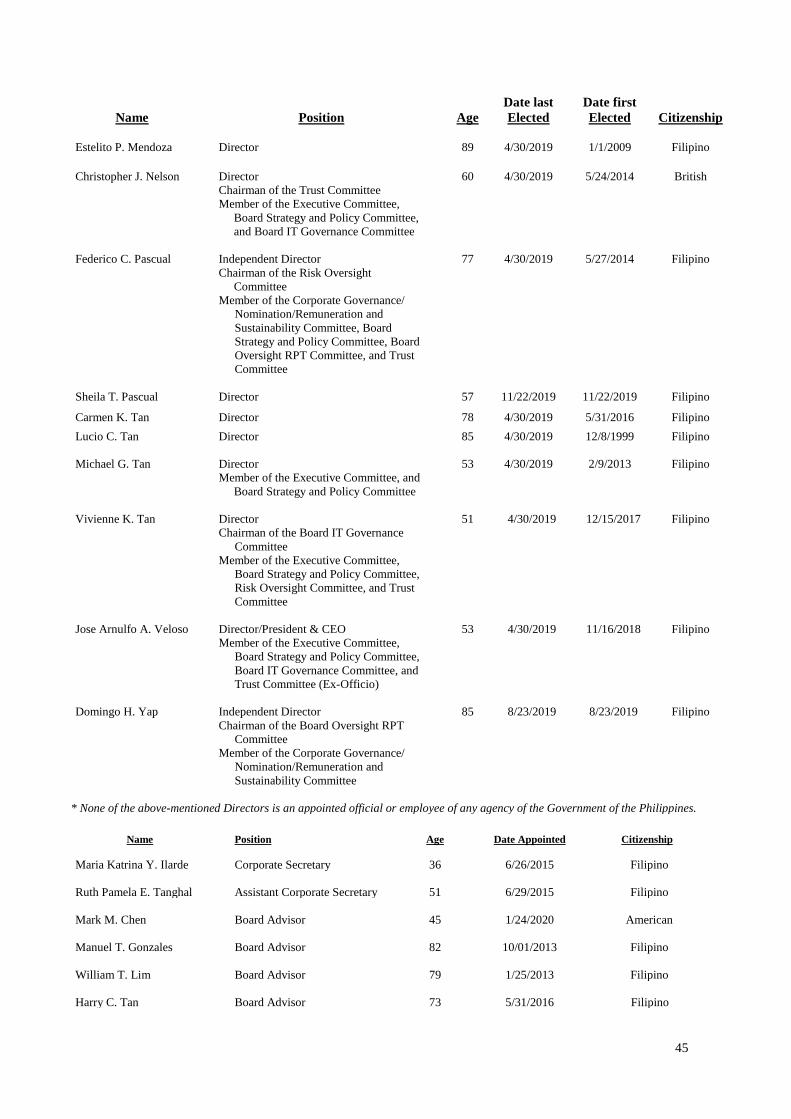
45
Name
Position
Age
Date last
Elected
Date first
Elected
Citizenship
Estelito P. Mendoza Director 89 4/30/2019 1/1/2009 Filipino
Christopher J. Nelson Director
Chairman of the Trust Committee
Member of the Executive Committee,
Board Strategy and Policy Committee,
and Board IT Governance Committee
60 4/30/2019 5/24/2014 British
Federico C. Pascual Independent Director
Chairman of the Risk Oversight
Committee
Member of the Corporate Governance/
Nomination/Remuneration and
Sustainability Committee, Board
Strategy and Policy Committee, Board
Oversight RPT Committee, and Trust
Committee
77 4/30/2019 5/27/2014 Filipino
Sheila T. Pascual Director 57 11/22/2019 11/22/2019 Filipino
Carmen K. Tan Director 78 4/30/2019 5/31/2016 Filipino
Lucio C. Tan Director
85 4/30/2019 12/8/1999 Filipino
Michael G. Tan Director
Member of the Executive Committee, and
Board Strategy and Policy Committee
53 4/30/2019 2/9/2013 Filipino
Vivienne K. Tan Director
Chairman of the Board IT Governance
Committee
Member of the Executive Committee,
Board Strategy and Policy Committee,
Risk Oversight Committee, and Trust
Committee
51 4/30/2019 12/15/2017 Filipino
Jose Arnulfo A. Veloso Director/President & CEO
Member of the Executive Committee,
Board Strategy and Policy Committee,
Board IT Governance Committee, and
Trust Committee (Ex-Officio)
53 4/30/2019 11/16/2018 Filipino
Domingo H. Yap Independent Director
Chairman of the Board Oversight RPT
Committee
Member of the Corporate Governance/
Nomination/Remuneration and
Sustainability Committee
85 8/23/2019 8/23/2019 Filipino
* None of the above-mentioned Directors is an appointed official or employee of any agency of the Government of the Philippines.
Name Position Age Date Appointed Citizenship
Maria Katrina Y. Ilarde Corporate Secretary 36 6/26/2015 Filipino
Ruth Pamela E. Tanghal Assistant Corporate Secretary 51 6/29/2015 Filipino
Mark M. Chen Board Advisor 45 1/24/2020 American
Manuel T. Gonzales Board Advisor
82
10/01/2013 Filipino
William T. Lim Board Advisor 79 1/25/2013 Filipino
Harry C. Tan Board Advisor 73 5/31/2016 Filipino
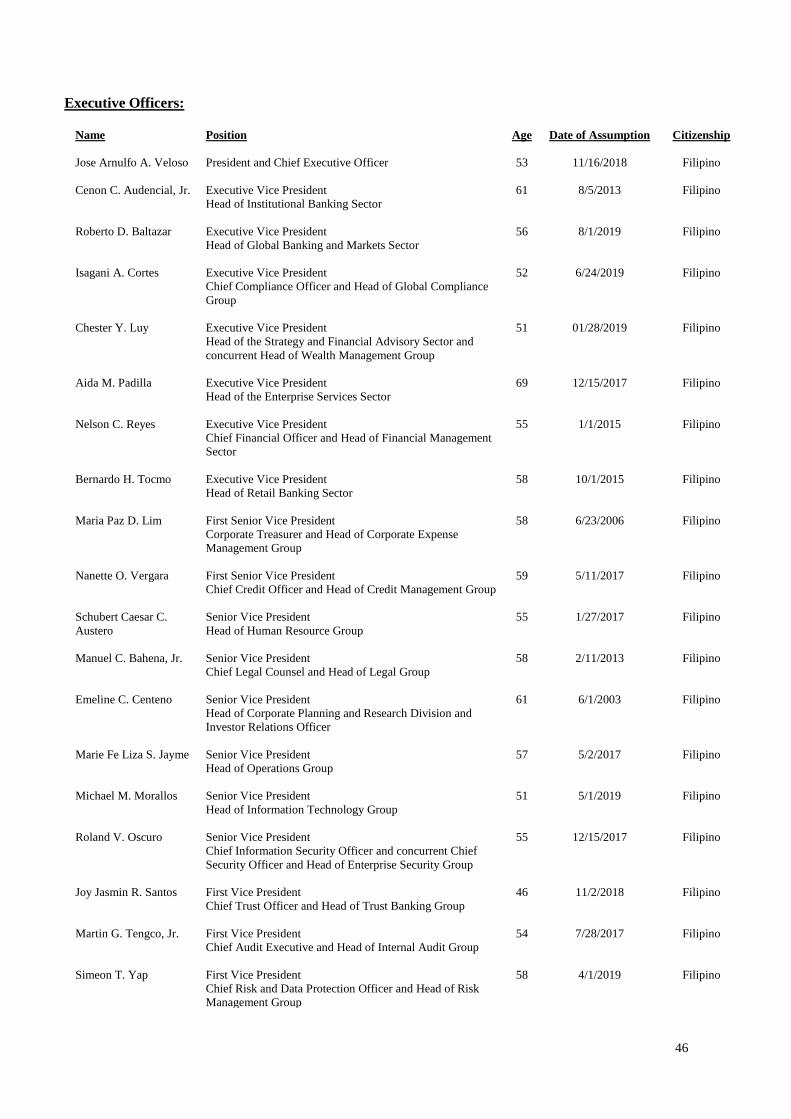
46
Executive Officers:
Name
Position Age Date of Assumption Citizenship
Jose Arnulfo A. Veloso President and Chief Executive Officer 53 11/16/2018 Filipino
Cenon C. Audencial, Jr.
Executive Vice President
Head of Institutional Banking Sector
61 8/5/2013
Filipino
Roberto D. Baltazar Executive Vice President
Head of Global Banking and Markets Sector
56 8/1/2019 Filipino
Isagani A. Cortes Executive Vice President
Chief Compliance Officer and Head of Global Compliance
Group
52 6/24/2019 Filipino
Chester Y. Luy Executive Vice President
Head of the Strategy and Financial Advisory Sector and
concurrent Head of Wealth Management Group
51 01/28/2019 Filipino
Aida M. Padilla Executive Vice President
Head of the Enterprise Services Sector
69 12/15/2017 Filipino
Nelson C. Reyes Executive Vice President
Chief Financial Officer and Head of Financial Management
Sector
55 1/1/2015 Filipino
Bernardo H. Tocmo Executive Vice President
Head of Retail Banking Sector
58 10/1/2015 Filipino
Maria Paz D. Lim First Senior Vice President
Corporate Treasurer and Head of Corporate Expense
Management Group
58 6/23/2006 Filipino
Nanette O. Vergara First Senior Vice President
Chief Credit Officer and Head of Credit Management Group
59 5/11/2017 Filipino
Schubert Caesar C.
Austero
Senior Vice President
Head of Human Resource Group
55 1/27/2017 Filipino
Manuel C. Bahena, Jr. Senior Vice President
Chief Legal Counsel and Head of Legal Group
58 2/11/2013 Filipino
Emeline C. Centeno Senior Vice President
Head of Corporate Planning and Research Division and
Investor Relations Officer
61 6/1/2003 Filipino
Marie Fe Liza S. Jayme Senior Vice President
Head of Operations Group
57 5/2/2017 Filipino
Michael M. Morallos
Senior Vice President
Head of Information Technology Group
51 5/1/2019 Filipino
Roland V. Oscuro Senior Vice President
Chief Information Security Officer and concurrent Chief
Security Officer and Head of Enterprise Security Group
55 12/15/2017 Filipino
Joy Jasmin R. Santos First Vice President
Chief Trust Officer and Head of Trust Banking Group
46 11/2/2018 Filipino
Martin G. Tengco, Jr. First Vice President
Chief Audit Executive and Head of Internal Audit Group
54 7/28/2017 Filipino
Simeon T. Yap
First Vice President
Chief Risk and Data Protection Officer and Head of Risk
Management Group
58 4/1/2019 Filipino
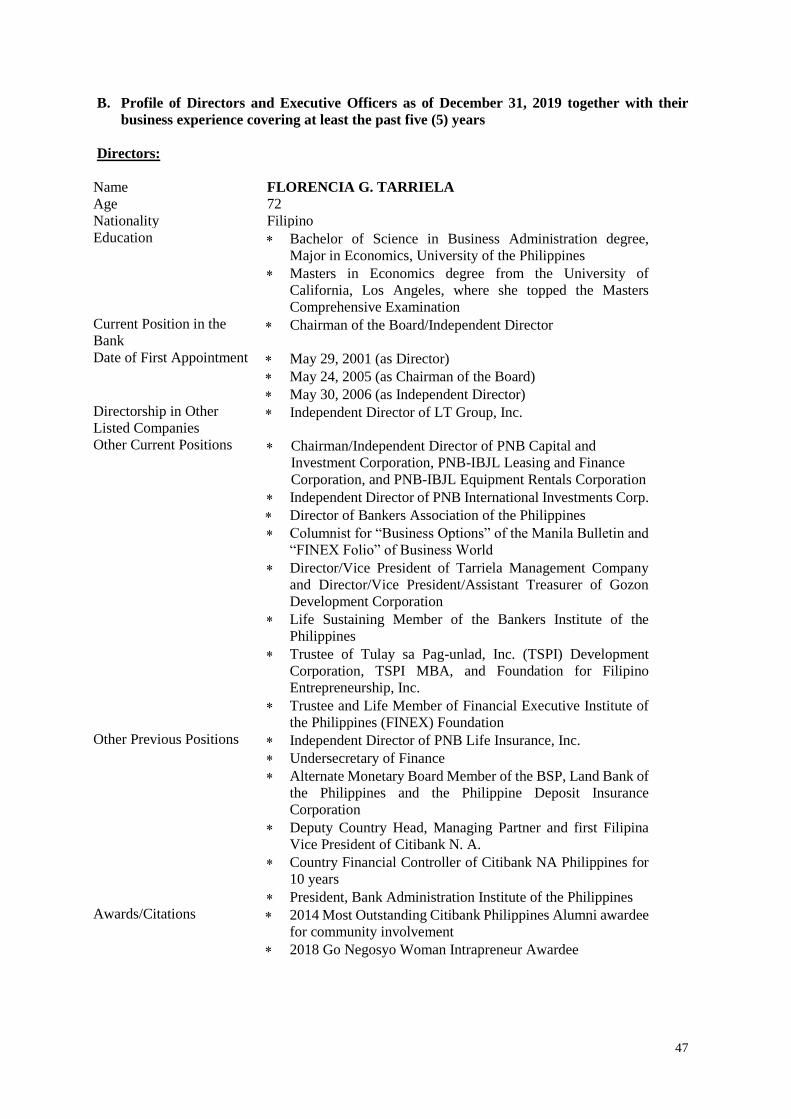
47
B. Profile of Directors and Executive Officers as of December 31, 2019 together with their
business experience covering at least the past five (5) years
Directors:
Name FLORENCIA G. TARRIELA
Age 72
Nationality Filipino
Education Bachelor of Science in Business Administration degree,
Major in Economics, University of the Philippines
Masters in Economics degree from the University of
California, Los Angeles, where she topped the Masters
Comprehensive Examination
Current Position in the
Bank Chairman of the Board/Independent Director
Date of First Appointment
May 29, 2001 (as Director)
May 24, 2005 (as Chairman of the Board)
May 30, 2006 (as Independent Director)
Directorship in Other
Listed Companies Independent Director of LT Group, Inc.
Other Current Positions Chairman/Independent Director of PNB Capital and
Investment Corporation, PNB-IBJL Leasing and Finance
Corporation, and PNB-IBJL Equipment Rentals Corporation
Independent Director of PNB International Investments Corp.
Director of Bankers Association of the Philippines
Columnist for “Business Options” of the Manila Bulletin and
“FINEX Folio” of Business World
Director/Vice President of Tarriela Management Company
and Director/Vice President/Assistant Treasurer of Gozon
Development Corporation
Life Sustaining Member of the Bankers Institute of the
Philippines
Trustee of Tulay sa Pag-unlad, Inc. (TSPI) Development
Corporation, TSPI MBA, and Foundation for Filipino
Entrepreneurship, Inc.
Trustee and Life Member of Financial Executive Institute of
the Philippines (FINEX) Foundation
Other Previous Positions Independent Director of PNB Life Insurance, Inc.
Undersecretary of Finance
Alternate Monetary Board Member of the BSP, Land Bank of
the Philippines and the Philippine Deposit Insurance
Corporation
Deputy Country Head, Managing Partner and first Filipina
Vice President of Citibank N. A.
Country Financial Controller of Citibank NA Philippines for
10 years
President, Bank Administration Institute of the Philippines
Awards/Citations 2014 Most Outstanding Citibank Philippines Alumni awardee
for community involvement
2018 Go Negosyo Woman Intrapreneur Awardee
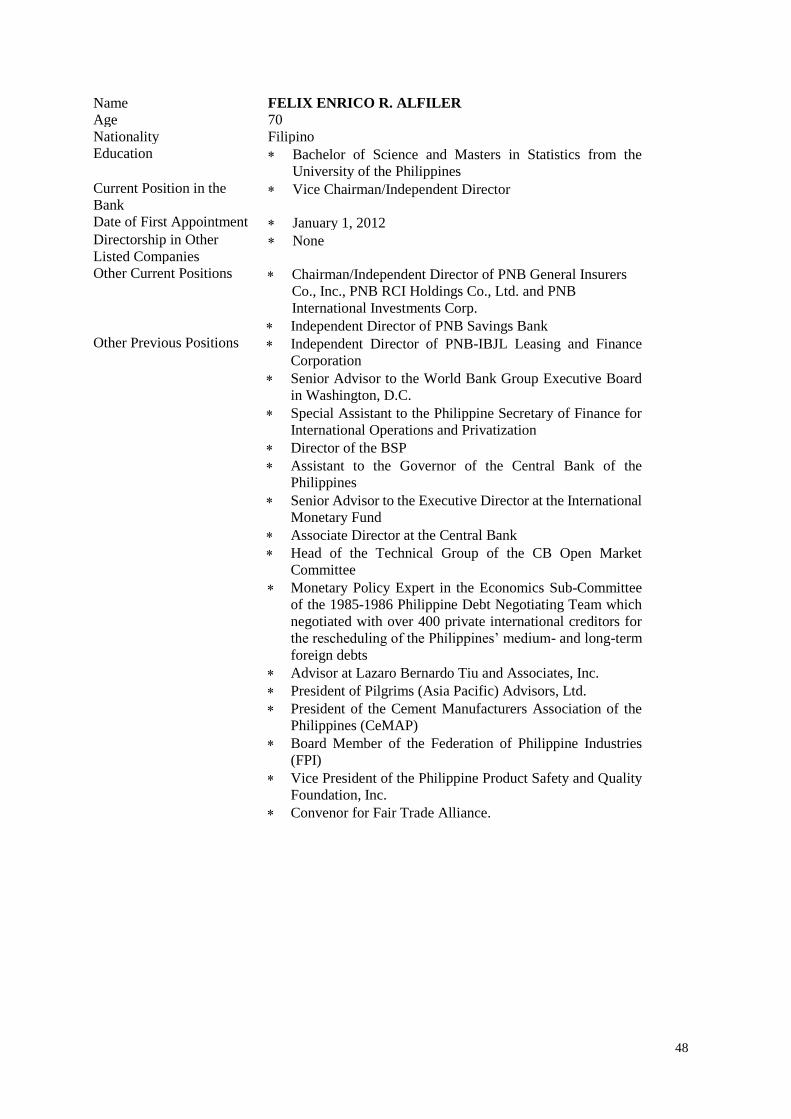
48
Name FELIX ENRICO R. ALFILER
Age 70
Nationality Filipino
Education Bachelor of Science and Masters in Statistics from the
University of the Philippines
Current Position in the
Bank Vice Chairman/Independent Director
Date of First Appointment January 1, 2012
Directorship in Other
Listed Companies None
Other Current Positions Chairman/Independent Director of PNB General Insurers
Co., Inc., PNB RCI Holdings Co., Ltd. and PNB
International Investments Corp.
Independent Director of PNB Savings Bank
Other Previous Positions Independent Director of PNB-IBJL Leasing and Finance
Corporation
Senior Advisor to the World Bank Group Executive Board
in Washington, D.C.
Special Assistant to the Philippine Secretary of Finance for
International Operations and Privatization
Director of the BSP
Assistant to the Governor of the Central Bank of the
Philippines
Senior Advisor to the Executive Director at the International
Monetary Fund
Associate Director at the Central Bank
Head of the Technical Group of the CB Open Market
Committee
Monetary Policy Expert in the Economics Sub-Committee
of the 1985-1986 Philippine Debt Negotiating Team which
negotiated with over 400 private international creditors for
the rescheduling of the Philippines’ medium- and long-term
foreign debts
Advisor at Lazaro Bernardo Tiu and Associates, Inc.
President of Pilgrims (Asia Pacific) Advisors, Ltd.
President of the Cement Manufacturers Association of the
Philippines (CeMAP)
Board Member of the Federation of Philippine Industries
(FPI)
Vice President of the Philippine Product Safety and Quality
Foundation, Inc.
Convenor for Fair Trade Alliance.
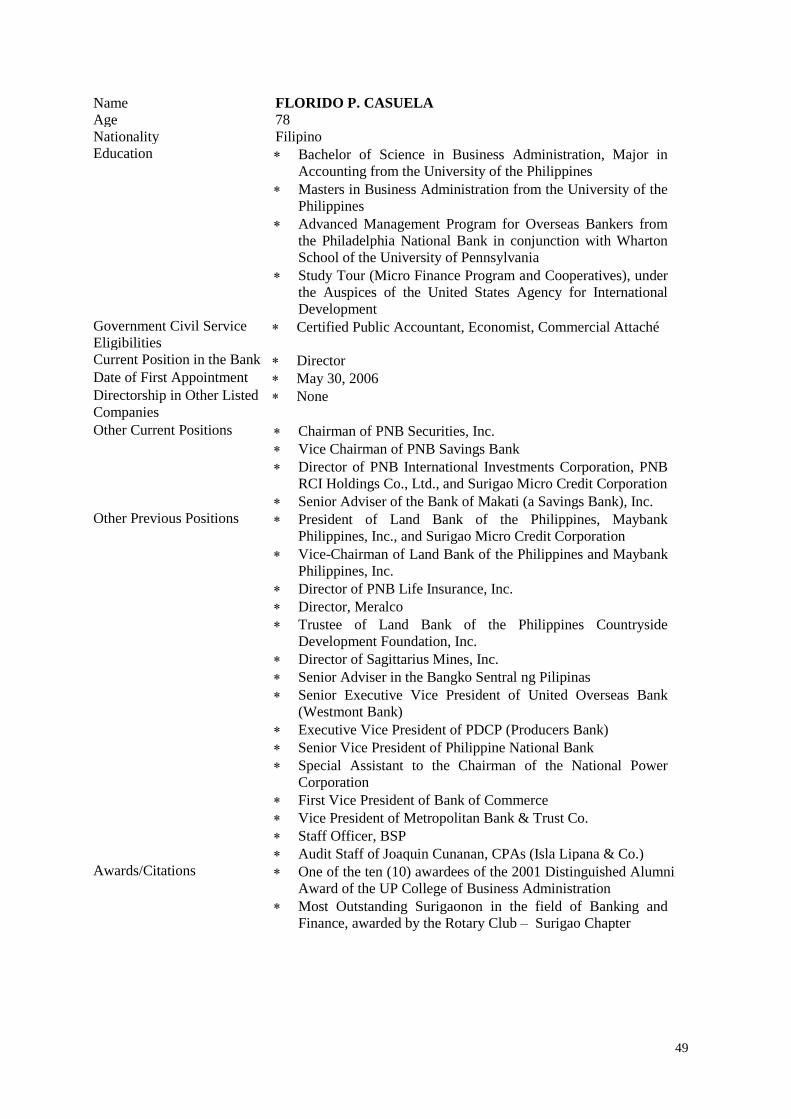
49
Name FLORIDO P. CASUELA
Age 78
Nationality Filipino
Education Bachelor of Science in Business Administration, Major in
Accounting from the University of the Philippines
Masters in Business Administration from the University of the
Philippines
Advanced Management Program for Overseas Bankers from
the Philadelphia National Bank in conjunction with Wharton
School of the University of Pennsylvania
Study Tour (Micro Finance Program and Cooperatives), under
the Auspices of the United States Agency for International
Development
Government Civil Service
Eligibilities Certified Public Accountant, Economist, Commercial Attaché
Current Position in the Bank Director
Date of First Appointment May 30, 2006
Directorship in Other Listed
Companies None
Other Current Positions Chairman of PNB Securities, Inc.
Vice Chairman of PNB Savings Bank
Director of PNB International Investments Corporation, PNB
RCI Holdings Co., Ltd., and Surigao Micro Credit Corporation
Senior Adviser of the Bank of Makati (a Savings Bank), Inc.
Other Previous Positions President of Land Bank of the Philippines, Maybank
Philippines, Inc., and Surigao Micro Credit Corporation
Vice-Chairman of Land Bank of the Philippines and Maybank
Philippines, Inc.
Director of PNB Life Insurance, Inc.
Director, Meralco
Trustee of Land Bank of the Philippines Countryside
Development Foundation, Inc.
Director of Sagittarius Mines, Inc.
Senior Adviser in the Bangko Sentral ng Pilipinas
Senior Executive Vice President of United Overseas Bank
(Westmont Bank)
Executive Vice President of PDCP (Producers Bank)
Senior Vice President of Philippine National Bank
Special Assistant to the Chairman of the National Power
Corporation
First Vice President of Bank of Commerce
Vice President of Metropolitan Bank & Trust Co.
Staff Officer, BSP
Audit Staff of Joaquin Cunanan, CPAs (Isla Lipana & Co.)
Awards/Citations
One of the ten (10) awardees of the 2001 Distinguished Alumni
Award of the UP College of Business Administration
Most Outstanding Surigaonon in the field of Banking and
Finance, awarded by the Rotary Club – Surigao Chapter
50
Name LEONILO G. CORONEL
Age 73
Nationality Filipino
Education Bachelor of Arts degree, Major in Economics from the Ateneo
de Manila University
Advance Management Program of the University of Hawaii
Current Position in the Bank Director
Date of First Appointment May 28, 2013
Directorship in Other Listed
Companies Independent Director of Megawide Construction Corporation
Other Current Positions Independent Director of DBP-Daiwa Capital Markets Phil.
Director of Software Ventures International
Other Previous Positions Chairman of PNB-IBJL Leasing and Finance Corporation and
PNB-IBJL Equipment Rentals Corporation
Executive Director of the Bankers Association of the
Philippines and RBB Micro Finance Foundation
Director/Treasurer of Philippine Depository and Trust
Corporation
Director of the Philippine Clearing House Corporation, the
Philippine Dealing System and the Capital Markets
Development Council
Managing Director of Bankers Association of the Philippines
(BAP) – Credit Bureau
President of Cebu Bankers Association
Consultant of Land Bank of the Philippines, Arthur Young, U.S.
Aid, Bankers Association of the Philippines and Economic
Development Corporation
Worked with Citibank, Manila for twenty (20) years, occupying
various positions.
Awards/Citations Fellow of the Australian Institute of Company Directors in 2002
Name EDGAR A. CUA
Age 64
Nationality Filipino
Education * Bachelor of Arts in Economics degree (Honors Program) from the
Ateneo de Manila University
* Masters of Arts in Economics degree from the University of
Southern California
* Masters of Planning Urban and Regional Environment degree
from the University of Southern California
* Advanced Chinese from the Beijing Language and Culture
University
* Sustainable Development Training Program, Cambridge
University
Current Position in the Bank * Independent Director
Date of First Appointment * May 31, 2016
Directorship in Other Listed
Companies
* None
Other Current Positions * Independent Director of PNB Capital and Investment Corporation
and Allied Commercial Bank, Xiamen
* Director of Davao Unicar Corporation
51
Previous Positions
Held various managerial and staff positions at the Asian
Development Bank (ADB) during a 30-year professional career.
Retired in 2015 as Senior Advisor, East Asia Department of the
Asian Development Bank (ADB), based in ADB's Resident
Mission in Beijing, People's Republic of China (PRC). Other
managerial positions in ADB included Deputy Director General,
East Asia Department, Country Director, ADB Resident
Mission in Indonesia and Deputy Country Director, ADB
Resident Mission in PRC.
Staff Consultant, SGV & Co.
Name ESTELITO P. MENDOZA
Age 89
Nationality Filipino
Education Bachelor of Laws (cum laude) from the University of the
Philippines
Master of Laws from Harvard University
Current Position in the
Bank Director
Date of First Appointment January 1, 2009
Directorship in Other Listed
Companies Director of San Miguel Corporation and Petron Corporation
Other Current Positions Chairman of Prestige Travel, Inc.
Practicing lawyer for more than sixty (60) years
Other Previous Positions Professorial Lecturer of law at the University of the Philippines
Undersecretary of Justice, Solicitor General and Minister of
Justice
Member of the Batasang Pambansa and Provincial Governor of
Pampanga
Chairman of the Sixth (Legal) Committee, 31st Session of the
UN General Assembly and the Special Committee on the
Charter of the United Nations and the Strengthening of the Role
of the Organization.
Awards/Citations Doctor of Laws degree (honoris causa) by Central Colleges of
the Philippines, Hanyang University (Seoul, Korea), University
of Manila, Angeles University Foundation and the University of
the East
Doctor of Humane Letters degree by the Misamis University
Recipient of a Presidential Medal of Merit as Special Counsel
on Marine and Ocean Concerns
University of the Philippines Alumni Association’s 1975
“Professional Award in Law” and 2013 “Lifetime Distinguished
Achievement Award”

52
Name CHRISTOPHER J. NELSON
Age 60
Nationality British
Education Bachelor of Arts and Masters of Arts in History from Emmanuel
College, Cambridge University, U.K.
Diploma in Marketing from the Institute of Marketing,
Cranfield, U.K.
Current Position in the
Bank Director
Date of First Appointment
March 21, 2013 (Director)
May 27, 2014 (Board Advisor)
May 26, 2015 (Director)
Directorship in Other
Listed Companies None
Other Current Positions Director of the Philippine Band of Mercy, the Federation of
Philippine Industries, and Greenlands Community
Vice President/Member of the Board of Trustees of the
American Chamber Foundation Philippines, Inc.
Executive Director of British Chamber of Commerce of the
Philippines
Member of the Society of Fellows of the Institute of Corporate
Directors
Trustee of Dualtech Training Foundation as of March 2017
Other Previous Positions Director of PNB Holdings Corporation
Trustee of Tan Yan Kee Foundation
Director of the American Chamber of Commerce of the
Philippines, Inc.
President of Philip Morris Philippines Manufacturing, Inc., a
position he held for 10 years
Various management positions with Philip Morris International
for 25 years including Area Director for Saudi Arabia, Kuwait,
Gulf Cooperation Council, Yemen, and Horn of Africa
Name FEDERICO C. PASCUAL
Age 77
Nationality Filipino
Education Bachelor of Arts, Ateneo de Manila University
Bachelor of Laws (Member, Law Honors Society), University
of the Philippines
Master of Laws, Columbia University
Current Position in the
Bank Independent Director
Date of First Appointment May 27, 2014
Directorship in Other
Listed Companies None
Other Current Positions Independent Director of Allianz PNB Life Insurance, Inc., PNB-
IBJL Leasing and Finance Corporation, PNB International
Investments Corporation and PNB Holdings Corporation
Chairman of Bataan Peninsula Educational Institution, Inc
President/Director of Tala Properties, Inc. and Woldingham
Realty, Inc.

53
Director of Apo Reef World Resort and Sarco Land Resources
Ventures Corporation
Proprietor of Green Grower Farm
Partner of the University of Nueva Caceres Bataan Branch
Member, Multi Sectoral Governing Council of Bureau of
Customs
Other Previous Positions Chairman/Independent Director of PNB General Insurers Co.,
Inc.
President and General Manager of Government Service
Insurance System
President and CEO of Allied Banking Corporation and PNOC
Alternative Fuels Corporation
Various positions with PNB for twenty (20) years in various
positions, including Acting President, CEO and Vice Chairman
President and Director of Philippine Chamber of Commerce and
Industry
Chairman of National Reinsurance Corporation
Co-Chairman of the Industry Development Council of the
Department of Trade and Industry
Chairman of Alabang Country Club
President of Alabang Country Club
Treasurer of BAP – Credit Guarantee
Director of San Miguel Corporation, Philippine Stock
Exchange, Manila Hotel Corporation, Cultural Center of the
Philippines, CITEM, Bankers Association of the Philippines,
Philippine National Construction Corporation, Allied Cap
Resources HK, Oceanic Bank SF, USA, AIDSISA Sugar Mill,
PDCP Bank, Equitable PCIB, Bankard, Philippine International
Trading Corporation, and Philippine National Oil Corporation
Name SHEILA T. PASCUAL
Age 57
Nationality Filipino
Education Bachelor of Science in Business Management from the Ateneo
de Manila University
Current Position in the
Bank Director
Date of First Appointment November 22, 2019
Directorship in Other
Listed Companies
* None
Other Current Positions Marketing and Development Officer of Allied Banking
Corporation Hong Kong
Other Previous Positions Marketing Development Officer of Asia Brewery Incorporated
54
Name CARMEN K. TAN
Age 78
Nationality Filipino
Current Position in the
Bank Director
Date of First Appointment May 31, 2016
Directorship in Other Listed
Companies
* Director of MacroAsia Corporation, LT Group, Inc., and PAL
Holdings, Inc.
Other Current Positions * Vice Chairman of Philippine Airlines, Inc.
* Director: Air Philippines Corporation, Asia Brewery, Inc.,
Buona Sorte Holdings, Inc., Cosmic Holdings Corporation, The
Charter House, Inc., Dominium Realty and Construction
Corporation, Eton City, Inc., Foremost Farms, Inc., Fortune
Tobacco Corporation, Himmel Industries, Inc., Lucky Travel
Corporation, Manufacturing Services & Trade Corp.,
Progressive Farms, Inc., PMFTC, Inc., Shareholdings Inc.,
Sipalay Trading Corp., Tanduay Distillers, Inc., Tangent
Holdings Corporation, Trustmark Holdings Corp., Zuma
Holdings and Management Corp., Grandspan Development
Corp., Basic Holdings Corp., Saturn Holdings, Inc., Paramount
Land Equities, Inc., Interbev Philippines, Inc., Waterich
Resources Corp., and REM Development Corp.
Major Affiliations * Director of Tan Yan Kee Foundation
* Member of Tzu Chi Foundation
Name LUCIO C. TAN
Age 85
Nationality Filipino
Education Bachelor of Science in Chemical Engineering degree from Far
Eastern University
Doctor of Philosophy, Major in Commerce, from University
of Santo Tomas
Current Position in the
Bank Director
Date of First Appointment December 8, 1999
Directorship in Other Listed
Companies Chairman and CEO: LT Group, Inc., PAL Holdings, Inc., and
MacroAsia Corporation
Other Current Positions
Chairman and CEO of Philippine Airlines, Inc. and University
of the East
Chairman and President: Buona Sorte Holdings, Inc., Lucky
Travel Corporation, Tangent Holdings Corporation,
Trustmark Holdings Corporation, and Zuma Holdings and
Management Corporation
Chairman: Absolut Distillers, Inc., AlliedBankers Insurance
Corporation, Allied Commercial Bank, Allied Banking
Corporation (HK) Ltd., Allianz PNB Life Insurance, Air
Philippines Corporation, Asian Alcohol Corporation, Belton
Communities, Inc., Cosmic Holdings Corporation, Eton
Properties Philippines, Inc., Eton City, Inc., Fortune Tobacco
55
Corporation, PMFTC, Inc., PNB Holdings Corporation, PNB
Savings Bank, Tanduay Distillers, Inc., Tanduay Brands
International, Inc., The Charter House, Inc., Manufacturing
Services & Trade Corp., Foremost Farms, Inc., Dominium
Realty & Construction Corp., Shareholdings, Inc., REM
Development Corporation, Sipalay Trading Corp., and
Progressive Farms, Inc.
President: Basic Holdings Corporation, Himmel Industries,
Inc., and Grandspan Development Corporation
Chairman Emeritus of the Federation of Filipino-Chinese
Chambers of Commerce and Industry, Inc.
Founder and Vice Chairman of the Foundation for Upgrading
the Standard of Education, Inc.
Founded the Tan Yan Kee Foundation, Inc., of which he is the
Chairman and President
Other Previous Positions Chairman: Allied Banking Corporation and Allied Leasing
and Finance Corporation
Awards/Citations Honorary degrees from various universities
Lifetime Achievement Awardee by the Dr. Jose P. Rizal
Awards for Excellence
Adopted to the Ancient Order of the Chamorri and designated
Ambassador-at-Large of the U.S. Island-territory of Guam
Diploma of Merit by the Socialist Republic of Vietnam
Outstanding Manilan for the year 2000
UST Medal of Excellence in 1999
Most Distinguished Bicolano Business Icon in 2005
2003 Most Outstanding Member Award by the Philippine
Chamber of Commerce and Industry (PCCI)
Award of Distinction by the Cebu Chamber of Commerce and
Industry
Award for Exemplary Civilian Service of the Philippine
Medical Association
Honorary Mayor and Adopted Son of Bacolod City; Adopted
Son of Cauayan City, Isabela and Entrepreneurial Son of
Zamboanga
Distinguished Fellow during the 25th Conference of the
ASEAN Federation of Engineering Association
2008 Achievement Award for service to the chemistry
profession during the 10th Eurasia Conference on Chemical
Sciences
56
Name MICHAEL G. TAN
Age 53
Nationality Filipino
Education Bachelor of Applied Science in Civil Engineering, Major in
Structural Engineering, from the University of British
Columbia, Canada
Current Position in the
Bank Director
Date of First Appointment February 9, 2013
Directorship in Other
Listed Companies Director and President of LT Group, Inc.
Director of Victorias Milling Company, Inc.
Other Current Positions Director of PNB Management and Development Corporation,
PNB Savings Bank, Allied Commercial Bank, PNB Global
Remittance and Financial Company (HK) Ltd. and Allied
Banking Corp. (Hong Kong) Limited
President and Chief Operating Officer of Asia Brewery, Inc.
Director of the following companies: Philippine Airlines
Foundation, Inc., Air Philippines Corp., Philippine Airlines,
Inc., Absolut Distillers, Inc., Eton Properties Phils., Inc.,
Grandway Konstruct, Inc., Shareholdings, Inc., Lucky Travel
Corporation, Eton City, Inc., Abacus Distribution Systems
Philippines, Inc., PMFTC, Inc., Tangent Holdings
Corporation, and Alliedbankers Insurance Corporation
Other Previous Positions Chairman of PNB Holdings Corporation
Director of Bulawan Mining Corporation and PNB Forex,
Inc.
Director of Allied Banking Corporation (ABC) from January
30, 2008 until the ABC’s merger with PNB on February 9,
2013
Name VIVIENNE K. TAN
Age 51
Nationality Filipino
Education Bachelor of Science - Double Degree in Mathematics and
Computer Science from the University of San Francisco,
U.S.A
Diploma in Fashion Design and Manufacturing Management
from the Fashion Institute of Design and Merchandising, Los
Angeles, U.S.A. Current Position in the
Bank Director
Date of First Appointment December 15, 2017
Directorship in Other
Listed Companies Director of LT Group, Inc., PAL Holdings, and MacroAsia
Corporation Other Current Positions * Director/Executive Vice President/Treasurer/Chief
Administrative Officer of Philippine Airlines
* Director of MMC Management and Development Corp.
(formerly PNB Management and Development Corporation)
and Eton Properties Philippines, Inc. Board Advisor of LT
Group, Inc.
* Executive Director of Dynamic Holdings Limited
57
* Member of the Board of Trustees of the University of the East
and the University of the East Ramon Magsaysay Memorial
Medical Center
* Founding Chairperson of the Entrepreneurs School of Asia
(ESA)
* Founding Trustee of the Philippine Center for
Entrepreneurship (Go Negosyo)
Other Previous Positions * Board Advisor of LT Group, Inc.
* Director of Bulawan Mining Corporation
* Executive Vice President, Commercial Group and Manager,
Corporate Development, of Philippine Airlines
* Founder and President of Thames International Business
School
* Owner of Vaju, Inc. (Los Angeles, U.S.A.)
* Systems Analyst/Programmer of Fallon Bixby & Cheng Law
Office (San Francisco, U.S.A.)
* Member of the Board of Trustees of Bantay Bata (Children’s
Foundation)
* Proponent/Partner of various NGO/social work projects like
Gawad Kalinga’s GK-Batya sa Bagong Simula, livelihood
programs thru Teenpreneur Challenge spearheaded by ESA,
Conserve and Protect Foundation’s artificial reef project in
Calatagan, Batangas, Quezon City Sikap-Buhay Project’s
training and mentorship program for micro-entrepreneurs, and
as Chairman of Ten Inspirational Entreprenuer Students
Award
Awards/Citations * Recipient of the Ten Outstanding Young Men (TOYM)
Award for Business Education and Entrepreneurship (2006),
UNESCO Excellence in Education and Social
Entrepreneurship Award (2007), Leading Women of the
World Award (2007), and “People of the Year”, People Asia
Award (2008)
Name JOSE ARNULFO A. VELOSO
Age 53
Nationality Filipino
Education Bachelor of Science in Commerce – Marketing Management
from De La Salle University
Current Position in the
Bank President and Chief Executive Officer
Date of First Appointment November 16, 2018
Directorship in Other
Listed Companies None
Other Current Positions Director of Allianz PNB Life Insurance Inc.
Director of BancNet, Inc.
Director of European Chamber of Commerce of the
Philippines
Director of Phil. Payments Management Inc.
Member of Management Association of the Philippines
Other Previous Positions Chairman and Director of HSBC Insurance Brokers
(Philippines), Inc. and HSBC Savings Bank (Philippines),
Inc.
Director of PNB Global Remittance & Financial Co. (HK)
58
Director and Chairperson of the Open Market Committee of
Banker’s Association of the Philippines
Director of the Philippine Dealing and Exchange Corporation
Member of Management Association of the Philippines
Director of the British Chamber of Commerce Philippines
President of the Money Market Association of the Philippines
Managing Director, Treasurer and Head of Global Banking
and Markets of HSBC Global Markets
Treasurer and Head of Global Markets of HSBC Treasury
Head of Domestic Treasury of PCI Bank/ PCI-Capital
Fixed Income Portfolio Head of Citibank
Fixed Income Trader of Asiatrust Development Bank
Supervisor of Urban Bank
Chairman of the Council of Trustees of the British School
Manila
Member of Association Cambiste Internationale (ACI)
Name DOMINGO H. YAP
Age 86
Nationality Filipino
Education Bachelor of Science in Business Administration major in
Business Management from San Sebastian College Recoletos
Current Position in the
Bank Independent Director
Date of First Appointment August 23, 2019
Directorship in Other
Listed Companies None
Other Current Positions President of H-Chem Industries, Inc., DHY Realty and
Development Inc., Colorado Chemical Sales Corporation,
Universal Paint & Coating Philippines, Inc., and Alliance
Land Development Corporation
Other Previous Positions * President of the Federation of Filipino-Chinese Chamber of
Commerce and Industries, Inc.
* Governor of Y’s Men Club Philippines
* President of Y’s Men Club Downtown of Manila
* President of Rotary Club of Pasay City
59
Board Advisors:
Name MARK M. CHEN
Age 45
Nationality American
Education Bachelor of Arts in Economics (with Honors), Harvard
University – Dean’s List and a Harvard College Scholar
Executive Masters in Business Administration from the
Northwestern Kellogg – Hong Kong University of Science &
Technology (HKUST), graduated top of the class
Current Position in the Bank Board Advisor
Date of First Appointment January 24, 2020
Other Current Positions Director – Philippine Airlines, Inc.
Chief Executive Officer of Cobalt Equity Partners
Adjunct Professor of finance/investment at Kellogg Hong Kong
University of Science & Technology (HKUST) Business
School
Other Previous Positions Chief Executive Officer of General Electric (GE) Equity Asia
Pacific, 2006 to 2015
Senior Vice President of General Electric (GE) Equity Asia
Pacific, 2000 to 2005
Associate – Bankers Trust, 1996 to 1999
Awards/Citations United States Presidential Scholar
United States Byrd Congressional Award
Name MANUEL T. GONZALES
Age 82
Nationality Filipino
Education Bachelor of Science in Commerce from the De La Salle
University
Masters of Arts in Economics from Ateneo De Manila
University
Current Position in the Bank Board Advisor
Date of First Appointment October 1, 2013
Directorship in Other Listed
Companies None
Other Current Positions Director of PNB Securities, Inc.
Director of Allied Bankers Insurance Corporation
Board Advisor of PNB-IBJL Leasing and Finance Corporation
Board Advisor of PNB-IBJL Equipment Rentals Corporation
Other Previous Positions Director of Allied Banking Corporation and Allied Leasing and
Finance Corporation
Member, Management Association of the Philippines (MAP)
Member, Financial Executives of the Philippines (FINEX)
Member, European Chamber of Commerce of the Philippines
(ECCP)
Member, Bankers Institute of the Philippines
60
Name WILLIAM T. LIM
Age 79
Nationality Filipino
Education Bachelor of Science in Chemistry from Adamson University
Current Position in the Bank Board Advisor
Date of First Appointment January 25, 2013
Directorship in Other Listed
Companies
* None
Other Current Positions President of Jas Lordan, Inc.
Director of PNB Holdings Corporation, Allied Commercial
Bank – Xiamen, General BH Fashion Retailers, Inc., and
Concept Clothing, Co., Inc.
Board Advisor of PNB Savings Bank
Advisor to the Chairman of the Board of Directors of Allianz
PNB Life Insurance, Inc.
Other Previous Positions Director of PNB Life Insurance, Inc.
Consultant of Allied Banking Corporation
Director of Corporate Apparel, Inc.
Director of Concept Clothing
Director of Freeman Management and Development
Corporation
Worked with Equitable Banking Corporation for 30 years,
occupying various positions, including as VP & Head of the
Foreign Department
Name HARRY C. TAN
Age 73
Nationality Filipino
Education Bachelor of Science in Chemical Engineering from the Mapua
Institute of Technology
Current Position in the Bank Board Advisor
Date of First Appointment May 31, 2016
Directorship in Other Listed
Companies
Director of LT Group, Inc.
Other Current Positions Chairman of PNB Management Development Corporation, and
PNB Global Remittance and Financial Company (HK) Limited
Director of PNB Savings Bank
Chairman of the Tobacco Board of Fortune Tobacco
Corporation
President of Landcom Realty Corporation and Century Park
Hotel
Vice Chairman of Lucky Travel Corporation, Eton Properties
Philippines, Inc., Belton Communities, Inc., and Eton City, Inc.
Managing Director/Vice Chairman of The Charter House Inc.
Director of various private firms which include Asia Brewery,
Inc., Dominium Realty and Construction Corporation,
Progressive Farms, Inc., Shareholdings Inc., Himmel
Industries, Inc., Basic Holdings Corporation, Asian Alcohol
Corporation, Pan Asia Securities Inc., Tanduay Distillers, Inc.,
Manufacturing Services and Trade Corporation, Foremost
61
Farms, Inc., Grandspan Development Corporation, Absolut
Distillers, Inc., Tanduay Brands International Inc., Allied
Bankers Insurance Corp., Allied Banking Corporation (Hong
Kong) Limited, PMFTC, Inc., and Allied Commercial Bank
Other Previous Positions Chairman of Bulawan Mining Corporation
Director of Philippine National Bank
Director of Allied Banking Corporation
Director of Philippine Airlines
Director of MacroAsia Corporation
Executive Officers:
CENON C. AUDENCIAL, JR., 61, Filipino, Executive Vice President, is the Head of the Institutional
Banking Sector. Before joining the Bank in 2009, he headed the Institutional and Corporate Bank of
ANZ, prior to which he was a Senior Relationship Manager of Corporate Banking and Unit Head of
Global Relationship Banking for Citibank N.A. He previously served as a Vice President and Unit Head
of Standard Chartered Bank’s Relationship Management Group, and was a Relationship Manager in
Citytrust Banking Corporation. Before his 25-year stint as a Relationship Manager, he was a Credit
Analyst for Saudi French Bank and AEA Development Corporation. Mr. Audencial obtained his
Bachelor of Arts degree in Economics from the Ateneo de Manila University.
ROBERTO D. BALTAZAR, 56, Filipino, Executive Vice President, is the Head of Global Banking
and Markets Sector. Mr. Baltazar brings with him over 30 years of Banking experience both in the
Financial Markets and Corporate Banking Sector. He spent 4 years in Citibank as a foreign exchange
trader then moved to Hongkong and Shanghai Banking Corporation (HSBC) in 1994 as head of FX
Trading then eventually became Head of Global Markets, Debt Capital Markets and Securities Services
in 2014. He sustained Debt Capital Markets and HSS position as the number one Debt Capital Markets
and Global Custodianship Business during his tenure. During this time, HSBC was likewise one of the
top FX and Bond Trading houses. He was President of ACI Philippines in 2013. He was an active
member of the Open Market Committee of the BAP, specifically in the FX subcommittee. He obtained
his Bachelor of Arts degree in Economics from the Ateneo de Manila University and Masters in Business
Administration Degree from the University of North Carolina at Chapel Hill, USA.
ISAGANI A. CORTES, 52, Filipino, Executive Vice President, was appointed as the Chief
Compliance Officer of the Bank effective April 8, 2019. He obtained his Bachelor of Arts degree in
English from the University of the East and his Bachelor of Laws degree from the University of the
Philippines in Diliman. Prior to joining the Bank, Atty. Cortes was the Senior Vice President and
Deputy Head of the Regulatory Affairs Group of Rizal Commercial Banking Corporation (RCBC). His
group was responsible for corporate governance, data privacy and tax transparency. Prior to RCBC, he
spent 14 years in HSBC focusing on compliance. As SVP and Country Head of Financial Crime
Compliance of HSBC, he was the subject matter expert and risk steward in financial crime risk. He
also held Regulatory Compliance and Legal functions in HSBC. He also worked for East West Bank
and ABN AMRO Philippines.
CHESTER Y. LUY, 51, Filipino, Executive Vice President, is the Head of the Strategy Sector and
concurrently serves as the Head of the Wealth Management Group. The Strategy Group is responsible
for crafting the bank's overall business strategy as well as its competitive positioning within the industry.
It is comprised of the Corporate Planning and Analysis Division, the Strategic Initiatives Unit and the
Research Division (Macroeconomic, Equity and Fixed Income Research). The Wealth Management
Group advises clients on financial investments, helping clients outperform in the financial markets and
62
plan for their and their families’ financial future. Mr. Luy serves as a member of the Board of Directors
of PNB-IBJL Leasing and Finance Corporation, PNB Europe and PNB Global Remittance and Financial
Corporation (HK). Mr. Luy also serves as a member of the PNB Management Committee, PNB ALCO
(Asset Liability Committee), and the PNB Procurement Committee. He is a regular participant at the
PNB Board Strategy and Policy Committee. Mr. Luy served as the Senior Executive Vice President and
Treasurer of RCBC. He served as the Group Head for the Financial Advisory and Markets Group which
is comprised of the Treasury Group and the Wealth Management Group at RCBC. Mr. Luy has 27 years
of experience in banking and finance. He served in leadership roles as Managing Director across a
variety of businesses with several international banks and was based in New York, Singapore and Manila.
His leadership experience includes Treasury, Wealth Management and Private Banking, Trust-related
businesses like Investment Management and Research, Corporate Finance and Investment Banking and
Credit Risk Analysis. Mr. Luy has worked with a number of banks including JPMorgan, Bank of
America Merrill Lynch, Barclays Capital, HSBC, Julius Baer, Bank of Singapore and RCBC. He
graduated from the University of the Philippines with a Bachelor of Science degree in Business
Administration (Magna Cum Laude) and was awarded as the “Most Outstanding Business
Administration Student for the Class of 1990”. He earned his Masters in Management (MBA) degree
from the J.L. Kellogg Graduate School of Management at Northwestern University. He is a CFA
(Chartered Financial Analyst). During his stint with various global banks in the U.S., for several years,
he was consistently awarded as Top Senior Analyst in his field by Institutional Investor Magazine during
its annual survey of investors, including money management firms. He served as a member of the
Singapore Institute of Directors, an association of independent directors in Singapore and served on the
board of a Singapore-based hospitality and real estate entity.
AIDA M. PADILLA, 70, Filipino, Executive Vice President, is the Head of the Enterprise Services
Sector. She is the chief strategist for problem and distressed accounts. A seasoned professional, she
rose from the branch banking ranks at the Philippine Banking Corporation to become Vice President
for Marketing of its Corporate Banking Group. She obtained her Bachelor of Science degree in
Commerce, Major in Accounting, from St. Theresa’s College.
NELSON C. REYES, 55, Filipino, Executive Vice President, is the Chief Financial Officer and the
Head of Financial Management Sector. In 2018, he became a member of the Board of PNB (Europe)
PLC and was appointed Chairman in 2019. Prior to joining the Bank in 2015, he was the Chief Financial
Officer of HSBC Ltd., Philippine Branch, a position he held for over ten (10) years. He was also a
Director for HSBC Savings Bank Philippines, Inc. and HSBC Insurance Brokers Philippines, Inc. His
banking career with HSBC spanned twenty-eight (28) years and covered the areas of Credit Operations,
Corporate Banking, Treasury Operations and Finance. He gained international banking exposure
working in HSBC offices in Australia, Thailand and Hong Kong. Mr. Reyes graduated from De La
Salle University with a Bachelor of Science degree in Commerce, Major in Accounting, and is a
Certified Public Accountant.
BERNARDO H. TOCMO, 57, Filipino, Executive Vice President, is the Head of Retail Banking Sector
who manages the RBS Sales & Support Group, three (3) Branch Banking Groups, International Banking
and Remittance Group, Cards Banking Solutions Group and Retail Lending Group of the Bank. Mr.
Tocmo obtained his Masters in Business Economics from the University of Asia and the Pacific and
where he likewise finished the Strategic Business Economics Program. He graduated with a Bachelor
of Science in AgriBusiness, major in Management from the Visayas State University. He joined
Philippine National Bank in October 1, 2015. Mr. Tocmo is a seasoned banker with over three decades
of work experience with the country’s top and mid-tier commercial banks. He started his career with
United Coconut Planters Bank in 1982. He further honed his skills at Union Bank of the Philippines
where he assumed key managerial positions in 1990 to 1996. He left Union Bank as a Senior Manager
and joined Security Bank Corporation in 1996 as Assistant Vice President until his promotion to First
Vice President in 2005 as Area Business Manager. Subsequently, he joined Metropolitan Bank & Trust
63
Company in September 2005 as Vice President and was appointed Head of National Branch Banking
Sector with the rank of Executive Vice President. He was also a Director of Metrobank Card Corporation
from 2012 to 2015.
MARIA PAZ D. LIM, 58, Filipino, First Senior Vice President, is the Corporate Treasurer and Head
of Corporate Expense Management Group. She is also concurrently the Treasurer of PNB Capital and
Investment Corporation. She obtained her Bachelor of Science degree in Business Administration,
Major in Finance and Marketing, from the University of the Philippines, and Masters in Business
Administration from the Ateneo de Manila University. She joined PNB on June 23, 1981, rose from the
ranks and occupied various officer positions at the Department of Economics & Research, Budget Office
and Corporate Disbursing Office prior to her present position.
NANETTE O. VERGARA, 59, Filipino, First Senior Vice President, is the Chief Credit Officer and
Head of Credit Management Group. She obtained her degree in Bachelor of Science in Statistics (Cum
Laude) in 1981 from the University of the Philippines in Diliman. She joined PNB in 2006 and was
appointed as First Vice President & Head of Credit Management Division. She started her banking
career with Bank of Commerce in 1981. She moved to the Credit Rating Services Department of the
Credit Information Bureau in 1983 and went back to banking in 1992 when she joined Union Bank of
the Philippines. She later transferred to Solidbank Corporation in 1993 to head various credit-related
units. Prior to joining PNB, she worked with United Overseas Bank from 2000-2006 as VP/Head of
Credit Risk Management.
SCHUBERT CAESAR C. AUSTERO, 56, Filipino, Senior Vice President, is the Head of Human
Resource (HR) Group. He has been connected with PNB since 2006 as Head of Human Capital
Development Division and as Deputy HR Head. A Bachelor of Arts graduate at the Leyte Normal
University where he earned a number of academic and non-academic distinctions. He has been an HR
professional for more than 30 years. Prior to joining PNB, he was connected with the First Abacus
Financial Group as Vice President and Group Head of the Human Resources, with the Philippine Bank
of Communications as Assistant Vice President and Training Director, and with Solidbank Corporation
as Recruitment and Training Manager, and later as Senior Manager and Head of Corporate
Communications and Public Affairs. He was National President of the People Management Association
of the Philippines in 2011 and continues to be active in the association as Thought Leader for Learning
and Development, as Director for Strategic Planning, and as the current Chairperson of the Council of
Presidents. He was appointed by President Benigno Aquino as Employer Representative to the National
Tripartite Industrial Peace Council in 2012. He currently sits as Director of the Organization
Development Practitioners Network.
MANUEL C. BAHENA, JR., 58, Filipino, Senior Vice President, is the Chief Legal Counsel and Head
of Legal Group. He joined PNB in 2003 and was appointed as Head of Documentation and Research
Division of the Legal Group in 2009. Before joining PNB, he was the Corporate Secretary and Vice
President of the Legal Department of Multinational Investment Bancorporation. He also formerly
served as Corporate Secretary and Legal Counsel of various corporations, among which are the
Corporate Partnership for Management in Business, Inc.; Orioxy Investment Corporation; Philippine
Islands Corporation for Tourism and Development; Cencorp (Trade, Travel and Tours), Inc.; and
Central Bancorporation General Merchants, Inc.
EMELINE C. CENTENO, 61, Filipino, Senior Vice President, is the Head of Corporate Planning and
Research Division and the Investor Relations Officer of the Bank. She obtained her Bachelor of Science
degree in Statistics (Dean’s Lister) and completed her Masters of Arts in Economics degree (on
64
scholarship) from the University of the Philippines. She joined PNB in 1983, rose from the ranks and
held various positions at the Department of Economics and Research, Product Development, Monitoring
and Implementation Division, and the Corporate Planning Division before assuming her present position
as Head of the merged Corporate Planning and Analysis Division. Ms. Centeno was awarded as one of
the Ten Outstanding Employees of the Bank in 1987.
MARIE FE LIZA S. JAYME, 57, Filipino, Senior Vice President, is the Head of Operations Group.
She graduated with a degree in Bachelor of Arts, Major in Communication Arts and Business
Administration from the Assumption College and completed academic units in Master in Business
Administration from the Ateneo de Manila University. She joined PNB in 2007 as Head of Cash Product
Management Division to establish the Bank’s cash management services. Ms. Jayme began her career
in banking in 1990 as an account officer with Land Bank of the Philippines. From then on, she assumed
expanded and multiple roles and responsibilities in account management as Senior Manager with United
Coconut Planters Bank; risk management, cash and trades sales, cash products as Assistant Vice
President in Citibank, N.A.’s Global Transaction Services/E-business; and marketing and product
management as Vice President and Head of Marketing and Product Management Group of Export and
Industry Bank. Prior to banking, Ms. Jayme held senior staff positions with the Office of the Secretary
of Finance, Department of Trade and Industry and former Office of the Prime Minister.
MICHAEL M. MORALLOS, 51, Filipino, Senior Vice President, is the Head of Information
Technology Group. He obtained his Bachelor of Arts degree major in Philosophy and Political Science
from the University of the Philippines and completed advanced computer studies at the National
Computer Institute of the Philippines. His company trainings include Wharton Senior Executive
Program, IBM Project Management, Ateneo Banking Principles and extensive systems training at the
FIS Training Center, LR, Arkansas. He brings with him over 26 years of work experience and was a
Senior FIS Systematics Consultant. Prior to joining PNB, he was First Senior Vice President and Head
of Technology Platform at the Siam Commercial Bank, the largest Thai bank with over 28,000 Customer
Accounts and 1,200 domestic branches.
ROLAND V. OSCURO, 56, Filipino, Senior Vice President, is the Chief Information Security Officer
and, in concurrent capacity, the Chief Security Officer and Head of Enterprise Security Group. He
obtained his Bachelor of Science in Electronics and Communications Engineering degree from Mapua
Institute of Technology and took up units in Master in Business Administration for Middle Manager at
the Ateneo de Manila Graduate School. He is an Electronic and Communications Engineering Board
passer. He is also an Information Systems Audit and Control Association’s (ISACA) Certified
Information Security Manager (CISM). Prior to his present position, Mr. Oscuro was hired as IT
Consultant of the Bank on November 2, 2003. In May 2004, he was appointed as the Head of Network
Management Division of Information Technology Group with the rank of First Vice President. He was
the Operational Support System Group Manager of Multi-Media Telephony, Inc. (Broadband
Philippines) prior to joining PNB. He was also connected with various corporations such as Ediserve
Corp. (Global Sources), Sterling Tobacco Corporation, Zero Datasoft (Al Bassam), Metal Industry
Research and Development Center, and Pacific Office Machines, Inc.
JOY JASMIN R. SANTOS, 46, Filipino, First Vice President, is the Chief Trust Officer and Head of
Trust Banking Group. She has served as Vice President and Corporate Trust Division Head from 2013
to 2018 and Business Development Division Head of the Trust Banking Group from 2010 to 2012. Prior
to joining PNB in June 2010, she was the International Business Development Head for Asia of Globe
Telecom. She was also Vice President for Retail Banking of Citibank Savings, Inc. from 2005 to 2009.
She held managerial positions in Keppel Bank, American Express Bank, and Bank of the Philippine
Islands. Ms. Santos graduated as Cum Laude in 1994 from the Ateneo de Manila University with a
degree of Bachelor of Arts, Major in Management Economics and obtained her Masters in Business
65
Administration from the Australian National University, Canberra, Australia in 2002. She has completed
the One-Year Course on Trust Operations and Investment Management given by the Trust Institute
Foundation of the Philippines in 2015 and graduated with Distinction.
MARTIN G. TENGCO, JR., 54, Filipino, First Vice President, is the Chief Audit Executive (CAE) of
the Bank and Head of Internal Audit Group. A Certified Public Accountant, he holds a Bachelor of
Science in Business Administration degree, Major in Accounting, from the Philippine School of
Business Administration. He obtained his Master in Business Administration degree at Ateneo de
Manila University under the Ateneo-Regis University MBA program. He started his career as a working
student in 1984 as an accountant in a construction company before joining Allied Banking Corporation
on June 1, 1992 as a Junior Auditor. He rose from the ranks to become an officer in 1996, and in 2009,
was designated as Deputy CAE and Information Systems Audit Division Head until his appointment as
CAE of PNB on June 1, 2017. He also served as the Business Continuity Coordinator of Allied Banking
Corporation from June 2007 to April 2008. He served as a member of the Audit Committee of Bancnet
from 2009 to 2014. He is a member of the Philippine Institute of Certified Public Accountants, Institute
of Internal Auditors (IIA), ISACA and Association of Certified Fraud Examiners-Philippines.
SIMEON T. YAP, 58, Filipino, First Vice President, is the Bank’s Chief Risk and Data Protection
Officer and Head of Risk Management Group. He is an Economics graduate from the University of the
Philippines’ School of Economics. Prior to joining PNB, he was the Market Risk Officer of Security
Bank from 2009 to 2018. He was also the Associate Director for Product Development of PDEx in 2008.
He was also with Citibank where he was a trader, Money Market Head of Citibank Shanghai and Market
Risk Officer.
C. Independent Directors
In carrying out their responsibilities, the directors must act prudently and exercise independent
judgment while encouraging transparency and accountability. The Bank has five (5) independent
directors representing 33% of the members of the Board, beyond the 20% requirement of the SEC.
The appointment of the 5 independent directors composed of the Board Chairman Florencia G.
Tarriela, and Messrs. Felix Enrico R. Alfiler, Edgar A. Cua, Federico C. Pascual and Domingo H.
Yap, were approved and confirmed by the appropriate regulatory bodies.
The independent directors act as Chairman of the Board, Corporate Governance/Nomination
/Remuneration Committee, Board Oversight Committee – Domestic and Foreign Subsidiaries/
Affiliates, Board Audit and Compliance Committee and Board Oversight Related Party Transaction
(RPT) Committee. The independent directors are also members of four other board committees such
as the Board ICAAP Steering Committee, Trust Committee, Board IT Governance Committee and
the Risk Oversight Committee. The latter board committee Chairman is a non-executive director
and former president of a government bank with universal banking license.
D. Identify Significant Employees
All employees of the Bank are valued for their contribution to the business. The management,
however, expect the executive officers to make any significant contribution to the business of the
Bank.
66
E. Family Relationship
▪ Directors Lucio C. Tan and Carmen K. Tan are spouses.
▪ Directors Vivienne K. Tan, Sheila Tan Pascual, and Michael G. Tan are children of Director
Lucio C. Tan.
▪ Board Advisor Harry C. Tan is the brother of Director Lucio C. Tan.
F. Involvement in Certain Proceedings
Neither the directors nor any of the executive officers have, for a period covering the past five (5)
years, reported:
i. any petition for bankruptcy filed by or against a business with which they are related as a
general partner or executive officer;
ii. any criminal conviction by final judgment or being subject to a pending criminal
proceeding, domestic or foreign;
iii. being subject to any order, judgment, or decree, of a competent court, domestic or foreign,
permanently or temporarily enjoining, barring, suspending or limiting their involvement
in any type of business, securities, commodities or banking activities; or
iv. being found by a domestic or foreign court of competent jurisdiction (in a civil action), the
Commission or comparable foreign body, or a domestic or Foreign Exchange or other
organized trading market or self-regulatory organization, to have violated a securities or
commodities law or regulation, and the judgment has not been reversed, suspended, or
vacated.
G. Brief Description of Any Material Pending Legal Proceedings to which the Registrant or any
of its Subsidiaries is a Party
The Bank and some of its subsidiaries are parties to various legal proceedings which arose in the
ordinary course of their operations. None of such legal proceedings, either individually or in the
aggregate, are expected to have a material adverse effect on the Bank and its subsidiaries or their
financial condition.
Item No. 10 – Executive Compensation
A. Executive Compensation
The annual compensation of executive officers consists of a 16-month guaranteed cash emolument.
There are no other arrangements concerning compensation for services rendered by Directors or
executive officers to the Bank and its subsidiaries.
B. Compensation of Directors
The Directors receive a reasonable per diem for each attendance at a Board meeting or any meeting
of the Board Committees. Total per diem given to the Board of Directors of the Bank amounted
to P45.5 million in 2019 from P43.0 million in 2018.
67
C. Summary of Compensation Table
Annual Compensation (in Philippine Pesos)
Name and
Principal Position
Year Salary
Bonus Others Total
Mr. Jose Arnulfo A. Veloso
President and CEO
Four most highly compensated
executive officers other than the
CEO
1. Audencial, Cenon Jr. C.
Executive Vice President
2. Luy, Chester Y.
Executive Vice President
3. Reyes, Nelson C.
Executive Vice President
4. Tocmo, Bernardo H.
Executive Vice President
CEO and Four (4) Most Highly
Compensated Executive Officers
Actual 2018 73,547,609 24,911,289 – 98,458,898
Actual 2019 79,069,694 25,160,854 – 104,230,548
Projected
2020
86,186,000 27,425,000 – 113,611,000
All other officers and directors (as
a group unnamed)
Actual 2018 3,643,289,879 1,050,554,000 – 4,693,843,879
Actual 2019 3,627,413,255 1,157,568,874 – 4,784,982,129
Projected
2020
3,953,880,000 1,261,750,000 – 5,215,630,000
D. Employment Contracts and Termination of Employment and Change-in-Control
Arrangements
The annual compensation of executive officers is covered by the Bank’s standard employment
contract which guarantees annual compensation on a 16-month schedule of payment. In
accordance with the Bank’s Amended By-Laws, Article VI, Sec. 6.1, all officers with the rank of
Vice President and up hold office and serve at the pleasure of the Board of Directors.
E. Warrants and Options Outstanding: Repricing
No warrants or options on the Bank’s shares of stock have been issued or given to the Directors
or executive officers as a form of compensation for services rendered.
Item No. 10A – Remuneration Policy
PNB’s remuneration policy manifests the Bank’s belief that the quality of its human resource is
a key competitive edge in the industry. As such, the Bank maintains remuneration and benefits
program that attracts, motivates, and retains talents and develops their potentials. The Bank’s
remuneration and benefits program aims to 1) ensure compliance with requirements of labor and
other regulatory laws; 2) establish competitiveness with peer groups in the industry; and c)
strengthen alignment with and accomplishment of the Bank’s business strategies.

68
The following are the features of the Bank’s remuneration policy for Directors and Officers:
I. Emolument and Fringe Benefits of the Board of Directors
- Cash Emolument in the form of Per Diem for every Board and Board Committee meeting
- Non-Cash Benefit in the form of Healthcare Plan, Group Life Insurance, and Group Accident
Insurance
II. Officers’ Compensation and Benefits
1. Monetary Emoluments
- Monthly compensation in the form of monthly basic pay which is reviewed annually and
subject to the adjustment thru merit increase effective July 1 based on Officer’s performance
and achievements
- Bonuses equivalent to four (4) months Basic Salary per year
- Allowances to cover business-related expenses, official travel, social and recreational
activities (i.e., Teambuilding activity / Christmas party), and relocation expenses; other
monetary allowances that include annual rice subsidy and annual clothing allowance.
- Service Incentive in the form of cash award upon reaching milestones in length of service
(i.e., 10th, 15th, 20th, 25th, 30th, 35th and 40th year of service)
2. Non-Cash Benefits
- Healthcare Plan in the form of hospitalization, consultation and other medical benefits for
the Officer and two (2) of his/her primary dependents
- Group Life Insurance coverage in amounts based on the Officer’s rank
- Group Accident Insurance coverage in amounts based on the officer’s rank
- Leave Privileges in the form of leave with pay benefits for the following purposes: a)
vacation; b) sick; c) maternity; d) paternity; e) birthday; f) bereavement; g) solo parent; h)
emergency; i) special leave for female employees; j) special leave privilege for victims under
the “Anti-Violence Against Women and their Children Act”.
- Car Plan in the form of car cost-sharing scheme based on the officer’s rank
3. Fringe Benefits
- Loan Facilities available for the following purposes: a) housing; b) car financing; c) general
purpose d) motorcycle loan and e) computer loan
4. Retirement Benefits
- Retirement benefits equivalent to applicable monthly pay per year of service for those who
attained the required age or minimum length of service under the Plan.
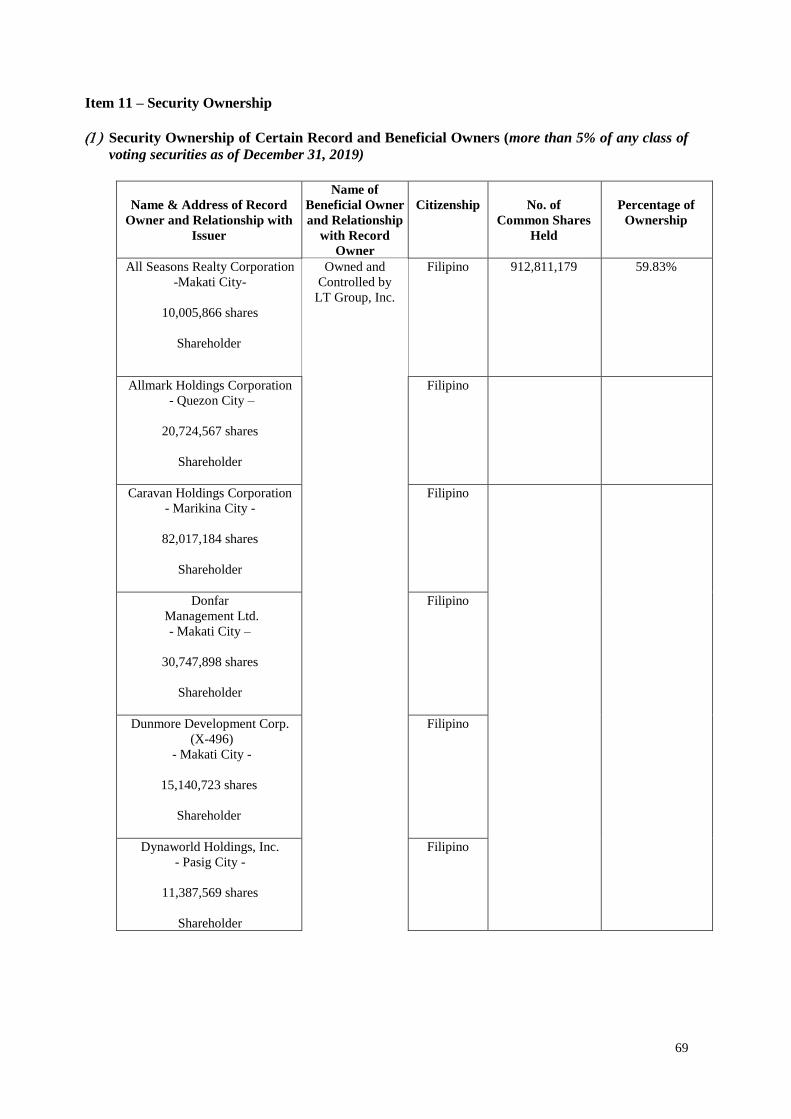
69
Item 11 – Security Ownership
() Security Ownership of Certain Record and Beneficial Owners (more than 5% of any class of
voting securities as of December 31, 2019)
Name & Address of Record
Owner and Relationship with
Issuer
Name of
Beneficial Owner
and Relationship
with Record
Owner
Citizenship
No. of
Common Shares
Held
Percentage of
Ownership
All Seasons Realty Corporation
-Makati City-
10,005,866 shares
Shareholder
Owned and
Controlled by
LT Group, Inc.
Filipino 912,811,179
59.83%
Allmark Holdings Corporation
- Quezon City –
20,724,567 shares
Shareholder
Filipino
Caravan Holdings Corporation
- Marikina City -
82,017,184 shares
Shareholder
Filipino
Donfar
Management Ltd.
- Makati City –
30,747,898 shares
Shareholder
Filipino
Dunmore Development Corp.
(X-496)
- Makati City -
15,140,723 shares
Shareholder
Filipino
Dynaworld Holdings, Inc.
- Pasig City -
11,387,569 shares
Shareholder
Filipino
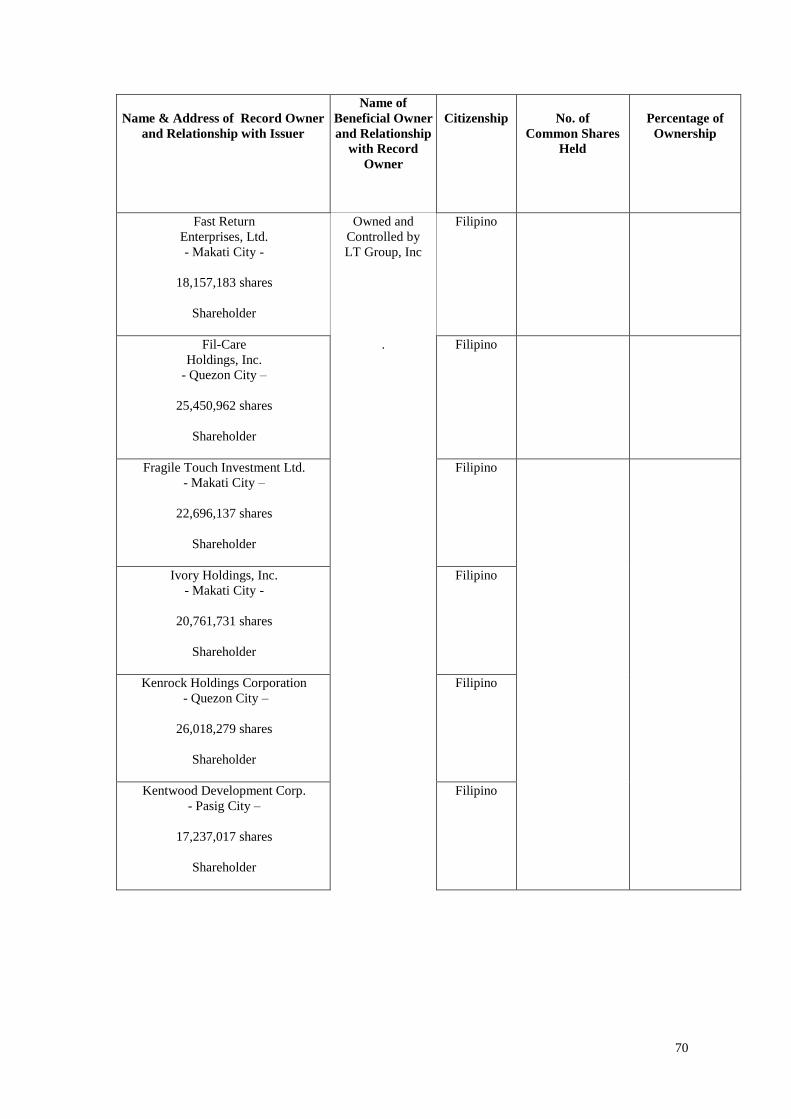
70
Name & Address of Record Owner
and Relationship with Issuer
Name of
Beneficial Owner
and Relationship
with Record
Owner
Citizenship
No. of
Common Shares
Held
Percentage of
Ownership
Fast Return
Enterprises, Ltd.
- Makati City -
18,157,183 shares
Shareholder
Owned and
Controlled by
LT Group, Inc
Filipino
Fil-Care
Holdings, Inc.
- Quezon City –
25,450,962 shares
Shareholder
.
Filipino
Fragile Touch Investment Ltd.
- Makati City –
22,696,137 shares
Shareholder
Filipino
Ivory Holdings, Inc.
- Makati City -
20,761,731 shares
Shareholder
Filipino
Kenrock Holdings Corporation
- Quezon City –
26,018,279 shares
Shareholder
Filipino
Kentwood Development Corp.
- Pasig City –
17,237,017 shares
Shareholder
Filipino
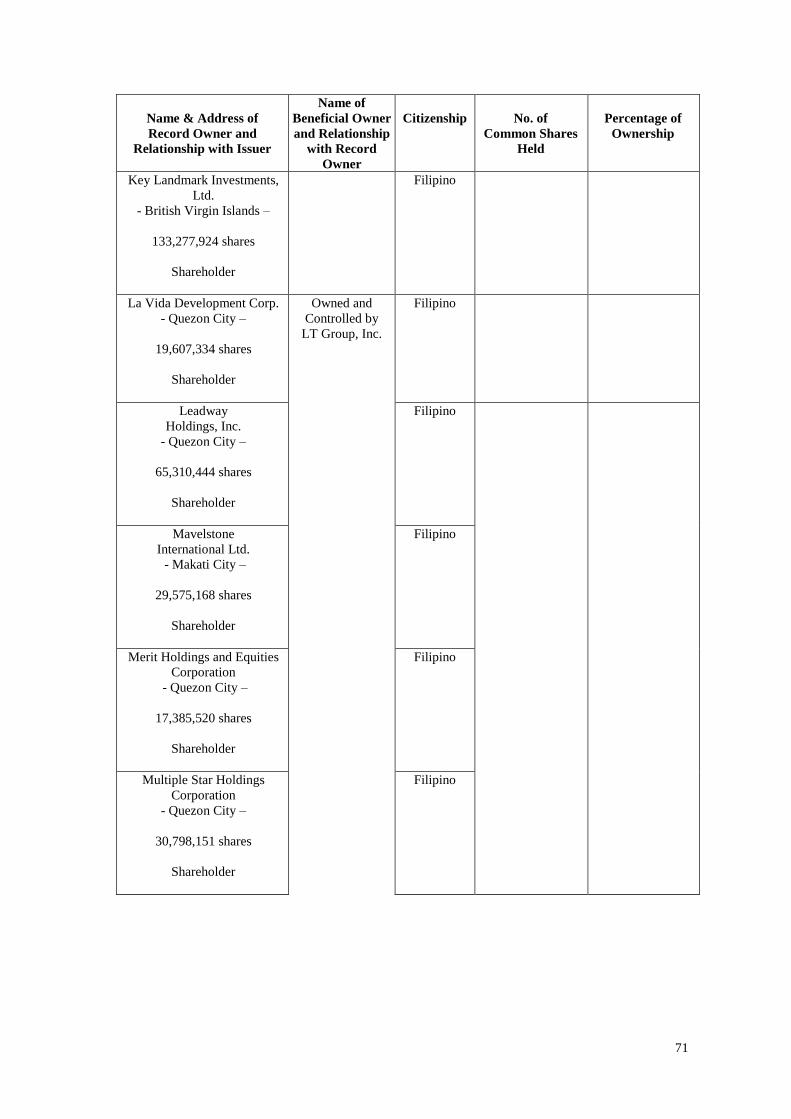
71
Name & Address of
Record Owner and
Relationship with Issuer
Name of
Beneficial Owner
and Relationship
with Record
Owner
Citizenship
No. of
Common Shares
Held
Percentage of
Ownership
Key Landmark Investments,
Ltd.
- British Virgin Islands –
133,277,924 shares
Shareholder
Filipino
La Vida Development Corp.
- Quezon City –
19,607,334 shares
Shareholder
Owned and
Controlled by
LT Group, Inc.
Filipino
Leadway
Holdings, Inc.
- Quezon City –
65,310,444 shares
Shareholder
Filipino
Mavelstone
International Ltd.
- Makati City –
29,575,168 shares
Shareholder
Filipino
Merit Holdings and Equities
Corporation
- Quezon City –
17,385,520 shares
Shareholder
Filipino
Multiple Star Holdings
Corporation
- Quezon City –
30,798,151 shares
Shareholder
Filipino
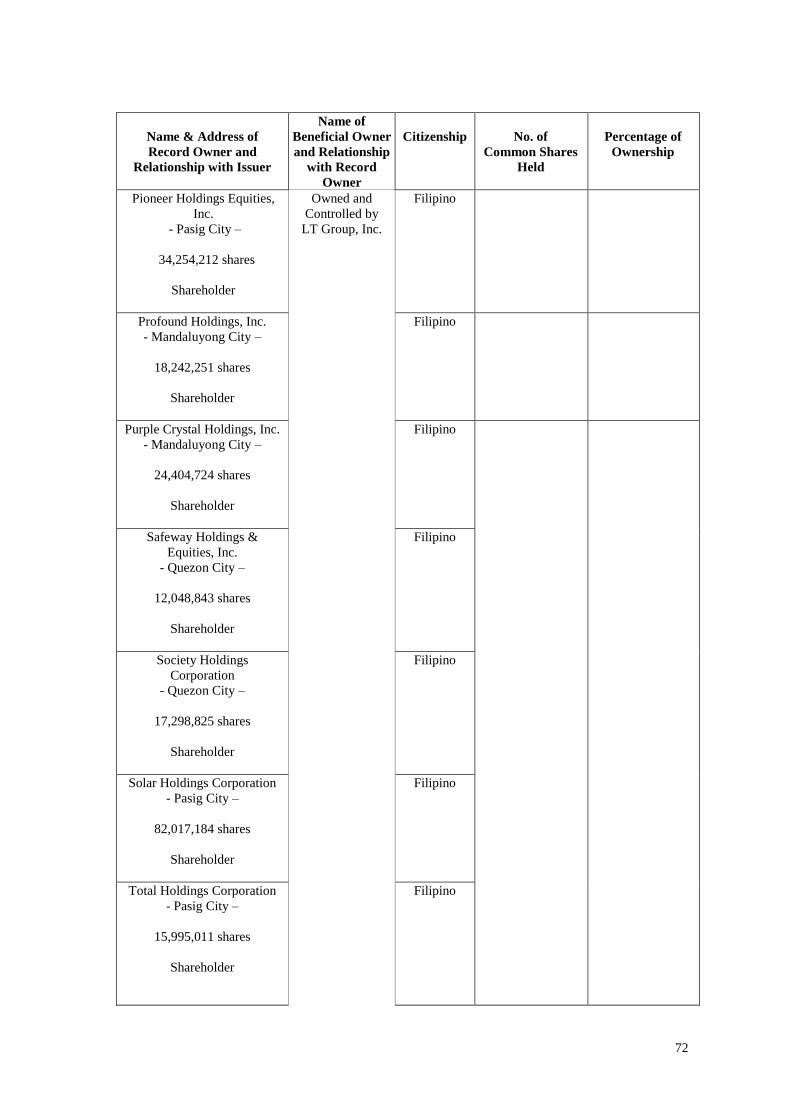
72
Name & Address of
Record Owner and
Relationship with Issuer
Name of
Beneficial Owner
and Relationship
with Record
Owner
Citizenship
No. of
Common Shares
Held
Percentage of
Ownership
Pioneer Holdings Equities,
Inc.
- Pasig City –
34,254,212 shares
Shareholder
Owned and
Controlled by
LT Group, Inc.
Filipino
Profound Holdings, Inc.
- Mandaluyong City –
18,242,251 shares
Shareholder
Filipino
Purple Crystal Holdings, Inc.
- Mandaluyong City –
24,404,724 shares
Shareholder
Filipino
Safeway Holdings &
Equities, Inc.
- Quezon City –
12,048,843 shares
Shareholder
Filipino
Society Holdings
Corporation
- Quezon City –
17,298,825 shares
Shareholder
Filipino
Solar Holdings Corporation
- Pasig City –
82,017,184 shares
Shareholder
Filipino
Total Holdings Corporation
- Pasig City –
15,995,011 shares
Shareholder
Filipino
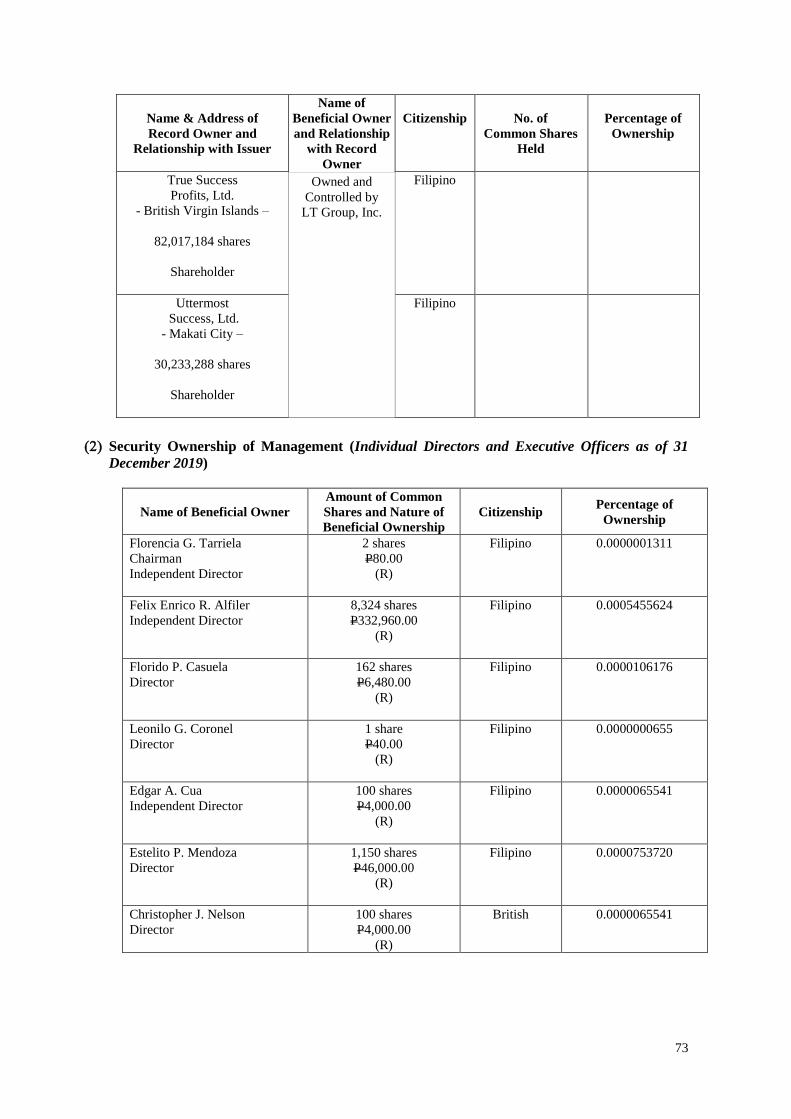
73
Name & Address of
Record Owner and
Relationship with Issuer
Name of
Beneficial Owner
and Relationship
with Record
Owner
Citizenship
No. of
Common Shares
Held
Percentage of
Ownership
True Success
Profits, Ltd.
- British Virgin Islands –
82,017,184 shares
Shareholder
Owned and
Controlled by
LT Group, Inc.
Filipino
Uttermost
Success, Ltd.
- Makati City –
30,233,288 shares
Shareholder
Filipino
() Security Ownership of Management (Individual Directors and Executive Officers as of 31
December 2019)
Name of Beneficial Owner
Amount of Common
Shares and Nature of
Beneficial Ownership
Citizenship Percentage of
Ownership
Florencia G. Tarriela
Chairman
Independent Director
2 shares
P80.00
(R)
Filipino
0.0000001311
Felix Enrico R. Alfiler
Independent Director
8,324 shares
P332,960.00
(R)
Filipino 0.0005455624
Florido P. Casuela
Director
162 shares
P6,480.00
(R)
Filipino 0.0000106176
Leonilo G. Coronel
Director
1 share
P40.00
(R)
Filipino 0.0000000655
Edgar A. Cua
Independent Director
100 shares
P4,000.00
(R)
Filipino 0.0000065541
Estelito P. Mendoza
Director
1,150 shares
P46,000.00
(R)
Filipino 0.0000753720
Christopher J. Nelson
Director
100 shares
P4,000.00
(R)
British 0.0000065541
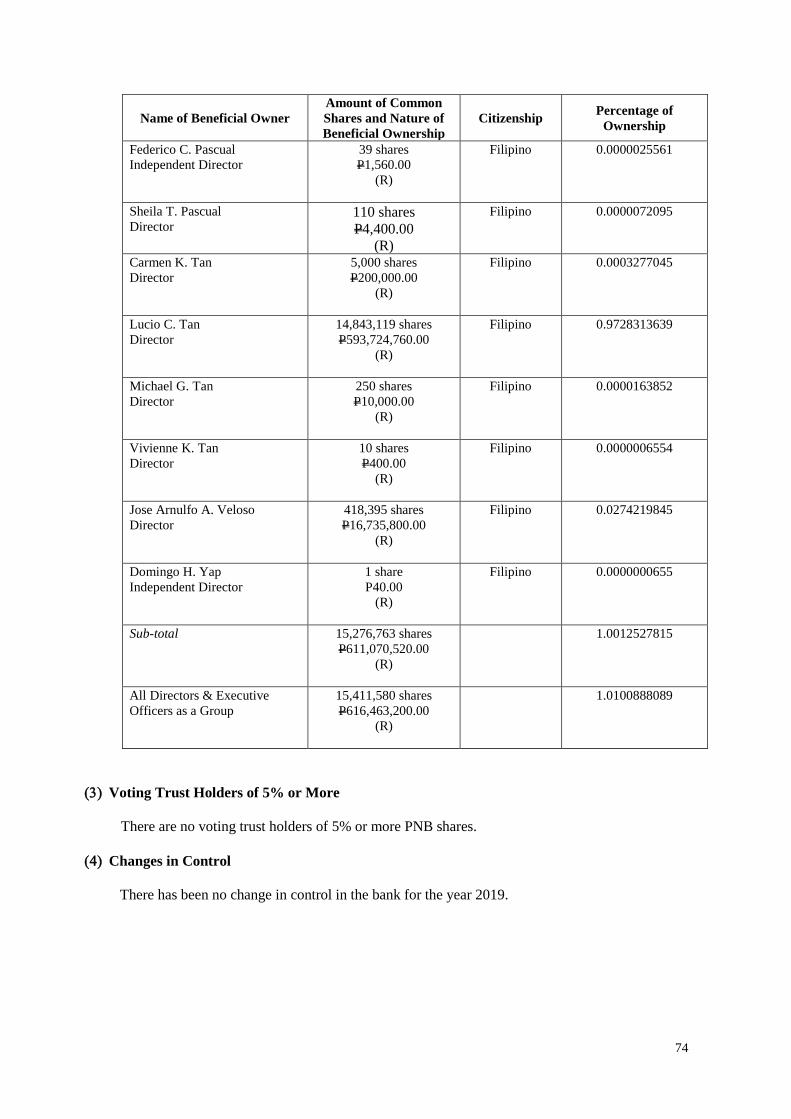
74
Name of Beneficial Owner
Amount of Common
Shares and Nature of
Beneficial Ownership
Citizenship Percentage of
Ownership
Federico C. Pascual
Independent Director
39 shares
P1,560.00
(R)
Filipino 0.0000025561
Sheila T. Pascual
Director 110 shares
P4,400.00
(R)
Filipino 0.0000072095
Carmen K. Tan
Director
5,000 shares
P200,000.00
(R)
Filipino 0.0003277045
Lucio C. Tan
Director
14,843,119 shares
P593,724,760.00
(R)
Filipino 0.9728313639
Michael G. Tan
Director
250 shares
P10,000.00
(R)
Filipino 0.0000163852
Vivienne K. Tan
Director
10 shares
P400.00
(R)
Filipino 0.0000006554
Jose Arnulfo A. Veloso
Director
418,395 shares
P16,735,800.00
(R)
Filipino 0.0274219845
Domingo H. Yap
Independent Director
1 share
P40.00
(R)
Filipino 0.0000000655
Sub-total 15,276,763 shares
P611,070,520.00
(R)
1.0012527815
All Directors & Executive
Officers as a Group
15,411,580 shares
P616,463,200.00
(R)
1.0100888089
() Voting Trust Holders of 5% or More
There are no voting trust holders of 5% or more PNB shares.
() Changes in Control
There has been no change in control in the bank for the year 2019.
75
Item 12. Certain Relationships and Related Transactions
In the ordinary course of business, the Parent Company has loans and other transactions with its
subsidiaries and affiliates, and with certain directors, officers, stockholders and related interests
(DOSRI). Under the Parent Company’s policy, these loans and other transactions are made
substantially on the same terms as with other individuals and businesses of comparable risks. The
amount of direct credit accommodations to each of the Parent Company’s DOSRI, 70.00% of
which must be secured, should not exceed the amount of their respective deposits and book value
of their respective investments in the Parent Company.
In the aggregate, DOSRI loans generally should not exceed the Parent Company’s equity or 15%
of the Parent Company’s total loan portfolio, whichever is lower. As of December 31, 2019 and
2018, the Group and Parent Company were in compliance with such regulations.
Parties are considered to be related if one party has the ability, directly or indirectly, to control
the other party or exercise significant influence over the other party in making financial and
operating decisions. The Group’s related parties include:
• key management personnel, close family members of key management personnel and
entities which are controlled, significantly influenced by or for which significant voting
power is held by key management personnel or their close family members;
• significant investors;
• subsidiaries, joint ventures and associates and their respective subsidiaries; and
• post-employment benefit plans for the benefit of the Group’s employees.
For proper monitoring of related party transactions (RPT) and to assist the Board in performing
its oversight functions in monitoring and managing potential conflicts of interest of management,
board members and shareholders, the Bank created the Board Oversight RPT Committee (BORC).
The BORC is composed of at least five (5) regular members which include three (3) independent
directors and two (2) non-voting members (the Chief Audit Executive and the Chief Compliance
Officer). The Chairman of the committee is an independent director and appointed by the Board.
Information related to transactions with related parties and with certain Directors, Officers,
Stockholders and Related Interests (DOSRI) is shown under Note 33 of the Audited Financial
Statements of the Bank and Subsidiaries and Exhibit IV of the Supplementary Schedules Required
by SRC Rule 68 Annex J.
76
PART IV - EXHIBITS AND REPORTS ON SEC 17-C
A. Exhibits
Exhibit I List of Bank Owned Properties as of December 31, 2019
Exhibit II List of Branches under Lease as of December 31, 2019
Exhibit III Statement of Management’s Responsibility, Independent Auditor’s Report and
Audited Financial Statements of Philippine National Bank and its Subsidiaries
as of December 31, 2019 and 2018 and for each of the three years ended
December 31, 2019, 2018 and 2017 and Notes to Financial Statements
Exhibit IV Independent Auditor’s Report on Supplementary Schedules
Independent Auditor’s Report on Components of Financial Soundness
Indicators
Reconciliation of Retained Earnings Available for Dividend Declaration
Map of Relationships of Companies Within the Group
Supplementary Schedules Required by SRC Rule 68 Annex J
Financial Soundness Indicators
Recent Offering of Securities to the Public
Reconciliation Between PFRS and BSP’s Financial Reporting Framework
Exhibit V Sustainability Report for the Year 2019
B. Reports on SEC Form 17-C
LIST OF SEC FORM 17-C REPORTS DURING
FOR THE YEAR 2019
DATE PARTICULARS
January 15, 2019 Change in the shareholdings of Mr. Jose Arnulfo A. Veloso, Director/President of the Bank,
through acquisition of PNB common shares, with details as follows:
Date of Acquisition No. of PNB shares
acquired
Price
January 8, 2019 500 P43.45
January 8, 2019 2,000 P43.50
January 8, 2019 2,000 P43.65
January 8, 2019 2,000 P43.85
January 8, 2019 2,000 P44.05
January 10, 2019 1,500 P44.65
January 10, 2019 1,500 P44.55
January 10, 2019 1,500 P44.45
As a result of the acquisition, Mr. Veloso now has a total of 145,101 indirect PNB shares under
his name.
January 25, 2019
Board approval of the following:
1. Holding of the Annual Stockholders’ Meeting of the Bank on April 30, 2019 at 8:00 a.m. at
the Grand Ballroom, Upper Lobby, Century Park Hotel, 599 Pablo Ocampo Sr. St., Malate,
Manila. Only stockholders of record as of April 1, 2019 will be entitled to notice of and to
vote at the meeting.
The Agenda for the Meeting will be as follows:
1. Call to Order
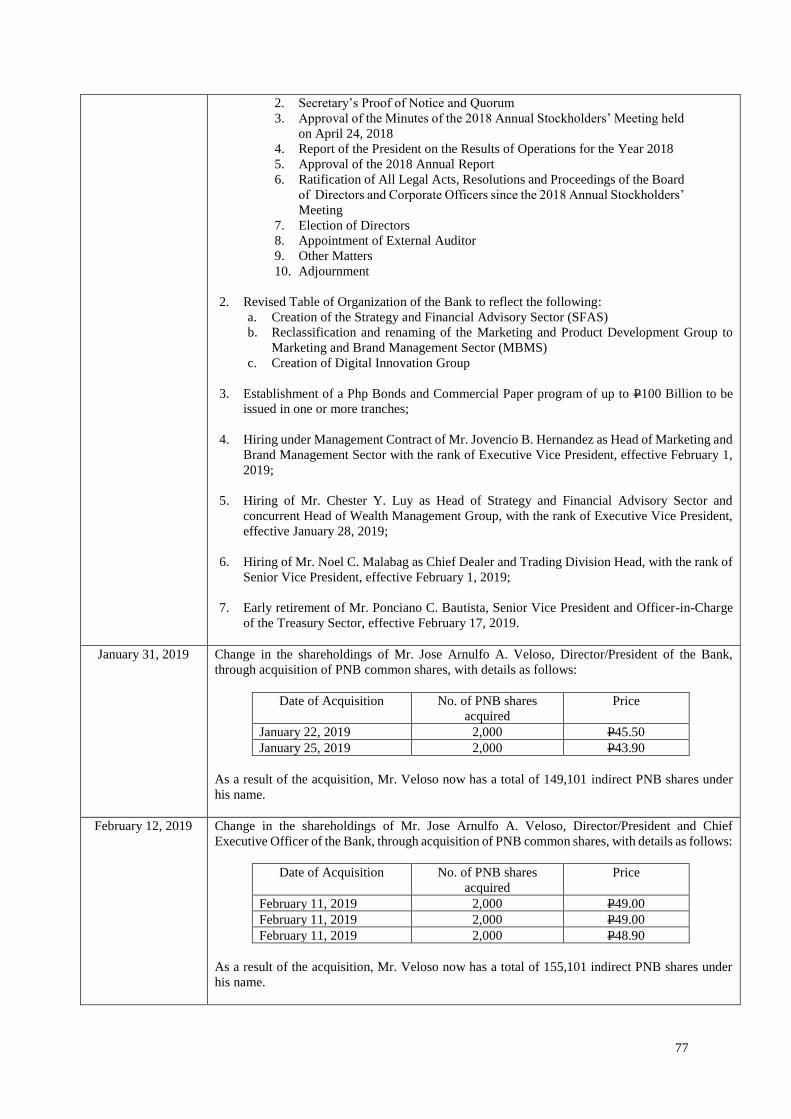
77
2. Secretary’s Proof of Notice and Quorum
3. Approval of the Minutes of the 2018 Annual Stockholders’ Meeting held
on April 24, 2018
4. Report of the President on the Results of Operations for the Year 2018
5. Approval of the 2018 Annual Report
6. Ratification of All Legal Acts, Resolutions and Proceedings of the Board
of Directors and Corporate Officers since the 2018 Annual Stockholders’
Meeting
7. Election of Directors
8. Appointment of External Auditor
9. Other Matters
10. Adjournment
2. Revised Table of Organization of the Bank to reflect the following:
a. Creation of the Strategy and Financial Advisory Sector (SFAS)
b. Reclassification and renaming of the Marketing and Product Development Group to
Marketing and Brand Management Sector (MBMS)
c. Creation of Digital Innovation Group
3. Establishment of a Php Bonds and Commercial Paper program of up to P100 Billion to be
issued in one or more tranches;
4. Hiring under Management Contract of Mr. Jovencio B. Hernandez as Head of Marketing and
Brand Management Sector with the rank of Executive Vice President, effective February 1,
2019;
5. Hiring of Mr. Chester Y. Luy as Head of Strategy and Financial Advisory Sector and
concurrent Head of Wealth Management Group, with the rank of Executive Vice President,
effective January 28, 2019;
6. Hiring of Mr. Noel C. Malabag as Chief Dealer and Trading Division Head, with the rank of
Senior Vice President, effective February 1, 2019;
7. Early retirement of Mr. Ponciano C. Bautista, Senior Vice President and Officer-in-Charge
of the Treasury Sector, effective February 17, 2019.
January 31, 2019 Change in the shareholdings of Mr. Jose Arnulfo A. Veloso, Director/President of the Bank,
through acquisition of PNB common shares, with details as follows:
Date of Acquisition No. of PNB shares
acquired
Price
January 22, 2019 2,000 P45.50
January 25, 2019 2,000 P43.90
As a result of the acquisition, Mr. Veloso now has a total of 149,101 indirect PNB shares under
his name.
February 12, 2019 Change in the shareholdings of Mr. Jose Arnulfo A. Veloso, Director/President and Chief
Executive Officer of the Bank, through acquisition of PNB common shares, with details as follows:
Date of Acquisition No. of PNB shares
acquired
Price
February 11, 2019 2,000 P49.00
February 11, 2019 2,000 P49.00
February 11, 2019 2,000 P48.90
As a result of the acquisition, Mr. Veloso now has a total of 155,101 indirect PNB shares under
his name.
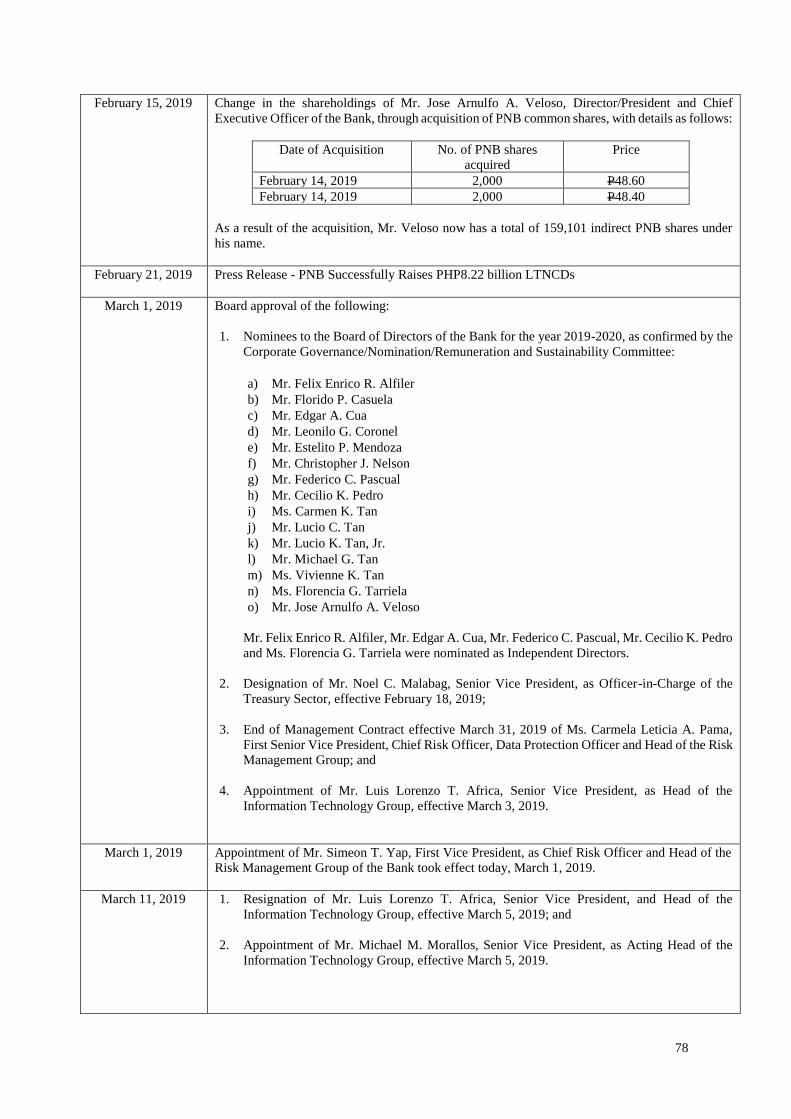
78
February 15, 2019 Change in the shareholdings of Mr. Jose Arnulfo A. Veloso, Director/President and Chief
Executive Officer of the Bank, through acquisition of PNB common shares, with details as follows:
Date of Acquisition No. of PNB shares
acquired
Price
February 14, 2019 2,000 P48.60
February 14, 2019 2,000 P48.40
As a result of the acquisition, Mr. Veloso now has a total of 159,101 indirect PNB shares under
his name.
February 21, 2019 Press Release - PNB Successfully Raises PHP8.22 billion LTNCDs
March 1, 2019 Board approval of the following:
1. Nominees to the Board of Directors of the Bank for the year 2019-2020, as confirmed by the
Corporate Governance/Nomination/Remuneration and Sustainability Committee:
a) Mr. Felix Enrico R. Alfiler
b) Mr. Florido P. Casuela
c) Mr. Edgar A. Cua
d) Mr. Leonilo G. Coronel
e) Mr. Estelito P. Mendoza
f) Mr. Christopher J. Nelson
g) Mr. Federico C. Pascual
h) Mr. Cecilio K. Pedro
i) Ms. Carmen K. Tan
j) Mr. Lucio C. Tan
k) Mr. Lucio K. Tan, Jr.
l) Mr. Michael G. Tan
m) Ms. Vivienne K. Tan
n) Ms. Florencia G. Tarriela
o) Mr. Jose Arnulfo A. Veloso
Mr. Felix Enrico R. Alfiler, Mr. Edgar A. Cua, Mr. Federico C. Pascual, Mr. Cecilio K. Pedro
and Ms. Florencia G. Tarriela were nominated as Independent Directors.
2. Designation of Mr. Noel C. Malabag, Senior Vice President, as Officer-in-Charge of the
Treasury Sector, effective February 18, 2019;
3. End of Management Contract effective March 31, 2019 of Ms. Carmela Leticia A. Pama,
First Senior Vice President, Chief Risk Officer, Data Protection Officer and Head of the Risk
Management Group; and
4. Appointment of Mr. Luis Lorenzo T. Africa, Senior Vice President, as Head of the
Information Technology Group, effective March 3, 2019.
March 1, 2019 Appointment of Mr. Simeon T. Yap, First Vice President, as Chief Risk Officer and Head of the
Risk Management Group of the Bank took effect today, March 1, 2019.
March 11, 2019 1. Resignation of Mr. Luis Lorenzo T. Africa, Senior Vice President, and Head of the
Information Technology Group, effective March 5, 2019; and
2. Appointment of Mr. Michael M. Morallos, Senior Vice President, as Acting Head of the
Information Technology Group, effective March 5, 2019.
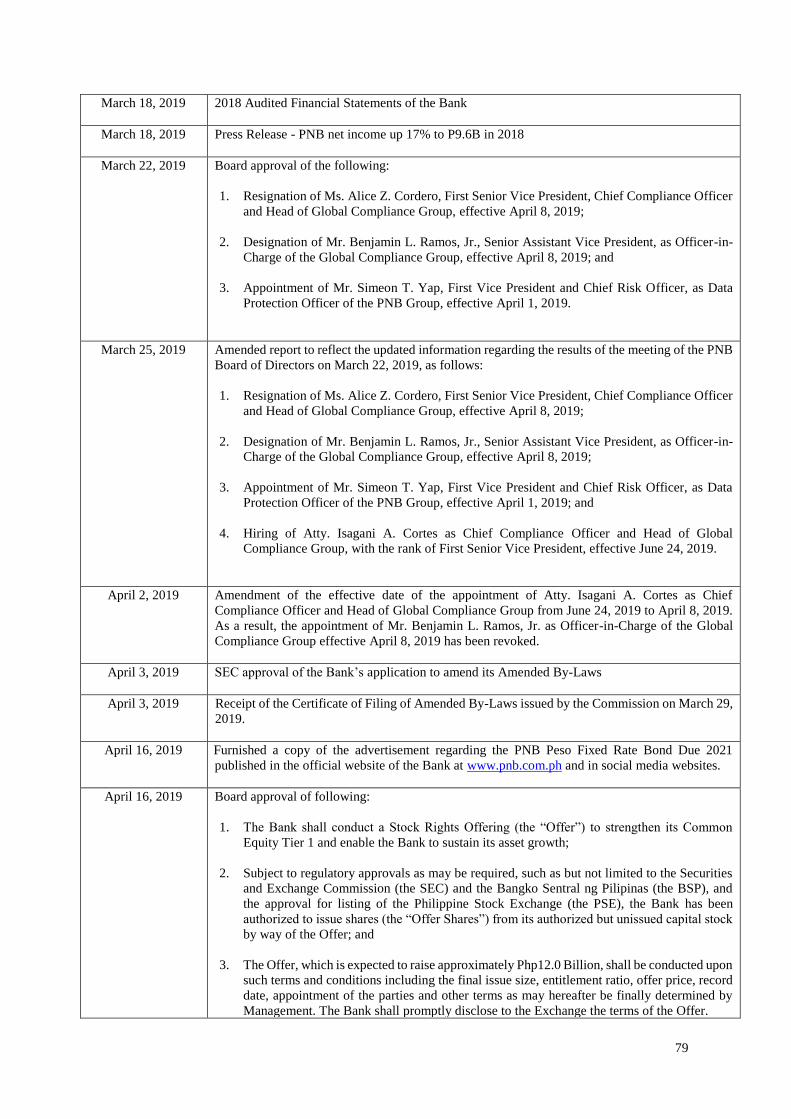
79
March 18, 2019 2018 Audited Financial Statements of the Bank
March 18, 2019 Press Release - PNB net income up 17% to P9.6B in 2018
March 22, 2019 Board approval of the following:
1. Resignation of Ms. Alice Z. Cordero, First Senior Vice President, Chief Compliance Officer
and Head of Global Compliance Group, effective April 8, 2019;
2. Designation of Mr. Benjamin L. Ramos, Jr., Senior Assistant Vice President, as Officer-in-
Charge of the Global Compliance Group, effective April 8, 2019; and
3. Appointment of Mr. Simeon T. Yap, First Vice President and Chief Risk Officer, as Data
Protection Officer of the PNB Group, effective April 1, 2019.
March 25, 2019 Amended report to reflect the updated information regarding the results of the meeting of the PNB
Board of Directors on March 22, 2019, as follows:
1. Resignation of Ms. Alice Z. Cordero, First Senior Vice President, Chief Compliance Officer
and Head of Global Compliance Group, effective April 8, 2019;
2. Designation of Mr. Benjamin L. Ramos, Jr., Senior Assistant Vice President, as Officer-in-
Charge of the Global Compliance Group, effective April 8, 2019;
3. Appointment of Mr. Simeon T. Yap, First Vice President and Chief Risk Officer, as Data
Protection Officer of the PNB Group, effective April 1, 2019; and
4. Hiring of Atty. Isagani A. Cortes as Chief Compliance Officer and Head of Global
Compliance Group, with the rank of First Senior Vice President, effective June 24, 2019.
April 2, 2019 Amendment of the effective date of the appointment of Atty. Isagani A. Cortes as Chief
Compliance Officer and Head of Global Compliance Group from June 24, 2019 to April 8, 2019.
As a result, the appointment of Mr. Benjamin L. Ramos, Jr. as Officer-in-Charge of the Global
Compliance Group effective April 8, 2019 has been revoked.
April 3, 2019 SEC approval of the Bank’s application to amend its Amended By-Laws
April 3, 2019 Receipt of the Certificate of Filing of Amended By-Laws issued by the Commission on March 29,
2019.
April 16, 2019 Furnished a copy of the advertisement regarding the PNB Peso Fixed Rate Bond Due 2021
published in the official website of the Bank at www.pnb.com.ph and in social media websites.
April 16, 2019 Board approval of following:
1. The Bank shall conduct a Stock Rights Offering (the “Offer”) to strengthen its Common
Equity Tier 1 and enable the Bank to sustain its asset growth;
2. Subject to regulatory approvals as may be required, such as but not limited to the Securities
and Exchange Commission (the SEC) and the Bangko Sentral ng Pilipinas (the BSP), and
the approval for listing of the Philippine Stock Exchange (the PSE), the Bank has been
authorized to issue shares (the “Offer Shares”) from its authorized but unissued capital stock
by way of the Offer; and
3. The Offer, which is expected to raise approximately Php12.0 Billion, shall be conducted upon
such terms and conditions including the final issue size, entitlement ratio, offer price, record
date, appointment of the parties and other terms as may hereafter be finally determined by
Management. The Bank shall promptly disclose to the Exchange the terms of the Offer.
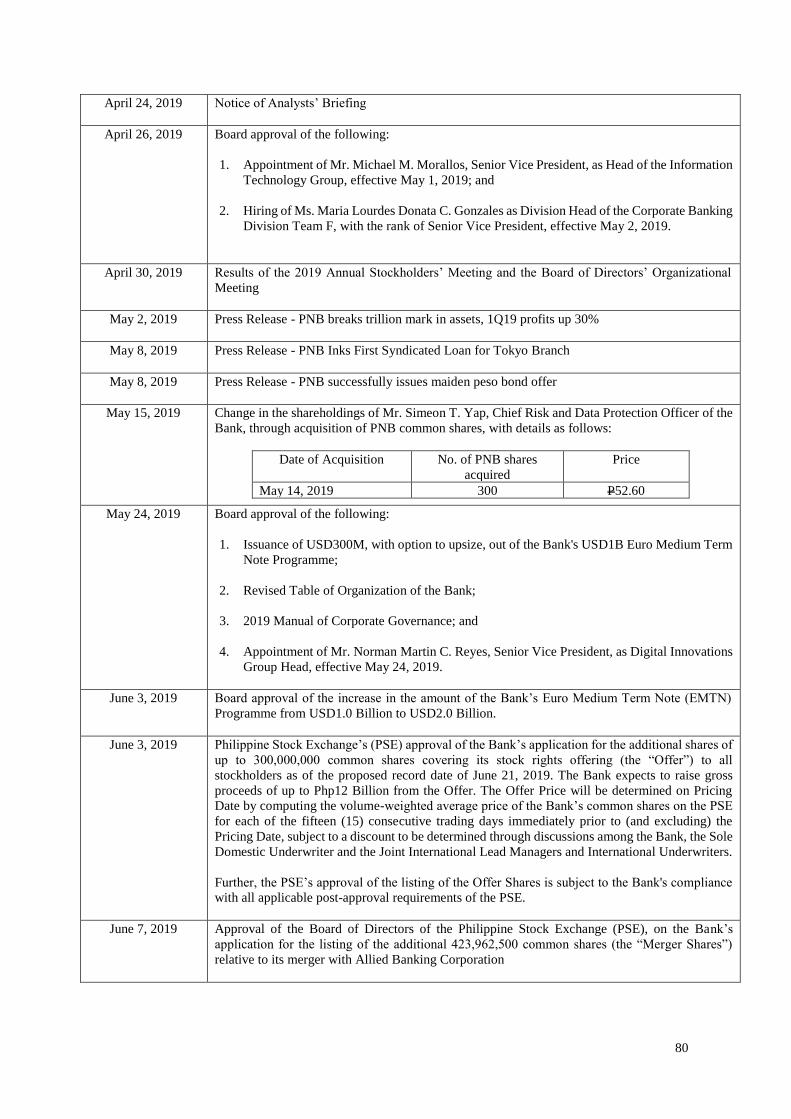
80
April 24, 2019 Notice of Analysts’ Briefing
April 26, 2019 Board approval of the following:
1. Appointment of Mr. Michael M. Morallos, Senior Vice President, as Head of the Information
Technology Group, effective May 1, 2019; and
2. Hiring of Ms. Maria Lourdes Donata C. Gonzales as Division Head of the Corporate Banking
Division Team F, with the rank of Senior Vice President, effective May 2, 2019.
April 30, 2019 Results of the 2019 Annual Stockholders’ Meeting and the Board of Directors’ Organizational
Meeting
May 2, 2019 Press Release - PNB breaks trillion mark in assets, 1Q19 profits up 30%
May 8, 2019 Press Release - PNB Inks First Syndicated Loan for Tokyo Branch
May 8, 2019 Press Release - PNB successfully issues maiden peso bond offer
May 15, 2019 Change in the shareholdings of Mr. Simeon T. Yap, Chief Risk and Data Protection Officer of the
Bank, through acquisition of PNB common shares, with details as follows:
Date of Acquisition No. of PNB shares
acquired
Price
May 14, 2019 300 P52.60
May 24, 2019 Board approval of the following:
1. Issuance of USD300M, with option to upsize, out of the Bank's USD1B Euro Medium Term
Note Programme;
2. Revised Table of Organization of the Bank;
3. 2019 Manual of Corporate Governance; and
4. Appointment of Mr. Norman Martin C. Reyes, Senior Vice President, as Digital Innovations
Group Head, effective May 24, 2019.
June 3, 2019 Board approval of the increase in the amount of the Bank’s Euro Medium Term Note (EMTN)
Programme from USD1.0 Billion to USD2.0 Billion.
June 3, 2019 Philippine Stock Exchange’s (PSE) approval of the Bank’s application for the additional shares of
up to 300,000,000 common shares covering its stock rights offering (the “Offer”) to all
stockholders as of the proposed record date of June 21, 2019. The Bank expects to raise gross
proceeds of up to Php12 Billion from the Offer. The Offer Price will be determined on Pricing
Date by computing the volume-weighted average price of the Bank’s common shares on the PSE
for each of the fifteen (15) consecutive trading days immediately prior to (and excluding) the
Pricing Date, subject to a discount to be determined through discussions among the Bank, the Sole
Domestic Underwriter and the Joint International Lead Managers and International Underwriters.
Further, the PSE’s approval of the listing of the Offer Shares is subject to the Bank's compliance
with all applicable post-approval requirements of the PSE.
June 7, 2019 Approval of the Board of Directors of the Philippine Stock Exchange (PSE), on the Bank’s
application for the listing of the additional 423,962,500 common shares (the “Merger Shares”)
relative to its merger with Allied Banking Corporation
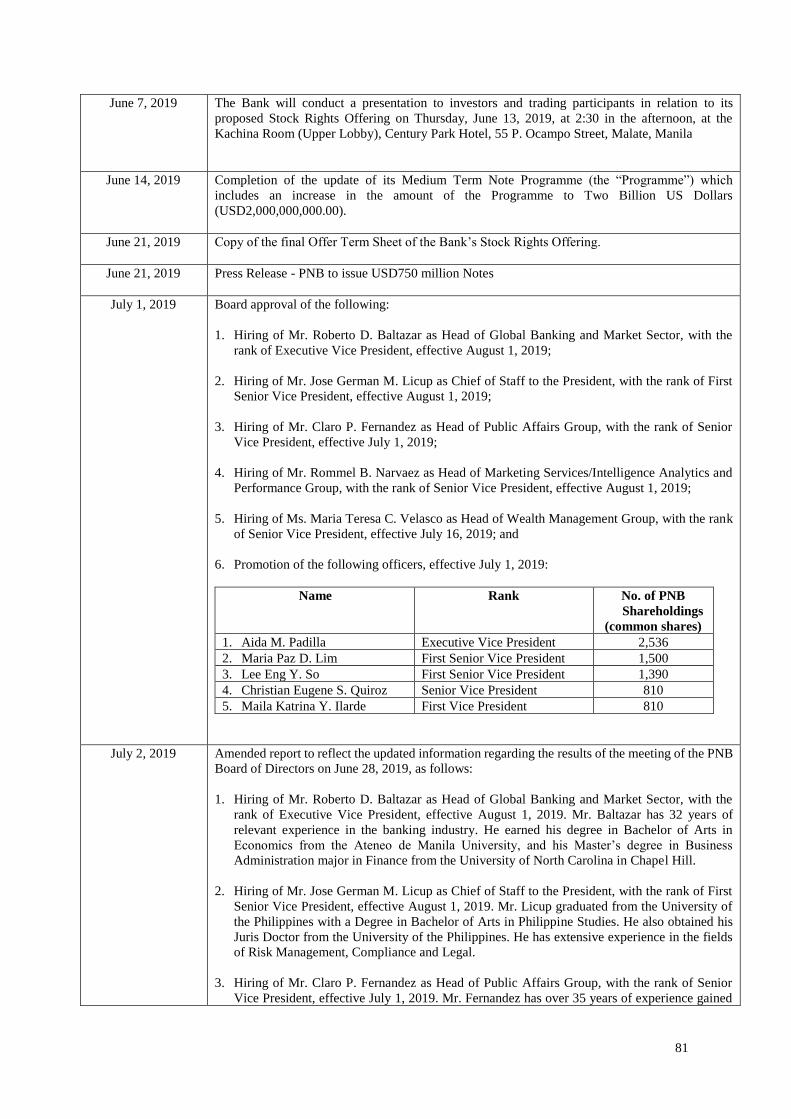
81
June 7, 2019 The Bank will conduct a presentation to investors and trading participants in relation to its
proposed Stock Rights Offering on Thursday, June 13, 2019, at 2:30 in the afternoon, at the
Kachina Room (Upper Lobby), Century Park Hotel, 55 P. Ocampo Street, Malate, Manila
June 14, 2019 Completion of the update of its Medium Term Note Programme (the “Programme”) which
includes an increase in the amount of the Programme to Two Billion US Dollars
(USD2,000,000,000.00).
June 21, 2019 Copy of the final Offer Term Sheet of the Bank’s Stock Rights Offering.
June 21, 2019 Press Release - PNB to issue USD750 million Notes
July 1, 2019 Board approval of the following:
1. Hiring of Mr. Roberto D. Baltazar as Head of Global Banking and Market Sector, with the
rank of Executive Vice President, effective August 1, 2019;
2. Hiring of Mr. Jose German M. Licup as Chief of Staff to the President, with the rank of First
Senior Vice President, effective August 1, 2019;
3. Hiring of Mr. Claro P. Fernandez as Head of Public Affairs Group, with the rank of Senior
Vice President, effective July 1, 2019;
4. Hiring of Mr. Rommel B. Narvaez as Head of Marketing Services/Intelligence Analytics and
Performance Group, with the rank of Senior Vice President, effective August 1, 2019;
5. Hiring of Ms. Maria Teresa C. Velasco as Head of Wealth Management Group, with the rank
of Senior Vice President, effective July 16, 2019; and
6. Promotion of the following officers, effective July 1, 2019:
Name Rank No. of PNB
Shareholdings
(common shares)
1. Aida M. Padilla Executive Vice President 2,536
2. Maria Paz D. Lim First Senior Vice President 1,500
3. Lee Eng Y. So First Senior Vice President 1,390
4. Christian Eugene S. Quiroz Senior Vice President 810
5. Maila Katrina Y. Ilarde First Vice President 810
July 2, 2019 Amended report to reflect the updated information regarding the results of the meeting of the PNB
Board of Directors on June 28, 2019, as follows:
1. Hiring of Mr. Roberto D. Baltazar as Head of Global Banking and Market Sector, with the
rank of Executive Vice President, effective August 1, 2019. Mr. Baltazar has 32 years of
relevant experience in the banking industry. He earned his degree in Bachelor of Arts in
Economics from the Ateneo de Manila University, and his Master’s degree in Business
Administration major in Finance from the University of North Carolina in Chapel Hill.
2. Hiring of Mr. Jose German M. Licup as Chief of Staff to the President, with the rank of First
Senior Vice President, effective August 1, 2019. Mr. Licup graduated from the University of
the Philippines with a Degree in Bachelor of Arts in Philippine Studies. He also obtained his
Juris Doctor from the University of the Philippines. He has extensive experience in the fields
of Risk Management, Compliance and Legal.
3. Hiring of Mr. Claro P. Fernandez as Head of Public Affairs Group, with the rank of Senior
Vice President, effective July 1, 2019. Mr. Fernandez has over 35 years of experience gained
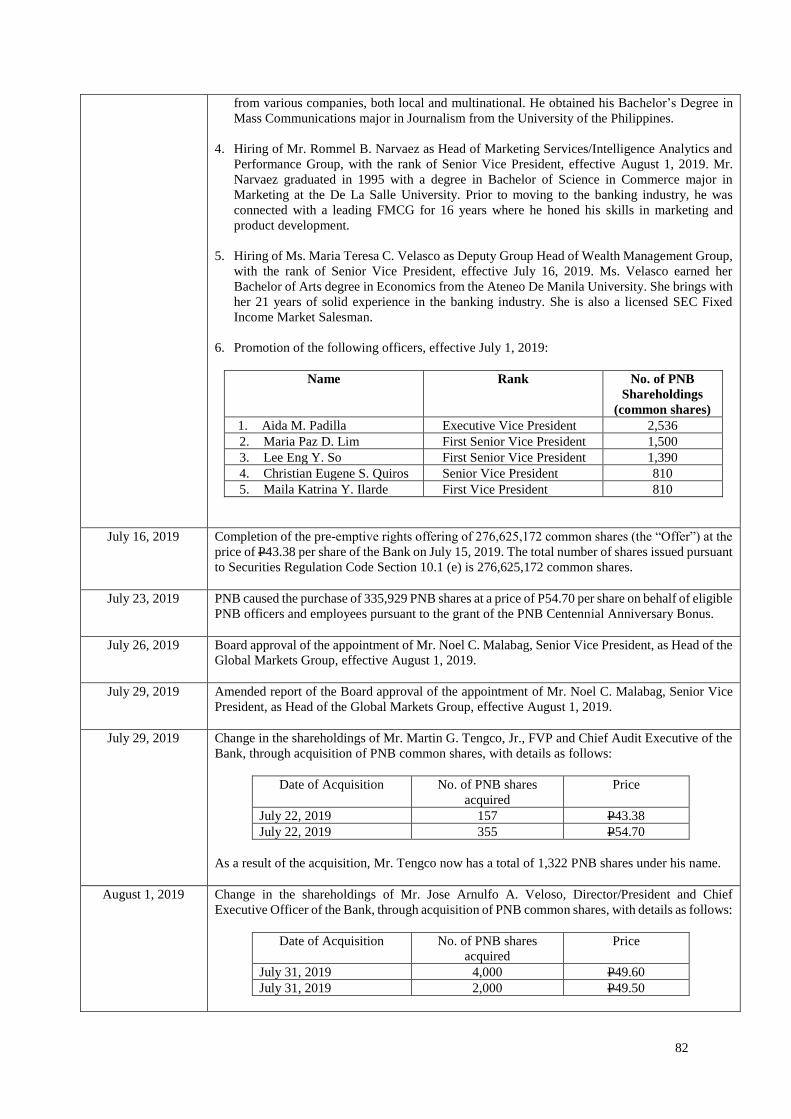
82
from various companies, both local and multinational. He obtained his Bachelor’s Degree in
Mass Communications major in Journalism from the University of the Philippines.
4. Hiring of Mr. Rommel B. Narvaez as Head of Marketing Services/Intelligence Analytics and
Performance Group, with the rank of Senior Vice President, effective August 1, 2019. Mr.
Narvaez graduated in 1995 with a degree in Bachelor of Science in Commerce major in
Marketing at the De La Salle University. Prior to moving to the banking industry, he was
connected with a leading FMCG for 16 years where he honed his skills in marketing and
product development.
5. Hiring of Ms. Maria Teresa C. Velasco as Deputy Group Head of Wealth Management Group,
with the rank of Senior Vice President, effective July 16, 2019. Ms. Velasco earned her
Bachelor of Arts degree in Economics from the Ateneo De Manila University. She brings with
her 21 years of solid experience in the banking industry. She is also a licensed SEC Fixed
Income Market Salesman.
6. Promotion of the following officers, effective July 1, 2019:
Name Rank No. of PNB
Shareholdings
(common shares)
1. Aida M. Padilla Executive Vice President 2,536
2. Maria Paz D. Lim First Senior Vice President 1,500
3. Lee Eng Y. So First Senior Vice President 1,390
4. Christian Eugene S. Quiros Senior Vice President 810
5. Maila Katrina Y. Ilarde First Vice President 810
July 16, 2019 Completion of the pre-emptive rights offering of 276,625,172 common shares (the “Offer”) at the
price of P43.38 per share of the Bank on July 15, 2019. The total number of shares issued pursuant
to Securities Regulation Code Section 10.1 (e) is 276,625,172 common shares.
July 23, 2019 PNB caused the purchase of 335,929 PNB shares at a price of P54.70 per share on behalf of eligible
PNB officers and employees pursuant to the grant of the PNB Centennial Anniversary Bonus.
July 26, 2019 Board approval of the appointment of Mr. Noel C. Malabag, Senior Vice President, as Head of the
Global Markets Group, effective August 1, 2019.
July 29, 2019 Amended report of the Board approval of the appointment of Mr. Noel C. Malabag, Senior Vice
President, as Head of the Global Markets Group, effective August 1, 2019.
July 29, 2019 Change in the shareholdings of Mr. Martin G. Tengco, Jr., FVP and Chief Audit Executive of the
Bank, through acquisition of PNB common shares, with details as follows:
Date of Acquisition No. of PNB shares
acquired
Price
July 22, 2019 157 P43.38
July 22, 2019 355 P54.70
As a result of the acquisition, Mr. Tengco now has a total of 1,322 PNB shares under his name.
August 1, 2019 Change in the shareholdings of Mr. Jose Arnulfo A. Veloso, Director/President and Chief
Executive Officer of the Bank, through acquisition of PNB common shares, with details as follows:
Date of Acquisition No. of PNB shares
acquired
Price
July 31, 2019 4,000 P49.60
July 31, 2019 2,000 P49.50
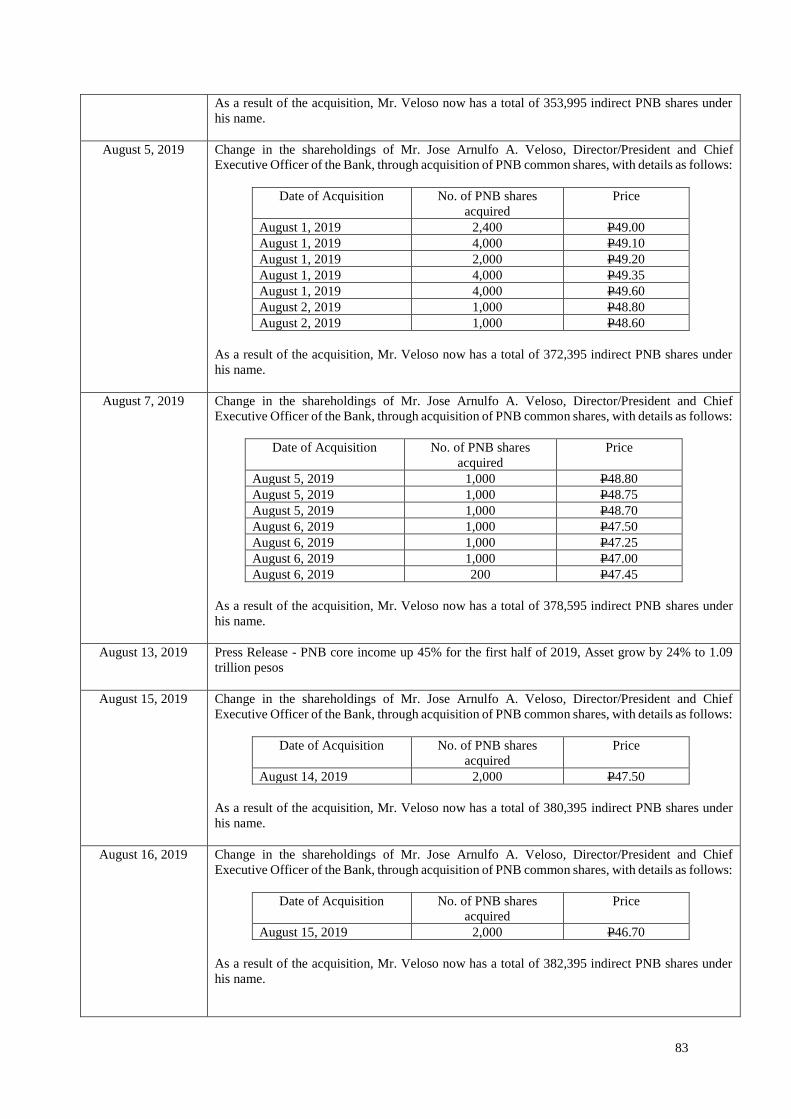
83
As a result of the acquisition, Mr. Veloso now has a total of 353,995 indirect PNB shares under
his name.
August 5, 2019 Change in the shareholdings of Mr. Jose Arnulfo A. Veloso, Director/President and Chief
Executive Officer of the Bank, through acquisition of PNB common shares, with details as follows:
Date of Acquisition No. of PNB shares
acquired
Price
August 1, 2019 2,400 P49.00
August 1, 2019 4,000 P49.10
August 1, 2019 2,000 P49.20
August 1, 2019 4,000 P49.35
August 1, 2019 4,000 P49.60
August 2, 2019 1,000 P48.80
August 2, 2019 1,000 P48.60
As a result of the acquisition, Mr. Veloso now has a total of 372,395 indirect PNB shares under
his name.
August 7, 2019 Change in the shareholdings of Mr. Jose Arnulfo A. Veloso, Director/President and Chief
Executive Officer of the Bank, through acquisition of PNB common shares, with details as follows:
Date of Acquisition No. of PNB shares
acquired
Price
August 5, 2019 1,000 P48.80
August 5, 2019 1,000 P48.75
August 5, 2019 1,000 P48.70
August 6, 2019 1,000 P47.50
August 6, 2019 1,000 P47.25
August 6, 2019 1,000 P47.00
August 6, 2019 200 P47.45
As a result of the acquisition, Mr. Veloso now has a total of 378,595 indirect PNB shares under
his name.
August 13, 2019 Press Release - PNB core income up 45% for the first half of 2019, Asset grow by 24% to 1.09
trillion pesos
August 15, 2019 Change in the shareholdings of Mr. Jose Arnulfo A. Veloso, Director/President and Chief
Executive Officer of the Bank, through acquisition of PNB common shares, with details as follows:
Date of Acquisition No. of PNB shares
acquired
Price
August 14, 2019 2,000 P47.50
As a result of the acquisition, Mr. Veloso now has a total of 380,395 indirect PNB shares under
his name.
August 16, 2019 Change in the shareholdings of Mr. Jose Arnulfo A. Veloso, Director/President and Chief
Executive Officer of the Bank, through acquisition of PNB common shares, with details as follows:
Date of Acquisition No. of PNB shares
acquired
Price
August 15, 2019 2,000 P46.70
As a result of the acquisition, Mr. Veloso now has a total of 382,395 indirect PNB shares under
his name.
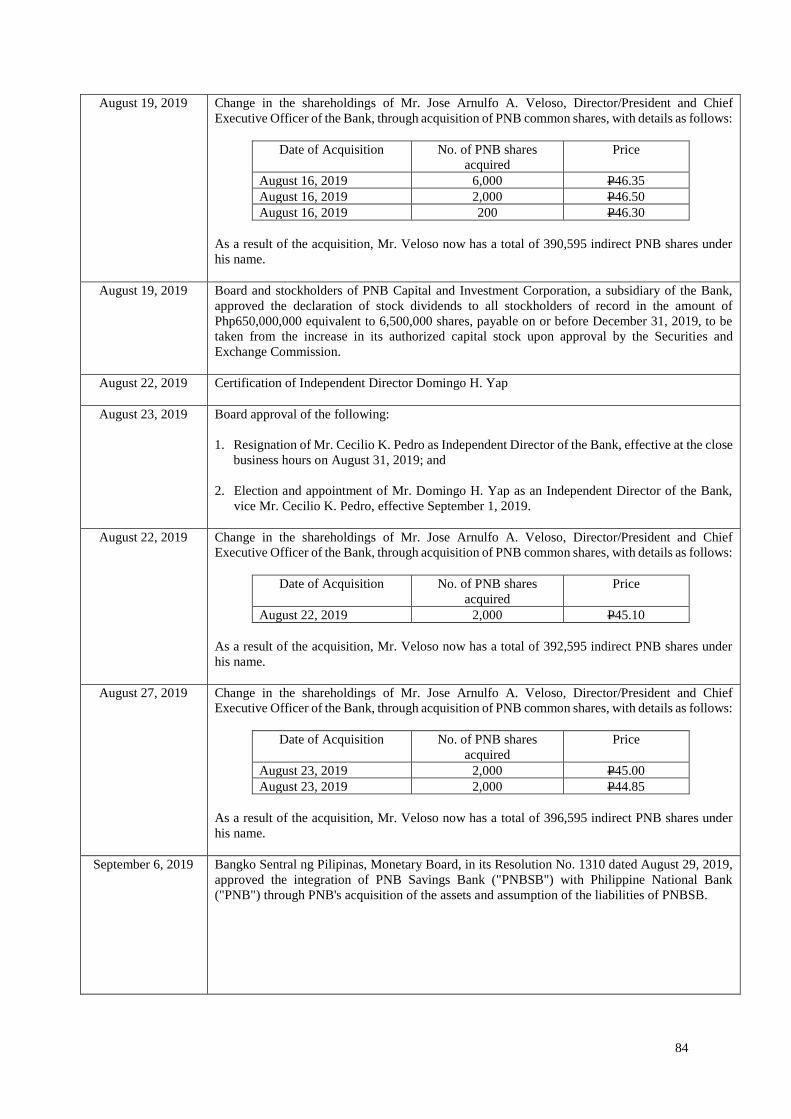
84
August 19, 2019 Change in the shareholdings of Mr. Jose Arnulfo A. Veloso, Director/President and Chief
Executive Officer of the Bank, through acquisition of PNB common shares, with details as follows:
Date of Acquisition No. of PNB shares
acquired
Price
August 16, 2019 6,000 P46.35
August 16, 2019 2,000 P46.50
August 16, 2019 200 P46.30
As a result of the acquisition, Mr. Veloso now has a total of 390,595 indirect PNB shares under
his name.
August 19, 2019 Board and stockholders of PNB Capital and Investment Corporation, a subsidiary of the Bank,
approved the declaration of stock dividends to all stockholders of record in the amount of
Php650,000,000 equivalent to 6,500,000 shares, payable on or before December 31, 2019, to be
taken from the increase in its authorized capital stock upon approval by the Securities and
Exchange Commission.
August 22, 2019 Certification of Independent Director Domingo H. Yap
August 23, 2019 Board approval of the following:
1. Resignation of Mr. Cecilio K. Pedro as Independent Director of the Bank, effective at the close
business hours on August 31, 2019; and
2. Election and appointment of Mr. Domingo H. Yap as an Independent Director of the Bank,
vice Mr. Cecilio K. Pedro, effective September 1, 2019.
August 22, 2019 Change in the shareholdings of Mr. Jose Arnulfo A. Veloso, Director/President and Chief
Executive Officer of the Bank, through acquisition of PNB common shares, with details as follows:
Date of Acquisition No. of PNB shares
acquired
Price
August 22, 2019 2,000 P45.10
As a result of the acquisition, Mr. Veloso now has a total of 392,595 indirect PNB shares under
his name.
August 27, 2019 Change in the shareholdings of Mr. Jose Arnulfo A. Veloso, Director/President and Chief
Executive Officer of the Bank, through acquisition of PNB common shares, with details as follows:
Date of Acquisition No. of PNB shares
acquired
Price
August 23, 2019 2,000 P45.00
August 23, 2019 2,000 P44.85
As a result of the acquisition, Mr. Veloso now has a total of 396,595 indirect PNB shares under
his name.
September 6, 2019 Bangko Sentral ng Pilipinas, Monetary Board, in its Resolution No. 1310 dated August 29, 2019,
approved the integration of PNB Savings Bank ("PNBSB") with Philippine National Bank
("PNB") through PNB's acquisition of the assets and assumption of the liabilities of PNBSB.
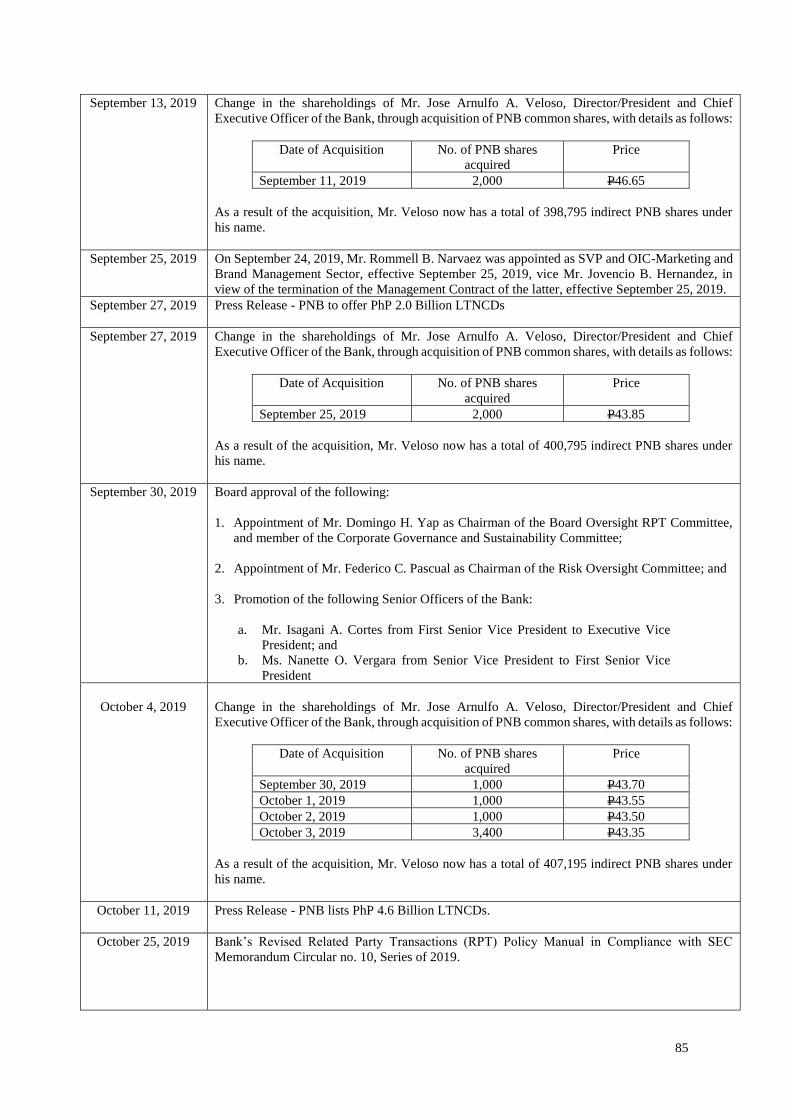
85
September 13, 2019 Change in the shareholdings of Mr. Jose Arnulfo A. Veloso, Director/President and Chief
Executive Officer of the Bank, through acquisition of PNB common shares, with details as follows:
Date of Acquisition No. of PNB shares
acquired
Price
September 11, 2019 2,000 P46.65
As a result of the acquisition, Mr. Veloso now has a total of 398,795 indirect PNB shares under
his name.
September 25, 2019 On September 24, 2019, Mr. Rommell B. Narvaez was appointed as SVP and OIC-Marketing and
Brand Management Sector, effective September 25, 2019, vice Mr. Jovencio B. Hernandez, in
view of the termination of the Management Contract of the latter, effective September 25, 2019.
September 27, 2019 Press Release - PNB to offer PhP 2.0 Billion LTNCDs
September 27, 2019 Change in the shareholdings of Mr. Jose Arnulfo A. Veloso, Director/President and Chief
Executive Officer of the Bank, through acquisition of PNB common shares, with details as follows:
Date of Acquisition No. of PNB shares
acquired
Price
September 25, 2019 2,000 P43.85
As a result of the acquisition, Mr. Veloso now has a total of 400,795 indirect PNB shares under
his name.
September 30, 2019 Board approval of the following:
1. Appointment of Mr. Domingo H. Yap as Chairman of the Board Oversight RPT Committee,
and member of the Corporate Governance and Sustainability Committee;
2. Appointment of Mr. Federico C. Pascual as Chairman of the Risk Oversight Committee; and
3. Promotion of the following Senior Officers of the Bank:
a. Mr. Isagani A. Cortes from First Senior Vice President to Executive Vice
President; and
b. Ms. Nanette O. Vergara from Senior Vice President to First Senior Vice
President
October 4, 2019
Change in the shareholdings of Mr. Jose Arnulfo A. Veloso, Director/President and Chief
Executive Officer of the Bank, through acquisition of PNB common shares, with details as follows:
Date of Acquisition No. of PNB shares
acquired
Price
September 30, 2019 1,000 P43.70
October 1, 2019 1,000 P43.55
October 2, 2019 1,000 P43.50
October 3, 2019 3,400 P43.35
As a result of the acquisition, Mr. Veloso now has a total of 407,195 indirect PNB shares under
his name.
October 11, 2019 Press Release - PNB lists PhP 4.6 Billion LTNCDs.
October 25, 2019 Bank’s Revised Related Party Transactions (RPT) Policy Manual in Compliance with SEC
Memorandum Circular no. 10, Series of 2019.
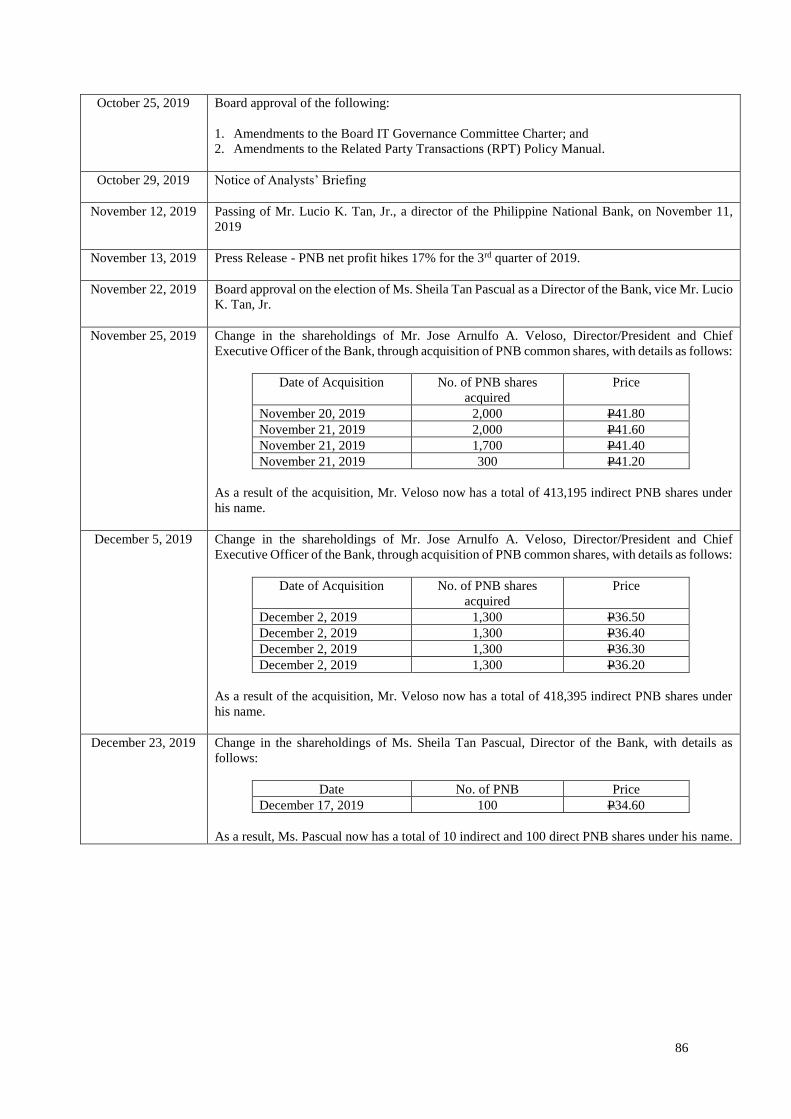
86
October 25, 2019 Board approval of the following:
1. Amendments to the Board IT Governance Committee Charter; and
2. Amendments to the Related Party Transactions (RPT) Policy Manual.
October 29, 2019 Notice of Analysts’ Briefing
November 12, 2019 Passing of Mr. Lucio K. Tan, Jr., a director of the Philippine National Bank, on November 11,
2019
November 13, 2019 Press Release - PNB net profit hikes 17% for the 3rd quarter of 2019.
November 22, 2019 Board approval on the election of Ms. Sheila Tan Pascual as a Director of the Bank, vice Mr. Lucio
K. Tan, Jr.
November 25, 2019 Change in the shareholdings of Mr. Jose Arnulfo A. Veloso, Director/President and Chief
Executive Officer of the Bank, through acquisition of PNB common shares, with details as follows:
Date of Acquisition No. of PNB shares
acquired
Price
November 20, 2019 2,000 P41.80
November 21, 2019 2,000 P41.60
November 21, 2019 1,700 P41.40
November 21, 2019 300 P41.20
As a result of the acquisition, Mr. Veloso now has a total of 413,195 indirect PNB shares under
his name.
December 5, 2019 Change in the shareholdings of Mr. Jose Arnulfo A. Veloso, Director/President and Chief
Executive Officer of the Bank, through acquisition of PNB common shares, with details as follows:
Date of Acquisition No. of PNB shares
acquired
Price
December 2, 2019 1,300 P36.50
December 2, 2019 1,300 P36.40
December 2, 2019 1,300 P36.30
December 2, 2019 1,300 P36.20
As a result of the acquisition, Mr. Veloso now has a total of 418,395 indirect PNB shares under
his name.
December 23, 2019 Change in the shareholdings of Ms. Sheila Tan Pascual, Director of the Bank, with details as
follows:
Date No. of PNB Price
December 17, 2019 100 P34.60
As a result, Ms. Pascual now has a total of 10 indirect and 100 direct PNB shares under his name.
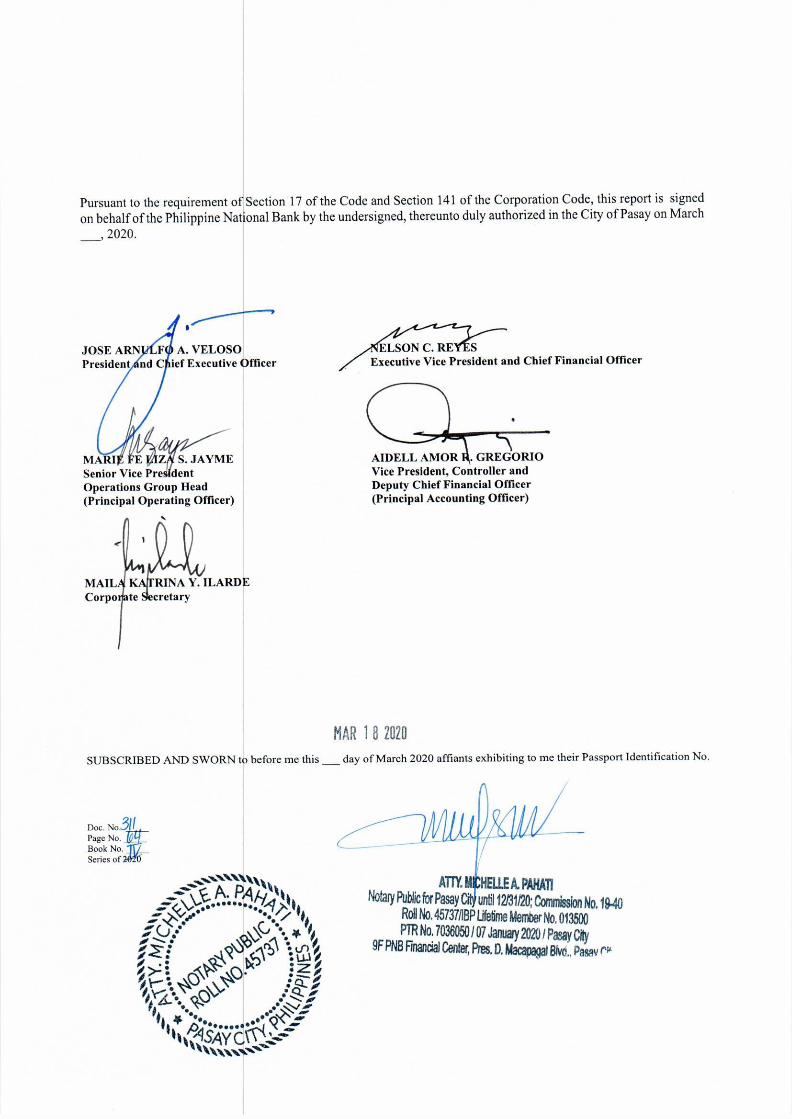
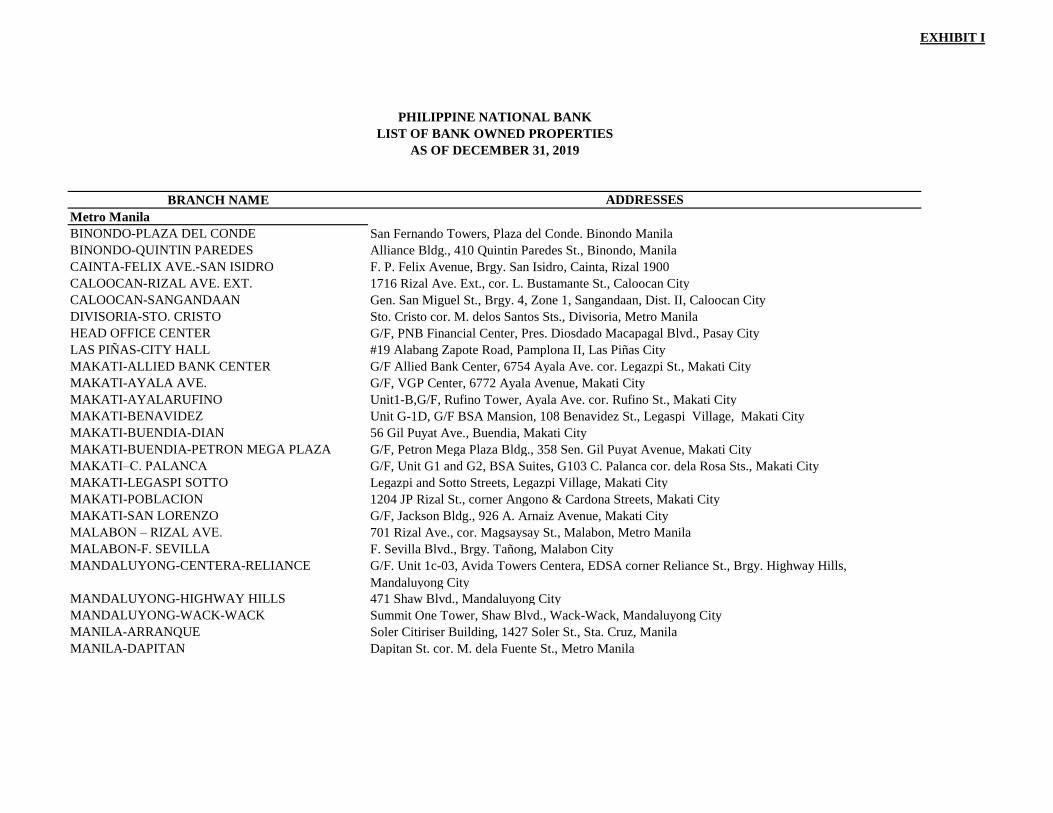
EXHIBIT I
BRANCH NAME ADDRESSES
Metro Manila
BINONDO-PLAZA DEL CONDE San Fernando Towers, Plaza del Conde. Binondo Manila
BINONDO-QUINTIN PAREDES Alliance Bldg., 410 Quintin Paredes St., Binondo, Manila
CAINTA-FELIX AVE.-SAN ISIDRO F. P. Felix Avenue, Brgy. San Isidro, Cainta, Rizal 1900
CALOOCAN-RIZAL AVE. EXT. 1716 Rizal Ave. Ext., cor. L. Bustamante St., Caloocan City
CALOOCAN-SANGANDAAN Gen. San Miguel St., Brgy. 4, Zone 1, Sangandaan, Dist. II, Caloocan City
DIVISORIA-STO. CRISTO Sto. Cristo cor. M. delos Santos Sts., Divisoria, Metro Manila
HEAD OFFICE CENTER G/F, PNB Financial Center, Pres. Diosdado Macapagal Blvd., Pasay City
LAS PIÑAS-CITY HALL #19 Alabang Zapote Road, Pamplona II, Las Piñas City
MAKATI-ALLIED BANK CENTER G/F Allied Bank Center, 6754 Ayala Ave. cor. Legazpi St., Makati City
MAKATI-AYALA AVE. G/F, VGP Center, 6772 Ayala Avenue, Makati City
MAKATI-AYALARUFINO Unit1-B,G/F, Rufino Tower, Ayala Ave. cor. Rufino St., Makati City
MAKATI-BENAVIDEZ Unit G-1D, G/F BSA Mansion, 108 Benavidez St., Legaspi Village, Makati City
MAKATI-BUENDIA-DIAN 56 Gil Puyat Ave., Buendia, Makati City
MAKATI-BUENDIA-PETRON MEGA PLAZA G/F, Petron Mega Plaza Bldg., 358 Sen. Gil Puyat Avenue, Makati City
MAKATI–C. PALANCA G/F, Unit G1 and G2, BSA Suites, G103 C. Palanca cor. dela Rosa Sts., Makati City
MAKATI-LEGASPI SOTTO Legazpi and Sotto Streets, Legazpi Village, Makati City
MAKATI-POBLACION 1204 JP Rizal St., corner Angono & Cardona Streets, Makati City
MAKATI-SAN LORENZO G/F, Jackson Bldg., 926 A. Arnaiz Avenue, Makati City
MALABON – RIZAL AVE. 701 Rizal Ave., cor. Magsaysay St., Malabon, Metro Manila
MALABON-F. SEVILLA F. Sevilla Blvd., Brgy. Tañong, Malabon City
MANDALUYONG-CENTERA-RELIANCE G/F. Unit 1c-03, Avida Towers Centera, EDSA corner Reliance St., Brgy. Highway Hills,
Mandaluyong City
MANDALUYONG-HIGHWAY HILLS 471 Shaw Blvd., Mandaluyong City
MANDALUYONG-WACK-WACK Summit One Tower, Shaw Blvd., Wack-Wack, Mandaluyong City
MANILA-ARRANQUE Soler Citiriser Building, 1427 Soler St., Sta. Cruz, Manila
MANILA-DAPITAN Dapitan St. cor. M. dela Fuente St., Metro Manila
PHILIPPINE NATIONAL BANK
LIST OF BANK OWNED PROPERTIES
AS OF DECEMBER 31, 2019
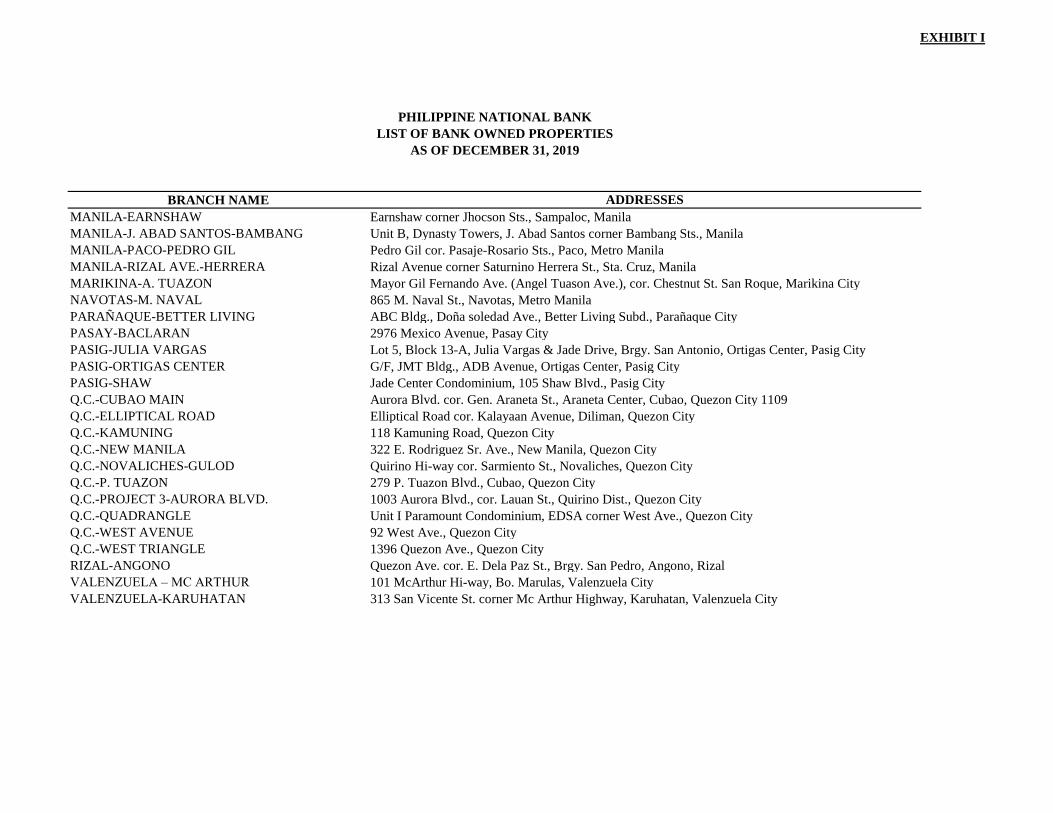
EXHIBIT I
BRANCH NAME ADDRESSES
PHILIPPINE NATIONAL BANK
LIST OF BANK OWNED PROPERTIES
AS OF DECEMBER 31, 2019
MANILA-EARNSHAW Earnshaw corner Jhocson Sts., Sampaloc, Manila
MANILA-J. ABAD SANTOS-BAMBANG Unit B, Dynasty Towers, J. Abad Santos corner Bambang Sts., Manila
MANILA-PACO-PEDRO GIL Pedro Gil cor. Pasaje-Rosario Sts., Paco, Metro Manila
MANILA-RIZAL AVE.-HERRERA Rizal Avenue corner Saturnino Herrera St., Sta. Cruz, Manila
MARIKINA-A. TUAZON Mayor Gil Fernando Ave. (Angel Tuason Ave.), cor. Chestnut St. San Roque, Marikina City
NAVOTAS-M. NAVAL 865 M. Naval St., Navotas, Metro Manila
PARAÑAQUE-BETTER LIVING ABC Bldg., Doña soledad Ave., Better Living Subd., Parañaque City
PASAY-BACLARAN 2976 Mexico Avenue, Pasay City
PASIG-JULIA VARGAS Lot 5, Block 13-A, Julia Vargas & Jade Drive, Brgy. San Antonio, Ortigas Center, Pasig City
PASIG-ORTIGAS CENTER G/F, JMT Bldg., ADB Avenue, Ortigas Center, Pasig City
PASIG-SHAW Jade Center Condominium, 105 Shaw Blvd., Pasig City
Q.C.-CUBAO MAIN Aurora Blvd. cor. Gen. Araneta St., Araneta Center, Cubao, Quezon City 1109
Q.C.-ELLIPTICAL ROAD Elliptical Road cor. Kalayaan Avenue, Diliman, Quezon City
Q.C.-KAMUNING 118 Kamuning Road, Quezon City
Q.C.-NEW MANILA 322 E. Rodriguez Sr. Ave., New Manila, Quezon City
Q.C.-NOVALICHES-GULOD Quirino Hi-way cor. Sarmiento St., Novaliches, Quezon City
Q.C.-P. TUAZON 279 P. Tuazon Blvd., Cubao, Quezon City
Q.C.-PROJECT 3-AURORA BLVD. 1003 Aurora Blvd., cor. Lauan St., Quirino Dist., Quezon City
Q.C.-QUADRANGLE Unit I Paramount Condominium, EDSA corner West Ave., Quezon City
Q.C.-WEST AVENUE 92 West Ave., Quezon City
Q.C.-WEST TRIANGLE 1396 Quezon Ave., Quezon City
RIZAL-ANGONO Quezon Ave. cor. E. Dela Paz St., Brgy. San Pedro, Angono, Rizal
VALENZUELA – MC ARTHUR 101 McArthur Hi-way, Bo. Marulas, Valenzuela City
VALENZUELA-KARUHATAN 313 San Vicente St. corner Mc Arthur Highway, Karuhatan, Valenzuela City
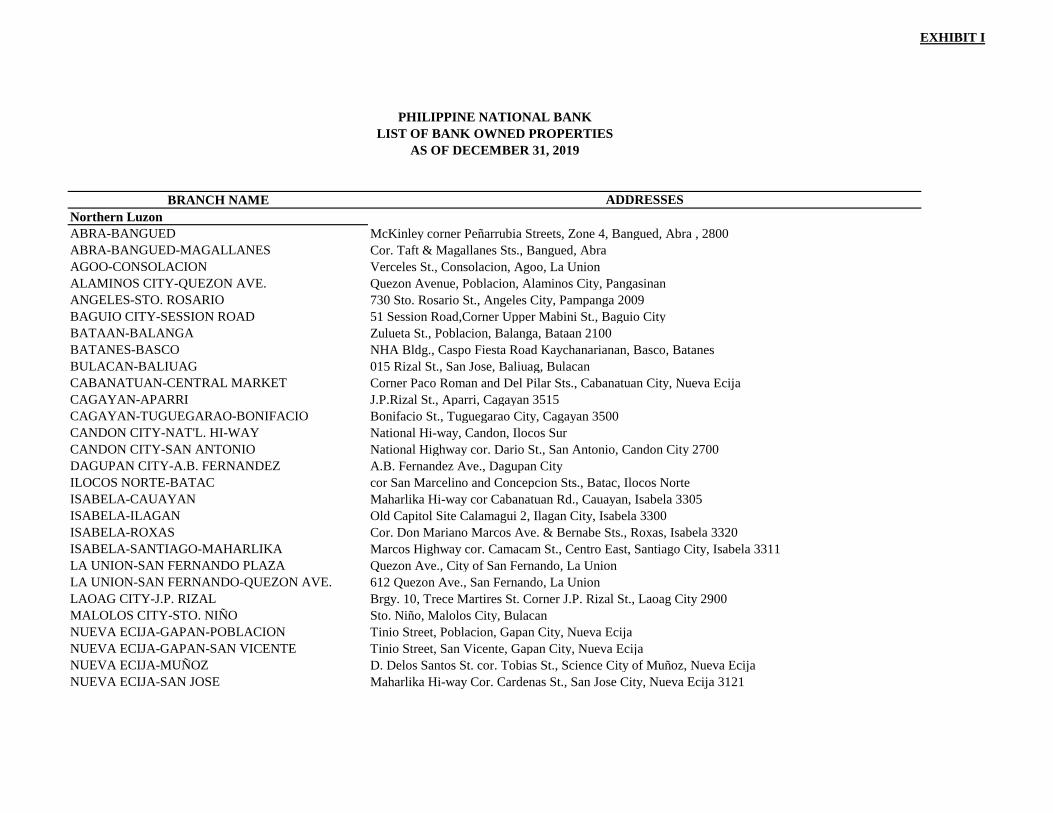
EXHIBIT I
BRANCH NAME ADDRESSES
PHILIPPINE NATIONAL BANK
LIST OF BANK OWNED PROPERTIES
AS OF DECEMBER 31, 2019
Northern Luzon
ABRA-BANGUED McKinley corner Peñarrubia Streets, Zone 4, Bangued, Abra , 2800
ABRA-BANGUED-MAGALLANES Cor. Taft & Magallanes Sts., Bangued, Abra
AGOO-CONSOLACION Verceles St., Consolacion, Agoo, La Union
ALAMINOS CITY-QUEZON AVE. Quezon Avenue, Poblacion, Alaminos City, Pangasinan
ANGELES-STO. ROSARIO 730 Sto. Rosario St., Angeles City, Pampanga 2009
BAGUIO CITY-SESSION ROAD 51 Session Road,Corner Upper Mabini St., Baguio City
BATAAN-BALANGA Zulueta St., Poblacion, Balanga, Bataan 2100
BATANES-BASCO NHA Bldg., Caspo Fiesta Road Kaychanarianan, Basco, Batanes
BULACAN-BALIUAG 015 Rizal St., San Jose, Baliuag, Bulacan
CABANATUAN-CENTRAL MARKET Corner Paco Roman and Del Pilar Sts., Cabanatuan City, Nueva Ecija
CAGAYAN-APARRI J.P.Rizal St., Aparri, Cagayan 3515
CAGAYAN-TUGUEGARAO-BONIFACIO Bonifacio St., Tuguegarao City, Cagayan 3500
CANDON CITY-NAT'L. HI-WAY National Hi-way, Candon, Ilocos Sur
CANDON CITY-SAN ANTONIO National Highway cor. Dario St., San Antonio, Candon City 2700
DAGUPAN CITY-A.B. FERNANDEZ A.B. Fernandez Ave., Dagupan City
ILOCOS NORTE-BATAC cor San Marcelino and Concepcion Sts., Batac, Ilocos Norte
ISABELA-CAUAYAN Maharlika Hi-way cor Cabanatuan Rd., Cauayan, Isabela 3305
ISABELA-ILAGAN Old Capitol Site Calamagui 2, Ilagan City, Isabela 3300
ISABELA-ROXAS Cor. Don Mariano Marcos Ave. & Bernabe Sts., Roxas, Isabela 3320
ISABELA-SANTIAGO-MAHARLIKA Marcos Highway cor. Camacam St., Centro East, Santiago City, Isabela 3311
LA UNION-SAN FERNANDO PLAZA Quezon Ave., City of San Fernando, La Union
LA UNION-SAN FERNANDO-QUEZON AVE. 612 Quezon Ave., San Fernando, La Union
LAOAG CITY-J.P. RIZAL Brgy. 10, Trece Martires St. Corner J.P. Rizal St., Laoag City 2900
MALOLOS CITY-STO. NIÑO Sto. Niño, Malolos City, Bulacan
NUEVA ECIJA-GAPAN-POBLACION Tinio Street, Poblacion, Gapan City, Nueva Ecija
NUEVA ECIJA-GAPAN-SAN VICENTE Tinio Street, San Vicente, Gapan City, Nueva Ecija
NUEVA ECIJA-MUÑOZ D. Delos Santos St. cor. Tobias St., Science City of Muñoz, Nueva Ecija
NUEVA ECIJA-SAN JOSE Maharlika Hi-way Cor. Cardenas St., San Jose City, Nueva Ecija 3121
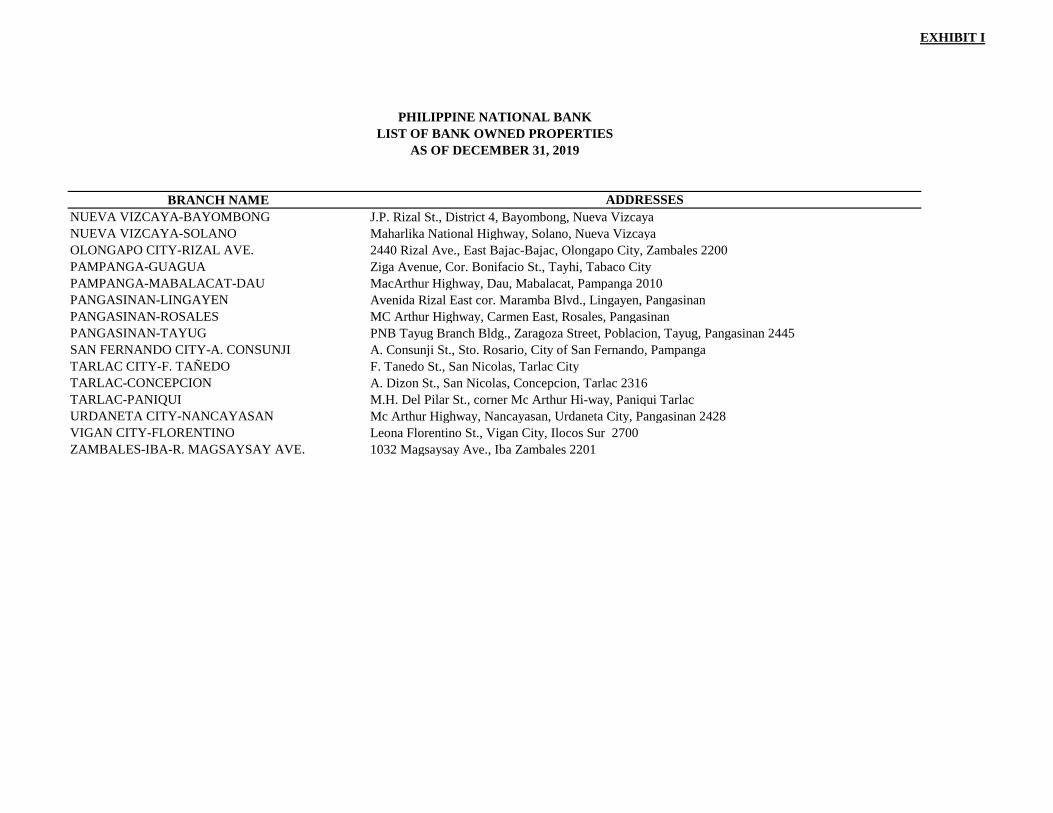
EXHIBIT I
BRANCH NAME ADDRESSES
PHILIPPINE NATIONAL BANK
LIST OF BANK OWNED PROPERTIES
AS OF DECEMBER 31, 2019
NUEVA VIZCAYA-BAYOMBONG J.P. Rizal St., District 4, Bayombong, Nueva Vizcaya
NUEVA VIZCAYA-SOLANO Maharlika National Highway, Solano, Nueva Vizcaya
OLONGAPO CITY-RIZAL AVE. 2440 Rizal Ave., East Bajac-Bajac, Olongapo City, Zambales 2200
PAMPANGA-GUAGUA Ziga Avenue, Cor. Bonifacio St., Tayhi, Tabaco City
PAMPANGA-MABALACAT-DAU MacArthur Highway, Dau, Mabalacat, Pampanga 2010
PANGASINAN-LINGAYEN Avenida Rizal East cor. Maramba Blvd., Lingayen, Pangasinan
PANGASINAN-ROSALES MC Arthur Highway, Carmen East, Rosales, Pangasinan
PANGASINAN-TAYUG PNB Tayug Branch Bldg., Zaragoza Street, Poblacion, Tayug, Pangasinan 2445
SAN FERNANDO CITY-A. CONSUNJI A. Consunji St., Sto. Rosario, City of San Fernando, Pampanga
TARLAC CITY-F. TAÑEDO F. Tanedo St., San Nicolas, Tarlac City
TARLAC-CONCEPCION A. Dizon St., San Nicolas, Concepcion, Tarlac 2316
TARLAC-PANIQUI M.H. Del Pilar St., corner Mc Arthur Hi-way, Paniqui Tarlac
URDANETA CITY-NANCAYASAN Mc Arthur Highway, Nancayasan, Urdaneta City, Pangasinan 2428
VIGAN CITY-FLORENTINO Leona Florentino St., Vigan City, Ilocos Sur 2700
ZAMBALES-IBA-R. MAGSAYSAY AVE. 1032 Magsaysay Ave., Iba Zambales 2201
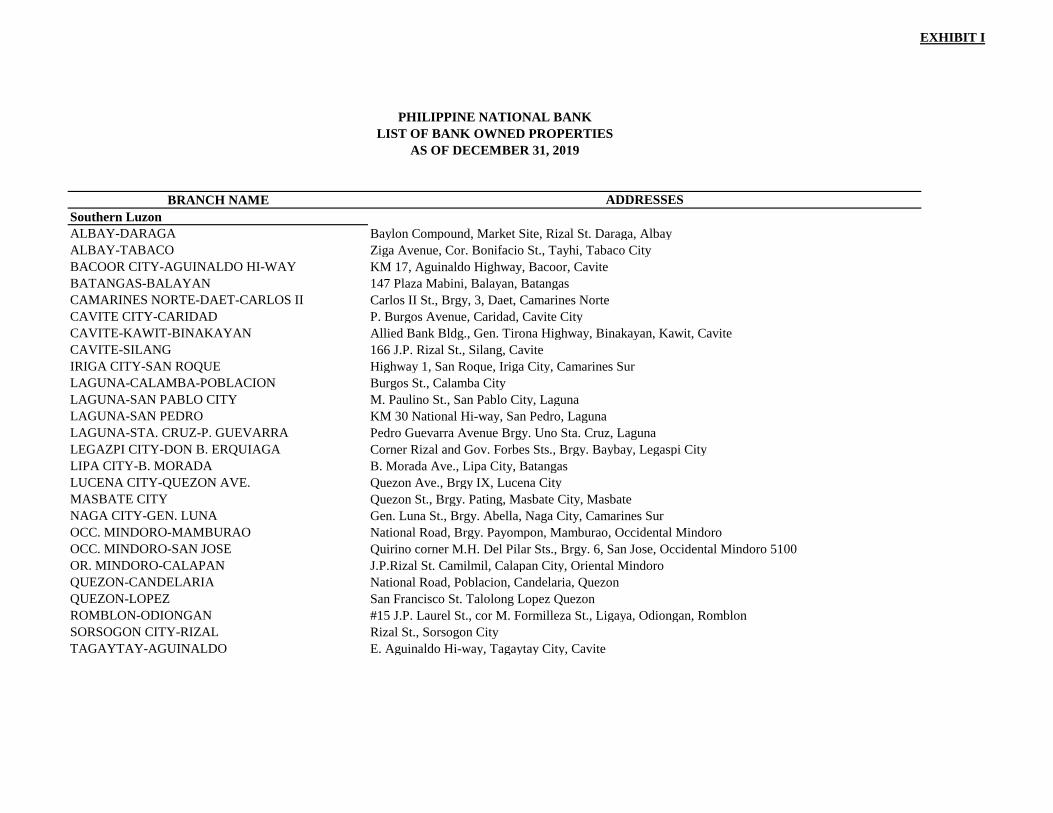
EXHIBIT I
BRANCH NAME ADDRESSES
PHILIPPINE NATIONAL BANK
LIST OF BANK OWNED PROPERTIES
AS OF DECEMBER 31, 2019
Southern Luzon
ALBAY-DARAGA Baylon Compound, Market Site, Rizal St. Daraga, Albay
ALBAY-TABACO Ziga Avenue, Cor. Bonifacio St., Tayhi, Tabaco City
BACOOR CITY-AGUINALDO HI-WAY KM 17, Aguinaldo Highway, Bacoor, Cavite
BATANGAS-BALAYAN 147 Plaza Mabini, Balayan, Batangas
CAMARINES NORTE-DAET-CARLOS II Carlos II St., Brgy, 3, Daet, Camarines Norte
CAVITE CITY-CARIDAD P. Burgos Avenue, Caridad, Cavite City
CAVITE-KAWIT-BINAKAYAN Allied Bank Bldg., Gen. Tirona Highway, Binakayan, Kawit, Cavite
CAVITE-SILANG 166 J.P. Rizal St., Silang, Cavite
IRIGA CITY-SAN ROQUE Highway 1, San Roque, Iriga City, Camarines Sur
LAGUNA-CALAMBA-POBLACION Burgos St., Calamba City
LAGUNA-SAN PABLO CITY M. Paulino St., San Pablo City, Laguna
LAGUNA-SAN PEDRO KM 30 National Hi-way, San Pedro, Laguna
LAGUNA-STA. CRUZ-P. GUEVARRA Pedro Guevarra Avenue Brgy. Uno Sta. Cruz, Laguna
LEGAZPI CITY-DON B. ERQUIAGA Corner Rizal and Gov. Forbes Sts., Brgy. Baybay, Legaspi City
LIPA CITY-B. MORADA B. Morada Ave., Lipa City, Batangas
LUCENA CITY-QUEZON AVE. Quezon Ave., Brgy IX, Lucena City
MASBATE CITY Quezon St., Brgy. Pating, Masbate City, Masbate
NAGA CITY-GEN. LUNA Gen. Luna St., Brgy. Abella, Naga City, Camarines Sur
OCC. MINDORO-MAMBURAO National Road, Brgy. Payompon, Mamburao, Occidental Mindoro
OCC. MINDORO-SAN JOSE Quirino corner M.H. Del Pilar Sts., Brgy. 6, San Jose, Occidental Mindoro 5100
OR. MINDORO-CALAPAN J.P.Rizal St. Camilmil, Calapan City, Oriental Mindoro
QUEZON-CANDELARIA National Road, Poblacion, Candelaria, Quezon
QUEZON-LOPEZ San Francisco St. Talolong Lopez Quezon
ROMBLON-ODIONGAN #15 J.P. Laurel St., cor M. Formilleza St., Ligaya, Odiongan, Romblon
SORSOGON CITY-RIZAL Rizal St., Sorsogon City
TAGAYTAY-AGUINALDO E. Aguinaldo Hi-way, Tagaytay City, Cavite
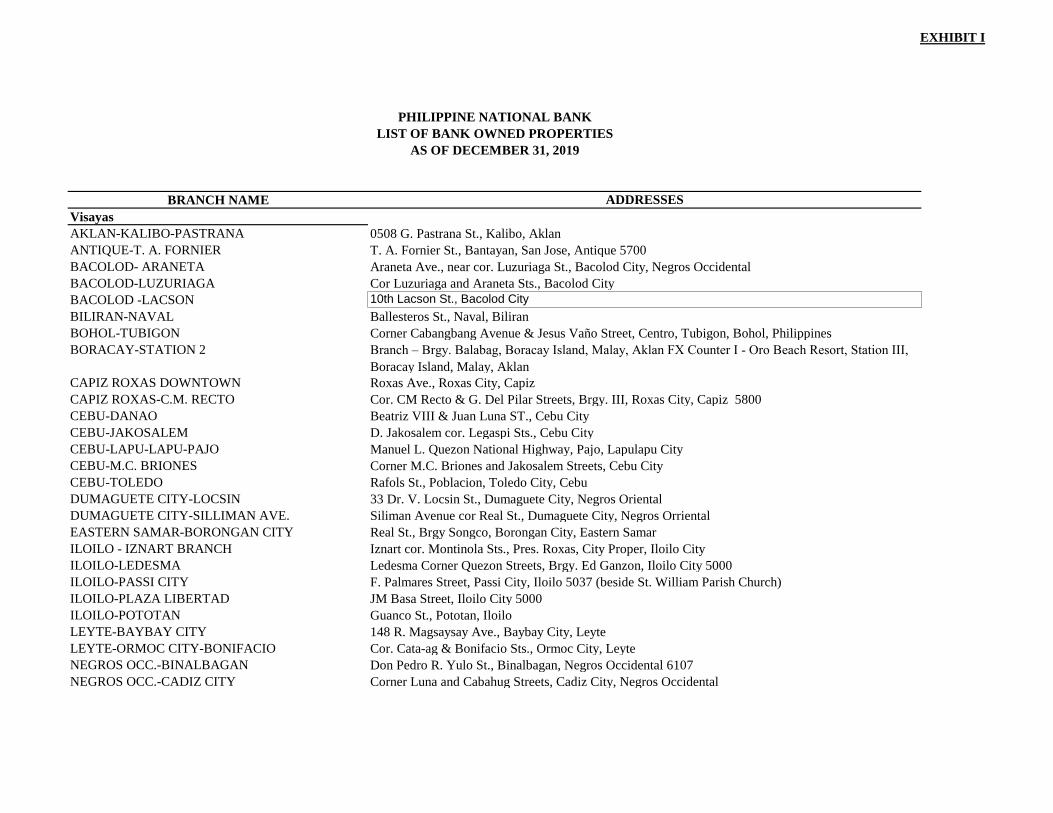
EXHIBIT I
BRANCH NAME ADDRESSES
PHILIPPINE NATIONAL BANK
LIST OF BANK OWNED PROPERTIES
AS OF DECEMBER 31, 2019
Visayas
AKLAN-KALIBO-PASTRANA 0508 G. Pastrana St., Kalibo, Aklan
ANTIQUE-T. A. FORNIER T. A. Fornier St., Bantayan, San Jose, Antique 5700
BACOLOD- ARANETA Araneta Ave., near cor. Luzuriaga St., Bacolod City, Negros Occidental
BACOLOD-LUZURIAGA Cor Luzuriaga and Araneta Sts., Bacolod City
BACOLOD -LACSON 10th Lacson St., Bacolod City
BILIRAN-NAVAL Ballesteros St., Naval, Biliran
BOHOL-TUBIGON Corner Cabangbang Avenue & Jesus Vaño Street, Centro, Tubigon, Bohol, Philippines
BORACAY-STATION 2 Branch – Brgy. Balabag, Boracay Island, Malay, Aklan FX Counter I - Oro Beach Resort, Station III,
Boracay Island, Malay, Aklan
CAPIZ ROXAS DOWNTOWN Roxas Ave., Roxas City, Capiz
CAPIZ ROXAS-C.M. RECTO Cor. CM Recto & G. Del Pilar Streets, Brgy. III, Roxas City, Capiz 5800
CEBU-DANAO Beatriz VIII & Juan Luna ST., Cebu City
CEBU-JAKOSALEM D. Jakosalem cor. Legaspi Sts., Cebu City
CEBU-LAPU-LAPU-PAJO Manuel L. Quezon National Highway, Pajo, Lapulapu City
CEBU-M.C. BRIONES Corner M.C. Briones and Jakosalem Streets, Cebu City
CEBU-TOLEDO Rafols St., Poblacion, Toledo City, Cebu
DUMAGUETE CITY-LOCSIN 33 Dr. V. Locsin St., Dumaguete City, Negros Oriental
DUMAGUETE CITY-SILLIMAN AVE. Siliman Avenue cor Real St., Dumaguete City, Negros Orriental
EASTERN SAMAR-BORONGAN CITY Real St., Brgy Songco, Borongan City, Eastern Samar
ILOILO - IZNART BRANCH Iznart cor. Montinola Sts., Pres. Roxas, City Proper, Iloilo City
ILOILO-LEDESMA Ledesma Corner Quezon Streets, Brgy. Ed Ganzon, Iloilo City 5000
ILOILO-PASSI CITY F. Palmares Street, Passi City, Iloilo 5037 (beside St. William Parish Church)
ILOILO-PLAZA LIBERTAD JM Basa Street, Iloilo City 5000
ILOILO-POTOTAN Guanco St., Pototan, Iloilo
LEYTE-BAYBAY CITY 148 R. Magsaysay Ave., Baybay City, Leyte
LEYTE-ORMOC CITY-BONIFACIO Cor. Cata-ag & Bonifacio Sts., Ormoc City, Leyte
NEGROS OCC.-BINALBAGAN Don Pedro R. Yulo St., Binalbagan, Negros Occidental 6107
NEGROS OCC.-CADIZ CITY Corner Luna and Cabahug Streets, Cadiz City, Negros Occidental
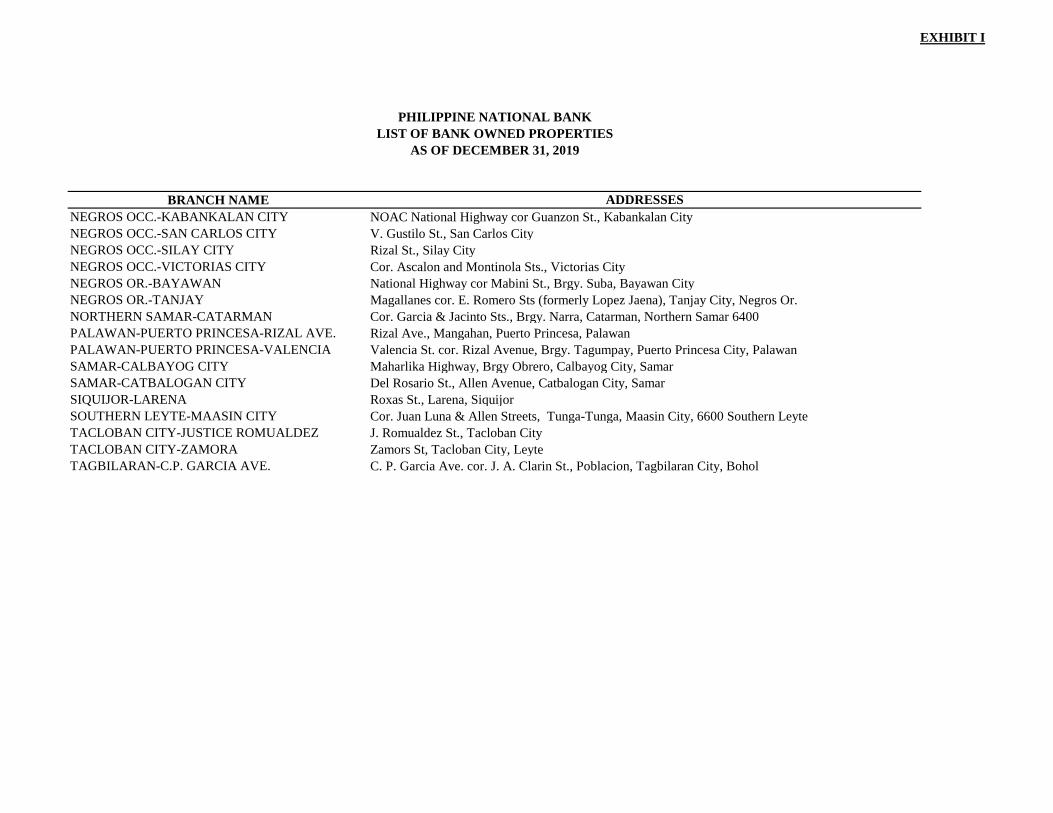
EXHIBIT I
BRANCH NAME ADDRESSES
PHILIPPINE NATIONAL BANK
LIST OF BANK OWNED PROPERTIES
AS OF DECEMBER 31, 2019
NEGROS OCC.-KABANKALAN CITY NOAC National Highway cor Guanzon St., Kabankalan City
NEGROS OCC.-SAN CARLOS CITY V. Gustilo St., San Carlos City
NEGROS OCC.-SILAY CITY Rizal St., Silay City
NEGROS OCC.-VICTORIAS CITY Cor. Ascalon and Montinola Sts., Victorias City
NEGROS OR.-BAYAWAN National Highway cor Mabini St., Brgy. Suba, Bayawan City
NEGROS OR.-TANJAY Magallanes cor. E. Romero Sts (formerly Lopez Jaena), Tanjay City, Negros Or.
NORTHERN SAMAR-CATARMAN Cor. Garcia & Jacinto Sts., Brgy. Narra, Catarman, Northern Samar 6400
PALAWAN-PUERTO PRINCESA-RIZAL AVE. Rizal Ave., Mangahan, Puerto Princesa, Palawan
PALAWAN-PUERTO PRINCESA-VALENCIA Valencia St. cor. Rizal Avenue, Brgy. Tagumpay, Puerto Princesa City, Palawan
SAMAR-CALBAYOG CITY Maharlika Highway, Brgy Obrero, Calbayog City, Samar
SAMAR-CATBALOGAN CITY Del Rosario St., Allen Avenue, Catbalogan City, Samar
SIQUIJOR-LARENA Roxas St., Larena, Siquijor
SOUTHERN LEYTE-MAASIN CITY Cor. Juan Luna & Allen Streets, Tunga-Tunga, Maasin City, 6600 Southern Leyte
TACLOBAN CITY-JUSTICE ROMUALDEZ J. Romualdez St., Tacloban City
TACLOBAN CITY-ZAMORA Zamors St, Tacloban City, Leyte
TAGBILARAN-C.P. GARCIA AVE. C. P. Garcia Ave. cor. J. A. Clarin St., Poblacion, Tagbilaran City, Bohol
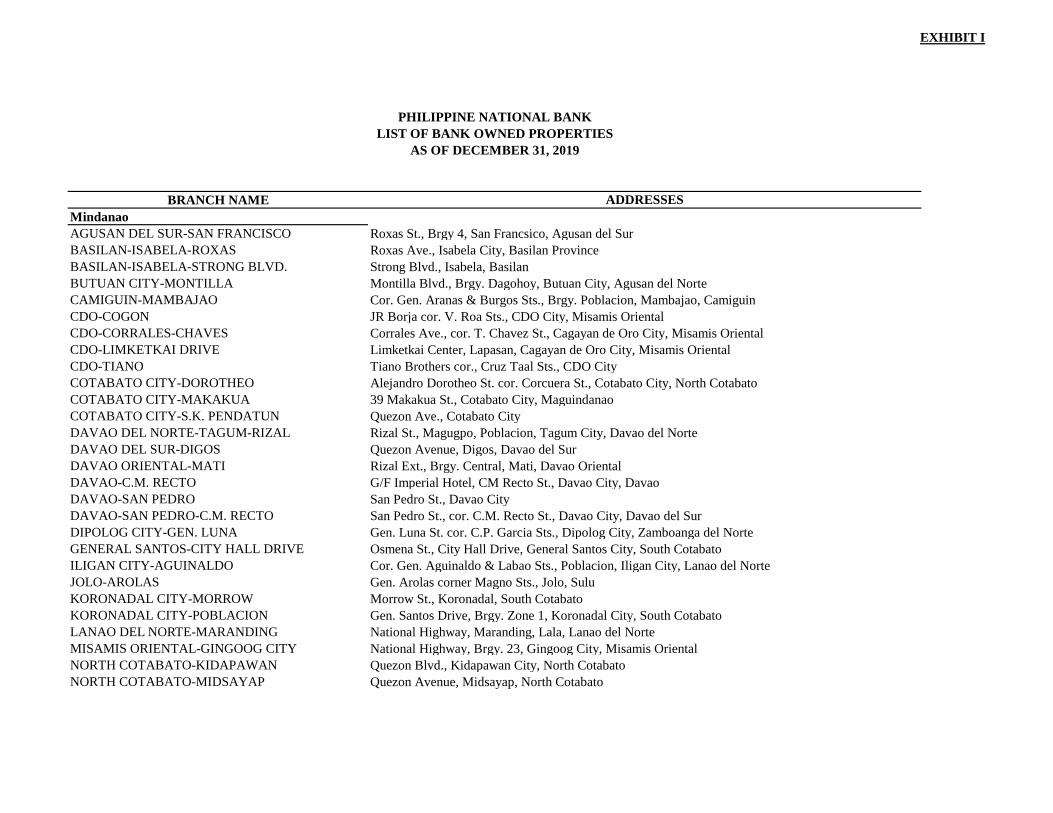
EXHIBIT I
BRANCH NAME ADDRESSES
PHILIPPINE NATIONAL BANK
LIST OF BANK OWNED PROPERTIES
AS OF DECEMBER 31, 2019
Mindanao
AGUSAN DEL SUR-SAN FRANCISCO Roxas St., Brgy 4, San Francsico, Agusan del Sur
BASILAN-ISABELA-ROXAS Roxas Ave., Isabela City, Basilan Province
BASILAN-ISABELA-STRONG BLVD. Strong Blvd., Isabela, Basilan
BUTUAN CITY-MONTILLA Montilla Blvd., Brgy. Dagohoy, Butuan City, Agusan del Norte
CAMIGUIN-MAMBAJAO Cor. Gen. Aranas & Burgos Sts., Brgy. Poblacion, Mambajao, Camiguin
CDO-COGON JR Borja cor. V. Roa Sts., CDO City, Misamis Oriental
CDO-CORRALES-CHAVES Corrales Ave., cor. T. Chavez St., Cagayan de Oro City, Misamis Oriental
CDO-LIMKETKAI DRIVE Limketkai Center, Lapasan, Cagayan de Oro City, Misamis Oriental
CDO-TIANO Tiano Brothers cor., Cruz Taal Sts., CDO City
COTABATO CITY-DOROTHEO Alejandro Dorotheo St. cor. Corcuera St., Cotabato City, North Cotabato
COTABATO CITY-MAKAKUA 39 Makakua St., Cotabato City, Maguindanao
COTABATO CITY-S.K. PENDATUN Quezon Ave., Cotabato City
DAVAO DEL NORTE-TAGUM-RIZAL Rizal St., Magugpo, Poblacion, Tagum City, Davao del Norte
DAVAO DEL SUR-DIGOS Quezon Avenue, Digos, Davao del Sur
DAVAO ORIENTAL-MATI Rizal Ext., Brgy. Central, Mati, Davao Oriental
DAVAO-C.M. RECTO G/F Imperial Hotel, CM Recto St., Davao City, Davao
DAVAO-SAN PEDRO San Pedro St., Davao City
DAVAO-SAN PEDRO-C.M. RECTO San Pedro St., cor. C.M. Recto St., Davao City, Davao del Sur
DIPOLOG CITY-GEN. LUNA Gen. Luna St. cor. C.P. Garcia Sts., Dipolog City, Zamboanga del Norte
GENERAL SANTOS-CITY HALL DRIVE Osmena St., City Hall Drive, General Santos City, South Cotabato
ILIGAN CITY-AGUINALDO Cor. Gen. Aguinaldo & Labao Sts., Poblacion, Iligan City, Lanao del Norte
JOLO-AROLAS Gen. Arolas corner Magno Sts., Jolo, Sulu
KORONADAL CITY-MORROW Morrow St., Koronadal, South Cotabato
KORONADAL CITY-POBLACION Gen. Santos Drive, Brgy. Zone 1, Koronadal City, South Cotabato
LANAO DEL NORTE-MARANDING National Highway, Maranding, Lala, Lanao del Norte
MISAMIS ORIENTAL-GINGOOG CITY National Highway, Brgy. 23, Gingoog City, Misamis Oriental
NORTH COTABATO-KIDAPAWAN Quezon Blvd., Kidapawan City, North Cotabato
NORTH COTABATO-MIDSAYAP Quezon Avenue, Midsayap, North Cotabato
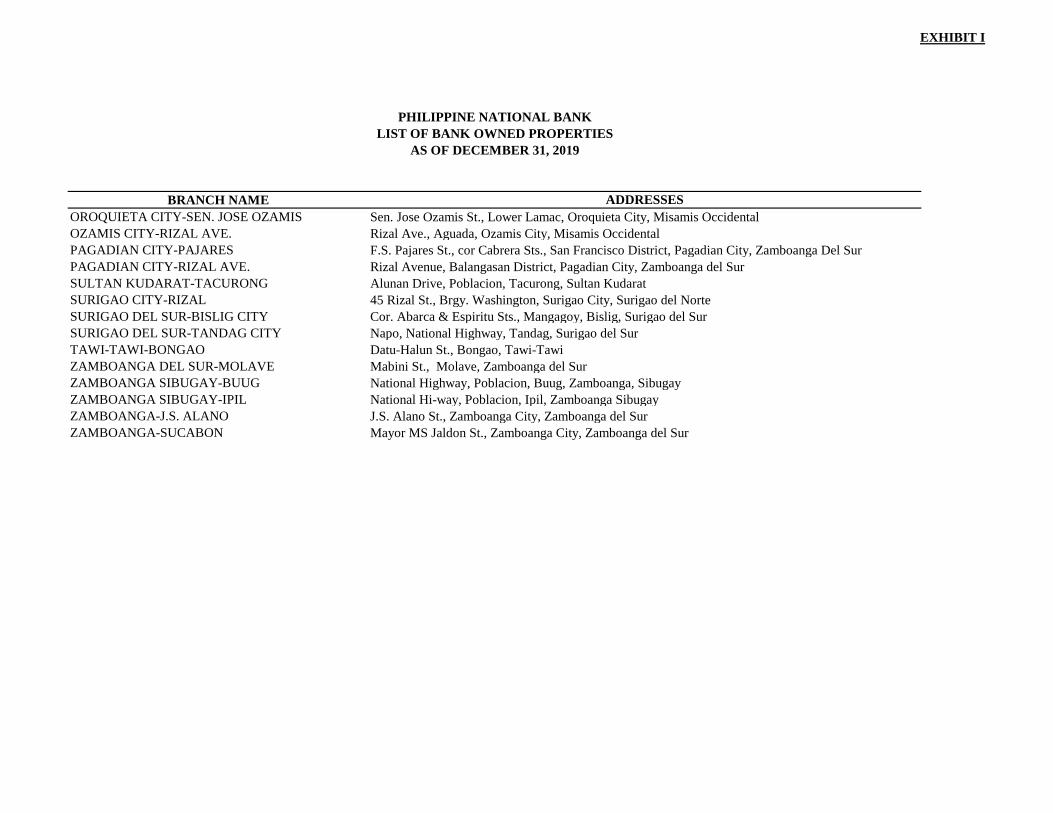
EXHIBIT I
BRANCH NAME ADDRESSES
PHILIPPINE NATIONAL BANK
LIST OF BANK OWNED PROPERTIES
AS OF DECEMBER 31, 2019
OROQUIETA CITY-SEN. JOSE OZAMIS Sen. Jose Ozamis St., Lower Lamac, Oroquieta City, Misamis Occidental
OZAMIS CITY-RIZAL AVE. Rizal Ave., Aguada, Ozamis City, Misamis Occidental
PAGADIAN CITY-PAJARES F.S. Pajares St., cor Cabrera Sts., San Francisco District, Pagadian City, Zamboanga Del Sur
PAGADIAN CITY-RIZAL AVE. Rizal Avenue, Balangasan District, Pagadian City, Zamboanga del Sur
SULTAN KUDARAT-TACURONG Alunan Drive, Poblacion, Tacurong, Sultan Kudarat
SURIGAO CITY-RIZAL 45 Rizal St., Brgy. Washington, Surigao City, Surigao del Norte
SURIGAO DEL SUR-BISLIG CITY Cor. Abarca & Espiritu Sts., Mangagoy, Bislig, Surigao del Sur
SURIGAO DEL SUR-TANDAG CITY Napo, National Highway, Tandag, Surigao del Sur
TAWI-TAWI-BONGAO Datu-Halun St., Bongao, Tawi-Tawi
ZAMBOANGA DEL SUR-MOLAVE Mabini St., Molave, Zamboanga del Sur
ZAMBOANGA SIBUGAY-BUUG National Highway, Poblacion, Buug, Zamboanga, Sibugay
ZAMBOANGA SIBUGAY-IPIL National Hi-way, Poblacion, Ipil, Zamboanga Sibugay
ZAMBOANGA-J.S. ALANO J.S. Alano St., Zamboanga City, Zamboanga del Sur
ZAMBOANGA-SUCABON Mayor MS Jaldon St., Zamboanga City, Zamboanga del Sur
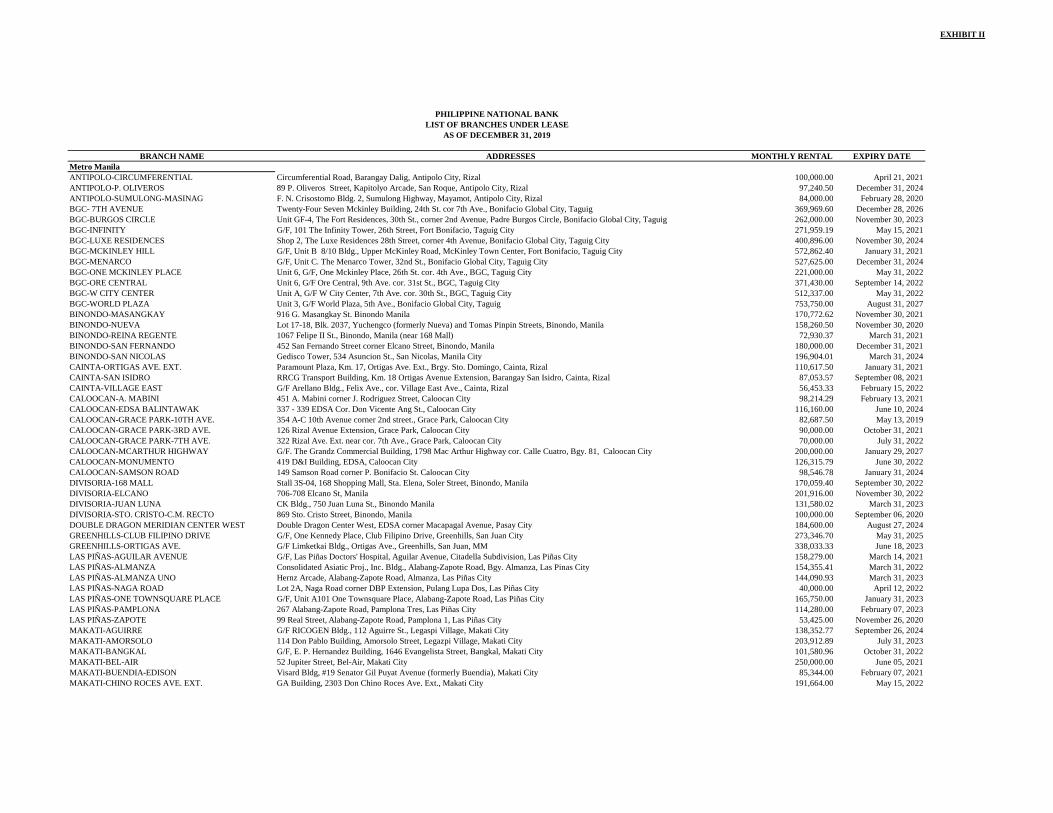
EXHIBIT II
BRANCH NAME ADDRESSES MONTHLY RENTAL EXPIRY DATE
Metro Manila
ANTIPOLO-CIRCUMFERENTIAL Circumferential Road, Barangay Dalig, Antipolo City, Rizal 100,000.00 April 21, 2021
ANTIPOLO-P. OLIVEROS 89 P. Oliveros Street, Kapitolyo Arcade, San Roque, Antipolo City, Rizal 97,240.50 December 31, 2024
ANTIPOLO-SUMULONG-MASINAG F. N. Crisostomo Bldg. 2, Sumulong Highway, Mayamot, Antipolo City, Rizal 84,000.00 February 28, 2020
BGC- 7TH AVENUE Twenty-Four Seven Mckinley Building, 24th St. cor 7th Ave., Bonifacio Global City, Taguig 369,969.60 December 28, 2026
BGC-BURGOS CIRCLE Unit GF-4, The Fort Residences, 30th St., corner 2nd Avenue, Padre Burgos Circle, Bonifacio Global City, Taguig 262,000.00 November 30, 2023
BGC-INFINITY G/F, 101 The Infinity Tower, 26th Street, Fort Bonifacio, Taguig City 271,959.19 May 15, 2021
BGC-LUXE RESIDENCES Shop 2, The Luxe Residences 28th Street, corner 4th Avenue, Bonifacio Global City, Taguig City 400,896.00 November 30, 2024
BGC-MCKINLEY HILL G/F, Unit B 8/10 Bldg., Upper McKinley Road, McKinley Town Center, Fort Bonifacio, Taguig City 572,862.40 January 31, 2021
BGC-MENARCO G/F, Unit C. The Menarco Tower, 32nd St., Bonifacio Global City, Taguig City 527,625.00 December 31, 2024
BGC-ONE MCKINLEY PLACE Unit 6, G/F, One Mckinley Place, 26th St. cor. 4th Ave., BGC, Taguig City 221,000.00 May 31, 2022
BGC-ORE CENTRAL Unit 6, G/F Ore Central, 9th Ave. cor. 31st St., BGC, Taguig City 371,430.00 September 14, 2022
BGC-W CITY CENTER Unit A, G/F W City Center, 7th Ave. cor. 30th St., BGC, Taguig City 512,337.00 May 31, 2022
BGC-WORLD PLAZA Unit 3, G/F World Plaza, 5th Ave., Bonifacio Global City, Taguig 753,750.00 August 31, 2027
BINONDO-MASANGKAY 916 G. Masangkay St. Binondo Manila 170,772.62 November 30, 2021
BINONDO-NUEVA Lot 17-18, Blk. 2037, Yuchengco (formerly Nueva) and Tomas Pinpin Streets, Binondo, Manila 158,260.50 November 30, 2020
BINONDO-REINA REGENTE 1067 Felipe II St., Binondo, Manila (near 168 Mall) 72,930.37 March 31, 2021
BINONDO-SAN FERNANDO 452 San Fernando Street corner Elcano Street, Binondo, Manila 180,000.00 December 31, 2021
BINONDO-SAN NICOLAS Gedisco Tower, 534 Asuncion St., San Nicolas, Manila City 196,904.01 March 31, 2024
CAINTA-ORTIGAS AVE. EXT. Paramount Plaza, Km. 17, Ortigas Ave. Ext., Brgy. Sto. Domingo, Cainta, Rizal 110,617.50 January 31, 2021
CAINTA-SAN ISIDRO RRCG Transport Building, Km. 18 Ortigas Avenue Extension, Barangay San Isidro, Cainta, Rizal 87,053.57 September 08, 2021
CAINTA-VILLAGE EAST G/F Arellano Bldg., Felix Ave., cor. Village East Ave., Cainta, Rizal 56,453.33 February 15, 2022
CALOOCAN-A. MABINI 451 A. Mabini corner J. Rodriguez Street, Caloocan City 98,214.29 February 13, 2021
CALOOCAN-EDSA BALINTAWAK 337 - 339 EDSA Cor. Don Vicente Ang St., Caloocan City 116,160.00 June 10, 2024
CALOOCAN-GRACE PARK-10TH AVE. 354 A-C 10th Avenue corner 2nd street., Grace Park, Caloocan City 82,687.50 May 13, 2019
CALOOCAN-GRACE PARK-3RD AVE. 126 Rizal Avenue Extension, Grace Park, Caloocan City 90,000.00 October 31, 2021
CALOOCAN-GRACE PARK-7TH AVE. 322 Rizal Ave. Ext. near cor. 7th Ave., Grace Park, Caloocan City 70,000.00 July 31, 2022
CALOOCAN-MCARTHUR HIGHWAY G/F. The Grandz Commercial Building, 1798 Mac Arthur Highway cor. Calle Cuatro, Bgy. 81, Caloocan City 200,000.00 January 29, 2027
CALOOCAN-MONUMENTO 419 D&I Building, EDSA, Caloocan City 126,315.79 June 30, 2022
CALOOCAN-SAMSON ROAD 149 Samson Road corner P. Bonifacio St. Caloocan City 98,546.78 January 31, 2024
DIVISORIA-168 MALL Stall 3S-04, 168 Shopping Mall, Sta. Elena, Soler Street, Binondo, Manila 170,059.40 September 30, 2022
DIVISORIA-ELCANO 706-708 Elcano St, Manila 201,916.00 November 30, 2022
DIVISORIA-JUAN LUNA CK Bldg., 750 Juan Luna St., Binondo Manila 131,580.02 March 31, 2023
DIVISORIA-STO. CRISTO-C.M. RECTO 869 Sto. Cristo Street, Binondo, Manila 100,000.00 September 06, 2020
DOUBLE DRAGON MERIDIAN CENTER WEST Double Dragon Center West, EDSA corner Macapagal Avenue, Pasay City 184,600.00 August 27, 2024
GREENHILLS-CLUB FILIPINO DRIVE G/F, One Kennedy Place, Club Filipino Drive, Greenhills, San Juan City 273,346.70 May 31, 2025
GREENHILLS-ORTIGAS AVE. G/F Limketkai Bldg., Ortigas Ave., Greenhills, San Juan, MM 338,033.33 June 18, 2023
LAS PIÑAS-AGUILAR AVENUE G/F, Las Piñas Doctors' Hospital, Aguilar Avenue, Citadella Subdivision, Las Piñas City 158,279.00 March 14, 2021
LAS PIÑAS-ALMANZA Consolidated Asiatic Proj., Inc. Bldg., Alabang-Zapote Road, Bgy. Almanza, Las Pinas City 154,355.41 March 31, 2022
LAS PIÑAS-ALMANZA UNO Hernz Arcade, Alabang-Zapote Road, Almanza, Las Piñas City 144,090.93 March 31, 2023
LAS PIÑAS-NAGA ROAD Lot 2A, Naga Road corner DBP Extension, Pulang Lupa Dos, Las Piñas City 40,000.00 April 12, 2022
LAS PIÑAS-ONE TOWNSQUARE PLACE G/F, Unit A101 One Townsquare Place, Alabang-Zapote Road, Las Piñas City 165,750.00 January 31, 2023
LAS PIÑAS-PAMPLONA 267 Alabang-Zapote Road, Pamplona Tres, Las Piñas City 114,280.00 February 07, 2023
LAS PIÑAS-ZAPOTE 99 Real Street, Alabang-Zapote Road, Pamplona 1, Las Piñas City 53,425.00 November 26, 2020
MAKATI-AGUIRRE G/F RICOGEN Bldg., 112 Aguirre St., Legaspi Village, Makati City 138,352.77 September 26, 2024
MAKATI-AMORSOLO 114 Don Pablo Building, Amorsolo Street, Legazpi Village, Makati City 203,912.89 July 31, 2023
MAKATI-BANGKAL G/F, E. P. Hernandez Building, 1646 Evangelista Street, Bangkal, Makati City 101,580.96 October 31, 2022
MAKATI-BEL-AIR 52 Jupiter Street, Bel-Air, Makati City 250,000.00 June 05, 2021
MAKATI-BUENDIA-EDISON Visard Bldg, #19 Senator Gil Puyat Avenue (formerly Buendia), Makati City 85,344.00 February 07, 2021
MAKATI-CHINO ROCES AVE. EXT. GA Building, 2303 Don Chino Roces Ave. Ext., Makati City 191,664.00 May 15, 2022
PHILIPPINE NATIONAL BANK
LIST OF BRANCHES UNDER LEASE
AS OF DECEMBER 31, 2019
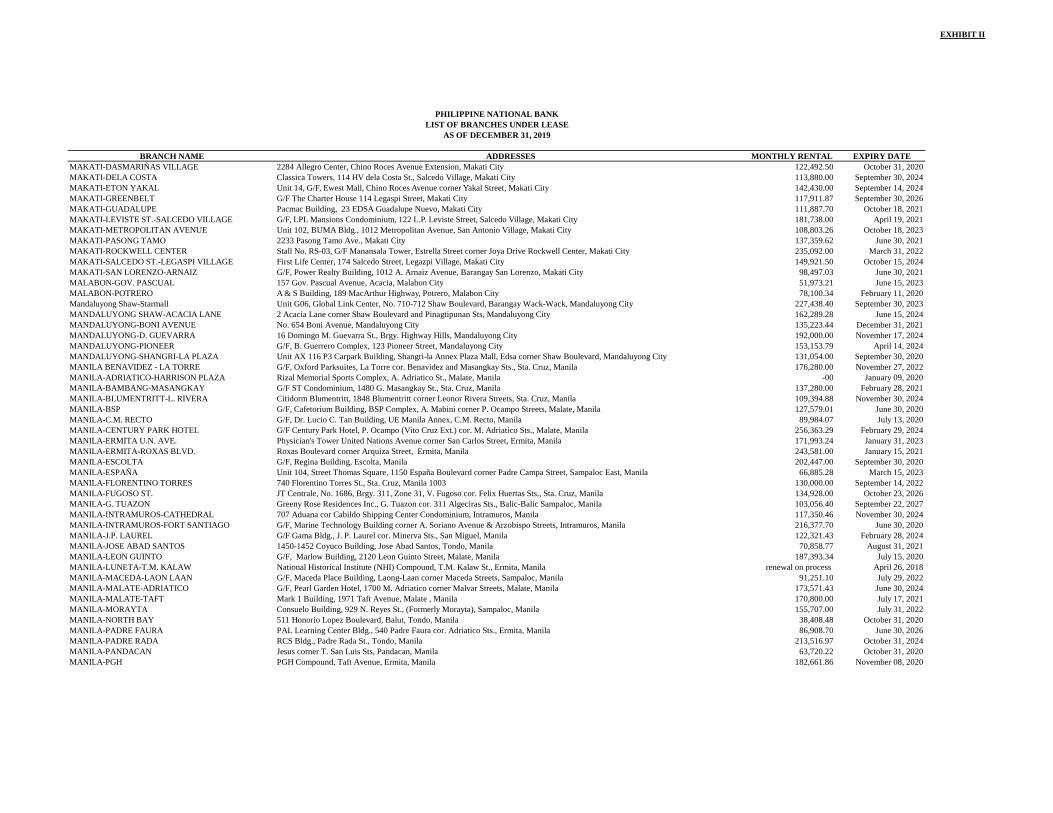
EXHIBIT II
BRANCH NAME ADDRESSES MONTHLY RENTAL EXPIRY DATE
PHILIPPINE NATIONAL BANK
LIST OF BRANCHES UNDER LEASE
AS OF DECEMBER 31, 2019
MAKATI-DASMARIÑAS VILLAGE 2284 Allegro Center, Chino Roces Avenue Extension, Makati City 122,492.50 October 31, 2020
MAKATI-DELA COSTA Classica Towers, 114 HV dela Costa St., Salcedo Village, Makati City 113,880.00 September 30, 2024
MAKATI-ETON YAKAL Unit 14, G/F, Ewest Mall, Chino Roces Avenue corner Yakal Street, Makati City 142,430.00 September 14, 2024
MAKATI-GREENBELT G/F The Charter House 114 Legaspi Street, Makati City 117,911.87 September 30, 2026
MAKATI-GUADALUPE Pacmac Building, 23 EDSA Guadalupe Nuevo, Makati City 111,887.70 October 18, 2021
MAKATI-LEVISTE ST.-SALCEDO VILLAGE G/F, LPL Mansions Condominium, 122 L.P. Leviste Street, Salcedo Village, Makati City 181,738.00 April 19, 2021
MAKATI-METROPOLITAN AVENUE Unit 102, BUMA Bldg., 1012 Metropolitan Avenue, San Antonio Village, Makati City 108,803.26 October 18, 2023
MAKATI-PASONG TAMO 2233 Pasong Tamo Ave., Makati City 137,359.62 June 30, 2021
MAKATI-ROCKWELL CENTER Stall No. RS-03, G/F Manansala Tower, Estrella Street corner Joya Drive Rockwell Center, Makati City 235,092.00 March 31, 2022
MAKATI-SALCEDO ST.-LEGASPI VILLAGE First Life Center, 174 Salcedo Street, Legazpi Village, Makati City 149,921.50 October 15, 2024
MAKATI-SAN LORENZO-ARNAIZ G/F, Power Realty Building, 1012 A. Arnaiz Avenue, Barangay San Lorenzo, Makati City 98,497.03 June 30, 2021
MALABON-GOV. PASCUAL 157 Gov. Pascual Avenue, Acacia, Malabon City 51,973.21 June 15, 2023
MALABON-POTRERO A & S Building, 189 MacArthur Highway, Potrero, Malabon City 78,100.34 February 11, 2020
Mandaluyong Shaw-Starmall Unit G06, Global Link Center, No. 710-712 Shaw Boulevard, Barangay Wack-Wack, Mandaluyong City 227,438.40 September 30, 2023
MANDALUYONG SHAW-ACACIA LANE 2 Acacia Lane corner Shaw Boulevard and Pinagtipunan Sts, Mandaluyong City 162,289.28 June 15, 2024
MANDALUYONG-BONI AVENUE No. 654 Boni Avenue, Mandaluyong City 135,223.44 December 31, 2021
MANDALUYONG-D. GUEVARRA 16 Domingo M. Guevarra St., Brgy. Highway Hills, Mandaluyong City 192,000.00 November 17, 2024
MANDALUYONG-PIONEER G/F, B. Guerrero Complex, 123 Pioneer Street, Mandaluyong City 153,153.79 April 14, 2024
MANDALUYONG-SHANGRI-LA PLAZA Unit AX 116 P3 Carpark Building, Shangri-la Annex Plaza Mall, Edsa corner Shaw Boulevard, Mandaluyong City 131,054.00 September 30, 2020
MANILA BENAVIDEZ - LA TORRE G/F, Oxford Parksuites, La Torre cor. Benavidez and Masangkay Sts., Sta. Cruz, Manila 176,280.00 November 27, 2022
MANILA-ADRIATICO-HARRISON PLAZA Rizal Memorial Sports Complex, A. Adriatico St., Malate, Manila -00 January 09, 2020
MANILA-BAMBANG-MASANGKAY G/F ST Condominium, 1480 G. Masangkay St., Sta. Cruz, Manila 137,280.00 February 28, 2021
MANILA-BLUMENTRITT-L. RIVERA Citidorm Blumentritt, 1848 Blumentritt corner Leonor Rivera Streets, Sta. Cruz, Manila 109,394.88 November 30, 2024
MANILA-BSP G/F, Cafetorium Building, BSP Complex, A. Mabini corner P. Ocampo Streets, Malate, Manila 127,579.01 June 30, 2020
MANILA-C.M. RECTO G/F, Dr. Lucio C. Tan Building, UE Manila Annex, C.M. Recto, Manila 89,984.07 July 13, 2020
MANILA-CENTURY PARK HOTEL G/F Century Park Hotel, P. Ocampo (Vito Cruz Ext.) cor. M. Adriatico Sts., Malate, Manila 256,363.29 February 29, 2024
MANILA-ERMITA U.N. AVE. Physician's Tower United Nations Avenue corner San Carlos Street, Ermita, Manila 171,993.24 January 31, 2023
MANILA-ERMITA-ROXAS BLVD. Roxas Boulevard corner Arquiza Street, Ermita, Manila 243,581.00 January 15, 2021
MANILA-ESCOLTA G/F, Regina Building, Escolta, Manila 202,447.00 September 30, 2020
MANILA-ESPAÑA Unit 104, Street Thomas Square, 1150 España Boulevard corner Padre Campa Street, Sampaloc East, Manila 66,885.28 March 15, 2023
MANILA-FLORENTINO TORRES 740 Florentino Torres St., Sta. Cruz, Manila 1003 130,000.00 September 14, 2022
MANILA-FUGOSO ST. JT Centrale, No. 1686, Brgy. 311, Zone 31, V. Fugoso cor. Felix Huertas Sts., Sta. Cruz, Manila 134,928.00 October 23, 2026
MANILA-G. TUAZON Greeny Rose Residences Inc., G. Tuazon cor. 311 Algeciras Sts., Balic-Balic Sampaloc, Manila 103,056.40 September 22, 2027
MANILA-INTRAMUROS-CATHEDRAL 707 Aduana cor Cabildo Shipping Center Condominium, Intramuros, Manila 117,350.46 November 30, 2024
MANILA-INTRAMUROS-FORT SANTIAGO G/F, Marine Technology Building corner A. Soriano Avenue & Arzobispo Streets, Intramuros, Manila 216,377.70 June 30, 2020
MANILA-J.P. LAUREL G/F Gama Bldg., J. P. Laurel cor. Minerva Sts., San Miguel, Manila 122,321.43 February 28, 2024
MANILA-JOSE ABAD SANTOS 1450-1452 Coyuco Building, Jose Abad Santos, Tondo, Manila 70,858.77 August 31, 2021
MANILA-LEON GUINTO G/F, Marlow Building, 2120 Leon Guinto Street, Malate, Manila 187,393.34 July 15, 2020
MANILA-LUNETA-T.M. KALAW National Historical Institute (NHI) Compound, T.M. Kalaw St., Ermita, Manila renewal on process April 26, 2018
MANILA-MACEDA-LAON LAAN G/F, Maceda Place Building, Laong-Laan corner Maceda Streets, Sampaloc, Manila 91,251.10 July 29, 2022
MANILA-MALATE-ADRIATICO G/F, Pearl Garden Hotel, 1700 M. Adriatico corner Malvar Streets, Malate, Manila 173,571.43 June 30, 2024
MANILA-MALATE-TAFT Mark 1 Building, 1971 Taft Avenue, Malate , Manila 170,800.00 July 17, 2021
MANILA-MORAYTA Consuelo Building, 929 N. Reyes St., (Formerly Morayta), Sampaloc, Manila 155,707.00 July 31, 2022
MANILA-NORTH BAY 511 Honorio Lopez Boulevard, Balut, Tondo, Manila 38,408.48 October 31, 2020
MANILA-PADRE FAURA PAL Learning Center Bldg., 540 Padre Faura cor. Adriatico Sts., Ermita, Manila 86,908.70 June 30, 2026
MANILA-PADRE RADA RCS Bldg., Padre Rada St., Tondo, Manila 213,516.97 October 31, 2024
MANILA-PANDACAN Jesus corner T. San Luis Sts, Pandacan, Manila 63,720.22 October 31, 2020
MANILA-PGH PGH Compound, Taft Avenue, Ermita, Manila 182,661.86 November 08, 2020
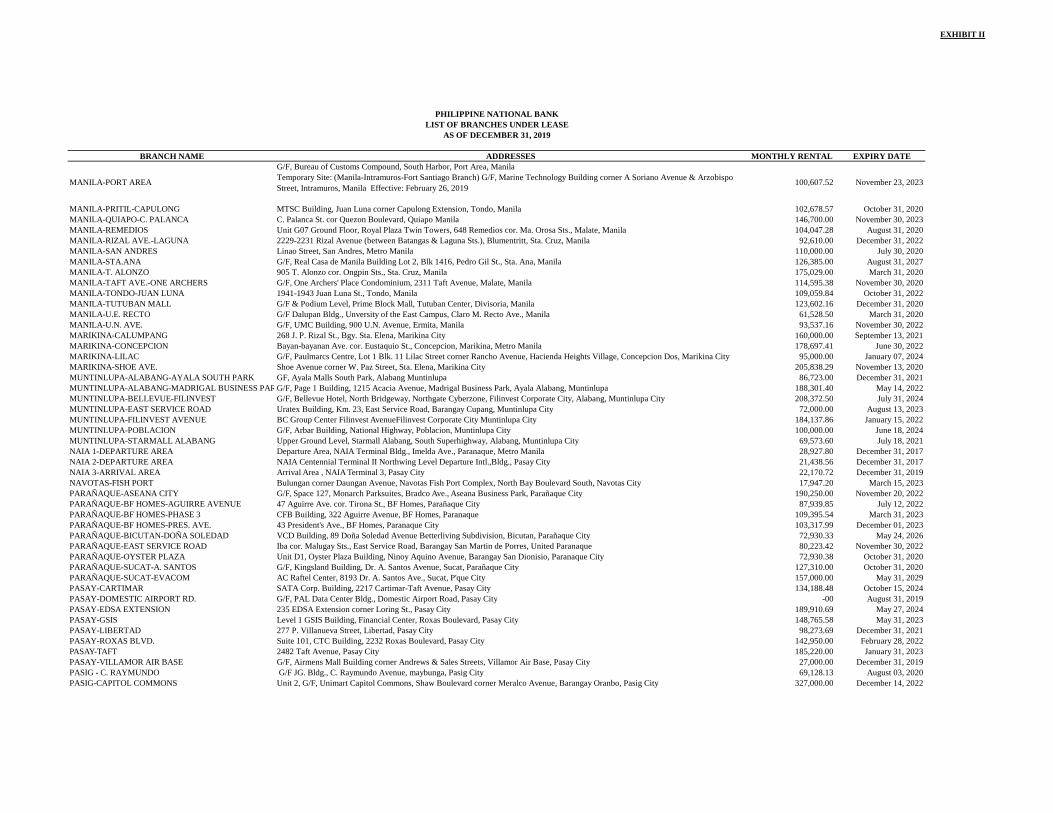
EXHIBIT II
BRANCH NAME ADDRESSES MONTHLY RENTAL EXPIRY DATE
PHILIPPINE NATIONAL BANK
LIST OF BRANCHES UNDER LEASE
AS OF DECEMBER 31, 2019
MANILA-PORT AREA
G/F, Bureau of Customs Compound, South Harbor, Port Area, Manila
Temporary Site: (Manila-Intramuros-Fort Santiago Branch) G/F, Marine Technology Building corner A Soriano Avenue & Arzobispo
Street, Intramuros, Manila Effective: February 26, 2019100,607.52 November 23, 2023
MANILA-PRITIL-CAPULONG MTSC Building, Juan Luna corner Capulong Extension, Tondo, Manila 102,678.57 October 31, 2020
MANILA-QUIAPO-C. PALANCA C. Palanca St. cor Quezon Boulevard, Quiapo Manila 146,700.00 November 30, 2023
MANILA-REMEDIOS Unit G07 Ground Floor, Royal Plaza Twin Towers, 648 Remedios cor. Ma. Orosa Sts., Malate, Manila 104,047.28 August 31, 2020
MANILA-RIZAL AVE.-LAGUNA 2229-2231 Rizal Avenue (between Batangas & Laguna Sts.), Blumentritt, Sta. Cruz, Manila 92,610.00 December 31, 2022
MANILA-SAN ANDRES Linao Street, San Andres, Metro Manila 110,000.00 July 30, 2020
MANILA-STA.ANA G/F, Real Casa de Manila Building Lot 2, Blk 1416, Pedro Gil St., Sta. Ana, Manila 126,385.00 August 31, 2027
MANILA-T. ALONZO 905 T. Alonzo cor. Ongpin Sts., Sta. Cruz, Manila 175,029.00 March 31, 2020
MANILA-TAFT AVE.-ONE ARCHERS G/F, One Archers' Place Condominium, 2311 Taft Avenue, Malate, Manila 114,595.38 November 30, 2020
MANILA-TONDO-JUAN LUNA 1941-1943 Juan Luna St., Tondo, Manila 109,059.84 October 31, 2022
MANILA-TUTUBAN MALL G/F & Podium Level, Prime Block Mall, Tutuban Center, Divisoria, Manila 123,602.16 December 31, 2020
MANILA-U.E. RECTO G/F Dalupan Bldg., Unversity of the East Campus, Claro M. Recto Ave., Manila 61,528.50 March 31, 2020
MANILA-U.N. AVE. G/F, UMC Building, 900 U.N. Avenue, Ermita, Manila 93,537.16 November 30, 2022
MARIKINA-CALUMPANG 268 J. P. Rizal St., Bgy. Sta. Elena, Marikina City 160,000.00 September 13, 2021
MARIKINA-CONCEPCION Bayan-bayanan Ave. cor. Eustaquio St., Concepcion, Marikina, Metro Manila 178,697.41 June 30, 2022
MARIKINA-LILAC G/F, Paulmarcs Centre, Lot 1 Blk. 11 Lilac Street corner Rancho Avenue, Hacienda Heights Village, Concepcion Dos, Marikina City 95,000.00 January 07, 2024
MARIKINA-SHOE AVE. Shoe Avenue corner W. Paz Street, Sta. Elena, Marikina City 205,838.29 November 13, 2020
MUNTINLUPA-ALABANG-AYALA SOUTH PARK GF, Ayala Malls South Park, Alabang Muntinlupa 86,723.00 December 31, 2021
MUNTINLUPA-ALABANG-MADRIGAL BUSINESS PARKG/F, Page 1 Building, 1215 Acacia Avenue, Madrigal Business Park, Ayala Alabang, Muntinlupa 188,301.40 May 14, 2022
MUNTINLUPA-BELLEVUE-FILINVEST G/F, Bellevue Hotel, North Bridgeway, Northgate Cyberzone, Filinvest Corporate City, Alabang, Muntinlupa City 208,372.50 July 31, 2024
MUNTINLUPA-EAST SERVICE ROAD Uratex Building, Km. 23, East Service Road, Barangay Cupang, Muntinlupa City 72,000.00 August 13, 2023
MUNTINLUPA-FILINVEST AVENUE BC Group Center Filinvest Avenue Filinvest Corporate City Muntinlupa City 184,137.86 January 15, 2022
MUNTINLUPA-POBLACION G/F, Arbar Building, National Highway, Poblacion, Muntinlupa City 100,000.00 June 18, 2024
MUNTINLUPA-STARMALL ALABANG Upper Ground Level, Starmall Alabang, South Superhighway, Alabang, Muntinlupa City 69,573.60 July 18, 2021
NAIA 1-DEPARTURE AREA Departure Area, NAIA Terminal Bldg., Imelda Ave., Paranaque, Metro Manila 28,927.80 December 31, 2017
NAIA 2-DEPARTURE AREA NAIA Centennial Terminal II Northwing Level Departure Intl.,Bldg., Pasay City 21,438.56 December 31, 2017
NAIA 3-ARRIVAL AREA Arrival Area , NAIA Terminal 3, Pasay City 22,170.72 December 31, 2019
NAVOTAS-FISH PORT Bulungan corner Daungan Avenue, Navotas Fish Port Complex, North Bay Boulevard South, Navotas City 17,947.20 March 15, 2023
PARAÑAQUE-ASEANA CITY G/F, Space 127, Monarch Parksuites, Bradco Ave., Aseana Business Park, Parañaque City 190,250.00 November 20, 2022
PARAÑAQUE-BF HOMES-AGUIRRE AVENUE 47 Aguirre Ave. cor. Tirona St., BF Homes, Parañaque City 87,939.85 July 12, 2022
PARAÑAQUE-BF HOMES-PHASE 3 CFB Building, 322 Aguirre Avenue, BF Homes, Paranaque 109,395.54 March 31, 2023
PARAÑAQUE-BF HOMES-PRES. AVE. 43 President's Ave., BF Homes, Paranaque City 103,317.99 December 01, 2023
PARAÑAQUE-BICUTAN-DOÑA SOLEDAD VCD Building, 89 Doña Soledad Avenue Betterliving Subdivision, Bicutan, Parañaque City 72,930.33 May 24, 2026
PARAÑAQUE-EAST SERVICE ROAD Iba cor. Malugay Sts., East Service Road, Barangay San Martin de Porres, United Paranaque 80,223.42 November 30, 2022
PARAÑAQUE-OYSTER PLAZA Unit D1, Oyster Plaza Building, Ninoy Aquino Avenue, Barangay San Dionisio, Paranaque City 72,930.38 October 31, 2020
PARAÑAQUE-SUCAT-A. SANTOS G/F, Kingsland Building, Dr. A. Santos Avenue, Sucat, Parañaque City 127,310.00 October 31, 2020
PARAÑAQUE-SUCAT-EVACOM AC Raftel Center, 8193 Dr. A. Santos Ave., Sucat, P'que City 157,000.00 May 31, 2029
PASAY-CARTIMAR SATA Corp. Building, 2217 Cartimar-Taft Avenue, Pasay City 134,188.48 October 15, 2024
PASAY-DOMESTIC AIRPORT RD. G/F, PAL Data Center Bldg., Domestic Airport Road, Pasay City -00 August 31, 2019
PASAY-EDSA EXTENSION 235 EDSA Extension corner Loring St., Pasay City 189,910.69 May 27, 2024
PASAY-GSIS Level 1 GSIS Building, Financial Center, Roxas Boulevard, Pasay City 148,765.58 May 31, 2023
PASAY-LIBERTAD 277 P. Villanueva Street, Libertad, Pasay City 98,273.69 December 31, 2021
PASAY-ROXAS BLVD. Suite 101, CTC Building, 2232 Roxas Boulevard, Pasay City 142,950.00 February 28, 2022
PASAY-TAFT 2482 Taft Avenue, Pasay City 185,220.00 January 31, 2023
PASAY-VILLAMOR AIR BASE G/F, Airmens Mall Building corner Andrews & Sales Streets, Villamor Air Base, Pasay City 27,000.00 December 31, 2019
PASIG - C. RAYMUNDO G/F JG. Bldg., C. Raymundo Avenue, maybunga, Pasig City 69,128.13 August 03, 2020
PASIG-CAPITOL COMMONS Unit 2, G/F, Unimart Capitol Commons, Shaw Boulevard corner Meralco Avenue, Barangay Oranbo, Pasig City 327,000.00 December 14, 2022
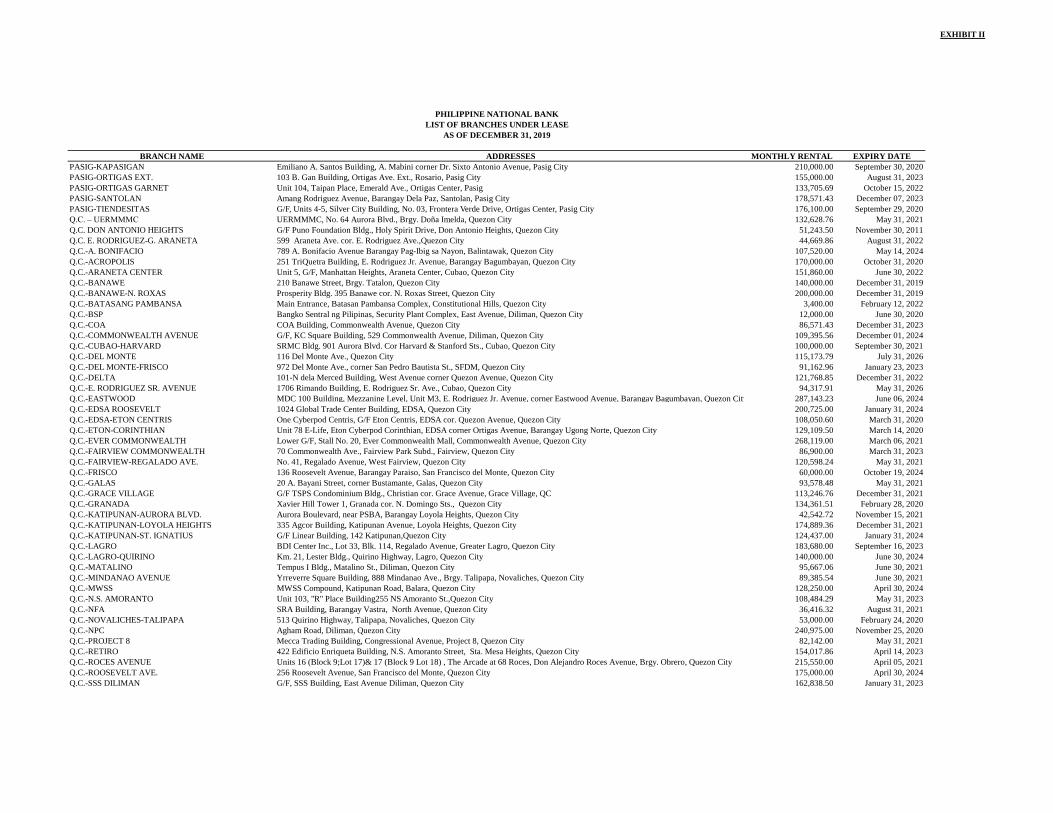
EXHIBIT II
BRANCH NAME ADDRESSES MONTHLY RENTAL EXPIRY DATE
PHILIPPINE NATIONAL BANK
LIST OF BRANCHES UNDER LEASE
AS OF DECEMBER 31, 2019
PASIG-KAPASIGAN Emiliano A. Santos Building, A. Mabini corner Dr. Sixto Antonio Avenue, Pasig City 210,000.00 September 30, 2020
PASIG-ORTIGAS EXT. 103 B. Gan Building, Ortigas Ave. Ext., Rosario, Pasig City 155,000.00 August 31, 2023
PASIG-ORTIGAS GARNET Unit 104, Taipan Place, Emerald Ave., Ortigas Center, Pasig 133,705.69 October 15, 2022
PASIG-SANTOLAN Amang Rodriguez Avenue, Barangay Dela Paz, Santolan, Pasig City 178,571.43 December 07, 2023
PASIG-TIENDESITAS G/F, Units 4-5, Silver City Building, No. 03, Frontera Verde Drive, Ortigas Center, Pasig City 176,100.00 September 29, 2020
Q.C. – UERMMMC UERMMMC, No. 64 Aurora Blvd., Brgy. Doña Imelda, Quezon City 132,628.76 May 31, 2021
Q.C. DON ANTONIO HEIGHTS G/F Puno Foundation Bldg., Holy Spirit Drive, Don Antonio Heights, Quezon City 51,243.50 November 30, 2011
Q.C. E. RODRIGUEZ-G. ARANETA 599 Araneta Ave. cor. E. Rodriguez Ave.,Quezon City 44,669.86 August 31, 2022
Q.C.-A. BONIFACIO 789 A. Bonifacio Avenue Barangay Pag-Ibig sa Nayon, Balintawak, Quezon City 107,520.00 May 14, 2024
Q.C.-ACROPOLIS 251 TriQuetra Building, E. Rodriguez Jr. Avenue, Barangay Bagumbayan, Quezon City 170,000.00 October 31, 2020
Q.C.-ARANETA CENTER Unit 5, G/F, Manhattan Heights, Araneta Center, Cubao, Quezon City 151,860.00 June 30, 2022
Q.C.-BANAWE 210 Banawe Street, Brgy. Tatalon, Quezon City 140,000.00 December 31, 2019
Q.C.-BANAWE-N. ROXAS Prosperity Bldg. 395 Banawe cor. N. Roxas Street, Quezon City 200,000.00 December 31, 2019
Q.C.-BATASANG PAMBANSA Main Entrance, Batasan Pambansa Complex, Constitutional Hills, Quezon City 3,400.00 February 12, 2022
Q.C.-BSP Bangko Sentral ng Pilipinas, Security Plant Complex, East Avenue, Diliman, Quezon City 12,000.00 June 30, 2020
Q.C.-COA COA Building, Commonwealth Avenue, Quezon City 86,571.43 December 31, 2023
Q.C.-COMMONWEALTH AVENUE G/F, KC Square Building, 529 Commonwealth Avenue, Diliman, Quezon City 109,395.56 December 01, 2024
Q.C.-CUBAO-HARVARD SRMC Bldg. 901 Aurora Blvd. Cor Harvard & Stanford Sts., Cubao, Quezon City 100,000.00 September 30, 2021
Q.C.-DEL MONTE 116 Del Monte Ave., Quezon City 115,173.79 July 31, 2026
Q.C.-DEL MONTE-FRISCO 972 Del Monte Ave., corner San Pedro Bautista St., SFDM, Quezon City 91,162.96 January 23, 2023
Q.C.-DELTA 101-N dela Merced Building, West Avenue corner Quezon Avenue, Quezon City 121,768.85 December 31, 2022
Q.C.-E. RODRIGUEZ SR. AVENUE 1706 Rimando Building, E. Rodriguez Sr. Ave., Cubao, Quezon City 94,317.91 May 31, 2026
Q.C.-EASTWOOD MDC 100 Building, Mezzanine Level, Unit M3, E. Rodriguez Jr. Avenue, corner Eastwood Avenue, Barangay Bagumbayan, Quezon City 287,143.23 June 06, 2024
Q.C.-EDSA ROOSEVELT 1024 Global Trade Center Building, EDSA, Quezon City 200,725.00 January 31, 2024
Q.C.-EDSA-ETON CENTRIS One Cyberpod Centris, G/F Eton Centris, EDSA cor. Quezon Avenue, Quezon City 108,050.60 March 31, 2020
Q.C.-ETON-CORINTHIAN Unit 78 E-Life, Eton Cyberpod Corinthian, EDSA corner Ortigas Avenue, Barangay Ugong Norte, Quezon City 129,109.50 March 14, 2020
Q.C.-EVER COMMONWEALTH Lower G/F, Stall No. 20, Ever Commonwealth Mall, Commonwealth Avenue, Quezon City 268,119.00 March 06, 2021
Q.C.-FAIRVIEW COMMONWEALTH 70 Commonwealth Ave., Fairview Park Subd., Fairview, Quezon City 86,900.00 March 31, 2023
Q.C.-FAIRVIEW-REGALADO AVE. No. 41, Regalado Avenue, West Fairview, Quezon City 120,598.24 May 31, 2021
Q.C.-FRISCO 136 Roosevelt Avenue, Barangay Paraiso, San Francisco del Monte, Quezon City 60,000.00 October 19, 2024
Q.C.-GALAS 20 A. Bayani Street, corner Bustamante, Galas, Quezon City 93,578.48 May 31, 2021
Q.C.-GRACE VILLAGE G/F TSPS Condominium Bldg., Christian cor. Grace Avenue, Grace Village, QC 113,246.76 December 31, 2021
Q.C.-GRANADA Xavier Hill Tower 1, Granada cor. N. Domingo Sts., Quezon City 134,361.51 February 28, 2020
Q.C.-KATIPUNAN-AURORA BLVD. Aurora Boulevard, near PSBA, Barangay Loyola Heights, Quezon City 42,542.72 November 15, 2021
Q.C.-KATIPUNAN-LOYOLA HEIGHTS 335 Agcor Building, Katipunan Avenue, Loyola Heights, Quezon City 174,889.36 December 31, 2021
Q.C.-KATIPUNAN-ST. IGNATIUS G/F Linear Building, 142 Katipunan, Quezon City 124,437.00 January 31, 2024
Q.C.-LAGRO BDI Center Inc., Lot 33, Blk. 114, Regalado Avenue, Greater Lagro, Quezon City 183,680.00 September 16, 2023
Q.C.-LAGRO-QUIRINO Km. 21, Lester Bldg., Quirino Highway, Lagro, Quezon City 140,000.00 June 30, 2024
Q.C.-MATALINO Tempus I Bldg., Matalino St., Diliman, Quezon City 95,667.06 June 30, 2021
Q.C.-MINDANAO AVENUE Yrreverre Square Building, 888 Mindanao Ave., Brgy. Talipapa, Novaliches, Quezon City 89,385.54 June 30, 2021
Q.C.-MWSS MWSS Compound, Katipunan Road, Balara, Quezon City 128,250.00 April 30, 2024
Q.C.-N.S. AMORANTO Unit 103, "R" Place Building 255 NS Amoranto St., Quezon City 108,484.29 May 31, 2023
Q.C.-NFA SRA Building, Barangay Vastra, North Avenue, Quezon City 36,416.32 August 31, 2021
Q.C.-NOVALICHES-TALIPAPA 513 Quirino Highway, Talipapa, Novaliches, Quezon City 53,000.00 February 24, 2020
Q.C.-NPC Agham Road, Diliman, Quezon City 240,975.00 November 25, 2020
Q.C.-PROJECT 8 Mecca Trading Building, Congressional Avenue, Project 8, Quezon City 82,142.00 May 31, 2021
Q.C.-RETIRO 422 Edificio Enriqueta Building, N.S. Amoranto Street, Sta. Mesa Heights, Quezon City 154,017.86 April 14, 2023
Q.C.-ROCES AVENUE Units 16 (Block 9;Lot 17)& 17 (Block 9 Lot 18) , The Arcade at 68 Roces, Don Alejandro Roces Avenue, Brgy. Obrero, Quezon City 215,550.00 April 05, 2021
Q.C.-ROOSEVELT AVE. 256 Roosevelt Avenue, San Francisco del Monte, Quezon City 175,000.00 April 30, 2024
Q.C.-SSS DILIMAN G/F, SSS Building, East Avenue Diliman, Quezon City 162,838.50 January 31, 2023
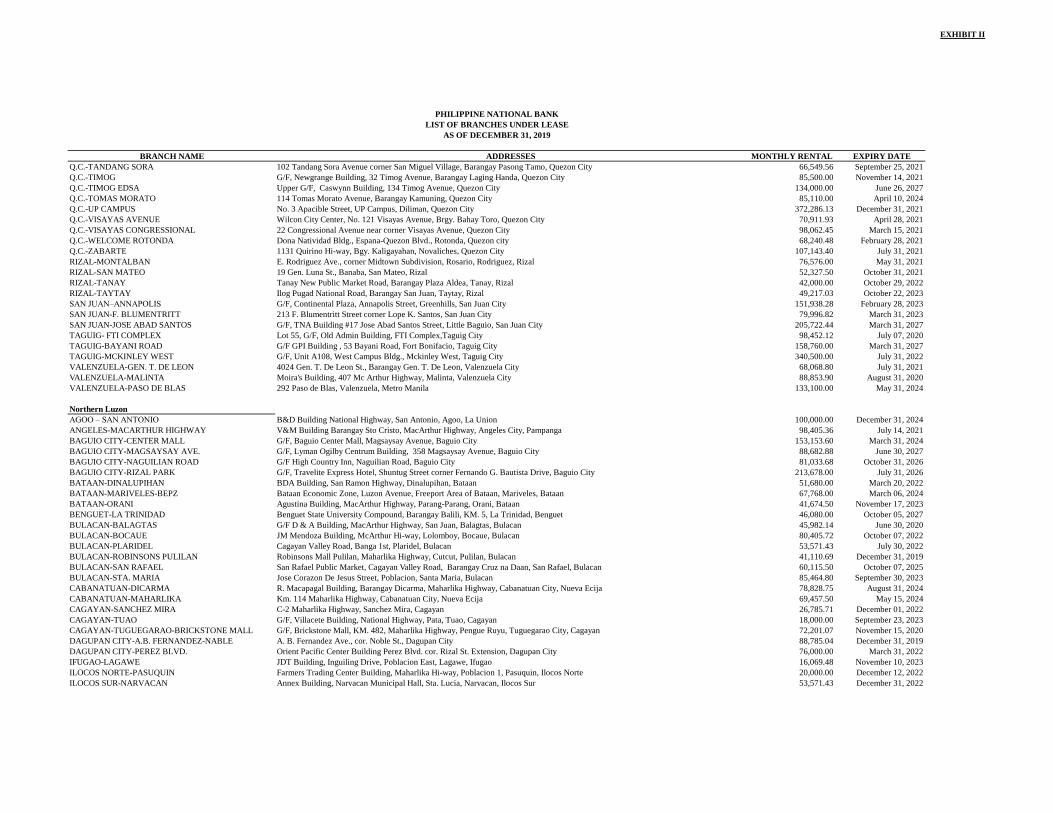
EXHIBIT II
BRANCH NAME ADDRESSES MONTHLY RENTAL EXPIRY DATE
PHILIPPINE NATIONAL BANK
LIST OF BRANCHES UNDER LEASE
AS OF DECEMBER 31, 2019
Q.C.-TANDANG SORA 102 Tandang Sora Avenue corner San Miguel Village, Barangay Pasong Tamo, Quezon City 66,549.56 September 25, 2021
Q.C.-TIMOG G/F, Newgrange Building, 32 Timog Avenue, Barangay Laging Handa, Quezon City 85,500.00 November 14, 2021
Q.C.-TIMOG EDSA Upper G/F, Caswynn Building, 134 Timog Avenue, Quezon City 134,000.00 June 26, 2027
Q.C.-TOMAS MORATO 114 Tomas Morato Avenue, Barangay Kamuning, Quezon City 85,110.00 April 10, 2024
Q.C.-UP CAMPUS No. 3 Apacible Street, UP Campus, Diliman, Quezon City 372,286.13 December 31, 2021
Q.C.-VISAYAS AVENUE Wilcon City Center, No. 121 Visayas Avenue, Brgy. Bahay Toro, Quezon City 70,911.93 April 28, 2021
Q.C.-VISAYAS CONGRESSIONAL 22 Congressional Avenue near corner Visayas Avenue, Quezon City 98,062.45 March 15, 2021
Q.C.-WELCOME ROTONDA Dona Natividad Bldg., Espana-Quezon Blvd., Rotonda, Quezon city 68,240.48 February 28, 2021
Q.C.-ZABARTE 1131 Quirino Hi-way, Bgy. Kaligayahan, Novaliches, Quezon City 107,143.40 July 31, 2021
RIZAL-MONTALBAN E. Rodriguez Ave., corner Midtown Subdivision, Rosario, Rodriguez, Rizal 76,576.00 May 31, 2021
RIZAL-SAN MATEO 19 Gen. Luna St., Banaba, San Mateo, Rizal 52,327.50 October 31, 2021
RIZAL-TANAY Tanay New Public Market Road, Barangay Plaza Aldea, Tanay, Rizal 42,000.00 October 29, 2022
RIZAL-TAYTAY Ilog Pugad National Road, Barangay San Juan, Taytay, Rizal 49,217.03 October 22, 2023
SAN JUAN–ANNAPOLIS G/F, Continental Plaza, Annapolis Street, Greenhills, San Juan City 151,938.28 February 28, 2023
SAN JUAN-F. BLUMENTRITT 213 F. Blumentritt Street corner Lope K. Santos, San Juan City 79,996.82 March 31, 2023
SAN JUAN-JOSE ABAD SANTOS G/F, TNA Building #17 Jose Abad Santos Street, Little Baguio, San Juan City 205,722.44 March 31, 2027
TAGUIG- FTI COMPLEX Lot 55, G/F, Old Admin Building, FTI Complex,Taguig City 98,452.12 July 07, 2020
TAGUIG-BAYANI ROAD G/F GPI Building , 53 Bayani Road, Fort Bonifacio, Taguig City 158,760.00 March 31, 2027
TAGUIG-MCKINLEY WEST G/F, Unit A108, West Campus Bldg., Mckinley West, Taguig City 340,500.00 July 31, 2022
VALENZUELA-GEN. T. DE LEON 4024 Gen. T. De Leon St., Barangay Gen. T. De Leon, Valenzuela City 68,068.80 July 31, 2021
VALENZUELA-MALINTA Moira's Building, 407 Mc Arthur Highway, Malinta, Valenzuela City 88,853.90 August 31, 2020
VALENZUELA-PASO DE BLAS 292 Paso de Blas, Valenzuela, Metro Manila 133,100.00 May 31, 2024
Northern Luzon
AGOO – SAN ANTONIO B&D Building National Highway, San Antonio, Agoo, La Union 100,000.00 December 31, 2024
ANGELES-MACARTHUR HIGHWAY V&M Building Barangay Sto Cristo, MacArthur Highway, Angeles City, Pampanga 98,405.36 July 14, 2021
BAGUIO CITY-CENTER MALL G/F, Baguio Center Mall, Magsaysay Avenue, Baguio City 153,153.60 March 31, 2024
BAGUIO CITY-MAGSAYSAY AVE. G/F, Lyman Ogilby Centrum Building, 358 Magsaysay Avenue, Baguio City 88,682.88 June 30, 2027
BAGUIO CITY-NAGUILIAN ROAD G/F High Country Inn, Naguilian Road, Baguio City 81,033.68 October 31, 2026
BAGUIO CITY-RIZAL PARK G/F, Travelite Express Hotel, Shuntug Street corner Fernando G. Bautista Drive, Baguio City 213,678.00 July 31, 2026
BATAAN-DINALUPIHAN BDA Building, San Ramon Highway, Dinalupihan, Bataan 51,680.00 March 20, 2022
BATAAN-MARIVELES-BEPZ Bataan Economic Zone, Luzon Avenue, Freeport Area of Bataan, Mariveles, Bataan 67,768.00 March 06, 2024
BATAAN-ORANI Agustina Building, MacArthur Highway, Parang-Parang, Orani, Bataan 41,674.50 November 17, 2023
BENGUET-LA TRINIDAD Benguet State University Compound, Barangay Balili, KM. 5, La Trinidad, Benguet 46,080.00 October 05, 2027
BULACAN-BALAGTAS G/F D & A Building, MacArthur Highway, San Juan, Balagtas, Bulacan 45,982.14 June 30, 2020
BULACAN-BOCAUE JM Mendoza Building, McArthur Hi-way, Lolomboy, Bocaue, Bulacan 80,405.72 October 07, 2022
BULACAN-PLARIDEL Cagayan Valley Road, Banga 1st, Plaridel, Bulacan 53,571.43 July 30, 2022
BULACAN-ROBINSONS PULILAN Robinsons Mall Pulilan, Maharlika Highway, Cutcut, Pulilan, Bulacan 41,110.69 December 31, 2019
BULACAN-SAN RAFAEL San Rafael Public Market, Cagayan Valley Road, Barangay Cruz na Daan, San Rafael, Bulacan 60,115.50 October 07, 2025
BULACAN-STA. MARIA Jose Corazon De Jesus Street, Poblacion, Santa Maria, Bulacan 85,464.80 September 30, 2023
CABANATUAN-DICARMA R. Macapagal Building, Barangay Dicarma, Maharlika Highway, Cabanatuan City, Nueva Ecija 78,828.75 August 31, 2024
CABANATUAN-MAHARLIKA Km. 114 Maharlika Highway, Cabanatuan City, Nueva Ecija 69,457.50 May 15, 2024
CAGAYAN-SANCHEZ MIRA C-2 Maharlika Highway, Sanchez Mira, Cagayan 26,785.71 December 01, 2022
CAGAYAN-TUAO G/F, Villacete Building, National Highway, Pata, Tuao, Cagayan 18,000.00 September 23, 2023
CAGAYAN-TUGUEGARAO-BRICKSTONE MALL G/F, Brickstone Mall, KM. 482, Maharlika Highway, Pengue Ruyu, Tuguegarao City, Cagayan 72,201.07 November 15, 2020
DAGUPAN CITY-A.B. FERNANDEZ-NABLE A. B. Fernandez Ave., cor. Noble St., Dagupan City 88,785.04 December 31, 2019
DAGUPAN CITY-PEREZ BLVD. Orient Pacific Center Building Perez Blvd. cor. Rizal St. Extension, Dagupan City 76,000.00 March 31, 2022
IFUGAO-LAGAWE JDT Building, Inguiling Drive, Poblacion East, Lagawe, Ifugao 16,069.48 November 10, 2023
ILOCOS NORTE-PASUQUIN Farmers Trading Center Building, Maharlika Hi-way, Poblacion 1, Pasuquin, Ilocos Norte 20,000.00 December 12, 2022
ILOCOS SUR-NARVACAN Annex Building, Narvacan Municipal Hall, Sta. Lucia, Narvacan, Ilocos Sur 53,571.43 December 31, 2022
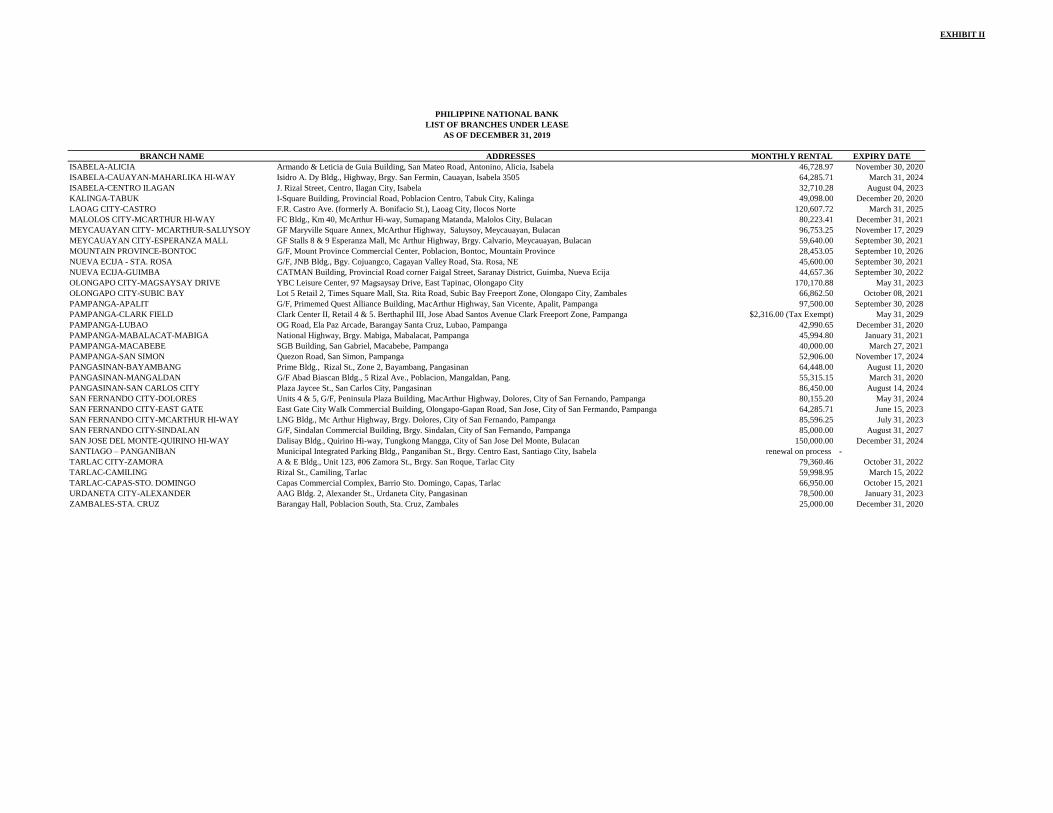
EXHIBIT II
BRANCH NAME ADDRESSES MONTHLY RENTAL EXPIRY DATE
PHILIPPINE NATIONAL BANK
LIST OF BRANCHES UNDER LEASE
AS OF DECEMBER 31, 2019
ISABELA-ALICIA Armando & Leticia de Guia Building, San Mateo Road, Antonino, Alicia, Isabela 46,728.97 November 30, 2020
ISABELA-CAUAYAN-MAHARLIKA HI-WAY Isidro A. Dy Bldg., Highway, Brgy. San Fermin, Cauayan, Isabela 3505 64,285.71 March 31, 2024
ISABELA-CENTRO ILAGAN J. Rizal Street, Centro, Ilagan City, Isabela 32,710.28 August 04, 2023
KALINGA-TABUK I-Square Building, Provincial Road, Poblacion Centro, Tabuk City, Kalinga 49,098.00 December 20, 2020
LAOAG CITY-CASTRO F.R. Castro Ave. (formerly A. Bonifacio St.), Laoag City, Ilocos Norte 120,607.72 March 31, 2025
MALOLOS CITY-MCARTHUR HI-WAY FC Bldg., Km 40, McArthur Hi-way, Sumapang Matanda, Malolos City, Bulacan 80,223.41 December 31, 2021
MEYCAUAYAN CITY- MCARTHUR-SALUYSOY GF Maryville Square Annex, McArthur Highway, Saluysoy, Meycauayan, Bulacan 96,753.25 November 17, 2029
MEYCAUAYAN CITY-ESPERANZA MALL GF Stalls 8 & 9 Esperanza Mall, Mc Arthur Highway, Brgy. Calvario, Meycauayan, Bulacan 59,640.00 September 30, 2021
MOUNTAIN PROVINCE-BONTOC G/F, Mount Province Commercial Center, Poblacion, Bontoc, Mountain Province 28,453.05 September 10, 2026
NUEVA ECIJA - STA. ROSA G/F, JNB Bldg., Bgy. Cojuangco, Cagayan Valley Road, Sta. Rosa, NE 45,600.00 September 30, 2021
NUEVA ECIJA-GUIMBA CATMAN Building, Provincial Road corner Faigal Street, Saranay District, Guimba, Nueva Ecija 44,657.36 September 30, 2022
OLONGAPO CITY-MAGSAYSAY DRIVE YBC Leisure Center, 97 Magsaysay Drive, East Tapinac, Olongapo City 170,170.88 May 31, 2023
OLONGAPO CITY-SUBIC BAY Lot 5 Retail 2, Times Square Mall, Sta. Rita Road, Subic Bay Freeport Zone, Olongapo City, Zambales 66,862.50 October 08, 2021
PAMPANGA-APALIT G/F, Primemed Quest Alliance Building, MacArthur Highway, San Vicente, Apalit, Pampanga 97,500.00 September 30, 2028
PAMPANGA-CLARK FIELD Clark Center II, Retail 4 & 5. Berthaphil III, Jose Abad Santos Avenue Clark Freeport Zone, Pampanga $2,316.00 (Tax Exempt) May 31, 2029
PAMPANGA-LUBAO OG Road, Ela Paz Arcade, Barangay Santa Cruz, Lubao, Pampanga 42,990.65 December 31, 2020
PAMPANGA-MABALACAT-MABIGA National Highway, Brgy. Mabiga, Mabalacat, Pampanga 45,994.80 January 31, 2021
PAMPANGA-MACABEBE SGB Building, San Gabriel, Macabebe, Pampanga 40,000.00 March 27, 2021
PAMPANGA-SAN SIMON Quezon Road, San Simon, Pampanga 52,906.00 November 17, 2024
PANGASINAN-BAYAMBANG Prime Bldg., Rizal St., Zone 2, Bayambang, Pangasinan 64,448.00 August 11, 2020
PANGASINAN-MANGALDAN G/F Abad Biascan Bldg., 5 Rizal Ave., Poblacion, Mangaldan, Pang. 55,315.15 March 31, 2020
PANGASINAN-SAN CARLOS CITY Plaza Jaycee St., San Carlos City, Pangasinan 86,450.00 August 14, 2024
SAN FERNANDO CITY-DOLORES Units 4 & 5, G/F, Peninsula Plaza Building, MacArthur Highway, Dolores, City of San Fernando, Pampanga 80,155.20 May 31, 2024
SAN FERNANDO CITY-EAST GATE East Gate City Walk Commercial Building, Olongapo-Gapan Road, San Jose, City of San Fermando, Pampanga 64,285.71 June 15, 2023
SAN FERNANDO CITY-MCARTHUR HI-WAY LNG Bldg., Mc Arthur Highway, Brgy. Dolores, City of San Fernando, Pampanga 85,596.25 July 31, 2023
SAN FERNANDO CITY-SINDALAN G/F, Sindalan Commercial Building, Brgy. Sindalan, City of San Fernando, Pampanga 85,000.00 August 31, 2027
SAN JOSE DEL MONTE-QUIRINO HI-WAY Dalisay Bldg., Quirino Hi-way, Tungkong Mangga, City of San Jose Del Monte, Bulacan 150,000.00 December 31, 2024
SANTIAGO – PANGANIBAN Municipal Integrated Parking Bldg., Panganiban St., Brgy. Centro East, Santiago City, Isabela renewal on process -
TARLAC CITY-ZAMORA A & E Bldg., Unit 123, #06 Zamora St., Brgy. San Roque, Tarlac City 79,360.46 October 31, 2022
TARLAC-CAMILING Rizal St., Camiling, Tarlac 59,998.95 March 15, 2022
TARLAC-CAPAS-STO. DOMINGO Capas Commercial Complex, Barrio Sto. Domingo, Capas, Tarlac 66,950.00 October 15, 2021
URDANETA CITY-ALEXANDER AAG Bldg. 2, Alexander St., Urdaneta City, Pangasinan 78,500.00 January 31, 2023
ZAMBALES-STA. CRUZ Barangay Hall, Poblacion South, Sta. Cruz, Zambales 25,000.00 December 31, 2020
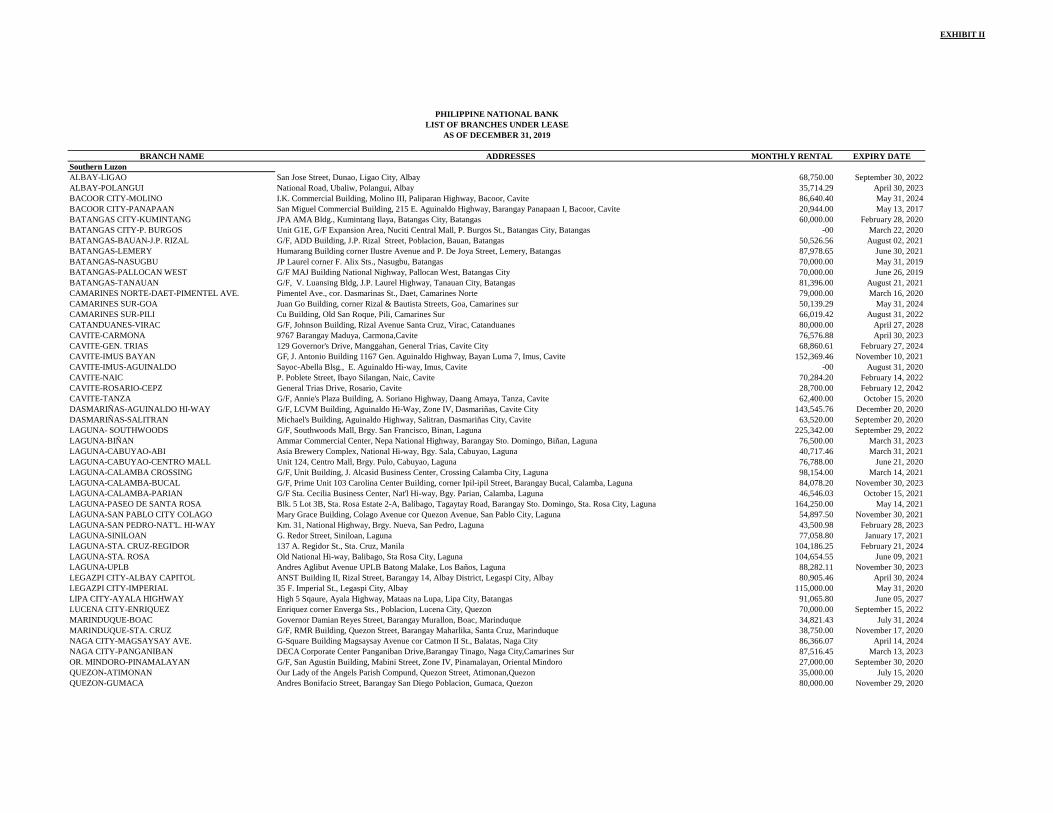
EXHIBIT II
BRANCH NAME ADDRESSES MONTHLY RENTAL EXPIRY DATE
PHILIPPINE NATIONAL BANK
LIST OF BRANCHES UNDER LEASE
AS OF DECEMBER 31, 2019
Southern Luzon
ALBAY-LIGAO San Jose Street, Dunao, Ligao City, Albay 68,750.00 September 30, 2022
ALBAY-POLANGUI National Road, Ubaliw, Polangui, Albay 35,714.29 April 30, 2023
BACOOR CITY-MOLINO I.K. Commercial Building, Molino III, Paliparan Highway, Bacoor, Cavite 86,640.40 May 31, 2024
BACOOR CITY-PANAPAAN San Miguel Commercial Building, 215 E. Aguinaldo Highway, Barangay Panapaan I, Bacoor, Cavite 20,944.00 May 13, 2017
BATANGAS CITY-KUMINTANG JPA AMA Bldg., Kumintang Ilaya, Batangas City, Batangas 60,000.00 February 28, 2020
BATANGAS CITY-P. BURGOS Unit G1E, G/F Expansion Area, Nuciti Central Mall, P. Burgos St., Batangas City, Batangas -00 March 22, 2020
BATANGAS-BAUAN-J.P. RIZAL G/F, ADD Building, J.P. Rizal Street, Poblacion, Bauan, Batangas 50,526.56 August 02, 2021
BATANGAS-LEMERY Humarang Building corner Ilustre Avenue and P. De Joya Street, Lemery, Batangas 87,978.65 June 30, 2021
BATANGAS-NASUGBU JP Laurel corner F. Alix Sts., Nasugbu, Batangas 70,000.00 May 31, 2019
BATANGAS-PALLOCAN WEST G/F MAJ Building National Nighway, Pallocan West, Batangas City 70,000.00 June 26, 2019
BATANGAS-TANAUAN G/F, V. Luansing Bldg, J.P. Laurel Highway, Tanauan City, Batangas 81,396.00 August 21, 2021
CAMARINES NORTE-DAET-PIMENTEL AVE. Pimentel Ave., cor. Dasmarinas St., Daet, Camarines Norte 79,000.00 March 16, 2020
CAMARINES SUR-GOA Juan Go Building, corner Rizal & Bautista Streets, Goa, Camarines sur 50,139.29 May 31, 2024
CAMARINES SUR-PILI Cu Building, Old San Roque, Pili, Camarines Sur 66,019.42 August 31, 2022
CATANDUANES-VIRAC G/F, Johnson Building, Rizal Avenue Santa Cruz, Virac, Catanduanes 80,000.00 April 27, 2028
CAVITE-CARMONA 9767 Barangay Maduya, Carmona, Cavite 76,576.88 April 30, 2023
CAVITE-GEN. TRIAS 129 Governor's Drive, Manggahan, General Trias, Cavite City 68,860.61 February 27, 2024
CAVITE-IMUS BAYAN GF, J. Antonio Building 1167 Gen. Aguinaldo Highway, Bayan Luma 7, Imus, Cavite 152,369.46 November 10, 2021
CAVITE-IMUS-AGUINALDO Sayoc-Abella Blsg., E. Aguinaldo Hi-way, Imus, Cavite -00 August 31, 2020
CAVITE-NAIC P. Poblete Street, Ibayo Silangan, Naic, Cavite 70,284.20 February 14, 2022
CAVITE-ROSARIO-CEPZ General Trias Drive, Rosario, Cavite 28,700.00 February 12, 2042
CAVITE-TANZA G/F, Annie's Plaza Building, A. Soriano Highway, Daang Amaya, Tanza, Cavite 62,400.00 October 15, 2020
DASMARIÑAS-AGUINALDO HI-WAY G/F, LCVM Building, Aguinaldo Hi-Way, Zone IV, Dasmariñas, Cavite City 143,545.76 December 20, 2020
DASMARIÑAS-SALITRAN Michael's Building, Aguinaldo Highway, Salitran, Dasmariñas City, Cavite 63,520.00 September 20, 2020
LAGUNA- SOUTHWOODS G/F, Southwoods Mall, Brgy. San Francisco, Binan, Laguna 225,342.00 September 29, 2022
LAGUNA-BIÑAN Ammar Commercial Center, Nepa National Highway, Barangay Sto. Domingo, Biñan, Laguna 76,500.00 March 31, 2023
LAGUNA-CABUYAO-ABI Asia Brewery Complex, National Hi-way, Bgy. Sala, Cabuyao, Laguna 40,717.46 March 31, 2021
LAGUNA-CABUYAO-CENTRO MALL Unit 124, Centro Mall, Brgy. Pulo, Cabuyao, Laguna 76,788.00 June 21, 2020
LAGUNA-CALAMBA CROSSING G/F, Unit Building, J. Alcasid Business Center, Crossing Calamba City, Laguna 98,154.00 March 14, 2021
LAGUNA-CALAMBA-BUCAL G/F, Prime Unit 103 Carolina Center Building, corner Ipil-ipil Street, Barangay Bucal, Calamba, Laguna 84,078.20 November 30, 2023
LAGUNA-CALAMBA-PARIAN G/F Sta. Cecilia Business Center, Nat'l Hi-way, Bgy. Parian, Calamba, Laguna 46,546.03 October 15, 2021
LAGUNA-PASEO DE SANTA ROSA Blk. 5 Lot 3B, Sta. Rosa Estate 2-A, Balibago, Tagaytay Road, Barangay Sto. Domingo, Sta. Rosa City, Laguna 164,250.00 May 14, 2021
LAGUNA-SAN PABLO CITY COLAGO Mary Grace Building, Colago Avenue cor Quezon Avenue, San Pablo City, Laguna 54,897.50 November 30, 2021
LAGUNA-SAN PEDRO-NAT'L. HI-WAY Km. 31, National Highway, Brgy. Nueva, San Pedro, Laguna 43,500.98 February 28, 2023
LAGUNA-SINILOAN G. Redor Street, Siniloan, Laguna 77,058.80 January 17, 2021
LAGUNA-STA. CRUZ-REGIDOR 137 A. Regidor St., Sta. Cruz, Manila 104,186.25 February 21, 2024
LAGUNA-STA. ROSA Old National Hi-way, Balibago, Sta Rosa City, Laguna 104,654.55 June 09, 2021
LAGUNA-UPLB Andres Aglibut Avenue UPLB Batong Malake, Los Baños, Laguna 88,282.11 November 30, 2023
LEGAZPI CITY-ALBAY CAPITOL ANST Building II, Rizal Street, Barangay 14, Albay District, Legaspi City, Albay 80,905.46 April 30, 2024
LEGAZPI CITY-IMPERIAL 35 F. Imperial St., Legaspi City, Albay 115,000.00 May 31, 2020
LIPA CITY-AYALA HIGHWAY High 5 Sqaure, Ayala Highway, Mataas na Lupa, Lipa City, Batangas 91,065.80 June 05, 2027
LUCENA CITY-ENRIQUEZ Enriquez corner Enverga Sts., Poblacion, Lucena City, Quezon 70,000.00 September 15, 2022
MARINDUQUE-BOAC Governor Damian Reyes Street, Barangay Murallon, Boac, Marinduque 34,821.43 July 31, 2024
MARINDUQUE-STA. CRUZ G/F, RMR Building, Quezon Street, Barangay Maharlika, Santa Cruz, Marinduque 38,750.00 November 17, 2020
NAGA CITY-MAGSAYSAY AVE. G-Square Building Magsaysay Avenue cor Catmon II St., Balatas, Naga City 86,366.07 April 14, 2024
NAGA CITY-PANGANIBAN DECA Corporate Center Panganiban Drive, Barangay Tinago, Naga City, Camarines Sur 87,516.45 March 13, 2023
OR. MINDORO-PINAMALAYAN G/F, San Agustin Building, Mabini Street, Zone IV, Pinamalayan, Oriental Mindoro 27,000.00 September 30, 2020
QUEZON-ATIMONAN Our Lady of the Angels Parish Compund, Quezon Street, Atimonan,Quezon 35,000.00 July 15, 2020
QUEZON-GUMACA Andres Bonifacio Street, Barangay San Diego Poblacion, Gumaca, Quezon 80,000.00 November 29, 2020
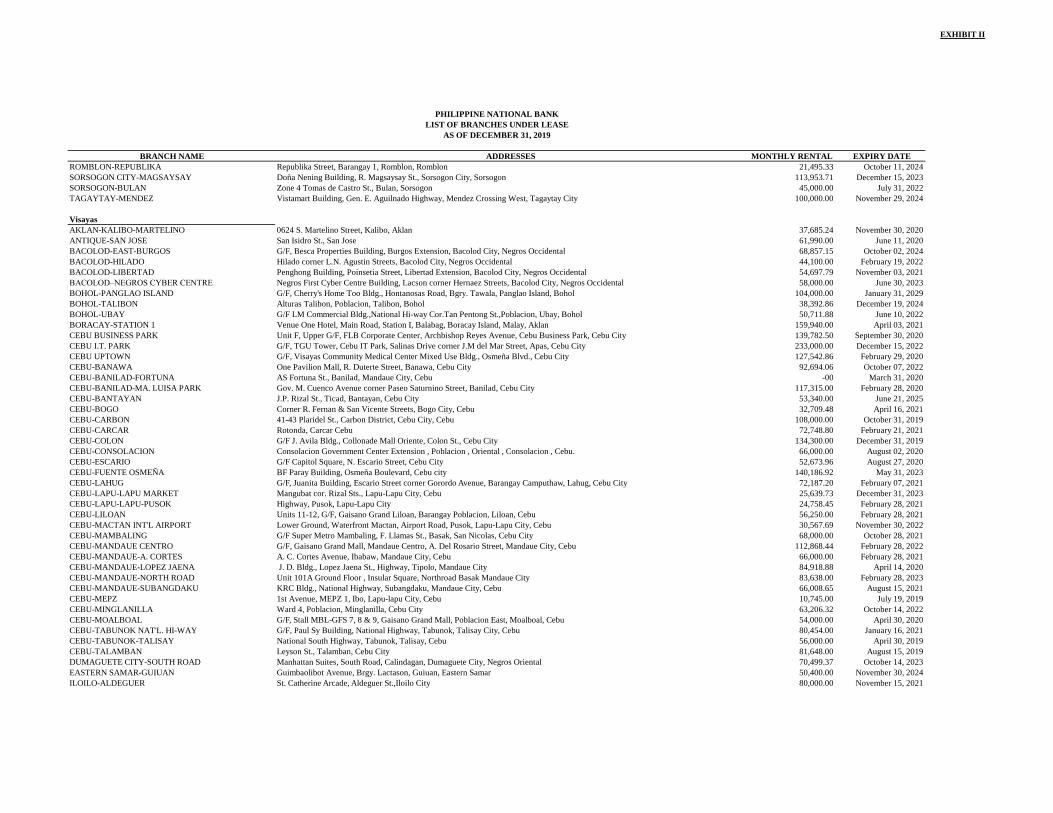
EXHIBIT II
BRANCH NAME ADDRESSES MONTHLY RENTAL EXPIRY DATE
PHILIPPINE NATIONAL BANK
LIST OF BRANCHES UNDER LEASE
AS OF DECEMBER 31, 2019
ROMBLON-REPUBLIKA Republika Street, Barangay 1, Romblon, Romblon 21,495.33 October 11, 2024
SORSOGON CITY-MAGSAYSAY Doña Nening Building, R. Magsaysay St., Sorsogon City, Sorsogon 113,953.71 December 15, 2023
SORSOGON-BULAN Zone 4 Tomas de Castro St., Bulan, Sorsogon 45,000.00 July 31, 2022
TAGAYTAY-MENDEZ Vistamart Building, Gen. E. Aguilnado Highway, Mendez Crossing West, Tagaytay City 100,000.00 November 29, 2024
Visayas
AKLAN-KALIBO-MARTELINO 0624 S. Martelino Street, Kalibo, Aklan 37,685.24 November 30, 2020
ANTIQUE-SAN JOSE San Isidro St., San Jose 61,990.00 June 11, 2020
BACOLOD-EAST-BURGOS G/F, Besca Properties Building, Burgos Extension, Bacolod City, Negros Occidental 68,857.15 October 02, 2024
BACOLOD-HILADO Hilado corner L.N. Agustin Streets, Bacolod City, Negros Occidental 44,100.00 February 19, 2022
BACOLOD-LIBERTAD Penghong Building, Poinsetia Street, Libertad Extension, Bacolod City, Negros Occidental 54,697.79 November 03, 2021
BACOLOD–NEGROS CYBER CENTRE Negros First Cyber Centre Building, Lacson corner Hernaez Streets, Bacolod City, Negros Occidental 58,000.00 June 30, 2023
BOHOL-PANGLAO ISLAND G/F, Cherry's Home Too Bldg., Hontanosas Road, Bgry. Tawala, Panglao Island, Bohol 104,000.00 January 31, 2029
BOHOL-TALIBON Alturas Talibon, Poblacion, Talibon, Bohol 38,392.86 December 19, 2024
BOHOL-UBAY G/F LM Commercial Bldg.,National Hi-way Cor.Tan Pentong St.,Poblacion, Ubay, Bohol 50,711.88 June 10, 2022
BORACAY-STATION 1 Venue One Hotel, Main Road, Station I, Balabag, Boracay Island, Malay, Aklan 159,940.00 April 03, 2021
CEBU BUSINESS PARK Unit F, Upper G/F, FLB Corporate Center, Archbishop Reyes Avenue, Cebu Business Park, Cebu City 139,782.50 September 30, 2020
CEBU I.T. PARK G/F, TGU Tower, Cebu IT Park, Salinas Drive corner J.M del Mar Street, Apas, Cebu City 233,000.00 December 15, 2022
CEBU UPTOWN G/F, Visayas Community Medical Center Mixed Use Bldg., Osmeña Blvd., Cebu City 127,542.86 February 29, 2020
CEBU-BANAWA One Pavilion Mall, R. Duterte Street, Banawa, Cebu City 92,694.06 October 07, 2022
CEBU-BANILAD-FORTUNA AS Fortuna St., Banilad, Mandaue City, Cebu -00 March 31, 2020
CEBU-BANILAD-MA. LUISA PARK Gov. M. Cuenco Avenue corner Paseo Saturnino Street, Banilad, Cebu City 117,315.00 February 28, 2020
CEBU-BANTAYAN J.P. Rizal St., Ticad, Bantayan, Cebu City 53,340.00 June 21, 2025
CEBU-BOGO Corner R. Fernan & San Vicente Streets, Bogo City, Cebu 32,709.48 April 16, 2021
CEBU-CARBON 41-43 Plaridel St., Carbon District, Cebu City, Cebu 108,000.00 October 31, 2019
CEBU-CARCAR Rotonda, Carcar Cebu 72,748.80 February 21, 2021
CEBU-COLON G/F J. Avila Bldg., Collonade Mall Oriente, Colon St., Cebu City 134,300.00 December 31, 2019
CEBU-CONSOLACION Consolacion Government Center Extension , Poblacion , Oriental , Consolacion , Cebu. 66,000.00 August 02, 2020
CEBU-ESCARIO G/F Capitol Square, N. Escario Street, Cebu City 52,673.96 August 27, 2020
CEBU-FUENTE OSMEÑA BF Paray Building, Osmeña Boulevard, Cebu city 140,186.92 May 31, 2023
CEBU-LAHUG G/F, Juanita Building, Escario Street corner Gorordo Avenue, Barangay Camputhaw, Lahug, Cebu City 72,187.20 February 07, 2021
CEBU-LAPU-LAPU MARKET Mangubat cor. Rizal Sts., Lapu-Lapu City, Cebu 25,639.73 December 31, 2023
CEBU-LAPU-LAPU-PUSOK Highway, Pusok, Lapu-Lapu City 24,758.45 February 28, 2021
CEBU-LILOAN Units 11-12, G/F, Gaisano Grand Liloan, Barangay Poblacion, Liloan, Cebu 56,250.00 February 28, 2021
CEBU-MACTAN INT'L AIRPORT Lower Ground, Waterfront Mactan, Airport Road, Pusok, Lapu-Lapu City, Cebu 30,567.69 November 30, 2022
CEBU-MAMBALING G/F Super Metro Mambaling, F. Llamas St., Basak, San Nicolas, Cebu City 68,000.00 October 28, 2021
CEBU-MANDAUE CENTRO G/F, Gaisano Grand Mall, Mandaue Centro, A. Del Rosario Street, Mandaue City, Cebu 112,868.44 February 28, 2022
CEBU-MANDAUE-A. CORTES A. C. Cortes Avenue, Ibabaw, Mandaue City, Cebu 66,000.00 February 28, 2021
CEBU-MANDAUE-LOPEZ JAENA J. D. Bldg., Lopez Jaena St., Highway, Tipolo, Mandaue City 84,918.88 April 14, 2020
CEBU-MANDAUE-NORTH ROAD Unit 101A Ground Floor , Insular Square, Northroad Basak Mandaue City 83,638.00 February 28, 2023
CEBU-MANDAUE-SUBANGDAKU KRC Bldg., National Highway, Subangdaku, Mandaue City, Cebu 66,008.65 August 15, 2021
CEBU-MEPZ 1st Avenue, MEPZ 1, Ibo, Lapu-lapu City, Cebu 10,745.00 July 19, 2019
CEBU-MINGLANILLA Ward 4, Poblacion, Minglanilla, Cebu City 63,206.32 October 14, 2022
CEBU-MOALBOAL G/F, Stall MBL-GFS 7, 8 & 9, Gaisano Grand Mall, Poblacion East, Moalboal, Cebu 54,000.00 April 30, 2020
CEBU-TABUNOK NAT'L. HI-WAY G/F, Paul Sy Building, National Highway, Tabunok, Talisay City, Cebu 80,454.00 January 16, 2021
CEBU-TABUNOK-TALISAY National South Highway, Tabunok, Talisay, Cebu 56,000.00 April 30, 2019
CEBU-TALAMBAN Leyson St., Talamban, Cebu City 81,648.00 August 15, 2019
DUMAGUETE CITY-SOUTH ROAD Manhattan Suites, South Road, Calindagan, Dumaguete City, Negros Oriental 70,499.37 October 14, 2023
EASTERN SAMAR-GUIUAN Guimbaolibot Avenue, Brgy. Lactason, Guiuan, Eastern Samar 50,400.00 November 30, 2024
ILOILO-ALDEGUER St. Catherine Arcade, Aldeguer St., Iloilo City 80,000.00 November 15, 2021
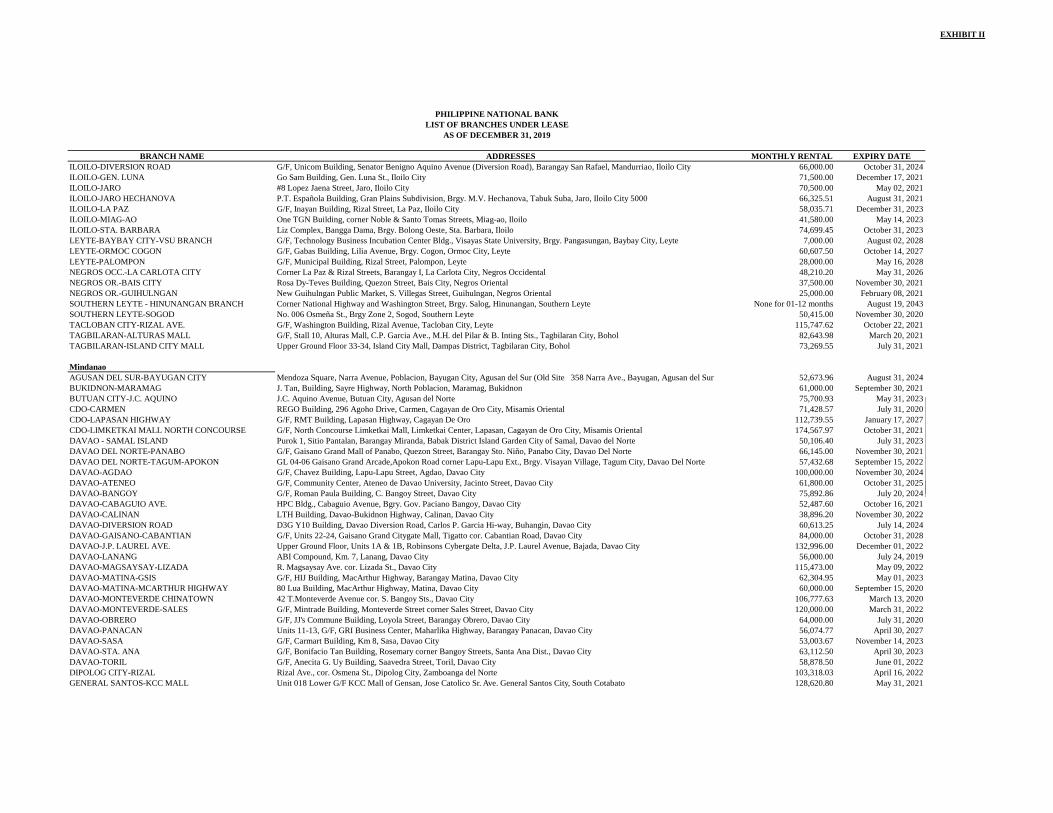
EXHIBIT II
BRANCH NAME ADDRESSES MONTHLY RENTAL EXPIRY DATE
PHILIPPINE NATIONAL BANK
LIST OF BRANCHES UNDER LEASE
AS OF DECEMBER 31, 2019
ILOILO-DIVERSION ROAD G/F, Unicom Building, Senator Benigno Aquino Avenue (Diversion Road), Barangay San Rafael, Mandurriao, Iloilo City 66,000.00 October 31, 2024
ILOILO-GEN. LUNA Go Sam Building, Gen. Luna St., Iloilo City 71,500.00 December 17, 2021
ILOILO-JARO #8 Lopez Jaena Street, Jaro, Iloilo City 70,500.00 May 02, 2021
ILOILO-JARO HECHANOVA P.T. Española Building, Gran Plains Subdivision, Brgy. M.V. Hechanova, Tabuk Suba, Jaro, Iloilo City 5000 66,325.51 August 31, 2021
ILOILO-LA PAZ G/F, Inayan Building, Rizal Street, La Paz, Iloilo City 58,035.71 December 31, 2023
ILOILO-MIAG-AO One TGN Building, corner Noble & Santo Tomas Streets, Miag-ao, Iloilo 41,580.00 May 14, 2023
ILOILO-STA. BARBARA Liz Complex, Bangga Dama, Brgy. Bolong Oeste, Sta. Barbara, Iloilo 74,699.45 October 31, 2023
LEYTE-BAYBAY CITY-VSU BRANCH G/F, Technology Business Incubation Center Bldg., Visayas State University, Brgy. Pangasungan, Baybay City, Leyte 7,000.00 August 02, 2028
LEYTE-ORMOC COGON G/F, Gabas Building, Lilia Avenue, Brgy. Cogon, Ormoc City, Leyte 60,607.50 October 14, 2027
LEYTE-PALOMPON G/F, Municipal Building, Rizal Street, Palompon, Leyte 28,000.00 May 16, 2028
NEGROS OCC.-LA CARLOTA CITY Corner La Paz & Rizal Streets, Barangay I, La Carlota City, Negros Occidental 48,210.20 May 31, 2026
NEGROS OR.-BAIS CITY Rosa Dy-Teves Building, Quezon Street, Bais City, Negros Oriental 37,500.00 November 30, 2021
NEGROS OR.-GUIHULNGAN New Guihulngan Public Market, S. Villegas Street, Guihulngan, Negros Oriental 25,000.00 February 08, 2021
SOUTHERN LEYTE - HINUNANGAN BRANCH Corner National Highway and Washington Street, Brgy. Salog, Hinunangan, Southern Leyte None for 01-12 months August 19, 2043
SOUTHERN LEYTE-SOGOD No. 006 Osmeña St., Brgy Zone 2, Sogod, Southern Leyte 50,415.00 November 30, 2020
TACLOBAN CITY-RIZAL AVE. G/F, Washington Building, Rizal Avenue, Tacloban City, Leyte 115,747.62 October 22, 2021
TAGBILARAN-ALTURAS MALL G/F, Stall 10, Alturas Mall, C.P. Garcia Ave., M.H. del Pilar & B. Inting Sts., Tagbilaran City, Bohol 82,643.98 March 20, 2021
TAGBILARAN-ISLAND CITY MALL Upper Ground Floor 33-34, Island City Mall, Dampas District, Tagbilaran City, Bohol 73,269.55 July 31, 2021
Mindanao
AGUSAN DEL SUR-BAYUGAN CITY Mendoza Square, Narra Avenue, Poblacion, Bayugan City, Agusan del Sur (Old Site 358 Narra Ave., Bayugan, Agusan del Sur 52,673.96 August 31, 2024
BUKIDNON-MARAMAG J. Tan, Building, Sayre Highway, North Poblacion, Maramag, Bukidnon 61,000.00 September 30, 2021
BUTUAN CITY-J.C. AQUINO J.C. Aquino Avenue, Butuan City, Agusan del Norte 75,700.93 May 31, 2023
CDO-CARMEN REGO Building, 296 Agoho Drive, Carmen, Cagayan de Oro City, Misamis Oriental 71,428.57 July 31, 2020
CDO-LAPASAN HIGHWAY G/F, RMT Building, Lapasan Highway, Cagayan De Oro 112,739.55 January 17, 2027
CDO-LIMKETKAI MALL NORTH CONCOURSE G/F, North Concourse Limketkai Mall, Limketkai Center, Lapasan, Cagayan de Oro City, Misamis Oriental 174,567.97 October 31, 2021
DAVAO - SAMAL ISLAND Purok 1, Sitio Pantalan, Barangay Miranda, Babak District Island Garden City of Samal, Davao del Norte 50,106.40 July 31, 2023
DAVAO DEL NORTE-PANABO G/F, Gaisano Grand Mall of Panabo, Quezon Street, Barangay Sto. Niño, Panabo City, Davao Del Norte 66,145.00 November 30, 2021
DAVAO DEL NORTE-TAGUM-APOKON GL 04-06 Gaisano Grand Arcade,Apokon Road corner Lapu-Lapu Ext., Brgy. Visayan Village, Tagum City, Davao Del Norte 57,432.68 September 15, 2022
DAVAO-AGDAO G/F, Chavez Building, Lapu-Lapu Street, Agdao, Davao City 100,000.00 November 30, 2024
DAVAO-ATENEO G/F, Community Center, Ateneo de Davao University, Jacinto Street, Davao City 61,800.00 October 31, 2025
DAVAO-BANGOY G/F, Roman Paula Building, C. Bangoy Street, Davao City 75,892.86 July 20, 2024
DAVAO-CABAGUIO AVE. HPC Bldg., Cabaguio Avenue, Bgry. Gov. Paciano Bangoy, Davao City 52,487.60 October 16, 2021
DAVAO-CALINAN LTH Building, Davao-Bukidnon Highway, Calinan, Davao City 38,896.20 November 30, 2022
DAVAO-DIVERSION ROAD D3G Y10 Building, Davao Diversion Road, Carlos P. Garcia Hi-way, Buhangin, Davao City 60,613.25 July 14, 2024
DAVAO-GAISANO-CABANTIAN G/F, Units 22-24, Gaisano Grand Citygate Mall, Tigatto cor. Cabantian Road, Davao City 84,000.00 October 31, 2028
DAVAO-J.P. LAUREL AVE. Upper Ground Floor, Units 1A & 1B, Robinsons Cybergate Delta, J.P. Laurel Avenue, Bajada, Davao City 132,996.00 December 01, 2022
DAVAO-LANANG ABI Compound, Km. 7, Lanang, Davao City 56,000.00 July 24, 2019
DAVAO-MAGSAYSAY-LIZADA R. Magsaysay Ave. cor. Lizada St., Davao City 115,473.00 May 09, 2022
DAVAO-MATINA-GSIS G/F, HIJ Building, MacArthur Highway, Barangay Matina, Davao City 62,304.95 May 01, 2023
DAVAO-MATINA-MCARTHUR HIGHWAY 80 Lua Building, MacArthur Highway, Matina, Davao City 60,000.00 September 15, 2020
DAVAO-MONTEVERDE CHINATOWN 42 T.Monteverde Avenue cor. S. Bangoy Sts., Davao City 106,777.63 March 13, 2020
DAVAO-MONTEVERDE-SALES G/F, Mintrade Building, Monteverde Street corner Sales Street, Davao City 120,000.00 March 31, 2022
DAVAO-OBRERO G/F, JJ's Commune Building, Loyola Street, Barangay Obrero, Davao City 64,000.00 July 31, 2020
DAVAO-PANACAN Units 11-13, G/F, GRI Business Center, Maharlika Highway, Barangay Panacan, Davao City 56,074.77 April 30, 2027
DAVAO-SASA G/F, Carmart Building, Km 8, Sasa, Davao City 53,003.67 November 14, 2023
DAVAO-STA. ANA G/F, Bonifacio Tan Building, Rosemary corner Bangoy Streets, Santa Ana Dist., Davao City 63,112.50 April 30, 2023
DAVAO-TORIL G/F, Anecita G. Uy Building, Saavedra Street, Toril, Davao City 58,878.50 June 01, 2022
DIPOLOG CITY-RIZAL Rizal Ave., cor. Osmena St., Dipolog City, Zamboanga del Norte 103,318.03 April 16, 2022
GENERAL SANTOS-KCC MALL Unit 018 Lower G/F KCC Mall of Gensan, Jose Catolico Sr. Ave. General Santos City, South Cotabato 128,620.80 May 31, 2021
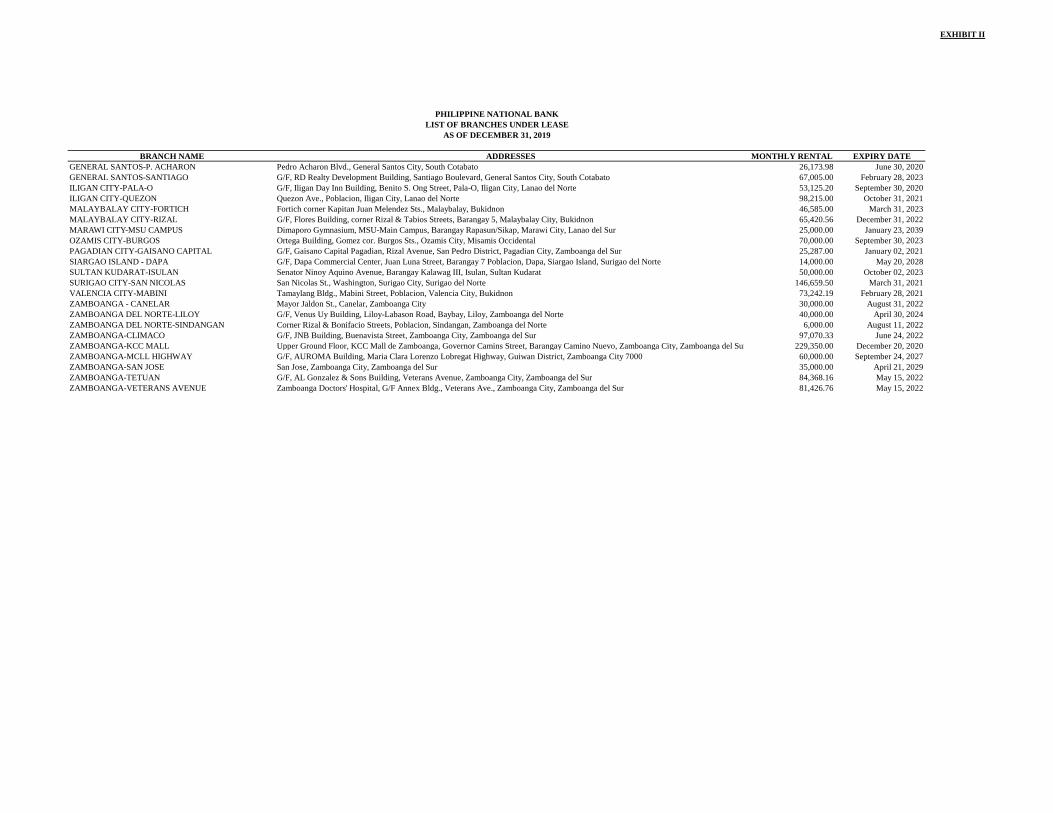
EXHIBIT II
BRANCH NAME ADDRESSES MONTHLY RENTAL EXPIRY DATE
PHILIPPINE NATIONAL BANK
LIST OF BRANCHES UNDER LEASE
AS OF DECEMBER 31, 2019
GENERAL SANTOS-P. ACHARON Pedro Acharon Blvd., General Santos City, South Cotabato 26,173.98 June 30, 2020
GENERAL SANTOS-SANTIAGO G/F, RD Realty Development Building, Santiago Boulevard, General Santos City, South Cotabato 67,005.00 February 28, 2023
ILIGAN CITY-PALA-O G/F, Iligan Day Inn Building, Benito S. Ong Street, Pala-O, Iligan City, Lanao del Norte 53,125.20 September 30, 2020
ILIGAN CITY-QUEZON Quezon Ave., Poblacion, Iligan City, Lanao del Norte 98,215.00 October 31, 2021
MALAYBALAY CITY-FORTICH Fortich corner Kapitan Juan Melendez Sts., Malaybalay, Bukidnon 46,585.00 March 31, 2023
MALAYBALAY CITY-RIZAL G/F, Flores Building, corner Rizal & Tabios Streets, Barangay 5, Malaybalay City, Bukidnon 65,420.56 December 31, 2022
MARAWI CITY-MSU CAMPUS Dimaporo Gymnasium, MSU-Main Campus, Barangay Rapasun/Sikap, Marawi City, Lanao del Sur 25,000.00 January 23, 2039
OZAMIS CITY-BURGOS Ortega Building, Gomez cor. Burgos Sts., Ozamis City, Misamis Occidental 70,000.00 September 30, 2023
PAGADIAN CITY-GAISANO CAPITAL G/F, Gaisano Capital Pagadian, Rizal Avenue, San Pedro District, Pagadian City, Zamboanga del Sur 25,287.00 January 02, 2021
SIARGAO ISLAND - DAPA G/F, Dapa Commercial Center, Juan Luna Street, Barangay 7 Poblacion, Dapa, Siargao Island, Surigao del Norte 14,000.00 May 20, 2028
SULTAN KUDARAT-ISULAN Senator Ninoy Aquino Avenue, Barangay Kalawag III, Isulan, Sultan Kudarat 50,000.00 October 02, 2023
SURIGAO CITY-SAN NICOLAS San Nicolas St., Washington, Surigao City, Surigao del Norte 146,659.50 March 31, 2021
VALENCIA CITY-MABINI Tamaylang Bldg., Mabini Street, Poblacion, Valencia City, Bukidnon 73,242.19 February 28, 2021
ZAMBOANGA - CANELAR Mayor Jaldon St., Canelar, Zamboanga City 30,000.00 August 31, 2022
ZAMBOANGA DEL NORTE-LILOY G/F, Venus Uy Building, Liloy-Labason Road, Baybay, Liloy, Zamboanga del Norte 40,000.00 April 30, 2024
ZAMBOANGA DEL NORTE-SINDANGAN Corner Rizal & Bonifacio Streets, Poblacion, Sindangan, Zamboanga del Norte 6,000.00 August 11, 2022
ZAMBOANGA-CLIMACO G/F, JNB Building, Buenavista Street, Zamboanga City, Zamboanga del Sur 97,070.33 June 24, 2022
ZAMBOANGA-KCC MALL Upper Ground Floor, KCC Mall de Zamboanga, Governor Camins Street, Barangay Camino Nuevo, Zamboanga City, Zamboanga del Sur 229,350.00 December 20, 2020
ZAMBOANGA-MCLL HIGHWAY G/F, AUROMA Building, Maria Clara Lorenzo Lobregat Highway, Guiwan District, Zamboanga City 7000 60,000.00 September 24, 2027
ZAMBOANGA-SAN JOSE San Jose, Zamboanga City, Zamboanga del Sur 35,000.00 April 21, 2029
ZAMBOANGA-TETUAN G/F, AL Gonzalez & Sons Building, Veterans Avenue, Zamboanga City, Zamboanga del Sur 84,368.16 May 15, 2022
ZAMBOANGA-VETERANS AVENUE Zamboanga Doctors' Hospital, G/F Annex Bldg., Veterans Ave., Zamboanga City, Zamboanga del Sur 81,426.76 May 15, 2022
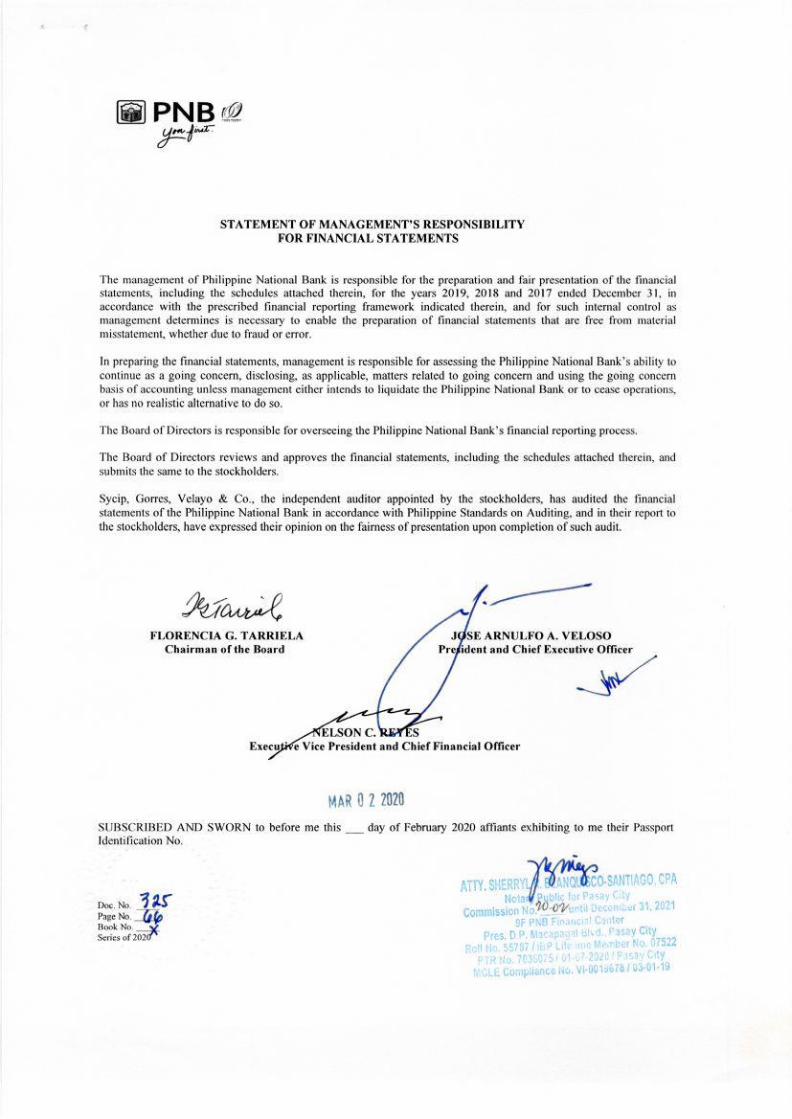
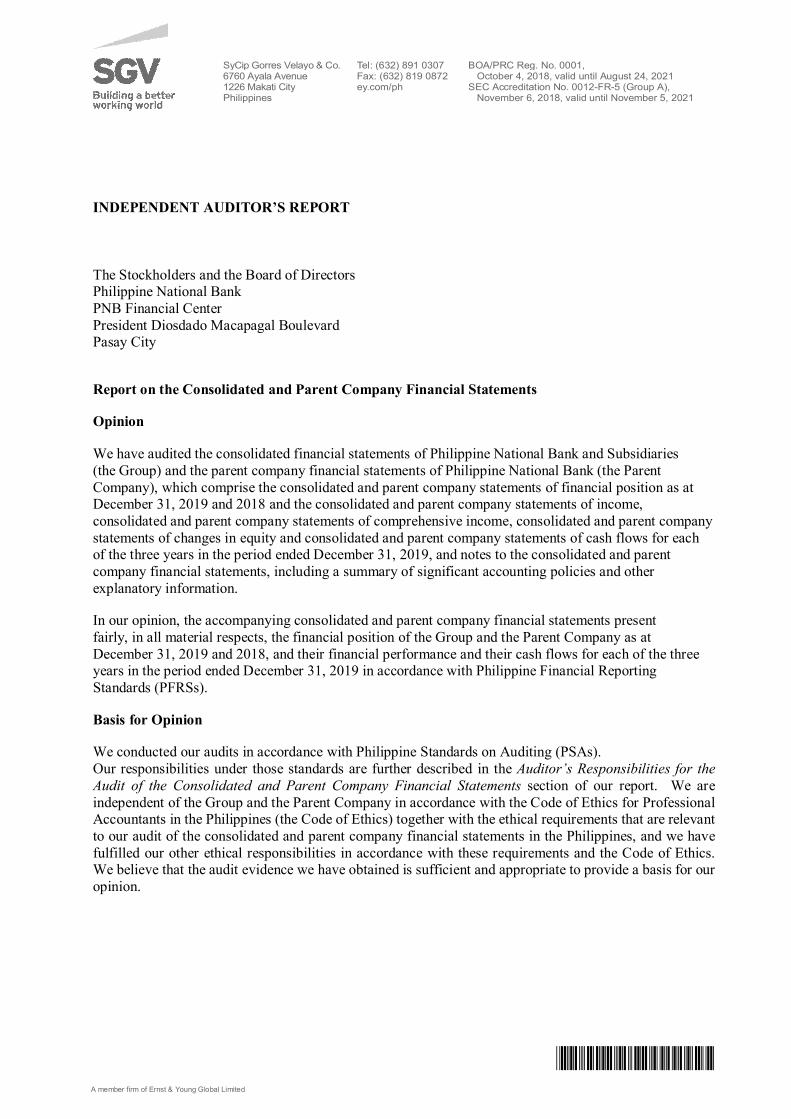
*SGVFS038920*
INDEPENDENT AUDITOR’S REPORT
The Stockholders and the Board of DirectorsPhilippine National BankPNB Financial CenterPresident Diosdado Macapagal BoulevardPasay City
Report on the Consolidated and Parent Company Financial Statements
Opinion
We have audited the consolidated financial statements of Philippine National Bank and Subsidiaries(the Group) and the parent company financial statements of Philippine National Bank (the ParentCompany), which comprise the consolidated and parent company statements of financial position as atDecember 31, 2019 and 2018 and the consolidated and parent company statements of income,consolidated and parent company statements of comprehensive income, consolidated and parent companystatements of changes in equity and consolidated and parent company statements of cash flows for eachof the three years in the period ended December 31, 2019, and notes to the consolidated and parentcompany financial statements, including a summary of significant accounting policies and otherexplanatory information.
In our opinion, the accompanying consolidated and parent company financial statements presentfairly, in all material respects, the financial position of the Group and the Parent Company as atDecember 31, 2019 and 2018, and their financial performance and their cash flows for each of the threeyears in the period ended December 31, 2019 in accordance with Philippine Financial ReportingStandards (PFRSs).
Basis for Opinion
We conducted our audits in accordance with Philippine Standards on Auditing (PSAs).Our responsibilities under those standards are further described in the Auditor’s Responsibilities for theAudit of the Consolidated and Parent Company Financial Statements section of our report. We areindependent of the Group and the Parent Company in accordance with the Code of Ethics for ProfessionalAccountants in the Philippines (the Code of Ethics) together with the ethical requirements that are relevantto our audit of the consolidated and parent company financial statements in the Philippines, and we havefulfilled our other ethical responsibilities in accordance with these requirements and the Code of Ethics.We believe that the audit evidence we have obtained is sufficient and appropriate to provide a basis for ouropinion.
SyCip Gorres Velayo & Co.6760 Ayala Avenue1226 Makati CityPhilippines
Tel: (632) 891 0307Fax: (632) 819 0872ey.com/ph
BOA/PRC Reg. No. 0001, October 4, 2018, valid until August 24, 2021SEC Accreditation No. 0012-FR-5 (Group A), November 6, 2018, valid until November 5, 2021
A member firm of Ernst & Young Global Limited
*SGVFS038920*
- 2 -
Key Audit Matters
Key audit matters are those matters that, in our professional judgment, were of most significance in ouraudit of the consolidated and parent company financial statements of the current period. These matterswere addressed in the context of our audit of the consolidated and parent company financial statements asa whole, and in forming our opinion thereon, and we do not provide a separate opinion on these matters.For each matter below, our description of how our audit addressed the matter is provided in that context.
We have fulfilled the responsibilities described in the Auditor’s Responsibilities for the Audit of theConsolidated and Parent Company Financial Statements section of our report, including in relation tothese matters. Accordingly, our audit included the performance of procedures designed to respond to ourassessment of the risks of material misstatement of the consolidated and parent company financialstatements. The results of our audit procedures, including the procedures performed to address thematters below, provide the basis for our audit opinion on the accompanying consolidated and parentcompany financial statements.
Applicable to the audit of the consolidated and parent company financial statements
Adoption of PFRS 16, LeasesEffective January 1, 2019, the Group and the Parent Company adopted PFRS 16, Leases, under themodified retrospective approach which resulted in significant changes in the Group’s and the ParentCompany’s accounting policy for leases. The Group’s and the Parent Company’s adoption of PFRS 16 issignificant to our audit because the Group and the Parent Company have high volume of leaseagreements; the recorded amounts are material to the consolidated and parent company financialstatements; and adoption involves application of significant judgment and estimation in determining thelease term, including evaluating whether the Group and the Parent Company are reasonably certain toexercise options to extend or terminate the lease, and in determining the incremental borrowing rate. Thisresulted in the recognition of right-of-use assets amounting to P=1.8 billion and P=1.6 billion for the Groupand Parent Company, respectively, and lease liability amounting to P=1.9 billion and P=1.6 billion for theGroup and the Parent Company, respectively, as of January 1, 2019, recognition of depreciation expenseof P=568.1 million and P=488.2 million for the Group and the Parent Company, respectively, and interestexpense of P=131.7 million and P=118.4 million and for the Group and the Parent Company, respectively,for the year ended December 31, 2019.
The disclosures related to the adoption of PFRS 16 are included in Notes 2, 11 and 29 to the financialstatements.
Audit response
We obtained an understanding of the Group’s and the Parent Company’s process in implementing thenew standard, including the determination of the population of the lease contracts covered by PFRS 16,the application of the short-term lease and low value assets exemptions, the selection of the transitionapproach and any election of available practical expedients. We tested the completeness of the populationof lease agreements by comparing the number of leases per operational report against the lease contractdatabase. On a test basis, we inspected lease agreements (i.e., lease agreements existing prior to theadoption of PFRS 16 and new lease agreements) from the contract database, identified their contractualterms and conditions, and traced these contractual terms and conditions to the lease calculation preparedby management, which covers the calculation of the financial impact of PFRS 16, including the transitionadjustments.
A member firm of Ernst & Young Global Limited
*SGVFS038920*
- 3 -
For selected lease contracts with renewal and/or termination option, we reviewed the management’sassessment of whether it is reasonably certain that the Group and the Parent Company will exercise theoption to renew or not exercise the option to terminate. We tested the parameters used in thedetermination of the incremental borrowing rate by reference to market data. We test computed the leasecalculation prepared by management on a sample basis, including the transition adjustments.
We reviewed the disclosures related to the transition adjustments based on the requirements of PFRS 16and PAS 8, Accounting Policies, Changes in Accounting Estimates and Errors.
Recognition of Allowance for Credit Losses on Loans and ReceivablesThe Group’s and the Parent Company’s application of the expected credit losses (ECL) model indetermining the allowance for credit losses on loans and receivables is significant to our audit as itinvolves the exercise of significant management judgment. Key areas of judgment include: segmentingthe Group’s and the Parent Company’s credit risk exposures; determining the method to estimate ECL;defining default; identifying exposures with significant deterioration in credit quality; determiningassumptions to be used in the ECL model such as the counterparty credit risk rating, the expected life ofthe financial asset and expected recoveries from defaulted accounts; and incorporating forward-lookinginformation in calculating ECL.
The allowance for credit losses as of December 31, 2019 amounted to P=18.4 billion and P=14.3 billion forthe Group and the Parent Company, respectively. Provision for credit losses in 2019 amounted toP=2.5 billion and P=1.6 billion for the Group and the Parent Company, respectively.
Refer to Note 16 of the financial statements for the disclosure on the details of the allowance for creditlosses using the ECL model.
Audit ResponseWe obtained an understanding of the board approved methodologies and models used for the Group’s andthe Parent Company’s different credit exposures and assessed whether these considered the requirementsof PFRS 9 to reflect an unbiased and probability-weighted outcome, and to consider time value of moneyand the best available forward-looking information.
We (a) assessed the Group’s and the Parent Company’s segmentation of its credit risk exposures based onhomogeneity of credit risk characteristics; (b) tested the definition of default and significant increase incredit risk criteria against historical analysis of accounts and credit risk management policies andpractices in place, (c) tested the Group’s and the Parent Company’s application of internal credit riskrating system by reviewing the ratings of sample credit exposures; (d) assessed whether expected life isdifferent from the contractual life by testing the maturity dates reflected in the Group’s and the ParentCompany’s records and considering management’s assumptions regarding future collections, advances,extensions, renewals and modifications; (e) tested loss given default by inspecting historical recoveriesand related costs, write-offs and collateral valuations; (f) tested exposure at default consideringoutstanding commitments and repayment scheme; (g) checked the reasonableness of forward-lookinginformation used through corroboration using publicly available information and our understanding of theGroup’s and the Parent Company’s lending portfolios and broader industry knowledge; and (h) tested theeffective interest rate used in discounting the expected loss.
A member firm of Ernst & Young Global Limited
*SGVFS038920*
- 4 -
Further, we checked the data used in the ECL models by reconciling data from source system reports tothe data warehouse and from the data warehouse to the loss allowance analysis/models and financialreporting systems. To the extent that the loss allowance analysis is based on credit exposures that havebeen disaggregated into subsets of debt financial assets with similar risk characteristics, we traced or re-performed the disaggregation from source systems to the loss allowance analysis. We also assessed theassumptions used where there are missing or insufficient data.
We recalculated impairment provisions on a sample basis. We checked the appropriateness of thetransition adjustments and reviewed the completeness of the disclosures made in the financial statements.
We involved our internal specialists in the performance of the above procedures.
Recoverability of Deferred Tax AssetsAs of December 31, 2019, the deferred tax assets of the Group and the Parent Company amounted toP=2.6 billion and P=2.0 billion, respectively. The analysis of the recoverability of deferred tax assets wassignificant to our audit because the assessment process is complex and judgmental, and is based onassumptions that are affected by expected future market or economic conditions and the expectedperformance of the Group and the Parent Company.
The disclosures in relation to deferred income taxes are included in Note 30 to the financial statements.
Audit responseWe reviewed the management’s assessment on the availability of future taxable income in reference tofinancial forecast and tax strategies. We evaluated management’s forecast by comparing the loanportfolio and deposit growth rates with that of the industry and the historical performance of the Group.We also reviewed the timing of the reversal of future taxable and deductible temporary differences.
Impairment Testing of GoodwillAs at December 31, 2019, the Group and the Parent Company has goodwill amounting toP=13.4 billion as a result of the acquisition of Allied Banking Corporation in 2013. Under PFRS, theGroup is required annually to test the amount of goodwill for impairment. Goodwill has been allocatedto three cash generating units (CGUs) namely retail banking, corporate banking and global banking andmarket. The Group performed the impairment testing using the value in use calculation. The annualimpairment test was significant to our audit because it involves significant judgment and is based onassumptions such as estimates of future cash flows from business, interest margin, discount rate,current local gross domestic product and long-term growth rate used to project cash flows.
The disclosures related to goodwill impairment are included in Note 14 to the financial statements.
A member firm of Ernst & Young Global LimitedA member firm of Ernst & Young Global Limited
*SGVFS038920*
- 5 -
Audit ResponseWe involved our internal specialist in evaluating the methodology and assumptions used by the Group.These assumptions include estimates of future cash flows from business, interest margin, discount rateand long-term growth rate used to project cash flows. We compared the interest margin and long-termgrowth rate to the historical performance of the CGUs and to economic and industry forecasts. We testedthe current local gross domestic product and parameters used in the derivation of the discount rate againstmarket data.
Other Information
Management is responsible for the other information. The other information comprises the informationincluded in the SEC Form 20-IS (Definitive Information Statement), SEC Form 17-A and Annual Reportfor the year ended December 31, 2019, but does not include the consolidated and parent companyfinancial statements and our auditor’s report thereon. The SEC Form 20-IS (Definitive InformationStatement) SEC Form 17-A and Annual Report for the year ended December 31, 2019 are expected to bemade available to us after the date of this auditor's report.
Our opinion on the consolidated and parent company financial statements does not cover the otherinformation and we will not express any form of assurance conclusion thereon.
In connection with our audit of the consolidated and parent company financial statements, ourresponsibility is to read the other information identified above when it becomes available and, in doingso, consider whether the other information is materially inconsistent with the financial statements or ourknowledge obtained in the audit, or otherwise appears to be materially misstated.
Responsibilities of Management and Those Charged with Governance for the Consolidated andParent Company Financial Statements
Management is responsible for the preparation and fair presentation of the consolidated and parentcompany financial statements in accordance with PFRSs, and for such internal control as managementdetermines is necessary to enable the preparation of financial statements that are free from materialmisstatement, whether due to fraud or error.
In preparing the consolidated and parent company financial statements, management is responsible forassessing the Group’s and the Parent Company’s ability to continue as a going concern, disclosing, asapplicable, matters related to going concern and using the going concern basis of accounting unlessmanagement either intends to liquidate the Group and the Parent Company or to cease operations, or hasno realistic alternative but to do so.
Those charged with governance are responsible for overseeing the Group’s and the Parent Company’sfinancial reporting process.
A member firm of Ernst & Young Global Limited
*SGVFS038920*
- 6 -
Auditor’s Responsibilities for the Audit of the Consolidated and Parent Company FinancialStatements
Our objectives are to obtain reasonable assurance about whether the consolidated and parent companyfinancial statements as a whole are free from material misstatement, whether due to fraud or error, and toissue an auditor’s report that includes our opinion. Reasonable assurance is a high level of assurance, butis not a guarantee that an audit conducted in accordance with PSAs will always detect a materialmisstatement when it exists. Misstatements can arise from fraud or error and are considered material if,individually or in the aggregate, they could reasonably be expected to influence the economic decisions ofusers taken on the basis of these financial statements.
As part of an audit in accordance with PSAs, we exercise professional judgment and maintainprofessional skepticism throughout the audit. We also:
· Identify and assess the risks of material misstatement of the financial statements, whether due tofraud or error, design and perform audit procedures responsive to those risks, and obtain auditevidence that is sufficient and appropriate to provide a basis for our opinion. The risk of notdetecting a material misstatement resulting from fraud is higher than for one resulting from error, asfraud may involve collusion, forgery, intentional omissions, misrepresentations, or the override ofinternal control.
· Obtain an understanding of internal control relevant to the audit in order to design audit proceduresthat are appropriate in the circumstances, but not for the purpose of expressing an opinion on theeffectiveness of the Group’s and the Parent Company’s internal control.
· Evaluate the appropriateness of accounting policies used and the reasonableness of accountingestimates and related disclosures made by management.
· Conclude on the appropriateness of management’s use of the going concern basis of accounting and,based on the audit evidence obtained, whether a material uncertainty exists related to events orconditions that may cast significant doubt on the Group’s and the Parent Company’s ability tocontinue as a going concern. If we conclude that a material uncertainty exists, we are required todraw attention in our auditor’s report to the related disclosures in the consolidated and parentcompany financial statements or, if such disclosures are inadequate, to modify our opinion. Ourconclusions are based on the audit evidence obtained up to the date of our auditor’s report. However,future events or conditions may cause the Group and the Parent Company to cease to continue as agoing concern.
· Evaluate the overall presentation, structure and content of the consolidated and parent companyfinancial statements, including the disclosures, and whether the consolidated and parent companyfinancial statements represent the underlying transactions and events in a manner that achieves fairpresentation.
Obtain sufficient appropriate audit evidence regarding the financial information of the entities or businessactivities within the Group and the Parent Company to express an opinion on the consolidated and parentcompany financial statements. We are responsible for the direction, supervision and performance of thegroup audit. We remain solely responsible for our audit opinion.
A member firm of Ernst & Young Global Limited
*SGVFS038920*
- 7 -
We communicate with those charged with governance regarding, among other matters, the planned scopeand timing of the audit and significant audit findings, including any significant deficiencies in internalcontrol that we identify during our audit.
We also provide those charged with governance with a statement that we have complied with relevantethical requirements regarding independence, and to communicate with them all relationships and othermatters that may reasonably be thought to bear on our independence, and where applicable, relatedsafeguards.
From the matters communicated with those charged with governance, we determine those matters thatwere of most significance in the audit of the financial statements of the current period and are thereforethe key audit matters. We describe these matters in our auditor’s report unless law or regulationprecludes public disclosure about the matter or when, in extremely rare circumstances, we determine thata matter should not be communicated in our report because the adverse consequences of doing so wouldreasonably be expected to outweigh the public interest benefits of such communication.
Report on the Supplementary Information Required Under Revenue Regulations 15-2010 andBangko Sentral ng Pilipinas Circular No. 1074
Our audits were conducted for the purpose of forming an opinion on the basic financial statements takenas a whole. The supplementary information required under Revenue Regulations 15-2010 in Note 39 andthe Bangko Sentral ng Pilipinas Circular No. 1074 in Note 40 to the financial statements are presented forpurposes of filing with the Bureau of Internal Revenue and Bangko Sentral ng Pilipinas, respectively, andis not a required part of the basic financial statements. Such information is the responsibility of themanagement of Philippine National Bank. The information has been subjected to the auditing proceduresapplied in our audit of the basic financial statements. In our opinion, the information is fairly stated, in allmaterial respects, in relation to the basic financial statements taken as a whole.
The engagement partner on the audit resulting in this independent auditor’s report isJaneth T. Nuñez-Javier.
SYCIP GORRES VELAYO & CO.
Janeth T. Nuñez-JavierPartnerCPA Certificate No. 111092SEC Accreditation No. 1328-AR-2 (Group A), July 9, 2019, valid until July 8, 2022Tax Identification No. 900-322-673BIR Accreditation No. 08-001998-69-2018, February 26, 2018, valid until February 25, 2021PTR No. 8125274, January 7, 2020, Makati City
February 28, 2020
A member firm of Ernst & Young Global Limited
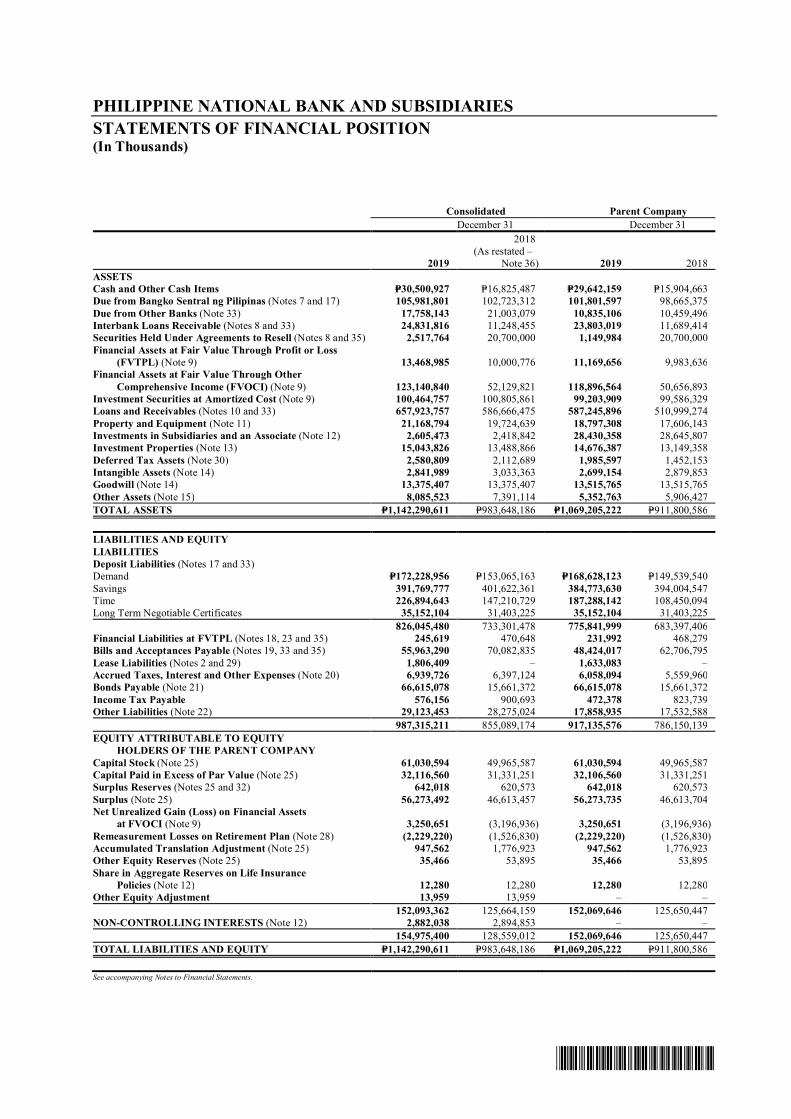
*SGVFS038920*
PHILIPPINE NATIONAL BANK AND SUBSIDIARIESSTATEMENTS OF FINANCIAL POSITION(In Thousands)
Consolidated Parent CompanyDecember 31 December 31
2019
2018(As restated –
Note 36) 2019 2018ASSETSCash and Other Cash Items P=30,500,927 P=16,825,487 P=29,642,159 P=15,904,663Due from Bangko Sentral ng Pilipinas (Notes 7 and 17) 105,981,801 102,723,312 101,801,597 98,665,375Due from Other Banks (Note 33) 17,758,143 21,003,079 10,835,106 10,459,496Interbank Loans Receivable (Notes 8 and 33) 24,831,816 11,248,455 23,803,019 11,689,414Securities Held Under Agreements to Resell (Notes 8 and 35) 2,517,764 20,700,000 1,149,984 20,700,000Financial Assets at Fair Value Through Profit or Loss
(FVTPL) (Note 9) 13,468,985 10,000,776 11,169,656 9,983,636Financial Assets at Fair Value Through Other
Comprehensive Income (FVOCI) (Note 9) 123,140,840 52,129,821 118,896,564 50,656,893Investment Securities at Amortized Cost (Note 9) 100,464,757 100,805,861 99,203,909 99,586,329Loans and Receivables (Notes 10 and 33) 657,923,757 586,666,475 587,245,896 510,999,274Property and Equipment (Note 11) 21,168,794 19,724,639 18,797,308 17,606,143Investments in Subsidiaries and an Associate (Note 12) 2,605,473 2,418,842 28,430,358 28,645,807Investment Properties (Note 13) 15,043,826 13,488,866 14,676,387 13,149,358Deferred Tax Assets (Note 30) 2,580,809 2,112,689 1,985,597 1,452,153Intangible Assets (Note 14) 2,841,989 3,033,363 2,699,154 2,879,853Goodwill (Note 14) 13,375,407 13,375,407 13,515,765 13,515,765Other Assets (Note 15) 8,085,523 7,391,114 5,352,763 5,906,427TOTAL ASSETS P=1,142,290,611 P=983,648,186 P=1,069,205,222 P=911,800,586
LIABILITIES AND EQUITYLIABILITIESDeposit Liabilities (Notes 17 and 33)Demand P=172,228,956 P=153,065,163 P=168,628,123 P=149,539,540Savings 391,769,777 401,622,361 384,773,630 394,004,547Time 226,894,643 147,210,729 187,288,142 108,450,094Long Term Negotiable Certificates 35,152,104 31,403,225 35,152,104 31,403,225
826,045,480 733,301,478 775,841,999 683,397,406Financial Liabilities at FVTPL (Notes 18, 23 and 35) 245,619 470,648 231,992 468,279Bills and Acceptances Payable (Notes 19, 33 and 35) 55,963,290 70,082,835 48,424,017 62,706,795Lease Liabilities (Notes 2 and 29) 1,806,409 – 1,633,083 –Accrued Taxes, Interest and Other Expenses (Note 20) 6,939,726 6,397,124 6,058,094 5,559,960Bonds Payable (Note 21) 66,615,078 15,661,372 66,615,078 15,661,372Income Tax Payable 576,156 900,693 472,378 823,739Other Liabilities (Note 22) 29,123,453 28,275,024 17,858,935 17,532,588
987,315,211 855,089,174 917,135,576 786,150,139EQUITY ATTRIBUTABLE TO EQUITY
HOLDERS OF THE PARENT COMPANYCapital Stock (Note 25) 61,030,594 49,965,587 61,030,594 49,965,587Capital Paid in Excess of Par Value (Note 25) 32,116,560 31,331,251 32,106,560 31,331,251Surplus Reserves (Notes 25 and 32) 642,018 620,573 642,018 620,573Surplus (Note 25) 56,273,492 46,613,457 56,273,735 46,613,704Net Unrealized Gain (Loss) on Financial Assets
at FVOCI (Note 9) 3,250,651 (3,196,936) 3,250,651 (3,196,936)Remeasurement Losses on Retirement Plan (Note 28) (2,229,220) (1,526,830) (2,229,220) (1,526,830)Accumulated Translation Adjustment (Note 25) 947,562 1,776,923 947,562 1,776,923Other Equity Reserves (Note 25) 35,466 53,895 35,466 53,895Share in Aggregate Reserves on Life Insurance
Policies (Note 12) 12,280 12,280 12,280 12,280Other Equity Adjustment 13,959 13,959 – –
152,093,362 125,664,159 152,069,646 125,650,447NON-CONTROLLING INTERESTS (Note 12) 2,882,038 2,894,853 – –
154,975,400 128,559,012 152,069,646 125,650,447TOTAL LIABILITIES AND EQUITY P=1,142,290,611 P=983,648,186 P=1,069,205,222 P=911,800,586
See accompanying Notes to Financial Statements.
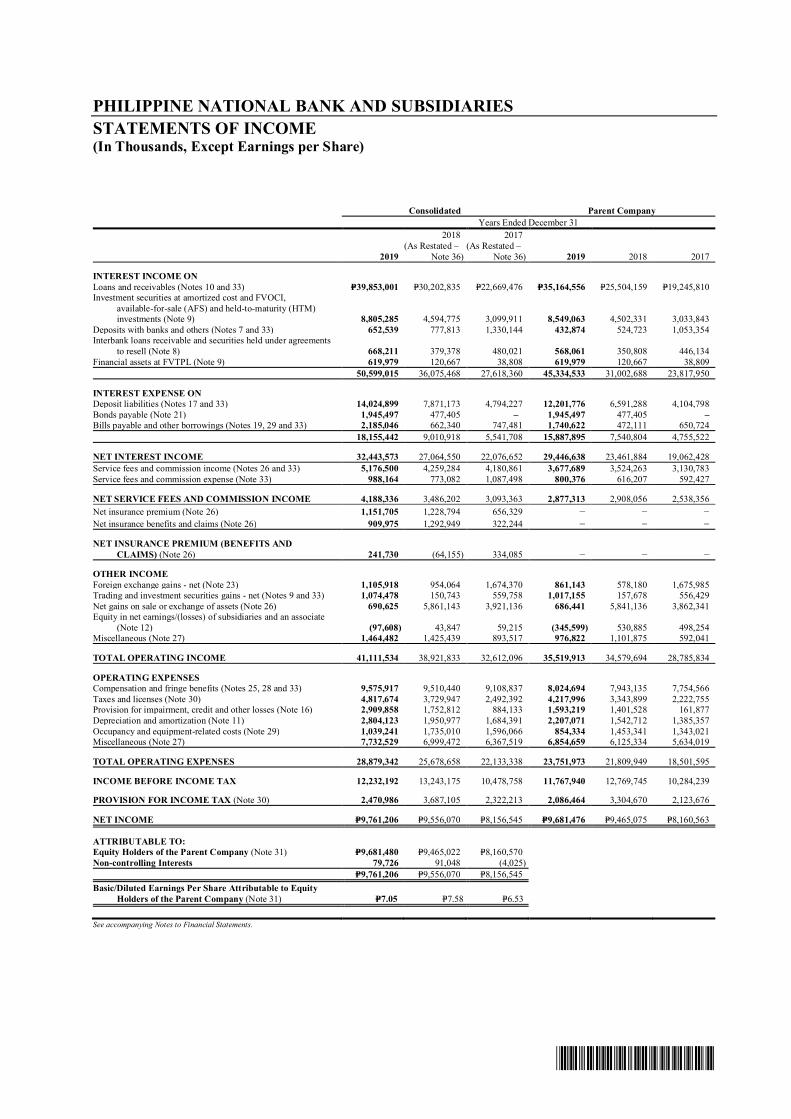
*SGVFS038920*
PHILIPPINE NATIONAL BANK AND SUBSIDIARIESSTATEMENTS OF INCOME(In Thousands, Except Earnings per Share)
Consolidated Parent CompanyYears Ended December 31
2018 2017
2019(As Restated –
Note 36)(As Restated –
Note 36) 2019 2018 2017
INTEREST INCOME ONLoans and receivables (Notes 10 and 33) P=39,853,001 P=30,202,835 P=22,669,476 P=35,164,556 P=25,504,159 P=19,245,810Investment securities at amortized cost and FVOCI,
available-for-sale (AFS) and held-to-maturity (HTM)investments (Note 9) 8,805,285 4,594,775 3,099,911 8,549,063 4,502,331 3,033,843
Deposits with banks and others (Notes 7 and 33) 652,539 777,813 1,330,144 432,874 524,723 1,053,354Interbank loans receivable and securities held under agreements
to resell (Note 8) 668,211 379,378 480,021 568,061 350,808 446,134Financial assets at FVTPL (Note 9) 619,979 120,667 38,808 619,979 120,667 38,809
50,599,015 36,075,468 27,618,360 45,334,533 31,002,688 23,817,950
INTEREST EXPENSE ONDeposit liabilities (Notes 17 and 33) 14,024,899 7,871,173 4,794,227 12,201,776 6,591,288 4,104,798Bonds payable (Note 21) 1,945,497 477,405 – 1,945,497 477,405 –Bills payable and other borrowings (Notes 19, 29 and 33) 2,185,046 662,340 747,481 1,740,622 472,111 650,724
18,155,442 9,010,918 5,541,708 15,887,895 7,540,804 4,755,522
NET INTEREST INCOME 32,443,573 27,064,550 22,076,652 29,446,638 23,461,884 19,062,428Service fees and commission income (Notes 26 and 33) 5,176,500 4,259,284 4,180,861 3,677,689 3,524,263 3,130,783Service fees and commission expense (Note 33) 988,164 773,082 1,087,498 800,376 616,207 592,427
NET SERVICE FEES AND COMMISSION INCOME 4,188,336 3,486,202 3,093,363 2,877,313 2,908,056 2,538,356Net insurance premium (Note 26) 1,151,705 1,228,794 656,329 – – –Net insurance benefits and claims (Note 26) 909,975 1,292,949 322,244 – – –
NET INSURANCE PREMIUM (BENEFITS ANDCLAIMS) (Note 26) 241,730 (64,155) 334,085 – – –
OTHER INCOMEForeign exchange gains - net (Note 23) 1,105,918 954,064 1,674,370 861,143 578,180 1,675,985Trading and investment securities gains - net (Notes 9 and 33) 1,074,478 150,743 559,758 1,017,155 157,678 556,429Net gains on sale or exchange of assets (Note 26) 690,625 5,861,143 3,921,136 686,441 5,841,136 3,862,341Equity in net earnings/(losses) of subsidiaries and an associate
(Note 12) (97,608) 43,847 59,215 (345,599) 530,885 498,254Miscellaneous (Note 27) 1,464,482 1,425,439 893,517 976,822 1,101,875 592,041
TOTAL OPERATING INCOME 41,111,534 38,921,833 32,612,096 35,519,913 34,579,694 28,785,834
OPERATING EXPENSESCompensation and fringe benefits (Notes 25, 28 and 33) 9,575,917 9,510,440 9,108,837 8,024,694 7,943,135 7,754,566Taxes and licenses (Note 30) 4,817,674 3,729,947 2,492,392 4,217,996 3,343,899 2,222,755Provision for impairment, credit and other losses (Note 16) 2,909,858 1,752,812 884,133 1,593,219 1,401,528 161,877Depreciation and amortization (Note 11) 2,804,123 1,950,977 1,684,391 2,207,071 1,542,712 1,385,357Occupancy and equipment-related costs (Note 29) 1,039,241 1,735,010 1,596,066 854,334 1,453,341 1,343,021Miscellaneous (Note 27) 7,732,529 6,999,472 6,367,519 6,854,659 6,125,334 5,634,019
TOTAL OPERATING EXPENSES 28,879,342 25,678,658 22,133,338 23,751,973 21,809,949 18,501,595
INCOME BEFORE INCOME TAX 12,232,192 13,243,175 10,478,758 11,767,940 12,769,745 10,284,239
PROVISION FOR INCOME TAX (Note 30) 2,470,986 3,687,105 2,322,213 2,086,464 3,304,670 2,123,676
NET INCOME P=9,761,206 P=9,556,070 P=8,156,545 P=9,681,476 P=9,465,075 P=8,160,563
ATTRIBUTABLE TO:Equity Holders of the Parent Company (Note 31) P=9,681,480 P=9,465,022 P=8,160,570Non-controlling Interests 79,726 91,048 (4,025)
P=9,761,206 P=9,556,070 P=8,156,545Basic/Diluted Earnings Per Share Attributable to Equity
Holders of the Parent Company (Note 31) P=7.05 P=7.58 P=6.53
See accompanying Notes to Financial Statements.
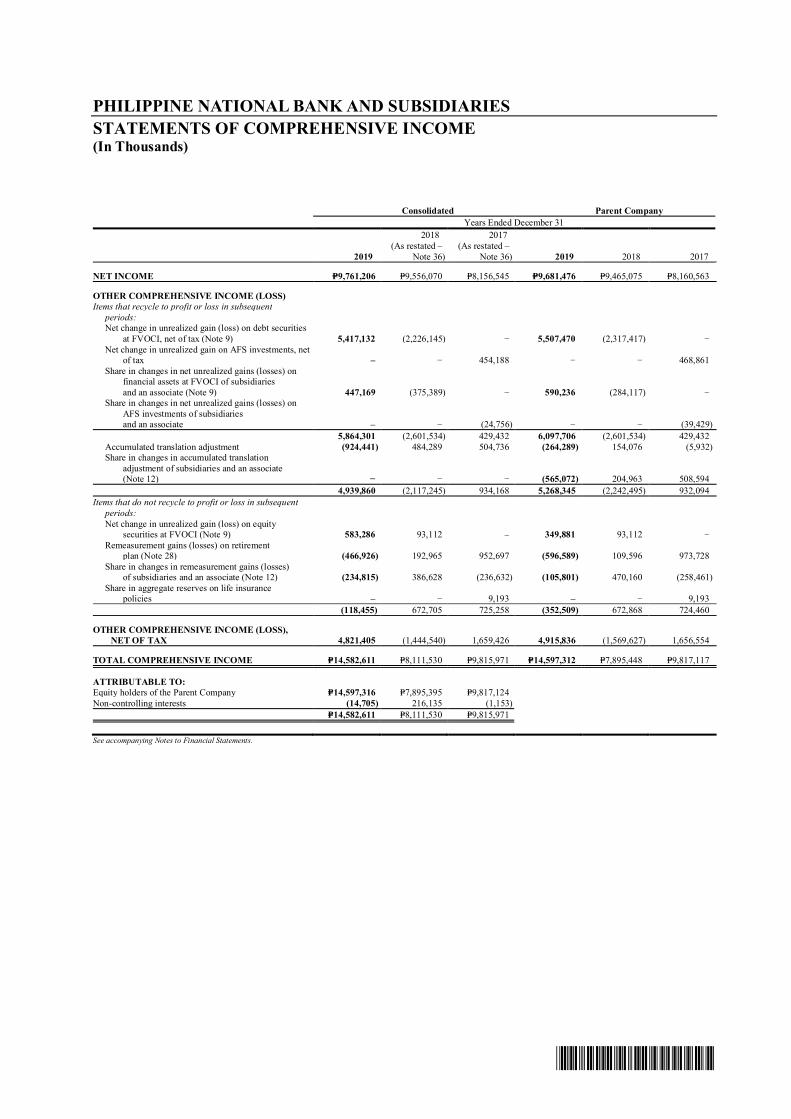
*SGVFS038920*
PHILIPPINE NATIONAL BANK AND SUBSIDIARIESSTATEMENTS OF COMPREHENSIVE INCOME(In Thousands)
Consolidated Parent CompanyYears Ended December 31
2018 2017
2019(As restated –
Note 36)(As restated –
Note 36) 2019 2018 2017
NET INCOME P=9,761,206 P=9,556,070 P=8,156,545 P=9,681,476 P=9,465,075 P=8,160,563
OTHER COMPREHENSIVE INCOME (LOSS)Items that recycle to profit or loss in subsequent
periods:Net change in unrealized gain (loss) on debt securities
at FVOCI, net of tax (Note 9) 5,417,132 (2,226,145) − 5,507,470 (2,317,417) −Net change in unrealized gain on AFS investments, net
of tax – − 454,188 − − 468,861Share in changes in net unrealized gains (losses) on
financial assets at FVOCI of subsidiariesand an associate (Note 9) 447,169 (375,389) − 590,236 (284,117) −
Share in changes in net unrealized gains (losses) onAFS investments of subsidiariesand an associate – − (24,756) − − (39,429)
5,864,301 (2,601,534) 429,432 6,097,706 (2,601,534) 429,432Accumulated translation adjustment (924,441) 484,289 504,736 (264,289) 154,076 (5,932)Share in changes in accumulated translation
adjustment of subsidiaries and an associate(Note 12) − − − (565,072) 204,963 508,594
4,939,860 (2,117,245) 934,168 5,268,345 (2,242,495) 932,094Items that do not recycle to profit or loss in subsequent
periods:Net change in unrealized gain (loss) on equity
securities at FVOCI (Note 9) 583,286 93,112 – 349,881 93,112 −Remeasurement gains (losses) on retirement
plan (Note 28) (466,926) 192,965 952,697 (596,589) 109,596 973,728Share in changes in remeasurement gains (losses)
of subsidiaries and an associate (Note 12) (234,815) 386,628 (236,632) (105,801) 470,160 (258,461)Share in aggregate reserves on life insurance
policies – − 9,193 – − 9,193(118,455) 672,705 725,258 (352,509) 672,868 724,460
OTHER COMPREHENSIVE INCOME (LOSS),NET OF TAX 4,821,405 (1,444,540) 1,659,426 4,915,836 (1,569,627) 1,656,554
TOTAL COMPREHENSIVE INCOME P=14,582,611 P=8,111,530 P=9,815,971 P=14,597,312 P=7,895,448 P=9,817,117
ATTRIBUTABLE TO:Equity holders of the Parent Company P=14,597,316 P=7,895,395 P=9,817,124Non-controlling interests (14,705) 216,135 (1,153)
P=14,582,611 P=8,111,530 P=9,815,971
See accompanying Notes to Financial Statements.
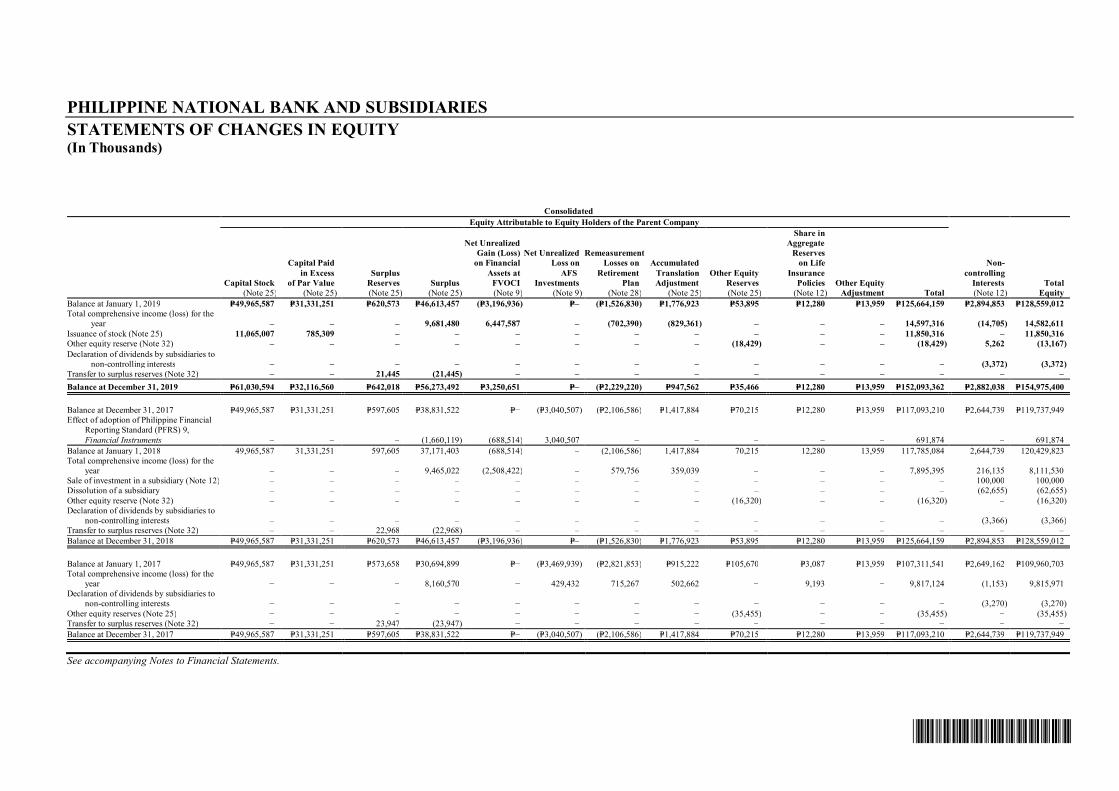
*SGVFS038920*
PHILIPPINE NATIONAL BANK AND SUBSIDIARIESSTATEMENTS OF CHANGES IN EQUITY(In Thousands)
ConsolidatedEquity Attributable to Equity Holders of the Parent Company
Non-controlling
Interests(Note 12)
TotalEquity
Capital Stock(Note 25)
Capital Paidin Excess
of Par Value(Note 25)
SurplusReserves(Note 25)
Surplus(Note 25)
Net UnrealizedGain (Loss)
on FinancialAssets at
FVOCI(Note 9)
Net UnrealizedLoss on
AFSInvestments
(Note 9)
RemeasurementLosses on
RetirementPlan
(Note 28)
AccumulatedTranslationAdjustment
(Note 25)
Other EquityReserves(Note 25)
Share inAggregate
Reserveson Life
InsurancePolicies
(Note 12)Other Equity
Adjustment TotalBalance at January 1, 2019 P=49,965,587 P=31,331,251 P=620,573 P=46,613,457 (P=3,196,936) P=– (P=1,526,830) P=1,776,923 P=53,895 P=12,280 P=13,959 P=125,664,159 P=2,894,853 P=128,559,012Total comprehensive income (loss) for the
year – – – 9,681,480 6,447,587 – (702,390) (829,361) – – – 14,597,316 (14,705) 14,582,611Issuance of stock (Note 25) 11,065,007 785,309 – – – – – – – – – 11,850,316 – 11,850,316Other equity reserve (Note 32) – – – – – – – – (18,429) – – (18,429) 5,262 (13,167)Declaration of dividends by subsidiaries to
non-controlling interests – – – – – – – – – – – – (3,372) (3,372)Transfer to surplus reserves (Note 32) – – 21,445 (21,445) – – – – – – – – – –Balance at December 31, 2019 P=61,030,594 P=32,116,560 P=642,018 P=56,273,492 P=3,250,651 P=– (P=2,229,220) P=947,562 P=35,466 P=12,280 P=13,959 P=152,093,362 P=2,882,038 P=154,975,400
Balance at December 31, 2017 P=49,965,587 P=31,331,251 P=597,605 P=38,831,522 P=− (P=3,040,507) (P=2,106,586) P=1,417,884 P=70,215 P=12,280 P=13,959 P=117,093,210 P=2,644,739 P=119,737,949Effect of adoption of Philippine Financial
Reporting Standard (PFRS) 9,Financial Instruments – – – (1,660,119) (688,514) 3,040,507 – – – – – 691,874 – 691,874
Balance at January 1, 2018 49,965,587 31,331,251 597,605 37,171,403 (688,514) – (2,106,586) 1,417,884 70,215 12,280 13,959 117,785,084 2,644,739 120,429,823Total comprehensive income (loss) for the
year – – – 9,465,022 (2,508,422) – 579,756 359,039 – – – 7,895,395 216,135 8,111,530Sale of investment in a subsidiary (Note 12) – – – – – – – – – – – – 100,000 100,000Dissolution of a subsidiary – – – – – – – – – – – – (62,655) (62,655)Other equity reserve (Note 32) – – – – – – – – (16,320) – – (16,320) – (16,320)Declaration of dividends by subsidiaries to
non-controlling interests – – – – – – – – – – – – (3,366) (3,366)Transfer to surplus reserves (Note 32) – – 22,968 (22,968) – – – – – – – – – –Balance at December 31, 2018 P=49,965,587 P=31,331,251 P=620,573 P=46,613,457 (P=3,196,936) P=– (P=1,526,830) P=1,776,923 P=53,895 P=12,280 P=13,959 P=125,664,159 P=2,894,853 P=128,559,012
Balance at January 1, 2017 P=49,965,587 P=31,331,251 P=573,658 P=30,694,899 P=− (P=3,469,939) (P=2,821,853) P=915,222 P=105,670 P=3,087 P=13,959 P=107,311,541 P=2,649,162 P=109,960,703Total comprehensive income (loss) for the
year − − − 8,160,570 − 429,432 715,267 502,662 − 9,193 − 9,817,124 (1,153) 9,815,971Declaration of dividends by subsidiaries to
non-controlling interests − − − − − − − − − − − − (3,270) (3,270)Other equity reserves (Note 25) − − − − − − − − (35,455) − − (35,455) − (35,455)Transfer to surplus reserves (Note 32) − − 23,947 (23,947) − − − − − − − − − −Balance at December 31, 2017 P=49,965,587 P=31,331,251 P=597,605 P=38,831,522 P=− (P=3,040,507) (P=2,106,586) P=1,417,884 P=70,215 P=12,280 P=13,959 P=117,093,210 P=2,644,739 P=119,737,949
See accompanying Notes to Financial Statements.
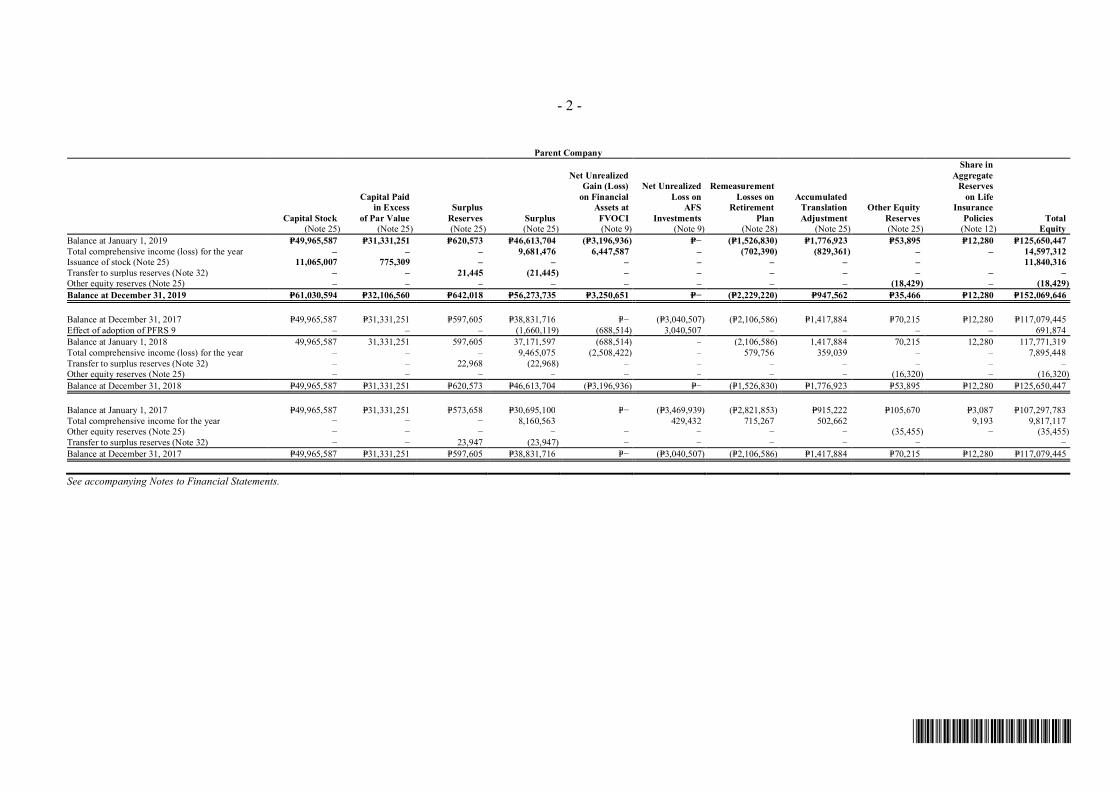
*SGVFS038920*
- 2 -
Parent Company
Capital Stock(Note 25)
Capital Paidin Excess
of Par Value(Note 25)
SurplusReserves(Note 25)
Surplus(Note 25)
Net UnrealizedGain (Loss)
on FinancialAssets at
FVOCI(Note 9)
Net UnrealizedLoss on
AFSInvestments
(Note 9)
RemeasurementLosses on
RetirementPlan
(Note 28)
AccumulatedTranslationAdjustment
(Note 25)
Other EquityReserves(Note 25)
Share inAggregate
Reserveson Life
InsurancePolicies
(Note 12)Total
EquityBalance at January 1, 2019 P=49,965,587 P=31,331,251 P=620,573 P=46,613,704 (P=3,196,936) P=− (P=1,526,830) P=1,776,923 P=53,895 P=12,280 P=125,650,447Total comprehensive income (loss) for the year – – – 9,681,476 6,447,587 – (702,390) (829,361) – – 14,597,312Issuance of stock (Note 25) 11,065,007 775,309 – – – – – – – 11,840,316Transfer to surplus reserves (Note 32) – – 21,445 (21,445) – – – – – – –Other equity reserves (Note 25) – – – – – – – – (18,429) – (18,429)Balance at December 31, 2019 P=61,030,594 P=32,106,560 P=642,018 P=56,273,735 P=3,250,651 P=− (P=2,229,220) P=947,562 P=35,466 P=12,280 P=152,069,646
Balance at December 31, 2017 P=49,965,587 P=31,331,251 P=597,605 P=38,831,716 P=− (P=3,040,507) (P=2,106,586) P=1,417,884 P=70,215 P=12,280 P=117,079,445Effect of adoption of PFRS 9 – – – (1,660,119) (688,514) 3,040,507 – – – – 691,874Balance at January 1, 2018 49,965,587 31,331,251 597,605 37,171,597 (688,514) – (2,106,586) 1,417,884 70,215 12,280 117,771,319Total comprehensive income (loss) for the year – – – 9,465,075 (2,508,422) – 579,756 359,039 – – 7,895,448Transfer to surplus reserves (Note 32) – – 22,968 (22,968) – – – – – – –Other equity reserves (Note 25) – – – – – – – – (16,320) – (16,320)Balance at December 31, 2018 P=49,965,587 P=31,331,251 P=620,573 P=46,613,704 (P=3,196,936) P=− (P=1,526,830) P=1,776,923 P=53,895 P=12,280 P=125,650,447
Balance at January 1, 2017 P=49,965,587 P=31,331,251 P=573,658 P=30,695,100 P=− (P=3,469,939) (P=2,821,853) P=915,222 P=105,670 P=3,087 P=107,297,783Total comprehensive income for the year − − − 8,160,563 429,432 715,267 502,662 9,193 9,817,117Other equity reserves (Note 25) − − − − − − − − (35,455) − (35,455)Transfer to surplus reserves (Note 32) − − 23,947 (23,947) − − − − − −Balance at December 31, 2017 P=49,965,587 P=31,331,251 P=597,605 P=38,831,716 P=− (P=3,040,507) (P=2,106,586) P=1,417,884 P=70,215 P=12,280 P=117,079,445
See accompanying Notes to Financial Statements.
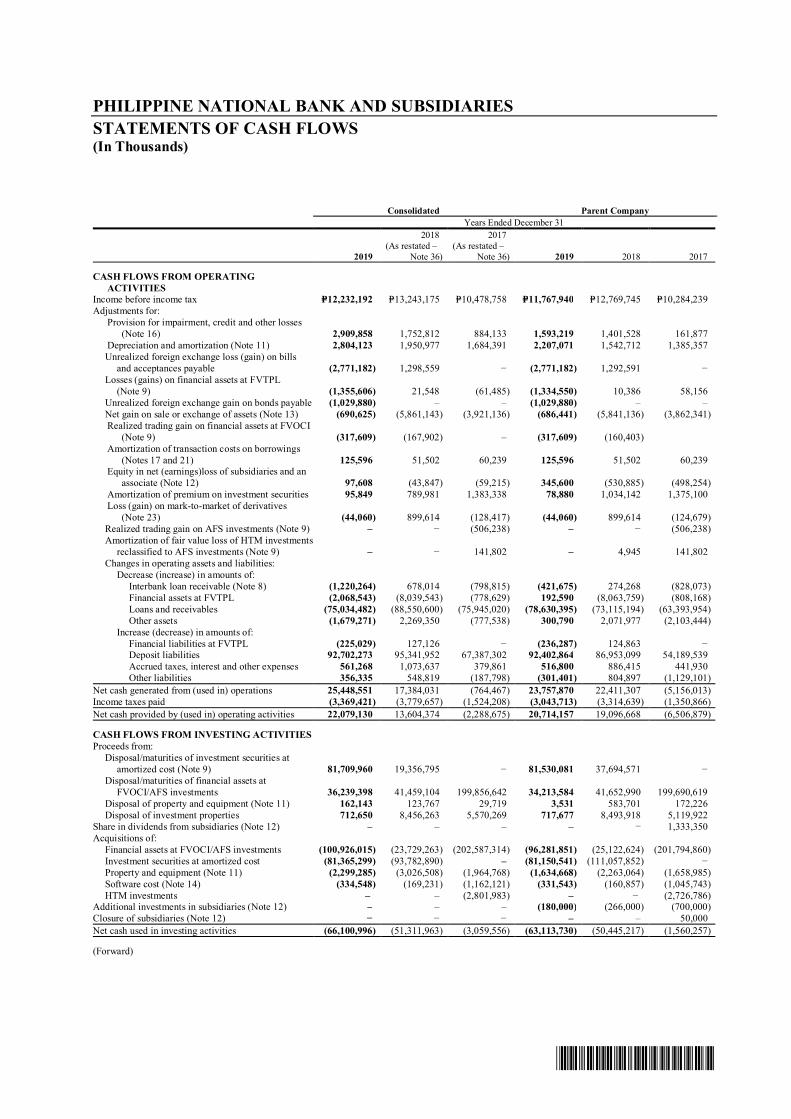
*SGVFS038920*
PHILIPPINE NATIONAL BANK AND SUBSIDIARIESSTATEMENTS OF CASH FLOWS(In Thousands)
Consolidated Parent CompanyYears Ended December 31
2019
2018(As restated –
Note 36)
2017(As restated –
Note 36) 2019 2018 2017
CASH FLOWS FROM OPERATINGACTIVITIES
Income before income tax P=12,232,192 P=13,243,175 P=10,478,758 P=11,767,940 P=12,769,745 P=10,284,239Adjustments for:
Provision for impairment, credit and other losses(Note 16) 2,909,858 1,752,812 884,133 1,593,219 1,401,528 161,877
Depreciation and amortization (Note 11) 2,804,123 1,950,977 1,684,391 2,207,071 1,542,712 1,385,357Unrealized foreign exchange loss (gain) on bills
and acceptances payable (2,771,182) 1,298,559 − (2,771,182) 1,292,591 −Losses (gains) on financial assets at FVTPL (Note 9) (1,355,606) 21,548 (61,485) (1,334,550) 10,386 58,156Unrealized foreign exchange gain on bonds payable (1,029,880) – – (1,029,880) – –Net gain on sale or exchange of assets (Note 13) (690,625) (5,861,143) (3,921,136) (686,441) (5,841,136) (3,862,341)Realized trading gain on financial assets at FVOCI
(Note 9) (317,609) (167,902) – (317,609) (160,403)Amortization of transaction costs on borrowings
(Notes 17 and 21) 125,596 51,502 60,239 125,596 51,502 60,239Equity in net (earnings)loss of subsidiaries and an
associate (Note 12) 97,608 (43,847) (59,215) 345,600 (530,885) (498,254)Amortization of premium on investment securities 95,849 789,981 1,383,338 78,880 1,034,142 1,375,100Loss (gain) on mark-to-market of derivatives
(Note 23) (44,060) 899,614 (128,417) (44,060) 899,614 (124,679)Realized trading gain on AFS investments (Note 9) – − (506,238) – − (506,238)Amortization of fair value loss of HTM investments
reclassified to AFS investments (Note 9) – − 141,802 – 4,945 141,802Changes in operating assets and liabilities:
Decrease (increase) in amounts of:Interbank loan receivable (Note 8) (1,220,264) 678,014 (798,815) (421,675) 274,268 (828,073)Financial assets at FVTPL (2,068,543) (8,039,543) (778,629) 192,590 (8,063,759) (808,168)Loans and receivables (75,034,482) (88,550,600) (75,945,020) (78,630,395) (73,115,194) (63,393,954)Other assets (1,679,271) 2,269,350 (777,538) 300,790 2,071,977 (2,103,444)
Increase (decrease) in amounts of:Financial liabilities at FVTPL (225,029) 127,126 − (236,287) 124,863 −Deposit liabilities 92,702,273 95,341,952 67,387,302 92,402,864 86,953,099 54,189,539Accrued taxes, interest and other expenses 561,268 1,073,637 379,861 516,800 886,415 441,930Other liabilities 356,335 548,819 (187,798) (301,401) 804,897 (1,129,101)
Net cash generated from (used in) operations 25,448,551 17,384,031 (764,467) 23,757,870 22,411,307 (5,156,013)Income taxes paid (3,369,421) (3,779,657) (1,524,208) (3,043,713) (3,314,639) (1,350,866)Net cash provided by (used in) operating activities 22,079,130 13,604,374 (2,288,675) 20,714,157 19,096,668 (6,506,879)
CASH FLOWS FROM INVESTING ACTIVITIESProceeds from:
Disposal/maturities of investment securities atamortized cost (Note 9) 81,709,960 19,356,795 − 81,530,081 37,694,571 −
Disposal/maturities of financial assets atFVOCI/AFS investments 36,239,398 41,459,104 199,856,642 34,213,584 41,652,990 199,690,619
Disposal of property and equipment (Note 11) 162,143 123,767 29,719 3,531 583,701 172,226Disposal of investment properties 712,650 8,456,263 5,570,269 717,677 8,493,918 5,119,922
Share in dividends from subsidiaries (Note 12) – – – – − 1,333,350Acquisitions of:
Financial assets at FVOCI/AFS investments (100,926,015) (23,729,263) (202,587,314) (96,281,851) (25,122,624) (201,794,860)Investment securities at amortized cost (81,365,299) (93,782,890) – (81,150,541) (111,057,852) −Property and equipment (Note 11) (2,299,285) (3,026,508) (1,964,768) (1,634,668) (2,263,064) (1,658,985)Software cost (Note 14) (334,548) (169,231) (1,162,121) (331,543) (160,857) (1,045,743)HTM investments – – (2,801,983) – − (2,726,786)
Additional investments in subsidiaries (Note 12) – – – (180,000) (266,000) (700,000)Closure of subsidiaries (Note 12) − − − – – 50,000Net cash used in investing activities (66,100,996) (51,311,963) (3,059,556) (63,113,730) (50,445,217) (1,560,257)
(Forward)
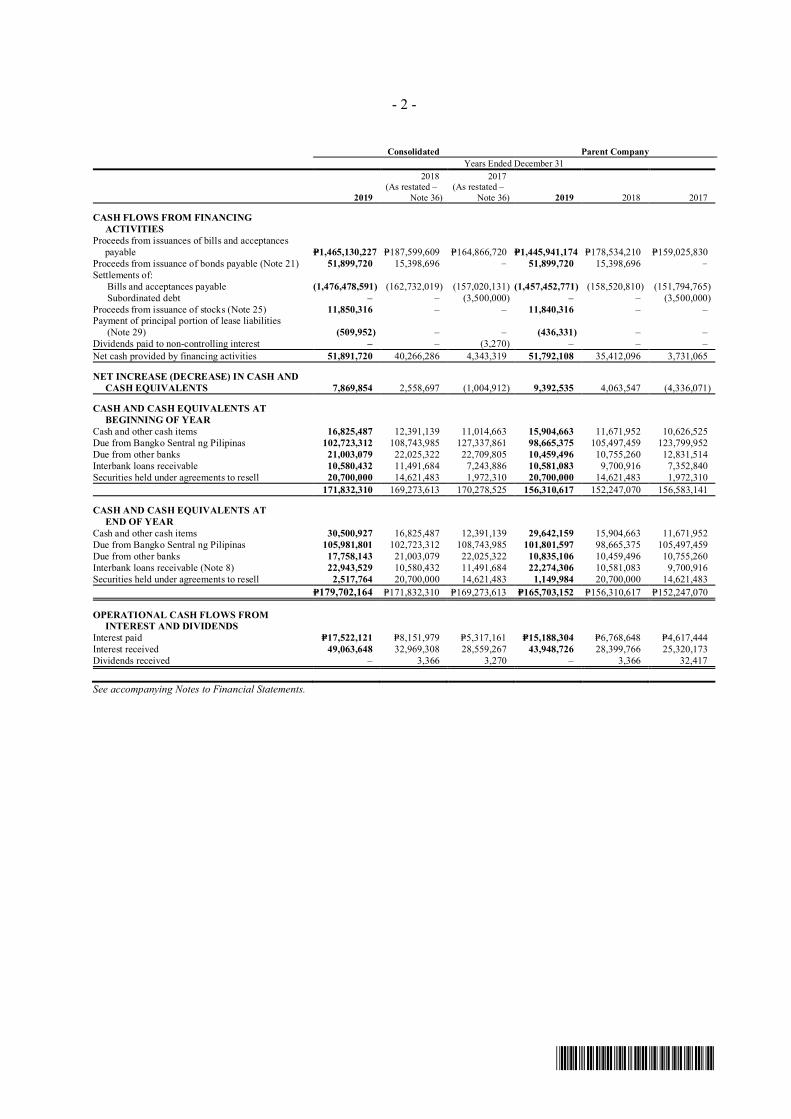
*SGVFS038920*
- 2 -
Consolidated Parent CompanyYears Ended December 31
2019
2018(As restated –
Note 36)
2017(As restated –
Note 36) 2019 2018 2017
CASH FLOWS FROM FINANCINGACTIVITIES
Proceeds from issuances of bills and acceptancespayable P=1,465,130,227 P=187,599,609 P=164,866,720 P=1,445,941,174 P=178,534,210 P=159,025,830
Proceeds from issuance of bonds payable (Note 21) 51,899,720 15,398,696 − 51,899,720 15,398,696 −Settlements of: Bills and acceptances payable (1,476,478,591) (162,732,019) (157,020,131) (1,457,452,771) (158,520,810) (151,794,765) Subordinated debt – – (3,500,000) – – (3,500,000)Proceeds from issuance of stocks (Note 25) 11,850,316 – – 11,840,316 – –Payment of principal portion of lease liabilities (Note 29) (509,952) – – (436,331) – –Dividends paid to non-controlling interest – – (3,270) – – –Net cash provided by financing activities 51,891,720 40,266,286 4,343,319 51,792,108 35,412,096 3,731,065
NET INCREASE (DECREASE) IN CASH ANDCASH EQUIVALENTS 7,869,854 2,558,697 (1,004,912) 9,392,535 4,063,547 (4,336,071)
CASH AND CASH EQUIVALENTS ATBEGINNING OF YEAR
Cash and other cash items 16,825,487 12,391,139 11,014,663 15,904,663 11,671,952 10,626,525Due from Bangko Sentral ng Pilipinas 102,723,312 108,743,985 127,337,861 98,665,375 105,497,459 123,799,952Due from other banks 21,003,079 22,025,322 22,709,805 10,459,496 10,755,260 12,831,514Interbank loans receivable 10,580,432 11,491,684 7,243,886 10,581,083 9,700,916 7,352,840Securities held under agreements to resell 20,700,000 14,621,483 1,972,310 20,700,000 14,621,483 1,972,310
171,832,310 169,273,613 170,278,525 156,310,617 152,247,070 156,583,141
CASH AND CASH EQUIVALENTS ATEND OF YEAR
Cash and other cash items 30,500,927 16,825,487 12,391,139 29,642,159 15,904,663 11,671,952Due from Bangko Sentral ng Pilipinas 105,981,801 102,723,312 108,743,985 101,801,597 98,665,375 105,497,459Due from other banks 17,758,143 21,003,079 22,025,322 10,835,106 10,459,496 10,755,260Interbank loans receivable (Note 8) 22,943,529 10,580,432 11,491,684 22,274,306 10,581,083 9,700,916Securities held under agreements to resell 2,517,764 20,700,000 14,621,483 1,149,984 20,700,000 14,621,483
P=179,702,164 P=171,832,310 P=169,273,613 P=165,703,152 P=156,310,617 P=152,247,070
OPERATIONAL CASH FLOWS FROMINTEREST AND DIVIDENDS
Interest paid P=17,522,121 P=8,151,979 P=5,317,161 P=15,188,304 P=6,768,648 P=4,617,444Interest received 49,063,648 32,969,308 28,559,267 43,948,726 28,399,766 25,320,173Dividends received – 3,366 3,270 – 3,366 32,417
See accompanying Notes to Financial Statements.
*SGVFS038920*
PHILIPPINE NATIONAL BANK AND SUBSIDIARIESNOTES TO FINANCIAL STATEMENTS(Amounts in Thousand Pesos except When Otherwise Indicated)
1. Corporate Information
Philippine National Bank (PNB or the Parent Company) is a universal bank established in thePhilippines in 1916. On June 21, 1989, PNB’s shares were listed with the Philippine StockExchange (PSE). As of December 31, 2019 and 2018, the shares of PNB are held by the following:
2019 2018LT Group, Inc. (LTG) (indirect ownership through
its various holding companies) 59.83% 59.83%PCD Nominee Corporation 17.86% 17.33%Other stockholders owning less than 10% each 22.31% 22.84%
100.00% 100.00%
PNB’s immediate parent company, LTG, and ultimate parent company, Tangent HoldingsCorporation, are also incorporated in the Philippines.
The Parent Company provides a full range of banking and other financial services, which includedeposit-taking, lending, bills discounting, trade finance, foreign exchange dealings, investmentbanking, treasury operations, fund transfers, remittance and trust services, through its 715 and 711domestic branches as of December 31, 2019 and 2018, respectively. As of the same dates, the ParentCompany has 71 overseas branches, representative offices, remittance centers and subsidiaries in 16locations in Asia, North America and Europe.
The subsidiaries of the Parent Company are engaged in a number of diversified financial and relatedbusinesses such as remittance, nonlife insurance, banking, leasing, stock brokerage, foreign exchangetrading and/or related services. The Parent Company and the subsidiaries are collectively referredhereinto as the Group.
The principal place of business of the Parent Company is at PNB Financial Center, PresidentDiosdado Macapagal Boulevard, Pasay City, Metro Manila, Philippines.
Merger with Allied Banking CorporationOn March 6, 2012, the respective shareholders of PNB and Allied Banking Corporation (ABC),another listed universal bank, representing at least 2/3 of the outstanding capital stock of both banks,approved the Plan of Merger of the two banks. Under the Plan of Merger, PNB will be the survivingentity and it will issue to ABC shareholders 130 PNB common shares for every ABC common shareand 22.763 PNB common shares for every ABC preferred share. Merger and business combinationare terms used interchangeably within the accompanying financial statements and have the samemeaning.
On February 9, 2013 (the acquisition date), PNB concluded its merger with ABC with a purchaseconsideration amounting to P=41.5 billion, representing 423,962,500 common shares at the fair valueof P=97.90 per share in exchange for the 100.00% voting interest in ABC at the share swap ratio above(Note 14). The fair value of the shares is the published price of the shares of PNB as of February 9,2013. There are no contingent considerations arrangements as part of the merger.
On March 2, 2017, the Bureau of Internal Revenue (BIR) issued a final confirmation ruling that thestatutory merger of PNB and ABC is a tax-free merger under Section 40(C)(2) of the NationalInternal Revenue Code of 1997 as amended (Tax Code).
- 2 -
*SGVFS038920*
In connection with the merger, the BSP gave certain incentives to PNB, which include, among others:· recognition of the fair value adjustments in both books prepared under Philippine Financial
Reporting Standards (PFRS) and Regulatory Accounting Principles (RAP);· full recognition of appraisal increment from the revaluation of premises, improvements and
equipment in the computation of its capital adequacy ratio (CAR).
2. Summary of Significant Accounting Policies
Basis of Preparation of the Financial StatementsThe Group prepared the accompanying financial statements on a historical cost basis, except for thefollowing accounts which are measured at fair value:· financial assets and liabilities at fair value through profit or loss (FVTPL); and· financial assets at fair value through other comprehensive income (FVOCI).
The financial statements of the Parent Company and PNB Savings Bank (PNBSB) reflect theaccounts maintained in their Regular Banking Unit (RBU) and Foreign Currency Deposit Unit(FCDU). The functional currency of RBU and FCDU is Philippine pesos (P= or PHP) and UnitedStates Dollar (USD), respectively. The individual financial statements of these units are combinedand any inter-unit accounts and transactions are eliminated.
The Group presents the amounts in the financial statements to the nearest thousand pesos (P=000),unless otherwise stated.
Statement of ComplianceThe Group prepared these financial statements in accordance with PFRS.
Presentation of the Financial StatementsThe Group presents the statements of financial position in order of liquidity. An analysis regardingrecovery or settlement within 12 months after the reporting date (current) and more than 12 monthsafter the reporting date (non-current) is presented in Note 24.
The Group generally presents financial assets and financial liabilities at their gross amounts in thestatement of financial position, unless the offsetting criteria under PFRS are met. The Group does notalso set off items of income and expenses, unless offsetting is required or permitted by PFRS, or isspecifically disclosed in the Group’s accounting policies.
Basis of ConsolidationThe consolidated financial statements comprise the financial statements of the Parent Company andits subsidiaries. The financial statements of the subsidiaries are prepared on the same reportingperiod as the Parent Company using consistent accounting policies. In the consolidation, the Groupeliminates in full all significant intra-group balances, transactions, and results of intra-grouptransactions.
The Group consolidates its subsidiaries from the date on which the Group obtains control over thesubsidiary. The Group controls an investee if, and only if, the Group has:· power over the investee (i.e., those existing rights that give the Group the current ability to direct
the relevant activities of the investee);· exposure or rights to variable returns from its involvement with the investee; and· the ability to use its power over the investee to affect its returns.
- 3 -
*SGVFS038920*
When the Group has less than majority of the voting or similar rights of an investee, the Groupconsiders all relevant facts and circumstances in assessing whether it has power over an investee,such as contractual arrangements with other voting shareholders of the investee, rights arising fromother contractual arrangements, or any potential voting rights of the Group.
For partially-owned subsidiaries, the Group attributes the subsidiary’s income, expenses andcomponents of other comprehensive income (OCI) to the equity holders of the Parent Company andto the non-controlling interests (NCI), even if this results in deficit balances of the NCI. NCIrepresents the portion of profit or loss and the net assets not held by the Group, which are presentedseparately in the consolidated financial statements. NCI consists of the amount attributed to suchinterest from the date of business combination and its share in any changes in equity of the subsidiary.
When the Group’s ownership interest in a subsidiary changed but it did not result in a loss of control,the Group adjusts the carrying amounts of the controlling interests and the NCI to their new relativeinterests in the subsidiary. The Group recognizes any difference between the amount by which theNCI is adjusted and the fair value of the consideration paid or received directly in equity as ‘Otherequity adjustment’, which is attributed to the owners of the Parent Company.
Consolidation of a subsidiary ceases when the Group loses control over the subsidiary. In suchcircumstances, the Group derecognizes the assets (including goodwill), liabilities, NCI, and othercomponents of equity of the subsidiary, and recognizes the consideration received and any investmentretained at their fair values. The Group records any resulting difference in the statement of income.
Changes in Accounting Policies and DisclosuresStarting January 1, 2019, the Group applied for the first time the following new and amendedaccounting standards and interpretations.
New Standard and Interpretation· PFRS 16, Leases
PFRS 16 supersedes Philippine Accounting Standards (PAS) 17, Leases, Philippine InterpretationIFRIC 4, Determining Whether an Arrangement Contains a Lease, Philippine InterpretationSIC-15, Operating Leases–Incentives, and Philippine Interpretation SIC-27, Evaluating theSubstance of Transactions Involving the Legal Form of a Lease. PFRS 16 sets out the principlesfor the recognition, measurement, presentation and disclosure of leases and requires lessees torecognize most leases on the statement of financial position.
Group as lessorLessor accounting under PFRS 16 is substantially unchanged from PAS 17. The Group continuesto classify leases as either operating or finance leases using similar principles as in PAS 17.Therefore, PFRS 16 did not have an impact on leases where the Group is the lessor.
Group as lesseeThe Group adopted PFRS 16 using the modified retrospective method of adoption with the dateof initial application of January 1, 2019. Under this method, the Group applied PFRS 16retrospectively with the cumulative effect of initially applying the standard recognized at the dateof initial application. The Group elected to use the transition practical expedient to no longerreassess whether a contract is, or contains, a lease at January 1, 2019. Instead, the Group appliedPFRS 16 only to contracts that were previously identified as leases applying PAS 17 andPhilippine Interpretation IFRIC 4 at January 1, 2019.
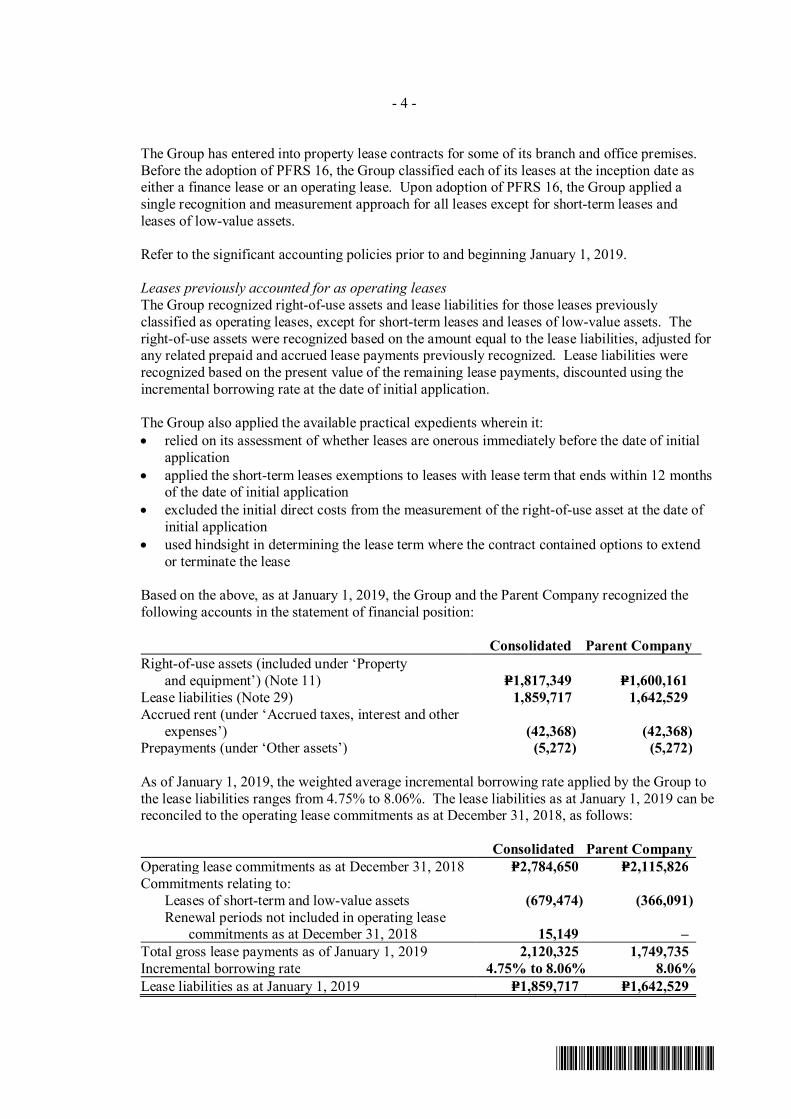
- 4 -
*SGVFS038920*
The Group has entered into property lease contracts for some of its branch and office premises.Before the adoption of PFRS 16, the Group classified each of its leases at the inception date aseither a finance lease or an operating lease. Upon adoption of PFRS 16, the Group applied asingle recognition and measurement approach for all leases except for short-term leases andleases of low-value assets.
Refer to the significant accounting policies prior to and beginning January 1, 2019.
Leases previously accounted for as operating leasesThe Group recognized right-of-use assets and lease liabilities for those leases previouslyclassified as operating leases, except for short-term leases and leases of low-value assets. Theright-of-use assets were recognized based on the amount equal to the lease liabilities, adjusted forany related prepaid and accrued lease payments previously recognized. Lease liabilities wererecognized based on the present value of the remaining lease payments, discounted using theincremental borrowing rate at the date of initial application.
The Group also applied the available practical expedients wherein it:· relied on its assessment of whether leases are onerous immediately before the date of initial
application· applied the short-term leases exemptions to leases with lease term that ends within 12 months
of the date of initial application· excluded the initial direct costs from the measurement of the right-of-use asset at the date of
initial application· used hindsight in determining the lease term where the contract contained options to extend
or terminate the lease
Based on the above, as at January 1, 2019, the Group and the Parent Company recognized thefollowing accounts in the statement of financial position:
Consolidated Parent CompanyRight-of-use assets (included under ‘Property
and equipment’) (Note 11) P=1,817,349 P=1,600,161Lease liabilities (Note 29) 1,859,717 1,642,529Accrued rent (under ‘Accrued taxes, interest and other
expenses’) (42,368) (42,368)Prepayments (under ‘Other assets’) (5,272) (5,272)
As of January 1, 2019, the weighted average incremental borrowing rate applied by the Group tothe lease liabilities ranges from 4.75% to 8.06%. The lease liabilities as at January 1, 2019 can bereconciled to the operating lease commitments as at December 31, 2018, as follows:
Consolidated Parent CompanyOperating lease commitments as at December 31, 2018 P=2,784,650 P=2,115,826Commitments relating to:
Leases of short-term and low-value assets (679,474) (366,091) Renewal periods not included in operating lease
commitments as at December 31, 2018 15,149 –Total gross lease payments as of January 1, 2019 2,120,325 1,749,735Incremental borrowing rate 4.75% to 8.06% 8.06%Lease liabilities as at January 1, 2019 P=1,859,717 P=1,642,529
- 5 -
*SGVFS038920*
The adoption of PFRS 16 had no impact on the Group’s Statement of income, comprehensiveincome, changes in equity and cash flows. It has also no material impact on the Group’s CARand Common Equity Tier 1 (CET1) ratio.
· Philippine Interpretation IFRIC 23, Uncertainty over Income Tax TreatmentThe Interpretation addresses the accounting for income taxes when tax treatments involveuncertainty that affects the application of PAS 12, Income Taxes. It does not apply to taxes orlevies outside the scope of PAS 12, nor does it specifically include requirements relating tointerest and penalties associated with uncertain tax treatments. The Interpretation specificallyaddresses the following:· whether the Group considers uncertain tax treatments separately;· the assumptions the Group makes about the examination of tax treatments by taxation
authorities;· how the Group determines taxable income (tax loss), tax bases, unused tax losses, unused tax
credits and tax rates; and· how the Group considers changes in facts and circumstances
The Group determines whether to consider each uncertain tax treatment separately or togetherwith one or more other uncertain tax treatments and uses the approach that better predicts theresolution of the uncertainty. The Group assumes that the taxation authority will examineamounts that it has a right to examine and have full knowledge of all related information whenmaking those examinations. If the Group concludes that it is not probable that the taxationauthority will accept an uncertain tax treatment, the Group shall reflect the effect of theuncertainty for each uncertain tax treatment using the method the Group expects to better predictthe resolution of the uncertainty.
Upon adoption of the Interpretation, the Group has assessed whether it has any uncertain taxposition and applies significant judgment in identifying uncertainties over its income taxtreatments. Since the Group operates in a complex and regulated environment, it assessedwhether the Interpretation had an impact on its financial statements. Based on its assessment andin consultation with its tax counsel, the Group determined that it is probable that its income taxtreatments (including those for the subsidiaries) will be accepted by the taxation authorities.Accordingly, the Interpretation did not have an impact on the financial statements of the Group.
Amendments to Accounting StandardsThe adoption of the following amendments and improvements to accounting standards as atJanuary 1, 2019 did not have an impact on the financial statements of the Group:
· Amendments to PFRS 9, Financial Instruments: Prepayment Features with NegativeCompensation
· Amendments to PAS 19, Employee Benefits: Plan Amendment, Curtailment or Settlement· Amendments to PAS 28, Investments in Associates and Joint Ventures: Long-term Interests in
Associates and Joint Ventures· Annual Improvements to PFRS 2015 to 2017 Cycle
· PFRS 3, Business Combinations, and PFRS 11, Joint Arrangements–Previously held interestin a joint operation
· PAS 12, Income Taxes–Income tax consequence of payments on financial instrumentsclassified as equity
· PAS 23, Borrowing Costs–Borrowing costs eligible for capitalization
- 6 -
*SGVFS038920*
Future Changes in Accounting StandardsListed below are accounting standards and interpretations issued but not yet effective up to the date ofissuance of the Group’s financial statements. The Group intends to adopt these standards when theybecome effective. Except as otherwise indicated, the Group does not expect the adoption of thesenew and amended standards and interpretations to have significant impact on the financial statements.
Effective beginning on or after January 1, 2020· Amendments to PFRS 3, Business Combinations: Definition of a Business
The amendments clarify the minimum requirements to be a business, remove the assessment of amarket participant’s ability to replace missing elements, and narrow the definition of outputs.The amendments also add guidance to assess whether an acquired process is substantive and addillustrative examples. An optional fair value concentration test is introduced which permits asimplified assessment of whether an acquired set of activities and assets is not a business. Theseamendments will apply to future business combinations of the Group.
· Amendments to PAS 1, Presentation of Financial Statements, and PAS 8, Accounting Policies,Changes in Accounting Estimates and Errors: Definition of MaterialThe amendments refine the definition of material in PAS 1 and align the definitions used acrossPFRS and other pronouncements. They are intended to improve the understanding of the existingrequirements rather than to significantly impact an entity’s materiality judgments.
Effective beginning on or after January 1, 2021 (subject to Board of Accountancy’s approval)· PFRS 17, Insurance Contracts
PFRS 17 is comprehensive new accounting standard for insurance contracts, covering recognitionand measurement, presentation and disclosure. Once effective, PFRS 17 will replace PFRS 4,Insurance Contracts. PFRS 17 applies to all types of insurance contracts (i.e., life, non-life,direct insurance and re-insurance), regardless of the type of entities that issue them, as well as tocertain guarantees and financial instruments with discretionary participation features. PFRS 17 iseffective for reporting periods beginning on or after January 1, 2021, with comparative figuresrequired. On November 14, 2019, the International Accounting Standards Board (IASB)proposed to extend the effective date to January 1, 2022. Early application is permitted but onlyif the entity also applies PFRS 9 and PFRS 15. The Group is still assessing the impact ofadopting this standard.
Deferred effectivity· PFRS 10, Consolidated Financial Statements, and PAS 28: Sale or Contribution of Assets
between an Investor and its Associate or Joint Venture (Amendments)The amendments address the conflict between PFRS 10 and PAS 28 in dealing with the loss ofcontrol of a subsidiary that is sold or contributed to an associate or joint venture. Theamendments clarify that a full gain or loss is recognized when a transfer to an associate or jointventure involves a business as defined in PFRS 3. Any gain or loss resulting from the sale orcontribution of assets that does not constitute a business, however, is recognized only to theextent of unrelated investors’ interests in the associate or joint venture.
On January 13, 2016, the Financial Reporting Standards Council postponed the original effectivedate of January 1, 2016 of the said amendments until the International Accounting StandardsBoard has completed its broader review of the research project on equity accounting that mayresult in the simplification of accounting for such transactions and of other aspects of accountingfor associates and joint ventures.
- 7 -
*SGVFS038920*
Significant Accounting Policies
Business Combinations and GoodwillThe Group accounts for business combinations using the acquisition method. Under this method, theGroup measures the acquisition cost as the aggregate of the fair value of the consideration transferredand any amount of NCI in the acquiree. The Group then allocates that cost to the acquired identifiableassets and liabilities based on their respective fair values. Any excess acquisition cost over the fairvalue of the net assets acquired is allocated to goodwill. If the fair value of the net assets acquiredexceeds the acquisition cost, the gain is recognized in the statement of income.
The Group recognizes any acquisition-related costs as administrative expenses as they are incurred. TheGroup also recognizes any contingent consideration to be transferred by the acquirer at its fair value atthe acquisition date.
After initial recognition, the Group measures goodwill at cost less any accumulated impairment losses.For the purpose of impairment testing, the Group allocates the goodwill acquired in a businesscombination to each of its cash-generating units (CGUs) that are expected to benefit from the businesscombination.
In business combinations involving entities under common control, the Group determines whether ornot the business combination has commercial substance. When there is commercial substance, theGroup accounts for the transaction using the acquisition method as discussed above. Otherwise, theGroup accounts for the transaction similar to a pooling of interests (i.e., the assets and liabilities of theacquired entities and that of the Group are reflected at their carrying values, and any resulting differencewith the fair value of the consideration given is accounted for as an equity transaction).
Non-current Assets and Disposal Group Held for Sale and Discontinued OperationsThe Group classifies non-current assets and disposal group as held for sale if their carrying amounts willbe recovered principally through a sale transaction. As such, non-current assets and disposal groups aremeasured at the lower of their carrying amounts and fair value less costs to sell (i.e., the incrementalcosts directly attributable to the sale, excluding finance costs and income taxes).
The Group regards the criteria for held for sale classification as met only when:· the Group has initiated an active program to locate a buyer;· the Group is committed to the plan to sell the asset or disposal group, which should be available
for immediate sale in its present condition;· the sale is highly probable (i.e, expected to happen within one year from the date of the
classification); and· actions required to complete the plan indicate that it is unlikely that the plan will be significantly
changed or withdrawn.
The Group presents separately the assets and liabilities of disposal group classified as held for sale inthe statement of financial position.
The Group classifies a disposal group as discontinued operation if it is a component of the Group thateither has been disposed of, or is classified as held for sale, and:· represents a separate major line of business or geographical area of operations;· is part of a single coordinated plan to dispose of a separate major line of business or geographical
area of operations; or· is a subsidiary acquired exclusively with a view to resale.
- 8 -
*SGVFS038920*
The Group excludes discontinued operations from the results of continuing operations and presentsthem as a single amount as profit or loss after tax from discontinued operations in the statement ofincome.
If the above criteria are no longer met, the Group ceases to classify the asset or disposal group as heldfor sale. In such cases, the Group measures such asset or disposal group at the lower of its:· carrying amount before it was classified as held for sale, adjusted for any depreciation, amortization
or revaluations that would have been recognized had it not been classified as such; and· recoverable amount at the date of the subsequent decision not to sell.
The Group also amends financial statements for the periods since classification as held for sale if theasset or disposal group that ceases to be classified as held for sale is a subsidiary, joint operation, jointventure, associate, or a portion of an interest in a joint venture or an associate. Accordingly, for allperiods presented, the Group reclassifies and includes in income from continuing operations the resultsof operations of the asset or disposal group previously presented in discontinued operations.
Foreign Currency TranslationFor financial reporting purposes, the Group translates all accounts in the FCDU books and foreigncurrency-denominated accounts in the RBU books into their equivalents in Philippine pesos. Eachentity in the Group determines its own functional currency and items included in the consolidatedfinancial statements are measured using that functional currency.
Transactions and balancesAs at reporting date, the Group translates the following foreign currency-denominated accounts in theRBU in Philippine peso using:
Financial statement accounts in RBU Exchange rateMonetary assets and liabilities Bankers Association of the Philippines
(BAP) closing rate at end of yearIncome and expenses Rate prevailing at transaction dateNon-monetary items measured at historical
cost in a foreign currencyRate at the date of initial transaction
Non-monetary items measured at fair valuein a foreign currency
Rate at the date when fair value isdetermined
The Group recognizes in the statement of income any foreign exchange differences arising fromrevaluation of monetary assets and liabilities. For non-monetary items measured at fair values, theGroup recognizes any foreign exchange differences arising from revaluation in line with therecognition of the gain or loss on the change in fair value of the item (i.e., translation differences onitems whose fair value gain or loss is recognized in OCI or profit or loss are also recognized in OCIor profit or loss, respectively).
FCDU and overseas branches and subsidiariesAs at the reporting date, the Group translates the assets and liabilities of the FCDU and overseasbranches and subsidiaries in Philippine peso at the BAP closing rate prevailing at the reporting date,and their income and expenses at the average exchange rate for the year. Foreign exchangedifferences arising on translation are taken directly to OCI under ‘Accumulated TranslationAdjustment’. Upon disposal of a foreign entity or upon actual remittance of FCDU profits to RBU,the deferred cumulative amount recognized in OCI relating to the particular foreign operation isrecognized in the statement of income.
- 9 -
*SGVFS038920*
Insurance Product ClassificationInsurance contracts are those contracts where the Group (the insurer) has accepted significantinsurance risk from another party (the policyholders) by agreeing to compensate the policyholders if aspecified uncertain future event (the insured event) adversely affects the policyholders. As a generalguideline, the Group determines whether it has significant insurance risk, by comparing benefits paidwith benefits payable if the insured event did not occur. Insurance contracts can also transferfinancial risk, which is the risk of a possible future change in one or more of a specified interest rate,security or commodity price, foreign exchange rate, a credit rating or credit index, or other variables.Investment contracts mainly transfer financial risk but can also transfer insignificant insurance risk.
Once a contract has been classified as an insurance contract, it remains an insurance contract for theremainder of its lifetime, even if the insurance risk reduces significantly during this period, unless allrights and obligations are extinguished or has expired. Investment contracts, however, can bereclassified to insurance contracts after inception if the insurance risk becomes significant.All non-life insurance products issued by the Group meet the definitions of insurance contract.
Cash and Cash EquivalentsFor purposes of reporting cash flows, cash and cash equivalents include cash and other cash items(COCI), amounts due from Bangko Sentral ng Pilipinas (BSP) and other banks, interbank loansreceivable and securities held under agreements to resell that are convertible to known amounts ofcash, with original maturities of three months or less from dates of placements and that are subject toan insignificant risk of changes in fair value. Due from BSP includes statutory reserves required bythe BSP, which the Group considers as cash equivalents wherein drawings can be made to meet cashrequirement.
Fair Value MeasurementFair value is the price that the Group would receive to sell an asset or pay to transfer a liability in anorderly transaction between market participants at the measurement date (i.e., an exit price). The fairvalue measurement is based on the presumption that these transactions take place either:· in the principal market for the asset or liability; or· in the absence of a principal market, in the most advantageous market for the asset or liability.
The principal or the most advantageous market must be accessible to the Group. The Groupmeasures the fair value of an asset or a liability using the assumptions that market participants woulduse when pricing the asset or liability, assuming that market participants act in their economic bestinterest. If an asset or a liability measured at fair value has both bid and ask prices, the Group usesthe price within the bid-ask spread, which is the most representative of fair value in thecircumstances.
For nonfinancial assets, the Group measures their fair value considering a market participant’s abilityto generate economic benefits by using an asset in its highest and best use or by selling it to anothermarket participant that would use the asset in its highest and best use.
The Group uses valuation techniques that are appropriate in the circumstances and for whichsufficient data are available to measure fair value, maximizing the use of relevant observable inputsand minimizing the use of unobservable inputs.
All assets and liabilities for which fair value is measured or disclosed in the financial statements arecategorized within the fair value hierarchy, described in Note 5, based on the lowest level input that issignificant to the fair value measurement as a whole.
- 10 -
*SGVFS038920*
Financial Instruments – Initial RecognitionDate of recognitionThe Group recognizes purchases or sales of financial assets that require delivery of assets within thetime frame established by regulation or convention in the marketplace on settlement date (i.e., thedate that an asset is delivered to or by the Group), while derivatives are recognized on trade date (i.e.,the date that the Group commits to purchase or sell). The Group recognizes deposits, amounts due tobanks and customers and loans when cash is received by the Group or advanced to the borrowers.
Initial recognition of financial instrumentsAll financial instruments are initially recognized at fair value. Except for financial instruments atFVTPL, the initial measurement of financial instruments includes transaction costs.
Financial Instruments – Classification and Subsequent MeasurementThe Group classifies and measures financial assets at FVTPL unless these are measured at FVOCI orat amortized cost. The classification of financial assets depends on the contractual terms and thebusiness model for managing those financial assets.
The Group first assesses the contractual terms of financial assets to identify whether they pass thecontractual cash flows test (‘solely payments of principal and interest’ or SPPI test). For the purposeof the SPPI test, principal is defined as the fair value of the financial asset at initial recognition andmay change over the life of the financial asset (for example, if there are repayments of principal oramortization of the premium or discount). The most significant elements of interest within a lendingarrangement are typically the consideration for the time value of money and credit risk. In contrast,contractual terms that introduce a more than insignificant exposure to risks or volatility in thecontractual cash flows that are unrelated to a basic lending arrangement do not give rise to contractualcash flows that are SPPI. In such cases, the financial asset is required to be measured at FVTPL.Only financial assets that pass the SPPI test are eligible to be measured at FVOCI or at amortizedcost.
The Group determines its business model at the level that best reflects how it manages groups offinancial assets to achieve its business objective. The Group’s business model is not assessed on aninstrument-by-instrument basis, but at a higher level of aggregated portfolios. If cash flows afterinitial recognition are realized in a way that is different from the Group’s original expectations, theGroup does not change the classification of the remaining financial assets held in that business model,but incorporates such information when assessing newly originated or newly purchased financialassets going forward.
For financial liabilities, the Group classifies them as either financial liabilities at FVTPL or financialliabilities at amortized cost.
Financial assets at FVTPLFinancial assets at FVTPL include the following:· Financial assets held for trading–those acquired for the purpose of selling or repurchasing in the
near term;· Derivative instruments–contracts entered into by the Group (such as currency forwards, currency
swaps, interest rate swaps and warrants) as a service to customers and as a means of reducing ormanaging their respective financial risk exposures, as well as for trading purposes;
· Financial assets that are not SPPI, irrespective of the business model; or· Debt financial assets designated upon initial recognition at FVTPL – those assets where the
Group applied the fair value option at initial recognition if doing so eliminates or significantlyreduces an accounting mismatch
- 11 -
*SGVFS038920*
The Group carries financial assets at FVTPL in the statement of financial position at fair value.Derivatives are carried as assets when the fair value is positive and as liabilities when the fair value isnegative. The Group recognizes any gains or losses arising from changes in fair values of financialassets at FVTPL directly in the statement of income under ‘Trading and investment securities gains -net’, except for currency forwards and currency swaps, where fair value changes are included under‘Foreign exchange gains - net’.
Financial assets at FVOCIFinancial assets at FVOCI include debt and equity securities, which are subsequently measured at fairvalue. The Group recognizes the unrealized gains and losses arising from the fair valuation offinancial assets at FVOCI, net of tax, in the statement of comprehensive income as ‘Change in netunrealized loss on financial assets at FVOCI’.
Debt securities at FVOCI are those that meet both of the following conditions:· the asset is held within a business model whose objective is to hold the financial asset in order to
both collect contractual cash flows and sell the financial asset; and· the contractual terms of the financial asset give rise on specified dates to cash flows that are SPPI
on the outstanding principal amount.
The Group reports the effective yield component of debt securities at FVOCI, as well as the impact ofrestatement on foreign currency-denominated debt securities at FVOCI, in the statement of income.When the debt securities at FVOCI are disposed of, the cumulative gain or loss previously recognizedin OCI is recognized as ‘Trading and securities gain (loss) - net’ in the statement of income. TheGroup recognizes the expected credit losses (ECL) arising from impairment of such financial assets inOCI with a corresponding charge to ‘Provision for impairment, credit and other losses’ in thestatement of income.
Equity securities designated at FVOCI are those that the Group made an irrevocable election at initialrecognition to present in OCI the subsequent changes in fair value. The Group recognizes thedividends earned on holding the equity securities at FVOCI in the statement of income when theright to payment has been established. Gains and losses on disposal of these equity securities atFVOCI are never recycled to profit or loss, but the cumulative gain or loss previously recognized inthe OCI is reclassified to ‘Surplus’ or any other appropriate equity account upon disposal. The Groupdoes not subject equity securities at FVOCI to impairment assessment.
Financial assets at amortized costFinancial assets at amortized cost are debt financial assets that meet both of the following conditions:· the asset is held within a business model whose objective is to hold the financial asset in order to
collect contractual cash flows; and· the contractual terms of the financial asset give rise on specified dates to cash flows that are SPPI
on the outstanding principal amount.
This accounting policy relates to the statement of financial position captions ‘Due from BSP’, ‘Duefrom other banks’, ‘Interbank loans receivable’, ‘Securities held under agreements to resell’,‘Investment securities at amortized cost’, and ‘Loans and receivables’.
The Group subsequently measures financial assets at amortized cost using the effective interestmethod of amortization, less allowance for credit losses. The Group includes the amortization in‘Interest income’, and the ECL arising from impairment of such financial assets in ‘Provision forimpairment, credit and other losses’ in the statement of income.
- 12 -
*SGVFS038920*
Policies on subsequent measurement of financial instruments affecting the 2017 financial statementsPrior to its adoption of PFRS 9 in January 1, 2018, the Group classified certain investment securitiesas available-for-sale (AFS) investments, which was the residual classification of financial assetsunder previous accounting policies. The Group recognized the unrealized gains and losses arisingfrom the fair valuation of AFS investments, net of tax, in OCI, which is similar to the treatment of fairvalue changes of financial assets at FVOCI under PFRS 9. However, unlike financial assets atFVOCI, when the securities are disposed of, the Group recognized the cumulative gain or loss of AFSinvestments previously recognized in OCI as ‘Trading and investment securities gains - net’ in thestatement of income, regardless whether the AFS investment is a debt or an equity security. TheGroup also subjected both AFS debt and equity securities to impairment assessment.
Subsequent measurement of loans and receivables and held-to-maturity (HTM) investments underPAS 39 were similar to that of financial assets at amortized cost under PFRS 9 (i.e., using effectiveinterest method of amortization and subject to impairment). Further, there was no change in thesubsequent measurement of financial assets at FVTPL from PAS 39 to PFRS 9, where all changes infair values are recognized directly in the statement of income.
Financial liabilities at amortized costThe Group classifies issued financial instruments or their components which are not designated atFVTPL, as financial liabilities at amortized cost under ‘Deposit liabilities’, ‘Bills and acceptancespayable’, ‘Bonds payable’ or other appropriate financial liability accounts. The substance of thecontractual arrangement for these instruments results in the Group having an obligation either todeliver cash or another financial asset to the holder, or to satisfy the obligation other than by theexchange of a fixed amount of cash or another financial asset for a fixed number of own equityshares. The components of issued financial instruments that contain both liability and equityelements are accounted for separately, with the equity component being assigned the residual amountafter deducting from the instrument as a whole the amount separately determined as the fair value ofthe liability component on the date of issue.
The Group subsequently measures financial liabilities at amortized cost using the effective interestmethod of amortization.
Repurchase and reverse repurchase agreementsThe Group does not derecognize from the statement of financial position securities sold underagreements to repurchase at a specified future date (‘repos’). Instead, the Group recognizes thecorresponding cash received, including accrued interest, as a loan to the Group, reflecting theeconomic substance of such transaction.
Conversely, the Group does not recognize securities purchased under agreements to resell at aspecified future date (‘reverse repos’). The Group is not permitted to sell or repledge the securities inthe absence of default by the owner of the collateral. The Group recognizes the corresponding cashpaid, including accrued interest, as a loan to the counterparty. The difference between the purchaseprice and resale price is treated as interest income and is accrued over the life of the agreement usingthe effective interest method.
Reclassification of financial instrumentsSubsequent to initial recognition, the Group may reclassify its financial assets only when there is achange in the business models for managing these financial assets. Reclassification of financialliabilities is not allowed.
- 13 -
*SGVFS038920*
Financial Instruments – DerecognitionFinancial assetsThe Group derecognizes a financial asset (or, where applicable, a part of a financial asset or part of agroup of financial assets) when:· the rights to receive cash flows from the asset have expired;· the Group retains the right to receive cash flows from the asset, but has assumed an obligation to
pay them in full without material delay to a third party under a ‘pass-through’ arrangement; or· the Group has transferred its rights to receive cash flows from the asset and either (a) has
transferred substantially all the risks and rewards of the asset, or (b) has neither transferred norretained the risk and rewards of the asset but has transferred control over the asset.
Where the Group has transferred its rights to receive cash flows from an asset or has entered into apass-through arrangement, and has neither transferred nor retained substantially all the risks andrewards of the asset nor transferred control over the asset, the Group recognizes the asset only to theextent of its continuing involvement in the asset. Continuing involvement that takes the form of aguarantee over the transferred asset is measured at the lower of original carrying amount of the assetand the maximum amount of consideration that the Group could be required to repay.
Financial liabilitiesThe Group derecognizes a financial liability when the obligation under the liability is discharged orcancelled or has expired. Where an existing financial liability is replaced by another from the samelender on substantially different terms, or the terms of an existing liability are substantially modified,the Group treats such an exchange or modification as a derecognition of the original liability andrecognition of a new liability, and Group recognizes the difference in the respective carrying amountsin the statement of income.
Financial Instruments – ImpairmentECL methodologyThe Group’s loss impairment method on financial instruments applies a forward-looking ECLapproach, which covers all loans and other debt financial assets not held at FVTPL, together withloan commitments and financial guarantee contracts. The ECL allowance is based on the creditlosses expected to arise on a 12-month duration if there has been no significant increase in credit risk(SICR) of the financial instrument since origination (12-month ECL). Otherwise, if an SICR isobserved, then the Group extends its ECL estimation until the end of the life of the financialinstrument (Lifetime ECL). Both Lifetime ECLs and 12-month ECLs are calculated on either anindividual basis or a collective basis, depending on the nature of the underlying portfolio of financialinstruments.
Staging assessmentThe Group categorizes financial instruments subject to the ECL methodology into three stages:· Stage 1 – comprised of all non-impaired financial instruments which have not experienced an
SICR since initial recognition. The Group recognizes 12-month ECL for Stage 1 financialinstruments.
· Stage 2 – comprised of all non-impaired financial instruments which have experienced an SICRsince initial recognition. The Group recognizes Lifetime ECL for Stage 2 financial instruments.
· Stage 3 – comprised of financial instruments which have objective evidence of impairment as aresult of one or more loss events that have occurred after initial recognition with a negativeimpact on their estimated future cash flows. The Group recognizes Lifetime ECL for Stage 3(credit-impaired) financial instruments.
- 14 -
*SGVFS038920*
Definition of “default” and “cure”The Group considers default to have occurred when:· the obligor is past due for more than 90 days on any material credit obligation to the Group; or· the obligor is unlikely to pay its credit obligations to the Group in full, without recourse by the
Group to actions such as realizing collateral, as applicable.
The Group no longer considers an instrument to be in default when it no longer meets any of thedefault criteria and has exhibited satisfactory and acceptable track record for six consecutive paymentperiods, subject to applicable rules and regulations of the BSP.
Determining SICRAt each reporting date, the Group assesses whether the credit risk on a loan or credit exposure hasincreased significantly since initial recognition. The Group’s assessment of SICR involves looking atboth the qualitative and quantitative elements, as well as if the loan or credit exposure is unpaid for atleast 30 days (“backstop”).
The Group assesses SICR on loans or credit exposures having potential credit weaknesses based oncurrent and/or forward-looking information that warrant management’s close attention. Suchweaknesses, if left uncorrected, may affect the repayment of these exposures. The loan or creditexposure also exhibits SICR if there are adverse or foreseen adverse economic or market conditionsthat may affect the counterparty’s ability to meet the scheduled repayments in the future.
The Group looks at the quantitative element through statistical models or credit ratings process orscoring process that captures certain information, which the Group considers as relevant in assessingchanges in credit risk. The Group also looks at the number of notches downgrade of credit risk rating(CRR) or certain thresholds for the probabilities of default being generated from statistical models todetermine whether SICR has occurred subsequent to initial recognition date.
Transfer between stagesThe Group transfers credit exposures from Stage 1 to Stage 2 if there is an SICR from initialrecognition date. In subsequent reporting periods, if the credit risk of the financial instrumentimproves such that there is no longer an SICR since initial recognition, then the Group reverts them toStage 1.
The Group transfers credit exposures from Stage 3 (non-performing) to Stage 1 (performing) whenthere is sufficient evidence to support their full collection. Such exposures should exhibit both of thefollowing indicators:· quantitative – characterized by payments made within an observation period; and· qualitative – pertain to the results of assessment of the borrower’s financial capacity.
Generally, the Group considers that full collection is probable when payments of interest and/orprincipal are received for at least six months.
Modified or restructured loans and other credit exposuresIn certain circumstances, the Group modifies the original terms and conditions of a credit exposure toform a new loan agreement or payment schedule. Such modifications can be provided depending onthe borrower’s current or expected financial difficulties. Modifications may include, but are notlimited to, change in interest rate and terms, principal amount, maturity date and schedule of periodicpayments.
- 15 -
*SGVFS038920*
If a loan or credit exposure has been renegotiated or modified, and was not derecognized, the Groupshall assess whether there has been a SICR by comparing the risk of default at reporting date based onmodified terms, and the risk of default at initial recognition date based on original terms.
Purchased or originated credit-impaired loansThe Group considers a loan as credit-impaired on purchase or origination if there is evidence ofimpairment at the time of initial recognition (i.e., acquired/purchased at a deep discounted price). TheGroup recognizes the cumulative changes in Lifetime ECL since initial recognition as a lossallowance for purchased or originated credit-impaired loan.
Measurement of ECLECLs are generally measured based on the risk of default over one of two different time horizons,depending on whether there has been SICR since initial recognition. ECL calculations are based onthe following components:· Probability of default (PD) – an estimate of the likelihood that a borrower will default on its
obligations over the next 12 months for Stage 1 or over the remaining life of the credit exposurefor Stages 2 and 3.
· Loss-given-default (LGD) – an estimate of the loss arising in case where default occurs at a giventime. It is based on the difference between the contractual cash flows due and those that theGroup would expect to receive, including from any collateral.
· Exposure-at-default (EAD) – an estimate of the exposure at a future/default date taking intoaccount expected changes in the exposure after the reporting date, including repayments ofprincipal and interest, expected drawdown on committed facilities and accrued interest frommissed payments.
· Discount rate – represents the rate to be used to discount an expected loss to present value at thereporting date using the original effective interest rate (EIR) determined at initial recognition.
In measuring ECL, the Group considers forward-looking information depending on the creditexposure. The Group applies experienced credit judgment, which is essential in assessing thesoundness of forward-looking information and in ensuring that these are adequately supported.Forward-looking macroeconomic information and scenarios consider:· factors that may affect the general economic or market conditions in which the Group operates,
such as gross domestic product growth rates, foreign exchange rates, inflation rate, among others;· changes in government policies, rules and regulations, such as adjustments to policy rates;· other factors pertinent to the Group, including the proper identification and mitigation of risks
such as incidences of loan defaults or losses.
The Group also measures ECL by evaluating a range of possible outcomes and using reasonable andsupportable pieces of information that are available without undue cost or effort at the reporting dateabout past events, current conditions and forecasts of future economic conditions.
Policies on impairment of financial instruments affecting the 2017 financial statementsPrior to adoption of PFRS 9 on January 1, 2018, the Group applied the incurred loss approach byassessing impairment only when there had been an objective evidence of impairment, such asindications that the borrower was experiencing significant financial difficulty, default or delinquencyin interest or principal payments, the probability that they will enter bankruptcy or other financialreorganization, and where observable data indicated that there was measurable decrease in theestimated future cash flows.
- 16 -
*SGVFS038920*
For financial assets carried at amortized cost (such as loans and receivables and HTM investments),AFS debt securities, and reinsurance assets, the Group first assessed impairment for financial assetsthat are individually significant, or collectively for financial assets that are not individuallysignificant. If there was an objective evidence of incurred impairment, the Group measured theamount of the impairment loss as the difference between the asset’s carrying amount and the presentvalue of the estimated future cash flows computed using the financial asset’s original EIR. If theGroup determined that no objective evidence of impairment exists for an individually assessedfinancial asset, whether significant or not, it included the asset in a group of financial assets withsimilar credit risk characteristics (such as internal credit risk rating, collateral type, past-due status orterm) and collectively assessed them for impairment based on historical loss experience.
The methodology and assumptions used by the Group for estimating future cash flows are reviewedregularly by the Group to reduce any differences between loss estimates and actual loss experience.
The Group assessed for impairment its consumer loans and credit card receivables on a collectivebasis using a net flow rate methodology. Net flow tables were derived from account-level monitoringof monthly movements between different stage buckets, from one-day past due to 180-days past due.The net flow rate methodology relied on the last 60 months for consumer loans and 24 months forcredit card receivables of net flow tables to establish a percentage (net flow rate) of receivables thatare current or in any state of delinquency (i.e., 30, 60, 90, 120, 150 and 180 days past due) as of thereporting date that will eventually result in write-off. The Group then computed the gross provisionbased on the outstanding balances of the receivables as of the reporting date and the net flow rateswere determined for the current and each delinquency bucket.
For AFS equity securities, the Group assessed impairment whether there was a significant orprolonged decline in the fair value of the investments below their cost. The Group treated‘significant’ generally as 20.00% or more and ‘prolonged’ greater than 12 months. In addition, theGroup evaluated other factors, including normal volatility in share price for quoted equity securitiesand the future cash flows and the discount factors for unquoted equity securities. When there wasevidence of impairment, the Group excludes the cumulative loss on the AFS equity securities fromOCI and recognized them in the statement of income. The Group did not reverse impairment losseson AFS equity securities through the statement of income and any increases in fair value afterimpairment were recognized directly in OCI.
Financial Guarantees and Undrawn Loan CommitmentsThe Group gives loan commitments and financial guarantees consisting of letters of credit, letters ofguarantees, and acceptances.
Financial guarantees are contracts that require the Group as issuer to make specified payments toreimburse the holder for a loss it incurs because a specified debtor fails to make payments when duein accordance with the terms of a debt instrument. The Group initially recognizes financialguarantees on trade receivables at fair value under ‘Bills and acceptances payable’ or ‘Otherliabilities’ in the statement of financial position. Subsequent to initial recognition, the Groupmeasures these financial guarantees at the higher of:· the initial fair value less any cumulative amount of income or amortization recognized in the
statement of income; and· the ECL determined under PFRS 9.
Undrawn loan commitments and letters of credit are commitments under which, over the duration ofthe commitment, the Group is required to provide a loan with pre-specified terms to the customer.
- 17 -
*SGVFS038920*
The nominal contractual value of financial guarantees and undrawn loan commitments, where theloan agreed to be provided is on market terms, are not recorded in the statement of financial position.
The Group estimates the expected portion of the undrawn loan commitments that will be drawn overtheir expected life. The ECL related to financial guarantees and loan commitments withoutoutstanding drawn amounts is recognized in ‘Miscellaneous liabilities’ under ‘Other liabilities’.
Investments in Subsidiaries in the Parent Company Financial StatementsIn the separate financial statements of the Parent Company, the Parent Company accounts for itsinvestments in subsidiaries under the equity method of accounting as discussed below.
Investment in an AssociateThe Group’s associate pertains to the entity over which the Group has significant influence, which isthe power to participate in the financial and operating policy decisions of the investee, but is notcontrol or joint control over those policies.
The Group accounts for its investment in an associate under the equity method of accounting. Underthis method, the Group carries the investment in an associate in the statement of financial position atcost plus post-acquisition changes in the share in the net assets of the associate. The Group reflectsits share in the results of operations of the associate in the statement of income. When there has beena change recognized in the associate’s OCI, the Group recognizes its share in any changes anddiscloses this in the statement of comprehensive income. The Group eliminates any profits or lossesarising from transactions between the Group and the associate to the extent of the interest of theGroup in the associate.
Upon loss of significant influence over the associate, the Group measures and recognizes any retainedinvestment at its fair value. Any resulting difference between the aggregate of the associate’scarrying amount upon disposal and the fair value of the retained investment, and proceeds fromdisposal is recognized in the statement of income.
Property and EquipmentThe Group carries its land at cost less any impairment in value, and its depreciable properties such asbuildings, right-of-use assets, furniture, fixtures and equipment, long-term leasehold land, andleasehold improvements at cost less accumulated depreciation and amortization and any impairmentin value.
The initial cost of property and equipment consists of its purchase price, including import duties,taxes and any directly attributable costs of bringing the asset to its working condition and location forits intended use. See accounting policy on Leases for the recognition and measurement of right-of-use assets included under ‘Property and equipment’.
The Group derecognizes an item of property and equipment upon disposal or when no futureeconomic benefits are expected from its use or disposal. The Group includes any gain or loss arisingfrom derecognition of the asset (calculated as the difference between the net disposal proceeds andthe carrying amount of the asset) in the statement of income in the period the asset is derecognized.
Investment Properties and Chattel Mortgage PropertiesThe Group initially measures investment properties and chattel mortgage properties initially at cost,including transaction costs. When the investment property or chattel mortgage property is acquiredthrough an exchange transaction, the Group measures the asset at its fair value, unless the fair valueof such an asset cannot be reliably measured in which case the asset acquired is measured at the
- 18 -
*SGVFS038920*
carrying amount of asset given up. The Group recognizes any gain or loss on exchange in thestatement of income under ‘Miscellaneous income’.
Foreclosed properties are classified under ‘Investment properties’ upon:· entry of judgment in case of judicial foreclosure;· execution of the Sheriff’s Certificate of Sale in case of extra-judicial foreclosure; or· notarization of the Deed of Dacion in case of payment in kind (dacion en pago).
Subsequent to initial recognition, the Group carries the investment properties and chattel mortgageproperties at cost less accumulated depreciation (for depreciable properties) and any impairment invalue.
The Group derecognizes investment properties and chattel mortgage properties when they have eitherbeen disposed of or when the asset is permanently withdrawn from use and no future benefit isexpected from its disposal. The Group recognizes any gains or losses on the retirement or disposal ofan investment property in the statement of income under ‘Net gain on sale or exchange of assets’ inthe period of retirement or disposal.
The Group transfers assets to investment properties when, and only when, there is a change in useevidenced by ending of owner occupation, commencement of an operating lease to another party orending of construction or development. Conversely, the Group transfers out of investment propertieswhen, and only when, there is a change in use evidenced by commencement of owner occupation orcommencement of development with a view to sale.
Intangible AssetsThe Group initially measures separately acquired intangible assets at cost, and the intangible assetsacquired in a business combination at their fair values at the date of acquisition. Following initialrecognition, the Group carries intangible assets at cost less any accumulated amortization andaccumulated impairment losses. The Group does not capitalize internally generated intangibles,excluding capitalized development costs, and reflects in profit or loss the related expenditures in theperiod in which the expenditure is incurred.
The Group measures any gains or losses arising from derecognition of an intangible asset as thedifference between the net disposal proceeds and the carrying amount of the asset. The Grouprecognizes these gains or losses in the statement of income in the period when the intangible asset isdisposed of.
Intangibles with finite livesThe Group capitalizes software costs, included in ‘Intangible assets’, on the basis of the cost incurredto acquire and bring to use the specific software.
Customer relationship intangibles (CRI) and core deposits intangibles (CDI) are the intangible assetsacquired by the Group through business combination. The Group initially measures these intangibleassets at their fair values at the date of acquisition. The fair value of these intangible assets reflectsexpectations about the probability that the expected future economic benefits embodied in the assetwill flow to the Group.
Following initial recognition, intangibles with finite lives are measured at cost less accumulatedamortization and any accumulated impairment losses.
- 19 -
*SGVFS038920*
GoodwillThe Group initially measures goodwill acquired in a business combination at cost. With respect toinvestments in an associate, the Group includes goodwill in the carrying amount of the investments.Goodwill is not amortized, but is tested for impairment annually or more frequently if events orchanges in circumstances that the carrying value may be impaired.
Impairment of Nonfinancial AssetsProperty and equipment, investment properties, intangible assets with finite lives, chattel mortgageproperties, and investments in subsidiaries and an associateAt each reporting date, the Group assesses whether there is any indication that its property andequipment, investment properties, intangible assets with finite lives, chattel mortgage properties, andinvestments in subsidiaries and an associate may be impaired. When an indicator of impairmentexists, the Group makes a formal estimate of recoverable amount. Recoverable amount is the higherof an asset’s fair value less costs to sell and its value in use and is determined for an individual asset,unless the asset does not generate cash inflows that are largely independent of those from other assetsor groups of assets, in which case the recoverable amount is assessed as part of the CGU to which itbelongs.
When the carrying amount of an asset exceeds its recoverable amount, the Group considers the assetas impaired and writes the asset down to its recoverable amount. In assessing value in use, the Groupdiscounts the estimated future cash flows to their present value using a pre-tax discount rate thatreflects current market assessments of the time value of money and the risks specific to the asset.
The Group charges the impairment loss against current operations. At each reporting date, the Groupassesses whether there is any indication that previously recognized impairment losses may no longerexist or may have decreased. If such indication exists, the Group estimates the recoverable amountand reverses a previously recognized impairment loss only if there has been a change in the estimatesused to determine the asset’s recoverable amount since the last impairment loss was recognized. Thereversal recognized in the statement of income cannot exceed the carrying amount that would havebeen determined, net of depreciation and amortization, had no impairment loss been recognized forthe asset in prior years. After such reversal, the Group adjust the depreciation and amortization infuture periods to allocate the asset’s revised carrying amount, less any residual value, on a systematicbasis over its remaining life.
GoodwillThe Group performs its annual impairment test of goodwill every fourth quarter, or more frequently ifevents or changes in circumstances indicate that the carrying value may be impaired.
The Group determines impairment for goodwill by assessing the recoverable amount of the CGU (orgroup of CGUs) to which the goodwill relates. When the recoverable amount of the CGU (or groupof CGUs) is less than the carrying amount of the CGU (or group of CGUs) to which goodwill hasbeen allocated (or to the aggregate carrying amount of a group of CGUs to which the goodwill relatesbut cannot be allocated), the Group recognizes an impairment loss immediately in the statement ofincome. Impairment losses relating to goodwill cannot be reversed for subsequent increases in itsrecoverable amount in future periods.
Nonlife Insurance Contract LiabilitiesThe Group recognizes insurance contract liabilities when contracts are entered into and premiums arecharged.
- 20 -
*SGVFS038920*
Claims provisions and incurred but not reported (IBNR) lossesThe Group estimates outstanding claims provisions based on the ultimate cost of all claims incurredbut not settled at the reporting date, whether reported or not, together with related claims handlingcosts and reduction for the expected value of salvage and other recoveries. Delays can beexperienced in the notification and settlement of certain types of claims, therefore the ultimate cost ofwhich cannot be known with certainty at the end of the reporting period. The Group does notdiscount the liability for the time value of money and includes any provision for IBNR claims. TheGroup does not also recognize provision for equalization or catastrophic reserves. The Groupderecognizes the liability when the contract is discharged or cancelled, and has expired.
Provision for unearned premiumsThe Group defers as provision for unearned premiums the proportion of written premiums, gross ofcommissions payable to intermediaries, attributable to subsequent periods or to risks that have not yetexpired. The Group accounts for the portion of the premiums written that relate to the unexpiredperiods of the policies at the reporting date as provision for unearned premiums and presented under‘Insurance contract liabilities’ as part of ‘Other liabilities’ in the consolidated statement of financialposition. Any change in the provision for unearned premiums is taken to the statement of income inthe order that revenue is recognized over the period of risk. The Group makes further provisions tocover claims under unexpired insurance contracts which may exceed the unearned premiums and thepremiums due in respect of these contracts.
Liability adequacy testAt each reporting date, liability adequacy tests are performed, to ensure the adequacy of insurancecontract liabilities, net of related deferred acquisition costs. In performing the test, current bestestimates of future cash flows, claims handling and policy administration expenses, as well asinvestment income from assets backing such liabilities, are used. Changes in expected claims thathave occurred, but which have not been settled, are reflected by adjusting the liability for claims andfuture benefits. Any inadequacy is immediately charged to the statement of income by establishingan unexpired risk provision for losses arising from the liability adequacy tests. The provision forunearned premiums is increased to the extent that the future claims and expenses in respect of currentinsurance contracts exceed future premiums plus the current provision for unearned premiums.
ReinsuranceThe Group cedes insurance risk in the normal course of business. Reinsurance assets representbalances due from reinsurance companies. Recoverable amounts are estimated in a manner consistentwith the outstanding claims provision and are in accordance with the reinsurance contract. Whenclaims are paid, such reinsurance assets are reclassified to ‘Loans and receivables’.
Ceded reinsurance arrangements do not relieve the Group from its obligations to policyholders.The Group also assumes reinsurance risk in the normal course of business for insurance contracts.Premiums and claims on assumed reinsurance are recognized as income and expenses in the samemanner as they would be if the reinsurance were considered direct business, taking into account theproduct classification of the reinsured business. Reinsurance liabilities represent balances due toceding companies. Amounts payable are estimated in a manner consistent with the associatedreinsurance contract.
Premiums and claims are presented on a gross basis for both ceded and assumed reinsurance.Reinsurance assets or liabilities are derecognized when the contractual rights are extinguished orexpired or when the contract is transferred to another party.
- 21 -
*SGVFS038920*
When the Group enters into a proportional treaty reinsurance agreement for ceding out its insurancebusiness, the Group initially recognizes a liability at transaction price. Subsequent to initialrecognition, the portion of the amount initially recognized as a liability will be withheld and includedas part of ‘Other liabilities’ in the consolidated statement of financial position. The amount withheldis generally released after a year.
Deferred Acquisition Costs (DAC)Commission and other acquisition costs incurred during the financial period that vary with and arerelated to securing new insurance contracts and/or renewing existing insurance contracts, but whichrelates to subsequent financial periods, are deferred to the extent that they are recoverable out offuture revenue margins. All other acquisition costs are recognized as an expense when incurred.Subsequent to initial recognition, these costs are amortized using the 24th method, except for marinecargo where the DAC pertains to the commissions for the last two months of the year. Amortizationis charged to ‘Service fees and commission expense’ in the consolidated statement of income.
An impairment review is performed at each end of the reporting period or more frequently when anindication of impairment arises. The carrying value is written down to the recoverable amount andthe impairment loss is charged to the consolidated statement of income. The DAC is also consideredin the liability adequacy test for each reporting period.
EquityThe Group measures capital stock at par value for all shares issued and outstanding. When the sharesare sold at a premium, the Group credits the difference between the proceeds and the par value to‘Capital paid in excess of par value’. ‘Surplus’ represents accumulated earnings (losses) of the Groupless dividends declared.
The reserves recorded in equity in the statement of financial position include:· Remeasurement losses on retirement plan – pertains to the remeasurement comprising actuarial
gains or losses on the present value of the defined benefit obligation, net of return on plan assets· Accumulated translation adjustment – used to record exchange differences arising from the
translation of the FCDU accounts and foreign operations (i.e., overseas branches and subsidiaries)to Philippine peso
· Net unrealized gain (loss) on financial assets at FVOCI – comprises changes in fair value offinancial assets at FVOCI
DividendsThe Group recognizes dividends on common shares as a liability and deduction against ‘Surplus’when approved by the Board of Directors (BOD) of the Parent Company. For dividends that areapproved after the reporting date, the Group discloses them in the financial statements as an eventafter the reporting date.
Securities Issuance CostsThe Group capitalizes the issuance, underwriting and other related expenses incurred in connectionwith the issuance of debt securities (other than debt securities designated at FVTPL) and amortizesover the terms of the instruments using the effective interest method. The Group includes anyunamortized debt issuance costs in the carrying value of the related debt instruments in the statementof financial position.
- 22 -
*SGVFS038920*
For underwriting, share registration, and other share issuance costs and taxes incurred in connectionwith the issuance of equity securities, the Group accounts for these costs as reduction of equityagainst ‘Capital paid in excess of par value’. If the ‘Capital paid in excess of par value’ is notsufficient, the share issuance costs are charged against the ‘Surplus’. For transaction costs that relatejointly to the offering and listing of the shares, the Group allocates the costs to those transactions (i.e.,reduction against equity for those allocated to offering of shares, and expensed for those allocated tolisting of shares) using a basis of allocation that is rational and consistent with similar transactions.
Revenue RecognitionPrior to January 1, 2018, under PAS 18, Revenue, revenue is recognized to the extent that it isprobable that economic benefits will flow to the Group and the revenue can be reliably measured.Revenue is measured at the fair value of the consideration received.
Upon adoption of PFRS 15, Revenue from Contracts with Customers, effective January 1, 2018,revenue is recognized upon transfer of services to the customer at an amount that reflects theconsideration to which the Group expects to be entitled in exchange for those services.
The Group assesses its revenue arrangements against specific criteria in order to determine if it isacting as principal or agent. The Group has concluded that it is acting as a principal in all of itsrevenue arrangements except for brokerage transactions. The following specific recognition criteriamust also be met before revenue is recognized within the scope of PFRS 15:
Service fees and commission incomeThe Group earns fee and commission income from diverse range of services it provides to itscustomers:
· Fees from services that are provided over a certain period of timeThe Group accrues fees earned for the provision of services over a period of time. These feesinclude investment fund fees, custodian fees, fiduciary fees, credit-related fees, trust fees,portfolio and other management fees, and advisory fees.
· Bancassurance feesThe Group recognizes non-refundable access fees on a straight-line basis over the term of theperiod of the provision of the access. Milestone fees or variable and fixed earn-out fees arerecognized in reference to the stage of achievement of the milestones.
· Fee income from providing transaction servicesThe Group recognizes the fees arising from negotiating or participating in the negotiation of atransaction for a third party, such as the arrangement of the acquisition of shares or othersecurities or the purchase or sale of businesses, only upon completion of the underlyingtransaction. For fees or components of fees that are linked to a certain performance, the Grouprecognizes revenue after fulfilling the corresponding criteria. These fees include underwritingfees, corporate finance fees, remittance fees, brokerage fees, commissions, deposit-related andother credit-related fees.
The Group recognizes loan syndication fees as revenue when the syndication has been completedand the Group retains no part of the loans for itself or retains part at the same EIR as the otherparticipants.
The Group assessed that there is no difference in accounting for the above service fees andcommission income under PFRS 15 and PAS 18.
- 23 -
*SGVFS038920*
Interchange fees and revenue from rewards redeemedThe Group takes up as income the interchange fees under ‘Service fees and commission income’upon receipt from member establishments of charges arising from credit availments by the Group’scardholders. These discounts are computed based on certain agreed rates and are deducted fromamounts remitted to the member establishments.
The Group operates a loyalty points program which allows customers to accumulate points when theypurchase from member establishments using the issued card of the Group. The points can then beredeemed for free products subject to a minimum number of points being redeemed.
Prior to January 1, 2018, the Group allocates the consideration received between the discountsearned, interchange fee and the loyalty points earned, with the consideration allocated to the loyaltypoints equal to its fair value. The fair value is determined by applying statistical analysis. The Groupthen defers the fair value of the points issued and recognizes revenue only when the loyalty points areredeemed or have expired.
Effective January 1, 2018, the Group allocates a portion of the consideration received from discountsearned and interchange fees from credit cards to the reward points based on the estimated stand-aloneselling prices. The Group defers the amount allocated to the loyalty program and recognizes revenueonly when the loyalty points are redeemed or the likelihood of the credit cardholder redeeming theloyalty points becomes remote. The Group includes the deferred balance under ‘Other liabilities’ inthe statement of financial position.
Commissions on credit cardsThe Group recognizes commissions earned as revenue upon receipt from member establishments ofcharges arising from credit availments by credit cardholders. These commissions are computed basedon certain agreed rates and are deducted from amounts remittable to member establishments.
Other incomeThe Group recognizes income from sale of properties upon completion of the earning process (i.e.,upon transfer of control under PFRS 15 and transfer of risks and rewards under PAS 18) and whenthe collectability of the sales price is reasonably assured.
The following are revenue streams of the Group, which are covered by accounting standards otherthan PFRS 15:
Interest incomeFor all financial instruments measured at amortized cost and interest-bearing financial instrumentsclassified as financial assets at FVOCI/AFS investments, the Group records interest income using theEIR, which is the rate that exactly discounts estimated future cash payments or receipts through theexpected life of the financial instrument or a shorter period, where appropriate, to the net carryingamount of the financial asset or financial liability. In calculating EIR, the Group considers allcontractual terms of the financial instrument (for example, prepayment options), and includes anyfees or incremental costs that are directly attributable to the instrument and are an integral part of theEIR, but not future credit losses. The Group adjusts the carrying amount of the financial instrumentthrough ‘Interest income’ in the statement of income based on the original EIR.
Under PFRS 9, when a financial asset becomes credit-impaired and is, therefore, regarded as Stage 3,the Group calculates interest income by applying the EIR to the net amortized cost of the financialasset. If the financial asset cures and is no longer credit-impaired, the Group reverts to calculatinginterest income on a gross basis. Under PAS 39, once the recorded value of a financial asset or groupof similar financial assets carried at amortized cost has been reduced due to an impairment loss, the
- 24 -
*SGVFS038920*
Group continues to recognize interest income using the original EIR applied to the new carryingamount.
Commitment feesThe Group defers the commitment fees for loans that are likely to be drawn down (together with anyincremental costs) and includes them as part of the EIR of the loan. These are amortized using EIRand recognized as revenue over the expected life of the loan.
Commissions on installment credit salesThe Group records the purchases by the credit cardholders, collectible on installment basis, at the costof the items purchased plus certain percentage of cost. The Group recognizes the excess over cost as‘Unearned and other deferred income’, which is shown as a deduction from ‘Loans and receivables’in the statement of financial position. The Group amortizes and recognizes as revenue the unearnedand other deferred income over the installment terms using the effective interest method.
Insurance premiums and commissions on reinsuranceGross insurance written premiums comprise the total premiums receivable for the whole period ofcover provided by contracts entered into during the accounting period. Premiums include anyadjustments arising in the accounting period for premiums receivable in respect of business written inprior periods. The Group recognizes premiums from short-duration insurance contracts andreinsurance commissions as revenue over the period of the contracts using the 24th method, exceptfor marine cargo where the provision for unearned premiums pertain to the premiums for the last twomonths of the year. The Group recognizes in the statement of income for the period the net changesin provisions for unearned premiums and deferred reinsurance premiums.
Dividend incomeThe Group recognizes dividend income when the Group’s right to receive payment is established.
Trading and investment securities gains - netThe Group recognizes in ‘Trading and investment securities gains - net’ the results arising fromtrading activities, all gains and losses from changes in fair value of financial assets and financialliabilities at FVTPL, and gains and losses from disposal of debt securities at FVOCI (underPFRS 9) and AFS investments (under PAS 39).
Rental incomeThe Group accounts for rental income arising on leased properties on a straight-line basis over thelease terms of ongoing leases, which is recorded in the statement of income under ‘Miscellaneousincome’.
Income on direct financing leases and receivables financedThe Group recognizes income on direct financing leases and receivables financed using the effectiveinterest method and any unearned discounts are shown as deduction against ‘Loans and receivables’ .Unearned discounts are amortized over the term of the note or lease using the effective interestmethod and consist of:· transaction and finance fees on finance leases and loans and receivables financed with long-term
maturities; and· excess of the aggregate lease rentals plus the estimated residual value of the leased equipment
over its cost.
- 25 -
*SGVFS038920*
ExpendituresOperating expensesThis encompasses those expenses that arise in the course of the ordinary activities of the Group, aswell as any losses incurred. These are recognized in the statement of income as they are incurred.
Taxes and licensesThis includes all other taxes, local and national, including gross receipts taxes (GRT), documentarystamp taxes, real estate taxes, licenses and permit fees that are recognized when incurred.
Depreciation and amortizationThe Group computes for depreciation and amortization of depreciable assets using the straight-linemethod over the estimated useful lives of the respective assets. The estimated useful lives of thedepreciable assets follow:
YearsProperty and equipment:
Buildings 25 - 50 Right-of-use assets More than 1 - 25 or the
lease term, whichever isshorter (provided that
lease term is more thanone year)
Furniture, fixtures and equipment 5Long-term leasehold land 46 - 50
Leasehold improvements 10 or the lease term,whichever is shorter
Investment properties 10 - 25Chattel mortgage properties 5Intangible assets with finite lives:
Software costs 5CDI 10CRI 3
The Group reviews periodically the useful life and the depreciation and amortization method toensure that these are consistent with the expected pattern of economic benefits from the depreciableassets. Changes in the expected useful life or the expected pattern of consumption of future economicbenefits embodied in the asset are considered to modify the depreciation and amortization period ormethod, as appropriate, and are treated as changes in accounting estimates.
Expenditures on nonfinancial assetsThe Group charges against current operations the expenditures incurred after the nonfinancial assets(i.e., property and equipment, investment properties, software costs, and chattel mortgage properties)have been put into operation, such as repairs and maintenance. In situations where it can be clearlydemonstrated that the expenditures have resulted in an increase in the future economic benefitsexpected to be obtained from the use of these nonfinancial assets beyond their originally assessedstandard of performance, the Group capitalizes such expenditures as additional cost.
Borrowing costsThe Group recognizes borrowing costs as expense in the year in which these costs are incurred.Borrowing costs consist of interest expense calculated using the effective interest method that theGroup incurs in connection with borrowing of funds.
- 26 -
*SGVFS038920*
Retirement BenefitsDefined benefit planAt the end of the reporting period, the Group determines its net defined benefit liability (or asset) asthe difference between the present value of the defined benefit obligation and the fair value of planassets, adjusted for any effect of asset ceiling. The asset ceiling is the present value of any economicbenefits available in the form of refunds from the plan or reductions in future contributions to theplan. The cost of providing benefits under the defined benefit plan is actuarially determined using theprojected unit credit method.
Defined benefit costs recognized in the statement of income consist of the following:· service costs – include current service costs, past service costs (recognized when plan amendment
or curtailment occurs) and gains or losses on non-routine settlements; and· net interest on the net defined benefit liability or asset – pertains to the change during the period
in the net defined benefit liability (or asset) that arises from the passage of time, which isdetermined by applying the discount rate based on government bonds to the net defined benefitliability or asset.
Changes in the net defined benefit liability (or asset) also include remeasurements comprisingactuarial gains and losses, return on plan assets and any change in the effect of the asset ceiling,excluding net interest on defined benefit liability (or asset). The Group recognizes thesesremeasurements immediately in OCI in the period in which they arise. The Group does not reclassifythese remeasurements to profit or loss in subsequent periods.
Plan assets are assets that are held by a long-term employee benefit fund or qualifying insurancepolicies, and are not available to the creditors of the Group, nor can they be paid directly to theGroup. Fair value of plan assets is based on market price information. When no market price isavailable, the Group estimates the fair value of plan assets by discounting expected future cash flowsusing a discount rate that reflects both the risk associated with the plan assets and the maturity orexpected disposal date of those assets (or, if they have no maturity, the expected period until thesettlement of the related obligations).
The Group recognizes its right to be reimbursed of some or all of the expenditure required to settle adefined benefit obligation as a separate asset at fair value when and only when reimbursement isvirtually certain.
Employee leave entitlementThe Group recognizes entitlements of employees to annual leave as a liability when they are accruedto the employees. The Group recognizes the undiscounted liability for leave expected to be settledwholly before 12 months after the end of the reporting period for services rendered by employees upto the end of the reporting period. For leave entitlements expected to be settled for more than 12months after the reporting date, the Group engages an actuary to estimate the long-term liability,which is reported in ‘Accrued taxes, interest and other Expenses’ in the statement of financialposition.
Share-based PaymentEmployees of the Parent Company receive remuneration in the form of share-based payments, whereemployees render services as consideration for equity instruments. The Parent Company determinesthe cost of equity-settled transactions at fair value at the date when the grant is made, and recognizesas ‘Compensation and fringe benefits’, together with a corresponding increase in equity (‘Otherequity reserves’), over the period in which the service is fulfilled. The cumulative expenserecognized for equity-settled transactions at each reporting date until the vesting date reflects to theextent to which the vesting period has expired and the Parent Company’s best estimate of the number
- 27 -
*SGVFS038920*
of equity instruments that will ultimately vest. The expense or credit in the statement of income for aperiod represents the movement in the cumulative expense recognized as at the beginning and end ofthe period.
LeasesPolicies applicable effective January 1, 2019The Group determines at contract inception whether a contract is, or contains, a lease by assessingwhether the contract conveys the right to control the use of an identified asset for a period of time inexchange for consideration.
Group as a lesseeThe Group applies a single recognition and measurement approach for all leases, except for short-term leases and leases of low-value assets. The Group recognizes right-of-use assets representing theright to use the underlying assets and lease liabilities to make lease payments.
· Right-of-use assetsAt the commencement date of the lease (i.e, the date the underlying asset is available for use), theGroup recognizes right-of-use assets measured at cost. The cost of right-of-use assets includesthe amount of lease liabilities recognized, initial direct costs incurred, and lease payments madeat or before the commencement date less any lease incentives received. Subsequent to initialrecognition, the Group measures the right-of-use assets at cost less any accumulated depreciationand impairment losses, and adjusted for any remeasurement of lease liabilities.
The Group presents the right-of-use assets in ‘Property and equipment’ and subjects it toimpairment in line with the Group’s policy on impairment of nonfinancial assets.
· Lease liabilitiesAt the commencement date of the lease, the Group recognizes lease liabilities measured at thepresent value of lease payments to be made over the lease term discounted using the Group’sincremental borrowing rate, which is the rate of interest that the Group would have to pay toborrow over a similar term, and with a similar security, the funds necessary to obtain an asset of asimilar value to the right-of-use asset in a similar economic environment. The lease paymentsinclude fixed payments, any variable lease payments that depend on an index or a rate, and anyamounts expected to be paid under residual value guarantees. The lease payments also includethe exercise price of a purchase option reasonably certain to be exercised by the Group andpayments of penalties for terminating the lease, if the lease term reflects exercising the option toterminate. Variable lease payments that do not depend on an index or a rate are recognized asexpenses in the period in which the event or condition that triggers the payment occurs.
After the commencement date of the lease, the Group measures the lease liabilities by increasingthe carrying amount to reflect interest on the lease liabilities (recorded in ‘Interest expense onbills payable and other borrowings’), reducing the carrying amount to reflect the lease paymentsmade, and remeasuring the carrying amount to reflect any reassessment or lease modifications, orto reflect revised in-substance fixed lease payments.
· Short-term leases and leases of low-value assetsThe Group applies the short-term lease recognition exemption to its leases that have a lease termof 12 months or less from the commencement date and do not contain a purchase option, and theleases of low-value assets recognition exemption to its leases of ATM offsite locations and otherequipment that are considered of low value (i.e., below P=250,000). Lease payments on short-term
- 28 -
*SGVFS038920*
leases and leases of low-value assets are recognized as expense under ‘Occupancy andequipment-related costs’ on a straight-line basis over the lease term.
Group as a lessorFor finance leases where the Group transfers substantially all the risks and rewards incidental toownership of the leased item, the Group recognizes a lease receivable in the statement of financialposition at an amount equivalent to the net investment (asset cost) in the lease. The Group includesall income resulting from the receivable in ‘Interest income on loans and receivables’ in the statementof income.
The residual value of leased assets, which approximates the amount of guaranty deposit paid by thelessee at the inception of the lease, is the estimated proceeds from the sale of the leased asset at theend of the lease term. At the end of the lease term, the residual value of the leased asset is generallyapplied against the guaranty deposit of the lessee when the lessee decides to buy the leased asset.
In operating leases where the Group does not transfer substantially all the risks and rewards incidentalto ownership of an asset, the Group recognizes rental income on a straight-line basis over the leaseterms. The Group adds back the initial direct costs incurred in negotiating and arranging an operatinglease to the carrying amount of the leased asset and recognizes them as rental income over the leaseterm on the same basis. The Group recognizes contingent rents as revenue in the period in whichthey are earned.
Policies applicable prior to January 1, 2019In determining whether an arrangement was, or contained a lease, the Group assessed the substanceof the arrangement whether the fulfillment of the arrangement was dependent on the use of a specificasset or assets, and the arrangement conveyed a right to use the asset. After inception of the lease, theGroup reassesed the above basis only if one of the following applies:· there is a change in contractual terms, other than a renewal or extension of the arrangement;· there is a change in the determination of whether fulfillment is dependent on a specified asset;· there is a substantial change to the asset; or· a renewal option is exercised or extension granted, unless that term of the renewal or extension
was initially included in the lease term.
Where a reassessment was made, the Group commenced or ceased its lease accounting from the datewhen the change in circumstances gave rise to the reassessment for first three scenarios above, and atthe date of renewal or extension period for last scenario above.
Group as lesseeAt the inception of the lease, the Group capitalized finance leases, which are lease arrangements thattransfer to the Group substantially all the risks and rewards incidental to ownership of the leased item,at the fair value of the leased property or, if lower, at the present value of the minimum leasepayments. The Group included the amounts capitalized in ‘Property and equipment’ with thecorresponding liability to the lessor included in ‘Other liabilities’. The Group apportioned the leasepayments between the finance charges (recorded in ‘Interest expense on bills payable and otherborrowings’) and reduction of the lease liabilities so as to achieve a constant rate of interest on theremaining balance of the liability.
The Group depreciated the leased assets over the shorter of the estimated useful lives of the assets orthe respective lease terms, if there was no reasonable certainty that the Group will obtain ownershipby the end of the lease term.
- 29 -
*SGVFS038920*
For operating leases where the lessor retained substantially all the risks and rewards of ownership ofthe asset, the Group recognized the lease payments as expense in the statement of income on astraight-line basis over the lease term.
Group as lessorPolicies for lessor accounting under PAS 17 are substantially similar with those under PFRS 16, asdescribed above.
ProvisionsThe Group recognizes provisions when:· the Group has a present obligation (legal or constructive) as a result of a past event;· it is probable that an outflow of assets embodying economic benefits will be required to settle the
obligation; and· a reliable estimate can be made of the amount of the obligation.
When the Group expects some or all of a provision to be reimbursed, for example, under an insurancecontract, the Group recognizes the reimbursement as a separate asset but only when thereimbursement is virtually certain. The Group presents the expense relating to any provision in thestatement of income, net of any reimbursement.
If the effect of the time value of money is material, the Group determines provisions by discountingthe expected future cash flows at a pre-tax rate that reflects current market assessments of the timevalue of money and, where appropriate, the risks specific to the liability. When discounting is used,the Group recognizes the increase in the provision due to the passage as ‘Interest expense on billspayable and other borrowings’.
Contingent Liabilities and Contingent AssetsContingent liabilities are not recognized in the financial statements but are disclosed unless thepossibility of an outflow of assets embodying economic benefits is remote. Contingent assets are notrecognized but are disclosed in the financial statements when an inflow of economic benefits isprobable.
Income TaxesIncome tax on profit and loss for the year comprises current and deferred tax. Income tax isdetermined in accordance with tax laws and is recognized in the statement of income, except to theextent that it relates to items directly recognized in OCI.
Current taxThe Group measures current tax assets and liabilities for the current periods at the amount expected tobe recovered from or paid to the taxation authorities using the tax rates and tax laws that are enactedor substantively enacted at the reporting date.
Deferred taxThe Group provides for deferred tax using the balance sheet liability method on all temporarydifferences at the reporting date between the tax bases of assets and liabilities and their carryingamounts for financial reporting purposes.
The Group recognizes deferred tax liabilities for all taxable temporary differences, including assetrevaluations. The Group recognizes deferred tax assets for all deductible temporary differences,carryforward of unused tax credits from the excess of minimum corporate income tax (MCIT) overthe regular corporate income tax (RCIT), and unused net operating loss carryover (NOLCO), to the
- 30 -
*SGVFS038920*
extent that it is probable that sufficient taxable income will be available against which the deductibletemporary differences and carryforward of unused tax credits from MCIT and unused NOLCO can beutilized.
The Group, however, does not recognize deferred tax on temporary differences that arise from theinitial recognition of an asset or liability in a transaction that is not a business combination and, at thetime of the transaction, affects neither the accounting income nor taxable income.
The Group does not also provide deferred tax liabilities on non-taxable temporary differencesassociated with investments in domestic subsidiaries and an associate. With respect to investments inforeign subsidiaries, the Group does not recognize deferred tax liabilities, except where the timing ofthe reversal of the temporary difference can be controlled and it is probable that the temporarydifference will not reverse in the foreseeable future.
The Group reviews the carrying amount of deferred tax assets at each reporting date and reduces therecognized amount to the extent that it is no longer probable that sufficient future taxable income willbe available to allow all or part of the deferred income tax asset to be utilized. The Group reassessesunrecognized deferred tax assets at each reporting date and recognizes amounts to the extent that ithas become probable that future taxable income will allow the deferred tax asset to be recovered.
The Group measures deferred tax assets and liabilities at the tax rates that are applicable to the periodwhen the asset is realized or the liability is settled, based on tax rates (and tax laws) that have beenenacted or substantively enacted at the reporting date.
For current and deferred tax relating to items recognized directly in OCI, the Group recognizes themalso in OCI and not in the statement of income.In the consolidated financial statements, the Group offsets deferred tax assets and liabilities if alegally enforceable right exists to set off current tax assets against current tax liabilities and deferredtaxes related to the same taxable entity and the same taxation authority.
Earnings per ShareThe Group computes for the basic earnings per share (EPS) by dividing net income for the periodattributable to common shareholders by the weighted average number of common shares outstandingduring the period, after giving retroactive effect to any bonus issue, share split or reverse share splitduring the period.
The Group computes for the diluted EPS by dividing the aggregate of net income for the periodattributable to common shareholders by the weighted average number of common shares outstandingduring the period, adjusted for the effects of any dilutive shares.
Events after the Reporting DateThe Group reflects in the financial statements any post-year-end event that provides additionalinformation about the Group’s position at the reporting date (adjusting event). The Group disclosespost-year-end events that are not adjusting events, if any, when material to the financial statements.
Segment ReportingThe Group’s operating businesses are organized and managed separately according to the nature ofthe products and services provided, with each segment representing a strategic business unit thatoffers different products and serves different markets. Refer to Note 6 for the detailed disclosure onsegment information.
- 31 -
*SGVFS038920*
Fiduciary ActivitiesThe Group excludes from these financial statements the assets and income arising from fiduciaryactivities, together with related undertakings to return such assets to customers, where the Group actsin a fiduciary capacity such as nominee, trustee or agent.
3. Significant Accounting Judgments and Estimates
The preparation of the financial statements in compliance with PFRS requires the Group to makejudgments and estimates that affect the reported amounts and disclosures. The Group continuallyevaluates judgments and estimates and uses as basis its historical experience and other factors,including expectations of future events. The Group reflects the effects of any changes in estimates inthe financial statements as they become reasonably determinable.
Judgments(a) Classification of financial assets (applicable effective January 1, 2018)
The Group classifies its financial assets depending on the results of the SPPI test and on thebusiness model used for managing those financial assets.
When performing the SPPI test, the Group applies judgment and evaluates relevant factors andcharacteristics such as the behavior and nature of contractual cash flows, its original currencydenomination, the timing and frequency of interest rate repricing, contingent events that wouldalter the amount and/or timing of cash flows, leverage features, prepayment or extension optionsand other features that may modify the consideration for the time value of money.
As a second step, the Group performs business model assessment to reflect how financial assetsare managed in order to generate net cash inflows based on the following factors:· business objectives and strategies for holding the financial assets;· performance measures and benchmarks being used to evaluate the Group’s key management
personnel accountable to the financial assets;· risks associated to the financial assets and the tools applied in managing those risks;· compensation structure of business units, including whether based on fair value changes of
the investments managed or on the generated cash flows from transactions; and· frequency and timing of disposals.
In applying judgment, the Group also considers the circumstances surrounding the transaction aswell as the prudential requirements of the BSP, particularly the guidelines contained in CircularNo. 1011.
(b) Fair valuation of financial instrumentsWhen the fair values of financial assets and financial liabilities recorded in the statement offinancial position cannot be derived from active markets, the Group uses valuation techniquesand mathematical models (Note 5). The Group derives the inputs to these models fromobservable markets where possible, otherwise, a degree of judgment is required in establishingfair values. The judgments include considerations of liquidity and model inputs such ascorrelation and volatility for longer-dated derivatives.
- 32 -
*SGVFS038920*
(c) Determination of lease term for lease contracts with renewal and termination options (applicableeffective January 1, 2019)The Group determines the lease term as the non-cancellable term of the lease, together with anyperiods covered by an option to extend the lease if it is reasonably certain to be exercised, or anyperiods covered by an option to terminate the lease, if it is reasonably certain not to be exercised.
The Group has several lease contracts that include extension and termination options. The Groupapplies judgment in evaluating whether it is reasonably certain whether or not to exercise theoption to renew or terminate the lease. That is, it considers all relevant factors that create aneconomic incentive for it to exercise either the renewal or termination. After the commencementdate, the Group reassesses the lease term if there is a significant event or change in circumstancesthat is within its control that affects its ability to exercise or not to exercise the option to renew orto terminate (e.g., construction of significant leasehold improvements or significant customizationof the leased asset).
(d) Classification of leases (applicable prior to January 1, 2019)In arrangements that are, or contain, leases, the Group determines based on an evaluation of theterms and conditions of the arrangements whether or not the lessor retains all the significant risksand rewards of ownership of the properties which are leased out.
In classifying such arrangements as operating leases, the Group considers the following:· the lease does not transfer ownership of the asset to the lessee by the end of the lease term;· the lessee has no option to purchase the asset at a price that is expected to be sufficiently
lower than the fair value at the date the option is exercisable;· the present value of the minimum lease payments is substantially lower than the fair value of
the leased asset;· the losses associated with any cancellation of the lease are borne by the lessor; and· the lease term is not for the major part of the asset’s economic useful life.
When the above terms and provisions do not apply, the Group classifies the lease arrangements asfinance leases.
(e) ContingenciesThe Group is currently involved in legal proceedings. The estimate of the probable cost for theresolution of claims has been developed in consultation with the aid of the outside legal counselshandling the Group’s defense in these matters and is based upon an analysis of potential results.Management does not believe that the outcome of these matters will affect the results ofoperations. It is probable, however, that future results of operations could be materially affectedby changes in the estimates or in the effectiveness of the strategies relating to the proceedings(Note 34).
(f) Determination of functional currencyPAS 21, The Effects of Changes in Foreign Exchange Rates, requires the Group to use itsjudgment to determine the functional currency of the Group, including its foreign operations,such that it most faithfully represents the economic effects of the underlying transactions, eventsand conditions that are relevant to each entity or reporting unit.
In making this judgment, the Group considers the following:· the currency that mainly influences prices for financial instruments and services (this will
often be the currency in which prices for its financial instruments and services aredenominated and settled);
- 33 -
*SGVFS038920*
· the currency in which funds from financing activities are generated; and· the currency in which receipts from operating activities are usually retained.
Estimates(a) Credit losses on financial assets effective January 1, 2018
The Group’s ECL calculations are mainly derived from outputs of complex statistical models andexpert judgment, with a number of underlying assumptions regarding the choice of variableinputs as well as their independencies. The Group considers the following elements of the ECLmodels, among others, as significant accounting judgments and estimates:· segmentation of the portfolio, where the appropriate ECL approach and/or model is used,
including whether assessments should be done individually or collectively;· quantitative and qualitative criteria for determining whether there has been SICR as at a given
reporting date and the corresponding transfers between stages;· determination of expected life of the financial asset and expected recoveries from defaulted
accounts;· development of ECL models, including the various formulas and the choice of inputs;· determination of correlations and interdependencies between risk factors, macroeconomic
scenarios and economic inputs, such as inflation, policy rates and collateral values, and theresulting impact to PDs, LGDs and EADs; and
· selection of forward-looking information and determination of probability-weightings toderive the ECL.
Refer to Note 16 for the details of the carrying value of financial assets subject to ECL and for thedetails of the ECL.
(b) Credit losses on loans and receivables prior to January 1, 2018The Group reviews its impaired loans and receivables on a quarterly basis to assess whetheradditional provision for credit losses should be recorded in the statement of income. In particular,judgment by the management is required in the estimating the amount and timing of future cashflows to determine the required level of allowance. Such estimates are based on assumptionsabout a number of factors and actual results may differ, resulting in future changes to theallowance. Estimated future cash flows of a collateralized loan reflects the cash flows that mayresult from foreclosure less costs for obtaining and selling the collateral, whether or notforeclosure is probable. The Group takes into account the latest available information of theborrower’s financial condition, industry risk and market trends.
In addition to specific allowance against individually significant loans and receivables, the Groupalso makes a collective impairment allowance against exposures which, although not specificallyidentified as requiring a specific allowance, have a greater risk of default than when originallygranted. For the purpose of a collective impairment, loans and receivables are grouped on thebasis of their credit risk characteristics such as internal credit risk rating, collateral type, past-duestatus and term. Future cash flows in a group of financial assets that are collectively evaluatedfor impairment are estimated on the basis of historical loss experience for assets with credit riskcharacteristics similar to those in the group.
Refer to Note 16 for the details of the provision for credit losses recognized in 2017.
(c) Recognition of deferred tax assetsDeferred tax assets are recognized for all unused tax losses and temporary differences to theextent that it is probable that future taxable profit will be available against which the losses can beutilized. Significant management judgment is required to determine the amount of deferred tax
- 34 -
*SGVFS038920*
assets that can be recognized, based upon the availability of future taxable income in reference tofinancial forecast and tax strategies. The Group takes into consideration the loan portfolio anddeposit growth rates .
(d) Present value of lease liabilities (applicable effective January 1, 2019)The Group cannot readily determine the interest rate implicit in the lease, therefore, it uses itsincremental borrowing rate to measure lease liabilities. The incremental borrowing rate reflectswhat the Group ‘would have to pay’, which requires estimation when no observable rates areavailable (such as for subsidiaries that do not enter into financing transactions) or when they needto be adjusted to reflect the terms and conditions of the lease (for example, when leases are not inthe subsidiary’s functional currency).
The Group estimates the incremental borrowing rate using observable inputs (such as marketinterest rates) when available and is required to make certain entity-specific adjustments (such asthe subsidiary’s stand-alone credit rating, or to reflect the terms and conditions of the lease).
The carrying amount of lease liabilities as of December 31, 2019 is disclosed in Note 29.
(e) Present value of retirement obligationThe Group determines the cost of defined benefit pension plan and other post-employmentbenefits using actuarial valuations, which involve making assumptions about discount rates,future salary increases, mortality rates and employee turnover. Due to the long-term nature ofthese plans, such estimates are subject to significant uncertainty. The Group reviews allassumptions at each reporting date.
The discount rate is based on zero-coupon yield of government bonds with remaining maturityapproximating the estimated average duration of benefit payment. Future salary increases arebased on the Group’s policy considering the prevailing inflation rate. The mortality rate used isbased on publicly available mortality table modified accordingly with estimates of mortalityimprovements. The employee turnover is based on the Group’s most recent experience.
The fair value of plan assets is based on market price information. When no market price isavailable, the Group estimates the fair value of plan assets by discounting expected future cashflows using a discount rate that reflects both the risk associated with the plan assets and thematurity or expected disposal date of those assets.
The present value of retirement obligation and fair value of plan assets are disclosed inNote 28.
(f) Impairment of nonfinancial assetsThe Parent Company assesses impairment on its investments in subsidiaries and an associatewhenever events or changes in circumstances indicate that the carrying amount of the asset maynot be recoverable. Among others, the Parent Company considers the following triggers for animpairment review on its investments in subsidiaries and an associate:· deteriorating or poor financial condition;· recurring net losses; and· significant changes on the technological, market, economic, or legal environment which had
an adverse effect on the subsidiary or associate during the period or in the near future, inwhich the subsidiary or associate operates.
- 35 -
*SGVFS038920*
The Group also assesses impairment on its property and equipment, investment properties andchattel properties, and intangibles with finite useful lives and considers the following impairmentindicators:· significant underperformance relative to expected historical or projected future operating
results;· significant changes in the manner of use of the acquired assets or the strategy for overall
business; and· significant negative industry or economic trends.
Except for investment properties and land and building where recoverable amount is determinedbased on fair value less cost to sell, the recoverable amount of all other nonfinancial assets isdetermined based on the asset’s value-in-use (VIU), which considers the present value ofestimated future cash flows expected to be generated from the continued use of the asset or groupof assets. The VIU calculation is most sensitive to the following assumptions: productionvolume, price, exchange rates, capital expenditures, and long-term growth-rates.
The carrying values of the Group’s property and equipment, investments in subsidiaries and anassociate, investment properties, intangible assets, and other nonfinancial assets are disclosed inNotes 11, 12, 13, 14 and 15.
(g) Impairment of goodwillThe Group conducts an annual review for any impairment in the value of goodwill. Goodwill iswritten down for impairment where the recoverable amount is insufficient to support its carryingvalue. The recoverable amount of the CGU is determined based on a VIU calculation using cashflow projections from financial budgets approved by senior management and BOD of the ParentCompany covering a three-year period. The assumptions used in the calculation of VIU aresensitive to estimates of future cash flows from business, interest margin, discount rate, long-termgrowth rate (derived based on the forecast local gross domestic product) used to project cashflows.
The carrying values of the Group’s goodwill and key assumptions used in determining VIU aredisclosed in Note 14.
(h) Valuation of insurance contractsFor insurance contracts, the Group estimates both for the expected ultimate cost of claimsreported and the expected ultimate cost of IBNR at the reporting date. It can take a significantperiod of time before the ultimate claim costs can be established with certainty.
In estimating the cost of notified and IBNR claims, the Group uses past claims settlement trendsas primary technique to predict future claims settlement trends. At each reporting date, the Groupassesses the estimates for adequacy and charges to provision any changes made to the estimates.
The carrying values of total provisions for claims reported and claims IBNR are included in the‘Insurance contract liabilities’ disclosed in Note 22.
- 36 -
*SGVFS038920*
4. Financial Risk Management Objectives and Policies
IntroductionThe Parent Company’s BOD has overall responsibility for the establishment and oversight of theGroup’s risk management framework. As delegated by the BOD, the Risk Oversight Committee(ROC) is mandated to set risk appetite, approve frameworks, policies and processes for managingrisk, and accept risks beyond the approval discretion provided to management. The ROC advises onthe overall current and future risk appetite and strategy and assists in overseeing the implementationof those strategies and business plans by senior management. Details of the Parent Company’s riskframework are discussed under the Risk Management Disclosure Section of the Parent Company’sannual report.
The Group’s activities are principally related to the development, delivery, servicing and use offinancial instruments. Risk is inherent in these activities but it is managed through a process ofongoing identification, measurement and monitoring, subject to risk limits and other controls. Thisprocess of risk management is critical to the Group’s continuing profitability.
The Group defines material risks (at group level) as those risks from any business activity largeenough to threaten the Parent Company’s capital position to drop below its desired level resulting ineither a P=13.3 billion increase in risk weighted assets or a P=1.7 billion reduction in earnings and/orqualifying capital which translate into a reduction in CAR by 20 bps.
Resulting from the assessments based on the premise identified above, the Parent Company agreesand reviews on a regular basis the material risks that need particular focus from all three lines ofdefense. For the assessment period 2019-2021, these are based on the following nine (11) materialrisks, which are grouped under Pillar 1 and Pillar 2 risks, and shall be covered in the ICAAPDocument and required for monitoring.
Types and definition of each of these risks are discussed hereunder:
Pillar 1 Risks:1. Credit Risk (includes Counterparty and Country Risks)2. Market Risk3. Operational Risk
Pillar 2 Risks:4. Credit Concentration Risk5. Interest Rate Risk in Banking Book (IRRBB)6. Liquidity Risk7. Reputational / Customer Franchise Risk8. Strategic Business Risk9. Cyber Security Risk
The Risk Management Group (RMG) provides the legwork for the ROC in its role of formulating therisk management strategy, the development and maintenance of the internal risk managementframework, and the definition of the governing risk management principles. The RMG providesassistance to the Assets and Liabilities Committee (ALCO) on capital management and the BoardPolicy Committee on the management of regulatory capital.
- 37 -
*SGVFS038920*
The mandate of the RMG involves:· Implementing the risk management framework of identifying, measuring, controlling and
monitoring the various risk taking activities of the Group, inherent in all financial institutions;· Providing services to the risk-taking units and personnel in the implementation of risk mitigation
strategies; and· Establishing recommended limits based on the results of its analysis of exposures.
Credit RiskCredit risk is the non-recovery of credit exposures (on-and-off balance sheet exposures). Managingcredit risk also involves monitoring of migration risk, concentration risk, country risk and settlementrisk. The Group manages its credit risk at various levels (i.e., strategic level, portfolio level down toindividual transaction).
The credit risk management of the entire loan portfolio is under the direct oversight of the ROC andExecutive Committee. Credit risk assessment of individual borrower is performed by the businesssector, remedial sector and credit management sector. Risk management is embedded in the entirecredit process, i.e., from credit origination to remedial management (if needed).
Among the tools used by the Group in identifying, assessing and managing credit risk include:· Documented credit policies and procedures: sound credit granting process, risk asset acceptance
criteria, target market and approving authorities;· System for administration and monitoring of exposure;· Pre-approval review of loan proposals;· Post approval review of implemented loans;· Work out system for managing problem credits;· Regular review of the sufficiency of valuation reserves;· Monitoring of the adequacy of capital for credit risk via the CAR report;· Monitoring of breaches in regulatory and internal limits;· Credit Risk Management Dashboard;· Diversification;· Internal Risk Rating System for corporate accounts;· Credit Scoring for retail accounts; and· Active loan portfolio management undertaken to determine the quality of the loan portfolio and
identify the following:a. portfolio growthb. movement of loan portfolioc. adequacy of loan loss reservesd. trend of nonperforming loans (NPLs)e. concentration risk (per classified account, per industry, clean exposure, large exposure,
contingent exposure, currency, security, facility, demographic, etc.)
The Group follows the BOD approved policy on the generic classification of loans based on the typeof borrowers and the purpose of the loan. The loan portfolio is grouped based on the underlying riskcharacteristics that are expected to respond in a similar manner to macroeconomic factors andforward looking conditions.
Credit-related commitmentsThe exposures represent guarantees, standby letters of credit (LCs) issued by the Parent Company anddocumentary/commercial LCs which are written undertakings by the Parent Company.
- 38 -
*SGVFS038920*
To mitigate this risk the Parent Company requires hard collaterals, as discussed under Collateral andother credit enhancement, for standby LCs lines while commercial LCs are collateralized by theunderlying shipments of goods to which they relate.
Derivative financial instrumentsCredit risk arising from derivative financial instruments is, at any time, limited to those with positivefair values, as recorded in the statement of financial position.
Collateral and other credit enhancementAs a general rule, character is the single most important consideration in granting loans. However,collaterals are requested to mitigate risk. The loan value and type of collateral required depend on theassessment of the credit risk of the borrower or counterparty. The Group follows guidelines on theacceptability of types of collateral and valuation parameters.
The main types of collateral obtained are as follows:
· For corporate accounts - deposit hold outs, guarantees, securities, physical collaterals (e.g., realestate, chattels, inventory, etc.); as a general rule, commercial, industrial and residential lots arepreferred
· For retail lending - mortgages on residential properties and vehicles financed· For securities lending and reverse repurchase transactions - cash or securities
The disposal of the foreclosed properties is handled by the Asset Management Sector which adheresto the general policy of disposing assets at the highest possible market value.
Management regularly monitors the market value of the collateral and requests additional collateral inaccordance with the underlying agreement. The existing market value of the collateral is consideredduring the review of the adequacy of the allowance for credit losses. Generally, collateral is not heldover loans and advances to banks except for reverse repurchase agreements. The Group is notpermitted to sell or repledge the collateral held over loans and advances to counterparty banks andBSP in the absence of default by the owner of the collateral.
Maximum exposure to credit risk after collateral held or other credit enhancementsAn analysis of the maximum exposure to credit risk after taking into account any collateral held orother credit enhancements for the Group and the Parent Company is shown below:
Consolidated2019
MaximumExposure
Fair Value ofCollateral
NetExposure
FinancialEffect of
CollateralSecurities held under agreements to resell P=2,517,764 P=2,517,745 P=396 P=2,517,368Loans and receivables:
Receivables from customers*:Corporates 540,584,483 287,490,436 378,128,173 162,456,310Local government units (LGU) 6,728,852 130,000 6,694,295 34,557Credit Cards 14,264,195 – 14,264,195 –Retail small and medium enterprises (SME) 18,942,720 28,248,029 5,493,593 13,449,127Housing Loans 32,017,146 28,804,731 12,632,623 19,384,523Auto Loans 12,861,345 13,687,982 9,681,175 3,180,170Others 10,897,481 18,435,894 2,778,469 8,119,012
Other receivables 20,973,257 5,515,162 18,278,171 2,695,086 P=659,787,243 P=384,829,979 P=447,951,090 P=211,836,153
*Receivables from customers exclude residual value of the leased asset (Note 10).
- 39 -
*SGVFS038920*
Consolidated2018
MaximumExposure
Fair Value ofCollateral
NetExposure
FinancialEffect of
CollateralSecurities held under agreements to resell P=20,700,000 P=19,947,247 P=752,753 P=19,947,247Loans and receivables:
Receivables from customers*:Corporates 471,254,760 349,173,297 413,164,650 58,090,110LGU 6,849,595 203,000 6,646,595 203,000Credit Cards 12,336,487 – 12,336,487 –Retail SME 11,079,479 19,751,481 5,448,270 5,631,209Housing Loans 32,569,910 32,010,871 12,442,493 20,127,417Auto Loans 11,511,890 10,948,300 8,409,930 3,101,960Others 16,995,348 13,688,546 12,984,529 4,010,819
Other receivables 23,419,669 11,841,204 12,645,429 10,774,240P=606,717,138 P=457,563,946 P=484,831,136 P=121,886,002
*Receivables from customers exclude residual value of the leased asset (Note 10).
Parent Company2019
MaximumExposure
Fair Value ofCollateral
NetExposure
FinancialEffect of
CollateralSecurities held under agreements to resell P=1,149,984 P=1,149,588 P=396 P=1,149,588Loans and receivables:
Receivables from customers:Corporates 528,998,204 265,980,283 377,651,021 151,347,183LGU 6,728,852 130,000 6,694,295 34,557Credit Cards 14,264,195 – 14,264,195 –Retail SME 12,028,359 13,133,414 4,955,295 7,073,064Housing Loans 3,772,739 2,090,860 2,511,743 1,260,996Auto Loans 2,710,244 2,743,755 1,079,259 1,630,985Others 3,910,134 13,656,194 1,079,543 2,830,591
Other receivables 14,833,169 5,515,162 12,138,083 2,695,086 P=588,395,880 P=304,399,256 P=420,373,830 P=168,022,050
Parent Company2018
MaximumExposure
Fair Value ofCollateral
NetExposure
FinancialEffect of
CollateralSecurities held under agreements to resell P=20,700,000 P=19,947,247 P=752,753 P=19,947,247Loans and receivables:
Receivables from customers:Corporates 453,054,812 323,072,021 409,334,975 43,719,837LGU 6,849,595 203,000 6,646,595 203,000Credit Cards 12,336,487 – 12,336,487 –Retail SME 7,240,249 6,387,250 4,993,424 2,246,825Housing Loans 1,569,098 1,405,724 1,469,991 99,107Auto Loans 433 4,074 – 433Others 13,487,060 13,480,147 9,557,934 3,929,126
Other receivables 16,461,540 11,835,919 5,692,585 10,768,955P=531,699,274 P=376,335,382 P=450,784,744 P=80,914,530
The maximum credit risk, without taking into account the fair value of any collateral and nettingagreements, is limited to the amounts on the statement of financial position plus commitments tocustomers such as unused commercial letters of credit, outstanding guarantees and others.
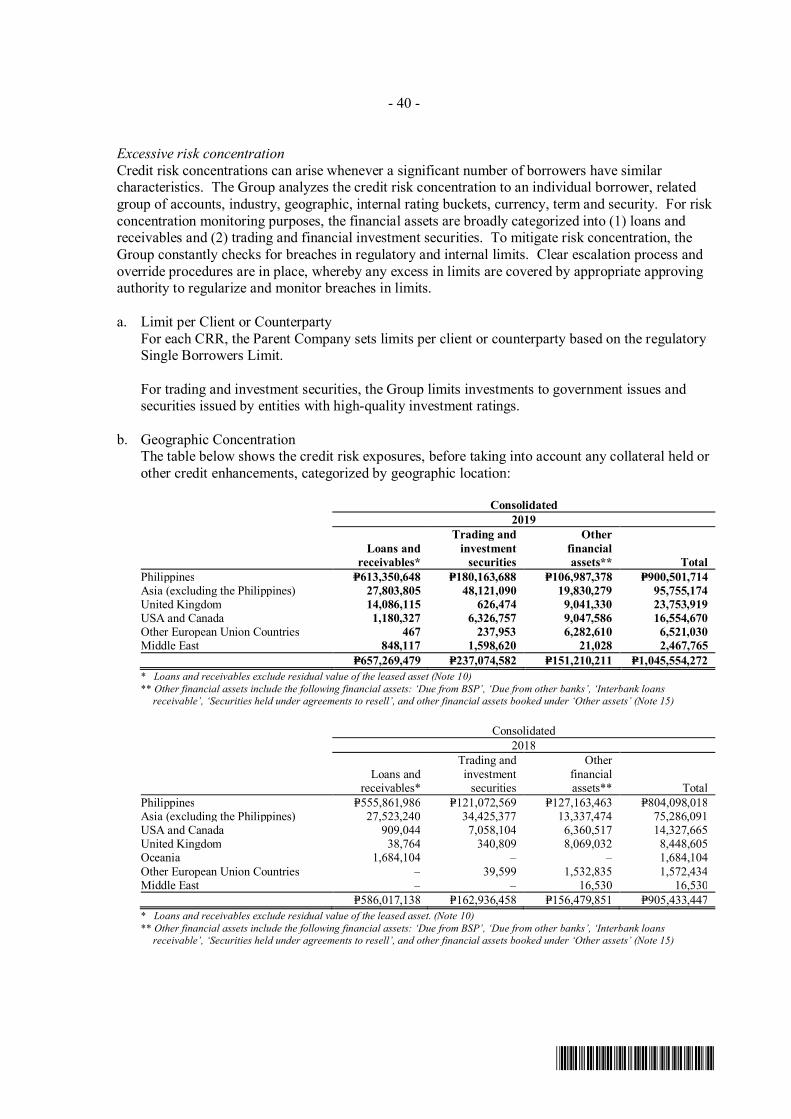
- 40 -
*SGVFS038920*
Excessive risk concentrationCredit risk concentrations can arise whenever a significant number of borrowers have similarcharacteristics. The Group analyzes the credit risk concentration to an individual borrower, relatedgroup of accounts, industry, geographic, internal rating buckets, currency, term and security. For riskconcentration monitoring purposes, the financial assets are broadly categorized into (1) loans andreceivables and (2) trading and financial investment securities. To mitigate risk concentration, theGroup constantly checks for breaches in regulatory and internal limits. Clear escalation process andoverride procedures are in place, whereby any excess in limits are covered by appropriate approvingauthority to regularize and monitor breaches in limits.
a. Limit per Client or CounterpartyFor each CRR, the Parent Company sets limits per client or counterparty based on the regulatorySingle Borrowers Limit.
For trading and investment securities, the Group limits investments to government issues andsecurities issued by entities with high-quality investment ratings.
b. Geographic ConcentrationThe table below shows the credit risk exposures, before taking into account any collateral held orother credit enhancements, categorized by geographic location:
Consolidated2019
Loans andreceivables*
Trading andinvestment
securities
Otherfinancialassets** Total
Philippines P=613,350,648 P=180,163,688 P=106,987,378 P=900,501,714Asia (excluding the Philippines) 27,803,805 48,121,090 19,830,279 95,755,174United Kingdom 14,086,115 626,474 9,041,330 23,753,919USA and Canada 1,180,327 6,326,757 9,047,586 16,554,670Other European Union Countries 467 237,953 6,282,610 6,521,030Middle East 848,117 1,598,620 21,028 2,467,765
P=657,269,479 P=237,074,582 P=151,210,211 P=1,045,554,272* Loans and receivables exclude residual value of the leased asset (Note 10)** Other financial assets include the following financial assets: ‘Due from BSP’, ‘Due from other banks’, ‘Interbank loans
receivable’, ‘Securities held under agreements to resell’, and other financial assets booked under ‘Other assets’ (Note 15)
Consolidated2018
Loans andreceivables*
Trading andinvestment
securities
Otherfinancialassets** Total
Philippines P=555,861,986 P=121,072,569 P=127,163,463 P=804,098,018Asia (excluding the Philippines) 27,523,240 34,425,377 13,337,474 75,286,091USA and Canada 909,044 7,058,104 6,360,517 14,327,665United Kingdom 38,764 340,809 8,069,032 8,448,605Oceania 1,684,104 – – 1,684,104Other European Union Countries – 39,599 1,532,835 1,572,434Middle East – – 16,530 16,530
P=586,017,138 P=162,936,458 P=156,479,851 P=905,433,447* Loans and receivables exclude residual value of the leased asset. (Note 10)** Other financial assets include the following financial assets: ‘Due from BSP’, ‘Due from other banks’, ‘Interbank loans
receivable’, ‘Securities held under agreements to resell’, and other financial assets booked under ‘Other assets’ (Note 15)
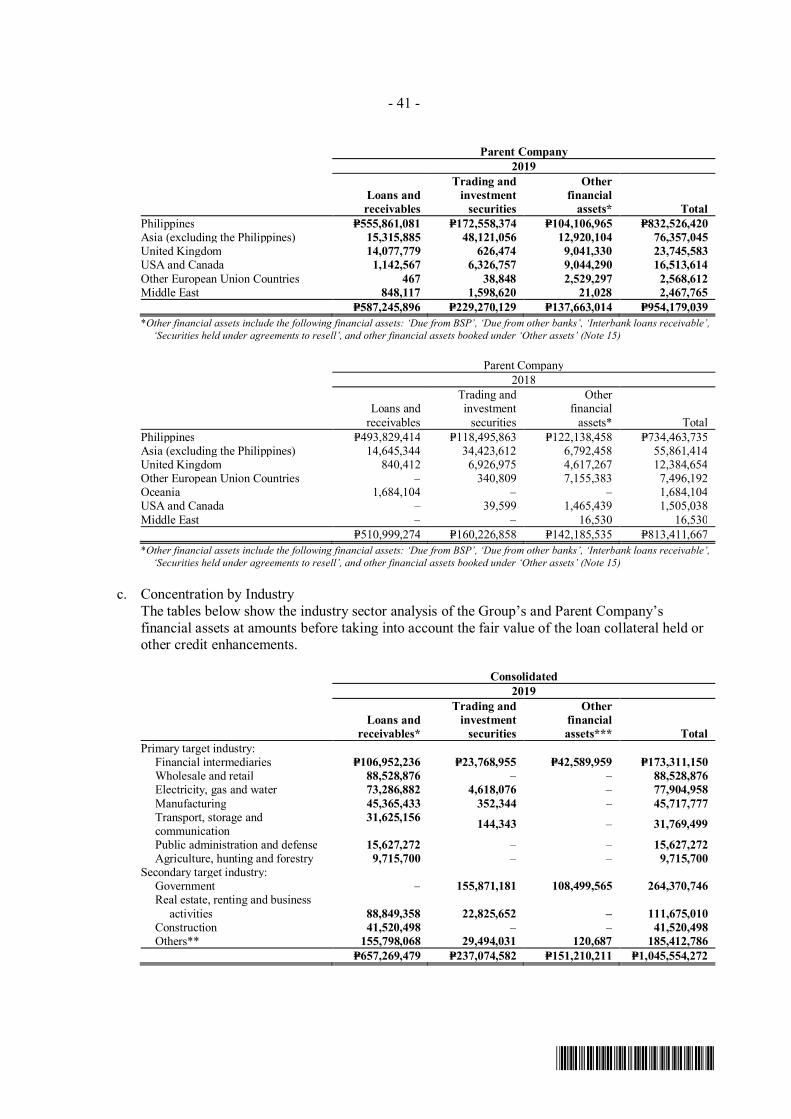
- 41 -
*SGVFS038920*
Parent Company2019
Loans andreceivables
Trading andinvestment
securities
Otherfinancial
assets* TotalPhilippines P=555,861,081 P=172,558,374 P=104,106,965 P=832,526,420Asia (excluding the Philippines) 15,315,885 48,121,056 12,920,104 76,357,045United Kingdom 14,077,779 626,474 9,041,330 23,745,583USA and Canada 1,142,567 6,326,757 9,044,290 16,513,614Other European Union Countries 467 38,848 2,529,297 2,568,612Middle East 848,117 1,598,620 21,028 2,467,765
P=587,245,896 P=229,270,129 P=137,663,014 P=954,179,039*Other financial assets include the following financial assets: ‘Due from BSP’, ‘Due from other banks’, ‘Interbank loans receivable’,
‘Securities held under agreements to resell’, and other financial assets booked under ‘Other assets’ (Note 15)
Parent Company2018
Loans andreceivables
Trading andinvestment
securities
Otherfinancial
assets* TotalPhilippines P=493,829,414 P=118,495,863 P=122,138,458 P=734,463,735Asia (excluding the Philippines) 14,645,344 34,423,612 6,792,458 55,861,414United Kingdom 840,412 6,926,975 4,617,267 12,384,654Other European Union Countries – 340,809 7,155,383 7,496,192Oceania 1,684,104 – – 1,684,104USA and Canada – 39,599 1,465,439 1,505,038Middle East – – 16,530 16,530
P=510,999,274 P=160,226,858 P=142,185,535 P=813,411,667*Other financial assets include the following financial assets: ‘Due from BSP’, ‘Due from other banks’, ‘Interbank loans receivable’,
‘Securities held under agreements to resell’, and other financial assets booked under ‘Other assets’ (Note 15)
c. Concentration by IndustryThe tables below show the industry sector analysis of the Group’s and Parent Company’sfinancial assets at amounts before taking into account the fair value of the loan collateral held orother credit enhancements.
Consolidated2019
Loans andreceivables*
Trading andinvestment
securities
Otherfinancialassets*** Total
Primary target industry:Financial intermediaries P=106,952,236 P=23,768,955 P=42,589,959 P=173,311,150Wholesale and retail 88,528,876 – – 88,528,876
Electricity, gas and water 73,286,882 4,618,076 – 77,904,958Manufacturing 45,365,433 352,344 – 45,717,777
Transport, storage andcommunication
31,625,156 144,343 – 31,769,499
Public administration and defense 15,627,272 – – 15,627,272Agriculture, hunting and forestry 9,715,700 – – 9,715,700
Secondary target industry:Government – 155,871,181 108,499,565 264,370,746
Real estate, renting and businessactivities 88,849,358 22,825,652 – 111,675,010
Construction 41,520,498 – – 41,520,498Others** 155,798,068 29,494,031 120,687 185,412,786
P=657,269,479 P=237,074,582 P=151,210,211 P=1,045,554,272
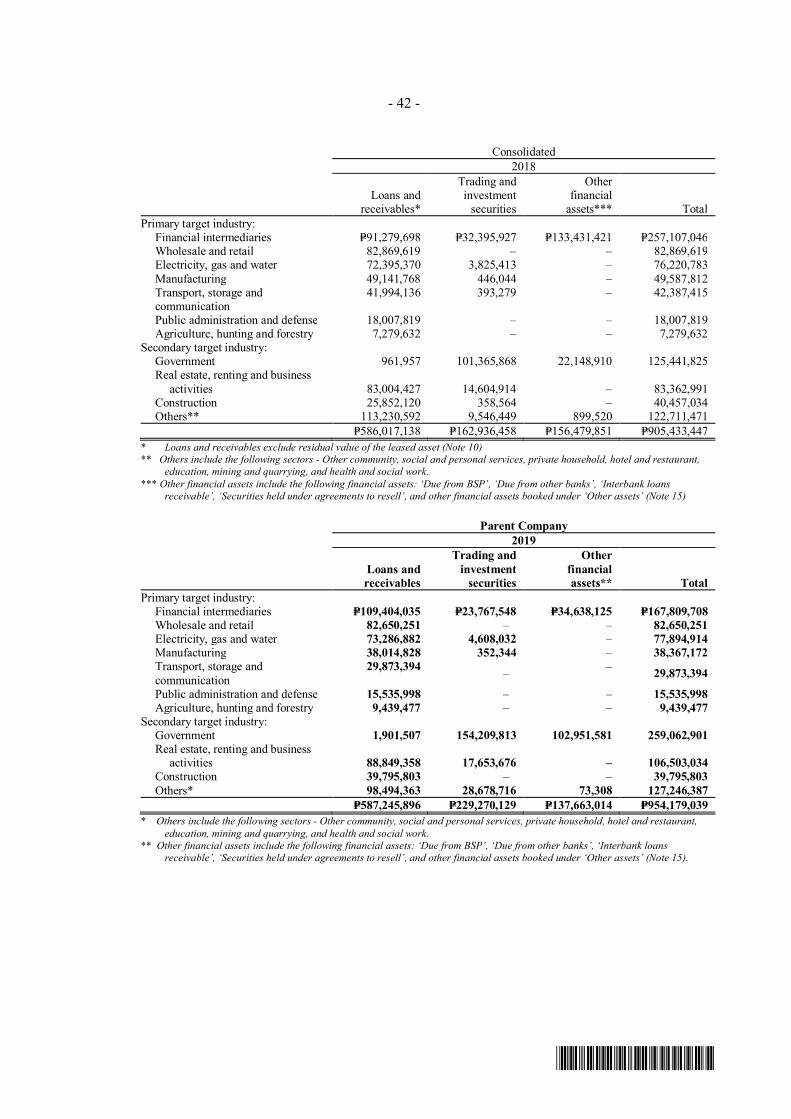
- 42 -
*SGVFS038920*
Consolidated2018
Loans andreceivables*
Trading andinvestment
securities
Otherfinancial
assets*** TotalPrimary target industry:
Financial intermediaries P=91,279,698 P=32,395,927 P=133,431,421 P=257,107,046Wholesale and retail 82,869,619 – – 82,869,619
Electricity, gas and water 72,395,370 3,825,413 – 76,220,783Manufacturing 49,141,768 446,044 – 49,587,812
Transport, storage andcommunication
41,994,136 393,279 – 42,387,415
Public administration and defense 18,007,819 – – 18,007,819Agriculture, hunting and forestry 7,279,632 – – 7,279,632
Secondary target industry:Government 961,957 101,365,868 22,148,910 125,441,825
Real estate, renting and businessactivities 83,004,427 14,604,914 – 83,362,991
Construction 25,852,120 358,564 – 40,457,034Others** 113,230,592 9,546,449 899,520 122,711,471
P=586,017,138 P=162,936,458 P=156,479,851 P=905,433,447* Loans and receivables exclude residual value of the leased asset (Note 10)** Others include the following sectors - Other community, social and personal services, private household, hotel and restaurant,
education, mining and quarrying, and health and social work.*** Other financial assets include the following financial assets: ‘Due from BSP’, ‘Due from other banks’, ‘Interbank loans
receivable’, ‘Securities held under agreements to resell’, and other financial assets booked under ‘Other assets’ (Note 15)
Parent Company2019
Loans andreceivables
Trading andinvestment
securities
Otherfinancialassets** Total
Primary target industry:Financial intermediaries P=109,404,035 P=23,767,548 P=34,638,125 P=167,809,708Wholesale and retail 82,650,251 – – 82,650,251Electricity, gas and water 73,286,882 4,608,032 – 77,894,914Manufacturing 38,014,828 352,344 – 38,367,172
Transport, storage andcommunication
29,873,394 – – 29,873,394
Public administration and defense 15,535,998 – – 15,535,998Agriculture, hunting and forestry 9,439,477 – – 9,439,477
Secondary target industry:Government 1,901,507 154,209,813 102,951,581 259,062,901
Real estate, renting and businessactivities 88,849,358 17,653,676 – 106,503,034
Construction 39,795,803 – – 39,795,803Others* 98,494,363 28,678,716 73,308 127,246,387
P=587,245,896 P=229,270,129 P=137,663,014 P=954,179,039* Others include the following sectors - Other community, social and personal services, private household, hotel and restaurant,
education, mining and quarrying, and health and social work.** Other financial assets include the following financial assets: ‘Due from BSP’, ‘Due from other banks’, ‘Interbank loans
receivable’, ‘Securities held under agreements to resell’, and other financial assets booked under ‘Other assets’ (Note 15).
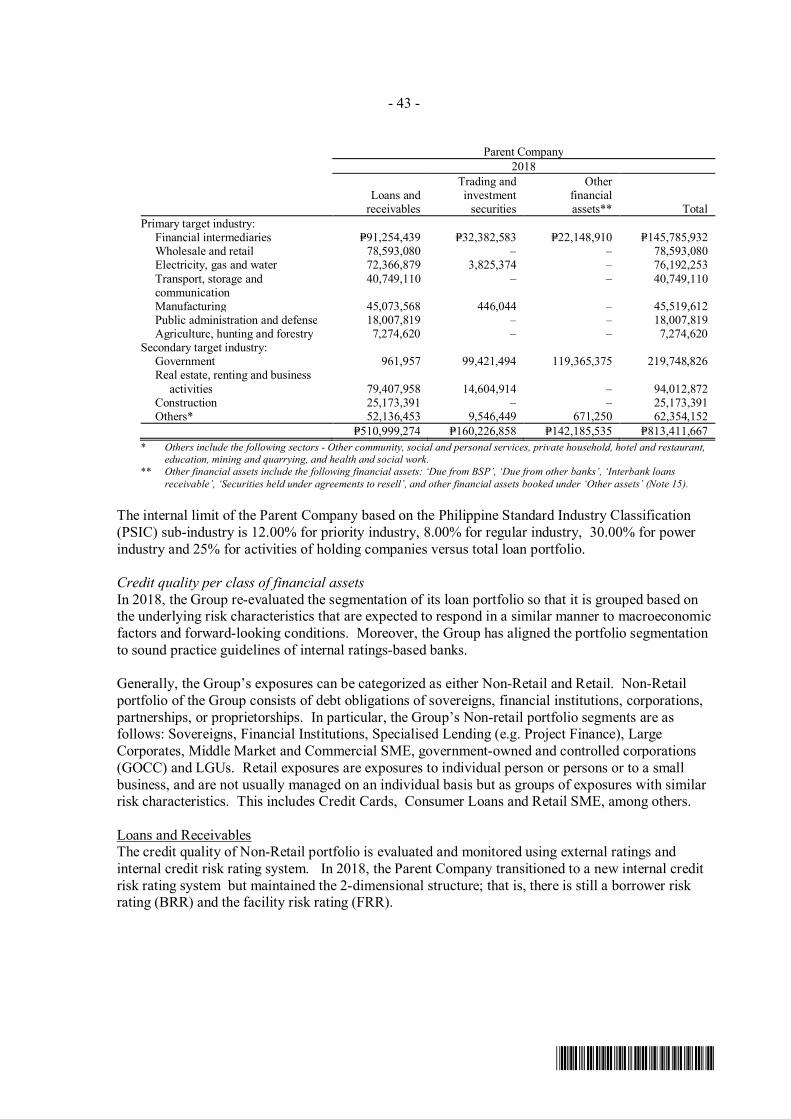
- 43 -
*SGVFS038920*
Parent Company2018
Loans andreceivables
Trading andinvestment
securities
Otherfinancialassets** Total
Primary target industry:Financial intermediaries P=91,254,439 P=32,382,583 P=22,148,910 P=145,785,932Wholesale and retail 78,593,080 – – 78,593,080
Electricity, gas and water 72,366,879 3,825,374 – 76,192,253 Transport, storage and
communication 40,749,110 – – 40,749,110
Manufacturing 45,073,568 446,044 – 45,519,612Public administration and defense 18,007,819 – – 18,007,819Agriculture, hunting and forestry 7,274,620 – – 7,274,620
Secondary target industry:Government 961,957 99,421,494 119,365,375 219,748,826
Real estate, renting and businessactivities 79,407,958 14,604,914 – 94,012,872
Construction 25,173,391 – – 25,173,391Others* 52,136,453 9,546,449 671,250 62,354,152
P=510,999,274 P=160,226,858 P=142,185,535 P=813,411,667* Others include the following sectors - Other community, social and personal services, private household, hotel and restaurant,
education, mining and quarrying, and health and social work.** Other financial assets include the following financial assets: ‘Due from BSP’, ‘Due from other banks’, ‘Interbank loans
receivable’, ‘Securities held under agreements to resell’, and other financial assets booked under ‘Other assets’ (Note 15).
The internal limit of the Parent Company based on the Philippine Standard Industry Classification(PSIC) sub-industry is 12.00% for priority industry, 8.00% for regular industry, 30.00% for powerindustry and 25% for activities of holding companies versus total loan portfolio.
Credit quality per class of financial assetsIn 2018, the Group re-evaluated the segmentation of its loan portfolio so that it is grouped based onthe underlying risk characteristics that are expected to respond in a similar manner to macroeconomicfactors and forward-looking conditions. Moreover, the Group has aligned the portfolio segmentationto sound practice guidelines of internal ratings-based banks.
Generally, the Group’s exposures can be categorized as either Non-Retail and Retail. Non-Retailportfolio of the Group consists of debt obligations of sovereigns, financial institutions, corporations,partnerships, or proprietorships. In particular, the Group’s Non-retail portfolio segments are asfollows: Sovereigns, Financial Institutions, Specialised Lending (e.g. Project Finance), LargeCorporates, Middle Market and Commercial SME, government-owned and controlled corporations(GOCC) and LGUs. Retail exposures are exposures to individual person or persons or to a smallbusiness, and are not usually managed on an individual basis but as groups of exposures with similarrisk characteristics. This includes Credit Cards, Consumer Loans and Retail SME, among others.
Loans and ReceivablesThe credit quality of Non-Retail portfolio is evaluated and monitored using external ratings andinternal credit risk rating system. In 2018, the Parent Company transitioned to a new internal creditrisk rating system but maintained the 2-dimensional structure; that is, there is still a borrower riskrating (BRR) and the facility risk rating (FRR).
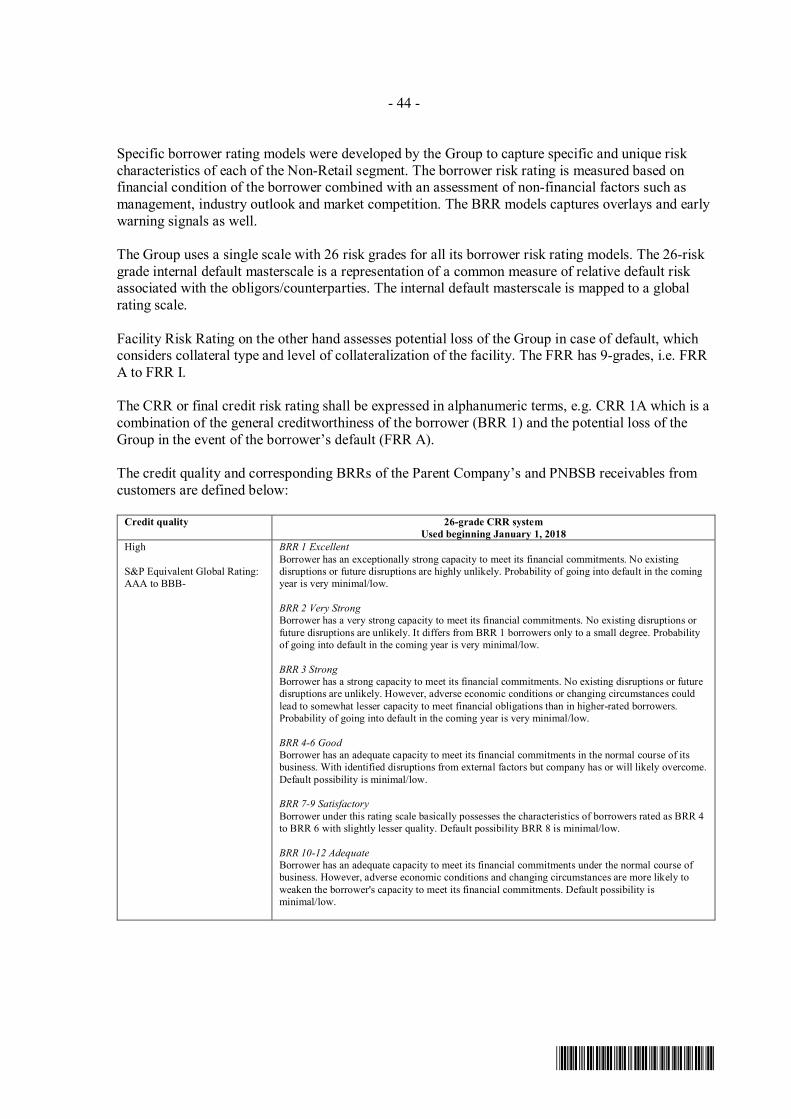
- 44 -
*SGVFS038920*
Specific borrower rating models were developed by the Group to capture specific and unique riskcharacteristics of each of the Non-Retail segment. The borrower risk rating is measured based onfinancial condition of the borrower combined with an assessment of non-financial factors such asmanagement, industry outlook and market competition. The BRR models captures overlays and earlywarning signals as well.
The Group uses a single scale with 26 risk grades for all its borrower risk rating models. The 26-riskgrade internal default masterscale is a representation of a common measure of relative default riskassociated with the obligors/counterparties. The internal default masterscale is mapped to a globalrating scale.
Facility Risk Rating on the other hand assesses potential loss of the Group in case of default, whichconsiders collateral type and level of collateralization of the facility. The FRR has 9-grades, i.e. FRRA to FRR I.
The CRR or final credit risk rating shall be expressed in alphanumeric terms, e.g. CRR 1A which is acombination of the general creditworthiness of the borrower (BRR 1) and the potential loss of theGroup in the event of the borrower’s default (FRR A).
The credit quality and corresponding BRRs of the Parent Company’s and PNBSB receivables fromcustomers are defined below:
Credit quality 26-grade CRR systemUsed beginning January 1, 2018
High
S&P Equivalent Global Rating:AAA to BBB-
BRR 1 ExcellentBorrower has an exceptionally strong capacity to meet its financial commitments. No existingdisruptions or future disruptions are highly unlikely. Probability of going into default in the comingyear is very minimal/low.
BRR 2 Very StrongBorrower has a very strong capacity to meet its financial commitments. No existing disruptions orfuture disruptions are unlikely. It differs from BRR 1 borrowers only to a small degree. Probabilityof going into default in the coming year is very minimal/low.
BRR 3 StrongBorrower has a strong capacity to meet its financial commitments. No existing disruptions or futuredisruptions are unlikely. However, adverse economic conditions or changing circumstances couldlead to somewhat lesser capacity to meet financial obligations than in higher-rated borrowers.Probability of going into default in the coming year is very minimal/low.
BRR 4-6 GoodBorrower has an adequate capacity to meet its financial commitments in the normal course of itsbusiness. With identified disruptions from external factors but company has or will likely overcome.Default possibility is minimal/low.
BRR 7-9 SatisfactoryBorrower under this rating scale basically possesses the characteristics of borrowers rated as BRR 4to BRR 6 with slightly lesser quality. Default possibility BRR 8 is minimal/low.
BRR 10-12 AdequateBorrower has an adequate capacity to meet its financial commitments under the normal course ofbusiness. However, adverse economic conditions and changing circumstances are more likely toweaken the borrower's capacity to meet its financial commitments. Default possibility isminimal/low.
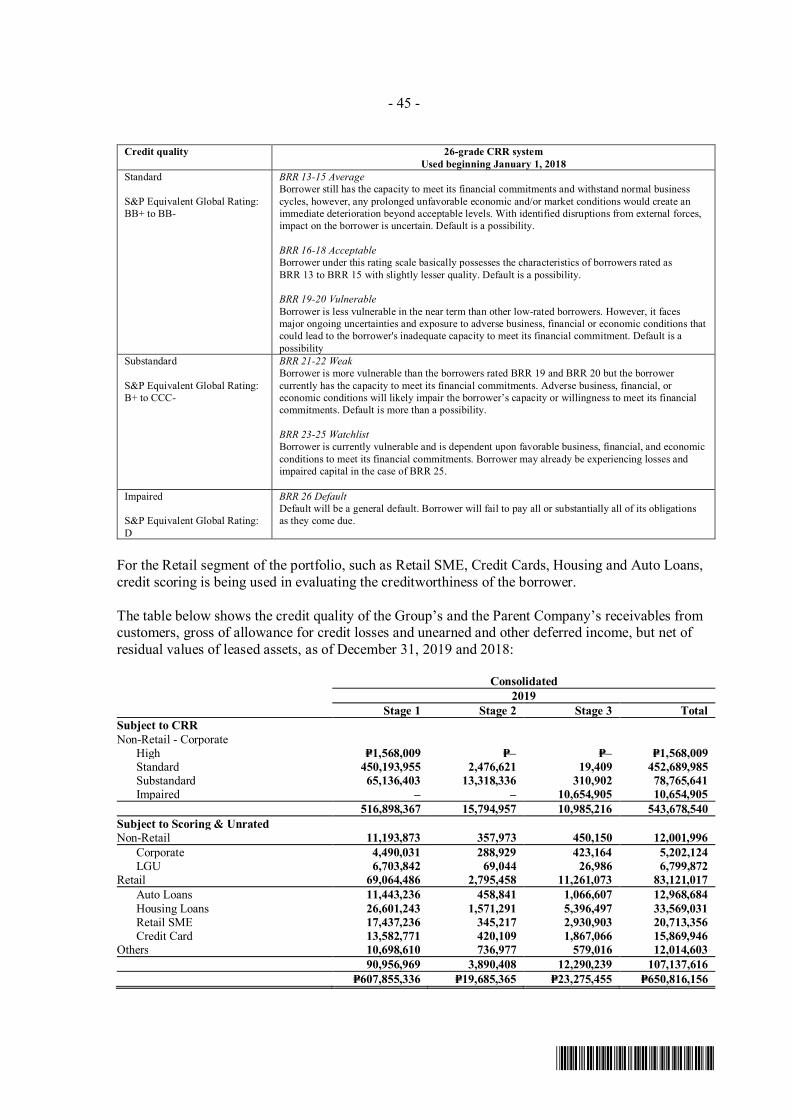
- 45 -
*SGVFS038920*
Credit quality 26-grade CRR systemUsed beginning January 1, 2018
Standard
S&P Equivalent Global Rating:BB+ to BB-
BRR 13-15 AverageBorrower still has the capacity to meet its financial commitments and withstand normal businesscycles, however, any prolonged unfavorable economic and/or market conditions would create animmediate deterioration beyond acceptable levels. With identified disruptions from external forces,impact on the borrower is uncertain. Default is a possibility.
BRR 16-18 AcceptableBorrower under this rating scale basically possesses the characteristics of borrowers rated asBRR 13 to BRR 15 with slightly lesser quality. Default is a possibility.
BRR 19-20 VulnerableBorrower is less vulnerable in the near term than other low-rated borrowers. However, it facesmajor ongoing uncertainties and exposure to adverse business, financial or economic conditions thatcould lead to the borrower's inadequate capacity to meet its financial commitment. Default is apossibility
Substandard
S&P Equivalent Global Rating:B+ to CCC-
BRR 21-22 WeakBorrower is more vulnerable than the borrowers rated BRR 19 and BRR 20 but the borrowercurrently has the capacity to meet its financial commitments. Adverse business, financial, oreconomic conditions will likely impair the borrower’s capacity or willingness to meet its financialcommitments. Default is more than a possibility.
BRR 23-25 WatchlistBorrower is currently vulnerable and is dependent upon favorable business, financial, and economicconditions to meet its financial commitments. Borrower may already be experiencing losses andimpaired capital in the case of BRR 25.
Impaired
S&P Equivalent Global Rating:D
BRR 26 DefaultDefault will be a general default. Borrower will fail to pay all or substantially all of its obligationsas they come due.
For the Retail segment of the portfolio, such as Retail SME, Credit Cards, Housing and Auto Loans,credit scoring is being used in evaluating the creditworthiness of the borrower.
The table below shows the credit quality of the Group’s and the Parent Company’s receivables fromcustomers, gross of allowance for credit losses and unearned and other deferred income, but net ofresidual values of leased assets, as of December 31, 2019 and 2018:
Consolidated2019
Stage 1 Stage 2 Stage 3 TotalSubject to CRRNon-Retail - Corporate
High P=1,568,009 P=– P=– P=1,568,009Standard 450,193,955 2,476,621 19,409 452,689,985Substandard 65,136,403 13,318,336 310,902 78,765,641Impaired – – 10,654,905 10,654,905
516,898,367 15,794,957 10,985,216 543,678,540Subject to Scoring & UnratedNon-Retail 11,193,873 357,973 450,150 12,001,996
Corporate 4,490,031 288,929 423,164 5,202,124LGU 6,703,842 69,044 26,986 6,799,872
Retail 69,064,486 2,795,458 11,261,073 83,121,017 Auto Loans 11,443,236 458,841 1,066,607 12,968,684
Housing Loans 26,601,243 1,571,291 5,396,497 33,569,031Retail SME 17,437,236 345,217 2,930,903 20,713,356Credit Card 13,582,771 420,109 1,867,066 15,869,946
Others 10,698,610 736,977 579,016 12,014,60390,956,969 3,890,408 12,290,239 107,137,616
P=607,855,336 P=19,685,365 P=23,275,455 P=650,816,156
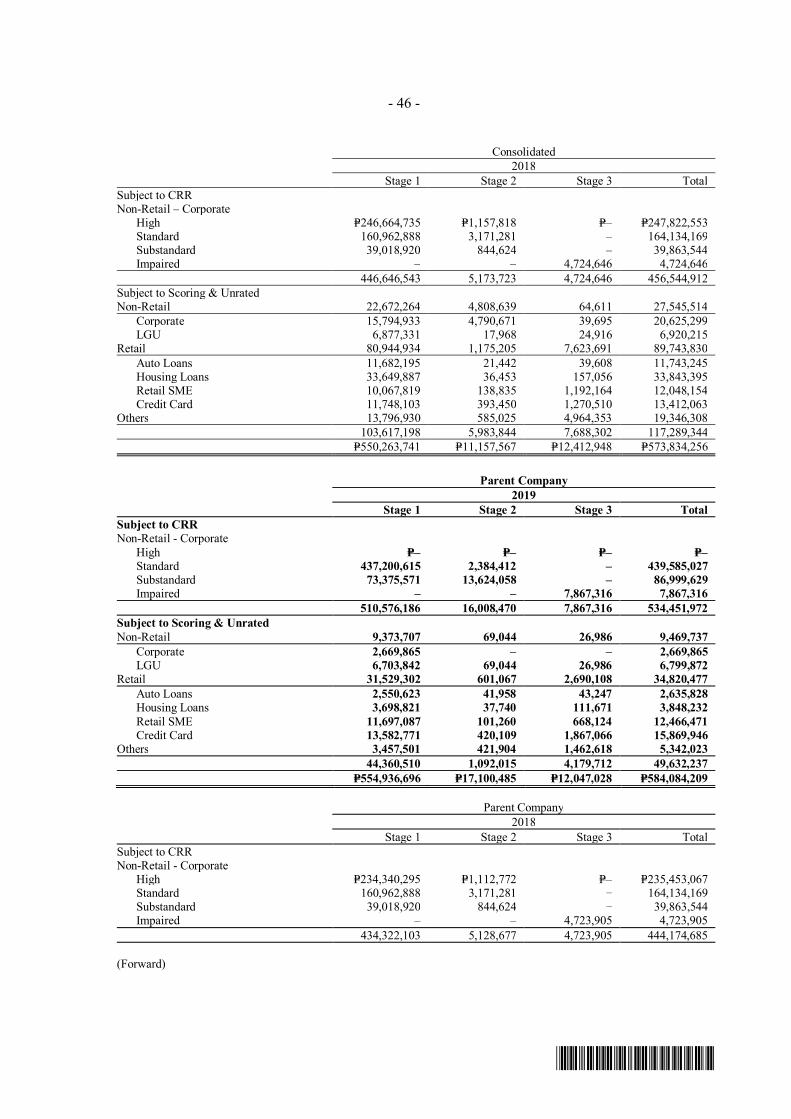
- 46 -
*SGVFS038920*
Consolidated2018
Stage 1 Stage 2 Stage 3 TotalSubject to CRRNon-Retail – Corporate
High P=246,664,735 P=1,157,818 P=– P=247,822,553Standard 160,962,888 3,171,281 – 164,134,169Substandard 39,018,920 844,624 – 39,863,544Impaired – – 4,724,646 4,724,646
446,646,543 5,173,723 4,724,646 456,544,912Subject to Scoring & UnratedNon-Retail 22,672,264 4,808,639 64,611 27,545,514
Corporate 15,794,933 4,790,671 39,695 20,625,299LGU 6,877,331 17,968 24,916 6,920,215
Retail 80,944,934 1,175,205 7,623,691 89,743,830Auto Loans 11,682,195 21,442 39,608 11,743,245Housing Loans 33,649,887 36,453 157,056 33,843,395Retail SME 10,067,819 138,835 1,192,164 12,048,154Credit Card 11,748,103 393,450 1,270,510 13,412,063
Others 13,796,930 585,025 4,964,353 19,346,308103,617,198 5,983,844 7,688,302 117,289,344
P=550,263,741 P=11,157,567 P=12,412,948 P=573,834,256
Parent Company2019
Stage 1 Stage 2 Stage 3 TotalSubject to CRRNon-Retail - Corporate
High P=– P=– P=– P=–Standard 437,200,615 2,384,412 – 439,585,027Substandard 73,375,571 13,624,058 – 86,999,629Impaired – – 7,867,316 7,867,316
510,576,186 16,008,470 7,867,316 534,451,972Subject to Scoring & UnratedNon-Retail 9,373,707 69,044 26,986 9,469,737
Corporate 2,669,865 – – 2,669,865LGU 6,703,842 69,044 26,986 6,799,872
Retail 31,529,302 601,067 2,690,108 34,820,477Auto Loans 2,550,623 41,958 43,247 2,635,828
Housing Loans 3,698,821 37,740 111,671 3,848,232Retail SME 11,697,087 101,260 668,124 12,466,471Credit Card 13,582,771 420,109 1,867,066 15,869,946
Others 3,457,501 421,904 1,462,618 5,342,02344,360,510 1,092,015 4,179,712 49,632,237
P=554,936,696 P=17,100,485 P=12,047,028 P=584,084,209
Parent Company2018
Stage 1 Stage 2 Stage 3 TotalSubject to CRRNon-Retail - Corporate
High P=234,340,295 P=1,112,772 P=– P=235,453,067Standard 160,962,888 3,171,281 – 164,134,169Substandard 39,018,920 844,624 – 39,863,544
Impaired – – 4,723,905 4,723,905434,322,103 5,128,677 4,723,905 444,174,685
(Forward)
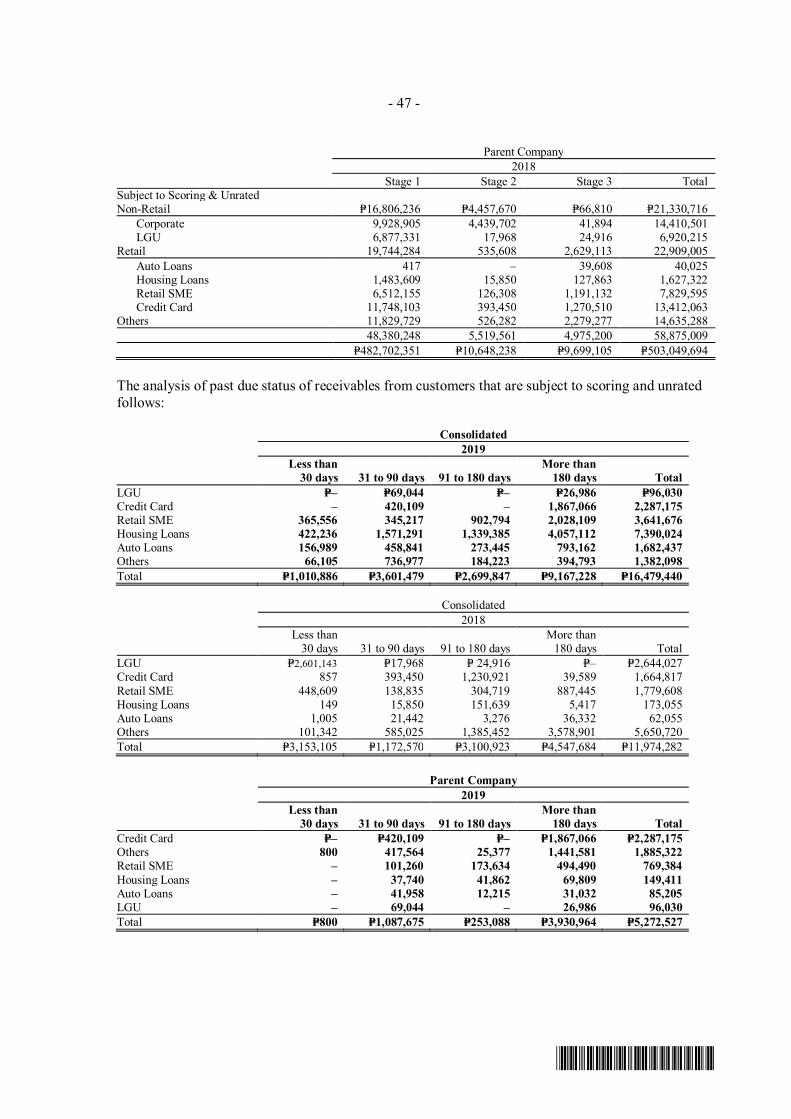
- 47 -
*SGVFS038920*
Parent Company2018
Stage 1 Stage 2 Stage 3 TotalSubject to Scoring & UnratedNon-Retail P=16,806,236 P=4,457,670 P=66,810 P=21,330,716
Corporate 9,928,905 4,439,702 41,894 14,410,501LGU 6,877,331 17,968 24,916 6,920,215
Retail 19,744,284 535,608 2,629,113 22,909,005Auto Loans 417 – 39,608 40,025Housing Loans 1,483,609 15,850 127,863 1,627,322Retail SME 6,512,155 126,308 1,191,132 7,829,595Credit Card 11,748,103 393,450 1,270,510 13,412,063
Others 11,829,729 526,282 2,279,277 14,635,28848,380,248 5,519,561 4,975,200 58,875,009
P=482,702,351 P=10,648,238 P=9,699,105 P=503,049,694
The analysis of past due status of receivables from customers that are subject to scoring and unratedfollows:
Consolidated2019
Less than30 days 31 to 90 days 91 to 180 days
More than180 days Total
LGU P=– P=69,044 P=– P=26,986 P=96,030Credit Card – 420,109 – 1,867,066 2,287,175Retail SME 365,556 345,217 902,794 2,028,109 3,641,676Housing Loans 422,236 1,571,291 1,339,385 4,057,112 7,390,024Auto Loans 156,989 458,841 273,445 793,162 1,682,437Others 66,105 736,977 184,223 394,793 1,382,098Total P=1,010,886 P=3,601,479 P=2,699,847 P=9,167,228 P=16,479,440
Consolidated2018
Less than30 days 31 to 90 days 91 to 180 days
More than180 days Total
LGU P=2,601,143 P=17,968 P= 24,916 P=– P=2,644,027Credit Card 857 393,450 1,230,921 39,589 1,664,817Retail SME 448,609 138,835 304,719 887,445 1,779,608Housing Loans 149 15,850 151,639 5,417 173,055Auto Loans 1,005 21,442 3,276 36,332 62,055Others 101,342 585,025 1,385,452 3,578,901 5,650,720Total P=3,153,105 P=1,172,570 P=3,100,923 P=4,547,684 P=11,974,282
Parent Company2019
Less than30 days 31 to 90 days 91 to 180 days
More than180 days Total
Credit Card P=– P=420,109 P=– P=1,867,066 P=2,287,175Others 800 417,564 25,377 1,441,581 1,885,322Retail SME – 101,260 173,634 494,490 769,384Housing Loans – 37,740 41,862 69,809 149,411Auto Loans – 41,958 12,215 31,032 85,205LGU – 69,044 – 26,986 96,030Total P=800 P=1,087,675 P=253,088 P=3,930,964 P=5,272,527
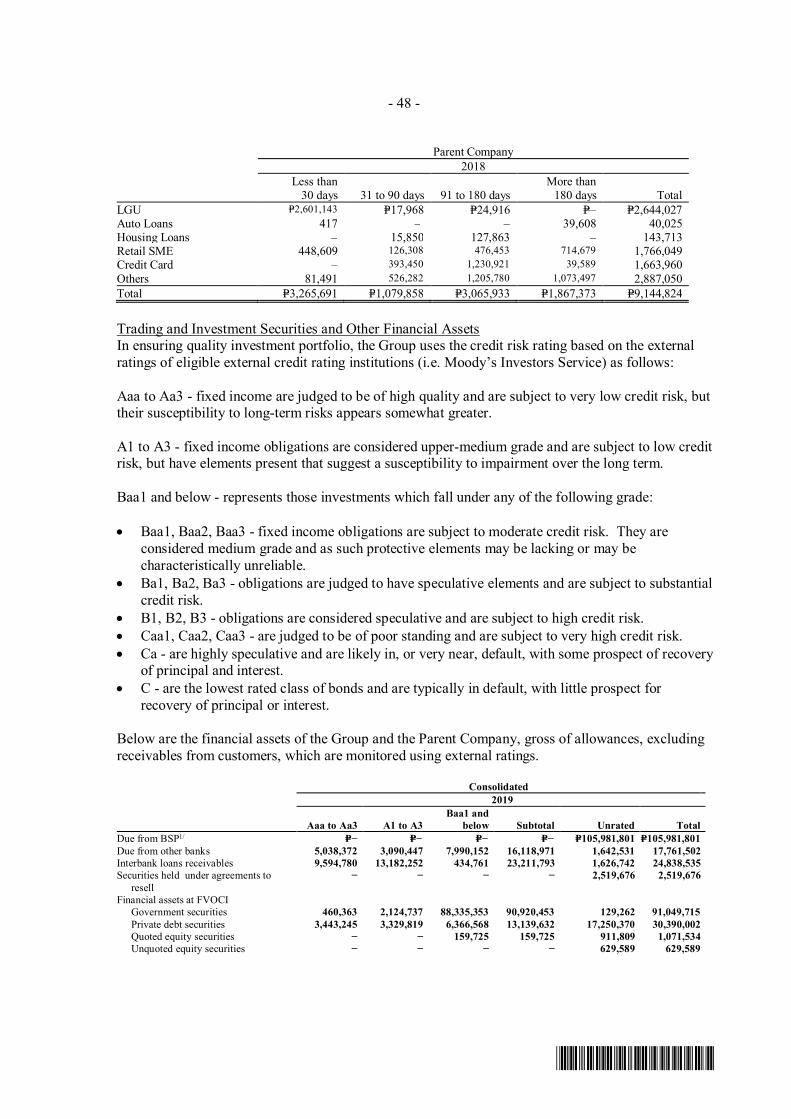
- 48 -
*SGVFS038920*
Parent Company2018
Less than30 days 31 to 90 days 91 to 180 days
More than180 days Total
LGU P=2,601,143 P=17,968 P=24,916 P=– P=2,644,027Auto Loans 417 – – 39,608 40,025Housing Loans – 15,850 127,863 – 143,713Retail SME 448,609 126,308 476,453 714,679 1,766,049Credit Card – 393,450 1,230,921 39,589 1,663,960Others 81,491 526,282 1,205,780 1,073,497 2,887,050Total P=3,265,691 P=1,079,858 P=3,065,933 P=1,867,373 P=9,144,824
Trading and Investment Securities and Other Financial AssetsIn ensuring quality investment portfolio, the Group uses the credit risk rating based on the externalratings of eligible external credit rating institutions (i.e. Moody’s Investors Service) as follows:
Aaa to Aa3 - fixed income are judged to be of high quality and are subject to very low credit risk, buttheir susceptibility to long-term risks appears somewhat greater.
A1 to A3 - fixed income obligations are considered upper-medium grade and are subject to low creditrisk, but have elements present that suggest a susceptibility to impairment over the long term.
Baa1 and below - represents those investments which fall under any of the following grade:
· Baa1, Baa2, Baa3 - fixed income obligations are subject to moderate credit risk. They areconsidered medium grade and as such protective elements may be lacking or may becharacteristically unreliable.
· Ba1, Ba2, Ba3 - obligations are judged to have speculative elements and are subject to substantialcredit risk.
· B1, B2, B3 - obligations are considered speculative and are subject to high credit risk.· Caa1, Caa2, Caa3 - are judged to be of poor standing and are subject to very high credit risk.· Ca - are highly speculative and are likely in, or very near, default, with some prospect of recovery
of principal and interest.· C - are the lowest rated class of bonds and are typically in default, with little prospect for
recovery of principal or interest.
Below are the financial assets of the Group and the Parent Company, gross of allowances, excludingreceivables from customers, which are monitored using external ratings.
Consolidated2019
Aaa to Aa3 A1 to A3Baa1 and
below Subtotal Unrated TotalDue from BSP1/ P=− P=− P=− P=− P=105,981,801 P=105,981,801Due from other banks 5,038,372 3,090,447 7,990,152 16,118,971 1,642,531 17,761,502Interbank loans receivables 9,594,780 13,182,252 434,761 23,211,793 1,626,742 24,838,535Securities held under agreements to
resell− − − − 2,519,676 2,519,676
Financial assets at FVOCI Government securities 460,363 2,124,737 88,335,353 90,920,453 129,262 91,049,715
Private debt securities 3,443,245 3,329,819 6,366,568 13,139,632 17,250,370 30,390,002Quoted equity securities − − 159,725 159,725 911,809 1,071,534
Unquoted equity securities − − − − 629,589 629,589
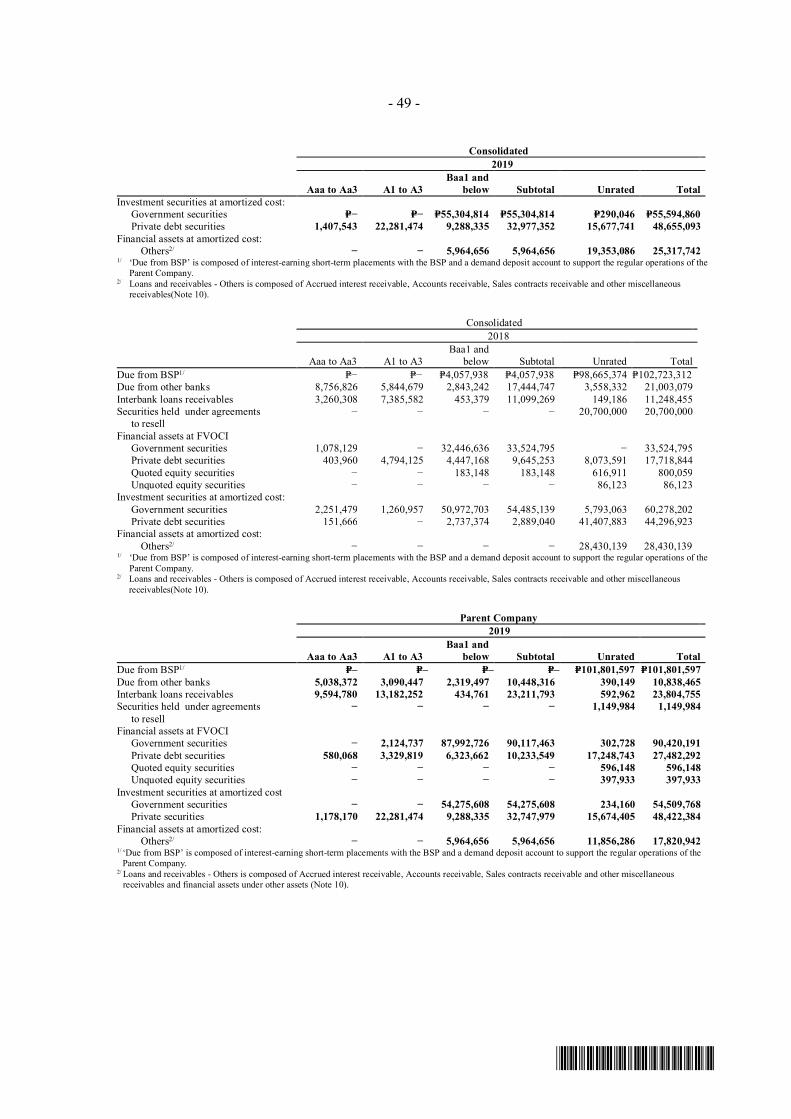
- 49 -
*SGVFS038920*
Consolidated2019
Aaa to Aa3 A1 to A3Baa1 and
below Subtotal Unrated TotalInvestment securities at amortized cost:
Government securities P=− P=− P=55,304,814 P=55,304,814 P=290,046 P=55,594,860Private debt securities 1,407,543 22,281,474 9,288,335 32,977,352 15,677,741 48,655,093
Financial assets at amortized cost:Others2/ − − 5,964,656 5,964,656 19,353,086 25,317,742
1/ ‘Due from BSP’ is composed of interest-earning short-term placements with the BSP and a demand deposit account to support the regular operations of theParent Company.
2/ Loans and receivables - Others is composed of Accrued interest receivable, Accounts receivable, Sales contracts receivable and other miscellaneousreceivables(Note 10).
Consolidated2018
Aaa to Aa3 A1 to A3Baa1 and
below Subtotal Unrated TotalDue from BSP1/ P=− P=− P=4,057,938 P=4,057,938 P=98,665,374 P=102,723,312Due from other banks 8,756,826 5,844,679 2,843,242 17,444,747 3,558,332 21,003,079Interbank loans receivables 3,260,308 7,385,582 453,379 11,099,269 149,186 11,248,455Securities held under agreements
to resell− − − − 20,700,000 20,700,000
Financial assets at FVOCIGovernment securities 1,078,129 − 32,446,636 33,524,795 − 33,524,795
Private debt securities 403,960 4,794,125 4,447,168 9,645,253 8,073,591 17,718,844Quoted equity securities − − 183,148 183,148 616,911 800,059Unquoted equity securities − − − − 86,123 86,123
Investment securities at amortized cost:Government securities 2,251,479 1,260,957 50,972,703 54,485,139 5,793,063 60,278,202Private debt securities 151,666 − 2,737,374 2,889,040 41,407,883 44,296,923
Financial assets at amortized cost:Others2/ − − − − 28,430,139 28,430,139
1/ ‘Due from BSP’ is composed of interest-earning short-term placements with the BSP and a demand deposit account to support the regular operations of theParent Company.
2/ Loans and receivables - Others is composed of Accrued interest receivable, Accounts receivable, Sales contracts receivable and other miscellaneousreceivables(Note 10).
Parent Company2019
Aaa to Aa3 A1 to A3Baa1 and
below Subtotal Unrated TotalDue from BSP1/ P=– P=– P=– P=– P=101,801,597 P=101,801,597Due from other banks 5,038,372 3,090,447 2,319,497 10,448,316 390,149 10,838,465Interbank loans receivables 9,594,780 13,182,252 434,761 23,211,793 592,962 23,804,755Securities held under agreements
to resell− − − − 1,149,984 1,149,984
Financial assets at FVOCI Government securities − 2,124,737 87,992,726 90,117,463 302,728 90,420,191
Private debt securities 580,068 3,329,819 6,323,662 10,233,549 17,248,743 27,482,292Quoted equity securities − − − − 596,148 596,148
Unquoted equity securities − − − − 397,933 397,933Investment securities at amortized cost
Government securities − − 54,275,608 54,275,608 234,160 54,509,768Private securities 1,178,170 22,281,474 9,288,335 32,747,979 15,674,405 48,422,384
Financial assets at amortized cost:Others2/ − − 5,964,656 5,964,656 11,856,286 17,820,942
1/ ‘Due from BSP’ is composed of interest-earning short-term placements with the BSP and a demand deposit account to support the regular operations of theParent Company.
2/ Loans and receivables - Others is composed of Accrued interest receivable, Accounts receivable, Sales contracts receivable and other miscellaneousreceivables and financial assets under other assets (Note 10).
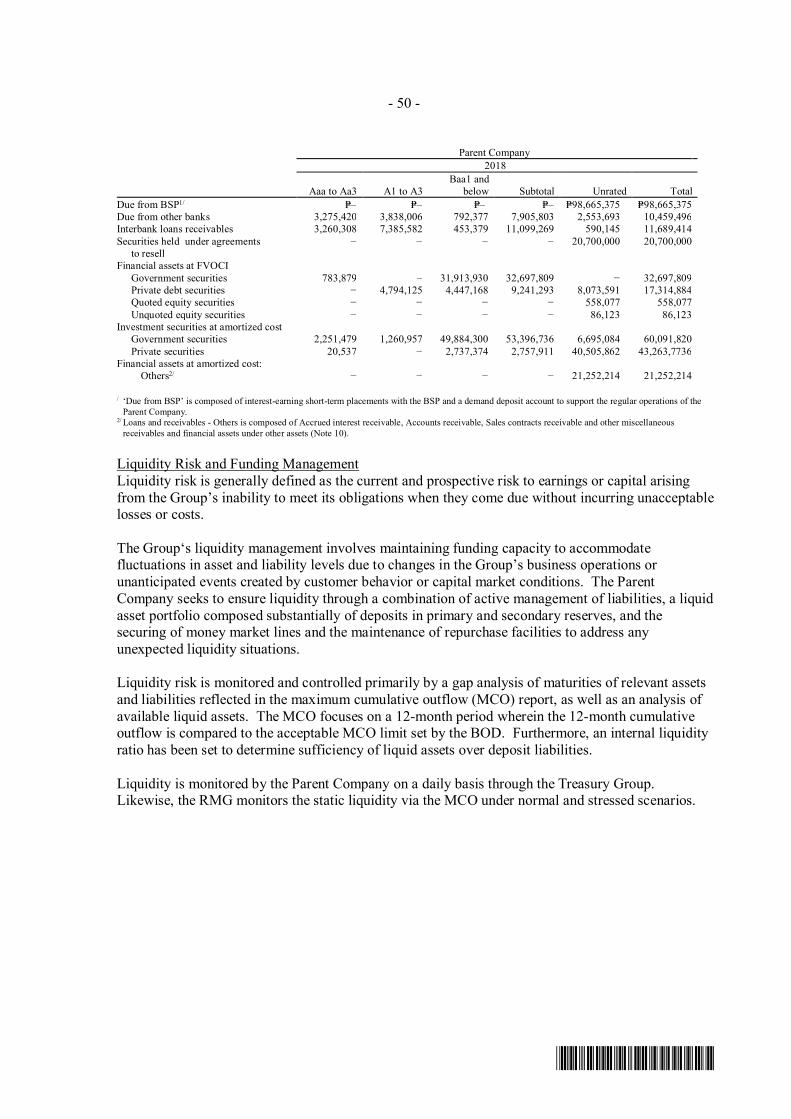
- 50 -
*SGVFS038920*
Parent Company2018
Aaa to Aa3 A1 to A3Baa1 and
below Subtotal Unrated TotalDue from BSP1/ P=– P=– P=– P=– P=98,665,375 P=98,665,375Due from other banks 3,275,420 3,838,006 792,377 7,905,803 2,553,693 10,459,496Interbank loans receivables 3,260,308 7,385,582 453,379 11,099,269 590,145 11,689,414Securities held under agreements
to resell− − − − 20,700,000 20,700,000
Financial assets at FVOCIGovernment securities 783,879 – 31,913,930 32,697,809 − 32,697,809Private debt securities − 4,794,125 4,447,168 9,241,293 8,073,591 17,314,884
Quoted equity securities − − − − 558,077 558,077Unquoted equity securities − − − − 86,123 86,123
Investment securities at amortized cost Government securities 2,251,479 1,260,957 49,884,300 53,396,736 6,695,084 60,091,820
Private securities 20,537 − 2,737,374 2,757,911 40,505,862 43,263,7736Financial assets at amortized cost:
Others2/ − − − − 21,252,214 21,252,214
/ ‘Due from BSP’ is composed of interest-earning short-term placements with the BSP and a demand deposit account to support the regular operations of theParent Company.
2/ Loans and receivables - Others is composed of Accrued interest receivable, Accounts receivable, Sales contracts receivable and other miscellaneousreceivables and financial assets under other assets (Note 10).
Liquidity Risk and Funding ManagementLiquidity risk is generally defined as the current and prospective risk to earnings or capital arisingfrom the Group’s inability to meet its obligations when they come due without incurring unacceptablelosses or costs.
The Group‘s liquidity management involves maintaining funding capacity to accommodatefluctuations in asset and liability levels due to changes in the Group’s business operations orunanticipated events created by customer behavior or capital market conditions. The ParentCompany seeks to ensure liquidity through a combination of active management of liabilities, a liquidasset portfolio composed substantially of deposits in primary and secondary reserves, and thesecuring of money market lines and the maintenance of repurchase facilities to address anyunexpected liquidity situations.
Liquidity risk is monitored and controlled primarily by a gap analysis of maturities of relevant assetsand liabilities reflected in the maximum cumulative outflow (MCO) report, as well as an analysis ofavailable liquid assets. The MCO focuses on a 12-month period wherein the 12-month cumulativeoutflow is compared to the acceptable MCO limit set by the BOD. Furthermore, an internal liquidityratio has been set to determine sufficiency of liquid assets over deposit liabilities.
Liquidity is monitored by the Parent Company on a daily basis through the Treasury Group.Likewise, the RMG monitors the static liquidity via the MCO under normal and stressed scenarios.
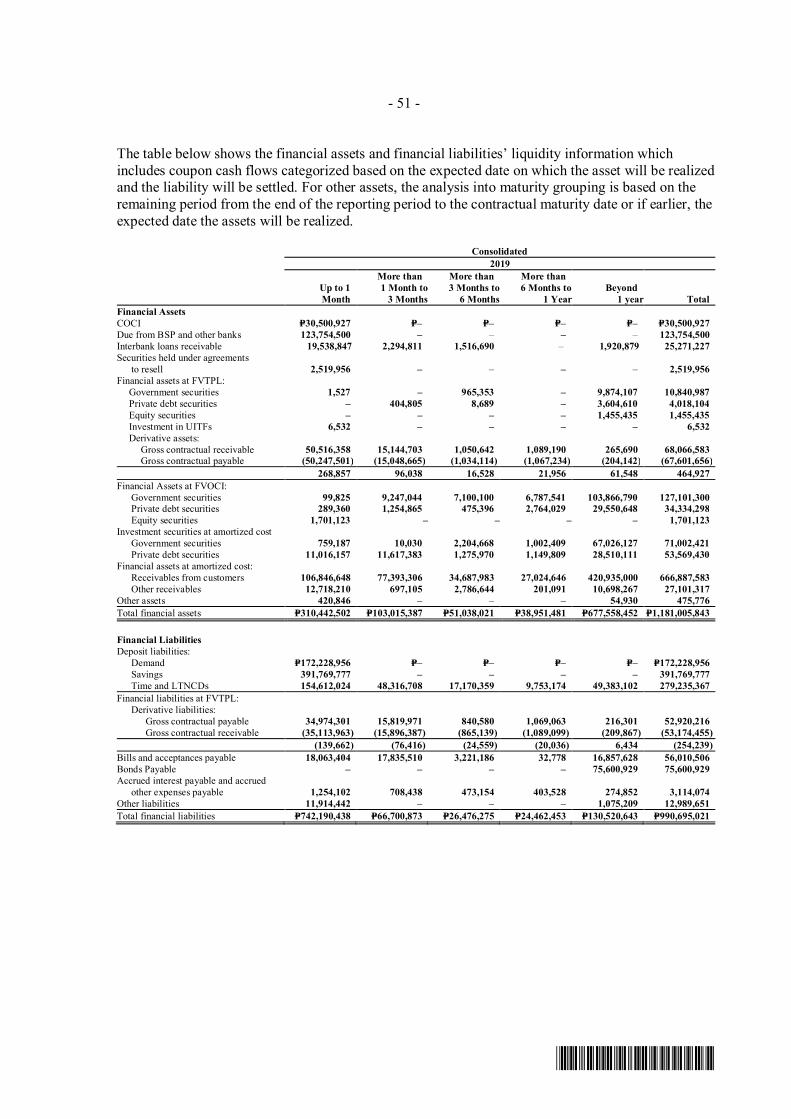
- 51 -
*SGVFS038920*
The table below shows the financial assets and financial liabilities’ liquidity information whichincludes coupon cash flows categorized based on the expected date on which the asset will be realizedand the liability will be settled. For other assets, the analysis into maturity grouping is based on theremaining period from the end of the reporting period to the contractual maturity date or if earlier, theexpected date the assets will be realized.
Consolidated2019
Up to 1Month
More than1 Month to
3 Months
More than3 Months to
6 Months
More than6 Months to
1 YearBeyond
1 year TotalFinancial AssetsCOCI P=30,500,927 P=– P=– P=– P=– P=30,500,927Due from BSP and other banks 123,754,500 – – – – 123,754,500Interbank loans receivable 19,538,847 2,294,811 1,516,690 – 1,920,879 25,271,227Securities held under agreements
to resell 2,519,956 – – – – 2,519,956Financial assets at FVTPL: Government securities 1,527 – 965,353 – 9,874,107 10,840,987 Private debt securities – 404,805 8,689 – 3,604,610 4,018,104 Equity securities – – – – 1,455,435 1,455,435 Investment in UITFs 6,532 – – – – 6,532 Derivative assets: Gross contractual receivable 50,516,358 15,144,703 1,050,642 1,089,190 265,690 68,066,583 Gross contractual payable (50,247,501) (15,048,665) (1,034,114) (1,067,234) (204,142) (67,601,656)
268,857 96,038 16,528 21,956 61,548 464,927Financial Assets at FVOCI: Government securities 99,825 9,247,044 7,100,100 6,787,541 103,866,790 127,101,300 Private debt securities 289,360 1,254,865 475,396 2,764,029 29,550,648 34,334,298 Equity securities 1,701,123 – – – – 1,701,123Investment securities at amortized cost Government securities 759,187 10,030 2,204,668 1,002,409 67,026,127 71,002,421 Private debt securities 11,016,157 11,617,383 1,275,970 1,149,809 28,510,111 53,569,430Financial assets at amortized cost: Receivables from customers 106,846,648 77,393,306 34,687,983 27,024,646 420,935,000 666,887,583 Other receivables 12,718,210 697,105 2,786,644 201,091 10,698,267 27,101,317Other assets 420,846 – – – 54,930 475,776Total financial assets P=310,442,502 P=103,015,387 P=51,038,021 P=38,951,481 P=677,558,452 P=1,181,005,843
Financial LiabilitiesDeposit liabilities: Demand P=172,228,956 P=– P=– P=– P=– P=172,228,956 Savings 391,769,777 – – – – 391,769,777 Time and LTNCDs 154,612,024 48,316,708 17,170,359 9,753,174 49,383,102 279,235,367Financial liabilities at FVTPL: Derivative liabilities: Gross contractual payable 34,974,301 15,819,971 840,580 1,069,063 216,301 52,920,216 Gross contractual receivable (35,113,963) (15,896,387) (865,139) (1,089,099) (209,867) (53,174,455)
(139,662) (76,416) (24,559) (20,036) 6,434 (254,239)Bills and acceptances payable 18,063,404 17,835,510 3,221,186 32,778 16,857,628 56,010,506Bonds Payable – – – – 75,600,929 75,600,929Accrued interest payable and accrued
other expenses payable 1,254,102 708,438 473,154 403,528 274,852 3,114,074Other liabilities 11,914,442 – – – 1,075,209 12,989,651Total financial liabilities P=742,190,438 P=66,700,873 P=26,476,275 P=24,462,453 P=130,520,643 P=990,695,021
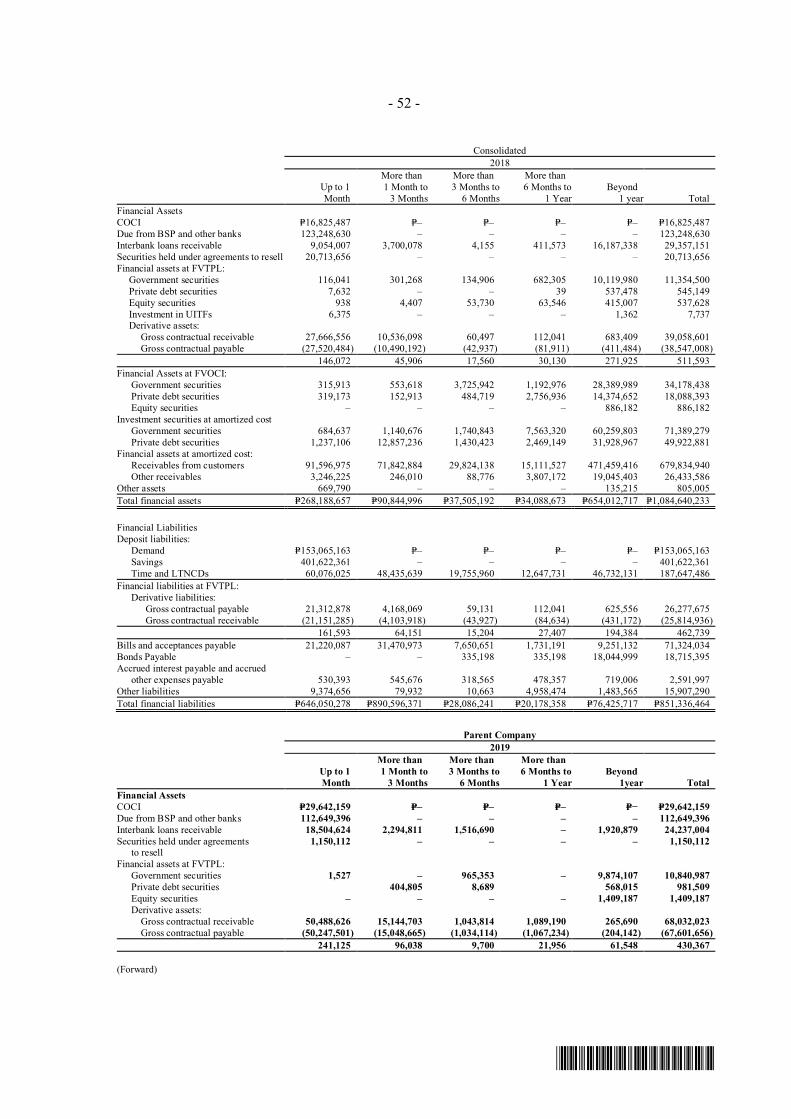
- 52 -
*SGVFS038920*
Consolidated2018
Up to 1Month
More than1 Month to
3 Months
More than3 Months to
6 Months
More than6 Months to
1 YearBeyond
1 year TotalFinancial AssetsCOCI P=16,825,487 P=– P=– P=– P=– P=16,825,487Due from BSP and other banks 123,248,630 – – – – 123,248,630Interbank loans receivable 9,054,007 3,700,078 4,155 411,573 16,187,338 29,357,151Securities held under agreements to resell 20,713,656 – – – – 20,713,656Financial assets at FVTPL: Government securities 116,041 301,268 134,906 682,305 10,119,980 11,354,500 Private debt securities 7,632 – – 39 537,478 545,149 Equity securities 938 4,407 53,730 63,546 415,007 537,628 Investment in UITFs 6,375 – – – 1,362 7,737 Derivative assets: Gross contractual receivable 27,666,556 10,536,098 60,497 112,041 683,409 39,058,601 Gross contractual payable (27,520,484) (10,490,192) (42,937) (81,911) (411,484) (38,547,008)
146,072 45,906 17,560 30,130 271,925 511,593Financial Assets at FVOCI: Government securities 315,913 553,618 3,725,942 1,192,976 28,389,989 34,178,438 Private debt securities 319,173 152,913 484,719 2,756,936 14,374,652 18,088,393 Equity securities – – – – 886,182 886,182Investment securities at amortized cost Government securities 684,637 1,140,676 1,740,843 7,563,320 60,259,803 71,389,279 Private debt securities 1,237,106 12,857,236 1,430,423 2,469,149 31,928,967 49,922,881Financial assets at amortized cost: Receivables from customers 91,596,975 71,842,884 29,824,138 15,111,527 471,459,416 679,834,940 Other receivables 3,246,225 246,010 88,776 3,807,172 19,045,403 26,433,586Other assets 669,790 – – – 135,215 805,005Total financial assets P=268,188,657 P=90,844,996 P=37,505,192 P=34,088,673 P=654,012,717 P=1,084,640,233
Financial LiabilitiesDeposit liabilities: Demand P=153,065,163 P=– P=– P=– P=– P=153,065,163 Savings 401,622,361 – – – – 401,622,361 Time and LTNCDs 60,076,025 48,435,639 19,755,960 12,647,731 46,732,131 187,647,486Financial liabilities at FVTPL: Derivative liabilities: Gross contractual payable 21,312,878 4,168,069 59,131 112,041 625,556 26,277,675 Gross contractual receivable (21,151,285) (4,103,918) (43,927) (84,634) (431,172) (25,814,936)
161,593 64,151 15,204 27,407 194,384 462,739Bills and acceptances payable 21,220,087 31,470,973 7,650,651 1,731,191 9,251,132 71,324,034Bonds Payable – – 335,198 335,198 18,044,999 18,715,395Accrued interest payable and accrued
other expenses payable 530,393 545,676 318,565 478,357 719,006 2,591,997Other liabilities 9,374,656 79,932 10,663 4,958,474 1,483,565 15,907,290Total financial liabilities P=646,050,278 P=890,596,371 P=28,086,241 P=20,178,358 P=76,425,717 P=851,336,464
Parent Company2019
Up to 1Month
More than1 Month to
3 Months
More than3 Months to
6 Months
More than6 Months to
1 YearBeyond
1year TotalFinancial AssetsCOCI P=29,642,159 P=– P=– P=– P=− P=29,642,159Due from BSP and other banks 112,649,396 – – – – 112,649,396Interbank loans receivable 18,504,624 2,294,811 1,516,690 – 1,920,879 24,237,004Securities held under agreements
to resell1,150,112 – – – – 1,150,112
Financial assets at FVTPL: Government securities 1,527 – 965,353 – 9,874,107 10,840,987 Private debt securities 404,805 8,689 568,015 981,509 Equity securities – – – – 1,409,187 1,409,187 Derivative assets: Gross contractual receivable 50,488,626 15,144,703 1,043,814 1,089,190 265,690 68,032,023 Gross contractual payable (50,247,501) (15,048,665) (1,034,114) (1,067,234) (204,142) (67,601,656)
241,125 96,038 9,700 21,956 61,548 430,367
(Forward)
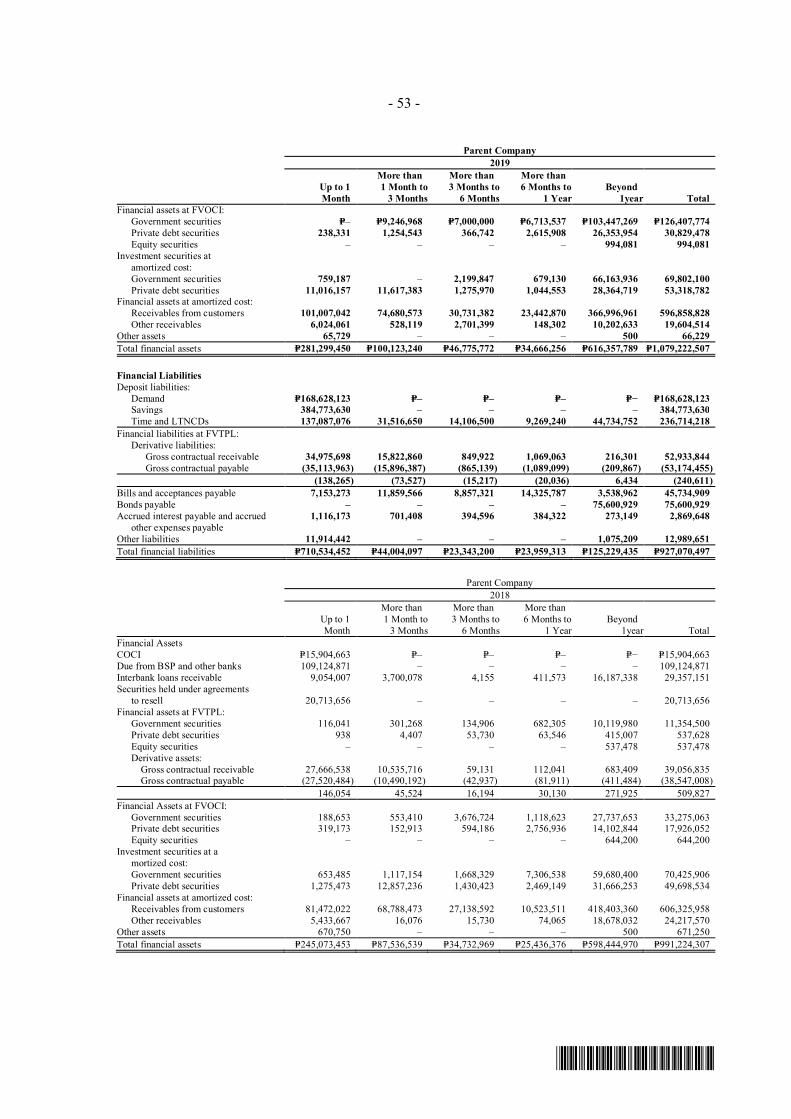
- 53 -
*SGVFS038920*
Parent Company2019
Up to 1Month
More than1 Month to
3 Months
More than3 Months to
6 Months
More than6 Months to
1 YearBeyond
1year TotalFinancial assets at FVOCI: Government securities P=– P=9,246,968 P=7,000,000 P=6,713,537 P=103,447,269 P=126,407,774 Private debt securities 238,331 1,254,543 366,742 2,615,908 26,353,954 30,829,478 Equity securities – – – – 994,081 994,081Investment securities at
amortized cost: Government securities 759,187 – 2,199,847 679,130 66,163,936 69,802,100 Private debt securities 11,016,157 11,617,383 1,275,970 1,044,553 28,364,719 53,318,782Financial assets at amortized cost: Receivables from customers 101,007,042 74,680,573 30,731,382 23,442,870 366,996,961 596,858,828 Other receivables 6,024,061 528,119 2,701,399 148,302 10,202,633 19,604,514Other assets 65,729 – – – 500 66,229Total financial assets P=281,299,450 P=100,123,240 P=46,775,772 P=34,666,256 P=616,357,789 P=1,079,222,507
Financial LiabilitiesDeposit liabilities: Demand P=168,628,123 P=– P=– P=– P=− P=168,628,123 Savings 384,773,630 – – – – 384,773,630 Time and LTNCDs 137,087,076 31,516,650 14,106,500 9,269,240 44,734,752 236,714,218Financial liabilities at FVTPL: Derivative liabilities: Gross contractual receivable 34,975,698 15,822,860 849,922 1,069,063 216,301 52,933,844 Gross contractual payable (35,113,963) (15,896,387) (865,139) (1,089,099) (209,867) (53,174,455)
(138,265) (73,527) (15,217) (20,036) 6,434 (240,611)Bills and acceptances payable 7,153,273 11,859,566 8,857,321 14,325,787 3,538,962 45,734,909Bonds payable – – – – 75,600,929 75,600,929Accrued interest payable and accrued
other expenses payable1,116,173 701,408 394,596 384,322 273,149 2,869,648
Other liabilities 11,914,442 – – – 1,075,209 12,989,651Total financial liabilities P=710,534,452 P=44,004,097 P=23,343,200 P=23,959,313 P=125,229,435 P=927,070,497
Parent Company2018
Up to 1Month
More than1 Month to
3 Months
More than3 Months to
6 Months
More than6 Months to
1 YearBeyond
1year TotalFinancial AssetsCOCI P=15,904,663 P=– P=– P=– P=− P=15,904,663Due from BSP and other banks 109,124,871 – – – – 109,124,871Interbank loans receivable 9,054,007 3,700,078 4,155 411,573 16,187,338 29,357,151Securities held under agreements
to resell 20,713,656 – – – – 20,713,656Financial assets at FVTPL: Government securities 116,041 301,268 134,906 682,305 10,119,980 11,354,500 Private debt securities 938 4,407 53,730 63,546 415,007 537,628 Equity securities – – – – 537,478 537,478 Derivative assets: Gross contractual receivable 27,666,538 10,535,716 59,131 112,041 683,409 39,056,835 Gross contractual payable (27,520,484) (10,490,192) (42,937) (81,911) (411,484) (38,547,008)
146,054 45,524 16,194 30,130 271,925 509,827Financial Assets at FVOCI: Government securities 188,653 553,410 3,676,724 1,118,623 27,737,653 33,275,063 Private debt securities 319,173 152,913 594,186 2,756,936 14,102,844 17,926,052 Equity securities – – – – 644,200 644,200Investment securities at a
mortized cost: Government securities 653,485 1,117,154 1,668,329 7,306,538 59,680,400 70,425,906 Private debt securities 1,275,473 12,857,236 1,430,423 2,469,149 31,666,253 49,698,534Financial assets at amortized cost: Receivables from customers 81,472,022 68,788,473 27,138,592 10,523,511 418,403,360 606,325,958 Other receivables 5,433,667 16,076 15,730 74,065 18,678,032 24,217,570Other assets 670,750 – – – 500 671,250Total financial assets P=245,073,453 P=87,536,539 P=34,732,969 P=25,436,376 P=598,444,970 P=991,224,307
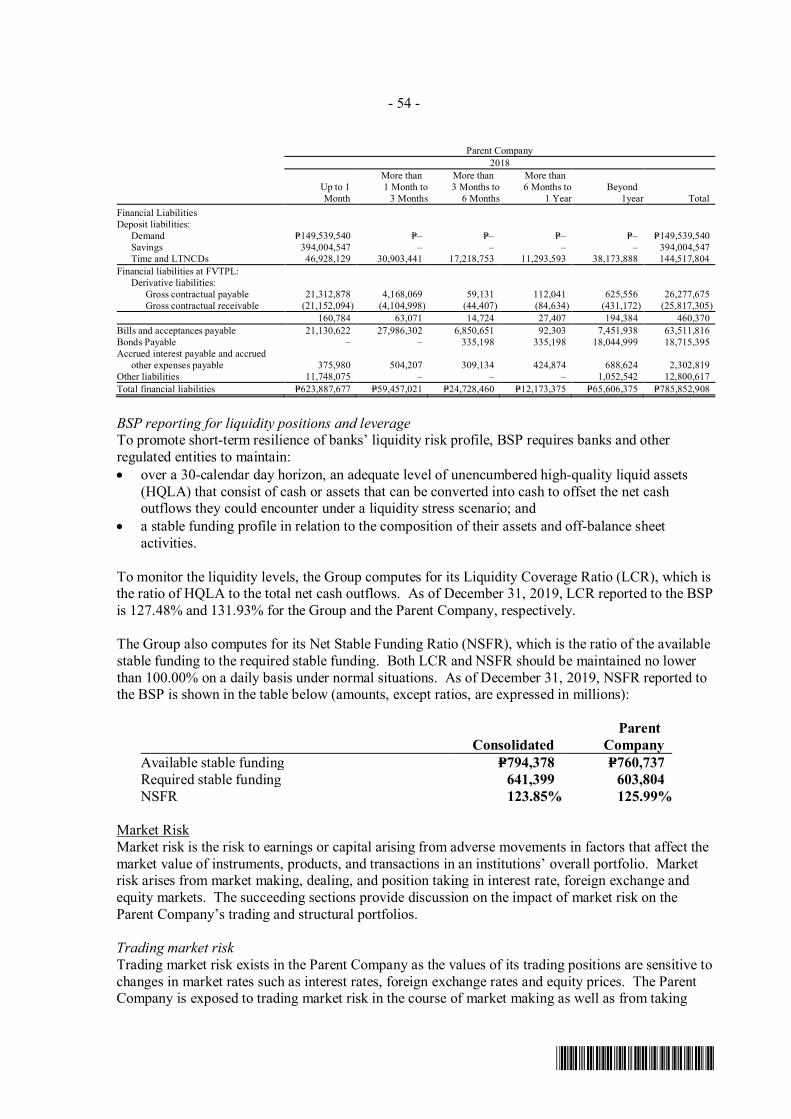
- 54 -
*SGVFS038920*
Parent Company2018
Up to 1Month
More than1 Month to
3 Months
More than3 Months to
6 Months
More than6 Months to
1 YearBeyond
1year TotalFinancial LiabilitiesDeposit liabilities: Demand P=149,539,540 P=– P=– P=– P=– P=149,539,540 Savings 394,004,547 – – – – 394,004,547 Time and LTNCDs 46,928,129 30,903,441 17,218,753 11,293,593 38,173,888 144,517,804Financial liabilities at FVTPL: Derivative liabilities: Gross contractual payable 21,312,878 4,168,069 59,131 112,041 625,556 26,277,675 Gross contractual receivable (21,152,094) (4,104,998) (44,407) (84,634) (431,172) (25,817,305)
160,784 63,071 14,724 27,407 194,384 460,370Bills and acceptances payable 21,130,622 27,986,302 6,850,651 92,303 7,451,938 63,511,816Bonds Payable – – 335,198 335,198 18,044,999 18,715,395Accrued interest payable and accrued
other expenses payable 375,980 504,207 309,134 424,874 688,624 2,302,819Other liabilities 11,748,075 – – – 1,052,542 12,800,617Total financial liabilities P=623,887,677 P=59,457,021 P=24,728,460 P=12,173,375 P=65,606,375 P=785,852,908
BSP reporting for liquidity positions and leverageTo promote short-term resilience of banks’ liquidity risk profile, BSP requires banks and otherregulated entities to maintain:· over a 30-calendar day horizon, an adequate level of unencumbered high-quality liquid assets
(HQLA) that consist of cash or assets that can be converted into cash to offset the net cashoutflows they could encounter under a liquidity stress scenario; and
· a stable funding profile in relation to the composition of their assets and off-balance sheetactivities.
To monitor the liquidity levels, the Group computes for its Liquidity Coverage Ratio (LCR), which isthe ratio of HQLA to the total net cash outflows. As of December 31, 2019, LCR reported to the BSPis 127.48% and 131.93% for the Group and the Parent Company, respectively.
The Group also computes for its Net Stable Funding Ratio (NSFR), which is the ratio of the availablestable funding to the required stable funding. Both LCR and NSFR should be maintained no lowerthan 100.00% on a daily basis under normal situations. As of December 31, 2019, NSFR reported tothe BSP is shown in the table below (amounts, except ratios, are expressed in millions):
ConsolidatedParent
CompanyAvailable stable funding P=794,378 P=760,737Required stable funding 641,399 603,804NSFR 123.85% 125.99%
Market RiskMarket risk is the risk to earnings or capital arising from adverse movements in factors that affect themarket value of instruments, products, and transactions in an institutions’ overall portfolio. Marketrisk arises from market making, dealing, and position taking in interest rate, foreign exchange andequity markets. The succeeding sections provide discussion on the impact of market risk on theParent Company’s trading and structural portfolios.
Trading market riskTrading market risk exists in the Parent Company as the values of its trading positions are sensitive tochanges in market rates such as interest rates, foreign exchange rates and equity prices. The ParentCompany is exposed to trading market risk in the course of market making as well as from taking
- 55 -
*SGVFS038920*
advantage of market opportunities. For internal monitoring of the risks in the trading portfolio, theParent Company uses the Value at Risk (VaR) as a primary risk measurement tool. It adopts both theParametric VaR methodology and Historical Simulation Methodology (with 99% confidence level) tomeasure the Parent Company’s trading market risk. Both the Parametric models and HistoricalSimulation models were validated by an external independent validator. Volatilities used in theparametric are updated on a daily basis and are based on historical data for a rolling 261-day periodwhile yields and prices in the historical VaR approach are also updated daily. The RMG reports theVaR utilization and breaches to limits to the risk taking personnel on a daily basis and to the ALCOand ROC on a monthly basis. All risk reports discussed in the ROC meeting are noted by the BOD.The VaR figures are back tested to validate the robustness of the VaR model. Results of backtestingon a rolling one year period are reported also to the ROC.
Objectives and limitations of the VaR methodologyThe VaR models are designed to measure market risk in a normal market environment. The modelsassume that any changes occurring in the risk factors affecting the normal market environment willfollow a normal distribution. The use of VaR has limitations because it is based on historicalvolatilities in market prices and assumes that future price movements will follow a statisticaldistribution. Due to the fact that VaR relies heavily on historical data to provide information and maynot clearly predict the future changes and modifications of the risk factors, the probability of largemarket moves may be under estimated if changes in risk factors fail to align with the normaldistribution assumption. VaR may also be under- or over- estimated due to the assumptions placedon risk factors and the relationship between such factors for specific instruments. Even thoughpositions may change throughout the day, the VaR only represents the risk of the portfolios at theclose of each business day, and it does not account for any losses that may occur beyond the 99.00%confidence level.
VaR assumptions/parametersVaR estimates the potential loss on the current portfolio assuming a specified time horizon and levelof confidence at 99.00%. The use of a 99.00% confidence level means that, within a one day horizon,losses exceeding the VaR figure should occur, on average, not more than once every one hundreddays.
BacktestingThe validity of the assumptions underlying the Parent Company’s VaR models can only be checkedby appropriate backtesting procedures. Backtesting is a formal statistical framework that consists ofverifying that actual losses are within the projected VaR approximations. The Parent Companyadopts both the clean backtesting and dirty backtesting approaches approach in backtesting. Cleanbacktesting, consists of comparing the VaR estimates with some hypothetical P&L values of theportfolio, having kept its composition unchanged. In this case, the same portfolio is repriced ormarked-to-market at the end of the time interval and the hypothetical P&L is then compared with theVaR. The other method, called dirty backtesting, consists of comparing the VaR estimates with theactual P&L values at the end of the time horizon. This method, however, may pose a problem if theportfolio has changed drastically because of trading activities between the beginning and the end ofthe time horizon since VaR models assume that the portfolio is "frozen" over the horizon. The ParentCompany uses the regulatory 3-zone (green, yellow and red) boundaries in evaluating the backtestingresults. For the years 2019 and 2018, the number of observations which fell outside the VaR is withinthe allowable number of exceptions in the green and yellow zones to conclude that there is noproblem with the quality and accuracy of the VaR models at 99.00% confidence level. Nonetheless,closer monitoring and regular review of the model’s parameters and assumptions are beingconducted.
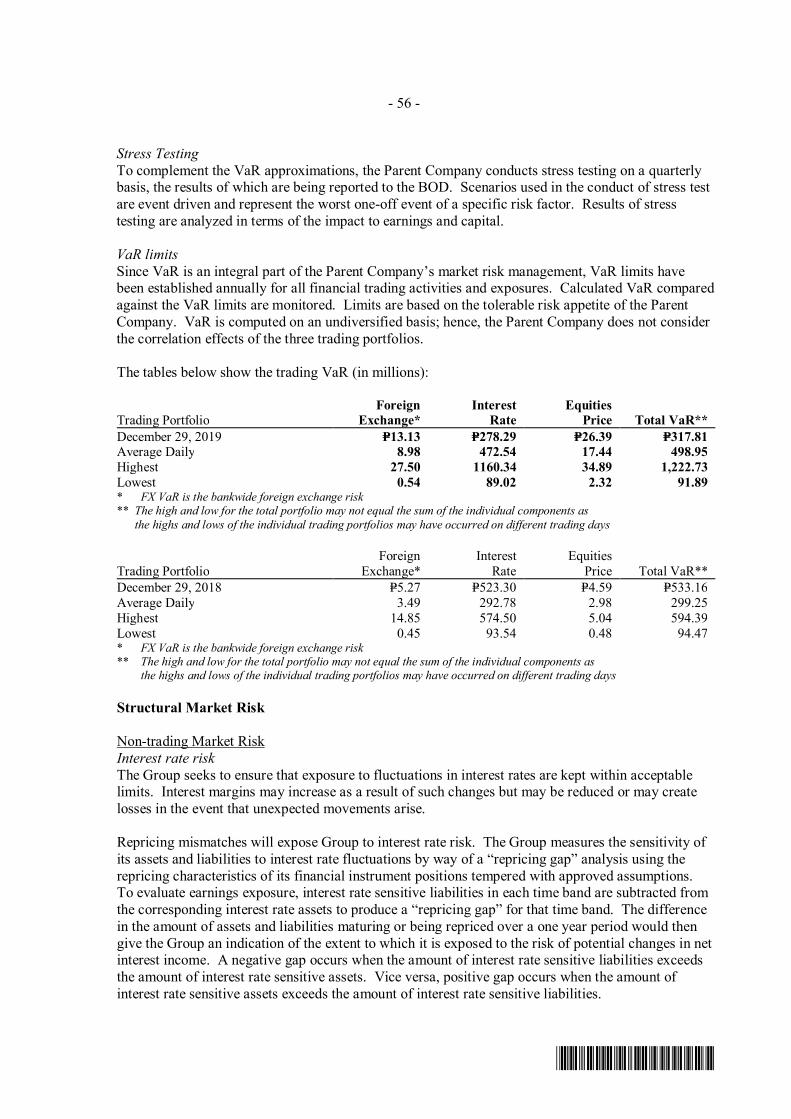
- 56 -
*SGVFS038920*
Stress TestingTo complement the VaR approximations, the Parent Company conducts stress testing on a quarterlybasis, the results of which are being reported to the BOD. Scenarios used in the conduct of stress testare event driven and represent the worst one-off event of a specific risk factor. Results of stresstesting are analyzed in terms of the impact to earnings and capital.
VaR limitsSince VaR is an integral part of the Parent Company’s market risk management, VaR limits havebeen established annually for all financial trading activities and exposures. Calculated VaR comparedagainst the VaR limits are monitored. Limits are based on the tolerable risk appetite of the ParentCompany. VaR is computed on an undiversified basis; hence, the Parent Company does not considerthe correlation effects of the three trading portfolios.
The tables below show the trading VaR (in millions):
Trading PortfolioForeign
Exchange*Interest
RateEquities
Price Total VaR**December 29, 2019 P=13.13 P=278.29 P=26.39 P=317.81Average Daily 8.98 472.54 17.44 498.95Highest 27.50 1160.34 34.89 1,222.73Lowest 0.54 89.02 2.32 91.89* FX VaR is the bankwide foreign exchange risk** The high and low for the total portfolio may not equal the sum of the individual components as
the highs and lows of the individual trading portfolios may have occurred on different trading days
Trading PortfolioForeign
Exchange*Interest
RateEquities
Price Total VaR**December 29, 2018 P=5.27 P=523.30 P=4.59 P=533.16Average Daily 3.49 292.78 2.98 299.25Highest 14.85 574.50 5.04 594.39Lowest 0.45 93.54 0.48 94.47* FX VaR is the bankwide foreign exchange risk** The high and low for the total portfolio may not equal the sum of the individual components as
the highs and lows of the individual trading portfolios may have occurred on different trading days
Structural Market Risk
Non-trading Market RiskInterest rate riskThe Group seeks to ensure that exposure to fluctuations in interest rates are kept within acceptablelimits. Interest margins may increase as a result of such changes but may be reduced or may createlosses in the event that unexpected movements arise.
Repricing mismatches will expose Group to interest rate risk. The Group measures the sensitivity ofits assets and liabilities to interest rate fluctuations by way of a “repricing gap” analysis using therepricing characteristics of its financial instrument positions tempered with approved assumptions.To evaluate earnings exposure, interest rate sensitive liabilities in each time band are subtracted fromthe corresponding interest rate assets to produce a “repricing gap” for that time band. The differencein the amount of assets and liabilities maturing or being repriced over a one year period would thengive the Group an indication of the extent to which it is exposed to the risk of potential changes in netinterest income. A negative gap occurs when the amount of interest rate sensitive liabilities exceedsthe amount of interest rate sensitive assets. Vice versa, positive gap occurs when the amount ofinterest rate sensitive assets exceeds the amount of interest rate sensitive liabilities.
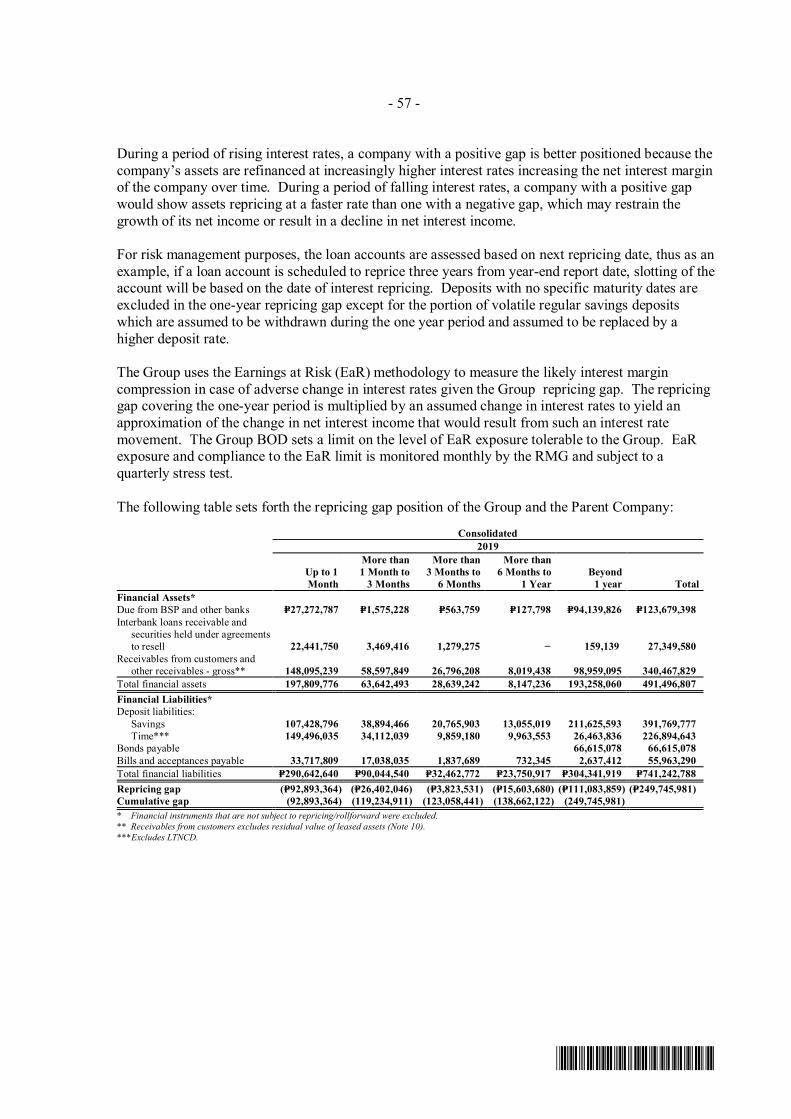
- 57 -
*SGVFS038920*
During a period of rising interest rates, a company with a positive gap is better positioned because thecompany’s assets are refinanced at increasingly higher interest rates increasing the net interest marginof the company over time. During a period of falling interest rates, a company with a positive gapwould show assets repricing at a faster rate than one with a negative gap, which may restrain thegrowth of its net income or result in a decline in net interest income.
For risk management purposes, the loan accounts are assessed based on next repricing date, thus as anexample, if a loan account is scheduled to reprice three years from year-end report date, slotting of theaccount will be based on the date of interest repricing. Deposits with no specific maturity dates areexcluded in the one-year repricing gap except for the portion of volatile regular savings depositswhich are assumed to be withdrawn during the one year period and assumed to be replaced by ahigher deposit rate.
The Group uses the Earnings at Risk (EaR) methodology to measure the likely interest margincompression in case of adverse change in interest rates given the Group repricing gap. The repricinggap covering the one-year period is multiplied by an assumed change in interest rates to yield anapproximation of the change in net interest income that would result from such an interest ratemovement. The Group BOD sets a limit on the level of EaR exposure tolerable to the Group. EaRexposure and compliance to the EaR limit is monitored monthly by the RMG and subject to aquarterly stress test.
The following table sets forth the repricing gap position of the Group and the Parent Company:
Consolidated2019
Up to 1Month
More than1 Month to
3 Months
More than3 Months to
6 Months
More than6 Months to
1 YearBeyond
1 year TotalFinancial Assets*Due from BSP and other banks P=27,272,787 P=1,575,228 P=563,759 P=127,798 P=94,139,826 P=123,679,398Interbank loans receivable and
securities held under agreementsto resell 22,441,750 3,469,416 1,279,275 − 159,139 27,349,580
Receivables from customers andother receivables - gross** 148,095,239 58,597,849 26,796,208 8,019,438 98,959,095 340,467,829
Total financial assets 197,809,776 63,642,493 28,639,242 8,147,236 193,258,060 491,496,807Financial Liabilities*Deposit liabilities:
Savings 107,428,796 38,894,466 20,765,903 13,055,019 211,625,593 391,769,777Time*** 149,496,035 34,112,039 9,859,180 9,963,553 26,463,836 226,894,643
Bonds payable 66,615,078 66,615,078Bills and acceptances payable 33,717,809 17,038,035 1,837,689 732,345 2,637,412 55,963,290Total financial liabilities P=290,642,640 P=90,044,540 P=32,462,772 P=23,750,917 P=304,341,919 P=741,242,788Repricing gap (P=92,893,364) (P=26,402,046) (P=3,823,531) (P=15,603,680) (P=111,083,859) (P=249,745,981)Cumulative gap (92,893,364) (119,234,911) (123,058,441) (138,662,122) (249,745,981)* Financial instruments that are not subject to repricing/rollforward were excluded.** Receivables from customers excludes residual value of leased assets (Note 10).***Excludes LTNCD.
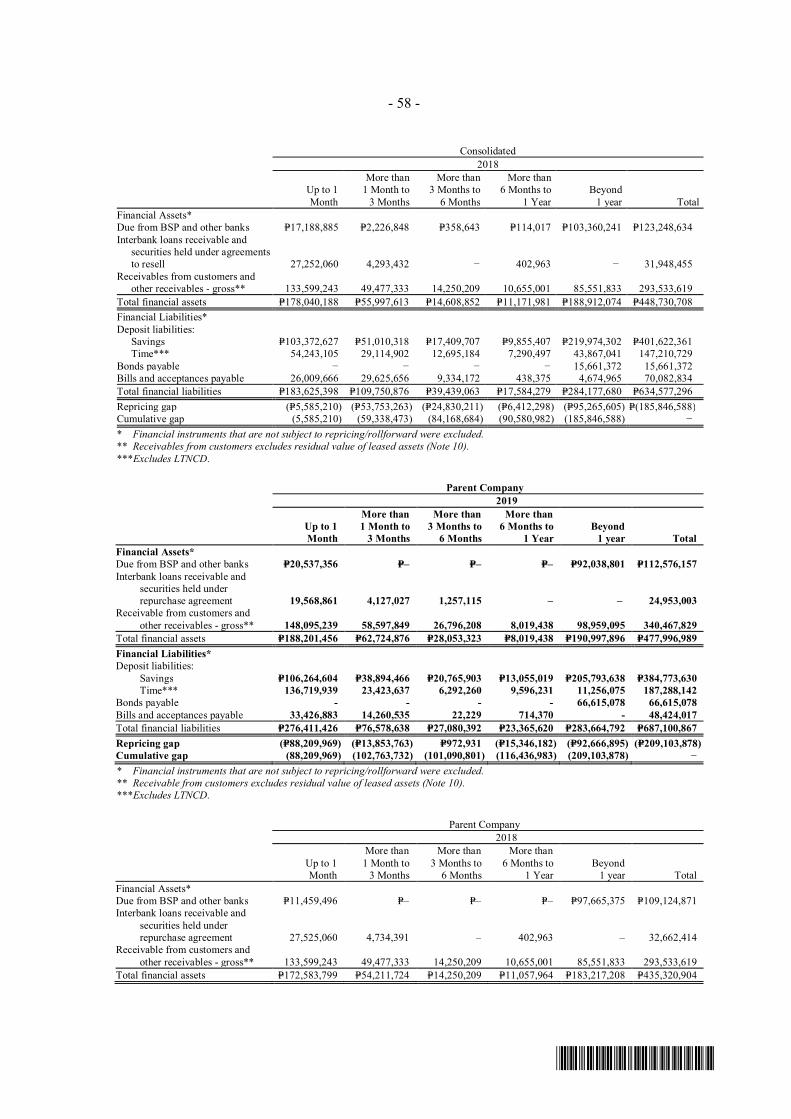
- 58 -
*SGVFS038920*
Consolidated2018
Up to 1Month
More than1 Month to
3 Months
More than3 Months to
6 Months
More than6 Months to
1 YearBeyond
1 year TotalFinancial Assets*Due from BSP and other banks P=17,188,885 P=2,226,848 P=358,643 P=114,017 P=103,360,241 P=123,248,634Interbank loans receivable and
securities held under agreementsto resell 27,252,060 4,293,432 − 402,963 − 31,948,455
Receivables from customers andother receivables - gross** 133,599,243 49,477,333 14,250,209 10,655,001 85,551,833 293,533,619
Total financial assets P=178,040,188 P=55,997,613 P=14,608,852 P=11,171,981 P=188,912,074 P=448,730,708Financial Liabilities*Deposit liabilities:
Savings P=103,372,627 P=51,010,318 P=17,409,707 P=9,855,407 P=219,974,302 P=401,622,361 Time*** 54,243,105 29,114,902 12,695,184 7,290,497 43,867,041 147,210,729Bonds payable − − − − 15,661,372 15,661,372Bills and acceptances payable 26,009,666 29,625,656 9,334,172 438,375 4,674,965 70,082,834Total financial liabilities P=183,625,398 P=109,750,876 P=39,439,063 P=17,584,279 P=284,177,680 P=634,577,296Repricing gap (P=5,585,210) (P=53,753,263) (P=24,830,211) (P=6,412,298) (P=95,265,605) P=(185,846,588)Cumulative gap (5,585,210) (59,338,473) (84,168,684) (90,580,982) (185,846,588) −* Financial instruments that are not subject to repricing/rollforward were excluded.** Receivables from customers excludes residual value of leased assets (Note 10).***Excludes LTNCD.
Parent Company2019
Up to 1Month
More than1 Month to
3 Months
More than3 Months to
6 Months
More than6 Months to
1 YearBeyond
1 year TotalFinancial Assets*Due from BSP and other banks P=20,537,356 P=– P=– P=– P=92,038,801 P=112,576,157Interbank loans receivable and
securities held underrepurchase agreement 19,568,861 4,127,027 1,257,115 – – 24,953,003
Receivable from customers andother receivables - gross** 148,095,239 58,597,849 26,796,208 8,019,438 98,959,095 340,467,829
Total financial assets P=188,201,456 P=62,724,876 P=28,053,323 P=8,019,438 P=190,997,896 P=477,996,989Financial Liabilities*Deposit liabilities:
Savings P=106,264,604 P=38,894,466 P=20,765,903 P=13,055,019 P=205,793,638 P=384,773,630Time*** 136,719,939 23,423,637 6,292,260 9,596,231 11,256,075 187,288,142
Bonds payable - - - - 66,615,078 66,615,078Bills and acceptances payable 33,426,883 14,260,535 22,229 714,370 - 48,424,017Total financial liabilities P=276,411,426 P=76,578,638 P=27,080,392 P=23,365,620 P=283,664,792 P=687,100,867Repricing gap (P=88,209,969) (P=13,853,763) P=972,931 (P=15,346,182) (P=92,666,895) (P=209,103,878)Cumulative gap (88,209,969) (102,763,732) (101,090,801) (116,436,983) (209,103,878) −* Financial instruments that are not subject to repricing/rollforward were excluded.** Receivable from customers excludes residual value of leased assets (Note 10).***Excludes LTNCD.
Parent Company2018
Up to 1Month
More than1 Month to
3 Months
More than3 Months to
6 Months
More than6 Months to
1 YearBeyond
1 year TotalFinancial Assets*Due from BSP and other banks P=11,459,496 P=– P=– P=– P=97,665,375 P=109,124,871Interbank loans receivable and
securities held underrepurchase agreement 27,525,060 4,734,391 – 402,963 – 32,662,414
Receivable from customers andother receivables - gross** 133,599,243 49,477,333 14,250,209 10,655,001 85,551,833 293,533,619
Total financial assets P=172,583,799 P=54,211,724 P=14,250,209 P=11,057,964 P=183,217,208 P=435,320,904
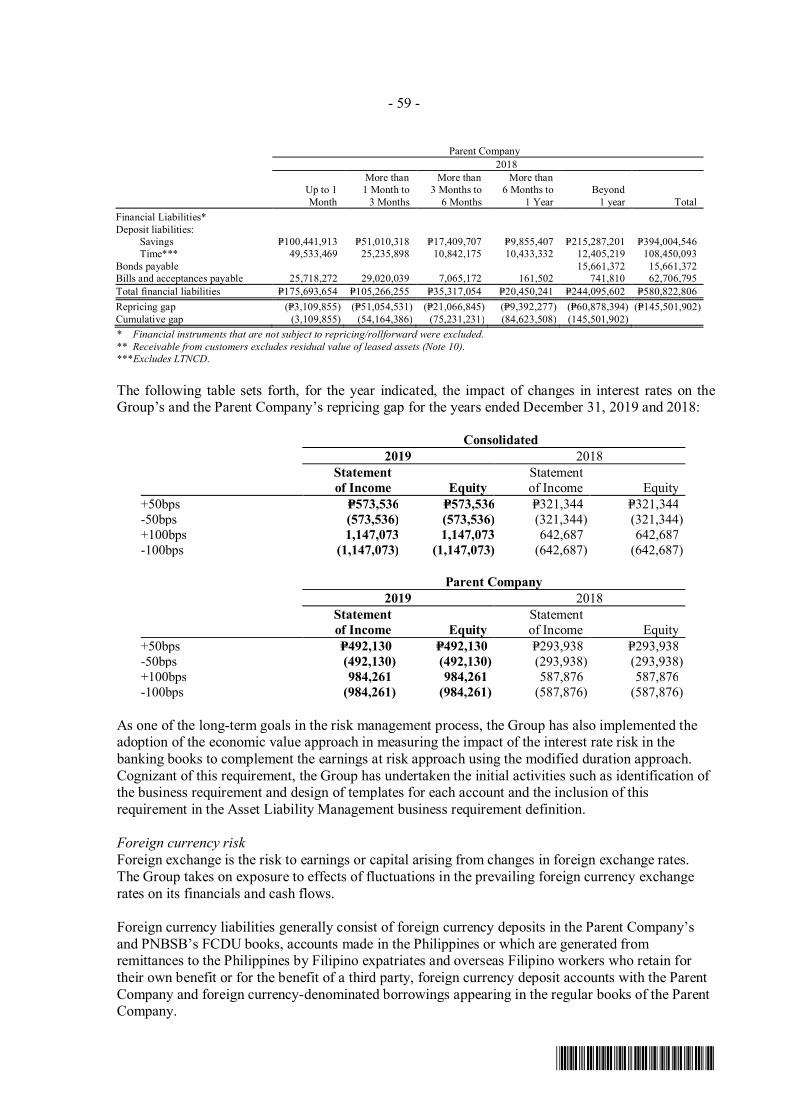
- 59 -
*SGVFS038920*
Parent Company2018
Up to 1Month
More than1 Month to
3 Months
More than3 Months to
6 Months
More than6 Months to
1 YearBeyond
1 year TotalFinancial Liabilities*Deposit liabilities:
Savings P=100,441,913 P=51,010,318 P=17,409,707 P=9,855,407 P=215,287,201 P=394,004,546Time*** 49,533,469 25,235,898 10,842,175 10,433,332 12,405,219 108,450,093
Bonds payable 15,661,372 15,661,372Bills and acceptances payable 25,718,272 29,020,039 7,065,172 161,502 741,810 62,706,795Total financial liabilities P=175,693,654 P=105,266,255 P=35,317,054 P=20,450,241 P=244,095,602 P=580,822,806Repricing gap (P=3,109,855) (P=51,054,531) (P=21,066,845) (P=9,392,277) (P=60,878,394) (P=145,501,902)Cumulative gap (3,109,855) (54,164,386) (75,231,231) (84,623,508) (145,501,902)* Financial instruments that are not subject to repricing/rollforward were excluded.** Receivable from customers excludes residual value of leased assets (Note 10).***Excludes LTNCD.
The following table sets forth, for the year indicated, the impact of changes in interest rates on theGroup’s and the Parent Company’s repricing gap for the years ended December 31, 2019 and 2018:
Consolidated2019 2018
Statementof Income Equity
Statementof Income Equity
+50bps P=573,536 P=573,536 P=321,344 P=321,344-50bps (573,536) (573,536) (321,344) (321,344)+100bps 1,147,073 1,147,073 642,687 642,687-100bps (1,147,073) (1,147,073) (642,687) (642,687)
Parent Company2019 2018
Statementof Income Equity
Statementof Income Equity
+50bps P=492,130 P=492,130 P=293,938 P=293,938-50bps (492,130) (492,130) (293,938) (293,938)+100bps 984,261 984,261 587,876 587,876-100bps (984,261) (984,261) (587,876) (587,876)
As one of the long-term goals in the risk management process, the Group has also implemented theadoption of the economic value approach in measuring the impact of the interest rate risk in thebanking books to complement the earnings at risk approach using the modified duration approach.Cognizant of this requirement, the Group has undertaken the initial activities such as identification ofthe business requirement and design of templates for each account and the inclusion of thisrequirement in the Asset Liability Management business requirement definition.
Foreign currency riskForeign exchange is the risk to earnings or capital arising from changes in foreign exchange rates.The Group takes on exposure to effects of fluctuations in the prevailing foreign currency exchangerates on its financials and cash flows.
Foreign currency liabilities generally consist of foreign currency deposits in the Parent Company’sand PNBSB’s FCDU books, accounts made in the Philippines or which are generated fromremittances to the Philippines by Filipino expatriates and overseas Filipino workers who retain fortheir own benefit or for the benefit of a third party, foreign currency deposit accounts with the ParentCompany and foreign currency-denominated borrowings appearing in the regular books of the ParentCompany.
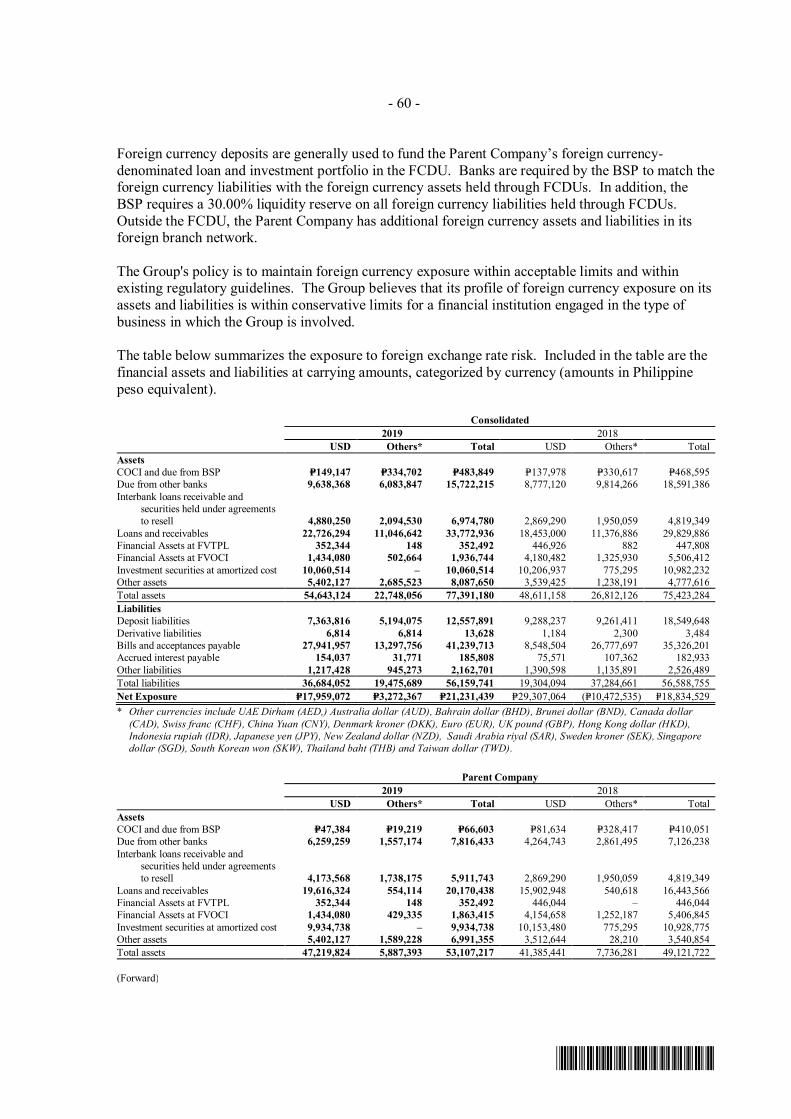
- 60 -
*SGVFS038920*
Foreign currency deposits are generally used to fund the Parent Company’s foreign currency-denominated loan and investment portfolio in the FCDU. Banks are required by the BSP to match theforeign currency liabilities with the foreign currency assets held through FCDUs. In addition, theBSP requires a 30.00% liquidity reserve on all foreign currency liabilities held through FCDUs.Outside the FCDU, the Parent Company has additional foreign currency assets and liabilities in itsforeign branch network.
The Group's policy is to maintain foreign currency exposure within acceptable limits and withinexisting regulatory guidelines. The Group believes that its profile of foreign currency exposure on itsassets and liabilities is within conservative limits for a financial institution engaged in the type ofbusiness in which the Group is involved.
The table below summarizes the exposure to foreign exchange rate risk. Included in the table are thefinancial assets and liabilities at carrying amounts, categorized by currency (amounts in Philippinepeso equivalent).
Consolidated2019 2018
USD Others* Total USD Others* TotalAssetsCOCI and due from BSP P=149,147 P=334,702 P=483,849 P=137,978 P=330,617 P=468,595Due from other banks 9,638,368 6,083,847 15,722,215 8,777,120 9,814,266 18,591,386Interbank loans receivable and
securities held under agreementsto resell 4,880,250 2,094,530 6,974,780 2,869,290 1,950,059 4,819,349
Loans and receivables 22,726,294 11,046,642 33,772,936 18,453,000 11,376,886 29,829,886Financial Assets at FVTPL 352,344 148 352,492 446,926 882 447,808Financial Assets at FVOCI 1,434,080 502,664 1,936,744 4,180,482 1,325,930 5,506,412Investment securities at amortized cost 10,060,514 – 10,060,514 10,206,937 775,295 10,982,232Other assets 5,402,127 2,685,523 8,087,650 3,539,425 1,238,191 4,777,616Total assets 54,643,124 22,748,056 77,391,180 48,611,158 26,812,126 75,423,284LiabilitiesDeposit liabilities 7,363,816 5,194,075 12,557,891 9,288,237 9,261,411 18,549,648Derivative liabilities 6,814 6,814 13,628 1,184 2,300 3,484Bills and acceptances payable 27,941,957 13,297,756 41,239,713 8,548,504 26,777,697 35,326,201Accrued interest payable 154,037 31,771 185,808 75,571 107,362 182,933Other liabilities 1,217,428 945,273 2,162,701 1,390,598 1,135,891 2,526,489Total liabilities 36,684,052 19,475,689 56,159,741 19,304,094 37,284,661 56,588,755Net Exposure P=17,959,072 P=3,272,367 P=21,231,439 P=29,307,064 (P=10,472,535) P=18,834,529* Other currencies include UAE Dirham (AED,) Australia dollar (AUD), Bahrain dollar (BHD), Brunei dollar (BND), Canada dollar
(CAD), Swiss franc (CHF), China Yuan (CNY), Denmark kroner (DKK), Euro (EUR), UK pound (GBP), Hong Kong dollar (HKD),Indonesia rupiah (IDR), Japanese yen (JPY), New Zealand dollar (NZD), Saudi Arabia riyal (SAR), Sweden kroner (SEK), Singaporedollar (SGD), South Korean won (SKW), Thailand baht (THB) and Taiwan dollar (TWD).
Parent Company2019 2018
USD Others* Total USD Others* TotalAssetsCOCI and due from BSP P=47,384 P=19,219 P=66,603 P=81,634 P=328,417 P=410,051Due from other banks 6,259,259 1,557,174 7,816,433 4,264,743 2,861,495 7,126,238Interbank loans receivable and
securities held under agreementsto resell 4,173,568 1,738,175 5,911,743 2,869,290 1,950,059 4,819,349
Loans and receivables 19,616,324 554,114 20,170,438 15,902,948 540,618 16,443,566Financial Assets at FVTPL 352,344 148 352,492 446,044 – 446,044Financial Assets at FVOCI 1,434,080 429,335 1,863,415 4,154,658 1,252,187 5,406,845Investment securities at amortized cost 9,934,738 – 9,934,738 10,153,480 775,295 10,928,775Other assets 5,402,127 1,589,228 6,991,355 3,512,644 28,210 3,540,854Total assets 47,219,824 5,887,393 53,107,217 41,385,441 7,736,281 49,121,722
(Forward)
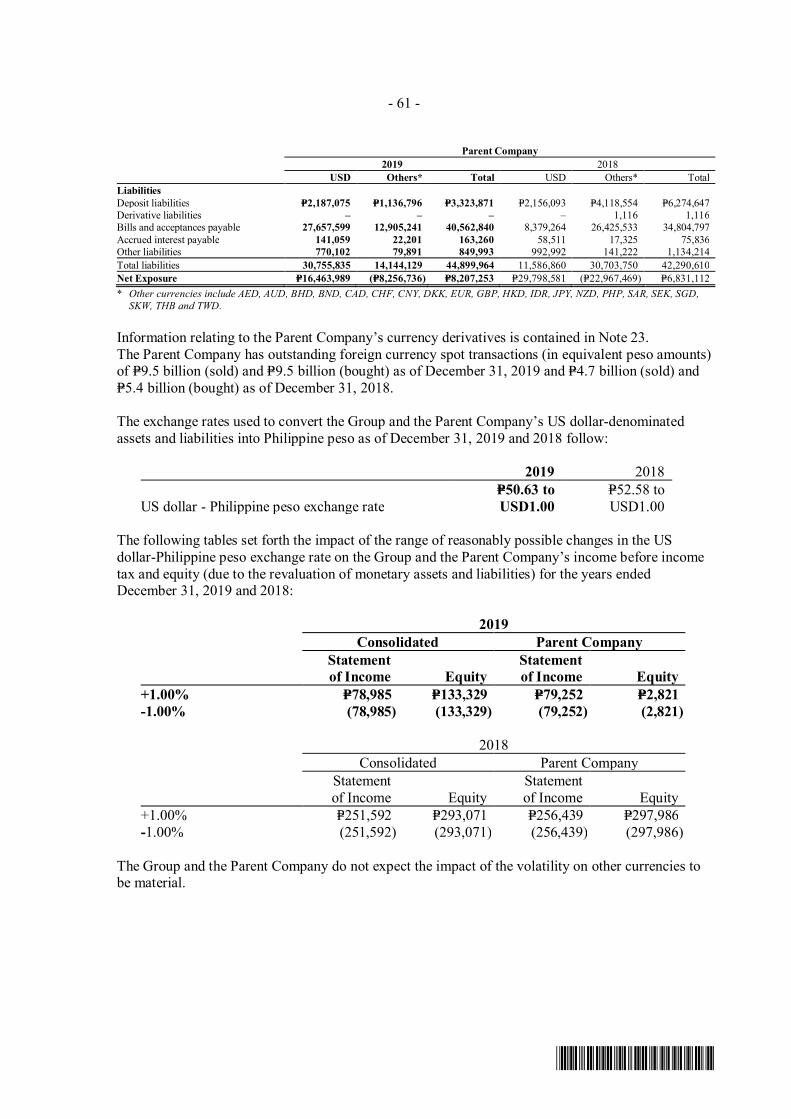
- 61 -
*SGVFS038920*
Parent Company2019 2018
USD Others* Total USD Others* TotalLiabilitiesDeposit liabilities P=2,187,075 P=1,136,796 P=3,323,871 P=2,156,093 P=4,118,554 P=6,274,647Derivative liabilities – – – – 1,116 1,116Bills and acceptances payable 27,657,599 12,905,241 40,562,840 8,379,264 26,425,533 34,804,797Accrued interest payable 141,059 22,201 163,260 58,511 17,325 75,836Other liabilities 770,102 79,891 849,993 992,992 141,222 1,134,214Total liabilities 30,755,835 14,144,129 44,899,964 11,586,860 30,703,750 42,290,610Net Exposure P=16,463,989 (P=8,256,736) P=8,207,253 P=29,798,581 (P=22,967,469) P=6,831,112* Other currencies include AED, AUD, BHD, BND, CAD, CHF, CNY, DKK, EUR, GBP, HKD, IDR, JPY, NZD, PHP, SAR, SEK, SGD,
SKW, THB and TWD.
Information relating to the Parent Company’s currency derivatives is contained in Note 23.The Parent Company has outstanding foreign currency spot transactions (in equivalent peso amounts)of P=9.5 billion (sold) and P=9.5 billion (bought) as of December 31, 2019 and P=4.7 billion (sold) andP=5.4 billion (bought) as of December 31, 2018.
The exchange rates used to convert the Group and the Parent Company’s US dollar-denominatedassets and liabilities into Philippine peso as of December 31, 2019 and 2018 follow:
2019 2018
US dollar - Philippine peso exchange rateP=50.63 toUSD1.00
P=52.58 toUSD1.00
The following tables set forth the impact of the range of reasonably possible changes in the USdollar-Philippine peso exchange rate on the Group and the Parent Company’s income before incometax and equity (due to the revaluation of monetary assets and liabilities) for the years endedDecember 31, 2019 and 2018:
2019Consolidated Parent Company
Statementof Income Equity
Statementof Income Equity
+1.00% P=78,985 P=133,329 P=79,252 P=2,821-1.00% (78,985) (133,329) (79,252) (2,821)
2018Consolidated Parent Company
Statementof Income Equity
Statementof Income Equity
+1.00% P=251,592 P=293,071 P=256,439 P=297,986-1.00% (251,592) (293,071) (256,439) (297,986)
The Group and the Parent Company do not expect the impact of the volatility on other currencies tobe material.
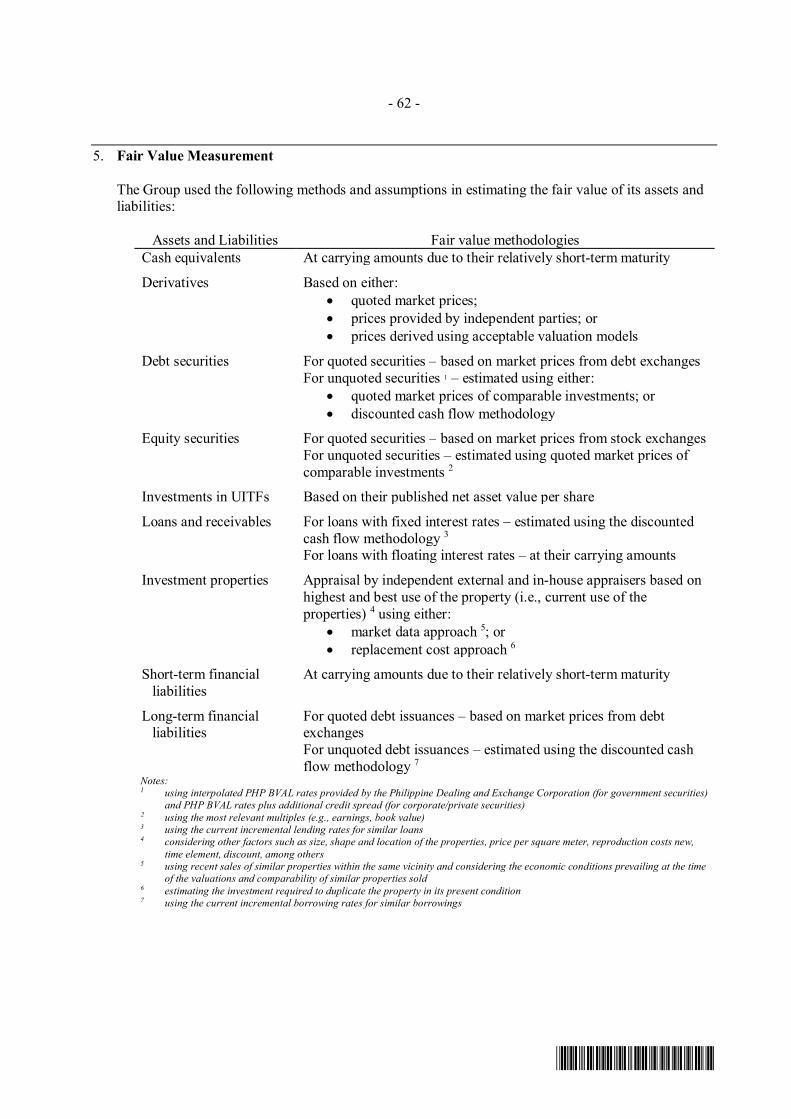
- 62 -
*SGVFS038920*
5. Fair Value Measurement
The Group used the following methods and assumptions in estimating the fair value of its assets andliabilities:
Assets and Liabilities Fair value methodologiesCash equivalents At carrying amounts due to their relatively short-term maturity
Derivatives Based on either:· quoted market prices;· prices provided by independent parties; or· prices derived using acceptable valuation models
Debt securities For quoted securities – based on market prices from debt exchangesFor unquoted securities 1 – estimated using either:
· quoted market prices of comparable investments; or· discounted cash flow methodology
Equity securities For quoted securities – based on market prices from stock exchangesFor unquoted securities – estimated using quoted market prices ofcomparable investments 2
Investments in UITFs Based on their published net asset value per share
Loans and receivables For loans with fixed interest rates – estimated using the discountedcash flow methodology 3
For loans with floating interest rates – at their carrying amounts
Investment properties Appraisal by independent external and in-house appraisers based onhighest and best use of the property (i.e., current use of theproperties) 4 using either:
· market data approach 5; or· replacement cost approach 6
Short-term financialliabilities
At carrying amounts due to their relatively short-term maturity
Long-term financialliabilities
For quoted debt issuances – based on market prices from debtexchangesFor unquoted debt issuances – estimated using the discounted cashflow methodology 7
Notes:1 using interpolated PHP BVAL rates provided by the Philippine Dealing and Exchange Corporation (for government securities)
and PHP BVAL rates plus additional credit spread (for corporate/private securities)2 using the most relevant multiples (e.g., earnings, book value)3 using the current incremental lending rates for similar loans4 considering other factors such as size, shape and location of the properties, price per square meter, reproduction costs new,
time element, discount, among others5 using recent sales of similar properties within the same vicinity and considering the economic conditions prevailing at the time
of the valuations and comparability of similar properties sold6 estimating the investment required to duplicate the property in its present condition7 using the current incremental borrowing rates for similar borrowings
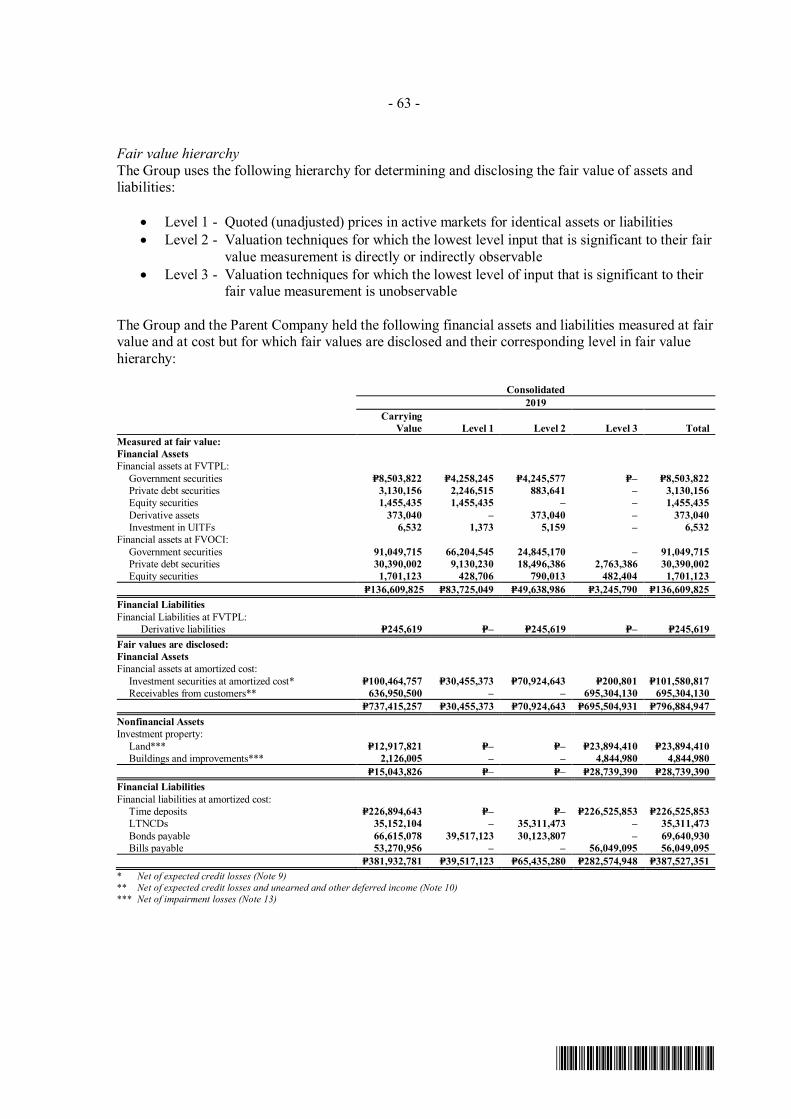
- 63 -
*SGVFS038920*
Fair value hierarchyThe Group uses the following hierarchy for determining and disclosing the fair value of assets andliabilities:
· Level 1 - Quoted (unadjusted) prices in active markets for identical assets or liabilities· Level 2 - Valuation techniques for which the lowest level input that is significant to their fair
value measurement is directly or indirectly observable· Level 3 - Valuation techniques for which the lowest level of input that is significant to their
fair value measurement is unobservable
The Group and the Parent Company held the following financial assets and liabilities measured at fairvalue and at cost but for which fair values are disclosed and their corresponding level in fair valuehierarchy:
Consolidated2019
Carrying Value Level 1 Level 2 Level 3 Total
Measured at fair value:Financial AssetsFinancial assets at FVTPL:
Government securities P=8,503,822 P=4,258,245 P=4,245,577 P=– P=8,503,822Private debt securities 3,130,156 2,246,515 883,641 – 3,130,156Equity securities 1,455,435 1,455,435 – – 1,455,435Derivative assets 373,040 – 373,040 – 373,040Investment in UITFs 6,532 1,373 5,159 – 6,532
Financial assets at FVOCI:Government securities 91,049,715 66,204,545 24,845,170 – 91,049,715Private debt securities 30,390,002 9,130,230 18,496,386 2,763,386 30,390,002Equity securities 1,701,123 428,706 790,013 482,404 1,701,123
P=136,609,825 P=83,725,049 P=49,638,986 P=3,245,790 P=136,609,825Financial LiabilitiesFinancial Liabilities at FVTPL:
Derivative liabilities P=245,619 P=– P=245,619 P=– P=245,619Fair values are disclosed:Financial AssetsFinancial assets at amortized cost:
Investment securities at amortized cost* P=100,464,757 P=30,455,373 P=70,924,643 P=200,801 P=101,580,817Receivables from customers** 636,950,500 – – 695,304,130 695,304,130
P=737,415,257 P=30,455,373 P=70,924,643 P=695,504,931 P=796,884,947Nonfinancial AssetsInvestment property:
Land*** P=12,917,821 P=– P=– P=23,894,410 P=23,894,410Buildings and improvements*** 2,126,005 – – 4,844,980 4,844,980
P=15,043,826 P=– P=– P=28,739,390 P=28,739,390Financial LiabilitiesFinancial liabilities at amortized cost:
Time deposits P=226,894,643 P=– P=– P=226,525,853 P=226,525,853LTNCDs 35,152,104 – 35,311,473 – 35,311,473Bonds payable 66,615,078 39,517,123 30,123,807 – 69,640,930Bills payable 53,270,956 – – 56,049,095 56,049,095
P=381,932,781 P=39,517,123 P=65,435,280 P=282,574,948 P=387,527,351* Net of expected credit losses (Note 9)** Net of expected credit losses and unearned and other deferred income (Note 10)*** Net of impairment losses (Note 13)
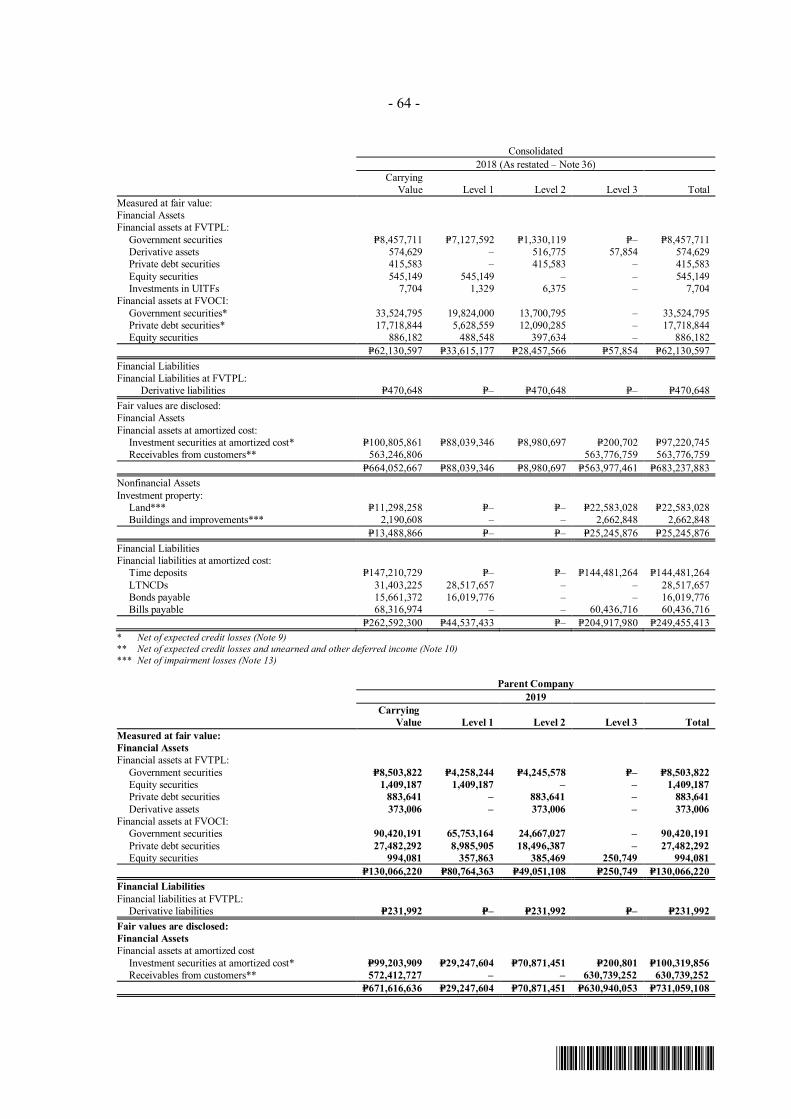
- 64 -
*SGVFS038920*
Consolidated2018 (As restated – Note 36)
Carrying Value Level 1 Level 2 Level 3 Total
Measured at fair value:Financial AssetsFinancial assets at FVTPL:
Government securities P=8,457,711 P=7,127,592 P=1,330,119 P=– P=8,457,711Derivative assets 574,629 – 516,775 57,854 574,629Private debt securities 415,583 – 415,583 – 415,583Equity securities 545,149 545,149 – – 545,149Investments in UITFs 7,704 1,329 6,375 – 7,704
Financial assets at FVOCI:Government securities* 33,524,795 19,824,000 13,700,795 – 33,524,795Private debt securities* 17,718,844 5,628,559 12,090,285 – 17,718,844Equity securities 886,182 488,548 397,634 – 886,182
P=62,130,597 P=33,615,177 P=28,457,566 P=57,854 P=62,130,597Financial LiabilitiesFinancial Liabilities at FVTPL:
Derivative liabilities P=470,648 P=– P=470,648 P=– P=470,648Fair values are disclosed:Financial AssetsFinancial assets at amortized cost:
Investment securities at amortized cost* P=100,805,861 P=88,039,346 P=8,980,697 P=200,702 P=97,220,745Receivables from customers** 563,246,806 563,776,759 563,776,759
P=664,052,667 P=88,039,346 P=8,980,697 P=563,977,461 P=683,237,883Nonfinancial AssetsInvestment property:
Land*** P=11,298,258 P=– P=– P=22,583,028 P=22,583,028Buildings and improvements*** 2,190,608 – – 2,662,848 2,662,848
P=13,488,866 P=– P=– P=25,245,876 P=25,245,876Financial LiabilitiesFinancial liabilities at amortized cost:
Time deposits P=147,210,729 P=– P=– P=144,481,264 P=144,481,264LTNCDs 31,403,225 28,517,657 – – 28,517,657Bonds payable 15,661,372 16,019,776 – – 16,019,776Bills payable 68,316,974 – – 60,436,716 60,436,716
P=262,592,300 P=44,537,433 P=– P=204,917,980 P=249,455,413* Net of expected credit losses (Note 9)** Net of expected credit losses and unearned and other deferred income (Note 10)*** Net of impairment losses (Note 13)
Parent Company2019
CarryingValue Level 1 Level 2 Level 3 Total
Measured at fair value:Financial AssetsFinancial assets at FVTPL:
Government securities P=8,503,822 P=4,258,244 P=4,245,578 P=– P=8,503,822Equity securities 1,409,187 1,409,187 – – 1,409,187Private debt securities 883,641 – 883,641 – 883,641Derivative assets 373,006 – 373,006 – 373,006
Financial assets at FVOCI:Government securities 90,420,191 65,753,164 24,667,027 – 90,420,191Private debt securities 27,482,292 8,985,905 18,496,387 – 27,482,292Equity securities 994,081 357,863 385,469 250,749 994,081
P=130,066,220 P=80,764,363 P=49,051,108 P=250,749 P=130,066,220Financial LiabilitiesFinancial liabilities at FVTPL:
Derivative liabilities P=231,992 P=– P=231,992 P=– P=231,992Fair values are disclosed:Financial AssetsFinancial assets at amortized cost
Investment securities at amortized cost* P=99,203,909 P=29,247,604 P=70,871,451 P=200,801 P=100,319,856Receivables from customers** 572,412,727 – – 630,739,252 630,739,252
P=671,616,636 P=29,247,604 P=70,871,451 P=630,940,053 P=731,059,108
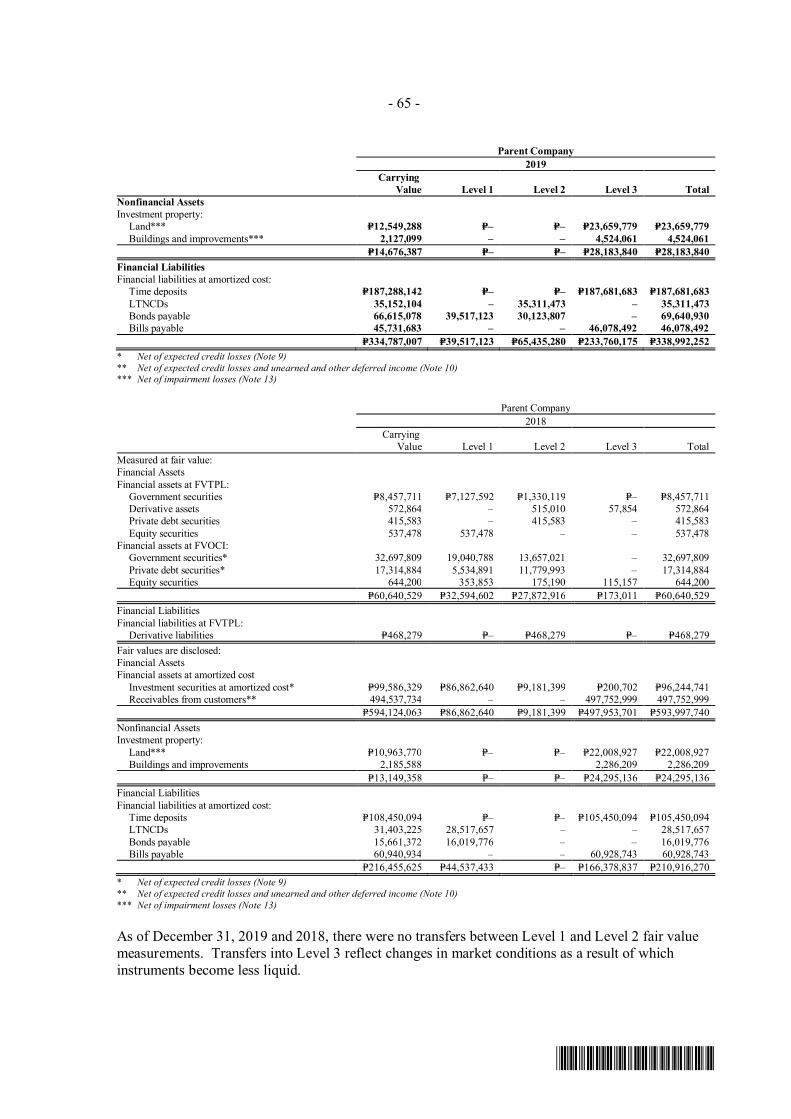
- 65 -
*SGVFS038920*
Parent Company2019
CarryingValue Level 1 Level 2 Level 3 Total
Nonfinancial AssetsInvestment property:
Land*** P=12,549,288 P=– P=– P=23,659,779 P=23,659,779Buildings and improvements*** 2,127,099 – – 4,524,061 4,524,061
P=14,676,387 P=– P=– P=28,183,840 P=28,183,840Financial LiabilitiesFinancial liabilities at amortized cost:
Time deposits P=187,288,142 P=– P=– P=187,681,683 P=187,681,683LTNCDs 35,152,104 – 35,311,473 – 35,311,473Bonds payable 66,615,078 39,517,123 30,123,807 – 69,640,930Bills payable 45,731,683 – – 46,078,492 46,078,492
P=334,787,007 P=39,517,123 P=65,435,280 P=233,760,175 P=338,992,252* Net of expected credit losses (Note 9)** Net of expected credit losses and unearned and other deferred income (Note 10)*** Net of impairment losses (Note 13)
Parent Company2018
CarryingValue Level 1 Level 2 Level 3 Total
Measured at fair value:Financial AssetsFinancial assets at FVTPL:
Government securities P=8,457,711 P=7,127,592 P=1,330,119 P=– P=8,457,711Derivative assets 572,864 – 515,010 57,854 572,864Private debt securities 415,583 – 415,583 – 415,583Equity securities 537,478 537,478 – – 537,478
Financial assets at FVOCI:Government securities* 32,697,809 19,040,788 13,657,021 – 32,697,809Private debt securities* 17,314,884 5,534,891 11,779,993 – 17,314,884Equity securities 644,200 353,853 175,190 115,157 644,200
P=60,640,529 P=32,594,602 P=27,872,916 P=173,011 P=60,640,529Financial LiabilitiesFinancial liabilities at FVTPL:
Derivative liabilities P=468,279 P=– P=468,279 P=– P=468,279Fair values are disclosed:Financial AssetsFinancial assets at amortized cost
Investment securities at amortized cost* P=99,586,329 P=86,862,640 P=9,181,399 P=200,702 P=96,244,741Receivables from customers** 494,537,734 – – 497,752,999 497,752,999
P=594,124,063 P=86,862,640 P=9,181,399 P=497,953,701 P=593,997,740Nonfinancial AssetsInvestment property:
Land*** P=10,963,770 P=– P=– P=22,008,927 P=22,008,927Buildings and improvements 2,185,588 2,286,209 2,286,209
P=13,149,358 P=– P=– P=24,295,136 P=24,295,136Financial LiabilitiesFinancial liabilities at amortized cost:
Time deposits P=108,450,094 P=– P=– P=105,450,094 P=105,450,094LTNCDs 31,403,225 28,517,657 – – 28,517,657Bonds payable 15,661,372 16,019,776 – – 16,019,776Bills payable 60,940,934 – – 60,928,743 60,928,743
P=216,455,625 P=44,537,433 P=– P=166,378,837 P=210,916,270* Net of expected credit losses (Note 9)** Net of expected credit losses and unearned and other deferred income (Note 10)*** Net of impairment losses (Note 13)
As of December 31, 2019 and 2018, there were no transfers between Level 1 and Level 2 fair valuemeasurements. Transfers into Level 3 reflect changes in market conditions as a result of whichinstruments become less liquid.
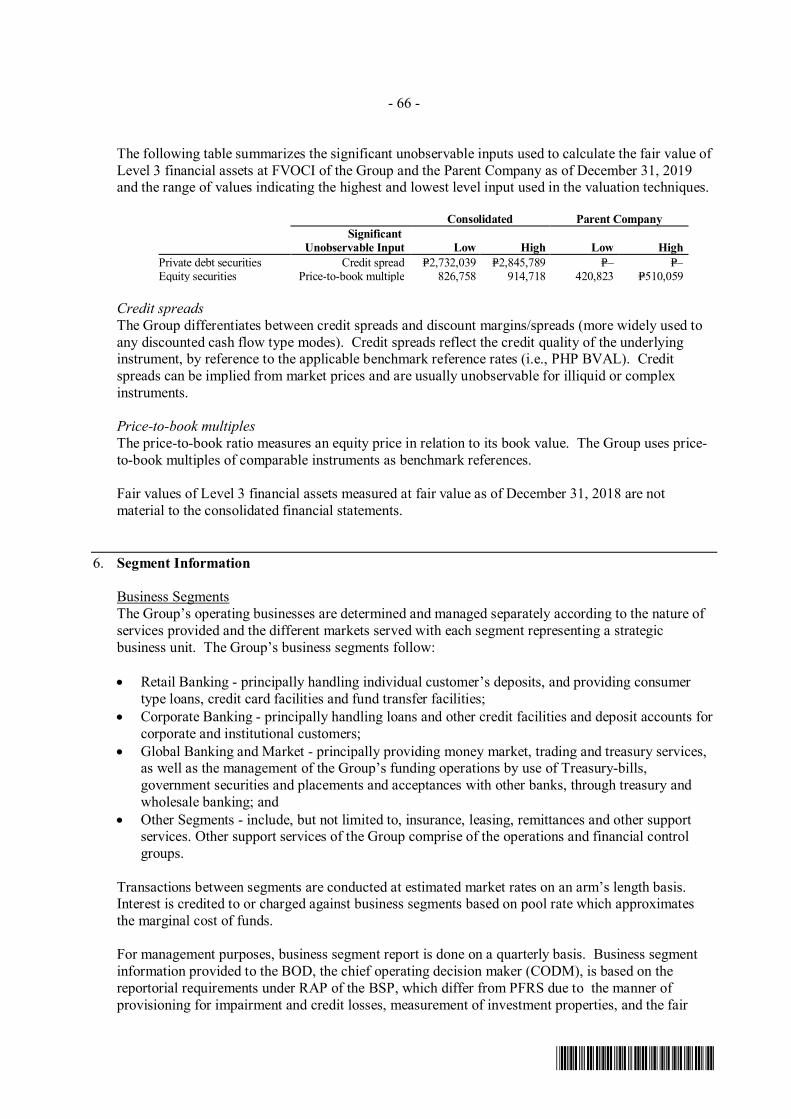
- 66 -
*SGVFS038920*
The following table summarizes the significant unobservable inputs used to calculate the fair value ofLevel 3 financial assets at FVOCI of the Group and the Parent Company as of December 31, 2019and the range of values indicating the highest and lowest level input used in the valuation techniques.
Consolidated Parent CompanySignificant
Unobservable Input Low High Low HighPrivate debt securities Credit spread P=2,732,039 P=2,845,789 P=– P=–Equity securities Price-to-book multiple 826,758 914,718 420,823 P=510,059
Credit spreadsThe Group differentiates between credit spreads and discount margins/spreads (more widely used toany discounted cash flow type modes). Credit spreads reflect the credit quality of the underlyinginstrument, by reference to the applicable benchmark reference rates (i.e., PHP BVAL). Creditspreads can be implied from market prices and are usually unobservable for illiquid or complexinstruments.
Price-to-book multiplesThe price-to-book ratio measures an equity price in relation to its book value. The Group uses price-to-book multiples of comparable instruments as benchmark references.
Fair values of Level 3 financial assets measured at fair value as of December 31, 2018 are notmaterial to the consolidated financial statements.
6. Segment Information
Business SegmentsThe Group’s operating businesses are determined and managed separately according to the nature ofservices provided and the different markets served with each segment representing a strategicbusiness unit. The Group’s business segments follow:
· Retail Banking - principally handling individual customer’s deposits, and providing consumertype loans, credit card facilities and fund transfer facilities;
· Corporate Banking - principally handling loans and other credit facilities and deposit accounts forcorporate and institutional customers;
· Global Banking and Market - principally providing money market, trading and treasury services,as well as the management of the Group’s funding operations by use of Treasury-bills,government securities and placements and acceptances with other banks, through treasury andwholesale banking; and
· Other Segments - include, but not limited to, insurance, leasing, remittances and other supportservices. Other support services of the Group comprise of the operations and financial controlgroups.
Transactions between segments are conducted at estimated market rates on an arm’s length basis.Interest is credited to or charged against business segments based on pool rate which approximatesthe marginal cost of funds.
For management purposes, business segment report is done on a quarterly basis. Business segmentinformation provided to the BOD, the chief operating decision maker (CODM), is based on thereportorial requirements under RAP of the BSP, which differ from PFRS due to the manner ofprovisioning for impairment and credit losses, measurement of investment properties, and the fair
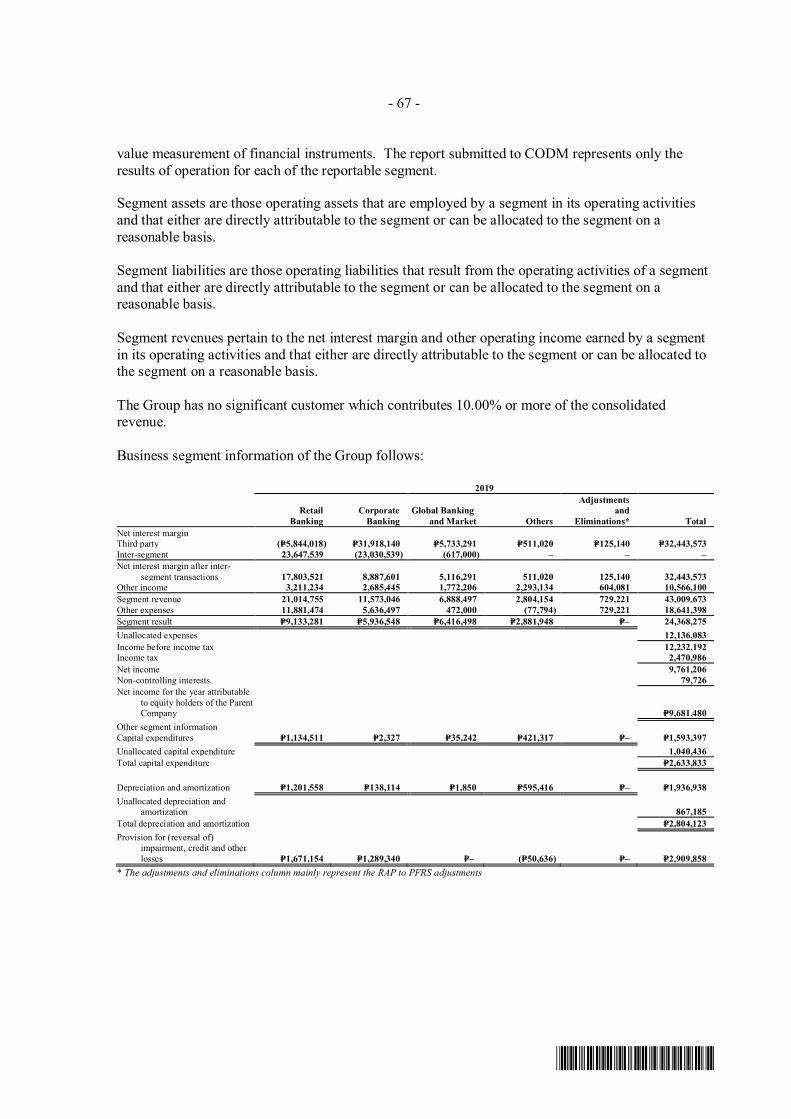
- 67 -
*SGVFS038920*
value measurement of financial instruments. The report submitted to CODM represents only theresults of operation for each of the reportable segment.
Segment assets are those operating assets that are employed by a segment in its operating activitiesand that either are directly attributable to the segment or can be allocated to the segment on areasonable basis.
Segment liabilities are those operating liabilities that result from the operating activities of a segmentand that either are directly attributable to the segment or can be allocated to the segment on areasonable basis.
Segment revenues pertain to the net interest margin and other operating income earned by a segmentin its operating activities and that either are directly attributable to the segment or can be allocated tothe segment on a reasonable basis.
The Group has no significant customer which contributes 10.00% or more of the consolidatedrevenue.
Business segment information of the Group follows:
2019
RetailBanking
CorporateBanking
Global Bankingand Market Others
Adjustmentsand
Eliminations* TotalNet interest marginThird party (P=5,844,018) P=31,918,140 P=5,733,291 P=511,020 P=125,140 P=32,443,573Inter-segment 23,647,539 (23,030,539) (617,000) – – –Net interest margin after inter-
segment transactions 17,803,521 8,887,601 5,116,291 511,020 125,140 32,443,573Other income 3,211,234 2,685,445 1,772,206 2,293,134 604,081 10,566,100Segment revenue 21,014,755 11,573,046 6,888,497 2,804,154 729,221 43,009,673Other expenses 11,881,474 5,636,497 472,000 (77,794) 729,221 18,641,398Segment result P=9,133,281 P=5,936,548 P=6,416,498 P=2,881,948 P=– 24,368,275Unallocated expenses 12,136,083Income before income tax 12,232,192Income tax 2,470,986Net income 9,761,206Non-controlling interests 79,726Net income for the year attributable
to equity holders of the ParentCompany P=9,681,480
Other segment informationCapital expenditures P=1,134,511 P=2,327 P=35,242 P=421,317 P=– P=1,593,397Unallocated capital expenditure 1,040,436Total capital expenditure P=2,633,833
Depreciation and amortization P=1,201,558 P=138,114 P=1,850 P=595,416 P=– P=1,936,938Unallocated depreciation and
amortization 867,185Total depreciation and amortization P=2,804,123Provision for (reversal of)
impairment, credit and otherlosses P=1,671,154 P=1,289,340 P=– (P=50,636) P=– P=2,909,858
* The adjustments and eliminations column mainly represent the RAP to PFRS adjustments
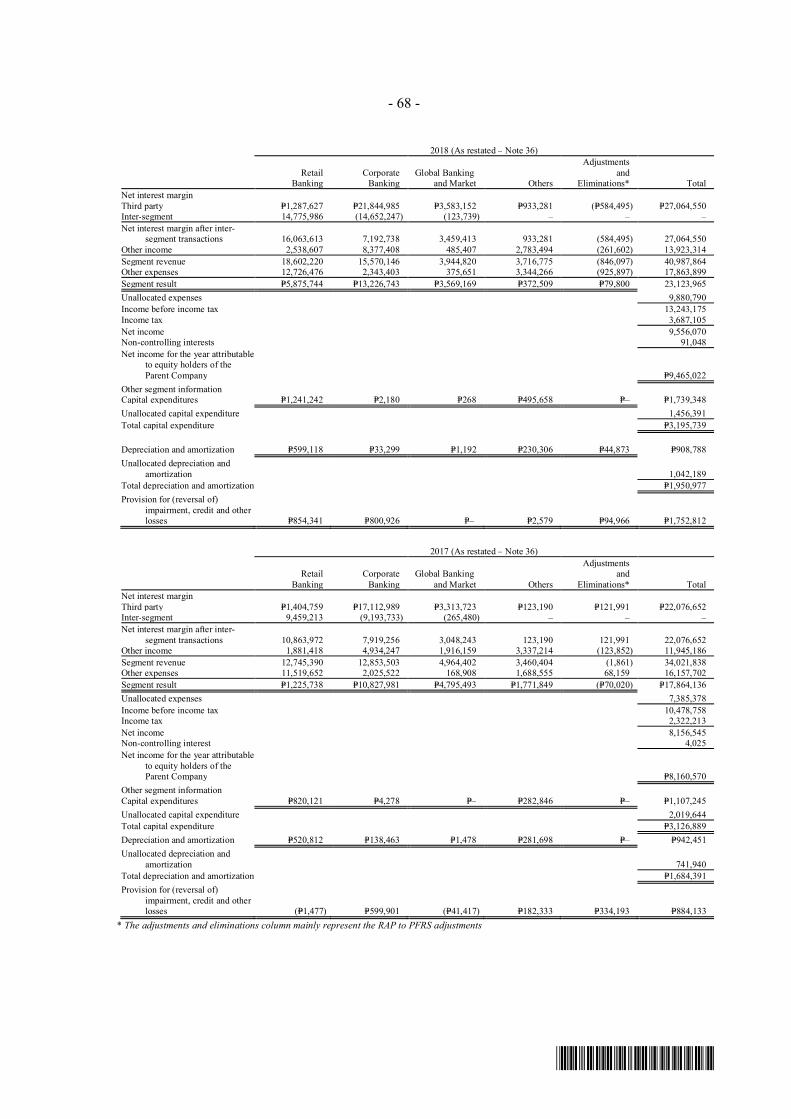
- 68 -
*SGVFS038920*
2018 (As restated – Note 36)
RetailBanking
CorporateBanking
Global Bankingand Market Others
Adjustmentsand
Eliminations* TotalNet interest marginThird party P=1,287,627 P=21,844,985 P=3,583,152 P=933,281 (P=584,495) P=27,064,550Inter-segment 14,775,986 (14,652,247) (123,739) – – –Net interest margin after inter-
segment transactions 16,063,613 7,192,738 3,459,413 933,281 (584,495) 27,064,550Other income 2,538,607 8,377,408 485,407 2,783,494 (261,602) 13,923,314Segment revenue 18,602,220 15,570,146 3,944,820 3,716,775 (846,097) 40,987,864Other expenses 12,726,476 2,343,403 375,651 3,344,266 (925,897) 17,863,899Segment result P=5,875,744 P=13,226,743 P=3,569,169 P=372,509 P=79,800 23,123,965Unallocated expenses 9,880,790Income before income tax 13,243,175Income tax 3,687,105Net income 9,556,070Non-controlling interests 91,048Net income for the year attributable
to equity holders of theParent Company P=9,465,022
Other segment informationCapital expenditures P=1,241,242 P=2,180 P=268 P=495,658 P=– P=1,739,348Unallocated capital expenditure 1,456,391Total capital expenditure P=3,195,739
Depreciation and amortization P=599,118 P=33,299 P=1,192 P=230,306 P=44,873 P=908,788Unallocated depreciation and
amortization 1,042,189Total depreciation and amortization P=1,950,977Provision for (reversal of)
impairment, credit and otherlosses P=854,341 P=800,926 P=– P=2,579 P=94,966 P=1,752,812
2017 (As restated – Note 36)
RetailBanking
CorporateBanking
Global Bankingand Market Others
Adjustmentsand
Eliminations* TotalNet interest marginThird party P=1,404,759 P=17,112,989 P=3,313,723 P=123,190 P=121,991 P=22,076,652Inter-segment 9,459,213 (9,193,733) (265,480) – – –Net interest margin after inter-
segment transactions 10,863,972 7,919,256 3,048,243 123,190 121,991 22,076,652Other income 1,881,418 4,934,247 1,916,159 3,337,214 (123,852) 11,945,186Segment revenue 12,745,390 12,853,503 4,964,402 3,460,404 (1,861) 34,021,838Other expenses 11,519,652 2,025,522 168,908 1,688,555 68,159 16,157,702Segment result P=1,225,738 P=10,827,981 P=4,795,493 P=1,771,849 (P=70,020) P=17,864,136Unallocated expenses 7,385,378Income before income tax 10,478,758Income tax 2,322,213Net income 8,156,545Non-controlling interest 4,025Net income for the year attributable
to equity holders of theParent Company P=8,160,570
Other segment informationCapital expenditures P=820,121 P=4,278 P=– P=282,846 P=– P=1,107,245Unallocated capital expenditure 2,019,644Total capital expenditure P=3,126,889Depreciation and amortization P=520,812 P=138,463 P=1,478 P=281,698 P=– P=942,451Unallocated depreciation and
amortization 741,940Total depreciation and amortization P=1,684,391Provision for (reversal of)
impairment, credit and otherlosses (P=1,477) P=599,901 (P=41,417) P=182,333 P=334,193 P=884,133
* The adjustments and eliminations column mainly represent the RAP to PFRS adjustments
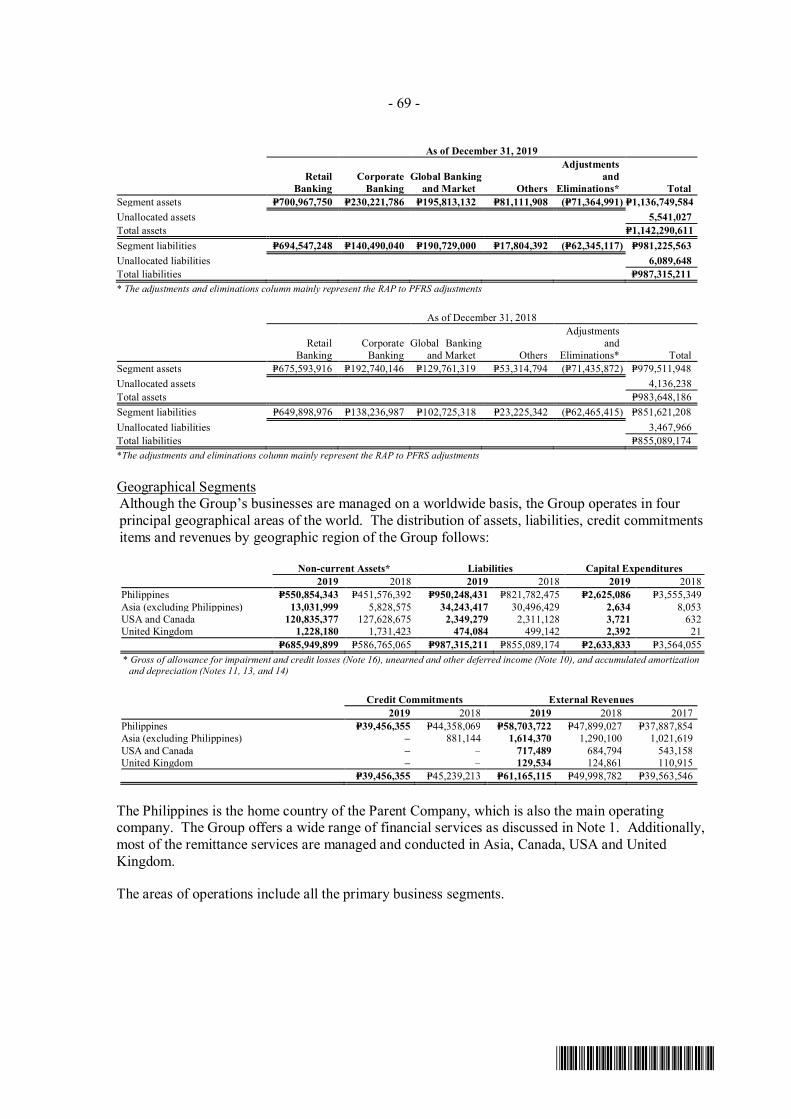
- 69 -
*SGVFS038920*
As of December 31, 2019
RetailBanking
CorporateBanking
Global Bankingand Market Others
Adjustmentsand
Eliminations* TotalSegment assets P=700,967,750 P=230,221,786 P=195,813,132 P=81,111,908 (P=71,364,991) P=1,136,749,584Unallocated assets 5,541,027Total assets P=1,142,290,611Segment liabilities P=694,547,248 P=140,490,040 P=190,729,000 P=17,804,392 (P=62,345,117) P=981,225,563Unallocated liabilities 6,089,648Total liabilities P=987,315,211* The adjustments and eliminations column mainly represent the RAP to PFRS adjustments
As of December 31, 2018
RetailBanking
CorporateBanking
Global Bankingand Market Others
Adjustmentsand
Eliminations* TotalSegment assets P=675,593,916 P=192,740,146 P=129,761,319 P=53,314,794 (P=71,435,872) P=979,511,948Unallocated assets 4,136,238Total assets P=983,648,186Segment liabilities P=649,898,976 P=138,236,987 P=102,725,318 P=23,225,342 (P=62,465,415) P=851,621,208Unallocated liabilities 3,467,966Total liabilities P=855,089,174*The adjustments and eliminations column mainly represent the RAP to PFRS adjustments
Geographical SegmentsAlthough the Group’s businesses are managed on a worldwide basis, the Group operates in fourprincipal geographical areas of the world. The distribution of assets, liabilities, credit commitmentsitems and revenues by geographic region of the Group follows:
Non-current Assets* Liabilities Capital Expenditures2019 2018 2019 2018 2019 2018
Philippines P=550,854,343 P=451,576,392 P=950,248,431 P=821,782,475 P=2,625,086 P=3,555,349Asia (excluding Philippines) 13,031,999 5,828,575 34,243,417 30,496,429 2,634 8,053USA and Canada 120,835,377 127,628,675 2,349,279 2,311,128 3,721 632United Kingdom 1,228,180 1,731,423 474,084 499,142 2,392 21
P=685,949,899 P=586,765,065 P=987,315,211 P=855,089,174 P=2,633,833 P=3,564,055* Gross of allowance for impairment and credit losses (Note 16), unearned and other deferred income (Note 10), and accumulated amortization
and depreciation (Notes 11, 13, and 14)
Credit Commitments External Revenues2019 2018 2019 2018 2017
Philippines P=39,456,355 P=44,358,069 P=58,703,722 P=47,899,027 P=37,887,854Asia (excluding Philippines) – 881,144 1,614,370 1,290,100 1,021,619USA and Canada – – 717,489 684,794 543,158United Kingdom – – 129,534 124,861 110,915
P=39,456,355 P=45,239,213 P=61,165,115 P=49,998,782 P=39,563,546
The Philippines is the home country of the Parent Company, which is also the main operatingcompany. The Group offers a wide range of financial services as discussed in Note 1. Additionally,most of the remittance services are managed and conducted in Asia, Canada, USA and UnitedKingdom.
The areas of operations include all the primary business segments.
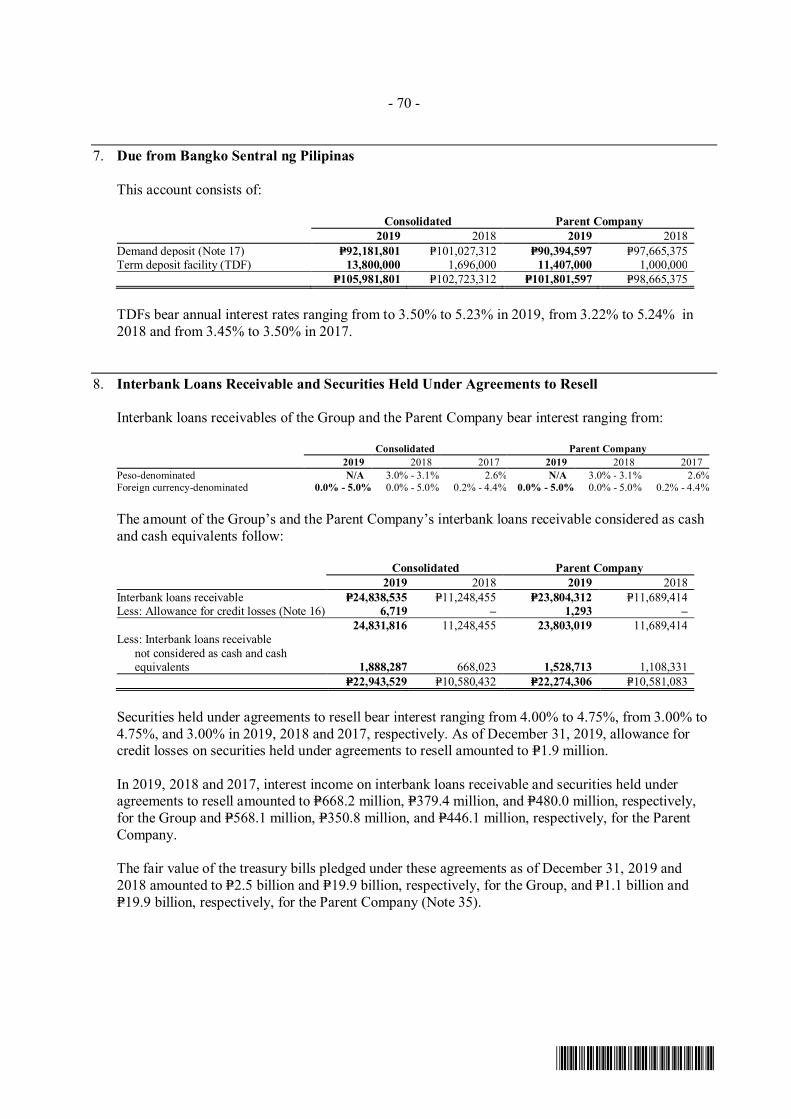
- 70 -
*SGVFS038920*
7. Due from Bangko Sentral ng Pilipinas
This account consists of:
Consolidated Parent Company2019 2018 2019 2018
Demand deposit (Note 17) P=92,181,801 P=101,027,312 P=90,394,597 P=97,665,375Term deposit facility (TDF) 13,800,000 1,696,000 11,407,000 1,000,000
P=105,981,801 P=102,723,312 P=101,801,597 P=98,665,375
TDFs bear annual interest rates ranging from to 3.50% to 5.23% in 2019, from 3.22% to 5.24% in2018 and from 3.45% to 3.50% in 2017.
8. Interbank Loans Receivable and Securities Held Under Agreements to Resell
Interbank loans receivables of the Group and the Parent Company bear interest ranging from:
Consolidated Parent Company2019 2018 2017 2019 2018 2017
Peso-denominated N/A 3.0% - 3.1% 2.6% N/A 3.0% - 3.1% 2.6%Foreign currency-denominated 0.0% - 5.0% 0.0% - 5.0% 0.2% - 4.4% 0.0% - 5.0% 0.0% - 5.0% 0.2% - 4.4%
The amount of the Group’s and the Parent Company’s interbank loans receivable considered as cashand cash equivalents follow:
Consolidated Parent Company2019 2018 2019 2018
Interbank loans receivable P=24,838,535 P=11,248,455 P=23,804,312 P=11,689,414Less: Allowance for credit losses (Note 16) 6,719 – 1,293 –
24,831,816 11,248,455 23,803,019 11,689,414Less: Interbank loans receivable not considered as cash and cash
equivalents 1,888,287 668,023 1,528,713 1,108,331P=22,943,529 P=10,580,432 P=22,274,306 P=10,581,083
Securities held under agreements to resell bear interest ranging from 4.00% to 4.75%, from 3.00% to4.75%, and 3.00% in 2019, 2018 and 2017, respectively. As of December 31, 2019, allowance forcredit losses on securities held under agreements to resell amounted to P=1.9 million.
In 2019, 2018 and 2017, interest income on interbank loans receivable and securities held underagreements to resell amounted to P=668.2 million, P=379.4 million, and P=480.0 million, respectively,for the Group and P=568.1 million, P=350.8 million, and P=446.1 million, respectively, for the ParentCompany.
The fair value of the treasury bills pledged under these agreements as of December 31, 2019 and2018 amounted to P=2.5 billion and P=19.9 billion, respectively, for the Group, and P=1.1 billion andP=19.9 billion, respectively, for the Parent Company (Note 35).
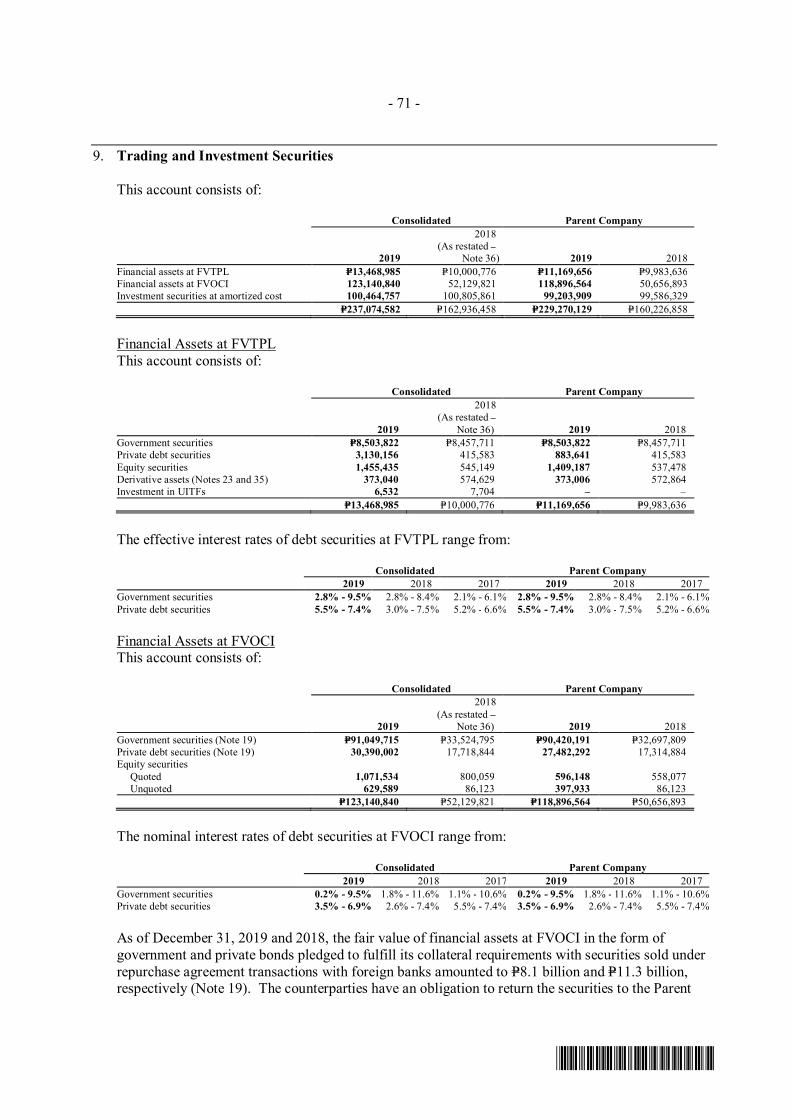
- 71 -
*SGVFS038920*
9. Trading and Investment Securities
This account consists of:
Consolidated Parent Company
2019
2018(As restated –
Note 36) 2019 2018Financial assets at FVTPL P=13,468,985 P=10,000,776 P=11,169,656 P=9,983,636Financial assets at FVOCI 123,140,840 52,129,821 118,896,564 50,656,893Investment securities at amortized cost 100,464,757 100,805,861 99,203,909 99,586,329
P=237,074,582 P=162,936,458 P=229,270,129 P=160,226,858
Financial Assets at FVTPLThis account consists of:
Consolidated Parent Company
2019
2018(As restated –
Note 36) 2019 2018Government securities P=8,503,822 P=8,457,711 P=8,503,822 P=8,457,711Private debt securities 3,130,156 415,583 883,641 415,583Equity securities 1,455,435 545,149 1,409,187 537,478Derivative assets (Notes 23 and 35) 373,040 574,629 373,006 572,864Investment in UITFs 6,532 7,704 – –
P=13,468,985 P=10,000,776 P=11,169,656 P=9,983,636
The effective interest rates of debt securities at FVTPL range from:
Consolidated Parent Company2019 2018 2017 2019 2018 2017
Government securities 2.8% - 9.5% 2.8% - 8.4% 2.1% - 6.1% 2.8% - 9.5% 2.8% - 8.4% 2.1% - 6.1%Private debt securities 5.5% - 7.4% 3.0% - 7.5% 5.2% - 6.6% 5.5% - 7.4% 3.0% - 7.5% 5.2% - 6.6%
Financial Assets at FVOCIThis account consists of:
Consolidated Parent Company
2019
2018(As restated –
Note 36) 2019 2018Government securities (Note 19) P=91,049,715 P=33,524,795 P=90,420,191 P=32,697,809Private debt securities (Note 19) 30,390,002 17,718,844 27,482,292 17,314,884Equity securities
Quoted 1,071,534 800,059 596,148 558,077Unquoted 629,589 86,123 397,933 86,123
P=123,140,840 P=52,129,821 P=118,896,564 P=50,656,893
The nominal interest rates of debt securities at FVOCI range from:
Consolidated Parent Company2019 2018 2017 2019 2018 2017
Government securities 0.2% - 9.5% 1.8% - 11.6% 1.1% - 10.6% 0.2% - 9.5% 1.8% - 11.6% 1.1% - 10.6%Private debt securities 3.5% - 6.9% 2.6% - 7.4% 5.5% - 7.4% 3.5% - 6.9% 2.6% - 7.4% 5.5% - 7.4%
As of December 31, 2019 and 2018, the fair value of financial assets at FVOCI in the form ofgovernment and private bonds pledged to fulfill its collateral requirements with securities sold underrepurchase agreement transactions with foreign banks amounted to P=8.1 billion and P=11.3 billion,respectively (Note 19). The counterparties have an obligation to return the securities to the Parent
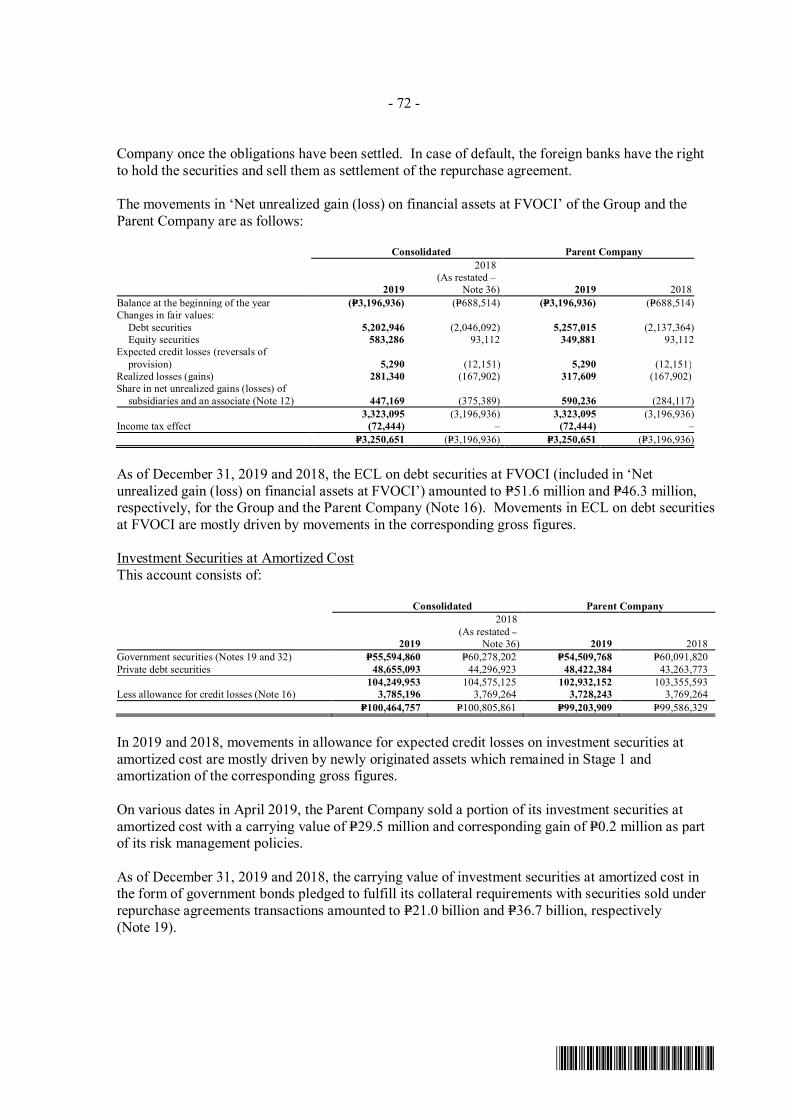
- 72 -
*SGVFS038920*
Company once the obligations have been settled. In case of default, the foreign banks have the rightto hold the securities and sell them as settlement of the repurchase agreement.
The movements in ‘Net unrealized gain (loss) on financial assets at FVOCI’ of the Group and theParent Company are as follows:
Consolidated Parent Company
2019
2018(As restated –
Note 36) 2019 2018Balance at the beginning of the year (P=3,196,936) (P=688,514) (P=3,196,936) (P=688,514)Changes in fair values:
Debt securities 5,202,946 (2,046,092) 5,257,015 (2,137,364)Equity securities 583,286 93,112 349,881 93,112
Expected credit losses (reversals ofprovision) 5,290 (12,151) 5,290 (12,151)
Realized losses (gains) 281,340 (167,902) 317,609 (167,902)Share in net unrealized gains (losses) of
subsidiaries and an associate (Note 12) 447,169 (375,389) 590,236 (284,117)3,323,095 (3,196,936) 3,323,095 (3,196,936)
Income tax effect (72,444) – (72,444) –P=3,250,651 (P=3,196,936) P=3,250,651 (P=3,196,936)
As of December 31, 2019 and 2018, the ECL on debt securities at FVOCI (included in ‘Netunrealized gain (loss) on financial assets at FVOCI’) amounted to P=51.6 million and P=46.3 million,respectively, for the Group and the Parent Company (Note 16). Movements in ECL on debt securitiesat FVOCI are mostly driven by movements in the corresponding gross figures.
Investment Securities at Amortized CostThis account consists of:
Consolidated Parent Company
2019
2018(As restated –
Note 36) 2019 2018Government securities (Notes 19 and 32) P=55,594,860 P=60,278,202 P=54,509,768 P=60,091,820Private debt securities 48,655,093 44,296,923 48,422,384 43,263,773
104,249,953 104,575,125 102,932,152 103,355,593Less allowance for credit losses (Note 16) 3,785,196 3,769,264 3,728,243 3,769,264
P=100,464,757 P=100,805,861 P=99,203,909 P=99,586,329
In 2019 and 2018, movements in allowance for expected credit losses on investment securities atamortized cost are mostly driven by newly originated assets which remained in Stage 1 andamortization of the corresponding gross figures.
On various dates in April 2019, the Parent Company sold a portion of its investment securities atamortized cost with a carrying value of P=29.5 million and corresponding gain of P=0.2 million as partof its risk management policies.
As of December 31, 2019 and 2018, the carrying value of investment securities at amortized cost inthe form of government bonds pledged to fulfill its collateral requirements with securities sold underrepurchase agreements transactions amounted to P=21.0 billion and P=36.7 billion, respectively(Note 19).
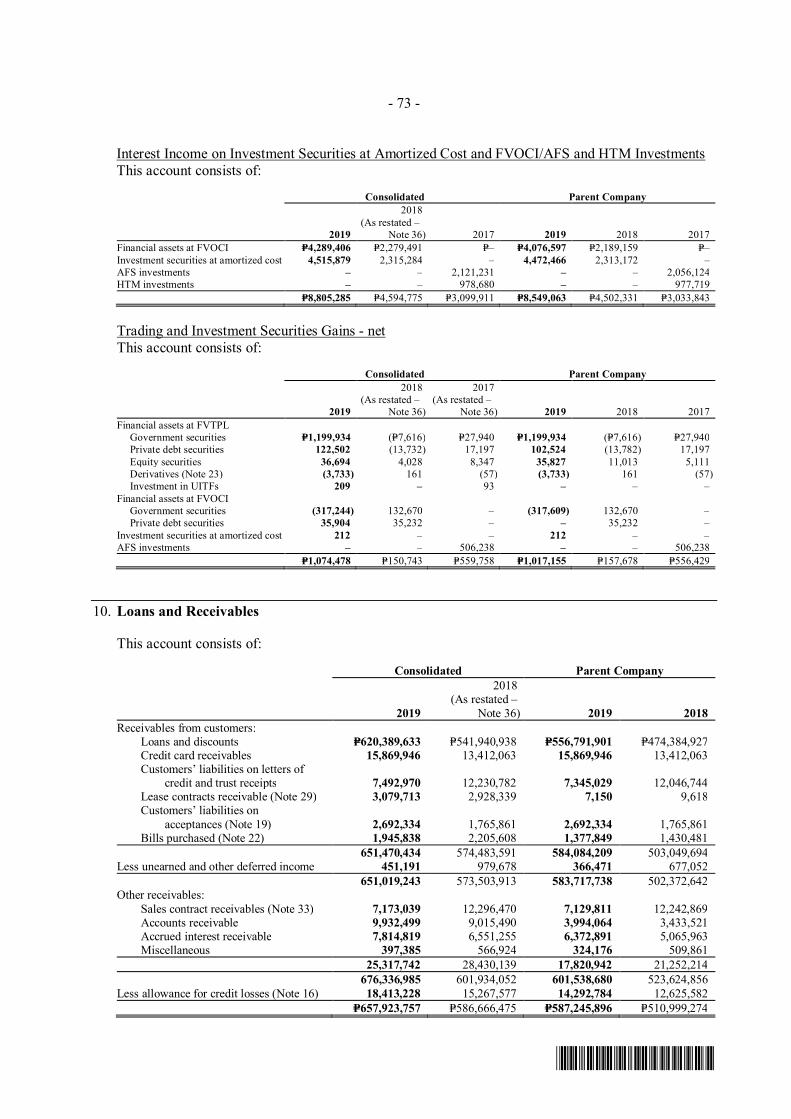
- 73 -
*SGVFS038920*
Interest Income on Investment Securities at Amortized Cost and FVOCI/AFS and HTM InvestmentsThis account consists of:
Consolidated Parent Company
2019
2018(As restated –
Note 36) 2017 2019 2018 2017Financial assets at FVOCI P=4,289,406 P=2,279,491 P=– P=4,076,597 P=2,189,159 P=–Investment securities at amortized cost 4,515,879 2,315,284 – 4,472,466 2,313,172 –AFS investments – – 2,121,231 – – 2,056,124HTM investments – – 978,680 – – 977,719
P=8,805,285 P=4,594,775 P=3,099,911 P=8,549,063 P=4,502,331 P=3,033,843
Trading and Investment Securities Gains - netThis account consists of:
Consolidated Parent Company
2019
2018(As restated –
Note 36)
2017(As restated –
Note 36) 2019 2018 2017Financial assets at FVTPL
Government securities P=1,199,934 (P=7,616) P=27,940 P=1,199,934 (P=7,616) P=27,940 Private debt securities 122,502 (13,732) 17,197 102,524 (13,782) 17,197
Equity securities 36,694 4,028 8,347 35,827 11,013 5,111Derivatives (Note 23) (3,733) 161 (57) (3,733) 161 (57)
Investment in UITFs 209 – 93 – – –Financial assets at FVOCI
Government securities (317,244) 132,670 – (317,609) 132,670 – Private debt securities 35,904 35,232 – – 35,232 –Investment securities at amortized cost 212 – – 212 – –AFS investments – – 506,238 – – 506,238
P=1,074,478 P=150,743 P=559,758 P=1,017,155 P=157,678 P=556,429
10. Loans and Receivables
This account consists of:
Consolidated Parent Company
2019
2018(As restated –
Note 36) 2019 2018Receivables from customers:
Loans and discounts P=620,389,633 P=541,940,938 P=556,791,901 P=474,384,927Credit card receivables 15,869,946 13,412,063 15,869,946 13,412,063
Customers’ liabilities on letters ofcredit and trust receipts 7,492,970 12,230,782 7,345,029 12,046,744
Lease contracts receivable (Note 29) 3,079,713 2,928,339 7,150 9,618 Customers’ liabilities on
acceptances (Note 19) 2,692,334 1,765,861 2,692,334 1,765,861Bills purchased (Note 22) 1,945,838 2,205,608 1,377,849 1,430,481
651,470,434 574,483,591 584,084,209 503,049,694Less unearned and other deferred income 451,191 979,678 366,471 677,052
651,019,243 573,503,913 583,717,738 502,372,642Other receivables:
Sales contract receivables (Note 33) 7,173,039 12,296,470 7,129,811 12,242,869Accounts receivable 9,932,499 9,015,490 3,994,064 3,433,521Accrued interest receivable 7,814,819 6,551,255 6,372,891 5,065,963Miscellaneous 397,385 566,924 324,176 509,861
25,317,742 28,430,139 17,820,942 21,252,214676,336,985 601,934,052 601,538,680 523,624,856
Less allowance for credit losses (Note 16) 18,413,228 15,267,577 14,292,784 12,625,582 P=657,923,757 P=586,666,475 P=587,245,896 P=510,999,274
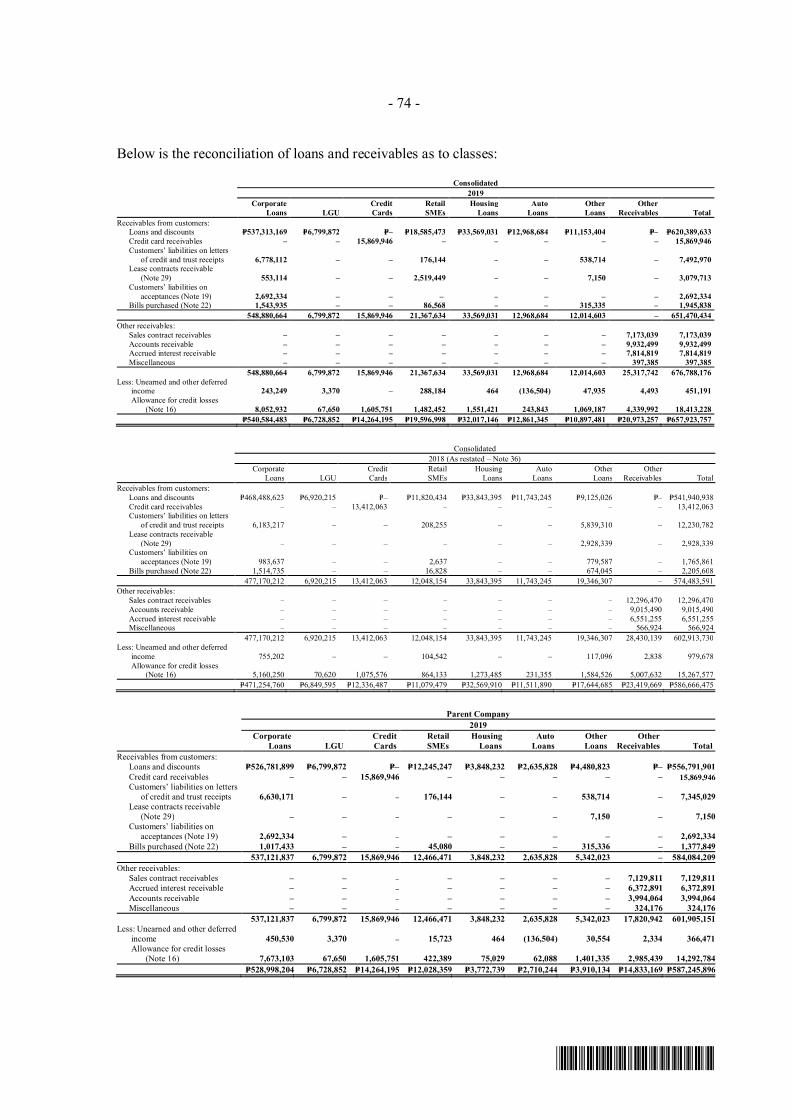
- 74 -
*SGVFS038920*
Below is the reconciliation of loans and receivables as to classes:
Consolidated2019
CorporateLoans LGU
CreditCards
RetailSMEs
HousingLoans
AutoLoans
OtherLoans
OtherReceivables Total
Receivables from customers:Loans and discounts P=537,313,169 P=6,799,872 P=– P=18,585,473 P=33,569,031 P=12,968,684 P=11,153,404 P=– P=620,389,633Credit card receivables – – 15,869,946 – – – – – 15,869,946Customers’ liabilities on letters
of credit and trust receipts 6,778,112 – – 176,144 – – 538,714 – 7,492,970Lease contracts receivable
(Note 29) 553,114 – – 2,519,449 – – 7,150 – 3,079,713Customers’ liabilities on
acceptances (Note 19) 2,692,334 – – – – – – – 2,692,334Bills purchased (Note 22) 1,543,935 – – 86,568 – – 315,335 – 1,945,838
548,880,664 6,799,872 15,869,946 21,367,634 33,569,031 12,968,684 12,014,603 – 651,470,434Other receivables:
Sales contract receivables – – – – – – – 7,173,039 7,173,039Accounts receivable – – – – – – – 9,932,499 9,932,499Accrued interest receivable – – – – – – – 7,814,819 7,814,819Miscellaneous – – – – – – – 397,385 397,385
548,880,664 6,799,872 15,869,946 21,367,634 33,569,031 12,968,684 12,014,603 25,317,742 676,788,176Less: Unearned and other deferred
income 243,249 3,370 – 288,184 464 (136,504) 47,935 4,493 451,191 Allowance for credit losses
(Note 16) 8,052,932 67,650 1,605,751 1,482,452 1,551,421 243,843 1,069,187 4,339,992 18,413,228 P=540,584,483 P=6,728,852 P=14,264,195 P=19,596,998 P=32,017,146 P=12,861,345 P=10,897,481 P=20,973,257 P=657,923,757
Consolidated2018 (As restated – Note 36)
CorporateLoans LGU
CreditCards
RetailSMEs
HousingLoans
AutoLoans
OtherLoans
OtherReceivables Total
Receivables from customers:Loans and discounts P=468,488,623 P=6,920,215 P=– P=11,820,434 P=33,843,395 P=11,743,245 P=9,125,026 P=– P=541,940,938Credit card receivables – – 13,412,063 – – – – – 13,412,063Customers’ liabilities on letters
of credit and trust receipts 6,183,217 – – 208,255 – – 5,839,310 – 12,230,782Lease contracts receivable
(Note 29) – – – – – – 2,928,339 – 2,928,339Customers’ liabilities on
acceptances (Note 19) 983,637 – – 2,637 – – 779,587 – 1,765,861Bills purchased (Note 22) 1,514,735 – – 16,828 – – 674,045 – 2,205,608
477,170,212 6,920,215 13,412,063 12,048,154 33,843,395 11,743,245 19,346,307 – 574,483,591Other receivables:
Sales contract receivables – – – – – – – 12,296,470 12,296,470Accounts receivable – – – – – – – 9,015,490 9,015,490Accrued interest receivable – – – – – – – 6,551,255 6,551,255Miscellaneous – – – – – – – 566,924 566,924
477,170,212 6,920,215 13,412,063 12,048,154 33,843,395 11,743,245 19,346,307 28,430,139 602,913,730Less: Unearned and other deferred
income 755,202 – – 104,542 – – 117,096 2,838 979,678 Allowance for credit losses
(Note 16) 5,160,250 70,620 1,075,576 864,133 1,273,485 231,355 1,584,526 5,007,632 15,267,577P=471,254,760 P=6,849,595 P=12,336,487 P=11,079,479 P=32,569,910 P=11,511,890 P=17,644,685 P=23,419,669 P=586,666,475
Parent Company2019
CorporateLoans LGU
CreditCards
RetailSMEs
HousingLoans
AutoLoans
OtherLoans
OtherReceivables Total
Receivables from customers:Loans and discounts P=526,781,899 P=6,799,872 P=– P=12,245,247 P=3,848,232 P=2,635,828 P=4,480,823 P=– P=556,791,901Credit card receivables – – 15,869,946 – – – – – 15,869,946Customers’ liabilities on letters
of credit and trust receipts 6,630,171 – – 176,144 – – 538,714 – 7,345,029Lease contracts receivable
(Note 29) – – – – – – 7,150 – 7,150Customers’ liabilities on
acceptances (Note 19) 2,692,334 – – – – – – – 2,692,334Bills purchased (Note 22) 1,017,433 – – 45,080 – – 315,336 – 1,377,849
537,121,837 6,799,872 15,869,946 12,466,471 3,848,232 2,635,828 5,342,023 – 584,084,209Other receivables:
Sales contract receivables – – – – – – – 7,129,811 7,129,811Accrued interest receivable – – – – – – – 6,372,891 6,372,891Accounts receivable – – – – – – – 3,994,064 3,994,064Miscellaneous – – – – – – – 324,176 324,176
537,121,837 6,799,872 15,869,946 12,466,471 3,848,232 2,635,828 5,342,023 17,820,942 601,905,151Less: Unearned and other deferred
income 450,530 3,370 – 15,723 464 (136,504) 30,554 2,334 366,471 Allowance for credit losses (Note 16) 7,673,103 67,650 1,605,751 422,389 75,029 62,088 1,401,335 2,985,439 14,292,784
P=528,998,204 P=6,728,852 P=14,264,195 P=12,028,359 P=3,772,739 P=2,710,244 P=3,910,134 P=14,833,169 P=587,245,896
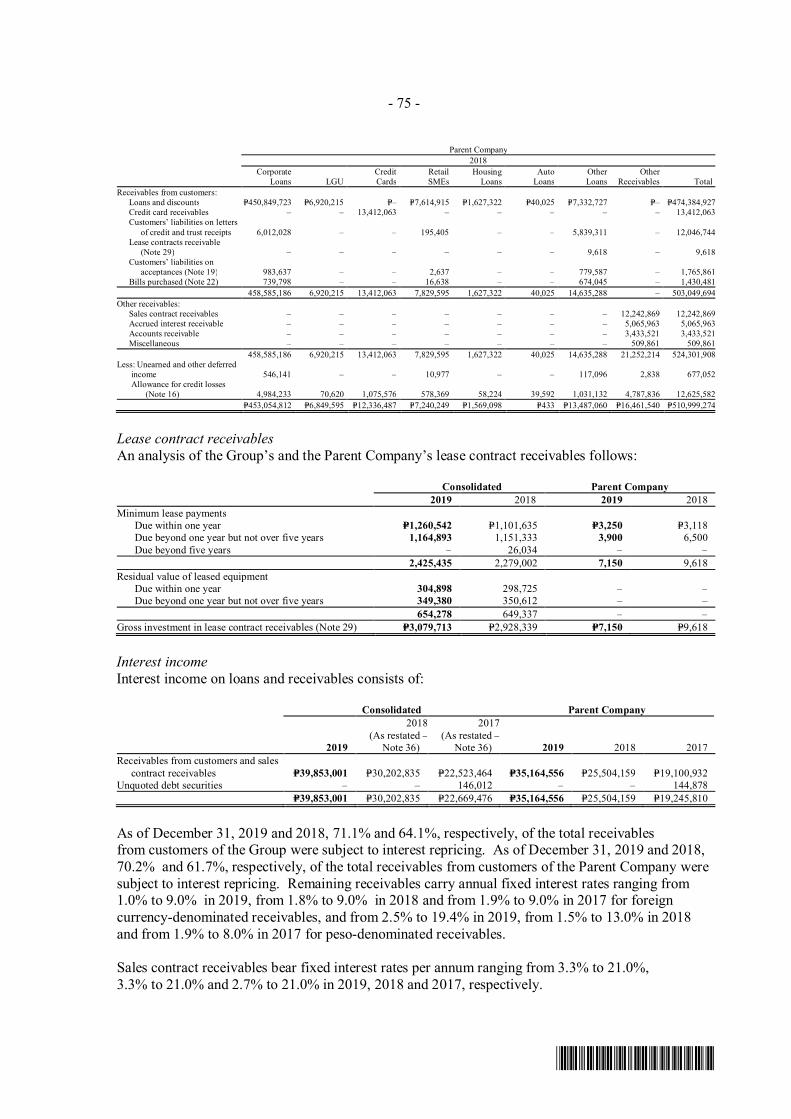
- 75 -
*SGVFS038920*
Parent Company2018
CorporateLoans LGU
CreditCards
RetailSMEs
HousingLoans
AutoLoans
OtherLoans
OtherReceivables Total
Receivables from customers:Loans and discounts P=450,849,723 P=6,920,215 P=– P=7,614,915 P=1,627,322 P=40,025 P=7,332,727 P=– P=474,384,927Credit card receivables – – 13,412,063 – – – – – 13,412,063Customers’ liabilities on letters
of credit and trust receipts 6,012,028 – – 195,405 – – 5,839,311 – 12,046,744Lease contracts receivable
(Note 29) – – – – – – 9,618 – 9,618Customers’ liabilities on
acceptances (Note 19) 983,637 – – 2,637 – – 779,587 – 1,765,861Bills purchased (Note 22) 739,798 – – 16,638 – – 674,045 – 1,430,481
458,585,186 6,920,215 13,412,063 7,829,595 1,627,322 40,025 14,635,288 – 503,049,694Other receivables:
Sales contract receivables – – – – – – – 12,242,869 12,242,869Accrued interest receivable – – – – – – – 5,065,963 5,065,963Accounts receivable – – – – – – – 3,433,521 3,433,521Miscellaneous – – – – – – – 509,861 509,861
458,585,186 6,920,215 13,412,063 7,829,595 1,627,322 40,025 14,635,288 21,252,214 524,301,908Less: Unearned and other deferred
income 546,141 – – 10,977 – – 117,096 2,838 677,052 Allowance for credit losses
(Note 16) 4,984,233 70,620 1,075,576 578,369 58,224 39,592 1,031,132 4,787,836 12,625,582P=453,054,812 P=6,849,595 P=12,336,487 P=7,240,249 P=1,569,098 P=433 P=13,487,060 P=16,461,540 P=510,999,274
Lease contract receivablesAn analysis of the Group’s and the Parent Company’s lease contract receivables follows:
Consolidated Parent Company2019 2018 2019 2018
Minimum lease paymentsDue within one year P=1,260,542 P=1,101,635 P=3,250 P=3,118Due beyond one year but not over five years 1,164,893 1,151,333 3,900 6,500Due beyond five years – 26,034 – –
2,425,435 2,279,002 7,150 9,618Residual value of leased equipment
Due within one year 304,898 298,725 – –Due beyond one year but not over five years 349,380 350,612 – –
654,278 649,337 – –Gross investment in lease contract receivables (Note 29) P=3,079,713 P=2,928,339 P=7,150 P=9,618
Interest incomeInterest income on loans and receivables consists of:
Consolidated Parent Company
2019
2018(As restated –
Note 36)
2017(As restated –
Note 36) 2019 2018 2017Receivables from customers and sales
contract receivables P=39,853,001 P=30,202,835 P=22,523,464 P=35,164,556 P=25,504,159 P=19,100,932Unquoted debt securities – – 146,012 – – 144,878
P=39,853,001 P=30,202,835 P=22,669,476 P=35,164,556 P=25,504,159 P=19,245,810
As of December 31, 2019 and 2018, 71.1% and 64.1%, respectively, of the total receivablesfrom customers of the Group were subject to interest repricing. As of December 31, 2019 and 2018,70.2% and 61.7%, respectively, of the total receivables from customers of the Parent Company weresubject to interest repricing. Remaining receivables carry annual fixed interest rates ranging from1.0% to 9.0% in 2019, from 1.8% to 9.0% in 2018 and from 1.9% to 9.0% in 2017 for foreigncurrency-denominated receivables, and from 2.5% to 19.4% in 2019, from 1.5% to 13.0% in 2018and from 1.9% to 8.0% in 2017 for peso-denominated receivables.
Sales contract receivables bear fixed interest rates per annum ranging from 3.3% to 21.0%,3.3% to 21.0% and 2.7% to 21.0% in 2019, 2018 and 2017, respectively.
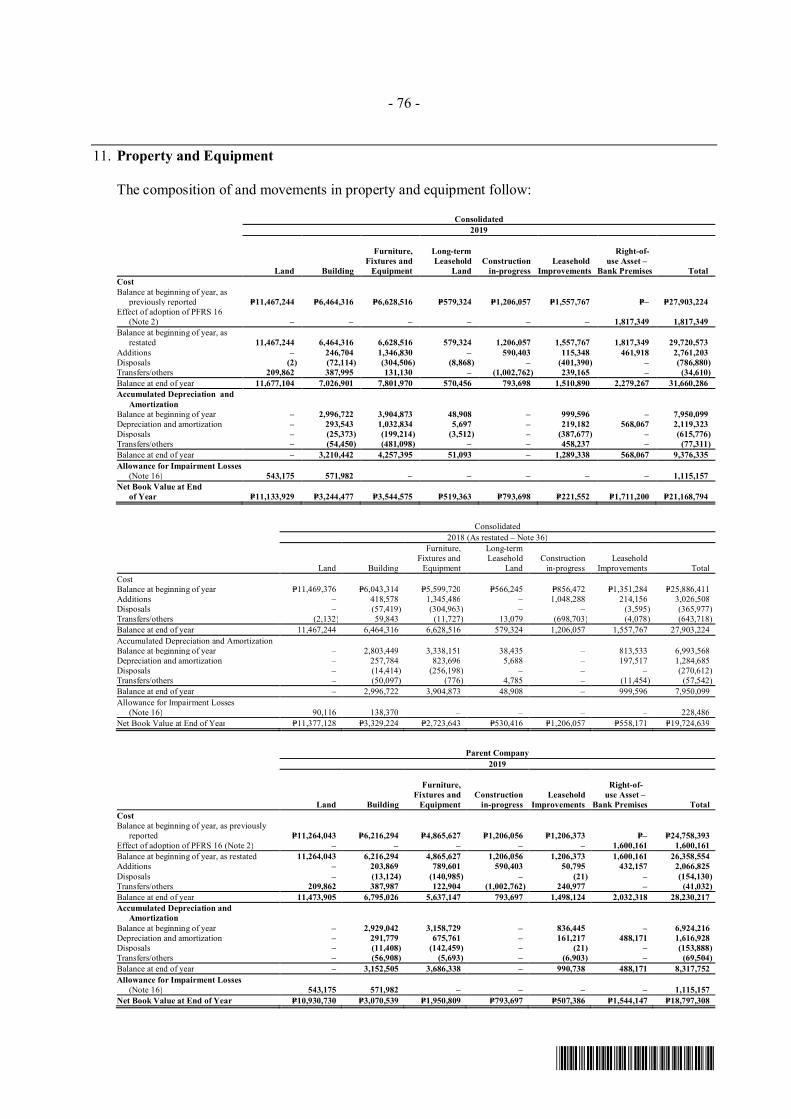
- 76 -
*SGVFS038920*
11. Property and Equipment
The composition of and movements in property and equipment follow:
Consolidated2019
Land Building
Furniture,Fixtures and
Equipment
Long-termLeasehold
LandConstruction
in-progressLeasehold
Improvements
Right-of-use Asset –
Bank Premises TotalCostBalance at beginning of year, as
previously reported P=11,467,244 P=6,464,316 P=6,628,516 P=579,324 P=1,206,057 P=1,557,767 P=– P=27,903,224Effect of adoption of PFRS 16
(Note 2) – – – – – – 1,817,349 1,817,349Balance at beginning of year, as
restated 11,467,244 6,464,316 6,628,516 579,324 1,206,057 1,557,767 1,817,349 29,720,573Additions – 246,704 1,346,830 – 590,403 115,348 461,918 2,761,203Disposals (2) (72,114) (304,506) (8,868) – (401,390) – (786,880)Transfers/others 209,862 387,995 131,130 – (1,002,762) 239,165 – (34,610)Balance at end of year 11,677,104 7,026,901 7,801,970 570,456 793,698 1,510,890 2,279,267 31,660,286Accumulated Depreciation and
AmortizationBalance at beginning of year – 2,996,722 3,904,873 48,908 – 999,596 – 7,950,099Depreciation and amortization – 293,543 1,032,834 5,697 – 219,182 568,067 2,119,323Disposals – (25,373) (199,214) (3,512) – (387,677) – (615,776)Transfers/others – (54,450) (481,098) – – 458,237 – (77,311)Balance at end of year – 3,210,442 4,257,395 51,093 – 1,289,338 568,067 9,376,335Allowance for Impairment Losses
(Note 16) 543,175 571,982 – – – – – 1,115,157Net Book Value at End of Year P=11,133,929 P=3,244,477 P=3,544,575 P=519,363 P=793,698 P=221,552 P=1,711,200 P=21,168,794
Consolidated2018 (As restated – Note 36)
Land Building
Furniture,Fixtures and
Equipment
Long-termLeasehold
LandConstruction
in-progressLeasehold
Improvements TotalCostBalance at beginning of year P=11,469,376 P=6,043,314 P=5,599,720 P=566,245 P=856,472 P=1,351,284 P=25,886,411Additions – 418,578 1,345,486 – 1,048,288 214,156 3,026,508Disposals – (57,419) (304,963) – – (3,595) (365,977)Transfers/others (2,132) 59,843 (11,727) 13,079 (698,703) (4,078) (643,718)Balance at end of year 11,467,244 6,464,316 6,628,516 579,324 1,206,057 1,557,767 27,903,224Accumulated Depreciation and AmortizationBalance at beginning of year – 2,803,449 3,338,151 38,435 – 813,533 6,993,568Depreciation and amortization – 257,784 823,696 5,688 – 197,517 1,284,685Disposals – (14,414) (256,198) – – – (270,612)Transfers/others – (50,097) (776) 4,785 – (11,454) (57,542)Balance at end of year – 2,996,722 3,904,873 48,908 – 999,596 7,950,099Allowance for Impairment Losses
(Note 16) 90,116 138,370 – – – – 228,486Net Book Value at End of Year P=11,377,128 P=3,329,224 P=2,723,643 P=530,416 P=1,206,057 P=558,171 P=19,724,639
Parent Company2019
Land Building
Furniture,Fixtures and
EquipmentConstruction
in-progressLeasehold
Improvements
Right-of-use Asset –
Bank Premises TotalCostBalance at beginning of year, as previously
reported P=11,264,043 P=6,216,294 P=4,865,627 P=1,206,056 P=1,206,373 P=– P=24,758,393Effect of adoption of PFRS 16 (Note 2) – – – – – 1,600,161 1,600,161Balance at beginning of year, as restated 11,264,043 6,216,294 4,865,627 1,206,056 1,206,373 1,600,161 26,358,554Additions – 203,869 789,601 590,403 50,795 432,157 2,066,825Disposals – (13,124) (140,985) – (21) – (154,130)Transfers/others 209,862 387,987 122,904 (1,002,762) 240,977 – (41,032)Balance at end of year 11,473,905 6,795,026 5,637,147 793,697 1,498,124 2,032,318 28,230,217Accumulated Depreciation and
AmortizationBalance at beginning of year – 2,929,042 3,158,729 – 836,445 – 6,924,216Depreciation and amortization – 291,779 675,761 – 161,217 488,171 1,616,928Disposals – (11,408) (142,459) – (21) – (153,888)Transfers/others – (56,908) (5,693) – (6,903) – (69,504)Balance at end of year – 3,152,505 3,686,338 – 990,738 488,171 8,317,752Allowance for Impairment Losses
(Note 16) 543,175 571,982 – – – – 1,115,157Net Book Value at End of Year P=10,930,730 P=3,070,539 P=1,950,809 P=793,697 P=507,386 P=1,544,147 P=18,797,308
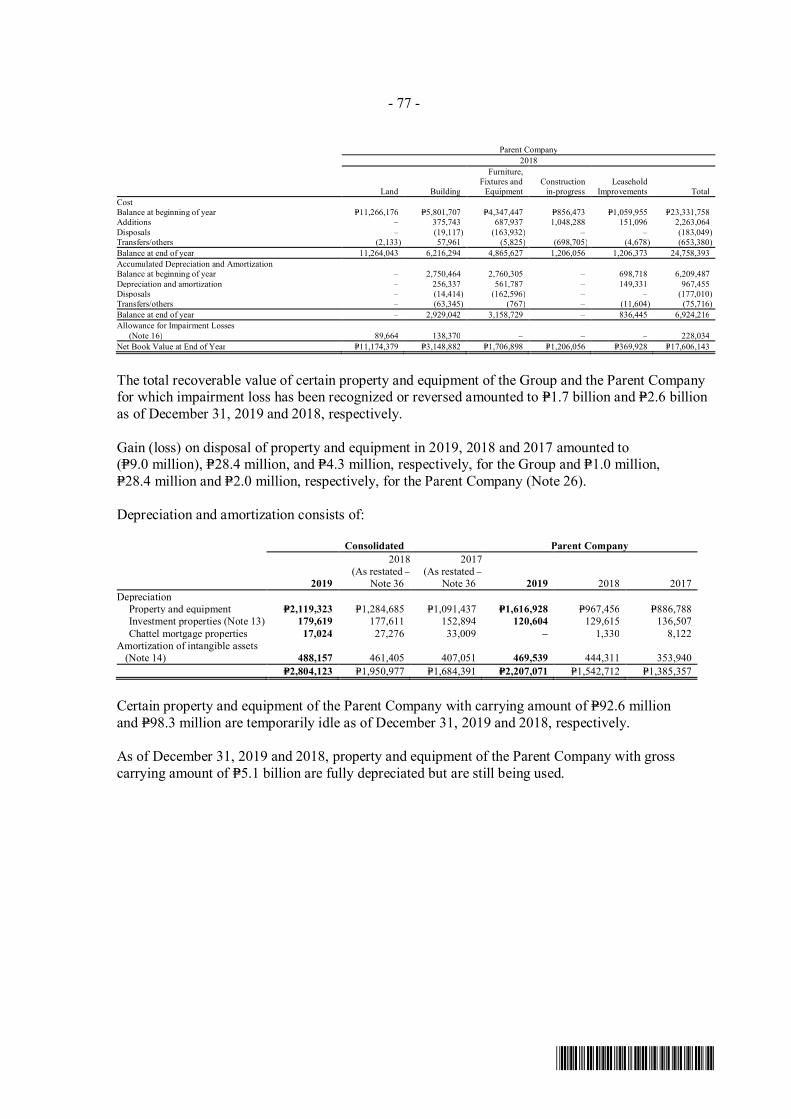
- 77 -
*SGVFS038920*
Parent Company2018
Land Building
Furniture,Fixtures and
EquipmentConstruction
in-progressLeasehold
Improvements TotalCostBalance at beginning of year P=11,266,176 P=5,801,707 P=4,347,447 P=856,473 P=1,059,955 P=23,331,758Additions – 375,743 687,937 1,048,288 151,096 2,263,064Disposals – (19,117) (163,932) – – (183,049)Transfers/others (2,133) 57,961 (5,825) (698,705) (4,678) (653,380)Balance at end of year 11,264,043 6,216,294 4,865,627 1,206,056 1,206,373 24,758,393Accumulated Depreciation and AmortizationBalance at beginning of year – 2,750,464 2,760,305 – 698,718 6,209,487Depreciation and amortization – 256,337 561,787 – 149,331 967,455Disposals – (14,414) (162,596) – – (177,010)Transfers/others – (63,345) (767) – (11,604) (75,716)Balance at end of year – 2,929,042 3,158,729 – 836,445 6,924,216Allowance for Impairment Losses
(Note 16) 89,664 138,370 – – – 228,034Net Book Value at End of Year P=11,174,379 P=3,148,882 P=1,706,898 P=1,206,056 P=369,928 P=17,606,143
The total recoverable value of certain property and equipment of the Group and the Parent Companyfor which impairment loss has been recognized or reversed amounted to P=1.7 billion and P=2.6 billionas of December 31, 2019 and 2018, respectively.
Gain (loss) on disposal of property and equipment in 2019, 2018 and 2017 amounted to(P=9.0 million), P=28.4 million, and P=4.3 million, respectively, for the Group and P=1.0 million,P=28.4 million and P=2.0 million, respectively, for the Parent Company (Note 26).
Depreciation and amortization consists of:
Consolidated Parent Company
2019
2018(As restated –
Note 36
2017(As restated –
Note 36 2019 2018 2017Depreciation
Property and equipment P=2,119,323 P=1,284,685 P=1,091,437 P=1,616,928 P=967,456 P=886,788Investment properties (Note 13) 179,619 177,611 152,894 120,604 129,615 136,507Chattel mortgage properties 17,024 27,276 33,009 – 1,330 8,122
Amortization of intangible assets(Note 14) 488,157 461,405 407,051 469,539 444,311 353,940
P=2,804,123 P=1,950,977 P=1,684,391 P=2,207,071 P=1,542,712 P=1,385,357
Certain property and equipment of the Parent Company with carrying amount of P=92.6 millionand P=98.3 million are temporarily idle as of December 31, 2019 and 2018, respectively.
As of December 31, 2019 and 2018, property and equipment of the Parent Company with grosscarrying amount of P=5.1 billion are fully depreciated but are still being used.
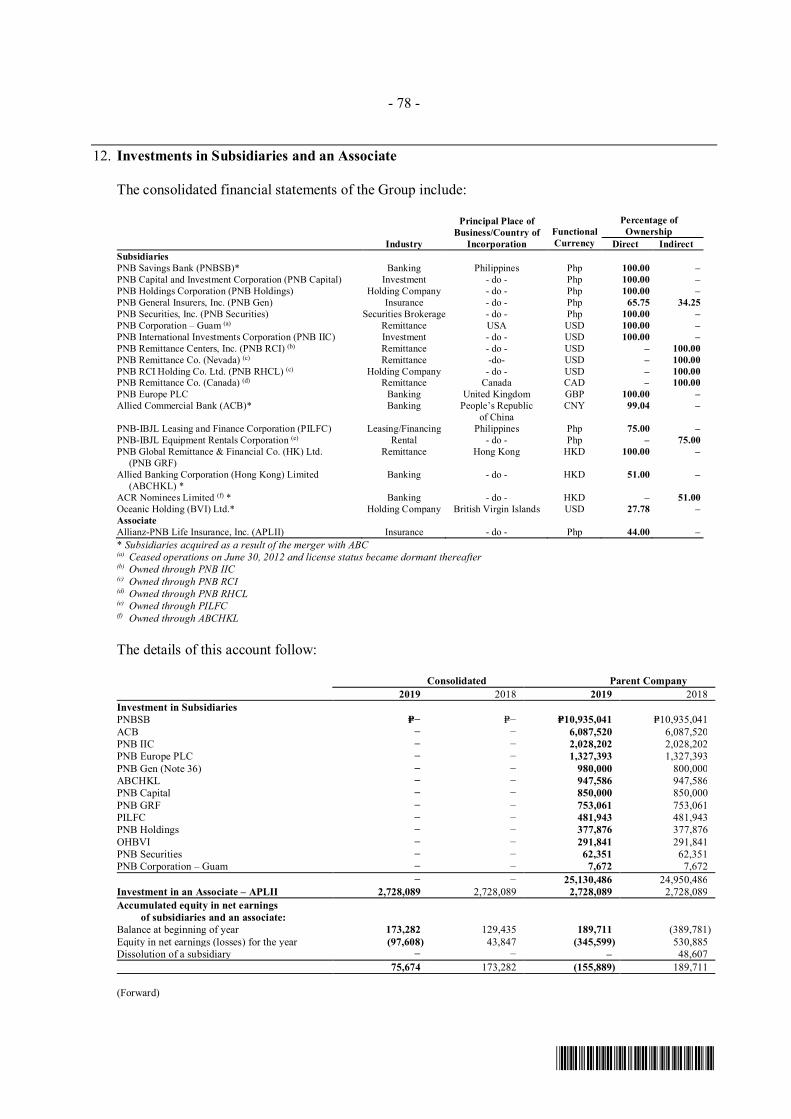
- 78 -
*SGVFS038920*
12. Investments in Subsidiaries and an Associate
The consolidated financial statements of the Group include:
Industry
Principal Place ofBusiness/Country of
IncorporationFunctionalCurrency
Percentage ofOwnership
Direct IndirectSubsidiariesPNB Savings Bank (PNBSB)* Banking Philippines Php 100.00 –PNB Capital and Investment Corporation (PNB Capital) Investment - do - Php 100.00 –PNB Holdings Corporation (PNB Holdings) Holding Company - do - Php 100.00 –PNB General Insurers, Inc. (PNB Gen) Insurance - do - Php 65.75 34.25PNB Securities, Inc. (PNB Securities) Securities Brokerage - do - Php 100.00 –PNB Corporation – Guam (a) Remittance USA USD 100.00 –PNB International Investments Corporation (PNB IIC) Investment - do - USD 100.00 –PNB Remittance Centers, Inc. (PNB RCI) (b) Remittance - do - USD – 100.00PNB Remittance Co. (Nevada) (c) Remittance -do- USD – 100.00PNB RCI Holding Co. Ltd. (PNB RHCL) (c) Holding Company - do - USD – 100.00PNB Remittance Co. (Canada) (d) Remittance Canada CAD – 100.00PNB Europe PLC Banking United Kingdom GBP 100.00 –Allied Commercial Bank (ACB)* Banking People’s Republic
of ChinaCNY 99.04 –
PNB-IBJL Leasing and Finance Corporation (PILFC) Leasing/Financing Philippines Php 75.00 –PNB-IBJL Equipment Rentals Corporation (e) Rental - do - Php – 75.00PNB Global Remittance & Financial Co. (HK) Ltd.
(PNB GRF)Remittance Hong Kong HKD 100.00 –
Allied Banking Corporation (Hong Kong) Limited(ABCHKL) *
Banking - do - HKD 51.00 –
ACR Nominees Limited (f) * Banking - do - HKD – 51.00Oceanic Holding (BVI) Ltd.* Holding Company British Virgin Islands USD 27.78 –AssociateAllianz-PNB Life Insurance, Inc. (APLII) Insurance - do - Php 44.00 –* Subsidiaries acquired as a result of the merger with ABC(a) Ceased operations on June 30, 2012 and license status became dormant thereafter(b) Owned through PNB IIC(c) Owned through PNB RCI(d) Owned through PNB RHCL(e) Owned through PILFC(f) Owned through ABCHKL
The details of this account follow:
Consolidated Parent Company2019 2018 2019 2018
Investment in SubsidiariesPNBSB P=− P=− P=10,935,041 P=10,935,041ACB − − 6,087,520 6,087,520PNB IIC − − 2,028,202 2,028,202PNB Europe PLC − − 1,327,393 1,327,393PNB Gen (Note 36) − − 980,000 800,000ABCHKL − − 947,586 947,586PNB Capital − − 850,000 850,000PNB GRF − − 753,061 753,061PILFC − − 481,943 481,943PNB Holdings − − 377,876 377,876OHBVI − − 291,841 291,841PNB Securities − − 62,351 62,351PNB Corporation – Guam − − 7,672 7,672
− − 25,130,486 24,950,486Investment in an Associate – APLII 2,728,089 2,728,089 2,728,089 2,728,089Accumulated equity in net earnings
of subsidiaries and an associate:Balance at beginning of year 173,282 129,435 189,711 (389,781)Equity in net earnings (losses) for the year (97,608) 43,847 (345,599) 530,885Dissolution of a subsidiary − − – 48,607
75,674 173,282 (155,889) 189,711
(Forward)
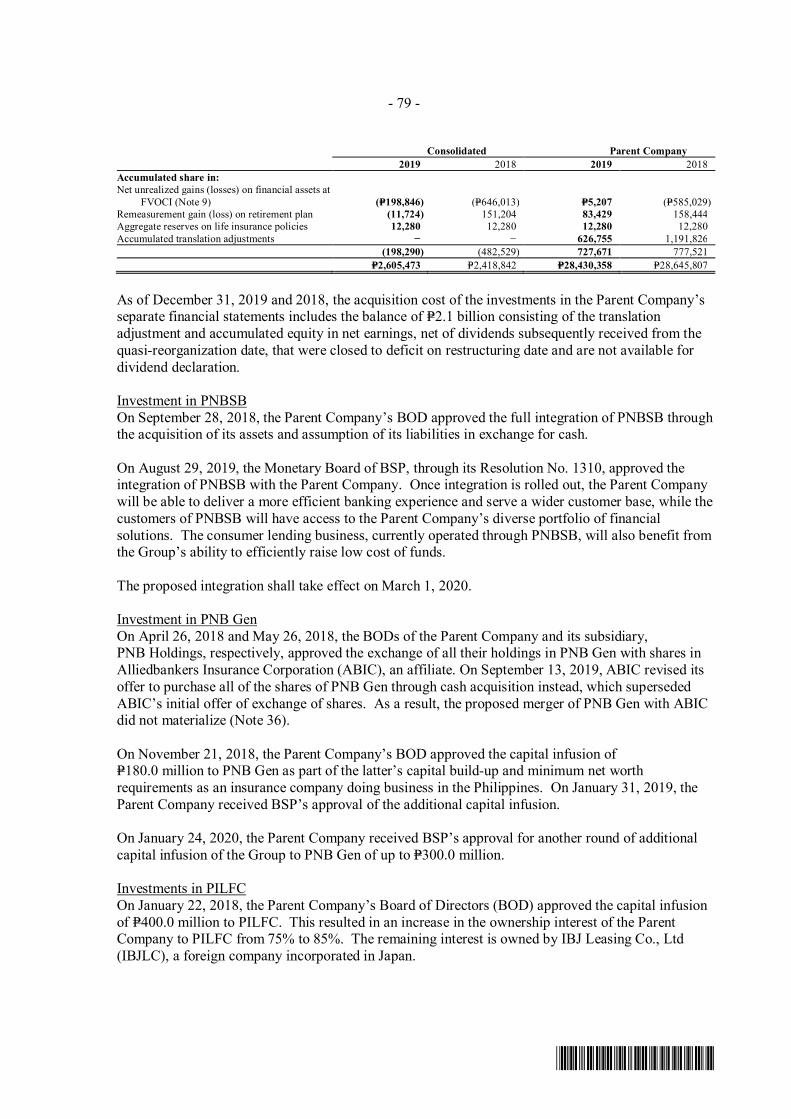
- 79 -
*SGVFS038920*
Consolidated Parent Company2019 2018 2019 2018
Accumulated share in:Net unrealized gains (losses) on financial assets at
FVOCI (Note 9) (P=198,846) (P=646,013) P=5,207 (P=585,029)Remeasurement gain (loss) on retirement plan (11,724) 151,204 83,429 158,444Aggregate reserves on life insurance policies 12,280 12,280 12,280 12,280Accumulated translation adjustments − − 626,755 1,191,826
(198,290) (482,529) 727,671 777,521P=2,605,473 P=2,418,842 P=28,430,358 P=28,645,807
As of December 31, 2019 and 2018, the acquisition cost of the investments in the Parent Company’sseparate financial statements includes the balance of P=2.1 billion consisting of the translationadjustment and accumulated equity in net earnings, net of dividends subsequently received from thequasi-reorganization date, that were closed to deficit on restructuring date and are not available fordividend declaration.
Investment in PNBSBOn September 28, 2018, the Parent Company’s BOD approved the full integration of PNBSB throughthe acquisition of its assets and assumption of its liabilities in exchange for cash.
On August 29, 2019, the Monetary Board of BSP, through its Resolution No. 1310, approved theintegration of PNBSB with the Parent Company. Once integration is rolled out, the Parent Companywill be able to deliver a more efficient banking experience and serve a wider customer base, while thecustomers of PNBSB will have access to the Parent Company’s diverse portfolio of financialsolutions. The consumer lending business, currently operated through PNBSB, will also benefit fromthe Group’s ability to efficiently raise low cost of funds.
The proposed integration shall take effect on March 1, 2020.
Investment in PNB GenOn April 26, 2018 and May 26, 2018, the BODs of the Parent Company and its subsidiary,PNB Holdings, respectively, approved the exchange of all their holdings in PNB Gen with shares inAlliedbankers Insurance Corporation (ABIC), an affiliate. On September 13, 2019, ABIC revised itsoffer to purchase all of the shares of PNB Gen through cash acquisition instead, which supersededABIC’s initial offer of exchange of shares. As a result, the proposed merger of PNB Gen with ABICdid not materialize (Note 36).
On November 21, 2018, the Parent Company’s BOD approved the capital infusion ofP=180.0 million to PNB Gen as part of the latter’s capital build-up and minimum net worthrequirements as an insurance company doing business in the Philippines. On January 31, 2019, theParent Company received BSP’s approval of the additional capital infusion.
On January 24, 2020, the Parent Company received BSP’s approval for another round of additionalcapital infusion of the Group to PNB Gen of up to P=300.0 million.
Investments in PILFCOn January 22, 2018, the Parent Company’s Board of Directors (BOD) approved the capital infusionof P=400.0 million to PILFC. This resulted in an increase in the ownership interest of the ParentCompany to PILFC from 75% to 85%. The remaining interest is owned by IBJ Leasing Co., Ltd(IBJLC), a foreign company incorporated in Japan.
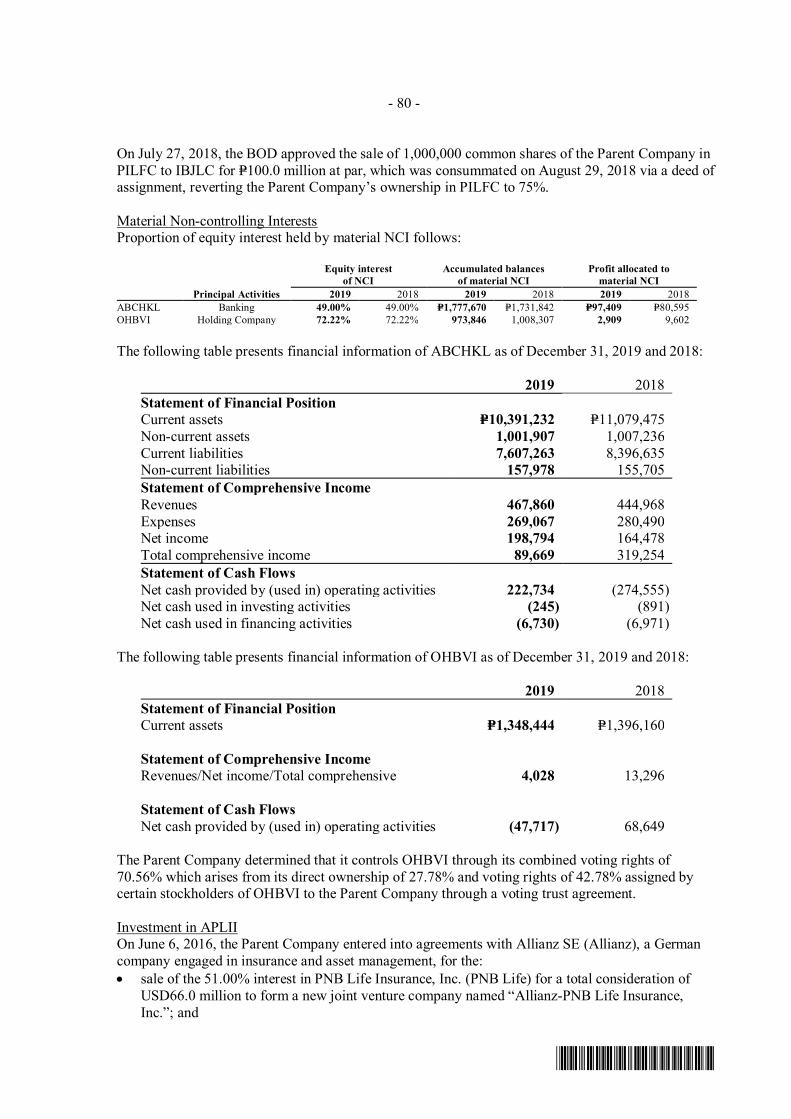
- 80 -
*SGVFS038920*
On July 27, 2018, the BOD approved the sale of 1,000,000 common shares of the Parent Company inPILFC to IBJLC for P=100.0 million at par, which was consummated on August 29, 2018 via a deed ofassignment, reverting the Parent Company’s ownership in PILFC to 75%.
Material Non-controlling InterestsProportion of equity interest held by material NCI follows:
Equity interestof NCI
Accumulated balancesof material NCI
Profit allocated tomaterial NCI
Principal Activities 2019 2018 2019 2018 2019 2018ABCHKL Banking 49.00% 49.00% P=1,777,670 P=1,731,842 P=97,409 P=80,595OHBVI Holding Company 72.22% 72.22% 973,846 1,008,307 2,909 9,602
The following table presents financial information of ABCHKL as of December 31, 2019 and 2018:
2019 2018Statement of Financial PositionCurrent assets P=10,391,232 P=11,079,475Non-current assets 1,001,907 1,007,236Current liabilities 7,607,263 8,396,635Non-current liabilities 157,978 155,705Statement of Comprehensive IncomeRevenues 467,860 444,968Expenses 269,067 280,490Net income 198,794 164,478Total comprehensive income 89,669 319,254Statement of Cash FlowsNet cash provided by (used in) operating activities 222,734 (274,555)Net cash used in investing activities (245) (891)Net cash used in financing activities (6,730) (6,971)
The following table presents financial information of OHBVI as of December 31, 2019 and 2018:
2019 2018Statement of Financial PositionCurrent assets P=1,348,444 P=1,396,160
Statement of Comprehensive IncomeRevenues/Net income/Total comprehensive 4,028 13,296
Statement of Cash FlowsNet cash provided by (used in) operating activities (47,717) 68,649
The Parent Company determined that it controls OHBVI through its combined voting rights of70.56% which arises from its direct ownership of 27.78% and voting rights of 42.78% assigned bycertain stockholders of OHBVI to the Parent Company through a voting trust agreement.
Investment in APLIIOn June 6, 2016, the Parent Company entered into agreements with Allianz SE (Allianz), a Germancompany engaged in insurance and asset management, for the:· sale of the 51.00% interest in PNB Life Insurance, Inc. (PNB Life) for a total consideration of
USD66.0 million to form a new joint venture company named “Allianz-PNB Life Insurance,Inc.”; and
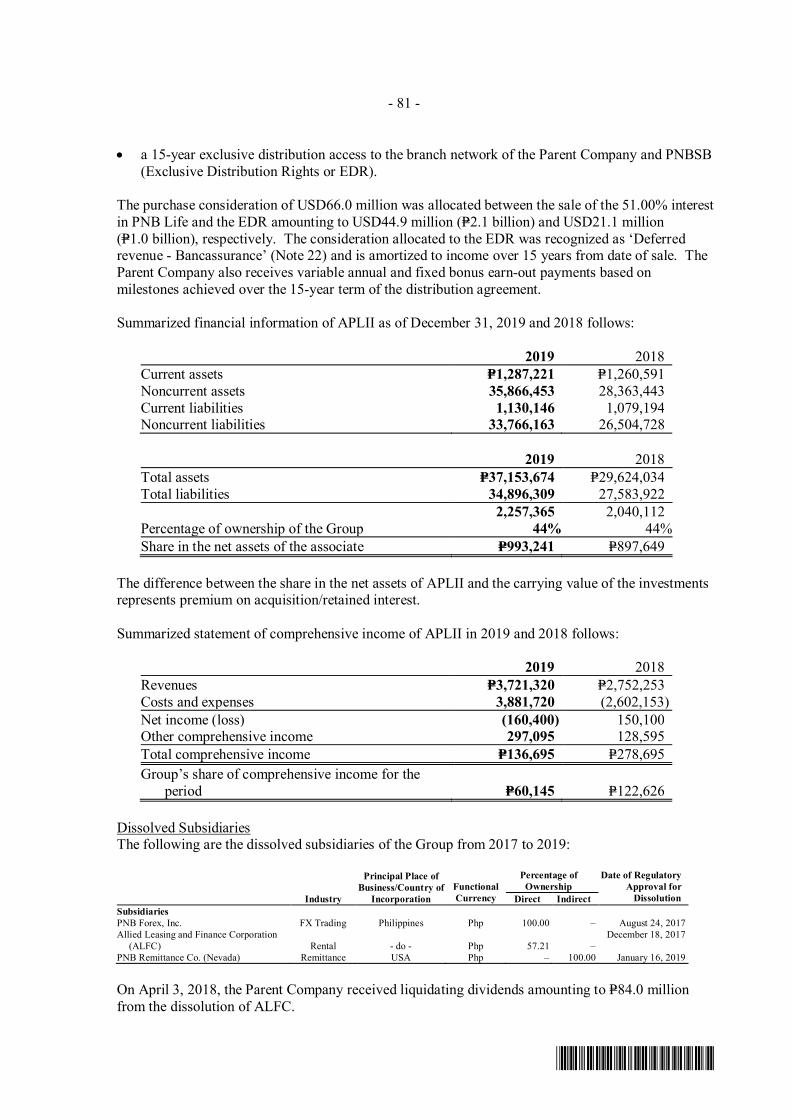
- 81 -
*SGVFS038920*
· a 15-year exclusive distribution access to the branch network of the Parent Company and PNBSB(Exclusive Distribution Rights or EDR).
The purchase consideration of USD66.0 million was allocated between the sale of the 51.00% interestin PNB Life and the EDR amounting to USD44.9 million (P=2.1 billion) and USD21.1 million(P=1.0 billion), respectively. The consideration allocated to the EDR was recognized as ‘Deferredrevenue - Bancassurance’ (Note 22) and is amortized to income over 15 years from date of sale. TheParent Company also receives variable annual and fixed bonus earn-out payments based onmilestones achieved over the 15-year term of the distribution agreement.
Summarized financial information of APLII as of December 31, 2019 and 2018 follows:
2019 2018Current assets P=1,287,221 P=1,260,591Noncurrent assets 35,866,453 28,363,443Current liabilities 1,130,146 1,079,194Noncurrent liabilities 33,766,163 26,504,728
2019 2018Total assets P=37,153,674 P=29,624,034Total liabilities 34,896,309 27,583,922
2,257,365 2,040,112Percentage of ownership of the Group 44% 44%Share in the net assets of the associate P=993,241 P=897,649
The difference between the share in the net assets of APLII and the carrying value of the investmentsrepresents premium on acquisition/retained interest.
Summarized statement of comprehensive income of APLII in 2019 and 2018 follows:
2019 2018Revenues P=3,721,320 P=2,752,253Costs and expenses 3,881,720 (2,602,153)Net income (loss) (160,400) 150,100Other comprehensive income 297,095 128,595Total comprehensive income P=136,695 P=278,695Group’s share of comprehensive income for the
period P=60,145 P=122,626
Dissolved SubsidiariesThe following are the dissolved subsidiaries of the Group from 2017 to 2019:
Industry
Principal Place ofBusiness/Country of
IncorporationFunctionalCurrency
Percentage ofOwnership
Date of RegulatoryApproval for
DissolutionDirect IndirectSubsidiariesPNB Forex, Inc. FX Trading Philippines Php 100.00 – August 24, 2017Allied Leasing and Finance Corporation
(ALFC) Rental - do - Php 57.21 –December 18, 2017
PNB Remittance Co. (Nevada) Remittance USA Php – 100.00 January 16, 2019
On April 3, 2018, the Parent Company received liquidating dividends amounting to P=84.0 millionfrom the dissolution of ALFC.
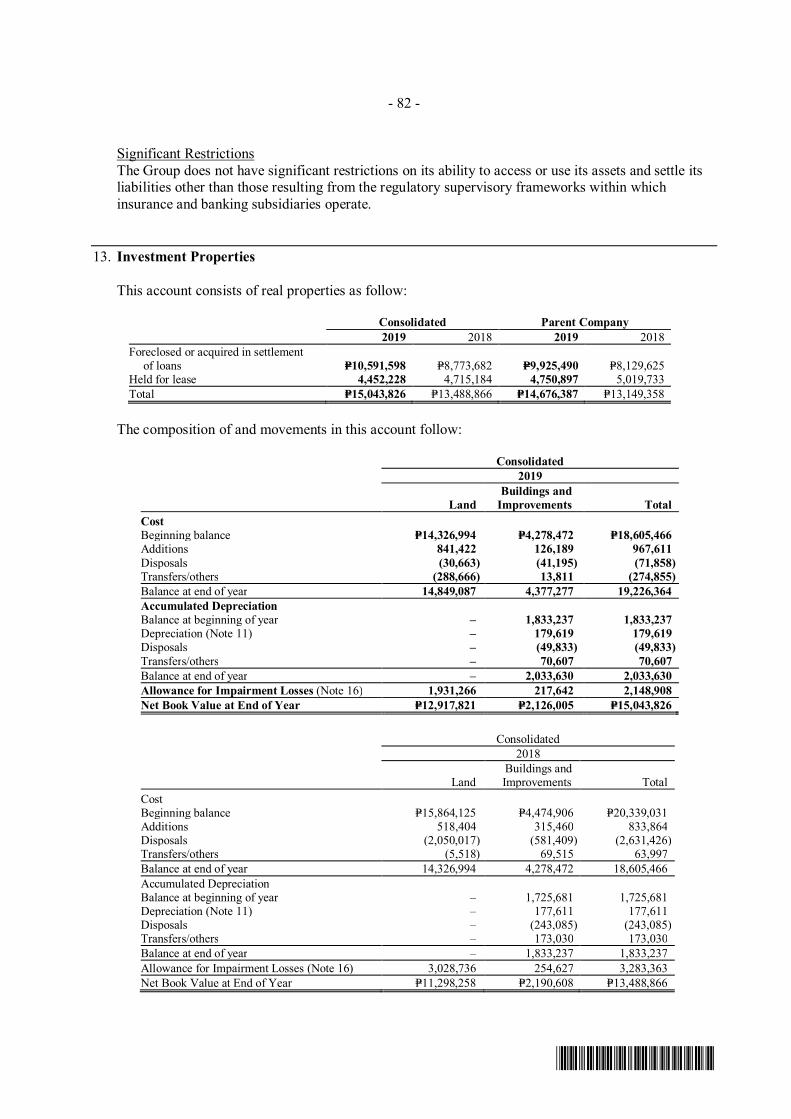
- 82 -
*SGVFS038920*
Significant RestrictionsThe Group does not have significant restrictions on its ability to access or use its assets and settle itsliabilities other than those resulting from the regulatory supervisory frameworks within whichinsurance and banking subsidiaries operate.
13. Investment Properties
This account consists of real properties as follow:
Consolidated Parent Company2019 2018 2019 2018
Foreclosed or acquired in settlementof loans P=10,591,598 P=8,773,682 P=9,925,490 P=8,129,625
Held for lease 4,452,228 4,715,184 4,750,897 5,019,733Total P=15,043,826 P=13,488,866 P=14,676,387 P=13,149,358
The composition of and movements in this account follow:
Consolidated2019
LandBuildings and
Improvements TotalCostBeginning balance P=14,326,994 P=4,278,472 P=18,605,466Additions 841,422 126,189 967,611Disposals (30,663) (41,195) (71,858)Transfers/others (288,666) 13,811 (274,855)Balance at end of year 14,849,087 4,377,277 19,226,364Accumulated DepreciationBalance at beginning of year – 1,833,237 1,833,237Depreciation (Note 11) – 179,619 179,619Disposals – (49,833) (49,833)Transfers/others – 70,607 70,607Balance at end of year – 2,033,630 2,033,630Allowance for Impairment Losses (Note 16) 1,931,266 217,642 2,148,908Net Book Value at End of Year P=12,917,821 P=2,126,005 P=15,043,826
Consolidated2018
LandBuildings andImprovements Total
CostBeginning balance P=15,864,125 P=4,474,906 P=20,339,031Additions 518,404 315,460 833,864Disposals (2,050,017) (581,409) (2,631,426)Transfers/others (5,518) 69,515 63,997Balance at end of year 14,326,994 4,278,472 18,605,466Accumulated DepreciationBalance at beginning of year – 1,725,681 1,725,681Depreciation (Note 11) – 177,611 177,611Disposals – (243,085) (243,085)Transfers/others – 173,030 173,030Balance at end of year – 1,833,237 1,833,237Allowance for Impairment Losses (Note 16) 3,028,736 254,627 3,283,363Net Book Value at End of Year P=11,298,258 P=2,190,608 P=13,488,866
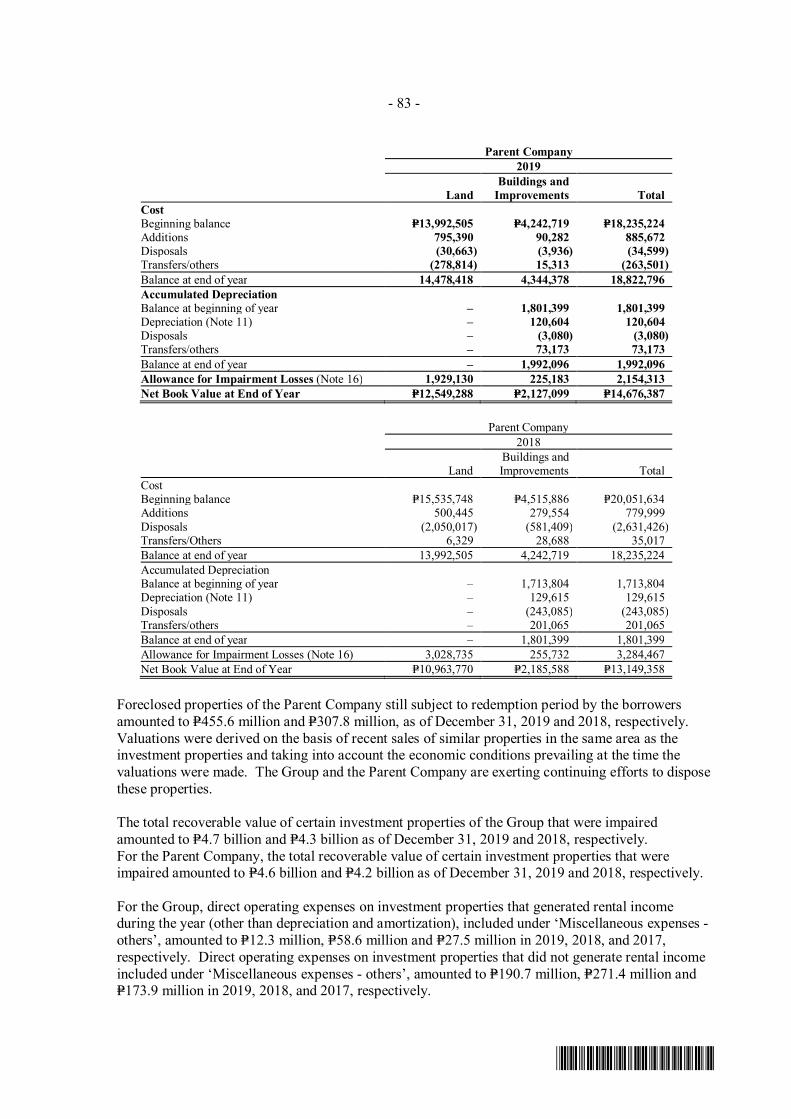
- 83 -
*SGVFS038920*
Parent Company2019
LandBuildings and
Improvements TotalCostBeginning balance P=13,992,505 P=4,242,719 P=18,235,224Additions 795,390 90,282 885,672Disposals (30,663) (3,936) (34,599)Transfers/others (278,814) 15,313 (263,501)Balance at end of year 14,478,418 4,344,378 18,822,796Accumulated DepreciationBalance at beginning of year – 1,801,399 1,801,399Depreciation (Note 11) – 120,604 120,604Disposals – (3,080) (3,080)Transfers/others – 73,173 73,173Balance at end of year – 1,992,096 1,992,096Allowance for Impairment Losses (Note 16) 1,929,130 225,183 2,154,313Net Book Value at End of Year P=12,549,288 P=2,127,099 P=14,676,387
Parent Company2018
LandBuildings andImprovements Total
CostBeginning balance P=15,535,748 P=4,515,886 P=20,051,634Additions 500,445 279,554 779,999Disposals (2,050,017) (581,409) (2,631,426)Transfers/Others 6,329 28,688 35,017Balance at end of year 13,992,505 4,242,719 18,235,224Accumulated DepreciationBalance at beginning of year – 1,713,804 1,713,804Depreciation (Note 11) – 129,615 129,615Disposals – (243,085) (243,085)Transfers/others – 201,065 201,065Balance at end of year – 1,801,399 1,801,399Allowance for Impairment Losses (Note 16) 3,028,735 255,732 3,284,467Net Book Value at End of Year P=10,963,770 P=2,185,588 P=13,149,358
Foreclosed properties of the Parent Company still subject to redemption period by the borrowersamounted to P=455.6 million and P=307.8 million, as of December 31, 2019 and 2018, respectively.Valuations were derived on the basis of recent sales of similar properties in the same area as theinvestment properties and taking into account the economic conditions prevailing at the time thevaluations were made. The Group and the Parent Company are exerting continuing efforts to disposethese properties.
The total recoverable value of certain investment properties of the Group that were impairedamounted to P=4.7 billion and P=4.3 billion as of December 31, 2019 and 2018, respectively.For the Parent Company, the total recoverable value of certain investment properties that wereimpaired amounted to P=4.6 billion and P=4.2 billion as of December 31, 2019 and 2018, respectively.
For the Group, direct operating expenses on investment properties that generated rental incomeduring the year (other than depreciation and amortization), included under ‘Miscellaneous expenses -others’, amounted to P=12.3 million, P=58.6 million and P=27.5 million in 2019, 2018, and 2017,respectively. Direct operating expenses on investment properties that did not generate rental incomeincluded under ‘Miscellaneous expenses - others’, amounted to P=190.7 million, P=271.4 million andP=173.9 million in 2019, 2018, and 2017, respectively.
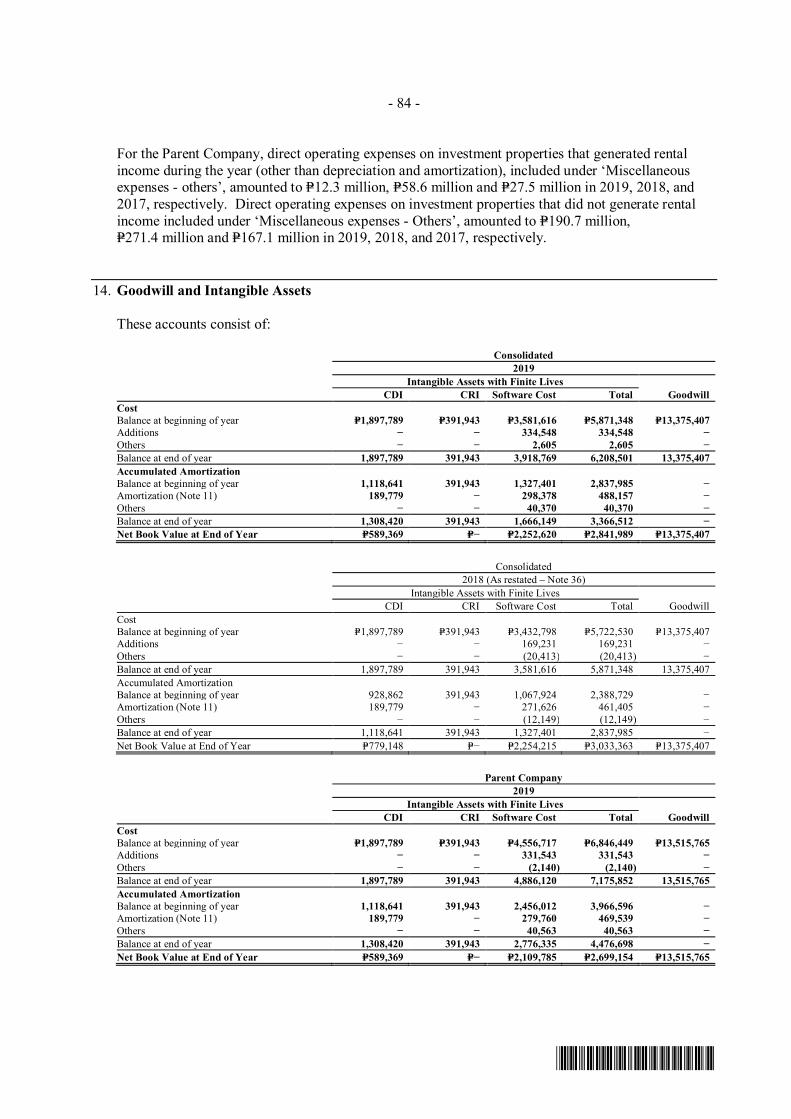
- 84 -
*SGVFS038920*
For the Parent Company, direct operating expenses on investment properties that generated rentalincome during the year (other than depreciation and amortization), included under ‘Miscellaneousexpenses - others’, amounted to P=12.3 million, P=58.6 million and P=27.5 million in 2019, 2018, and2017, respectively. Direct operating expenses on investment properties that did not generate rentalincome included under ‘Miscellaneous expenses - Others’, amounted to P=190.7 million,P=271.4 million and P=167.1 million in 2019, 2018, and 2017, respectively.
14. Goodwill and Intangible Assets
These accounts consist of:
Consolidated2019
Intangible Assets with Finite LivesCDI CRI Software Cost Total Goodwill
CostBalance at beginning of year P=1,897,789 P=391,943 P=3,581,616 P=5,871,348 P=13,375,407Additions − − 334,548 334,548 −Others − − 2,605 2,605 −Balance at end of year 1,897,789 391,943 3,918,769 6,208,501 13,375,407Accumulated AmortizationBalance at beginning of year 1,118,641 391,943 1,327,401 2,837,985 −Amortization (Note 11) 189,779 − 298,378 488,157 −Others − − 40,370 40,370 −Balance at end of year 1,308,420 391,943 1,666,149 3,366,512 −Net Book Value at End of Year P=589,369 P=− P=2,252,620 P=2,841,989 P=13,375,407
Consolidated2018 (As restated – Note 36)
Intangible Assets with Finite LivesCDI CRI Software Cost Total Goodwill
CostBalance at beginning of year P=1,897,789 P=391,943 P=3,432,798 P=5,722,530 P=13,375,407Additions − − 169,231 169,231 −Others − − (20,413) (20,413) −Balance at end of year 1,897,789 391,943 3,581,616 5,871,348 13,375,407Accumulated AmortizationBalance at beginning of year 928,862 391,943 1,067,924 2,388,729 −Amortization (Note 11) 189,779 − 271,626 461,405 −Others − − (12,149) (12,149) −Balance at end of year 1,118,641 391,943 1,327,401 2,837,985 −Net Book Value at End of Year P=779,148 P=− P=2,254,215 P=3,033,363 P=13,375,407
Parent Company2019
Intangible Assets with Finite LivesCDI CRI Software Cost Total Goodwill
CostBalance at beginning of year P=1,897,789 P=391,943 P=4,556,717 P=6,846,449 P=13,515,765Additions − − 331,543 331,543 −Others − − (2,140) (2,140) −Balance at end of year 1,897,789 391,943 4,886,120 7,175,852 13,515,765Accumulated AmortizationBalance at beginning of year 1,118,641 391,943 2,456,012 3,966,596 −Amortization (Note 11) 189,779 − 279,760 469,539 −Others − − 40,563 40,563 −Balance at end of year 1,308,420 391,943 2,776,335 4,476,698 −Net Book Value at End of Year P=589,369 P=− P=2,109,785 P=2,699,154 P=13,515,765
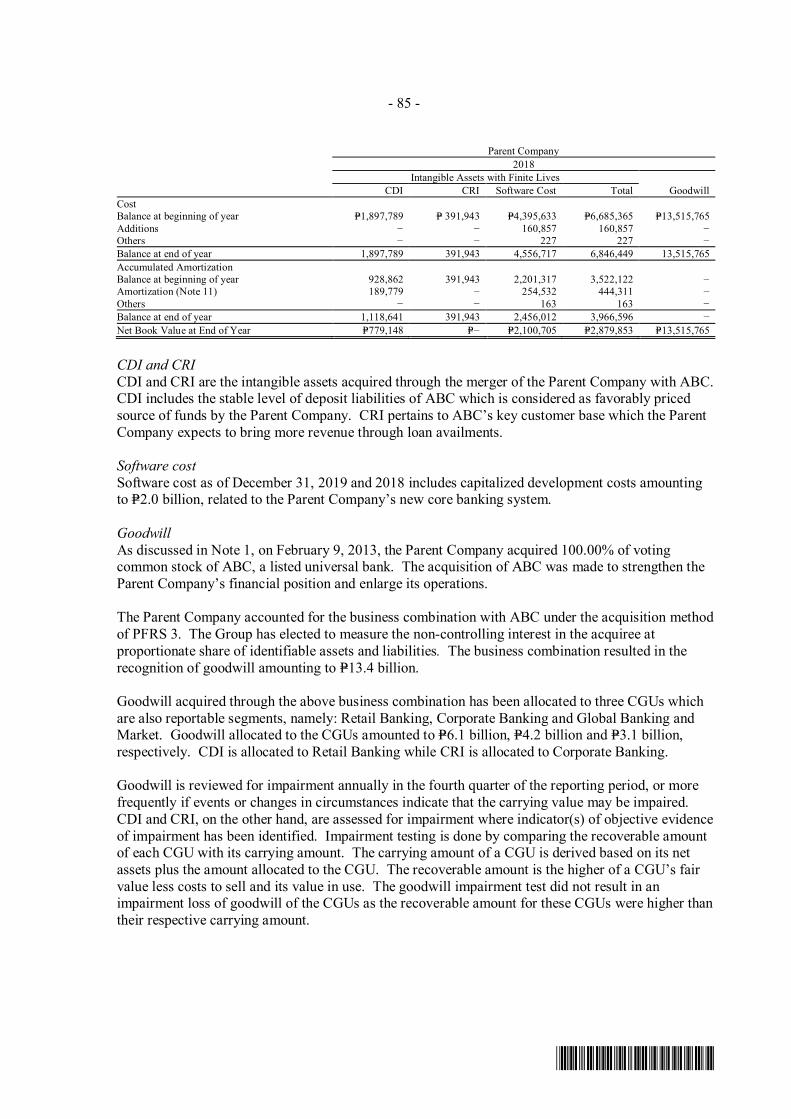
- 85 -
*SGVFS038920*
Parent Company2018
Intangible Assets with Finite LivesCDI CRI Software Cost Total Goodwill
CostBalance at beginning of year P=1,897,789 P= 391,943 P=4,395,633 P=6,685,365 P=13,515,765Additions − − 160,857 160,857 −Others − − 227 227 −Balance at end of year 1,897,789 391,943 4,556,717 6,846,449 13,515,765Accumulated AmortizationBalance at beginning of year 928,862 391,943 2,201,317 3,522,122 −Amortization (Note 11) 189,779 − 254,532 444,311 −Others − − 163 163 −Balance at end of year 1,118,641 391,943 2,456,012 3,966,596 −Net Book Value at End of Year P=779,148 P=− P=2,100,705 P=2,879,853 P=13,515,765
CDI and CRICDI and CRI are the intangible assets acquired through the merger of the Parent Company with ABC.CDI includes the stable level of deposit liabilities of ABC which is considered as favorably pricedsource of funds by the Parent Company. CRI pertains to ABC’s key customer base which the ParentCompany expects to bring more revenue through loan availments.
Software costSoftware cost as of December 31, 2019 and 2018 includes capitalized development costs amountingto P=2.0 billion, related to the Parent Company’s new core banking system.
GoodwillAs discussed in Note 1, on February 9, 2013, the Parent Company acquired 100.00% of votingcommon stock of ABC, a listed universal bank. The acquisition of ABC was made to strengthen theParent Company’s financial position and enlarge its operations.
The Parent Company accounted for the business combination with ABC under the acquisition methodof PFRS 3. The Group has elected to measure the non-controlling interest in the acquiree atproportionate share of identifiable assets and liabilities. The business combination resulted in therecognition of goodwill amounting to P=13.4 billion.
Goodwill acquired through the above business combination has been allocated to three CGUs whichare also reportable segments, namely: Retail Banking, Corporate Banking and Global Banking andMarket. Goodwill allocated to the CGUs amounted to P=6.1 billion, P=4.2 billion and P=3.1 billion,respectively. CDI is allocated to Retail Banking while CRI is allocated to Corporate Banking.
Goodwill is reviewed for impairment annually in the fourth quarter of the reporting period, or morefrequently if events or changes in circumstances indicate that the carrying value may be impaired.CDI and CRI, on the other hand, are assessed for impairment where indicator(s) of objective evidenceof impairment has been identified. Impairment testing is done by comparing the recoverable amountof each CGU with its carrying amount. The carrying amount of a CGU is derived based on its netassets plus the amount allocated to the CGU. The recoverable amount is the higher of a CGU’s fairvalue less costs to sell and its value in use. The goodwill impairment test did not result in animpairment loss of goodwill of the CGUs as the recoverable amount for these CGUs were higher thantheir respective carrying amount.
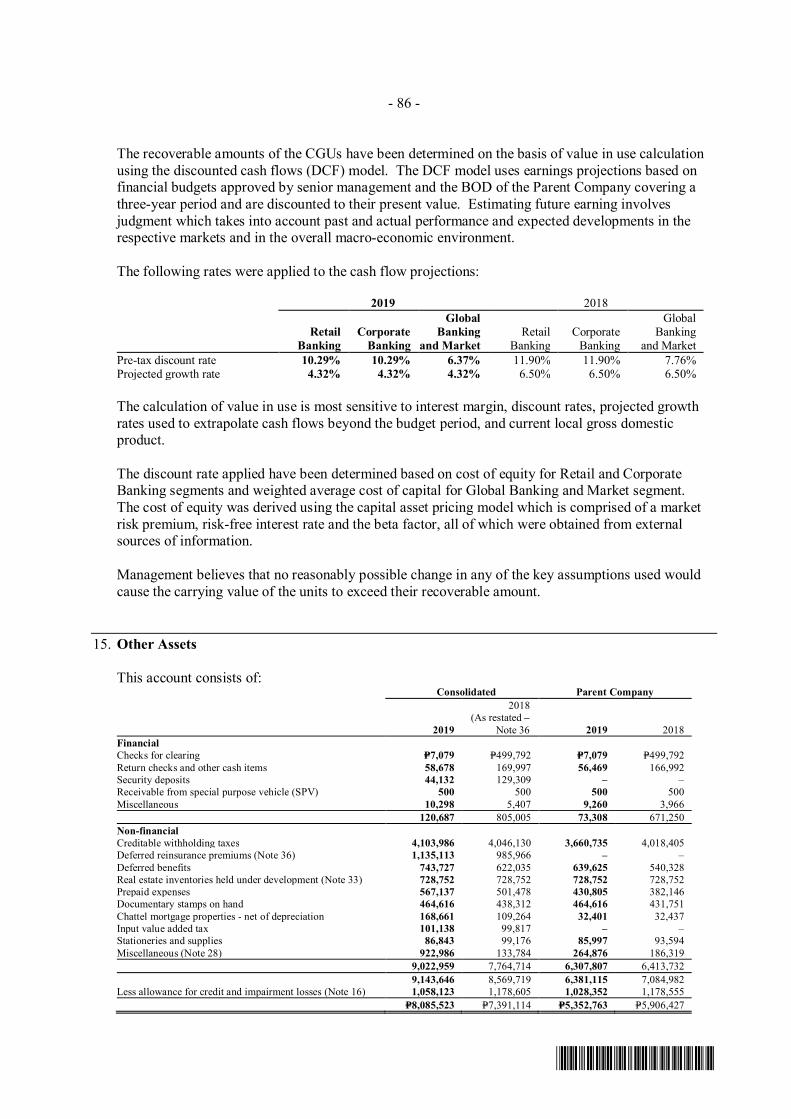
- 86 -
*SGVFS038920*
The recoverable amounts of the CGUs have been determined on the basis of value in use calculationusing the discounted cash flows (DCF) model. The DCF model uses earnings projections based onfinancial budgets approved by senior management and the BOD of the Parent Company covering athree-year period and are discounted to their present value. Estimating future earning involvesjudgment which takes into account past and actual performance and expected developments in therespective markets and in the overall macro-economic environment.
The following rates were applied to the cash flow projections:
2019 2018
RetailBanking
CorporateBanking
GlobalBanking
and MarketRetail
BankingCorporate
Banking
GlobalBanking
and MarketPre-tax discount rate 10.29% 10.29% 6.37% 11.90% 11.90% 7.76%Projected growth rate 4.32% 4.32% 4.32% 6.50% 6.50% 6.50%
The calculation of value in use is most sensitive to interest margin, discount rates, projected growthrates used to extrapolate cash flows beyond the budget period, and current local gross domesticproduct.
The discount rate applied have been determined based on cost of equity for Retail and CorporateBanking segments and weighted average cost of capital for Global Banking and Market segment.The cost of equity was derived using the capital asset pricing model which is comprised of a marketrisk premium, risk-free interest rate and the beta factor, all of which were obtained from externalsources of information.
Management believes that no reasonably possible change in any of the key assumptions used wouldcause the carrying value of the units to exceed their recoverable amount.
15. Other Assets
This account consists of:Consolidated Parent Company
2019
2018(As restated –
Note 36 2019 2018FinancialChecks for clearing P=7,079 P=499,792 P=7,079 P=499,792Return checks and other cash items 58,678 169,997 56,469 166,992Security deposits 44,132 129,309 – –Receivable from special purpose vehicle (SPV) 500 500 500 500Miscellaneous 10,298 5,407 9,260 3,966
120,687 805,005 73,308 671,250Non-financialCreditable withholding taxes 4,103,986 4,046,130 3,660,735 4,018,405Deferred reinsurance premiums (Note 36) 1,135,113 985,966 – –Deferred benefits 743,727 622,035 639,625 540,328Real estate inventories held under development (Note 33) 728,752 728,752 728,752 728,752Prepaid expenses 567,137 501,478 430,805 382,146Documentary stamps on hand 464,616 438,312 464,616 431,751Chattel mortgage properties - net of depreciation 168,661 109,264 32,401 32,437Input value added tax 101,138 99,817 – –Stationeries and supplies 86,843 99,176 85,997 93,594Miscellaneous (Note 28) 922,986 133,784 264,876 186,319
9,022,959 7,764,714 6,307,807 6,413,7329,143,646 8,569,719 6,381,115 7,084,982
Less allowance for credit and impairment losses (Note 16) 1,058,123 1,178,605 1,028,352 1,178,555P=8,085,523 P=7,391,114 P=5,352,763 P=5,906,427
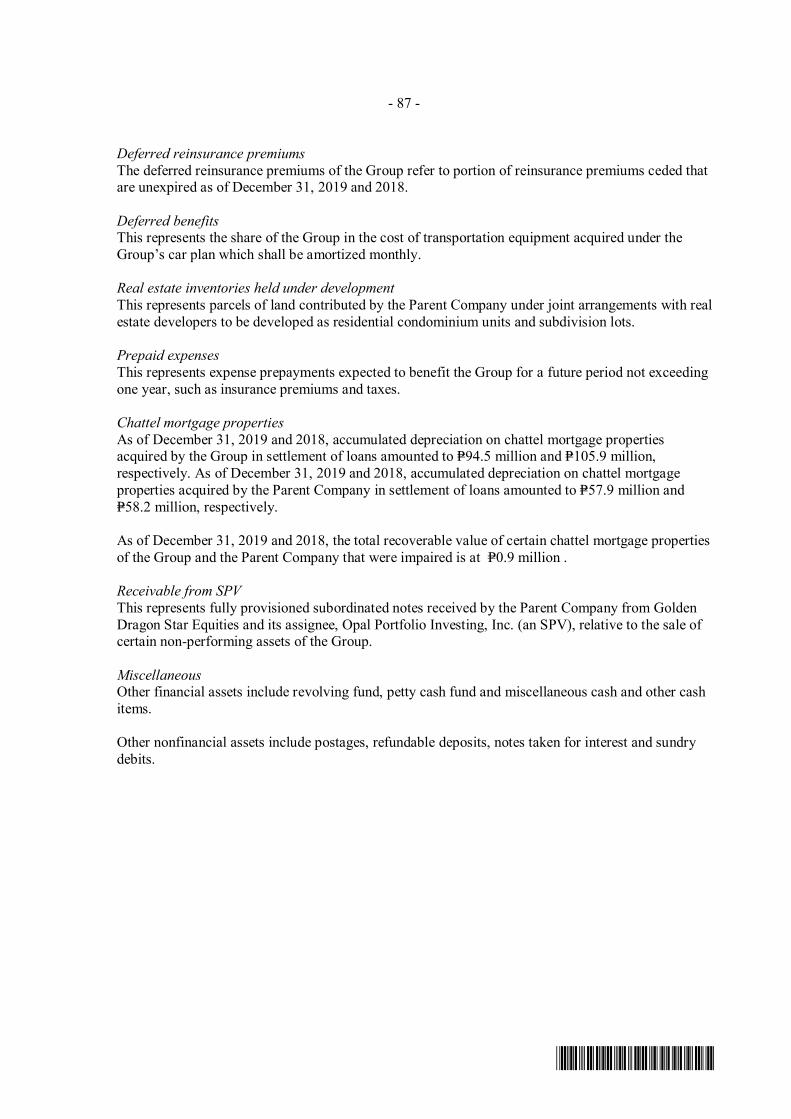
- 87 -
*SGVFS038920*
Deferred reinsurance premiumsThe deferred reinsurance premiums of the Group refer to portion of reinsurance premiums ceded thatare unexpired as of December 31, 2019 and 2018.
Deferred benefitsThis represents the share of the Group in the cost of transportation equipment acquired under theGroup’s car plan which shall be amortized monthly.
Real estate inventories held under developmentThis represents parcels of land contributed by the Parent Company under joint arrangements with realestate developers to be developed as residential condominium units and subdivision lots.
Prepaid expensesThis represents expense prepayments expected to benefit the Group for a future period not exceedingone year, such as insurance premiums and taxes.
Chattel mortgage propertiesAs of December 31, 2019 and 2018, accumulated depreciation on chattel mortgage propertiesacquired by the Group in settlement of loans amounted to P=94.5 million and P=105.9 million,respectively. As of December 31, 2019 and 2018, accumulated depreciation on chattel mortgageproperties acquired by the Parent Company in settlement of loans amounted to P=57.9 million andP=58.2 million, respectively.
As of December 31, 2019 and 2018, the total recoverable value of certain chattel mortgage propertiesof the Group and the Parent Company that were impaired is at P=0.9 million .
Receivable from SPVThis represents fully provisioned subordinated notes received by the Parent Company from GoldenDragon Star Equities and its assignee, Opal Portfolio Investing, Inc. (an SPV), relative to the sale ofcertain non-performing assets of the Group.
MiscellaneousOther financial assets include revolving fund, petty cash fund and miscellaneous cash and other cashitems.
Other nonfinancial assets include postages, refundable deposits, notes taken for interest and sundrydebits.
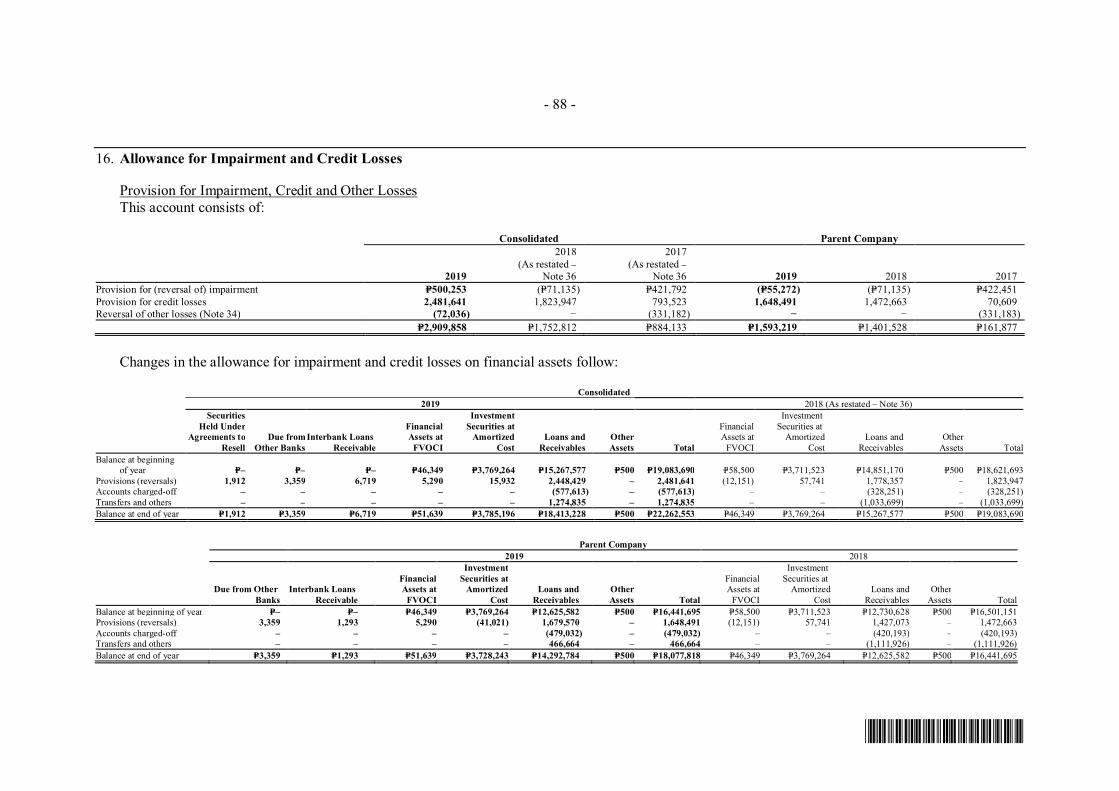
- 88 -
*SGVFS038920*
16. Allowance for Impairment and Credit Losses
Provision for Impairment, Credit and Other LossesThis account consists of:
Consolidated Parent Company
2019
2018(As restated –
Note 36
2017(As restated –
Note 36 2019 2018 2017Provision for (reversal of) impairment P=500,253 (P=71,135) P=421,792 (P=55,272) (P=71,135) P=422,451Provision for credit losses 2,481,641 1,823,947 793,523 1,648,491 1,472,663 70,609Reversal of other losses (Note 34) (72,036) − (331,182) − − (331,183)
P=2,909,858 P=1,752,812 P=884,133 P=1,593,219 P=1,401,528 P=161,877
Changes in the allowance for impairment and credit losses on financial assets follow:
Consolidated2019 2018 (As restated – Note 36)
SecuritiesHeld Under
Agreements toResell
Due fromOther Banks
Interbank LoansReceivable
FinancialAssets at
FVOCI
InvestmentSecurities at
AmortizedCost
Loans andReceivables
OtherAssets Total
FinancialAssets at
FVOCI
InvestmentSecurities at
AmortizedCost
Loans andReceivables
OtherAssets Total
Balance at beginningof year P=– P=– P=– P=46,349 P=3,769,264 P=15,267,577 P=500 P=19,083,690 P=58,500 P=3,711,523 P=14,851,170 P=500 P=18,621,693
Provisions (reversals) 1,912 3,359 6,719 5,290 15,932 2,448,429 – 2,481,641 (12,151) 57,741 1,778,357 – 1,823,947Accounts charged-off – – – – – (577,613) – (577,613) – – (328,251) – (328,251)Transfers and others – – – – – 1,274,835 – 1,274,835 – – (1,033,699) – (1,033,699)Balance at end of year P=1,912 P=3,359 P=6,719 P=51,639 P=3,785,196 P=18,413,228 P=500 P=22,262,553 P=46,349 P=3,769,264 P=15,267,577 P=500 P=19,083,690
Parent Company2019 2018
Due from OtherBanks
Interbank LoansReceivable
FinancialAssets at
FVOCI
InvestmentSecurities at
AmortizedCost
Loans andReceivables
OtherAssets Total
FinancialAssets at
FVOCI
InvestmentSecurities at
AmortizedCost
Loans andReceivables
OtherAssets Total
Balance at beginning of year P=– P=– P=46,349 P=3,769,264 P=12,625,582 P=500 P=16,441,695 P=58,500 P=3,711,523 P=12,730,628 P=500 P=16,501,151Provisions (reversals) 3,359 1,293 5,290 (41,021) 1,679,570 – 1,648,491 (12,151) 57,741 1,427,073 – 1,472,663Accounts charged-off – – – – (479,032) – (479,032) – – (420,193) – (420,193)Transfers and others – – – – 466,664 – 466,664 – – (1,111,926) – (1,111,926)Balance at end of year P=3,359 P=1,293 P=51,639 P=3,728,243 P=14,292,784 P=500 P=18,077,818 P=46,349 P=3,769,264 P=12,625,582 P=500 P=16,441,695
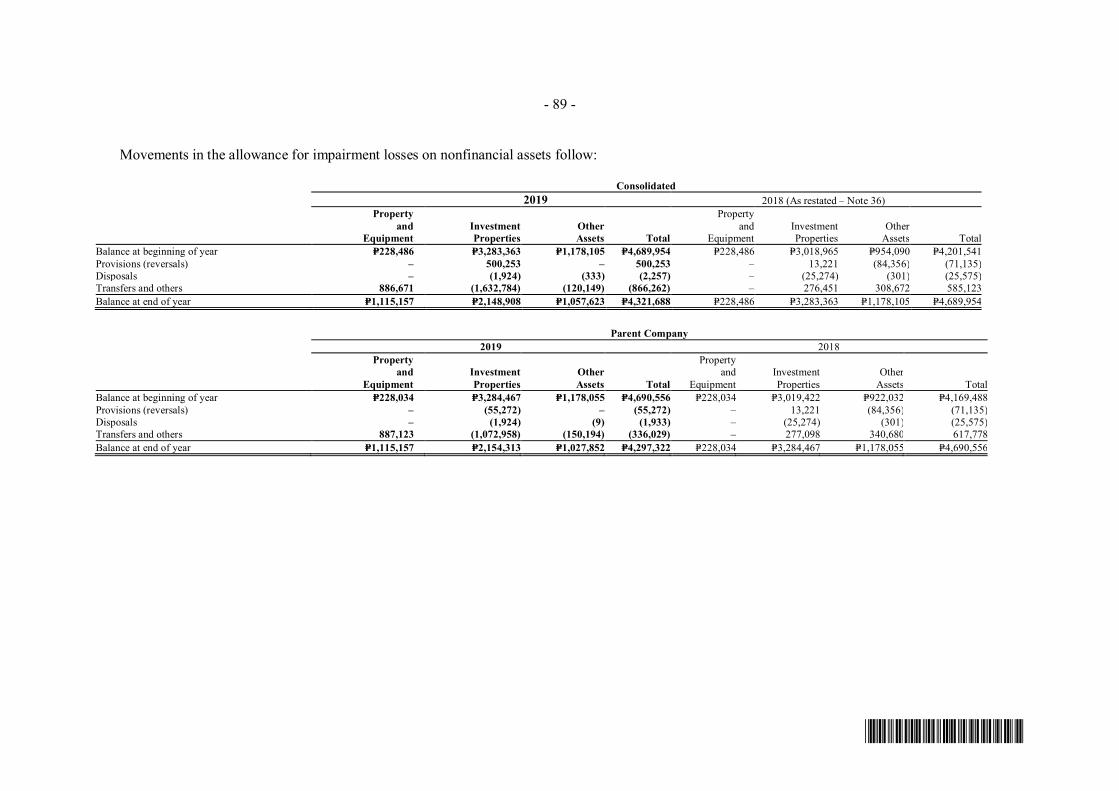
- 89 -
*SGVFS038920*
Movements in the allowance for impairment losses on nonfinancial assets follow:
Consolidated2019 2018 (As restated – Note 36)
Propertyand
EquipmentInvestmentProperties
OtherAssets Total
Propertyand
EquipmentInvestmentProperties
OtherAssets Total
Balance at beginning of year P=228,486 P=3,283,363 P=1,178,105 P=4,689,954 P=228,486 P=3,018,965 P=954,090 P=4,201,541Provisions (reversals) – 500,253 – 500,253 – 13,221 (84,356) (71,135)Disposals – (1,924) (333) (2,257) – (25,274) (301) (25,575)Transfers and others 886,671 (1,632,784) (120,149) (866,262) – 276,451 308,672 585,123Balance at end of year P=1,115,157 P=2,148,908 P=1,057,623 P=4,321,688 P=228,486 P=3,283,363 P=1,178,105 P=4,689,954
Parent Company2019 2018
Propertyand
EquipmentInvestmentProperties
OtherAssets Total
Propertyand
EquipmentInvestmentProperties
OtherAssets Total
Balance at beginning of year P=228,034 P=3,284,467 P=1,178,055 P=4,690,556 P=228,034 P=3,019,422 P=922,032 P=4,169,488Provisions (reversals) – (55,272) – (55,272) – 13,221 (84,356) (71,135)Disposals – (1,924) (9) (1,933) – (25,274) (301) (25,575)Transfers and others 887,123 (1,072,958) (150,194) (336,029) – 277,098 340,680 617,778Balance at end of year P=1,115,157 P=2,154,313 P=1,027,852 P=4,297,322 P=228,034 P=3,284,467 P=1,178,055 P=4,690,556
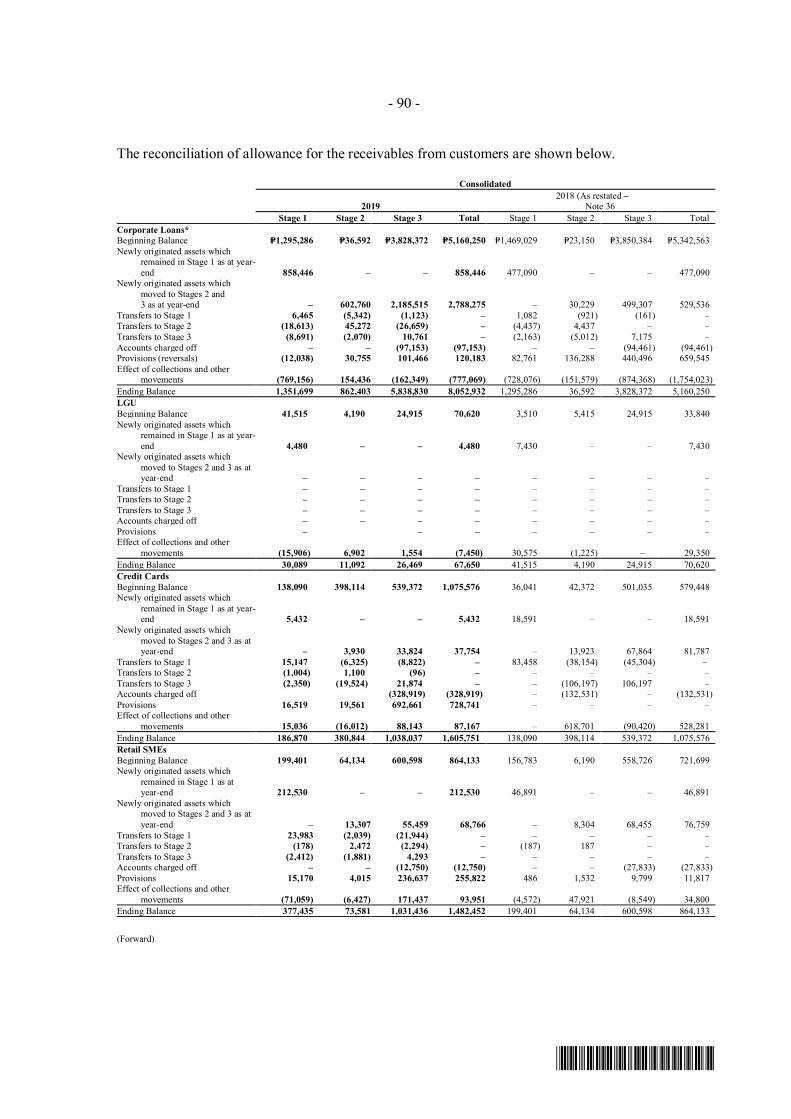
- 90 -
*SGVFS038920*
The reconciliation of allowance for the receivables from customers are shown below.
Consolidated
20192018 (As restated –
Note 36Stage 1 Stage 2 Stage 3 Total Stage 1 Stage 2 Stage 3 Total
Corporate Loans*Beginning Balance P=1,295,286 P=36,592 P=3,828,372 P=5,160,250 P=1,469,029 P=23,150 P=3,850,384 P=5,342,563Newly originated assets which
remained in Stage 1 as at year-end 858,446 – – 858,446 477,090 – – 477,090
Newly originated assets whichmoved to Stages 2 and3 as at year-end – 602,760 2,185,515 2,788,275 – 30,229 499,307 529,536
Transfers to Stage 1 6,465 (5,342) (1,123) – 1,082 (921) (161) –Transfers to Stage 2 (18,613) 45,272 (26,659) – (4,437) 4,437 – –Transfers to Stage 3 (8,691) (2,070) 10,761 – (2,163) (5,012) 7,175 –Accounts charged off – – (97,153) (97,153) – – (94,461) (94,461)Provisions (reversals) (12,038) 30,755 101,466 120,183 82,761 136,288 440,496 659,545Effect of collections and other
movements (769,156) 154,436 (162,349) (777,069) (728,076) (151,579) (874,368) (1,754,023)Ending Balance 1,351,699 862,403 5,838,830 8,052,932 1,295,286 36,592 3,828,372 5,160,250LGUBeginning Balance 41,515 4,190 24,915 70,620 3,510 5,415 24,915 33,840Newly originated assets which
remained in Stage 1 as at year-end 4,480 – – 4,480 7,430 – – 7,430
Newly originated assets whichmoved to Stages 2 and 3 as atyear-end – – – – – – – –
Transfers to Stage 1 – – – – – – – –Transfers to Stage 2 – – – – – – – –Transfers to Stage 3 – – – – – – – –Accounts charged off – – – – – – – –Provisions – – – – – – –Effect of collections and other
movements (15,906) 6,902 1,554 (7,450) 30,575 (1,225) – 29,350Ending Balance 30,089 11,092 26,469 67,650 41,515 4,190 24,915 70,620Credit CardsBeginning Balance 138,090 398,114 539,372 1,075,576 36,041 42,372 501,035 579,448Newly originated assets which
remained in Stage 1 as at year-end 5,432 – – 5,432 18,591 – – 18,591
Newly originated assets whichmoved to Stages 2 and 3 as atyear-end – 3,930 33,824 37,754 – 13,923 67,864 81,787
Transfers to Stage 1 15,147 (6,325) (8,822) – 83,458 (38,154) (45,304) –Transfers to Stage 2 (1,004) 1,100 (96) – – – – –Transfers to Stage 3 (2,350) (19,524) 21,874 – – (106,197) 106,197 –Accounts charged off (328,919) (328,919) – (132,531) – (132,531)Provisions 16,519 19,561 692,661 728,741 – – – –Effect of collections and other
movements 15,036 (16,012) 88,143 87,167 – 618,701 (90,420) 528,281Ending Balance 186,870 380,844 1,038,037 1,605,751 138,090 398,114 539,372 1,075,576Retail SMEsBeginning Balance 199,401 64,134 600,598 864,133 156,783 6,190 558,726 721,699Newly originated assets which
remained in Stage 1 as atyear-end 212,530 – – 212,530 46,891 – – 46,891
Newly originated assets whichmoved to Stages 2 and 3 as atyear-end – 13,307 55,459 68,766 – 8,304 68,455 76,759
Transfers to Stage 1 23,983 (2,039) (21,944) – – – – –Transfers to Stage 2 (178) 2,472 (2,294) – (187) 187 – –Transfers to Stage 3 (2,412) (1,881) 4,293 – – – – –Accounts charged off – – (12,750) (12,750) – – (27,833) (27,833)Provisions 15,170 4,015 236,637 255,822 486 1,532 9,799 11,817Effect of collections and other
movements (71,059) (6,427) 171,437 93,951 (4,572) 47,921 (8,549) 34,800Ending Balance 377,435 73,581 1,031,436 1,482,452 199,401 64,134 600,598 864,133
(Forward)
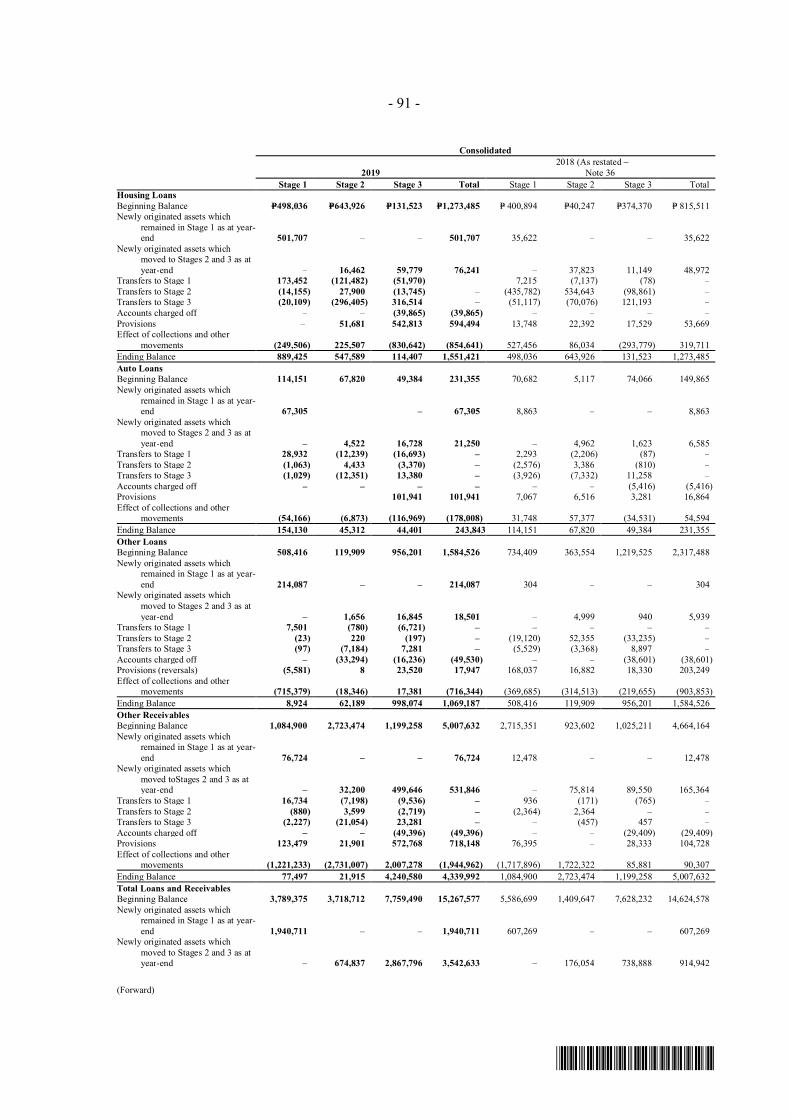
- 91 -
*SGVFS038920*
Consolidated
20192018 (As restated –
Note 36Stage 1 Stage 2 Stage 3 Total Stage 1 Stage 2 Stage 3 Total
Housing LoansBeginning Balance P=498,036 P=643,926 P=131,523 P=1,273,485 P= 400,894 P=40,247 P=374,370 P= 815,511Newly originated assets which
remained in Stage 1 as at year-end 501,707 – – 501,707 35,622 – – 35,622
Newly originated assets whichmoved to Stages 2 and 3 as atyear-end – 16,462 59,779 76,241 – 37,823 11,149 48,972
Transfers to Stage 1 173,452 (121,482) (51,970) 7,215 (7,137) (78) –Transfers to Stage 2 (14,155) 27,900 (13,745) – (435,782) 534,643 (98,861) –Transfers to Stage 3 (20,109) (296,405) 316,514 – (51,117) (70,076) 121,193 –Accounts charged off – – (39,865) (39,865) – – – –Provisions – 51,681 542,813 594,494 13,748 22,392 17,529 53,669Effect of collections and other
movements (249,506) 225,507 (830,642) (854,641) 527,456 86,034 (293,779) 319,711Ending Balance 889,425 547,589 114,407 1,551,421 498,036 643,926 131,523 1,273,485Auto LoansBeginning Balance 114,151 67,820 49,384 231,355 70,682 5,117 74,066 149,865Newly originated assets which
remained in Stage 1 as at year-end 67,305 – 67,305 8,863 – – 8,863
Newly originated assets whichmoved to Stages 2 and 3 as atyear-end – 4,522 16,728 21,250 – 4,962 1,623 6,585
Transfers to Stage 1 28,932 (12,239) (16,693) – 2,293 (2,206) (87) –Transfers to Stage 2 (1,063) 4,433 (3,370) – (2,576) 3,386 (810) –Transfers to Stage 3 (1,029) (12,351) 13,380 – (3,926) (7,332) 11,258 –Accounts charged off – – – – – – (5,416) (5,416)Provisions 101,941 101,941 7,067 6,516 3,281 16,864Effect of collections and other
movements (54,166) (6,873) (116,969) (178,008) 31,748 57,377 (34,531) 54,594Ending Balance 154,130 45,312 44,401 243,843 114,151 67,820 49,384 231,355Other LoansBeginning Balance 508,416 119,909 956,201 1,584,526 734,409 363,554 1,219,525 2,317,488Newly originated assets which
remained in Stage 1 as at year-end 214,087 – – 214,087 304 – – 304
Newly originated assets whichmoved to Stages 2 and 3 as atyear-end – 1,656 16,845 18,501 – 4,999 940 5,939
Transfers to Stage 1 7,501 (780) (6,721) – – – – –Transfers to Stage 2 (23) 220 (197) – (19,120) 52,355 (33,235) –Transfers to Stage 3 (97) (7,184) 7,281 – (5,529) (3,368) 8,897 –Accounts charged off – (33,294) (16,236) (49,530) – – (38,601) (38,601)Provisions (reversals) (5,581) 8 23,520 17,947 168,037 16,882 18,330 203,249Effect of collections and other
movements (715,379) (18,346) 17,381 (716,344) (369,685) (314,513) (219,655) (903,853)Ending Balance 8,924 62,189 998,074 1,069,187 508,416 119,909 956,201 1,584,526Other ReceivablesBeginning Balance 1,084,900 2,723,474 1,199,258 5,007,632 2,715,351 923,602 1,025,211 4,664,164Newly originated assets which
remained in Stage 1 as at year-end 76,724 – – 76,724 12,478 – – 12,478
Newly originated assets whichmoved toStages 2 and 3 as atyear-end – 32,200 499,646 531,846 – 75,814 89,550 165,364
Transfers to Stage 1 16,734 (7,198) (9,536) – 936 (171) (765) –Transfers to Stage 2 (880) 3,599 (2,719) – (2,364) 2,364 – –Transfers to Stage 3 (2,227) (21,054) 23,281 – – (457) 457 –Accounts charged off – – (49,396) (49,396) – – (29,409) (29,409)Provisions 123,479 21,901 572,768 718,148 76,395 – 28,333 104,728Effect of collections and other
movements (1,221,233) (2,731,007) 2,007,278 (1,944,962) (1,717,896) 1,722,322 85,881 90,307Ending Balance 77,497 21,915 4,240,580 4,339,992 1,084,900 2,723,474 1,199,258 5,007,632Total Loans and ReceivablesBeginning Balance 3,789,375 3,718,712 7,759,490 15,267,577 5,586,699 1,409,647 7,628,232 14,624,578Newly originated assets which
remained in Stage 1 as at year-end 1,940,711 – – 1,940,711 607,269 – – 607,269
Newly originated assets whichmoved to Stages 2 and 3 as atyear-end – 674,837 2,867,796 3,542,633 – 176,054 738,888 914,942
(Forward)
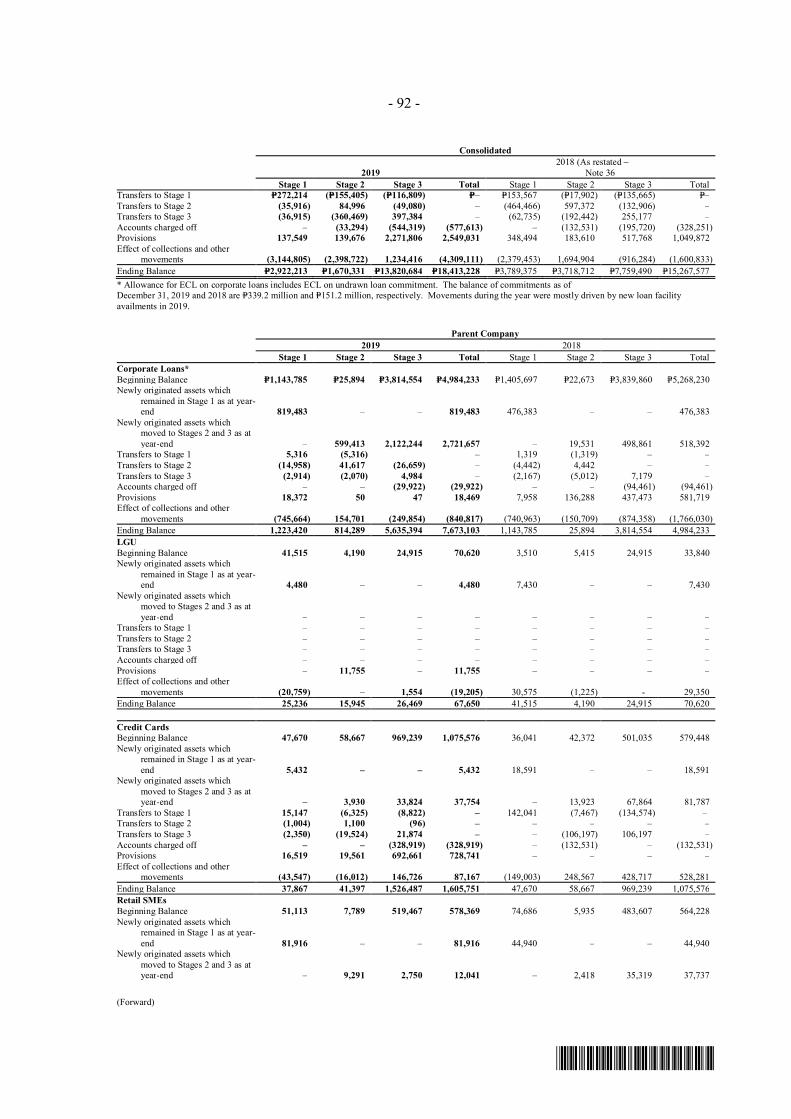
- 92 -
*SGVFS038920*
Consolidated
20192018 (As restated –
Note 36Stage 1 Stage 2 Stage 3 Total Stage 1 Stage 2 Stage 3 Total
Transfers to Stage 1 P=272,214 (P=155,405) (P=116,809) P=– P=153,567 (P=17,902) (P=135,665) P=–Transfers to Stage 2 (35,916) 84,996 (49,080) – (464,466) 597,372 (132,906) –Transfers to Stage 3 (36,915) (360,469) 397,384 – (62,735) (192,442) 255,177 –Accounts charged off – (33,294) (544,319) (577,613) – (132,531) (195,720) (328,251)Provisions 137,549 139,676 2,271,806 2,549,031 348,494 183,610 517,768 1,049,872Effect of collections and other
movements (3,144,805) (2,398,722) 1,234,416 (4,309,111) (2,379,453) 1,694,904 (916,284) (1,600,833)Ending Balance P=2,922,213 P=1,670,331 P=13,820,684 P=18,413,228 P=3,789,375 P=3,718,712 P=7,759,490 P=15,267,577* Allowance for ECL on corporate loans includes ECL on undrawn loan commitment. The balance of commitments as ofDecember 31, 2019 and 2018 are P=339.2 million and P=151.2 million, respectively. Movements during the year were mostly driven by new loan facilityavailments in 2019.
Parent Company2019 2018
Stage 1 Stage 2 Stage 3 Total Stage 1 Stage 2 Stage 3 TotalCorporate Loans*Beginning Balance P=1,143,785 P=25,894 P=3,814,554 P=4,984,233 P=1,405,697 P=22,673 P=3,839,860 P=5,268,230Newly originated assets which
remained in Stage 1 as at year-end 819,483 – – 819,483 476,383 – – 476,383
Newly originated assets whichmoved to Stages 2 and 3 as atyear-end – 599,413 2,122,244 2,721,657 – 19,531 498,861 518,392
Transfers to Stage 1 5,316 (5,316) – 1,319 (1,319) – –Transfers to Stage 2 (14,958) 41,617 (26,659) – (4,442) 4,442 – –Transfers to Stage 3 (2,914) (2,070) 4,984 – (2,167) (5,012) 7,179 –Accounts charged off – – (29,922) (29,922) – – (94,461) (94,461)Provisions 18,372 50 47 18,469 7,958 136,288 437,473 581,719Effect of collections and other
movements (745,664) 154,701 (249,854) (840,817) (740,963) (150,709) (874,358) (1,766,030)Ending Balance 1,223,420 814,289 5,635,394 7,673,103 1,143,785 25,894 3,814,554 4,984,233LGUBeginning Balance 41,515 4,190 24,915 70,620 3,510 5,415 24,915 33,840Newly originated assets which
remained in Stage 1 as at year-end 4,480 – – 4,480 7,430 – – 7,430
Newly originated assets whichmoved to Stages 2 and 3 as atyear-end – – – – – – – –
Transfers to Stage 1 – – – – – – – –Transfers to Stage 2 – – – – – – – –Transfers to Stage 3 – – – – – – – –Accounts charged off – – – – – – – –Provisions – 11,755 – 11,755 – – – –Effect of collections and other
movements (20,759) – 1,554 (19,205) 30,575 (1,225) - 29,350Ending Balance 25,236 15,945 26,469 67,650 41,515 4,190 24,915 70,620
Credit CardsBeginning Balance 47,670 58,667 969,239 1,075,576 36,041 42,372 501,035 579,448Newly originated assets which
remained in Stage 1 as at year-end 5,432 – – 5,432 18,591 – – 18,591
Newly originated assets whichmoved to Stages 2 and 3 as atyear-end – 3,930 33,824 37,754 – 13,923 67,864 81,787
Transfers to Stage 1 15,147 (6,325) (8,822) – 142,041 (7,467) (134,574) –Transfers to Stage 2 (1,004) 1,100 (96) – – – – –Transfers to Stage 3 (2,350) (19,524) 21,874 – – (106,197) 106,197 –Accounts charged off – – (328,919) (328,919) – (132,531) – (132,531)Provisions 16,519 19,561 692,661 728,741 – – – –Effect of collections and other
movements (43,547) (16,012) 146,726 87,167 (149,003) 248,567 428,717 528,281Ending Balance 37,867 41,397 1,526,487 1,605,751 47,670 58,667 969,239 1,075,576Retail SMEsBeginning Balance 51,113 7,789 519,467 578,369 74,686 5,935 483,607 564,228Newly originated assets which
remained in Stage 1 as at year-end 81,916 – – 81,916 44,940 – – 44,940
Newly originated assets whichmoved to Stages 2 and 3 as atyear-end – 9,291 2,750 12,041 – 2,418 35,319 37,737
(Forward)
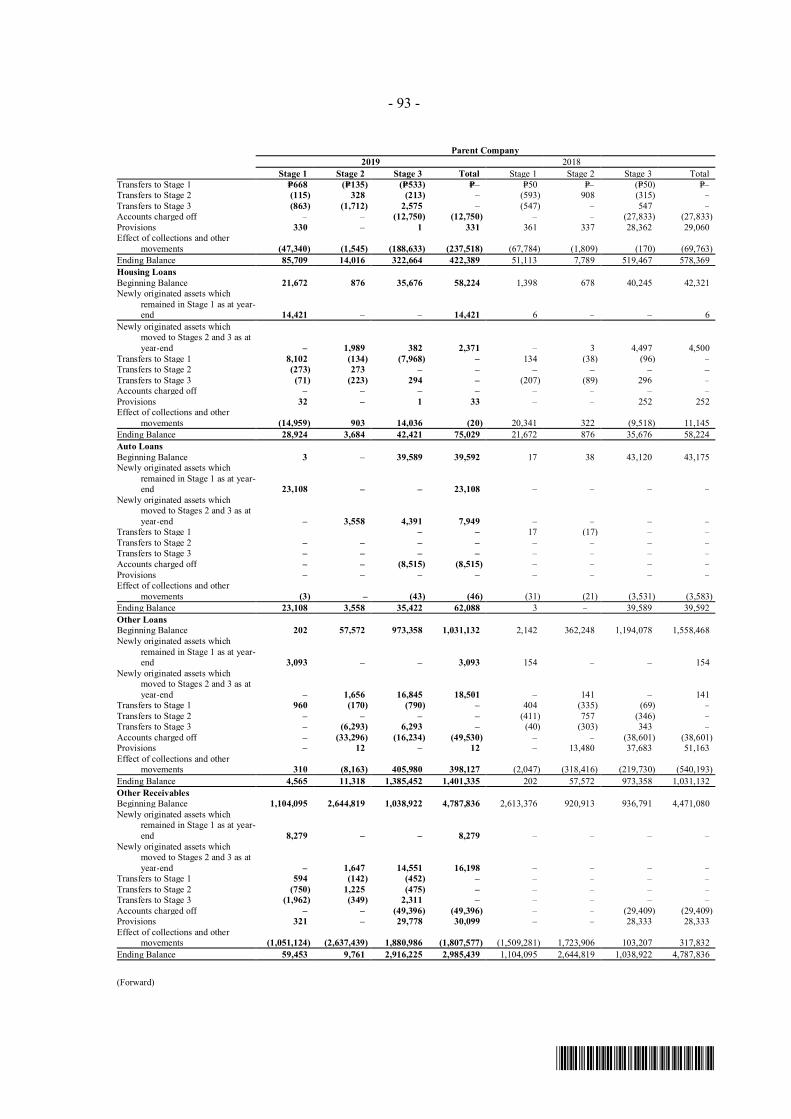
- 93 -
*SGVFS038920*
Parent Company2019 2018
Stage 1 Stage 2 Stage 3 Total Stage 1 Stage 2 Stage 3 TotalTransfers to Stage 1 P=668 (P=135) (P=533) P=– P=50 P=– (P=50) P=–Transfers to Stage 2 (115) 328 (213) – (593) 908 (315) –Transfers to Stage 3 (863) (1,712) 2,575 – (547) – 547 –Accounts charged off – – (12,750) (12,750) – – (27,833) (27,833)Provisions 330 – 1 331 361 337 28,362 29,060Effect of collections and other
movements (47,340) (1,545) (188,633) (237,518) (67,784) (1,809) (170) (69,763)Ending Balance 85,709 14,016 322,664 422,389 51,113 7,789 519,467 578,369Housing LoansBeginning Balance 21,672 876 35,676 58,224 1,398 678 40,245 42,321Newly originated assets which
remained in Stage 1 as at year-end 14,421 – – 14,421 6 – – 6
Newly originated assets whichmoved to Stages 2 and 3 as atyear-end – 1,989 382 2,371 – 3 4,497 4,500
Transfers to Stage 1 8,102 (134) (7,968) – 134 (38) (96) –Transfers to Stage 2 (273) 273 – – – – – –Transfers to Stage 3 (71) (223) 294 – (207) (89) 296 –Accounts charged off – – – – – – – –Provisions 32 – 1 33 – – 252 252Effect of collections and other
movements (14,959) 903 14,036 (20) 20,341 322 (9,518) 11,145Ending Balance 28,924 3,684 42,421 75,029 21,672 876 35,676 58,224Auto LoansBeginning Balance 3 – 39,589 39,592 17 38 43,120 43,175Newly originated assets which
remained in Stage 1 as at year-end 23,108 – – 23,108 – – – –
Newly originated assets whichmoved to Stages 2 and 3 as atyear-end – 3,558 4,391 7,949 – – – –
Transfers to Stage 1 – – 17 (17) – –Transfers to Stage 2 – – – – – – – –Transfers to Stage 3 – – – – – – – –Accounts charged off – – (8,515) (8,515) – – – –Provisions – – – – – – – –Effect of collections and other
movements (3) – (43) (46) (31) (21) (3,531) (3,583)Ending Balance 23,108 3,558 35,422 62,088 3 – 39,589 39,592Other LoansBeginning Balance 202 57,572 973,358 1,031,132 2,142 362,248 1,194,078 1,558,468Newly originated assets which
remained in Stage 1 as at year-end 3,093 – – 3,093 154 – – 154
Newly originated assets whichmoved to Stages 2 and 3 as atyear-end – 1,656 16,845 18,501 – 141 – 141
Transfers to Stage 1 960 (170) (790) – 404 (335) (69) –Transfers to Stage 2 – – – – (411) 757 (346) –Transfers to Stage 3 – (6,293) 6,293 – (40) (303) 343 –Accounts charged off – (33,296) (16,234) (49,530) – – (38,601) (38,601)Provisions – 12 – 12 – 13,480 37,683 51,163Effect of collections and other
movements 310 (8,163) 405,980 398,127 (2,047) (318,416) (219,730) (540,193)Ending Balance 4,565 11,318 1,385,452 1,401,335 202 57,572 973,358 1,031,132Other ReceivablesBeginning Balance 1,104,095 2,644,819 1,038,922 4,787,836 2,613,376 920,913 936,791 4,471,080Newly originated assets which
remained in Stage 1 as at year-end 8,279 – – 8,279 – – – –
Newly originated assets whichmoved to Stages 2 and 3 as atyear-end – 1,647 14,551 16,198 – – – –
Transfers to Stage 1 594 (142) (452) – – – – –Transfers to Stage 2 (750) 1,225 (475) – – – – –Transfers to Stage 3 (1,962) (349) 2,311 – – – – –Accounts charged off – – (49,396) (49,396) – – (29,409) (29,409)Provisions 321 – 29,778 30,099 – – 28,333 28,333Effect of collections and other
movements (1,051,124) (2,637,439) 1,880,986 (1,807,577) (1,509,281) 1,723,906 103,207 317,832Ending Balance 59,453 9,761 2,916,225 2,985,439 1,104,095 2,644,819 1,038,922 4,787,836
(Forward)
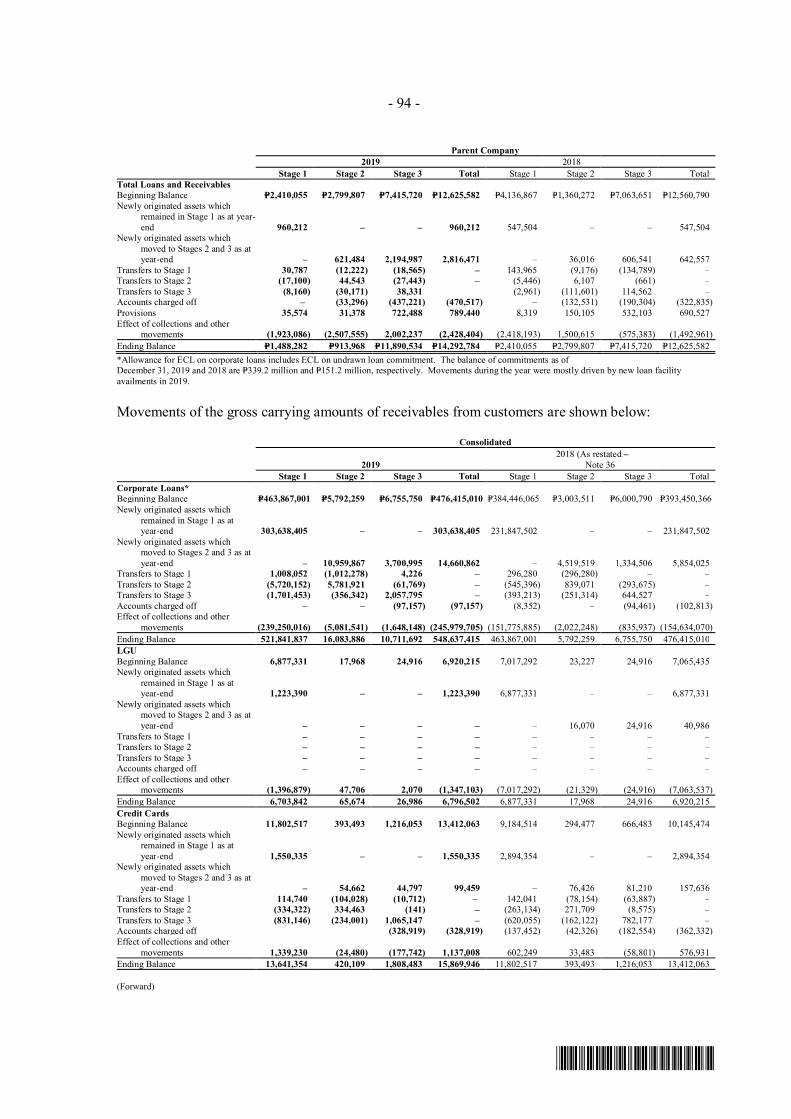
- 94 -
*SGVFS038920*
Parent Company2019 2018
Stage 1 Stage 2 Stage 3 Total Stage 1 Stage 2 Stage 3 TotalTotal Loans and ReceivablesBeginning Balance P=2,410,055 P=2,799,807 P=7,415,720 P=12,625,582 P=4,136,867 P=1,360,272 P=7,063,651 P=12,560,790Newly originated assets which
remained in Stage 1 as at year-end 960,212 – – 960,212 547,504 – – 547,504
Newly originated assets whichmoved to Stages 2 and 3 as atyear-end – 621,484 2,194,987 2,816,471 – 36,016 606,541 642,557
Transfers to Stage 1 30,787 (12,222) (18,565) – 143,965 (9,176) (134,789) –Transfers to Stage 2 (17,100) 44,543 (27,443) – (5,446) 6,107 (661) –Transfers to Stage 3 (8,160) (30,171) 38,331 (2,961) (111,601) 114,562 –Accounts charged off – (33,296) (437,221) (470,517) – (132,531) (190,304) (322,835)Provisions 35,574 31,378 722,488 789,440 8,319 150,105 532,103 690,527Effect of collections and other
movements (1,923,086) (2,507,555) 2,002,237 (2,428,404) (2,418,193) 1,500,615 (575,383) (1,492,961)Ending Balance P=1,488,282 P=913,968 P=11,890,534 P=14,292,784 P=2,410,055 P=2,799,807 P=7,415,720 P=12,625,582*Allowance for ECL on corporate loans includes ECL on undrawn loan commitment. The balance of commitments as ofDecember 31, 2019 and 2018 are P=339.2 million and P=151.2 million, respectively. Movements during the year were mostly driven by new loan facilityavailments in 2019.
Movements of the gross carrying amounts of receivables from customers are shown below:
Consolidated
20192018 (As restated –
Note 36Stage 1 Stage 2 Stage 3 Total Stage 1 Stage 2 Stage 3 Total
Corporate Loans*Beginning Balance P=463,867,001 P=5,792,259 P=6,755,750 P=476,415,010 P=384,446,065 P=3,003,511 P=6,000,790 P=393,450,366Newly originated assets which
remained in Stage 1 as atyear-end 303,638,405 – – 303,638,405 231,847,502 – – 231,847,502
Newly originated assets whichmoved to Stages 2 and 3 as atyear-end – 10,959,867 3,700,995 14,660,862 – 4,519,519 1,334,506 5,854,025
Transfers to Stage 1 1,008,052 (1,012,278) 4,226 – 296,280 (296,280) – –Transfers to Stage 2 (5,720,152) 5,781,921 (61,769) – (545,396) 839,071 (293,675) –Transfers to Stage 3 (1,701,453) (356,342) 2,057,795 – (393,213) (251,314) 644,527 –Accounts charged off – – (97,157) (97,157) (8,352) – (94,461) (102,813)Effect of collections and other
movements (239,250,016) (5,081,541) (1,648,148) (245,979,705) (151,775,885) (2,022,248) (835,937) (154,634,070)Ending Balance 521,841,837 16,083,886 10,711,692 548,637,415 463,867,001 5,792,259 6,755,750 476,415,010LGUBeginning Balance 6,877,331 17,968 24,916 6,920,215 7,017,292 23,227 24,916 7,065,435Newly originated assets which
remained in Stage 1 as atyear-end 1,223,390 – – 1,223,390 6,877,331 – – 6,877,331
Newly originated assets whichmoved to Stages 2 and 3 as atyear-end – – – – – 16,070 24,916 40,986
Transfers to Stage 1 – – – – – – – –Transfers to Stage 2 – – – – – – – –Transfers to Stage 3 – – – – – – – –Accounts charged off – – – – – – – –Effect of collections and other
movements (1,396,879) 47,706 2,070 (1,347,103) (7,017,292) (21,329) (24,916) (7,063,537)Ending Balance 6,703,842 65,674 26,986 6,796,502 6,877,331 17,968 24,916 6,920,215Credit CardsBeginning Balance 11,802,517 393,493 1,216,053 13,412,063 9,184,514 294,477 666,483 10,145,474Newly originated assets which
remained in Stage 1 as atyear-end 1,550,335 – – 1,550,335 2,894,354 – – 2,894,354
Newly originated assets whichmoved to Stages 2 and 3 as atyear-end – 54,662 44,797 99,459 – 76,426 81,210 157,636
Transfers to Stage 1 114,740 (104,028) (10,712) – 142,041 (78,154) (63,887) –Transfers to Stage 2 (334,322) 334,463 (141) – (263,134) 271,709 (8,575) –Transfers to Stage 3 (831,146) (234,001) 1,065,147 – (620,055) (162,122) 782,177 –Accounts charged off (328,919) (328,919) (137,452) (42,326) (182,554) (362,332)Effect of collections and other
movements 1,339,230 (24,480) (177,742) 1,137,008 602,249 33,483 (58,801) 576,931Ending Balance 13,641,354 420,109 1,808,483 15,869,946 11,802,517 393,493 1,216,053 13,412,063
(Forward)
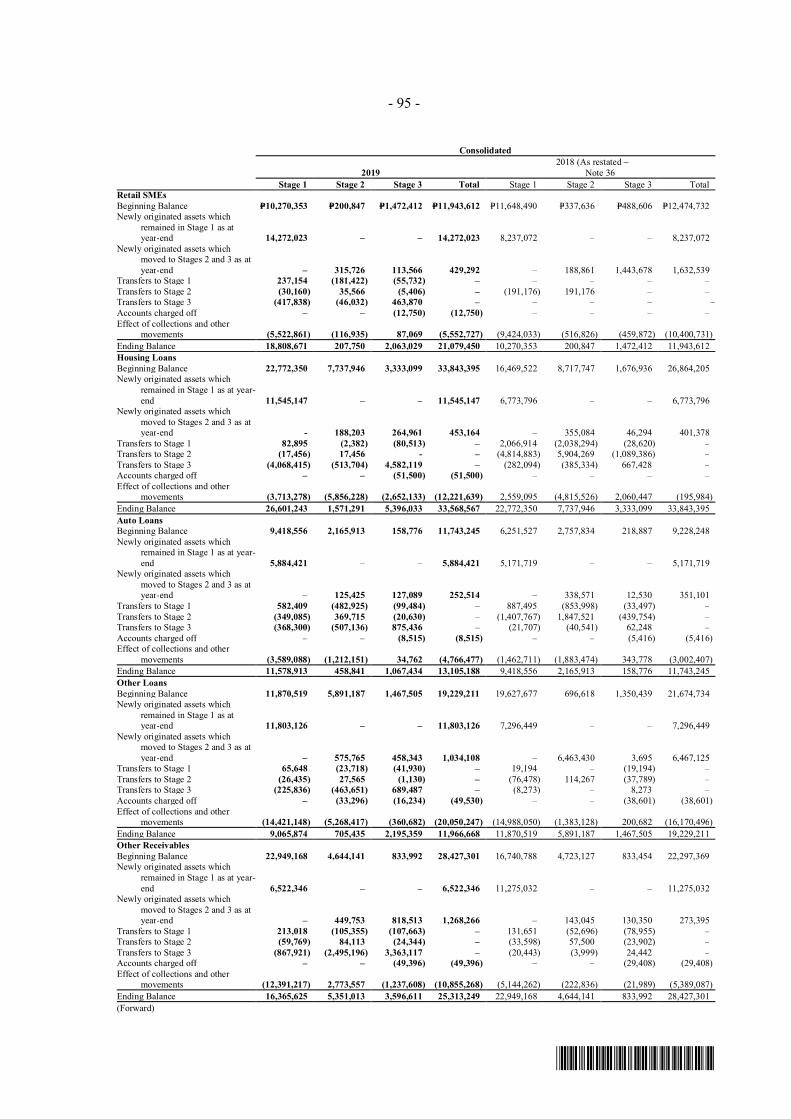
- 95 -
*SGVFS038920*
Consolidated
20192018 (As restated –
Note 36Stage 1 Stage 2 Stage 3 Total Stage 1 Stage 2 Stage 3 Total
Retail SMEsBeginning Balance P=10,270,353 P=200,847 P=1,472,412 P=11,943,612 P=11,648,490 P=337,636 P=488,606 P=12,474,732Newly originated assets which
remained in Stage 1 as atyear-end 14,272,023 – – 14,272,023 8,237,072 – – 8,237,072
Newly originated assets whichmoved to Stages 2 and 3 as atyear-end – 315,726 113,566 429,292 – 188,861 1,443,678 1,632,539
Transfers to Stage 1 237,154 (181,422) (55,732) – – – – –Transfers to Stage 2 (30,160) 35,566 (5,406) – (191,176) 191,176 – –Transfers to Stage 3 (417,838) (46,032) 463,870 – – – – –Accounts charged off – – (12,750) (12,750) – – – –Effect of collections and other
movements (5,522,861) (116,935) 87,069 (5,552,727) (9,424,033) (516,826) (459,872) (10,400,731)Ending Balance 18,808,671 207,750 2,063,029 21,079,450 10,270,353 200,847 1,472,412 11,943,612Housing LoansBeginning Balance 22,772,350 7,737,946 3,333,099 33,843,395 16,469,522 8,717,747 1,676,936 26,864,205Newly originated assets which
remained in Stage 1 as at year-end 11,545,147 – – 11,545,147 6,773,796 – – 6,773,796
Newly originated assets whichmoved to Stages 2 and 3 as atyear-end - 188,203 264,961 453,164 – 355,084 46,294 401,378
Transfers to Stage 1 82,895 (2,382) (80,513) – 2,066,914 (2,038,294) (28,620) –Transfers to Stage 2 (17,456) 17,456 - – (4,814,883) 5,904,269 (1,089,386) –Transfers to Stage 3 (4,068,415) (513,704) 4,582,119 – (282,094) (385,334) 667,428 –Accounts charged off – – (51,500) (51,500) – – – –Effect of collections and other
movements (3,713,278) (5,856,228) (2,652,133) (12,221,639) 2,559,095 (4,815,526) 2,060,447 (195,984)Ending Balance 26,601,243 1,571,291 5,396,033 33,568,567 22,772,350 7,737,946 3,333,099 33,843,395Auto LoansBeginning Balance 9,418,556 2,165,913 158,776 11,743,245 6,251,527 2,757,834 218,887 9,228,248Newly originated assets which
remained in Stage 1 as at year-end 5,884,421 – – 5,884,421 5,171,719 – – 5,171,719
Newly originated assets whichmoved to Stages 2 and 3 as atyear-end – 125,425 127,089 252,514 – 338,571 12,530 351,101
Transfers to Stage 1 582,409 (482,925) (99,484) – 887,495 (853,998) (33,497) –Transfers to Stage 2 (349,085) 369,715 (20,630) – (1,407,767) 1,847,521 (439,754) –Transfers to Stage 3 (368,300) (507,136) 875,436 – (21,707) (40,541) 62,248 –Accounts charged off – – (8,515) (8,515) – – (5,416) (5,416)Effect of collections and other
movements (3,589,088) (1,212,151) 34,762 (4,766,477) (1,462,711) (1,883,474) 343,778 (3,002,407)Ending Balance 11,578,913 458,841 1,067,434 13,105,188 9,418,556 2,165,913 158,776 11,743,245Other LoansBeginning Balance 11,870,519 5,891,187 1,467,505 19,229,211 19,627,677 696,618 1,350,439 21,674,734Newly originated assets which
remained in Stage 1 as atyear-end 11,803,126 – – 11,803,126 7,296,449 – – 7,296,449
Newly originated assets whichmoved to Stages 2 and 3 as atyear-end – 575,765 458,343 1,034,108 – 6,463,430 3,695 6,467,125
Transfers to Stage 1 65,648 (23,718) (41,930) – 19,194 – (19,194) –Transfers to Stage 2 (26,435) 27,565 (1,130) – (76,478) 114,267 (37,789) –Transfers to Stage 3 (225,836) (463,651) 689,487 – (8,273) – 8,273 –Accounts charged off – (33,296) (16,234) (49,530) – – (38,601) (38,601)Effect of collections and other
movements (14,421,148) (5,268,417) (360,682) (20,050,247) (14,988,050) (1,383,128) 200,682 (16,170,496)Ending Balance 9,065,874 705,435 2,195,359 11,966,668 11,870,519 5,891,187 1,467,505 19,229,211Other ReceivablesBeginning Balance 22,949,168 4,644,141 833,992 28,427,301 16,740,788 4,723,127 833,454 22,297,369Newly originated assets which
remained in Stage 1 as at year-end 6,522,346 – – 6,522,346 11,275,032 – – 11,275,032
Newly originated assets whichmoved to Stages 2 and 3 as atyear-end – 449,753 818,513 1,268,266 – 143,045 130,350 273,395
Transfers to Stage 1 213,018 (105,355) (107,663) – 131,651 (52,696) (78,955) –Transfers to Stage 2 (59,769) 84,113 (24,344) – (33,598) 57,500 (23,902) –Transfers to Stage 3 (867,921) (2,495,196) 3,363,117 – (20,443) (3,999) 24,442 –Accounts charged off – – (49,396) (49,396) – – (29,408) (29,408)Effect of collections and other
movements (12,391,217) 2,773,557 (1,237,608) (10,855,268) (5,144,262) (222,836) (21,989) (5,389,087)Ending Balance 16,365,625 5,351,013 3,596,611 25,313,249 22,949,168 4,644,141 833,992 28,427,301(Forward)
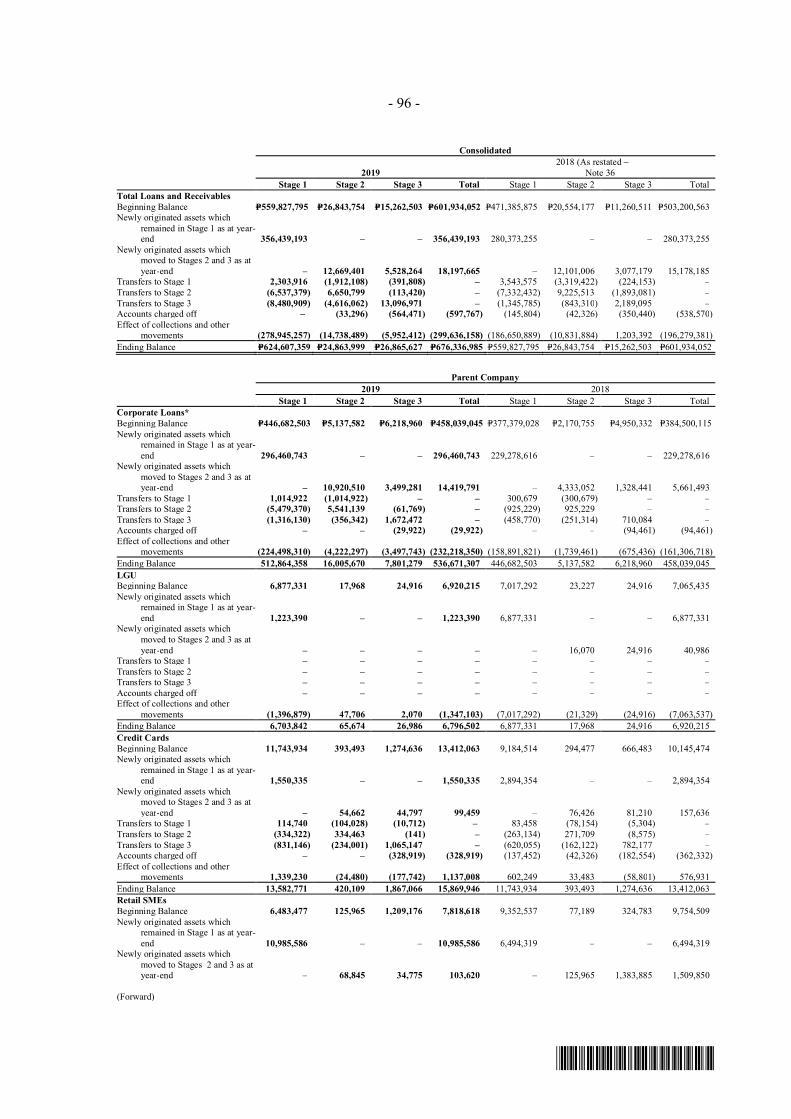
- 96 -
*SGVFS038920*
Consolidated
20192018 (As restated –
Note 36Stage 1 Stage 2 Stage 3 Total Stage 1 Stage 2 Stage 3 Total
Total Loans and ReceivablesBeginning Balance P=559,827,795 P=26,843,754 P=15,262,503 P=601,934,052 P=471,385,875 P=20,554,177 P=11,260,511 P=503,200,563Newly originated assets which
remained in Stage 1 as at year-end 356,439,193 – – 356,439,193 280,373,255 – – 280,373,255
Newly originated assets whichmoved to Stages 2 and 3 as atyear-end – 12,669,401 5,528,264 18,197,665 – 12,101,006 3,077,179 15,178,185
Transfers to Stage 1 2,303,916 (1,912,108) (391,808) – 3,543,575 (3,319,422) (224,153) –Transfers to Stage 2 (6,537,379) 6,650,799 (113,420) – (7,332,432) 9,225,513 (1,893,081) –Transfers to Stage 3 (8,480,909) (4,616,062) 13,096,971 – (1,345,785) (843,310) 2,189,095 –Accounts charged off – (33,296) (564,471) (597,767) (145,804) (42,326) (350,440) (538,570)Effect of collections and other
movements (278,945,257) (14,738,489) (5,952,412) (299,636,158) (186,650,889) (10,831,884) 1,203,392 (196,279,381)Ending Balance P=624,607,359 P=24,863,999 P=26,865,627 P=676,336,985 P=559,827,795 P=26,843,754 P=15,262,503 P=601,934,052
Parent Company2019 2018
Stage 1 Stage 2 Stage 3 Total Stage 1 Stage 2 Stage 3 TotalCorporate Loans*Beginning Balance P=446,682,503 P=5,137,582 P=6,218,960 P=458,039,045 P=377,379,028 P=2,170,755 P=4,950,332 P=384,500,115Newly originated assets which
remained in Stage 1 as at year-end 296,460,743 – – 296,460,743 229,278,616 – – 229,278,616
Newly originated assets whichmoved to Stages 2 and 3 as atyear-end – 10,920,510 3,499,281 14,419,791 – 4,333,052 1,328,441 5,661,493
Transfers to Stage 1 1,014,922 (1,014,922) – – 300,679 (300,679) – –Transfers to Stage 2 (5,479,370) 5,541,139 (61,769) – (925,229) 925,229 – –Transfers to Stage 3 (1,316,130) (356,342) 1,672,472 – (458,770) (251,314) 710,084 –Accounts charged off – – (29,922) (29,922) – – (94,461) (94,461)Effect of collections and other
movements (224,498,310) (4,222,297) (3,497,743) (232,218,350) (158,891,821) (1,739,461) (675,436) (161,306,718)Ending Balance 512,864,358 16,005,670 7,801,279 536,671,307 446,682,503 5,137,582 6,218,960 458,039,045LGUBeginning Balance 6,877,331 17,968 24,916 6,920,215 7,017,292 23,227 24,916 7,065,435Newly originated assets which
remained in Stage 1 as at year-end 1,223,390 – – 1,223,390 6,877,331 – – 6,877,331
Newly originated assets whichmoved to Stages 2 and 3 as atyear-end – – – – – 16,070 24,916 40,986
Transfers to Stage 1 – – – – – – – –Transfers to Stage 2 – – – – – – – –Transfers to Stage 3 – – – – – – – –Accounts charged off – – – – – – – –Effect of collections and other
movements (1,396,879) 47,706 2,070 (1,347,103) (7,017,292) (21,329) (24,916) (7,063,537)Ending Balance 6,703,842 65,674 26,986 6,796,502 6,877,331 17,968 24,916 6,920,215Credit CardsBeginning Balance 11,743,934 393,493 1,274,636 13,412,063 9,184,514 294,477 666,483 10,145,474Newly originated assets which
remained in Stage 1 as at year-end 1,550,335 – – 1,550,335 2,894,354 – – 2,894,354
Newly originated assets whichmoved to Stages 2 and 3 as atyear-end – 54,662 44,797 99,459 – 76,426 81,210 157,636
Transfers to Stage 1 114,740 (104,028) (10,712) – 83,458 (78,154) (5,304) –Transfers to Stage 2 (334,322) 334,463 (141) – (263,134) 271,709 (8,575) –Transfers to Stage 3 (831,146) (234,001) 1,065,147 – (620,055) (162,122) 782,177 –Accounts charged off – – (328,919) (328,919) (137,452) (42,326) (182,554) (362,332)Effect of collections and other
movements 1,339,230 (24,480) (177,742) 1,137,008 602,249 33,483 (58,801) 576,931Ending Balance 13,582,771 420,109 1,867,066 15,869,946 11,743,934 393,493 1,274,636 13,412,063Retail SMEsBeginning Balance 6,483,477 125,965 1,209,176 7,818,618 9,352,537 77,189 324,783 9,754,509Newly originated assets which
remained in Stage 1 as at year-end 10,985,586 – – 10,985,586 6,494,319 – – 6,494,319
Newly originated assets whichmoved to Stages 2 and 3 as atyear-end – 68,845 34,775 103,620 – 125,965 1,383,885 1,509,850
(Forward)
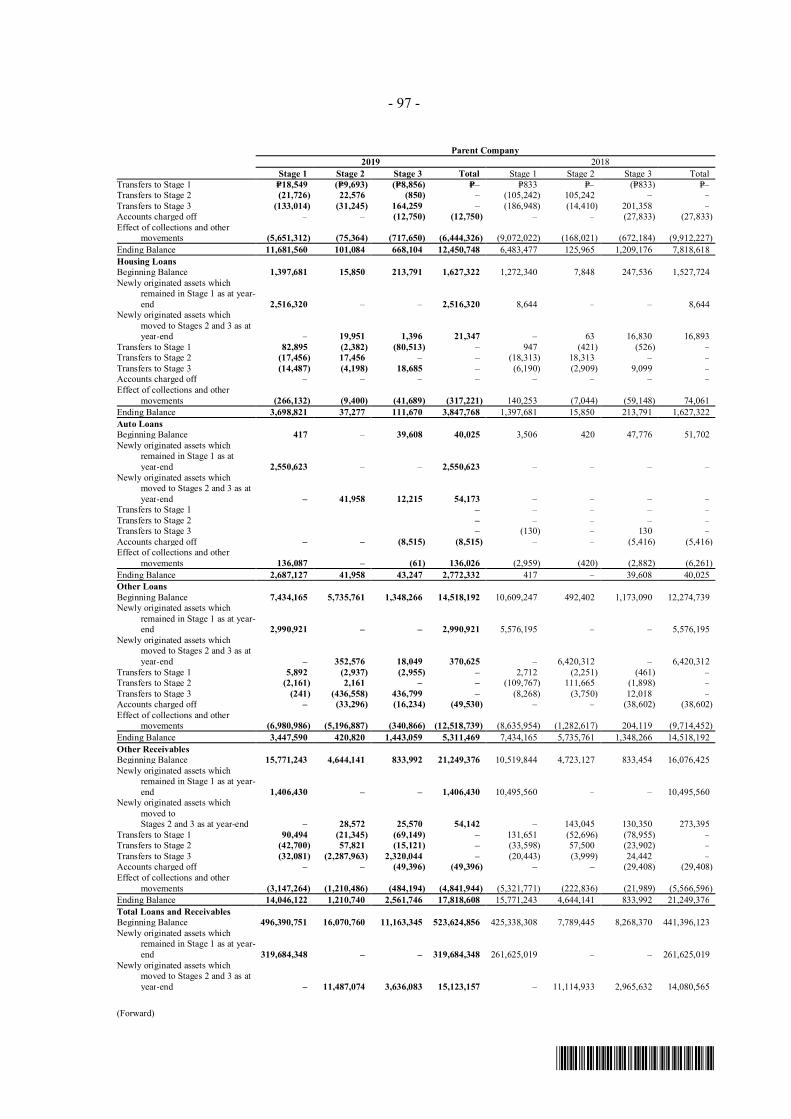
- 97 -
*SGVFS038920*
Parent Company2019 2018
Stage 1 Stage 2 Stage 3 Total Stage 1 Stage 2 Stage 3 TotalTransfers to Stage 1 P=18,549 (P=9,693) (P=8,856) P=– P=833 P=– (P=833) P=–Transfers to Stage 2 (21,726) 22,576 (850) – (105,242) 105,242 – –Transfers to Stage 3 (133,014) (31,245) 164,259 – (186,948) (14,410) 201,358 –Accounts charged off – – (12,750) (12,750) – – (27,833) (27,833)Effect of collections and other
movements (5,651,312) (75,364) (717,650) (6,444,326) (9,072,022) (168,021) (672,184) (9,912,227)Ending Balance 11,681,560 101,084 668,104 12,450,748 6,483,477 125,965 1,209,176 7,818,618Housing LoansBeginning Balance 1,397,681 15,850 213,791 1,627,322 1,272,340 7,848 247,536 1,527,724Newly originated assets which
remained in Stage 1 as at year-end 2,516,320 – – 2,516,320 8,644 – – 8,644
Newly originated assets whichmoved to Stages 2 and 3 as atyear-end – 19,951 1,396 21,347 – 63 16,830 16,893
Transfers to Stage 1 82,895 (2,382) (80,513) – 947 (421) (526) –Transfers to Stage 2 (17,456) 17,456 – – (18,313) 18,313 – –Transfers to Stage 3 (14,487) (4,198) 18,685 – (6,190) (2,909) 9,099 –Accounts charged off – – – – – – – –Effect of collections and other
movements (266,132) (9,400) (41,689) (317,221) 140,253 (7,044) (59,148) 74,061Ending Balance 3,698,821 37,277 111,670 3,847,768 1,397,681 15,850 213,791 1,627,322Auto LoansBeginning Balance 417 – 39,608 40,025 3,506 420 47,776 51,702Newly originated assets which
remained in Stage 1 as atyear-end 2,550,623 – – 2,550,623 – – – –
Newly originated assets whichmoved to Stages 2 and 3 as atyear-end – 41,958 12,215 54,173 – – – –
Transfers to Stage 1 – – – – –Transfers to Stage 2 – – – – –Transfers to Stage 3 – (130) – 130 –Accounts charged off – – (8,515) (8,515) – – (5,416) (5,416)Effect of collections and other
movements 136,087 – (61) 136,026 (2,959) (420) (2,882) (6,261)Ending Balance 2,687,127 41,958 43,247 2,772,332 417 – 39,608 40,025Other LoansBeginning Balance 7,434,165 5,735,761 1,348,266 14,518,192 10,609,247 492,402 1,173,090 12,274,739Newly originated assets which
remained in Stage 1 as at year-end 2,990,921 – – 2,990,921 5,576,195 – – 5,576,195
Newly originated assets whichmoved to Stages 2 and 3 as atyear-end – 352,576 18,049 370,625 – 6,420,312 – 6,420,312
Transfers to Stage 1 5,892 (2,937) (2,955) – 2,712 (2,251) (461) –Transfers to Stage 2 (2,161) 2,161 – – (109,767) 111,665 (1,898) –Transfers to Stage 3 (241) (436,558) 436,799 – (8,268) (3,750) 12,018 –Accounts charged off – (33,296) (16,234) (49,530) – – (38,602) (38,602)Effect of collections and other
movements (6,980,986) (5,196,887) (340,866) (12,518,739) (8,635,954) (1,282,617) 204,119 (9,714,452)Ending Balance 3,447,590 420,820 1,443,059 5,311,469 7,434,165 5,735,761 1,348,266 14,518,192Other ReceivablesBeginning Balance 15,771,243 4,644,141 833,992 21,249,376 10,519,844 4,723,127 833,454 16,076,425Newly originated assets which
remained in Stage 1 as at year-end 1,406,430 – – 1,406,430 10,495,560 – – 10,495,560
Newly originated assets whichmoved toStages 2 and 3 as at year-end – 28,572 25,570 54,142 – 143,045 130,350 273,395
Transfers to Stage 1 90,494 (21,345) (69,149) – 131,651 (52,696) (78,955) –Transfers to Stage 2 (42,700) 57,821 (15,121) – (33,598) 57,500 (23,902) –Transfers to Stage 3 (32,081) (2,287,963) 2,320,044 – (20,443) (3,999) 24,442 –Accounts charged off – – (49,396) (49,396) – – (29,408) (29,408)Effect of collections and other
movements (3,147,264) (1,210,486) (484,194) (4,841,944) (5,321,771) (222,836) (21,989) (5,566,596)Ending Balance 14,046,122 1,210,740 2,561,746 17,818,608 15,771,243 4,644,141 833,992 21,249,376Total Loans and ReceivablesBeginning Balance 496,390,751 16,070,760 11,163,345 523,624,856 425,338,308 7,789,445 8,268,370 441,396,123Newly originated assets which
remained in Stage 1 as at year-end 319,684,348 – – 319,684,348 261,625,019 – – 261,625,019
Newly originated assets whichmoved to Stages 2 and 3 as atyear-end – 11,487,074 3,636,083 15,123,157 – 11,114,933 2,965,632 14,080,565
(Forward)
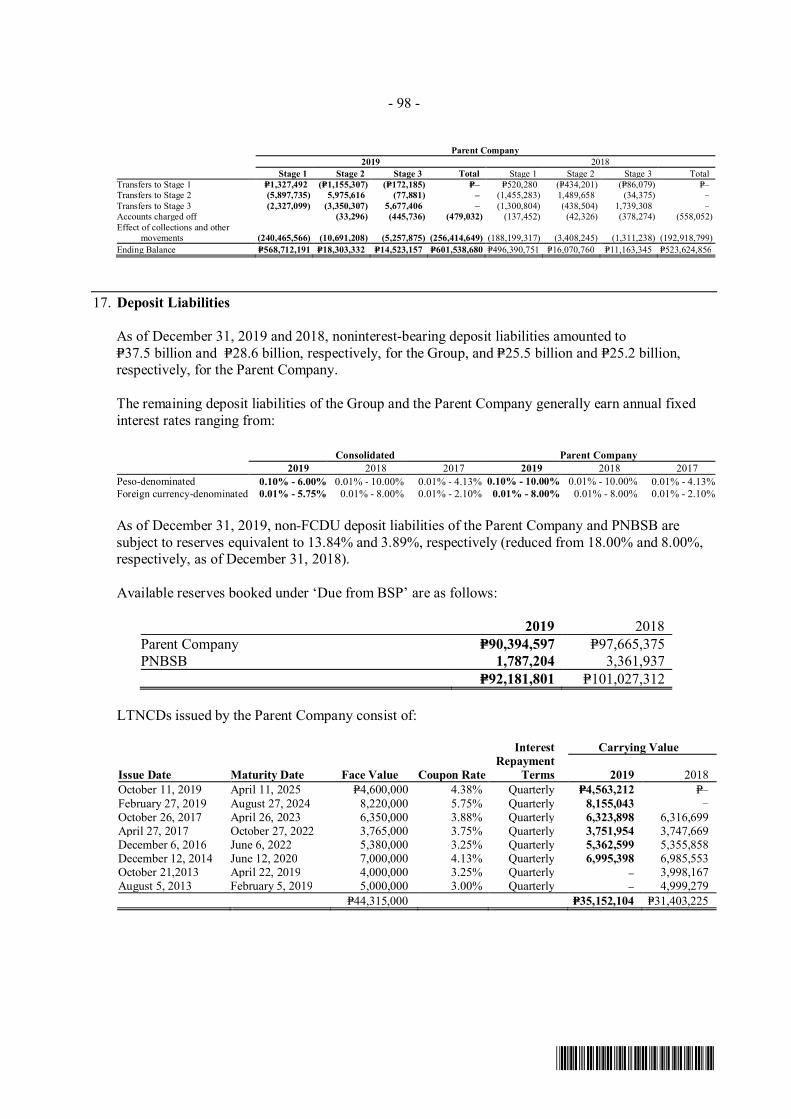
- 98 -
*SGVFS038920*
Parent Company2019 2018
Stage 1 Stage 2 Stage 3 Total Stage 1 Stage 2 Stage 3 TotalTransfers to Stage 1 P=1,327,492 (P=1,155,307) (P=172,185) P=– P=520,280 (P=434,201) (P=86,079) P=–Transfers to Stage 2 (5,897,735) 5,975,616 (77,881) – (1,455,283) 1,489,658 (34,375) –Transfers to Stage 3 (2,327,099) (3,350,307) 5,677,406 – (1,300,804) (438,504) 1,739,308 –Accounts charged off (33,296) (445,736) (479,032) (137,452) (42,326) (378,274) (558,052)Effect of collections and other
movements (240,465,566) (10,691,208) (5,257,875) (256,414,649) (188,199,317) (3,408,245) (1,311,238) (192,918,799)Ending Balance P=568,712,191 P=18,303,332 P=14,523,157 P=601,538,680 P=496,390,751 P=16,070,760 P=11,163,345 P=523,624,856
17. Deposit Liabilities
As of December 31, 2019 and 2018, noninterest-bearing deposit liabilities amounted toP=37.5 billion and P=28.6 billion, respectively, for the Group, and P=25.5 billion and P=25.2 billion,respectively, for the Parent Company.
The remaining deposit liabilities of the Group and the Parent Company generally earn annual fixedinterest rates ranging from:
Consolidated Parent Company2019 2018 2017 2019 2018 2017
Peso-denominated 0.10% - 6.00% 0.01% - 10.00% 0.01% - 4.13% 0.10% - 10.00% 0.01% - 10.00% 0.01% - 4.13%Foreign currency-denominated 0.01% - 5.75% 0.01% - 8.00% 0.01% - 2.10% 0.01% - 8.00% 0.01% - 8.00% 0.01% - 2.10%
As of December 31, 2019, non-FCDU deposit liabilities of the Parent Company and PNBSB aresubject to reserves equivalent to 13.84% and 3.89%, respectively (reduced from 18.00% and 8.00%,respectively, as of December 31, 2018).
Available reserves booked under ‘Due from BSP’ are as follows:
2019 2018Parent Company P=90,394,597 P=97,665,375PNBSB 1,787,204 3,361,937
P=92,181,801 P=101,027,312
LTNCDs issued by the Parent Company consist of:
Issue Date Maturity Date Face Value Coupon Rate
Interest Repayment
Terms
Carrying Value
2019 2018October 11, 2019 April 11, 2025 P=4,600,000 4.38% Quarterly P=4,563,212 P=–February 27, 2019 August 27, 2024 8,220,000 5.75% Quarterly 8,155,043 –October 26, 2017 April 26, 2023 6,350,000 3.88% Quarterly 6,323,898 6,316,699April 27, 2017 October 27, 2022 3,765,000 3.75% Quarterly 3,751,954 3,747,669December 6, 2016 June 6, 2022 5,380,000 3.25% Quarterly 5,362,599 5,355,858December 12, 2014 June 12, 2020 7,000,000 4.13% Quarterly 6,995,398 6,985,553October 21,2013 April 22, 2019 4,000,000 3.25% Quarterly – 3,998,167August 5, 2013 February 5, 2019 5,000,000 3.00% Quarterly – 4,999,279
P=44,315,000 P=35,152,104 P=31,403,225
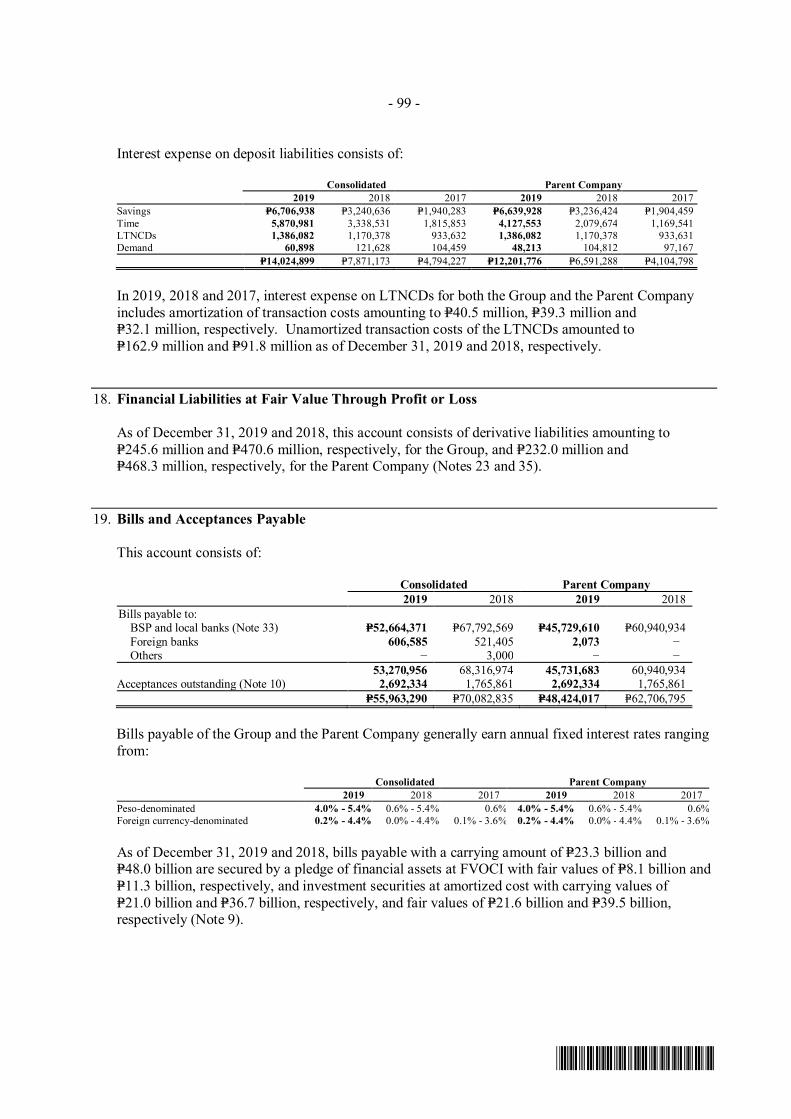
- 99 -
*SGVFS038920*
Interest expense on deposit liabilities consists of:
Consolidated Parent Company2019 2018 2017 2019 2018 2017
Savings P=6,706,938 P=3,240,636 P=1,940,283 P=6,639,928 P=3,236,424 P=1,904,459Time 5,870,981 3,338,531 1,815,853 4,127,553 2,079,674 1,169,541LTNCDs 1,386,082 1,170,378 933,632 1,386,082 1,170,378 933,631Demand 60,898 121,628 104,459 48,213 104,812 97,167
P=14,024,899 P=7,871,173 P=4,794,227 P=12,201,776 P=6,591,288 P=4,104,798
In 2019, 2018 and 2017, interest expense on LTNCDs for both the Group and the Parent Companyincludes amortization of transaction costs amounting to P=40.5 million, P=39.3 million andP=32.1 million, respectively. Unamortized transaction costs of the LTNCDs amounted toP=162.9 million and P=91.8 million as of December 31, 2019 and 2018, respectively.
18. Financial Liabilities at Fair Value Through Profit or Loss
As of December 31, 2019 and 2018, this account consists of derivative liabilities amounting toP=245.6 million and P=470.6 million, respectively, for the Group, and P=232.0 million andP=468.3 million, respectively, for the Parent Company (Notes 23 and 35).
19. Bills and Acceptances Payable
This account consists of:
Consolidated Parent Company2019 2018 2019 2018
Bills payable to:BSP and local banks (Note 33) P=52,664,371 P=67,792,569 P=45,729,610 P=60,940,934Foreign banks 606,585 521,405 2,073 −Others − 3,000 − −
53,270,956 68,316,974 45,731,683 60,940,934Acceptances outstanding (Note 10) 2,692,334 1,765,861 2,692,334 1,765,861
P=55,963,290 P=70,082,835 P=48,424,017 P=62,706,795
Bills payable of the Group and the Parent Company generally earn annual fixed interest rates rangingfrom:
Consolidated Parent Company2019 2018 2017 2019 2018 2017
Peso-denominated 4.0% - 5.4% 0.6% - 5.4% 0.6% 4.0% - 5.4% 0.6% - 5.4% 0.6%Foreign currency-denominated 0.2% - 4.4% 0.0% - 4.4% 0.1% - 3.6% 0.2% - 4.4% 0.0% - 4.4% 0.1% - 3.6%
As of December 31, 2019 and 2018, bills payable with a carrying amount of P=23.3 billion andP=48.0 billion are secured by a pledge of financial assets at FVOCI with fair values of P=8.1 billion andP=11.3 billion, respectively, and investment securities at amortized cost with carrying values ofP=21.0 billion and P=36.7 billion, respectively, and fair values of P=21.6 billion and P=39.5 billion,respectively (Note 9).
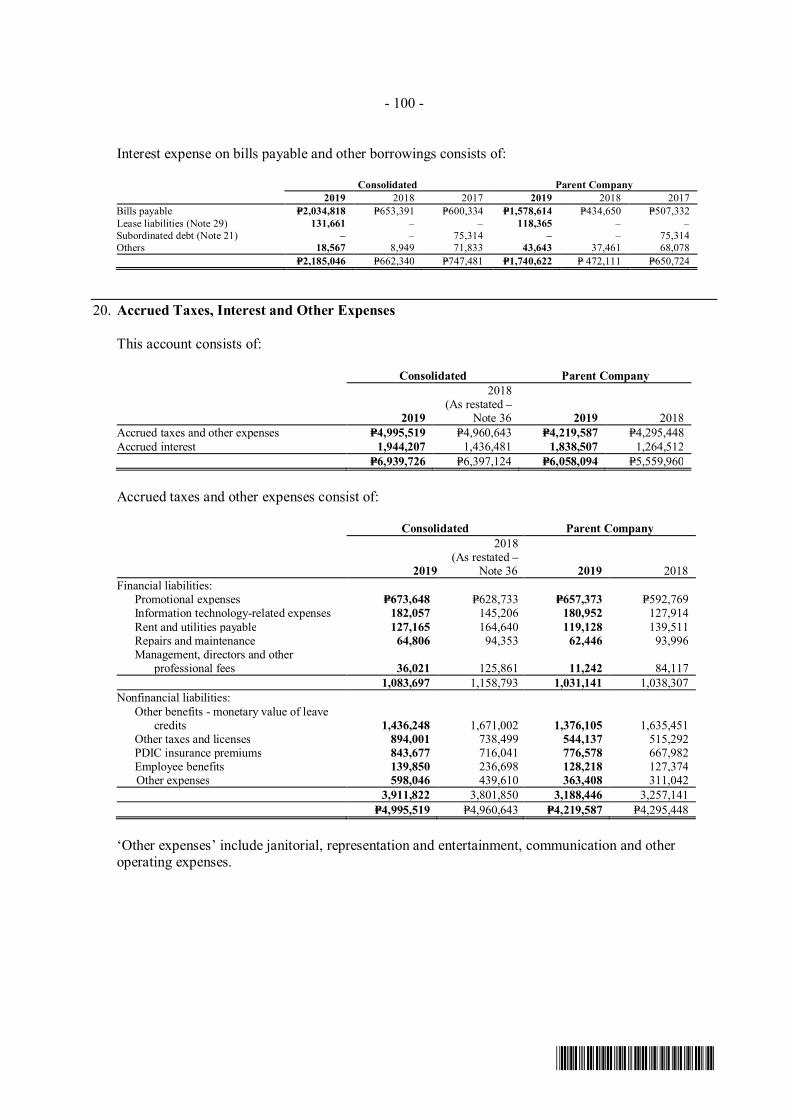
- 100 -
*SGVFS038920*
Interest expense on bills payable and other borrowings consists of:
Consolidated Parent Company2019 2018 2017 2019 2018 2017
Bills payable P=2,034,818 P=653,391 P=600,334 P=1,578,614 P=434,650 P=507,332Lease liabilities (Note 29) 131,661 – – 118,365 – –Subordinated debt (Note 21) – – 75,314 – – 75,314Others 18,567 8,949 71,833 43,643 37,461 68,078
P=2,185,046 P=662,340 P=747,481 P=1,740,622 P= 472,111 P=650,724
20. Accrued Taxes, Interest and Other Expenses
This account consists of:
Consolidated Parent Company
2019
2018(As restated –
Note 36 2019 2018Accrued taxes and other expenses P=4,995,519 P=4,960,643 P=4,219,587 P=4,295,448Accrued interest 1,944,207 1,436,481 1,838,507 1,264,512
P=6,939,726 P=6,397,124 P=6,058,094 P=5,559,960
Accrued taxes and other expenses consist of:
Consolidated Parent Company
2019
2018(As restated –
Note 36 2019 2018Financial liabilities:
Promotional expenses P=673,648 P=628,733 P=657,373 P=592,769Information technology-related expenses 182,057 145,206 180,952 127,914Rent and utilities payable 127,165 164,640 119,128 139,511Repairs and maintenance 64,806 94,353 62,446 93,996Management, directors and other
professional fees 36,021 125,861 11,242 84,1171,083,697 1,158,793 1,031,141 1,038,307
Nonfinancial liabilities:Other benefits - monetary value of leave
credits 1,436,248 1,671,002 1,376,105 1,635,451Other taxes and licenses 894,001 738,499 544,137 515,292PDIC insurance premiums 843,677 716,041 776,578 667,982Employee benefits 139,850 236,698 128,218 127,374Other expenses 598,046 439,610 363,408 311,042
3,911,822 3,801,850 3,188,446 3,257,141P=4,995,519 P=4,960,643 P=4,219,587 P=4,295,448
‘Other expenses’ include janitorial, representation and entertainment, communication and otheroperating expenses.
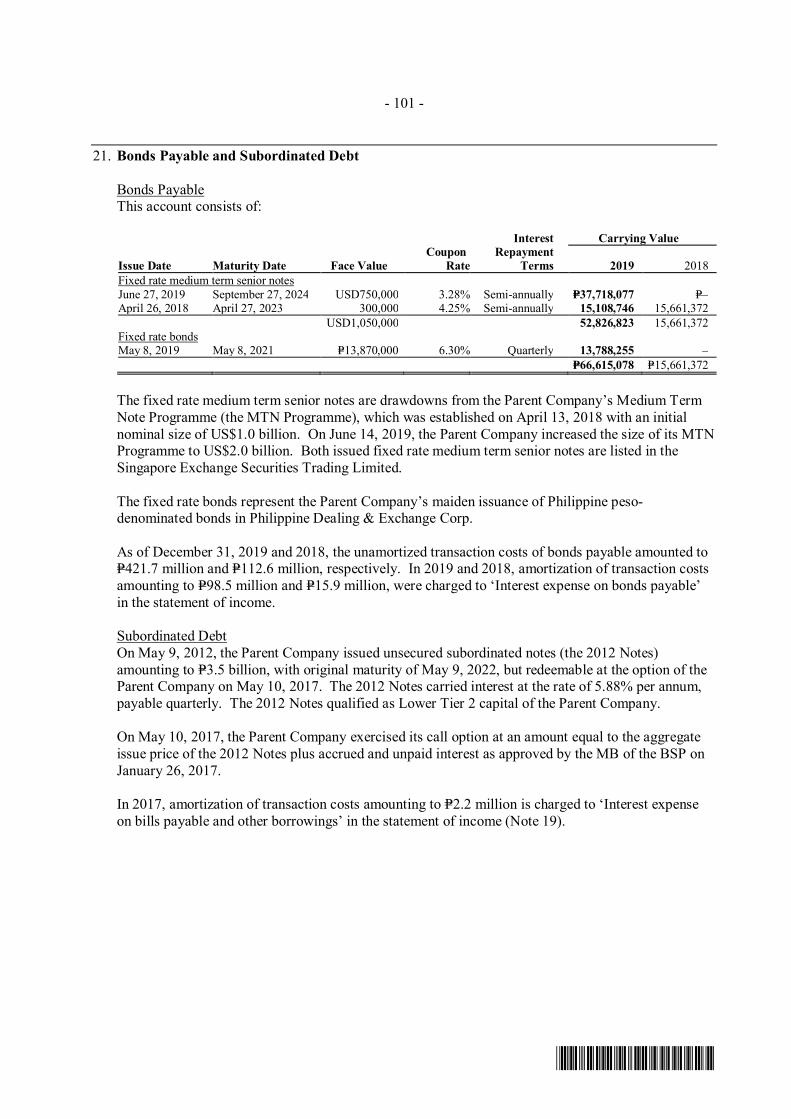
- 101 -
*SGVFS038920*
21. Bonds Payable and Subordinated Debt
Bonds PayableThis account consists of:
Issue Date Maturity Date Face ValueCoupon
Rate
Interest Repayment
Terms
Carrying Value
2019 2018Fixed rate medium term senior notesJune 27, 2019 September 27, 2024 USD750,000 3.28% Semi-annually P=37,718,077 P=–April 26, 2018 April 27, 2023 300,000 4.25% Semi-annually 15,108,746 15,661,372
USD1,050,000 52,826,823 15,661,372Fixed rate bondsMay 8, 2019 May 8, 2021 P=13,870,000 6.30% Quarterly 13,788,255 –
P=66,615,078 P=15,661,372
The fixed rate medium term senior notes are drawdowns from the Parent Company’s Medium TermNote Programme (the MTN Programme), which was established on April 13, 2018 with an initialnominal size of US$1.0 billion. On June 14, 2019, the Parent Company increased the size of its MTNProgramme to US$2.0 billion. Both issued fixed rate medium term senior notes are listed in theSingapore Exchange Securities Trading Limited.
The fixed rate bonds represent the Parent Company’s maiden issuance of Philippine peso-denominated bonds in Philippine Dealing & Exchange Corp.
As of December 31, 2019 and 2018, the unamortized transaction costs of bonds payable amounted toP=421.7 million and P=112.6 million, respectively. In 2019 and 2018, amortization of transaction costsamounting to P=98.5 million and P=15.9 million, were charged to ‘Interest expense on bonds payable’in the statement of income.
Subordinated DebtOn May 9, 2012, the Parent Company issued unsecured subordinated notes (the 2012 Notes)amounting to P=3.5 billion, with original maturity of May 9, 2022, but redeemable at the option of theParent Company on May 10, 2017. The 2012 Notes carried interest at the rate of 5.88% per annum,payable quarterly. The 2012 Notes qualified as Lower Tier 2 capital of the Parent Company.
On May 10, 2017, the Parent Company exercised its call option at an amount equal to the aggregateissue price of the 2012 Notes plus accrued and unpaid interest as approved by the MB of the BSP onJanuary 26, 2017.
In 2017, amortization of transaction costs amounting to P=2.2 million is charged to ‘Interest expenseon bills payable and other borrowings’ in the statement of income (Note 19).
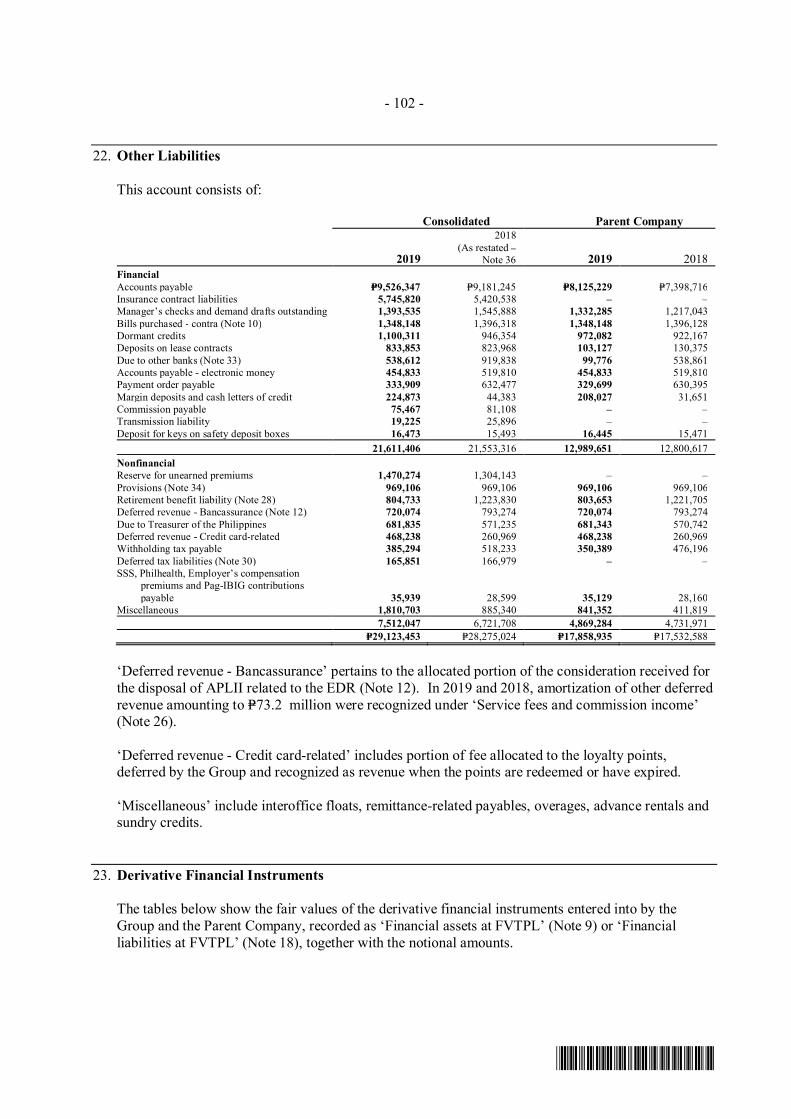
- 102 -
*SGVFS038920*
22. Other Liabilities
This account consists of:
Consolidated Parent Company
2019
2018(As restated –
Note 36 2019 2018FinancialAccounts payable P=9,526,347 P=9,181,245 P=8,125,229 P=7,398,716Insurance contract liabilities 5,745,820 5,420,538 – –Manager’s checks and demand drafts outstanding 1,393,535 1,545,888 1,332,285 1,217,043Bills purchased - contra (Note 10) 1,348,148 1,396,318 1,348,148 1,396,128Dormant credits 1,100,311 946,354 972,082 922,167Deposits on lease contracts 833,853 823,968 103,127 130,375Due to other banks (Note 33) 538,612 919,838 99,776 538,861Accounts payable - electronic money 454,833 519,810 454,833 519,810Payment order payable 333,909 632,477 329,699 630,395Margin deposits and cash letters of credit 224,873 44,383 208,027 31,651Commission payable 75,467 81,108 – –Transmission liability 19,225 25,896 – –Deposit for keys on safety deposit boxes 16,473 15,493 16,445 15,471
21,611,406 21,553,316 12,989,651 12,800,617NonfinancialReserve for unearned premiums 1,470,274 1,304,143 – –Provisions (Note 34) 969,106 969,106 969,106 969,106Retirement benefit liability (Note 28) 804,733 1,223,830 803,653 1,221,705Deferred revenue - Bancassurance (Note 12) 720,074 793,274 720,074 793,274Due to Treasurer of the Philippines 681,835 571,235 681,343 570,742Deferred revenue - Credit card-related 468,238 260,969 468,238 260,969Withholding tax payable 385,294 518,233 350,389 476,196Deferred tax liabilities (Note 30) 165,851 166,979 – –SSS, Philhealth, Employer’s compensation
premiums and Pag-IBIG contributionspayable 35,939 28,599 35,129 28,160
Miscellaneous 1,810,703 885,340 841,352 411,8197,512,047 6,721,708 4,869,284 4,731,971
P=29,123,453 P=28,275,024 P=17,858,935 P=17,532,588
‘Deferred revenue - Bancassurance’ pertains to the allocated portion of the consideration received forthe disposal of APLII related to the EDR (Note 12). In 2019 and 2018, amortization of other deferredrevenue amounting to P=73.2 million were recognized under ‘Service fees and commission income’(Note 26).
‘Deferred revenue - Credit card-related’ includes portion of fee allocated to the loyalty points,deferred by the Group and recognized as revenue when the points are redeemed or have expired.
‘Miscellaneous’ include interoffice floats, remittance-related payables, overages, advance rentals andsundry credits.
23. Derivative Financial Instruments
The tables below show the fair values of the derivative financial instruments entered into by theGroup and the Parent Company, recorded as ‘Financial assets at FVTPL’ (Note 9) or ‘Financialliabilities at FVTPL’ (Note 18), together with the notional amounts.
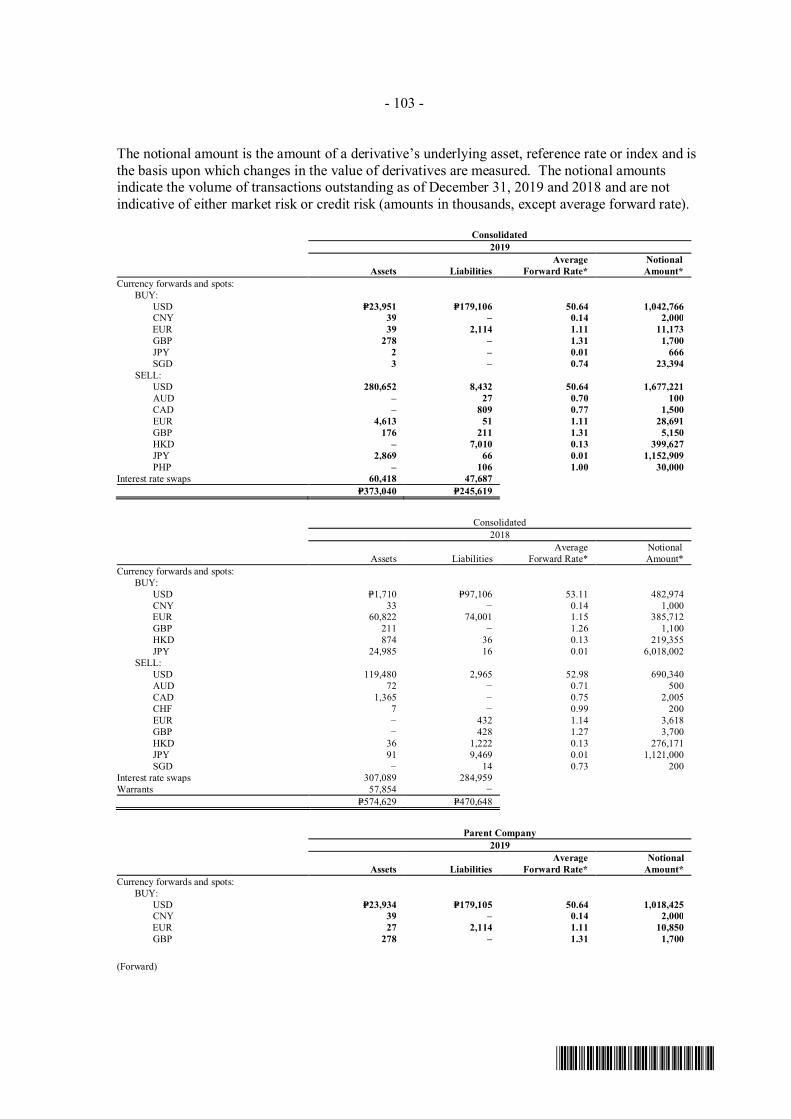
- 103 -
*SGVFS038920*
The notional amount is the amount of a derivative’s underlying asset, reference rate or index and isthe basis upon which changes in the value of derivatives are measured. The notional amountsindicate the volume of transactions outstanding as of December 31, 2019 and 2018 and are notindicative of either market risk or credit risk (amounts in thousands, except average forward rate).
Consolidated2019
Assets LiabilitiesAverage
Forward Rate*NotionalAmount*
Currency forwards and spots:BUY:
USD P=23,951 P=179,106 50.64 1,042,766CNY 39 – 0.14 2,000
EUR 39 2,114 1.11 11,173GBP 278 – 1.31 1,700JPY 2 – 0.01 666
SGD 3 – 0.74 23,394SELL:
USD 280,652 8,432 50.64 1,677,221AUD – 27 0.70 100CAD – 809 0.77 1,500EUR 4,613 51 1.11 28,691GBP 176 211 1.31 5,150HKD – 7,010 0.13 399,627JPY 2,869 66 0.01 1,152,909PHP – 106 1.00 30,000
Interest rate swaps 60,418 47,687P=373,040 P=245,619
Consolidated2018
Assets LiabilitiesAverage
Forward Rate*NotionalAmount*
Currency forwards and spots:BUY:
USD P=1,710 P=97,106 53.11 482,974CNY 33 − 0.14 1,000
EUR 60,822 74,001 1.15 385,712GBP 211 − 1.26 1,100HKD 874 36 0.13 219,355JPY 24,985 16 0.01 6,018,002
SELL:USD 119,480 2,965 52.98 690,340AUD 72 − 0.71 500CAD 1,365 − 0.75 2,005CHF 7 − 0.99 200EUR − 432 1.14 3,618GBP − 428 1.27 3,700HKD 36 1,222 0.13 276,171JPY 91 9,469 0.01 1,121,000SGD − 14 0.73 200
Interest rate swaps 307,089 284,959Warrants 57,854 −
P=574,629 P=470,648
Parent Company2019
Assets LiabilitiesAverage
Forward Rate*Notional
Amount*Currency forwards and spots:
BUY:USD P=23,934 P=179,105 50.64 1,018,425CNY 39 – 0.14 2,000
EUR 27 2,114 1.11 10,850GBP 278 – 1.31 1,700
(Forward)
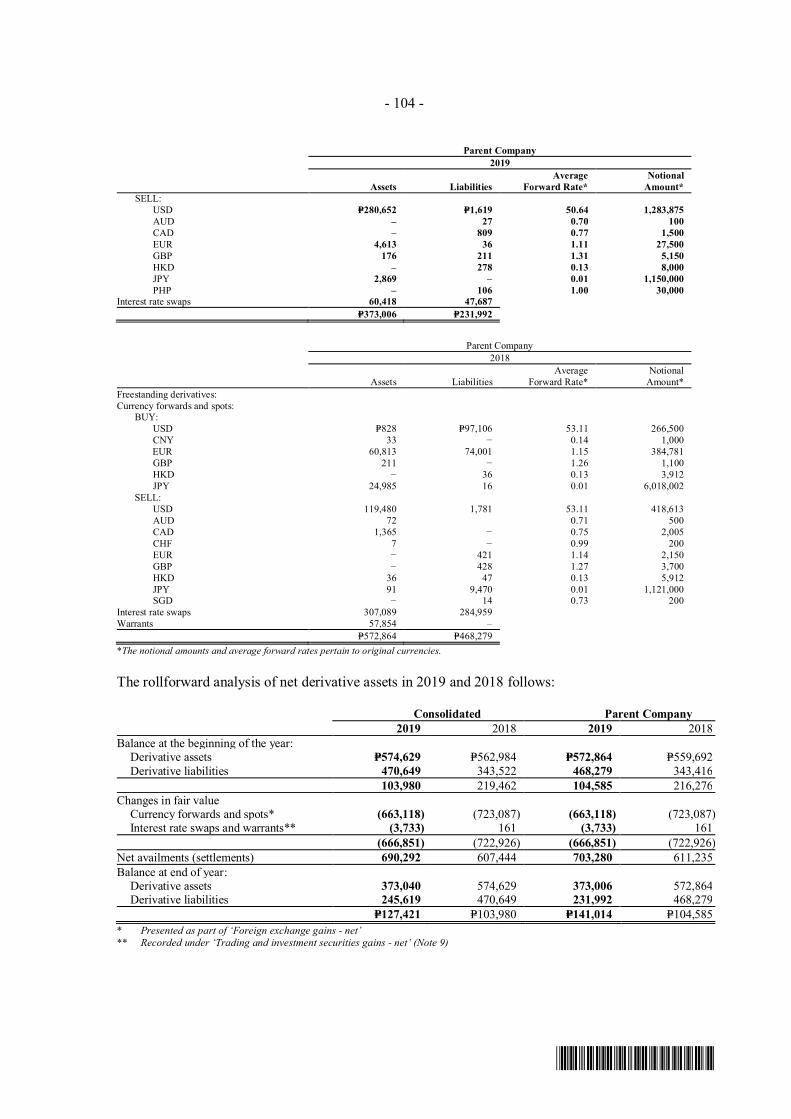
- 104 -
*SGVFS038920*
Parent Company2019
Assets LiabilitiesAverage
Forward Rate*Notional
Amount*SELL:
USD P=280,652 P=1,619 50.64 1,283,875AUD – 27 0.70 100CAD – 809 0.77 1,500EUR 4,613 36 1.11 27,500GBP 176 211 1.31 5,150HKD – 278 0.13 8,000JPY 2,869 – 0.01 1,150,000PHP – 106 1.00 30,000
Interest rate swaps 60,418 47,687P=373,006 P=231,992
Parent Company2018
Assets LiabilitiesAverage
Forward Rate*Notional
Amount*Freestanding derivatives:Currency forwards and spots:
BUY:USD P=828 P=97,106 53.11 266,500CNY 33 − 0.14 1,000
EUR 60,813 74,001 1.15 384,781GBP 211 − 1.26 1,100HKD − 36 0.13 3,912JPY 24,985 16 0.01 6,018,002
SELL:USD 119,480 1,781 53.11 418,613AUD 72 0.71 500CAD 1,365 − 0.75 2,005CHF 7 − 0.99 200EUR − 421 1.14 2,150GBP − 428 1.27 3,700HKD 36 47 0.13 5,912JPY 91 9,470 0.01 1,121,000SGD − 14 0.73 200
Interest rate swaps 307,089 284,959Warrants 57,854 –
P=572,864 P=468,279*The notional amounts and average forward rates pertain to original currencies.
The rollforward analysis of net derivative assets in 2019 and 2018 follows:
Consolidated Parent Company2019 2018 2019 2018
Balance at the beginning of the year:Derivative assets P=574,629 P=562,984 P=572,864 P=559,692Derivative liabilities 470,649 343,522 468,279 343,416
103,980 219,462 104,585 216,276Changes in fair value
Currency forwards and spots* (663,118) (723,087) (663,118) (723,087)Interest rate swaps and warrants** (3,733) 161 (3,733) 161
(666,851) (722,926) (666,851) (722,926)Net availments (settlements) 690,292 607,444 703,280 611,235Balance at end of year:
Derivative assets 373,040 574,629 373,006 572,864Derivative liabilities 245,619 470,649 231,992 468,279
P=127,421 P=103,980 P=141,014 P=104,585* Presented as part of ‘Foreign exchange gains - net’** Recorded under ‘Trading and investment securities gains - net’ (Note 9)
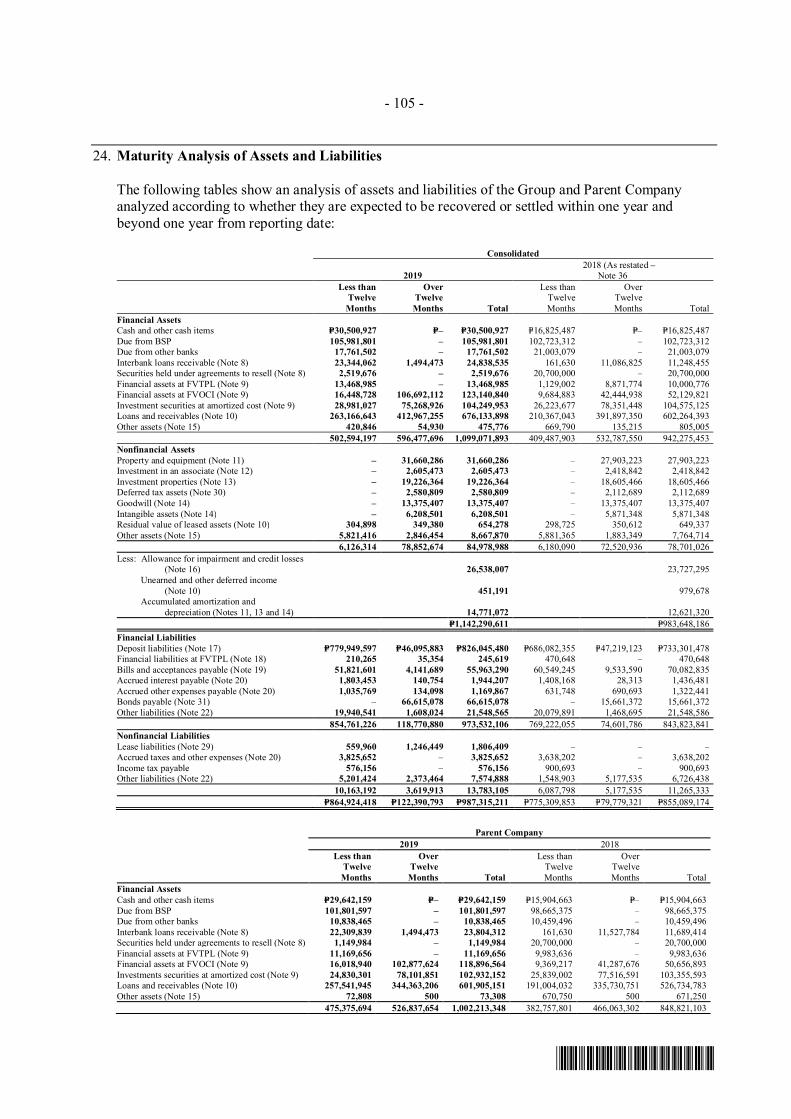
- 105 -
*SGVFS038920*
24. Maturity Analysis of Assets and Liabilities
The following tables show an analysis of assets and liabilities of the Group and Parent Companyanalyzed according to whether they are expected to be recovered or settled within one year andbeyond one year from reporting date:
Consolidated
20192018 (As restated –
Note 36Less than
TwelveMonths
OverTwelveMonths Total
Less thanTwelveMonths
OverTwelveMonths Total
Financial AssetsCash and other cash items P=30,500,927 P=– P=30,500,927 P=16,825,487 P=– P=16,825,487Due from BSP 105,981,801 – 105,981,801 102,723,312 – 102,723,312Due from other banks 17,761,502 – 17,761,502 21,003,079 – 21,003,079Interbank loans receivable (Note 8) 23,344,062 1,494,473 24,838,535 161,630 11,086,825 11,248,455Securities held under agreements to resell (Note 8) 2,519,676 – 2,519,676 20,700,000 – 20,700,000Financial assets at FVTPL (Note 9) 13,468,985 – 13,468,985 1,129,002 8,871,774 10,000,776Financial assets at FVOCI (Note 9) 16,448,728 106,692,112 123,140,840 9,684,883 42,444,938 52,129,821Investment securities at amortized cost (Note 9) 28,981,027 75,268,926 104,249,953 26,223,677 78,351,448 104,575,125Loans and receivables (Note 10) 263,166,643 412,967,255 676,133,898 210,367,043 391,897,350 602,264,393Other assets (Note 15) 420,846 54,930 475,776 669,790 135,215 805,005
502,594,197 596,477,696 1,099,071,893 409,487,903 532,787,550 942,275,453Nonfinancial AssetsProperty and equipment (Note 11) – 31,660,286 31,660,286 – 27,903,223 27,903,223Investment in an associate (Note 12) – 2,605,473 2,605,473 – 2,418,842 2,418,842Investment properties (Note 13) – 19,226,364 19,226,364 – 18,605,466 18,605,466Deferred tax assets (Note 30) – 2,580,809 2,580,809 – 2,112,689 2,112,689Goodwill (Note 14) – 13,375,407 13,375,407 – 13,375,407 13,375,407Intangible assets (Note 14) – 6,208,501 6,208,501 – 5,871,348 5,871,348Residual value of leased assets (Note 10) 304,898 349,380 654,278 298,725 350,612 649,337Other assets (Note 15) 5,821,416 2,846,454 8,667,870 5,881,365 1,883,349 7,764,714
6,126,314 78,852,674 84,978,988 6,180,090 72,520,936 78,701,026Less: Allowance for impairment and credit losses
(Note 16) 26,538,007 23,727,295Unearned and other deferred income
(Note 10) 451,191 979,678Accumulated amortization and
depreciation (Notes 11, 13 and 14) 14,771,072 12,621,320P=1,142,290,611 P=983,648,186
Financial LiabilitiesDeposit liabilities (Note 17) P=779,949,597 P=46,095,883 P=826,045,480 P=686,082,355 P=47,219,123 P=733,301,478Financial liabilities at FVTPL (Note 18) 210,265 35,354 245,619 470,648 – 470,648Bills and acceptances payable (Note 19) 51,821,601 4,141,689 55,963,290 60,549,245 9,533,590 70,082,835Accrued interest payable (Note 20) 1,803,453 140,754 1,944,207 1,408,168 28,313 1,436,481Accrued other expenses payable (Note 20) 1,035,769 134,098 1,169,867 631,748 690,693 1,322,441Bonds payable (Note 31) – 66,615,078 66,615,078 – 15,661,372 15,661,372Other liabilities (Note 22) 19,940,541 1,608,024 21,548,565 20,079,891 1,468,695 21,548,586
854,761,226 118,770,880 973,532,106 769,222,055 74,601,786 843,823,841Nonfinancial LiabilitiesLease liabilities (Note 29) 559,960 1,246,449 1,806,409 – – –Accrued taxes and other expenses (Note 20) 3,825,652 – 3,825,652 3,638,202 – 3,638,202Income tax payable 576,156 – 576,156 900,693 – 900,693Other liabilities (Note 22) 5,201,424 2,373,464 7,574,888 1,548,903 5,177,535 6,726,438
10,163,192 3,619,913 13,783,105 6,087,798 5,177,535 11,265,333P=864,924,418 P=122,390,793 P=987,315,211 P=775,309,853 P=79,779,321 P=855,089,174
Parent Company2019 2018
Less thanTwelveMonths
OverTwelveMonths Total
Less thanTwelveMonths
OverTwelveMonths Total
Financial AssetsCash and other cash items P=29,642,159 P=– P=29,642,159 P=15,904,663 P=– P=15,904,663Due from BSP 101,801,597 – 101,801,597 98,665,375 – 98,665,375Due from other banks 10,838,465 – 10,838,465 10,459,496 – 10,459,496Interbank loans receivable (Note 8) 22,309,839 1,494,473 23,804,312 161,630 11,527,784 11,689,414Securities held under agreements to resell (Note 8) 1,149,984 – 1,149,984 20,700,000 – 20,700,000Financial assets at FVTPL (Note 9) 11,169,656 – 11,169,656 9,983,636 – 9,983,636Financial assets at FVOCI (Note 9) 16,018,940 102,877,624 118,896,564 9,369,217 41,287,676 50,656,893Investments securities at amortized cost (Note 9) 24,830,301 78,101,851 102,932,152 25,839,002 77,516,591 103,355,593Loans and receivables (Note 10) 257,541,945 344,363,206 601,905,151 191,004,032 335,730,751 526,734,783Other assets (Note 15) 72,808 500 73,308 670,750 500 671,250
475,375,694 526,837,654 1,002,213,348 382,757,801 466,063,302 848,821,103
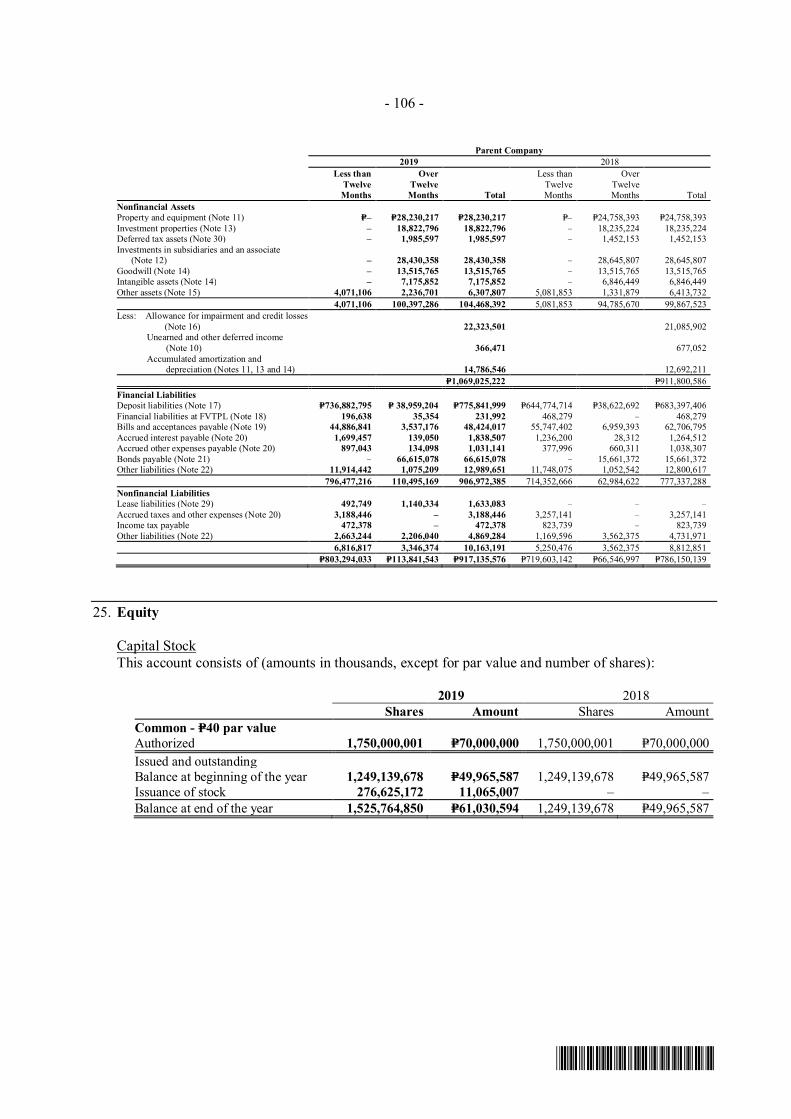
- 106 -
*SGVFS038920*
Parent Company2019 2018
Less thanTwelveMonths
OverTwelveMonths Total
Less thanTwelveMonths
OverTwelveMonths Total
Nonfinancial AssetsProperty and equipment (Note 11) P=– P=28,230,217 P=28,230,217 P=– P=24,758,393 P=24,758,393Investment properties (Note 13) – 18,822,796 18,822,796 – 18,235,224 18,235,224Deferred tax assets (Note 30) – 1,985,597 1,985,597 – 1,452,153 1,452,153Investments in subsidiaries and an associate
(Note 12) – 28,430,358 28,430,358 – 28,645,807 28,645,807Goodwill (Note 14) – 13,515,765 13,515,765 – 13,515,765 13,515,765Intangible assets (Note 14) – 7,175,852 7,175,852 – 6,846,449 6,846,449Other assets (Note 15) 4,071,106 2,236,701 6,307,807 5,081,853 1,331,879 6,413,732
4,071,106 100,397,286 104,468,392 5,081,853 94,785,670 99,867,523Less: Allowance for impairment and credit losses
(Note 16) 22,323,501 21,085,902Unearned and other deferred income
(Note 10) 366,471 677,052Accumulated amortization and
depreciation (Notes 11, 13 and 14) 14,786,546 12,692,211P=1,069,025,222 P=911,800,586
Financial LiabilitiesDeposit liabilities (Note 17) P=736,882,795 P= 38,959,204 P=775,841,999 P=644,774,714 P=38,622,692 P=683,397,406Financial liabilities at FVTPL (Note 18) 196,638 35,354 231,992 468,279 – 468,279Bills and acceptances payable (Note 19) 44,886,841 3,537,176 48,424,017 55,747,402 6,959,393 62,706,795Accrued interest payable (Note 20) 1,699,457 139,050 1,838,507 1,236,200 28,312 1,264,512Accrued other expenses payable (Note 20) 897,043 134,098 1,031,141 377,996 660,311 1,038,307Bonds payable (Note 21) – 66,615,078 66,615,078 – 15,661,372 15,661,372Other liabilities (Note 22) 11,914,442 1,075,209 12,989,651 11,748,075 1,052,542 12,800,617
796,477,216 110,495,169 906,972,385 714,352,666 62,984,622 777,337,288Nonfinancial LiabilitiesLease liabilities (Note 29) 492,749 1,140,334 1,633,083 – – –Accrued taxes and other expenses (Note 20) 3,188,446 – 3,188,446 3,257,141 – 3,257,141Income tax payable 472,378 – 472,378 823,739 – 823,739Other liabilities (Note 22) 2,663,244 2,206,040 4,869,284 1,169,596 3,562,375 4,731,971
6,816,817 3,346,374 10,163,191 5,250,476 3,562,375 8,812,851P=803,294,033 P=113,841,543 P=917,135,576 P=719,603,142 P=66,546,997 P=786,150,139
25. Equity
Capital StockThis account consists of (amounts in thousands, except for par value and number of shares):
2019 2018Shares Amount Shares Amount
Common - P=40 par valueAuthorized 1,750,000,001 P=70,000,000 1,750,000,001 P=70,000,000Issued and outstandingBalance at beginning of the year 1,249,139,678 P=49,965,587 1,249,139,678 P=49,965,587Issuance of stock 276,625,172 11,065,007 – –Balance at end of the year 1,525,764,850 P=61,030,594 1,249,139,678 P=49,965,587
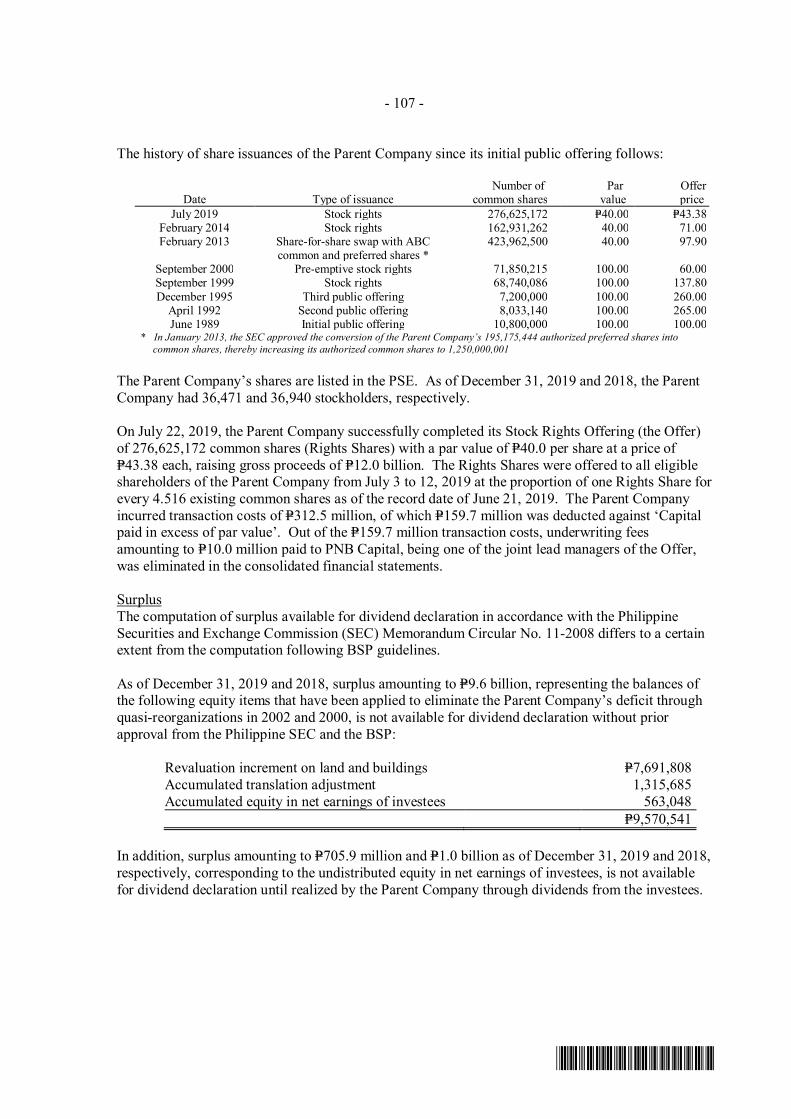
- 107 -
*SGVFS038920*
The history of share issuances of the Parent Company since its initial public offering follows:
Date Type of issuanceNumber of
common sharesPar
valueOfferprice
July 2019 Stock rights 276,625,172 P=40.00 P=43.38February 2014 Stock rights 162,931,262 40.00 71.00February 2013 Share-for-share swap with ABC
common and preferred shares *423,962,500 40.00 97.90
September 2000 Pre-emptive stock rights 71,850,215 100.00 60.00September 1999 Stock rights 68,740,086 100.00 137.80December 1995 Third public offering 7,200,000 100.00 260.00
April 1992 Second public offering 8,033,140 100.00 265.00June 1989 Initial public offering 10,800,000 100.00 100.00
* In January 2013, the SEC approved the conversion of the Parent Company’s 195,175,444 authorized preferred shares intocommon shares, thereby increasing its authorized common shares to 1,250,000,001
The Parent Company’s shares are listed in the PSE. As of December 31, 2019 and 2018, the ParentCompany had 36,471 and 36,940 stockholders, respectively.
On July 22, 2019, the Parent Company successfully completed its Stock Rights Offering (the Offer)of 276,625,172 common shares (Rights Shares) with a par value of P=40.0 per share at a price ofP=43.38 each, raising gross proceeds of P=12.0 billion. The Rights Shares were offered to all eligibleshareholders of the Parent Company from July 3 to 12, 2019 at the proportion of one Rights Share forevery 4.516 existing common shares as of the record date of June 21, 2019. The Parent Companyincurred transaction costs of P=312.5 million, of which P=159.7 million was deducted against ‘Capitalpaid in excess of par value’. Out of the P=159.7 million transaction costs, underwriting feesamounting to P=10.0 million paid to PNB Capital, being one of the joint lead managers of the Offer,was eliminated in the consolidated financial statements.
SurplusThe computation of surplus available for dividend declaration in accordance with the PhilippineSecurities and Exchange Commission (SEC) Memorandum Circular No. 11-2008 differs to a certainextent from the computation following BSP guidelines.
As of December 31, 2019 and 2018, surplus amounting to P=9.6 billion, representing the balances ofthe following equity items that have been applied to eliminate the Parent Company’s deficit throughquasi-reorganizations in 2002 and 2000, is not available for dividend declaration without priorapproval from the Philippine SEC and the BSP:
Revaluation increment on land and buildings P=7,691,808Accumulated translation adjustment 1,315,685Accumulated equity in net earnings of investees 563,048
P=9,570,541
In addition, surplus amounting to P=705.9 million and P=1.0 billion as of December 31, 2019 and 2018,respectively, corresponding to the undistributed equity in net earnings of investees, is not availablefor dividend declaration until realized by the Parent Company through dividends from the investees.
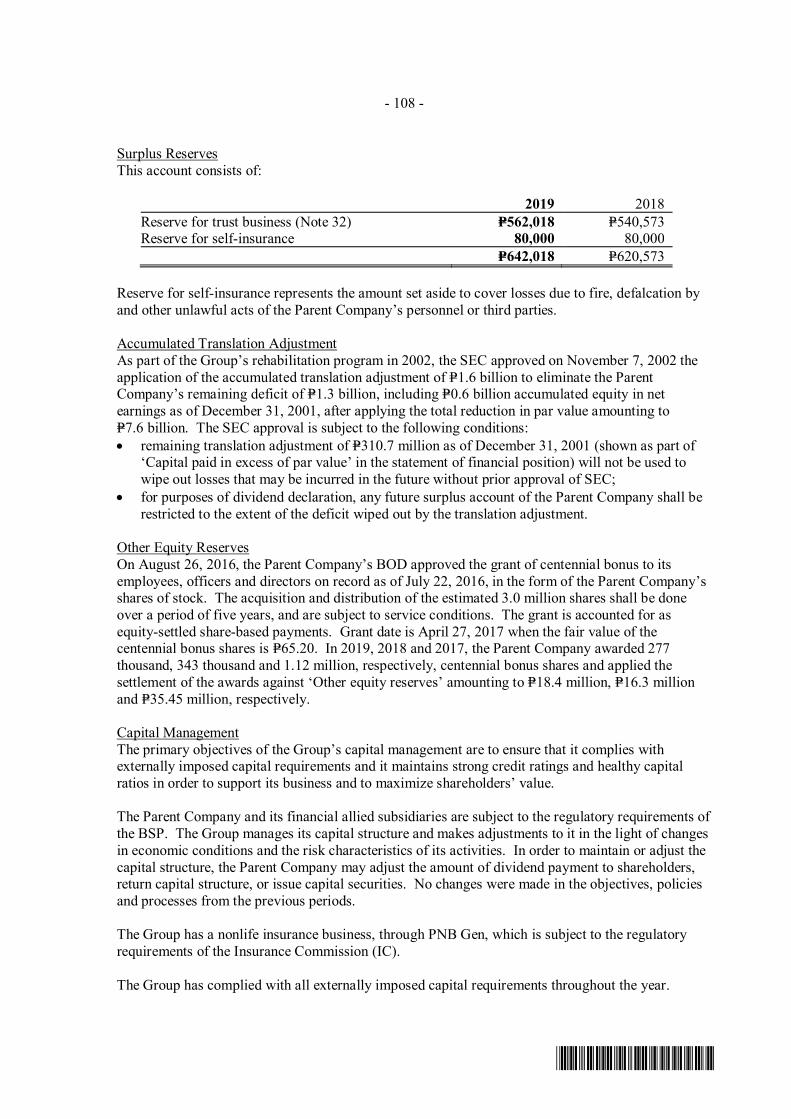
- 108 -
*SGVFS038920*
Surplus ReservesThis account consists of:
2019 2018Reserve for trust business (Note 32) P=562,018 P=540,573Reserve for self-insurance 80,000 80,000
P=642,018 P=620,573
Reserve for self-insurance represents the amount set aside to cover losses due to fire, defalcation byand other unlawful acts of the Parent Company’s personnel or third parties.
Accumulated Translation AdjustmentAs part of the Group’s rehabilitation program in 2002, the SEC approved on November 7, 2002 theapplication of the accumulated translation adjustment of P=1.6 billion to eliminate the ParentCompany’s remaining deficit of P=1.3 billion, including P=0.6 billion accumulated equity in netearnings as of December 31, 2001, after applying the total reduction in par value amounting toP=7.6 billion. The SEC approval is subject to the following conditions:· remaining translation adjustment of P=310.7 million as of December 31, 2001 (shown as part of
‘Capital paid in excess of par value’ in the statement of financial position) will not be used towipe out losses that may be incurred in the future without prior approval of SEC;
· for purposes of dividend declaration, any future surplus account of the Parent Company shall berestricted to the extent of the deficit wiped out by the translation adjustment.
Other Equity ReservesOn August 26, 2016, the Parent Company’s BOD approved the grant of centennial bonus to itsemployees, officers and directors on record as of July 22, 2016, in the form of the Parent Company’sshares of stock. The acquisition and distribution of the estimated 3.0 million shares shall be doneover a period of five years, and are subject to service conditions. The grant is accounted for asequity-settled share-based payments. Grant date is April 27, 2017 when the fair value of thecentennial bonus shares is P=65.20. In 2019, 2018 and 2017, the Parent Company awarded 277thousand, 343 thousand and 1.12 million, respectively, centennial bonus shares and applied thesettlement of the awards against ‘Other equity reserves’ amounting to P=18.4 million, P=16.3 millionand P=35.45 million, respectively.
Capital ManagementThe primary objectives of the Group’s capital management are to ensure that it complies withexternally imposed capital requirements and it maintains strong credit ratings and healthy capitalratios in order to support its business and to maximize shareholders’ value.
The Parent Company and its financial allied subsidiaries are subject to the regulatory requirements ofthe BSP. The Group manages its capital structure and makes adjustments to it in the light of changesin economic conditions and the risk characteristics of its activities. In order to maintain or adjust thecapital structure, the Parent Company may adjust the amount of dividend payment to shareholders,return capital structure, or issue capital securities. No changes were made in the objectives, policiesand processes from the previous periods.
The Group has a nonlife insurance business, through PNB Gen, which is subject to the regulatoryrequirements of the Insurance Commission (IC).
The Group has complied with all externally imposed capital requirements throughout the year.
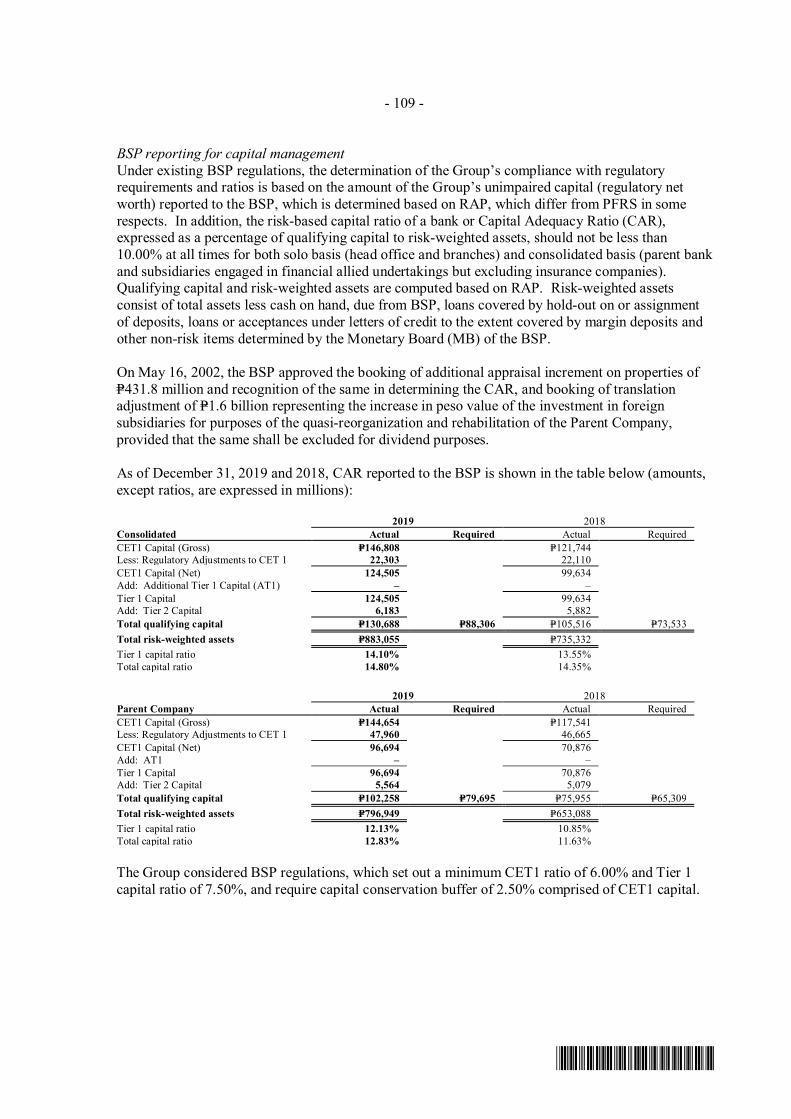
- 109 -
*SGVFS038920*
BSP reporting for capital managementUnder existing BSP regulations, the determination of the Group’s compliance with regulatoryrequirements and ratios is based on the amount of the Group’s unimpaired capital (regulatory networth) reported to the BSP, which is determined based on RAP, which differ from PFRS in somerespects. In addition, the risk-based capital ratio of a bank or Capital Adequacy Ratio (CAR),expressed as a percentage of qualifying capital to risk-weighted assets, should not be less than10.00% at all times for both solo basis (head office and branches) and consolidated basis (parent bankand subsidiaries engaged in financial allied undertakings but excluding insurance companies).Qualifying capital and risk-weighted assets are computed based on RAP. Risk-weighted assetsconsist of total assets less cash on hand, due from BSP, loans covered by hold-out on or assignmentof deposits, loans or acceptances under letters of credit to the extent covered by margin deposits andother non-risk items determined by the Monetary Board (MB) of the BSP.
On May 16, 2002, the BSP approved the booking of additional appraisal increment on properties ofP=431.8 million and recognition of the same in determining the CAR, and booking of translationadjustment of P=1.6 billion representing the increase in peso value of the investment in foreignsubsidiaries for purposes of the quasi-reorganization and rehabilitation of the Parent Company,provided that the same shall be excluded for dividend purposes.
As of December 31, 2019 and 2018, CAR reported to the BSP is shown in the table below (amounts,except ratios, are expressed in millions):
2019 2018Consolidated Actual Required Actual RequiredCET1 Capital (Gross) P=146,808 P=121,744Less: Regulatory Adjustments to CET 1 22,303 22,110CET1 Capital (Net) 124,505 99,634Add: Additional Tier 1 Capital (AT1) – –Tier 1 Capital 124,505 99,634Add: Tier 2 Capital 6,183 5,882Total qualifying capital P=130,688 P=88,306 P=105,516 P=73,533Total risk-weighted assets P=883,055 P=735,332Tier 1 capital ratio 14.10% 13.55%Total capital ratio 14.80% 14.35%
2019 2018Parent Company Actual Required Actual RequiredCET1 Capital (Gross) P=144,654 P=117,541Less: Regulatory Adjustments to CET 1 47,960 46,665CET1 Capital (Net) 96,694 70,876Add: AT1 – –Tier 1 Capital 96,694 70,876Add: Tier 2 Capital 5,564 5,079Total qualifying capital P=102,258 P=79,695 P=75,955 P=65,309Total risk-weighted assets P=796,949 P=653,088Tier 1 capital ratio 12.13% 10.85%Total capital ratio 12.83% 11.63%
The Group considered BSP regulations, which set out a minimum CET1 ratio of 6.00% and Tier 1capital ratio of 7.50%, and require capital conservation buffer of 2.50% comprised of CET1 capital.
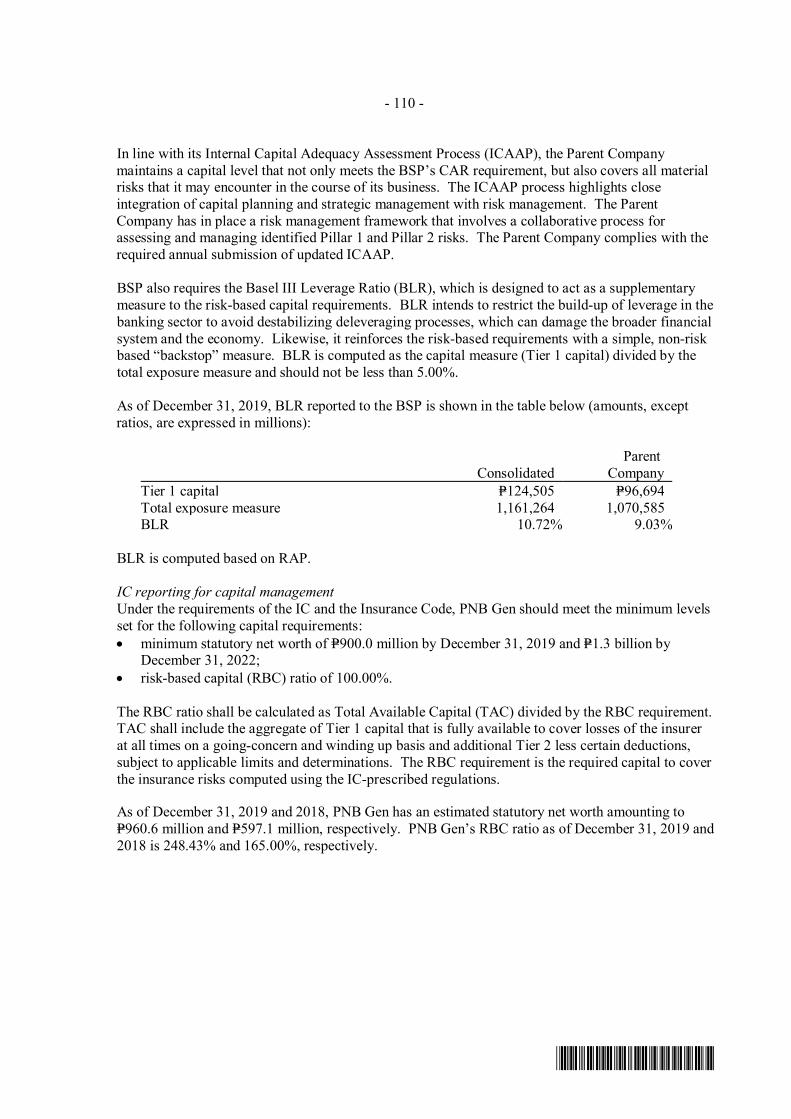
- 110 -
*SGVFS038920*
In line with its Internal Capital Adequacy Assessment Process (ICAAP), the Parent Companymaintains a capital level that not only meets the BSP’s CAR requirement, but also covers all materialrisks that it may encounter in the course of its business. The ICAAP process highlights closeintegration of capital planning and strategic management with risk management. The ParentCompany has in place a risk management framework that involves a collaborative process forassessing and managing identified Pillar 1 and Pillar 2 risks. The Parent Company complies with therequired annual submission of updated ICAAP.
BSP also requires the Basel III Leverage Ratio (BLR), which is designed to act as a supplementarymeasure to the risk-based capital requirements. BLR intends to restrict the build-up of leverage in thebanking sector to avoid destabilizing deleveraging processes, which can damage the broader financialsystem and the economy. Likewise, it reinforces the risk-based requirements with a simple, non-riskbased “backstop” measure. BLR is computed as the capital measure (Tier 1 capital) divided by thetotal exposure measure and should not be less than 5.00%.
As of December 31, 2019, BLR reported to the BSP is shown in the table below (amounts, exceptratios, are expressed in millions):
ConsolidatedParent
CompanyTier 1 capital P=124,505 P=96,694Total exposure measure 1,161,264 1,070,585BLR 10.72% 9.03%
BLR is computed based on RAP.
IC reporting for capital managementUnder the requirements of the IC and the Insurance Code, PNB Gen should meet the minimum levelsset for the following capital requirements:· minimum statutory net worth of P=900.0 million by December 31, 2019 and P=1.3 billion by
December 31, 2022;· risk-based capital (RBC) ratio of 100.00%.
The RBC ratio shall be calculated as Total Available Capital (TAC) divided by the RBC requirement.TAC shall include the aggregate of Tier 1 capital that is fully available to cover losses of the insurerat all times on a going-concern and winding up basis and additional Tier 2 less certain deductions,subject to applicable limits and determinations. The RBC requirement is the required capital to coverthe insurance risks computed using the IC-prescribed regulations.
As of December 31, 2019 and 2018, PNB Gen has an estimated statutory net worth amounting toP=960.6 million and P=597.1 million, respectively. PNB Gen’s RBC ratio as of December 31, 2019 and2018 is 248.43% and 165.00%, respectively.
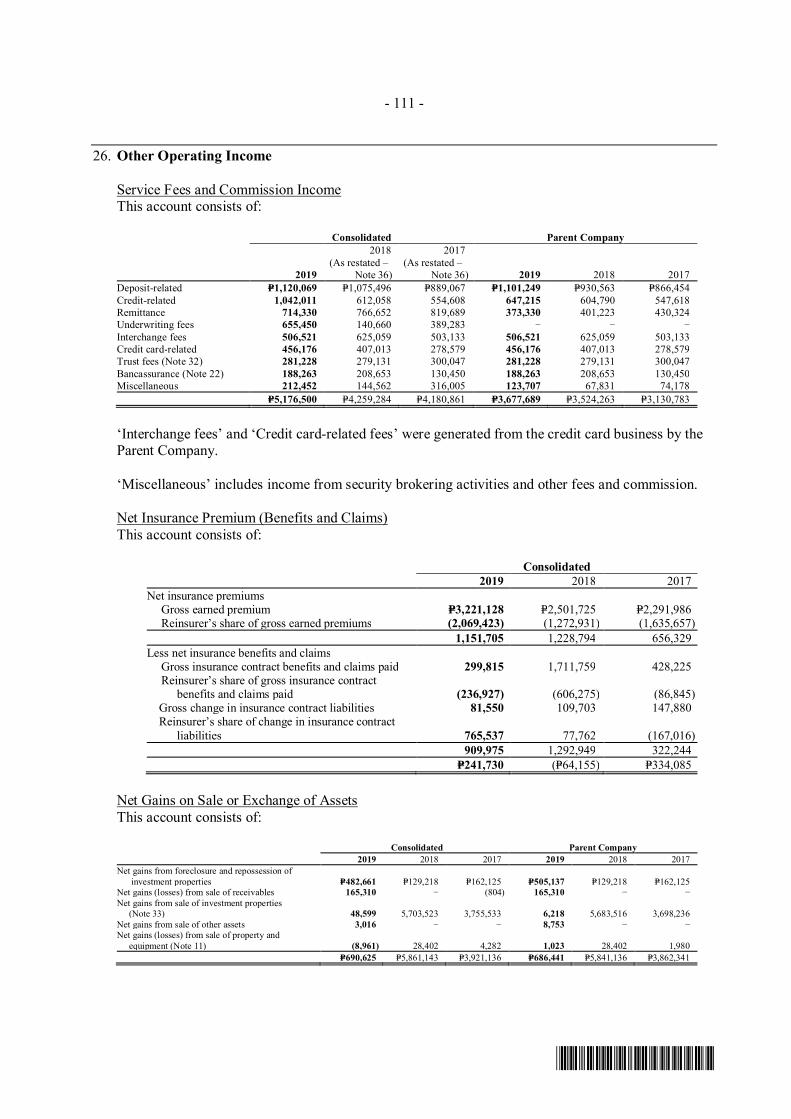
- 111 -
*SGVFS038920*
26. Other Operating Income
Service Fees and Commission IncomeThis account consists of:
Consolidated Parent Company
2019
2018(As restated –
Note 36)
2017(As restated –
Note 36) 2019 2018 2017Deposit-related P=1,120,069 P=1,075,496 P=889,067 P=1,101,249 P=930,563 P=866,454Credit-related 1,042,011 612,058 554,608 647,215 604,790 547,618Remittance 714,330 766,652 819,689 373,330 401,223 430,324Underwriting fees 655,450 140,660 389,283 – – –Interchange fees 506,521 625,059 503,133 506,521 625,059 503,133Credit card-related 456,176 407,013 278,579 456,176 407,013 278,579Trust fees (Note 32) 281,228 279,131 300,047 281,228 279,131 300,047Bancassurance (Note 22) 188,263 208,653 130,450 188,263 208,653 130,450Miscellaneous 212,452 144,562 316,005 123,707 67,831 74,178
P=5,176,500 P=4,259,284 P=4,180,861 P=3,677,689 P=3,524,263 P=3,130,783
‘Interchange fees’ and ‘Credit card-related fees’ were generated from the credit card business by theParent Company.
‘Miscellaneous’ includes income from security brokering activities and other fees and commission.
Net Insurance Premium (Benefits and Claims)This account consists of:
Consolidated2019 2018 2017
Net insurance premiumsGross earned premium P=3,221,128 P=2,501,725 P=2,291,986Reinsurer’s share of gross earned premiums (2,069,423) (1,272,931) (1,635,657)
1,151,705 1,228,794 656,329Less net insurance benefits and claims
Gross insurance contract benefits and claims paid 299,815 1,711,759 428,225 Reinsurer’s share of gross insurance contract
benefits and claims paid (236,927) (606,275) (86,845)Gross change in insurance contract liabilities 81,550 109,703 147,880Reinsurer’s share of change in insurance contract
liabilities 765,537 77,762 (167,016)909,975 1,292,949 322,244
P=241,730 (P=64,155) P=334,085
Net Gains on Sale or Exchange of AssetsThis account consists of:
Consolidated Parent Company2019 2018 2017 2019 2018 2017
Net gains from foreclosure and repossession ofinvestment properties P=482,661 P=129,218 P=162,125 P=505,137 P=129,218 P=162,125
Net gains (losses) from sale of receivables 165,310 − (804) 165,310 − −Net gains from sale of investment properties
(Note 33) 48,599 5,703,523 3,755,533 6,218 5,683,516 3,698,236Net gains from sale of other assets 3,016 − − 8,753 − −Net gains (losses) from sale of property and
equipment (Note 11) (8,961) 28,402 4,282 1,023 28,402 1,980P=690,625 P=5,861,143 P=3,921,136 P=686,441 P=5,841,136 P=3,862,341
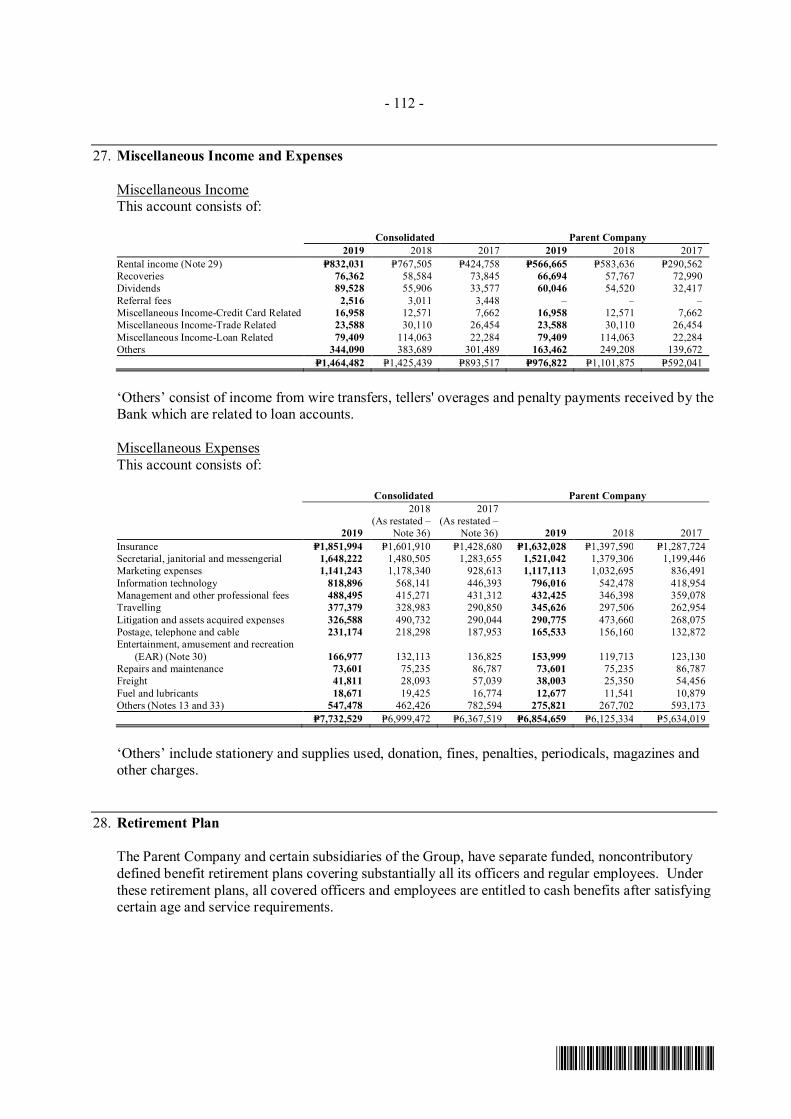
- 112 -
*SGVFS038920*
27. Miscellaneous Income and Expenses
Miscellaneous IncomeThis account consists of:
Consolidated Parent Company2019 2018 2017 2019 2018 2017
Rental income (Note 29) P=832,031 P=767,505 P=424,758 P=566,665 P=583,636 P=290,562Recoveries 76,362 58,584 73,845 66,694 57,767 72,990Dividends 89,528 55,906 33,577 60,046 54,520 32,417Referral fees 2,516 3,011 3,448 – – –Miscellaneous Income-Credit Card Related 16,958 12,571 7,662 16,958 12,571 7,662Miscellaneous Income-Trade Related 23,588 30,110 26,454 23,588 30,110 26,454Miscellaneous Income-Loan Related 79,409 114,063 22,284 79,409 114,063 22,284Others 344,090 383,689 301,489 163,462 249,208 139,672
P=1,464,482 P=1,425,439 P=893,517 P=976,822 P=1,101,875 P=592,041
‘Others’ consist of income from wire transfers, tellers' overages and penalty payments received by theBank which are related to loan accounts.
Miscellaneous ExpensesThis account consists of:
Consolidated Parent Company
2019
2018(As restated –
Note 36)
2017(As restated –
Note 36) 2019 2018 2017Insurance P=1,851,994 P=1,601,910 P=1,428,680 P=1,632,028 P=1,397,590 P=1,287,724Secretarial, janitorial and messengerial 1,648,222 1,480,505 1,283,655 1,521,042 1,379,306 1,199,446Marketing expenses 1,141,243 1,178,340 928,613 1,117,113 1,032,695 836,491Information technology 818,896 568,141 446,393 796,016 542,478 418,954Management and other professional fees 488,495 415,271 431,312 432,425 346,398 359,078Travelling 377,379 328,983 290,850 345,626 297,506 262,954Litigation and assets acquired expenses 326,588 490,732 290,044 290,775 473,660 268,075Postage, telephone and cable 231,174 218,298 187,953 165,533 156,160 132,872Entertainment, amusement and recreation
(EAR) (Note 30) 166,977 132,113 136,825 153,999 119,713 123,130Repairs and maintenance 73,601 75,235 86,787 73,601 75,235 86,787Freight 41,811 28,093 57,039 38,003 25,350 54,456Fuel and lubricants 18,671 19,425 16,774 12,677 11,541 10,879Others (Notes 13 and 33) 547,478 462,426 782,594 275,821 267,702 593,173
P=7,732,529 P=6,999,472 P=6,367,519 P=6,854,659 P=6,125,334 P=5,634,019
‘Others’ include stationery and supplies used, donation, fines, penalties, periodicals, magazines andother charges.
28. Retirement Plan
The Parent Company and certain subsidiaries of the Group, have separate funded, noncontributorydefined benefit retirement plans covering substantially all its officers and regular employees. Underthese retirement plans, all covered officers and employees are entitled to cash benefits after satisfyingcertain age and service requirements.
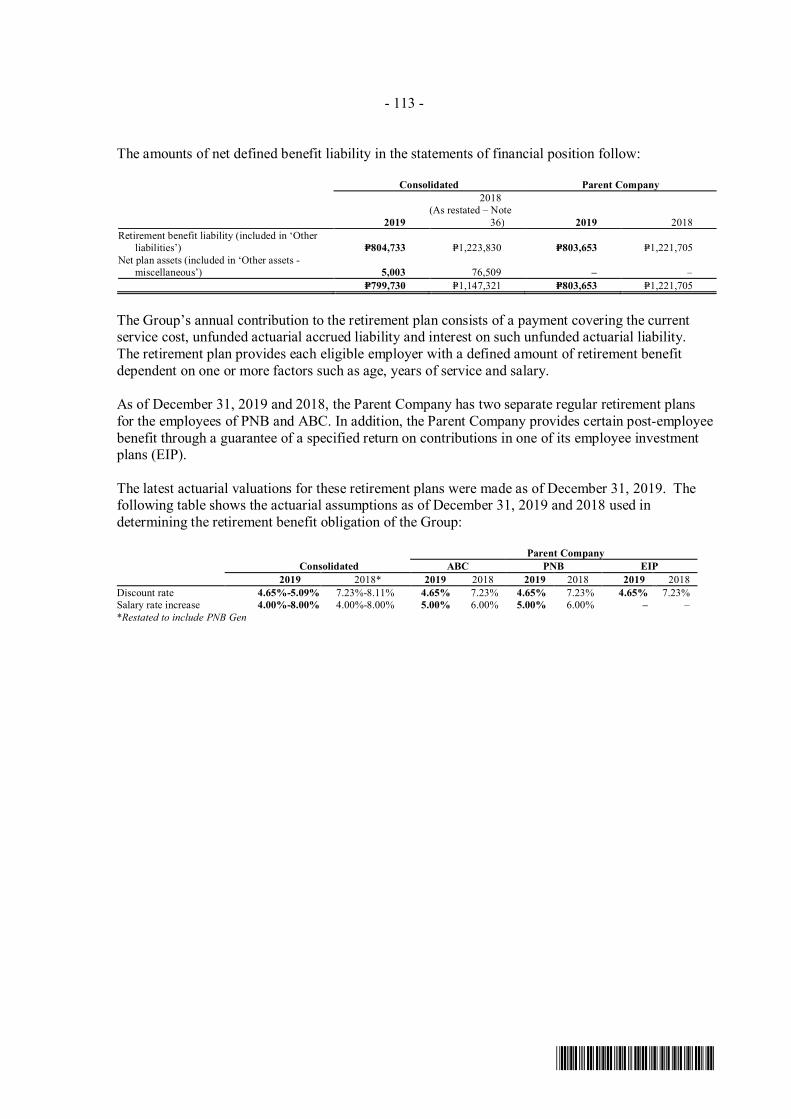
- 113 -
*SGVFS038920*
The amounts of net defined benefit liability in the statements of financial position follow:
Consolidated Parent Company
2019
2018(As restated – Note
36) 2019 2018Retirement benefit liability (included in ‘Other
liabilities’) P=804,733 P=1,223,830 P=803,653 P=1,221,705Net plan assets (included in ‘Other assets -
miscellaneous’) 5,003 76,509 – –P=799,730 P=1,147,321 P=803,653 P=1,221,705
The Group’s annual contribution to the retirement plan consists of a payment covering the currentservice cost, unfunded actuarial accrued liability and interest on such unfunded actuarial liability.The retirement plan provides each eligible employer with a defined amount of retirement benefitdependent on one or more factors such as age, years of service and salary.
As of December 31, 2019 and 2018, the Parent Company has two separate regular retirement plansfor the employees of PNB and ABC. In addition, the Parent Company provides certain post-employeebenefit through a guarantee of a specified return on contributions in one of its employee investmentplans (EIP).
The latest actuarial valuations for these retirement plans were made as of December 31, 2019. Thefollowing table shows the actuarial assumptions as of December 31, 2019 and 2018 used indetermining the retirement benefit obligation of the Group:
ConsolidatedParent Company
ABC PNB EIP2019 2018* 2019 2018 2019 2018 2019 2018
Discount rate 4.65%-5.09% 7.23%-8.11% 4.65% 7.23% 4.65% 7.23% 4.65% 7.23%Salary rate increase 4.00%-8.00% 4.00%-8.00% 5.00% 6.00% 5.00% 6.00% – –*Restated to include PNB Gen
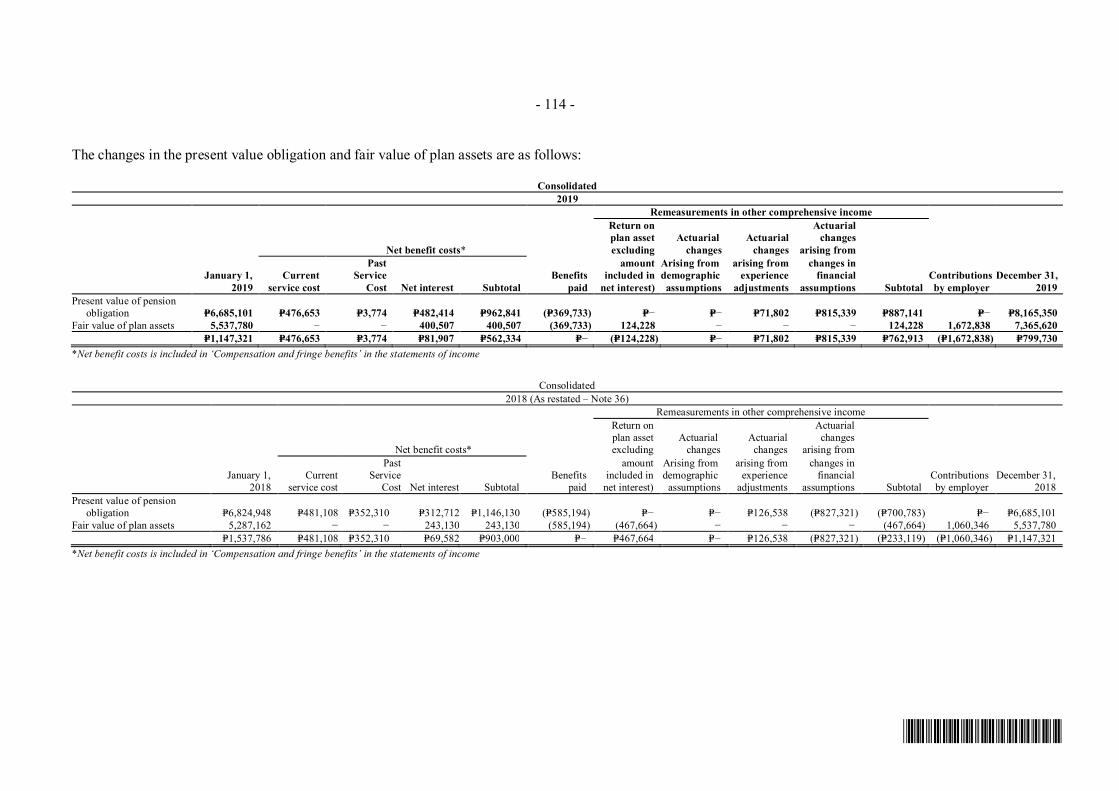
- 114 -
*SGVFS038920*
The changes in the present value obligation and fair value of plan assets are as follows:
Consolidated2019
Remeasurements in other comprehensive income
Net benefit costs*
Return onplan assetexcluding
Actuarialchanges
Actuarialchanges
Actuarialchanges
arising from
January 1,2019
Currentservice cost
PastService
Cost Net interest SubtotalBenefits
paid
amountincluded in
net interest)
Arising fromdemographicassumptions
arising fromexperience
adjustments
changes infinancial
assumptions SubtotalContributionsby employer
December 31,2019
Present value of pensionobligation P=6,685,101 P=476,653 P=3,774 P=482,414 P=962,841 (P=369,733) P=− P=− P=71,802 P=815,339 P=887,141 P=− P=8,165,350
Fair value of plan assets 5,537,780 − − 400,507 400,507 (369,733) 124,228 − − − 124,228 1,672,838 7,365,620P=1,147,321 P=476,653 P=3,774 P=81,907 P=562,334 P=− (P=124,228) P=− P=71,802 P=815,339 P=762,913 (P=1,672,838) P=799,730
*Net benefit costs is included in ‘Compensation and fringe benefits’ in the statements of income
Consolidated2018 (As restated – Note 36)
Remeasurements in other comprehensive income
Net benefit costs*
Return onplan assetexcluding
Actuarialchanges
Actuarialchanges
Actuarialchanges
arising from
January 1,2018
Currentservice cost
PastService
Cost Net interest SubtotalBenefits
paid
amountincluded in
net interest)
Arising fromdemographic
assumptions
arising fromexperience
adjustments
changes infinancial
assumptions SubtotalContributionsby employer
December 31,2018
Present value of pensionobligation P=6,824,948 P=481,108 P=352,310 P=312,712 P=1,146,130 (P=585,194) P=− P=− P=126,538 (P=827,321) (P=700,783) P=− P=6,685,101
Fair value of plan assets 5,287,162 − − 243,130 243,130 (585,194) (467,664) − − − (467,664) 1,060,346 5,537,780P=1,537,786 P=481,108 P=352,310 P=69,582 P=903,000 P=− P=467,664 P=− P=126,538 (P=827,321) (P=233,119) (P=1,060,346) P=1,147,321
*Net benefit costs is included in ‘Compensation and fringe benefits’ in the statements of income
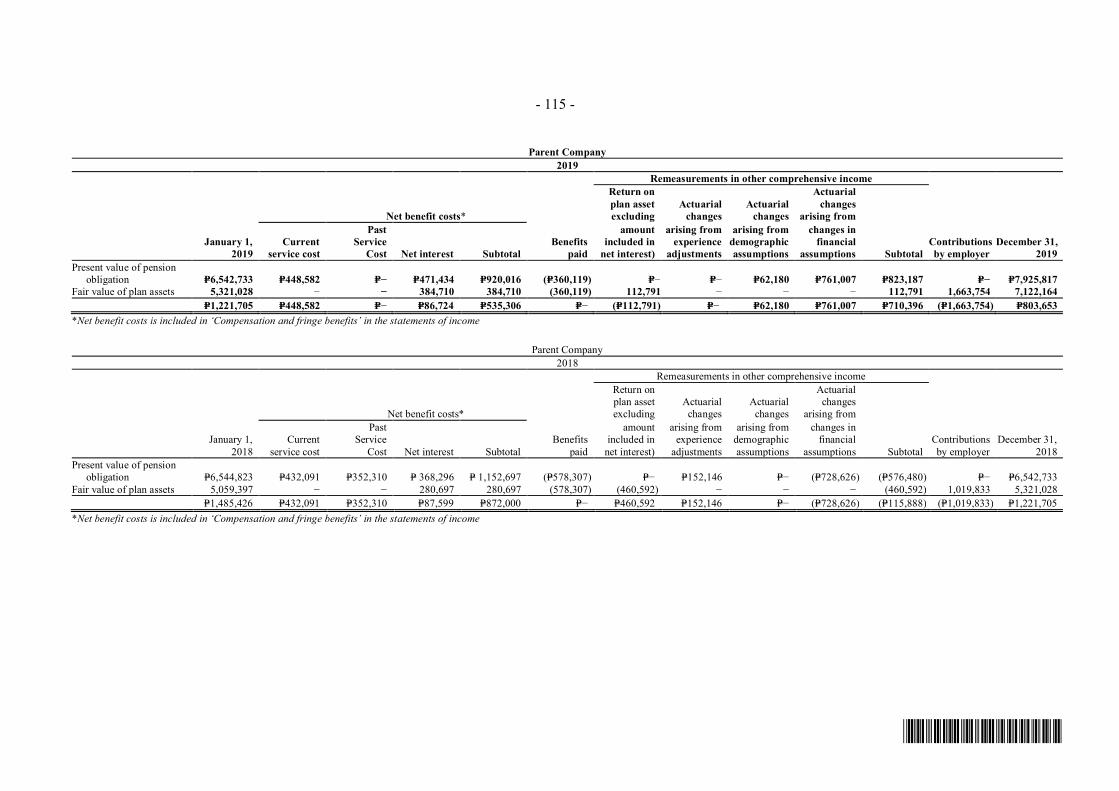
- 115 -
*SGVFS038920*
Parent Company2019
Remeasurements in other comprehensive income
Net benefit costs*
Return onplan assetexcluding
Actuarialchanges
Actuarialchanges
Actuarialchanges
arising from
January 1,2019
Currentservice cost
PastService
Cost Net interest SubtotalBenefits
paid
amountincluded in
net interest)
arising fromexperience
adjustments
arising fromdemographicassumptions
changes infinancial
assumptions SubtotalContributionsby employer
December 31,2019
Present value of pensionobligation P=6,542,733 P=448,582 P=− P=471,434 P=920,016 (P=360,119) P=− P=− P=62,180 P=761,007 P=823,187 P=− P=7,925,817
Fair value of plan assets 5,321,028 − − 384,710 384,710 (360,119) 112,791 − − − 112,791 1,663,754 7,122,164P=1,221,705 P=448,582 P=− P=86,724 P=535,306 P=− (P=112,791) P=− P=62,180 P=761,007 P=710,396 (P=1,663,754) P=803,653
*Net benefit costs is included in ‘Compensation and fringe benefits’ in the statements of income
Parent Company2018
Remeasurements in other comprehensive income
Net benefit costs*
Return onplan assetexcluding
Actuarialchanges
Actuarialchanges
Actuarialchanges
arising from
January 1,2018
Currentservice cost
PastService
Cost Net interest SubtotalBenefits
paid
amountincluded in
net interest)
arising fromexperience
adjustments
arising fromdemographicassumptions
changes infinancial
assumptions SubtotalContributionsby employer
December 31,2018
Present value of pensionobligation P=6,544,823 P=432,091 P=352,310 P= 368,296 P= 1,152,697 (P=578,307) P=− P=152,146 P=− (P=728,626) (P=576,480) P=− P=6,542,733
Fair value of plan assets 5,059,397 − − 280,697 280,697 (578,307) (460,592) − − − (460,592) 1,019,833 5,321,028P=1,485,426 P=432,091 P=352,310 P=87,599 P=872,000 P=− P=460,592 P=152,146 P=− (P=728,626) (P=115,888) (P=1,019,833) P=1,221,705
*Net benefit costs is included in ‘Compensation and fringe benefits’ in the statements of income
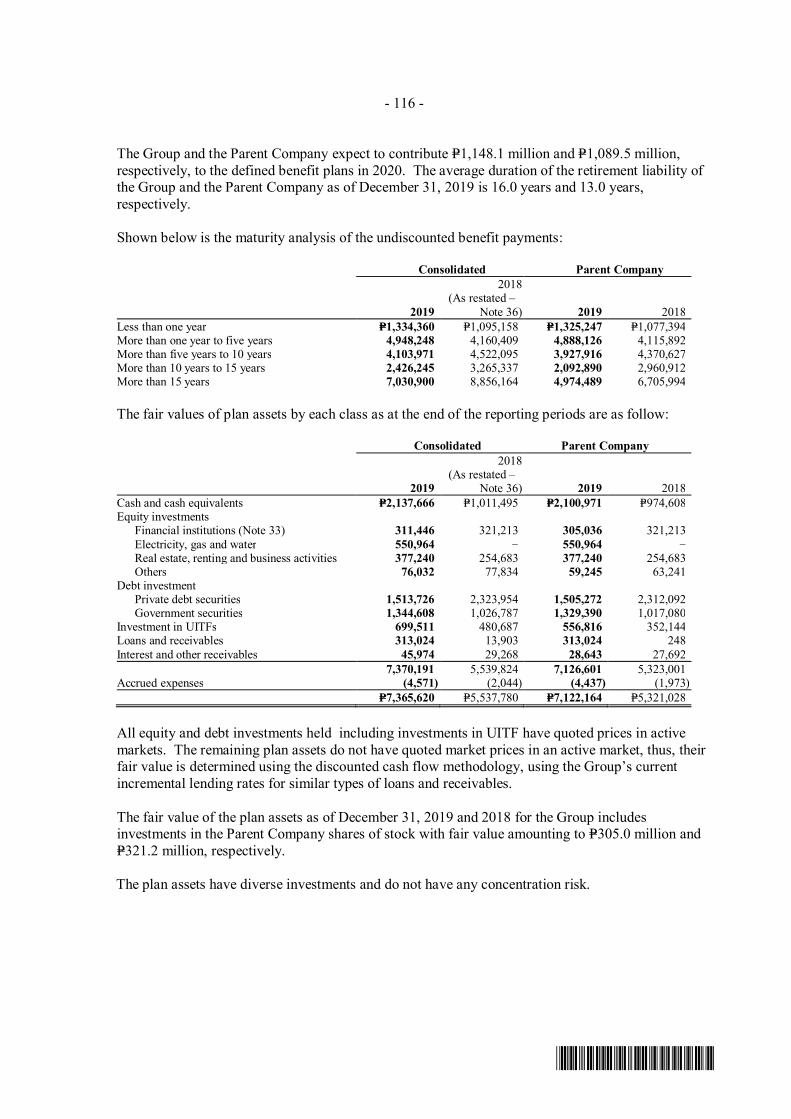
- 116 -
*SGVFS038920*
The Group and the Parent Company expect to contribute P=1,148.1 million and P=1,089.5 million,respectively, to the defined benefit plans in 2020. The average duration of the retirement liability ofthe Group and the Parent Company as of December 31, 2019 is 16.0 years and 13.0 years,respectively.
Shown below is the maturity analysis of the undiscounted benefit payments:
Consolidated Parent Company
2019
2018(As restated –
Note 36) 2019 2018Less than one year P=1,334,360 P=1,095,158 P=1,325,247 P=1,077,394More than one year to five years 4,948,248 4,160,409 4,888,126 4,115,892More than five years to 10 years 4,103,971 4,522,095 3,927,916 4,370,627More than 10 years to 15 years 2,426,245 3,265,337 2,092,890 2,960,912More than 15 years 7,030,900 8,856,164 4,974,489 6,705,994
The fair values of plan assets by each class as at the end of the reporting periods are as follow:
Consolidated Parent Company
2019
2018(As restated –
Note 36) 2019 2018Cash and cash equivalents P=2,137,666 P=1,011,495 P=2,100,971 P=974,608Equity investments
Financial institutions (Note 33) 311,446 321,213 305,036 321,213Electricity, gas and water 550,964 − 550,964 −Real estate, renting and business activities 377,240 254,683 377,240 254,683Others 76,032 77,834 59,245 63,241
Debt investmentPrivate debt securities 1,513,726 2,323,954 1,505,272 2,312,092Government securities 1,344,608 1,026,787 1,329,390 1,017,080
Investment in UITFs 699,511 480,687 556,816 352,144Loans and receivables 313,024 13,903 313,024 248Interest and other receivables 45,974 29,268 28,643 27,692
7,370,191 5,539,824 7,126,601 5,323,001Accrued expenses (4,571) (2,044) (4,437) (1,973)
P=7,365,620 P=5,537,780 P=7,122,164 P=5,321,028
All equity and debt investments held including investments in UITF have quoted prices in activemarkets. The remaining plan assets do not have quoted market prices in an active market, thus, theirfair value is determined using the discounted cash flow methodology, using the Group’s currentincremental lending rates for similar types of loans and receivables.
The fair value of the plan assets as of December 31, 2019 and 2018 for the Group includesinvestments in the Parent Company shares of stock with fair value amounting to P=305.0 million andP=321.2 million, respectively.
The plan assets have diverse investments and do not have any concentration risk.
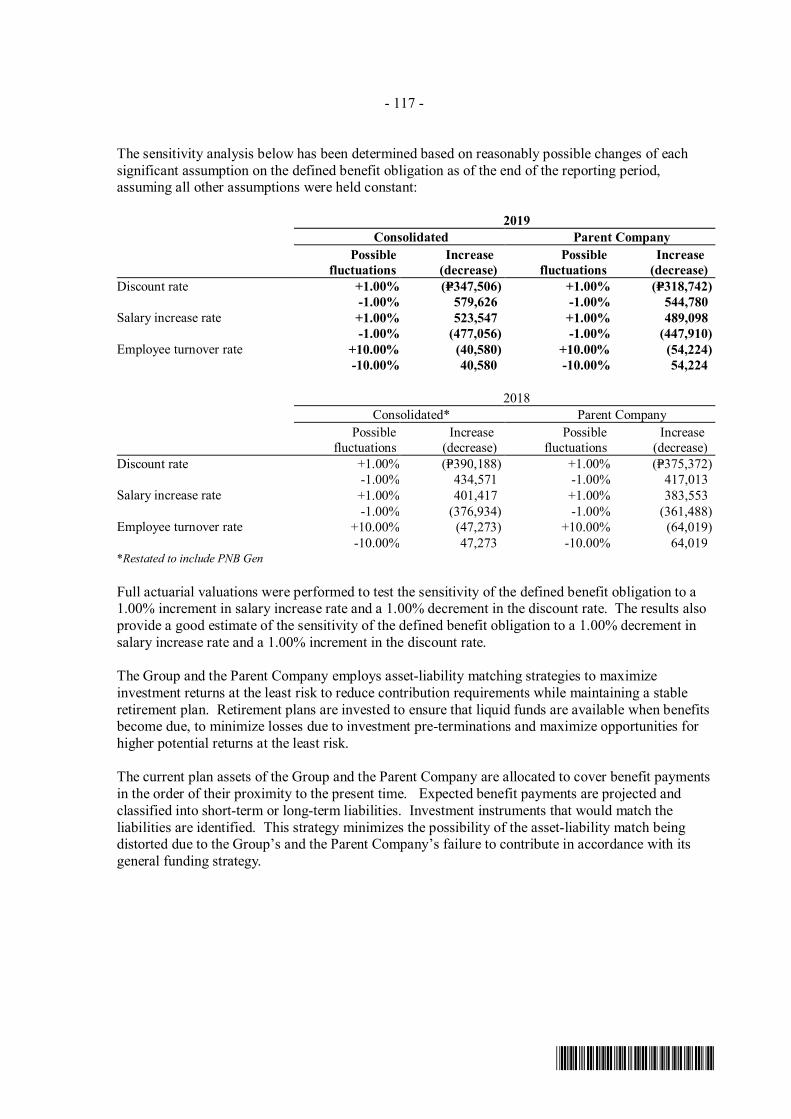
- 117 -
*SGVFS038920*
The sensitivity analysis below has been determined based on reasonably possible changes of eachsignificant assumption on the defined benefit obligation as of the end of the reporting period,assuming all other assumptions were held constant:
2019Consolidated Parent Company
Possiblefluctuations
Increase(decrease)
Possiblefluctuations
Increase(decrease)
Discount rate +1.00% (P=347,506) +1.00% (P=318,742)-1.00% 579,626 -1.00% 544,780
Salary increase rate +1.00% 523,547 +1.00% 489,098-1.00% (477,056) -1.00% (447,910)
Employee turnover rate +10.00% (40,580) +10.00% (54,224)-10.00% 40,580 -10.00% 54,224
2018Consolidated* Parent Company
Possiblefluctuations
Increase(decrease)
Possiblefluctuations
Increase(decrease)
Discount rate +1.00% (P=390,188) +1.00% (P=375,372)-1.00% 434,571 -1.00% 417,013
Salary increase rate +1.00% 401,417 +1.00% 383,553-1.00% (376,934) -1.00% (361,488)
Employee turnover rate +10.00% (47,273) +10.00% (64,019)-10.00% 47,273 -10.00% 64,019
*Restated to include PNB Gen
Full actuarial valuations were performed to test the sensitivity of the defined benefit obligation to a1.00% increment in salary increase rate and a 1.00% decrement in the discount rate. The results alsoprovide a good estimate of the sensitivity of the defined benefit obligation to a 1.00% decrement insalary increase rate and a 1.00% increment in the discount rate.
The Group and the Parent Company employs asset-liability matching strategies to maximizeinvestment returns at the least risk to reduce contribution requirements while maintaining a stableretirement plan. Retirement plans are invested to ensure that liquid funds are available when benefitsbecome due, to minimize losses due to investment pre-terminations and maximize opportunities forhigher potential returns at the least risk.
The current plan assets of the Group and the Parent Company are allocated to cover benefit paymentsin the order of their proximity to the present time. Expected benefit payments are projected andclassified into short-term or long-term liabilities. Investment instruments that would match theliabilities are identified. This strategy minimizes the possibility of the asset-liability match beingdistorted due to the Group’s and the Parent Company’s failure to contribute in accordance with itsgeneral funding strategy.
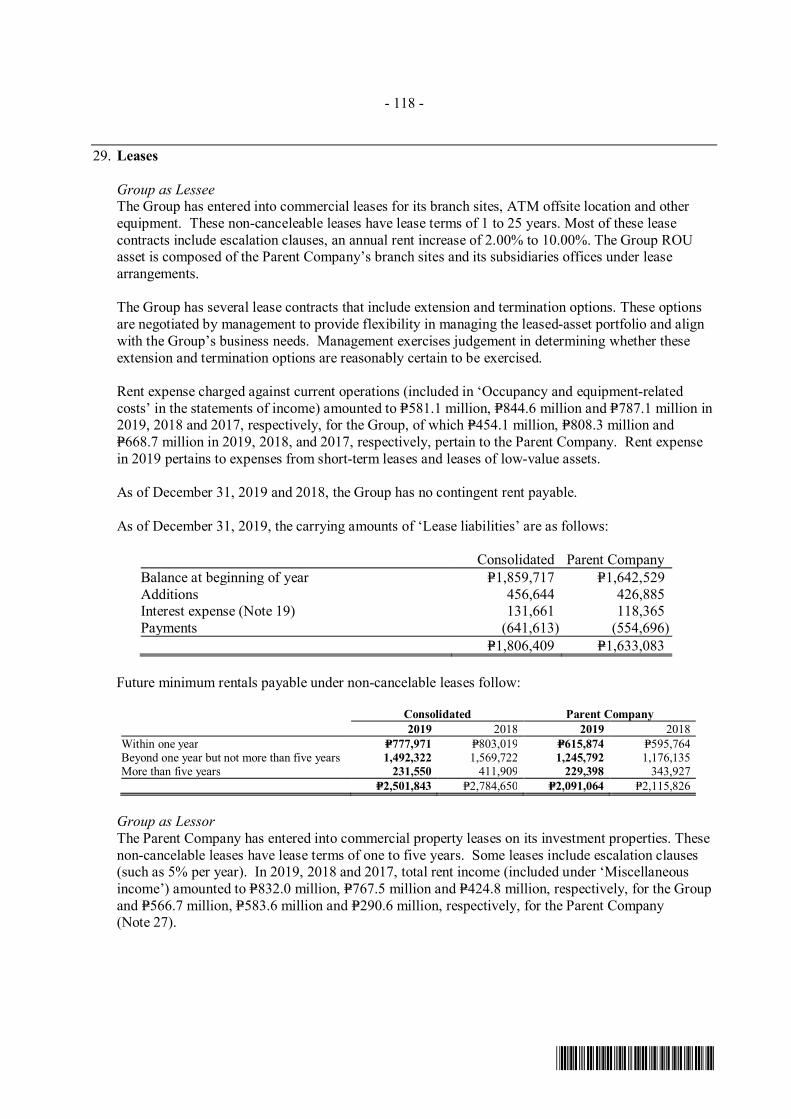
- 118 -
*SGVFS038920*
29. Leases
Group as LesseeThe Group has entered into commercial leases for its branch sites, ATM offsite location and otherequipment. These non-canceleable leases have lease terms of 1 to 25 years. Most of these leasecontracts include escalation clauses, an annual rent increase of 2.00% to 10.00%. The Group ROUasset is composed of the Parent Company’s branch sites and its subsidiaries offices under leasearrangements.
The Group has several lease contracts that include extension and termination options. These optionsare negotiated by management to provide flexibility in managing the leased-asset portfolio and alignwith the Group’s business needs. Management exercises judgement in determining whether theseextension and termination options are reasonably certain to be exercised.
Rent expense charged against current operations (included in ‘Occupancy and equipment-relatedcosts’ in the statements of income) amounted to P=581.1 million, P=844.6 million and P=787.1 million in2019, 2018 and 2017, respectively, for the Group, of which P=454.1 million, P=808.3 million andP=668.7 million in 2019, 2018, and 2017, respectively, pertain to the Parent Company. Rent expensein 2019 pertains to expenses from short-term leases and leases of low-value assets.
As of December 31, 2019 and 2018, the Group has no contingent rent payable.
As of December 31, 2019, the carrying amounts of ‘Lease liabilities’ are as follows:
Consolidated Parent CompanyBalance at beginning of year P=1,859,717 P=1,642,529Additions 456,644 426,885Interest expense (Note 19) 131,661 118,365Payments (641,613) (554,696)
P=1,806,409 P=1,633,083
Future minimum rentals payable under non-cancelable leases follow:
Consolidated Parent Company2019 2018 2019 2018
Within one year P=777,971 P=803,019 P=615,874 P=595,764Beyond one year but not more than five years 1,492,322 1,569,722 1,245,792 1,176,135More than five years 231,550 411,909 229,398 343,927
P=2,501,843 P=2,784,650 P=2,091,064 P=2,115,826
Group as LessorThe Parent Company has entered into commercial property leases on its investment properties. Thesenon-cancelable leases have lease terms of one to five years. Some leases include escalation clauses(such as 5% per year). In 2019, 2018 and 2017, total rent income (included under ‘Miscellaneousincome’) amounted to P=832.0 million, P=767.5 million and P=424.8 million, respectively, for the Groupand P=566.7 million, P=583.6 million and P=290.6 million, respectively, for the Parent Company(Note 27).
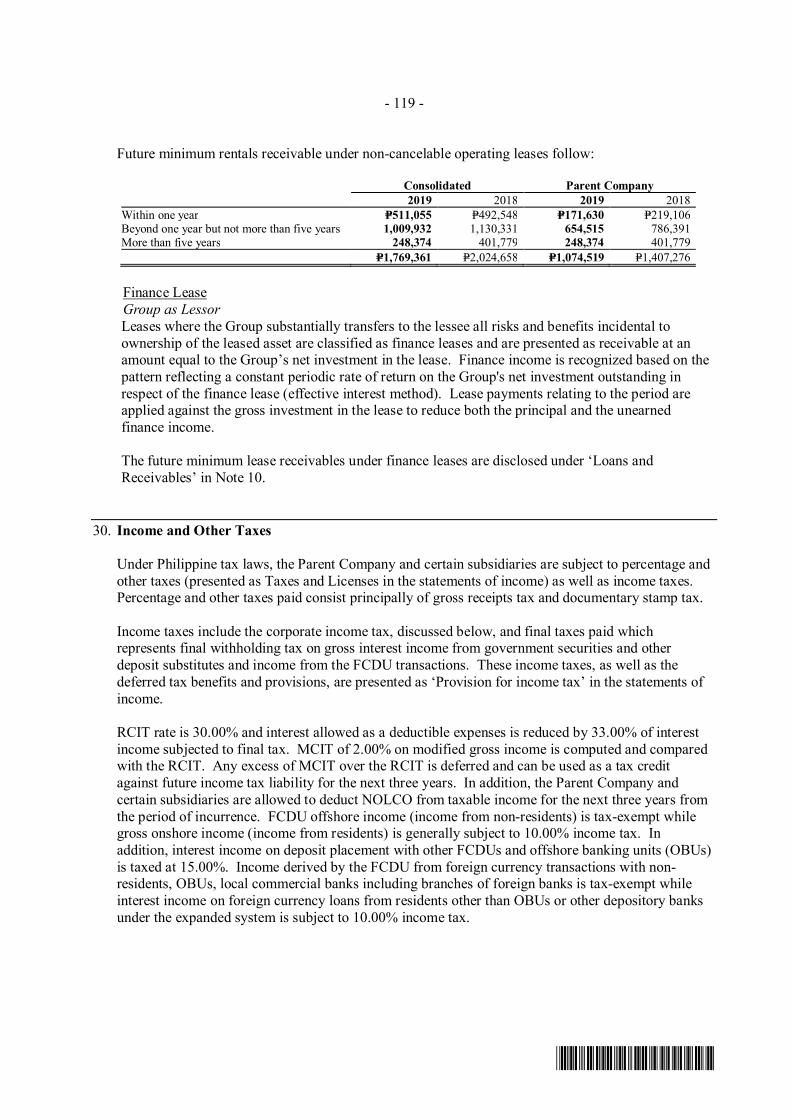
- 119 -
*SGVFS038920*
Future minimum rentals receivable under non-cancelable operating leases follow:
Consolidated Parent Company2019 2018 2019 2018
Within one year P=511,055 P=492,548 P=171,630 P=219,106Beyond one year but not more than five years 1,009,932 1,130,331 654,515 786,391More than five years 248,374 401,779 248,374 401,779
P=1,769,361 P=2,024,658 P=1,074,519 P=1,407,276
Finance LeaseGroup as LessorLeases where the Group substantially transfers to the lessee all risks and benefits incidental toownership of the leased asset are classified as finance leases and are presented as receivable at anamount equal to the Group’s net investment in the lease. Finance income is recognized based on thepattern reflecting a constant periodic rate of return on the Group's net investment outstanding inrespect of the finance lease (effective interest method). Lease payments relating to the period areapplied against the gross investment in the lease to reduce both the principal and the unearnedfinance income.
The future minimum lease receivables under finance leases are disclosed under ‘Loans andReceivables’ in Note 10.
30. Income and Other Taxes
Under Philippine tax laws, the Parent Company and certain subsidiaries are subject to percentage andother taxes (presented as Taxes and Licenses in the statements of income) as well as income taxes.Percentage and other taxes paid consist principally of gross receipts tax and documentary stamp tax.
Income taxes include the corporate income tax, discussed below, and final taxes paid whichrepresents final withholding tax on gross interest income from government securities and otherdeposit substitutes and income from the FCDU transactions. These income taxes, as well as thedeferred tax benefits and provisions, are presented as ‘Provision for income tax’ in the statements ofincome.
RCIT rate is 30.00% and interest allowed as a deductible expenses is reduced by 33.00% of interestincome subjected to final tax. MCIT of 2.00% on modified gross income is computed and comparedwith the RCIT. Any excess of MCIT over the RCIT is deferred and can be used as a tax creditagainst future income tax liability for the next three years. In addition, the Parent Company andcertain subsidiaries are allowed to deduct NOLCO from taxable income for the next three years fromthe period of incurrence. FCDU offshore income (income from non-residents) is tax-exempt whilegross onshore income (income from residents) is generally subject to 10.00% income tax. Inaddition, interest income on deposit placement with other FCDUs and offshore banking units (OBUs)is taxed at 15.00%. Income derived by the FCDU from foreign currency transactions with non-residents, OBUs, local commercial banks including branches of foreign banks is tax-exempt whileinterest income on foreign currency loans from residents other than OBUs or other depository banksunder the expanded system is subject to 10.00% income tax.
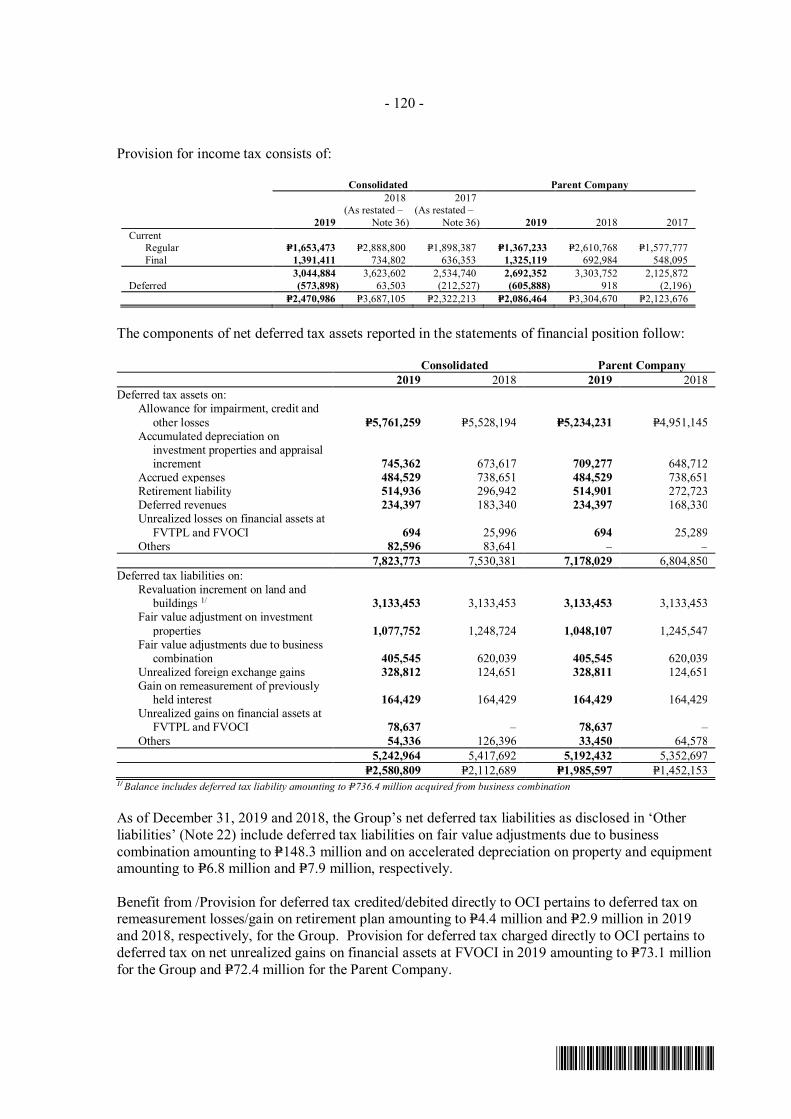
- 120 -
*SGVFS038920*
Provision for income tax consists of:
Consolidated Parent Company
2019
2018(As restated –
Note 36)
2017(As restated –
Note 36) 2019 2018 2017Current Regular P=1,653,473 P=2,888,800 P=1,898,387 P=1,367,233 P=2,610,768 P=1,577,777
Final 1,391,411 734,802 636,353 1,325,119 692,984 548,0953,044,884 3,623,602 2,534,740 2,692,352 3,303,752 2,125,872
Deferred (573,898) 63,503 (212,527) (605,888) 918 (2,196)P=2,470,986 P=3,687,105 P=2,322,213 P=2,086,464 P=3,304,670 P=2,123,676
The components of net deferred tax assets reported in the statements of financial position follow:
Consolidated Parent Company2019 2018 2019 2018
Deferred tax assets on:Allowance for impairment, credit and
other losses P=5,761,259 P=5,528,194 P=5,234,231 P=4,951,145Accumulated depreciation on
investment properties and appraisalincrement 745,362 673,617 709,277 648,712
Accrued expenses 484,529 738,651 484,529 738,651Retirement liability 514,936 296,942 514,901 272,723Deferred revenues 234,397 183,340 234,397 168,330Unrealized losses on financial assets at
FVTPL and FVOCI 694 25,996 694 25,289Others 82,596 83,641 – –
7,823,773 7,530,381 7,178,029 6,804,850Deferred tax liabilities on:
Revaluation increment on land andbuildings 1/ 3,133,453 3,133,453 3,133,453 3,133,453
Fair value adjustment on investmentproperties 1,077,752 1,248,724 1,048,107 1,245,547
Fair value adjustments due to businesscombination 405,545 620,039 405,545 620,039
Unrealized foreign exchange gains 328,812 124,651 328,811 124,651Gain on remeasurement of previously
held interest 164,429 164,429 164,429 164,429Unrealized gains on financial assets at
FVTPL and FVOCI 78,637 – 78,637 –Others 54,336 126,396 33,450 64,578
5,242,964 5,417,692 5,192,432 5,352,697P=2,580,809 P=2,112,689 P=1,985,597 P=1,452,153
1/ Balance includes deferred tax liability amounting to P=736.4 million acquired from business combination
As of December 31, 2019 and 2018, the Group’s net deferred tax liabilities as disclosed in ‘Otherliabilities’ (Note 22) include deferred tax liabilities on fair value adjustments due to businesscombination amounting to P=148.3 million and on accelerated depreciation on property and equipmentamounting to P=6.8 million and P=7.9 million, respectively.
Benefit from /Provision for deferred tax credited/debited directly to OCI pertains to deferred tax onremeasurement losses/gain on retirement plan amounting to P=4.4 million and P=2.9 million in 2019and 2018, respectively, for the Group. Provision for deferred tax charged directly to OCI pertains todeferred tax on net unrealized gains on financial assets at FVOCI in 2019 amounting to P=73.1 millionfor the Group and P=72.4 million for the Parent Company.
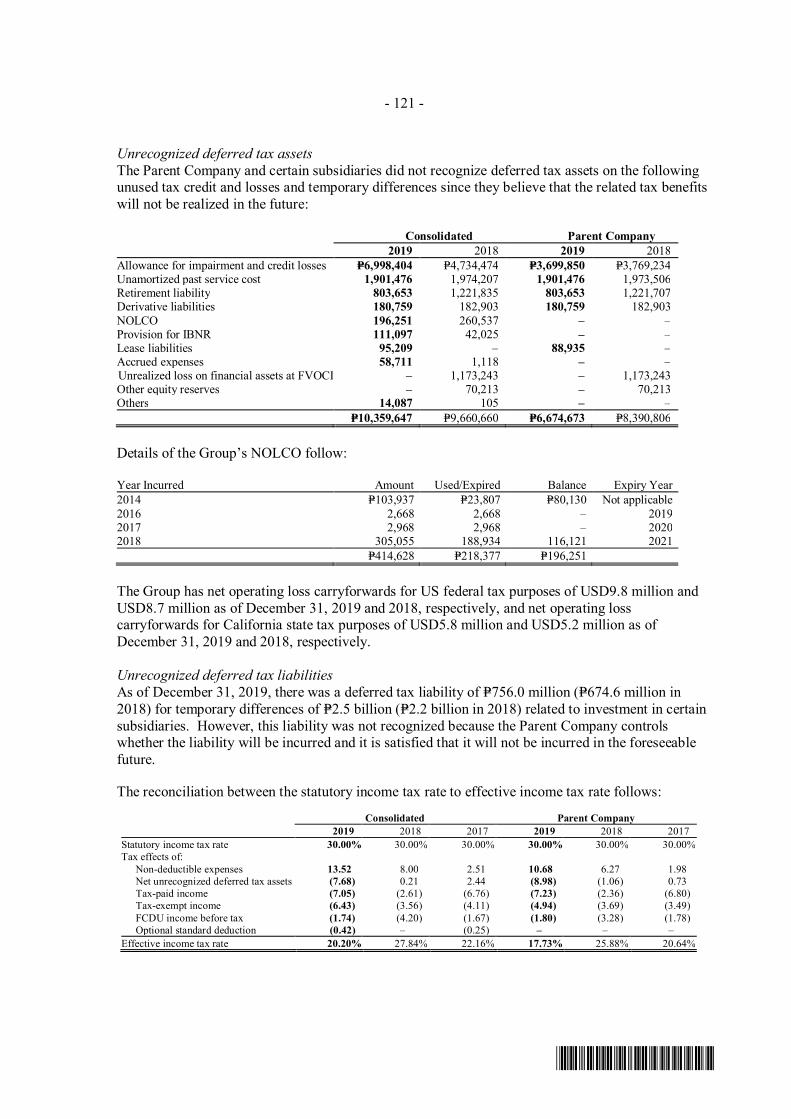
- 121 -
*SGVFS038920*
Unrecognized deferred tax assetsThe Parent Company and certain subsidiaries did not recognize deferred tax assets on the followingunused tax credit and losses and temporary differences since they believe that the related tax benefitswill not be realized in the future:
Consolidated Parent Company2019 2018 2019 2018
Allowance for impairment and credit losses P=6,998,404 P=4,734,474 P=3,699,850 P=3,769,234Unamortized past service cost 1,901,476 1,974,207 1,901,476 1,973,506Retirement liability 803,653 1,221,835 803,653 1,221,707Derivative liabilities 180,759 182,903 180,759 182,903NOLCO 196,251 260,537 – –Provision for IBNR 111,097 42,025 – –Lease liabilities 95,209 – 88,935 –Accrued expenses 58,711 1,118 – –Unrealized loss on financial assets at FVOCI – 1,173,243 – 1,173,243Other equity reserves – 70,213 – 70,213Others 14,087 105 – –
P=10,359,647 P=9,660,660 P=6,674,673 P=8,390,806
Details of the Group’s NOLCO follow:
Year Incurred Amount Used/Expired Balance Expiry Year2014 P=103,937 P=23,807 P=80,130 Not applicable2016 2,668 2,668 – 20192017 2,968 2,968 – 20202018 305,055 188,934 116,121 2021
P=414,628 P=218,377 P=196,251
The Group has net operating loss carryforwards for US federal tax purposes of USD9.8 million andUSD8.7 million as of December 31, 2019 and 2018, respectively, and net operating losscarryforwards for California state tax purposes of USD5.8 million and USD5.2 million as ofDecember 31, 2019 and 2018, respectively.
Unrecognized deferred tax liabilitiesAs of December 31, 2019, there was a deferred tax liability of P=756.0 million (P=674.6 million in2018) for temporary differences of P=2.5 billion (P=2.2 billion in 2018) related to investment in certainsubsidiaries. However, this liability was not recognized because the Parent Company controlswhether the liability will be incurred and it is satisfied that it will not be incurred in the foreseeablefuture.
The reconciliation between the statutory income tax rate to effective income tax rate follows:
Consolidated Parent Company2019 2018 2017 2019 2018 2017
Statutory income tax rate 30.00% 30.00% 30.00% 30.00% 30.00% 30.00%Tax effects of:
Non-deductible expenses 13.52 8.00 2.51 10.68 6.27 1.98Net unrecognized deferred tax assets (7.68) 0.21 2.44 (8.98) (1.06) 0.73Tax-paid income (7.05) (2.61) (6.76) (7.23) (2.36) (6.80)
Tax-exempt income (6.43) (3.56) (4.11) (4.94) (3.69) (3.49)FCDU income before tax (1.74) (4.20) (1.67) (1.80) (3.28) (1.78)Optional standard deduction (0.42) – (0.25) – – –
Effective income tax rate 20.20% 27.84% 22.16% 17.73% 25.88% 20.64%
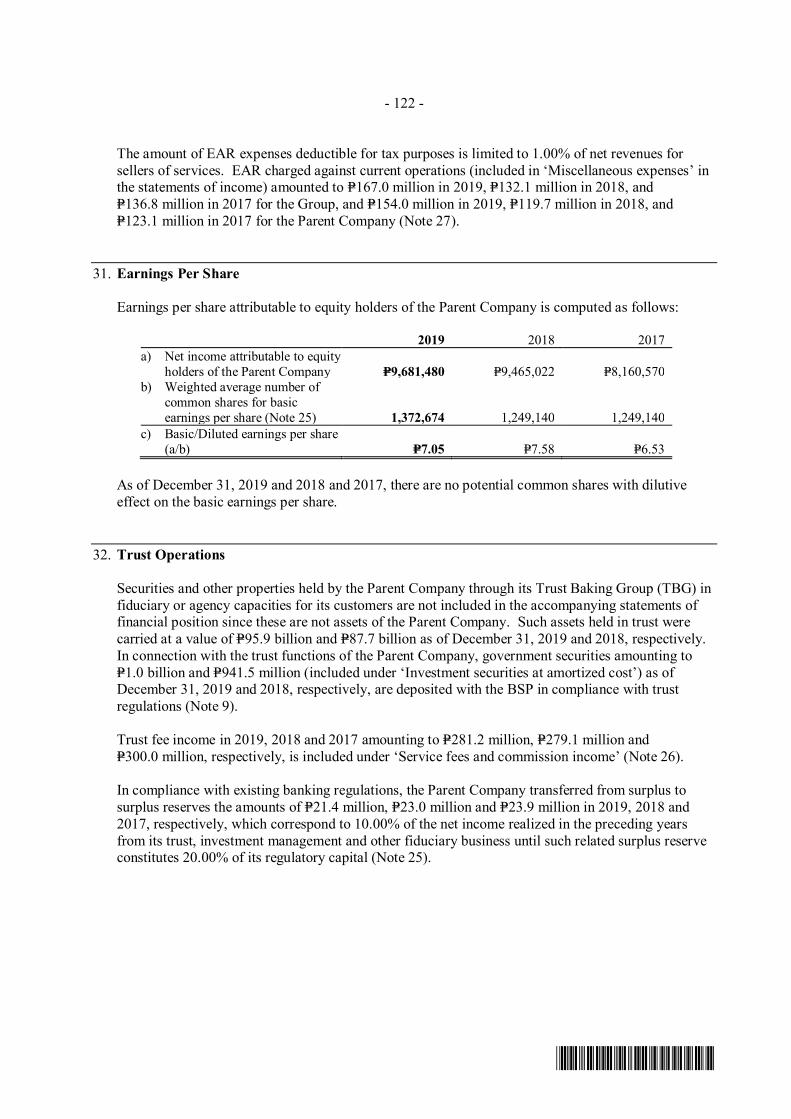
- 122 -
*SGVFS038920*
The amount of EAR expenses deductible for tax purposes is limited to 1.00% of net revenues forsellers of services. EAR charged against current operations (included in ‘Miscellaneous expenses’ inthe statements of income) amounted to P=167.0 million in 2019, P=132.1 million in 2018, andP=136.8 million in 2017 for the Group, and P=154.0 million in 2019, P=119.7 million in 2018, andP=123.1 million in 2017 for the Parent Company (Note 27).
31. Earnings Per Share
Earnings per share attributable to equity holders of the Parent Company is computed as follows:
2019 2018 2017a) Net income attributable to equity
holders of the Parent Company P=9,681,480 P=9,465,022 P=8,160,570b) Weighted average number of
common shares for basicearnings per share (Note 25) 1,372,674 1,249,140 1,249,140
c) Basic/Diluted earnings per share(a/b) P=7.05 P=7.58 P=6.53
As of December 31, 2019 and 2018 and 2017, there are no potential common shares with dilutiveeffect on the basic earnings per share.
32. Trust Operations
Securities and other properties held by the Parent Company through its Trust Baking Group (TBG) infiduciary or agency capacities for its customers are not included in the accompanying statements offinancial position since these are not assets of the Parent Company. Such assets held in trust werecarried at a value of P=95.9 billion and P=87.7 billion as of December 31, 2019 and 2018, respectively.In connection with the trust functions of the Parent Company, government securities amounting toP=1.0 billion and P=941.5 million (included under ‘Investment securities at amortized cost’) as ofDecember 31, 2019 and 2018, respectively, are deposited with the BSP in compliance with trustregulations (Note 9).
Trust fee income in 2019, 2018 and 2017 amounting to P=281.2 million, P=279.1 million andP=300.0 million, respectively, is included under ‘Service fees and commission income’ (Note 26).
In compliance with existing banking regulations, the Parent Company transferred from surplus tosurplus reserves the amounts of P=21.4 million, P=23.0 million and P=23.9 million in 2019, 2018 and2017, respectively, which correspond to 10.00% of the net income realized in the preceding yearsfrom its trust, investment management and other fiduciary business until such related surplus reserveconstitutes 20.00% of its regulatory capital (Note 25).
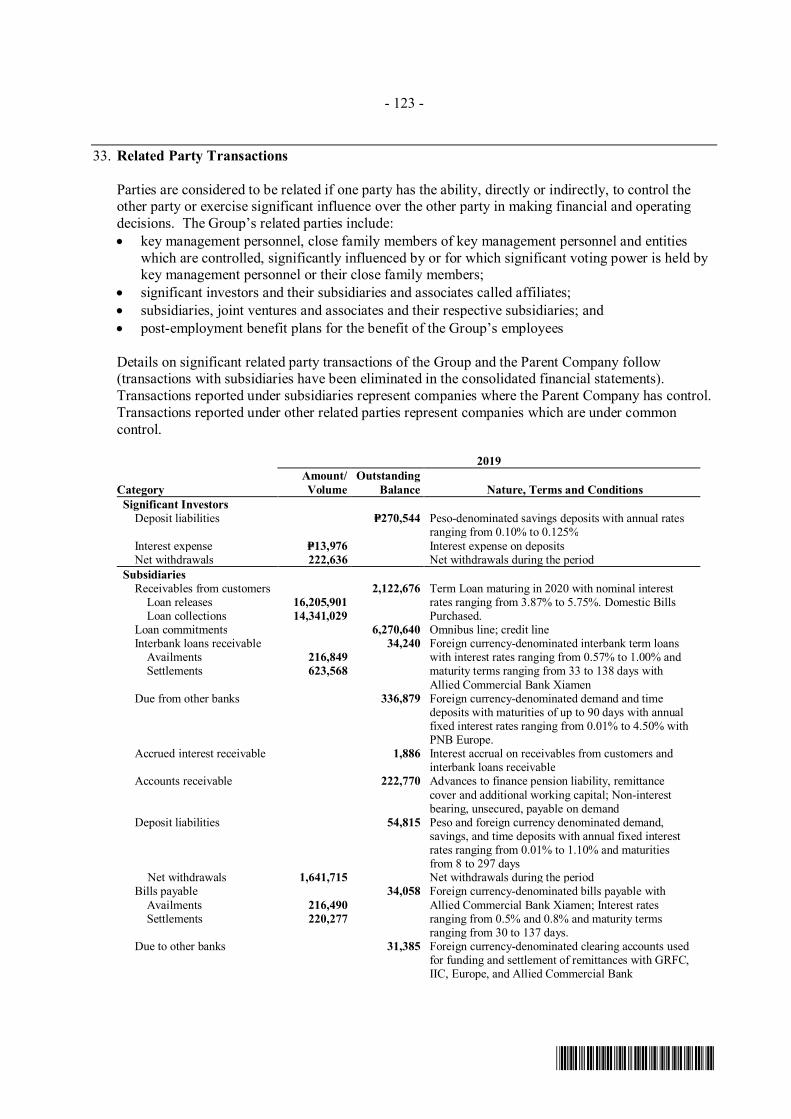
- 123 -
*SGVFS038920*
33. Related Party Transactions
Parties are considered to be related if one party has the ability, directly or indirectly, to control theother party or exercise significant influence over the other party in making financial and operatingdecisions. The Group’s related parties include:· key management personnel, close family members of key management personnel and entities
which are controlled, significantly influenced by or for which significant voting power is held bykey management personnel or their close family members;
· significant investors and their subsidiaries and associates called affiliates;· subsidiaries, joint ventures and associates and their respective subsidiaries; and· post-employment benefit plans for the benefit of the Group’s employees
Details on significant related party transactions of the Group and the Parent Company follow(transactions with subsidiaries have been eliminated in the consolidated financial statements).Transactions reported under subsidiaries represent companies where the Parent Company has control.Transactions reported under other related parties represent companies which are under commoncontrol.
2019
CategoryAmount/Volume
OutstandingBalance Nature, Terms and Conditions
Significant InvestorsDeposit liabilities P=270,544 Peso-denominated savings deposits with annual rates
ranging from 0.10% to 0.125%Interest expense P=13,976 Interest expense on depositsNet withdrawals 222,636 Net withdrawals during the period
SubsidiariesReceivables from customers Loan releases
Loan collections16,205,90114,341,029
2,122,676 Term Loan maturing in 2020 with nominal interestrates ranging from 3.87% to 5.75%. Domestic BillsPurchased.
Loan commitments 6,270,640 Omnibus line; credit lineInterbank loans receivable Availments Settlements
216,849623,568
34,240 Foreign currency-denominated interbank term loanswith interest rates ranging from 0.57% to 1.00% andmaturity terms ranging from 33 to 138 days withAllied Commercial Bank Xiamen
Due from other banks 336,879 Foreign currency-denominated demand and timedeposits with maturities of up to 90 days with annualfixed interest rates ranging from 0.01% to 4.50% withPNB Europe.
Accrued interest receivable 1,886 Interest accrual on receivables from customers andinterbank loans receivable
Accounts receivable 222,770 Advances to finance pension liability, remittancecover and additional working capital; Non-interestbearing, unsecured, payable on demand
Deposit liabilities 54,815 Peso and foreign currency denominated demand,savings, and time deposits with annual fixed interestrates ranging from 0.01% to 1.10% and maturitiesfrom 8 to 297 days
Net withdrawals 1,641,715 Net withdrawals during the periodBills payable Availments Settlements
216,490220,277
34,058 Foreign currency-denominated bills payable withAllied Commercial Bank Xiamen; Interest ratesranging from 0.5% and 0.8% and maturity termsranging from 30 to 137 days.
Due to other banks 31,385 Foreign currency-denominated clearing accounts usedfor funding and settlement of remittances with GRFC,IIC, Europe, and Allied Commercial Bank
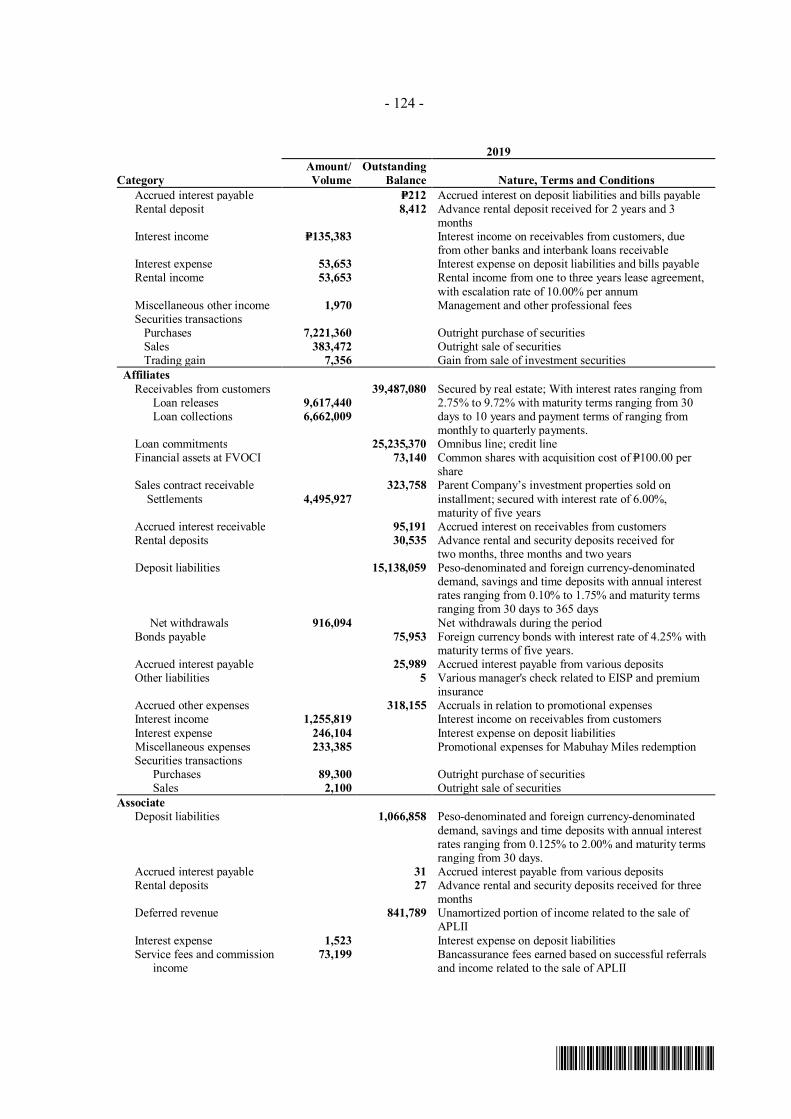
- 124 -
*SGVFS038920*
2019
CategoryAmount/Volume
OutstandingBalance Nature, Terms and Conditions
Accrued interest payable P=212 Accrued interest on deposit liabilities and bills payableRental deposit 8,412 Advance rental deposit received for 2 years and 3
monthsInterest income P=135,383 Interest income on receivables from customers, due
from other banks and interbank loans receivableInterest expense 53,653 Interest expense on deposit liabilities and bills payableRental income 53,653 Rental income from one to three years lease agreement,
with escalation rate of 10.00% per annumMiscellaneous other incomeSecurities transactions
1,970 Management and other professional fees
Purchases 7,221,360 Outright purchase of securitiesSales 383,472 Outright sale of securitiesTrading gain 7,356 Gain from sale of investment securities
AffiliatesReceivables from customers Loan releases Loan collections
9,617,4406,662,009
39,487,080 Secured by real estate; With interest rates ranging from2.75% to 9.72% with maturity terms ranging from 30days to 10 years and payment terms of ranging frommonthly to quarterly payments.
Loan commitments 25,235,370 Omnibus line; credit lineFinancial assets at FVOCI 73,140 Common shares with acquisition cost of P=100.00 per
shareSales contract receivable Settlements 4,495,927
323,758 Parent Company’s investment properties sold oninstallment; secured with interest rate of 6.00%,maturity of five years
Accrued interest receivable 95,191 Accrued interest on receivables from customersRental deposits 30,535 Advance rental and security deposits received for
two months, three months and two yearsDeposit liabilities 15,138,059 Peso-denominated and foreign currency-denominated
demand, savings and time deposits with annual interestrates ranging from 0.10% to 1.75% and maturity termsranging from 30 days to 365 days
Net withdrawals 916,094 Net withdrawals during the periodBonds payable 75,953 Foreign currency bonds with interest rate of 4.25% with
maturity terms of five years.Accrued interest payable 25,989 Accrued interest payable from various depositsOther liabilities 5 Various manager's check related to EISP and premium
insuranceAccrued other expenses 318,155 Accruals in relation to promotional expensesInterest income 1,255,819 Interest income on receivables from customersInterest expense 246,104 Interest expense on deposit liabilitiesMiscellaneous expenses 233,385 Promotional expenses for Mabuhay Miles redemptionSecurities transactions
Purchases 89,300 Outright purchase of securitiesSales 2,100 Outright sale of securities
AssociateDeposit liabilities 1,066,858 Peso-denominated and foreign currency-denominated
demand, savings and time deposits with annual interestrates ranging from 0.125% to 2.00% and maturity termsranging from 30 days.
Accrued interest payable 31 Accrued interest payable from various depositsRental deposits 27 Advance rental and security deposits received for three
monthsDeferred revenue 841,789 Unamortized portion of income related to the sale of
APLIIInterest expense 1,523 Interest expense on deposit liabilitiesService fees and commission
income73,199 Bancassurance fees earned based on successful referrals
and income related to the sale of APLII
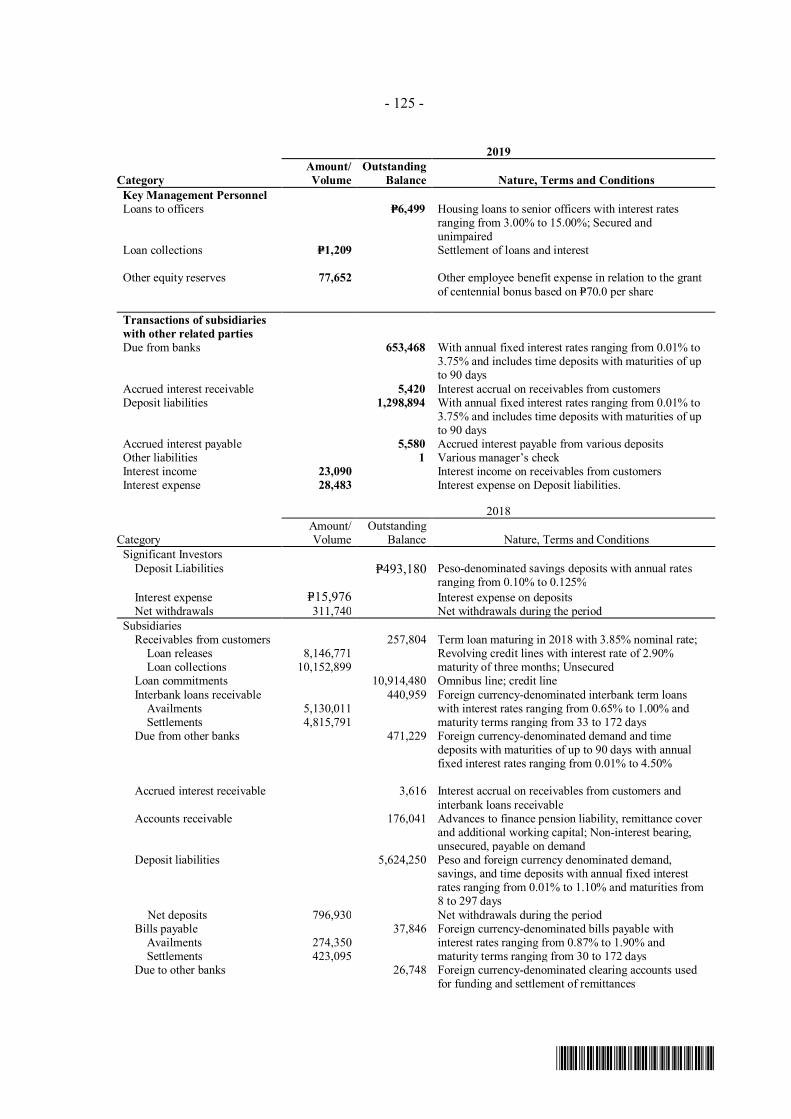
- 125 -
*SGVFS038920*
2019
CategoryAmount/Volume
OutstandingBalance Nature, Terms and Conditions
Key Management PersonnelLoans to officers P=6,499 Housing loans to senior officers with interest rates
ranging from 3.00% to 15.00%; Secured andunimpaired
Loan collections P=1,209 Settlement of loans and interest
Other equity reserves 77,652 Other employee benefit expense in relation to the grantof centennial bonus based on P=70.0 per share
Transactions of subsidiarieswith other related partiesDue from banks 653,468 With annual fixed interest rates ranging from 0.01% to
3.75% and includes time deposits with maturities of upto 90 days
Accrued interest receivable 5,420 Interest accrual on receivables from customersDeposit liabilities 1,298,894 With annual fixed interest rates ranging from 0.01% to
3.75% and includes time deposits with maturities of upto 90 days
Accrued interest payable 5,580 Accrued interest payable from various depositsOther liabilities 1 Various manager’s checkInterest income 23,090 Interest income on receivables from customersInterest expense 28,483 Interest expense on Deposit liabilities.
2018
CategoryAmount/Volume
OutstandingBalance Nature, Terms and Conditions
Significant InvestorsDeposit Liabilities P=493,180 Peso-denominated savings deposits with annual rates
ranging from 0.10% to 0.125%Interest expense P=15,976 Interest expense on depositsNet withdrawals 311,740 Net withdrawals during the period
SubsidiariesReceivables from customers Loan releases
Loan collections8,146,771
10,152,899
257,804 Term loan maturing in 2018 with 3.85% nominal rate;Revolving credit lines with interest rate of 2.90%maturity of three months; Unsecured
Loan commitments 10,914,480 Omnibus line; credit lineInterbank loans receivable Availments
Settlements5,130,0114,815,791
440,959 Foreign currency-denominated interbank term loanswith interest rates ranging from 0.65% to 1.00% andmaturity terms ranging from 33 to 172 days
Due from other banks 471,229 Foreign currency-denominated demand and timedeposits with maturities of up to 90 days with annualfixed interest rates ranging from 0.01% to 4.50%
Accrued interest receivable 3,616 Interest accrual on receivables from customers andinterbank loans receivable
Accounts receivable 176,041 Advances to finance pension liability, remittance coverand additional working capital; Non-interest bearing,unsecured, payable on demand
Deposit liabilities 5,624,250 Peso and foreign currency denominated demand,savings, and time deposits with annual fixed interestrates ranging from 0.01% to 1.10% and maturities from8 to 297 days
Net deposits 796,930 Net withdrawals during the periodBills payable Availments
Settlements274,350423,095
37,846 Foreign currency-denominated bills payable withinterest rates ranging from 0.87% to 1.90% andmaturity terms ranging from 30 to 172 days
Due to other banks 26,748 Foreign currency-denominated clearing accounts usedfor funding and settlement of remittances
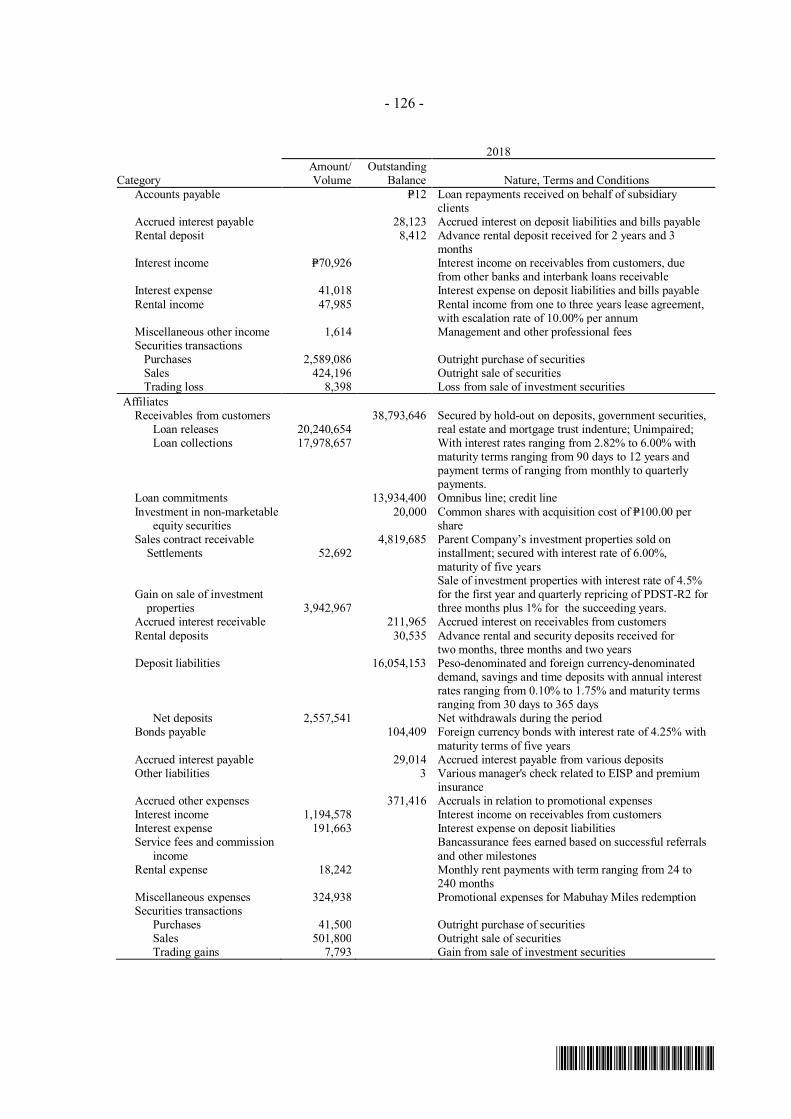
- 126 -
*SGVFS038920*
2018
CategoryAmount/Volume
OutstandingBalance Nature, Terms and Conditions
Accounts payable P=12 Loan repayments received on behalf of subsidiaryclients
Accrued interest payable 28,123 Accrued interest on deposit liabilities and bills payableRental deposit 8,412 Advance rental deposit received for 2 years and 3
monthsInterest income P=70,926 Interest income on receivables from customers, due
from other banks and interbank loans receivableInterest expense 41,018 Interest expense on deposit liabilities and bills payableRental income 47,985 Rental income from one to three years lease agreement,
with escalation rate of 10.00% per annumMiscellaneous other incomeSecurities transactions
1,614 Management and other professional fees
Purchases 2,589,086 Outright purchase of securitiesSales 424,196 Outright sale of securitiesTrading loss 8,398 Loss from sale of investment securities
AffiliatesReceivables from customers Loan releases Loan collections
20,240,65417,978,657
38,793,646 Secured by hold-out on deposits, government securities,real estate and mortgage trust indenture; Unimpaired;With interest rates ranging from 2.82% to 6.00% withmaturity terms ranging from 90 days to 12 years andpayment terms of ranging from monthly to quarterlypayments.
Loan commitments 13,934,400 Omnibus line; credit lineInvestment in non-marketable
equity securities20,000 Common shares with acquisition cost of P=100.00 per
shareSales contract receivable Settlements 52,692
4,819,685 Parent Company’s investment properties sold oninstallment; secured with interest rate of 6.00%,maturity of five years
Gain on sale of investmentproperties 3,942,967
Sale of investment properties with interest rate of 4.5%for the first year and quarterly repricing of PDST-R2 forthree months plus 1% for the succeeding years.
Accrued interest receivable 211,965 Accrued interest on receivables from customersRental deposits 30,535 Advance rental and security deposits received for
two months, three months and two yearsDeposit liabilities 16,054,153 Peso-denominated and foreign currency-denominated
demand, savings and time deposits with annual interestrates ranging from 0.10% to 1.75% and maturity termsranging from 30 days to 365 days
Net deposits 2,557,541 Net withdrawals during the periodBonds payable 104,409 Foreign currency bonds with interest rate of 4.25% with
maturity terms of five yearsAccrued interest payable 29,014 Accrued interest payable from various depositsOther liabilities 3 Various manager's check related to EISP and premium
insuranceAccrued other expenses 371,416 Accruals in relation to promotional expensesInterest income 1,194,578 Interest income on receivables from customersInterest expense 191,663 Interest expense on deposit liabilitiesService fees and commission
incomeBancassurance fees earned based on successful referralsand other milestones
Rental expense 18,242 Monthly rent payments with term ranging from 24 to240 months
Miscellaneous expenses 324,938 Promotional expenses for Mabuhay Miles redemptionSecurities transactions
Purchases 41,500 Outright purchase of securitiesSales 501,800 Outright sale of securities
Trading gains 7,793 Gain from sale of investment securities
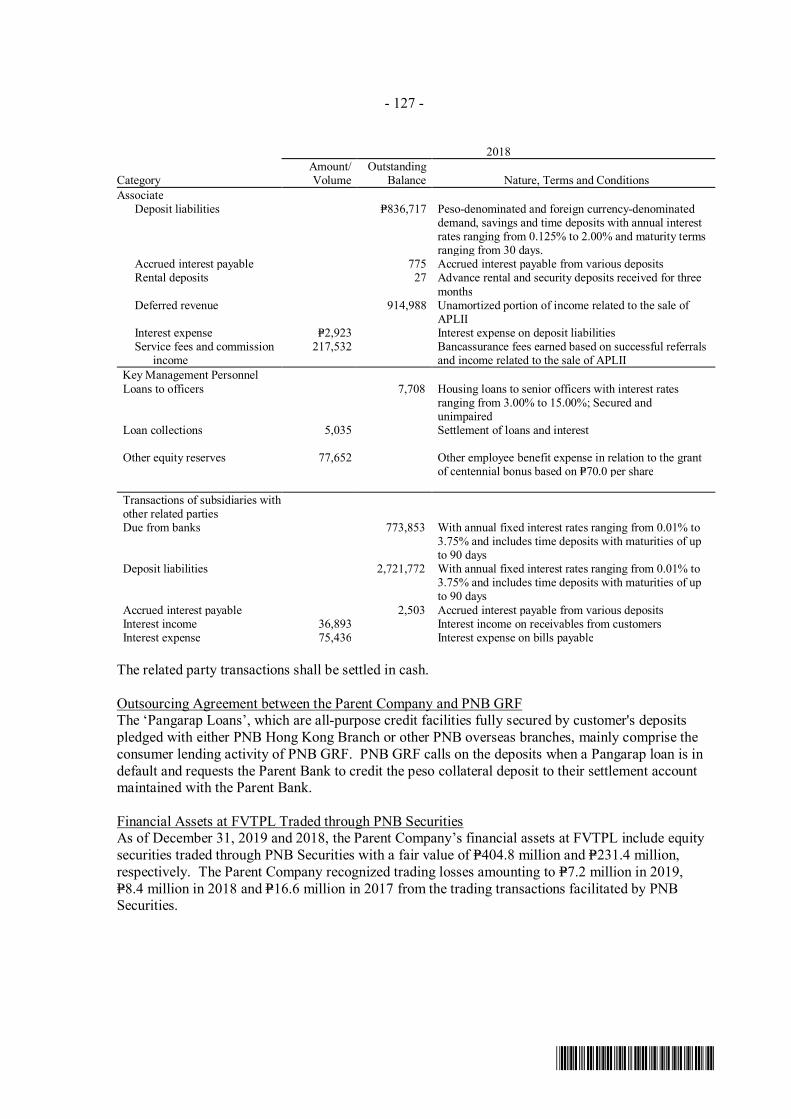
- 127 -
*SGVFS038920*
2018
CategoryAmount/Volume
OutstandingBalance Nature, Terms and Conditions
AssociateDeposit liabilities P=836,717 Peso-denominated and foreign currency-denominated
demand, savings and time deposits with annual interestrates ranging from 0.125% to 2.00% and maturity termsranging from 30 days.
Accrued interest payable 775 Accrued interest payable from various depositsRental deposits 27 Advance rental and security deposits received for three
monthsDeferred revenue 914,988 Unamortized portion of income related to the sale of
APLIIInterest expense P=2,923 Interest expense on deposit liabilitiesService fees and commission
income217,532 Bancassurance fees earned based on successful referrals
and income related to the sale of APLIIKey Management PersonnelLoans to officers 7,708 Housing loans to senior officers with interest rates
ranging from 3.00% to 15.00%; Secured andunimpaired
Loan collections 5,035 Settlement of loans and interest
Other equity reserves 77,652 Other employee benefit expense in relation to the grantof centennial bonus based on P=70.0 per share
Transactions of subsidiaries withother related partiesDue from banks 773,853 With annual fixed interest rates ranging from 0.01% to
3.75% and includes time deposits with maturities of upto 90 days
Deposit liabilities 2,721,772 With annual fixed interest rates ranging from 0.01% to3.75% and includes time deposits with maturities of upto 90 days
Accrued interest payable 2,503 Accrued interest payable from various depositsInterest income 36,893 Interest income on receivables from customersInterest expense 75,436 Interest expense on bills payable
The related party transactions shall be settled in cash.
Outsourcing Agreement between the Parent Company and PNB GRFThe ‘Pangarap Loans’, which are all-purpose credit facilities fully secured by customer's depositspledged with either PNB Hong Kong Branch or other PNB overseas branches, mainly comprise theconsumer lending activity of PNB GRF. PNB GRF calls on the deposits when a Pangarap loan is indefault and requests the Parent Bank to credit the peso collateral deposit to their settlement accountmaintained with the Parent Bank.
Financial Assets at FVTPL Traded through PNB SecuritiesAs of December 31, 2019 and 2018, the Parent Company’s financial assets at FVTPL include equitysecurities traded through PNB Securities with a fair value of P=404.8 million and P=231.4 million,respectively. The Parent Company recognized trading losses amounting to P=7.2 million in 2019,P=8.4 million in 2018 and P=16.6 million in 2017 from the trading transactions facilitated by PNBSecurities.
- 128 -
*SGVFS038920*
Compensation of Key Management PersonnelThe compensation of the key management personnel for the Group and Parent Company follows:
2019 2018 2017Short-term employee benefits P=541,386 P=519,441 P=481,011Post-employment benefits 45,996 47,215 60,554
P=587,382 P=566,656 P=541,565
Members of the BOD are entitled to a per diem of P=0.05 million for attendance at each meeting of theBoard and of any committees, and other non-cash benefit in the form of healthcare plans andinsurance. In 2019 and 2018, total per diem given to the BOD amounted to P=45.5 million andP=43.0 million, respectively, recorded in ‘Miscellaneous expenses’ in the statements of income.Directors’ remuneration covers all BOD activities and membership of committees and subsidiarycompanies. In 2019 and 2018, key management personnel received Parent Company shares inrelation to the centennial bonus distribution of 29,951 and 36,262, respectively.
Joint ArrangementsThe Parent Company and Eton Properties Philippines, Inc. (EPPI) signed two joint ventureAgreements (JVAs) for the development of two real estate properties of the Parent Company includedunder ‘Other assets’ and with carrying values of P=1.2 billion at the time of signing. EPPI and theGroup are under common control. These two projects are among the Parent Company’s strategies inreducing its non-performing assets.
The Parent Company contributed the aforementioned properties into the joint venture (JV) asapproved by BSP. EPPI, on the other hand, contributed its resources and technical expertise for thecompletion of the said JV. The Parent Company is prohibited to contribute funds for thedevelopment of the JV. Income from the sale of the properties under the JV will be shared by theParent Company and EPPI in accordance with the terms of the JVAs.
In July 2016, the Parent Company executed deeds of conveyance to EPPI on the areas of the landunder the JVA arrangement. The execution of the deeds of conveyance was made to facilitate theissuance of the condominium certificates of title to the buyers.
Outsourcing Agreement between the Parent Company and PNBSBPNBSB and the Parent Company entered into a servicing agreement pertaining to the purchased loanportfolio. The agreement shall be valid and binding until terminated by the either party if so requiredby the BSP or upon a 60-day prior written notice to the other party. As to the amount of service fee,the Parent Company shall charge PNBSB with the amount it charges it customers.
Service charges pertain to outsourced services rendered by the Parent Company, including legal andinformation technology services. These are payable on a monthly basis.
PNBSB has available credit lines with the Parent Company amounting to P=750.0 million as ofDecember 31, 2019 and 2018, respectively. As of December 31, 2019 and 2018, the credit linesremain undrawn.
Transactions with Retirement PlansManagement of the retirement funds of the Group and the Parent Company is handled by its TBG.The fair values and carrying values of the funds of the Parent Company amounted to P=7.1 billion andP=5.3 billion as of December 31, 2019 and 2018, respectively.
- 129 -
*SGVFS038920*
Relevant information on assets/liabilities and income/expense of the retirement plan assets follows:
Consolidated Parent Company2019 2018 2019 2018
Deposits with PNB P=563,314 P=102,689 P=563,314 P=102,326Investment in UITFs 556,816 476,336 556,816 352,144Investment in PNB Shares 305,036 321,213 305,036 321,213Investment in PNB bonds 142,724 – 142,724 –Total Fund Assets P=1,567,890 P=900,238 P=1,567,890 P=775,683Unrealized loss on PNB shares (P=73,992) (P=124,241) (P=73,992) (P=124,241)Interest income 7,454 1,293 7,454 850
(66,538) (122,948) (66,538) (123,391)Trust fees (7,468) (6,449) (7,468) (6,288)Fund loss (P=74,006) (P=129,397) (P=74,006) (P=129,679)
As of December 31, 2019 and 2018, the retirement fund of the Group and the Parent Companyincludes 8,841,622 and 7,513,746 PNB shares, respectively, classified as financial assets FVTPL.There are no limitations and restrictions over the PNB shares while the corresponding voting rightsare exercised by a trust officer or any of its designated alternate officer of TBG.
In addition to the regular retirement funds, TBG also manages the funds of the Parent Company’semployee investment plans.
34. Provisions, Contingent Liabilities and Other Commitments
In the normal course of business, the Group makes various commitments and incurs certaincontingent liabilities that are not presented in the financial statements including several suits andclaims which remain unsettled. No specific disclosures on such unsettled assets and claims are madebecause any such specific disclosures would prejudice the Group’s position with the other partieswith whom it is in dispute. Such exemption from disclosures is allowed under PAS 37, Provisions,Contingent Liabilities and Contingent Assets. The Group and its legal counsel believe that any lossesarising from these contingencies which are not specifically provided for will not have a materialadverse effect on the financial statements.
In 2019, the Group and the Parent Company’s outstanding provisions for legal claims remained atP=0.5 billion as of December 31, 2019 and 2018.
There were no significant settlements made in 2019.
Tax AssessmentIn the ordinary course of the Group’s operations, certain entities within the Group have pending taxassessments/claims which are in various stages of protest/appeal with the tax authorities, the amountsof which cannot be reasonably estimated. Management believes that the bases of said protest/appealare legally valid such that the ultimate resolution of these assessments/claims would not have materialeffects on the consolidated financial position and results of operations.
- 130 -
*SGVFS038920*
35. Offsetting of Financial Assets and Liabilities
The Group is required to disclose information about rights of offset and related arrangements (such ascollateral posting requirements) for financial instruments under an enforceable master nettingagreements or similar arrangements. The effects of these arrangements to the Group and the ParentCompany’s financial statements are disclosed in the succeeding tables.
Consolidated
2019
Financial assets recognized atend of reporting period bytype
Gross carryingamounts (before
offsetting)
Gross amountsoffset in
accordance withthe offsetting
criteria
Net amountpresented in
statements offinancialposition
[a-b]
Effect of remaining rights of set-off (including rights to set off financial collateral) that do not meet PAS 32
offsetting criteria
Net exposure[c-d]
Financialinstruments
Fair value offinancial
collateral[a] [b] [c] [d] [e]
Derivative assets P=74,965,186 (P=74,592,146) P=373,040 (P=45,891) P=– P=327,149Securities held under
agreements to resell(Note 8) 2,517,764 – 2,517,764 – (2,517,745) 396
Total P=77,482,950 (P=74,592,146) P=2,890,804 (P=45,891) (P=2,517,745) P=327,545
2018
Financial assets recognized atend of reporting period bytype
Gross carryingamounts (before
offsetting)
Gross amountsoffset in
accordance withthe offsetting
criteria
Net amountpresented in
statements offinancialposition
[a-b]
Effect of remaining rights of set-off (including rights to set off financial collateral) that do not meet PAS 32
offsetting criteria
Net exposure[c-d]
Financialinstruments
Fair value offinancialcollateral
[a] [b] [c] [d] [e]Derivative assets P=46,075,448 (P=45,569,485) P=505,963 (P=58,838) P=− P=447,125Securities held under
agreements to resell(Note 8) 20,700,000 − 20,700,000 − (19,947,247) 752,753
Total P= 66,775,448 (P=45,569,485) P= 21,205,963 (P=58,838) (P=19,947,247) P= 1,199,878
2019
Financial liabilitiesrecognized at end ofreporting period by type
Gross carryingamounts (before
offsetting)
Gross amountsoffset in
accordance withthe offsetting
criteria
Net amountpresented in
statements offinancialposition
[a-b]
Effect of remaining rights of set-off (including rights to set off financial collateral) that do not meet PAS 32
offsetting criteria
Net exposure[c-d]
Financialinstruments
Fair value offinancial
collateral[a] [b] [c] [d] [e]
Derivative liabilities P=60,131,350 (P=59,885,731) P=245,619 (P=155,245) P= P=90,374Securities sold under
agreements to repurchase(Notes 9 and 19)* 23,268,257 – 23,268,257 – (29,655,404) –
Total P=83,399,607 (P=59,885,731) P=23,513,876 (P=155,245) (P=29,655,404) P=90,374
2018
Financial liabilities recognizedat end of reporting period bytype
Gross carryingamounts (before
offsetting)
Gross amountsoffset in
accordance withthe offsetting
criteria
Net amountpresented in
statements offinancialposition
[a-b]
Effect of remaining rights of set-off (including rights to set off financial collateral) that do not meet PAS 32
offsetting criteria
Net exposure[c-d]
Financialinstruments
Fair value offinancialcollateral
[a] [b] [c] [d] [e]Derivative liabilities P=32,870,042 (P=33,325,851) (P=455,809) (P=92,025) P=− (P=363,784)Securities sold under
agreements to repurchase(Notes 9 and 19)* 48,035,239 − 48,035,239 − (50,776,539) −
Total P=80,905,281 (P=33,325,851) P=47,579,430 (P=92,025) (P=50,776,539) (P=363,784)* Included in bills and acceptances payable in the statements of financial position
- 131 -
*SGVFS038920*
Parent Company
2019
Financial assets recognized atend of reporting period bytype
Gross carryingamounts (before
offsetting)
Gross amountsoffset in
accordance withthe offsetting
criteria
Net amountpresented in
statements offinancialposition
[a-b]
Effect of remaining rights of set-off (including rights to set off financial collateral) that do not meet PAS 32
offsetting criteria
Net exposure[c-d]
Financialinstruments
Fair value offinancial
collateral[a] [b] [c] [d] [e]
Derivative assets P=74,965,136 (P=74,592,130) P=373,006 (P=45,571) P=– P=327,435Securities held under
agreements to resell(Notes 8 and 19) 1,149,984 – 1,149,984 – (1,149,588) 396
Total P=76,115,120 (P=74,592,130) P=1,522,990 (P=45,571) (P=1,149,588) P=327,831
2018
Financial assets recognized atend of reporting period bytype
Gross carryingamounts (before
offsetting)
Gross amountsoffset in
accordance withthe offsetting
criteria
Net amountpresented in
statements offinancialposition
[a-b]
Effect of remaining rights of set-off (including rights to set off financial collateral) that do not meet PAS 32
offsetting criteria
Net exposure[c-d]
Financialinstruments
Fair value offinancialcollateral
[a] [b] [c] [d] [e]Derivative assets P=46,075,448 (P=45,569,485) P=505,963 (P=58,838) P=− P=447,125Securities held under
agreements to resell(Notes 8 and 19) 20,700,000 − 20,700,000 − (19,947,247) 752,753
Total P= 66,775,448 (P=45,569,485) P= 21,205,963 (P=58,838) (P=19,947,247) P= 1,199,878
2019
Financial liabilitiesrecognized at end ofreporting period by type
Gross carryingamounts (before
offsetting)
Gross amountsoffset in
accordance withthe offsetting
criteria
Net amountpresented in
statements offinancialposition
[a-b]
Effect of remaining rights of set-off (including rights to set off financial collateral) that do not meet PAS 32
offsetting criteria
Net exposure[c-d]
Financialinstruments
Fair value offinancial
collateral[a] [b] [c] [d] [e]
Derivative liabilities P=60,117,063 (P=59,885,071) P=231,992 (P=144,586) P= P=87,406Securities sold under
agreements to repurchase(Notes 9 and 19)* 23,268,257 – 23,268,257 – (29,655,404) –
Total P=83,385,320 (P=59,885,071) P=23,500,429 (P=144,586) (P=29,655,404) P=87,406
2018
Financial liabilities recognizedat end of reporting period bytype
Gross carryingamounts (before
offsetting)
Gross amountsoffset in
accordance withthe offsetting
criteria
Net amountpresented in
statements offinancialposition
[a-b]
Effect of remaining rights of set-off (including rights to set off financial collateral) that do not meet PAS 32
offsetting criteria
Net exposure[c-d]
Financialinstruments
Fair value offinancialcollateral
[a] [b] [c] [d] [e]Derivative liabilities P=32,870,042 (P=33,325,851) (P=455,809) (P=92,025) P=− (P=363,784)Securities sold under
agreements to repurchase(Notes 9 and 19)* 48,035,239 − 48,035,239 − (50,776,539) −
Total P=80,905,281 (P=33,325,851) P=47,579,430 (P=92,025) (P=50,776,539) (P=363,784)* Included in bills and acceptances payable in the statements of financial position
The amounts disclosed in column (d) include those rights to set-off amounts that are only enforceableand exercisable in the event of default, insolvency or bankruptcy. This includes amounts related tofinancial collateral both received and pledged, whether cash or non-cash collateral, excluding theextent of over-collateralization.
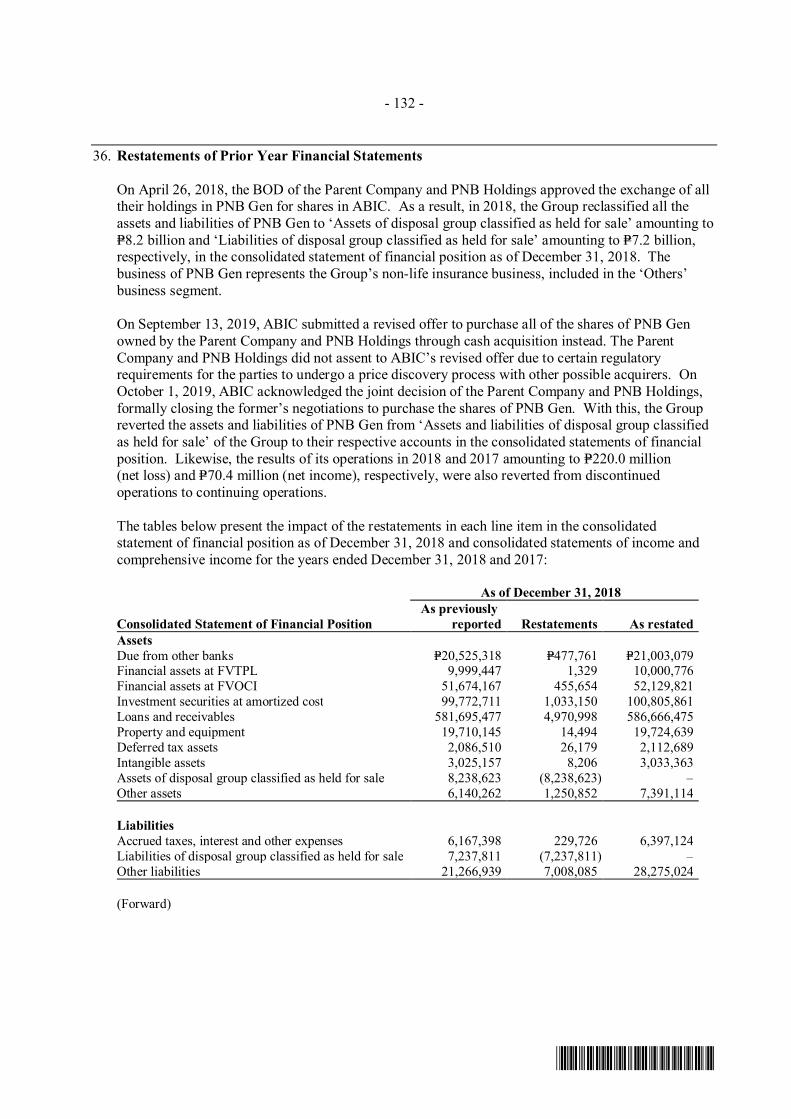
- 132 -
*SGVFS038920*
36. Restatements of Prior Year Financial Statements
On April 26, 2018, the BOD of the Parent Company and PNB Holdings approved the exchange of alltheir holdings in PNB Gen for shares in ABIC. As a result, in 2018, the Group reclassified all theassets and liabilities of PNB Gen to ‘Assets of disposal group classified as held for sale’ amounting toP=8.2 billion and ‘Liabilities of disposal group classified as held for sale’ amounting to P=7.2 billion,respectively, in the consolidated statement of financial position as of December 31, 2018. Thebusiness of PNB Gen represents the Group’s non-life insurance business, included in the ‘Others’business segment.
On September 13, 2019, ABIC submitted a revised offer to purchase all of the shares of PNB Genowned by the Parent Company and PNB Holdings through cash acquisition instead. The ParentCompany and PNB Holdings did not assent to ABIC’s revised offer due to certain regulatoryrequirements for the parties to undergo a price discovery process with other possible acquirers. OnOctober 1, 2019, ABIC acknowledged the joint decision of the Parent Company and PNB Holdings,formally closing the former’s negotiations to purchase the shares of PNB Gen. With this, the Groupreverted the assets and liabilities of PNB Gen from ‘Assets and liabilities of disposal group classifiedas held for sale’ of the Group to their respective accounts in the consolidated statements of financialposition. Likewise, the results of its operations in 2018 and 2017 amounting to P=220.0 million(net loss) and P=70.4 million (net income), respectively, were also reverted from discontinuedoperations to continuing operations.
The tables below present the impact of the restatements in each line item in the consolidatedstatement of financial position as of December 31, 2018 and consolidated statements of income andcomprehensive income for the years ended December 31, 2018 and 2017:
As of December 31, 2018
Consolidated Statement of Financial PositionAs previously
reported Restatements As restatedAssetsDue from other banks P=20,525,318 P=477,761 P=21,003,079Financial assets at FVTPL 9,999,447 1,329 10,000,776Financial assets at FVOCI 51,674,167 455,654 52,129,821Investment securities at amortized cost 99,772,711 1,033,150 100,805,861Loans and receivables 581,695,477 4,970,998 586,666,475Property and equipment 19,710,145 14,494 19,724,639Deferred tax assets 2,086,510 26,179 2,112,689Intangible assets 3,025,157 8,206 3,033,363Assets of disposal group classified as held for sale 8,238,623 (8,238,623) –Other assets 6,140,262 1,250,852 7,391,114
LiabilitiesAccrued taxes, interest and other expenses 6,167,398 229,726 6,397,124Liabilities of disposal group classified as held for sale 7,237,811 (7,237,811) –Other liabilities 21,266,939 7,008,085 28,275,024
(Forward)
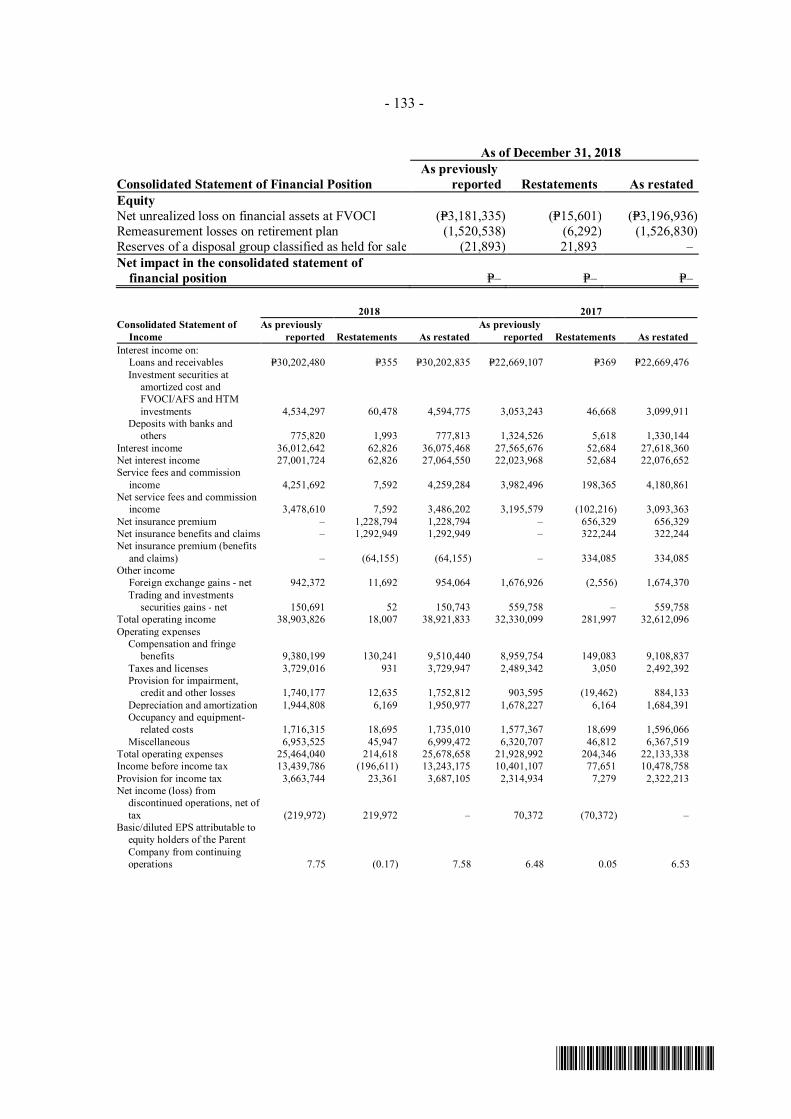
- 133 -
*SGVFS038920*
As of December 31, 2018
Consolidated Statement of Financial PositionAs previously
reported Restatements As restatedEquityNet unrealized loss on financial assets at FVOCI (P=3,181,335) (P=15,601) (P=3,196,936)Remeasurement losses on retirement plan (1,520,538) (6,292) (1,526,830)Reserves of a disposal group classified as held for sale (21,893) 21,893 –Net impact in the consolidated statement of
financial position P=– P=– P=–
2018 2017Consolidated Statement of
IncomeAs previously
reported Restatements As restatedAs previously
reported Restatements As restatedInterest income on: Loans and receivables P=30,202,480 P=355 P=30,202,835 P=22,669,107 P=369 P=22,669,476
Investment securities atamortized cost andFVOCI/AFS and HTMinvestments 4,534,297 60,478 4,594,775 3,053,243 46,668 3,099,911
Deposits with banks andothers 775,820 1,993 777,813 1,324,526 5,618 1,330,144
Interest income 36,012,642 62,826 36,075,468 27,565,676 52,684 27,618,360Net interest income 27,001,724 62,826 27,064,550 22,023,968 52,684 22,076,652Service fees and commission
income 4,251,692 7,592 4,259,284 3,982,496 198,365 4,180,861Net service fees and commission
income 3,478,610 7,592 3,486,202 3,195,579 (102,216) 3,093,363Net insurance premium – 1,228,794 1,228,794 – 656,329 656,329Net insurance benefits and claims – 1,292,949 1,292,949 – 322,244 322,244Net insurance premium (benefits
and claims) – (64,155) (64,155) – 334,085 334,085Other income Foreign exchange gains - net 942,372 11,692 954,064 1,676,926 (2,556) 1,674,370
Trading and investmentssecurities gains - net 150,691 52 150,743 559,758 – 559,758
Total operating income 38,903,826 18,007 38,921,833 32,330,099 281,997 32,612,096Operating expenses
Compensation and fringebenefits 9,380,199 130,241 9,510,440 8,959,754 149,083 9,108,837
Taxes and licenses 3,729,016 931 3,729,947 2,489,342 3,050 2,492,392Provision for impairment,
credit and other losses 1,740,177 12,635 1,752,812 903,595 (19,462) 884,133Depreciation and amortization 1,944,808 6,169 1,950,977 1,678,227 6,164 1,684,391Occupancy and equipment-
related costs 1,716,315 18,695 1,735,010 1,577,367 18,699 1,596,066Miscellaneous 6,953,525 45,947 6,999,472 6,320,707 46,812 6,367,519
Total operating expenses 25,464,040 214,618 25,678,658 21,928,992 204,346 22,133,338Income before income tax 13,439,786 (196,611) 13,243,175 10,401,107 77,651 10,478,758Provision for income tax 3,663,744 23,361 3,687,105 2,314,934 7,279 2,322,213Net income (loss) from
discontinued operations, net oftax (219,972) 219,972 – 70,372 (70,372) –
Basic/diluted EPS attributable toequity holders of the ParentCompany from continuingoperations 7.75 (0.17) 7.58 6.48 0.05 6.53
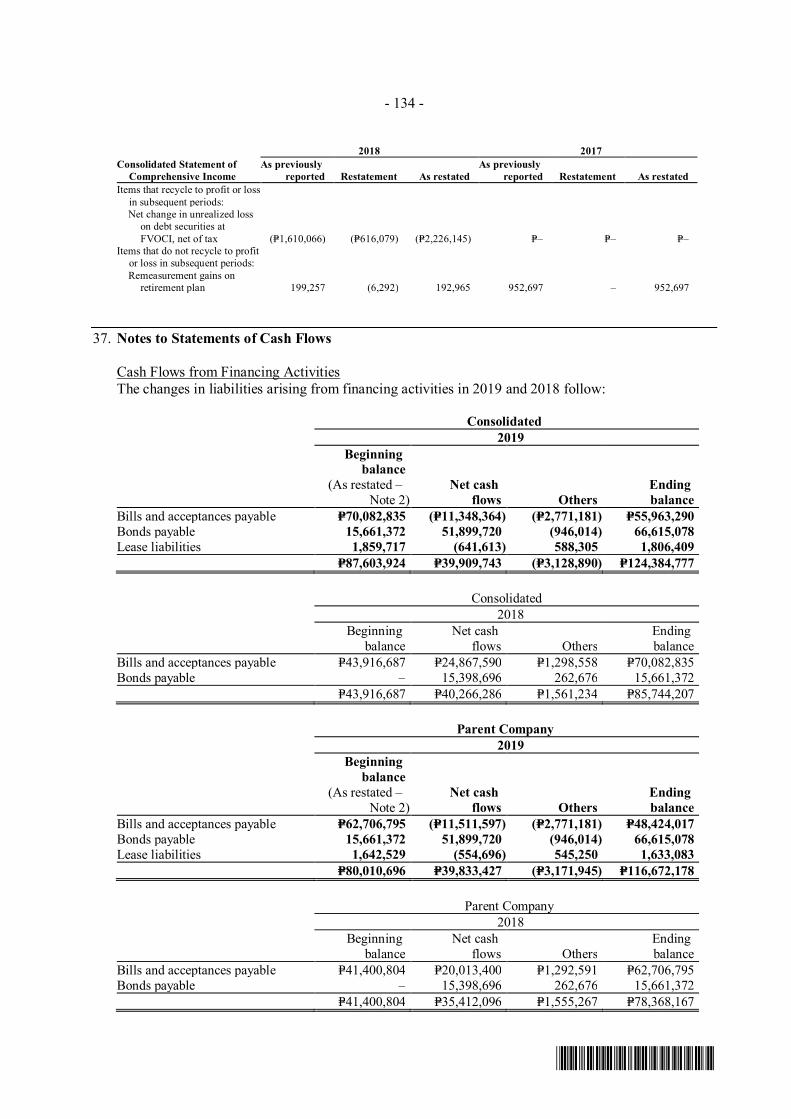
- 134 -
*SGVFS038920*
2018 2017Consolidated Statement of
Comprehensive IncomeAs previously
reported Restatement As restatedAs previously
reported Restatement As restatedItems that recycle to profit or loss
in subsequent periods:Net change in unrealized loss
on debt securities atFVOCI, net of tax (P=1,610,066) (P=616,079) (P=2,226,145) P=– P=– P=–
Items that do not recycle to profitor loss in subsequent periods:Remeasurement gains on
retirement plan 199,257 (6,292) 192,965 952,697 – 952,697
37. Notes to Statements of Cash Flows
Cash Flows from Financing ActivitiesThe changes in liabilities arising from financing activities in 2019 and 2018 follow:
Consolidated2019
Beginningbalance
(As restated –Note 2)
Net cashflows Others
Endingbalance
Bills and acceptances payable P=70,082,835 (P=11,348,364) (P=2,771,181) P=55,963,290Bonds payable 15,661,372 51,899,720 (946,014) 66,615,078Lease liabilities 1,859,717 (641,613) 588,305 1,806,409
P=87,603,924 P=39,909,743 (P=3,128,890) P=124,384,777
Consolidated2018
Beginningbalance
Net cashflows Others
Endingbalance
Bills and acceptances payable P=43,916,687 P=24,867,590 P=1,298,558 P=70,082,835Bonds payable – 15,398,696 262,676 15,661,372
P=43,916,687 P=40,266,286 P=1,561,234 P=85,744,207
Parent Company2019
Beginningbalance
(As restated –Note 2)
Net cashflows Others
Endingbalance
Bills and acceptances payable P=62,706,795 (P=11,511,597) (P=2,771,181) P=48,424,017Bonds payable 15,661,372 51,899,720 (946,014) 66,615,078Lease liabilities 1,642,529 (554,696) 545,250 1,633,083
P=80,010,696 P=39,833,427 (P=3,171,945) P=116,672,178
Parent Company2018
Beginningbalance
Net cashflows Others
Endingbalance
Bills and acceptances payable P=41,400,804 P=20,013,400 P=1,292,591 P=62,706,795Bonds payable – 15,398,696 262,676 15,661,372
P=41,400,804 P=35,412,096 P=1,555,267 P=78,368,167
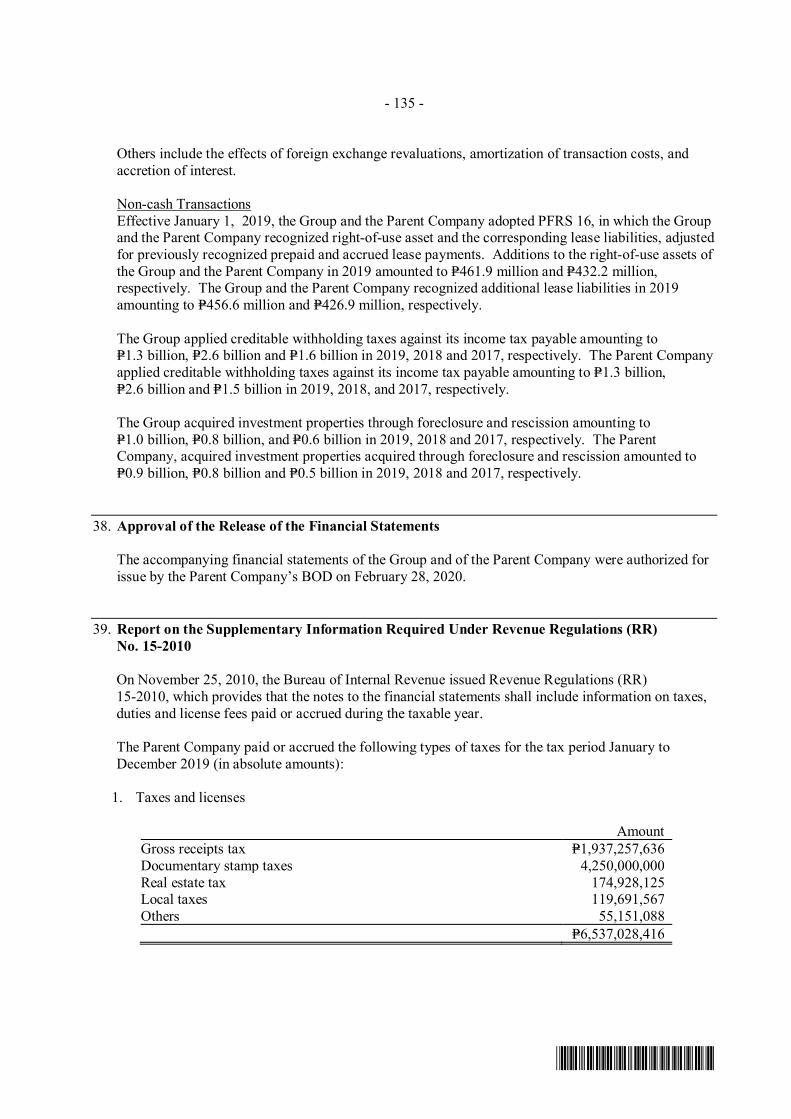
- 135 -
*SGVFS038920*
Others include the effects of foreign exchange revaluations, amortization of transaction costs, andaccretion of interest.
Non-cash TransactionsEffective January 1, 2019, the Group and the Parent Company adopted PFRS 16, in which the Groupand the Parent Company recognized right-of-use asset and the corresponding lease liabilities, adjustedfor previously recognized prepaid and accrued lease payments. Additions to the right-of-use assets ofthe Group and the Parent Company in 2019 amounted to P=461.9 million and P=432.2 million,respectively. The Group and the Parent Company recognized additional lease liabilities in 2019amounting to P=456.6 million and P=426.9 million, respectively.
The Group applied creditable withholding taxes against its income tax payable amounting toP=1.3 billion, P=2.6 billion and P=1.6 billion in 2019, 2018 and 2017, respectively. The Parent Companyapplied creditable withholding taxes against its income tax payable amounting to P=1.3 billion,P=2.6 billion and P=1.5 billion in 2019, 2018, and 2017, respectively.
The Group acquired investment properties through foreclosure and rescission amounting toP=1.0 billion, P=0.8 billion, and P=0.6 billion in 2019, 2018 and 2017, respectively. The ParentCompany, acquired investment properties acquired through foreclosure and rescission amounted toP=0.9 billion, P=0.8 billion and P=0.5 billion in 2019, 2018 and 2017, respectively.
38. Approval of the Release of the Financial Statements
The accompanying financial statements of the Group and of the Parent Company were authorized forissue by the Parent Company’s BOD on February 28, 2020.
39. Report on the Supplementary Information Required Under Revenue Regulations (RR)No. 15-2010
On November 25, 2010, the Bureau of Internal Revenue issued Revenue Regulations (RR)15-2010, which provides that the notes to the financial statements shall include information on taxes,duties and license fees paid or accrued during the taxable year.
The Parent Company paid or accrued the following types of taxes for the tax period January toDecember 2019 (in absolute amounts):
1. Taxes and licenses
AmountGross receipts tax P=1,937,257,636Documentary stamp taxes 4,250,000,000Real estate tax 174,928,125Local taxes 119,691,567Others 55,151,088
P=6,537,028,416
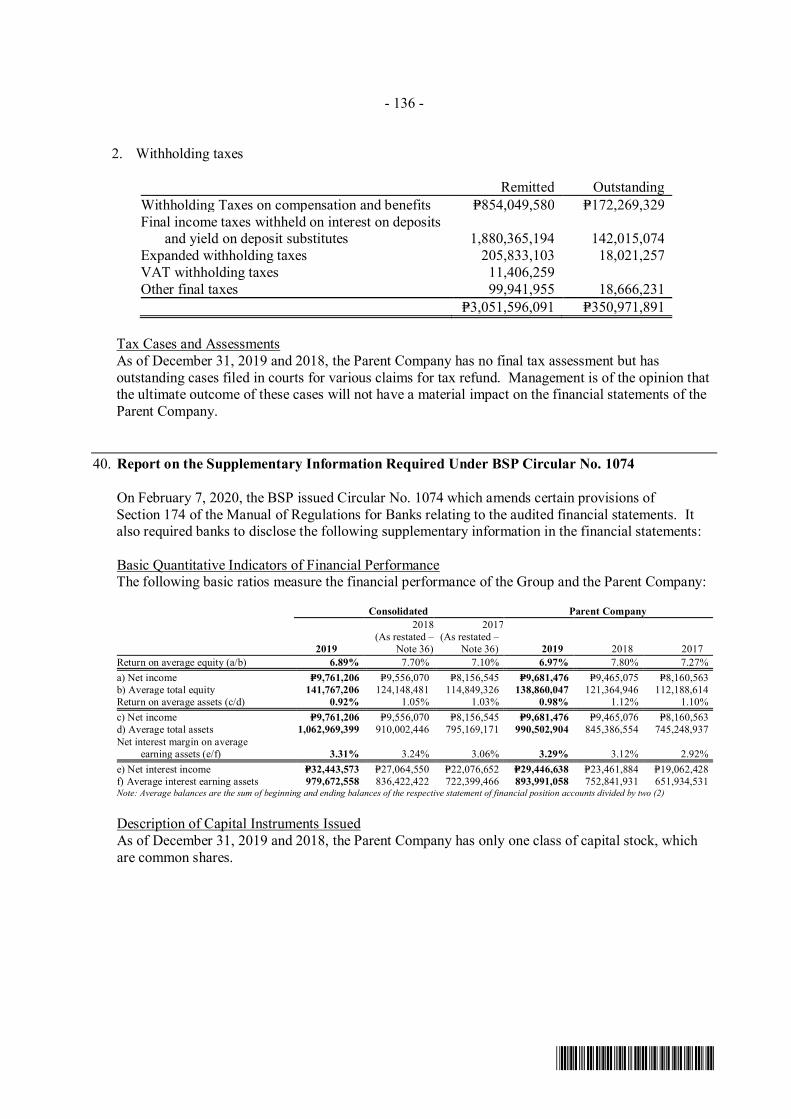
- 136 -
*SGVFS038920*
2. Withholding taxes
Remitted OutstandingWithholding Taxes on compensation and benefits P=854,049,580 P=172,269,329Final income taxes withheld on interest on deposits
and yield on deposit substitutes 1,880,365,194 142,015,074Expanded withholding taxes 205,833,103 18,021,257VAT withholding taxes 11,406,259Other final taxes 99,941,955 18,666,231
P=3,051,596,091 P=350,971,891
Tax Cases and AssessmentsAs of December 31, 2019 and 2018, the Parent Company has no final tax assessment but hasoutstanding cases filed in courts for various claims for tax refund. Management is of the opinion thatthe ultimate outcome of these cases will not have a material impact on the financial statements of theParent Company.
40. Report on the Supplementary Information Required Under BSP Circular No. 1074
On February 7, 2020, the BSP issued Circular No. 1074 which amends certain provisions ofSection 174 of the Manual of Regulations for Banks relating to the audited financial statements. Italso required banks to disclose the following supplementary information in the financial statements:
Basic Quantitative Indicators of Financial Performance The following basic ratios measure the financial performance of the Group and the Parent Company:
Consolidated Parent Company
2019
2018(As restated –
Note 36)
2017(As restated –
Note 36) 2019 2018 2017Return on average equity (a/b) 6.89% 7.70% 7.10% 6.97% 7.80% 7.27%a) Net income P=9,761,206 P=9,556,070 P=8,156,545 P=9,681,476 P=9,465,075 P=8,160,563b) Average total equity 141,767,206 124,148,481 114,849,326 138,860,047 121,364,946 112,188,614Return on average assets (c/d) 0.92% 1.05% 1.03% 0.98% 1.12% 1.10%c) Net income P=9,761,206 P=9,556,070 P=8,156,545 P=9,681,476 P=9,465,076 P=8,160,563d) Average total assets 1,062,969,399 910,002,446 795,169,171 990,502,904 845,386,554 745,248,937Net interest margin on average
earning assets (e/f) 3.31% 3.24% 3.06% 3.29% 3.12% 2.92%e) Net interest income P=32,443,573 P=27,064,550 P=22,076,652 P=29,446,638 P=23,461,884 P=19,062,428f) Average interest earning assets 979,672,558 836,422,422 722,399,466 893,991,058 752,841,931 651,934,531Note: Average balances are the sum of beginning and ending balances of the respective statement of financial position accounts divided by two (2)
Description of Capital Instruments IssuedAs of December 31, 2019 and 2018, the Parent Company has only one class of capital stock, whichare common shares.
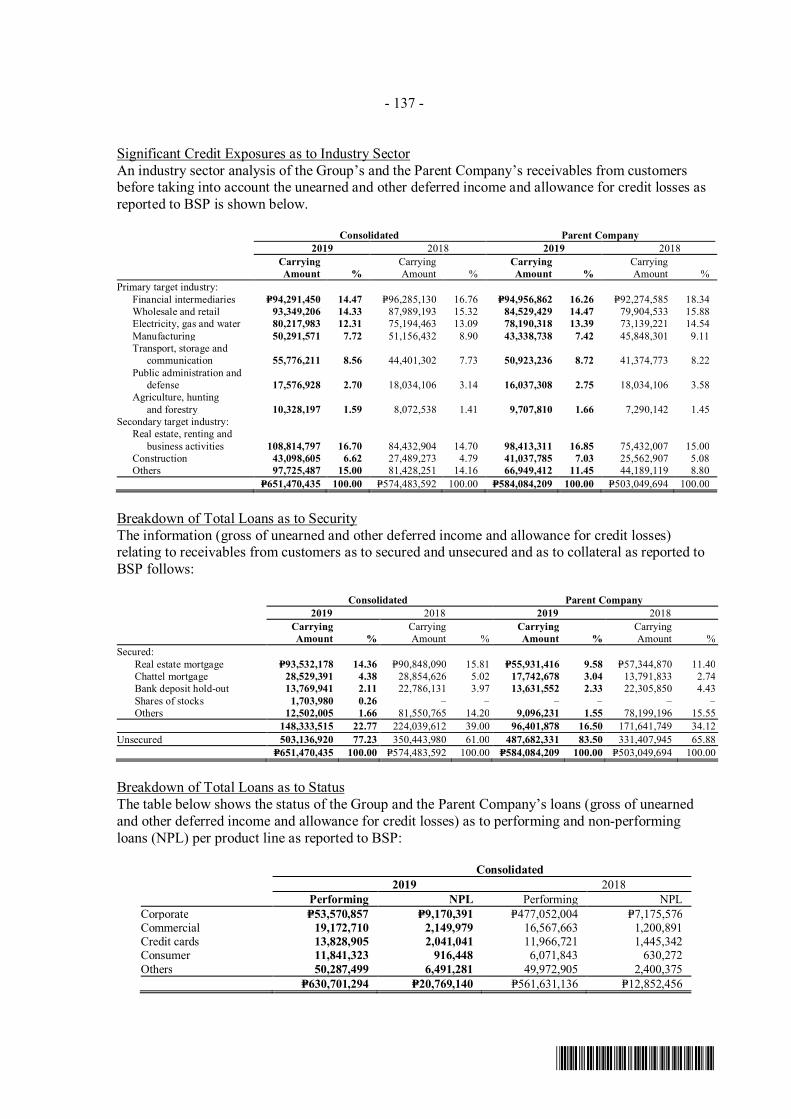
- 137 -
*SGVFS038920*
Significant Credit Exposures as to Industry SectorAn industry sector analysis of the Group’s and the Parent Company’s receivables from customersbefore taking into account the unearned and other deferred income and allowance for credit losses asreported to BSP is shown below.
Consolidated Parent Company2019 2018 2019 2018
CarryingAmount %
CarryingAmount %
CarryingAmount %
CarryingAmount %
Primary target industry:Financial intermediaries P=94,291,450 14.47 P=96,285,130 16.76 P=94,956,862 16.26 P=92,274,585 18.34Wholesale and retail 93,349,206 14.33 87,989,193 15.32 84,529,429 14.47 79,904,533 15.88Electricity, gas and water 80,217,983 12.31 75,194,463 13.09 78,190,318 13.39 73,139,221 14.54Manufacturing 50,291,571 7.72 51,156,432 8.90 43,338,738 7.42 45,848,301 9.11Transport, storage and
communication 55,776,211 8.56 44,401,302 7.73 50,923,236 8.72 41,374,773 8.22Public administration and
defense 17,576,928 2.70 18,034,106 3.14 16,037,308 2.75 18,034,106 3.58Agriculture, hunting
and forestry 10,328,197 1.59 8,072,538 1.41 9,707,810 1.66 7,290,142 1.45Secondary target industry:
Real estate, renting andbusiness activities 108,814,797 16.70 84,432,904 14.70 98,413,311 16.85 75,432,007 15.00
Construction 43,098,605 6.62 27,489,273 4.79 41,037,785 7.03 25,562,907 5.08Others 97,725,487 15.00 81,428,251 14.16 66,949,412 11.45 44,189,119 8.80
P=651,470,435 100.00 P=574,483,592 100.00 P=584,084,209 100.00 P=503,049,694 100.00
Breakdown of Total Loans as to SecurityThe information (gross of unearned and other deferred income and allowance for credit losses)relating to receivables from customers as to secured and unsecured and as to collateral as reported toBSP follows:
Consolidated Parent Company2019 2018 2019 2018
CarryingAmount %
CarryingAmount %
CarryingAmount %
CarryingAmount %
Secured:Real estate mortgage P=93,532,178 14.36 P=90,848,090 15.81 P=55,931,416 9.58 P=57,344,870 11.40Chattel mortgage 28,529,391 4.38 28,854,626 5.02 17,742,678 3.04 13,791,833 2.74Bank deposit hold-out 13,769,941 2.11 22,786,131 3.97 13,631,552 2.33 22,305,850 4.43Shares of stocks 1,703,980 0.26 – – – – – –Others 12,502,005 1.66 81,550,765 14.20 9,096,231 1.55 78,199,196 15.55
148,333,515 22.77 224,039,612 39.00 96,401,878 16.50 171,641,749 34.12Unsecured 503,136,920 77.23 350,443,980 61.00 487,682,331 83.50 331,407,945 65.88
P=651,470,435 100.00 P=574,483,592 100.00 P=584,084,209 100.00 P=503,049,694 100.00
Breakdown of Total Loans as to StatusThe table below shows the status of the Group and the Parent Company’s loans (gross of unearnedand other deferred income and allowance for credit losses) as to performing and non-performingloans (NPL) per product line as reported to BSP:
Consolidated2019 2018
Performing NPL Performing NPLCorporate P=53,570,857 P=9,170,391 P=477,052,004 P=7,175,576Commercial 19,172,710 2,149,979 16,567,663 1,200,891Credit cards 13,828,905 2,041,041 11,966,721 1,445,342Consumer 11,841,323 916,448 6,071,843 630,272Others 50,287,499 6,491,281 49,972,905 2,400,375
P=630,701,294 P=20,769,140 P=561,631,136 P=12,852,456
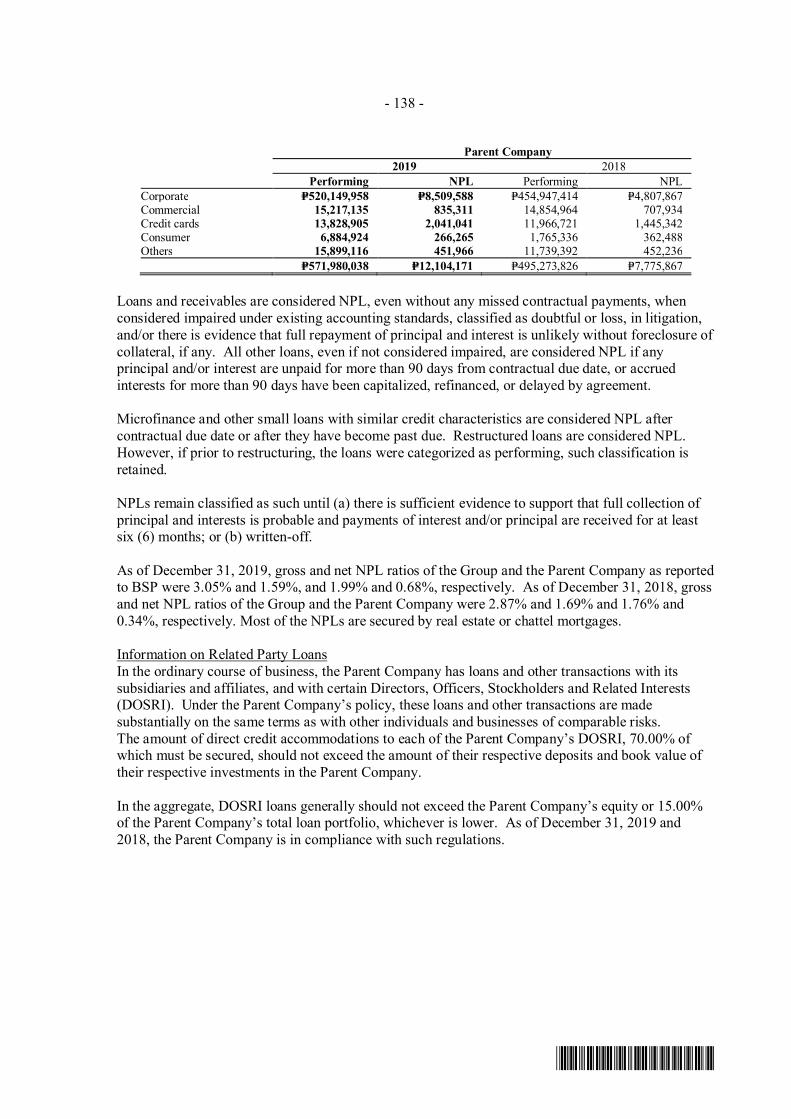
- 138 -
*SGVFS038920*
Parent Company2019 2018
Performing NPL Performing NPLCorporate P=520,149,958 P=8,509,588 P=454,947,414 P=4,807,867Commercial 15,217,135 835,311 14,854,964 707,934Credit cards 13,828,905 2,041,041 11,966,721 1,445,342Consumer 6,884,924 266,265 1,765,336 362,488Others 15,899,116 451,966 11,739,392 452,236
P=571,980,038 P=12,104,171 P=495,273,826 P=7,775,867
Loans and receivables are considered NPL, even without any missed contractual payments, whenconsidered impaired under existing accounting standards, classified as doubtful or loss, in litigation,and/or there is evidence that full repayment of principal and interest is unlikely without foreclosure ofcollateral, if any. All other loans, even if not considered impaired, are considered NPL if anyprincipal and/or interest are unpaid for more than 90 days from contractual due date, or accruedinterests for more than 90 days have been capitalized, refinanced, or delayed by agreement.
Microfinance and other small loans with similar credit characteristics are considered NPL aftercontractual due date or after they have become past due. Restructured loans are considered NPL.However, if prior to restructuring, the loans were categorized as performing, such classification isretained.
NPLs remain classified as such until (a) there is sufficient evidence to support that full collection ofprincipal and interests is probable and payments of interest and/or principal are received for at leastsix (6) months; or (b) written-off.
As of December 31, 2019, gross and net NPL ratios of the Group and the Parent Company as reportedto BSP were 3.05% and 1.59%, and 1.99% and 0.68%, respectively. As of December 31, 2018, grossand net NPL ratios of the Group and the Parent Company were 2.87% and 1.69% and 1.76% and0.34%, respectively. Most of the NPLs are secured by real estate or chattel mortgages.
Information on Related Party LoansIn the ordinary course of business, the Parent Company has loans and other transactions with itssubsidiaries and affiliates, and with certain Directors, Officers, Stockholders and Related Interests(DOSRI). Under the Parent Company’s policy, these loans and other transactions are madesubstantially on the same terms as with other individuals and businesses of comparable risks.The amount of direct credit accommodations to each of the Parent Company’s DOSRI, 70.00% ofwhich must be secured, should not exceed the amount of their respective deposits and book value oftheir respective investments in the Parent Company.
In the aggregate, DOSRI loans generally should not exceed the Parent Company’s equity or 15.00%of the Parent Company’s total loan portfolio, whichever is lower. As of December 31, 2019 and2018, the Parent Company is in compliance with such regulations.
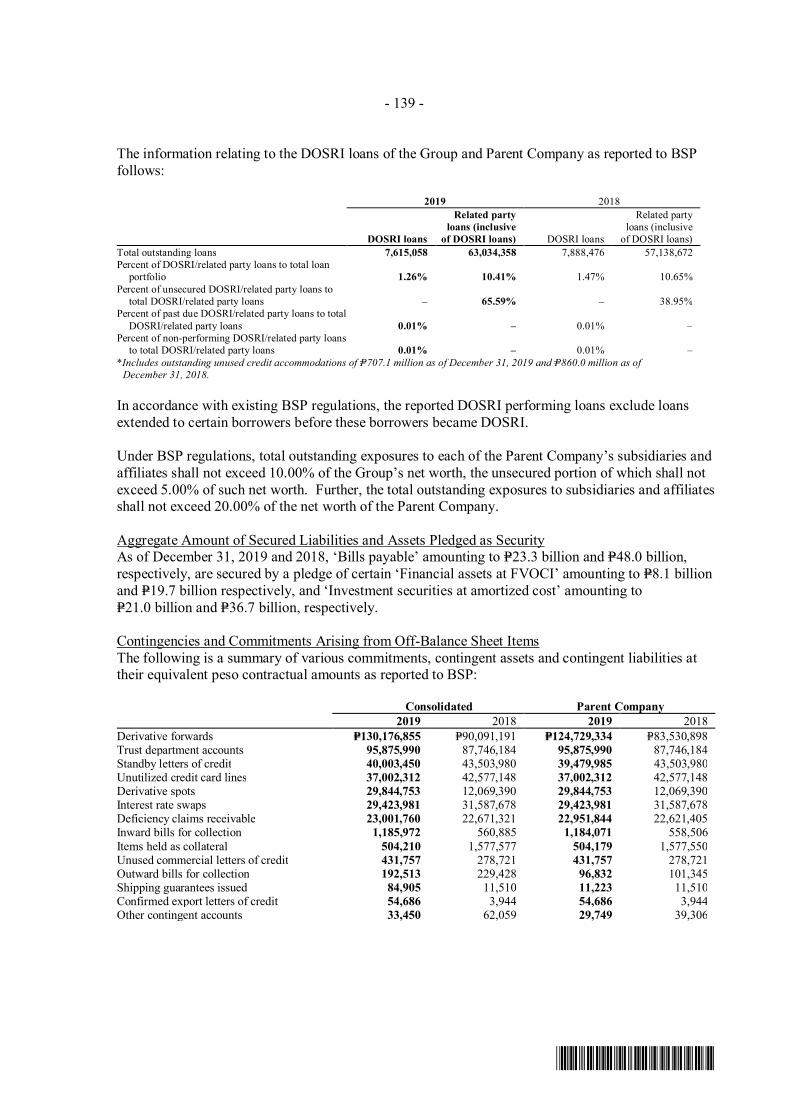
- 139 -
*SGVFS038920*
The information relating to the DOSRI loans of the Group and Parent Company as reported to BSPfollows:
2019 2018
DOSRI loans
Related partyloans (inclusive
of DOSRI loans) DOSRI loans
Related partyloans (inclusive
of DOSRI loans)Total outstanding loans 7,615,058 63,034,358 7,888,476 57,138,672Percent of DOSRI/related party loans to total loan
portfolio 1.26% 10.41% 1.47% 10.65%Percent of unsecured DOSRI/related party loans to
total DOSRI/related party loans – 65.59% – 38.95%Percent of past due DOSRI/related party loans to total
DOSRI/related party loans 0.01% – 0.01% –Percent of non-performing DOSRI/related party loans
to total DOSRI/related party loans 0.01% – 0.01% –*Includes outstanding unused credit accommodations of P=707.1 million as of December 31, 2019 and P=860.0 million as of
December 31, 2018.
In accordance with existing BSP regulations, the reported DOSRI performing loans exclude loansextended to certain borrowers before these borrowers became DOSRI.
Under BSP regulations, total outstanding exposures to each of the Parent Company’s subsidiaries andaffiliates shall not exceed 10.00% of the Group’s net worth, the unsecured portion of which shall notexceed 5.00% of such net worth. Further, the total outstanding exposures to subsidiaries and affiliatesshall not exceed 20.00% of the net worth of the Parent Company.
Aggregate Amount of Secured Liabilities and Assets Pledged as SecurityAs of December 31, 2019 and 2018, ‘Bills payable’ amounting to P=23.3 billion and P=48.0 billion,respectively, are secured by a pledge of certain ‘Financial assets at FVOCI’ amounting to P=8.1 billionand P=19.7 billion respectively, and ‘Investment securities at amortized cost’ amounting toP=21.0 billion and P=36.7 billion, respectively.
Contingencies and Commitments Arising from Off-Balance Sheet ItemsThe following is a summary of various commitments, contingent assets and contingent liabilities attheir equivalent peso contractual amounts as reported to BSP:
Consolidated Parent Company2019 2018 2019 2018
Derivative forwards P=130,176,855 P=90,091,191 P=124,729,334 P=83,530,898Trust department accounts 95,875,990 87,746,184 95,875,990 87,746,184Standby letters of credit 40,003,450 43,503,980 39,479,985 43,503,980Unutilized credit card lines 37,002,312 42,577,148 37,002,312 42,577,148Derivative spots 29,844,753 12,069,390 29,844,753 12,069,390Interest rate swaps 29,423,981 31,587,678 29,423,981 31,587,678Deficiency claims receivable 23,001,760 22,671,321 22,951,844 22,621,405Inward bills for collection 1,185,972 560,885 1,184,071 558,506Items held as collateral 504,210 1,577,577 504,179 1,577,550Unused commercial letters of credit 431,757 278,721 431,757 278,721Outward bills for collection 192,513 229,428 96,832 101,345Shipping guarantees issued 84,905 11,510 11,223 11,510Confirmed export letters of credit 54,686 3,944 54,686 3,944Other contingent accounts 33,450 62,059 29,749 39,306
*SGVFS038920*
INDEPENDENT AUDITOR’S REPORTON SUPPLEMENTARY SCHEDULES
The Stockholders and the Board of DirectorsPhilippine National BankPNB Financial CenterPresident Diosdado Macapagal BoulevardPasay City
We have audited in accordance with Philippine Standards on Auditing, the consolidated financialstatements of Philippine National Bank and Subsidiaries (the Group) as at December 31, 2019 and 2018,and for each of the three years in the period ended December 31, 2019, included in this Form 17-A andhave issued our report thereon dated February 28, 2020. Our audits were made for the purpose offorming an opinion on the basic financial statements taken as a whole. The schedules listed in the Indexto the Consolidated Financial Statements and Supplementary Schedules are the responsibility of theGroup’s management. These schedules are presented for purposes of complying with the RevisedSecurities Regulation Code Rule 68, and are not part of the basic financial statements. These scheduleshave been subjected to the auditing procedures applied in the audit of the basic financial statements and,in our opinion, fairly state, in all material respects, the financial information required to be set forththerein in relation to the basic financial statements taken as a whole.
SYCIP GORRES VELAYO & CO.
Janeth T. Nuñez-JavierPartnerCPA Certificate No. 111092SEC Accreditation No. 1328-AR-2 (Group A), July 9, 2019, valid until July 8, 2022Tax Identification No. 900-322-673BIR Accreditation No. 08-001998-69-2018, February 26, 2018, valid until February 25, 2021PTR No. 8125274, January 7, 2020, Makati City
February 28, 2020
SyCip Gorres Velayo & Co.6760 Ayala Avenue1226 Makati CityPhilippines
Tel: (632) 891 0307Fax: (632) 819 0872ey.com/ph
BOA/PRC Reg. No. 0001, October 4, 2018, valid until August 24, 2021SEC Accreditation No. 0012-FR-5 (Group A), November 6, 2018, valid until November 5, 2021
A member firm of Ernst & Young Global Limited
*SGVFS038920*
INDEPENDENT AUDITOR’S REPORT ONCOMPONENTS OF FINANCIAL SOUNDNESS INDICATORS
The Stockholders and the Board of DirectorsPhilippine National BankPNB Financial CenterPresident Diosdado Macapagal BoulevardPasay City
We have audited in accordance with Philippine Standards on Auditing, the consolidated financialstatements of Philippine National Bank and Subsidiaries (the Group) as at December 31, 2019 and 2018and for each of the three years in the period ended December 31, 2019, and have issued our report thereondated February 28, 2020. Our audits were made for the purpose of forming an opinion on the basicfinancial statements taken as a whole. The Supplementary Schedule on Financial Soundness Indicators,including their definitions, formulas, calculation, and their appropriateness or usefulness to the intendedusers, are the responsibility of the Group’s management. These financial soundness indicators are notmeasures of operating performance defined by Philippine Financial Reporting Standards (PFRS) and maynot be comparable to similarly titled measures presented by other companies. This schedule is presentedfor the purpose of complying with the Revised Securities Regulation Code Rule 68 issued by theSecurities and Exchange Commission, and is not a required part of the basic financial statements preparedin accordance with PFRS. The components of these financial soundness indicators have been traced tothe Group’s consolidated financial statements as at December 31, 2019 and 2018 and for each of the threeyears in the period ended December 31, 2019 and no material exceptions were noted.
SYCIP GORRES VELAYO & CO.
Janeth T. Nuñez-JavierPartnerCPA Certificate No. 111092SEC Accreditation No. 1328-AR-2 (Group A), July 9, 2019, valid until July 8, 2022Tax Identification No. 900-322-673BIR Accreditation No. 08-001998-69-2018, February 26, 2018, valid until February 25, 2021PTR No. 8125274, January 7, 2020, Makati City
February 28, 2020
SyCip Gorres Velayo & Co.6760 Ayala Avenue1226 Makati CityPhilippines
Tel: (632) 891 0307Fax: (632) 819 0872ey.com/ph
BOA/PRC Reg. No. 0001, October 4, 2018, valid until August 24, 2021SEC Accreditation No. 0012-FR-5 (Group A), November 6, 2018, valid until November 5, 2021
A member firm of Ernst & Young Global Limited
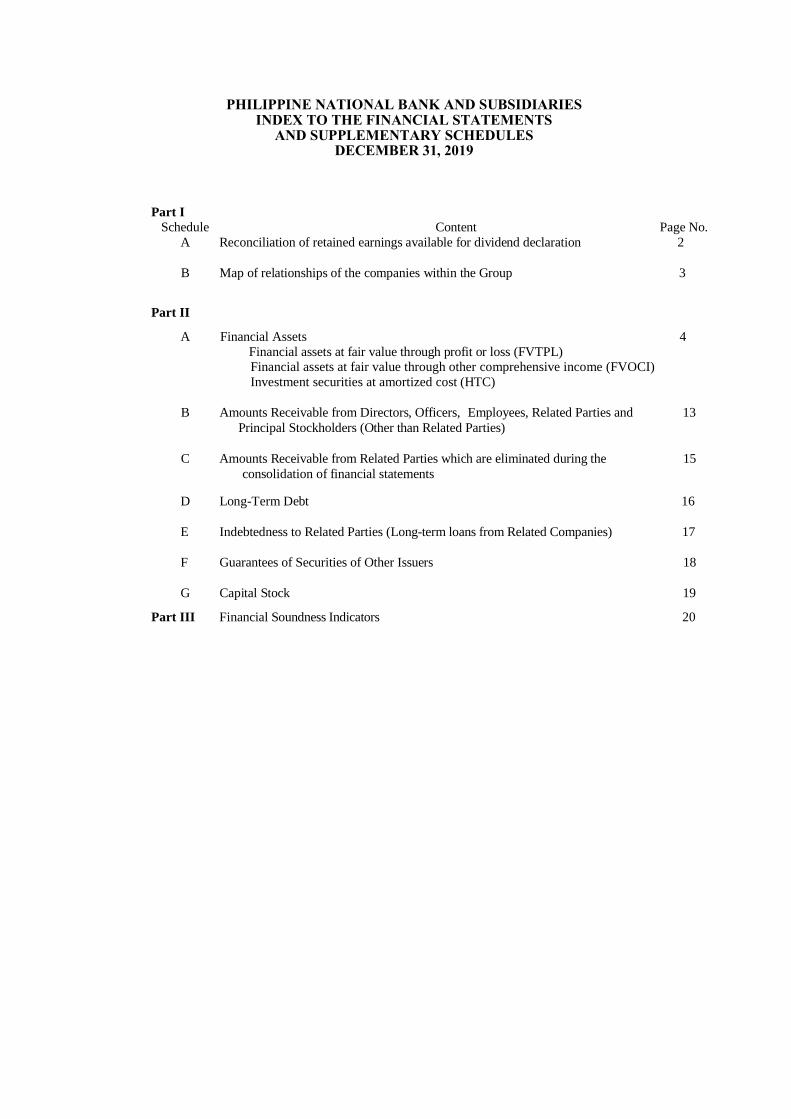
PHILIPPINE NATIONAL BANK AND SUBSIDIARIES INDEX TO THE FINANCIAL STATEMENTS
AND SUPPLEMENTARY SCHEDULES DECEMBER 31, 2019
Part I Schedule Content Page No.
A Reconciliation of retained earnings available for dividend declaration 2
B Map of relationships of the companies within the Group 3
Part II
A Financial Assets 4
Financial assets at fair value through profit or loss (FVTPL) Financial assets at fair value through other comprehensive income (FVOCI)
Investment securities at amortized cost (HTC)
B Amounts Receivable from Directors, Officers, Employees, Related Parties and 13
Principal Stockholders (Other than Related Parties)
C Amounts Receivable from Related Parties which are eliminated during the 15
consolidation of financial statements
D Long-Term Debt 16
E Indebtedness to Related Parties (Long-term loans from Related Companies) 17
F Guarantees of Securities of Other Issuers 18
G Capital Stock 19
Part III Financial Soundness Indicators 20
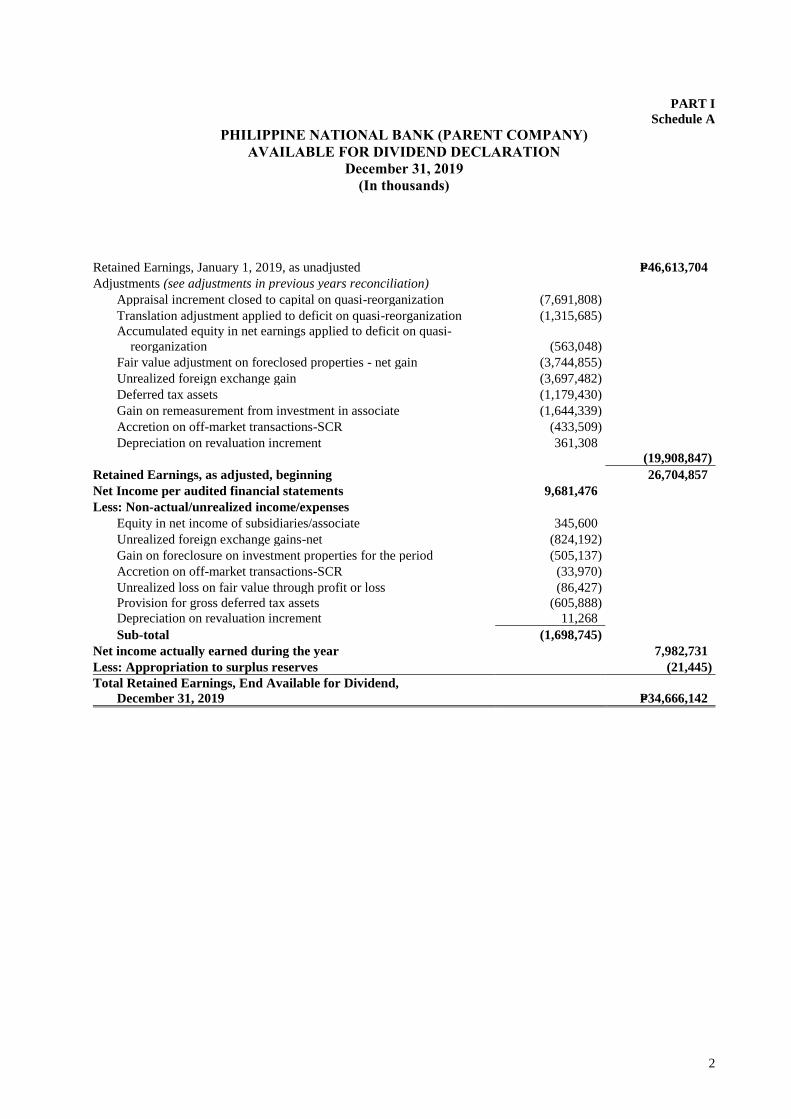
2
PART I
Schedule A
PHILIPPINE NATIONAL BANK (PARENT COMPANY)
AVAILABLE FOR DIVIDEND DECLARATION
December 31, 2019
(In thousands)
Retained Earnings, January 1, 2019, as unadjusted P=46,613,704
Adjustments (see adjustments in previous years reconciliation) Appraisal increment closed to capital on quasi-reorganization (7,691,808) Translation adjustment applied to deficit on quasi-reorganization (1,315,685) Accumulated equity in net earnings applied to deficit on quasi-
reorganization (563,048) Fair value adjustment on foreclosed properties - net gain (3,744,855) Unrealized foreign exchange gain (3,697,482)
Deferred tax assets (1,179,430) Gain on remeasurement from investment in associate (1,644,339) Accretion on off-market transactions-SCR (433,509)
Depreciation on revaluation increment 361,308
(19,908,847)
Retained Earnings, as adjusted, beginning 26,704,857
Net Income per audited financial statements 9,681,476 Less: Non-actual/unrealized income/expenses
Equity in net income of subsidiaries/associate 345,600 Unrealized foreign exchange gains-net (824,192) Gain on foreclosure on investment properties for the period (505,137) Accretion on off-market transactions-SCR (33,970) Unrealized loss on fair value through profit or loss (86,427)
Provision for gross deferred tax assets (605,888) Depreciation on revaluation increment 11,268
Sub-total (1,698,745) Net income actually earned during the year 7,982,731
Less: Appropriation to surplus reserves (21,445)
Total Retained Earnings, End Available for Dividend,
December 31, 2019 P=34,666,142
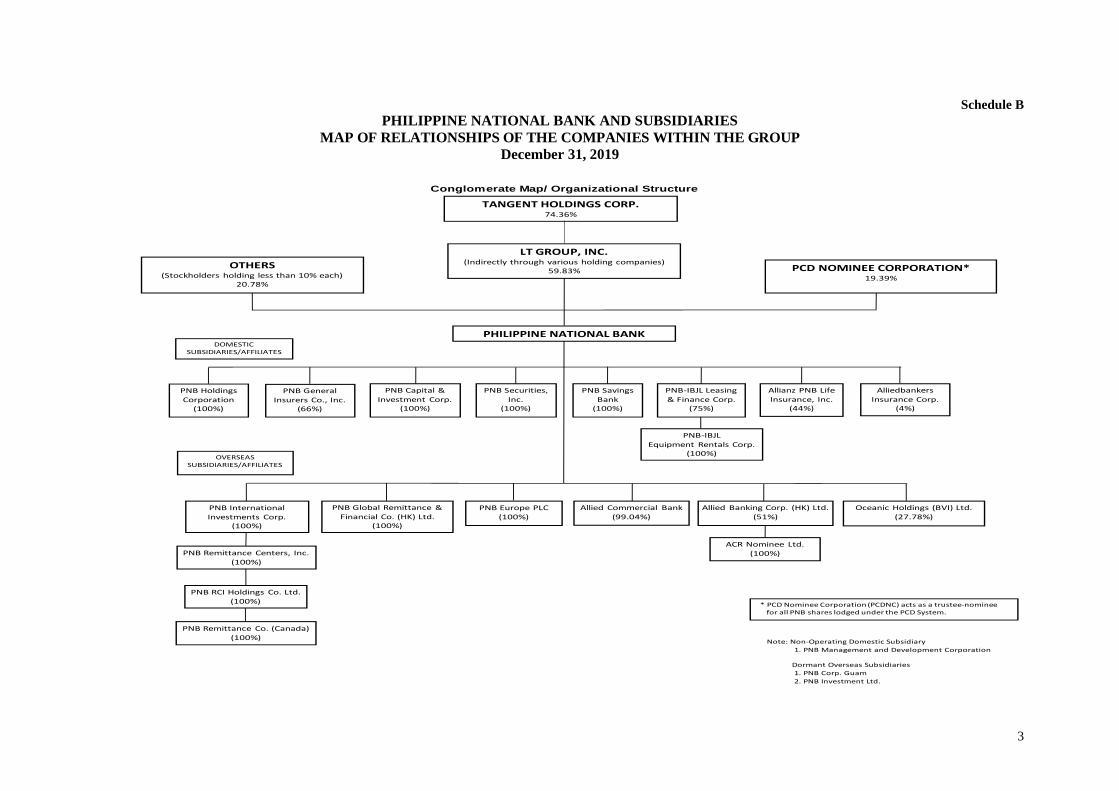
3
Schedule B
PHILIPPINE NATIONAL BANK AND SUBSIDIARIES
MAP OF RELATIONSHIPS OF THE COMPANIES WITHIN THE GROUP
December 31, 2019
Conglomerate Map/ Organizational Structure
Note: Non-Operating Domestic Subsidiary
1. PNB Management and Development Corporation
Dormant Overseas Subsidiaries
1. PNB Corp. Guam
2. PNB Investment Ltd.
LT GROUP, INC.(Indirectly through various holding companies)
59.83%OTHERS
(Stockholders holding less than 10% each)20.78%
PCD NOMINEE CORPORATION*19.39%
PHILIPPINE NATIONAL BANKDOMESTIC
SUBSIDIARIES/AFFILIATES
PNB General
Insurers Co., Inc.(66%)
PNB Holdings
Corporation(100%)
PNB Securities,
Inc.(100%)
PNB Capital &
Investment Corp.(100%)
PNB Savings
Bank(100%)
PNB-IBJL Leasing
& Finance Corp.(75%)
Allianz PNB Life
Insurance, Inc. (44%)
Alliedbankers
Insurance Corp. (4%)
OVERSEASSUBSIDIARIES/AFFILIATES
PNB International
Investments Corp.(100%)
PNB Global Remittance &
Financial Co. (HK) Ltd.(100%)
PNB Europe PLC
(100%)
Allied Commercial Bank
(99.04%)
Allied Banking Corp. (HK) Ltd.
(51%)
ACR Nominee Ltd.
(100%)
Oceanic Holdings (BVI) Ltd.
(27.78%)
PNB Remittance Centers, Inc.
(100%)
PNB RCI Holdings Co. Ltd.
(100%)
PNB Remittance Co. (Canada)
(100%)
* PCD Nominee Corporation (PCDNC) acts as a trustee-nomineefor all PNB shares lodged under the PCD System.
PNB-IBJL
Equipment Rentals Corp.(100%)
TANGENT HOLDINGS CORP.74.36%
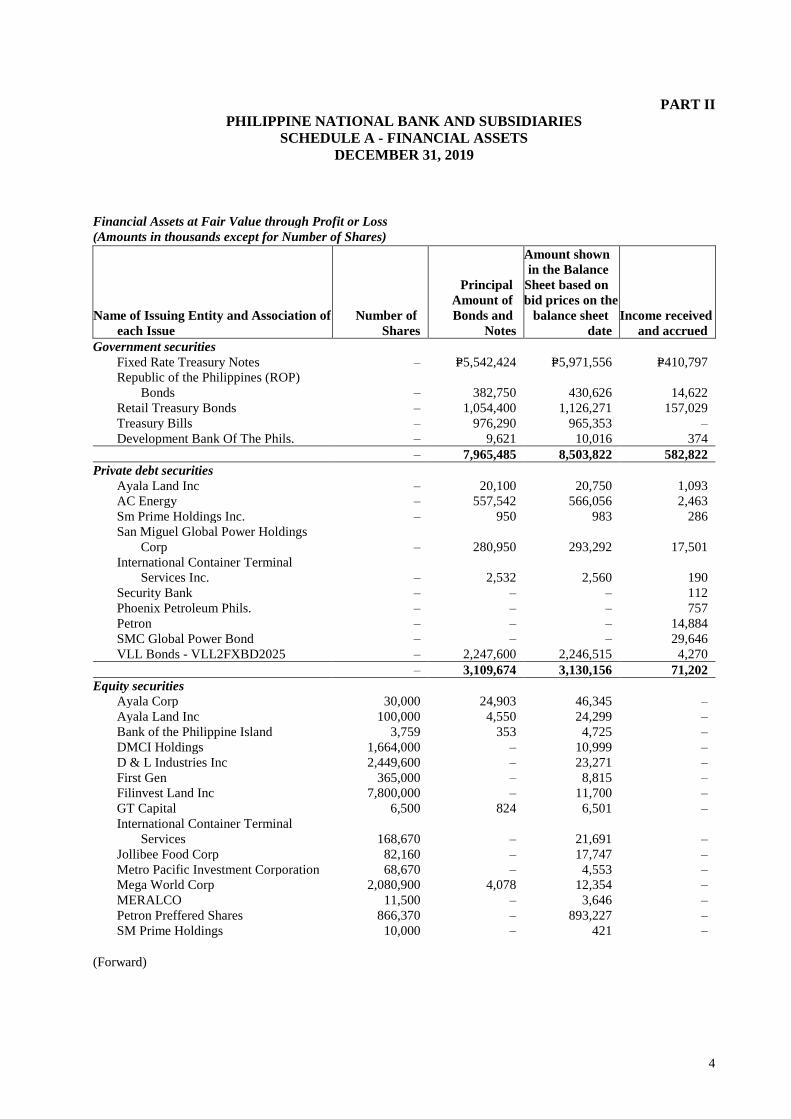
4
PART II
PHILIPPINE NATIONAL BANK AND SUBSIDIARIES
SCHEDULE A - FINANCIAL ASSETS
DECEMBER 31, 2019
Financial Assets at Fair Value through Profit or Loss (Amounts in thousands except for Number of Shares)
Name of Issuing Entity and Association of
each Issue
Number of
Shares
Principal
Amount of
Bonds and
Notes
Amount shown
in the Balance
Sheet based on
bid prices on the
balance sheet
date
Income received
and accrued
Government securities Fixed Rate Treasury Notes ‒ P=5,542,424 P=5,971,556 P=410,797
Republic of the Philippines (ROP)
Bonds ‒ 382,750 430,626 14,622
Retail Treasury Bonds ‒ 1,054,400 1,126,271 157,029
Treasury Bills ‒ 976,290 965,353 ‒
Development Bank Of The Phils. ‒ 9,621 10,016 374
‒ 7,965,485 8,503,822 582,822
Private debt securities Ayala Land Inc ‒ 20,100 20,750 1,093
AC Energy ‒ 557,542 566,056 2,463
Sm Prime Holdings Inc. ‒ 950 983 286
San Miguel Global Power Holdings
Corp ‒ 280,950 293,292 17,501
International Container Terminal
Services Inc. ‒ 2,532 2,560 190
Security Bank ‒ ‒ ‒ 112
Phoenix Petroleum Phils. ‒ ‒ ‒ 757
Petron ‒ ‒ ‒ 14,884
SMC Global Power Bond ‒ ‒ ‒ 29,646
VLL Bonds - VLL2FXBD2025 ‒ 2,247,600 2,246,515 4,270
‒ 3,109,674 3,130,156 71,202
Equity securities Ayala Corp 30,000 24,903 46,345 –
Ayala Land Inc 100,000 4,550 24,299 ‒
Bank of the Philippine Island 3,759 353 4,725 ‒
DMCI Holdings 1,664,000 ‒ 10,999 ‒
D & L Industries Inc 2,449,600 ‒ 23,271 ‒
First Gen 365,000 ‒ 8,815 ‒
Filinvest Land Inc 7,800,000 ‒ 11,700 ‒
GT Capital 6,500 824 6,501 ‒
International Container Terminal
Services 168,670 ‒ 21,691 ‒
Jollibee Food Corp 82,160 ‒ 17,747 ‒
Metro Pacific Investment Corporation 68,670 ‒ 4,553 ‒
Mega World Corp 2,080,900 4,078 12,354 ‒
MERALCO 11,500 ‒ 3,646 ‒
Petron Preffered Shares 866,370 ‒ 893,227 ‒
SM Prime Holdings 10,000 ‒ 421 ‒
(Forward)
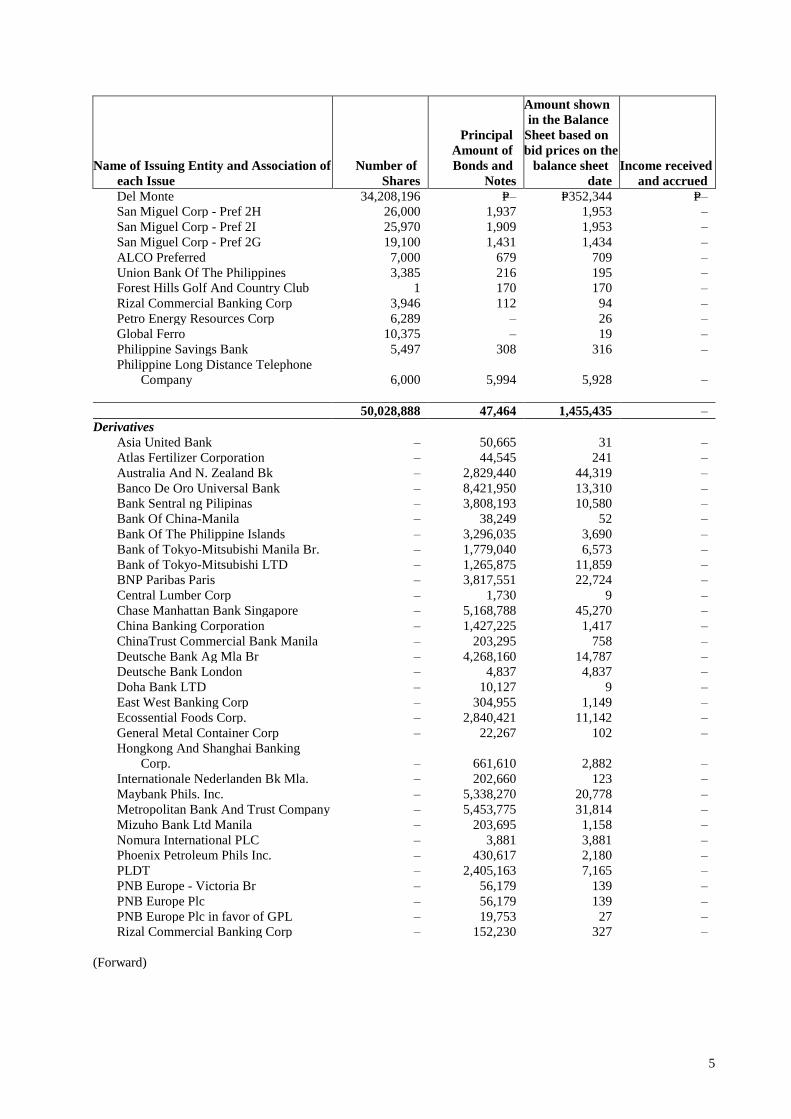
5
Name of Issuing Entity and Association of
each Issue
Number of
Shares
Principal
Amount of
Bonds and
Notes
Amount shown
in the Balance
Sheet based on
bid prices on the
balance sheet
date
Income received
and accrued
Del Monte 34,208,196 P=‒ P=352,344 P=‒
San Miguel Corp - Pref 2H 26,000 1,937 1,953 ‒
San Miguel Corp - Pref 2I 25,970 1,909 1,953 ‒
San Miguel Corp - Pref 2G 19,100 1,431 1,434 ‒
ALCO Preferred 7,000 679 709 ‒
Union Bank Of The Philippines 3,385 216 195 ‒
Forest Hills Golf And Country Club 1 170 170 ‒
Rizal Commercial Banking Corp 3,946 112 94 ‒
Petro Energy Resources Corp 6,289 ‒ 26 ‒
Global Ferro 10,375 ‒ 19 ‒
Philippine Savings Bank 5,497 308 316 ‒
Philippine Long Distance Telephone
Company 6,000 5,994 5,928 ‒
50,028,888 47,464 1,455,435 ‒
Derivatives Asia United Bank ‒ 50,665 31 ‒
Atlas Fertilizer Corporation ‒ 44,545 241 ‒
Australia And N. Zealand Bk ‒ 2,829,440 44,319 ‒
Banco De Oro Universal Bank ‒ 8,421,950 13,310 ‒
Bank Sentral ng Pilipinas ‒ 3,808,193 10,580 ‒
Bank Of China-Manila ‒ 38,249 52 ‒
Bank Of The Philippine Islands ‒ 3,296,035 3,690 ‒
Bank of Tokyo-Mitsubishi Manila Br. ‒ 1,779,040 6,573 ‒
Bank of Tokyo-Mitsubishi LTD ‒ 1,265,875 11,859 ‒
BNP Paribas Paris ‒ 3,817,551 22,724 ‒
Central Lumber Corp ‒ 1,730 9 ‒
Chase Manhattan Bank Singapore ‒ 5,168,788 45,270 ‒
China Banking Corporation ‒ 1,427,225 1,417 ‒
ChinaTrust Commercial Bank Manila ‒ 203,295 758 ‒
Deutsche Bank Ag Mla Br ‒ 4,268,160 14,787 ‒
Deutsche Bank London ‒ 4,837 4,837 ‒
Doha Bank LTD ‒ 10,127 9 ‒
East West Banking Corp ‒ 304,955 1,149 ‒
Ecossential Foods Corp. ‒ 2,840,421 11,142 ‒
General Metal Container Corp ‒ 22,267 102 ‒
Hongkong And Shanghai Banking
Corp. ‒ 661,610 2,882 ‒
Internationale Nederlanden Bk Mla. ‒ 202,660 123 ‒
Maybank Phils. Inc. ‒ 5,338,270 20,778 ‒
Metropolitan Bank And Trust Company ‒ 5,453,775 31,814 ‒
Mizuho Bank Ltd Manila ‒ 203,695 1,158 ‒
Nomura International PLC ‒ 3,881 3,881 ‒
Phoenix Petroleum Phils Inc. ‒ 430,617 2,180 ‒
PLDT ‒ 2,405,163 7,165 ‒
PNB Europe - Victoria Br ‒ 56,179 139 ‒
PNB Europe Plc ‒ 56,179 139 ‒
PNB Europe Plc in favor of GPL ‒ 19,753 27 ‒
Rizal Commercial Banking Corp ‒ 152,230 327 ‒
(Forward)
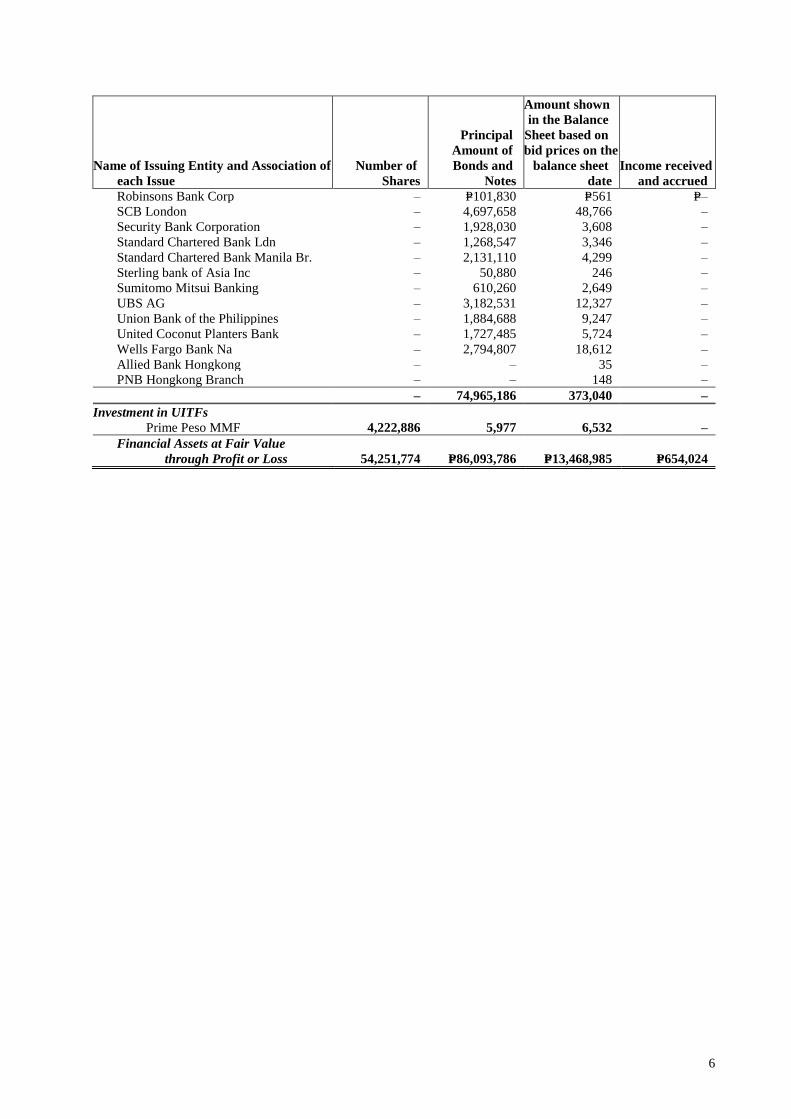
6
Name of Issuing Entity and Association of
each Issue
Number of
Shares
Principal
Amount of
Bonds and
Notes
Amount shown
in the Balance
Sheet based on
bid prices on the
balance sheet
date
Income received
and accrued
Robinsons Bank Corp ‒ P=101,830 P=561 P=‒
SCB London ‒ 4,697,658 48,766 ‒
Security Bank Corporation ‒ 1,928,030 3,608 ‒
Standard Chartered Bank Ldn ‒ 1,268,547 3,346 ‒
Standard Chartered Bank Manila Br. ‒ 2,131,110 4,299 ‒
Sterling bank of Asia Inc ‒ 50,880 246 ‒
Sumitomo Mitsui Banking ‒ 610,260 2,649 ‒
UBS AG ‒ 3,182,531 12,327 ‒
Union Bank of the Philippines ‒ 1,884,688 9,247 ‒
United Coconut Planters Bank ‒ 1,727,485 5,724 ‒
Wells Fargo Bank Na ‒ 2,794,807 18,612 ‒
Allied Bank Hongkong ‒ ‒ 35 ‒
PNB Hongkong Branch ‒ ‒ 148 ‒
‒ 74,965,186 373,040 ‒
Investment in UITFs Prime Peso MMF 4,222,886 5,977 6,532 ‒
Financial Assets at Fair Value
through Profit or Loss 54,251,774 P=86,093,786 P=13,468,985 P=654,024
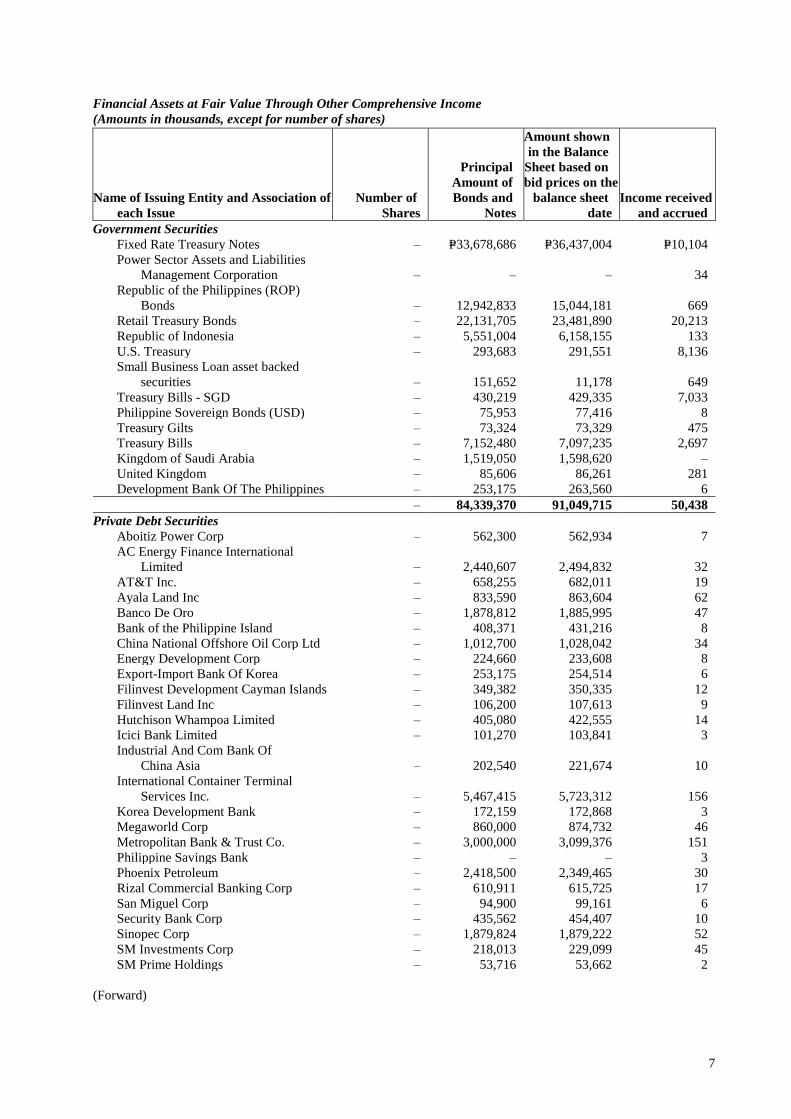
7
Financial Assets at Fair Value Through Other Comprehensive Income (Amounts in thousands, except for number of shares)
Name of Issuing Entity and Association of
each Issue
Number of
Shares
Principal
Amount of
Bonds and
Notes
Amount shown
in the Balance
Sheet based on
bid prices on the
balance sheet
date
Income received
and accrued
Government Securities Fixed Rate Treasury Notes ‒ P=33,678,686 P=36,437,004 P=10,104
Power Sector Assets and Liabilities
Management Corporation ‒ ‒ ‒ 34
Republic of the Philippines (ROP)
Bonds ‒ 12,942,833 15,044,181 669
Retail Treasury Bonds ‒ 22,131,705 23,481,890 20,213
Republic of Indonesia ‒ 5,551,004 6,158,155 133
U.S. Treasury ‒ 293,683 291,551 8,136
Small Business Loan asset backed
securities ‒ 151,652 11,178 649
Treasury Bills - SGD ‒ 430,219 429,335 7,033
Philippine Sovereign Bonds (USD) ‒ 75,953 77,416 8
Treasury Gilts ‒ 73,324 73,329 475
Treasury Bills ‒ 7,152,480 7,097,235 2,697
Kingdom of Saudi Arabia ‒ 1,519,050 1,598,620 ‒
United Kingdom ‒ 85,606 86,261 281
Development Bank Of The Philippines ‒ 253,175 263,560 6
‒ 84,339,370 91,049,715 50,438
Private Debt Securities Aboitiz Power Corp ‒ 562,300 562,934 7
AC Energy Finance International
Limited ‒ 2,440,607 2,494,832 32
AT&T Inc. ‒ 658,255 682,011 19
Ayala Land Inc ‒ 833,590 863,604 62
Banco De Oro ‒ 1,878,812 1,885,995 47
Bank of the Philippine Island ‒ 408,371 431,216 8
China National Offshore Oil Corp Ltd ‒ 1,012,700 1,028,042 34
Energy Development Corp ‒ 224,660 233,608 8
Export-Import Bank Of Korea ‒ 253,175 254,514 6
Filinvest Development Cayman Islands ‒ 349,382 350,335 12
Filinvest Land Inc ‒ 106,200 107,613 9
Hutchison Whampoa Limited ‒ 405,080 422,555 14
Icici Bank Limited ‒ 101,270 103,841 3
Industrial And Com Bank Of
China Asia ‒ 202,540 221,674 10
International Container Terminal
Services Inc. ‒ 5,467,415 5,723,312 156
Korea Development Bank ‒ 172,159 172,868 3
Megaworld Corp ‒ 860,000 874,732 46
Metropolitan Bank & Trust Co. ‒ 3,000,000 3,099,376 151
Philippine Savings Bank ‒ – – 3
Phoenix Petroleum ‒ 2,418,500 2,349,465 30
Rizal Commercial Banking Corp ‒ 610,911 615,725 17
San Miguel Corp ‒ 94,900 99,161 6
Security Bank Corp ‒ 435,562 454,407 10
Sinopec Corp ‒ 1,879,824 1,879,222 52
SM Investments Corp ‒ 218,013 229,099 45
SM Prime Holdings ‒ 53,716 53,662 2
(Forward)
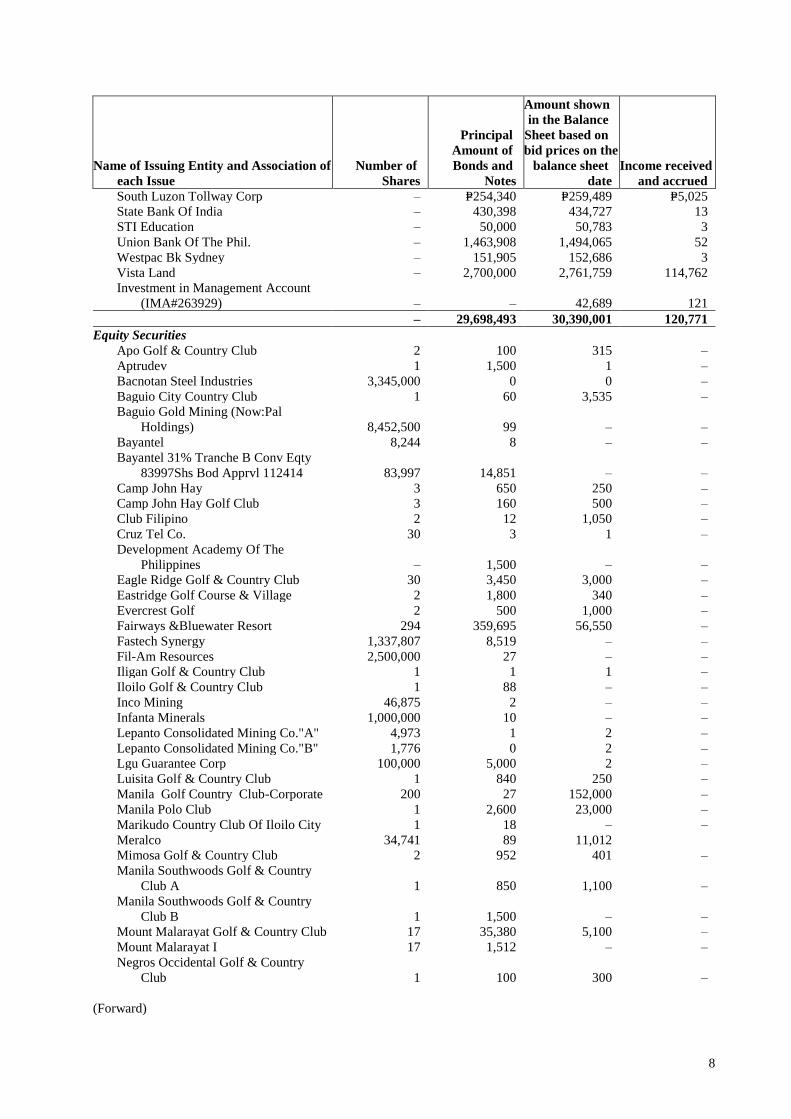
8
Name of Issuing Entity and Association of
each Issue
Number of
Shares
Principal
Amount of
Bonds and
Notes
Amount shown
in the Balance
Sheet based on
bid prices on the
balance sheet
date
Income received
and accrued
South Luzon Tollway Corp ‒ P=254,340 P=259,489 P=5,025
State Bank Of India ‒ 430,398 434,727 13
STI Education ‒ 50,000 50,783 3
Union Bank Of The Phil. ‒ 1,463,908 1,494,065 52
Westpac Bk Sydney ‒ 151,905 152,686 3
Vista Land ‒ 2,700,000 2,761,759 114,762
Investment in Management Account
(IMA#263929) ‒ ‒ 42,689 121
‒ 29,698,493 30,390,001 120,771
Equity Securities Apo Golf & Country Club 2 100 315 –
Aptrudev 1 1,500 1 ‒
Bacnotan Steel Industries 3,345,000 0 0 ‒
Baguio City Country Club 1 60 3,535 ‒
Baguio Gold Mining (Now:Pal
Holdings) 8,452,500 99 ‒ ‒
Bayantel 8,244 8 ‒ ‒
Bayantel 31% Tranche B Conv Eqty
83997Shs Bod Apprvl 112414 83,997 14,851 ‒ ‒
Camp John Hay 3 650 250 ‒
Camp John Hay Golf Club 3 160 500 ‒
Club Filipino 2 12 1,050 ‒
Cruz Tel Co. 30 3 1 ‒
Development Academy Of The
Philippines ‒ 1,500 ‒ ‒
Eagle Ridge Golf & Country Club 30 3,450 3,000 ‒
Eastridge Golf Course & Village 2 1,800 340 ‒
Evercrest Golf 2 500 1,000 ‒
Fairways &Bluewater Resort 294 359,695 56,550 ‒
Fastech Synergy 1,337,807 8,519 ‒ ‒
Fil-Am Resources 2,500,000 27 ‒ ‒
Iligan Golf & Country Club 1 1 1 ‒
Iloilo Golf & Country Club 1 88 ‒ ‒
Inco Mining 46,875 2 ‒ ‒
Infanta Minerals 1,000,000 10 ‒ ‒
Lepanto Consolidated Mining Co."A" 4,973 1 2 ‒
Lepanto Consolidated Mining Co."B" 1,776 0 2 ‒
Lgu Guarantee Corp 100,000 5,000 2 ‒
Luisita Golf & Country Club 1 840 250 ‒
Manila Golf Country Club-Corporate 200 27 152,000 ‒
Manila Polo Club 1 2,600 23,000 ‒
Marikudo Country Club Of Iloilo City 1 18 ‒ ‒
Meralco 34,741 89 11,012
Mimosa Golf & Country Club 2 952 401 ‒
Manila Southwoods Golf & Country
Club A 1 850 1,100 ‒
Manila Southwoods Golf & Country
Club B 1 1,500 ‒ ‒
Mount Malarayat Golf & Country Club 17 35,380 5,100 ‒
Mount Malarayat I 17 1,512 ‒ ‒
Negros Occidental Golf & Country
Club 1 100 300 ‒
(Forward)
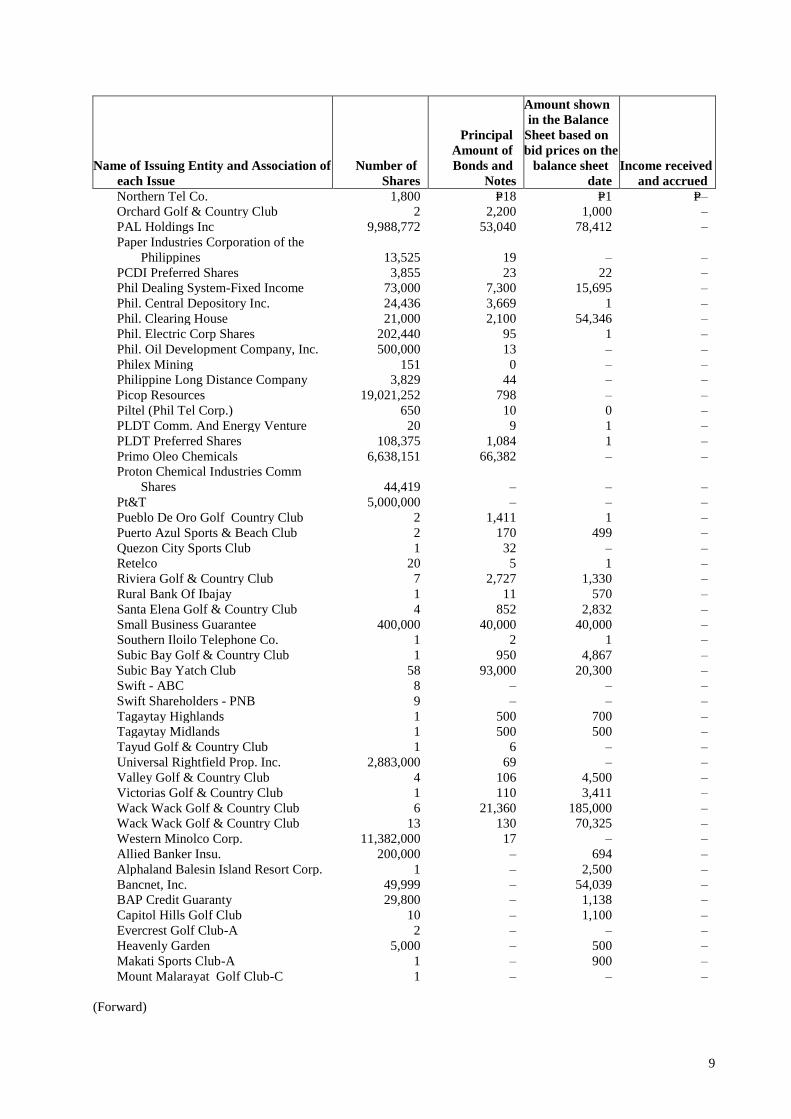
9
Name of Issuing Entity and Association of
each Issue
Number of
Shares
Principal
Amount of
Bonds and
Notes
Amount shown
in the Balance
Sheet based on
bid prices on the
balance sheet
date
Income received
and accrued
Northern Tel Co. 1,800 P=18 P=1 P=‒
Orchard Golf & Country Club 2 2,200 1,000 ‒
PAL Holdings Inc 9,988,772 53,040 78,412 ‒
Paper Industries Corporation of the
Philippines 13,525 19 ‒ ‒
PCDI Preferred Shares 3,855 23 22 ‒
Phil Dealing System-Fixed Income 73,000 7,300 15,695 ‒
Phil. Central Depository Inc. 24,436 3,669 1 ‒
Phil. Clearing House 21,000 2,100 54,346 ‒
Phil. Electric Corp Shares 202,440 95 1 ‒
Phil. Oil Development Company, Inc. 500,000 13 ‒ ‒
Philex Mining 151 0 ‒ ‒
Philippine Long Distance Company 3,829 44 ‒ ‒
Picop Resources 19,021,252 798 ‒ ‒
Piltel (Phil Tel Corp.) 650 10 0 ‒
PLDT Comm. And Energy Venture 20 9 1 ‒
PLDT Preferred Shares 108,375 1,084 1 ‒
Primo Oleo Chemicals 6,638,151 66,382 ‒ ‒
Proton Chemical Industries Comm
Shares 44,419 ‒ ‒ ‒
Pt&T 5,000,000 ‒ ‒ ‒
Pueblo De Oro Golf Country Club 2 1,411 1 ‒
Puerto Azul Sports & Beach Club 2 170 499 ‒
Quezon City Sports Club 1 32 ‒ ‒
Retelco 20 5 1 ‒
Riviera Golf & Country Club 7 2,727 1,330 ‒
Rural Bank Of Ibajay 1 11 570 ‒
Santa Elena Golf & Country Club 4 852 2,832 ‒
Small Business Guarantee 400,000 40,000 40,000 ‒
Southern Iloilo Telephone Co. 1 2 1 ‒
Subic Bay Golf & Country Club 1 950 4,867 ‒
Subic Bay Yatch Club 58 93,000 20,300 ‒
Swift - ABC 8 ‒ ‒ ‒
Swift Shareholders - PNB 9 ‒ ‒ ‒
Tagaytay Highlands 1 500 700 ‒
Tagaytay Midlands 1 500 500 ‒
Tayud Golf & Country Club 1 6 ‒ ‒
Universal Rightfield Prop. Inc. 2,883,000 69 ‒ ‒
Valley Golf & Country Club 4 106 4,500 ‒
Victorias Golf & Country Club 1 110 3,411 ‒
Wack Wack Golf & Country Club 6 21,360 185,000 ‒
Wack Wack Golf & Country Club 13 130 70,325 ‒
Western Minolco Corp. 11,382,000 17 ‒ ‒
Allied Banker Insu. 200,000 ‒ 694 ‒
Alphaland Balesin Island Resort Corp. 1 ‒ 2,500 ‒
Bancnet, Inc. 49,999 ‒ 54,039 ‒
BAP Credit Guaranty 29,800 ‒ 1,138 ‒
Capitol Hills Golf Club 10 ‒ 1,100 ‒
Evercrest Golf Club-A 2 ‒ ‒ ‒
Heavenly Garden 5,000 ‒ 500 ‒
Makati Sports Club-A 1 ‒ 900 ‒
Mount Malarayat Golf Club-C 1 ‒ ‒ ‒
(Forward)
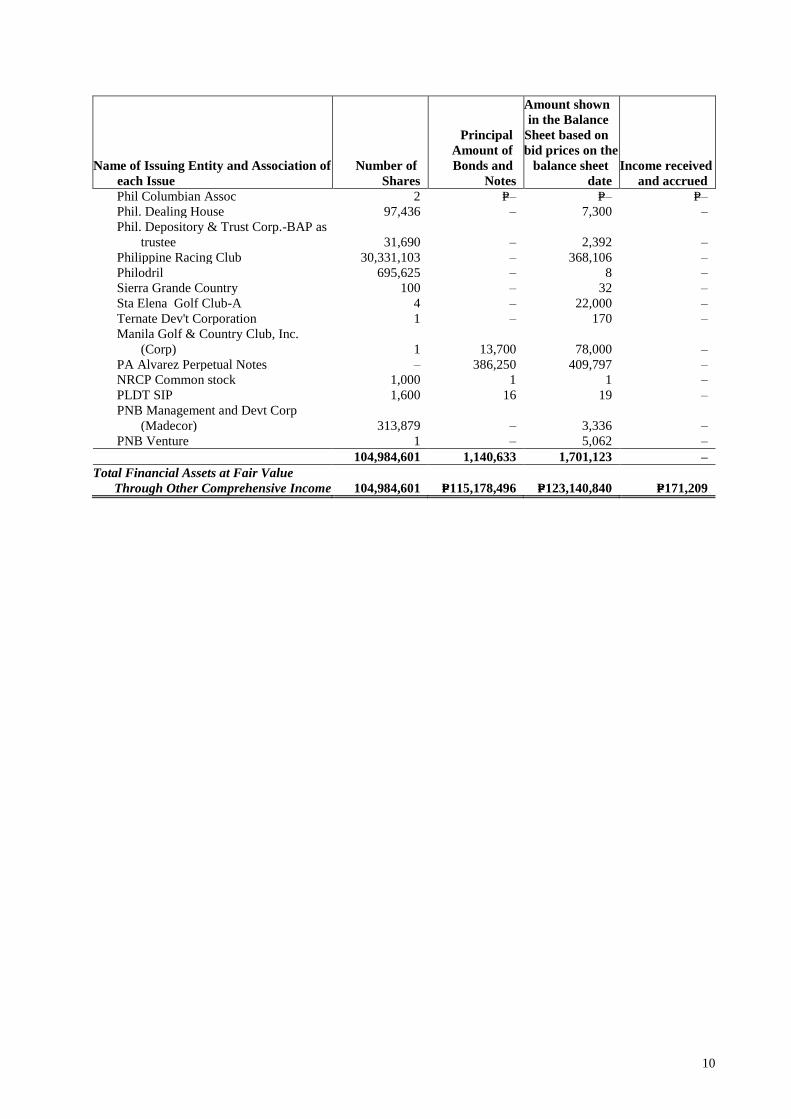
10
Name of Issuing Entity and Association of
each Issue
Number of
Shares
Principal
Amount of
Bonds and
Notes
Amount shown
in the Balance
Sheet based on
bid prices on the
balance sheet
date
Income received
and accrued
Phil Columbian Assoc 2 P=‒ P=‒ P=‒
Phil. Dealing House 97,436 ‒ 7,300 ‒
Phil. Depository & Trust Corp.-BAP as
trustee 31,690 ‒ 2,392 ‒
Philippine Racing Club 30,331,103 ‒ 368,106 ‒
Philodril 695,625 ‒ 8 ‒
Sierra Grande Country 100 ‒ 32 ‒
Sta Elena Golf Club-A 4 ‒ 22,000 ‒
Ternate Dev't Corporation 1 ‒ 170 ‒
Manila Golf & Country Club, Inc.
(Corp) 1 13,700 78,000 ‒
PA Alvarez Perpetual Notes ‒ 386,250 409,797 ‒
NRCP Common stock 1,000 1 1 ‒
PLDT SIP 1,600 16 19 ‒
PNB Management and Devt Corp
(Madecor) 313,879 ‒ 3,336 ‒
PNB Venture 1 ‒ 5,062 ‒
104,984,601 1,140,633 1,701,123 ‒
Total Financial Assets at Fair Value
Through Other Comprehensive Income 104,984,601 P=115,178,496 P=123,140,840 P=171,209
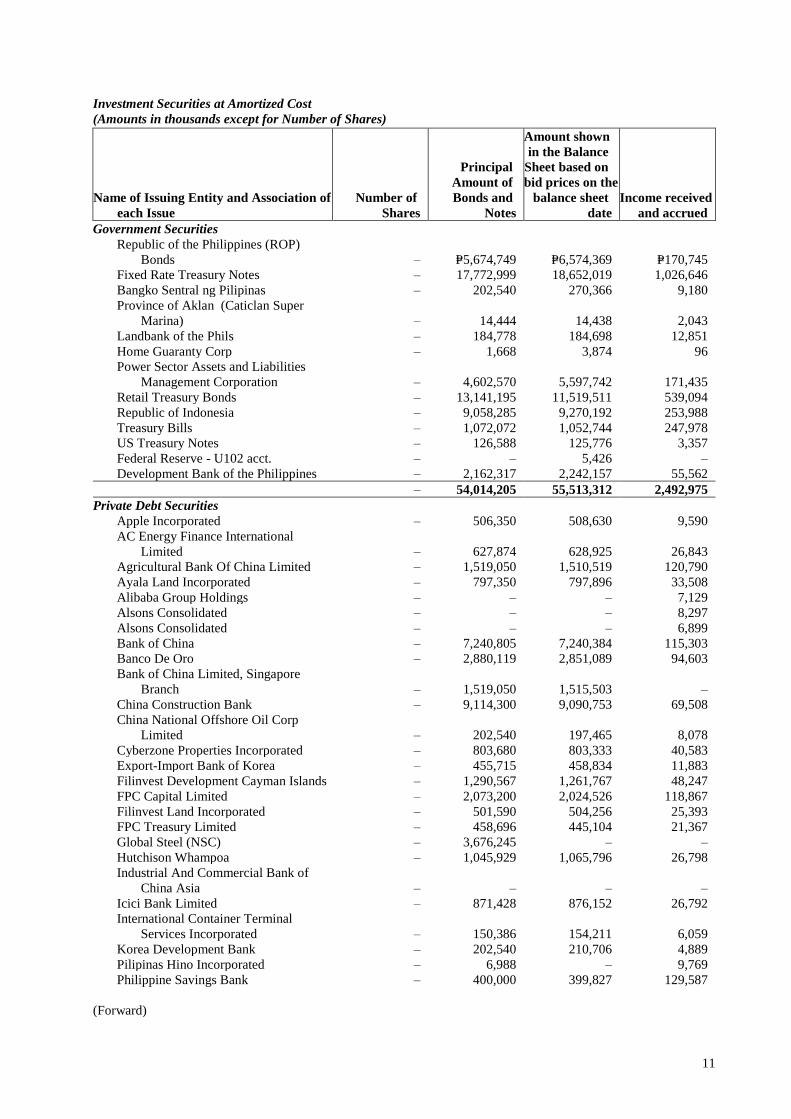
11
Investment Securities at Amortized Cost (Amounts in thousands except for Number of Shares)
Name of Issuing Entity and Association of
each Issue
Number of
Shares
Principal
Amount of
Bonds and
Notes
Amount shown
in the Balance
Sheet based on
bid prices on the
balance sheet
date
Income received
and accrued
Government Securities Republic of the Philippines (ROP)
Bonds ‒ P=5,674,749 P=6,574,369 P=170,745
Fixed Rate Treasury Notes ‒ 17,772,999 18,652,019 1,026,646
Bangko Sentral ng Pilipinas ‒ 202,540 270,366 9,180
Province of Aklan (Caticlan Super
Marina) ‒ 14,444 14,438 2,043
Landbank of the Phils ‒ 184,778 184,698 12,851
Home Guaranty Corp ‒ 1,668 3,874 96
Power Sector Assets and Liabilities
Management Corporation ‒ 4,602,570 5,597,742 171,435
Retail Treasury Bonds ‒ 13,141,195 11,519,511 539,094
Republic of Indonesia ‒ 9,058,285 9,270,192 253,988
Treasury Bills ‒ 1,072,072 1,052,744 247,978
US Treasury Notes ‒ 126,588 125,776 3,357
Federal Reserve - U102 acct. ‒ ‒ 5,426 ‒
Development Bank of the Philippines ‒ 2,162,317 2,242,157 55,562
‒ 54,014,205 55,513,312 2,492,975
Private Debt Securities Apple Incorporated ‒ 506,350 508,630 9,590
AC Energy Finance International
Limited ‒ 627,874 628,925 26,843
Agricultural Bank Of China Limited ‒ 1,519,050 1,510,519 120,790
Ayala Land Incorporated ‒ 797,350 797,896 33,508
Alibaba Group Holdings ‒ ‒ ‒ 7,129
Alsons Consolidated ‒ ‒ ‒ 8,297
Alsons Consolidated ‒ ‒ ‒ 6,899
Bank of China ‒ 7,240,805 7,240,384 115,303
Banco De Oro ‒ 2,880,119 2,851,089 94,603
Bank of China Limited, Singapore
Branch ‒ 1,519,050 1,515,503 ‒
China Construction Bank ‒ 9,114,300 9,090,753 69,508
China National Offshore Oil Corp
Limited ‒ 202,540 197,465 8,078
Cyberzone Properties Incorporated ‒ 803,680 803,333 40,583
Export-Import Bank of Korea ‒ 455,715 458,834 11,883
Filinvest Development Cayman Islands ‒ 1,290,567 1,261,767 48,247
FPC Capital Limited ‒ 2,073,200 2,024,526 118,867
Filinvest Land Incorporated ‒ 501,590 504,256 25,393
FPC Treasury Limited ‒ 458,696 445,104 21,367
Global Steel (NSC) ‒ 3,676,245 ‒ ‒
Hutchison Whampoa ‒ 1,045,929 1,065,796 26,798
Industrial And Commercial Bank of
China Asia ‒ ‒ ‒ ‒
Icici Bank Limited ‒ 871,428 876,152 26,792
International Container Terminal
Services Incorporated ‒ 150,386 154,211 6,059
Korea Development Bank ‒ 202,540 210,706 4,889
Pilipinas Hino Incorporated ‒ 6,988 ‒ 9,769
Philippine Savings Bank ‒ 400,000 399,827 129,587
(Forward)
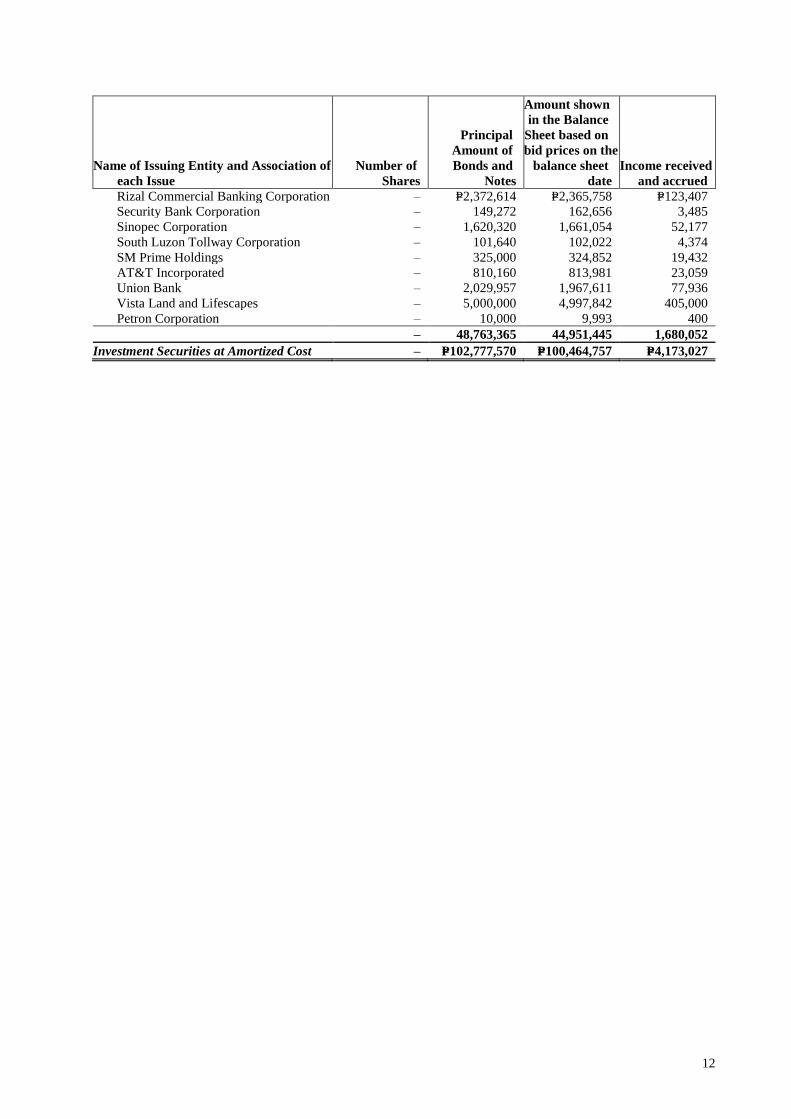
12
Name of Issuing Entity and Association of
each Issue
Number of
Shares
Principal
Amount of
Bonds and
Notes
Amount shown
in the Balance
Sheet based on
bid prices on the
balance sheet
date
Income received
and accrued
Rizal Commercial Banking Corporation ‒ P=2,372,614 P=2,365,758 P=123,407
Security Bank Corporation ‒ 149,272 162,656 3,485
Sinopec Corporation ‒ 1,620,320 1,661,054 52,177
South Luzon Tollway Corporation ‒ 101,640 102,022 4,374
SM Prime Holdings ‒ 325,000 324,852 19,432
AT&T Incorporated ‒ 810,160 813,981 23,059
Union Bank ‒ 2,029,957 1,967,611 77,936
Vista Land and Lifescapes ‒ 5,000,000 4,997,842 405,000
Petron Corporation ‒ 10,000 9,993 400
‒ 48,763,365 44,951,445 1,680,052
Investment Securities at Amortized Cost ‒ P=102,777,570 P=100,464,757 P=4,173,027
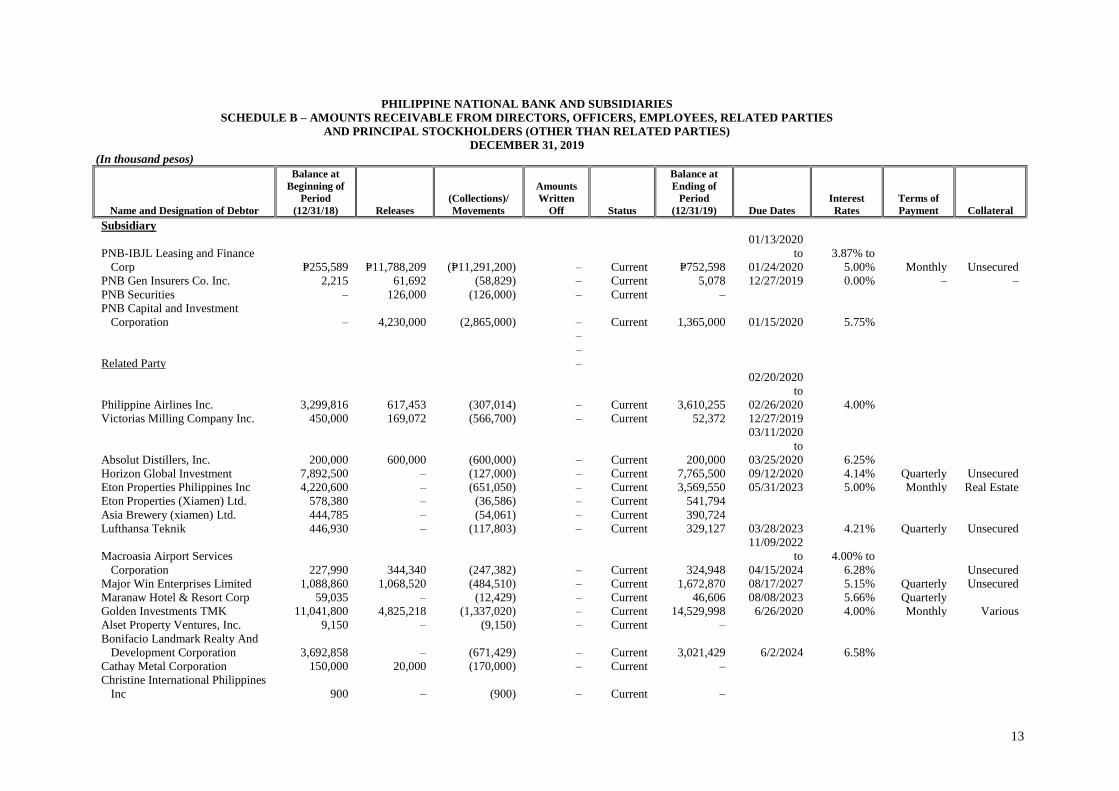
13
PHILIPPINE NATIONAL BANK AND SUBSIDIARIES
SCHEDULE B – AMOUNTS RECEIVABLE FROM DIRECTORS, OFFICERS, EMPLOYEES, RELATED PARTIES
AND PRINCIPAL STOCKHOLDERS (OTHER THAN RELATED PARTIES)
DECEMBER 31, 2019
(In thousand pesos)
Name and Designation of Debtor
Balance at
Beginning of
Period
(12/31/18) Releases
(Collections)/
Movements
Amounts
Written
Off Status
Balance at
Ending of
Period
(12/31/19) Due Dates
Interest
Rates
Terms of
Payment Collateral
Subsidiary
PNB-IBJL Leasing and Finance
Corp P=255,589 P=11,788,209 (P=11,291,200) ‒ Current P=752,598
01/13/2020
to
01/24/2020
3.87% to
5.00% Monthly Unsecured
PNB Gen Insurers Co. Inc. 2,215 61,692 (58,829) ‒ Current 5,078 12/27/2019 0.00% ‒ ‒
PNB Securities ‒ 126,000 (126,000) ‒ Current ‒
PNB Capital and Investment
Corporation ‒ 4,230,000 (2,865,000) ‒ Current 1,365,000 01/15/2020 5.75%
‒
‒
Related Party ‒
Philippine Airlines Inc. 3,299,816 617,453 (307,014) ‒ Current 3,610,255
02/20/2020
to
02/26/2020 4.00%
Victorias Milling Company Inc. 450,000 169,072 (566,700) ‒ Current 52,372 12/27/2019
Absolut Distillers, Inc. 200,000 600,000 (600,000) ‒ Current 200,000
03/11/2020
to
03/25/2020 6.25%
Horizon Global Investment 7,892,500 ‒ (127,000) ‒ Current 7,765,500 09/12/2020 4.14% Quarterly Unsecured
Eton Properties Philippines Inc 4,220,600 ‒ (651,050) ‒ Current 3,569,550 05/31/2023 5.00% Monthly Real Estate
Eton Properties (Xiamen) Ltd. 578,380 ‒ (36,586) ‒ Current 541,794
Asia Brewery (xiamen) Ltd. 444,785 ‒ (54,061) ‒ Current 390,724
Lufthansa Teknik 446,930 ‒ (117,803) ‒ Current 329,127 03/28/2023 4.21% Quarterly Unsecured
Macroasia Airport Services
Corporation 227,990 344,340 (247,382) ‒ Current 324,948
11/09/2022
to
04/15/2024
4.00% to
6.28% Unsecured
Major Win Enterprises Limited 1,088,860 1,068,520 (484,510) ‒ Current 1,672,870 08/17/2027 5.15% Quarterly Unsecured
Maranaw Hotel & Resort Corp 59,035 ‒ (12,429) ‒ Current 46,606 08/08/2023 5.66% Quarterly
Golden Investments TMK 11,041,800 4,825,218 (1,337,020) ‒ Current 14,529,998 6/26/2020 4.00% Monthly Various
Alset Property Ventures, Inc. 9,150 ‒ (9,150) ‒ Current ‒
Bonifacio Landmark Realty And
Development Corporation 3,692,858 ‒ (671,429) ‒ Current 3,021,429 6/2/2024 6.58%
Cathay Metal Corporation 150,000 20,000 (170,000) ‒ Current ‒
Christine International Philippines
Inc 900 ‒ (900) ‒ Current ‒
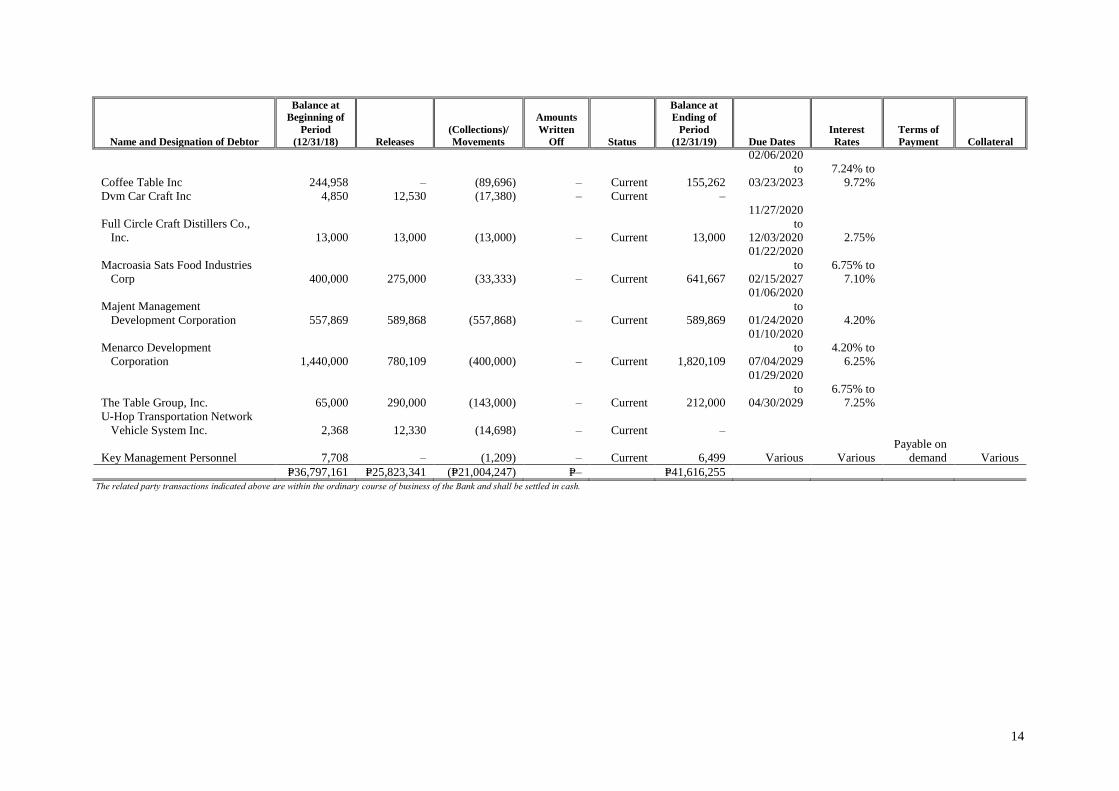
14
Name and Designation of Debtor
Balance at
Beginning of
Period
(12/31/18) Releases
(Collections)/
Movements
Amounts
Written
Off Status
Balance at
Ending of
Period
(12/31/19) Due Dates
Interest
Rates
Terms of
Payment Collateral
Coffee Table Inc 244,958 ‒ (89,696) ‒ Current 155,262
02/06/2020
to
03/23/2023
7.24% to
9.72%
Dvm Car Craft Inc 4,850 12,530 (17,380) ‒ Current ‒
Full Circle Craft Distillers Co.,
Inc. 13,000 13,000 (13,000) ‒ Current 13,000
11/27/2020
to
12/03/2020 2.75%
Macroasia Sats Food Industries
Corp 400,000 275,000 (33,333) ‒ Current 641,667
01/22/2020
to
02/15/2027
6.75% to
7.10%
Majent Management
Development Corporation 557,869 589,868 (557,868) ‒ Current 589,869
01/06/2020
to
01/24/2020 4.20%
Menarco Development
Corporation 1,440,000 780,109 (400,000) ‒ Current 1,820,109
01/10/2020
to
07/04/2029
4.20% to
6.25%
The Table Group, Inc. 65,000 290,000 (143,000) ‒ Current 212,000
01/29/2020
to
04/30/2029
6.75% to
7.25%
U-Hop Transportation Network
Vehicle System Inc. 2,368 12,330 (14,698) ‒ Current ‒
Key Management Personnel 7,708 ‒ (1,209) ‒ Current 6,499 Various Various
Payable on
demand Various
P=36,797,161 P=25,823,341 (P=21,004,247) P=‒ P=41,616,255 The related party transactions indicated above are within the ordinary course of business of the Bank and shall be settled in cash.
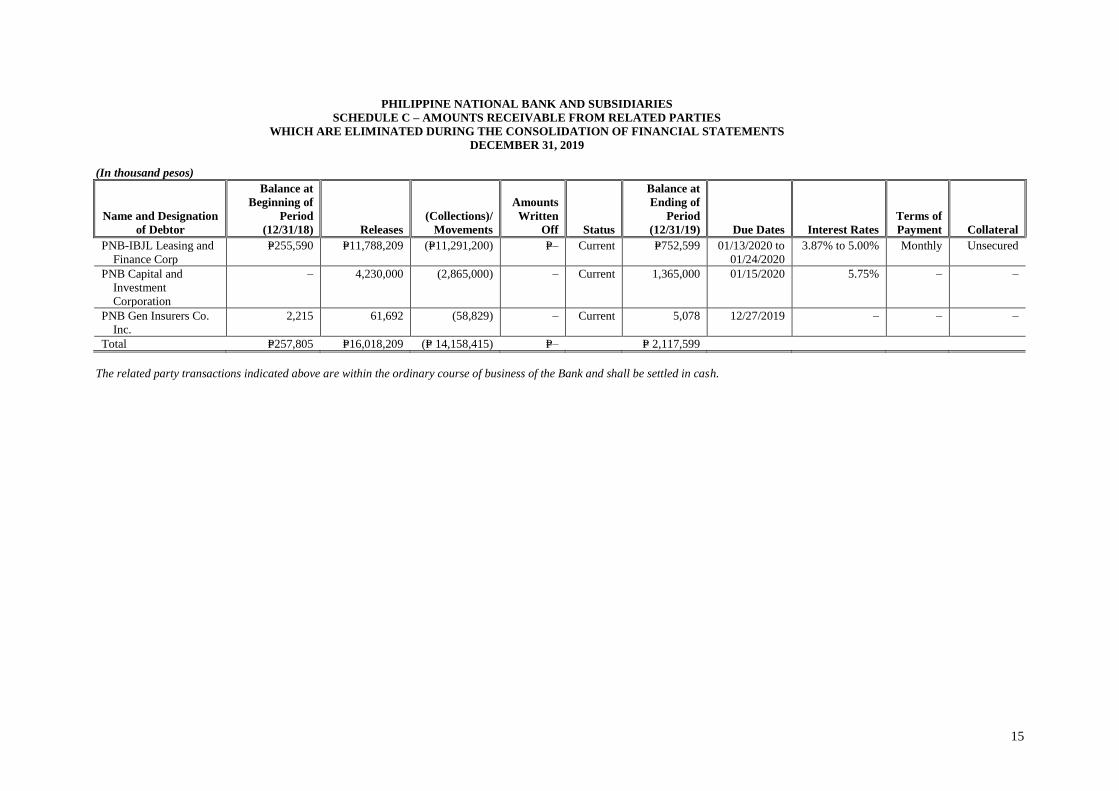
15
PHILIPPINE NATIONAL BANK AND SUBSIDIARIES
SCHEDULE C – AMOUNTS RECEIVABLE FROM RELATED PARTIES
WHICH ARE ELIMINATED DURING THE CONSOLIDATION OF FINANCIAL STATEMENTS
DECEMBER 31, 2019
(In thousand pesos)
Name and Designation
of Debtor
Balance at
Beginning of
Period
(12/31/18) Releases
(Collections)/
Movements
Amounts
Written
Off Status
Balance at
Ending of
Period
(12/31/19) Due Dates Interest Rates
Terms of
Payment Collateral
PNB-IBJL Leasing and
Finance Corp
P=255,590 P=11,788,209 (P=11,291,200) P=– Current P=752,599 01/13/2020 to
01/24/2020
3.87% to 5.00% Monthly Unsecured
PNB Capital and
Investment
Corporation
– 4,230,000 (2,865,000) – Current 1,365,000 01/15/2020 5.75% – –
PNB Gen Insurers Co.
Inc.
2,215 61,692 (58,829) – Current 5,078 12/27/2019 – – –
Total P=257,805 P=16,018,209 (P= 14,158,415) P=– P= 2,117,599
The related party transactions indicated above are within the ordinary course of business of the Bank and shall be settled in cash.
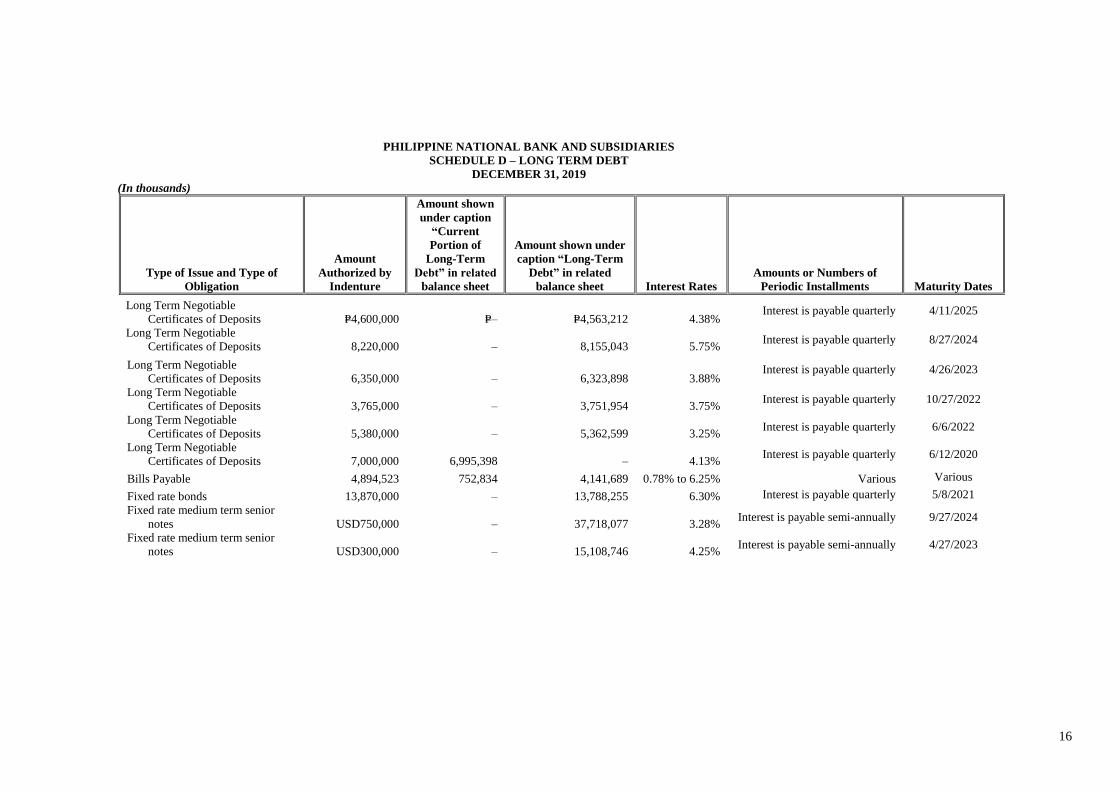
16
PHILIPPINE NATIONAL BANK AND SUBSIDIARIES
SCHEDULE D – LONG TERM DEBT
DECEMBER 31, 2019
(In thousands)
Type of Issue and Type of
Obligation
Amount
Authorized by
Indenture
Amount shown
under caption
“Current
Portion of
Long-Term
Debt” in related
balance sheet
Amount shown under
caption “Long-Term
Debt” in related
balance sheet Interest Rates
Amounts or Numbers of
Periodic Installments Maturity Dates
Long Term Negotiable
Certificates of Deposits P=4,600,000 P=–
P=4,563,212 4.38% Interest is payable quarterly 4/11/2025
Long Term Negotiable
Certificates of Deposits 8,220,000 – 8,155,043 5.75% Interest is payable quarterly 8/27/2024
Long Term Negotiable
Certificates of Deposits 6,350,000 – 6,323,898 3.88% Interest is payable quarterly 4/26/2023
Long Term Negotiable
Certificates of Deposits 3,765,000 – 3,751,954 3.75% Interest is payable quarterly 10/27/2022
Long Term Negotiable
Certificates of Deposits
5,380,000 – 5,362,599 3.25% Interest is payable quarterly 6/6/2022
Long Term Negotiable
Certificates of Deposits
7,000,000 6,995,398 – 4.13% Interest is payable quarterly 6/12/2020
Bills Payable 4,894,523 752,834 4,141,689 0.78% to 6.25% Various Various
Fixed rate bonds 13,870,000 – 13,788,255 6.30% Interest is payable quarterly 5/8/2021
Fixed rate medium term senior
notes USD750,000 – 37,718,077 3.28% Interest is payable semi-annually 9/27/2024
Fixed rate medium term senior
notes USD300,000 – 15,108,746 4.25% Interest is payable semi-annually 4/27/2023
17
PHILIPPINE NATIONAL BANK AND SUBSIDIARIES
SCHEDULE E – INDEBTEDNESS TO RELATED PARTIES
DECEMBER 31, 2019
(In thousand pesos)
Name of Related Parties (i) Balance at Beginning of Period Balance at Ending of Period (ii) Nature, Terms and Conditions
None to report
(i) The related parties named shall be grouped as in Schedule D. The information called shall be stated for any persons whose investments shown separately in such related schedule.
(ii) For each affiliate named in the first column, explain in a note hereto the nature and purpose of any increase during the period that is in excess of 10 percent of the related balance at either the
beginning or end of the period.
18
PHILIPPINE NATIONAL BANK AND SUBSIDIARIES
SCHEDULE F – GUARANTEES OF SECURITIES OF OTHER ISSUERS
DECEMBER 31, 2019
Name of issuing entity of securities guaranteed by the
company for
which this statement is filed
Title of issue of each class
of
securities guaranteed
Total amount of guaranteed and
outstanding (i)
Amount owned by person of
which
statement is filed
Nature of
Guarantee(ii)
None to report
(i) Indicate in a note any significant changes since the date of the last balance sheet file. If this schedule is filed in support of consolidated financial statements there shall be set forth guarantees by any
person included in the consolidation except such guarantees of securities which are included in the consolidation balance sheet.
(ii) There must be a brief statement of the nature of the guarantee, such as “Guarantee of principal and interest”, “Guarantee of Interest”, “Guarantee of Dividends”. If the guarantee is of interest,
dividends, or both, state the annual aggregate amount of interest or dividends so guarantee.
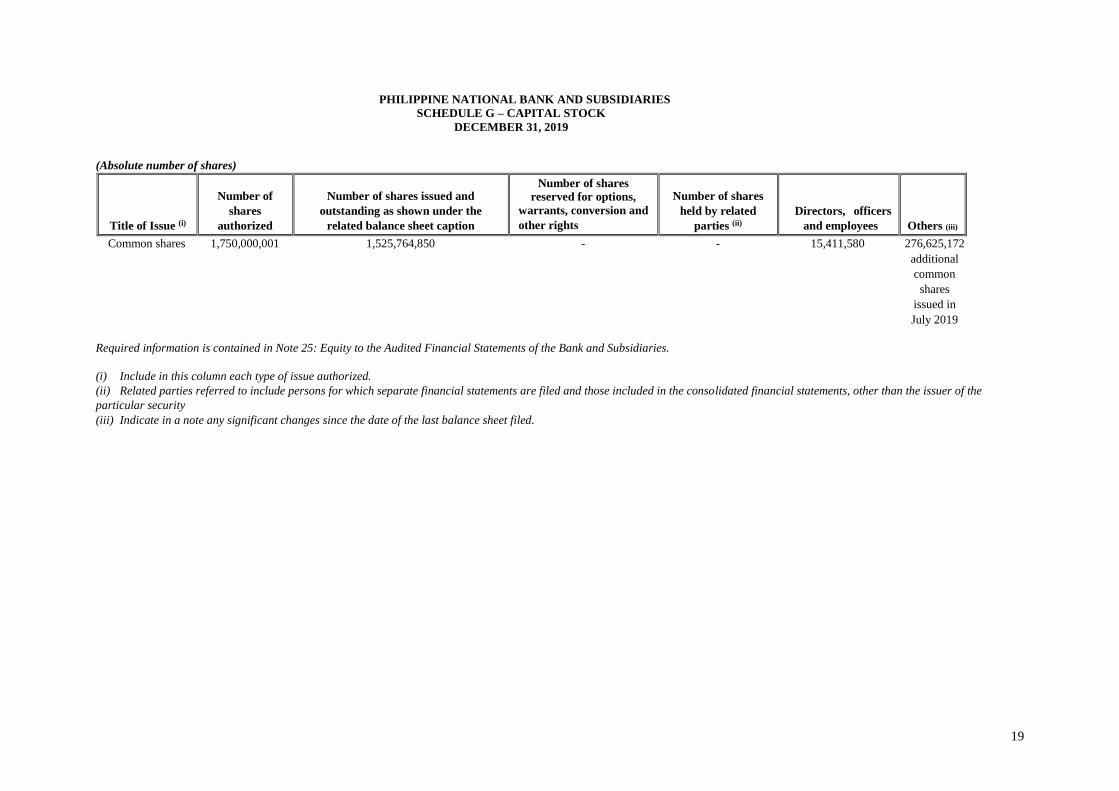
19
PHILIPPINE NATIONAL BANK AND SUBSIDIARIES
SCHEDULE G – CAPITAL STOCK
DECEMBER 31, 2019
(Absolute number of shares)
Title of Issue (i)
Number of
shares
authorized
Number of shares issued and
outstanding as shown under the
related balance sheet caption
Number of shares
reserved for options,
warrants, conversion and
other rights
Number of shares
held by related
parties (ii)
Directors, officers
and employees Others (iii)
Common shares 1,750,000,001 1,525,764,850 - - 15,411,580 276,625,172
additional
common
shares
issued in
July 2019
Required information is contained in Note 25: Equity to the Audited Financial Statements of the Bank and Subsidiaries.
(i) Include in this column each type of issue authorized.
(ii) Related parties referred to include persons for which separate financial statements are filed and those included in the consolidated financial statements, other than the issuer of the
particular security
(iii) Indicate in a note any significant changes since the date of the last balance sheet filed.
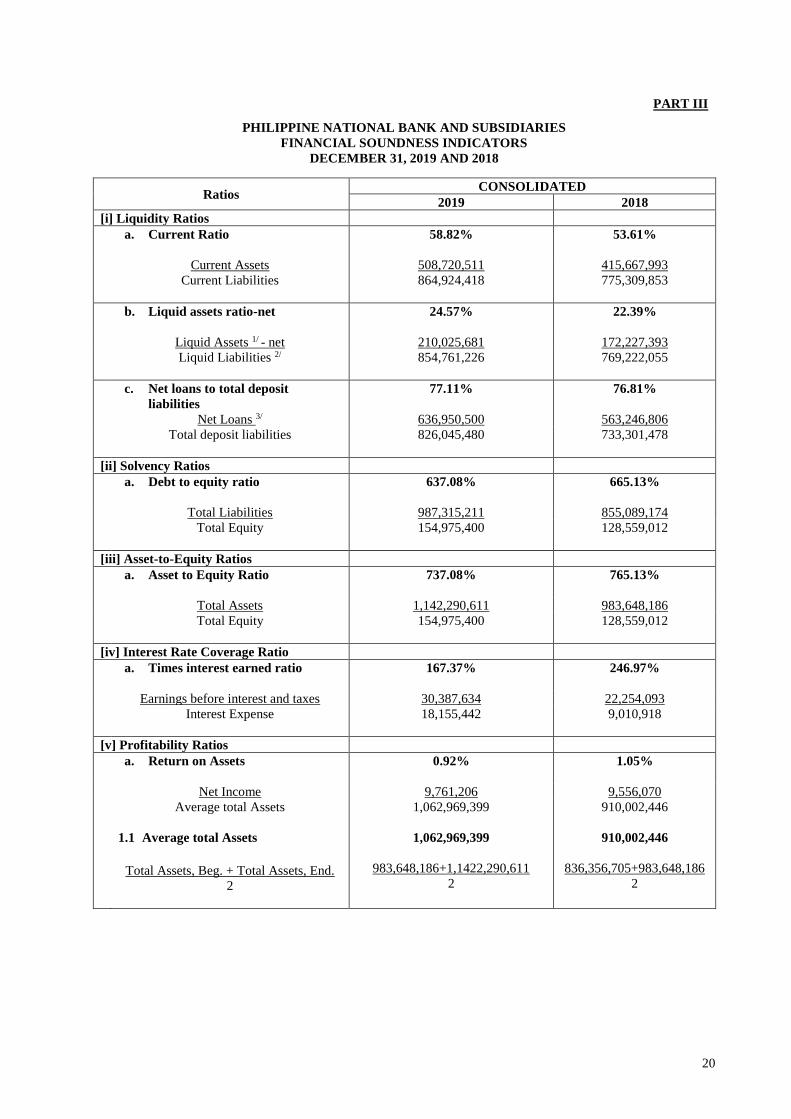
20
PART III
PHILIPPINE NATIONAL BANK AND SUBSIDIARIES
FINANCIAL SOUNDNESS INDICATORS
DECEMBER 31, 2019 AND 2018
Ratios CONSOLIDATED
2019 2018
[i] Liquidity Ratios
a. Current Ratio 58.82%
53.61%
Current Assets 508,720,511 415,667,993
Current Liabilities
864,924,418 775,309,853
b. Liquid assets ratio-net 24.57%
22.39%
Liquid Assets 1/ - net 210,025,681 172,227,393
Liquid Liabilities 2/
854,761,226 769,222,055
c. Net loans to total deposit
liabilities
77.11%
76.81%
Net Loans 3/ 636,950,500 563,246,806
Total deposit liabilities
826,045,480 733,301,478
[ii] Solvency Ratios
a. Debt to equity ratio 637.08%
665.13%
Total Liabilities 987,315,211 855,089,174
Total Equity
154,975,400 128,559,012
[iii] Asset-to-Equity Ratios
a. Asset to Equity Ratio 737.08%
765.13%
Total Assets 1,142,290,611 983,648,186
Total Equity
154,975,400 128,559,012
[iv] Interest Rate Coverage Ratio
a. Times interest earned ratio 167.37%
246.97%
Earnings before interest and taxes 30,387,634 22,254,093
Interest Expense
18,155,442 9,010,918
[v] Profitability Ratios
a. Return on Assets 0.92%
1.05%
Net Income 9,761,206 9,556,070
Average total Assets
1.1 Average total Assets
Total Assets, Beg. + Total Assets, End.
2
1,062,969,399
1,062,969,399
983,648,186+1,1422,290,611
2
910,002,446
910,002,446
836,356,705+983,648,186
2
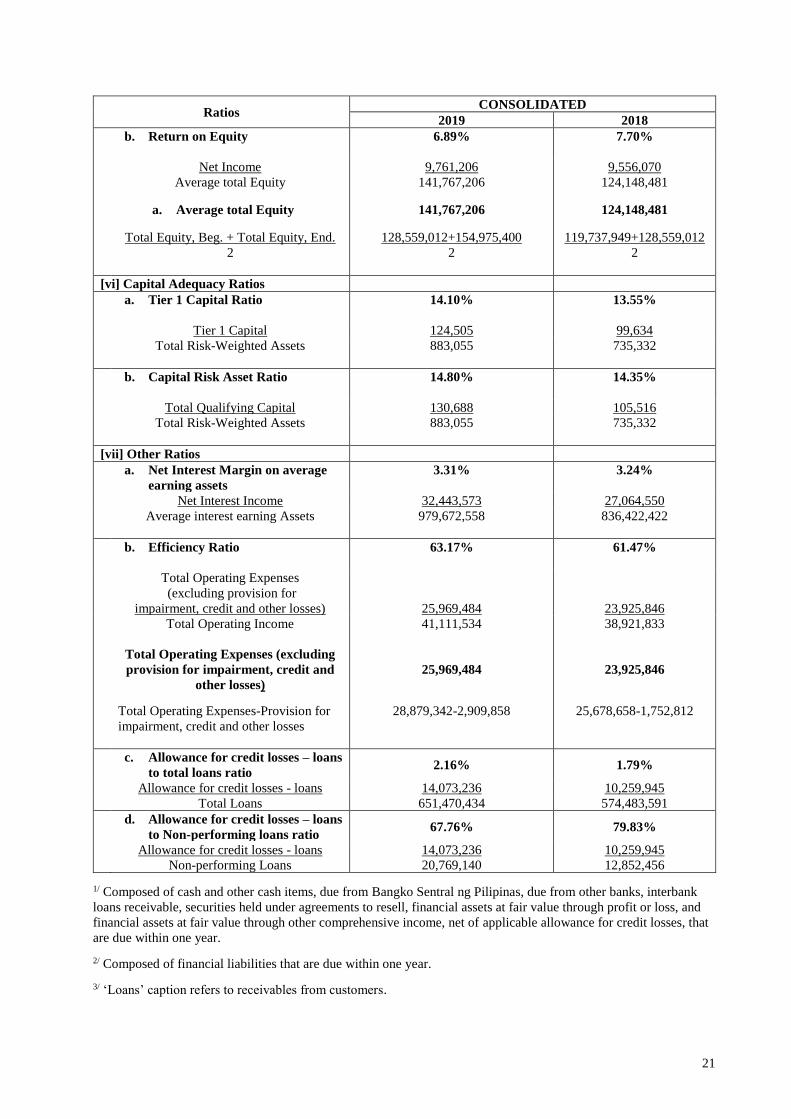
21
Ratios CONSOLIDATED
2019 2018
b. Return on Equity 6.89%
7.70%
Net Income 9,761,206 9,556,070
Average total Equity
a. Average total Equity
Total Equity, Beg. + Total Equity, End.
2
141,767,206
141,767,206
128,559,012+154,975,400
2
124,148,481
124,148,481
119,737,949+128,559,012
2
[vi] Capital Adequacy Ratios
a. Tier 1 Capital Ratio 14.10%
13.55%
Tier 1 Capital 124,505 99,634
Total Risk-Weighted Assets
883,055 735,332
b. Capital Risk Asset Ratio 14.80%
14.35%
Total Qualifying Capital 130,688 105,516
Total Risk-Weighted Assets
883,055 735,332
[vii] Other Ratios
a. Net Interest Margin on average
earning assets
3.31%
3.24%
Net Interest Income 32,443,573 27,064,550
Average interest earning Assets
979,672,558 836,422,422
b. Efficiency Ratio 63.17%
61.47%
Total Operating Expenses
(excluding provision for
impairment, credit and other losses)
25,969,484
23,925,846
Total Operating Income
Total Operating Expenses (excluding
provision for impairment, credit and
other losses)
Total Operating Expenses-Provision for
impairment, credit and other losses
41,111,534
25,969,484
28,879,342-2,909,858
38,921,833
23,925,846
25,678,658-1,752,812
c. Allowance for credit losses – loans
to total loans ratio 2.16% 1.79%
Allowance for credit losses - loans 14,073,236 10,259,945
Total Loans 651,470,434 574,483,591
d. Allowance for credit losses – loans
to Non-performing loans ratio 67.76% 79.83%
Allowance for credit losses - loans 14,073,236 10,259,945
Non-performing Loans 20,769,140 12,852,456 1/ Composed of cash and other cash items, due from Bangko Sentral ng Pilipinas, due from other banks, interbank
loans receivable, securities held under agreements to resell, financial assets at fair value through profit or loss, and
financial assets at fair value through other comprehensive income, net of applicable allowance for credit losses, that
are due within one year. 2/ Composed of financial liabilities that are due within one year. 3/ ‘Loans’ caption refers to receivables from customers.
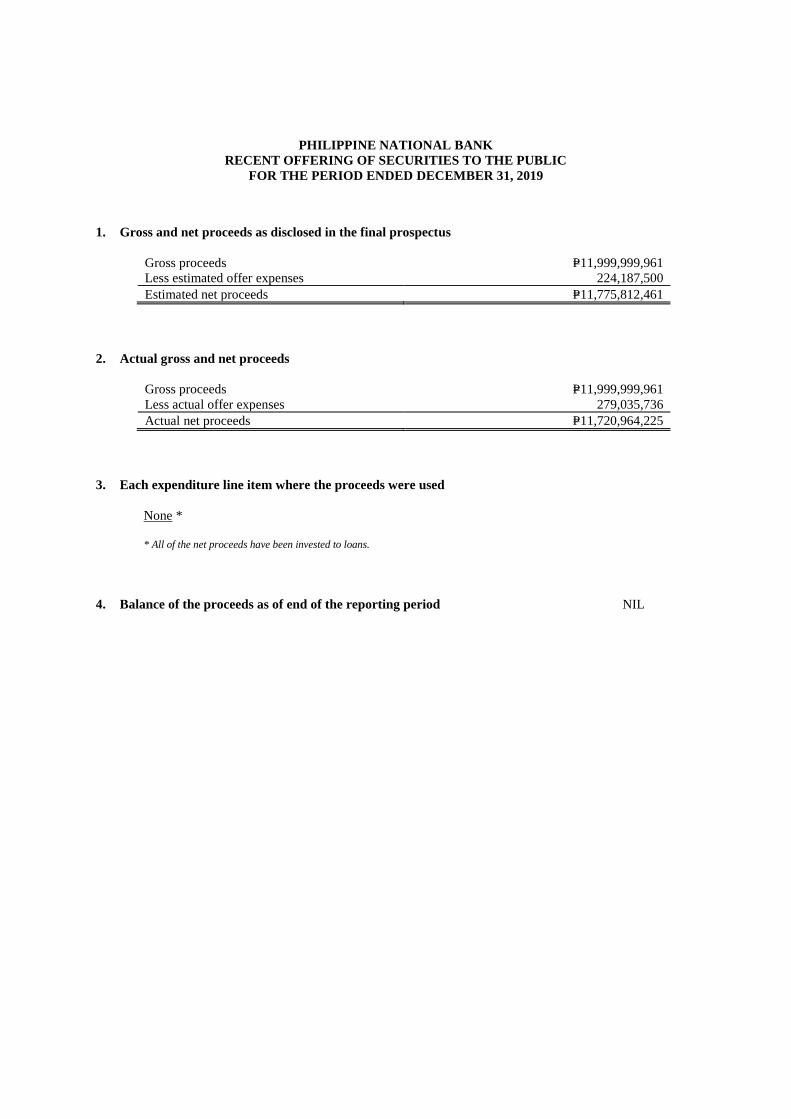
PHILIPPINE NATIONAL BANK
RECENT OFFERING OF SECURITIES TO THE PUBLIC
FOR THE PERIOD ENDED DECEMBER 31, 2019
1. Gross and net proceeds as disclosed in the final prospectus
Gross proceeds P=11,999,999,961
Less estimated offer expenses 224,187,500
Estimated net proceeds P=11,775,812,461
2. Actual gross and net proceeds
Gross proceeds P=11,999,999,961
Less actual offer expenses 279,035,736
Actual net proceeds P=11,720,964,225
3. Each expenditure line item where the proceeds were used
None *
* All of the net proceeds have been invested to loans.
4. Balance of the proceeds as of end of the reporting period NIL
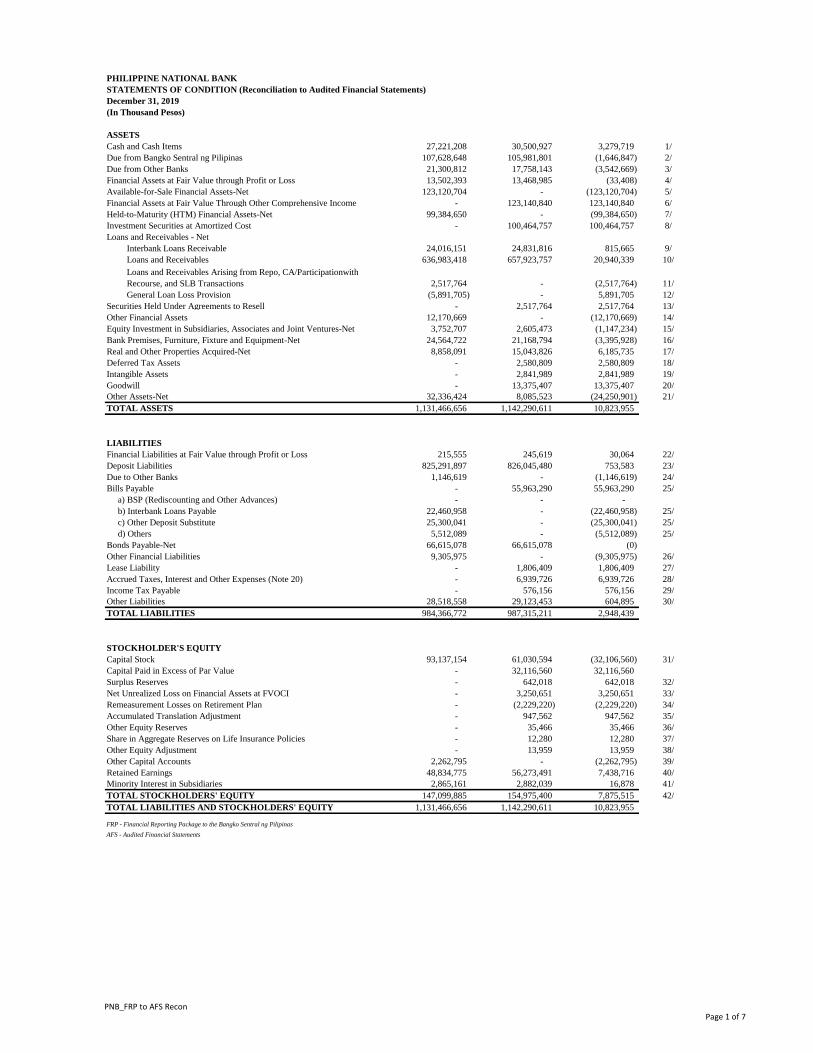
ASSETS
Cash and Cash Items 27,221,208 30,500,927 3,279,719 1/
Due from Bangko Sentral ng Pilipinas 107,628,648 105,981,801 (1,646,847) 2/
Due from Other Banks 21,300,812 17,758,143 (3,542,669) 3/
Financial Assets at Fair Value through Profit or Loss 13,502,393 13,468,985 (33,408) 4/
Available-for-Sale Financial Assets-Net 123,120,704 - (123,120,704) 5/
Financial Assets at Fair Value Through Other Comprehensive Income - 123,140,840 123,140,840 6/
Held-to-Maturity (HTM) Financial Assets-Net 99,384,650 - (99,384,650) 7/
Investment Securities at Amortized Cost - 100,464,757 100,464,757 8/
Loans and Receivables - Net
Interbank Loans Receivable 24,016,151 24,831,816 815,665 9/
Loans and Receivables 636,983,418 657,923,757 20,940,339 10/
Loans and Receivables Arising from Repo, CA/Participationwith
Recourse, and SLB Transactions 2,517,764 - (2,517,764) 11/
General Loan Loss Provision (5,891,705) - 5,891,705 12/
Securities Held Under Agreements to Resell - 2,517,764 2,517,764 13/
Other Financial Assets 12,170,669 - (12,170,669) 14/
Equity Investment in Subsidiaries, Associates and Joint Ventures-Net 3,752,707 2,605,473 (1,147,234) 15/
Bank Premises, Furniture, Fixture and Equipment-Net 24,564,722 21,168,794 (3,395,928) 16/
Real and Other Properties Acquired-Net 8,858,091 15,043,826 6,185,735 17/
Deferred Tax Assets - 2,580,809 2,580,809 18/
Intangible Assets - 2,841,989 2,841,989 19/
Goodwill - 13,375,407 13,375,407 20/
Other Assets-Net 32,336,424 8,085,523 (24,250,901) 21/
TOTAL ASSETS 1,131,466,656 1,142,290,611 10,823,955
LIABILITIES
Financial Liabilities at Fair Value through Profit or Loss 215,555 245,619 30,064 22/
Deposit Liabilities 825,291,897 826,045,480 753,583 23/
Due to Other Banks 1,146,619 - (1,146,619) 24/
Bills Payable - 55,963,290 55,963,290 25/
a) BSP (Rediscounting and Other Advances) - - -
b) Interbank Loans Payable 22,460,958 - (22,460,958) 25/
c) Other Deposit Substitute 25,300,041 - (25,300,041) 25/
d) Others 5,512,089 - (5,512,089) 25/
Bonds Payable-Net 66,615,078 66,615,078 (0)
Other Financial Liabilities 9,305,975 - (9,305,975) 26/
Lease Liability - 1,806,409 1,806,409 27/
Accrued Taxes, Interest and Other Expenses (Note 20) - 6,939,726 6,939,726 28/
Income Tax Payable - 576,156 576,156 29/
Other Liabilities 28,518,558 29,123,453 604,895 30/
TOTAL LIABILITIES 984,366,772 987,315,211 2,948,439
STOCKHOLDER'S EQUITY
Capital Stock 93,137,154 61,030,594 (32,106,560) 31/
Capital Paid in Excess of Par Value - 32,116,560 32,116,560
Surplus Reserves - 642,018 642,018 32/
Net Unrealized Loss on Financial Assets at FVOCI - 3,250,651 3,250,651 33/
Remeasurement Losses on Retirement Plan - (2,229,220) (2,229,220) 34/
Accumulated Translation Adjustment - 947,562 947,562 35/
Other Equity Reserves - 35,466 35,466 36/
Share in Aggregate Reserves on Life Insurance Policies - 12,280 12,280 37/
Other Equity Adjustment - 13,959 13,959 38/
Other Capital Accounts 2,262,795 - (2,262,795) 39/
Retained Earnings 48,834,775 56,273,491 7,438,716 40/
Minority Interest in Subsidiaries 2,865,161 2,882,039 16,878 41/
TOTAL STOCKHOLDERS' EQUITY 147,099,885 154,975,400 7,875,515 42/
TOTAL LIABILITIES AND STOCKHOLDERS' EQUITY 1,131,466,656 1,142,290,611 10,823,955
FRP - Financial Reporting Package to the Bangko Sentral ng Pilipinas
AFS - Audited Financial Statements
PHILIPPINE NATIONAL BANK
STATEMENTS OF CONDITION (Reconciliation to Audited Financial Statements)
December 31, 2019
(In Thousand Pesos)
PNB_FRP to AFS ReconPage 1 of 7
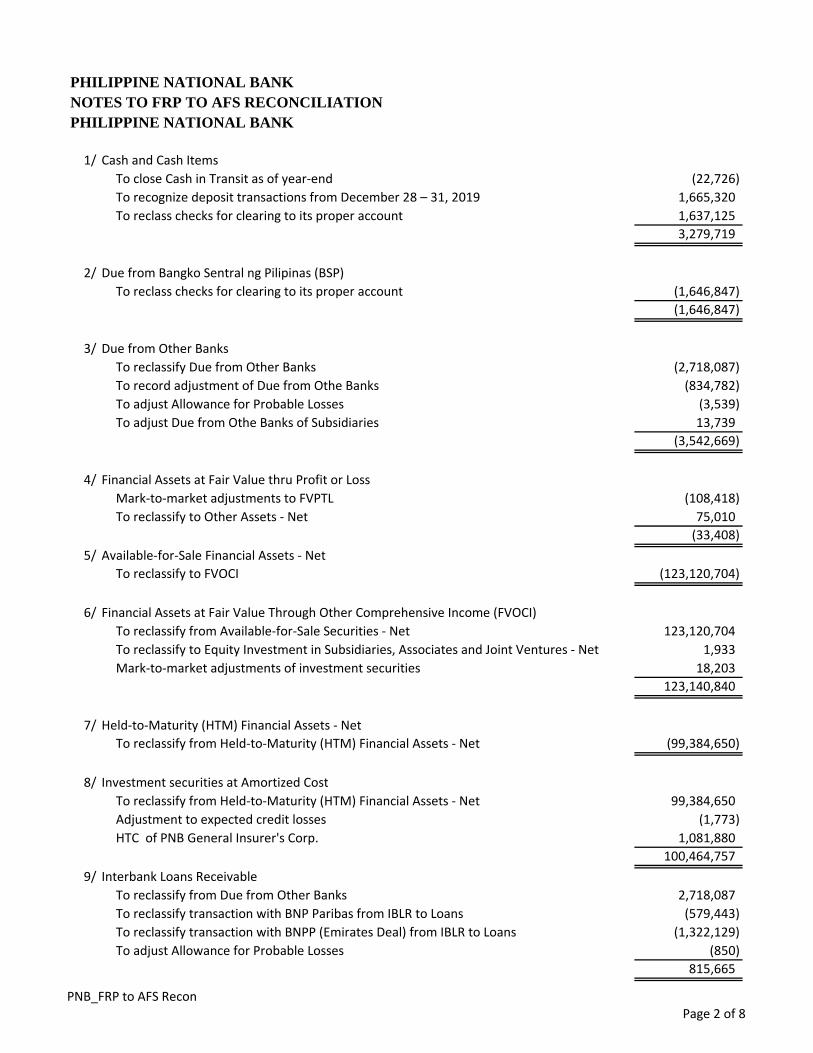
1/ Cash and Cash Items
To close Cash in Transit as of year-end (22,726)
To recognize deposit transactions from December 28 – 31, 2019 1,665,320
To reclass checks for clearing to its proper account 1,637,125
3,279,719
2/ Due from Bangko Sentral ng Pilipinas (BSP)
To reclass checks for clearing to its proper account (1,646,847)
(1,646,847)
3/ Due from Other Banks
To reclassify Due from Other Banks (2,718,087)
To record adjustment of Due from Othe Banks (834,782)
To adjust Allowance for Probable Losses (3,539)
To adjust Due from Othe Banks of Subsidiaries 13,739
(3,542,669)
4/ Financial Assets at Fair Value thru Profit or Loss
Mark-to-market adjustments to FVPTL (108,418)
To reclassify to Other Assets - Net 75,010
(33,408)
5/ Available-for-Sale Financial Assets - Net
To reclassify to FVOCI (123,120,704)
6/ Financial Assets at Fair Value Through Other Comprehensive Income (FVOCI)
To reclassify from Available-for-Sale Securities - Net 123,120,704
To reclassify to Equity Investment in Subsidiaries, Associates and Joint Ventures - Net 1,933
Mark-to-market adjustments of investment securities 18,203
123,140,840
7/ Held-to-Maturity (HTM) Financial Assets - Net
To reclassify from Held-to-Maturity (HTM) Financial Assets - Net (99,384,650)
8/ Investment securities at Amortized Cost
To reclassify from Held-to-Maturity (HTM) Financial Assets - Net 99,384,650
Adjustment to expected credit losses (1,773)
HTC of PNB General Insurer's Corp. 1,081,880
100,464,757
9/ Interbank Loans Receivable
To reclassify from Due from Other Banks 2,718,087
To reclassify transaction with BNP Paribas from IBLR to Loans (579,443)
To reclassify transaction with BNPP (Emirates Deal) from IBLR to Loans (1,322,129)
To adjust Allowance for Probable Losses (850)
815,665
PHILIPPINE NATIONAL BANK
NOTES TO FRP TO AFS RECONCILIATION
PHILIPPINE NATIONAL BANK
PNB_FRP to AFS ReconPage 2 of 8
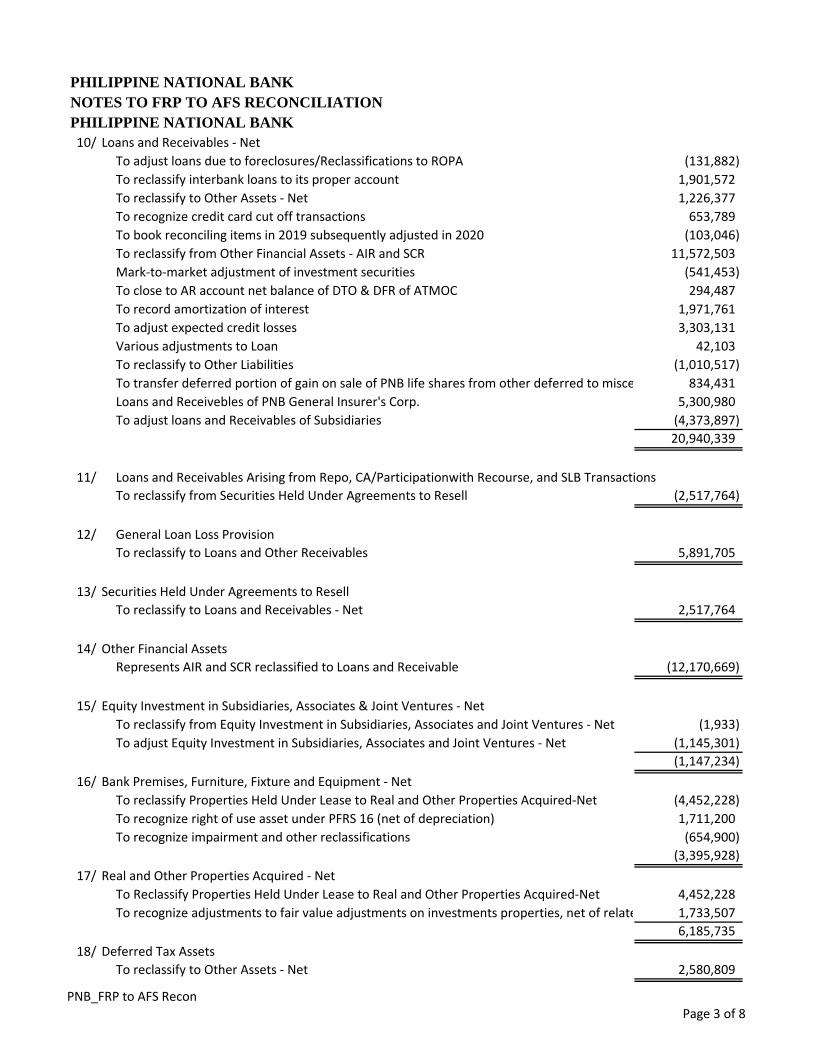
PHILIPPINE NATIONAL BANK
NOTES TO FRP TO AFS RECONCILIATION
PHILIPPINE NATIONAL BANK
10/ Loans and Receivables - Net
To adjust loans due to foreclosures/Reclassifications to ROPA (131,882)
To reclassify interbank loans to its proper account 1,901,572
To reclassify to Other Assets - Net 1,226,377
To recognize credit card cut off transactions 653,789
To book reconciling items in 2019 subsequently adjusted in 2020 (103,046)
To reclassify from Other Financial Assets - AIR and SCR 11,572,503
Mark-to-market adjustment of investment securities (541,453)
To close to AR account net balance of DTO & DFR of ATMOC 294,487
To record amortization of interest 1,971,761
To adjust expected credit losses 3,303,131
Various adjustments to Loan 42,103
To reclassify to Other Liabilities (1,010,517)
To transfer deferred portion of gain on sale of PNB life shares from other deferred to miscellaneous liab834,431
Loans and Receivebles of PNB General Insurer's Corp. 5,300,980
To adjust loans and Receivables of Subsidiaries (4,373,897)
20,940,339
11/ Loans and Receivables Arising from Repo, CA/Participationwith Recourse, and SLB Transactions
To reclassify from Securities Held Under Agreements to Resell (2,517,764)
12/ General Loan Loss Provision
To reclassify to Loans and Other Receivables 5,891,705
13/ Securities Held Under Agreements to Resell
To reclassify to Loans and Receivables - Net 2,517,764
14/ Other Financial Assets
Represents AIR and SCR reclassified to Loans and Receivable (12,170,669)
15/ Equity Investment in Subsidiaries, Associates & Joint Ventures - Net
To reclassify from Equity Investment in Subsidiaries, Associates and Joint Ventures - Net (1,933)
To adjust Equity Investment in Subsidiaries, Associates and Joint Ventures - Net (1,145,301)
(1,147,234)
16/ Bank Premises, Furniture, Fixture and Equipment - Net
To reclassify Properties Held Under Lease to Real and Other Properties Acquired-Net (4,452,228)
To recognize right of use asset under PFRS 16 (net of depreciation) 1,711,200
To recognize impairment and other reclassifications (654,900)
(3,395,928)
17/ Real and Other Properties Acquired - Net
To Reclassify Properties Held Under Lease to Real and Other Properties Acquired-Net 4,452,228
To recognize adjustments to fair value adjustments on investments properties, net of related impairment1,733,507
6,185,735
18/ Deferred Tax Assets
To reclassify to Other Assets - Net 2,580,809
PNB_FRP to AFS ReconPage 3 of 8
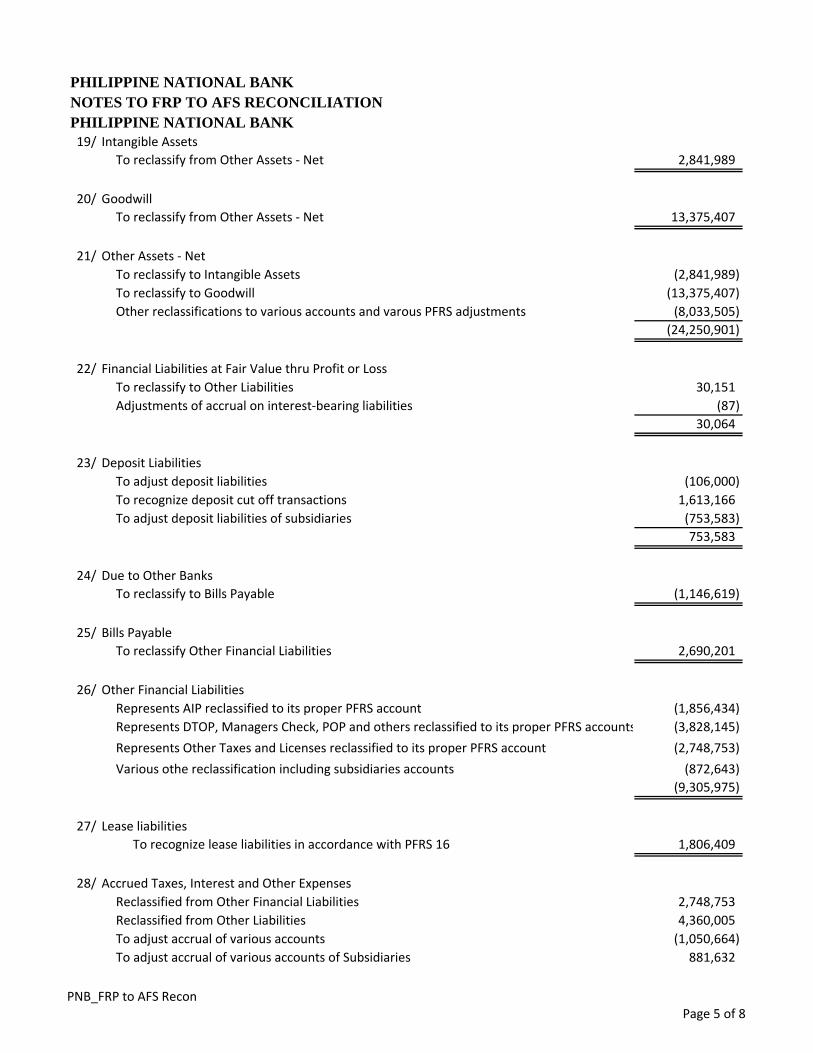
PHILIPPINE NATIONAL BANK
NOTES TO FRP TO AFS RECONCILIATION
PHILIPPINE NATIONAL BANK
19/ Intangible Assets
To reclassify from Other Assets - Net 2,841,989
20/ Goodwill
To reclassify from Other Assets - Net 13,375,407
21/ Other Assets - Net
To reclassify to Intangible Assets (2,841,989)
To reclassify to Goodwill (13,375,407)
Other reclassifications to various accounts and varous PFRS adjustments (8,033,505)
(24,250,901)
22/ Financial Liabilities at Fair Value thru Profit or Loss
To reclassify to Other Liabilities 30,151
Adjustments of accrual on interest-bearing liabilities (87)
30,064
23/ Deposit Liabilities
To adjust deposit liabilities (106,000)
To recognize deposit cut off transactions 1,613,166
To adjust deposit liabilities of subsidiaries (753,583)
753,583
24/ Due to Other Banks
To reclassify to Bills Payable (1,146,619)
25/ Bills Payable
To reclassify Other Financial Liabilities 2,690,201
26/ Other Financial Liabilities
Represents AIP reclassified to its proper PFRS account (1,856,434)
Represents DTOP, Managers Check, POP and others reclassified to its proper PFRS accounts (3,828,145)
Represents Other Taxes and Licenses reclassified to its proper PFRS account (2,748,753)
Various othe reclassification including subsidiaries accounts (872,643)
(9,305,975)
27/ Lease liabilities
To recognize lease liabilities in accordance with PFRS 16 1,806,409
28/ Accrued Taxes, Interest and Other Expenses
Reclassified from Other Financial Liabilities 2,748,753
Reclassified from Other Liabilities 4,360,005
To adjust accrual of various accounts (1,050,664)
To adjust accrual of various accounts of Subsidiaries 881,632
PNB_FRP to AFS ReconPage 5 of 8
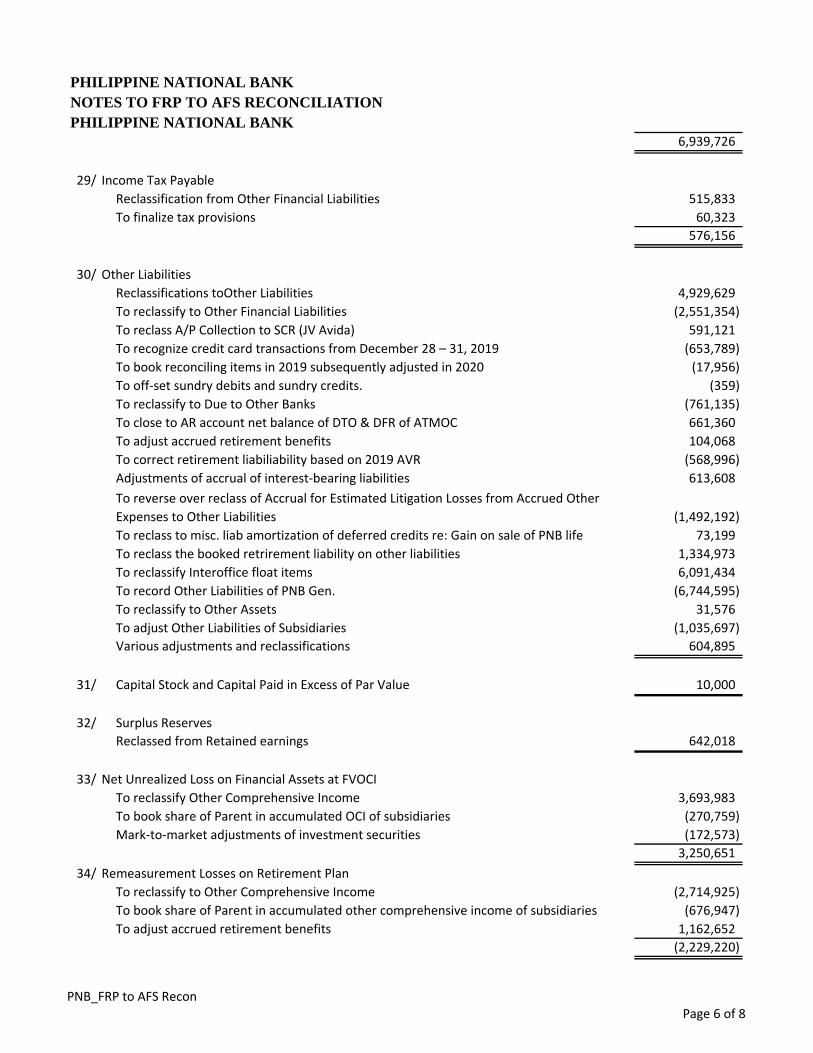
PHILIPPINE NATIONAL BANK
NOTES TO FRP TO AFS RECONCILIATION
PHILIPPINE NATIONAL BANK
6,939,726
29/ Income Tax Payable
Reclassification from Other Financial Liabilities 515,833
To finalize tax provisions 60,323
576,156
30/ Other Liabilities
Reclassifications toOther Liabilities 4,929,629
To reclassify to Other Financial Liabilities (2,551,354)
To reclass A/P Collection to SCR (JV Avida) 591,121
To recognize credit card transactions from December 28 – 31, 2019 (653,789)
To book reconciling items in 2019 subsequently adjusted in 2020 (17,956)
To off-set sundry debits and sundry credits. (359)
To reclassify to Due to Other Banks (761,135)
To close to AR account net balance of DTO & DFR of ATMOC 661,360
To adjust accrued retirement benefits 104,068
To correct retirement liabiliability based on 2019 AVR (568,996)
Adjustments of accrual of interest-bearing liabilities 613,608
(1,492,192)
To reclass to misc. liab amortization of deferred credits re: Gain on sale of PNB life 73,199
To reclass the booked retrirement liability on other liabilities 1,334,973
To reclassify Interoffice float items 6,091,434
To record Other Liabilities of PNB Gen. (6,744,595)
To reclassify to Other Assets 31,576
To adjust Other Liabilities of Subsidiaries (1,035,697)
Various adjustments and reclassifications 604,895
31/ Capital Stock and Capital Paid in Excess of Par Value 10,000
32/ Surplus Reserves
Reclassed from Retained earnings 642,018
33/ Net Unrealized Loss on Financial Assets at FVOCI
To reclassify Other Comprehensive Income 3,693,983
To book share of Parent in accumulated OCI of subsidiaries (270,759)
Mark-to-market adjustments of investment securities (172,573)
3,250,651
34/ Remeasurement Losses on Retirement Plan
To reclassify to Other Comprehensive Income (2,714,925)
To book share of Parent in accumulated other comprehensive income of subsidiaries (676,947)
To adjust accrued retirement benefits 1,162,652
(2,229,220)
To reverse over reclass of Accrual for Estimated Litigation Losses from Accrued Other
Expenses to Other Liabilities
PNB_FRP to AFS ReconPage 6 of 8
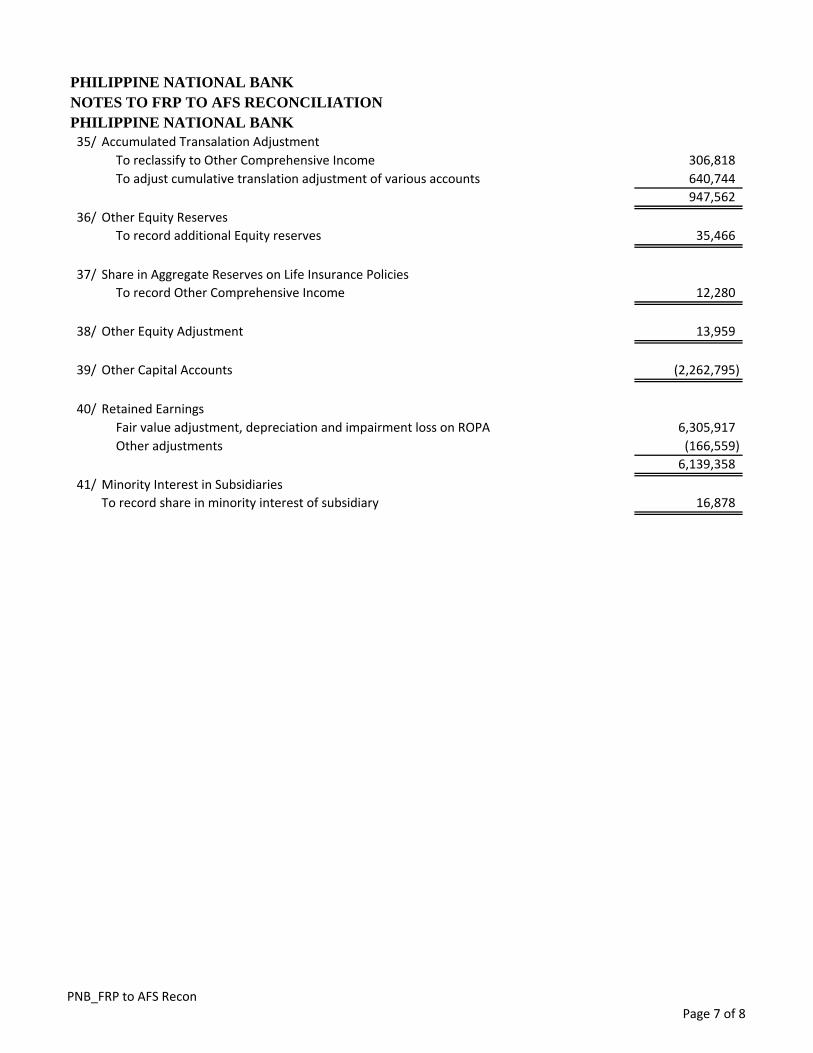
PHILIPPINE NATIONAL BANK
NOTES TO FRP TO AFS RECONCILIATION
PHILIPPINE NATIONAL BANK
35/ Accumulated Transalation Adjustment
To reclassify to Other Comprehensive Income 306,818
To adjust cumulative translation adjustment of various accounts 640,744
947,562
36/ Other Equity Reserves
To record additional Equity reserves 35,466
37/ Share in Aggregate Reserves on Life Insurance Policies
To record Other Comprehensive Income 12,280
38/ Other Equity Adjustment 13,959
39/ Other Capital Accounts (2,262,795)
40/ Retained Earnings
Fair value adjustment, depreciation and impairment loss on ROPA 6,305,917
Other adjustments (166,559)
6,139,358
41/ Minority Interest in Subsidiaries
To record share in minority interest of subsidiary 16,878
PNB_FRP to AFS ReconPage 7 of 8
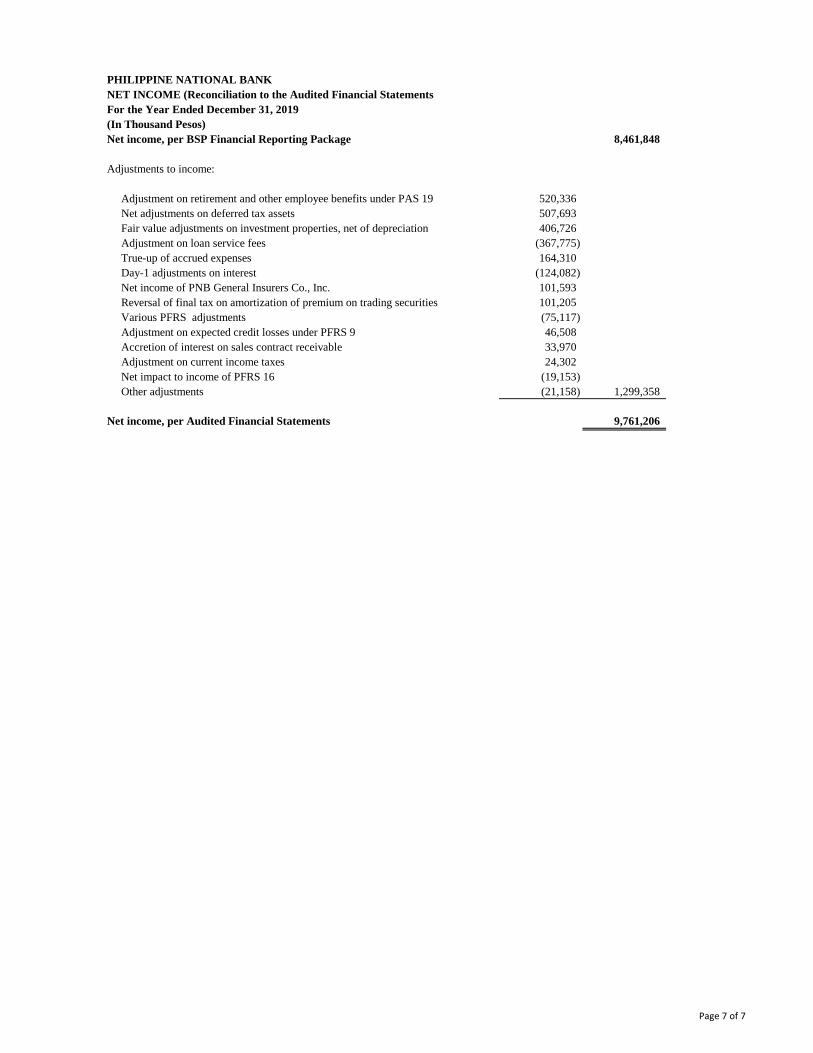
Net income, per BSP Financial Reporting Package 8,461,848
Adjustments to income:
Adjustment on retirement and other employee benefits under PAS 19 520,336
Net adjustments on deferred tax assets 507,693
Fair value adjustments on investment properties, net of depreciation 406,726
Adjustment on loan service fees (367,775)
True-up of accrued expenses 164,310
Day-1 adjustments on interest (124,082)
Net income of PNB General Insurers Co., Inc. 101,593
Reversal of final tax on amortization of premium on trading securities 101,205
Various PFRS adjustments (75,117)
Adjustment on expected credit losses under PFRS 9 46,508
Accretion of interest on sales contract receivable 33,970
Adjustment on current income taxes 24,302
Net impact to income of PFRS 16 (19,153)
Other adjustments (21,158) 1,299,358
Net income, per Audited Financial Statements 9,761,206
PHILIPPINE NATIONAL BANK
NET INCOME (Reconciliation to the Audited Financial Statements
For the Year Ended December 31, 2019
(In Thousand Pesos)
Page 7 of 7
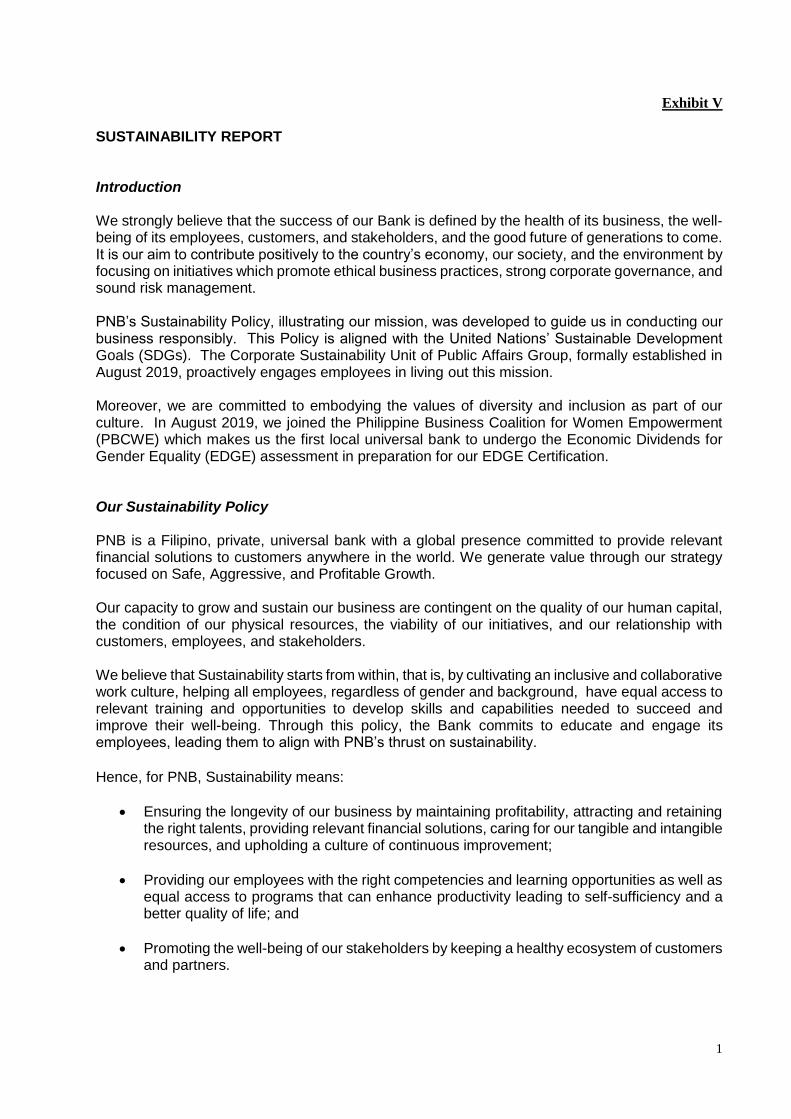
1
Exhibit V
SUSTAINABILITY REPORT Introduction We strongly believe that the success of our Bank is defined by the health of its business, the well-being of its employees, customers, and stakeholders, and the good future of generations to come. It is our aim to contribute positively to the country’s economy, our society, and the environment by focusing on initiatives which promote ethical business practices, strong corporate governance, and sound risk management. PNB’s Sustainability Policy, illustrating our mission, was developed to guide us in conducting our business responsibly. This Policy is aligned with the United Nations’ Sustainable Development Goals (SDGs). The Corporate Sustainability Unit of Public Affairs Group, formally established in August 2019, proactively engages employees in living out this mission. Moreover, we are committed to embodying the values of diversity and inclusion as part of our culture. In August 2019, we joined the Philippine Business Coalition for Women Empowerment (PBCWE) which makes us the first local universal bank to undergo the Economic Dividends for Gender Equality (EDGE) assessment in preparation for our EDGE Certification. Our Sustainability Policy PNB is a Filipino, private, universal bank with a global presence committed to provide relevant financial solutions to customers anywhere in the world. We generate value through our strategy focused on Safe, Aggressive, and Profitable Growth. Our capacity to grow and sustain our business are contingent on the quality of our human capital, the condition of our physical resources, the viability of our initiatives, and our relationship with customers, employees, and stakeholders. We believe that Sustainability starts from within, that is, by cultivating an inclusive and collaborative work culture, helping all employees, regardless of gender and background, have equal access to relevant training and opportunities to develop skills and capabilities needed to succeed and improve their well-being. Through this policy, the Bank commits to educate and engage its employees, leading them to align with PNB’s thrust on sustainability. Hence, for PNB, Sustainability means:
• Ensuring the longevity of our business by maintaining profitability, attracting and retaining the right talents, providing relevant financial solutions, caring for our tangible and intangible resources, and upholding a culture of continuous improvement;
• Providing our employees with the right competencies and learning opportunities as well as equal access to programs that can enhance productivity leading to self-sufficiency and a better quality of life; and
• Promoting the well-being of our stakeholders by keeping a healthy ecosystem of customers and partners.
2
Our Sustainability Pillars Our economic, social, and environmental responsibility includes complying with the relevant laws, rules, and regulations. Hence, our focus on the following Pillars:
1. Economic
• Revenue growth, profitability, and business continuity.
• Financial wellness and long-term value for customers, employees, and stakeholders.
• Financial inclusion through available products and services.
2. Social
• Succession planning through capability building, leadership development, and strategic talent acquisition.
• Improvement in our employees’ quality of life.
• An empowering and non-discriminatory culture where our employees, customers, and stakeholders are treated fairly and given equal opportunities.
• Positive contributions to communities through employee volunteerism and other initiatives imbibing responsible corporate citizenship.
3. Environmental
• Efficient use of natural and man-made resources.
• Reduced environmental footprint of the Bank and our employees.
4. Governance
• Compliance with all applicable laws, rules, and regulations that govern our business.
• Transparency and accountability in all areas of our operations. Our Commitment
1. For our people, we will:
• Provide a safe, respectful, and collaborative work environment that cultivates personal and professional growth.
• Educate, encourage, and inspire employees in contributing positively to their respective communities.
• Provide access to various skills development and learning programs relevant to our employees’ existing functions and target roles.
• Provide equal opportunities for candidates to be hired without biases on their skills and competencies.
• Provide equal opportunities for employees to be promoted based on performance, potentials, and aspirations, regardless of gender and background.
• Eliminate biases, whether conscious or unconscious, towards certain groups or individuals and ensure that decisions are rendered objectively and fairly.
• Promote gender equality in employment and in the workplace.
2. For our customers and stakeholders, we will:
• Ensure the continuity of our business through strategic succession planning.
• Support businesses and projects that foster economic and inclusive growth, social development, environmental protection, and nation-building.
• Promote financial wellness and create value through tailor-fit products and services.
3
3. For our shareholders and regulators, we will:
• Adhere to all applicable laws, rules, and regulations governing our scope of business and areas of operations.
• Report the progress and milestones of our Sustainability Programs to the Board of Directors at least semi-annually.
• Review and update our Sustainability Policy at least annually.
4. For our environment, we will:
• Reduce the environmental impact of our operations through the efficient use of natural or man-made resources.
• Adapt eco-friendly technologies. Our Contribution to the United Nations’ Sustainable Development Goals (SDGs) Realizing our capacity for contributing to sustainable development, we will align our initiatives with the United Nations’ SDGs to ensure the success of our business, the well-being of our employees, customers, and stakeholders, and the future of generations to come. Setting the Tone from the Top GRI 102-29, 102-32 Driving our Sustainability thrusts are the Chairperson of the Board of Directors and the President & CEO. As our Sustainability Champions, both play vital roles by influencing the Bank’s Management Team on integrating aspects of Sustainability in our scope of business and areas of operations. To centralize all our efforts, the Corporate Sustainability Unit was established in August 2019. Reporting under the Public Affairs Group, the unit is tasked to develop and implement the Bank’s Sustainability initiatives with guidance from the Office of the President and the Corporate Governance & Sustainability Committee, a Board-level committee tasked to promote environmental, social, and governance advocacies and exercise corporate governance oversight functions.
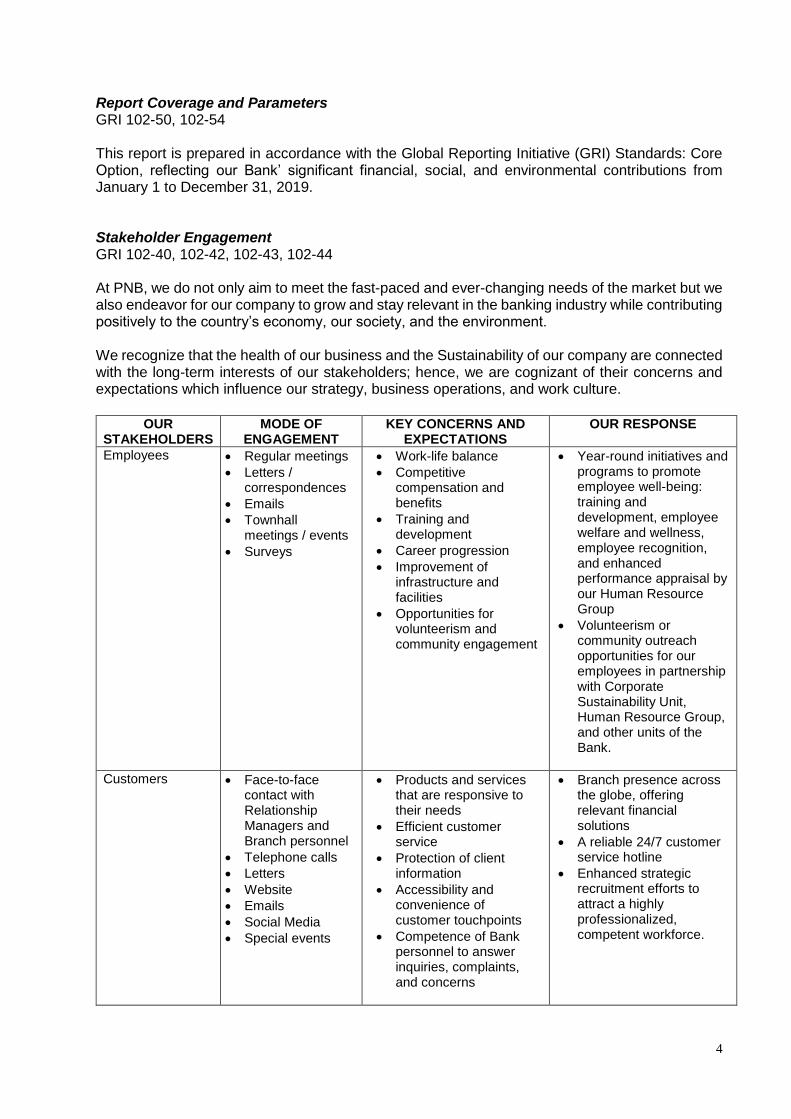
4
Report Coverage and Parameters GRI 102-50, 102-54 This report is prepared in accordance with the Global Reporting Initiative (GRI) Standards: Core Option, reflecting our Bank’ significant financial, social, and environmental contributions from January 1 to December 31, 2019. Stakeholder Engagement GRI 102-40, 102-42, 102-43, 102-44 At PNB, we do not only aim to meet the fast-paced and ever-changing needs of the market but we also endeavor for our company to grow and stay relevant in the banking industry while contributing positively to the country’s economy, our society, and the environment. We recognize that the health of our business and the Sustainability of our company are connected with the long-term interests of our stakeholders; hence, we are cognizant of their concerns and expectations which influence our strategy, business operations, and work culture.
OUR
STAKEHOLDERS MODE OF
ENGAGEMENT KEY CONCERNS AND
EXPECTATIONS OUR RESPONSE
Employees • Regular meetings
• Letters / correspondences
• Emails
• Townhall meetings / events
• Surveys
• Work-life balance
• Competitive compensation and benefits
• Training and development
• Career progression
• Improvement of infrastructure and facilities
• Opportunities for volunteerism and community engagement
• Year-round initiatives and programs to promote employee well-being: training and development, employee welfare and wellness, employee recognition, and enhanced performance appraisal by our Human Resource Group
• Volunteerism or community outreach opportunities for our employees in partnership with Corporate Sustainability Unit, Human Resource Group, and other units of the Bank.
Customers • Face-to-face contact with Relationship Managers and Branch personnel
• Telephone calls
• Letters
• Website
• Emails
• Social Media
• Special events
• Products and services that are responsive to their needs
• Efficient customer service
• Protection of client information
• Accessibility and convenience of customer touchpoints
• Competence of Bank personnel to answer inquiries, complaints, and concerns
• Branch presence across the globe, offering relevant financial solutions
• A reliable 24/7 customer service hotline
• Enhanced strategic recruitment efforts to attract a highly professionalized, competent workforce.
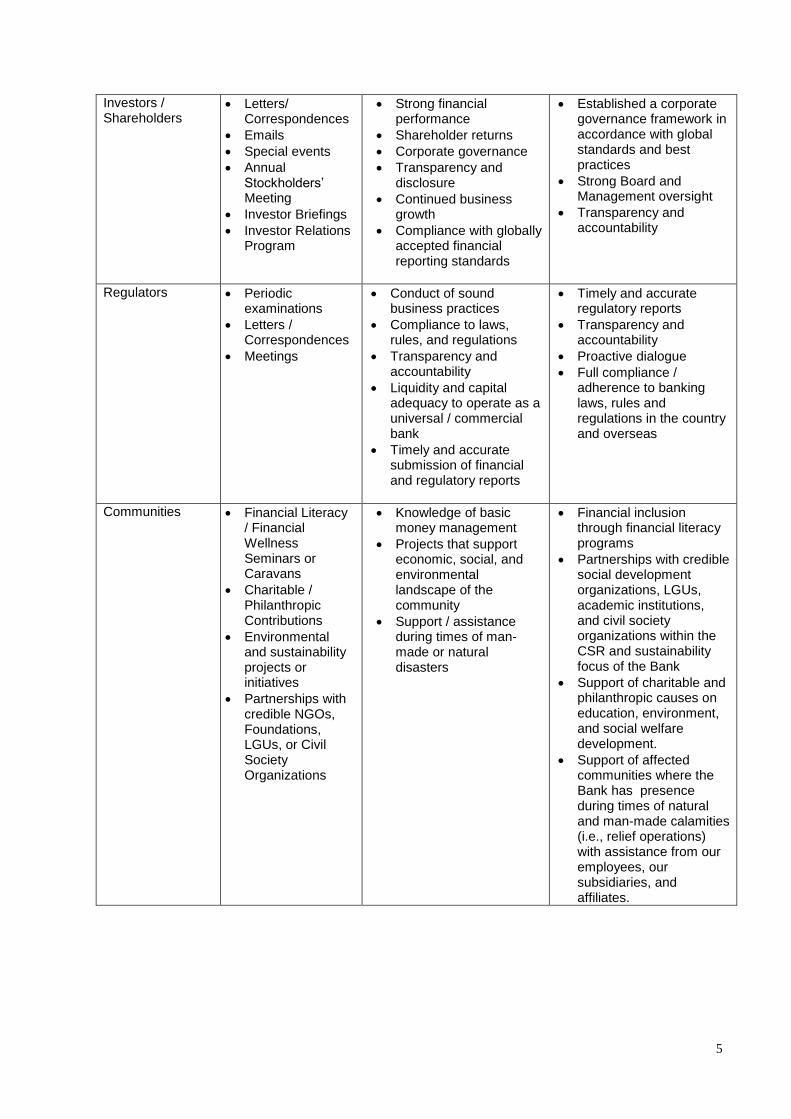
5
Investors / Shareholders
• Letters/ Correspondences
• Emails
• Special events
• Annual Stockholders’ Meeting
• Investor Briefings
• Investor Relations Program
• Strong financial performance
• Shareholder returns
• Corporate governance
• Transparency and disclosure
• Continued business growth
• Compliance with globally accepted financial reporting standards
• Established a corporate governance framework in accordance with global standards and best practices
• Strong Board and Management oversight
• Transparency and accountability
Regulators • Periodic examinations
• Letters / Correspondences
• Meetings
• Conduct of sound business practices
• Compliance to laws, rules, and regulations
• Transparency and accountability
• Liquidity and capital adequacy to operate as a universal / commercial bank
• Timely and accurate submission of financial and regulatory reports
• Timely and accurate regulatory reports
• Transparency and accountability
• Proactive dialogue
• Full compliance / adherence to banking laws, rules and regulations in the country and overseas
Communities • Financial Literacy / Financial Wellness Seminars or Caravans
• Charitable / Philanthropic Contributions
• Environmental and sustainability projects or initiatives
• Partnerships with credible NGOs, Foundations, LGUs, or Civil Society Organizations
• Knowledge of basic money management
• Projects that support economic, social, and environmental landscape of the community
• Support / assistance during times of man-made or natural disasters
• Financial inclusion through financial literacy programs
• Partnerships with credible social development organizations, LGUs, academic institutions, and civil society organizations within the CSR and sustainability focus of the Bank
• Support of charitable and philanthropic causes on education, environment, and social welfare development.
• Support of affected communities where the Bank has presence during times of natural and man-made calamities (i.e., relief operations) with assistance from our employees, our subsidiaries, and affiliates.
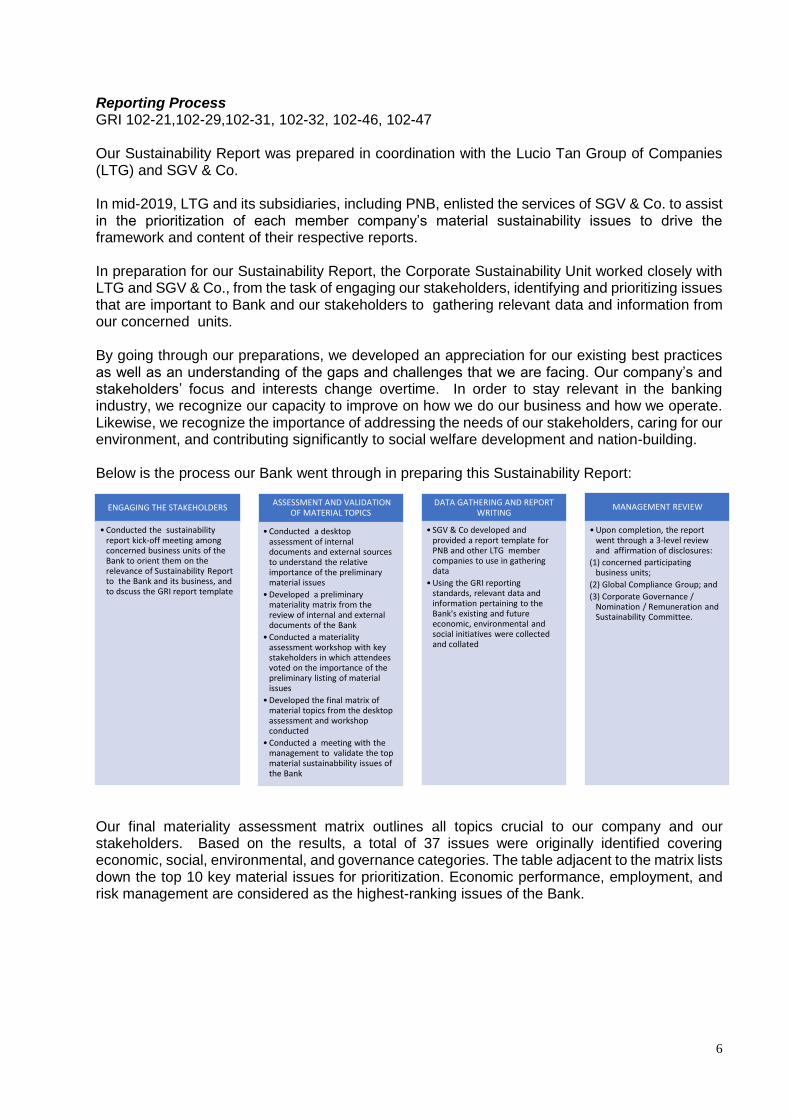
6
Reporting Process GRI 102-21,102-29,102-31, 102-32, 102-46, 102-47 Our Sustainability Report was prepared in coordination with the Lucio Tan Group of Companies (LTG) and SGV & Co. In mid-2019, LTG and its subsidiaries, including PNB, enlisted the services of SGV & Co. to assist in the prioritization of each member company’s material sustainability issues to drive the framework and content of their respective reports. In preparation for our Sustainability Report, the Corporate Sustainability Unit worked closely with LTG and SGV & Co., from the task of engaging our stakeholders, identifying and prioritizing issues that are important to Bank and our stakeholders to gathering relevant data and information from our concerned units. By going through our preparations, we developed an appreciation for our existing best practices as well as an understanding of the gaps and challenges that we are facing. Our company’s and stakeholders’ focus and interests change overtime. In order to stay relevant in the banking industry, we recognize our capacity to improve on how we do our business and how we operate. Likewise, we recognize the importance of addressing the needs of our stakeholders, caring for our environment, and contributing significantly to social welfare development and nation-building. Below is the process our Bank went through in preparing this Sustainability Report:
Our final materiality assessment matrix outlines all topics crucial to our company and our stakeholders. Based on the results, a total of 37 issues were originally identified covering economic, social, environmental, and governance categories. The table adjacent to the matrix lists down the top 10 key material issues for prioritization. Economic performance, employment, and risk management are considered as the highest-ranking issues of the Bank.
ENGAGING THE STAKEHOLDERS
•Conducted the sustainability report kick-off meeting among concerned business units of the Bank to orient them on the relevance of Sustainability Report to the Bank and its business, and to dscuss the GRI report template
ASSESSMENT AND VALIDATION OF MATERIAL TOPICS
•Conducted a desktop assessment of internal documents and external sources to understand the relative importance of the preliminary material issues
•Developed a preliminary materiality matrix from the review of internal and external documents of the Bank
•Conducted a materiality assessment workshop with key stakeholders in which attendees voted on the importance of the preliminary listing of material issues
•Developed the final matrix of material topics from the desktop assessment and workshop conducted
•Conducted a meeting with the management to validate the top material sustainabbility issues of the Bank
DATA GATHERING AND REPORT WRITING
• SGV & Co developed and provided a report template for PNB and other LTG member companies to use in gathering data
•Using the GRI reporting standards, relevant data and information pertaining to the Bank's existing and future economic, environmental and social initiatives were collected and collated
MANAGEMENT REVIEW
•Upon completion, the report went through a 3-level review and affirmation of disclosures:
(1) concerned participating business units;
(2) Global Compliance Group; and
(3) Corporate Governance / Nomination / Remuneration and Sustainability Committee.
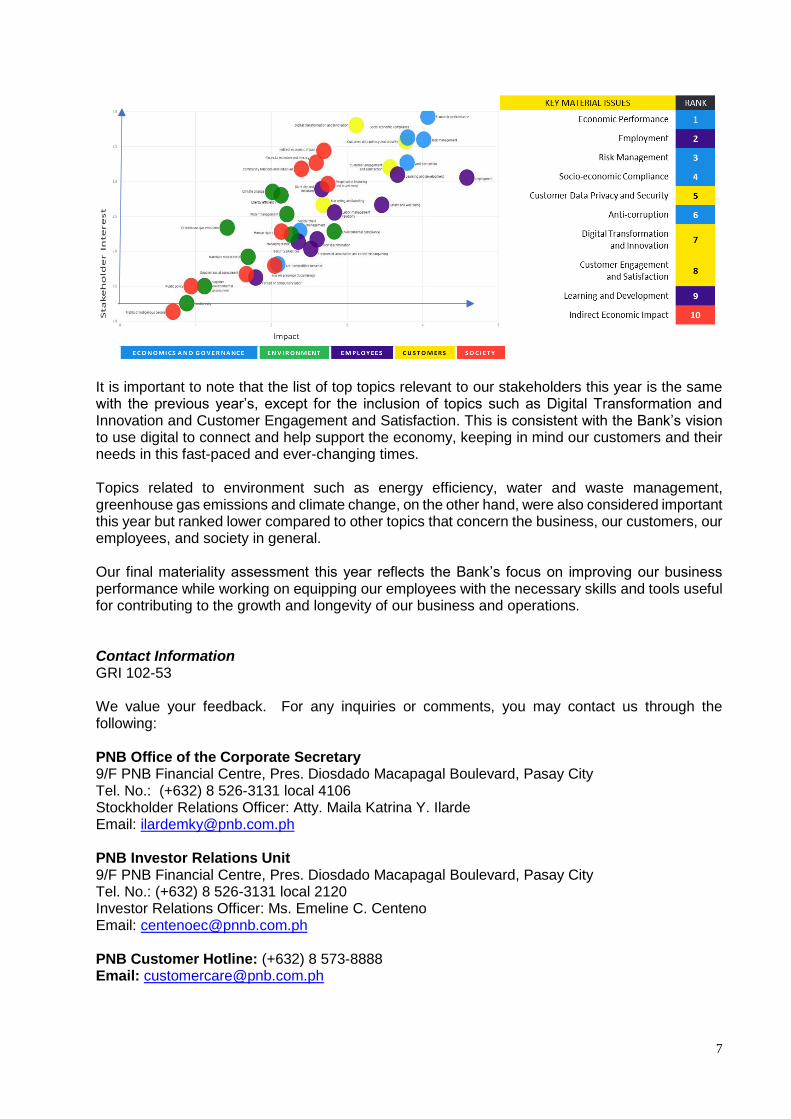
7
It is important to note that the list of top topics relevant to our stakeholders this year is the same with the previous year’s, except for the inclusion of topics such as Digital Transformation and Innovation and Customer Engagement and Satisfaction. This is consistent with the Bank’s vision to use digital to connect and help support the economy, keeping in mind our customers and their needs in this fast-paced and ever-changing times. Topics related to environment such as energy efficiency, water and waste management, greenhouse gas emissions and climate change, on the other hand, were also considered important this year but ranked lower compared to other topics that concern the business, our customers, our employees, and society in general. Our final materiality assessment this year reflects the Bank’s focus on improving our business performance while working on equipping our employees with the necessary skills and tools useful for contributing to the growth and longevity of our business and operations. Contact Information GRI 102-53 We value your feedback. For any inquiries or comments, you may contact us through the following: PNB Office of the Corporate Secretary 9/F PNB Financial Centre, Pres. Diosdado Macapagal Boulevard, Pasay City Tel. No.: (+632) 8 526-3131 local 4106 Stockholder Relations Officer: Atty. Maila Katrina Y. Ilarde Email: [email protected] PNB Investor Relations Unit 9/F PNB Financial Centre, Pres. Diosdado Macapagal Boulevard, Pasay City Tel. No.: (+632) 8 526-3131 local 2120 Investor Relations Officer: Ms. Emeline C. Centeno Email: [email protected] PNB Customer Hotline: (+632) 8 573-8888 Email: [email protected]
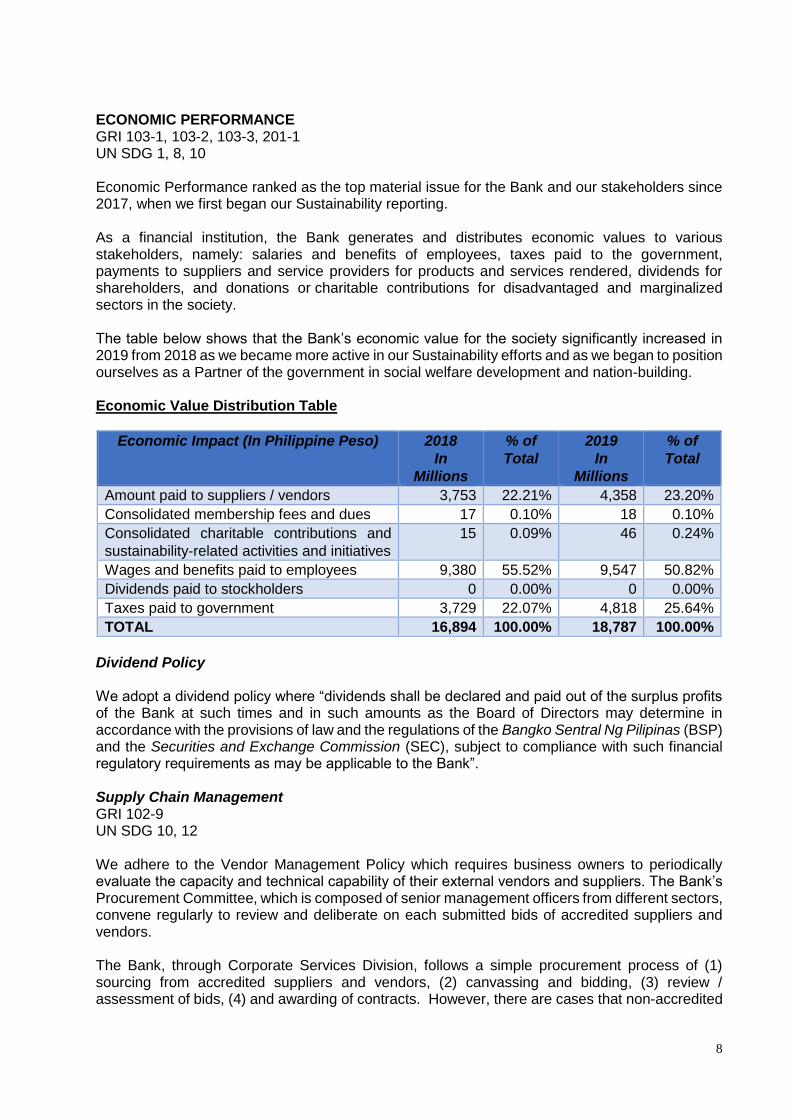
8
ECONOMIC PERFORMANCE GRI 103-1, 103-2, 103-3, 201-1 UN SDG 1, 8, 10 Economic Performance ranked as the top material issue for the Bank and our stakeholders since 2017, when we first began our Sustainability reporting. As a financial institution, the Bank generates and distributes economic values to various stakeholders, namely: salaries and benefits of employees, taxes paid to the government, payments to suppliers and service providers for products and services rendered, dividends for shareholders, and donations or charitable contributions for disadvantaged and marginalized sectors in the society. The table below shows that the Bank’s economic value for the society significantly increased in 2019 from 2018 as we became more active in our Sustainability efforts and as we began to position ourselves as a Partner of the government in social welfare development and nation-building. Economic Value Distribution Table
Economic Impact (In Philippine Peso) 2018
In
Millions
% of
Total
2019
In
Millions
% of
Total
Amount paid to suppliers / vendors 3,753 22.21% 4,358 23.20%
Consolidated membership fees and dues 17 0.10% 18 0.10%
Consolidated charitable contributions and
sustainability-related activities and initiatives
15 0.09% 46 0.24%
Wages and benefits paid to employees 9,380 55.52% 9,547 50.82%
Dividends paid to stockholders 0 0.00% 0 0.00%
Taxes paid to government 3,729 22.07% 4,818 25.64%
TOTAL 16,894 100.00% 18,787 100.00%
Dividend Policy We adopt a dividend policy where “dividends shall be declared and paid out of the surplus profits of the Bank at such times and in such amounts as the Board of Directors may determine in accordance with the provisions of law and the regulations of the Bangko Sentral Ng Pilipinas (BSP) and the Securities and Exchange Commission (SEC), subject to compliance with such financial regulatory requirements as may be applicable to the Bank”. Supply Chain Management GRI 102-9 UN SDG 10, 12 We adhere to the Vendor Management Policy which requires business owners to periodically evaluate the capacity and technical capability of their external vendors and suppliers. The Bank’s Procurement Committee, which is composed of senior management officers from different sectors, convene regularly to review and deliberate on each submitted bids of accredited suppliers and vendors. The Bank, through Corporate Services Division, follows a simple procurement process of (1) sourcing from accredited suppliers and vendors, (2) canvassing and bidding, (3) review / assessment of bids, (4) and awarding of contracts. However, there are cases that non-accredited
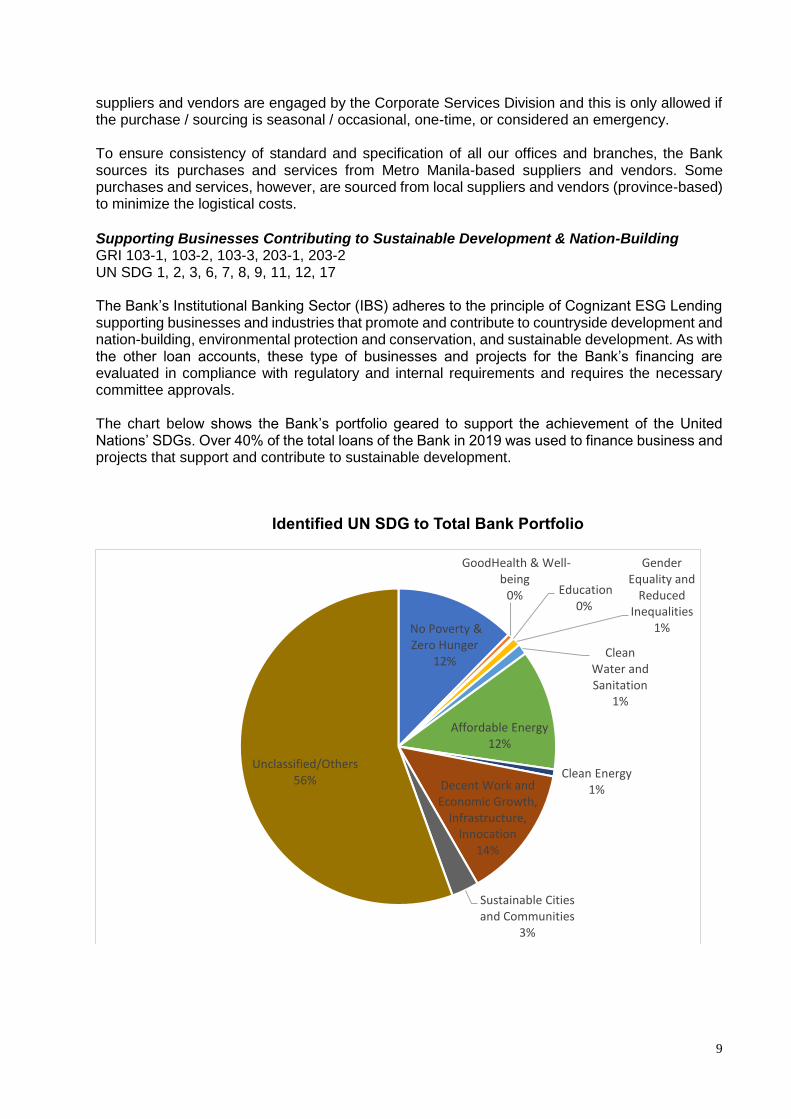
9
suppliers and vendors are engaged by the Corporate Services Division and this is only allowed if the purchase / sourcing is seasonal / occasional, one-time, or considered an emergency. To ensure consistency of standard and specification of all our offices and branches, the Bank sources its purchases and services from Metro Manila-based suppliers and vendors. Some purchases and services, however, are sourced from local suppliers and vendors (province-based) to minimize the logistical costs. Supporting Businesses Contributing to Sustainable Development & Nation-Building GRI 103-1, 103-2, 103-3, 203-1, 203-2 UN SDG 1, 2, 3, 6, 7, 8, 9, 11, 12, 17 The Bank’s Institutional Banking Sector (IBS) adheres to the principle of Cognizant ESG Lending supporting businesses and industries that promote and contribute to countryside development and nation-building, environmental protection and conservation, and sustainable development. As with the other loan accounts, these type of businesses and projects for the Bank’s financing are evaluated in compliance with regulatory and internal requirements and requires the necessary committee approvals. The chart below shows the Bank’s portfolio geared to support the achievement of the United Nations’ SDGs. Over 40% of the total loans of the Bank in 2019 was used to finance business and projects that support and contribute to sustainable development.
No Poverty & Zero Hunger
12%
GoodHealth & Well-being
0% Education 0%
Gender Equality and
Reduced Inequalities
1%
Clean Water and Sanitation
1%
Affordable Energy12%
Clean Energy1%Decent Work and
Economic Growth, Infrastructure,
Innocation14%
Sustainable Cities and Communities
3%
Unclassified/Others56%
Identified UN SDG to Total Bank Portfolio
10
The Bank has supported more business and industries that are into (1) food manufacturing and production; (2) energy transmission, generation, distribution; and (3) infrastructure development. In compliance with the BSP’s 2019 Circular requiring all banks to integrate environmental, social, and governance financing guidelines in their business operations, we drafted our own Sustainable Financing Policy and Framework for lending and investing. Once approved, the said policy and framework will allow the Bank to effectively assess and manage our environmental and social risks and impacts associated with supporting particular businesses, projects, and industry sectors. ENVIRONMENTAL IMPACT Although environmental concerns ranked lower in the Bank’s materiality assessment, we consider these as an integral part of our business and operations. To show our commitment to mitigating climate change, we began to take concrete actions by raising environmental awareness among our employees through campaigns and initiatives for reducing the Bank’s environmental footprint such as improving energy and water consumption, implementing proper waste management, and ensuring that the businesses, projects, and industries we support are also environmentally compliant. The report below covers the environmental footprint of the Bank’s headquarters in Metro Manila, namely, the PNB Financial Center in Pasay City and PNB Makati Center in Makati City. The Bank aims to report on its countrywide environmental footprint in 2021, covering our branches and offices all over the Philippines. Assessing the Environmental Impact of Our Supported Businesses GRI 103-1, 103-2, 103-3, 308-1 UN SDG 9,11 The Bank ensures that the businesses and industries we support are compliant with environmental regulations and laws through covenants provided for in financial agreements or contracts and submission of permits such as Environmental Compliance Certificates (ECC) issued by the Department of Environment and Natural Resources (DENR) and other pertinent government agencies. Businesses such as power, water, infrastructure, industrial, and mining projects situated in environmentally critical areas such as national parks, sanctuaries, and potential tourist spots are considered Environmentally Critical Projects (ECPs). Thus, these ECPs are required to submit Environmental Assessment Reports as part of their loan requirements, and their business proposals are reviewed and carefully deliberated on by relevant Bank committees. Upon granting approval on the loan, the Bank continuously monitors the environmental compliance, including the climate change related risks and impacts of these ECPs to the overall business during the period of engagement and partnership. For 2019, the Bank provided financing for environmentally compliant ECPs as follows:
• Operation of Toll Roads and Bridges; • Generation and Distribution of Power and Water; • Construction of Green or LEED buildings and infrastructure; and • Real Estate Development.

11
Participating on the Earth Hour and International Water Day UN SDG 6, 7, 13 During the water and power crisis on the first and second quarters of 2019, the Bank encouraged all employees to contribute in reducing the use of electricity and conserving water at work and in their own homes by actively participating in the World Water Day last March 22, 2019 and the Earth Hour last March 30, 2019. The World Water Day is a yearly international day of observance declared by the United Nations to help spread awareness on the importance of water conservation and inspire people to take steps in making safe water available for everyone. The Earth Hour, on the other hand, is the annual 60-minute “lights-off” global movement led by the World Wildlife Fund for Nature (WWF) that aims to empower individuals, organizations, and governments to take tangible actions to help protect the planet. In solidarity with the rest of the country and the world, the Bank turned off all non-essential lights in its branches and offices from 8:30PM to 9:30PM, including the lights on all its billboards nationwide. The Bank also initiated a call tree advisory among its employees on March 29, 2019 and March 30, 2019 encouraging them to join the 60-minute symbolic switch off of non-essential lights and appliances in their own homes. Project P.L.A.N.E.T. and the Campaign to Reduce Single-Use Plastics at Work UN SDG 12, 13 On July 2019, we launched Project P.L.A.N.E.T. (Protect, Love, And Nurture the Environment Together), an internal campaign which aims to raise environmental and sustainability awareness among employees and inspire them to reduce their environmental footprint at work and in their own homes. A component of Project P.L.A.N.E.T. is a 6-month long campaign piloted at the PNB Financial Center and PNB Makati Center that aims to reduce the Bank’s consumption of single-use plastics as our commitment to mitigate the effects of climate change, protect the seas and oceans, and preserve underwater wildlife. The Bank’s Corporate Sustainability Unit, together with the Human Resource Group and the Food Committee, oriented the food concessionaires on the campaign. They were also consulted and requested to provide alternatives to single-use plastic packaging and utensils such as food-grade containers and paper boxes, paper cups, and bamboo-made or starch-made eating utensils. In addition, the employees were also encouraged to reduce their usage of single-use plastics by discontinuing the use of plastic straws and using their own food containers when buying meals or snacks from canteen concessionaires. Since the start of the campaign in July 2019, the Bank was successful in reducing the monthly consumption of the following single-use plastics:
Type of Single-Use Plastics Monthly Inventory before the Campaign
Average Monthly Inventory by End of 2019
Sando Bags 26,100 pcs 0
Plastic Bags for Viands 42,760 pcs 220 pcs
Plastic Straws 8,800 pcs 0
Plastic Stirrers 10,200 pcs 0
Plastic Spoons, Forks 21,225 pcs spoons 21,959 pcs forks
50 pcs spoons 50 pcs forks
Plastic Lids (on coffee / drinks) 4,678 pcs 1,300 pcs
Plastic Cups 5,274 pcs 25 pcs
Styrofoam / polystyrene containers
0 0
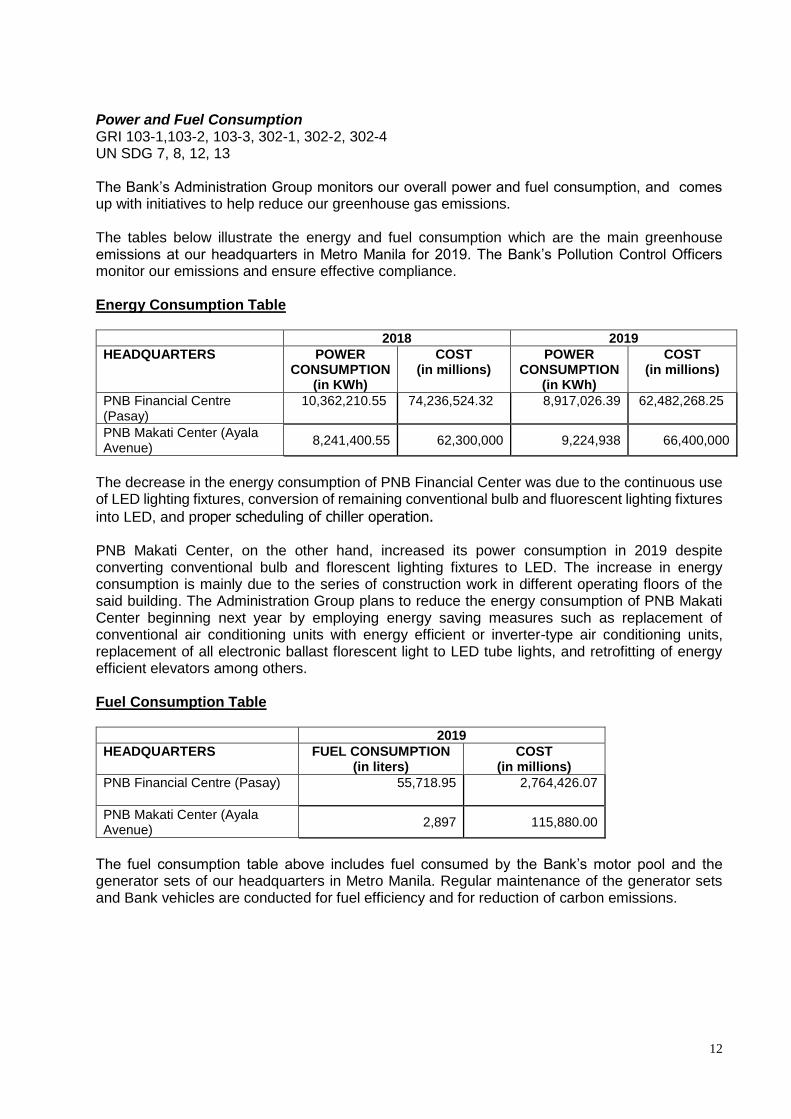
12
Power and Fuel Consumption GRI 103-1,103-2, 103-3, 302-1, 302-2, 302-4 UN SDG 7, 8, 12, 13 The Bank’s Administration Group monitors our overall power and fuel consumption, and comes up with initiatives to help reduce our greenhouse gas emissions. The tables below illustrate the energy and fuel consumption which are the main greenhouse emissions at our headquarters in Metro Manila for 2019. The Bank’s Pollution Control Officers monitor our emissions and ensure effective compliance. Energy Consumption Table
2018 2019
HEADQUARTERS POWER CONSUMPTION
(in KWh)
COST (in millions)
POWER CONSUMPTION
(in KWh)
COST (in millions)
PNB Financial Centre (Pasay)
10,362,210.55 74,236,524.32 8,917,026.39 62,482,268.25
PNB Makati Center (Ayala Avenue)
8,241,400.55 62,300,000 9,224,938 66,400,000
The decrease in the energy consumption of PNB Financial Center was due to the continuous use of LED lighting fixtures, conversion of remaining conventional bulb and fluorescent lighting fixtures
into LED, and proper scheduling of chiller operation. PNB Makati Center, on the other hand, increased its power consumption in 2019 despite converting conventional bulb and florescent lighting fixtures to LED. The increase in energy consumption is mainly due to the series of construction work in different operating floors of the said building. The Administration Group plans to reduce the energy consumption of PNB Makati Center beginning next year by employing energy saving measures such as replacement of conventional air conditioning units with energy efficient or inverter-type air conditioning units, replacement of all electronic ballast florescent light to LED tube lights, and retrofitting of energy efficient elevators among others. Fuel Consumption Table
2019
HEADQUARTERS FUEL CONSUMPTION (in liters)
COST (in millions)
PNB Financial Centre (Pasay) 55,718.95
2,764,426.07
PNB Makati Center (Ayala Avenue)
2,897 115,880.00
The fuel consumption table above includes fuel consumed by the Bank’s motor pool and the generator sets of our headquarters in Metro Manila. Regular maintenance of the generator sets and Bank vehicles are conducted for fuel efficiency and for reduction of carbon emissions.
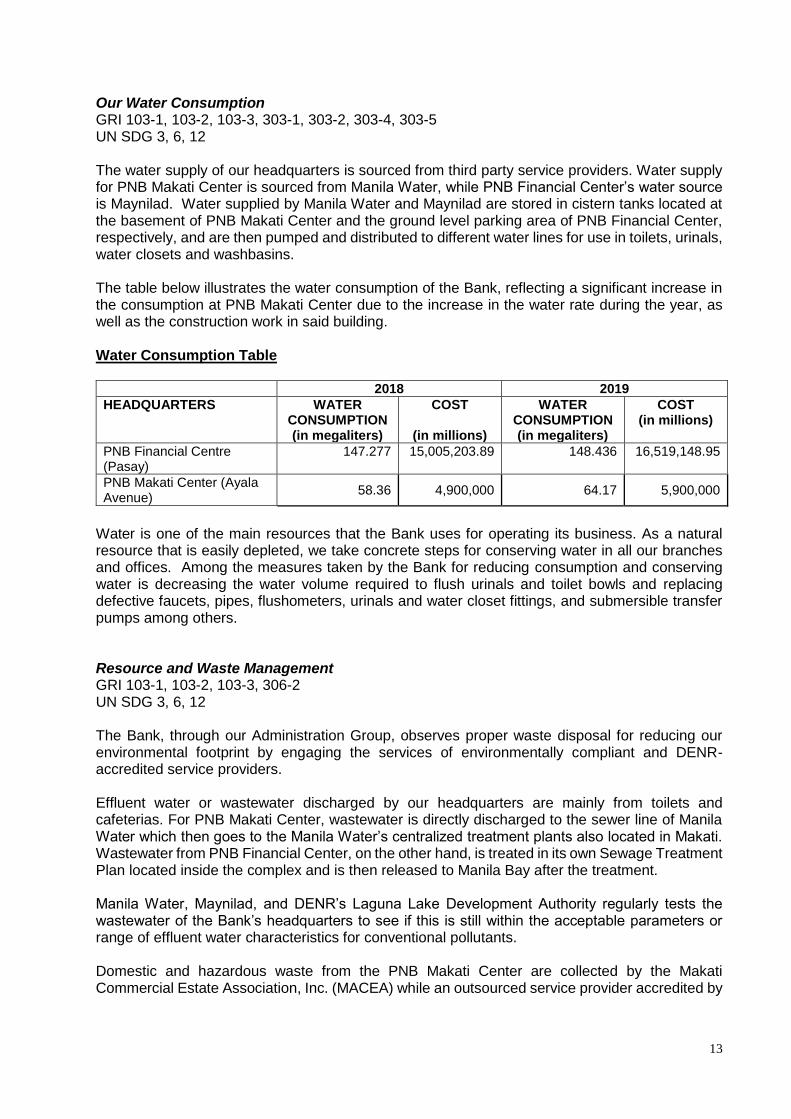
13
Our Water Consumption GRI 103-1, 103-2, 103-3, 303-1, 303-2, 303-4, 303-5 UN SDG 3, 6, 12 The water supply of our headquarters is sourced from third party service providers. Water supply for PNB Makati Center is sourced from Manila Water, while PNB Financial Center’s water source is Maynilad. Water supplied by Manila Water and Maynilad are stored in cistern tanks located at the basement of PNB Makati Center and the ground level parking area of PNB Financial Center, respectively, and are then pumped and distributed to different water lines for use in toilets, urinals, water closets and washbasins. The table below illustrates the water consumption of the Bank, reflecting a significant increase in the consumption at PNB Makati Center due to the increase in the water rate during the year, as well as the construction work in said building. Water Consumption Table
2018 2019
HEADQUARTERS WATER CONSUMPTION (in megaliters)
COST
(in millions)
WATER CONSUMPTION (in megaliters)
COST (in millions)
PNB Financial Centre (Pasay)
147.277 15,005,203.89
148.436 16,519,148.95
PNB Makati Center (Ayala Avenue)
58.36 4,900,000 64.17 5,900,000
Water is one of the main resources that the Bank uses for operating its business. As a natural resource that is easily depleted, we take concrete steps for conserving water in all our branches and offices. Among the measures taken by the Bank for reducing consumption and conserving water is decreasing the water volume required to flush urinals and toilet bowls and replacing defective faucets, pipes, flushometers, urinals and water closet fittings, and submersible transfer pumps among others. Resource and Waste Management GRI 103-1, 103-2, 103-3, 306-2 UN SDG 3, 6, 12 The Bank, through our Administration Group, observes proper waste disposal for reducing our environmental footprint by engaging the services of environmentally compliant and DENR-accredited service providers. Effluent water or wastewater discharged by our headquarters are mainly from toilets and cafeterias. For PNB Makati Center, wastewater is directly discharged to the sewer line of Manila Water which then goes to the Manila Water’s centralized treatment plants also located in Makati. Wastewater from PNB Financial Center, on the other hand, is treated in its own Sewage Treatment Plan located inside the complex and is then released to Manila Bay after the treatment. Manila Water, Maynilad, and DENR’s Laguna Lake Development Authority regularly tests the wastewater of the Bank’s headquarters to see if this is still within the acceptable parameters or range of effluent water characteristics for conventional pollutants. Domestic and hazardous waste from the PNB Makati Center are collected by the Makati Commercial Estate Association, Inc. (MACEA) while an outsourced service provider accredited by
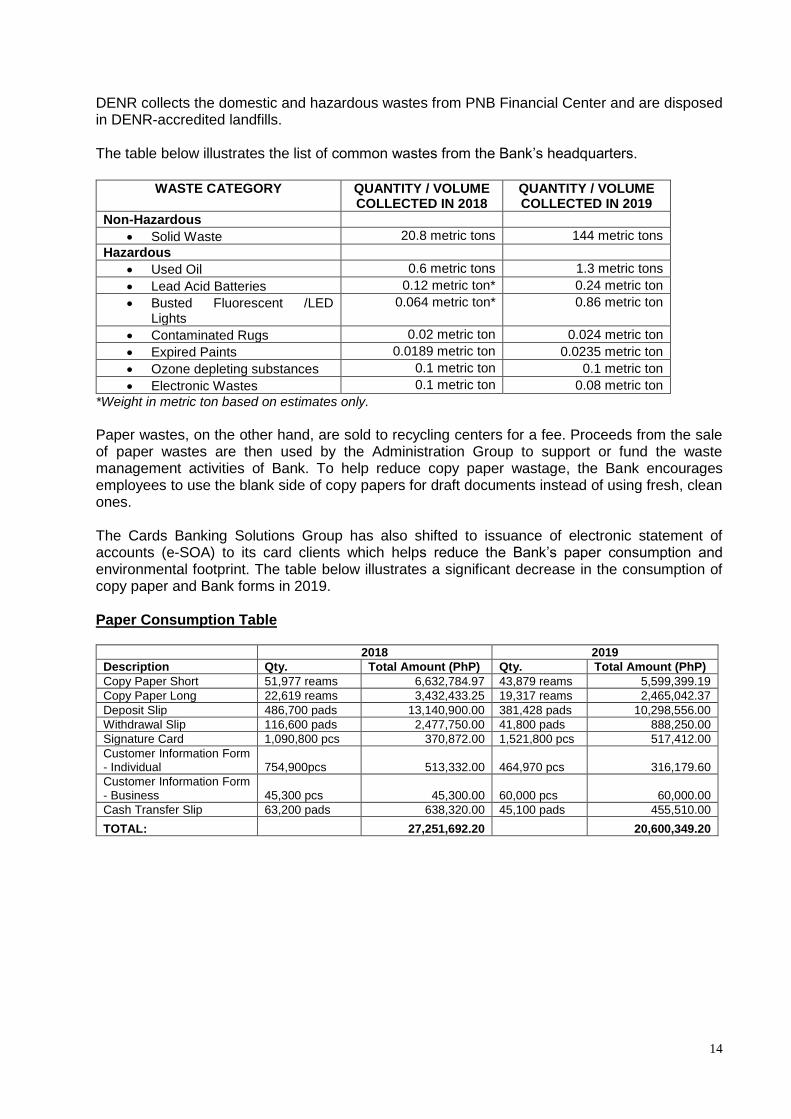
14
DENR collects the domestic and hazardous wastes from PNB Financial Center and are disposed in DENR-accredited landfills. The table below illustrates the list of common wastes from the Bank’s headquarters.
WASTE CATEGORY QUANTITY / VOLUME
COLLECTED IN 2018 QUANTITY / VOLUME COLLECTED IN 2019
Non-Hazardous
• Solid Waste 20.8 metric tons 144 metric tons
Hazardous
• Used Oil 0.6 metric tons 1.3 metric tons
• Lead Acid Batteries 0.12 metric ton* 0.24 metric ton
• Busted Fluorescent /LED Lights
0.064 metric ton* 0.86 metric ton
• Contaminated Rugs 0.02 metric ton 0.024 metric ton
• Expired Paints 0.0189 metric ton 0.0235 metric ton
• Ozone depleting substances 0.1 metric ton 0.1 metric ton
• Electronic Wastes 0.1 metric ton 0.08 metric ton
*Weight in metric ton based on estimates only.
Paper wastes, on the other hand, are sold to recycling centers for a fee. Proceeds from the sale of paper wastes are then used by the Administration Group to support or fund the waste management activities of Bank. To help reduce copy paper wastage, the Bank encourages employees to use the blank side of copy papers for draft documents instead of using fresh, clean ones. The Cards Banking Solutions Group has also shifted to issuance of electronic statement of accounts (e-SOA) to its card clients which helps reduce the Bank’s paper consumption and environmental footprint. The table below illustrates a significant decrease in the consumption of copy paper and Bank forms in 2019. Paper Consumption Table
2018 2019
Description Qty. Total Amount (PhP) Qty. Total Amount (PhP) Copy Paper Short 51,977 reams 6,632,784.97 43,879 reams 5,599,399.19 Copy Paper Long 22,619 reams 3,432,433.25 19,317 reams 2,465,042.37 Deposit Slip 486,700 pads 13,140,900.00 381,428 pads 10,298,556.00 Withdrawal Slip 116,600 pads 2,477,750.00 41,800 pads 888,250.00 Signature Card 1,090,800 pcs 370,872.00 1,521,800 pcs 517,412.00 Customer Information Form - Individual 754,900pcs 513,332.00 464,970 pcs 316,179.60 Customer Information Form - Business 45,300 pcs 45,300.00 60,000 pcs 60,000.00 Cash Transfer Slip 63,200 pads 638,320.00 45,100 pads 455,510.00
TOTAL: 27,251,692.20 20,600,349.20
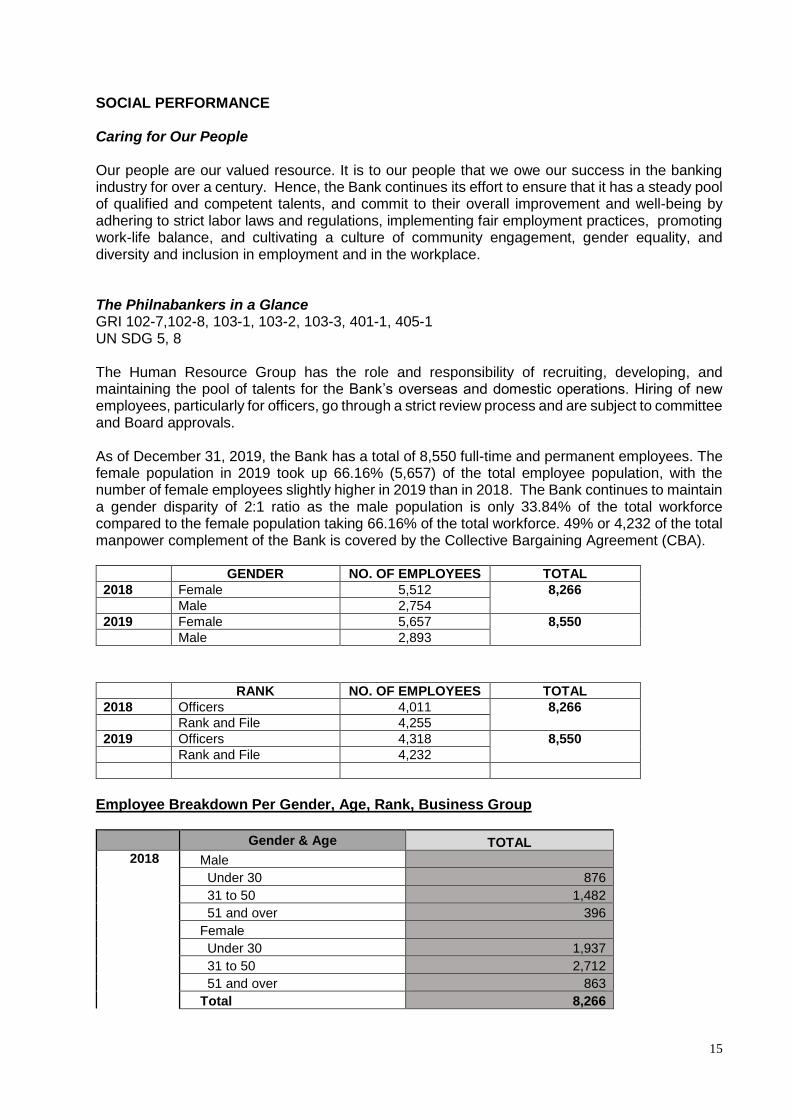
15
SOCIAL PERFORMANCE Caring for Our People Our people are our valued resource. It is to our people that we owe our success in the banking industry for over a century. Hence, the Bank continues its effort to ensure that it has a steady pool of qualified and competent talents, and commit to their overall improvement and well-being by adhering to strict labor laws and regulations, implementing fair employment practices, promoting work-life balance, and cultivating a culture of community engagement, gender equality, and diversity and inclusion in employment and in the workplace. The Philnabankers in a Glance GRI 102-7,102-8, 103-1, 103-2, 103-3, 401-1, 405-1 UN SDG 5, 8 The Human Resource Group has the role and responsibility of recruiting, developing, and maintaining the pool of talents for the Bank’s overseas and domestic operations. Hiring of new employees, particularly for officers, go through a strict review process and are subject to committee and Board approvals. As of December 31, 2019, the Bank has a total of 8,550 full-time and permanent employees. The female population in 2019 took up 66.16% (5,657) of the total employee population, with the number of female employees slightly higher in 2019 than in 2018. The Bank continues to maintain a gender disparity of 2:1 ratio as the male population is only 33.84% of the total workforce compared to the female population taking 66.16% of the total workforce. 49% or 4,232 of the total manpower complement of the Bank is covered by the Collective Bargaining Agreement (CBA).
GENDER NO. OF EMPLOYEES TOTAL
2018 Female 5,512 8,266
Male 2,754
2019 Female 5,657 8,550
Male 2,893
RANK NO. OF EMPLOYEES TOTAL
2018 Officers 4,011 8,266
Rank and File 4,255
2019 Officers 4,318 8,550
Rank and File 4,232
Employee Breakdown Per Gender, Age, Rank, Business Group
Gender & Age TOTAL
2018 Male
Under 30 876
31 to 50 1,482
51 and over 396
Female
Under 30 1,937
31 to 50 2,712
51 and over 863
Total 8,266
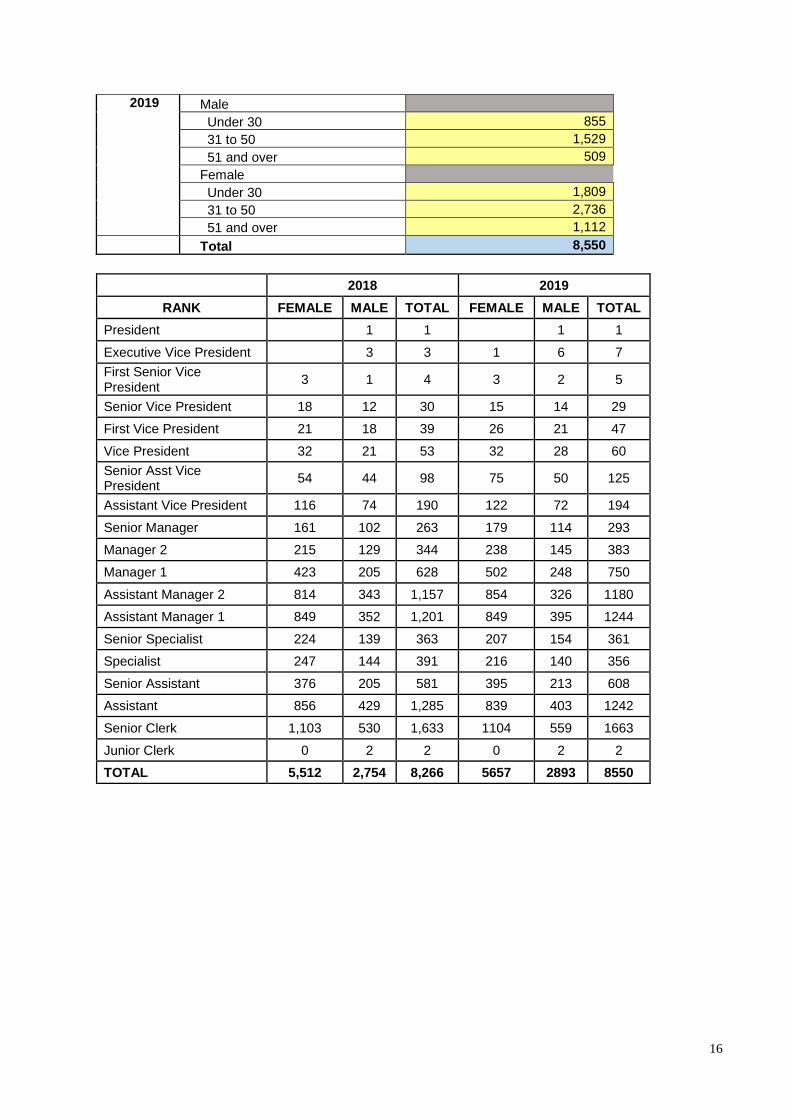
16
2019
Male
Under 30 855
31 to 50 1,529
51 and over 509
Female
Under 30 1,809
31 to 50 2,736
51 and over 1,112
Total 8,550
2018 2019
RANK FEMALE MALE TOTAL FEMALE MALE TOTAL
President 1 1 1 1
Executive Vice President 3 3 1 6 7
First Senior Vice President
3 1 4 3 2 5
Senior Vice President 18 12 30 15 14 29
First Vice President 21 18 39 26 21 47
Vice President 32 21 53 32 28 60
Senior Asst Vice President
54 44 98 75 50 125
Assistant Vice President 116 74 190 122 72 194
Senior Manager 161 102 263 179 114 293
Manager 2 215 129 344 238 145 383
Manager 1 423 205 628 502 248 750
Assistant Manager 2 814 343 1,157 854 326 1180
Assistant Manager 1 849 352 1,201 849 395 1244
Senior Specialist 224 139 363 207 154 361
Specialist 247 144 391 216 140 356
Senior Assistant 376 205 581 395 213 608
Assistant 856 429 1,285 839 403 1242
Senior Clerk 1,103 530 1,633 1104 559 1663
Junior Clerk 0 2 2 0 2 2
TOTAL 5,512 2,754 8,266 5657 2893 8550
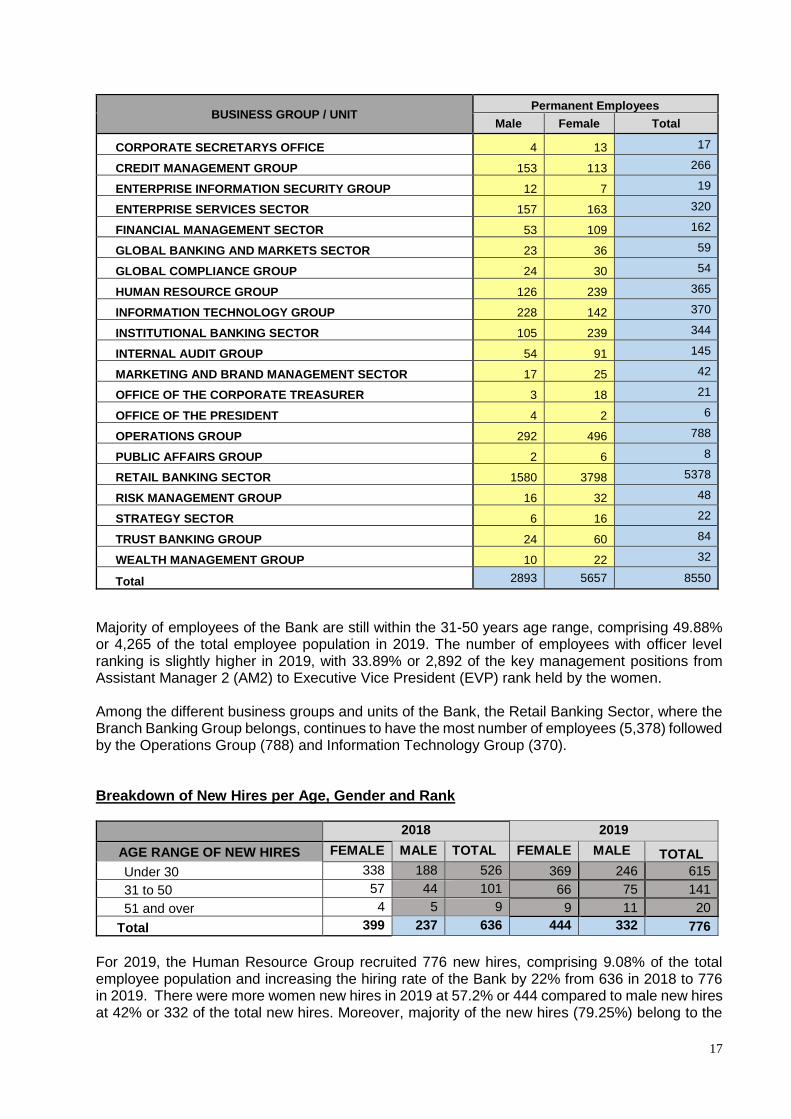
17
BUSINESS GROUP / UNIT Permanent Employees
Male Female Total
CORPORATE SECRETARYS OFFICE 4 13 17
CREDIT MANAGEMENT GROUP 153 113 266
ENTERPRISE INFORMATION SECURITY GROUP 12 7 19
ENTERPRISE SERVICES SECTOR 157 163 320
FINANCIAL MANAGEMENT SECTOR 53 109 162
GLOBAL BANKING AND MARKETS SECTOR 23 36 59
GLOBAL COMPLIANCE GROUP 24 30 54
HUMAN RESOURCE GROUP 126 239 365
INFORMATION TECHNOLOGY GROUP 228 142 370
INSTITUTIONAL BANKING SECTOR 105 239 344
INTERNAL AUDIT GROUP 54 91 145
MARKETING AND BRAND MANAGEMENT SECTOR 17 25 42
OFFICE OF THE CORPORATE TREASURER 3 18 21
OFFICE OF THE PRESIDENT 4 2 6
OPERATIONS GROUP 292 496 788
PUBLIC AFFAIRS GROUP 2 6 8
RETAIL BANKING SECTOR 1580 3798 5378
RISK MANAGEMENT GROUP 16 32 48
STRATEGY SECTOR 6 16 22
TRUST BANKING GROUP 24 60 84
WEALTH MANAGEMENT GROUP 10 22 32
Total 2893 5657 8550
Majority of employees of the Bank are still within the 31-50 years age range, comprising 49.88% or 4,265 of the total employee population in 2019. The number of employees with officer level ranking is slightly higher in 2019, with 33.89% or 2,892 of the key management positions from Assistant Manager 2 (AM2) to Executive Vice President (EVP) rank held by the women. Among the different business groups and units of the Bank, the Retail Banking Sector, where the Branch Banking Group belongs, continues to have the most number of employees (5,378) followed by the Operations Group (788) and Information Technology Group (370). Breakdown of New Hires per Age, Gender and Rank
2018 2019
AGE RANGE OF NEW HIRES FEMALE MALE TOTAL FEMALE MALE TOTAL
Under 30 338 188 526 369 246 615
31 to 50 57 44 101 66 75 141
51 and over 4 5 9 9 11 20
Total 399 237 636 444 332 776
For 2019, the Human Resource Group recruited 776 new hires, comprising 9.08% of the total employee population and increasing the hiring rate of the Bank by 22% from 636 in 2018 to 776 in 2019. There were more women new hires in 2019 at 57.2% or 444 compared to male new hires at 42% or 332 of the total new hires. Moreover, majority of the new hires (79.25%) belong to the
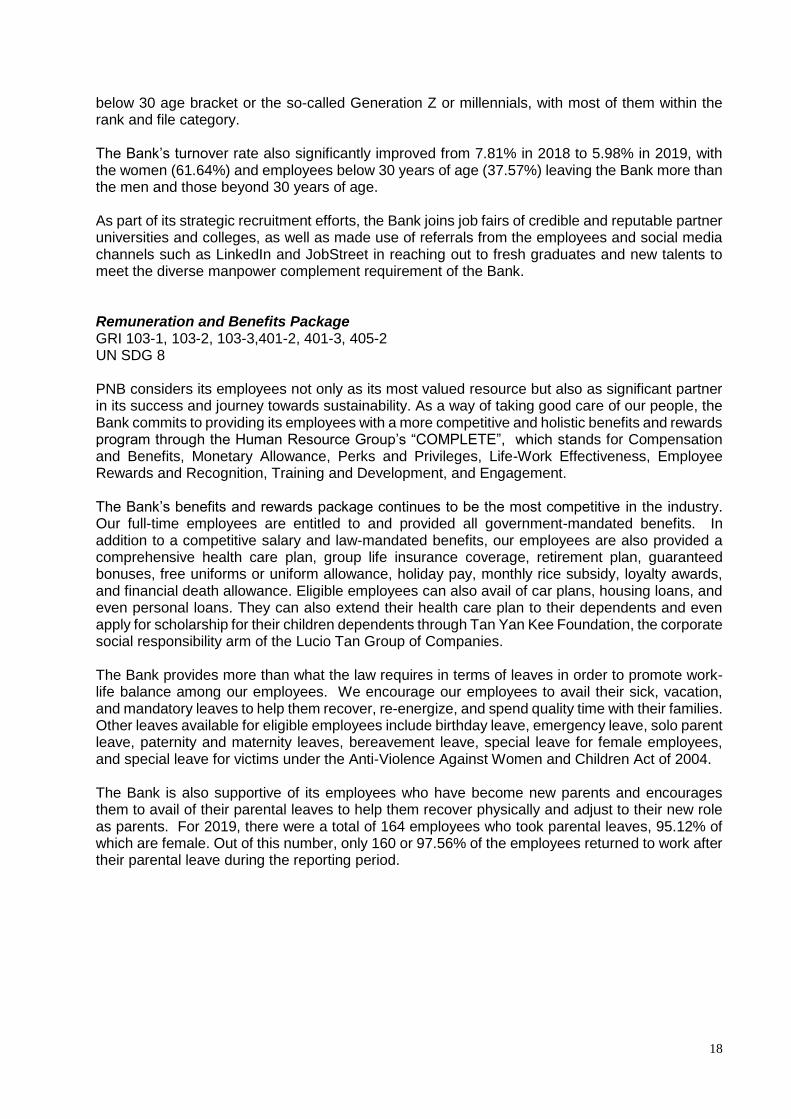
18
below 30 age bracket or the so-called Generation Z or millennials, with most of them within the rank and file category. The Bank’s turnover rate also significantly improved from 7.81% in 2018 to 5.98% in 2019, with the women (61.64%) and employees below 30 years of age (37.57%) leaving the Bank more than the men and those beyond 30 years of age. As part of its strategic recruitment efforts, the Bank joins job fairs of credible and reputable partner universities and colleges, as well as made use of referrals from the employees and social media channels such as LinkedIn and JobStreet in reaching out to fresh graduates and new talents to meet the diverse manpower complement requirement of the Bank. Remuneration and Benefits Package GRI 103-1, 103-2, 103-3,401-2, 401-3, 405-2 UN SDG 8 PNB considers its employees not only as its most valued resource but also as significant partner in its success and journey towards sustainability. As a way of taking good care of our people, the Bank commits to providing its employees with a more competitive and holistic benefits and rewards program through the Human Resource Group’s “COMPLETE”, which stands for Compensation and Benefits, Monetary Allowance, Perks and Privileges, Life-Work Effectiveness, Employee Rewards and Recognition, Training and Development, and Engagement. The Bank’s benefits and rewards package continues to be the most competitive in the industry. Our full-time employees are entitled to and provided all government-mandated benefits. In addition to a competitive salary and law-mandated benefits, our employees are also provided a comprehensive health care plan, group life insurance coverage, retirement plan, guaranteed bonuses, free uniforms or uniform allowance, holiday pay, monthly rice subsidy, loyalty awards, and financial death allowance. Eligible employees can also avail of car plans, housing loans, and even personal loans. They can also extend their health care plan to their dependents and even apply for scholarship for their children dependents through Tan Yan Kee Foundation, the corporate social responsibility arm of the Lucio Tan Group of Companies. The Bank provides more than what the law requires in terms of leaves in order to promote work-life balance among our employees. We encourage our employees to avail their sick, vacation, and mandatory leaves to help them recover, re-energize, and spend quality time with their families. Other leaves available for eligible employees include birthday leave, emergency leave, solo parent leave, paternity and maternity leaves, bereavement leave, special leave for female employees, and special leave for victims under the Anti-Violence Against Women and Children Act of 2004. The Bank is also supportive of its employees who have become new parents and encourages them to avail of their parental leaves to help them recover physically and adjust to their new role as parents. For 2019, there were a total of 164 employees who took parental leaves, 95.12% of which are female. Out of this number, only 160 or 97.56% of the employees returned to work after their parental leave during the reporting period.
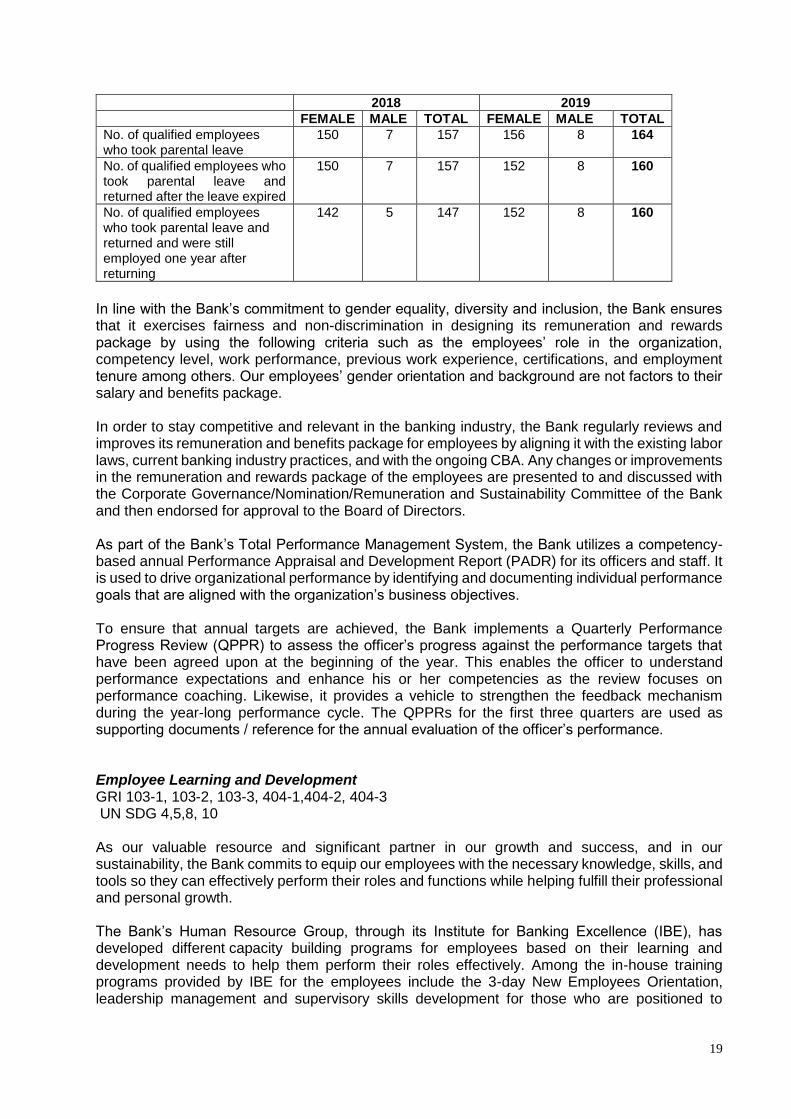
19
2018 2019
FEMALE MALE TOTAL FEMALE MALE TOTAL
No. of qualified employees who took parental leave
150 7 157 156 8 164
No. of qualified employees who took parental leave and returned after the leave expired
150 7 157 152 8 160
No. of qualified employees who took parental leave and returned and were still employed one year after returning
142 5 147 152 8 160
In line with the Bank’s commitment to gender equality, diversity and inclusion, the Bank ensures that it exercises fairness and non-discrimination in designing its remuneration and rewards package by using the following criteria such as the employees’ role in the organization, competency level, work performance, previous work experience, certifications, and employment tenure among others. Our employees’ gender orientation and background are not factors to their salary and benefits package. In order to stay competitive and relevant in the banking industry, the Bank regularly reviews and improves its remuneration and benefits package for employees by aligning it with the existing labor laws, current banking industry practices, and with the ongoing CBA. Any changes or improvements in the remuneration and rewards package of the employees are presented to and discussed with the Corporate Governance/Nomination/Remuneration and Sustainability Committee of the Bank and then endorsed for approval to the Board of Directors. As part of the Bank’s Total Performance Management System, the Bank utilizes a competency-based annual Performance Appraisal and Development Report (PADR) for its officers and staff. It is used to drive organizational performance by identifying and documenting individual performance goals that are aligned with the organization’s business objectives. To ensure that annual targets are achieved, the Bank implements a Quarterly Performance Progress Review (QPPR) to assess the officer’s progress against the performance targets that have been agreed upon at the beginning of the year. This enables the officer to understand performance expectations and enhance his or her competencies as the review focuses on performance coaching. Likewise, it provides a vehicle to strengthen the feedback mechanism during the year-long performance cycle. The QPPRs for the first three quarters are used as supporting documents / reference for the annual evaluation of the officer’s performance. Employee Learning and Development GRI 103-1, 103-2, 103-3, 404-1,404-2, 404-3
UN SDG 4,5,8, 10
As our valuable resource and significant partner in our growth and success, and in our sustainability, the Bank commits to equip our employees with the necessary knowledge, skills, and tools so they can effectively perform their roles and functions while helping fulfill their professional and personal growth. The Bank’s Human Resource Group, through its Institute for Banking Excellence (IBE), has developed different capacity building programs for employees based on their learning and development needs to help them perform their roles effectively. Among the in-house training programs provided by IBE for the employees include the 3-day New Employees Orientation, leadership management and supervisory skills development for those who are positioned to
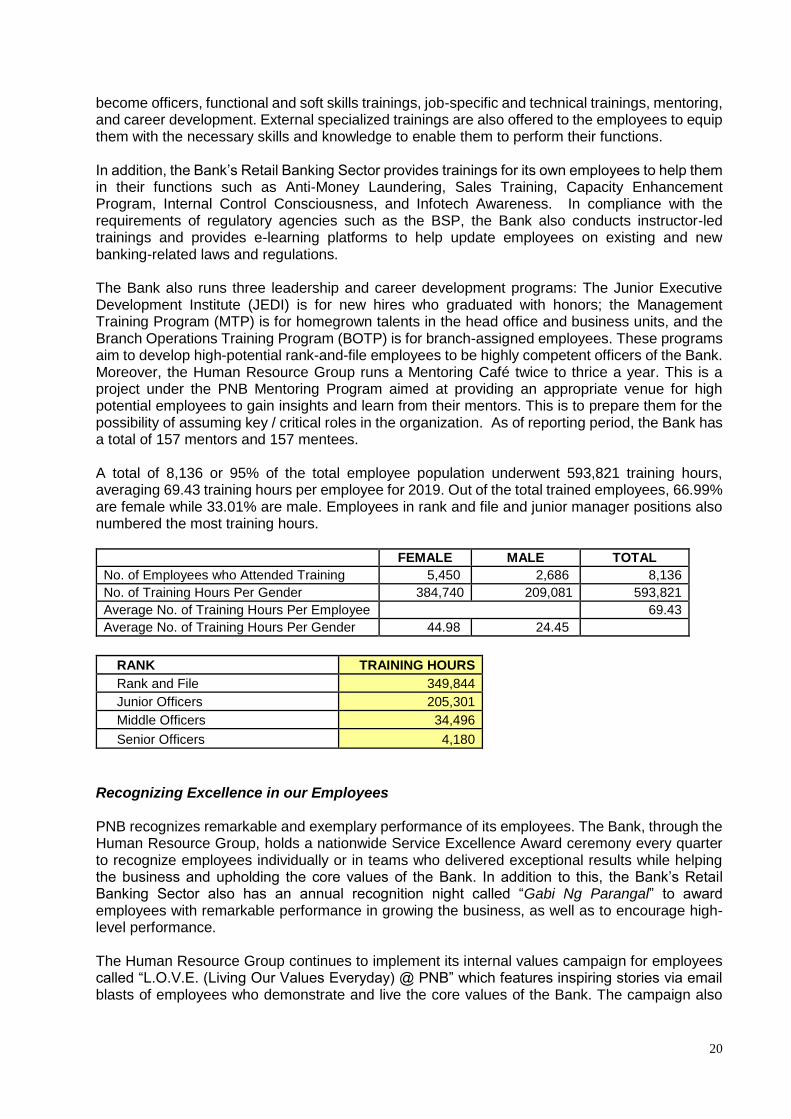
20
become officers, functional and soft skills trainings, job-specific and technical trainings, mentoring, and career development. External specialized trainings are also offered to the employees to equip them with the necessary skills and knowledge to enable them to perform their functions. In addition, the Bank’s Retail Banking Sector provides trainings for its own employees to help them in their functions such as Anti-Money Laundering, Sales Training, Capacity Enhancement Program, Internal Control Consciousness, and Infotech Awareness. In compliance with the requirements of regulatory agencies such as the BSP, the Bank also conducts instructor-led trainings and provides e-learning platforms to help update employees on existing and new banking-related laws and regulations. The Bank also runs three leadership and career development programs: The Junior Executive Development Institute (JEDI) is for new hires who graduated with honors; the Management Training Program (MTP) is for homegrown talents in the head office and business units, and the Branch Operations Training Program (BOTP) is for branch-assigned employees. These programs aim to develop high-potential rank-and-file employees to be highly competent officers of the Bank. Moreover, the Human Resource Group runs a Mentoring Café twice to thrice a year. This is a project under the PNB Mentoring Program aimed at providing an appropriate venue for high potential employees to gain insights and learn from their mentors. This is to prepare them for the possibility of assuming key / critical roles in the organization. As of reporting period, the Bank has a total of 157 mentors and 157 mentees. A total of 8,136 or 95% of the total employee population underwent 593,821 training hours, averaging 69.43 training hours per employee for 2019. Out of the total trained employees, 66.99% are female while 33.01% are male. Employees in rank and file and junior manager positions also numbered the most training hours.
FEMALE MALE TOTAL No. of Employees who Attended Training 5,450 2,686 8,136 No. of Training Hours Per Gender 384,740 209,081 593,821 Average No. of Training Hours Per Employee 69.43 Average No. of Training Hours Per Gender 44.98 24.45
RANK TRAINING HOURS
Rank and File 349,844
Junior Officers 205,301
Middle Officers 34,496
Senior Officers 4,180
Recognizing Excellence in our Employees PNB recognizes remarkable and exemplary performance of its employees. The Bank, through the Human Resource Group, holds a nationwide Service Excellence Award ceremony every quarter to recognize employees individually or in teams who delivered exceptional results while helping the business and upholding the core values of the Bank. In addition to this, the Bank’s Retail Banking Sector also has an annual recognition night called “Gabi Ng Parangal” to award employees with remarkable performance in growing the business, as well as to encourage high-level performance. The Human Resource Group continues to implement its internal values campaign for employees called “L.O.V.E. (Living Our Values Everyday) @ PNB” which features inspiring stories via email blasts of employees who demonstrate and live the core values of the Bank. The campaign also
21
aims to inspire others to practice PNB’s values in their day to day experiences to achieve personal success and the Bank’s business goals. In the third Quarter of 2019, the Human Resource Group launched its new recognition program called “What Outstanding Work! (W.O.W!)” which aims to inspire employees through a timely recognition for values-centered and business-driven behaviors. Employees recognized on the spot are also given tokens of appreciation that they can keep as mementos. These employees and their inspiring stories are also featured in the L.O.V.E. @ PNB campaign internal email blast. On its second year, the Human Resource Group held “Celebrate Love at Work” in February 2019. It is an engagement project during Valentine’s week where all employees are encouraged to express their appreciation to PNB, their fellow employees, and our clients through simple acts such as leaving appreciation notes and offering tokens and gifts. Prioritizing Employee Safety and Security GRI 103-1,103-2,103-3, 403-1, 403-2, 403-4, 403-5, 403-6 UN SDG 3, 8, PNB is taking all the necessary measures to provide a safe and secure work environment for all its employees. Employment practices and workplace safety and security is part of the Bank's Risk Management framework. The Bank’s Occupational Safety, Health and Family Welfare (OSHF) Committee, composed of representatives from both the management and employees, with the latter represented by labor union employees, meet regularly to discuss and manage reported work-related hazards, and monitor and evaluate the committee’s existing programs by ensuring that they are aligned with the current general labor requirement. Among the efforts of the committee on ensuring the safety and security of the employees include the conduct of OSH / safety awareness program, dissemination of safety advisories through different channels, disaster / emergency response training for all floor marshals-assigned employees, first aid training, deployment of emergency responders, and safety inspections / analysis of branches among others. Employees appointed by the Bank as Safety Officers are also regularly updated on their training such as Basic Occupational Safety and Health Program, Safety Program Audit, and Loss Control Management. The Bank also has existing guidelines for notification and keeping of records of accidents or illnesses in the workplace. Any work-related incidents are reported to the OSHF Committee. Emergency, fire, and earthquake drills at our Manila and Pasay Headquarters are also conducted annually by the Bank’s Corporate Security Group with the Makati and Pasay Fire Departments to help prepare the employees during times of man-made and natural calamities. They also release e-mail bulletins regularly to provide employees with helpful tips on how to prepare during times of disasters or calamities. Employees, particularly those assigned in the branches are also provided trainings on Standard First Aid and Basic Life Support, and Disaster Preparedness. For 2019, there are 458 employees trained on Standard First Aid and Basic Life Support, and 50 employees trained on Disaster Preparedness. The Bank plans to increase the number of employees trained on these topics in partnership with Philippine Red Cross in 2020. With the ongoing renovations at the PNB Financial Center and PNB Makati Center, the Bank also takes extra precautionary measures to ensure the safety and security of the employees by cordoning off the construction areas, posting safety reminders for employees, and assigning

22
emergency medical response team members and security guards to include inspections or visits of these areas. All employees are covered by the Bank’s occupational health and safety management system. There were no reported incidents of work-related injuries in 2019.
Promoting Work-Life Balance Among Employees UN SDG 2, 3, 8, 12 At PNB, we commit and endeavor to promote the holistic growth and development of our employees. We do not only encourage our employees to take their leaves to relax and spend more quality time with their families, but we also conduct activities where our employees can show and share their talents, hobbies, and time with their work colleagues and even with our communities. In doing so, we do not only help improve the health of our employees, but we also enable camaraderie among employees, strengthen organization commitment, and boost work-life balance.
• Health and Wellness The health of our employees is important to us. We encourage and help our employees live a healthy lifestyle to improve their health condition and overall well-being. We do this by encouraging our employees to use the three well-equipped gyms at our Pasay and Makati Headquarters. We also partner with a fitness gym provider for discounted rates so our employees can access fitness centers outside of Pasay and Makati areas. We also encourage our employees to join sports activities organized by different employee groups or associations such as basketball, badminton, and running. The Bank also organized fun runs and power classes such as Zumba, Yoga, Dance, Pilates, and Mixed Martial Arts. The Human Resource Group, in partnership with the Bank’s health care provider, ValuCare, continues to conduct health and wellness lectures. Wellness bulletins are released to increase health awareness and by sharing practical tips among all employees. Lastly, all employees are required to undergo the annual physical examination every year as part of the Bank’s health care program. Last October 23, the Human Resource Group partnered with Philippine Airlines to organize and conduct a Wellness Day. Dubbed “Well @Work”, the said activity was designed to celebrate workplace wellness, connect employees to the different wellness partners, and provide tips on how to live a healthier lifestyle. Wellness advocates were invited to share their expertise through talks and demonstrations on topics ranging from chair yoga, preparing healthy eats at work, ergonomics in the workplace, and relieving stress through hypnotherapy. Wellness merchant partners were also invited to provide free services to our employees such as massage, haircut and scalp analysis, as well as showcase their products from food, sportswear, gym membership, dental care, insurance, and motivational and self-help books.
• Sustainable Lifestyle Fair In November, our Corporate Sustainability Unit under the Public Affairs Group piloted a 3-day Sustainable Lifestyle Fair for our employees assigned at the PNB Financial Centre in Pasay City. The 3-day fair was organized to help raise climate change and environmental awareness among our employees, and encourage them to do their part to help the planet by reducing their carbon footprint. The event featured an eco-bazaar where invited merchants showcased eco-friendly and sustainably- sourced products, and organic food items as alternative products or food items for our employees. Resource persons for the brown bag learning sessions during lunch breaks for the 3-day fair were also invited to give
23
talks on climate change awareness and environmental sustainability, sustainability and resilient communities, and Zero Waste 101 and environment-conscious living. In partnership with Tan Yan Kee Foundation, the CSR arm of the Lucio Tan Group of Companies, the Bank also helps the employees access affordable but premium quality organic fresh produce for their own personal consumption. Straight from the farm of Tan Yan Kee Foundation in Nueva Vizcaya, the harvested organic produce reaches our employees at least twice a month. By inviting Tan Yan Kee Foundation to sell their organic produce at PNB Financial and Makati Centers, we are helping our employees to eat healthy while helping the Foundation and the farmers at the same time.
• Nurturing the Spirituality of Our Employees We acknowledge the importance and role of spirituality in the lives of our employees. In support of this, we hold daily worship services during lunch break at our in-house chapel at the PNB Financial Centre. Our own choir group from among our talented employees sing during the daily mass at our in-house chapel, and we invite renowned priests to officiate during special mass for healing and other important events. Moreover, we continue to do the 3 o’clock prayer habit at our PNB Financial Office which encourages our employees to pause for a few minutes to pray and reflect, and to take a short breather from their work or meeting. We also continue to host the annual Fiesta del Sto. Nino celebration at our PNB Financial Centre in Pasay City every January, where the different images of the Sto. Nino from the oldest, biggest, and to the smallest images are shown to the public.
• Employee Sale Events We continue to help make shopping convenient for our employees by holding seasonal employee sale events or bazaars, especially during the Bank’s anniversary and Christmas season, through our Cards Banking Solutions Group. Concessionaires and entrepreneurs are invited to put up booths and sell their products and services ranging from food, bags, clothes, shoes, and accessories. Merchants selling appliances and digital items like cameras, mobile phones, laptops, and printers are also invited during special employee sale events or bazaars. By doing this, we also help promote our cards products among our employees while helping our invited merchants or concessionaires generate sales.
• Townhall Meetings, Bank-Wide Events, and Work Chats We continue to provide avenues and opportunities that enable camaraderie and help develop a sense of belongingness and being one with other employees and the organization such as the Bank anniversary, Chinese New Year celebration, Christmas Parties and the likes. The Bank’s quarterly Pulong Ng Bayan townhall meetings and regular townhall gatherings of the various business units, on the other hand, do not only allow the employees to get together with their work colleagues but also provide opportunity for them to hear updates on the Bank’s business and operations straight from the top management. Our Senior Management meetings, which gathers the heads of all business groups and their one-down, are conducted on a weekly basis to help keep Bank officers with key functions updated on our business and operations. The Office of the President’s roadshows locally and abroad, on the other hand, provide opportunities for the employees
24
to share their experiences, express their opinions, and make suggestions on how to help improve the Bank’s business and operations to the President and CEO in person. In 2019, the Bank implemented the use of Facebook Work Chat as a tool for ease of communication and collaboration among the members of the senior management team and the regional and area heads of the Branch Banking Group. To date, the Bank’s Work Chat group has 260 employee members and users.
Labor Relations and Human Rights in the Workplace GRI 103-1, 103-2, 103-3, 102-41, 407-1, 412-2 UN SDG 8, 16 Industrial peace continues to be of paramount importance to us, allowing us to operate our business smoothly together with our employees. We are able to maintain this industrial peace in our workplace by respecting and supporting the right of our employees to form a labor union to uphold and safeguard their own rights as workers and as humans. We listen to our employees’ voices through the representatives of the employees’ union who are regularly invited to Labor Management Council Meetings by the Bank’s labor relations unit. These meetings become venues for both the employee union and the Bank to discuss employee concerns, clarify revisions in HR policies, and collaborate on initiatives. The Bank also has a Grievance Machinery to address or resolve misunderstanding, dispute, or controversy arising from the interpretation, and meaning application and implementation of any provision of the Collective Bargaining Agreement between the employee union and the Bank; and / or between the Bank and any covered employee. For 2019, there were no reported labor and human rights violations among employees. Lawful and Ethical Behavior GRI 103-1, 103-2, 103-3, 102-17, 205-2, 205-3 UN SDG 16 As a financial institution, we are committed to uphold the public’s trust. We do this by ensuring that our employees, top management, and directors conduct themselves in a lawful and ethical manner. The Bank’s Human Resource Group has developed and established the following policies and guidelines to ensure that all employees conduct themselves ethically: Code of Conduct, Corporate Governance Manual, Policy on Selling PNB Securities, Policy on Soliciting and / or Receiving Gifts, Personal Investment Policy, Whistleblower Policy , and Office Decorum which includes the Anti-Bribery and Anti-Corruption provisions. These policies and guidelines are regularly reviewed and revised as necessary with the approval of the Board of Directors to ensure its applicability to current work situations. The Bank’s Code of Conduct, Office Decorum, Whistleblowing Policy and Anti-Bribery / Anti-Corruption Policy are part of the onboarding process for new hires. New employees are made to read and understand the said policies and guidelines during their onboarding. They are also oriented on these policies during the New Hires Orientation. All employees can easily access these policies and guidelines through the Bank’s intranet facility. In addition, the Bank's Performance Appraisal and Development Report (PADR) for employees cover employee behavior such as promoting work ethics and culture of integrity. Supervising officers are expected to ensure that their subordinates comply with the Bank's rules and policies. To date, there were no reported incidents of bribery and corruption among employees or with the Bank’s suppliers / vendors during the covered report period.
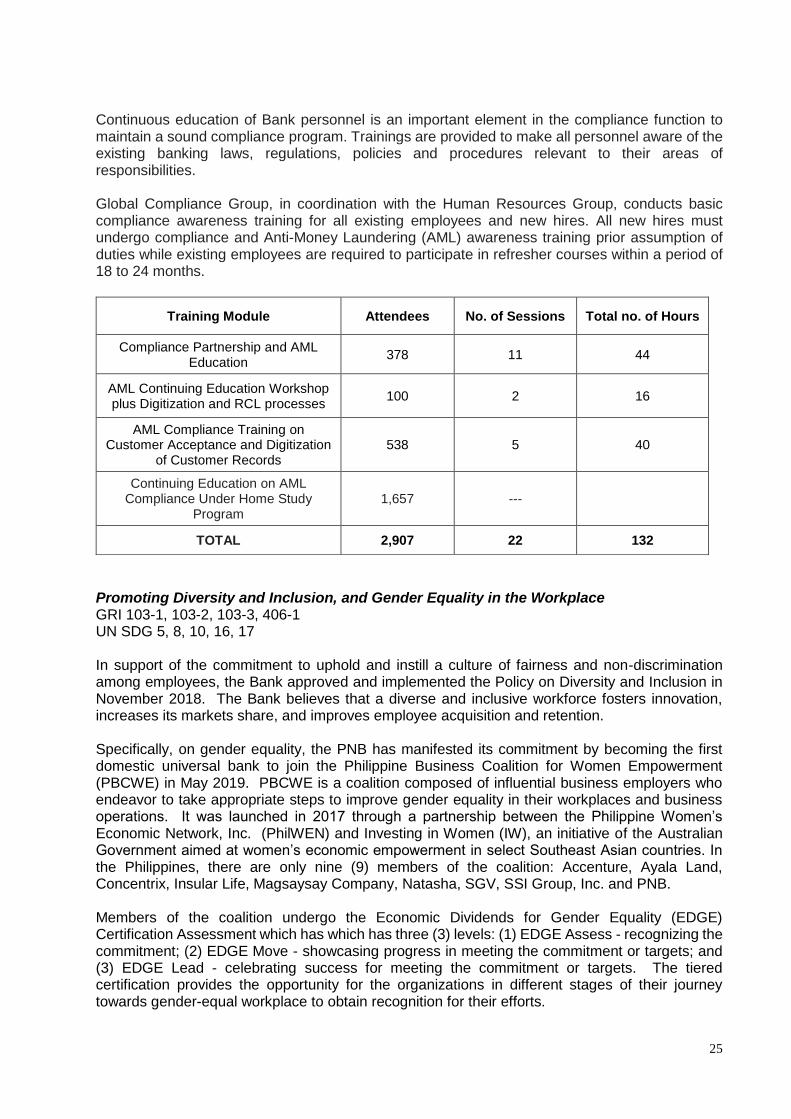
25
Continuous education of Bank personnel is an important element in the compliance function to maintain a sound compliance program. Trainings are provided to make all personnel aware of the existing banking laws, regulations, policies and procedures relevant to their areas of responsibilities. Global Compliance Group, in coordination with the Human Resources Group, conducts basic compliance awareness training for all existing employees and new hires. All new hires must undergo compliance and Anti-Money Laundering (AML) awareness training prior assumption of duties while existing employees are required to participate in refresher courses within a period of 18 to 24 months.
Training Module Attendees No. of Sessions Total no. of Hours
Compliance Partnership and AML Education
378 11 44
AML Continuing Education Workshop plus Digitization and RCL processes
100 2 16
AML Compliance Training on Customer Acceptance and Digitization
of Customer Records 538 5 40
Continuing Education on AML Compliance Under Home Study
Program 1,657 ---
TOTAL 2,907 22 132
Promoting Diversity and Inclusion, and Gender Equality in the Workplace GRI 103-1, 103-2, 103-3, 406-1 UN SDG 5, 8, 10, 16, 17 In support of the commitment to uphold and instill a culture of fairness and non-discrimination among employees, the Bank approved and implemented the Policy on Diversity and Inclusion in November 2018. The Bank believes that a diverse and inclusive workforce fosters innovation, increases its markets share, and improves employee acquisition and retention. Specifically, on gender equality, the PNB has manifested its commitment by becoming the first domestic universal bank to join the Philippine Business Coalition for Women Empowerment (PBCWE) in May 2019. PBCWE is a coalition composed of influential business employers who endeavor to take appropriate steps to improve gender equality in their workplaces and business operations. It was launched in 2017 through a partnership between the Philippine Women’s Economic Network, Inc. (PhilWEN) and Investing in Women (IW), an initiative of the Australian Government aimed at women’s economic empowerment in select Southeast Asian countries. In the Philippines, there are only nine (9) members of the coalition: Accenture, Ayala Land, Concentrix, Insular Life, Magsaysay Company, Natasha, SGV, SSI Group, Inc. and PNB. Members of the coalition undergo the Economic Dividends for Gender Equality (EDGE) Certification Assessment which has which has three (3) levels: (1) EDGE Assess - recognizing the commitment; (2) EDGE Move - showcasing progress in meeting the commitment or targets; and (3) EDGE Lead - celebrating success for meeting the commitment or targets. The tiered certification provides the opportunity for the organizations in different stages of their journey towards gender-equal workplace to obtain recognition for their efforts.
26
As part of the membership, the Bank underwent the EDGE Assessment in the 3rd quarter of 2019. The assessment will help the Bank understand, identify, and develop solutions to address gaps and challenges on gender equality in its employment practices and in the workplace. Sources of information such as employee experience through conduct of employee survey, demographics / statistics within the reference period from July 1, 2018 to June 30, 2019, and existing Bank policies and procedures were used by EDGE Certified Foundation during the Bank’s assessment. For the survey conducted by the Bank’s Human Resource Group in August 2019, 42% of the total population participated as survey respondents. Out of the female population, 43% participated while 38% participated among male employees. Below is the summary of findings from the EDGE assessment that the Bank underwent:
• PNB’s career transition chart illustrates, that women are overrepresented at the following levels (i) rank-and-file (66% women-34% men), (ii) officers below department head level (68% women - 32% men), (iii) department / branch head level (66% women -34% men), and (iv) division head level (59% women - 41% men); while there is an overrepresentation of men at the sector/group head level (39% women - 61% men). While generally overrepresented by women, career transitions (i.e. recruitment, functional promotion, and separation) of men were more dynamic than the women’s.
• When it comes to the effectiveness of policies and practices, the analysis suggests important improvement opportunities for the Bank such as gender diverse candidate pools, gender composition at the management level, gender composition at any management level, gender dimension in its succession planning, flexible working options for its employees, and allocation of resources for gender equality initiatives.
Overall, the inclusive culture based on the employee perception is above the EDGE standard of 50%. Ninety-six percent (96%) of female and male respondents believe that men and women are given equal opportunities to be hired. Seventy-four percent (74%) of female and male respondents believe that they are given fair opportunities to be promoted. Sixty-two percent (62%) of female respondents and sixty-eight (68%) of male respondents consider themselves to be paid fairly for the work that they do. It is also generally perceived by both men and women that the Bank gives equal access to career-critical assignments. The Bank intends to revisit a number of its policies and continuously study the possibility of including specific provisions on gender such as gender mix of top talents, promotion rates of mentees classified according to gender, gender mix of identified successors, employment interviews to be conducted by male and female interviewers, gender diverse candidate pool, and the like. The Bank shall also explore possible alternative work arrangements for employees. The results of the EDGE Certification Assessment shall be subject to audit to be conducted by a third-party auditor which is scheduled in February 2020. The result of the audit will determine the possible certification level that will be awarded to PNB which will be valid for two (2) years. Moreover, in order to provide a safe work place for all our employees, the Bank adopted a policy on Anti-Sexual Harassment pursuant to Republic Act (R.A.) No. 7877, otherwise known as the Anti-Sexual Harassment Act of 1995, and Republic Act No. 11313, otherwise known as the “Safe Spaces Act” of 2019. Approved in October 2019, the Bank’s Anti-Sexual Harassment Policy covers all employees with permanent or probationary employment status and provides the definition of gender-based harassment at the workplace, list of all forms of sexual harassment at work, duties and responsibilities of the employees and the employer, and the role of the Committee on Conduct and Investigation that leads the investigation of reported cases.
27
Responsible Corporate Citizenship and Caring for Our Communities GRI 103-1, 103-2, 103-3, 413-1 UN SDG 1, 3, 4, 8, 10, 12, 17 Our commitment to incorporate and implement and corporate social responsibility (CSR) and sustainability-related initiatives and activities in our operations is primarily driven by our aspirations to make a positive contribution to the society as a partner in social development and nation building. With the creation of our new Corporate Sustainability Unit, we are currently developing our sustainability policy, framework, and roadmap. The same unit is also responsible for developing and implementing our CSR programs and activities, as well as leading employee volunteerism or community engagement for the Bank. Financial Literacy and Financial Wellness Seminars Financial Literacy Seminars were conducted among students, teachers, parents, and OFWs by the International Banking and Remittance Group (IBRG) in partnership with other business units such as the Corporate Sustainability Unit and Bank branches such as the Marikina-Shoedrive, Espana and Morayta, Cebu-Banilad-Maria Luisa Park, Cebu-Banawa, Q.C.-Cubao Main, Q.C.-Project 3-Aurora Blvd, Q.C.-New Manila, Manila-Tondo-Juan Luna, Manila-Jose Abad Santos, Cainta-Ortigas Ave. Ext, and Las Pinas City Hall. The target participants were taught the basics of money management: identifying needs and wants, budgeting, spending, and saving. Applicable PNB products and services were also presented to the seminar participants by the partner branches.
In partnership with Tan Yan Kee Foundation, the Bank’s Corporate Sustainability Unit also organized a financial literacy seminar together with IBRG among the members of the Barangay Association of Treasurers of the Municipality of Aritao in Nueva Vizcaya last October 24, 2019. The LGU of Aritao, Nueva Vizcaya is a partner of TYKFI.
The Bank’s Trust Banking Group also organized financial wellness talks among corporate clients of the Bank and OFWs in Iloilo, Japan, and Singapore on investing and different investment products of the Bank such as UITFs. Supporting Communities and Small Entrepreneurs A total of 113 decommissioned desktop computers from ITG were turned over to ACTION, Inc. in Olongapo City in April 2019 to benefit a total of 19 NGOs, 1 LGU, 4 public high schools, 2 public elementary schools, 3 barangay councils, and 1 DSWD facility. In December 2019, PNB also turned over another 55 decommissioned desktop computers to the H.O.U.S.E. Foundation, and another 2 decommissioned units were turned over to Pentecostal Missionary Church of Christ in Cainta, Rizal. Through donation of these computers, PNB is able to help social development organizations do their work effectively. In addition, the Bank continues its partnership with Caritas Manila by donating its old billboard and activity tarpaulins that were recycled into functional items such as bags and wallets by the women of Caritas Manila’s partner communities. In 2019, a total of 365 kilos of old billboard and activity tarpaulins were donated by the Bank to Caritas Manila. Proceeds from the sale of these bags were used to support the Caritas Manila’s programs and services for the urban poor. The partnership enables the Bank to better its waste management while helping communities become self-sustaining through livelihood opportunities.
28
In support of the Bank’s commitment to help small businesses, the Corporate Sustainability Unit invited small and medium-sized social entrepreneurs to join the 3-day Sustainable Lifestyle Fair at PNB Financial Center in Pasay City last November 25-27, 2019. Twenty (20) invited social entrepreneurs showcased and sold organic and sustainably-sourced products during the eco-bazaar to help provide eco-friendly and healthy alternatives for the Bank employees. Among the products sold during the 3-day fair were eco-friendly shampoo and conditioner bars, reusable straws and eating utensils, women’s accessories such as earrings made of recyclable materials, bags made of old interior tires and foils packs, organic vegetables, and healthy vegan snacks and condiments. With the success of the activity, the Bank plans to organize another Sustainable Lifestyle Fair next year where more women entrepreneurs will be invited. Relief Operations for Disaster-Affected Communities A Boxful of LOVE is a donation and fund-raising campaign of the Bank’s Human Resource Group
for the marginalized and Mindanao earthquake victims. The campaign calls for in-kind donations
among Bank employees via e-mail blast. Employee donors drop their donations in drop boxes
located at the 2/F ATM Lobby of the PNB Financial Center. Donations received by HRG were
turned over to Caritas Manila.
In cooperation with Tan Yan Kee Foundation, the Bank’s Corporate Sustainability Unit together with the Mindanao Regional Office, Area Offices, and Branches conducted a simultaneous relief operation for the earthquake-affected communities in Digos City, Davao del Sur and Kidapawan, North Cotabato last December 21. A total of 1,000 identified beneficiary families received relief packs containing non-food essentials such as toiletries, oral hygiene kits, and sleeping materials that were personally distributed by the employee volunteers. Volunteerism at Heart A total of 630 PNB employees from different areas and branches nationwide conducted employee volunteerism activities in 41 cities and municipalities out of the 48 areas where the Bank has business presence. These employee volunteers pooled their resources and rendered a total of 2,520 manhours of community volunteer service such as conducting relief operations for disaster-affected areas, giving gifts and distributing school supplies to students, participating in DepEd’s Brigada Eskwela campaigns, doing cleanup drives, running art and crafts classes, and doing story-telling activities for children. The employees also spent time with the parents of the children they interact with to know more about the situation of families in the communities. Among the groups and communities they visited and interacted with are the Aetas in Zambales, poor families in urban areas, and families in a remote fishing island in Iloilo to name a few. The “Pagtutulungan Ng Bayan” is a continuous employee-giving program organized and sustained by employees for the employees in need. The said employee-giving program aims to provide financial assistance to employees who are victims of natural calamities and alleviate medical expenses of employees and their immediate relatives. Partnerships for A Cause The Bank partnered with Ateneo Scholarship Foundation, Inc. to aid the education of in-need but promising college students of Ateneo de Manila University through a Php5.0 million to support the Gov. Amando M. Tetangco, Jr. Scholarship Fund. The entire PNB community hopes that with the donation to the Ateneo Scholarship Foundation, the Bank is able to help the Ateneo de Manila University mold the next generation of Filipino bankers who will change the landscape of banking and finance in the country.
29
Moreover, the Bank also signed 2 partnership agreements with the Philippine Red Cross for the
conduct of Standard First Aid & Basic Life Support training for PNB employees and the donation
of 2 ambulance units worth Php5.0 million for Visayas and Mindanao. The partnership with the
Philippine Red Cross is in line with the Bank’s Corporate Sustainability goals which is to provide
all PNB employees with the necessary skills to provide emergency response and enable the Bank
to help other people in emergency situations and times of natural or man-made calamities.
SOCIO-ECONOMIC AND ENVIRONMENTAL COMPLIANCE GRI 103-1, 103-2, 103-3, 307-1, 419- 1 UN SDG 16 Beyond regulatory compliance, our Bank upholds social and economic areas of its business as part of its continuing journey towards sustainability. We are committed in preserving the social and economic areas of our business, examples of which include the following:
• The Bank’s declaration of dividends is subject to compliance with the provisions of law and the regulations of the Bangko Sentral ng Pilipinas (BSP) and the Securities and Exchange Commission (SEC), and other financial regulatory requirements as may be applicable to the Bank.
• PNB complies with established consumer protection practices in order to safeguard their transactions with the Bank and be heard though appropriate channels when they escalate feedback and concerns.
• PNB has fulfilled the requirements on general labor and occupational safety and health standards, as required by the Department of Labor and Employment (DOLE).
Our Bank has existing mechanisms in place to monitor its compliance with laws and regulations in the social and economic areas. The Corporate Governance and Sustainability Committee, as stipulated in its amended charter, is responsible for assessing the Bank's sustainability performance across various benchmarks, including economic, social and environmental performance indicators. At the management level, the Corporate Sustainability Unit (CSU) of the Public Affairs Group has spearheaded various advocacies to support social, environmental, and economic initiatives. In terms of coordinating relationships, the CSU liaises and establishes a constructive working relationship with the Marketing and Brand Management Sector, Human Resource Group, Administration Group, and other relevant parties possessing important roles in the effective implementation of the Unit's mandate. We also adhere to the laws and policies, particularly on environmental regulations, of the locality where we have business operations by ensuring that all our offices and branches have the necessary business and environmental permits and approvals. In 2019, there were five (5) reported incidents of minor breaches of environmental laws and regulations resulting in the imposition of nominal monetary fines concerning air pollution and hazardous waste management measures, such as failure to replace environmental law officers at branches and failure to secure additional permits for electrical generators, which were required by subsequent legislation and regulations. Out of these five (5) reported incidents, two (2) were already resolved and closed, while the remaining three (3) cases are still awaiting action or resolution from the DENR.
30
CUSTOMER EXPERIENCE We aim to provide the best customer service experience to our clients. We provide them various channels for their inquiries, requests and complaints on how they can connect with the Bank: 24x7 Customer Service Hotline, Email, Facetime / Skype and Private Messaging. Our Consumer Protection Policy ensures that any reported complaints are recorded, monitored and addressed in a timely manner. In accordance to the BSP requirement in reporting complaints, a consolidated complaints report is submitted monthly to the Management and Risk Oversight Committee and quarterly to the BSP. As part of ensuring the quality of service provided to the client, Customer Experience Division (CED) developed a project called “After Call Survey for 8573-8888” that aims to secure a qualitative feedback from customers at point of call. MARKETING AND LABELING GRI 103-1, 103-2, 103-3, 417-1, 417-2, 417-3 UN SDG 12 We continue to look for better ways to improve and provide the best financial solutions for our customers anywhere in the world. Our new Marketing and Brand Management Sector studied our customers’ experience in order for our Bank to develop new products and services or improve on our existing products and services to help address their financial needs. This exercise was supplemented by the 2-day PNB Sprint 2019: Mindful Customer Transformation Seminar organized by the Human Resource Group’s Institute of Banking Excellence in late 2019, where select employees from different business groups were taught how to design and develop bank products and services for identified customers by studying and understanding their experience and needs. As a result, the Marketing and Brand Management Sector was able to map out and identify the Bank’s target markets, identify gaps and challenges in the Bank’s products and services, and develop a marketing and product development plan for the Bank. In addition, the Marketing and Brand Management Sector ensures that all advertising and promotional collaterals of the different business units strictly adhere to the Bank’s branding guidelines and are compliant to all regulatory requirements, such as those required by the BSP, SEC, PDIC, BancNet, Department of Trade and Industry, ASC, and Insurance Commission among others. The Bank’s Social Media Framework is also in place to help us manage our reputational risk across our social media platforms For 2019, there were no reported incidents of non-compliance in marketing and labeling efforts of the Bank. DIGITAL TRANSFORMATION AND INNOVATION UN SDG 9 We recognize the importance of digital transformation and innovation in creating a convenient banking experience for our customers. Currently, the Bank has 1,457 automatic teller machines (ATMs), and 81 cash accept machines (CAM) for the 24-hour banking convenience of our customers.
31
In addition, the Bank’s mobile application allows our customers to do inter-bank fund transfers, online bank payments, and viewing of transaction history. Customers can also use our mobile banking application to keep track of their credit card transactions. The Bank enhanced its mobile banking services by supporting the government’s National Retail Payment System’s (NRPS) Philippine Electronic Fund Transfer System and Operations Network or PESONet and InstaPay. Customers can do electronic fund transfers through PESONet and InstaPay by logging on to their PNB Mobile App. Customers can do real-time electronic fund transfers of up to Php100,000 to any participating banks within the Philippines for PESONet and up to Php50,000 per transaction for InstaPay. Moreover, our Bank continues to look for better ways to improve our website and other information channels for ease-of-access to our clients. CUSTOMER DATA PRIVACY AND SECURITY GRI 103-1, 103-2, 103-3, 418-1 UN SDG 16 At PNB, we respect and value the right to data privacy and protection of our data subjects (e.g., customer, employee). We take all necessary actions to safeguard our data subjects’ information, making sure that personal data collected from them are processed in adherence to the general principles of transparency, legitimate purpose, and proportionality. Our Enterprise Data Privacy Policy reinforces our commitment to data privacy and security by implementing appropriate organizational, physical, and technical security measures in relation to the processing of personal data. We ensure strict compliance with both local and international laws and regulations as well as international standards, including the compliance checklist of the National Privacy Commission (NPC) among others. Our Data Protection Officer (DPO), with the assistance of Data Privacy Management Division (DPMD), works with our Customer Experience Division (CED) for a quick and easy way to resolve any data privacy-related concerns directly coming from our data subjects. DPMD is consistently coordinating with the Enterprise Information Security Group (EISG) to ensure that Bank’s information security is maintained. Our Bank employees are also bound by a confidentiality agreement. DPMD regularly sends out data privacy advisories and conduct data privacy awareness training to all employees, including third party service providers, to ensure that all personnel who process personal data understand their responsibilities in the proper handling and protection of personal data. Our DPO and DPMD continuously monitor updates and trends on data privacy and security through NPC issuances and participation to various seminars and conferences conducted by professional associations such as Bankers Association of the Philippines to ensure the continuing suitability, adequacy, and effectiveness of the Bank’s data privacy practices. For 2019, the Bank’s existing process handled and ensured that all concerns regarding the processing of client personal data were addressed and resolved immediately. Our Bank’s mobile and online banking facilities have security features that protect personal data and other information such as use of log in credentials, One-Time-Pin (OTP), Touch ID, SMS and email alerts, among others. In addition, the Bank’s Cards Banking and Solutions Group also sends out SMS and email alerts to our customers whenever significant amounts are used on their credit cards or debit cards. As part of the Bank’s efforts in maintaining transparent processing of personal data, the Bank ensures that all data subjects are informed about how PNB processes and protects personal data. Hence, PNB Data Privacy Statement is accessible to the public through the PNB website.

32
MEMBERSHIPS AND ASSOCIATIONS GRI 102-13
• ACI Philippines
• Association of Certified Fraud Examiners
• Association of Certified Public Accountant in Commerce
• Association of AML Officers (AMLO)
• Association of Bank Compliance Officers (ABCOMP)
• Agusan Chamber; Asian Bankers Institute
• Asian Bankers Association; Bankers Institute of the Philippines
• Bankers Association of the Philippines
• Bank Marketing Association of the Philippines
• British Chamber
• Bank Security Management Association
• Credit Management Association of the Philippines
• Credit Card Association of the Philippines
• Executives Finance Management Association
• Federation of the Philippine Industries, Inc.
• Financial Executive Institute of the Philippines
• Financial Technology of the Philippines
• Institute of Corporate Directors, Inc.
• Institute of Internal Auditors of the Philippines
• Integrated Bar of the Philippines
• Japanese Chamber
• Korean Chamber
• Information Systems, Audit and Control Association
• Makati Commercial Estate Association, Inc.
• Management Association of the Philippines
• Money Market Association of the Philippines, Inc.
• Philippine Association of National Advertisers, Inc.
• Philippine Chamber of Commerce and Industries, Inc.
• People Management Association of the Philippines
• Mabuhay Miles; Philippine Business Coalition for Women Empowerment
• Philippine Payments Management, Inc.
• Public Relations Society of the Philippines
• Rotary Club
• Tax Management Association of the Philippines
• The Financial Markets Association, Inc.
• Trust Officers Association of the Philippines
• Women’s Business World


