Embed Size (px)
Citation preview
Information Economics and Policy 14 (2002) 371–384www.elsevier.com/ locate/econbase
Marginal value-based pricing of additional spectrumassigned to cellular telephony operators
a b c c ,*R. Sweet , I. Viehoff , D. Linardatos , N. KalouptsidisaThus plc, Glasgow, UK
bBooz Allen & Hamilton International (UK) Ltd., London, UKcUniversity of Athens, Department of Informatics and Telecommunications,
Division of Communications and Signal Processing, Panepistimiopolis, Athens 15784,Greece
Abstract
This paper deals with the development of a framework for estimating the spectrum pricewhen additional spectrum is assigned to cellular telephony operators. Pricing is based on thespectrum marginal value and expresses the cost savings achieved over infrastructure via theuse of the additional spectrum. The resulting values reflect the economic/engineering valueof the spectrum and do not take account of its strategic value. 2002 Elsevier Science B.V. All rights reserved.
Keywords: Spectrum pricing; Administrative pricing; Marginal value
JEL Classification: L96; L51
1. Introduction
Cellular telephony services hold one of the top positions in the spectrum valuescale. Almost all cellular operators worldwide encounter spectrum congestionproblems, which are increasing day by day. Demand rises sharply with theintroduction of new services, the competition and the economical growth ingeneral. The increase will be more impressive if the fixed-mobile convergence istaken into account together with the convergence of communications andbroadcasting. These facts have led the operators to request from governments theassignment of additional spectrum in 900 MHz and 1800 MHz bands.
*Corresponding author. Tel.:130-1-0727-5304; fax:130-1-0727-5601.E-mail address: [email protected] (N. Kalouptsidis).
0167-6245/02/$ – see front matter 2002 Elsevier Science B.V. All rights reserved.PI I : S0167-6245( 02 )00047-1

372 R. Sweet et al. / Information Economics and Policy 14 (2002) 371–384
On the other hand, spectrum is a limited resource of great economical andpolitical importance. The increasing demand for telecommunications and broad-casting services in combination with market liberalization press for more efficientspectrum management. Spectrum pricing is one of the most significant tools ofefficient spectrum management. Spectrum pricing instigates the licensees toreconsider the way they use spectrum, rewards the most efficient use anddiscourages the hoarding of redundant spectrum. The methods of spectrum pricingcan be split into approaches based on market mechanisms (competitive bids,auctions and secondary spectrum trading) and administrative pricing.
In the present paper we develop in detail an administrative pricing methodologybased on the notion of marginal value that determines the additional spectrumvalue for both a macrocell and microcell layer cellular network. The paper isorganized as follows: Section 2 analyses the concept of the proposed methodology.Section 3 describes two network models assumed for subsequent development. InSection 4, first the marginal value is estimated for both types of networks, andthen, the price of a specific quantity of additional spectrum assigned over a specificperiod of time is determined. Section 5 examines the sensitivity of the obtainedresults. Finally, Section 6 includes our conclusions.
2. Administrative pricing based on marginal spectrum value
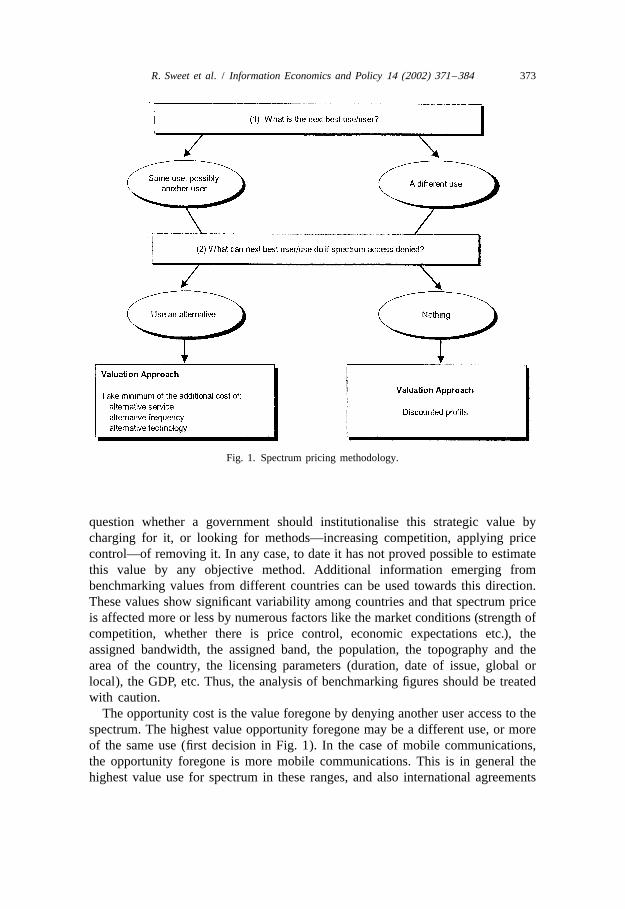
Our approach aims to estimate the underlying resource value of the additionalspectrum assigned to cellular operators through an economic/engineering ap-proach depicted in Fig. 1 (Marks et al., 1996). The value calculated is theopportunity cost or deprival value of the spectrum to the users, which is the cost ofmaking without it in its next best use. This approach is an administrativetechnique. Administrative pricing provides the possibility to rationally identify thelicense assignment fees so that the real spectrum value is approximated. Theadministrative techniques appear as the next suitable and practically applicablechoice when the required presumptions for applying the methods based on marketmechanisms are not fulfilled. The market methods involve a direct market test ofvalue, and they are therefore, prima facie, likely to be the most reliable inassigning spectrum to the party who values it most highly, under the basicassumption that both the long term spectrum availability and the significant policyelements (requirements for service level, pricing control, environment of competi-tion, etc.) have been clearly defined. In parallel, administrative techniques such asour approach can be used for the preparation of the market-based mechanisms asthey can provide an indicative initial estimation to the spectrum managementagency.
The economical /engineering approach does not take account of the ‘strategic’value of the spectrum, which arises because markets are not fully competitive, andthere is value in controlling access to that market. It is a rather delicate policy
R. Sweet et al. / Information Economics and Policy 14 (2002) 371–384 373
Fig. 1. Spectrum pricing methodology.
question whether a government should institutionalise this strategic value bycharging for it, or looking for methods—increasing competition, applying pricecontrol—of removing it. In any case, to date it has not proved possible to estimatethis value by any objective method. Additional information emerging frombenchmarking values from different countries can be used towards this direction.These values show significant variability among countries and that spectrum priceis affected more or less by numerous factors like the market conditions (strength ofcompetition, whether there is price control, economic expectations etc.), theassigned bandwidth, the assigned band, the population, the topography and thearea of the country, the licensing parameters (duration, date of issue, global orlocal), the GDP, etc. Thus, the analysis of benchmarking figures should be treatedwith caution.
The opportunity cost is the value foregone by denying another user access to thespectrum. The highest value opportunity foregone may be a different use, or moreof the same use (first decision in Fig. 1). In the case of mobile communications,the opportunity foregone is more mobile communications. This is in general thehighest value use for spectrum in these ranges, and also international agreements
374 R. Sweet et al. / Information Economics and Policy 14 (2002) 371–384
restrict this spectrum to this service. Thus the appropriate deprival value isdeprival from cellular telephony.
We must next identify what the cost to the marginal user is (i.e. least profitableuser who stays in the market) in being denied access to an additional unit ofspectrum. Under the assumption that it is worthwhile for the cellular operator tospend the additional engineering costs to deliver capacity, the marginal value ofspectrum is identified by the cost of the next suitable alternative available. Giventhat all technical measures (like frequency hopping, discontinuous transmission,etc.) have already been implemented, the next suitable alternative is the reductionin cell size. The development of additional cells results in the increment ofcapacity. For example, the capacity may be increased by a factor of more than 40by reducing the cell size from 2 km to 0.3 km (ERO, 1998). The differencebetween the cost of the alternative of additional cells and the cost of networkdevelopment that will obtain the same capacity if additional spectrum is assigned,identifies the marginal value of spectrum. This is an important conclusion, for itsays that the value of the spectrum to a cellular operator who already has asubstantial holding is not revenue foregone from lost calls, but the cost ofadditional engineering to recapture those calls.
3. Network description
Two types of networks are typically used by cellular operators to cover thetraffic demands (Lee, 1993, 1995; Rappaport, 1996). The first type consists of ahomogeneous macrocell layer and is typically used in urban areas. The secondtype consists of a homogeneous microcell layer deployed over an existinghomogeneous macrocell layer and is typically used in dense urban areas. Themacrocell layer provides contiguous area coverage, filling in the gaps betweenmicro cells and also adding to the capacity within the micro cells. The assumptionof homogeneity means that all network cells of the same layer type share an equalnumber of transceivers and serve an equal amount of traffic.
3.1. Macrocell layer
The capacity of a homogeneous macrocell network being upgraded on asemiannual basis is given by
Q(i)5 n(i) ? u ? v(i) ? s ?g(i) (1)
where, for semesteri, Q(i) is the network capacity (busy hour Erlangs),n(i) thenumber of sites,u the number of cells per site,v(i) the number of transceivers(carriers) per cell,s the number of channels per carrier andg(i) the ratio of thecapacity in Erlangs to the number of channels (note thatg(i) depends on the gradeof serviceG of the network). Let alsoZ (i) denote the assigned spectrum (pairedas
R. Sweet et al. / Information Economics and Policy 14 (2002) 371–384 375
MHz) in semesteri, Z(i)#Z (i) the part of assigned spectrum used in cellas
carriers,z the carrier bandwidth (typicallyz 5200 kHz) andf the frequency0 0
reuse parameter. Then, it holds that:
z ? f0]]Z(i)5 z ? v(i) ? f 5 N(i) (2)0 s
whereN(i)5 v(i)s denotes the number of channels at a particular cell. The aboveequations indicate that the pair (Q, Z) represents the network state which evolvesover time since the continuously increasing traffic demand requires a continuousnetwork upgrading.
3.2. Microcell layer deployed over an existing macrocell layer
The capacity of the overall network is the sum of the capacity of the two layers.Suitable adaptation of Eqs. (1) and (2) leads to:
Q(i)5 (n (i) ? u ? v (i)1rn (i) ? u ? v (i)) ? s ?g(i) (3)m m m m m m
Z(i)5q Z(i)1q Z(i)5 z ? (v (i) ? f 1 v (i) ? f ) (4)m m 0 m m m m
where subscriptsm andm denote values relating to macro and microcell layers,respectively, andu , u (u 1u 5 1) are the fraction of spectrum allocated tom m m m
macro and micro layers, respectively, andr is the ratio of micro sites to macrosites.
3.3. Evolution of network states
Since traffic demand increases with time, network capacity should be graduallyincreased in accordance with the expected demand. Network designers considerthe offered capacity as a constant fraction of the demand. An operator willtypically aim to keep the offered capacity 10–20% ahead of the demand to providefor around 6 months growth. In the sequel, we assume that the network designersconsider the network as being congested and proceed with its upgrading if theexpected demand of the next semester exceeds 80% of the current capacity.
As long as the used spectrum is less than the assigned to the operators spectrum,adding new transceivers in the existing cells is the simplest way of increasingcapacity. A network is defined to be capacity-limited if its capacity can only beincreased by obtaining new frequencies or installing new sites. Under suchconditions, additional spectrum is of value to an operator of a macrocell layernetwork since it enables him to increase capacity more cost-effectively, by addingnew transceivers to existing sites, rather than by installing new sites. Similarly, inthe case of a second type network which is capacity-limited, additional spectrum isof value to the network’s operator since it enables him to increase capacity morecost-effectively, by adding new transceivers to existing micro sites, rather than by
376 R. Sweet et al. / Information Economics and Policy 14 (2002) 371–384
installing new micro sites (note that in both cases the number of macro sites is notaltered). Obviously, if the assigned spectrum is not sufficient to serve all trafficrequirements both the number of sites and the number of transceivers per cellshould be increased.
Finally, we define the capacity-limited curve. This curve lives in theQ–Z space.It initiates from a point corresponding to a network state where the network iscapacity-limited and evolves in the state space consisting of all subsequentcapacity-limited states, under the assumption that small quantities of additionalspectrum dZ are assigned gradually.
4. Pricing of additional spectrum
In this section, first we estimate the marginal value of spectrum illustrating howit varies with key parameters. Next we estimate the integrated value of spectrum,which is the resulting price of a quantity of additional spectrum assigned over aspecific period of time.
4.1. The marginal value
The estimation of the marginal value of spectrum is based on the trade-offbetween the upgrade either toN 1 dN transceivers per cell, or to smaller cells. Theoption of increasing the number of sites involves establishing new sites and isgenerally more expensive. The option of increasing the number of transceivers atexisting sites is cheaper but requires access to additional radio spectrum. Themarginal value of the additional spectrum may be equated to the cost saving whichit allows the operator to achieve. Specifically, we estimate the marginal value byconstructing three hypothetical cell planning models: (A) a model of a baselinecapacity-limited network; (B) a model of how the network might be expanded ifmore spectrum was available, i.e. adding new transceivers to each cell; (C) amodel of how the network might be expanded using more sites and smaller cellsizes (with the same capacity as (B) and the same spectrum as(A)).
The estimated marginal value of spectrum per paired MHz is then given by:
Cost22Cost1]]]]Value 5 (5)
dZ
whereCost1 is the additional cost of expanding the network using more spectrum(i.e. migrating from (A) to (B)),Cost2 is the additional cost of expanding thenetwork using smaller cells (i.e. migrating from (A) to (C)) anddZ is theadditional spectrum required for (B) (paired MHz).
Application of the above procedure to the macrocell layer network leads to thefollowing expression for the marginal value of the spectrumV expressed as netNPV ,
R. Sweet et al. / Information Economics and Policy 14 (2002) 371–384 377
present value (NPV) per paired MHz (for sake of simplicity, the semesterireferred to in Eq. (1) is omitted):
Q 1 dv g * (g * 2g )]]]]] ]] ]]]V 5 1 (C 1 u ? v ?C )2 uFS DNPV s,NPV t,NPVZ u ? dv ? s ?g v g g
?dv ?C (6)Gt,NPV
wheredv is the incremental number of transceivers per cell andg * the ratio ofcapacity to channels for the increased number of channels.C is the fulls,NPV
incremental cost (NPV) of a ‘bare’ site (i.e. no transceivers) andC the fullt,NPV
incremental cost (NPV) of a transceiver. Site (transceiver) cost is split into set-upcostC (C ) and (annually) running costC (C ). Set-up costs,set-up t,set-up s,running t,running
includes the cost of civil works, the cost of mast, the cost of equipment etc., whilerunning cost includes the site rent, the maintenance cost, the cost of microwavelinks, etc. If d is the discount rate andy the number of years over which therunning costs are summed (it is assumed that running costs are incurred at the endof the year), it holds that
C 5C 1a ?C andC 5C 1a ?C ,s,NPV s,set-up s,running t,NPV t,set-up t,running
y
2ia5O (11 d) . (7)
i51
Analysis of Eq. (6) leads to the conclusion that, since it corresponds to a specificnetwork state (at a specific semester) anddv is considered as a constant,VNPV
expresses the ‘instantaneous’ marginal value and depends on two key parameters:
• the total spectrum assigned to the operator;• the capacity of the capacity-limited network (the ‘capacity-limited capacity’).
Although more complicated, the above analysis is carried over the microcell layernetwork. In general, the marginal cost of increasing capacity (in the absence ofnew frequencies) is higher than for the macrocellular. This is because, although thesite costs are lower, the sites are omni- rather than tri-sector and there are fewertransceivers per site (since spectrum is shared with the macro layer). Hence morenew sites are needed to match a given percentage increase in transceivers.
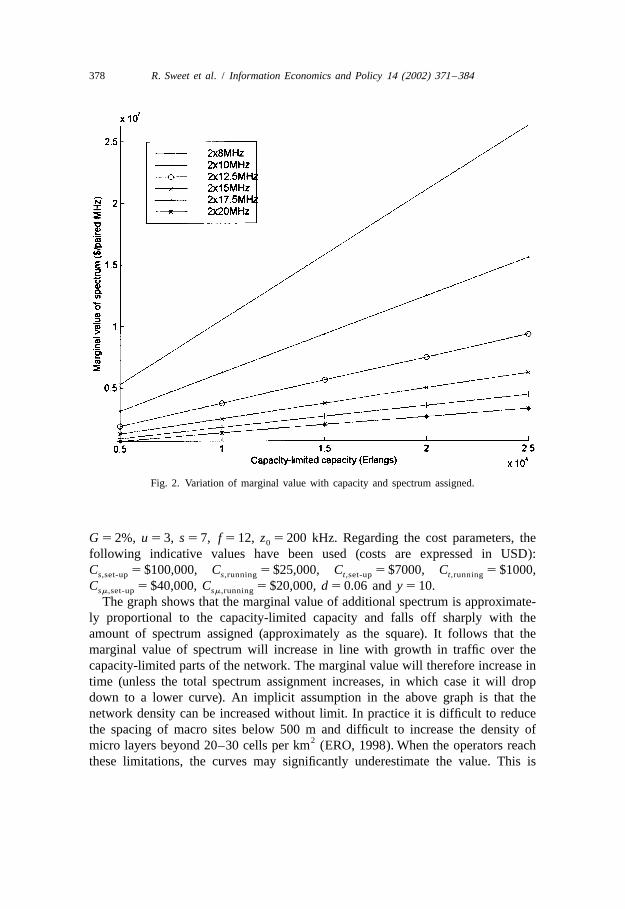
Example 1. (Marginal value estimates) Fig. 2 shows the marginal valueV as aNPV
function of the capacity-limited capacityQ for different values of initial spectrumassignment. Eq. (6) has been employed usingdv 5 1 and the network parameters:
378 R. Sweet et al. / Information Economics and Policy 14 (2002) 371–384
Fig. 2. Variation of marginal value with capacity and spectrum assigned.
G 5 2%, u 5 3, s 57, f 512, z 5 200 kHz. Regarding the cost parameters, the0
following indicative values have been used (costs are expressed in USD):C 5$100,000, C 5 $25,000, C 5$7000, C 5 $1000,s,set-up s,running t,set-up t,running
C 5 $40,000,C 5$20,000,d 5 0.06 andy 5 10.sm,set-up sm,running
The graph shows that the marginal value of additional spectrum is approximate-ly proportional to the capacity-limited capacity and falls off sharply with theamount of spectrum assigned (approximately as the square). It follows that themarginal value of spectrum will increase in line with growth in traffic over thecapacity-limited parts of the network. The marginal value will therefore increase intime (unless the total spectrum assignment increases, in which case it will dropdown to a lower curve). An implicit assumption in the above graph is that thenetwork density can be increased without limit. In practice it is difficult to reducethe spacing of macro sites below 500 m and difficult to increase the density of
2micro layers beyond 20–30 cells per km (ERO, 1998). When the operators reachthese limitations, the curves may significantly underestimate the value. This is
R. Sweet et al. / Information Economics and Policy 14 (2002) 371–384 379
because once the capacity limit has been reached the opportunity cost relates theloss of revenue rather than infrastructure costs.h
4.2. The integrated value
In practice the actual problem is the pricing of a specific additional spectrumquantity assigned to an operator over a specific period of time, i.e. 10 or 15 years.For this purpose an integrated procedure should be applied on the estimatedmarginal values. As already mentioned the estimated marginal values (Eq. (6))depend explicitly on the capacity-limited capacity and the spectrumZ. In addition,marginal values exhibit a time dependence arising from the facts that capacity isan increasing function of time,Z depends on time and costs depend on time.
Therefore, if a network is presently at a capacity-limited state, the value of theadditional spectrum depends not only on the quantity of the additional spectrumbut also on the time schedule of the assignment and the time schedule ofexploitation of the additional spectrum by the operator. Since the marginal valueestimates of the previous section depend on time, they can be explicitly written asV 5V(Q, Z, t), wheret represents time.V corresponds to an assignment of aNPV NPV
small quantity of spectrumdZ 5 dZ. Thus, the spectrum price can be obtained bysumming the values of successive additional spectrum assignments dZ taking intoaccount the time dependence of the corresponding ‘instantaneous’ marginal values.Since dZ is a spectrum quantity used to increase network capacityQ by installingnew transceivers while the number of sites is kept constant, the new state (Q9,Z 1dZ) belongs to the capacity-limited curve. The new capacityQ9 is sufficient toserve traffic until the network becomes congested. Consequently, the spectrumprice estimation procedure is an integration procedure over the assigned additionalspectrum taking into account the period of interest, as well. The resulting spectrumprice is termed as ‘integrated’ value and is denoted byV . Embedding the aboveint
discussion in a formula we write:
Z fin
V 5E V(Q, Z, t) dZ (8)intZ in
where Z and Z are the initial and final value (after the additional spectrumin fin
assignment) of the assigned to the operator spectrum, respectively. Eq. (8) isdefined for Z being less than a valueZ such that, within the specifiedfin total
observation period ofy years (2y semesters), no further increment of networkcapacity is necessary to serve traffic demand. For assignmentsZ . Z thetotal
marginal value ofZ 2 Z spectrum is zero since this quantity is not used neithertotal
by planning model (B) nor by planning model (C) (see Section 4.1).In practice, the integral (8) is numerically calculated for quantities of additional
spectrum that are multiples of 1 MHz. Calculations are based on the fact that Eq.

380 R. Sweet et al. / Information Economics and Policy 14 (2002) 371–384
Table 1Procedure of integrated spectrum value estimation
1. Calculate the number of sites and transceivers to provide the current capacity-limited capacity, assuming the current assignment of spectrum.
2. For each semester within the period of interest, calculate the number of new sitesrequired to provide the capacity in case of no additional assignment.Then for a given amount of additional spectrum between 1 and 20 MHz:
3. For each semester within the period of interest, calculate the number of newtransceivers to provide the required capacity-limited capacity at the end of thatsemester, or (once the additional spectrum has been used up) the number of new sitesrequired to provide the capacity.
4. Calculate the cost incurred in each 6-month period, made up of running costs ofall sites and transceivers and the set-up costs of new sites and new transceivers(assumed to fall at the end of the current year).
5. Calculate the NPV of the costs incurred over the period.6. Calculate the cost savings achieved compared to the case of no additional
assignment.
(8) reflects the cost savings which accrue to the operator as a result of being givenaccess to an amount of additional spectrum (assumed to be with effect right afterthe assignment). Thus the spectrum value can be calculated via the procedurewhich is illustrated in Table 1. Calculations are repeated for different spectrumincrements, that is, for different values ofZ . The NPV of the costs falls as thefin
amount of additional spectrum is increased. We note that the amount by which itfalls for each successive increment of spectrum gives the marginal value of thatincrement. In other words, the marginal value of successive increment equals thecost savings between the two planning models (B and C) followed whenupgrading the network. The summation of successive increments provides theintegrated value for the total corresponding quantity of additional spectrum.
Example 2. (Estimation of integrated value) Consider a region split in urban anddense urban areas being served by a cellular operator whose network parametersare: G 52%, u 5 3, s 57, f 5 12, z 5200 kHz, r 53.5, u 5 0.7, f 5 12,0 m m
u 5 3, f 5 7, u 51. Fig. 3a provides a graphical representation of the trafficm m m
during the past 5 years (semesteri 50 indicates the current semester) and the0
forecasted estimates of traffic demand for the nexty 5 10 years. The currentassigned bandwidth isZ 510 MHz. In addition, we assume that the network isin
now capacity-limited and congested and additional spectrum is going to beassigned for a 10-year period. Using the traffic demand estimates of Fig. 3a, weestimateZ 52320.8 MHz. The integrated value estimates over the 10-yeartotal
period of interest are depicted in Fig. 3b for different amounts of additionalspectrum. It may be seen that above 23 11 MHz of additional spectrum, thesavings are constant, indicating that the marginal value decreases to zero. Thisvalue is equal to the least required spectrumZ estimated above.htotal

R. Sweet et al. / Information Economics and Policy 14 (2002) 371–384 381
Fig. 3. (a) Evolution of traffic demand (historical and forecasted data) in the network of Example 2. (b)Integrated value over the 10-year period of interest expressed as NPV (million USD).
5. Sensitivity analysis
The necessity of sensitivity analysis stems from the fact that estimates involveparameters such as subscriber and traffic growth or costs, which are subject toinherently considerable uncertainty. Sensitivity analysis shows the impact of eachfactor in the estimated marginal value. These factors can be grouped into threegroups: cost parameters, demand parameters and network parameters.
Let us first examine the impact of cost parameters. Since the marginal value(Eq. (6)) depends linearly on the cost parametersC , C , C ,s,set-up s,running t,set-up
C , it is easy to see that the uncertainties in the spectrum value arising fromt,running
382 R. Sweet et al. / Information Economics and Policy 14 (2002) 371–384
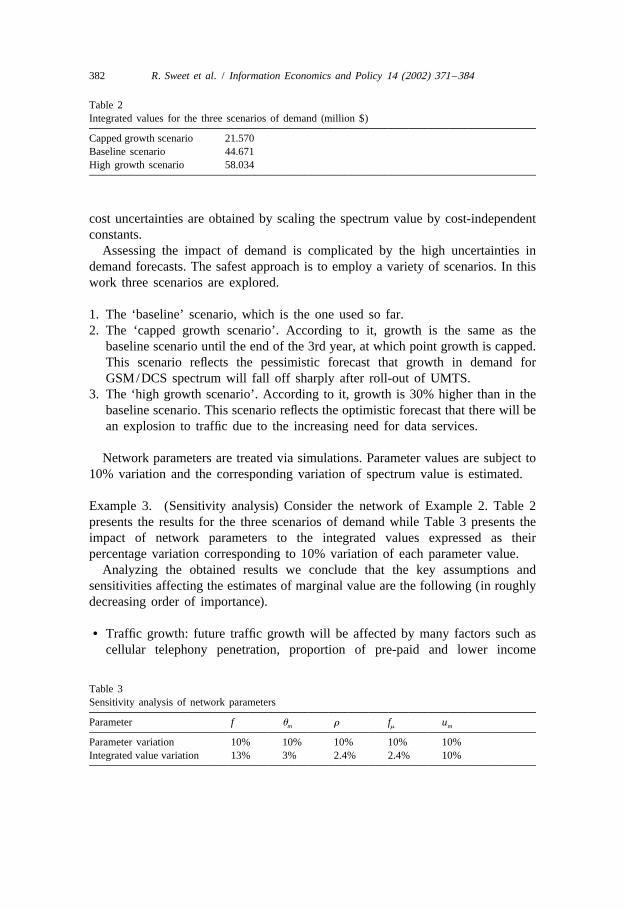
Table 2Integrated values for the three scenarios of demand (million $)
Capped growth scenario 21.570Baseline scenario 44.671High growth scenario 58.034
cost uncertainties are obtained by scaling the spectrum value by cost-independentconstants.
Assessing the impact of demand is complicated by the high uncertainties indemand forecasts. The safest approach is to employ a variety of scenarios. In thiswork three scenarios are explored.
1. The ‘baseline’ scenario, which is the one used so far.2. The ‘capped growth scenario’. According to it, growth is the same as the
baseline scenario until the end of the 3rd year, at which point growth is capped.This scenario reflects the pessimistic forecast that growth in demand forGSM/DCS spectrum will fall off sharply after roll-out of UMTS.
3. The ‘high growth scenario’. According to it, growth is 30% higher than in thebaseline scenario. This scenario reflects the optimistic forecast that there will bean explosion to traffic due to the increasing need for data services.
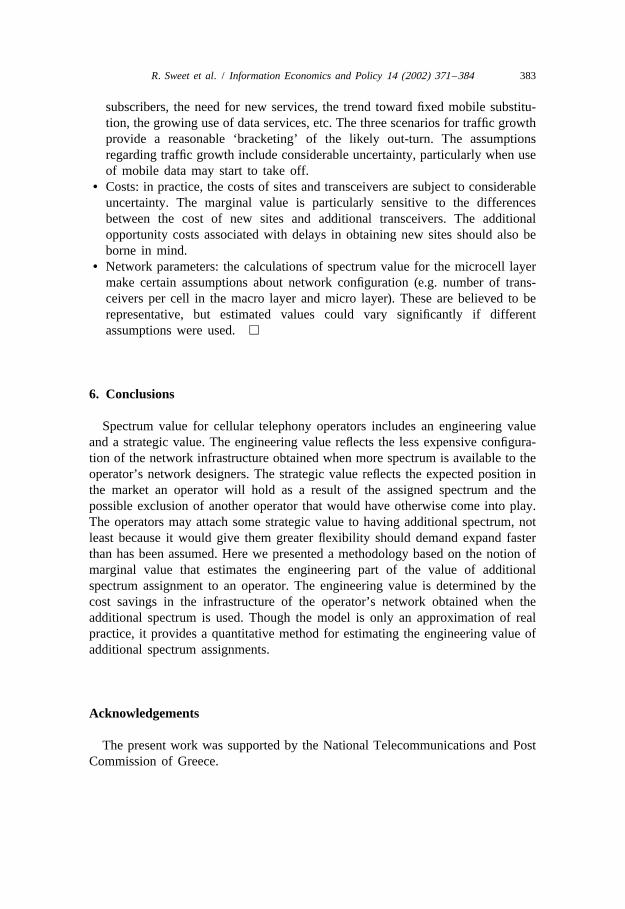
Network parameters are treated via simulations. Parameter values are subject to10% variation and the corresponding variation of spectrum value is estimated.
Example 3. (Sensitivity analysis) Consider the network of Example 2. Table 2presents the results for the three scenarios of demand while Table 3 presents theimpact of network parameters to the integrated values expressed as theirpercentage variation corresponding to 10% variation of each parameter value.
Analyzing the obtained results we conclude that the key assumptions andsensitivities affecting the estimates of marginal value are the following (in roughlydecreasing order of importance).
• Traffic growth: future traffic growth will be affected by many factors such ascellular telephony penetration, proportion of pre-paid and lower income
Table 3Sensitivity analysis of network parameters
Parameter f u r f um m m
Parameter variation 10% 10% 10% 10% 10%Integrated value variation 13% 3% 2.4% 2.4% 10%
R. Sweet et al. / Information Economics and Policy 14 (2002) 371–384 383
subscribers, the need for new services, the trend toward fixed mobile substitu-tion, the growing use of data services, etc. The three scenarios for traffic growthprovide a reasonable ‘bracketing’ of the likely out-turn. The assumptionsregarding traffic growth include considerable uncertainty, particularly when useof mobile data may start to take off.
• Costs: in practice, the costs of sites and transceivers are subject to considerableuncertainty. The marginal value is particularly sensitive to the differencesbetween the cost of new sites and additional transceivers. The additionalopportunity costs associated with delays in obtaining new sites should also beborne in mind.
• Network parameters: the calculations of spectrum value for the microcell layermake certain assumptions about network configuration (e.g. number of trans-ceivers per cell in the macro layer and micro layer). These are believed to berepresentative, but estimated values could vary significantly if differentassumptions were used.h
6. Conclusions
Spectrum value for cellular telephony operators includes an engineering valueand a strategic value. The engineering value reflects the less expensive configura-tion of the network infrastructure obtained when more spectrum is available to theoperator’s network designers. The strategic value reflects the expected position inthe market an operator will hold as a result of the assigned spectrum and thepossible exclusion of another operator that would have otherwise come into play.The operators may attach some strategic value to having additional spectrum, notleast because it would give them greater flexibility should demand expand fasterthan has been assumed. Here we presented a methodology based on the notion ofmarginal value that estimates the engineering part of the value of additionalspectrum assignment to an operator. The engineering value is determined by thecost savings in the infrastructure of the operator’s network obtained when theadditional spectrum is used. Though the model is only an approximation of realpractice, it provides a quantitative method for estimating the engineering value ofadditional spectrum assignments.
Acknowledgements
The present work was supported by the National Telecommunications and PostCommission of Greece.

384 R. Sweet et al. / Information Economics and Policy 14 (2002) 371–384
References
ERO (European Radiocommunications Office), 1998. Traffic Loading of GSM Networks.Lee, W.C., 1993. Mobile Communications Design Fundamentals. Wiley, New York.Lee, W.C., 1995. Mobile Cellular Communications. McGraw Hill.Marks, P., Viehoff, I., Saadat, U., Webb, W., 1996. Study into the Use of Spectrum Pricing.
Radiocommunications Agency, London.Rappaport, T., 1996. Wireless Communications. Prentice Hall.


