Embed Size (px)
Citation preview

�����������������
Citation: Kelley, S.R.; Tallman, S.D.
Population-Inclusive
Assigned-Sex-at-Birth Estimation
from Skull Computed Tomography
Scans. Forensic Sci. 2022, 2, 321–348.
https://doi.org/10.3390/
forensicsci2020024
Academic Editors: Francisca Alves
Cardoso, Vanessa Campanacho and
Claudia Regina Plens
Received: 1 March 2022
Accepted: 24 March 2022
Published: 26 March 2022
Publisher’s Note: MDPI stays neutral
with regard to jurisdictional claims in
published maps and institutional affil-
iations.
Copyright: © 2022 by the authors.
Licensee MDPI, Basel, Switzerland.
This article is an open access article
distributed under the terms and
conditions of the Creative Commons
Attribution (CC BY) license (https://
creativecommons.org/licenses/by/
4.0/).
Article
Population-Inclusive Assigned-Sex-at-Birth Estimation fromSkull Computed Tomography ScansSamantha R. Kelley 1 and Sean D. Tallman 2,*
1 Department of Anthropology, Boston University, Boston, MA 02215, USA; [email protected] Department of Anatomy & Neurobiology, Boston University School of Medicine, Boston, MA 02118, USA* Correspondence: [email protected]; Tel.:+1-617-358-1810
Abstract: Methods for estimating assigned, binary sex at birth from skeletonized remains haveprimarily been developed for specific population groups in the U.S. (e.g., African American, Eu-ropean American, Hispanic) and, thus, inherently rely on ancestry estimation as a foundationalcomponent for constructing the biological profile. However, ongoing discussions in forensic anthro-pology highlight pressing issues with ancestry estimation practices. Therefore, this research providespopulation-inclusive assigned-sex estimation models for cases where ancestry is not estimated or istruly unknown. The study sample (n = 431) includes 3D volume-rendered skull computed tomog-raphy scans from the novel New Mexico Decedent Image Database of African, Asian, European,Latin, and Native Americans. Five standard nonmetric traits were scored, and eighteen standardmeasurements were obtained. Binary logistic regressions and discriminant function analyses wereemployed to produce models and classification accuracies, and intraobserver reliability was assessed.The population-inclusive nonmetric and metric models produced cross-validated classification accu-racies of 81.0–87.0% and 86.7–87.0%, respectively, which did not differ significantly from the accuracyof most population-specific models. Moreover, combined nonmetric and metric models increasedaccuracy to 88.8–91.6%. This study indicates that population-inclusive assigned-sex estimation mod-els can be used instead of population-specific models in cases where ancestry is intentionally notestimated, given current concerns with ancestry estimation.
Keywords: forensic anthropology; United States; sexual dimorphism; assigned sex estimation;population-inclusive models; population affinity
1. Introduction1.1. The Role of Ancestry in the Biological Profile and Study Rationale
The prevailing theory that population variation affects levels of skeletal sexual dimor-phism [1–3] continues to influence researchers in the development of population-specificmetric and nonmetric methods of sex estimation using the cranial [1,4–18] and postcranialskeleton [1,6,15,19–28]. Although sexual dimorphism differs between certain populations,this variation does not fall along ancestral (i.e., “racial”) lines; however, the estimation ofancestry (i.e., “population affinity”, “race”, “bioaffinity”) becomes compulsory for humanidentification, because components of the biological profile—such as sex, age, and statureestimation—often depend on population-specific models [29].
Until relatively recently, the majority of U.S.-based practicing forensic anthropologistsoperated under the explicit assumption that ancestry is an essential and critical piece of the bi-ological profile; however, the accompanying methods—especially morphoscopic approaches—are problematic and poorly understood [29,30]. In particular, ancestry estimation may un-wittingly propagate the long-debunked biological race concept and stymie identificationefforts—especially for people of color. Additionally, at present, we do not understand theheritability or ecogeographical causes of many of the nonmetric (i.e., macromorphoscopic)traits frequently used in forensic ancestry estimations [30]. Although some research has
Forensic Sci. 2022, 2, 321–348. https://doi.org/10.3390/forensicsci2020024 https://www.mdpi.com/journal/forensicsci

Forensic Sci. 2022, 2 322
quantified population differences with regard to sex estimation (e.g., [2,3,16,31–34]), there is alack of research on large-scale patterns of sexual dimorphism, their proximate mechanisms,and their probable causes [2,17]. Given the deficiency in understanding the primary mecha-nisms behind the manifestation of the traits used in current ancestry estimation, as well asa lack of critical inquiry into their role as tools for reinforcing the debunked biological raceconcept and white supremacy [29], the role of ancestry estimation has questionable value asan ongoing component of the biological profile [29,30,35–46]. Consequently, many forensicanthropologists are removing ancestry estimation from their analyses.
The present study seeks to engage with the ongoing conversation regarding the roleof ancestry in the biological profile by proposing a method of assigned-sex estimation fromcomputed tomography (CT) scans that does not rely on an estimation of population affinity.A population-inclusive model is applicable in cases where population affinity is unknownor intentionally not estimated in order to mitigate the potential for racial biases such asthe “missing white woman syndrome” [42,44], and in light of the debate surrounding theremoval of certain ancestry estimation methods from the construction of the biologicalprofile. While limited postcranial research indicates that highly accurate population-inclusive sex estimation and other identification methods can be developed [36,38,47],population-specific methods continue to be used in most cases, even if the appropriatepopulation-specific method does not exist [2]. Thus, the aims of this study are twofold:(1) to provide population-inclusive models for assigned sex estimation when populationaffinity is not estimated or is unknown; and (2) to demonstrate the utility of CT scans inmetric and nonmetric assigned-sex estimation. Through analyzing the sexual dimorphismof a demographically diverse sample, we hypothesize that population-inclusive modelsfor estimating assigned sex will produce classification accuracies that are not statisticallydifferent and, ultimately, perform better than population-specific models.
1.2. The Study Collection: New Mexico Decedent Image Database
The study sample was derived from the New Mexico Decedent Image Database(NMDID) [48], which was created through a 2010 initiative by the National Instituteof Justice (NIJ) that awarded the New Mexico Office of the Medical Investigator (OMI) aresearch grant to explore the value of CT scans and their potential in supplanting traditionalautopsies [49,50]. The OMI is a centralized medical examiner’s office that serves the stateof New Mexico, and from mid-2010 to mid-2017 any decedent who was routed to the OMIand underwent subsequent autopsy also received a high-resolution, full-body CT scan.This included any individual who died in a sudden, untimely, or unexpected manner, aswell as any person found dead for whom the cause of death was unknown.
The database contains CT scans on approximately 15,242 decedents with full-bodyscout images equivalent to whole-body radiographs, and potentially as many as 69 meta-data fields. Each decedent is associated with two sets of CT scans, augmented for both softtissue and bone analysis, comprising 4000 axial image slices, with a 512 × 512 matrix anda slice thickness of 1 mm, with a 0.5 mm overlap [51]. In 2016, the NIJ awarded a grantspecifically to develop the CT database with the corresponding metadata [51]. As such, theNMDID serves as a unique documented virtual skeletal and soft tissue “collection”.
Of the NMDID sample, 4475 are female, 10,750 are male, and 17 are unknown. Morethan two-thirds of the CT scans have no discernable decomposition [51]. There are alsometadata fields for race, tribe, and ethnicity, and these fields can be further divided de-pending on paternal and maternal attribution (ancestry). The metadata field for raceincludes 17 identification options, the field for ethnicity includes 4, and there are 24 tribalaffiliation options. These metadata categories are either self-identified or determinedby next of kin (NOK). Thus, the NMDID captures an impressive range of very modern,“real-world” human biological variation that traditional U.S.-based skeletal collections—primarily composed of African-American (i.e., Black) and European-American (i.e., white)individuals [45,52]—cannot approximate.

Forensic Sci. 2022, 2 323
1.3. Assigned Skeletal Sex Estimation
Assigned sex or “sex at birth” refers to an individual’s assigned classification at birthby medical professionals—usually female or male—which is largely based on the visualassessment and interpretation of external anatomy, and specifically determined and in-fluenced by a combination of characteristics, including chromosomes, hormones, internaland external reproductive organs, and secondary sex characteristics [53]. Estimating theassigned sex of modern skeletonized remains is possible because the skeleton, as a sec-ondary sex characteristic, is dimorphic, and is aligned with and reflective of the primarysex characteristics (i.e., soft tissue) used in assigning sex at birth. We contend that, similarto medical professionals, forensic anthropologists bioculturally interpret skeletal morpho-metrics (i.e., shape and size) to assign skeletal sex and predict assigned sex. To moreaccurately reflect this process, we use “assigned female at birth (AFAB)” and “assignedmale at birth (AMAB)” over the traditionally used “female” and “male.” Such inclusiveterminology (i.e., AFAB/AMAB) importantly reflects that sex is mutable, that there maybe a discordance between assigned and self-identified sex, and that, ultimately, we do notknow how decedents self-identified. However, sex is not binary, and numerous chromoso-mal combinations exist beyond the female/male typology, resulting in an estimated 2%of individuals being intersex [54]. While not the subject of the present study, the term“intersex” is used to describe persons with innate sex characteristics that emerge duringembryological development and fall outside conventional conceptions of AFAB or AMABbodies [53].
The onset of skeletal sexually dimorphic trait expressions occurs during adolescenceand coincides with increased levels of circulating sex steroids such as androgens and es-trogens [55,56]. The steroids that drive sexual maturation play an essential role in skeletalgrowth and development [55,57–60]. Factors including thermoregulation, biomechanicalprocesses involved in obstetrics, sexual selection, mating preferences, and allometric con-siderations result in an increase in bone growth [61–64], but the size, shape, robustness,and gracility of the skull in particular are influenced by hormone-controlled allometricdifferences that promote sex-specific patterns of growth and development [1,63,64].
Assigned skeletal sex estimation is an integral component in the development of thebiological profile [1,2,14,15,65–67], as it can winnow the list of missing persons, and oftenserves as an important variable for methods used to estimate age and stature [1,2]. Thepelvis is generally accepted as the best indicator of assigned sex at birth, due to the re-productive differences between AFABs and AMABs [6,11,20,22,27,66], followed by the longbones [15,21,23,24,26,68]. In cases where the pelvis or long bones are not available, the skull(cranium and mandible) is recognized as the next best indicator of assigned sex [11,67,69]. Gen-erally, AMAB skulls tend to be more robust, larger in size, and have heavier muscle attachmentswhen compared to AFAB skulls, but the extent to which discrete sexually dimorphic cranialtraits vary across populations is still the subject of many studies [2,3,31–34,70]. While sex is notbinary, forensic anthropological methods to estimate an individual’s assigned sex at birth havebeen built on simplistic models that position “female” and “male” on a spectrum of “gracile”to “robust” [71]. Moreover, these sex estimation models are overwhelmingly developed forspecific “populations” or continental/racialized groups, and rely on the estimation of popula-tion affinity or, more commonly, ancestry. Therefore, this research advocates for a move awayfrom ancestrally/continentally/racially-based methods, and proposes population-inclusiveassigned-sex estimation models.
1.4. Methods for Estimating Assigned Sex
The sex of unidentified skeletal remains can be estimated in a variety of ways, in-cluding visual and metric, as well as with the application of statistical software such asFordisc that customizes metrically based discriminant functions [1,3,4,6,14,15,72]. Thevisual and metric methods are usually complementary, and tend to result in similar levelsof accuracy [4,11,23].
Forensic Sci. 2022, 2 324
The visual assessment of morphology, which typically ranges from gracile to robust,is most easily employed when estimating sex [2,6,63]. Early methods of sex assessmentwere based on gestalt analyses and female/male-associated ordinal scores, which werecompiled for a decision table or majority-rule approach [73–79] without the use of statisticalprobabilities that current visual methods and Fordisc employ [17,27,66,72,80]. Worldwidestudies show that the glabella, supraorbital margin, mastoid process, nuchal crest, andmental eminence are variably sexually dimorphic [2,4,6,12,16,17,70]; however, overlapbetween trait expression—scored from 1 (gracile) to 5 (robust)—occurs due to ambiguousexpression, age effects, population variation, reduced sexual dimorphism, biomechanicaldifferences, secular change, and idiosyncratic variation [1]. Furthermore, because there willalways be AFABs and AMABs who fall variably on the gradient of human variation andsexual dimorphism, the goal of the ordinal scale is to provide a simple and less subjectivemethod of scoring that relies on assessments of the robustness/gracility or size/shape of aspecific trait without any presumption of sex or femininity/masculinity [1].
Metric methods have likewise undergone a transformation since their advent [20,28,81],into modern studies that employ statistical probabilities that were developed on expandedreference groups [7,15,72]. Metric techniques typically involve the univariate or multivari-ate analysis of skeletal measurements, as well as multivariate shape analyses [12]. WhileFordisc [72] is regularly used for metric sex estimation, its discriminant functions classifyindividuals along eight problematic and conflated ancestral and/or racial lines (i.e., AmericanBlack, American Indian, American white, Chinese, Guatemalan, Hispanic, Japanese, andVietnamese), and are therefore inherently population-specific. Moreover, several populationgroups in Fordisc lack females (i.e., Chinese, Guatemalan, and Vietnamese), and sample sizesfor all groups aside from the Black, Hispanic, and white samples are low—especially forfemales [72].
Regardless of the type of analysis employed, many of the current methods used in U.S.-based forensic anthropological casework and research are centered on groups of African-American and European-American individuals, many of whom come from the Hamann–Todd, Terry, and Bass skeletal collections [15,52]. These methods often perform poorlywhen applied to genetically, temporally, or biogeographically unrelated groups [2,21,52,82].Additionally, the Forensic Anthropology Data Bank (FDB) has a dearth of data on positivelyidentified Hispanic individuals—and other underrepresented groups—meaning that manypopulation-specific sex estimation discriminant function models are fundamentally fraughtwith problems [52]. Moreover, U.S.-based skeletal collections and databases used to developmethods largely lack demographic diversity [83], thereby necessitating the use of morerepresentative alternatives, such as large-scale CT databases—such as the NMDID used inthe present study—for advancing forensic-related research.
2. Materials and Methods2.1. Study Sample
The study sample comprised 431 individual 3D volume-rendered (VR) CT images ofthe skull—originally 494, and later reduced due to downloading errors and incompatiblevolume rendering that affected approximately 13% of the original sample. The use ofCT scans has been shown to be an acceptable alternative method of data collection totraditional analysis of dry bone [84–89]. Such technology has allowed researchers to attemptidentification methods with CT scans of skeletons without the removal of soft tissue [89],and provides researchers with examination capabilities beyond in-person observation [84].
Decedents were selected based on sex, age, and population affinity, and scout imageswere used to briefly assess the condition of the remains. Population affinity for the samplewas based on the self-identified or NOK-identified “race”, “ancestry”, and/or “ethnicity”recorded in the NMDID. The exclusion criteria included (1) causes of death that wouldimpede data collection from the skull (e.g., blunt force trauma and gunshot wounds to thehead and neck; thermal injuries), (2) ages not contained within the range of 18–90 years; and(3) individuals who did not identify with the female or male sex assignment at birth. These

Forensic Sci. 2022, 2 325
exclusion criteria were applied when possible, but were limited by the set study cohortsas well as the overall diversity of the NMDID, which is disproportionately composed ofwhite AMABs. The criteria for inclusion encompassed AFAB and AMAB individuals be-tween 18 and 90 years from one of the five predetermined population affinities, resulting in189 AFABs and 242 AMABs. Four age cohorts were established to ensure a similar distribu-tion across both sex categories as well as across population affinities. The age cohorts were18–30 years (n = 109), 31–50 years (n = 114), 51–70 years (n = 168), and 71–90 years (n = 40)(Table 1).
Table 1. Study sample divided by age cohort, population affinity, and assigned sex.
Age (years) Population Affinity AMAB AFAB
18–30
African American 10 9Asian American 18 6
European American 10 12Latin American 12 11
Native American 11 10
31–50
African American 11 12Asian American 19 3
European American 12 11Latin American 11 12
Native American 11 12
51–70
African American 15 18Asian American 26 8
European American 18 13Latin American 17 16
Native American 20 17
71–90
African American 4 4Asian American 6 3
European American 3 5Latin American 4 4
Native American 4 3
Total Sample Size 242 189
The five groups used in this research were constructed from broad social race cate-gories of the U.S. census as a rough proxy for population affinity, as well as the “PhysicalCharacteristics” subcategories of “race” and “ethnicity” of the NMDID, which are relativelyequally distributed across all five groups (Figure 1). The analyzed groups in no way cap-ture the entire range of human skeletal variation, but represent the five major bureaucraticdemographics listed on U.S. government data collection forms. The final groups created forthis study include African American (original NMDID variable: Black or African American(race); AFAB = 43, AMAB = 40), Asian American (original NMDID variable: Chinese,Filipino, Japanese, Korean, Vietnamese, and other Asian (race); AFAB = 20, AMAB = 69),European American (original NMDID variable: white (race); AFAB = 41, AMAB = 43),Latin American (original NMDID variable: Hispanic or Latino (ethnicity); AFAB = 43,AMAB = 44), and Native American (original NMDID variable (race): not broken downby tribe, AFAB = 42, AMAB = 46). The Asian-American group was constructed from theseparate NMDID “race” categories of Chinese, Filipino, Japanese, Korean, Vietnamese, and“other Asian” because these groups individually did not have a large enough representationwithin the database compared to the other population affinities. When selecting individualsfor all population groups excluding Latin American, ethnicity was additionally selectedto be “Not Hispanic, Latino, or Middle Eastern” to ensure no cross-listing between thecategories. When the Latin-American group was constructed, the Hispanic and Latinoethnicity was selected.

Forensic Sci. 2022, 2 326
Forensic Sci. 2022, 2, FOR PEER REVIEW 6
AMAB = 43), Latin American (original NMDID variable: Hispanic or Latino (ethnicity); AFAB = 43, AMAB = 44), and Native American (original NMDID variable (race): not bro-ken down by tribe, AFAB = 42, AMAB = 46). The Asian-American group was constructed from the separate NMDID “race” categories of Chinese, Filipino, Japanese, Korean, Viet-namese, and “other Asian” because these groups individually did not have a large enough representation within the database compared to the other population affinities. When se-lecting individuals for all population groups excluding Latin American, ethnicity was ad-ditionally selected to be “Not Hispanic, Latino, or Middle Eastern” to ensure no cross-listing between the categories. When the Latin-American group was constructed, the His-panic and Latino ethnicity was selected.
Figure 1. Percentages of study sample by population affinity.
2.2. Study Sample Preparation and Data Collection The preparation of the samples consisted of a multistep process. The CT image files
for each individual were downloaded and visualized using the 64-bit version of OsiriX MD imaging software (v.11.0.4) on an iMac™ computer. Using this software, 3D images of the osseous structures were rendered using the 3D-VR function, with a focus on bone. This image was then converted to a Meshmix file using Meshmixer™ (https://www.mesh-mixer.com), a free online software for creating and manipulating 3D files, in order to pro-cess the original image. The editing process consisted of removing life-saving equipment (e.g., defibrillator pads, tubes, wiring, clamps) as well as personal artifacts (e.g., eye-glasses, jewelry, hairpins, buttons) and other artifacts. The aim of this editing process was to create a sample of 3D-VR images that consisted solely of an isolated skull, as well as to maximize accessibility to the features that were scored and surfaces where points were placed for measurement (e.g., removal of the first cervical vertebrae for access to the fora-men magnum as well as the basion), and to remove any potential for biases (e.g., removal of jewelry, hairpins) (Figure 2).
Figure 1. Percentages of study sample by population affinity.
2.2. Study Sample Preparation and Data Collection
The preparation of the samples consisted of a multistep process. The CT image filesfor each individual were downloaded and visualized using the 64-bit version of OsiriX MDimaging software (v.11.0.4) on an iMac™ computer. Using this software, 3D images of theosseous structures were rendered using the 3D-VR function, with a focus on bone. This imagewas then converted to a Meshmix file using Meshmixer™ (https://www.meshmixer.com,accessed on 16 September 2021), a free online software for creating and manipulating 3D files,in order to process the original image. The editing process consisted of removing life-savingequipment (e.g., defibrillator pads, tubes, wiring, clamps) as well as personal artifacts (e.g.,eyeglasses, jewelry, hairpins, buttons) and other artifacts. The aim of this editing processwas to create a sample of 3D-VR images that consisted solely of an isolated skull, as well asto maximize accessibility to the features that were scored and surfaces where points wereplaced for measurement (e.g., removal of the first cervical vertebrae for access to the foramenmagnum as well as the basion), and to remove any potential for biases (e.g., removal of jewelry,hairpins) (Figure 2).
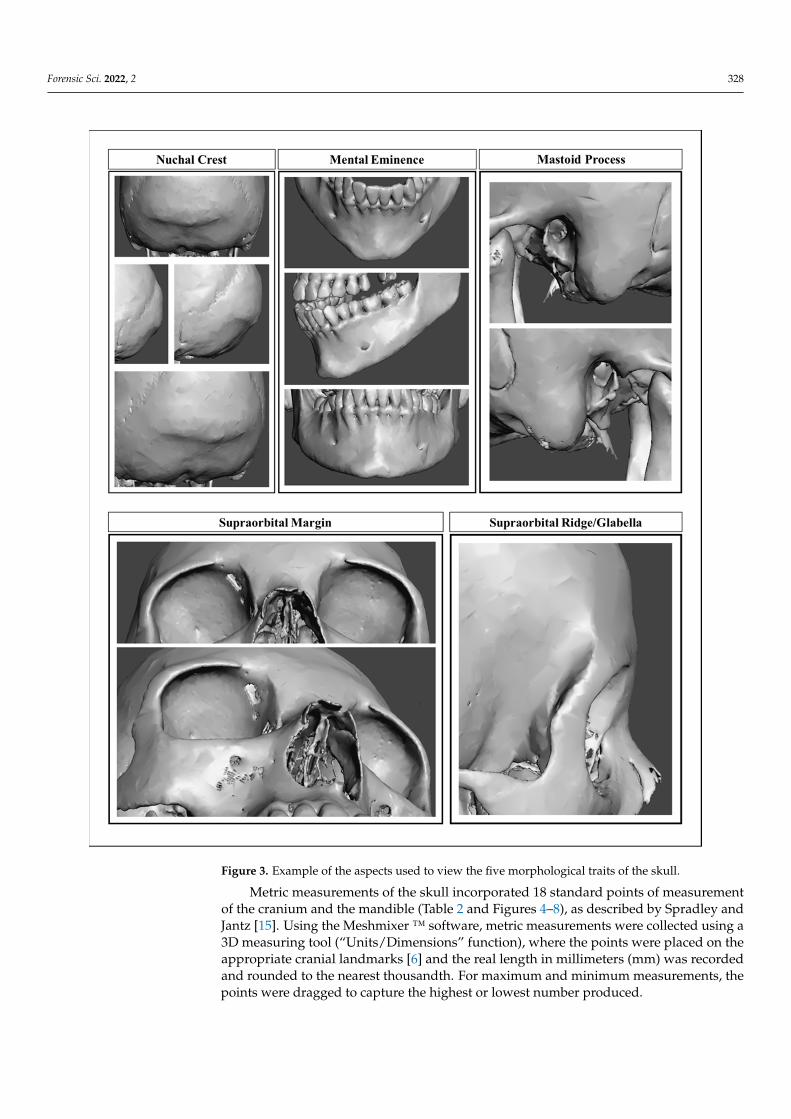
Nonmetric traits were scored according to the diagrams and descriptions in the worksof Buikstra and Ubelaker [6] and Walker [17], and included the supraorbital ridge/glabella,supraorbital margin, mastoid process, nuchal crest, and mental eminence. The 3D-VR CTskulls were visually examined from the same angle each time (Figure 3), and the traits wereeach assigned an ordinal score on a scale from 1 to 5 (i.e., gracile to robust). Traits werescored only if they were complete or mostly complete, and if the surrounding structureswere sufficiently intact to provide relative comparison. The mental eminence was notscored if there was significant alveolar resorption.

Forensic Sci. 2022, 2 327Forensic Sci. 2022, 2, FOR PEER REVIEW 7
Figure 2. Sample preparation example that includes the progression of an individual from CT image slices, to a 3D-VR CT image, to a completely edited Meshmix file.
Nonmetric traits were scored according to the diagrams and descriptions in the works of Buikstra and Ubelaker [6] and Walker [17], and included the supraorbital ridge/glabella, supraorbital margin, mastoid process, nuchal crest, and mental eminence. The 3D-VR CT skulls were visually examined from the same angle each time (Figure 3), and the traits were each assigned an ordinal score on a scale from 1 to 5 (i.e., gracile to
Figure 2. Sample preparation example that includes the progression of an individual from CT imageslices, to a 3D-VR CT image, to a completely edited Meshmix file.
Forensic Sci. 2022, 2 328
Forensic Sci. 2022, 2, FOR PEER REVIEW 8
robust). Traits were scored only if they were complete or mostly complete, and if the sur-rounding structures were sufficiently intact to provide relative comparison. The mental eminence was not scored if there was significant alveolar resorption.
Figure 3. Example of the aspects used to view the five morphological traits of the skull.
Metric measurements of the skull incorporated 18 standard points of measurement of the cranium and the mandible (Table 2 and Figures 4–8), as described by Spradley and Jantz [15]. Using the Meshmixer ™ software, metric measurements were collected using a 3D measuring tool (“Units/Dimensions” function), where the points were placed on the appropriate cranial landmarks [6] and the real length in millimeters (mm) was recorded and rounded to the nearest thousandth. For maximum and minimum measurements, the points were dragged to capture the highest or lowest number produced.
Figure 3. Example of the aspects used to view the five morphological traits of the skull.
Metric measurements of the skull incorporated 18 standard points of measurementof the cranium and the mandible (Table 2 and Figures 4–8), as described by Spradley andJantz [15]. Using the Meshmixer ™ software, metric measurements were collected using a3D measuring tool (“Units/Dimensions” function), where the points were placed on theappropriate cranial landmarks [6] and the real length in millimeters (mm) was recordedand rounded to the nearest thousandth. For maximum and minimum measurements, thepoints were dragged to capture the highest or lowest number produced.

Forensic Sci. 2022, 2 329
Table 2. Metric measurements and associated landmarks following Spradley and Jantz [17].
Metric Measurements
1. Minimum frontal breadth (ft-ft) 10. Bicondylar breadth (cdl-cdl)2. Orbital height 11. Biauricular breadth (au-au)
3. Upper facial height (n-pr) 12. Foramen magnum breadth4. Parietal chord (b-l) 13. Occipital chord (l-o)
5. Glabella occipital length (g-op) 14. Bigonial breadth (go-go)6. Mastoid length 15. Basion–bregma height (ba-b)
7. Mandibular length 16. Basion–nasion length (ba-n)8. Maximum ramus height 17. Frontal chord (n-b)
9. Bizygomatic breadth (zy-zy) 18. Nasal height (n-ns)
Forensic Sci. 2022, 2, FOR PEER REVIEW 9
Table 2. Metric measurements and associated landmarks following Spradley and Jantz [17].
Metric Measurements
1. Minimum frontal breadth (ft-ft) 10. Bicondylar breadth (cdl-cdl)
2. Orbital height 11. Biauricular breadth (au-au)
3. Upper facial height (n-pr) 12. Foramen magnum breadth
4. Parietal chord (b-l) 13. Occipital chord (l-o)
5. Glabella occipital length (g-op) 14. Bigonial breadth (go-go)
6. Mastoid length 15. Basion–bregma height (ba-b)
7. Mandibular length 16. Basion–nasion length (ba-n)
8. Maximum ramus height 17. Frontal chord (n-b)
9. Bizygomatic breadth (zy-zy) 18. Nasal height (n-ns)
Figure 4. Examples of metric measurements from an anterior perspective, including (1) minimum frontal breadth, (2) orbital height, and (3) upper facial height.
Figure 4. Examples of metric measurements from an anterior perspective, including (1) minimumfrontal breadth, (2) orbital height, and (3) upper facial height.

Forensic Sci. 2022, 2 330Forensic Sci. 2022, 2, FOR PEER REVIEW 10
Figure 5. Examples of metric measurements from a lateral perspective, including (4) parietal chord, (5) glabella occipital length, (6) mastoid length, (7) mandibular length, and (8) maximum ramus height.
Figure 5. Examples of metric measurements from a lateral perspective, including (4) parietal chord,(5) glabella occipital length, (6) mastoid length, (7) mandibular length, and (8) maximum ramus height.

Forensic Sci. 2022, 2 331Forensic Sci. 2022, 2, FOR PEER REVIEW 11
Figure 6. Examples of metric measurements from an inferior perspective, including (9) bizygomatic breadth, (10) bicondylar breadth, (11) biauricular breadth, and (12) foramen magnum breadth.
Figure 6. Examples of metric measurements from an inferior perspective, including (9) bizygomaticbreadth, (10) bicondylar breadth, (11) biauricular breadth, and (12) foramen magnum breadth.

Forensic Sci. 2022, 2 332Forensic Sci. 2022, 2, FOR PEER REVIEW 12
Figure 7. Examples of metric measurements from a posterior perspective, including (13) occipital chord and (14) bigonial breadth.
Figure 7. Examples of metric measurements from a posterior perspective, including (13) occipitalchord and (14) bigonial breadth.

Forensic Sci. 2022, 2 333Forensic Sci. 2022, 2, FOR PEER REVIEW 13
Figure 8. Examples of metric measurements from an anterolateral perspective, including (15) ba-sion–bregma height, (16) basion–nasion length, (17) frontal chord, and (18) nasal height.
2.3. Statistical Analyses All statistical analyses were run with IBM SPSS (version 27). Binary logistic regres-
sion (BLR) and discriminant function analysis (DFA) were employed in order to develop population-specific and population-inclusive models. Population-specific models were produced to provide classification accuracies for comparison to the population-inclusive models, so as to assess whether there was a reduction in resolution with an increase in inclusivity. Two-way cross-tabulation tables were created in SPSS using Fisher’s exact test based on the chi-squared statistic, in order to evaluate whether significant differences ex-isted between the population-inclusive and population-specific models.
BLR was used to analyze the nonmetric traits, because BLR analysis does not require normal distributions, avoids assumptions of linearity, and is well suited to ordinal scoring methods [17,90,91]. The forward Wald stepwise selection method was employed so that
Figure 8. Examples of metric measurements from an anterolateral perspective, including (15) basion–bregma height, (16) basion–nasion length, (17) frontal chord, and (18) nasal height.
2.3. Statistical Analyses
All statistical analyses were run with IBM SPSS (version 27). Binary logistic regres-sion (BLR) and discriminant function analysis (DFA) were employed in order to developpopulation-specific and population-inclusive models. Population-specific models wereproduced to provide classification accuracies for comparison to the population-inclusivemodels, so as to assess whether there was a reduction in resolution with an increase ininclusivity. Two-way cross-tabulation tables were created in SPSS using Fisher’s exact

Forensic Sci. 2022, 2 334
test based on the chi-squared statistic, in order to evaluate whether significant differencesexisted between the population-inclusive and population-specific models.
BLR was used to analyze the nonmetric traits, because BLR analysis does not requirenormal distributions, avoids assumptions of linearity, and is well suited to ordinal scoringmethods [17,90,91]. The forward Wald stepwise selection method was employed so thatvariables would be removed or tested based on significance. The sectioning point was setat 0.5, so individuals with probabilities less than 0.5 were estimated to be AFAB, whilethose with probabilities greater than 0.5 were estimated to be AMAB. There was onepopulation-inclusive regression equation that was cross-validated by generating a hold-out sample (HOS), where 30% of the study sample was removed from the BLR and apopulation-inclusive BLR equation was produced on the remaining 70%. In additionto the population-inclusive BLR equations, five population-specific BLR equations andaccompanying accuracies were produced for each population affinity group. These SPSSmodels were then tested on the study sample to generate applied accuracies.
A BLR was additionally run that combined both the metric and nonmetric data toproduce a mixed model. BLR was chosen in this instance because it avoided the problemof assuming linearity [90]. This BLR produced a population-inclusive regression equationwith statistically significant coefficient variables. This equation was cross-validated on a30% HOS. BLR was run for each of the five population affinity groups, but results were notreported due to a lack of statistical significance for the coefficient variables.
The metric data were statistically analyzed using DFA in SPSS as described by Spradleyand Jantz [15], and because of the linear relationship between cranial dimensions andmeasurements [90] (p. 599). The Mahalanobis distance stepwise method was used tocontrol for outlying variables. The sectioning points were obtained by adding the femaleand male means and dividing by two. Values that fell above the sectioning point wereconsidered AMAB, and values that fell below the sectioning point were considered AFAB.The DFA was cross-validated using the leave-one-out cross-validation (LOOCV) method.The measurements for nasion–prosthion height, parietal chord, and occipital chord wereexcluded from the DFA due to small sample sizes. There was one population-inclusiveDFA equation developed with SPSS. This SPSS model was then tested on the study sample,and new applied model accuracies were produced. In addition to the population-inclusiveDFA equation, five population-specific DFA equations were produced for each populationaffinity group. The SPSS models were then tested on the study sample in the same manneras with the population-inclusive DFA model.
Intrarater reliability was calculated for a random selection of 52 individuals—approximately12% of the total study sample—who were scored and measured on a second occasion by thefirst author. Cohen’s kappa analysis [92,93] was employed to assess the degree of agreement ordisagreement in both observations for the nonmetric traits of the cranium and mandible. Thekappa value evaluates the “proportion of agreement between observers corrected for chanceand the standard measure of (intraobserver) reliability with nominal data (e.g., male vs. fe-male)” [18] (p. 135). Kappa values are on a scale between 0 to 1, with 0 representing a level ofagreement that would be expected if ordinal scores were assigned at random (i.e., low agree-ment), and 1.0 representing perfect agreement [27]. The significance of the Kappa values wasdetermined following Landis and Koch [94], with a Kappa statistic of less than 0.00 indicatingpoor agreement, 0.00–0.20 as slight agreement, 0.21–0.40 as fair agreement, 0.41–0.60 as moderateagreement, 0.61–0.80 as substantial agreement, and 0.81–1.00 as almost perfect agreement.
The intraclass correlation coefficient (ICC) was calculated for the metric measurementsin order to assess their reliability and the relationships between variables. ICC measures therelationship between variables in the same class that measure the same thing [90] (p. 678)—inthis case, variables that estimate sex.
3. Results
Overall, the hypothesis was supported by the results of the present study, whichshowed that nearly all of the population-inclusive models performed statistically similarly

Forensic Sci. 2022, 2 335
to the population-specific models and, in fact, performed statistically better than someof the population-specific models. The results of this research indicate that a population-inclusive model can be applied in place of population-specific methods without hinderingthe estimation of assigned sex, as it resulted in both statistically similar and generallystatistically better classification accuracy.
3.1. Nonmetric Models
A BLR analysis was run with SPSS to produce population-inclusive and population-specific classification accuracies, including an HOS to cross-validate the population-inclusivemodels. The stepwise-selected classification functions and cross-validated SPSS accuraciesare presented in Table 3. The population-inclusive overall SPSS accuracy was 87.0%, andthe population-specific overall accuracies ranged from 82.0% to 91.0%. The model was thenapplied to the study’s sample groups, producing applied accuracies ranging from 78.8% to91.7% (Table 4).
Table 3. Population-inclusive and population-specific binary logistic regression models a.
Stepwise-Selected Classification Functions bClassification Statistics
AFAB AMAB Overall c
Population-InclusiveY = (glabella * 1.385) + (mastoid process * 0.902) +(mental eminence * 0.44) + (−5.888)
N 149 189 338% 86.6% 87.1% 87.0%
Population-Inclusive d
Y = (glabella * 1.363) + (mastoid process * 0.876) +(nuchal crest * 0.393) + (−5.664)
N 103 122 225% 88.0% 82.4% 85.0%
African AmericanY = (glabella * 1.335) + (mastoid process * 1.046) +(−5.164)
N 33 27 60% 86.8% 77.1% 82.0%
Asian AmericanY = (glabella * 3.033) + (mastoid process * 1.012) +(−6.438)
N 16 61 77% 84.2% 93.2% 91.0%
European AmericanY = (glabella * 1.628) + (metal eminence * 1.002) +(−6.309)
N 35 34 69% 87.5% 82.9% 85.0%
Latin American
Y = (glabella * 1.324) + (nuchal crest * 0.995) + (−5.18) N 33 33 66% 89.2% 80.5% 85.0%
Native AmericanY = (glabella * 1.827) + (mastoid process * 1.276) +(−7.037)
N 35 35 70% 92.1% 85.4 89.0%
a Sectioning point is 0.5; below = AFAB; above = AMAB. b All class means were statistically significant, p < 0.05.c No classification accuracies were significantly different from the population-inclusive model (p ≥ 0.5, 2-tailed).d Population-inclusive model calculated on 70% of the sample.
Using Pearson’s chi-squared statistic with a p-value of 0.05, the statistical significanceof both the SPSS and applied classification accuracies were tested against the population-inclusive SPSS and applied classification accuracies. All SPSS classification accuracies hadp-values greater than 0.05, and were not significantly different than the population-inclusivemodels for the SPSS classification accuracies. The African-American, European-American,Latin-American, and Native-American applied accuracies were not significantly differentfrom the population-inclusive applied accuracy (81.0%); however, the Asian-Americanoverall applied accuracy (91.7%) was significantly different.

Forensic Sci. 2022, 2 336
Table 4. Applied classification accuracies for binary logistic regression models.
Applied ModelClassification Statistics
AFAB AMAB Overall
Population-Inclusive N 156 159 315% 90.7% 73.3% 81.0%
Population-Inclusive a N 53 56 109% 91.4% 76.7% 83.2%
African AmericanN 37 26 63% 88.1% 70.3% 79.7%
Asian AmericanN 16 61 77% 84.2% 93.8% 91.7% b
European American N 35 34 69% 87.5% 82.9% 85.2%
Latin AmericanN 38 29 67% 90.5% 67.4% 78.8%
Native AmericanN 38 37 75% 92.7% 84.1% 88.2%
a Tested on the population-inclusive 30% HOS. b Significantly different accuracy compared to the overall % forthe population-inclusive model (p ≤ 0.05, 2-tailed).
3.2. Metric Models
DFA was run with SPSS to produce one population-inclusive and five separate population-specific models (Table 5). The population-inclusive and population-specific LOOCV SPSSclassification accuracies for this model are presented in Table 5. The population-inclusivemodel had a total classification accuracy of 86.7% (AFABs: 88.0%; AMABs: 85.7%). Thepopulation-specific models produced SPSS overall classification accuracies that ranged from77.1% to 88.2%. The DFA equations were then applied to the study sample’s groups, produc-ing applied classification accuracies (Table 6). The population-inclusive model produced anoverall applied accuracy of 87.0% (AFABs: 90.4%; AMABs: 84.3%). The population-specificmodels produced an overall applied accuracies that ranged from 78.0% to 95.0%.
Using Pearson’s chi-squared statistics, the differences between the population-specificand population-inclusive SPSS and applied classification accuracies were evaluated. TheAfrican-American, Asian-American, European-American, and Native-American SPSS andapplied accuracies were not significantly different than the population-inclusive modelclassification accuracy; however, the Latin-American SPSS (77.1%) and applied (78.0%)classification accuracies were significantly different from the population-inclusive SPSS(86.7%) and applied (87.0%) models.
3.3. Mixed Model
A BLR was run with SPSS that combined the metric and nonmetric data to produce apopulation-inclusive mixed model (Table 7), and a BLR built on 70% was run on the 30%HOS to cross-validate the population-inclusive model. The coefficients and constants for themixed models are presented in Table 7. The population-inclusive mixed model had a totalclassification rate of 91.6% (AFABs: 88.8%; AMABs: 93.3%) (Table 7) and an overall appliedaccuracy of 88.8% (AFABs: 88.1%; AMABs: 89.3%) (Table 8). The population-specificcoefficients in each population group all consistently produced p-values greater than 0.05,and were therefore not statistically significant. Overall, the mixed model produced betterclassification accuracy relative to the individual metric and nonmetric trait models.

Forensic Sci. 2022, 2 337
Table 5. Population-inclusive and population-specific discriminant function models.
Stepwise-Selected Classification Functions a and Sectioning Points (SP) bClassification Statistics
AFAB AMAB Overall
Population-InclusiveY = (glabella occipital length * 0.057) + (bizygomatic breadth * 0.126) + (biauricular breadth * −0.047) + (minimum frontal breadth * −0.069) + (nasal height * 0.059) + (orbitalheight * −0.115) + (mastoid height * 0.081) + (bigonial breadth * 0.037) + (maximum ramus height * 0.074) + (mandibular length * −0.046) + (−20.182); SP = −0.221
N 146 180 326% 88.0% 85.7% 86.7%
African AmericanY = (bizygomatic breadth * 0.335) + (biauricular breadth * −0.188) + (minimum frontal breadth * −0.185) + (mastoid height * 0.123) + (bicondylar breadth * −0.089) +(maximum ramus height * 0.185) + (−9.561); SP = −0.312
N 32 30 62% 84.2% 88.2% 86.1%
Asian American
Y = (basion–nasion length * 0.142) + (frontal chord * 0.102) + (mastoid height * 0.101) + (−29.68); SP = −0.6335N 15 52 67% 93.8% 86.7% 88.2%
European American
Y = (bizygomatic breadth * 0.14) + (orbital height * −0.337) + (bigonial breadth * 0.079) + (maximum ramus height * 0.109) + (mandibular length * −0.085) + (−13.013); SP =−0.059
N 31 33 64% 81.6% 80.5% 81.0%
Latin American
Y = (bizygomatic breadth * 0.136) + (maximum ramus height * 0.106) + (−24.507); SP = −0.087N 34 30 64% 82.9% 71.4% 77.1% c
Native American
Y = (glabella occipital length * 0.082) + (orbital height * −0.197) + (mastoid height * 0.082) + (bigonial breadth * 0.102) + (maximum ramus height * 0.075) + (−25.132); SP =−0.248
N 29 40 69% 80.6% 90.9% 86.3%
a All class means were statistically significant (p ≤ 0.05). b Below SP = AFAB; above SP = AMAB. c Significantly different overall accuracy compared to the population-inclusive model(p ≤ 0.05, 2-tailed).

Forensic Sci. 2022, 2 338
Table 6. Applied classification accuracies for the discriminant function models.
Applied ModelClassification Statistics
AFAB AMAB Overall
Population-Inclusive N 150 177 327% 90.4% 84.3% 87.0%
African AmericanN 34 35 69% 89.5% 100% 95.0%
Asian AmericanN 15 54 69% 93.8% 90.0% 91.0%
European American N 32 36 68% 84.2% 87.8% 86.0%
Latin AmericanN 35 30 65% 85.4% 71.4% 78.0% a
Native AmericanN 29 42 71% 80.6% 95.5% 89.0%
a Significantly different accuracy compared to the population-inclusive model (p ≤ 0.05, 2-tailed).
Table 7. Mixed-model population-inclusive (nonmetric and metric) binary logistic regression models.
Stepwise-Selected Classification Functions a,bClassification Statistics
AFAB AMAB Overall
Population-InclusiveY = (glabella * 1.13) + (mastoid * 0.957) + (mental eminence * 0.594) + (glabella occipital length * 0.102) +(bizygomatic breadth * 0.1620) + (maximum ramus height * 0.147) + (mandibular length * −0.101) + (−44.921)
N 111 182 293% 88.8% 93.3% 91.6%
Population-Inclusive c
Y = (glabella score * 2.027) + (bizygomatic breadth * 0.263) + (−38.097) N 32 53 85% 84.2% 89.8% 87.6%
a Sectioning point is 0.5; below = AFAB; above = AMAB. b All class means were significantly different (p ≤ 0.05).c Tested on the population-inclusive 30% HOS.
Table 8. Mixed-model population-inclusive applied binary logistic regression classification accuracies.
Applied ModelClassification Statistics
AFAB AMAB Overall
Population-Inclusive N 141 160 301% 88.1% 89.3% 88.8%
Population-Inclusive a N 52 57 109% 91.2% 86.8% 88.8%
a Tested on the population-inclusive 30% HOS.
3.4. Intrarater Reliability
A random sample of approximately 12% (n = 52) of the study sample was revisited fornonmetric and metric data collection to assess intraobserver agreement. Intraobserver errorfor nonmetric scoring was assessed using Cohen’s kappa statistic [93] in order to evaluatethe magnitude of potential error and level of consistency, and agreement was establishedas described by Landis and Koch [94]. All kappa values were between 0.365 and 0.563,and all traits were statistically significant. The nuchal crest performed with a fair level ofagreement, while the mastoid process, supraorbital margin, glabella, and mental eminenceperformed with a moderate level of agreement (Table 9). All metric measurements exceptone had ICC values above 0.8 and were statistically significant, indicating high intraraterreliability (Table 10). The ICC ranged from 0.777 to 0.989, with the glabella occipital lengthperforming the best and the parietal chord performing the worst. All class means werestatistically significant, with p-values below 0.001.

Forensic Sci. 2022, 2 339
Table 9. Intraobserver error rates for the nonmetric trait scores.
Morphological Traits a Kappa Value Level of Agreement b Asymptotic SE Approximate T
Nuchal crest 0.365 Fair 0.081 5.839Mastoid 0.563 Moderate 0.088 7.267
Supraorbital margin 0.432 Moderate 0.088 6.097Glabella 0.531 Moderate 0.083 7.393
Mental eminence 0.452 Moderate 0.088 6.210a All class means were statistically significant (p ≤ 0.001). b As defined by Landis and Koch [94].
Table 10. Intraobserver error rates for metric measurements a.
Measurement Valid Cases(n)
Valid Cases(%)
Excluded Cases(n)
Total Cases(n)
ICC (for AverageMeasures)
95% ConfidenceInterval
Glabella occipitallength 51 98.1% 1 52 0.989 0.980–0.994
Bizygomatic breadth 52 100% 0 52 0.931 0.880–0.960Basion–bregmaheight 46 88.5% 6 52 0.825 0.682–0.903
Basion–nasion length 51 98.1% 1 52 0.923 0.865–0.956Biauricular breadth 50 96.2% 2 52 0.909 0.836–0.949Nasion–prosthionheight 38 73.1% 14 52 0.981 0.961–0.990
Minimum frontalbreadth 52 100% 0 52 0.880 0.792–0.931
Nasal height 51 98.1% 1 52 0.941 0.896–0.966Orbital height 52 100% 0 52 0.930 0.877–0.960Frontal chord 47 90.4% 5 52 0.908 0.836–0.949Parietal chord 38 73.1% 14 52 0.777 0.575–0.883Occipital chord 39 75.0% 13 52 0.926 0.859–0.961Foramen magnumbreadth 51 98.1% 1 52 0.980 0.965–0.988
Mastoid height 51 98.1% 1 52 0.837 0.509–0.929Bigonial breadth 52 100% 0 52 0.987 0.978–0.003Bicondylar breadth 52 100% 0 52 0.938 0.893–0.965Maximum ramusheight 52 100% 0 52 0.945 0.904–0.968
Mandibular length 50 96.2% 2 52 0.904 0.813–0.948a All class means were statistically significant (p ≤ 0.001).
4. Discussion
The results of this study indicate that population-inclusive nonmetric and metricmethods can be employed to accurately estimate assigned sex without producing signifi-cantly different or, more importantly, statistically lower classification rates. In particular,population-inclusive methods resulted in classification accuracies of 81.0% to 87.0% fornonmetric and 86.7% to 87.0% for metric models. Moreover, population-inclusive mixedmodels outperformed the nonmetric and metric models alone, producing overall clas-sification accuracies of 88.8% to 91.6%. Population-inclusive methods of estimating sexbased on the skull have the potential to supplement currently used ancestry-dependentmodels of sex estimation [14,17] that generally employ data from either African-Americanor European-American groups [52]. Furthermore, estimation of assigned sex from 3D-VR CT images of the skull can augment forensic analyses and studies of human skeletalvariation—especially in cases where soft tissue cannot be removed, and where access toskeletal collections is limited. Following the findings that CT scans are highly representativeof dry bones [84–89], the 3D-VR CT scan-derived models presented here can be applied andvalidated on both additional CT scans and skeletonized remains. Additionally, future datacollection and testing should focus on heterogeneous samples, with particular attention

Forensic Sci. 2022, 2 340
paid to Asian-American and Latin-American groups who, as documented here, exhibitconsiderable cranial variation.
Emphasis has recently focused on the need for forensic anthropological researchers tosuspend their dependence on antiquated methods of ancestry estimation that are rooted intypology, and instead focus on understanding the evolutionary mechanisms behind bio-geographic differences and the effects that secular change, intersectionality, and bioculturalprocesses have on creating variation across diverse populations [29,30,37,39,40]. Currentancestry estimation practices utilized in forensic anthropology are based on assumptionsabout population differences that are inconsistent with observable patterns of biologicalvariation in myriad human groups [37,40]. Concurrently, critical race theory, broadly—andcritical race empiricism, specifically—are helping the field to question the groups thatwe operationalize in research—along with the negative and essentializing effects of thosegroupings—and to analyze how racial/ancestral categories undergird, guide, and informour research, methods, assumptions, and perceptions of human biological variation [95–97].Such criticality has highlighted how our research reifies biological race, reinforces colonial-ist power structures, is coopted for racial and nationalistic agendas, and maintains whitesupremacy [30,35,46,98]. While there is considerable work to be done to fully understandthe hold that structural racism has on forensic anthropology, it is essential that we divorceourselves from approaches that unwittingly validate biological race categories.
A population-inclusive method of sex estimation will be an important tool for combat-ting outdated ancestry-based estimation methods. Research indicates that some level ofpopulation variation exists across skeletal morphology, and has the potential to affect the ex-pression of sexually dimorphic traits [1,15–17,22], but the majority of the methods availableto researchers are exclusionary in nature, having been developed on African-American andEuropean-American populations [1,2]. Until the mechanisms behind population variationin skeletal morphology are better understood beyond ancestral/racial lines, population-inclusive models for estimating sex, age, and stature should be developed, validated, andmade part of standard practices.
4.1. Nonmetric Models
The population-inclusive BLR model, which included the glabella, mastoid process,and mental eminence, incorporated more nonmetric traits than the population-specificmodels (three instead of two). This was likely due to the variation in sample size, which isoften one of the greatest limitations in stepwise procedures [90], as the population-inclusivemodel was developed on 389 individuals and the population-specific models were alldeveloped on group sizes between 73 and 81 individuals.
Each nonmetric BLR model—both population-inclusive and population-specific—included the glabella; however, the African-American, Asian-American, and Native-American models also included the mastoid process. Research indicates that the glabellaand mastoid process are the best discriminators of binary sex, due to their highly sexuallydimorphic nature [2,17]. Tallman [2] likewise found that the glabella and mastoid processare the best at estimating sex in East and Southeast Asian groups. Garvin et al. [8] similarlyfound that when estimating sex in Arikara Native American, Nubian, U.S. Black, and U.S.white groups, the mastoid process and glabella performed the best.
Interestingly, both the population-inclusive and the European-American models incor-porated the mental eminence. Despite previous research demonstrating that a difficultyexists with scoring the mental eminence [8,12,99], this trait performed with moderateintraobserver agreement and with statistically significant class means for the population-inclusive BLR model, as well as for the population-specific European-American model.The Latin-American model was the only population-specific model that incorporated thenuchal crest into the regression equation; however, the nuchal crest performed with only afair level of intraobserver agreement.
Overall, the population-inclusive BLR models did not produce significantly lower clas-sification accuracy rates than the population-specific models. The Asian-American model
Forensic Sci. 2022, 2 341
produced the highest classification accuracy compared to the other population-specific mod-els. The SPSS classification accuracy saw a 4% increase relative to the population-inclusivemodel, but this was not significantly higher; however, the applied classification accuracywas significantly higher by 10.7%. This increase in accuracy is potentially skewed due to thedisproportionately small AFAB sample sizes. Research indicates that sexual dimorphism insome East and Southeast Asian groups is reduced compared to U.S. groups [2,21,82], sothe Asian-American population-specific models should theoretically demonstrate loweraccuracies and higher sex biases [2]. Instead, the Asian-American BLR model produceda higher classification accuracy for AMABs, suggesting that the statistical significance islikely related to sample size [90]. Alternatively, the Asian-American individuals likely hadaccess to relatively high caloric food common to the U.S.A. Groups with high levels ofovernutrition (e.g., Americans) tend to exhibit more sexual dimorphism overall, regardlessof continental ancestry [2], whereas populations that are nutrient-limited or -deficientexhibit slower maturation rates and reduced sexual dimorphism [100,101].
The Latin-American model exhibited the lowest overall applied classification accuracy;however, this was not significantly lower than that of the population-inclusive model. Thisis potentially due to higher variability in skull morphology for Latin-American-derivedskulls—and especially AMABs. Klales and Cole [102] found that Latin-American maleskulls were more variable than corresponding females in score frequency for all traits exceptthe mental eminence. Males received variable scores for the nuchal crest in particular, withthe majority being given a score of 2 (on a scale of 1 to 5) [102]. The majority of maleswere also given scores of 2 for the glabella [102]. The African-American model producedreduced SPSS and applied classification accuracies compared to the population-inclusivemodel, while the European-American model produced reduced SPSS and increased appliedclassification accuracy; however, no classification accuracy was significantly different fromthe population-inclusive model. The Native-American model produced increased SPSSand applied classification accuracies, but neither were significantly different. Walker’sstudy [17] found that the population-specific BLR equations for African-American andEuropean-American individuals correctly classified individuals 84% to 88% of the time.Similarly, Garvin et al. [8] found that population-specific BLR equations for Arikara NativeAmerican, medieval Nubian, U.S. Black, and U.S. white individuals were correctly classified74% to 99% of the time, which is consistent with the results of the present study.
The applied accuracies for both the population-inclusive and population-specificnonmetric models all show higher applied classification rates for AFABs than AMABs,except for the Asian-American model. Overall, this pattern with lower applied maleaccuracy indicates that the BLR models are biased toward AFABs. Other research has founda similar female sex bias—especially in more modern samples—due either to populationvariation or secular change [16,102].
4.2. Metric Models
The population-inclusive model incorporated the most variables in the final DFA,which was attributed to the overall sample size [90]. No DFA model used the samecombination of variables, but glabella occipital length, bizygomatic breadth, biauricularbreadth, mandibular length, maximum ramus height, orbital height, minimum frontalbreadth, bigonial breadth, and mastoid height were included in more than one equation.Richard et al. [87] found that glabella occipital length, bizygomatic breadth, and biauricularbreadth, in particular, were reliable landmarks for discriminating sex in a sample of skullsfrom the Bass skeletal collection.
The population-inclusive DFA model did not produce significantly lower classificationaccuracy rates than any of the population-specific models. Furthermore, the appliedclassification accuracies for the population-inclusive and population-specific metric modelswere higher than those of their SPSS counterparts, which was likely due to an increase insample size [90].

Forensic Sci. 2022, 2 342
The DFA model with the highest classification accuracy was the population-specificAfrican-American model, but this was not significantly higher than the population-inclusivemodel. The Asian-American model had the highest AFAB classification accuracy, which waspotentially due to sample size [90]. The Latin-American model had the overall lowest SPSSand applied classification accuracies compared to the other population-specific models,and had a significantly lower classification accuracy than the population-inclusive model.Specifically, the Latin-American AMABs had the lowest SPSS and applied classificationaccuracies. Research indicates that this could be due to a high level of skeletal variation inmale skulls specifically [102]. A metric study on the estimation of sex from the FDB usingHispanic skeletons by Spradley et al. [103] found that females were nearly always classifiedcorrectly, whereas males were often classified as female. Thus, future population-inclusiveresearch should prioritize the incorporation of Latin-American individuals in order tobetter capture this range of variation.
4.3. Mixed Model
Overall, the population-inclusive mixed model had higher SPSS and applied accuraciesthan both the nonmetric and metric population-inclusive models. The mixed model didnot have a significantly different classification accuracy than the metric SPSS and appliedaccuracies or the nonmetric SPSS accuracy; however, it was significantly higher than thenonmetric applied accuracy (increase of 10.7%). A BLR was attempted through SPSS inorder to produce population-specific models, but none of the population-specific modelsyielded class means with p-values greater than 0.05; therefore, they were not statisticallysignificant. The lack of statistical significance found here was likely due to the small samplesizes in the mixed models, resulting from the incorporation of more variables.
Most sex estimations conventionally used in forensic casework apply nonmetric andmetric models in a complementary fashion [1], and there do not appear to be any methodscurrently employed that combine both the nonmetric and metric traits into one regressionequation as seen in this study. Since most practitioners prefer to separately use both non-metric and metric methods estimating sex based on the skull, this regression that combinesboth could be a valuable addition to the forensic anthropologists’ toolkit. Moreover, sincethe classification accuracies for this mixed model equation are higher than those of thenonmetric and metric models alone, it is recommended that more studies be conducted inorder to explore the validity of mixed nonmetric and metric models.
4.4. Intrarater Reliability
Intraobserver agreement was highly significant for all nonmetric trait scores(p-values ≤ 0.001). As described by Landis and Koch [94], the nuchal crest and supraorbitalmargin had the lowest kappa values (0.365 and 0.432, respectively), suggesting that bothtraits were difficult to score consistently between observations. These results are dissimilarto the intraobserver reliability test from Tallman’s [2] cranial nonmetric analysis on East andSoutheast Asian individuals, where the nuchal crest had a substantial level of agreementbetween observations; however, the mastoid process, supraorbital margin, glabella, andmental eminence all had a moderate level of agreement between observations [2]. Garvinet al. [8] found that the nuchal crest and mental eminence had the lowest levels of agreement.Garvin et al. [8] postulated that the nuchal crest was more difficult to score consistentlybecause it involves a larger area compared to other morphological traits, and the rangeof shape variation is relatively smaller and, thus, more difficult to visualize. Althoughthe 3D-VR CT image was manipulated and rotated in order to examine the nuchal crestfrom all angles, the visual extent of rugosity could have been inhibited due to the qualityof the CT image or partial volume effects (PVEs). Stull et al. [89] found that the ability toassess VR CT images was notably impacted by PVEs during the volume-rendering process.This occurs when the CT scanner has difficulty in distinguishing between materials withdifferent Hounsfield units, such as air and bone, and results in the appearance of artifactsthat can obscure an area, or the softening of the object’s surface [89]. In the case of the

Forensic Sci. 2022, 2 343
nuchal crest, the PVE phenomenon could have reduced the appearance of rugosity, makingit more difficult to consistently score. In the case of the supraorbital margin, the difficultylay in the inability to estimate the relative width and roundness or sharpness of the marginthrough palpation, which would be done with dry bone. In the future, caution shouldbe applied when analyzing the nuchal crest and supraorbital margin via VR images. Themastoid process and glabella performed with moderate levels of agreement, but had thehighest kappa values (0.563 and 0.531, respectively). Walker [17] similarly found that theglabella and mastoid process had the highest levels of agreement relative to the nuchalcrest, supraorbital margin, and mental eminence.
The ICC values indicate a high level of intrarater reliability for the metric measure-ments. This confirms that measurements can be successfully taken on CT scans and performbetter than the more subjective nonmetric traits. The glabella occipital length had the high-est ICC (0.989), and the parietal chord had the lowest ICC (0.777). The parietal chord,occipital chord, and nasion–prosthion height all had the most cases excluded from the ICCanalysis due to small samples sizes, and were removed from the DFA in order to maximizethe sample sizes. One of the occasional artifacts of PVEs is a softening of overall imagesthat can cause cranial sutures to appear faded or obliterated [89], making some cranialchords difficult to measure. The nasion–prosthion height was often unable to be measureddue to alveolar resorption, damage to the craniometric landmark, or PVEs—potentiallyfrom dental fillings or soft tissue. A study by Menéndez [104] looked at intraobservermeasurement error of 3D-VR craniofacial landmarks, and found that the nasion had thehighest intraobserver error rates, and was difficult to establish consistently across multi-ple observational sessions. The occipital chord and parietal chord are also craniometriclandmarks that have demonstrably variable intraobserver reliability [85,87]. The cranialchords rely on landmarks demarcated by suture lines, which could also be affected by thequality of the 3D-VR image [87]. In the future, it would be best to remove measurementsthat include cranial sutures, because of the difficulty in scoring them consistently whenthey are faded or obliterated due to PVEs or CT quality. Removing these measurementsmay help to maximize sample sizes; however, such measurements are sexually dimorphic.
4.5. Data Collection from 3D-VR CT Images
The majority of nonmetric traits had a moderate level of intraobserver agreement,while the metric traits, as aforementioned, all had statistically significant ICC valuesand overall higher accuracy rates. The data collection for the nonmetric scores from VRCT images of the skull from multiple angles was impacted by the nature of viewingan image on a computer rather than physical palpation, as well as by the obstructivenature of PVEs. While research shows that data collection from VR CT images of theskeleton can be accomplished with statistically significant accuracy [84,89,105], certaintraits—such as the supraorbital margin—are more difficult to examine than others, andfurther critical study into the value and assessment of these traits is warranted. Buikstraand Ubelaker’s [6] definition for scoring the supraorbital margin as well as the nuchal crestrecommends palpating the feature/trait, which does not translate to digital observation.However, a study that explores the isolated shape and topography of the supraorbitalmargin (sensu [9,106]) would be helpful in assessing whether the levels of sharpness,roundness, and rugosity can be reliably quantified with VR CT images and correlated withordinal scores. The additional challenge of depth perception, as seen with the nuchal crestand mental eminence, could be addressed in the future via manipulation of the opacityramp. Stull et al. [89] noted that lowering the opacity ramp helped with visualizing certainsutures as well as overall bone morphology. When a VR image is constructed, the opacitycurve determines the various tissues’ transparency and opacity [89].
Additional limitations, mainly including the accessible demographics of the NMDIDand cause of death, affected sample size. The challenge of establishing an equally dis-tributed sample across all demographics was due, in part, to the availability of the NMDID,which is disproportionately composed of white AMABs, despite its large size. Furthermore,
Forensic Sci. 2022, 2 344
the study sample’s VR CT scans were derived from the OCME of New Mexico; therefore,the completeness or usability of each VR skull was variably affected by the cause of death,and was not readily apparent until after the CT image had been volume rendered and PVEshad been removed; however, this type of sample is both directly representative of the typeof remains found in forensic contexts (i.e., incomplete) and contains more human variationthan the skeletal collections traditionally used in the development of estimation methods.As previously discussed, PVEs in some cases could not be removed without affectingthe surface of the skull, limiting the ability to view and measure the skull and, therefore,collect data. Despite the limitations, the benefits of VR CT analysis help to advance forensicresearch analysis and the development of biological profile methods, because large CTdatabases such as the NMDID provide researchers with relatively easy access to a plethoraof osteological data that reflects extensive human skeletal variation.
4.6. Sex and Gender
Because sex and gender identities intersect variably and are rooted in biocultural,performative processes that move beyond biological or anatomical processes, it is impor-tant for forensic anthropologists to avoid restricting identity to biological or anatomicaldefinitions in isolation [71]. Most importantly, forensic anthropologists should endeavorto avoid assuming that all individuals are cisgender, avoid preconceived notions of het-eronormativity, and bear in mind that not all individuals share the same perspective on sex,gender, and related expressions [71]. Presently, there is no existing standardized methodof reporting if a decedent is trans, intersex, or gender diverse [71]. Moreover, current sexestimation methods for analysis and reporting have generally not evolved to be alignedwith modern social perceptions of sex, gender, and intersectional identity [71]. While thisresearch applies novel technology and methodological approaches to understand sexualdimorphism with more inclusive terminology, we acknowledge that it does not address theneed to expand binary sex estimation.
5. Conclusions
As demonstrated here, population-inclusive methods will not produce significantly dif-ferent accuracy rates compared to population-specific methods of assigned-sex estimation,suggesting that population-inclusive models could be used to estimate the assigned sexof unidentified remains without knowing or estimating ancestry. Overall, the population-inclusive nonmetric model produced classification accuracies that ranged from 81.0% to87.0%, while the metric model produced classification accuracies that ranged from 86.7% to87.0%. Additionally, the population-inclusive mixed model produced classification accu-racies that ranged from 88.8% to 91.6%—higher than the separate nonmetric and metricpopulation-inclusive model classification accuracies. These results indicate that this novelmixed model approach has the potential to better estimate assigned sex than metric or non-metric models alone, and it is recommended that further applications should validate thesefindings on heterogeneous samples. Additionally, this study demonstrates the utility of VRCT scans for developing assigned-sex estimation models, despite the inherent limitationsin analyzing the skull virtually. While the supraorbital margin, nuchal crest, and somemeasurements reliant on cranial sutures were difficult to assess—and should continue to beevaluated—this study affirms that VR CT scans are valid for the development of nonmetricand metric assigned-sex estimation methods.
Ongoing discussion in the field of forensic anthropology regarding the role of ances-try in the biological profile has made the problematic nature of currently used ancestry-dependent sex estimation models more apparent [29,30,35,37,39–41,43,45,46]. As sex es-timation methods have generally been developed and tested on specific populations ofAfrican-American, European-American, and occasionally Native-American and Hispanicindividuals [52], these models are inherently exclusive, and produce reduced classifica-tion accuracy when applied to biogeographically different groups. More specifically, thefoundational ancestry methods for these models have not taken into consideration the

Forensic Sci. 2022, 2 345
evolutionary mechanisms behind biogeographic differences, or the influence that secularchange, intersectionality, embodied racism, and biocultural processes have on skeletalvariability across populations [29,30,37,39,40,46]. While population-specific methods ofidentification have a clear utility in certain population-circumscribed or relatively homo-geneous contexts, the scope of populations that have validated estimation methods islacking—particularly for a relatively heterogeneous country such as the U.S. Therefore,there is a necessity for the application of population-inclusive methods, which includesignificantly more variation and are, therefore, more appropriate for individuals who maynot be included in the model development (e.g., truly unknown cases). This research indi-cates that the population-inclusive models will be able to accommodate significantly morevariation than population-specific models. Furthermore, population-inclusive methodsof sex, age, and stature estimation should be further explored, developed, validated, andmade part of forensic anthropologists’ standard toolkit.
Author Contributions: Conceptualization, S.R.K. and S.D.T.; methodology, S.R.K. and S.D.T.; vali-dation, S.R.K.; formal analysis, S.R.K.; investigation, S.R.K.; resources, S.R.K.; data curation, S.R.K.;writing—original draft preparation, S.R.K. and S.D.T.; writing—review and editing, S.R.K. and S.D.T.;visualization, S.R.K. and S.D.T.; supervision, S.D.T.; project administration, S.R.K. and S.D.T. Allauthors have read and agreed to the published version of the manuscript.
Funding: This research received no external funding.
Institutional Review Board Statement: The study was deemed “exempt” by Boston University’sInstitutional Review Board (H-40441, 1 July 2020).
Informed Consent Statement: Not applicable.
Data Availability Statement: The data for this study are kept by the first author and the NMDID.
Acknowledgments: The authors would like to thank the personnel who manage the NMDID forcurating the CT scans and providing access, particularly Heather Edgar. Additionally, the authorswould like to thank Francisca Alves Cardoso, Vanessa Campanacho, and Claudia Regina Plens forediting this Special Issue and including our work. Lastly, our thanks to the anonymous peer reviewerswhose comments helped to improve this article.
Conflicts of Interest: The authors declare no conflict of interest.
References1. Klales, A.R. Sex Estimation of the Human Skeleton: History, Methods, and Emerging Techniques, 1st ed.; Elsevier Press: Waltham, MA,
USA, 2020; pp. 1–364.2. Tallman, S.D. Cranial nonmetric sexual dimorphism and sex estimation in east and southeast Asian individuals. Forensic Anthropol.
2019, 2, 204–221. [CrossRef]3. Ubelaker, D.H.; DeGaglia, C.M. Population variation in skeletal sexual dimorphism. Forensic Sci. Int. 2017, 278, 407.e1–407.e7.
[CrossRef]4. Acsádi, G.; Nemeskéri, J. History of Human Life Span and Mortality; Akadémiai Kiadó: Budapest, Hungary, 1970.5. Broca, P. Instructions Craniologiques et Craniométriques; Series 2; Society of Anthropology of Paris: Paris, France, 1875.6. Buikstra, J.E.; Ubelaker, D.H. Standards for Data Collection from Human Skeletal Remains; Research Series No. 44; Arkansas
Archaeological Survey: Fayetteville, NC, USA, 1994.7. Dayal, M.R.; Spocter, M.A.; Bidmos, M.A. An assessment of sex using the skull of black South Africans by discriminant function
analysis. Homo 2008, 59, 209–221. [CrossRef] [PubMed]8. Garvin, H.M.; Sholts, S.B.; Mosca, L.A. Sexual dimorphism in human cranial trait scores: Effects of population, age, and body size.
Am. J. Phys. Anthropol. 2014, 154, 259–269. [CrossRef]9. Graw, M.; Czarnetzki, A.; Haffner, H.T. The form of the supraorbital margin as a criterion in identification of sex from the skull:
Investigations based on modern human skulls. Am. J. Phys. Anthropol. 1999, 108, 91–96. [CrossRef]10. Krogman, W.M. The skeleton in forensic medicine. Postgrad. Med. J. 1955, 17, A48–A62.11. Krogman, W.M.; Iscan, M.Y. The Human Skeleton in Forensic Medicine; Charles C Thomas: Springfield, IL, USA, 1986.12. Lewis, C.J.; Garvin, H.M. Reliability of the Walker cranial nonmetric method of implications for sex estimation. J. Forensic Sci.
2016, 61, 743–751. [CrossRef]13. Martin, R.; Knussman, R. Anthropologie: Handbuch der Vergleichenden Biologie des Menschen; Gustav Fisher Verlag: Stuttgart,
Germany, 1988.

Forensic Sci. 2022, 2 346
14. Rogers, T.L. Determining the sex of human remains through cranial morphology. J. Forensic Sci. 2005, 50, 493–500. [CrossRef][PubMed]
15. Spradley, M.K.; Jantz, R.L. Sex estimation in forensic anthropology: Skull versus postcranial elements. J. Forensic Sci. 2011, 56,289–296. [CrossRef] [PubMed]
16. Tallman, S.D.; Go, M.C. Application of the optimized summed scored attributes method to sex estimation in Asian crania.J. Forensic Sci. 2018, 63, 809–814. [CrossRef] [PubMed]
17. Walker, P.L. Sexing skulls using discriminant function analysis of visually assessed traits. Am. J. Phys. Anthropol. 2008, 136, 39–50.[CrossRef] [PubMed]
18. Walrath, D.E.; Turner, P.; Bruzek, J. Reliability test of the visual assessment of cranial traits for sex determination. Am. J. Phys.Anthropol. 2004, 125, 132–137. [CrossRef] [PubMed]
19. Karsten, J.K. A test of the preauricular sulcus as an indicator of sex. Am. J. Phys. Anthropol. 2017, 165, 604–608. [CrossRef]20. Letterman, G.S. The greater sciatic notch in American Whites and Negroes. Am. J. Phys. Anthropol. 1941, 98, 59–72. [CrossRef]21. Patterson, M.M.; Tallman, S.D. Cranial and postcranial metric sex estimation in modern Thai and Ancient Native American
individuals. Forensic Anthropol. 2019, 2, 233–252. [CrossRef]22. Phenice, T.W. A newly developed visual method of sexing the os pubis. Am. J. Phys. Anthropol. 1969, 30, 297–301. [CrossRef]23. Rogers, T.L. A visual method of determining the sex of the skeleton using the distal humerus. J. Forensic Sci. 1999, 44, 57–60.
[CrossRef] [PubMed]24. Rogers, N.L.; Flournoy, L.E.; McCormick, W.F. The rhomboid fossa of the clavicle as a sex and age estimator. J. Forensic Sci. 2000,
45, 61–67. [CrossRef]25. Tallman, S.D.; Blanton, A.I. Distal humerus morphological variation and sex estimation in modern Thai individuals. J. Forensic
Sci. 2020, 65, 361–371. [CrossRef] [PubMed]26. Vance, V.L.; Steyn, M.; L’Abbé, E.N.L. Nonmetric sex determination from the distal and posterior humerus in Black and white
South Africans. J. Forensic Sci. 2011, 56, 710–714. [CrossRef]27. Walker, P.L. Greater sciatic notch morphology: Sex, age, and population differences. Am. J. Phys. Anthropol. 2005, 127, 385–391.
[CrossRef]28. Washburn, S.L. Sex difference in the pubic bone. Am. J. Phys. Anthropol. 1948, 6, 199–207. [CrossRef]29. Bethard, J.D.; DiGangi, E.A. Moving beyond a lost cause: Forensic anthropology and ancestry estimates in the United States.
J. Forensic Sci. 2020, 65, 1791–1792. [CrossRef] [PubMed]30. DiGangi, E.A.; Bethard, J.D. Uncloaking a lost cause: Decolonizing ancestry estimation in the United States. Am. J. Phys. Anthropol.
2021, 175, 422–436. [CrossRef]31. Cunha, E.; van Vark, G. The construction of sex discriminant functions from a large collection of skulls of known sex. Int. J.
Anthropol. 1991, 6, 53–66. [CrossRef]32. Eleveth, P.B.; Tanner, J.M. Worldwide Variation in Human Growth, 2nd ed.; Cambridge University Press: Cambridge, UK, 1990.33. Franklin, D.; Freedman, L.; Milne, N. Sexual dimorphism and discriminant function sexing in indigenous South African crania.
Homo 2005, 55, 213–228. [CrossRef] [PubMed]34. Kemkes, A.; Gobel, T. Metric assessment of the “mastoid triangle” for sex determination: A validation study. J. Forensic Sci. 2006,
51, 985–989. [CrossRef]35. Adams, D.M.; Pilloud, M.A. The (mis)appropriation of biological anthropology in race science and the implications for forensic
anthropology. Forensic Anthropol. 2021, 4, 1–22. [CrossRef]36. Albanese, J. A method for estimating sex using the clavicle, humerus, radius, and ulna. J. Forensic Sci. 2013, 58, 1413–1419.
[CrossRef] [PubMed]37. Albanese, J.; Saunders, S.R. Is it possible to escape racial typology in forensic identification? In Forensic Anthropology and Medicine:
Complementary Sciences from Recovery to Cause of Death; Schmitt, A., Cunha, E., Pinheiro, J., Eds.; Humana Press: Totowa, NJ, USA,2006; pp. 281–316.
38. Albanese, J.; Eklics, G.; Tuck, A. A metric method for sex determination using the proximal femur and fragmentary hipbone.J. Forensic Sci. 2008, 53, 1283–1288. [CrossRef] [PubMed]
39. Blakey, M.L. Understanding racism in physical (biological) anthropology. Am. J. Phys. Anthropol. 2021, 175, 316–325. [CrossRef]40. Carson, E.A. Maximum likelihood estimation of human craniometrics heritabilities. Am. J. Phys. Anthropol. 2006, 131, 169–180.
[CrossRef]41. Edgar, H.J.H. Population structure, population, heterogeneity, and sources of error in the forensic estimation of “race”. In
Proceedings of the 72nd Annual Scientific Meeting of the American Academy of Forensic Sciences, Anaheim, CA, USA, 17–22February 2020.
42. Moss, J.L. The forgotten victims of missing white woman syndrome: An examination of legal measures that contribute to the lackof search and recovery of missing black girls and women. Race Gender Soc. Just. 2018, 25, 737–762.
43. Ross, A.H.; Pilloud, M. The need to incorporate human variation and evolutionary theory in forensic anthropology: A call forreform. Am. J. Phys. Anthropol. 2021, 176, 672–683. [CrossRef] [PubMed]
44. Sommers, Z. Missing white woman syndrome: An empirical analysis of race and gender disparities in online news coverage ofmissing persons. J. Crim. Law Criminol. 2016, 106, 275–314.

Forensic Sci. 2022, 2 347
45. Spradley, K.; Jantz, R.L. What are we really estimating in forensic anthropological practice, population affinity or ancestry?Forensic Anthropol. 2021, 4, 171–180. [CrossRef]
46. Tallman, S.D.; Parr, N.M.; Winburn, A.P. Assumed differences; unquestioned typologies: The oversimplification of race andancestry in forensic anthropology. Forensic Anthropol. 2021, 4, 73–96. [CrossRef]
47. Albanese, J.; Tuck, A.; Gomes, J.; Cardoso, H.F.V. An alternative approach for estimating stature from long bones that is notpopulation-or group-specific. Forensic Sci. Int. 2016, 259, 59–68. [CrossRef]
48. Edgar, H.J.H.; Daneshvari Verry, S.; Moes, E.; Adolphi, N.L.; Bridges, P.; Nolte, K.B. New Mexico Decedent Image Database; Office ofthe Medical Investigator, University of New Mexico: Albuquerque, NM, USA, 2020. [CrossRef]
49. Berry, S.R. Metadata Determination for Cadaveric Collection. Master’s Thesis, University of New Mexico, Albuquerque, NM,USA, 2014.
50. Daneshvari Berry, S.; Edgar, H.J.H. Development of a large-scale, whole body CT image database. In Proceedings of the AMIAAnnual Symposium, Washington, DC, USA, 6–8 November 2017.
51. Daneshvari Berry, S.; Edgar, H.J.H. Announcement: The New Mexico decedent image database. Forensic Imaging 2021, 24, 1–3.52. Tise, M.L.; Spradley, M.K.; Anderson, B.E. Postcranial sex estimation of individuals considered Hispanic. J. Forensic Sci. 2013, 58
(Suppl. S1), S9–S14. [CrossRef] [PubMed]53. GLAAD. Available online: https://www.glaad.org/reference/transgender (accessed on 16 September 2021).54. Blackless, M.; Charuvastra, A.; Derryck, A.; Fausto-Sterling, A.; Lauzanne, K.; Lee, E. How sexually dimorphic are we? Review
and synthesis. Am. J. Hum. Biol. 2000, 12, 151–156. [CrossRef]55. Stock, M.K. A preliminary analysis of the age of full expression of sexually dimorphic cranial traits. J. Forensic Sci. 2018, 63,
1802–1808. [CrossRef]56. Vanderschueren, D.; Vandenput, L.; Boonen, S.; Lindberg, M.L.; Bouillon, R.; Ohlsson, C. Androgens and bone. Endocr. Rev. 2004,
25, 389–425. [CrossRef]57. Bouillon, R.; Bex, M.; Vanderschueren, D.; Boonen, S. Estrogens are essential for male pubertal periosteal bone expansion. J. Clin.
Endocrinol. Metab. 2004, 89, 6025–6029. [CrossRef]58. Carson, J.A.; Manolagas, S.C. Effects of sex steroids on bones and muscles: Similarities, parallels, and putative interactions in
health and disease. Bone 2015, 80, 67–78. [CrossRef]59. Vanderschueren, D.; Venken, K.; Ophoff, J.; Boullon, R.; Boonen, S. Sex steroids and the periosteum-reconsidering the roles of
androgens and estrogens in periosteal expansion. J. Clin. Endocrinol. Metab. 2006, 91, 378–382. [CrossRef]60. Saggese, G.; Baroncelli, G.I.; Bertelloni, S. Puberty and bone development. Best Pract. Res. Clin. Endocrinol. Metab. 2002, 16, 53–64.
[CrossRef]61. Arsuaga, J.L.; Carretero, J.M. Multivariate analysis of the sexual dimorphism of the hip bone in modern human population and in
early hominids. Am. J. Phys. Anthropol. 1994, 93, 241–257. [CrossRef]62. Best, K.C.; Garvin, M.S.; Cabo, L.L. An investigation into the relationship between human cranial and pelvic sexual dimorphism.
J. Forensic Sci. 2018, 63, 990–1000. [CrossRef]63. Frayer, D.; Wolpoff, M. Sexual dimorphism. Annu. Rev. Anthropol. 1985, 14, 429–473. [CrossRef]64. Scheuer, L.; Black, S. The Juvenile Skeleton, 1st ed.; Academic Press: London, UK, 2004; p. 140.65. Klales, A.R. Current practices in physical anthropology for sex estimation in unidentified, adult individuals. Am. J. Phys.
Anthropol. 2013, 150, 168.66. Klales, A.R.; Ousley, S.D.; Vollner, J.M. A revised method of sexing the human innominate using Phenice’s nonmetric traits and
statistical methods. Am. J. Phys. Anthropol. 2012, 149, 104–114. [CrossRef] [PubMed]67. Stewart, T. Essentials for Forensic Anthropology; Charles C Thomas: Springfield, IL, USA, 1979.68. Curate, F.; Coelho, J.; Gonçalves, D.; Coelho, C.; Ferreira, M.T.; Navega, D.; Cunha, E. A method for sex estimation using the
proximal femur. Forensic Sci. Int. 2016, 266, 579.e1–579.e7. [CrossRef]69. Bass, W.M. Human Osteology: A Laboratory and Field Manual, 5th ed.; Missouri Archaeological Society: Columbia, MO, USA, 2005.70. Garvin, H.M.; Ruff, C.B. Sexual dimorphism in skeletal browridge and chin morphologies determined using a new quantitative
method. Am. J. Phys. Anthropol. 2012, 147, 661–670. [CrossRef] [PubMed]71. Tallman, S.D.; Kincer, C.D.; Plemons, E.D. Centering transgender individuals in forensic anthropology and expanding binary sex
estimation in casework and research. Forensic Anthropol. 2022, 5, 161–180. [CrossRef]72. Jantz, R.; Ousley, S. Fordisc 3: Third generation of computer-aided forensic anthropology. Rechtsmedizin 2013, 23, 97–99.73. Burns, K.R. Forensic Anthropology Training Manual, 2nd ed.; Pearson: New York, NY, USA, 2006.74. Gray, H. Gray’s Anatomy; LEA & FEBIGER: Philadelphia, PA, USA, 1966.75. Hrdlicka, A. Practical Anthropometry, 4th ed.; Stewart, T.D., Ed.; Wistar Institute of Anatomy and Biology: Philadelphia, PA, USA, 1952.76. Krogman, W.M. The Human Skeleton in Forensic Medicine; Charles C Thomas: Springfield, IL, USA, 1962.77. Montagu, M.F.A. Introduction to Physical Anthropology; Charles C Thomas: Springfield, IL, USA, 1960.78. Rogers, T.L.; Saunders, S. Accuracy of sex determination using morphological traits of the human pelvis. J. Forensic Sci. 1994, 39,
1047–1056. [CrossRef]79. Stewart, T.D. Evaluation of evidence form the skeleton. In Legal Medicine; Gradwohl, R.B.H., Ed.; CV Mosley: St. Louis, MO, USA, 1954.80. Rennie, S.R. Summary Sex: A Multivariate Approach to Sex Estimation from the Human Pelvis. Ph.D. Thesis, Liverpool John
Moores University, Liverpool, UK, 2018.

Forensic Sci. 2022, 2 348
81. Washburn, S.L. Sex difference in the pubic bone of Bantu and Bushman. Am. J. Phys. Anthropol. 1949, 7, 425–432. [CrossRef]82. Roth, M.; Ousley, S.D.; Tuamsuk, P. Sex estimation using non-metric traits in Thai crania with the Walker (2008) method. In Proceedings
of the 65th Annual Meeting of the American Academy of Forensic Sciences, Washington, DC, USA, 18–23 February 2013.83. Winburn, A.P.; Jennings, A.L.; Steadman, D.W.; DiGangi, E.A. Ancestral diversity in skeletal collections: Perspectives on African
American body donation. Forensic Anthropol. 2022, 5, 141–152. [CrossRef]84. Decker, S.J.; Davy-Jow, S.L.; Ford, J.M.; Hilbelink, D.R. Virtual determination of sex: Metric and nonmetric traits of the adult
pelvis from 3D computed tomography models. J. Forensic Sci. 2011, 56, 1107–1114. [CrossRef]85. Herrera, M.D.; Tallman, S.D. Craniometric variation and ancestry estimation in two contemporary Caribbean populations.
Forensic Sci. Int. 2019, 305, 110013. [CrossRef] [PubMed]86. Hughes, C.E.; Tise, M.L.; Trammell, L.H.; Anderson, B.E. Cranial morphological variation among contemporary Mexicans:
Regional trends, ancestral affinities, and genetic comparisons. Am. J. Phys. Anthropol. 2013, 151, 506–517. [CrossRef] [PubMed]87. Richard, A.H.; Parks, C.L.; Monson, K.L. Accuracy of standard craniometrics measurements using multiple data formats. Forensic
Sci. Int. 2014, 242, 177–185. [CrossRef]88. Ross, A.H. Cranial evidence of pre-contact multiple population expansions in the Caribbean. Caribb. J. Sci. 2004, 40, 291–298.89. Stull, K.E.; Tise, M.L.; Ali, Z.; Fowler, D.R. Accuracy and reliability of measurements obtained from computed tomography
3D-volume rendered images. Forensic Sci. Int. 2014, 238, 133–140. [CrossRef]90. Field, A. Discovering Statistics Using SPSS, 3rd ed.; SAGE: Thousand Oaks, CA, USA, 2009; pp. 267–678.91. Hefner, J.T. Cranial nonmetric variation and estimating ancestry. J. Forensic Sci. 2009, 54, 985–995. [CrossRef]92. Cohen, J. A coefficient of agreement for nominal scales. Educ. Psychol. Meas. 1960, 20, 37–46. [CrossRef]93. Cohen, J. Weighted Kappa: Nominal scale agreement with provision for scaled disagreement or partial credit. Psychol. Bull. 1968,
70, 213–220. [CrossRef] [PubMed]94. Landis, J.R.; Koch, G.G. The measurement of observer agreement for categorical data. Biometrics 1977, 33, 159–174. [CrossRef]95. Barnes, M.L. Empirical methods and critical race theory: A discourse on possibilities for a hybrid methodology. Wis. L. Rev. 2016,
443, 443–476.96. Ford, C.L.; Airhihenbuwa, C.O. Commentary: Just what is critical race theory and what’s it doing in a progressive field like
public health? Ethn. Dis. 2018, 28, 223–230. [CrossRef] [PubMed]97. Quintanilla, V.D. Critical race empiricism: A new means to measure civil procedure. UC Irvine L. Rev. 2013, 3, 187–216.98. Go, M.C.; Yuki, N.; Chu, E.Y. On WEIRD anthropologists and their white skeletons. Forensic Anthropol. 2021, 4, 145–160. [CrossRef]99. Williams, B.A.; Rogers, T. Evaluating the accuracy and precision of cranial morphological traits for sex determination. J. Forensic
Sci. 2006, 51, 729–735. [CrossRef] [PubMed]100. Stinson, S. Sex differences in environmental sensitivity during growth and development. Yearb. Phys. Anthropol. 1985, 28, 123–147.
[CrossRef]101. Stinson, S. Growth variation: Biological and cultural factors. In Human Biology: An Evolutionary and Biocultural Perspective, 2nd ed.;
Stinson, S., Bogin, B., O’Rourke, D., Eds.; Wiley: Hoboken, NJ, USA, 2012; pp. 587–635.102. Klales, A.R.; Cole, S.J. Improving nonmetric sex classification for Hispanic individuals. J. Forensic Sci. 2017, 62, 975–980. [CrossRef]103. Spradley, M.K.; Jantz, R.L.; Robinson, A.; Peccerelli, F. Demographic change and forensic identification: Problems in metric
identification of Hispanic skeletons. J. Forensic Sci. 2008, 53, 21–28. [CrossRef]104. Mendéndez, L.P. Comparing methods to assess intraobserver measurement of error of 3D craniofacial landmarks using geometric
morphometrics through a digitizer arm. J. Forensic Sci. 2017, 62, 741–746. [CrossRef]105. Robinson, C.; Eisma, R.; Morgan, B.; Jeffery, A.; Graham, E.A.M.; Black, S.; Rutty, G.N. Anthropological measurement of lower
limb and foot bones using multi-detector computed tomography. J. Forensic Sci. 2008, 53, 1289–1295. [CrossRef]106. Pinto, S.C.; Urbanová, P.; Ceaser, R.M., Jr. Two-dimensional wavelet analysis of supraorbital margins of the human skull for
characterizing sexual dimorphism. IEEE Trans. Inf. Forensics Secur. 2016, 11, 1542–1548. [CrossRef]


