Embed Size (px)
Citation preview
1 | P a g e
MARK 977Authentic Tasks-Quantitative Research
Factors impacting theadoption of e-books
among studentsBy
Thinh Nguyen Tran Quoc 4217329Liang BIAN 4041124YiLiang LIU 4328218Liang SHI 4222210
Yi WU (Jess) 4182418
Quantitative report – E-books adoption
2 | P a g e
Executive Summary
The objective of this quantitative research is to analyse and
interpret the survey data on the adoption of e-book and its usage
for our client – Amazon. 200 survey samples had been collected by
using Qualtrics then the data and results had been input into
SPSS software. Several statistical analyses have been conducted
to help marketer identify valuable insights from e-books
adoption. Based on the analyses that our group concluded,
statistical findings have been transformed into marketing
decisions meanwhile overall recommendations have been suggested
as well. Our group also provides certain numbers of research
question and statistical hypothesize which are intended to be
addressed and justified via gaining an explicit understanding of
the research's objective as well as certain statistical
methodologies.
The research findings basically indicate that the gender of main
e-book user is female who are aged between 18-25 years old. In
the meantime, we also found that the majority of them are
Quantitative report – E-books adoption
3 | P a g e
students who are undertaking the study with Commerce Faculty.
Furthermore, from respondents' point of view, it can be concluded
that the respondents have a positive attitude rating (M = 5.35)
towards a good number of students would use academic e-books in
the next 5 years. Additionally, the respondents seem to have a
positive attitude towards current using of e-books for particular
purposese (academic & recreational). Certain results could also
mirror that individual productivity of e-books users is partly
depended on their competency level in using computer technology.
Generally speaking, the tendency of e-books adoption is
increasing.
Certainly, there are limitations remaining in this research.
Firstly, the survey uses non-probability method to get data.
Secondly, major users are between 18~25 years old, who
comparatively have less capability of consumption. In the
meantime, marketers also need to consider how to improve the
advancement of product line in order to increase the demand of e-
books adoption in near future. Last but not least, marketers must
figure out certain ways to align smartphone applications with
users’ needs of protecting eyesight.
Table of content
Contents
Quantitative report – E-books adoption
4 | P a g e
Executive Summary....................................................2Table of content.....................................................3
1. Introduction:.....................................................41.1. Research problem...............................................4
1.2. Research objectives............................................41.3. Research questions.............................................5
2. Literature review.................................................63. Methodology.......................................................8
3.1. Justification for use of survey technique......................83.2. Sampling technique.............................................8
3.3. Scaling technique..............................................84. Results...........................................................9
4.1. Demographic profile analysis...................................94.2. Descriptive analysis..........................................10
4.3. Hypothesis testing result.....................................115. Discussion and conclusion........................................17
6. References and appendices........................................19
Quantitative report – E-books adoption
5 | P a g e
1. Introduction:
1.1. Research problemA research problem provides context for the study and
reveals what the researcher is trying to answer (Malhotra,
2010). Previous literatures explicitly revealed the
underlying implications and valuable views of adopting e-
book, as the contents Shelburne (2009) claimed in article –
‘E-book usage in an academic library: user attitudes and
behaviors’. Referring to real world problem, in a more
practical way, e-book seemingly lost its direction and
customer base since more advanced technologies and personal
terminal devices have been invented, platforms as
smartphone, tablet and even ‘rookie’ ultra-book has partly
occupied the market shares which are used to belong to e-
books product category. This can be interpreted as e-book
products are gradually tapping into the laggard or decline
stage of Product Life Cycle, e-books businesses definitely
need to be managed and healed. In order to solve this
practical problem of e-books adoption, marketing
researchers first must solve research question about how
user adopt/not adopt e-books. The main objective of this
quantitative report is exactly to analyse and interpret the
survey data on the adoption of e-books and its usage for
our client – Amazon. In this report, our group has prepared
a structured business report which includes research
objective & questions, methodologies, results and
Quantitative report – E-books adoption
6 | P a g e
discussion sections with marketing implications, which are
taken from the transformed statistical findings. Several
statistical analyses have been conducted to help marketer
identify valuable insights from e-books adoption, analysis
including Frequency distribution & Cross Tabulation,
different T-tests, Regression and Factor Analysis.
1.2. Research objectivesThe general objective of this quantitative report is to
analyse and interpret the survey data on the adoption of e-
books and its usage for our client Amazon. The specific
research objective can be summarized by addressing the
following questions:
i) Gaining knowledge of how to increase the e-book
adoption and its users.
ii) Gaining a better understanding and insight of why
customer choosing e-books.
In this quantitative research, 200 survey samples have been
collected from both males and females respondents in UOW
campus. For marketing research, it is crucial to consider
objectives both on the corporate and project level at the
same time (Malhotra, 2010). Increasing sales of e-books and
understanding why consumers buy e-books, these two purposes
are simultaneously coordinated with corporate objectives.
In this way, marketing strategies can be efficiently
developed. For project objectives, certain factors are
included such as sampling the population, analysing data
Quantitative report – E-books adoption
7 | P a g e
through using the most appropriate methods, and providing
the most valuable recommendations which are generated from
the results and findings. Furthermore, it is also important
to conduct valid and reliable research results which are
derived from specific research questions. Last but not
least, keep in mind the corporate objective of stimulating
e-books adoption and understanding the consumers’ needs
1.3. Research questionsIn order to meet the research objectives, several research
questions have been conducted and analysed through the
research:
RQ1: How many percentages of customer using e-books in term
of different faculty, gender and age?
RQ2: Are there any e-books categories more useful than
others?
RQ2.1: Do student from which faculty use e-books the most
for academic purpose?
RQ3.1: Will a good number of people adopt using e-books in
the next 5 years?
RQ3.1.2: Do people have a positive attitude toward using e-
books for academic purpose?
RQ3.1.3: Do people have a positive attitude toward using e-
books for recreational purpose?
RQ 4: Will males and females be different in using e-books
once the usage is established?
Quantitative report – E-books adoption
8 | P a g e
RQ5: Which e-books’ benefits would better impact on
individual performance?
RQ6: Does the competency level in using computer technology
impact on improving individual productivity when using e-
books?
RQ7: Is there any underlying dimensions, or factors, that
explain the correlation among ten variables within e-books
usages?
2. Literature reviewE-book is widely popular among today’s university students.
This is a part that introducing some studies about the factors
affecting e-books adoption and use behavior to gain an
understanding of reader’s thinking toward e-books.
According to Foasberg’s (2011) research, he found that the
reason of e-book so attractive to college students include the
features such like light weight, ability to hold various
reading sources at the same time, and the speed with material
delivery. One the other hand, he also showed some
disadvantages of e-book such as unable to copy and paste
document, limited note-taking competencies (Foasberg, 2011).
There are some reasons for people adopt using e-books. A
research from Vanessa (2010) social cognitive learning theory
Quantitative report – E-books adoption
9 | P a g e
which found Australian youths not to be influenced by
observing others when deciding to use e-book devices, a
potential reason is that the youth’s friends, family and
social network does not use e-book. Consequently, a reason for
the adoption of e-book devices by youth should be influenced
by their social network. Another research of adoption e-book
is examining why users develop resistance to e-books as
innovation. Ram (1987) indicated that most innovation research
is biased, restricting itself to by the adoption through a
‘pro-innovation bias’ (Rogers, 1995). He also argued that
study of innovation resistance is important, because
resistance to change is a normally response by users.
Moreover, Rogers also argued that there are five important
perceived attributes of innovation that influence the
decision-making process of e-book adoption, which include
relative advantages, compatibility, complexity, triability,
and observability (Lee, 2012). A study of library and
information science perspective of e-book adoption from Akter
(2013), it showed the respondents indicated that convenience
is an important factor and e-book should emulate the
functionality of the World Wide Web. In a further qualitative
study geosciences academics and graduate students, Foote and
Rupp-Serrano (2010) pointed out discipline-specific issues
such as high-quality graphics, ability to export graphics to
software and operate graphics are significantly related, and
the ease of outputting in various formats, provision of
Quantitative report – E-books adoption
10 | P a g e
hyperlinks, and customization of content are important to
viability of e-books.
Christianson and Aucoin (2005) have another perspective about
topics that available in e-books and physical books which also
have an impact on the adoption of using e-books. More
specifically, those topics as library science are focused on
the use of traditional books when philosophy topics are
particular characteristic of e-books. They also pointed out
that although physical books were used more than new e-books
entrant, the e-book entrant has a higher average level than
traditional one.
Bennett and Landoni (2005) also found that new users usually
see the e-book industry as an adoption of new technology. The
advantages or attractiveness factors of an e-book are
described as searchability, portability, and environment
sustainability. It also described the disadvantages such as
onscreen reading, navigation issues, searching issues and
Digital Rights Management (DRM) issues (Shelburne, 2009).
However, Bennett (2005) also pointed out a certain number of
people are ‘still unaware of e-books even when their academic
libraries’ e-books holdings are high. Thus he attributed a
‘lack of promotion within the university’ to the lack of
knowledge on e-books and higher usage rates. Cynthia (2008)
also took a study of the attitudes of undergraduate students
Quantitative report – E-books adoption
11 | P a g e
towards e-books, she found the majority respondents are
preferred to use traditional print books rather than e-books.
The factors act as key elements in the attributes of
undergraduate population are portability, navigation issues.
To sum up, from these researches we can find so many factors
that are influences e-books adoption among youth, college
students, librarian and other users or agents. As a
consequence, we can conclude that e-books are a new way for
people reading books rather than traditional way of reading
physical books. Besides, it does have some limitations that
cannot be regularly adopt all people in the world.
3. Methodology
3.1. Justification for use of survey techniqueThis survey is attempted to use a short online
questionnaire survey which include multiple choice question
and matrix table questions. This method we have chosen is
aim at right groups, college or university students who
potentially use e-books. Moreover, it also collect the
Quantitative report – E-books adoption
12 | P a g e
right target groups information and responses by using of
descriptive research project which based on the sample
population. Additionally, we have also use quantitative
method to analyze e-books adoption to gain an understanding
of e-book adoption and marketing implication.The objective
of this report firstly is to gain knowledge of how to
increase the e-book adoption and users. Secondly, it help
to gain a better understanding of why customer choose e-
books, the analysis of quantitative data will show the
evidences of how customer think and response to adopt e-
books.
3.2. Sampling techniqueThe sample of the population is mainly acquired from the
faculty of commerce students. It offers a 200 sample size
and mostly people are aged between 18-33 ranges. On the
other hand, there is some limitations of sampling
techniques because it is only took account with demographic
issues, other elements such like time, energy, money issue
cannot be calculated.
3.3. Scaling techniqueLikert scale is used as a primary methodology in this
survey, it is a scale that require consumer to indicate a
degree of agreement or disagreement with each of a series
of statements related to the attitude object (Quester, et,
al, 2011). The respondents are required to choose the best
or worst degree range from 1 to 5 in a Likert scale
Quantitative report – E-books adoption
13 | P a g e
technique. Also, the best-worst scaling method has the
advantage of not having numerical anchors, which can be
easier and more comfortable responded by respondents.There
are three important elements should be paid importance on
which are validity, reliability, and the level of
information (Malhotra, 2010). Validity refers to the extent
differences in the observed scores among the objects being
measured, Reliability is described as the extent to a scale
produces consistent results if repeated measurements are
made, the last must be planned is the level of information
required (Malhotra, 2010).
4. Results
4.1. Demographic profile analysis4.1.1. Research question 1: How many percentages of
customer using e-books in term of different faculty,
gender and age?
4.1.1.1. Variables used: Nominal scale for non-metric
data: Faculty (QD1), Gender (QD2), Age (QD4)
4.1.1.2. Statistical test conducted: Frequency
distribution
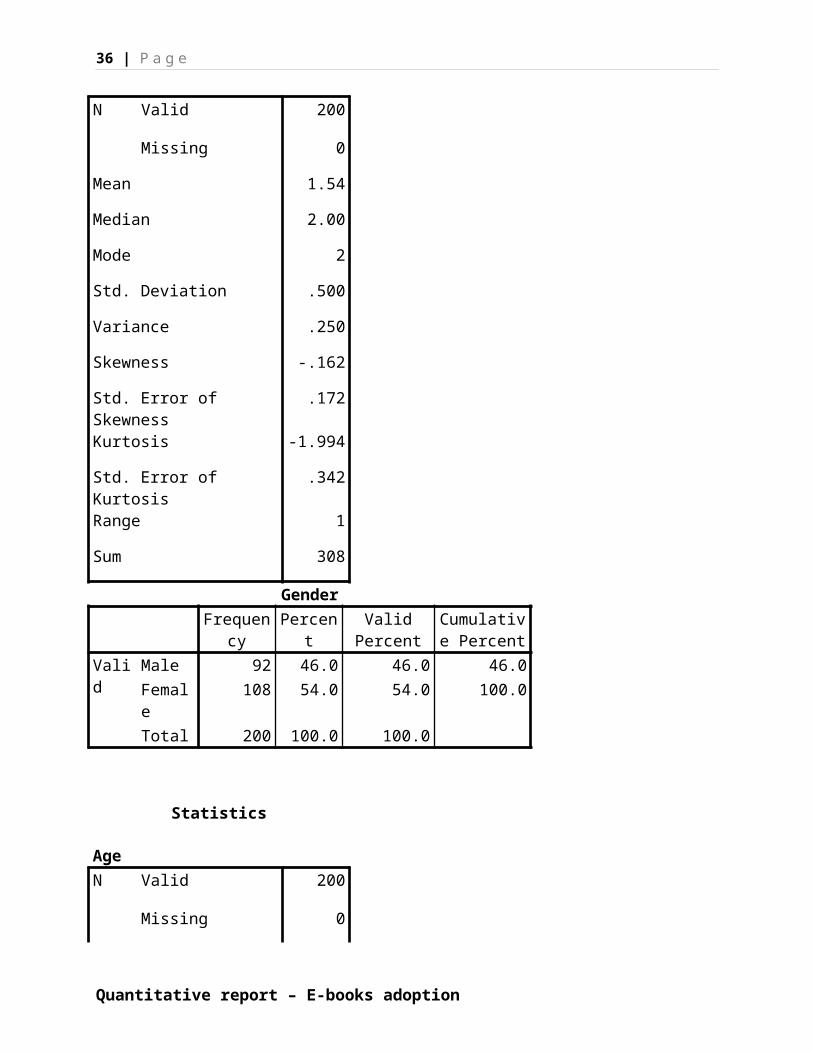
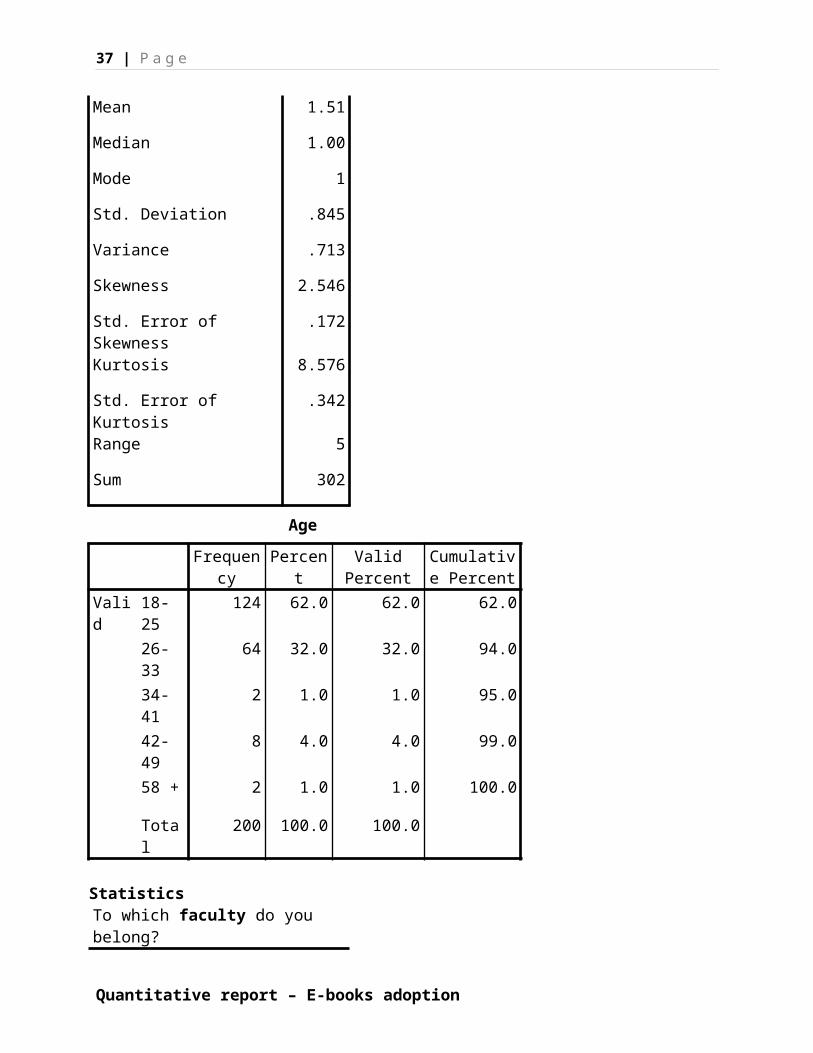
4.1.1.3. Analysis and finding: Nominal scale is used
only for question QD1, QD2, QD4. Based on the result
from frequency distribution table, 46% of male
respondents and 54% of female respondent using e-
Quantitative report – E-books adoption
14 | P a g e
books are currently using e-books. It also indicate
female are the main respondents in this survey. On
the other side, some information based on age table,
most of e-books users are young customers when 94% of
respondents from 18 to 33 years old (62% from 18 to
25 and 32% from 26 to 33) while there are just 1%
from 34 to 41 years old, 4% from 42 to 49 years old
and 1% from over 58 years old using e-books. Finally,
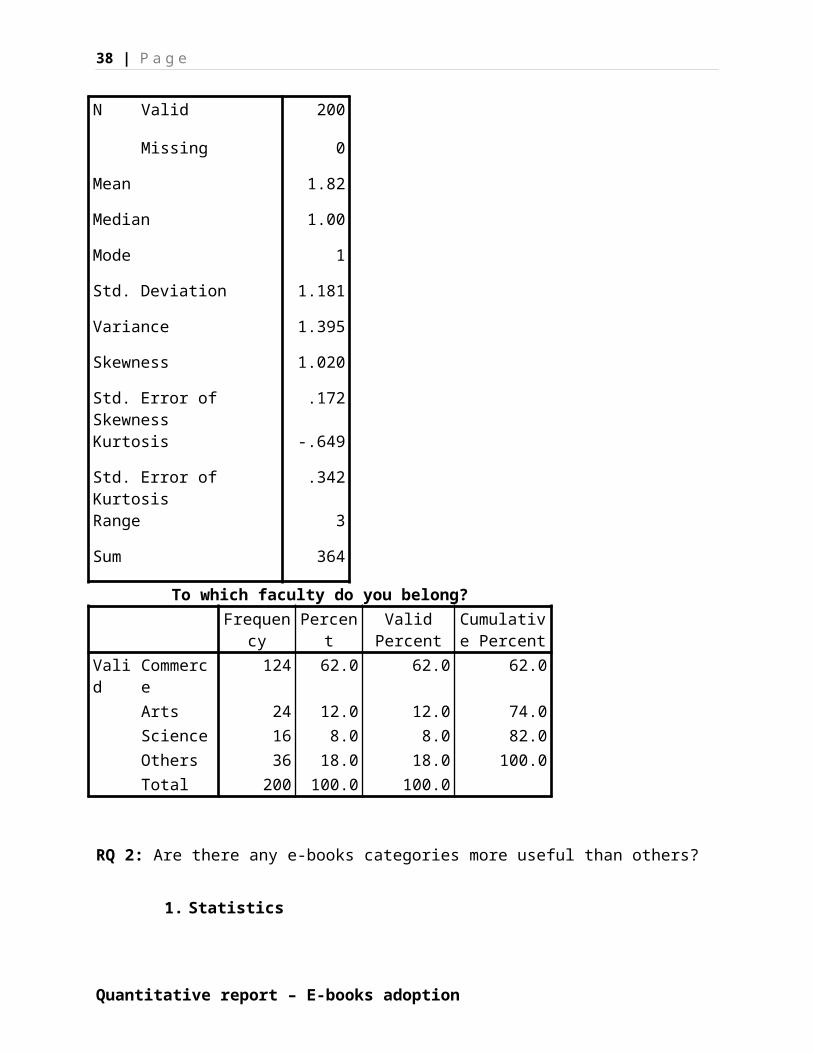
some statistics from faculty data indicate that
commerce student are those people using e-books the
most with 62% of respondents, art students sometimes
also using e-books with 12% of respondents and 8% of
respondents studying in science faculty. The rest
(18%) come from other faculties.
4.1.1.4. Marketing decisions: Based on the result from
demographic variables testing, marketers from Amazon
can identify the main target customers that they
should focus on in their marketing communication or
other marketing activities. They are those people
from the young female customers under 33 years old
and they are currently or used to be commerce
students.
4.1.2. Research question 2: Are there any e-books
categories more useful than others?
4.1.2.1. Variables used: Nominal scale for non-metric
data: E-books categories usefulness (QM2)
Quantitative report – E-books adoption
15 | P a g e
4.1.2.2. Statistical test conducted: Frequency
distribution
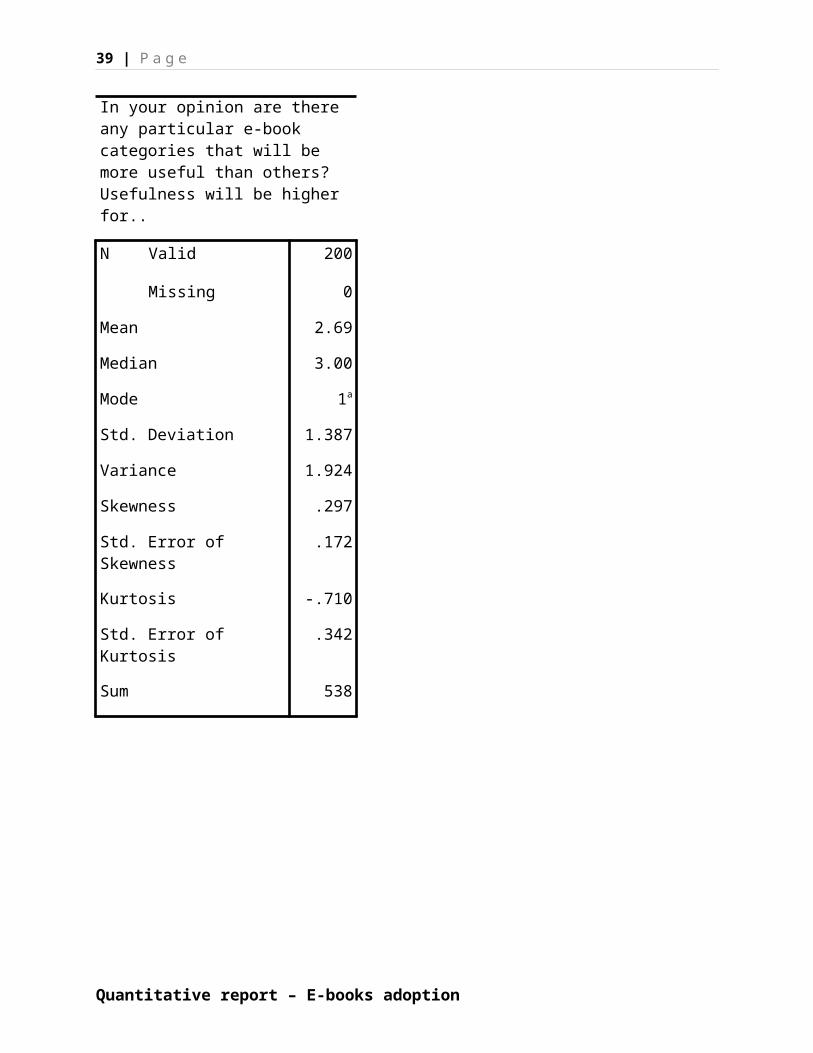
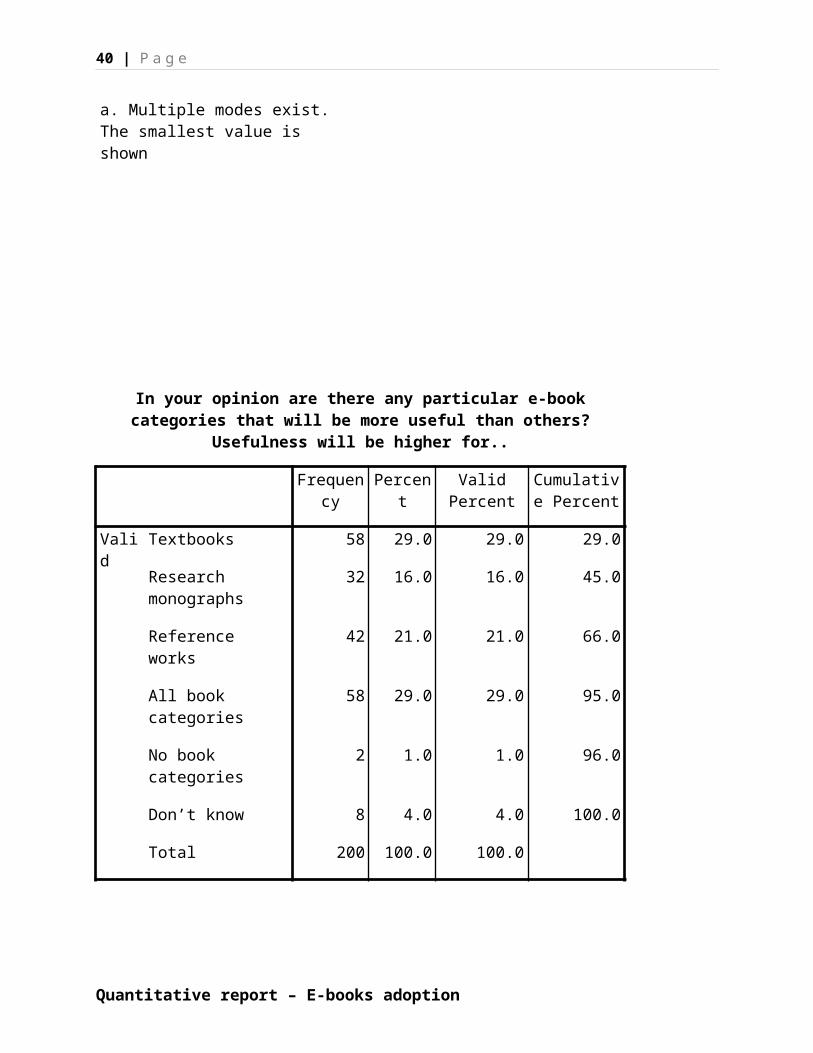
4.1.2.3. Analysis and finding: Based on result of
table, it shows that the most of respondents believe
that e-book for textbook usage is most important
(29%). The second most important factor is reference
works is with 21% agreement from respondents and the
last factor which is research monographs occupy 16%
of respondents. Finally, there are 29% respondents
show all book categories is useful in e-book.
4.1.2.4. Marketing decisions As Amazon Company, it is
necessary to provide more academic material such as
transferring more sources of information into e-books
format when they launch promotion to attract younger
groups, especially textbook to satisfy user’s need.
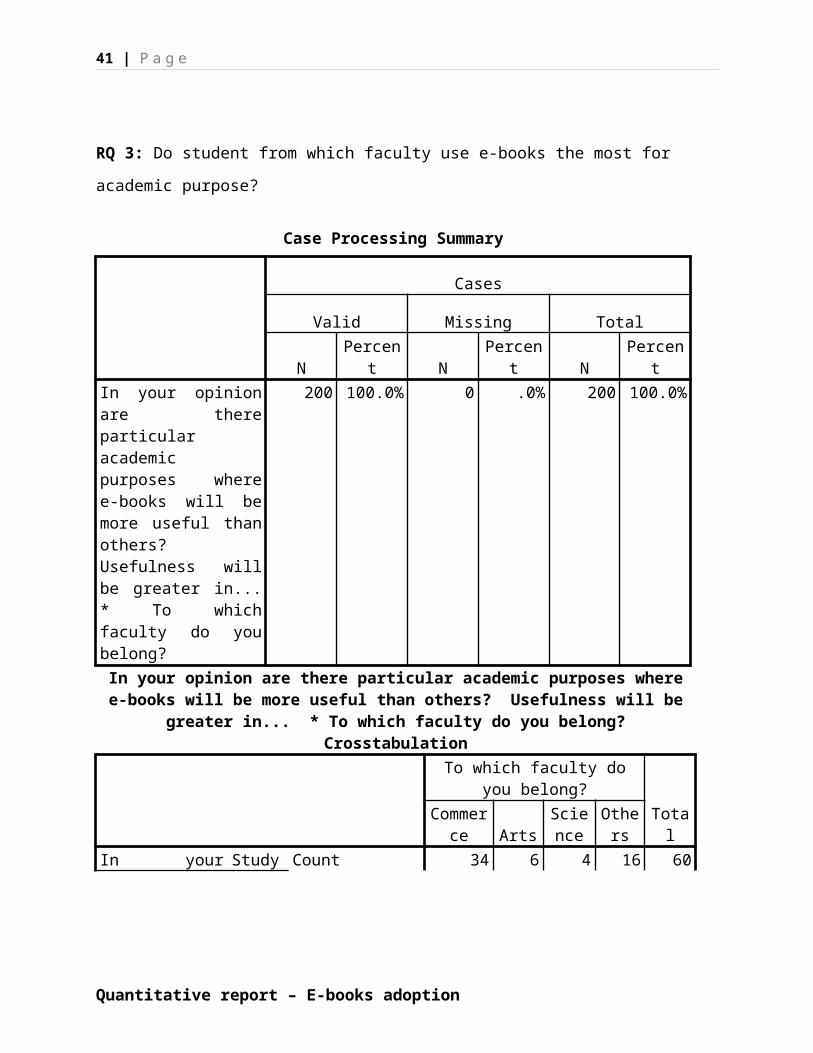
4.2. Descriptive analysis4.2.1. Research question: Do student from which faculty
use e-books the most for academic purpose?
4.2.1.1. Variables used: Nominal scale from non-metric
data: Faculty (QD1) and e-books academic purpose
(QM3)
4.2.1.2. Statistical test conducted: Cross tabulation
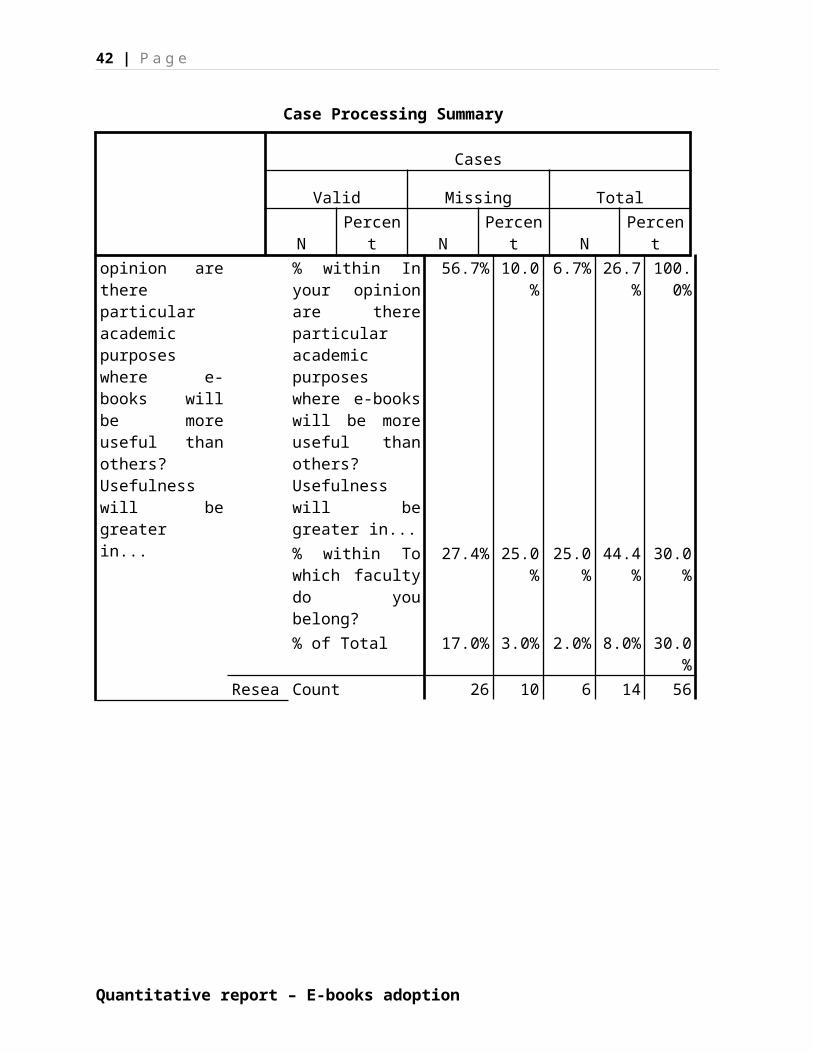
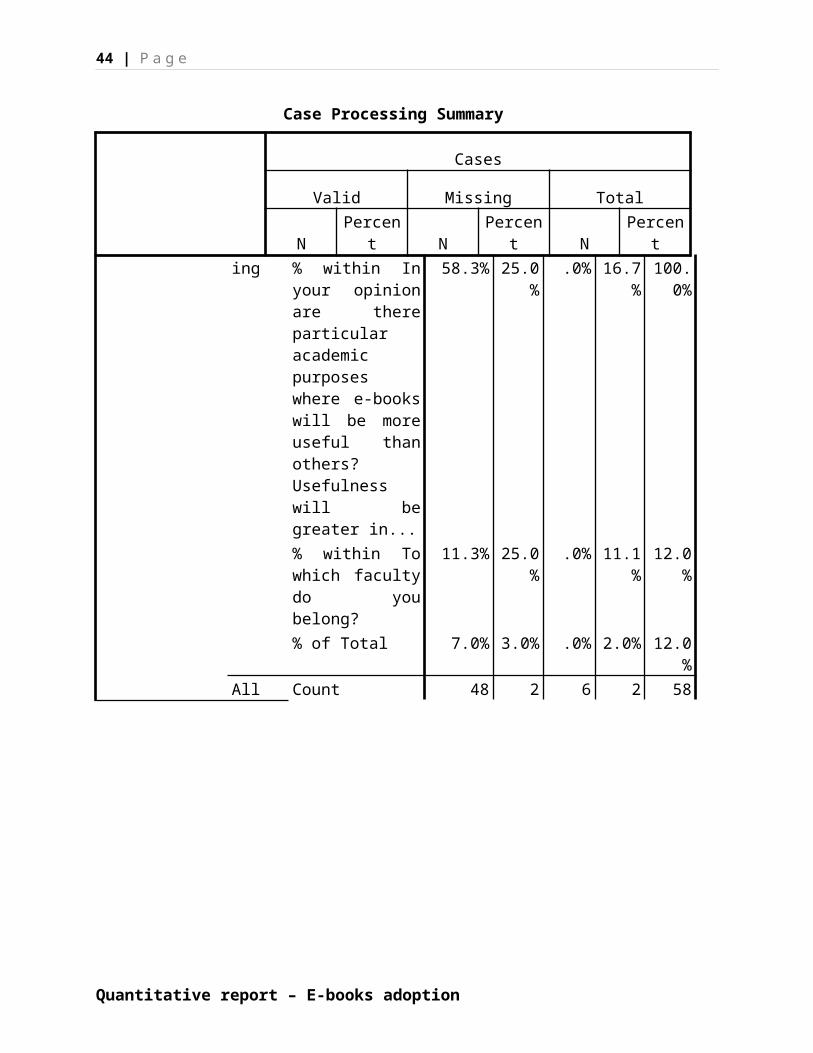
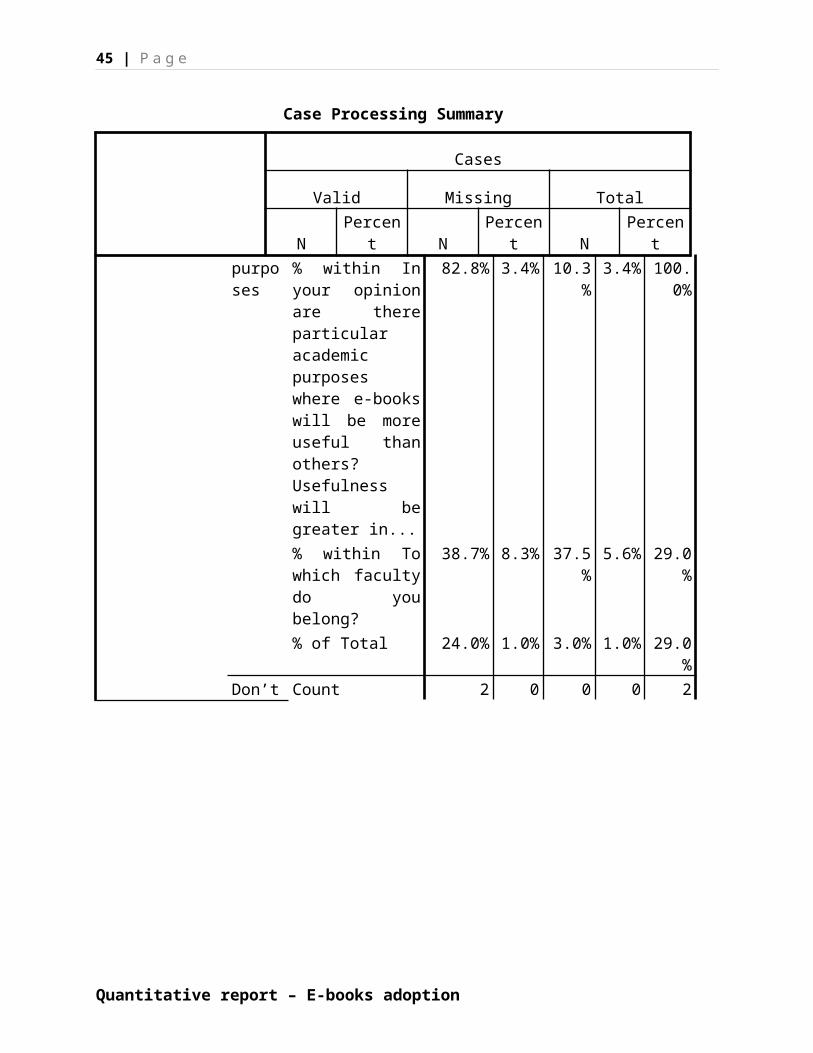
4.2.1.3. Analysis and finding: From the result of
cross tabulation table, we can generally conclude
that student from commerce faculty using e-books for
academic purpose more than students from other
Quantitative report – E-books adoption
16 | P a g e
faculties. To be more detail, when comparing the
percentage of number of student from commerce faculty
using e-books for each type of academic purpose such
as study, research or teaching with percentage of
student from other faculties such as arts or science
or other faculties, the statistics indicate that
there are 56.7% student from commerce faculty, 10%
from art students, 6.7% science student and 26.7%
students from other faculties choose to use e-books
for studying purpose, 46.4% of commerce students,
17.9% from arts students, 10.7% from science faculty
and 25% from other faculty choose to use in research
purpose. 58.3%, 25%, 0%, 16.7% from commerce, arts,
science and other faculties respectively use e-books
for teaching. 82.8% from commerce student, 3.4% from
art, 10.3% from science and 3.4 from other faculty
use e-books for all academic purpose. The rest of
respondents (2% from commerce students) do not know
how to use e-books for academic purpose.
4.2.1.4. Marketing decisions: From these statistics,
marketers can see that most of people use e-books are
come from commerce faculty which means that the
company can consider how to integrate more sources of
Quantitative report – E-books adoption
17 | P a g e
information or books that related to economic issues
into e-books format to attract those customers.
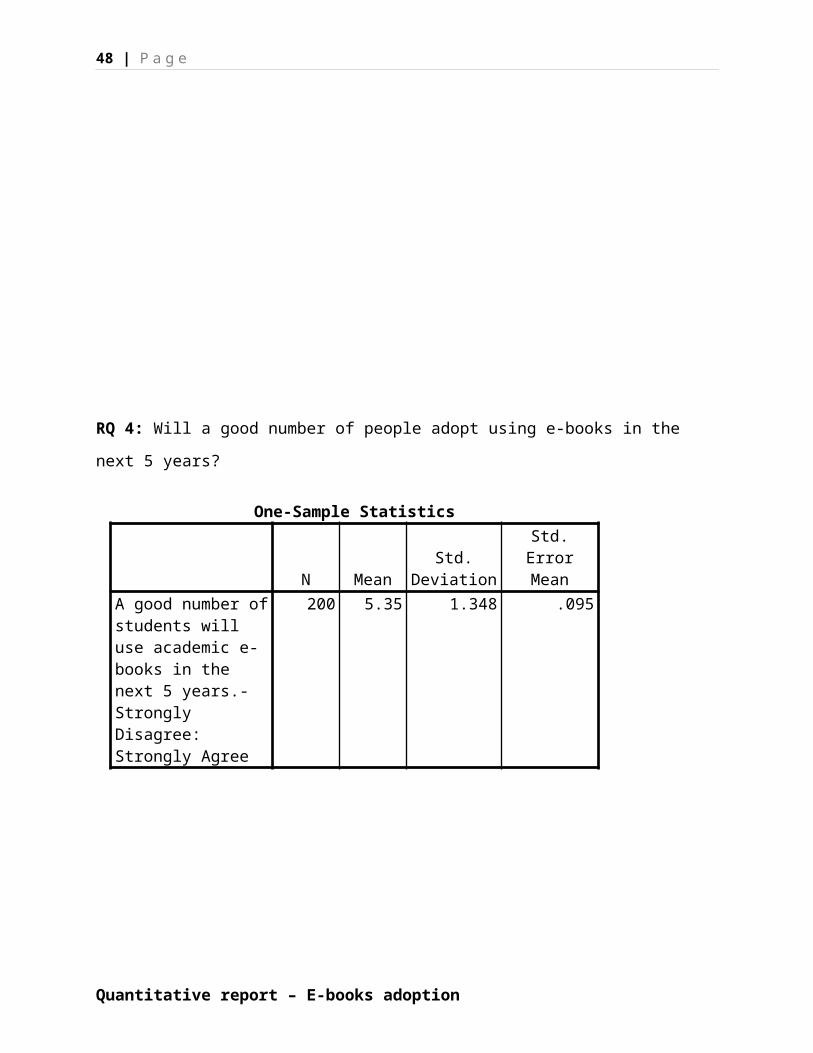
4.3. Hypothesis testing result4.3.1. Research question 1: Will a good number of people
adopt using e-books in the next 5 years?
4.3.1.1. Variables used: Interval scale for metric
data: Likelihood to use e-books (QM4)
4.3.1.2. Statistical test conducted: One Sample T-test
4.3.1.3. Analysis and finding:
Hypothesis development:
H0: M ≤ 4 (Negative or neutral)
HA: M > 4 (Positive)
α= 0.05
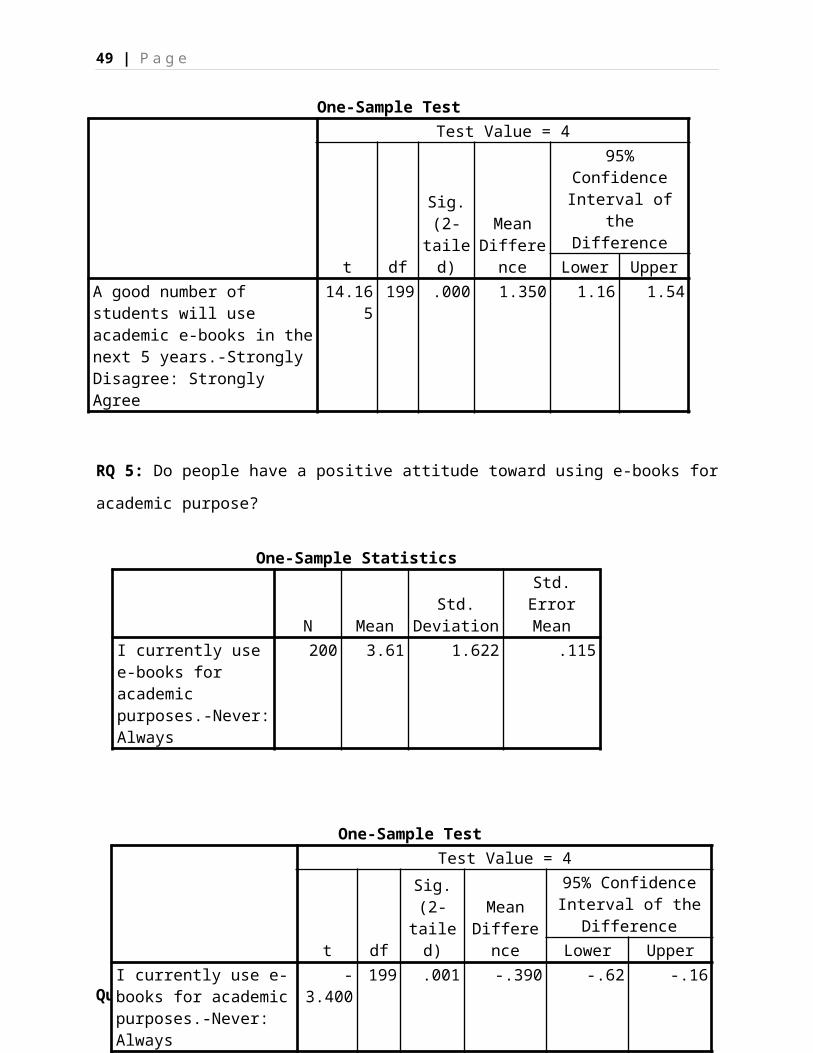
Statistical conclusion: The critical test value = 1.6525
(derived from the t-distribution table) and the
calculated test value = 14.165 (derived from SPSS output
above). The output indicates that there is a significant
difference in attitude toward a good number of students
will use academic e-book in the next 5 years against the
test value – t (199) = 14.165, p = 0.000 < 0.05. Thus,
the respondents seem to have a positive attitude rating
(M = 5.35) towards a good number of students will use
academic e-books in the next 5 years.
4.3.1.4. Marketing decisions: By conducting this
research question and hypothesis testing method, we
have a belief that in the near future most of people
Quantitative report – E-books adoption
18 | P a g e
will use e-books as the new way for reading books. It
also implied that there will have large potential
market for e-books in the near future.
4.3.2. Research question 2: Do people have a positive
attitude in using e-books for academic purpose?
4.3.2.1. Variables used: Interval scale for metric
data: Using e-books for academic purpose (QM5)
4.3.2.2. Statistical test conducted: One Sample T-test
4.3.2.3. Analysis and finding:
Hypothesis development:
H0: M ≤ 4 (Negative or neutral)
HA: M > 4 (Positive)
α= 0.05
Statistical conclusion: The critical test value = 1.6525
(derived from the t-distribution table) and the calculated
test value = 3.400 (derived from SPSS output above). The
output indicates that there won’t be a significant
difference in attitude toward using e-books for academic
purpose against the test value – t (199) = -3.400, p =
0.001 < 0.05. Thus, the respondents seem to have a positive
attitude towards currently using e-books for academic
purpose.
4.3.2.4. Marketing decisions: Due to the result from
testing hypothesis, we can conclude that people
generally have a positive attitude in using e-books
for academic purpose.
Quantitative report – E-books adoption
19 | P a g e
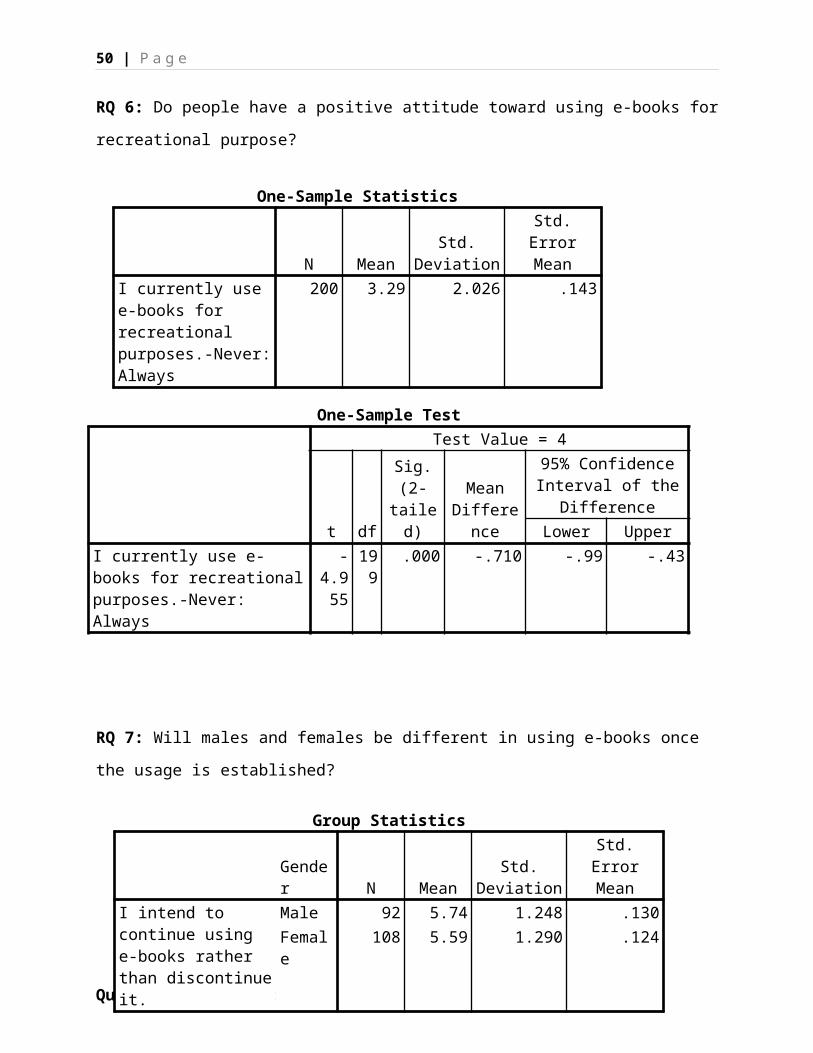
4.3.3. Research question 3: Do people have a positive
attitude in using e-books for recreational purpose?
4.3.3.1. Variables used: Interval scale for metric
data: Using e-books for recreational purpose (QM6)
4.3.3.2. Statistical test conducted: One Sample T-test
4.3.3.3. Analysis and finding:
Hypothesis development:
H0: M ≤ 4 (Negative or neutral)
HA: M > 4 (Positive)
α= 0.05
Statistical conclusion: The critical test value = 1.6525
(derived from the t-distribution table) and the
calculated test value = 4.955 (derived from SPSS output
above). The output indicates that there won’t be a
significant difference in attitude toward using e-books
for recreational purpose against the test value – t
(199) = -4.955, p = 0.000 < 0.05. Thus, the respondents
seem to have a positive attitude towards currently using
e-books for recreational purpose.
4.3.3.4. Marketing decisions: Due to the result from
testing hypothesis, we can conclude that people
generally also have a positive attitude in using e-
books for recreational purpose.
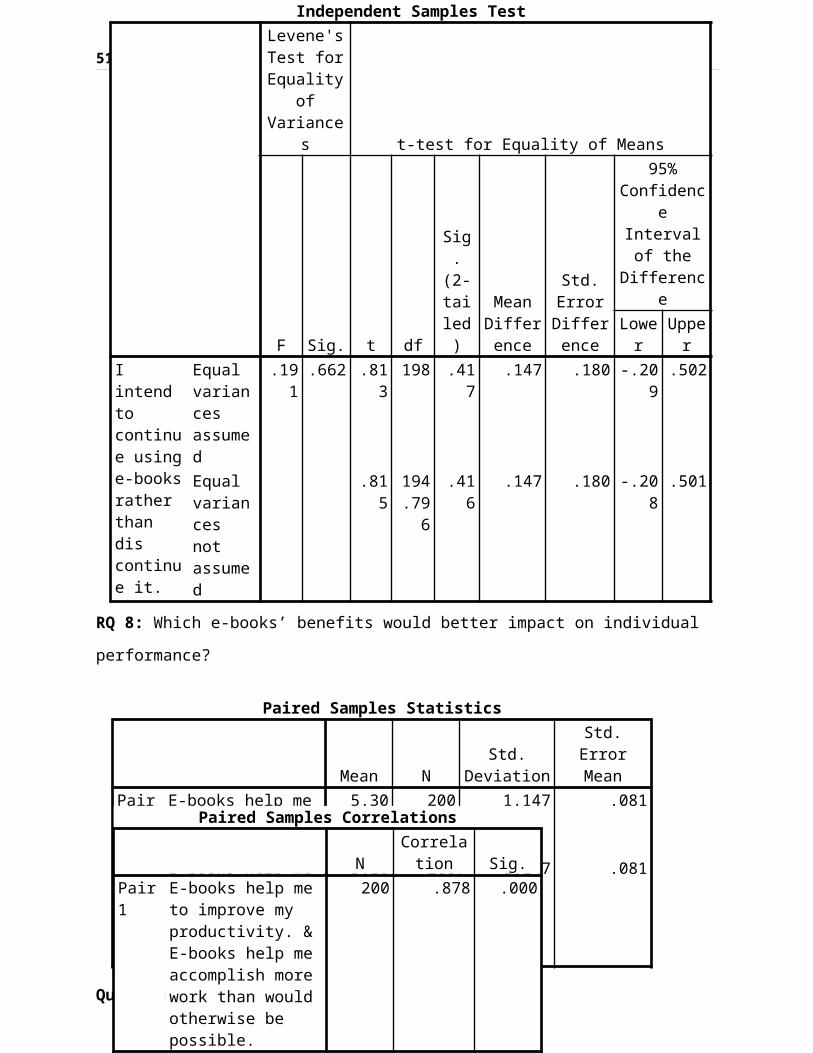
4.3.4. Research question 4: Will males and females be
different in using e-books once the usage is
established?
Quantitative report – E-books adoption
20 | P a g e
4.3.4.1. Variables used: Parametric data and non-
parametric data:
Interval scale for metric data (dependent variable):
Likelihood to use e-books (QM4)
Nominal scale for non-parametric data (independent
variable): Gender (QD2)
4.3.4.2. Statistical test conducted: Independent
Samples T-test
4.3.4.3. Analysis and finding:
Hypothesis development:
H0: M = 0 (male and female have no difference in
continuing using e-book)
HA: M ≠ 0 (male and female have difference in continuing
using e-book)
α= 0.025
Statistical conclusion: The critical test value = 1.9720
(derived from the t-distribution table) and the
calculated test value = 0.813 (male) and 0.815 (female)
(derived from SPSS output above). No significant
difference exists between male (M = 5.74) and female (M
= 5.59) – t (198) = 0.813 and 0.815, p = 0.147 > 0.05.
In other words, the differences between the mean scores
are not statically significant. Thus, females and males
have similar attitude towards continuing to use e-books
rather than discontinue it.
Quantitative report – E-books adoption
21 | P a g e
4.3.4.4. Marketing decisions: From the data in
independent samples T-test, we find that both males
and females customers have the same attitude in using
e-books in the near future.
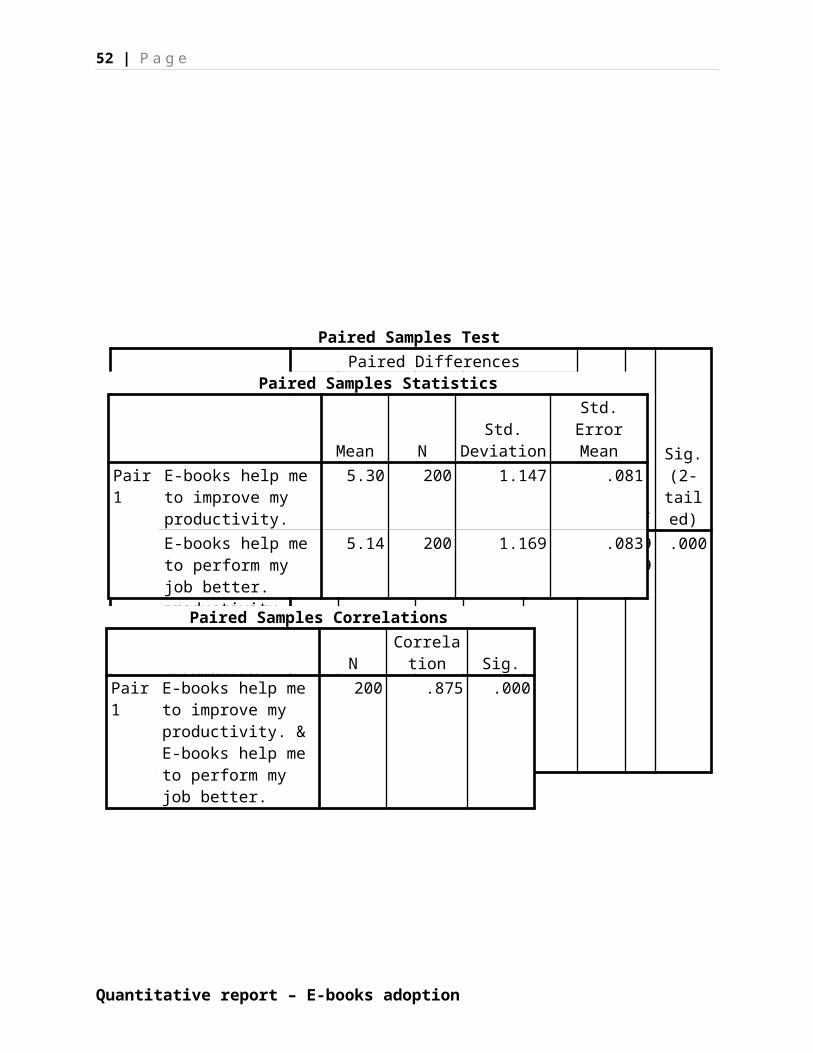
4.3.5. Research question 5: Which e-books’ benefits have
greatest impact on individual performance?
4.3.5.1. Variables used:
Interval scale for metric data set 1:
Improving productivity (QM8_1)
Performing job better (QM8_2)
Interval scale for metric data set 2:
Improving productivity (QM8_1)
Accomplishing more works (QM8_3)
4.3.5.2. Statistical test conducted: Paired Samples T-
test
4.3.5.3. Analysis and finding:
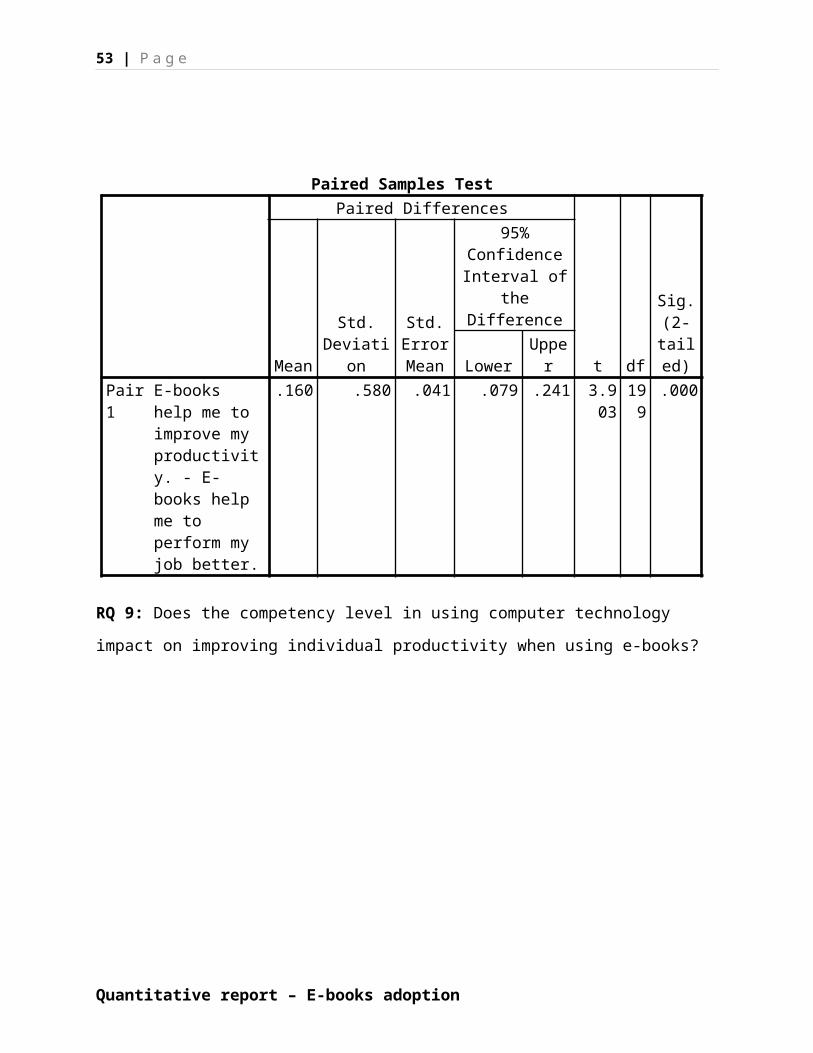
Hypothesis 1 development:
H0: M = 0 (No different between QM8_1 and QM8_2)
HA: M ≠ 0 (There is different between Qm8_1 and Qm8_2)
α= 0.025
Statistical conclusions: The critical test value = 1.9720
(derived from the t-distribution table) and the
calculated test value = 3.903 (derived from SPSS outputs
above). There is significant difference between
respondents’ attitudes toward to e-books’ benefits which
are ‘E-books help me to improve my productivity’ (M =
Quantitative report – E-books adoption
22 | P a g e
5.30) and ‘E-books help me to perform my job better’ (M
= 5.14) – t = 3.903, p < 0.05. Hence, the higher mean
score for variable 1 convince us productivity is a
better benefit for user rather than performing job
better.
Hypothesis 2 development:
H0: M = 0 (No different between QM8_1 and QM8_3)
HA: M ≠ 0 (There is different Qm8_1 and QM8_3)
α= 0.025
Statistical conclusions: The critical test value = 1.9720
(derived from the t-distribution table) and the
calculated test value = 4.987 (derived from SPSS output
above). There is significant difference between
respondents’ attitudes toward to e-books’ benefits which
are ‘E-books help me to improve my productivity’ (M =
5.30) and ‘E-books help me accomplish more work than
would otherwise be possible’ (M = 5.10) – t = 4.987, p <
0.05. Hence, the higher mean score for variable 1 also
convince us productivity is a better benefit for user
rather than the quantities of accomplished works.
4.3.5.4. Marketing decisions: Based on two separate
hypothesis testing to find out which benefits between
three variables that shown in the questionnaire, we
conclude that improving productivity is the best
benefits for user rather than accomplishing more
works and performing job better.
Quantitative report – E-books adoption
23 | P a g e
4.3.6. Research question 6: Does the competency level in
using computer technology impact on improving individual
productivity when using e-books?
4.3.6.1. Variables used: Interval scale for metric
data:
Dependent variable: Competency level in using computer
technology (QM1)
Independent variable: Improving individual productivity
(QM8_1)
4.3.6.2. Statistical test conducted: Regression
Analysis
4.3.6.3. Analysis and finding:
Hypothesis development for testing the significance of overall model:
H0: R2 = 0 (regression model is not significant)
HA: R2 > 0 (regression model is significant)
Hypothesis development for testing the impact of individual IV on DV:
H0: β = 0 (There is no impact of QM1 on QM8_1)
H1: β ≠ 0 (There is an impact of QM1 on QM8_1)
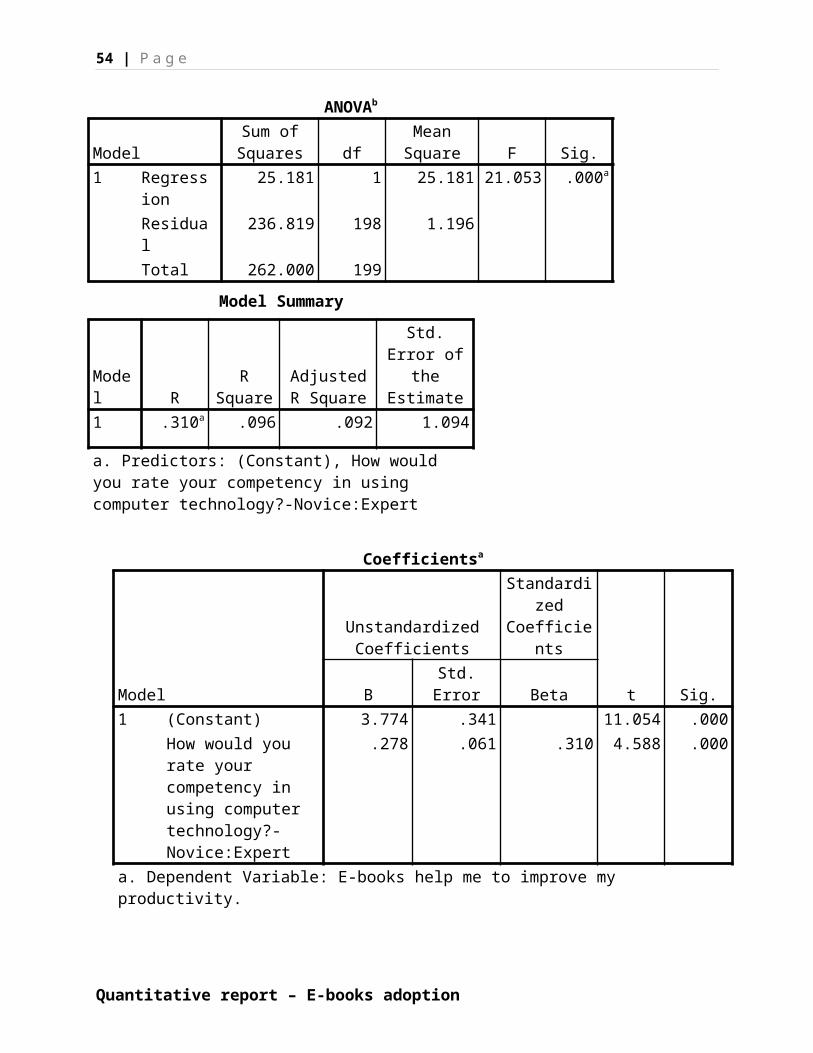
Statistical conclusions: Since P is less than 0.05, the study
accepts the alternative hypothesis (H1). Thus, the
overall regression model is significant. The independent
variable (competency level in using computer
technologies) explains a certain amount of variance of
the dependent variable (e-books help me to improve
productivity). There is an association between
individual productivity and competency level in using
Quantitative report – E-books adoption
24 | P a g e
computer technologies. However, Coefficients table
indicates that P is less than 0.05 so the study accepts
the alternative hypothesis (H1). Thus, the competency
level in using computer technologies (X) has an impact
on individual productivity of e-books user (Y).
Moreover, based on model summary, R square indicates
that the competency level in using computer technologies
explains 9.6% variance of the productivity. According to
Cohen (1998), this is categorized as weak effect as R
square < 0.10. Finally, we can conclude that
relationship between competency level in using computer
technology and productivity improvement when using e-
books through the model:
Individual productivity of e-books user (Y) = a + b * (competency
level in using computer technologies (X))
Individual productivity of e-books user (Y) = 3.774 + 0.278 *
(competency level in using computer technologies (X))
4.3.6.4. Marketing decisions: Based on the finding in
regression analysis, we can see that individual
productivity of e-books users is partly depend on
their competency level in using computer technology.
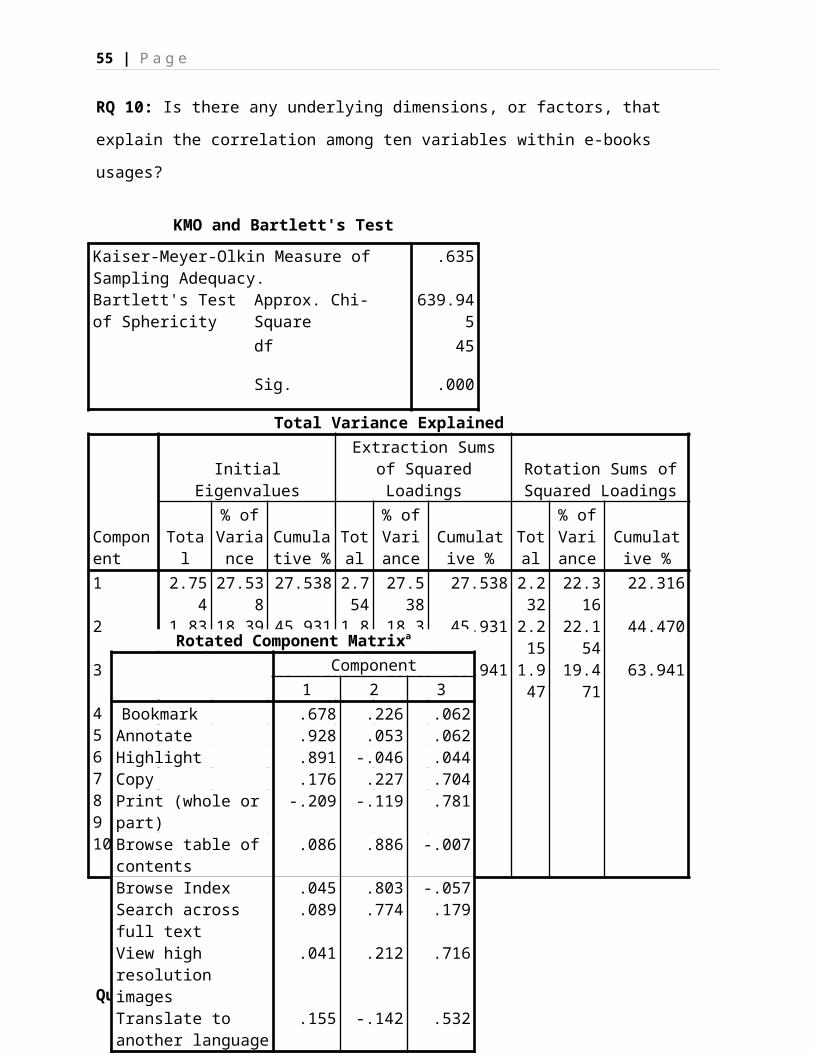
4.3.7. Research question 7: Is there any underlying
dimensions, or factors, that explain the correlation
among ten variables within e-books usages?
Quantitative report – E-books adoption
25 | P a g e
4.3.7.1. Variables used: Interval scale for metric
data: interdependent variables: E-books features
(QM7)
4.3.7.2. Statistical test conducted: Factor Analysis
4.3.7.3. Analysis and finding:
Hypothesis development:
H0: Variables are uncorrelated
HA: Variables are correlated
Statistical conclusion: The KMO value is greater than 0.5 which
indicate that the sample size is adequacy (Sample size
is appropriate. Thus the overall factor analysis is
valid). Additionally, in Bartlett’s test p < 0.05, hence
we accept alternative hypothesis (variables are
correlated, thus overall Factor Analysis is valid). The
SPSS result also reveals there are three factors whose
eigenvalues is greater than 1, thus we have factor 1
(2.754), factor 2 (1.839) and factor 3 (1.801). Finally,
rotated component matrix reveal three variables
(bookmark, annotate and highlight) which are having
loading greater than 0.5 under factor 1, three variables
(browse table of contents, browse index and search
across full text) are greater than 0.5 under factor 2
and four variables (copy, print, resolution images and
language translation) under factor 3. (0.50 loadings
indicate the minimum amount of variance that is
necessary to be included under a factor)
Quantitative report – E-books adoption
26 | P a g e
4.3.7.4. Marketing decisions: Based on the results of
table, there are 3 biggest factors to explain why
people adopt using e-book:
Factor 1: Functionality (bookmark, annotate and
highlight information)
Factor 2: Convenience (browse table of content,
index, search across full text) Factor 3: Additional
extras (print, copy, high resolution, language
translation)
5. Discussion and conclusion5.1. Findings:
By using different research methods, there are many various
aspects from e-books adoption process have been revealed that
help company have a general overview about the current trends as
well as requirement for using e-books in near future. Based on
demographic profile analysis and descriptive analysis, marketing
practitioners from Amazon can consider young female customers who
study commerce as their primary target audience in their
marketing communication and impression on using e-books for
academic purpose can potentially be an ideal way to attract those
promising customers. It is also found that there will be a good
number of people are going to use e-books in near future
regardless their genders, and they use e-books not only for
academic purpose but also for relaxation activities as well.
Additionally, paired samples t-test reveals that productivity
Quantitative report – E-books adoption
27 | P a g e
improvement is the greatest benefits in term of individual
performance and factor analysis indicate three biggest factors
which are functionality, ease to use and additional extra
contents to describe how people use e-books. Finally, regression
analysis shows that there is the relationship between user
competency level in using computer technology and productivity
improvement when using e-books.
5.2. Marketing implications:
Basically, various quantitative research and literature review
analysis help marketer identify many insights about e-books
adoption. First of all, by realizing social network is one of
main reason for adopting-books and combine with Akter
recommendation (2013) about emulating World Wide Web
functionality, it is necessary for e-books producers think about
how to change the e-books technology so that it can become more
attractive when compare to laptop or other internet accessed
devices. Moreover, by reviewing demographic analysis and
descriptive analysis, marketers now potentially have more new
ideas to attract their target customers when most of them are
young female people, such as providing more color choices,
redesign external appearance, or choosing suitable media platform
to deliver their marketing advertisements. Additionally,
according to Bennett’s analysis (2005) in literature review part,
the lack of e-books promotion within university also provide an
urgent need to carrying out more marketing activities to generate
Quantitative report – E-books adoption
28 | P a g e
e-books adoption within young customers. Besides, company as
Amazon also has to think about the copyright issues in the
attempt to transfer sources of economic information from physical
books to e-books format due to the ease to copy and print
characteristics of e-books to adopt the increasing need of using
e-books for academic purpose of commerce students. On the other
side, marketers also need to think about how to corporate well
with company production departments in order to improve the
production line to adopt the increasing demand in the next 5
years. Furthermore, when people have both positive attitudes
toward using e-books for academic purpose and recreational
purpose regardless gender, it implies some insight such as
marketers can think about integrating some fiction and non-
fiction books or various kinds of video games as the default
programs or applications which focus on both these purposes when
people buy the new e-books device, or they can consider
transferring e-books device into tablet to increase the
attractiveness in customers’ eyes. In addition to, literature
review also reveal some issues from Foasberg’s finding (2011)
when he pointed out some current disadvantages of e-books is lack
of copy and paste function as computer or the limitation of note-
taking competencies which are belong to two of three biggest
factors as mentioned in factor analysis. If marketers can improve
drawbacks, they possibly generate new competitive advantages and
apply in marketing activities to attract customers effectively
and efficiently. Finally, the most interesting insight ideas
Quantitative report – E-books adoption
29 | P a g e
based on the relationship between user competency level in using
computer technology and using e-books for improving productivity.
The result provides both opportunity and challenge for company.
Although the relationship between computer technology competency
level and improving productivity is significant, the effect is
weak. This is the potential opportunity for company, if they can
improve this relationship, they can utilize them as the
competitive advantage to compete with other companies. However,
it also presents a problem when each people have the specific
level in using technology and the model in regression analysis
also indicate a big change in competency level of using computer
technologies is needed for a small change in improving
productivity. It implies that Amazon need to think about the
totally new innovation in their new product development process
which cost a lot of time and money that are able to utilize the
users’ level competency in computer technology more effectively
to contribute to improving productivity when designing the next
generation of e-books devices. Overall, it is obvious that
marketers can carry out various research methods to analyze e-
books adoption process from different perspectives, from then
they can acquire many insights in creating e-books adoption
strategies and developing competitive advantages for companies.
6. References and appendices6.1. References
Bennett, L., & Landoni, M. (2005). E-books in academic
libraries. The Electronic Library, 23(1), 9–16.
Quantitative report – E-books adoption
30 | P a g e
Christianson, M. & Aucoin, M. (2005). Electronic or print
books: Which are used? Technical Services, Volume 29, Issue
1, pp 71-81.
Cynthia, G.L. (2008). "But I Want a Real Book": An
Investigation of Undergraduates' Usage and Attitudes toward
Electronic Books. Volume, 47, 3. Pp 266-273.
D’Ambra, J. Wilson, C.S. & Akter, S. (2013). Application of
the Task-Technology Fit Model to
Structure and Evaluate the Adoption of E-Booksby Academics.
Journal of the American Society For Information Science and
Technology. Dol: 10.1002/asi.
Foasberg, N.M. (2011). Adoption of e-book readers among
college students: a survey. Information Technology and
Libraries. American Library Association.
Foote, J.B., & Rupp-Serrano, K. (2010). Exploring e-book
usage among faculty and graduate students in the
geosciences: Results of a small survey and focus group
approach. Science and Technology Libraries, 29(3), 216–234.
Quantitative report – E-books adoption
31 | P a g e
Lee, S. (2012). An integrated adoption model for e-books in
a mobile environment: Evidence from South Korea. Telematics
and Informatics. Volume 30, Issue 2, pp 165-176.
Malhotra N. (2010). Marketing Research: An applied
orientation. 6th Ed, Pearson, New Jersey.
Quester, P., Neal, C., Pettigrew, S., and Hawkins, D.
(2011). Consumer Behaviour: Implications for Marketing
Strategy 6th Edition. McGraw Hill: Boston.
Ram, S., (1987). A model of innovation resistance. Advances
in Consumer Research XIV, 208–212.
Rogers, (1995). E.M. Rogers Diffusion of Innovations. 4th
ed. Free Press, New York (1995).
Shelburne, W.A. (2009). E-book usage in an academic
library: User attitudes and behaviors. Library Collections,
Acquisitions, & Technical Services, 33(2–3), 59–72.
Vanessa, R. (2010). Social Cognitive Theory and the
Adoption of e-Book Devices. International Journal of e-
Business Management, Vol. 4, No. 2.
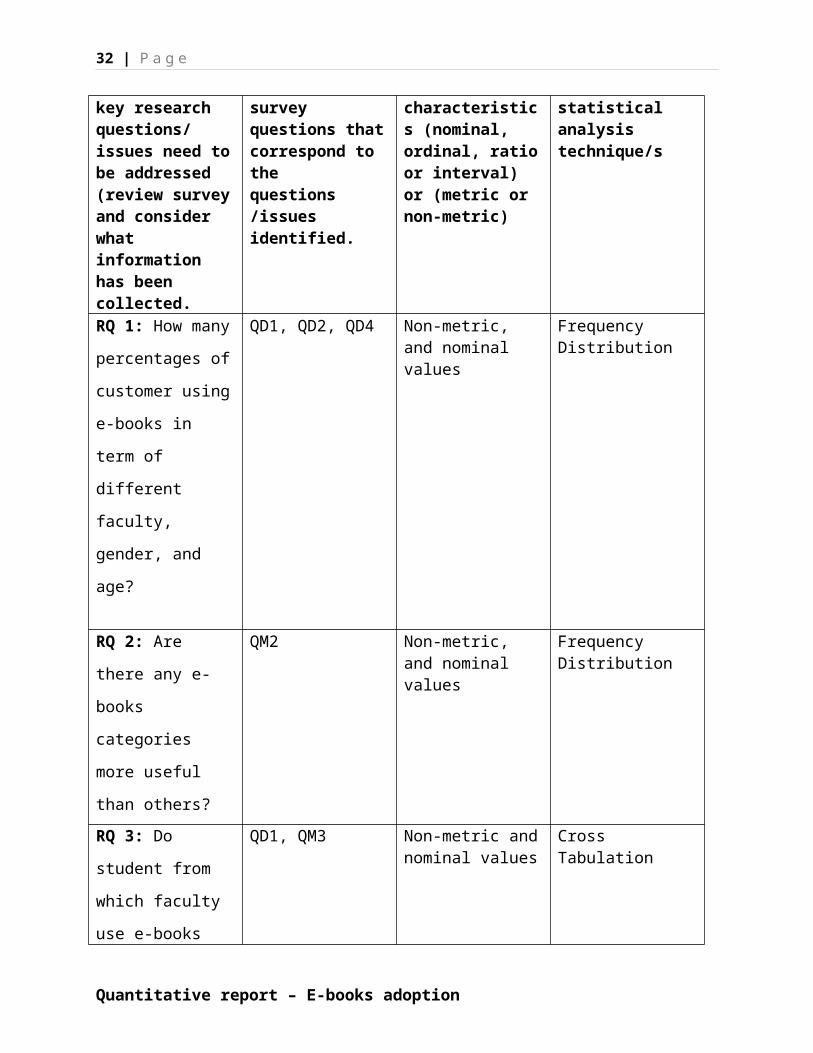
6.2. Checklist for e-books adoption report
Identify the Specify the Data Proposed
Quantitative report – E-books adoption
32 | P a g e
key research questions/ issues need tobe addressed (review surveyand consider what information has been collected.
survey questions thatcorrespond to the questions /issues identified.
characteristics (nominal, ordinal, ratioor interval) or (metric or non-metric)
statistical analysis technique/s
RQ 1: How many
percentages of
customer using
e-books in
term of
different
faculty,
gender, and
age?
QD1, QD2, QD4 Non-metric, and nominal values
Frequency Distribution
RQ 2: Are
there any e-
books
categories
more useful
than others?
QM2 Non-metric, and nominal values
Frequency Distribution
RQ 3: Do
student from
which faculty
use e-books
QD1, QM3 Non-metric andnominal values
Cross Tabulation
Quantitative report – E-books adoption
33 | P a g e
the most for
academic
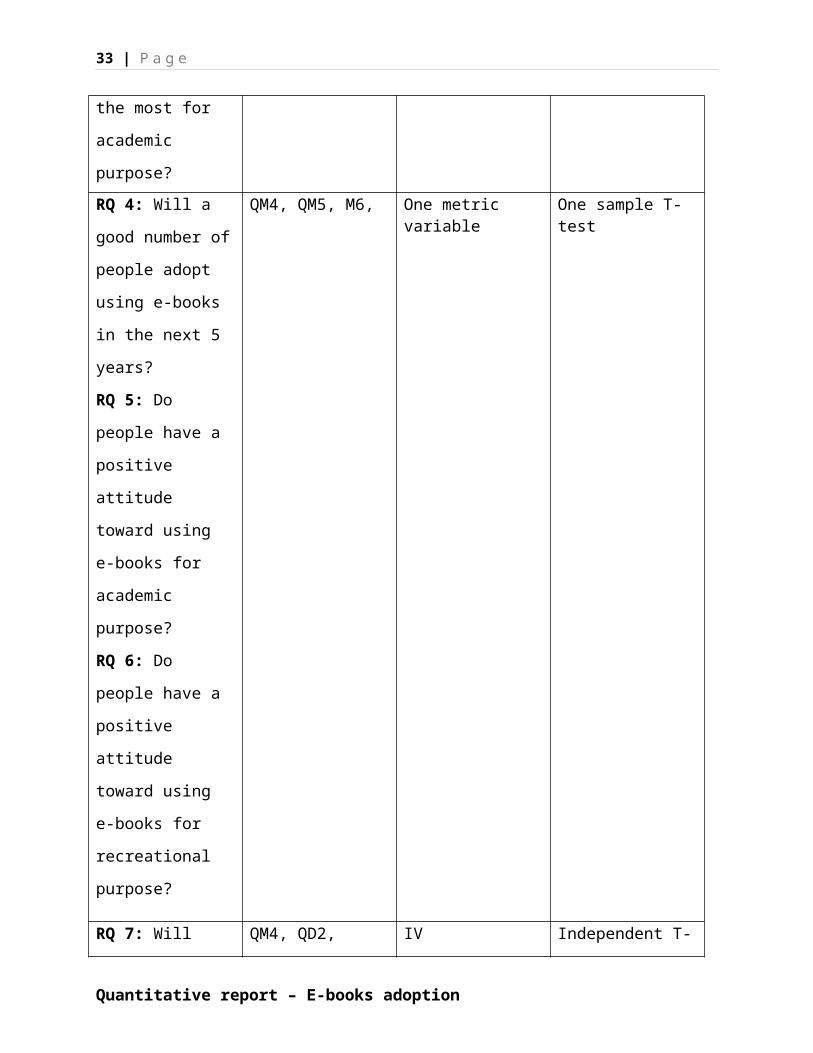
purpose?RQ 4: Will a
good number of
people adopt
using e-books
in the next 5
years?
RQ 5: Do
people have a
positive
attitude
toward using
e-books for
academic
purpose?
RQ 6: Do
people have a
positive
attitude
toward using
e-books for
recreational
purpose?
QM4, QM5, M6, One metric variable
One sample T-test
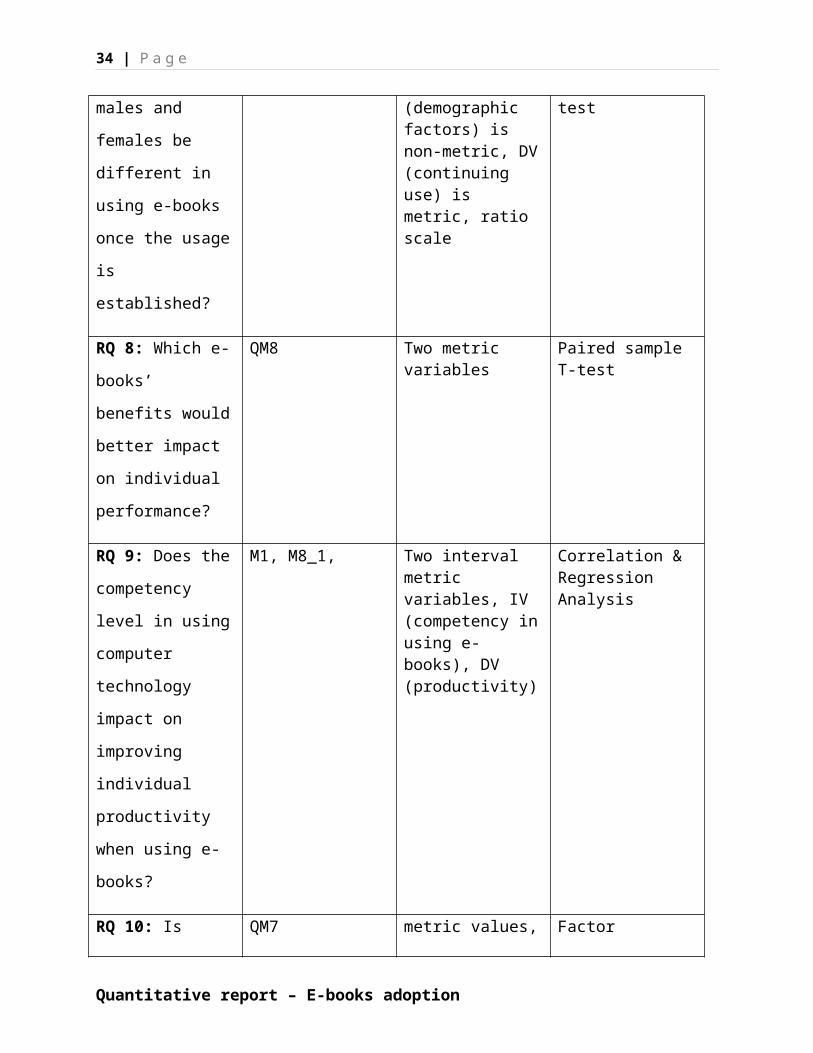
RQ 7: Will QM4, QD2, IV Independent T-
Quantitative report – E-books adoption
34 | P a g e
males and
females be
different in
using e-books
once the usage
is
established?
(demographic factors) is non-metric, DV(continuing use) is metric, ratio scale
test
RQ 8: Which e-
books’
benefits would
better impact
on individual
performance?
QM8 Two metric variables
Paired sample T-test
RQ 9: Does the
competency
level in using
computer
technology
impact on
improving
individual
productivity
when using e-
books?
M1, M8_1, Two interval metric variables, IV (competency inusing e-books), DV (productivity)
Correlation & Regression Analysis
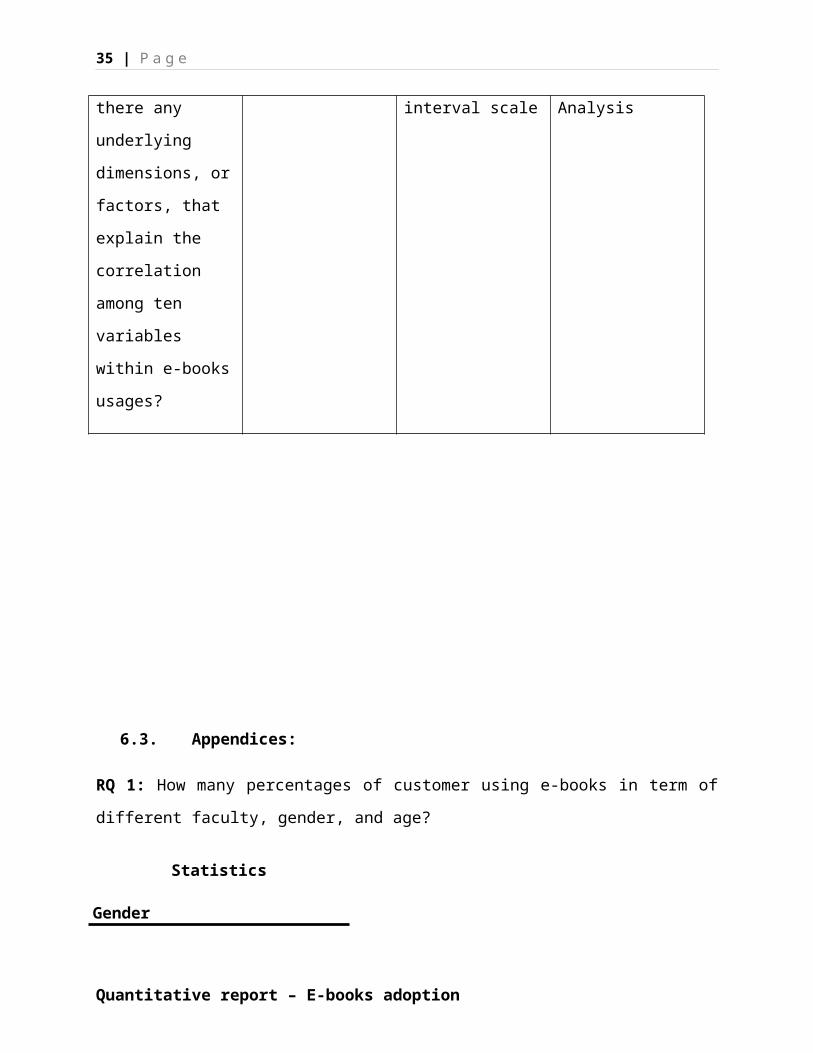
RQ 10: Is QM7 metric values, Factor
Quantitative report – E-books adoption
35 | P a g e
there any
underlying
dimensions, or
factors, that
explain the
correlation
among ten
variables
within e-books
usages?
interval scale Analysis
6.3. Appendices:
RQ 1: How many percentages of customer using e-books in term of
different faculty, gender, and age?
Statistics
Gender
Quantitative report – E-books adoption
36 | P a g e
N Valid 200
Missing 0
Mean 1.54
Median 2.00
Mode 2
Std. Deviation .500
Variance .250
Skewness -.162
Std. Error of Skewness
.172
Kurtosis -1.994
Std. Error of Kurtosis
.342
Range 1
Sum 308
GenderFrequen
cyPercen
tValidPercent
Cumulative Percent
Valid
Male 92 46.0 46.0 46.0Female
108 54.0 54.0 100.0
Total 200 100.0 100.0
Statistics
AgeN Valid 200
Missing 0
Quantitative report – E-books adoption
37 | P a g e
Mean 1.51
Median 1.00
Mode 1
Std. Deviation .845
Variance .713
Skewness 2.546
Std. Error of Skewness
.172
Kurtosis 8.576
Std. Error of Kurtosis
.342
Range 5
Sum 302
AgeFrequen
cyPercen
tValidPercent
Cumulative Percent
Valid
18-25
124 62.0 62.0 62.0
26-33
64 32.0 32.0 94.0
34-41
2 1.0 1.0 95.0
42-49
8 4.0 4.0 99.0
58 + 2 1.0 1.0 100.0
Total
200 100.0 100.0
StatisticsTo which faculty do you belong?
Quantitative report – E-books adoption
38 | P a g e
N Valid 200
Missing 0
Mean 1.82
Median 1.00
Mode 1
Std. Deviation 1.181
Variance 1.395
Skewness 1.020
Std. Error of Skewness
.172
Kurtosis -.649
Std. Error of Kurtosis
.342
Range 3
Sum 364
To which faculty do you belong?Frequen
cyPercen
tValid
PercentCumulative Percent
Valid
Commerce
124 62.0 62.0 62.0
Arts 24 12.0 12.0 74.0Science 16 8.0 8.0 82.0Others 36 18.0 18.0 100.0Total 200 100.0 100.0
RQ 2: Are there any e-books categories more useful than others?
1. Statistics
Quantitative report – E-books adoption
39 | P a g e
In your opinion are there any particular e-book categories that will be more useful than others? Usefulness will be higher for..
N Valid 200
Missing 0
Mean 2.69
Median 3.00
Mode 1a
Std. Deviation 1.387
Variance 1.924
Skewness .297
Std. Error of Skewness
.172
Kurtosis -.710
Std. Error of Kurtosis
.342
Sum 538
Quantitative report – E-books adoption
40 | P a g e
a. Multiple modes exist. The smallest value is shown
In your opinion are there any particular e-bookcategories that will be more useful than others?
Usefulness will be higher for..
Frequency
Percent
ValidPercent
Cumulative Percent
Valid
Textbooks 58 29.0 29.0 29.0
Research monographs
32 16.0 16.0 45.0
Reference works
42 21.0 21.0 66.0
All book categories
58 29.0 29.0 95.0
No book categories
2 1.0 1.0 96.0
Don’t know 8 4.0 4.0 100.0
Total 200 100.0 100.0
Quantitative report – E-books adoption
41 | P a g e
RQ 3: Do student from which faculty use e-books the most for
academic purpose?
Case Processing Summary
Cases
Valid Missing Total
NPercen
t NPercen
t NPercen
tIn your opinionare thereparticularacademicpurposes wheree-books will bemore useful thanothers?Usefulness willbe greater in...* To whichfaculty do youbelong?
200 100.0% 0 .0% 200 100.0%
In your opinion are there particular academic purposes wheree-books will be more useful than others? Usefulness will be
greater in... * To which faculty do you belong?Crosstabulation
To which faculty doyou belong?
Total
Commerce Arts
Science
Others
In your Study Count 34 6 4 16 60
Quantitative report – E-books adoption
42 | P a g e
Case Processing Summary
Cases
Valid Missing Total
NPercen
t NPercen
t NPercen
topinion arethereparticularacademicpurposeswhere e-books willbe moreuseful thanothers?Usefulnesswill begreaterin...
% within Inyour opinionare thereparticularacademicpurposeswhere e-bookswill be moreuseful thanothers?Usefulnesswill begreater in...
56.7% 10.0%
6.7% 26.7%
100.0%
% within Towhich facultydo youbelong?
27.4% 25.0%
25.0%
44.4%
30.0%
% of Total 17.0% 3.0% 2.0% 8.0% 30.0%
Resea Count 26 10 6 14 56
Quantitative report – E-books adoption

43 | P a g e
Case Processing Summary
Cases
Valid Missing Total
NPercen
t NPercen
t NPercen
trch % within In
your opinionare thereparticularacademicpurposeswhere e-bookswill be moreuseful thanothers?Usefulnesswill begreater in...
46.4% 17.9%
10.7%
25.0%
100.0%
% within Towhich facultydo youbelong?
21.0% 41.7%
37.5%
38.9%
28.0%
% of Total 13.0% 5.0% 3.0% 7.0% 28.0%
Teach Count 14 6 0 4 24
Quantitative report – E-books adoption
44 | P a g e
Case Processing Summary
Cases
Valid Missing Total
NPercen
t NPercen
t NPercen
ting % within In
your opinionare thereparticularacademicpurposeswhere e-bookswill be moreuseful thanothers?Usefulnesswill begreater in...
58.3% 25.0%
.0% 16.7%
100.0%
% within Towhich facultydo youbelong?
11.3% 25.0%
.0% 11.1%
12.0%
% of Total 7.0% 3.0% .0% 2.0% 12.0%
All Count 48 2 6 2 58
Quantitative report – E-books adoption
45 | P a g e
Case Processing Summary
Cases
Valid Missing Total
NPercen
t NPercen
t NPercen
tpurposes
% within Inyour opinionare thereparticularacademicpurposeswhere e-bookswill be moreuseful thanothers?Usefulnesswill begreater in...
82.8% 3.4% 10.3%
3.4% 100.0%
% within Towhich facultydo youbelong?
38.7% 8.3% 37.5%
5.6% 29.0%
% of Total 24.0% 1.0% 3.0% 1.0% 29.0%
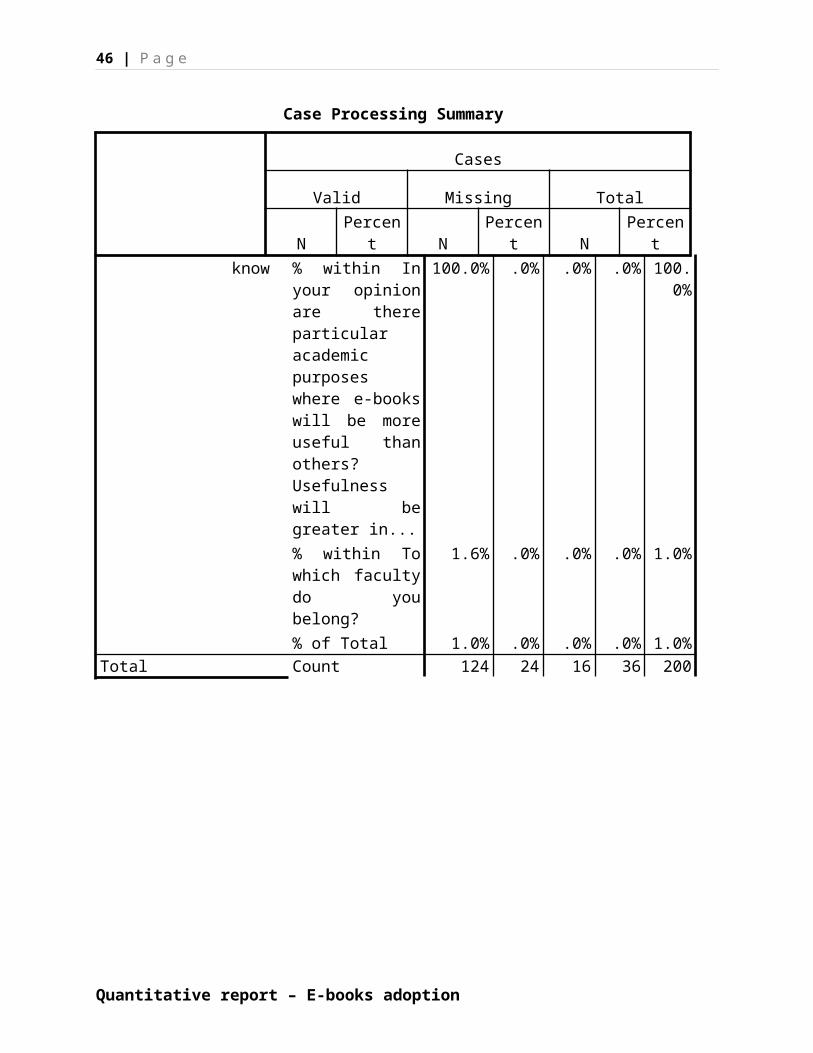
Don’t Count 2 0 0 0 2
Quantitative report – E-books adoption
46 | P a g e
Case Processing Summary
Cases
Valid Missing Total
NPercen
t NPercen
t NPercen
tknow % within In
your opinionare thereparticularacademicpurposeswhere e-bookswill be moreuseful thanothers?Usefulnesswill begreater in...
100.0% .0% .0% .0% 100.0%
% within Towhich facultydo youbelong?
1.6% .0% .0% .0% 1.0%
% of Total 1.0% .0% .0% .0% 1.0%Total Count 124 24 16 36 200
Quantitative report – E-books adoption
47 | P a g e
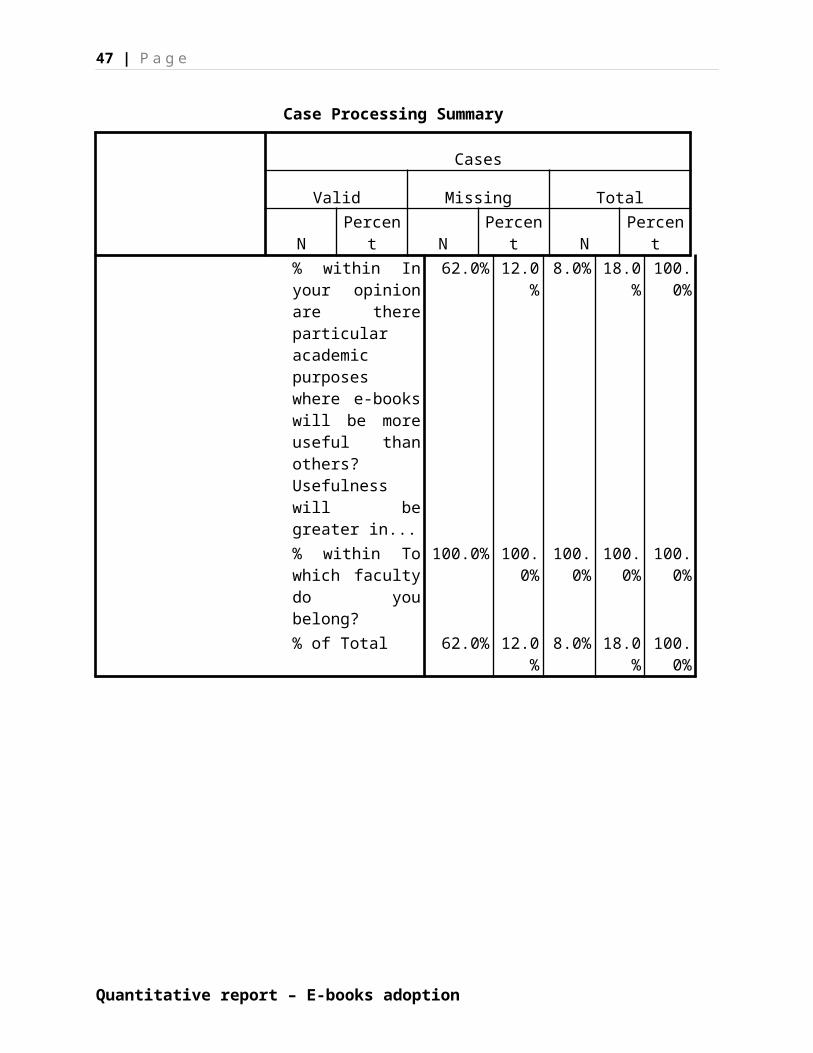
Case Processing Summary
Cases
Valid Missing Total
NPercen
t NPercen
t NPercen
t% within Inyour opinionare thereparticularacademicpurposeswhere e-bookswill be moreuseful thanothers?Usefulnesswill begreater in...
62.0% 12.0%
8.0% 18.0%
100.0%
% within Towhich facultydo youbelong?
100.0% 100.0%
100.0%
100.0%
100.0%
% of Total 62.0% 12.0%
8.0% 18.0%
100.0%
Quantitative report – E-books adoption
48 | P a g e
RQ 4: Will a good number of people adopt using e-books in the
next 5 years?
Quantitative report – E-books adoption
One-Sample Statistics
N MeanStd.
Deviation
Std.ErrorMean
A good number ofstudents will use academic e-books in the next 5 years.-Strongly Disagree: Strongly Agree
200 5.35 1.348 .095
49 | P a g e
One-Sample TestTest Value = 4
t df
Sig.(2-tailed)
MeanDifference
95%ConfidenceInterval of
theDifference
Lower UpperA good number of students will use academic e-books in thenext 5 years.-Strongly Disagree: Strongly Agree
14.165
199 .000 1.350 1.16 1.54
RQ 5: Do people have a positive attitude toward using e-books for
academic purpose?
Quantitative report – E-books adoption
One-Sample Statistics
N MeanStd.
Deviation
Std.ErrorMean
I currently use e-books for academic purposes.-Never:Always
200 3.61 1.622 .115
One-Sample TestTest Value = 4
t df
Sig.(2-
tailed)
MeanDiffere
nce
95% ConfidenceInterval of the
DifferenceLower Upper
I currently use e-books for academicpurposes.-Never: Always
-3.400
199 .001 -.390 -.62 -.16
50 | P a g e
RQ 6: Do people have a positive attitude toward using e-books for
recreational purpose?
One-Sample TestTest Value = 4
t df
Sig.(2-tailed)
MeanDifference
95% ConfidenceInterval of the
DifferenceLower Upper
I currently use e-books for recreationalpurposes.-Never: Always
-4.955
199
.000 -.710 -.99 -.43
RQ 7: Will males and females be different in using e-books once
the usage is established?
Quantitative report – E-books adoption
One-Sample Statistics
N MeanStd.
Deviation
Std.ErrorMean
I currently use e-books for recreational purposes.-Never:Always
200 3.29 2.026 .143
Group Statistics
Gender N Mean
Std.Deviation
Std.ErrorMean
I intend to continue using e-books rather than discontinueit.
Male 92 5.74 1.248 .130Female
108 5.59 1.290 .124
51 | P a g e
RQ 8: Which e-books’ benefits would better impact on individual
performance?
Quantitative report – E-books adoption
Independent Samples TestLevene'sTest forEquality
ofVariance
s t-test for Equality of Means
F Sig. t df
Sig.(2-tailed)
MeanDifference
Std.ErrorDifference
95%Confidenc
eIntervalof the
Difference
Lower
Upper
I intend to continue usinge-booksrather than dis continue it.
Equal variances assumed
.191.662 .81
3198 .41
7.147 .180 -.20
9.502
Equal variances not assumed
.815
194.796
.416
.147 .180 -.208
.501
Paired Samples Statistics
Mean NStd.
Deviation
Std.ErrorMean
Pair1
E-books help me to improve my productivity.
5.30 200 1.147 .081
E-books help me accomplish more work than would otherwise be possible.
5.10 200 1.147 .081
Paired Samples Correlations
NCorrelation Sig.
Pair1
E-books help me to improve my productivity. & E-books help me accomplish more work than would otherwise be possible.
200 .878 .000
52 | P a g e
Quantitative report – E-books adoption
Paired Samples TestPaired Differences
t df
Sig.(2-tailed)Mean
Std.Deviati
on
Std.Error
Mean
95%ConfidenceInterval of
theDifference
LowerUpper
Pair1
E-books helpme to improve my productivity. - E-books help me accomplish more work than would otherwise bepossible.
.200 .567 .040 .121 .279 4.987
199
.000
Paired Samples Statistics
Mean NStd.
Deviation
Std.ErrorMean
Pair1
E-books help me to improve my productivity.
5.30 200 1.147 .081
E-books help me to perform my job better.
5.14 200 1.169 .083
Paired Samples Correlations
NCorrelation Sig.
Pair1
E-books help me to improve my productivity. & E-books help me to perform my job better.
200 .875 .000
53 | P a g e
RQ 9: Does the competency level in using computer technology
impact on improving individual productivity when using e-books?
Quantitative report – E-books adoption
Paired Samples TestPaired Differences
t df
Sig.(2-tailed)Mean
Std.Deviati
on
Std.ErrorMean
95%ConfidenceInterval of
theDifference
LowerUpper
Pair1
E-books help me to improve my productivity. - E-books help me to perform my job better.
.160 .580 .041 .079 .241 3.903
199
.000
54 | P a g e
ANOVAb
ModelSum ofSquares df
MeanSquare F Sig.
1 Regression
25.181 1 25.181 21.053 .000a
Residual
236.819 198 1.196
Total 262.000 199Model Summary
Model R
RSquare
AdjustedR Square
Std.Error of
theEstimate
1 .310a .096 .092 1.094
a. Predictors: (Constant), How would you rate your competency in using computer technology?-Novice:Expert
Quantitative report – E-books adoption
Coefficientsa
Model
UnstandardizedCoefficients
Standardized
Coefficients
t Sig.BStd.Error Beta
1 (Constant) 3.774 .341 11.054 .000How would you rate your competency in using computer technology?-Novice:Expert
.278 .061 .310 4.588 .000
a. Dependent Variable: E-books help me to improve my productivity.
55 | P a g e
RQ 10: Is there any underlying dimensions, or factors, that
explain the correlation among ten variables within e-books
usages?
KMO and Bartlett's TestKaiser-Meyer-Olkin Measure of Sampling Adequacy.
.635
Bartlett's Test of Sphericity
Approx. Chi-Square
639.945
df 45
Sig. .000
Total Variance Explained
Component
InitialEigenvalues
Extraction Sumsof SquaredLoadings
Rotation Sums ofSquared Loadings
Total
% ofVariance
Cumulative %
Total
% ofVariance
Cumulative %
Total
% ofVariance
Cumulative %
1 2.75427.53
827.538 2.7
5427.538
27.538 2.232
22.316
22.316
2 1.83918.39
345.931 1.8
3918.393
45.931 2.215
22.154
44.470
3 1.80118.01
063.941 1.8
0118.010
63.941 1.947
19.471
63.941
4 .941 9.411 73.3525 .682 6.817 80.1686 .592 5.919 86.0877 .523 5.226 91.3138 .407 4.065 95.3799 .281 2.810 98.18910 .181 1.811 100.00
0
Quantitative report – E-books adoption
Rotated Component Matrixa
Component1 2 3
Bookmark .678 .226 .062Annotate .928 .053 .062Highlight .891 -.046 .044Copy .176 .227 .704Print (whole or part)
-.209 -.119 .781
Browse table of contents
.086 .886 -.007
Browse Index .045 .803 -.057Search across full text
.089 .774 .179
View high resolution images
.041 .212 .716
Translate to another language
.155 -.142 .532

56 | P a g e
Quantitative report – E-books adoption


