Embed Size (px)
Citation preview
Authors:Wolter Elbersen (Wageningen UR - AFSG), Rolien Wiersinga (Wageningen UR – LEI) & Yuca Waarts (Wageningen UR – LEI)
LNV contactpersons:Meeuwes Brouwer (LNV, Kiev) & Evert Jan Krajenbrink (LNV, I&H)
Market Scan Bioenergy Ukraine
Report for the Dutch Ministry of Agriculture, Nature and Food Quality
Report BO-10-006-062

Market Scan Bioenergy Ukraine
Report for the Dutch Ministry of Agriculture, Nature and Food Quality
April 2009
Authors:Wolter Elbersen (Wageningen UR - AFSG), Rolien Wiersinga (Wageningen UR – LEI) & Yuca Waarts (Wageningen UR – LEI)
LNV contactpersons:Meeuwes Brouwer (LNV, Kiev) & Evert Jan Krajenbrink (LNV, I&H)
Report BO-10-006-062
©Agrotechnology & Food Innovations B.V. Member of Wageningen UR 2
Colophon
The quality management system of Agrotechnology & Food Innovations B.V. is certified by SGS International Certification Services EESV according to ISO 9001:2000.
Title Market scan bioenergy Ukraine Author(s) Wolter Elbersen, Rolien Wiersinga and Yuca Waarts AFSG number 1037 ISBN-number 978-90-8585-410-4 Date of publication April 2009 Confidentiality Until April 28 LNV Project code. BO-10-006-062
Agrotechnology & Food Innovations B.V. P.O. Box 17 NL-6700 AA Wageningen Tel: +31 (0)317 480 084 E-mail: [email protected] Internet: www.agrotechnologyandfood.wur.nl
© Agrotechnology & Food Innovations B.V. Alle rechten voorbehouden. Niets uit deze uitgave mag worden verveelvoudigd, opgeslagen in een geautomatiseerd gegevensbestand of openbaar gemaakt in enige vorm of op enige wijze, hetzij elektronisch, hetzij mechanisch, door fotokopieën, opnamen of enige andere manier, zonder voorafgaande schriftelijke toestemming van de uitgever. De uitgever aanvaardt geen aansprakelijkheid voor eventuele fouten of onvolkomenheden. All right reserved. No part of this publication may be reproduced, stored in a retrieval system of any nature, or transmitted, in any form or by any means, electronic, mechanical, photocopying, recording or otherwise, without the prior permission of the publisher. The publisher does not accept any liability for the inaccuracies in this report.
This report is authorised by: Rene van Ree
©Agrotechnology & Food Innovations B.V. Member of Wageningen UR 3
AbstractThe Ukraine has a big, largely undeveloped, potential for the production of biomass feed-stocks. Western Europe provides a large import market for biomass feedstocks or bio-fuels. At the same time the EU and The Netherlands can serve as a provider of knowledge and technology for developing a sustainable bioenergy industry in the Ukraine. Therefore The Netherlands Ministry of Agriculture, Nature and Food Quality has requested a report on the opportunities for collaboration with the Ukraine in the field of bio-energy with the aim of providing companies in The Netherlands with relevant information on the subject.
The main drivers for bioenergy production in the EU are sustainability (mainly reduction of GHG emissions) and security of energy supply. In The Netherlands local production of feedstocks is limited and free trade policies are traditionally favored. This has contributed to large import volumes of biomass for electricity and heat production. In recent years the import of (feedstocks for) biofuels has also taken off. The Netherlands sees itself and the harbor of Rotterdam in particular as the main entry point for biomass into Europe. The local conversion of biomass into bio-fuels and chemicals is envisioned for coming decades.
The Ukraine has undergone a large decline in industrial productivity (and energy use) and a sharp decline in agricultural productivity since independence in 1990. Though these sectors have been recuperating in the last decade restructuring is still ongoing. The energy infrastructure of the Ukraine is characterized by a large dependence on imported energy sources (particularly natural gas) and a low energy efficiency. The agricultural sector is characterized by a low productivity (per ha) but also by a very large untapped potential especially by using existing agricultural. The potential for biomass and bioenergy production is very large in the Ukraine. Still, bioenergy only accounts for 0.65% of primary energy use. Though bioenergy is enjoying increasing interest in the Ukraine policies lack implementation or are still under development.
Many business opportunities especially in the energy and bioenergy sector exist. Ukraine does have the highest biomass potential in Europe which has largely been untapped and labor, especially in rural areas, is inexpensive. This provides many opportunities for inves-tments in local bioenergy production and in the export of bioenegy feedstocks. Ukraine is already an important supplier of feedstock to Europe, exporting rape seed for biodiesel production and biomass (pellets) for electricity and heat production. Opportunities exist in; upgrading of energy infrastructure incorporating biomass; setting up sustainable biomass production; transfer of knowledge and expertise; developing the oil seed and biodiesel sectors; setting up systems for complying/ monitoring of sustainable biomass produc-tion; development of a local biofuels market and infrastructure; rural biogas production in concert with expanding animal production; financing of the bioenergy sector.

©Agrotechnology & Food Innovations B.V. Member of Wageningen UR 4
©Agrotechnology & Food Innovations B.V. Member of Wageningen UR 5
Abbreviations
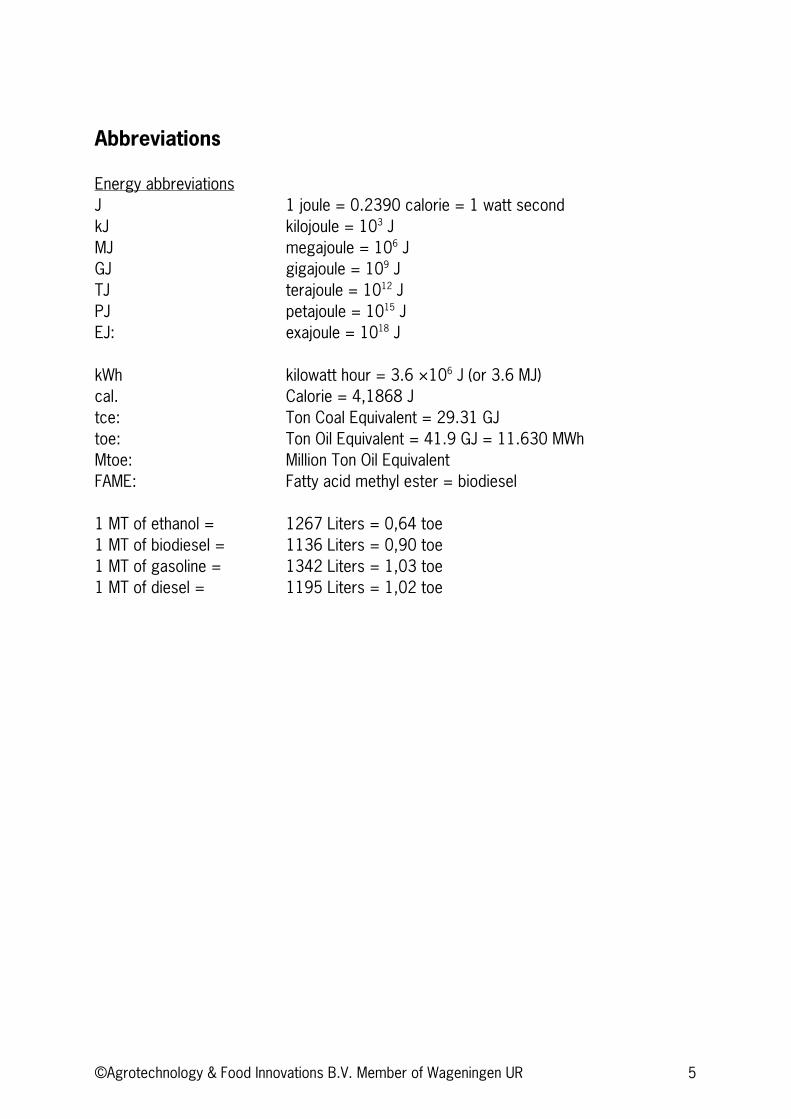
Energy abbreviationsJ 1 joule = 0.2390 calorie = 1 watt second kJ kilojoule = 103 J MJ megajoule = 106 J GJ gigajoule = 109 J TJ terajoule = 1012 J PJ petajoule = 1015 J EJ: exajoule = 1018 J
kWh kilowatt hour = 3.6 ×10⁶ J (or 3.6 MJ) cal. Calorie = 4,1868 J tce: Ton Coal Equivalent = 29.31 GJ toe: Ton Oil Equivalent = 41.9 GJ = 11.630 MWh Mtoe: Million Ton Oil Equivalent FAME: Fatty acid methyl ester = biodiesel
1 MT of ethanol = 1267 Liters = 0,64 toe 1 MT of biodiesel = 1136 Liters = 0,90 toe 1 MT of gasoline = 1342 Liters = 1,03 toe 1 MT of diesel = 1195 Liters = 1,02 toe

©Agrotechnology & Food Innovations B.V. Member of Wageningen UR 6
©Agrotechnology & Food Innovations B.V. Member of Wageningen UR 7
Content
page
Abstract 3
Abbreviations 5
1 Introduction and approach 91.1 Project 91.2 Objective 91.3 Approach 9
2 The EU demand for biomass feedstocks with focus on the Netherlands 112.1 Biomass and Bioenergy and the EU 112.2 Transportation fuels 122.3 Electricity and heat 152.4 Sustainability 16
3 Introduction to the Ukraine and the Ukrainian energy infrastructure 193.1 Introduction 193.2 Ukrainian energy infrastructure 213.3 Ukrainian Agriculture 25
4 The Ukrainian biomass potential and possibilities for exporting feedstocks 294.1 The potential for 1st generation bioenergy production in Ukraine 304.2 The potential for production of biomass for heat and electricity and 2nd
generation biofuels in the Ukraine 324.3 Institutions affecting the bioenergy production potential 34
5 Analysis of bioenergy business opportunities in the Ukraine and a short comparison to other potential biomass exporting countries 355.1 Analysis of market aspects: how much trade of what and with whom 355.2 SWOT analysis of the Ukrainian bioenergy sector 365.3 A short comparison of Ukraine to Brazil in sustainability 37
6 Opportunities and bottlenecks for investments by Dutch business 39
References 43
Acknowledgements 47
Annex I: Useful contacts 49

©Agrotechnology & Food Innovations B.V. Member of Wageningen UR 8
©Agrotechnology & Food Innovations B.V. Member of Wageningen UR 9
1 Introduction and approach
1.1 Project
The Ukraine has a big, largely undeveloped, potential for the production of biomass feedstocks. Western Europe provides a large import market for biomass feedstocks or biofuels. The EU and the Netherlands in particular can serve as a provider of knowledge and technology for developing a sustainable bioenergy industry in the Ukraine.
The Netherlands Ministry of Agriculture, Nature and Food Quality has requested a report on the opportunities for collaboration with the Ukraine in the field of bio-energy with the aim of providing relevant (agri-related) industries in The Netherlands with relevant information.
1.2 Objective
The objective of this market scan is to review the potential and options for production and processing of biomass feedstocks for energy production (heat, electricity and transportation fuels) in the Ukraine and to identify options for collaboration with the Dutch industry. Collaboration should contribute to the energy security and sustainability of the Netherlands, economic development in the Ukraine and development of a biobased economy in the Netherlands and Europe.
1.3 Approach
This report is divided into the following parts:Characterization of EU demand for biomass feedstocks with focus on the NetherlandsCharacterization of Ukrainian energy infrastructure and local demand for bioenergy Characterisation of the Ukrainian biomass potential and possibilities for exporting feedstocksAnalysis of bioenergy business opportunities in the Ukraine and a short comparison with other potential exporting countries, including a SWOT analysis.Recommendations on opportunities for collaboration with parties in The Netherlands.
Most of the information has been obtained from literature and from a few interviews with informants in Ukraine and in The Netherlands.

©Agrotechnology & Food Innovations B.V. Member of Wageningen UR 10
©Agrotechnology & Food Innovations B.V. Member of Wageningen UR 11
2 The EU demand for biomass feedstocks with focus on the Netherlands
2.1 Biomass and Bioenergy and the EU
The main drivers for bioenergy production in the EU are sustainability, security of energy supply and employment1 and 2. In EU policy documents sustainability refers mainly to reduction of GHG (Green House Gas) emissions. In The Netherlands bio-energy is driven even more by the wish to reduce GHG emissions than in the EU as a whole. Local production of feedstocks is limited and free trade policies are traditionally favored. This has contributed to large import volumes of biomass for local energy production. The Netherlands sees itself and the harbor of Rotterdam in particular as the main port for biomass into Europe3. The local conversion of biomass into bio-fuels and chemicals is envisioned for the coming decades.
In Table 1 the total renewable energy targets for 2010 of the EU are presented for electricity, heat and transportation.
Table 1. Total projected renewable energy requirement for EU-15 to meet the 2010 renewable energy targets.
The 12% target for 2010 (Mtoe)
Renewable Electricity 84-93(22.1% achieved)
(RESIDENTIAL) Heat production 68-77
Biomass 66 Geothermal 4
Solar thermal 2 Biofuels 19
Total 182
Source: COM(2004)366, p.34
For beyond 2010 even higher biomass and bioenergy targets are being developed, as 10% biofuels of total energy requirement in 2020 in the EU (see below). In the
1 http://ec.europa.eu/energy/energy_policy/documents_en.htm 2 JRC.2008. Biofuels in the European Context: Facts and Uncertainties 3 http://www.innovatienetwerk.org/nl/bibliotheek/rapporten/241/BioportNederlandalsmainportvoorbiomassa
©Agrotechnology & Food Innovations B.V. Member of Wageningen UR 12
Netherlands the Biobased Raw Materials Platform has formulated a vision for the Biobased Economy which aims at replacing 30% of fossil fuels by biomass requiring some 1000PJ of biomass in 2030. Most of this biomass will have to be imported, making imports of at least 30 million tons of biomass (DM) necessary (Rabou et al., 2006).
2.2 Transportation fuels
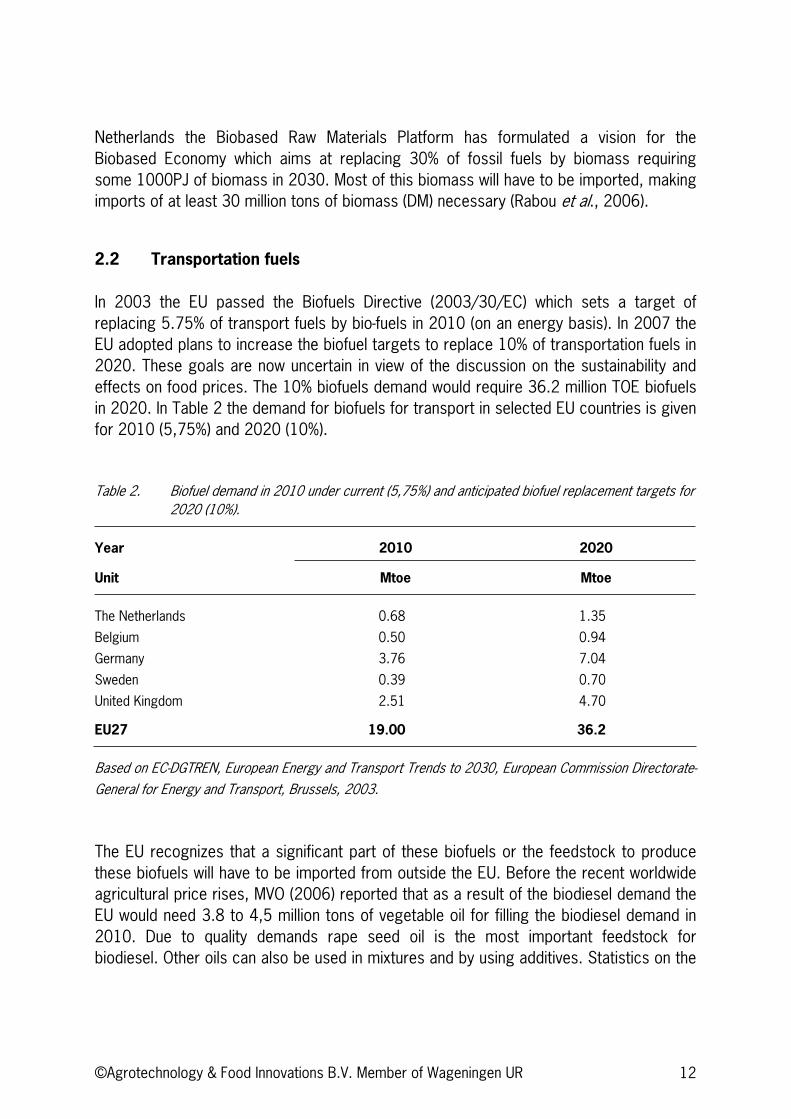
In 2003 the EU passed the Biofuels Directive (2003/30/EC) which sets a target of replacing 5.75% of transport fuels by bio-fuels in 2010 (on an energy basis). In 2007 the EU adopted plans to increase the biofuel targets to replace 10% of transportation fuels in 2020. These goals are now uncertain in view of the discussion on the sustainability and effects on food prices. The 10% biofuels demand would require 36.2 million TOE biofuels in 2020. In Table 2 the demand for biofuels for transport in selected EU countries is given for 2010 (5,75%) and 2020 (10%).
Table 2. Biofuel demand in 2010 under current (5,75%) and anticipated biofuel replacement targets for 2020 (10%).
Year 2010 2020
Unit Mtoe Mtoe
The Netherlands 0.68 1.35
Belgium 0.50 0.94
Germany 3.76 7.04
Sweden 0.39 0.70
United Kingdom 2.51 4.70
EU27 19.00 36.2
Based on EC-DGTREN, European Energy and Transport Trends to 2030, European Commission Directorate-General for Energy and Transport, Brussels, 2003.
The EU recognizes that a significant part of these biofuels or the feedstock to produce these biofuels will have to be imported from outside the EU. Before the recent worldwide agricultural price rises, MVO (2006) reported that as a result of the biodiesel demand the EU would need 3.8 to 4,5 million tons of vegetable oil for filling the biodiesel demand in 2010. Due to quality demands rape seed oil is the most important feedstock for biodiesel. Other oils can also be used in mixtures and by using additives. Statistics on the
©Agrotechnology & Food Innovations B.V. Member of Wageningen UR 13
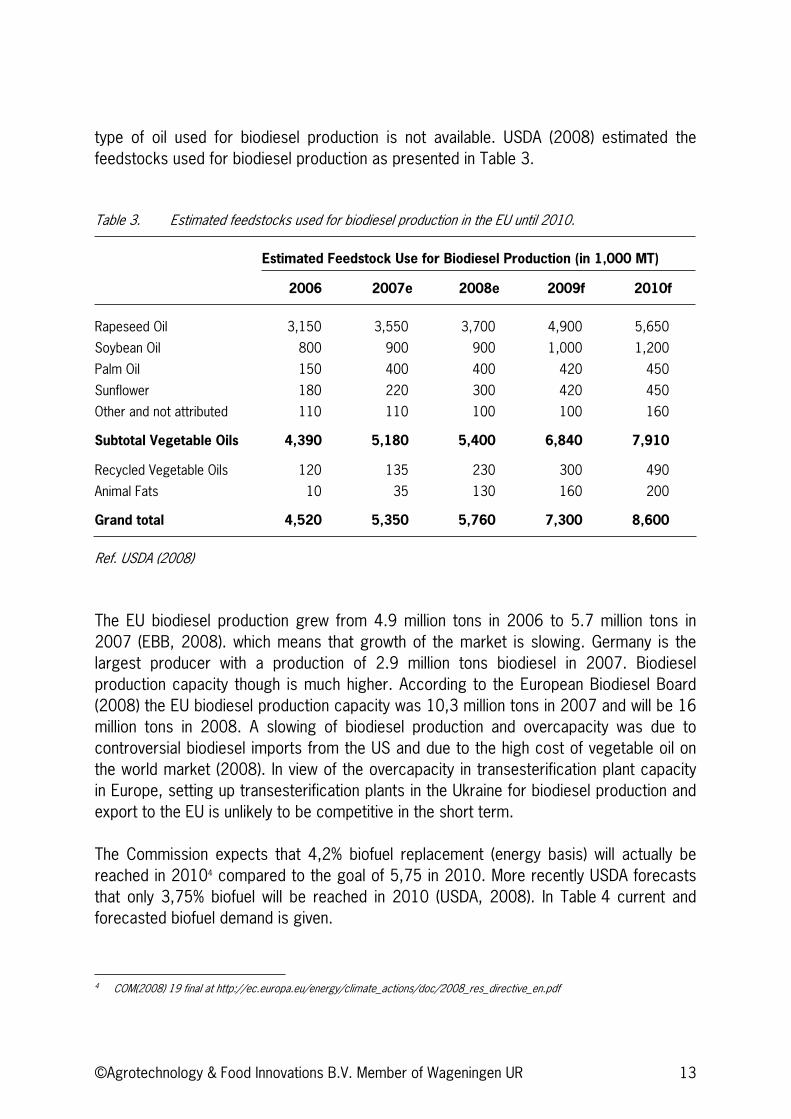
type of oil used for biodiesel production is not available. USDA (2008) estimated the feedstocks used for biodiesel production as presented in Table 3.
Table 3. Estimated feedstocks used for biodiesel production in the EU until 2010.
Estimated Feedstock Use for Biodiesel Production (in 1,000 MT)
2006 2007e 2008e 2009f 2010f
Rapeseed Oil 3,150 3,550 3,700 4,900 5,650
Soybean Oil 800 900 900 1,000 1,200
Palm Oil 150 400 400 420 450
Sunflower 180 220 300 420 450
Other and not attributed 110 110 100 100 160
Subtotal Vegetable Oils 4,390 5,180 5,400 6,840 7,910
Recycled Vegetable Oils 120 135 230 300 490
Animal Fats 10 35 130 160 200
Grand total 4,520 5,350 5,760 7,300 8,600
Ref. USDA (2008)
The EU biodiesel production grew from 4.9 million tons in 2006 to 5.7 million tons in 2007 (EBB, 2008). which means that growth of the market is slowing. Germany is the largest producer with a production of 2.9 million tons biodiesel in 2007. Biodiesel production capacity though is much higher. According to the European Biodiesel Board (2008) the EU biodiesel production capacity was 10,3 million tons in 2007 and will be 16 million tons in 2008. A slowing of biodiesel production and overcapacity was due to controversial biodiesel imports from the US and due to the high cost of vegetable oil on the world market (2008). In view of the overcapacity in transesterification plant capacity in Europe, setting up transesterification plants in the Ukraine for biodiesel production and export to the EU is unlikely to be competitive in the short term.
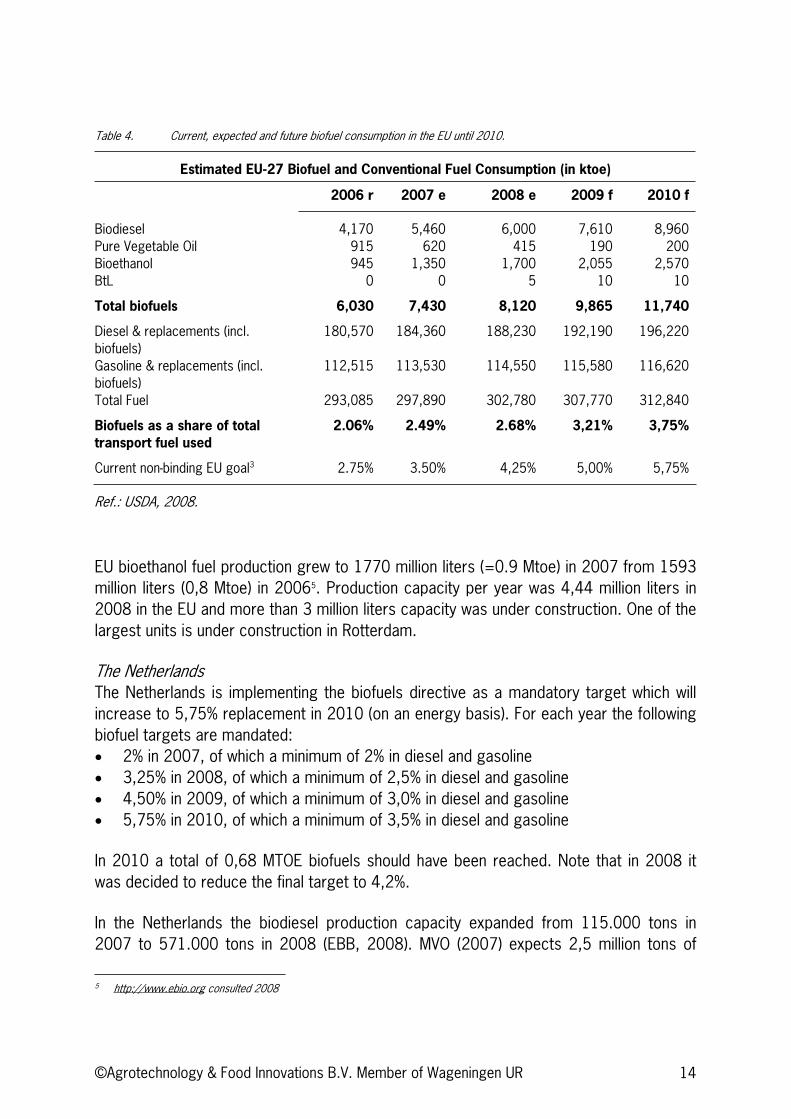
The Commission expects that 4,2% biofuel replacement (energy basis) will actually be reached in 20104 compared to the goal of 5,75 in 2010. More recently USDA forecasts that only 3,75% biofuel will be reached in 2010 (USDA, 2008). In Table 4 current and forecasted biofuel demand is given.
4 COM(2008) 19 final at http://ec.europa.eu/energy/climate_actions/doc/2008_res_directive_en.pdf
©Agrotechnology & Food Innovations B.V. Member of Wageningen UR 14
Table 4. Current, expected and future biofuel consumption in the EU until 2010.
Estimated EU-27 Biofuel and Conventional Fuel Consumption (in ktoe)
2006 r 2007 e 2008 e 2009 f 2010 f
Biodiesel 4,170 5,460 6,000 7,610 8,960Pure Vegetable Oil 915 620 415 190 200Bioethanol 945 1,350 1,700 2,055 2,570BtL 0 0 5 10 10
Total biofuels 6,030 7,430 8,120 9,865 11,740
Diesel & replacements (incl. biofuels)
180,570 184,360 188,230 192,190 196,220
Gasoline & replacements (incl. biofuels)
112,515 113,530 114,550 115,580 116,620
Total Fuel 293,085 297,890 302,780 307,770 312,840
Biofuels as a share of total transport fuel used
2.06% 2.49% 2.68% 3,21% 3,75%
Current non-binding EU goal3 2.75% 3.50% 4,25% 5,00% 5,75%
Ref.: USDA, 2008.
EU bioethanol fuel production grew to 1770 million liters (=0.9 Mtoe) in 2007 from 1593 million liters (0,8 Mtoe) in 20065. Production capacity per year was 4,44 million liters in 2008 in the EU and more than 3 million liters capacity was under construction. One of the largest units is under construction in Rotterdam.
The Netherlands The Netherlands is implementing the biofuels directive as a mandatory target which will increase to 5,75% replacement in 2010 (on an energy basis). For each year the following biofuel targets are mandated:
2% in 2007, of which a minimum of 2% in diesel and gasoline3,25% in 2008, of which a minimum of 2,5% in diesel and gasoline 4,50% in 2009, of which a minimum of 3,0% in diesel and gasoline 5,75% in 2010, of which a minimum of 3,5% in diesel and gasoline
In 2010 a total of 0,68 MTOE biofuels should have been reached. Note that in 2008 it was decided to reduce the final target to 4,2%.
In the Netherlands the biodiesel production capacity expanded from 115.000 tons in 2007 to 571.000 tons in 2008 (EBB, 2008). MVO (2007) expects 2,5 million tons of
5 http://www.ebio.org consulted 2008
©Agrotechnology & Food Innovations B.V. Member of Wageningen UR 15
biodiesel production capacity by 2009. At the same time high vegetable oil prices and imports of subsidized biodiesel from the USA are hurting EU and Dutch biodiesel producers. To what extent this capacity will be put into operation is unclear under the changing market condition at the moment.
Rotterdam and the Benelux as a whole is an important point of entry for biofuels or feedstocks for biofuels into Europe. Biofuels can be used locally for blending in local refineries or can be shipped further up-river or to smaller ports in Europe (Sweden and the UK). In 2006 1,2 million tons of ethanol were imported and 0,4 million tons were exported from Rotterdam. In 2006 0,7 million tons of biodiesel were imported and 0,5 million tons were exported. On top of this, capacity for production of 480 million liters of fuel ethanol is under construction in Rotterdam and even more is planned. At least one second generation bioethanol plant is currently planned in Rotterdam. It is expected that production expansion will be significant due to the proximity to the seaport and the proximity to fuel distribution networks and existing refineries.
2.3 Electricity and heat
Various European targets have been set including doubling the share of renewables to 12% in 2010 (White Paper) and tripling the use of biomass to 135 Mtoe (5.7 EJ) compared to 1997.
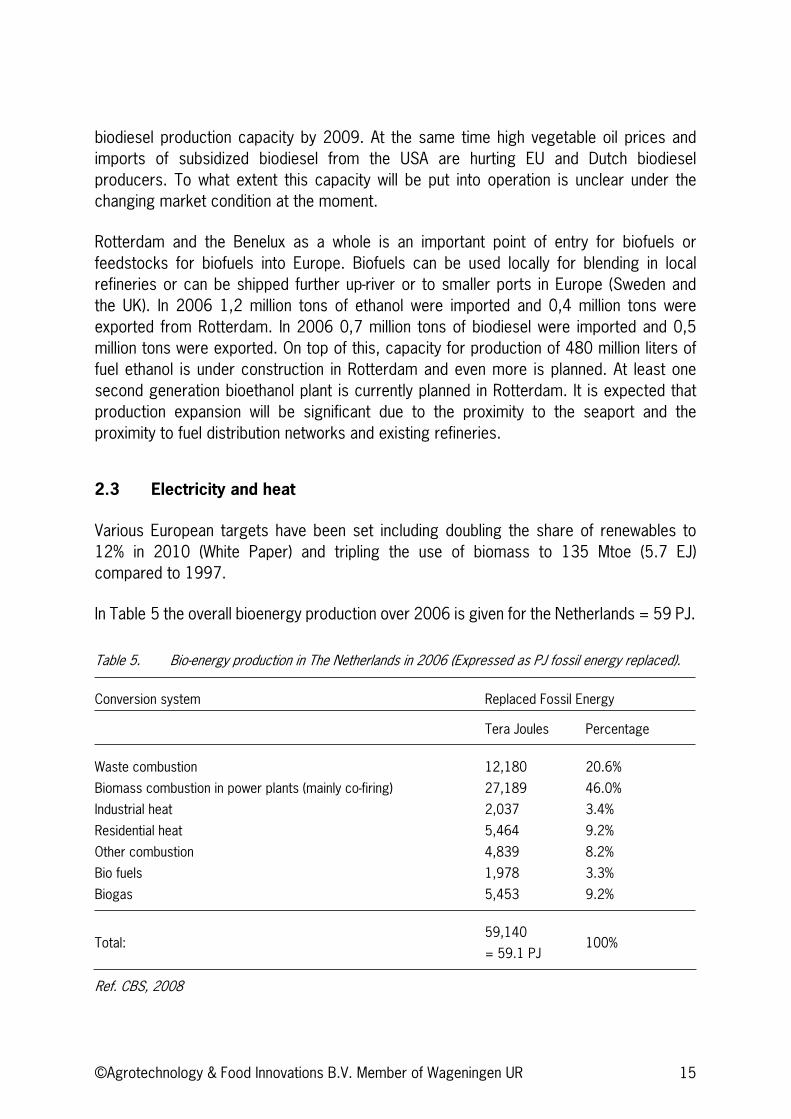
In Table 5 the overall bioenergy production over 2006 is given for the Netherlands = 59 PJ.
Table 5. Bio-energy production in The Netherlands in 2006 (Expressed as PJ fossil energy replaced).
Conversion system Replaced Fossil Energy
Tera Joules Percentage
Waste combustion 12,180 20.6%
Biomass combustion in power plants (mainly co-firing) 27,189 46.0%
Industrial heat 2,037 3.4%
Residential heat 5,464 9.2%
Other combustion 4,839 8.2%
Bio fuels 1,978 3.3%
Biogas 5,453 9.2%
Total:59,140
= 59.1 PJ 100%
Ref. CBS, 2008
©Agrotechnology & Food Innovations B.V. Member of Wageningen UR 16
60 to 80% of the biomass used for co-firing is imported (Sikkema et al., 2007). Mostly in the form of wood pellets.
Biomass Pellets Biomass pellets are becoming a commodity which is easily traded over long distances. Different grades of biomass pellets can be defined. The EU in 2006 produced 4,5 million tons of wood pellets (IEA Bioenergy task 40)6 while an expansion of the wood pellet market to 75 million tons in the EU may be possible (AeBiom, 2008)7. Increasingly biomass pellets are also being used in small scale systems or even for residential heating (Sikkema et al., 2007), like in Sweden, Denmark and Italy. In some EU countries pellets are also used for large scale co-firing in coal or natural gas powered stations. In the Netherlands an estimated 665.000 tons of pellets were used mostly for co-firing (2007) which was largely imported, since the local production capacity is just over 100.000 tons8. At this moment the market of biomass pellets is expected to expand further. Quality of pellets in relation to combustion and emission properties is important (low ash, low N, low Cl, low K, etc). Though the market for co-firing declined in 2007 compared to 2006 we may expect the demand for energy pellets to expand further in the coming years both in the EU and in the Netherlands. On top of the demand for residential heating and large scale (co)firing second generation ethanol and Fischer Tropsch diesel plants will require large amounts of biomass. Biomass pellets may become the fuel of choice for these plants. It may be expected that these plants will be sited in Rotterdam or other ports in the Netherlands which provide good access for supply of imported biomass (pellets).
2.4 Sustainability
In EU policy documents sustainability refers mainly to reduction of GHG emissions. Still, in recent years the sustainability of certain biomass types used for large scale electricity production (palm oil for combustion) have been put into question because of the associated rainforest destruction (and resulting GHG emissions and biodiversity loss). Biofuels (for transport) have also been criticized for having GHG emissions which are sometimes higher than those of fossil fuels they intend to replace. Since a lowering of GHG emissions is a key aim of using biofuels in the EU and especially in The Netherlands, this issue will have to be solved. On top of this the large increase in food prices have been blamed on the demand for biofuel feedstocks (maize, wheat, vegetable oil). As a result of these concerns The Netherlands was one of the first countries to develop sustainability criteria for bioenergy. In the UK, Germany and at EU level these criteria are
6 http://www.bioenergytrade.org/downloads/ieatask40pelletandrawmaterialstudynov2007final.pdf 7 http://www.bioenergy-business.com/index.cfm?section=lead&action=view&id=11401 8 http://www.pelletsatlas.info
©Agrotechnology & Food Innovations B.V. Member of Wageningen UR 17
also being developed. These sustainability criteria aim at assuring a minimum GHG efficiency compared to fossil fuel production and avoiding negative effects on food production, biodiversity, soils and other aspects. For details see recent reviews such as Vis et al. (2008) and van Dam et al. ( 2008).
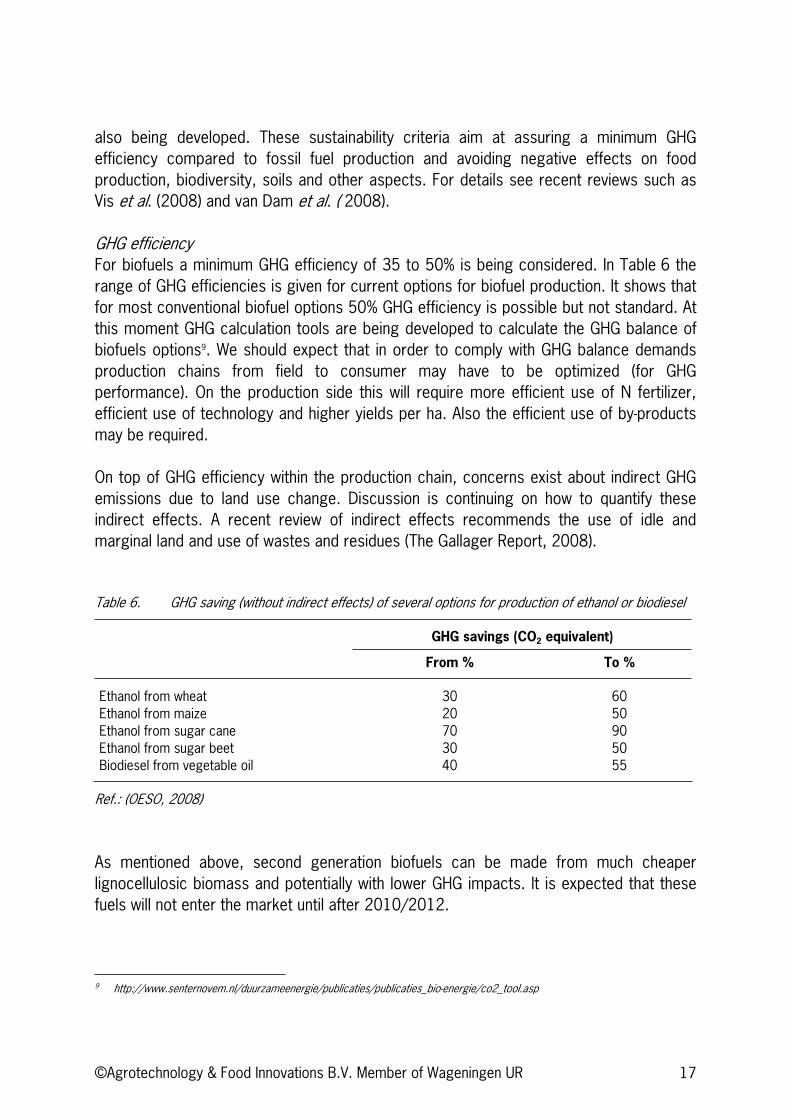
GHG efficiency For biofuels a minimum GHG efficiency of 35 to 50% is being considered. In Table 6 the range of GHG efficiencies is given for current options for biofuel production. It shows that for most conventional biofuel options 50% GHG efficiency is possible but not standard. At this moment GHG calculation tools are being developed to calculate the GHG balance of biofuels options9. We should expect that in order to comply with GHG balance demands production chains from field to consumer may have to be optimized (for GHG performance). On the production side this will require more efficient use of N fertilizer, efficient use of technology and higher yields per ha. Also the efficient use of by-products may be required.
On top of GHG efficiency within the production chain, concerns exist about indirect GHG emissions due to land use change. Discussion is continuing on how to quantify these indirect effects. A recent review of indirect effects recommends the use of idle and marginal land and use of wastes and residues (The Gallager Report, 2008).
Table 6. GHG saving (without indirect effects) of several options for production of ethanol or biodiesel
GHG savings (CO2 equivalent)
From % To %
Ethanol from wheat 30 60 Ethanol from maize 20 50 Ethanol from sugar cane 70 90 Ethanol from sugar beet 30 50 Biodiesel from vegetable oil 40 55
Ref.: (OESO, 2008)
As mentioned above, second generation biofuels can be made from much cheaper lignocellulosic biomass and potentially with lower GHG impacts. It is expected that these fuels will not enter the market until after 2010/2012.
9 http://www.senternovem.nl/duurzameenergie/publicaties/publicaties_bio-energie/co2_tool.asp

©Agrotechnology & Food Innovations B.V. Member of Wageningen UR 18
©Agrotechnology & Food Innovations B.V. Member of Wageningen UR 19
3 Introduction to the Ukraine and the Ukrainian energy infrastructure
3.1 Introduction
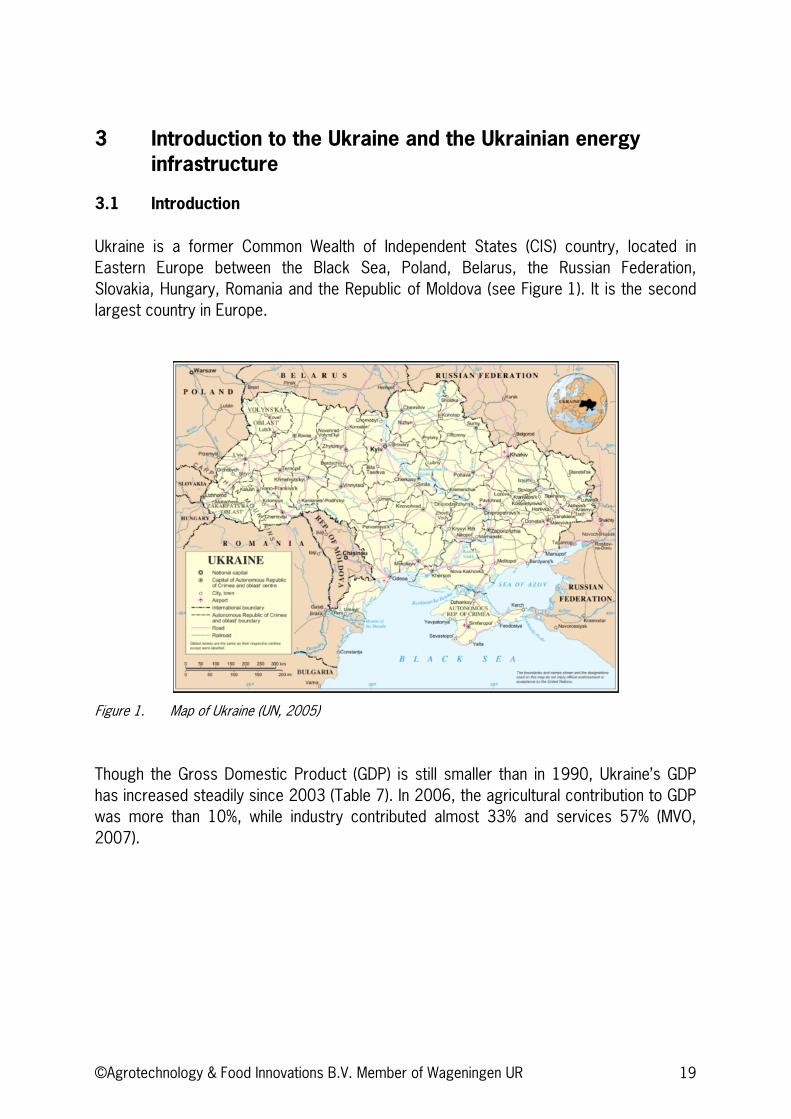
Ukraine is a former Common Wealth of Independent States (CIS) country, located in Eastern Europe between the Black Sea, Poland, Belarus, the Russian Federation, Slovakia, Hungary, Romania and the Republic of Moldova (see Figure 1). It is the second largest country in Europe.
Figure 1. Map of Ukraine (UN, 2005)
Though the Gross Domestic Product (GDP) is still smaller than in 1990, Ukraine’s GDP has increased steadily since 2003 (Table 7). In 2006, the agricultural contribution to GDP was more than 10%, while industry contributed almost 33% and services 57% (MVO, 2007).
©Agrotechnology & Food Innovations B.V. Member of Wageningen UR 20
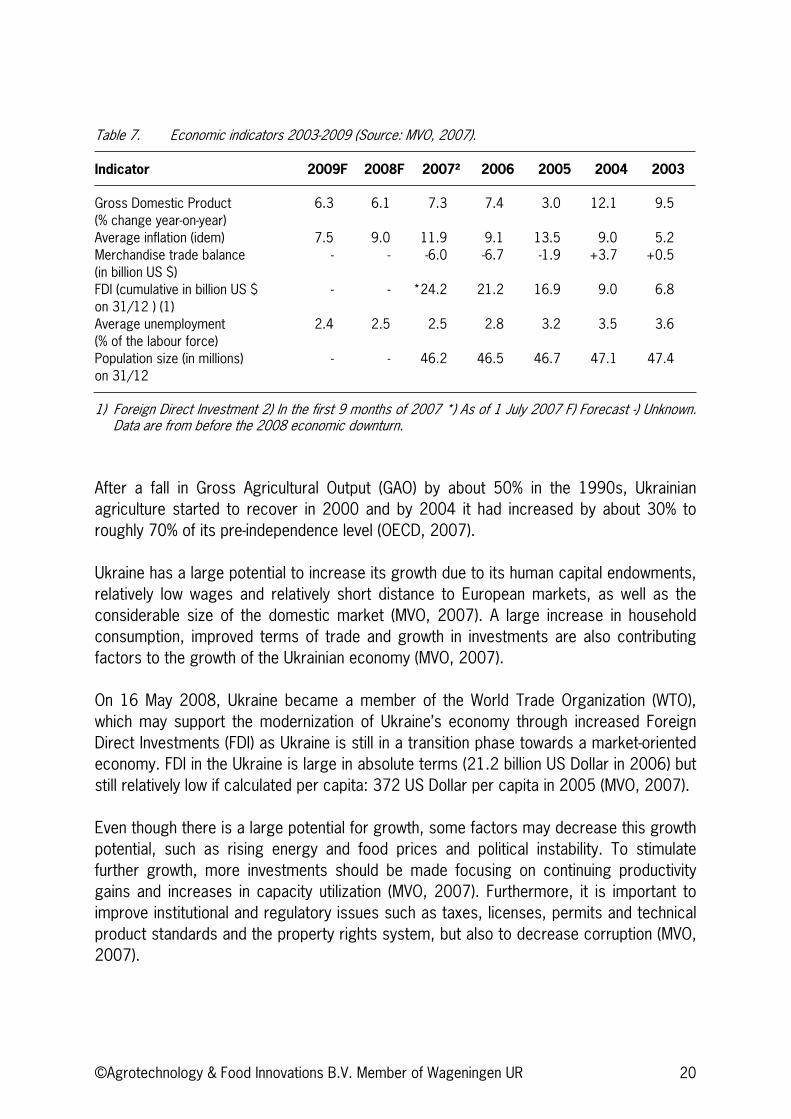
Table 7. Economic indicators 2003-2009 (Source: MVO, 2007).
Indicator 2009F 2008F 2007² 2006 2005 2004 2003
Gross Domestic Product (% change year-on-year)
6.3 6.1 7.3 7.4 3.0 12.1 9.5
Average inflation (idem) 7.5 9.0 11.9 9.1 13.5 9.0 5.2 Merchandise trade balance (in billion US $)
- - -6.0 -6.7 -1.9 +3.7 +0.5
FDI (cumulative in billion US $ on 31/12 ) (1)
- - *24.2 21.2 16.9 9.0 6.8
Average unemployment (% of the labour force)
2.4 2.5 2.5 2.8 3.2 3.5 3.6
Population size (in millions) on 31/12
- - 46.2 46.5 46.7 47.1 47.4
1) Foreign Direct Investment 2) In the first 9 months of 2007 *) As of 1 July 2007 F) Forecast -) Unknown. Data are from before the 2008 economic downturn.
After a fall in Gross Agricultural Output (GAO) by about 50% in the 1990s, Ukrainian agriculture started to recover in 2000 and by 2004 it had increased by about 30% to roughly 70% of its pre-independence level (OECD, 2007).
Ukraine has a large potential to increase its growth due to its human capital endowments, relatively low wages and relatively short distance to European markets, as well as the considerable size of the domestic market (MVO, 2007). A large increase in household consumption, improved terms of trade and growth in investments are also contributing factors to the growth of the Ukrainian economy (MVO, 2007).
On 16 May 2008, Ukraine became a member of the World Trade Organization (WTO), which may support the modernization of Ukraine’s economy through increased Foreign Direct Investments (FDI) as Ukraine is still in a transition phase towards a market-oriented economy. FDI in the Ukraine is large in absolute terms (21.2 billion US Dollar in 2006) but still relatively low if calculated per capita: 372 US Dollar per capita in 2005 (MVO, 2007).
Even though there is a large potential for growth, some factors may decrease this growth potential, such as rising energy and food prices and political instability. To stimulate further growth, more investments should be made focusing on continuing productivity gains and increases in capacity utilization (MVO, 2007). Furthermore, it is important to improve institutional and regulatory issues such as taxes, licenses, permits and technical product standards and the property rights system, but also to decrease corruption (MVO, 2007).
©Agrotechnology & Food Innovations B.V. Member of Wageningen UR 21
In Ukraine, agriculture has a great potential to increase its production because of the available agricultural land and relatively cheap labour, but capital investment has been low resulting out of date infrastructure. Also, obtaining credit for long-term loans is very difficult (MVO, 2007). These factors hamper an increase in agricultural production.
3.2 Ukrainian energy infrastructure
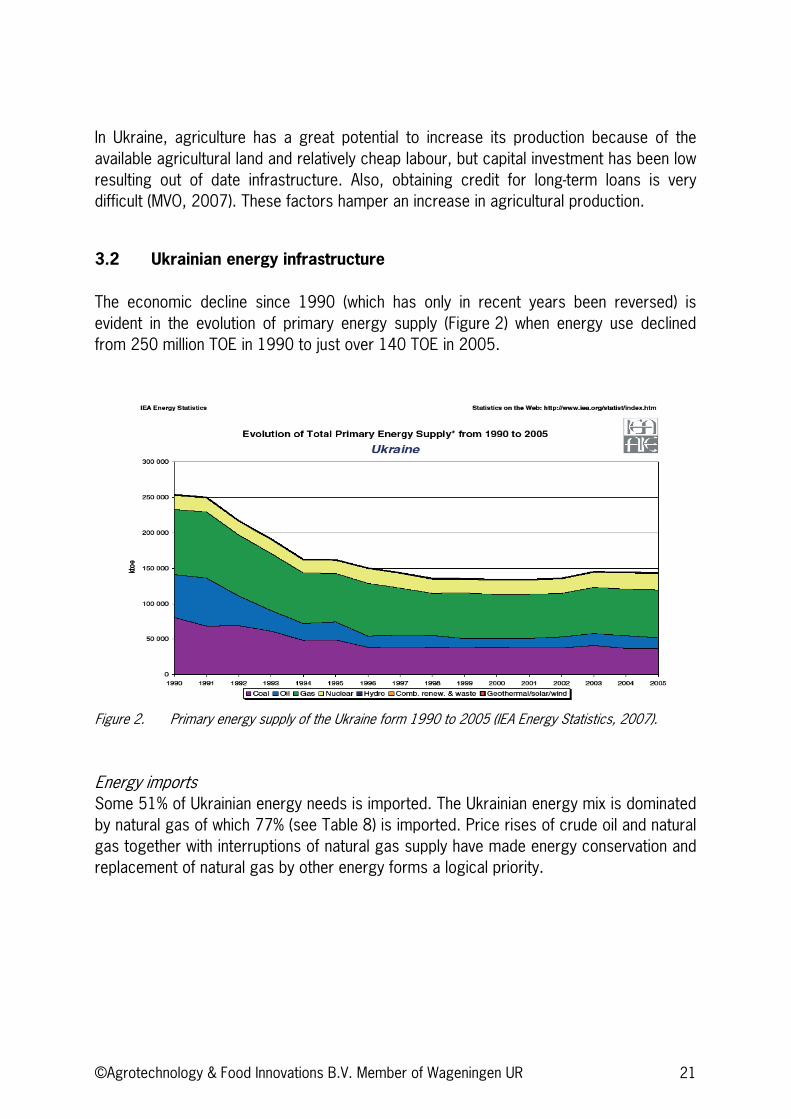
The economic decline since 1990 (which has only in recent years been reversed) is evident in the evolution of primary energy supply (Figure 2) when energy use declined from 250 million TOE in 1990 to just over 140 TOE in 2005.
Figure 2. Primary energy supply of the Ukraine form 1990 to 2005 (IEA Energy Statistics, 2007).
Energy imports Some 51% of Ukrainian energy needs is imported. The Ukrainian energy mix is dominated by natural gas of which 77% (see Table 8) is imported. Price rises of crude oil and natural gas together with interruptions of natural gas supply have made energy conservation and replacement of natural gas by other energy forms a logical priority.
©Agrotechnology & Food Innovations B.V. Member of Wageningen UR 22
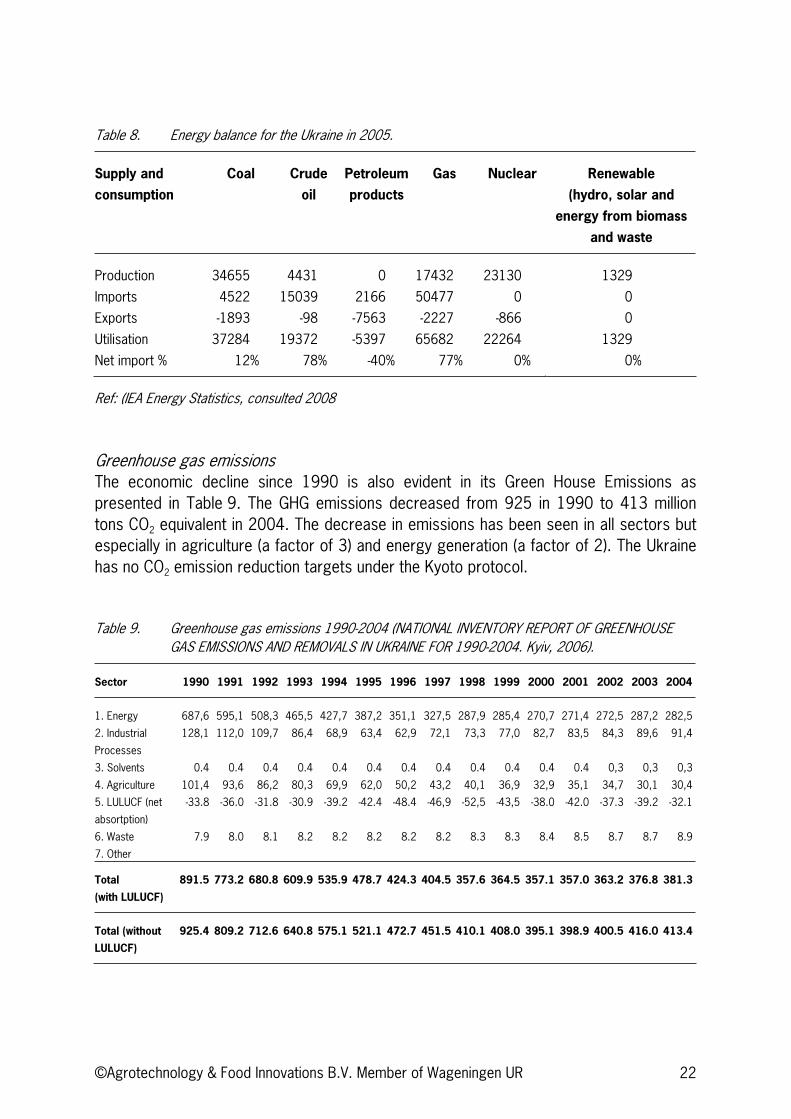
Table 8. Energy balance for the Ukraine in 2005.
Supply and
consumption
Coal Crude
oil
Petroleum
products
Gas Nuclear Renewable
(hydro, solar and
energy from biomass
and waste
Production 34655 4431 0 17432 23130 1329
Imports 4522 15039 2166 50477 0 0
Exports -1893 -98 -7563 -2227 -866 0
Utilisation 37284 19372 -5397 65682 22264 1329
Net import % 12% 78% -40% 77% 0% 0%
Ref: (IEA Energy Statistics, consulted 2008
Greenhouse gas emissions The economic decline since 1990 is also evident in its Green House Emissions as presented in Table 9. The GHG emissions decreased from 925 in 1990 to 413 million tons CO2 equivalent in 2004. The decrease in emissions has been seen in all sectors but especially in agriculture (a factor of 3) and energy generation (a factor of 2). The Ukraine has no CO2 emission reduction targets under the Kyoto protocol.
Table 9. Greenhouse gas emissions 1990-2004 (NATIONAL INVENTORY REPORT OF GREENHOUSE GAS EMISSIONS AND REMOVALS IN UKRAINE FOR 1990-2004. Kyiv, 2006).
Sector 1990 1991 1992 1993 1994 1995 1996 1997 1998 1999 2000 2001 2002 2003 2004
1. Energy 687,6 595,1 508,3 465,5 427,7 387,2 351,1 327,5 287,9 285,4 270,7 271,4 272,5 287,2 282,5
2. Industrial
Processes
128,1 112,0 109,7 86,4 68,9 63,4 62,9 72,1 73,3 77,0 82,7 83,5 84,3 89,6 91,4
3. Solvents 0.4 0.4 0.4 0.4 0.4 0.4 0.4 0.4 0.4 0.4 0.4 0.4 0,3 0,3 0,3
4. Agriculture 101,4 93,6 86,2 80,3 69,9 62,0 50,2 43,2 40,1 36,9 32,9 35,1 34,7 30,1 30,4
5. LULUCF (net
absortption)
-33.8 -36.0 -31.8 -30.9 -39.2 -42.4 -48.4 -46,9 -52,5 -43,5 -38.0 -42.0 -37.3 -39.2 -32.1
6. Waste 7.9 8.0 8.1 8.2 8.2 8.2 8.2 8.2 8.3 8.3 8.4 8.5 8.7 8.7 8.9
7. Other
Total
(with LULUCF)
891.5 773.2 680.8 609.9 535.9 478.7 424.3 404.5 357.6 364.5 357.1 357.0 363.2 376.8 381.3
Total (without
LULUCF)
925.4 809.2 712.6 640.8 575.1 521.1 472.7 451.5 410.1 408.0 395.1 398.9 400.5 416.0 413.4
©Agrotechnology & Food Innovations B.V. Member of Wageningen UR 23
Even though energy use has decreased, the energy intensity per GDP is (still) very high. Current energy intensity is 0.50 toe (ton oil equivalent) per thousand US$ (purchasing power). Compared to 0.20 for the world average this is among the highest in the World (IEA, 2006). The Ukraine has a tremendous potential for energy saving which should involve investments in upgrading it’s energy infrastructure. The benefits and opportunities of switching to bioenergy may be viewed in two ways. On the one hand, investments in biomass energy can be seen as less useful if the energy is then used inefficiently (IERPC, 2007; IEA). On the other hand, Rabou et al. (2006) have pointed out that an important restriction of the possibilities to use biomass is formed by the inertia of the existing fossil fuel based infrastructure especially if the infrastructure is new. As there is an obvious need for upgrading the energy infrastructure in the Ukraine, this should also offer opportunities to introduce bioenergy. The need for investment and supply of technology should offer possibilities for EU investors (Geletukha et al., 2006)
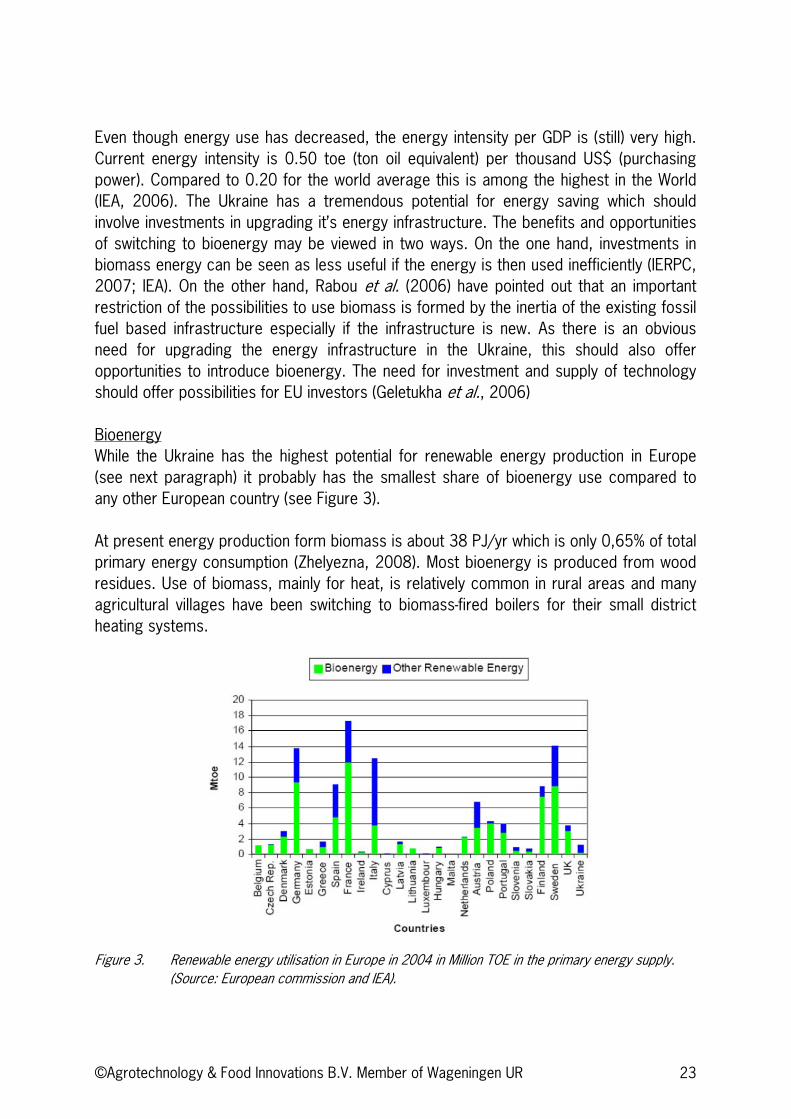
Bioenergy While the Ukraine has the highest potential for renewable energy production in Europe (see next paragraph) it probably has the smallest share of bioenergy use compared to any other European country (see Figure 3).
At present energy production form biomass is about 38 PJ/yr which is only 0,65% of total primary energy consumption (Zhelyezna, 2008). Most bioenergy is produced from wood residues. Use of biomass, mainly for heat, is relatively common in rural areas and many agricultural villages have been switching to biomass-fired boilers for their small district heating systems.
Figure 3. Renewable energy utilisation in Europe in 2004 in Million TOE in the primary energy supply. (Source: European commission and IEA).
©Agrotechnology & Food Innovations B.V. Member of Wageningen UR 24
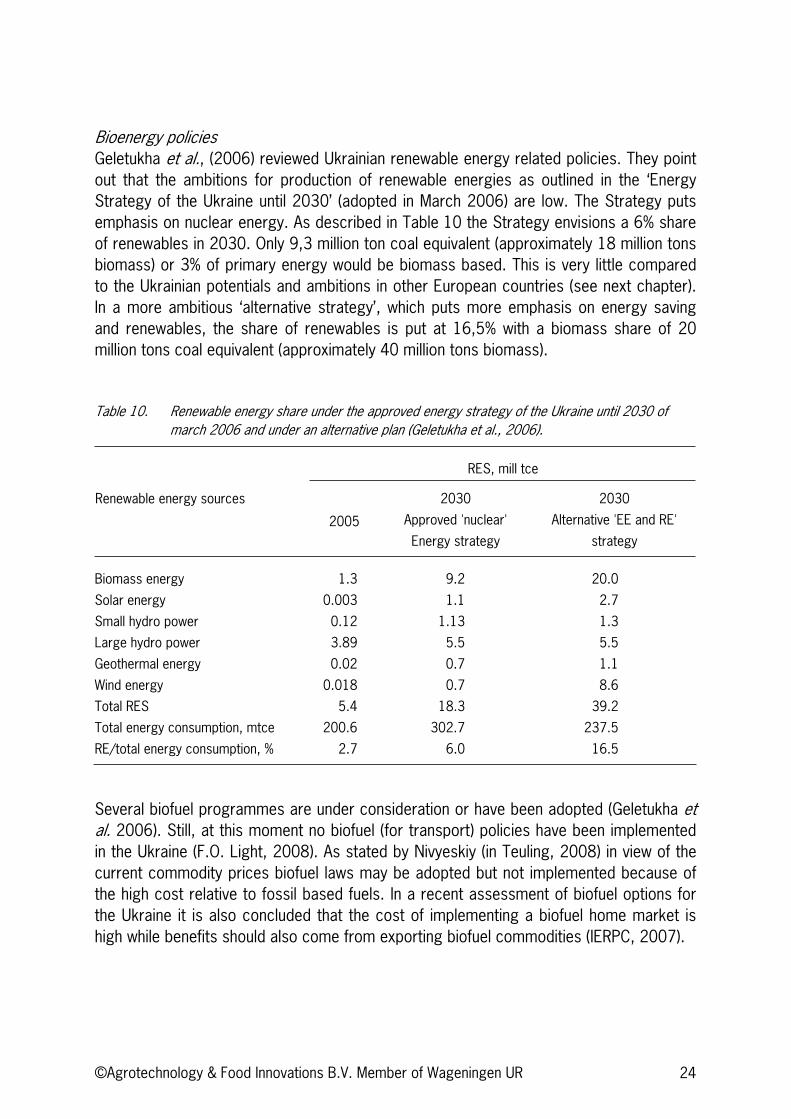
Bioenergy policies Geletukha et al., (2006) reviewed Ukrainian renewable energy related policies. They point out that the ambitions for production of renewable energies as outlined in the ‘Energy Strategy of the Ukraine until 2030’ (adopted in March 2006) are low. The Strategy puts emphasis on nuclear energy. As described in Table 10 the Strategy envisions a 6% share of renewables in 2030. Only 9,3 million ton coal equivalent (approximately 18 million tons biomass) or 3% of primary energy would be biomass based. This is very little compared to the Ukrainian potentials and ambitions in other European countries (see next chapter). In a more ambitious ‘alternative strategy’, which puts more emphasis on energy saving and renewables, the share of renewables is put at 16,5% with a biomass share of 20 million tons coal equivalent (approximately 40 million tons biomass).
Table 10. Renewable energy share under the approved energy strategy of the Ukraine until 2030 of march 2006 and under an alternative plan (Geletukha et al., 2006).
RES, mill tce
Renewable energy sources
2005
2030
Approved 'nuclear'
Energy strategy
2030
Alternative 'EE and RE'
strategy
Biomass energy 1.3 9.2 20.0
Solar energy 0.003 1.1 2.7
Small hydro power 0.12 1.13 1.3
Large hydro power 3.89 5.5 5.5
Geothermal energy 0.02 0.7 1.1
Wind energy 0.018 0.7 8.6
Total RES 5.4 18.3 39.2
Total energy consumption, mtce 200.6 302.7 237.5
RE/total energy consumption, % 2.7 6.0 16.5
Several biofuel programmes are under consideration or have been adopted (Geletukha et al. 2006). Still, at this moment no biofuel (for transport) policies have been implemented in the Ukraine (F.O. Light, 2008). As stated by Nivyeskiy (in Teuling, 2008) in view of the current commodity prices biofuel laws may be adopted but not implemented because of the high cost relative to fossil based fuels. In a recent assessment of biofuel options for the Ukraine it is also concluded that the cost of implementing a biofuel home market is high while benefits should also come from exporting biofuel commodities (IERPC, 2007).
©Agrotechnology & Food Innovations B.V. Member of Wageningen UR 25
3.3 Ukrainian Agriculture
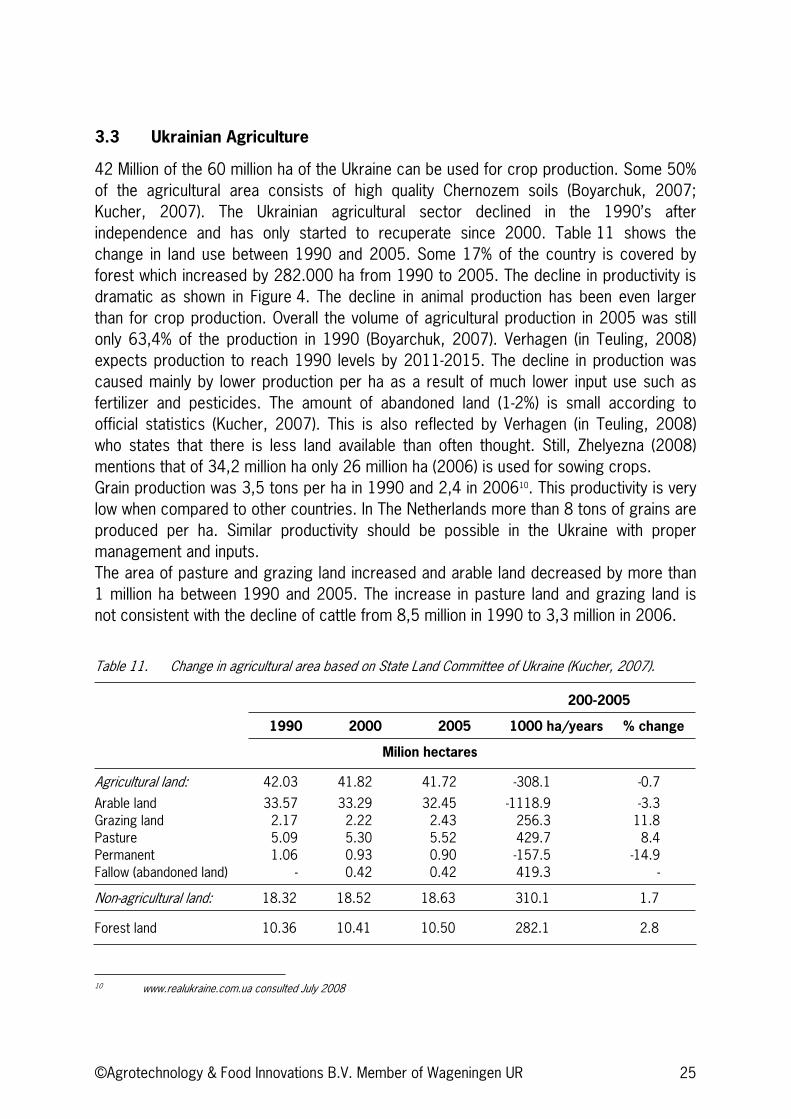
42 Million of the 60 million ha of the Ukraine can be used for crop production. Some 50% of the agricultural area consists of high quality Chernozem soils (Boyarchuk, 2007; Kucher, 2007). The Ukrainian agricultural sector declined in the 1990’s after independence and has only started to recuperate since 2000. Table 11 shows the change in land use between 1990 and 2005. Some 17% of the country is covered by forest which increased by 282.000 ha from 1990 to 2005. The decline in productivity is dramatic as shown in Figure 4. The decline in animal production has been even larger than for crop production. Overall the volume of agricultural production in 2005 was still only 63,4% of the production in 1990 (Boyarchuk, 2007). Verhagen (in Teuling, 2008) expects production to reach 1990 levels by 2011-2015. The decline in production was caused mainly by lower production per ha as a result of much lower input use such as fertilizer and pesticides. The amount of abandoned land (1-2%) is small according to official statistics (Kucher, 2007). This is also reflected by Verhagen (in Teuling, 2008) who states that there is less land available than often thought. Still, Zhelyezna (2008) mentions that of 34,2 million ha only 26 million ha (2006) is used for sowing crops. Grain production was 3,5 tons per ha in 1990 and 2,4 in 200610. This productivity is very low when compared to other countries. In The Netherlands more than 8 tons of grains are produced per ha. Similar productivity should be possible in the Ukraine with proper management and inputs.The area of pasture and grazing land increased and arable land decreased by more than 1 million ha between 1990 and 2005. The increase in pasture land and grazing land is not consistent with the decline of cattle from 8,5 million in 1990 to 3,3 million in 2006.
Table 11. Change in agricultural area based on State Land Committee of Ukraine (Kucher, 2007).
200-2005
1990 2000 2005 1000 ha/years % change
Milion hectares
Agricultural land: 42.03 41.82 41.72 -308.1 -0.7
Arable land 33.57 33.29 32.45 -1118.9 -3.3 Grazing land 2.17 2.22 2.43 256.3 11.8 Pasture 5.09 5.30 5.52 429.7 8.4 Permanent 1.06 0.93 0.90 -157.5 -14.9 Fallow (abandoned land) - 0.42 0.42 419.3 -
Non-agricultural land: 18.32 18.52 18.63 310.1 1.7
Forest land 10.36 10.41 10.50 282.1 2.8
10 www.realukraine.com.ua consulted July 2008
©Agrotechnology & Food Innovations B.V. Member of Wageningen UR 26
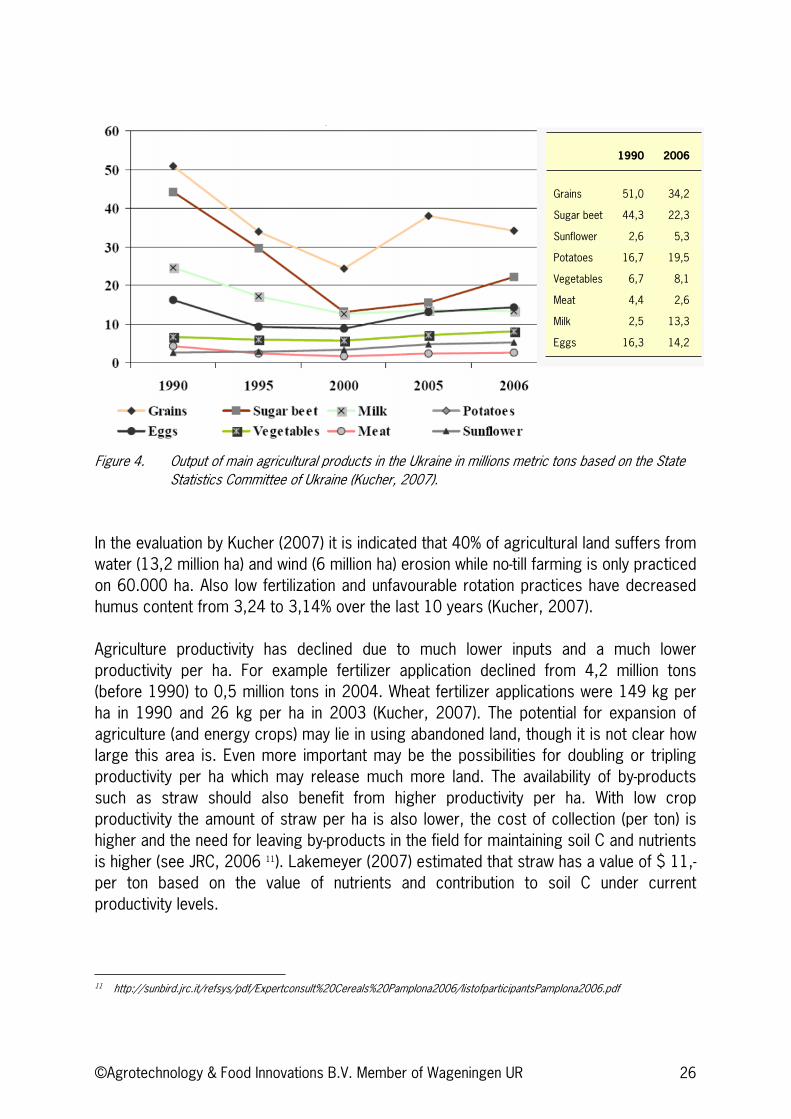
Figure 4. Output of main agricultural products in the Ukraine in millions metric tons based on the State Statistics Committee of Ukraine (Kucher, 2007).
In the evaluation by Kucher (2007) it is indicated that 40% of agricultural land suffers from water (13,2 million ha) and wind (6 million ha) erosion while no-till farming is only practiced on 60.000 ha. Also low fertilization and unfavourable rotation practices have decreased humus content from 3,24 to 3,14% over the last 10 years (Kucher, 2007).
Agriculture productivity has declined due to much lower inputs and a much lower productivity per ha. For example fertilizer application declined from 4,2 million tons (before 1990) to 0,5 million tons in 2004. Wheat fertilizer applications were 149 kg per ha in 1990 and 26 kg per ha in 2003 (Kucher, 2007). The potential for expansion of agriculture (and energy crops) may lie in using abandoned land, though it is not clear how large this area is. Even more important may be the possibilities for doubling or tripling productivity per ha which may release much more land. The availability of by-products such as straw should also benefit from higher productivity per ha. With low crop productivity the amount of straw per ha is also lower, the cost of collection (per ton) is higher and the need for leaving by-products in the field for maintaining soil C and nutrients is higher (see JRC, 2006 11). Lakemeyer (2007) estimated that straw has a value of $ 11,- per ton based on the value of nutrients and contribution to soil C under current productivity levels.
11 http://sunbird.jrc.it/refsys/pdf/Expertconsult%20Cereals%20Pamplona2006/listofparticipantsPamplona2006.pdf
1990 2006
Grains 51,0 34,2
Sugar beet 44,3 22,3
Sunflower 2,6 5,3
Potatoes 16,7 19,5
Vegetables 6,7 8,1
Meat 4,4 2,6
Milk 2,5 13,3
Eggs 16,3 14,2
©Agrotechnology & Food Innovations B.V. Member of Wageningen UR 27
Development of policies to protect erosion prone soils may offer opportunities for growing perennial biomass crops (switchgrass, Miscanthus, willow, poplar) which can offer erosion control. The USA Conservation Reserve Programme may be an example here.
Land ownership OECD (2007) reviewed ownership of land and farm size. In 2006 6,8 million citizens had received land certificates and owned on average 4 ha of land. At the same time there are restrictions on land sales and maximum land ownership. Therefore large scale farms often lease land for up to 49 years.

©Agrotechnology & Food Innovations B.V. Member of Wageningen UR 28
©Agrotechnology & Food Innovations B.V. Member of Wageningen UR 29
4 The Ukrainian biomass potential and possibilities for exporting feedstocks
Biomass for energy is sourced from by-products or from growing crops (or commodities). For first generation biofuels (ethanol and biodiesel) the amount of by-products that can be used as feedstock are generally very limited, for example molasses for ethanol or used frying oil and animal fats for biodiesel. Feedstock for biomass energy are mostly commodities such as grain for ethanol and rapeseed for biodiesel.
For heat and electricity generation and for second generation biofuel production (lignocellulose based) the feedstock base is much wider. Generally very considerable amounts of secondary by-products (from processing) and primary by-products (at field level) are available.
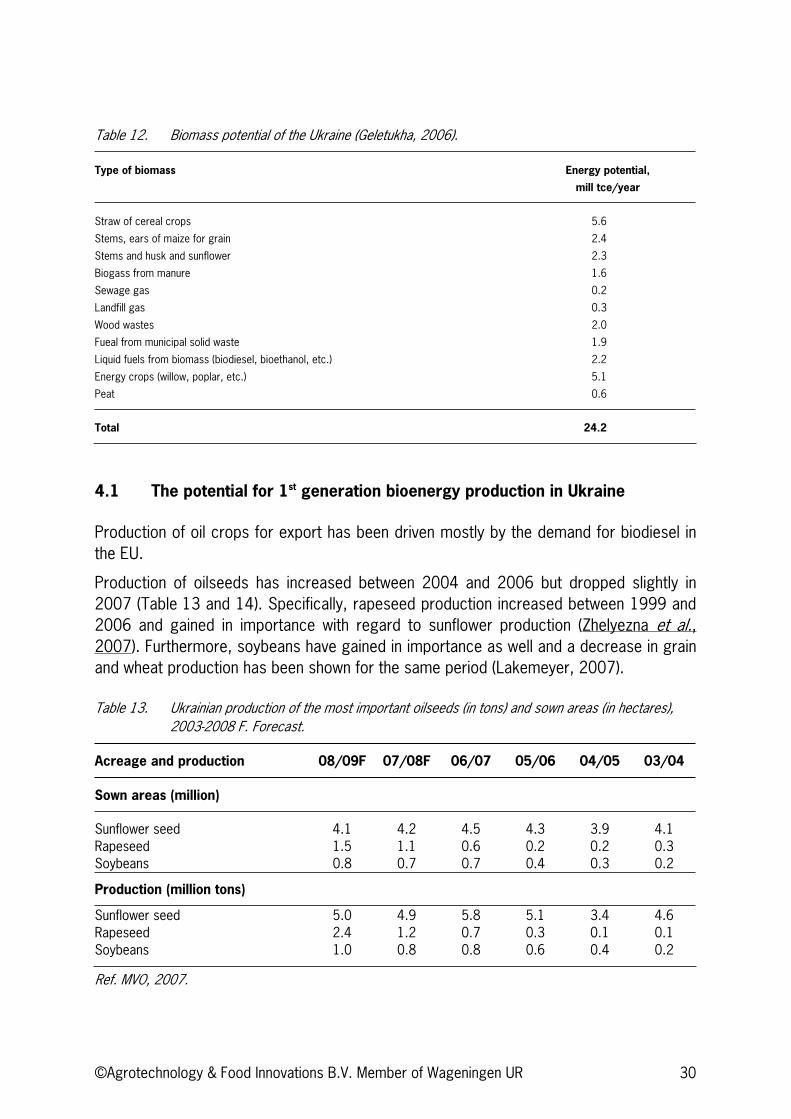
Biomass potentials have been estimated for the Ukraine. In Table 12 the estimate is given by Geletukha (2006). One should probably consider this as a maximum economically feasible estimate under current conditions as also discussed by Zhelyezna (2008).
©Agrotechnology & Food Innovations B.V. Member of Wageningen UR 30
Table 12. Biomass potential of the Ukraine (Geletukha, 2006).
Type of biomass Energy potential,
mill tce/year
Straw of cereal crops 5.6
Stems, ears of maize for grain 2.4
Stems and husk and sunflower 2.3
Biogass from manure 1.6
Sewage gas 0.2
Landfill gas 0.3
Wood wastes 2.0
Fueal from municipal solid waste 1.9
Liquid fuels from biomass (biodiesel, bioethanol, etc.) 2.2
Energy crops (willow, poplar, etc.) 5.1
Peat 0.6
Total 24.2
4.1 The potential for 1st generation bioenergy production in Ukraine
Production of oil crops for export has been driven mostly by the demand for biodiesel in the EU.
Production of oilseeds has increased between 2004 and 2006 but dropped slightly in 2007 (Table 13 and 14). Specifically, rapeseed production increased between 1999 and 2006 and gained in importance with regard to sunflower production (Zhelyezna et al.,2007). Furthermore, soybeans have gained in importance as well and a decrease in grain and wheat production has been shown for the same period (Lakemeyer, 2007).
Table 13. Ukrainian production of the most important oilseeds (in tons) and sown areas (in hectares), 2003-2008 F. Forecast.
Acreage and production 08/09F 07/08F 06/07 05/06 04/05 03/04
Sown areas (million)
Sunflower seed 4.1 4.2 4.5 4.3 3.9 4.1 Rapeseed 1.5 1.1 0.6 0.2 0.2 0.3 Soybeans 0.8 0.7 0.7 0.4 0.3 0.2
Production (million tons)
Sunflower seed 5.0 4.9 5.8 5.1 3.4 4.6 Rapeseed 2.4 1.2 0.7 0.3 0.1 0.1 Soybeans 1.0 0.8 0.8 0.6 0.4 0.2
Ref. MVO, 2007.
©Agrotechnology & Food Innovations B.V. Member of Wageningen UR 31
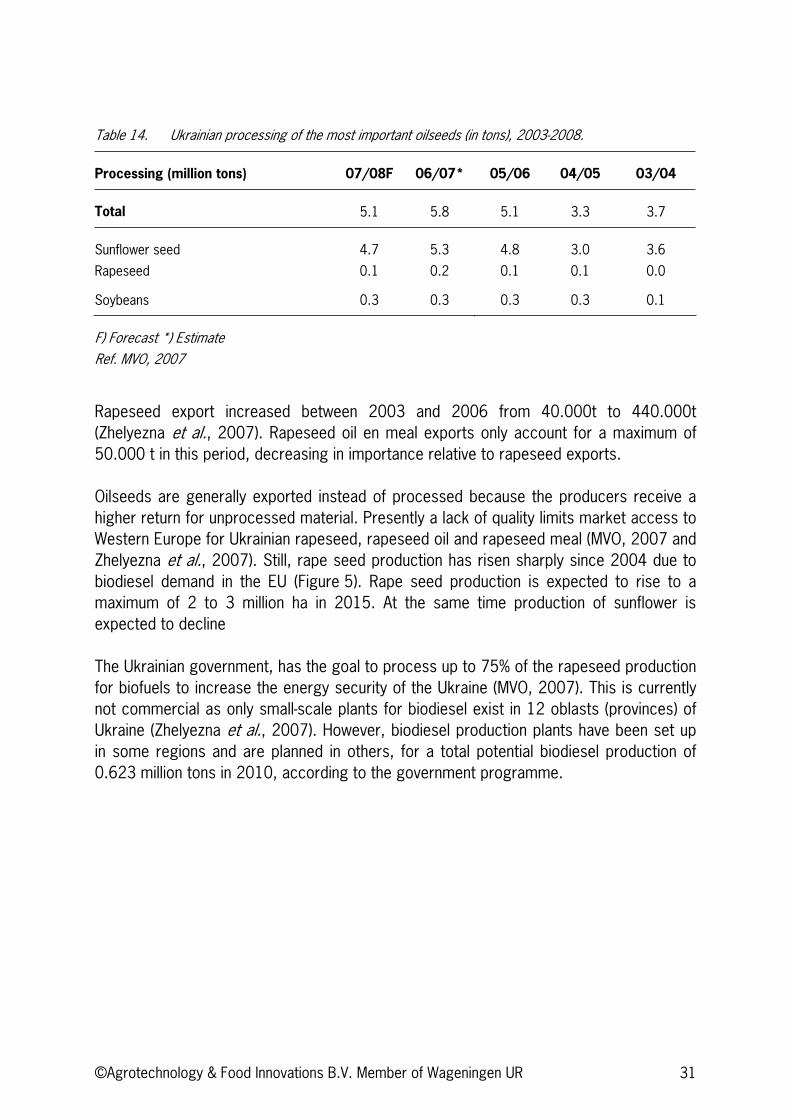
Table 14. Ukrainian processing of the most important oilseeds (in tons), 2003-2008.
Processing (million tons) 07/08F 06/07* 05/06 04/05 03/04
Total 5.1 5.8 5.1 3.3 3.7
Sunflower seed 4.7 5.3 4.8 3.0 3.6
Rapeseed 0.1 0.2 0.1 0.1 0.0
Soybeans 0.3 0.3 0.3 0.3 0.1
F) Forecast *) Estimate Ref. MVO, 2007
Rapeseed export increased between 2003 and 2006 from 40.000t to 440.000t (Zhelyezna et al., 2007). Rapeseed oil en meal exports only account for a maximum of 50.000 t in this period, decreasing in importance relative to rapeseed exports.
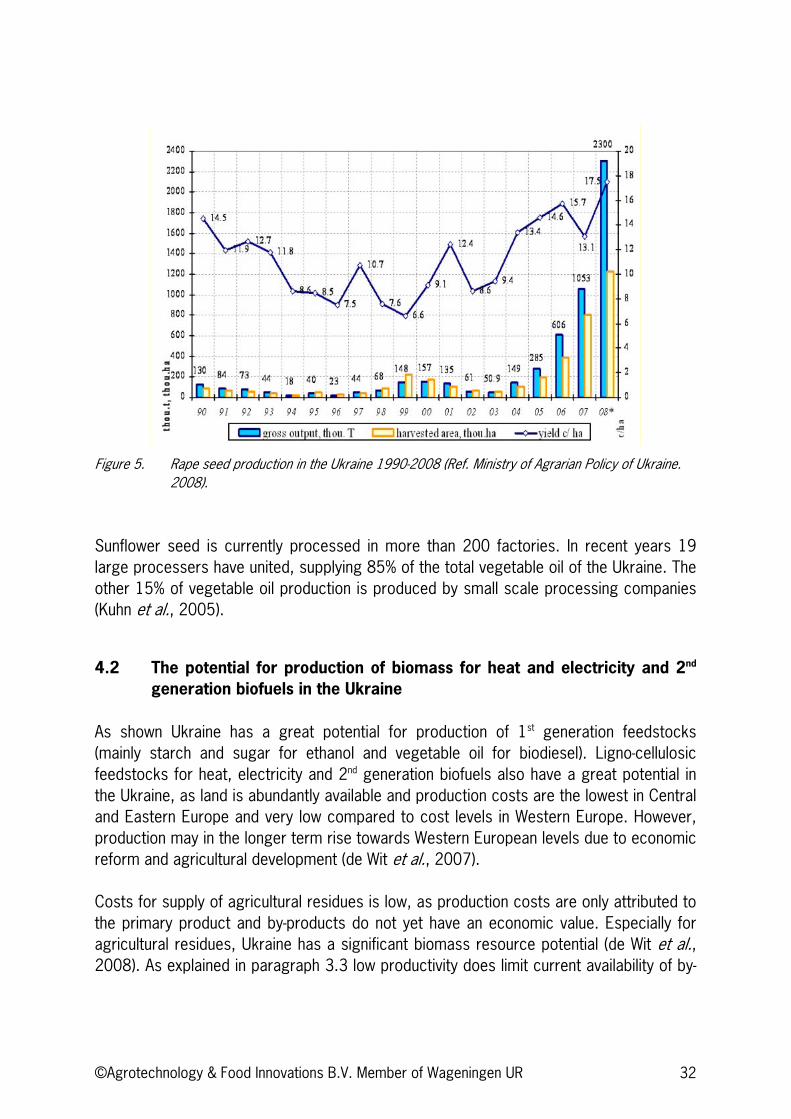
Oilseeds are generally exported instead of processed because the producers receive a higher return for unprocessed material. Presently a lack of quality limits market access to Western Europe for Ukrainian rapeseed, rapeseed oil and rapeseed meal (MVO, 2007 and Zhelyezna et al., 2007). Still, rape seed production has risen sharply since 2004 due to biodiesel demand in the EU (Figure 5). Rape seed production is expected to rise to a maximum of 2 to 3 million ha in 2015. At the same time production of sunflower is expected to decline
The Ukrainian government, has the goal to process up to 75% of the rapeseed production for biofuels to increase the energy security of the Ukraine (MVO, 2007). This is currently not commercial as only small-scale plants for biodiesel exist in 12 oblasts (provinces) of Ukraine (Zhelyezna et al., 2007). However, biodiesel production plants have been set up in some regions and are planned in others, for a total potential biodiesel production of 0.623 million tons in 2010, according to the government programme.
©Agrotechnology & Food Innovations B.V. Member of Wageningen UR 32
Figure 5. Rape seed production in the Ukraine 1990-2008 (Ref. Ministry of Agrarian Policy of Ukraine. 2008).
Sunflower seed is currently processed in more than 200 factories. In recent years 19 large processers have united, supplying 85% of the total vegetable oil of the Ukraine. The other 15% of vegetable oil production is produced by small scale processing companies (Kuhn et al., 2005).
4.2 The potential for production of biomass for heat and electricity and 2nd
generation biofuels in the Ukraine
As shown Ukraine has a great potential for production of 1st generation feedstocks (mainly starch and sugar for ethanol and vegetable oil for biodiesel). Ligno-cellulosic feedstocks for heat, electricity and 2nd generation biofuels also have a great potential in the Ukraine, as land is abundantly available and production costs are the lowest in Central and Eastern Europe and very low compared to cost levels in Western Europe. However, production may in the longer term rise towards Western European levels due to economic reform and agricultural development (de Wit et al., 2007).
Costs for supply of agricultural residues is low, as production costs are only attributed to the primary product and by-products do not yet have an economic value. Especially for agricultural residues, Ukraine has a significant biomass resource potential (de Wit et al.,2008). As explained in paragraph 3.3 low productivity does limit current availability of by-
©Agrotechnology & Food Innovations B.V. Member of Wageningen UR 33
products if soil carbon is to be maintained. Using straw for heating systems is cheaper than using other agricultural products and is abundantly available in most parts of Ukraine at a low cost. Together with biogas from livestock manure and other waste, heating systems based on straw could satisfy part of the energy demand in remote areas in Ukraine (Lakemeyer, 2007).
Bioenergy crop production costs are especially low for woody crops and other second generation biofuels, as lower inputs are needed, high yields can be harvested, especially wood has a higher energy-efficiency and the production of these crops is done in a relatively extensive way (Lakemeyer, 2007). For instance, the production costs for woody crops were below 2.5 Euro GJ-1 in 2005 (de Wit et al., 2008).
The EU REFUEL project analyzed the prospects for biofuels in EU 27 and the Ukraine with regard to resource potential, costs and impacts of different biofuels, effects of different policy strategies, and broader system impacts of biofuels. The REFUEL project has developed three scenarios to forecast the prospects for biofuels in Europe. In the baseline scenario, historic trends are extrapolated to the future, for CEEC (de Wit et al.,2007). In this baseline scenario, arable land and pasture land availability for bioenergy crop production as ratio of whole arable or pasture land are assumed to rise from respectively 42% and 16% in 2010 to 59% and 42% in 2020 (de Wit et al., 2008). This high ratio of land availability for bioenergy crops is also due to the fact that Ukraine has limited national food requirements because of a decreasing population (de Wit et al.,2008). It is even forecasted that in 2030 20 million of hectares of agricultural land could become potentially available for energy crop production in the Ukraine (Refuel, 2008). In such a scenario, the Ukraine, Romania, Poland and France would constitute of 50% of the total annual biomass resource potential of Europe (de Wit et al., 2007).
The costs of the whole supply chain for 2nd generation biofuels need to be clarified, as currently the conversion from the raw material to the end product is still only practiced in pilot scale and small scale plants, which does not take place in the Ukraine. Conversion costs for 1st generation fuels are currently lower than for 2nd generation biofuels, but the conversion costs for 2nd generation fuels have the potential to decrease in the future when new technologies are developed (de Wit et al., 2008). There is a potential for increasing the production of 2nd generation biofuels, but to achieve economies of scale, very large plants will most probably be needed for the production process. Extensive logistical systems would then also be needed for the gathering and transportation of the raw materials (Lakemeyer, 2007). Overall availability of large second generation plants is not believed realistic before 2013/2015 at the earliest. Due to the large investments needed it seems likely these plants will be located in the EU rather than in the Ukraine.
©Agrotechnology & Food Innovations B.V. Member of Wageningen UR 34
To increase the production of bioenergy in Ukraine, many investments in (agricultural and forestry) equipment need to be made. Currently old technologies are used and agricultural and forestry infrastructure will need to be improved (Geletukha, 2006). Geletukha (2006) reasons that many bioenergy projects are bankable projects, as the Internal Rate of Return is often high, the pay-back period is ‘relatively’ short (less than 7.5 years) and CO2 credits could be obtained through Joint Implementation schemes. These investments would also make it more economically feasible to export bioenergy crops or biofuels.
Rape seed production in Ukraine is competitive with other countries but biodiesel from rapeseed or bio-ethanol from grains or sugar beet is not yet profitable without subsidies, as energy and raw material prices are high (Lakemeyer, 2007). It is expected, however, that investments will be made by the domestic industry in the future in rape seed crushing, ‘to increase its share in the value chain’ (Lakemeyer, 2007). Still, the overcapacity of biodiesel production (transesterification) in the EU together with uncertainty in the biofuels targets beyond 2010 may make this uncompetitive activity at least for export to the EU in the coming years (see Chapter 2).
Crushing costs were high in the Ukraine but have fallen since the 1990s, as significant investments have been made in oilseed processing in the last 5 years. Therefore, Ukraine is a region which is internationally competitive in sunflower seed processing, ideally located near important import markets (Kuhn et al., 2005).
Sugar beet production in the Ukraine is more competitive than in the European Union with regard to the costs, but Brazil is more competitive than the Ukraine, producing ethanol from sugar cane (Lakemeyer, 2007).
4.3 Institutions affecting the bioenergy production potential
In the Ukraine, several institutions affect the bioenergy production potential. Positive institutional developments for bioenergy production are for instance considerable domestic and foreign investments in market infrastructure and port logistics which have decreased transaction costs (Lakemeyer, 2007).
According to Zhelyezna et al. (2007) institutions which could be improved in the Ukraine are the development of clear state policy with regard to biofuels, effective state support mechanisms such as tax remissions and special laws. However, the Ukrainian government should not interfere in the market as farmers then can seize upon the opportunities given by favorable world market conditions increasing their production, productivity, and profits (IERPC, 2007a).
©Agrotechnology & Food Innovations B.V. Member of Wageningen UR 35
5 Analysis of bioenergy business opportunities in the Ukraine and a short comparison to other potential biomass exporting countries
5.1 Analysis of market aspects: how much trade of what and with whom
Ukraine is a member of the WTO and is engaged in informal bilateral consultations of the future EU-Ukraine Free Trade Agreement (FTA).
Raw materials and preparations thereof, mineral products and chemicals are the most important products which are exported by the Ukraine, constituting more than 60% of Ukraine’s export (MVO, 2007). The most important products which are imported by Ukraine are mineral products, machines, electric and technical equipment and transport facilities, amounting to almost 50% of total imports in 2006. Ukraine has an extensive trade relationship with the Russian Federation, as more than 30% of Ukraine’s import came from the Russian Federation and more than 22% of its exports was directed towards the Russian Federation in 2006. The trade relationship with the EU is also large: more than 37% of its import came from the EU while almost 33% of its exports was traded with the EU in 2006 (MVO, 2006). The Netherlands has presently only a small trade relationship with the Ukraine; both imports from and exports to the Netherlands were less than 2% of total imports and exports in 2006 (MVO, 2007).
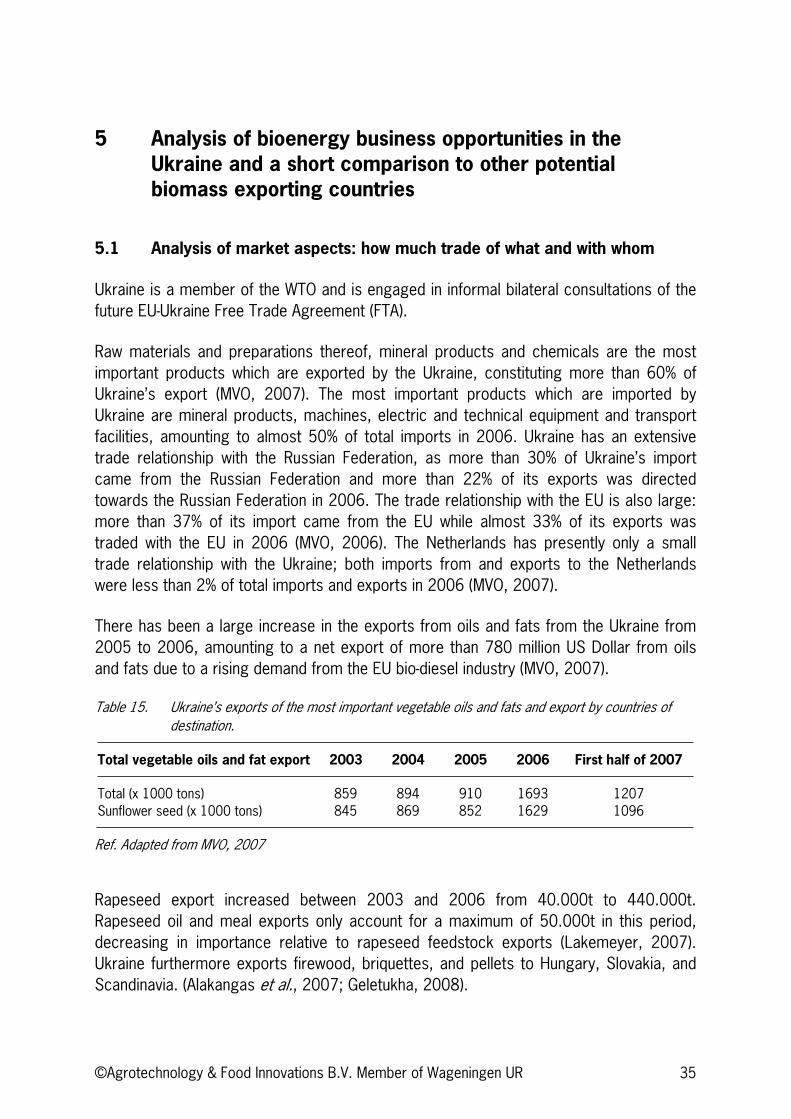
There has been a large increase in the exports from oils and fats from the Ukraine from 2005 to 2006, amounting to a net export of more than 780 million US Dollar from oils and fats due to a rising demand from the EU bio-diesel industry (MVO, 2007).
Table 15. Ukraine’s exports of the most important vegetable oils and fats and export by countries of destination.
Total vegetable oils and fat export 2003 2004 2005 2006 First half of 2007
Total (x 1000 tons) 859 894 910 1693 1207 Sunflower seed (x 1000 tons) 845 869 852 1629 1096
Ref. Adapted from MVO, 2007
Rapeseed export increased between 2003 and 2006 from 40.000t to 440.000t. Rapeseed oil and meal exports only account for a maximum of 50.000t in this period, decreasing in importance relative to rapeseed feedstock exports (Lakemeyer, 2007). Ukraine furthermore exports firewood, briquettes, and pellets to Hungary, Slovakia, and Scandinavia. (Alakangas et al., 2007; Geletukha, 2008).
©Agrotechnology & Food Innovations B.V. Member of Wageningen UR 36
5.2 SWOT analysis of the Ukrainian bioenergy sector
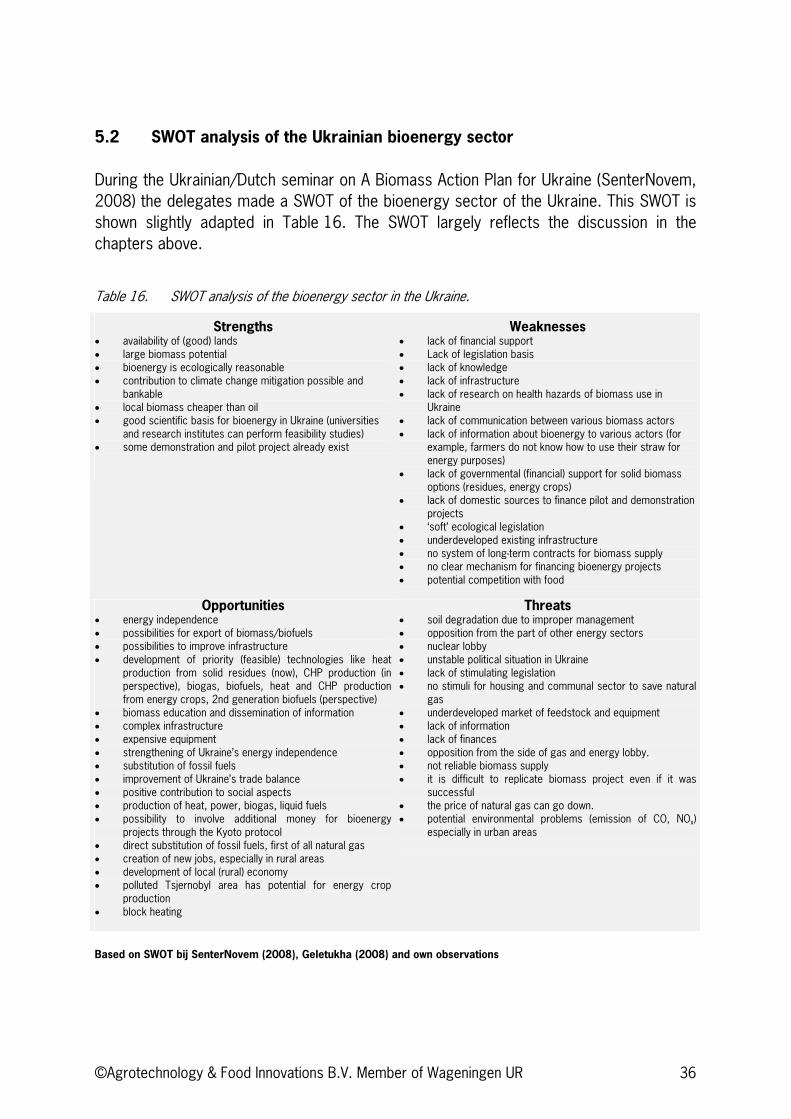
During the Ukrainian/Dutch seminar on A Biomass Action Plan for Ukraine (SenterNovem, 2008) the delegates made a SWOT of the bioenergy sector of the Ukraine. This SWOT is shown slightly adapted in Table 16. The SWOT largely reflects the discussion in the chapters above.
Table 16. SWOT analysis of the bioenergy sector in the Ukraine.
Strengths availability of (good) lands large biomass potential bioenergy is ecologically reasonable contribution to climate change mitigation possible and bankable local biomass cheaper than oil good scientific basis for bioenergy in Ukraine (universities and research institutes can perform feasibility studies) some demonstration and pilot project already exist
Weaknesses lack of financial support Lack of legislation basis lack of knowledge lack of infrastructure lack of research on health hazards of biomass use in Ukraine lack of communication between various biomass actors lack of information about bioenergy to various actors (for example, farmers do not know how to use their straw for energy purposes) lack of governmental (financial) support for solid biomass options (residues, energy crops) lack of domestic sources to finance pilot and demonstration projects ‘soft’ ecological legislation underdeveloped existing infrastructure no system of long-term contracts for biomass supply no clear mechanism for financing bioenergy projects potential competition with food
Opportunities energy independence possibilities for export of biomass/biofuels possibilities to improve infrastructure development of priority (feasible) technologies like heat production from solid residues (now), CHP production (in perspective), biogas, biofuels, heat and CHP production from energy crops, 2nd generation biofuels (perspective) biomass education and dissemination of information complex infrastructure expensive equipment strengthening of Ukraine’s energy independence substitution of fossil fuels improvement of Ukraine’s trade balance positive contribution to social aspects production of heat, power, biogas, liquid fuels possibility to involve additional money for bioenergy projects through the Kyoto protocol direct substitution of fossil fuels, first of all natural gas creation of new jobs, especially in rural areas development of local (rural) economy polluted Tsjernobyl area has potential for energy crop production block heating
Threatssoil degradation due to improper management opposition from the part of other energy sectors nuclear lobby unstable political situation in Ukraine lack of stimulating legislation no stimuli for housing and communal sector to save natural gasunderdeveloped market of feedstock and equipment lack of information lack of finances opposition from the side of gas and energy lobby. not reliable biomass supply it is difficult to replicate biomass project even if it was successful the price of natural gas can go down. potential environmental problems (emission of CO, NOx)especially in urban areas
Based on SWOT bij SenterNovem (2008), Geletukha (2008) and own observations
©Agrotechnology & Food Innovations B.V. Member of Wageningen UR 37
In chapter 6 the SWOT is translated into opportunities and potential drawbacks for investments for Dutch business.
5.3 A short comparison of Ukraine to Brazil in sustainability
Compared to Brazil the Ukraine has a smaller area and also a smaller potential area for bioenergy production. This limits expansion possibilities in Ukraine but may also offer possibilities for sustainability. Smeets (2008) recently analyzed the additional cost for complying with bioenergy sustainability criteria in Brazil and in the Ukraine. The case for supplying lignocellulosic material from eucalyptus in Brazil and poplar in Ukraine was analyzed. Sustainability criteria included social economic criteria (wages, health care, education) and environmental criteria (soil erosion, pesticide use and nutrient losses). GHG and biodiversity impact was not included in the analysis. The results indicated that the cost of complying with the sustainability demands increased the cost of biomass by 35 to 88% in Brazil and by 10 to 26% in Ukraine.
The above chapters have shown that Ukraine has room for expanding agricultural production by increased productivity. On top of this converting erosion prone land to low input biomass crops may offer a sustainable biomass production option. Though biomass production opportunities are (much) smaller than in Brazil the potential for negative land use changes (i.e. deforestation) seems less of a problem. The forest area in the Ukraine is actually expanding. In countries like Brazil and Malaysia bioenegry production is much more associated with (often indirect) negative land conversion. Brazil also has opportunities to increase production within the current agricultural area by using degraded land and by using grassland more efficiently thus freeing land for crops (Elbersen et al., 2008). In practice this appears not to be happening (yet).
In the Ukraine much of the biomass potential may also be found in production of by-product from increased crop productivity. If this can be attained together with a lower cost of complying with sustainability criteria this may favor Ukraine more than Brazil (in the future).
Though more thorough analysis is needed there is an indication that compared to other countries (like Brazil) Ukraine may be able to expand its biomass and biofuel production in a more sustainable way because it has many possibilities to increase production within current agriculture. This should have less (indirect) negative effects than expansion into virgin areas which is the case in countries like Brazil (and Malaysia).

©Agrotechnology & Food Innovations B.V. Member of Wageningen UR 38
©Agrotechnology & Food Innovations B.V. Member of Wageningen UR 39
6 Opportunities and bottlenecks for investments by Dutch business
This report focuses on the opportunities and bottlenecks for investments in the Ukrainian Bioenergy sector. Some general observations on investments in Ukraine and the energy and agricultural sectors as a whole are also discussed.
GeneralUkraine is a country still in transition to a market economy and it is also a young democracy. Political instability makes anticipating developments difficult. Bureaucratic hurdles and corruption are often a problem for business. Many sectors are still virtual monopolies.
Still many business opportunities especially in the energy and bioenergy sector exist. Ukraine does have the highest biomass potential in Europe which has largely been untapped and labor, especially in rural areas, is inexpensive. This provides many opportunities for investments in local bioenergy production and in the export of bioenegy feedstocks. Opportunities abound as the whole bioenergy related infrastructure will require continuous development at many levels, from new policies and regulations to new farm practices and infrastructure for biomass processing and conversion. At the same time vested interests or a lack of incentives makes the introduction of bioenergy and development and implementation of plans and regulations a problem. Financing projects is often problematic or expensive due to political instability and a lack of clear regulations.
The Ukrainian - Dutch project to develop a Biomass action Plan for the Ukraine12 should contribute to the development of a vision on bioenergy and the needed regulations, incentives and standards. The plan should be in place by 2009 after which implementation should start. Therefore opportunities exist for Dutch energy and bio-energy consultants to help the Ukraine develop its legislation and regulatory framework. This should be possible both at the national and at the local level. Much experience is available in the Netherlands as a result of putting in place these regulations in the Netherlands and the EU.
Upgrading energy infrastructure Local bioenergy demand is expected to focus mainly on replacement of natural gas. Natural gas prices for the Ukraine will have risen 10 fold in 2009 compared to 2005. This will make investments in better energy efficiency much more relevant and profitable. At the same time low energy efficiency dictates that investments in bioenergy will only be
12 See Sliman Abu Amara, SenterNovem
©Agrotechnology & Food Innovations B.V. Member of Wageningen UR 40
useful if energy efficiency is also increased. This demand for efficient use of energy may actually offer possibilities for fitting biomass into the energy system. Relevant systems include block heating, industrial energy generation and rural heating. Also co-firing of biomass with coal should become relevant as the proper regulations are implemented. At local levels smaller initiatives are already taking off.Therefore opportunities exist for Dutch energy and bio-energy companies to invest in upgrading energy conversion systems and include biomass in the new systems. Specific areas that may be of interest include larger scale biomass biolers (>10MW) Biogas, Ukraine has no producers of biogas installations. Also in many other fields importing equipment will be necessary.
Biomass production Production of lignocellulosic biomass (pellets, briquettes) for electricity and heat (and in the future for 2nd generation biofuels) has become important both for export and increasingly for local use. Low cost materials such as straw and wood residues are still abundantly available and there is a potential to expand significantly by growing lignocellulosic crops (i.e. Miscanthus, switchgrass, short rotation coppice, etc). As demand increases it will become a very large export opportunity for Ukraine. Though the whole infrastructure for export is available it is often old and will need upgrading. This includes setting up biomass handling, port facilities and shipping.Also freeing up sufficient by-products through higher yields per ha and free land suitable for lignocellulosic crops is necessary. Therefore a large array of business opportunities exist in mobilizing biomass and converting it into pellets and briquettes both for export and for local use. Setting up plantations is an opportunity in the near future.
Knowledge and expertise Knowledge of bioenergy is limited at all levels, hampering the development of policies and commercial activities. The bioenergy related research capacity; from crop production, logistics, conversion and economics and sustainability analysis is limited even though the basic research and schooling infrastructure is available. Therefore opportunities exist for knowledge transfer and research collaboration at all levels.
Oil seeds for biodiesel Rape is currently the most relevant biofuel product. Expansion of rape to 3 or 4 million ha may be possible compared to 1,5 million ha now. Increasing productivity, optimizing management practices and storage and handling are required. Quality of oil seeds is a concern limiting business options.
©Agrotechnology & Food Innovations B.V. Member of Wageningen UR 41
Therefore business opportunities exist for implementation of agricultural improvements in rape seed production over the whole chain. This should include handling, storage and drying.
Sustainability In order to keep serving the EU biofuel and bioenergy market, data on sustainability, in particular GHG performance are needed. Optimizing production for sustainability may give Ukraine some advantages over a country like Brazil (see chapter 5.3). At this moment sustainability of bioenergy is not a relevant concern in the Ukraine. As biomass expands in the Ukraine this should become relevant.Therefore expertise on implementing sustainability (certification, verification, optimization of performance, etc) is needed first for export and later also for the local market.
Local biofuels At this moment Ukraine has put forward plans for biofuel production but it has not implemented them. At the same time high price levels of feedstocks materials (in 2008) made the production of biodiesel and bioethanol unprofitable for the local market in the Ukraine. So at that moment the best option for the Ukraine was to export grains and oilseeds, benefiting from high world market prices for bioenergy related commodities. When the price ratios would change in favor of bioenergy, investors would be able to seize the opportunities in investing in biodiesel and bioethanol production in Ukraine for the local market. This would than also require that other bottlenecks would have to be removed such as the ethanol monopoly (at this moment ethanol production is essentially a monopoly), possible tax exemption for biofuels, regulations for issuing licenses, development of technical products standards, etc. Therefore opportunities exist for Dutch biofuel industry to help draft biofuel regulations. As the market becomes clearer due to implementation of policies opportunities exist to set up biofuel production projects.
BiogasSetting up biogas plants may become relevant in rural areas especially as larger scale farming expands (as it is expected to do). Though GHG emission reduction are less of an incentive fro the Ukraine itself Joint Implementation projects may offer opportunities for making investments viable especially in high GHG return projects such as biogas plants on the basis of manure and co-products.Therefore biogas in rural areas in combination with the expanding animal husbandry should be an investment option. Biogas installations are not produced in Ukraine.
Production of wheat or maize for ethanol production the EU may be an opportunity now. Export of ethanol (from sugar beet or other feedstocks) is not competitive compared to
©Agrotechnology & Food Innovations B.V. Member of Wageningen UR 42
Brazil. To be competitive a much more efficient infrastructure at farm and processing level is needed both for local use as for export. The introduction of alternative ethanol crops like sweet sorghum is also an opportunity.Therefore upgrading of the ethanol industry at all levels is a business and investment opportunity. As mentioned above this also requires implementation of new regulations.
Financing Financing is expensive in Ukraine. At the same time increasing natural gas prices are making many bioenergy projects very profitable (see Geletukha, 2008). It may be expected that the securities needed for making financing possible are put into place in the coming years. These should include the guarantee to feed in electricity to the grid, etc. CO2 credits i.e. Joint Implementation may also help in financing projects. Therefore business opportunities should exist for financial institutions that have experience in handling bio-energy projects.
©Agrotechnology & Food Innovations B.V. Member of Wageningen UR 43
References
Alakangas, E., A. Heikkinen, T. Lensu and P. Vesterinen.
Biomass fuel trade in Europe - Summary Report. VTT, 2007
Boyarchuk, D.
Analysis of consequenses for the EU-Ukraine FTA: Selected Sub-sectors of Agriculture. 2007.
Cramer Commission.
Criteria voor duurzame biomassa productie. Eindrapport Projectgroep ‘Duurzame productie van biomassa’. 2006.
Jinke van Dam van, J. M. Junginger, A. Faaij, I. Jürgens, G. Best, U. Fritsche.
Overview of recent developments in sustainable biomass certification. In Special Issue: on
International Bio-energy Trade - Biomass & Bioenergy. 2008.
Dolinsky, A.
4th International Conference on biomass for energy. September 22-24, 2008, Kyiv, Ukraine. Institute
of Engineering Thermophysics, NAS of Ukraine, 2008
EBB (European Biodiesel Board). 2008. Press release. 2007 – 2008
Production statistics show restrained growth in the EU due to market conditions and competition
from US B99 imports. Press Release June 25th 2008.Elbersen, H.W., P.S. Bindraban, R. Blaauw and R. Jongman. 2008.
Biodiesel in Brazil. Report for the Dutch Ministry of Agriculture, Nature and Food Quality. Report BO-CI-35. Wageningen, Agrotechnology & Food Innovations.
Ericsson K., and L.J. Nilsson. Assessment of the potential biomass supply in Europe using a resource-focused approach. Biomass and Bioenergy 30; 1-15, 2006
Gallager, E.The Gallagher Review of the indirect effects of biofuels production. The Renewable Fuels Agency, UK. July 2008.
Geletukha, G. Development of Biomass to Energy Technologies in Ukraine. Scientific Engineering Centre Biomass and Institute of Engineering Thermophysics of National Academy of Sciences of Ukraine, Ukraine, 2006
Geletukha, G.G. et al., 2006.
Overview on Renewable energy in agriculture and forestry in Ukraine. Institute for Economic
Research and Policy Consulting. November 2006.
Geletukha, G.G. 2008.
State of the art and prospects for bioenergy technologies in Ukraine. Presentation at the 4th
International Conference on Biomass for Energy, September 22-24, 2008, Kyiv, Ukraine.
IERPC.
Agricultural land market in Ukraine; allow or forbid? German – Ukrainian agricultural policy dialogue Policy Paper 8. Institute for economic research and policy consulting, Kyiv, Ukraine, 2006
IERPC.
The World Biofuel Boom and Ukraine – How to Reap the Benefits. German – Ukrainian agricultural
©Agrotechnology & Food Innovations B.V. Member of Wageningen UR 44
policy dialogue Policy Paper 7. Institute for economic research and policy consulting, Kyiv,
Ukraine, 2007
Kuger, O. Ukrainian
agriculture and agri-environmental concern. Discussionspapier. Universitat fur bodenkultur, Wien. DP-
24-2007. July 2007.
Kuhn, A., and O. Nivyevs’kiy. Evaluating the Ukrainian Oilseed Export Tax. Working Paper 29. Institute for economic research
and policy consulting, Kyiv, Ukraine, 2005
Lakemeyer, E.
Bioenergy production in Ukraine: The competitiveness of crops and other raw materials From agriculture and forestry. German – Ukrainian agricultural policy dialogue Policy Paper 11. Institute
for economic research and policy consulting, Kyiv, Ukraine, 2007
Ministry of Agrarian Policy of Ukraine. 2008.
On status of development of bio-based raw materials, production and consumption of biofuels.
Presentation at the Workshop: Insights into the Dutch Biomass & Biofuel Business Community
Ukraine and Netherlands. The Hague, June 19, 2008.
MVO. Quickscan Ukraine Update 2007.
Product Board for Margarine, Fats and Oils, Rijswijk, the Netherlands, 2007
OECD.
Agricultural policies in non-oecd countries: monitoring and evaluation 2007 – 146 ISBN 978-92-64-
03121-0 – OECD 2007
Platform Groene Grondstoffen.
Groenboek. 2007
Rabou RPLM, Deurwaarder EP, Elbersen HW & Scott EL (2006)
Biomassa in de Nederlandse energiehuishouding in 2030. Een studie door ECN en WUR Biobased
Products voor het Platform
Refuel.
Eyes on the track, mind on the horizon. From inconvenient rapeseed to clean wood: A European road map for biofuels. Refuel final road map. Energy research Centre of the Netherlands, Petten, the
Netherlands, 2007
SenterNovem (2008).
Minutes Seminar on A Biomass Action Plan for Ukraine A Dutch-Ukrainian Cooperation Carried out by
SenterNovem and the Ministry of Agricultural Policy of Ukraine. September 22, 2008. Kyiv, Ukraine.
At the 4th International Conference on BIOMASS FOR ENERGY, The Great Conference Hall of the
National Academy of Sciences of Ukraine,Volodymyrska street, 55, Kiev
Smeets, E.
Possibilities and limitations for sustainable bioenergy production systems. Dissertation Utrecht
University. 2008.
UN.
Ukraine. Map No. 37773 rev. 4. United Nations Cartographic Section, 2005
©Agrotechnology & Food Innovations B.V. Member of Wageningen UR 45
USDA.
EU-27 Bio-Fuels Annual 2008. GAIN report E48063. May 30, 2008.
Vis, M.W, J. Vos, D. van den Berg.
Sustainability criteria & certification systems for biomass production. For DG TREM, European
Commission. February 2008.
http://www.btgworld.com/uploads/documents/SustainabilityCriteriaandCertificationSystemsforBiom
assfinalreport.pdf
Wit, de, M., A. Faaij, G. Fischer, F. Prieler, H. Van Velthuizen.
The potential of European biomass resources and related costs in the EU-27 and the Ukraine. 15th
European biomass conference and exhibition, 2-11 May 2007, Berlin, Germany, 2007
Wit, de, M.P. and A.P.C. Faaij.
Biomass Resources Potential and Related Costs -Assessment of the EU-27, Switzerland, Norway and Ukraine. REFUEL Work Package 3 final report. Copernicus Institute - Utrecht University, the
Netherlands, 2008
Zhelyezna, T, G. Geletukha, O. Morozova.
Production of liquid biofuels in Ukraine; present status and prospects. Institute of Engineering
Thermophysics NASU, SEC ‘ Biomass’. 15th European biomass conference and exhibition, 2-11 May
2007, Berlin, Germany, 2007
Zhelyezna T.
Bioenergy development in Ukraine: Estimation of resources. For SenterNovem, The Netherlands,
2008.

©Agrotechnology & Food Innovations B.V. Member of Wageningen UR 46
©Agrotechnology & Food Innovations B.V. Member of Wageningen UR 47
Acknowledgements
The authors wish to thank Ton Verhagen (LNV), Georgiy Geletukha (Scientific Engineering Centre ‘Biomass’), MVO (Product Board for Margarine, Fats and Oils), Sliman Mr Abu Amara and Kees Kwant (SenterNovem), and many others for sharing their thoughts on bio-energy opportunities in the Ukraine.

©Agrotechnology & Food Innovations B.V. Member of Wageningen UR 48
©Agrotechnology & Food Innovations B.V. Member of Wageningen UR 49
Annex I: Useful contacts
SenterNovem: Sliman Abu Amara and Kees Kwant http://www.senternovem.nl/kei/31_projecten/13_biomass_and_biofuels_oekraine/index.asp
Netherlands Ukrainian Energy Platform: http://www.nusep.org/
Ukrainian company ‘Scientific Engineering Centre ‘Biomass’ Ltd. The company has experience in setting up bioenegry projects, policy advice and Joint Implementation projects.http://www.biomass.kiev.ua
Factsheet on Ukraine: www.minlnv.nl/cdlpub/servlet/CDLServlet?p_file_id=15313

©Agrotechnology & Food Innovations B.V. Member of Wageningen UR 50


