Embed Size (px)
Citation preview
Universitat Politecnica de Catalunya
The University of Warwick
Bachelor’s thesis in Engineering Physics
Mass and eccentricity constraints on
the planetary debris orbiting the
white dwarf WD 1145+017
POL GURRI
Supervisors:Dr. Boris T. Gansicke
Dr. Enrique Garcıa-Berro
June 2016

Abstract
An important fraction of planets are thought to continue orbiting their host starseven after their giant branch evolution. This prediction is endorsed by metal-pollutedatmospheres of white dwarfs; disrupting planetary bodies can create a circumstellardebris disk from which the white dwarf may accrete metals. Although tidal disruptionof planetesimals near the Roche limit has been long theorised as a polluting mechanism,visual confirmation of this process was not supplied until the recent discovery of severalbodies transiting the white dwarf WD 1145+017.
To date, not much is known about the exact origin and nature of the orbiting bodiesnor about the process of disruption and posterior circularisation that lead to a dustycircumstellar debris disk. WD 1145+017 constitutes a complex system of many (at least6) disintegrating bodies directly measurable from photometric transit light curves. On-going observations are providing transits with precision on the order of seconds, andphase shifts between the bodies. However, the multiplicity, size, mass and eccentricity ofthe debris are among the still unknown properties, some of them unconstrained withinmany orders of magnitude.
In this work we provide a computational study for the system WD 1145+017 by usingN-body simulations. Using a modified version of the Mercury code it has been possibleto track the behaviour of planetesimals orbiting a white dwarf for time-spans up to fiveyears. Furthermore, from analysing the many-body interactions it was possible to obtainperiod deviations from the observed orbits and determine for which arrangements thereare greater chances of long-term dynamical stability. As a result, this work gives newinsight on the WD 1145+017 system and sets more strict boundaries for the mass andeccentricity of the orbiting bodies. A direct comparison is also made between phaseshifts provided by observations and our simulations.
Acknowledgments
I would like to express my deep gratitude to Dr. Boris T. Gansicke for allowingme to become part of his research team with little prior knowledge of my experience.His continuous and enthusiastic encouragement during the whole project have been verymuch appreciated. Furthermore, I would like to thank him for offering me the chance toparticipate in future projects related to this work. I would also like to express my verygreat appreciation to Dr. Enrique Garcıa-Berro for all his advice, both in a professionaland personal sense, which went well beyond his duties. I cannot imagine any of theseexperiences without him. My grateful thanks are also extended to Dr. Dimitri Verasfor his valuable and constructive suggestions during my stay. His willingness to helptogether with his fast and detailed answers have been essential for me. I also want tothank him for all the personal advice he has given to me. I also want to acknowledge theEngineering Physics staff and professors for such a devoted task. Thanks to their dailyand often not mentioned efforts many of us will have a brighter future.
I am extremely thankful for all the friendships I created with the people from TheUniversity of Warwick, they have made this experience incredible. Their willingness tohelp and share good moments together made me feel like home. I also want to thankall my friends from UPC for walking together with me during this 4 last years. Thefriendships made there will certainly be life-lasting. Finally, I am immensely thankfulfor the love received from all my family, for being there during good and bad times, andfor their never-ending trust in me.

Contents
1 Motivation 1
2 White dwarfs 22.1 General background . . . . . . . . . . . . . . . . . . . . . . . . . . . . . . 22.2 History . . . . . . . . . . . . . . . . . . . . . . . . . . . . . . . . . . . . . 32.3 Formation . . . . . . . . . . . . . . . . . . . . . . . . . . . . . . . . . . . . 42.4 Classification . . . . . . . . . . . . . . . . . . . . . . . . . . . . . . . . . . 62.5 Internal composition . . . . . . . . . . . . . . . . . . . . . . . . . . . . . . 72.6 Energy sources . . . . . . . . . . . . . . . . . . . . . . . . . . . . . . . . . 9
3 Planets 103.1 Planet formation history . . . . . . . . . . . . . . . . . . . . . . . . . . . . 103.2 The nebular hypothesis . . . . . . . . . . . . . . . . . . . . . . . . . . . . 113.3 Exoplanets detection . . . . . . . . . . . . . . . . . . . . . . . . . . . . . . 123.4 Fate of planets . . . . . . . . . . . . . . . . . . . . . . . . . . . . . . . . . 13
4 Circumstellar disks 154.1 Circumstellar disks . . . . . . . . . . . . . . . . . . . . . . . . . . . . . . . 154.2 Disks and metal pollution . . . . . . . . . . . . . . . . . . . . . . . . . . . 16
5 WD 1145+017 185.1 Relevance . . . . . . . . . . . . . . . . . . . . . . . . . . . . . . . . . . . . 185.2 History . . . . . . . . . . . . . . . . . . . . . . . . . . . . . . . . . . . . . 19
6 Simulation set up 226.1 Motivation . . . . . . . . . . . . . . . . . . . . . . . . . . . . . . . . . . . 226.2 Mercury Code . . . . . . . . . . . . . . . . . . . . . . . . . . . . . . . . . . 226.3 Automatizing . . . . . . . . . . . . . . . . . . . . . . . . . . . . . . . . . . 24
7 Results 257.1 Mass and eccentricity constraints . . . . . . . . . . . . . . . . . . . . . . . 25
8 Conclusions 33

1Motivation
Beyond the sky, far from our Earth, lies the vast expanse of the Universe. Thedeeper we see into space, the more we discover. There are countless galaxies, eachhosting hundreds of billions of stars being orbited by planets and asteroids. We findout about the Universe through light, which may have been reflected, absorbed and re-emitted, but its origin can often be found in the very heart of the stars. Some of thosecelestial bodies are so far away that the light arriving today to Earth left them millionsof years ago, opening to us a unique window to the past.
Sunken in a sea of stars, mankind has long speculated about the possibility of life existingon distant planets. Throughout history we have been trying to observe and understandwhat lies beyond the ultimate frontier, but only recently have we been able to detectplanetary systems similar to ours. As these systems are billions of times fainter thantheir host stars, detecting planets requires an extraordinarily demanding study of light.
Another great discussion topic has always been the fate of the Earth. Little is knownabout how planets can survive the inevitable transformations their host stars undergo.In about 5 billion years, the sun’s hydrogen fuel supply will run out and, after increasingin size and probably swallowing some planets, it will expel its outer layers and becomewhat it is known as a white dwarf.
Although a significant fraction of planets are thought to survive such process, only onesystem has been observed to subsist after the transformation of its star into a whitedwarf. Being the first of its kind, WD 1145+071 provides a new avenue to understandthe interactions between planets and the final evolutionary state of most of the stars,the white dwarfs.
1
2White dwarfs
2.1 | General background
White dwarfs are the final evolutionary state of all stars that do not have enoughmass to form a neutron star or a black hole. This matter translates into about 95% of allthe stars in the Universe (97% in the Milky Way) becoming white dwarfs at some pointin their lives. These types of star exhibit volumes comparable to that of the Earth butwith extremely larger masses, more comparable to the Sun’s. Nevertheless, white dwarfstars are not broadly studied only because most stars, including our Sun, will becomeone, but also because they are very old objects and therefore carry valuable informationabout the history of the Universe.
Almost everything we know about the Universe is thanks to a cautious study of lightthat traveled through space towards the Earth. Light often is the result of nuclear fusionprocesses in the cores of the stars. Gravity pulls the star toward its center, increasing itspressure and temperature to extreme values that warrant nuclear fusion’s requirements.When nuclear fusion takes place, energy is released and the center pushes back stronglyenough to prevent gravity from further compressing the star. The extra energy liberatedby nuclear fusion is emitted in the form of light. As long as a star has plenty of fuel,fusion will continue, and the star will be stable and shining.
White dwarf stars are formed when a star runs out of fuel, gravity takes over againand the star rapidly collapses. During the compression, matter gets extremely squashedand electrons, repelling each other, create resistance against further confining. Thus,the electron pressure created due to gravity prevents the star from totally collapsing.White dwarfs shine simply from the release of left-over heat from when the star was stillundergoing nuclear reactions. As time passes, they radiate all their remaining energyand gently cool down. A white dwarf’s cooling time can be longer than the age of theUniverse and therefore, the coldest white dwarfs stars are among the oldest objects inthe Universe.
2

CHAPTER 2. WHITE DWARFS Pol Gurri
White dwarf’s surfaces are directly observable using traditional methods (like spec-troscopy or stellar atmosphere modeling via transits), which makes white dwarfs easierto study than other old, high-dense objects like neutron stars or black holes. Employingthese highly used techniques, it has been possible to provide reliable data for effectivetemperatures, surface gravities, chemical abundances, masses, radii and even ages of suchstars. Furthermore, white dwarfs offer the possibility of studying matter under very ex-treme conditions, at temperatures and densities that are impossible to achieve on Earth.In this way, white dwarfs contribute to other fields of current research, like quantumphysics, supplying data about electron degeneracy and neutrinos among others.
Once recognized the relevance of such objects, this chapter provides some general back-ground about white dwarfs. This includes a brief historical timeline and reviews abouthow they are formed, their main properties, classification, internal composition and theenergy sources they rely on.
Further reading about white dwarfs.1–3
2.2 | History
The beginning of the 20th century was one of the brightest moments in the historyof science. That epoch gave birth to the first quantum theory (1900), the wave-particleduality (1905), the special (1905) and general (1915) theories of relativity, the discoveryof atoms (1911)... It was also back then (1910) when Henry Norris Russell, EdwardCharles Pickering and Williamina Fleming, discovered that despite being a really faintstar (same luminosity as an M dwarf), 40 Eridani B was a white star (spectral type A).This finding, being an exception on star spectral analysis, later established the name“white dwarf”.
The stellar remnant 40 Erdiani B, later studied by Russell (1914)4 and Walter Adams(1914)5 (who provided a detailed spectral study of the star), revealed the existence ofa very different star nature, white dwarfs. Nevertheless, it was Sirius B that showedthe first properties of a white dwarf. The mass of Sirius B was known to be near 1M�,thanks to the interaction with its companion Sirius, but it did exhibit a hotter surfacetemperature and much lower luminosity than all the known hot typical (main sequence)stars.
Knowing the distance to Sirius and the surface temperature of Sirius B (via spectral andluminosity studies), Walter Adams (1915)6 found the value of its radius and therefore theinternal density of that peculiar star. The resulting density was ρ ∼ 104 g cm−3 (nowadaysa value of ρ ∼ 106 g cm−3 is accepted), which was a completely bizarre density at thattime. Adams (1925)7 provided an independent measure of the density by determining thegravitational redshift created by Sirius B, which led to a similar result. This discoveryled Arthur Stanley Eddington (1928)8 to state that ”Professor Adams...has confirmedour suspicion that matter 2,000 times denser than platinum is not only possible, but isactually present in the Universe”.
An explanation for this tremendous density remained a mystery until Ralph H. Fowler(1926)9 provided a plausible explanation using quantum mechanics and Fermi-Dirac(1926)10 statistics. Fowler presented that a gas of almost fully degenerate electrons iscapable of creating enough pressure to support the star and prevent it from gravitationalcollapse. The density of the theoretical degenerate electron gas was as enormous as theestimate for Sirius B.
3
CHAPTER 2. WHITE DWARFS Pol Gurri
After Fowler’s work, many renowned astrophysicists like Wilhelm Anderson (1929),11
Edmun Stoner (1930),12 Subrahmanyan Chandrasekhar (1931)13 and (1939)14 or DonaldD. Clayton (1968)15 among others, contributed to the research on white dwarfs. Thanksto their works it has been possible to determine that white dwarfs can be modelled asa zero temperature gas made of degenerate electrons following Fermi-Dirac statistics,and thus demonstrate that white dwarfs have a maximum mass, also known as theChandrasekhar mass. This upper limit is generated due the maximum speed at whichelectrons can move, the speed of light. The concept of a maximum mass turned out tobe of great importance in stellar evolution, and it has been shown to be a key factor indetermining the end state of all stars in the Universe.
Nowadays there are numerous research groups devoted only to the study of white dwarfs,there are more than 20,000 confirmed white dwarfs and more than 100 papers about themwere published during the last year 2015.
Further reading about white dwarf history.16
2.3 | Formation
Galaxies are mainly formed of stars, stellar remnants and the interstellar medium,which is made out of gas (mostly hydrogen and helium) and dust. Higher density regionsof the interstellar medium form clouds, also known as nebulae, where star formationoriginates. Stars are born from the condensation of a gas; individual molecules, and thengroups of them, undergo gravitational attraction on each other, gathering themselvescloser together. If a cloud is massive enough that the gas pressure is insufficient tocounter the effects of gravity (i.e. greater than the Jeans mass17), the cloud will undergoa gravitational collapse. This “protostellar” cloud will continue to contract and itsdensity and temperature will increase until they are high enough to dissociate and ionizeatoms. At this stage, the cloud rapidly compresses even more to reach temperaturessuitable for hydrogen fusion, point at which a new star is formed.
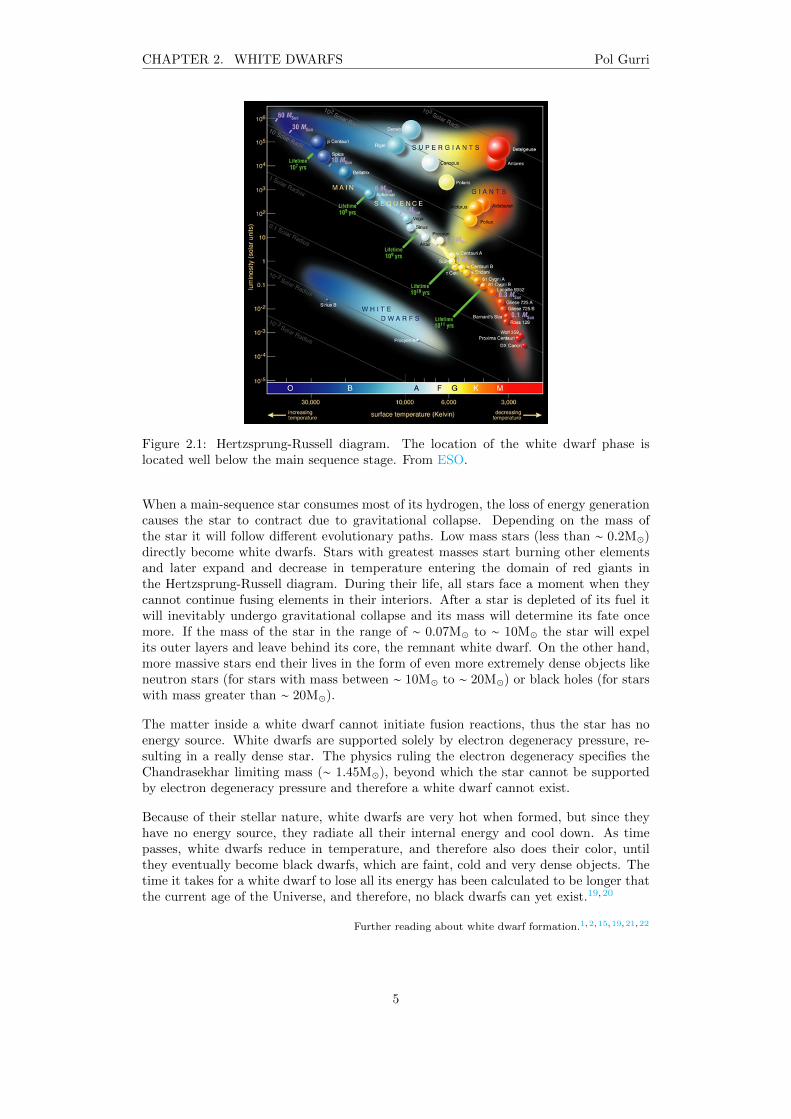
The different stages of the stellar evolution can be observed in the Hertzsprung-Russelldiagram (Figure 2.1), which is one of the most useful and powerful plots in astrophysics.It originated when Ejnar Hertzsprung (1911)18 plotted the absolute magnitude of starsagainst their effective temperature. Later on, Henry Norris Russell (1913)4 representedthe spectral class against the absolute magnitude of stars. Their plots combined showedthat the relationship between temperature and luminosity of a star is not random butinstead appears to split in different groups or stages.
After a star has formed and it starts to burn hydrogen, it enters the main sequenceband, where stars are dominated by hydrostatic equilibrium. The equilibrium occurswhen external forces such as gravity are balanced by a pressure gradient force createdby the energy released via fusion in the cores of stars. The temperature and density ofthe core are self-regulated to maintain the star stable. A sudden reduction in the coreenergy production will cause the star to collapse, increasing the temperature and densityin the core, and consequently creating an increase of the energy production rate up toits initial state. The same reasoning can be applied in the opposite direction, increasingthe rate of energy production forces the star to expand, which reduces its temperatureand density in the core, and therefore, lowers again the fusion rate. Stars are thereforeself-regulating systems during their main-sequence lifetime. The majority of stars canbe found along the main-sequence stage, a line on the Hertzsprung-Russell diagram, inwhich both the spectral type and the luminosity depend only on the star’s mass.
4
CHAPTER 2. WHITE DWARFS Pol Gurri
Figure 2.1: Hertzsprung-Russell diagram. The location of the white dwarf phase islocated well below the main sequence stage. From ESO.
When a main-sequence star consumes most of its hydrogen, the loss of energy generationcauses the star to contract due to gravitational collapse. Depending on the mass ofthe star it will follow different evolutionary paths. Low mass stars (less than ∼ 0.2M�)directly become white dwarfs. Stars with greatest masses start burning other elementsand later expand and decrease in temperature entering the domain of red giants inthe Hertzsprung-Russell diagram. During their life, all stars face a moment when theycannot continue fusing elements in their interiors. After a star is depleted of its fuel itwill inevitably undergo gravitational collapse and its mass will determine its fate oncemore. If the mass of the star in the range of ∼ 0.07M� to ∼ 10M� the star will expelits outer layers and leave behind its core, the remnant white dwarf. On the other hand,more massive stars end their lives in the form of even more extremely dense objects likeneutron stars (for stars with mass between ∼ 10M� to ∼ 20M�) or black holes (for starswith mass greater than ∼ 20M�).
The matter inside a white dwarf cannot initiate fusion reactions, thus the star has noenergy source. White dwarfs are supported solely by electron degeneracy pressure, re-sulting in a really dense star. The physics ruling the electron degeneracy specifies theChandrasekhar limiting mass (∼ 1.45M�), beyond which the star cannot be supportedby electron degeneracy pressure and therefore a white dwarf cannot exist.
Because of their stellar nature, white dwarfs are very hot when formed, but since theyhave no energy source, they radiate all their internal energy and cool down. As timepasses, white dwarfs reduce in temperature, and therefore also does their color, untilthey eventually become black dwarfs, which are faint, cold and very dense objects. Thetime it takes for a white dwarf to lose all its energy has been calculated to be longer thatthe current age of the Universe, and therefore, no black dwarfs can yet exist.19,20
Further reading about white dwarf formation.1,2,15,19,21,22
5
CHAPTER 2. WHITE DWARFS Pol Gurri
2.4 | Classification
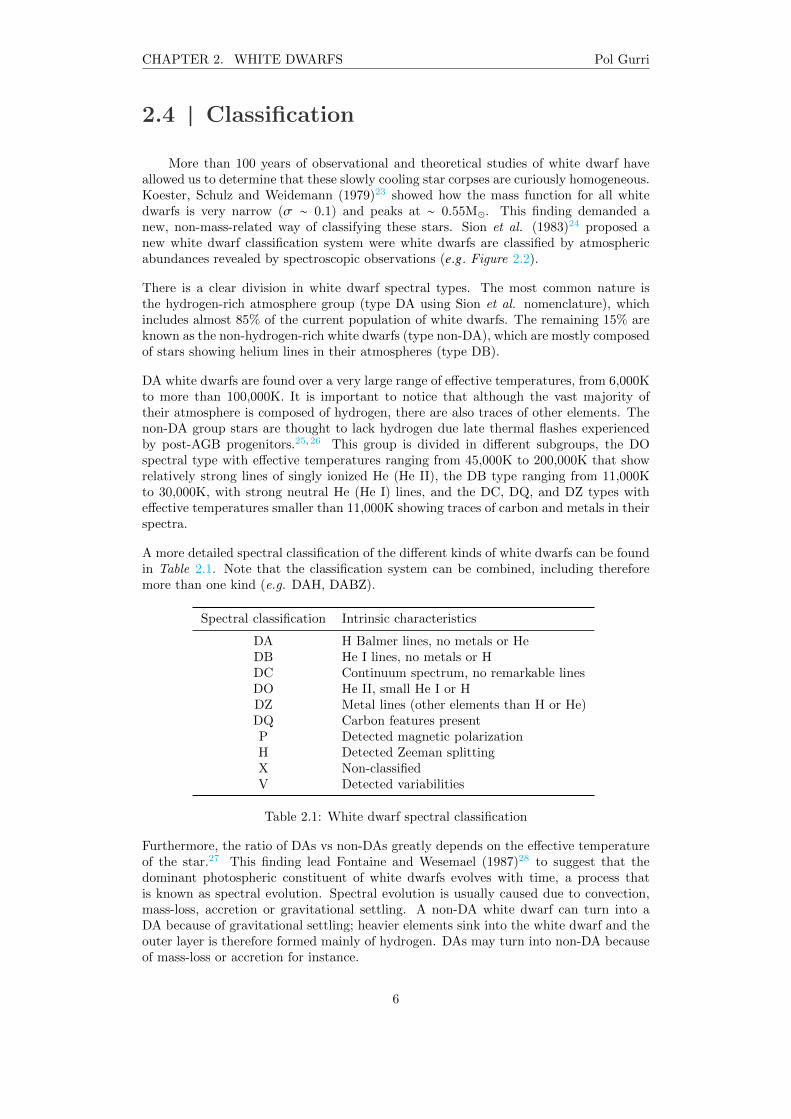
More than 100 years of observational and theoretical studies of white dwarf haveallowed us to determine that these slowly cooling star corpses are curiously homogeneous.Koester, Schulz and Weidemann (1979)23 showed how the mass function for all whitedwarfs is very narrow (σ ∼ 0.1) and peaks at ∼ 0.55M�. This finding demanded anew, non-mass-related way of classifying these stars. Sion et al. (1983)24 proposed anew white dwarf classification system were white dwarfs are classified by atmosphericabundances revealed by spectroscopic observations (e.g. Figure 2.2).
There is a clear division in white dwarf spectral types. The most common nature isthe hydrogen-rich atmosphere group (type DA using Sion et al. nomenclature), whichincludes almost 85% of the current population of white dwarfs. The remaining 15% areknown as the non-hydrogen-rich white dwarfs (type non-DA), which are mostly composedof stars showing helium lines in their atmospheres (type DB).
DA white dwarfs are found over a very large range of effective temperatures, from 6,000Kto more than 100,000K. It is important to notice that although the vast majority oftheir atmosphere is composed of hydrogen, there are also traces of other elements. Thenon-DA group stars are thought to lack hydrogen due late thermal flashes experiencedby post-AGB progenitors.25,26 This group is divided in different subgroups, the DOspectral type with effective temperatures ranging from 45,000K to 200,000K that showrelatively strong lines of singly ionized He (He II), the DB type ranging from 11,000Kto 30,000K, with strong neutral He (He I) lines, and the DC, DQ, and DZ types witheffective temperatures smaller than 11,000K showing traces of carbon and metals in theirspectra.
A more detailed spectral classification of the different kinds of white dwarfs can be foundin Table 2.1. Note that the classification system can be combined, including thereforemore than one kind (e.g. DAH, DABZ).
Spectral classification Intrinsic characteristics
DA H Balmer lines, no metals or HeDB He I lines, no metals or HDC Continuum spectrum, no remarkable linesDO He II, small He I or HDZ Metal lines (other elements than H or He)DQ Carbon features presentP Detected magnetic polarizationH Detected Zeeman splittingX Non-classifiedV Detected variabilities
Table 2.1: White dwarf spectral classification
Furthermore, the ratio of DAs vs non-DAs greatly depends on the effective temperatureof the star.27 This finding lead Fontaine and Wesemael (1987)28 to suggest that thedominant photospheric constituent of white dwarfs evolves with time, a process thatis known as spectral evolution. Spectral evolution is usually caused due to convection,mass-loss, accretion or gravitational settling. A non-DA white dwarf can turn into aDA because of gravitational settling; heavier elements sink into the white dwarf and theouter layer is therefore formed mainly of hydrogen. DAs may turn into non-DA becauseof mass-loss or accretion for instance.
6
CHAPTER 2. WHITE DWARFS Pol Gurri
The chemical composition of a white dwarf is strongly related to the progenitor main-sequence star. The nuclear reactions that happened in the past are the responsible for thedifferent atmospheric compositions the white dwarfs shows now. DAs for instance have95% of their mass provided by a carbon-oxygen core, which is the result of the progenitorstar burning helium into carbon through the triple-alpha process. As we move from theinside out of a DA white dwarf we can see how oxygen and carbon disappear leavingroom for: (i) a layer of He (usually called He-buffer) formed due to previous H burningand (ii) an outer layer of H separated from the He via gravitational settling.
Figure 2.2: WD 1145+017 spectrum from the Hamburg/ESO survey from Friedrich et al.(2000).29 Although far from a perfect example, WD 1145+017 presents a DBZ spectrum(the original spectrum did not show signs of metals and therefore the star was classifiedas DB).
Further reading about white dwarf classification.1,2,24
2.5 | Internal composition
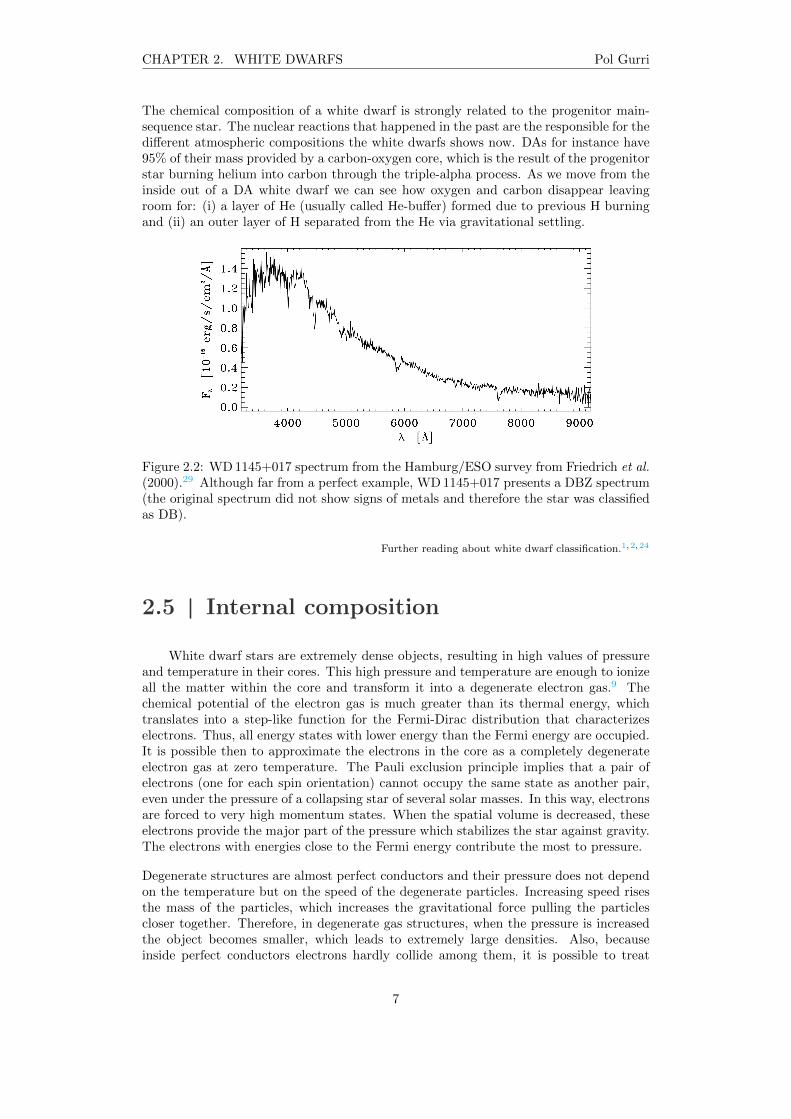
White dwarf stars are extremely dense objects, resulting in high values of pressureand temperature in their cores. This high pressure and temperature are enough to ionizeall the matter within the core and transform it into a degenerate electron gas.9 Thechemical potential of the electron gas is much greater than its thermal energy, whichtranslates into a step-like function for the Fermi-Dirac distribution that characterizeselectrons. Thus, all energy states with lower energy than the Fermi energy are occupied.It is possible then to approximate the electrons in the core as a completely degenerateelectron gas at zero temperature. The Pauli exclusion principle implies that a pair ofelectrons (one for each spin orientation) cannot occupy the same state as another pair,even under the pressure of a collapsing star of several solar masses. In this way, electronsare forced to very high momentum states. When the spatial volume is decreased, theseelectrons provide the major part of the pressure which stabilizes the star against gravity.The electrons with energies close to the Fermi energy contribute the most to pressure.
Degenerate structures are almost perfect conductors and their pressure does not dependon the temperature but on the speed of the degenerate particles. Increasing speed risesthe mass of the particles, which increases the gravitational force pulling the particlescloser together. Therefore, in degenerate gas structures, when the pressure is increasedthe object becomes smaller, which leads to extremely large densities. Also, becauseinside perfect conductors electrons hardly collide among them, it is possible to treat
7

CHAPTER 2. WHITE DWARFS Pol Gurri
mechanical and thermal structures separately. For mechanical structures its is possibleto apply a zero temperature gas approximation. Unluckily, thermal structures cannotbe approximated in this way as the star radiates because of its internal temperature.
Chandrasekhar (1931)13 developed the zero-temperature gas approximation for the me-chanical structure of white dwarfs, assuming non-interacting and completely degenerateelectrons. In the limit of complete degeneracy, the electron pressure can be consideredonly due the energy states below the Fermi energy. Using that fact and combining it withthe equations of hydrostatic equilibrium and mass conservation, Chandrasekhar showedhow the problem can be addressed as a second order differential equation with two freeparameters: the central density and the molecular weight per electron.
d
dr
(r2
ρ
dPdr
)= −4πGr2ρ (2.1)
Where ρ = Cx3, x = pf /mec, C = 8πm3ec3µeM/3h3, and µe the electron molecular weight.
The other constants have their usual values.
For a fixed value of the electron molecular weight (µe ∼ 2 for carbon-oxygen composi-tion) it is possible to integrate Eq. 2.1 for different values of the central density, whichestablishes a unique relation between mass and radius. This famous mass-radius relationalso sets a limiting mass when the density tends to infinity and the radius approacheszero. This mass is known as the Chandrasekhar limiting mass (∼ 1.45M� for carbon-oxygen white dwarfs). Larger masses would lead to non-stable white dwarfs as the gravitywould be stronger than the degenerate electron pressure. This limiting mass is closelyrelated with Type Ia (thermonuclear) supernovae, some of the most energetic events inthe Universe.
Chandrasekhar’s model provides a good description of the mechanical structure of a whitedwarf. The equivalent model for the thermal structure was made by Mestel (1952)30 as-suming that the white dwarf is not actually at zero temperature. This model explainstwo concepts: how much energy does the white dwarf has, and how quickly it looses it.To address the first concept we can assume that all the core is at the same temperature,which is a good approximation for cold white dwarfs because degenerate electrons arevery good at heat transportation. The second concept needs the use of heat transporta-tion equations for the envelope, which is a fairly thin layer where temperature dropssubstantially. In the envelope it is not possible to assume electron degeneracy and there-fore heat transfer is performed by less efficient mechanisms such as convection and/orradiation.
If it is assumed that the energy is transported by radiation (a good approximation forhot white dwarfs), putting together the equation of hydrostatic equilibrium with theradiative transport leads to Eq. 2.2.
dTdr= − 3
4acκρ
T3
Lr
4πr2(2.2)
Where Lr is the luminosity through the sphere of radius r and κ is the radiative opacity.
Assuming that nuclear energy is not involved so that total luminosity is almost equal toLr , that the pressure is due an ideal gas of ions and electrons and that the core is uni-thermal, it is possible to find a relation between the mass and the luminosity of the whitedwarf. Those are large approximations which are not usually verified in white dwarfs,
8
CHAPTER 2. WHITE DWARFS Pol Gurri
but they give a general idea of the behavior of the envelope’s heat transportation. Mestel(1952)30 found that for a one solar mass white dwarf with a luminosity 10−4 times thatof the Sun, its temperature is around 106 K, which provides a approximate idea aboutthe relationship between temperature and luminosity of white dwarfs. With a deeperanalysis of the equations it is possible to prove that white dwarfs undergo a coolingprocess where its core chemical composition determines its cooling speed. Moreover, themore massive a white dwarf is, the lower its radius, which implies less luminosity andtherefore longer cooling times.
Further reading about white dwarf composition.1–3,14,30
2.6 | Energy sources
White dwarfs experience a cooling process that slowly lowers their temperature andtherefore their internal energy. Although most of the energy loss is due to light radiationthrough the envelope there are other processes by which the star loses energy. Thissection gives an overview of the most significant ones.
Light radiation. As mentioned in the previous section, there is an energy leak throughthe thin, non-degenereate envelope. The light emitted by the star can be modeled usingMestel’s (1952)30 equation, which provides the luminosity of the star (L = K MT7/2 whereK depends on the opacity of the envelope). In this way, the hotter the star is, the moreit radiates.
Nuclear energy. The role of nuclear burning as a main energy source ceases as soonas the hot white dwarf reaches the cooling branch and starts decreasing in temperature.However, nuclear processes never stop completely, and during the whole life of the starunstable nuclear burning may be relevant. This unstable nuclear burning happens in theexteriors shells of white dwarfs, where occasionally hydrogen (via the CNO cycle) andhelium can be burned. The energy produced by these events is rapidly radiated away.
Gravitational energy. The radii of white dwarfs change over time. Gravitationalforces shrink the white dwarf to as little as half the initial radius over its cooling age.This contraction is by no means negligible, and it can be the responsible for up to 30%of the star’s luminosity. After the first hot stage of the white dwarf, its gravitationalenergy does not contribute to the luminosity but mainly to increase the Fermi energy ofthe degenerate electrons.
Neutrino losses. Within white dwarfs neutrinos are created from photons. Through aprocess called the plasmon neutrino process, a single photon in a plasma decays into aneutrino-antineutrino pair. Because neutrinos barely interact with matter, they have noopposition to leave star and result in a big energy leak, specially for hot white dwarfs.Neutrino losses can actually be precisely calculated thoughtout the hydrogen-exhaustedcores of white dwarfs.31
There are also other mechanisms by which a white dwarf can lose energy. For example,crystallization of the carbon-oxygen core or gravitational settling of minor species in thecore are two main energy-lose processes that need to be addressed with thermodynamicsof high-dense matter.
Further reading about white dwarf energy sources.1,30–32
9
3Planets
3.1 | Planet formation history
To a first approximation, planets can be defined as large spherical bodies orbitingstars. The main difference between planets and stars is that planets are not massiveenough to power nuclear fusion in their cores. For this reason, planets have a maximummass of approximately 13 Jupiter masses (∼ 2.5 × 1028 kg). A lower mass limit is notwell defined; only massive enough bodies capable of clearing their neighborhoods of otherlarge bodies are considered planets. Smaller, planet-like objects that fail to accomplishthe last definition are known as planetesimals or dwarf planets.
The theoretical study of planet formation has a long history, and numerous books andreview articles have been written about the topic. Kant (1755)33 and Laplace (1796)34
were the first to put the origin of planets in a scientific framework and developed themost widely accepted model for planet formation, the nebular hypothesis. This chapterreviews the basic aspects about planet formation under the general assumption of thenebular hypothesis.
Descartes’ (1644)35 work proved a breakthrough in planet formation; he argued thatplanets, as well as stars, were formed from a system of vortices. His early picturehad no explanation for vortices formation and did not consider their rotation direction.Three hundred years later, Weizsacker (1944)36 presented for the first time the idea of aturbulent disk rotating around a star. This disk was responsible for hosting the vorticesthat, through the accretion of small particles, formed the planets. He was also the firstto theorise angular momentum transportation in the disk, which explains how mass flowsinto the star and momentum is gained by the outer particles.
Kuiper (1951)37 suggested that giant planets could form from Jeans instability in asimilar way to stars. Supporting the idea, Cameron (1969)38 showed that, enhanced bythe effects of vortices, the protoplanetary disk could break up into axisymmetric ringswhich could then form planets by Jeans instability.
10
CHAPTER 3. PLANETS Pol Gurri
The first magnetic approach came from the hand of Hoyle (1960),39 who explainedthat pure viscous effects were not sufficient to prevent a high rotation speed for the star.Instead, magnetic fields coming from the star could transfer sufficient angular momentumto the disk and cause the necessary magnetic braking of the star. Modern theories, likeShu et al. (1994),40 show that the basic angular momentum-loss mechanism for the staris indeed magnetic transfer.
Barge and Sommeria (1995)41 combined the previous approaches to show that smallparticles could easily be captured in vortices and lead to the formation of planets. Later,Klahr and Bodenheimer (2003)42 used hydrostatic simulations to show that, under op-timum conditions, disks could create the needed vortices to form planets. Improvingunderstanding of some of these poorly known planet formation processes continues tosupport many on-going research projects.
Further reading about planet formation history.43–45
3.2 | The nebular hypothesis
As mentioned in the previous chapter, stars are born from collapsing clouds throughJeans instability processes. Molecular clouds are not homogeneous structures and there-fore they always posses some angular momentum.36 As compression starts, the conserva-tion of angular momentum forces the surrounding gas to rotate faster. This accelerationpushes the gas away from the collapsing core and facilitates the formation of a gasdisk in the equatorial plane.36,39 The nebular hypothesis states that under certain cir-cumstances, the disk, known as the protoplanetary disk, may give birth to a planetarysystem. One of the major problems in understanding disk evolution and planet forma-tion is determining how gaseous disks with dust grains evolve into debris disks containingplanetary and asteroidal bodies.
Protoplanetary disks are not static arrangements of particles, but rather slowly evolvingstructures that agglomerate into larger bodies.46 Although there are sophisticated mod-els to understand this process (e.g.47), gas and dust in the disk experience drag, settlingprocesses, radial drift, diffusion, Brownian motions and turbulence, which makes detailedstudy of disks very complicated.
Small solid particles appear to grow by coagulation; collisions cause them to stick to-gether and therefore grow in size.46 There appears to be no theoretical impediment tothe rapid growth of dusty or icy particles up to millimetric dimensions usign this mech-anism. The growth of bodies larger than a few millimeters has proved more challengingto model and currently there exists no widely accepted mechanism to explain this pro-cess. However, some have speculated about a similar coagulation process working upto planetesimal-size bodies48 or gravitational instabilities rapidly forming planetesimalsfrom smaller bodies,49 but none of them provides a complete description of the process.
Once planetesimal-size bodies are formed, the gas disk provides, to a good approximation,only an aerodynamic role.50 At this stage, further growth is controlled by gravitationalinteraction between bodies,50 which can be modeled using Newtonian laws of gravity.Planetesimals colliding and attaching together create larger bodies. This process is wellunderstood and can be reproduced via simulations. The major problem is found whentrying to simulate interactions between all the bodies needed to form big systems. Forexample, ∼ 109 bodies may be needed to recreate the Solar System,43 a number for whichcurrent N-body simulations are infeasible.
11
CHAPTER 3. PLANETS Pol Gurri
Instead, the earliest phases of this stage are simulated using gas-like models that canrecreate large amounts of particles. When the number of bodies has dropped, standardsimulations can be used to track the evolution of the planets.
Formation of giant planets needs to take into account the gas of the protoplanetary diskonce more. Unlike terrestrial planets, most of the giant planets are primarily composedof low-boiling-point materials like gases or ices. Two competing theories purport toexplain the formation of those planets. On one hand, a large enough terrestrial planet(> 10M⊕) could acquire a massive gaseous envelop through the accretion of hydrogenfrom the gas disc.51 On the other hand, Jeans instability can give rise to fragmentation,allowing smaller overdense regions of the molecular cloud to collapse. If the gas is ableto cool in a short time scale it may be possible to directly form giant gaseous planets.52
Further reading about the nebular hypothesis.43–45
3.3 | Exoplanets detection
The detection of exoplanets is a challenging matter; we know about them becauseof light perturbations on their host stars or due their thermal radiation emission. Beingextremely fainter and only separated by few seconds of arc from their host stars makesdirect detection of exoplanets extraordinarily demanding. Most methods rely on thedetection of dynamical perturbations that the planet creates on the star.
The first unambiguous exoplanet detection took place in 1992 with the discovery ofseveral terrestrial-mass planets orbiting a highly magnetized, rotating neutron star.53 In1995, using radial velocity methods, which are indirect methods of detection that relyon the Doppler effect, Mayor and Queloz (1995)54 detected a giant planet around a mainsequence star. This discovery conceived a new domain of research, and from then, morethan 3000 exoplanets have been discovered.
There are five main detection methods for exoplanetary systems. Radial velocity andtransit surveys have been the most successful techniques for exoplanetary discovery (interms of numbers). The radial velocity method was proposed by Struve (1952)55 when hedemonstrated that a very large planet would cause its parent star to exhibit measurableDoppler shifts as the two objects orbit around their center of mass. A detailed study ofthe Doppler shifts exhibited by the star can also reveal the number of orbiting bodiesaround the star. Although being an indirect method, 648 exoplanets have been discoveredby the radial velocity method according to the open exoplanet catalogue.
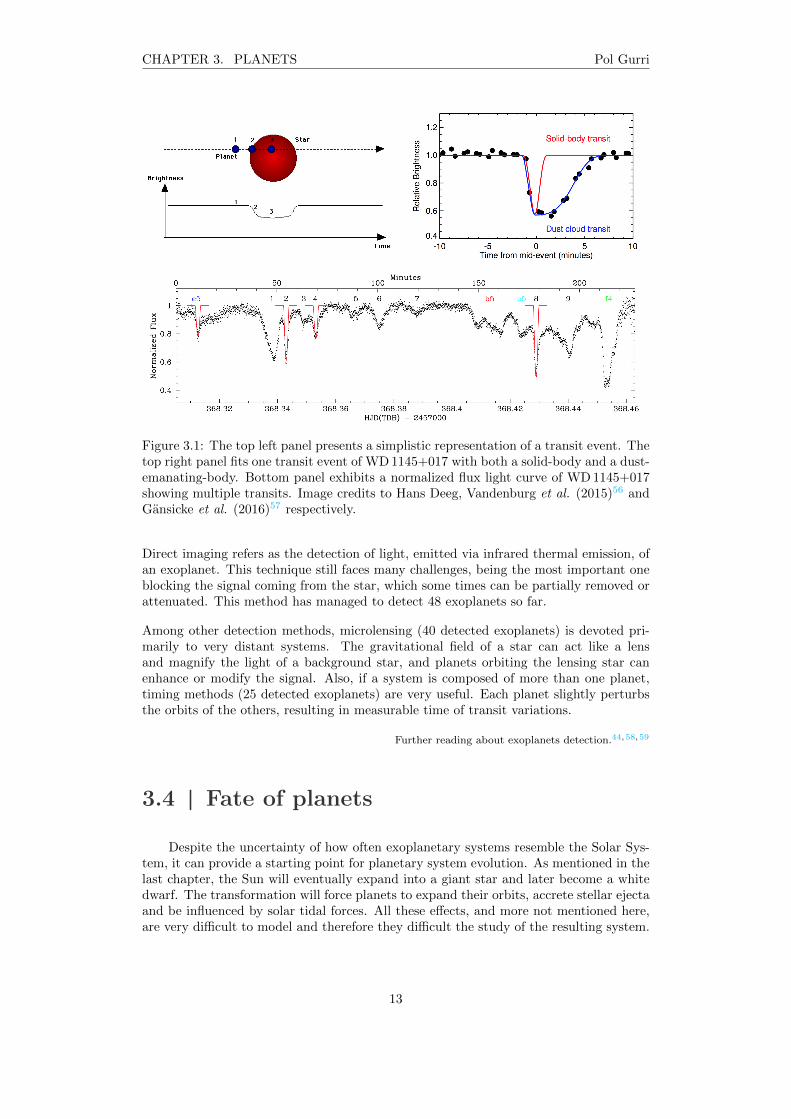
Transit detection is by far the most effective discovery method with 2641 exoplanetsalready identified. To detect a transit it is necessary that the planet is orthogonal tothe plane of the sky (i.e. the method depends on the planet position with respect tothe Earth). If a planet crosses in front of its parent star, the observed light of the staris dropped a small amount (e.g. Figure 3.1). The amount the star dims depends on therelative sizes of the star and the planet, and if used together with radial velocity methods,they provide an unambiguous determination about the mass and radius of the planet(with respect to the parent star). Density follows from mass and radius, and gives afirst estimate of the composition of the planet. Furthermore, during specific times of thetransit it is possible to obtain atmospheric photometry and spectroscopy, which provideanother insight into the planet’s composition.
12
CHAPTER 3. PLANETS Pol Gurri
Figure 3.1: The top left panel presents a simplistic representation of a transit event. Thetop right panel fits one transit event of WD 1145+017 with both a solid-body and a dust-emanating-body. Bottom panel exhibits a normalized flux light curve of WD 1145+017showing multiple transits. Image credits to Hans Deeg, Vandenburg et al. (2015)56 andGansicke et al. (2016)57 respectively.
Direct imaging refers as the detection of light, emitted via infrared thermal emission, ofan exoplanet. This technique still faces many challenges, being the most important oneblocking the signal coming from the star, which some times can be partially removed orattenuated. This method has managed to detect 48 exoplanets so far.
Among other detection methods, microlensing (40 detected exoplanets) is devoted pri-marily to very distant systems. The gravitational field of a star can act like a lensand magnify the light of a background star, and planets orbiting the lensing star canenhance or modify the signal. Also, if a system is composed of more than one planet,timing methods (25 detected exoplanets) are very useful. Each planet slightly perturbsthe orbits of the others, resulting in measurable time of transit variations.
Further reading about exoplanets detection.44,58,59
3.4 | Fate of planets
Despite the uncertainty of how often exoplanetary systems resemble the Solar Sys-tem, it can provide a starting point for planetary system evolution. As mentioned in thelast chapter, the Sun will eventually expand into a giant star and later become a whitedwarf. The transformation will force planets to expand their orbits, accrete stellar ejectaand be influenced by solar tidal forces. All these effects, and more not mentioned here,are very difficult to model and therefore they difficult the study of the resulting system.
13
CHAPTER 3. PLANETS Pol Gurri
During the first expansion process of the Sun, Mercury will most likely be engulfed whileVenus and the Earth will probably expand their orbits and prevent engulfment.60 Tidalforces will largely affect and maybe consume Venus61 while the Earth’s fate is a morecomplex matter. According to Schroder and Smith (2008),62 the Earth will be engulfedunless all parameters within the evolution model are at the edge of their uncertaintyranges. When the Sun stabilizes into a white dwarf, the remaining Solar System isthought to remain stable and retain more than half of the actual system’s mass.63
During stellar evolution, the ratio of orbital distance to the star remains constant forall bodies, preventing in this way instabilities. Nevertheless, the change in mass of thestar may be enough to make a planetary system become unstable during the post-mainsequence evolution of its host star.64 In this way, the asteroid belt in the Solar Systemwill undergo dynamical instabilities that are likely to force asteroids to orbit eccentricallyaround the evolved star. In this scenario, highly eccentric bodies can be tidally disruptedif they orbit close enough to the star (i.e. inside the Roche radius).
Bonsor et al. 201165 developed a model for the evolution of planetesimal structures likethe Neptune-Kuiper belt. They showed that an important fraction of the mass remainsorbiting the the evolved star and that enough mass is engulfed by the star to polluteits atmosphere. The atmospheres of white dwarfs are easier to study than exoplanetsor belts of asteroids, thus, a proper atmospheric study can give information about theactual orbiting system as well as the one that used to orbit the main sequence star.
Further reading about planetary fate.66,67
14
4Circumstellar disks
4.1 | Circumstellar disks
Circumstellar disks are flattened, ring-shaped structures of matter, usually gas anddust, in orbit around a star. The fact that they are almost confined to the plane ofstellar rotation distinguishes them from spherical clouds or envelopes. Disks orbit starsat various stages of their evolution life cycles. As seen in Chapter 2 stars are formedfrom a collapsing cloud of matter. When the pre-main sequence star is composed, thecloud is already flattened creating a disk that is thought to be related to the creationand existence of planets (see Chapter 3). As the star evolves so does its disk. Mature,main-sequence stars exhibit dusty disks created by collisions of smaller bodies such asasteroids or planetesimals. After stars have evolved beyond the main sequence, the natureof their orbiting disks is more complicated to understand and often still an unexplainedphenomena.
Circumstellar, dusty disks around main-sequence stars were first discovered by the in-frared satellite (IRAS) in 1983. Some bright stars emitted much more radiation at theinfrared range than the stellar photosphere can produce. This infrared excess is usuallyassociated with the presence of dust particles. Absorbing optical and ultraviolet lightfrom the star, dust particles are able to re-radiate light back in the infrared range.46,68
Although most of the detected material consists of small dust particles, a few stars alsoshow evidence of gas in their circumstellar disks (e.g.69,70). While dust particles arethought to be linked with the formation of rocky bodies, gas might be related to giantgassy planets.69
The Sun itself has a circumstellar disk that can be thought of as the whole Solar Systemwithout the planets, formed in this way mainly by the Asteroid and Kupier belts. TheSun’s circumstellar disk is used as a model for most of the observed disks in other stars.While circumstellar disks around main-sequence stars, like our Sun, can provide insighton planet formation, when orbiting more evolved stars like white dwarfs they might opena new door to the understanding of their previous planetary systems.71
15
CHAPTER 4. CIRCUMSTELLAR DISKS Pol Gurri
The Universe is highly bright in the infrared, which makes disk detections very difficult.Circumstellar dust orbiting white dwarfs has been historically hard to distinguish, andeven today, disks around these stars are extremely challenging to study. The complexityarises mainly for two reasons: (i) the radiation of the disk is proportional to the luminos-ity of the star, and white dwarfs are around 10−4 less luminous than their main-sequencecounterparts, and (ii) the observed excess might not come from the white dwarf disk butfrom companion stars that can easily outshine the white dwarf in the infrared.72
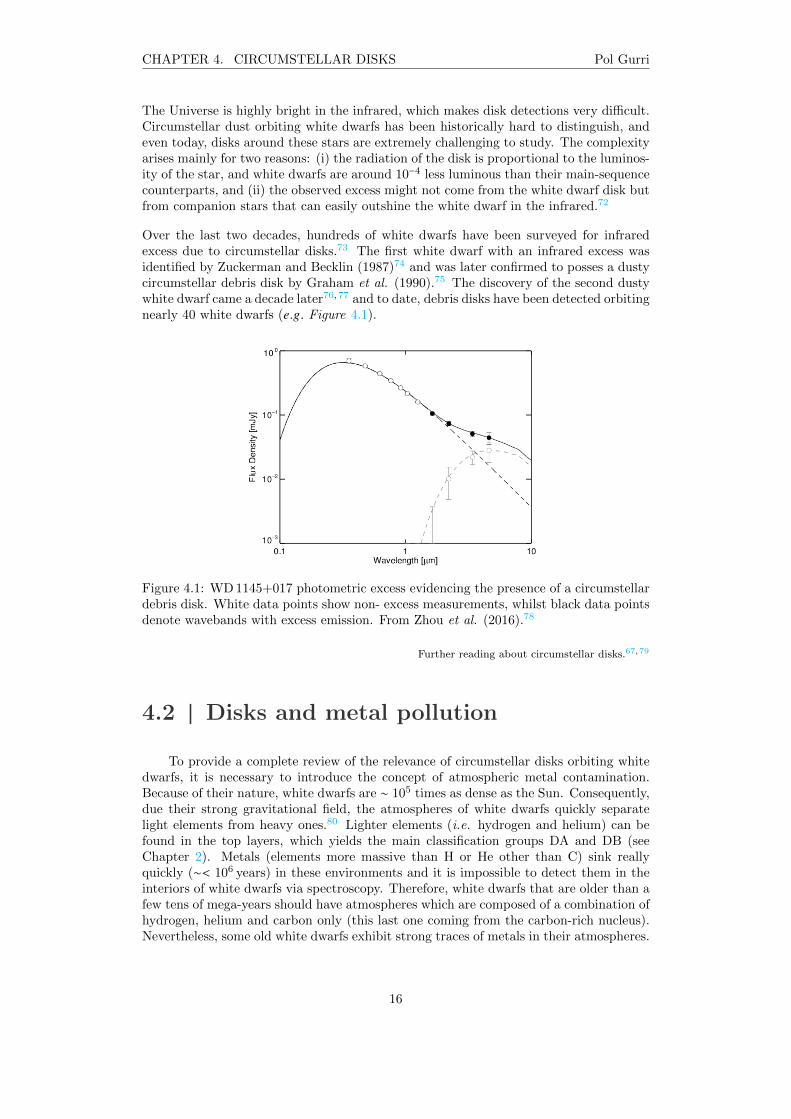
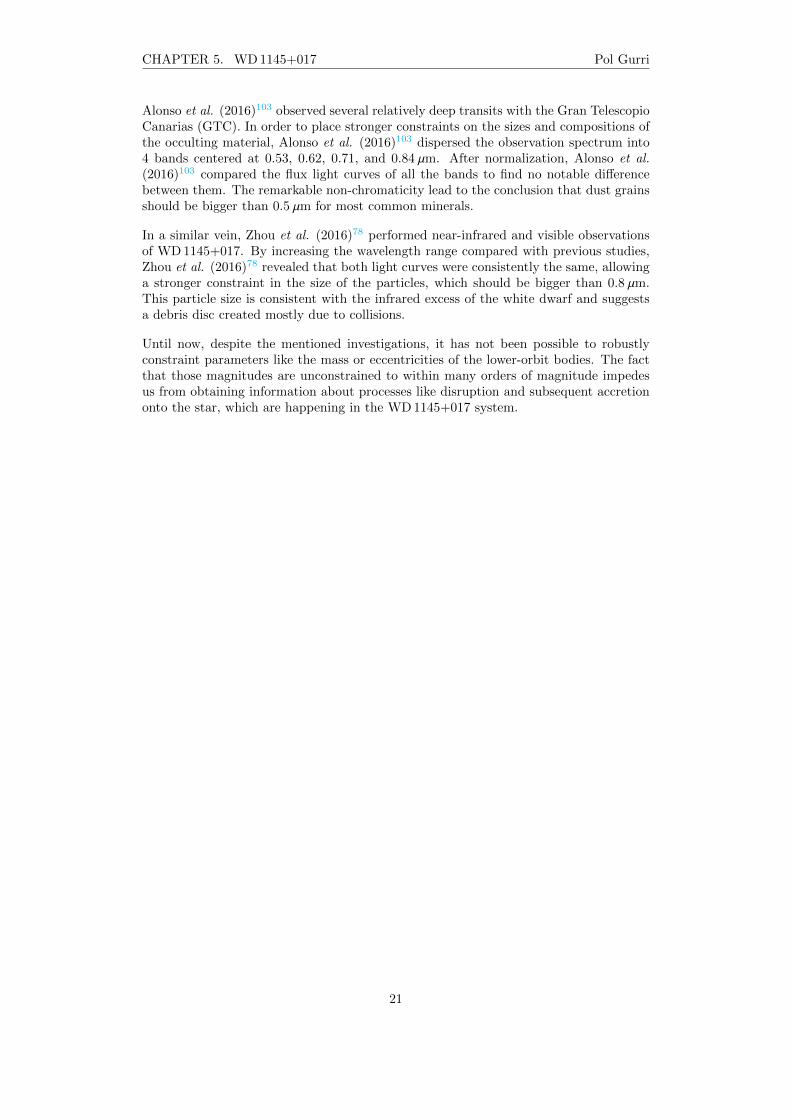
Over the last two decades, hundreds of white dwarfs have been surveyed for infraredexcess due to circumstellar disks.73 The first white dwarf with an infrared excess wasidentified by Zuckerman and Becklin (1987)74 and was later confirmed to posses a dustycircumstellar debris disk by Graham et al. (1990).75 The discovery of the second dustywhite dwarf came a decade later76,77 and to date, debris disks have been detected orbitingnearly 40 white dwarfs (e.g. Figure 4.1).
Figure 4.1: WD 1145+017 photometric excess evidencing the presence of a circumstellardebris disk. White data points show non- excess measurements, whilst black data pointsdenote wavebands with excess emission. From Zhou et al. (2016).78
Further reading about circumstellar disks.67,79
4.2 | Disks and metal pollution
To provide a complete review of the relevance of circumstellar disks orbiting whitedwarfs, it is necessary to introduce the concept of atmospheric metal contamination.Because of their nature, white dwarfs are ∼ 105 times as dense as the Sun. Consequently,due their strong gravitational field, the atmospheres of white dwarfs quickly separatelight elements from heavy ones.80 Lighter elements (i.e. hydrogen and helium) can befound in the top layers, which yields the main classification groups DA and DB (seeChapter 2). Metals (elements more massive than H or He other than C) sink reallyquickly (∼< 106 years) in these environments and it is impossible to detect them in theinteriors of white dwarfs via spectroscopy. Therefore, white dwarfs that are older than afew tens of mega-years should have atmospheres which are composed of a combination ofhydrogen, helium and carbon only (this last one coming from the carbon-rich nucleus).Nevertheless, some old white dwarfs exhibit strong traces of metals in their atmospheres.
16
CHAPTER 4. CIRCUMSTELLAR DISKS Pol Gurri
There are two possible origins for the atmospheric metal traces observed in white dwarfs:accretion from the interstellar medium or accretion from a remnant planetary system. Inboth cases the most probable scenario is that the accretion is facilitated by a circumstellardisk from which the white dwarf continuously renews its metal supply. No confidentlyreported debris disk around a single unpolluted white dwarf exists, suggesting a linkbetween pollution and disks. At least a few percent, and up to all white dwarfs, hostcircumstellar disks.81,82
Accretion from the interstellar medium was the most widely accepted theory to explainmetals in white dwarfs. The model predicts that white dwarfs can accrete enough ma-terial to pollute their atmospheres when going through dense regions of the interstellarmedium. Nevertheless, this approach faces two major obstacles. The first one is that,using proper motion studies, it is possible to know the past trajectory of the star, andin many cases, white dwarfs showing the presence of metals did not go though any rea-sonably dense cloud of interstellar medium. The second problem comes when tryingto explain DBZ white dwarfs, which show metals traces but no sign of hydrogen intheir atmospheres. Because the interstellar medium is composed mainly of hydrogen,metal polluted white dwarfs should also be accreting hydrogen and therefore present ahydrogen-rich atmosphere.
Nowadays, a planetary origin for the metal pollution is the accepted theory. This modelstates that the metals are accreted from a remnant planetary system that survived theevolution of the star. In this way, asteroids, planetesimals or planets are engulfed bythe white dwarf providing a reservoir of metals. There is plenty of evidence supportingthis suggestion. Debris disks, which are likely formed through orbiting disrupted bodies,are always found around metal polluted white dwarfs. Also, the chemical abundancesof white dwarf’s atmospheres are very similar to the bulk composition of planetesimalsorbiting our solar system (e.g.83). Finally, there have been recent observations of rockybodies disintegrating around a metal polluted white dwarf.56
The existence of a remnant planetary system also aids with the explanation of detecteddebris disks. The observed compact debris disks around white dwarfs cannot have formedduring the pre-white dwarf stage of the star because they would have been engulfedduring the red-giant phase. Also, because of their age and composition disks cannothave formed due to interstellar fallback as metals would have been already accreted.This yielded the currently accepted prediction to be that those disks are formed from thedisruption of bodies around the star.71,84 These bodies, expected to orbit eccentrically,can be disrupted by tidal forces and create a dusty debris disk around a white dwarffrom which to accrete enough metals to explain its metal pollution.85
Further reading about disks and metal pollution.67,86
17

5WD1145+017
5.1 | Relevance
Previous chapters 2, 3 and 4 provide necessary background to understand a basicdescription of the white dwarf WD 1145+017 and its system. The aim of this chapteris to present the importance of this white dwarf and provide a review of the researchperformed on the system.
Chapter 2 illustrates that white dwarfs are extremely dense objects usually classifiedby abundances in their atmospheres. Between 25 and 50% of all white dwarfs coolerthan 20,000 K exhibit the presence of elements heavier than hydrogen or helium in theiratmospheres.87–89 Due to the density of the star, these elements quickly (compared totheir cooling times) sink beneath the outer layers of hydrogen and/or helium. The de-tection of metals in white dwarfs atmospheres implies that heavy materials were recentlydeposited onto the surfaces of these stars (e.g.88,89).
Although it was suggested that this material originated from the interstellar mediumand was acreted to the star (e.g.90), there were many problems with this theory. High-resolution observations of these polluted white dwarfs display metal abundances similarto the ones of solar system objects,91 which helped with a new approach. The currentlyaccepted origin for these elements is that they come from massive rocky bodies that havebeen orbitally perturbed and tidally disrupted by the star.64 Then, material from thesebodies accretes onto the white dwarf.71,88
Chapter 3 explains that planets around main-sequence stars are rather common92,93
and that some of them are thought to keep orbiting the star during its white dwarftransformation.94,95 It also reviews the current detection mechanisms for exoplanetsand how difficult it is to detect them.
Chapter 4 describes how rocky bodies can be responsible for the creation of dusty cir-cumstellar debris disks around post main-sequence stars. These debris disks are thoughtto be an accretion mechanism for white dwarfs, linking the presence of metals in their
18
CHAPTER 5. WD 1145+017 Pol Gurri
atmospheres to circumstellar material near the star’s tidal disruption radius for rockymaterial.73,81,96,97 Dusty debris disks have been found around many of these pollutedwhite dwarfs by detecting an infrared excesses.74,96
The current accepted explanation for these observations is that the mass loss associatedwith the white dwarf transformation destabilizes the original planetary system to thepoint that rocky bodies get close enough to the white dwarf for tidal disruption. Hence,those fragmented bodies create a debris disk capable of polluting the white dwarf’satmosphere.64,85,98,99
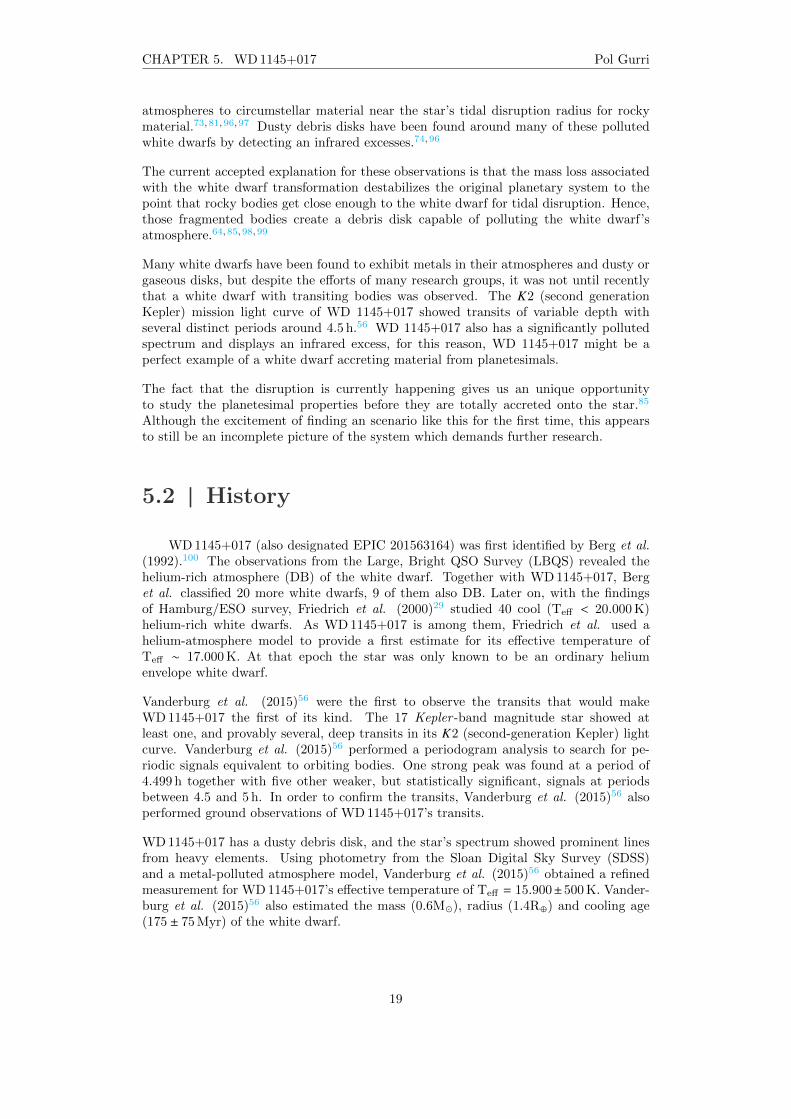
Many white dwarfs have been found to exhibit metals in their atmospheres and dusty orgaseous disks, but despite the efforts of many research groups, it was not until recentlythat a white dwarf with transiting bodies was observed. The K2 (second generationKepler) mission light curve of WD 1145+017 showed transits of variable depth withseveral distinct periods around 4.5 h.56 WD 1145+017 also has a significantly pollutedspectrum and displays an infrared excess, for this reason, WD 1145+017 might be aperfect example of a white dwarf accreting material from planetesimals.
The fact that the disruption is currently happening gives us an unique opportunityto study the planetesimal properties before they are totally accreted onto the star.85
Although the excitement of finding an scenario like this for the first time, this appearsto still be an incomplete picture of the system which demands further research.
5.2 | History
WD 1145+017 (also designated EPIC 201563164) was first identified by Berg et al.(1992).100 The observations from the Large, Bright QSO Survey (LBQS) revealed thehelium-rich atmosphere (DB) of the white dwarf. Together with WD 1145+017, Berget al. classified 20 more white dwarfs, 9 of them also DB. Later on, with the findingsof Hamburg/ESO survey, Friedrich et al. (2000)29 studied 40 cool (Teff < 20.000 K)helium-rich white dwarfs. As WD 1145+017 is among them, Friedrich et al. used ahelium-atmosphere model to provide a first estimate for its effective temperature ofTeff ∼ 17.000 K. At that epoch the star was only known to be an ordinary heliumenvelope white dwarf.
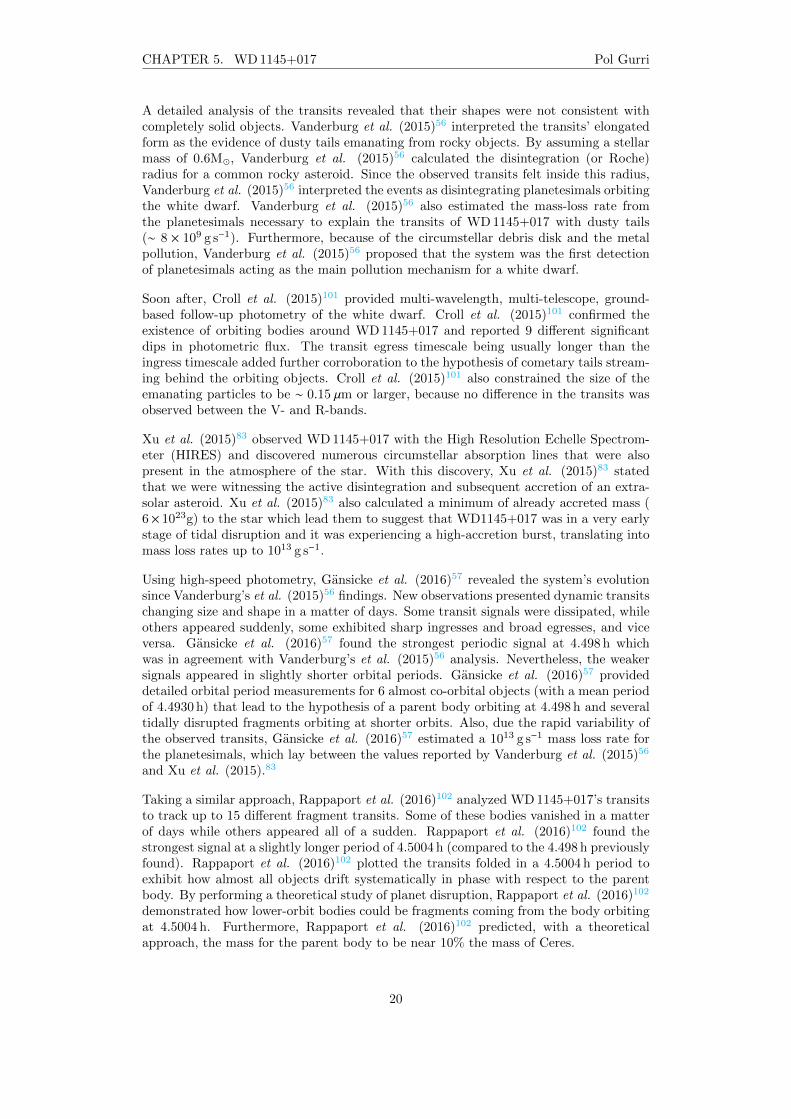
Vanderburg et al. (2015)56 were the first to observe the transits that would makeWD 1145+017 the first of its kind. The 17 Kepler -band magnitude star showed atleast one, and provably several, deep transits in its K2 (second-generation Kepler) lightcurve. Vanderburg et al. (2015)56 performed a periodogram analysis to search for pe-riodic signals equivalent to orbiting bodies. One strong peak was found at a period of4.499 h together with five other weaker, but statistically significant, signals at periodsbetween 4.5 and 5 h. In order to confirm the transits, Vanderburg et al. (2015)56 alsoperformed ground observations of WD 1145+017’s transits.
WD 1145+017 has a dusty debris disk, and the star’s spectrum showed prominent linesfrom heavy elements. Using photometry from the Sloan Digital Sky Survey (SDSS)and a metal-polluted atmosphere model, Vanderburg et al. (2015)56 obtained a refinedmeasurement for WD 1145+017’s effective temperature of Teff = 15.900±500 K. Vander-burg et al. (2015)56 also estimated the mass (0.6M�), radius (1.4R⊕) and cooling age(175 ± 75 Myr) of the white dwarf.
19
CHAPTER 5. WD 1145+017 Pol Gurri
A detailed analysis of the transits revealed that their shapes were not consistent withcompletely solid objects. Vanderburg et al. (2015)56 interpreted the transits’ elongatedform as the evidence of dusty tails emanating from rocky objects. By assuming a stellarmass of 0.6M�, Vanderburg et al. (2015)56 calculated the disintegration (or Roche)radius for a common rocky asteroid. Since the observed transits felt inside this radius,Vanderburg et al. (2015)56 interpreted the events as disintegrating planetesimals orbitingthe white dwarf. Vanderburg et al. (2015)56 also estimated the mass-loss rate fromthe planetesimals necessary to explain the transits of WD 1145+017 with dusty tails(∼ 8 × 10⁹ g s−1). Furthermore, because of the circumstellar debris disk and the metalpollution, Vanderburg et al. (2015)56 proposed that the system was the first detectionof planetesimals acting as the main pollution mechanism for a white dwarf.
Soon after, Croll et al. (2015)101 provided multi-wavelength, multi-telescope, ground-based follow-up photometry of the white dwarf. Croll et al. (2015)101 confirmed theexistence of orbiting bodies around WD 1145+017 and reported 9 different significantdips in photometric flux. The transit egress timescale being usually longer than theingress timescale added further corroboration to the hypothesis of cometary tails stream-ing behind the orbiting objects. Croll et al. (2015)101 also constrained the size of theemanating particles to be ∼ 0.15 µm or larger, because no difference in the transits wasobserved between the V- and R-bands.
Xu et al. (2015)83 observed WD 1145+017 with the High Resolution Echelle Spectrom-eter (HIRES) and discovered numerous circumstellar absorption lines that were alsopresent in the atmosphere of the star. With this discovery, Xu et al. (2015)83 statedthat we were witnessing the active disintegration and subsequent accretion of an extra-solar asteroid. Xu et al. (2015)83 also calculated a minimum of already accreted mass (6× 10²³g) to the star which lead them to suggest that WD1145+017 was in a very earlystage of tidal disruption and it was experiencing a high-accretion burst, translating intomass loss rates up to 1013 g s−1.
Using high-speed photometry, Gansicke et al. (2016)57 revealed the system’s evolutionsince Vanderburg’s et al. (2015)56 findings. New observations presented dynamic transitschanging size and shape in a matter of days. Some transit signals were dissipated, whileothers appeared suddenly, some exhibited sharp ingresses and broad egresses, and viceversa. Gansicke et al. (2016)57 found the strongest periodic signal at 4.498 h whichwas in agreement with Vanderburg’s et al. (2015)56 analysis. Nevertheless, the weakersignals appeared in slightly shorter orbital periods. Gansicke et al. (2016)57 provideddetailed orbital period measurements for 6 almost co-orbital objects (with a mean periodof 4.4930 h) that lead to the hypothesis of a parent body orbiting at 4.498 h and severaltidally disrupted fragments orbiting at shorter orbits. Also, due the rapid variability ofthe observed transits, Gansicke et al. (2016)57 estimated a 1013 g s−1 mass loss rate forthe planetesimals, which lay between the values reported by Vanderburg et al. (2015)56
and Xu et al. (2015).83
Taking a similar approach, Rappaport et al. (2016)102 analyzed WD 1145+017’s transitsto track up to 15 different fragment transits. Some of these bodies vanished in a matterof days while others appeared all of a sudden. Rappaport et al. (2016)102 found thestrongest signal at a slightly longer period of 4.5004 h (compared to the 4.498 h previouslyfound). Rappaport et al. (2016)102 plotted the transits folded in a 4.5004 h period toexhibit how almost all objects drift systematically in phase with respect to the parentbody. By performing a theoretical study of planet disruption, Rappaport et al. (2016)102
demonstrated how lower-orbit bodies could be fragments coming from the body orbitingat 4.5004 h. Furthermore, Rappaport et al. (2016)102 predicted, with a theoreticalapproach, the mass for the parent body to be near 10% the mass of Ceres.
20
CHAPTER 5. WD 1145+017 Pol Gurri
Alonso et al. (2016)103 observed several relatively deep transits with the Gran TelescopioCanarias (GTC). In order to place stronger constraints on the sizes and compositions ofthe occulting material, Alonso et al. (2016)103 dispersed the observation spectrum into4 bands centered at 0.53, 0.62, 0.71, and 0.84 µm. After normalization, Alonso et al.(2016)103 compared the flux light curves of all the bands to find no notable differencebetween them. The remarkable non-chromaticity lead to the conclusion that dust grainsshould be bigger than 0.5 µm for most common minerals.
In a similar vein, Zhou et al. (2016)78 performed near-infrared and visible observationsof WD 1145+017. By increasing the wavelength range compared with previous studies,Zhou et al. (2016)78 revealed that both light curves were consistently the same, allowinga stronger constraint in the size of the particles, which should be bigger than 0.8 µm.This particle size is consistent with the infrared excess of the white dwarf and suggestsa debris disc created mostly due to collisions.
Until now, despite the mentioned investigations, it has not been possible to robustlyconstraint parameters like the mass or eccentricities of the lower-orbit bodies. The factthat those magnitudes are unconstrained to within many orders of magnitude impedesus from obtaining information about processes like disruption and subsequent accretiononto the star, which are happening in the WD 1145+017 system.
21
6Simulation set up
6.1 | Motivation
With its unique nature, WD 1145+017 can help us shed some light on planetesimalsprocesses which are still poorly understood. Observations of this star have revealed thepresence of one parent body orbiting at a period of ∼ 4.5 h and at least six fragmentsorbiting at shorter (∼ 4.49 h) and constant periods (over ∼ 550 days). However, toaccurately describe the behaviour of the planetesimals around this white dwarf it isnecessary to improve the current constraints on their masses and eccentricities. This workapproaches the system from a computational point of view. In contrast to what observed,N-body simulations of the system show that, under specific configurations, planetaryfragments abandon their observational orbital periods. A computational approach cantherefore provide new insights into the stability and evolution of planetesimals aroundwhite dwarfs.
6.2 | Mercury Code
This work uses John E. Chambers’ (1999)104 Mercury as a numerical integratorto simulate the dynamics of the system orbiting WD 1145+017. Mercury code is aFortran package which specializes in modelling planetary dynamical evolution. The codewas created with the aim to offer a versatile way of studying the long-term stabilityof planetary systems and modelling the orbital evolution of different celestial bodies.Mercury is designed to understand both Cartesian and Keplerian elements and offersthe possibility to use different numerical integrators to monitor the trajectories of thebodies. Mercury also records details about close encounters, ejections and collisionsbetween objects.
22
CHAPTER 6. SIMULATION SET UP Pol Gurri
Mercury uses a set of “in” files which define the integration behaviour and producesa corresponding set of “out” files containing the trajectories and the results of the inte-gration:
In files are text documents that determine the initial conditions of all bodies and theway the code should perform the numerical integration. Usual configuration of Mercuryincludes “Big.in”, “Small.in”, “Param.in” and “Element.in” files.
– Big.in: The Big.in file contains the initial conditions of all bodies which are consid-ered massive. These bodies are the ones which would have a gravitational impacton other objects. Initial conditions are the position and velocities of the bodies(if using Cartesian coordinates) or the asteroidal components (if using Keplariancoordinates) at the beginning of the integration. This work considers all bodies asmassive bodies.
– Small.in: The Small.in file contains the initial conditions of all bodies considerednot massive. Not massive bodies are the ones that despite being affected by gravitydo not have an effect on other bodies. Initial conditions are specified in the sameway as in Big.in.
– Param.in: The Param.in file regulates the way the integration is going to beperformed. The file sets which integrator will be used (Bulirsh-Stoer (BS) , mixed-variable symplectic or a hybrid integrator), the time-step for the integrator (BSuses an automatic time-step), the length of the simulation (in days), the accuracyparameter and the variables that describe the central body (mass and radius of thecentral star).
– Element.in: The Element.in file determines the format of the output files. Thisfile defines whether the output trajectories of the bodies will be given with respectto a fixed central body in the origin (no orbital motion of the central star) or withrespect to the barycentric point fixed in the origin (accounting for orbital motionof the central star). Element.in also establishes the interval between outputs (howoften a point is added to a trajectory) and all the trajectory parameters to beprinted out at each output time-step.
Out files are text documents produced after the numerical integration. These filescontain information about the trajectories and interactions between the bodies. Usualconfiguration of Mercury includes “Body.aei” and “Info.out” files.
– Body.aei: Body.aei files are a set of documents containing the details of eachbody’s trajectory. For each output time-step the file shows the values for all thetrajectory parameters defined in the “Element.in” file . There is one “.aei” file foreach body.
– Info.out: The Info.out file contains a summary of the simulation. It shows theerror introduced by the integrator in terms of fractional energy change [AU2 days−2]and angular momentum change [AU2 days−1] of the system. It also shows theinteractions between bodies, which include close encounters (one body orbits closeto another), collisions (one body hits another one or the star) and ejections (onebody goes out of the simulation spacial domain).
The code used in this work is an slightly modified version of Mercury which includessome adjustments to better implement the effects of general relativity and to improvethe collision detection mechanism (for details see Veras et al. (2013)95).
23
CHAPTER 6. SIMULATION SET UP Pol Gurri
6.3 | Automatizing
The aim of this work is to simulate many different possible scenarios for the systemWD 1145+017 and compare their evolution with observations. For our initial conditionswe assume 6 co-orbital lighter bodies and a larger one orbiting a white dwarf with a massof 0.6M� and a radius of 1.4R⊕.
In order to accurately model interactions between planetesimals (a necessity for thisstudy) we use the Bulirsch-Stoer (BS) integrator which yields the best precision. Thisintegrator features an adaptive time-step, which is determined by a tolerance parametergiven at the start of the simulation. A tolerance of 10−12 is considered to be highlyaccurate105 and, therefore, we adopt it for these simulations. As a safety check, some ofthe simulations are also run again with an accuracy parameter of 10−13.
In this work we aim to constrain the mass and the eccentricity of all the orbiting bodies.Under the assumption that the lighter bodies are are tidally disrupted fragments of thesame parent body, we constraint the mass of the fragments to be between 0.01% and 20%of the parent body mass. For each simulation, every fragment is assigned a different andrandom value of mass within the specified range. Also, because no spatial configurationcan be resolved by observations, our simulations include initial mean anomalies drawnfrom a uniform random distribution.
The fact that fragments have been in the same orbits for at least ∼ 550 days suggeststhat they have low eccentricities because tidal disruption is a strong function of orbitalpericentre and almost independent of semimajor axis.85
Assuming no eccentricity for the fragments, the only parameters left to define are themass of the parent body and its eccentricity, henceforth (M,e) pair. In this work wesample permutations of (M,e) pairs and compute the evolution of the fragments over atime-span of 2 or 5 years. Because of the big number of (M,e) pairs and the fact thatmore than 50 simulations are performed per each (M,e) pair, an automatizing methodwas essential.
Because of the author’s experience in Matlab, the automatizing method is coded usingthis language. The code creates a copy of the Mercury package in a new folder witha specific name highlighting the special features it will contain ((M,e) pair and numberof simulation). All the In Files in the folder are then automatically modified just beforerunning the Fortran Mercury code. After the integration is completed, the code anal-yses the results and either performs changes in the current simulation or proceeds withthe next one. The automatized algorithm has to handle 3 different coding languages(Matlab, Fortrant and Bash), deal with large amounts of data and distribute tasks todifferent computers in order to decrease computation time.
24
7Results
7.1 | Mass and eccentricity constraints
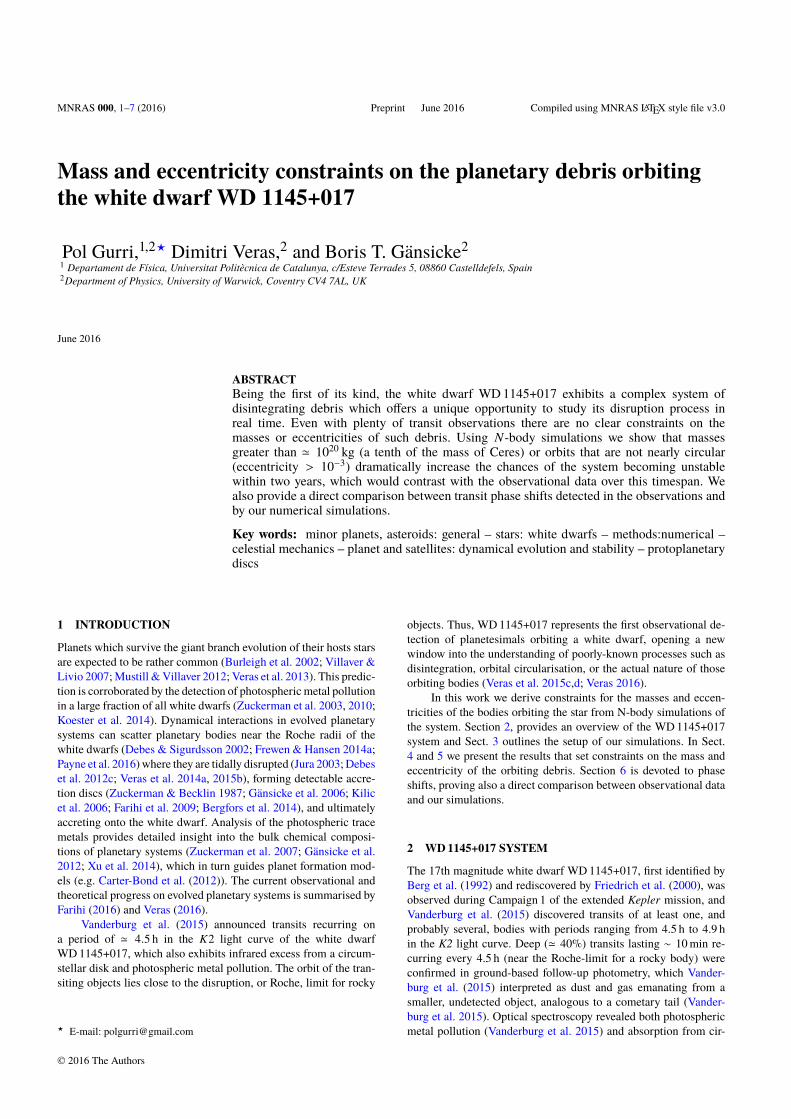
All the results obtained are presented in the following paper, which has alreadybeen submitted to MNRAS (Monthly Notices of the Royal Astronomical Society). Thepaper includes sections such as “Introduction”, “WD 1145+017 system” and “Simulationsetup” that are also included and covered more detailedly in this work.
25
MNRAS 000, 1–7 (2016) Preprint 20 June 2016 Compiled using MNRAS LATEX style file v3.0
Mass and eccentricity constraints on the planetary debris orbitingthe white dwarf WD 1145+017
Pol Gurri,1,2? Dimitri Veras,2 and Boris T. Gänsicke21 Departament de Física, Universitat Politècnica de Catalunya, c/Esteve Terrades 5, 08860 Castelldefels, Spain2Department of Physics, University of Warwick, Coventry CV4 7AL, UK
June 2016
ABSTRACTBeing the first of its kind, the white dwarf WD 1145+017 exhibits a complex system ofdisintegrating debris which o�ers a unique opportunity to study its disruption process inreal time. Even with plenty of transit observations there are no clear constraints on themasses or eccentricities of such debris. Using N-body simulations we show that massesgreater than ' 1020 kg (a tenth of the mass of Ceres) or orbits that are not nearly circular(eccentricity > 10�3) dramatically increase the chances of the system becoming unstablewithin two years, which would contrast with the observational data over this timespan. Wealso provide a direct comparison between transit phase shifts detected in the observations andby our numerical simulations.
Key words: minor planets, asteroids: general – stars: white dwarfs – methods:numerical –celestial mechanics – planet and satellites: dynamical evolution and stability – protoplanetarydiscs
1 INTRODUCTION
Planets which survive the giant branch evolution of their hosts starsare expected to be rather common (Burleigh et al. 2002; Villaver &Livio 2007; Mustill & Villaver 2012; Veras et al. 2013). This predic-tion is corroborated by the detection of photospheric metal pollutionin a large fraction of all white dwarfs (Zuckerman et al. 2003, 2010;Koester et al. 2014). Dynamical interactions in evolved planetarysystems can scatter planetary bodies near the Roche radii of thewhite dwarfs (Debes & Sigurdsson 2002; Frewen & Hansen 2014a;Payne et al. 2016) where they are tidally disrupted (Jura 2003; Debeset al. 2012c; Veras et al. 2014a, 2015b), forming detectable accre-tion discs (Zuckerman & Becklin 1987; Gänsicke et al. 2006; Kilicet al. 2006; Farihi et al. 2009; Bergfors et al. 2014), and ultimatelyaccreting onto the white dwarf. Analysis of the photospheric tracemetals provides detailed insight into the bulk chemical composi-tions of planetary systems (Zuckerman et al. 2007; Gänsicke et al.2012; Xu et al. 2014), which in turn guides planet formation mod-els (e.g. Carter-Bond et al. (2012)). The current observational andtheoretical progress on evolved planetary systems is summarised byFarihi (2016) and Veras (2016).
Vanderburg et al. (2015) announced transits recurring ona period of ' 4.5 h in the K2 light curve of the white dwarfWD 1145+017, which also exhibits infrared excess from a circum-stellar disk and photospheric metal pollution. The orbit of the tran-siting objects lies close to the disruption, or Roche, limit for rocky
? E-mail: [email protected]
objects. Thus, WD 1145+017 represents the first observational de-tection of planetesimals orbiting a white dwarf, opening a newwindow into the understanding of poorly-known processes such asdisintegration, orbital circularisation, or the actual nature of thoseorbiting bodies (Veras et al. 2015c,d; Veras 2016).
In this work we derive constraints for the masses and eccen-tricities of the bodies orbiting the star from N-body simulations ofthe system. Section 2, provides an overview of the WD 1145+017system and Sect. 3 outlines the setup of our simulations. In Sect.4 and 5 we present the results that set constraints on the mass andeccentricity of the orbiting debris. Section 6 is devoted to phaseshifts, proving also a direct comparison between observational dataand our simulations.
2 WD 1145+017 SYSTEM
The 17th magnitude white dwarf WD 1145+017, first identified byBerg et al. (1992) and rediscovered by Friedrich et al. (2000), wasobserved during Campaign 1 of the extended Kepler mission, andVanderburg et al. (2015) discovered transits of at least one, andprobably several, bodies with periods ranging from 4.5 h to 4.9 hin the K2 light curve. Deep (' 40%) transits lasting ⇠ 10 min re-curring every 4.5 h (near the Roche-limit for a rocky body) wereconfirmed in ground-based follow-up photometry, which Vander-burg et al. (2015) interpreted as dust and gas emanating from asmaller, undetected object, analogous to a cometary tail (Vander-burg et al. 2015). Optical spectroscopy revealed both photosphericmetal pollution (Vanderburg et al. 2015) and absorption from cir-
© 2016 The Authors
2 Gurri,Veras and Gänsicke
cumstellar gas (Xu et al. 2016), and an infrared excess detectedin the UKIDSS and WISE photometry confirmed the presence ofcircumstellar dust (Vanderburg et al. 2015).
High-speed photometry obtained by Gänsicke et al. (2016) overthe course of 15 nights in November and December 2016 revealedthe rapid evolution of the system since the discovery by Vanderburget al. (2015). Multiple transits typically lasting 3 � 12 min and withdepths of 10 � 60% were observed on every occasion. While thesetransit events changed depth and shape on time scales of days, Gän-sicke et al. (2016) could track six individual features over at leastthree individual observing nights, and concluded that at least sixobjects were orbiting WD 1145+017 on nearly identical orbits, witha mean period of 4.4930±0.0013 h. This period is significantly dis-tinct, and shorter, compared to the dominant 4.5 h period measuredby Vanderburg et al. (2015) from the K2 data. A few transits withsimilarly short periods were also detected by Croll et al. (2015).
Additional extensive photometry obtained with small-aperturetelescopes confirmed the presence of multiple objects with peri-ods of ' 4.493 h, as well as the 4.5 h period detected in the K2 data(Rappaport et al. 2016). Comparing these two distinct periods, Rap-paport et al. (2016) used an analytical model in which fragmentsdrift o� a Roche-lobe filling asteroid to estimate the mass of theasteroid to be ' 1020 kg, about one tenth of the mass of Ceres. Inthe context of this paper, we will refer to the object at ' 4.5 h as theparent body, and to the multiple objects with periods of ' 4.493 has fragments.
The physical nature of the obscuring material has been inves-tigated by Alonso et al. (2016) who obtained spectroscopic transitobservations through a wide slit. Binning their data into four bandscentred at 0.53, 0.62, 0.71, and 0.84 µm, Alonso et al. (2016) foundpractically no colour-dependence of the transit shapes and depths,and concluded that the particle size of the debris must be >⇠ 0.5µm.More recently, Zhou et al. (2016) obtained multi-band photometryspanning 0.5 � 1.2µm using several telescopes, and derived a 2�lower limit on the particle size of 0.8µm.
Several estimates of the current accretion rates were derivedfrom the dust extinction (' 8 ⇥ 106 kg s�1, Vanderburg et al. 2015;' 108 kg s�1, Gänsicke et al. 2016) and the gas absorption lines(' 109 kg s�1, Xu et al. 2016). The metal content of the white dwarfenvelope is ' 6.6 ⇥ 1020 kg (Xu et al. 2016), however, given thatthe time scales on which the metals di�use out of the envelope are afew 105 yr, it is not possible to unambiguously associate that metalcontent with the ongoing disruption event.
3 SIMULATION SETUP
Our N-body numerical simulations are based on a model ofWD 1145+017 that, while taking into account the results from therecent follow-up observations, ignores the detailed process of thetidal disruption of the bodies orbiting the white dwarf (Debes et al.2012a; Veras et al. 2014a), as well as e�ects such as collisionsand interactions with the debris disk, white dwarf radiation (Ve-ras et al. 2015c,a,d) or gas drag (Veras et al. 2015a,b) which mayplay an important role in the evolution of the system. The studyof Veras et al. (2016a) considered only equal-mass bodies in ini-tially strictly co-orbital configurations, an approach which is unsuit-able for WD 1145+017. We rather intend to provide understandingof many-body interactions specifically for the system harbouringWD 1145+017.
All simulations are performed using the N-Body code M��-���� (Chambers 1999) with some extra modifications which in-clude the e�ects of general relativity and improve the collision de-tection mechanism in the same way as used by Veras et al. (2013).Our simulations record the interactions between bodies for a dura-tion of at least two years, spanning approximately the observationalbaseline. We use a BS (Bulirsch-Stoer) integrator with an accuracyparameter of 10�12. For every set of simulations, a subset of themare re-run with a smaller accuracy parameter of 10�13 and resultsare double-checked using both Cartesian and Keplerian coordinates.
Each simulation recorded the interactions between a parentbody at an orbital period of 4.498h and six fragments at 4.493 horbiting a 0.6M� and 1.4R� white dwarf like WD 1145+017 (Van-derburg et al. 2015). The lack of strong observational evidencesupporting any specific orbital configuration for the bodies moti-vated us to randomly sample from a uniform distribution the initialmean anomalies for all bodies and simulations. Also, under the hy-pothesis of the fragments being tidally-disrupted parts of the parentbody, we assumed their masses to range from 0.01% to 20% of theparent body’s mass, and we lineally randomised the masses of allfragments for every simulation between those values. Therefore, theonly free, non-random parameter in our simulations was the massof the parent body.
4 MASS CONSTRAINTS
Being able to obtain an order-of-magnitude constraint on the massof the bodies was the first motivation of the simulations. Observa-tions suggest that the planetesimal(s) at WD 1145+017 have beenin the same, or very similar, orbits for at least ⇠ 500 days (Gänsickeet al. 2016) and therefore should have low eccentricities (tidal dis-ruption strongly correlates with orbital pericentre instead of semi-major axis (Veras et al. 2015c), meaning that highly eccentric orbitswould cause a rapid disruption of planetesimals). Thus, we imposedcompletely circular orbits for all bodies and ran simulations for anextended time of five years to gain insight into the time scale onwhich the system evolves. We gradually increased the parent body’smass, using 10 linearly-distributed values per decade in mass, from⇠ 1018 kg to ⇠ 1021 kg and performed 100 simulations for eachmass value. As a result, we obtained detailed trajectories for allbodies over time, allowing us to track changes in their orbital peri-ods.
Interactions between bodies can cause observationally measur-able deviations in the orbital periods (Veras et al. 2016a). Therefore,we monitored the di�erence that each body experienced betweenits orbital period during the simulation, T (t), and its initial orbitalperiod, T (0) = 4.493 h, which we will refer as �T (t) = T (t)�T (0).For each simulation, we only kept the maximum value of �T (t)among six fragments, �Tmax (see Figure 1). Performing 100 sim-ulations for each value of parent body’s mass yielded an averagemaximum period deviation h�Tmaxi which depended only on themass of the parent body.�Tmax provides insight into the stability of the system. Large
values of �Tmax >⇠ 20 s translates into fragments being greatly af-fected by the parent body and experiencing potentially detectablechanges in their orbital periods. With the periods of the fragmentsand the parent body being initially separated by ' 30 s, period de-viations up to 60 s resulted in some simulations where fragmentsentered new orbits around the parent body! In contrast, small perioddeviations imply a low level of interaction between bodies and agreater chance of long-term dynamical stability.
MNRAS 000, 1–7 (2016)
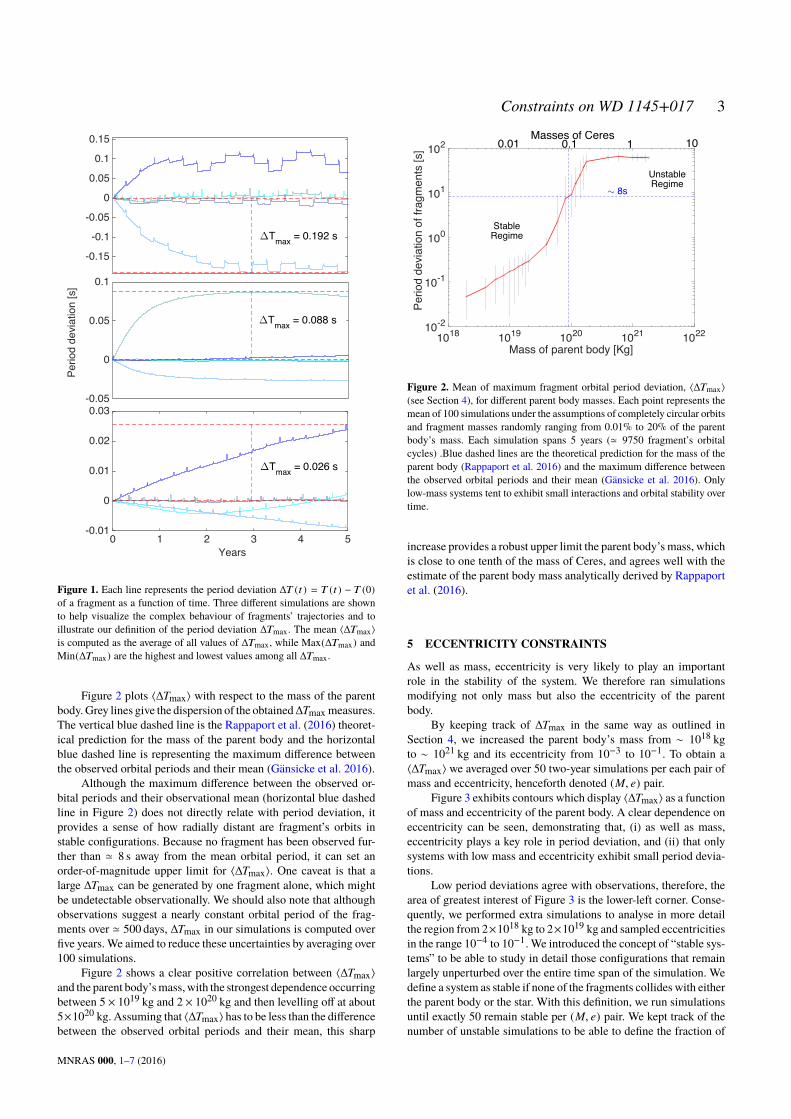
Constraints on WD 1145+017 3
-0.15
-0.1
-0.05
0
0.05
0.1
0.15
∆Tmax = 0.192 s
-0.05
0
0.05
0.1
∆Tmax = 0.088 s
Years0 1 2 3 4 5
Perio
d de
viat
ion
[s]
-0.01
0
0.01
0.02
0.03
∆Tmax = 0.026 s
Figure 1. Each line represents the period deviation �T (t ) = T (t ) � T (0)of a fragment as a function of time. Three di�erent simulations are shownto help visualize the complex behaviour of fragments’ trajectories and toillustrate our definition of the period deviation �Tmax. The mean h�Tmaxiis computed as the average of all values of �Tmax, while Max(�Tmax) andMin(�Tmax) are the highest and lowest values among all �Tmax.
Figure 2 plots h�Tmaxi with respect to the mass of the parentbody. Grey lines give the dispersion of the obtained�Tmax measures.The vertical blue dashed line is the Rappaport et al. (2016) theoret-ical prediction for the mass of the parent body and the horizontalblue dashed line is representing the maximum di�erence betweenthe observed orbital periods and their mean (Gänsicke et al. 2016).
Although the maximum di�erence between the observed or-bital periods and their observational mean (horizontal blue dashedline in Figure 2) does not directly relate with period deviation, itprovides a sense of how radially distant are fragment’s orbits instable configurations. Because no fragment has been observed fur-ther than ' 8 s away from the mean orbital period, it can set anorder-of-magnitude upper limit for h�Tmaxi. One caveat is that alarge �Tmax can be generated by one fragment alone, which mightbe undetectable observationally. We should also note that althoughobservations suggest a nearly constant orbital period of the frag-ments over ' 500 days, �Tmax in our simulations is computed overfive years. We aimed to reduce these uncertainties by averaging over100 simulations.
Figure 2 shows a clear positive correlation between h�Tmaxiand the parent body’s mass, with the strongest dependence occurringbetween 5 ⇥ 1019 kg and 2 ⇥ 1020 kg and then levelling o� at about5⇥1020 kg. Assuming that h�Tmaxi has to be less than the di�erencebetween the observed orbital periods and their mean, this sharp
Mass of parent body [Kg]1018 1019 1020 1021 1022
Perio
d de
viat
ion
of fr
agm
ents
[s]
10-2
10-1
100
101
102 101
∼ 8s
Masses of Ceres0.10.01
StableRegime
UnstableRegime
Figure 2. Mean of maximum fragment orbital period deviation, h�Tmaxi(see Section 4), for di�erent parent body masses. Each point represents themean of 100 simulations under the assumptions of completely circular orbitsand fragment masses randomly ranging from 0.01% to 20% of the parentbody’s mass. Each simulation spans 5 years (' 9750 fragment’s orbitalcycles) .Blue dashed lines are the theoretical prediction for the mass of theparent body (Rappaport et al. 2016) and the maximum di�erence betweenthe observed orbital periods and their mean (Gänsicke et al. 2016). Onlylow-mass systems tent to exhibit small interactions and orbital stability overtime.
increase provides a robust upper limit the parent body’s mass, whichis close to one tenth of the mass of Ceres, and agrees well with theestimate of the parent body mass analytically derived by Rappaportet al. (2016).
5 ECCENTRICITY CONSTRAINTS
As well as mass, eccentricity is very likely to play an importantrole in the stability of the system. We therefore ran simulationsmodifying not only mass but also the eccentricity of the parentbody.
By keeping track of �Tmax in the same way as outlined inSection 4, we increased the parent body’s mass from ⇠ 1018 kgto ⇠ 1021 kg and its eccentricity from 10�3 to 10�1. To obtain ah�Tmaxi we averaged over 50 two-year simulations per each pair ofmass and eccentricity, henceforth denoted (M, e) pair.
Figure 3 exhibits contours which display h�Tmaxi as a functionof mass and eccentricity of the parent body. A clear dependence oneccentricity can be seen, demonstrating that, (i) as well as mass,eccentricity plays a key role in period deviation, and (ii) that onlysystems with low mass and eccentricity exhibit small period devia-tions.
Low period deviations agree with observations, therefore, thearea of greatest interest of Figure 3 is the lower-left corner. Conse-quently, we performed extra simulations to analyse in more detailthe region from 2⇥1018 kg to 2⇥1019 kg and sampled eccentricitiesin the range 10�4 to 10�1. We introduced the concept of “stable sys-tems” to be able to study in detail those configurations that remainlargely unperturbed over the entire time span of the simulation. Wedefine a system as stable if none of the fragments collides with eitherthe parent body or the star. With this definition, we run simulationsuntil exactly 50 remain stable per (M, e) pair. We kept track of thenumber of unstable simulations to be able to define the fraction of
MNRAS 000, 1–7 (2016)

4 Gurri,Veras and Gänsicke
Mass of parent body [Kg]1019 1020 1021
Ecce
ntric
ity o
f par
ent b
ody
10-3
10-2
10-1
Perio
d de
viat
ion
of fr
agm
ents
[s]
0.1
0.3
1
3
10
60
Figure 3. Mean of maximum fragment orbital period deviation, h�Tmaxi(see Section 4), as a function of the parent body’s mass and eccentricity.Eccentricity and mass are sampled by 20 and 15 values, respectively, whichare logarithmically spaced, and the fragment masses are randomly drawnranging from 0.01% to 20% of the parent body’s mass. Each (M, e) pairrepresents the mean of 50, 2-year simulations. Low values of h�Tmaxi areonly found for both low parent body masses and low eccentricity.
Mass of parent body [x1018 Kg]2 3 4 5 6 7 8 910 11
Ecce
ntric
ity o
f par
ent b
ody
10-4
10-3
10-2
10-1
Inst
abilit
y %
5 6 8 101316202530506590
20
Figure 4. The fraction of unstable systems is defined as the ratio of 50 stablesimulations over the total number of simulations performed (see Section 5),and it is shown as function of the parent body’s mass and eccentricity. Stablesystems are defined as systems without collisions between fragments andparent or the star. There is a clear increase in the number of unstable systemswith larger eccentricities.
unstable systems per (M, e) pair, defined as the ratio of unstablesimulations (Nunstable) divided by the total number of simulationsperformed (Nunstable + 50).
Figure 4 plots the fraction of unstable systems as a contourplot. A clear positive correlation can be seen between fraction ofunstable systems and eccentricity, with a sharp increase in instabilityfor eccentricities greater than 10�3. Mass has a less drastic e�ectbut also increases instability, more evidently for masses greater than1019 kg.
Figure 5 plots h�Tmaxi of the 50 stable solutions found per(M, e) pair, both on linear and logarithmic eccentricity scales. Acomparison between Figures 4 and 5 highlights how highly unstableregions (i.e. larger eccentricities) can still host systems with low
0
Mass of parent body [x1018 Kg]2 3 4 5 6 7 8 910 11
Ecce
ntric
ity o
f par
ent b
ody
0.01
0.02
0.03
0.04
0.05
0.06
0.07
0.08
0.09
0.1
Perio
d de
viat
ion
of fr
agm
ents
[s]
0.1
0.3
1
3
10
60
20
Mass of parent body [x1018 Kg]2 3 4 5 6 7 8 910 11
Ecce
ntric
ity o
f par
ent b
ody
10-4
10-3
10-2
10-1
Perio
d de
viat
ion
of fr
agm
ents
[s]
0.1
0.3
1
3
10
60
20
Figure 5. Mean of maximum fragment orbital period deviation, h�Tmaxi(see Section 4), averaged for 50 stable simulations per (M, e) pair (seeSection 5), shown on a linear scale in the top panel and on a logarithmicscale below. While systems with high eccentricities of up to ' 0.1 are rarelystable (Fig. 4), they can have low h�Tmaxi.
�Tmax – however, at a much reduced likelihood. The bottom panel ofFigure 5 emphasizes the mass dependence of h�Tmaxi even for stablescenarios. Stable systems with masses higher than 1019kg exhibithigh perturbations which most probably will lead to collisions in thefuture. Alternatively, eccentricity does not show a prominent e�ecton stable, low-mass (< 1019kg) systems.
Figure 6 displays the temporal evolution of stable systems. Wecomputed not only h�Tmaxi but also Max(�Tmax) and Min(�Tmax),being the maximum and minimum of �Tmax recorded in the 50 sta-ble simulations. Max(�Tmax), h�Tmaxi and Min(�Tmax) are plottedat three di�erent epochs throughout the simulations, six months,one year and two years after the start of the simulation. Figure 6reveals that there is not a noticeable variation of either Max(�Tmax),h�Tmaxi or Min(�Tmax) over time, meaning that stable systems donot evolve strongly with time and are robust regardless of samplingtime. This finding is important because it ensures compatibility, andpermits direct comparisons, between simulations that last years andobservational data that only spans months.
MNRAS 000, 1–7 (2016)

Constraints on WD 1145+017 5
2 3 4 5 6 7 8 910 11 2 3 4 5 6 7 8 910 11
Max Average Min
2y
1y
0.5y
Ecce
ntric
ity o
f par
ent b
ody
Mass of parent body [x1018 Kg]
10-4
10-3
10-2
10-1
Perio
d de
viat
ion
of fr
agm
ents
[s]
0.1
0.3
1
3
10
60
10-4
10-3
10-2
10-1
2 3 4 5 6 7 8 910 1110-4
10-3
10-2
10-1
20 20 20
Figure 6. Max(�Tmax), h�Tmaxi and Min(�Tmax) for 50 stable simulations (see Section 5), as a function of the parent body’s mass and eccentricity. All plotsare repeated for three di�erent epochs throughout the simulations: six months, one year and two years after the start of the simulation. The number of analysedvalues as well as assumptions are the same than in Figure 3. This figure illustrates the long-term robustness of stable systems over extended periods of time.
Ecce
ntric
ity o
f par
ent
2 3 4 5 6 7 8910 2010-4
10-3
10-2
10-1
Frag
men
t shi
fts
0.94
0.95
0.96
0.97
0.98
0.99
1
2 3 4 5 6 7 8910 200.94
0.942
0.944
0.946
0.948
0.95
Maxθ ⟨ θ ⟩ Minθ
Mass of parent body [x1018 Kg]
2 3 4 5 6 7 8910 200.6
0.65
0.7
0.75
0.8
0.85
0.9
Figure 7. Max(✓), h✓i and Min(✓) phase shifts in orbital cycles after 80 days (see Section 6) for 50 stable simulations, with respect to mass and eccentricity ofthe parent body. Max(✓) and Min(✓) show the same structure as Figure 5, while h✓i remains almost constant regardless of mass or eccentricity, meaning thaton average, all fragments shift on phase in a similar way.
6 PHASE SHIFTS
The fact that the parent body and the fragments have di�erent or-bital periods o�ers the possibility to determine phase shifts betweenthem. By folding the transit signals of the fragments onto the par-ent’s period, Rappaport et al. (2016) illustrated how the phase ofthe transit features shifts from night to night. Because �Tmax of
stable systems remains almost constant in time, we used the stablesimulations of Section 5 to calculate these phase shifts and obtain adirect comparison between observational data and our simulations.
In order to determine an average phase shift, h✓i, we computedthe ratio between the period of each fragment and the parent’sone, ✓ = Tfrag/Tparent , at each time step of the simulation (i.e.
MNRAS 000, 1–7 (2016)
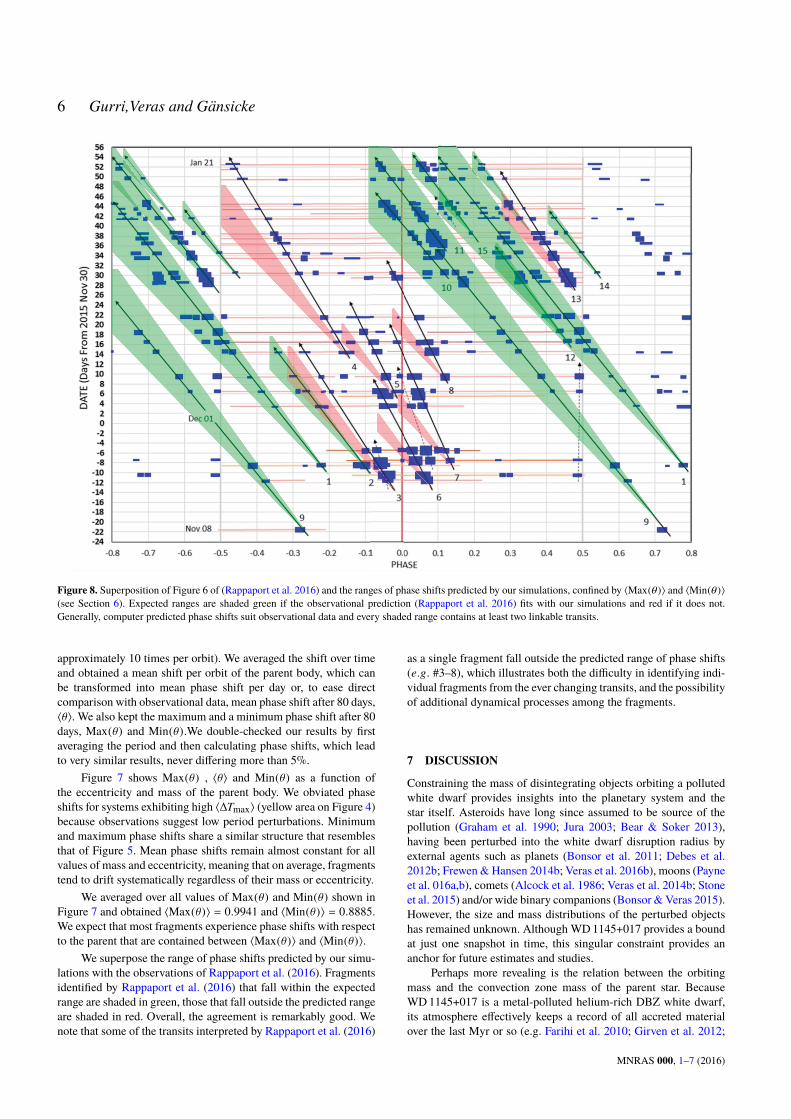
6 Gurri,Veras and Gänsicke
Figure 8. Superposition of Figure 6 of (Rappaport et al. 2016) and the ranges of phase shifts predicted by our simulations, confined by hMax(✓)i and hMin(✓)i(see Section 6). Expected ranges are shaded green if the observational prediction (Rappaport et al. 2016) fits with our simulations and red if it does not.Generally, computer predicted phase shifts suit observational data and every shaded range contains at least two linkable transits.
approximately 10 times per orbit). We averaged the shift over timeand obtained a mean shift per orbit of the parent body, which canbe transformed into mean phase shift per day or, to ease directcomparison with observational data, mean phase shift after 80 days,h✓i. We also kept the maximum and a minimum phase shift after 80days, Max(✓) and Min(✓).We double-checked our results by firstaveraging the period and then calculating phase shifts, which leadto very similar results, never di�ering more than 5%.
Figure 7 shows Max(✓) , h✓i and Min(✓) as a function ofthe eccentricity and mass of the parent body. We obviated phaseshifts for systems exhibiting high h�Tmaxi (yellow area on Figure 4)because observations suggest low period perturbations. Minimumand maximum phase shifts share a similar structure that resemblesthat of Figure 5. Mean phase shifts remain almost constant for allvalues of mass and eccentricity, meaning that on average, fragmentstend to drift systematically regardless of their mass or eccentricity.
We averaged over all values of Max(✓) and Min(✓) shown inFigure 7 and obtained hMax(✓)i = 0.9941 and hMin(✓)i = 0.8885.We expect that most fragments experience phase shifts with respectto the parent that are contained between hMax(✓)i and hMin(✓)i.
We superpose the range of phase shifts predicted by our simu-lations with the observations of Rappaport et al. (2016). Fragmentsidentified by Rappaport et al. (2016) that fall within the expectedrange are shaded in green, those that fall outside the predicted rangeare shaded in red. Overall, the agreement is remarkably good. Wenote that some of the transits interpreted by Rappaport et al. (2016)
as a single fragment fall outside the predicted range of phase shifts(e.g. #3–8), which illustrates both the di�culty in identifying indi-vidual fragments from the ever changing transits, and the possibilityof additional dynamical processes among the fragments.
7 DISCUSSION
Constraining the mass of disintegrating objects orbiting a pollutedwhite dwarf provides insights into the planetary system and thestar itself. Asteroids have long since assumed to be source of thepollution (Graham et al. 1990; Jura 2003; Bear & Soker 2013),having been perturbed into the white dwarf disruption radius byexternal agents such as planets (Bonsor et al. 2011; Debes et al.2012b; Frewen & Hansen 2014b; Veras et al. 2016b), moons (Payneet al. 016a,b), comets (Alcock et al. 1986; Veras et al. 2014b; Stoneet al. 2015) and/or wide binary companions (Bonsor & Veras 2015).However, the size and mass distributions of the perturbed objectshas remained unknown. Although WD 1145+017 provides a boundat just one snapshot in time, this singular constraint provides ananchor for future estimates and studies.
Perhaps more revealing is the relation between the orbitingmass and the convection zone mass of the parent star. BecauseWD 1145+017 is a metal-polluted helium-rich DBZ white dwarf,its atmosphere e�ectively keeps a record of all accreted materialover the last Myr or so (e.g. Farihi et al. 2010; Girven et al. 2012;
MNRAS 000, 1–7 (2016)
Constraints on WD 1145+017 7
Xu & Jura 2012). All this material may arise from the accretionof a single object, or multiple objects. The measured convectionzone masses in DBZ white dwarfs range from about 1016 kg to1023 kg, which roughly encompasses the mass range of Saturn’smoon Phobos to Jupiter’s moon Europa. The maximum mass of theobjects orbiting WD 1145+017 (⇠ 1021 kg) towards the upper endof this range (see Fig. 6 of Veras 2016).
8 CONCLUSIONS
Despite many on-going observations of WD 1145+017, it has notbeen possible to robustly constrain the mass and eccentricity of theorbiting debris. We have performed N-body simulations to gain in-sight on such uncertainties and revealed that either masses greaterthan ' 1020 kg (0.1 the mass of Ceres) or orbits that are not nearlycircular (eccentricity > 10�3) increase the likelihood of dynam-ical instability during the timespan of the observations. We alsocomputed an expected phase shift for the orbiting bodies, whichallowed us to validate most of the objects detected by Rappaportet al. (2016).
Future work could include a disruption model for the disinte-grating bodies. This model might help better pinpoint the disrup-tion radius of WD 1145+017 as well as understand poorly-knownprocesses such as the disruption and accretion of planetesimals inmain-sequence planetary systems (Rappaport et al. 2012; Croll et al.2014; Rappaport et al. 2014; Bochinski et al. 2015; Sanchis-Ojedaet al. 2015).
ACKNOWLEDGMENTS
The undergraduate exchange program of Engineering Physics fromUPC (BarcelonaTech) made this research possible.
DV and BTG have received funding from the EuropeanResearch Council under the European Union’s Seventh Frame-work Programme (FP/2007-2013)/ERC Grant Agreement n. 320964(WDTracer).
REFERENCESAlcock C., Fristrom C. C., Siegelman R., 1986, ApJ, 302, 462Alonso R., Rappaport S., Deeg H. J., Palle E., 2016, preprint,
(arXiv:1603.08823)Bear E., Soker N., 2013, New Astron., 19, 56Berg C., Wegner G., Foltz C. B., Cha�ee Jr. F. H., Hewett P. C., 1992, ApJS,
78, 409Bergfors C., Farihi J., Dufour P., Rocchetto M., 2014, MNRAS, 444, 2147Bochinski J. J., Haswell C. A., Marsh T. R., Dhillon V. S., Littlefair S. P.,
2015, ApJ, 800, L21Bonsor A., Veras D., 2015, MNRAS, 454, 53Bonsor A., Mustill A. J., Wyatt M. C., 2011, MNRAS, 414, 930Burleigh M. R., Clarke F. J., Hodgkin S. T., 2002, MNRAS, 331, L41Carter-Bond J. C., O’Brien D. P., Raymond S. N., 2012, ApJ, 760, 44Chambers J. E., 1999, MNRAS, 304, 793Croll B., et al., 2014, ApJ, 786, 100Croll B., et al., 2015, preprint, (arXiv:1510.06434)Debes J. H., Sigurdsson S., 2002, ApJ, 572, 556Debes J. H., Walsh K. J., Stark C., 2012a, ApJ, 747, 148Debes J. H., Walsh K. J., Stark C., 2012b, ApJ, 747, 148Debes J. H., Kilic M., Faedi F., Shkolnik E. L., Lopez-Morales M., Wein-
berger A. J., Slesnick C., West R. G., 2012c, ApJ, 754, 59Farihi J., 2016, New Astron. Rev., 71, 9Farihi J., Jura M., Zuckerman B., 2009, ApJ, 694, 805
Farihi J., Barstow M. A., Redfield S., Dufour P., Hambly N. C., 2010,MNRAS, 404, 2123
Frewen S. F. N., Hansen B. M. S., 2014a, MNRAS, 439, 2442Frewen S. F. N., Hansen B. M. S., 2014b, MNRAS, 439, 2442Friedrich S., Koester D., Christlieb N., Reimers D., Wisotzki L., 2000, A&A,
363, 1040Gänsicke B. T., Marsh T. R., Southworth J., Rebassa-Mansergas A., 2006,
Science, 314, 1908Gänsicke B. T., Koester D., Farihi J., Girven J., Parsons S. G., Breedt E.,
2012, MNRAS, 424, 333Gänsicke B. T., et al., 2016, ApJ, 818, L7Girven J., Brinkworth C. S., Farihi J., Gänsicke B. T., Hoard D. W., Marsh
T. R., Koester D., 2012, ApJ, 749, 154Graham J. R., Matthews K., Neugebauer G., Soifer B. T., 1990, ApJ, 357,
216Jura M., 2003, ApJ, 584, L91Kilic M., von Hippel T., Leggett S. K., Winget D. E., 2006, ApJ, 646, 474Koester D., Gänsicke B. T., Farihi J., 2014, A&A, 566, A34Mustill A. J., Villaver E., 2012, ApJ, 761, 121Payne M. J., Veras D., Holman M. J., Gänsicke B. T., 2016, MNRAS, 457,
217Payne M. J., Veras D., Holman M. J., Gänsicke B. T., 2016a, MNRAS, 457,
217Payne M. J., Veras D., Gänsicke B. T., Holman M. J., 2016b, Submitted to
MNRASRappaport S., et al., 2012, ApJ, 752, 1Rappaport S., Barclay T., DeVore J., Rowe J., Sanchis-Ojeda R., Still M.,
2014, ApJ, 784, 40Rappaport S., Gary B. L., Kaye T., Vanderburg A., Croll B., Benni P., Foote
J., 2016, preprint, (arXiv:1602.00740)Sanchis-Ojeda R., et al., 2015, ApJ, 812, 112Stone N., Metzger B. D., Loeb A., 2015, MNRAS, 448, 188Vanderburg A., et al., 2015, Nature, 526, 546Veras D., 2016, Royal Society Open Science, 3, 150571Veras D., Mustill A. J., Bonsor A., Wyatt M. C., 2013, MNRAS, 431, 1686Veras D., Leinhardt Z. M., Bonsor A., Gänsicke B. T., 2014a, MNRAS, 445,
2244Veras D., Shannon A., Gänsicke B. T., 2014b, MNRAS, 445, 4175Veras D., Eggl S., Gänsicke B. T., 2015a, MNRAS, 451, 2814Veras D., Leinhardt Z. M., Eggl S., Gänsicke B. T., 2015b, MNRAS, 451,
3453Veras D., Leinhardt Z. M., Eggl S., Gänsicke B. T., 2015c, MNRAS, 451,
3453Veras D., Eggl S., Gänsicke B. T., 2015d, MNRAS, 452, 1945Veras D., Marsh T. M., Gänsicke B. T., 2016a, Submitted to MNRASVeras D., Mustill A. J., Gänsicke B. T., Redfield S., Georgakarakos N.,
Bowler A. B., Lloyd M. J. S., 2016b, MNRAS, 458, 3942Villaver E., Livio M., 2007, ApJ, 661, 1192Xu S., Jura M., 2012, ApJ, 745, 88Xu S., Jura M., Koester D., Klein B., Zuckerman B., 2014, ApJ, 783, 79Xu S., Jura M., Dufour P., Zuckerman B., 2016, ApJ, 816, L22Zhou G., et al., 2016, preprint, (arXiv:1604.07405)Zuckerman B., Becklin E. E., 1987, Nature, 330, 138Zuckerman B., Koester D., Reid I. N., Hünsch M., 2003, ApJ, 596, 477Zuckerman B., Koester D., Melis C., Hansen B. M., Jura M., 2007, ApJ,
671, 872Zuckerman B., Melis C., Klein B., Koester D., Jura M., 2010, ApJ, 722, 725
MNRAS 000, 1–7 (2016)
8Conclusions
In this work we review the essentials for a basic understanding of the WD 1145+017system, which offers for the first time a unique opportunity to validate a tidal disruptionmodel that has long been theorised. While WD 1145+017 system has been subject toa number of detailed observational follow-up studies, relatively little is known about itsdisintegrating planetary system. By taking a different and complementary approach,we performed numerical simulations with the aim to alleviate the dearth of constraintsdefining WD 1145+017’s orbiting bodies.
Using N-body simulations we have been able to recreate the temporal evolution of thesystem and reproduce the interactions between the orbiting bodies. By keeping trackof the orbital period, we have constrained under which circumstances our simulationsmost resemble the reality. We presented that debris with large masses (m > ∼1020 kg)or eccentricities (e > ∼10−3) cause long-term dynamical instabilities that would counterobservations. We also provided a direct comparison between our simulations and obser-vations by recreating phase shifts between debris, which have been a major source ofobservational information for the system.
Although this work specially focuses on WD 1145+017, it may provide a first estimate forfuture studies on disintegrating objects orbiting a white dwarf. The obtained mass andeccentricity constraints help to better estimate the disruption radius of a star, provide anorder-of-magnitude approximation for disk properties and better understand processessuch as disintegration, orbital circularisation and the actual nature of those orbitingbodies.
Despite the insight provided by this work, there is still much room for new research onthe system. New simulations could include tidal disruption models, interaction with thedusty and gaseous disk or a better model of the white dwarf. Additionally, numericalmodel’s precision will improve when more observations are available. In preparation, wehave already started to study new light-curves to better understand the system and theprocesses behind it.
33
Bibliography
1 L. G. Althaus, A. H. Corsico, J. Isern, and E. Garcıa-Berro. Evolutionary and pulsa-tional properties of white dwarf stars. Astronomy and Astrophysics Reviews, 18:471–566, October 2010. http://adsabs.harvard.edu/abs/2010A%26ARv..18..471A.
2 D. Koester. White Dwarf Stars, page 559. 2013. http://adsabs.harvard.edu/abs/2013pss4.book..559K.
3 M. A. Wood. Astero-Archaeology: Reading the Galactic History Recorded in theWhite Dwarf Stars. Publications of the ASP, 102:954, August 1990. http://adsabs.harvard.edu/abs/1990PASP..102..954W.
4 H. N. Russell. Relations Between the Spectra and Other Characteristics of the Stars.Popular Astronomy, 22:331–351, June 1914. http://adsabs.harvard.edu/abs/1914PA.....22..331R.
5 W. S. Adams. An A-Type Star of Very Low Luminosity. Publications of the ASP,26:198, October 1914. http://adsabs.harvard.edu/abs/1914PASP...26..198A.
6 W. S. Adams. The Spectrum of the Companion of Sirius. Publications of the ASP,27:236, December 1915. http://adsabs.harvard.edu/abs/1915PASP...27..236A.
7 W. S. Adams. The relativity displacement of the spectral lines in the companion ofSirius. The Observatory, 48:337–342, November 1925. http://adsabs.harvard.edu/abs/1925Obs....48..337A.
8 H. N. Russell. REVIEW: The Internal Constitution of the Stars by A. S. Edding-ton. Astrophysical Journal, 67:83, January 1928. http://adsabs.harvard.edu/abs/1928ApJ....67...83R.
9 R. H. Fowler. On dense matter. Monthly Notices of the RAS, 87:114–122, December1926. http://adsabs.harvard.edu/abs/1926MNRAS..87..114F.
10 P. A. M. Dirac. On the Theory of Quantum Mechanics. Proceedings of the RoyalSociety of London Series A, 112:661–677, October 1926. http://adsabs.harvard.edu/abs/1926RSPSA.112..661D.
11 W. Anderson. Gewohnliche Materie und strahlende Energie als verschiedene#8222Phasen“ eines und desselben Grundstoffes. Zeitschrift fur Physik, 54:433–444,May 1929. http://adsabs.harvard.edu/abs/1929ZPhy...54..433A.
12 E. Stoner. The Equilibrium of Dense Stars. The London, Edinburgh, and Dublin Philo-sophical Magazine and Journal of Science: Series 7, Volume 9, Issue 60, p. 944-963,9:944–963, January 1930. http://adsabs.harvard.edu/abs/1930LEDPM...9..944S.
13 S. Chandrasekhar. The Maximum Mass of Ideal White Dwarfs. Astrophysical Journal,
34
BIBLIOGRAPHY Pol Gurri
74:81, July 1931. http://adsabs.harvard.edu/abs/1931ApJ....74...81C.
14 S. Chandrasekhar. An introduction to the study of stellar structure. 1939. http://adsabs.harvard.edu/abs/1939isss.book.....C.
15 D. D. Clayton. Principles of stellar evolution and nucleosynthesis. 1968. http://adsabs.harvard.edu/abs/1968psen.book.....C.
16 J. B. Holberg. How Degenerate Stars Came to be Known as White Dwarfs. In Amer-ican Astronomical Society Meeting Abstracts, volume 37 of Bulletin of the AmericanAstronomical Society, page 1503, December 2005. http://adsabs.harvard.edu/abs/2005AAS...20720501H.
17 J. H. Jeans. The Stability of a Spherical Nebula. Philosophical Transactions of theRoyal Society of London Series A, 199:1–53, 1902. http://adsabs.harvard.edu/abs/1902RSPTA.199....1J.
18 E. Hertzsprung. Uber die photographische Schwarzungskurve. AstronomischeNachrichten, 190:119, December 1911. http://adsabs.harvard.edu/abs/1911AN....190..119H.
19 E. Garcia-Berro, M. Hernanz, J. Isern, and R. Mochkovitch. Properties of high-density binary mixtures and the age of the universe from white dwarf stars. Nature,333:642–644, June 1988. http://adsabs.harvard.edu/abs/1988Natur.333..642G.
20 D. E. Winget, C. J. Hansen, J. Liebert, H. M. van Horn, G. Fontaine, R. E. Nather,S. O. Kepler, and D. Q. Lamb. An independent method for determining the age ofthe universe. Astrophysical Journal, 315:L77–L81, April 1987. http://adsabs.harvard.edu/abs/1987ApJ...315L..77W.
21 H. A. Bethe. Energy Production in Stars. Physical Review, 55:434–456, March 1939.http://adsabs.harvard.edu/abs/1939PhRv...55..434B.
22 W. A. Fowler. Experimental and theoretical nuclear astrophysics: the quest for theorigin of the elements. Reviews of Modern Physics, 56:149–179, April 1984. http://adsabs.harvard.edu/abs/1984RvMP...56..149F.
23 D. Koester, H. Schulz, and V. Weidemann. Atmospheric parameters and mass dis-tribution of DA white dwarfs. Astronomy and Astrophysics, 76:262–275, July 1979.http://adsabs.harvard.edu/abs/1979A%26A....76..262K.
24 E. M. Sion, J. L. Greenstein, J. D. Landstreet, J. Liebert, H. L. Shipman, and G. A.Wegner. A proposed new white dwarf spectral classification system. Astrophysi-cal Journal, 269:253–257, June 1983. http://adsabs.harvard.edu/abs/1983ApJ...269..253S.
25 A. Renzini. Mass loss and stellar evolution. In B. E. Westerlund, editor, Stars andstar systems, volume 75 of Astrophysics and Space Science Library, pages 155–171,1979. http://adsabs.harvard.edu/abs/1979ASSL...75..155R.
26 T. Blocker. Evolution on the AGB and beyond: on the formation of H-deficientpost-AGB stars. Astrophysics and Space Science, 275:1–14, January 2001. http://adsabs.harvard.edu/abs/2001Ap%26SS.275....1B.
27 J. L. Greenstein. Spectrophotometry of the white dwarfs. Astrophysical Journal,276:602–620, January 1984. http://adsabs.harvard.edu/abs/1984ApJ...276..602G.
35
BIBLIOGRAPHY Pol Gurri
28 G. Fontaine and F. Wesemael. Recent advances in the theory of white dwarf spectralevolution. In A. G. D. Philip, D. S. Hayes, and J. W. Liebert, editors, IAU Colloq. 95:Second Conference on Faint Blue Stars, pages 319–326, 1987. http://adsabs.harvard.edu/abs/1987fbs..conf..319F.
29 S. Friedrich, D. Koester, N. Christlieb, D. Reimers, and L. Wisotzki. Cool helium-richwhite dwarfs from the Hamburg/ESO survey. Astronomy and Astrophysics, 363:1040–1050, November 2000. http://adsabs.harvard.edu/abs/2000A%26A...363.1040F.
30 L. Mestel. On the theory of white dwarf stars. I. The energy sources of whitedwarfs. Monthly Notices of the RAS, 112:583, 1952. http://adsabs.harvard.edu/abs/1952MNRAS.112..583M.
31 G. Beaudet, V. Petrosian, and E. E. Salpeter. Energy Losses due to Neutrino Pro-cesses. Astrophysical Journal, 150:979, December 1967. http://adsabs.harvard.edu/abs/1967ApJ...150..979B.
32 I. Renedo, L. G. Althaus, M. M. Miller Bertolami, A. D. Romero, A. H. Corsico,R. D. Rohrmann, and E. Garcıa-Berro. New Cooling Sequences for Old WhiteDwarfs. Astrophysical Journal, 717:183–195, July 2010. http://adsabs.harvard.edu/abs/2010ApJ...717..183R.
33 I. Kant. Universal natural history and theory of the heavens. Ann Arbor paper-backs. University of Michigan Press, 1969. https://books.google.co.uk/books?id=HvPWAAAAMAAJ.
34 P.S. de Laplace. Exposition du systeme du monde. Courcier, 1808. https://books.google.co.uk/books?id=JTEAAAAAQAAJ.
35 R.P. Miller. Rene Descartes: Principles of Philosophy: Translated, with ExplanatoryNotes. Synthese Historical Library. Springer Netherlands, 1984. https://books.google.co.uk/books?id=8vt0uWWVzEYC.
36 C. F. V. Weizsacker. Uber die Entstehung des Planetensystems. Mit 2 Abbildungen.Zeitschrift fuer Astrophysik, 22:319, 1944. http://adsabs.harvard.edu/abs/1943ZA.....22..319W.
37 G. P. Kuiper. On the Evolution of the Protoplanets. Proceedings of the Na-tional Academy of Science, 37:383–393, July 1951. http://adsabs.harvard.edu/abs/1951PNAS...37..383K.
38 A. G. W. Cameron. Physical Conditions in the Primitive Solar Nebula. In P. M.Millman, editor, Meteorite Research, volume 12 of Astrophysics and Space ScienceLibrary, page 7, 1969.
39 F. Hoyle. The Origin of the Solar Nebula. Quarterly Journal of the RAS, 1:28,September 1960. http://adsabs.harvard.edu/abs/1960QJRAS...1...28H.
40 F. Shu, J. Najita, E. Ostriker, F. Wilkin, S. Ruden, and S. Lizano. Magnetocentrifu-gally driven flows from young stars and disks. 1: A generalized model. Astrophysi-cal Journal, 429:781–796, July 1994. http://adsabs.harvard.edu/abs/1994ApJ...429..781S.
41 P. Barge and J. Sommeria. Did planet formation begin inside persistent gaseousvortices? Astronomy and Astrophysics, 295:L1–L4, March 1995. http://adsabs.harvard.edu/abs/1995A%26A...295L...1B.
36

BIBLIOGRAPHY Pol Gurri
42 H. H. Klahr and P. Bodenheimer. Turbulence in Accretion Disks: Vorticity Gen-eration and Angular Momentum Transport via the Global Baroclinic Instability.Astrophysical Journal, 582:869–892, January 2003. http://adsabs.harvard.edu/abs/2003ApJ...582..869K.
43 P.J. Armitage. Astrophysics of Planet Formation. Cambridge University Press, 2010.https://books.google.co.uk/books?id=zjlZQnFfMs8C.
44 H. Klahr and W. Brandner. Planet Formation: Theory, Observations, and Ex-periments. Cambridge Astrobiology. Cambridge University Press, 2006. https://books.google.co.uk/books?id= 37CR1DfPUcC.
45 V. S. Safronov. Evoliutsiia doplanetnogo oblaka. 1969. http://adsabs.harvard.edu/abs/1969edo..book.....S.
46 K. E. Haisch, Jr., E. A. Lada, and C. J. Lada. Disk Frequencies and Lifetimesin Young Clusters. The Astrophysical Journal, 553:L153–L156, June 2001. http://adsabs.harvard.edu/abs/2001ApJ...553L.153H.
47 C. P. Dullemond and C. Dominik. Dust coagulation in protoplanetary disks: Arapid depletion of small grains. Astronomy and Astrophysics, 434:971–986, May 2005.http://adsabs.harvard.edu/abs/2005A%26A...434..971D.
48 E. W. Thommes, M. J. Duncan, and H. F. Levison. Oligarchic growth of giant planets.Icarus, 161:431–455, February 2003. http://adsabs.harvard.edu/abs/2003Icar..161..431T.
49 E. Chiang and A. N. Youdin. Forming Planetesimals in Solar and Extrasolar Nebulae.Annual Review of Earth and Planetary Sciences, 38:493–522, May 2010. http://adsabs.harvard.edu/abs/2010AREPS..38..493C.
50 I. Adachi, C. Hayashi, and K. Nakazawa. The gas drag effect on the elliptical motion ofa solid body in the primordial solar nebula. Progress of Theoretical Physics, 56:1756–1771, December 1976. http://adsabs.harvard.edu/abs/1976PThPh..56.1756A.
51 F. Perri and A. G. W. Cameron. Hydrodynamic instability of the solar nebula inthe presence of a planetary core. Icarus, 22:416–425, August 1974. http://adsabs.harvard.edu/abs/1974Icar...22..416P.
52 A. P. Boss. Formation of giant gaseous protoplanets by gravitational instability. InLunar and Planetary Science Conference, volume 28 of Lunar and Planetary ScienceConference, page 137, March 1997. http://adsabs.harvard.edu/abs/1997LPI....28..137B.
53 A. Wolszczan and D. A. Frail. A planetary system around the millisecond pulsarPSR1257 + 12. Nature, 355:145–147, January 1992. http://adsabs.harvard.edu/abs/1992Natur.355..145W.
54 M. Mayor and D. Queloz. A Jupiter-mass companion to a solar-type star. Nature,378:355–359, November 1995. http://adsabs.harvard.edu/abs/1995Natur.378..355M.
55 O. Struve. Proposal for a project of high-precision stellar radial velocity work. TheObservatory, 72:199–200, October 1952. http://adsabs.harvard.edu/abs/1952Obs....72..199S.
56 A. Vanderburg, J. A. Johnson, S. Rappaport, A. Bieryla, J. Irwin, J. A. Lewis,
37
BIBLIOGRAPHY Pol Gurri
D. Kipping, W. R. Brown, P. Dufour, D. R. Ciardi, R. Angus, L. Schaefer, D. W.Latham, D. Charbonneau, C. Beichman, J. Eastman, N. McCrady, R. A. Wittenmyer,and J. T. Wright. A disintegrating minor planet transiting a white dwarf. Nature,526:546–549, October 2015. http://adsabs.harvard.edu/abs/2015Natur.526..546V.
57 B. T. Gansicke, A. Aungwerojwit, T. R. Marsh, V. S. Dhillon, D. I. Sahman, D. Veras,J. Farihi, P. Chote, R. Ashley, S. Arjyotha, S. Rattanasoon, S. P. Littlefair, D. Pol-lacco, and M. R. Burleigh. High-speed Photometry of the Disintegrating Planetesi-mals at WD1145+017: Evidence for Rapid Dynamical Evolution. The AstrophysicalJournal Letters, 818:L7, February 2016. http://adsabs.harvard.edu/abs/2016ApJ...818L...7G.
58 M. Perryman. The Exoplanet Handbook. Cambridge University Press, 2011. https://books.google.nl/books?id=xekY6FuKuAcC.
59 V. Mannings, A. Boss, and S.S. Russell. Protostars and Planets IV. Number v. 4in Space science series. University of Arizona Press, 2000. https://books.google.nl/books?id=o4 vAAAAMAAJ.
60 I.-J. Sackmann, A. I. Boothroyd, and K. E. Kraemer. Our Sun. III. Present andFuture. Astrophysical Journal, 418:457, November 1993. http://adsabs.harvard.edu/abs/1993ApJ...418..457S.
61 F. A. Rasio, C. A. Tout, S. H. Lubow, and M. Livio. Tidal Decay of Close PlanetaryOrbits. Astrophysical Journal, 470:1187, October 1996. http://adsabs.harvard.edu/abs/1996ApJ...470.1187R.
62 K.-P. Schroder and R. Connon Smith. Distant future of the Sun and Earth revisited.Monthly Notices of the RAS, 386:155–163, May 2008. http://adsabs.harvard.edu/abs/2008MNRAS.386..155S.
63 M. J. Duncan and J. J. Lissauer. The Effects of Post-Main-Sequence Solar MassLoss on the Stability of Our Planetary System. Icarus, 134:303–310, August 1998.http://adsabs.harvard.edu/abs/1998Icar..134..303D.
64 J. H. Debes and S. Sigurdsson. Are There Unstable Planetary Systems around WhiteDwarfs? Astrophysical Journal, 572:556–565, June 2002. http.
65 A. Bonsor, A. J. Mustill, and M. C. Wyatt. Dynamical effects of stellar mass-losson a Kuiper-like belt. Monthly Notices of the RAS, 414:930–939, June 2011. http://adsabs.harvard.edu/abs/2011MNRAS.414..930B.
66 Dimitri Veras. Post-main-sequence planetary system evolution. Royal Society OpenScience, 3(2), 2016. http://rsos.royalsocietypublishing.org/content/3/2/150571.
67 J. Farihi. Circumstellar debris and pollution at white dwarf stars. New AstronomyReviews, 71:9–34, April 2016. http://adsabs.harvard.edu/abs/2016NewAR..71....9F.
68 S. J. Kenyon and L. Hartmann. Pre-Main-Sequence Evolution in the Taurus-AurigaMolecular Cloud. Astrophysical Journal, 101:117, November 1995. http://adsabs.harvard.edu/abs/1995ApJS..101..117K.
69 B. Zuckerman, T. Forveille, and J. H. Kastner. Inhibition of giant-planet formationby rapid gas depletion around young stars. Nature, 373:494–496, February 1995.http://adsabs.harvard.edu/abs/1995Natur.373..494Z.
38
BIBLIOGRAPHY Pol Gurri
70 B. T. Gansicke, T. R. Marsh, J. Southworth, and A. Rebassa-Mansergas. A GaseousMetal Disk Around a White Dwarf. Science, 314:1908, December 2006. http://adsabs.harvard.edu/abs/2006Sci...314.1908G.
71 M. Jura. A Tidally Disrupted Asteroid around the White Dwarf G29-38. Astrophys-ical Journal Letters, 584:L91–L94, February 2003. http://adsabs.harvard.edu/abs/2003ApJ...584L..91J.
72 R. G. Probst. Infrared Detection of Very Low Mass Stars. 1981. http://adsabs.harvard.edu/abs/1981PhDT........45P.
73 S. D. Barber, A. J. Patterson, M. Kilic, S. K. Leggett, P. Dufour, J. S. Bloom, andD. L. Starr. The Frequency of Debris Disks at White Dwarfs. Astrophysical Journal,760:26, November 2012. http://adsabs.harvard.edu/abs/2012ApJ...760...26B.
74 B. Zuckerman and E. E. Becklin. Excess infrared radiation from a white dwarf - anorbiting brown dwarf? Nature, 330:138–140, November 1987. http://adsabs.harvard.edu/abs/1987Natur.330..138Z.
75 J. R. Graham, K. Matthews, G. Neugebauer, and B. T. Soifer. The infrared excessof G29-38 - A brown dwarf or dust? Astrophysical Journal, 357:216–223, July 1990.http://adsabs.harvard.edu/abs/1990ApJ...357..216G.
76 M. Kilic, T. von Hippel, S. K. Leggett, and D. E. Winget. Excess Infrared Radiationfrom the Massive DAZ White Dwarf GD 362: A Debris Disk? Astrophysical Jour-nal, 632:L115–L118, October 2005. http://adsabs.harvard.edu/abs/2005ApJ...632L.115K.
77 E. E. Becklin, J. Farihi, M. Jura, I. Song, A. J. Weinberger, and B. Zuckerman.A Dusty Disk around GD 362, a White Dwarf with a Uniquely High PhotosphericMetal Abundance. The Astrophysical Journal, 632:L119–L122, October 2005. http://adsabs.harvard.edu/abs/2005ApJ...632L.119B.
78 G. Zhou, L. Kedziora-Chudczer, J. Bailey, J. P. Marshall, D. D. R. Bayliss, C. Stock-ade, P. Nelson, T. G. Tan, J. E. Rodriguez, C. G. Tinney, D. Dragomir, K. Colon,A. Shporer, J. Bento, R. Sefako, K. Horne, and W. Cochran. Simultaneous infraredand optical observations of the transiting debris cloud around WD 1145+017. ArXive-prints, April 2016. http://adsabs.harvard.edu/abs/2016arXiv160407405Z.
79 S. Wolf, F. Malbet, R. Alexander, J.-P. Berger, M. Creech-Eakman, G. Duchene,A. Dutrey, C. Mordasini, E. Pantin, F. Pont, J.-U. Pott, E. Tatulli, and L. Testi.Circumstellar disks and planets. Science cases for next-generation optical/infraredlong-baseline interferometers. Astronomy and Astrophysics Review manuscript, 20:52,March 2012.
80 E. Schatzman. Theorie du debit d’energie des naines blanches. Annalesd’Astrophysique, 8:143, January 1945. http://adsabs.harvard.edu/abs/1945AnAp....8..143S.
81 J. Farihi, M. Jura, and B. Zuckerman. Infrared Signatures of Disrupted Minor Planetsat White Dwarfs. Astrophysical Journal, 694:805–819, April 2009. http://adsabs.harvard.edu/abs/2009ApJ...694..805F.
82 C. Bergfors, J. Farihi, P. Dufour, and M. Rocchetto. Signs of a faint disc populationat polluted white dwarfs. Monthly Notices of the RAS, 444:2147–2156, November2014. http://adsabs.harvard.edu/abs/2014MNRAS.444.2147B.
39
BIBLIOGRAPHY Pol Gurri
83 S. Xu, M. Jura, P. Dufour, and B. Zuckerman. Evidence for Gas from a DisintegratingExtrasolar Asteroid. The Astrophysical Journal Letters, 816:L22, January 2016. http://adsabs.harvard.edu/abs/2016ApJ...816L..22X.
84 M. Jura. Pollution of Single White Dwarfs by Accretion of Many Small Asteroids.The Astronomical Journal, 135:1785–1792, May 2008. http://adsabs.harvard.edu/abs/2008AJ....135.1785J.
85 D. Veras, Z. M. Leinhardt, A. Bonsor, and B. T. Gansicke. Formation of plan-etary debris discs around white dwarfs - I. Tidal disruption of an extremely ec-centric asteroid. Monthly Notices of the RAS, 445:2244–2255, December 2014.http://adsabs.harvard.edu/abs/2014MNRAS.445.2244V.
86 D. Veras. Post-main-sequence planetary system evolution. Royal Society OpenScience, 3:150571, February 2016. http://adsabs.harvard.edu/abs/2016RSOS....3.0571V.
87 B. Zuckerman, D. Koester, I. N. Reid, and M. Hunsch. Metal Lines in DA WhiteDwarfs. Astrophysical Journal, 596:477–495, October 2003. http://adsabs.harvard.edu/abs/2003ApJ...596..477Z.
88 B. Zuckerman, C. Melis, B. Klein, D. Koester, and M. Jura. Ancient PlanetarySystems are Orbiting a Large Fraction of White Dwarf Stars. Astrophysical Journal,722:725–736, October 2010. http://adsabs.harvard.edu/abs/2010ApJ...722..725Z.
89 D. Koester, J. Provencal, and B. T. Gansicke. Atmospheric parameters and carbonabundance for hot DB white dwarfs. Astronomy and Astrophysics, 568:A118, August2014.
90 J. Dupuis, G. Fontaine, C. Pelletier, and F. Wesemael. A study of metal abundancepatterns in cool white dwarfs. II - Simulations of accretion episodes. AstrophysicalJournal, 84:73–89, January 1993. http://adsabs.harvard.edu/abs/1993ApJS...84...73D.
91 M. Jura and E. D. Young. Extrasolar Cosmochemistry. Annual Review ofEarth and Planetary Sciences, 42:45–67, May 2014. http://adsabs.harvard.edu/abs/2014AREPS..42...45J.
92 A. Cassan, D. Kubas, J.-P. Beaulieu, M. Dominik, K. Horne, J. Greenhill, J. Wamb-sganss, J. Menzies, A. Williams, U. G. Jørgensen, A. Udalski, D. P. Bennett, M. D.Albrow, V. Batista, S. Brillant, J. A. R. Caldwell, A. Cole, C. Coutures, K. H. Cook,S. Dieters, D. D. Prester, J. Donatowicz, P. Fouque, K. Hill, N. Kains, S. Kane,J.-B. Marquette, R. Martin, K. R. Pollard, K. C. Sahu, C. Vinter, D. Warren,B. Watson, M. Zub, T. Sumi, M. K. Szymanski, M. Kubiak, R. Poleski, I. Soszynski,K. Ulaczyk, G. Pietrzynski, and L. Wyrzykowski. One or more bound planets perMilky Way star from microlensing observations. Nature, 481:167–169, January 2012.http://adsabs.harvard.edu/abs/2012Natur.481..167C.
93 F. Fressin, G. Torres, D. Charbonneau, S. T. Bryson, J. Christiansen, C. D. Dressing,J. M. Jenkins, L. M. Walkowicz, and N. M. Batalha. The False Positive Rate ofKepler and the Occurrence of Planets. Astrophysical Journal, 766:81, April 2013.http://adsabs.harvard.edu/abs/2013ApJ...766...81F.
94 A. J. Mustill and E. Villaver. Foretellings of Ragnarok: World-engulfing Asymp-totic Giants and the Inheritance of White Dwarfs. Astrophysical Journal, 761:121,December 2012. http://adsabs.harvard.edu/abs/2012ApJ...761..121M.
40
BIBLIOGRAPHY Pol Gurri
95 D. Veras, A. J. Mustill, A. Bonsor, and M. C. Wyatt. Simulations of two-planet sys-tems through all phases of stellar evolution: implications for the instability boundaryand white dwarf pollution. Monthly Notices of the RAS, 431:1686–1708, May 2013.http://adsabs.harvard.edu/abs/2013MNRAS.431.1686V.
96 M. Kilic, T. von Hippel, S. K. Leggett, and D. E. Winget. Debris Disks aroundWhite Dwarfs: The DAZ Connection. Astrophysical Journal, 646:474–479, July 2006.http://adsabs.harvard.edu/abs/2006ApJ...646..474K.
97 M. Rocchetto, J. Farihi, B. T. Gansicke, and C. Bergfors. The frequency and in-frared brightness of circumstellar discs at white dwarfs. Monthly Notices of the RAS,449:574–587, May 2015. http://adsabs.harvard.edu/abs/2015MNRAS.449..574R.
98 J. H. Debes, M. Kilic, F. Faedi, E. L. Shkolnik, M. Lopez-Morales, A. J. Weinberger,C. Slesnick, and R. G. West. Detection of Weak Circumstellar Gas around the DAZWhite Dwarf WD 1124-293: Evidence for the Accretion of Multiple Asteroids. Astro-physical Journal, 754:59, July 2012. http://adsabs.harvard.edu/abs/2012ApJ...754...59D.
99 A. J. Mustill, D. Veras, and E. Villaver. Long-term evolution of three-planet systemsto the post-main sequence and beyond. Monthly Notices of the RAS, 437:1404–1419,January 2014.
100 C. Berg, G. Wegner, C. B. Foltz, F. H. Chaffee, Jr., and P. C. Hewett. Spec-troscopy and spectral types for 387 stellar objects from the large, bright QSO sur-vey. Astrophysical Journal Supplement Series, 78:409–421, February 1992. http://adsabs.harvard.edu/abs/1992ApJS...78..409B.
101 B. Croll, P. A. Dalba, A. Vanderburg, J. Eastman, S. Rappaport, J. DeVore,A. Bieryla, P. S. Muirhead, E. Han, D. W. Latham, T. G. Beatty, R. A. Wittenmyer,J. T. Wright, J. A. Johnson, and N. McCrady. Multiwavelength Transit Observa-tions of the Candidate Disintegrating Planetesimals Orbiting WD 1145+017. ArXive-prints, October 2015. http://adsabs.harvard.edu/abs/2015arXiv151006434C.
102 S. Rappaport, B. L. Gary, T. Kaye, A. Vanderburg, B. Croll, P. Benni, and J. Foote.Drifting Asteroid Fragments Around WD 1145+017. ArXiv e-prints, February 2016.http://adsabs.harvard.edu/abs/2016arXiv160200740R.
103 R. Alonso, S. Rappaport, H. J. Deeg, and E. Palle. Grey Dust Transits of WD1145+017 Over the Visible Band. ArXiv e-prints, March 2016. http://adsabs.harvard.edu/abs/2016arXiv160308823A.
104 J. E. Chambers. A hybrid symplectic integrator that permits close encounters betweenmassive bodies. Monthly Notices of the RAS, 304:793–799, April 1999. http://adsabs.harvard.edu/abs/1999MNRAS.304..793C.
105 M. Juric and S. Tremaine. Dynamical Origin of Extrasolar Planet Eccentricity Dis-tribution. Astrophysical Journal, 686:603–620, October 2008. http://adsabs.harvard.edu/abs/2008ApJ...686..603J.
41