Embed Size (px)
Citation preview
Maternal History of Reading Difficulty is Associated withReduced Language-Related Grey Matter in Beginning Readers
Jessica M. Black, PhDa,*, Hiroko Tanaka, MSa,b, Leanne Stanley, MSa,b, MasanoriNagamine, MD PhDc, Nahal Zakerani, MSa,b, Alexandra Thurston, BAa,b, Shelli Kesler,PhDa, Charles Hulme, PhDd, Heikki Lyytinen, PhDe, Gary H. Glover, PhDf, ChristineSerrone, BSa, Mira Michelle Raman, MSa, Allan L. Reiss, MDa, and Fumiko Hoeft, MD PhDa
aCenter for Interdisciplinary Brain Sciences Research (CIBSR), Department of Psychiatry andBehavioral Sciences, Stanford University School of Medicine, 401 Quarry Rd., Stanford, CA94305-5795, USA bPacific Graduate School of Psychology, 405 Broadway St., Redwood City, CA94063, USA cDepartment of Psychiatry, National Defense Medical College, 3-2 Namiki,Tokorozawa, 359-8513 Japan dDepartment of Psychology, University of York, Heslington, York,YO10 5DD, UK eDepartment of Psychology and Child Research Center, AGORA building PL 35,University of Jyväskylä, 40351 Jyväskylä, Finland fDepartment of Radiology, Stanford UniversitySchool of Medicine, 300 Pasteur Dr., Stanford, CA 94305-5105, USA
AbstractFamily history and poor preliteracy skills (referred to here as familial and behavioral risk,respectively) are critical predictors of developmental dyslexia. This study systematicallyinvestigated the independent contribution of familial and behavioral risks on brain structures,which had not been explored in past studies. We also examined the differential effects of maternalversus paternal history on brain morphometry, and familial risk dimensionally versuscategorically, which were also novel aspects of the study. We assessed 51 children (5 to 6 years ofage) with varying degrees of familial and behavioral risks for developmental dyslexia andexamined associations with brain morphometry. We found that greater maternal history of readingdisability was associated with smaller bilateral prefrontal and parieto-temporal grey, but not whitematter volumes. Regressing out behavioral risk, socioeconomic status, and maternal education andother confounds did not change the results. No such relationship was observed for paternal readinghistory and behavioral risk. Results of cortical surface area and thickness further showed that therewas a significant negative relationship between cortical surface area (but not thickness) andgreater severity of maternal history, in particular within the left inferior parietal lobule, suggestingprenatal influence of maternal history on children’s brain morphometry. The results suggestedgreater maternal, possibly prenatal, influence on language-related brain structures. These results
© 2011 Elsevier Inc. All rights reserved.
Correspondence to: Fumiko Hoeft, Center for Interdisciplinary Brain Sciences Research, Department of Psychiatry and BehavioralSciences, 401 Quarry Road, Stanford, CA 94305-5795, USA Tel (650) 245-7016 Fax (650) 724-4794 [email protected].*present address: Graduate School of Social Work, Boston College, 140 Commonwealth Ave., Chestnut Hill, MA 02467, [email protected] (Jessica M. Black); [email protected] (Hiroko Tanaka), [email protected] (Leanne Stanley),[email protected] (Masanori Nagamine), [email protected] (Nahal Zakerani), [email protected](Alexandra Thurston), [email protected] (Shelli Kesler), [email protected] (Charles Hulme), [email protected] (HeikkiLyytinen), [email protected] (Gary H. Glover), [email protected] (Christine Serrone), [email protected](Mira Michelle Raman), [email protected] (Allan L. Reiss), [email protected] (Fumiko Hoeft)
Publisher's Disclaimer: This is a PDF file of an unedited manuscript that has been accepted for publication. As a service to ourcustomers we are providing this early version of the manuscript. The manuscript will undergo copyediting, typesetting, and review ofthe resulting proof before it is published in its final citable form. Please note that during the production process errors may bediscovered which could affect the content, and all legal disclaimers that apply to the journal pertain.
NIH Public AccessAuthor ManuscriptNeuroimage. Author manuscript; available in PMC 2013 April 17.
Published in final edited form as:Neuroimage. 2012 February 1; 59(3): 3021–3032. doi:10.1016/j.neuroimage.2011.10.024.
NIH
-PA Author Manuscript
NIH
-PA Author Manuscript
NIH
-PA Author Manuscript
help to guide future neuroimaging research focusing on environmental and genetic influences andprovide new information that may help predict which child will develop dyslexia in the future.
KeywordsMRI; voxel-based morphometry (VBM); brain; dyslexia; reading; risk
1 INTRODUCTIONDevelopmental dyslexia is a condition characterized by marked yet unexpected difficultylearning to read (Shaywitz and Shaywitz, 2005) affecting approximately 5-10% (up to17.5%) of children and accounting for 80% of all learning disabilities (Shaywitz, 1998).
A deficit in phonological representations is thought to be the proximal cognitive deficit ofthe reading problems seen in dyslexia (Shaywitz and Shaywitz, 2005; Swan and Goswami,1997; Wagner and Torgensen, 1987). While the cause of the disorder is still unknown, tworisk factors for dyslexia, familial (having a family history of reading disabilities) andbehavioral (having poor reading-related skills prior to formal reading instruction), have beenexamined extensively albeit independently. Perhaps the lack of independence is because pre-readers with a family history of reading impairment often have poor reading-related ability(Specht et al., 2009), making it difficult to disentangle whether these abnormalities in thebrain stem from having a familial or behavioral risk.
There is increasing evidence to suggest that the reading difficulties seen in dyslexia haveneurobiological substrates. Functional MRI (fMRI) studies regularly report hypoactivationof left parieto-temporal and occipito-temporal regions (subserving phonological andorthographic processes) during reading in individuals with dyslexia (reviewed in(Gabrieli,2009; Maisog et al., 2008; Richlan et al., 2009; Shaywitz and Shaywitz, 2008). In dyslexia,hyperactivation during reading, most typically in bilateral inferior frontal gyrus (IFG)(Brunswick et al., 1999; Georgiewa et al., 2002; Milne et al., 2002; Richards et al., 2002;Rumsey, 1992; Salmelin et al., 1996; Shaywitz et al., 2004; Shaywitz et al., 2002; Shaywitzet al., 1998) or right posterior regions homologous to the hypoactive left hemisphere regions(Shaywitz et al., 2002) may reflect compensatory processes.
To date, only a handful of neuroimaging studies have investigated how familial risk factorsfor developmental dyslexia influence the brain. Several studies have reported event-relatedpotential (ERP) (Benasich et al., 2006; Guttorm et al., 2009; Leppänen et al., 1999; Lyytinenet al., 2003; Maurer et al., 2003; Torppa et al., 2006) fMRI (Specht et al., 2009) andstructural (using voxel-based morphometry, VBM) (Raschle et al., 2010) abnormalities inchildren with a family history of dyslexia before they receive formal reading instructioncompared to those without. These studies indicate that abnormalities are unlikely to beshaped by children’s reading experience. The mechanism in which family history affectschildren’s pre-reading brains however, remain unknown. We expand on previous studies infour important ways by (1) taking an individual difference approach by examining familyhistory dimensionally as previous studies have taken a categorical approach and comparedthose with and without family history even though reading skill is along a continuum, (2)dissociating the effects of behavioral and familial risks on brain structure, which correlatehighly, (3) dissociating maternal versus paternal influence within family risk, and (4)dissociating prenatal (Kapellou et al., 2006) versus postnatal influence (Landing et al., 2002;Shaw et al., 2008) of maternal history on the brain by examination of cortical surface areaand thickness.
Black et al. Page 2
Neuroimage. Author manuscript; available in PMC 2013 April 17.
NIH
-PA Author Manuscript
NIH
-PA Author Manuscript
NIH
-PA Author Manuscript
2 MATERIAL AND METHODS2.1 Subjects
A total of 51 healthy, native English-speaking 5- and 6-year old children participated in ourstudy. The majority of children were beginning kindergarteners (N=47) and four werebeginning first-graders. Standard behavioral assessment of the participants (children) andparents, socio-economic status (SES) and home environment were assessed (Table 1 andTable 2). Children (with and without family history of reading difficulty based on parentalself-report) were recruited from local newspapers, school mailings (including both schoolsfor children with learning disabilities and conventional schools), flyers, and mother’s clubs.Family history was initially defined as parental report of reading disability in a first-degreerelative (either biological parent or sibling). Once recruited, as in previous literature, familyrisk was assessed using the Adult Reading History Questionnaire (ARHQ [referred to as“familial risk index [FamRI]” in this study]) (Lefly and Pennington, 2000). The children(males, 29; females, 22) did not have any neurological or psychiatric disorders, were not onmedication, and had no contraindications to MRI. The Stanford University Panel on HumanSubjects in Medical Research approved the study and informed consent was obtained.
2.2 Self (parental)-report of Family HistoryAmong the group where the parents reported of having a reading disability (self [parental]-report of family history group, selfFH+ group, N=24, age: mean, 5.66; SD, 0.52), 12children had paternal history (four with previous formal diagnosis and one with a sibling,with formal diagnosis), 10 had maternal history (four with previous formal diagnosis), andtwo had both maternal and paternal history (both not formally diagnosed). In the self-reported group without family history (selfFH− group, N=27, age: mean, 5.52; SD, 0.31)there was no report of maternal, paternal or sibling reading impairment history for anyfamily, though three families did report having a member of their extended family with suchimpairment.
The demographics of the two self-reported family history groups (with [selfFH+] vs. without[selfFH−]) (e.g., child age, parent age, socio-economic status [SES], maternal and paternaleducation level, percentage of time spent with mother and father overall and related toeducation) were not significantly different (Table 2).
2.3 Familial Risk Index (FamRI)We operationally defined familial risk or “Maternal and Paternal Familial Risk Indices(mFamRI, pFamRI),” as the maternal and paternal scores from the Adult Reading HistoryQuestionnaire (ARHQ), a commonly used, valid and reliable self-rating assessment of pastreading disability in adults (Lefly and Pennington, 2000). Greater scores on the ARHQindicate more reading impairment during childhood. Paternal (mean: 0.35; SD: 0.15) andmaternal (mean: 0.31; SD: 0.14) ARHQ scores were not significantly different from eachother (t(49)=1.42, p=0.16). While using neuropsychological tests of reading is more ideal toassess current and past reading (dis)ability in the parents, we opted to choose ARHQ scoresbecause reading scores (Test of Word Reading Efficiency Phonemic Decoding Efficiency[TOWRE PDE], a timed measure of decoding) were not available on all parents. In theavailable data (N=36), however, intraclass correlation (ICC) (used to measure the correlationof units within groups rather than traditional observations that are based on pairs) andreceiver operating characteristic (ROC) (a graphical plot of the sensitivity versus thespecificity for a binary classifier where the threshold is variable) analyses were performed toinvestigate the reliability of ARHQ scores. ICC calculation using a 2-way random effectsANOVA model and absolute agreement (ICC(2,1) showed a Cronbach’s alpha estimate of0.67 and ICC of 0.67 (F(35,35)=3.004, p=0.001)).
Black et al. Page 3
Neuroimage. Author manuscript; available in PMC 2013 April 17.
NIH
-PA Author Manuscript
NIH
-PA Author Manuscript
NIH
-PA Author Manuscript
We further performed ROC analysis to examine ideal cut-off ARHQ score for past readingdisability. While the original research suggested a cut-off score of 0.3 (Lefly andPennington, 2000), more recent neuroimaging research using ARHQ has used a cut-offscore of 0.4 (e.g., (Maurer et al., 2007; Maurer et al., 2009; Maurer et al., 2003). Whencriteria of current decoding dysfunction and suspected past reading disability was defined asa TOWRE PDE score of 90 (25th percentile), and an ARHQ score of 0.385, sensitivity was100% and specificity 77.1%. When self-report of past reading disability was used as criteriaof past reading disability, at an ARHQ score of 0.375, sensitivity was 90% and specificity88.5%. These ARHQ scores of 0.385 and 0.375 are similar to what past neuroimagingstudies have used in their study as a cut-off score (= 0.40) (Maurer et al., 2007; Maurer etal., 2009; Maurer et al., 2003). They, too, validated using neuropsychological testing(Maurer et al., 2003). Together with the ICC analyses, the results show that ARHQ score isa good indicator of past and current reading ability in adults.
Using an ARHQ cut-off score >0.4, 24 (out of 51) families met the criteria for familyhistory; 9 had only mothers, 17 had only fathers, and 2 had both mothers and fathers whomet the criteria for reading difficulty. There were no significant correlations identifiedbetween ARHQ scores (maternal and paternal) and demographic information such as SES(or any of the individual factors such as education and occupation) or percentage of timespent with child generally and related to educational activities specifically (all p’s>0.05).
2.4 Behavioral Risk Index (BxRI)Behavioral risk (or BxRI) was defined as a composite measure of phonological awareness(PA; combined score [cs] of the Elision and Blending Words subtests in ComprehensiveTest of Phonological Processing [CTOPP]) (Wagner et al., 1999) rapid naming (RN; meanss of Color and Object subtests in Rapid Automatized Naming Test [RAN]) (Wolf andDenckla, 2005) and letter identification (LID; Letter Identification [LID] subtest inWoodcock-Johnson III Tests of Achievement [WJ-III-Ach]) (Woodcock, 1998). These threemeasures have been identified as predictors of reading achievement in previous studies (e.g.(Lyytinen et al., 2008; Lyytinen et al., 2006; Puolakanaho et al., 2007). BxRI was defined asthe first eigenvariate of PA, RN and LID scores, and explained 63.2% of the total variance.Higher BxRI scores indicate more impairment in these measures.
2.5 Intelligence and Literacy SkillsThe Woodcock-Johnson III Tests of Cognitive Abilities Brief Intellectual Ability (WJIII-BIA), which was used as a measure of intelligence, is comprised of three subtests: VerbalComprehension, Concept Formation, and Visual Matching. The three subtests in partrespectively measure Comprehension-Knowledge (Gc), Fluid Reasoning (Gf), andProcessing Speed (Gs), which represent the best sample of an individual’s verbal ability,thinking ability, and efficiency in performing cognitive tasks (Mather and Woodcock, 2001).Full-scale IQ showed significant negative correlation with mFamRI (i.e., the greater thematernal history of reading impairment, the lower the child’s IQ, p<0.05 uncorrected formultiple comparison, not significant when Bonferroni corrected), although all children hadaverage to superior IQ (Figure 1). Further, selfFH− was significantly greater than selfFH+for full-scale IQ (p=0.003) and verbal IQ (VIQ, p<0.001), though performance IQ (PIQ) wasnot significantly different from each other (p=0.27) (Table 2).
For results from the tests of literacy skills, the Behavioral Risk Index (BxRI), phonologicalawareness (PA), rapid naming (RN) and letter identification (LID) were highly correlatedamongst each other. Recall BxRI was defined as the first eigenvariate of PA, RN and LIDscores. In general, these measures considered as markers for precursors of reading, weaklybut significantly negatively correlated with mFamRI (p<0.05 uncorrected, n.s. after
Black et al. Page 4
Neuroimage. Author manuscript; available in PMC 2013 April 17.
NIH
-PA Author Manuscript
NIH
-PA Author Manuscript
NIH
-PA Author Manuscript
Bonferroni correction) but not with pFamRI (Figure 1). On all measures (PA, LID, and onlymarginally for RN) self-reported FH+ underperformed FH− (Table 2), suggesting greaterimpairment of literacy-related skills in the selfFH+ group (Table 2).
2.6 Parental Intelligence and Literacy skillsTo measure IQ in parents, all mothers and fathers (except four fathers) completed theShipley Institute of Living Scale (SILS) (Zachary, 2006), which is a self-administeredintelligence measure used in place of the Wechsler Adult Intelligence Scale-Revised(WAIS-R) (that would have required the parent to complete the test with a researcher). Wethen converted the scores on the SILS to the WAIS-R. Specifically, from the SILS the totalraw score along with raw scores on the vocabulary (corresponding to VIQ) and the abstractthinking (corresponding to PIQ) subscales were totaled and converted to a Wechsler AdultIntelligence Scale-Revised (WAIS-R) standard score (WAIS-ss) using standard conversiontables. The SILS and WAIS are correlated ranging from 0.73 to 0.90 depending on the study(Zachary, 2006). The scores on the WAIS-R converted from SILS indicated that all IQ fellwithin the average to superior range (Table 1). Both maternal and paternal ARHQ scoreswere significantly greater (i.e. showing more impaired reading) for selfFH+ than selfFH−(Table 2).
2.7 Home environmentTo determine whether the selfFH+ and selfFH− groups were similar in terms of elementswithin the home that are related to children’s reading achievement, we examinedsocioeconomic status (SES). SES was measured based on the procedure and questionnaire ofNoble et al (2006). Parents completed a brief questionnaire with items related to parentaleducation, occupation and income (income data for five families were not available and thusan SES score could not be calculated for them). Parental education was defined as theaverage education of any parents (and stepparents/guardians) in the home (education levelfor one father was not available). We used the 9-point Hollingshead Index OccupationalStatus Scale (Bornstein and Bradley, 2003) to score parental occupation, and used only thehighest score of any parent, stepparent or guardian in the home. The income score wasdefined as the total family income divided by the official federal poverty threshold for afamily of that size. Thus, for each family, an income-to-needs ratio was computed wherebythe total family income was divided by official poverty threshold. Finally, a composite SESscore was calculated for each child by factor analyzing the three scores (parental education,occupation, and income) using principal component analysis. A single principal componentemerged, accounting for 57.1% of the variance. SES in our study refers to the factor loadingscore (mean 0; SD 1) that was computed for each child and entered into our subsequentanalyses. SES was not significantly correlated with ARHQ (mFamRI: r=0.14, p=0.36;pFamRI: r=−0.19, p=0.22; Figure 1) or maternal IQ (r=0.16, p=0.29), though the correlationwith paternal IQ was tending toward significance (r=0.28, p=0.07). It appears significancewas due to paternal VIQ (r=.35, p=0.02) rather than paternal PIQ (r=0.15, p=0.35) (Table 2).
2.8 MRI Data AcquisitionImaging data were acquired in the summer and fall of 2008 and 2009 at the Richard M.Lucas Center for Imaging at Stanford University. Imaging data was acquired using GEHealthcare 3.0 Tesla 750 scanner 20.x software revision and an 8-channel phased array headcoil (GE Healthcare, Waukesha, WI). Images acquired included an axial-oblique 3D T1-weighted sequence (fast spoiled gradient recalled echo [FSPGR] pulse sequence, inversionrecovery preparation pulse TI=400 ms; repetition time [TR]=8.5 ms; echo-time [TE]=3.4ms; flip angle=15°; Receiver ban dwidth ±32 kHz; slice thickness=1.2 mm; 128 slicelocations; number of excitations [number of signals averaged]=1; field-of-view [FOV]=22cm; Phase FOV 0.75; acquisition matrix=256 × 192). The total time of scan was 4:34.
Black et al. Page 5
Neuroimage. Author manuscript; available in PMC 2013 April 17.
NIH
-PA Author Manuscript
NIH
-PA Author Manuscript
NIH
-PA Author Manuscript
To prepare for the scan, families received a packet of materials, including a CD of scannernoises and a DVD of a child going into a scanner, designed to desensitize him/her to thescanner sounds and environment. Children also participated in simulated MRI sessions at thecenter.
2.9 Preprocessing of MR imagesPreprocessing was carried out using the Statistical Parametric Mapping 8 (SPM8) statisticalpackage (http://www.fil.ion.ucl.ac.uk/spm) including the Diffeomorphic AnatomicalRegistration Through Exponentiated Lie Algebra (DARTEL) toolbox (Ashburner, 2007).Images were bias-field corrected and segmented to grey matter (GM), white matter (WM)and cerebro-spinal fluid (CSF) using the New Segment feature of SPM8. The images werespatially normalized (to MNI space), modulated and smoothed (8-mm isotropic Gaussiankernel) using the DARTEL toolbox and default settings. For each participant, segmentationand normalization accuracy were manually inspected.
2.10 Analyses of Regional GM Volume (GMV) and WM Volume (WMV)Voxel-based morphometry (VBM) analyses of regional GMV and WMV were examinedusing SPM8 and was corrected for non-isotropic smoothness. Statistical threshold for whole-brain analyses was set at p=0.01 for voxel height and p=0.05 family-wise error corrected forextent while also correcting for non-stationary smoothness (p=0.05 corrected). Whole-braincorrelation analyses were performed between regional GMV and WMV with the followingdependent measures; mFamRI, pFamRI and BxRI. Total GMV (TGMV) and total WMV(TWMV) were included as nuisance variables in all analyses. To investigate the effect ofFamRI without the effect of BxRI and vice versa, these analyses were repeated by includingBxRI as a nuisance variable when examining the brain correlates of FamRI, and mFamRI asa nuisance variable when examining BxRI.
Possible confounding factors (age, beginning first-graders [N=4], left-handedness [N=5] ormanual dexterity index, year of study entry [Phase I: 2008, N=27, Phase II: 2009, N=24], IQ[WJ BIA], father spent more time with child [N=1 spent more total time with father, N=3spent more education-related time with father]) were controlled by regressing thesemeasures out as nuisance variables or by excluding children who were already in first grade,left-handed, or whose father spent more time with the child. These were performed both atthe whole-brain voxel-by-voxel level and also by extracting the mean values of each regionthat showed a significant effect (i.e., bilateral prefrontal, left parieto-temporal and rightparieto-temporal regions in which GMV was significantly negatively correlated withmFamRI). Mean values of each cluster were extracted using REX (http://web.mit.edu/swg/software.htm). The results were similar (children that are left-handed and 1st graders aremarked in Figure 4).
To examine the effect of scan year, we also performed whole-brain voxel-by-voxelindependent t-tests between Phase I (2008, N=27) and Phase II (2009; N=24) scans. Clusterswere located using XJview (http://www.alivelearn.net/xjview8/) and by visual inspection ofclusters overlaid on the templates.
2.11 Free Surfer AnalysisCortical reconstruction and volumetric segmentation were performed with the FreeSurferimage analysis suite version 5.0.0, which is documented and freely available for downloadonline (http://surfer.nmr.mgh.harvard.edu/). The technical details of these procedures aredescribed in prior publications (Dale et al., 1999; Dale and Sereno, 1993; Fischl and Dale,2000; Fischl et al., 2001; Fischl et al., 2002; Fischl et al., 2004a; Fischl et al., 1999a; Fischlet al., 1999b; Fischl et al., 2004b; Han et al., 2006; Jovicich et al., 2006; Segonne et al.,
Black et al. Page 6
Neuroimage. Author manuscript; available in PMC 2013 April 17.
NIH
-PA Author Manuscript
NIH
-PA Author Manuscript
NIH
-PA Author Manuscript
2004). Briefly, this processing includes motion correction and averaging of multiplevolumetric T1 weighted images (when more than one is available), removal of non-braintissue using a hybrid watershed/surface deformation procedure (Segonne et al., 2004),automated Talairach transformation, segmentation of the subcortical white matter and deepgray matter volumetric structures (including hippocampus, amygdala, caudate, putamen,ventricles) (Fischl et al., 2002; Fischl et al., 2004a) intensity normalization (Sled et al.,1998), tessellation of the gray matter white matter boundary, automated topology correction(Fischl et al., 2001; Segonne et al., 2007), and surface deformation following intensitygradients to optimally place the gray/white (main) and gray/cerebrospinal fluid (pial)borders at the location where the greatest shift in intensity defines the transition to the othertissue class (Dale et al., 1999; Dale and Sereno, 1993; Fischl and Dale, 2000). The main andpial surfaces were visually inspected, and where needed, the appropriate manual correctionswere preformed as per the FreeSurfer Tutorial (http://surfer.nmr.mgh.harvard.edu/fswiki/FsTutorial). All raters were trained to achieve inter-rater reliability of ≥0.95 (intraclasscorrelation coefficient) with gold-standard datasets for volumetric regions of interest.
Once the cortical models are complete, a number of deformable procedures can beperformed for in further data processing and analysis including surface inflation (Fischl etal., 1999a) registration to a spherical atlas which utilized individual cortical folding patternsto match cortical geometry across subjects (Fischl et al., 1999b), parcellation of the cerebralcortex into units based on gyral and sulcal structure (Desikan et al., 2006; Fischl et al.,2004b), and creation of a variety of surface based data including maps of curvature andsulcal depth. This method uses both intensity and continuity information from the entirethree dimensional MR volume in segmentation and deformation procedures to producerepresentations of cortical thickness, calculated as the closest distance from the gray/whiteboundary to the gray/CSF boundary at each vertex on the tessellated surface (Fischl andDale, 2000). The maps are created using spatial intensity gradients across tissue classes andare therefore not simply reliant on absolute signal intensity. The maps produced are notrestricted to the voxel resolution of the original data thus are capable of detectingsubmillimeter differences between groups. Procedures for the measurement of corticalthickness have been validated against histological analysis (Rosas et al., 2002) and manualmeasurements (Kuperberg et al., 2003; Salat et al., 2004). Freesurfer morphometricprocedures show good test-retest reliability across scanner manufacturers and across fieldstrengths (Han et al., 2006).
We focused on brain regions and measures that were supported both by our main VBManalyses and by the past literature on dyslexia (Frye et al.). These included cortical surfacearea and thickness of bilateral inferior parietal lobule (IPL) and pars opercularis of theinferior frontal gyrus (IFG).
3 RESULTS3.1 Neuropsychological Results
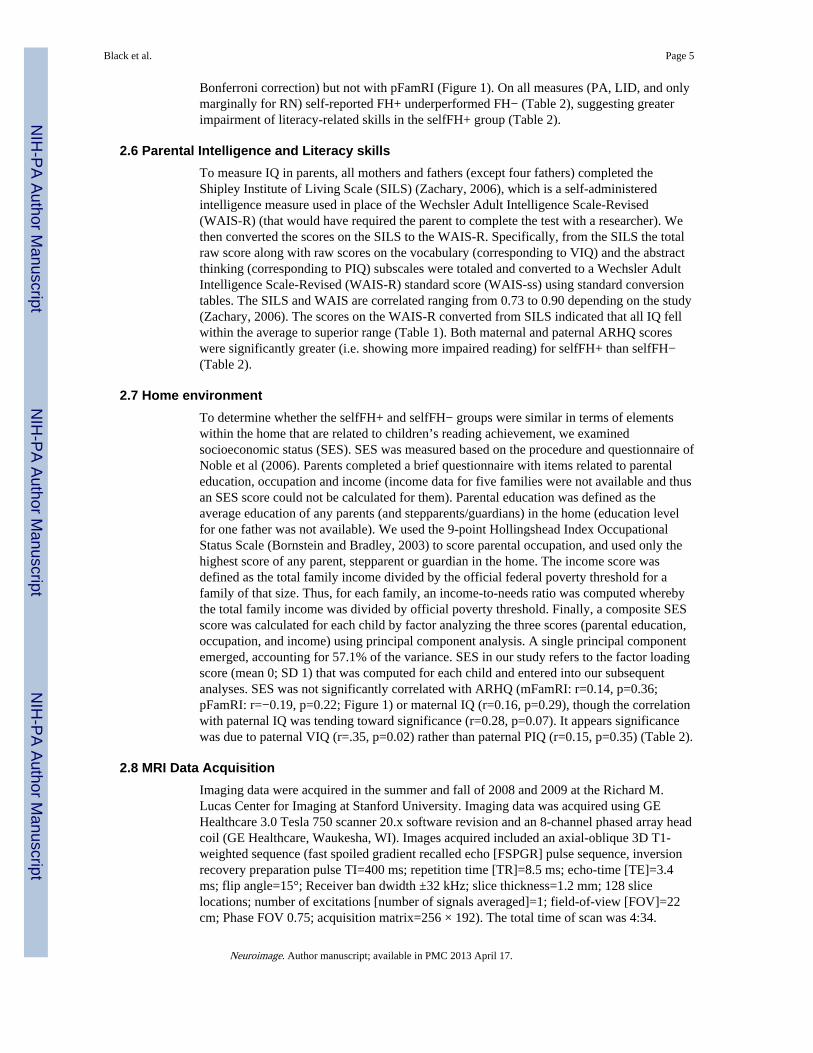
First we examined relationships between mFamRI, pFamRI, BxRI and other demographicand behavioral measures such as PA, RN, LID (see Figure 1). In general, there was anegative relationship between mFamRI and cognitive and behavioral measures such as PA,LID and IQ (verbal [VIQ] and performance [PIQ]), i.e., the worse the mother’s self-reportedpast reading difficulties, the lower the child’s reading-related cognitive and behavioralscores. There were no significant correlations with pFamRI and these measures. BxRI wassignificantly negatively correlated with phonological memory, IQ (VIQ, PIQ), processingspeed, maternal IQ and maternal education level. There was a trend for significant positivecorrelation between BxRI and mFamRI (r=0.24, p=0.088). Correlations that survivedcorrection for multiple comparisons are indicated in red in Figure 1 (lower right panel).
Black et al. Page 7
Neuroimage. Author manuscript; available in PMC 2013 April 17.
NIH
-PA Author Manuscript
NIH
-PA Author Manuscript
NIH
-PA Author Manuscript
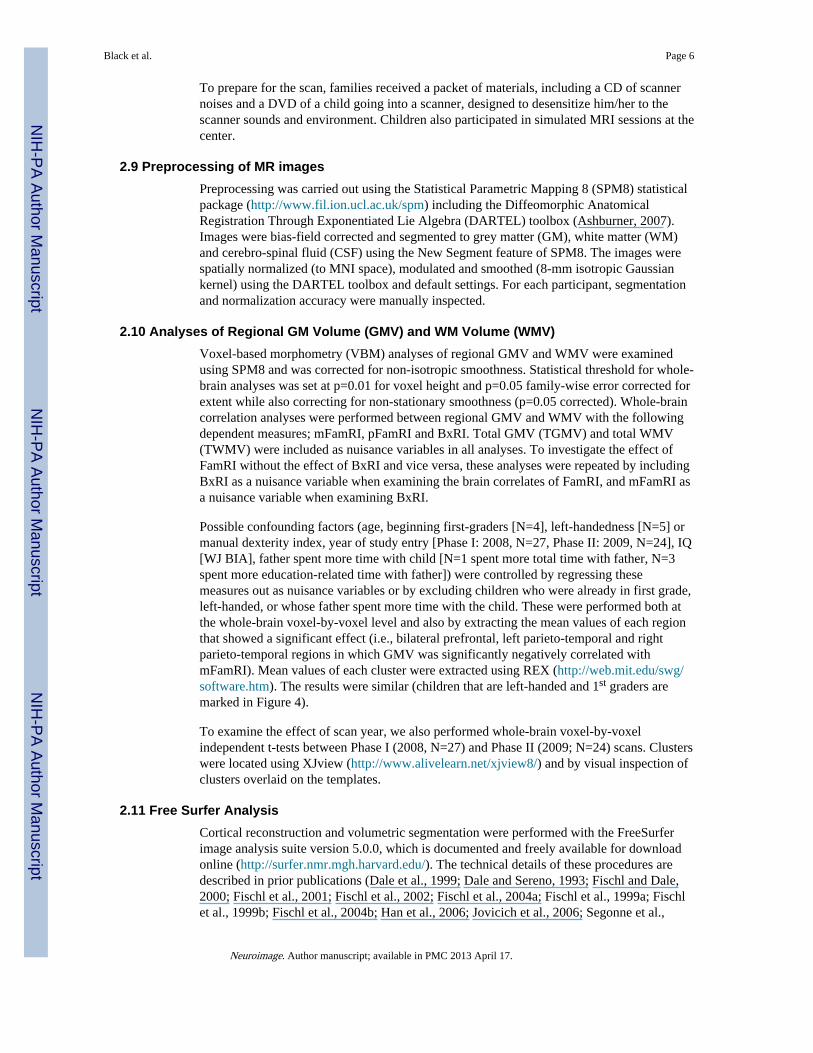
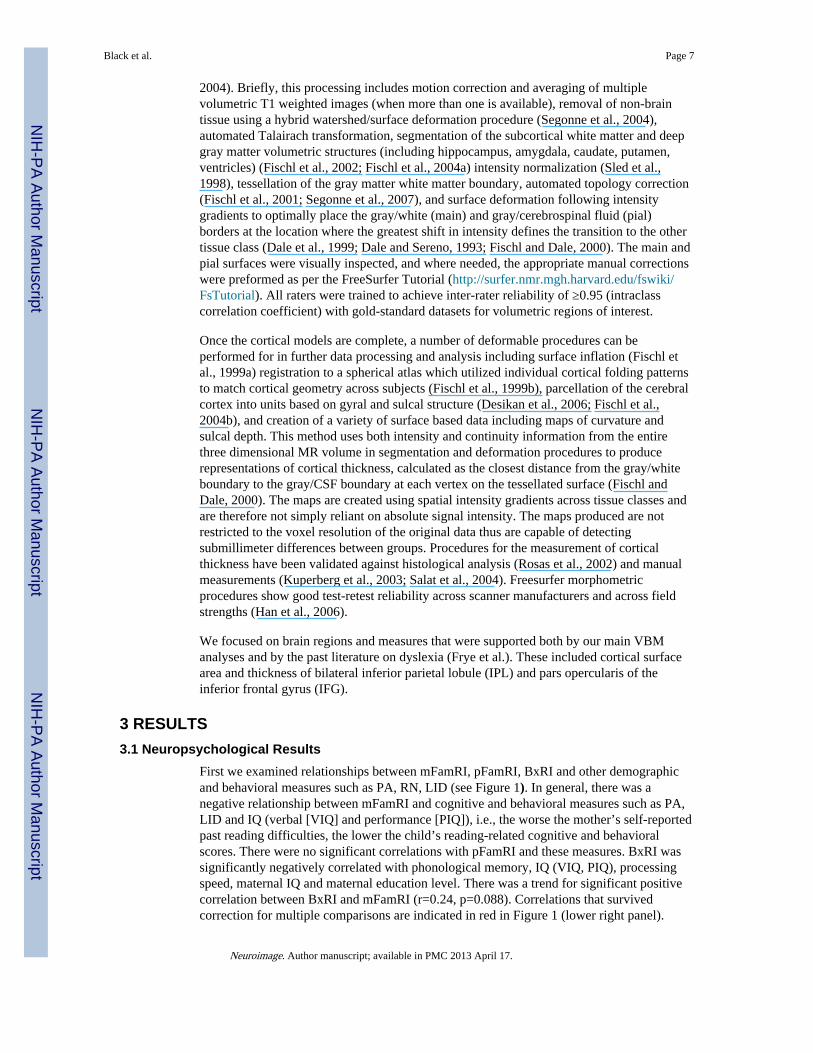
3.2 Regional GM and WM VolumesThere was a significant negative association between mFamRI and voxel-by-voxel GMV,i.e., the more severe the mother’s past reading disability, the lower the child’s GMV, inbilateral prefrontal and parieto-temporal regions (p<0.05 corrected; Figure 2). There wasalso a trend for significant negative correlation between mFamRI and WMV in the leftparieto-temporal region spatially adjacent to the GM finding (p<0.1 corrected; Figure 3a).
Examination of the relationship between whole-brain structural MRIs and pFamRI or BxRIshowed no significant positive or negative association with regional GMV or WMV. Theseresults indicate that pFamRI and BxRI do not play a large role in morphometric variation atthis young age. Since there was a non-significant but non-negligible relationship betweenmFamRI and BxRI (Figure 1, r=0.24, p=0.088) and because of our interest in dissociatingthese two measures, we repeated the analyses controlling for BxRI. The results were verysimilar for GMV (Figure 2) while the effect no longer showed a trend for significantcorrelation in WMV.
3.2.1 Controlling Possible Confounds—We also examined differences in brainmorphometry based on measures of family history such as formal clinical diagnosis andARHQ scores or parents compared to self (parental)-report. Among the children withself(parental)-reported reading disability, those with (N=17) and without (N=7) a formaldiagnosis of any first degree family member showed no significant difference in regionalGMV. Since independent sample t-tests are not comparable with regression analysesperformed to examine relationships with brain and mFamRI, we categorized children intothose with and without family history based on maternal ARHQ scores. The aforementionedresults in the frontal and right parieto-temporal regions remained significant but the leftparieto-temporal region was no longer significant (Figure 3b). However, the left parieto-temporal region showed significantly greater GMV in children with a self (parental)-reportof maternal family history compared to those without a reported family history or aself(parental)-report of paternal family history. This region spatially overlapped with theregion that showed a negative association between mFamRI and GMV (Figure 3c).
When possible confounding factors (age, beginning first-graders [N=4], left-handedness[N=5] or manual dexterity index, year of study entry [Phase I: 2008, N=27, Phase II: 2009,N=24], IQ [WJ BIA], father spent more time with child [N=1 spent more total time withfather, N=3 spent more education-related time with father]) were controlled, the results weresimilar (children that are left-handed and 1st graders are marked in Figure 4). Specifically,for handedness, beginning first-graders and father spending more time with child, weeliminated the left-handed participants or first-graders or those that spent more time with thedad from our analysis and the effect was the same. For age and year of study entry, weentered this as a nuisance variable. To examine the effect of scan year, we also performedwhole-brain voxel-by-voxel independent t-tests between Phase I (2008, N=27) and Phase II(2009; N=24) scans and found no significant differences. The most significant cluster was atthe base of the cerebellum (p=0.225 corrected, cluster size [k]=1594) and was followed bymuch less significant clusters (p’s>0.70 corrected, k<731).
3.2.2 Effect of Environment—These results indicate the specific influence of maternalbut not paternal reading history on brain morphometry, in particular GMV. To examinewhether the influence of mFamRI was more likely due to general environmental effects, weperformed a series of analyses. First, we regressed out SES and maternal education level(which is one measure that goes into SES calculation) but the results were still significant.Next, we examined the time the child spent with each parent. Because we were interested infurther understanding the evidence of mFamRI influence but not pFamRI, we analyzed
Black et al. Page 8
Neuroimage. Author manuscript; available in PMC 2013 April 17.
NIH
-PA Author Manuscript
NIH
-PA Author Manuscript
NIH
-PA Author Manuscript
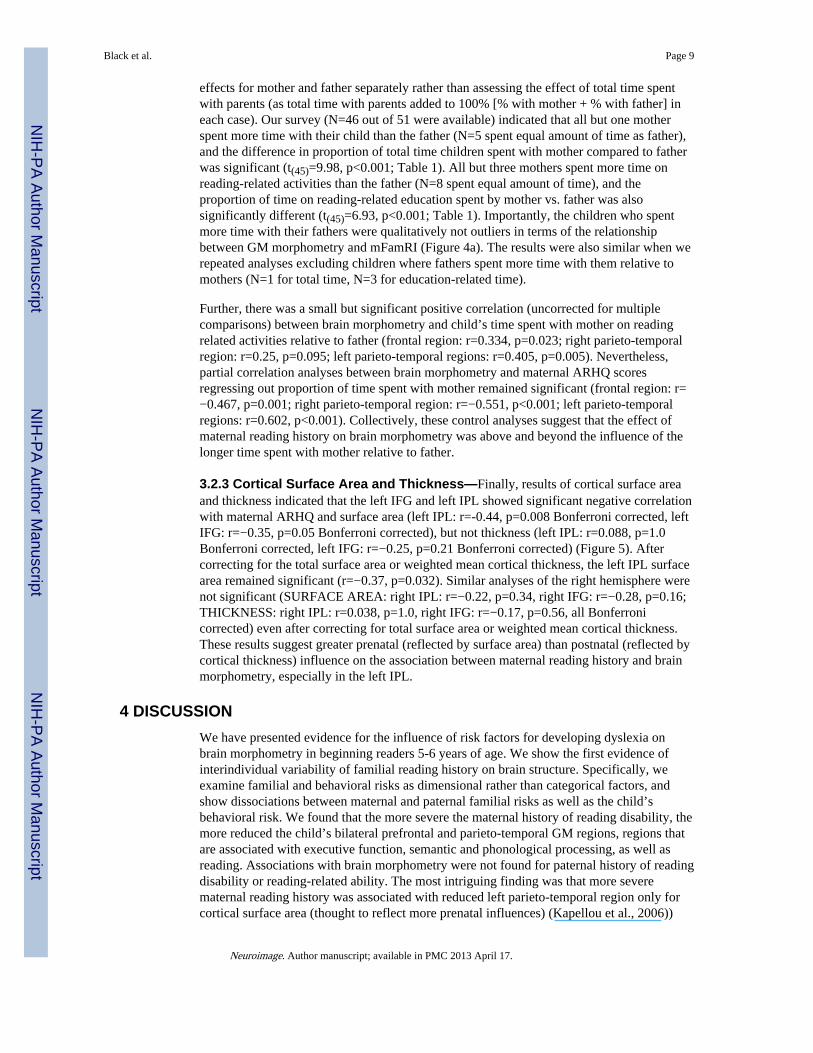
effects for mother and father separately rather than assessing the effect of total time spentwith parents (as total time with parents added to 100% [% with mother + % with father] ineach case). Our survey (N=46 out of 51 were available) indicated that all but one motherspent more time with their child than the father (N=5 spent equal amount of time as father),and the difference in proportion of total time children spent with mother compared to fatherwas significant (t(45)=9.98, p<0.001; Table 1). All but three mothers spent more time onreading-related activities than the father (N=8 spent equal amount of time), and theproportion of time on reading-related education spent by mother vs. father was alsosignificantly different (t(45)=6.93, p<0.001; Table 1). Importantly, the children who spentmore time with their fathers were qualitatively not outliers in terms of the relationshipbetween GM morphometry and mFamRI (Figure 4a). The results were also similar when werepeated analyses excluding children where fathers spent more time with them relative tomothers (N=1 for total time, N=3 for education-related time).
Further, there was a small but significant positive correlation (uncorrected for multiplecomparisons) between brain morphometry and child’s time spent with mother on readingrelated activities relative to father (frontal region: r=0.334, p=0.023; right parieto-temporalregion: r=0.25, p=0.095; left parieto-temporal regions: r=0.405, p=0.005). Nevertheless,partial correlation analyses between brain morphometry and maternal ARHQ scoresregressing out proportion of time spent with mother remained significant (frontal region: r=−0.467, p=0.001; right parieto-temporal region: r=−0.551, p<0.001; left parieto-temporalregions: r=0.602, p<0.001). Collectively, these control analyses suggest that the effect ofmaternal reading history on brain morphometry was above and beyond the influence of thelonger time spent with mother relative to father.
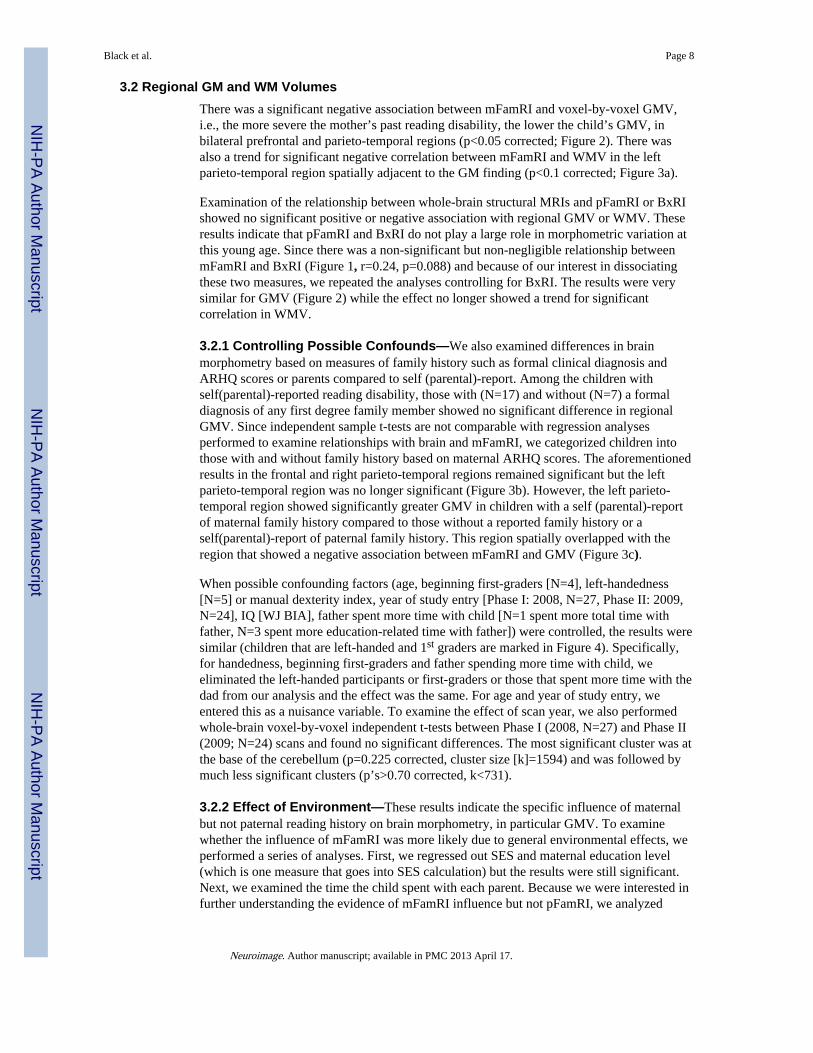
3.2.3 Cortical Surface Area and Thickness—Finally, results of cortical surface areaand thickness indicated that the left IFG and left IPL showed significant negative correlationwith maternal ARHQ and surface area (left IPL: r=-0.44, p=0.008 Bonferroni corrected, leftIFG: r=−0.35, p=0.05 Bonferroni corrected), but not thickness (left IPL: r=0.088, p=1.0Bonferroni corrected, left IFG: r=−0.25, p=0.21 Bonferroni corrected) (Figure 5). Aftercorrecting for the total surface area or weighted mean cortical thickness, the left IPL surfacearea remained significant (r=−0.37, p=0.032). Similar analyses of the right hemisphere werenot significant (SURFACE AREA: right IPL: r=−0.22, p=0.34, right IFG: r=−0.28, p=0.16;THICKNESS: right IPL: r=0.038, p=1.0, right IFG: r=−0.17, p=0.56, all Bonferronicorrected) even after correcting for total surface area or weighted mean cortical thickness.These results suggest greater prenatal (reflected by surface area) than postnatal (reflected bycortical thickness) influence on the association between maternal reading history and brainmorphometry, especially in the left IPL.
4 DISCUSSIONWe have presented evidence for the influence of risk factors for developing dyslexia onbrain morphometry in beginning readers 5-6 years of age. We show the first evidence ofinterindividual variability of familial reading history on brain structure. Specifically, weexamine familial and behavioral risks as dimensional rather than categorical factors, andshow dissociations between maternal and paternal familial risks as well as the child’sbehavioral risk. We found that the more severe the maternal history of reading disability, themore reduced the child’s bilateral prefrontal and parieto-temporal GM regions, regions thatare associated with executive function, semantic and phonological processing, as well asreading. Associations with brain morphometry were not found for paternal history of readingdisability or reading-related ability. The most intriguing finding was that more severematernal reading history was associated with reduced left parieto-temporal region only forcortical surface area (thought to reflect more prenatal influences) (Kapellou et al., 2006))
Black et al. Page 9
Neuroimage. Author manuscript; available in PMC 2013 April 17.
NIH
-PA Author Manuscript
NIH
-PA Author Manuscript
NIH
-PA Author Manuscript
and not thickness (thought to reflect more postnatal influences) (Landing et al., 2002; Shawet al., 2008). Together with analyses controlling for SES and maternal education, resultsindicate that the maternal influence on brain morphometry is at least in part prenatal and notdue to postnatal environmental influences.
The significant negative association between GMV and mFamRI (but not pFamRI) inbilateral prefrontal and parieto-temporal regions suggests that GM morphometry ispresumably more strongly influenced by maternal rather than paternal reading history (evenafter controlling for child’s behavioral risk which was assessed using tests of PA, RN ofcolors and objects and LID). The trend for a significant negative correlation with WMV andmFamRI in the left parieto-temporal region (spatially adjacent to and statistically in thesame direction as the GM finding) was no longer significant after controlling for behavioralrisk, suggesting that it is the GM that is most influenced by maternal reading history.
The left parieto-temporal region is recruited during successful reading and supports themapping of orthography onto phonology and phonological working memory (Vigneau et al.,2006), and this region has been repeatedly shown to be abnormal in dyslexia (Caylak, 2009;Habib, 2000; Maisog et al., 2008; Richlan et al., 2009).The contralateral right posterior brainsystem is thought to be important during development and parietal GM region is also oftenreduced in volume and activation level in dyslexia (Hoeft et al., 2007) with ‘normalization’after successful intervention (Aylward et al., 2003; Eden et al., 2004; Meyler et al., 2008).We consider our findings in reference to key studies that have identified important regionsfor improved accuracy (compensation) in impaired readers, as we feel one potential benefitof studies with young readers is to consider possible intervention paths.
Shaywitz and colleagues (2003) found that among three groups of adolescent readers (non-impaired, persistently poor, and compensated), the compensated readers group recruited theright superior frontal and right middle temporal regions, suggesting that this groupdeveloped greater reliance on compensatory neural systems (Shaywitz et al., 2003). Theseregions, however, were activated more in both the persistently poor and the compensatedgroups relative to the non-impaired group, suggesting that these right hemisphere regionsreflect trait rather than state markers. Clearly the potential to recruit from right regionshomologues to left language regions seems important to overcome early neural deficitsassociated with language function. Using Magnetoencephalography (MEG) recently Rezaieand colleagues (2011) identified key regions of the brain predictive of response to increasesin word level skills and reading comprehension one year later. Compared to InadequateResponders, middle school students classified as Adequate Responders showed increasedactivation in the left parietotemporal regions (supramarginal and angular gyri, along withbilaterally in the superior and middle temporal gyri), with the amount of activationpredictive of later gains in reading scores (Rezaie et al., 2011). These studies highlight keyregions identified in our study as being important for compensation for impaired readers,and we feel our study is an important next step in considering some of the potentialenvironmental factors that may mediate potential protective factors or risks for thedevelopment of reading deficits. Hence our findings suggest possible mediation by abnormalparieto-temporal neurodevelopment leading to increased risks for children of developingdyslexia with greater maternal history of reading impairments.
Another area that showed negative correlation with maternal reading history and regionalGMV was the prefrontal region, associated with both naming on the left (Fiez and Petersen,1998), and bilaterally with executive processing and working memory (Alloway et al., 2004;Bunge et al., 2000; Smith and Jonides, 1999), and impairment in executive function inreaders with dyslexia has been suggested (Shaywitz and Shaywitz, 2008). Differences inactivation in the inferior frontal regions by reading group (typical versus impaired),
Black et al. Page 10
Neuroimage. Author manuscript; available in PMC 2013 April 17.
NIH
-PA Author Manuscript
NIH
-PA Author Manuscript
NIH
-PA Author Manuscript
however, offer contradictory findings, with studies reporting over-activation, under-activation, or no differences between the two groups (Maisog et al., 2008; Richlan et al.,2009). In an MEG study of adult readers with and without dyslexia, Frye and colleagues(2010b) attempted to elucidate the extant inconsistent findings by examining not only theamount of activation, but also effective connectivity (inward versus outward connectivity)from the inferior frontal areas. The timing of activation may be important as oneintervention study using MEG found that in typical readers activation in the inferior frontalareas was preceded by activation in the parieto-temporal areas, whereas in the group withdyslexia the timing of activation was not significantly different (Simos et al., 2007).Findings from Frye et al. (2010b) suggest that among readers with dyslexia, greaterconnectivity from the left IFA to other regions (such as the left and right parieto-temporalareas and the right inferior frontal areas) during the pre-stimulus period was associated withbetter performance on rhyme trials. Thus, it appears that for successful compensation amongreaders with dyslexia, the top-down inferior frontal areas connect to other important brainregions, and these cortical regions are not restricted to only the left hemisphere but also theright homologous regions (Frye et al., 2010b). While the present study did not examine pre-stimulus effective connectivity, inferior frontal areas were implicated in our findings, andfuture work could consider examination of effective connectivity. In sum, in our study itappears that more severe history of reading impairment in mothers is associated withatypical brain morphometry in children in regions necessary for phonological processing andphonological/verbal working memory, fluid reading and higher order cognitive processes.
We next consider the results of greater maternal influence by one of two possible avenues(though the two are likely to be associated with each other), greater maternal time spent withchild and a sex-based genetic transmission of dyslexia. First, mothers did report spendingsignificantly more time (in general and related to educational activities like reading) withtheir children than did fathers. A wide body of literature suggests the importance of homeenvironmental factors on reading achievement and general cognitive skills (Bradley, 1993;Bradley and Corwyn, 2002; Espy et al., 2001; Molfese et al., 2003; Molfese and Molfese,2002). Recall that the findings support at positive correlation between the amount of timethe mother spent reading to the child and grey matter variance, suggesting that environmentmay be a key contributor to morphometric differences seen in our sample of pre-readers.However, the influence of maternal reading history (i.e., the ARHQ score) on grey mattervariance remained significant even after controlling for this factor.
Therefore, in line with more recent work examining the biological contributors of good andpoor reading, we now consider whether our results may reflect evidence of a sex-specificthreshold model, suggested by (Pennington, 1990) for dyslexia (but also is true for othercognitive deficits such as Turner syndrome, (Kesler et al., 2003). The sex-specific modelposits that females require more risk genes (i.e., having a greater genetic load) than males toexhibit similar reading impairments. Therefore, if the deficits derive from a female ancestor,then offspring may have increased risk of being affected. If females require more risk genesthan males to express language and reading disorders, then when mothers evidenceimpairment their offspring may have increased risk for the disorder.
We cannot conclude from this study whether the specific association between brainmorphometry and maternal reading history is due to the influence of environmentalfactor(s), genes, or some combination of both. The association between mFamRI and GMmorphometry remaining significant even after regressing out the effect of SES or maternaleducation however, suggests that our results are at least not solely due to generalenvironmental influences and raise the interesting possibility of more neurobiological andgenetic influences. Further, the results from cortical surface area and thickness suggested
Black et al. Page 11
Neuroimage. Author manuscript; available in PMC 2013 April 17.
NIH
-PA Author Manuscript
NIH
-PA Author Manuscript
NIH
-PA Author Manuscript
that brain regions, in particular the left IPL, may reflect more prenatal maternal rather thanpostnatal environmental influence (but see, (Im et al., 2008).
Even though family history and behavioral risk for dyslexia are known to be comorbid, wedid not find any significant associations between BxRI and GMV or WMV. Thus, in thisyoung age group, current level of behavioral measures that are known to be predictors of thelater diagnosis of dyslexia (such as PA, RN or LID) were not associated with brainmeasures. It may be that these core functions critical for reading are associated with brainmeasures later in life, as numerous studies have shown associations between reading-relatedmeasures and fMRI activation or brain volumes in older samples (see for example,(Eckert etal., 2003; Hoeft et al., 2006; Kronbichler et al., 2008; Rumsey et al., 1999; Silani et al.,2005). Because these reading measures predict later development of dyslexia above andbeyond variance accounted for by familial risk (Puolakanaho et al., 2007), and because wehave evidence that English-speaking pre-readers with versus without risk for dyslexiadisplay differences in brain morphometry (Raschle et al., 2010), perhaps future readingachievement will be predicted with higher accuracy in our sample when neuroimaging andbehavioral measures are combined with environmental and genetic measures.
While the study presented is the first of its kind to suggest a dissociation between brainmorphometry and familial and behavioral risks for dyslexia in young children, there areimportant limitations that should be addressed in future studies. Suggestions for futurestudies include the following. First, while we did assess reading and cognitive skills directlyin many of the parents (N=36), it is important for future studies to evaluate the full samplewith perhaps a wider array of measures. Nevertheless, we do feel confident that the ARHQscores do reflect reading skill as our results showed an association between parents’ ARHQscores and the TOWRE PDE (a timed test of phonemic decoding) whereby more history ofreading impairment was associated with lower TOWRE scores. Second, whether theinfluence of maternal reading history on brain anatomy is due to environment (e.g., mothers’current reading behaviors and activities with children) and/or genes should be examined infuture large-scale longitudinal studies gathering genetic information. Further, in addition tosamples where mothers spend greater time with their children than fathers, it will be ofinterest to recruit families where both parents spend equal time with their child, and wherefathers spend more time than mothers. It is also possible that mothers’ reading backgroundwas more strongly associated because of a higher accuracy in the reporting of their readinghistory, which may have increased the correlations enough to make them significant.Compared to fathers, mothers are spending more time with their children on educationalactivities that may catalyze mothers’ thinking about their own experiences with reading.Finally, given that our results could suggest maternal neurobiological influences onchildren’s brain development, future studies should gather neuroimaging data on mothers(and if possible fathers).
Nevertheless, our findings suggest that previously described functional and structuralabnormalities in older individuals with dyslexia may not be due to experience through yearsof formal reading instructions, but rather are present in early childhood before school entry.Given that developmental dyslexia can so negatively affect children’s educationalattainments and self-appraisals, and that deficits seen in children with dyslexia can beremediated, it is essential that we continue efforts to explore the relationship among brain,behavior, genes and environment that may lead to early identification and intervention.
AcknowledgmentsThis study was supported by grants from NICHD HD054720, Lucile Packard Foundation for Children’s Health(LPFCH), Spectrum Child Health, Clinical and Translational Science Award, and the Dyslexia Foundation to FH,the Bette and Al Moorman Young Investigator Award to ALR, and P41RR009784 to GG. Funding for JMB was
Black et al. Page 12
Neuroimage. Author manuscript; available in PMC 2013 April 17.
NIH
-PA Author Manuscript
NIH
-PA Author Manuscript
NIH
-PA Author Manuscript
provided by an NIH-sponsored institutional research training grant (T32) 5T32MH019908-17 to ALR. We thankJoshua Heitzmann, Stuart Red, Rociel Martinez and Nicolle Bugescu for support in behavioral data collection, andBooil Jo for statistical consultation.
REFERENCESAlloway TP, Gathercole SE, Willis C, Adams AM. A structural analysis of working memory and
related cognitive skills in young children. J Exp Child Psychol. 2004; 87:85–106. [PubMed:14757066]
Ashburner J. A fast diffeomorphic image registration algorithm. NeuroImage. 2007; 38:95–113.[PubMed: 17761438]
Aylward EH, Richards TL, Beringer VW, Nagy WE, Field KM, Grimme AC, Richards AL, ThomsonJB, Cramer SC. Instructional treatment associated with changes in brain activation in children withdyslexia. Neurology. 2003; 61:212–219. [PubMed: 12874401]
Benasich AA, Choudhury N, Friedman JT, Realpe-Bonilla T, Chojnowska C, Gou Z. The infant as aprelinguistic model for language learning impairments: predicting from event-related potentials tobehavior. Neuropsychologia. 2006; 44:396–411. [PubMed: 16054661]
Bornstein, MH.; Bradley, RH., editors. Socioeconomic Status, Parenting, and Child Development.Lawrence Erlbaum Associates; Mahwah: 2003.
Bradley RH. Children’s home environments, health, behavior, and intervention efforts: a review usingthe HOME inventory as a marker measure. Genetic, social, and general psychology monographs.1993; 119:437.
Bradley RH, Corwyn RF. Socioeconomic status and child development. Annual Review ofPsychology. 2002; 53:371.
Brunswick N, McCrory E, Price CJ, Frith CD, Frith U. Explicit and implicit processing of words andpseudowords by adult developmental dyslexics. Brain. 1999; 122:1901–1917. [PubMed: 10506092]
Bunge SA, Klingberg T, Jacobsen RB, Gabrieli JD. A resource model of the neural basis of executiveworking memory. Proc Natl Acad Sci U S A. 2000; 97:3573–3578. [PubMed: 10725372]
Caylak E. Neurobiological approaches on brains of children with dyslexia: review. Acad Radiol. 2009;16:1003–1024. [PubMed: 19406674]
Dale AM, Fischl B, Sereno MI. Cortical surface-based analysis. I. Segmentation and surfacereconstruction. NeuroImage. 1999; 9:179–194. [PubMed: 9931268]
Dale AM, Sereno MI. Improved localization of cortical activity by combining EEG and MEG withMRI cortical surface reconstruction: a linear approach. Journal of Cognitive Neuroscience. 1993;5:162–176.
Desikan RS, Segonne F, Fischl B, Quinn BT, Dickerson BC, Blacker D, Buckner RL, Dale AM,Maguire RP, Hyman BT, Albert MS, Killiany RJ. An automated labeling system for subdividingthe human cerebral cortex on MRI scans into gyral based regions of interest. NeuroImage. 2006;31:968–980. [PubMed: 16530430]
Eckert MA, Leonard CM, Richards TL, Aylward EH, Thomson J, Berninger VW. Anatomicalcorrelates of dyslexia: frontal and cerebellar findings. Brain. 2003; 126:482–494. [PubMed:12538414]
Eden GF, Jones KM, Cappell K, Gareau L, Wood, Zeffiro TA, Dietz N, Agnew JA, Flowers DL.Neural changes following remediation in adult developmental dyslexia. Neuron. 2004; 44:411–422. [PubMed: 15504323]
Espy KA, Molfese VJ, DiLalla LF. Effects of environmental measures on intelligence in youngchildren: Growth curve modeling of longitudinal data. Merrill-Palmer Quarterly. 2001; 47:42–73.
Fiez JA, Petersen SE. Neuroimaging studies of word reading. Proc Natl Acad Sci U S A. 1998;95:914–921. [PubMed: 9448259]
Fischl B, Dale AM. Measuring the thickness of the human cerebral cortex from magnetic resonanceimages. Proc Natl Acad Sci U S A. 2000; 97:11050–11055. [PubMed: 10984517]
Fischl B, Liu A, Dale AM. Automated manifold surgery: constructing geometrically accurate andtopologically correct models of the human cerebral cortex. IEEE Trans Med Imaging. 2001;20:70–80. [PubMed: 11293693]
Black et al. Page 13
Neuroimage. Author manuscript; available in PMC 2013 April 17.
NIH
-PA Author Manuscript
NIH
-PA Author Manuscript
NIH
-PA Author Manuscript
Fischl B, Salat DH, Busa E, Albert M, Dieterich M, Haselgrove C, van der Kouwe A, Killiany R,Kennedy D, Klaveness S, Montillo A, Makris N, Rosen B, Dale AM. Whole brain segmentation:automated labeling of neuroanatomical structures in the human brain. Neuron. 2002; 33:341–355.[PubMed: 11832223]
Fischl B, Salat DH, van der Kouwe AJ, Makris N, Segonne F, Quinn BT, Dale AM. Sequence-independent segmentation of magnetic resonance images. NeuroImage. 2004a; 23(Suppl 1):S69–84. [PubMed: 15501102]
Fischl B, Sereno MI, Dale AM. Cortical surface-based analysis. II: Inflation, flattening, and a surface-based coordinate system. NeuroImage. 1999a; 9:195–207. [PubMed: 9931269]
Fischl B, Sereno MI, Tootell RB, Dale AM. High-resolution intersubject averaging and a coordinatesystem for the cortical surface. Hum Brain Mapp. 1999b; 8:272–284. [PubMed: 10619420]
Fischl B, van der Kouwe A, Destrieux C, Halgren E, Segonne F, Salat DH, Busa E, Seidman LJ,Goldstein J, Kennedy D, Caviness V, Makris N, Rosen B, Dale AM. Automatically parcellatingthe human cerebral cortex. Cereb Cortex. 2004b; 14:11–22. [PubMed: 14654453]
Frye RE, Liederman J, Malmberg B, McLean J, Strickland D, Beauchamp MS. Surface area accountsfor the relation of gray matter volume to reading-related skills and history of dyslexia. CerebCortex. 2010a; 20:2625–2635. [PubMed: 20154011]
Frye RE, Wu MH, Liederman J, Fisher JM. Greater Pre-Stimulus Effective Connectivity from the LeftInferior Frontal Area to other Areas is Associated with Better Phonological Decoding in DyslexicReaders. Frontiers in systems neuroscience. 2010b; 4:156. [PubMed: 21160549]
Gabrieli JD. Dyslexia: a new synergy between education and cognitive neuroscience. Science. 2009;325:280–283. [PubMed: 19608907]
Georgiewa P, Rzanny R, Gaser C, Gerhard UJ, Vieweg U, Freesmeyer D, Mentzel HJ, Kaiser WA,Blanz B. Phonological processing in dyslexic children: a study combining functional imaging andevent related potentials. Neurosci Lett. 2002; 318:5–8. [PubMed: 11786212]
Guttorm TK, Leppänen PH, Hämäläinen JA, Eklund KM, Lyytinen HJ. Newborn event-relatedpotentials predict poorer pre-reading skills in children at risk for dyslexia. J Learn Disabil. 2009;1:10.
Habib M. The neurobiological basis of developmental dyslexia: an overview and working hypothesis.Brain. 2000; 123:2373–2399. [PubMed: 11099442]
Han X, Jovicich J, Salat D, van der Kouwe A, Quinn B, Czanner S, Busa E, Pacheco J, Albert M,Killiany R, Maguire P, Rosas D, Makris N, Dale A, Dickerson B, Fischl B. Reliability of MRI-derived measurements of human cerebral cortical thickness: the effects of field strength, scannerupgrade and manufacturer. NeuroImage. 2006; 32:180–194. [PubMed: 16651008]
Hoeft F, Hernandez A, McMillon G, Taylor-Hill H, Martindale JL, Meyler A, Keller TA, Siok WT,Deutsch GK, Just MA, Whitfield-Gabrieli S, Gabrieli JD. Neural basis of dyslexia: a comparisonbetween dyslexic and nondyslexic children equated for reading ability. J Neurosci. 2006;26:10700–10708. [PubMed: 17050709]
Hoeft F, Meyler A, Hernandez A, Juel C, Taylor-Hill H, Martindale JL, McMillon G, Kolchugina G,Black JM, Faizi A, Deutsch GK, Siok WT, Reiss AL, Whitfield-Gabrieli S, Gabrieli JD.Functional and morphometric brain dissociation between dyslexia and reading ability. Proc NatlAcad Sci U S A. 2007; 104:4234–4239. [PubMed: 17360506]
Im K, Lee JM, Lyttelton O, Kim SH, Evans AC, Kim SI. Brain size and cortical structure in the adulthuman brain. Cereb Cortex. 2008; 18:2181–2191. [PubMed: 18234686]
Jovicich J, Czanner S, Greve D, Haley E, van der Kouwe A, Gollub R, Kennedy D, Schmitt F, BrownG, Macfall J, Fischl B, Dale A. Reliability in multi-site structural MRI studies: effects of gradientnon-linearity correction on phantom and human data. NeuroImage. 2006; 30:436–443. [PubMed:16300968]
Kapellou O, Counsell SJ, Kennea N, Dyet L, Saeed N, Stark J, Maalouf E, Duggan P, Ajayi-Obe M,Hajnal J, Allsop JM, Boardman J, Rutherford MA, Cowan F, Edwards AD. Abnormal corticaldevelopment after premature birth shown by altered allometric scaling of brain growth. PLoSMed. 2006; 3:e265. [PubMed: 16866579]
Black et al. Page 14
Neuroimage. Author manuscript; available in PMC 2013 April 17.
NIH
-PA Author Manuscript
NIH
-PA Author Manuscript
NIH
-PA Author Manuscript
Kesler SR, Blasey CM, Brown WE, Yankowitz J, Zeng SM, Bender BG, Reiss AL. Effects of X-monosomy and X-linked imprinting on superior temporal gyrus morphology in Turner syndrome.Biol Psychiatry. 2003; 54:636–646. [PubMed: 13129659]
Kronbichler M, Wimmer H, Staffen W, Hutzler F, Mair A, Ladurner G. Developmental dyslexia: graymatter abnormalities in the occipitotemporal cortex. Hum Brain Mapp. 2008; 29:613–625.[PubMed: 17636558]
Kuperberg GR, Broome MR, McGuire PK, David AS, Eddy M, Ozawa F, Goff D, West WC, WilliamsSC, van der Kouwe AJ, Salat DH, Dale AM, Fischl B. Regionally localized thinning of thecerebral cortex in schizophrenia. Arch Gen Psychiatry. 2003; 60:878–888. [PubMed: 12963669]
Landing BH, Shankle WR, Hara J, Brannock J, Fallon JH. The development of structure and functionin the postnatal human cerebral cortex from birth to 72 months: changes in thickness of layers IIand III co-relate to the onset of new age-specific behaviors. Pediatr Pathol Mol Med. 2002;21:321–342. [PubMed: 12056506]
Lefly DL, Pennington BF. Reliability and validity of the Adult Reading History Questionnaire. J LearnDisabil. 2000; 33:286–296. [PubMed: 15505966]
Leppänen PH, Pihko E, Eklund KM, Lyytinen H. Cortical responses of infants with and without agenetic risk for dyslexia: II. Group effects. Neuroreport. 1999; 10:969–973. [PubMed: 10321469]
Lyytinen, H.; Erskine, J.; Ahonen, T.; Aro, M.; Eklund, K.; Guttorm, T.; Hintikka, S.; Hämäläinen, J.;Ketonen, R.; Laakso, ML.; Leppänen, PHT.; Lyytinen, P.; Poikkeus, AM.; Puolakanaho, A.;Richardson, U.; Salmi, P.; Tolvanen, A.; Torppa, M.; Viholainen, H. Early identification andprevention of dyslexia: Results from a prospective follow-up study of children at familial risk fordyslexia. In: Reid, G.; Fawcett, A.; Siegel, L.; Manis, FR., editors. The SAGE Handbook ofDyslexia. SAGE Publications Ltd.; Thousand Oaks: 2008. p. 121-146.
Lyytinen H, Erskine J, Tolvanen A, Torppa M, Poikkeus A, Lyytinen P. Trajectories of readingdevelopment: A follow-up from birth to school age of children with and without risk for dyslexia.Merrill-Palmer Quarterly. 2006; 52:514–546.
Lyytinen, H.; Leppänen, PH.; Richardson, U.; Guttorm, TK. Brain functions and speech perception ininfants at risk for dyslexia. In: Csepe, V., editor. Dyslexia: Different Brain, Different Behaviour.Kluwer; Dorthrecht: 2003. p. 113-152.
Maisog JM, Einbinder ER, Flowers DL, Turkeltaub PE, Eden GF. A meta-analysis of functionalneuroimaging studies of dyslexia. Ann N Y Acad Sci. 2008; 1145:237–259. [PubMed: 19076401]
Mather, N.; Woodcock, RW. Woodcock-Johnson III Tests of Cognitive Abilities. RiversidePublishing; Rolling Meadows, IL: 2001.
Maurer U, Brem S, Bucher K, Kranz F, Benz R, Steinhausen HC, Brandeis D. Impaired tuning of afast occipito-temporal response for print in dyslexic children learning to read. Brain. 2007;130:3200–3210. [PubMed: 17728359]
Maurer U, Bucher K, Brem S, Benz R, Kranz F, Schulz E, van der Mark S, Steinhausen HC, BrandeisD. Neurophysiology in preschool improves behavioral prediction of reading ability throughoutprimary school. Biol Psychiatry. 2009; 66:341–348. [PubMed: 19423082]
Maurer U, Bucher K, Brem S, Brandeis D. Altered responses to tone and phoneme mismatch inkindergartners at familial dyslexia risk. Neuroreport. 2003; 14:2245–2250. [PubMed: 14625456]
Meyler A, Keller TA, Cherkassky VL, Gabrieli JD, Just MA. Modifying the brain activation of poorreaders during sentence comprehension with extended remedial instruction: a longitudinal study ofneuroplasticity. Neuropsychologia. 2008; 46:2580–2592. [PubMed: 18495180]
Milne RD, Syngeniotis A, Jackson G, Corballis MC. Mixed lateralization of phonological assembly indevelopmental dyslexia. Neurocase. 2002; 8:205–209. [PubMed: 12119315]
Molfese VJ, Modglin A, Molfese DL. The role of environment in the development of reading skills: Alongitudinal study of preschool and school-age measures. J Learn Disabil. 2003; 36:59–67.[PubMed: 15490892]
Molfese VJ, Molfese DL. Environmental and social influences on reading skills as indexed by brainand behavioral responses. Annals of Dyslexia. 2002; 52:121–137.
Pennington BF. The genetics of dyslexia. Journal of Child Psychology and Psychiatry. 1990; 31:193–201. [PubMed: 2179251]
Black et al. Page 15
Neuroimage. Author manuscript; available in PMC 2013 April 17.
NIH
-PA Author Manuscript
NIH
-PA Author Manuscript
NIH
-PA Author Manuscript
Puolakanaho A, Ahonen T, Aro M, Eklund K, Leppänen PH, Poikkeus AM, Tolvanen A, Torppa M,Lyytinen H. Very early phonological and language skills: estimating individual risk of readingdisability. J Child Psychol Psychiatry. 2007; 48:923–931. [PubMed: 17714377]
Raschle NM, Chang M, Gaab N. Structural brain alterations associated with dyslexia predate readingonset. NeuroImage. 2010
Rezaie R, Simos PG, Fletcher JM, Cirino PT, Vaughn S, Papanicolaou AC. Temporo-parietal BrainActivity as a Longitudinal Predictor of Response to Educational Interventions among MiddleSchool Struggling Readers. Journal of the International Neuropsychological Society : JINS. 2011;17:875–885. [PubMed: 21740612]
Richards TL, Berninger VW, Aylward EH, Richards AL, Thomson JB, Nagy WE, Carlisle JF, DagerSR, Abbott RD. Reproducibility of proton MR spectroscopic imaging (PEPSI): comparison ofdyslexic and normal-reading children and effects of treatment on brain lactate levels duringlanguage tasks. AJNR Am J Neuroradiol. 2002; 23:1678–1685. [PubMed: 12427623]
Richlan F, Kronbichler M, Wimmer H. Functional abnormalities in the dyslexic brain: a quantitativemeta-analysis of neuroimaging studies. Hum Brain Mapp. 2009; 30:3299–3308. [PubMed:19288465]
Rosas HD, Liu AK, Hersch S, Glessner M, Ferrante RJ, Salat DH, van der Kouwe A, Jenkins BG,Dale AM, Fischl B. Regional and progressive thinning of the cortical ribbon in Huntington’sdisease. Neurology. 2002; 58:695–701. [PubMed: 11889230]
Rumsey JM. The biology of developmental dyslexia. JAMA. 1992; 268:912–915. [PubMed: 1640623]
Rumsey JM, Horwitz B, Donohue BC, Nace KL, Maisog JM, Andreason P. A functional lesion indevelopmental dyslexia: left angular gyral blood flow predicts severity. Brain Lang. 1999; 70:187–204. [PubMed: 10550226]
Salat DH, Buckner RL, Snyder AZ, Greve DN, Desikan RS, Busa E, Morris JC, Dale AM, Fischl B.Thinning of the cerebral cortex in aging. Cereb Cortex. 2004; 14:721–730. [PubMed: 15054051]
Salmelin R, Service E, Kiesila P, Uutela K, Salonen O. Impaired visual word processing in dyslexiarevealed with magnetoencephalography. Ann Neurol. 1996; 40:157–162. [PubMed: 8773596]
Segonne F, Dale AM, Busa E, Glessner M, Salat D, Hahn HK, Fischl B. A hybrid approach to theskull stripping problem in MRI. NeuroImage. 2004; 22:1060–1075. [PubMed: 15219578]
Segonne F, Pacheco J, Fischl B. Geometrically accurate topology-correction of cortical surfaces usingnonseparating loops. IEEE Trans Med Imaging. 2007; 26:518–529. [PubMed: 17427739]
Shaw P, Kabani NJ, Lerch JP, Eckstrand K, Lenroot R, Gogtay N, Greenstein D, Clasen L, Evans A,Rapoport JL, Giedd JN, Wise SP. Neurodevelopmental trajectories of the human cerebral cortex. JNeurosci. 2008; 28:3586–3594. [PubMed: 18385317]
Shaywitz BA, Shaywitz SE, Blachman BA, Pugh KR, Fulbright RK, Skudlarski P, Mencl WE,Constable RT, Holahan JM, Marchione KE, Fletcher JM, Lyon GR, Gore JC. Development of leftoccipitotemporal systems for skilled reading in children after a phonologically- based intervention.Biol Psychiatry. 2004; 55:926–933. [PubMed: 15110736]
Shaywitz BA, Shaywitz SE, Pugh KR, Mencl WE, Fulbright RK, Skudlarski P, Constable RT,Marchione KE, Fletcher JM, Lyon GR, Gore JC. Disruption of posterior brain systems for readingin children with developmental dyslexia. Biol Psychiatry. 2002; 52:101–110. [PubMed: 12114001]
Shaywitz SE. Dyslexia. N Engl J Med. 1998; 338:307–312. [PubMed: 9445412]
Shaywitz SE, Shaywitz BA. Dyslexia (specific reading disability). Biological Psychiatry. 2005;57:1301–1309. [PubMed: 15950002]
Shaywitz SE, Shaywitz BA. Paying attention to reading: the neurobiology of reading and dyslexia.Dev Psychopathol. 2008; 20:1329–1349. [PubMed: 18838044]
Shaywitz SE, Shaywitz BA, Fulbright RK, Skudlarski P, Mencl WE, Constable RT, Pugh KR,Holahan JM, Marchione KE, Fletcher JM, Lyon GR, Gore JC. Neural systems for compensationand persistence: young adult outcome of childhood reading disability. Biol Psychiatry. 2003;54:25–33. [PubMed: 12842305]
Shaywitz SE, Shaywitz BA, Pugh KR, Fulbright RK, Constable RT, Mencl WE, Shankweiler DP,Liberman AM, Skudlarski P, Fletcher JM, Katz L, Marchione KE, Lacadie C, Gatenby C, GoreJC. Functional disruption in the organization of the brain for reading in dyslexia. Proc Natl AcadSci U S A. 1998; 95:2636–2641. [PubMed: 9482939]
Black et al. Page 16
Neuroimage. Author manuscript; available in PMC 2013 April 17.
NIH
-PA Author Manuscript
NIH
-PA Author Manuscript
NIH
-PA Author Manuscript
Silani G, Frith U, Demonet JF, Fazio F, Perani D, Price C, Frith CD, Paulesu E. Brain abnormalitiesunderlying altered activation in dyslexia: a voxel based morphometry study. Brain. 2005;128:2453–2461. [PubMed: 15975942]
Simos PG, Fletcher JM, Sarkari S, Billingsley RL, Denton C, Papanicolaou AC. Altering the braincircuits for reading through intervention: a magnetic source imaging study. Neuropsychology.2007; 21:485–496. [PubMed: 17605581]
Sled JG, Zijdenbos AP, Evans AC. A nonparametric method for automatic correction of intensitynonuniformity in MRI data. IEEE Trans Med Imaging. 1998; 17:87–97. [PubMed: 9617910]
Smith EE, Jonides J. Storage and executive processes in the frontal lobes. Science. 1999; 283:1657–1661. [PubMed: 10073923]
Specht K, Hugdahl K, Ofte S, Nygård M, Bjørnerud A, Plante E, Helland T. Brain activation on pre-reading tasks reveals at-risk status for dyslexia in 6-year-old children. Scand J Psychol. 2009;50:79–91. [PubMed: 18826418]
Swan D, Goswami U. Phonological awareness deficits in developmental dyslexia and the phonologicalrepresentations hypothesis. Journal of Experimental Child Psychology. 1997; 66:18–41. [PubMed:9226932]
Torppa M, Poikkeus AM, Laakso ML, Eklund K, Lyytinen H. Predicting delayed letter knowledgedevelopment and its relation to grade 1 reading achievement among children with and withoutfamilial risk for dyslexia. Dev Psychol. 2006; 42:1128–1142. [PubMed: 17087547]
Vigneau M, Beaucousin V, Herve PY, Duffau H, Crivello F, Houde O, Mazoyer B, Tzourio-MazoyerN. Meta-analyzing left hemisphere language areas: phonology, semantics, and sentenceprocessing. NeuroImage. 2006; 30:1414–1432. [PubMed: 16413796]
Wagner RK, Torgensen JK. The nature of phonological processing and its role in the acqusition ofreading skills. Psychological Bulletin. 1987; 101:192–212.
Wagner, RK.; Torgesen, JK.; Rashotte, CA. Comprehensive Test of Phonological Processing. Pro-Ed;Austin, TX: 1999.
Wolf, M.; Denckla, MB. Rapid Automized Naming and Rapid Alternating Stimulus Tests. Pro-Ed;Austin, TX: 2005.
Woodcock, RW. Woodcock Reading Mastery Tests - Revised/NU. American Guidance Service, Inc.;Circle Pines, MN: 1998.
Zachary, RA. Shipley Institute of Living Scale, Revised Manual. Western Psychological Services; LosAngeles: 2006.
Black et al. Page 17
Neuroimage. Author manuscript; available in PMC 2013 April 17.
NIH
-PA Author Manuscript
NIH
-PA Author Manuscript
NIH
-PA Author Manuscript
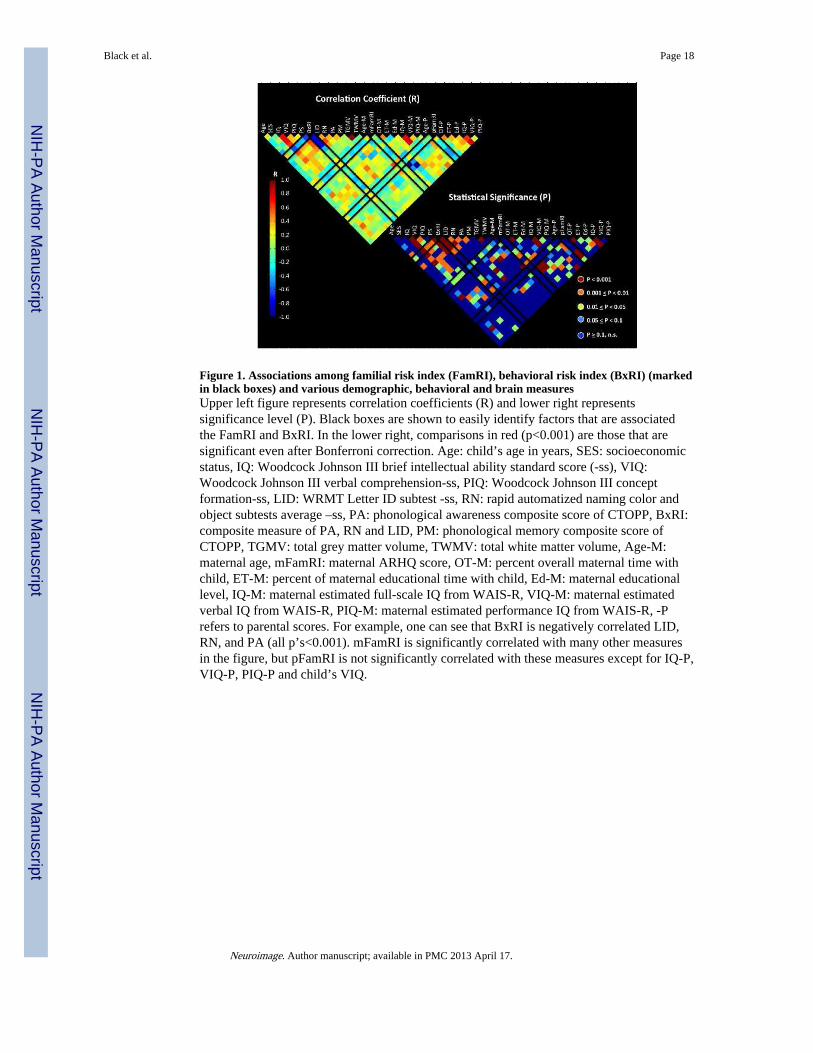
Figure 1. Associations among familial risk index (FamRI), behavioral risk index (BxRI) (markedin black boxes) and various demographic, behavioral and brain measuresUpper left figure represents correlation coefficients (R) and lower right representssignificance level (P). Black boxes are shown to easily identify factors that are associatedthe FamRI and BxRI. In the lower right, comparisons in red (p<0.001) are those that aresignificant even after Bonferroni correction. Age: child’s age in years, SES: socioeconomicstatus, IQ: Woodcock Johnson III brief intellectual ability standard score (-ss), VIQ:Woodcock Johnson III verbal comprehension-ss, PIQ: Woodcock Johnson III conceptformation-ss, LID: WRMT Letter ID subtest -ss, RN: rapid automatized naming color andobject subtests average –ss, PA: phonological awareness composite score of CTOPP, BxRI:composite measure of PA, RN and LID, PM: phonological memory composite score ofCTOPP, TGMV: total grey matter volume, TWMV: total white matter volume, Age-M:maternal age, mFamRI: maternal ARHQ score, OT-M: percent overall maternal time withchild, ET-M: percent of maternal educational time with child, Ed-M: maternal educationallevel, IQ-M: maternal estimated full-scale IQ from WAIS-R, VIQ-M: maternal estimatedverbal IQ from WAIS-R, PIQ-M: maternal estimated performance IQ from WAIS-R, -Prefers to parental scores. For example, one can see that BxRI is negatively correlated LID,RN, and PA (all p’s<0.001). mFamRI is significantly correlated with many other measuresin the figure, but pFamRI is not significantly correlated with these measures except for IQ-P,VIQ-P, PIQ-P and child’s VIQ.
Black et al. Page 18
Neuroimage. Author manuscript; available in PMC 2013 April 17.
NIH
-PA Author Manuscript
NIH
-PA Author Manuscript
NIH
-PA Author Manuscript
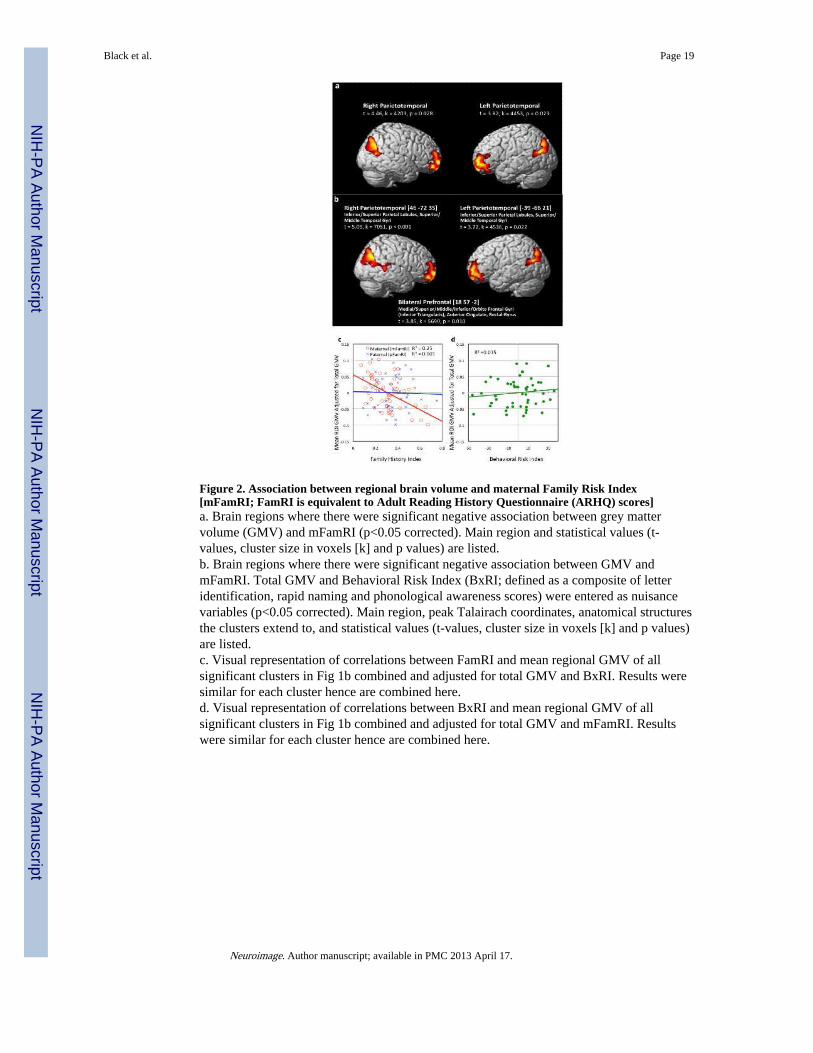
Figure 2. Association between regional brain volume and maternal Family Risk Index[mFamRI; FamRI is equivalent to Adult Reading History Questionnaire (ARHQ) scores]a. Brain regions where there were significant negative association between grey mattervolume (GMV) and mFamRI (p<0.05 corrected). Main region and statistical values (t-values, cluster size in voxels [k] and p values) are listed.b. Brain regions where there were significant negative association between GMV andmFamRI. Total GMV and Behavioral Risk Index (BxRI; defined as a composite of letteridentification, rapid naming and phonological awareness scores) were entered as nuisancevariables (p<0.05 corrected). Main region, peak Talairach coordinates, anatomical structuresthe clusters extend to, and statistical values (t-values, cluster size in voxels [k] and p values)are listed.c. Visual representation of correlations between FamRI and mean regional GMV of allsignificant clusters in Fig 1b combined and adjusted for total GMV and BxRI. Results weresimilar for each cluster hence are combined here.d. Visual representation of correlations between BxRI and mean regional GMV of allsignificant clusters in Fig 1b combined and adjusted for total GMV and mFamRI. Resultswere similar for each cluster hence are combined here.
Black et al. Page 19
Neuroimage. Author manuscript; available in PMC 2013 April 17.
NIH
-PA Author Manuscript
NIH
-PA Author Manuscript
NIH
-PA Author Manuscript
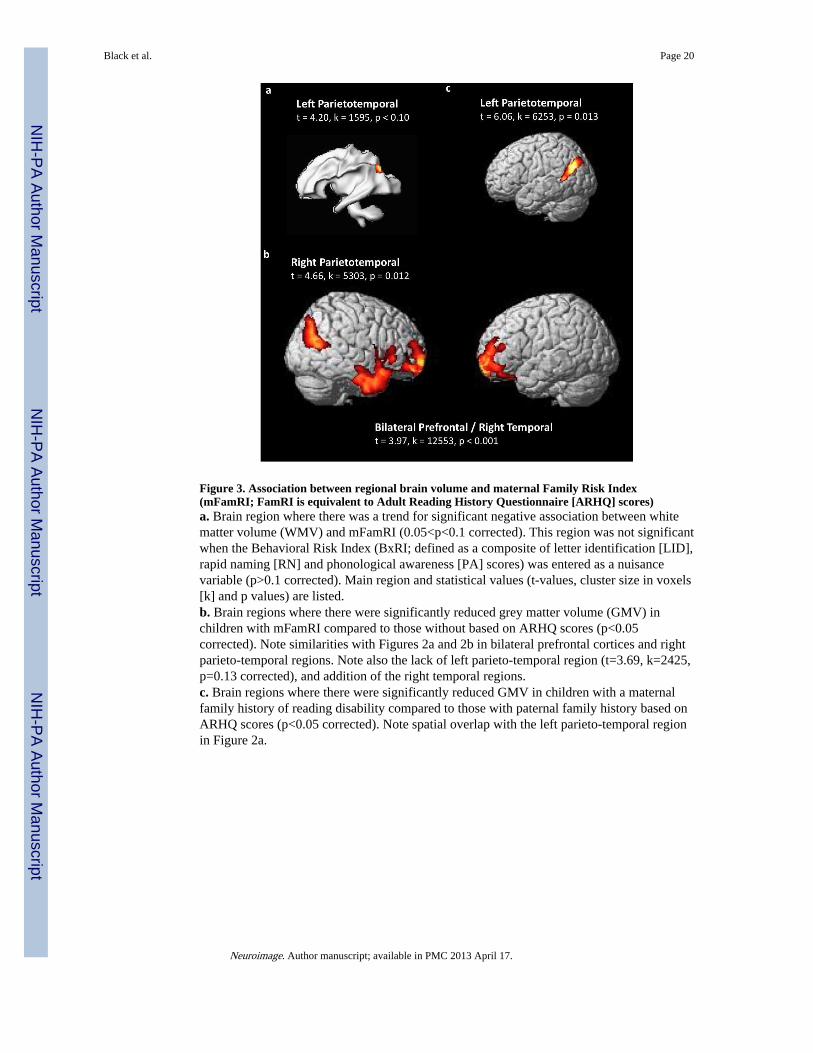
Figure 3. Association between regional brain volume and maternal Family Risk Index(mFamRI; FamRI is equivalent to Adult Reading History Questionnaire [ARHQ] scores)a. Brain region where there was a trend for significant negative association between whitematter volume (WMV) and mFamRI (0.05<p<0.1 corrected). This region was not significantwhen the Behavioral Risk Index (BxRI; defined as a composite of letter identification [LID],rapid naming [RN] and phonological awareness [PA] scores) was entered as a nuisancevariable (p>0.1 corrected). Main region and statistical values (t-values, cluster size in voxels[k] and p values) are listed.b. Brain regions where there were significantly reduced grey matter volume (GMV) inchildren with mFamRI compared to those without based on ARHQ scores (p<0.05corrected). Note similarities with Figures 2a and 2b in bilateral prefrontal cortices and rightparieto-temporal regions. Note also the lack of left parieto-temporal region (t=3.69, k=2425,p=0.13 corrected), and addition of the right temporal regions.c. Brain regions where there were significantly reduced GMV in children with a maternalfamily history of reading disability compared to those with paternal family history based onARHQ scores (p<0.05 corrected). Note spatial overlap with the left parieto-temporal regionin Figure 2a.
Black et al. Page 20
Neuroimage. Author manuscript; available in PMC 2013 April 17.
NIH
-PA Author Manuscript
NIH
-PA Author Manuscript
NIH
-PA Author Manuscript
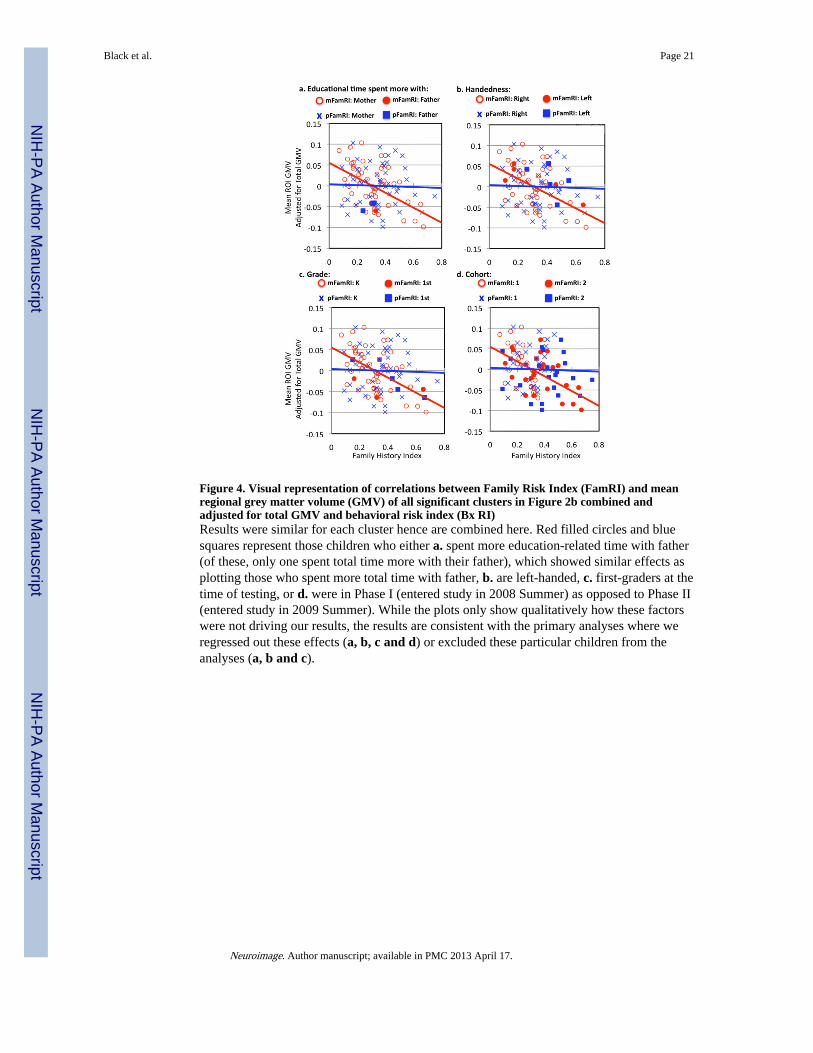
Figure 4. Visual representation of correlations between Family Risk Index (FamRI) and meanregional grey matter volume (GMV) of all significant clusters in Figure 2b combined andadjusted for total GMV and behavioral risk index (Bx RI)Results were similar for each cluster hence are combined here. Red filled circles and bluesquares represent those children who either a. spent more education-related time with father(of these, only one spent total time more with their father), which showed similar effects asplotting those who spent more total time with father, b. are left-handed, c. first-graders at thetime of testing, or d. were in Phase I (entered study in 2008 Summer) as opposed to Phase II(entered study in 2009 Summer). While the plots only show qualitatively how these factorswere not driving our results, the results are consistent with the primary analyses where weregressed out these effects (a, b, c and d) or excluded these particular children from theanalyses (a, b and c).
Black et al. Page 21
Neuroimage. Author manuscript; available in PMC 2013 April 17.
NIH
-PA Author Manuscript
NIH
-PA Author Manuscript
NIH
-PA Author Manuscript
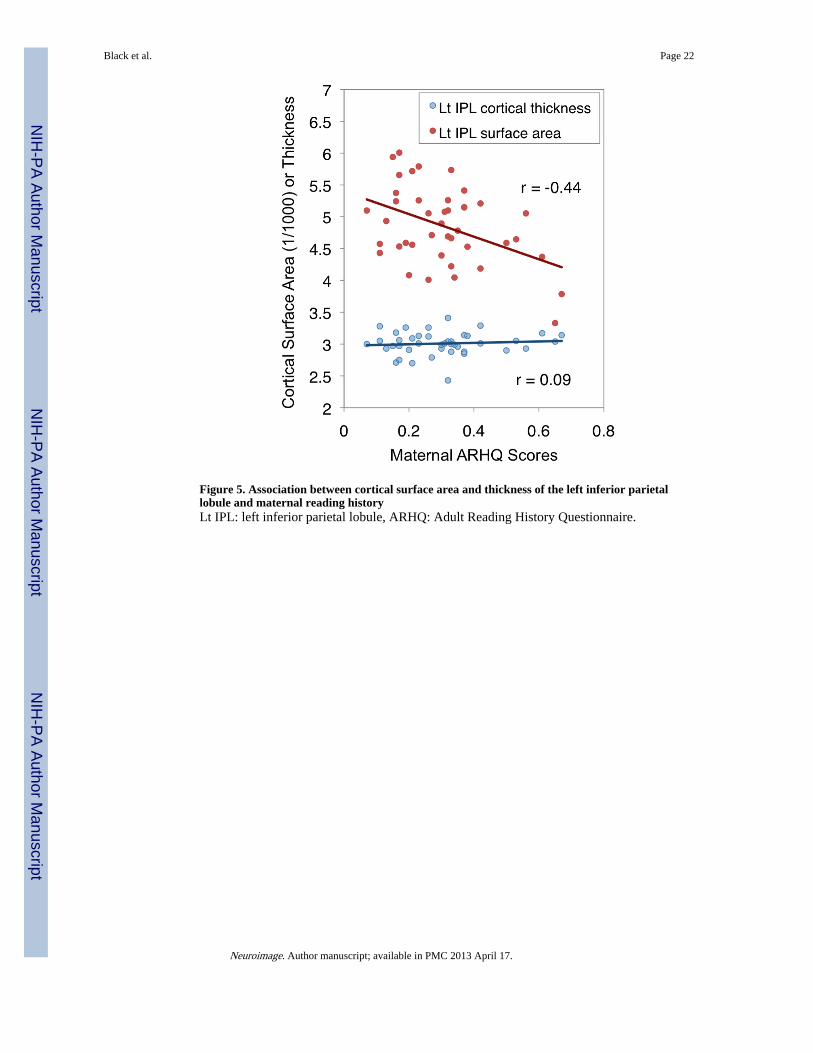
Figure 5. Association between cortical surface area and thickness of the left inferior parietallobule and maternal reading historyLt IPL: left inferior parietal lobule, ARHQ: Adult Reading History Questionnaire.
Black et al. Page 22
Neuroimage. Author manuscript; available in PMC 2013 April 17.
NIH
-PA Author Manuscript
NIH
-PA Author Manuscript
NIH
-PA Author Manuscript
NIH
-PA Author Manuscript
NIH
-PA Author Manuscript
NIH
-PA Author Manuscript
Black et al. Page 23
Table 1
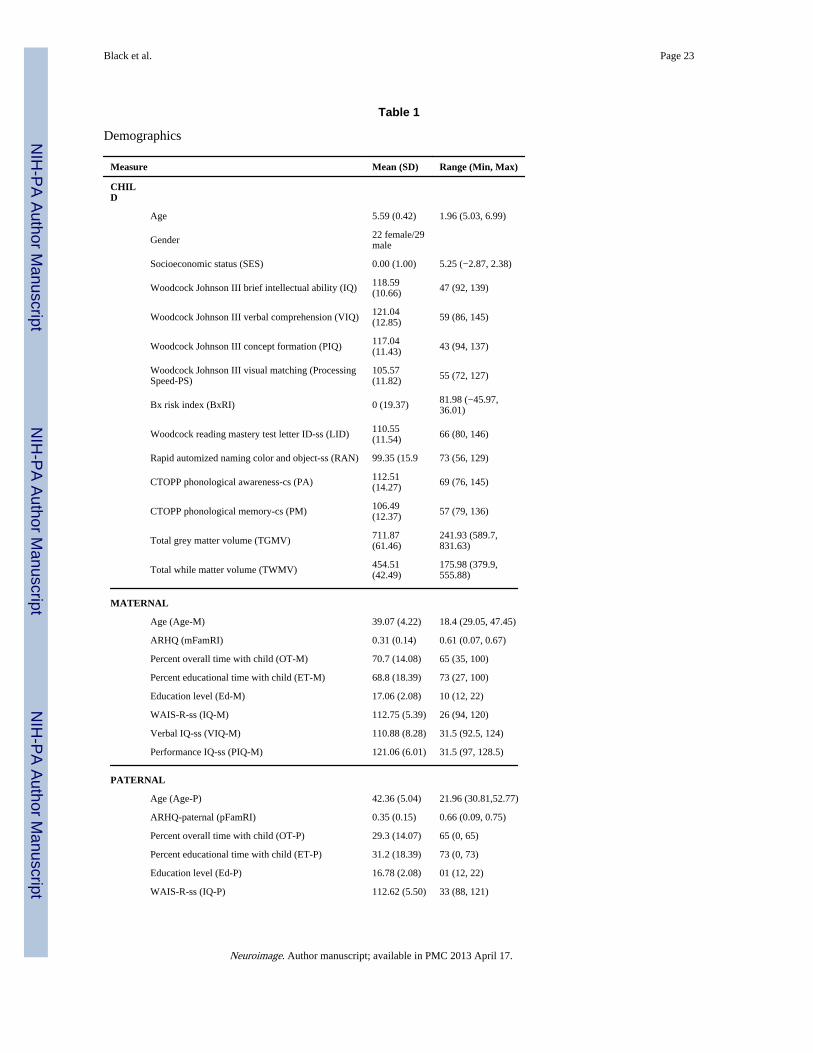
Demographics
Measure Mean (SD) Range (Min, Max)
CHILD
Age 5.59 (0.42) 1.96 (5.03, 6.99)
Gender 22 female/29male
Socioeconomic status (SES) 0.00 (1.00) 5.25 (−2.87, 2.38)
Woodcock Johnson III brief intellectual ability (IQ) 118.59(10.66) 47 (92, 139)
Woodcock Johnson III verbal comprehension (VIQ) 121.04(12.85) 59 (86, 145)
Woodcock Johnson III concept formation (PIQ) 117.04(11.43) 43 (94, 137)
Woodcock Johnson III visual matching (Processing Speed-PS)
105.57(11.82) 55 (72, 127)
Bx risk index (BxRI) 0 (19.37) 81.98 (−45.97,36.01)
Woodcock reading mastery test letter ID-ss (LID) 110.55(11.54) 66 (80, 146)
Rapid automized naming color and object-ss (RAN) 99.35 (15.9 73 (56, 129)
CTOPP phonological awareness-cs (PA) 112.51(14.27) 69 (76, 145)
CTOPP phonological memory-cs (PM) 106.49(12.37) 57 (79, 136)
Total grey matter volume (TGMV) 711.87(61.46)
241.93 (589.7,831.63)
Total while matter volume (TWMV) 454.51(42.49)
175.98 (379.9,555.88)
MATERNAL
Age (Age-M) 39.07 (4.22) 18.4 (29.05, 47.45)
ARHQ (mFamRI) 0.31 (0.14) 0.61 (0.07, 0.67)
Percent overall time with child (OT-M) 70.7 (14.08) 65 (35, 100)
Percent educational time with child (ET-M) 68.8 (18.39) 73 (27, 100)
Education level (Ed-M) 17.06 (2.08) 10 (12, 22)
WAIS-R-ss (IQ-M) 112.75 (5.39) 26 (94, 120)
Verbal IQ-ss (VIQ-M) 110.88 (8.28) 31.5 (92.5, 124)
Performance IQ-ss (PIQ-M) 121.06 (6.01) 31.5 (97, 128.5)
PATERNAL
Age (Age-P) 42.36 (5.04) 21.96 (30.81,52.77)
ARHQ-paternal (pFamRI) 0.35 (0.15) 0.66 (0.09, 0.75)
Percent overall time with child (OT-P) 29.3 (14.07) 65 (0, 65)
Percent educational time with child (ET-P) 31.2 (18.39) 73 (0, 73)
Education level (Ed-P) 16.78 (2.08) 01 (12, 22)
WAIS-R-ss (IQ-P) 112.62 (5.50) 33 (88, 121)
Neuroimage. Author manuscript; available in PMC 2013 April 17.

NIH
-PA Author Manuscript
NIH
-PA Author Manuscript
NIH
-PA Author Manuscript
Black et al. Page 24
Measure Mean (SD) Range (Min, Max)
Verbal IQ-ss (VIQ-P) 109.32 (8.77) 42 (79, 121)
Performance IQ-ss (PIQ-P) 123.11 (6.81) 42 (88, 130)
Neuroimage. Author manuscript; available in PMC 2013 April 17.
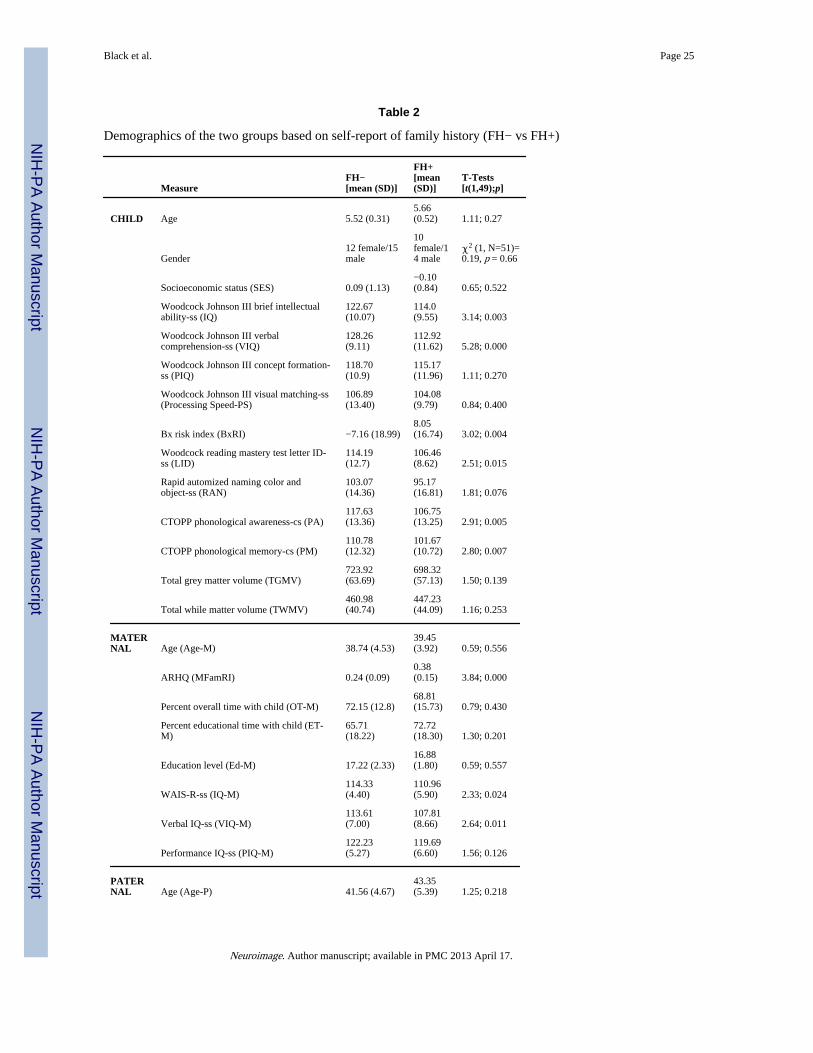
NIH
-PA Author Manuscript
NIH
-PA Author Manuscript
NIH
-PA Author Manuscript
Black et al. Page 25
Table 2
Demographics of the two groups based on self-report of family history (FH− vs FH+)
MeasureFH−[mean (SD)]
FH+[mean(SD)]
T-Tests[t(1,49);p]
CHILD Age 5.52 (0.31)5.66(0.52) 1.11; 0.27
Gender12 female/15male
10female/14 male
χ2 (1, N=51)=0.19, p = 0.66
Socioeconomic status (SES) 0.09 (1.13)−0.10(0.84) 0.65; 0.522
Woodcock Johnson III brief intellectualability-ss (IQ)
122.67(10.07)
114.0(9.55) 3.14; 0.003
Woodcock Johnson III verbalcomprehension-ss (VIQ)
128.26(9.11)
112.92(11.62) 5.28; 0.000
Woodcock Johnson III concept formation-ss (PIQ)
118.70(10.9)
115.17(11.96) 1.11; 0.270
Woodcock Johnson III visual matching-ss(Processing Speed-PS)
106.89(13.40)
104.08(9.79) 0.84; 0.400
Bx risk index (BxRI) −7.16 (18.99)8.05(16.74) 3.02; 0.004
Woodcock reading mastery test letter ID-ss (LID)
114.19(12.7)
106.46(8.62) 2.51; 0.015
Rapid automized naming color andobject-ss (RAN)
103.07(14.36)
95.17(16.81) 1.81; 0.076
CTOPP phonological awareness-cs (PA)117.63(13.36)
106.75(13.25) 2.91; 0.005
CTOPP phonological memory-cs (PM)110.78(12.32)
101.67(10.72) 2.80; 0.007
Total grey matter volume (TGMV)723.92(63.69)
698.32(57.13) 1.50; 0.139
Total while matter volume (TWMV)460.98(40.74)
447.23(44.09) 1.16; 0.253
MATERNAL Age (Age-M) 38.74 (4.53)
39.45(3.92) 0.59; 0.556
ARHQ (MFamRI) 0.24 (0.09)0.38(0.15) 3.84; 0.000
Percent overall time with child (OT-M) 72.15 (12.8)68.81(15.73) 0.79; 0.430
Percent educational time with child (ET-M)
65.71(18.22)
72.72(18.30) 1.30; 0.201
Education level (Ed-M) 17.22 (2.33)16.88(1.80) 0.59; 0.557
WAIS-R-ss (IQ-M)114.33(4.40)
110.96(5.90) 2.33; 0.024
Verbal IQ-ss (VIQ-M)113.61(7.00)
107.81(8.66) 2.64; 0.011
Performance IQ-ss (PIQ-M)122.23(5.27)
119.69(6.60) 1.56; 0.126
PATERNAL Age (Age-P) 41.56 (4.67)
43.35(5.39) 1.25; 0.218
Neuroimage. Author manuscript; available in PMC 2013 April 17.
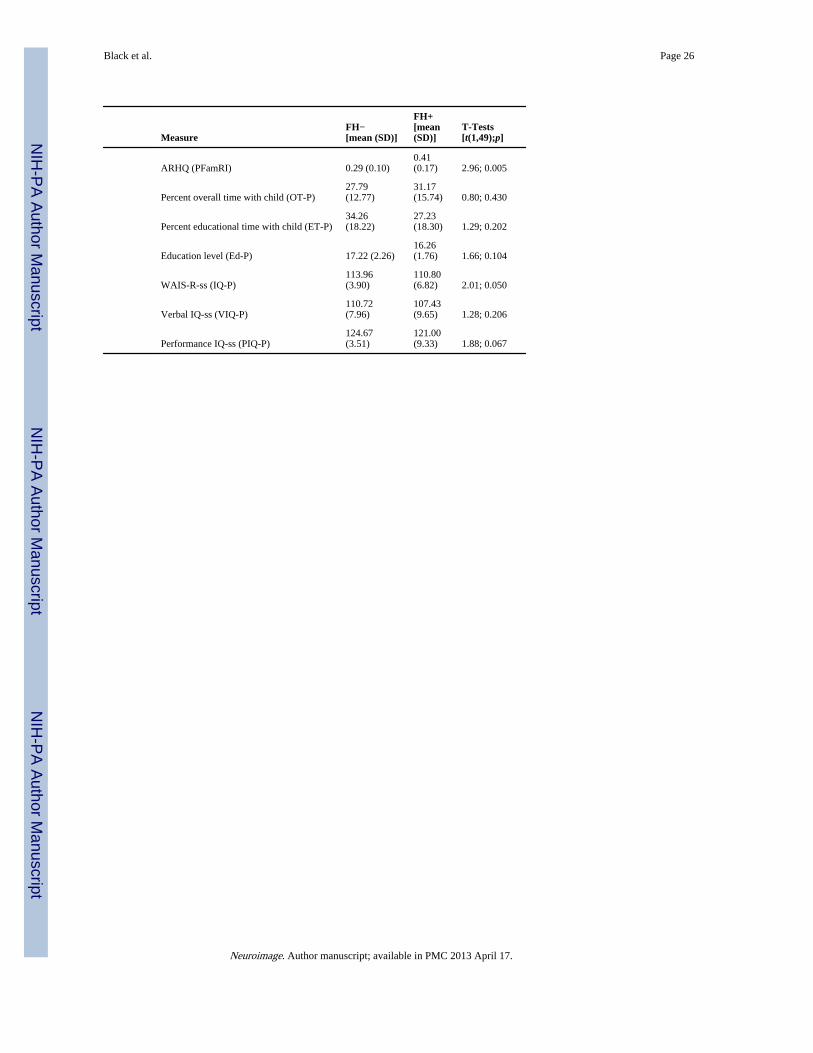
NIH
-PA Author Manuscript
NIH
-PA Author Manuscript
NIH
-PA Author Manuscript
Black et al. Page 26
MeasureFH−[mean (SD)]
FH+[mean(SD)]
T-Tests[t(1,49);p]
ARHQ (PFamRI) 0.29 (0.10)0.41(0.17) 2.96; 0.005
Percent overall time with child (OT-P)27.79(12.77)
31.17(15.74) 0.80; 0.430
Percent educational time with child (ET-P)34.26(18.22)
27.23(18.30) 1.29; 0.202
Education level (Ed-P) 17.22 (2.26)16.26(1.76) 1.66; 0.104
WAIS-R-ss (IQ-P)113.96(3.90)
110.80(6.82) 2.01; 0.050
Verbal IQ-ss (VIQ-P)110.72(7.96)
107.43(9.65) 1.28; 0.206
Performance IQ-ss (PIQ-P)124.67(3.51)
121.00(9.33) 1.88; 0.067
Neuroimage. Author manuscript; available in PMC 2013 April 17.