Embed Size (px)
Citation preview

ORIGINAL CONTRIBUTION
Metal nanoparticle formation on layer silicate lamellae
Szilvia Papp & Rita Patakfalvi & Imre Dékány
Received: 9 February 2007 /Revised: 16 June 2007 /Accepted: 18 June 2007 / Published online: 14 August 2007# Springer-Verlag 2007
Abstract Nanoparticles (Ag, Pd) were prepared by hetero-geneous nucleation on the interlayer space of layeredmontmorillonite and kaolinite minerals in aquatic disper-sion. Interlamellar incorporation of nanoparticles wasmonitored by X-ray diffraction and verified by transmissionelectron microscopy (TEM). After the reduction ofadsorbed metal ions, a new Bragg reflection appeared,proving the formation of nanoparticles in the interlamellarspace of clay mineral. Lamellar structure of layered silicatesis partly destroyed by the particle formation. TEM imagesshowed that larger nanoparticles were formed by UVirradiation and hydrazine hydrate than in the case ofreduction by NaBH4. Aqueous solutions of polyvinylpyrrolidone and clay minerals were used for the stabiliza-tion of Pd° nanoparticles. The size of particles generated onthe surface of clay minerals by heterogeneous nucleationincreased with increasing metal concentration. Whenpolymer is added to this system, particle size can bedecreased by increasing polymer concentration. In this case,the particles are stabilized by the concerted action of the
support and the macromolecule. The polymers promotedintercalation of nanoparticles into the clay mineral. In theabsence of nanoparticles, the intercalation of polymers wassignificantly less extensive.
Keywords Palladium . Silver . Layered silicate .
Nanoparticle formation . XRD . TEM
Introduction
The preparation and characterization of precious metalnanoparticles have moved into the focus of cutting-edgeresearch in the last few decades. Scientists have recognizedthat the physical and mechanical properties of nanosizeparticles differ from those of macroscopic material. Pre-cious metal nanoparticles are mainly utilized in solving theproblems of catalysis and hydrogen storage.
John Bradley [1] classified reactions that have so farbeen utilized for the preparation of transition metal particlesinto four groups corresponding to four types of methods.Due to its simplicity and effectivity, the currently mostpreferred preparation method is liquid-phase reduction ofmetal salts. The reducing agent employed is mainlyhydrogen gas [2, 3], hydrazine [4, 5], or sodium borohy-dride [6, 7], but citrate [8, 9], hypophosphorous acid [10],and oxidizable solvents such as alcohols [11, 12] have alsobeen successfully used in synthetic reactions. It is essentialthat aggregation be prevented in the course of preparation;in this way, the synthesis of even very small particles (inthe size range of a few nanometers) becomes possible. Themost widely used techniques make use of the physicallimitations of the preparation environment, like in reactionsstaged inside inverse micelles [13, 14], porous solidmaterials [15], gels [16], polymers [17], or dendrimers [18].
Colloid Polym Sci (2008) 286:3–14DOI 10.1007/s00396-007-1728-3
S. Papp : R. Patakfalvi : I. DékánySupramolecular and Nanostructured Materials ResearchGroup of the Hngarian Academy of Sciences,Szeged, Hungary
I. Dékány (*)Department of Colloid Chemistry, University of Szeged,Aradi Vértanúk tere 1,6720 Szeged, Hungarye-mail: [email protected]
I. DékányBay Zoltán Foundation for Applied Research,Institute for Nanotechnology,3519 Miskolc, Iglói út 2,Hungary

There is nowadays an ever-increasing need for metalcatalysts on solid supports. Many different physicalmethods (pulse laser evaporation, electron beam lithogra-phy) and chemical procedures are available for thepreparation of supported catalysts. These are mainlyprepared by the impregnation technique, preferred due toits simplicity. In the course of the procedure, the metallicprecursor is first impregnated on the support and laterreduced. The impregnation technique, however, does notallow control of the size, morphology, and surfacedistribution of nanoparticles. Methods generating nano-particles by colloid chemical means are becoming more andmore widespread. One of the most practical of these is thepreparation of metal sols and their deposition on supports.At the first stage of the procedure, a stabilized dispersion ofmetal particles is produced by reduction; the particles arenext bound to a support, and finally the product is washed.The main advantage of this method is that particle size isindependent of the support. Bönnemann et al. [19] adsorbedtransition metal particles synthesized in tetrahydrofurane,stabilized by quaternary ammonium salts, on the surface ofcharcoal. Reetz applied electrochemically obtained colloidson charcoal, silica, and alumina supports using twodifferent methods [20, 21]. He added the support to thereaction medium either in the course of particle formationor after the completion of the electrochemical reaction. Heestablished by transmission electron microscopy (TEM) ofthe support-bound particles that neither their structure northeir size was altered during adsorption in either case. Wanget al. [22, 23] bound polyvinyl pyrrolidone (PVP)- and poly(vinyl alcohol)-stabilized Pd, Pt, and Rh particles to silicasurfaces. They interpret binding as joint adsorption of thepolymer and the metal particles. Polymer adsorption is dueto hydrogen bonding with the hydroxyl groups of silica.
Another possibility for the preparation of nanosizeparticles is in situ synthesis within the solid–liquid interfaceof sols and dispersions, using the adsorption layer on thesurface of solid particles as “nanoreactors”. Layer silicateminerals with large internal surfaces, readily swelling inaqueous media, lend themselves well to the preparation ofparticles with diameters of a few nanometers not only ontheir surfaces, but—under suitable conditions—also withintheir interlamellar space [24–26].
The so-called solid/liquid interface nanoreactor tech-nique enables in situ formation and stabilization of metalfoci on the surface of the support. Király et al. [26]synthesized Pd particles (2–14 nm) in situ in organophilizedmontmorillonite (HDAM) in an ethanol–toluene binarymixture. After the establishment of the adsorption equilib-rium, they added Pd(OAc)2 solution in 1% toluene to thedispersion. At the appropriate ethanol/toluene ratio, ethanolis preferentially adsorbed in the interlamellar space (actingas a nanophase reactor) and reduces Pd2+ions transported
there by diffusion. A similar procedure was used for thepreparation of Pd subcolloids measuring 4–10 nm indiameter on pillared clay minerals [27]. In addition to insitu synthesis, this method is also successfully applicable tothe adsorption of fully-grown particles on supports [28].
In the course of this work, we synthesized silver andpalladium particles using methods successfully appliedearlier as well as others developed in our laboratory; westudied the possibilities of control over particle size offeredby the various methods. We prepared nanoparticle/supportcomposites by heterogeneous nucleation on the surface andin situ in the interlamellar space of montmorillonite andkaolinite. We use the stabilizing effect of the polymer/claymineral complex in the course of nanoparticle formation.The effect of the incorporation of nanoparticles into orderedlamellar structures was studied by X-ray diffraction (XRD).Particle size was determined by TEM and surface oxidationstate by X-ray photoelectron spectroscopy (XPS). Inparallel with in situ nanoparticle synthesis on the surfaceof montmorillonite, adsorption of the polymer stabilizers onNa–montmorillonite was also studied.
Materials and methods
Materials
Precursors: AgNO3 (Reanal, 99.9%), PdCl2 (Aldrich,99%)Reducing agents: ethanol (C2H5OH, p.a., Reanal),hydrazine hydrate (NH2NH2·H2O, 24–26% (m/m) aque-ous solution, Fluka), sodium borohydride (NaBH4, 99%,Aldrich)Stabilizing agents: PVP (Mw=40,000, Fluka)Supports: Na–montmorillonite (Süd-Chemie AG, Ger-many, aSBET ¼ 87:7 m2
�g) and kaolinite (Zettlitz, Ger-
many, aSBET ¼ 14 m2�g)
Other compounds used: dimethyl sulfoxide (DMSO,a.r., Reanal), methanol (CH3OH, a.r., Reanal)
Methods
Ultraviolet-visible absorption spectroscopy Ultraviolet-visible (UV-VIS) absorption studies were performed in anUvikon 930 dual-beam spectrophotometer. Measurementswere made in 1-cm quartz cuvettes in the wavelength rangeof 200–800 nm. Adsorption of nanoparticles on clayminerals was followed by measuring the spectrum of thesupernatant.
X-ray diffraction Basal spacing of the nanoparticle/claymineral intercalation structures and the size of metal
4 Colloid Polym Sci (2008) 286:3–14

crystallites were determined by large-angle XRD in aPhilips X-ray diffractometer (PW 1830 generator, PW1820 goniometer, CuK-α radiation: λ=0.1542 nm, 40 kV,25 mA). The values of basal spacing (dL) were calculatedfrom the first-order reflections (001) by the Bragg equation(dL=λ/2sinΘ) with the help of the APD 3.5 automatic X-ray diffraction software. The average diameter of metalcrystallites was calculated from the line broadening of the(111) reflection using the Scherrer equation: d=kλ/βcosΘ,where k is the constant characteristic of particle shape (k=0.9), λ is the wavelength of X-ray radiation, and Θ is theangle of reflection. β equals the difference of the linebreadth determined for the given sample (βS) and thatdetermined for the macrocrystalline material (β0). Thiscalculation was also performed by the Philips PC-APD 3.5program.
Transmission electron microscopy Size analysis of Agnanoparticles was carried out in a Philips CM-10 electronmicroscope (acceleration voltage 100 kV) equipped with aMegaview-II digital camera. Solid samples were studied indilute aqueous dispersions, whereas in the case of sols,droplets of the undiluted material were placed on Formwar-coated copper mesh grids (diameter 2 mm). The averageparticle diameter and size distribution of the samples weredetermined by the UTHSCSA Image Tool 2.00 software,based on the data of an average of 200 particles. Themaximal resolution of the microscope is approximately0.2 nm.
X-ray photoelectron spectroscopy Measurements were per-formed in the ultrahigh vacuum chamber (p ¼ 2� 10�9mbar)of a Kratos XSAM 800 instrument equipped with ahemispherical analyzer. Al Ka radiation (hν=1,486.6 eV)was used as the excitation source. The gun was operated at15 kV, 15 mA. The pass energy of the electron analyzer wasset to 40 eV, and the step width between the channels was50 meV. Usually ten scans were added to give a singlespectrum. All binding energies were referenced to the C (1s)line of the adventitious carbon assumed to have a constantbinding energy of 285.1 eV. Data acquisition and evaluationwere performed with the VISION 1.3.3 software provided byKratos.
We determined the adsorption isotherm of PVP, neces-sary for stabilization of sols, on montmorillonite. Na–montmorillonite was dispersed in polymer solutions ofvarious concentrations, and the dispersions were stirred atroom temperature for 2 days until adsorption equilibriumwas reached. The suspensions were centrifuged, and thecarbon content of the polymer solution (supernatant) wasdetermined by total carbon (TC) measuring system.Equilibrium concentrations of polymers were determinedby calibration measurements. The amount of bound polymer
was calculated as the difference of the initial (c0) and post-adsorption (ce) concentrations. Montmorillonite concentra-tion in the suspensions was 1 g/100 cm3 in all cases. Theamount of adsorbed polymer was calculated by therelationship nspol ¼ V � c0 � ceð Þ / m, where V° is the volumeof the polymer solution and m is the mass of montmoril-lonite. Amounts of adsorbed material were determined inthe concentration range of 0.025–2.5 g/100 cm3.
Total carbon measurements The amount of polymeradsorbed on the clay minerals was determined indirectly,based on the total carbon content of the supernatants of thesamples after adsorption. The measurements were per-formed in a Euroglas 1200 apparatus. The determination isbased on infrared detection of carbon dioxide generated byincineration of the sample at 1,000°C in high-purityoxygen–argon atmosphere. The apparatus can be used fordirect determination of carbon content in solutions anddispersions in the range of 0.5–1,000 ppm.
Photochemical reaction Photoreduction of Ag+ ions wascarried out with an Osram xenon lamp (P=75 W). Thedispersions were irradiated from an identical distance foridentical times (1 h). In the course of photoreduction, Ag+
concentration was set to bring the amount of silver added to1, 2, 5, and 10 g/100 g kaolinite. The suspension wasplaced in a quartz beaker and irradiated with a xenon lamp(P=150 W) from a distance of 10 cm for 1 h under constantstirring.
Results and discussion
Particle size control on clay minerals
Synthesis of palladium nanoparticles on montmorillonite
For the preparation of Pd-containing montmorillonite, Pd2+
ions—the required amount of which had been calculatedfrom the adsorption isotherm—were bound to the surfaceby ion exchange. The amount of ethanol to be used asreductant was determined on the basis of the adsorptionexcess isotherm of the ethanol–water mixture and theknown adequate composition of the nanophase reactor[29–31]. The temperature of montmorillonite dispersionswas raised to 65°C before addition of the precursor ions.Palladium particle size was controlled via the metal content.Theoretical and experimentally determined (ICP) Pd con-tents, the structural parameters of the composites, andparticle sizes are listed in Table 1.
Particle size can also be controlled through macro-molecules previously adsorbed on the support. Montmoril-
Colloid Polym Sci (2008) 286:3–14 5

lonite is stirred in polymer solution of the adequateconcentration for 24 h at 60°C; a mixture of ethanol inmildly acidic aqueous solution of Pd ions [pH=4.0, amountof precursor corresponding to 2% (m/m) Pd per unit mass ofsupport] is next added. Reduction was also performed, withNaBH4 replacing ethanol as reducing agent.
Compositions of the metal/polymer/montmorillonitecomposites are presented in Table 1. The metal contentdecreases with increasing polymer concentration; stabilizedmetal particles of brownish black color were visuallyretained in the supernatant after centrifugation.
X-ray diffractograms provide information on polymeradsorption and on the incorporation of nanoparticles
formed in the course of reduction. The (001) Braggreflection is shifted due to interlamellar incorporation ofpolymers. Basal spacing values of dL=1.45–1.57 nm wereobtained in dried samples containing interlayer alkali or Pd2+
ions. The new reflection appearing at larger angles(dL ¼ 2:84� 5:68 nm) seems to confirm the interlamellarpresence of particles as large as 4.7 nm, a value comparableto TEM results. Size distribution functions constructedfrom the data of TEM images of the samples suggest thatthe composites may harbor particles measuring even 5–10 nm in diameter. These particles probably grew on theexternal surfaces (Fig. 1). It is also theoretically possiblethat we are seeing anisometric expanded ellipsoid or disc-
Table 1 Structural parametersof Pd–montmorillonite samples
a Pd content determined by ICPdL Basal distance
Sample code Reductant Pd content(wt%)
PVP content(wt%)
dXRD(nm)
dTEM(nm)
dL (nm)
Na–montmorillonite – – – – – 1.44PVPM – – 12.4 – – 1.58PdM1 Ethanol 0.5 (0.502)a – 10.7 2.2 4.15; 1.49PdM2 Ethanol 1.0 (0.998)a – 18 4.7 3.74; 1.49PdM3 Ethanol 2.5 (2.533)a – 22 6.3 3.71; 1.48PdM4 NaBH4 1 – – 4.1 3.95; 1.57PdM5 NaBH4 2 – – 5.8 1.54PVPPdM1 Ethanol 2.0 (1.95)a 2.1 20.2 5.9 5.68; 1.45PVPPdM2 Ethanol 2.0 (1.93)a 4.1 16.2 3.8 3.24; 1.46PVPPdM3 Ethanol 2.0 (1.68)a 12.4 11.5 2.3 1.54PVPPdM4 NaBH4 1 3.8 – 2.8 3.82; 1.52
100 nm
a
0
10
20
30
40
50
60
0-1 2-3 4-5 6-7 8-9 10-11 12-13 14-15
Particle diameter (nm)
Fre
qu
ency
(%
)
b
0
10
20
30
40
50
60
0-1 1-2 2-3 3-4 4-5 5-6 6-7 7-8 8-9 9-10
Particle diameter (nm)
Fre
qu
ency
(%
)
100 nm
Fig. 1 TEM micrograph andsize distribution of Pd–montmo-rillonites. a PVPPdM1 (dave=5.9 nm), b PVPPdM4 (dave=2.8 nm)
6 Colloid Polym Sci (2008) 286:3–14
shaped particles in the TEM images, whose longitudinalaxes (lengths, diameters) may be longer than the valuesmeasured by XRD in side view.
Average particle sizes determined by TEM with differentmetal content are given in Table 1. The addition ofstabilizing polymer led to the formation of smaller particles;increasing the amount of polymer further decreased thesize. Reduction by NaBH4 led to the formation of smallerparticles than did reduction by ethanol (dave=4.1 and5.8 nm, respectively). Polymer addition further decreasedthe particle size also in the case of reduction by NaBH4
(dave=2.8 and 4.1 nm with and without PVP, respectively).Thus the size of palladium particles synthesizable on
montmorillonite can be successfully decreased by addingpolymer to the support in the course of synthesis, beforereduction of the palladium ions.
In the X-ray diagram, the (111) reflection characteristicof palladium appears at 40.15° (CuK→). With decreasingparticle size, the lattice constant increases, and as aconsequence, the position of (111) reflection shifts tosmaller two theta values. Particle sizes calculated from theline broadening by the Scherrer equation (10–22 nm)exceed those determined by electron microscopy. Thereason is that XRD analyzes the entire sample that maycontain large crystallites but fails to observe smaller,amorphous particles.
The role of macromolecules in surface fixationof nanoparticles
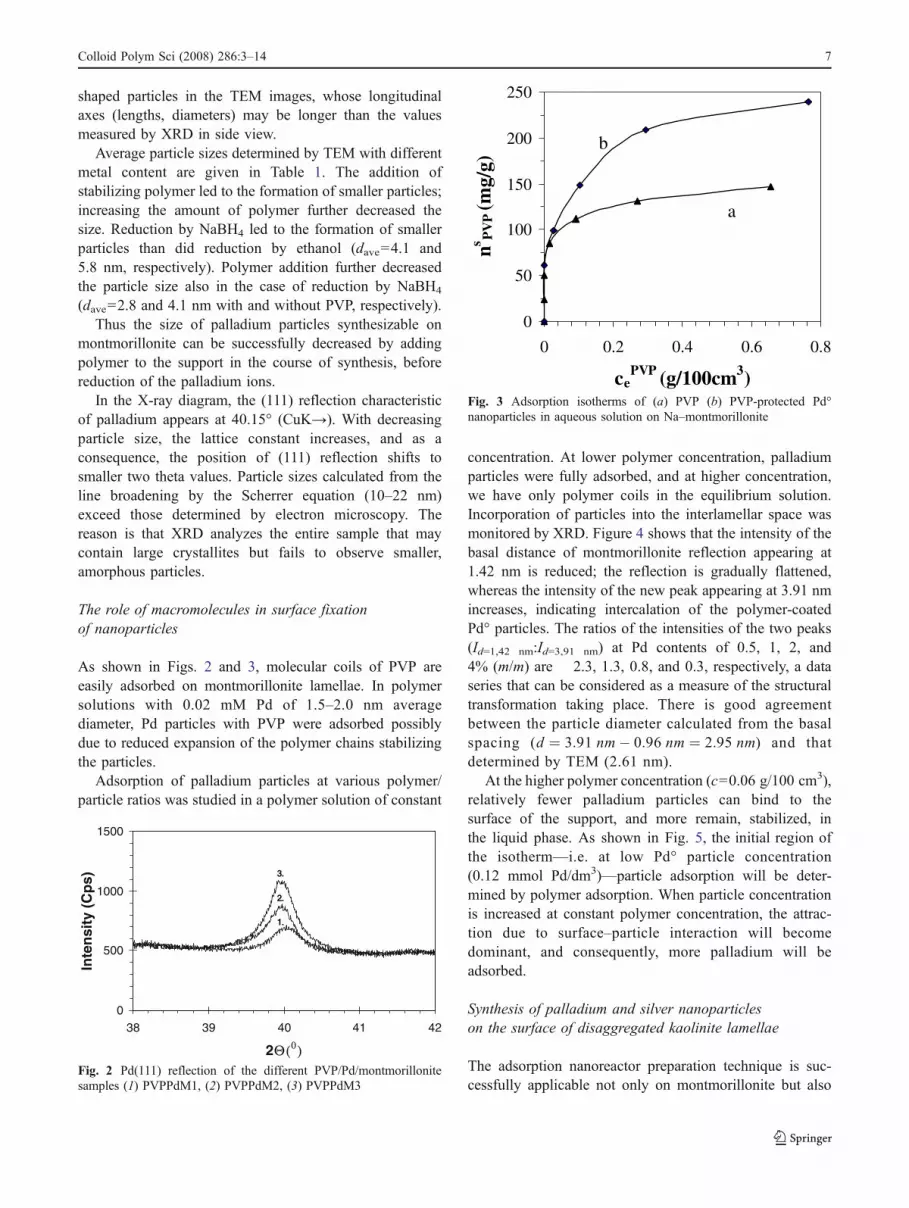
As shown in Figs. 2 and 3, molecular coils of PVP areeasily adsorbed on montmorillonite lamellae. In polymersolutions with 0.02 mM Pd of 1.5–2.0 nm averagediameter, Pd particles with PVP were adsorbed possiblydue to reduced expansion of the polymer chains stabilizingthe particles.
Adsorption of palladium particles at various polymer/particle ratios was studied in a polymer solution of constant
concentration. At lower polymer concentration, palladiumparticles were fully adsorbed, and at higher concentration,we have only polymer coils in the equilibrium solution.Incorporation of particles into the interlamellar space wasmonitored by XRD. Figure 4 shows that the intensity of thebasal distance of montmorillonite reflection appearing at1.42 nm is reduced; the reflection is gradually flattened,whereas the intensity of the new peak appearing at 3.91 nmincreases, indicating intercalation of the polymer-coatedPd° particles. The ratios of the intensities of the two peaks(Id=1,42 nm:Id=3,91 nm) at Pd contents of 0.5, 1, 2, and4% (m/m) are 2.3, 1.3, 0.8, and 0.3, respectively, a dataseries that can be considered as a measure of the structuraltransformation taking place. There is good agreementbetween the particle diameter calculated from the basalspacing (d ¼ 3:91 nm� 0:96 nm ¼ 2:95 nm) and thatdetermined by TEM (2.61 nm).
At the higher polymer concentration (c=0.06 g/100 cm3),relatively fewer palladium particles can bind to thesurface of the support, and more remain, stabilized, inthe liquid phase. As shown in Fig. 5, the initial region ofthe isotherm—i.e. at low Pd° particle concentration(0.12 mmol Pd/dm3)—particle adsorption will be deter-mined by polymer adsorption. When particle concentrationis increased at constant polymer concentration, the attrac-tion due to surface–particle interaction will becomedominant, and consequently, more palladium will beadsorbed.
Synthesis of palladium and silver nanoparticleson the surface of disaggregated kaolinite lamellae
The adsorption nanoreactor preparation technique is suc-cessfully applicable not only on montmorillonite but also
0
500
1000
1500
38 39 40 41 42
2Θ(0)
Inte
nsi
ty (
Cp
s)
1.
3.
2.
Fig. 2 Pd(111) reflection of the different PVP/Pd/montmorillonitesamples (1) PVPPdM1, (2) PVPPdM2, (3) PVPPdM3
0
50
100
150
200
250
0 0.2 0.4 0.6 0.8
cePVP (g/100cm3)
ns PV
P (m
g/g)
a
b
Fig. 3 Adsorption isotherms of (a) PVP (b) PVP-protected Pd°nanoparticles in aqueous solution on Na–montmorillonite
Colloid Polym Sci (2008) 286:3–14 7

on kaolinite. A large specific surface area is essential forparticle growth and can be created by delamination ofkaolinite lamellae. The delamination means the splitting ofthe particles (lamellae) into the single silicate layers, whichis very difficult for kaolinite and only processes in special
cases by interaction of very polar solvent. As the lamellarpackages of kaolinite are split to elementary lamellae byintercalation of DMSO, the interlamellar space is renderedsuitable for the growth of metal nanoparticles. Kaolinitewas swollen in DMSO for 24 h at 65°C and alternatelywashed in fresh methanol and decanted for 5 days. By theevidence of XRD, the (001) basal spacing of kaoliniteincreased from 0.72 to 1.12 nm (Fig. 6). The interlamellardistance was not altered after washing in methanol,indicating that the intercalated molecules were not removedfrom between the kaolinite lamellae by washing. Theintercalated kaolinite was further used similarly to mont-morillonite. The adsorbed Pd2+ ions were reduced byhydrazine or Na–borohydride. Reductants were applied ina fourfold excess. The metal contents of the products were0.95 and 1.9% (m/m). The silver ions were reduced byNaBH4 and UV irradiation. The amounts of silver added tokaolinite samples were 0.5, 1, 1.5, 2, and 5 g Ag/100 gkaolinite. The compositions and structural parameters of thesamples are shown in Table 2.
The presence of Ag nanoparticles in the supernatantswas tested by UV-VIS spectroscopy. It may be assumedthat in the lower Ag concentrations (0.5–2%) all nano-particles were formed on the surface of the support,whereas at higher Ag concentrations (5%) not all Ag+ ionscan be adsorbed on the kaolinite lamellae; therefore silvernanoparticles are also generated in the liquid phase. Whenhydrochloric acid was dripped into the supernatant aftercentrifugation, no AgCl precipitate was formed, which
0
2
4
6
8
10
12
0 0.005 0.01 0.015 0.02 0.025 0.03 0.035
cePd (mg/cm3)
ns Pd
(mg/
g)
Fig. 5 Adsorption isotherm of Pd nanoparticles stabilized by PVP inaqueous solution on Na–montmorillonite at 0.06 g/100 cm3 PVPconcentration
Fig. 6 XRD patterns of kaolinite (a), DMSO-treated kaolinite (b), andDMSO-treated kaolinite after washing by methanol (c)
1 3 5 7 9
Inte
nsi
ty (
a.u
.)
2% Pd
0.5% Pd
1% Pd
0% Pd
1.42 nm
3.91 nm
4% Pd
2Θ°Fig. 4 XRD patterns of polymer-protected Pd–montmorilloniteshowing Pd particles intercalated in the interlamellar space, atdifferent Pd contents
8 Colloid Polym Sci (2008) 286:3–14

means that reduction had proceeded to completion, as noAg+ ions remained in the dispersion.
Disaggregation and the structural change due to nano-particle incorporation between kaolinite lamellae can beconveniently monitored by XRD (Figs. 6 and 7). After theadsorption of PVP, the reflection characteristic of DMSO-treated kaolinite disappeared because the DMSO desorbedfrom the interlamellar space. The original (001) kaolinitereflection appeared, although at a reduced intensity. Theintensities of reflections are markedly lower, and their half-widths are larger in samples containing PVP and/or nano-particles than in the original clay mineral containing nosilver particle formation disrupting some of kaolinite layers.The X-ray diffractograms reveal an interesting mechanism
of particle formation in layered compounds. The presenceof two reflections, even broadened of reduced intensity,indicate that particle formation does not occur randomly insome interlayer spaces but in a certain number ofneighboring interlayer spaces so that more or less orderedpackets with interlayer metal particles alternate with lessordered packets of unreacted kaolinite layers. In otherwords, there is a certain segregation of the nanoparticlesseparated by kaolinite layers. On X-ray diffractograms ofpalladium-containing composites, the interlamellar locali-zation of metal clusters is evidenced by a shift of thereflection (dL=3.6 → 4.6 nm; Fig. 7). The basal spacingcan reach values as high as 6.84 nm (Table 2).
Comparison of the X-ray diffractograms of samples withidentical silver contents prepared by two methods ofreduction reveals significant differences. After photochem-ical reduction, the intercalation reflection is sharper andmore intensive at each Ag concentration. The reason forthis is that a larger proportion of Ag particles were formedin the interlamellar space, and these particles are larger thandL=5.64 nm (Table 3).
Although the dimensions of the interlamellar space limitparticle growth, we still observed in TEM pictures particlesexceeding this limitation: these particles must have formedon the external surface of the clay mineral. Pseudohex-agonal plate crystals characteristic of kaolinite are welldiscernible in TEM images (Fig. 8). PVP additiondecreased the particle size. TEM images of samplesPVPPdK1 and PVPPdK4 display spherical particles mea-suring 2–6 nm, situated separately on the lamellae, with nosign of aggregation (Fig. 8a). When metal content isincreased (Fig. 8b), strings of metal particles are seen tocling to the edges of the kaolinite lamellae, whereas theparticle diameter is not modified significantly. This allowsto conclude that the part of polymer chains, which couldnot be adsorbed on kaolinite, remained in the bulk phaseand stabilized the particles formed in the course ofreduction. These “large” units could only attach to theexternal surface of the lamellae. When palladium content is
1 53 7 9 11 13
2 Θ 0
Inte
nsi
ty (
a. u
.)
a
b
c
4.62 nm
3.64 nm
0.72 nm
d
4.58 nm
e5.24 nm
4.42 nm
AgK8
AgK1
AgK6
PVPPdK4
PVPK
Fig. 7 XRD patterns of PVP, Pd, and Ag intercalated kaolinitesamples
Table 2 Structural parametersof Pd–kaolinite samples
dL Basal distance
Sample code Reductant Pd content (wt%) PVP content (wt%) dTEM (nm) dL (nm)
Kaolinite – – – – 0.72DMSOK – – – – 1.12PVPK – – 1.9 – 3.64; 0.72PdK1 Hydrazine 0.95 – 7.2 4.13; 0.73PdK2 Hydrazine 1.90 – 14.3 5.33; 0.72PVPPdK1 Hydrazine 0.95 3.8 2.8 0.72PVPPdK2 Hydrazine 1.90 3.8 5.8 4.36; 0.72PVPPdK3 Hydrazine 0.95 28.0 2.6 4.21; 0.72PVPPdK4 NaBH4 0.95 3.8 4.7 4.62; 0.72PdK3 NaBH4 0.95 – 6.0 5.95; 0.73PdK4 NaBH4 1.90 – 8.1 6.87; 0.73
Colloid Polym Sci (2008) 286:3–14 9

Table 3 Structural parametersof Ag/kaolinite samples
dL Basal distance
Sample code Reductant Ag content (wt%) dL (nm) dXRD (nm) dTEM (nm)
AgK1 NaBH4 0.5 4.58 10.7 5.6AgK2 NaBH4 1.0 4.28 12.7 7.1AgK3 NaBH4 1.5 4.24 13 7.6AgK4 NaBH4 2.0 4.39 13.1 8.3AgK5 NaBH4 5.0 4.95 24 10.5AgK6 Photoreduction 1.0 4.42 10.1 8.3AgK7 Photoreduction 2.0 5.64 10.2 8.7AgK8 Photoreduction 5.0 5.24 11.3 11.2AgK9 Photoreduction 10.0 3.69 10.1 14.8
30 nm
b
0
10
20
30
40
50
0-1 4-5 8-9 12-13 16-17 20-21 24-25 28-29
Particle diameter (nm)
Fre
qu
ency
(%
)
30 nm
c
0
10
20
30
40
50
0-1 4-5 8-9 12-13 16-17 20-21 24-25 28-29
Particle diameter (nm)
Fre
qu
ency
(%
)
30 nm
a
0
10
20
30
40
50
0-1 4-5 8-9 12-13 16-17 20-21 24-25 28-29
Particle diameter (nm)
Fre
qu
ency
(%
)
Fig. 8 TEM micrograph andparticle size distribution of aPVPPdK1 (dave=2.8 nm), bPVPPdK3 (dave=2.6 nm), cPdK1 (dave=7.2 nm), d PdK2(dave=14.3 nm), e AgK4 (d=8.3 nm), f AgK6 (d=8.7 nm)
10 Colloid Polym Sci (2008) 286:3–14

increased at constant polymer content, larger particles areformed (0.95% → 2.8 nm; 1.9% → 5.8 nm, see Table 2).When palladium content is raised to 2% without polymerstabilization and the slower reduction method (hydrazine) isapplied, crystalline particles of diversified morphologymeasuring as large as 20–30 nm are formed.
The average size of silver nanoparticles also increaseswith increasing metal content: dTEM was 5.6 nm in sample0.5 AgK and 10.5 nm in sample 5 AgK. In accordance withthe results of XRD, photoreduction resulted in the forma-tion of larger particles than reduction by sodium borohy-dride. TEM images reveal (Figs. 8e,f) that particles arescattered more sparsely on photoreduced samples becauseslower reduction favored particle growth. In contrast,sodium borohydride added in excess rapidly reduced all
Ag+ ions present; particle growth was therefore favoredover nucleation, leading to the formation of a larger numberof smaller particles.
The (111) Ag Bragg reflections (2Θ=38.3°) revealed thatpeak intensities increase and half-widths decrease withincreasing the silver content of the samples because the sizeand crystallinity of silver particles increase (see Fig. 9).Average particle sizes calculated by the Scherrer equation aresomewhat larger (dXRD ¼ 10:7� 24 nm) than those obtainedby evaluation of TEM images (dTEM ¼ 5:6� 10:5 nm). Thereason for this discrepancy is that the average particlediameter determined by X-ray diffractometry is a so-calledmass-weighted average that yields a higher numeric valuethan the number-weighted average particle size derived fromTEM images.
100 nm
e
0
10
20
30
40
50
2-4 4-6 6-8 8-10 10-12 12-14 14-16
Particle diameter (nm)
Fre
qu
ency
(%
)
100 nm
f
0
10
20
30
40
50
2-4 4-6 6-8 8-10 10-12 12-14 14-16
Particle diameter (nm)
Fre
qu
ency
(%
)
30 nm
d
0
10
20
30
40
50
0-2 4-6 8-10 12-14 16-18 20-22 24-26 28-30
Particle diameter (nm)
Fre
qu
ency
(%
)
Fig. 8 (continued)
Colloid Polym Sci (2008) 286:3–14 11

Analysis of palladium and silver nanoparticles by X-rayphotoelectron spectroscopy
XPS studies were aimed at the assessment of the surfaceoxidation state of the particles. Figure 10 displays the spectraof samples PdM5 and PdK4 resolved to the lines of the Pd°and Pd4+ oxidation states. Input parameters are the bindingenergies of Pd 3d3/2 peaks, the difference of the bindingenergies of the Pd 3d3/2 and Pd 3d5/2 peaks, and the ratio ofthe intensities of the two peaks. Half-widths were identicalfor each peak in the different samples.
In addition to the peaks at 335.0 and 340.6 eVcorresponding to the binding energies attributable to thedoublets of 3d3/2 and Pd 3d5/2 of palladium in zerooxidation state, peaks also appear at 337.7 and 342.7 eV.These peaks are characteristic of the Pd4+ oxidation state. Inaddition to metal atoms in zero oxidation state, all Pd-containing catalysts studied contain ions in the Pd4+
oxidation state. This indicates that PdO is not formed onthe surface, but Pd° and PdO2 are present. Thus either onlypart of the metal ions added were reduced in the course ofsynthesis, or all metal ions were reduced, but some of themconverted to metal oxide by reacting with oxygen on thesurface. It cannot be excluded that the presence of forms inhigher oxidation states is due to a metal–support interactionon the surface.
Ag 3d X-ray photoelectron spectra (XPS) of the sampleswith different silver contents are presented in Fig. 11.Binding energies of Ag 3d5/2 peaks were in the range of367.7–367.9 eV, whereas those of Ag 3d3/2 peaks were inthe range of 373.75–373.9 eV. The position of the peak ischaracteristic of metallic silver and is independent of silverconcentration. Full widths at half maximum (FWHM)ranged from 1.81–1.83 eV, except for sample 5 AgK thatdisplayed a value of 1.68 eV. Binding energies and valuesof FWHM were within the limits of experimental error.
As peak areas are directly proportional with the numberof atoms present, the areas allow estimation of the silvercontent of the samples. The magnitude of the Ag 3d peak asa function of theoretical silver content is shown in Fig. 12.It is clearly seen in the figure that the function is linear upto 2% Ag+ content and then bends towards the x-axis,indicating that the actual silver content is lower than thevalue expected on the basis of the amount of Ag+ added.This is in accordance with the spectrophotometric results;i.e., above a certain concentration no more Ag+ ions can be
Fig. 10 XPS Pd3d spectra ofPd°–montmorillonite PdM5 (a)and Pd°–kaolinite samples PdK4(b)
36 37 38 39 40
2Θo
Inte
nsi
ty (
a.u
.)Ag (111)
5% Ag
2% Ag
1% Ag
kaolinite
Fig. 9 Ag(111) reflection of the different Ag/kaolinite samples
12 Colloid Polym Sci (2008) 286:3–14

adsorbed on the surface of kaolinite; therefore particles arealso formed in the liquid phase.
Conclusion
Palladium and silver nanoparticles were synthesized on thesurface of Na–montmorillonite and kaolinite lamellae.Metal nanoparticles can be conveniently incorporated intolamellar kaolinite if the interlamellar spaces were previous-ly expanded by dimethyl sulfoxide. Palladium chloride wasreduced by ethanol, hydrazinem, or sodium borohydride.XRD measurements revealed the appearance of a newBragg reflection in the small angle range in the course ofthe heterogeneous nucleation of nanoparticles, confirmingthat nanoparticles were also formed in the interlamellarspace. The presence of this reflection, even broadened andof weaker intensity, indicates a certain segregation of thenanoparticles in packets of kaolinite layers. The size ofparticles formed by heterogeneous nucleation increasedwith increasing metal content. Reduction by sodiumborohydride resulted in the formation of smaller particlesthan did reduction by ethanol or hydrazine. Photoreductionof silver also led to the formation of large particles.Photoreduction is a relatively slow process, creatingfavorable conditions for particle growth. When polymerhad been added before reduction, the particle size could bedecreased by increasing polymer concentration. In this case,the stabilizing effects of both the support and polymercooperate.
At low polymer concentrations, the particles of polymer-protected palladium particles not only attached to theexternal surface of the lamellae but also were incorporatedbetween the lamellae of the clay mineral. The number ofincorporated particles decreased with increasing polymerconcentration. At high polymer/particle ratios, polymeradsorption suppressed nanoparticle binding. At low poly-mer/particle ratios, attraction due to the particle–surfaceinteraction dominated, causing more Pd° particles to beadsorbed on the surface.
The surface oxidation state of the metal particles wasdetermined by XPS. Silver was shown to be present in thesamples in zero oxidation state, whereas the surface ofpalladium particles was partially oxidized in all cases. Inaddition to metallic palladium, PdO2 was also present.These results indicate that either only part of the Pd2+ ionsapplied to the support were reduced in the course ofsynthesis, or all ions were reduced but some ions convertedto metal oxide by reacting with oxygen on the surface. Itcannot be excluded that the presence of forms in higheroxidation states is due to a metal–support interaction on thesurface.
364369374379
Binding Energy (eV)
Inte
nsi
ty (
a.u
.)367.85
373.85
5% Ag
2% Ag
1.5% Ag
1% Ag
0.5% Ag
Fig. 11 Ag 3d X-ray photoelectron spectra of Ag/kaolinite samples(0.5, 1, 1.5, 2, and 5% Ag contents)
0.0E+00
5.0E+03
1.0E+04
1.5E+04
2.0E+04
2.5E+04
3.0E+04
0 2 51 3 4 6
Ag %
Ag3
d5/2
pea
k ar
ea
Fig. 12 Ag 3d peak area of Ag/kaolinite samples as a function of Agcontent
Colloid Polym Sci (2008) 286:3–14 13

Acknowledgement The authors wish their thanks for the financialsupport of the Péter Pázmány Program of the Hungarian NationalOffice of Research and Technology (number RET-07/2005).
References
1. Bradley JS (1994) Clusters and colloids: From theory toapplication In: Schmid G (ed) VCH, New York, pp 459–536
2. Rampino LD, Nord FF (1941) J Am Chem Soc 63:27453. Boutonnet M, Kizling J, Stenius P, Maire (1982) Colloids Surf
5:2094. Wang CC, Chen DH, Huang TC (2001) Colloids Surf A 189:1455. Nickel U, Castell A, Pöppl K, Schneider S (2000) Langmuir
16:90876. Zhao MQ, Crooks RM (1999) Chem Mater 11:33797. Naka Y, Kaeriyama K (1986) J Colloid Interface Sci 110:861268. Pillai ZS, Kamat PV (2004) J Phys Chem B 108:9459. Heard SM, Grieser F, Barraclough CG, Sanders JV (1983) J
Colloid Interface Sci 93:54510. Hoogsteen W, Fokkink LGJ (1995) J Colloid Interface Sci 175:1211. Hirai H, Nakao Y, Toshima N (1979) J Macromol Sci Chem
A13:72712. Teranishi T, Miyake M (1998) Chem Mater 10:59413. Wilcoxon JP, Williamson RL, Baughman R (1993) J Chem Phys
98:9933
14. Parsapour F, Kelley DF, Craft S, Wilcoxon JP (1996) Phys Chem104:4978
15. Pocard NL, Alsmeyer DC, McCreery RL, Neenan TX, CallstromMR (1992) J Am Chem Soc 114:769
16. Steigerwald ML, Brus LE (1990) Acc Chem Res 23:18317. Cheomg Chan YN, Schrock RR, Cohen RE (1992) Chem Mater
4:20518. Zhao M, Sun L, Crooks RM (1998) J Am Chem Soc 120:487719. Bönnemann H, Braun G, Brijoux W, Brinkmann R, Schulze TA,
Seevogel K, Siepen KJ (1996) Organomet Chem 520:14320. Reetz MT, Helbig WJ (1994) J Am Chem Soc 116:740121. Reetz MT, Quaiser SA, Breinbauer R, Tesche B (1995) Angew
Chem Int Ed Engl 34:224022. Wang Q, Liu H, Wang H (1997) J Colloid Interface Sci 190:38023. Wang Y, Liu H, Huang Y, (1996) Polym Adv Technol 7:63424. Dékány I, Turi L, Szűcs A, Király Z (1998) Colloids Surf A
141:40525. Papp Sz, Szűcs A, Dékány I (2001) Appl Clay Sci 19:15526. Király Z, Dékány I, Mastalir Á, Bartók M (1996) J Catal 161:40127. Szűcs A, Király Z, Berger F, Dékány I (1998) Colloids Surf A
139:10928. Király Z, Veisz B, Mastalir Á, Rázga Zs, Dékány I (1999) Chem
Comm 192529. Papp Sz, Szűcs A, Dékány I (2001) Appl Clay Sci 19:15530. Dékány I, Farkas A, Király Z, Klumpp E, Narres HD (1996)
Colloids Surf A 119:731. Dékány I, Ábrahám I, Nagy LG, László K (1987) Colloids Surf A
23:57
14 Colloid Polym Sci (2008) 286:3–14


