Embed Size (px)
Citation preview
DOI: 10.1002/cssc.201300133
Methane Adsorption on Aggregates of Fullerenes: Site-Selective Storage Capacities and Adsorption EnergiesAlexander Kaiser,[a] Samuel Zçttl,[a] Peter Bartl,[a] Christian Leidlmair,[a] Andreas Mauracher,[a]
Michael Probst,[a] Stephan Denifl,[a] Olof Echt,*[a, b] and Paul Scheier*[a]
Introduction
Adsorption of hydrogen, methane, and other hydrocarbons inporous carbonaceous materials shows promise for high-densitystorage of hydrogen-rich molecules that may one day be usedto power light-duty vehicles.[1–5] However, efficient on-boardstorage of hydrogen or methane presents a major technologi-cal challenge. For cars, some 10 kg of hydrogen need to bestored to achieve driving ranges greater than 300 miles(500 km). The 2017 target stated in the 2011 Interim Update ofthe Hydrogen Storage Engineering Center of Excellence is tostore 5.5 wt % of hydrogen at a volumetric density of0.040 kg L�1, with an ultimate target of 7.5 wt % at0.070 kg L�1.[5] The most promising alternatives for on-boardstorage of hydrogen are storage in form of metal hydrides,chemical compounds, or physisorption on light-weight adsor-bents with large surface areas.[4] Storage of gaseous or liquidH2 in tanks at very high pressures and/or very low tempera-tures is not likely to meet the targets and raises major safetyissues.
For hydrogen sorption, carbon is the material of choice be-cause of its low weight and benign environmental properties.However, the adsorption energies on the surfaces of pristinegraphene, nanotubes, and fullerenes are only 0.04–0.05 eV,well below the target of 0.1–0.4 eV (10–40 kJ mol�1) set by theHydrogen-Sorption Center of Excellence funded by the USDepartment of Energy.[6] Values below 0.1 eV would requirecryogenic temperatures combined with high pressures, whichwould decrease system efficiency and increase system cost;values above 0.4 eV would require temperatures well aboveambient for release of H2 and thus compromise energyefficiency and safety.
Several strategies exist that promise increased adsorptionenergies ; most of them involve either impurities, intrinsic de-fects, or multi-wall interactions, for example for adsorptionsites in the interior of narrow nanotubes, or in the grooves be-tween parallel nanotubes. Early research had indeed raisedhopes that single-walled nanotubes would be able to store hy-drogen at room temperature at 6 wt % and even higher.[7]
However, the most promising results were found to be in-correct due to measurement errors and the presence of un-controlled impurities, and no correlation could be establishedbetween the reported hydrogen capacities and various proper-ties of the nanotube structures or synthesis methods.[8]
Thus, research involving nanotubes faces a fundamental di-lemma: Defects are desirable because they increase adsorptionenergies ; on the other hand, the non-uniformity of actual sam-ples of nanotubes and the presence of unspecified defectsmakes it nearly impossible to determine the nature and ener-gies of adsorption sites.[9–12] Consequently, in 2006 the Depart-ment of Energy decided to discontinue applied research anddevelopment investment in pure, undoped single-walledcarbon nanotubes for vehicular hydrogen storage applica-tions.[8] Until today, the synthesis of aligned, strictly uniformsingle-walled nanotubes poses a major challenge.[13] Experi-ments on bundles of nanotubes suffer from non-uniform tube
Methane adsorption on positively charged aggregates of C60 isinvestigated by both mass spectrometry and computer simula-tions. Calculated adsorption energies of 118–281 meV are inthe optimal range for high-density storage of natural gas.Groove sites, dimple sites, and the first complete adsorptionshells are identified experimentally and confirmed by molecu-
lar dynamics simulations, using a newly developed force fieldfor methane–methane and fullerene–methane interaction. Theeffects of corrugation and curvature are discussed and com-pared with data for adsorption on graphite, graphene, andcarbon nanotubes.
[a] A. Kaiser, S. Zçttl, Dr. P. Bartl, Dr. C. Leidlmair, Dr. A. Mauracher,Prof. Dr. M. Probst, Dr. S. Denifl, Prof. Dr. O. Echt, Prof. Dr. P. ScheierInstitut f�r Ionenphysik und Angewandte PhysikUniversit�t InnsbruckTechniker Str. 25, 6020 Innsbruck (Austria)E-mail : [email protected]
[b] Prof. Dr. O. EchtDepartment of PhysicsUniversity of New HampshireDurham, NH 03824 (USA)
Supporting Information for this article is available on the WWW underhttp://dx.doi.org/10.1002/cssc.201300133.
� 2013 The Authors. Published by Wiley-VCH Verlag GmbH & Co. KGaA.This is an open access article under the terms of the Creative CommonsAttribution Non-Commercial NoDerivs License, which permits use anddistribution in any medium, provided the original work is properly cited,the use is non-commercial and no modifications or adaptations aremade.
� 2013 The Authors. Published by Wiley-VCH Verlag GmbH & Co. KGaA, Weinheim ChemSusChem 2013, 6, 1235 – 1244 1235
CHEMSUSCHEMFULL PAPERS
diameters, different tube chiralities, and defects including thepresence of nanosized metal and metal-oxide particles that areused in the catalytic chemical vapor deposition (CCVD) tech-nique, other impurities, and topological defects such as vacan-cies, non-hexagonal carbon rings, and the presence ofuncapped tubes.
Experiments on C60 that can be synthesized at very highpurity and free of defects offer a way out of this dilemma.Adsorption of hydrogen or methane on pristine or functional-ized fullerenes has already been subject to several theoreticalstudies.[3, 14–22] Our group computed a value of 49.5 meV forhydrogen adsorbed on pristine, isolated C60 by using thewB97X-D functional without zero-point correction; the valuedecreased to 37.5 meV for the PBE0 functional. The values arein good agreement with a value of 32 meV obtained by usingthe symmetry-adapted perturbation theory,[21] and 52 meV byusing local spin density approximation including the counter-poise correction.[20] The values agree closely with theoreticaland experimental results obtained for H2 adsorbed on nano-tubes[23] and graphene.[24]
Higher adsorption energies have been computed for C60
exohedrally doped with one or more metal atoms.[3, 14–18] Alkaliand earth alkaline atoms are found to reside on top of hexago-nal or pentagonal sites. The high electron affinity of C60 resultsin electron transfer from the metal to the fullerene, thus en-hancing the binding of hydrogen to the metal atoms. Thebinding energies calculated for alkali or earth alkaline atoms tothe fullerene exceed the cohesive energies of the bulk metals,thus avoiding undesirable clustering of metal atoms.[14–16]
Adsorption energies just below 0.1 eV per hydrogen moleculehave been computed for sodium,[15, 18] 0.17 eV for lithium,[18]
and 0.2–0.4 eV for strontium and calcium.[16]
However, experiments involving fullerenes are scarce. Sahaand Deng reported that the hydrogen adsorption capacity ofsolid C60 at 77 K and 120 bar could be tripled to 13 wt % uponcontrolled oxidation of the sample although the adsorptionisotherms indicated a heat of adsorption of only 25 meV.[25]
Yamada et al. investigated hydrogen adsorption on a C60
monolayer deposited on a Cu(111) surface by helium scatter-ing.[26] Thermal desorption of a hydrogen monolayer resultedin a desorption peak at 437 K from which the authors estimat-ed a binding energy of 1.2 eV. Mauron et al. investigated ad-sorption of hydrogen in sodium-intercalated fullerenes (i.e. ,sodium fullerites).[27] They concluded that chemically boundfulleranes including C60H36 are formed in the experiment.Teprovich et al. reported on reversible chemisorption of hydro-gen with lithium-doped C60 to form fulleranes.[28] The bindingenergies obtained in these latter studies[26–28] greatly exceedthe optimal range for sorbent materials.[6]
An alternative experimental approach involves individual,free C60 molecules rather than C60 solids. Metallofullerene com-plexes such as Ca32C60 have been synthesized in helium gasand identified in mass spectra,[29] but adsorption of H2 or othergases on these complexes has not yet been investigated.
We have recently designed a new method to study adsorp-tion of atoms and polar or nonpolar molecules on C60 or C70 bydoping cold (0.37 K), superfluid helium nanodroplets[30] with
fullerene plus H2O, NH3, He, H2, CH4, or other molecules.[31–33]
Nonpolar species such as He, H2, CH4 show a propensity toform a commensurate layer where each carbon hexagon andpentagon adsorbs one particle although He and H2 are suffi-ciently small to allow for adsorption of additional particles intothe first adsorption layer.
Here, we present a first detailed study of adsorption on freeaggregates of fullerenes (some results were already reported ina recent Letter[33]). We chose the C60–CH4 system because ourexperimental results for this system are the most comprehen-sive. Although hydrogen is the primary candidate for fuel cellsor internal combustion engines, CH4 is also of interest becauseof its low toxicity and dominance in natural gas.[1, 34] Room-temperature storage on graphitic nanostructures appears morefeasible for CH4 because the physisorption energies for CH4 aretwice as large as for hydrogen; numerous experimental andtheoretical investigations of CH4 and other small hydrocarbonmolecules adsorbed on graphite,[35–39] graphene,[40] nano-tubes,[9, 10, 12, 37, 39, 41, 42] and layers of C60
[19] have been reported.The experiment involves mass spectrometry, which allows us
to determine the exact number of adsorption sites for fullereneaggregates containing up to five C60. The nature and adsorp-tion energies of the sites in C60 aggregates are determined bydensity functional theory (DFT) and molecular dynamics (MD)simulations. The C60 aggregates offer a hierarchy of adsorptionsites including sites in the grooves between pairs of adjacentfullerenes that are analogous to groove sites between two par-allel single-walled nanotubes and dimple sites between tripletsof C60, analogous to dimple sites that exist over hexagonalclose-packed layers of C60.[19] Calculations are presented for ag-gregates containing up to four C60 molecules. As the experi-mental results pertain to positively charged complexes wepresent calculations for neutral as well as charged systems;they display the expected[43] increase of adsorption energiesupon charging. Excellent agreement between experiment andtheory is obtained for the adsorption capacity in these varioussites. The adsorption energy increases from 118 meV over hex-agonal sites to 220 meV for groove sites and 281 meV fordimple sites; these values are in the optimal range.[6]
Results and Discussion
Experimental
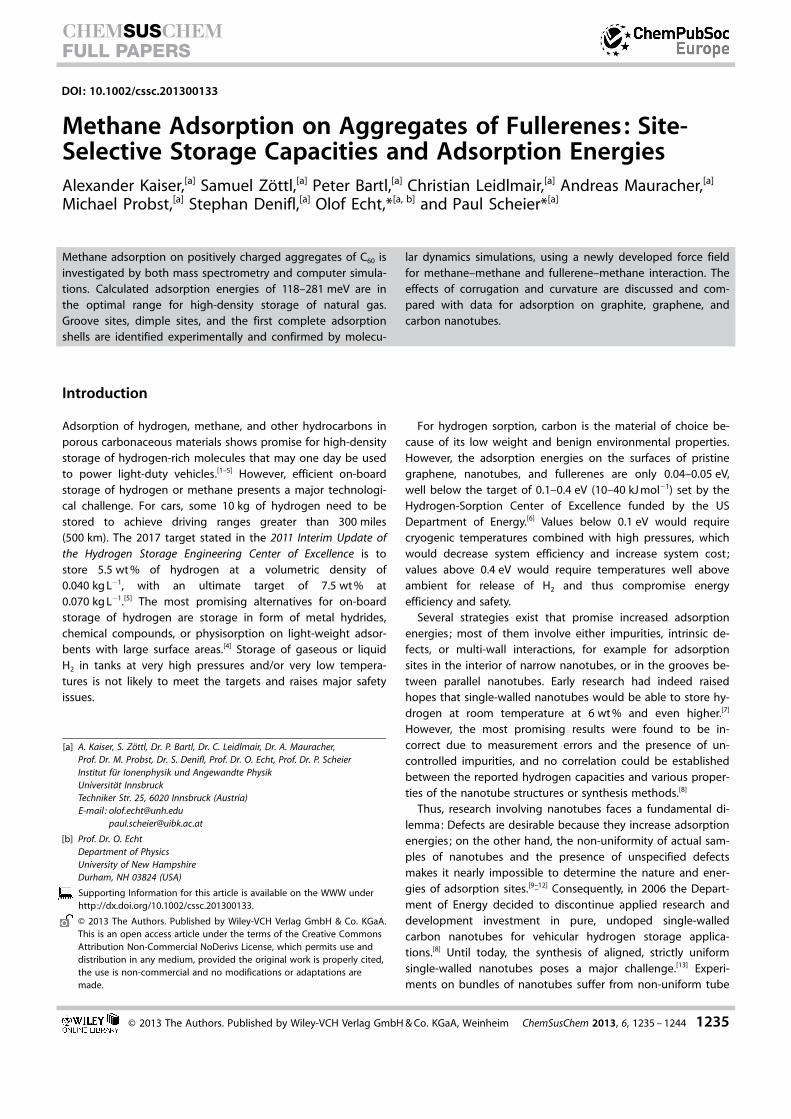
A mass spectrum of helium droplets doped with C60 and CH4 isdisplayed in Figure 1. The most prominent mass peaks are dueto aggregates that contain up to five C60 but no CH4 mole-cules. The absence of fragments such as C118, C116 etc. that arecharacteristic dissociation products of highly excited fullerenedimers[44] indicates that the ionized aggregates consist ofintact C60 units. The partial pressure of CH4 was kept low toavoid spill-over of one series, such as C60–CH4, into the nextseries, (C60)2–CH4.
Figure 1 reveals several anomalies in the otherwise smoothion yield of fullerene–methane complexes; labels above promi-nent anomalies indicate the number of methane molecules.Stars indicate mass peaks that are contaminated by contribu-
� 2013 The Authors. Published by Wiley-VCH Verlag GmbH & Co. KGaA, Weinheim ChemSusChem 2013, 6, 1235 – 1244 1236
CHEMSUSCHEMFULL PAPERS www.chemsuschem.org
tions from doubly charged fullerene trimers, pentamers, andso on; these contaminations can be avoided by reducing thepartial pressure of C60.
Each mass peak in Figure 1 actually consists of several close-ly spaced peaks that arise from i) intramolecular dissociation ofmethane, ii) ion–molecule reactions in the fullerene–methanecomplexes, and iii) contributions from isotopologues contain-ing one or more 13C isotopes (natural abundance 1.07 %). Theindividual peaks are well resolved for methane adsorbed onfullerene monomers and dimers. We corrected the ion yield forthe (substantial) contributions from 13C isotopes by usinga matrix method as described in a recent publication[45] andthus obtained the abundance of isotopically pure (12C only)ions.
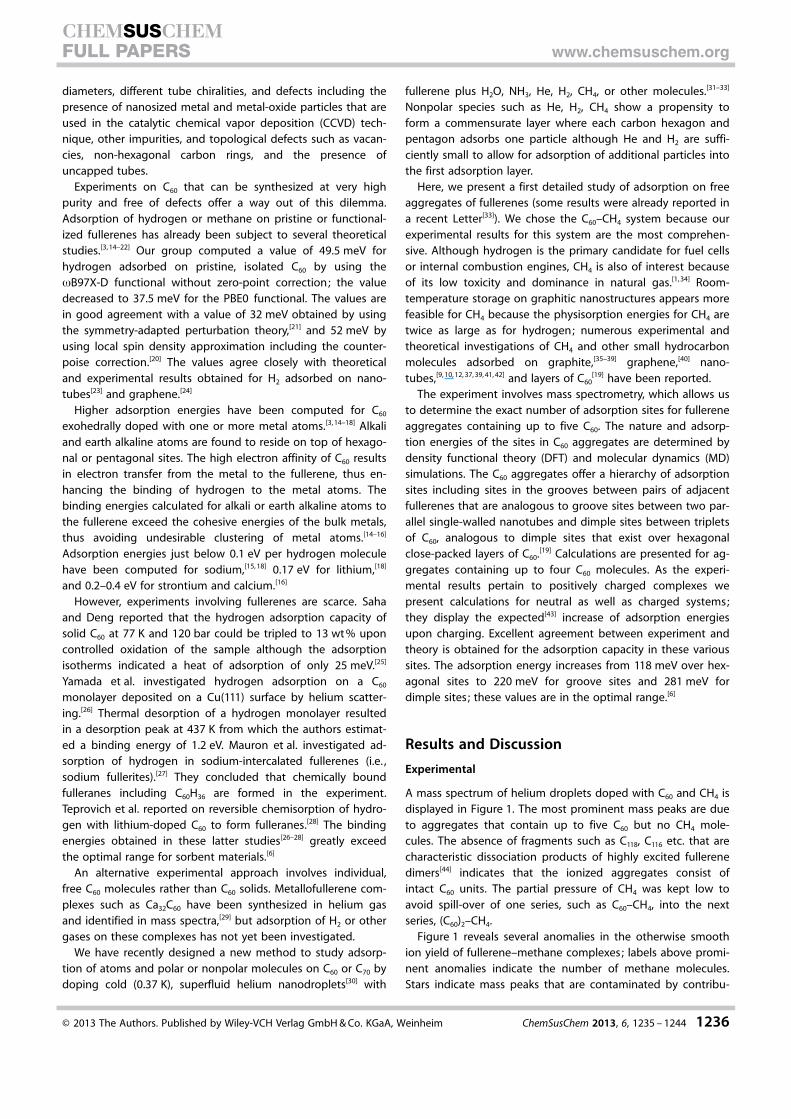
Figure 2 a displays the ion abundance of the three most in-tense ion series for the C60 monomer, namely C60(CH4)n
+ ,C60(CH4)n�1CH5
+ , and C60(CH4)n�1C2H2+ . All three series exhibit
a strong local maximum at n = 32. Similarly, Figure 2 b revealsthat C70–methane complexes are particularly abundant when37 molecular units are bound to the fullerene ion.
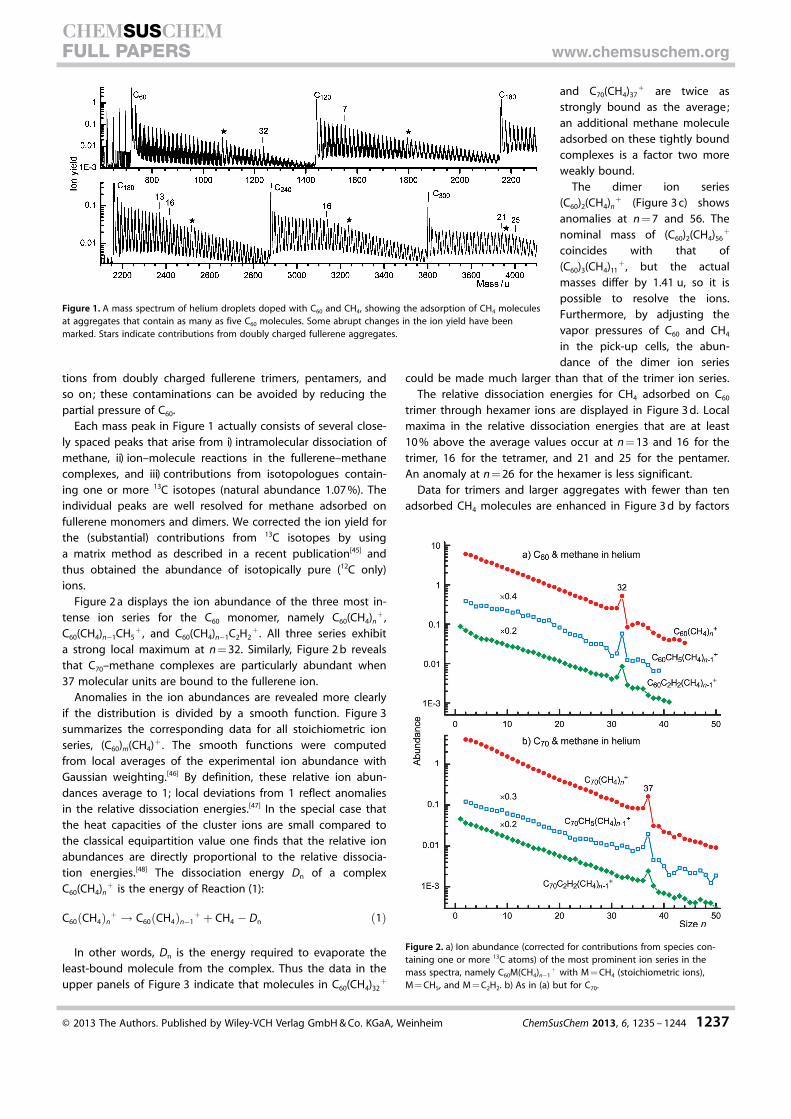
Anomalies in the ion abundances are revealed more clearlyif the distribution is divided by a smooth function. Figure 3summarizes the corresponding data for all stoichiometric ionseries, (C60)m(CH4)+ . The smooth functions were computedfrom local averages of the experimental ion abundance withGaussian weighting.[46] By definition, these relative ion abun-dances average to 1; local deviations from 1 reflect anomaliesin the relative dissociation energies.[47] In the special case thatthe heat capacities of the cluster ions are small compared tothe classical equipartition value one finds that the relative ionabundances are directly proportional to the relative dissocia-tion energies.[48] The dissociation energy Dn of a complexC60(CH4)n
+ is the energy of Reaction (1):
C60ðCH4Þnþ ! C60ðCH4Þn�1
þ þ CH4 � Dn ð1Þ
In other words, Dn is the energy required to evaporate theleast-bound molecule from the complex. Thus the data in theupper panels of Figure 3 indicate that molecules in C60(CH4)32
+
and C70(CH4)37+ are twice as
strongly bound as the average;an additional methane moleculeadsorbed on these tightly boundcomplexes is a factor two moreweakly bound.
The dimer ion series(C60)2(CH4)n
+ (Figure 3 c) showsanomalies at n = 7 and 56. Thenominal mass of (C60)2(CH4)56
+
coincides with that of(C60)3(CH4)11
+ , but the actualmasses differ by 1.41 u, so it ispossible to resolve the ions.Furthermore, by adjusting thevapor pressures of C60 and CH4
in the pick-up cells, the abun-dance of the dimer ion series
could be made much larger than that of the trimer ion series.The relative dissociation energies for CH4 adsorbed on C60
trimer through hexamer ions are displayed in Figure 3 d. Localmaxima in the relative dissociation energies that are at least10 % above the average values occur at n = 13 and 16 for thetrimer, 16 for the tetramer, and 21 and 25 for the pentamer.An anomaly at n = 26 for the hexamer is less significant.
Data for trimers and larger aggregates with fewer than tenadsorbed CH4 molecules are enhanced in Figure 3 d by factors
Figure 1. A mass spectrum of helium droplets doped with C60 and CH4, showing the adsorption of CH4 moleculesat aggregates that contain as many as five C60 molecules. Some abrupt changes in the ion yield have beenmarked. Stars indicate contributions from doubly charged fullerene aggregates.
Figure 2. a) Ion abundance (corrected for contributions from species con-taining one or more 13C atoms) of the most prominent ion series in themass spectra, namely C60M(CH4)n�1
+ with M = CH4 (stoichiometric ions),M = CH5, and M = C2H2. b) As in (a) but for C70.
� 2013 The Authors. Published by Wiley-VCH Verlag GmbH & Co. KGaA, Weinheim ChemSusChem 2013, 6, 1235 – 1244 1237
CHEMSUSCHEMFULL PAPERS www.chemsuschem.org
2 or 5; the dissociation energies exhibit local maxima at n = 2for the C60 trimer, 4 for the tetramer, and 7 for the pentamer.Even though the anomalies are weak they are statistically sig-nificant because the ion abundances are quite high.[49]
All observed anomalies are listed in Table 1. In the followingsection we will demonstrate that these data specify the maxi-mum numbers of molecules in specific types of adsorptionsites.
Computational
We have performed molecular dynamics (MD) simulations forthe adsorption of 50, 80, or 500 methane molecules on neutralor positively charged aggregates containing up to four C60
molecules. Most simulations were run for 400 ps with timesteps of 2 fs at a temperature of 4 K. The derivation of inter-molecular forces between fullerenes, between methane andneutral or charged fullerenes, and between methane mole-cules, is discussed at the end of this paper.
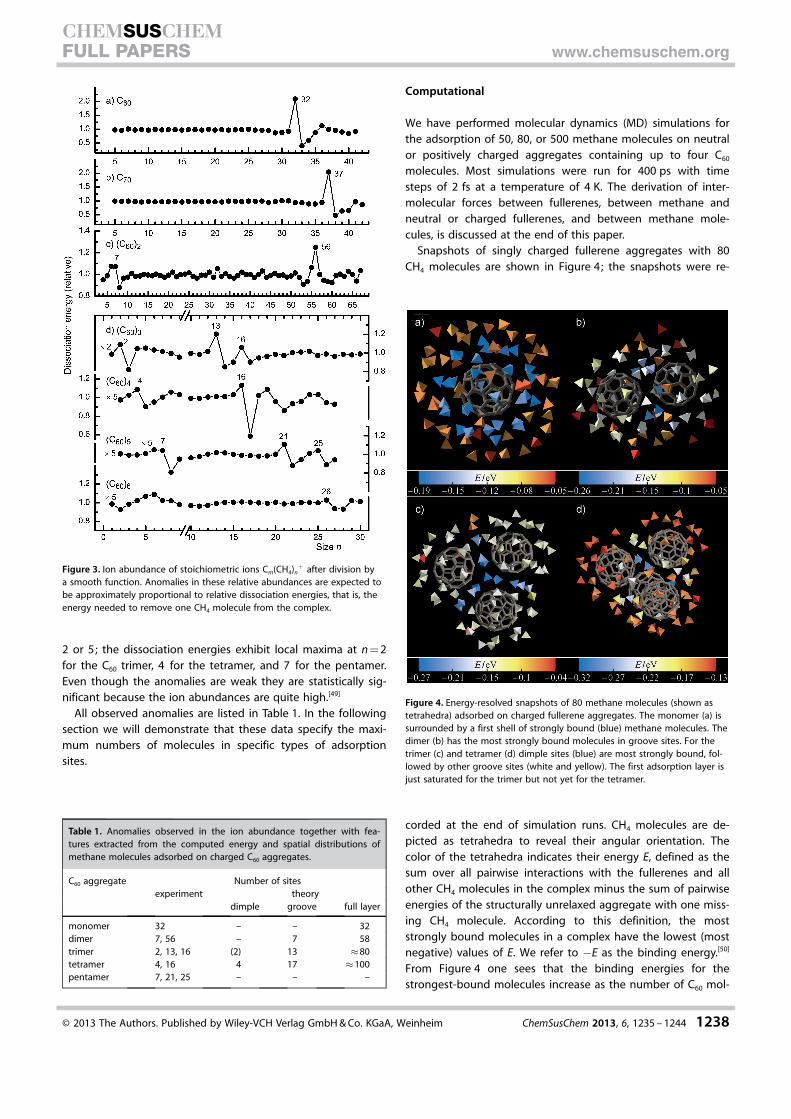
Snapshots of singly charged fullerene aggregates with 80CH4 molecules are shown in Figure 4; the snapshots were re-
corded at the end of simulation runs. CH4 molecules are de-picted as tetrahedra to reveal their angular orientation. Thecolor of the tetrahedra indicates their energy E, defined as thesum over all pairwise interactions with the fullerenes and allother CH4 molecules in the complex minus the sum of pairwiseenergies of the structurally unrelaxed aggregate with one miss-ing CH4 molecule. According to this definition, the moststrongly bound molecules in a complex have the lowest (mostnegative) values of E. We refer to �E as the binding energy.[50]
From Figure 4 one sees that the binding energies for thestrongest-bound molecules increase as the number of C60 mol-
Figure 3. Ion abundance of stoichiometric ions Cm(CH4)n+ after division by
a smooth function. Anomalies in these relative abundances are expected tobe approximately proportional to relative dissociation energies, that is, theenergy needed to remove one CH4 molecule from the complex.
Table 1. Anomalies observed in the ion abundance together with fea-tures extracted from the computed energy and spatial distributions ofmethane molecules adsorbed on charged C60 aggregates.
C60 aggregate Number of sitesexperiment theory
dimple groove full layer
monomer 32 – – 32dimer 7, 56 – 7 58trimer 2, 13, 16 (2) 13 �80tetramer 4, 16 4 17 �100pentamer 7, 21, 25 – – –
Figure 4. Energy-resolved snapshots of 80 methane molecules (shown astetrahedra) adsorbed on charged fullerene aggregates. The monomer (a) issurrounded by a first shell of strongly bound (blue) methane molecules. Thedimer (b) has the most strongly bound molecules in groove sites. For thetrimer (c) and tetramer (d) dimple sites (blue) are most strongly bound, fol-lowed by other groove sites (white and yellow). The first adsorption layer isjust saturated for the trimer but not yet for the tetramer.
� 2013 The Authors. Published by Wiley-VCH Verlag GmbH & Co. KGaA, Weinheim ChemSusChem 2013, 6, 1235 – 1244 1238
CHEMSUSCHEMFULL PAPERS www.chemsuschem.org
ecules in the complex increases (note that each panel inFigure 4 has a different energy-to-color conversion scale).
The first solvation shell of C60+ is easily visible in Figure 4 a;
the 32 most strongly bound molecules (colored blue) are ad-sorbed over the 12 pentagonal and 20 hexagonal faces. Forthe dimer (Figure 4 b), the most strongly bound (blue) CH4
molecules reside in the waist region; these adsorption siteswill be referred to as groove sites. Other molecules in the firstadsorption layer of the dimer are less strongly bound; they arecolored white.
The snapshot of the trimer (Figure 4 c) reveals the enhancedbinding in groove sites. Two of these groove sites offer particu-larly strong binding, namely the sites near the three-fold sym-metry axis, so-called dimple sites (above and below the planedefined by the fullerenes). The C60 tetramer (Figure 4 d) hasfour such dimple sites.
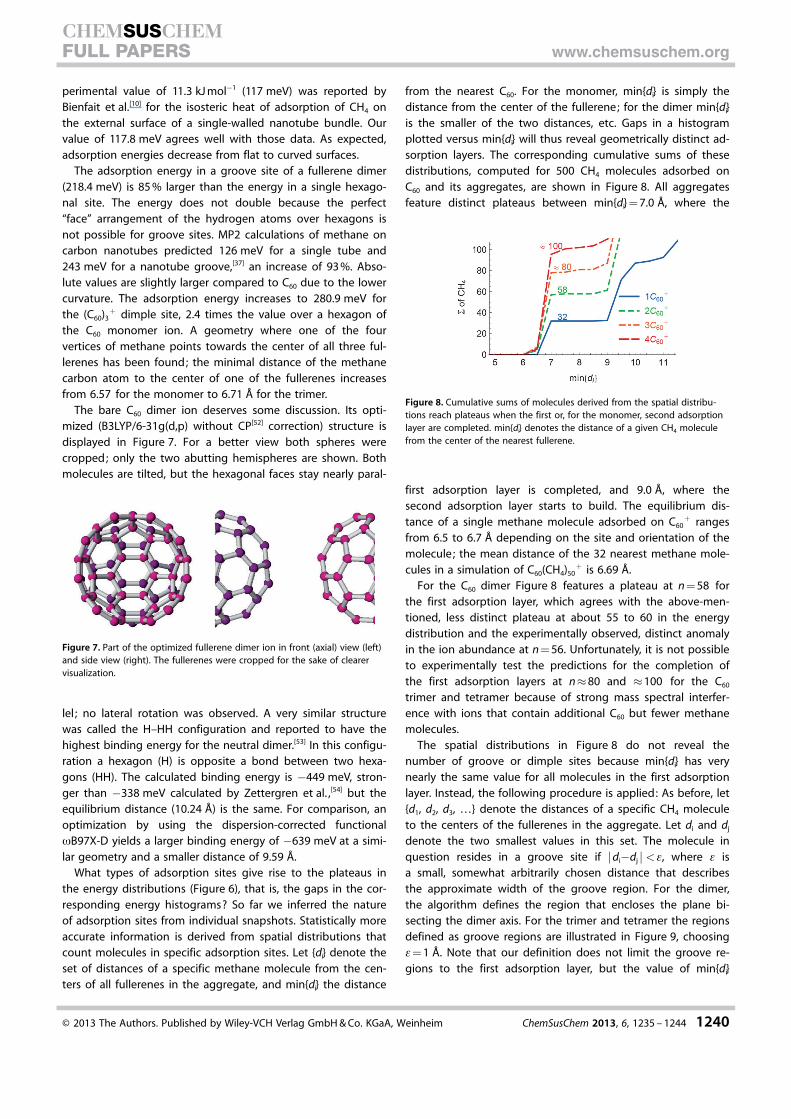
Snapshots are not necessarily representative of the systemover long times. To extract more reliable, quantitative data wehave analyzed the geometry and energy of the systems overthe last 50 ps of each simulation, with snapshots stored at in-crements of 1 ps. The histogram in Figure 5 displays the distri-
bution of energies E for C60(CH4)500+ . The 32 molecules that
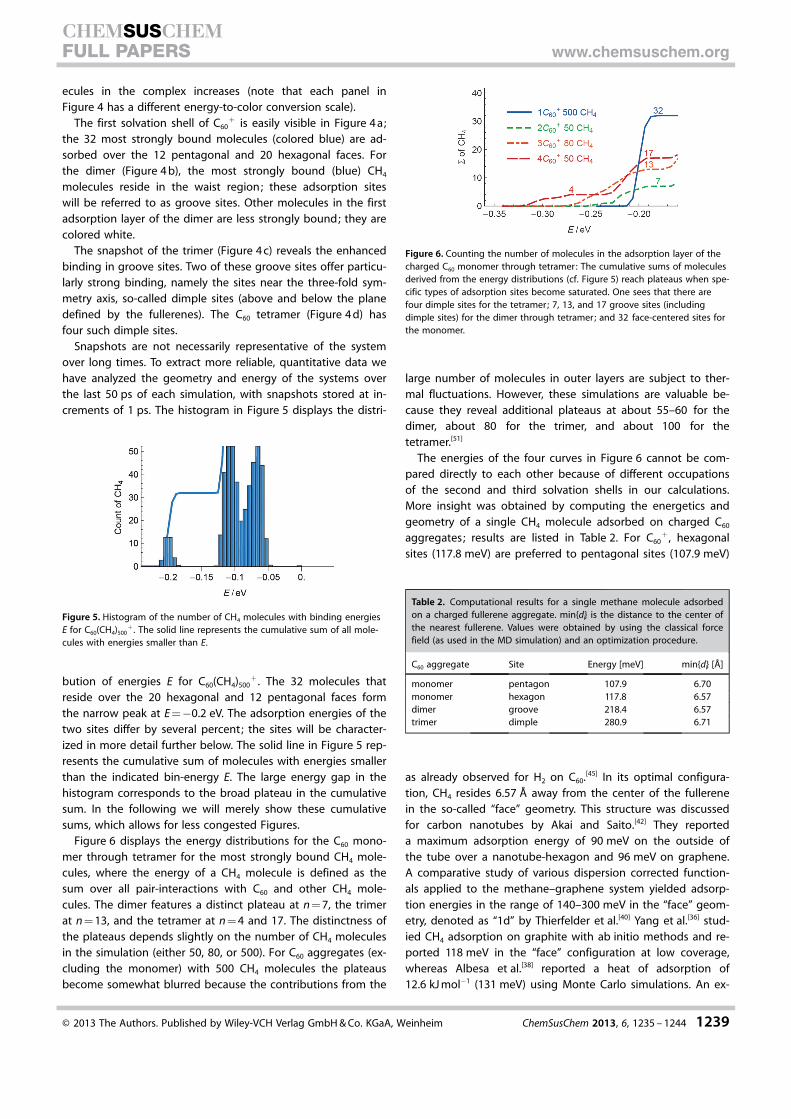
reside over the 20 hexagonal and 12 pentagonal faces formthe narrow peak at E =�0.2 eV. The adsorption energies of thetwo sites differ by several percent; the sites will be character-ized in more detail further below. The solid line in Figure 5 rep-resents the cumulative sum of molecules with energies smallerthan the indicated bin-energy E. The large energy gap in thehistogram corresponds to the broad plateau in the cumulativesum. In the following we will merely show these cumulativesums, which allows for less congested Figures.
Figure 6 displays the energy distributions for the C60 mono-mer through tetramer for the most strongly bound CH4 mole-cules, where the energy of a CH4 molecule is defined as thesum over all pair-interactions with C60 and other CH4 mole-cules. The dimer features a distinct plateau at n = 7, the trimerat n = 13, and the tetramer at n = 4 and 17. The distinctness ofthe plateaus depends slightly on the number of CH4 moleculesin the simulation (either 50, 80, or 500). For C60 aggregates (ex-cluding the monomer) with 500 CH4 molecules the plateausbecome somewhat blurred because the contributions from the
large number of molecules in outer layers are subject to ther-mal fluctuations. However, these simulations are valuable be-cause they reveal additional plateaus at about 55–60 for thedimer, about 80 for the trimer, and about 100 for thetetramer.[51]
The energies of the four curves in Figure 6 cannot be com-pared directly to each other because of different occupationsof the second and third solvation shells in our calculations.More insight was obtained by computing the energetics andgeometry of a single CH4 molecule adsorbed on charged C60
aggregates; results are listed in Table 2. For C60+ , hexagonal
sites (117.8 meV) are preferred to pentagonal sites (107.9 meV)
as already observed for H2 on C60.[45] In its optimal configura-tion, CH4 resides 6.57 � away from the center of the fullerenein the so-called “face” geometry. This structure was discussedfor carbon nanotubes by Akai and Saito.[42] They reporteda maximum adsorption energy of 90 meV on the outside ofthe tube over a nanotube-hexagon and 96 meV on graphene.A comparative study of various dispersion corrected function-als applied to the methane–graphene system yielded adsorp-tion energies in the range of 140–300 meV in the “face” geom-etry, denoted as “1d” by Thierfelder et al.[40] Yang et al.[36] stud-ied CH4 adsorption on graphite with ab initio methods and re-ported 118 meV in the “face” configuration at low coverage,whereas Albesa et al.[38] reported a heat of adsorption of12.6 kJ mol�1 (131 meV) using Monte Carlo simulations. An ex-
Figure 5. Histogram of the number of CH4 molecules with binding energiesE for C60(CH4)500
+ . The solid line represents the cumulative sum of all mole-cules with energies smaller than E.
Figure 6. Counting the number of molecules in the adsorption layer of thecharged C60 monomer through tetramer: The cumulative sums of moleculesderived from the energy distributions (cf. Figure 5) reach plateaus when spe-cific types of adsorption sites become saturated. One sees that there arefour dimple sites for the tetramer; 7, 13, and 17 groove sites (includingdimple sites) for the dimer through tetramer; and 32 face-centered sites forthe monomer.
Table 2. Computational results for a single methane molecule adsorbedon a charged fullerene aggregate. min{di} is the distance to the center ofthe nearest fullerene. Values were obtained by using the classical forcefield (as used in the MD simulation) and an optimization procedure.
C60 aggregate Site Energy [meV] min{di} [�]
monomer pentagon 107.9 6.70monomer hexagon 117.8 6.57dimer groove 218.4 6.57trimer dimple 280.9 6.71
� 2013 The Authors. Published by Wiley-VCH Verlag GmbH & Co. KGaA, Weinheim ChemSusChem 2013, 6, 1235 – 1244 1239
CHEMSUSCHEMFULL PAPERS www.chemsuschem.org
perimental value of 11.3 kJ mol�1 (117 meV) was reported byBienfait et al.[10] for the isosteric heat of adsorption of CH4 onthe external surface of a single-walled nanotube bundle. Ourvalue of 117.8 meV agrees well with those data. As expected,adsorption energies decrease from flat to curved surfaces.
The adsorption energy in a groove site of a fullerene dimer(218.4 meV) is 85 % larger than the energy in a single hexago-nal site. The energy does not double because the perfect“face” arrangement of the hydrogen atoms over hexagons isnot possible for groove sites. MP2 calculations of methane oncarbon nanotubes predicted 126 meV for a single tube and243 meV for a nanotube groove,[37] an increase of 93 %. Abso-lute values are slightly larger compared to C60 due to the lowercurvature. The adsorption energy increases to 280.9 meV forthe (C60)3
+ dimple site, 2.4 times the value over a hexagon ofthe C60 monomer ion. A geometry where one of the fourvertices of methane points towards the center of all three ful-lerenes has been found; the minimal distance of the methanecarbon atom to the center of one of the fullerenes increasesfrom 6.57 for the monomer to 6.71 � for the trimer.
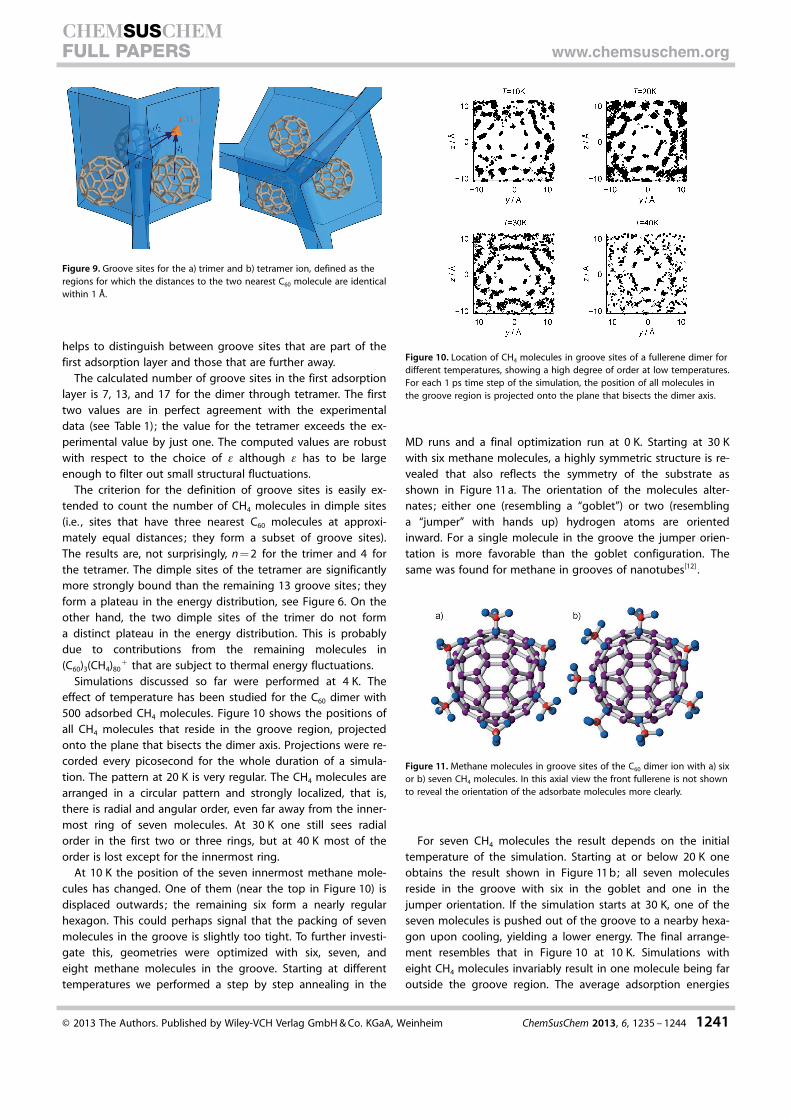
The bare C60 dimer ion deserves some discussion. Its opti-mized (B3LYP/6-31g(d,p) without CP[52] correction) structure isdisplayed in Figure 7. For a better view both spheres werecropped; only the two abutting hemispheres are shown. Bothmolecules are tilted, but the hexagonal faces stay nearly paral-
lel ; no lateral rotation was observed. A very similar structurewas called the H–HH configuration and reported to have thehighest binding energy for the neutral dimer.[53] In this configu-ration a hexagon (H) is opposite a bond between two hexa-gons (HH). The calculated binding energy is �449 meV, stron-ger than �338 meV calculated by Zettergren et al. ,[54] but theequilibrium distance (10.24 �) is the same. For comparison, anoptimization by using the dispersion-corrected functionalwB97X-D yields a larger binding energy of �639 meV at a simi-lar geometry and a smaller distance of 9.59 �.
What types of adsorption sites give rise to the plateaus inthe energy distributions (Figure 6), that is, the gaps in the cor-responding energy histograms? So far we inferred the natureof adsorption sites from individual snapshots. Statistically moreaccurate information is derived from spatial distributions thatcount molecules in specific adsorption sites. Let {di} denote theset of distances of a specific methane molecule from the cen-ters of all fullerenes in the aggregate, and min{di} the distance
from the nearest C60. For the monomer, min{di} is simply thedistance from the center of the fullerene; for the dimer min{di}is the smaller of the two distances, etc. Gaps in a histogramplotted versus min{di} will thus reveal geometrically distinct ad-sorption layers. The corresponding cumulative sums of thesedistributions, computed for 500 CH4 molecules adsorbed onC60 and its aggregates, are shown in Figure 8. All aggregatesfeature distinct plateaus between min{di} = 7.0 �, where the
first adsorption layer is completed, and 9.0 �, where thesecond adsorption layer starts to build. The equilibrium dis-tance of a single methane molecule adsorbed on C60
+ rangesfrom 6.5 to 6.7 � depending on the site and orientation of themolecule; the mean distance of the 32 nearest methane mole-cules in a simulation of C60(CH4)50
+ is 6.69 �.For the C60 dimer Figure 8 features a plateau at n = 58 for
the first adsorption layer, which agrees with the above-men-tioned, less distinct plateau at about 55 to 60 in the energydistribution and the experimentally observed, distinct anomalyin the ion abundance at n = 56. Unfortunately, it is not possibleto experimentally test the predictions for the completion ofthe first adsorption layers at n�80 and �100 for the C60
trimer and tetramer because of strong mass spectral interfer-ence with ions that contain additional C60 but fewer methanemolecules.
The spatial distributions in Figure 8 do not reveal thenumber of groove or dimple sites because min{di} has verynearly the same value for all molecules in the first adsorptionlayer. Instead, the following procedure is applied: As before, let{d1, d2, d3, …} denote the distances of a specific CH4 moleculeto the centers of the fullerenes in the aggregate. Let di and dj
denote the two smallest values in this set. The molecule inquestion resides in a groove site if jdi�dj j <e, where e isa small, somewhat arbitrarily chosen distance that describesthe approximate width of the groove region. For the dimer,the algorithm defines the region that encloses the plane bi-secting the dimer axis. For the trimer and tetramer the regionsdefined as groove regions are illustrated in Figure 9, choosinge= 1 �. Note that our definition does not limit the groove re-gions to the first adsorption layer, but the value of min{di}
Figure 7. Part of the optimized fullerene dimer ion in front (axial) view (left)and side view (right). The fullerenes were cropped for the sake of clearervisualization.
Figure 8. Cumulative sums of molecules derived from the spatial distribu-tions reach plateaus when the first or, for the monomer, second adsorptionlayer are completed. min{di} denotes the distance of a given CH4 moleculefrom the center of the nearest fullerene.
� 2013 The Authors. Published by Wiley-VCH Verlag GmbH & Co. KGaA, Weinheim ChemSusChem 2013, 6, 1235 – 1244 1240
CHEMSUSCHEMFULL PAPERS www.chemsuschem.org
helps to distinguish between groove sites that are part of thefirst adsorption layer and those that are further away.
The calculated number of groove sites in the first adsorptionlayer is 7, 13, and 17 for the dimer through tetramer. The firsttwo values are in perfect agreement with the experimentaldata (see Table 1); the value for the tetramer exceeds the ex-perimental value by just one. The computed values are robustwith respect to the choice of e although e has to be largeenough to filter out small structural fluctuations.
The criterion for the definition of groove sites is easily ex-tended to count the number of CH4 molecules in dimple sites(i.e. , sites that have three nearest C60 molecules at approxi-mately equal distances; they form a subset of groove sites).The results are, not surprisingly, n = 2 for the trimer and 4 forthe tetramer. The dimple sites of the tetramer are significantlymore strongly bound than the remaining 13 groove sites; theyform a plateau in the energy distribution, see Figure 6. On theother hand, the two dimple sites of the trimer do not forma distinct plateau in the energy distribution. This is probablydue to contributions from the remaining molecules in(C60)3(CH4)80
+ that are subject to thermal energy fluctuations.Simulations discussed so far were performed at 4 K. The
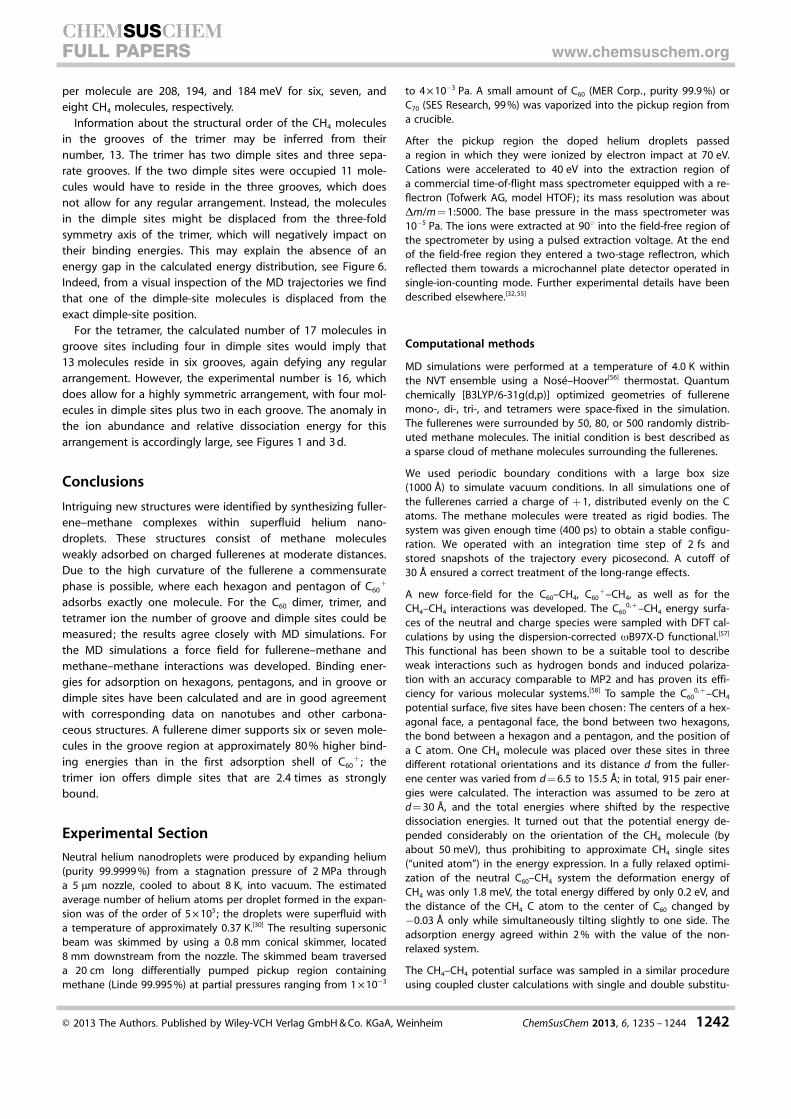
effect of temperature has been studied for the C60 dimer with500 adsorbed CH4 molecules. Figure 10 shows the positions ofall CH4 molecules that reside in the groove region, projectedonto the plane that bisects the dimer axis. Projections were re-corded every picosecond for the whole duration of a simula-tion. The pattern at 20 K is very regular. The CH4 molecules arearranged in a circular pattern and strongly localized, that is,there is radial and angular order, even far away from the inner-most ring of seven molecules. At 30 K one still sees radialorder in the first two or three rings, but at 40 K most of theorder is lost except for the innermost ring.
At 10 K the position of the seven innermost methane mole-cules has changed. One of them (near the top in Figure 10) isdisplaced outwards; the remaining six form a nearly regularhexagon. This could perhaps signal that the packing of sevenmolecules in the groove is slightly too tight. To further investi-gate this, geometries were optimized with six, seven, andeight methane molecules in the groove. Starting at differenttemperatures we performed a step by step annealing in the
MD runs and a final optimization run at 0 K. Starting at 30 Kwith six methane molecules, a highly symmetric structure is re-vealed that also reflects the symmetry of the substrate asshown in Figure 11 a. The orientation of the molecules alter-nates; either one (resembling a “goblet”) or two (resemblinga “jumper” with hands up) hydrogen atoms are orientedinward. For a single molecule in the groove the jumper orien-tation is more favorable than the goblet configuration. Thesame was found for methane in grooves of nanotubes[12] .
For seven CH4 molecules the result depends on the initialtemperature of the simulation. Starting at or below 20 K oneobtains the result shown in Figure 11 b; all seven moleculesreside in the groove with six in the goblet and one in thejumper orientation. If the simulation starts at 30 K, one of theseven molecules is pushed out of the groove to a nearby hexa-gon upon cooling, yielding a lower energy. The final arrange-ment resembles that in Figure 10 at 10 K. Simulations witheight CH4 molecules invariably result in one molecule being faroutside the groove region. The average adsorption energies
Figure 9. Groove sites for the a) trimer and b) tetramer ion, defined as theregions for which the distances to the two nearest C60 molecule are identicalwithin 1 �.
Figure 10. Location of CH4 molecules in groove sites of a fullerene dimer fordifferent temperatures, showing a high degree of order at low temperatures.For each 1 ps time step of the simulation, the position of all molecules inthe groove region is projected onto the plane that bisects the dimer axis.
Figure 11. Methane molecules in groove sites of the C60 dimer ion with a) sixor b) seven CH4 molecules. In this axial view the front fullerene is not shownto reveal the orientation of the adsorbate molecules more clearly.
� 2013 The Authors. Published by Wiley-VCH Verlag GmbH & Co. KGaA, Weinheim ChemSusChem 2013, 6, 1235 – 1244 1241
CHEMSUSCHEMFULL PAPERS www.chemsuschem.org
per molecule are 208, 194, and 184 meV for six, seven, andeight CH4 molecules, respectively.
Information about the structural order of the CH4 moleculesin the grooves of the trimer may be inferred from theirnumber, 13. The trimer has two dimple sites and three sepa-rate grooves. If the two dimple sites were occupied 11 mole-cules would have to reside in the three grooves, which doesnot allow for any regular arrangement. Instead, the moleculesin the dimple sites might be displaced from the three-foldsymmetry axis of the trimer, which will negatively impact ontheir binding energies. This may explain the absence of anenergy gap in the calculated energy distribution, see Figure 6.Indeed, from a visual inspection of the MD trajectories we findthat one of the dimple-site molecules is displaced from theexact dimple-site position.
For the tetramer, the calculated number of 17 molecules ingroove sites including four in dimple sites would imply that13 molecules reside in six grooves, again defying any regulararrangement. However, the experimental number is 16, whichdoes allow for a highly symmetric arrangement, with four mol-ecules in dimple sites plus two in each groove. The anomaly inthe ion abundance and relative dissociation energy for thisarrangement is accordingly large, see Figures 1 and 3 d.
Conclusions
Intriguing new structures were identified by synthesizing fuller-ene–methane complexes within superfluid helium nano-droplets. These structures consist of methane moleculesweakly adsorbed on charged fullerenes at moderate distances.Due to the high curvature of the fullerene a commensuratephase is possible, where each hexagon and pentagon of C60
+
adsorbs exactly one molecule. For the C60 dimer, trimer, andtetramer ion the number of groove and dimple sites could bemeasured; the results agree closely with MD simulations. Forthe MD simulations a force field for fullerene–methane andmethane–methane interactions was developed. Binding ener-gies for adsorption on hexagons, pentagons, and in groove ordimple sites have been calculated and are in good agreementwith corresponding data on nanotubes and other carbona-ceous structures. A fullerene dimer supports six or seven mole-cules in the groove region at approximately 80 % higher bind-ing energies than in the first adsorption shell of C60
+ ; thetrimer ion offers dimple sites that are 2.4 times as stronglybound.
Experimental Section
Neutral helium nanodroplets were produced by expanding helium(purity 99.9999 %) from a stagnation pressure of 2 MPa througha 5 mm nozzle, cooled to about 8 K, into vacuum. The estimatedaverage number of helium atoms per droplet formed in the expan-sion was of the order of 5 � 105; the droplets were superfluid witha temperature of approximately 0.37 K.[30] The resulting supersonicbeam was skimmed by using a 0.8 mm conical skimmer, located8 mm downstream from the nozzle. The skimmed beam traverseda 20 cm long differentially pumped pickup region containingmethane (Linde 99.995 %) at partial pressures ranging from 1 � 10�3
to 4 � 10�3 Pa. A small amount of C60 (MER Corp., purity 99.9 %) orC70 (SES Research, 99 %) was vaporized into the pickup region froma crucible.
After the pickup region the doped helium droplets passeda region in which they were ionized by electron impact at 70 eV.Cations were accelerated to 40 eV into the extraction region ofa commercial time-of-flight mass spectrometer equipped with a re-flectron (Tofwerk AG, model HTOF); its mass resolution was aboutDm/m = 1:5000. The base pressure in the mass spectrometer was10�5 Pa. The ions were extracted at 908 into the field-free region ofthe spectrometer by using a pulsed extraction voltage. At the endof the field-free region they entered a two-stage reflectron, whichreflected them towards a microchannel plate detector operated insingle-ion-counting mode. Further experimental details have beendescribed elsewhere.[32, 55]
Computational methods
MD simulations were performed at a temperature of 4.0 K withinthe NVT ensemble using a Nos�–Hoover[56] thermostat. Quantumchemically [B3LYP/6-31g(d,p)] optimized geometries of fullerenemono-, di-, tri-, and tetramers were space-fixed in the simulation.The fullerenes were surrounded by 50, 80, or 500 randomly distrib-uted methane molecules. The initial condition is best described asa sparse cloud of methane molecules surrounding the fullerenes.
We used periodic boundary conditions with a large box size(1000 �) to simulate vacuum conditions. In all simulations one ofthe fullerenes carried a charge of + 1, distributed evenly on the Catoms. The methane molecules were treated as rigid bodies. Thesystem was given enough time (400 ps) to obtain a stable configu-ration. We operated with an integration time step of 2 fs andstored snapshots of the trajectory every picosecond. A cutoff of30 � ensured a correct treatment of the long-range effects.
A new force-field for the C60–CH4, C60+–CH4, as well as for the
CH4–CH4 interactions was developed. The C600, +–CH4 energy surfa-
ces of the neutral and charge species were sampled with DFT cal-culations by using the dispersion-corrected wB97X-D functional.[57]
This functional has been shown to be a suitable tool to describeweak interactions such as hydrogen bonds and induced polariza-tion with an accuracy comparable to MP2 and has proven its effi-ciency for various molecular systems.[58] To sample the C60
0, +–CH4
potential surface, five sites have been chosen: The centers of a hex-agonal face, a pentagonal face, the bond between two hexagons,the bond between a hexagon and a pentagon, and the position ofa C atom. One CH4 molecule was placed over these sites in threedifferent rotational orientations and its distance d from the fuller-ene center was varied from d = 6.5 to 15.5 �; in total, 915 pair ener-gies were calculated. The interaction was assumed to be zero atd = 30 �, and the total energies where shifted by the respectivedissociation energies. It turned out that the potential energy de-pended considerably on the orientation of the CH4 molecule (byabout 50 meV), thus prohibiting to approximate CH4 single sites(“united atom”) in the energy expression. In a fully relaxed optimi-zation of the neutral C60–CH4 system the deformation energy ofCH4 was only 1.8 meV, the total energy differed by only 0.2 eV, andthe distance of the CH4 C atom to the center of C60 changed by�0.03 � only while simultaneously tilting slightly to one side. Theadsorption energy agreed within 2 % with the value of the non-relaxed system.
The CH4–CH4 potential surface was sampled in a similar procedureusing coupled cluster calculations with single and double substitu-
� 2013 The Authors. Published by Wiley-VCH Verlag GmbH & Co. KGaA, Weinheim ChemSusChem 2013, 6, 1235 – 1244 1242
CHEMSUSCHEMFULL PAPERS www.chemsuschem.org
tions (CCSD[59]) in combination with the cc-pVTZ basis set.[60] Thebasis set superposition error was accounted for by the counter-poise method. A total number of 816 points of the potentialenergy surface were calculated by scanning distances between 3and 13 � in 16 configurations. The CH4–CH4 interaction also de-pended strongly on the orientation of the molecules to each other.The CH4–CH4 system is ideally suited for benchmarking thewB97X-D functional by comparison to our CCSD results. We foundthat wB97X-D yielded relatively good adsorption distances within5 % of the CCSD results. The trends in the adsorption energieswere conserved with the wB97X-D functional, but the absolutevalues were overestimated by a factor of two.
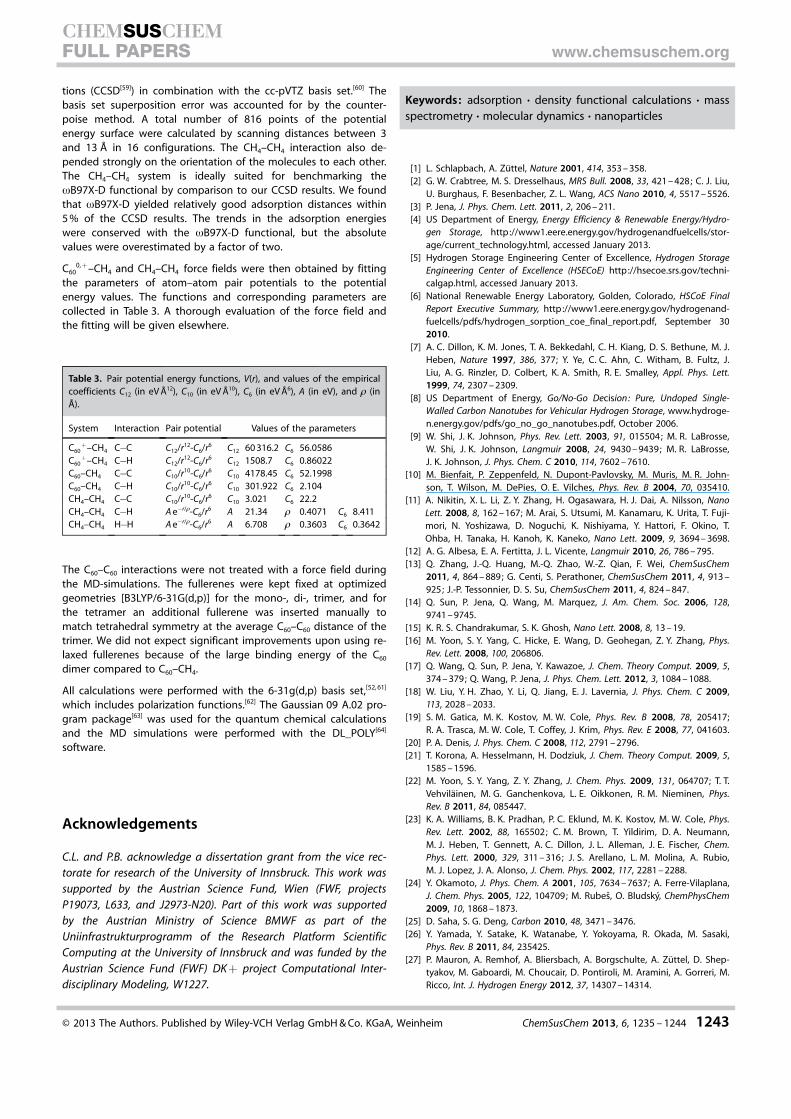
C600, +–CH4 and CH4–CH4 force fields were then obtained by fitting
the parameters of atom–atom pair potentials to the potentialenergy values. The functions and corresponding parameters arecollected in Table 3. A thorough evaluation of the force field andthe fitting will be given elsewhere.
The C60–C60 interactions were not treated with a force field duringthe MD-simulations. The fullerenes were kept fixed at optimizedgeometries [B3LYP/6-31G(d,p)] for the mono-, di-, trimer, and forthe tetramer an additional fullerene was inserted manually tomatch tetrahedral symmetry at the average C60–C60 distance of thetrimer. We did not expect significant improvements upon using re-laxed fullerenes because of the large binding energy of the C60
dimer compared to C60–CH4.
All calculations were performed with the 6-31g(d,p) basis set,[52, 61]
which includes polarization functions.[62] The Gaussian 09 A.02 pro-gram package[63] was used for the quantum chemical calculationsand the MD simulations were performed with the DL_POLY[64]
software.
Acknowledgements
C.L. and P.B. acknowledge a dissertation grant from the vice rec-torate for research of the University of Innsbruck. This work wassupported by the Austrian Science Fund, Wien (FWF, projectsP19073, L633, and J2973-N20). Part of this work was supportedby the Austrian Ministry of Science BMWF as part of theUniinfrastrukturprogramm of the Research Platform ScientificComputing at the University of Innsbruck and was funded by theAustrian Science Fund (FWF) DK + project Computational Inter-disciplinary Modeling, W1227.
Keywords: adsorption · density functional calculations · massspectrometry · molecular dynamics · nanoparticles
[1] L. Schlapbach, A. Z�ttel, Nature 2001, 414, 353 – 358.[2] G. W. Crabtree, M. S. Dresselhaus, MRS Bull. 2008, 33, 421 – 428; C. J. Liu,
U. Burghaus, F. Besenbacher, Z. L. Wang, ACS Nano 2010, 4, 5517 – 5526.[3] P. Jena, J. Phys. Chem. Lett. 2011, 2, 206 – 211.[4] US Department of Energy, Energy Efficiency & Renewable Energy/Hydro-
gen Storage, http://www1.eere.energy.gov/hydrogenandfuelcells/stor-age/current_technology.html, accessed January 2013.
[5] Hydrogen Storage Engineering Center of Excellence, Hydrogen StorageEngineering Center of Excellence (HSECoE) http://hsecoe.srs.gov/techni-calgap.html, accessed January 2013.
[6] National Renewable Energy Laboratory, Golden, Colorado, HSCoE FinalReport Executive Summary, http://www1.eere.energy.gov/hydrogenand-fuelcells/pdfs/hydrogen_sorption_coe_final_report.pdf, September 302010.
[7] A. C. Dillon, K. M. Jones, T. A. Bekkedahl, C. H. Kiang, D. S. Bethune, M. J.Heben, Nature 1997, 386, 377; Y. Ye, C. C. Ahn, C. Witham, B. Fultz, J.Liu, A. G. Rinzler, D. Colbert, K. A. Smith, R. E. Smalley, Appl. Phys. Lett.1999, 74, 2307 – 2309.
[8] US Department of Energy, Go/No-Go Decision: Pure, Undoped Single-Walled Carbon Nanotubes for Vehicular Hydrogen Storage, www.hydroge-n.energy.gov/pdfs/go_no_go_nanotubes.pdf, October 2006.
[9] W. Shi, J. K. Johnson, Phys. Rev. Lett. 2003, 91, 015504; M. R. LaBrosse,W. Shi, J. K. Johnson, Langmuir 2008, 24, 9430 – 9439; M. R. LaBrosse,J. K. Johnson, J. Phys. Chem. C 2010, 114, 7602 – 7610.
[10] M. Bienfait, P. Zeppenfeld, N. Dupont-Pavlovsky, M. Muris, M. R. John-son, T. Wilson, M. DePies, O. E. Vilches, Phys. Rev. B 2004, 70, 035410.
[11] A. Nikitin, X. L. Li, Z. Y. Zhang, H. Ogasawara, H. J. Dai, A. Nilsson, NanoLett. 2008, 8, 162 – 167; M. Arai, S. Utsumi, M. Kanamaru, K. Urita, T. Fuji-mori, N. Yoshizawa, D. Noguchi, K. Nishiyama, Y. Hattori, F. Okino, T.Ohba, H. Tanaka, H. Kanoh, K. Kaneko, Nano Lett. 2009, 9, 3694 – 3698.
[12] A. G. Albesa, E. A. Fertitta, J. L. Vicente, Langmuir 2010, 26, 786 – 795.[13] Q. Zhang, J.-Q. Huang, M.-Q. Zhao, W.-Z. Qian, F. Wei, ChemSusChem
2011, 4, 864 – 889; G. Centi, S. Perathoner, ChemSusChem 2011, 4, 913 –925; J.-P. Tessonnier, D. S. Su, ChemSusChem 2011, 4, 824 – 847.
[14] Q. Sun, P. Jena, Q. Wang, M. Marquez, J. Am. Chem. Soc. 2006, 128,9741 – 9745.
[15] K. R. S. Chandrakumar, S. K. Ghosh, Nano Lett. 2008, 8, 13 – 19.[16] M. Yoon, S. Y. Yang, C. Hicke, E. Wang, D. Geohegan, Z. Y. Zhang, Phys.
Rev. Lett. 2008, 100, 206806.[17] Q. Wang, Q. Sun, P. Jena, Y. Kawazoe, J. Chem. Theory Comput. 2009, 5,
374 – 379; Q. Wang, P. Jena, J. Phys. Chem. Lett. 2012, 3, 1084 – 1088.[18] W. Liu, Y. H. Zhao, Y. Li, Q. Jiang, E. J. Lavernia, J. Phys. Chem. C 2009,
113, 2028 – 2033.[19] S. M. Gatica, M. K. Kostov, M. W. Cole, Phys. Rev. B 2008, 78, 205417;
R. A. Trasca, M. W. Cole, T. Coffey, J. Krim, Phys. Rev. E 2008, 77, 041603.[20] P. A. Denis, J. Phys. Chem. C 2008, 112, 2791 – 2796.[21] T. Korona, A. Hesselmann, H. Dodziuk, J. Chem. Theory Comput. 2009, 5,
1585 – 1596.[22] M. Yoon, S. Y. Yang, Z. Y. Zhang, J. Chem. Phys. 2009, 131, 064707; T. T.
Vehvil�inen, M. G. Ganchenkova, L. E. Oikkonen, R. M. Nieminen, Phys.Rev. B 2011, 84, 085447.
[23] K. A. Williams, B. K. Pradhan, P. C. Eklund, M. K. Kostov, M. W. Cole, Phys.Rev. Lett. 2002, 88, 165502; C. M. Brown, T. Yildirim, D. A. Neumann,M. J. Heben, T. Gennett, A. C. Dillon, J. L. Alleman, J. E. Fischer, Chem.Phys. Lett. 2000, 329, 311 – 316; J. S. Arellano, L. M. Molina, A. Rubio,M. J. Lopez, J. A. Alonso, J. Chem. Phys. 2002, 117, 2281 – 2288.
[24] Y. Okamoto, J. Phys. Chem. A 2001, 105, 7634 – 7637; A. Ferre-Vilaplana,J. Chem. Phys. 2005, 122, 104709; M. Rubes, O. Bludsky, ChemPhysChem2009, 10, 1868 – 1873.
[25] D. Saha, S. G. Deng, Carbon 2010, 48, 3471 – 3476.[26] Y. Yamada, Y. Satake, K. Watanabe, Y. Yokoyama, R. Okada, M. Sasaki,
Phys. Rev. B 2011, 84, 235425.[27] P. Mauron, A. Remhof, A. Bliersbach, A. Borgschulte, A. Z�ttel, D. Shep-
tyakov, M. Gaboardi, M. Choucair, D. Pontiroli, M. Aramini, A. Gorreri, M.Ricco, Int. J. Hydrogen Energy 2012, 37, 14307 – 14314.
Table 3. Pair potential energy functions, V(r), and values of the empiricalcoefficients C12 (in eV �12), C10 (in eV �10), C6 (in eV �6), A (in eV), and 1 (in�).
System Interaction Pair potential Values of the parameters
C60+–CH4 C�C C12/r12-C6/r6 C12 60 316.2 C6 56.0586
C60+–CH4 C�H C12/r12-C6/r6 C12 1508.7 C6 0.86022
C60–CH4 C�C C10/r10-C6/r6 C10 4178.45 C6 52.1998C60–CH4 C�H C10/r10-C6/r6 C10 301.922 C6 2.104CH4–CH4 C�C C10/r10-C6/r6 C10 3.021 C6 22.2CH4–CH4 C�H A e�r/1-C6/r6 A 21.34 1 0.4071 C6 8.411CH4–CH4 H�H A e�r/1-C6/r6 A 6.708 1 0.3603 C6 0.3642
� 2013 The Authors. Published by Wiley-VCH Verlag GmbH & Co. KGaA, Weinheim ChemSusChem 2013, 6, 1235 – 1244 1243
CHEMSUSCHEMFULL PAPERS www.chemsuschem.org
[28] J. A. Teprovich, M. S. Wellons, R. Lascola, S. J. Hwang, P. A. Ward, R. N.Compton, R. Zidan, Nano Lett. 2012, 12, 582 – 589.
[29] U. Zimmermann, N. Malinowski, A. Burkhardt, T. P. Martin, Carbon 1995,33, 995 – 1006; A. Enders, N. Malinowski, D. Ievlev, E. Zurek, J. Autsch-bach, K. Kern, J. Chem. Phys. 2006, 125, 191102.
[30] J. P. Toennies, A. F. Vilesov, Angew. Chem. 2004, 116, 2674 – 2702; Angew.Chem. Int. Ed. 2004, 43, 2622 – 2648.
[31] S. Denifl, F. Zappa, I. M�hr, F. Ferreira da Silva, A. Aleem, A. Mauracher,M. Probst, J. Urban, P. Mach, A. Bacher, O. Echt, T. D. M�rk, P. Scheier,Angew. Chem. 2009, 121, 9102 – 9105; Angew. Chem. Int. Ed. 2009, 48,8940 – 8943; S. Denifl, F. Zappa, I. M�hr, A. Mauracher, M. Probst, J.Urban, P. Mach, A. Bacher, D. K. Bohme, O. Echt, T. D. M�rk, P. Scheier, J.Chem. Phys. 2010, 132, 234307; H. Schçbel, C. Leidlmair, P. Bartl, A.Aleem, M. Hager, O. Echt, T. D. M�rk, P. Scheier, Phys. Chem. Chem. Phys.2011, 13, 1092 – 1098; C. Leidlmair, Y. Wang, P. Bartl, H. Schçbel, S.Denifl, M. Probst, M. Alcam�, F. Mart�n, H. Zettergren, K. Hansen, O. Echt,P. Scheier, Phys. Rev. Lett. 2012, 108, 076101.
[32] C. Leidlmair, P. Bartl, H. Schçbel, S. Denifl, M. Probst, P. Scheier, O. Echt,Astrophys. J. Lett. 2011, 738, L4.
[33] S. Zçttl, A. Kaiser, P. Bartl, C. Leidlmair, A. Mauracher, M. Probst, S.Denifl, O. Echt, P. Scheier, J. Phys. Chem. Lett. 2012, 3, 2598 – 2603.
[34] T. D�ren, L. Sarkisov, O. M. Yaghi, R. Q. Snurr, Langmuir 2004, 20, 2683 –2689; A. V. Vakhrushev, M. V. Suyetin, Nanotechnology 2009, 20, 125602;Y. M. Li, G. A. Somorjai, Nano Lett. 2010, 10, 2289 – 2295.
[35] J. Piper, J. A. Morrison, Phys. Rev. B 1984, 30, 3486 – 3489.[36] S. H. Yang, L. Z. Ouyang, J. M. Phillips, W. Y. Ching, Phys. Rev. B 2006, 73,
165407.[37] A. Ricca, C. W. Bauschlicher, Chem. Phys. 2006, 324, 455 – 458.[38] A. G. Albesa, J. L. Llanos, J. L. Vicente, Langmuir 2008, 24, 3836 – 3840.[39] O. O. Adisa, B. J. Cox, J. M. Hill, Carbon 2011, 49, 3212 – 3218.[40] C. Thierfelder, M. Witte, S. Blankenburg, E. Rauls, W. G. Schmidt, Surf. Sci.
2011, 605, 746 – 749.[41] M. Muris, N. Dupont-Pavlovsky, M. Bienfait, P. Zeppenfeld, Surf. Sci.
2001, 492, 67 – 74; M. K. Kostov, M. M. Calbi, M. W. Cole, Phys. Rev. B2003, 68, 245403; A. D. Lueking, M. W. Cole, Phys. Rev. B 2007, 75,195425; J. Wu, F. Hagelberg, Phys. Rev. B 2010, 81, 155407.
[42] Y. Akai, S. Saito, Jpn. J. Appl. Phys. Part 1 2003, 42, 640 – 644.[43] M. Yoon, S. Y. Yang, E. Wang, Z. Y. Zhang, Nano Lett. 2007, 7, 2578 –
2583.[44] F. Rohmund, E. E. B. Campbell, O. Knospe, G. Seifert, R. Schmidt, Phys.
Rev. Lett. 1996, 76, 3289 – 3292.[45] A. Kaiser, C. Leidlmair, P. Bartl, S. Zçttl, S. Denifl, A. Mauracher, M.
Probst, P. Scheier, O. Echt, J. Chem. Phys. 2013, 138, 074311.[46] S. Prasalovich, K. Hansen, M. Kjellberg, V. N. Popok, E. E. B. Campbell, J.
Chem. Phys. 2005, 123, 084317.[47] C. E. Klots, Z. Phys. D 1991, 21, 335 – 342; R. Casero, J. M. Soler, J. Chem.
Phys. 1991, 95, 2927 – 2935; K. Hansen, U. N�her, Phys. Rev. A 1999, 60,1240 – 1250.
[48] L. An der Lan, P. Bartl, C. Leidlmair, R. Jochum, S. Denifl, O. Echt, P. Schei-er, Chem. Eur. J. 2012, 18, 4411 – 4418.
[49] It is not possible to use the method of running averages[46] near theends of the data set. Therefore, for n<10 a smooth function was
obtained by fitting a polynomial of third order to the size range1<n<10.
[50] The binding energy �E differs from the dissociation energy Dn as de-fined in Equation (1). It would be computationally costly to determineDn because simulations would have to be run for all values of n if onewants to see the energy difference for first shells, dimple sites, and soon. Nevertheless, the binding and dissociation energies are expected tobe strongly correlated.
[51] Occasionally, the initial configurations used in the simulations led tominor variations in the distributions.
[52] R. Ditchfield, W. J. Hehre, J. A. Pople, J. Chem. Phys. 1971, 54, 724.[53] F. Tournus, J. C. Charlier, P. Melinon, J. Chem. Phys. 2005, 122, 094315.[54] H. Zettergren, Y. Wang, A. Lamsabhi, M. Alcami, F. Martin, J. Chem. Phys.
2009, 130, 224302.[55] L. An der Lan, P. Bartl, C. Leidlmair, H. Schçbel, R. Jochum, S. Denifl, T. D.
M�rk, A. M. Ellis, P. Scheier, J. Chem. Phys. 2011, 135, 044309.[56] S. Nos�, Mol. Phys. 1984, 52, 255 – 268; W. G. Hoover, Phys. Rev. A 1985,
31, 1695 – 1697.[57] S. Grimme, J. Comput. Chem. 2006, 27, 1787 – 1799; J.-D. Chai, M. Head-
Gordon, Phys. Chem. Chem. Phys. 2008, 10, 6615 – 6620.[58] P. Hobza, Annu. Rep. Prog. Chem. Sect. C 2011, 107, 148 – 168; J. Klimes,
A. Michaelides, J. Chem. Phys. 2012, 137, 120901; M. P. Waller, H. Kruse,C. Muck-Lichtenfeld, S. Grimme, Chem. Soc. Rev. 2012, 41, 3119 – 3128;S. E. Huber, S. Dalnodar, W. Kausch, S. Kimeswenger, M. Probst, AIP Adv.2012, 2, 032180.
[59] G. E. Scuseria, C. L. Janssen, H. F. Sch�fer III. , J. Chem. Phys. 1988, 89,7382 – 7387.
[60] T. H. Dunning, J. Chem. Phys. 1989, 90, 1007 – 1023.[61] W. J. Hehre, R. Ditchfield, J. A. Pople, J. Chem. Phys. 1972, 56, 2257 –
2261.[62] P. C. Hariharan, J. A. Pople, Theor. Chim. Acta 1973, 28, 213 – 222.[63] Gaussian 09, Revision A.02, M. J. Frisch, G. W. Trucks, H. B. Schlegel, G. E.
Scuseria, M. A. Robb, J. R. Cheeseman, G. Scalmani, V. Barone, B. Men-nucci, G. A. Petersson, H. Nakatsuji, M. Caricato, X. Li, H. P. Hratchian,A. F. Izmaylov, J. Bloino, G. Zheng, J. L. Sonnenberg, M. Hada, M. Ehara,K. Toyota, R. Fukuda, J. Hasegawa, M. Ishida, T. Nakajima, Y. Honda, O.Kitao, H. Nakai, T. Vreven, J. A. Montgomery, Jr. , J. E. Peralta, F. Ogliaro,M. Bearpark, J. J. Heyd, E. Brothers, K. N. Kudin, V. N. Staroverov, R. Ko-bayashi, J. Normand, K. Raghavachari, A. Rendell, J. C. Burant, S. S. Iyen-gar, J. Tomasi, M. Cossi, N. Rega, J. M. Millam, M. Klene, J. E. Knox, J. B.Cross, V. Bakken, C. Adamo, J. Jaramillo, R. Gomperts, R. E. Stratmann,O. Yazyev, A. J. Austin, R. Cammi, C. Pomelli, J. W. Ochterski, R. L. Martin,K. Morokuma, V. G. Zakrzewski, G. A. Voth, P. Salvador, J. J. Dannenberg,S. Dapprich, A. D. Daniels, . Farkas, J. B. Foresman, J. V. Ortiz, J. Cio-slowski, D. J. Fox, Gaussian, Inc. , Wallingford CT, 2009.
[64] I. T. Todorov, W. Smith, K. Trachenko, M. T. Dove, J. Mater. Chem. 2006,16, 1911 – 1918.
Received: February 9, 2013
Published online on June 6, 2013
� 2013 The Authors. Published by Wiley-VCH Verlag GmbH & Co. KGaA, Weinheim ChemSusChem 2013, 6, 1235 – 1244 1244
CHEMSUSCHEMFULL PAPERS www.chemsuschem.org


