Embed Size (px)
Citation preview

Full Paper
740
Microwave ECR Plasma Assisted MOCVD ofY2O3 Thin Films Using Y(tod)3 Precursor andTheir Characterization
Shruti Barve, Mukul Deo, Rajib Kar, Nimisha Sreenivasan,Ramaswamy Kishore, Arup Biswas, Bhalchandra Bhanage, Mohan Rao,Lalit Mohan Gantayet, Dinkar Patil*
Yttrium oxide (Y2O3) thin films were deposited by microwave electron cyclotron resonance(ECR) plasma assisted metal organic chemical vapour deposition (MOCVD) process usingindigenously developed metal organic precursors Yttrium 2,7,7-trimethyl-3,5-octanedionates,commonly known as Y(tod)3whichwere synthesized by an ultrasoundmethod. A series of thinfilms were deposited by varying the oxygen flow rate from 1–9 sccm, keeping all otherparameters constant. The deposited coatings were characterized by X-ray photoelectronspectroscopy, glancing angle X-ray diffraction and infrared spectroscopy. Thickness androughness for the films were measured by stylus profilometry. Optical properties of thecoatings were studied by the spectroscopic ellip-sometry. Hardness and elastic modulus of thefilms were measured by nanoindentation tech-nique. Being that microwave ECR CVD process isoperating-pressure-sensitive, optimum oxygenactivity is very essential for a fixed flow rate ofprecursor, in order to get a single phase cubicyttrium oxide in the films. To the best of ourknowledge, this is the first effort that describesthe use of Y(tod)3 precursor for deposition of Y2O3
films using plasma assisted CVD process.20 25 30 35 40 45 50 55 60 65 70 75 80
Cou
nts
(arb
.uni
ts)
BCC Y2O3
Angle (2 theta)
S. Barve, R. Kar, L. M. Gantayet, D. PatilLaser and Plasma Technology Division, Bhabha Atomic ResearchCenter Trombay, Mumbai 400 085, IndiaE-mail: [email protected]. DeoHigh Pressure and Synchrotron Radiation Physics Division, BhabhaAtomic Research Center Trombay, Mumbai 400 085, IndiaN. Sreenivasan, M. RaoDepartment of Instrumentation and Applied Physics, IndianInstitute of Science, Bangalore 560 012, India
R. KishoreMaterials Science Division, Bhabha Atomic Research CenterTrombay, Mumbai 400 085, IndiaA. BiswasApplied Spectroscopy Division, Bhabha Atomic Research CenterTrombay, Mumbai 400 085, IndiaB. BhanageInstitute of Chemical Technology, Matunga, Mumbai 400 019,India
Plasma Process. Polym. 2011, 8, 740–749
� 2011 WILEY-VCH Verlag GmbH & Co. KGaA, Weinheim wileyonlinelibrary.com DOI: 10.1002/ppap.201000147

Microwave ECR Plasma Assisted MOCVD of Y2O3 Thin Films . . .
Introduction
Yttrium oxide thin films have been a topic of current
research interest due to their potential applications in
varied fields. Their high refractive index (1.8–2.4),
large dielectric constant (10–17), high breakdown strength
(1–5 MV � cm�1), high melting point (�2 400 8C), thermal
stability and hosting abilities for the lanthanide elements
make them highly important ceramics from technological
point of view. Y2O3 films are finding applications in many
areas, such as development of filters, optical coatings,
sensors, display devices, refractory materials, replacement
and replenishment of semiconductor films and dielectric
materials. Other structural forms of Y2O3 as nanotubes,
nanowires and nanorods are also being investigated for
their potential applications. Thermal stability of the cubic
yttria and its highmelting pointmakes it very useful in the
thermal barrier, reaction barrier/protective coatings. A
large variety of techniques like electron beam evaporation,
laser ablation, sputtering, thermal oxidation, plasma
assisted chemical vapor deposition (PACVD),metal-organic
chemical vapor deposition (MOCVD), molecular beam
epitaxy, hydrothermal deposition and atomic layer deposi-
tion etc. have been used for the deposition of yttriumoxide.
Each process is having its own advantages and limita-
tions.[1] Uniformity and purity of the deposited coatings,
plus ability to deposit on the large and complex substrates,
precision and repeatability are important commercial
aspects of the thin film deposition processes. Obviously
minimum contaminations in the deposition process,
plasma uniformity over the substrate, precise control of
the deposition parameters, repeatability and low deposi-
tion temperature are certain important requirementsof the
thin film deposition process. It has been known that,
microwave ECRMOCVDprocess is a highly efficient process
of plasma generation giving large area plasma uniformity
at the substrate location.[2] The system works at low
operating pressures,[3] and hence atom-by-atom deposi-
tions are possible, which leads to precision in the
deposition. Electrodelessnatureand lowpressureoperation
helps keep very low contamination level during the
deposition process.[1] And finally, energetic and ionization
processes involved in this plasma deposition method
makes it suitable for low temperature operation, which
helps in depositing very complex films as multiple oxide
coatings. Unlike conventional CVD processes, ECR MOCVD
can deposit films on varied types of substrates which may
get damage at higher temperature, e.g. one cannot afford to
have higher temperature while depositing on semiconduc-
tors. For the MOCVD of Y2O3 coatings, the most promising
and highly used precursors are b-diketones. These pre-
cursors have beenused inmetal-organic CVDprocesses due
to their high volatility at very low evaporation tempera-
tures, thermodynamic stability, atmospheric stability, non-
Plasma Process. Polym. 2011, 8, 740–749
� 2011 WILEY-VCH Verlag GmbH & Co. KGaA, Weinheim
corrosive nature (unlike fluorinated precursors) and ease of
handling.[4] In the tris type, non-halide b-diketone pre-
cursors Y(tod)3 (2,7,7-trimethyl-3,5-octanedionate of
yttrium) precursor is found to be much better in terms of
volatilityandstability thancommonlyusedY(thd)3 (2,2,6,6-
tetramethyl-3,5-heptanedionate of yttrium) and Y(acac)3(Yttrium Acetyl acetonate) precursors.[5,6] Due to the
presence of asymmetric isobutyl group in the structure,
flexibility of the Y(tod)3 molecule increases and better
shieldingof the centralmetal cation ispossible,which leads
to increase in the volatility.[6]
Here,we report on themicrowaveECRplasmadeposition
of the Y2O3 coatings using a Y(tod)3 precursor that is
developed in our laboratory. The precursor synthesis
process is discussed elsewhere.[7] The precursor tempera-
ture was fixed at 180 8C during all deposition experiments
and generated precursor vapors are introduced into the
deposition chamber. A series of thin film depositions were
carried out by varying the oxygen flow rate from 1–9 sccm.
All other parameters are kept constant throughout the
deposition experiments.
The deposited films were characterized by various
characterization techniques like: X-ray photoelectron
spectroscopy (XPS), glancing angle X-ray diffraction
(GAXRD), infrared spectroscopy (110–4 000 cm�1) and
spectroscopic ellipsometry. Thickness of the deposited
filmswasmeasured by stylus profilometer andmechanical
properties of the films were studied by using load depth
sensing nano indentation technique. Efforts were made
here to explain the role of oxygenactivityduringdeposition
on the properties of the deposited Y2O3 coatings.
Experimental Section
Microwave ECR plasma-assisted MOCVD setup that is used for the
depositions is described in detail elsewhere.[8] Initially substrates
were thoroughly cleaned in RCA-I solution and then in 10% HF
solution for 2min to remove the native oxide on the surface of the
substrates. Substrates were then ultrasonically cleaned in metha-
nol for 20min, driedunder the infrared light and then immediately
transferred to the substrate holder in the deposition chamber. The
whole system including precursor delivery lines was pumped
down to �1�10�5 mbar pressure by using a diffusion pump in
combination with a rotary pump. The substrate temperature was
kept constant at 350 8Cbyusingaproportionate integral derivative(PID) controller. Initially, argon gas flow (5 sccm) was started and
microwave ECR plasma was generated. Plasma was tuned for
minimum reflected power and for plasma uniformity over the
substrate area, by using tuning elements in the microwave
transmission line. After the sputter-cleaning of the substrates in
the argon plasma for 20min, argon gas flow rate was adjusted to
1 sccm and oxygen gas flow rate was adjusted to 1–9 sccm (in
different depositions). Precursor evaporator including delivery
lines was heated to a constant value of 180 8C simultaneously.
Keeping all other parameters constant, a set of five films were
www.plasma-polymers.org 741

50 100 150 200 250 300-32
-24
-16
-8
0
50 100 150 200 250 300-80
-60
-40
-20
0
(ii)
Mas
s lo
ss (m
g)M
ass
loss
(mg)
Temperature (ºC)
(i)
Figure 1. TGA plots for Y(tod)3 precursor measured in i) argon gasat atmospheric pressure (Ar gas), and ii) under vacuum at10�6 mbar pressure.
742
S. Barve et al.
depositedwith variationof oxygengas flow rate in the plasmafilm
A (1 sccm), B (3 sccm), C (4 sccm),D (7 sccm)andE (9 sccm). Precursor
vaporswere showered in the plasma (on the substrates) by using a
gas distribution ring. The final operating pressures in the
deposition chamber were 1.2� 10�4 mbar, 3.7�10�4 mbar,
5.9�10�4 mbar, 7.2�10�4 mbar and 7.8�10�4 mbar for films
A, B, C, D and E, respectively. Depositionswere carried out typically
at microwave power of 480W for 2h. Precursor temperature was
fixed to an appropriate value by studying the evaporation
characteristics of the precursor in vacuum. Thickness and rough-
ness of the filmsweremeasured by the stylus profilometer (Dektak
150, Veeko). XPS analysis was performed with SPECS GmbH
spectrometer (Phoibos 100 MCD Energy Analyzer) using MgKa
radiation (1 253.6 eV). The residual pressure inside the analysis
chamberwas in10�10mbar range.Thespectrometerwascalibrated
by using photoemission lines of Ag (Ag 3d3/2¼ 367 eV with
reference to the Fermi level). Peaks were recorded with constant
pass energy of 40 eV and counts per second are optimized to
minimize thenoise level in the spectrum.Becauseof surface charge
inducedpeakshifts,C1sat284.6 eVwastakenasa referenceenergy
position to correct the shift. An X’Pert PRO X-ray Diffractometer
(PANalytical) with 40 kV, 30mA power CuKa source was used for
getting the glancing angle X-ray diffraction patterns on the
deposited films. Incident angle of the source beamwas fixed to 1.88andX-ray diffractionpatterns are obtained in the 2u range of 208 to808 with the scan step of 0.058 per 3 s for all the films. IR
spectrometer (Bruker Vertex 80V) was configured with potassium
bromide (KBr), Mylar multilayer beam splitters, liquid nitrogen
cooledHgCdTe (MID-IR) andDeuteratedTriglycinSulphate (FAR-IR)
detectors. A 118 reflection accessory was used for taking the IR
spectra. Infrared spectra were recorded in the FAR-IR region (100–
600 cm�1), as well as in the MID-IR region (600–4000 cm�1) at a
spectral resolution of 2 cm�1. Spectroscopic Ellipsometry unit
(model SE800,makeSENTECH InstrumentsGmbH)wasused tofind
out the variation of optical properties of the films in 300nm to
1 200nmwavelength range. The experimentallymeasured ellipso-
metric parameters C and D have been fitted with theoretically
generated spectra. The theoretical values have been generated by
using Tauc-Lorentz model. Using the best fitted parameters the
refractive indices of the films were measured. Nanoindentation
was carried out using ultra-nano hardness tester (CSM, Switzer-
land) under load control mode up to amaximum load of 250mN. A
Berkovich three-sided pyramidal diamond nanoindenter with a
nominal angle of 65.38 was used for measuring the hardness and
elastic modulus of the films.
Results and Discussion
Thermo-gravimetric Analysis
Precursor evaporation characteristicswere studied inargon
gas at one atmospheric pressure and also in vacuum of
�10�6 mbar as shown in the Figure 1. From these
characteristics, it is seen that in argon gas at one
atmospheric pressure, approximately 76% mass of the
precursor is lost in the 190 8C to 350 8C temperature range,
small kinks in between are showing the preferential
Plasma Process. Polym. 2011, 8, 740–749
� 2011 WILEY-VCH Verlag GmbH & Co. KGaA, Weinheim
evaporationof somegroups fromthe largeY(tod)3precursor
molecule (Figure 1i). At 10�6 mbar pressure, a single step
evaporation of the precursor starting at�162 8C is observed
giving �81% mass loss till 200 8C. Vacuum TGA (Figure 1ii)
indicates that there are no features that shows precursor
decomposition below162 8C. It is evident fromFigure 1 that
low pressure helps in increasing vaporization of the solids
precursor. Toget reasonableflowrateof theprecursor at the
experimental operating pressures, precursor evaporator
temperature was fixed to 180 8C throughout the deposi-
tions.
Thickness and Roughness
Thickness and roughness values are high for film A,
decrease and pass through minima for film C and again
increase forfilmEas shown in the Figure 2.Deposition rates
calculated from the thickness values give the same trend. It
ismaximum for the filmA (�100 A �min�1), it decreases for
the film B (�65 A �min�1) with a further decrease for film C
(�18 A �min�1). Finally it increases for film D
(�75 A �min�1) and further for film E (�116 A �min�1),
giving minima for film C.
X-ray Photoelectron Spectroscopy
Survey scans taken on the deposited films show threemain
peaks corresponding to the energy levels of Y 3d, O 1s and
C 1s peaks. All the three peaks are further scanned in detail
with 0.05 eV step. Detailed scans are analyzed by using XPS
Peak fit 4.1. FWHM values for the fitted peaks are fixed
within the range 1 to 1.2 eV for Y 3d andO 1s peaks, while it
DOI: 10.1002/ppap.201000147
A B C D E0.0
0.2
0.4
0.6
0.8
1.0
1.2
1.4
1.6
Mec
hani
cal p
rope
rty
(mic
ron)
Film identification
Thickness (micron) Roughness (micron)
Figure 2. Variations in the thickness and roughness of the depos-ited films.
152 154 156 158 160 1620
800
1600
2400
152 154 156 158 160 1620
800
1600
2400
3200
152 154 156 158 160 1620
800
1600
2400
3200
152 154 156 158 160 1620
800
1600
2400
3200
152 154 156 158 160 1620
800
1600
2400
3200
4000
A
B
Cou
nts
/ sec
(arb
. uni
ts) x
102
Raw data Peak sum Y2O3-x Y2O3 Y-O-H / Y-O-C
C
D
Binding energy (eV)
E
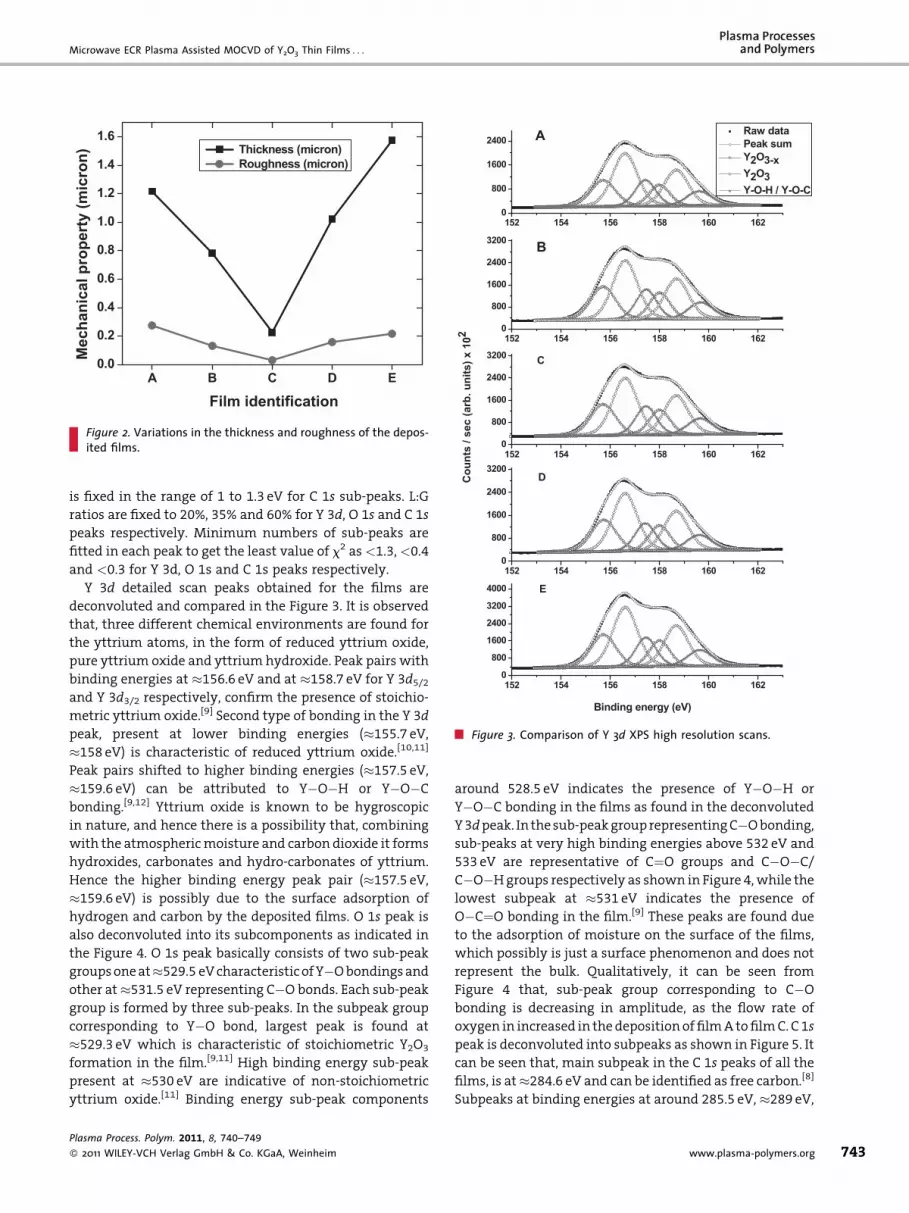
Figure 3. Comparison of Y 3d XPS high resolution scans.
Microwave ECR Plasma Assisted MOCVD of Y2O3 Thin Films . . .
is fixed in the range of 1 to 1.3 eV for C 1s sub-peaks. L:G
ratios are fixed to 20%, 35% and 60% for Y 3d, O 1s and C 1s
peaks respectively. Minimum numbers of sub-peaks are
fitted in each peak to get the least value of x2 as <1.3,<0.4
and <0.3 for Y 3d, O 1s and C 1s peaks respectively.
Y 3d detailed scan peaks obtained for the films are
deconvoluted and compared in the Figure 3. It is observed
that, three different chemical environments are found for
the yttrium atoms, in the form of reduced yttrium oxide,
pure yttrium oxide and yttrium hydroxide. Peak pairs with
binding energies at �156.6 eV and at �158.7 eV for Y 3d5/2and Y 3d3/2 respectively, confirm the presence of stoichio-
metric yttrium oxide.[9] Second type of bonding in the Y 3d
peak, present at lower binding energies (�155.7 eV,
�158 eV) is characteristic of reduced yttrium oxide.[10,11]
Peak pairs shifted to higher binding energies (�157.5 eV,
�159.6 eV) can be attributed to Y�O�H or Y�O�C
bonding.[9,12] Yttrium oxide is known to be hygroscopic
in nature, and hence there is a possibility that, combining
with the atmosphericmoisture and carbon dioxide it forms
hydroxides, carbonates and hydro-carbonates of yttrium.
Hence the higher binding energy peak pair (�157.5 eV,
�159.6 eV) is possibly due to the surface adsorption of
hydrogen and carbon by the deposited films. O 1s peak is
also deconvoluted into its subcomponents as indicated in
the Figure 4. O 1s peak basically consists of two sub-peak
groupsoneat�529.5 eVcharacteristic ofY�Obondingsand
other at�531.5 eV representing C�O bonds. Each sub-peak
group is formed by three sub-peaks. In the subpeak group
corresponding to Y�O bond, largest peak is found at
�529.3 eV which is characteristic of stoichiometric Y2O3
formation in the film.[9,11] High binding energy sub-peak
present at �530 eV are indicative of non-stoichiometric
yttrium oxide.[11] Binding energy sub-peak components
Plasma Process. Polym. 2011, 8, 740–749
� 2011 WILEY-VCH Verlag GmbH & Co. KGaA, Weinheim
around 528.5 eV indicates the presence of Y�O�H or
Y�O�C bonding in the films as found in the deconvoluted
Y3dpeak. In thesub-peakgrouprepresentingC�Obonding,
sub-peaks at very high binding energies above 532 eV and
533 eV are representative of C¼O groups and C�O�C/
C�O�Hgroups respectively as shown in Figure 4,while the
lowest subpeak at �531 eV indicates the presence of
O�C¼O bonding in the film.[9] These peaks are found due
to the adsorption of moisture on the surface of the films,
which possibly is just a surface phenomenon and does not
represent the bulk. Qualitatively, it can be seen from
Figure 4 that, sub-peak group corresponding to C�O
bonding is decreasing in amplitude, as the flow rate of
oxygen in increased in thedepositionof filmAtofilmC. C 1s
peak is deconvoluted into subpeaks as shown in Figure 5. It
can be seen that, main subpeak in the C 1s peaks of all the
films, is at�284.6 eV and can be identified as free carbon.[8]
Subpeaks at binding energies at around 285.5 eV, �289 eV,
www.plasma-polymers.org 743

526 528 530 532 534 536
800
1600
2400
526 528 530 532 534 536
1600
2400
3200
526 528 530 532 534 536
1600
2400
3200
526 528 530 532 534 536
1600
2400
3200
526 528 530 532 534 536
1600
2400
3200
4000
A
Raw data Peak sum Y-O-H / Y-O-C Y2O3 Y2O3-x O-C=O C=O C-O-H / C-O-C
B
Cou
nts
/ sec
(arb
. uni
ts) x
102
C
D
Binding energy (eV)
E
Figure 4. Comparison of O 1s XPS high resolution scans.
280 282 284 286 288 290 292 294
200
300
400
500
280 282 284 286 288 290 292 294100
200
300
400
500
280 282 284 286 288 290 292 294
220
330
440
550
660
280 282 284 286 288 290 292 294
220
330
440
550
660280 282 284 286 288 290 292 294
220
330
440
550
660
A
Carbide
C-C / C-HC-O-H /C-O-C
C=O
O-C=O
(O)2-C=O
B
Cou
nts
/ sec
(arb
. uni
ts) x
102
C
Binding energy (eV)
E
D
Figure 5. Comparison of C 1s XPS high resolution scans.
744
S. Barve et al.
290.2 eV and �291.5 eV represent C�O�H/C�O�C, C¼O,
O�C¼O and (O)2�C¼O bonding respectively.[9] It can be
seen that, as oxygen flow increases in the deposition of film
A to film E, carbon peaks on the higher binding energies
diminish. This indicates that, more the oxygen flow during
the deposition, less is the carbon contamination that is
found in the film. XPS being the surface analysis technique
and analysis is done ex situ, it is possible that presence of
carbon bonding in thefilm is just a surface phenomenon, as
discussed above. A small peak on lower binding energywas
found in the film A which possibly indicates some carbide
formation on the filmsurface. But no such subpeak is found
in the Y 3d peak of film A, as seen from the Figure 3.
Glancing Angle X-ray Diffraction
GAXRD patterns for all films are shown in the Figure 6. It is
seen that, there is a clear variation in the observed crystal
structure from film A to film E. Film A deposited under a
Plasma Process. Polym. 2011, 8, 740–749
� 2011 WILEY-VCH Verlag GmbH & Co. KGaA, Weinheim
relatively reduced environment (low oxygen flow rate)
shows the presence of hexagonal (hex) yttrium hydroxide
(JCPDS no. 83-2042). Peaks visible in the pattern like (110),
(200), (210) and (220) are coincidingwith the lines from the
said JCPDS card. A small peak at�298 indicates that, there isa possibility of the presence of BCCyttriumoxide in thefilm
A. As the oxygen partial pressure is further increased by
increasing the flow rate to 3 sccm (film B), mixed crystal
structures (cubic Y2O3 and hexagonal Y(OH)3) are seen from
the GAXRD pattern as seen in the Figure 6. Lines from the
JCPDS card numbered 41-1105matchedwell with the lines
from the GIXRD pattern of film B. Multiphase structure of
the film B is confirmed due to the presence of clearly
resolved lines of both the phases at �588. Due to the
existence of nearly located peaks of BCC Y2O3 and hex
DOI: 10.1002/ppap.201000147

100 150 200 250 300 350 400 450 500 550 6000.00
0.04
0.08
0.12
100 150 200 250 300 350 400 450 500 550 6000.00
0.04
0.08
0.12
100 150 200 250 300 350 400 450 500 550 6000.00
0.04
0.08
0.12
100 150 200 250 300 350 400 450 500 550 6000.00
0.04
0.08
0.12100 150 200 250 300 350 400 450 500 550 600
0.00
0.04
0.08
0.12Cou
nts
(arb
. uni
ts)
A
Wavenumber (cm-1)
B
Cubic Y2O3Hydroxide of yttrium
C
E
D
Figure 7. FAR-IR reflectance spectra for the deposited films.
20 25 30 35 40 45 50 55 60 65 70 75 800
100
200
300
20 25 30 35 40 45 50 55 60 65 70 75 800
100
200
300
20 25 30 35 40 45 50 55 60 65 70 75 800
500
1000
1500
20 25 30 35 40 45 50 55 60 65 70 75 80
0
300
600
900
20 25 30 35 40 45 50 55 60 65 70 75 80
0
200
400
600
c (4
4 0
)
h (1
1 0
), h
(1 0
1)
h (2
2 0
)
h (2
1 0
)
h (2
0 0
)
Cou
nts
(arb
. uni
ts)
A
h Y(OH)3 Hex: JCPDS 83-2042
c Y2O3 BCC: JCPDS 41-1105
h (2
2 0
)
c (6
2 2
)
c (4
4 0
)
c (4
3 1
)
h (2
0 0
),c (4
0 0
)
h (1
1 0
),c (2
2 2
)
B
Angle (2 theta)
c (2
1 1
)
c (6
6 2
)
c (6
2 2
)
c (4
4 0
)
c (4
3 1
)
c (4
1 1
)c (4
0 0
)
c (2
2 2
)Ch
(2 2
0)
c (6
2 2
)
h (2
0 0
),c (4
0 0
)
c (2
2 2
), h
(1 0
1)
c (4
3 1
)
c (4
4 0
)
c (2
1 1
)
D
c (2
2 2
), h
(1 0
1)
h (2
0 0
),c (4
0 0
)
c (4
4 0
)
c(6
2 2
), h
(2 2
0)
E
Figure 6. GAXRD patterns for the deposited films.
Microwave ECR Plasma Assisted MOCVD of Y2O3 Thin Films . . .
Y(OH)3 structures, all other peaks in the GAXRD pattern for
thefilmB, are unresolved. As the oxygenflowrate is further
increased,GAXRDpattern forfilmCshowssinglephaseBCC
yttrium oxide structure with all lines matching with the
lines from JCPDS card no. 41-1105. Decrease in FWHM and
increase in intensity of the peaks in the GAXRD pattern for
film C indicates that, grain size of cubic yttrium oxide is
increasing for film C as compared to film B. When oxygen
flow rate is increased further to 7 sccm, film D again shows
dual phasemixture of BCC Y2O3 and hex yttriumhydroxide
structures. Though other peaks are not well resolved, peak
positioned at �588 confirms the presence of two phases in
the filmD. Peak intensities and FWHMvalues fromGAXRD
pattern indicate that grain sizes are decreasing from film C
to film D again. Finally, as oxygen input during the
deposition is increased to 9 sccm, crystal structure for filmE
is again a multiphase (BCC oxideþhex hydroxide) of
yttrium with broad and less intense peaks indicating
unresolved lines of both the phases.
Infrared Spectroscopy
Reflectance spectra in the FAR-IR (100–600 cm�1) andMID-
IR region (600–4 000 cm�1) taken on the deposited films are
Plasma Process. Polym. 2011, 8, 740–749
� 2011 WILEY-VCH Verlag GmbH & Co. KGaA, Weinheim
shown in the Figure 7 and Figure 8, respectively. Presence of
cubic yttriumoxide in all films is confirmed by the triplet at
around 300 cm�1 in the FAR-IR region.[13] This confirms the
presence of BCC Y2O3 even in the film A as indicated from
the GAXRD results. All bands including band at 156 cm�1,
lower phonon vibrations in 180–190 cm�1 range, band at
241 cm�1, triplet at 305, 330 and 374 cm�1 and bands at
448 cm�1, 498 cm�1, 560 cm�1 are seen in theFAR IRspectra
of film C. Out of these, only few peaks including triplet
around 300 cm�1 and low lying phonon frequencies are
seen in other films.While peaks at the positions of 156, 420,
498 and 560 cm�1 are seen to be shifted on higher
wavenumber side for all other films except film C. For film
C, characteristic bands for yttrium oxide (�305 cm�1,
330 cm�1 and 376 cm�1) are well resolved and sharp as
reported previously.[13] Triplet intensity is decreasing for
film A (low oxygen flow), as well as for film E (high oxygen
flow), as seen from the Figure 7. This decrease in the
intensity and increase in thewidth of the IR bands towards
filmAandfilmEare basically indicative of a decrease in the
particle size of the yttrium oxide in the film.[14] These
observations support the XRD results as discussed in the
previous section. MID-IR bands for the films are shown in
theFigure8. It is observed that, thesebandsarevery intense
incaseof thefilmsA,DandE. SmallpeaksofO�Hstretching
mode of free hydroxyl groups,[15] in the range of 3 500–
www.plasma-polymers.org 745

200 400 600 800 1000 1200
1.681.761.84
200 400 600 800 1000 12001.61.71.81.9
200 400 600 800 1000 1200
2.22
2.28
2.34200 400 600 800 1000 1200
1.98
2.01
2.04
200 400 600 800 1000 1200
1.8
2.0
2.2
E
Wavelength (nm)
D
C
Ref
ract
ive
Inde
x (n
)
B
A
Figure 9. Variation of refractive index with the wavelength forthe deposited films.
1000 1500 2000 2500 3000 3500 40000.00
0.25
0.50
1000 1500 2000 2500 3000 3500 40000.00
0.08
0.16
1000 1500 2000 2500 3000 3500 40000.00
0.15
0.30
1000 1500 2000 2500 3000 3500 40000.00
0.35
0.70
1000 1500 2000 2500 3000 3500 40000.00
0.35
0.70
A
B
Cou
nts
(arb
. uni
ts)
C
D
Wavenumber (cm-1)
E
Figure 8. MID-IR reflectance spectra for the deposited films.
746
S. Barve et al.
3 700 cm�1 are seen in all films which support the
observations from Y 3d peak in the XPS analysis
(Figure 3). At 1 772 cm�1, a strong and wide peak is seen
for film D, which indicates that some carbonyl groups are
present in the film.[15] A significant peak corresponding to
�C¼C� stretchmode[16] isalso found forfilmsAandE in the
range of 1 640–1 680 cm�1. C�H bending modes (1 450–
1 470 cm�1) are found for all films, but are very strong for
filmsA, D and E.[15] Films A andD also show the presence of
some C�O groups represented by the band at 1 300 cm�1,
but this band for filmD ismore intense than that for filmA.
MID-IR results thus support theXPSanalysis confirming the
existence of hydroxide and carbonate bonding in the films,
which are due to the adsorbed contaminations of the film
surfaces. Though quantitative analysis from IR spectra is
notaccurate, it canbeseenthat,hydrogenandcarbonbands
are very significant for films A, D and E as compared to that
for film C and film B.
Ellipsometry
Optical properties of the films are studied by spectroscopic
ellipsometry. Variations of refractive index (n) for the films
with wavelength are shown in the Figure 9. Variation in n
for film A are drastic over the wavelength range. Film B is
having higher n values (2.05 to 1.985) and better trend over
the range of wavelength. Variation in the n values (2.35 to
Plasma Process. Polym. 2011, 8, 740–749
� 2011 WILEY-VCH Verlag GmbH & Co. KGaA, Weinheim
2.21) for the film C is matching the reported values for the
cubic yttrium oxide.[17,18] Again for film D, n values vary in
the range of 1.62 to 1.89 over thewavelength range. Finally
for film E, refractive index is low as compared to the other
films. Figure 10 gives the variation in the extinction
coefficient (k) of the films in the spectral region of 300–
1 200nm. k values for the films give a similar trends as
found for that of n over the wavelength. From Figure 9 and
Figure 10, it is observed that, film C is giving minimum
valueof absorption (near to zero)with thevalues increasing
towards film A as well as film E.
Nanoindentation
Using a Berkovich diamond indenter nine indents were
made on each filmand the values of elasticmodulus (E) and
hardness (H) are calculated as the average. Variations in the
E andH values for the films are shown in the Figure 11 and
Figure 12, respectively. Considering the error bars shown in
the graph it is seen that, E is higher for film C, while it
decreases towardsfilmAandfilmE. Similar trend is seen for
H values for the films (Figure 12). Some inconsistency in the
hardness value of film C is observed possibly because the
hardness of the film is an intrinsic property of thematerial,
which depends on the interplay between the sliding planes
present and residual porosity in the crystal structure.
DOI: 10.1002/ppap.201000147

200 400 600 800 1000 12000.000.060.120.18
200 400 600 800 1000 12000.000.080.160.24
200 400 600 800 1000 1200
0.00.61.2
200 400 600 800 1000 12000.00.10.20.3
200 400 600 800 1000 12000.100.150.200.25
E
Wavelength (nm)
D
C
Extin
ctio
n C
oeff.
(k)
B
A
Figure 10. Variation of extinction coefficient with the wavelengthfor the deposited films.
1 3 4 7 9
40
60
80
100
120
140
160
Elas
tic M
odul
us (G
Pa)
Oxygen flow rate (sccm)
Figure 11. Elastic modulus variation for the deposited films.
1 3 4 7 9
3
4
5
6
7
8
Har
dnes
s (G
Pa)
Oxygen flow rate (sccm)
Figure 12. Hardness variation for the deposited films.
Microwave ECR Plasma Assisted MOCVD of Y2O3 Thin Films . . .
Discussion
GAXRDresults showthestructural changes in thedeposited
films with the variation in oxygen flow rates during the
depositions. From the observations, it is clear that a single
phase cubic yttrium oxide structure is formed only at an
optimum oxygen gas flow rate (oxygen partial pressure)
Plasma Process. Polym. 2011, 8, 740–749
� 2011 WILEY-VCH Verlag GmbH & Co. KGaA, Weinheim
during deposition. Decreasing or increasing oxygen flow
rate changes the nature of the deposited phase in the film
from BCC Y2O3 to hex Y(OH)3. FAR-IR results confirm the
presence of BCC Y2O3 phase in all films. Decrease in the
intensity of bandswith theassociated increase in thewidth
of the bands is seen in the FAR-IR spectra and support the
GAXRD observations in respect to decrease in the grain size
of BCC yttrium oxide towards film A and E. Replacement of
‘O’ atoms in Y2O3 by ‘OH’ groups possibly increases the
bindingenergyofY�Obond,which isvisible fromtheslight
shift of some of the FAR-IR bands towards higher wave
number side (Figure 7) for films A, B, D and E as discussed
earlier. It has been known that, hex Y(OH)3 structure has an
intrinsic tendency to grow in the rod/tube like structure
where hexagonal columns are developed in the ‘c’ direction
of the crystal structure.[19] Deposition ofmixture of phases,
as well as columnar growth of hex Y(OH)3 increases the
voids in the films[20] towards films A and E. Yttrium oxide
being hygroscopic in nature, voids generated in the films
are susceptible to the adsorption and absorption of
moisture and atmospheric carbon dioxide into the film
leading to the formation of hydroxides and carbonates in
the films. This effect adds up to the effect of structural
change fromBCC Y2O3 (filmC) to hex Y(OH)3 towards filmA
and E, showing the maximum presence of hydroxide and
carbonate groups in the MID-IR spectra of these films. XPS
results support the observations from MID-IR spectra,
thoughquantitative estimationof different phaseswasnot
possiblewith the technique. Increase in thevoids andhence
increase in thewater susceptible sites in thefilmsdecreases
the refractive indices, as well as make them thermodyna-
mically unstable.[18,21] These effects are seen with the
decrease in thenand increase in thekvalues towardsfilmA
andEasseen fromtheellipsometry results (Figure9and10).
www.plasma-polymers.org 747

748
S. Barve et al.
It has been found that, porosity andwater adsorption in the
film increases with the increase in the thickness of
the films.[21] Decrease in the density of the films with the
increase in thevoidspresent in thedepositedfilmshasbeen
correlated by some investigators.[22]Minimumthickness of
film C with n and k variations approximating to the bulk
value of BCC-Y2O3 is an evidence of these effects. Oxygen
flow variations during the deposition changes the rough-
ness of the films due to the columnar growth of the
film.[22,23] This also explains why hexagonal Y(OH)3structures are found to have high surface roughness.
Thin films generally grow in the columnar fashion, but
efficient plasma ion activity and heavy ion bombardment
can convert the tensile stresses in the films to compressive
stresses increasing the lateral mobility of the adatoms at
the substrate surface.[16,20] Structural change of theyttrium
oxide film to amost stable cubic structure (filmC) indicates
thepresenceofmostefficientoxygen ionactivityduring the
deposition. Efficient ion activity during deposition leads to
more dense coatings andmore sputtering of loosely bound
species from the substrate surface in the plasma. Effects of
this are seen in terms of the preferred growth of a single
phase as well as in the decrease of thickness and growth
rates of the film C.
MicrowaveECRplasmagenerationoperates efficiently in
the optimum conditions of operating pressure (10�3 to
10�5 mbar pressure range). Plasma is efficiently ionized in
this pressure range giving maximum ion activity in the
plasma.[24,25] When oxygen flow is increased during the
deposition, the plasma generation process deviates from
this optimum pressure range of efficient ionization. Hence,
ion density, as well as ion energy is changed, which further
affects the ionization of precursor gas in the deposition
chamber and chemistry at the surface of the substrate in
such away that, films D and E give amixture of cubic oxide
and hexagonal hydroxide phase of yttrium even in the
presence of high oxygen flow rate. This indicates that, not
only the high oxygen flow rate but also the efficient
ionization of the gases are important for getting the
required phase formation during the plasma depositions of
yttrium oxide films. When oxygen partial pressure
decreases in the system, hexagonal hydroxide phase (film
A) isdeveloped. This canbeexplainedasbelow.Oxygen ions
play a dual role during the deposition process. First, it helps
in the deposition of yttrium oxide film on the substrate by
oxidizing the yttrium containing species, and, secondly,
they are also utilized in removal of unwanted carbon and
hydrocarbon species that are generated in the plasma due
to precursor decomposition. When oxygen flow rate is
decreased to 1 sccm (film A), oxygen ion activity that is
generated in thedepositionsystemispossiblynotsufficient
to completely oxidize the yttrium containing species in the
plasma. This possibly leads to the incorporation of more
hydrogen and carbon containing species in the film A,
Plasma Process. Polym. 2011, 8, 740–749
� 2011 WILEY-VCH Verlag GmbH & Co. KGaA, Weinheim
which help in the deposition of hydroxide phase. These
observations thus clearly indicate that optimization of
the oxygen flowwith the precursor flow rate, as well as the
optimization of the plasma ion activity during deposition,
are important factors for the deposition of a single phase
film.
Conclusion
Single phase cubic Y2O3 thin films are successfully
deposited on various substrates using microwave ECR
Plasma assisted CVD process and indigenously developed
precursor Y(tod)3 at a low substrate temperatures of 350 8C.The characterization results from various techniques are
supporting each other. The investigations reported here
clearly bring out the role of oxygen activity in the plasma
during the deposition of Y2O3 films using microwave ECR
plasma CVD process. The ECR CVD process being pressure
sensitive, increase in the oxygen flow rate during the
depositiondoesnotguarantee thesupplyof enoughoxygen
ions tohelp ingetting stoichiometric/singlephase coatings.
Properties of the deposited films are dependent on the
controlling parameters, and slight tuning of those para-
meters can bring the required changes in the film proper-
ties. The investigations reported here indicate that it is
essential tokeep theoptimumflowrateofoxygengas in the
system for depositing good quality C-Y2O3 film by ECR
plasma MOCVD process.
Acknowledgements: The authors are thankful to Prof. R. O.Dusane, IIT Mumbai, for his help during GAXRD work. Thanksare due to Dr. R. Mishra, Chemistry Division, BARC, Mumbai, forhis help during TGA work and Prof. R. Pintoo, IIT Mumbai, for hishelp during ellipsometry measurements. The authors are alsothankful to Mr. N. Chand, L&PTD, BARC, Mumbai, for his helpduring the deposition experiments.
Received: October 19, 2010; Revised: March 9, 2011; Accepted:March 16, 2011; DOI: 10.1002/ppap.201000147
Keywords: electron cyclotron resonance (ECR); low-pressuredischarges; oxides; plasma-enhanced chemical vapor deposition(PECVD); thin films
[1] Chemical Vapor Deposition: Precursors, Processes and Appli-cations, A. C. Jones, M. L. Hitchman, Eds., RSC Publishing, UK2009.
[2] S. A. Barve, N. S. Nandurkar, N. Chand, S. B. Singh, N. Mithal,Jagannath, B. M. Bhanage, D. S. Patil, L. M. Gantayet, J. Phys.:Conf. Ser. 2008, 114, 012045.
DOI: 10.1002/ppap.201000147

Microwave ECR Plasma Assisted MOCVD of Y2O3 Thin Films . . .
[3] J. Asmussen, J. Vac. Sci. Technol. 1989, A7, 883.[4] H. Mols,B L. Niinisto, M. Utriainen, Adv. Mater. Opt. Electron.
1994, 4, 389.[5] W. C. Andersen, B. C. Noll, S. P. Sellers, L. L. Whildin, R. E.
Sievers, Inorg. Chim. Acta 2002, 336, 105.[6] W. S. Rees, Jr., A. R. Barron, Mater. Sci. Forum 1993, 137-139,
473.[7] India 236638 (2009), B. M. Bhanage, N. S. Nandurkar, D. S. Patil.[8] S. A. Barve, Jagannath, N. Mithal, M. N. Deo, N. Chand, B. M.
Bhanage, L. M. Gantayet, D. S. Patil, Surf. Coat. Technol. 2010,204, 3167.
[9] T. Gougousi, Z. Chen, Thin Solid Films 2008, 516, 6197.[10] M. B. Pomfret, C. Stoltz, B. Varughese, R. A. Walker, Anal.
Chem. 2005, 77, 1791.[11] V. Craciun, J. Howard, E. S. Lambers, R. K. Singh, D. Craciun,
J. Perriere, Appl. Phys. 1999, A 69 [Suppl.], S535.[12] C. Durand, C. Dubourdieu, C. Vallee, V. Loup, M. Bonvalot,
O. Joubert, H. Roussel, O. Renault, J. Appl. Phys. 2004, 96, 1719.[13] Y. Repelin, C. Proust, E. Husson, J. M. Beny, J. Solid State Chem.
1995, 118, 163.[14] R. Srinivasan, R. Yogamalar, A. Chandra Bose,Mater. Res. Bull.
2010, 45, 1165.
Plasma Process. Polym. 2011, 8, 740–749
� 2011 WILEY-VCH Verlag GmbH & Co. KGaA, Weinheim
[15] W. Li, X. Wang, Y. Li, Chem. Commun. 2004, 2, 164.[16] S. A. Barve, Jagannath, M. N. Deo, R. Kishore, A. Biswas, L. M.
Gantayet, D. S. Patil, Appl. Surf. Sci. 2010, 257, 215.[17] Y. Nigara, Jpn. J. Appl. Phys. 1968, 7, 404.[18] X. J. Wang, L. D. Zhang, J. P. Zhang, G. He, M. Liu, L. Q. Zhu,
Mater. Lett. 2008, 62, 4235.[19] Y. Mao, J. Y. Huang, R. Ostroumov, K. L. Wang, J. P. Chang,
J. Phys. Chem. C 2008, 112, 2278.[20] J. J. Cuomo, J. M. E. Harper, C. R. Guarnieri, D. S. Yee, L. J.
Attanasio, J. Angilello, C. T. Wu, R. H. Hammond, J. Vac. Sci.Technol. 1982, 20, 349.
[21] D. F. Bezuidenhout, R. Pretorius, Thin Solid Films 1986, 139,121.
[22] G. Atanassov, R. Trielsch, D. Popov, Thin Solid Films 1993, 223,288.
[23] M. M. Giangregorio, M. Losurdo, A. Sacchetti, P. Capezzuto,G. Bruno, G. Malandrino, I. L. Fragala, R. L. Nigro, L. Armelao,D. Barreca, E. Tondello, Appl. Phys. Lett. 2007, 91, 061923.
[24] S. Geisler, A. Brockhaus, J. Engemann, J. Vac. Sci. Technol. 2001,A19, 539.
[25] W. J. Varhue, M. Massimo, J. M. Carrullis, V. Baranauskas,E. Adams, E. Broitman, J. Vac. Sci. Technol. 1993, A11, 1870.
www.plasma-polymers.org 749


